World Agricultural Supply and Demand Estimates Office of the Chief Economist Agricultural Marketing...
40
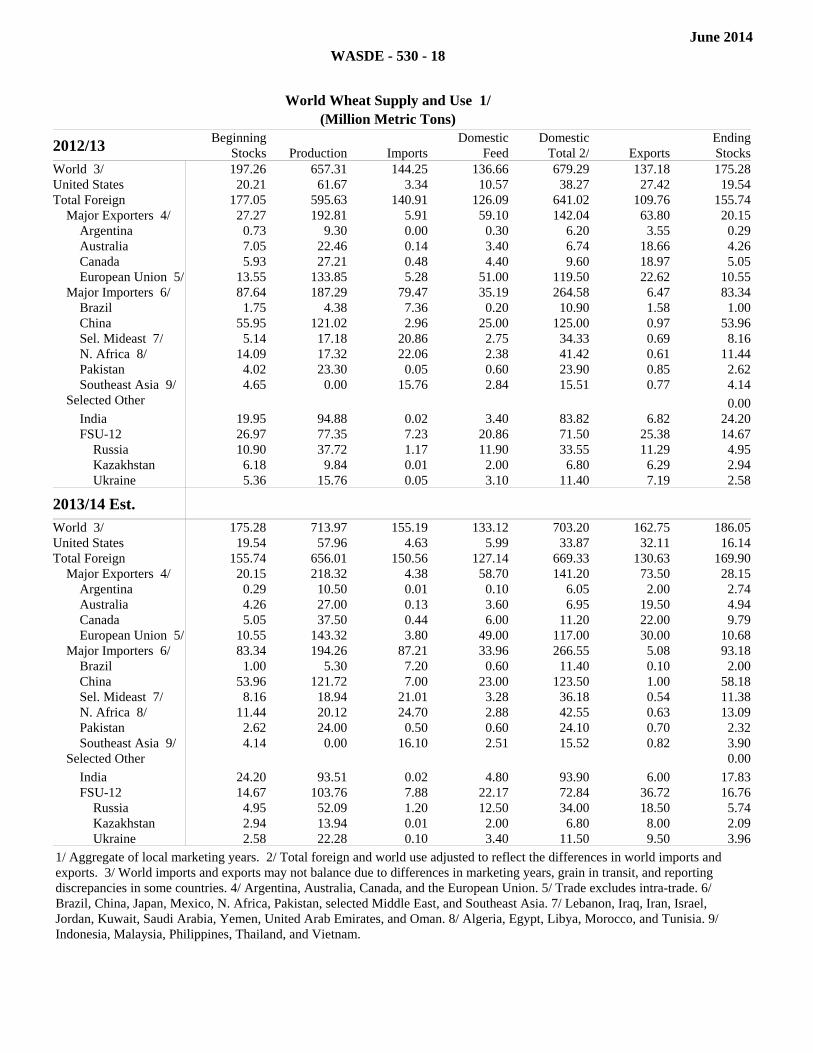
ISSN: 1554-9089 World Agricultural Supply and Demand Estimates Office of the Chief Economist Agricultural Marketing Service Farm Service Agency Economic Research Service Foreign Agricultural Service WASDE - 530 Approved by the World Agricultural Outlook Board June 11, 2014 Note: Because planting is still underway in the Northern Hemisphere and remains several months away in the Southern Hemisphere, these projections are highly tentative. National Agricultural Statistics Service (NASS) forecasts are used for U.S. winter wheat area, yield, and production. For other U.S. crops, methods used to project acreage and yield are noted on each table. WHEAT: Projected U.S. wheat supplies for 2014/15 are lowered this month as an increase in beginning stocks is more than offset by a reduction in forecast winter wheat production. Beginning stocks are raised with a 10-million-bushel reduction in 2013/14 food use and offsetting 5-million-bushel reductions in 2013/14 imports and exports. Projected production for 2014/15 is down 21 million bushels as reduced prospects for Hard Red Winter (HRW) wheat in the Southern and Central Plains and White Winter wheat in the Pacific Northwest more than outweigh higher forecast Soft Red Winter wheat production across the South and Midwest. Projected food use is lowered 10 million bushels for 2014/15 and for 2013/14. This month’s reduced outlook for food use assumes a higher flour extraction rate for both marketing years. Exports for 2014/15 are projected 25 million bushels lower with tighter supplies of HRW wheat and stronger competition from major exporters. Projected ending stocks are raised 34 million bushels. The projected range for the 2014/15 season-average farm price is lowered 30 cents on both ends to $6.35 to $7.65 per bushel based on the larger expected carryout, higher global production, and recent sharp declines in futures prices. Global wheat supplies for 2014/15 are raised 4.1 million tons as a 5.2-million-ton increase in foreign production is only partly offset by a 0.8-million-ton reduction in foreign beginning stocks and this month’s lower U.S. production outlook. Beginning stocks are lowered for Australia, Russia, and Turkey with increases in 2013/14 exports this month. World production for 2014/15 is projected at 701.6 million tons, up 4.6 million from last month with increases for India, the European Union, China, and Russia more than offsetting the decline in U.S. output. India production is raised 1.9 million tons based on the latest official government estimate. European Union production is raised 1.4 million tons as spring and early summer rainfall support higher yield outlooks for France, Germany, Poland, Romania, and Bulgaria. Production for China and Russia is raised 1.0 million tons each as favorable growing conditions also support higher expected yields. Dr. Gerald Bange retired as Chairperson for the World Agricultural Outlook Board on May 31, 2014. A USDA employee since 1971, Dr. Bange worked for USDA’s Agricultural Research Service and Foreign Agricultural Service before joining the Board in 1983. Dr. Bange was appointed Chairperson in 1994 and supervised the publication of 221 consecutive WASDE reports. Under his leadership, the WASDE report has become the authoritative source in the United States and around the world for commodity market outlook and intelligence.
-
Upload
independent -
Category
Documents
-
view
1 -
download
0
Transcript of World Agricultural Supply and Demand Estimates Office of the Chief Economist Agricultural Marketing...
ISSN: 1554-9089
World Agricultural Supply and Demand Estimates
Office of the Chief Economist
Agricultural Marketing Service Farm Service Agency
Economic Research Service Foreign Agricultural Service
WASDE - 530 Approved by the World Agricultural Outlook Board June 11, 2014 Note: Because planting is still underway in the Northern Hemisphere and remains several months away in the Southern Hemisphere, these projections are highly tentative. National Agricultural Statistics Service (NASS) forecasts are used for U.S. winter wheat area, yield, and production. For other U.S. crops, methods used to project acreage and yield are noted on each table. WHEAT: Projected U.S. wheat supplies for 2014/15 are lowered this month as an increase in beginning stocks is more than offset by a reduction in forecast winter wheat production. Beginning stocks are raised with a 10-million-bushel reduction in 2013/14 food use and offsetting 5-million-bushel reductions in 2013/14 imports and exports. Projected production for 2014/15 is down 21 million bushels as reduced prospects for Hard Red Winter (HRW) wheat in the Southern and Central Plains and White Winter wheat in the Pacific Northwest more than outweigh higher forecast Soft Red Winter wheat production across the South and Midwest. Projected food use is lowered 10 million bushels for 2014/15 and for 2013/14. This month’s reduced outlook for food use assumes a higher flour extraction rate for both marketing years. Exports for 2014/15 are projected 25 million bushels lower with tighter supplies of HRW wheat and stronger competition from major exporters. Projected ending stocks are raised 34 million bushels. The projected range for the 2014/15 season-average farm price is lowered 30 cents on both ends to $6.35 to $7.65 per bushel based on the larger expected carryout, higher global production, and recent sharp declines in futures prices. Global wheat supplies for 2014/15 are raised 4.1 million tons as a 5.2-million-ton increase in foreign production is only partly offset by a 0.8-million-ton reduction in foreign beginning stocks and this month’s lower U.S. production outlook. Beginning stocks are lowered for Australia, Russia, and Turkey with increases in 2013/14 exports this month. World production for 2014/15 is projected at 701.6 million tons, up 4.6 million from last month with increases for India, the European Union, China, and Russia more than offsetting the decline in U.S. output. India production is raised 1.9 million tons based on the latest official government estimate. European Union production is raised 1.4 million tons as spring and early summer rainfall support higher yield outlooks for France, Germany, Poland, Romania, and Bulgaria. Production for China and Russia is raised 1.0 million tons each as favorable growing conditions also support higher expected yields.
Dr. Gerald Bange retired as Chairperson for the World Agricultural Outlook Board on May 31, 2014. A USDA employee since 1971, Dr. Bange worked for USDA’s Agricultural Research Service and Foreign Agricultural Service before joining the Board in 1983. Dr. Bange was appointed Chairperson in 1994 and supervised the publication of 221 consecutive WASDE reports. Under his leadership, the WASDE report has become the authoritative source in the United States and around the world for commodity market outlook and intelligence.
WASDE-530-2
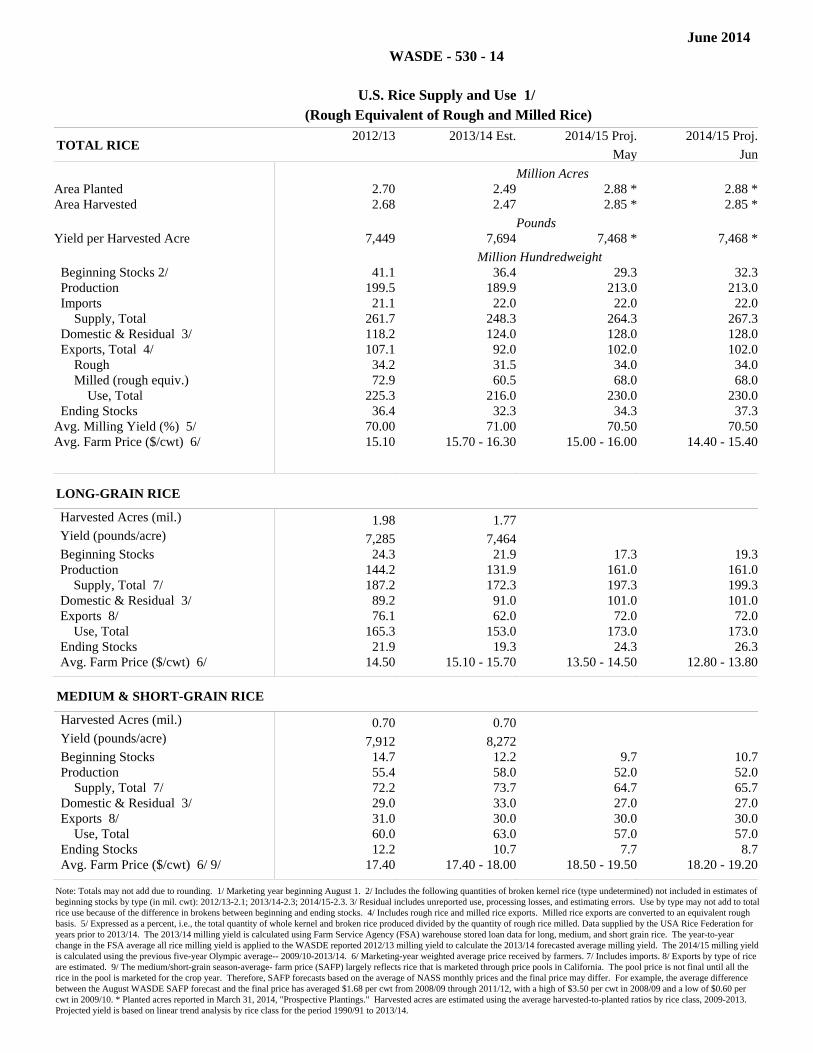
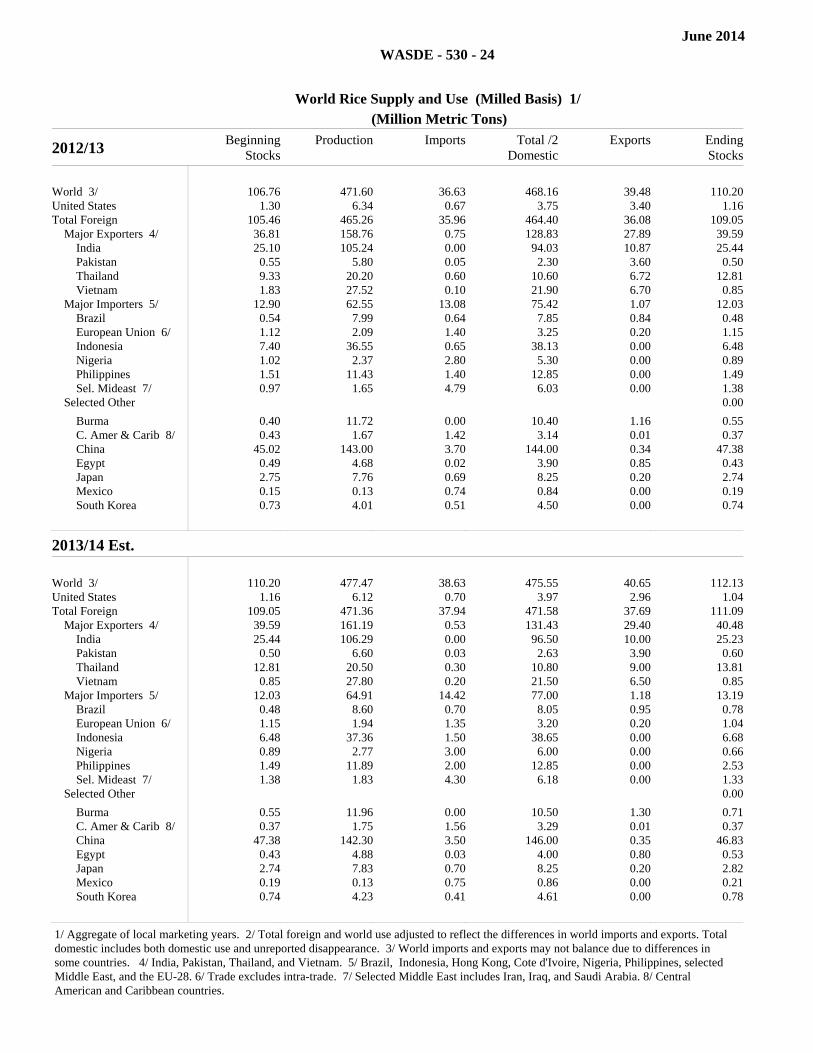
Global wheat trade and consumption for 2014/15 are raised with larger foreign supplies. Trade and consumption are also raised for 2013/14. Increases in world imports and exports for 2014/15 are relatively small, but world consumption is raised 2.9 million tons with increased feeding expected in China and the European Union and increased food use projected for India, all supported by larger crops. Exports for 2014/15 are raised 0.5 million tons each for the European Union and Russia, more than offsetting this month’s reduction in U.S. export prospects. World ending stocks for 2014/15 are projected 1.2 million tons higher with much of the increase in the United States. At 188.6 million tons, global stocks are up 2.6 million year-to-year. COARSE GRAINS: The outlook for 2014/15 U.S. feed grain supplies is virtually unchanged this month with only small changes made to barley and oats imports and exports for 2013/14. Other feed grain balance sheet items are unchanged for both marketing years. Projected corn production for 2014/15 is unchanged at a record 13,935 million bushels. The projected U.S. corn yield remains at 165.3 bushels per acre as a slightly slower-than-normal mid-May planting progress is expected to be offset by very favorable early season crop and weather conditions. U.S. crop conditions in the most recent Crop Progress report are the best in 4 years for the aggregated 18 reported states and better than any time since 2007 for the Corn Belt. The projected range for the 2014/15 season-average farm price is unchanged at $3.85 to $4.55 per bushel and below this month’s lower projected 2013/14 range of $4.45 to $4.65 per bushel. The 2013/14 price range is lowered 10 cents per bushel at the midpoint based on prices reported to date and the recent decline in nearby cash and futures prices. Global coarse grain supplies for 2014/15 are projected 2.3 million tons higher mostly with larger corn beginning stocks and production. Higher 2013/14 corn production for Brazil and India raise 2014/15 beginning stocks for both countries. Lower 2013/14 corn exports for Argentina also add to 2014/15 beginning stocks. Higher 2013/14 corn imports boost 2014/15 beginning stocks for Colombia, Egypt, and Turkey. Ukraine and China 2014/15 corn beginning stocks are lowered with higher 2013/14 exports for Ukraine and lower 2013/14 imports for China. Despite an increase in 2013/14 South Africa corn production, 2014/15 beginning stocks decline with higher 2013/14 consumption and exports. Global corn production for 2014/15 is raised 2.0 million tons with increases for Ukraine, the European Union, and Russia. Ukraine and Russia production are raised 1.0 million tons and 0.5 million tons, respectively, on higher expected yields as the latest trade data for both countries confirm further expansion in the use of imported hybrid seed corn. European Union production is raised 0.6 million tons with increases for Germany and central Europe reflecting improved early season growing conditions in the region. Serbia corn output is reduced slightly with less expected area. Global 2014/15 coarse grain trade is mostly unchanged this month except for small increases in corn and barley imports for Turkey. Global corn consumption is raised 1.8 million tons with increased feed use projected for Turkey, the European Union, Ukraine, and Russia. Global corn ending stocks for 2014/15 are projected 0.9 million tons higher with increases for Argentina, Brazil, Colombia, Egypt, India, and Russia partly offset by reductions for China, Ukraine, and South Africa. RICE: Rice supply and use 2014/15 balance sheets are changed little from last month. All rice beginning stocks for 2014/15 are raised 3.0 million cwt, long-grain rice stocks are raised 2.0

WASDE-530-3
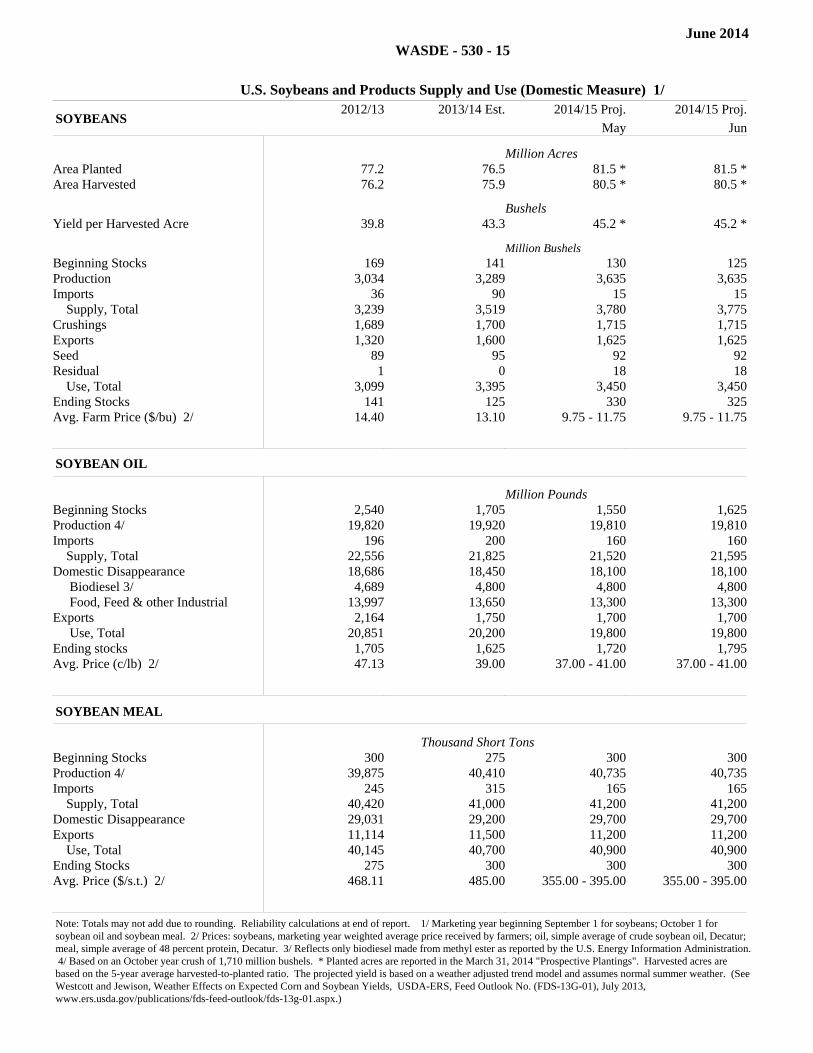
million, and combined medium- and short-grain stocks are up 1.0 million. The 2014/15 beginning stocks changes flow through the balance sheets to 2014/15 ending stocks. All rice 2014/15 ending stocks are raised 3.0 million cwt to 37.3 million—the largest stocks since 2011/12. Long-grain ending stocks are raised 2.0 million cwt to 26.3 million—the largest since 2010/11. Combined medium- and short-grain ending stocks are raised 1.0 million cwt to 8.7 million. All rice 2013/14 exports are lowered 3.0 million cwt to 92.0 million, long-grain exports are lowered 2.0 million to 62.0 million, and combined medium- and short-grain rice exports are lowered 1.0 million to 30.0 million. Rough rice exports and milled rice exports for 2013/14 are each lowered 1.5 million cwt to 31.5 million and 60.5 million (rough-equivalent basis), respectively. U.S. exports and export commitments to Central America, Africa, Venezuela, and Northeast Asia are lagging through May compared to a year ago. The 2014/15 U.S. long-grain rice season-average farm price is projected at $12.80 to $13.80 per cwt, down 70 cents per cwt on each end from a month ago and compares to a revised $15.10 to $15.70 per cwt for 2013/14. The 2014/15 combined medium- and short-grain rice season-average farm price is $18.20 to $19.20 per cwt, a decrease of 30 cents per cwt on each end from last month and compares to a revised $17.40 to $18.00 per cwt for 2013/14. The 2014/15 U.S. all rice season-average farm price is projected at $14.40 to $15.40 per cwt, down 60 cents per cwt on each end from a month ago and compares to a revised $15.70 to $16.30 per cwt for 2013/14. Global 2014/15 rice supply and use is little changed from a month ago. Global rice production is projected at a record 480.7 million tons, unchanged from a month ago. Global 2014/15 trade (imports and exports) are unchanged from a month ago. Global 2014/15 consumption is lowered slightly from last month. Ending stocks for 2014/15 are raised 0.9 million tons due mostly to an increase for India. Rice production for 2013/14 in India is raised 1.3 million tons to a record 106.3 million tons based on official statistics from the government of India. OILSEEDS: This month’s U.S. soybean supply and use projections for 2014/15 include a small reduction in beginning and ending stocks. Lower beginning stocks reflect a higher crush projection for 2013/14. Soybean crush for 2013/14 is raised 5 million bushels to 1,700 million reflecting an increase in projected soybean meal exports. Soybean meal exports are projected at 11.5 million short tons, up 0.4 million from last month reflecting stronger-than-expected shipments this spring. Soybean ending stocks for 2013/14 are projected at 125 million bushels, down 5 million from last month. Ending stocks for 2014/15 are also reduced 5 million bushels to 325 million. The 2014/15 season-average price for soybeans is projected at $9.75 to $11.75 per bushel, unchanged from last month. Soybean meal and soybean oil prices are projected at $355 to $395 per short ton, and 37 to 41 cents per pound, respectively. Product price projections are also unchanged from last month. Global oilseed production for 2014/15 is projected at 516.0 million tons, up 0.8 million from last month. Rapeseed production for the European Union is raised 0.5 million tons to 22.0 million on improved yield prospects, mainly for the United Kingdom, Germany, Poland, and Romania. Other changes include increased soybean production for the European Union and increased
WASDE-530-4
cottonseed production for the United States. Cottonseed production is also raised for India for 2013/14. SUGAR: The Mexico 2013/14 forecast for sugar production is lowered from last month by 250,000 metric tons (MT) to 6.10 million MT as output continues to lag well behind last year’s pace. Given lower supplies and sharply higher domestic prices, total exports are reduced by 121,000 MT to 2.278 million. However, exports to the United States are raised based on the pace to date, and exports to the rest of the world are forecast lower. Ending stocks fall by 129,000 MT to 818,000 MT, or 19.0 percent of consumption. For 2014/15, beginning stocks and exports are forecast lower. However, relatively higher prices in the U.S. sugar market provide the incentive for increased 2014/15 exports to the United States. Total 2013/14 U.S. supply is forecast to rise by 261,000 short tons, raw value (STRV) with a 10,000 STRV increase in sugar from sugarcane production in Texas and a 251,000 STRV increase in imports. Imports under the re-export program are raised 100,000 STRV, based on industry estimates, and imports from Mexico are increased 151,000 STRV. With total use unchanged, ending stocks are forecast to rise to 15.0 percent of use, compared with 12.9 percent in May. Total 2014/15 U.S. supply is projected up 811,000 STRV, with increases in beginning stocks and imports more than offsetting reduced production. Beginning stocks, at 1.857 million STRV, are up 261,000 STRV. Total sugar production is lowered 140,000 STRV, due to lower sugarcane production in Florida and Louisiana based on processors’ first projections for 2014/15. Total imports are forecast 690,000 STRV above May due to increased shipments from Mexico. With no changes in total use, ending stocks are forecast to rise to 15.8 percent of 2014/15 use from 9.1 percent. LIVESTOCK, POULTRY, AND DAIRY: The forecast for total meat production in 2014 is lowered from last month as lower beef and broiler production more than offsets increased pork and turkey production. Beef production is lowered as the pace of steer and heifer slaughter in the second quarter is reduced. However, carcass weights are forecast slightly higher as feed prices have moderated. Pork production is forecast higher due to a combination of larger second-quarter slaughter and higher carcass weights for the year. USDA’s Quarterly Hogs and Pigs report will be released on June 27 and provide an indication of producer farrowing intentions for the remainder of the year. Broiler production is lowered from last month as the pace of expansion remains slow. Turkey production is raised on higher second-quarter production. Egg production is raised as strong table egg prices are expected to support increased production. For 2015, no change is made to red meat or turkey forecasts, but the forecast for broiler production is reduced for early 2015. Forecasts for 2014 beef imports are raised as demand for processing grade beef remains strong; no change is made to the export forecast. Pork imports and exports are raised based on April trade data. Broiler exports are reduced as production forecasts are lowered from last month. The slower pace of exports is expected to carry into 2015. Turkey exports are unchanged from last month. Cattle, hog, and turkey price forecasts for 2014 and 2015 are unchanged from last month. Broiler prices are raised for 2014 as supplies are forecast smaller, but 2015 prices are
WASDE-530-5
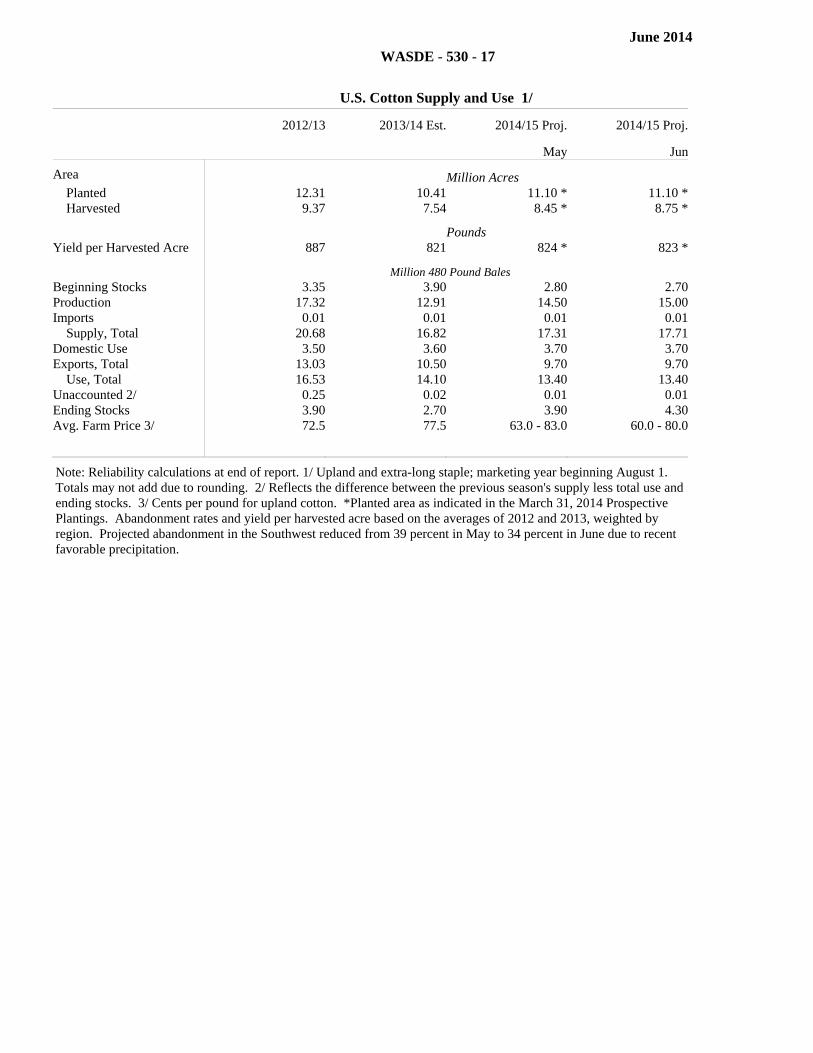
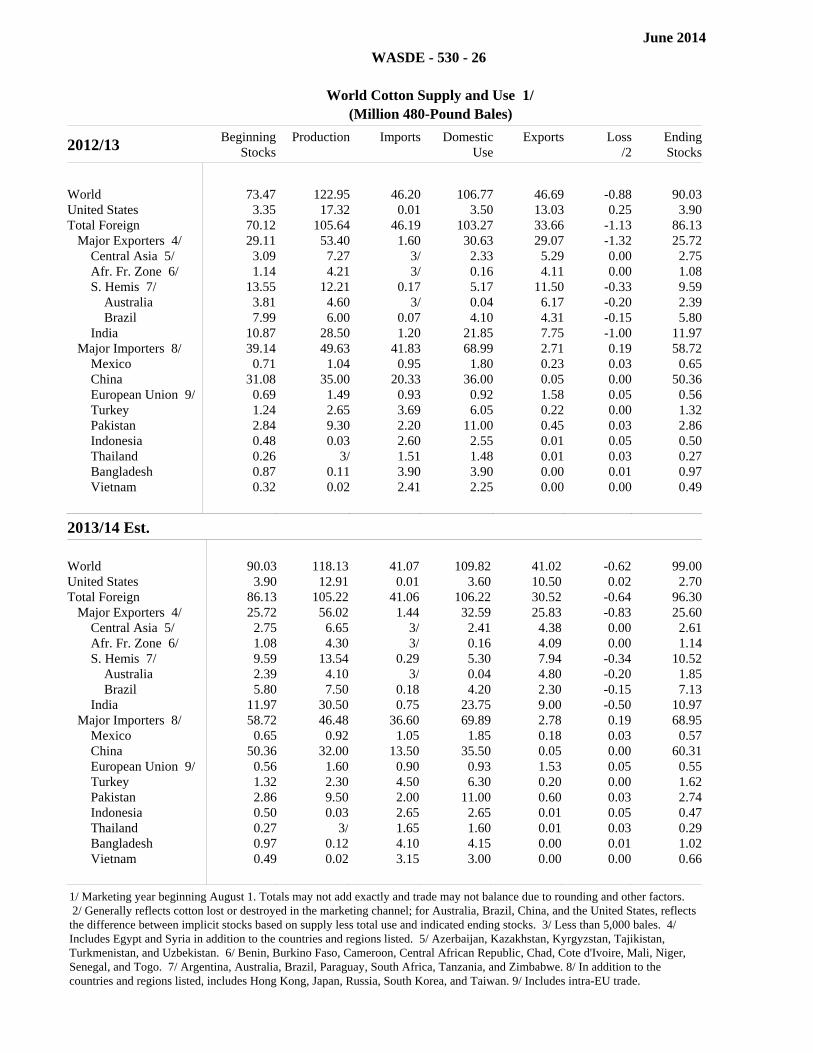
unchanged from last month. Egg prices for 2014 are raised from last month as demand remains strong; prices for 2015 are unchanged. Milk production forecasts for 2014 and 2015 are unchanged from last month. Export forecasts are raised on a fat basis for 2014 and 2015 with higher cheese exports. However, growth in 2014 exports is constrained by weaker butter sales as higher domestic prices have made U.S. butter less competitive on world markets. Skim-solids exports reflect strength in cheese and nonfat dry milk (NDM) exports. Imports for 2014 and 2015 are raised on higher imports of food ingredients. Cheese and butter prices for 2014 are forecast higher on strong demand for cheese and tight supplies of butter. The NDM price is lowered, but the whey price forecast is unchanged. Strength in butter prices is expected to carry into early 2015 resulting in an increase in the 2015 price, but the prices of cheese, NDM, and whey are unchanged from last month. Class III and Class IV prices for 2014 and 2015 are raised on stronger butterfat values. The all milk price is forecast at $22.90 to $23.30 per cwt for 2014 and $19.75 to $20.75 per cwt for 2015. COTTON: The 2014/15 U.S. cotton projections show higher production and ending stocks compared to last month. Projected abandonment in the Southwest has been reduced due to recent favorable rainfall, resulting in a production increase of 500,000 bales to 15.0 million. Overall U.S. abandonment is now projected at 21 percent, below the preceding 2 years, but above the long-run average, due to current subsoil moisture deficits in the Southwest. Domestic mill use and exports are unchanged from last month, resulting in ending stocks of 4.3 million bales. The forecast stocks-to-use ratio of 32 percent would be the highest in 6 years. The marketing-year average price received by producers is projected to range from 60 to 80 cents per pound, down 3 cents on both ends of the range. At the midpoint of 70 cents, prices would fall 10 percent from 2013/14. This month’s 2014/15 world projections include higher beginning and ending stocks, equivalent increases in production and consumption, and a decline in world trade. Beginning stocks are raised due mainly to a higher China import forecast for 2013/14 and higher 2013/14 production for India. For 2014/15, production is raised for the United States, while consumption is raised for India and Vietnam, but is lowered for Pakistan. World trade is reduced, as imports are lower for China and Pakistan, but higher for Vietnam. World stocks are raised nearly 1.1 million bales from last month. Approved by the Secretary of Agriculture and the Acting Chairperson of the World Agricultural Outlook Board Seth D. Meyer (202) 720-6030. This report was prepared by the Interagency Commodity Estimates Committees.
APPROVED BY:
ROBERT C. JOHANSSON
ACTING SECRETARY OF AGRICULTURE
WASDE-530-6
INTERAGENCY COMMODITY ESTIMATES COMMITTEES
Note: The World Agricultural Outlook Board reviews and approves the World Agricultural Supply and
Demand Estimates (WASDE) report. The Board’s analysts chair the Interagency Commodity
Estimates Committees (ICECs) that prepare the monthly report.
Wheat: Jerry Norton, ICEC Chair, WAOB, email: [email protected] Gary Vocke, ERS; Teresa McKeivier, FAS; Tom Tice, FSA. Rice: Andrew C. Aaronson, ICEC Chair, WAOB, email: [email protected] Nathan Childs, ERS; Debbie Rubas, FAS; Mark Simone, FSA. Feed Grains: Jerry Norton, ICEC Chair, WAOB, email: [email protected] Thomas Capehart, ERS; Richard O’Meara, FAS; Pete Riley, FSA. Oilseeds: Keith Menzie, ICEC Chair, WAOB, email: [email protected] Mark Ash, ERS; Bill George, FAS; Dale Leuck, FSA. Cotton: Carol Skelly, ICEC Chair, WAOB, email: [email protected] Darryl Earnest, AMS; Leslie Meyer, ERS; James Johnson, FAS; Scott Sanford, FSA. Sugar: David Stallings, Acting ICEC Chair, WAOB, email: [email protected] Stephen Haley, ERS; Ron Lord, FAS; Barbara Fecso, FSA. Meat Animals: Shayle Shagam, ICEC Chair, WAOB, email: [email protected] Sherry Wise, AMS; Kenneth Mathews, ERS; Claire Mezoughem, FAS; Dale Leuck, FSA. Poultry: Shayle Shagam, ICEC Chair, WAOB, email: [email protected] Larry Haller, AMS; David Harvey, ERS; Lazaro Sandoval, FAS; Milton Madison, FSA. Dairy: Shayle Shagam, ICEC Chair, WAOB, email: [email protected] Uthra Raghunathan, AMS; Roger Hoskin, ERS; Paul Kiendl, FAS; Milton Madison, FSA.
For 2014, the WASDE report release dates are: Jan 10, Feb 10, Mar 10, Apr 9, May 9, June 11, July 11, Aug 12, Sept 11, Oct 10, Nov 10, Dec 10
WASDE-530-7
T A B L E OF C O N T E N T S
Page
Highlights ............................................................................................................... 1
Interagency Commodity Estimates Committees ..................................................... 6
World & U.S. Supply & Use for Grains ................................................................... 8
World & U.S. Supply & Use for Cotton ................................................................... 9
World & U.S. Supply & Use for Oilseeds ............................................................. 10
U.S. Wheat Supply & Use .................................................................................... 11
U.S. Wheat Supply & Use by Class ..................................................................... 11
U.S. Feed Grain & Corn Supply & Use ................................................................ 12
U.S. Sorghum, Barley & Oats Supply & Use ........................................................ 13
U.S. Rice Supply & Use ....................................................................................... 14
U.S. Soybeans & Products Supply & Use ............................................................ 15
U.S. Sugar Supply & Use ..................................................................................... 16
Mexico Sugar Supply and Use ............................................................................. 16
U.S. Cotton Supply & Use .................................................................................... 17
World Wheat Supply & Use ................................................................................. 18
World Coarse Grains Supply & Use ..................................................................... 20
World Corn Supply & Use .................................................................................... 22
World Rice Supply & Use..................................................................................... 24
World Cotton Supply & Use ................................................................................. 26
World Soybean Supply & Use .............................................................................. 28
World Soybean Meal Supply & Use ..................................................................... 29
World Soybean Oil Supply & Use ........................................................................ 30
U.S. Quarterly Animal Product Production ........................................................... 31
U.S. Quarterly Prices for Animal Products ........................................................... 31
U.S. Meats Supply and Use ................................................................................. 32
U.S. Egg Supply & Use ........................................................................................ 33
U.S. Milk Supply and Use .................................................................................... 33
U.S. Dairy Prices ................................................................................................. 34
Reliability Tables ................................................................................................. 35
Related USDA Reports ........................................................................................ 38
Metric Conversion Factors ................................................................................... 38
Electronic Access and Subscriptions ....................................................................... 40
June 2014
WASDE - 530 - 8
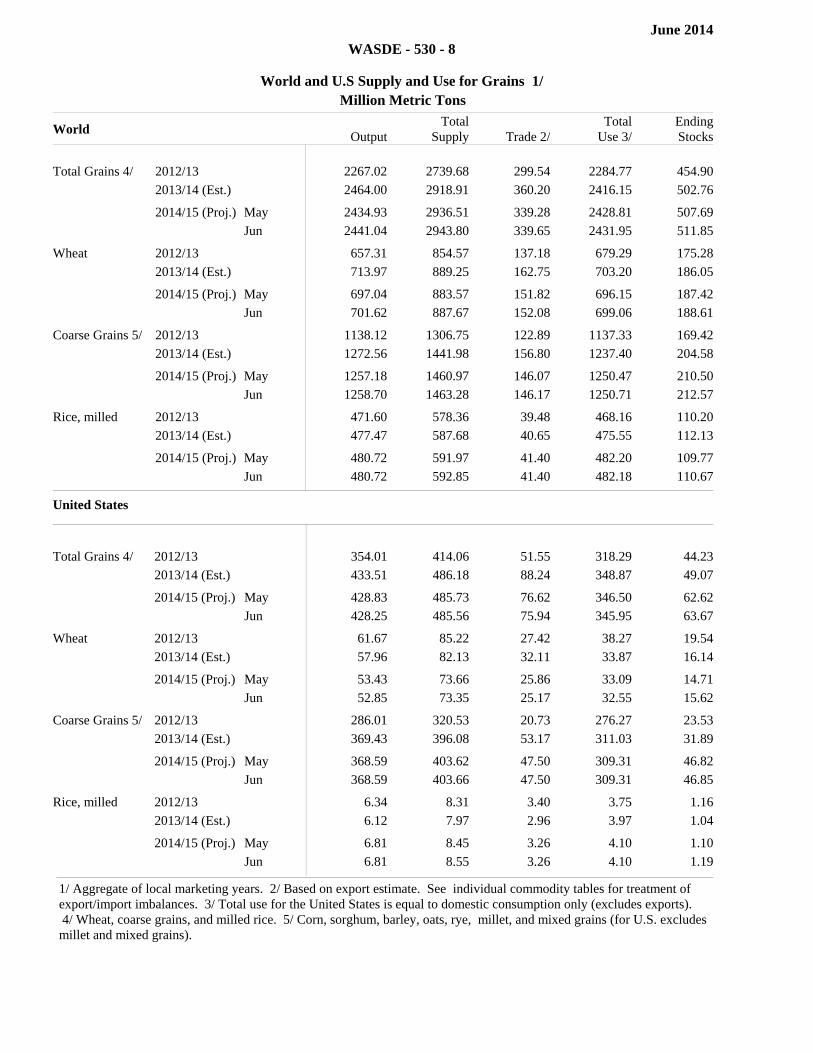
World and U.S Supply and Use for Grains 1/
Million Metric Tons
World Output
TotalSupply Trade 2/
TotalUse 3/
EndingStocks
Total Grains 4/ 2012/13 2267.02 2739.68 299.54 2284.77 454.90
2013/14 (Est.) 2464.00 2918.91 360.20 2416.15 502.76filler filler filler filler filler
2014/15 (Proj.) May 2434.93 2936.51 339.28 2428.81 507.69
2014/15 (Proj.) Jun 2441.04 2943.80 339.65 2431.95 511.85filler filler filler filler filler
Wheat 2012/13 657.31 854.57 137.18 679.29 175.28
2013/14 (Est.) 713.97 889.25 162.75 703.20 186.05filler filler filler filler filler
2014/15 (Proj.) May 697.04 883.57 151.82 696.15 187.42
2014/15 (Proj.) Jun 701.62 887.67 152.08 699.06 188.61filler filler filler filler filler
Coarse Grains 5/ 2012/13 1138.12 1306.75 122.89 1137.33 169.42
2013/14 (Est.) 1272.56 1441.98 156.80 1237.40 204.58filler filler filler filler filler
2014/15 (Proj.) May 1257.18 1460.97 146.07 1250.47 210.50
2014/15 (Proj.) Jun 1258.70 1463.28 146.17 1250.71 212.57filler filler filler filler filler
Rice, milled 2012/13 471.60 578.36 39.48 468.16 110.20
2013/14 (Est.) 477.47 587.68 40.65 475.55 112.13filler filler filler filler filler
2014/15 (Proj.) May 480.72 591.97 41.40 482.20 109.77
2014/15 (Proj.) Jun 480.72 592.85 41.40 482.18 110.67filler filler filler filler filler
United States Output
TotalSupply
Trade 2/ TotalUse 3/
EndingStocks
Total Grains 4/ 2012/13 354.01 414.06 51.55 318.29 44.23
2013/14 (Est.) 433.51 486.18 88.24 348.87 49.07filler filler filler filler filler
2014/15 (Proj.) May 428.83 485.73 76.62 346.50 62.62
2014/15 (Proj.) Jun 428.25 485.56 75.94 345.95 63.67filler filler filler filler filler
Wheat 2012/13 61.67 85.22 27.42 38.27 19.54
2013/14 (Est.) 57.96 82.13 32.11 33.87 16.14filler filler filler filler filler
2014/15 (Proj.) May 53.43 73.66 25.86 33.09 14.71
2014/15 (Proj.) Jun 52.85 73.35 25.17 32.55 15.62filler filler filler filler filler
Coarse Grains 5/ 2012/13 286.01 320.53 20.73 276.27 23.53
2013/14 (Est.) 369.43 396.08 53.17 311.03 31.89filler filler filler filler filler
2014/15 (Proj.) May 368.59 403.62 47.50 309.31 46.82
2014/15 (Proj.) Jun 368.59 403.66 47.50 309.31 46.85filler filler filler filler filler
Rice, milled 2012/13 6.34 8.31 3.40 3.75 1.16
2013/14 (Est.) 6.12 7.97 2.96 3.97 1.04filler filler filler filler filler
2014/15 (Proj.) May 6.81 8.45 3.26 4.10 1.10
2014/15 (Proj.) Jun 6.81 8.55 3.26 4.10 1.19filler filler filler filler filler
1/ Aggregate of local marketing years. 2/ Based on export estimate. See individual commodity tables for treatment of export/import imbalances. 3/ Total use for the United States is equal to domestic consumption only (excludes exports). 4/ Wheat, coarse grains, and milled rice. 5/ Corn, sorghum, barley, oats, rye, millet, and mixed grains (for U.S. excludes millet and mixed grains).
June 2014
WASDE - 530 - 9
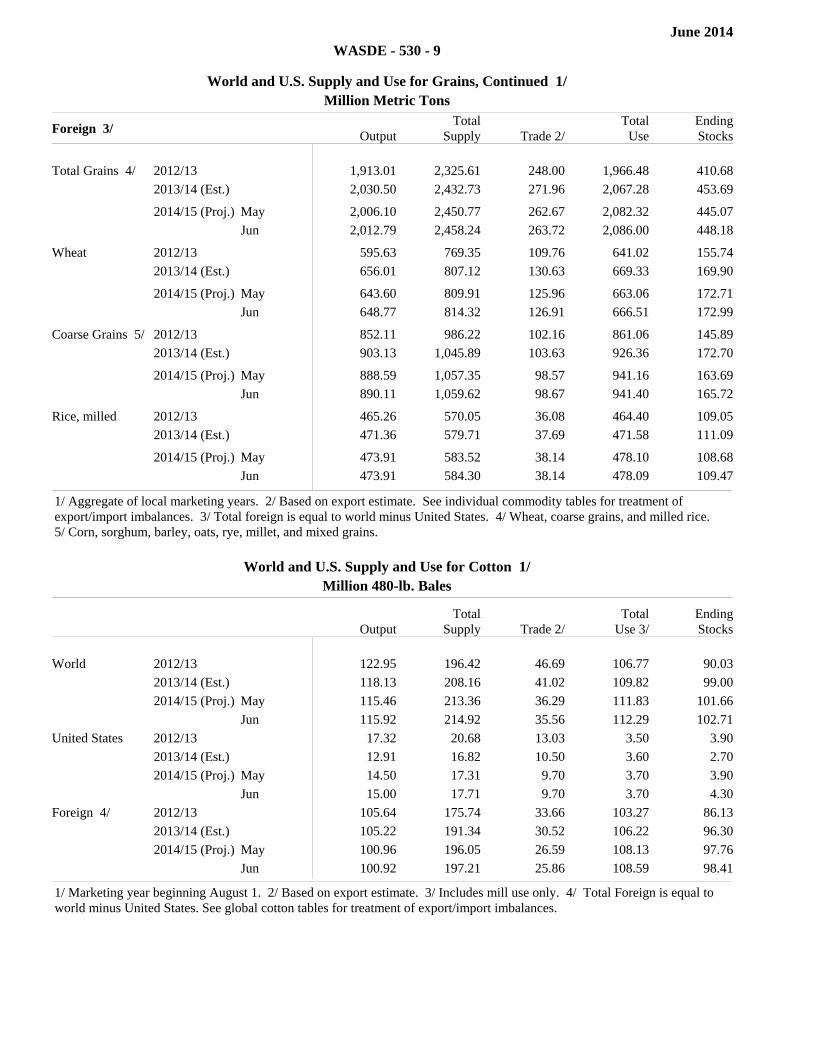
World and U.S. Supply and Use for Grains, Continued 1/
Million Metric Tons
Foreign 3/ Output
TotalSupply Trade 2/
TotalUse
EndingStocks
Total Grains 4/ 2012/13 1,913.01 2,325.61 248.00 1,966.48 410.68
2013/14 (Est.) 2,030.50 2,432.73 271.96 2,067.28 453.69filler filler filler filler filler
2014/15 (Proj.) May 2,006.10 2,450.77 262.67 2,082.32 445.07
2014/15 (Proj.) Jun 2,012.79 2,458.24 263.72 2,086.00 448.18filler filler filler filler filler
Wheat 2012/13 595.63 769.35 109.76 641.02 155.74
2013/14 (Est.) 656.01 807.12 130.63 669.33 169.90filler filler filler filler filler
2014/15 (Proj.) May 643.60 809.91 125.96 663.06 172.71
2014/15 (Proj.) Jun 648.77 814.32 126.91 666.51 172.99filler filler filler filler filler
Coarse Grains 5/ 2012/13 852.11 986.22 102.16 861.06 145.89
2013/14 (Est.) 903.13 1,045.89 103.63 926.36 172.70filler filler filler filler filler
2014/15 (Proj.) May 888.59 1,057.35 98.57 941.16 163.69
2014/15 (Proj.) Jun 890.11 1,059.62 98.67 941.40 165.72filler filler filler filler filler
Rice, milled 2012/13 465.26 570.05 36.08 464.40 109.05
2013/14 (Est.) 471.36 579.71 37.69 471.58 111.09filler filler filler filler filler
2014/15 (Proj.) May 473.91 583.52 38.14 478.10 108.68
2014/15 (Proj.) Jun 473.91 584.30 38.14 478.09 109.47filler filler filler filler filler
1/ Aggregate of local marketing years. 2/ Based on export estimate. See individual commodity tables for treatment of export/import imbalances. 3/ Total foreign is equal to world minus United States. 4/ Wheat, coarse grains, and milled rice. 5/ Corn, sorghum, barley, oats, rye, millet, and mixed grains.
World and U.S. Supply and Use for Cotton 1/
Million 480-lb. Bales
Output
TotalSupply Trade 2/
TotalUse 3/
EndingStocks
World 2012/13 122.95 196.42 46.69 106.77 90.03
2013/14 (Est.) 118.13 208.16 41.02 109.82 99.00
2014/15 (Proj.) May 115.46 213.36 36.29 111.83 101.66
2014/15 (Proj.) Jun 115.92 214.92 35.56 112.29 102.71
United States 2012/13 17.32 20.68 13.03 3.50 3.90
2013/14 (Est.) 12.91 16.82 10.50 3.60 2.70
2014/15 (Proj.) May 14.50 17.31 9.70 3.70 3.90
2014/15 (Proj.) Jun 15.00 17.71 9.70 3.70 4.30
Foreign 4/ 2012/13 105.64 175.74 33.66 103.27 86.13
2013/14 (Est.) 105.22 191.34 30.52 106.22 96.30
2014/15 (Proj.) May 100.96 196.05 26.59 108.13 97.76
2014/15 (Proj.) Jun 100.92 197.21 25.86 108.59 98.41
1/ Marketing year beginning August 1. 2/ Based on export estimate. 3/ Includes mill use only. 4/ Total Foreign is equal to world minus United States. See global cotton tables for treatment of export/import imbalances.
June 2014
WASDE - 530 - 10
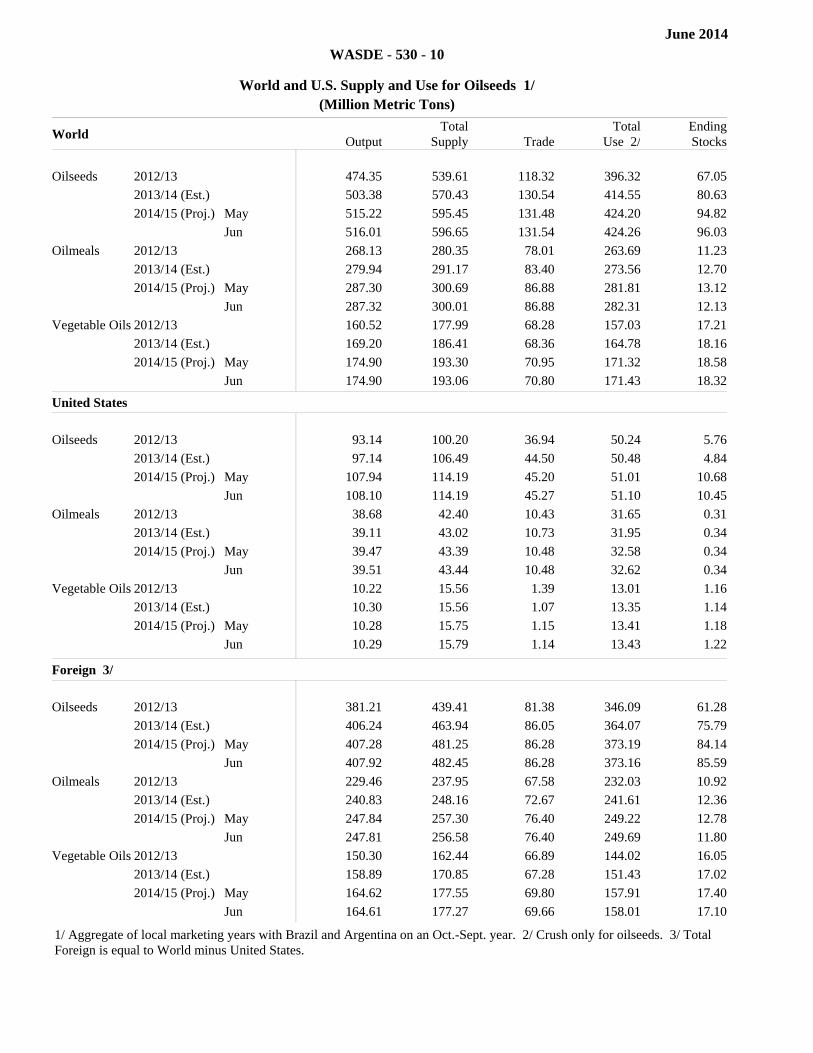
World and U.S. Supply and Use for Oilseeds 1/
(Million Metric Tons)
World Output
TotalSupply Trade
TotalUse 2/
EndingStocks
Oilseeds 2012/13 474.35 539.61 118.32 396.32 67.05
2013/14 (Est.) 503.38 570.43 130.54 414.55 80.63
2014/15 (Proj.) May 515.22 595.45 131.48 424.20 94.82
2014/15 (Proj.) Jun 516.01 596.65 131.54 424.26 96.03
Oilmeals 2012/13 268.13 280.35 78.01 263.69 11.23
2013/14 (Est.) 279.94 291.17 83.40 273.56 12.70
2014/15 (Proj.) May 287.30 300.69 86.88 281.81 13.12
2014/15 (Proj.) Jun 287.32 300.01 86.88 282.31 12.13
Vegetable Oils 2012/13 160.52 177.99 68.28 157.03 17.21
2013/14 (Est.) 169.20 186.41 68.36 164.78 18.16
2014/15 (Proj.) May 174.90 193.30 70.95 171.32 18.58
2014/15 (Proj.) Jun 174.90 193.06 70.80 171.43 18.32
United States Output
Total Supply Trade
Total Use 2/ Ending
Stocks
Oilseeds 2012/13 93.14 100.20 36.94 50.24 5.76
2013/14 (Est.) 97.14 106.49 44.50 50.48 4.84
2014/15 (Proj.) May 107.94 114.19 45.20 51.01 10.68
2014/15 (Proj.) Jun 108.10 114.19 45.27 51.10 10.45
Oilmeals 2012/13 38.68 42.40 10.43 31.65 0.31
2013/14 (Est.) 39.11 43.02 10.73 31.95 0.34
2014/15 (Proj.) May 39.47 43.39 10.48 32.58 0.34
2014/15 (Proj.) Jun 39.51 43.44 10.48 32.62 0.34
Vegetable Oils 2012/13 10.22 15.56 1.39 13.01 1.16
2013/14 (Est.) 10.30 15.56 1.07 13.35 1.14
2014/15 (Proj.) May 10.28 15.75 1.15 13.41 1.18
2014/15 (Proj.) Jun 10.29 15.79 1.14 13.43 1.22filler filler filler filler filler
Foreign 3/ Output
Total Supply Trade
Total Use 2/ Ending
Stocks
Oilseeds 2012/13 381.21 439.41 81.38 346.09 61.28
2013/14 (Est.) 406.24 463.94 86.05 364.07 75.79
2014/15 (Proj.) May 407.28 481.25 86.28 373.19 84.14
2014/15 (Proj.) Jun 407.92 482.45 86.28 373.16 85.59
Oilmeals 2012/13 229.46 237.95 67.58 232.03 10.92
2013/14 (Est.) 240.83 248.16 72.67 241.61 12.36
2014/15 (Proj.) May 247.84 257.30 76.40 249.22 12.78
2014/15 (Proj.) Jun 247.81 256.58 76.40 249.69 11.80
Vegetable Oils 2012/13 150.30 162.44 66.89 144.02 16.05
2013/14 (Est.) 158.89 170.85 67.28 151.43 17.02
2014/15 (Proj.) May 164.62 177.55 69.80 157.91 17.40
2014/15 (Proj.) Jun 164.61 177.27 69.66 158.01 17.10
1/ Aggregate of local marketing years with Brazil and Argentina on an Oct.-Sept. year. 2/ Crush only for oilseeds. 3/ Total Foreign is equal to World minus United States.
June 2014
WASDE - 530 - 11
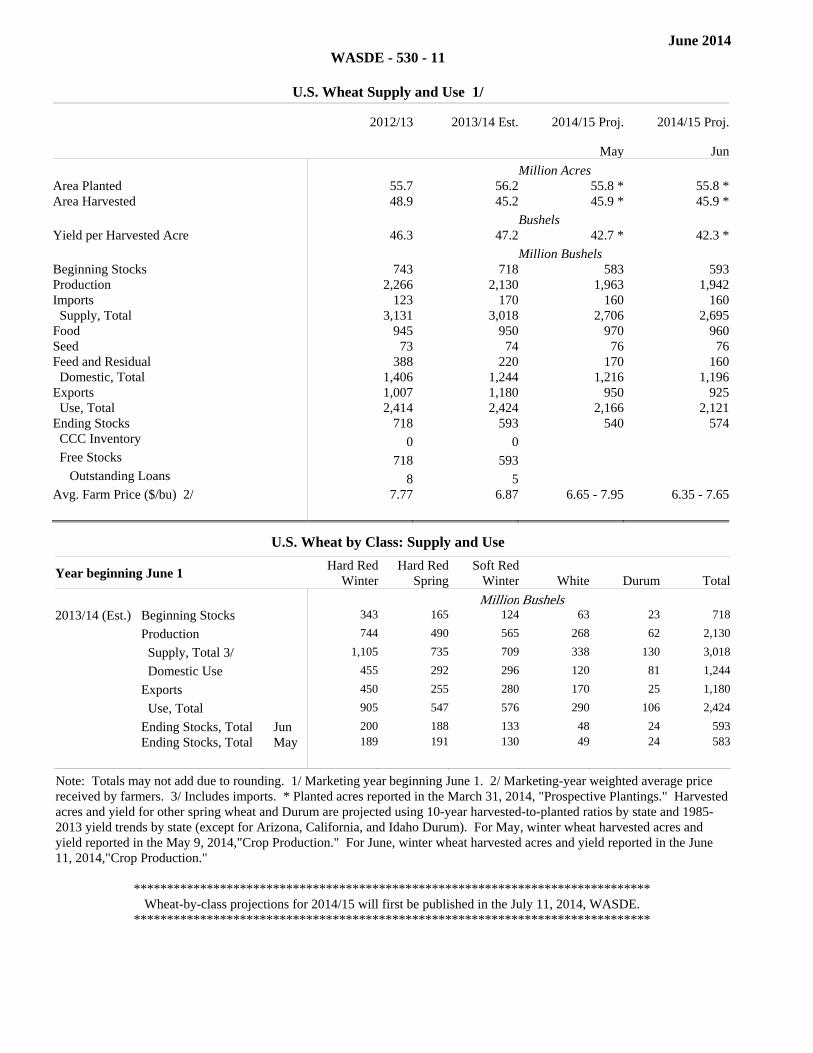
U.S. Wheat Supply and Use 1/
2012/13 2013/14 Est. 2014/15 Proj. 2014/15 Proj.
May Jun
Million Acres Area Planted 55.7 56.2 55.8 * 55.8 *Area Harvested 48.9 45.2 45.9 * 45.9 * Bushels Yield per Harvested Acre 46.3 47.2 42.7 * 42.3 * Million Bushels Beginning Stocks 743 718 583 593Production 2,266 2,130 1,963 1,942Imports 123 170 160 160 Supply, Total 3,131 3,018 2,706 2,695Food 945 950 970 960Seed 73 74 76 76Feed and Residual 388 220 170 160 Domestic, Total 1,406 1,244 1,216 1,196Exports 1,007 1,180 950 925 Use, Total 2,414 2,424 2,166 2,121Ending Stocks 718 593 540 574 CCC Inventory 0 0 Free Stocks 718 593 Outstanding Loans 8 5 Avg. Farm Price ($/bu) 2/ 7.77 6.87 6.65 - 7.95 6.35 - 7.65
U.S. Wheat by Class: Supply and Use
Year beginning June 1 Hard RedWinter
Hard RedSpring
Soft RedWinter White Durum Total
Million Bushels 2013/14 (Est.) Beginning Stocks 343 165 124 63 23 718
Production 744 490 565 268 62 2,130
Supply, Total 3/ 1,105 735 709 338 130 3,018
Domestic Use 455 292 296 120 81 1,244
Exports 450 255 280 170 25 1,180
Use, Total 905 547 576 290 106 2,424
Ending Stocks, Total Jun 200 188 133 48 24 593
Ending Stocks, Total May 189 191 130 49 24 583
Note: Totals may not add due to rounding. 1/ Marketing year beginning June 1. 2/ Marketing-year weighted average price received by farmers. 3/ Includes imports. * Planted acres reported in the March 31, 2014, "Prospective Plantings." Harvested acres and yield for other spring wheat and Durum are projected using 10-year harvested-to-planted ratios by state and 1985-2013 yield trends by state (except for Arizona, California, and Idaho Durum). For May, winter wheat harvested acres and yield reported in the May 9, 2014,"Crop Production." For June, winter wheat harvested acres and yield reported in the June 11, 2014,"Crop Production."
****************************************************************************** Wheat-by-class projections for 2014/15 will first be published in the July 11, 2014, WASDE.
******************************************************************************
June 2014
WASDE - 530 - 12
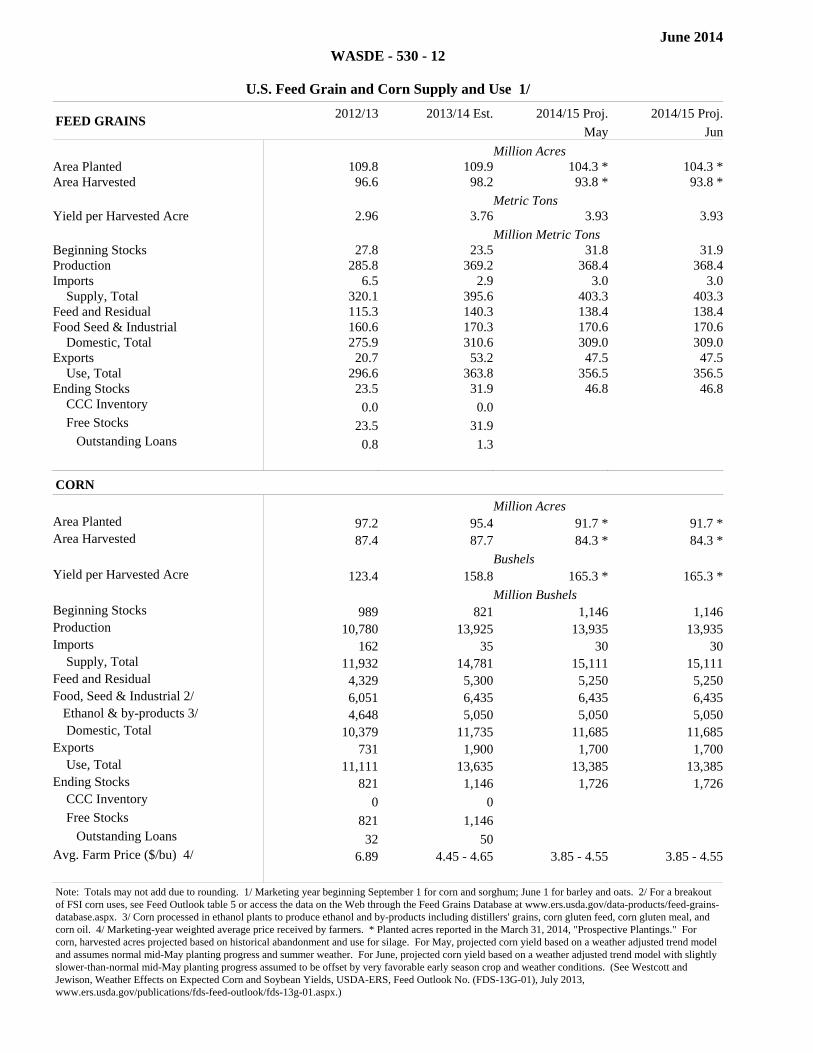
U.S. Feed Grain and Corn Supply and Use 1/
FEED GRAINS 2012/13 2013/14 Est. 2014/15 Proj. 2014/15 Proj. May Jun
Million Acres Area Planted 109.8 109.9 104.3 * 104.3 *Area Harvested 96.6 98.2 93.8 * 93.8 * Metric Tons Yield per Harvested Acre 2.96 3.76 3.93 3.93 Million Metric Tons Beginning Stocks 27.8 23.5 31.8 31.9Production 285.8 369.2 368.4 368.4Imports 6.5 2.9 3.0 3.0 Supply, Total 320.1 395.6 403.3 403.3Feed and Residual 115.3 140.3 138.4 138.4Food Seed & Industrial 160.6 170.3 170.6 170.6 Domestic, Total 275.9 310.6 309.0 309.0Exports 20.7 53.2 47.5 47.5 Use, Total 296.6 363.8 356.5 356.5Ending Stocks 23.5 31.9 46.8 46.8 CCC Inventory 0.0 0.0 Free Stocks 23.5 31.9 Outstanding Loans 0.8 1.3
CORN 2012/13 2013/14 Est. 2014/15 Proj. 2014/15 Proj.
May June
Million Acres Area Planted 97.2 95.4 91.7 * 91.7 *Area Harvested 87.4 87.7 84.3 * 84.3 * Bushels Yield per Harvested Acre 123.4 158.8 165.3 * 165.3 * Million Bushels Beginning Stocks 989 821 1,146 1,146Production 10,780 13,925 13,935 13,935Imports 162 35 30 30 Supply, Total 11,932 14,781 15,111 15,111Feed and Residual 4,329 5,300 5,250 5,250Food, Seed & Industrial 2/ 6,051 6,435 6,435 6,435 Ethanol & by-products 3/ 4,648 5,050 5,050 5,050 Domestic, Total 10,379 11,735 11,685 11,685Exports 731 1,900 1,700 1,700 Use, Total 11,111 13,635 13,385 13,385Ending Stocks 821 1,146 1,726 1,726 CCC Inventory 0 0 Free Stocks 821 1,146 Outstanding Loans 32 50 Avg. Farm Price ($/bu) 4/ 6.89 4.45 - 4.65 3.85 - 4.55 3.85 - 4.55
Note: Totals may not add due to rounding. 1/ Marketing year beginning September 1 for corn and sorghum; June 1 for barley and oats. 2/ For a breakout of FSI corn uses, see Feed Outlook table 5 or access the data on the Web through the Feed Grains Database at www.ers.usda.gov/data-products/feed-grains-database.aspx. 3/ Corn processed in ethanol plants to produce ethanol and by-products including distillers' grains, corn gluten feed, corn gluten meal, and corn oil. 4/ Marketing-year weighted average price received by farmers. * Planted acres reported in the March 31, 2014, "Prospective Plantings." For corn, harvested acres projected based on historical abandonment and use for silage. For May, projected corn yield based on a weather adjusted trend model and assumes normal mid-May planting progress and summer weather. For June, projected corn yield based on a weather adjusted trend model with slightly slower-than-normal mid-May planting progress assumed to be offset by very favorable early season crop and weather conditions. (See Westcott and Jewison, Weather Effects on Expected Corn and Soybean Yields, USDA-ERS, Feed Outlook No. (FDS-13G-01), July 2013, www.ers.usda.gov/publications/fds-feed-outlook/fds-13g-01.aspx.)

June 2014
WASDE - 530 - 13
U.S. Sorghum, Barley, and Oats Supply and Use 1/
SORGHUM 2012/13 2013/14 Est. 2014/15 Proj. 2014/15 Proj.
May Jun
Million Bushels Filler Filler Filler Filler Filler
Area Planted (mil. acres) 6.2 8.1 6.7 * 6.7 *Area Harvested (mil. acres) 5.0 6.5 5.6 * 5.6 *Yield (bushels/acre) 49.8 59.6 64.3 * 64.3 *Beginning Stocks 23 15 19 19Production 247 389 360 360Imports 10 0 0 0 Supply, Total 279 404 379 379Feed and Residual 93 110 90 90Food, Seed & Industrial 95 95 105 105 Total Domestic 188 205 195 195Exports 76 180 160 160 Use, Total 264 385 355 355Ending Stocks 15 19 24 24Avg. Farm Price ($/bu) 2/ 6.33 4.20 - 4.40 3.60 - 4.30 3.60 - 4.30Filler Filler Filler Filler Filler
BARLEY 2012/13 2013/14 Est. 2014/15 Proj. 2014/15 Proj.
May June
Filler Filler Filler Filler Filler
Area Planted (mil. acres) 3.6 3.5 3.2 * 3.2 *Area Harvested (mil. acres) 3.2 3.0 2.8 * 2.8 *Yield (bushels/acre) 67.9 71.7 70.0 * 70.0 *Beginning Stocks 60 80 85 85Production 220 215 196 196Imports 23 18 25 25 Supply, Total 304 314 306 306Feed and Residual 59 60 60 60Food, Seed & Industrial 155 155 154 154 Total Domestic 214 215 214 214Exports 9 14 10 10 Use, Total 223 229 224 224Ending Stocks 80 85 82 82Avg. Farm Price ($/bu) 2/ 6.43 6.05 4.45 - 5.25 4.45 - 5.25Filler Filler Filler Filler Filler
OATS 2012/13 2013/14 Est. 2014/15 Proj. 2014/15 Proj.
May June
Filler Filler Filler Filler Filler
Area Planted (mil. acres) 2.8 3.0 2.8 * 2.8 *Area Harvested (mil. acres) 1.0 1.0 1.1 * 1.1 *Yield (bushels/acre) 61.3 64.0 64.5 * 64.5 *Beginning Stocks 55 36 25 29Production 64 66 71 71Imports 93 93 100 100 Supply, Total 212 195 196 200Feed and Residual 98 90 80 80Food, Seed & Industrial 76 75 77 77 Total Domestic 174 165 157 157Exports 1 2 2 2 Use, Total 176 167 159 159Ending Stocks 36 29 37 41Avg. Farm Price ($/bu) 2/ 3.89 3.73 2.70 - 3.30 2.70 - 3.30Filler Filler Filler Filler Filler
Note: Totals may not add due to rounding. 1/ Marketing year beginning September 1 for sorghum; June 1 for barley and oats. 2/ Marketing-year weighted average price received by farmers. * Planted acres reported in the March 31, 2014, "Prospective Plantings." Harvested area - For sorghum, harvested acres are based on the 10-year Olympic average harvested-to-planted ratio, 2004-2013. For barley and oats, harvested acres are based on the 5-year average harvested-to-planted ratios, 2009-2013. Yield - For sorghum the projected yield is based on the average for 1990-2013 excluding years that are more than 1 standard deviation from the mean for the period. For barley and oats, projected yields are based on the 1990-2013 trends. Yields shown reflect production rounding.
June 2014
WASDE - 530 - 14
U.S. Rice Supply and Use 1/
(Rough Equivalent of Rough and Milled Rice)
TOTAL RICE 2012/13 2013/14 Est. 2014/15 Proj. 2014/15 Proj.
May Jun
Million Acres Area Planted 2.70 2.49 2.88 * 2.88 *Area Harvested 2.68 2.47 2.85 * 2.85 *Filler
Pounds Yield per Harvested Acre 7,449 7,694 7,468 * 7,468 * Million Hundredweight Beginning Stocks 2/ 41.1 36.4 29.3 32.3 Production 199.5 189.9 213.0 213.0 Imports 21.1 22.0 22.0 22.0 Supply, Total 261.7 248.3 264.3 267.3 Domestic & Residual 3/ 118.2 124.0 128.0 128.0 Exports, Total 4/ 107.1 92.0 102.0 102.0 Rough 34.2 31.5 34.0 34.0 Milled (rough equiv.) 72.9 60.5 68.0 68.0 Use, Total 225.3 216.0 230.0 230.0 Ending Stocks 36.4 32.3 34.3 37.3Avg. Milling Yield (%) 5/ 70.00 71.00 70.50 70.50Avg. Farm Price ($/cwt) 6/ 15.10 15.70 - 16.30 15.00 - 16.00 14.40 - 15.40Total
LONG-GRAIN RICE 2012/13 2013/14 Est. 2014/15 Proj. 2014/15 Proj.
May June
Harvested Acres (mil.) 1.98 1.77 Yield (pounds/acre) 7,285 7,464 Beginning Stocks 24.3 21.9 17.3 19.3 Production 144.2 131.9 161.0 161.0 Supply, Total 7/ 187.2 172.3 197.3 199.3 Domestic & Residual 3/ 89.2 91.0 101.0 101.0 Exports 8/ 76.1 62.0 72.0 72.0 Use, Total 165.3 153.0 173.0 173.0 Ending Stocks 21.9 19.3 24.3 26.3 Avg. Farm Price ($/cwt) 6/ 14.50 15.10 - 15.70 13.50 - 14.50 12.80 - 13.80Filler Filler Filler Filler Filler
MEDIUM & SHORT-GRAIN RICE 2012/13 2013/14 Est. 2014/15 Proj. 2014/15 Proj.
May June
Harvested Acres (mil.) 0.70 0.70 Yield (pounds/acre) 7,912 8,272 Beginning Stocks 14.7 12.2 9.7 10.7 Production 55.4 58.0 52.0 52.0 Supply, Total 7/ 72.2 73.7 64.7 65.7 Domestic & Residual 3/ 29.0 33.0 27.0 27.0 Exports 8/ 31.0 30.0 30.0 30.0 Use, Total 60.0 63.0 57.0 57.0 Ending Stocks 12.2 10.7 7.7 8.7 Avg. Farm Price ($/cwt) 6/ 9/ 17.40 17.40 - 18.00 18.50 - 19.50 18.20 - 19.20Filler Filler Filler Filler Filler
Note: Totals may not add due to rounding. 1/ Marketing year beginning August 1. 2/ Includes the following quantities of broken kernel rice (type undetermined) not included in estimates of beginning stocks by type (in mil. cwt): 2012/13-2.1; 2013/14-2.3; 2014/15-2.3. 3/ Residual includes unreported use, processing losses, and estimating errors. Use by type may not add to total rice use because of the difference in brokens between beginning and ending stocks. 4/ Includes rough rice and milled rice exports. Milled rice exports are converted to an equivalent rough basis. 5/ Expressed as a percent, i.e., the total quantity of whole kernel and broken rice produced divided by the quantity of rough rice milled. Data supplied by the USA Rice Federation for years prior to 2013/14. The 2013/14 milling yield is calculated using Farm Service Agency (FSA) warehouse stored loan data for long, medium, and short grain rice. The year-to-year change in the FSA average all rice milling yield is applied to the WASDE reported 2012/13 milling yield to calculate the 2013/14 forecasted average milling yield. The 2014/15 milling yield is calculated using the previous five-year Olympic average-- 2009/10-2013/14. 6/ Marketing-year weighted average price received by farmers. 7/ Includes imports. 8/ Exports by type of rice are estimated. 9/ The medium/short-grain season-average- farm price (SAFP) largely reflects rice that is marketed through price pools in California. The pool price is not final until all the rice in the pool is marketed for the crop year. Therefore, SAFP forecasts based on the average of NASS monthly prices and the final price may differ. For example, the average difference between the August WASDE SAFP forecast and the final price has averaged $1.68 per cwt from 2008/09 through 2011/12, with a high of $3.50 per cwt in 2008/09 and a low of $0.60 per cwt in 2009/10. * Planted acres reported in March 31, 2014, "Prospective Plantings." Harvested acres are estimated using the average harvested-to-planted ratios by rice class, 2009-2013. Projected yield is based on linear trend analysis by rice class for the period 1990/91 to 2013/14.
June 2014
WASDE - 530 - 15
U.S. Soybeans and Products Supply and Use (Domestic Measure) 1/
SOYBEANS 2012/13 2013/14 Est. 2014/15 Proj. 2014/15 Proj.
May JunFiller Filler Filler Filler Filler
Million Acres Area Planted 77.2 76.5 81.5 * 81.5 *Area Harvested 76.2 75.9 80.5 * 80.5 *Filler
Bushels Yield per Harvested Acre 39.8 43.3 45.2 * 45.2 *
Million Bushels Beginning Stocks 169 141 130 125Production 3,034 3,289 3,635 3,635Imports 36 90 15 15 Supply, Total 3,239 3,519 3,780 3,775Crushings 1,689 1,700 1,715 1,715Exports 1,320 1,600 1,625 1,625Seed 89 95 92 92Residual 1 0 18 18 Use, Total 3,099 3,395 3,450 3,450Ending Stocks 141 125 330 325Avg. Farm Price ($/bu) 2/ 14.40 13.10 9.75 - 11.75 9.75 - 11.75Total
SOYBEAN OIL 2012/13 2013/14 Est. 2014/15 Proj. 2014/15 Proj.
May June
Filler Filler Filler Filler Filler
Million Pounds Beginning Stocks 2,540 1,705 1,550 1,625Production 4/ 19,820 19,920 19,810 19,810Imports 196 200 160 160 Supply, Total 22,556 21,825 21,520 21,595Domestic Disappearance 18,686 18,450 18,100 18,100 Biodiesel 3/ 4,689 4,800 4,800 4,800 Food, Feed & other Industrial 13,997 13,650 13,300 13,300Exports 2,164 1,750 1,700 1,700 Use, Total 20,851 20,200 19,800 19,800Ending stocks 1,705 1,625 1,720 1,795Avg. Price (c/lb) 2/ 47.13 39.00 37.00 - 41.00 37.00 - 41.00Total
SOYBEAN MEAL 2012/13 2013/14 Est. 2014/15 Proj. 2014/15 Proj.
May June
Filler 1 2 3 4
Thousand Short Tons Beginning Stocks 300 275 300 300Production 4/ 39,875 40,410 40,735 40,735Imports 245 315 165 165 Supply, Total 40,420 41,000 41,200 41,200Domestic Disappearance 29,031 29,200 29,700 29,700Exports 11,114 11,500 11,200 11,200 Use, Total 40,145 40,700 40,900 40,900Ending Stocks 275 300 300 300Avg. Price ($/s.t.) 2/ 468.11 485.00 355.00 - 395.00 355.00 - 395.00Total
Note: Totals may not add due to rounding. Reliability calculations at end of report. 1/ Marketing year beginning September 1 for soybeans; October 1 for soybean oil and soybean meal. 2/ Prices: soybeans, marketing year weighted average price received by farmers; oil, simple average of crude soybean oil, Decatur; meal, simple average of 48 percent protein, Decatur. 3/ Reflects only biodiesel made from methyl ester as reported by the U.S. Energy Information Administration. 4/ Based on an October year crush of 1,710 million bushels. * Planted acres are reported in the March 31, 2014 "Prospective Plantings". Harvested acres are based on the 5-year average harvested-to-planted ratio. The projected yield is based on a weather adjusted trend model and assumes normal summer weather. (See Westcott and Jewison, Weather Effects on Expected Corn and Soybean Yields, USDA-ERS, Feed Outlook No. (FDS-13G-01), July 2013, www.ers.usda.gov/publications/fds-feed-outlook/fds-13g-01.aspx.)

June 2014
WASDE - 530 - 16
U.S. Sugar Supply and Use 1/
2012/13 2013/14 Est. 2014/15 Proj. 2014/15 Proj.
May JunFiller Filler Filler Filler Filler
1,000 Short Tons, Raw Value Beginning Stocks 1,979 2,158 1,596 1,857Production 2/ 8,982 8,490 8,495 8,355 Beet Sugar 5,076 4,800 4,750 4,750 Cane Sugar 3,906 3,690 3,745 3,605 Florida 1,867 1,760 1,850 1,770 Hawaii 179 190 180 180 Louisiana 1,686 1,600 1,580 1,520 Texas 173 140 135 135Imports 3,224 3,585 3,093 3,783 TRQ 3/ 957 1,369 1,262 1,262 Other Program 4/ 136 210 400 400 Other 5/ 2,131 2,006 1,431 2,121 Mexico 2,124 1,996 1,421 2,111 Total Supply 14,184 14,233 13,184 13,995 Exports 274 325 250 250Deliveries 11,752 12,051 11,835 11,835 Food 6/ 11,487 11,600 11,700 11,700 Other 7/ 265 451 135 135Miscellaneous 0 0 0 0 Total Use 12,026 12,376 12,085 12,085Ending Stocks 8/ 2,158 1,857 1,099 1,910Stocks to Use Ratio 17.9 15.0 9.1 15.8Total
1/ Fiscal years beginning Oct 1. Historical data are from FSA "Sweetener Market Data" (SMD). 2/ Production projections for 2013/14 are based on Crop Production and processor projections where appropriate. 3/ For 2014/15, includes only U.S. commitments under current trade agreements, minus shortfall. The Secretary will establish the actual level of the TRQ at a later date. For 2013/14, WTO TRQ shortfall (200). For 2014/15, WTO TRQ shortfall (200). 4/ Includes sugar under the re-export and polyhydric alcohol programs. 5/ For 2012/13, other high-tier (7) and other (0). For 2013/14, other high-tier (10) and other (0). For 2014/15, other high-tier (10) and other (0). 6/Combines SMD deliveries for domestic human food use and SMD miscellaneous uses. 7/ Transfers to sugar-containing products for reexport, and for nonedible alcohol, feed, and ethanol. 8/ For 2012/13, includes 316,415 short tons, raw value, of stocks held by the Commodity Credit Corporation.
Mexico Sugar Supply and Use and High Fructose Corn Syrup Imports 1/
Beginning
Stocks Production Imports Domestic 2/ ExportsEndingStocks
Sugar 1,000 Metric Tons, Actual Weight 2013/14 Est. May 1,460 6,350 226 4,690 2,399 9472013/14 Est. Jun 1,460 6,100 226 4,690 2,278 818
2014/15 Proj. May 947 6,500 226 4,690 2,036 9472014/15 Proj. Jun 818 6,500 226 4,690 1,907 947
1/ HFCS imports by Mexico (1,000 metric tons, dry basis): Oct-Sep 2012/13 = 1,105; Oct 2012-Apr 2013 = 649; Oct 2013-Apr 2014 = 503. Footnote source: Comite Nacional para el Desarollo Sustentable de la Cana de Azucar. 2/Includes domestic consumption, Mexico's products export program (IMMEX), and any residual statistical discrepancies. IMMEX: 2013/14 (384 est), 2014/15 (384 proj).
June 2014
WASDE - 530 - 17
U.S. Cotton Supply and Use 1/
2012/13 2013/14 Est. 2014/15 Proj. 2014/15 Proj.
May JunFiller Filler Filler Filler Filler
Area Million Acres Planted 12.31 10.41 11.10 * 11.10 * Harvested 9.37 7.54 8.45 * 8.75 *Filler
Pounds Yield per Harvested Acre 887 821 824 * 823 *
Million 480 Pound Bales Beginning Stocks 3.35 3.90 2.80 2.70Production 17.32 12.91 14.50 15.00Imports 0.01 0.01 0.01 0.01 Supply, Total 20.68 16.82 17.31 17.71Domestic Use 3.50 3.60 3.70 3.70Exports, Total 13.03 10.50 9.70 9.70 Use, Total 16.53 14.10 13.40 13.40Unaccounted 2/ 0.25 0.02 0.01 0.01Ending Stocks 3.90 2.70 3.90 4.30Avg. Farm Price 3/ 72.5 77.5 63.0 - 83.0 60.0 - 80.0Total
Note: Reliability calculations at end of report. 1/ Upland and extra-long staple; marketing year beginning August 1. Totals may not add due to rounding. 2/ Reflects the difference between the previous season's supply less total use and ending stocks. 3/ Cents per pound for upland cotton. *Planted area as indicated in the March 31, 2014 Prospective Plantings. Abandonment rates and yield per harvested acre based on the averages of 2012 and 2013, weighted by region. Projected abandonment in the Southwest reduced from 39 percent in May to 34 percent in June due to recent favorable precipitation.
June 2014
WASDE - 530 - 18
World Wheat Supply and Use 1/
(Million Metric Tons)
2012/13 Beginning
Stocks Production ImportsDomestic
FeedDomestic
Total 2/ ExportsEndingStocks
World 3/ 197.26 657.31 144.25 136.66 679.29 137.18 175.28United States 20.21 61.67 3.34 10.57 38.27 27.42 19.54Total Foreign 177.05 595.63 140.91 126.09 641.02 109.76 155.74 Major Exporters 4/ 27.27 192.81 5.91 59.10 142.04 63.80 20.15 Argentina 0.73 9.30 0.00 0.30 6.20 3.55 0.29 Australia 7.05 22.46 0.14 3.40 6.74 18.66 4.26 Canada 5.93 27.21 0.48 4.40 9.60 18.97 5.05 European Union 5/ 13.55 133.85 5.28 51.00 119.50 22.62 10.55 Major Importers 6/ 87.64 187.29 79.47 35.19 264.58 6.47 83.34 Brazil 1.75 4.38 7.36 0.20 10.90 1.58 1.00 China 55.95 121.02 2.96 25.00 125.00 0.97 53.96 Sel. Mideast 7/ 5.14 17.18 20.86 2.75 34.33 0.69 8.16 N. Africa 8/ 14.09 17.32 22.06 2.38 41.42 0.61 11.44 Pakistan 4.02 23.30 0.05 0.60 23.90 0.85 2.62 Southeast Asia 9/ 4.65 0.00 15.76 2.84 15.51 0.77 4.14 Selected Other 0.00 India 19.95 94.88 0.02 3.40 83.82 6.82 24.20 FSU-12 26.97 77.35 7.23 20.86 71.50 25.38 14.67 Russia 10.90 37.72 1.17 11.90 33.55 11.29 4.95 Kazakhstan 6.18 9.84 0.01 2.00 6.80 6.29 2.94 Ukraine 5.36 15.76 0.05 3.10 11.40 7.19 2.58
2013/14 Est. Beginning
Stocks Production ImportsDomestic
FeedDomestic
Total 2/ Exports Ending Stocks
World 3/ 175.28 713.97 155.19 133.12 703.20 162.75 186.05United States 19.54 57.96 4.63 5.99 33.87 32.11 16.14Total Foreign 155.74 656.01 150.56 127.14 669.33 130.63 169.90 Major Exporters 4/ 20.15 218.32 4.38 58.70 141.20 73.50 28.15 Argentina 0.29 10.50 0.01 0.10 6.05 2.00 2.74 Australia 4.26 27.00 0.13 3.60 6.95 19.50 4.94 Canada 5.05 37.50 0.44 6.00 11.20 22.00 9.79 European Union 5/ 10.55 143.32 3.80 49.00 117.00 30.00 10.68 Major Importers 6/ 83.34 194.26 87.21 33.96 266.55 5.08 93.18 Brazil 1.00 5.30 7.20 0.60 11.40 0.10 2.00 China 53.96 121.72 7.00 23.00 123.50 1.00 58.18 Sel. Mideast 7/ 8.16 18.94 21.01 3.28 36.18 0.54 11.38 N. Africa 8/ 11.44 20.12 24.70 2.88 42.55 0.63 13.09 Pakistan 2.62 24.00 0.50 0.60 24.10 0.70 2.32 Southeast Asia 9/ 4.14 0.00 16.10 2.51 15.52 0.82 3.90 Selected Other 0.00
India 24.20 93.51 0.02 4.80 93.90 6.00 17.83 FSU-12 14.67 103.76 7.88 22.17 72.84 36.72 16.76 Russia 4.95 52.09 1.20 12.50 34.00 18.50 5.74 Kazakhstan 2.94 13.94 0.01 2.00 6.80 8.00 2.09 Ukraine 2.58 22.28 0.10 3.40 11.50 9.50 3.96
1/ Aggregate of local marketing years. 2/ Total foreign and world use adjusted to reflect the differences in world imports and exports. 3/ World imports and exports may not balance due to differences in marketing years, grain in transit, and reporting discrepancies in some countries. 4/ Argentina, Australia, Canada, and the European Union. 5/ Trade excludes intra-trade. 6/ Brazil, China, Japan, Mexico, N. Africa, Pakistan, selected Middle East, and Southeast Asia. 7/ Lebanon, Iraq, Iran, Israel, Jordan, Kuwait, Saudi Arabia, Yemen, United Arab Emirates, and Oman. 8/ Algeria, Egypt, Libya, Morocco, and Tunisia. 9/ Indonesia, Malaysia, Philippines, Thailand, and Vietnam.
June 2014
WASDE - 530 - 19
World Wheat Supply and Use 1/ (Cont'd.)
(Million Metric Tons)
2014/15 Proj. Beginning
Stocks Production ImportsDomestic
FeedDomestic
Total 2/ ExportsEndingStocks
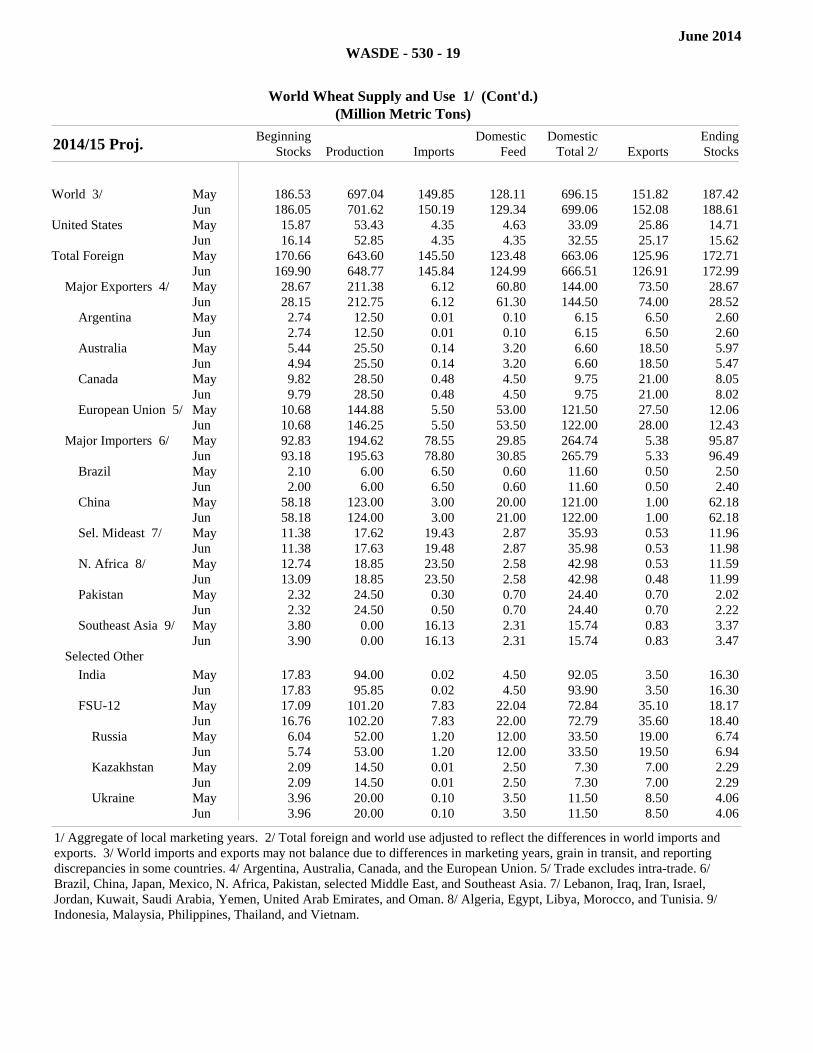
World 3/ May 186.53 697.04 149.85 128.11 696.15 151.82 187.42
Jun 186.05 701.62 150.19 129.34 699.06 152.08 188.61United States May 15.87 53.43 4.35 4.63 33.09 25.86 14.71
Jun 16.14 52.85 4.35 4.35 32.55 25.17 15.62Total Foreign May 170.66 643.60 145.50 123.48 663.06 125.96 172.71
Jun 169.90 648.77 145.84 124.99 666.51 126.91 172.99 Major Exporters 4/ May 28.67 211.38 6.12 60.80 144.00 73.50 28.67
Jun 28.15 212.75 6.12 61.30 144.50 74.00 28.52 Argentina May 2.74 12.50 0.01 0.10 6.15 6.50 2.60
Jun 2.74 12.50 0.01 0.10 6.15 6.50 2.60 Australia May 5.44 25.50 0.14 3.20 6.60 18.50 5.97
Jun 4.94 25.50 0.14 3.20 6.60 18.50 5.47 Canada May 9.82 28.50 0.48 4.50 9.75 21.00 8.05
Jun 9.79 28.50 0.48 4.50 9.75 21.00 8.02 European Union 5/ May 10.68 144.88 5.50 53.00 121.50 27.50 12.06
Jun 10.68 146.25 5.50 53.50 122.00 28.00 12.43 Major Importers 6/ May 92.83 194.62 78.55 29.85 264.74 5.38 95.87
Jun 93.18 195.63 78.80 30.85 265.79 5.33 96.49 Brazil May 2.10 6.00 6.50 0.60 11.60 0.50 2.50
Jun 2.00 6.00 6.50 0.60 11.60 0.50 2.40 China May 58.18 123.00 3.00 20.00 121.00 1.00 62.18
Jun 58.18 124.00 3.00 21.00 122.00 1.00 62.18 Sel. Mideast 7/ May 11.38 17.62 19.43 2.87 35.93 0.53 11.96
Jun 11.38 17.63 19.48 2.87 35.98 0.53 11.98 N. Africa 8/ May 12.74 18.85 23.50 2.58 42.98 0.53 11.59
Jun 13.09 18.85 23.50 2.58 42.98 0.48 11.99 Pakistan May 2.32 24.50 0.30 0.70 24.40 0.70 2.02
Jun 2.32 24.50 0.50 0.70 24.40 0.70 2.22 Southeast Asia 9/ May 3.80 0.00 16.13 2.31 15.74 0.83 3.37
Jun 3.90 0.00 16.13 2.31 15.74 0.83 3.47 Selected Other India May 17.83 94.00 0.02 4.50 92.05 3.50 16.30
Jun 17.83 95.85 0.02 4.50 93.90 3.50 16.30 FSU-12 May 17.09 101.20 7.83 22.04 72.84 35.10 18.17
Jun 16.76 102.20 7.83 22.00 72.79 35.60 18.40 Russia May 6.04 52.00 1.20 12.00 33.50 19.00 6.74
Jun 5.74 53.00 1.20 12.00 33.50 19.50 6.94 Kazakhstan May 2.09 14.50 0.01 2.50 7.30 7.00 2.29
Jun 2.09 14.50 0.01 2.50 7.30 7.00 2.29 Ukraine May 3.96 20.00 0.10 3.50 11.50 8.50 4.06
Jun 3.96 20.00 0.10 3.50 11.50 8.50 4.06
1/ Aggregate of local marketing years. 2/ Total foreign and world use adjusted to reflect the differences in world imports and exports. 3/ World imports and exports may not balance due to differences in marketing years, grain in transit, and reporting discrepancies in some countries. 4/ Argentina, Australia, Canada, and the European Union. 5/ Trade excludes intra-trade. 6/ Brazil, China, Japan, Mexico, N. Africa, Pakistan, selected Middle East, and Southeast Asia. 7/ Lebanon, Iraq, Iran, Israel, Jordan, Kuwait, Saudi Arabia, Yemen, United Arab Emirates, and Oman. 8/ Algeria, Egypt, Libya, Morocco, and Tunisia. 9/ Indonesia, Malaysia, Philippines, Thailand, and Vietnam.
June 2014
WASDE - 530 - 20
World Coarse Grain Supply and Use 1/
(Million Metric Tons)
2012/13 Beginning
Stocks Production ImportsDomestic
FeedDomestic
Total 2/ ExportsEndingStocks
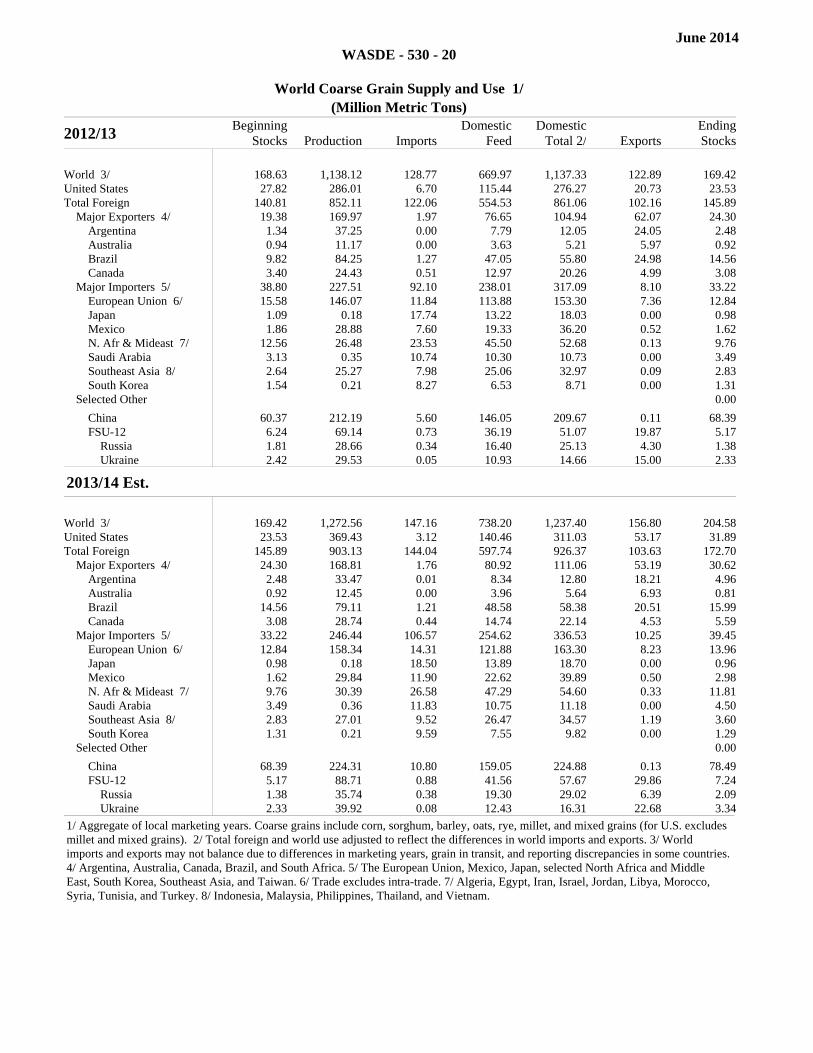
World 3/ 168.63 1,138.12 128.77 669.97 1,137.33 122.89 169.42United States 27.82 286.01 6.70 115.44 276.27 20.73 23.53Total Foreign 140.81 852.11 122.06 554.53 861.06 102.16 145.89 Major Exporters 4/ 19.38 169.97 1.97 76.65 104.94 62.07 24.30 Argentina 1.34 37.25 0.00 7.79 12.05 24.05 2.48 Australia 0.94 11.17 0.00 3.63 5.21 5.97 0.92 Brazil 9.82 84.25 1.27 47.05 55.80 24.98 14.56 Canada 3.40 24.43 0.51 12.97 20.26 4.99 3.08 Major Importers 5/ 38.80 227.51 92.10 238.01 317.09 8.10 33.22 European Union 6/ 15.58 146.07 11.84 113.88 153.30 7.36 12.84 Japan 1.09 0.18 17.74 13.22 18.03 0.00 0.98 Mexico 1.86 28.88 7.60 19.33 36.20 0.52 1.62 N. Afr & Mideast 7/ 12.56 26.48 23.53 45.50 52.68 0.13 9.76 Saudi Arabia 3.13 0.35 10.74 10.30 10.73 0.00 3.49 Southeast Asia 8/ 2.64 25.27 7.98 25.06 32.97 0.09 2.83 South Korea 1.54 0.21 8.27 6.53 8.71 0.00 1.31 Selected Other 0.00
China 60.37 212.19 5.60 146.05 209.67 0.11 68.39 FSU-12 6.24 69.14 0.73 36.19 51.07 19.87 5.17 Russia 1.81 28.66 0.34 16.40 25.13 4.30 1.38 Ukraine 2.42 29.53 0.05 10.93 14.66 15.00 2.33
2013/14 Est. Beginning
Stocks Production ImportsDomestic
FeedDomestic
Total 2/ Exports Ending Stocks
World 3/ 169.42 1,272.56 147.16 738.20 1,237.40 156.80 204.58United States 23.53 369.43 3.12 140.46 311.03 53.17 31.89Total Foreign 145.89 903.13 144.04 597.74 926.37 103.63 172.70 Major Exporters 4/ 24.30 168.81 1.76 80.92 111.06 53.19 30.62 Argentina 2.48 33.47 0.01 8.34 12.80 18.21 4.96 Australia 0.92 12.45 0.00 3.96 5.64 6.93 0.81 Brazil 14.56 79.11 1.21 48.58 58.38 20.51 15.99 Canada 3.08 28.74 0.44 14.74 22.14 4.53 5.59 Major Importers 5/ 33.22 246.44 106.57 254.62 336.53 10.25 39.45 European Union 6/ 12.84 158.34 14.31 121.88 163.30 8.23 13.96 Japan 0.98 0.18 18.50 13.89 18.70 0.00 0.96 Mexico 1.62 29.84 11.90 22.62 39.89 0.50 2.98 N. Afr & Mideast 7/ 9.76 30.39 26.58 47.29 54.60 0.33 11.81 Saudi Arabia 3.49 0.36 11.83 10.75 11.18 0.00 4.50 Southeast Asia 8/ 2.83 27.01 9.52 26.47 34.57 1.19 3.60 South Korea 1.31 0.21 9.59 7.55 9.82 0.00 1.29 Selected Other 0.00
China 68.39 224.31 10.80 159.05 224.88 0.13 78.49 FSU-12 5.17 88.71 0.88 41.56 57.67 29.86 7.24 Russia 1.38 35.74 0.38 19.30 29.02 6.39 2.09 Ukraine 2.33 39.92 0.08 12.43 16.31 22.68 3.34
1/ Aggregate of local marketing years. Coarse grains include corn, sorghum, barley, oats, rye, millet, and mixed grains (for U.S. excludes millet and mixed grains). 2/ Total foreign and world use adjusted to reflect the differences in world imports and exports. 3/ World imports and exports may not balance due to differences in marketing years, grain in transit, and reporting discrepancies in some countries. 4/ Argentina, Australia, Canada, Brazil, and South Africa. 5/ The European Union, Mexico, Japan, selected North Africa and Middle East, South Korea, Southeast Asia, and Taiwan. 6/ Trade excludes intra-trade. 7/ Algeria, Egypt, Iran, Israel, Jordan, Libya, Morocco, Syria, Tunisia, and Turkey. 8/ Indonesia, Malaysia, Philippines, Thailand, and Vietnam.

June 2014
WASDE - 530 - 21
World Coarse Grain Supply and Use 1/ (Cont'd.)
(Million Metric Tons)
2014/15 Proj. Beginning
Stocks Production ImportsDomestic
FeedDomestic
Total 2/ ExportsEndingStocks
World 3/ May 203.79 1,257.18 143.58 750.59 1,250.47 146.07 210.50
Jun 204.58 1,258.70 144.29 750.84 1,250.71 146.17 212.57United States May 31.85 368.59 3.18 138.47 309.31 47.50 46.82
Jun 31.89 368.59 3.18 138.47 309.31 47.50 46.85Total Foreign May 171.94 888.59 140.40 612.12 941.16 98.57 163.69
Jun 172.70 890.11 141.11 612.37 941.40 98.67 165.72 Major Exporters 4/ May 29.95 161.19 1.86 81.83 112.21 53.27 27.52
Jun 30.62 161.19 1.86 81.83 112.21 53.27 28.19 Argentina May 4.46 35.17 0.01 8.87 13.63 20.51 5.50
Jun 4.96 35.17 0.01 8.87 13.63 20.51 6.00 Australia May 0.81 11.81 0.00 4.06 5.74 5.93 0.95
Jun 0.81 11.81 0.00 4.06 5.74 5.93 0.95 Brazil May 15.49 77.11 1.21 50.08 59.90 20.01 13.89
Jun 15.99 77.11 1.21 50.08 59.90 20.01 14.39 Canada May 5.59 23.07 0.54 13.42 20.92 4.60 3.67
Jun 5.59 23.07 0.54 13.42 20.92 4.60 3.67 Major Importers 5/ May 38.55 238.56 103.78 255.84 338.65 8.80 33.43
Jun 39.45 237.60 104.48 255.34 338.15 9.10 34.28 European Union 6/ May 13.96 152.24 13.31 118.25 160.07 7.76 11.68
Jun 13.96 153.08 13.31 118.25 160.07 8.06 12.22 Japan May 0.96 0.18 18.90 14.29 19.10 0.00 0.94
Jun 0.96 0.18 18.90 14.29 19.10 0.00 0.94 Mexico May 2.98 30.14 11.40 23.42 40.94 0.50 3.08
Jun 2.98 30.14 11.40 23.42 40.94 0.50 3.08 N. Afr & Mideast 7/ May 10.91 27.78 27.01 49.26 56.67 0.11 8.92
Jun 11.81 25.98 27.71 48.76 56.17 0.11 9.22 Saudi Arabia May 4.50 0.36 10.01 11.13 11.60 0.00 3.26
Jun 4.50 0.36 10.01 11.13 11.60 0.00 3.26 Southeast Asia 8/ May 3.60 27.51 9.22 27.77 35.97 0.44 3.92
Jun 3.60 27.51 9.22 27.77 35.97 0.44 3.92 South Korea May 1.29 0.21 9.59 7.55 9.82 0.00 1.27
Jun 1.29 0.21 9.59 7.55 9.82 0.00 1.27 Selected Other China May 78.99 226.58 9.80 167.15 235.30 0.13 79.95
Jun 78.49 226.58 9.80 167.15 235.30 0.13 79.45 FSU-12 May 8.24 83.88 0.88 43.43 59.53 26.15 7.32
Jun 7.24 85.38 0.88 44.23 60.33 26.15 7.02 Russia May 2.09 37.50 0.28 20.90 30.90 7.11 1.85
Jun 2.09 38.00 0.28 21.20 31.20 7.11 2.05 Ukraine May 4.34 34.30 0.06 12.96 16.59 18.16 3.95
Jun 3.34 35.30 0.06 13.46 17.09 18.16 3.45
1/ Aggregate of local marketing years. Coarse grains include corn, sorghum, barley, oats, rye, millet, and mixed grains (for U.S. excludes millet and mixed grains). 2/ Total foreign and world use adjusted to reflect the differences in world imports and exports. 3/ World imports and exports may not balance due to differences in marketing years, grain in transit, and reporting discrepancies in some countries. 4/ Argentina, Australia, Canada, Brazil, and South Africa. 5/ The European Union, Mexico, Japan, selected North Africa and Middle East, South Korea, Southeast Asia, and Taiwan. 6/ Trade excludes intra-trade. 7/ Algeria, Egypt, Iran, Israel, Jordan, Libya, Morocco, Syria, Tunisia, and Turkey. 8/ Indonesia, Malaysia, Philippines, Thailand, and Vietnam.
June 2014
WASDE - 530 - 22
World Corn Supply and Use 1/
(Million Metric Tons)
2012/13 Beginning
Stocks Production ImportsDomestic
FeedDomestic
Total 2/ ExportsEndingStocks
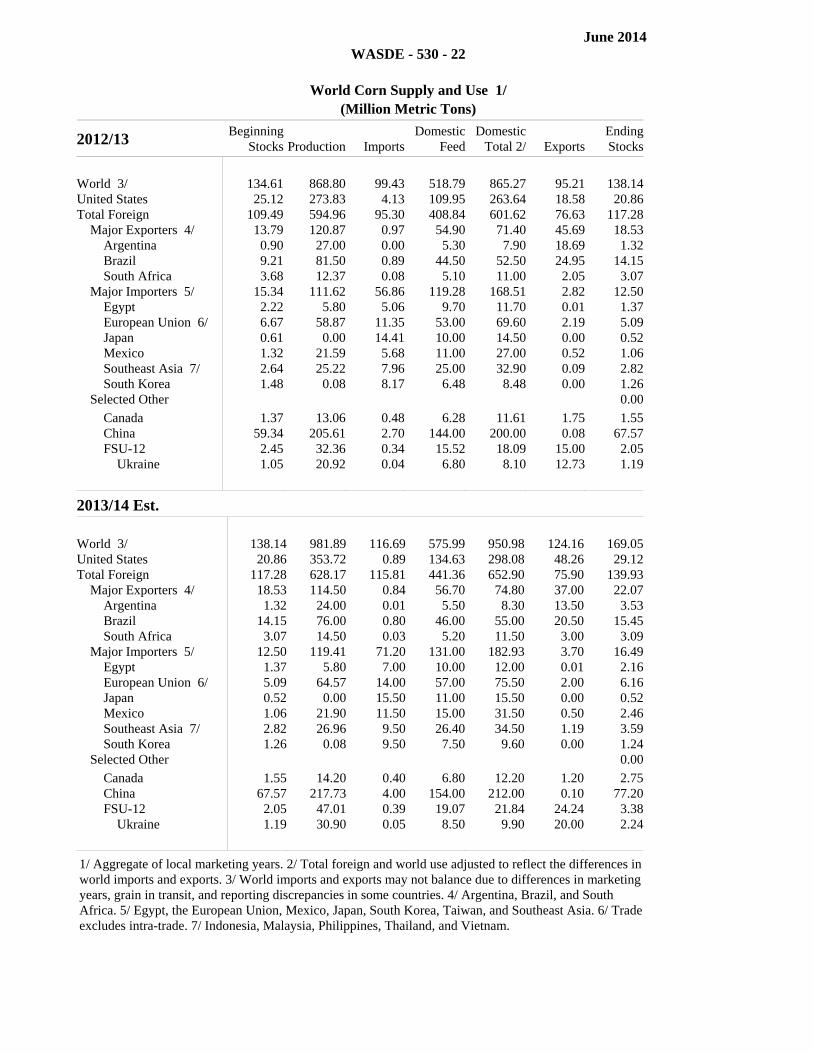
World 3/ 134.61 868.80 99.43 518.79 865.27 95.21 138.14United States 25.12 273.83 4.13 109.95 263.64 18.58 20.86Total Foreign 109.49 594.96 95.30 408.84 601.62 76.63 117.28 Major Exporters 4/ 13.79 120.87 0.97 54.90 71.40 45.69 18.53 Argentina 0.90 27.00 0.00 5.30 7.90 18.69 1.32 Brazil 9.21 81.50 0.89 44.50 52.50 24.95 14.15 South Africa 3.68 12.37 0.08 5.10 11.00 2.05 3.07 Major Importers 5/ 15.34 111.62 56.86 119.28 168.51 2.82 12.50 Egypt 2.22 5.80 5.06 9.70 11.70 0.01 1.37 European Union 6/ 6.67 58.87 11.35 53.00 69.60 2.19 5.09 Japan 0.61 0.00 14.41 10.00 14.50 0.00 0.52 Mexico 1.32 21.59 5.68 11.00 27.00 0.52 1.06 Southeast Asia 7/ 2.64 25.22 7.96 25.00 32.90 0.09 2.82 South Korea 1.48 0.08 8.17 6.48 8.48 0.00 1.26 Selected Other 0.00
Canada 1.37 13.06 0.48 6.28 11.61 1.75 1.55 China 59.34 205.61 2.70 144.00 200.00 0.08 67.57 FSU-12 2.45 32.36 0.34 15.52 18.09 15.00 2.05 Ukraine 1.05 20.92 0.04 6.80 8.10 12.73 1.19
2013/14 Est. Beginning Stocks Production Imports
Domestic Feed
Domestic Total 2/ Exports
Ending Stocks
World 3/ 138.14 981.89 116.69 575.99 950.98 124.16 169.05United States 20.86 353.72 0.89 134.63 298.08 48.26 29.12Total Foreign 117.28 628.17 115.81 441.36 652.90 75.90 139.93 Major Exporters 4/ 18.53 114.50 0.84 56.70 74.80 37.00 22.07 Argentina 1.32 24.00 0.01 5.50 8.30 13.50 3.53 Brazil 14.15 76.00 0.80 46.00 55.00 20.50 15.45 South Africa 3.07 14.50 0.03 5.20 11.50 3.00 3.09 Major Importers 5/ 12.50 119.41 71.20 131.00 182.93 3.70 16.49 Egypt 1.37 5.80 7.00 10.00 12.00 0.01 2.16 European Union 6/ 5.09 64.57 14.00 57.00 75.50 2.00 6.16 Japan 0.52 0.00 15.50 11.00 15.50 0.00 0.52 Mexico 1.06 21.90 11.50 15.00 31.50 0.50 2.46 Southeast Asia 7/ 2.82 26.96 9.50 26.40 34.50 1.19 3.59 South Korea 1.26 0.08 9.50 7.50 9.60 0.00 1.24 Selected Other 0.00
Canada 1.55 14.20 0.40 6.80 12.20 1.20 2.75 China 67.57 217.73 4.00 154.00 212.00 0.10 77.20 FSU-12 2.05 47.01 0.39 19.07 21.84 24.24 3.38 Ukraine 1.19 30.90 0.05 8.50 9.90 20.00 2.24
1/ Aggregate of local marketing years. 2/ Total foreign and world use adjusted to reflect the differences in world imports and exports. 3/ World imports and exports may not balance due to differences in marketing years, grain in transit, and reporting discrepancies in some countries. 4/ Argentina, Brazil, and South Africa. 5/ Egypt, the European Union, Mexico, Japan, South Korea, Taiwan, and Southeast Asia. 6/ Trade excludes intra-trade. 7/ Indonesia, Malaysia, Philippines, Thailand, and Vietnam.
June 2014
WASDE - 530 - 23
World Corn Supply and Use 1/ (Cont'd.)
(Million Metric Tons)
2014/15 Proj. Beginning
Stocks Production ImportsDomestic
FeedDomestic
Total 2/ ExportsEndingStocks
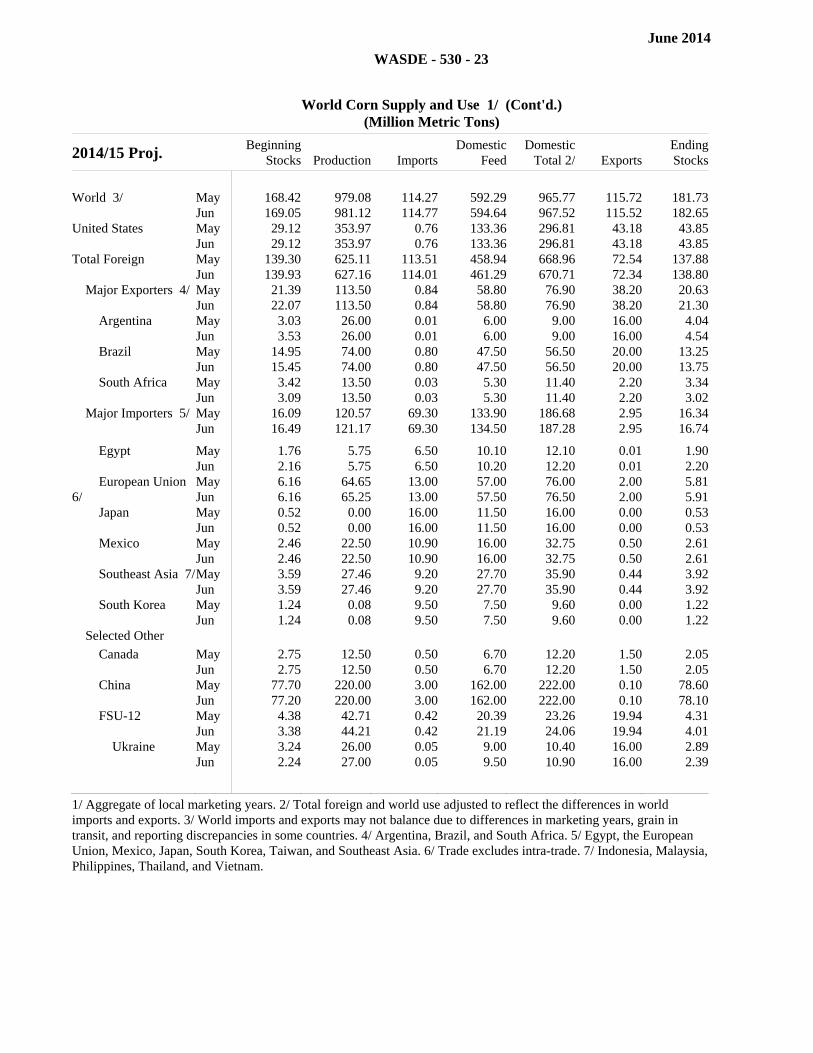
World 3/ May 168.42 979.08 114.27 592.29 965.77 115.72 181.73
Jun 169.05 981.12 114.77 594.64 967.52 115.52 182.65United States May 29.12 353.97 0.76 133.36 296.81 43.18 43.85
Jun 29.12 353.97 0.76 133.36 296.81 43.18 43.85Total Foreign May 139.30 625.11 113.51 458.94 668.96 72.54 137.88
Jun 139.93 627.16 114.01 461.29 670.71 72.34 138.80 Major Exporters 4/ May 21.39 113.50 0.84 58.80 76.90 38.20 20.63
Jun 22.07 113.50 0.84 58.80 76.90 38.20 21.30 Argentina May 3.03 26.00 0.01 6.00 9.00 16.00 4.04
Jun 3.53 26.00 0.01 6.00 9.00 16.00 4.54 Brazil May 14.95 74.00 0.80 47.50 56.50 20.00 13.25
Jun 15.45 74.00 0.80 47.50 56.50 20.00 13.75 South Africa May 3.42 13.50 0.03 5.30 11.40 2.20 3.34
Jun 3.09 13.50 0.03 5.30 11.40 2.20 3.02 Major Importers 5/ May 16.09 120.57 69.30 133.90 186.68 2.95 16.34
Jun 16.49 121.17 69.30 134.50 187.28 2.95 16.74filler filler filler filler filler filler filler
Egypt May 1.76 5.75 6.50 10.10 12.10 0.01 1.90Jun 2.16 5.75 6.50 10.20 12.20 0.01 2.20
European Union 6/
May 6.16 64.65 13.00 57.00 76.00 2.00 5.81Jun 6.16 65.25 13.00 57.50 76.50 2.00 5.91
Japan May 0.52 0.00 16.00 11.50 16.00 0.00 0.53Jun 0.52 0.00 16.00 11.50 16.00 0.00 0.53
Mexico May 2.46 22.50 10.90 16.00 32.75 0.50 2.61Jun 2.46 22.50 10.90 16.00 32.75 0.50 2.61
Southeast Asia 7/ May 3.59 27.46 9.20 27.70 35.90 0.44 3.92Jun 3.59 27.46 9.20 27.70 35.90 0.44 3.92
South Korea May 1.24 0.08 9.50 7.50 9.60 0.00 1.22Jun 1.24 0.08 9.50 7.50 9.60 0.00 1.22
Selected Other Canada May 2.75 12.50 0.50 6.70 12.20 1.50 2.05
Jun 2.75 12.50 0.50 6.70 12.20 1.50 2.05 China May 77.70 220.00 3.00 162.00 222.00 0.10 78.60
Jun 77.20 220.00 3.00 162.00 222.00 0.10 78.10 FSU-12 May 4.38 42.71 0.42 20.39 23.26 19.94 4.31
Jun 3.38 44.21 0.42 21.19 24.06 19.94 4.01 Ukraine May 3.24 26.00 0.05 9.00 10.40 16.00 2.89
Jun 2.24 27.00 0.05 9.50 10.90 16.00 2.39
1/ Aggregate of local marketing years. 2/ Total foreign and world use adjusted to reflect the differences in world imports and exports. 3/ World imports and exports may not balance due to differences in marketing years, grain in transit, and reporting discrepancies in some countries. 4/ Argentina, Brazil, and South Africa. 5/ Egypt, the European Union, Mexico, Japan, South Korea, Taiwan, and Southeast Asia. 6/ Trade excludes intra-trade. 7/ Indonesia, Malaysia, Philippines, Thailand, and Vietnam.
June 2014
WASDE - 530 - 24
World Rice Supply and Use (Milled Basis) 1/
(Million Metric Tons)
2012/13 Beginning
StocksProduction Imports Total /2
DomesticExports Ending
Stocks
World 3/ 106.76 471.60 36.63 468.16 39.48 110.20United States 1.30 6.34 0.67 3.75 3.40 1.16Total Foreign 105.46 465.26 35.96 464.40 36.08 109.05 Major Exporters 4/ 36.81 158.76 0.75 128.83 27.89 39.59 India 25.10 105.24 0.00 94.03 10.87 25.44 Pakistan 0.55 5.80 0.05 2.30 3.60 0.50 Thailand 9.33 20.20 0.60 10.60 6.72 12.81 Vietnam 1.83 27.52 0.10 21.90 6.70 0.85 Major Importers 5/ 12.90 62.55 13.08 75.42 1.07 12.03 Brazil 0.54 7.99 0.64 7.85 0.84 0.48 European Union 6/ 1.12 2.09 1.40 3.25 0.20 1.15 Indonesia 7.40 36.55 0.65 38.13 0.00 6.48 Nigeria 1.02 2.37 2.80 5.30 0.00 0.89 Philippines 1.51 11.43 1.40 12.85 0.00 1.49 Sel. Mideast 7/ 0.97 1.65 4.79 6.03 0.00 1.38 Selected Other 0.00
Burma 0.40 11.72 0.00 10.40 1.16 0.55 C. Amer & Carib 8/ 0.43 1.67 1.42 3.14 0.01 0.37 China 45.02 143.00 3.70 144.00 0.34 47.38 Egypt 0.49 4.68 0.02 3.90 0.85 0.43 Japan 2.75 7.76 0.69 8.25 0.20 2.74 Mexico 0.15 0.13 0.74 0.84 0.00 0.19 South Korea 0.73 4.01 0.51 4.50 0.00 0.74
2013/14 Est. Beginning
Stocks Production ImportsTotal /2
Domestic ExportsEndingStocks
World 3/ 110.20 477.47 38.63 475.55 40.65 112.13United States 1.16 6.12 0.70 3.97 2.96 1.04Total Foreign 109.05 471.36 37.94 471.58 37.69 111.09 Major Exporters 4/ 39.59 161.19 0.53 131.43 29.40 40.48 India 25.44 106.29 0.00 96.50 10.00 25.23 Pakistan 0.50 6.60 0.03 2.63 3.90 0.60 Thailand 12.81 20.50 0.30 10.80 9.00 13.81 Vietnam 0.85 27.80 0.20 21.50 6.50 0.85 Major Importers 5/ 12.03 64.91 14.42 77.00 1.18 13.19 Brazil 0.48 8.60 0.70 8.05 0.95 0.78 European Union 6/ 1.15 1.94 1.35 3.20 0.20 1.04 Indonesia 6.48 37.36 1.50 38.65 0.00 6.68 Nigeria 0.89 2.77 3.00 6.00 0.00 0.66 Philippines 1.49 11.89 2.00 12.85 0.00 2.53 Sel. Mideast 7/ 1.38 1.83 4.30 6.18 0.00 1.33 Selected Other 0.00
Burma 0.55 11.96 0.00 10.50 1.30 0.71 C. Amer & Carib 8/ 0.37 1.75 1.56 3.29 0.01 0.37 China 47.38 142.30 3.50 146.00 0.35 46.83 Egypt 0.43 4.88 0.03 4.00 0.80 0.53 Japan 2.74 7.83 0.70 8.25 0.20 2.82 Mexico 0.19 0.13 0.75 0.86 0.00 0.21 South Korea 0.74 4.23 0.41 4.61 0.00 0.78
1/ Aggregate of local marketing years. 2/ Total foreign and world use adjusted to reflect the differences in world imports and exports. Total domestic includes both domestic use and unreported disappearance. 3/ World imports and exports may not balance due to differences in some countries. 4/ India, Pakistan, Thailand, and Vietnam. 5/ Brazil, Indonesia, Hong Kong, Cote d'Ivoire, Nigeria, Philippines, selected Middle East, and the EU-28. 6/ Trade excludes intra-trade. 7/ Selected Middle East includes Iran, Iraq, and Saudi Arabia. 8/ Central American and Caribbean countries.

June 2014
WASDE - 530 - 25
World Rice Supply and Use (Milled Basis) 1/ (Cont'd.)
(Million Metric Tons)
2014/15 Proj. Beginning
StocksProduction Imports Total /2
DomesticExports Ending
Stocks
World 3/ May 111.25 480.72 38.32 482.20 41.40 109.77
Jun 112.13 480.72 38.32 482.18 41.40 110.67United States May 0.94 6.81 0.70 4.10 3.26 1.10
filler filler filler filler filler filler
Jun 1.04 6.81 0.70 4.10 3.26 1.19Total Foreign May 110.31 473.91 37.62 478.10 38.14 108.68
filler filler filler filler filler filler
Jun 111.09 473.91 37.62 478.09 38.14 109.47 Major Exporters 4/ May 39.69 161.00 0.60 133.10 29.60 38.59
Jun 40.48 161.00 0.60 133.10 29.60 39.38 India May 24.44 106.00 0.00 98.00 9.00 23.44
Jun 25.23 106.00 0.00 98.00 9.00 24.23filler filler filler filler filler filler
Pakistan May 0.60 6.70 0.00 2.70 3.90 0.70Jun 0.60 6.70 0.00 2.70 3.90 0.70
Thailand May 13.81 20.50 0.30 10.90 10.00 13.71Jun 13.81 20.50 0.30 10.90 10.00 13.71
Vietnam May 0.85 27.80 0.30 21.50 6.70 0.75Jun 0.85 27.80 0.30 21.50 6.70 0.75
Major Importers 5/ May 13.19 65.29 14.50 78.33 1.12 13.53Jun 13.19 65.29 14.50 78.33 1.12 13.53
Brazil May 0.78 8.50 0.70 8.15 0.90 0.93filler filler filler filler filler filler
Jun 0.78 8.50 0.70 8.15 0.90 0.93 European Union 6/ May 1.04 1.96 1.40 3.20 0.19 1.01
Jun 1.04 1.96 1.40 3.20 0.19 1.01 Indonesia May 6.68 37.70 1.00 39.20 0.00 6.18
Jun 6.68 37.70 1.00 39.20 0.00 6.18 Nigeria May 0.66 2.55 3.50 6.10 0.00 0.61
Jun 0.66 2.55 3.50 6.10 0.00 0.61 Philippines May 2.53 12.20 1.80 13.20 0.00 3.33
Jun 2.53 12.20 1.80 13.20 0.00 3.33 Sel. Mideast 7/ May 1.33 1.85 4.48 6.35 0.00 1.31
Jun 1.33 1.85 4.48 6.35 0.00 1.31 Selected Other Burma May 0.71 12.15 0.00 11.00 1.30 0.56
Jun 0.71 12.15 0.00 11.00 1.30 0.56 C. Amer & Carib 8/ May 0.37 1.77 1.55 3.30 0.01 0.37
Jun 0.37 1.77 1.55 3.30 0.01 0.37 China May 46.83 144.00 3.70 148.00 0.35 46.18
Jun 46.83 144.00 3.70 148.00 0.35 46.18 Egypt May 0.53 4.90 0.06 4.10 0.88 0.52
Jun 0.53 4.90 0.06 4.10 0.88 0.52 Japan May 2.82 7.70 0.70 8.20 0.20 2.82
Jun 2.82 7.70 0.70 8.20 0.20 2.82 Mexico May 0.21 0.13 0.78 0.89 0.00 0.23
Jun 0.21 0.13 0.78 0.89 0.00 0.23 South Korea May 0.78 4.15 0.41 4.59 0.00 0.75
Jun 0.78 4.15 0.41 4.59 0.00 0.75
1/ Aggregate of local marketing years. 2/ Total foreign and world use adjusted to reflect the differences in world imports and exports. Total domestic includes both domestic use and unreported disappearance. 3/ World imports and exports may not balance due to differences in some countries. 4/ India, Pakistan, Thailand, and Vietnam. 5/ Brazil, Indonesia, Hong Kong, Cote d'Ivoire, Nigeria, Philippines, selected Middle East, and the EU-28. 6/ Trade excludes intra-trade. 7/ Selected Middle East includes Iran, Iraq, and Saudi Arabia. 8/ Central American and Caribbean countries.
June 2014
WASDE - 530 - 26
World Cotton Supply and Use 1/
(Million 480-Pound Bales)
2012/13 Beginning
StocksProduction Imports Domestic
UseExports Loss
/2 EndingStocks
World 73.47 122.95 46.20 106.77 46.69 -0.88 90.03United States 3.35 17.32 0.01 3.50 13.03 0.25 3.90Total Foreign 70.12 105.64 46.19 103.27 33.66 -1.13 86.13 Major Exporters 4/ 29.11 53.40 1.60 30.63 29.07 -1.32 25.72 Central Asia 5/ 3.09 7.27 3/ 2.33 5.29 0.00 2.75 Afr. Fr. Zone 6/ 1.14 4.21 3/ 0.16 4.11 0.00 1.08 S. Hemis 7/ 13.55 12.21 0.17 5.17 11.50 -0.33 9.59 Australia 3.81 4.60 3/ 0.04 6.17 -0.20 2.39 Brazil 7.99 6.00 0.07 4.10 4.31 -0.15 5.80 India 10.87 28.50 1.20 21.85 7.75 -1.00 11.97 Major Importers 8/ 39.14 49.63 41.83 68.99 2.71 0.19 58.72 Mexico 0.71 1.04 0.95 1.80 0.23 0.03 0.65 China 31.08 35.00 20.33 36.00 0.05 0.00 50.36 European Union 9/ 0.69 1.49 0.93 0.92 1.58 0.05 0.56 Turkey 1.24 2.65 3.69 6.05 0.22 0.00 1.32 Pakistan 2.84 9.30 2.20 11.00 0.45 0.03 2.86 Indonesia 0.48 0.03 2.60 2.55 0.01 0.05 0.50 Thailand 0.26 3/ 1.51 1.48 0.01 0.03 0.27 Bangladesh 0.87 0.11 3.90 3.90 0.00 0.01 0.97 Vietnam 0.32 0.02 2.41 2.25 0.00 0.00 0.49
2013/14 Est. Beginning
Stocks Production ImportsDomestic
Use ExportsLoss
/2 EndingStocks
World 90.03 118.13 41.07 109.82 41.02 -0.62 99.00United States 3.90 12.91 0.01 3.60 10.50 0.02 2.70Total Foreign 86.13 105.22 41.06 106.22 30.52 -0.64 96.30 Major Exporters 4/ 25.72 56.02 1.44 32.59 25.83 -0.83 25.60 Central Asia 5/ 2.75 6.65 3/ 2.41 4.38 0.00 2.61 Afr. Fr. Zone 6/ 1.08 4.30 3/ 0.16 4.09 0.00 1.14 S. Hemis 7/ 9.59 13.54 0.29 5.30 7.94 -0.34 10.52 Australia 2.39 4.10 3/ 0.04 4.80 -0.20 1.85 Brazil 5.80 7.50 0.18 4.20 2.30 -0.15 7.13 India 11.97 30.50 0.75 23.75 9.00 -0.50 10.97 Major Importers 8/ 58.72 46.48 36.60 69.89 2.78 0.19 68.95 Mexico 0.65 0.92 1.05 1.85 0.18 0.03 0.57 China 50.36 32.00 13.50 35.50 0.05 0.00 60.31 European Union 9/ 0.56 1.60 0.90 0.93 1.53 0.05 0.55 Turkey 1.32 2.30 4.50 6.30 0.20 0.00 1.62 Pakistan 2.86 9.50 2.00 11.00 0.60 0.03 2.74 Indonesia 0.50 0.03 2.65 2.65 0.01 0.05 0.47 Thailand 0.27 3/ 1.65 1.60 0.01 0.03 0.29 Bangladesh 0.97 0.12 4.10 4.15 0.00 0.01 1.02 Vietnam 0.49 0.02 3.15 3.00 0.00 0.00 0.66
1/ Marketing year beginning August 1. Totals may not add exactly and trade may not balance due to rounding and other factors. 2/ Generally reflects cotton lost or destroyed in the marketing channel; for Australia, Brazil, China, and the United States, reflects the difference between implicit stocks based on supply less total use and indicated ending stocks. 3/ Less than 5,000 bales. 4/ Includes Egypt and Syria in addition to the countries and regions listed. 5/ Azerbaijan, Kazakhstan, Kyrgyzstan, Tajikistan, Turkmenistan, and Uzbekistan. 6/ Benin, Burkino Faso, Cameroon, Central African Republic, Chad, Cote d'Ivoire, Mali, Niger, Senegal, and Togo. 7/ Argentina, Australia, Brazil, Paraguay, South Africa, Tanzania, and Zimbabwe. 8/ In addition to the countries and regions listed, includes Hong Kong, Japan, Russia, South Korea, and Taiwan. 9/ Includes intra-EU trade.
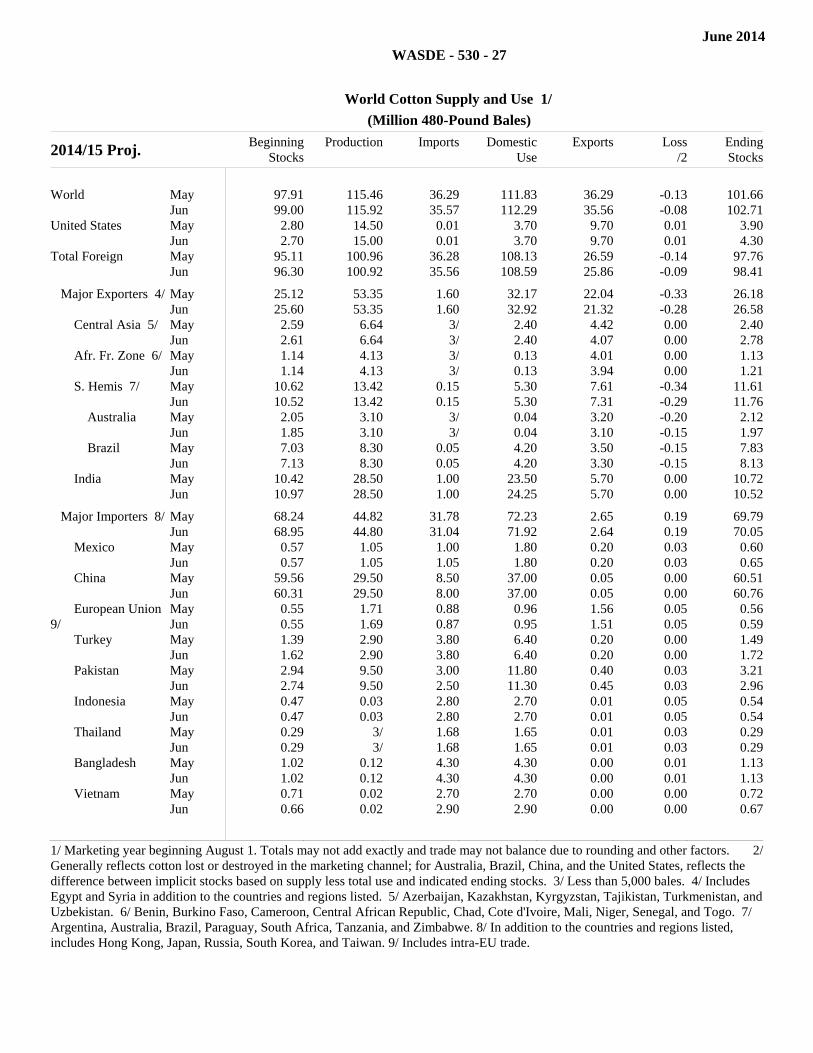
June 2014
WASDE - 530 - 27
World Cotton Supply and Use 1/
(Million 480-Pound Bales)
2014/15 Proj. Beginning
StocksProduction Imports Domestic
UseExports Loss
/2 EndingStocks
World May 97.91 115.46 36.29 111.83 36.29 -0.13 101.66
Jun 99.00 115.92 35.57 112.29 35.56 -0.08 102.71United States May 2.80 14.50 0.01 3.70 9.70 0.01 3.90
Jun 2.70 15.00 0.01 3.70 9.70 0.01 4.30Total Foreign May 95.11 100.96 36.28 108.13 26.59 -0.14 97.76
Jun 96.30 100.92 35.56 108.59 25.86 -0.09 98.41filler filler filler filler filler filler filler
Major Exporters 4/ May 25.12 53.35 1.60 32.17 22.04 -0.33 26.18Jun 25.60 53.35 1.60 32.92 21.32 -0.28 26.58
Central Asia 5/ May 2.59 6.64 3/ 2.40 4.42 0.00 2.40Jun 2.61 6.64 3/ 2.40 4.07 0.00 2.78
Afr. Fr. Zone 6/ May 1.14 4.13 3/ 0.13 4.01 0.00 1.13Jun 1.14 4.13 3/ 0.13 3.94 0.00 1.21
S. Hemis 7/ May 10.62 13.42 0.15 5.30 7.61 -0.34 11.61Jun 10.52 13.42 0.15 5.30 7.31 -0.29 11.76
Australia May 2.05 3.10 3/ 0.04 3.20 -0.20 2.12Jun 1.85 3.10 3/ 0.04 3.10 -0.15 1.97
Brazil May 7.03 8.30 0.05 4.20 3.50 -0.15 7.83Jun 7.13 8.30 0.05 4.20 3.30 -0.15 8.13
India May 10.42 28.50 1.00 23.50 5.70 0.00 10.72Jun 10.97 28.50 1.00 24.25 5.70 0.00 10.52
filler filler filler filler filler filler filler
Major Importers 8/ May 68.24 44.82 31.78 72.23 2.65 0.19 69.79Jun 68.95 44.80 31.04 71.92 2.64 0.19 70.05
Mexico May 0.57 1.05 1.00 1.80 0.20 0.03 0.60Jun 0.57 1.05 1.05 1.80 0.20 0.03 0.65
China May 59.56 29.50 8.50 37.00 0.05 0.00 60.51Jun 60.31 29.50 8.00 37.00 0.05 0.00 60.76
European Union 9/
May 0.55 1.71 0.88 0.96 1.56 0.05 0.56Jun 0.55 1.69 0.87 0.95 1.51 0.05 0.59
Turkey May 1.39 2.90 3.80 6.40 0.20 0.00 1.49Jun 1.62 2.90 3.80 6.40 0.20 0.00 1.72
Pakistan May 2.94 9.50 3.00 11.80 0.40 0.03 3.21Jun 2.74 9.50 2.50 11.30 0.45 0.03 2.96
Indonesia May 0.47 0.03 2.80 2.70 0.01 0.05 0.54Jun 0.47 0.03 2.80 2.70 0.01 0.05 0.54
Thailand May 0.29 3/ 1.68 1.65 0.01 0.03 0.29Jun 0.29 3/ 1.68 1.65 0.01 0.03 0.29
Bangladesh May 1.02 0.12 4.30 4.30 0.00 0.01 1.13Jun 1.02 0.12 4.30 4.30 0.00 0.01 1.13
Vietnam May 0.71 0.02 2.70 2.70 0.00 0.00 0.72Jun 0.66 0.02 2.90 2.90 0.00 0.00 0.67
1/ Marketing year beginning August 1. Totals may not add exactly and trade may not balance due to rounding and other factors. 2/ Generally reflects cotton lost or destroyed in the marketing channel; for Australia, Brazil, China, and the United States, reflects the difference between implicit stocks based on supply less total use and indicated ending stocks. 3/ Less than 5,000 bales. 4/ Includes Egypt and Syria in addition to the countries and regions listed. 5/ Azerbaijan, Kazakhstan, Kyrgyzstan, Tajikistan, Turkmenistan, and Uzbekistan. 6/ Benin, Burkino Faso, Cameroon, Central African Republic, Chad, Cote d'Ivoire, Mali, Niger, Senegal, and Togo. 7/ Argentina, Australia, Brazil, Paraguay, South Africa, Tanzania, and Zimbabwe. 8/ In addition to the countries and regions listed, includes Hong Kong, Japan, Russia, South Korea, and Taiwan. 9/ Includes intra-EU trade.
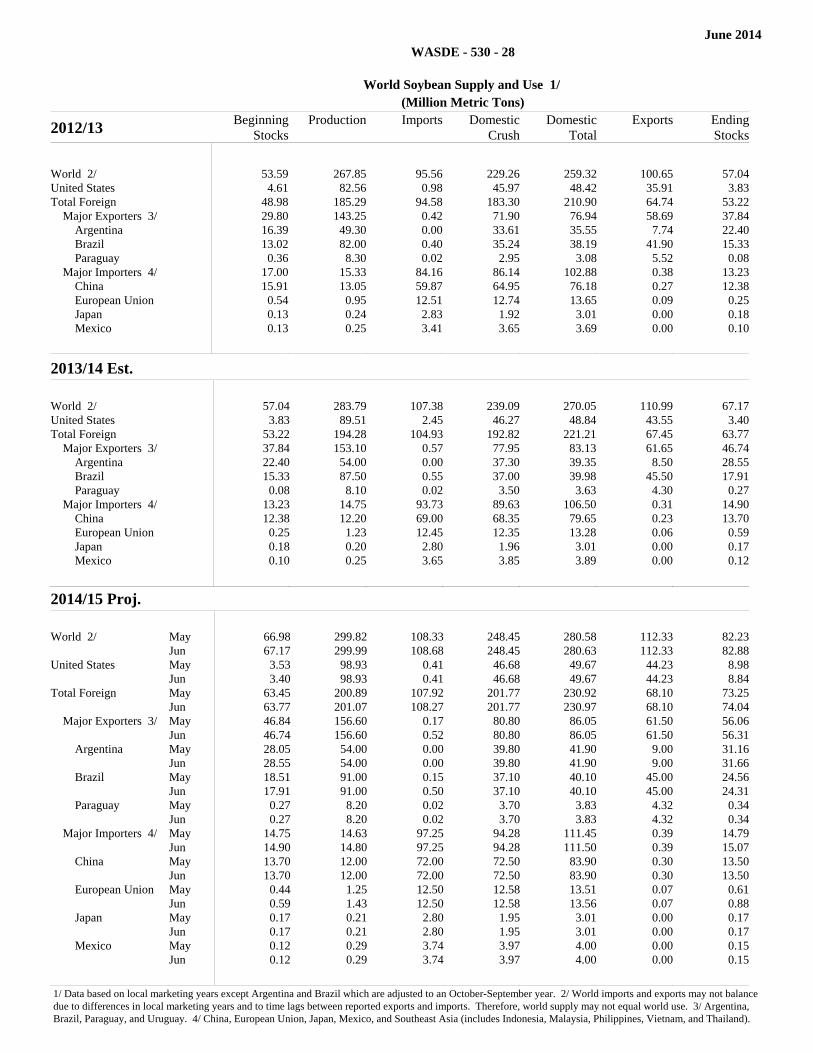
June 2014
WASDE - 530 - 28
World Soybean Supply and Use 1/
(Million Metric Tons)
2012/13 Beginning
StocksProduction Imports Domestic
CrushDomestic
TotalExports Ending
Stocks
World 2/ 53.59 267.85 95.56 229.26 259.32 100.65 57.04United States 4.61 82.56 0.98 45.97 48.42 35.91 3.83Total Foreign 48.98 185.29 94.58 183.30 210.90 64.74 53.22 Major Exporters 3/ 29.80 143.25 0.42 71.90 76.94 58.69 37.84 Argentina 16.39 49.30 0.00 33.61 35.55 7.74 22.40 Brazil 13.02 82.00 0.40 35.24 38.19 41.90 15.33 Paraguay 0.36 8.30 0.02 2.95 3.08 5.52 0.08 Major Importers 4/ 17.00 15.33 84.16 86.14 102.88 0.38 13.23 China 15.91 13.05 59.87 64.95 76.18 0.27 12.38 European Union 0.54 0.95 12.51 12.74 13.65 0.09 0.25 Japan 0.13 0.24 2.83 1.92 3.01 0.00 0.18 Mexico 0.13 0.25 3.41 3.65 3.69 0.00 0.10
2013/14 Est. Beginning
Stocks Production ImportsDomestic
CrushDomestic
Total ExportsEnding Stocks
World 2/ 57.04 283.79 107.38 239.09 270.05 110.99 67.17United States 3.83 89.51 2.45 46.27 48.84 43.55 3.40Total Foreign 53.22 194.28 104.93 192.82 221.21 67.45 63.77 Major Exporters 3/ 37.84 153.10 0.57 77.95 83.13 61.65 46.74 Argentina 22.40 54.00 0.00 37.30 39.35 8.50 28.55 Brazil 15.33 87.50 0.55 37.00 39.98 45.50 17.91 Paraguay 0.08 8.10 0.02 3.50 3.63 4.30 0.27 Major Importers 4/ 13.23 14.75 93.73 89.63 106.50 0.31 14.90 China 12.38 12.20 69.00 68.35 79.65 0.23 13.70 European Union 0.25 1.23 12.45 12.35 13.28 0.06 0.59 Japan 0.18 0.20 2.80 1.96 3.01 0.00 0.17 Mexico 0.10 0.25 3.65 3.85 3.89 0.00 0.12
2014/15 Proj. Beginning
Stocks Production Imports Domestic Crush
Domestic Total Exports Ending
Stocks
World 2/ May 66.98 299.82 108.33 248.45 280.58 112.33 82.23
Jun 67.17 299.99 108.68 248.45 280.63 112.33 82.88United States May 3.53 98.93 0.41 46.68 49.67 44.23 8.98
Jun 3.40 98.93 0.41 46.68 49.67 44.23 8.84Total Foreign May 63.45 200.89 107.92 201.77 230.92 68.10 73.25
Jun 63.77 201.07 108.27 201.77 230.97 68.10 74.04 Major Exporters 3/ May 46.84 156.60 0.17 80.80 86.05 61.50 56.06
Jun 46.74 156.60 0.52 80.80 86.05 61.50 56.31 Argentina May 28.05 54.00 0.00 39.80 41.90 9.00 31.16
Jun 28.55 54.00 0.00 39.80 41.90 9.00 31.66 Brazil May 18.51 91.00 0.15 37.10 40.10 45.00 24.56
Jun 17.91 91.00 0.50 37.10 40.10 45.00 24.31 Paraguay May 0.27 8.20 0.02 3.70 3.83 4.32 0.34
Jun 0.27 8.20 0.02 3.70 3.83 4.32 0.34 Major Importers 4/ May 14.75 14.63 97.25 94.28 111.45 0.39 14.79
Jun 14.90 14.80 97.25 94.28 111.50 0.39 15.07 China May 13.70 12.00 72.00 72.50 83.90 0.30 13.50
Jun 13.70 12.00 72.00 72.50 83.90 0.30 13.50 European Union May 0.44 1.25 12.50 12.58 13.51 0.07 0.61
Jun 0.59 1.43 12.50 12.58 13.56 0.07 0.88 Japan May 0.17 0.21 2.80 1.95 3.01 0.00 0.17
Jun 0.17 0.21 2.80 1.95 3.01 0.00 0.17 Mexico May 0.12 0.29 3.74 3.97 4.00 0.00 0.15
Jun 0.12 0.29 3.74 3.97 4.00 0.00 0.15
1/ Data based on local marketing years except Argentina and Brazil which are adjusted to an October-September year. 2/ World imports and exports may not balance due to differences in local marketing years and to time lags between reported exports and imports. Therefore, world supply may not equal world use. 3/ Argentina, Brazil, Paraguay, and Uruguay. 4/ China, European Union, Japan, Mexico, and Southeast Asia (includes Indonesia, Malaysia, Philippines, Vietnam, and Thailand).
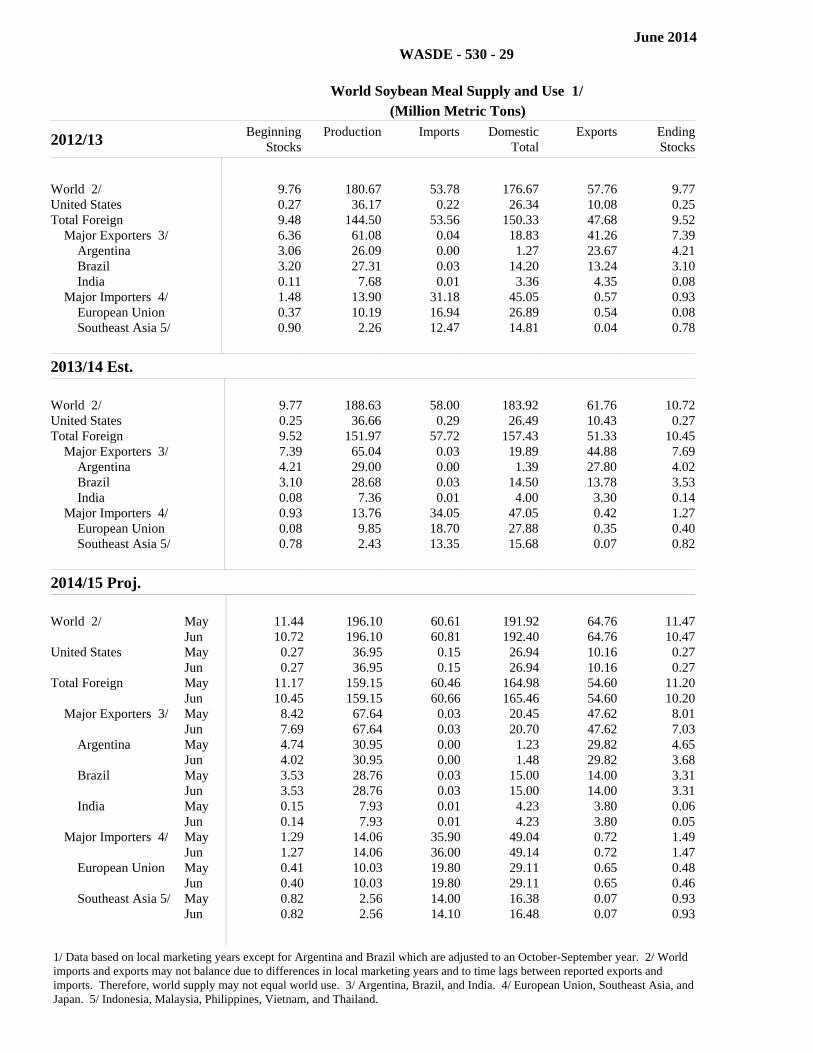
June 2014
WASDE - 530 - 29
World Soybean Meal Supply and Use 1/
(Million Metric Tons)
2012/13 Beginning
StocksProduction Imports Domestic
TotalExports Ending
Stocks
World 2/ 9.76 180.67 53.78 176.67 57.76 9.77United States 0.27 36.17 0.22 26.34 10.08 0.25Total Foreign 9.48 144.50 53.56 150.33 47.68 9.52 Major Exporters 3/ 6.36 61.08 0.04 18.83 41.26 7.39 Argentina 3.06 26.09 0.00 1.27 23.67 4.21 Brazil 3.20 27.31 0.03 14.20 13.24 3.10 India 0.11 7.68 0.01 3.36 4.35 0.08 Major Importers 4/ 1.48 13.90 31.18 45.05 0.57 0.93 European Union 0.37 10.19 16.94 26.89 0.54 0.08 Southeast Asia 5/ 0.90 2.26 12.47 14.81 0.04 0.78
2013/14 Est. Beginning
Stocks Production ImportsDomestic
Total Exports Ending Stocks
World 2/ 9.77 188.63 58.00 183.92 61.76 10.72United States 0.25 36.66 0.29 26.49 10.43 0.27Total Foreign 9.52 151.97 57.72 157.43 51.33 10.45 Major Exporters 3/ 7.39 65.04 0.03 19.89 44.88 7.69 Argentina 4.21 29.00 0.00 1.39 27.80 4.02 Brazil 3.10 28.68 0.03 14.50 13.78 3.53 India 0.08 7.36 0.01 4.00 3.30 0.14 Major Importers 4/ 0.93 13.76 34.05 47.05 0.42 1.27 European Union 0.08 9.85 18.70 27.88 0.35 0.40 Southeast Asia 5/ 0.78 2.43 13.35 15.68 0.07 0.82
2014/15 Proj. Beginning
Stocks Production Imports Domestic Total
Exports Ending Stocks
World 2/ May 11.44 196.10 60.61 191.92 64.76 11.47
Jun 10.72 196.10 60.81 192.40 64.76 10.47United States May 0.27 36.95 0.15 26.94 10.16 0.27
Jun 0.27 36.95 0.15 26.94 10.16 0.27Total Foreign May 11.17 159.15 60.46 164.98 54.60 11.20
Jun 10.45 159.15 60.66 165.46 54.60 10.20 Major Exporters 3/ May 8.42 67.64 0.03 20.45 47.62 8.01
Jun 7.69 67.64 0.03 20.70 47.62 7.03 Argentina May 4.74 30.95 0.00 1.23 29.82 4.65
Jun 4.02 30.95 0.00 1.48 29.82 3.68 Brazil May 3.53 28.76 0.03 15.00 14.00 3.31
Jun 3.53 28.76 0.03 15.00 14.00 3.31 India May 0.15 7.93 0.01 4.23 3.80 0.06
Jun 0.14 7.93 0.01 4.23 3.80 0.05 Major Importers 4/ May 1.29 14.06 35.90 49.04 0.72 1.49
Jun 1.27 14.06 36.00 49.14 0.72 1.47 European Union May 0.41 10.03 19.80 29.11 0.65 0.48
Jun 0.40 10.03 19.80 29.11 0.65 0.46 Southeast Asia 5/ May 0.82 2.56 14.00 16.38 0.07 0.93
Jun 0.82 2.56 14.10 16.48 0.07 0.93
1/ Data based on local marketing years except for Argentina and Brazil which are adjusted to an October-September year. 2/ World imports and exports may not balance due to differences in local marketing years and to time lags between reported exports and imports. Therefore, world supply may not equal world use. 3/ Argentina, Brazil, and India. 4/ European Union, Southeast Asia, and Japan. 5/ Indonesia, Malaysia, Philippines, Vietnam, and Thailand.
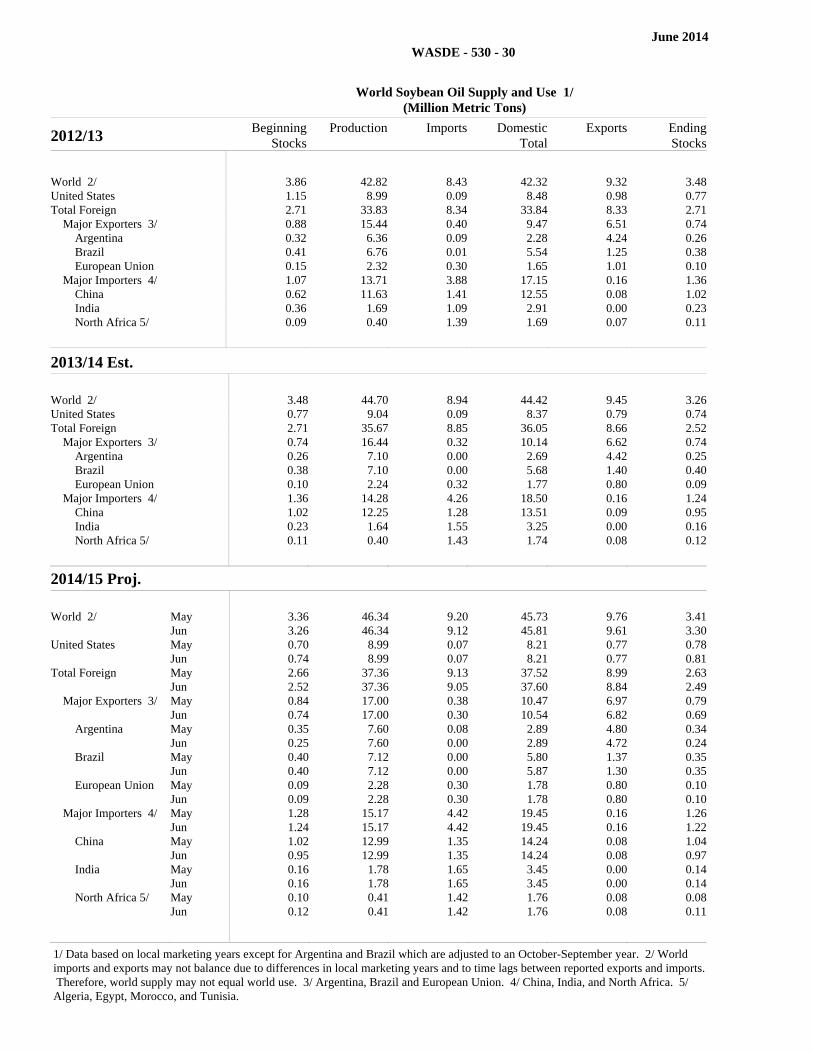
June 2014
WASDE - 530 - 30
World Soybean Oil Supply and Use 1/
(Million Metric Tons)
2012/13 Beginning
StocksProduction Imports Domestic
TotalExports Ending
Stocks
World 2/ 3.86 42.82 8.43 42.32 9.32 3.48United States 1.15 8.99 0.09 8.48 0.98 0.77Total Foreign 2.71 33.83 8.34 33.84 8.33 2.71 Major Exporters 3/ 0.88 15.44 0.40 9.47 6.51 0.74 Argentina 0.32 6.36 0.09 2.28 4.24 0.26 Brazil 0.41 6.76 0.01 5.54 1.25 0.38 European Union 0.15 2.32 0.30 1.65 1.01 0.10 Major Importers 4/ 1.07 13.71 3.88 17.15 0.16 1.36 China 0.62 11.63 1.41 12.55 0.08 1.02 India 0.36 1.69 1.09 2.91 0.00 0.23 North Africa 5/ 0.09 0.40 1.39 1.69 0.07 0.11
2013/14 Est. Beginning
Stocks Production ImportsDomestic
Total Exports Ending Stocks
World 2/ 3.48 44.70 8.94 44.42 9.45 3.26United States 0.77 9.04 0.09 8.37 0.79 0.74Total Foreign 2.71 35.67 8.85 36.05 8.66 2.52 Major Exporters 3/ 0.74 16.44 0.32 10.14 6.62 0.74 Argentina 0.26 7.10 0.00 2.69 4.42 0.25 Brazil 0.38 7.10 0.00 5.68 1.40 0.40 European Union 0.10 2.24 0.32 1.77 0.80 0.09 Major Importers 4/ 1.36 14.28 4.26 18.50 0.16 1.24 China 1.02 12.25 1.28 13.51 0.09 0.95 India 0.23 1.64 1.55 3.25 0.00 0.16 North Africa 5/ 0.11 0.40 1.43 1.74 0.08 0.12
2014/15 Proj. Beginning
Stocks Production Imports Domestic Total
Exports Ending Stocks
World 2/ May 3.36 46.34 9.20 45.73 9.76 3.41
Jun 3.26 46.34 9.12 45.81 9.61 3.30United States May 0.70 8.99 0.07 8.21 0.77 0.78
Jun 0.74 8.99 0.07 8.21 0.77 0.81Total Foreign May 2.66 37.36 9.13 37.52 8.99 2.63
Jun 2.52 37.36 9.05 37.60 8.84 2.49 Major Exporters 3/ May 0.84 17.00 0.38 10.47 6.97 0.79
Jun 0.74 17.00 0.30 10.54 6.82 0.69 Argentina May 0.35 7.60 0.08 2.89 4.80 0.34
Jun 0.25 7.60 0.00 2.89 4.72 0.24 Brazil May 0.40 7.12 0.00 5.80 1.37 0.35
Jun 0.40 7.12 0.00 5.87 1.30 0.35 European Union May 0.09 2.28 0.30 1.78 0.80 0.10
Jun 0.09 2.28 0.30 1.78 0.80 0.10 Major Importers 4/ May 1.28 15.17 4.42 19.45 0.16 1.26
Jun 1.24 15.17 4.42 19.45 0.16 1.22 China May 1.02 12.99 1.35 14.24 0.08 1.04
Jun 0.95 12.99 1.35 14.24 0.08 0.97 India May 0.16 1.78 1.65 3.45 0.00 0.14
Jun 0.16 1.78 1.65 3.45 0.00 0.14 North Africa 5/ May 0.10 0.41 1.42 1.76 0.08 0.08
Jun 0.12 0.41 1.42 1.76 0.08 0.11
1/ Data based on local marketing years except for Argentina and Brazil which are adjusted to an October-September year. 2/ World imports and exports may not balance due to differences in local marketing years and to time lags between reported exports and imports. Therefore, world supply may not equal world use. 3/ Argentina, Brazil and European Union. 4/ China, India, and North Africa. 5/ Algeria, Egypt, Morocco, and Tunisia.
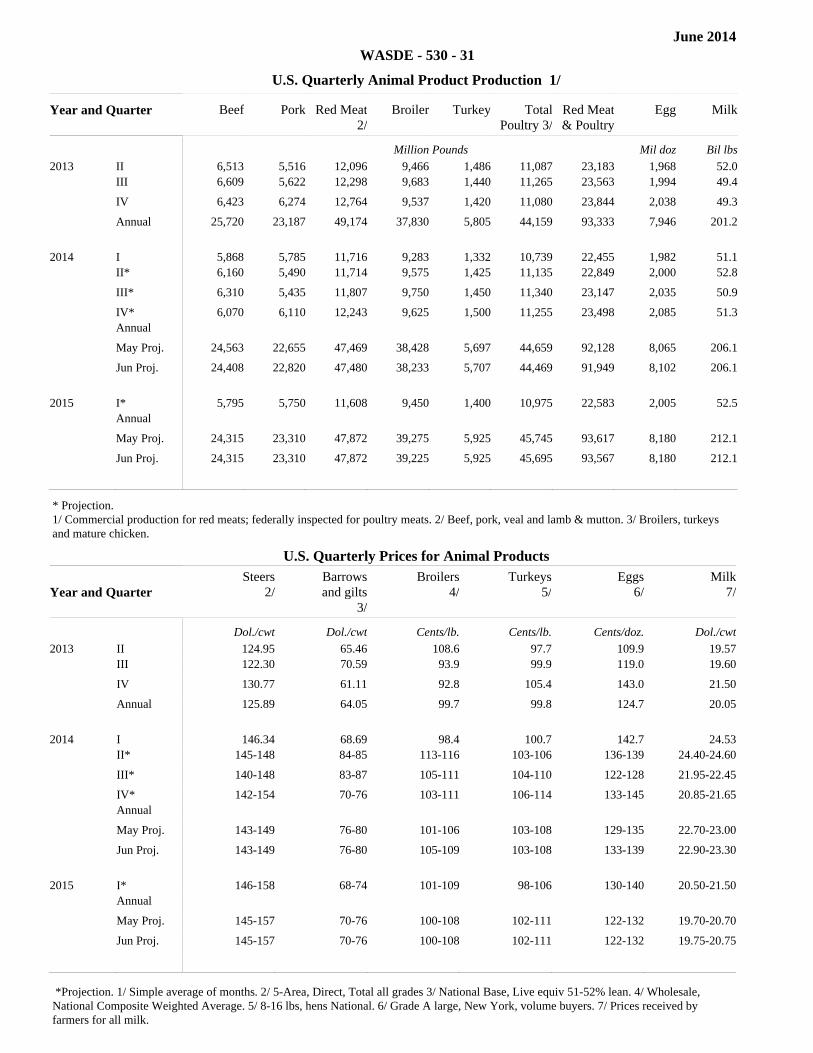
June 2014
WASDE - 530 - 31
U.S. Quarterly Animal Product Production 1/
Year and Quarter Beef Pork Red Meat2/
Broiler Turkey TotalPoultry 3/
Red Meat& Poultry
Egg Milk
Million Pounds Mil doz Bil lbs
2013 II 6,513 5,516 12,096 9,466 1,486 11,087 23,183 1,968 52.0
III 6,609 5,622 12,298 9,683 1,440 11,265 23,563 1,994 49.4
IV 6,423 6,274 12,764 9,537 1,420 11,080 23,844 2,038 49.3
Annual 25,720 23,187 49,174 37,830 5,805 44,159 93,333 7,946 201.2
2014 I 5,868 5,785 11,716 9,283 1,332 10,739 22,455 1,982 51.1
II* 6,160 5,490 11,714 9,575 1,425 11,135 22,849 2,000 52.8
III* 6,310 5,435 11,807 9,750 1,450 11,340 23,147 2,035 50.9
IV* 6,070 6,110 12,243 9,625 1,500 11,255 23,498 2,085 51.3Annual
May Proj. 24,563 22,655 47,469 38,428 5,697 44,659 92,128 8,065 206.1
Jun Proj. 24,408 22,820 47,480 38,233 5,707 44,469 91,949 8,102 206.1
2015 I* 5,795 5,750 11,608 9,450 1,400 10,975 22,583 2,005 52.5
Annual May Proj. 24,315 23,310 47,872 39,275 5,925 45,745 93,617 8,180 212.1
Jun Proj. 24,315 23,310 47,872 39,225 5,925 45,695 93,567 8,180 212.1
* Projection. 1/ Commercial production for red meats; federally inspected for poultry meats. 2/ Beef, pork, veal and lamb & mutton. 3/ Broilers, turkeys and mature chicken.
U.S. Quarterly Prices for Animal Products
Year and Quarter Steers
2/Barrowsand gilts
3/
Broilers4/
Turkeys5/
Eggs6/
Milk7/
Dol./cwt Dol./cwt Cents/lb. Cents/lb. Cents/doz. Dol./cwt
2013 II 124.95 65.46 108.6 97.7 109.9 19.57
III 122.30 70.59 93.9 99.9 119.0 19.60
IV 130.77 61.11 92.8 105.4 143.0 21.50
Annual 125.89 64.05 99.7 99.8 124.7 20.05
2014 I 146.34 68.69 98.4 100.7 142.7 24.53
II* 145-148 84-85 113-116 103-106 136-139 24.40-24.60
III* 140-148 83-87 105-111 104-110 122-128 21.95-22.45
IV* 142-154 70-76 103-111 106-114 133-145 20.85-21.65Annual
May Proj. 143-149 76-80 101-106 103-108 129-135 22.70-23.00
Jun Proj. 143-149 76-80 105-109 103-108 133-139 22.90-23.30
2015 I* 146-158 68-74 101-109 98-106 130-140 20.50-21.50
Annual May Proj. 145-157 70-76 100-108 102-111 122-132 19.70-20.70
Jun Proj. 145-157 70-76 100-108 102-111 122-132 19.75-20.75
*Projection. 1/ Simple average of months. 2/ 5-Area, Direct, Total all grades 3/ National Base, Live equiv 51-52% lean. 4/ Wholesale, National Composite Weighted Average. 5/ 8-16 lbs, hens National. 6/ Grade A large, New York, volume buyers. 7/ Prices received by farmers for all milk.
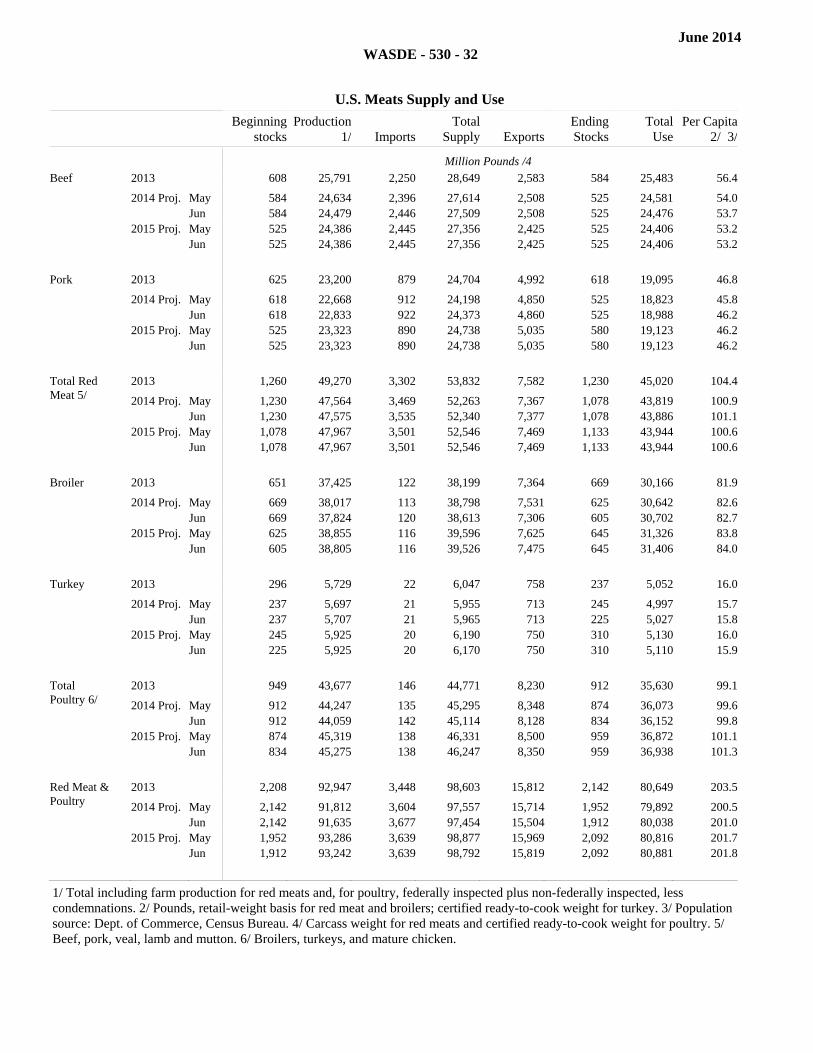
June 2014
WASDE - 530 - 32
U.S. Meats Supply and Use
Item Beginningstocks
Production1/ Imports
TotalSupply Exports
EndingStocks
TotalUse
Per Capita2/ 3/
Million Pounds /4 Beef 2013 608 25,791 2,250 28,649 2,583 584 25,483 56.4
2014 Proj. May 584 24,634 2,396 27,614 2,508 525 24,581 54.0Jun 584 24,479 2,446 27,509 2,508 525 24,476 53.7
2015 Proj. May 525 24,386 2,445 27,356 2,425 525 24,406 53.2Jun 525 24,386 2,445 27,356 2,425 525 24,406 53.2
Filler Filler Filler Filler Filler Filler Filler Filler
Pork 2013 625 23,200 879 24,704 4,992 618 19,095 46.8
2014 Proj. May 618 22,668 912 24,198 4,850 525 18,823 45.8Jun 618 22,833 922 24,373 4,860 525 18,988 46.2
2015 Proj. May 525 23,323 890 24,738 5,035 580 19,123 46.2Jun 525 23,323 890 24,738 5,035 580 19,123 46.2
Filler Filler Filler Filler Filler Filler Filler Filler
Total Red Meat 5/
2013 1,260 49,270 3,302 53,832 7,582 1,230 45,020 104.4
2014 Proj. May 1,230 47,564 3,469 52,263 7,367 1,078 43,819 100.9Jun 1,230 47,575 3,535 52,340 7,377 1,078 43,886 101.1
2015 Proj. May 1,078 47,967 3,501 52,546 7,469 1,133 43,944 100.6Jun 1,078 47,967 3,501 52,546 7,469 1,133 43,944 100.6
Filler Filler Filler Filler Filler Filler Filler Filler
Broiler 2013 651 37,425 122 38,199 7,364 669 30,166 81.9
2014 Proj. May 669 38,017 113 38,798 7,531 625 30,642 82.6Jun 669 37,824 120 38,613 7,306 605 30,702 82.7
2015 Proj. May 625 38,855 116 39,596 7,625 645 31,326 83.8Jun 605 38,805 116 39,526 7,475 645 31,406 84.0
Filler Filler Filler Filler Filler Filler Filler Filler
Turkey 2013 296 5,729 22 6,047 758 237 5,052 16.0
2014 Proj. May 237 5,697 21 5,955 713 245 4,997 15.7Jun 237 5,707 21 5,965 713 225 5,027 15.8
2015 Proj. May 245 5,925 20 6,190 750 310 5,130 16.0Jun 225 5,925 20 6,170 750 310 5,110 15.9
Filler Filler Filler Filler Filler Filler Filler Filler
Total Poultry 6/
2013 949 43,677 146 44,771 8,230 912 35,630 99.1
2014 Proj. May 912 44,247 135 45,295 8,348 874 36,073 99.6Jun 912 44,059 142 45,114 8,128 834 36,152 99.8
2015 Proj. May 874 45,319 138 46,331 8,500 959 36,872 101.1Jun 834 45,275 138 46,247 8,350 959 36,938 101.3
Filler Filler Filler Filler Filler Filler Filler Filler
Red Meat & Poultry
2013 2,208 92,947 3,448 98,603 15,812 2,142 80,649 203.5
2014 Proj. May 2,142 91,812 3,604 97,557 15,714 1,952 79,892 200.5Jun 2,142 91,635 3,677 97,454 15,504 1,912 80,038 201.0
2015 Proj. May 1,952 93,286 3,639 98,877 15,969 2,092 80,816 201.7Jun 1,912 93,242 3,639 98,792 15,819 2,092 80,881 201.8
1/ Total including farm production for red meats and, for poultry, federally inspected plus non-federally inspected, less condemnations. 2/ Pounds, retail-weight basis for red meat and broilers; certified ready-to-cook weight for turkey. 3/ Population source: Dept. of Commerce, Census Bureau. 4/ Carcass weight for red meats and certified ready-to-cook weight for poultry. 5/ Beef, pork, veal, lamb and mutton. 6/ Broilers, turkeys, and mature chicken.
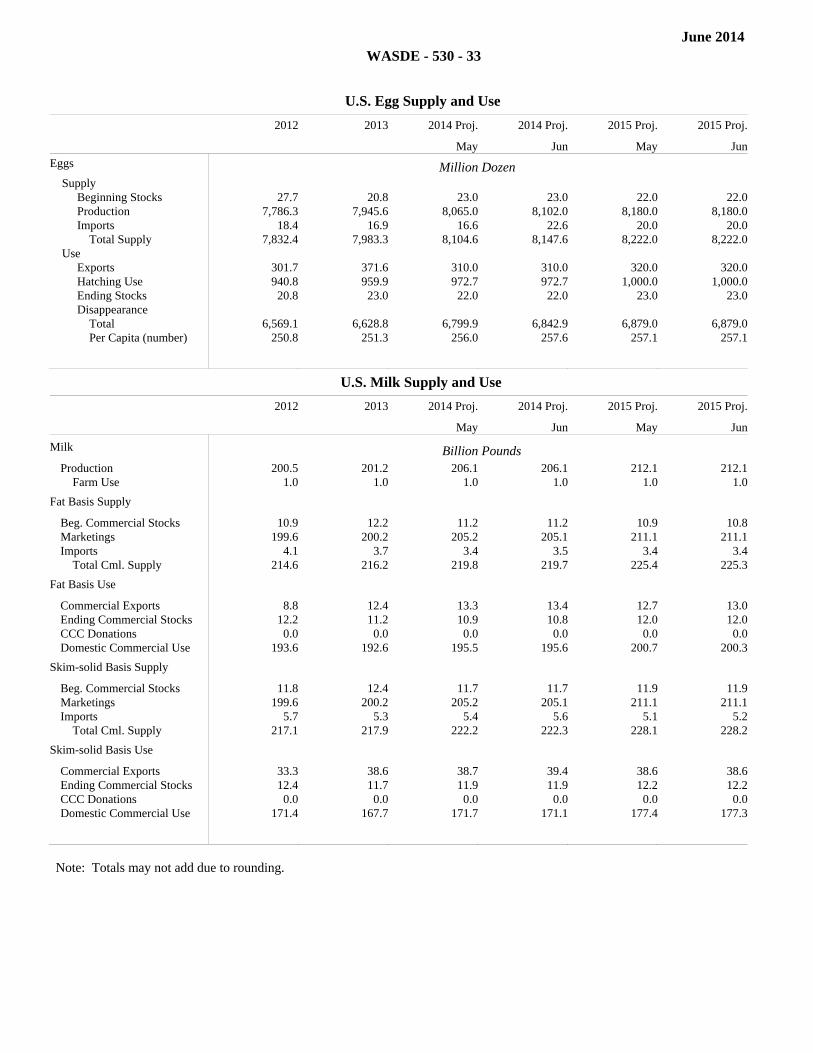
June 2014
WASDE - 530 - 33
U.S. Egg Supply and Use
Commodity 2012 2013 2014 Proj. 2014 Proj. 2015 Proj. 2015 Proj.
May Jun May Jun
Eggs Million Dozen Supply Beginning Stocks 27.7 20.8 23.0 23.0 22.0 22.0 Production 7,786.3 7,945.6 8,065.0 8,102.0 8,180.0 8,180.0 Imports 18.4 16.9 16.6 22.6 20.0 20.0 Total Supply 7,832.4 7,983.3 8,104.6 8,147.6 8,222.0 8,222.0 Use Exports 301.7 371.6 310.0 310.0 320.0 320.0 Hatching Use 940.8 959.9 972.7 972.7 1,000.0 1,000.0 Ending Stocks 20.8 23.0 22.0 22.0 23.0 23.0 Disappearance Total 6,569.1 6,628.8 6,799.9 6,842.9 6,879.0 6,879.0 Per Capita (number) 250.8 251.3 256.0 257.6 257.1 257.1Total
U.S. Milk Supply and Use
Commodity 2012 2013 2014 Proj. 2014 Proj. 2015 Proj. 2015 Proj.
May Jun May Jun
Milk Billion Pounds Production 200.5 201.2 206.1 206.1 212.1 212.1 Farm Use 1.0 1.0 1.0 1.0 1.0 1.0
Fat Basis Supply Beg. Commercial Stocks 10.9 12.2 11.2 11.2 10.9 10.8Marketings 199.6 200.2 205.2 205.1 211.1 211.1Imports 4.1 3.7 3.4 3.5 3.4 3.4 Total Cml. Supply 214.6 216.2 219.8 219.7 225.4 225.3
Fat Basis Use Commercial Exports 8.8 12.4 13.3 13.4 12.7 13.0Ending Commercial Stocks 12.2 11.2 10.9 10.8 12.0 12.0CCC Donations 0.0 0.0 0.0 0.0 0.0 0.0Domestic Commercial Use 193.6 192.6 195.5 195.6 200.7 200.3
Skim-solid Basis Supply Beg. Commercial Stocks 11.8 12.4 11.7 11.7 11.9 11.9Marketings 199.6 200.2 205.2 205.1 211.1 211.1Imports 5.7 5.3 5.4 5.6 5.1 5.2 Total Cml. Supply 217.1 217.9 222.2 222.3 228.1 228.2
Skim-solid Basis Use Commercial Exports 33.3 38.6 38.7 39.4 38.6 38.6Ending Commercial Stocks 12.4 11.7 11.9 11.9 12.2 12.2CCC Donations 0.0 0.0 0.0 0.0 0.0 0.0Domestic Commercial Use 171.4 167.7 171.7 171.1 177.4 177.3
Total
Note: Totals may not add due to rounding.

June 2014
WASDE - 530 - 34
U.S. Dairy Prices
Commodity 2012 2013 2014 Proj. 2014 Proj. 2015 Proj. 2015 Proj.
May Jun May Jun
Product Prices 1/ Dollars Per Pound Cheese 1.7076 1.7683 1.995-
2.0252.015-2.055
1.670-1.770
1.670-1.770
Butter 1.5943 1.5451 1.800-1.860
1.870-1.940
1.615-1.745
1.640-1.770
Nonfat Dry Milk 1.3279 1.7066 1.830-1.860
1.820-1.860
1.605-1.675
1.605-1.675
Dry Whey 0.5935 0.5902 0.630-0.650
0.630-0.650
0.550-0.580
0.550-0.580
Filler Dollars Per Cwt
Milk Prices 2/ Class III 17.44 17.99 20.55-
20.8520.80-21.20
16.90-17.90
16.95-17.95
Class IV 16.01 19.05 21.25-21.65
21.45-21.95
18.55-19.65
18.65-19.75
All Milk 3/ 18.52 20.05 22.70-23.00
22.90-23.30
19.70-20.70
19.75-20.75
1/ Simple average of monthly prices calculated by AMS from weekly average dairy product prices for class price computations. 2/ Annual Class III and Class IV prices are the simple averages of monthly minimum Federal order milk prices paid by regulated plants for milk used in the respective classes. All milk price is the simple average of monthly prices received by farmers for milk at average test. 3/ Does not reflect any deductions from producers as authorized by legislation.
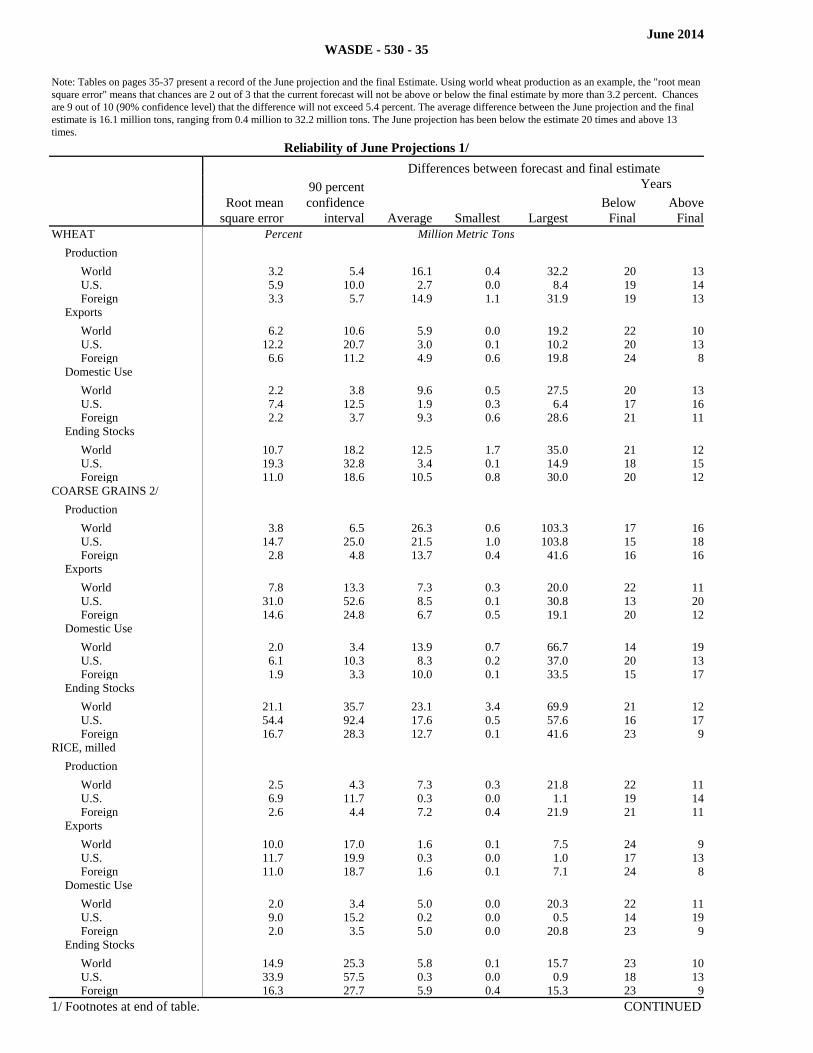
June 2014WASDE - 530 - 35
Note: Tables on pages 35-37 present a record of the June projection and the final Estimate. Using world wheat production as an example, the "root mean square error" means that chances are 2 out of 3 that the current forecast will not be above or below the final estimate by more than 3.2 percent. Chances are 9 out of 10 (90% confidence level) that the difference will not exceed 5.4 percent. The average difference between the June projection and the final estimate is 16.1 million tons, ranging from 0.4 million to 32.2 million tons. The June projection has been below the estimate 20 times and above 13 times.
Reliability of June Projections 1/
Differences between forecast and final estimate 90 percent Years
Commodity and Region
Root mean square error
confidenceinterval Average Smallest Largest
BelowFinal
AboveFinal
WHEAT
Percent
Million Metric Tons
Production
World
3.2
5.4
16.1 0.4 32.2 20 13
U.S.
5.9
10.0
2.7 0.0 8.4 19 14
Foreign
3.3
5.7
14.9 1.1 31.9 19 13
Exports
World
6.2
10.6
5.9 0.0 19.2 22 10
U.S.
12.2
20.7
3.0 0.1 10.2 20 13
Foreign
6.6
11.2
4.9 0.6 19.8 24 8
Domestic Use
World
2.2
3.8
9.6 0.5 27.5 20 13
U.S.
7.4
12.5
1.9 0.3 6.4 17 16
Foreign
2.2
3.7
9.3 0.6 28.6 21 11
Ending Stocks
World
10.7
18.2
12.5 1.7 35.0 21 12
U.S.
19.3
32.8
3.4 0.1 14.9 18 15
Foreign
11.0
18.6
10.5 0.8 30.0 20 12
COARSE GRAINS 2/
Production
World
3.8
6.5
26.3 0.6 103.3 17 16
U.S.
14.7
25.0
21.5 1.0 103.8 15 18
Foreign
2.8
4.8
13.7 0.4 41.6 16 16
Exports
World
7.8
13.3
7.3 0.3 20.0 22 11
U.S.
31.0
52.6
8.5 0.1 30.8 13 20
Foreign
14.6
24.8
6.7 0.5 19.1 20 12
Domestic Use
World
2.0
3.4
13.9 0.7 66.7 14 19
U.S.
6.1
10.3
8.3 0.2 37.0 20 13
Foreign
1.9
3.3
10.0 0.1 33.5 15 17
Ending Stocks
World
21.1
35.7
23.1 3.4 69.9 21 12
U.S.
54.4
92.4
17.6 0.5 57.6 16 17
Foreign
16.7
28.3
12.7 0.1 41.6 23 9
RICE, milled
Production
World
2.5
4.3
7.3 0.3 21.8 22 11
U.S.
6.9
11.7
0.3 0.0 1.1 19 14
Foreign
2.6
4.4
7.2 0.4 21.9 21 11
Exports
World
10.0
17.0
1.6 0.1 7.5 24 9
U.S.
11.7
19.9
0.3 0.0 1.0 17 13
Foreign
11.0
18.7
1.6 0.1 7.1 24 8
Domestic Use
World
2.0
3.4
5.0 0.0 20.3 22 11
U.S.
9.0
15.2
0.2 0.0 0.5 14 19
Foreign
2.0
3.5
5.0 0.0 20.8 23 9
Ending Stocks
World
14.9
25.3
5.8 0.1 15.7 23 10
U.S.
33.9
57.5
0.3 0.0 0.9 18 13
Foreign
16.3
27.7
5.9 0.4 15.3 23 9
1/ Footnotes at end of table. CONTINUED
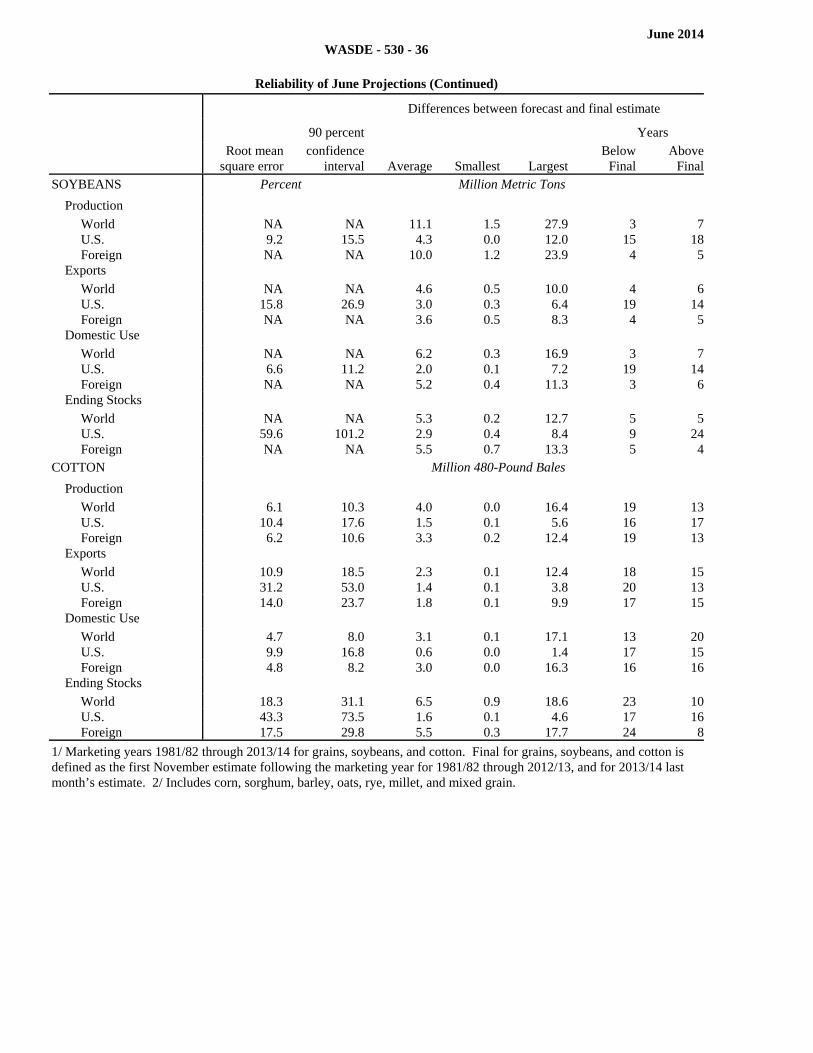
June 2014WASDE - 530 - 36
Reliability of June Projections (Continued)
Differences between forecast and final estimate
90 percent Years
Commodity and Region
Root mean square error
confidenceinterval Average Smallest Largest
BelowFinal
AboveFinal
SOYBEANS Percent Million Metric Tons Production
World NA NA 11.1 1.5 27.9 3 7U.S. 9.2 15.5 4.3 0.0 12.0 15 18Foreign NA NA 10.0 1.2 23.9 4 5
Exports World NA NA 4.6 0.5 10.0 4 6U.S. 15.8 26.9 3.0 0.3 6.4 19 14Foreign NA NA 3.6 0.5 8.3 4 5
Domestic Use World NA NA 6.2 0.3 16.9 3 7U.S. 6.6 11.2 2.0 0.1 7.2 19 14Foreign NA NA 5.2 0.4 11.3 3 6
Ending Stocks World NA NA 5.3 0.2 12.7 5 5U.S. 59.6 101.2 2.9 0.4 8.4 9 24Foreign NA NA 5.5 0.7 13.3 5 4
COTTON Million 480-Pound Bales Production
World 6.1 10.3 4.0 0.0 16.4 19 13U.S. 10.4 17.6 1.5 0.1 5.6 16 17Foreign 6.2 10.6 3.3 0.2 12.4 19 13
Exports World 10.9 18.5 2.3 0.1 12.4 18 15U.S. 31.2 53.0 1.4 0.1 3.8 20 13Foreign 14.0 23.7 1.8 0.1 9.9 17 15
Domestic Use World 4.7 8.0 3.1 0.1 17.1 13 20U.S. 9.9 16.8 0.6 0.0 1.4 17 15Foreign 4.8 8.2 3.0 0.0 16.3 16 16
Ending Stocks World 18.3 31.1 6.5 0.9 18.6 23 10U.S. 43.3 73.5 1.6 0.1 4.6 17 16Foreign 17.5 29.8 5.5 0.3 17.7 24 8
1/ Marketing years 1981/82 through 2013/14 for grains, soybeans, and cotton. Final for grains, soybeans, and cotton is defined as the first November estimate following the marketing year for 1981/82 through 2012/13, and for 2013/14 last month’s estimate. 2/ Includes corn, sorghum, barley, oats, rye, millet, and mixed grain.
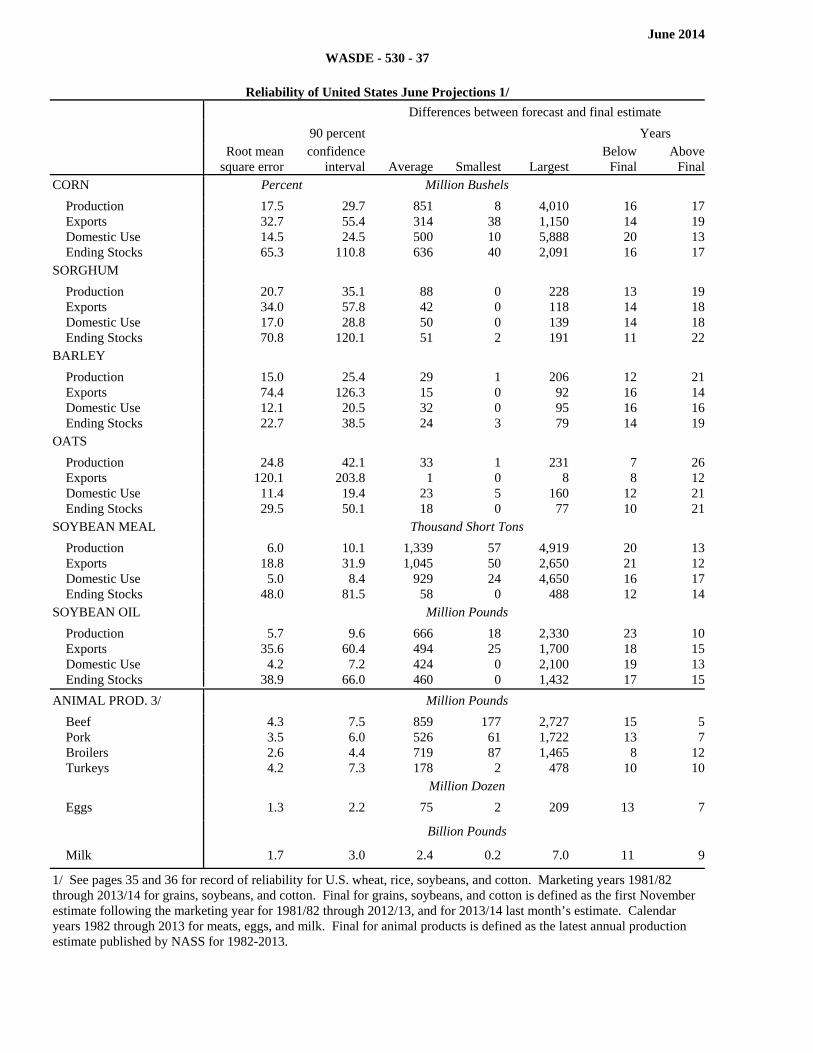
June 2014
WASDE - 530 - 37
Reliability of United States June Projections 1/
Differences between forecast and final estimate
90 percent Years
Root mean square error
confidenceinterval Average Smallest Largest
BelowFinal
AboveFinal
CORN Percent Million Bushels Production 17.5 29.7 851 8 4,010 16 17Exports 32.7 55.4 314 38 1,150 14 19Domestic Use 14.5 24.5 500 10 5,888 20 13Ending Stocks 65.3 110.8 636 40 2,091 16 17
SORGHUM Production 20.7 35.1 88 0 228 13 19Exports 34.0 57.8 42 0 118 14 18Domestic Use 17.0 28.8 50 0 139 14 18Ending Stocks 70.8 120.1 51 2 191 11 22
BARLEY Production 15.0 25.4 29 1 206 12 21Exports 74.4 126.3 15 0 92 16 14Domestic Use 12.1 20.5 32 0 95 16 16Ending Stocks 22.7 38.5 24 3 79 14 19
OATS Production 24.8 42.1 33 1 231 7 26Exports 120.1 203.8 1 0 8 8 12Domestic Use 11.4 19.4 23 5 160 12 21Ending Stocks 29.5 50.1 18 0 77 10 21
SOYBEAN MEAL Thousand Short Tons Production 6.0 10.1 1,339 57 4,919 20 13Exports 18.8 31.9 1,045 50 2,650 21 12Domestic Use 5.0 8.4 929 24 4,650 16 17Ending Stocks 48.0 81.5 58 0 488 12 14
SOYBEAN OIL Million Pounds Production 5.7 9.6 666 18 2,330 23 10Exports 35.6 60.4 494 25 1,700 18 15Domestic Use 4.2 7.2 424 0 2,100 19 13Ending Stocks 38.9 66.0 460 0 1,432 17 15
ANIMAL PROD. 3/ Million Pounds Beef 4.3 7.5 859 177 2,727 15 5Pork 3.5 6.0 526 61 1,722 13 7Broilers 2.6 4.4 719 87 1,465 8 12Turkeys 4.2 7.3 178 2 478 10 10
Million Dozen Eggs 1.3 2.2 75 2 209 13 7
Billion Pounds Milk 1.7 3.0 2.4 0.2 7.0 11 9
1/ See pages 35 and 36 for record of reliability for U.S. wheat, rice, soybeans, and cotton. Marketing years 1981/82 through 2013/14 for grains, soybeans, and cotton. Final for grains, soybeans, and cotton is defined as the first November estimate following the marketing year for 1981/82 through 2012/13, and for 2013/14 last month’s estimate. Calendar years 1982 through 2013 for meats, eggs, and milk. Final for animal products is defined as the latest annual production estimate published by NASS for 1982-2013.
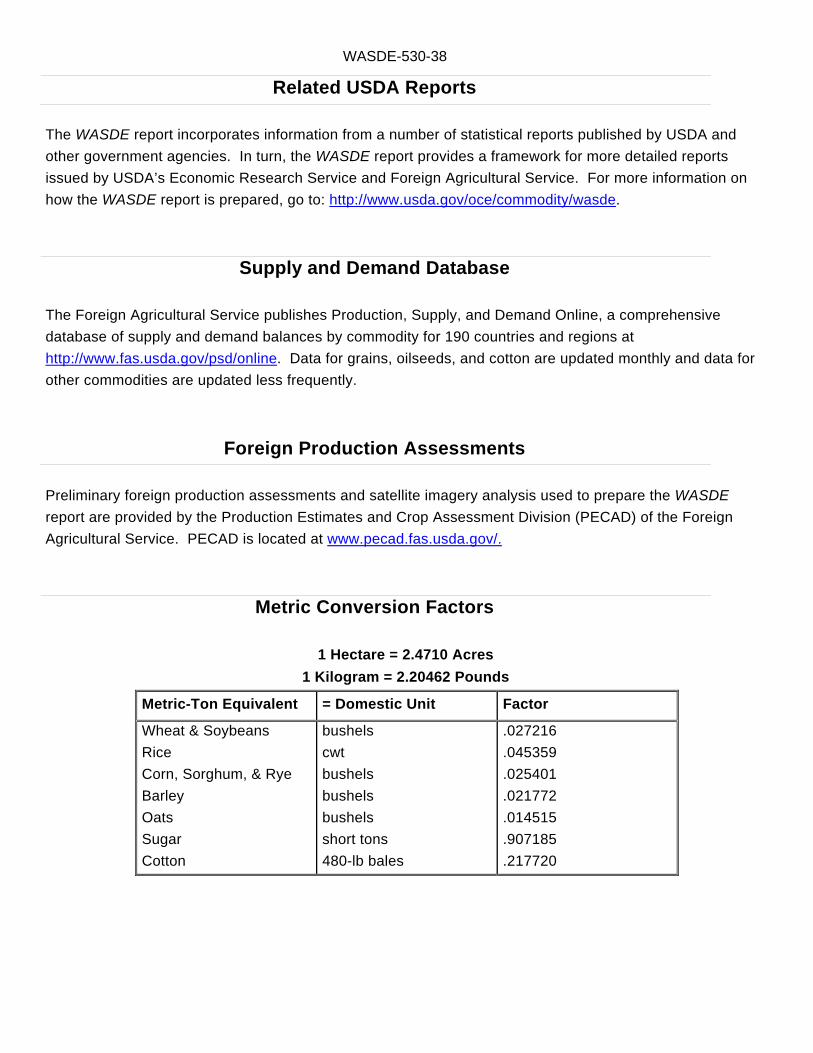
WASDE-530-38
Related USDA Reports
The WASDE report incorporates information from a number of statistical reports published by USDA and
other government agencies. In turn, the WASDE report provides a framework for more detailed reports
issued by USDA’s Economic Research Service and Foreign Agricultural Service. For more information on
how the WASDE report is prepared, go to: http://www.usda.gov/oce/commodity/wasde.
Supply and Demand Database
The Foreign Agricultural Service publishes Production, Supply, and Demand Online, a comprehensive
database of supply and demand balances by commodity for 190 countries and regions at
http://www.fas.usda.gov/psd/online. Data for grains, oilseeds, and cotton are updated monthly and data for
other commodities are updated less frequently.
Foreign Production Assessments
Preliminary foreign production assessments and satellite imagery analysis used to prepare the WASDE
report are provided by the Production Estimates and Crop Assessment Division (PECAD) of the Foreign
Agricultural Service. PECAD is located at www.pecad.fas.usda.gov/.
Metric Conversion Factors
1 Hectare = 2.4710 Acres
1 Kilogram = 2.20462 Pounds
Metric-Ton Equivalent = Domestic Unit Factor
Wheat & Soybeans
Rice
Corn, Sorghum, & Rye
Barley
Oats
Sugar
Cotton
bushels
cwt
bushels
bushels
bushels
short tons
480-lb bales
.027216
.045359
.025401
.021772
.014515
.907185
.217720

Intentionally left blank
UNITED STATES DEPARTMENT OF AGRICULTURE WORLD AGRICULTURAL OUTLOOK BOARD WASHINGTON, D.C. 20250-3812 ___________________ OFFICIAL BUSINESS Penalty for Private Use, $300
FIRST-CLASS MAIL POSTAGE & FEES PAID
USDA PERMIT NO. G-289
World Agricultural Supply and Demand Estimates
WASDE-530 – June 11, 2014
Electronic Subscriptions: Download the WASDE report at http://usda.mannlib.cornell.edu/.
Get a free e-mail subscription to the WASDE and other USDA crop reports at
http://usda.mannlib.cornell.edu. Select the “Reports by E-Mail” bar to sign up.
Print Subscriptions: For print subscriptions, call the National Technical Information Service
(NTIS) at 1-800-999-6779 or 703-605-6220.
The U.S. Department of Agriculture (USDA) prohibits discrimination in all its programs and
activities on the basis of race, color, national origin, gender, religion, age, disability, political
beliefs, sexual orientation, and marital or family status. (Not all prohibited bases apply to all
programs.) Persons with disabilities who require alternative means for communication of program
information (Braille, large print, audiotape, etc.) should contact USDA’s TARGET Center at 202-
720-2600 (voice and TDD).
To file a complaint of discrimination, write USDA, Director, Office of Civil Rights, Room 326-W,
Whitten Building, 1400 Independence Avenue, SW, Washington, D.C. 20250-9410 or call (202)
720-5964 (voice or TDD). USDA is an equal opportunity provider and employer.