Working paper No.2 Rev.1 - UNECE
61
Working paper No.2 Rev.1 8 December 2005 ENGLISH ONLY STATISTICAL COMMISSION and ECONOMIC COMMISSION FOR EUROPE CONFERENCE OF EUROPEAN STATISTICIANS Joint UNECE/EUROSTAT Meeting on Population and Housing Censuses Organised in cooperation with UNFPA (Geneva, 12-16 December 2005) STATISTICAL OFFICE OF THE EUROPEAN COMMUNITIES (EUROSTAT) Supporting paper Proposed Set of Recommended Tabulations for the United Nations Principles and Recommendations for Population and Housing Censuses, Revision 2 submitted by United Nations Statistics Division * Introduction 1. The United Nations Expert Group Meeting on the 2010 World Programme on Population and Housing Censuses (held in New York, 22-26 August 2001) assigned its Technical Subgroup on Core Set of Topics and Tabulations to prepare a proposal for consideration by the Expert Group as a whole and by the Drafting Group, in particular, that would identify those topics and tabulations that represent basic statistical needs that all countries would have to be able to generate at the lowest geographical level. 2. This proposal was prepared by the Demographic and Social Statistics Branch of the United Nations Statistics Division. It is based on the Report of the United Nations Expert Group Meeting, the current set of Principles and Recommendations for Population and Housing Censuses, the demographic and social topics collected for the purpose of the United Nations Demographic Yearbook, Eurostat’s Guidelines and Table Programme for the Community Programme of Population and Housing Censuses in 2001, Volume II: Table Programme and several national population and housing census tabulation programmes. 3. In the first step, all the relevant discussion in regard to specific topics that were raised in preparation of the Exp ert Group Meeting and the discussion in the meeting itself was taken into consideration to identify those topics that were in the forefront of the deliberations. 4. The second step consisted of analyzing the tabulation programme of the current version of the Principles and Recommendations for Population and Housing Censuses and matching it against the discussion and the set of tabulations used for collecting relevant statistics for the United Nations Demographic Yearbook. * Demographic Statistics Section, Demographic and Social Statistics Branch.
-
Upload
khangminh22 -
Category
Documents
-
view
2 -
download
0
Transcript of Working paper No.2 Rev.1 - UNECE
Working paper No.2 Rev.1 8 December 2005 ENGLISH ONLY
STATISTICAL COMMISSION and ECONOMIC COMMISSION FOR EUROPE
CONFERENCE OF EUROPEAN STATISTICIANS
Joint UNECE/EUROSTAT Meeting on Population and Housing Censuses Organised in cooperation with UNFPA (Geneva, 12-16 December 2005)
STATISTICAL OFFICE OF THE EUROPEAN COMMUNITIES (EUROSTAT)
Supporting paper Proposed Set of Recommended Tabulations for the United Nations Principles and
Recommendations for Population and Housing Censuses, Revision 2
submitted by United Nations Statistics Division∗ Introduction 1. The United Nations Expert Group Meeting on the 2010 World Programme on Population and Housing Censuses (held in New York, 22-26 August 2001) assigned its Technical Subgroup on Core Set of Topics and Tabulations to prepare a proposal for consideration by the Expert Group as a whole and by the Drafting Group, in particular, that would identify those topics and tabulations that represent basic statistical needs that all countries would have to be able to generate at the lowest geographical level. 2. This proposal was prepared by the Demographic and Social Statistics Branch of the United Nations Statistics Division. It is based on the Report of the United Nations Expert Group Meeting, the current set of Principles and Recommendations for Population and Housing Censuses, the demographic and social topics collected for the purpose of the United Nations Demographic Yearbook, Eurostat’s Guidelines and Table Programme for the Community Programme of Population and Housing Censuses in 2001, Volume II: Table Programme and several national population and housing census tabulation programmes. 3. In the first step, all the relevant discussion in regard to specific topics that were raised in preparation of the Exp ert Group Meeting and the discussion in the meeting itself was taken into consideration to identify those topics that were in the forefront of the deliberations. 4. The second step consisted of analyzing the tabulation programme of the current version of the Principles and Recommendations for Population and Housing Censuses and matching it against the discussion and the set of tabulations used for collecting relevant statistics for the United Nations Demographic Yearbook.
∗ Demographic Statistics Section, Demographic and Social Statistics Branch.
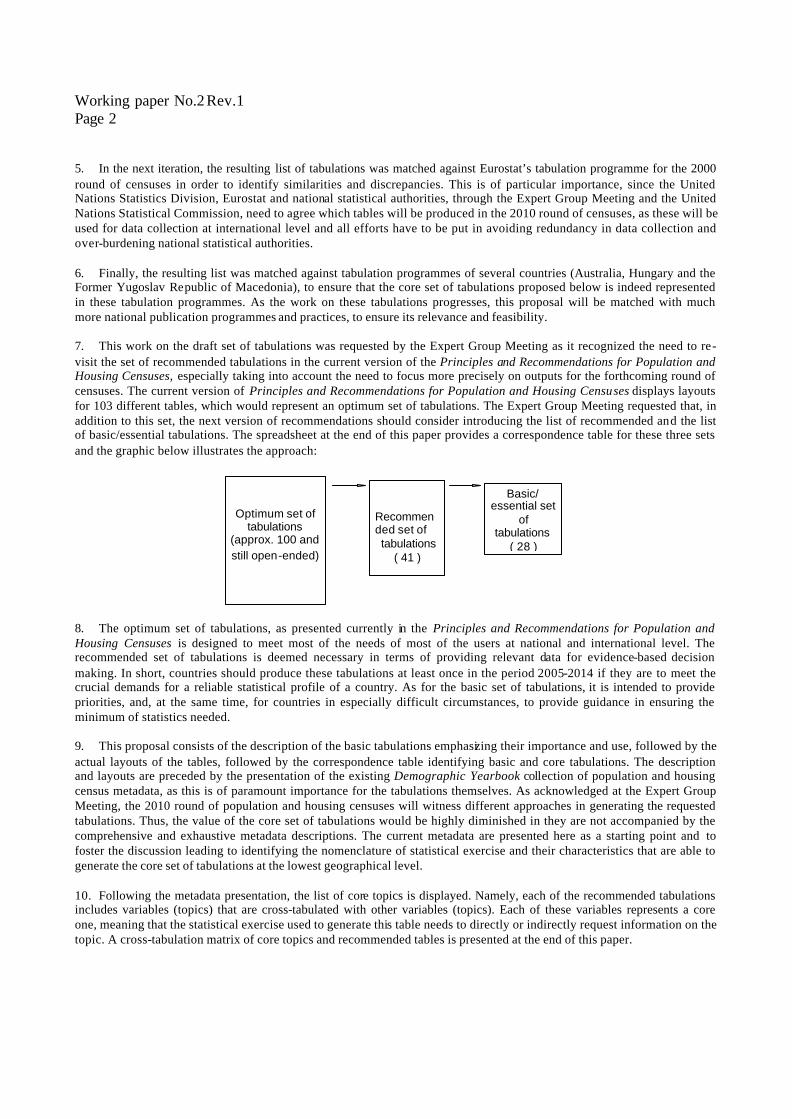
Working paper No.2 Rev.1 Page 2 5. In the next iteration, the resulting list of tabulations was matched against Eurostat’s tabulation programme for the 2000 round of censuses in order to identify similarities and discrepancies. This is of particular importance, since the United Nations Statistics Division, Eurostat and national statistical authorities, through the Expert Group Meeting and the United Nations Statistical Commission, need to agree which tables will be produced in the 2010 round of censuses, as these will be used for data collection at international level and all efforts have to be put in avoiding redundancy in data collection and over-burdening national statistical authorities. 6. Finally, the resulting list was matched against tabulation programmes of several countries (Australia, Hungary and the Former Yugoslav Republic of Macedonia), to ensure that the core set of tabulations proposed below is indeed represented in these tabulation programmes. As the work on these tabulations progresses, this proposal will be matched with much more national publication programmes and practices, to ensure its relevance and feasibility. 7. This work on the draft set of tabulations was requested by the Expert Group Meeting as it recognized the need to re-visit the set of recommended tabulations in the current version of the Principles and Recommendations for Population and Housing Censuses, especially taking into account the need to focus more precisely on outputs for the forthcoming round of censuses. The current version of Principles and Recommendations for Population and Housing Censuses displays layouts for 103 different tables, which would represent an optimum set of tabulations. The Expert Group Meeting requested that, in addition to this set, the next version of recommendations should consider introducing the list of recommended and the list of basic/essential tabulations. The spreadsheet at the end of this paper provides a correspondence table for these three sets and the graphic below illustrates the approach: 8. The optimum set of tabulations, as presented currently in the Principles and Recommendations for Population and Housing Censuses is designed to meet most of the needs of most of the users at national and international level. The recommended set of tabulations is deemed necessary in terms of providing relevant data for evidence-based decision making. In short, countries should produce these tabulations at least once in the period 2005-2014 if they are to meet the crucial demands for a reliable statistical profile of a country. As for the basic set of tabulations, it is intended to provide priorities, and, at the same time, for countries in especially difficult circumstances, to provide guidance in ensuring the minimum of statistics needed. 9. This proposal consists of the description of the basic tabulations emphasizing their importance and use, followed by the actual layouts of the tables, followed by the correspondence table identifying basic and core tabulations. The description and layouts are preceded by the presentation of the existing Demographic Yearbook collection of population and housing census metadata, as this is of paramount importance for the tabulations themselves. As acknowledged at the Expert Group Meeting, the 2010 round of population and housing censuses will witness different approaches in generating the requested tabulations. Thus, the value of the core set of tabulations would be highly diminished in they are not accompanied by the comprehensive and exhaustive metadata descriptions. The current metadata are presented here as a starting point and to foster the discussion leading to identifying the nomenclature of statistical exercise and their characteristics that are able to generate the core set of tabulations at the lowest geographical level. 10. Following the metadata presentation, the list of core topics is displayed. Namely, each of the recommended tabulations includes variables (topics) that are cross-tabulated with other variables (topics). Each of these variables represents a core one, meaning that the statistical exercise used to generate this table needs to directly or indirectly request information on the topic. A cross-tabulation matrix of core topics and recommended tables is presented at the end of this paper.
Optimum set of tabulations
(approx. 100 and still open-ended)
Recommended set of tabulations
( 41 )
Basic/ essential set
of tabulations
( 28 )
Working paper No.2 Rev.1 Page 3
Demographic Yearbook questions on population and housing census metadata
Presently, the United Nations Demographic Yearbook requests the following metadata in its population census questionnaires:
1. In terms of universality, the disposition of specific population groups, i.e. whether the following groups are included in the population total:
a) Nomads b) Persons living in inaccessible areas c) Military, naval and diplomatic personnel and their families located outside the country d) Merchant seaman and fishermen resident in the country, but at sea at the time of the census (including
those who have no place of residence other than their quarters aboard ship) e) Civilian residents temporarily in another country as seasonal workers f) Civilian residents who cross a frontier daily to work in another country g) Civilian residents other than those in c), e) and f) working in another country h) Civilian residents other than those c) – g) temporarily absent from the country i) Foreign military, naval and diplomatic personnel and their families located in the country j) Civilian aliens temporarily in the country as seasonal workers k) Civilian aliens who cross a frontier daily to work in the country l) Civilian aliens other than those in i), j) and k) working in the country m) Civilian aliens other than those in i) – l) temporarily in the country n) Transients on ship in harbor at the time of the census o) Other, specify
2. Census completeness
a) Method(s) used in estimating completeness i. Post-enumeration survey ii. Demographic analysis, with the specification of the method applied iii. Other methods, with specification
b) Estimated level of completeness: i. Gross under-enumeration (indicate whether enumerated population or estimated “complete”
population) ii. Gross over-enumeration (indicate whether enumerated population or estimated “complete”
population) iii. Net error (indicate whether enumerated population or estimated “complete” population)
c) This level of completeness based on: i. Post enumeration survey ii. Demographic analysis iii. Other iv. Combination of methods
3. If the post enumeration survey was used:
a) Date conducted b) Size of sample c) Specify any population groups excluded from the survey
4. On the basis of the fact whether the country is able to provide total population including visitors, foreigners
temporarily residing in the country and so forth, or whether the country provides data on usually resident population only, the Demographic Yearbook identifies the de facto and de jure population censuses.
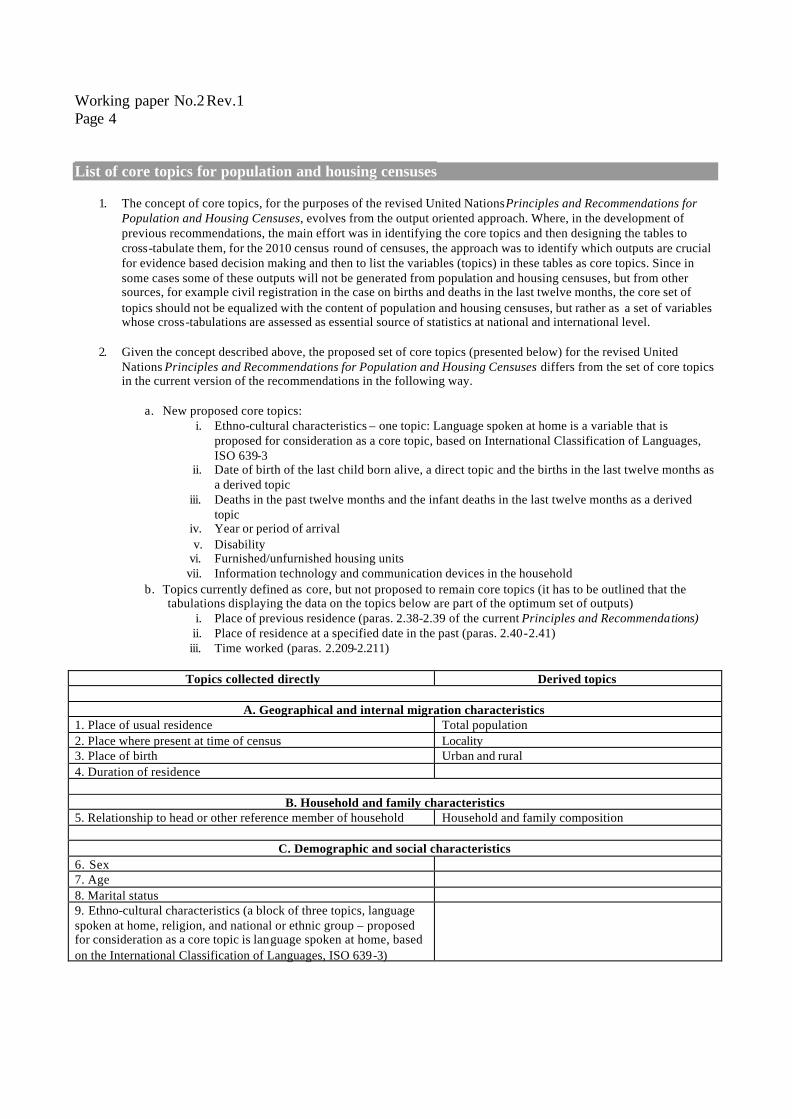
Working paper No.2 Rev.1 Page 4 List of core topics for population and housing censuses
1. The concept of core topics, for the purposes of the revised United Nations Principles and Recommendations for Population and Housing Censuses, evolves from the output oriented approach. Where, in the development of previous recommendations, the main effort was in identifying the core topics and then designing the tables to cross-tabulate them, for the 2010 census round of censuses, the approach was to identify which outputs are crucial for evidence based decision making and then to list the variables (topics) in these tables as core topics. Since in some cases some of these outputs will not be generated from population and housing censuses, but from other sources, for example civil registration in the case on births and deaths in the last twelve months, the core set of topics should not be equalized with the content of population and housing censuses, but rather as a set of variables whose cross-tabulations are assessed as essential source of statistics at national and international level.
2. Given the concept described above, the proposed set of core topics (presented below) for the revised United
Nations Principles and Recommendations for Population and Housing Censuses differs from the set of core topics in the current version of the recommendations in the following way.
a. New proposed core topics:
i. Ethno-cultural characteristics – one topic: Language spoken at home is a variable that is proposed for consideration as a core topic, based on International Classification of Languages, ISO 639-3
ii. Date of birth of the last child born alive, a direct topic and the births in the last twelve months as a derived topic
iii. Deaths in the past twelve months and the infant deaths in the last twelve months as a derived topic
iv. Year or period of arrival v. Disability
vi. Furnished/unfurnished housing units vii. Information technology and communication devices in the household
b. Topics currently defined as core, but not proposed to remain core topics (it has to be outlined that the tabulations displaying the data on the topics below are part of the optimum set of outputs)
i. Place of previous residence (paras. 2.38-2.39 of the current Principles and Recommendations) ii. Place of residence at a specified date in the past (paras. 2.40-2.41) iii. Time worked (paras. 2.209-2.211)
Topics collected directly Derived topics
A. Geographical and internal migration characteristics
1. Place of usual residence Total population 2. Place where present at time of census Locality 3. Place of birth Urban and rural 4. Duration of residence
B. Household and family characteristics
5. Relationship to head or other reference member of household Household and family composition
C. Demographic and social characteristics 6. Sex 7. Age 8. Marital status 9. Ethno-cultural characteristics (a block of three topics, language spoken at home, religion, and national or ethnic group – proposed for consideration as a core topic is language spoken at home, based on the International Classification of Languages, ISO 639-3)
Working paper No.2 Rev.1 Page 5
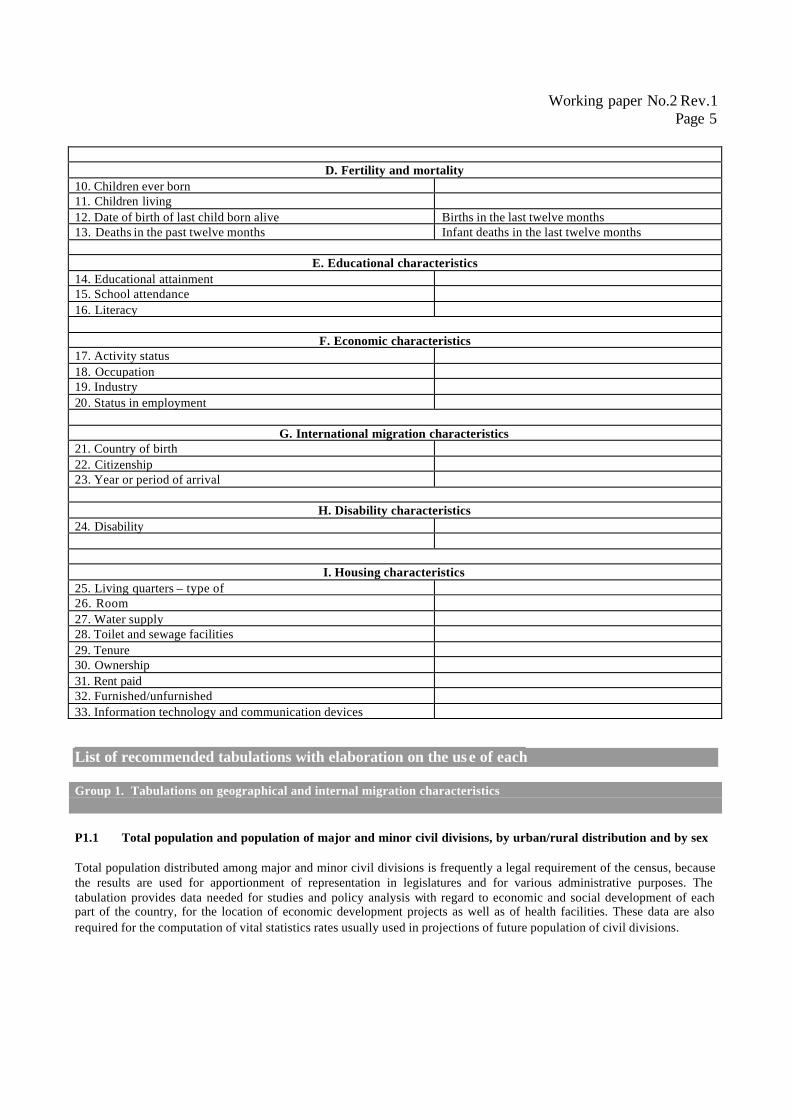
D. Fertility and mortality 10. Children ever born 11. Children living 12. Date of birth of last child born alive Births in the last twelve months 13. Deaths in the past twelve months Infant deaths in the last twelve months
E. Educational characteristics 14. Educational attainment 15. School attendance 16. Literacy
F. Economic characteristics 17. Activity status 18. Occupation 19. Industry 20. Status in employment
G. International migration characteristics 21. Country of birth 22. Citizenship 23. Year or period of arrival
H. Disability characteristics 24. Disability
I. Housing characteristics 25. Living quarters – type of 26. Room 27. Water supply 28. Toilet and sewage facilities 29. Tenure 30. Ownership 31. Rent paid 32. Furnished/unfurnished 33. Information technology and communication devices List of recommended tabulations with elaboration on the use of each Group 1. Tabulations on geographical and internal migration characteristics P1.1 Total population and population of major and minor civil divisions, by urban/rural distribution and by sex Total population distributed among major and minor civil divisions is frequently a legal requirement of the census, because the results are used for apportionment of representation in legislatures and for various administrative purposes. The tabulation provides data needed for studies and policy analysis with regard to economic and social development of each part of the country, for the location of economic development projects as well as of health facilities. These data are also required for the computation of vital statistics rates usually used in projections of future population of civil divisions.
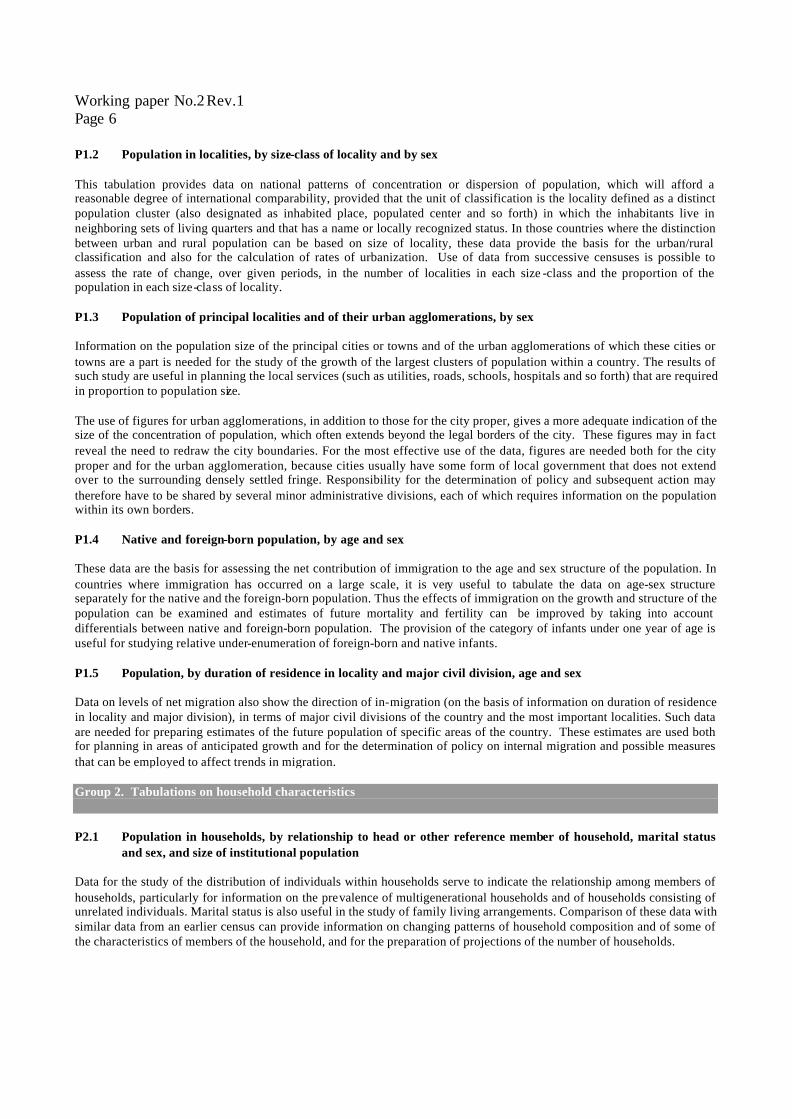
Working paper No.2 Rev.1 Page 6 P1.2 Population in localities, by size-class of locality and by sex This tabulation provides data on national patterns of concentration or dispersion of population, which will afford a reasonable degree of international comparability, provided that the unit of classification is the locality defined as a distinct population cluster (also designated as inhabited place, populated center and so forth) in which the inhabitants live in neighboring sets of living quarters and that has a name or locally recognized status. In those countries where the distinction between urban and rural population can be based on size of locality, these data provide the basis for the urban/rural classification and also for the calculation of rates of urbanization. Use of data from successive censuses is possible to assess the rate of change, over given periods, in the number of localities in each size -class and the proportion of the population in each size-class of locality. P1.3 Population of principal localities and of their urban agglomerations, by sex Information on the population size of the principal cities or towns and of the urban agglomerations of which these cities or towns are a part is needed for the study of the growth of the largest clusters of population within a country. The results of such study are useful in planning the local services (such as utilities, roads, schools, hospitals and so forth) that are required in proportion to population size. The use of figures for urban agglomerations, in addition to those for the city proper, gives a more adequate indication of the size of the concentration of population, which often extends beyond the legal borders of the city. These figures may in fact reveal the need to redraw the city boundaries. For the most effective use of the data, figures are needed both for the city proper and for the urban agglomeration, because cities usually have some form of local government that does not extend over to the surrounding densely settled fringe. Responsibility for the determination of policy and subsequent action may therefore have to be shared by several minor administrative divisions, each of which requires information on the population within its own borders. P1.4 Native and foreign-born population, by age and sex These data are the basis for assessing the net contribution of immigration to the age and sex structure of the population. In countries where immigration has occurred on a large scale, it is very useful to tabulate the data on age-sex structure separately for the native and the foreign-born population. Thus the effects of immigration on the growth and structure of the population can be examined and estimates of future mortality and fertility can be improved by taking into account differentials between native and foreign-born population. The provision of the category of infants under one year of age is useful for studying relative under-enumeration of foreign-born and native infants. P1.5 Population, by duration of residence in locality and major civil division, age and sex Data on levels of net migration also show the direction of in-migration (on the basis of information on duration of residence in locality and major division), in terms of major civil divisions of the country and the most important localities. Such data are needed for preparing estimates of the future population of specific areas of the country. These estimates are used both for planning in areas of anticipated growth and for the determination of policy on internal migration and possible measures that can be employed to affect trends in migration. Group 2. Tabulations on household characteristics P2.1 Population in households, by relationship to head or other reference member of household, marital status
and sex, and size of institutional population Data for the study of the distribution of individuals within households serve to indicate the relationship among members of households, particularly for information on the prevalence of multigenerational households and of households consisting of unrelated individuals. Marital status is also useful in the study of family living arrangements. Comparison of these data with similar data from an earlier census can provide information on changing patterns of household composition and of some of the characteristics of members of the household, and for the preparation of projections of the number of households.
Working paper No.2 Rev.1 Page 7
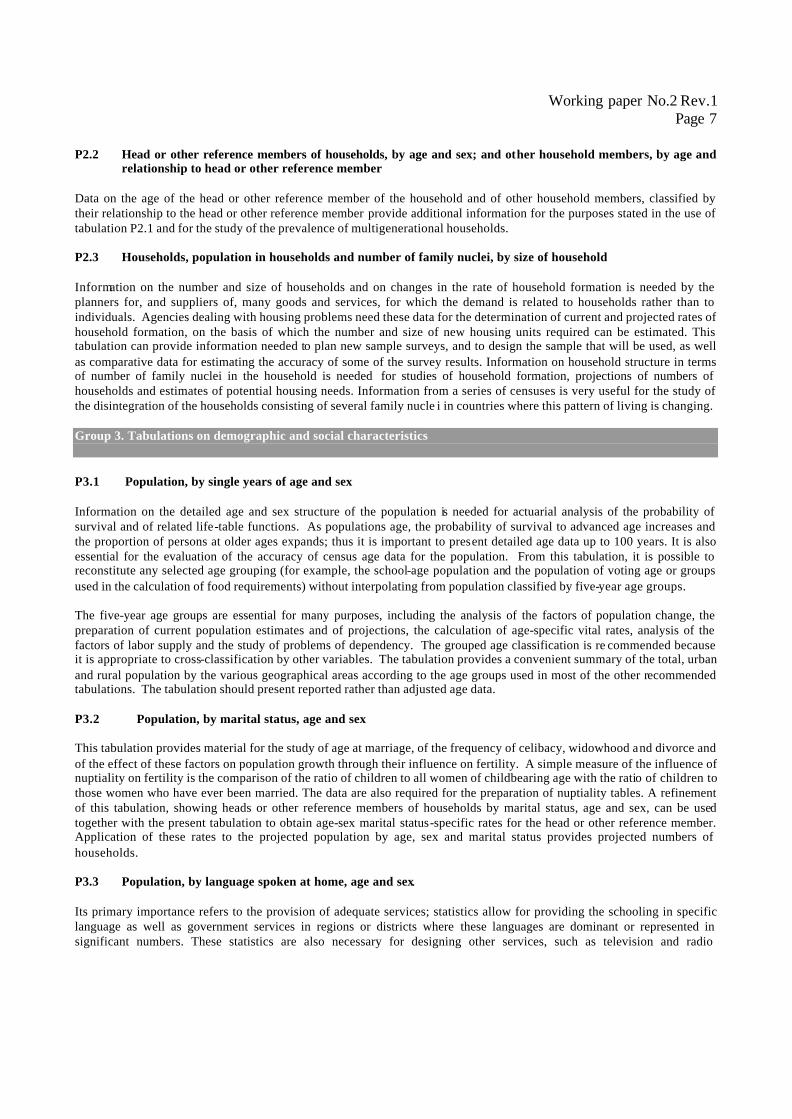
P2.2 Head or other reference members of households, by age and sex; and other household members, by age and
relationship to head or other reference member Data on the age of the head or other reference member of the household and of other household members, classified by their relationship to the head or other reference member provide additional information for the purposes stated in the use of tabulation P2.1 and for the study of the prevalence of multigenerational households. P2.3 Households, population in households and number of family nuclei, by size of household
Information on the number and size of households and on changes in the rate of household formation is needed by the planners for, and suppliers of, many goods and services, for which the demand is related to households rather than to individuals. Agencies dealing with housing problems need these data for the determination of current and projected rates of household formation, on the basis of which the number and size of new housing units required can be estimated. This tabulation can provide information needed to plan new sample surveys, and to design the sample that will be used, as well as comparative data for estimating the accuracy of some of the survey results. Information on household structure in terms of number of family nuclei in the household is needed for studies of household formation, projections of numbers of households and estimates of potential housing needs. Information from a series of censuses is very useful for the study of the disintegration of the households consisting of several family nucle i in countries where this pattern of living is changing.
Group 3. Tabulations on demographic and social characteristics P3.1 Population, by single years of age and sex Information on the detailed age and sex structure of the population is needed for actuarial analysis of the probability of survival and of related life-table functions. As populations age, the probability of survival to advanced age increases and the proportion of persons at older ages expands; thus it is important to present detailed age data up to 100 years. It is also essential for the evaluation of the accuracy of census age data for the population. From this tabulation, it is possible to reconstitute any selected age grouping (for example, the school-age population and the population of voting age or groups used in the calculation of food requirements) without interpolating from population classified by five-year age groups. The five-year age groups are essential for many purposes, including the analysis of the factors of population change, the preparation of current population estimates and of projections, the calculation of age-specific vital rates, analysis of the factors of labor supply and the study of problems of dependency. The grouped age classification is re commended because it is appropriate to cross-classification by other variables. The tabulation provides a convenient summary of the total, urban and rural population by the various geographical areas according to the age groups used in most of the other recommended tabulations. The tabulation should present reported rather than adjusted age data. P3.2 Population, by marital status, age and sex This tabulation provides material for the study of age at marriage, of the frequency of celibacy, widowhood and divorce and of the effect of these factors on population growth through their influence on fertility. A simple measure of the influence of nuptiality on fertility is the comparison of the ratio of children to all women of childbearing age with the ratio of children to those women who have ever been married. The data are also required for the preparation of nuptiality tables. A refinement of this tabulation, showing heads or other reference members of households by marital status, age and sex, can be used together with the present tabulation to obtain age-sex marital status-specific rates for the head or other reference member. Application of these rates to the projected population by age, sex and marital status provides projected numbers of households. P3.3 Population, by language spoken at home, age and sex. Its primary importance refers to the provision of adequate services; statistics allow for providing the schooling in specific language as well as government services in regions or districts where these languages are dominant or represented in significant numbers. These statistics are also necessary for designing other services, such as television and radio
Working paper No.2 Rev.1 Page 8 programming in specific languages and reaching to all the population for different purposes. They are also important for assessing the needs related to preserving the cultural and intellectual heritage of different regions. Group 3. Tabulations on fertility and mortality P4.1 Female population 15 years of age and over, by age and number of children ever born alive by sex Census data on fertility are particularly valuable for countries where birth registration statistics are lacking or deficient, because they can be used to estimate age-specific fertility rates, the total fertility rate, the crude incidence of births in the total population and other fertility indicators. In addition, they are useful as a supplement to satisfactory registration data, because they provide a summary of the lifetime fertility of the female population. The principal measures of fertility that can be derived from this tabulation are (a) the gross fertility ratio (average number of children ever born alive to women of childbearing age and over), (b) the average number of children ever born alive by sex to women who have reached the end of the childbearing period (in other words, 50 years of age and over), (c) the proportion of women who have had no children by the end of their reproductive life, (d) the average number of children born per woman who has already borne at least one child specified by sex and (e) cumulative average gross fertility ratios by age groups. The data also provide the base for the computation of birth rates specific for parity by sex. The use of information from a series of censuses makes it possible to identify cohorts of women and to study their reproductive patterns as they advance from one age group to another. P4.2 Female population 15 years of age and over, by age and number of children living (or dead) by sex The data are used to estimate fertility levels and patterns. This tabulation may be compiled in countries where experience has demonstrated that there has been substantial age-misreporting in past population censuses, which distorts fertility/mortality estimates based on children ever born and children living by age of women. This tabulation provides, for women in their first marriage, and for widowed, divorced and separated women who have had only one marriage, the data needed for computing all the measures of fertility described in connection with table P4.1. In countries where most births are legitimate, the tabulation is particularly useful for studies of trends in legitimate births, in association with information derived from current civil births, because of the information it provides on years of exposure to the risk of pregnancy. P4.3 Female population ... to 49 years of age, by age, number of live births, by sex within the 12 months preceding the census, and deaths among these live births, by sex This tabulation refers to female population between the minimum age limit adopted by the country for collecting information on current fertility and 49 years of age distributed among geographical divisions. It also provides data to estimate current age specific fertility rates and current infant mortality rates by sex, particularly as a supplement to vital rates or as estimation for these rates where birth and death registration is defective or inadequate. P4.4 Deaths, by sex and age1 within the 12 months preceding the census; and total population, by age and sex Census data on mortality are particularly valuable for countries where death registration statistics are lacking or deficient, because they can be used to estimate age-specific mortality rates, the total mortality rate, the crude incidence of deaths in the total population and other mortality indicators. These data are used to estimate levels and patterns of recent mortality in combination with data on the population by age and sex. Group 5. Tabulations on educational characteristics P5.1 Population ... years of age a/ and over not attending school, by educational attainment, age and sex By displaying the distribution of human resources by educational attainment in a country, this tabulation provides an important indication of the capacity and potential of the nation for economic, social and cultural development. When
1 Collected from the head of the household or reference person in the household.
Working paper No.2 Rev.1 Page 9
compared with current and anticipated needs for educated manpower by various sectors, types and levels of economic activities, it can guide the making of more effective policies and coordinated plans for the development of different levels/categories of education in close relation to development programmes. P5.2 Population 5 to 29 years of age, by school attendance, single years of age and sex Data on the classification of young persons attending and not attending school, by single years of age and sex are essential for studies of the numerical relationship between the population of school age and the population actually in school. The proportion of the school-age population that is able to take advantage of the educational system is one of the first types of information required for the assessment of the adequacy of the educational system of a country. School enrolment statistics derived from institutional records are not adequate, in many countries, for providing an exact measure of total attendance or data on important characteristics of the school-going population, particularly age. Even countries with detailed, comprehensive statistics compiled from records of educational institutions can benefit from a periodic assessment of the accuracy of these statistics by comparison with the census information on net school attendance. P5.3 Population 10 years of age and over, by literacy, age and sex Data on literacy provide one of the indicators of national levels of living and a measure of one of the factors in the national capacity for technological and cultural development; they are needed for tracing the progress in educational development of past generations and projecting future trends. In countries where the adult population is largely illiterate, the tabulation is of immediate use in planning for adult literacy, particularly if the data are tabulated for local areas. In addition, these data serve as the denominator in the computation of vital rates differentiated by literacy used as a socio-economic variable, such as birth rates by literacy of mother, and marriage and divorce rates by literacy of husband and wife.
Group 6. Tabulations dealing with economic characteristics P6.1 Population ... 3 years of age and over, by usual (or current) activity status, educational attainment, age and sex This tabulation provides the data needed for computing crude and age-specific participation rates, that is to say, the percentages of economically active persons, which are fundamental for studies of factors determining the size and structure of the economically active population, and for making projections, in conjunction with life-table functions, to calculate the working life expectancy, entry into and retirement from economic activity. Information on the employed and the unemployed furnishes part of the data needed for the appraisal of human resources utilization for policy formulation. It can provide some of the benchmark data for more current studies of employment, unemployment and underemployment. Relating educational attainment to economic activity permits the understanding of changes and relationship between education and activity status, allowing for more informed planning and tuning of the educational systems. P6.2 Usually (or currently) active population by activity status, main occupation, age and sex These data make it possible to carry out prospective studies of the number of workers likely to be attached to various occupations which serve as the basis for projections of the national economy and the total economically active population. The tabulation provides the basis for analysis of differential fertility and mortality according to occupation. It also makes available useful data for the planning of social welfare schemes, health insurance programmes and so forth, which frequently pertain only to the employed population P6.3 Usually (or currently) active population by activity status, main industry, age and sex These data furnish material for analyses of structural types of economic activities and may serve as a first indicator of socio-economic status. These data make it possible to carry out prospective studies of the number of workers likely to be attached to various industries in order to prepare projections of the national economy and the total economically active population. The tabulation also provides the basis for analysis of differential fertility and mortality according to industry. It also makes available useful data for the planning of social welfare schemes, health insurance programmes and so forth, which frequently pertain only to the employed population
3 The minimum age adopted by the country for enumerating the economically active population.
Working paper No.2 Rev.1 Page 10 P6.4 Usually (or currently) active population by activity status, main status in employment, age and sex These data make it possible to carry out prospective studies of the number of workers by status in employment in order to prepare projections of the national economy and the total economically active population. The tabulations also provide the basis for analysis of differential fertility and mortality according to status in employment. It also makes available useful data for the planning of social welfare schemes, health insurance programmes and so forth, which frequently pertain only to the employee group. A classification of unpaid family workers by sex and age is needed for international analysis of activity rates for females, in view of the different practices followed in defining and enumerating this group of workers in different countries. P6.5 Usually (or currently) active population by activity status, main status in employment, main industry and sex These tabulations furnish an inventory of a country's economically active population and its structure used in formulating economic policy and planning developmental programmes. Such tabulations play an essential part in analyses of national product and national income. Studies of the proportion of the economically active population in each industrial sector of the economy and of the shifts from one sector provide information on the level and trend of industrialization and on important aspects of the country's potential for economic development. Studies of migration from rural areas to cities require analysis of the industrial structure of employment in the cities and often of the major areas of out-migration, as an aid to assessment of economic aspects of internal migration. Studies of these types are also relevant to programmes of resettlement and to the formulation of policy with respect to internal migration. P6.6 Usually (or currently) active population by activity status, by main status in employment, main occupation and sex
This tabulation provides an inventory of a country's economically active population and its structure, used in formulating economic policy and planning developmental programmes. Together with tabulation P6.5, it provides information for analyzing national product and national income. Studies of migration from rural areas to cities require analysis of the occupational structure of employment in the cities and often of the major areas of out-migration, as an aid to assessment of economic aspects of internal migration. Also, decisions concerning possible sites for industrial establishments and vocational schools require information on the occupational structure of the labor force in various localities and regions of the country. P6.7 Usually (or currently) active population by activity status, main industry, main occupation and sex This tabulation provides an inventory of a country's economically active population and its structure in formulating economic policy and planning developmental programmes. In planning for the development and expansion of an educational system and efficient utilization of human resources, studies are needed that assess requirements of labour in different industries and occupations. The cross-classifications of occupation and of industry give indications of the occupations and industries in which particular status groups are employed. It enables further analysis of the contribution of unpaid family workers in different industrial sectors. In addition, information on the distribution by status in employment in a particular industry is a useful indication of the degree of development and modernization of that sector. The number of wage and salary workers in different industries is often needed as benchmark data for current statistics obtained from establishment reports. P6.8 Usually (or currently) inactive population by functional categories, age and sex This tabulation provides data classified by functional categories and reason for inactivity for the analysis of potential sources of human resources that are not readily available at present but that may become so under different circumstances. Group 7. Tabulations on international migration on immigrant stock P7.1 Foreign-born population, by country of birth, age and sex These data provide the basis for assessing the age and sex structure of the population and the contribution of immigration from specified countries. Thus the effects of immigration from specific countries on the growth and structure of the
Working paper No.2 Rev.1 Page 11
population can be estimated. As indicated in table P1.4, the differences in future fertility and mortality between immigrants from specific countries can be spotted. P7.2 Population, by country of birth and citizenship, age and sex
This tabulation is designed to identify the country of birth and citizenship of the population according to age and sex. It is possible to determine the frequency with which persons become citizens and the place of birth of citizens in each country. Data can also be of use in the study of the rate of assimilation of the foreign-born population.
P7.3 Economically active1 foreign-born population ...2 years of age and over, by period of arrival, occupation and
sex These data provide information on the occupations of the foreign-born population needed to study immigrant workers,
particularly their economic integration and mobility in the country of immigration. Together with a similar tabulation for the native population, the data constitute the basis for undertaking an in-depth analysis of occupational patterns and making occupational forecasts for the economy. From the cross-classification by period of arrival, one can observe the pattern of inflow of skilled migrants during previous years. When classification is also by country of birth, data are provided for countries that are losing a large volume of highly qualified migrants; such data are useful in the formulation of employment and educational policies in the countries of origin for dealing with the impact of the outflow of skilled personnel. Group 8. Tabulation on disability characteristics P8.1 Population with and without disabilities, by age and sex There is widespread interest in the prevalence of disability and human functioning in the population, by age and sex. This tabulation provides information for the calculation of prevalence rates distributed by geographical division, urban/rural residence.
Group 9. Tabulations for housing censuses H.1 Households, by broad types of living quarters and number of homeless households This is a broad summary table designed to show in very general terms the type of housing occupied by households and the number of households that are homeless. It provides background information as well as a control for preparation of more detailed tabulations for the categories shown. In fact, the magnitude of the number of households that occupy collective living quarters or are homeless and their geographical distribution provide an indication of the extent to which more detailed tabulations for these groups need to be prepared. H.2 Households in occupied housing units, by type of housing unit There is wide agreement concerning the usefulness of this tabulation or variants of it. Its most important function is to make a broad distinction between various types of housing according to the level of housing standards. Also, its purpose is to describe the occupants in terms of aggregates, households and family nuclei. The tabulation is of primary importance for the formulation of housing programmes and is a prerequisite of calculation of indicators on housing conditions. H.3 Households, by type of living quarters, cross-classified by sex and age of head of household It is assumed that the economic and demographic data required for housing tabulations will be obtained from the population census. In selecting characteristics to be used, the primary consideration should be their efficiency in providing insight into the housing requirements of the population as well as an indication of the possibilities that exist for meeting these
1 The treatment of unemployed immigrants (including those who never worked before) should be clearly stated. 2 The minimum age adopted by the country for enumerating the economically active population.
Working paper No.2 Rev.1 Page 12 requirements. This tabulation provides one component needed to compute headship rates specific for age and sex for the projection of number of households. H.4 Housing units, by number of rooms,1 cross-classified by type of housing unit and number of occupants per
housing unit This tabulation provides for the manual or automatic selection of data concerning any desired level of density considered to be of significance, from extreme overcrowding to under-occupancy. In establishing the statistical indicators on housing conditions, the Statistical Commission and the Inter-Agency Working Party on Statistics for Social Programmes agreed that dwellings with densities of three or more persons per room should be considered overcrowded under any circumstances. For national use, this level may be raised or lowered according to circumstances; levels set for urban areas may be different from those for rural areas (the outdoor spaces in rural areas are sometimes considered to offset, to some extent, the high densities prevailing within the housing units). H.5 Households in housing units, by type of housing unit occupied, cross-classified by number of households and
number of rooms per housing unit This tabulation provides information on the number of households that are sharing housing units with other households and thus provides an important basis for estimating housing needs. The importance of a separate housing unit for each household that desires one is widely recognized and is discussed under the uses for tabulation H2. Tabulation H23, which shows the number of subtenant households, provides similar information, since subtenant households are households that share a housing unit with one or more households. However, this tabulation provides additional information, since it shows the number of households that occupy the shared units plus the number of rooms in the housing units. H.6 Housing units, by type of housing unit occupied, cross-classified by water supply system and source of water
supply This tabulation displays a more detailed classification of water supply, which may be expanded according to the needs of a particular country or area. Alternatively, in order to avoid producing a table with many blank cells, it may be useful to collect and tabulate data on source of water supply only for those sets of living quarters that report either a piped water supply outside the housing unit or no piped water available within 200 meters from the housing unit. While all housing units with a piped water supply inside do not necessarily obtain the water from a community supply, there would tend to be a greater variety of sources from those either with piped water outside or without piped water, and the source of water in these cases would also seem to be of greater concern. H.7 Housing units, by type of housing unit occupied, cross-classified by type of toilet and type of sewage disposal The tabulation of toilet facilities shown provides the minimum data required for an evaluation of living quarters according to the facilities available. The information for dwellings is required for the computation of indicators of housing and its environment. If the number of sets of collective living quarters is large, it may be useful to prepare similar tabulations by type of collective living quarters. In fact, info rmation concerning the availability of toilet facilities in institutions, hotels and so on is frequently collected in housing censuses. With respect to these units, however, separate tabulations that would also show the number of toilets in relation to the number of occupants may be more useful than information that merely indicates the availability of toilets and the type of toilet. Similar information may be tabulated for housing units occupied by more than a certain number of households. In many countries the classification has been elaborated to provide information on availability of particular types of toilets (other than flush) that are prevalent and characteristic of the country or area concerned and imply varying degrees of efficiency from a sanitary point of view. This tabulation provides information on the type of toilet and the type of sewage disposal system. As mentioned above, toilet and sewage disposal facilities have an extremely important impact on public health and on maintaining a safe environment. As for the classification of types of sewage disposal systems, it consists of broad categories and may be further elaborated on the basis of prevalent systems in a specific country or area.
1 Excludin g rooms used wholly for business or professional purposes.
Working paper No.2 Rev.1 Page 13
H.8 Households in housing units, by type of housing unit, cross-classified by tenure of household and, for tenant
households, ownership of housing unit occupied
This tabulation yields data showing the type of tenure under which households occupy their living space. Data are tabulated in terms of households rather than housing units in order to show more clearly the tenure status of households sharing housing units. The number of owner-occupied housing units can be obtained from the tabulation using the corresponding figures for owner households in each category; an approximation for rented units could be obtained by subtracting the number of owner-occupied units from the total occupied housing units. Type of ownership of the housing unit occupied is shown in this table for renting households. Several variations of the classification of tenure have been found useful. Tenure data are sometimes classified so as to distinguish the tenure under which the living quarters are occupied from the tenure of land upon which they stand (in some countries such a classification may be of special significance). Owner-occupants are shown in some cases according to whether the housing unit is fully paid for or whether it is being paid for in installments or is mortgaged; rental data are sub-classified to show separate information for accommodation rented unfurnished and accommodation rented furnished. H.9 Households in housing units, by type of housing unit, cross-classified by type of owner of the housing unit,
availability of piped water and availability of toilet facilities In this tabulation, households are tabulated according to the type of housing unit occupied, the principal facilities available in the housing unit and the type of owner. The information on toilet and water supply is cross-classified in order to show the number of households by owner of the housing unit according to whether the housing unit has piped water and/or toilet facilities or neither of these types of facilities. Ownership of housing units lacking basic facilities would be of particular interest and it would be useful to know whether these units are occupied by their owners or by tenants. H.10 Rented1 housing units, classified by whether space occupied is furnished or unfurnished, and amount of rent
paid monthly for the housing unit, cros s-classified by type of housing unit, water supply system and toilet facilities
In this tabulation, rent paid is related to availability of water and toilet facilities, since these have an impact as an important factor in determining the cost of housing. The purpose of this tabulation is to relate the cost of housing to the adequacy of basic services -- in this case, the availability of piped water and toilet facilities. If information has been collected showing whether or not the rent is controlled, this could usefully be included in the tabulation. H.11 Households in housing units, by type of housing unit, cross-classified by ownership of information and
communication technology devices and access to Internet In this tabulation, households are tabulated according to the availability of information and communication technology devices and access to the Internet, as these topics gain in importance all over the world.
1 “Rented” in this case means wholly rented and does not refer to housing units occupied by an owner who rents part of the unit to
another household.
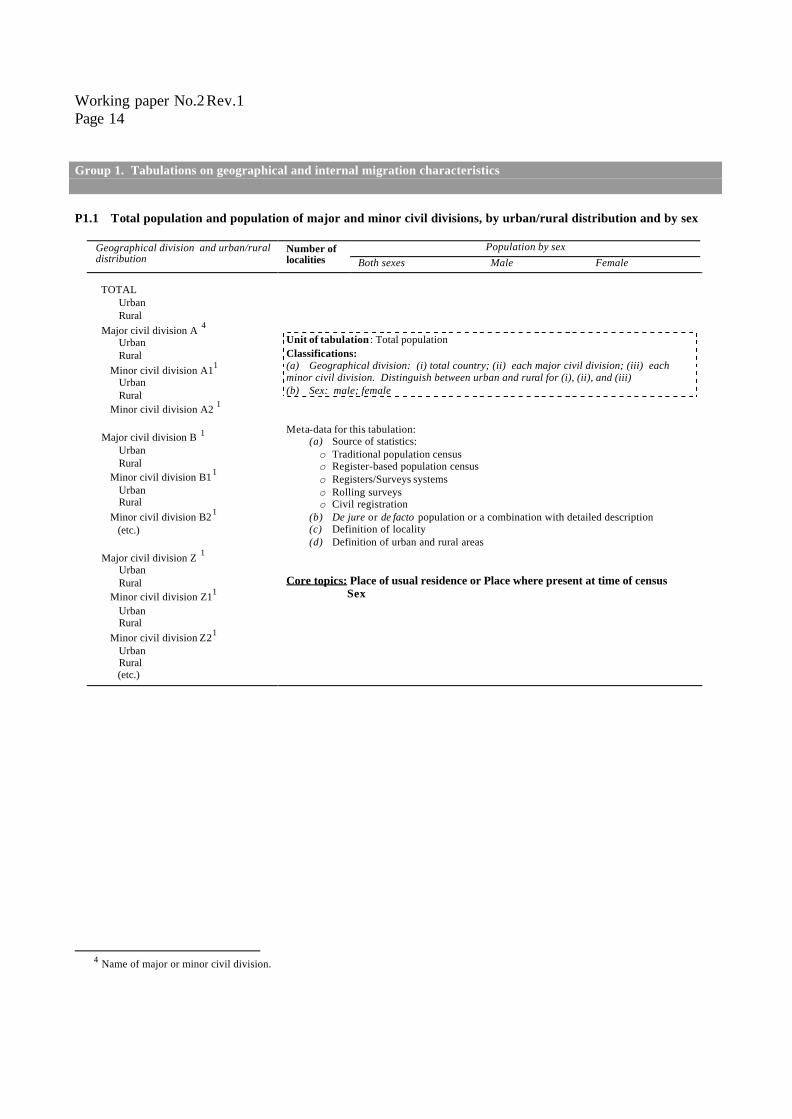
Working paper No.2 Rev.1 Page 14 Group 1. Tabulations on geographical and internal migration characteristics P1.1 Total population and population of major and minor civil divisions, by urban/rural distribution and by sex
Population by sex Geographical division and urban/rural distribution
Number of localities Both sexes Male Female
TOTAL Urban Rural Major civil division A 4 Urban Rural Minor civil division A11 Urban Rural Minor civil division A2 1 Major civil division B 1 Urban Rural Minor civil division B11 Urban Rural Minor civil division B21 (etc.) Major civil division Z 1 Urban Rural Minor civil division Z11 Urban Rural Minor civil division Z21 Urban Rural (etc.)
Unit of tabulation : Total population Classifications: (a) Geographical division: (i) total country; (ii) each major civil division; (iii) each minor civil division. Distinguish between urban and rural for (i), (ii), and (iii) (b) Sex: male; female Meta-data for this tabulation:
(a) Source of statistics: o Traditional population census o Register-based population census o Registers/Surveys systems o Rolling surveys o Civil registration
(b) De jure or de facto population or a combination with detailed description (c) Definition of locality (d) Definition of urban and rural areas
Core topics: Place of usual residence or Place where present at time of census Sex
4 Name of major or minor civil division.
Working paper No.2 Rev.1 Page 15
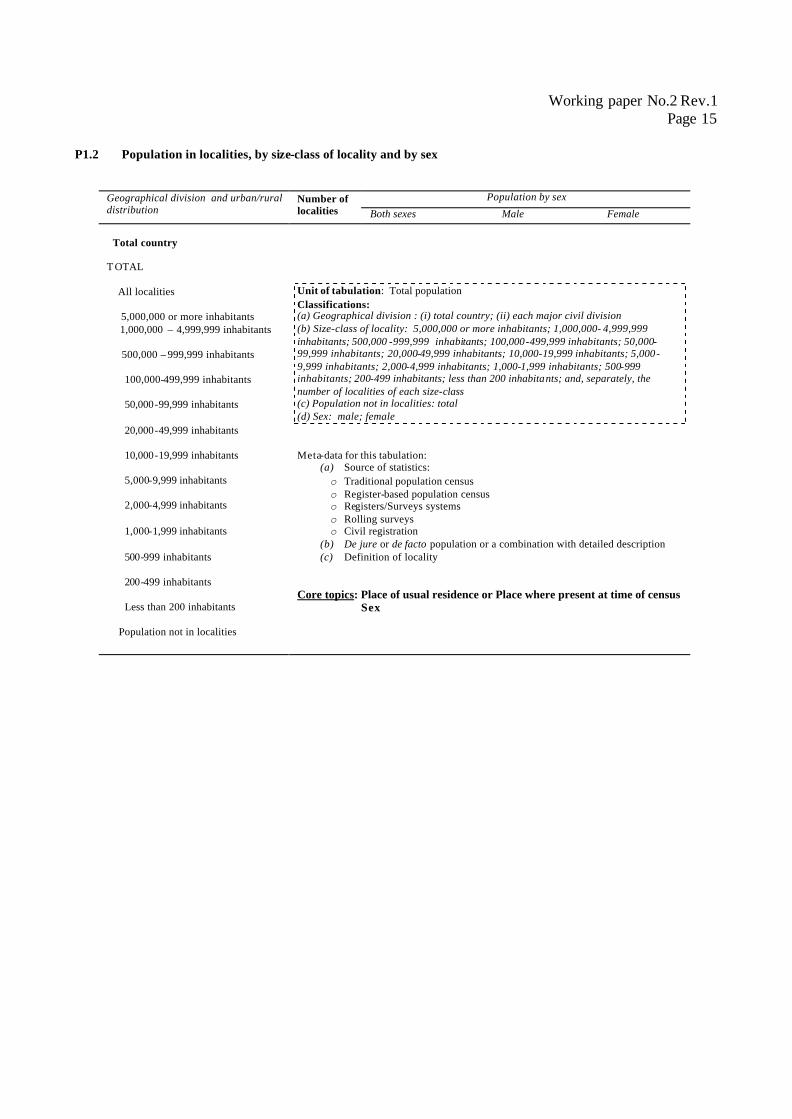
P1.2 Population in localities, by size-class of locality and by sex
Population by sex Geographical division and urban/rural distribution
Number of localities Both sexes Male Female
Total country T OTAL All localities 5,000,000 or more inhabitants 1,000,000 – 4,999,999 inhabitants 500,000 – 999,999 inhabitants 100,000-499,999 inhabitants 50,000-99,999 inhabitants 20,000-49,999 inhabitants 10,000-19,999 inhabitants 5,000-9,999 inhabitants 2,000-4,999 inhabitants 1,000-1,999 inhabitants 500-999 inhabitants 200-499 inhabitants Less than 200 inhabitants Population not in localities
Unit of tabulation: Total population Classifications: (a) Geographical division : (i) total country; (ii) each major civil division (b) Size-class of locality: 5,000,000 or more inhabitants; 1,000,000- 4,999,999 inhabitants; 500,000 -999,999 inhabitants; 100,000-499,999 inhabitants; 50,000-99,999 inhabitants; 20,000-49,999 inhabitants; 10,000-19,999 inhabitants; 5,000-9,999 inhabitants; 2,000-4,999 inhabitants; 1,000-1,999 inhabitants; 500-999 inhabitants; 200-499 inhabitants; less than 200 inhabitants; and, separately, the number of localities of each size-class (c) Population not in localities: total (d) Sex: male; female Meta-data for this tabulation:
(a) Source of statistics: o Traditional population census o Register-based population census o Registers/Surveys systems o Rolling surveys o Civil registration
(b) De jure or de facto population or a combination with detailed description (c) Definition of locality
Core topics: Place of usual residence or Place where present at time of census Sex
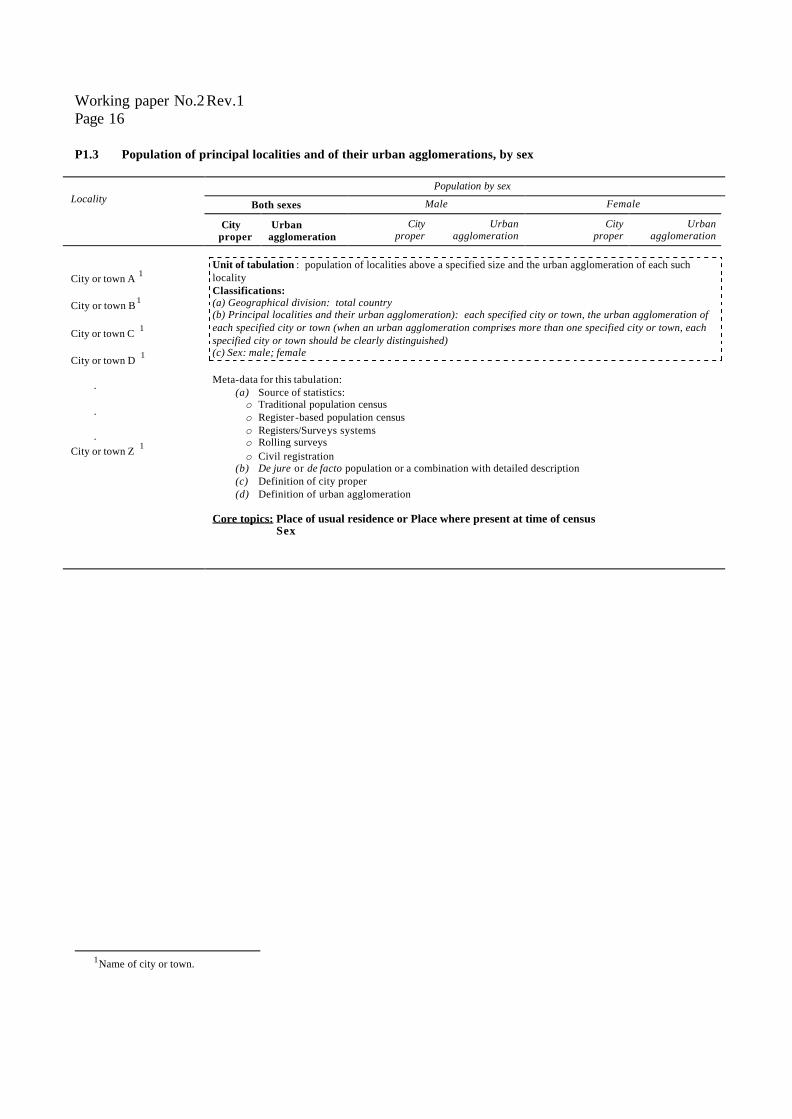
Working paper No.2 Rev.1 Page 16 P1.3 Population of principal localities and of their urban agglomerations, by sex
Population by sex
Both sexes
Male
Female
Locality
City proper
Urban agglomeration
City
proper
Urban
agglomeration
City
proper
Urban
agglomeration City or town A 1 City or town B 1 City or town C 1 City or town D 1 . . . City or town Z 1
Unit of tabulation : population of localities above a specified size and the urban agglomeration of each such locality Classifications: (a) Geographical division: total country (b) Principal localities and their urban agglomeration): each specified city or town, the urban agglomeration of each specified city or town (when an urban agglomeration comprises more than one specified city or town, each specified city or town should be clearly distinguished) (c) Sex: male; female Meta-data for this tabulation:
(a) Source of statistics: o Traditional population census o Register-based population census o Registers/Surveys systems o Rolling surveys o Civil registration
(b) De jure or de facto population or a combination with detailed description (c) Definition of city proper (d) Definition of urban agglomeration
Core topics: Place of usual residence or Place where present at time of census Sex
1Name of city or town.
Working paper No.2 Rev.1 Page 17
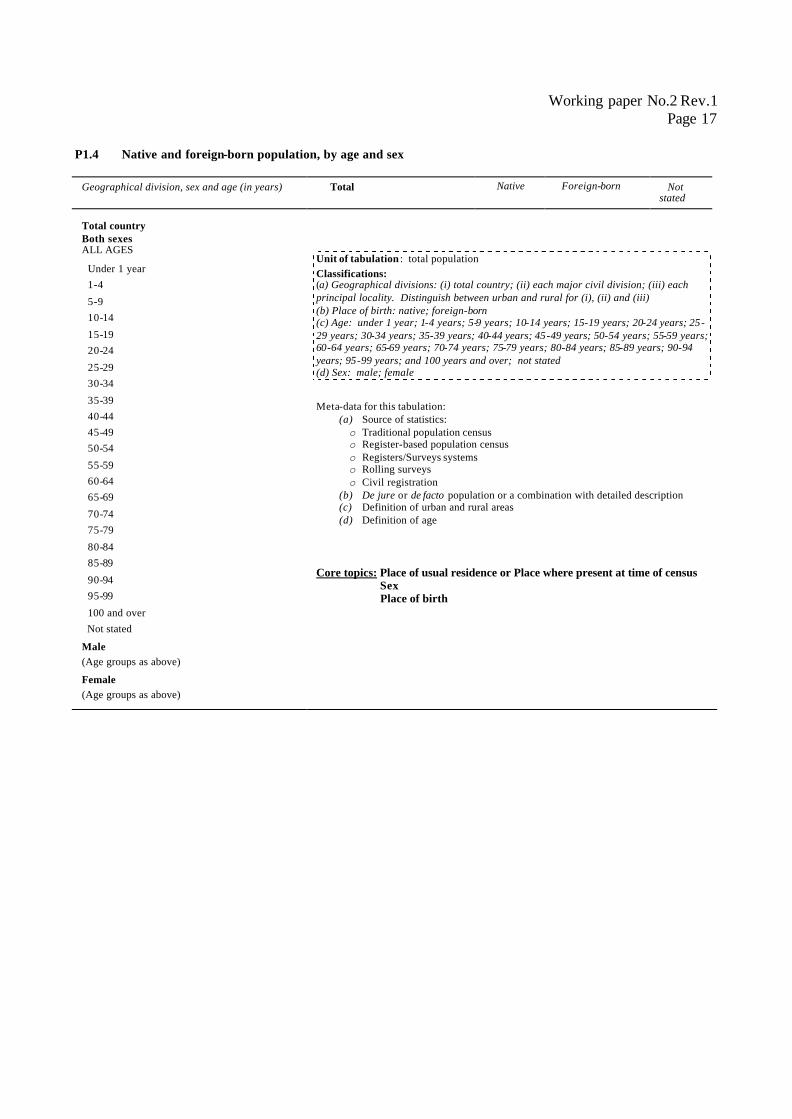
P1.4 Native and foreign-born population, by age and sex
Geographical division, sex and age (in years)
Total
Native
Foreign-born
Not stated
Total country Both sexes ALL AGES
Under 1 year 1-4
5-9 10-14
15-19 20-24
25-29 30-34
35-39 40-44 45-49 50-54
55-59 60-64 65-69
70-74 75-79
80-84 85-89
90-94 95-99
100 and over Not stated
Male (Age groups as above)
Female (Age groups as above)
Unit of tabulation : total population Classifications: (a) Geographical divisions: (i) total country; (ii) each major civil division; (iii) each principal locality. Distinguish between urban and rural for (i), (ii) and (iii) (b) Place of birth: native; foreign-born (c) Age: under 1 year; 1-4 years; 5-9 years; 10-14 years; 15-19 years; 20-24 years; 25-29 years; 30-34 years; 35-39 years; 40-44 years; 45-49 years; 50-54 years; 55-59 years; 60-64 years; 65-69 years; 70-74 years; 75-79 years; 80-84 years; 85-89 years; 90-94 years; 95-99 years; and 100 years and over; not stated (d) Sex: male; female
Meta-data for this tabulation: (a) Source of statistics: o Traditional population census o Register-based population census o Registers/Surveys systems o Rolling surveys o Civil registration
(b) De jure or de facto population or a combination with detailed description (c) Definition of urban and rural areas (d) Definition of age
Core topics: Place of usual residence or Place where present at time of census Sex Place of birth
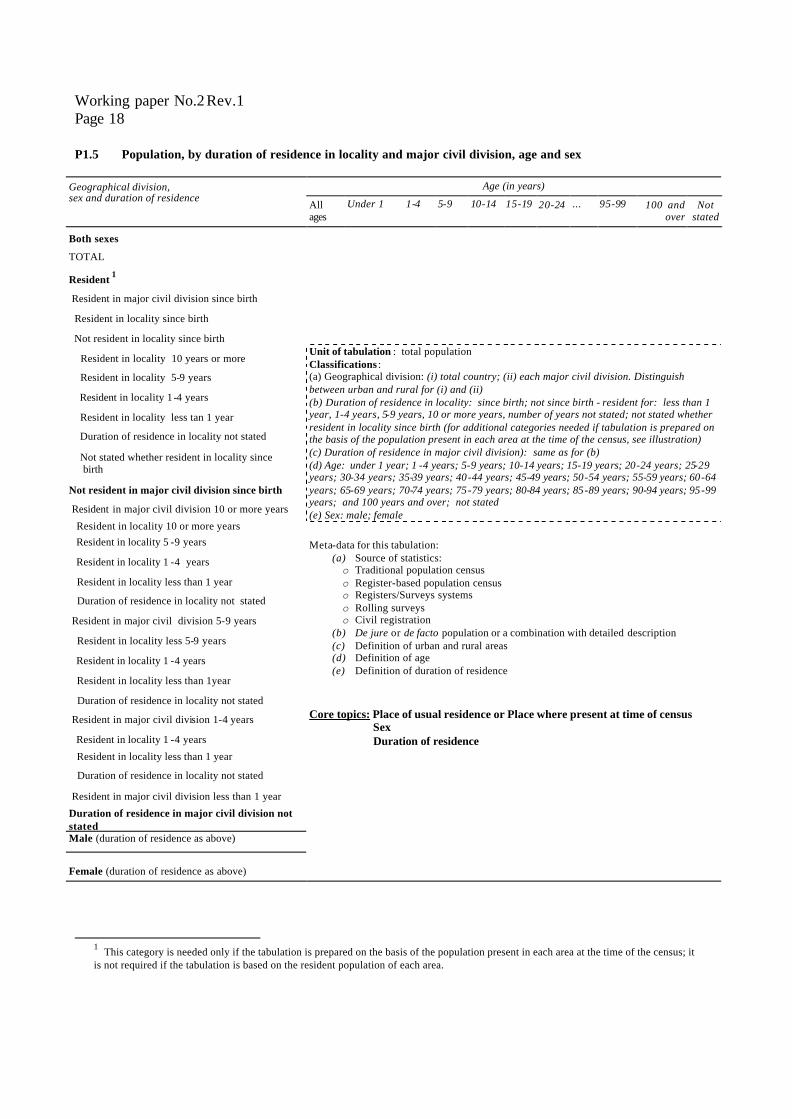
Working paper No.2 Rev.1 Page 18 P1.5 Population, by duration of residence in locality and major civil division, age and sex
Age (in years)
Geographical division, sex and duration of residence
All ages
Under 1
1-4
5-9
10-14
15-19
20-24
...
95-99
100 and
over
Not
stated Both sexes TOTAL Resident 1 Resident in major civil division since birth Resident in locality since birth Not resident in locality since birth Resident in locality 10 years or more Resident in locality 5-9 years Resident in locality 1 -4 years Resident in locality less tan 1 year Duration of residence in locality not stated Not stated whether resident in locality since birth Not resident in major civil division since birth Resident in major civil division 10 or more years
Resident in locality 10 or more years Resident in locality 5 -9 years Resident in locality 1 -4 years Resident in locality less than 1 year Duration of residence in locality not stated Resident in major civil division 5-9 years Resident in locality less 5-9 years Resident in locality 1 -4 years Resident in locality less than 1year Duration of residence in locality not stated Resident in major civil division 1-4 years Resident in locality 1 -4 years
Resident in locality less than 1 year Duration of residence in locality not stated Resident in major civil division less than 1 year
Duration of residence in major civil division not stated Male (duration of residence as above)
Female (duration of residence as above)
Unit of tabulation : total population Classifications : (a) Geographical division: (i) total country; (ii) each major civil division. Distinguish between urban and rural for (i) and (ii) (b) Duration of residence in locality: since birth; not since birth - resident for: less than 1 year, 1-4 years, 5-9 years, 10 or more years, number of years not stated; not stated whether resident in locality since birth (for additional categories needed if tabulation is prepared on the basis of the population present in each area at the time of the census, see illustration) (c) Duration of residence in major civil division): same as for (b) (d) Age: under 1 year; 1 -4 years; 5-9 years; 10-14 years; 15-19 years; 20-24 years; 25-29 years; 30-34 years; 35-39 years; 40-44 years; 45-49 years; 50-54 years; 55-59 years; 60-64 years; 65-69 years; 70-74 years; 75-79 years; 80-84 years; 85-89 years; 90-94 years; 95-99 years; and 100 years and over; not stated (e) Sex: male; female Meta-data for this tabulation:
(a) Source of statistics: o Traditional population census o Register-based population census o Registers/Surveys systems o Rolling surveys o Civil registration
(b) De jure or de facto population or a combination with detailed description (c) Definition of urban and rural areas (d) Definition of age (e) Definition of duration of residence
Core topics: Place of usual residence or Place where present at time of census Sex Duration of residence
1 This category is needed only if the tabulation is prepared on the basis of the population present in each area at the time of the census; it is not required if the tabulation is based on the resident population of each area.
Working paper No.2 Rev.1 Page 19
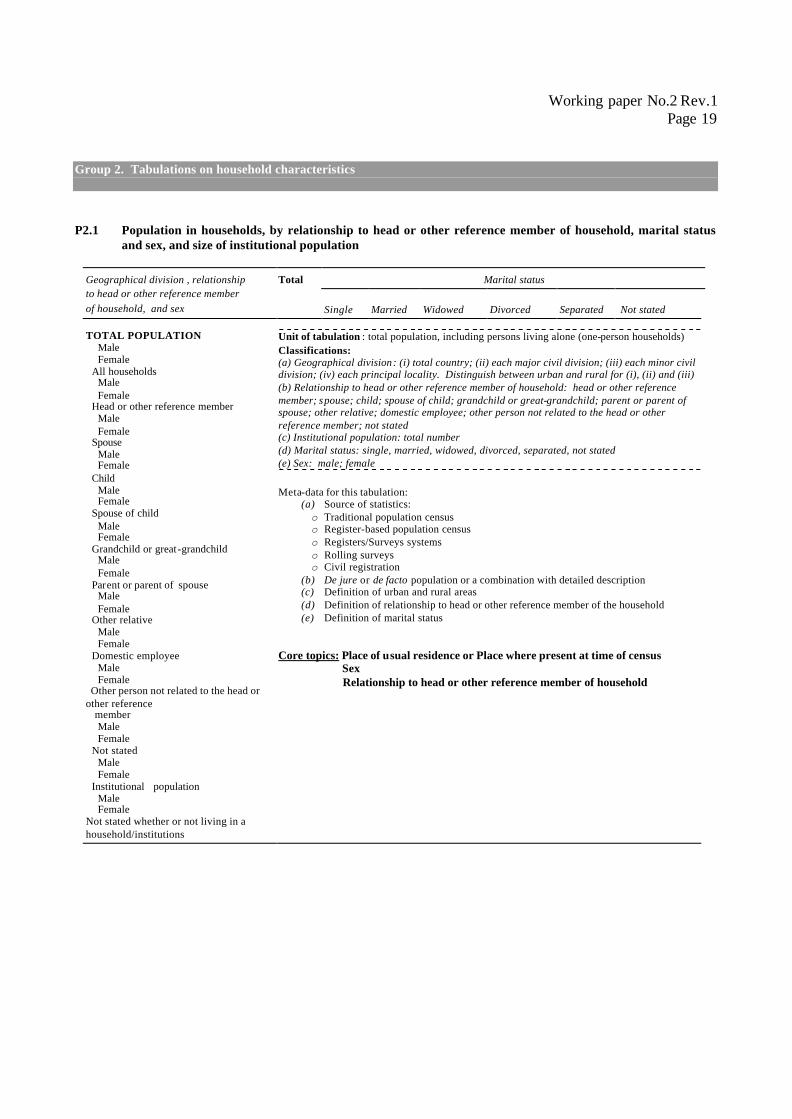
Group 2. Tabulations on household characteristics P2.1 Population in households, by relationship to head or other reference member of household, marital status
and sex, and size of institutional population
Marital status
Geographical division , relationship to head or other reference member of household, and sex
Total
Single
Married
Widowed
Divorced
Separated
Not stated
TOTAL POPULATION Male Female All households Male Female Head or other reference member Male Female Spouse Male Female Child Male Female Spouse of child Male Female Grandchild or great-grandchild Male Female Parent or parent of spouse Male Female Other relative Male Female Domestic employee Male Female Other person not related to the head or other reference member Male Female Not stated Male Female Institutional population Male Female Not stated whether or not living in a household/institutions
Unit of tabulation : total population, including persons living alone (one-person households) Classifications: (a) Geographical division: (i) total country; (ii) each major civil division; (iii) each minor civil division; (iv) each principal locality. Distinguish between urban and rural for (i), (ii) and (iii) (b) Relationship to head or other reference member of household: head or other reference member; spouse; child; spouse of child; grandchild or great-grandchild; parent or parent of spouse; other relative; domestic employee; other person not related to the head or other reference member; not stated (c) Institutional population: total number (d) Marital status: single, married, widowed, divorced, separated, not stated (e) Sex: male; female Meta-data for this tabulation:
(a) Source of statistics: o Traditional population census o Register-based population census o Registers/Surveys systems o Rolling surveys o Civil registration
(b) De jure or de facto population or a combination with detailed description (c) Definition of urban and rural areas (d) Definition of relationship to head or other reference member of the household (e) Definition of marital status
Core topics: Place of usual residence or Place where present at time of census Sex Relationship to head or other reference member of household
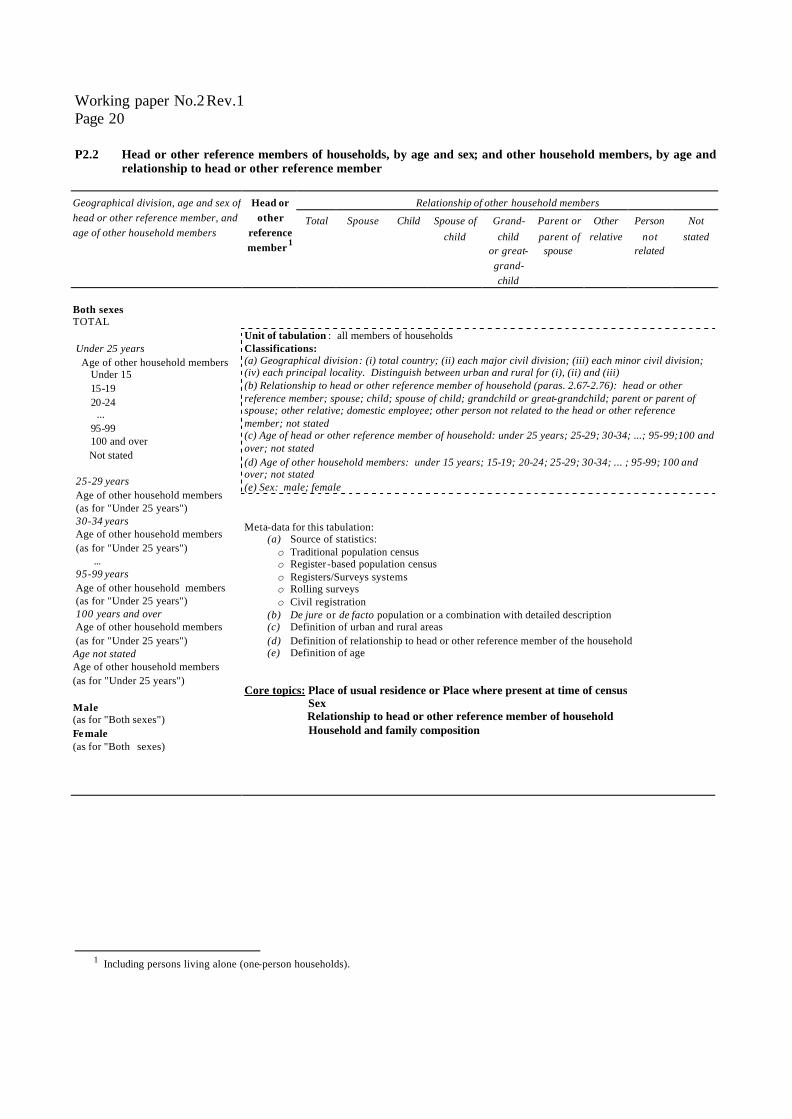
Working paper No.2 Rev.1 Page 20 P2.2 Head or other reference members of households, by age and sex; and other household members, by age and
relationship to head or other reference member
Relationship of other household members Geographical division, age and sex of head or other reference member, and age of other household members
Head or
other reference member 1
Total
Spouse
Child
Spouse of
child
Grand-child
or great- grand-child
Parent or parent of spouse
Other
relative
Person
not related
Not
stated
Both sexes TOTAL Under 25 years Age of other household members Under 15 15-19 20-24 ... 95-99 100 and over Not stated 25-29 years Age of other household members (as for "Under 25 years") 30-34 years Age of other household members (as for "Under 25 years") ... 95-99 years Age of other household members (as for "Under 25 years") 100 years and over Age of other household members (as for "Under 25 years") Age not stated Age of other household members (as for "Under 25 years") Male (as for "Both sexes") Fe male (as for "Both sexes)
Unit of tabulation : all members of households Classifications: (a) Geographical division: (i) total country; (ii) each major civil division; (iii) each minor civil division; (iv) each principal locality. Distinguish between urban and rural for (i), (ii) and (iii) (b) Relationship to head or other reference member of household (paras. 2.67-2.76): head or other reference member; spouse; child; spouse of child; grandchild or great-grandchild; parent or parent of spouse; other relative; domestic employee; other person not related to the head or other reference member; not stated (c) Age of head or other reference member of household: under 25 years; 25-29; 30-34; ...; 95-99;100 and over; not stated (d) Age of other household members: under 15 years; 15-19; 20-24; 25-29; 30-34; ... ; 95-99; 100 and over; not stated (e) Sex: male; female Meta-data for this tabulation:
(a) Source of statistics: o Traditional population census o Register-based population census o Registers/Surveys systems o Rolling surveys o Civil registration
(b) De jure or de facto population or a combination with detailed description (c) Definition of urban and rural areas (d) Definition of relationship to head or other reference member of the household (e) Definition of age
Core topics: Place of usual residence or Place where present at time of census Sex Relationship to head or other reference member of household Household and family composition
1 Including persons living alone (one-person households).
Working paper No.2 Rev.1 Page 21
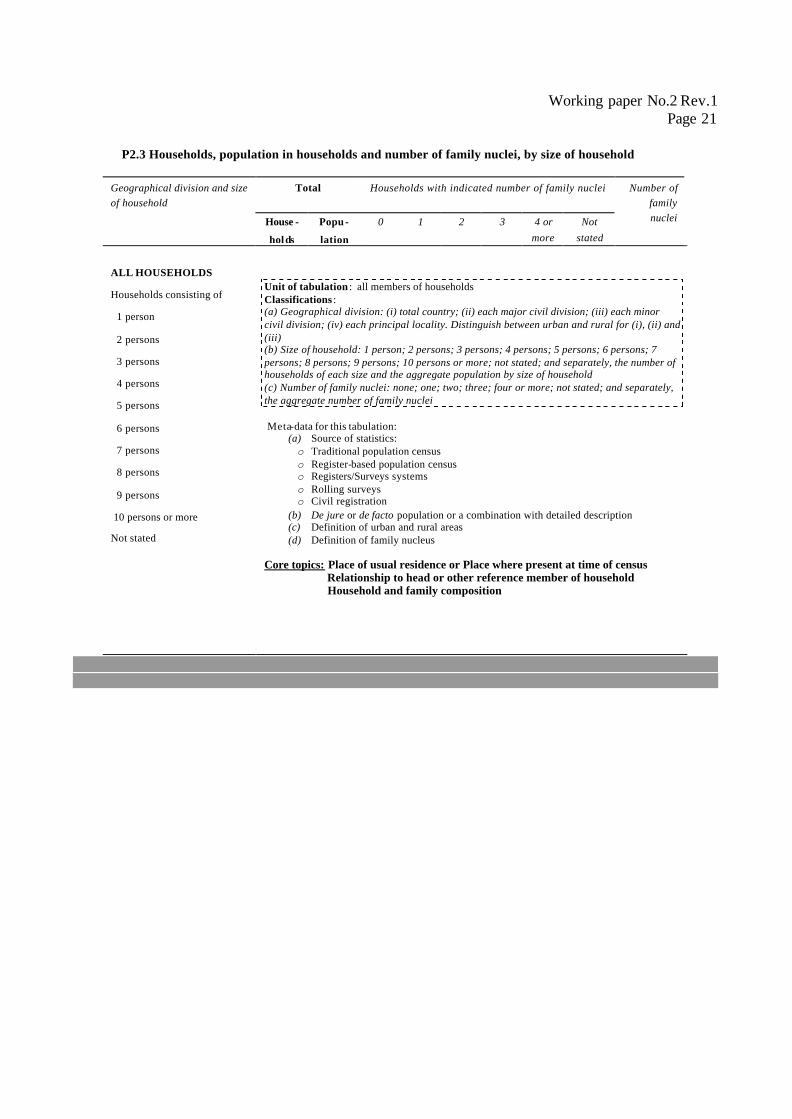
P2.3 Households, population in households and number of family nuclei, by size of household
Geographical division and size of household
Total
Households with indicated number of family nuclei
House -
holds
Popu-
lation
0 1 2 3 4 or more
Not stated
Number of
family nuclei
ALL HOUSEHOLDS
Households consisting of
1 person
2 persons
3 persons
4 persons
5 persons
6 persons
7 persons
8 persons
9 persons
10 persons or more
Not stated
Unit of tabulation : all members of households Classifications : (a) Geographical division: (i) total country; (ii) each major civil division; (iii) each minor civil division; (iv) each principal locality. Distinguish between urban and rural for (i), (ii) and (iii) (b) Size of household: 1 person; 2 persons; 3 persons; 4 persons; 5 persons; 6 persons; 7 persons; 8 persons; 9 persons; 10 persons or more; not stated; and separately, the number of households of each size and the aggregate population by size of household (c) Number of family nuclei: none; one; two; three; four or more; not stated; and separately, the aggregate number of family nuclei Meta-data for this tabulation:
(a) Source of statistics: o Traditional population census o Register-based population census o Registers/Surveys systems o Rolling surveys o Civil registration
(b) De jure or de facto population or a combination with detailed description (c) Definition of urban and rural areas (d) Definition of family nucleus
Core topics: Place of usual residence or Place where present at time of census Relationship to head or other reference member of household Household and family composition
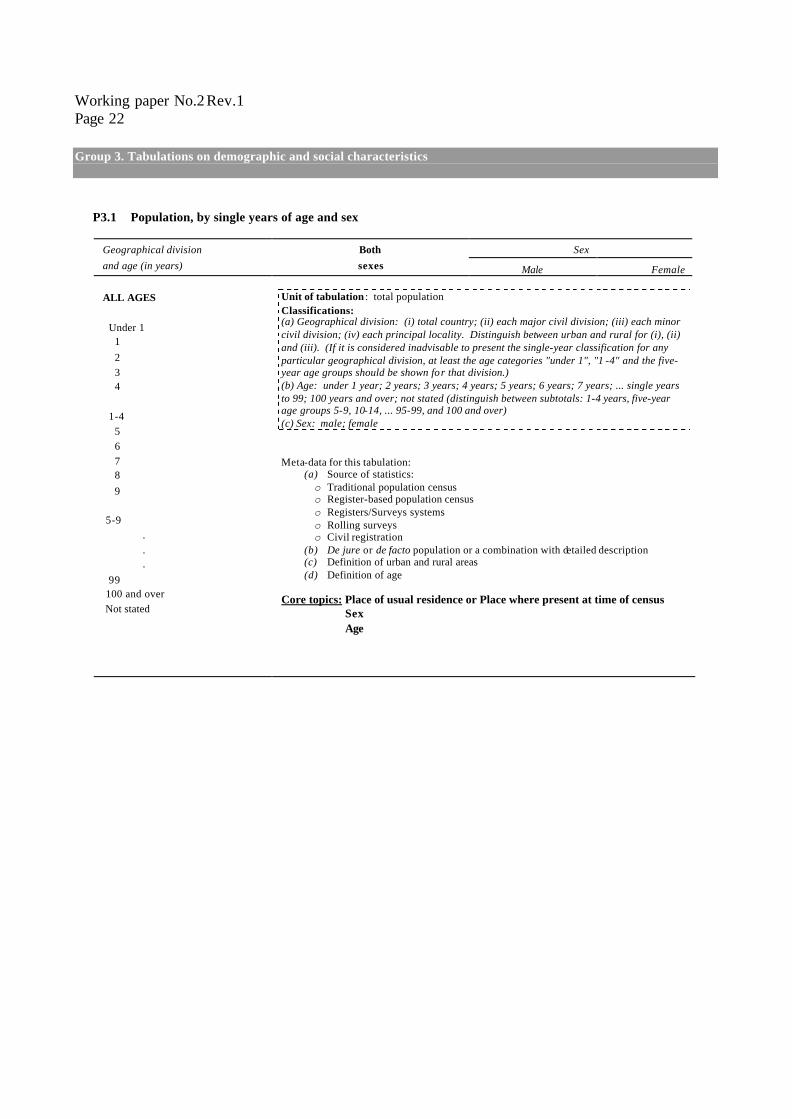
Working paper No.2 Rev.1 Page 22 Group 3. Tabulations on demographic and social characteristics P3.1 Population, by single years of age and sex
Sex Geographical division and age (in years)
Both sexes
Male
Female
ALL AGES Under 1 1 2 3 4 1-4 5 6 7 8 9 5-9 . . . 99 100 and over Not stated
Unit of tabulation : total population Classifications: (a) Geographical division: (i) total country; (ii) each major civil division; (iii) each minor civil division; (iv) each principal locality. Distinguish between urban and rural for (i), (ii) and (iii). (If it is considered inadvisable to present the single-year classification for any particular geographical division, at least the age categories "under 1", "1 -4" and the five-year age groups should be shown for that division.) (b) Age: under 1 year; 2 years; 3 years; 4 years; 5 years; 6 years; 7 years; ... single years to 99; 100 years and over; not stated (distinguish between subtotals: 1-4 years, five-year age groups 5-9, 10-14, ... 95-99, and 100 and over) (c) Sex: male; female Meta-data for this tabulation:
(a) Source of statistics: o Traditional population census o Register-based population census o Registers/Surveys systems o Rolling surveys o Civil registration
(b) De jure or de facto population or a combination with detailed description (c) Definition of urban and rural areas (d) Definition of age
Core topics: Place of usual residence or Place where present at time of census Sex Age
Working paper No.2 Rev.1 Page 23
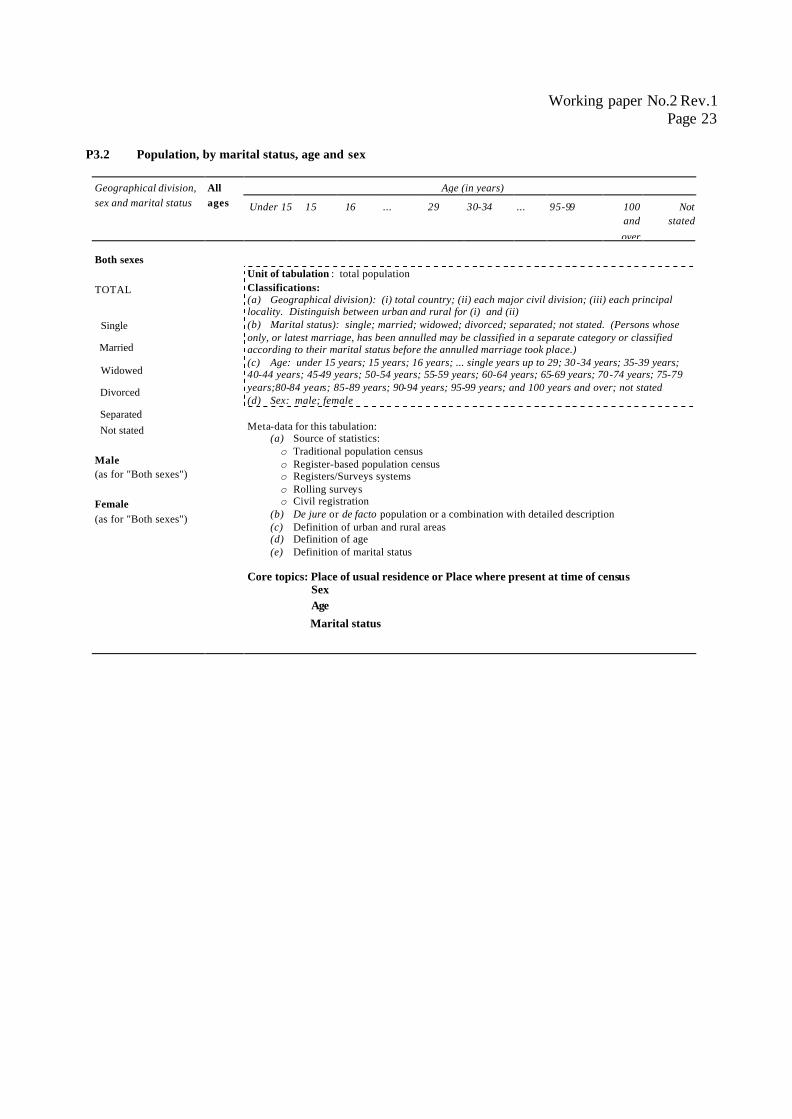
P3.2 Population, by marital status, age and sex
Age (in years) Geographical division, sex and marital status
All ages
Under 15
15
16
...
29
30-34
...
95-99
100 and
over
Not
stated
Both sexes TOTAL
Single
Married
Widowed
Divorced
Separated Not stated Male (as for "Both sexes") Female (as for "Both sexes")
Unit of tabulation : total population Classifications: (a) Geographical division): (i) total country; (ii) each major civil division; (iii) each principal locality. Distinguish between urban and rural for (i) and (ii) (b) Marital status): single; married; widowed; divorced; separated; not stated. (Persons whose only, or latest marriage, has been annulled may be classified in a separate category or classified according to their marital status before the annulled marriage took place.) (c) Age: under 15 years; 15 years; 16 years; ... single years up to 29; 30-34 years; 35-39 years; 40-44 years; 45-49 years; 50-54 years; 55-59 years; 60-64 years; 65-69 years; 70-74 years; 75-79 years;80-84 years; 85-89 years; 90-94 years; 95-99 years; and 100 years and over; not stated (d) Sex: male; female Meta-data for this tabulation:
(a) Source of statistics: o Traditional population census o Register-based population census o Registers/Surveys systems o Rolling surveys o Civil registration
(b) De jure or de facto population or a combination with detailed description (c) Definition of urban and rural areas (d) Definition of age (e) Definition of marital status
Core topics: Place of usual residence or Place where present at time of census Sex Age
Marital status
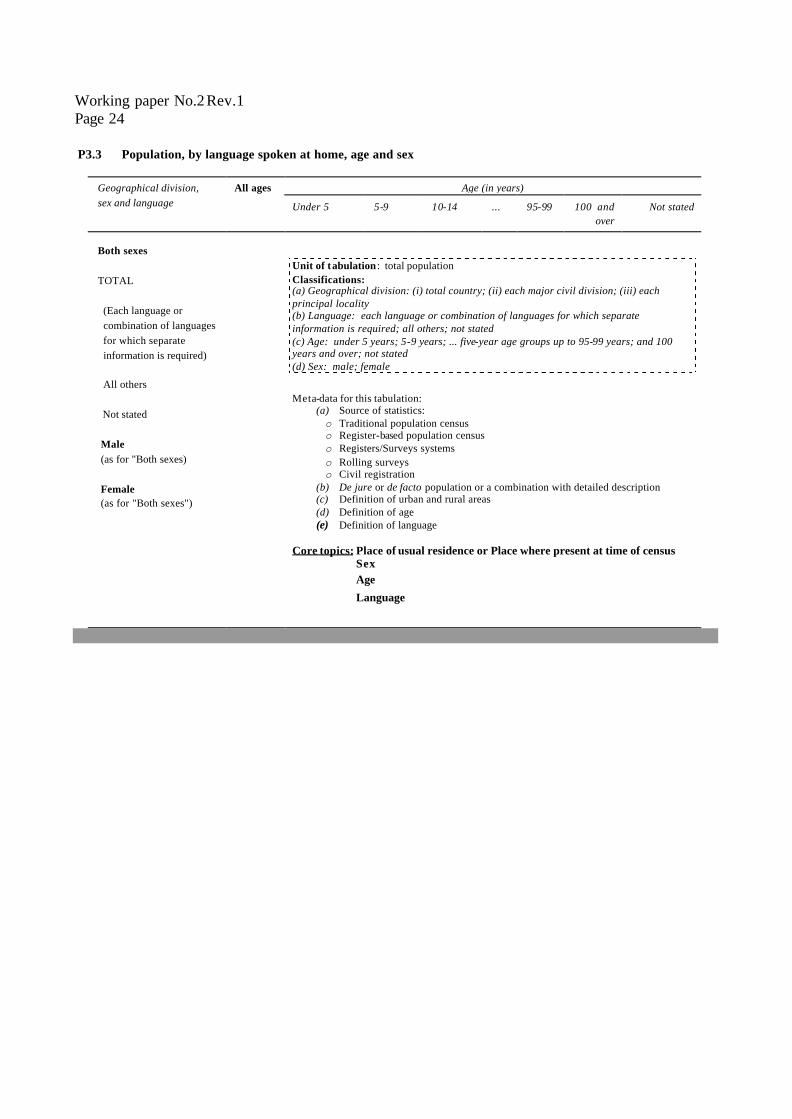
Working paper No.2 Rev.1 Page 24 P3.3 Population, by language spoken at home, age and sex
Age (in years)
Geographical division, sex and language
All ages
Under 5 5-9
10-14
...
95-99
100 and
over
Not stated
Both sexes TOTAL (Each language or combination of languages for which separate information is required) All others Not stated Male (as for "Both sexes) Female (as for "Both sexes")
Unit of tabulation : total population Classifications: (a) Geographical division: (i) total country; (ii) each major civil division; (iii) each principal locality (b) Language: each language or combination of languages for which separate information is required; all others; not stated (c) Age: under 5 years; 5-9 years; ... five-year age groups up to 95-99 years; and 100 years and over; not stated (d) Sex: male; female
Meta-data for this tabulation: (a) Source of statistics: o Traditional population census o Register-based population census o Registers/Surveys systems o Rolling surveys o Civil registration
(b) De jure or de facto population or a combination with detailed description (c) Definition of urban and rural areas (d) Definition of age (e) Definition of language
Core topics: Place of usual residence or Place where present at time of census Sex Age
Language
Working paper No.2 Rev.1 Page 25
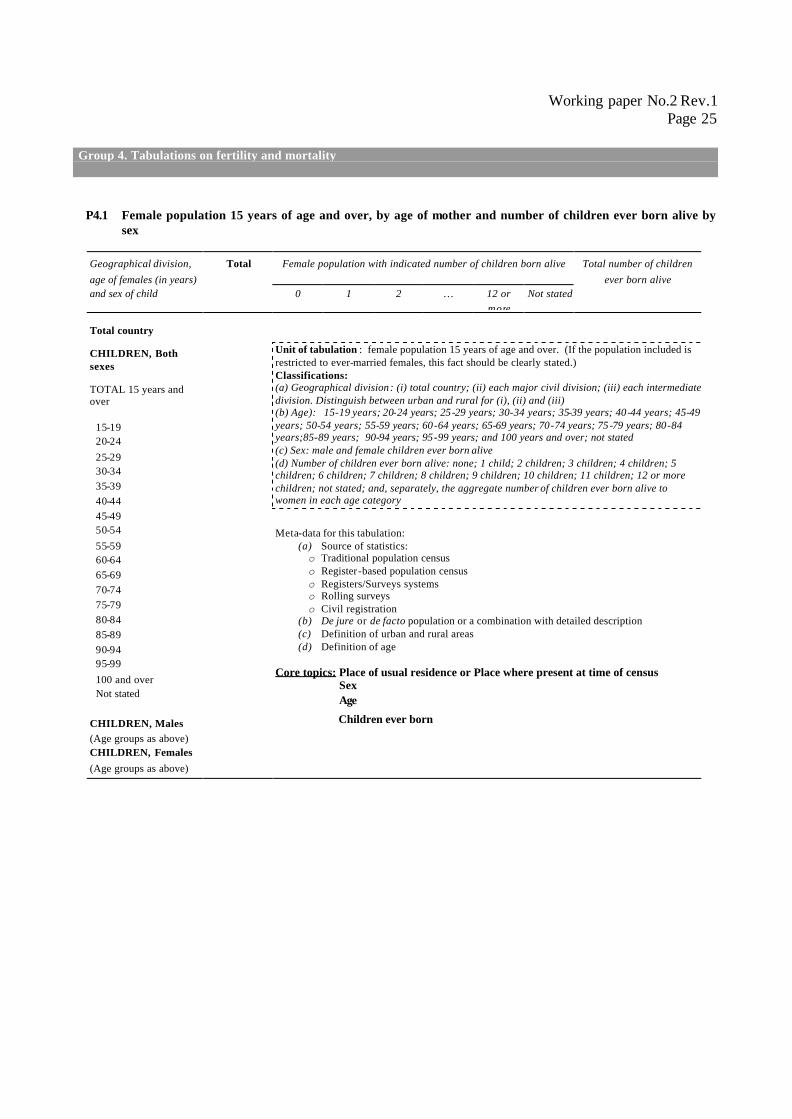
Group 4. Tabulations on fertility and mortality P4.1 Female population 15 years of age and over, by age of mother and number of children ever born alive by
sex
Female population with indicated number of children born alive Geographical division, age of females (in years) and sex of child
Total
0 1 2 … 12 or more
Not stated
Total number of children
ever born alive
Total country CHILDREN, Both sexes TOTAL 15 years and over 15-19 20-24 25-29 30-34 35-39 40-44 45-49 50-54 55-59 60-64 65-69 70-74 75-79 80-84 85-89 90-94 95-99 100 and over Not stated CHILDREN, Males (Age groups as above) CHILDREN, Females (Age groups as above)
Unit of tabulation : female population 15 years of age and over. (If the population included is restricted to ever-married females, this fact should be clearly stated.) Classifications: (a) Geographical division: (i) total country; (ii) each major civil division; (iii) each intermediate division. Distinguish between urban and rural for (i), (ii) and (iii) (b) Age): 15-19 years; 20-24 years; 25-29 years; 30-34 years; 35-39 years; 40-44 years; 45-49 years; 50-54 years; 55-59 years; 60-64 years; 65-69 years; 70-74 years; 75-79 years; 80-84 years;85-89 years; 90-94 years; 95-99 years; and 100 years and over; not stated (c) Sex: male and female children ever born alive (d) Number of children ever born alive: none; 1 child; 2 children; 3 children; 4 children; 5 children; 6 children; 7 children; 8 children; 9 children; 10 children; 11 children; 12 or more children; not stated; and, separately, the aggregate number of children ever born alive to women in each age category
Meta-data for this tabulation:
(a) Source of statistics: o Traditional population census o Register-based population census o Registers/Surveys systems o Rolling surveys o Civil registration
(b) De jure or de facto population or a combination with detailed description (c) Definition of urban and rural areas (d) Definition of age
Core topics: Place of usual residence or Place where present at time of census Sex Age
Children ever born
Working paper No.2 Rev.1 Page 26
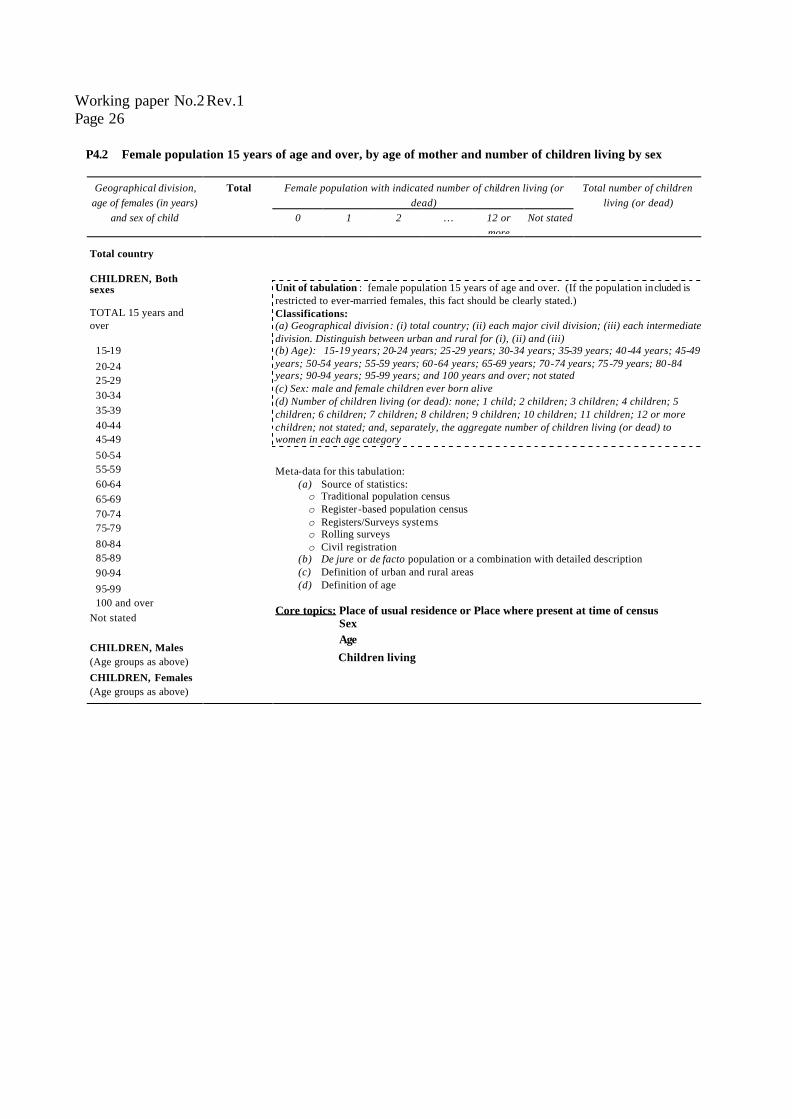
P4.2 Female population 15 years of age and over, by age of mother and number of children living by sex
Female population with indicated number of children living (or
dead)
Geographical division,
age of females (in years) and sex of child
Total
0 1 2 … 12 or more
Not stated
Total number of children
living (or dead)
Total country CHILDREN, Both sexes TOTAL 15 years and over 15-19 20-24 25-29 30-34 35-39 40-44 45-49 50-54 55-59 60-64 65-69 70-74 75-79 80-84 85-89 90-94 95-99 100 and over Not stated CHILDREN, Males (Age groups as above) CHILDREN, Females (Age groups as above)
Unit of tabulation : female population 15 years of age and over. (If the population included is restricted to ever-married females, this fact should be clearly stated.) Classifications: (a) Geographical division: (i) total country; (ii) each major civil division; (iii) each intermediate division. Distinguish between urban and rural for (i), (ii) and (iii) (b) Age): 15-19 years; 20-24 years; 25-29 years; 30-34 years; 35-39 years; 40-44 years; 45-49 years; 50-54 years; 55-59 years; 60-64 years; 65-69 years; 70-74 years; 75-79 years; 80-84 years; 90-94 years; 95-99 years; and 100 years and over; not stated (c) Sex: male and female children ever born alive (d) Number of children living (or dead): none; 1 child; 2 children; 3 children; 4 children; 5 children; 6 children; 7 children; 8 children; 9 children; 10 children; 11 children; 12 or more children; not stated; and, separately, the aggregate number of children living (or dead) to women in each age category Meta-data for this tabulation:
(a) Source of statistics: o Traditional population census o Register-based population census o Registers/Surveys systems o Rolling surveys o Civil registration
(b) De jure or de facto population or a combination with detailed description (c) Definition of urban and rural areas (d) Definition of age
Core topics: Place of usual residence or Place where present at time of census Sex Age
Children living
Working paper No.2 Rev.1 Page 27
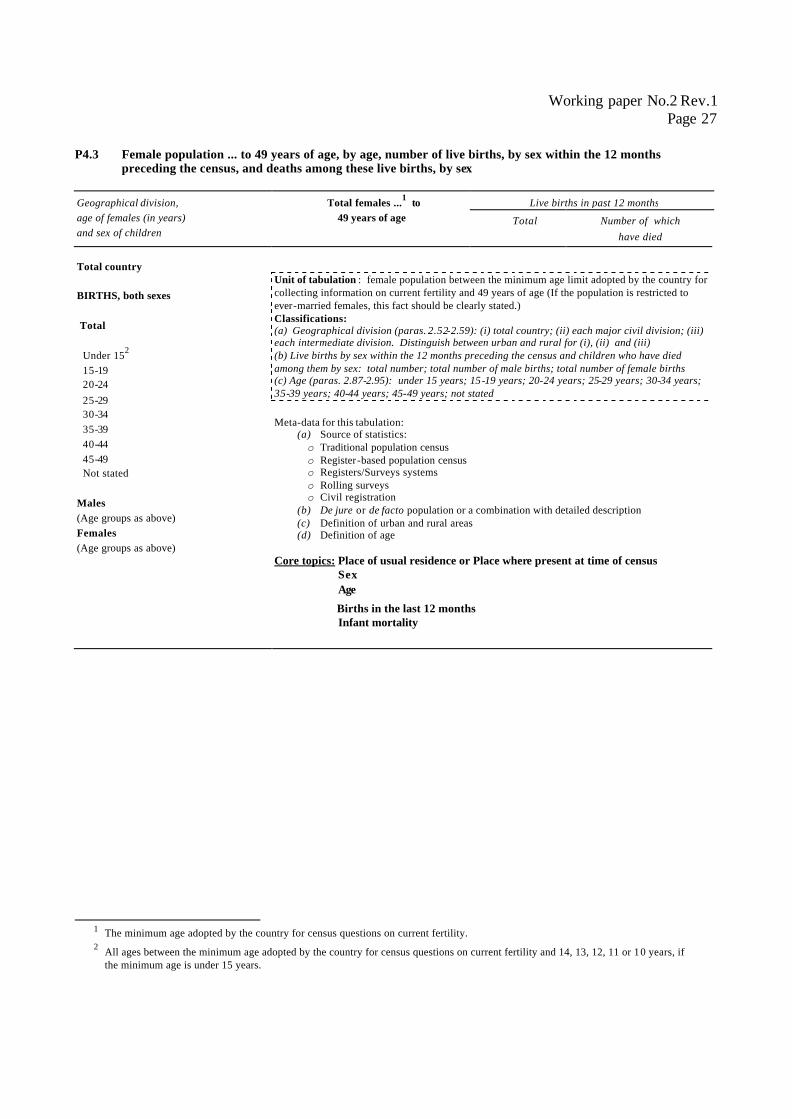
P4.3 Female population ... to 49 years of age, by age, number of live births, by sex within the 12 months preceding the census, and deaths among these live births, by sex
Live births in past 12 months Geographical division, age of females (in years) and sex of children
Total females ...1 to
49 years of age
Total
Number of which have died
Total country BIRTHS, both sexes Total Under 152 15-19 20-24 25-29 30-34 35-39 40-44 45-49 Not stated Males (Age groups as above) Females (Age groups as above)
Unit of tabulation : female population between the minimum age limit adopted by the country for collecting information on current fertility and 49 years of age (If the population is restricted to ever-married females, this fact should be clearly stated.) Classifications: (a) Geographical division (paras. 2.52-2.59): (i) total country; (ii) each major civil division; (iii) each intermediate division. Distinguish between urban and rural for (i), (ii) and (iii) (b) Live births by sex within the 12 months preceding the census and children who have died among them by sex: total number; total number of male births; total number of female births (c) Age (paras. 2.87-2.95): under 15 years; 15-19 years; 20-24 years; 25-29 years; 30-34 years; 35-39 years; 40-44 years; 45-49 years; not stated Meta-data for this tabulation:
(a) Source of statistics: o Traditional population census o Register-based population census o Registers/Surveys systems o Rolling surveys o Civil registration
(b) De jure or de facto population or a combination with detailed description (c) Definition of urban and rural areas (d) Definition of age
Core topics: Place of usual residence or Place where present at time of census Sex Age
Births in the last 12 months Infant mortality
1 The minimum age adopted by the country for census questions on current fertility. 2 All ages between the minimum age adopted by the country for census questions on current fertility and 14, 13, 12, 11 or 10 years, if
the minimum age is under 15 years.
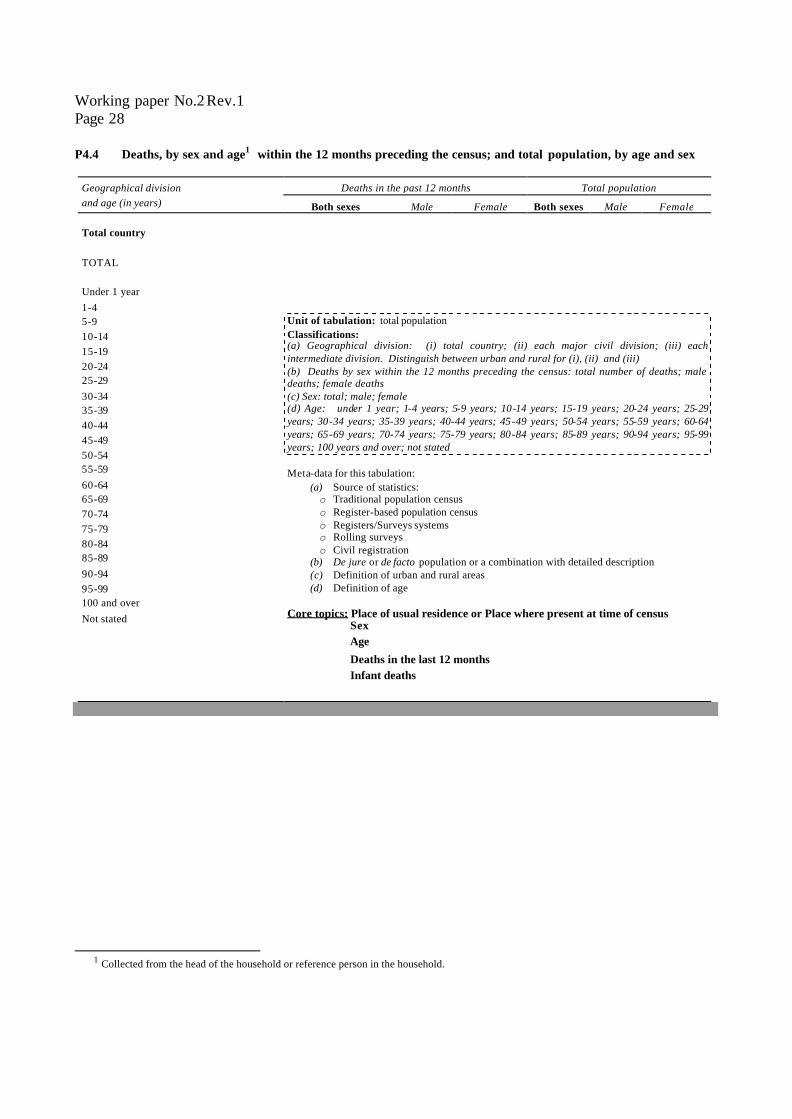
Working paper No.2 Rev.1 Page 28 P4.4 Deaths, by sex and age1 within the 12 months preceding the census; and total population, by age and sex
Deaths in the past 12 months
Total population
Geographical division and age (in years)
Both sexes
Male
Female
Both sexes
Male
Female
Total country TOTAL Under 1 year 1-4 5-9 10-14 15-19 20-24 25-29 30-34 35-39 40-44 45-49 50-54 55-59 60-64 65-69 70-74 75-79 80-84 85-89 90-94 95-99 100 and over Not stated
Unit of tabulation: total population Classifications: (a) Geographical division: (i) total country; (ii) each major civil division; (iii) each intermediate division. Distinguish between urban and rural for (i), (ii) and (iii) (b) Deaths by sex within the 12 months preceding the census: total number of deaths; male deaths; female deaths (c) Sex: total; male; female (d) Age: under 1 year; 1-4 years; 5-9 years; 10-14 years; 15-19 years; 20-24 years; 25-29 years; 30-34 years; 35-39 years; 40-44 years; 45-49 years; 50-54 years; 55-59 years; 60-64 years; 65-69 years; 70-74 years; 75-79 years; 80-84 years; 85-89 years; 90-94 years; 95-99 years; 100 years and over; not stated Meta-data for this tabulation:
(a) Source of statistics: o Traditional population census o Register-based population census o Registers/Surveys systems o Rolling surveys o Civil registration
(b) De jure or de facto population or a combination with detailed description (c) Definition of urban and rural areas (d) Definition of age
Core topics: Place of usual residence or Place where present at time of census Sex Age
Deaths in the last 12 months Infant deaths
1 Collected from the head of the household or reference person in the household.
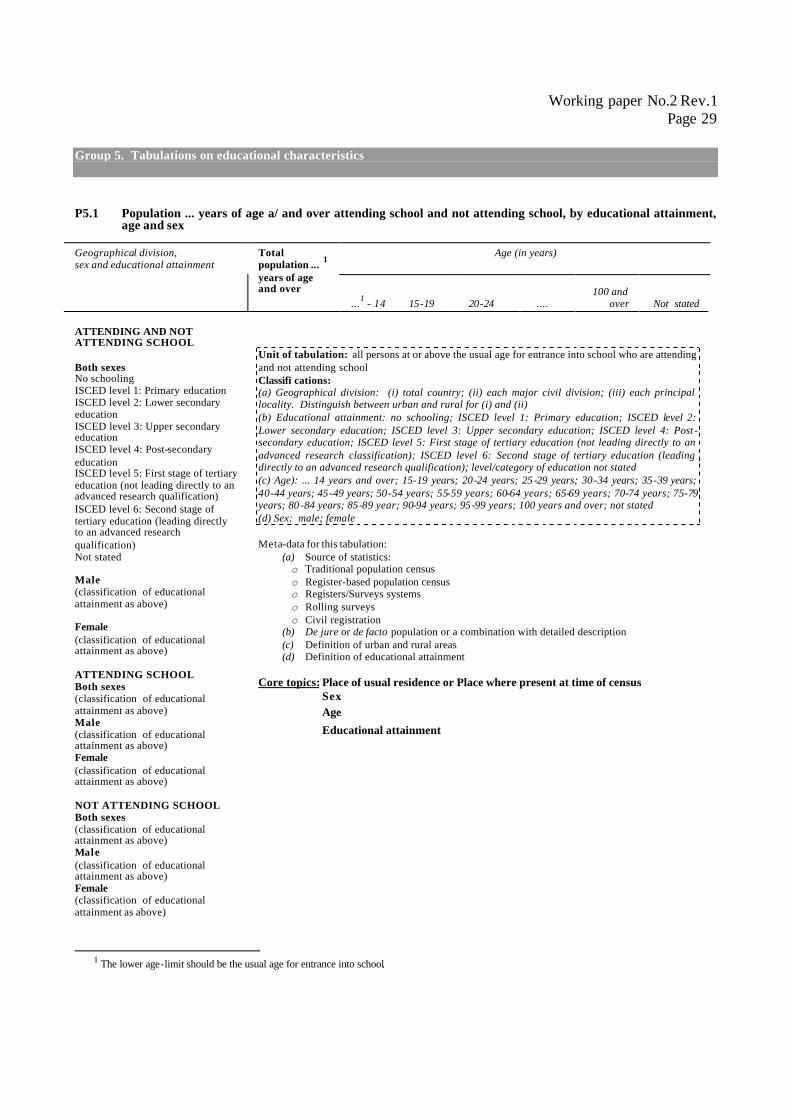
Working paper No.2 Rev.1 Page 29
Group 5. Tabulations on educational characteristics P5.1 Population ... years of age a/ and over attending school and not attending school, by educational attainment,
age and sex
Age (in years) Geographical division, sex and educational attainment
Total population ... 1 years of age and over
...1 - 14 15-19
20-24
....
100 and
over Not stated
ATTENDING AND NOT ATTENDING SCHOOL Both sexes No schooling ISCED level 1: Primary education ISCED level 2: Lower secondary education ISCED level 3: Upper secondary education ISCED level 4: Post-secondary education ISCED level 5: First stage of tertiary education (not leading directly to an advanced research qualification) ISCED level 6: Second stage of tertiary education (leading directly to an advanced research qualification) Not stated Male (classification of educational attainment as above) Female (classification of educational attainment as above) ATTENDING SCHOOL Both sexes (classification of educational attainment as above) Male (classification of educational attainment as above) Female (classification of educational attainment as above) NOT ATTENDING SCHOOL Both sexes (classification of educational attainment as above) Male (classification of educational attainment as above) Female (classification of educational attainment as above)
Unit of tabulation: all persons at or above the usual age for entrance into school who are attending and not attending school Classifi cations: (a) Geographical division: (i) total country; (ii) each major civil division; (iii) each principal locality. Distinguish between urban and rural for (i) and (ii) (b) Educational attainment: no schooling; ISCED level 1: Primary education; ISCED level 2: Lower secondary education; ISCED level 3: Upper secondary education; ISCED level 4: Post -secondary education; ISCED level 5: First stage of tertiary education (not leading directly to an advanced research classification); ISCED level 6: Second stage of tertiary education (leading directly to an advanced research qualification); level/category of education not stated (c) Age): ... 14 years and over; 15-19 years; 20-24 years; 25-29 years; 30-34 years; 35-39 years; 40-44 years; 45-49 years; 50-54 years; 55-59 years; 60-64 years; 65-69 years; 70-74 years; 75-79 years; 80-84 years; 85-89 year; 90-94 years; 95-99 years; 100 years and over; not stated (d) Sex: male; female Meta-data for this tabulation:
(a) Source of statistics: o Traditional population census o Register-based population census o Registers/Surveys systems o Rolling surveys o Civil registration
(b) De jure or de facto population or a combination with detailed description (c) Definition of urban and rural areas (d) Definition of educational attainment
Core topics: Place of usual residence or Place where present at time of census Sex Age
Educational attainment
1 The lower age-limit should be the usual age for entrance into school.
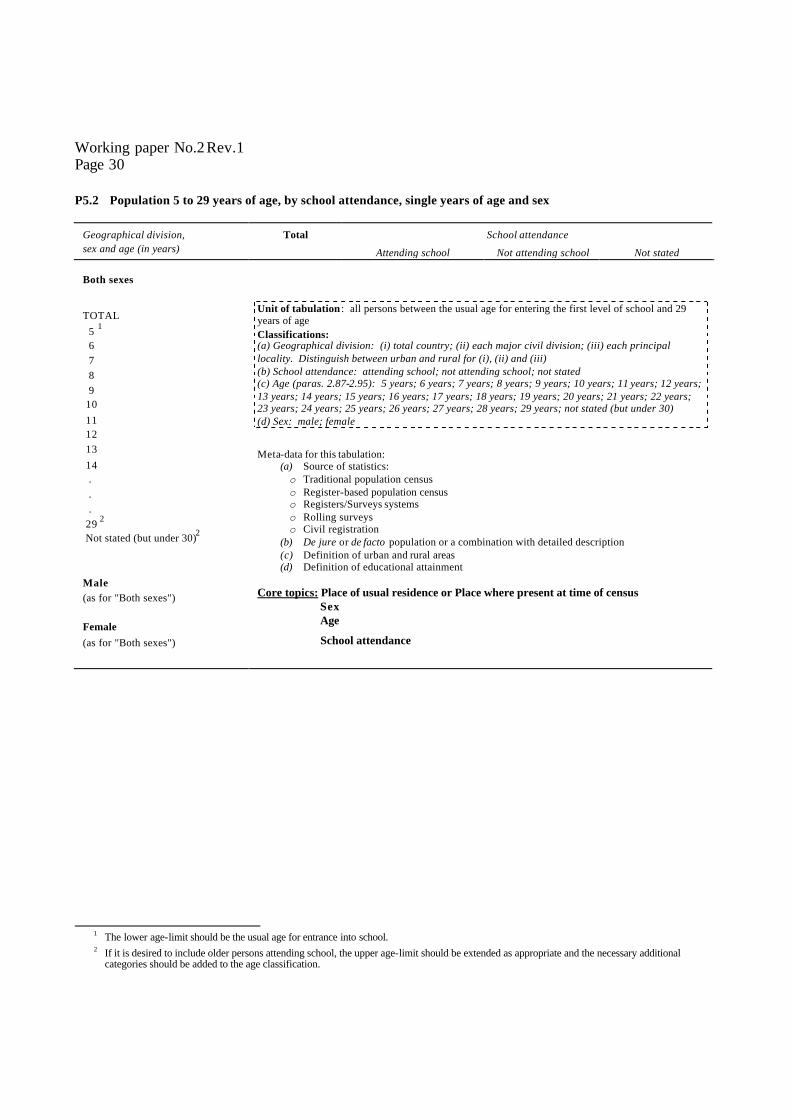
Working paper No.2 Rev.1 Page 30 P5.2 Population 5 to 29 years of age, by school attendance, single years of age and sex
School attendance Geographical division, sex and age (in years)
Total
Attending school Not attending school
Not stated
Both sexes
TOTAL 5 1 6 7 8 9 10 11 12 13 14 . . . 29 2 Not stated (but under 30)2 Male (as for "Both sexes") Female (as for "Both sexes")
Unit of tabulation : all persons between the usual age for entering the first level of school and 29 years of age Classifications: (a) Geographical division: (i) total country; (ii) each major civil division; (iii) each principal locality. Distinguish between urban and rural for (i), (ii) and (iii) (b) School attendance: attending school; not attending school; not stated (c) Age (paras. 2.87-2.95): 5 years; 6 years; 7 years; 8 years; 9 years; 10 years; 11 years; 12 years; 13 years; 14 years; 15 years; 16 years; 17 years; 18 years; 19 years; 20 years; 21 years; 22 years; 23 years; 24 years; 25 years; 26 years; 27 years; 28 years; 29 years; not stated (but under 30) (d) Sex: male; female
Meta-data for this tabulation: (a) Source of statistics: o Traditional population census o Register-based population census o Registers/Surveys systems o Rolling surveys o Civil registration
(b) De jure or de facto population or a combination with detailed description (c) Definition of urban and rural areas (d) Definition of educational attainment
Core topics: Place of usual residence or Place where present at time of census Sex Age
School attendance
1 The lower age-limit should be the usual age for entrance into school. 2 If it is desired to include older persons attending school, the upper age-limit should be extended as appropriate and the necessary additional
categories should be added to the age classification.
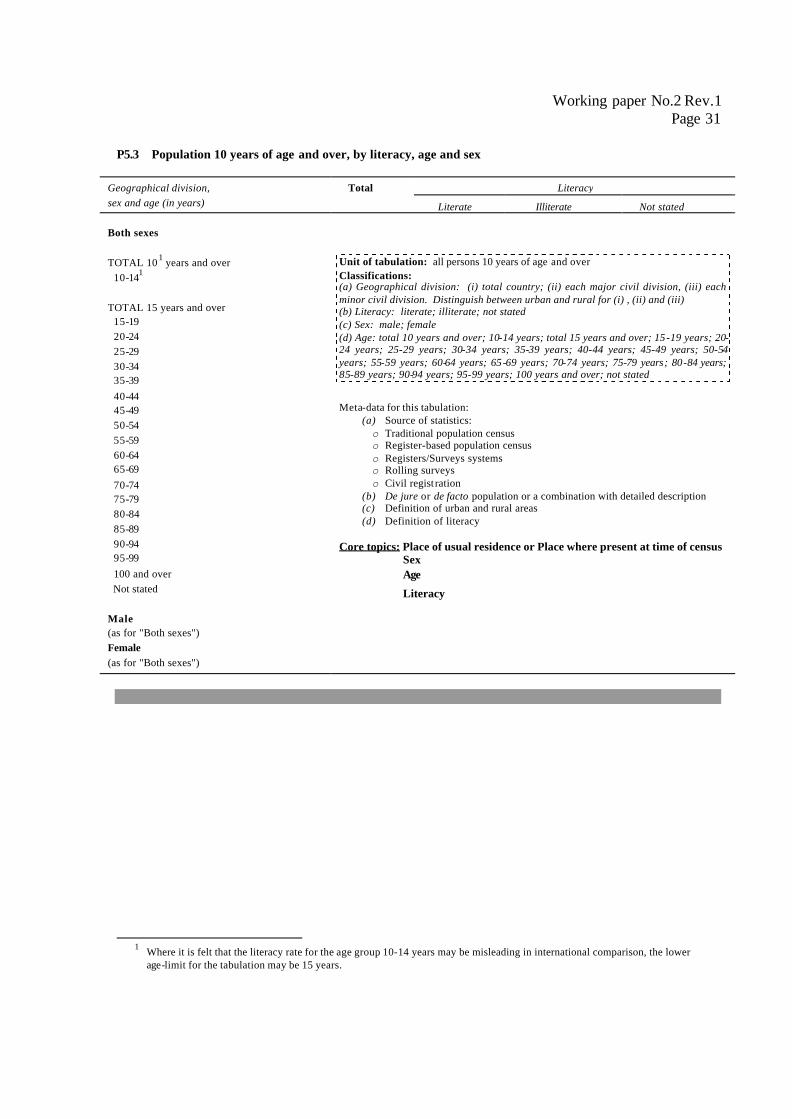
Working paper No.2 Rev.1 Page 31
P5.3 Population 10 years of age and over, by literacy, age and sex
Literacy Geographical division, sex and age (in years)
Total
Literate Illiterate
Not stated
Both sexes TOTAL 101 years and over 10-141 TOTAL 15 years and over 15-19 20-24 25-29 30-34 35-39 40-44 45-49 50-54 55-59 60-64 65-69 70-74 75-79 80-84 85-89 90-94 95-99 100 and over Not stated Male (as for "Both sexes") Female (as for "Both sexes")
Unit of tabulation: all persons 10 years of age and over Classifications: (a) Geographical division: (i) total country; (ii) each major civil division, (iii) each minor civil division. Distinguish between urban and rural for (i) , (ii) and (iii) (b) Literacy: literate; illiterate; not stated (c) Sex: male; female (d) Age: total 10 years and over; 10-14 years; total 15 years and over; 15-19 years; 20-24 years; 25-29 years; 30-34 years; 35-39 years; 40-44 years; 45-49 years; 50-54 years; 55-59 years; 60-64 years; 65-69 years; 70-74 years; 75-79 years; 80-84 years; 85-89 years; 90-94 years; 95-99 years; 100 years and over; not stated
Meta-data for this tabulation: (a) Source of statistics: o Traditional population census o Register-based population census o Registers/Surveys systems o Rolling surveys o Civil regist ration
(b) De jure or de facto population or a combination with detailed description (c) Definition of urban and rural areas (d) Definition of literacy
Core topics: Place of usual residence or Place where present at time of census Sex Age
Literacy
1 Where it is felt that the literacy rate for the age group 10-14 years may be misleading in international comparison, the lower
age-limit for the tabulation may be 15 years.
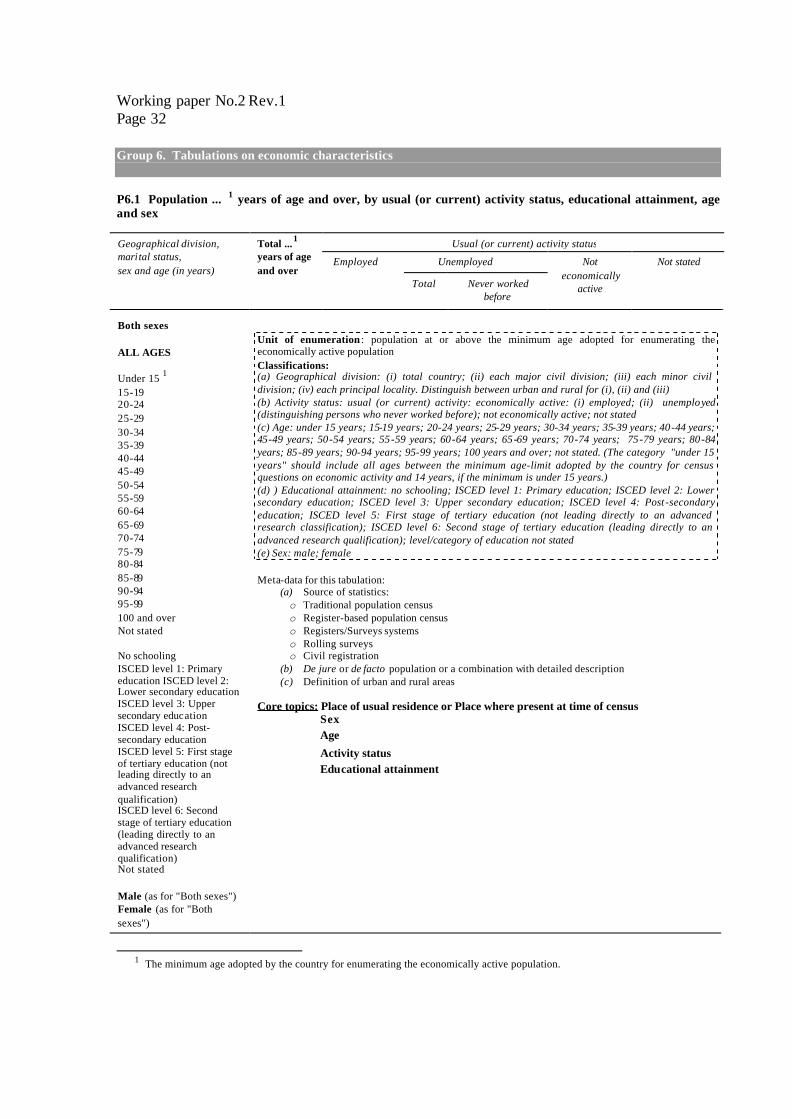
Working paper No.2 Rev.1 Page 32
Group 6. Tabulations on economic characteristics P6.1 Population ... 1 years of age and over, by usual (or current) activity status, educational attainment, age and sex
Usual (or current) activity status Unemployed
Not stated
Geographical division, marital status, sex and age (in years)
Total ...1 years of age and over
Employed
Total
Never worked before
Not
economically active
Both sexes ALL AGES Under 15 1 15-19 20-24 25-29 30-34 35-39 40-44 45-49 50-54 55-59 60-64 65-69 70-74 75-79 80-84 85-89 90-94 95-99 100 and over Not stated No schooling ISCED level 1: Primary education ISCED level 2: Lower secondary education ISCED level 3: Upper secondary education ISCED level 4: Post-secondary education ISCED level 5: First stage of tertiary education (not leading directly to an advanced research qualification) ISCED level 6: Second stage of tertiary education (leading directly to an advanced research qualification) Not stated Male (as for "Both sexes") Female (as for "Both sexes")
Unit of enumeration : population at or above the minimum age adopted for enumerating the economically active population Classifications: (a) Geographical division: (i) total country; (ii) each major civil division; (iii) each minor civil division; (iv) each principal locality. Distinguish between urban and rural for (i), (ii) and (iii) (b) Activity status: usual (or current) activity: economically active: (i) employed; (ii) unemployed (distinguishing persons who never worked before); not economically active; not stated (c) Age: under 15 years; 15-19 years; 20-24 years; 25-29 years; 30-34 years; 35-39 years; 40-44 years; 45-49 years; 50-54 years; 55-59 years; 60-64 years; 65-69 years; 70-74 years; 75-79 years; 80-84 years; 85-89 years; 90-94 years; 95-99 years; 100 years and over; not stated. (The category "under 15 years" should include all ages between the minimum age-limit adopted by the country for census questions on economic activity and 14 years, if the minimum is under 15 years.) (d) ) Educational attainment: no schooling; ISCED level 1: Primary education; ISCED level 2: Lower secondary education; ISCED level 3: Upper secondary education; ISCED level 4: Post -secondary education; ISCED level 5: First stage of tertiary education (not leading directly to an advanced research classification); ISCED level 6: Second stage of tertiary education (leading directly to an advanced research qualification); level/category of education not stated (e) Sex: male; female Meta-data for this tabulation:
(a) Source of statistics: o Traditional population census o Register-based population census o Registers/Surveys systems o Rolling surveys o Civil registration
(b) De jure or de facto population or a combination with detailed description (c) Definition of urban and rural areas
Core topics: Place of usual residence or Place where present at time of census Sex Age
Activity status Educational attainment
1 The minimum age adopted by the country for enumerating the economically active population.
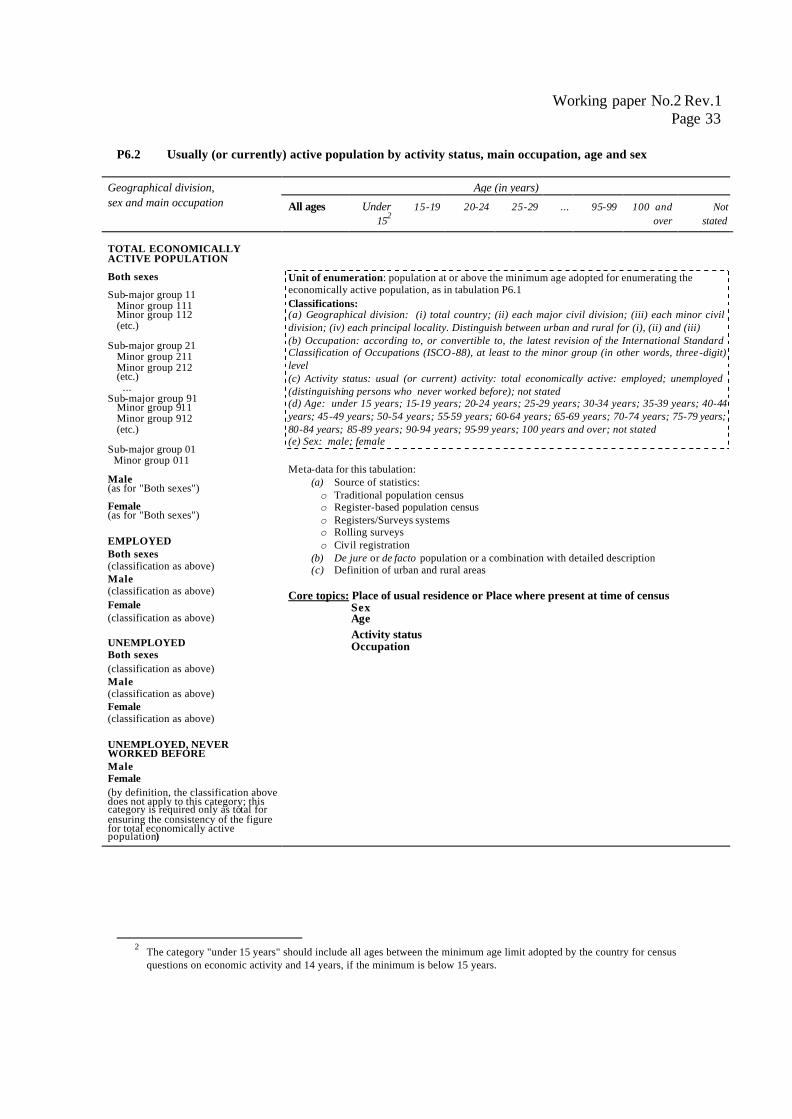
Working paper No.2 Rev.1 Page 33
P6.2 Usually (or currently) active population by activity status, main occupation, age and sex
Age (in years) Geographical division, sex and main occupation
All ages
Under
152
15-19
20-24
25-29
...
95-99
100 and
over
Not
stated
TOTAL ECONOMICALLY ACTIVE POPULATION Both sexes Sub-major group 11 Minor group 111 Minor group 112 (etc.) Sub-major group 21 Minor group 211 Minor group 212 (etc.) ... Sub-major group 91 Minor group 911 Minor group 912 (etc.) Sub-major group 01 Minor group 011 Male (as for "Both sexes") Female (as for "Both sexes") EMPLOYED Both sexes (classification as above) Male (classification as above) Female (classification as above) UNEMPLOYED Both sexes (classification as above) Male (classification as above) Female (classification as above) UNEMPLOYED, NEVER WORKED BEFORE Male Female (by definition, the classification above does not apply to this category; this category is required only as total for ensuring the consistency of the figure for total economically active population)
Unit of enumeration: population at or above the minimum age adopted for enumerating the economically active population, as in tabulation P6.1 Classifications: (a) Geographical division: (i) total country; (ii) each major civil division; (iii) each minor civil division; (iv) each principal locality. Distinguish between urban and rural for (i), (ii) and (iii) (b) Occupation: according to, or convertible to, the latest revision of the International Standard Classification of Occupations (ISCO-88), at least to the minor group (in other words, three-digit) level (c) Activity status: usual (or current) activity: total economically active: employed; unemployed (distinguishing persons who never worked before); not stated (d) Age: under 15 years; 15-19 years; 20-24 years; 25-29 years; 30-34 years; 35-39 years; 40-44 years; 45-49 years; 50-54 years; 55-59 years; 60-64 years; 65-69 years; 70-74 years; 75-79 years; 80-84 years; 85-89 years; 90-94 years; 95-99 years; 100 years and over; not stated (e) Sex: male; female Meta-data for this tabulation:
(a) Source of statistics: o Traditional population census o Register-based population census o Registers/Surveys systems o Rolling surveys o Civil registration
(b) De jure or de facto population or a combination with detailed description (c) Definition of urban and rural areas
Core topics: Place of usual residence or Place where present at time of census Sex Age Activity status Occupation
2 The category "under 15 years" should include all ages between the minimum age limit adopted by the country for census
questions on economic activity and 14 years, if the minimum is below 15 years.
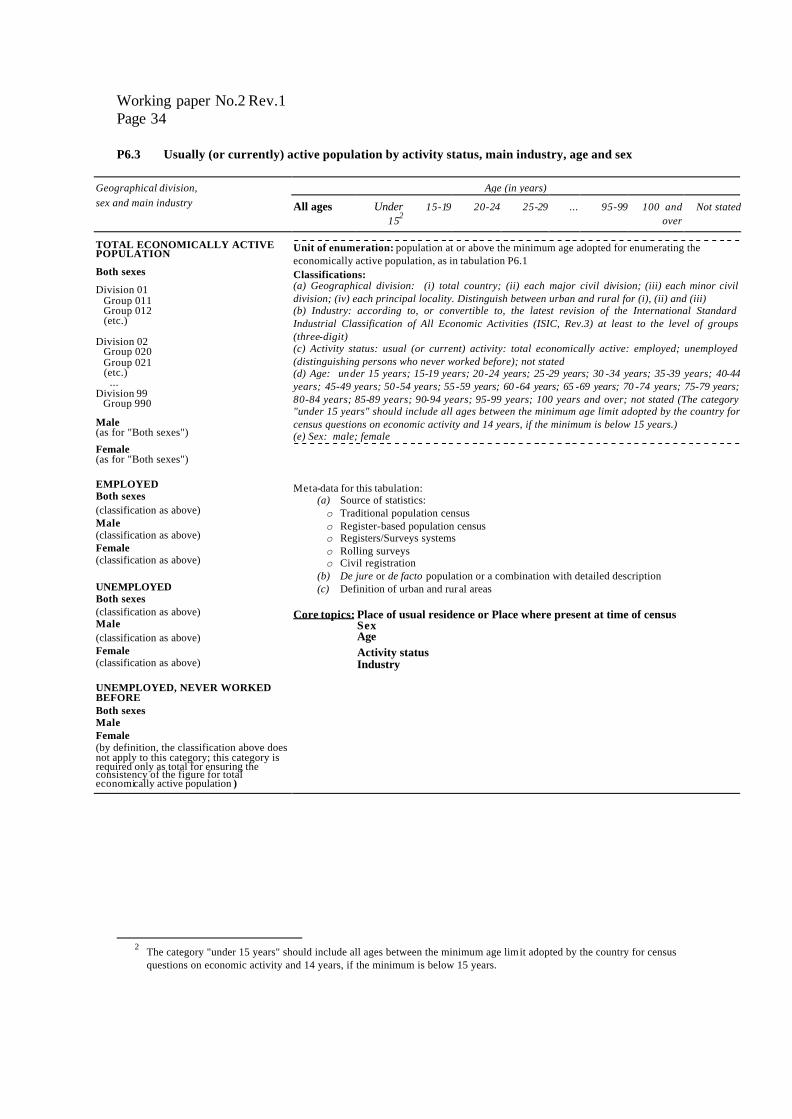
Working paper No.2 Rev.1 Page 34
P6.3 Usually (or currently) active population by activity status, main industry, age and sex
Age (in years) Geographical division, sex and main industry
All ages
Under
152
15-19
20-24
25-29
...
95-99
100 and
over
Not stated
TOTAL ECONOMICALLY ACTIVE POPULATION Both sexes Division 01 Group 011 Group 012 (etc.) Division 02 Group 020 Group 021 (etc.) ... Division 99 Group 990 Male (as for "Both sexes") Female (as for "Both sexes") EMPLOYED Both sexes (classification as above) Male (classification as above) Female (classification as above) UNEMPLOYED Both sexes (classification as above) Male (classification as above) Female (classification as above) UNEMPLOYED, NEVER WORKED BEFORE Both sexes Male Female (by definition, the classification above does not apply to this category; this category is required only as total for ensuring the consistency of the figure for total economically active population )
Unit of enumeration: population at or above the minimum age adopted for enumerating the economically active population, as in tabulation P6.1 Classifications: (a) Geographical division: (i) total country; (ii) each major civil division; (iii) each minor civil division; (iv) each principal locality. Distinguish between urban and rural for (i), (ii) and (iii) (b) Industry: according to, or convertible to, the latest revision of the International Standard Industrial Classification of All Economic Activities (ISIC, Rev.3) at least to the level of groups (three-digit) (c) Activity status: usual (or current) activity: total economically active: employed; unemployed (distinguishing persons who never worked before); not stated (d) Age: under 15 years; 15-19 years; 20-24 years; 25-29 years; 30 -34 years; 35-39 years; 40-44 years; 45-49 years; 50-54 years; 55-59 years; 60 -64 years; 65 -69 years; 70 -74 years; 75-79 years; 80-84 years; 85-89 years; 90-94 years; 95-99 years; 100 years and over; not stated (The category "under 15 years" should include all ages between the minimum age limit adopted by the country for census questions on economic activity and 14 years, if the minimum is below 15 years.) (e) Sex: male; female
Meta-data for this tabulation: (a) Source of statistics: o Traditional population census o Register-based population census o Registers/Surveys systems o Rolling surveys o Civil registration
(b) De jure or de facto population or a combination with detailed description (c) Definition of urban and rural areas
Core topics: Place of usual residence or Place where present at time of census Sex Age Activity status Industry
2 The category "under 15 years" should include all ages between the minimum age limit adopted by the country for census
questions on economic activity and 14 years, if the minimum is below 15 years.
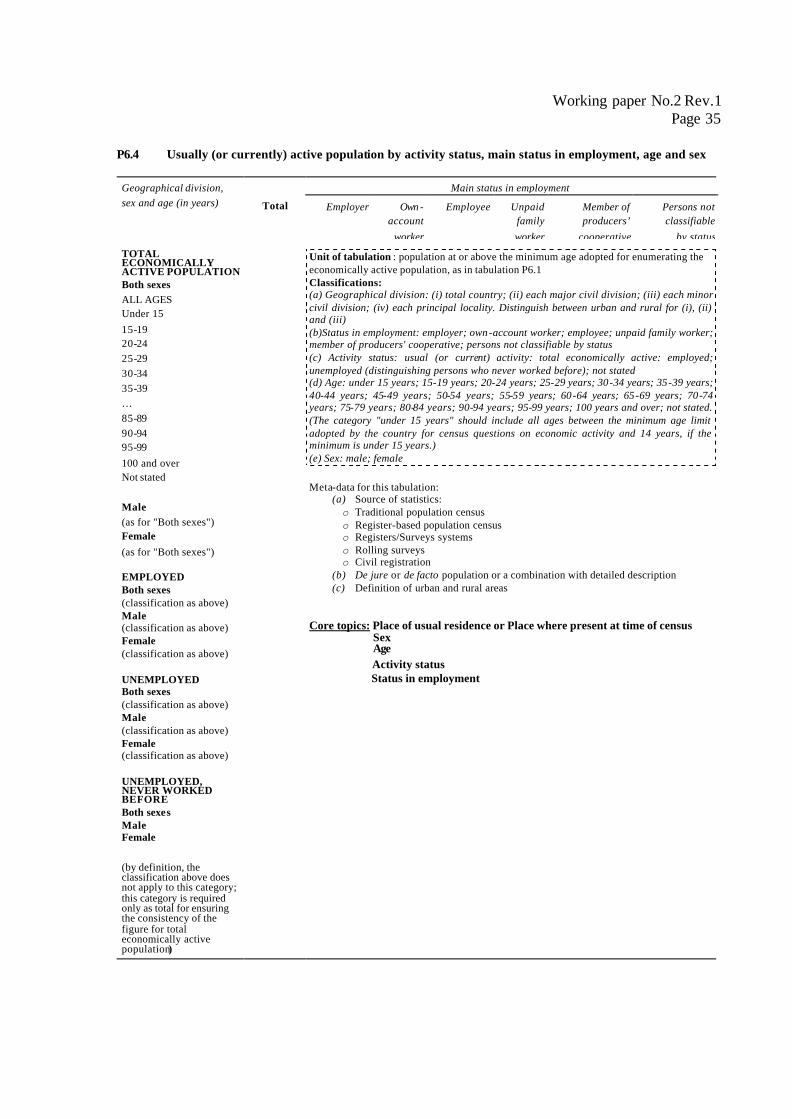
Working paper No.2 Rev.1 Page 35
P6.4 Usually (or currently) active population by activity status, main status in employment, age and sex
Main status in employment Geographical division, sex and age (in years)
Total
Employer
Own-
account worker
Employee
Unpaid
family worker
Member of producers’
cooperative
Persons not classifiable
by status TOTAL ECONOMICALLY ACTIVE POPULATION Both sexes ALL AGES Under 15 15-19 20-24 25-29 30-34 35-39 … 85-89 90-94 95-99 100 and over Not stated Male (as for "Both sexes") Female (as for "Both sexes") EMPLOYED Both sexes (classification as above) Male (classification as above) Female (classification as above) UNEMPLOYED Both sexes (classification as above) Male (classification as above) Female (classification as above) UNEMPLOYED, NEVER WORKED BEFORE Both sexes Male Female (by definition, the classification above does not apply to this category; this category is required only as total for ensuring the consistency of the figure for total economically active population)
Unit of tabulation : population at or above the minimum age adopted for enumerating the economically active population, as in tabulation P6.1 Classifications: (a) Geographical division: (i) total country; (ii) each major civil division; (iii) each minor civil division; (iv) each principal locality. Distinguish between urban and rural for (i), (ii) and (iii) (b)Status in employment: employer; own-account worker; employee; unpaid family worker; member of producers' cooperative; persons not classifiable by status (c) Activity status: usual (or current) activity: total economically active: employed; unemployed (distinguishing persons who never worked before); not stated (d) Age: under 15 years; 15-19 years; 20-24 years; 25-29 years; 30-34 years; 35-39 years; 40-44 years; 45-49 years; 50-54 years; 55-59 years; 60-64 years; 65-69 years; 70-74 years; 75-79 years; 80-84 years; 90-94 years; 95-99 years; 100 years and over; not stated. (The category "under 15 years" should include all ages between the minimum age limit adopted by the country for census questions on economic activity and 14 years, if the minimum is under 15 years.) (e) Sex: male; female Meta-data for this tabulation:
(a) Source of statistics: o Traditional population census o Register-based population census o Registers/Surveys systems o Rolling surveys o Civil registration
(b) De jure or de facto population or a combination with detailed description (c) Definition of urban and rural areas
Core topics: Place of usual residence or Place where present at time of census Sex Age Activity status Status in employment
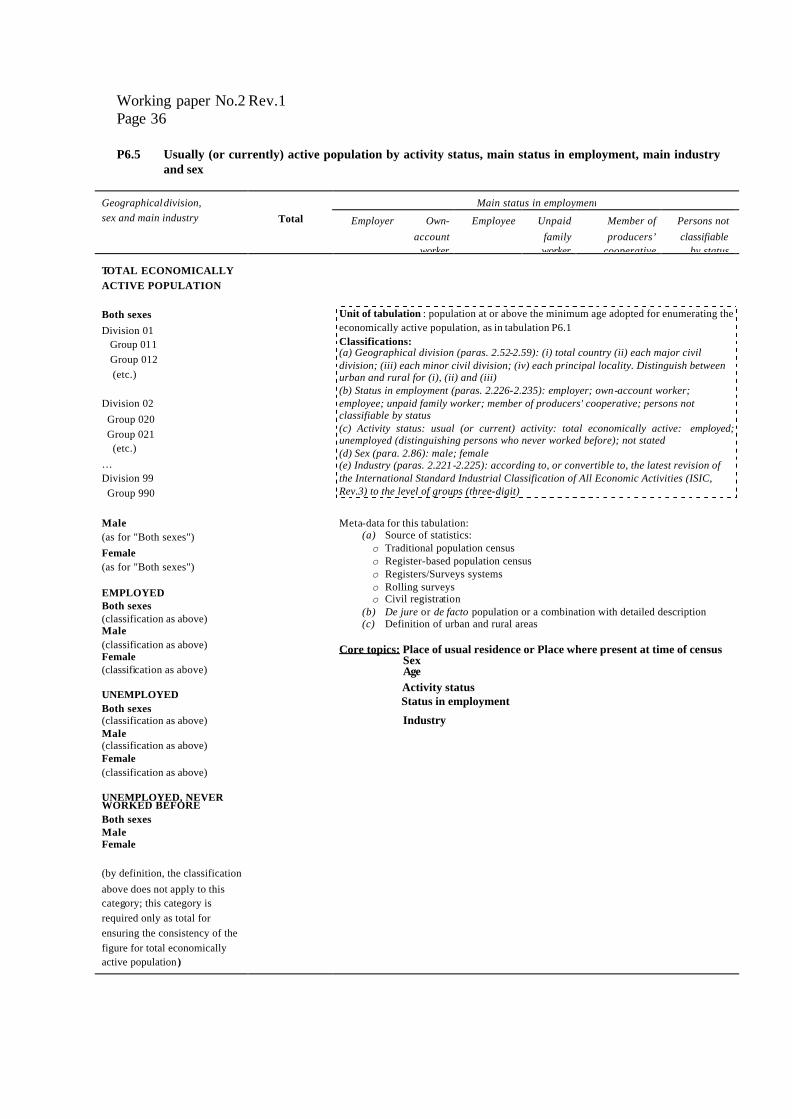
Working paper No.2 Rev.1 Page 36
P6.5 Usually (or currently) active population by activity status, main status in employment, main industry and sex
Main status in employment
Geographical division, sex and main industry
Total
Employer
Own-
account worker
Employee
Unpaid
family worker
Member of producers’
cooperative
Persons not classifiable
by status TOTAL ECONOMICALLY ACTIVE POPULATION Both sexes Division 01 Group 011 Group 012 (etc.) Division 02 Group 020 Group 021 (etc.) … Division 99 Group 990 Male (as for "Both sexes") Female (as for "Both sexes") EMPLOYED Both sexes (classification as above) Male (classification as above) Female (classification as above) UNEMPLOYED Both sexes (classification as above) Male (classification as above) Female (classification as above) UNEMPLOYED, NEVER WORKED BEFORE Both sexes Male Female (by definition, the classification above does not apply to this category; this category is required only as total for ensuring the consistency of the figure for total economically active population)
Unit of tabulation : population at or above the minimum age adopted for enumerating the economically active population, as in tabulation P6.1 Classifications: (a) Geographical division (paras. 2.52-2.59): (i) total country (ii) each major civil division; (iii) each minor civil division; (iv) each principal locality. Distinguish between urban and rural for (i), (ii) and (iii) (b) Status in employment (paras. 2.226-2.235): employer; own-account worker; employee; unpaid family worker; member of producers' cooperative; persons not classifiable by status (c) Activity status: usual (or current) activity: total economically active: employed; unemployed (distinguishing persons who never worked before); not stated (d) Sex (para. 2.86): male; female (e) Industry (paras. 2.221-2.225): according to, or convertible to, the latest revision of the International Standard Industrial Classification of All Economic Activities (ISIC, Rev.3) to the level of groups (three-digit) Meta-data for this tabulation:
(a) Source of statistics: o Traditional population census o Register-based population census o Registers/Surveys systems o Rolling surveys o Civil registration
(b) De jure or de facto population or a combination with detailed description (c) Definition of urban and rural areas
Core topics: Place of usual residence or Place where present at time of census Sex Age Activity status Status in employment
Industry
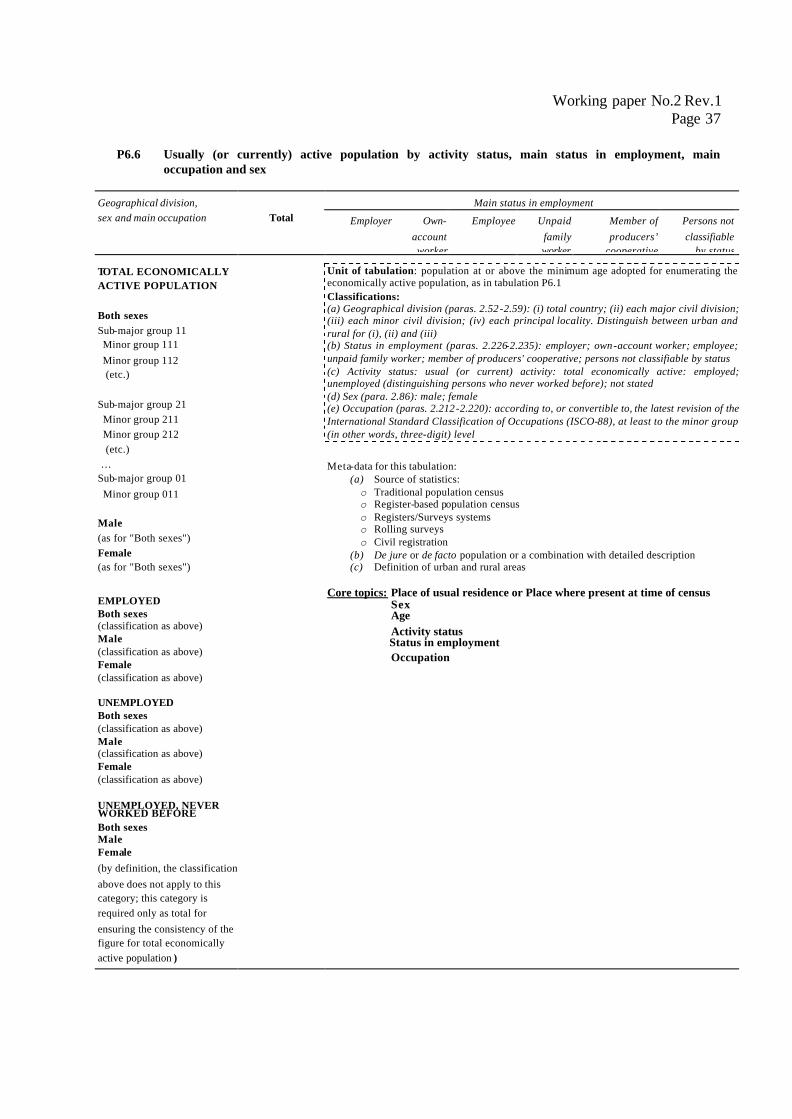
Working paper No.2 Rev.1 Page 37
P6.6 Usually (or currently) active population by activity status, main status in employment, main occupation and sex
Main status in employment Geographical division, sex and main occupation
Total
Employer
Own-
account worker
Employee
Unpaid
family worker
Member of producers’
cooperative
Persons not classifiable
by status TOTAL ECONOMICALLY ACTIVE POPULATION Both sexes Sub-major group 11 Minor group 111 Minor group 112 (etc.) Sub-major group 21 Minor group 211 Minor group 212 (etc.) … Sub-major group 01 Minor group 011 Male (as for "Both sexes") Female (as for "Both sexes")
EMPLOYED Both sexes (classification as above) Male (classification as above) Female (classification as above) UNEMPLOYED Both sexes (classification as above) Male (classification as above) Female (classification as above) UNEMPLOYED, NEVER WORKED BEFORE Both sexes Male Female (by definition, the classification above does not apply to this category; this category is required only as total for ensuring the consistency of the figure for total economically active population )
Unit of tabulation: population at or above the minimum age adopted for enumerating the economically active population, as in tabulation P6.1 Classifications: (a) Geographical division (paras. 2.52-2.59): (i) total country; (ii) each major civil division; (iii) each minor civil division; (iv) each principal locality. Distinguish between urban and rural for (i), (ii) and (iii) (b) Status in employment (paras. 2.226-2.235): employer; own-account worker; employee; unpaid family worker; member of producers' cooperative; persons not classifiable by status (c) Activity status: usual (or current) activity: total economically active: employed; unemployed (distinguishing persons who never worked before); not stated (d) Sex (para. 2.86): male; female (e) Occupation (paras. 2.212-2.220): according to, or convertible to, the latest revision of the International Standard Classification of Occupations (ISCO-88), at least to the minor group (in other words, three-digit) level Meta-data for this tabulation:
(a) Source of statistics: o Traditional population census o Register-based population census o Registers/Surveys systems o Rolling surveys o Civil registration
(b) De jure or de facto population or a combination with detailed description (c) Definition of urban and rural areas
Core topics: Place of usual residence or Place where present at time of census Sex Age Activity status Status in employment Occupation
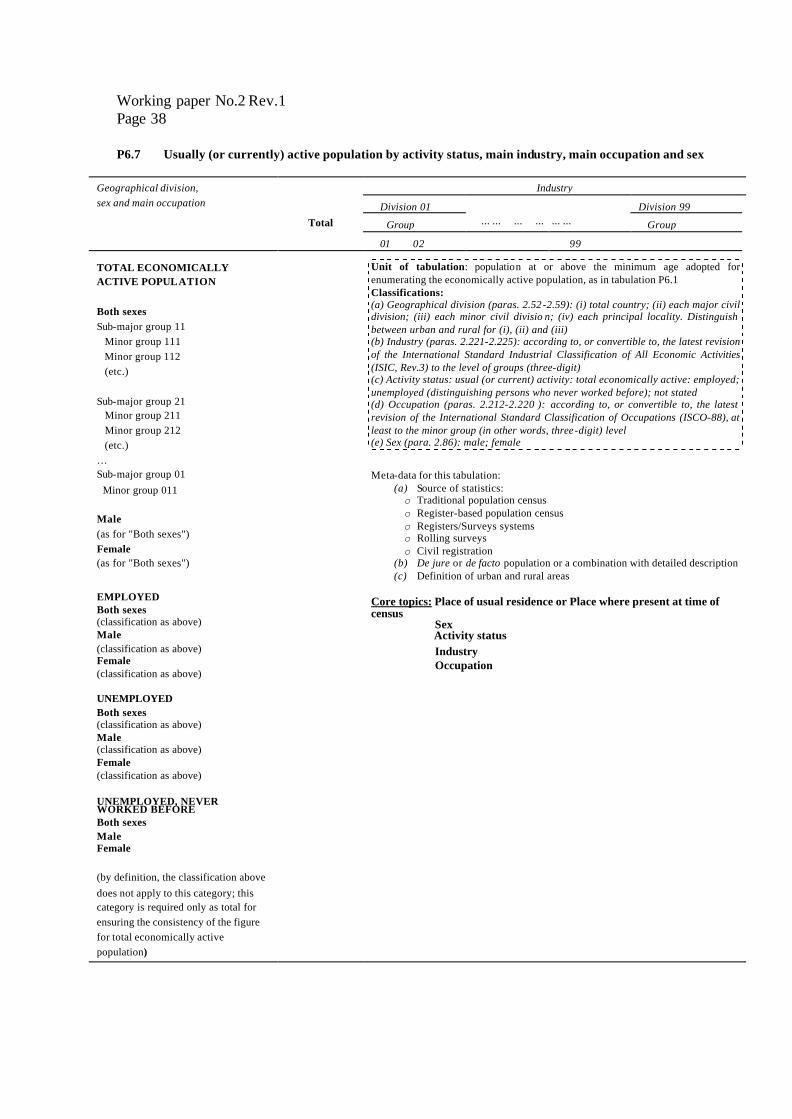
Working paper No.2 Rev.1 Page 38
P6.7 Usually (or currently) active population by activity status, main industry, main occupation and sex
Industry Division 01
Division 99
Group
... ... ... ... ... ...
Group
Geographical division, sex and main occupation
Total 01
02
99
TOTAL ECONOMICALLY ACTIVE POPULATION Both sexes Sub-major group 11 Minor group 111 Minor group 112 (etc.) Sub-major group 21 Minor group 211 Minor group 212 (etc.) … Sub-major group 01 Minor group 011 Male (as for "Both sexes") Female (as for "Both sexes")
EMPLOYED Both sexes (classification as above) Male (classification as above) Female (classification as above) UNEMPLOYED Both sexes (classification as above) Male (classification as above) Female (classification as above) UNEMPLOYED, NEVER WORKED BEFORE Both sexes Male Female (by definition, the classification above does not apply to this category; this category is required only as total for ensuring the consistency of the figure for total economically active population)
Unit of tabulation: population at or above the minimum age adopted for enumerating the economically active population, as in tabulation P6.1 Classifications: (a) Geographical division (paras. 2.52-2.59): (i) total country; (ii) each major civil division; (iii) each minor civil divisio n; (iv) each principal locality. Distinguish between urban and rural for (i), (ii) and (iii) (b) Industry (paras. 2.221-2.225): according to, or convertible to, the latest revision of the International Standard Industrial Classification of All Economic Activities (ISIC, Rev.3) to the level of groups (three-digit) (c) Activity status: usual (or current) activity: total economically active: employed; unemployed (distinguishing persons who never worked before); not stated (d) Occupation (paras. 2.212-2.220 ): according to, or convertible to, the latest revision of the International Standard Classification of Occupations (ISCO-88), at least to the minor group (in other words, three-digit) level (e) Sex (para. 2.86): male; female Meta-data for this tabulation:
(a) Source of statistics: o Traditional population census o Register-based population census o Registers/Surveys systems o Rolling surveys o Civil registration
(b) De jure or de facto population or a combination with detailed description (c) Definition of urban and rural areas
Core topics: Place of usual residence or Place where present at time of census Sex Activity status Industry Occupation
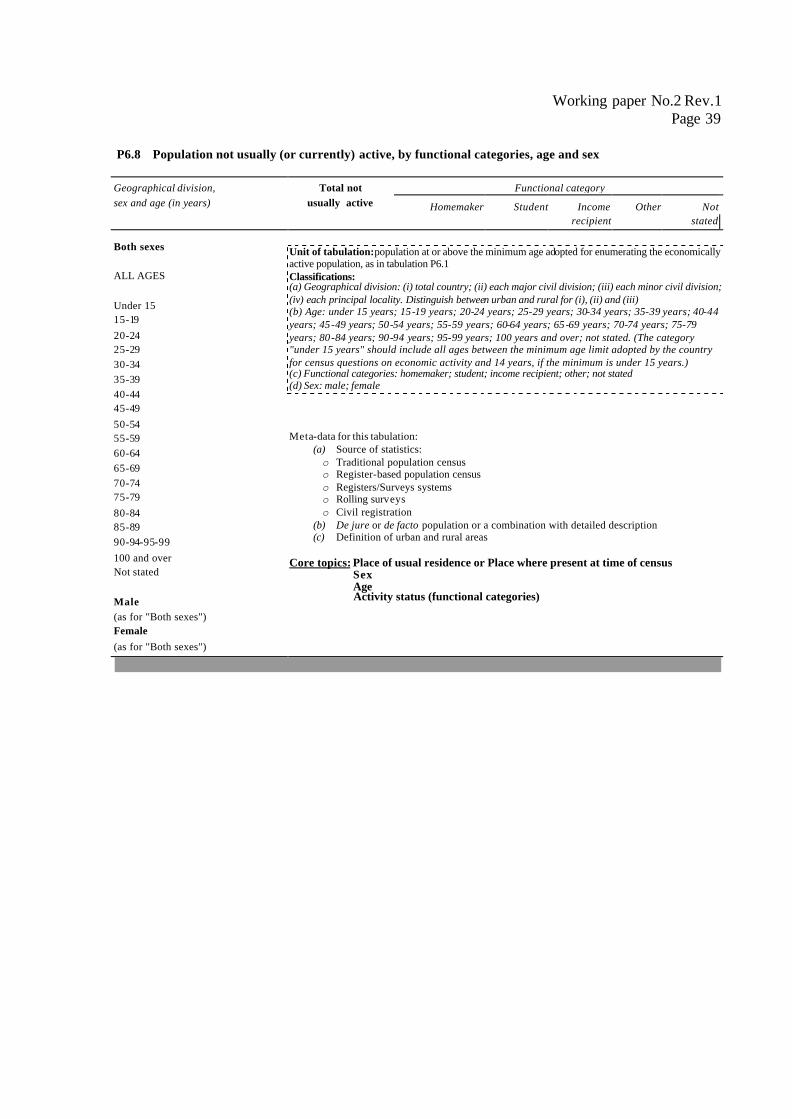
Working paper No.2 Rev.1 Page 39
P6.8 Population not usually (or currently) active, by functional categories, age and sex
Functional category Geographical division, sex and age (in years)
Total not
usually active
Homemaker
Student
Income recipient
Other
Not
stated Both sexes ALL AGES Under 15 15-19 20-24 25-29 30-34 35-39 40-44 45-49 50-54 55-59 60-64 65-69 70-74 75-79 80-84 85-89 90-94-95-99 100 and over Not stated Male (as for "Both sexes") Female (as for "Both sexes")
Unit of tabulation: population at or above the minimum age adopted for enumerating the economically active population, as in tabulation P6.1 Classifications: (a) Geographical division: (i) total country; (ii) each major civil division; (iii) each minor civil division; (iv) each principal locality. Distinguish between urban and rural for (i), (ii) and (iii) (b) Age: under 15 years; 15-19 years; 20-24 years; 25-29 years; 30-34 years; 35-39 years; 40-44 years; 45-49 years; 50-54 years; 55-59 years; 60-64 years; 65-69 years; 70-74 years; 75-79 years; 80-84 years; 90-94 years; 95-99 years; 100 years and over; not stated. (The category "under 15 years" should include all ages between the minimum age limit adopted by the country for census questions on economic activity and 14 years, if the minimum is under 15 years.) (c) Functional categories: homemaker; student; income recipient; other; not stated (d) Sex: male; female
Meta-data for this tabulation:
(a) Source of statistics: o Traditional population census o Register-based population census o Registers/Surveys systems o Rolling surveys o Civil registration
(b) De jure or de facto population or a combination with detailed description (c) Definition of urban and rural areas
Core topics: Place of usual residence or Place where present at time of census Sex Age Activity status (functional categories)
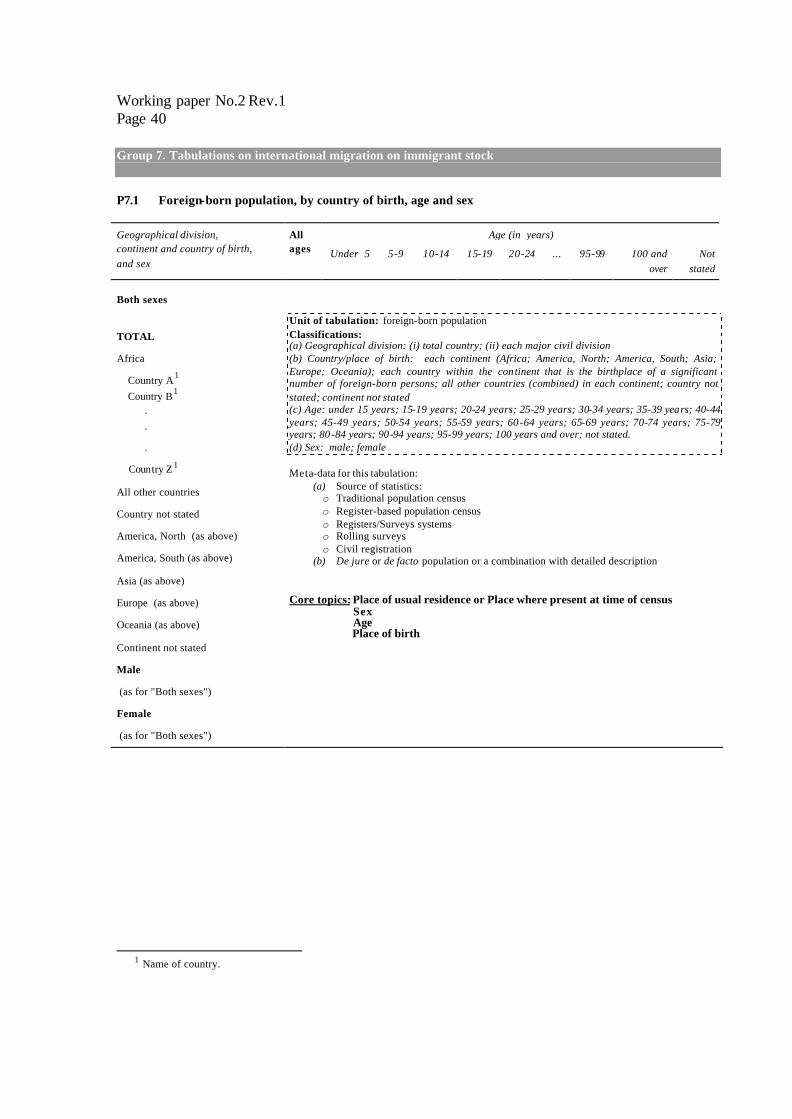
Working paper No.2 Rev.1 Page 40
Group 7. Tabulations on international migration on immigrant stock P7.1 Foreign-born population, by country of birth, age and sex
Age (in years) Geographical division, continent and country of birth, and sex
All ages
Under 5
5-9
10-14
15-19
20-24
...
95-99
100 and
over
Not
stated Both sexes
TOTAL
Africa
Country A1 Country B1 . .
.
Country Z1
All other countries
Country not stated
America, North (as above)
America, South (as above)
Asia (as above)
Europe (as above)
Oceania (as above)
Continent not stated
Male
(as for "Both sexes")
Female
(as for "Both sexes")
Unit of tabulation: foreign-born population Classifications: (a) Geographical division: (i) total country; (ii) each major civil division (b) Country/place of birth: each continent (Africa; America, North; America, South; Asia; Europe; Oceania); each country within the continent that is the birthplace of a significant number of foreign-born persons; all other countries (combined) in each continent; country not stated; continent not stated (c) Age: under 15 years; 15-19 years; 20-24 years; 25-29 years; 30-34 years; 35-39 years; 40-44 years; 45-49 years; 50-54 years; 55-59 years; 60-64 years; 65-69 years; 70-74 years; 75-79 years; 80-84 years; 90-94 years; 95-99 years; 100 years and over; not stated. (d) Sex: male; female Meta-data for this tabulation:
(a) Source of statistics: o Traditional population census o Register-based population census o Registers/Surveys systems o Rolling surveys o Civil registration
(b) De jure or de facto population or a combination with detailed description
Core topics: Place of usual residence or Place where present at time of census Sex Age Place of birth
1 Name of country.
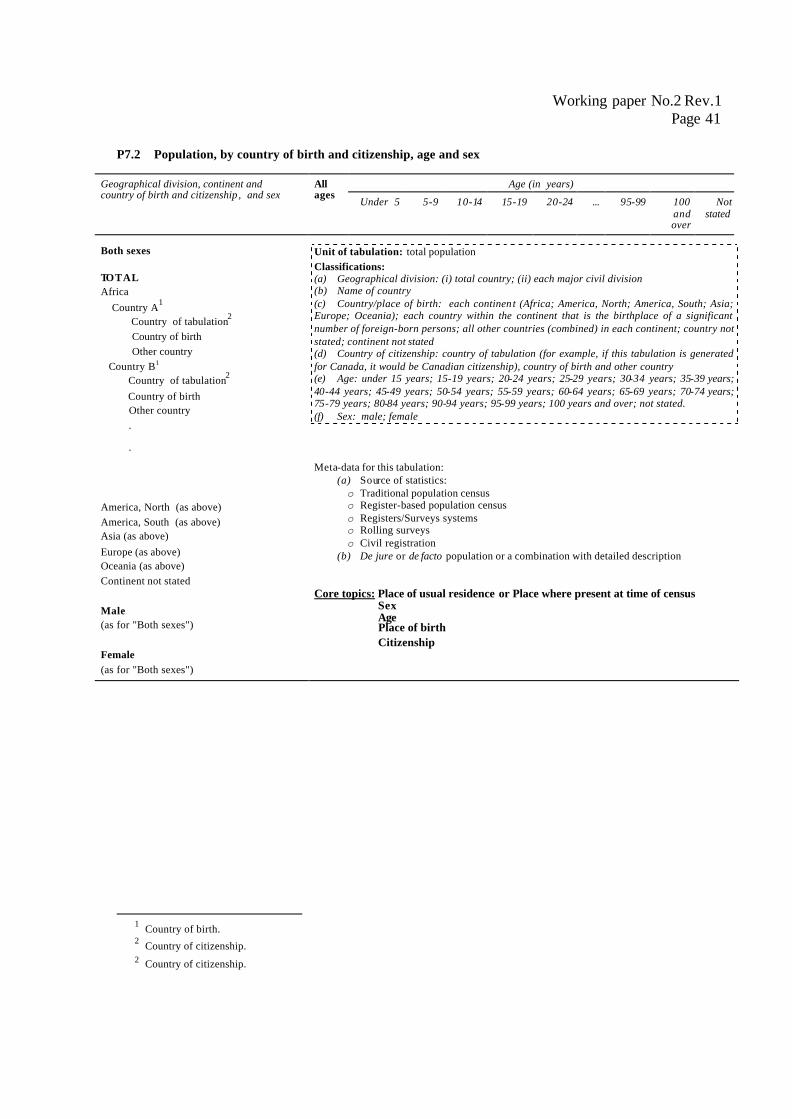
Working paper No.2 Rev.1 Page 41
P7.2 Population, by country of birth and citizenship, age and sex
Age (in years) Geographical division, continent and country of birth and citizenship , and sex
All ages
Under 5
5-9
10-14
15-19
20-24
...
95-99
100 and over
Not
stated
Both sexes TOTAL Africa Country A1 Country of tabulation2 Country of birth Other country Country B1 Country of tabulation2 Country of birth Other country .
. America, North (as above) America, South (as above) Asia (as above) Europe (as above) Oceania (as above) Continent not stated Male (as for "Both sexes") Female (as for "Both sexes")
Unit of tabulation: total population Classifications: (a) Geographical division: (i) total country; (ii) each major civil division (b) Name of country (c) Country/place of birth: each continen t (Africa; America, North; America, South; Asia; Europe; Oceania); each country within the continent that is the birthplace of a significant number of foreign-born persons; all other countries (combined) in each continent; country not stated; continent not stated (d) Country of citizenship: country of tabulation (for example, if this tabulation is generated for Canada, it would be Canadian citizenship), country of birth and other country (e) Age: under 15 years; 15-19 years; 20-24 years; 25-29 years; 30-34 years; 35-39 years; 40-44 years; 45-49 years; 50-54 years; 55-59 years; 60-64 years; 65-69 years; 70-74 years; 75-79 years; 80-84 years; 90-94 years; 95-99 years; 100 years and over; not stated. (f) Sex: male; female
Meta-data for this tabulation: (a) Source of statistics: o Traditional population census o Register-based population census o Registers/Surveys systems o Rolling surveys o Civil registration
(b) De jure or de facto population or a combination with detailed description
Core topics: Place of usual residence or Place where present at time of census Sex Age Place of birth Citizenship
1 Country of birth. 2 Country of citizenship. 2 Country of citizenship.
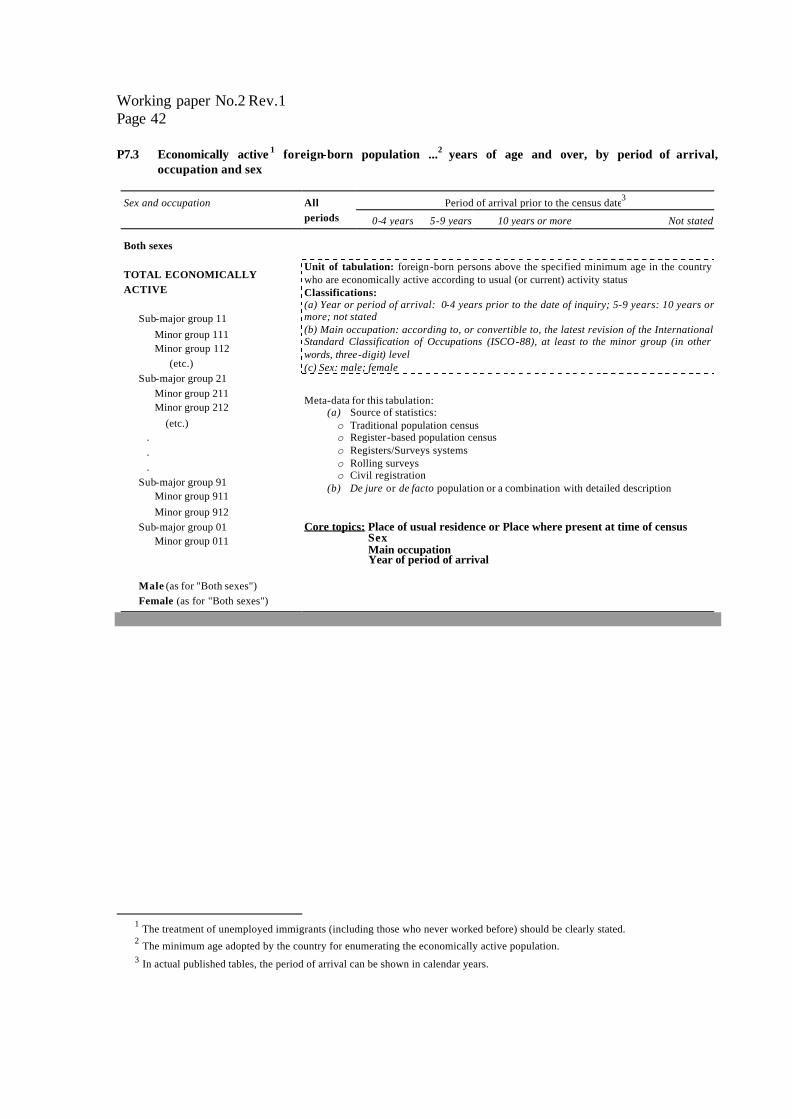
Working paper No.2 Rev.1 Page 42
P7.3 Economically active 1 foreign-born population ...2 years of age and over, by period of arrival, occupation and sex
Period of arrival prior to the census date3
Sex and occupation
All periods
0-4 years
5-9 years
10 years or more
Not stated
Both sexes TOTAL ECONOMICALLY ACTIVE
Sub-major group 11 Minor group 111 Minor group 112
(etc.) Sub-major group 21
Minor group 211 Minor group 212
(etc.) . . .
Sub-major group 91 Minor group 911 Minor group 912
Sub-major group 01 Minor group 011
Male (as for "Both sexes") Female (as for "Both sexes")
Unit of tabulation: foreign-born persons above the specified minimum age in the country who are economically active according to usual (or current) activity status Classifications: (a) Year or period of arrival: 0-4 years prior to the date of inquiry; 5-9 years: 10 years or more; not stated (b) Main occupation: according to, or convertible to, the latest revision of the International Standard Classification of Occupations (ISCO-88), at least to the minor group (in other words, three-digit) level (c) Sex: male; female Meta-data for this tabulation:
(a) Source of statistics: o Traditional population census o Register-based population census o Registers/Surveys systems o Rolling surveys o Civil registration
(b) De jure or de facto population or a combination with detailed description
Core topics: Place of usual residence or Place where present at time of census Sex Main occupation Year of period of arrival
1 The treatment of unemployed immigrants (including those who never worked before) should be clearly stated. 2 The minimum age adopted by the country for enumerating the economically active population. 3 In actual published tables, the period of arrival can be shown in calendar years.
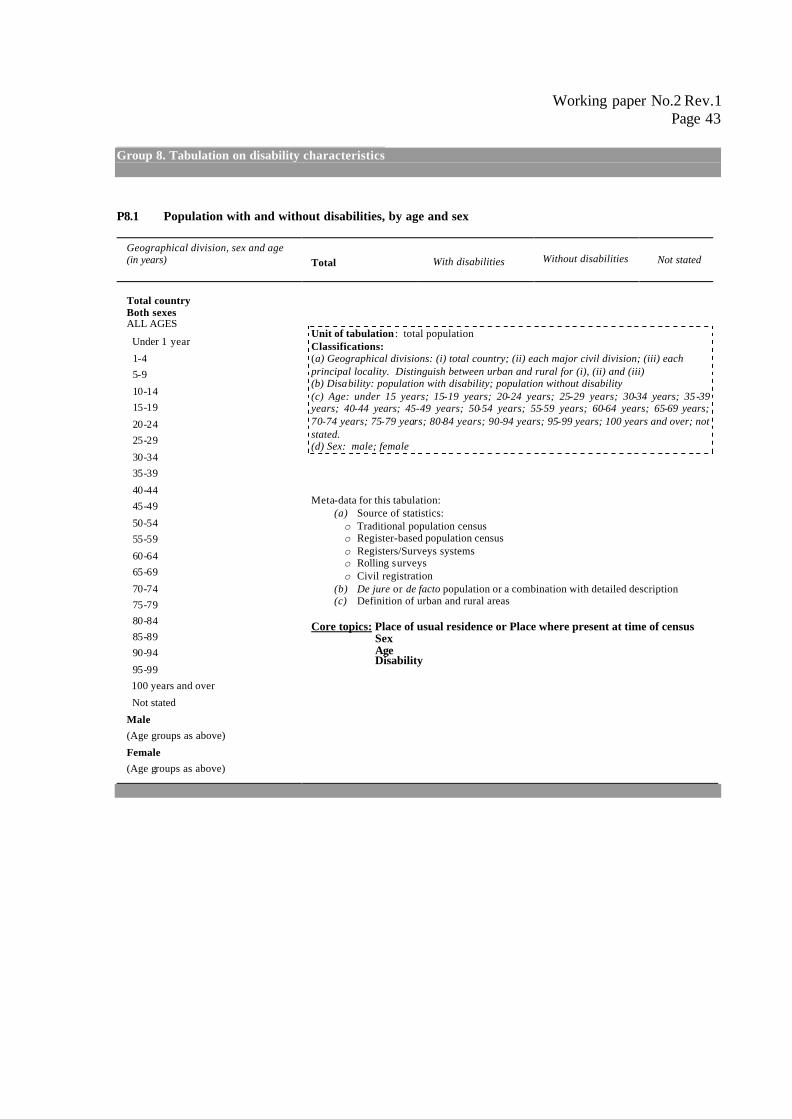
Working paper No.2 Rev.1 Page 43
Group 8. Tabulation on disability characteristics P8.1 Population with and without disabilities, by age and sex
Geographical division, sex and age (in years)
Total
With disabilities
Without disabilities
Not stated
Total country Both sexes ALL AGES
Under 1 year
1-4 5-9
10-14 15-19
20-24 25-29
30-34 35-39
40-44 45-49
50-54 55-59
60-64 65-69
70-74 75-79 80-84 85-89 90-94
95-99 100 years and over
Not stated
Male (Age groups as above)
Female (Age groups as above)
Unit of tabulation : total population Classifications: (a) Geographical divisions: (i) total country; (ii) each major civil division; (iii) each principal locality. Distinguish between urban and rural for (i), (ii) and (iii) (b) Disability: population with disability; population without disability (c) Age: under 15 years; 15-19 years; 20-24 years; 25-29 years; 30-34 years; 35-39 years; 40-44 years; 45-49 years; 50-54 years; 55-59 years; 60-64 years; 65-69 years; 70-74 years; 75-79 years; 80-84 years; 90-94 years; 95-99 years; 100 years and over; not stated. (d) Sex: male; female
Meta-data for this tabulation: (a) Source of statistics: o Traditional population census o Register-based population census o Registers/Surveys systems o Rolling surveys o Civil registration
(b) De jure or de facto population or a combination with detailed description (c) Definition of urban and rural areas
Core topics: Place of usual residence or Place where present at time of census Sex Age Disability
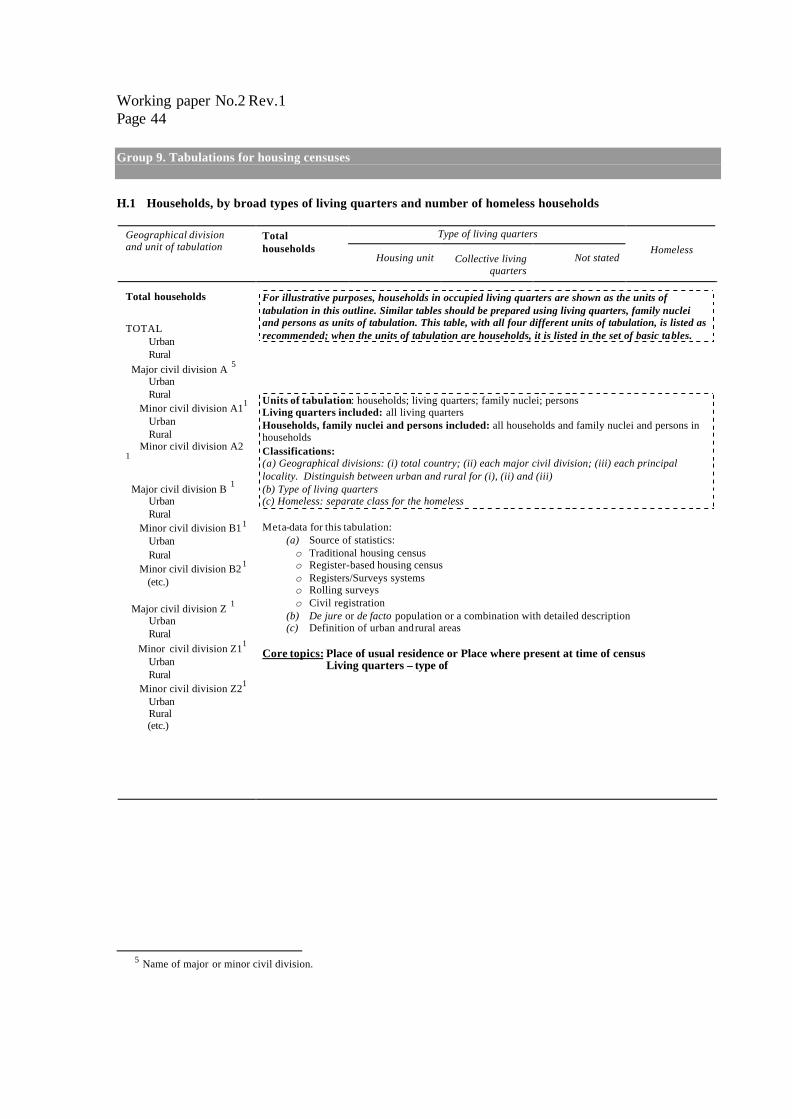
Working paper No.2 Rev.1 Page 44
Group 9. Tabulations for housing censuses H.1 Households, by broad types of living quarters and number of homeless households
Type of living quarters
Geographical division and unit of tabulation
Total households
Housing unit
Collective living
quarters
Not stated
Homeless
Total households TOTAL Urban Rural Major civil division A 5 Urban Rural Minor civil division A11 Urban Rural Minor civil division A2 1 Major civil division B 1 Urban Rural Minor civil division B11 Urban Rural Minor civil division B21 (etc.) Major civil division Z 1 Urban Rural Minor civil division Z11 Urban Rural Minor civil division Z21 Urban Rural (etc.)
For illustrative purposes, households in occupied living quarters are shown as the units of tabulation in this outline. Similar tables should be prepared using living quarters, family nuclei and persons as units of tabulation. This table, with all four different units of tabulation, is listed as recommended; when the units of tabulation are households, it is listed in the set of basic tables. Units of tabulation: households; living quarters; family nuclei; persons Living quarters included: all living quarters Households, family nuclei and persons included: all households and family nuclei and persons in households Classifications: (a) Geographical divisions: (i) total country; (ii) each major civil division; (iii) each principal locality. Distinguish between urban and rural for (i), (ii) and (iii) (b) Type of living quarters (c) Homeless: separate class for the homeless Meta-data for this tabulation:
(a) Source of statistics: o Traditional housing census o Register-based housing census o Registers/Surveys systems o Rolling surveys o Civil registration
(b) De jure or de facto population or a combination with detailed description (c) Definition of urban and rural areas
Core topics: Place of usual residence or Place where present at time of census Living quarters – type of
5 Name of major or minor civil division.
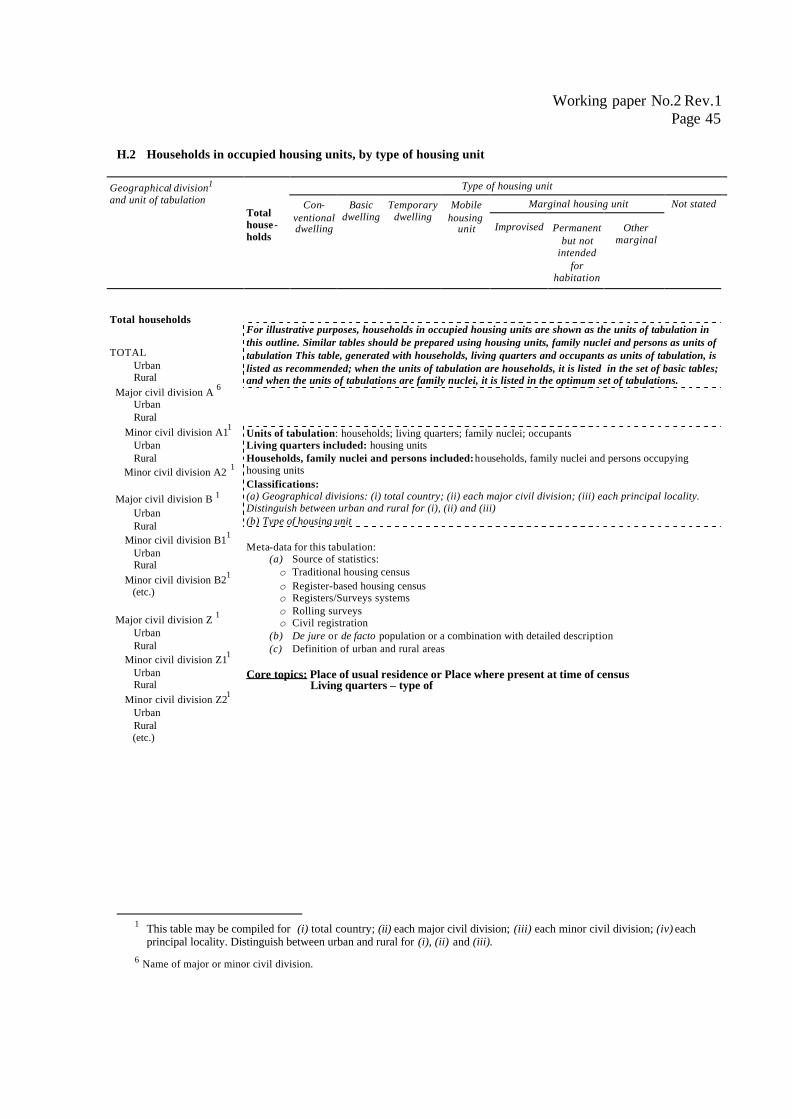
Working paper No.2 Rev.1 Page 45
H.2 Households in occupied housing units, by type of housing unit
Type of housing unit
Marginal housing unit
Not stated
Geographical division1 and unit of tabulation
Total house-holds
Con-
ventional dwelling
Basic
dwelling
Temporary
dwelling
Mobile
housing unit
Improvised
Permanent
but not intended
for habitation
Other
marginal
Total households
TOTAL Urban Rural Major civil division A 6 Urban Rural Minor civil division A11 Urban Rural Minor civil division A2 1 Major civil division B 1 Urban Rural Minor civil division B11 Urban Rural Minor civil division B21 (etc.) Major civil division Z 1 Urban Rural Minor civil division Z11 Urban Rural Minor civil division Z21 Urban Rural (etc.)
For illustrative purposes, households in occupied housing units are shown as the units of tabulation in this outline. Similar tables should be prepared using housing units, family nuclei and persons as units of tabulation This table, generated with households, living quarters and occupants as units of tabulation, is listed as recommended; when the units of tabulation are households, it is listed in the set of basic tables; and when the units of tabulations are family nuclei, it is listed in the optimum set of tabulations. Units of tabulation: households; living quarters; family nuclei; occupants Living quarters included: housing units Households, family nuclei and persons included: households, family nuclei and persons occupying housing units Classifications: (a) Geographical divisions: (i) total country; (ii) each major civil division; (iii) each principal locality. Distinguish between urban and rural for (i), (ii) and (iii) (b) Type of housing unit Meta-data for this tabulation:
(a) Source of statistics: o Traditional housing census o Register-based housing census o Registers/Surveys systems o Rolling surveys o Civil registration
(b) De jure or de facto population or a combination with detailed description (c) Definition of urban and rural areas
Core topics: Place of usual residence or Place where present at time of census Living quarters – type of
1 This table may be compiled for (i) total country; (ii) each major civil division; (iii) each minor civil division; (iv) each
principal locality. Distinguish between urban and rural for (i), (ii) and (iii). 6 Name of major or minor civil division.
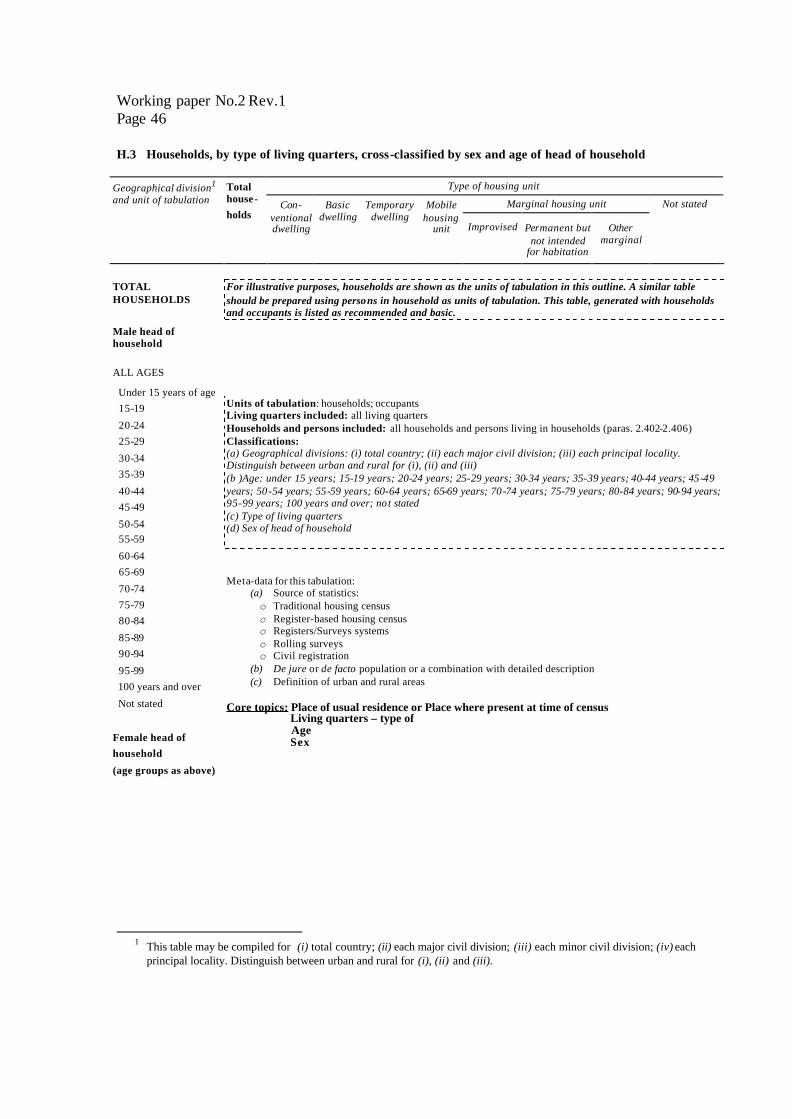
Working paper No.2 Rev.1 Page 46
H.3 Households, by type of living quarters, cross-classified by sex and age of head of household
Type of housing unit
Marginal housing unit
Not stated
Geographical division1 and unit of tabulation
Total house- holds
Con-
ventional dwelling
Basic
dwelling
Temporary
dwelling
Mobile
housing unit
Improvised
Permanent but
not intended for habitation
Other
marginal
TOTAL HOUSEHOLDS Male head of household ALL AGES
Under 15 years of age 15-19
20-24 25-29
30-34 35-39
40-44 45-49
50-54 55-59
60-64 65-69
70-74 75-79 80-84
85-89 90-94
95-99 100 years and over
Not stated
Female head of household
(age groups as above)
For illustrative purposes, households are shown as the units of tabulation in this outline. A similar table should be prepared using persons in household as units of tabulation. This table, generated with households and occupants is listed as recommended and basic. Units of tabulation: households; occupants Living quarters included: all living quarters Households and persons included: all households and persons living in households (paras. 2.402-2.406) Classifications: (a) Geographical divisions: (i) total country; (ii) each major civil division; (iii) each principal locality. Distinguish between urban and rural for (i), (ii) and (iii) (b )Age: under 15 years; 15-19 years; 20-24 years; 25-29 years; 30-34 years; 35-39 years; 40-44 years; 45-49 years; 50-54 years; 55-59 years; 60-64 years; 65-69 years; 70-74 years; 75-79 years; 80-84 years; 90-94 years; 95-99 years; 100 years and over; not stated (c) Type of living quarters (d) Sex of head of household Meta-data for this tabulation:
(a) Source of statistics: o Traditional housing census o Register-based housing census o Registers/Surveys systems o Rolling surveys o Civil registration
(b) De jure or de facto population or a combination with detailed description (c) Definition of urban and rural areas
Core topics: Place of usual residence or Place where present at time of census Living quarters – type of Age Sex
1 This table may be compiled for (i) total country; (ii) each major civil division; (iii) each minor civil division; (iv) each
principal locality. Distinguish between urban and rural for (i), (ii) and (iii).
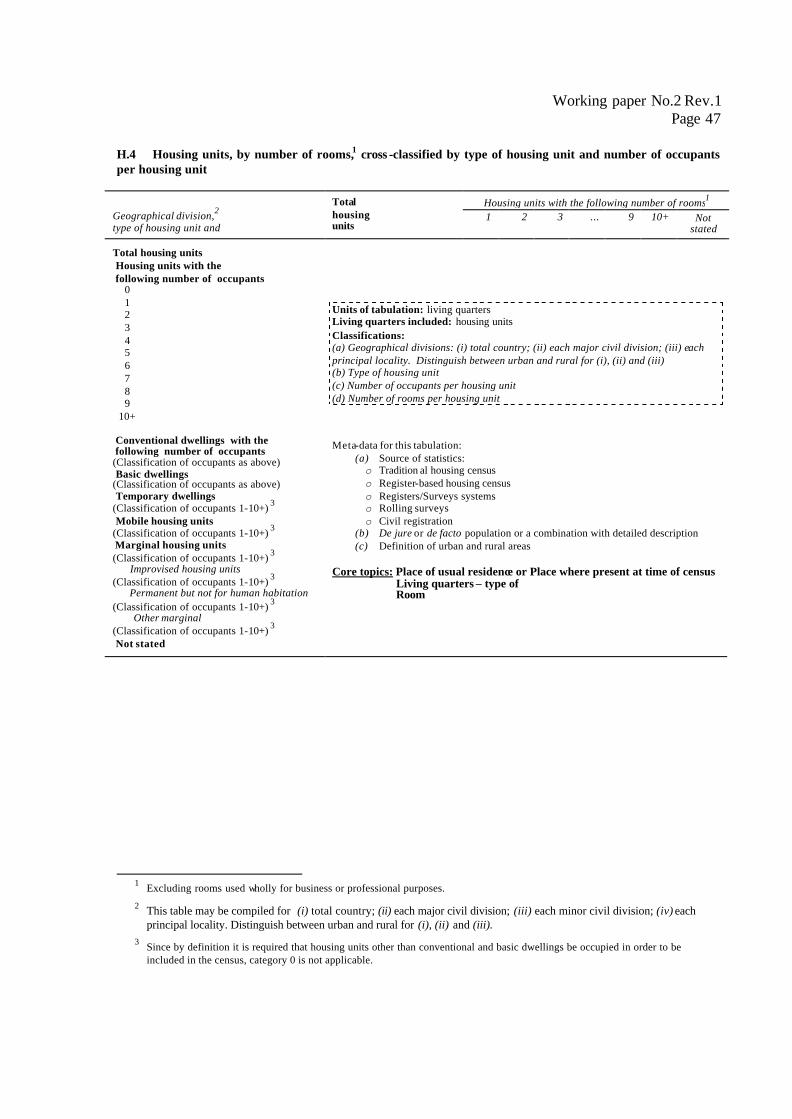
Working paper No.2 Rev.1 Page 47
H.4 Housing units, by number of rooms,1 cross -classified by type of housing unit and number of occupants per housing unit
Housing units with the following number of rooms1 Geographical division,2 type of housing unit and number of occupants
Total housing units
1
2
3
...
9
10+
Not
stated Total housing units Housing units with the following number of occupants 0 1 2 3 4 5 6 7 8 9 10+ Conventional dwellings with the following number of occupants (Classification of occupants as above) Basic dwellings (Classification of occupants as above) Temporary dwellings (Classification of occupants 1-10+) 3 Mobile housing units (Classification of occupants 1-10+) 3 Marginal housing units (Classification of occupants 1-10+) 3 Improvised housing units (Classification of occupants 1-10+) 3 Permanent but not for human habitation (Classification of occupants 1-10+) 3 Other marginal (Classification of occupants 1-10+) 3 Not stated
Units of tabulation: living quarters Living quarters included: housing units Classifications: (a) Geographical divisions: (i) total country; (ii) each major civil division; (iii) each principal locality. Distinguish between urban and rural for (i), (ii) and (iii) (b) Type of housing unit (c) Number of occupants per housing unit (d) Number of rooms per housing unit Meta-data for this tabulation:
(a) Source of statistics: o Tradition al housing census o Register-based housing census o Registers/Surveys systems o Rolling surveys o Civil registration
(b) De jure or de facto population or a combination with detailed description (c) Definition of urban and rural areas
Core topics: Place of usual residence or Place where present at time of census Living quarters – type of Room
1 Excluding rooms used wholly for business or professional purposes.
2 This table may be compiled for (i) total country; (ii) each major civil division; (iii) each minor civil division; (iv) each principal locality. Distinguish between urban and rural for (i), (ii) and (iii).
3 Since by definition it is required that housing units other than conventional and basic dwellings be occupied in order to be included in the census, category 0 is not applicable.
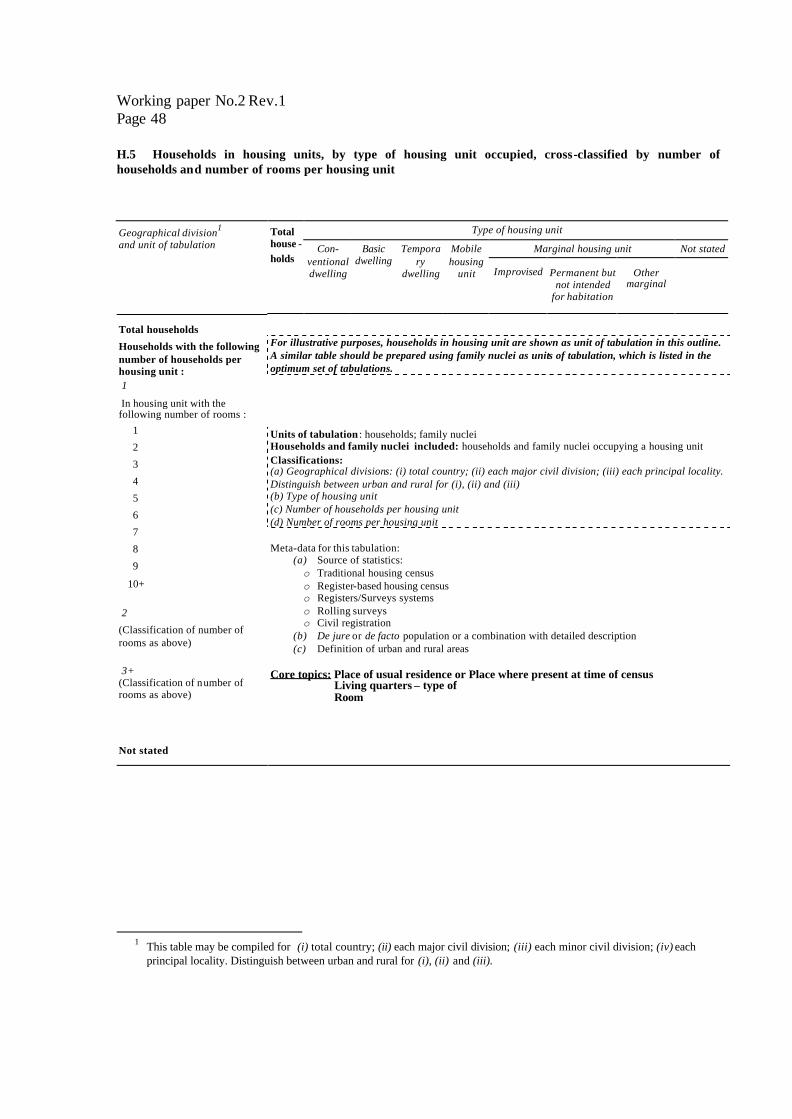
Working paper No.2 Rev.1 Page 48
H.5 Households in housing units, by type of housing unit occupied, cross-classified by number of households and number of rooms per housing unit
Total households Households with the following number of households per housing unit : 1 In housing unit with the following number of rooms : 1 2 3 4 5 6 7 8 9 10+ 2 (Classification of number of rooms as above) 3+ (Classification of number of rooms as above)
For illustrative purposes, households in housing unit are shown as unit of tabulation in this outline. A similar table should be prepared using family nuclei as units of tabulation, which is listed in the optimum set of tabulations. Units of tabulation : households; family nuclei Households and family nuclei included: households and family nuclei occupying a housing unit Classifications: (a) Geographical divisions: (i) total country; (ii) each major civil division; (iii) each principal locality. Distinguish between urban and rural for (i), (ii) and (iii) (b) Type of housing unit (c) Number of households per housing unit (d) Number of rooms per housing unit Meta-data for this tabulation:
(a) Source of statistics: o Traditional housing census o Register-based housing census o Registers/Surveys systems o Rolling surveys o Civil registration
(b) De jure or de facto population or a combination with detailed description (c) Definition of urban and rural areas
Core topics: Place of usual residence or Place where present at time of census Living quarters – type of Room
Not stated
1 This table may be compiled for (i) total country; (ii) each major civil division; (iii) each minor civil division; (iv) each
principal locality. Distinguish between urban and rural for (i), (ii) and (iii).
Type of housing unit
Marginal housing unit
Not stated
Geographical division1 and unit of tabulation
Total house - holds
Con-
ventional dwelling
Basic
dwelling
Tempora
ry dwelling
Mobile housing
unit
Improvised
Permanent but not intended
for habitation
Other
marginal
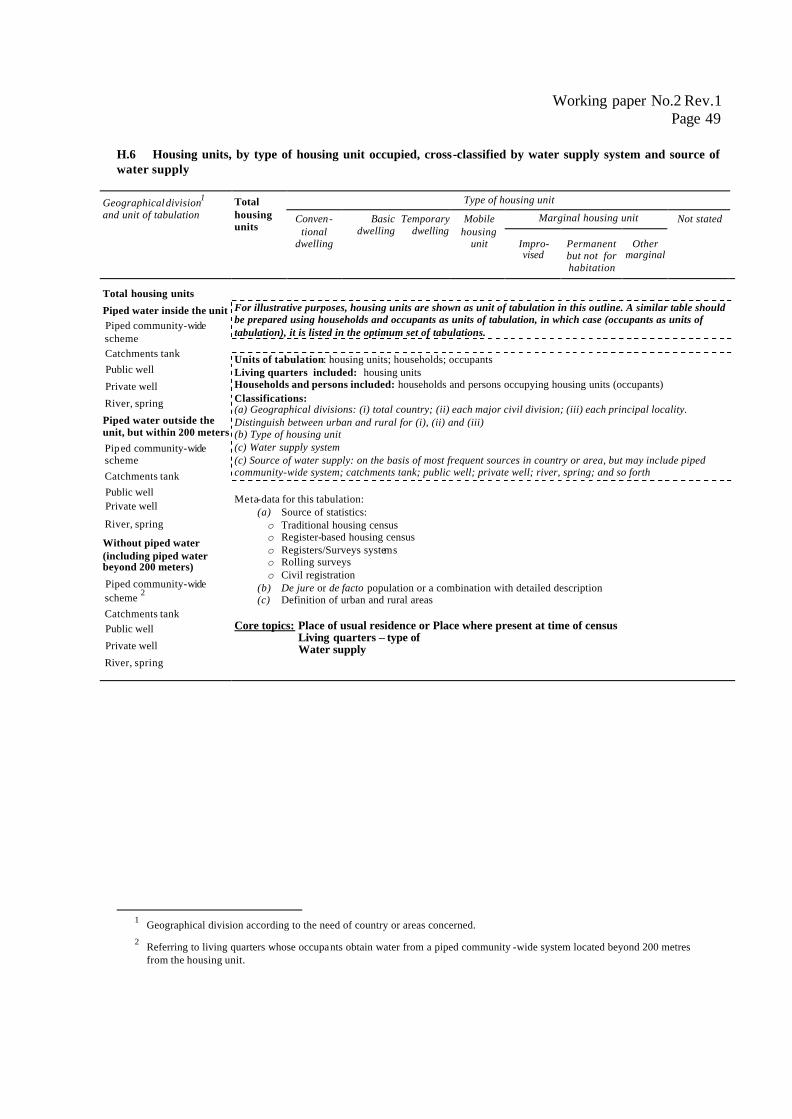
Working paper No.2 Rev.1 Page 49
H.6 Housing units, by type of housing unit occupied, cross-classified by water supply system and source of water supply
Type of housing unit
Marginal housing unit
Not stated stated
Geographical division1 and unit of tabulation
Total housing units
Conven-
tional dwelling
Basic
dwelling
Temporary
dwelling
Mobile
housing unit
Impro-vised
Permanent but not for habitation
Other
marginal
Total housing units Piped water inside the unit Piped community-wide scheme Catchments tank Public well Private well River, spring Piped water outside the unit, but within 200 meters Piped community-wide scheme Catchments tank Public well Private well River, spring Without piped water (including piped water beyond 200 meters) Piped community-wide scheme 2 Catchments tank Public well Private well River, spring
For illustrative purposes, housing units are shown as unit of tabulation in this outline. A similar table should be prepared using households and occupants as units of tabulation, in which case (occupants as units of tabulation), it is listed in the optimum set of tabulations. Units of tabulation: housing units; households; occupants Living quarters included: housing units Households and persons included: households and persons occupying housing units (occupants) Classifications: (a) Geographical divisions: (i) total country; (ii) each major civil division; (iii) each principal locality. Distinguish between urban and rural for (i), (ii) and (iii) (b) Type of housing unit (c) Water supply system (c) Source of water supply: on the basis of most frequent sources in country or area, but may include piped community-wide system; catchments tank; public well; private well; river, spring; and so forth
Meta-data for this tabulation:
(a) Source of statistics: o Traditional housing census o Register-based housing census o Registers/Surveys systems o Rolling surveys o Civil registration
(b) De jure or de facto population or a combination with detailed description (c) Definition of urban and rural areas
Core topics: Place of usual residence or Place where present at time of census Living quarters – type of Water supply
1 Geographical division according to the need of country or areas concerned. 2 Referring to living quarters whose occupants obtain water from a piped community -wide system located beyond 200 metres
from the housing unit.
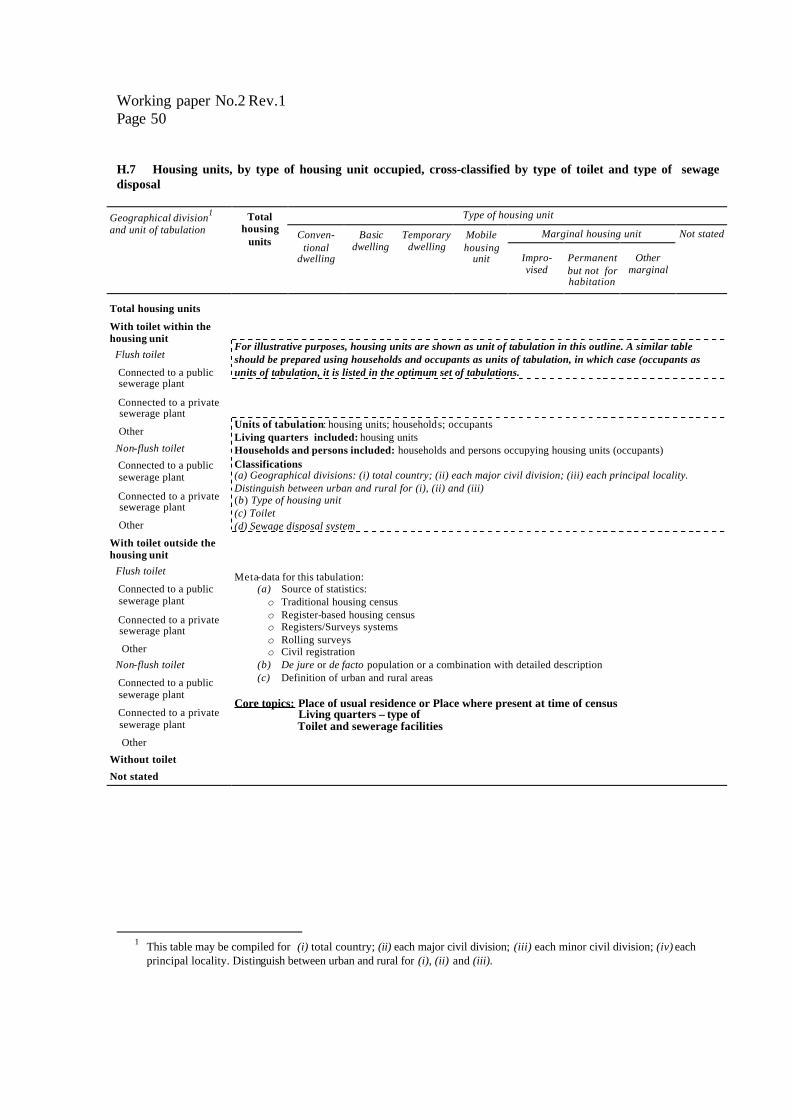
Working paper No.2 Rev.1 Page 50
H.7 Housing units, by type of housing unit occupied, cross-classified by type of toilet and type of sewage disposal
Type of housing unit
Marginal housing unit
Not stated
Geographical division1 and unit of tabulation
Total
housing units
Conven-
tional dwelling
Basic
dwelling
Temporary
dwelling
Mobile housing
unit
Impro-vised
Permanent but not for habitation
Other
marginal
Total housing units With toilet within the housing unit Flush toilet Connected to a public sewerage plant Connected to a private sewerage plant Other Non-flush toilet Connected to a public sewerage plant Connected to a private sewerage plant Other With toilet outside the housing unit Flush toilet Connected to a public sewerage plant Connected to a private sewerage plant Other Non-flush toilet Connected to a public sewerage plant Connected to a private sewerage plant Other Without toilet Not stated
For illustrative purposes, housing units are shown as unit of tabulation in this outline. A similar table should be prepared using households and occupants as units of tabulation, in which case (occupants as units of tabulation, it is listed in the optimum set of tabulations. Units of tabulation: housing units; households; occupants Living quarters included: housing units Households and persons included: households and persons occupying housing units (occupants) Classifications (a) Geographical divisions: (i) total country; (ii) each major civil division; (iii) each principal locality. Distinguish between urban and rural for (i), (ii) and (iii) (b) Type of housing unit (c) Toilet (d) Sewage disposal system Meta-data for this tabulation:
(a) Source of statistics: o Traditional housing census o Register-based housing census o Registers/Surveys systems o Rolling surveys o Civil registration
(b) De jure or de facto population or a combination with detailed description (c) Definition of urban and rural areas
Core topics: Place of usual residence or Place where present at time of census Living quarters – type of Toilet and sewerage facilities
1 This table may be compiled for (i) total country; (ii) each major civil division; (iii) each minor civil division; (iv) each
principal locality. Distinguish between urban and rural for (i), (ii) and (iii).
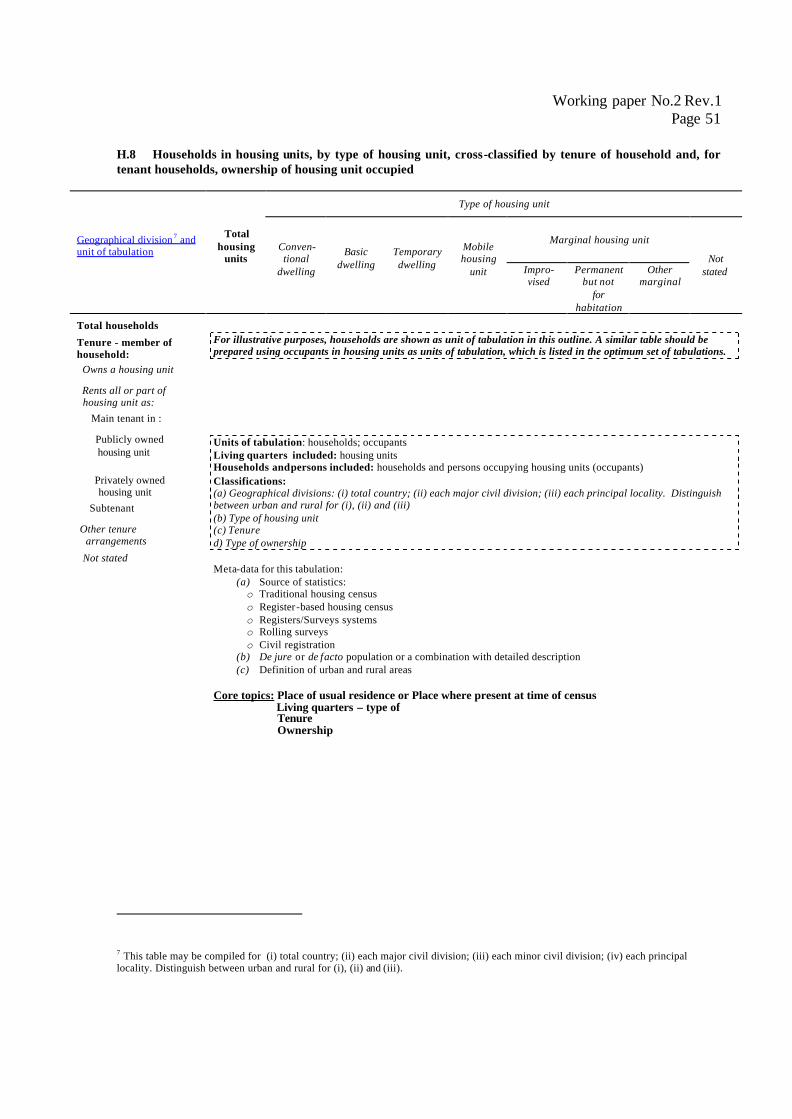
Working paper No.2 Rev.1 Page 51
H.8 Households in housing units, by type of housing unit, cross-classified by tenure of household and, for tenant households, ownership of housing unit occupied
Type of housing unit
Marginal housing unit Geographical division 7 and unit of tabulation
Total housing
units
Conven-tional
dwelling
Basic dwelling
Temporary dwelling
Mobile housing
unit
Impro-vised
Permanent but not
for habitation
Other marginal
Not stated
Total households Tenure - member of household: Owns a housing unit Rents all or part of housing unit as: Main tenant in : Publicly owned housing unit Privately owned housing unit Subtenant Other tenure arrangements Not stated
For illustrative purposes, households are shown as unit of tabulation in this outline. A similar table should be prepared using occupants in housing units as units of tabulation, which is listed in the optimum set of tabulations. Units of tabulation: households; occupants Living quarters included: housing units Households and persons included: households and persons occupying housing units (occupants) Classifications: (a) Geographical divisions: (i) total country; (ii) each major civil division; (iii) each principal locality. Distinguish between urban and rural for (i), (ii) and (iii) (b) Type of housing unit (c) Tenure d) Type of ownership Meta-data for this tabulation:
(a) Source of statistics: o Traditional housing census o Register-based housing census o Registers/Surveys systems o Rolling surveys o Civil registration
(b) De jure or de facto population or a combination with detailed description (c) Definition of urban and rural areas
Core topics: Place of usual residence or Place where present at time of census Living quarters – type of Tenure Ownership
7 This table may be compiled for (i) total country; (ii) each major civil division; (iii) each minor civil division; (iv) each principal locality. Distinguish between urban and rural for (i), (ii) and (iii).
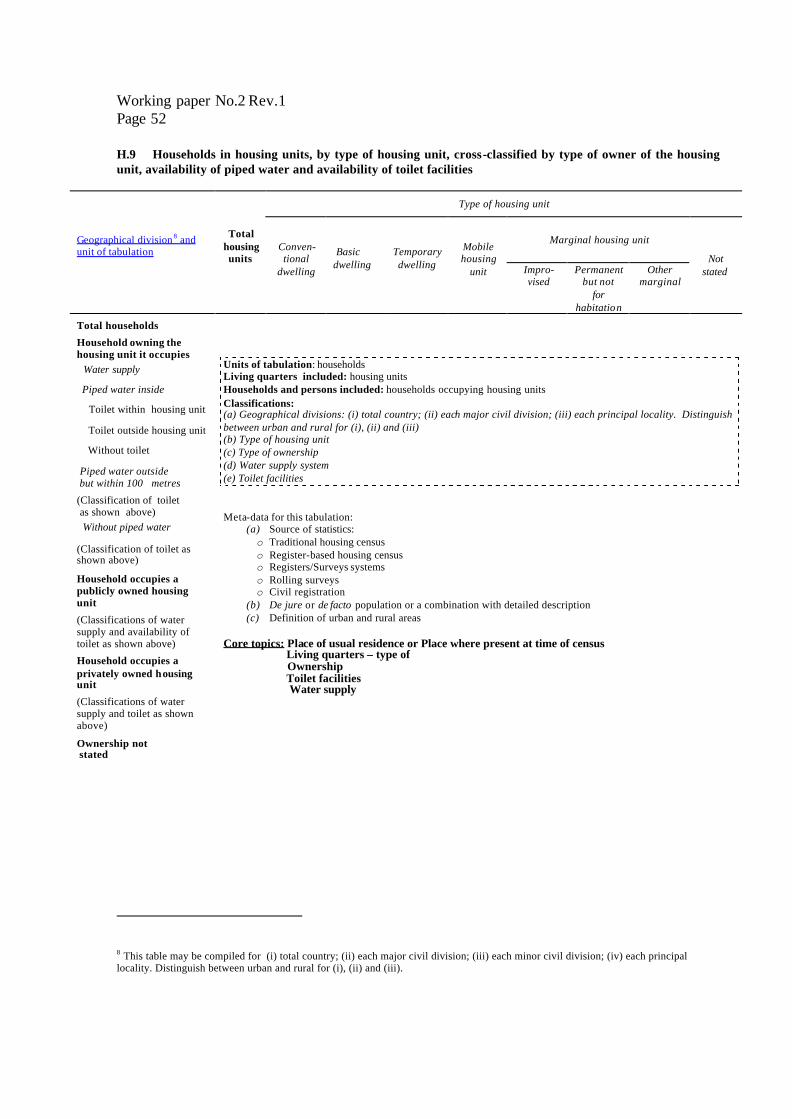
Working paper No.2 Rev.1 Page 52
H.9 Households in housing units, by type of housing unit, cross-classified by type of owner of the housing unit, availability of piped water and availability of toilet facilities
Type of housing unit
Marginal housing unit Geographical division 8 and unit of tabulation
Total housing units
Conven-tional
dwelling
Basic dwelling
Temporary dwelling
Mobile housing
unit
Impro-vised
Permanent but not
for habitation
Other marginal
Not stated
Total households Household owning the housing unit it occupies Water supply Piped water inside Toilet within housing unit Toilet outside housing unit Without toilet Piped water outside but within 100 metres (Classification of toilet as shown above) Without piped water (Classification of toilet as shown above) Household occupies a publicly owned housing unit (Classifications of water supply and availability of toilet as shown above) Household occupies a privately owned housing unit (Classifications of water supply and toilet as shown above) Ownership not stated
Units of tabulation: households Living quarters included: housing units Households and persons included: households occupying housing units Classifications: (a) Geographical divisions: (i) total country; (ii) each major civil division; (iii) each principal locality. Distinguish between urban and rural for (i), (ii) and (iii) (b) Type of housing unit (c) Type of ownership (d) Water supply system (e) Toilet facilities Meta-data for this tabulation:
(a) Source of statistics: o Traditional housing census o Register-based housing census o Registers/Surveys systems o Rolling surveys o Civil registration
(b) De jure or de facto population or a combination with detailed description (c) Definition of urban and rural areas
Core topics: Place of usual residence or Place where present at time of census Living quarters – type of Ownership Toilet facilities Water supply
8 This table may be compiled for (i) total country; (ii) each major civil division; (iii) each minor civil division; (iv) each principal locality. Distinguish between urban and rural for (i), (ii) and (iii).
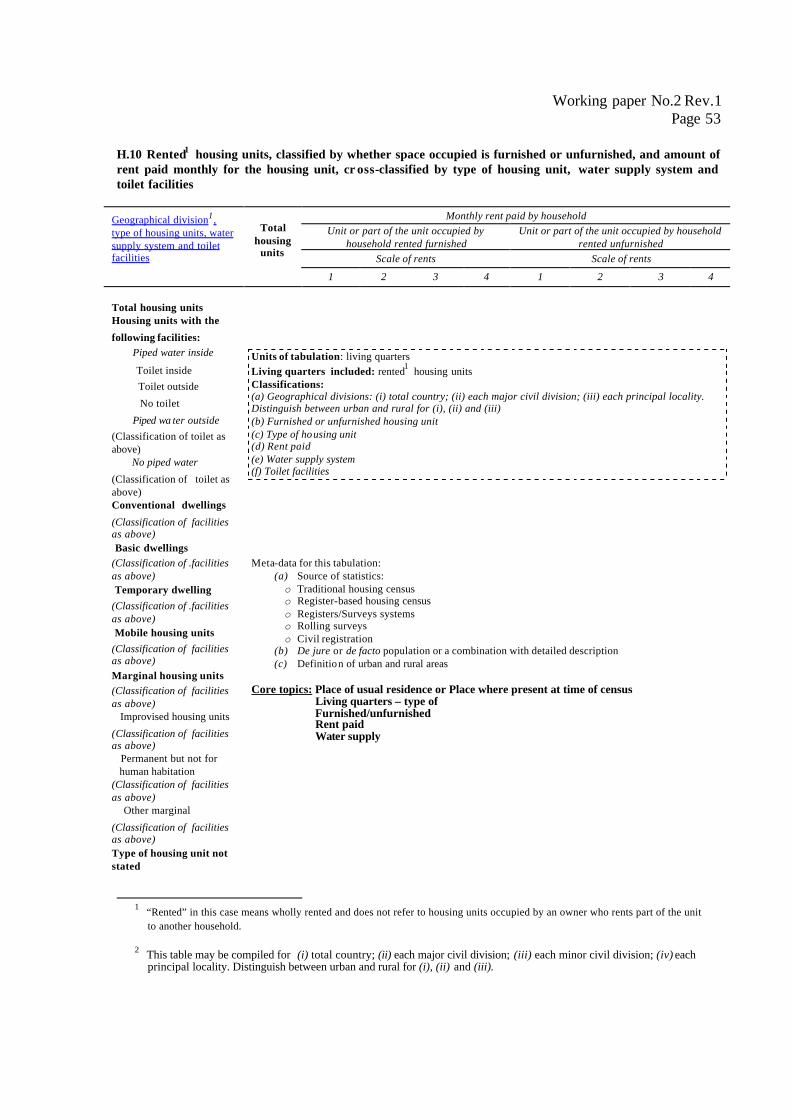
Working paper No.2 Rev.1 Page 53
H.10 Rented1 housing units, classified by whether space occupied is furnished or unfurnished, and amount of rent paid monthly for the housing unit, cr oss-classified by type of housing unit, water supply system and toilet facilities
Monthly rent paid by household Unit or part of the unit occupied by
household rented furnished Unit or part of the unit occupied by household
rented unfurnished Scale of rents Scale of rents
Geographical division1, type of housing units, water supply system and toilet facilities
Total housing
units
1 2 3 4 1 2 3 4 Total housing units Housing units with the following facilities: Piped water inside Toilet inside Toilet outside No toilet Piped wa ter outside (Classification of toilet as above) No piped water (Classification of toilet as above) Conventional dwellings (Classification of facilities as above) Basic dwellings
Units of tabulation: living quarters Living quarters included: rented1 housing units Classifications: (a) Geographical divisions: (i) total country; (ii) each major civil division; (iii) each principal locality. Distinguish between urban and rural for (i), (ii) and (iii) (b) Furnished or unfurnished housing unit (c) Type of housing unit (d) Rent paid (e) Water supply system (f) Toilet facilities
(Classification of .facilities as above) Temporary dwelling (Classification of .facilities as above) Mobile housing units (Classification of facilities as above) Marginal housing units (Classification of facilities as above) Improvised housing units (Classification of facilities as above) Permanent but not for human habitation (Classification of facilities as above) Other marginal (Classification of facilities as above) Type of housing unit not stated
Meta-data for this tabulation: (a) Source of statistics: o Traditional housing census o Register-based housing census o Registers/Surveys systems o Rolling surveys o Civil registration
(b) De jure or de facto population or a combination with detailed description (c) Definition of urban and rural areas
Core topics: Place of usual residence or Place where present at time of census Living quarters – type of Furnished/unfurnished Rent paid Water supply
1 “Rented” in this case means wholly rented and does not refer to housing units occupied by an owner who rents part of the unit
to another household.
2 This table may be compiled for (i) total country; (ii) each major civil division; (iii) each minor civil division; (iv) each principal locality. Distinguish between urban and rural for (i), (ii) and (iii).
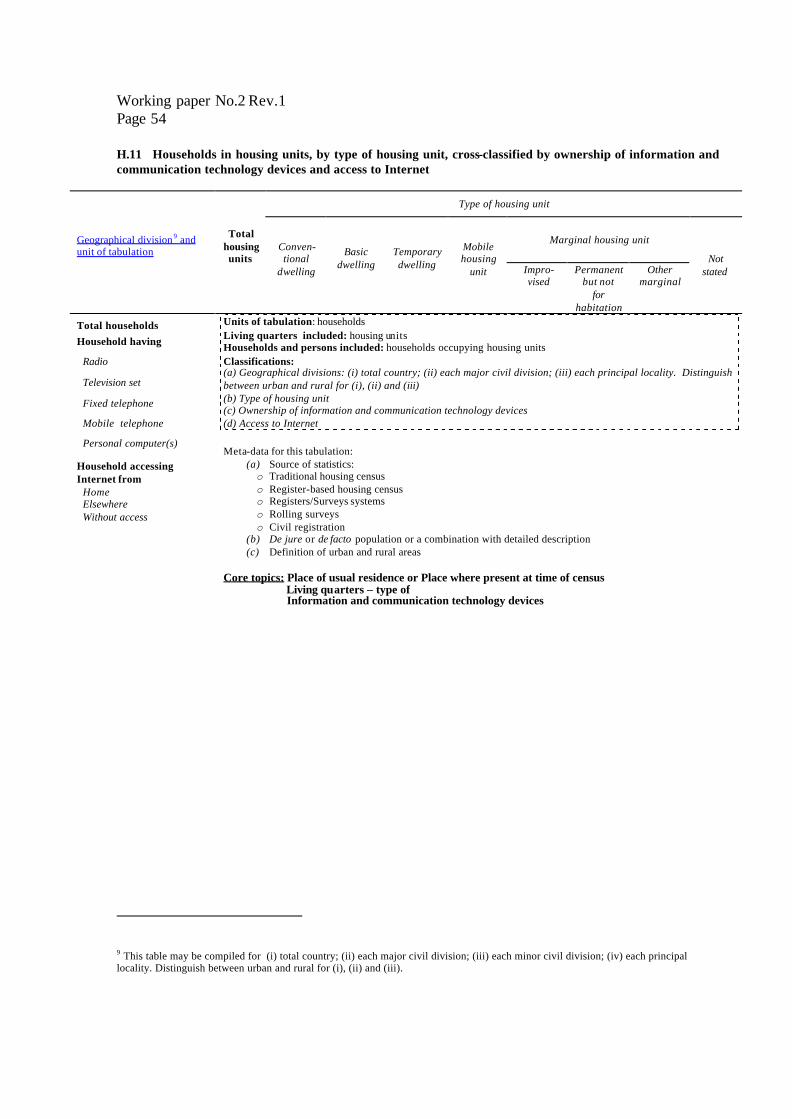
Working paper No.2 Rev.1 Page 54
H.11 Households in housing units, by type of housing unit, cross-classified by ownership of information and communication technology devices and access to Internet
Type of housing unit
Marginal housing unit Geographical division 9 and unit of tabulation
Total housing units
Conven-tional
dwelling
Basic dwelling
Temporary dwelling
Mobile housing
unit
Impro-vised
Permanent but not
for habitation
Other marginal
Not stated
Total households Household having Radio Television set Fixed telephone Mobile telephone Personal computer(s) Household accessing Internet from Home Elsewhere Without access
Units of tabulation: households Living quarters included: housing units Households and persons included: households occupying housing units Classifications: (a) Geographical divisions: (i) total country; (ii) each major civil division; (iii) each principal locality. Distinguish between urban and rural for (i), (ii) and (iii) (b) Type of housing unit (c) Ownership of information and communication technology devices (d) Access to Internet Meta-data for this tabulation:
(a) Source of statistics: o Traditional housing census o Register-based housing census o Registers/Surveys systems o Rolling surveys o Civil registration
(b) De jure or de facto population or a combination with detailed description (c) Definition of urban and rural areas
Core topics: Place of usual residence or Place where present at time of census Living quarters – type of Information and communication technology devices
9 This table may be compiled for (i) total country; (ii) each major civil division; (iii) each minor civil division; (iv) each principal locality. Distinguish between urban and rural for (i), (ii) and (iii).
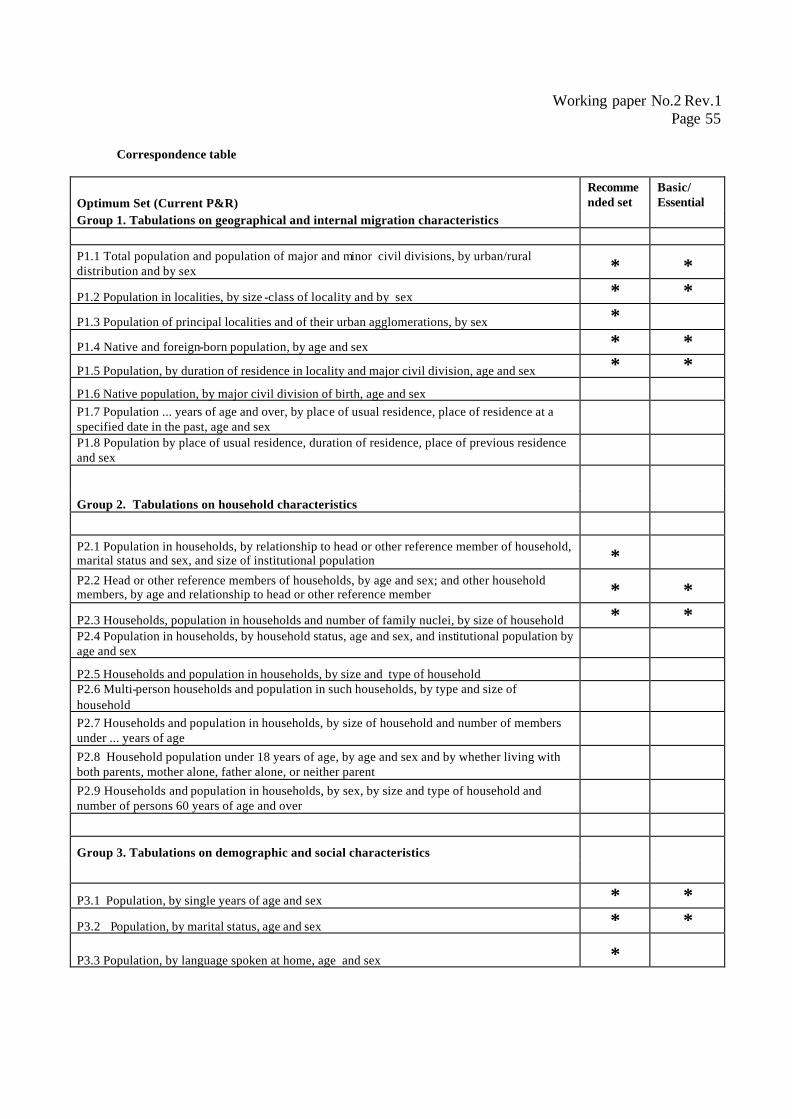
Working paper No.2 Rev.1 Page 55
Correspondence table
Optimum Set (Current P&R) Recommended set
Basic/ Essential
Group 1. Tabulations on geographical and internal migration characteristics P1.1 Total population and population of major and minor civil divisions, by urban/rural distribution and by sex * * P1.2 Population in localities, by size -class of locality and by sex * * P1.3 Population of principal localities and of their urban agglomerations, by sex * P1.4 Native and foreign-born population, by age and sex * * P1.5 Population, by duration of residence in locality and major civil division, age and sex * * P1.6 Native population, by major civil division of birth, age and sex P1.7 Population ... years of age and over, by place of usual residence, place of residence at a specified date in the past, age and sex P1.8 Population by place of usual residence, duration of residence, place of previous residence and sex Group 2. Tabulations on household characteristics P2.1 Population in households, by relationship to head or other reference member of household, marital status and sex, and size of institutional population * P2.2 Head or other reference members of households, by age and sex; and other household members, by age and relationship to head or other reference member * * P2.3 Households, population in households and number of family nuclei, by size of household * * P2.4 Population in households, by household status, age and sex, and institutional population by age and sex P2.5 Households and population in households, by size and type of household P2.6 Multi-person households and population in such households, by type and size of household P2.7 Households and population in households, by size of household and number of members under ... years of age P2.8 Household population under 18 years of age, by age and sex and by whether living with both parents, mother alone, father alone, or neither parent P2.9 Households and population in households, by sex, by size and type of household and number of persons 60 years of age and over Group 3. Tabulations on demographic and social characteristics P3.1 Population, by single years of age and sex * * P3.2 Population, by marital status, age and sex * *
P3.3 Population, by language spoken at home, age and sex *
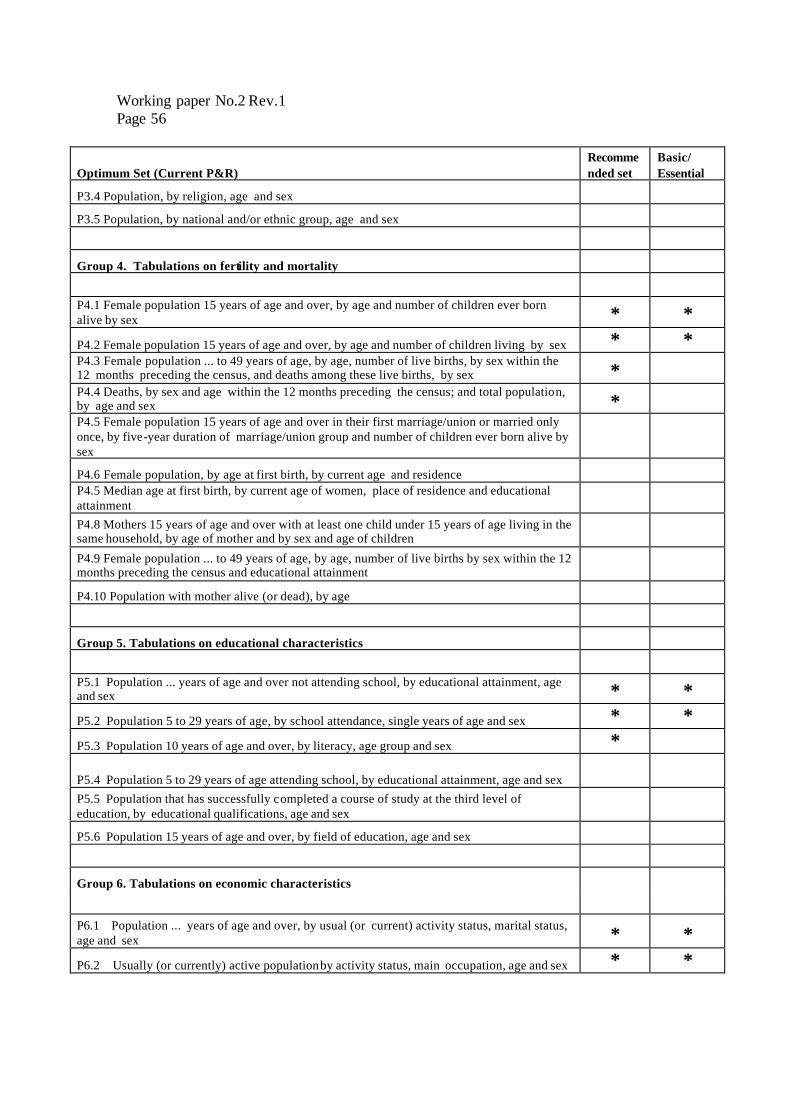
Working paper No.2 Rev.1 Page 56
Optimum Set (Current P&R) Recommended set
Basic/ Essential
P3.4 Population, by religion, age and sex P3.5 Population, by national and/or ethnic group, age and sex Group 4. Tabulations on fertility and mortality P4.1 Female population 15 years of age and over, by age and number of children ever born alive by sex * * P4.2 Female population 15 years of age and over, by age and number of children living by sex * * P4.3 Female population ... to 49 years of age, by age, number of live births, by sex within the 12 months preceding the census, and deaths among these live births, by sex * P4.4 Deaths, by sex and age within the 12 months preceding the census; and total population, by age and sex * P4.5 Female population 15 years of age and over in their first marriage/union or married only once, by five-year duration of marriage/union group and number of children ever born alive by sex P4.6 Female population, by age at first birth, by current age and residence P4.5 Median age at first birth, by current age of women, place of residence and educational attainment P4.8 Mothers 15 years of age and over with at least one child under 15 years of age living in the same household, by age of mother and by sex and age of children P4.9 Female population ... to 49 years of age, by age, number of live births by sex within the 12 months preceding the census and educational attainment P4.10 Population with mother alive (or dead), by age Group 5. Tabulations on educational characteristics P5.1 Population ... years of age and over not attending school, by educational attainment, age and sex * * P5.2 Population 5 to 29 years of age, by school attendance, single years of age and sex * * P5.3 Population 10 years of age and over, by literacy, age group and sex *
P5.4 Population 5 to 29 years of age attending school, by educational attainment, age and sex P5.5 Population that has successfully completed a course of study at the third level of education, by educational qualifications, age and sex P5.6 Population 15 years of age and over, by field of education, age and sex Group 6. Tabulations on economic characteristics P6.1 Population ... years of age and over, by usual (or current) activity status, marital status, age and sex * * P6.2 Usually (or currently) active population by activity status, main occupation, age and sex * *
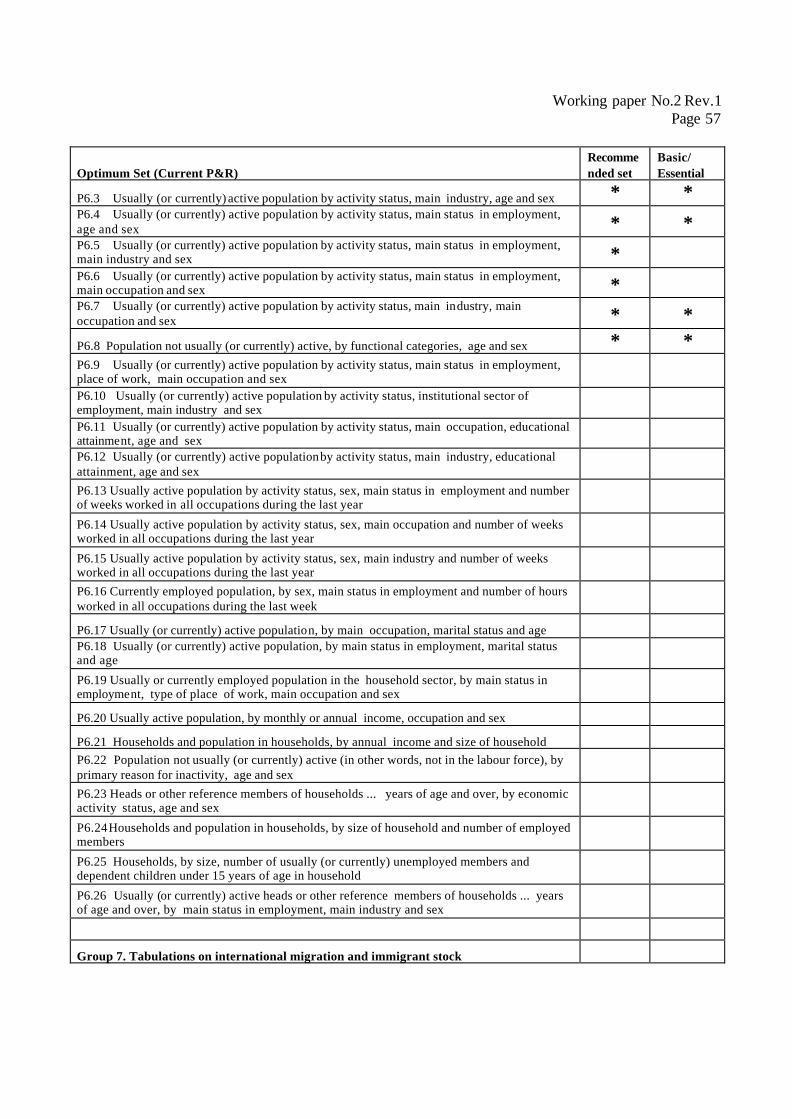
Working paper No.2 Rev.1 Page 57
Optimum Set (Current P&R) Recommended set
Basic/ Essential
P6.3 Usually (or currently) active population by activity status, main industry, age and sex * * P6.4 Usually (or currently) active population by activity status, main status in employment, age and sex * * P6.5 Usually (or currently) active population by activity status, main status in employment, main industry and sex * P6.6 Usually (or currently) active population by activity status, main status in employment, main occupation and sex * P6.7 Usually (or currently) active population by activity status, main industry, main occupation and sex * * P6.8 Population not usually (or currently) active, by functional categories, age and sex * * P6.9 Usually (or currently) active population by activity status, main status in employment, place of work, main occupation and sex P6.10 Usually (or currently) active population by activity status, institutional sector of employment, main industry and sex P6.11 Usually (or currently) active population by activity status, main occupation, educational attainment, age and sex P6.12 Usually (or currently) active population by activity status, main industry, educational attainment, age and sex P6.13 Usually active population by activity status, sex, main status in employment and number of weeks worked in all occupations during the last year P6.14 Usually active population by activity status, sex, main occupation and number of weeks worked in all occupations during the last year P6.15 Usually active population by activity status, sex, main industry and number of weeks worked in all occupations during the last year P6.16 Currently employed population, by sex, main status in employment and number of hours worked in all occupations during the last week P6.17 Usually (or currently) active population, by main occupation, marital status and age P6.18 Usually (or currently) active population, by main status in employment, marital status and age P6.19 Usually or currently employed population in the household sector, by main status in employment, type of place of work, main occupation and sex P6.20 Usually active population, by monthly or annual income, occupation and sex P6.21 Households and population in households, by annual income and size of household P6.22 Population not usually (or currently) active (in other words, not in the labour force), by primary reason for inactivity, age and sex P6.23 Heads or other reference members of households ... years of age and over, by economic activity status, age and sex P6.24 Households and population in households, by size of household and number of employed members P6.25 Households, by size, number of usually (or currently) unemployed members and dependent children under 15 years of age in household P6.26 Usually (or currently) active heads or other reference members of households ... years of age and over, by main status in employment, main industry and sex Group 7. Tabulations on international migration and immigrant stock
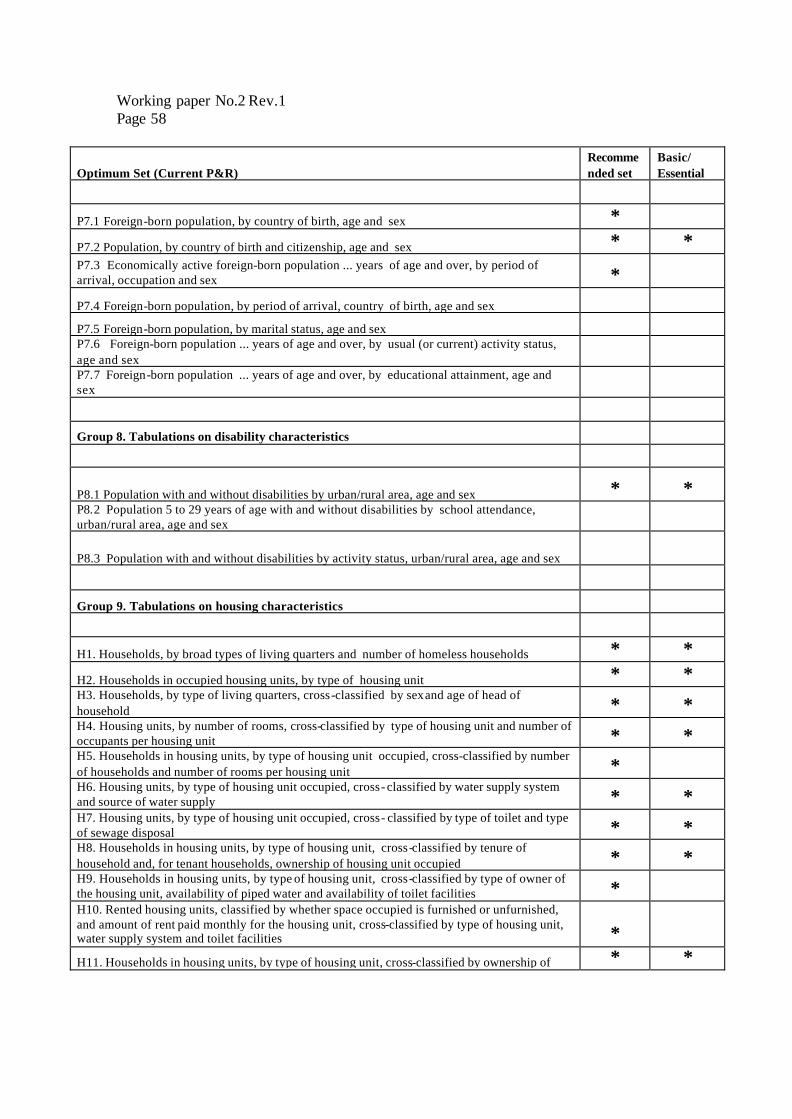
Working paper No.2 Rev.1 Page 58
Optimum Set (Current P&R) Recommended set
Basic/ Essential
P7.1 Foreign-born population, by country of birth, age and sex * P7.2 Population, by country of birth and citizenship, age and sex * * P7.3 Economically active foreign-born population ... years of age and over, by period of arrival, occupation and sex * P7.4 Foreign-born population, by period of arrival, country of birth, age and sex P7.5 Foreign-born population, by marital status, age and sex P7.6 Foreign-born population ... years of age and over, by usual (or current) activity status, age and sex P7.7 Foreign-born population ... years of age and over, by educational attainment, age and sex Group 8. Tabulations on disability characteristics
P8.1 Population with and without disabilities by urban/rural area, age and sex * * P8.2 Population 5 to 29 years of age with and without disabilities by school attendance, urban/rural area, age and sex
P8.3 Population with and without disabilities by activity status, urban/rural area, age and sex Group 9. Tabulations on housing characteristics H1. Households, by broad types of living quarters and number of homeless households * * H2. Households in occupied housing units, by type of housing unit * * H3. Households, by type of living quarters, cross-classified by sex and age of head of household * * H4. Housing units, by number of rooms, cross-classified by type of housing unit and number of occupants per housing unit * * H5. Households in housing units, by type of housing unit occupied, cross-classified by number of households and number of rooms per housing unit * H6. Housing units, by type of housing unit occupied, cross- classified by water supply system and source of water supply * * H7. Housing units, by type of housing unit occupied, cross- classified by type of toilet and type of sewage disposal * * H8. Households in housing units, by type of housing unit, cross-classified by tenure of household and, for tenant households, ownership of housing unit occupied * * H9. Households in housing units, by type of housing unit, cross-classified by type of owner of the housing unit, availability of piped water and availability of toilet facilities * H10. Rented housing units, classified by whether space occupied is furnished or unfurnished, and amount of rent paid monthly for the housing unit, cross-classified by type of housing unit, water supply system and toilet facilities * H11. Households in housing units, by type of housing unit, cross-classified by ownership of * *
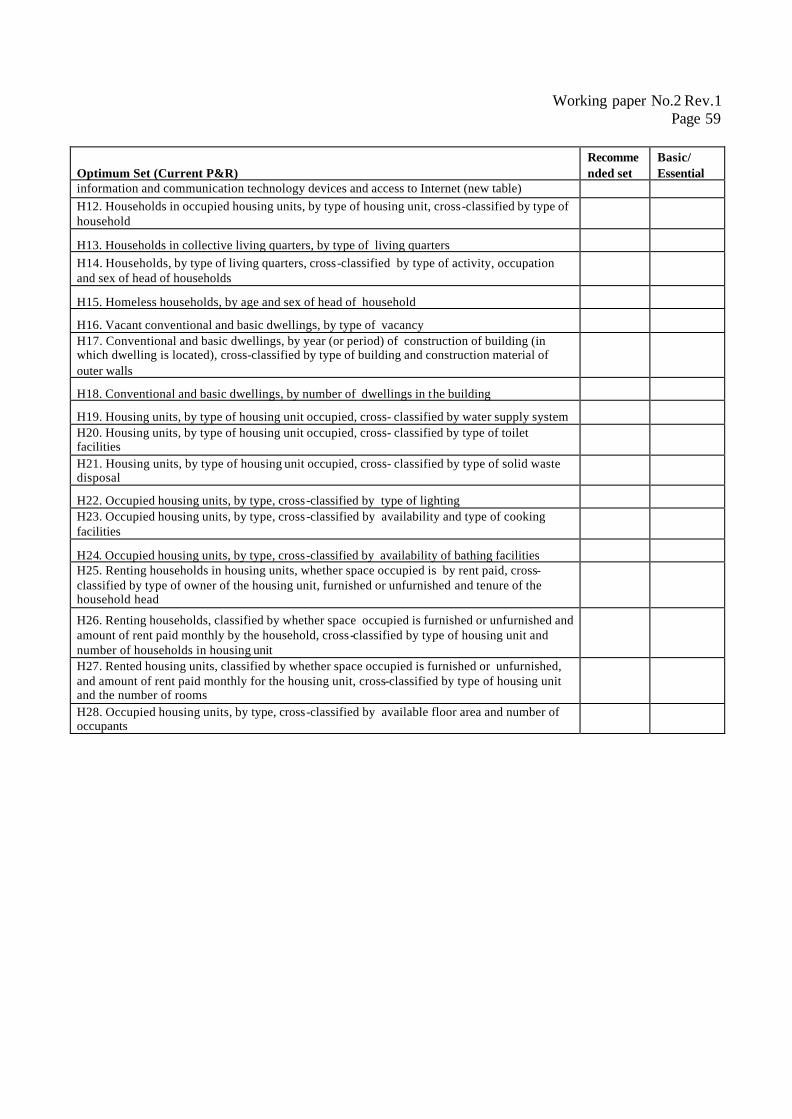
Working paper No.2 Rev.1 Page 59
Optimum Set (Current P&R) Recommended set
Basic/ Essential
information and communication technology devices and access to Internet (new table) H12. Households in occupied housing units, by type of housing unit, cross-classified by type of household H13. Households in collective living quarters, by type of living quarters H14. Households, by type of living quarters, cross-classified by type of activity, occupation and sex of head of households H15. Homeless households, by age and sex of head of household H16. Vacant conventional and basic dwellings, by type of vacancy H17. Conventional and basic dwellings, by year (or period) of construction of building (in which dwelling is located), cross-classified by type of building and construction material of outer walls H18. Conventional and basic dwellings, by number of dwellings in the building H19. Housing units, by type of housing unit occupied, cross- classified by water supply system H20. Housing units, by type of housing unit occupied, cross- classified by type of toilet facilities H21. Housing units, by type of housing unit occupied, cross- classified by type of solid waste disposal H22. Occupied housing units, by type, cross-classified by type of lighting H23. Occupied housing units, by type, cross-classified by availability and type of cooking facilities H24. Occupied housing units, by type, cross-classified by availability of bathing facilities H25. Renting households in housing units, whether space occupied is by rent paid, cross-classified by type of owner of the housing unit, furnished or unfurnished and tenure of the household head H26. Renting households, classified by whether space occupied is furnished or unfurnished and amount of rent paid monthly by the household, cross-classified by type of housing unit and number of households in housing unit H27. Rented housing units, classified by whether space occupied is furnished or unfurnished, and amount of rent paid monthly for the housing unit, cross-classified by type of housing unit and the number of rooms H28. Occupied housing units, by type, cross-classified by available floor area and number of occupants
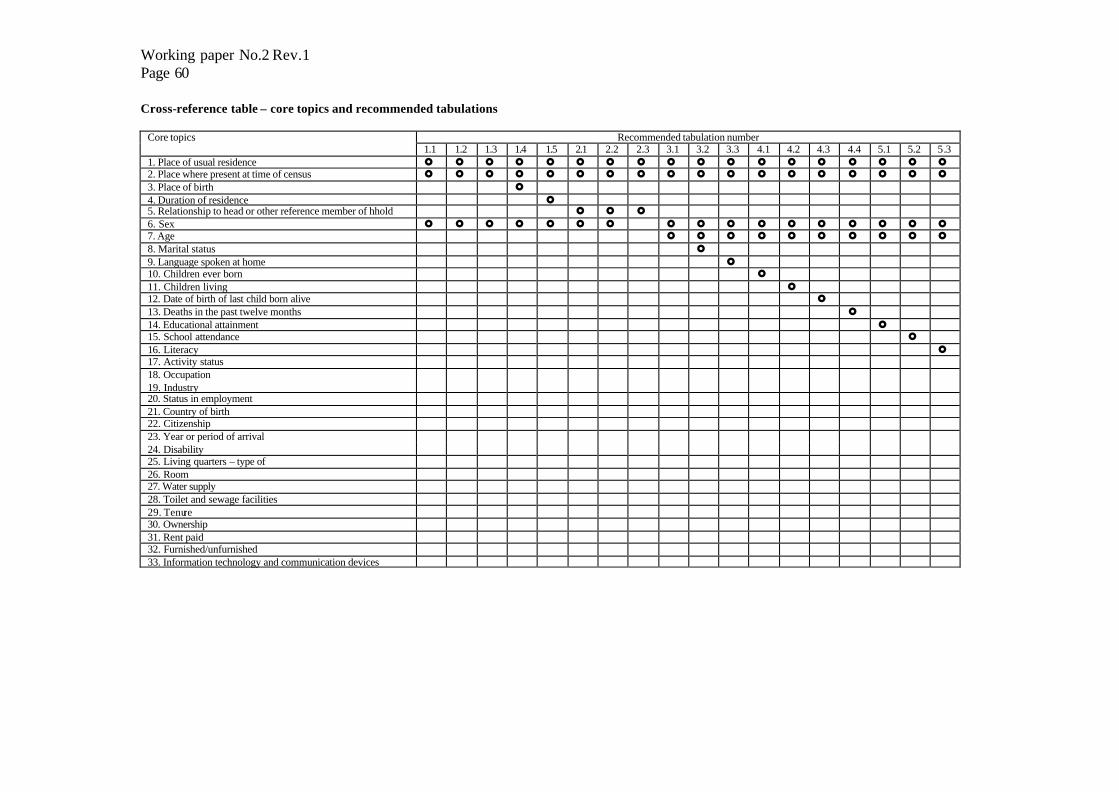
Working paper No.2 Rev.1 Page 60
Cross-reference table – core topics and recommended tabulations
Recommended tabulation number Core topics 1.1 1.2 1.3 1.4 1.5 2.1 2.2 2.3 3.1 3.2 3.3 4.1 4.2 4.3 4.4 5.1 5.2 5.3
1. Place of usual residence £ £ £ £ £ £ £ £ £ £ £ £ £ £ £ £ £ £ 2. Place where present at time of census £ £ £ £ £ £ £ £ £ £ £ £ £ £ £ £ £ £ 3. Place of birth £ 4. Duration of residence £ 5. Relationship to head or other reference member of hhold £ £ £ 6. Sex £ £ £ £ £ £ £ £ £ £ £ £ £ £ £ £ £ 7. Age £ £ £ £ £ £ £ £ £ £ 8. Marital status £ 9. Language spoken at home £ 10. Children ever born £ 11. Children living £ 12. Date of birth of last child born alive £ 13. Deaths in the past twelve months £ 14. Educational attainment £ 15. School attendance £ 16. Literacy £ 17. Activity status 18. Occupation 19. Industry 20. Status in employment 21. Country of birth 22. Citizenship 23. Year or period of arrival 24. Disability 25. Living quarters – type of 26. Room 27. Water supply 28. Toilet and sewage facilities 29. Tenure 30. Ownership 31. Rent paid 32. Furnished/unfurnished 33. Information technology and communication devices
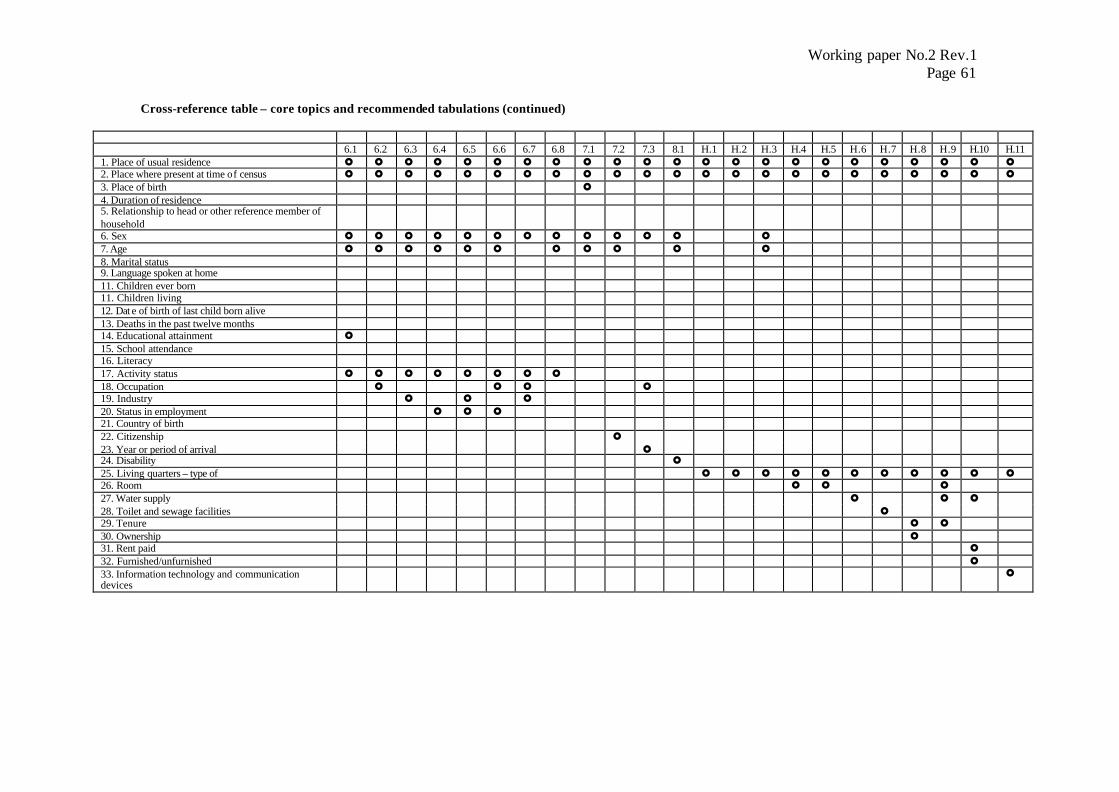
Working paper No.2 Rev.1 Page 61
Cross-reference table – core topics and recommended tabulations (continued)
6.1 6.2 6.3 6.4 6.5 6.6 6.7 6.8 7.1 7.2 7.3 8.1 H.1 H.2 H.3 H.4 H.5 H.6 H.7 H.8 H.9 H.10 H.11 1. Place of usual residence £ £ £ £ £ £ £ £ £ £ £ £ £ £ £ £ £ £ £ £ £ £ £ 2. Place where present at time of census £ £ £ £ £ £ £ £ £ £ £ £ £ £ £ £ £ £ £ £ £ £ £ 3. Place of birth £ 4. Duration of residence 5. Relationship to head or other reference member of household
6. Sex £ £ £ £ £ £ £ £ £ £ £ £ £ 7. Age £ £ £ £ £ £ £ £ £ £ £ 8. Marital status 9. Language spoken at home 11. Children ever born 11. Children living 12. Dat e of birth of last child born alive 13. Deaths in the past twelve months 14. Educational attainment £ 15. School attendance 16. Literacy 17. Activity status £ £ £ £ £ £ £ £ 18. Occupation £ £ £ £ 19. Industry £ £ £ 20. Status in employment £ £ £ 21. Country of birth 22. Citizenship £ 23. Year or period of arrival £ 24. Disability £ 25. Living quarters – type of £ £ £ £ £ £ £ £ £ £ £ 26. Room £ £ £ 27. Water supply £ £ £ 28. Toilet and sewage facilities £ 29. Tenure £ £ 30. Ownership £ 31. Rent paid £ 32. Furnished/unfurnished £ 33. Information technology and communication devices
£