TEM and TER Master Plan - UNECE
204
ECONOMIC COMMISSION FOR EUROPE Final Report Volume I: Main text Trans-European Motorway (TEM) Trans-European Railway (TER) Projects 2011 TEM and TER revised Master Plan
-
Upload
khangminh22 -
Category
Documents
-
view
5 -
download
0
Transcript of TEM and TER Master Plan - UNECE

ECONOMIC COMMISSION FOR EUROPE
Final Report Volume I: Main text
Trans-European Motorway (TEM)Trans-European Railway (TER)
Projects
2011
Printed by the Publishing Service, United Nations, Geneva — GE.12.20689 — February 2012 — ECE/TRANS/183/Rev.2 (Vol. I)
TEM and TER revised
Master Plan
ECE
TEM a
nd TER
revised M
aster Pla
n - Final R
eport - V
olu
me I: M
ain
text
United
Nations

E C O N O M I C C O M M I S S I O N F O R E U R O P E
1
Trans-European Motorway (TEM) project
Trans-European Railway (TER) project
TEM and TERrevised
Master Plan
Final report
Volume I : Main text
UNITED NATIONSNew York and Geneva, 2011
U N E C E T E M A N D T E R P R O J E C T S ’ M A S T E R P L A N – 2 0 1 1
2
ACKNOWLEDGEMENTS
The revised Master Plan of the Trans-European Motorway (TEM) and Trans-European Railway (TEM) projects was completed thanks to the work and contributions of National Coordinators and country experts from participating TEM and TER member countries, without whose commitment and input this revision would not have been possible; the TEM and TER Project Manager — Mr. Helmut Meelich; the United Nations Economic Commission for Europe as the executing agency of the projects; the consultants Mr. Petr Pospisil, Mr. Romeo Galbenu and Mr. Darek Przybyla, as well as experts from observer and other participating countries, whose valuable input enlarged the scope of the revised Master Plan.
ECE/TRANS/183/Rev.2(Vol. I)

E C O N O M I C C O M M I S S I O N F O R E U R O P E
3
TAbLE OF CONTENTS
Preface .............................................................................................................. 7Executive summary .............................................................................................. 9Introduction ........................................................................................................ 15
1. REVISION OF THE TEM AND TER MASTER PLAN ........................................... 17
2. REVISED TEM AND TER MASTER PLAN bACKbONE NETWORKS ................. 212.1 Revised TEM Master Plan backbone network ................................................. 222.2 Revised TER Master Plan backbone network .................................................. 26
3. COMPARISON OF THE MASTER PLAN bACKbONE NETWORKS WITH OTHER INTERNATIONAL INFRASTRUCTURE NETWORKS ............................. 333.1 TEM backbone network .............................................................................. 343.2 TER backbone network ............................................................................... 433.3 Summary .................................................................................................. 52
4. MISSING LINKS IN THE bACKbONE NETWORKS ......................................... 534.1 Motorway and road missing links incorporated in the revised TEM backbone
network .................................................................................................... 534.2 Railway missing links incorporated in the revised TER backbone network .......... 554.3 Other motorway and road missing links ....................................................... 574.4 Other railway missing links ......................................................................... 57
5. UPDATING OF THE TRAFFIC FORECAST FOR THE bACKbONE NETWORKS ..................................................................................................... 595.1 Past development ....................................................................................... 595.2 Traffic forecast for the TEM and TER Master Plan ........................................... 605.3 Other recent forecasts ................................................................................ 635.4 Comparison of existing forecast results ......................................................... 685.5 Questionnaires for the revision of the TEM and TER Master Plan ...................... 685.6 The influence of the global economic crisis on road and rail traffic developments
in 2008 and 2009 .................................................................................... 695.7 Groups of countries .................................................................................... 755.8 Basic development scenario ........................................................................ 755.9 Post-crisis development scenarios ................................................................. 775.10. Maps of road and rail traffic flows in 2020 .................................................. 79
6. REVISED MASTER PLAN PROJECTS ................................................................ 816.1 Overview ................................................................................................. 816.2 Motorway/road projects in the revised Master Plan ....................................... 836.3 Railway projects in the revised Master Plan ................................................... 996.4 Analysis of projects and their classification ................................................... 111
7. FUNDING CONSIDERATIONS FOR REVISED MASTER PLAN PROJECTS........ 113

U N E C E T E M A N D T E R P R O J E C T S ’ M A S T E R P L A N – 2 0 1 1
4
8. STATUS OF bACKbONE NETWORKS IN 2010, 2015 AND 2020 ................ 1158.1 Status maps of the TEM and TER backbone network ....................................... 1158.2 Lessons learnt ............................................................................................ 1158.3 Conclusions .............................................................................................. 116
9. bOTTLENECKS ON bACKbONE NETWORKS ................................................. 1199.1 Definition and identification ........................................................................ 1199.2 Roads ...................................................................................................... 1229.3 Railways ................................................................................................... 124
10. bORDER CROSSING ISSUES ........................................................................... 17710.1 Road border crossings on the TEM backbone network .................................... 17710.2 Railway border crossings of importance for international combined transport
according to the AGTC (European Agreement on Important International Combined Transport Lines and Related Installations) ....................................... 180
10.3 Other railway border crossings on the TER backbone network ......................... 18210.4 Border crossing traffic ................................................................................ 18310.5 Border crossing barriers and problems ......................................................... 18410.6 Solutions and remedial measures ................................................................. 186
11. INTERRELATIONSHIPS bETWEEN THE REVISED TER AND TEM bACK-bONE NETWORKS AND RELEVANT TRANSHIPMENT POINTS ...................... 18911.1 Common sections of revised TEM and TER backbone networks ........................ 18911.2 Terminals of importance for international combined transport .......................... 19211.3 Other terminals of importance for international combined transport linked to the
revised TEM and TER backbone networks ..................................................... 19711.4 Ferry links/ports forming part of the international combined transport network .. 20011.5 Other ferry links of high importance linked to the TEM and TER revised backbone
networks ................................................................................................... 20111.6 Other sea ports of high importance linked to the revised TEM and TER backbone
networks ................................................................................................... 20111.7 Terminals in inland waterway ports of importance for international combined
transport linked to the revised TEM and TER backbone networks ...................... 20211.8 Other river/lake ports of high importance linked to the revised TEM and TER
backbone networks .................................................................................... 204
12. INTELLIGENT TRANSPORT SYSTEMS ................................................................ 20712.1 ITS in the road sector ................................................................................. 20712.2 ITS in the rail sector ................................................................................... 20812.3 Motorway/road ITS systems and services in the participating countries ............ 20812.4 Rail ITS systems and services in the participating countries .............................. 210
13. ENVIRONMENTAL, SAFETY AND SECURITY ISSUES ......................................... 21313.1 Environmental impacts ................................................................................ 21313.2 Road safety ............................................................................................... 21713.3 Transport security ....................................................................................... 220
14. CONCLUSIONS ............................................................................................... 225

E C O N O M I C C O M M I S S I O N F O R E U R O P E
5
LIST OF MAPS 1. TEM and TER Master Plan Revision participating countries .............................. 1292. TEM Master Plan Revision backbone network ................................................ 1313. TER Master Plan Revision backbone network ................................................. 1334. TEM Master Plan Revision backbone network missing links ............................. 1355. TER Master Plan Revision backbone network missing links............................... 1376. TEM Master Plan Revision backbone network basic development scenario —
traffic flows in 2020 .................................................................................. 1397. TER Master Plan Revision backbone network basic development scenario —
passenger flows in 2020 ............................................................................ 1418. TER Master Plan Revision backbone network basic development scenario —
freight flows in 2020 ................................................................................. 1439. TEM Master Plan Revision backbone network — TEM revised Master Plan
projects .................................................................................................... 14510. TER Master Plan Revision backbone network — TER revised Master Plan
projects .................................................................................................... 14711. TEM Master Plan Revision backbone network status 2010 .............................. 14912. TEM Master Plan Revision backbone network status 2015 .............................. 15113. TEM Master Plan Revision backbone network status 2020 .............................. 15314. TER Master Plan Revision backbone network status 2010 ............................... 15515. TER Master Plan Revision backbone network status 2015 ............................... 15716. TER Master Plan Revision backbone network status 2020 ............................... 15917. TEM Master Plan Revision backbone network bottlenecks ............................... 16118. TER Master Plan Revision backbone network bottlenecks ................................ 16319. TEM and TER Master Plan Revision backbone networks interrelationships ......... 16520. TEM and TER Master Plan Revision backbone networks — common sections ..... 16721a. TEM Master Plan Revision backbone network — interrelationships between
the TEM backbone network and relevant transhipment points (terminals of international importance) ............................................................................ 169
21b. TEM Master Plan Revision backbone network — interrelationships between the TEM backbone network and relevant transhipment points (ports and ferries) ..... 171
22a TER Master Plan Revision backbone network — interrelationships between the TER backbone network and relevant transhipment points (terminals of international importance) .............................................................................................. 173
22b TER Master Plan Revision backbone network — interrelationships between the TER backbone network and relevant transhipment points (ports and ferries) ....... 175

U N E C E T E M A N D T E R P R O J E C T S ’ M A S T E R P L A N – 2 0 1 1
6

E C O N O M I C C O M M I S S I O N F O R E U R O P E
7
PREFACE
“Ensuring the adequate provision of infrastructure is a key Government responsibility because the transport sector has important implications throughout society and the economy …”
Ján Kubiš’ opening speech at the “Conference on Financing development of road and rail transport infrastructures” (Vienna, 17 November 2010)
The Trans-European North-South Motorway (TEM) and Trans-European Railway (TER) projects are unique Pan-European transport infrastructure projects bringing together countries of the European Union (EU), EU candidate countries as well as other United Nations Economic Commission for Europe (UNECE) Member States in Central, Eastern and South-Eastern Europe and the Caucasus. UNECE is the executing agency for both projects.
The original TEM and TER Master Plan was published in 2006. This revision of the original Master Plan was made possible through the commitment, skill, dedication and cooperation of National Coordinators from participating countries, the UNECE TEM and TER Project Manager, external consultants and the UNECE secretariat.
Two expert groups, one for road and one for rail, worked together over the last two years to consolidate and process substantive information on transport plans and priority needs for the participating countries, liaising with the relevant national authorities and the UNECE secretariat. This work resulted in a revised list of priority infrastructure projects of the TEM and TER backbone networks as well as recommendations on possibilities for funding. The expected status of the backbone networks in 2015 and 2020 is also projected based on their situation in the 2008 to 2009 period. The present final report contains information for 25 participating countries.
In the current challenging economic and financial environment, reflected by major budgetary cuts and capital market restrictions, special attention was paid to possibilities for financing road and rail infrastructure projects identified as priorities in the revised Master Plan. Four specific reports have been produced on issues related to financing: see Volume II of this publication.
The implementation of the projects contained in the revised Master Plan is a long-term process that will require, first and foremost, political will and commitment from the Governments of the participating countries. It will also require intensive follow-up work and progress monitoring through close cooperation between participating countries, the TEM and TER projects Central Offices and the UNECE, as well as with the European Commission and other international organizations, financial institutions and bodies whose assistance will be essential in completing this ambitious task.
I hope that this revised TEM and TER Master Plan will be widely used throughout the ECE region not only as a reference source for transport infrastructure planning in the international context but also as a very good example of effective collaboration among participating countries.
Ján Kubiš Executive Secretary United Nations Economic Commission for Europe

U N E C E T E M A N D T E R P R O J E C T S ’ M A S T E R P L A N – 2 0 1 1
8

E C O N O M I C C O M M I S S I O N F O R E U R O P E
9
EXECUTIVE SUMMARY
The objectives of the Master Plan revision were (a) to analyse the results of the road and rail infrastructure development in 25 participating countries of Central, Eastern and South-Eastern Europe and the Caucasus in the period 2005 to 2010, (b) to describe the existing status of road and rail networks, and (c) to set out the road and rail networks development programme until the year 2020.
Five years ago, the United Nations Economic Commission for Europe (UNECE) published the original Trans-European North-South Motorway (TEM) and Trans-European Railway (TER) projects Master Plan, presenting a reliable and pragmatic short-, medium- and long-term investment strategy for developing road, rail and combined transport backbone networks in the participating countries. The original Master Plan proved to be an important step towards improving the transport sector performance in the study region. Many targeted investments — for example, about 45 % of the 491 road and rail projects contained in the original Master Plan — have been completed.
Since the creation of the original Master Plan, important political, economic and technological changes have taken place and new challenges have emerged. Four additional countries — Albania, Armenia, Azerbaijan and Montenegro — have joined the revision process.
The slower than expected economic growth in some participating countries unfortunately has resulted in a minimal growth of their passenger and freight transport sectors. Budgetary constraints in many of the countries have limited transport infrastructure development. However, the original Master Plan had already acknowledged that the range of possible investments would greatly exceed the immediate and foreseeable capacities of national and international bodies to fund all the identified projects. The original Master Plan did not foresee the global crisis of 2008 and 2009, the consequences of which further deepened the imbalances between the investment needs and the funding sources.
The revised Master Plan endeavours to take the recent and expected future developments into account. First of all, it addresses the modifications of the TEM and TER Master Plan backbone networks identified in 2005. Furthermore, it reflects changes in traffic flows, political changes in the region, the needs of new participating countries, the desire to harmonize TEM and TER networks with other international transport networks, changes in priorities, as well as the need to connect these networks in the best way with important international combined transport routes and with transhipment points and nodes. During this work, the road and rail missing links identified in the original report were also considered and the great majority of them have been included in the revised networks.
Three scenarios for road and rail traffic growth on backbone networks up to 2020 have been developed. These scenarios are based on the results of the 2005 UNECE Censuses of Motor Traffic on Main International Traffic Arteries and of E Rail Traffic in Europe, results of recent national traffic censuses, the TEM and TER databases, national forecasts of traffic development in 2015 and 2020, and recent international studies. The basic scenario reflects, as far as possible, uncertainties inevitably linked with such projections. The other two scenarios take into account the consequences of the global economic crisis, with its impacts on the development of road and rail traffic in the participating countries in 2008 and 2009. These impacts were identified

U N E C E T E M A N D T E R P R O J E C T S ’ M A S T E R P L A N – 2 0 1 1
10
by a special enquiry carried out in the framework of the Master Plan revision work. As far as it is known, this is a first attempt to reflect the impact of the global crisis on the road and rail traffic developments in the forthcoming years. The forecast traffic flows on particular sections of the TEM (motorway/road) and TER (rail) backbone networks are also illustrated on the respective maps.
The changes in the backbone network, traffic forecast results as well as the above additional requirements have been reflected in the new Master Plan list of road and rail projects, comprising 294 motorway/road construction and/or rehabilitation and 191 rail projects with a total cost of approximately EUR 188 × 109. The average cost of a project (approximately EUR 388 × 106) increased almost twofold in comparison with the average project cost in the original Master Plan. This increase was partly due to inflation, but extensively due to the larger and more demanding construction projects (e.g. high-speed rail lines in some countries) which frequently focus on densely populated agglomerations. More stringent environmental protection measures also contributed to the increase.
Special attention was paid to project funding considerations in light of the present budgetary funding limitations in almost all participating countries. Annexes III to VI of Volume II focus on the financing of road and rail Master Plan projects and recommendations for their implementation.
The expected status of the backbone road and rail networks in the region in the years 2015 and 2020 is shown on the respective maps. This status was based on the assumption that identified infrastructure projects would be completed in accordance with the timetables indicated in this final report and also on other available sources as follows: the national master plans of participating countries and their data provided through the revision questionnaires; the TEM and TER projects databases; data from other relevant studies, and documentation and information from other sources. It should be noted, nevertheless, that the 2020 status maps in particular include a rather considerable degree of uncertainty and represent the most probable option based on the latest information available. The status data were also of importance for other topics dealt with in this final report, e.g. border crossing issues and intermodal relationships.
Different types of road and rail bottleneck were subsequently analysed, distinguishing between the condition bottlenecks, i.e. links in poor condition, and the capacity bottlenecks, i.e. congested road and rail links in the backbone networks. Both types of bottleneck are listed in the final report and are indicated on the corresponding maps.
The final report also includes detailed considerations on indicated barriers and on border crossing problems in the region, broken down according to their origin (i.e. infrastructure, procedures and staff ), which are particularly frequent on borders between Schengen and non-Schengen countries.
In comparison with the original TEM and TER Master Plan of 2005, this final report further considers the links between the road and rail backbone networks, and between them and the other transhipment points such as terminals, ferry links and sea, river and lake ports of importance for international combined transport.
The original Master Plan did not deal with Intelligent Transport Systems (ITS). ITS applications would improve overall service levels by improving transport management and the use of infrastructure. This final report underlines that the wider application of ITS could be increased by their integration. ITS integration is also a necessary precondition for interoperability of ITS at the European level.
Finally, the revised Master Plan focuses on the most important transport impacts on the environment, i.e. carbon dioxide emissions and noise pollution, as well as on road safety and

E C O N O M I C C O M M I S S I O N F O R E U R O P E
11
transport security issues. These issues, at present, are basic elements of the definition of transport service quality — provided that there is a balance between operational needs and security requirements.
This final report, including the maps, was prepared in close cooperation with the TEM and TER National Coordinators and focal points/contact persons in participating countries. The report recommends that the next revision of the Master Plan be prepared in the years 2015 to 2016.
Successful implementation of the revised TEM and TER Master Plan will be a long-term process, requiring political will and commitment from the participating countries as well as close cooperation between participating countries, UNECE and the TEM and TER projects Central Offices. The necessary follow-up work will require the actions identified in the conclusions of the final report and in its annexes, the most important of which are summarized below.
- Each participating country needs a clear transport policy and strategy, indicating objectives and measures/instruments for investment funding. Such a strategy should include an implementation schedule and a manageable financial plan, and should only include infrastructure projects which clearly demonstrate a significant cost–benefit ratio.
- National transport master plans, comprising infrastructure and transport policy for all modes, with clear objectives for a sustainable transport policy, should be established and regularly updated.
- A long-term “strategic” development plan for transport networks should be established based on the results of feasibility studies. The development plan should determine an implementation schedule and a tentative investment plan.
- The investment plan of the revised Master Plan should be updated regularly, and a monitoring system for implementing identified road and rail projects must be established.
- The updating of both national and international transport infrastructure development plans should be carefully and simultaneously considered with the aim of moving towards plans that acknowledge shared international needs and goals, recognizing at the same time the importance of specific national needs.
- National laws on tender and construction need appropriate harmonization with the emerging European good practices so as not to restrict interest in undertaking infrastructure works which, in turn, could likely lead to undermining cost-effectiveness and technical innovation in construction.
- A new planning culture is needed to prevent erroneous decisions and to ensure efficient allocation of the limited financial resources. The planning process and preparatory decisions need to be executed more carefully and the results should be made more visible by public decision-makers.
- The political, legal, institutional, financial and economic framework conditions which influence the transport sector should be carefully considered and the organizational structure revised if necessary.
- Efforts aimed at simplifying the bureaucratic and lengthy procedures for project approval should be intensified and appropriate legislative and administrative measures established, thus preventing substantial interference with or modification of the already approved medium-term financing plans during the annual budget allocation procedures.
- An appropriate project management system should be established to avoid systematically biased underestimation of project costs and overestimation of travel and transport demand, and to ensure appropriate risk assessment, quality of management as well as approbation of economically efficient projects.

U N E C E T E M A N D T E R P R O J E C T S ’ M A S T E R P L A N – 2 0 1 1
12
- The preparation of appropriate feasibility studies for each project in the pipeline should be organized as soon as possible, even if their implementation is not expected in a near future.
- New assessment instruments (such as Sustainable Development Analysis) should be introduced to ensure sustainable transport development.
- European standardization procedures on national construction and operation guidelines should be enabled and supported as quickly as possible since it is proven that their application significantly reduces the costs of infrastructure construction, maintenance and operation.
- Efficient completion of priority transport infrastructure networks needs to be pursued. The currently established practice in many countries is to extend the completion time of several infrastructure projects running in parallel because of underfunding; such a practice minimizes the economic benefits and should be avoided.
- Data on road and rail traffic flows will need to be regularly provided in the forthcoming years for verifying and updating road and rail traffic forecasts for the years 2015 and 2020.
- The provision of information on the location of new or extended transhipment points, sea and major river ports, freight villages and logistics centres would make it possible to adjust connections to the TEM and TER revised backbone networks.
- The deeper involvement of both the TEM and the TER project in the activities aimed at possible technical interoperability of the ITS at the European level should be considered.
- A special follow-up programme should be established to monitor regularly the progress achieved in implementing the revised Master Plan and to bring the TEM and TER backbone networks up to the standards set by the relevant UNECE International Agreements as well as by the “Standards and Recommended Practices for Projects”.
The possibilities for funding identified projects for which financing has not been fully secured at present should be seriously considered by respective countries, exploiting the ways and means identified and recommended in Annexes III to VI of Volume II as summarized below.
- Efforts should be intensified to develop and/or rearrange the system of institutions dealing with the transport sector when opting for the renewal and reorganization of financial practices.
- There is a strong need to have a dedicated unit within the competent Ministry of a country, which will integrate the critical links between the involved Ministries, EU bodies (if applicable), international financial institutions and other relevant public and private stakeholders. This unit may have a specific role to follow transport infrastructure projects.
- Governments should consider establishing transport funds. This will make additional funding available for investments in transport projects.
- All the advantages and disadvantages of public–private partnership (PPP) models for financing transport infrastructure should be discussed and made transparent before making decisions; experience indicates that some advantages of PPP models can be achieved also by changing organizational models and/or tendering procedures.
- Different organizational models for planning and financing activities should be considered; whether a public or a private corporation is the more successful model will depend on which entity has the lower interest rate and better credit rating, etc. More effective planning and construction management can be achieved also with the new method of “functionally oriented bidding”.
- The legal, financial, banking and economic environment should be ready when preparing PPP projects and appropriate rules should be set to streamline administrative procedures which could pose time limits on approval processes and the establishment of “special project vehicles” (SPVs).
E C O N O M I C C O M M I S S I O N F O R E U R O P E
13
- A special PPP unit or a programme in the government may address the capacity problem of the public sector effectively and promote private participation in a planned and coordinated manner taking into account the overall sector needs. Such an administrative arrangement can also help to enhance the social acceptability and transparency of private projects by institutionalizing the project identification and approval processes.
- Further efforts should be aimed at establishing fair cost sharing between taxpayers and transport users, since the current distribution of external costs may contribute to the future unsustainability of a transport system as a whole.
- For roads, opportunities for cost sharing of road infrastructure and road transport services in a fair and equitable manner should be considered, introducing and/or gradually developing appropriate toll collection systems.
- For railways, the long-term goal should be that contributions of railway users cover, at least, all operation costs and, as much as possible, the infrastructure costs with the exception of the share of the costs which are summarized under the terms non-profit and social costs.

U N E C E T E M A N D T E R P R O J E C T S ’ M A S T E R P L A N – 2 0 1 1
14

E C O N O M I C C O M M I S S I O N F O R E U R O P E
15
INTRODUCTION
The United Nations Economic Commission for Europe (UNECE) is the executing agency of the two international cooperation frameworks — the Trans-European North-South Motorway (TEM) and the Trans-European Railway (TER) projects — established respectively in 1977 and 1990, by the Governments of the Central, Eastern and South-Eastern European countries and the Caucasus.1 These projects, aimed at developing coherent transport infrastructure networks in the region and at facilitating international traffic, have to date been instrumental in the construction and upgrade of the transport networks in the participating countries, and thus have contributed to the interoperability of the European transport systems. At the same time, both projects, through their regular activities, have created and continuously updated databases, have published a large number of technical documents, studies, guidelines and recommendations, and have continued to work for the harmonization of the management, maintenance and operational procedures on roads, motorways and railways in the region and for their integration in the Pan-European context. The long-lasting, flexible, effective and self-sustaining structures of the TEM and TER projects, in combination with the great dedication and commitment of the participating countries, provide a useful framework for the development and monitoring of the progress of this unique sub-regional cooperation in the field of transport.
The original TEM and TER Master Plan, which was published in January 2006, represented the most important outcome of the new short-term strategies for the further integration of both projects in the new European transport context. The Master Plan was intended to assist the TEM and TER member countries in the development of their road, rail and combined transport infrastructures and in making decisions on relevant investments. It also addressed important questions such as alternative scenarios of growth, methodological aspects of project evaluation, infrastructure bottlenecks, missing links, border crossing issues, as well as problems of funding of transport infrastructure. More specifically, the work addressed the goals of promoting the integration of the European transport infrastructure, extending the Trans-European Transport Network (TEN-T), supporting the implementation of the Pan-European transport corridors and promoting intermodal transport operations.
The work on the original Master Plan, completed in 2005, resulted in the elaboration of a realistic investment strategy for the development of the road, rail and combined transport infrastructure in the 21 Central, Eastern and South-Eastern European countries involved. Within this framework, the road and rail backbone networks were defined taking into account the international importance of the relevant sections as well as the national priorities and proposals of the countries participating in this work. A special top-down methodology was developed for the evaluation and prioritization of the identified infrastructure projects. On the basis of the input from the participating countries, and following the agreed methodology, 491 projects of a total value of more than EUR 102 × 109 were evaluated and prioritized. Special emphasis was placed on seeking a balance between the national priorities of the participating countries for
1 The member countries of the TEM project were Armenia, Austria, Bosnia and Herzegovina, Bulgaria, Croatia, the Czech Republic, Georgia, Hungary, Italy, Lithuania, Poland, Romania, Slovakia, Slovenia and Turkey. The member countries of the TER project were Armenia, Austria, Bosnia and Herzegovina, Bulgaria, Croatia, the Czech Republic, Georgia, Greece, Hungary, Italy, Lithuania, Poland, Romania, the Russian Federation, Serbia, Slovakia, Slovenia and Turkey.

U N E C E T E M A N D T E R P R O J E C T S ’ M A S T E R P L A N – 2 0 1 1
16
the development of transport infrastructure within their own borders, and the recognition that many of the most important national links and projects were also critical to the establishment of effective international networks.
In general, the original TEM and TER Master Plan achieved its intended goals. Through the Master Plan, both projects offered a substantial contribution to the extension of the TEN-T, practical implementation of Pan-European transport corridors, promotion of intermodal operations, complementarity of transport modes and enhanced effective use of the transport infrastructure. The Master Plan also contributed to the integration and harmonization of transport beyond Europe, notably as input to the Euro-Asian Transport Links project. Meanwhile, it was clear that the implementation of the Master Plan would last many years, would require the continuing political will and commitment of all the countries involved, and would necessitate permanent monitoring of the progress in the realization of the projects identified as well as the intensive follow-up work.
The activities in the original Master Plan focused primarily on the review of the investment strategy for transport infrastructure reflecting, inter alia, the future political and economic developments, changing priorities and new transport needs in the region. At the same time, the objective was to raise awareness about the Master Plan implementation, to disseminate its results and outcomes, and to provide the missing information about the current status and planned progress in some parts of the backbone network. In this connection, the final report provided, inter alia, the specification of the complete shape of the TEM and TER backbone networks in the different time horizons of 2010, 2015 and 2020, and updated the investment plan and Geographical Information System database. Taking these facts into account, noting the importance of the progressive implementation of the TEM and TER Master Plan for the development of a coherent transport infrastructure in Europe, and following the conclusions and recommendations of the final report, the TEM and TER Steering Committees decided that the Master Plan should be revised every 5 years.
The UNECE Inland Transport Committee reiterated its support for the revision of the TEM and TER Master Plan and invited the Steering Committees of both projects, in close cooperation with the participating countries, to undertake this work and to complete the revised final report by the end of 2010.
E C O N O M I C C O M M I S S I O N F O R E U R O P E
17
1. REVISION OF THE TEM AND TER MASTER PLAN
This first Master Plan revision, carried out in 2009 and 2010, reflects the increased awareness of the importance for the implementation of the Master Plan projects. In comparison with the original Master Plan, its geographical coverage has been extended to 25 countries, i.e. Albania, Armenia, Austria, Azerbaijan, Belarus, Bosnia and Herzegovina, Bulgaria, Croatia, the Czech Republic, the former Yugoslav Republic of Macedonia, Georgia, Greece, Hungary, Italy, Lithuania, the Republic of Moldova, Montenegro, Poland, Romania, the Russian Federation, Serbia, Slovakia, Slovenia, Turkey and Ukraine (Map No. 1). During the revision, efforts were focused in particular on Albania, Armenia, Azerbaijan and Montenegro which did not participate in the original Master Plan. Based on actual and available data on gross domestic product (GDP) as well as on motorway/road infrastructure status and traffic flows, the aim was to establish realistic growth scenarios, to define their road and rail backbone networks, to develop respective traffic forecasts and to identify missing links, connections, bottlenecks and priority projects.
Since the elaboration of the original Master Plan, a number of new developments have taken place. These may be summarized as follows:
• completionof theworkof theEuropeanUnion (EU)HighLevelGroup (HLG) and theextension of the Trans-European Transportation Network (TEN-T) to neighbouring countries and regions2;
• theaccessionofArmeniaandSloveniatotheTEMandTERprojects;• theseparationofSerbiaandMontenegrointotwoindependentstates;• theaccessionofBulgariaandRomaniatotheEU;• the need to include all South-Eastern Europe andCaucasus countries in theMaster Plan
exercise (i.e. addition of Albania, Armenia, Azerbaijan, Montenegro and Serbia);• newproposalsonpriorities,projectsandlinkswhichemergedintheTEMandTERmember
countries in the course of the 2007 to 2009 follow-up work;• completionofthefirstphaseoftheUNECE–UNESCAPJointProjectonDevelopingEuro-
Asian Transport Linkages (EATL) and adoption of the priority routes and projects identified by it;
• newdata received fromtheparticipatingcountries, especiallywith regard to the identifiedtransport infrastructure projects;
• increased interest of the participating countries in intermodal aspects (including logisticscentres, combined transport terminals, seaports and maritime hinterland connections);
• theconsequencesoftheglobaleconomiccrisis.
2 The priority axes defined by the HLG chaired by Loyola de Palacio do not have the same binding character as the Pan-European corridors that were agreed by the Ministers of Transport.Turkey, as a negotiating candidate country for accession to the EU, supports the revision of the existing TEN-T in a more comprehensive framework and finds that the recommendations of the HLG report fall short of addressing satisfactorily its needs, priorities and considerations, and in particular those concerning transport axes, corridors and links within Turkey and towards its neighbouring countries. Therefore, Turkey does not concur with the HLG report in its entirety. Hence, Turkey reads all references to the HLG report with the understanding that Turkey’s needs, priorities and considerations are addressed, on a mutually-acceptable basis, in the Transport Infrastructure Needs Assessment (TINA) study and in the framework of the accession negotiations.Turkey’s border with Armenia is currently not operational and there is no freight and passenger traffic.

U N E C E T E M A N D T E R P R O J E C T S ’ M A S T E R P L A N – 2 0 1 1
18
In order to reflect these developments, on the basis of the inputs from the participating countries, the TEM and TER project Central Offices, in close collaboration with the UNECE and external consultants, prepared the terms of reference for the revision of the Master Plan. These terms of reference were approved by the Steering Committees of the TEM and TER projects in 2008 and contained the following work packages:
1. Project management
2. Updating of data including those for countries newly involved
3. Updating of traffic forecasts
4. Consideration and evaluation of new emerging developments
5. New and/or revised Master Plan infrastructure projects
6. Review of facilitation aspects along the TEM Master Plan backbone network
7. Assessment and modification of the Master Plan backbone network
8. Backbone network status in 2015 and 2020
9. Funding considerations and securing of funds for the Master Plan projects
10. Intermodal transport considerations
11. Operational aspects
12. Lessons learnt and recommendations
The work on the revision was coordinated and supervised by the Coordination Group, consisting of the UNECE secretariat representatives, the TEM and TER Project Manager and external consultants. The Coordination Group was assisted by groups of experts composed of the TEM and TER Project Manager, National Coordinators and experts from participating countries, the UNECE Transport Division Regional Adviser, and consultants. During the revision of the Master Plan, the Coordination Group met six times and the expert groups met five times.
One of the first and most important tasks of the Master Plan revision process was the modification and updating of the original backbone networks, consisting of the most important motorway/road and railway links in the participating countries. This task was necessary because of the need to reflect the latest relevant developments described above, the increased interest of the participating countries in intermodal aspects (including seaports and maritime hinterland connections), new road and rail projects initiated in the meantime as well as new data received from the participating countries. Moreover, during their revision, the TEM and TER backbone networks have been extended to include Albania, Armenia, Azerbaijan and Montenegro, which did not participate in the original Master Plan. It was also necessary to take into consideration the identified missing links, broadly following the relevant recommendations of the UNECE Working Party on Transport Trends and Economics (WP.5). In addition, some participating countries proposed additional links, with special consideration being given to the interconnections and the continuity of these additional links with the respective parts of both road and rail backbone networks. In the course of this work, modifications related to the backbone network´s intermodal relationships (motorways of the sea, combined transport terminals, freight villages and logistics centres) have been duly taken into account. The final scope of the revised TEM and TER Master Plan backbone networks, reflecting all these changes and proposals, is documented on the respective maps in this final report.
Particular attention was paid to the development and updating of the road and rail traffic forecast for the years 2015 and 2020. This work was based on verification of the forecast data in the original Master Plan (these data were based on the results of the 2005 censuses), other

E C O N O M I C C O M M I S S I O N F O R E U R O P E
19
recent forecasts presented by international organizations and the data and national forecasts of the participating countries. Two development scenarios were created which also took into account the present and expected impacts of the global recession on road and rail traffic. At the same time, the Master Plan traffic forecast was extended to include Armenia (as a new TEM and TER member country) and also to cover Albania, Azerbaijan and Montenegro. The results of updating the traffic forecast were also taken into account in the identification of bottlenecks on the backbone networks and served as input for the elaboration of the maps showing road and rail traffic flows in 2020.
The revised Master Plan puts forward a total of 485 new or revised projects (294 motorway/road projects and 191 rail projects) proposed by the participating countries. Most of the proposed road infrastructure projects were evaluated and prioritized in order to assign them a corresponding score and class. The results of this exercise are presented in detail in Annex III of Volume II of this final report. Out of the total number of projects, 268 projects (55 %) were taken over from the original Master Plan, mostly with revised or changed parameters. Thus, in the period 2006 to 2010, a total of 223 projects contained in the original Master Plan (45 %) were completed, most of them on the railway network.
During the revision, the work carried out by the relevant international organizations and institutions was reviewed with a special emphasis on bottlenecks in the TEM and TER backbone networks and on border crossing problems. The work in this segment focused on the identification of bottlenecks and missing links as well as on proposals and measures aimed at the removal of bottlenecks and the resolution of other priority transport needs in the backbone network. For this purpose, use was also made of the UNECE document “Methodological Basis for the Definition of Common Criteria regarding the Identification of Bottlenecks, Missing Links and Quality of Service in Infrastructure Networks”. With respect to border crossings, concrete actions were proposed in order to remove obstacles and to resolve the problems identified in relation to infrastructure, procedures and staff.
The status maps of rail and road backbone networks in 2010, 2015 and 2020 were produced on the basis of the national master plans of the participating countries, national data, TEM and TER projects databases, the TEMSTAT monitoring system, and available documentation and information gained from other sources. In some participating countries, approved investment plans up to the year 2020 did not exist, or such plans were undergoing revision and change as a result of the economic recession. For such cases, the infrastructure status shown on the maps represents the most probable option based on the latest information available, as communicated by the participating countries.
At the time of the revision of the Master Plan, a considerable proportion of the total implementation costs for the realization of projects has not been secured. The main sources of funding of the investment plans have been identified in Annexes III to VI of Volume II of the final report. This information will assist participating countries in advancing further and in continuing the process of funds acquisition in close cooperation with the international financial institutions.
The work also aimed at the identification of the relationship of backbone networks with the intermodal infrastructure and its facilities and nodal points. The mutual relationships between the TEM and TER backbone networks as well as the combined transport routes were examined. The locations of the shipping points (motorways of the sea, sea ports and major river ports), freight villages and logistics centres were identified, including their connections to the TEM and TER revised backbone networks.

U N E C E T E M A N D T E R P R O J E C T S ’ M A S T E R P L A N – 2 0 1 1
20
Finally, the Master Plan revision summarizes the experience gained by the participating countries in the implementation of individual components of the Intelligent Transport Systems (ITS), including the electronic toll collection (ETC) systems and plans and recommendations for their wider implementation in the future. Other items analysed in the revision include the possibilities for balancing transport facilitation and security measures to contribute to full interoperability of road transport, as well as considerations of environmental, safety and security issues especially with regard to international road and rail freight traffic.

E C O N O M I C C O M M I S S I O N F O R E U R O P E
21
2. REVISED TEM AND TER MASTER PLAN bACKbONE NETWORKS
The TEM and TER Master Plan backbone networks, consisting of the most important motorway/road and railway links in the participating countries, were defined during the preparation of the original Master Plan in 2005 on the basis of proposals made by National Coordinators from participating countries, the TEM and TER projects Central Offices and their consultants in close cooperation with the UNECE. The selection of lines and sections included in these networks was done on the basis of well-defined and commonly agreed criteria, which took into consideration the international importance of the traffic on these lines and sections. Most of these lines are part of the Pan-European transport corridors, the EU TEN-T and the Euro-Asian Transport Links as well as national priority lines of the participating countries.
After the original Master Plan was produced, the document “Networks for Peace and Development — Extension of the major trans-European transport axes to the neighbouring countries and regions” developed by the HLG was published in November 2005. In this document, the group identified five major trans-national axes to connect the EU with its neighbours (the Northern, Central, South Eastern and South Western axes and motorways of the sea); the first three generally cover the region of the TEM and TER Master Plan.
Furthermore, the Euro-Asian road and rail transport routes were identified in the framework of the UNECE–UNESCAP Joint Project on Developing Euro-Asian Transport Linkages (EATL). In the meantime, Bulgaria and Romania joined the EU, Serbia and Montenegro separated into two independent states and four new countries — Albania, Armenia, Azerbaijan and Montenegro — expressed interest in taking part in the Master Plan follow-up activities.
In order to take into account the developments described above, to reflect the increased interest of countries in intermodal aspects (including logistics centres, combined transport terminals, seaports and maritime hinterland connections), and to include new road and rail projects which were brought up in the meantime, as well as new data received from the participating countries, it was necessary to revise the original Master Plan and its original road and rail backbone networks.
In the course of the revision, additional links were proposed for inclusion in the revised TEM and TER Master Plan backbone networks. Special consideration was given to the interconnections and the continuity of the additional links with the respective parts of both road and rail backbone networks. Also new links, proposed by some participating countries, were added to these revised backbone networks.
Following the above-mentioned approach, the components of the revised TEM and TER Master Plan backbone networks specified in chapters 2.1 and 2.2 were identified (see also Maps No. 2 and No. 3).

U N E C E T E M A N D T E R P R O J E C T S ’ M A S T E R P L A N – 2 0 1 1
22
2.1 Revised TEM Master Plan backbone network
Note: The ISO alpha-3 country code is indicated where useful.
Albania (ALB)Hani i Hotit (MNE) – Shkoder – Fushe Kruja – TiranaMorina – Kukes – crossing of 2 roads Lezhe/Fushe KrujaTirana – Durres – Rrogozhine – Elbasan – Perrenjas – Qafe Thana (MKD)Kapshtica (GRC) – Pogradec – PerrenjasKakavija (GRC) – Gjirokaster – Fier – RrogozhineFier – Vlore
Armenia (ARM)Bavra (GEO) – Gyumri – YerevanBagratashen (GEO) – Vanadzor – YerevanYerevan – Ararat – Vayk – Goris – Meghri (IRN)
Austria (AUT)Nickelsdorf (HUN) – Parndorf – WienKittsee (SVK) – ParndorfWien – Graz – Villach – Arnoldstein (ITA)Wien – Drasenhofen (CZE)Salzburg (DEU) – Sattledt – Linz – WienSattledt – St. Michael – Graz – Spielfeld (SVN)Linz – Wullowitz (CZE)Villach – Karawanken Tunnel (SVN)
Azerbaijan (AZE)Baku – Sumgayit – Samur (RUS)Alat – Astara (IRN)Baku – Ganja – Gazakh – Boyuk – Red bridge (GEO)Baku – Alat – Horadiz – Agband (ARM)Kerchivan (ARM) – Sadarak (ARM)
Belarus (BLR)Novaja Zjamlja (RUS) – Minsk – Brest (POL)Kamenny Loh (LTU) – Minsk – HomyelEzerische (RUS) – Vitebsk – Homyel – Novaja Guta (UKR)
Bosnia and Herzegovina (BIH)Samac/Bosanski Samac (HRV) – Zenica – Lasva – Sarajevo – Bijaca (HRV)Sarajevo – Visegrad – Vardiste (SRB)Jajce – Banja Luka – Gradiska/Bosanska Gradiska (HRV)Izacic (HRV) – Bihac – Jajce – Travnik – LasvaSarajevo – Foca – Hum (MNE)
Bulgaria (BGR)Kalotina (SRB) – Sofia – Orizovo – Svilengrad – Kapitan Andreevo (TUR)Ruse (ROU) – Bjala – HaskovoSvilengrad – Novo Selo (GRC)Orizovo – Stara Zagora – Sliven – Burgas – VarnaBotevgrad – Bjala – Sumen –Varna

E C O N O M I C C O M M I S S I O N F O R E U R O P E
23
Vidin (ROU) – Botevgrad – SofiaDaskalovo – Gjusevo (MKD)Sofia – Daskalovo – Kulata (GRC)Varna – Durankulak (ROU)
Croatia (HRV)Bregana (SVN) – Zagreb – Lipovac (SRB)Gorican (HUN) – Zagreb – Karlovac – Bosiljevo – Rijeka –Matulji – Rupa (SVN)Knezevo (HUN) – Osijek – Slavonski Samac (BIH)Metkovic (BIH) – PloceMacelj (SVN) – ZagrebKarlovac – Bosiljevo/Slunj – Zadar/Knin – Split – PloceMatulji – Pazin – Kanfanar – PulaKanfanar – Plovanija (SVN)Licko Petrovo Selo (BIH) – KarlovacOkucani – Donji Varos (BIH)
The Czech Republic (CZE)Cinovec (DEU) – Praha – Brno – Lanzhot (SVK)Rozvadov (DEU) – PrahaMikulov (AUT) – Brno – Ostrava – Cesky Tesin/Vernovice (POL)Praha – Dolni Dvoriste (AUT)Praha – Hradec Kralove – Kralovec (POL)
The former Yugoslav Republic of Macedonia (MKD)Tabanovce (SRB) – Kumanovo – Miladinovci – Veles – Gevgelija (GRC)Miladinovci – Skopje – Debar (ALB)Veles – Bitola – Medzitlija (GRC)Kumanovo – Kriva Palanka (BGR)Bitola – Ohrid – Podmolje – Struga – Mali Vlaj (ALB)
Georgia (GEO)Leselidze (RUS) – Senaki – Khashuri – Tbilisi – Tsiteli Khidi (AZE)Sarpi (TUR) – Poti – SenakiLarsi (RUS) – Tbilisi – Sadakhlo (ARM)Arali (TUR) – Akhaltsikhe – Khashuri
Greece (GRC)Promachonas (BGR) – ThessalonikiEvzoni (MKD) – Chalastra – Klidi – Athinai – Korinthos – Tripolis – KalamataTripolis – GitheionKorinthos – Rio – PatraIgoumenitsa – Ioannina – Paleokastro – Kozani – KlidiChalastra – Thessaloniki – Alexandroupoli – Peplos – Ormenio (BGR)Ktismata (ALB) – Ioannina – Agrinio – RioKristalopigi (ALB) – Kastora – PaleokastroNiki (MKD) – KozaniPeplos – Kipi (TUR)

U N E C E T E M A N D T E R P R O J E C T S ’ M A S T E R P L A N – 2 0 1 1
24
Hungary (HUN)Hegyeshalom (AUT) – Level – Gyor – Budapest – Szeged – Roszke (SRB)Rajka (SVK) – LevelSzeged – Nagylak (ROU)Letenye (HRV) – Budapest – Istvanmajor – Zahony (UKR)Budapest – Udvar (HRV)Tornyosnemeti (SVK) – Miskolc – IstvanmajorHont (SVK) – Vac – BudapestTornyiszentmiklos (SVN) – Letenye
Italy (ITA)Ventimiglia (FRA) – Genova – Alessandria – Brescia – Padova – Palmanova – Trieste /Fernetti (SVN)Coccau (AUT) – PalmanovaPadova – Bologna – Bari – BrindisiBrescia – Milano – Biandrate Alessandria – Biandrate – Domodossola – Iselle (CHE)Alessandria – Torino – Bardonecchia (FRA)
Lithuania (LTU)Klaipeda – Sitkunai – Kaunas – Vilnius – Medininkai (BLR) Kaunas – Marijampole – Sangruda (POL)Salociai (LVA) – SitkunaiMarijampole – Kybartai (RUS)Vilnius – Panevezys – Siauliai – Palanga – Klaipeda
The Republic of Moldova (MDA)Leuseny (ROU) – Chisinau – Dubasari – Dobau (UKR)Chisinau – Pervomaise (UKR)
Montenegro (MNE)Donje Krusevo (BIH) – Podgorica – Bozaj (ALB)Metanjac (SRB) – Bijelo Polje – Podgorica – Bar
Poland (POL)Swiecko (DEU) – Poznan – Warszawa – Terespol (BLR)Gdansk – Lodz – Piotrkow Trybunalski – Katowice/Sosnica – Gorzyczki (CZE)Jedrzychowice (DEU) – Krzyzowa – Wroclaw – Katowice – Krakow – Rzeszow – Korczowa (UKR)Olszyna (DEU) – KrzyzowaBialystok – Warszawa – Piotrkow TrybunalskiWarszawa – Lublin – Plaski – Hrebenne (UKR)Pyrzowice – Kosztowy – Bielsko Biala – Cieszyn (CZE)Bielsko Biala – Zywiec – Zwardon (SVK)Piaski – Dorohusk (UKR)Gdansk – Elblag – Warszawa – Kielce – Krakow – Chyzne (SVK)Budzisko (LTU) – Suwalki – Elk – Lomza – Ostrow MazowieckaWroclaw – Poznan – Bydgoszcz – Grudziadz (A1)Barwinek (SVK) – Rzeszow – Lublin – Miedzyrzec Podlaski – Bialystok – Kuznica Bialostocka (BLR)Swinoujscie – Szczecin – Gorzow Wielkopolski – Zielona Gora – Legnica – Lubawka (CZE)

E C O N O M I C C O M M I S S I O N F O R E U R O P E
25
Wroclaw – LodzGrzechotki (RUS) – Elblag
Romania (ROU)Nadlac (HUN) – Timisoara – Lugoj – Sebes – Bucuresti – ConstantaLugoj – Craiova – Rosiori de Vede – BucurestiCraiova – Calafat (BGR)Timisoara – Moravita (SRB)Albita (MDA) – Marasesti – Bucuresti – Giurgiu (BGR)Siret (UKR) – Suceava – Bacau – MarasestiHalmeu (UKR) – Baia Mare – ZalauConstanta – Vama Veche (BGR) Zalau – Cluj Napoca – Brasov – Ploiesti – Bucuresti
The Russian Federation (RUS)Moskva – Nizhny NovgorodMoskva – St. PetersburgMoskva – Smolensk – Krasnoye (BLR)Moskva – Jaroslavl – VologdaMoskva – Brjansk – Kalinovka (UKR)St. Petersburg – Pskov – Lobok (BLR)Moskva – Tambov – Borisoglebsk – VolgogradKozino (UKR) – Kursk – Voronezh – Borisoglebsk – SaratovDonetsk (UKR) – Kamensk-Shakhtinskiy – Morozovsk – Volgograd – AstrakhanNovoshakhtinsk (UKR) – Mayskiy – Rostov na Donu – Pavlovskaya – Novorossiysk – Adler (GEO)Pavlovskaya – Pyatigorsk – Vladikavkaz – Groznyy – MakhachkalaVladikavkaz – Verkhniy Lars (GEO)Karaozek (KAZ) – Astrakhan – Makhachkala – Novogaptsakh (AZE)Kaliningrad – Nesterov – Chernyshevskoye (LTU)Kaliningrad – Mamonovo (POL)
Serbia (SRB)Horgos (HUN) – Novi Sad – Beograd – Batocina – Nis – Dimitrovgrad (BGR)Beograd – Batrovci (HRV)Nis – Leskovac – Presevo (MKD)Beograd – Vrsac (ROU)Mokra Gora (BIH) – Uzice – Kraljevo – NisBeograd – Pozega – Uzice – Boljare (MNE)Kraljevo – Kragujevac – Batocina
Slovakia (SVK)Kuty (CZE) – Bratislava – Rusovce (HUN)Bratislava Petrzalka (AUT) – Trnava – Zilina – Kosice – Vysne Nemecke (UKR)Skalite (POL) – ZilinaRuzomberok – Zvolen – Sahy (HUN)Vysny Komarnik (POL) – Presov – Kosice – Milhost (HUN)Trstena (POL) – Dolny Kubin – Ruzomberok

U N E C E T E M A N D T E R P R O J E C T S ’ M A S T E R P L A N – 2 0 1 1
26
Slovenia (SVN)Koper – Divaca – Ljubljana – Novo Mesto – Obrezje (HRV)Sezana (ITA) – DivacaPostojna/Divaca – Jelsane (HRV)Sentilj (AUT) – Maribor – Gruskovje (HRV)Ljubljana – Maribor – Pince (HUN)Ljubljana – Jesenice (AUT)Koper – Smarje – Dragonja (HRV)
Turkey (TUR)Kapikule (BGR) – Istanbul – Gerede – Ankara – Refahiye – Askale – Horasan – Gurbulak (IRN)Gerede – Suluova – Samsun – Trabzon – Sarp (GEO)Trabzon – AskaleIzmir – Afyon – AnkaraSuluova – Amasya – RefahiyeAnkara – Tarsus – Adana – Toprakkale – Gaziantep – Sanliurfa – Habur (IRQ)Toprakkale – Iskenderun – Yayladagi (SYR)Tarsus – MersinIzmir – Balikesir – Bursa – Yalova – GebzeSanliurfa – Diyarbakir – Bitlis – DogubayazitIzmir – CesmeIzmir – Aydin – Denizli – AntalyaAfyon – Konya – Eregli – E 90 road junctionHorasan – Kars – Turkgozu (GEO)Kinali 1 junction – Tekirdag – Ipsala (GRC)
Ukraine (UKR)Chop (HUN) – Užhorod (SVK) – Mukaceve – Stryj – Lviv – Kyjiv – Kharkïv – Debaltseve – Dovzhanskiy (RUS)Stryj – Ternopil – Uman – Dnipropetrovsk – Doneck – Debaltseve – Krasnodon (RUS)Ternopil – Porubne (ROU)Novi Yarylovychi (BLR) – Kipti – Kyjiv – Uman – Demydivka – OdesaDemydivka – Poplavka (MDA)Odesa – Kuchurhan (MDA)Kipti – Konotop – Hluchov – Zarutske/Bachivsk (RUS)Starovoitove (POL) – Kovel – Korosten – KyjivRava-Ruska (POL) – LvivKrakovets (POL) – LvivNevetlenfolu (ROU) – Berehove – Mukaceve
2.2 Revised TER Master Plan backbone network
Albania (ALB)Hani-i-Hotit (MNE) – Shkoder – Vore – TiranaVore – Durres – Rrogozhine – Elbasan – Lin (MKD)Rrogozhine – Vlore

E C O N O M I C C O M M I S S I O N F O R E U R O P E
27
Armenia (ARM)Ayrum – Gyumri – Masis – YerevanMasis – YeraskhMeghri – Niuvedi
Austria (AUT)Salzburg – Bischofshofen – Schwarzach – Spittal am der Dran – Villach – Rosenbach (SVN)Wernstein am Inn (DEU) – Neumarkt – Wels – Linz – St. Valentin – St. Polten – WienLinz – Salzburg – Innsbruck – BregenzWien – Parndorf – Nickelsdorf (HUN)/Kittsee (SVK)Wien – Bruck an der Mur – Klagenfurt – Villach – Arnoldstein (ITA)Wien – Hohenau – Bernhardsthal (CZE)Summerau (CZE) – Linz – Selzthal – St. Michael – Leoben – Bruck an der Mur – Graz – Spielfeld (SVN)Innsbruck – Brenner (ITA)Baumgarten im Burgenland (HUN) – Ebenfurth – WienKlagenfurt – Koralm – Graz – Jennersdorf (HUN)
Azerbaijan (AZE)Baku – Yalama (RUS)Baku – Osmanly – AstaraBaku – Ganca – Boyuk-Kesik (GEO)Osmanly – Horadiz – Agband (ARM)Kerchivan (ARM) – Sadarak (ARM)
Belarus (BLR)Orsha (RUS) – Minsk – Brest (POL)Gudagai (LTU) – Homyel (UKR)Ezjaryszcza (RUS) – Vitebsk – Asipoviczy
Bosnia and Herzegovina (BIH)Samac/Bosanski Samac (HRV) – Doboj – Zenica – Sarajevo – Konjic – Mostar – Capljina (HRV) – Dobrljin (HRV) – Bosanski Novi – Banja Luka – Doboj – Bosanska Poljana – Zvornik (SRB) – Capljina – Trebinje – MNE
Bulgaria (BGR)Vidin (ROU) – Mezdra – Sofia – Pernik – Radomir – Dupniza – Kulata (GRC)Russe (ROU) – Gorna Oriahovitza – Dubovo – Stara Zagora – Dimitrovgrad – Svilengrad (GRC, TUR)Dragoman (SRB) – Sofia – Mezdra – Pleven – G. Oriahovitza – Kaspichan – Sindel – VarnaSofia – Plovdiv – DimitrovgradStara Zagora – Karnobat – BurgasRadomir – Gjusevo (MKD)
Croatia (HRV)(HUN) Koprivnica – Zagreb – Ostarije – RijekaRijeka – Sapjane (SVN)Ostarije – Gospic – Knin – Perkovic – SplitKnin – Zadar

U N E C E T E M A N D T E R P R O J E C T S ’ M A S T E R P L A N – 2 0 1 1
28
Perkovic – Sibenik(HUN) Beli Manastir – Osijek – Slavonski Samac (BIH) – (BIH) Metkovic – Ploce(SVN) Savski Marof – Zagreb – Novska – Vinkovci – Tovarnik (SRB)Zagreb – Sisak – Sunja – NovskaSunja – Volinja (BIH)(SVN) Cakovec – Kotoriba (HUN)
The Czech Republic (CZE)Decin (DEU) – Ustí nad Labem – Lovosice – Kralupy – Praha – Kolin – Pardubice – Ceska Trebova – Brno – Breclav (AUT, SVK)Petrovice u Karvine (POL) – Bohumin (POL) – Ostrava – Prerov – Breclav (AUT, SVK)Cheb (DEU) – Plzen – Beroun – Praha – Kolin – Pardubice – Olomouc – Prerov – Ostrava – Mosty u Jablunkova (SVK)Lichkov (POL) – Usti nad Orlici – Pardubice – Kolin – Praha – Benesov – Tabor – Veseli nad Luznici – Ceské Budejovice – Horni Dvoriste (AUT)Prerov – BrnoHranice na Morave – Horní Lidec (SVK)
The former Yugoslav Republic of Macedonia (MKD)Tabanovce (SRB) – Kumarovo – Skopje – Titov VelesTitov Veles – Kremenica (GRC)Titov Veles – Gevgelija (GRC)Kumanovo – Kriva Palanka (BGR)Skopje – Kicevo – Struga (ALB)
Georgia (GEO)Gantiadi (RUS) – Achadara – Gali – Abasha – BatumiAbasha – PotiAbasha – Agara – Gori – Kaspi – Tbilisi – Sadakhlo (ARM)Tbilisi – Gardabani (AZE)Tbilisi – Akhalkalaki – Kartsakhi (TUR)
Greece (GRC)Dikea (BGR) – Alexandroupoli – ThessalonikiPromachonas (BGR) – Thessaloniki – AthinaThessaloniki – Idomeni (MKD)Neos Kafkasos (MKD) – Plati
Hungary (HUN)Sopron (AUT) – Gyor – BudapestBudapest – Hatvan – Miskolc – Nyiregyhaza – Zahony (UKR)Felsozsolca – Hidasnemeti (SVK)Oriszentpeter (SVN) – Zalalovo – Zalaegerszeg – Ukk – Boba – Szekesfehervar – BudapestBudapest – Szolnok – Szajol – Puspokladany – Biharkeresztes (ROU)Szajol – Bekescsaba – Lokoshaza (ROU)Szob (SVK) – BudapestBudapest – Pusztaszabolcs – Dombovar – Pecs – Magyarboly (HRV)Budapest – Kelebia (SRB)Dombovar – Gyekenyes (HRV)Gyor – Hegyeshalom (AUT)

E C O N O M I C C O M M I S S I O N F O R E U R O P E
29
Hegyeshalom – Rajka (SVK)Szentgotthard (AUT) – Szombathely – BobaMurakeresztur (HRV) – Nagykanizsa – SzekesfehervarPuspokladany Debrecen – Nyiregyhaza
Italy (ITA)Villa Opicina (SVN) – Trieste – Venezia – Bologna – Ancona – RomaVerona – VeneziaBrennero (AUT) – Verona – BolognaTarvisio (AUT) – Udine
Lithuania (LTU)Kena (BLR) – Kaisiadorys – KlaipedaKaisiadorys – Kybartai (RUS)Radviliskis – Pagegiai (RUS)Mockava (POL) – Kazlu Ruda – Palemonas – Gaiziunai – Siauliai – Joniskis (LVA)
The Republic of Moldova (MDA)Ungheni (ROU) – Chisinau – Tighina – Bender (UKR)Reni (UKR) – Besarabeasca – Cainari – Chisinau
Montenegro (MNE)Bijelo Polje (SRB) – Podgorica – Tuzi (ALB)BIH – Niksic – PodgoricaPodgorica – Bar
Poland (POL)Gdynia – Gdansk – Tczew – Malbork/Bydgoszcz – Warszawa – Myslowice – Zebrzydowice (CZE)Trakiszki (LTU) – Suwalki – Sokolka/Elk – Bialystok – WarszawaRzepin (DEU) – Poznan – Warszawa/Mszczonow – Lukow – Terespol (BLR)Warszawa – Dorohusk (UKR)Wroclaw – Miedzylesie (CZE)Zgorzelec/Wegliniec (DEU) – Wroclaw – Opole – Kedzierzyn Kozle – Katowice – Krakow– Medyka (UKR)Swinoujscie – Szczecin – Kostrzyn/Poznan – Wroclaw – Opole – Chalupki (CZE)Malbork – Braniewo (RUS)Zwardon (SVK) – Czechowice-DziedziceMuszyna (SVK) – TarnowPoznan – Inowroclaw
Romania (ROU)Episcopia Bihor (HUN) – Oradea– Poieni – Cluj – Apahida – Alba Iulia – Copsa M. – Brasov – PloiestiVicsani (UKR) – Suceava – Pascani – Adjud – Marasesti – Buzau – PloiestiPloiesti – Bucuresti – Giurgiu (BGR)Bucuresti – Fetesti – Medgidia – ConstantaBucuresti – Videle – Craiova – Drobeta Turnu Severin – Timisoara – Arad – Curtici (HUN)Craiova – Calafat (BGR)

U N E C E T E M A N D T E R P R O J E C T S ’ M A S T E R P L A N – 2 0 1 1
30
Stamora (SRB) – TimisoaraArad – Alba IuliaArad – Oradea – Halmeu (UKR)Pascani – Iasi – Cristesti Jijia (MDA)Buzau – Faurei – Braila – Galati – Giurgiulesti (UKR)Vintu de Jos – Sibiu – Ramnicu Valcea – Pitesti – BucurestiBucuresti – Armasesti – Urziceni – FaureiSatu Mare – Beclean – Deda – AdjudRazboeni – Targu Mures – DedaBeclean – SuceavaSimeria – FiliasiTulcea – MedgidiaConstanta – Mangalia
The Russian Federation (RUS)Moskva – N. Novgorod – KotelnichMoskva – St. Petersburg – Buslovskaya (FIN)Moskva – Krasnoye (BLR)Moskva – Suzemka (UKR)Moskva – EkaterinburgSt. Petersburg/Ust-Luga – Vologda – Kotelnich – Perm – Ekaterinburg – KurganVologda – Yaroslavl – MoskvaSt. Petersburg – Pskov – Dubishche (BLR)Moskva – Voronezh – Rostov na Donu – Krasnodar – Veseloe (GEO)Kavkaz/Novorossiysk – Krasnodar – Volgograd – Saratov – Syzran – Samara – Chelyabinsk – KurganSamara – Orenburg – Akbulak (KAZ)Shelayevo (UKR) – Liski – Penza – Syzran – SamaraRyazan – Ruzayevka – SyzranKochetovka – Rtishchevo – SaratovMatveev Kurgan (UKR) – Rostov na DonuGukovo (UKR) – Likhaya – Volgograd – Astrakhan (KAZ)/Olya – Makhachkala – Samur (AZE)Mamonovo (POL) – Kaliningrad – Nesterov (LTU)Kaliningrad – Sovetsk (LTU)
Serbia (SRB)Stara Pazova – Novi Sad – Subotica (HUN)Beograd – Stara Pazova – Ruma – Sid (HRV)Ruma – Zvornik (BIH)Beograd – Valjevo – Uzice – Vrbnica (MNE)Beograd – Vrsac (ROU)Beograd – NisNis – Leskovac – Presevo (MKD)Nis – Pirot – Dimitrovgrad (BGR)Stalac – Kraljevo – PozegaLapovo – Kraljevo

E C O N O M I C C O M M I S S I O N F O R E U R O P E
31
Slovakia (SVK)Kuty (CZE) – Malacky – Devinska Nova Ves – Bratislava Petrzalka (AUT) – Rusovce (HUN)Zilina – Puchov – Nove Mesto nad Vahom – Leopoldov – Bratislava/GalantaBratislava – Galanta – Nove Zamky – Sturovo (HUN)Cadca (CZE) – Zilina – Vrutky – Ruzomberok – Kralova Lehota – Poprad – Spisska Nova Ves – Margecany – Kysak – Kosice – Cierna nad Tisou (UKR)Plavec (POL) – Presov – Kysak – Kosice – Cana (HUN)Cadca – Skalite (POL)Luky pod Makytou (CZE) – Puchov
Slovenia (SVN)Koper – Divaca – Pivka – Ljubljana – Zidani Most – Pragersko – Ormoz – Murska – Sobota – Puconci – Hodos (HUN)Divaca – Sezana (ITA)Pivka – Ilirska Bistrica (HRV)Ljubljana – Jesenice (AUT)Pragersko – Maribor – Sentilj (AUT)Ormoz – Sredisce (HRV)Ljubljana – Zidani Most – Dobova (HRV)
Turkey (TUR)Kapikoy (IRN) – Van – Tatvan – Yolcati – Malatya – CetinkayaCetinkaya – Divrigi – Erzurum – Kars – Dogukapi (ARM) (border closed)Kars – Aktas (GEO)Cetinkaya – Sivas – Kalin – Bogazkopru – Kirikkale – Irmak – Ankara – Istanbul – Halkali – Mandra – Pehlivankoy – Kapikule (BGR)Kalin – Yildizeli – Amasya – SamsunMalatya – Narli – Fevzipasa – Toprakkale – IskenderunToprakkale – Adana – Yenice – MersinEskisehir – Alayunt – Balikesir – Manisa – IzmirIrmak – ZonguldakBalikesir – BandirmaAlayunt – Afyon – Konya – UlukislaBogazkopru – Ulukisla – YeniceAfyon – ManisaAfyon – Karakuyu – Aydin – IzmirFevzipasa – Meydanekbez (SYR)Narli – Gaziantep – Karkamis – Nusaybin (SYR)Karkamis – Cobanbey (SYR)Tekirdag – MuratliPehlivankoy – Uzunkopru (GRC)Polatli – Konya

U N E C E T E M A N D T E R P R O J E C T S ’ M A S T E R P L A N – 2 0 1 1
32
kraine (UKR)Dobrjanka (BLR) – Chernihiv – Kyjiv– Vinnytsya – Khmelnytskyy – Ternopil – Lviv – Mostiska (POL)Zernovo (RUS) – Kyjiv Izov (POL) – Kovel – Kyjiv– Kharkov – Topoli (RUS)Fastiv – Donetsk – Krasnaia Mogila (RUS)Donetsk – Kvashino (RUS)Kovel – Lvov – Chop (HUN, SVK)Djakove (ROU) – Berehove – VuzloveVadu Siret (ROU) – Cernivci – TernopilZmerinka – Rozdilna (MDA) – Odessa

E C O N O M I C C O M M I S S I O N F O R E U R O P E
33
3. COMPARISON OF THE MASTER PLAN bACKbONE NETWORKS WITH OTHER INTERNATIONAL INFRASTRUCTURE NETWORKS
The tables in chapters 3.1 and 3.2 include the results of link-by-link and country-by-country detailed comparisons of the revised TEM and TER backbone networks together with the following:• thelinesfromthefinalreportoftheEUHLGontheextensionofthemajorTrans-European
multimodal transport axes and trans-national axes to the neighbouring countries and regions [out of the five axes defined by the Group, three of them (i.e. the Northern, Central and South-Eastern axes) were subjected to this comparison since the two remaining ones (the motorways of the sea and the South-Western axis) were of no relevance to this final report];
• thelinesincludedintheEUTEN-TaccordingtotheCorrigendumtoDecision884/2004/EC of the European Parliament and of the Council of 29 April 2004 (Official Journal of the EU Volume 47 - 7 June 2004) as well as the lines from the Accession Treaties of the TEM and TER Member States which joined the EU in 2004 and 2007;
• theroadandrailroutesdefinedintheframeworkofthe1stphaseoftheEuro-AsianTransportLinkages (EATL) project, developed jointly by the UNECE and the United Nations Economic and Social Commission for Asia and the Pacific (UNESCAP);
• the links of E road and E rail networks according to the EuropeanAgreements onMainInternational Traffic Arteries (AGR) and Main International Railway Lines (AGC).
Note: In the tables in 3.1 and 3.2, “X” indicates “compatible” backbone road and rail links in the revised Master Plan which overlap with other international networks over a substantial part of their length but not over their full length.

U N E C E T E M A N D T E R P R O J E C T S ’ M A S T E R P L A N – 2 0 1 1
34
3.1 TEM backbone network
TEM backbone network links
Part
of H
LG
tran
snat
iona
l ax
is
Part
of E
roa
d ne
twor
k
Part
of E
ATL
Part
of T
EN-T
CountryFrom
(country border)To
(country border)
Albania
Hani Hotit(MNE) Tirana
Morina Fushe Kruja
Tirana Qafe Thana(MKD) X
Kapshtica(GRC) Perrenjas
Kakavija(GRC) Rrogozhine
Fier Vlore
Armenia
Bavra(GEO) Yerevan X
Bagratashen(GEO) Yerevan X X X
Yerevan Meghri(IRN) X X
Austria
Salzburg(DEU) Wien X X
Wien Arnoldstein(ITA) X X
Wien Parndorf X X
Parndorf Nickelsdorf(HUN) X X
Parndorf Kittsee(SVK) X X
Sattledt Spielfeld(SVN) X X
Linz Wullowitz(CZE) X X
Drasenhofen(CZE) Wien X X
Villach Karawanken tunnel(SVN) X X X
Azerbaijan
Baku Samur(RUS) X X
Alat Astara(IRN) X X
Baku Red bridge(GEO) X X X
Baku Agband(ARM) X X
Kerchivan(ARM)
Sadarak(ARM) X X X

E C O N O M I C C O M M I S S I O N F O R E U R O P E
35
TEM backbone network links
Part
of H
LG
tran
snat
iona
l ax
is
Part
of E
roa
d ne
twor
k
Part
of E
ATL
Part
of T
EN-T
CountryFrom
(country border)To
(country border)
Belarus
Jezjarysca(RUS)
Novaja Guta(UKR) X X
Brest(POL) Novaja Zjamlja (RUS) X X X
Kamenny Loh (LTU) Homyel X X X
Bosnia and Herzegovina
Sarajevo Vardiste(SRB) X
Samac/Bosanski Samac(HRV)
Bijaca(HRV) X X
Jajce Gradiska/Bosanska Gradiska (HRV) X
Izacic(HRV) Lasva X
Sarajevo Hum(MNE) X
Bulgaria
Ruse(ROU) Haskovo X X
Bjala Varna X X
Vidin(ROU) Sofia X X X
Sofia Kulata (GRC) X X
Novo Selo(GRC) Svilengrad X X
Kalotina(SRB)
Kapitan Andreevo(TUR) X X X X
Gjusevo(MKD) Daskalovo X X X X
Orizovo Burgas X X X X
Sofia Bjala X X X
Burgas Durankulak (ROU) X X
Croatia
Gorican(HUN) Zagreb X
Macelj(SVN) Zagreb X
Zagreb Bosiljevo X
Bosiljevo Ploce X
Bosiljevo Rupa(SVN) X
Matulji Pula X

U N E C E T E M A N D T E R P R O J E C T S ’ M A S T E R P L A N – 2 0 1 1
36
TEM backbone network links
Part
of H
LG
tran
snat
iona
l ax
is
Part
of E
roa
d ne
twor
k
Part
of E
ATL
Part
of T
EN-T
CountryFrom
(country border)To
(country border)
Croatia
Kanfanar Plovanija(SVN) X
Bregana(SVN)
Lipovac(SRB) X X
Knezevo(HUN)
Slavonski Samac(BIH) X X
Metkovic(BIH) Ploce X X
Licko Petrovo Selo(BIH) Karlovac X
Okucani Donji Varos(BIH) X
The Czech Republic
Cinovec (DEU) Praha X X
Praha Lanzhot (SVK) X X
Rozvadov(DEU) Praha X X
Praha Dolni Dvoriste(AUT) X X
Cesky Tesin/Vernovice(POL)
Mikulov(AUT) X X
Praha Kralovec(POL) X X
The former Yugoslav Republic of Macedonia
Tabanovce(SRB)
Gevgelija(GRC) X X
Miladinovci Debar(ALB) X X
Veles Medzitlija(GRC)
Kumanovo Kriva Palanka(BGR) X X
Bitola Mali Vlaj(ALB) X
Georgia
Leselidze(RUS)
Tsiteli Khidi(AZE) X X X
Senaki Sarpi(TUR) X X X
Larsi(RUS)
Sadakhlo(ARM) X X
Arali(TUR) Khashuri

E C O N O M I C C O M M I S S I O N F O R E U R O P E
37
TEM backbone network links
Part
of H
LG
tran
snat
iona
l ax
is
Part
of E
roa
d ne
twor
k
Part
of E
ATL
Part
of T
EN-T
CountryFrom
(country border)To
(country border)
Greece
Korinthos Kalamata X X
Tripolis Githeion X
Ioannina Ktismata(ALB) X X
Paleokastro Kristalopigi(ALB)
X
Kozani Niki(MKD) X X
Evzoni(MKD) Athinai X X X
Korinthos Patra X X
Rio Ioannina X X
Igoumenitsa Klidi X X X
Chalastra Ormenio(BGR) X X X
Thessaloniki Promachonas (BGR) X X
Peplos Kipi(TUR) X X X
Hungary
Hegyeshalom(AUT) Budapest X X
Letenye(HRV) Budapest X X
Rajka(SVK) Level X X
Szeged Nagylak(ROU) X X
Budapest Zahony(UKR) X X
Budapest Szeged X X X
Szeged Roszke(SRB) X X X
Budapest Udvar(HRV) X X X
Tornyosnemeti(SVK) Istvanmajor X X
Hont(SVK) Budapest X X
Tornyiszentmiklos(SVN) Letenye X X

U N E C E T E M A N D T E R P R O J E C T S ’ M A S T E R P L A N – 2 0 1 1
38
TEM backbone network links
Part
of H
LG
tran
snat
iona
l ax
is
Part
of E
roa
d ne
twor
k
Part
of E
ATL
Part
of T
EN-T
CountryFrom
(country border)To
(country border)
Italy
Coccau(AUT) Palmanova X X
Palmanova Trieste/Fernetti(SVN) X X
Padova Brindisi X X
Iselle(CHE) Alessandria X X
Ventimiglia(FRA) Alessandria X X
Alessandria Palmanova X X
Bardonecchia(FRA) Alessandria X X
Lithuania
Sangruda(POL) Kaunas X X X X
Sitkunai Salociai(LVA) X X
Klaipeda Medininkai(BLR) X X X X
Marijampole Kybartai(RUS) X X X X
Vilnius Klaipeda(via Siauliai) X X X
The Republic of Moldova
Leuseny(ROU)
Dobau(UKR) X X
Chisinau Pervomaise(UKR) X X
Montenegro
Donje Krusevo(BIH)
Bozaj(ALB) X
Metanjac(SRB) Bar X
Poland
Olszyna(DEU) Krzyzowa X X
Piotrkow Trybunalski Bialystok X X
Bielsko Biala Zwardon(SVK)
X
Warszawa Hrebenne(UKR) X X
Piaski Dorohusk(UKR) X X
Gdansk Sosnica X X
Sosnica Gorzyczki(CZE)
X

E C O N O M I C C O M M I S S I O N F O R E U R O P E
39
TEM backbone network links
Part
of H
LG
tran
snat
iona
l ax
is
Part
of E
roa
d ne
twor
k
Part
of E
ATL
Part
of T
EN-T
CountryFrom
(country border)To
(country border)
Poland
Swiecko(DEU)
Terespol(BLR) X X X
Jedrzychowice(DEU)
Korczowa(UKR) X X X
Pyrzowice Cieszyn(CZE) X X
Gdansk Chyzne(SVK) X X
Budzisko(LTU) Ostrow Mazowiecka
Wroclaw Grudziadz (A1) X X
Barwinek(SVK)
Kuznica Bialostocka(BLR)
Swinoujscie Lubawka(CZE) X X
Wroclaw Lodz X X
Grzechotki(RUS) Elblag X
Romania
Timisoara Moravita (SRB) X X
Lugoj Bucuresti(via Craiova) X X X
Craiova Calafat (BGR) X X X
Marasesti Giurgiu (BGR) X X X
Marasesti Siret (UKR) X X
Marasesti Albita (MDA) X X X
Nadlac (HUN) Bucuresti X X X
Bucuresti Constanta X X X
Halmeu (UKR) Zalau X X
Constanta Vama Veche(BGR) X X
Zalau Bucuresti X X
The Russian Federation
Moskva Nizhny Novgorod X X X
Moskva Vologda X X X
Moskva Kalinovka(UKR) X X X
Moskva Volgograd X X

U N E C E T E M A N D T E R P R O J E C T S ’ M A S T E R P L A N – 2 0 1 1
40
TEM backbone network links
Part
of H
LG
tran
snat
iona
l ax
is
Part
of E
roa
d ne
twor
k
Part
of E
ATL
Part
of T
EN-T
CountryFrom
(country border)To
(country border)
The Russian Federation
Kozino(UKR) Saratov X X
Donetsk(UKR) Astrakhan X X
Novogaptsakh(AZE)
Karaozek(KAZ) X X
St. Petersburg Lobok(BLR) X X
Krasnoye(BLR) Moskva X X X
St. Petersburg Moskva X X X
Kaliningrad Chernyshevskoye(LTU) X X X
Novoshakhtinsk(UKR)
Adler(GEO) X X
Vladikavkaz Verkhniy Lars(GEO) X
Pavlovskaya Makhachkala X X
Kaliningrad Mamonovo(POL)
Serbia
Vrsac(ROU) Beograd X
Mokra Gora(BIH) Nis X
Batrovci(HRV) Beograd X X
Horgos(HUN)
Dimitrovgrad(BGR) X X
Nis Presevo(MKD) X X
Beograd Boljare(MNE) X
Kraljevo Batocina
Slovakia
Petrzalka/Bratislava (AUT)
Vysne Nemecke(UKR) X X
Kuty(CZE)
Rusovce(HUN) X X
Skalite(POL) Zilina X X
Ruzomberok Sahy(HUN) X X
Vysny Komarnik(POL)
Milhost(HUN) X X
Trstena(POL) Ruzomberok X
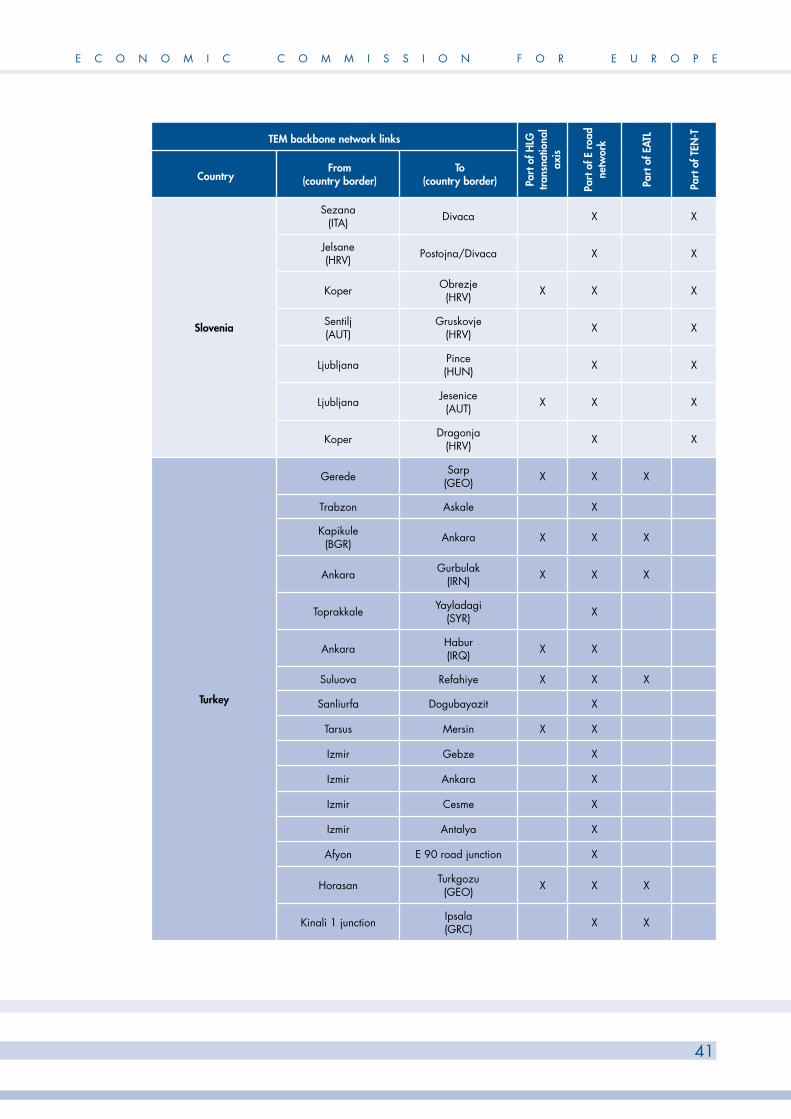
E C O N O M I C C O M M I S S I O N F O R E U R O P E
41
TEM backbone network links
Part
of H
LG
tran
snat
iona
l ax
is
Part
of E
roa
d ne
twor
k
Part
of E
ATL
Part
of T
EN-T
CountryFrom
(country border)To
(country border)
Slovenia
Sezana(ITA) Divaca X X
Jelsane(HRV) Postojna/Divaca X X
Koper Obrezje(HRV) X X X
Sentilj(AUT)
Gruskovje(HRV) X X
Ljubljana Pince(HUN) X X
Ljubljana Jesenice(AUT) X X X
Koper Dragonja(HRV) X X
Turkey
Gerede Sarp(GEO) X X X
Trabzon Askale X
Kapikule(BGR) Ankara X X X
Ankara Gurbulak(IRN) X X X
Toprakkale Yayladagi(SYR) X
Ankara Habur(IRQ) X X
Suluova Refahiye X X X
Sanliurfa Dogubayazit X
Tarsus Mersin X X
Izmir Gebze X
Izmir Ankara X
Izmir Cesme X
Izmir Antalya X
Afyon E 90 road junction X
Horasan Turkgozu(GEO) X X X
Kinali 1 junction Ipsala(GRC) X X

U N E C E T E M A N D T E R P R O J E C T S ’ M A S T E R P L A N – 2 0 1 1
42
TEM backbone network links
Part
of H
LG
tran
snat
iona
l ax
is
Part
of E
roa
d ne
twor
k
Part
of E
ATL
Part
of T
EN-T
CountryFrom
(country border)To
(country border)
Ukraine
Starovoitove(POL) Kyjiv X X
Rava-Ruska(POL) Lviv X
Stryj Uman X X
Uman Krasnodon(RUS) X X
Ternopil Porubne(ROU) X
Poplavka(MDA) Demydivka X
Kuchurhan(MDA) Odesa X X
Krakovets(POL) Lviv X X X
Chop(HUN) Kyjiv X X
Novi Yarylovychi(BLR) Odesa X X
Kipti Zarutske/Bachivsk(RUS) X X
Kyjiv Dovzhanskiy(RUS) X X
Nevetlenfolu(ROU) Mukaceve

E C O N O M I C C O M M I S S I O N F O R E U R O P E
43
3.2 TER backbone network
TER backbone network links Part of HLG
trans-national
axis
Part of E rail
network
Part of EATL
Part of TEN-T
CountryFrom
(country border)To
(country border)
Albania
Hani i Hotit(MNE) Tirana
Vore Lin(MKD)
X
Rrogozhine Vlore
Armenia
Ayrum(GEO) Yerevan X X X
Masis Yeraskh(AZE) X
Meghri(AZE)
Niuvedi(AZE) X
Austria
Wernstein am Inn(DEU) Wien X X
Salzburg Rosenbach(SVN) X X X
Linz Bregenz X X
Wien Nickelsdorf(HUN) X X
Parndorf Kittsee(SVK) X X
Summerau(CZE)
Spielfeld(SVN) X X
Wien Arnoldstein(ITA) X X
Wien Bernhardsthal(CZE) X X
Innsbruck Brenner(ITA) X X
Baumgarten im Burgenland
(HUN)Wien X
Klagenfurt Jennersdorf(HUN) X
Azerbaijan
Baku Yalama(RUS) X
Baku Astara X
Baku Boyuk-Kesik(GEO) X X X
Osmanly Agband(ARM) X
Kerchivan(ARM)
Sadarak(ARM) X
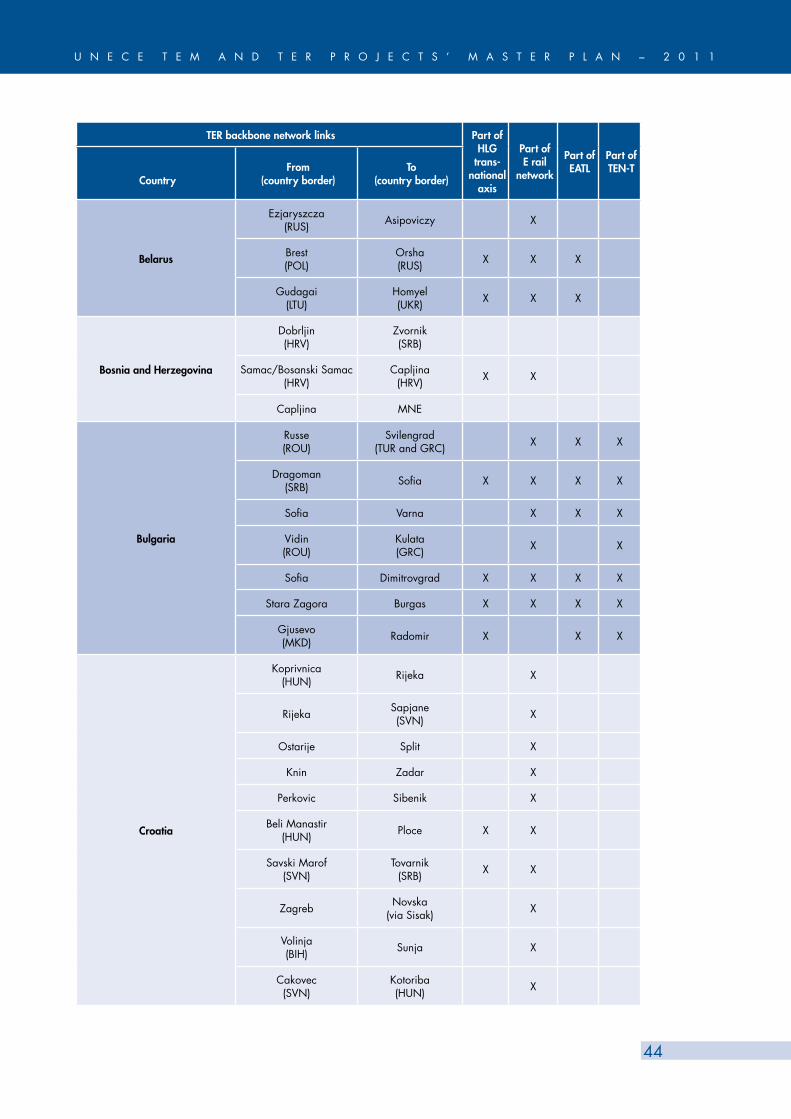
U N E C E T E M A N D T E R P R O J E C T S ’ M A S T E R P L A N – 2 0 1 1
44
TER backbone network links Part of HLG
trans-national
axis
Part of E rail
network
Part of EATL
Part of TEN-T
CountryFrom
(country border)To
(country border)
Belarus
Ezjaryszcza(RUS) Asipoviczy X
Brest(POL)
Orsha(RUS) X X X
Gudagai(LTU)
Homyel(UKR) X X X
Bosnia and Herzegovina
Dobrljin(HRV)
Zvornik(SRB)
Samac/Bosanski Samac(HRV)
Capljina(HRV) X X
Capljina MNE
Bulgaria
Russe(ROU)
Svilengrad(TUR and GRC) X X X
Dragoman(SRB) Sofia X X X X
Sofia Varna X X X
Vidin(ROU)
Kulata(GRC) X X
Sofia Dimitrovgrad X X X X
Stara Zagora Burgas X X X X
Gjusevo(MKD) Radomir X X X
Croatia
Koprivnica(HUN) Rijeka X
Rijeka Sapjane(SVN) X
Ostarije Split X
Knin Zadar X
Perkovic Sibenik X
Beli Manastir(HUN) Ploce X X
Savski Marof(SVN)
Tovarnik (SRB) X X
Zagreb Novska(via Sisak) X
Volinja(BIH) Sunja X
Cakovec(SVN)
Kotoriba(HUN) X

E C O N O M I C C O M M I S S I O N F O R E U R O P E
45
TER backbone network links Part of HLG
trans-national
axis
Part of E rail
network
Part of EATL
Part of TEN-T
CountryFrom
(country border)To
(country border)
The Czech Republic
Decin(DEU)
Breclav(AUT and SVK) X X
Petrovice u Karvine(POL)
Breclav(AUT and SVK) X X
Cheb(DEU)
Mosty u Jablunkova(SVK) X X
Lichkov(POL)
Horni Dvoriste(AUT) X X
Prerov Brno X
Hranice na Morave Horni Lidec(SVK) X X
The former Yugoslav Republic of Macedonia
Tabanovce(SRB) Titov Veles X X
Titov Veles Kremenica(GRC)
Titov Veles Gevgelija(GRC) X X
Kumanovo Kriva Palanka(BGR) X
Skopje Struga(ALB) X
Georgia
Gantiadi(RUS) Batumi X X X
Tbilisi Kartsakhi(TUR) X
Abasha Sadakhlo(ARM) X X X
Tbilisi Gardabani(AZE) X X X
Abasha Poti X X X
Greece
Dikea(BGR) Thessaloniki X X
Promachonas(BGR) Athina X X
Thessaloniki Idomeni(MKD) X X X
Neos Kafkasos(MKD) Plati X

U N E C E T E M A N D T E R P R O J E C T S ’ M A S T E R P L A N – 2 0 1 1
46
TER backbone network links Part of HLG
trans-national
axis
Part of E rail
network
Part of EATL
Part of TEN-T
CountryFrom
(country border)To
(country border)
Hungary
Sopron(AUT) Budapest X
Budapest Zahony(UKR) X X
Felsozsolca Hidasnemeti(SVK) X X
Oriszentpeter(SVN)
Szekesfehervar X
Budapest Biharkeresztes(ROU) X X
Szajol Lokoshaza(ROU) X X
Budapest Magyarboly(HRV) X X X
Budapest Kelebia(SRB) X X X
Szob(SVK) Budapest X X
Dombovar Gyekenyes(HRV) X X X
Gyor Hegyeshalom(AUT) X X
Hegyeshalom Rajka(SVK) X
Szentgotthard(AUT) Boba X
Murakeresztur(HRV) Budapest X X
Puspokladany Nyiregyhaza X X
Italy
Tarvisio(AUT) Udine X X
Villa Opicina(SVN) Roma X X
Verona Venezia X X
Brennero(AUT) Bologna X X
Lithuania
Mockava(POL)
Joniskis(LVA) X X
Kena(BLR) Klaipeda X X X
Kaisiadorys Kybartai(RUS) X X X
Radviliskis Pagegiai(RUS) X

E C O N O M I C C O M M I S S I O N F O R E U R O P E
47
TER backbone network links Part of HLG
trans-national
axis
Part of E rail
network
Part of EATL
Part of TEN-T
CountryFrom
(country border)To
(country border)
The Republic of Moldova
Ungheni(ROU)
Bender(UKR) X X
Chisinau Reni(UKR) X X
Montenegro
Bijelo Polje(SRB)
Tuzi(ALB) X
(BIH) Podgorica
Podgorica Bar X
Poland
Gdynia Warszawa X X
Trakiszki(LTU) Warszawa X X
Warszawa Katowice X X
Warszawa Terespol(BLR) X X X
Warszawa Dorohusk(UKR) X X
Rzepin(DEU) Warszawa X X X
Wroclaw Miedzylesie(CZE) X X
Wegliniec (DEU) Krakow X X X
Swinoujscie Chalupki(CZE) X X
Malbork Braniewo(RUS) X
Krakow Medyka(UKR) X X X
Tczew Gliwice X
Katowice Zebrzydowice(CZE) X X
Zwardon(SVK)
Czechowice-Dziedzice X X
Poznan Inowroclaw X
Muszyna(SVK) Tarnow X X

U N E C E T E M A N D T E R P R O J E C T S ’ M A S T E R P L A N – 2 0 1 1
48
TER backbone network links Part of HLG
trans-national
axis
Part of E rail
network
Part of EATL
Part of TEN-T
CountryFrom
(country border)To
(country border)
Romania
Episcopia Bihor(HUN) Ploiesti X X X
Vicsani(UKR) Ploiesti X X X
Ploiesti Giurgiu(BGR) X X X
Bucuresti Constanta X X X
Bucuresti Curtici(HUN) X X X
Craiova Calafat(BGR) X X
Stamora(SRB) Timisoara X
Arad Alba Iulia X X X
Arad Halmeu(UKR) X X
Pascani Cristesti Jijia (MDA) X X X
Buzau Giurgiulesti(UKR) X X
Vintu de Jos Bucuresti X
Bucuresti Faurei
Satu Mare Adjud X
Razboeni Deda
Beclean Suceava X
Simeria Filiasi
Tulcea Medgidia
Constanta Mangalia
The Russian Federation
Moskva Kotelnich X X X
Moskva Buslovskaya(FIN) X X X
Moskva Suzemka(UKR) X X X
Moskva Krasnoye(BLR) X X X
Moskva Ekaterinburg X
St. Petersburg Kurgan X X X
Vologda Moskva X
St. Petersburg Dubishche(BLR)

E C O N O M I C C O M M I S S I O N F O R E U R O P E
49
TER backbone network links Part of HLG
trans-national
axis
Part of E rail
network
Part of EATL
Part of TEN-T
CountryFrom
(country border)To
(country border)
The Russian Federation
Moskva Veseloe(GEO) X
Kavkaz/Novorossiysk Kurgan
Samara Akbulak(KAZ) X
Shelayevo(UKR) Samara X X X
Ryazan Syzran X
Kochetovka Saratov X
Matveev Kurgan(UKR) Rostov na Donu X X X
Gukovo(UKR) Astrakhan/Olya X X
Astrakhan Samur(AZE)
Mamonovo(POL)
Nesterov(LTU) X
Kaliningrad Sovetsk(LTU)
Serbia
Stara Pazova Subotica(HUN) X X
Beograd Sid(HRV) X X
Ruma Zvornik(BIH)
Beograd Vrbnica(MNE) X
Beograd Vrsac(ROU) X
Beograd Nis X X
Nis Presevo(MKD) X X
Nis Dimitrovgrad(BGR) X X
Stalac Pozega
Lapovo Kraljevo X

U N E C E T E M A N D T E R P R O J E C T S ’ M A S T E R P L A N – 2 0 1 1
50
TER backbone network links Part of HLG
trans-national
axis
Part of E rail
network
Part of EATL
Part of TEN-T
CountryFrom
(country border)To
(country border)
Slovakia
Kuty(CZE)
Bratislava Petrzalka/Rusovce
(AUT and HUN)X X
Zilina Bratislava/Galanta X X
Bratislava Sturovo(HUN) X X
Cadca(CZE)
Cierna nad Tisou(UKR) X X
Plavec(POL)
Cana(HUN) X X
Cadca Skalite(POL) X X
Luky pod Makytou(CZE) Puchov X X
Slovenia
Sezana(ITA) Divaca X X
Koper Hodos(HUN) X X
Pivka Ilirska Bistrica(HRV) X X
Ljubljana Jesenice(AUT) X X X
Pragersko Sentilj(AUT) X X
Ormoz Sredisce(HRV) X X
Ljubljana Dobova(HRV) X X X
Turkey
Cetinkaya Kapikoy(IRN) X X X
CetinkayaDogukapi
(ARM)(border closed)
X X X
Kars Aktas(GEO) X X
Kapikule(BGR) Cetinkaya X X X
Samsun Kalin X X X
Malatya Iskenderun X X X
Toprakkale Mersin X X X
Eskisehir Izmir X X
Irmak Zonguldak

E C O N O M I C C O M M I S S I O N F O R E U R O P E
51
TER backbone network links Part of HLG
trans-national
axis
Part of E rail
network
Part of EATL
Part of TEN-T
CountryFrom
(country border)To
(country border)
Turkey
Balikesir Bandirma X
Alayunt Ulukisla X X
Bogazkopru Yenice X X
Afyon Manisa X X
Afyon Izmir
Fevzipasa Meydanekbez(SYR) X X X
Narli Nusaybin(SYR) X X
Karkamis Cobanbey(SYR) X
Tekirdag Muratli
Pehlivankoy Uzunkopru(GRC) X
Polatli Konya
Ukraine
Mostiska(POL)
Dobrjanka(BLR) X X X
Zernovo(RUS) Kiev X X X
Izov(POL)
Piski(RUS) X X X
Fastiv Sverdlovsk(RUS) X X
Donetsk Amvrosyivka(RUS) X X X
Kovel Chop(HUN and SVK) X X X
Djakove(ROU) Vuzlove X
Vadu Siret(ROU) Ternopil X
Zmerinka Odessa X X X

U N E C E T E M A N D T E R P R O J E C T S ’ M A S T E R P L A N – 2 0 1 1
52
3.3 Summary
The main conclusion drawn from these comparisons is that almost all sections of the revised TEM and TER Master Plan backbone network in the participating countries are compatible with the E road and E rail networks. The same conclusion applies to the EU member countries and the TEN-T network of the EU. The compatibility is also high with respect to the EU HLG trans-national axes as well as with the EATL, taking into account that these links are in general less dense than those in the Master Plan revised backbone network and that these networks (HLG and EATL) cover the territory of only some countries which participated in the Master Plan revision.

E C O N O M I C C O M M I S S I O N F O R E U R O P E
53
4. MISSING LINKS IN THE bACKbONE NETWORKS
As is for the case for bottlenecks (Cf. Chapters 9.2 and 9.3), there is no widely available and internationally agreed definition of what constitutes a missing link. The existing definitions are even more vague than those of a bottleneck, and allow for a very wide interpretation. For example, the UNECE report TRANS/WP.5/R.60 describes a missing link as “a situation in which the quality of service has extreme low values due to the fact that no direct link exists between two points”. Two other documents deal with the identification of missing links; one of them (mentioned in chapter 1), the UNECE document “Methodological Basis for the Definition of Common Criteria regarding the Identification of Bottlenecks, Missing Links and Quality of Service in Infrastructure Networks”, deals with the identification in a theoretical and general way only. The maps of the TENCONNECT study shown in chapter 9.1 define missing links (green colour) in the road sector as those below motorway standard (2 × 2 lanes, neglecting the fact that in some cases with low traffic flow levels, a 2-lane road may be sufficient even in 2030) and in the rail sector as those below infrastructural standard (single track and/or non-electrified) and having importance for EU cohesion. These simplified criteria seem very questionable since the identified links are in place (i.e. they are not missing) although they have a lower — but sometimes quite satisfactory — standard. Therefore, the same approach as in the case of bottlenecks has been taken, i.e. on a country-by-country basis, use has been made of the data and information provided by the participating countries, distinguishing between two categories of link: (i) links having a networking character (i.e. links which are mostly longer and with a higher share of international traffic) and (ii) short or local missing links. The first category of links (listed in chapters 4.1 and 4.2) has been incorporated in the revised backbone networks of the TEM and TER Master Plan. Some of the local or short missing links are also located on these networks.
4.1 Motorway and road missing links incorporated in the revised TEM backbone network
Albania (ALB)Hani Hotit (MNE) – Shkoder – Fushe Kruja – TiranaMorina – Kukes – crossing road Lezhe/Fushe KrujaTirana – Durres – Rrogozhine – Elbasan – Perrenjas – Qafe Thana (MKD)Kapshtica (GRC) – Pogradec – PerrenjasKakavija (GRC) – Gjirokaster – Fier – RrogozhineFier – Vlore
Armenia (ARM)Bavra (GEO) – Gyumri – YerevanBagratashen (GEO) – Vanadzor – YerevanYerevan – Ararat – Vayk – Goris – Meghri (IRN)
Austria (AUT)Villach – Karawanken Tunnel (SVN)

U N E C E T E M A N D T E R P R O J E C T S ’ M A S T E R P L A N – 2 0 1 1
54
Azerbaijan (AZE)Baku – Sumgayit – Samur (RUS)Alat – Astara (IRN)Baku – Ganja – Gazakh – Boyuk – Red bridge (GEO)Baku – Alat – Horadiz – Agband (ARM)Kerchivan (ARM) – Sadarak (ARM)
Bosnia and Herzegovina (BIH)Jajce – Banja Luka – Gradiska/Bosanska Gradiska (HRV)Izacic (HRV) – Bihac – Jajce – Travnik – LasvaSarajevo – Foca – Hum (MNE)
Bulgaria (BGR)Varna – Durankulak (ROU)Botevgrad – Bjala
Croatia (HRV)Licko Petrovo Selo (BIH) – KarlovacOkucani – Donji Varos (BIH)
The Czech Republic (CZE)Praha – Hradec Kralove – Kralovec (POL)
The former Yugoslav Republic of Macedonia (MKD)Bitola – Ohrid – Podmolje – Struga – Mali Vlaj (ALB)
Georgia (GEO)Arali (TUR) – Akhaltsikhe – Khashuri
Greece (GRC)Peplos – Kipi (TUR)
Hungary (HUN)Tornyosnemeti (SVK) – Miskolc – IstvanmajorHont (SVK) – Vac – BudapestTornyiszentmiklos (SVN) – Letenye
Lithuania (LTU)Vilnius – Panevezys – Siauliai – Palanga – Klaipeda
Montenegro (MNE)Donje Krusevo (BIH) – Podgorica – Bozaj (ALB)Metanjac (SRB) – Bijelo Polje – Podgorica – Bar
Poland (POL)Gdansk – Elblag – Warszawa – Kielce – Krakow – Chyzne (SVK)Budzisko (LTU) – Suwalki – Elk – Lomza – Ostrow MazowieckaWroclaw – Poznan – Bydgoszcz – Grudziadz (A1)Barwinek (SVK) – Rzeszow – Lublin – Miedzyrzec Podlaski – Bialystok – Kuznica Bialostocka (BLR)Swinoujscie – Szczecin – Gorzow Wielkopolski – Zielona Gora – Legnica – Lubawka (CZE)Wroclaw – LodzGrzechotki (RUS) – Elblag

E C O N O M I C C O M M I S S I O N F O R E U R O P E
55
Romania (ROU)Halmeu (UKR) – Baia Mare – ZalauConstanta – Vama Veche (BGR)Zalau – Cluj Napoca – Brasov – Ploiesti – Bucuresti
The Russian Federation (RUS)Kaliningrad – Mamonovo (POL)
Serbia (SRB)Beograd – Pozega – Uzice – Boljare (MNE)Kraljevo – Kragujevac – Batocina
Slovakia (SVK)Ruzomberok – Zvolen – Sahy (HUN)Vysny Komarnik (POL) – Presov – Kosice – Milhost (HUN)Trstena (POL) – Dolny Kubin – Ruzomberok
Slovenia (SVN)Ljubljana – Maribor – Pince (HUN)Ljubljana – Jesenice – Karavanke (AUT)Koper – Smarje – Dragonja (HRV)Sentilj – Maribor – Gruskovje (HRV)Koper – Divaca
Ukraine (UKR)Nevetlenfolu (ROU) – Berehove – Mukaceve
4.2 Railway missing links incorporated in the revised TER backbone network
Albania (ALB)Hani-i-Hotit (MNE) – Shkoder – Vore – TiranaVore – Durres – Rrogozhine – Elbasan – Lin (MKD)Rrogozhine – Vlore
Armenia (ARM)Ayrum – Gyumri – Masis – YerevanMasis – YeraskhMeghri – Niuvedi
Austria (AUT)Baumgarten im Burgenland (HUN) – Ebenfurth – WienKlagenfurt – Koralm – Graz – Jennersdorf (HUN)
Azerbaijan (AZE)Baku – Yalama (RUS)Baku – Osmanly – AstaraBaku – Ganca – Boyuk-Kesik (GEO)Osmanly – Horadiz – Agband (ARM)Kerchivan – Sadarak (ARM)

U N E C E T E M A N D T E R P R O J E C T S ’ M A S T E R P L A N – 2 0 1 1
56
Bosnia and Herzegovina (BIH)Dobrljin (HRV) – Bosanski Novi – Banja Luka – Doboj – Bosanska Poljana – Zvornik (SRB)Capljina – Trebinje – MNE
Croatia (HRV)Zagreb – Sisak – Sunja – NovskaSunja – Volinja (BIH)(SVN) Cakovec – Kotoriba (HUN)
The former Yugoslav Republic of Macedonia (MKD)Skopje – Kicevo – Struga (ALB)
Greece (GRC)Neos Kafkasos (MKD) – Plati
Hungary (HUN)Gyor – Hegyeshalom (AUT)Hegyeshalom – Rajka (SVK)Szentgotthard (AUT) – Szombathely – BobaMurakeresztur (HRV) – Nagykanizsa – SzekesfehervarPuspokladany – Debrecen – Nyiregyhaza
Italy (ITA)Tarvisio (AUT) – Udine
The Republic of Moldova (MDA)Reni (UKR) – Besarabeasca – Cainari – Chisinau
Montenegro (MNE)Bijelo Polje (SRB) – Podgorica – Tuzi (ALB)BIH – Niksic – Podgorica
Poland (POL)Katowice – Zebrzydowice (CZE)Zwardon (SVK) – Czechowice-DziedziceMuszyna (SVK) – Tarnow ¨Suwalki – Elk – BialystokLowicz – Mszczonow – LukowPoznan – InowroclawPoznan – Szczecin – SwinoujscieSzczecin – RzepinOpole – Chalupki
Romania (ROU)Buzau – Faurei – Braila – Galati – Giurgiulesti (UKR)Vintu de Jos – Sibiu – Ramnicu Valcea – Pitesti – BucurestiBucuresti – Armasesti – Urziceni – FaureiSatu Mare – Beclean – Deda – AdjudRazboeni – Targu Mures – DedaBeclean – SuceavaSimeria – FiliasiTulcea – MedgidiaConstanta – Mangalia

E C O N O M I C C O M M I S S I O N F O R E U R O P E
57
The Russian Federation (RUS)Kaliningrad – Sovetsk (LTU)
Serbia (SRB)Ruma – Zvornik (BIH)Beograd – Valjevo – Uzice – Vrbnica (MNE)Stalac – Kraljevo – PozegaLapovo – Kraljevo
4.3 Other motorway and road missing links
Road section Remark
Albania (ALB)
Fier – Levan – Tepelene under construction, to be opened in 2011
Thumane – Vore – Rrogozhine planned
Tirana – Bulqize under construction
Central-South Corridor Fushe Kruja – Tepelene planned
Azerbaijan (AZE)
Bridge over river Astarachay (IRN) planned
The former Yugoslav Republic of Macedonia (MKD)
Podmolje – Bitola planned
Serbia (SRB)
Beograd bypass, section Ibarska – E 75 planned
Map No. 4 shows the locations of these missing links.
4.4 Other railway missing links
Road section Remark
Azerbaijan (AZE)
Astara – IRN programmed
Croatia (HRV)
Matulji – Ucka tunnel – Borut
Map No. 5 shows the locations of these missing links.

U N E C E T E M A N D T E R P R O J E C T S ’ M A S T E R P L A N – 2 0 1 1
58

E C O N O M I C C O M M I S S I O N F O R E U R O P E
59
5. UPDATING OF THE TRAFFIC FORECAST FOR THE bACKbONE NETWORKS
5.1 Past development
Road transport
According to European Road Statistics (European Union Road Federation, Brussels 2009), road transport in 25 countries of the EU developed in the period 1995 to 2007 as shown in the following table in which the year 1995 = 100.
Year Passenger transport(passenger-km)
Freight transport(tonne-km)
1996 101 102
1997 105 105
1998 109 108
1999 112 111
2000 117 115
2001 119 117
2002 121 118
2003 122 120
2004 128 123
2005 132 125
2006 135 130
2007 137 133
The total road transport growth in the period 1995 to 2007 amounted to 33 % (freight) and to 37 % (passenger), corresponding to an average freight annual growth rate of about 2.4 % and an average passenger annual growth rate of about 2.7 %.
Rail transport
According to European rail transport core statistics (the UIC report “Rail Transport and Environment: Facts and Figures”, November 2008), the rail freight transport output in 25 countries of the EU increased in the period 1995 to 2005 by 9.2 %, reflecting an average annual growth rate of 0.9 %. The rail passenger transport increase in the same period amounted to 8.6 %, corresponding also to an average annual growth rate of about 0.9 %.

U N E C E T E M A N D T E R P R O J E C T S ’ M A S T E R P L A N – 2 0 1 1
60
The respective differences in average annual growth rate in countries participating in the revision of the TER part of the Master Plan, and listed in the UIC report, in the period between 1995 and 2006 were as shown in the following table.
Country Rail passengers (%) Rail freight (%)
Albania -59 -32
Austria -10 +44
Bulgaria -48 -39
Croatia +44 +67
The Czech Republic -14 -28
The former Yugoslav Republic of Macedonia +62 +263
Greece +15 +126
Hungary MÁV +10GYSEV +74
MÁV +16GYSEV +165
Italy -7 -6
Lithuania -62 +79
Poland -19 -37
Romania -57 -52
Slovakia -48 -29
Slovenia +33 +17
Turkey +1 +7
5.2 Traffic forecast for the TEM and TER Master Plan
The road and rail traffic forecast for 2020 based on the year 2000 values was carried out separately for three groups of countries:
Group 1: EU member countries before 1 May 2004 — Austria, Greece, Italy
Group 2: EU member countries and acceding countries after 1 May 2004 — Bulgaria, the Czech Republic, Hungary, Lithuania, Poland, Romania, Slovakia, Slovenia, Turkey
Group 3: Other TEM and TER Master Plan countries — Belarus, Bosnia and Herzegovina, Croatia, the former Yugoslav Republic of Macedonia, Georgia, the Republic of Moldova, Montenegro, the Russian Federation, Serbia and Ukraine
and for two development scenarios, i.e. the moderate and the optimistic.
Transport demand forecasting was performed (a) by analysing the current trends in the transport industry in order to identify existing interrelations between transport demand and the transport-relevant socio-economic parameters (population, GDP and foreign trade) and (b) by using the forecasts of such parameters (population, GDP or any other relevant economic data, such as foreign trade) from the base year 2000 to the target year 2020. The official forecasts for road and rail transport growth were treated as reference/comparison points. The following results were obtained for the three groups.

E C O N O M I C C O M M I S S I O N F O R E U R O P E
61
• For the EU member countries before 1 May 2004, the two basic factors underlying theforecast of passenger transport were the growing incomes and the growing car ownership, both of which strongly correlated with the expected growth in GDP. For the freight transport forecast, the main underlying factors stimulating the expected growth were the globalization of the economy and the liberalization of the internal market, the evolution of complex trading networks, specialization of production processes and preferences of customers as well as low load factors. The following summary regional trends were expected in the period 2000 to 2020:
- annual growth in passenger transport by car: 1.32 % to 1.81 %;
- annual growth in passenger transport by bus: 0.03 % to 0.19 %;
- annual growth in passenger transport by rail: 1.31 % to 2.55 %;
- annual growth in freight transport by road: 3.2 % to 3.38 %;
- annual growth in freight transport by rail: 3.43 % to 3.67 %.
• FortheEUmemberandaccedingcountriesafter1 May2004,anegativetrendwasexpectedin public passenger transport that was explained by the higher competitiveness of private cars and decreasing accessibility, a consequence of both urban sprawl and somewhat degrading public transportation systems. Concerning freight transport, the shares of road and rail transport were expected to remain about the same owing to the increase in rail transport prices, liberalization and deregulation in road transport as well as capacity expansion of the road infrastructure. The following summary regional trends were expected in the period 2000 to 2020:
- annual growth in passenger transport by car: 2.07 % to 3.10 %;
- annual growth in passenger transport by bus: -0.01 % to -0.28 %;
- annual growth in passenger transport by rail: 0.75 % to 1.18 %;
- annual growth in freight transport by road: 2.49 % to 2.77 %;
- annual growth in freight transport by rail: 2.57 % to 2.59 %.
• Innon-EU,non-acceding,countriesthefollowingsummaryregionaltrendswereexpectedinthe period 2000 to 2020:
- accumulated road traffic growth: between 187.2 % and 255.6 %;
- accumulated rail traffic growth: between 61.2 % and 81.6 %.

U N E C E T E M A N D T E R P R O J E C T S ’ M A S T E R P L A N – 2 0 1 1
62
The forecast for the TEM part of the Master Plan forecast contained the following growth rates for the individual countries concerned.
Country Mode
Moderate scenario growth rate (%) Optimistic scenario growth rate (%)
19952005
20052015
20002020
19952005
20052015
20002020
Bosnia and HerzegovinaPassenger 159 190.80
Freight 172 206.40
Bulgaria 47 38 37.31 47 38 44.77
CroatiaPassenger 93 111.60
Freight 159 190.80
The Czech Republic 21 18 15.58 21 18 18.70
The former Yugoslav Republic of Macedonia
Passenger 156 187.20
Freight 164 196.80
Hungary 38 20 23.91 38 20 28.69
Lithuania 53 38 40.21 53 38 48.25
Poland 59 38 43.10 59 38 51.72
Romania 117 83 107.94 117 83 129.53
Serbia and MontenegroPassenger 171 205.20
Freight 213 255.60
Slovakia 129 47 85.85 129 47 103.02
Slovenia 27 17 18.11 27 17 21.73
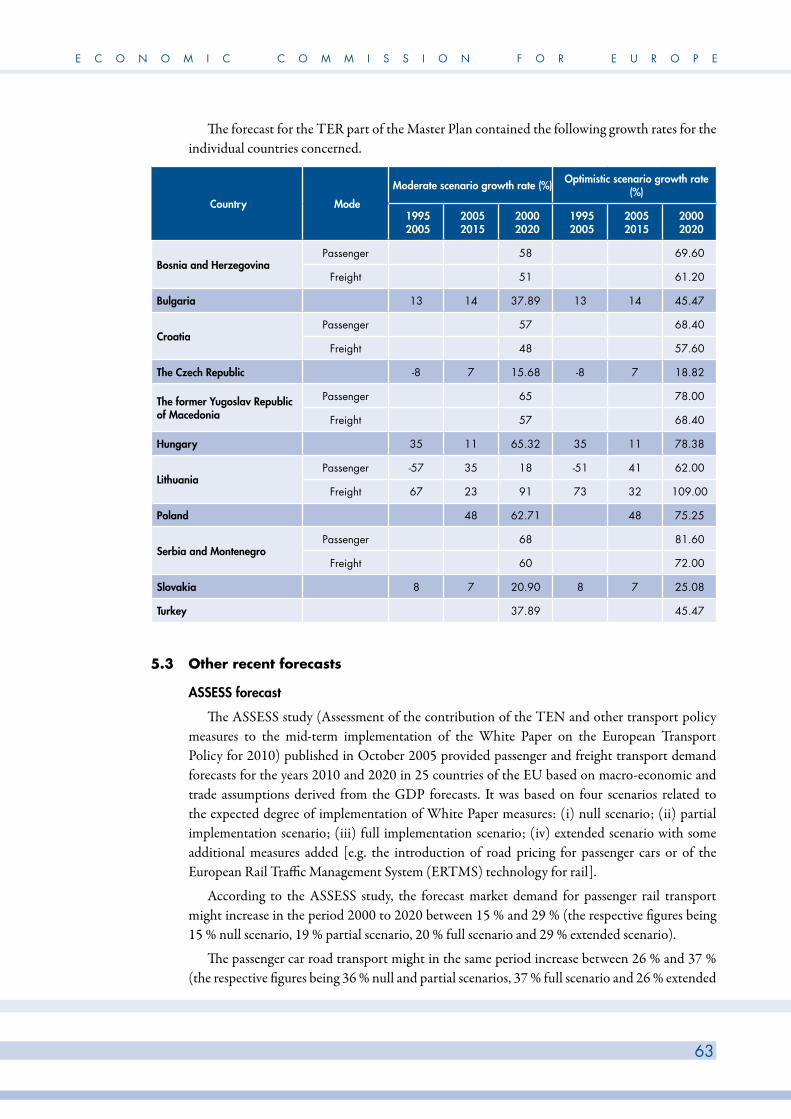
E C O N O M I C C O M M I S S I O N F O R E U R O P E
63
The forecast for the TER part of the Master Plan contained the following growth rates for the individual countries concerned.
Country Mode
Moderate scenario growth rate (%) Optimistic scenario growth rate (%)
19952005
20052015
20002020
19952005
20052015
20002020
Bosnia and HerzegovinaPassenger 58 69.60
Freight 51 61.20
Bulgaria 13 14 37.89 13 14 45.47
CroatiaPassenger 57 68.40
Freight 48 57.60
The Czech Republic -8 7 15.68 -8 7 18.82
The former Yugoslav Republic of Macedonia
Passenger 65 78.00
Freight 57 68.40
Hungary 35 11 65.32 35 11 78.38
LithuaniaPassenger -57 35 18 -51 41 62.00
Freight 67 23 91 73 32 109.00
Poland 48 62.71 48 75.25
Serbia and MontenegroPassenger 68 81.60
Freight 60 72.00
Slovakia 8 7 20.90 8 7 25.08
Turkey 37.89 45.47
5.3 Other recent forecasts
ASSESS forecast
The ASSESS study (Assessment of the contribution of the TEN and other transport policy measures to the mid-term implementation of the White Paper on the European Transport Policy for 2010) published in October 2005 provided passenger and freight transport demand forecasts for the years 2010 and 2020 in 25 countries of the EU based on macro-economic and trade assumptions derived from the GDP forecasts. It was based on four scenarios related to the expected degree of implementation of White Paper measures: (i) null scenario; (ii) partial implementation scenario; (iii) full implementation scenario; (iv) extended scenario with some additional measures added [e.g. the introduction of road pricing for passenger cars or of the European Rail Traffic Management System (ERTMS) technology for rail].
According to the ASSESS study, the forecast market demand for passenger rail transport might increase in the period 2000 to 2020 between 15 % and 29 % (the respective figures being 15 % null scenario, 19 % partial scenario, 20 % full scenario and 29 % extended scenario).
The passenger car road transport might in the same period increase between 26 % and 37 % (the respective figures being 36 % null and partial scenarios, 37 % full scenario and 26 % extended

U N E C E T E M A N D T E R P R O J E C T S ’ M A S T E R P L A N – 2 0 1 1
64
scenario). The corresponding bus/coach road transport figures were 0 % to 8 % (0 % null and partial scenarios, 3 % full scenario and 8 % extended scenario).
The forecast development of freight rail transport in the period 2000 to 2020 was expected to vary between a decrease of 6 % (i.e. -6 %) and an increase of 30 % (the respective figures being -6 % null scenario, 11 % to 13 % partial scenario, 19 % full scenario and 30 % extended scenario).
The freight road transport might in the period 2000 to 2020 increase between 32 % and 55 % (the respective figures being 52 % null scenario, 43 % to 55 % partial scenario, 38 % full scenario and 32 % extended scenario).
ERIM
The ERIM (European Rail Infrastructure Masterplan) of the UIC published in February 2007 was based on all available national and European demand studies (including those mentioned above) as well as on an exchange of views with its member railways in order to establish how the market conditions and the rail offers may translate into future rail traffic growth.
The study estimated the rail traffic growth figures for the ERIM network (corresponding mostly to the TER backbone network) between the years 2004 and 2020 in each of the International Road Transport Union (IRU) 32 member countries. The respective figures for countries participating in the revision of the TER Master Plan are listed in the following table.
Country
Passenger growth (%) Freight growth (%)
Total Domestic International Total Domestic International
Austria 34 33 39 45 43 46
Bosnia and Herzegovina 400 400 400 800 800 800
Bulgaria 45 45 45 29 29 29
Croatia 35 35 35 176 176 176
The Czech Republic 16 16 16 16 16 16
The former Yugoslav Republic of Macedonia 108 108 108 140 140 140
Greece 25 25 25 35 35 35
Hungary 65 65 74 80 80 80
Italy 26 25 32 59 58 61
Lithuania 30 30 30 30 30 30
Poland 40 40 44 28 23 38
Romania 18 18 18 18 18 18
Serbia and Montenegro 156 156 156 213 213 213
Slovakia 46 46 46 2 2 2
Slovenia 15 15 15 40 40 40
Turkey 25 25 25 35 35 35

E C O N O M I C C O M M I S S I O N F O R E U R O P E
65
According to the ERIM (on the basis of the 2005 data), the forecast market demand for passenger rail transport might in the period 2005 to 2020 amount to 35 % (domestic traffic) and 50 % (international traffic), which correspond to an annual growth of 2.0 % and 2.7 % respectively.
The forecast market demand for freight rail transport in the period 2005 to 2020 amount to 61 % (domestic traffic) and 68 % (international traffic), which correspond to an annual growth of 3.2 % and 3.5 % respectively.
The overall ERIM forecast for passenger rail transport was very similar to the TER Master Plan forecast results and was a little more optimistic than the ASSESS and TEN-STAC results, due inter alia to higher ERIM forecasts in the Balkan countries. The ERIM freight forecast was very close to the results obtained in TEN-STAC and TER Master Plan, while the ASSESS study is more pessimistic in this respect.
TRANSvisions “Report on Transport Scenarios with a 20 and 40 Horizon”
This study, coordinated by Tetraplan A/S (Denmark) and published in March 2009, was aimed at the provision of technical support to a debate on transport scenarios with a 20- and 40-year horizon by • collectingandanalysinginteraliainformationontransportlong-termscenarioforecasting,• developinglong-termtransportscenariosincludingmodellingworkandcasestudies,and• suggestinglong-termobjectivesfortheEuropeantransportpolicies.
Three scenarios were set up: “Baseline” (business as usual), “High growth” and “Low growth”. Descriptions of the scenarios were based as far as possible on assumptions taken from official forecasts, using other assumptions (based on previous developments or assessments) where necessary. The Baseline scenario was basically a prolongation of existing trends until 2020 and 2030. The High growth scenario was based on elements giving priority to EU cohesion (higher economic growth and improvement of infrastructure particularly in EU12) and elements based on competition (each mode of transport paying its own costs). The Low growth scenario reflected, in particular, increasing costs of energy (particularly oil), which resulted in mobility reduction because of higher operating costs.
Regarding the socio-economic development, the study assumed that the total EU population would grow from about 491 × 106 in 2005 to almost 496 × 106 in 2020 and then it would remain almost constant up to 2030 (495 × 106). Population in the EU15 would grow slightly from 387 × 106 to 399 × 106, whereas a fall in population was expected in EU12 (from 104 × 106 in 2005 to 96 × 106 in 2030). The economic development up to 2030 was based on the European Commission´s DG-ECFIN Note 253 of June 2006. The economic development in GDP per capita was expected to be fastest in the eastern part of the EU and slower in the western part, in line with the development experienced in the last 10 years. GDP per capita in EU15 in 2005 was about EUR 24,000 in constant 2000 prices, expected to increase to about EUR 37,000 in 2030. In EU12 the GDP per capita was about EUR 5,000 in 2005, expected to increase to about EUR 13,000 in 2030. The ratio between GDP per capita in EU15 and in EU12 would then decrease from 4.7 to 2.9.

U N E C E T E M A N D T E R P R O J E C T S ’ M A S T E R P L A N – 2 0 1 1
66
The resulting figures for passenger (passenger-km) and freight (tonne-km) traffic are given in the following table.
IndicatorBaseline scenario
2020
Baseline scenario
2030
High growth scenario
2030
Low growth scenario
2030
Annual GDP increase with respect to 2005 2.2 1.9 2.3 0.7
Annual increase in tonne-km (%) 1.9 1.6 1.95 0.6
Annual increase in passenger-km (%) 1.3 1.3 1.8 0.35
It may be noted that the overall growth in both freight and passenger road and rail transport was predicted to be lower than the projected GDP growth rate in all scenarios.
As regards rail and road modal share, the rail passenger mode share grew from 10 % in 2005 to between 20 % and 35 % in 2050 (depending on the scenario), whereas the growth of the freight modal share was lower in all scenarios [from 27 % (in 2005) to a maximum of 33 % in 2050], although freight might have some further growth potential after 2050. In general, passenger rail shares grew more than freight rail shares up to 2030, whilst after 2030 the opposite seemed to happen. In the short-term, passenger rail increased in relative terms, due to investments in high-speed lines and an increase in long-distance trips (in passenger-km). In the long-term, rail freight might grow because of the high growth of goods imported from and exported to overseas.
The overall conclusion could be drawn that road traffic was expected to remain the dominant transport mode in passenger transport, although it would lose some market share to the benefit of railways. In relation to freight, road transport might also lose some market share, but only marginally.
TENCONNECT
The TENCONNECT study published in December 2009, coordinated also by Tetraplan A/S (Denmark), provided a coherent forecast for the future traffic flows in the EU and neighbouring countries for 2020 and 2030 with particular focus on flows between old and new Member States, between new Member States, and between the EU and neighbouring countries. The analysis covered all transport modes, including both freight and passenger traffic on links and through nodes with a focus on the TEN-T network. On the basis of this assessment, two scenarios for the situation in 2020 and 2030 were defined: a “Baseline” scenario and a scenario called “Sustainable Economic Development”.
The Baseline scenario was a “business as usual” scenario, including infrastructure and policy measures already agreed, and in line with the current trends. The Sustainable Economic Development scenario described a faster economic and demographic development, higher fuel costs and provided for an intensive development of the road and rail networks. Forecasts for all modes for 2020 and 2030 in the Baseline and Sustainable Economic Development scenarios for both freight and passenger transport were produced. Subsequently, these forecasts were then applied for identifying the most important infrastructure axes for cohesion, development of the internal EU market and the relations with neighbouring countries.
With regard to the neighbouring countries, the population forecasts were based on the UN 2006 “World Population Prospects”, and the economic forecasts of the UNECE TEM and TER Master Plan. For those countries not covered by the TEM and TER study, the CEPII “The Long Term Growth Prospects of the World Economy: Horizon 2050” (Poncet, 2006) was used.
The resulting growth data are given in the following table.

E C O N O M I C C O M M I S S I O N F O R E U R O P E
67
Indicator Baseline scenario2005/2020
Baseline scenario2005/2030
Difference betweenSustainable Economic
Development and Baseline scenario in
2030
Road — increase in passenger-km (%) 20 35 6
Rail — increase in passenger-km (%) 44 76 37
Road — increase in tonne-km (%) 27 40 6
Rail — increase in tonne-km (%) 44 70 12
The growth in passenger-km by car (35 %) in the Baseline scenario was slightly higher than the growth in vehicle-km (33 %according to the findings of the study). One of the reasons for this was that the types of trip that were growing the most were those where there were more passengers in the cars (i.e. holiday and private trips). But vehicle-km also included trucks and vans, and tonne-km increased in the study faster than did vehicle-km indicating that utilization and/or empty driving would be reduced in the future. Since the study expected that the number of trips by rail would increase by only 1 %, increases in passenger-km had to be due to longer trip lengths. Constructions of high-speed rail lines would reduce travel times and inspire people to travel to more distant destinations. A change in mode choice from air to rail, in particular, for vacation trips was apparent.
Tonne-km by truck in the Baseline scenario was estimated to increase 27 % from 2005 to 2020 and 40 % from 2005 to 2030. Outside EU25 the growth in truck transport was expected to be higher: 44 % from 2005 to 2020 and 80 % from 2005 to 2030. Tonne-km by rail was on average forecast to increase by 44 % from 2005 to 2020 and 70 % from 2005 to 2030 within EU25. Outside EU25, the figures were 75 % and 136 % respectively.
According to the Baseline scenario, the forecast traffic growth between 2005 and 2020 in TEM and TER countries participating in the revision of the Master Plan was as shown in the following table.
CountryPassenger growth (%) Freight growth (%)
Road Rail Road Rail
Austria 21 35 40 35
Bulgaria 50 210 46 127
The Czech Republic 21 20 52 110
Greece 10 45 63 63
Hungary 22 25 46 97
Italy 14 10 19 24
Lithuania 20 1,000 57 72
Poland 22 125 72 96
Romania 47 30 64 132
Slovakia 24 20 55 120
Slovenia 29 240 37 67

U N E C E T E M A N D T E R P R O J E C T S ’ M A S T E R P L A N – 2 0 1 1
68
5.4 Comparison of existing forecast results
A comparison of the total and annual growth rates forecast by the studies described in chapter 5.3 is shown in the following table (note that the ERIM and TENCONNECT data are related to the 2005 to 2020 period, whereas the other studies covered the 2000 to 2020 period). This comparison of different forecasts is useful to reveal differences and to analyse relative magnitudes, but the consistency of the forecasts is strongly influenced by the fact that the different studies were based on different assumptions and modelling tools.
Study Period Mode Total growth rate (%) Annual growth rate (%)
UN TER (rail) 2000 to 2020Passenger 18 to 82 depending on country 0.8 to 2.6
Freight 48 to109 depending on country 2.6 to 3.7
UN TEM (road) 2000 to 2020Passengera) 93 to 205 depending on country 1.3 to 3.7
Freight 159 to 256 depending on country 2.5 to 3.4
ASSESS rail 2000 to 2020Passenger 22 1.0
Freight 12 0.6
ASSESS road 2000 to 2020 Passenger 32 1.3
Freight 55 2.2
ERIM rail 2005 to 2020Passenger 35 (national) and 50 (international) 2.0 and 2.7
Freight 61 (national) and 68 (international) 3.2 and 3.5
TRANSvisions rail
2000 to 2020 Passenger 158 Baseline scenario 3.7
Freight 79 Baseline scenario 2.9
TRANSvisions road
2000 to 2020 Passenger 43 Baseline scenario 1.8
Freight 60 Baseline scenario 2.4
TENCONNECT rail 2005 to 2020
Passenger 44 Baseline scenario 1.8
Freight 48 Baseline scenario 2.0
TENCONNECT road 2005 to 2020
Passenger 20 Baseline scenario 0.9
Freight 28 Baseline scenario 1.2
a) Excluding bus/coach transport.
To summarize, most of the forecast values are in line with those of other studies (each one of which is based on its own scenarios and geographic coverage), but the growth rates in the TEM and TER Master Plan are generally rather high and the modal split for rail is higher than in the ERIM and TRANSvisions studies. Meanwhile, none of these studies took into account (and could not have taken into account) the occurrence of the recent global economic and financial crisis and its impacts.
5.5 Questionnaires for the revision of the TEM and TER Master Plan
To collect the actual national forecast data for the years 2015 and 2020, the TEM and TER projects Central Offices distributed in the fourth quarter of 2008 detailed revision questionnaires dealing, inter alia, with this topic. The revision questionnaires provided the Project Central

E C O N O M I C C O M M I S S I O N F O R E U R O P E
69
Offices with valuable data, based on the results of the 2005 traffic counts (see Volume II, Annexes I and II), used for elaboration of the revised forecasts. However, the analysis of the data provided revealed some inconsistencies and sometimes even differences in the approaches taken. In some cases, data on the number of passengers and tonnes transported were given, while in most cases data comprised the number of trains (either separately for passenger and freight, or in total), and it was very difficult to transform passenger data to train data because there was no information about the length of trains, the number of seats per train and their occupancy rate. In other cases, the data provided comprised ranges within which the values fell or growth rates (coefficients).
In some cases, recent rail traffic data were not supplied (and were not requested in the revision questionnaires), because these data were taken from the UNECE Censuses of Motor Traffic on Main International Traffic Arteries and of E Rail Traffic in Europe in 2005. Since these censuses covered only Austria, Bulgaria (road only), Croatia (road only), the Czech Republic, the former Yugoslav Republic of Macedonia (road only), Greece (rail only), Hungary, Italy (rail only), Lithuania, Poland, Romania (road only), Serbia (road only), Slovakia, Slovenia and Turkey, the data from the remaining countries were taken from the TEMSTAT templates, the revision questionnaires and other sources.
Since practically all national forecasts mentioned above were formulated before the advent of the global crisis, in general they anticipated the constant growth of both passenger and freight road and rail traffic (particularly in the optimistic scenarios). The revised forecast for the Master Plan also had to take into account the consequences of the crisis, which were extremely difficult to determine at the time of elaboration of the revision. It was necessary, therefore, to request the participating countries to convey data on the development of road and rail traffic between 2008 and 2009 in order to adjust the final forecast results accordingly.
5.6 The influence of the global economic crisis on road and rail traffic develop-ments in 2008 and 2009
To evaluate the influence of the global economic crisis on road and rail traffic developments in 2008 and 2009, in the spring of 2010 the TEM and TER Project Central Offices requested the participating countries to provide the following data.
For road traffic• Total decrease/increase ofAADT (AnnualAverageDailyTraffic) on the roadnetwork in
2009 compared to 2008 (in %)• Totaldecrease/increaseoftrucksandbusestrafficontheroadnetworkin2009comparedto
2008 (in %) • Totaldecrease/increaseofpassengercars trafficontheroadnetwork in2009comparedto
2008 (in %) • Totaldecrease/increaseofAADTonthemain(national)roadnetworkin2009comparedto
2008 (in %)• Totaldecrease/increaseof trucksandbuses trafficon themain(national) roadnetwork in
2009 compared to 2008 (in %)• Totaldecrease/increaseofpassengercarstrafficonthemain(national)roadnetworkin2009
compared to 2008 (in %)

U N E C E T E M A N D T E R P R O J E C T S ’ M A S T E R P L A N – 2 0 1 1
70
The responses obtained are summarized in Chart 1.
For rail traffic• Totaldecrease/increaseofnumberofpassengerkilometresontherailwaynetwork in2009
compared to 2008 (in %) • Totaldecrease/increaseofaveragenumberofpassengertrains/dayin2009comparedto2008
(in %)• Totaldecrease/increaseofannualfreightoutput(tonne-kilometres)ontherailwaynetworkin
2009 compared to 2008 (in %)• Totaldecrease/increaseofaveragenumberof freighttrains/day in2009comparedto2008
(in %)
The responses obtained are summarized in Chart 2.

E C O N O M I C C O M M I S S I O N F O R E U R O P E
71
Chart 1
2009/2008 road traffic development
Total decrease/increase of trucks and buses traf c on the whole network
+3%
-3.1%
2009
-8%
-11%
-16.6%
-46%
2008
+2.3%
-50
-40
-30
-20
-10
0
10
AZETURROMPOLCZELTUALB
Total decrease/increase of passenger cars traf�c on the whole road network
+ 8.4%
+ 2%
2009
+0.2%
--6.5%
+ 3%
2008
+4.2%
-8
-6
-4
-2
0
2
4
6
8
10
AZETURROMPOLCZELTUALB

U N E C E T E M A N D T E R P R O J E C T S ’ M A S T E R P L A N – 2 0 1 1
72
Total decrease/increase of trucks and buses traf c on the main ( national ) road network
+3%+3.2%
-14%
2009
-20.2%
2008
-12.8%
+2.5%
-25
-20
-15
-10
-5
0
5
ROMALBTURAUTPOLLTU
Total decrease/increase of passenger cars traf�c on the main ( national ) road network
+3.5%
2009
+2%
2008
-8%
0%
+4.3%
-10
-8
-6
-4
-2
0
2
4
6
TURROMPOLAUTLTU
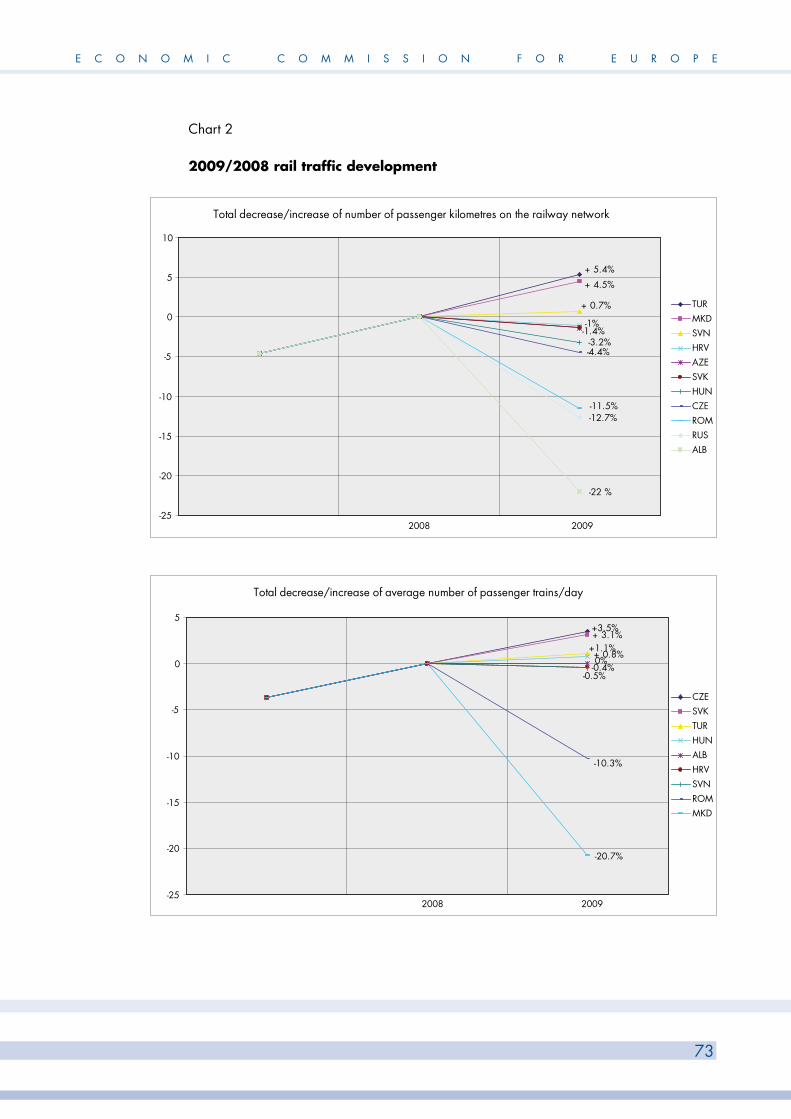
E C O N O M I C C O M M I S S I O N F O R E U R O P E
73
Chart 2
2009/2008 rail traffic development
Total decrease/increase of number of passenger kilometres on the railway network
+ 5.4%
+ 4.5%
+ 0.7%
-1%
-11.5%
-1.4%
-4.4% -3.2%
-12.7%
2009
-22 %
2008-25
-20
-15
-10
-5
0
5
10
TURMKDSVNHRVAZESVKHUNCZEROMRUSALB
Total decrease/increase of average number of passenger trains/day
+ 3.1%
+ 0.8% 0%-0.4%
-0.5%
-10.3%
2009
-20.7%
2008
+3.5%
+1.1%
-25
-20
-15
-10
-5
0
5
CZESVKTURHUNALBHRVSVNROMMKD

U N E C E T E M A N D T E R P R O J E C T S ’ M A S T E R P L A N – 2 0 1 1
74
Total decrease/increase of annual freight output ( tonne - kilometres ) on the railway network
-4.7%
-11.9%
-3.0%
-20%
-21.7% -22.9%
-26%
-30%
2009
-31.8%
2008
-32.6%-35
-30
-25
-20
-15
-10
-5
0
TURALBRUSHRVCZEHUNSVNAZESVKROMMKD
Total decrease/increase of average number of freight trains/day
-9.4 %
-21.1%
- 6.3%
-25%
-29.6% -29.7%
2009
-30%
2008
-17%
-19.6%
-35
-30
-25
-20
-15
-10
-5
0
TURMKDHRVCZESVNSVKROMHUNALB
As can be seen in the charts, passenger traffic on the main national road network (which roughly corresponds to the TEM backbone links) was not influenced too much by the crisis (annual in-crease 2008 to 2009 between 0 % and 4.3 %, lower in Central European countries, higher in East-ern European ones, the only exception being Lithuania, registering a decrease of 6 % to 8 %). The impact on the road freight traffic in Central Europe was much more pronounced, while in Eastern Europe the crisis seemed to be reflected only by a slower increase.

E C O N O M I C C O M M I S S I O N F O R E U R O P E
75
As far as the rail transport was concerned and taking into account only the number of passenger trains/day (which is the indicator used in the UNECE rail census and the one defining the capacity of the line), the results of the enquiry showed that in most of the countries in the region, the number of passenger trains grew slightly (between 0 % and 4 % in general). The only exceptions were Romania and, in particular, the former Yugoslav Republic of Macedonia, but these decreases may have been caused by other factors, e.g. by a shift to road transport, limited budgetary resources, closures of local railway lines, etc. As for the road freight transport, the global crisis brought about a decline in the number of freight trains, this time much more pronounced, in all reporting countries. This decline ranged between 5 % and 30 % and again, in general, affected more the Central European countries and less the Eastern European ones.
This recent development would certainly have an influence on the former traffic forecasts, particularly in the short run, and the findings discussed in chapter 5.6 have been reflected in the revised forecast for the Master Plan.
5.7 Groups of countries
As stated in chapter 5.2, for traffic forecasting purposes, the original TEM and TER Master Plan distinguished between three groups of countries according to their respective potentials, historic background, the time period when they entered into the transition process and their political as well as economic developments:
Group 1: EU member countries before 1 May 2004 — Austria, Greece, Italy
Group 2: EU member countries and acceding countries after 1 May 2004 — Bulgaria, the Czech Republic, Hungary, Lithuania, Poland, Romania, Slovakia, Slovenia, Turkey
Group 3: Other TEM and TER Master Plan countries — Belarus, Bosnia and Herzegovina, Croatia, the former Yugoslav Republic of Macedonia, Georgia, the Republic of Moldova, Montenegro, the Russian Federation, Serbia and Ukraine
To reflect the political and economic development which occurred in the period 2005 to 2010 as well as the fact that four more countries — Albania, Armenia, Azerbaijan and Montenegro — decided to join the revision of the Master Plan, it has been necessary to modify the participation in the groups accordingly. For the revised traffic forecast, Croatia (as an EU candidate country) has been transferred to Group 2, while Albania, Armenia, Azerbaijan and Montenegro have been added to Group 3.
5.8 basic development scenario
For the purpose of establishment of the basic road and rail traffic development scenario, all relevant recent forecast results were taken into account, namely the forecast for the Master Plan from 2005, the ERIM rail forecast (February 2007), data received from the participating countries (2008) and in particular (with respect to the EU member countries) the most recent (December 2009) and well-documented TENCONNECT study described in chapter 5.3.
The results are summarized in the following table which gives the traffic growth increase between 2005 and 2020.

U N E C E T E M A N D T E R P R O J E C T S ’ M A S T E R P L A N – 2 0 1 1
76
Group of countries Mode
Master Plan
annual growth
(%)
Master Plan revision
questionnaire(%)
ERIM(%)
TENCONNECT Baseline
(%)
Master Plan revision questionnaire
(%)
Group 1
Road passenger 1.3 to 1.8 25 to 32 10 to 21
Road freight 3.2 to 3.4 60 to 66 19 to 63
Rail passenger 1.3 to 2.6 25 to 47 25 to 34 10 to 45
Rail freight 3.4 to 3.7 66 to 72 35 to 59 24 to 63
Group 2
Road passenger 2.1 to 3.1 37 to 58 20 to 50
46 to 109
Road freight 2.5 to 2.8 45 to 51 37 to 72
Rail passenger 0.7 to 1.2 12 to 22 15 to 65 20 to 24021 to 123
Rail freight 2.6 47 2 to 176 67 to 132
Group 3
Road passenger 4.8 to 6.5 102 to 157 86 to 150
Road freight
Rail passenger
2.1 to 3.0 37 to 56
108 to 400
35 to 161
Rail freight 140 to 800
It can be concluded from this table that in many cases the ranges of data are excessively large, notably those for the ERIM freight forecast for most of the countries in Groups 2 and 3, the TENCONNECT Baseline rail passenger forecast for Group 2 and the rail forecast in the revision questionnaires of some Group 3 countries. Moreover, the maximum growth values for some countries in Group 3 in the ERIM forecast (2005/2020 increases of up to 800 %) do not seem reliable from the current perspective. The TENCONNECT Baseline and Master Plan revision questionnaires seem to be the most authoritative, being also the most recent ones. Therefore, they have been taken as the reference points for the revised forecast for the Master Plan basic development scenario. At the same time, it was also taken into account that in most cases (especially with the rail passenger forecast) the TENCONNECT data ranges are larger than those in the Master Plan revision questionnaire.
On this basis, the revised basic development scenario trends for the TEM and TER Master Plan expected in the period 2005 to 2020 are as follows.
• FortheEUmembercountriesbefore1 May2004(Group 1countries):
- annual growth in road transport (AADT): 1.2 % to 2.3 %;
- annual growth in passenger transport by rail: 1.3 % to 2.0 %;
- annual growth in freight transport by rail: 2.0 % to 2.7 %.• FortheEUmembercountriesandaccedingcountriesafter1 May2004(Group 2countries):
- annual growth in road transport (AADT): 1.7 % to 2.9 %;
- annual growth in passenger transport by rail: 1.1 % to 1.3 %;
- annual growth in freight transport by rail: 2.8 % to 3.6 %.

E C O N O M I C C O M M I S S I O N F O R E U R O P E
77
Within Group 2, in Bulgaria, Croatia, Romania and Turkey the following higher development potential is envisaged:
- annual growth in road transport (AADT): 2.6 % to 5.4 %;
- annual growth in passenger transport by rail: 2.4 % to 5.0 %;
- annual growth in freight transport by rail: 2.8 % to 5.5 %;
with the growth rates of Turkey expected to lie in the upper parts of these ranges.
• Innon-EU,non-acceding,countries(Group 3countries):
- annual growth in road transport (AADT): 2.3 % to 6.3 %;
- annual growth in passenger transport by rail: 3.0 % to 4.3 %;
- annual growth in freight transport by rail: 3.6 % to 5.5 %.
5.9 Post-crisis development scenarios
Neither the forecast results discussed above in chapters 5.2 to 5.4 nor the revised basic development scenario for the Master Plan took into account the consequences of the global economic and financial crisis whose partial impacts on the road and rail traffic development in 2008 and 2009 in the participating countries were introduced in chapter 5.6.
To reflect these impacts and knowing that — as the International Transport Forum´s “Transport Outlook 2010” puts it — economic recovery is uncertain and uneven, two more post-crisis development scenarios, modifying the basic scenario, have been formulated as follows.
Post-crisis development scenario “1”
This scenario proceeded from the assumption that the consequences of the crisis would not be long-term, i.e. that owing to the faster economic development in the forthcoming period, its impacts would not be traceable by 2020. In other words, the traffic flow levels reached in 2020 would be the same as those in the basic scenario. The annual growth figures for the whole period 2005 to 2020 (specified in chapter 5.8) would also remain the same (despite the slower average development in the period 2005 to 2010 and a higher average development in the period 2010 to 2020) and thus would be valid also for this post-crisis development scenario.
Post-crisis development scenario “2”
In this scenario, the assumption was that the decrease in traffic resulting from the road crisis in 2009 will influence the future road and rail traffic development up to the year 2020, i.e. the annual growth rates in the period 2010 to 2020 will be the same as those of the basic development scenario, but starting from the 2009 actual (i.e. lower) level. With a great degree of generalization, the 2008 to 2009 traffic development according to the results of the inquiry presented in Charts 1 and 2 can be summarized as follows.
Road passenger traffic:
Group 1 — no increase
Group 2 — no influence (Lithuania decrease about 7 %)
Group 3 — no influence

U N E C E T E M A N D T E R P R O J E C T S ’ M A S T E R P L A N – 2 0 1 1
78
Road freight traffic:
Group 1 — decrease about 10 %
Group 2 — decrease about 10 % (Lithuania about -15 %, Romania and Bulgaria only about -2 %, Turkey no influence)
Group 3 — no influence (Balkan countries decrease about 20 %)
Rail passenger traffic:
Group 1 — no increase
Group 2 — no increase (Romania and Bulgaria -10 %, Turkey no influence)
Group 3 — decrease about 10 % (Balkan countries about -20 %)
Rail freight traffic:
Group 1 — decrease about 20 %
Group 2 — decrease about 20 % (Romania and Bulgaria -30 %, Turkey -5 %)
Group 3 — decrease about 20 % (the Russian Federation -10 %).
These figures are approximate, are based on the limited amount of data available and may also vary country by country within the respective group.
Taking these figures into account, the trends expected in the period 2005 to 2020 according to the revised post-crisis development scenario “2” are as follows:
• FortheEUmembercountriesbefore1 May2004(Group 1countries):
- annual growth in road transport (AADT): 0.8 % to 1.9 %;
- annual growth in passenger transport by rail: 1.1 % to 1.8 %;
- annual growth in freight transport by rail: 0.5 % to 1.2 %.
• FortheEUmembercountriesandaccedingcountriesafter1 May2004(Group 2countries):
- annual growth in road transport (AADT): 0.8 % to 2.6 %;
- annual growth in passenger transport by rail: 1.0 % to 1.2 %;
- annual growth in freight transport by rail: 1.2 % to 2.2 %.
Within Group 2, in Bulgaria, Croatia, Romania and Turkey the following higher development potential is envisaged:
- annual growth in road transport (AADT): 2.5 % to 5.4 %;
- annual growth in passenger transport by rail: 1.7 % to 5.0 %;
- annual growth in freight transport by rail: 2.4 % to 5.3 %
with the growth rates of Turkey expected to lie in the upper parts of these ranges.
• Innon-EU,non-acceding,countries(Group 3countries):
- annual growth in road transport (AADT): 2.0 % to 6.3 %;
- annual growth in passenger transport by rail: 1.5 % to 2.8 %;
- annual growth in freight transport by rail: 2.0 % to 4.2 %.

E C O N O M I C C O M M I S S I O N F O R E U R O P E
79
5.10 Maps of road and rail traffic flows in 2020
Maps No. 6 to 8, showing the forecast traffic volumes in 2020 according to the basic development scenarios, were compiled taking into account the results of the 2005 traffic counts and the forecast trends, making allowance also for the national forecasts and maps published in the framework of the recent TENCONNECT study. To allow comparison, the same legend indicators (for roads AADT; for rail passengers/day and rail freight tonne/day) were used, but slightly modified to reflect the specific situation in the region (especially the lower road traffic flows than in Central Western Europe).

U N E C E T E M A N D T E R P R O J E C T S ’ M A S T E R P L A N – 2 0 1 1
80

E C O N O M I C C O M M I S S I O N F O R E U R O P E
81
6. REVISED MASTER PLAN PROJECTS
6.1 Overview
On the basis of the replies from participating countries in the course of 2009, and of subsequent consultations and updated data received up to the end of 2010, altogether 485 new or revised projects (294 motorway/road and 191 rail) have been identified and proposed by the participating countries, i.e. about the same number (491) as in the original Master Plan of 2005 (see also Maps No. 9 and 10). Some of the projects which emerged in the reporting period are new; these are indicated using bold print in the tables in chapters 6.2 and 6.3. The projects indicated using regular print were already contained in the original Master Plan, but have not been completed yet and so they are listed with revised/updated parameters.
The total cost of all Master Plan revision projects amounts to EUR 188,401 × 109. The implementation of motorway/road projects will require EUR 115,123 × 109 and rail projects EUR 73,278 × 109. The total cost of all projects is much higher than in the original Master Plan (EUR 102,114 × 109). Taking into account that the total number of projects is almost identical, this fact indicates that the average price of a project has increased almost two times from EUR 208 × 106 to about EUR 388 × 106; this is partly due to inflation but mostly because bigger and more-demanding construction projects (e.g. high-speed rail lines) are in the list of some countries. The total number of projects and their cost in individual countries is shown in the following table (only known and reported costs are included).

U N E C E T E M A N D T E R P R O J E C T S ’ M A S T E R P L A N – 2 0 1 1
82
CountryTEM projects TER projects
No. EUR ×106 No. EUR ×106
Albania 6 564 2 29
Austria 17 13,639
Azerbaijan 3 389 2 319
Bosnia and Herzegovina 9 4,583 7 70
Bulgaria 13 1,479 8 7,665
Croatia 13 3,365 16 4,839
The Czech Republic 2 2,437 4 4,053
The former Yugoslav Republic of Macedonia 2 1,024 4 555
Georgia 7 1,523
Greece 3 575
Hungary 8
Lithuania 12 920 31 685
Montenegro 3 104 1 33
Poland 78 41,452 20 5,652
Romania 49a 33,939 5 4,747
The Russian Federation 12 20 3,790
Serbia 12 3,902 11 4,021
Slovakia 19 6,555 13 7,559
Slovenia 3 640 9 3,401
Turkey 36 10,629 21 12,221
Ukraine 4 1,043
a) Including projects put into operation recently.

E C O N O M I C C O M M I S S I O N F O R E U R O P E
83
6.2
M
oto
rway/r
oad p
roje
cts
in t
he
revi
sed M
ast
er P
lan
Not
e 1:
New
pro
ject
s in
the
revi
sed
Mas
ter
Plan
are
indi
cate
d us
ing
bold
prin
t.
Proj
ect I
DPr
ojec
t des
crip
tion
Leng
th (k
m)
Cost
(E
UR
×106 )
Star
t ye
arEn
d ye
ar
% fu
ndin
g se
cure
d fr
om fo
llow
ing
sour
ce
Nat
iona
lBa
nkG
rant
Priv
ate
ALB
AN
IA
AL-H
-5Le
van
– Te
pele
ne (c
onst
ruct
ion)
7070
2010
2011
100
AL-H
-6D
urre
s (P
lepa
) – R
rogo
zhin
e (r
ehab
ilita
tion)
(fro
m 1
1 li
ne to
2 ×
2 li
ne)
2834
2009
2011
100
AL-H
-7Li
braz
hd (Q
ukes
) – P
ogra
dec
(con
stru
ctio
n)50
6920
1020
1310
0
AL-H
-8Ti
rana
– E
lbas
an (K
rrab
e) (c
onst
ruct
ion)
3233
020
1020
1310
0
AL-H
-9Fu
she
Kruj
e –
Milo
t Thu
man
e (r
ehab
ilita
tion)
(fro
m 1
× 1
line
to 2
× 2
line
)25
3420
0920
1110
0
AL-H
-10
Shko
der
– H
ani i
Hot
it (r
ehab
ilita
tion)
3927
2010
2011
100
AZE
RBA
IJA
N
AZ-
H-5
Baku
– R
US
bord
er (1
34 k
m to
198
km
)64
150
2010
2011
100
AZ-
H-8
Gaz
akh
– Re
d br
idge
3854
AZ-
H-1
0M
asal
li –
Ast
ara
(con
stru
ctio
n)57
185
2009
2011
BO
SNIA
AN
D H
ERZE
GO
VIN
A
BH-M
-2C
onstr
uctio
n of
Tuz
la –
Ora
sje
expr
essw
ay61
400
2013
2017
BH-M
-3Co
nstr
uctio
n of
Ban
ja L
uka
– D
oboj
mot
orw
ay72
500
2010
2012
BH-H
-4Im
prov
emen
t of F
oca
– H
um ro
ad18
8020
1220
14
BH-H
-5C
onstr
uctio
n of
Mos
tar b
ypas
s14
20
BH-H
-6Im
prov
emen
t of L
asva
– T
ravn
ik ro
ad54
200
2012
2015
BH-H
-7Im
prov
emen
t of S
tola
c –
Neu
m ro
ad32
BH-H
-8C
onstr
uctio
n of
Cor
ridor
Vc
mot
orw
ay29
03,
200
2001
2018
16

U N E C E T E M A N D T E R P R O J E C T S ’ M A S T E R P L A N – 2 0 1 1
84
Proj
ect I
DPr
ojec
t des
crip
tion
Leng
th (k
m)
Cost
(E
UR
×106 )
Star
t ye
arEn
d ye
ar
% fu
ndin
g se
cure
d fr
om fo
llow
ing
sour
ce
Nat
iona
lBa
nkG
rant
Priv
ate
BH-H
-9Re
cons
truc
tion
of T
uzla
– S
araj
evo
road
sec
tion
120
135
BH-H
-10
Cons
truc
tion
of R
enov
ica
– M
esic
i roa
d20
48
BULG
ARI
A
BG-M
-1Ro
ad E
85 (r
econ
struc
tion)
113
2015
BG-M
-2M
aritz
a m
otor
way
, Sec
tion
131
104
2011
2013
2080
BG-M
-3M
aritz
a m
otor
way
, Sec
tion
235
105
2011
2013
2080
BG-M
-4M
aritz
a m
otor
way
, Sec
tion
343
120
2008
2013
919
BG-M
-5Ka
lotin
a –
Sofia
mot
orw
ay, s
ectio
n: D
rago
man
– S
livni
tza
– So
fia37
123
2015
BG-M
-6Ka
lotin
a –
Sofia
mot
orw
ay, s
ectio
n: K
alot
ina
– D
rago
man
1226
2015
BG-M
-7Ka
lotin
a –
Sofia
mot
orw
ay, s
ectio
n: H
emus
Con
nect
or9
3220
1020
1220
80
BG-M
-8Ka
lotin
a –
Sofia
mot
orw
ay, s
ectio
n: S
ofia
Ring
Roa
d –
Nor
th A
rc22
137
2015
BG-M
-9H
emus
mot
orw
ay, s
ectio
n 1
5917
820
15
BG-M
-10
Hem
us m
otor
way
, sec
tion
185
191
2015
BG-M
-11
Trak
ia m
otor
way
, sec
tion
232
9620
1020
1220
80
BG-M
-12
Trak
ia m
otor
way
, sec
tion
336
108
2010
2012
2080
BG-M
-13
Trak
ia m
otor
way
, sec
tion
448
146
2010
2012
2080
CRO
ATIA
CR-
M-6
A7-
02 K
rizis
ce –
Sen
j41
467
2015
2020
2080
Kriz
isce
– N
ovi V
inod
olsk
i25
275
2015
2020
2080
Nov
i Vin
odol
ski –
Sen
j16
192
2015
2020
2080
CR-
M-7
A7-
03 S
enj –
Zut
a Lo
kva
1521
220
1420
1620
80

E C O N O M I C C O M M I S S I O N F O R E U R O P E
85
Proj
ect I
DPr
ojec
t des
crip
tion
Leng
th (k
m)
Cost
(E
UR
×106 )
Star
t ye
arEn
d ye
ar
% fu
ndin
g se
cure
d fr
om fo
llow
ing
sour
ce
Nat
iona
lBa
nkG
rant
Priv
ate
CR-
M-1
2
A1-
05 Z
agvo
zd (M
akar
ska)
– P
loce
4864
120
0620
1340
60
Zagv
ozd
– Ra
vca
(in o
pera
tion)
2724
120
0620
0840
60
Ravc
a –
Ploc
e21
400
2008
2013
4060
CR-
M-1
3
A1-
06 P
loce
– N
eum
3046
520
1120
18
Ploc
e –
Met
kovi
c6
7020
1120
1310
0
Met
kovi
c –
Opu
zen
1119
520
1520
2020
80
Opu
zen
– C
vor P
elje
sac
696
2015
2020
2080
Cvo
r Pel
jesa
c –B
IH b
orde
r7
104
2015
2020
2080
CR-
M-1
4
A1-
07 N
eum
– D
ubro
vnik
4796
520
1520
2010
0
BIH
bor
der –
Dol
i15
188
2015
2020
100
Dol
i – D
ubro
vnik
2872
720
1520
2010
0
Dub
rovn
ik –
BIH
bor
der
450
2015
2020
100
CR-
M-1
8A
1-09
Dug
opol
je –
Klis
3020
1120
13
CR-
M-1
9A
1-10
Klis
– S
plit
4520
1120
13
CR-
M-2
0A
5-01
Kne
zevo
– C
emin
ac15
112
2012
2015
CR-
M-2
1A
5-02
Cem
inac
– O
sije
k15
205
2011
2013
CR-
M-2
3
A5-
04 S
reda
nci –
Svi
laj
349
2011
2013
100
HU
N (B
ranj
in V
rh) –
Bel
i Man
astir
555
2013
2015
100
Beli
Man
astir
– O
sije
k25
298
2011
2015
100
CR-
M-2
4A
10-0
1 M
etko
vic
– Pl
oce
451
2011
2013
Met
kovi
c –
BIH
bor
der
211
2011
2013
100

U N E C E T E M A N D T E R P R O J E C T S ’ M A S T E R P L A N – 2 0 1 1
86
Proj
ect I
DPr
ojec
t des
crip
tion
Leng
th (k
m)
Cost
(E
UR
×106 )
Star
t ye
arEn
d ye
ar
% fu
ndin
g se
cure
d fr
om fo
llow
ing
sour
ce
Nat
iona
lBa
nkG
rant
Priv
ate
CR-
M-2
5A
5-05
Cem
inac
– B
atin
a90
2018
2019
CR-
M-2
6A
9-01
Vod
njan
– P
ula
1333
2005
2011
THE
CZEC
H R
EPU
BLIC
CZ-
M-2
Mot
orw
ay D
8 Lo
vosi
ce –
Reh
lovi
ce16
567
2004
2011
5644
CZ-
M-5
Mot
orw
ay D
47 L
ipni
k –
POL
bord
er80
1,87
020
0220
1110
0
THE
FORM
ER Y
UG
OSL
AV R
EPU
BLIC
OF
MA
CED
ON
IA
MA
-M-1
Con
struc
tion
of D
emir
Kapi
ja –
Sm
okvi
ca ro
ad s
ectio
n, P
hase
I28
174
2011
2014
MA
-M-3
Con
struc
tion
of C
orrid
or V
III, S
kopj
e by
pass
304
850
2179
GEO
RGIA
GE-
M-5
Gor
i – R
ikot
i (re
habi
litat
ion
and
upgr
adin
g)63
317
2009
2013
GE-
H-6
Riko
ti –
Zest
afon
i (re
habi
litat
ion
and
upgr
adin
g)44
366
2011
2015
GE-
H-7
Zest
afon
i – S
amtr
edia
(reh
abili
tatio
n an
d up
grad
ing)
7826
820
1020
13
GE-
H-8
Sam
tred
ia –
Pot
i (re
habi
litat
ion
and
upgr
adin
g)67
178
2014
2017
GE-
H-9
Poti
– Ch
oloq
i (re
habi
litat
ion
and
upgr
adin
g)31
6720
1320
16
GE-
H-1
0Ch
oloq
i – S
arpi
(reh
abili
tatio
n an
d up
grad
ing)
5222
520
0920
14
GE-
H-1
3Tb
ilisi
– M
arne
uli (
reha
bilit
atio
n an
d up
grad
ing)
2910
220
1020
16
GRE
ECE
GR-
M-1
Egna
tia m
otor
way
, sec
tion
Stry
mon
as –
Nea
Per
amos
4224
020
1120
15
GR-
M-2
Profi
tis –
Mac
edon
ia a
irpor
t, du
al c
arria
gew
ay40
235
2016
2021
GR-
M-4
Siat
ista
– K
rista
lore
lopi
gi m
otor
way
, sec
tion
Siat
ista
– A
rgos
Ore
stiko
3010
020
1120
15
HU
NG
ARY

E C O N O M I C C O M M I S S I O N F O R E U R O P E
87
Proj
ect I
DPr
ojec
t des
crip
tion
Leng
th (k
m)
Cost
(E
UR
×106 )
Star
t ye
arEn
d ye
ar
% fu
ndin
g se
cure
d fr
om fo
llow
ing
sour
ce
Nat
iona
lBa
nkG
rant
Priv
ate
HU
-M-4
M2:
Vac
– H
UN
/SVK
bor
der
3820
1650
50
HU
-M-6
M3:
Nyi
regy
haza
– H
UN
/UKR
bor
der
64
HU
-M-9
M6:
Dun
aujv
aros
– B
oly
114
2008
2015
100
HU
-M-1
0M
6: B
oly
– H
UN
/HRV
bor
der
2510
0
HU
-M-1
4M
43: M
ako
– H
UN
/RU
S bo
rder
2620
1020
1250
50
HU
-M-1
5Sz
omba
thel
y –
Nag
ykan
izsa
105
2016
2020
5050
HU
-M-1
6M
30: S
VK/H
UN
bor
der –
Mis
kolc
6020
1720
2050
50
HU
-M-2
047
/42:
Deb
rece
n-H
UN
/RU
S bo
rder
5020
1220
15
LITH
UA
NIA
LT-M
-4Br
idge
on
road
A1
acro
ss N
eris
rive
r in
Kaun
as (w
iden
ing)
129
2011
2013
5050
LT-M
-5Ro
ad A
1 (w
iden
ing)
(6 tr
affic
lane
s)9
1720
1320
1550
50
LT-M
-6Ro
ad A
1 (w
iden
ing)
(6 tr
affic
lane
s)78
9020
25
LT-M
-7Ro
ad A
5 Ka
unas
-Mar
ijam
pole
– S
uval
kai (
cons
truct
ion
of s
econ
d dr
ivin
g di
rect
ion)
3579
2010
2013
3763
LT-M
-8Ro
ad A
5 Ka
unas
-Mar
ijam
pole
– S
uval
kai (
cons
truct
ion
of s
econ
d dr
ivin
g di
rect
ion)
3680
2018
2020
LT-M
-9Ro
ad A
8 Pa
neve
zys
– A
rista
va –
Sitk
unai
(con
struc
tion
of s
econ
d dr
ivin
g di
rect
ion)
3480
2020
2022
LT-M
-10
Road
A8
Pane
vezy
s –
Aris
tava
– S
itkun
ai (c
onstr
uctio
n of
sec
ond
driv
ing
dire
ctio
n)47
120
2025
2027
LT-M
-11
Jaka
i int
erse
ctio
n on
roa
d A
1 in
Kla
iped
a ap
proa
ches
(con
struc
tion)
464
2009
2013
6733
LT-M
-12
Viln
ius
sout
hern
byp
ass
(I. s
tage
)40
2009
2011
1585
LT-M
-13
Klai
peda
city
sou
ther
n ac
cess
to th
e se
a po
rt6
4020
1120
1315
85
LT-M
-14
Viln
ius
city
wes
tern
byp
ass
1024
020
0820
1558
42
LT-M
-15
Ram
ygal
a by
pass
, sec
tion
Salo
ciai
– S
itkun
ai7
4120
1420
2543
57
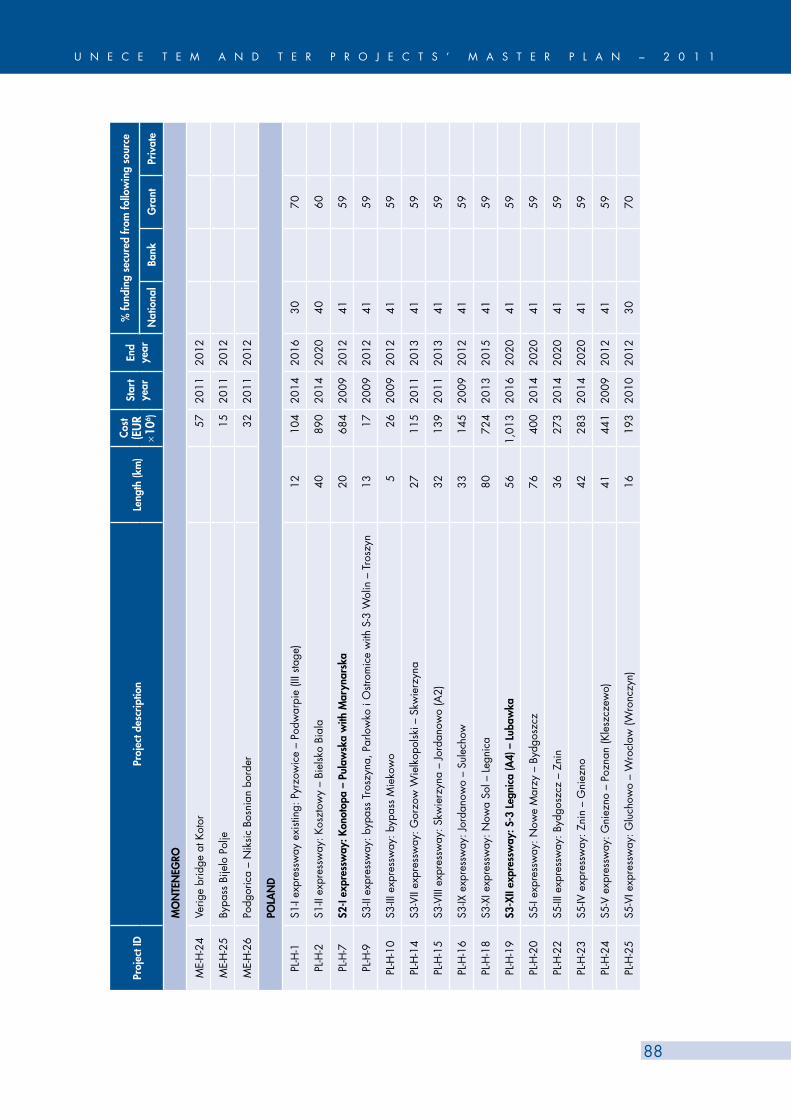
U N E C E T E M A N D T E R P R O J E C T S ’ M A S T E R P L A N – 2 0 1 1
88
Proj
ect I
DPr
ojec
t des
crip
tion
Leng
th (k
m)
Cost
(E
UR
×106 )
Star
t ye
arEn
d ye
ar
% fu
ndin
g se
cure
d fr
om fo
llow
ing
sour
ce
Nat
iona
lBa
nkG
rant
Priv
ate
MO
NTE
NEG
RO
ME-
H-2
4Ve
rige
brid
ge a
t Kot
or57
2011
2012
ME-
H-2
5By
pass
Bije
lo P
olje
1520
1120
12
ME-
H-2
6Po
dgor
ica
– N
iksi
c Bo
snia
n bo
rder
3220
1120
12
POLA
ND
PL-H
-1S1
-I ex
pres
sway
exi
sting
: Pyr
zow
ice
– Po
dwar
pie
(III s
tage
)12
104
2014
2016
30
70
PL-H
-2S1
-II e
xpre
ssw
ay: K
oszt
owy
– Bi
elsk
o Bi
ala
4089
020
1420
2040
60
PL-H
-7S2
-I ex
pres
sway
: Kon
otop
a –
Pula
wsk
a w
ith M
aryn
arsk
a 20
684
2009
2012
41
59
PL-H
-9S3
-II e
xpre
ssw
ay: b
ypas
s Tr
oszy
na, P
arlo
wko
i O
strom
ice
with
S-3
Wol
in –
Tro
szyn
1317
2009
2012
41
59
PL-H
-10
S3-II
I exp
ress
way
: byp
ass
Mie
kow
o5
2620
0920
1241
59
PL-H
-14
S3-V
II ex
pres
sway
: Gor
zow
Wie
lkop
olsk
i – S
kwie
rzyn
a27
115
2011
2013
41
59
PL-H
-15
S3-V
III e
xpre
ssw
ay: S
kwie
rzyn
a –
Jord
anow
o (A
2)32
139
2011
2013
41
59
PL-H
-16
S3-IX
exp
ress
way
: Jor
dano
wo
– Su
lech
ow33
145
2009
2012
41
59
PL-H
-18
S3-X
I exp
ress
way
: Now
a So
l – L
egni
ca80
724
2013
2015
41
59
PL-H
-19
S3-X
II ex
pres
sway
: S-3
Leg
nica
(A4)
– L
ubaw
ka56
1,01
320
1620
2041
59
PL-H
-20
S5-I
expr
essw
ay: N
owe
Mar
zy –
Byd
gosz
cz76
400
2014
2020
41
59
PL-H
-22
S5-II
I exp
ress
way
: Byd
gosz
cz –
Zni
n36
273
2014
2020
41
59
PL-H
-23
S5-IV
exp
ress
way
: Zni
n –
Gni
ezno
4228
320
1420
2041
59
PL-H
-24
S5-V
exp
ress
way
: Gni
ezno
– P
ozna
n (K
lesz
czew
o)41
441
2009
2012
41
59
PL-H
-25
S5-V
I exp
ress
way
: Glu
chow
o –
Wro
claw
(Wro
nczy
n)16
193
2010
2012
30
70

E C O N O M I C C O M M I S S I O N F O R E U R O P E
89
Proj
ect I
DPr
ojec
t des
crip
tion
Leng
th (k
m)
Cost
(E
UR
×106 )
Star
t ye
arEn
d ye
ar
% fu
ndin
g se
cure
d fr
om fo
llow
ing
sour
ce
Nat
iona
lBa
nkG
rant
Priv
ate
PL-H
-26
S5-V
II ex
pres
sway
: Poz
nan
(A-2
junc
tion
“Głu
chow
o”) –
Wro
claw
(A-8
junc
tion
“Wid
awa”
)15
51,
105
2013
2016
50
59
PL-H
-27
S6- I
exp
ress
way
: Slu
psk
– Le
bork
40
572
2013
2016
50
50
PL-H
-28
S6-II
exp
ress
way
: Leb
ork
– Bo
ze P
ole
3644
820
1220
1450
50
PL-H
-29
S6-II
I exp
ress
way
: Boz
e Po
le –
Gda
nsk
(Tra
sa K
aszu
bska
)11
8920
1220
1450
50
PL-H
-30
S7-I
expr
essw
ay: G
dans
k (A
-1) –
Elb
lag
(S-2
2)60
1,43
420
0920
1241
59
PL-H
-31
S7-II
exp
ress
way
: Elb
lag
(S-2
2) –
Ols
ztyn
ek (S
-51)
107
1,02
620
0820
1241
59
PL-H
-32
S7-II
I exp
ress
way
: Ols
ztyn
ek (S
-51)
– P
lons
k (S
-10)
128
1,07
020
1020
1541
59
PL-H
-33
S7-IV
exp
ress
way
: Plo
nsk
(S-1
0) –
War
szaw
a (S
-8)
5092
320
1420
1641
59
PL-H
-34
S7-V
exp
ress
way
: War
szaw
a –
Gro
jec
2147
020
1320
1541
59
PL-H
-38
S7-IX
exp
ress
way
: Rad
om (J
edlin
sk) –
Jed
rzej
ow75
910
2013
2016
41
59
PL-H
-39
S7-X
exp
ress
way
: Jed
rzej
ow –
voi
vode
ship
bor
der
2019
620
1320
1641
59
PL-H
-41
S7-X
I exp
ress
way
: Jed
rzej
ow –
voi
vode
ship
bor
der
1819
720
1020
1250
50
PL-H
-42
S7-X
II ex
pres
sway
: voi
vode
ship
bor
der –
Kra
kow
6039
520
1020
1350
50
PL-H
-43
S7-X
III e
xpre
ssw
ay: K
rako
w –
Mys
leni
ce (r
econ
struc
tion)
3069
2010
2013
50
50
PL-H
-45
S7-X
VI e
xpre
ssw
ay: L
ubie
n –
Rabk
a w
ith tu
nnel
1859
020
1320
1541
59
PL-H
-46
S8-I
expr
essw
ay: W
rocl
aw –
Ole
snic
a 48
7520
0920
1230
70
PL-H
-48
S8-II
I exp
ress
way
: Ole
snic
a –
Syco
w19
8320
0920
1230
70
PL-H
-49
S8-IV
exp
ress
way
: Syc
ow –
Wal
ichn
owy
4643
720
1120
1530
70
PL-H
-50
S8-V
exp
ress
way
: Wal
ichn
owy
– Lo
dz10
41,
591
2011
2015
30
70
PL-H
-51
S8-V
I exp
ress
way
: Pio
trkow
Try
buna
lski –
Wol
ica
116
296
2009
2012
41
59

U N E C E T E M A N D T E R P R O J E C T S ’ M A S T E R P L A N – 2 0 1 1
90
Proj
ect I
DPr
ojec
t des
crip
tion
Leng
th (k
m)
Cost
(E
UR
×106 )
Star
t ye
arEn
d ye
ar
% fu
ndin
g se
cure
d fr
om fo
llow
ing
sour
ce
Nat
iona
lBa
nkG
rant
Priv
ate
PL-H
-52
S8-V
II ex
pres
sway
: Wol
ica
– Sa
lom
ea16
159
2009
2012
100
PL-H
-54
S8-IX
exp
ress
way
: Pow
azko
wsk
a –
Mar
ki (P
ilsud
skie
go)
727
020
0920
1241
59
PL-H
-55
S8-X
exp
ress
way
: Mar
ki –
Rad
zym
in15
130
2013
2015
100
PL-H
-58
S8-X
III e
xpre
ssw
ay: W
yszk
ow –
Ostr
ow M
az27
580
2009
2012
41
59
PL-H
-59
S8-X
IV e
xpre
ssw
ay: O
strow
Maz
owie
cka
– Za
mbr
ow22
480
2009
2012
41
59
PL-H
-60
S8-X
V ex
pres
sway
: byp
ass
Zam
brow
1634
920
0920
1241
59
PL-H
-61
S8-X
VI e
xpre
ssw
ay: Z
ambr
ow –
Jeze
wo
2962
120
0920
1241
59
PL-H
-62
S8-X
VII e
xpre
ssw
ay: J
ezew
o –
Bial
ysto
k23
501
2009
2012
41
59
PL-H
-63
S8-X
VIII
expr
essw
ay: b
ypas
s Bi
alys
tok
858
020
0920
1241
59
PL-H
-64
S17-
I exp
ress
way
: War
szaw
a (ju
nctio
n “Z
akre
t”) –
Gar
wol
in42
383
2013
2016
41
59
PL-H
-66
S17-
III e
xpre
ssw
ay: G
arw
olin
– K
urow
5952
920
1320
1541
59
PL-H
-67
S17-
IV e
xpre
ssw
ay: K
urow
– L
ublin
– P
iask
i 69
859
2012
2015
41
59
PL-H
-68
S19-
I exp
ress
way
: Kuz
nica
Bia
lost
ocka
– B
ialy
stok
(Cho
rosz
cz)
122
1,12
320
1320
1641
59
PL-H
-69
S17-
VI e
xpre
ssw
ay: P
iask
i – H
rebe
nne
123
657
2013
2016
50
50
PL-H
-70
S19-
I exp
ress
way
: Bia
lyst
ok –
Mie
dzyr
zec
Podl
aski
157
1,45
220
1320
1641
59
PL-H
-71
S19-
II ex
pres
sway
: Mie
dzyr
zec
Podl
aski
– L
ubar
tow
6929
220
1220
1541
59
PL-H
-72
S19-
III e
xpre
ssw
ay: L
ubar
tow
– K
rasn
ik68
336
2014
2016
41
59
PL-H
-73
S19-
IV e
xpre
ssw
ay: K
rasn
ik –
Sto
bier
na49
568
2013
2015
41
59
PL-H
-74
S19-
V e
xpre
ssw
ay: S
tobi
erna
– L
utor
yz33
206
2012
2015
41
59
PL-H
-75
S19-
VI e
xpre
ssw
ay: L
utor
yz –
Bar
win
ek89
261
2012
2015
41
59
PL-H
-77
S61-
XXI e
xpre
ssw
ay: O
stro
w M
azow
ieck
a –
Lom
za –
Suw
alki
– B
udzi
sko
(via
Bal
tica)
220
1,32
020
1520
2050
50
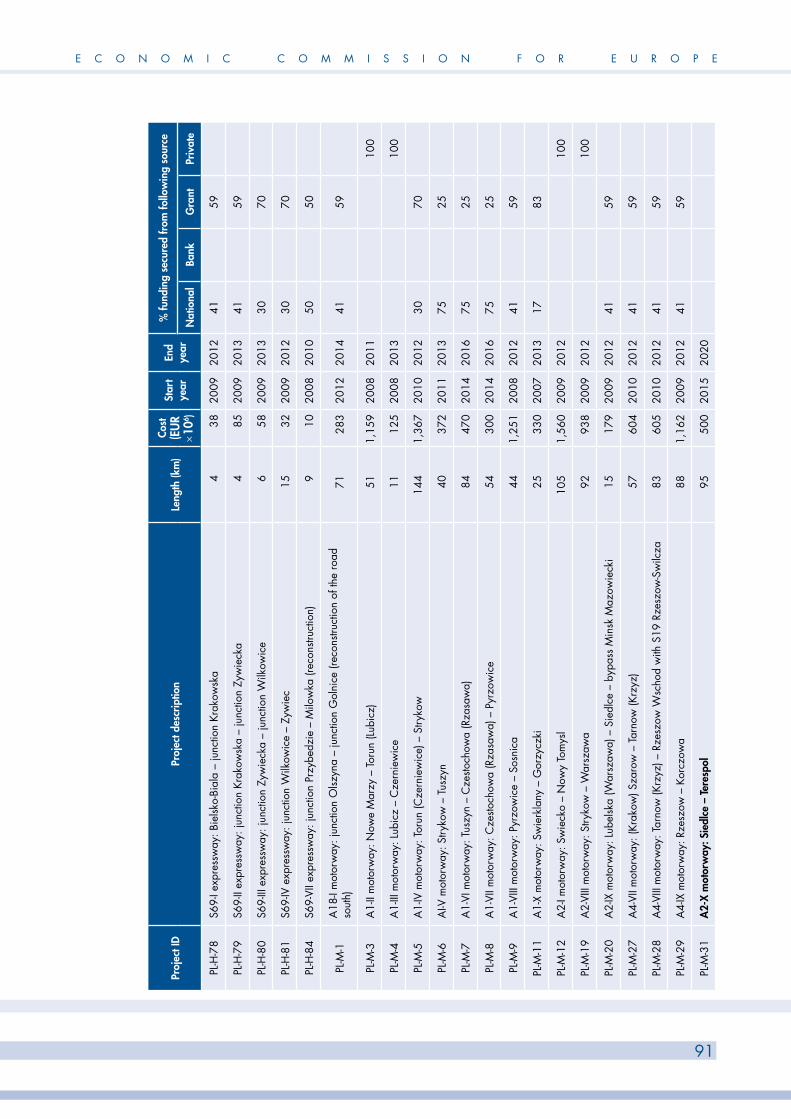
E C O N O M I C C O M M I S S I O N F O R E U R O P E
91
Proj
ect I
DPr
ojec
t des
crip
tion
Leng
th (k
m)
Cost
(E
UR
×106 )
Star
t ye
arEn
d ye
ar
% fu
ndin
g se
cure
d fr
om fo
llow
ing
sour
ce
Nat
iona
lBa
nkG
rant
Priv
ate
PL-H
-78
S69-
I exp
ress
way
: Bie
lsko-
Bial
a –
junc
tion
Krak
owsk
a4
3820
0920
1241
59
PL-H
-79
S69-
II ex
pres
sway
: jun
ctio
n Kr
akow
ska
– ju
nctio
n Zy
wie
cka
485
2009
2013
41
59
PL-H
-80
S69-
III e
xpre
ssw
ay: j
unct
ion
Zyw
ieck
a –
junc
tion
Wilk
owic
e6
5820
0920
1330
70
PL-H
-81
S69-
IV e
xpre
ssw
ay: j
unct
ion
Wilk
owic
e –
Zyw
iec
1532
2009
2012
30
70
PL-H
-84
S69-
VII e
xpre
ssw
ay: j
unct
ion
Przy
bedz
ie –
Milo
wka
(rec
onstr
uctio
n)9
1020
0820
1050
50
PL-M
-1A
18-I
mot
orw
ay: j
unct
ion
Olsz
yna
– ju
nctio
n G
olni
ce (r
econ
struc
tion
of th
e ro
ad
sout
h)71
283
2012
2014
41
59
PL-M
-3A
1-II
mot
orw
ay: N
owe
Mar
zy –
Tor
un (L
ubic
z)51
1,15
920
0820
1110
0
PL-M
-4A
1-III
mot
orw
ay: L
ubic
z –
Cze
rnie
wic
e11
125
2008
2013
10
0
PL-M
-5A
1-IV
mot
orw
ay: T
orun
(Cze
rnie
wic
e) –
Stry
kow
144
1,36
720
1020
1230
70
PL-M
-6A
I-V m
otor
way
: Stry
kow
– T
uszy
n40
372
2011
2013
75
25
PL-M
-7A
1-VI
mot
orw
ay: T
uszy
n –
Cze
stoch
owa
(Rza
saw
a)84
470
2014
2016
75
25
PL-M
-8A
1-VI
I mot
orw
ay: C
zesto
chow
a (R
zasa
wa)
– P
yrzo
wic
e54
300
2014
2016
75
25
PL-M
-9A
1-VI
II m
otor
way
: Pyr
zow
ice
– So
snic
a44
1,25
120
0820
1241
59
PL-M
-11
A1-
X m
otor
way
: Sw
ierk
lany
– G
orzy
czki
2533
020
0720
1317
83
PL-M
-12
A2-
I mot
orw
ay: S
wie
cko
– N
owy
Tom
ysl
105
1,56
020
0920
1210
0
PL-M
-19
A2-
VIII
mot
orw
ay: S
tryko
w –
War
szaw
a92
938
2009
2012
100
PL-M
-20
A2-
IX m
otor
way
: Lub
elsk
a (W
arsz
awa)
– S
iedl
ce –
byp
ass
Min
sk M
azow
ieck
i15
179
2009
2012
41
59
PL-M
-27
A4-
VII m
otor
way
: (Kr
akow
) Sza
row
– T
arno
w (K
rzyz
)57
604
2010
2012
41
59
PL-M
-28
A4-
VIII
mot
orw
ay: T
arno
w (K
rzyz
) – R
zesz
ow W
scho
d w
ith S
19 R
zesz
ow-S
wilc
za83
605
2010
2012
41
59
PL-M
-29
A4-
IX m
otor
way
: Rze
szow
– K
orcz
owa
881,
162
2009
2012
41
59
PL-M
-31
A2-
X m
otor
way
: Sie
dlce
– T
eres
pol
9550
020
1520
20

U N E C E T E M A N D T E R P R O J E C T S ’ M A S T E R P L A N – 2 0 1 1
92
Proj
ect I
DPr
ojec
t des
crip
tion
Leng
th (k
m)
Cost
(E
UR
×106 )
Star
t ye
arEn
d ye
ar
% fu
ndin
g se
cure
d fr
om fo
llow
ing
sour
ce
Nat
iona
lBa
nkG
rant
Priv
ate
PL-M
-32
A8-
IX m
otor
way
: Byp
ass
Wro
claw
3694
520
0520
1110
0
ROM
AN
IA
RO-M
-1N
adla
c –
Tim
isoa
ra84
588
2009
2012
3027
43
RO-M
-2Ti
mis
oara
– L
ugoj
3635
920
1120
1315
85
RO-M
-3Lu
goj –
Dev
a10
01,
172
2011
2013
1585
RO-M
-4D
eva
– O
rasti
e33
253
2010
2013
1585
RO-M
-5O
rasti
e –
Sibi
u (in
clud
ing
Sebe
s by
pass
)82
792
2011
2013
1585
RO-M
-6Si
biu
– Pi
testi
117
3,24
620
1120
1310
0
RO-M
-7Bu
cure
sti S
outh
byp
ass
4890
220
1220
1510
0
RO-M
-8Bu
cure
sti N
orth
byp
ass
5396
820
1220
1510
0
RO-M
-12
Cer
navo
da –
Con
stant
a51
396
2009
2011
4555
RO-M
-13
Bucu
resti
– G
iurg
iu60
259
2015
2020
RO-M
-14
Lugo
j – D
robe
ta T
urnu
Sev
erin
180
990
2023
2028
RO-M
-15
Dro
beta
Tur
nu S
ever
in –
Cra
iova
9956
120
3020
35
RO-M
-16
Cra
iova
– B
ucur
esti
220
948
2020
2024
100
RO-M
-17
Tim
isoa
ra –
Sta
mor
a M
orav
ita30
402
2015
2020
RO-M
-18
Ora
dea
– Za
lau
140
806
2004
2012
RO-M
-19
Hal
meu
– S
atu
Mar
e19
215
2015
2020
RO-M
-20
Satu
Mar
e –
Zala
u92
528
2025
2032
RO-M
-21
Zala
u –
Clu
j Nap
oca
2414
920
1120
13
RO-M
-23
Turd
a –
Sebe
s74
920
2015
2020

E C O N O M I C C O M M I S S I O N F O R E U R O P E
93
Proj
ect I
DPr
ojec
t des
crip
tion
Leng
th (k
m)
Cost
(E
UR
×106 )
Star
t ye
arEn
d ye
ar
% fu
ndin
g se
cure
d fr
om fo
llow
ing
sour
ce
Nat
iona
lBa
nkG
rant
Priv
ate
RO-M
-24
(Cam
pia
Turz
ii) T
urda
– O
gra
(Tar
gu M
ures
)36
143
2010
2012
100
RO-M
-25
(Tar
gu M
ures
) Ogr
a –
Sigh
isoa
ra56
344
2011
2013
100
RO-M
-26
Sigh
isoa
ra –
Bra
sov
105
500
2011
2013
100
RO-M
-27
Bras
ov –
Pre
deal
2232
220
1120
1310
0
RO-M
-28
Pred
eal –
Com
arni
c37
522
2011
2013
100
RO-M
-29
Com
arni
c –
Ploi
esti
4837
920
1120
1310
0
RO-M
-30
Ploi
esti
– Bu
cure
sti62
415
2007
2011
100
RO-M
-31
Alb
ita –
Cra
sna
47
2,84
9
2012
2014
RO-M
-32
Cra
sna
– Te
cuci
8620
1220
14
RO-M
-33
Tecu
ci –
Mar
ases
ti19
2012
2014
RO-M
-34
Mar
ases
ti –
Ram
nicu
Sar
at –
Buz
au89
2012
2014
RO-M
-35
Buza
u –
Bucu
resti
N/E
(Plo
iesti
– B
ucur
esti
sect
ion
is in
clud
ed in
RO
-M-3
0)94
2012
2014
RO-M
-36
Sire
t – S
ucea
va42
220
2015
2019
RO-M
-37
Suce
ava
– Sa
baoa
ni95
589
2022
2027
100
RO-M
-38
Saba
oani
– B
acau
5223
120
2720
3310
0
RO-M
-39
Baca
u –
Mar
ases
ti87
484
2033
2038
100
RO-M
-40
(Ung
heni
) Scu
leni
– Ia
si25
138
2011
2014
100
RO-M
-41
Iasi
– T
argu
Fru
mos
4825
320
1120
1410
0
RO-M
-42
Targ
u Fr
umos
– S
abao
ani
2716
520
1520
19
RO-M
-43
Sibi
u –
Faga
ras
7361
420
1520
20
RO-M
-44
Targ
u M
ures
– P
iatr
a N
eam
t – R
oman
281
6,35
220
1120
1410
0
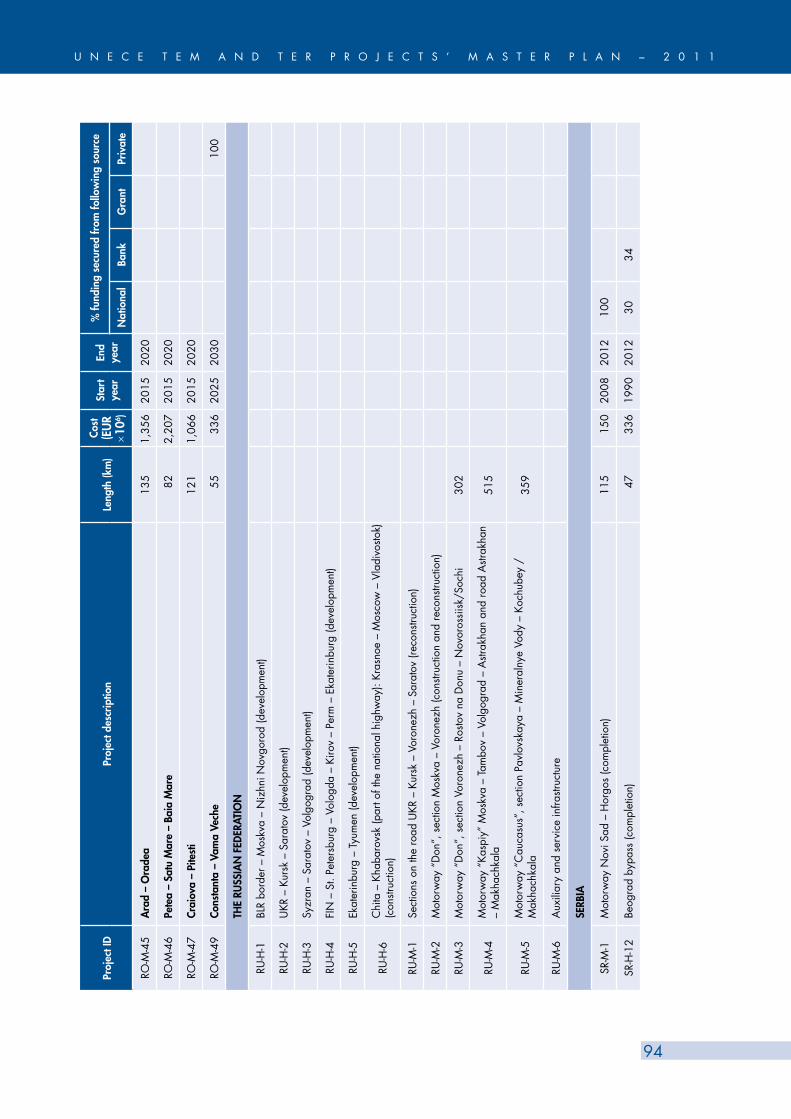
U N E C E T E M A N D T E R P R O J E C T S ’ M A S T E R P L A N – 2 0 1 1
94
Proj
ect I
DPr
ojec
t des
crip
tion
Leng
th (k
m)
Cost
(E
UR
×106 )
Star
t ye
arEn
d ye
ar
% fu
ndin
g se
cure
d fr
om fo
llow
ing
sour
ce
Nat
iona
lBa
nkG
rant
Priv
ate
RO-M
-45
Ara
d –
Ora
dea
135
1,35
620
1520
20
RO-M
-46
Pete
a –
Satu
Mar
e –
Baia
Mar
e82
2,20
720
1520
20
RO-M
-47
Crai
ova
– Pi
test
i12
11,
066
2015
2020
RO-M
-49
Cons
tant
a –
Vam
a Ve
che
5533
620
2520
3010
0
THE
RUSS
IAN
FED
ERAT
ION
RU-H
-1BL
R bo
rder
– M
oskv
a –
Niz
hni N
ovgo
rod
(dev
elop
men
t)
RU-H
-2U
KR –
Kur
sk –
Sar
atov
(dev
elop
men
t)
RU-H
-3Sy
zran
– S
arat
ov –
Vol
gogr
ad (d
evel
opm
ent)
RU-H
-4FI
N –
St.
Pete
rsbu
rg –
Vol
ogda
– K
irov
– Pe
rm –
Eka
terin
burg
(dev
elop
men
t)
RU-H
-5Ek
ater
inbu
rg –
Tyu
men
(dev
elop
men
t)
RU-H
-6C
hita
– K
haba
rovs
k (p
art o
f the
nat
iona
l hig
hway
): Kr
asno
e –
Mos
cow
– V
ladi
vosto
k)
(con
struc
tion)
RU-M
-1Se
ctio
ns o
n th
e ro
ad U
KR –
Kur
sk –
Vor
onez
h –
Sara
tov
(reco
nstru
ctio
n)
RU-M
-2M
otor
way
“D
on”,
sec
tion
Mos
kva
– Vo
rone
zh (c
onstr
uctio
n an
d re
cons
truct
ion)
RU-M
-3M
otor
way
“D
on”,
sec
tion
Voro
nezh
– R
osto
v na
Don
u –
Nov
oros
siis
k/So
chi
302
RU-M
-4M
otor
way
“Ka
spiy
” M
oskv
a –
Tam
bov
– Vo
lgog
rad
– A
strak
han
and
road
Astr
akha
n –
Mak
hach
kala
515
RU-M
-5M
otor
way
“C
auca
sus”
, sec
tion
Pavl
ovsk
aya
– M
iner
alny
e Vo
dy –
Koc
hube
y /
Mak
hach
kala
359
RU-M
-6A
uxili
ary
and
serv
ice
infra
struc
ture
SERB
IA
SR-M
-1M
otor
way
Nov
i Sad
– H
orgo
s (c
ompl
etio
n)11
515
020
0820
1210
0
SR-H
-12
Beog
rad
bypa
ss (c
ompl
etio
n)47
336
1990
2012
3034

E C O N O M I C C O M M I S S I O N F O R E U R O P E
95
Proj
ect I
DPr
ojec
t des
crip
tion
Leng
th (k
m)
Cost
(E
UR
×106 )
Star
t ye
arEn
d ye
ar
% fu
ndin
g se
cure
d fr
om fo
llow
ing
sour
ce
Nat
iona
lBa
nkG
rant
Priv
ate
SR-M
-3Co
rrid
or X
, Les
kova
c –
Pres
evo
(MKD
bor
der)
9662
020
0820
1184
16
SR-M
-4Co
rrid
or X
b, N
is –
Dim
itrov
grad
(BG
R)83
620
2008
2011
100
SR-M
-5M
otor
way
Beo
grad
– S
outh
Adr
iatic
, sec
tion
Beog
rad
– Po
zega
148
600
2009
2015
5050
SR-M
-6M
otor
way
E 7
61 P
ojat
e –
Prel
jina
110
413
2012
SR-M
-7M
otor
way
E 7
63 (E
761
) Pre
ljina
– P
ozeg
a41
2012
SR-M
-8M
otor
way
E 7
61 P
ozeg
a –
Uzi
ce –
BIH
6048
020
12
SR-M
-10
Mot
orw
ay P
ance
vo –
Vrs
ac95
200
2009
2012
100
SR-H
-27
Sem
imot
orw
ay K
ikin
da –
Ada
– N
ovi S
ad –
Sre
msk
a M
itrov
ica
– Sa
bac
– Lo
znic
a28
020
0920
1210
0
SR-H
-28
Sem
imot
orw
ay P
ozar
evac
– K
ucev
o –
Maj
danp
ek –
Neg
otin
170
2009
2012
100
SR-H
-29
Beog
rad,
Gaz
ela
brid
ge (r
ehab
ilita
tion
proj
ect)
433
2008
2011
100
SLO
VAKI
A
SK-M
-1M
otor
way
D1
Bido
vce
– D
argo
v13
143
2014
2017
100
SK-M
-2M
otor
way
D1
Dar
gov
– Po
zdis
ovce
1996
2014
2017
100
SK-M
-3M
otor
way
D1
Pozd
isov
ce –
Sta
te b
orde
r SRB
/UKR
4349
820
1420
1710
0
SK-M
-5M
otor
way
D3
Cad
ca, B
ukov
– S
vrci
nove
c5
8520
1220
1510
0
SK-M
-6M
otor
way
D3
Svrc
inov
ec –
Ska
lite
1219
020
1120
1410
0
SK-H
-1Ex
pres
sway
R3
Hor
na S
tubn
a, b
ypas
s15
2008
2011
100
SK-H
-2Ex
pres
sway
R4
Kosi
ce –
Milh
ost
1499
2010
2013
100
SK-M
-8M
otor
way
D1
Hric
ovsk
e Po
dhra
die
– D
ubna
Ska
la38
1,34
820
1020
1435
65
SK-M
-9M
otor
way
D1
Dub
na S
kala
– T
uran
y17
194
2009
2013
3565
SK-M
-10
Mot
orw
ay D
1 Tu
rany
– H
ubov
a13
508
2010
2014
3565

U N E C E T E M A N D T E R P R O J E C T S ’ M A S T E R P L A N – 2 0 1 1
96
Proj
ect I
DPr
ojec
t des
crip
tion
Leng
th (k
m)
Cost
(E
UR
×106 )
Star
t ye
arEn
d ye
ar
% fu
ndin
g se
cure
d fr
om fo
llow
ing
sour
ce
Nat
iona
lBa
nkG
rant
Priv
ate
SK-M
-11
Mot
orw
ay D
1 H
ubov
a –
Ivac
hnov
a35
520
0920
1335
65
SK-M
-12
Mot
orw
ay D
1 Ja
novc
e –
Jabl
onov
1937
220
0820
1335
65
SK-M
-13
Mot
orw
ay D
1 Ja
blon
ov –
Beh
arov
ce63
2009
2011
3565
SK-M
-14
Mot
orw
ay D
1 Fr
icov
ce –
Svi
nia
1120
120
1020
1310
0
SK-M
-15
Mot
orw
ay D
1 Pr
esov
Wes
t – P
reso
v So
uth
724
320
1220
1610
0
SK-M
-16
Mot
orw
ay D
1 Bu
dim
ir –
Bido
vce
1412
520
1120
1310
0
SK-M
-17
Mot
orw
ay D
4 Br
atis
lava
, Jar
ovce
– Iv
anka
pri
Dun
aji,
nort
h23
900
2014
2017
100
SK-M
-18
Mot
orw
ay D
4 Iv
anka
pri
Dun
aji,
nort
h –
Zaho
rska
Bys
tric
a17
1,00
020
1420
1810
0
SK-M
-20
Mot
orw
ay D
4 D
evin
ska
Nov
a Ve
s –
stat
e bo
rder
SV
K/A
UT
412
020
1620
1810
0
SLO
VEN
IA
SL-M
-3Vr
ba –
Per
acic
a, s
ectio
n Pe
raci
ca –
Pod
tabo
r11
420
0820
1113
7512
SL-M
-5Ko
per –
Dra
gonj
a32
920
12
SL-M
-7D
raže
nci –
Gru
škov
je19
720
1120
13
TURK
EY
TU-M
-1A
nkar
a –
Poza
nti m
otor
way
, Sec
tion
1: A
nkar
a –
Aci
kuyu
112
509
2011
2015
1585
TU-M
-2A
nkar
a –
Poza
nti m
otor
way
, Sec
tion
2: A
ciku
yu –
Orta
koy
7843
520
1120
1515
85
TU-M
-3A
nkar
a –
Poza
nti m
otor
way
, Sec
tion
3: O
rtako
y –
Gol
cuk
9348
720
1120
1515
85
TU-M
-4A
nkar
a –
Poza
nti m
otor
way
, Sec
tion
4: G
olcu
k –
Poza
nti
941,
031
2000
2015
1585
TU-M
-5Bu
rsa
– Iz
mir
mot
orw
ay, S
ectio
n 1:
Orh
anga
zi –
Bur
sa34
215
2010
2014
100
TU-M
-6Bu
rsa
– Iz
mir
mot
orw
ay, S
ectio
n 2:
(Bur
sa –
Kar
acab
ey) j
unct
ion
– Su
surlu
k63
292
2010
2014
100
TU-M
-7Bu
rsa
– Iz
mir
mot
orw
ay, S
ectio
n 3:
Sus
urlu
k –
(Bal
ikes
ir –
Edre
mit)
junc
tion
6231
420
1020
1410
0

E C O N O M I C C O M M I S S I O N F O R E U R O P E
97
Proj
ect I
DPr
ojec
t des
crip
tion
Leng
th (k
m)
Cost
(E
UR
×106 )
Star
t ye
arEn
d ye
ar
% fu
ndin
g se
cure
d fr
om fo
llow
ing
sour
ce
Nat
iona
lBa
nkG
rant
Priv
ate
TU-M
-8Bu
rsa
– Iz
mir
mot
orw
ay, S
ectio
n 4:
(Bal
ikes
ir –
Edre
mit)
junc
tion
– Ki
rkag
ac65
310
2010
2014
100
TU-M
-9Bu
rsa
– Iz
mir
mot
orw
ay, S
ectio
n 5:
Kirk
agac
– M
anis
a52
244
2010
2014
100
TU-M
-10
Burs
a –
Izm
ir m
otor
way
, Sec
tion
5: M
anis
a –
Izm
ir56
309
2010
2014
100
TU-M
-11
Teki
rdag
– I. ps
ala
bord
er ro
ad, S
ectio
n 1:
Kin
ali j
unct
ion
– Te
kird
ag56
32
1998
2013
100
TU-M
-12
Teki
rdag
– I. ps
ala
bord
er ro
ad, S
ectio
n 2:
Tek
irdag
byp
ass
15 2
320
0520
1310
0
TU-M
-13
Teki
rdag
– I. ps
ala
bord
er ro
ad, S
ectio
n 3:
Tek
irdag
– M
alka
ra ju
nctio
n55
52
2005
2013
100
TU-M
-14
Teki
rdag
– I. ps
ala
bord
er ro
ad, S
ectio
n 4:
Mal
kara
junc
tion
– I. ps
ala
bord
er52
49
2003
2013
100
TU-M
-15
Sanl
iurfa
– H
abur
bor
der,
Sect
ion
1: S
anliu
rfa –
Vira
nseh
ir91
120
2005
2012
100
TU-M
-16
Sanl
iurfa
– H
abur
bor
der,
Sect
ion
2: V
irans
ehir
– Ki
zilte
pe72
99
2005
2012
100
TU-M
-17
Sanl
iurfa
– H
abur
bor
der,
Sect
ion
3: K
izilt
epe
– N
usay
bin
junc
tion
56 7
820
0520
1210
0
TU-M
-18
Sanl
iurfa
– H
abur
bor
der,
Sect
ion
4: N
usay
bin
junc
tion
– O
yali
45 6
320
0520
1210
0
TU-M
-19
Sanl
iurfa
– H
abur
bor
der,
Sect
ion
5: O
yali
– C
izre
55 8
020
0520
1210
0
TU-M
-20
Sanl
iurfa
– H
abur
bor
der,
Sect
ion
6: C
izre
– S
ilopi
3240
2005
2012
100
TU-M
-21
Ista
nbul
– Iz
mir
mot
orw
ay, S
ectio
n 1:
Geb
ze –
(Yal
ova
– Ka
ram
urse
l) ju
nctio
n (n
ew
brid
ge)
131,
420
2010
2014
100
TU-M
-22
Ista
nbul
– Iz
mir
mot
orw
ay, S
ectio
n 2:
(Yal
ova
– Ka
ram
urse
l) ju
nctio
n –
Orh
anga
zi30
307
2010
2014
100
TU-M
-23
Ger
ede
– M
erzi
fon,
Sec
tion
1: G
ered
e –
15. D
ivis
ion
bord
er75
6820
0520
1210
0
TU-M
-24
Ger
ede
– M
erzi
fon,
Sec
tion
2: 4
. Div
isio
n bo
rder
– Il
gaz
junc
tion
– (K
asta
mon
u-
Korg
un) j
unct
ion
5838
2008
2013
100
TU-M
-25
Ger
ede
– M
erzi
fon,
Sec
tion
3: (K
asta
mon
u –
Korg
un) j
unct
ion
– To
sya
– 7/
15 D
ivis
ion
bord
er66
4420
0820
1310
0
TU-M
-26
Ger
ede
– M
erzi
fon,
Sec
tion
4: 7
/15
Div
isio
n bo
rder
– O
sman
cik
5738
2008
2013
100
TU-M
-27
Ger
ede
– M
erzi
fon,
Sec
tion
5: O
sman
cik
– M
erzi
fon
4928
2008
2013
100

U N E C E T E M A N D T E R P R O J E C T S ’ M A S T E R P L A N – 2 0 1 1
98
Proj
ect I
DPr
ojec
t des
crip
tion
Leng
th (k
m)
Cost
(E
UR
×106 )
Star
t ye
arEn
d ye
ar
% fu
ndin
g se
cure
d fr
om fo
llow
ing
sour
ce
Nat
iona
lBa
nkG
rant
Priv
ate
TU-M
-28
Am
asya
– R
efah
iye
junc
tion
284
401
2010
2014
100
TU-M
-29
Afy
on –
Kon
ya –
Ere
gli –
(Ank
ara-
Poza
ntı)
mot
orw
ay ju
nctio
n39
155
220
1020
1410
0
TU-M
-30
Nor
th M
arm
ara
mot
orw
ay, S
ectio
n 1:
Kın
alı –
Izze
ttin
4724
220
1120
1510
0
TU-M
-31
Nor
th M
arm
ara
mot
orw
ay ,
Sect
ion
2: Iz
zetti
n –
Oda
yeri
2815
820
1120
1510
0
TU-M
-32
Nor
th M
arm
ara
mot
orw
ay (i
nclu
ding
3rd
sus
pens
ion
brid
ge o
n Is
tanb
ul S
trai
t),
Sect
ion
3: O
daye
ri/Pa
sako
y95
1,20
020
1120
1510
0
TU-M
-33
Nor
th M
arm
ara
mot
orw
ay, S
ectio
n 4:
Pas
akoy
– G
ebze
4417
920
1120
1510
0
TU-M
-34
Nor
th M
arm
ara
mot
orw
ay, S
ectio
n 5:
Geb
ze –
Izm
it71
489
2011
2015
100
TU-M
-35
Nor
th M
arm
ara
mot
orw
ay, S
ectio
n 6:
Izm
it –
Aky
azi
7236
220
1120
1510
0
TU-M
-36
Nor
th M
arm
ara
mot
orw
ay, S
ectio
n 7:
Izze
ttin
– H
asda
l58
321
2011
2015
100
UKR
AIN
E
UKR
-M-1
Mot
orw
ay W
este
rn B
orde
r of U
krai
ne (K
osyn
y) –
Kyi
v, s
ectio
n Vi
nnyt
za –
Kyi
v (b
uild
ing
and
mai
nten
ance
)46
620
1120
1825
2525
25
UKR
-M-2
Mot
orw
ay L
viv
– Kr
akov
ets
(bui
ldin
g an
d m
aint
enan
ce)
244
2009
2012
2525
2525
UKR
-M-3
Mot
orw
ay L
viv
– Br
ody
(bui
ldin
g an
d m
aint
enan
ce)
178
2010
2012
2525
2525
UKR
-M-4
Mot
orw
ay fr
om R
US
bord
er (S
cher
baki
vka)
to th
e m
otor
way
Kyi
v –
Khar
kiv
– D
ovzh
ansk
y (b
uild
ing
and
mai
nten
ance
)15
520
1120
1825
2525
25

E C O N O M I C C O M M I S S I O N F O R E U R O P E
99
6.3
Railw
ay p
roje
cts
in t
he
revi
sed M
ast
er P
lan
Not
e 1:
New
pro
ject
s in
the
revi
sed
Mas
ter
Plan
are
indi
cate
d us
ing
bold
prin
t.
Proj
ect I
DPr
ojec
t des
crip
tion
Leng
th
(km
)Co
st
(EU
R ×1
06 )St
art y
ear
End
year
% fu
ndin
g se
cure
d fr
om fo
llow
ing
sour
ce
Nat
iona
lBa
nkG
rant
Priv
ate
ALB
AN
IA
AL-R
-1Po
rto
Rom
ano
Port
(LPG
and
oil
term
inal
) to
Sukt
h st
atio
n13
24
AL-R
-4
Link
rai
lway
Lin
es –
bor
der
with
MKD
35
AU
STRI
A (N
ote
to fu
ndin
g: in
maj
ority
of c
ases
, 70
% o
f ban
k lo
ans
to b
e re
imbu
rsed
by
Sta
te)
AT-R
-2G
logg
nitz
– M
urzz
usch
lag,
new
tunn
el, r
ehab
ilita
tion,
saf
ety
conc
ept
421,
123
2002
2011
100
AT-R
-3G
oder
sdor
f – R
osen
bach
, Kar
awan
ken
tunn
el, u
pgra
ding
and
tunn
el s
afet
y23
109
100
AT-R
-4W
ien
– Se
mm
erin
g, u
pgra
ding
and
reh
abili
tatio
n of
acc
ess
to S
emm
erin
g ba
se tu
nnel
7568
5 20
0220
1110
0
AT-R
-5Br
uck/
Mur
– G
raz,
upg
radi
ng a
nd r
ehab
ilita
tion
5410
5 20
0220
1110
0
AT-R
-6G
raz
– Sp
ielfe
ld, c
onst
ruct
ion
of 2
nd tr
ack,
reh
abili
tatio
n an
d up
grad
ing
4965
4 20
0220
1110
0
AT-R
-7Pa
ssau
– W
els,
reh
abili
tatio
n an
d up
grad
ing
8118
9 20
0220
1110
0
AT-R
-8W
ien
– Br
atis
lava
, con
stru
ctio
n of
new
line
and
reh
abili
tatio
n of
exi
stin
g on
e45
348
2002
2011
100
AT-R
-9Tr
aun
– Se
lzth
al, r
ehab
ilita
tion
and
upgr
adin
g10
411
3 20
0220
1110
0
AT-R
-10
Sum
mer
au –
Lin
z, c
onst
ruct
ion
of 2
nd tr
ack
5513
8 20
0720
1110
0
AT-R
-11
Kora
lm p
roje
ct, n
ew li
ne G
raz
– Kl
agen
furt
125
2,98
8 20
0220
1110
0
AT-R
-13
Frei
lass
ing
– Sa
lzbu
rg, c
onst
ruct
ion
of 3
rd tr
ack
411
6 20
0720
1110
0
AT-R
-14
Kufs
tein
– W
orgl
– K
undl
, con
stru
ctio
n of
add
ition
al 2
trac
ks, u
pgra
ding
of e
xist
ing
line
651,
339
2012
2021
100

U N E C E T E M A N D T E R P R O J E C T S ’ M A S T E R P L A N – 2 0 1 1
100
Proj
ect I
DPr
ojec
t des
crip
tion
Leng
th
(km
)Co
st
(EU
R ×1
06 )St
art y
ear
End
year
% fu
ndin
g se
cure
d fr
om fo
llow
ing
sour
ce
Nat
iona
lBa
nkG
rant
Priv
ate
AT-R
-15
Linz
– W
ien,
con
stru
ctio
n of
61
km n
ew 4
-trac
k lin
e, a
dditi
onal
2 tr
acks
on
the
rem
aini
ng 1
27 k
m
188
4,78
4 20
0220
1110
0
AT-R
-16
Linz
– S
alzb
urg,
con
stru
ctio
n of
add
ition
al 2
trac
ks, u
pgra
ding
and
reh
abili
tatio
n12
427
6 20
0720
1110
0
AT-R
-17
Buch
s –
Inns
bruc
k, c
onst
ruct
ion
of 2
nd tr
ack,
reh
abili
tatio
n an
d up
grad
ing,
tunn
el
safe
ty13
738
1 20
0220
1110
0
AT-R
-20
Wie
n –
Bern
hard
stha
l, re
habi
litat
ion
and
upgr
adin
g78
95
2002
2011
100
AT-R
-21
Klag
enfu
rt –
Vill
ach,
new
line
con
stru
ctio
n38
196
2002
2011
100
AZE
RBA
IJA
N
AZ-
R-1
Reco
nstr
uctio
n an
d re
habi
litat
ion
of th
e Ba
ku –
Boy
uk –
Kes
ik (G
EO) l
ine
503
319
AZ-
R-2
Cons
truc
tion
of n
ew r
ailw
ay li
ne A
star
a –
IRN
8
BOSN
IA A
ND
HER
ZEG
OV
INA
BH-R
-1Re
habi
litat
ion
and
upgr
adin
g of
Sam
ac/B
osan
ski S
amac
– D
oboj
line
6240
20
150
00
0
BH-R
-2b
Reha
bilit
atio
n of
Sar
ajev
o –
Ploc
e lin
e, s
ectio
n Sa
raje
vo –
Bra
dina
4030
20
1120
120
00
0
BH-R
-3Sa
mac
/Bos
ansk
i Sam
ac –
Cel
ebic
i, m
oder
niza
tion
of s
igna
lling
sys
tem
BH-R
-4Sa
mac
/Bos
ansk
i Sam
ac –
Cel
ebic
i, m
oder
niza
tion
of te
leco
mm
unic
atio
n sy
stem
2011
2014
BH-R
-5D
oboj
– D
obrlj
in, t
rack
ove
rhau
l and
reco
nstru
ctio
n of
sec
tion
Dob
oj –
Josa
vka
to T
ER
stand
ards
7820
1020
11
BH-R
-6D
obrlj
in –
B. L
uka
–Dob
oj –
Tuz
la –
Zvo
rnik
, mod
erni
zatio
n of
sig
nalli
ng s
yste
m20
1120
14
BH-R
-7D
obrlj
in –
B. L
uka
–Dob
oj –
Tuz
la –
Zvo
rnik
, mod
erni
zatio
n of
tele
com
mun
icat
ion
syste
m20
1120
14

E C O N O M I C C O M M I S S I O N F O R E U R O P E
101
Proj
ect I
DPr
ojec
t des
crip
tion
Leng
th
(km
)Co
st
(EU
R ×1
06 )St
art y
ear
End
year
% fu
ndin
g se
cure
d fr
om fo
llow
ing
sour
ce
Nat
iona
lBa
nkG
rant
Priv
ate
BULG
ARI
A
BG-R
-1El
ectri
ficat
ion
and
upgr
adin
g of
Plo
vdiv
– S
vile
ngra
d lin
e15
134
0 20
0020
1111
4445
0
BG-R
-3El
ectr
ifica
tion
and
reco
nstr
uctio
n of
Svi
leng
rad
– TU
R lin
e16
40
2007
2011
200
800
BG-R
-4M
oder
niza
tion
of V
idin
– S
ofia
– Ku
lata
line
480
4,80
0 20
0720
2020
080
0
BG-R
-5M
oder
niza
tion
of S
ofia
– Pl
ovdi
v –
Burg
as/V
arna
line
607
1,60
0 20
0720
1520
080
0
BG-R
-6M
oder
niza
tion
and
elec
trific
atio
n of
Rad
omir
– G
uesh
evo
line
8830
0 20
0920
1720
080
0
BG-R
-7Re
habi
litat
ion
of S
ofia
– Ka
rlovo
– Z
imni
tza
line
320
200
2007
2013
100
00
0
BG-R
-8M
oder
niza
tion
of S
ofia
– D
rago
man
line
4385
20
0820
1520
080
0
BG-R
-9Re
habi
litat
ion
of M
ezdr
a –
Gor
na O
ryah
ovitz
a lin
e20
630
0 20
0720
1320
080
0
CRO
ATIA
CR-
R-1
Reco
nstru
ctio
n of
sec
tion
Osi
jek
– St
riziv
ojna
(Vrp
olje
)48
44
2008
2013
CR-
R-2
Elec
trific
atio
n of
nor
th s
ectio
n Be
li M
anas
tir –
Stri
zivo
jna
(Vrp
olje
)79
25
2014
2015
CR-
R-3
Con
struc
tion
of 2
nd tr
ack
and
reco
nstru
ctio
n of
exi
sting
one
Dug
o Se
lo –
Kop
rivni
ca
– Bo
tovo
7951
0 20
0920
1510
0
CR-
R-4
Cons
truc
tion
of 2
nd tr
ack
Zagr
eb G
lavn
i Kol
odvo
r –
Hor
vati
1350
20
1720
18
CR-
R-5
Cons
truc
tion
of n
ew li
ne H
orva
ti –
Kras
ica
152
2,23
3 20
1120
21
CR-
R-6
Cons
truc
tion
of n
ew li
ne M
atuj
i – T
unel
Uck
a –
Boru
t44
421
2013
2021
CR-
R-7
Mod
ifica
tion
of e
lect
rical
trac
tion
syste
m M
orav
ice
– Ri
jeka
– S
apja
ne (S
krlje
vo –
Ba
kar)
129
65
2008
2011
100
CR-
R-8
Rem
ote
cont
rol s
yste
m, l
ine
Boto
vo –
Zag
reb
– Ri
jeka
329
2011
2021
CR-
R-9
Reco
nstru
ctio
n of
sig
nalli
ng a
nd s
afet
y de
vice
s of
Zag
reb
Mai
n St
atio
n18
20
1020
1217
83
CR-
R-10
Con
struc
tion
of 2
nd tr
ack
Zagr
eb –
Vel
ika
Gor
ica
1590
20
1420
23

U N E C E T E M A N D T E R P R O J E C T S ’ M A S T E R P L A N – 2 0 1 1
102
Proj
ect I
DPr
ojec
t des
crip
tion
Leng
th
(km
)Co
st
(EU
R ×1
06 )St
art y
ear
End
year
% fu
ndin
g se
cure
d fr
om fo
llow
ing
sour
ce
Nat
iona
lBa
nkG
rant
Priv
ate
CR-
R-11
Den
ivel
atio
n of
Zag
reb
mai
n st
atio
n an
d lin
e se
ctio
n th
ru Z
agre
b6
301
2018
2023
CR-
R-12
Cons
truc
tion
of n
ew d
oubl
e tr
ack
line
Zapr
esic
– H
orva
ti –
Dug
o Se
lo (b
ypas
s of
Za
greb
)64
436
2013
2016
CR-
R-13
Con
struc
tion
of 2
nd tr
ack
Dug
o Se
lo –
Nov
ska
8551
0 20
1620
20
CR-
R-14
Elec
trifi
catio
n w
ith A
C 25
kV/5
0Hz
of V
inko
vci –
Vuk
ovar
line
196
2014
2014
CR-
R-15
Stat
ion
reco
nstru
ctio
n an
d up
rade
of s
igna
lling
and
saf
ety
syste
m, O
starij
e –
Knin
–
Split
line
326
90
2008
2011
100
CR-
R-16
Reco
nstr
uctio
n of
Rije
ka ju
nctio
n4
40
2011
2021
THE
CZEC
H R
EPU
BLIC
CZ-
R-1
Mod
erni
zatio
n of
line
Ben
esov
– C
eske
Bud
ejov
ice
120
1,40
0 20
0720
1638
2141
0
CZ-
R-3
Upg
radi
ng o
f lin
e St
ate
bord
er –
Che
b –
Plze
n11
766
9 20
0620
1442
2335
0
CZ-
R-4
Det
mar
ovic
e –
Mos
ty u
Jabl
unko
va54
505
2007
2014
4235
230
CZ-
R-7
Plze
n –
Prah
a10
91,
479
2008
2016
4223
350
THE
FORM
ER Y
UG
OSL
AV R
EPU
BLIC
OF
MA
CED
ON
IA
MA
-R-1
aC
onstr
uctio
n of
railw
ay K
icev
o –
Lini (
ALB
)80
200
2010
MA
-R-1
bC
onstr
uctio
n of
railw
ay K
uman
ovo
– D
eve
Bair
(BG
R)66
200
2010
MA
-R-3
Spee
d in
crea
se o
n se
ctio
ns V
eles
– Z
grop
olci
– D
emir
Kapi
ja21
615
0 20
0820
12
MA
-R-4
Mul
timod
al te
rmin
al a
t Stru
ga5
LITH
UA
NIA
LT-R
-1M
oder
niza
tion
of s
igna
lling
and
pow
er s
uppl
y on
Cor
ridor
IXD
, sec
tions
Pal
emon
as –
Ro
kai a
nd K
auna
s –
Kyba
rtai
41
2009
2014
8515
LT-R
-2Tr
ack
mod
erni
zatio
n on
Cor
ridor
IXD
, sec
tions
Pal
emon
as –
Rok
ai a
nd K
auna
s –
Kyba
rtai
8 20
0820
1285
15

E C O N O M I C C O M M I S S I O N F O R E U R O P E
103
Proj
ect I
DPr
ojec
t des
crip
tion
Leng
th
(km
)Co
st
(EU
R ×1
06 )St
art y
ear
End
year
% fu
ndin
g se
cure
d fr
om fo
llow
ing
sour
ce
Nat
iona
lBa
nkG
rant
Priv
ate
LT-R
-3Tr
ack
mod
erni
zatio
n fo
r sp
eed
up to
160
km
/h o
n Ka
unas
– K
aisi
ador
ys li
ne89
20
1120
1385
15
LT-R
-4Co
nstr
uctio
n of
sec
ond
trac
k on
Pus
ynas
– P
aner
iai l
ine
(Viln
ius
stat
ion
bypa
ss)
9 20
1020
1285
15
LT-R
-5Co
nstr
uctio
n of
sec
ond
trac
k on
Kyv
iske
s –
Valc
iuna
i lin
e (V
ilniu
s st
atio
n by
pass
)39
20
1020
1285
15
LT-R
-6El
imin
atio
n of
cro
ssin
gs (b
uild
ing
of ro
ad o
verp
asse
s) o
n C
orrid
or IX
D20
1520
30
LT-R
-7El
imin
atio
n of
cro
ssin
gs (b
uild
ing
of ro
ad o
verp
asse
s) o
n C
orrid
or IX
B20
1520
30
LT-R
-8Co
nstr
uctio
n of
sec
ond
trac
k on
Tel
siai
– L
iepl
auke
line
19
2011
2014
8515
LT-R
-9Tr
ack
mod
erni
zatio
n fo
r spe
ed u
p to
160
km
/h o
n Ka
isia
dory
s –
Viln
ius
line
161
2015
2020
8515
LT-R
-10
Cons
truc
tion
of s
econ
d tr
ack
on K
ulup
enai
– K
retin
ga li
ne30
20
1120
1385
15
LT-R
-11
Mod
erni
zatio
n of
sig
nalli
ng o
n C
orrid
or IX
B, s
ectio
n Ra
dvili
skis
– S
iaul
iai
26
2010
2013
8515
LT-R
-13
Dev
elop
men
t of K
laip
eda
railw
ay n
ode
(mod
erni
zatio
n of
Dra
ugys
tes
stat
ion
trac
ks)
3 20
0920
1185
15
LT-R
-14
Dev
elop
men
t of K
laip
eda
railw
ay n
ode
(mod
erni
zatio
n of
Rim
ku s
tatio
n tr
acks
)7
2011
2013
8515
LT-R
-15
Dev
elop
men
t of K
laip
eda
railw
ay n
ode
(mod
erni
zatio
n of
Pau
ostis
sta
tion
trac
ks)
21
2011
2013
8515
LT-R
-16
Dev
elop
men
t of K
laip
eda
railw
ay n
ode
(mod
erni
zatio
n of
Kla
iped
a st
atio
n tr
acks
)29
20
1020
1485
15
LT-R
-17
Cons
truc
tion
of s
econ
d tr
ack
on P
aven
ciai
– R
uden
ai li
ne13
20
1220
1485
15
LT-R
-18
Elec
trific
atio
n of
Ken
a –
Kyba
rtai l
ine
2020
LT-R
-19
Elec
trific
atio
n of
Kai
siad
orys
– R
advi
liski
s lin
e20
24
LT-R
-20
Elec
trific
atio
n of
Rad
vilis
kis
– Kl
aipe
da li
ne20
24
LT-R
-21
Cons
truc
tion
of s
econ
d tr
ack
on P
lung
e –
Sate
ikia
i lin
e20
20
1220
1485
15
LT-R
-22
Cons
truc
tion
of s
econ
d tr
ack
on T
elsi
ai –
Dus
eiki
ai li
ne7
2012
2015
8515
LT-R
-23
Mod
erni
zatio
n of
sig
nalli
ng o
n Co
rrid
or IX
B, s
ectio
n Ka
unas
– K
aisi
ador
ys li
ne15
20
1220
1485
15
LT-R
-24
Mod
erni
zatio
n of
ele
ctrifi
catio
n of
Pal
emon
as –
Kai
siad
orys
line
25
2010
2014
8515

U N E C E T E M A N D T E R P R O J E C T S ’ M A S T E R P L A N – 2 0 1 1
104
Proj
ect I
DPr
ojec
t des
crip
tion
Leng
th
(km
)Co
st
(EU
R ×1
06 )St
art y
ear
End
year
% fu
ndin
g se
cure
d fr
om fo
llow
ing
sour
ce
Nat
iona
lBa
nkG
rant
Priv
ate
LT-R
-25
Cons
truc
tion
of tr
affic
con
trol
cen
tre
22
2010
2013
8515
LT-R
-26
Cons
truc
tion
of s
econ
d tr
ack
on Z
eim
ia –
Luk
siai
and
Gim
boga
la –
Lin
kaic
iai l
ines
27
2011
2014
8515
LT-R
-27
Cons
truc
tion
of s
econ
d tr
ack
on S
ilain
iai –
Ked
aini
ai, G
aizi
unai
– J
onav
a lin
es a
nd
mod
erni
zatio
n of
sig
nalli
ng s
yste
m in
Jon
ava
and
Gai
ziun
ai s
tatio
ns47
20
1220
1585
15
LT-R
-28
Cons
truc
tion
of n
ew s
tand
ard
gaug
e (R
ail B
altic
a) o
n bo
rder
cro
ssin
g se
ctio
ns27
20
1020
1573
27
LT-R
-29
Impl
emen
tatio
n of
ETC
S-1
on th
e ra
il Co
rrid
or IX
D K
ena
– Ka
unas
2019
2022
LT-R
-30
Impl
emen
tatio
n of
ETC
S-1
on th
e ra
il Co
rrid
or IX
B Ka
isia
dory
s –
Klai
peda
2022
2025
LT-R
-31
Impl
emen
tatio
n of
ETC
S-1
on th
e ra
il Co
rrid
or IX
B Ra
dvili
skis
– J
onis
kis
2022
2025
LT-R
-32
Mod
erni
zatio
n of
ele
ctrifi
catio
n of
Viln
ius
– Ka
unas
line
2018
MO
NTE
NEG
RO
ME-
R-2
Reha
bilit
atio
n of
brid
ges
and
tunn
els,
mec
hani
zatio
n an
d tr
actio
n po
wer
sup
ply
33
2010
2012
POLA
ND
PL-R
-1M
oder
niza
tion
of E
-20
line
(Sed
lce
– Te
resp
ol s
ectio
n)12
026
8 20
0420
1025
75
189
2009
2015
3070
PL-R
-2M
oder
niza
tion
of E
-20
line
(Soc
hacz
ew –
Sw
arze
dz
sect
ion)
234
504
2012
2015
PL-R
-3M
oder
niza
tion
of C
-28
line
(War
szaw
a W
scho
dnia
– D
oroh
usk
sect
ion)
, vi
aduc
ts c
onst
ruct
ion
proj
ects
05
2010
2012
PL-R
-4M
oder
niza
tion
of E
30 li
ne (W
eglin
iec
– Zg
orze
lec,
Weg
linie
c –
Biel
awa
Dol
na
sect
ions
)39
103
2002
2010
2575
PL-R
-5M
oder
niza
tion
of E
30 li
ne (L
egni
ca –
Weg
linie
c se
ctio
n)71
194
2001
2010
2575
PL-R
-6M
oder
niza
tion
of E
30 li
ne (B
iela
wa
Dol
na –
Hor
ka s
ectio
n) a
nd c
onst
ruct
ion
of b
ridge
on
Nys
a Łu
zyck
a an
d el
ectr
ifica
tion
140
20
0920
14
PL-R
-7M
oder
niza
tion
of E
30 li
ne (Z
abrz
e –
Krak
ów s
ectio
n)58
354
2011
2015

E C O N O M I C C O M M I S S I O N F O R E U R O P E
105
Proj
ect I
DPr
ojec
t des
crip
tion
Leng
th
(km
)Co
st
(EU
R ×1
06 )St
art y
ear
End
year
% fu
ndin
g se
cure
d fr
om fo
llow
ing
sour
ce
Nat
iona
lBa
nkG
rant
Priv
ate
PL-R
-8M
oder
niza
tion
of E
30/C
E30
line
(Kra
ków
– R
zesz
ów s
ectio
n)13
984
8 20
1020
1530
70
PL-R
-9M
oder
niza
tion
of C
30/1
line
(Tar
nów
– S
tróz
e se
ctio
n)13
13
2009
2011
PL-R
-10
Mod
erni
zatio
n of
E59
line
(Dol
nosla
skie
Voi
vode
ship
bor
der
– Po
znan sec
tion)
104
640
2011
2015
4258
PL-R
-11
Mod
erni
zatio
n of
E59
line
(Wro
cław
– D
olno
slask
ie V
oivo
desh
ip b
orde
r se
ctio
n)58
390
2006
2015
PL-R
-12
Mod
erni
zatio
n of
CE5
9 lin
e (M
iedz
yles
ie –
Szc
zeci
n se
ctio
n) 3
563
2004
2010
2575
PL-R
-13
Mod
erni
zatio
n of
E65
/CE6
5 lin
e (S
wie
rcze
– M
ław
a se
ctio
n)60
453
2003
2012
3466
PL-R
-14
Mod
erni
zatio
n of
E65
/CE6
5 lin
e (M
albo
rk –
Iław
a se
ctio
n)10
357
8 20
0320
13
PL-R
-15
Mod
erni
zatio
n of
E65
/CE6
5 lin
e (G
dans
k –
Gdy
nia
sect
ion)
3924
8 20
0320
14
PL-R
-16
Mod
erni
zatio
n of
CE6
5 lin
e (Tc
zew
– P
szcz
yna
sect
ion)
58
05
2008
2010
PL-R
-17
Mod
erni
zatio
n of
E65
line
(Opo
czno
– K
napó
wka
sec
tion)
161
191
2010
2013
PL-R
-18
Proj
ect a
nd d
evel
opm
ent o
f ETC
S 1
on E
65 li
ne (G
rodz
isk
Maz
owie
cki –
Zaw
ierc
ie
sect
ion)
224
17
2009
2013
5050
PL-R
-19
Mod
erni
zatio
n of
E75
line
Rai
l Bal
tica
(War
szaw
a Re
mbe
rtów
– S
adow
ne s
ectio
n)66
504
2011
2015
3565
PL-R
-20
Impr
ovem
ent o
f acc
essi
bilit
y to
Por
t of G
dańs
k (b
ridge
con
stru
ctio
n an
d do
uble
-trac
k ra
ilway
line
mod
erni
zatio
n )
12
105
2007
2014
ROM
AN
IA
RO-R
-1Re
habi
litat
ion
and
mod
erni
zatio
n of
line
Cra
iova
– C
alaf
at10
742
2 20
1420
160
00
0
RO-R
-2Re
habi
litat
ion
of li
ne B
ucur
esti
– Vi
dele
– G
iurg
iu11
773
3 20
1420
160
00
0
RO-R
-4Re
habi
litat
ion
and
mod
erni
zatio
n of
line
Bra
sov
– Si
ghis
oara
– C
urtic
i48
03,
143
2009
2015
00
RO-R
-5Re
habi
litat
ion
of li
ne B
raso
v –
Pred
eal
2625
0 15
085
0
RO-R
-6Re
habi
litat
ion
of li
ne P
rede
al –
Cam
pina
4819
9 20
0920
1225
075
0

U N E C E T E M A N D T E R P R O J E C T S ’ M A S T E R P L A N – 2 0 1 1
106
Proj
ect I
DPr
ojec
t des
crip
tion
Leng
th
(km
)Co
st
(EU
R ×1
06 )St
art y
ear
End
year
% fu
ndin
g se
cure
d fr
om fo
llow
ing
sour
ce
Nat
iona
lBa
nkG
rant
Priv
ate
THE
RUSS
IAN
FED
ERAT
ION
RU-R
-1Re
cons
truc
tion
of S
t. Pe
ters
burg
rai
lway
junc
tion
400
a20
1020
15
RU-R
-2Co
nstr
uctio
n of
sid
e tr
ack
in th
e pa
ssag
e Vy
borg
-Pas
sazh
irska
ya –
Bus
lovs
kaya
18
1,17
6 a
2015
RU-R
-3Co
nstr
uctio
n of
a n
ew li
ne P
etya
yarv
i – K
amen
nogo
rsk
6420
15
RU-R
-4Co
nstr
uctio
n of
sid
e tr
ack
in th
e pa
ssag
e Vy
borg
-Tov
arna
ya –
Kam
enno
gors
k40
2015
RU-R
-5El
ectr
ifica
tion
of S
osno
vo –
Kam
enno
gors
k –
Vybo
rg p
assa
ge (P
rimor
sk, V
ysot
sk)
2015
RU-R
-6Co
mpl
ex r
econ
stru
ctio
n of
Mga
– G
atch
ina
–Vey
mar
n –
Ivan
goro
d pa
ssag
e an
d ra
ilway
app
roac
hes
to th
e po
rts
loca
ted
in th
e so
uthe
rn c
oast
of F
inni
sh B
ay36
4 a
2015
RU-R
-7Co
nstr
uctio
n of
by-
road
aro
und
Sara
tov
junc
tion
80 a
2010
2015
RU-R
-8Co
nstr
uctio
n of
sid
e tr
ack
in th
e pa
ssag
e Vo
lgog
rad
– Ti
khor
etsk
aya
428
523
a 20
15
RU-R
-9Co
nstr
uctio
n of
sid
e tr
ack
in th
e pa
ssag
e Ti
khor
etsk
aya
– Ko
reno
vsk
6075
a 20
15
RU-R
-10
Cons
truc
tion
of s
ide
trac
k in
the
pass
age
Enem
– K
riven
kovs
kaya
2436
a 20
1020
15
RU-R
-11
Cons
truc
tion
of s
ide
trac
k in
the
pass
age
Tim
ashe
vska
ya –
Krim
skay
a11
215
0 a
2015
RU-R
-12
Cons
truc
tion
of s
ide
trac
k in
the
pass
age
Enem
(Afip
skay
a) –
Krim
skay
a23
31 a
2015
RU-R
-13
Com
plex
rec
onst
ruct
ion
of 9
km
– Y
urov
skiy
– A
napa
– T
emru
k pa
ssag
e24
1 a
2010
2015
RU-R
-14
Cons
truc
tion
of b
y-ro
ad a
roun
d Kr
asno
dar
junc
tion
168
a 20
15
RU-R
-15
Cons
truc
tion
of a
new
sta
tion
Razy
ezd
9 km
89 a
2015
RU-R
-16
Elec
trific
atio
n of
Rtis
hevo
– K
oche
tovk
a pa
ssag
e24
414
9 a
2015
RU-R
-17
Cons
truc
tion
of s
ide
trac
k in
the
pass
age
Akh
tuba
– T
rubn
aya
8399
a 20
15
RU-R
-18
Elec
trifi
catio
n of
Tru
bnay
a –
Aks
aray
skay
a pa
ssag
e36
518
5 a
2015
RU-R
-19
Cons
truc
tion
of th
ird r
ail-t
rack
s in
the
pass
age
Beka
sovo
– N
ara
822
a 20
15

E C O N O M I C C O M M I S S I O N F O R E U R O P E
107
Proj
ect I
DPr
ojec
t des
crip
tion
Leng
th
(km
)Co
st
(EU
R ×1
06 )St
art y
ear
End
year
% fu
ndin
g se
cure
d fr
om fo
llow
ing
sour
ce
Nat
iona
lBa
nkG
rant
Priv
ate
RU-R
-20
Rest
orat
ion
of c
ross
ing
poin
ts in
Dno
– N
ovos
okol
niki
pas
sage
2 a
2010
2015
SERB
IA
SR-R
-1M
oder
niza
tion
of li
ne B
eogr
ad –
Sid
– H
RV12
231
8 20
1520
216
SR-R
-2M
oder
niza
tion
and
cons
truct
ion
of 2
nd tr
ack
of li
ne B
eogr
ad –
Sub
otic
a –
HU
N18
267
0 20
0820
15
SR-R
-3C
ompl
etio
n of
con
struc
tion
(new
par
t) an
d re
cons
truct
ion
(exi
sting
par
t) of
Bel
grad
e Ra
il N
ode
5527
8 20
1020
25
SR-R
-4M
oder
niza
tion
of li
ne B
eogr
ad –
Nis
to a
dou
ble-
track
line
244
850
2010
2024
3
SR-R
-5M
oder
niza
tion
of li
ne N
is –
Pre
sevo
– M
KD b
orde
r15
753
0 20
1120
21
SR-R
-6M
oder
niza
tion
of li
ne N
is –
Dim
itrov
grad
– B
GR
104
300
2008
2014
3
SR-R
-7M
oder
niza
tion
and
elec
trifi
catio
n of
line
Lap
ovo
– Kr
alje
vo85
85
2010
SR-R
-8M
oder
niza
tion
and
elec
trifi
catio
n of
line
Sta
lac
– Kr
alje
vo –
Poz
ega
139
88
2010
SR-R
-9M
oder
niza
tion
and
elec
trifi
catio
n of
line
Pan
cevo
– V
rsac
– R
OU
102
102
2009
2015
SR-R
-10
Reha
bilit
atio
n of
line
Beo
grad
– V
rbni
ca –
MN
E 28
740
0 20
0920
21
SR-R
-11
Mod
erni
zatio
n of
line
Rum
a –
Zvor
nik
– BI
H28
740
0
SLO
VAKI
A
SK-R
-1M
oder
niza
tion
of li
ne Z
ilina
– K
rasn
o na
d Ky
suco
u20
216
2009
2011
441
550
SK-R
-3M
oder
niza
tion
of li
ne K
ysak
– K
osic
e16
363
2013
2017
170
504
SK-R
-4St
atio
n Ci
erna
nad
Tis
ou –
UKR
53
2009
2011
940
600
SK-R
-5M
oder
niza
tion
of li
ne N
ove
Mes
to n
ad V
ahom
– P
ucho
v59
1,11
8 20
0920
1330
174
0
SK-R
-6M
oder
niza
tion
of li
ne P
ucho
v –
Zilin
a39
564
2013
2017
190
810
SK-R
-8M
oder
niza
tion
of li
ne Z
ilina
– K
ralo
vany
3940
3 20
1520
201

U N E C E T E M A N D T E R P R O J E C T S ’ M A S T E R P L A N – 2 0 1 1
108
Proj
ect I
DPr
ojec
t des
crip
tion
Leng
th
(km
)Co
st
(EU
R ×1
06 )St
art y
ear
End
year
% fu
ndin
g se
cure
d fr
om fo
llow
ing
sour
ce
Nat
iona
lBa
nkG
rant
Priv
ate
SK-R
-9M
oder
niza
tion
of li
ne K
uty
– CZ
E7
82
2011
2014
390
820
SK-R
-10
Mod
erni
zatio
n of
line
Kut
y –
Brat
isla
va71
388
2011
2017
180
802
SK-R
-11
Mod
erni
zatio
n of
line
Kos
ice
– Ci
erna
nad
Tis
ou95
567
2009
2012
11
SK-R
-12
Mod
erni
zatio
n of
line
Kra
lova
ny –
Lip
tovs
ky M
ikul
as
5643
2 20
1420
172
3
SK-R
-13
Mod
erni
zatio
n of
line
Kro
mpa
chy
– Ky
sak
2978
8 20
1320
1716
084
0
SK-R
-14
Mod
erni
zatio
n of
line
Lip
tovs
ky M
ikul
as –
Pop
rad
561,
182
2013
2017
12
1
SK-R
-15
Mod
erni
zatio
n of
line
Pop
rad
– Kr
ompa
chy
561,
403
2013
2017
11
SLO
VEN
IA
SL-R
-1M
oder
niza
tion
of li
ne P
rage
rsko
– O
rmoz
– P
roje
ct A
4095
74
26
SL-R
-2Re
cons
truct
ion
and
elec
trific
atio
n of
line
Pra
gers
ko –
Hod
os11
032
5
SL-R
-3C
onstr
uctio
n of
2nd
trac
k on
line
Mar
ibor
– S
entil
j – A
UT
1712
2
SL-R
-4a
Intro
duct
ion
of E
RTM
S/ET
CS
syste
m o
n Sl
oven
ian
rail
netw
ork
565
145
6535
SL-R
-4b
Intro
duct
ion
of G
SM-R
sys
tem
on
Slov
enia
n ra
il ne
twor
k1,
229
80
SL-R
-5M
oder
niza
tion
of e
xisti
ng li
ne K
oper
– D
ivac
a46
141
5941
SL-R
-7C
onstr
uctio
n of
new
line
Div
aca
– Ko
per
281,
200
SL-R
-8Co
nstr
uctio
n of
new
line
Lju
blja
na –
Kra
nj –
Jes
enic
e w
ith c
onne
ctio
n to
Lju
blja
na
airp
ort
SL-R
-9Cr
oss
bord
er li
ne T
riest
e –
Div
aca
481,
293
TURK
EY
TR-R
-1A
nkar
a –
Ista
nbul
Hig
h-Sp
eed
Railw
ay p
roje
ct53
32,
400
2003
2011
2575
00
TR-R
-2A
nkar
a –
Kony
a H
igh-
Spee
d Ra
ilway
pro
ject
212
500
2005
2012
100
00
0

E C O N O M I C C O M M I S S I O N F O R E U R O P E
109
Proj
ect I
DPr
ojec
t des
crip
tion
Leng
th
(km
)Co
st
(EU
R ×1
06 )St
art y
ear
End
year
% fu
ndin
g se
cure
d fr
om fo
llow
ing
sour
ce
Nat
iona
lBa
nkG
rant
Priv
ate
TR-R
-3A
nkar
a –
Siva
s H
igh-
Spee
d Ra
ilway
pro
ject
450
910
2007
2013
100
00
0
TR-R
-4A
nkar
a –
Izm
ir H
igh-
Spee
d Ra
ilway
pro
ject
606
2,10
0 20
0820
14
TR-R
-5Bu
rsa
– O
sman
eli H
igh-
Spee
d Ra
ilway
pro
ject
278
390
2008
2014
1090
00
TR-R
-6Ye
rkoy
– K
ayse
ri H
igh-
Spee
d Ra
ilway
pro
ject
105
730
TR-R
-7H
alka
li –
Kapi
kule
Hig
h-Sp
eed
Railw
ay p
roje
ct23
11,
700
2010
2014
2575
00
TR-R
-8G
ebze
– H
alka
li (M
arm
aray
) Rai
lway
pro
ject
762,
000
2004
2011
100
900
TR-R
-9Bo
gazk
opru
– Y
enic
e, M
ersi
n –
Topr
akka
le, s
igna
lling
, tel
ecom
mun
icat
ion
and
stat
ion
exte
nsio
n42
514
0 20
0520
1215
850
0
TR-R
-10
Boga
zkop
ru –
Ulu
kisl
a –
Yeni
ce, M
ersi
n –
Ada
na –
Top
rakk
ale
elec
trifi
catio
n pr
ojec
t42
560
20
0920
1215
850
0
TR-R
-11
Irmak
– K
arab
uk –
Zon
guld
ak r
ehab
ilita
tion
and
sign
allin
g pr
ojec
t41
532
0 20
1020
1415
850
0
TR-R
-12
Eski
sehi
r –
Balik
esir
sign
allin
g pr
ojec
t32
810
0 20
1020
130
100
00
TR-R
-13
Eski
sehi
r –
Balik
esir
elec
trifi
catio
n pr
ojec
t32
870
20
1120
13
TR-R
-14
Band
irma
– M
enem
en s
igna
lling
pro
ject
341
100
2011
2013
TR-R
-15
Izm
ir (C
umao
vasi
) – K
arak
uyu
sign
allin
g pr
ojec
t39
013
0 20
1220
140
100
00
TR-R
-16
New
ferr
ies,
wha
rf r
ehab
ilita
tion,
set
ting
up o
f mai
nten
ance
and
rep
air
wor
ksho
p (L
ake
Van)
50
2006
2011
100
00
0
TR-R
-17
Sam
sun
– Ka
lin e
lect
rifica
tion
and
sign
allin
g pr
ojec
t37
855
20
1120
13
TR-R
-18
Kaya
s –
Cetin
kaya
ele
ctrifi
catio
n pr
ojec
t70
290
20
1120
13
TR-R
-19
Pehl
ivan
koy
– U
zunk
opru
ele
ctrifi
catio
n an
d si
gnal
ling
proj
ect
3010
20
1120
130
100
00
TR-R
-20
Kars
– D
ivrig
i sig
nalli
ng p
roje
ct57
820
0 20
1220
14
TR-R
-21
Kars
– A
ktas
new
railw
ay li
ne w
ith s
igna
lling
and
ele
ctrifi
catio
n sy
stem
s 7
616
6 20
0820
1110
00
00
a Con
vers
ion
rate
: 1 E
UR
= 4
5 R
UB
.

U N E C E T E M A N D T E R P R O J E C T S ’ M A S T E R P L A N – 2 0 1 1
110
6.4 Analysis of projects and their classification
For the analysis and classification of revised Master Plan projects, a simplified evaluation method was developed, based on that used in the original Master Plan. The method applies principles of Multi-Criteria Analysis (MCA), and establishes preferences between options by reference to an explicit set of objectives, identified by the decision-makers. Measurable criteria were chosen to assess the extent to which these objectives had been achieved. These criteria were defined through observation, discussion and trial-and-error processes. In spite of an inherent subjectivity associated with this method, it may bring a degree of structure, analysis and openness to the decision-making process.
Its methodological framework was structured in three phases, i.e. identification, analysis and time period classification, in order to ensure the inclusion of all available projects, and employed a set of criteria reflecting the societal values, priorities and available resources of the participating countries as well as the viability of the projects and their international character.
Phase A — Identification
The identification phase entailed the selection of prospective projects primarily on the basis of their funding possibilities and secondarily on the basis of commonly-shared objectives of the national or international authority responsible as well as of the collection of available information/data regarding these projects.
Phase b — Analysis
The analysis phase had as an objective the derivation of scores (the degree of performance) for unfunded, or partly funded, projects to be used in the prioritization phase, and included the following components: • definitionofcriteria —twohyper-criteria;• measurementofcriteria —scores;• weighting/hierarchyofcriteria —Delphi/pairwisecomparison;• derivationoftotalscoreperproject(totalperformanceofproject).
Definition of criteria
The criteria were grouped in two clusters as follows.
Cluster A — Horizontal dimension: Functionality/coherence criteria • serves internationalconnectivity (reachesabordercrossingpointorprovidesaconnection
with a link that crosses a border);• promotes solutions to the particular transit transport needs of landlocked developing
countries;• connectslowincomeand/orleastdevelopedcountriestomajorEuropeanandAsianmarkets;• theprojectcrossesnaturalbarriers,removesbottlenecks,raisessubstandardsectionstomeet
international standards, or fills missing links in the network.
Cluster B — Vertical dimension: Socio-economic efficiency and sustainability criteria • hasahighdegreeofurgencyduetoimportanceattributedbythenationalauthoritiesand/or
social interest; • passestheeconomicviabilitytest;• hasahighdegreeofmaturity,suchthatitcanbecarriedoutquickly(i.e.projectstage);• financingfeasibility;• hasenvironmentalandsocialimpacts.

E C O N O M I C C O M M I S S I O N F O R E U R O P E
111
Measurement of criteria
The criteria were measured firstly using a “physical scale” either by direct classification according to available data/measurable characteristics and/or by quality attributes, provided by preference judgment from the national authority involved. To make the various criteria compatible, it was necessary to transform them into a common measurement unit, or in other words to transform them from a “physical scale” measurement into a common “artificial scale” measurement. This was carried out using a simple linear function, connecting threshold values of an artificial scale with those of a physical scale. The artificial scale chosen was 1 to 5, with 5 representing the highest value.
Weighting/hierarchy of criteria
A pairwise comparison matrix in combination with the Delphi method was used for establishing the criteria weights, the sum of which had to be 1. For their establishment, the participating countries were requested through their National Coordinators to provide their own weight with an appropriate justification.
Derivation of total score per project
The total score of each project was calculated by the consultant based on multi-attribute utility theory.
Phase C — Time period classification
The time period classification phase resulted in the selection of projects according to their performance score on the basis of which projects were classified into four time period classes (1, 2, 3 and 4), each related to a specified time horizon:
Class 1 — projects started before 2011;Class 2 — projects which are expected to start before 2015; Class 3 — projects which are expected to start before 2020;Class 4 — projects which are expected to start after 2020, and projects for which sufficient
data are not available.
Evaluation results
The results of evaluation of the motorway/road projects with the respective data are contained in the TEM and TER revised Master Plan final report, Volume II “Financing of road and rail infrastructure for the TEM and TER Master Plan revision”. According to these results, the total number of evaluated projects reached 367, with a total cost of EUR 100,881 × 106. Out of this number, 94 were completed. From the remaining 273 motorway/road projects, 227 belonged to Class 1, 3 to Class 2, 20 to Class 3 and 23 to Class 4. In Annex III of Volume II, these projects were analysed in detail also with respect to their construction costs, and the GDP and national budget of the individual countries. Volume II of the final report also contains considerations regarding funding and recommendations addressed to some of the participating countries.
It has not been possible to apply the methodology described above to all motorway/road Master Plan projects and nor has it been possible to apply it to any of the rail projects. The timing of the realization of any project is not only dependent on societal values, political priorities, financing feasibility and the international importance of the project. It may also depend on the design stage, the results of the environmental impact assessment analysis, decisions related to the territorial location of the project, the possibilities for land acquisition, the availability of a construction permit and funds, etc. The realistic start and end years for the implementation of all (road and rail) revision projects, taking all the relevant aspects into account, are stated in the respective columns of the tables in chapters 6.2 and 6.3, thus indicating de facto the real project time priorities.

U N E C E T E M A N D T E R P R O J E C T S ’ M A S T E R P L A N – 2 0 1 1
112

E C O N O M I C C O M M I S S I O N F O R E U R O P E
113
7. FUNDING CONSIDERATIONS FOR REVISED MASTER PLAN PROJECTS
Owing to the complexity of the transport infrastructure funding arrangements and of the multitude of their possible technical and institutional aspects, the funding considerations for revised Master Plan projects is dealt with in detail in Volume II “Financing of road and rail infrastructure for the TEM and TER Master Plan revision” of this final report. Volume II includes the identification of possible sources of funding for road and rail projects as well as the eligibility criteria and required procedures to be followed in order to receive the needed funds.
Volume II, Annex III “How to ensure financing for road projects in the Master Plan” presents these funding sources, criteria and procedures and how to obtain them, together with concrete and detailed recommendations specifically tailored to actual motorway/road projects for which funding has not yet been fully secured.
Volume II, Annex IV “Road financing in Europe and recommendations for the financing of road projects in the Master Plan” provides an up-to-date review of the literature and practices concerning road financing in Europe. It presents a summary of the various means and methods available for securing financing of motorway/road projects, taking into consideration the information collected from the participating countries, and formulates some recommendations for the countries which were engaged in the TEM component of the Master Plan revision.
Volume II, Annex V “Financing the railway infrastructure in the revised Master Plan” deals with the present and future ways of funding of railway infrastructure, and the identification of possible sources, criteria and procedures for obtaining the needed funds. It further provides an overview of costs of railway infrastructure and instruments for railway financing, and formulates recommendations with regard to financial sources for railway construction, improvement of planning and preparation of decisions for a greater efficiency of the rail infrastructure. It also proposes an organizational model for the operation and financing of this infrastructure. In addition, it contains selected examples of current European rail funding experience and practices.
Volume II, Annex VI “Funding considerations for railway infrastructure projects in the Master Plan” contains an overview of the railway projects in the revised Master Plan, their funding status and possible sources of funding. It also deals with the evaluation criteria for projects, funding considerations for non-secured or partly secured financing for projects, prerequisites for bankable projects, steps to be followed for ensuring funding and establishment of the technical and institutional actions required to secure missing funds.

U N E C E T E M A N D T E R P R O J E C T S ’ M A S T E R P L A N – 2 0 1 1
114

E C O N O M I C C O M M I S S I O N F O R E U R O P E
115
8. STATUS OF bACKbONE NETWORKS IN 2010, 2015 AND 2020
In accordance with the terms of reference for the revision of the Master Plan, the need to document the development and expected status of the TEM and TER backbone networks in the years 2010, 2015 and 2020 was identified as a precondition for the identification of their bottlenecks. These status data were also of importance to, or indirectly connected to, other topics in this final report, e.g. border crossing issues, intermodal relationships and ITS, as well as to environmental aspects, safety and security.
8.1 Status maps of the TEM and TER backbone network
Status maps of the rail and road backbone networks in 2010, 2015 and 2020 were developed on the basis of the national master plans, data and assistance of the participating countries, the revision questionnaires, the TEMSTAT monitoring system, data from other relevant studies (in particular from the UIC ERIM and the TENCONNECT study), internet sources (especially with regard to the status of high-speed railways and their planned development), and available documentation and information gained from other sources (see Maps No. 11 to 13 for the TEM backbone network and No. 14 to 16 for the TER backbone network). In the majority of participating countries, there is a national master plan (strategy) of approved infrastructure development with a horizon extending up to the years 2013 to 2015. Only some of the participating countries have investment plans that extend to the year 2020, and these are (or may soon be) undergoing revision and change as a result of the economic recession. Therefore, for such cases, the infrastructure status shown on the 2020 status maps includes a considerable element of uncertainty and represents the most probable option based on the latest information available, as communicated by the representatives of the participating countries.
The TER status maps (No. 14 to 16) show sections with the design speed limits below 160 km/h and those with design speed limits equal to 160 km/h, 200 km/h to 230 km/h, 250 km/h and 300 km/h. The TEM status maps (No. 11 to 13) show sections with “motorways or dual carriageways in operation” in the given year (i.e. motorways, expressways and also dual-carriageway highways, sometimes even those for which access of slow vehicles is permitted and at-grade intersections). Distinction between these different categories of “dual carriageway” was not possible since in some countries the term “motorway” is not defined and the term “expressway” has a very different meaning from one country to another (sometimes it includes also two-lane roads).
8.2 Lessons learnt
The lessons learnt in the course of the elaboration of the status maps of the TEM and TER backbone networks can be summarized as follows.
Road• Insomecases,planningandevenconstructionofmotorwayconnectionsbetweenparticipating
countries is not properly coordinated, in particular with respect to their timing.• The concepts for the terms describing different categories of “dual carriageway” (and in
particular the term “expressway”) need to be clarified and if possible harmonized. More detailed information about the types of dual-carriageway communications is desirable within the framework of the follow-up to the Master Plan revision.

U N E C E T E M A N D T E R P R O J E C T S ’ M A S T E R P L A N – 2 0 1 1
116
• Moredetailedandregulardataonroadinfrastructuredevelopmentwouldbeverybeneficial,especially those from the non-TEM member countries participating in the revision, since there is a certain lack of consistency between the infrastructure data from the TEM countries (through the TEMSTAT information and monitoring system) and those from the other countries (where no regular information flows have been established yet).
• It shouldbe further clarifiedhow realistic the futuremotorwaydevelopmentplans are; insome countries they seem quite ambitious when compared with the pace of past constructions.
Rail• Thereisnoregionalhigh-speedrailmasterplanfortheregioncoveredbytheTERMaster
Plan; in practice, the vast majority of the participating countries are planning the development and construction of high-speed railways taking account only of their national needs.
• Someoftheparticipatingcountriespossessnationalhigh-speedrailmasterplans,or futureplans for their construction are at different stages of approval.
• Atpresent,someparticipatingcountrieshavenoplansforanationalhigh-speedrailnetworkor its construction.
• Insomeofthedatareceivedfromtheparticipatingcountries,itisnotcleartowhichspeedcategory a particular rail section belongs. This is particularly the case with respect to the speed limit of 160 km/h: the term frequently used is “up to 160 km/h” and in some cases the respective data differ (e.g. for the same section, one source indicates a design speed of 140 km/h and another a design speed of 160 km/h).
• Inmanycases it isnot clearhow realistic (inparticular from thepointof viewof securedfunding) the future development plans are, especially as far as the 2020 status is concerned. For example, plans to construct in hilly terrain (where the current line allows speeds from 60 km/h to 80 km/h) hundreds of kilometres of railway links in 4 years to 5 years and with a design speed of 160 km/h seem to be extremely ambitious.
8.3 Conclusions
According to the TEM status maps (No. 11 to 13) and taking into account the remarks above, it is possible to assume that in 2020 the TEM Master Plan backbone network with motorway or dual carriageway sections would be in full operation in Austria, Italy, Poland, Slovenia and Turkey and, with a few exceptions, also in Croatia, the Czech Republic, Hungary, Greece, Serbia and Slovakia. There also seems to be some hope for its completion in the foreseeable future in Armenia, Belarus, Bulgaria, the former Yugoslav Republic of Macedonia and Romania, while in the remaining participating countries the chance seems to be rather low.
According to the TER status maps (No. 14 to 16), railway sections with a design speed of 160 km/h exist at present in Austria, Bulgaria, Croatia, the Czech Republic, Hungary, Italy, Poland, the Russian Federation and Turkey, i.e. in 9 out of the 25 countries participating in the revision. In 2015, this number is expected to grow to 14 and in 2020 to a total of 17 countries (Austria, Belarus, Bosnia and Herzegovina, Bulgaria, Croatia, the Czech Republic, Hungary, Italy, Lithuania, Poland, Romania, the Russian Federation, Serbia, Slovakia, Slovenia, Turkey and Ukraine). It seems possible that in the region in 2020, a few more or less continuous 160 km/h main lines may exist, interconnecting most of the countries of Central and Eastern Europe including Belarus, the Russian Federation, Turkey and Ukraine. Because of the total absence of a regional high-speed rail master plan in the region (and taking into consideration the introduction of the 160 km/h speed limit on major international lines), the elaboration of such a master plan under the auspices of the UNECE, and possibly also of the European Commission (EC), could be the subject of one of the follow-up activities in the future.

E C O N O M I C C O M M I S S I O N F O R E U R O P E
117
Since the backbone network construction plans may be, at least in some countries, negatively influenced by the present economic recession, the results of which are difficult to foresee, it seems probable that the maps for 2015 and 2020 present the maximum possible, and the reality, especially in 2020, might be rather more modest than estimated. For this reason, it is necessary to ensure regular monitoring of the progress of the transport infrastructure construction and updating of the respective mid-term investment plans and long-term strategies.

U N E C E T E M A N D T E R P R O J E C T S ’ M A S T E R P L A N – 2 0 1 1
118

E C O N O M I C C O M M I S S I O N F O R E U R O P E
119
9. bOTTLENECKS ON bACKbONE NETWORKS
9.1 Definition and identification
In general, there are different causes of bottlenecks. In road and rail transport, two types are usually distinguished: condition bottlenecks, where the poor infrastructure limits the speed, and capacity bottlenecks, where the heavy traffic flows cause delays. Bottlenecks can also be caused by other reasons, e.g. by border crossings and rail gauge changes, and temporary bottlenecks can be caused because of infrastructure repair works, accidents, landslides, earthquakes, floods etc. Special types of transport-related bottleneck represent the so-called social and environmental bottlenecks, i.e. cases where the transport infrastructure development is at odds with the priorities or goals of social or environmental legislation, institutions and groups. Most of the studies and documents dealing with bottlenecks in the transport sector concentrate on condition and/or capacity bottlenecks and the same approach has been chosen in the course of the revision of the Master Plan.
It is commonly accepted that a fully rigorous and theoretically founded basis for identifying bottlenecks is not available. On the whole, the identification of bottlenecks appears to have been done individually by each country, without reference to any common definition or parameter.
With respect to condition bottlenecks, the main indicators of the quality of an infrastructure are its type (e.g. limited access road, ordinary road, railway gauge, high-speed railway, signalling system, electrification), capacity (expressed in number of lanes or tracks, or number of cars, trains or passengers), axle load, permitted speed and restrictions. For capacity bottlenecks, there are many criteria proposed in various documents and studies. For example, the CEDR SG-TERN in its report “Bottlenecks in Road Networks” suggested that a road section may be considered as a bottleneck if over the period of one year, congestion occurs for more than 200 h or speed falls below the threshold value. The UNECE documents TRANS/WP.5/R.60 and TRANS/WP.5/2006/2 suggested that rail bottlenecks be identified by assessing whether the demand exceeded 60 to 80 trains/day for a single track and 2 × 100 trains/day to 2 × 200 trains/day for a double-track line. A motorway/road bottleneck would be a section where the traffic exceeded 12,000 PCU/day on a 2-lane road and 60,000 PCU/day on a 4-lane motorway for more than 80 days to 120 days a year. The WSP Finland Ltd pilot study “The Northern Transport Axis” made use of the same criteria for rail capacity bottlenecks, and considered a road as congested when the travel speed of heavy goods vehicles (HGVs) decreased below 50 km/h. The road capacity limits suggested by the UNECE (above) together with the level of service concept of the US “Highway Capacity Manual” were also used as a basis for the identification of bottlenecks in the TEM component of the original Master Plan. Finally, according to the TENCONNECT report, the applied capacity of a 4-lane motorway was 4,600 PCU/h, corresponding to a level of service E. A practical lane capacity of a 2-lane road was considered to be about 1,400 PCU/h, reduced to about 950 PCU/h in urban areas. In rail transport, double-track sections with more than 230 trains/day or sections with mixed usage of tracks by high-frequent suburban trains, long-distance passenger trains and freight trains (or a combination of these factors) were considered as bottlenecks. In these calculations, the rail passenger and freight flows were transformed to train numbers using the conversion factors of 700 net tonnes/train, 350 passengers/train and 50 % share of passenger and freight trains.

U N E C E T E M A N D T E R P R O J E C T S ’ M A S T E R P L A N – 2 0 1 1
120
Meanwhile, none of these documents and studies resulted in the identification of concrete bottlenecks in the TEM and TER region with the exception of the TENCONNECT study. At first, it presented the road bottlenecks (red colour) and missing links (green colour) in 2030 on the following schematic map of the major trans-national axes of “EU importance” of the south-western part of the region, based simply on the criterion of exceeding the capacity of the link in the two morning peak hours.
Following a more detailed analysis of road capacity bottlenecks, the study registered their existence only in large cities and agglomerations (Athens, Bucharest, Budapest, Florence, Gdansk, Istanbul, Katowice, Kaunas, Kiev, Milan, Moscow, Naples, Prague, Rome, Sofia, St. Petersburg, Vilnius, Warsaw, Vienna and Zagreb), but not on any intercity motorway/road links.
A similar schematic map of the south-western part of the region (see below) identified the rail capacity bottlenecks (red colour) on links where the average daily rail traffic was above 25,000 passengers/day. According to the map, rail capacity bottlenecks existed only in Warsaw, Vienna and in about 5 places in Italy. (In this map, the green colour again identifies the missing links.)

E C O N O M I C C O M M I S S I O N F O R E U R O P E
121
As a result of a more-detailed analysis of rail freight and passenger transport capacity bottlenecks, the TENCONNECT study analysed them in general and only on the links of selected main network. It identified bottlenecks in conurbations too, but in 2030 in Vienna and Milan only.
Bearing in mind that there is no generally accepted approach for the identification of bottlenecks, and taking into consideration all the findings and limitations described above, as well as the fact that the methodology used in the original Master Plan cannot be applied to rail bottlenecks, it was decided to identify road and rail bottlenecks in the revised Master Plan on a country-by-country basis from the data delivered by the participating countries. These bottlenecks are identified in chapters 9.2 and 9.3 and Maps No. 17 and 18.

U N E C E T E M A N D T E R P R O J E C T S ’ M A S T E R P L A N – 2 0 1 1
122
9.2 Roads
Note: Under “Type”, CA = capacity bottleneck, CO = condition bottleneck.
No. / Country / Road section Type Remark
Albania
1. Durres (Plepa) – Kavaje – Rrogozhine CA second carriageway under construction
Austria
2. Tauern tunnel, second tube CO under construction
3. Roppen tunnel, second tube CO under construction
4. Pfaender tunnel, second tube CO under construction
5. Traismauer – Jettsdorf, Danube bridge CO under construction
6. Klaus tunnel, second tube CO programmed
7. Bosruck tunnel, second tube CO planned
8. Linz Hummelhof – Linz Urfahr CA planned
9. Schwechat – Sussenbrunn CA planned
10. Judenburg – St. Georgen CA second carriageway planned
11. St. Georgen – Scheifling CA second carriageway planned
12. Scheifling – Klagenfurt North CA second carriageway planned
Azerbaijan
13. Sumgayit – G.Z. Tagiyev CO reconstruction of bypass road
14. Ganja – Gazakh CO 4 road relocations needed
15. Salyan – Kura river bridge CO bridge reconstruction
16. Bilasuvar – Astara CO bridge reconstructions and short road relocations
17. Hadjigabul – Red bridge CA 2 more traffic lanes planned
Bosnia and Herzegovina
18. Foca – Hum CO reconstruction planned
19. Stolac – Neum CO construction programmed
20. Border crossing Doljani CO new crossing under design
21. Border crossing Vardiste CO new crossing under design
The Czech Republic
22. Lovosice – Rehlovice CA under construction
The former Yugoslav Republic of Macedonia
23. Tabanovce – Kumanovo CO under construction

E C O N O M I C C O M M I S S I O N F O R E U R O P E
123
No. / Country / Road section Type Remark
Georgia
24. Vale – TUR CO planned
Lithuania
25. Kaunas bypass (A5 – A6 road crossings) CA widening to 2 × 3 lanes planned
26. Jakai intersection in Klaipeda CA grade separation planned
27. Kaunas – Medininkai, Vilnius thoroughfare CA Vilnius southern bypass planned
Serbia
28. Beska Danube bridge CO under construction
29. Kelebia –Subotica (E 75 Y-branch) CO designed
Slovakia
30. Sverepec – Vrtizer CA under construction
31. Hricovske Podhradie – Dubna Skala CA under construction
32. Dubna Skala – Ivachnova CA under construction
33. Janovce – Jablonov CA under construction
34. Fricovce – Svinia CA under construction
Slovenia
36. Peracica – Podtabor CA under construction
37. Drazenci – Gruskovje CA under construction
Turkey
38. Izmit Bay crossing CA under construction
39. Istanbul Strait Crossings CA 3rd suspension bridge construction will start in 2011

U N E C E T E M A N D T E R P R O J E C T S ’ M A S T E R P L A N – 2 0 1 1
124
9.3 Railways
Note: Under “Type”, CA = capacity bottleneck, CO = condition bottleneck.
No. / Country / Road section Type Remark
Albania
1. Durres (Plepa) – Kavaje – Rrogozhine CA second carriageway under construction
Austria
1. St. Polten – Wien CA
2. Neunkirchen – Murzzuschlag CA Semmering base tunnel planned
3. Klagenfurt node CA
4. Schwarzach/St. Veit node CA
5. Attnang/Puchheim – Selzthal CA
6. Feldkirch – Bregenz CA
Azerbaijan
7. Osmanly – Astara CA second track under construction
Bosnia and Herzegovina
8. Samac/Bosanski Samac border crossing CAagreement on cross-border and cross-country use of locomotives and crews
9. Capljina border crossing CA
10. Doboj Inter-Entity boundary line CA
Croatia
11. Zagreb junction CA
construction of rail bypass, new marshalling yard and other measures aimed at increased junction capacity
12. Dugo Selo – Koprivnica CA reconstruction and second track
13. Dugo Selo – Novska CA second track, new signalling
14. Zagreb – Karlovac CA construction of new line Horvati – Krasica
15. Moravice – Rijeka CA new electrification and signalling systems
16. Rijeka – Sapjane CO new electrification and signalling systems
Hungary
17. Budapest – Nagykanizsa CA
18. Budapest – Kelebia CA
19. Gyor – Boba CA
Romania
20. Predeal – Brasov CA rehabilitation and modernization programmed

E C O N O M I C C O M M I S S I O N F O R E U R O P E
125
No. / Country / Road section Type Remark
The Rssian Federation
21. Bogdanovich – Bajenovo – Sverdlovsk CA parallel schedule of trains
22. Kungur – Perm – Cheptsa CO improvement of power supply
23. Mga, Bogdanovich, Vologda and Losta stations CO extension and rehabilitation of station tracks
24. Lyangasovo – Kotelnich CO improvement of technical state
25. Kanalnaya – Salsk CA
26. M. Gorkogo – Kotelnikovo – Korenovsk CA construction of second track
27. Timashevskaya – Krimskaya CA construction of second track
28. Krasnodar junction CA new double-track bypass
29. Krimskaya – Novorossijsk CA reconstruction of tunnel
30. Primyikanie – Saratov CA
31. Krotovka – Obsharovka CO improvement of power supply
32. Chelyabinsk main station CA improvement of railway sidings
33. Zamchalovo – Kiziterinka CA
34. Bekasovo – Nara CA
35. Bakasovo – Sandarovo CO improvement of power supply
36. Shilovo – Ryibnoe CO improvement of power supply
Serbia
37. Beograd – Subotica – HUN CA construction of second track
38. Beograd Rail Node CA construction of new part and reconstruction of existing one
39. Beograd – Nis CA construction of second track
Slovenia
40. Maribor- Sentilj – AUT CA construction of second track
41. Divaca – Koper CA construction of new line
42. Trieste – Divaca cross-border railway CO construction of new line
43. Ljubljana – Jesenice CA construction of new line
Turkey
44. Istanbul, Istanbul Strait crossing CAtunnel and upgrading of existing lines (Marmaray project) under construction
45. Tatvan – Van CA procurement of 2 new ferries ongoing

U N E C E T E M A N D T E R P R O J E C T S ’ M A S T E R P L A N – 2 0 1 1
126

E C O N O M I C C O M M I S S I O N F O R E U R O P E
127
LIST OF MAPS
1. TEM and TER Master Plan Revision participating countries
2. TEM Master Plan Revision backbone network
3. TER Master Plan Revision backbone network
4. TEM Master Plan Revision backbone network missing links
5. TER Master Plan Revision backbone network missing links
6. TEM Master Plan Revision backbone network basic development scenario — traffic flows in 2020
7. TER Master Plan Revision backbone network basic development scenario — passenger flows in 2020
8. TER Master Plan Revision backbone network basic development scenario — freight flows in 2020
9. TEM Master Plan Revision backbone network — TEM revised Master Plan projects
10. TER Master Plan Revision backbone network — TER revised Master Plan projects
11. TEM Master Plan Revision backbone network status 2010
12. TEM Master Plan Revision backbone network status 2015
13. TEM Master Plan Revision backbone network status 2020
14. TER Master Plan Revision backbone network status 2010
15. TER Master Plan Revision backbone network status 2015
16. TER Master Plan Revision backbone network status 2020
17. TEM Master Plan Revision backbone network bottlenecks
18. TER Master Plan Revision backbone network bottlenecks
19. TEM and TER Master Plan Revision backbone networks interrelationships
20. TEM and TER Master Plan Revision backbone networks — common sections
21a. TEM Master Plan Revision backbone network — interrelationships between the TEM backbone network and relevant transhipment points (terminals of international importance)
21b. TEM Master Plan Revision backbone network — interrelationships between the TEM backbone network and relevant transhipment points (ports and ferries)
22a TER Master Plan Revision backbone network — interrelationships between the TER backbone network and relevant transhipment points (terminals of international importance)
22b TER Master Plan Revision backbone network — interrelationships between the TER backbone network and relevant transhipment points (ports and ferries)

U N E C E T E M A N D T E R P R O J E C T S ’ M A S T E R P L A N – 2 0 1 1
128

E C O N O M I C C O M M I S S I O N F O R E U R O P E
129

E C O N O M I C C O M M I S S I O N F O R E U R O P E
131

E C O N O M I C C O M M I S S I O N F O R E U R O P E
133
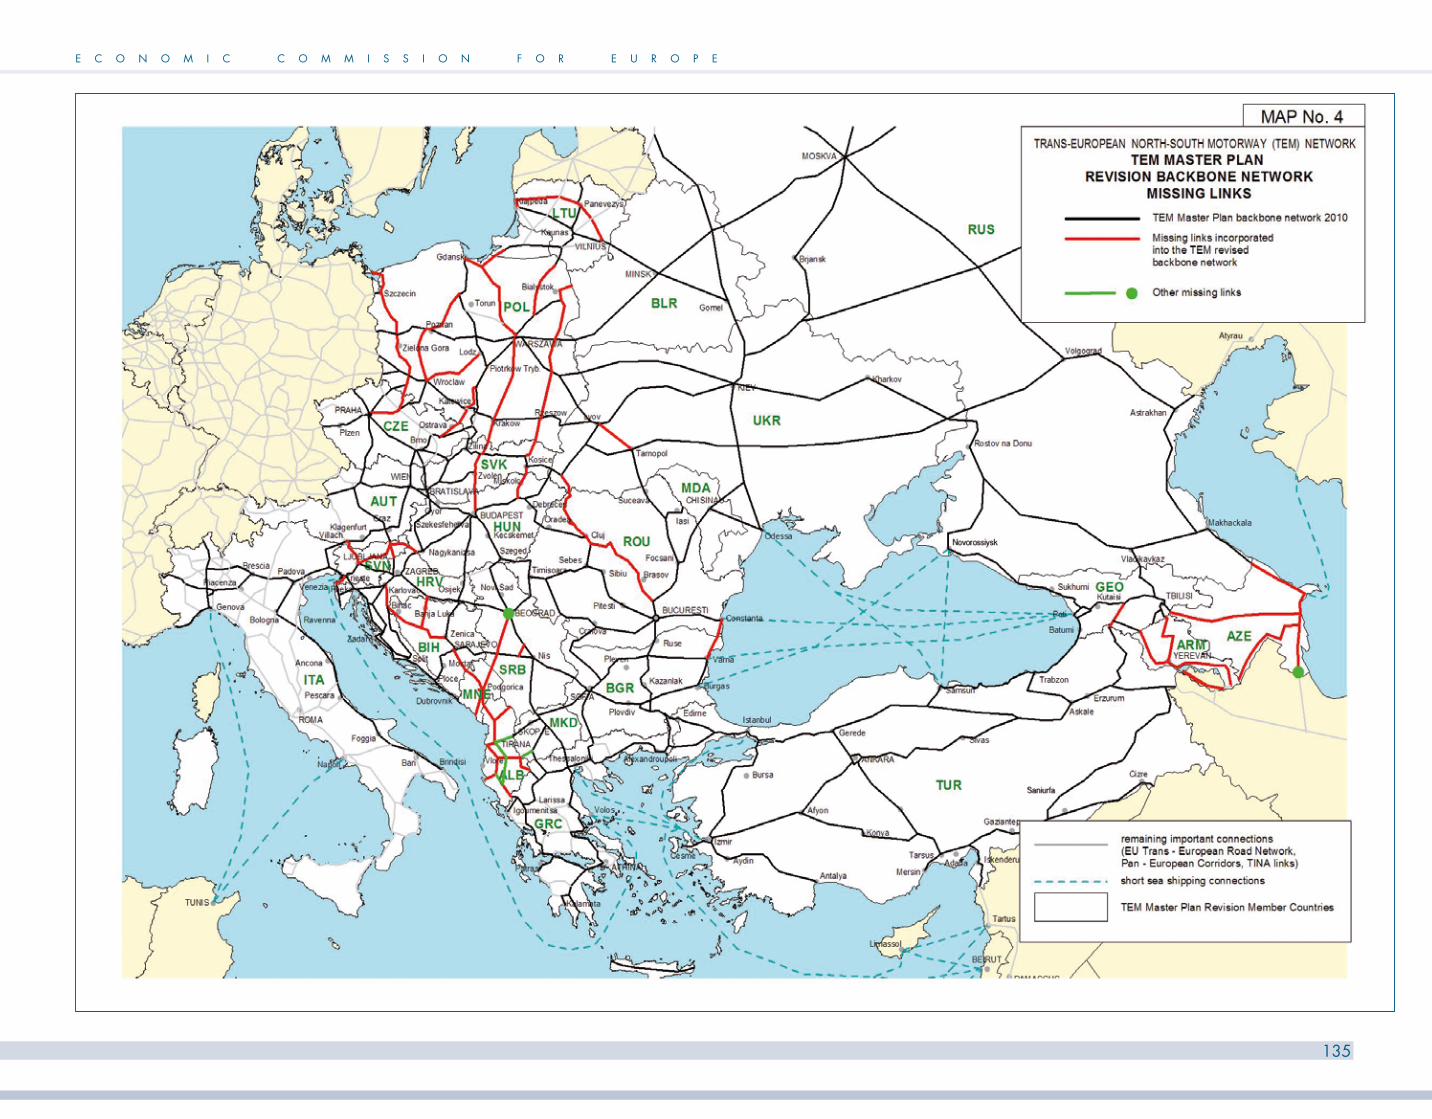
E C O N O M I C C O M M I S S I O N F O R E U R O P E
135

E C O N O M I C C O M M I S S I O N F O R E U R O P E
137
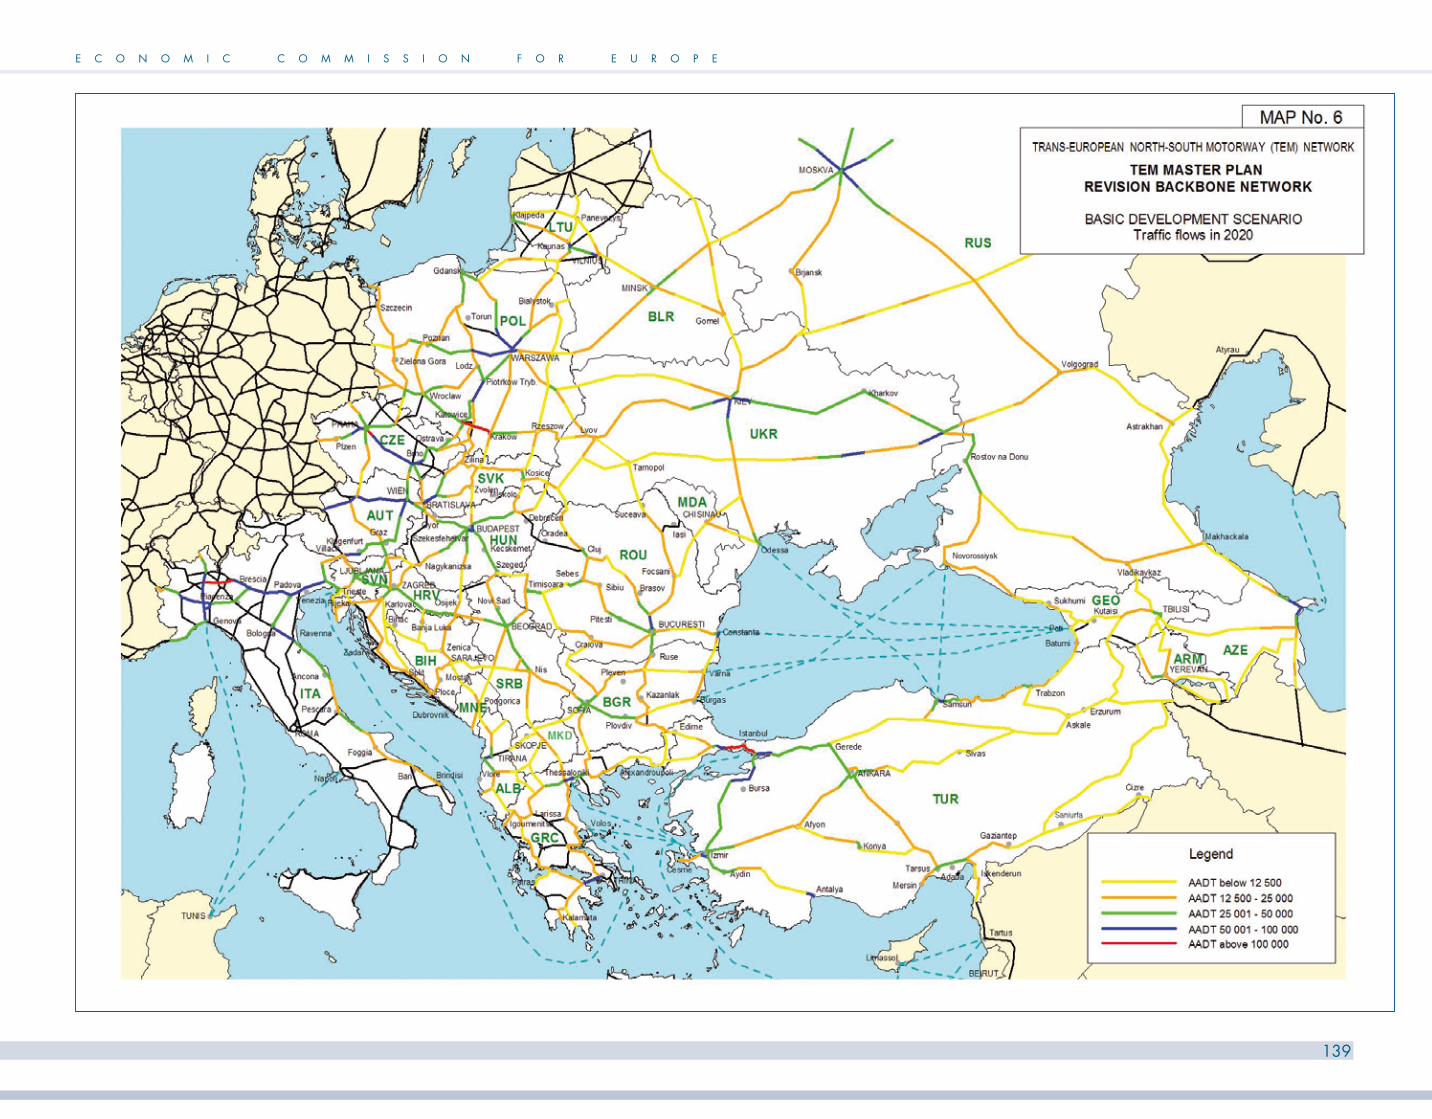
E C O N O M I C C O M M I S S I O N F O R E U R O P E
139
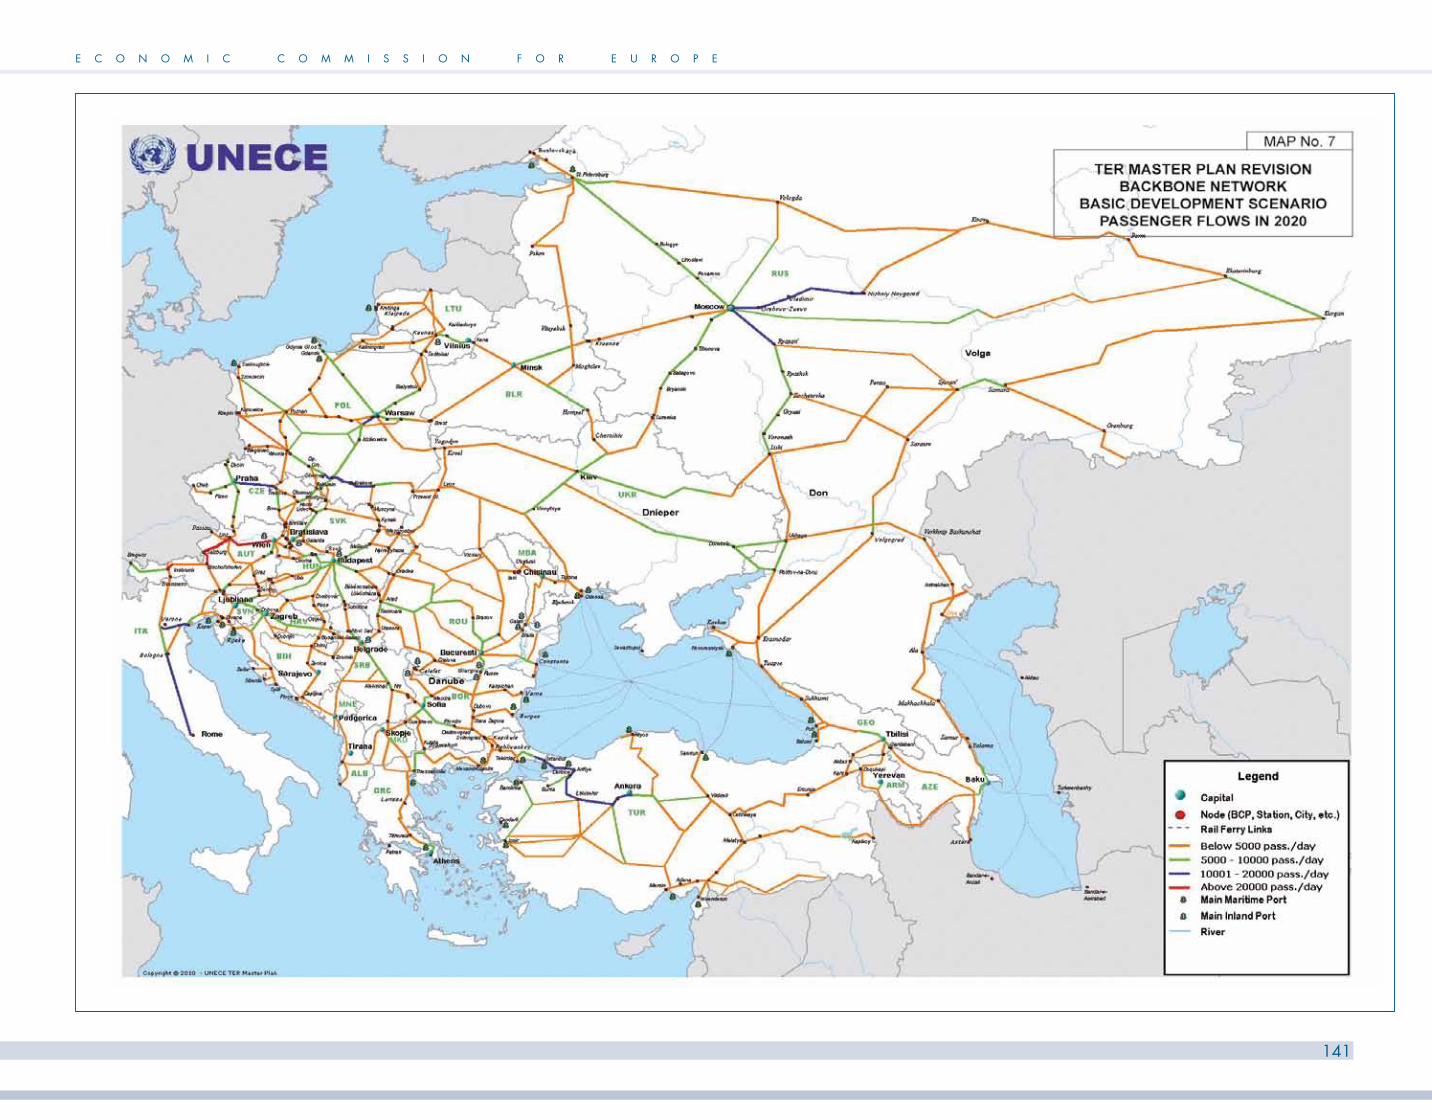
E C O N O M I C C O M M I S S I O N F O R E U R O P E
141

E C O N O M I C C O M M I S S I O N F O R E U R O P E
143
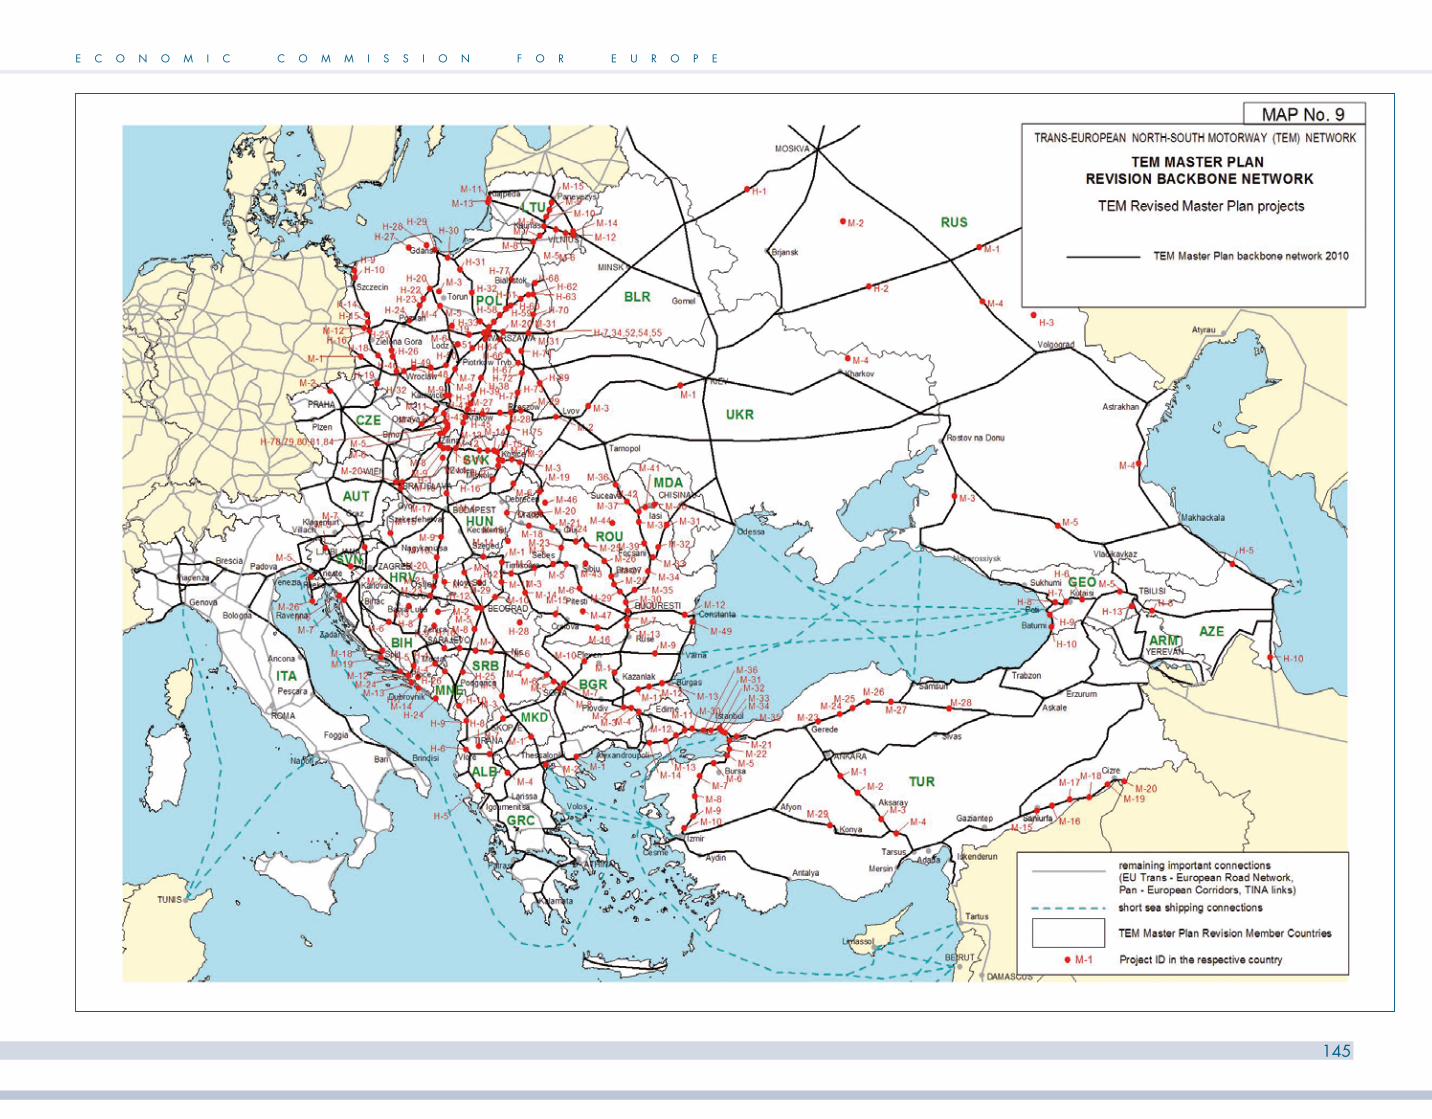
E C O N O M I C C O M M I S S I O N F O R E U R O P E
145

E C O N O M I C C O M M I S S I O N F O R E U R O P E
147

E C O N O M I C C O M M I S S I O N F O R E U R O P E
149

E C O N O M I C C O M M I S S I O N F O R E U R O P E
151

E C O N O M I C C O M M I S S I O N F O R E U R O P E
153
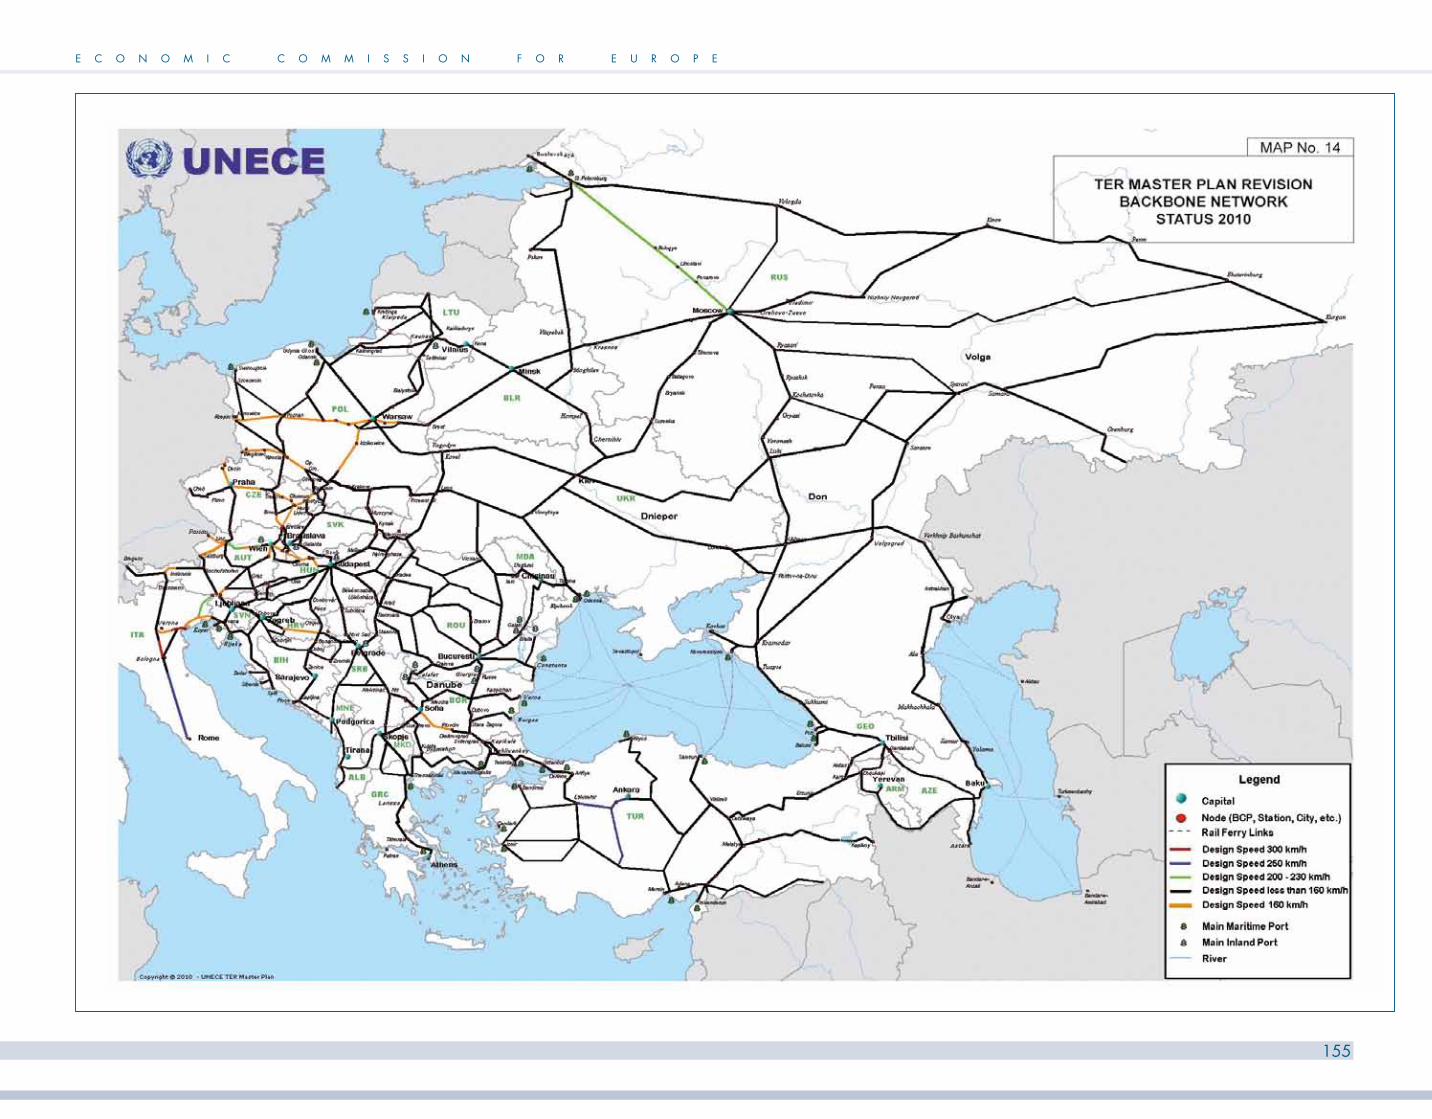
E C O N O M I C C O M M I S S I O N F O R E U R O P E
155

E C O N O M I C C O M M I S S I O N F O R E U R O P E
157

E C O N O M I C C O M M I S S I O N F O R E U R O P E
159

E C O N O M I C C O M M I S S I O N F O R E U R O P E
161

E C O N O M I C C O M M I S S I O N F O R E U R O P E
163
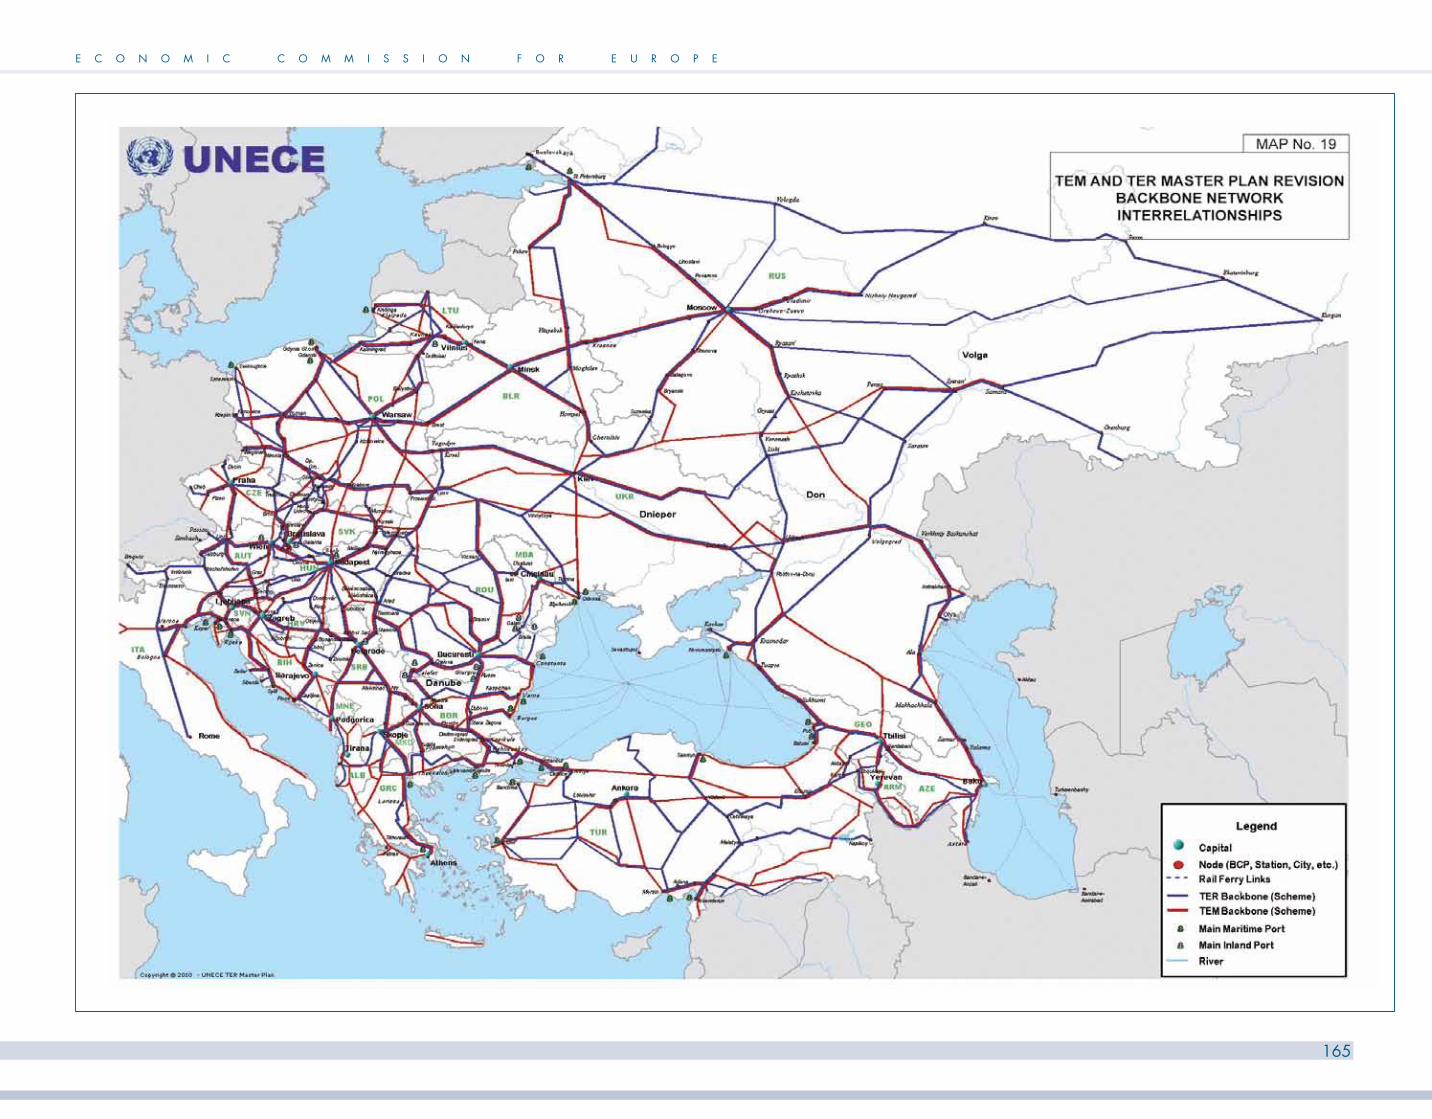
E C O N O M I C C O M M I S S I O N F O R E U R O P E
165

E C O N O M I C C O M M I S S I O N F O R E U R O P E
20
E C O N O M I C C O M M I S S I O N F O R E U R O P E
167

E C O N O M I C C O M M I S S I O N F O R E U R O P E
21
E C O N O M I C C O M M I S S I O N F O R E U R O P E
169

E C O N O M I C C O M M I S S I O N F O R E U R O P E
22
E C O N O M I C C O M M I S S I O N F O R E U R O P E
171

E C O N O M I C C O M M I S S I O N F O R E U R O P E
23
E C O N O M I C C O M M I S S I O N F O R E U R O P E
173

E C O N O M I C C O M M I S S I O N F O R E U R O P E
24
E C O N O M I C C O M M I S S I O N F O R E U R O P E
175

E C O N O M I C C O M M I S S I O N F O R E U R O P E
177
10. bORDER CROSSING ISSUES
Border crossings and related procedures may constitute significant transport barriers. The obstacles at borders result in difficulties in both road and rail services, and long waiting times at borders cause disruptions to logistical activities, increase their costs and reduce the efficiency of the global economy. While transport operators can waste time at these crossings, it is the shippers and ultimately the consumers who pay the price for delays. Since the elaboration of the original Master Plan in 2005, considerable improvement has been achieved through the extension of the Schengen area to all the EU member countries, and thus practically no problems have been observed at the internal borders between the 10 participating countries which are in the EU. In the region covered by the TEM and TER Master Plan, long waiting times lead to difficulties in the road transport services especially at border crossing with the Commonwealth of Independent States (CIS) countries, where the waiting time for trade and traffic operations is increasing rapidly. The growing rail transport at these borders is also hampered by the gauge difference.
As was the case for the original Master Plan, the inventory of border crossings and of the respective traffic flows was made as a first step, followed by the identification of border crossing problems and recommendations for alleviation of these problems.
The following border crossings identified in chapters 10.1 to 10.3 are located on the revised TEM and TER Master Plan backbone network.
10.1 Road border crossings on the TEM backbone network
Hani-i-Hotit (ALB) – Bozaj (MNE)
Qafe Thane (ALB) – Kjafasan (MKD)
Kakavija (ALB) – Ktismata (GRC)
Morine (ALB) – Zhur
Kapshtice (ALB) – Kristalopigi (GRC)
Meghri (ARM) – Nurduz (IRN)
Arnoldstein (AUT) – Coccau (ITA)
Salzburg (AUT) – Piding (DEU)
Nickelsdorf (AUT) – Hegyeshalom (HUN)
Kittsee (AUT) – Petrzalka (SVK)
Spielfeld (AUT) – Sentilj (SVN)
Karawanken tunnel (AUT) – Jesenice (SVN)
Samur (AZE) – Novogaptsakh (RUS)
Astara (AZE) – Astara (IRN)
Novaja Guta (BLR) – Novi Yarylovychi (UKR)
Ezjaryszcza (BLR) – Lobok (RUS)
Novaja Zjamlja (BLR) – Krasnoe (RUS)
Visici (BIH) – Metkovic (HRV)

U N E C E T E M A N D T E R P R O J E C T S ’ M A S T E R P L A N – 2 0 1 1
178
Samac/Bosanski Samac (BIH) – Slavonski Samac (HRV)
Donje Vardiste (BIH) – Bratislava Basta (SRB)
Izacic (BIH) – Vaganac (HRV)
Gradiska/Bosanska Gradiska (BIH) – Novi Varos (HRV)
Hum (BIH) – Scepan Polje (MNE)
Kalotina (BGR) – Gradina (SRB)
Kapitan Andreevo (BGR) – Kapikule (TUR)
Kulata (BGR) – Promachon (GRC)
Russe (BGR) – Giurgiu (ROU)
Vidin (BGR) – Calafat (ROU)
Durankulak (BGR) – Vama Veche (ROU)
Gjusevo (BGR) – Kriva Palanka (MKD)
Svilengrad (BGR) – Ormenio (GRC)
Bregana (HRV) – Obrezje (SVN)
Gorican (HRV) – Letenye (HUN)
Knezevo (HRV) – Udvar (HUN)
Lipovac (HRV) – Batrovci (SRB)
Macelj (HRV) – Gruskovje (SVN)
Rupa (HRV) – Jelsane (SVN)
Plovanija (HRV) – Dragonja (SVN)
Rozvadov (CZE) – Waidhaus (DEU)
Krasny Les (CZE) – Breitenau (DEU)
Kralovec (CZE) – Lubawka (POL)
Cesky Tesin (CZE) – Cieszyn (POL)
Vernovice (CZE) – Gorzyczki (POL)
Lanzhot (CZE) – Kuty (SVK)
Dolni Dvoriste (CZE) – Wullowitz (AUT)
Mikulov (CZE) – Drasenhofen (AUT)
Gevgelija (MKD) – Evzoni (GRC)
Medzitlija (MKD) – Niki (GRC)
Sarpi (GEO) – Sarp (TUR)
Naohrebi (GEO) – Turkozu (TUR)
Larsi (GEO) – Verhnij Lars (RUS)
Leselidze (GEO) – Adler (RUS)
Tsiteli Khidi (GEO) – Red Bridge (AZE)
Sadakhlo (GEO) – Ayrum (ARM)
Kipi (GRC) – Ipsala (TUR)
Rajka (HUN) – Rusovce (SVK)

E C O N O M I C C O M M I S S I O N F O R E U R O P E
179
Parassapuszta (HUN) – Sahy (SVK)
Tornyosnemeti (HUN) – Milhost (SVK)
Zahony (HUN) – Chop (UKR)
Nagylak (HUN) – Nadlac (ROU)
Roszke (HUN) – Horgos (SRB)
Tornyiszentmiklos (HUN) – Pince (SVN)
Trieste Villa Opicina (ITA) – Fernetici (SVN)
Rabuiese (ITA) – Skofije (SVN)
Iselle (ITA) – Gondo (CHE)
Bardonecchia (ITA) – Foumeaux (FRA)
Ventimiglia (ITA) – Menton (FRA)
Kalvarija (LTU) – Budzisko (POL)
Salociai (LTU) – Grenctale (LVA)
Medininkai (LTU) – Kamenny Loh (BLR)
Kybartai (LTU) – Chernyshevskoye (RUS)
Dobau (MDA) – Platonove (UKR)
Pervomaise (MDA) – Kuchurhan (UKR)
Boljari (MNE) – Brodarevo (SRB)
Swiecko (POL) – Frankfurt (DEU)
Olszyna (POL) – Forst (DEU)
Jedrzychowice (POL) – Ludwigsdorf (DEU)
Barwinek (POL) – Vysny Komarnik (SVK)
Zwardon (POL) – Skalite (SVK)
Terespol (POL) – Kozlovichi (BLR)
Korczowa (POL) – Krakoviec (UKR)
Chyzne (POL) – Trstena (SVK)
Rattles (POL) – Mamonovo (RUS)
Hrebenne (POL) – Rava Russkaya (UKR)
Okopy Nowe (POL) – Izov (UKR)
Moravita (ROU) – Vrsac (SRB)
Siret (ROU) – Porubne (UKR)
Halmeu (ROU) – Djakove (UKR)
Albita (ROU) – Leuseni (MDA)
Kotyayevka (RUS) – Akkol (KAZ)
Donetsk (RUS) – Krasnodon (UKR)
Novoshakhtinsk (RUS) – Dovzhanskiy (UKR)
Kozino (RUS) – Zarutske (UKR)

U N E C E T E M A N D T E R P R O J E C T S ’ M A S T E R P L A N – 2 0 1 1
180
Kalinovka (RUS) – Bachivsk (UKR)
Presevo (SRB) – Tabanovce (MKD)
Vysne Nemecke (SVK) – Uzhgorod (UKR)
Gurbulak (TUR) – Maku (IRN)
Habur (TUR) – Zakhu (Iraq)
Yayladagi (TUR) – Yayladag (SYR)
In order to determine the border crossing traffic flows and the average waiting times for passenger and freight transport, as well as to identify major problems causing the longer delays at these crossings, special enquiries focused on these topics were launched in the framework of the revision of the Master Plan. The resulting data and findings are summarized in Annexes VII and VIII of Volume II of the final report.
10.2 Railway border crossings of importance for international combined trans-port according to the AGTC (European Agreement on Important International Combined Transport Lines and Related Installations)
Passau (DEU/AUT)
Salzburg (DEU/AUT)
Brennero (ITA/AUT)
Tarvisio (ITA) – Arnoldstein (AUT)
Ebenfurth (AUT) – Sopron (HUN)
Nickelsdorf (AUT) – Hegyeshalom (HUN)
Frankfurt/O. (DEU) – Kunowice (POL)
Horka (DEU) – Wegliniec (POL)
Kelebia (HUN) – Subotica (SRB)
Lokoshaza (HUN) – Curtici (ROU)
Presevo (SRB) – Tabanovci (MKD)
Dimitrovgrad (SRB) – Dragoman (BGR)
Episcopia Bihor (ROU) – Biharkeresztes (HUN)
Giurgiu (ROU) – Ruse (BGR)
Svilengrad (BGR) – Kapikule (TUR)
Vidin (BGR) – Calafat (ROU)
Kulata (BGR) – Promachon (GRC)
Kapikoy (TUR) – Razi (IRN)
Kittsee (AUT) – Bratislava (SVK)
Gdynia (POL) – Ystad, Stockholm (SWE) / Helsinki (FIN)
Chalupki (POL) – Bohumin (CZE)
Schirnding (DEU) – Cheb (CZE)
Bad Schandau (DEU) – Decin (CZE)
Bernhardsthal (AUT) – Breclav (CZE)
Summerau (AUT) – Horni Dvoriste (CZE)

E C O N O M I C C O M M I S S I O N F O R E U R O P E
181
Vainikkala (FIN) – Buslovskaya (RUS)
Orsha (BLR) – Krasnoye (RUS)
Gudagai (BLR) – Kena (LTU)
Meitene (LVA) – Sarkiai (LTU)
Zernovo (UKR) – Suzemka (RUS)
Zaverezhye (RUS) – Ezerischa (BLR)
Nesterov (RUS) – Kibartai (LTU)
Valuiki (RUS) – Topoli (UKR)
Gukovo (RUS) – Krasnaya Mogila (UKR)
Petukhovo (RUS) – Mamlyutka (KAZ)
Astrakhan (RUS) – Aksaraiskaya II (KAZ)
Orenburg (RUS) – Iletsk I (KAZ)
Trakiszki (POL) – Mockava (LTU)
Dorohusk (POL) – Izov (UKR)
Zwardon (POL) – Skalite (SVK)
Zebrzydowice (POL) – Petrovice u Karvine (CZE)
Medzylesie (POL) – Lichkov (CZE)
Cadca (SVK) – Mosty u Jablunkova (CZE)
Luky pod Makytou (SVK) – Horni Lidec (CZE)
Kuty (SVK) – Lanzhot (CZE)
Cierna nad Tisou (SVK) – Chop (UKR)
Sturovo (SVK) – Szob (HUN)
Rusovce (SVK) – Rajka (HUN)
Cana (SVK) – Hidasnemeti (HUN)
Plavec (SVK) – Muszyna (POL)
Magyarboly (HUN) – Beli Manastir (HRV)
Gevgelia (MKD) – Idomeni (GRC)
Dikea (GRC) – Svilengrad (BGR)
Stamora Moravita (ROU) – Vrsac (SRB)
Halmeu (ROU) – Deakovo (UKR)
Dornesti (ROU) – Vadu Siret (UKR)
Dogukapi (TUR) – Ahuryan (ARM) (closed)
Koprivnica (HRV) – Gyekenyes (HUN)
Savski Marof (HRV) – Dobova (SVN)
Tovarnik (HRV) – Sid (SRB)
Slavonski Samac (HRV) – Samac/Bosanski Samac (BIH)
Metkovic (HRV) – Capljina (BIH)

U N E C E T E M A N D T E R P R O J E C T S ’ M A S T E R P L A N – 2 0 1 1
182
Sapjane (HRV) – Ilirska Bistrica (SVN)
Rosenbach (AUT) – Jesenice (SVN)
Spielfeld Strass (AUT) – Sentilj (SVN)
Sredisce (SVN) – Cakovec (HRV)
Hodos (SVN/ HUN)
Villa Opicina (ITA) – Sezana (SVN)
Terespol (POL) – Brest (BLR)
Medyka (POL) – Mostiska (UKR)
Zahony (HUN) – Chop (UKR)
Ungheni (MDA) – Cristesti Jijia Fr. (ROU)
Novosavytskoe (MDA) – Kuchurgan (UKR)
Kvashino (UKR) – Uspenskaya (RUS)
Veseloe (RUS) – Gantiadi (GEO)
Kars (TUR) – Akhalkalaki (GEO) under construction
Boyuk Kasik (AZE) – Gardabani (GEO)
10.3 Other railway border crossings on the TER backbone network
Apart from the AGTC railway border crossing points of importance for international combined transport listed above, the remaining railway border crossings located on the revised TER backbone network are as follows.
Bregenz (AUT) – Lindau (DEU)
Cobanbey (TUR) – Aleppo (SYR)
Fevzipasa (TUR) – Meydanekbez (SYR)
Galati Larga (ROU) – Reni (UKR)
Jennersdorf (AUT) – Szentgotthard (HUN)
Kotoriba (HRV) – Murakeresztur (HUN)
Kremenica (MKD) – Neos Kafkasos (GRC)
Kriva Palanka (MKD) – Gjusevo (BGR) under construction
Nusaybin (TUR) – Al Qamishli (SYR)
Qafe Thane (ALB) – Struga (MKD) under construction
Sadakhlo (GEO) – Ayrum (ARM)
Teryukha (BLR) – Hornostayivka (UKR)
Tuzi (MNE) – Hani-i-Hotit (ALB)
Volinja (HRV) – Dobrljin (BIH)
Vrbnica (SRB) – Bijelo Polje (MNE)
Yalama (AZE) – Samur (RUS)
Zvornik Novi (BIH) – Donja Borina (SRB)
Uzunkopru (TUR) – Pythion (GRC)

E C O N O M I C C O M M I S S I O N F O R E U R O P E
183
10.4 border crossing traffic
According to the results of the enquiry into the border crossings on the road backbone network, the highest annual average border crossing traffic (up to 15,000 cars/day) was registered at the borders between the old (Austria and Germany) and the new (Poland and the Czech Republic) EU member countries. High traffic volumes were also detected at the Czech/Slovak motorway border crossing Breclav/Brodske (about 12,000 cars/day). At the Schengen border crossings, no delays or problems have been reported. At other road border crossings, the average waiting times ranged from 5 min to 40 min for passenger cars and from 10 min to 50 mins for trucks at the borders of non-EU Balkan countries and Turkey. Longer waiting times (up to 90 min) were registered at EU borders with Belarus and Ukraine and in special cases in Turkey (for trucks carrying agricultural products and at the border crossing to Iraq in Habur). These average data of course do not reflect the fact that in individual cases, on particular days and at particular time periods, the real waiting times may be much longer. According to the IRU “Border Waiting Times Observatory (BWTO)” and other IRU documents, the waiting times at the Lithuanian borders with the Russian Federation (Kaliningradskaya Oblast) and Belarus reached up to 36 h in 2008, between Poland and Belarus 20 h to 40 h, and at the most overloaded crossing on the link Warsaw – Minsk – (Moscow) even 100 h in January 2008. A similar situation was registered at road border crossings between Poland and Ukraine, where a record waiting time of almost 150 h was faced at the crossing Korczowa/Krakovec (Krakow – Lviv). Border waiting times were also influenced negatively in Albania, Azerbaijan and Bosnia and Herzegovina by the inadequate crossing infrastructure. At some crossings between Poland, Germany, Lithuania and the Czech Republic capacity problems were caused by high traffic flows.
The average rail border crossing traffic according to the results of the enquiry ranged between 2 freight trains/day at the Albania/Montenegro crossing Hani i Hotit and more than 100 trains/day at the Breclav crossing between the Czech Republic and Austria/Slovakia. At the Schengen border crossings, no delays or only very short ones (about 5 min for passenger trains and minor technical stops for freight trains) have been reported. At the other rail border crossings, the average passenger train waiting times were approximately 15 min in Croatia, 30 min in Serbia, 30 min to 40 min at the Romanian and Slovak borders with Ukraine, 90 min in Azerbaijan and about 100 min in Turkey. Freight trains waited for about 60 min on average in Azerbaijan and Bosnia and Herzegovina, 180 min in Bulgaria, up to 90 min in Croatia, 75 min to 300 min in Romania, 220 min to more than 7 h (at the Finnish border) in the Russian Federation, 130 min to 240 min in Serbia, 30 min to 150 min in Slovakia, 55 min to 185 min in Slovenia and 45 min to 200 min in Turkey. At three railway border crossings (Hani i Hotit between Albania and Montenegro, and Halmeu and Galati Larga between Romania and Ukraine), there is no passenger traffic and six border crossings (all between Armenia and Azerbaijan and Turkey) are closed. In some cases, the data reported from the two sides of the border differed considerably, which could not be explained by diverse counting methodologies only; the same is valid for some road crossings border traffic data.
In their response to the revision questionnaire, some countries (e.g. Bulgaria and Turkey) mentioned the following border crossing problems: (i) delays arising from the supply of locomotives; (ii) delays of one train caused by the delay of another train; (iii) lack of personnel at the exchange border stations; (iv) delays faced during customs controls; (v) inefficiency in the exchange of information and certificates between the border stations and lack of technical equipment and personnel. The proposed measures to improve the situation inter alia include the following.

U N E C E T E M A N D T E R P R O J E C T S ’ M A S T E R P L A N – 2 0 1 1
184
• Supplyofthenecessarytechnicalequipmentandpersonnelrequiredtocarryoutcontrolsininternational passenger trains during the train journey.
• Coordination between railway administrations, with exchange of information about trainoperations on their network and supply of locomotives, taking into account the arrival times of trains at the border stations.
• Minimization by railway administrations, through all the necessarymeasures, of delays intrains on their network, thereby avoiding further delays to other trains.
• Acceptancebyrailwayadministrationsonlyofthatluggagedefinedinthetariffs.• Efficiencyintheexchangeofthecertificatesissuedbytheborderstations,andminimization
of the handover formalities at stations.
Furthermore, a specific problem exists in the Russian Federation related to the location of rail customs supervision posts, which according to the respective Government decree of 2003 should be situated not further than 30 km from the border. This condition is not fulfilled in some cases with respect to freight trains, namely on the Moscow (border crossing to Ukraine) and on the North-Caucasus (border crossing to Azerbaijan) railways. It is planned, therefore, to construct new border crossing and customs infrastructure at the border crossing stations Suzemka and Samur respectively.
The main causes of waiting times in general are (i) visa issues (documentary and time requirements, validity), (ii) documentation and customs procedures, (iii) safety and security especially at road border crossings, (iv) congestions in road transport and (v) reloading procedures at rail crossings with different gauges.
10.5 border crossing barriers and problems
The existing border crossing barriers and problems in the region, broken down according to their origin (infrastructure, procedures, staff ), are the following.
TEM road border crossings
INFRASTRUCTURE• Unsuitableandinsufficientcapacityofbordercrossinginstallations• Obsoleteandpoorqualityfacilitiesortheirabsenceatterminals• Inadequateequipment• Absenceofseparatelanesfortransittrafficandemptyvehicles• Absenceofspeciallanesdedicatedtothetransportofdangerousgoods• Undersizedaccessroadstobordercrossings,andthepoorstateoftheseaccessroads• Insufficientparkingspace
PROCEDURES• Eitherinsufficientoroverly-complexcontrolprocedures• Discrepanciesbetweentheopeningtimesofcustomsandsanitary,phytosanitary,veterinary
and other services• Insufficientcomputerizationofcontrolprocedures• Non-applicationofelectronicdatainterchangeanduseofpaper-baseddocuments• Systematic control of all vehicles instead of control based on risk assessmentmanagement
techniques• Complexandoftencontentiousweighingproceduresforcommercialvehicles• Absenceofround-the-clockveterinaryandphytosanitarycontrols• Sometimesexcessiveburdenofnationaldocumentationrequirements• Lack of coordination between customs administrations of neighbouring countries and
authorities responsible for controls, in particular insufficient information exchange

E C O N O M I C C O M M I S S I O N F O R E U R O P E
185
• Non-compliancewithTIRprocedures• Breach or non-application of other international agreements and conventions related to
border crossing• Failurestoprovideadvanceinformationtotransportoperatorsandprivatesectortravellers• Changesofprocedurewithoutpriornotice• Proliferationoftaxes,dutiesandfees• Impositionof compulsorypay servicesusing “commercial” structures establishedatborder
crossing points
STAFF• Shortageofcontrolpersonnel• Lowproductivity• Limitedworkinghours• Lackofskillsandinadequatetraining• Inappropriatebehaviourofsomeofficials• Lackofcontinuityinmanagementofcontrolsduetofrequentstaffrotationatallpositions
TER rail border crossings
INFRASTRUCTURE• Unsuitableandinsufficientcapacityofbordercrossinginstallations• Obsoleteandpoorqualityfacilities• Inadequateequipment• Gaugedifferences
PROCEDURES• Lackofadequatetechnologyforhandlingthearrivalanddepartureoftrains• Delayeddispositionoflocomotives• Absenceofsuitablewagonsandtheirpositioningoneachsideoftheborder• Differenttrainlengthsoneachsideoftheborder• Positioningofemptycontainers• Insufficientcoordinationandmanagement• Phytosanitarycontrolproblems,e.g.withpallets• Slowimplementationofmeasuresaimedatmoreadequateinformationabouttrafficflows• Sloworinadequatetransmissionofdatainsideandoutsideofthecountry• Insufficientlegalbasisforestablishingrulesandrelationsbetweenrailwayadministrationsand
other interested institutions with regard to harmonization of border procedures• Differentcostcharacteristicsofrailway-ownedandprivatewagons• Incorrectdocumentationandconsignmentnotes• Differentdocumentationrules,languagesandcodes• Inaccuraciesinthecompletionofdocuments• Inadequatecooperationandlackofinitiativeatalllevels• Insufficientcomputerizationofcontrolandmonitoringprocedures• PoorinteroperabilitybetweenITsystemsofcustomsauthoritiesandrailwaycompanies
STAFF• Latearrivalsofstaff• Shortageofcontrolpersonnel• Lowproductivity• Lackofskillsandtraining

U N E C E T E M A N D T E R P R O J E C T S ’ M A S T E R P L A N – 2 0 1 1
186
10.6 Solutions and remedial measures
Certain solutions and remedial measures for each group of problems are recommended below on the basis of the existing border crossing barriers and problems mentioned in chapter 10.5. Their implementation has to be considered for each border crossing point on the basis of an evaluation of the specificities of that border crossing. At the same time, decision-makers should anticipate the future growth of traffic flows and take relevant measures — especially infrastructure investments — well in advance. In these activities, it is indispensable for governments and all the authorities on both sides of a border to closely coordinate activities and to work together to avoid wasting limited resources and to reduce waiting times and alleviate barriers in the most efficient manner. The participating Governments should focus especially on accession to and implementation of all the related UNECE international agreements and conventions, which provide a common legal and technical platform for both EU and non-EU countries to achieve harmonized and efficient performance of border controls.
TEM road border crossings
INFRASTRUCTURE• Improvementinbordercrossingfacilities• Provisionofasufficientnumberofcontrollanesandwindows• Improvementinaccesstobordercrossingsbyupgradingaccessroads• Implementationofmoderninformationandtrafficmanagementsystems• Separationoftransitaccessandcontrollanesfromthoseforothertypesoftraffic• Creationofasufficientnumberofbordercrossinglanes
PROCEDURES• Introductionofcommoncustomspostsandperformanceofjointcontrols• Transfer of control procedures to sites inside the country or to the places of destination
(especially for transit traffic and for checks of drivers´ rest and driving times)• Introductionofsimplifiedcontrolprocedures• StrictcompliancewiththeprovisionsoftheTIRConvention• ImplementationandefficientuseoftheTIRConvention,e.g.viatheIRUTIREnvironmental
Product Declaration• Applicationofriskassessmentandmanagementtechnologies• Simplificationandharmonizationofvehicleweighingprocedures• Improvementincoordinationbetweencustomsauthoritiesofneighbouringcountries• Limitationoftruckconvoystojustifiedcasesonly• Improvementincooperationbetweenrespectivenationaladministrations• Considerationofreductionoftaxes,feesanddutieschargedatbordercrossings• Facilitationofissuanceofvisastoprofessionaldrivers• Improvementincommunicationwiththeprivatesector• Harmonizationand,ifpossible,reductionoftrafficbans
STAFF• Increaseinthenumberofstaffemployedatborders• Increaseintheavailabilityofcontrolservicesto24/24-hourand7/7-dayschemeswherever
justified
• Harmonizationandcoordinationofborderpostopeningtimes• Trainingofcontrolpersonnel• Motivationofcontrolofficials• Implementationofmeasurestofightagainstcorruption

E C O N O M I C C O M M I S S I O N F O R E U R O P E
187
TER rail border crossings
INFRASTRUCTURE• Increaseincapacityofbordercrossinginstallations• Improvementinthequalityofbordercrossingfacilitiesandequipment• Upgradeinrailwayinfrastructureatbordercrossingsandaccesslines
PROCEDURES• Improvementincommunicationamongallauthoritiesandbodiesinvolvedinbordercrossing
operations• Timelydispositionoflocomotives• Guaranteedavailabilityofsuitablewagons• Improvement in coordination between customs authorities of neighbouring countries and
between the respective national administrations• Harmonizationindocumentationrules,languagesandcodes• Computerizationofcontrolandmonitoringprocedures• Adoptionandimplementationofbestpracticesdevelopedinthefieldbyallpartiesinvolved
in border crossing operations• Organizationofbordercrossingoperationsinrunningtrains• Performance of non-railway procedures, e.g. customs formalities, at origin anddestination
stations where possible• Incombinedtransport,performanceofallcustomsandbordercontroloperationsatpointsof
loading and unloading• Improvementinqualityoftechnicalfacilitiesofbordercrossingpoints• Improvement in the interoperability between information technology systems of customs
authorities and railway companies• Introductionofperformanceindicatorstomonitorfutureprogressonbordercrossings
STAFF• Trainingofcontrolpersonnel• Increaseinproductivityofstaff• Implementationofmeasurestofightagainstcorruption• Implementationofmeasurestofightagainstcrime• Increaseinthenumberofcontrolpersonnelwherenecessary

U N E C E T E M A N D T E R P R O J E C T S ’ M A S T E R P L A N – 2 0 1 1
188

E C O N O M I C C O M M I S S I O N F O R E U R O P E
189
11. INTERRELATIONSHIPS bETWEEN THE REVISED TER AND TEM bACKbONE NETWORKS AND RELEVANT TRANSHIPMENT POINTS
Two maps showing the interrelationship between the revised TEM and TER backbone networks were developed during the revision of the intermodal transport aspects of the Master Plan. The first map (No. 19) shows the layout of the road backbone network vis-a-vis the rail backbone network. The second map (No. 20) identifies the sections which are common to both networks (only sections longer than 100 km are indicated).
These common sections of the backbone networks may offer the best intermodal conditions for passenger and goods transportation, providing practically equal-distance opportunities for both rail and road transport modes as well as for combined transport, especially since the great majority of them are situated in flat terrain and almost all of them also form part of the AGTC (European Agreement on Important International Combined Transport Lines and Related Installations) transport lines.
11.1 Common sections of revised TEM and TER backbone networks
The common sections of the revised TEM and TER backbone networks are specified in the following table, which also shows the number of respective AGTC sections according to Annex I of the AGTC Agreement.
Country Section description AGTC No. Note
Italy
(Innsbruck – ) Brennero – Verona – Bologna – Ancona – Foggia – Bari – Brindisi C-E 45
(Arnoldstein – ) Tarvisio – Udine – Venezia – Bologna C-E 55
Verona – Trieste – Villa Opicina ( – Sezana) C-E 70
Austria
(Freilassing – ) Salzburg C-E 43
Salzburg – Wels – Linz – Wien – ( – Hegyeshalom) C-E 50
(Horni Dvoriste – ) Summerau – Linz C-E 55
(Bratislava – ) Kittsee – Parndorf – Wien C-E 63
Bruck a.d. Mur – Graz – Spielfeld Strass ( – Sentilj) C-E 67
Linz – Selzthal – St.Michael C-E 551
St. Michael – Bruck an der Dran – Mur C-E 65
Poland
(Frankfurt(O) – ) Kunowice – Poznan – Lowicz – Warszawa – Lukow – Terespol ( – Brest) C-E 20
(Görlitz – ) Zgorzelec – Wroclaw – Katowice – Krakow – Przemysl – Medyka ( – Mostiska) C-E 30
Warszawa – Katowice C-E 65
Warszawa – Bialystok – Sokolka – Suwalki – Trakiszki ( – Mockava) C-E 75
Warszawa – Lublin – Dorohusk ( – Izov) C 28

U N E C E T E M A N D T E R P R O J E C T S ’ M A S T E R P L A N – 2 0 1 1
190
Country Section description AGTC No. Note
The Czech Republic
Brno – Olomouc – Prerov – Hranice na Morave – Bohumin C-E 40 section Brno-Prerov
not in AGTC
Brno – Breclav – Lanzhot ( – Kuty) C-E 61
Praha – Horni Dvoriste ( – Summerau) C-E 551
Slovakia
Cadca – Zilina – Poprad – Tatry – Kosice – Cierna nad Tisou ( – Chop) C-E 40
(Lanzhot – ) Kuty – Bratislava – Rusovce ( – Hegyeshalom) C-E 61
Zilina – Leopoldov – Bratislava ( – Kittsee) C-E 63
Hungary
(Wien – ) Hegyeshalom – Gyor – Budapest – Miskolc – Nyiregyhaza – Zahony ( – Chop) C-E 50
(Bratislava) – Hegyeshalom C-E 61
Slovenia
Ljubljana – Ilirska Bistrica ( – Sapjane) C-E 65
Divaca – Koper C-E 69
(Villa Opicina – ) Sezana – Ljubljana – Zidani Most – Dobova ( – Savski Marof) C-E 70
Croatia
(Ilirska Bistrica – ) Sapjane – Rijeka C-E 65
(Dobova – ) Savski Marof – Zagreb – Strizivojna Vrpolje – Vinkovci – Tovarnik ( – Sid)
C-E 70
Zagreb – Karlovac – Ostarije – Rijeka C-E 71
(Bogojevo – ) Erdut–Vinkovci–Strizivojna Vrpolje – Slavonski Samac ( – Samac/Bosanski Samac) and (Capljina – ) Metkovic – Ploce
C-E 771
(Magyarboly – ) Beli Manastir – Osijek – Strizivojna Vrpolje C 773
Bosnia and Herzegovina
(Slavonski Samac – ) Samac/Bosanski Samac – Sarajevo – Capljina ( – Metkovic) C-E 771
Serbia
Beograd – Vrsac ( – Stamora Moravita) C-E 66
(Tovarnik – ) Sid – Beograd – Nis – Dimitrovgrad ( – Dragoman) C-E 70
Subotica – Bogojevo ( – Erdut) C-E 771
(Kelebia – ) Subotica – Beograd and Nis – Presevo ( – Tabanovci) C-E 85
The former Yugoslav Republic of Macedonia
(Presevo – ) Tabanovci – Skopje – Gevgelia ( – Idomeni) C-E 85
Kumanovo – Kriva Palanka( – Gjushevo) not in AGTC,under construction
Greece
(Gevgelia – ) Idomeni – Thessaloniki – Athinai C-E 85
(Kulata – ) Promachon – Thessaloniki C-E 855
Strymonas – Alexandroupolis – Dikea ( – Svilengrad) C 70/2
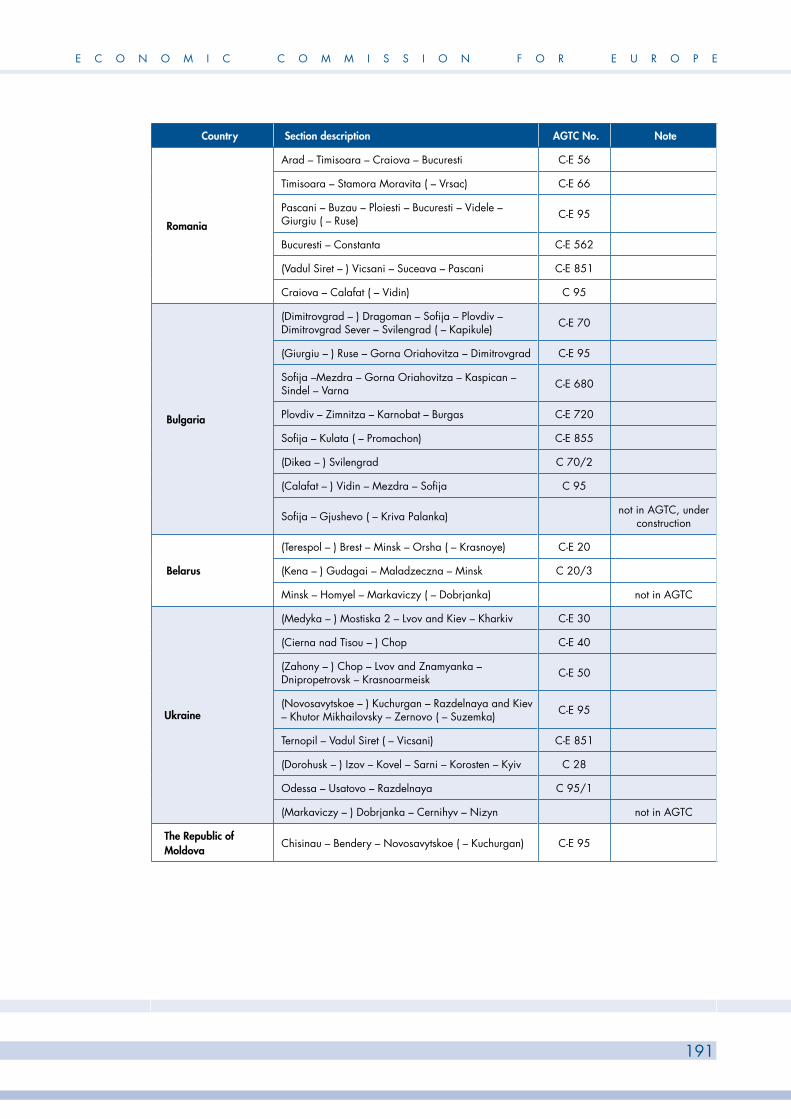
E C O N O M I C C O M M I S S I O N F O R E U R O P E
191
Country Section description AGTC No. Note
Romania
Arad – Timisoara – Craiova – Bucuresti C-E 56
Timisoara – Stamora Moravita ( – Vrsac) C-E 66
Pascani – Buzau – Ploiesti – Bucuresti – Videle – Giurgiu ( – Ruse) C-E 95
Bucuresti – Constanta C-E 562
(Vadul Siret – ) Vicsani – Suceava – Pascani C-E 851
Craiova – Calafat ( – Vidin) C 95
Bulgaria
(Dimitrovgrad – ) Dragoman – Sofija – Plovdiv – Dimitrovgrad Sever – Svilengrad ( – Kapikule) C-E 70
(Giurgiu – ) Ruse – Gorna Oriahovitza – Dimitrovgrad C-E 95
Sofija –Mezdra – Gorna Oriahovitza – Kaspican – Sindel – Varna C-E 680
Plovdiv – Zimnitza – Karnobat – Burgas C-E 720
Sofija – Kulata ( – Promachon) C-E 855
(Dikea – ) Svilengrad C 70/2
(Calafat – ) Vidin – Mezdra – Sofija C 95
Sofija – Gjushevo ( – Kriva Palanka) not in AGTC, under construction
Belarus
(Terespol – ) Brest – Minsk – Orsha ( – Krasnoye) C-E 20
(Kena – ) Gudagai – Maladzeczna – Minsk C 20/3
Minsk – Homyel – Markaviczy ( – Dobrjanka) not in AGTC
Ukraine
(Medyka – ) Mostiska 2 – Lvov and Kiev – Kharkiv C-E 30
(Cierna nad Tisou – ) Chop C-E 40
(Zahony – ) Chop – Lvov and Znamyanka – Dnipropetrovsk – Krasnoarmeisk C-E 50
(Novosavytskoe – ) Kuchurgan – Razdelnaya and Kiev – Khutor Mikhailovsky – Zernovo ( – Suzemka) C-E 95
Ternopil – Vadul Siret ( – Vicsani) C-E 851
(Dorohusk – ) Izov – Kovel – Sarni – Korosten – Kyiv C 28
Odessa – Usatovo – Razdelnaya C 95/1
(Markaviczy – ) Dobrjanka – Cernihyv – Nizyn not in AGTC
The Republic of Moldova
Chisinau – Bendery – Novosavytskoe ( – Kuchurgan) C-E 95

U N E C E T E M A N D T E R P R O J E C T S ’ M A S T E R P L A N – 2 0 1 1
192
Country Section description AGTC No. Note
The Russian Federation
St. Petersburg – Moskva C-E 10
(Orsha – ) Krasnoye – Smolensk – Moskva – Nizhniy Novgorod C-E 20
Moskva – Ryazan C-E 24
Gukovo – Likhaya – Volgograd – Astrakhan ( – Aksaraiskaya II) C-E 50
(Zernovo – ) Suzemka – Bryansk – Moskva C-E 95
Ryazan – Kochetovka I and Rostov na Donu – Krasnodar – Veseloe ( – Gantiadi)Novorossiysk
C-E 99
Kaliningrad – Cherniakhovsk – Nesterov ( – Kibartai) C 20/3
Kochetovka – Gryazi – Povorino – Volgograd not in AGTC
Astrakhan – Makhachkala – Samur ( – Yalama) not in AGTC
Turkey
(Svilengrad – ) Kapikule – Istanbul – Haydarpasa – Ankara – Sivas C-E 70
Ankara-Sivas under construction of the
new line
Mersin – Adana–Toprakkale – Fevzipasa and Toprakkale – Iskenderun C-E 97
Lithuania
(Trakiszki – ) Mockava – Sestokai – Kazlu Ruda – Kaunas – Radviliskis – Siauliai – Joniskis ( – Meitene) C-E 75
(Nesterov – ) Kybartai – Kazlu Ruda and Kaisiadorys – Vilnius – Kena ( – Gudagai) C 20/3
Georgia (Adler – ) Gantiadi – Sukhumi – Senaki – Tbilisi – Gardabani ( – Boyuk Kasik) not in AGTC
11.2 Terminals of importance for international combined transport
The following terminals of importance for international combined transport, located or closely linked to the revised TEM and TER backbone networks, are listed in Annex II to the AGTC Agreement. The distance to the terminals not located on or in the immediate vicinity of the respective revised backbone networks is given in the “Remark” column.
No. / Country / Location Situated on backbone Remark
No. / Country / Location Situated on backbone Remark
Austria
1. Linz-Stadthafen TEM, TER
2. Graz Süd/Werndorf TEM, TER
3. Salzburg Hauptbahnhof/Liefering TEM, TER
4. Villach Süd TEM, TER
5. Wels Hauptbahnhof TER motorway linkage to TEM 12 km
6. Wien Freudenau Hafen TEM, TER
7. Wien Nordwestbahnhof TEM, TER

E C O N O M I C C O M M I S S I O N F O R E U R O P E
193
No. / Country / Location Situated on backbone Remark
Belarus
8. Brest TEM, TER
9. Minsk TEM, TER
Bosnia and Herzegovina
10. Sarajevo TEM, TER
Bulgaria
11. Burgas TEM, TER
12. Dimitrovgrad Sever TEM, TER
13. Filipovo (Plovdiv) TEM, TER
14. Gorna Oriahovitza TER road linkage to TEM 7 km
15. Kaspichan TEM, TER
16. Ruse TEM, TER
17. Sofia TEM, TER
18. Stara Zagora TEM, TER
19. Svilengrad TEM, TER
20. Varna TEM, TER
Croatia
21. Rijeka TEM, TER
22. Slavonski Brod TEM, TER
23. Split TEM, TER
24. Zagreb TEM, TER
The Czech Republic
25. Brno TEM, TER
26. Lovosice TEM, TER
27. Praha Uhrineves TER road linkage to TEM 5 km
28. Praha Zizkov TEM, TER
Greece
29. Aghii Anargyri (Athinai) TEM, TER
30. Alexandroupolis TEM, TER
31. Patras TEM narrow gauge rail linkage to TER 203 km
32. Thessaloniki TEM, TER
33. Igoumenitsa TEM no rail linkage
34. Volos no road linkage to TEM 12 km
rail linkage to TER 54 km

U N E C E T E M A N D T E R P R O J E C T S ’ M A S T E R P L A N – 2 0 1 1
194
No. / Country / Location Situated on backbone Remark
Hungary
35. BILK Kombiterminal Budapest TEM, TER
36. Budapest Kikotö TEM, TER
37. Miskolc-Gomori TEM, TER
38. Sopron TER road linkage to TEM 38 km
39. Szeged-Kiskundorozsma TEM rail linkage to TER 41 km
40. Szolnok TER road linkage to TEM 64 km
41. Záhony TEM, TER
Italy
42. Bari-Lamasinata TEM rail linkage to TER 440 km
43. Bologna-Interporto TEM, TER
44. Brindisi TEM rail linkage to TER 560 km
45. Busto Arsizio no road linkage to TEM 20 km
rail linkage to TER 185 km
46. Milano Greco Pirelli TEM rail linkage to TER 157 km
47. Milano-Rogoredo TEM rail linkage to TER 157 km
48. Padova-Interporto TEM, TER
49. Pescara-Porta Nuova TEM rail linkage to TER 198 km
50. Pomezia-Santa Palomba no rail linkage to TER 40 km
road linkage to TEM 240 km
51. Rivalta Scrivia TEM rail linkage to TER 210 km
52. Trieste TEM, TER
53. Verona-Quadrante Europa TEM, TER
Lithuania
54. Draugyst (Klaipeda) TEM, TER
55. Klaipeda TEM, TER
56. Paneriai (Vilnius) TEM, TER
57. Kaunas TEM, TER
58. Sestokai TER road linkage to TEM 20 km
Poland
59. Gdansk TEM, TER
60. Gdynia TER expressway linkage to TEM 26 km
61. Gliwice TEM, TER
62. Krakow TEM, TER
63. Lodz TEM rail linkage to TER 45 km
64. Malaszewicze TEM, TER

E C O N O M I C C O M M I S S I O N F O R E U R O P E
195
No. / Country / Location Situated on backbone Remark
65. Poznan TEM, TER
66. Pruszkow TER road linkage to TEM 10 km
67. Sosnowiec TEM, TER
68. Warszawa TEM, TER
69. Wroclaw TEM, TER
The Republic of Moldova
70. Ungeny TER road linkage to TEM 58 km
71. Chisinau TEM, TER
Romania
72. Bucuresti TEM, TER
73. Constanta TEM, TER
74. Craiova TEM, TER
75. Oradea TER road linkage to TEM 120 km
The Russian Federation
76. Blochnaya (Perm) TER road linkage to TEM 920 km
77. Brjansk-Lgovskiy (Brjansk) TEM, TER
78. Kirov-Kotlasskiy (Kirov) TER road linkage to TEM 490 km
79. Kostarikha (Nizhniy Novgorod) TEM, TER
80. Moskva-Tovarnaya-Smolenskaya TEM, TER
81. Novorossiysk-Port TEM, TER
82. Rostov-Tovarnyi (Rostov-na-Donu) TEM, TER
83. Smolensk TEM, TER
84. St. Petersburg Port TEM, TER
85. St. Petersburg-Tovarnyi-Vitebskiy TEM, TER
86. Ekaterinburg-Passagirskiy TER road linkage to TEM 1,240 km
87. Kuntsevo II (Moskva) TEM, TER
88. Kutum (Astrakhan) TEM, TER
89. Moskva-Kievskaya TEM, TER
90. Moskva-Tovarnaya-Oktyabrskaya TEM, TER
91. Moskva-Tovarnaya-Paveletskaya TEM, TER
92. Voinovka (Tyumen) TER road linkage to TEM 1,560 km
93. Volzhskiy (Volgograd) TEM, TER
Serbia
94. Beograd TEM, TER

U N E C E T E M A N D T E R P R O J E C T S ’ M A S T E R P L A N – 2 0 1 1
196
No. / Country / Location Situated on backbone Remark
Slovakia
95. Bratislava TEM, TER
96. Cierna nad Tisou TER road linkage to TEM 40 km
97. Kosice TEM, TER
98. Zilina TEM, TER
Slovenia
99. Koper TEM, TER
100. Ljubljana TEM, TER
101. Maribor TEM, TER
The former Yugoslav Republic of Macedonia
102. Skopje TEM, TER
Turkey
103. Derince TEM, TER
104. Iskenderun TEM, TER
105. Istanbul TEM, TER freight village
106. Izmir TEM, TER
107. Mersin TEM, TER
108. Samsun TEM, TER
199. Bandirma TEM, TER
Ukraine
109. Chop TEM, TER
110. Dnepropetrovsk Gruzovoy TEM, TER
111. Kiev TEM, TER
112. Kiev-Lisky TEM, TER
113. Kharkov Chervonozavodskoy TEM, TER
114. Lvov TEM, TER
115. Lugansk Gruzovoy TEM rail linkage to TER 70 km
116. Usatove (Odessa) TEM, TER
As this overview shows, practically all of the AGTC international combined transport terminals are located on TEM or TER backbone networks, which indicates that the revised layout of these networks has been properly designed.

E C O N O M I C C O M M I S S I O N F O R E U R O P E
197
11.3 Other terminals of importance for international combined transport linked to the revised TEM and TER backbone networks
In the course of drafting the revised backbone networks of the Master Plan, additional terminals (freight villages, logistics centres and other intermodal transhipment points) were indicated by the participating countries. They are listed below. As for the AGTC terminals, for those not located on or in the immediate vicinity of the respective revised backbone network, the distance is given in the “Remark” column.
No. / Country / Location Situated on backbone Remark
Austria
117. Container terminal Enns TEM, TER
118. Hafen Krems no road linkage to TEM 35 km
rail linkage to TER 32 km
119. Terminal Bludenz TER motorway/road linkage to TEM320 km
120. Terminal Hall in Tirol TER motorway linkage to TEM 128 km
121. Terminal Kapfenberg TER expressway linkage to TEM 65 km
122. Terminal Lambach TER road linkage to TEM 12 km
123. Terminal St. Michael TER motorway linkage to TEM 58 km
124. Terminal St. Polten TEM, TER
125. Terminal Wolfurt TER motorway/road linkage to TEM 310 km
126. Brenner/Brennersee TER motorway linkage to TEM 280 km
127. Worgl TER motorway linkage to TEM 95 km
Azerbaijan
128. Baku International Sea Trade Port TEM, TER
129. Alat Sea Port (under construction) TEM, TER
Bosnia and Herzegovina
130. Mostar (planned) TEM, TER
131. Banja Luka (planned) TEM, TER
132. Tuzla (planned) no road linkage to TEM 70 km
rail linkage to TER 70 km
133. Brcko (planned) no road linkage to TEM 30 km
rail linkage to TER 55 km
134. Samac/Bosanski Samac (planned) TEM, TER

U N E C E T E M A N D T E R P R O J E C T S ’ M A S T E R P L A N – 2 0 1 1
198
No. / Country / Location Situated on backbone Remark
Bulgaria
135. Lom no road linkage to TEM 50 km
rail linkage to TER 30 km
136. Septemvri TER road linkage to TEM 38 km
Croatia
137. Osijek TEM, TER
138. Zadar TER road linkage to TEM 20 km
139. Solin TER rail linkage to TEM 15 km
140. Ploce TEM, TER
141. Pazin TEM rail linkage to TER 55 km
142. Vinkovci TER road linkage to TEM 25 km
143. Koprivnica TER road linkage to TEM 40 km
502. Spacva road linkage to TEM 20 km
The Czech Republic
144. Prerov TER road linkage to TEM 15 km
145. Paskov (Ostrava) no expressway linkage to TEM 10 km
rail linkage to TER 15 km
Georgia
146. Poti TEM, TER
147. Batumi TEM, TER
148. Tbilisi TEM, TER
Italy
149. Genova TEM
150. Trieste TEM, TER
151. Mestre TEM, TER
152. Ancona TEM
153. Bari TEM
154. Brindisi TEM
Romania
155. Brasov TEM, TER
156. Arad TEM, TER
The Russian Federation
157. Moskva (Beliy Rast) TEM, TER planned
158. Ekaterinburg (Gipsovaya) TER road linkage to TEM 1,240 km
159. Samara TER planned, road linkage to TEM 410 km
160. St. Petersburg (Shushary) TEM, TER

E C O N O M I C C O M M I S S I O N F O R E U R O P E
199
No. / Country / Location Situated on backbone Remark
161. Kaliningrad TEM, TER planned
162. Nijni Novgorod (Doskino) TEM, TER planned
163. Saratov TEM, TER planned
164. Chelyabinsk TER planned, road linkage to TEM 1,300 km
165. Yaroslavl TEM, TER planned
166. Ust-Luga TER road linkage to TEM 140 km,
167. Kazan TER planned, road linkage to TEM 400 km
168. Voronezh TEM, TER planned
500. Krymsk (Razyezd 9 km) TEM, TER planned
501. Ufa TER planned
Serbia
169. Novi Sad TEM, TER
170. Nis TEM ,TER
171. Subotica (planned) TEM, TER
172. Senta (planned) no road linkage to TEM 35 km
rail linkage to TER 40 km
173. Sombor (planned) no road linkage to TEM 45 km
rail linkage to TER 60 km
174. Sabac (planned) TER road linkage to TEM 25 km
175. Smederevo (planned) no road linkage to TEM 15 km
rail linkage to TER 50 km
176. Prahovo (planned) no road linkage to TEM 145 km
rail linkage to TER 155 km
177. Jagodina (planned) TEM, TER
178. Uzice (planned) TEM, TER
179. Krusevac (planned) TEM rail linkage to TER 15 km
180. Kragujevac (planned) TEM rail linkage to TER 30 km
181. Presevo (planned) TEM, TER
Slovakia
182. Sladkovicovo TER road linkage to TEM 20 km
183. Zvolen (planned) TEM rail linkage to TER 95 km
184. Ružomberok TEM, TER
185. Dunajska Streda no road linkage to TEM 50 km
rail linkage to TER 60 km

U N E C E T E M A N D T E R P R O J E C T S ’ M A S T E R P L A N – 2 0 1 1
200
No. / Country / Location Situated on backbone Remark
Slovenia
186. Celje TEM, TER
187. Sezana TEM, TER
Turkey
188. Gokkoy (Balikesir) TEM, TER
189. Bogazkopru (Kayseri) TER road linkage to TEM 150 km
190. Hasanbey (Eskisehir) TER road linkage to TEM 100 km
191. Kosekoy (Izmit) TEM, TER
192. Palandoken (Erzurum) TEM, TER
193. Kaklik (Denizli) TEM, TER
194. Usak TEM, TER
195. Kayacik (Konya) TEM, TER
196. Tekirdag TER new railway line from Muratli
108. Gelemen (Samsun) TEM, TER freight village
197. Yenice (Mersin) TEM, TER freight village
The list of additional terminals of importance for international combined transport shows that the great majority of them are again located on the TEM and/or TER revised backbone network. These terminals and intermodal transhipment points are, or will preferably be, located on the major railway lines. Therefore, in some countries, where the main road or motorway link follows other routes (e.g. in Austria, Bulgaria, Croatia, the Czech Republic and the Russian Federation), the majority are located on the railway backbone network only.
11.4 Ferry links/ports forming part of the international combined transport network
The AGTC lists those ferry links/ports in the region covered by the revised TEM and TER Master Plan as follows (the numbers correspond to those on Maps No. 21 and 22).200. Samsun – Constanta (TUR – ROU)201. Mersin – Venezia (TUR – ITA)202. Gdynía – Ystad (POL – SWE)203. Gdynía – Stockholm (POL – SWE)204. Gdynía – Helsinki (POL – FIN)205. Calafat – Vidin (ROU – BGR) (until bridge completion)206. Kaliningrad – Lubeck (RUS – DEU)207. Draugyste (Klaipeda) – Mukran (Sassnitz) (LTU – DEU)208. Varna – Odessa (BGR – UKR)209. Varna – Novorossiysk (BGR – RUS)210. Varna – Poti/Batumi (BGR – GEO)211. Burgas (port) – Novorossiysk (BGR – RUS)212. Burgas (port) – Poti (BGR – GEO)

E C O N O M I C C O M M I S S I O N F O R E U R O P E
201
11.5 Other ferry links of high importance linked to the TEM and TER revised backbone networks213. Varna – Kavkaz (BGR – RUS)214. Kavkaz – Crimea (RUS – UKR)215. Kavkaz – Poti (RUS – GEO)216. Kavkaz – Samsun (RUS – TUR)217. Ilyichevsk – Poti (UKR – GEO)218. Ust-Luga – Baltiisk – Sassnitz (RUS – DEU)219. Varna – Ilyichevsk (BGR – UKR)220. Constanta – Derince (ROU – TUR)221. Tekirdag – Bandirma (TUR)222. Tatvan – Van (TUR)223. Tekirdag – Derince (TUR)
11.6 Other sea ports of high importance linked to the revised TEM and TER backbone networks
Note: The numbers correspond to those on Maps No. 21 and 22.
Albania301. Durres302. Porto Romano303. Petroliferra (Vlore)
Azerbaijan304. Baku International Sea Trade Port305. Aliat International Sea Port (under construction)
Croatia306. Rijeka307. Zadar308. Sibeník309. Split310. Ploce311. Pula
Georgia312. Batumi
Greece313. Pireas314. Thessaloniki315. Patra316. Alexandroupoli317. Volos318. Kalamata319. Igoumenitsa320. Iraklio
The Russian Federation321. Murmansk

U N E C E T E M A N D T E R P R O J E C T S ’ M A S T E R P L A N – 2 0 1 1
202
322. Belomorsk323. St. Petersburg324. Vyborg325. Rostov na Donu326. Tuapse327. Makhachkala328. Alya329. Astrakhan
Slovenia330. Koper
Ukraine331. Ilyichevsk
Turkey332. Haydarpasa333. Derince334. Iskenderun335. Izmir336. Antalya337. Ordu338. Giresun339. Trabzon340. Rize341. Hopa342. Ceyhan343. Bandirma344. Ambarli (Marport)345. Zonguldak346. Sinop347. Cesme
It should be noted that, according to the UNECE report on “Hinterland Connections of Seaports”, the ports of Pireas (Greece), Constanta (Romania) and Genova (Italy) are ranked in 12th, 14th and 15th place respectively among the 20 top EU container ports, . Similarly, on the basis of the volume of containers handled, the ports of St. Petersburg (the Russian Federation), Ambarli and Izmir in Turkey are in 13th, 14th and 20th place respectively among the top non-EU ports in the world.
11.7 Terminals in inland waterway ports of importance for international combi-ned transport linked to the revised TEM and TER backbone networks
The following terminals in inland waterway ports of importance for international combined transport, listed in Annex II of the “Protocol on Combined Transport on Inland Waterways” to the AGTC Agreement, are located or closely linked to the TEM and TER revised backbone networks.
Note: The numbers indicated correspond to those on Maps No. 21 and 22 followed by the number of the waterway indicated in Annex I to the “Protocol on Combined Transport on Inland Waterways”.

E C O N O M I C C O M M I S S I O N F O R E U R O P E
203
Austria400. C-P 80-33 Linz 401. C-P 80-34 Linz-Voest402. C-P 80-35 Enns-Ennsdorf403. C-P 80-37 Wien
Bulgaria404. C 80-01 Vidin405. C-P 80-56 Rousse
Croatia406. C-P 80-08-01 Osijek407. C-P 80-12-01 Slavonski Brod
The Czech Republic408. C-P 20-15 Decin409. C-P 20-16 Usti nad Labem410. C 20-01 Pardubice (planned)411. C-P 20-06-01 Praha
Hungary412. C-P 80-42 Budapest
Poland413. C-P 30 Gliwice Labedy414. C-P 30 Opole415. C-P 30 Wroclaw
Romania416. C-P 80-51 Turnu Severin417. C-P 80-57 Giurgiu418. C-P 80-14-03 Constanta
The Russian Federation419. C-P 50-02 St. Petersburg river port420. C-P 50-03 Podporozhie (Volgo-Baltijskiy canal)421. C-P 50-04 Cherepovets (Volgo-Baltijskiy canal)422. C-P 50-06 Nizhniy Novgorod423. C-P 50-09 Samara424. C-P 50-10 Saratov425. C-P 50-11 Volgograd426. C-P 50-12 Astrakhan427. C 50-03 Tolyatti428. C-P 50-02-01 Moskva Northern Port429. C-P 50-02-02 Moskva Western Port430. C-P 50-02-03 Moskva Southern Port431. C-P 50-01-01 Perm432. C-P 90-03 Azov433. C-P 90-04 Rostov na Donu434. C-P 90-05 Ust-Donetsk

U N E C E T E M A N D T E R P R O J E C T S ’ M A S T E R P L A N – 2 0 1 1
204
Slovakia435. C-P 80-38 Bratislava436. C-P 80-41 Sturovo-JCP437. C 81-01 Sered438. C-81-02 Sala439. C 20/30-01 Devinska Nova Ves
Ukraine440. C-P 40-05 Kyiv441. C-P 40-09 Dnipropetrovsk
11.8 Other river/lake ports of high importance linked to the revised TEM and TER backbone networks
Note: The numbers correspond to those on Maps No. 21 and 22.
Austria442. Krems
Bosnia and Herzegovina443. Samac444. Brcko
Bulgaria445. Lom
Croatia446. Vukovar447. Sisak
The Republic of Moldova448. Giurgiulesti449. Bendery450. Ungheni451. Ribnita
Romania452. Calafat453. Cernavoda454. Braila455. Galati
The Russian Federation456. Kazan457. Yaroslavl458. Eysk
Serbia459. Beograd460. Novi Sad461. Smederevo
Slovakia462. Komarno

E C O N O M I C C O M M I S S I O N F O R E U R O P E
205
Turkey463. Van464. Tatvan
Ukraine465. Bilhorod-Dnistrovskiy466. Ismail467. Ust-Dunaisk468. Reni469. Kherson470. Zaporozhye471. Mykolaiyv
Maps No. 21 and 22 show the locations of the terminals, ferry links, sea and river ports and their positions vis-a-vis the TEM and TER revised backbone networks.

U N E C E T E M A N D T E R P R O J E C T S ’ M A S T E R P L A N – 2 0 1 1
206

E C O N O M I C C O M M I S S I O N F O R E U R O P E
207
12. INTELLIGENT TRANSPORT SYSTEMS
In a very general sense, Intelligent Transport Systems (ITS) and services relate to the connection between information and communication technologies, vehicles and transport networks. There are many current ITS applications aimed at the intelligent and efficient use of existing motorway, road, railway, seaport and airport infrastructures, and new applications are emerging on a frequent basis. New technologies such as radio-frequency identification, satellite navigation (GPS, Galileo) and the global system for mobile communications (GSM), coupled with other ITS applications, may ease the interfaces between transport modes as well as cross-border traffic, and create greater possibilities for managing transport and the more efficient use of infrastructure, and thus create better overall service levels. Such new technologies and other ITS applications also make the logistics and the handling of goods more efficient, improve just-in-time deliveries and could also reduce congestion in cities. In railways, they can inter alia boost their competitiveness by reducing safety distances between trains and thus increasing line capacity. ITS applications can further enable accurate and continuous tracking of boxes, containers and pallets and, coupled with other technologies such as radio frequency identification devices, improve the management of supply chains and fleets in all transport modes. The potential of ITS could be increased greatly by their integration. Such integration requires a strategic framework to act as a basis for choices concerning their design and deployment as well as for investment decisions covering technical aspects as well as all organizational, legal and social issues involved. The ability for integration is a factor of growing importance since it represents a precondition for the much-needed interoperability of ITS at the European level.
12.1 ITS in the road sector
In the road sector, the ITS applications can be broken down into those intended for passenger cars, for public passenger transport, for trucks and lorries and for motorway and road infrastructure. The ITS for passenger cars include traffic information systems, wireless application protocol (WAP) services, traffic message canals (TMC), parking information and guidance systems, car navigation and location systems, uniform emergency calling systems, and advanced driver assistance systems (driver behaviour tracking, weather information, visibility improvement, collision warning or avoidance, speed and car distance control, voice recognition, etc.). Floating car data (FCD) and Extended floating car data (XFCD) systems make use of mobile phones and other sensors in cars as anonymous traffic probes, and convert these data into accurate traffic flow information. Data communication and exchange, information services for passengers, automatic vehicle location, speed control and public transport priority assignment systems, and electronic ticketing are some of the ITS applications for public passenger transportation. Systems for the management and tracking of HGV pools, the routing and tracking of vehicles carrying dangerous goods, and the intelligent location of accidents and for their investigation, as well as digital tachographs and weigh-in-motion (WIM) systems, belong to the category of the ITS for goods vehicles. These ITS result in the better management of vehicles and loads, improved safety and reduced vehicle wear, transportation times and fuel consumption.
For the purposes of the revision of the Master Plan, the ITS applications for infrastructure are of greatest importance. They include various technologies for electronic toll collection (ETC) which make it possible for vehicles to drive through toll gates at traffic speed, thus reducing

U N E C E T E M A N D T E R P R O J E C T S ’ M A S T E R P L A N – 2 0 1 1
208
congestion at the gates. Another form of road pricing scheme is the high occupancy toll (HOT) lanes which are reserved for passenger cars with more than one occupant. Variable intelligent road signs and messaging also constitute an efficient way to fight congestion and improve safety. Intelligent systems could establish variable speed limits on motorways and roads, and dynamic sequencing of traffic lights in urban environments in order to enhance traffic flows. They could also be used to manage fees and tolls dynamically, and thus to distribute traffic flows over different times of the day and week. Automatically controlled cordon zones make it possible to collect congestion charges and fees from vehicles entering city centres. Automatic road enforcement systems, consisting of cameras and vehicle-monitoring devices, can detect and identify vehicles disobeying speed limits and other road legal requirements, and can contribute considerably to road safety. In the future, ITS may also encompass automated motorways/roads with driverless cars and platooning, where vehicles are coupled, driving very close to one another, thus increasing the capacity of the highway and contributing to the road safety at the same time.
12.2 ITS in the rail sector
In the rail sector, the main components of the ITS are the European Train Control System (ETCS) and the Global system for Mobile Communication for Railways (GSM-R), which both form part of the ERTMS (European Rail Traffic Management System). In 2006, when the original TEM and TER Master Plan was published, the ETCS was installed only on one link in the region, namely on the Vienna – Budapest line in Austria and Hungary. At that time, over the complete length of the main European railway network, the ETCS was installed and in operation on only 1,340 km of line according to the UIC ERIM study. This figure should increase to 36,232 km (about 73 % of the network) in 2020, covering almost all main lines in the EU member and candidate countries participating in the revision of the TER part of the Master Plan.
The coverage of GSM-R in actual service on the same main network in Europe in 2006 amounted to 8,676 km (about 18 % of the total length). At that time, in the region, it was in operation on only two short sections in the Czech Republic and on most of the main lines in Italy. According to the UIC ERIM study, it is planned to increase the GSM-R coverage to 43,882 km (about 88 %) in 2020, again covering almost all main lines in the EU member and candidate countries participating in the revision of the TER part of the Master Plan.
In the revision of the Master Plan, the participating countries were requested to convey their experience gained in the implementation of individual components of ITS and to describe any plans for their wider exploitation in the future, including possible coordination between the road and rail traffic in urban areas in order to mitigate congestion (including Park and Ride systems etc.). The information obtained is summarized in chapters 12.3 and 12.4 for road and rail ITS systems and services respectively.
12.3 Motorway/road ITS systems and services in the participating countries
Austria
To finance the construction and maintenance of the primary Austrian road network (motorways and expressways), Austria has successfully introduced a dual toll collection system consisting of a time-based toll sticker for passenger cars (in operation since 1997) and a distance-related electronic toll system for trucks and coaches (introduced in 2004).

E C O N O M I C C O M M I S S I O N F O R E U R O P E
209
Azerbaijan
The Intelligent Management System of the City Transport in Baku (the Baku city ITS project) is being implemented in the 2009 to 2011 period. This system will automate the management of bus stops, the regulation of intervals between buses, and traffic speeds, will gather information about road/street traffic and will fulfil additional functions. This system will not only cover the capital but also the whole of the Absheron peninsula.
The Czech Republic
ITS are widely implemented. Electronic toll collection is in operation on motorways, and Park and Ride systems are in use, for example at metro terminals in the capital city of Prague. The “Intelligent Motorway” project for traffic control on the section of the D1 motorway between Prague and Brno and on the Prague southern bypass expressway is under implementation. The Centre of Traffic Information provides real-time traffic information for all users of the road network, etc.
Romania
An ad-hoc group comprising experts from the ITS field and transport representatives has been established to examine the use of ITS, to collect data and to propose solutions to be implemented in the forthcoming years.
Serbia
The implementation of ITS applications intended to increase road safety, namely real-time navigation and information systems on the road network and traffic flows, has top priority. The “Strategy of Planning, Development and Implementation of ITS on the Roads in the Republic of Serbia” includes a number of projects of which the following implementations are the most important:• acentrefortrafficmanagement;• ITSapplicationsatringroadsandintunnels;• atrafficmanagementandroaduserinformation;• anRWIS(RoadWeatherInformationSystem;• anetworkofstationsformeasuringaxleloadsofmovingvehicles• a warning system aimed at addressing the safety of road users in areas where there are
construction works;• asystemforpreventingtheformationoficeonthecarriagewaysonbridges;• asystemformeasuringtheweightofcommercialvehiclesintransit;• coordinationoftrafficsignalsystems;• signalsforindicatingtheright-of-wayforemergencyinterventionvehicles;• aninfraredsystemforcheckingvehiclebrakes;• laptopandwirelesscommunicationsforinspectionalongtheroads;• systemsformonitoringcommercialvehiclesremotely;• informationonrestareas;• anti-rolloverwarningsystemsforcommercialvehicles.
Slovakia
The country’s first electronic satellite-based highway toll system, obligatory for all vehicles over 3.5 tonnes, was launched on 1 January 2010. The National Highway Company (NDS) signed a EUR 716 × 106 contract with the supplier of ETC services, the SanToll-Ibertax consortium, on 13 January 2009 for construction of the system and its operation over 13 years, with a possible

U N E C E T E M A N D T E R P R O J E C T S ’ M A S T E R P L A N – 2 0 1 1
210
extension for a further 5 years. The project covers not only motorways and dual carriageways but also, to a large extent, first-class roads. The solution of the ETC system, based on GPS-GSM technology, provides maximum flexibility in order to accommodate increases in the volume of freight transport and extension of the road network. There are about 60 distribution and contact points across Slovakia where drivers obtain so-called on-board units (OBUs). Through the use of the OBUs, the system monitors (via satellite) the position of vehicles, and automatically calculates the number of kilometres driven on toll roads. Tolls on first-class roads are lower than those on motorways and dual carriageways. Slovakia has decided to launch the tolling system on first-class roads to avoid the situation wherein heavy vehicles bypass tolled motorways by using the first-class roads.
Turkey
The General Directorate of Highways launched an ITS installation programme on its motorway network in the 1990s. Electronic toll collection was chosen as the primary ITS service to be installed as a first step, and all toll stations have been covered using a microwave-based motorway toll system and contactless smart card system. Three traffic control systems have been established in İstanbul, İzmir and Mersin with a view to managing the traffic and travel information systems. Various stretches of motorway network have been equipped with detection and dissemination systems including meteorological sensors, multi-lane vehicle detectors, travel-time detectors, surveillance cameras, communication systems, variable-message signs and other supplementary equipment. Tunnels longer than 500 m have been equipped with safety-related systems as well as emergency (exits or escapes). The ITS will be extended to the rest of the motorway sections as a function of budget availability. Additionally, new developments in ITS technology will be taken into consideration and the capacity of systems will be broadened.
12.4 Rail ITS systems and services in the participating countries
Austria
In the period 2002 to 2011, investments in the introduction of the European Train Control System (ETCS) system amounted to EUR 109 × 106, in Park and Ride projects to EUR 181.7 × 10⁶ and in technological improvement projects and operational performance improvement projects to EUR 399.7 × 10⁶. Moreover, investments in tunnel safety projects in the years 2002 to 2006 amounted to EUR 65.4 × 10⁶, upgrading of railway terminals to EUR 72.7 × 10⁶ and interconnections of railway and metro stations in Vienna to EUR 189.0 × 10⁶.
Bulgaria
An ETCS level 1 has been implemented along the Plovdiv – Burgas railway line and is in operation since 2003. A strategy for the ERTMS implementation was developed in 2007, according to which the backbone network will be equipped with ERTMS facilities by the end of 2020.
Romania
In September 2007, Romania submitted to the EC its National Plan for the development and implementation of the ERTMS. The implementation of this system at national level is based on the TEN-T corridor strategy. The strategy envisages the implementation of this system along the IV Pan-European rail corridor to an extent of 15 % by 2015. The “Sectoral Operational Programme — Transport” (SOP-T) for the period 2007 to 2013 for modernization and development of the railway infrastructure along the TEN-T priority axis 22 (Curtici – Constanta) will aim at rehabilitating/upgrading/modernizing this TEN-T priority axis. The focus of the operations will

E C O N O M I C C O M M I S S I O N F O R E U R O P E
211
be on the northern branch (Curtici – Predeal), while all necessary preparatory studies will be envisaged for the southern branch (Arad – Calafat), with the aim of starting the work in the next programming period. In addition to modernizing the rail infrastructure, and in order to ensure effective interoperability, the project will include the introduction of the ERTMS/ETCS.
Slovakia
With respect to the implementation of the ERTMS (ETCS and GSM-R), Slovakia is modernizing the main Pan-European corridors, mainly Corridors IV, V(a) and VI. In accordance with the EC rules for funding and the interoperability directives, all modernized lines will be equipped with the ERTMS to provide interoperability. For Corridor V(a), the ETCS L1 was implemented from Bratislava to Nove Mesto nad Vahom by 2009, and that from Nove Mesto nad Vahom to Puchov will be implemented by 2015. Corridor VI (Zilina – Krasno – Cadca) should be equipped by the end of 2013 and Corridor IV by the year 2015. A pilot GSM-R project is being built from Bratislava to Senec and Nove Zamky, and should be put into service already in 2010. A GSM-R should be implemented on Corridor V(a) from Bratislava to Zilina by the year 2011.
Slovenia
The implementation of the ERTMS is being carried out in accordance with the “National Implementation Plan of TSI for Control-command and signalling subsystem”. The first implementation will be on the pilot sections of Corridor D (Corridor V). Following that, the conventional signalling will be replaced on the other sections of Corridor D and later on the rest of the Slovenian railway network.
Turkey
In order to improve the safety level throughout the whole railway network and to maintain a high safety level for new railway projects, Turkey is giving high priority and importance to the interoperability of the railway network for both domestic and international operations. Accordingly, Turkey has been investing in new high-speed railway lines throughout the country, all of which are equipped with ERTMS.
The Ankara – Eskisehir high-speed line has been in operation since March 2009 and is equipped with ERTMS ETCS Level 1. The Eskisehir – Istanbul high-speed line is under construction and will be equipped with ERTMS ETCS Level 1. There is a project to install a GSM-R system to cover the Ankara – Istanbul high-speed line and to upgrade the high-speed line to ETCS Level 2. The Ankara – Konya high-speed line is under construction and will have ERTMS ETCS Level 1 and Level 2. The third ongoing high-speed line railway project is Ankara – Sivas. Other high-speed lines, such as Ankara – Izmir, Bursa – Osmaneli, Yerkoy – Kayseri and Halkali – Kapıkule, will also be equipped with the ERTMS.
Additionally, there are upgrading projects on conventional lines, all of which also comprise installation of the ERTMS. On the Bogazkopru – Yenice and Mersin – Toprakkale line sections, ERTMS Level 1 has been installed within the scope of the ongoing “Signalling, Telecommunication & Station Extension” project. The “Irmak – Karabuk – Zonguldak Rehabilitation and Signalling” project will be put out for tender in 2011 and will be equipped with ERTMS Level 1 over its whole length. All other signalling upgrading projects and new signalling projects will provide ERTMS to be installed on corresponding line sections in Turkey.

U N E C E T E M A N D T E R P R O J E C T S ’ M A S T E R P L A N – 2 0 1 1
212

E C O N O M I C C O M M I S S I O N F O R E U R O P E
213
13. ENVIRONMENTAL, SAFETY AND SECURITY ISSUES
13.1 Environmental impacts
According to the “Millennium Ecosystem Assessment” report (MEA 2005), over the past 50 years humans have changed ecosystems more rapidly and extensively than in any comparable period of time in human history, largely to meet rapidly growing demands for food, fresh water, raw materials and fuel. Transport activities contributed a great deal to these changes through their environmental impacts, namely through noise, vibrations and especially air pollution. The main components of transport emissions include carbon dioxide (CO2), particulate matters (PM), nitrogen oxides (NOx), sulphur dioxide (SO2), carbon monoxide (CO), lead (Pb), benzene and volatile components (CmHn). The construction and use of transport infrastructure may cause landscape fragmentation and the partitioning of ecosystems and of species populations; in urban areas they may lead to a reduction in the space available for other users. Moreover, transport activities contribute indirectly to negative environmental impacts through fuel and electricity production and the production and maintenance of vehicles.
All the adverse impacts of transport activities on the environment are clearly significant, and emissions from transport (in particular) constitute a very high share of the overall emissions. The main environmental impacts, such as air and noise pollution, are related to road traffic, but rail traffic also causes noise problems in the vicinity of lines with diesel traction, and near marshalling yards and rail and intermodal terminals. Since the traffic volumes are dominated by road and rail transport, the ultimate extent of the environmental impacts will depend also on the development of the modal split between these two modes of transport. Because rail causes less negative environmental impacts than road, it would be desirable, from the environmental and safety point of view, to increase the share of the rail transport as well as the share of combined transport, in particular along the backbone network links. Nevertheless, it remains questionable whether the objective of shifting freight from road to the more-environmentally-friendly rail is feasible at least in the near future, especially if the basic improvement in the rail infrastructure and the introduction of market-oriented economic reforms in the rail sector are delayed as has happened frequently in the past.
Decisions on the choice of transport mode depend on the quality of alternatives, prices and other market-relevant characteristics such as reliability, frequency of departure, duration of the trip, departure and arrival times, availability of information, safety record and security environment. As long as rail transport does not represent a viable economic alternative, significant shifts to it will not happen and the expansion of road transport will continue to generate significant negative externalities, especially taking into account the environmental consequences of more frequent road congestions.
One way to alleviate this problem and to slow down environmental degradation is the introduction of regulations which form part of the EU transport policy to mitigate potential conflicts between infrastructure and its users on one side, and the environment on the other side. According to the “Evaluation of the Common Transport Policy (CTP) of the EU from 2000 to 2008 and analysis of the evolution and structure of the European transport sector in the context of the long-term development of the CTP” of August 2009, policy measures should in general

U N E C E T E M A N D T E R P R O J E C T S ’ M A S T E R P L A N – 2 0 1 1
214
target overall reductions in emissions rather than specifically modal shift. This could be achieved, inter alia, by the internalization of external costs, which in the transport sector would certainly bring important benefits, namely by taxing environmental degradation, establishing cap and trade systems, and estimating the true external costs (including life-cycle impacts), and using that information to fix criteria for green public procurement. Also, in some places, the application of appropriate charges may establish a sustainable balance between transport and environmental impacts.
According to the 2005 report of the EU HLG chaired by Loyola de Palacio, it is of utmost importance to assess the environmental impacts of transport infrastructure early, i.e. already at the stage of project definition and analysis. Infrastructure projects should be designed so that any severe or dangerous environmental effects are offset by mitigating measures. In the context of strategic environmental assessment, the policy option of promoting alternative modes to road transport ought to be considered always. In cases where such projects are to be funded or co-funded by international financial institutions, they are always subject to their standard environmental impact assessment procedures. In the framework of these procedures, the development banks not only consider the narrowly defined environmental criteria, but also take into account public health and concerns for preservation of the cultural heritage. Furthermore, the UNECE 1991 “Convention on Environmental Impact Assessment in a Transboundary Context” stipulates that its contracting parties have to undertake environmental impact assessments at the project level of planned transport infrastructure activities. Where the proposed activity may have a significant adverse transboundary impact, the party of origin should notify any affected party as early as possible and enter into consultations concerning measures to reduce or eliminate such an impact. Furthermore, the 2003 “Kiev Protocol” mandates its parties to analyse the environmental consequences of their infrastructure development programmes much earlier than does the Convention, and to include extensive public participation. Finally, improvements in rail intermodality and in the combined transport infrastructure may also influence the share of transport modes, because the competitiveness of railways would then be more directly linked to that of other modes. Given the strong economic and transport links that exist amongst the participating countries of the region, the realization of environmental benefits associated with intermodality would require coordinated action at the international level.
In the following text, the most important transport environmental impacts, i.e. carbon dioxide (CO2) emissions and noise pollution, are analysed in more detail.
CO2 pollution
The increase in carbon dioxide emissions reflects a rapid acceleration of human activities, including transport, over the last 50 years. This increase is caused not so much by population growth, but is associated primarily with a rapid rise in per capita consumption by a fraction of the population. Because of increased atmospheric CO2 concentration, average global temperatures have also risen as a result of the greenhouse effect. On the basis of baseline climate model projections, the Intergovernmental Panel on Climate Change (IPCC) predicted that without wide-ranging measures to reduce greenhouse gas emissions, the global warming would accelerate with severe consequences, such as longer heat-waves and more frequent floods. According to the OECD simulations, if nothing is done and current trends regarding transport technologies and modal share are maintained, global greenhouse gas (GHG) emissions may increase by 52 % by 2050, which would cause increases in mean temperatures of 1.7 °C to 2.4 °C, not taking into account the possible “snowball” effect wherein the reduced sea ice cover would change the reflectivity of the Earth’s surface and increased methane emissions from melting permafrost would accelerate climate change even more.

E C O N O M I C C O M M I S S I O N F O R E U R O P E
215
To slow down or limit this trend, the international community should take action now — at the moment does not seem to be the case if one considers the unsatisfactory results of the UN Climate Change Conference in 2009, and the consequences of global economic recession. Theoretically — according to the OECD simulations — climate stabilisation goals are affordable and could be achieved by 2030 through measures costing roughly 0.5 % of world GDP, such as imposing a tax of USD 25 (escalating at roughly 2 % a year) on every tonne of GHG produced. A more ambitious scenario, reflecting a phased-in tax set at the level necessary to limit atmospheric concentrations to 450 ppm of CO2-eq in the atmosphere, would even lead to a reduction in global emissions by about 40 % in 2050 compared to 2000 levels. However, in addition to the total cost of introducing the necessary measures, there would be the problem of their distribution amongst the countries, since should a straightforward global tax policy be used, developing countries would face far bigger GDP losses than would developed countries.
As far as transport CO2 emissions are concerned, transport is the second largest contributing sector to the EU27 greenhouse gases emissions after the stationary energy sector; for example in 2005, it accounted for 23.4 % of all EU27 emissions. Moreover, in the last three decades, CO2 emissions from transport have risen faster than those from all other sectors and will most probably continue to rise even more rapidly in the coming years. The vast majority of these emissions (76 %) are produced by the road transport sector. Both rail and road transport modes also contribute to global warming not only by their direct emissions of CO2, but also by the indirect ones such as emissions from oil refineries, and from the production of electricity used by electric trains, vehicle manufacture, maintenance, support and disposal as well as those caused by infrastructure construction and maintenance. Ideally, all these indirect emissions should be considered, but since their effects are generally negligible, in most cases only emissions from the vehicle operations themselves are taken into account. Nevertheless, indirect emissions from petrol and diesel production will gain in importance for vehicles complying with stricter emission standards such as Euro 2 or higher.
Actions and measures aimed at reducing transport greenhouse gas emissions should be focused on implementation of policies to control emission ratios and on technological innovations, in particular on the evolution of car technologies. For example, the introduction of lower speed limits in road traffic such as 100 km/h for motorways and 80 km/h for roads would reduce CO2 emissions by about 5 % through the elimination of very fast traffic. According to the EC TRANSvisions “Report on Transport Scenarios with a 20 and 40 Horizon” of March 2009, the implementation of the policy package (including pricing mechanisms to increase the average occupancy of cars, the load factor of trucks and the long-distance rail modal share) would reduce CO2 emissions by 2 % in 2020 and 22 % in 2050. Road investments aimed at reducing congestion on roads by 20 % would reduce these emissions by another 1 %. On the other hand, the study forecast that indirect CO2 emissions by vehicles not using fossil fuels will increase significantly due to the presence of fossil fuels in the primary generation of electricity.
Full implementation of the Euro 5 directive for cars, according to which vehicles with old technology would be replaced by vehicles with Euro 5 technology, would reduce CO2 emissions by an additional 2 %. More promising is the car design evolution: according to “Trends in Vehicle and Fuel Technologies” published by the EC Joint Research Centre — Institute for Prospective Technological Studies ( JRC-IPTS) in 2003, a likely evolution of car technologies may increase the market shares of hybrid cars by 27 %, of fuel cell cars by 10 % and of electric cars by 5 % by 2020 and bring about a 28 % reduction in CO2 emissions in fossil-fuel-based cars due to increases
U N E C E T E M A N D T E R P R O J E C T S ’ M A S T E R P L A N – 2 0 1 1
216
in their efficiency. In the short term, the present economic recession and lower economic growth over the next years may result in slower growth of transport greenhouse gas emissions, provided that governments and companies do not cut their research and technical development investments, that the renewal of vehicle fleets is not significantly decreased and that the pace of technological innovations is maintained.
In order to reduce air pollution and thus to protect human health and the environment, Directive 2008/50/EC of the European Parliament and of the Council on ambient air quality and cleaner air for Europe determined target values for pollutants. In this Directive, most of the existing legislation has been merged and new objectives and limit values for particles were included. The respective standards and objectives in the Directive apply over different periods of time for each of the pollutants because the observed health impacts associated with various pollutants have different exposure times.
Noise pollution
Noise is the second most important transport environmental impact. Its levels are much more difficult to predict than those from CO2 emissions, since it represents a very local burden and non-linearities are involved in its aggregation and perception by human beings. It is recognized not only as a nuisance, but also as a serious health problem. According to the World Health Organization (WHO), half of the citizens in European live in noisy surroundings and about third of them suffer from sleep disturbances during the night time. Road traffic noise also hinders communication and learning, contributes to fatalities and causes physical health problems including hearing loss, raised blood pressure and heart disease. It is generally understood that the noise levels causing health impacts are the following:
- above 40 dB(A) Leq to 50 dB(A) Leq may lead to significant annoyance;
- between 40 dB(A) Leq and 60 dB(A) Leq may disturb sleep;
- between 65 dB(A) Leq and 70 dB(A) Leq may be risk factors for school performance and ischemic heart diseases;
- above 70 dB(A) Leq may cause hearing impairment.
The European Parliament and Council adopted Directive 2002/49/EC of 25 June 2002 relating to the Assessment and Management of Environmental Noise, the aim of which was to provide a common basis for tackling the noise problem in the EU. This Directive is based on the following principles.
1. Monitoring of the environmental problem by requiring competent authorities in Member States to draw up “strategic noise maps” for major roads, railways and agglomerations, using the harmonized noise indicators Lden (day-evening-night equivalent level) and Lnight (night equivalent level). These maps will be used to assess the number of people annoyed and sleep-disturbed throughout Europe.
2. Informing and consulting the public about noise exposure, its effects, and the measures considered to address noise.
3. Addressing local noise issues by requiring competent authorities to draw up action plans to reduce noise where necessary and to maintain environmental noise quality where it is good. The respective measures to be used in the action plans will remain at the discretion of the competent authorities.
E C O N O M I C C O M M I S S I O N F O R E U R O P E
217
4. Developing a long-term EU strategy, which includes objectives to reduce the number of people affected by noise in the longer term, and provides a framework for developing existing European Community policy on noise reduction from source.
In this Directive, the EC did not set any common threshold values, but required the Member States to determine national target values not to be exceeded. The Directive established a way to identify areas where noise calculations need to be carried out. For roads, these are the areas where the main roads carry more than 6 × 10⁶ vehicles per year. For railways, they are those areas with more than 250,000 inhabitants that are crossed by railroads carrying more than 60,000 trains/year.
In recent years, the EU Member States have transposed this Directive into national legislation. The elaboration of strategic noise maps along the main roads and across large agglomerations in each member country is to be followed by the drafting of specific action plans and implementation of the proposed initiatives. Following the implementation of the first action plans, each country should provide to the EC feedback on the effectiveness of the measures taken to reduce noise pollution. This effectiveness should not be measured in terms of a reduction in dB (decibels) only, but should also take into account the general feeling of improvement perceived by the inhabitants. The application of mandatory impact assessment methods in the EU member countries should significantly contribute to the reduction in noise pollution and improve the quality of life of its citizens.
In general, road and rail traffic noise nuisance can be reduced by (i) measures at the source, (ii) measures connected to the diffusion of noise, and (iii) measures undertaken at buildings. Abatement measures which reduce the traffic noise nuisance connected to new infrastructure construction include alteration of the horizontal and vertical alignment, erection of absorptive or reflective noise barriers and provision of low-noise road surface materials, which can reduce noise by up to 3 dB(A). In built-up areas, roads and streets carrying heavy traffic flows should be located as far as possible from residential areas, speeds on urban expressways and other major roads should be reduced, trees and shrubs should be planted as noise mufflers, buildings and dwellings should be sound insulated and appropriate traffic management systems should be employed. In addition to most of these measures, rail-structure-borne noise at the source could be reduced by making use of elastic pads for rail fasteners, elastic sleeper pads, ballast mats, elastic supports for slab tracks and troughs (mass-spring systems).
13.2 Road safety
Road traffic accidents and fatalities have an important social impact, whereas figures regarding rail accidents and fatalities are comparatively negligible. According to data provided by the WHO, about 1.2 × 10⁶ people are killed and more than 50 × 106 are injured every year in road accidents. During the decade 1994 to 2004, in the UNECE member countries, each year there were on average more than 150,000 persons killed and about 6 × 10⁶ injured in 4 × 10⁶ road accidents. In Europe, road safety indicators are improving in general as a consequence of a number of policy measures implemented at both the EU and the national level. The steep decline in road deaths in the participating countries in the period 2008 to 2009, as well as in the first decade of the 21st century, is illustrated in the following table which is based on data of the IRTAD Group of the International Transport Forum (ITF).

U N E C E T E M A N D T E R P R O J E C T S ’ M A S T E R P L A N – 2 0 1 1
218
CountryRoad fatalities
2008 2009 Evolution 2008 to 2009 Evolution 2000 to 2009
Austria 679 633 -6.8 % -35 %
The Czech Republic 1,076 901 -16.3 % -39 %
Greece 1,553 1,456 -6 % -29 %
Hungary 996 822 -17.5 % -32 %
Italy 4,731 4,050 -14.4 % -43 %
Lithuania 499 370 -25.9 % -42 %
Poland 5,437 4,572 -15.9 % -27 %
Slovenia 214 171 -20.1 % -46 %
Moreover, according to the WHO’s “Global Burden of Disease”, the number of road accident victims will decrease in these countries by 30 % over the period from 2000 to 2020. Meanwhile, this positive development will be more than offset in the same period by an 80 % increase in victims in developing countries (where about 90 % of the global road fatalities occur). Therefore, reduction in the number of traffic casualties remains a very important objective of transport policy and especially of the road infrastructure development, since newly-built roads and motorways with improved standards are assumed to have a positive effect on road traffic safety. With the aim of reducing road accidents and fatalities, the United Nations declared the period 2011 to 2020 the Decade of Action for Road Safety.
The following table, which summarizes data from the UNECE statistical database and from the ITF, shows for the countries participating in the revision of the TEM and TER Master Plan, the number of road traffic accidents per 103 road motor vehicles in 2008, the number of road fatalities per 105 in 2009 and per 109 vehicle-km travelled on roads in 2008.
CountryAccidents per 103 vehicles
2008
Fatalities per 105 inhabitants
2009
Fatalities per 109 vehicle-km
2008 a)
Albania 3.5
Austria 8.4 7.6 9.0
Azerbaijan 3.5
Bulgaria 2.9
Croatia 8.0
The Czech Republic 4.2 8.6 19.4
The former Yugoslav Republic of Macedonia 14.2
Georgia 11.5
Greece 2.5 13.8
Hungary 5.5 8.2
Italy 4.6 7.9
Lithuania 9.5 11.0

E C O N O M I C C O M M I S S I O N F O R E U R O P E
219
CountryAccidents per 103 vehicles
2008
Fatalities per 105 inhabitants
2009
Fatalities per 109 vehicle-km
2008 a)
The Republic of Moldova 6.9 (2007)
Poland 2.5 12.0
Romania 2.3
The Russian Federation 5.7
Slovakia 4.1
Slovenia 7.8 8.4 12.3
Turkey 10.8
a) The indicator “fatalities per 109 vehicle-km travelled” represents a direct measure of the risk of road travel in the country, but most of the countries do not systematically collect data on vehicle-km.
Regarding the future development in the individual EU countries, the TEN-STAC study on “Scenarios, Traffic Forecasts and Analysis of Corridors on the Trans-European network” of September 2004 forecast the accident rates for 2020 taking into account the past and current accident rates, the impacts of new transport infrastructure as well as realistically achievable safety improvements. The results for the countries which took part in the revision of the TEM and TER Master Plan were as given in the following table.
Country
Fatalities per 109 vehicle-km2020
Injurous accidents per 106 vehicle-km2020
Motorways Other roads Total Motorways Other roads Total
Austria 5.43 9.42 8.28 0.13 0.53 0.42
Bulgaria 10.40 24.80 16.30 0.15 0.40 0.37
The Czech Republic 6.90 24.51 21.86 0.09 0.54 0.48
Greece 8.09 15.09 14.38 0.10 0.20 0.19
Hungary 8.16 25.83 23.18 0.09 0.45 0.40
Italy 4.63 11.59 9.46 0.14 0.47 0.37
Lithuania 26.20 36.65 34.87 0.43 0.47 0.45
Poland 15.45 26.94 25.68 0.10 0.30 0.29
Romania 12.07 36.40 34.13 0.10 0.13 0.12
Slovakia 7.47 32.09 28.80 0.06 0.48 0.43
Slovenia 6.83 18.15 15.91 0.12 0.68 0.52
Injuries and disabilities resulting from road traffic accidents put a significant drain on economies, typically consuming between 1 % and 3 % of a country’s gross national product per annum. In this connection, one of the crucial points is the calculation of the social costs of accidents. Globally, estimates in 2003 suggested that the economic costs of road traffic injuries amounted to USD 518 × 109 per annum. In developing countries, the costs were estimated to be USD 100 × 109, twice the annual amount of the development assistance given to developing countries. According to the British trade union Unite, the value per fatality was EUR 2.158 × 10⁶ in 2003 values, consisting of a statistical life value of EUR 1.962 × 10⁶ and health care costs of

U N E C E T E M A N D T E R P R O J E C T S ’ M A S T E R P L A N – 2 0 1 1
220
EUR 0.196 × 10⁶. For serious and minor injuries, the respective figures were 13 % and 1 % of these values.
Acknowledging the importance of the work focused on the improvement of road safety, the UNECE established already in 1950 the Ad Hoc Working Group on the prevention of road accidents which was replaced by the Working Party on Road Traffic Safety (WP.1) in 1988. Within the general mandate of the United Nations, WP.1 initiates and pursues actions aimed at reinforcing and improving road safety, developing and harmonizing traffic regulations and rules for road signs and signals and strengthening cooperation between member countries. The WP.1 developed the “Geneva Convention on Road Traffic”, the “Vienna Convention on Road Traffic” and the “Vienna Convention on Road Signs and Signals”, as well as the European Agreements supplementing them. WP.1 remains today the only permanent intergovernmental body in the United Nations dealing with road safety and is open to all countries of the world.
Moreover, the UNECE, concerned with the importance of improving safety in both road and rail tunnels, created two ad hoc Multidisciplinary Groups of Experts on Road and Rail Safety in Tunnels. Final reports produced by the two groups contain recommendations for minimum requirements concerning safety in road and rail tunnels respectively. These recommendations have been taken into account in the work of national authorities and international entities such as the EC.
In the period 2008 to 2009, the United Nations Development Account funded the project “Improving Global Road Safety: Setting Regional and National Road Traffic Casualty Reduction Targets”, which was set up to assist governments in low- and middle-income countries to develop regional and national road safety targets and to exchange experience in good practice for achieving these targets by 2015. The project emphasized the importance of knowledge transfer from high-income countries, where progress has already been made, to low- and middle-income countries where the effects of increased motorization on safety performance have not yet been mitigated by effective risk-reducing actions.
13.3 Transport security
The national economies of all countries are heavily dependent on transport and energy networks. Following the terrorist attacks on 11 September 2001, the threat of terrorist attacks against critical transport infrastructures has emerged. It is increasingly recognized that all transport modes are at risk from such attacks and crimes. In these attacks, transport systems have been used either as a means or as a target. Since the safety of people and the integrity of critical infrastructures are at stake, security concerns in both international and national transport, and measures to reduce the risk of terrorist attacks and to minimize their consequences, have become increasingly prominent. In addition to a considerable tightening of security, especially that in the container transport field, the strategic approach to national security has to include further improvements in the infrastructure and the regulatory environment influencing both the road and the rail sector. Although the fight against terrorism is of primary importance, security is also an issue with respect to common criminal acts such as the theft of vehicles, transported goods and dangerous substances, attacks on drivers and conductors, illegal immigration, smuggling and physical aggression in public transport vehicles. The need to protect passengers, drivers, personnel, vehicles, freight as well as vulnerable transport infrastructure is, therefore, becoming increasingly urgent.
The EC has recently funded “Counteract”, a research project focused on improved security against terrorist attacks, aimed inter alia at public passenger transport and intermodal freight

E C O N O M I C C O M M I S S I O N F O R E U R O P E
221
transport. The project reviewed the existing security policies, procedures, methodologies and technologies to identify the best practices, which in turn will be promoted throughout the relevant EU security community.
Acknowledging the importance of the transport security issue, the UNECE has paid great attention to the work on this topic. In 2007, a Multidisciplinary Group of Experts on Inland Transport Security (AC.11) was established to examine threats to inland transport security and to provide recommendations to UNECE Governments on how to tackle them. Amongst other things, the group prepared the document “Guidelines and Best Practices in The Field of Inland Transport Security”, published in Geneva in 2008.
Road
The leading international organization in the road transport security field is the IRU. The IRU has developed many important documents and reports on the topic, and these have greatly contributed to increased security and crime prevention in the road sector.
The report “Haulage Security in the EU and beyond: IRU Position” contained a variety of recommendations designed primarily to combat terrorism. The report stated inter alia that security cooperation between the public and private sectors can be extremely effective, and it made the following recommendations: the existing security/facilitation instruments offering both security and facilitation benefits, such as the UNECE TIR and the EU’s Common and Community Transit procedures, should be used to the maximum; “self-security” measures taken by the haulage industry should remain high on the agenda; security policies must be information-based; enhanced security should not reduce unnecessarily operators’ freedom; electronic advance customs declarations should not be implemented hastily and, in the case of road traffic at border crossings, a 24-hour pre-arrival notification to customs authorities is excessive. The IRU position is that the economic needs of transport organizations and entities should be balanced with the necessary security. The facilitation of transport and trade cannot be ignored, even when security considerations are high on the agenda.
The IRU “Position on Supply Chain Security” formulated proposals for increasing the level of security without impeding the free flow of trade and for establishing a common transport framework for Europe. These proposals included establishment of a mandatory system requiring EU Member States to create a security quality label (“secure operator”) to be awarded to operators who meet European minimum security levels in the land transport supply chain, and introduction of a voluntary scheme for operators to increase their security performance in exchange for incentives. The proposals further provided for four separate “security operators” within the security framework, with the following separate functions: the preparation of goods for shipment and shipment from the production site; the transportation of goods; the forwarding of goods; the warehousing, storing and inland terminal operation shipping.
The “IRU Resolution on Security in Road Transport” adopted by the IRU General Assembly in November 2002 included the following proposals for governments in addressing land transport systems. • Applyallpossiblepreventivemeasuresinthefightagainstinternationalterrorismandcriminal
activities at national and international levels in cooperation with the road transport industry. • Takeandguideeffectivemeasuresagainstcrimeringsspecializinginsmugglingandhuman
trafficking.

U N E C E T E M A N D T E R P R O J E C T S ’ M A S T E R P L A N – 2 0 1 1
222
• Reinforce the control and application of national law and international conventions,permitting the identification and sanctioning of all beneficiaries of illegal activities.
• Providefairandhumanetreatment,aswellasallnecessaryassistance(legalandotherwise),to all commercial vehicle drivers and owners involved in the transport of illegal immigrants without their knowledge.
• Preservethetradefacilitationbenefitsprovidedbyinternationalcustomstransitsystems,suchas the common transit and the TIR systems.
• Increasetheefficiencyofstatecontrolandcrimepreventionbypolice,otherauthoritiesandlicensed special private organizations against smuggling and laundering of huge financial profits.
• Cooperate with the national organizations representing the transport industry, includingtrade associations, to exchange information.
• Increasethenumberofsecureparkingplacesandprovidemoreaccurateinformationontheirfacilities and location in cooperation with private business.
• Improvebordercrossingconditionsandfacilitiesinordertoreduceaccessbyterroristsandcriminals to drivers, vehicles, cargo and information.
• Makeconsignorsandconsigneesco-responsible for fraudulentand illegalactivities inroadtransport operations.
• Promote international security standards through the World Customs Organization, theWorld Trade Organization and other relevant bodies, to create a secure environment without impeding commerce and tourism, or undermining the efficiency and reliability of the road transport industry.
• Developandapplyeffectiveandefficientmeasures,includingriskmanagement,inaccordancewith cost–benefit analyses.
The report further required transport associations and operators• toimplementintheirdailybusiness,riskmanagementproceduresestablishedbytheprofession,
including all the IRU rules, procedures and recommendations to counter terrorism, crime and fraudulent activities;
• toencouragethedevelopmentofinternalsecuritymanagementsystemswithincompanies,• to reinforce the criteria for access to the facilitiesprovidedbycustoms transit systemsand
association membership, • topromoteandimplementthebesttriedandtestedfraudandcrimepreventionpractices,• tosupporttheuseofmoderninformationandcommunicationtechnologiesindailyoperations,
including vehicle and goods tracking, • to support, recommend and apply the use of industry codes of conduct, rules and
recommendations aimed at making the environment of transport operations secure, • toentrustdangerousgoodstransportsafetyadvisorswiththespecialtaskofreducingtherisk
of terrorism, in partnership with consignors and consignees, • to improve the information flow and quality of driver training with special attention to
security and the risk of terrorism, illegal immigration and fraud, • toexchangeinformationamongstassociationsand,ifnecessary,withthecompetentauthorities,
on issues of relevance in the fight against terrorism, illegal immigration, smuggling and crime, • to cooperate fullyonall issueswithpolice andother authorities including licensed special
private agencies, and • toextendcooperationwithothertransportmodeswithdueregardtoensuringsecurityacross
the complete intermodal transport and supply chains.

E C O N O M I C C O M M I S S I O N F O R E U R O P E
223
The “IRU Road Passenger Transport Security Guidelines” dealt with security issues concerning public transport, and proposed voluntary guidelines for operators. The document discussed recommendations for all aspects of transport security, including specific forms of transportation (e.g. buses), specific situations (i.e. bomb threats) and security suggestions for public transport administrative entities. The report also listed a collection of security-related support materials that can be used in security plans.
Finally, the “IRU Road Transport Security Guidelines” fulfilled a similar purpose for individuals involved in inland transport. Again, the report discussed the possible security measures and proposed voluntary guidelines. It dealt with dangerous goods specifically, providing general provisions for dangerous goods transport and emphasizing the need for the appropriate training of personnel. Finally, the report considered cooperative arrangements with customs and customs officials.
The IRU also recently published facts and figures on “Attacks on Drivers of International Heavy Goods Vehicles”, underlining the fact that the number of vehicle thefts and freight robbery incidents are not only a major security issue, but appear to be increasing in many countries. According to this document, about 17 % of all drivers interviewed had suffered an attack during the past 5 years, and 30 % of the attacked drivers reported that they had been attacked more than once. About two thirds of attacks (66.8 %) happened during the night between 22:00 and 6:00. About 42 % of all the attacks occurred in truck parks, and a further 19 % of them were at motorway service stations. Moreover, some attacks remained unreported for multiple reasons such as language difficulties, lack of trust in the authorities and insufficient information about where and to whom to report. In this connection, the document pointed out that the increasing number of attacks on drivers of international HGVs resulted also from the fact that effective measures to fight crime, such as the provision of a sufficient number of secure truck parking areas, the wider use of protective devices onboard vehicles, the setting up of efficient and accessible incident reporting and recording structures as well as the awareness raising of police forces, are in most countries implemented either insufficiently or not at all.
Rail
In November 2008, the UNECE Working Party on Rail Transport (SC.2) established a Task Force on Rail Security to address selected security issues in the rail sector, including the collection and exchange of information about best practices in securing rail systems, cost–benefit assessments, regional and international cooperation as well as cooperation between government agencies and railway sector. Experts from the public sector and international organizations (the EC, OSJD, OTIF, OSCE, UIC), railway companies as well as those from the business sector took part in this task force.
The task force concluded that for the time being, mandatory rules and standards for railway security at the UNECE level are neither desirable nor necessary. However, best practice guidelines for the installation and use of specific security tools [e.g. closed-circuit television (CCTV) cameras] could be useful for national authorities. Mandatory rules at the national level, tailored to specific security needs, continue to be appropriate as well as mandatory rules at the bilateral or trilateral levels, if needed. Industry representatives in the task force have emphasized that since ordinary crimes present everyday problems for rail operators, practically each network has to set up an organization involving stakeholders to control and reduce these crimes. Counter-terrorism approaches ought to be based on these pre-existing structures created for coping with ordinary criminal activities, and additional responsibilities should be assigned to them.

U N E C E T E M A N D T E R P R O J E C T S ’ M A S T E R P L A N – 2 0 1 1
224
With respect to the international transport of goods and passengers, the task force agreed that guidelines and intergovernmental cooperation are important, although national security regimes need not be uniform. An effective combination of such national risk-adequate diversities and intensive cross-border cooperation may change over time in response to technical progress and emerging threats. Effective methods of managing railway security should be shared and their adoption encouraged across the region. Further cooperation along these lines could lead to the elaboration of an international framework agreement that would leave enough scope for the individual approaches to be adapted efficiently to national conditions.
The task force also recommended to national authorities to develop a suitable architecture for a toolbox of guidelines and good practices. This could be accomplished by setting up a Technical Working Group (TWG) that would become a unique internationally accepted focal point for rail security. The TWG would be asked to analyse existing security requirements and practices, and to produce guidelines and design strategies for an effective sharing of good practices by national authorities and railway industry professionals. It would also develop an international research agenda for rail security. The main rail security guidelines, once developed by the TWG and approved by participating Governments and industry representatives, ought to be promoted by the UNECE and other regional commissions of the UN system. Technically, the toolbox would be a protected website that would help policy makers, law enforcement authorities and designated rail transport professionals to solve security problems.
The task force also agreed that the cost–benefit analysis of rail safety measures can be applied to a limited extent to security problems. Therefore, an appropriate model for appraising rail security risks based on this analysis needs to be developed with the assistance of national and international transport research centres.

E C O N O M I C C O M M I S S I O N F O R E U R O P E
225
14. CONCLUSIONS
The work on the revision of the 2005 TEM and TER Master Plan represents a substantial contribution to the development of road and rail infrastructure in the region and to the integration and harmonization of road and rail infrastructure even beyond Europe. The implementation of the investment strategy of the revised Master Plan would also stimulate the economic growth of the participating countries and be beneficial to their populations. Furthermore, this investment strategy as well as the other results will assist the participating countries in the elaboration and revision of their national master plans and/or of their medium- and long-term transport infrastructure development plans.
However, the work on the revised Master Plan cannot be considered to be complete but should continue; such follow-up work will require the strong desire, commitment and political will of the participating countries as well as close cooperation between the participating countries and their immediate neighbours, the UNECE and the TEM and TER project Central Offices.
These follow-up activities will first and foremost need a permanent monitoring system with continuous data supply with respect to all the topics covered in the TEM and TER Master Plan revision. In particular, this relates to missing information about individual participating country plans, priorities and missing data from some participating countries, as well as to the progress in bringing the Master Plan backbone networks up to the UNECE AGR and AGC requirements and to the TEM and TER standards and recommended practices. Of the same importance will be the monitoring of the implementation of the identified road and rail projects on the basis of commonly accepted technical and operational standards.
The successful implementation of the revised TEM and TER Master Plan and the follow-up work will require in particular the following actions.• Therelevantdatashouldbesupplieddirectlybytheparticipatingcountries tosupportthe
decision-making processes regarding the development of transport infrastructures and to adjust and modify the layout of the backbone networks in order to respond appropriately to the economic development of the countries in the region.
• Amonitoringsystemfortheimplementationoftheidentifiedroadandrailprojectsmustbeestablished to ensure that the investment plan contained in the revised Master Plan is kept up to date. To facilitate the monitoring process, countries participating in the elaboration of the Master Plan who are not yet members of the TEM and TER Projects, may wish to consider full membership.
• The possibilities for external financing of projects which have not fully secured fundingat present should be explored and considered using the ways and methods identified and recommended in Annexes III to VI of Volume II of the final report as well as through PPP schemes.
• Theregularprovisionofdataonroadandrailtrafficflowsintheforthcomingyearsshouldbe assured to permit the verification and updating of the rail and road traffic forecasts for the years 2015 and 2020 in the revised Master Plan in the participating countries and in the region covered.

U N E C E T E M A N D T E R P R O J E C T S ’ M A S T E R P L A N – 2 0 1 1
226
• Changesandrevisionsofnationalmasterplansandapprovednewroadandrailinvestmentplans should be reported as soon as possible to the TEM and TER projects Central Offices so that they can be duly reflected in their transport infrastructure databases as well as in the maps of the 2015 and 2020 backbone network status.
• Reflecting these infrastructure changes as well as the results of the relevant work of therespective bodies of the UNECE and of international organizations and institutions dealing with the road and rail transport, the status of the bottlenecks identified and the situation at border crossings should be monitored and necessary remedial measures proposed.
• Informationaboutthelocationsofneworextendedtranshipmentpoints,seaandmajorriverports, freight villages and logistics centres should be supplied to make it possible to adjust connections to the revised TEM and TER backbone networks.
• TheexperiencegainedbytheparticipatingcountriesregardingtheITSandplans fortheirfuture implementation should be communicated to the TEM and TER projects Central Offices and thus shared with the other countries that participated in the revision of the Master Plan.
• Inthecourseofthefollow-upwork,thedeeperinvolvementofboththeTEMandtheTERprojects in activities aimed at enhancing technical interoperability of the ITS systems at the European level, and especially in the participating countries which are not members of the European Union, should be considered.
• Within the framework of theDecade of Action for Road Safety declared by theUnitedNations, the TEM project should organize, preferably already in 2011, a seminar on road infrastructure safety in which the experience gained in the course of the revision of the Master Plan can be exploited.
• TheGeographicalInformationSystemoftheTEMandTERprojectsCentralOffices,whichinter alia served the purposes of the revision, should be further upgraded and developed.
• A special follow-upprogramme should be established based on regularmonitoring of theprogress in implementation, as described above. The results should be submitted to the sessions of the TEM and TER Steering Committees at least once a year.
• TheTEMandTERprojectsCentralOffices, inclosecollaborationwith theparticipatingcountries and the UNECE, should regularly publish information about the implementation progress and the results of the revised Master Plan.
These actions and activities cannot be treated as single and one-off since the implementation of the revised TEM and TER Master Plan will require that they are carried out on a permanent basis. It is also recommended that the next revision of the TEM and TER Master Plan and of its investment strategy should follow and be carried out in five years, i.e. in the years 2015 to 2016, with the related preparatory work starting as early as 2014.
ECONOMIC COMMISSION FOR EUROPE
Final Report Volume I: Main text
Trans-European Motorway (TEM)Trans-European Railway (TER)
Projects
2011
Printed by the Publishing Service, United Nations, Geneva — GE.12.20689 — February 2012 — ECE/TRANS/183/Rev.2 (Vol. I)
TEM and TER revised
Master Plan
ECE
TEM a
nd TER
revised M
aster Pla
n - Final R
eport - V
olu
me I: M
ain
text
United
Nations