Work from Home & Productivity: Evidence from Personnel ...
37
DISCUSSION PAPER SERIES IZA DP No. 14336 Michael Gibbs Friederike Mengel Christoph Siemroth Work from Home & Productivity: Evidence from Personnel & Analytics Data on IT Professionals MAY 2021
-
Upload
khangminh22 -
Category
Documents
-
view
0 -
download
0
Transcript of Work from Home & Productivity: Evidence from Personnel ...

DISCUSSION PAPER SERIES
IZA DP No. 14336
Michael Gibbs
Friederike Mengel
Christoph Siemroth
Work from Home & Productivity: Evidence from Personnel & Analytics Data on IT Professionals
MAY 2021
Any opinions expressed in this paper are those of the author(s) and not those of IZA. Research published in this series may include views on policy, but IZA takes no institutional policy positions. The IZA research network is committed to the IZA Guiding Principles of Research Integrity.
The IZA Institute of Labor Economics is an independent economic research institute that conducts research in labor economics and offers evidence-based policy advice on labor market issues. Supported by the Deutsche Post Foundation, IZA runs the world’s largest network of economists, whose research aims to provide answers to the global labor market challenges of our time. Our key objective is to build bridges between academic research, policymakers and society.
IZA Discussion Papers often represent preliminary work and are circulated to encourage discussion. Citation of such a paper should account for its provisional character. A revised version may be available directly from the author.
Schaumburg-Lippe-Straße 5–953113 Bonn, Germany
Phone: +49-228-3894-0Email: [email protected] www.iza.org
IZA – Institute of Labor Economics
DISCUSSION PAPER SERIES
ISSN: 2365-9793
IZA DP No. 14336
Work from Home & Productivity: Evidence from Personnel & Analytics Data on IT Professionals
MAY 2021
Michael GibbsUniversity of Chicago and IZA
Friederike MengelUniversity of Essex and Lund University
Christoph SiemrothUniversity of Essex
ABSTRACT
IZA DP No. 14336 MAY 2021
Work from Home & Productivity: Evidence from Personnel & Analytics Data on IT Professionals*
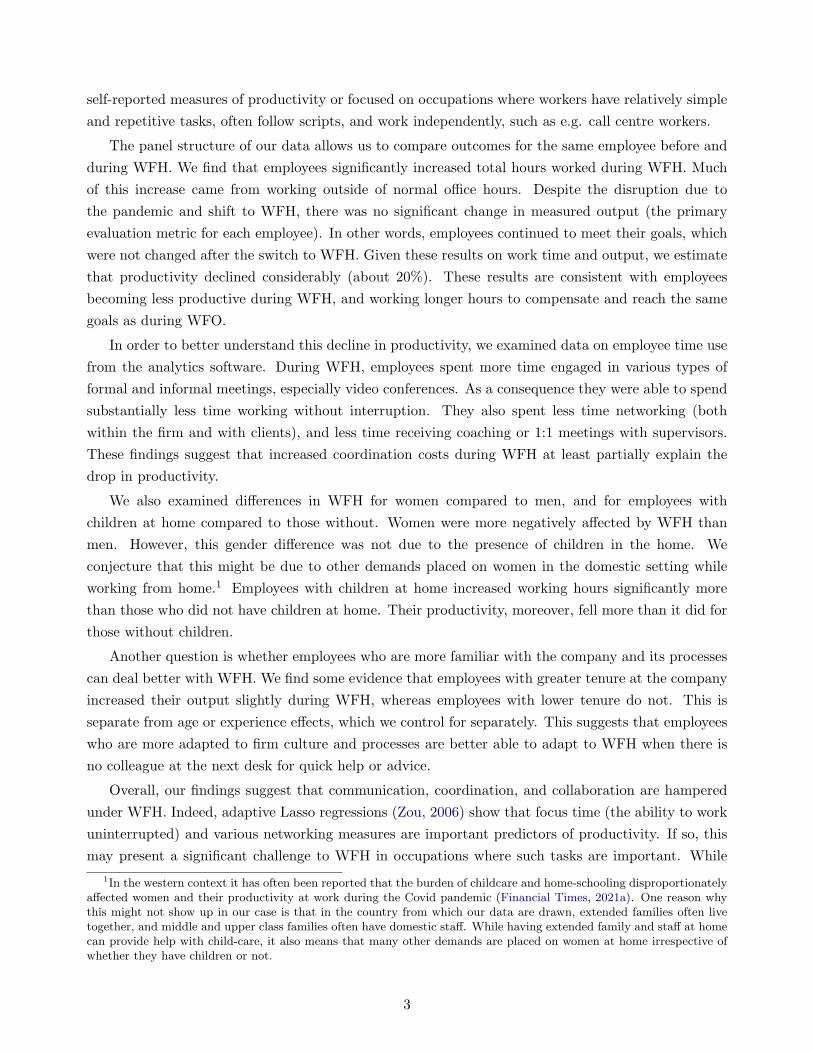
Using personnel and analytics data from over 10,000 skilled professionals at a large Asian IT
services company, we compare productivity before and during the work from home [WFH]
period of the Covid-19 pandemic. Total hours worked increased by roughly 30%, including
a rise of 18% in working after normal business hours. Average output did not significantly
change. Therefore, productivity fell by about 20%. Time spent on coordination activities
and meetings increased, but uninterrupted work hours shrank considerably. Employees also
spent less time networking, and received less coaching and 1:1 meetings with supervisors.
These findings suggest that communication and coordination costs increased substantially
during WFH, and constituted an important source of the decline in productivity. Employees
with children living at home increased hours worked more than those without children at
home, and suffered a bigger decline in productivity than those without children.
JEL Classification: D2, M5
Keywords: collaboration, COVID-19, pandemic, productivity, remote
working, telecommuting, working from home, work hours,
work time
Corresponding author:Michael GibbsUniversity of ChicagoBooth School of Business5807 S. WoodlawnChicago, IL 60637USA
E-mail: [email protected]
* We are grateful to several employees of the company who spent a great deal of time helping us collect the data
and understand the firm and context, during a difficult period of time. We thank the Tata Center for Development at
the University of Chicago for funding that helped cover the cost of WPA licenses. We appreciate helpful comments
from Sonia Bhalotra, Ron Burt, Hans Peter Grüner, Kathryn Ierulli, Tim Perri, Paul Smeets and Wim Van der Stede, and
from seminar participants at the University of Mannheim.

1 Introduction
Working from Home [WFH] has been rising for years, as more occupations use computers and telecom-
munications, more people have reliable home Internet connections, and more families have both parents
working full time. Compared to Working from the Office [WFO], WFH has the potential to reduce
commute time, provide more flexible working hours, increase job satisfaction, and improve work-life
balance. The Covid-19 pandemic forced a dramatic rush to WFH in early 2020 for a large fraction of
the workforce in countries across the world. Even if only a fraction of this shift became permanent, it
would have implications for urban design, infrastructure development and reallocation of investment
from inner cities to residential areas. Of course, it would also have significant implications for how
businesses organize and manage their workforces.
There is significant debate about how effective WFH will be, how much farther we can improve
implementation, and the extent to which firms will continue using WFH. Initial experiences led to
optimism, but many firms are starting to question the sustainability of extensive WFH (WSJ, 2020;
Financial Times, 2021b). One of the most important questions in this context is how WFH affects
productivity. Our knowledge about these issues is thin; to date there are less than a handful of studies
of WFH that use workplace data.
In this paper we provide an analysis of the effects of the switch from WFO to WFH in a large
Asian IT services company. The company abruptly switched all employees to WFH in March 2020,
in response to the largely unanticipated Covid pandemic shock. Our study has several novel and
interesting features. The company provided rich data for a large sample of more than 10,000 employees,
for 17 months before and during WFH, from its personnel records and workforce analytics systems.
It has a highly-developed process for setting goals and tracking progress towards them, culminating
in a primary output measure for each employee.
The data also include information on hours worked, our primary input measure. This is measured in
a sophisticated way, as the analytics software takes into account whether an employee actually engages
in a relevant task (which counts as work time) or merely procrastinates at their desk (not counted), by
monitoring which software tools the employee uses. Our key outcome measure is Productivity, output
divided by hours worked. Thus, in contrast to studies of productivity during WFH based on surveys,
our outcome variables are based on relatively objective analytics and monitoring data.
Moreover, our data include (for a subset of employees) how time was allocated to various activities.
That includes meetings, collaboration, and time focused on performing work without distractions. It
also includes information on networking activities (contacts) with colleagues inside and outside the
firm. Finally, we have data on employee characteristics such as age, experience, tenure at the company,
gender, whether or not there is a child in the home, and an estimate of commute time during WFO.
Of particular note, the setting is highly-skilled professionals in an information technology company.
Virtually all are college educated. The jobs involve significant cognitive work, developing new software
or hardware applications or solutions, collaborating with teams of professionals, working with clients,
and engaging in innovation and continuous improvement. These job characteristics may present sig-
nificant challenges to effective WFH. By contrast, previous studies of WFH productivity either used
2
self-reported measures of productivity or focused on occupations where workers have relatively simple
and repetitive tasks, often follow scripts, and work independently, such as e.g. call centre workers.
The panel structure of our data allows us to compare outcomes for the same employee before and
during WFH. We find that employees significantly increased total hours worked during WFH. Much
of this increase came from working outside of normal office hours. Despite the disruption due to
the pandemic and shift to WFH, there was no significant change in measured output (the primary
evaluation metric for each employee). In other words, employees continued to meet their goals, which
were not changed after the switch to WFH. Given these results on work time and output, we estimate
that productivity declined considerably (about 20%). These results are consistent with employees
becoming less productive during WFH, and working longer hours to compensate and reach the same
goals as during WFO.
In order to better understand this decline in productivity, we examined data on employee time use
from the analytics software. During WFH, employees spent more time engaged in various types of
formal and informal meetings, especially video conferences. As a consequence they were able to spend
substantially less time working without interruption. They also spent less time networking (both
within the firm and with clients), and less time receiving coaching or 1:1 meetings with supervisors.
These findings suggest that increased coordination costs during WFH at least partially explain the
drop in productivity.
We also examined differences in WFH for women compared to men, and for employees with
children at home compared to those without. Women were more negatively affected by WFH than
men. However, this gender difference was not due to the presence of children in the home. We
conjecture that this might be due to other demands placed on women in the domestic setting while
working from home.1 Employees with children at home increased working hours significantly more
than those who did not have children at home. Their productivity, moreover, fell more than it did for
those without children.
Another question is whether employees who are more familiar with the company and its processes
can deal better with WFH. We find some evidence that employees with greater tenure at the company
increased their output slightly during WFH, whereas employees with lower tenure do not. This is
separate from age or experience effects, which we control for separately. This suggests that employees
who are more adapted to firm culture and processes are better able to adapt to WFH when there is
no colleague at the next desk for quick help or advice.
Overall, our findings suggest that communication, coordination, and collaboration are hampered
under WFH. Indeed, adaptive Lasso regressions (Zou, 2006) show that focus time (the ability to work
uninterrupted) and various networking measures are important predictors of productivity. If so, this
may present a significant challenge to WFH in occupations where such tasks are important. While
1In the western context it has often been reported that the burden of childcare and home-schooling disproportionatelyaffected women and their productivity at work during the Covid pandemic (Financial Times, 2021a). One reason whythis might not show up in our case is that in the country from which our data are drawn, extended families often livetogether, and middle and upper class families often have domestic staff. While having extended family and staff at homecan provide help with child-care, it also means that many other demands are placed on women at home irrespective ofwhether they have children or not.
3
WFH is likely to remain a feature of modern workplaces, some aspects of in-person interactions cannot
easily be replicated virtually, including the quality of collaboration and coaching, and “productive
accidents” that arise from spontaneously meeting people (including those with whom there is not yet
have a working relationship).
2 Literature
Our research contributes to a broad agenda in economics trying to understand the determinants of
individual productivity. A significant amount of work has focused on incentive pay (e.g., Lazear,
2000; Hamilton et al., 2003; Shearer, 2004; Babcock et al., 2015; Friebel et al., 2017; Aakvik et al.,
2017; Dohmen and Falk, 2011). Some research looks at the effects of other human resource prac-
tices, particularly those aimed at eliciting employee participation in continuous improvement, and on
complementarities between these policies (Ichniowski et al., 1995; Ichniowski and Shaw, 2003; Bartel
et al., 2007). There is limited research in other areas, such as ways to engage employees in innovation
(Gibbs et al., 2017). Some literature studies the productivity effects of supervisors (Lazear et al.,
2015) or peers (Bandiera et al., 2005; Arcidiacono et al., 2017; Song et al., 2018). Presumably peer
effects would be weaker during WFH as there is no face-to-face interaction and probably less overall
interaction among employees. Our finding of a decline in networking is in line with such a channel.
A smaller literature studies how the work environment shapes productivity. Graff Zivin and Neidell
(2012) find that ozone concentration increases productivity of agricultural workers. Gubler et al. (2018)
find positive impacts on productivity due to health improvements stemming from increases in physical
activity, attention to diet, and other lifestyle changes. Such changes are likely to become relevant for
the long term impact of WFH.
The research that is closest to this paper analyzes Work from Home policies. At the start of the
Covid-19 pandemic, a few papers provided predictions of the likelihood that a job would shift from
WFO to WFH (e.g., Dingel and Neiman, 2020; Adams-Prassl et al., 2020), typically using descriptions
of occupations in classifications such as O*NET. The data studied here are from an industry and set
of occupations which are among those predicted as most likely to be able to effectively switch to
WFH. For example, Dingel and Neiman (2020) list “Computer and Mathematical Occupations” as
the occupation predicted to be most amenable to WFH.
Several surveys appeared soon after, documenting actual incidence of WFH, and perceptions of its
effects (Bick et al., 2020; Brynjolfsson et al., 2020; Von Gaudecker et al., 2020; Gottlieb et al., 2021;
Hensvik et al., 2020). These confirmed that professionals, managers, knowledge workers, and those in
clerical support or data processing jobs made more use of WFH. WFH was more likely among those
with higher education or income. The UK Household Longitudinal Survey indicated that employees
who work from home believe that they are about as productive as they were in the office (Etheridge
et al., 2020). Those who did perceive declines in productivity also experienced lower levels of well-being
from WFH. Bellmann and Hubler (2020) find that working remotely has no long-run effect on work-life
balance, and that a switch to WFH increases job satisfaction only temporarily. Work-life balance may
also be affected by decreased commuting time. Barrero et al. (2020) estimate that during the height
4
of the pandemic, WFH reduced total commuting time among US workers by more than 60 million
hours per work day. Their survey suggests that about 35% of commute time saved was reallocated
to work. In contrast, we do not find that commute times predict increases in work hours. Barrero
et al. (2021) provide evidence from waves of a large panel of US employees who have been working
from home. Their data suggests that the use of WFH will remain four times more prevalent than
it was before the pandemic. Respondents reported benefits from lower commute time, more flexible
work hours, and increased productivity. Moreover, employers have made investments in technology,
revised practices, and moved up the learning curve with respect to WFH. They estimate that the net
effect of these changes, including benefits such as reduced commute time, will be an increase in overall
productivity of about 5%.
Our paper complements these survey studies, as we rely on activity tracking data rather than
self-reported outcomes. Survey data might have downsides in the context of productivity during
WFH, not only because perceptions might be biased, but also because there may be strategic motives
to overstate productivity. For example, when companies struggle, their workers might see increased
chances of retaining their job when claiming to be productive, or workers might overstate productivity
in an effort to retain WFH possibilities after the pandemic. Another possibility is that employees really
mean “output” when questioned about productivity. Our finding of a drop in productivity certainly
contrasts with some survey findings (e.g., Etheridge et al., 2020).
Closest to this paper are the few studies of WFH productivity and other outcomes that use
employment data. Bloom et al. (2015) analyzed random assignment of call-center employees to WFH
at a Chinese firm. Output rose for those assigned to WFH, partly because they worked more hours, and
partly because their productivity increased. Employee satisfaction increased, and attrition declined.
Emanuel and Harrington (2020) studied call-center workers at a large US company, including those
who abruptly moved to WFH in response to Covid-19. Productivity rose in the switch to remote work.
However, average productivity was lower for remote workers than in-office workers. They conclude
that remote work has an adverse selection effect, and more productive workers prefer to be at the
office. If so, that might be a barrier to more widespread implementation in the future.
While those two studies involve call-center workers, Kunn et al. (2020) analyze an occupation
with extremely high cognitive demands: professional chess players. They compare performance of the
same player in tournaments that were in-person to an online tournament during Covid-19, and find
that chess players had lower quality performance when playing online. That said, the highly-unusual
occupation makes it difficult to generalize from their findings.
Our research setting is notable, because it involves a type of employee and job which are important
for innovation and growth, yet may face significant obstacles to fully remote work. The subjected are
skilled professionals. Their jobs are complex, with multiple tasks, high cognitive demands, involve
innovation, and require significant collaboration. This study is one of the first to study WFH for such
professionals.
5
3 Data
The company that provided data is one of the world’s largest IT services companies. They have over
150,000 employees who work with clients across the globe. Most work in the home country, a rapidly-
developing Asian nation. Some of the company’s business involves business-process outsourcing, in
which they perform various technology services on behalf of clients. That includes outsourced product
and process improvement and R&D to develop new products and services.
The company’s workforce is highly skilled and educated. Virtually all have at least a bachelor’s
degree, often in a technology field such as computer engineering or electronics. Most work at the
company’s large, modern corporate campuses in several cities of its home country. These campuses
look and feel very similar to what one sees at Microsoft, Apple or Amazon.
Since the company is dominated by computer engineers and sells IT products and services, it
should not be surprising that they devote significant resources to analyzing organizational practices,
and to implementing intranet systems to manage their workforce. We were provided with anonymized
employee data of various kinds, extracted from these systems.
3.1 Main outcome variables
To track employee activity, the firm uses Sapience Analytics, software that is installed on the em-
ployee’s computer. Employees are aware that Sapience is used in this way. Our three main outcome
variables derive from Sapience records: time worked per day in a month (Input), the percentage of
completed tasks relative to assigned tasks (Output), and Output divided by time worked that month
(Productivity).
Sapience transmits data to an encrypted cloud server, where it is aggregated. Managers use the
analytics reports based on these data to support managerial decisions. The company has devoted
substantial effort into making sure that the data are meaningful and reliable. One of its key uses is
by managers for setting employee goals on key tasks (e.g., completing a software coding project), and
measuring that performance. The company sets and monitors achievement towards goals from the top
of the organization downward. That includes supervisors, who then set subordinate goals. Employees
therefore had implicit incentives to try to hit their goals.
We obtained these data for all employees from the R&D part of the firm who are analyzed via
Sapience. Data cover April 2019 through August 2020, resulting in a panel dataset with 10,384 unique
employees observed over 17 months. The company moved abruptly to WFH in March 2020 as Covid-19
became serious in that country. The company started to partially move back to WFO in late October
2020.
Sapience records the time that an employee is working each month. This tracks which applications
or websites are active, and whether the employee is active (i.e., using the keyboard or mouse). If an
employee procrastinates on a social media platform, and this is not part of that employee’s job, this
would not be recorded as work time. If a programming tool is the active window, this is recorded
as work time. Based on these data, we calculate the outcome variable Input, equal to the average
6
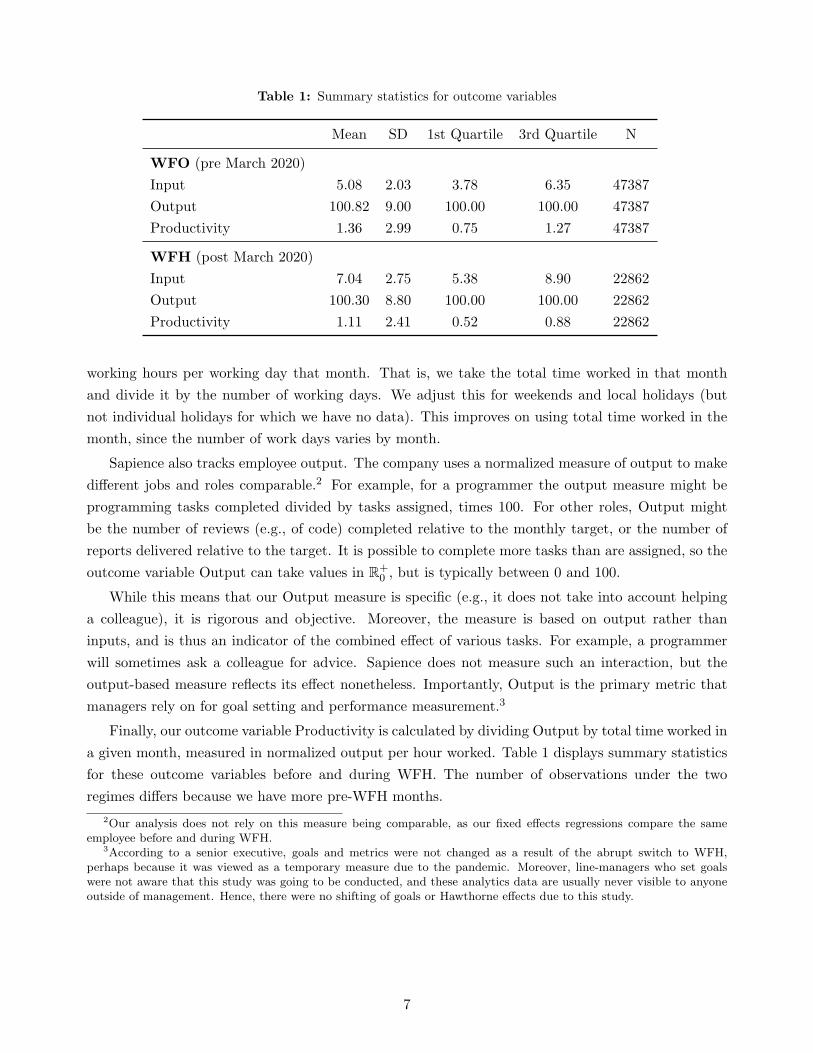
Table 1: Summary statistics for outcome variables
Mean SD 1st Quartile 3rd Quartile N
WFO (pre March 2020)
Input 5.08 2.03 3.78 6.35 47387
Output 100.82 9.00 100.00 100.00 47387
Productivity 1.36 2.99 0.75 1.27 47387
WFH (post March 2020)
Input 7.04 2.75 5.38 8.90 22862
Output 100.30 8.80 100.00 100.00 22862
Productivity 1.11 2.41 0.52 0.88 22862
working hours per working day that month. That is, we take the total time worked in that month
and divide it by the number of working days. We adjust this for weekends and local holidays (but
not individual holidays for which we have no data). This improves on using total time worked in the
month, since the number of work days varies by month.
Sapience also tracks employee output. The company uses a normalized measure of output to make
different jobs and roles comparable.2 For example, for a programmer the output measure might be
programming tasks completed divided by tasks assigned, times 100. For other roles, Output might
be the number of reviews (e.g., of code) completed relative to the monthly target, or the number of
reports delivered relative to the target. It is possible to complete more tasks than are assigned, so the
outcome variable Output can take values in R+0 , but is typically between 0 and 100.
While this means that our Output measure is specific (e.g., it does not take into account helping
a colleague), it is rigorous and objective. Moreover, the measure is based on output rather than
inputs, and is thus an indicator of the combined effect of various tasks. For example, a programmer
will sometimes ask a colleague for advice. Sapience does not measure such an interaction, but the
output-based measure reflects its effect nonetheless. Importantly, Output is the primary metric that
managers rely on for goal setting and performance measurement.3
Finally, our outcome variable Productivity is calculated by dividing Output by total time worked in
a given month, measured in normalized output per hour worked. Table 1 displays summary statistics
for these outcome variables before and during WFH. The number of observations under the two
regimes differs because we have more pre-WFH months.
2Our analysis does not rely on this measure being comparable, as our fixed effects regressions compare the sameemployee before and during WFH.
3According to a senior executive, goals and metrics were not changed as a result of the abrupt switch to WFH,perhaps because it was viewed as a temporary measure due to the pandemic. Moreover, line-managers who set goalswere not aware that this study was going to be conducted, and these analytics data are usually never visible to anyoneoutside of management. Hence, there were no shifting of goals or Hawthorne effects due to this study.
7
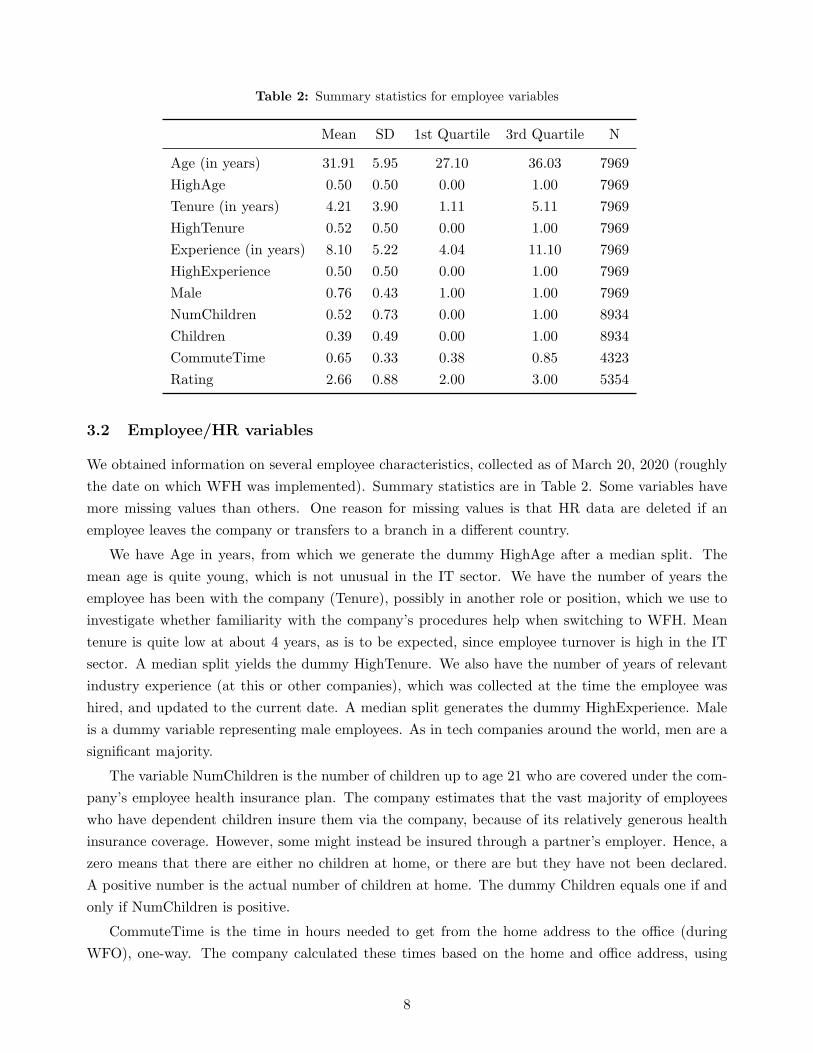
Table 2: Summary statistics for employee variables
Mean SD 1st Quartile 3rd Quartile N
Age (in years) 31.91 5.95 27.10 36.03 7969
HighAge 0.50 0.50 0.00 1.00 7969
Tenure (in years) 4.21 3.90 1.11 5.11 7969
HighTenure 0.52 0.50 0.00 1.00 7969
Experience (in years) 8.10 5.22 4.04 11.10 7969
HighExperience 0.50 0.50 0.00 1.00 7969
Male 0.76 0.43 1.00 1.00 7969
NumChildren 0.52 0.73 0.00 1.00 8934
Children 0.39 0.49 0.00 1.00 8934
CommuteTime 0.65 0.33 0.38 0.85 4323
Rating 2.66 0.88 2.00 3.00 5354
3.2 Employee/HR variables
We obtained information on several employee characteristics, collected as of March 20, 2020 (roughly
the date on which WFH was implemented). Summary statistics are in Table 2. Some variables have
more missing values than others. One reason for missing values is that HR data are deleted if an
employee leaves the company or transfers to a branch in a different country.
We have Age in years, from which we generate the dummy HighAge after a median split. The
mean age is quite young, which is not unusual in the IT sector. We have the number of years the
employee has been with the company (Tenure), possibly in another role or position, which we use to
investigate whether familiarity with the company’s procedures help when switching to WFH. Mean
tenure is quite low at about 4 years, as is to be expected, since employee turnover is high in the IT
sector. A median split yields the dummy HighTenure. We also have the number of years of relevant
industry experience (at this or other companies), which was collected at the time the employee was
hired, and updated to the current date. A median split generates the dummy HighExperience. Male
is a dummy variable representing male employees. As in tech companies around the world, men are a
significant majority.
The variable NumChildren is the number of children up to age 21 who are covered under the com-
pany’s employee health insurance plan. The company estimates that the vast majority of employees
who have dependent children insure them via the company, because of its relatively generous health
insurance coverage. However, some might instead be insured through a partner’s employer. Hence, a
zero means that there are either no children at home, or there are but they have not been declared.
A positive number is the actual number of children at home. The dummy Children equals one if and
only if NumChildren is positive.
CommuteTime is the time in hours needed to get from the home address to the office (during
WFO), one-way. The company calculated these times based on the home and office address, using
8
the Google Maps API to incorporate factors such as traffic and not merely distance. Thus, it is an
estimate of the usual time taken, assuming that an employee commutes by car.4 The address data
is often not complete, so we have more missing values here than in the other variables. Moreover,
we discarded extreme values (larger than 2 hours). According to the company these are cases where
commute time is unreliable; for example, an employee actually worked at a client’s office closer to
home, not the company office where his or her team is located.
Rating is the supervisor’s subjective evaluation of the employee on an integer scale of 1 to 5, where
1 is the best rating. We have the most recent rating from May/June 2020. Sapience outcome measures
are predictive of performance ratings: mean input and mean productivity in the months prior to the
rating significantly improve that rating (see Table A.1 in the Appendix). The effect of Output on
the rating is not monotone. Figure B.1 in the Appendix plots kernel density estimates of subjective
ratings for different levels of Output. Ratings generally rise with Output, but the opposite is true for
Output that substantially exceeds the target. One possible interpretation is that such an employee
has given too much emphasis to quantified aspects of performance, and the supervisor gives a lower
subjective rating to reflect too little emphasis on qualitative aspects of work. Another is that the
target was too easy to achieve. Overall, this is strong evidence that the Sapience outcome measures
are meaningful.
3.3 Workplace Analytics Data
Workplace Analytics [WPA] is a tool developed by Microsoft that many companies use to track and
analyze various aspects of their workforces. For example, it can be used to analyze collaboration
or professional networking activity, by using data on emails, calendar appointments, amount of time
spent in meetings, etc. WPA data are starting to be used in organizational studies (Brynjolfsson and
McAfee, 2012; Hoffmann et al., 2012; Levenson, 2018).
The company has been considering adoption of this tool. For the purposes of this study they
purchased 914 licenses to apply to a subset of employees in our full sample. Appendix Table A.2
compares the characteristics of those in the WPA sample to those not in the WPA sample. The WPA
group are slightly younger, have lower tenure and are less productive, but are overall quite similar on
average. Because WPA is based on data from Outlook and other systems, the company was able to
extract retrospective measures for the pre-WFH period as well as for the WFH period.
Table 3 summarizes the variables obtained from WPA. WPA data were collected at the weekly
level. We have 10 weeks of data before WFH (starting January 1, 2020) and 24 weeks of data during
WFH (ending September 6, 2020). The switch to WFH happened in the week starting March 16.
Variables fall into several categories. Working Hours measures overall time worked by the employee,
not only the time where they actively move the mouse or use the keyboard. While this variable is
measured using different definitions, frequencies (weekly vs monthly) and software than the Sapience
variable Input discussed above, they are nevertheless significantly correlated (ρ = 0.1160∗∗∗). This is
4Of course, some employees might use public transport, but we have no information about the mode of travel.
9
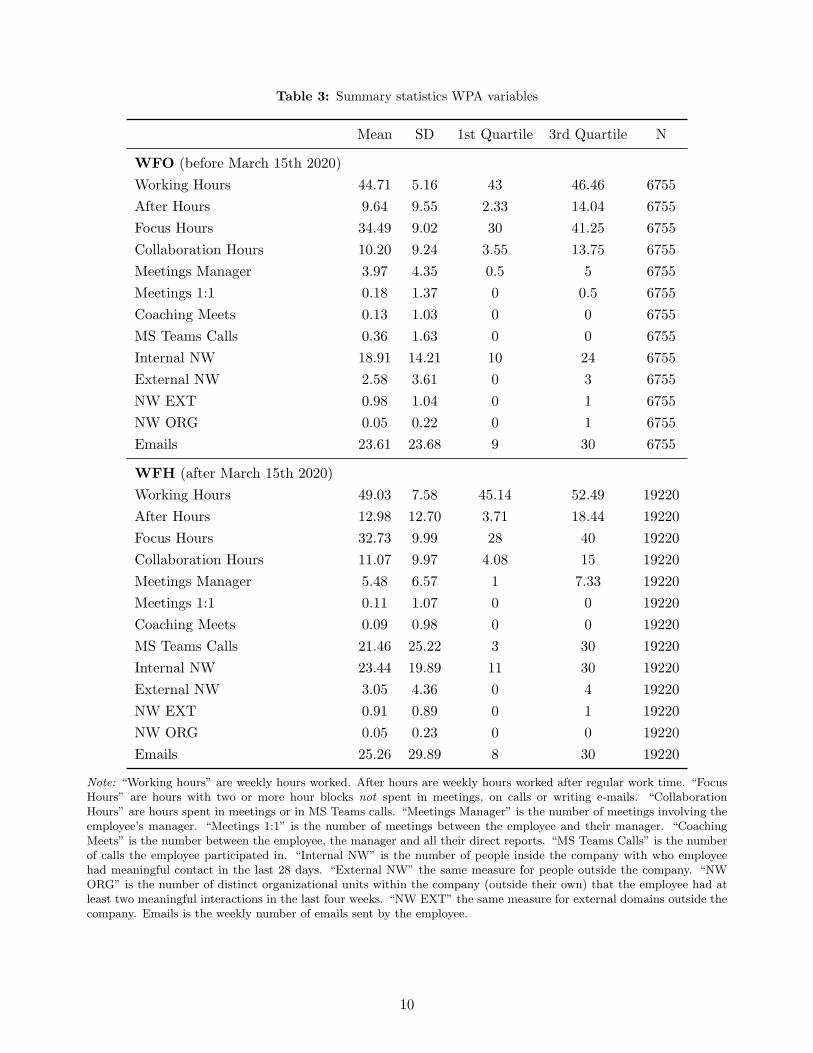
Table 3: Summary statistics WPA variables
Mean SD 1st Quartile 3rd Quartile N
WFO (before March 15th 2020)
Working Hours 44.71 5.16 43 46.46 6755
After Hours 9.64 9.55 2.33 14.04 6755
Focus Hours 34.49 9.02 30 41.25 6755
Collaboration Hours 10.20 9.24 3.55 13.75 6755
Meetings Manager 3.97 4.35 0.5 5 6755
Meetings 1:1 0.18 1.37 0 0.5 6755
Coaching Meets 0.13 1.03 0 0 6755
MS Teams Calls 0.36 1.63 0 0 6755
Internal NW 18.91 14.21 10 24 6755
External NW 2.58 3.61 0 3 6755
NW EXT 0.98 1.04 0 1 6755
NW ORG 0.05 0.22 0 1 6755
Emails 23.61 23.68 9 30 6755
WFH (after March 15th 2020)
Working Hours 49.03 7.58 45.14 52.49 19220
After Hours 12.98 12.70 3.71 18.44 19220
Focus Hours 32.73 9.99 28 40 19220
Collaboration Hours 11.07 9.97 4.08 15 19220
Meetings Manager 5.48 6.57 1 7.33 19220
Meetings 1:1 0.11 1.07 0 0 19220
Coaching Meets 0.09 0.98 0 0 19220
MS Teams Calls 21.46 25.22 3 30 19220
Internal NW 23.44 19.89 11 30 19220
External NW 3.05 4.36 0 4 19220
NW EXT 0.91 0.89 0 1 19220
NW ORG 0.05 0.23 0 0 19220
Emails 25.26 29.89 8 30 19220
Note: “Working hours” are weekly hours worked. After hours are weekly hours worked after regular work time. “FocusHours” are hours with two or more hour blocks not spent in meetings, on calls or writing e-mails. “CollaborationHours” are hours spent in meetings or in MS Teams calls. “Meetings Manager” is the number of meetings involving theemployee’s manager. “Meetings 1:1” is the number of meetings between the employee and their manager. “CoachingMeets” is the number between the employee, the manager and all their direct reports. “MS Teams Calls” is the numberof calls the employee participated in. “Internal NW” is the number of people inside the company with who employeehad meaningful contact in the last 28 days. “External NW” the same measure for people outside the company. “NWORG” is the number of distinct organizational units within the company (outside their own) that the employee had atleast two meaningful interactions in the last four weeks. “NW EXT” the same measure for external domains outside thecompany. Emails is the weekly number of emails sent by the employee.
10
not surprising, as both are measures relating to the amount of time worked. After Hours measures
the number of weekly hours worked outside of regular office hours.
A second group of variables (Focus Hours, Collaboration Hours, Meetings Manager, Meetings 1:1,
Coaching Meets and MS Teams Calls) relate to meetings. Collaboration Hours is the total time
spent in these various forms of meetings. Focus Hours is time that is uninterrupted by meetings,
calls or emails. It is hence a measure of the amount of time the employee can work in a focused
or concentrated manner on a task. The latter four variables measure time in meetings by structure
and purpose. Meetings Manager is the number of meetings the employee attends that involve their
manager, and Meetings 1:1 are personal meetings between the employee and manager. Coaching
Meets is the number of meetings involving the employee, their manager and all of the manager’s
direct reports. MS Teams Calls is the number of calls using MS Teams (a virtual meeting platform
similar to Zoom).
Appendix Table A.3 shows (pre WFH) pairwise correlations between these meeting related vari-
ables. As expected, all types of meetings negatively correlate with Focus Hours, with the most negative
correlation coming from overall collaboration hours and Meetings Manager. All pairwise correlations
are statistically significant at the 1% level. The different types of meetings are positively related among
each other, but with smaller correlation coefficients. These correlations are positive both across em-
ployees – some job roles involve more meetings than others – and across time – some periods involve
more meetings of all types.
The third group of variables (Internal NW, External NW, NW EXT, NW ORG, Emails) relate to
networking with colleagues and clients more explicitly. The first two measure the number of individual
people (inside and outside of the company, respectively) with whom the employee had contact during
that period. The latter two measure the number of business units (e.g., teams) involved in those
contacts. These measure the breadth of the employee’s communications and networking contacts.
Appendix Table A.4 shows the (pre WFH) pairwise correlation between these networking related
variables. All correlations are positive and highly statistically significant, across employees as well as
across time.
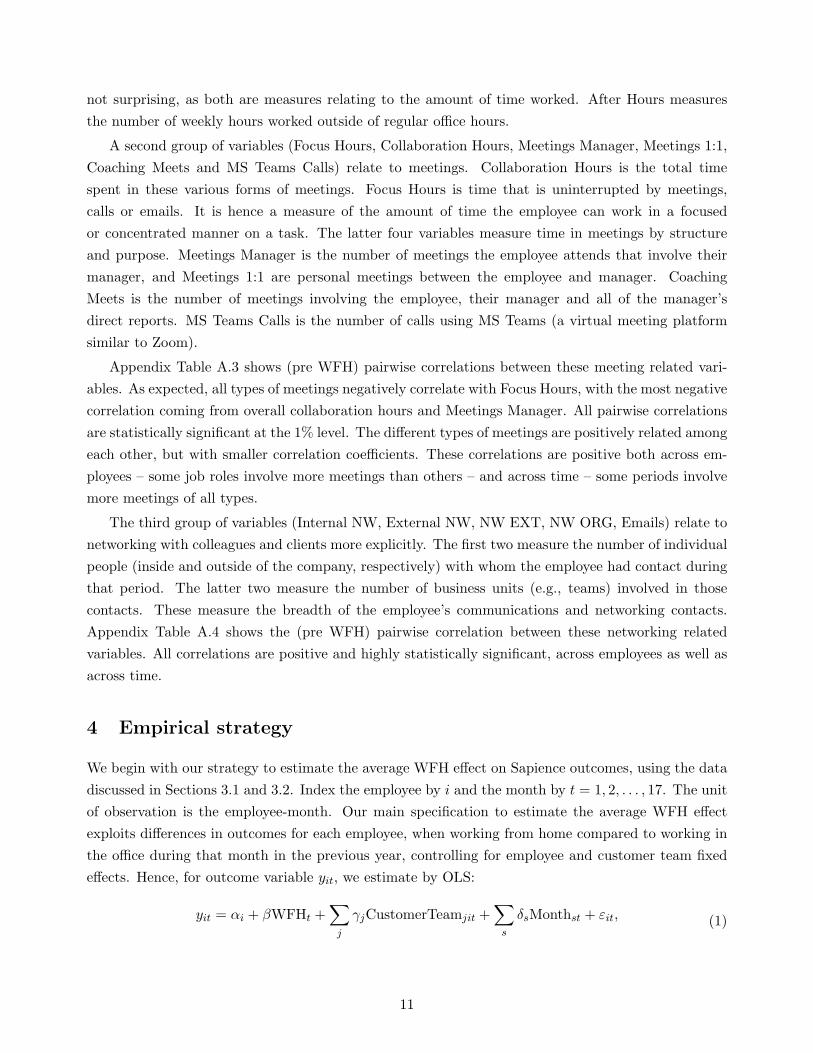
4 Empirical strategy
We begin with our strategy to estimate the average WFH effect on Sapience outcomes, using the data
discussed in Sections 3.1 and 3.2. Index the employee by i and the month by t = 1, 2, . . . , 17. The unit
of observation is the employee-month. Our main specification to estimate the average WFH effect
exploits differences in outcomes for each employee, when working from home compared to working in
the office during that month in the previous year, controlling for employee and customer team fixed
effects. Hence, for outcome variable yit, we estimate by OLS:
yit = αi + βWFHt +∑
j
γjCustomerTeamjit +∑
s
δsMonthst + εit, (1)
11
where WFH is a dummy variable indicating months working from home, CustomerTeamjit is a dummy
variable equal to one if and only if employee i in month t was part of team j, and Monthst is a dummy
variable equal to one if and only if s = t. In addition, we report an alternative specification controlling
for a linear rather than seasonal time trend:
yit = αi + βWFHt +∑
j
γjCustomerTeamjit + δt+ εit. (2)
To analyze which factors influence the WFH effect, we interact the WFH dummy in the previous spec-
ifications with additional explanatory variables X1i,X2i, . . .. Because the Xji variables are employee
specific but time invariant, we do not separately control for them, as this is already achieved by the
employee fixed effects.5
We exclude March 2020 (t = 12) from regressions,6 because our main outcome variables are
collected at the monthly level, and working from home started in mid-March 2020. Thus, this month
is neither purely WFO nor WFH. Moreover, it is likely that WFH increased in the days prior to the
official WFH start, so the switch date was not clear-cut. An implication of excluding March 2020 is
that teething problems and short-term adaption effects are not reflected in our estimate.7
For our analysis of mechanisms, we rely on the WPA data described above. Here our empirical
strategy is identical to the one described in equation (2), except that we control for weekly instead
of monthly time trends, as these data are available weekly. Hence, in these regressions t = 1, ..., 34
represents weeks. For all types of analyses we cluster standard errors at the employee level.
5 Results
This section contains our main results. We discuss the average effect of WFH on Input, Output and
Productivity in Section 5.1, the heterogeneity of these effects in Section 5.2, and potential mechanisms
explaining these findings in Section 5.3.
5.1 Average WFH effect
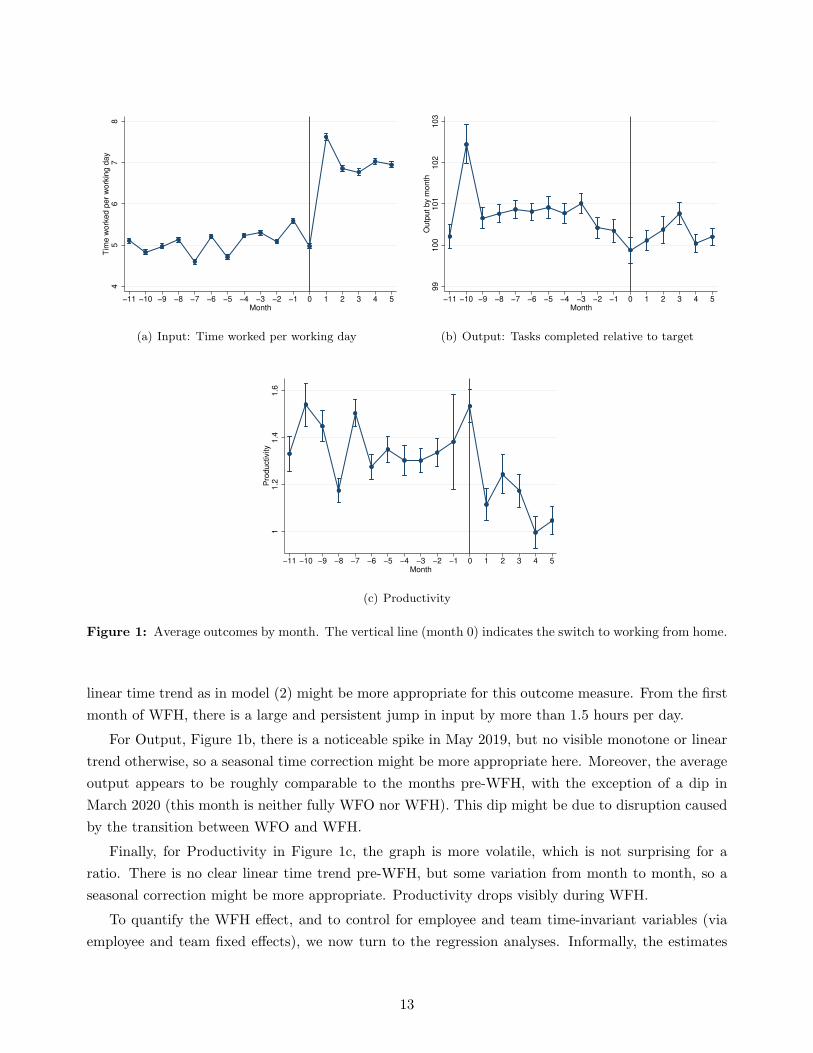
Before proceeding to the regression analysis, Figure 1 plots the three main outcomes by month to get
an intuitive idea about the WFH effect. This will also help us understand which of the econometric
models (1) and (2) seems the most appropriate method of controlling for time trends.
According to Figure 1a, Input, employees provide about 5-5.5 hours of daily input; i.e., time in
which they are actively using their software or programming tools. As time is only recorded as “active”
when there is activity on the keyboard or the mouse, this number is lower than overall working hours.
There is relatively little variation in average input pre-WFH, with a slight upward trend. Hence, a
5While age, tenure, and experience are not time invariant, our sample window is only 17 months, so there is nomeaningful variation during that window. Hence, to avoid collinearity issues, we use only employee fixed effects.
6This month is nevertheless plotted in the graphs.7For example, not every employee had suitable hardware at home to work with in the days after the switch. This was
fixed quickly, but can explain some of the noticeable drops in time worked and output in March 2020, see Figure 1a.
12
45
67
8T
ime
wo
rke
d p
er
wo
rkin
g d
ay
−11 −10 −9 −8 −7 −6 −5 −4 −3 −2 −1 0 1 2 3 4 5Month
(a) Input: Time worked per working day
99
10
01
01
10
21
03
Ou
tpu
t b
y m
on
th
−11 −10 −9 −8 −7 −6 −5 −4 −3 −2 −1 0 1 2 3 4 5Month
(b) Output: Tasks completed relative to target
11
.21
.41
.6P
rod
uctivity
−11 −10 −9 −8 −7 −6 −5 −4 −3 −2 −1 0 1 2 3 4 5Month
(c) Productivity
Figure 1: Average outcomes by month. The vertical line (month 0) indicates the switch to working from home.
linear time trend as in model (2) might be more appropriate for this outcome measure. From the first
month of WFH, there is a large and persistent jump in input by more than 1.5 hours per day.
For Output, Figure 1b, there is a noticeable spike in May 2019, but no visible monotone or linear
trend otherwise, so a seasonal time correction might be more appropriate here. Moreover, the average
output appears to be roughly comparable to the months pre-WFH, with the exception of a dip in
March 2020 (this month is neither fully WFO nor WFH). This dip might be due to disruption caused
by the transition between WFO and WFH.
Finally, for Productivity in Figure 1c, the graph is more volatile, which is not surprising for a
ratio. There is no clear linear time trend pre-WFH, but some variation from month to month, so a
seasonal correction might be more appropriate. Productivity drops visibly during WFH.
To quantify the WFH effect, and to control for employee and team time-invariant variables (via
employee and team fixed effects), we now turn to the regression analyses. Informally, the estimates
13
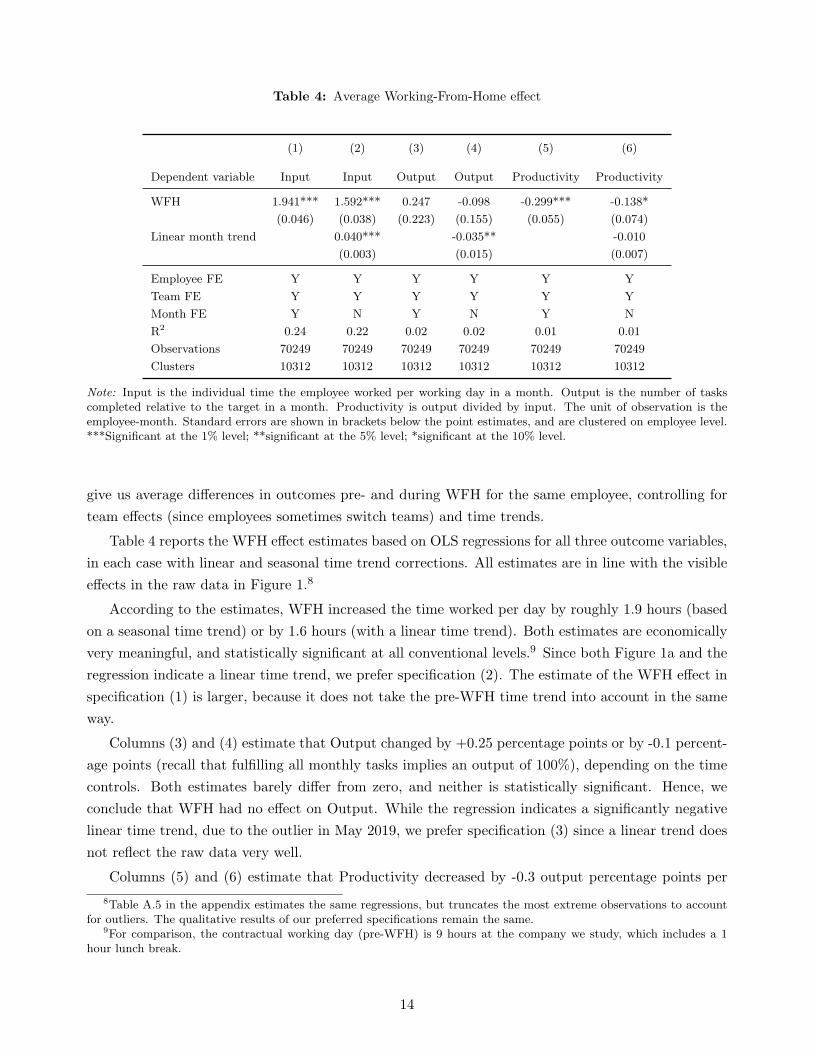
Table 4: Average Working-From-Home effect
(1) (2) (3) (4) (5) (6)
Dependent variable Input Input Output Output Productivity Productivity
WFH 1.941*** 1.592*** 0.247 -0.098 -0.299*** -0.138*
(0.046) (0.038) (0.223) (0.155) (0.055) (0.074)
Linear month trend 0.040*** -0.035** -0.010
(0.003) (0.015) (0.007)
Employee FE Y Y Y Y Y Y
Team FE Y Y Y Y Y Y
Month FE Y N Y N Y N
R2 0.24 0.22 0.02 0.02 0.01 0.01
Observations 70249 70249 70249 70249 70249 70249
Clusters 10312 10312 10312 10312 10312 10312
Note: Input is the individual time the employee worked per working day in a month. Output is the number of taskscompleted relative to the target in a month. Productivity is output divided by input. The unit of observation is theemployee-month. Standard errors are shown in brackets below the point estimates, and are clustered on employee level.***Significant at the 1% level; **significant at the 5% level; *significant at the 10% level.
give us average differences in outcomes pre- and during WFH for the same employee, controlling for
team effects (since employees sometimes switch teams) and time trends.
Table 4 reports the WFH effect estimates based on OLS regressions for all three outcome variables,
in each case with linear and seasonal time trend corrections. All estimates are in line with the visible
effects in the raw data in Figure 1.8
According to the estimates, WFH increased the time worked per day by roughly 1.9 hours (based
on a seasonal time trend) or by 1.6 hours (with a linear time trend). Both estimates are economically
very meaningful, and statistically significant at all conventional levels.9 Since both Figure 1a and the
regression indicate a linear time trend, we prefer specification (2). The estimate of the WFH effect in
specification (1) is larger, because it does not take the pre-WFH time trend into account in the same
way.
Columns (3) and (4) estimate that Output changed by +0.25 percentage points or by -0.1 percent-
age points (recall that fulfilling all monthly tasks implies an output of 100%), depending on the time
controls. Both estimates barely differ from zero, and neither is statistically significant. Hence, we
conclude that WFH had no effect on Output. While the regression indicates a significantly negative
linear time trend, due to the outlier in May 2019, we prefer specification (3) since a linear trend does
not reflect the raw data very well.
Columns (5) and (6) estimate that Productivity decreased by -0.3 output percentage points per
8Table A.5 in the appendix estimates the same regressions, but truncates the most extreme observations to accountfor outliers. The qualitative results of our preferred specifications remain the same.
9For comparison, the contractual working day (pre-WFH) is 9 hours at the company we study, which includes a 1hour lunch break.
14
hour worked, or by 0.14 output percentage points per hour worked, depending on the time controls.
Both are economically significant: if employees worked a fixed 40 hours per week, this would imply
a drop in output of 12 or 5.6 output percentage points in a week. In other words, if employees had
not increased the time worked during WFH, on average they would have completed only 88-94 of
100 tasks they were assigned. The WFH effect in specification (6) is significantly different from zero
only at the 10% confidence level, whereas the effect in specification (5) is statistically significant at
all conventional levels. We prefer specification (5), since both the plot and the linear time trend
coefficient indicate that a linear trend is not as appropriate.10
In summary, this evidence indicates that employees worked longer but less productively, with out-
put remaining about the same. Thus, there appear to be two countervailing effects on output that
roughly offset each other. Our interpretation of these patterns is that employees are less productive
during WFH, but still aim to reach the same output or goals, hence they work more until the same
output level is reached. In the next sections, additional results will support the interpretation that de-
creased productivity—due to more distractions and increased coordination costs—and a compensating
increase in work hours explain these patterns.
A potential alternative explanation for the jump in time worked during WFH might be that
employees are “gaming” or manipulating the Input numbers, rather than working more to compensate
for a loss in productivity. It is unlikely that this is driving our results for the following reasons.
First, Sapience time measurement is sophisticated and designed to be resilient to simple manipulation
attempts. Merely keeping the computer on for longer or watching videos instead of working does
not increase Input. Rather, it would require having the relevant work software as the active window,
and giving continuous user input (via mouse, keyboard). Employees would have to put in significant
effort to figure this out and actually do the manipulation – time that could be spent actually working.
Second, gaming time measurement in Sapience would not translate into increases in the other time
measurement in WPA.11 This is because the WPA time recording is from activity in MS Outlook,
MS Teams etc., rather than programming tools or similar, and is not dependent on mouse/keyboard
activity. Yet, the WFH effect we see with this alternative time measurement is very similar, see
section 5.3. Third, employees are not paid by the hour, so there is no direct financial incentive to
ramp up hours. To impress superiors to further one’s career, time is better spent generating output
than manipulating input measurements. Fourth, Sapience was in use long before the switch to WFH,
so this potential concern cannot explain the WFH effect well. Fifth, the additional WFH effects we
find from WPA activity (section 5.3), such as more time spent on conference calls and fewer focus
hours, cannot be explained by the “gaming” explanation.
10We also estimated the productivity regression without time controls. The WFH estimate is -0.2 output percent-age points per hour worked with a t-statistic of -6.8; i.e., a highly significant effect that is consistent with the otherspecifications.
11Unlike Sapience, employees were not aware of the use of WPA analytics. WPA licenses were purchased for the firsttime and for this study specifically. Very few people at the company knew about it and had access to these data.
15
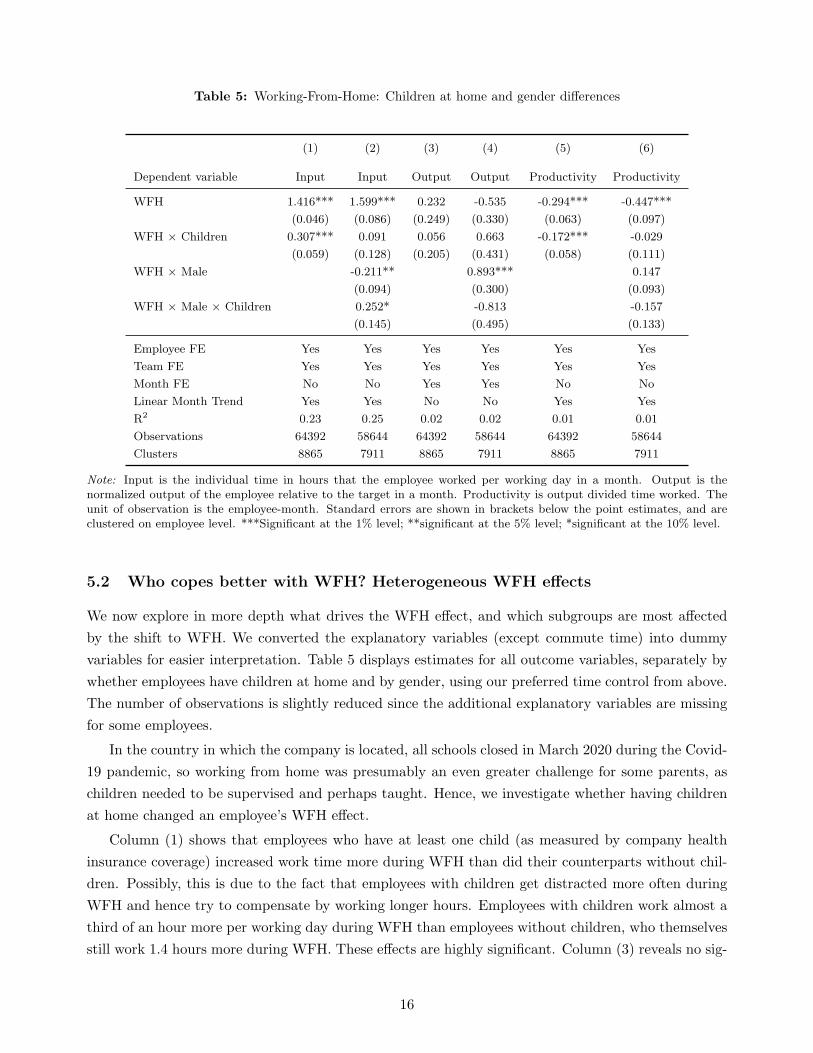
Table 5: Working-From-Home: Children at home and gender differences
(1) (2) (3) (4) (5) (6)
Dependent variable Input Input Output Output Productivity Productivity
WFH 1.416*** 1.599*** 0.232 -0.535 -0.294*** -0.447***
(0.046) (0.086) (0.249) (0.330) (0.063) (0.097)
WFH × Children 0.307*** 0.091 0.056 0.663 -0.172*** -0.029
(0.059) (0.128) (0.205) (0.431) (0.058) (0.111)
WFH × Male -0.211** 0.893*** 0.147
(0.094) (0.300) (0.093)
WFH × Male × Children 0.252* -0.813 -0.157
(0.145) (0.495) (0.133)
Employee FE Yes Yes Yes Yes Yes Yes
Team FE Yes Yes Yes Yes Yes Yes
Month FE No No Yes Yes No No
Linear Month Trend Yes Yes No No Yes Yes
R2 0.23 0.25 0.02 0.02 0.01 0.01
Observations 64392 58644 64392 58644 64392 58644
Clusters 8865 7911 8865 7911 8865 7911
Note: Input is the individual time in hours that the employee worked per working day in a month. Output is thenormalized output of the employee relative to the target in a month. Productivity is output divided time worked. Theunit of observation is the employee-month. Standard errors are shown in brackets below the point estimates, and areclustered on employee level. ***Significant at the 1% level; **significant at the 5% level; *significant at the 10% level.
5.2 Who copes better with WFH? Heterogeneous WFH effects
We now explore in more depth what drives the WFH effect, and which subgroups are most affected
by the shift to WFH. We converted the explanatory variables (except commute time) into dummy
variables for easier interpretation. Table 5 displays estimates for all outcome variables, separately by
whether employees have children at home and by gender, using our preferred time control from above.
The number of observations is slightly reduced since the additional explanatory variables are missing
for some employees.
In the country in which the company is located, all schools closed in March 2020 during the Covid-
19 pandemic, so working from home was presumably an even greater challenge for some parents, as
children needed to be supervised and perhaps taught. Hence, we investigate whether having children
at home changed an employee’s WFH effect.
Column (1) shows that employees who have at least one child (as measured by company health
insurance coverage) increased work time more during WFH than did their counterparts without chil-
dren. Possibly, this is due to the fact that employees with children get distracted more often during
WFH and hence try to compensate by working longer hours. Employees with children work almost a
third of an hour more per working day during WFH than employees without children, who themselves
still work 1.4 hours more during WFH. These effects are highly significant. Column (3) reveals no sig-
16
nificant change in the WFH effect on output with children at home. However, column (5) shows that
the increased working time implies a larger drop in productivity when there are children at home,
which is about a 60% larger productivity drop compared to employees without children at home.
Consequently, the patterns we have seen for the average employee are exacerbated for employees with
children.
The even columns in Table 5 investigate whether there was a gender difference in how the outcomes
changed during WFH, conditional on whether there were children at home.
The WFH × Male interaction represents the difference in the WFH effect between male and
female employees without children. Male employees without children increased working time by about
0.2 hours less per day than did female employees without children, a significant effect. These male
employees also increased their output by about 0.9 percentage points more during WFH than did
their female counterparts. These estimates imply that male employees were able to adapt better to
WFH than female employees, if there were no children at home. This suggests a gender difference in
the WFH effect that is unrelated to childcare responsibilities. We conjecture that this may be due to
the greater demands placed on women in the domestic setting.12
The WFH × Children interaction represents the difference in the WFH effect between female
employees with and without children. Female employees with children did not significantly increase
working time during WFH compared to female employees without children, nor did their output or
productivity significantly differ.
Finally, the WFH × Male × Children interaction is the difference in the WFH effect between
male and female employees with children. The difference in time worked reverses, and male employees
increase work time during WFH more than female employees do if there are children at home, but
this effect is significant only at the 10% level. There is no difference in other outcome measures.
Our analysis therefore shows that female employees are more adversely affected by WFH, but this
is not due to child care responsibilities. The latter finding contrasts with much of the narrative in
western countries, where childcare responsibilities are given as a main reason why women are more
adversely affected by WFH (Financial Times, 2021a). This does not seem to be the dominant effect
in this country. Instead, we conjecture it is the greater expectations placed on women by parents and
parents-in-law in the domestic setting that generates the gender difference.
Next, we investigate whether employees with more industry experience or company tenure were
affected differently by WFH. One reason this could be the case is that they have greater institutional
knowledge and social capital, and are less reliant on help from colleagues or find it relatively easier to
obtain during WFH.
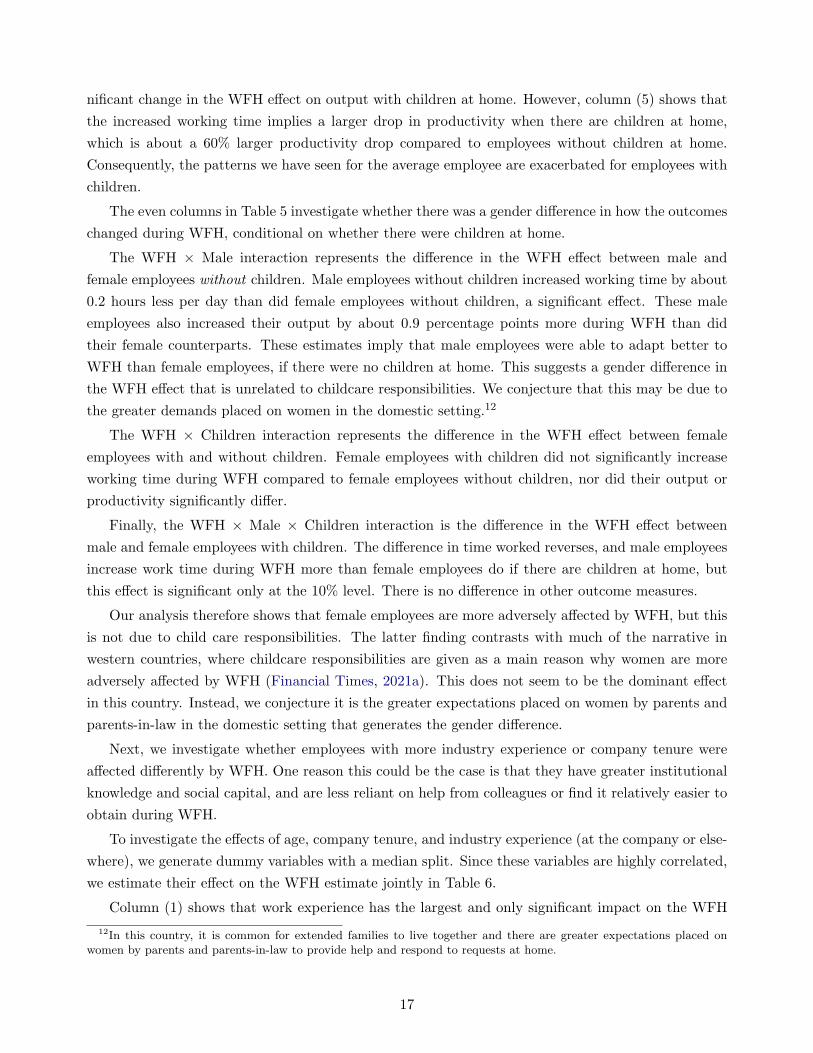
To investigate the effects of age, company tenure, and industry experience (at the company or else-
where), we generate dummy variables with a median split. Since these variables are highly correlated,
we estimate their effect on the WFH estimate jointly in Table 6.
Column (1) shows that work experience has the largest and only significant impact on the WFH
12In this country, it is common for extended families to live together and there are greater expectations placed onwomen by parents and parents-in-law to provide help and respond to requests at home.
17
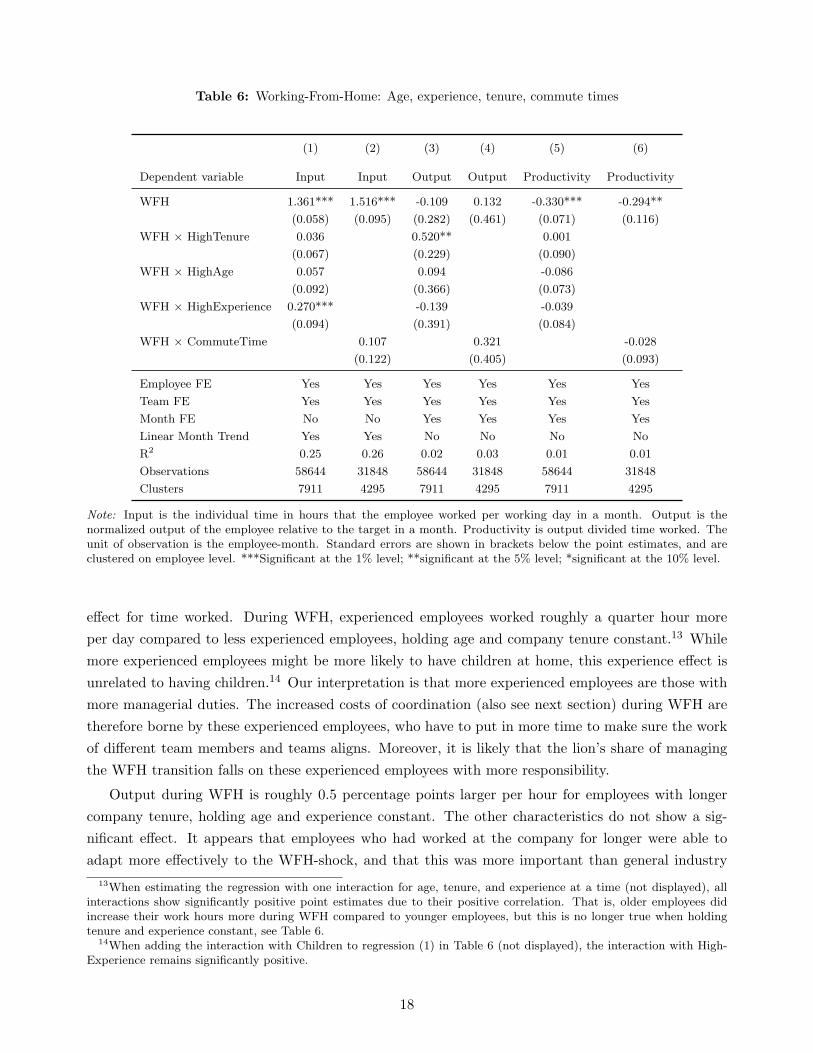
Table 6: Working-From-Home: Age, experience, tenure, commute times
(1) (2) (3) (4) (5) (6)
Dependent variable Input Input Output Output Productivity Productivity
WFH 1.361*** 1.516*** -0.109 0.132 -0.330*** -0.294**
(0.058) (0.095) (0.282) (0.461) (0.071) (0.116)
WFH × HighTenure 0.036 0.520** 0.001
(0.067) (0.229) (0.090)
WFH × HighAge 0.057 0.094 -0.086
(0.092) (0.366) (0.073)
WFH × HighExperience 0.270*** -0.139 -0.039
(0.094) (0.391) (0.084)
WFH × CommuteTime 0.107 0.321 -0.028
(0.122) (0.405) (0.093)
Employee FE Yes Yes Yes Yes Yes Yes
Team FE Yes Yes Yes Yes Yes Yes
Month FE No No Yes Yes Yes Yes
Linear Month Trend Yes Yes No No No No
R2 0.25 0.26 0.02 0.03 0.01 0.01
Observations 58644 31848 58644 31848 58644 31848
Clusters 7911 4295 7911 4295 7911 4295
Note: Input is the individual time in hours that the employee worked per working day in a month. Output is thenormalized output of the employee relative to the target in a month. Productivity is output divided time worked. Theunit of observation is the employee-month. Standard errors are shown in brackets below the point estimates, and areclustered on employee level. ***Significant at the 1% level; **significant at the 5% level; *significant at the 10% level.
effect for time worked. During WFH, experienced employees worked roughly a quarter hour more
per day compared to less experienced employees, holding age and company tenure constant.13 While
more experienced employees might be more likely to have children at home, this experience effect is
unrelated to having children.14 Our interpretation is that more experienced employees are those with
more managerial duties. The increased costs of coordination (also see next section) during WFH are
therefore borne by these experienced employees, who have to put in more time to make sure the work
of different team members and teams aligns. Moreover, it is likely that the lion’s share of managing
the WFH transition falls on these experienced employees with more responsibility.
Output during WFH is roughly 0.5 percentage points larger per hour for employees with longer
company tenure, holding age and experience constant. The other characteristics do not show a sig-
nificant effect. It appears that employees who had worked at the company for longer were able to
adapt more effectively to the WFH-shock, and that this was more important than general industry
13When estimating the regression with one interaction for age, tenure, and experience at a time (not displayed), allinteractions show significantly positive point estimates due to their positive correlation. That is, older employees didincrease their work hours more during WFH compared to younger employees, but this is no longer true when holdingtenure and experience constant, see Table 6.
14When adding the interaction with Children to regression (1) in Table 6 (not displayed), the interaction with High-Experience remains significantly positive.
18
experience. This finding suggests that greater firm-specific human capital in the form of familiarity
with company procedures, or more fully-developed networks and working relationships with colleagues
and clients, were helpful during WFH. Alternatively, those with greater experience or tenure might be
in positions with more responsibility, and so responded more to the shift to WFH. For the last out-
come measure, productivity, there is no significant difference in the WFH effect among these employee
groups.
The even columns in Table 6 estimate the WFH effect by the commute time of the employee
(when working from the office). The WFH effect does not significantly differ by commute time for
any of our three outcome measures. Hence, our finding that WFH increased the hours worked is not
merely due to the fact that WFH employees have more time available that was previously needed to
commute to the workplace. Rather, it supports our interpretation that productivity fell during WFH,
and employees work more to compensate for this productivity drop.
5.3 Mechanisms: What contributes to lower productivity?
To better understand the mechanisms behind the decrease in productivity, we study the subsample
of 914 employees for which WPA data were obtained (see Table A.2). Using these data we document
three patterns: an overall increase in working time; a shift away from performing work tasks and
towards spending time on meetings, calls, or answering e-mails; and reduced time networking with
others or meeting 1:1 with one’s manager.
Working Hours
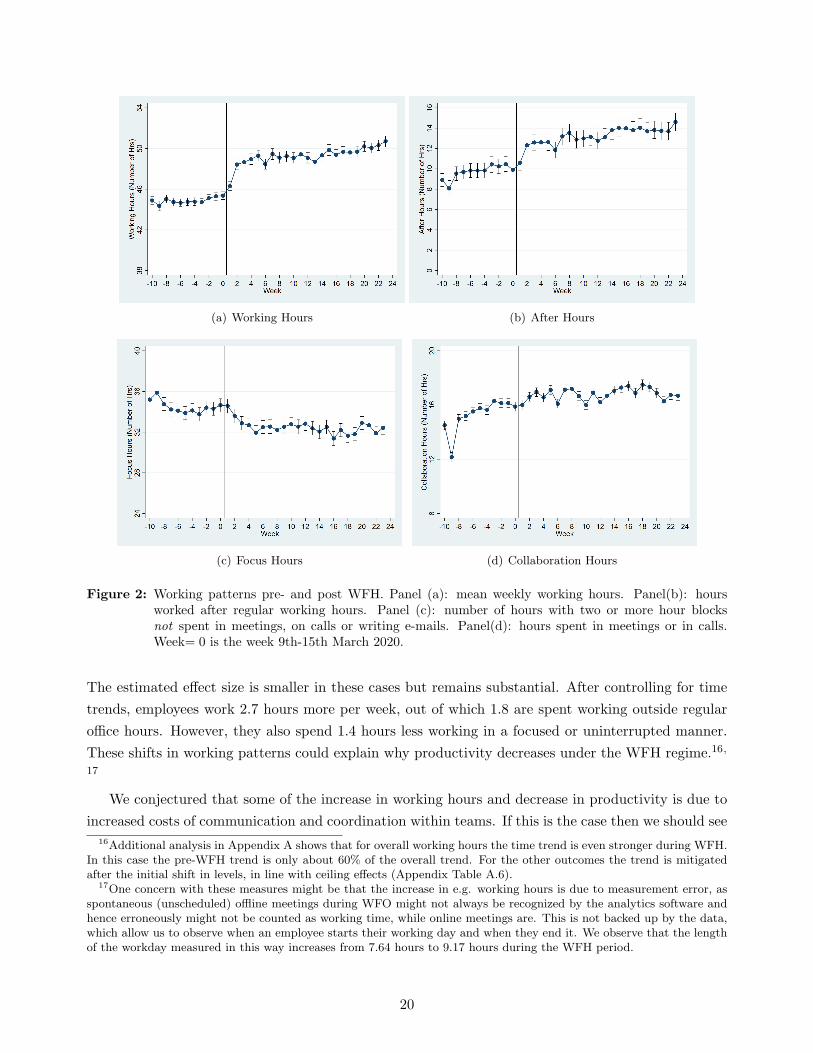
Figure 2 illustrates the shift in working patterns after the start of WFH. In line with the evidence
in Section 5.1, the WPA data show that overall hours worked increased, including those after regular
office hours. Panels (c) and (d) show an interesting pattern. Employees spend more time in meetings or
calls and have less “focus time” (i.e., time uninterrupted by meetings or calls to focus on completing
tasks). The increased time spent in meetings, and its persistence after the initial WFH transition
phase, suggest substantial and ongoing coordination costs with WFH, which negatively impact time
available to work in a productive manner.
Appendix Figure B.2 illustrates the technological shift post WFH with a drastically increased
number of hours spent on virtual meetings using MS Teams.15 Interestingly, the number of such
meetings continues to increase almost six months after the introduction of WFH.
Table 7 shows regressions estimating the WFH effect on these outcomes. Both overall working
hours and working hours outside of regular office time increase during WFH. In fact, comparing the
size of coefficients in columns (1) and (3) we see that the increase in overall working hours takes
place almost entirely after hours. The table also confirms the increase in time spent in meetings and
on calls, with a corresponding decrease in uninterrupted work time (focus hours). In all cases, the
WFH effect persists and remains highly statistically significant when we include a linear time trend.
15Barrero et al. (2021) show evidence of the surge in technological innovations that support WFH during the pandemic.
19
(a) Working Hours (b) After Hours
(c) Focus Hours (d) Collaboration Hours
Figure 2: Working patterns pre- and post WFH. Panel (a): mean weekly working hours. Panel(b): hoursworked after regular working hours. Panel (c): number of hours with two or more hour blocksnot spent in meetings, on calls or writing e-mails. Panel(d): hours spent in meetings or in calls.Week= 0 is the week 9th-15th March 2020.
The estimated effect size is smaller in these cases but remains substantial. After controlling for time
trends, employees work 2.7 hours more per week, out of which 1.8 are spent working outside regular
office hours. However, they also spend 1.4 hours less working in a focused or uninterrupted manner.
These shifts in working patterns could explain why productivity decreases under the WFH regime.16,
17
We conjectured that some of the increase in working hours and decrease in productivity is due to
increased costs of communication and coordination within teams. If this is the case then we should see
16Additional analysis in Appendix A shows that for overall working hours the time trend is even stronger during WFH.In this case the pre-WFH trend is only about 60% of the overall trend. For the other outcomes the trend is mitigatedafter the initial shift in levels, in line with ceiling effects (Appendix Table A.6).
17One concern with these measures might be that the increase in e.g. working hours is due to measurement error, asspontaneous (unscheduled) offline meetings during WFO might not always be recognized by the analytics software andhence erroneously might not be counted as working time, while online meetings are. This is not backed up by the data,which allow us to observe when an employee starts their working day and when they end it. We observe that the lengthof the workday measured in this way increases from 7.64 hours to 9.17 hours during the WFH period.
20
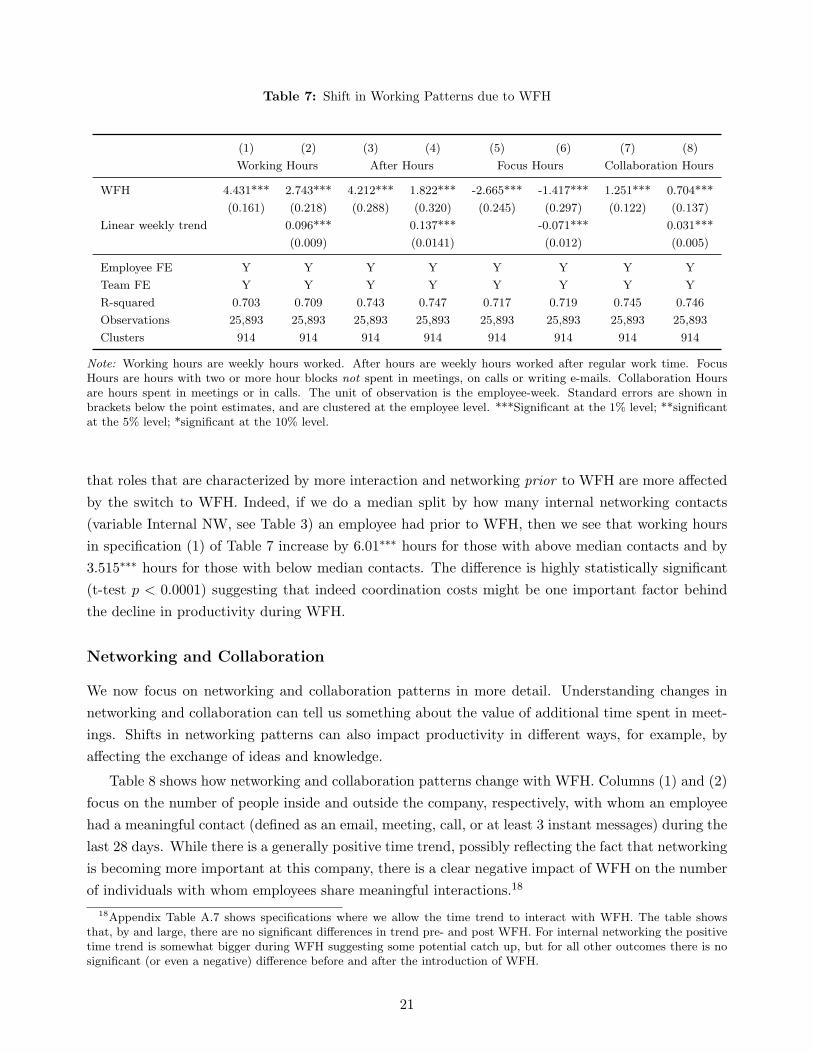
Table 7: Shift in Working Patterns due to WFH
(1) (2) (3) (4) (5) (6) (7) (8)
Working Hours After Hours Focus Hours Collaboration Hours
WFH 4.431*** 2.743*** 4.212*** 1.822*** -2.665*** -1.417*** 1.251*** 0.704***
(0.161) (0.218) (0.288) (0.320) (0.245) (0.297) (0.122) (0.137)
Linear weekly trend 0.096*** 0.137*** -0.071*** 0.031***
(0.009) (0.0141) (0.012) (0.005)
Employee FE Y Y Y Y Y Y Y Y
Team FE Y Y Y Y Y Y Y Y
R-squared 0.703 0.709 0.743 0.747 0.717 0.719 0.745 0.746
Observations 25,893 25,893 25,893 25,893 25,893 25,893 25,893 25,893
Clusters 914 914 914 914 914 914 914 914
Note: Working hours are weekly hours worked. After hours are weekly hours worked after regular work time. FocusHours are hours with two or more hour blocks not spent in meetings, on calls or writing e-mails. Collaboration Hoursare hours spent in meetings or in calls. The unit of observation is the employee-week. Standard errors are shown inbrackets below the point estimates, and are clustered at the employee level. ***Significant at the 1% level; **significantat the 5% level; *significant at the 10% level.
that roles that are characterized by more interaction and networking prior to WFH are more affected
by the switch to WFH. Indeed, if we do a median split by how many internal networking contacts
(variable Internal NW, see Table 3) an employee had prior to WFH, then we see that working hours
in specification (1) of Table 7 increase by 6.01∗∗∗ hours for those with above median contacts and by
3.515∗∗∗ hours for those with below median contacts. The difference is highly statistically significant
(t-test p < 0.0001) suggesting that indeed coordination costs might be one important factor behind
the decline in productivity during WFH.
Networking and Collaboration
We now focus on networking and collaboration patterns in more detail. Understanding changes in
networking and collaboration can tell us something about the value of additional time spent in meet-
ings. Shifts in networking patterns can also impact productivity in different ways, for example, by
affecting the exchange of ideas and knowledge.
Table 8 shows how networking and collaboration patterns change with WFH. Columns (1) and (2)
focus on the number of people inside and outside the company, respectively, with whom an employee
had a meaningful contact (defined as an email, meeting, call, or at least 3 instant messages) during the
last 28 days. While there is a generally positive time trend, possibly reflecting the fact that networking
is becoming more important at this company, there is a clear negative impact of WFH on the number
of individuals with whom employees share meaningful interactions.18
18Appendix Table A.7 shows specifications where we allow the time trend to interact with WFH. The table showsthat, by and large, there are no significant differences in trend pre- and post WFH. For internal networking the positivetime trend is somewhat bigger during WFH suggesting some potential catch up, but for all other outcomes there is nosignificant (or even a negative) difference before and after the introduction of WFH.
21

Table 8: Shift in Networking Patterns and types of meetings due to WFH
(1) (2) (3) (4) (5) (6) (7) (8)
Internal External NW NW Meetings Meetings Coaching E-mails
NW NW ORG EXT Manager 1:1 Meets
WFH -7.621*** -0.532*** -0.009 -0.150*** 1.723*** -0.089* -0.060* 4.282***
(0.369) (0.103) (0.005) (0.027) (0.205) (0.048) (0.033) (0.680)
Linear weekly trend 0.787*** 0.078*** 0.001*** 0.008*** 0.016** 0.002 0.002 -0.020
(0.026) (0.006) (0.000) (0.001) (0.008) (0.002) (0.002) (0.029)
Employee FE Y Y Y Y Y Y Y Y
Team FE Y Y Y Y Y Y Y Y
R-squared 0.801 0.758 0.665 0.624 0.757 0.320 0.386 0.766
Observations 25,893 25,893 25,893 25,893 25,893 25,893 25,893 25,893
Clusters 914 914 914 914 914 914 914 914
Note: “Internal NW” is the number of people inside the company with who employee had meaningful contact in last28 days. “External NW” the same measure for people outside the company. “NW ORG” is the number of distinctorganizational units within the company that the employee had at least two meaningful interactions in the last fourweeks. “NW EXT” the same measure for external domains outside the company. “Meetings Manager” is the numberof meetings involving the manager. “Meetings 1:1” is the number of meetings between the employee and their manager.“Coaching Meets” is the number between the employee, the manager and all their direct reports. “E-mails” is thenumber of emails sent. The unit of observation is the employee-week. Standard errors are shown in brackets below thepoint estimates, and are clustered at the employee level. ***Significant at the 1% level; **significant at the 5% level;*significant at the 10% level.
Columns (3) and (4) contain results for similar measures, now focused on the number of organiza-
tional units inside and outside the company at which an employee interacted with someone (column
(4)). Here we also see a decline in contacts caused by WFH despite a general upward trend, though
in the case of internal organizational units the decline is not statistically significant.
Columns (5)-(7) focus on collaboration patterns. In line with our earlier analysis, we see that the
number of meetings involving the manager increases. By contrast, the number of both 1:1 supervisor
meetings and coaching meetings decrease during WFH. Employees seem to receive less mentoring and
coaching, even though these effects are only statistically significant at the 10% level.
Last, column (8) shows that the number of emails sent increased substantially during WFH with
about 4 more emails being sent on average. This corresponds to an about 17% increase over the
baseline (see Table 3).
Overall, these patterns highlight a detrimental impact of WFH on networking. Employees have
fewer contacts with different individuals and organizational units both inside and outside the company.
They also have fewer 1:1 meetings with superiors, and receive less coaching. These lost opportunities
to network may help explain why WFH lowers productivity. It is also likely that they slowed employee
development, though that is beyond estimation with our data.
22
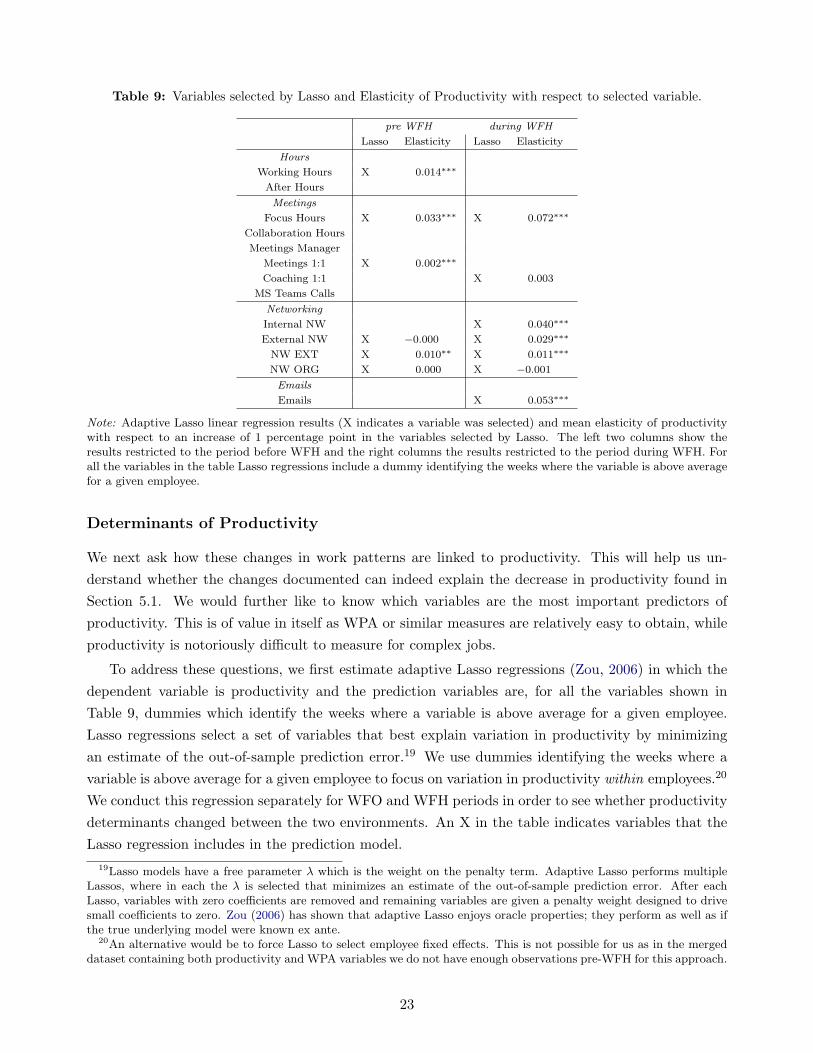
Table 9: Variables selected by Lasso and Elasticity of Productivity with respect to selected variable.
pre WFH during WFH
Lasso Elasticity Lasso Elasticity
Hours
Working Hours X 0.014∗∗∗
After Hours
Meetings
Focus Hours X 0.033∗∗∗ X 0.072∗∗∗
Collaboration Hours
Meetings Manager
Meetings 1:1 X 0.002∗∗∗
Coaching 1:1 X 0.003
MS Teams Calls
Networking
Internal NW X 0.040∗∗∗
External NW X −0.000 X 0.029∗∗∗
NW EXT X 0.010∗∗ X 0.011∗∗∗
NW ORG X 0.000 X −0.001
Emails
Emails X 0.053∗∗∗
Note: Adaptive Lasso linear regression results (X indicates a variable was selected) and mean elasticity of productivitywith respect to an increase of 1 percentage point in the variables selected by Lasso. The left two columns show theresults restricted to the period before WFH and the right columns the results restricted to the period during WFH. Forall the variables in the table Lasso regressions include a dummy identifying the weeks where the variable is above averagefor a given employee.
Determinants of Productivity
We next ask how these changes in work patterns are linked to productivity. This will help us un-
derstand whether the changes documented can indeed explain the decrease in productivity found in
Section 5.1. We would further like to know which variables are the most important predictors of
productivity. This is of value in itself as WPA or similar measures are relatively easy to obtain, while
productivity is notoriously difficult to measure for complex jobs.
To address these questions, we first estimate adaptive Lasso regressions (Zou, 2006) in which the
dependent variable is productivity and the prediction variables are, for all the variables shown in
Table 9, dummies which identify the weeks where a variable is above average for a given employee.
Lasso regressions select a set of variables that best explain variation in productivity by minimizing
an estimate of the out-of-sample prediction error.19 We use dummies identifying the weeks where a
variable is above average for a given employee to focus on variation in productivity within employees.20
We conduct this regression separately for WFO and WFH periods in order to see whether productivity
determinants changed between the two environments. An X in the table indicates variables that the
Lasso regression includes in the prediction model.
19Lasso models have a free parameter λ which is the weight on the penalty term. Adaptive Lasso performs multipleLassos, where in each the λ is selected that minimizes an estimate of the out-of-sample prediction error. After eachLasso, variables with zero coefficients are removed and remaining variables are given a penalty weight designed to drivesmall coefficients to zero. Zou (2006) has shown that adaptive Lasso enjoys oracle properties; they perform as well as ifthe true underlying model were known ex ante.
20An alternative would be to force Lasso to select employee fixed effects. This is not possible for us as in the mergeddataset containing both productivity and WPA variables we do not have enough observations pre-WFH for this approach.
23
The variables selected include working hours, focus hours as well as most networking variables.
Working After Hours and attending many meetings does not seem to contribute substantially to
productivity, nor does spending time on MS Teams calls. The set of selected variables is quite con-
sistent before and during WFH, with focus hours and the networking measures crucial indicators of
productivity. Interestingly overall working hours is selected before WFH but not afterwards.
To assess the economic significance of these associations, we compute the elasticity of productivity
with respect to a 1 percentage point increase in the variables selected by Lasso. Table 9 shows
the mean choice elasticities. Before WFH, the most important variables to explain productivity are
working hours, focus hours and NW EXT. A 1 percentage point increase in overall working hours
is associated with a 0.014 percentage point average increase in productivity. A 1 percentage point
increase in focus hours is associated with a 0.033 percentage point average increase in productivity,
and a 1 percentage point increase in network contacts outside the company is associated with a 0.01
percentage point average increase in productivity. These elasticities show that these variables are
important determinants of productivity. During WFH, the most important variables are focus hours,
and internal and external networking. As before, both internal and external networking are positively
associated with productivity. Focus Hours are now more than twice as important in terms of their
average marginal effect on productivity, with a 1 percentage point increase in focus hours associated
with a 0.072 percentage point average increase in productivity. There seems to be a broadly stable
relationship between working patterns and productivity. The increased importance of focus hours
during WFH might be explained by the fact that employees have less of it during WFH.
In summary, in this section we showed that WFH induced a significant shift in working patterns.
Employees work more, including after regular office hours, but have less uninterrupted time to focus
on task completion as they spend more time in meetings. They network less and spend less time being
evaluated, trained and coached. We further showed that these reductions, especially in focus hours
and networking, are detrimental to productivity.
6 Conclusion
In the classical economic model, when inputs (labour and capital) are fixed, productivity and output
go hand in hand. Here, while labour input at the extensive margin was fixed (there were no new hires
due to WFH), it increased at the intensive margin with employees putting in more time. On the other
hand, we document substantial communication and coordination costs among co-workers. The net
effect was a large drop in productivity. This decrease in productivity did not result in a decline in
average output, because time worked compensated for it. It would be interesting to see if this change
was sustainable over a longer period of time, especially in light of evidence of the adverse effect of
long work hours on employee well-being, mental and physical health (Sparks et al., 1997; Sokejima
and Kagamimori, 1998; Sparks et al., 2001).
The employees studied here are educated professionals engaged in work with significant cognitive,
innovation, and interpersonal tasks. That contrasts with the few prior studies of the productivity
effects of WFH. Our research site involves occupations and an industry that are predicted to have
24
the highest likelihood of success with WFH. Our findings suggest that predictions of success at WFH
based on occupational descriptions may have been optimistic, perhaps because professionals engage
in many tasks that require collaboration, communication, and innovation, which are more difficult to
achieve with virtual, scheduled interactions. It would be of great interest to replicate our findings
with data from other firms, occupations and industries, and uncover patterns for relative success or
failure of WFH in various settings.
It is likely that WFH resulted in a decline in intangibles that are valuable to the employee and
company. Increased coordination costs may mean that teams and other working relationships suffered.
Employees spent less time networking with each other and people outside the company. That would
lead to a loss of social capital if this continued. More subtly, when people work in the same location,
they experience unplanned interactions. That can lead to new working relationships, and “productive
accidents” that spur innovation. It is not easy to generate similar unplanned interactions on telecon-
ferences. Finally, our evidence indicates that employees enjoyed fewer opportunities for coaching by
mentors, and meeting directly with supervisors. This undoubtedly slowed their development of human
capital.
A potential positive effect of WFH is that commuting is unnecessary and hence employees might
have more leisure time, thus increasing welfare. However, if we compute the sum of work and commute
time during WFO, and compare it to work times during WFH, then employees still spent significantly
more time at work during WFH than during WFO, about a third of an hour per day. Of course, our
commute times are only estimates, and breaks taken at the office—while not work time—cannot be
counted as leisure time either. Still, based on our data, the argument that WFH implies more leisure
time is not necessarily true. Of course, that time was spent in productive work instead of sitting in
traffic, which is beneficial.
Despite these downsides and hurdles during WFH, the firm’s employees continued to meet their
goals during a severe exogenous shock. It is noteworthy how quickly the firm was able to adapt. Even
though almost all employees worked from the office prior to March 2020, they were able to adjust
quickly and kept meeting their targets during the entire period of WFH, albeit at the cost of longer
working hours. That many employees already worked with laptops in the office was no doubt a factor
in the ability to transition quickly.
The WFH period we observe took place during the Covid-19 pandemic, which raises the question
of whether factors other than home-working could have contributed to our findings. One possibility
is that employees work more simply because lockdown measures closed restaurants, cinemas, etc.,
thereby reducing the value of leisure time. Under this explanation, however, we would expect Output to
increase and Productivity to remain approximately constant, which is not what we observe. Appendix
Figure B.3 further shows that while we see a slight dip in working hours after every stage of lockdown
easing, the effect is small and, more importantly, only temporary. We also do not find evidence that
productivity or other outcomes co-vary with national or regional indicators of the severity of Covid,
such as deaths or case rates.
While the average effect of working from home on productivity is negative in our study, this does
25
not rule out that a “targeted working from home” regime might be desirable. Employees whose role
allows for effective working from home might do so, while others that rely more on interpersonal
interactions might return to the office, at least for a few days a week. This way, companies might
be able to use the best of both worlds. Moreover, firms will continue to learn and improve WFH
practices. Given the significant benefits of reductions in commute time, and more flexibility in work
hours (Barrero et al. (2021)), WFH is likely to be used much more in the future, with positive net
effects if implemented well.
References
Aakvik, A., F. Hansen, and G. Torsvik (2017): “Productivity dynamics, performance feedback
and group incentives in a sales organization,” Labour Economics, 46, 110 – 117.
Adams-Prassl, A., T. Boneva, M. Golin, and C. Rauh (2020): “Work tasks that can be done
from home: Evidence on variation within & across occupations and industries,” CEPR Discussion
Paper No. DP14901.
Arcidiacono, P., J. Kinsler, and J. Price (2017): “Productivity Spillovers in Team Production:
Evidence from Professional Basketball,” Journal of Labor Economics, 35, 191–225.
Babcock, P., K. Bedard, G. Charness, J. Hartman, and H. Royer (2015): “Letting Down
the Team? Social Effects of Team Incentives,” Journal of the European Economic Association, 13,
841–870.
Bandiera, O., I. Barankay, and I. Rasul (2005): “Social Preferences and the Response to
Incentives: Evidence from Personnel Data,” The Quarterly Journal of Economics, 120, 917–962.
Barrero, J., N. Bloom, and S. Davis (2021): “Why Working From Home Will Stick,” Working
Paper, Department of Economics, Stanford University.
Barrero, J. M., N. Bloom, and S. J. Davis (2020): “60 million fewer commuting hours per day:
How Americans use time saved by working from home,” University of Chicago, Becker Friedman
Institute for Economics Working Paper.
Bartel, A., C. Ichniowski, and K. Shaw (2007): “How does information technology affect pro-
ductivity? Plant-level comparisons of product innovation, process improvement, and worker skills,”
The Quarterly Journal of Economics, 122, 1721–1758.
Bellmann, L. and O. Hubler (2020): “Job Satisfaction and Work-Life Balance: Differences be-
tween Homework and Work at the Workplace of the Company,” IZA Discussion Paper.
Bick, A., A. Blandin, and K. Mertens (2020): “Work from home after the COVID-19 Outbreak,”
CEPR Discussion Paper No. DP15000.
26
Bloom, N., J. Liang, J. Roberts, and Z. J. Ying (2015): “Does working from home work?
Evidence from a Chinese experiment,” The Quarterly Journal of Economics, 130, 165–218.
Brynjolfsson, E., J. J. Horton, A. Ozimek, D. Rock, G. Sharma, and H.-Y. TuYe (2020):
“COVID-19 and remote work: An early look at US data,” Tech. rep., National Bureau of Economic
Research.
Brynjolfsson, E. and A. McAfee (2012): “Big Data’s Management Revolution.” Harvard Busi-
ness Review, 9.
Dingel, J. I. and B. Neiman (2020): “How many jobs can be done at home?” Journal of Public
Economics, 189, 104235.
Dohmen, T. and A. Falk (2011): “Performance Pay and Multidimensional Sorting: Productivity,
Preferences, and Gender,” American Economic Review, 101, 556–90.
Emanuel, N. and E. Harrington (2020): ““Working” Remotely?” Working Paper, Department
of Economics, Harvard University.
Etheridge, B., Y. Wang, and L. Tang (2020): “Worker Productivity during Lockdown and
Working from Home: Evidence from Self-Reports,” Covid Economics, 52, 118–151.
Financial Times (2021a): ““I am close to quitting my career”: Mothers step
back at work to cope with pandemic parenting,” https://www.ft.com/content/
d5d01f06-9f7c-4cdc9fee-225e15b5750b.
——— (2021b): “Where’s the Spark? How Lockdown Caused a Creativity Crisis.” https://www.ft.
com/content/27364b27-6c0c-4dec-b109-17c054b49465.
Friebel, G., M. Heinz, M. Krueger, and N. Zubanov (2017): “Team Incentives and Perfor-
mance: Evidence from a Retail Chain,” American Economic Review, 107, 2168–2203.
Gibbs, M., S. Neckermann, and C. Siemroth (2017): “A field experiment in motivating employee
ideas,” Review of Economics and Statistics, 99, 577–590.
Gottlieb, C., J. Grobovsek, M. Poschke, and F. Saltiel (2021): “Working from home in
developing countries,” European Economic Review, 103679.
Graff Zivin, J. and M. Neidell (2012): “The Impact of Pollution on Worker Productivity,”
American Economic Review, 102, 3652–73.
Gubler, T., I. Larkin, and L. Pierce (2018): “Doing Well by Making Well: The Impact of
Corporate Wellness Programs on Employee Productivity,” Management Science, 64, 4967–4987.
Hamilton, B. H., J. A. Nickerson, and H. Owan (2003): “Team Incentives and Worker Hetero-
geneity: An Empirical Analysis of the Impact of Teams on Productivity and Participation,” Journal
of Political Economy, 111, 465–497.
27
Hensvik, L., T. Le Barbanchon, and R. Rathelot (2020): “Which jobs are done from home?
Evidence from the American Time Use Survey,” CEPR Discussion Paper No. DP14611.
Hoffmann, C., E. Lesser, and T. Ringo (2012): “Calculating Success.” Harvard Business Press.
Ichniowski, C. and K. Shaw (2003): “Beyond incentive pay: Insiders’ estimates of the value
of complementary human resource management practices,” Journal of Economic Perspectives, 17,
155–180.
Ichniowski, C., K. Shaw, and G. Prennushi (1995): “The effects of human resource management
practices on productivity,” Tech. rep., National bureau of economic research.
Kunn, S., C. Seel, and D. Zegners (2020): “Cognitive Performance in the Home Office-Evidence
from Professional Chess,” IZA Discussion Paper.
Lazear, E. P. (2000): “Performance Pay and Productivity,” The American Economic Review, 90,
1346–1361.
Lazear, E. P., K. L. Shaw, and C. T. Stanton (2015): “The value of bosses,” Journal of Labor
Economics, 33, 823–861.
Levenson, A. (2018): “Using workforce analytics to improve strategy execution.” Human Resource
Management, 57, 685–700.
Shearer, B. (2004): “Piece Rates, Fixed Wages and Incentives: Evidence from a Field Experiment,”
The Review of Economic Studies, 71, 513–534.
Sokejima, S. and S. Kagamimori (1998): “Working hours as a risk factor for acute myocardiol
infarction in Japan: Case-control study,” British Medical Journal, 317, 775–780.
Song, H., A. L. Tucker, K. L. Murrell, and D. R. Vinson (2018): “Closing the Produc-
tivity Gap: Improving Worker Productivity Through Public Relative Performance Feedback and
Validation of Best Practices,” Management Science, 64, 2628–2649.
Sparks, K., C. Cooper, Y. Fried, and A. Shirom (1997): “The effects of hours of work on health:
A meta-analytic review,” Journal of Occupational and Organizational Psychology, 70, 391–408.
Sparks, K., B. Fragher, and C. Cooper (2001): “Well-being and occupational health in the 21st
century workplace,” Journal of Occupational and Organizational Psychology, 74, 489–509.
Von Gaudecker, H.-M., R. Holler, L. Janys, B. Siflinger, and C. Zimpelmann (2020):
“Labour supply in the early stages of the CoViD-19 Pandemic: Empirical Evidence on hours, home
office, and expectations,” IZA Discussion Paper.
WSJ (2020): “Companies Start to Think Remote Work Isn’t So Great After All,” https://www.wsj.
com/articles/companies-start-to-think-remote-work-isnt-so-great-after-all-11595603397.
Zou, H. (2006): “The adaptive lasso and its oracle properties.” Journal of the American Statistical
Association, 101, 1418–1429.
28

Online Appendix “Productivity, Collaboration & Networking During
Work From Home: Evidence from IT Professionals”
M. Gibbs, F. Mengel, C. Siemroth
For Online Publication
Contents
A Additional Tables 2
B Additional Figures 6
1
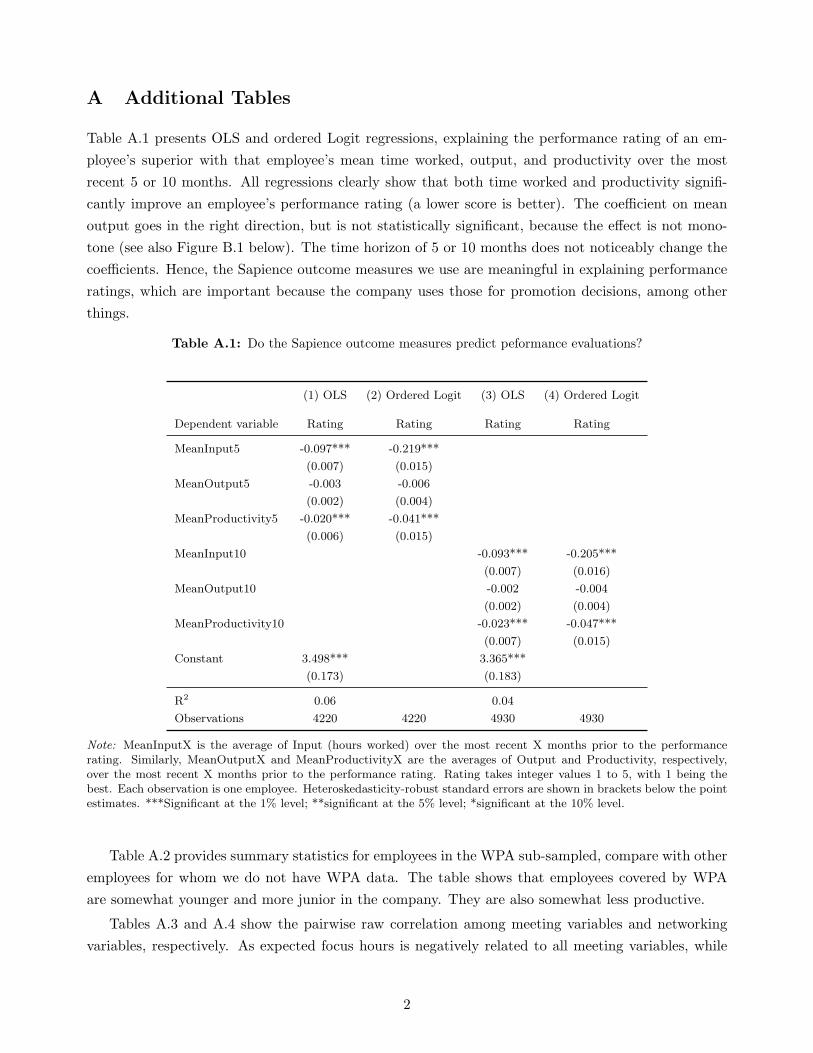
A Additional Tables
Table A.1 presents OLS and ordered Logit regressions, explaining the performance rating of an em-
ployee’s superior with that employee’s mean time worked, output, and productivity over the most
recent 5 or 10 months. All regressions clearly show that both time worked and productivity signifi-
cantly improve an employee’s performance rating (a lower score is better). The coefficient on mean
output goes in the right direction, but is not statistically significant, because the effect is not mono-
tone (see also Figure B.1 below). The time horizon of 5 or 10 months does not noticeably change the
coefficients. Hence, the Sapience outcome measures we use are meaningful in explaining performance
ratings, which are important because the company uses those for promotion decisions, among other
things.
Table A.1: Do the Sapience outcome measures predict peformance evaluations?
(1) OLS (2) Ordered Logit (3) OLS (4) Ordered Logit
Dependent variable Rating Rating Rating Rating
MeanInput5 -0.097*** -0.219***
(0.007) (0.015)
MeanOutput5 -0.003 -0.006
(0.002) (0.004)
MeanProductivity5 -0.020*** -0.041***
(0.006) (0.015)
MeanInput10 -0.093*** -0.205***
(0.007) (0.016)
MeanOutput10 -0.002 -0.004
(0.002) (0.004)
MeanProductivity10 -0.023*** -0.047***
(0.007) (0.015)
Constant 3.498*** 3.365***
(0.173) (0.183)
R2 0.06 0.04
Observations 4220 4220 4930 4930
Note: MeanInputX is the average of Input (hours worked) over the most recent X months prior to the performancerating. Similarly, MeanOutputX and MeanProductivityX are the averages of Output and Productivity, respectively,over the most recent X months prior to the performance rating. Rating takes integer values 1 to 5, with 1 being thebest. Each observation is one employee. Heteroskedasticity-robust standard errors are shown in brackets below the pointestimates. ***Significant at the 1% level; **significant at the 5% level; *significant at the 10% level.
Table A.2 provides summary statistics for employees in the WPA sub-sampled, compare with other
employees for whom we do not have WPA data. The table shows that employees covered by WPA
are somewhat younger and more junior in the company. They are also somewhat less productive.
Tables A.3 and A.4 show the pairwise raw correlation among meeting variables and networking
variables, respectively. As expected focus hours is negatively related to all meeting variables, while
2
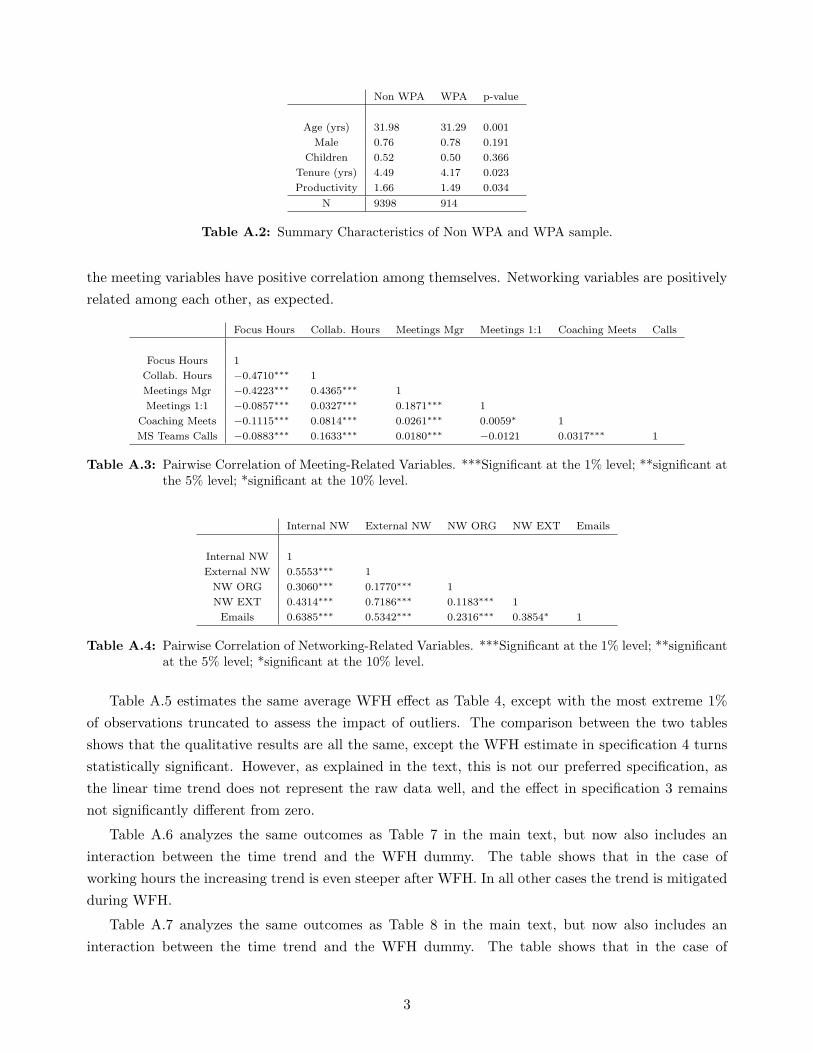
Non WPA WPA p-value
Age (yrs) 31.98 31.29 0.001
Male 0.76 0.78 0.191
Children 0.52 0.50 0.366
Tenure (yrs) 4.49 4.17 0.023
Productivity 1.66 1.49 0.034
N 9398 914
Table A.2: Summary Characteristics of Non WPA and WPA sample.
the meeting variables have positive correlation among themselves. Networking variables are positively
related among each other, as expected.
Focus Hours Collab. Hours Meetings Mgr Meetings 1:1 Coaching Meets Calls
Focus Hours 1
Collab. Hours −0.4710∗∗∗ 1
Meetings Mgr −0.4223∗∗∗ 0.4365∗∗∗ 1
Meetings 1:1 −0.0857∗∗∗ 0.0327∗∗∗ 0.1871∗∗∗ 1
Coaching Meets −0.1115∗∗∗ 0.0814∗∗∗ 0.0261∗∗∗ 0.0059∗ 1
MS Teams Calls −0.0883∗∗∗ 0.1633∗∗∗ 0.0180∗∗∗ −0.0121 0.0317∗∗∗ 1
Table A.3: Pairwise Correlation of Meeting-Related Variables. ***Significant at the 1% level; **significant atthe 5% level; *significant at the 10% level.
Internal NW External NW NW ORG NW EXT Emails
Internal NW 1
External NW 0.5553∗∗∗ 1
NW ORG 0.3060∗∗∗ 0.1770∗∗∗ 1
NW EXT 0.4314∗∗∗ 0.7186∗∗∗ 0.1183∗∗∗ 1
Emails 0.6385∗∗∗ 0.5342∗∗∗ 0.2316∗∗∗ 0.3854∗ 1
Table A.4: Pairwise Correlation of Networking-Related Variables. ***Significant at the 1% level; **significantat the 5% level; *significant at the 10% level.
Table A.5 estimates the same average WFH effect as Table 4, except with the most extreme 1%
of observations truncated to assess the impact of outliers. The comparison between the two tables
shows that the qualitative results are all the same, except the WFH estimate in specification 4 turns
statistically significant. However, as explained in the text, this is not our preferred specification, as
the linear time trend does not represent the raw data well, and the effect in specification 3 remains
not significantly different from zero.
Table A.6 analyzes the same outcomes as Table 7 in the main text, but now also includes an
interaction between the time trend and the WFH dummy. The table shows that in the case of
working hours the increasing trend is even steeper after WFH. In all other cases the trend is mitigated
during WFH.
Table A.7 analyzes the same outcomes as Table 8 in the main text, but now also includes an
interaction between the time trend and the WFH dummy. The table shows that in the case of
3
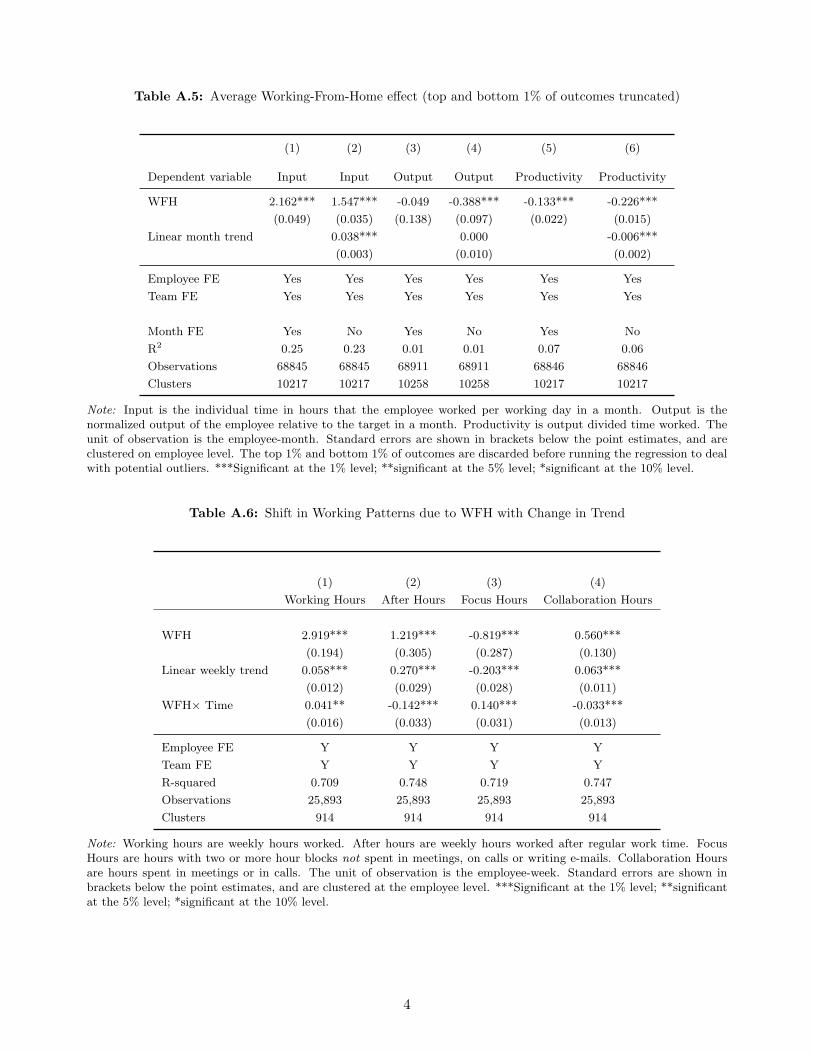
Table A.5: Average Working-From-Home effect (top and bottom 1% of outcomes truncated)
(1) (2) (3) (4) (5) (6)
Dependent variable Input Input Output Output Productivity Productivity
WFH 2.162*** 1.547*** -0.049 -0.388*** -0.133*** -0.226***
(0.049) (0.035) (0.138) (0.097) (0.022) (0.015)
Linear month trend 0.038*** 0.000 -0.006***
(0.003) (0.010) (0.002)
Employee FE Yes Yes Yes Yes Yes Yes
Team FE Yes Yes Yes Yes Yes Yes
Month FE Yes No Yes No Yes No
R2 0.25 0.23 0.01 0.01 0.07 0.06
Observations 68845 68845 68911 68911 68846 68846
Clusters 10217 10217 10258 10258 10217 10217
Note: Input is the individual time in hours that the employee worked per working day in a month. Output is thenormalized output of the employee relative to the target in a month. Productivity is output divided time worked. Theunit of observation is the employee-month. Standard errors are shown in brackets below the point estimates, and areclustered on employee level. The top 1% and bottom 1% of outcomes are discarded before running the regression to dealwith potential outliers. ***Significant at the 1% level; **significant at the 5% level; *significant at the 10% level.
Table A.6: Shift in Working Patterns due to WFH with Change in Trend
(1) (2) (3) (4)
Working Hours After Hours Focus Hours Collaboration Hours
WFH 2.919*** 1.219*** -0.819*** 0.560***
(0.194) (0.305) (0.287) (0.130)
Linear weekly trend 0.058*** 0.270*** -0.203*** 0.063***
(0.012) (0.029) (0.028) (0.011)
WFH× Time 0.041** -0.142*** 0.140*** -0.033***
(0.016) (0.033) (0.031) (0.013)
Employee FE Y Y Y Y
Team FE Y Y Y Y
R-squared 0.709 0.748 0.719 0.747
Observations 25,893 25,893 25,893 25,893
Clusters 914 914 914 914
Note: Working hours are weekly hours worked. After hours are weekly hours worked after regular work time. FocusHours are hours with two or more hour blocks not spent in meetings, on calls or writing e-mails. Collaboration Hoursare hours spent in meetings or in calls. The unit of observation is the employee-week. Standard errors are shown inbrackets below the point estimates, and are clustered at the employee level. ***Significant at the 1% level; **significantat the 5% level; *significant at the 10% level.
4
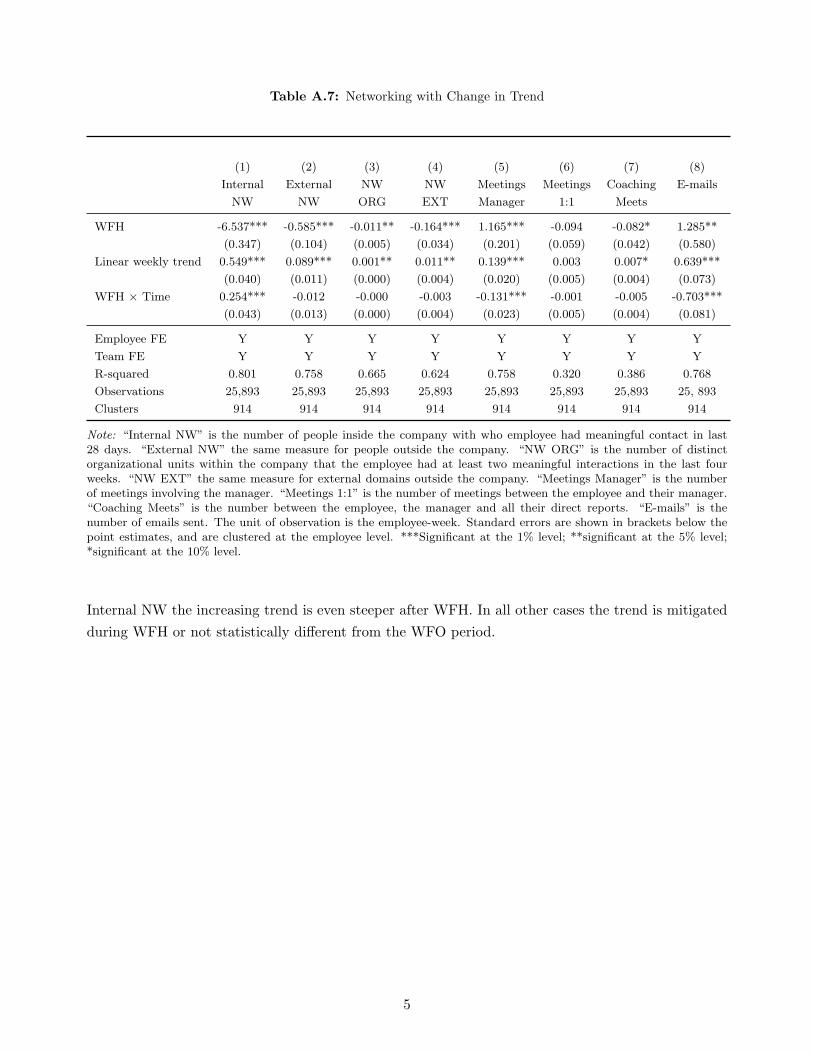
Table A.7: Networking with Change in Trend
(1) (2) (3) (4) (5) (6) (7) (8)
Internal External NW NW Meetings Meetings Coaching E-mails
NW NW ORG EXT Manager 1:1 Meets
WFH -6.537*** -0.585*** -0.011** -0.164*** 1.165*** -0.094 -0.082* 1.285**
(0.347) (0.104) (0.005) (0.034) (0.201) (0.059) (0.042) (0.580)
Linear weekly trend 0.549*** 0.089*** 0.001** 0.011** 0.139*** 0.003 0.007* 0.639***
(0.040) (0.011) (0.000) (0.004) (0.020) (0.005) (0.004) (0.073)
WFH × Time 0.254*** -0.012 -0.000 -0.003 -0.131*** -0.001 -0.005 -0.703***
(0.043) (0.013) (0.000) (0.004) (0.023) (0.005) (0.004) (0.081)
Employee FE Y Y Y Y Y Y Y Y
Team FE Y Y Y Y Y Y Y Y
R-squared 0.801 0.758 0.665 0.624 0.758 0.320 0.386 0.768
Observations 25,893 25,893 25,893 25,893 25,893 25,893 25,893 25, 893
Clusters 914 914 914 914 914 914 914 914
Note: “Internal NW” is the number of people inside the company with who employee had meaningful contact in last28 days. “External NW” the same measure for people outside the company. “NW ORG” is the number of distinctorganizational units within the company that the employee had at least two meaningful interactions in the last fourweeks. “NW EXT” the same measure for external domains outside the company. “Meetings Manager” is the numberof meetings involving the manager. “Meetings 1:1” is the number of meetings between the employee and their manager.“Coaching Meets” is the number between the employee, the manager and all their direct reports. “E-mails” is thenumber of emails sent. The unit of observation is the employee-week. Standard errors are shown in brackets below thepoint estimates, and are clustered at the employee level. ***Significant at the 1% level; **significant at the 5% level;*significant at the 10% level.
Internal NW the increasing trend is even steeper after WFH. In all other cases the trend is mitigated
during WFH or not statistically different from the WFO period.
5
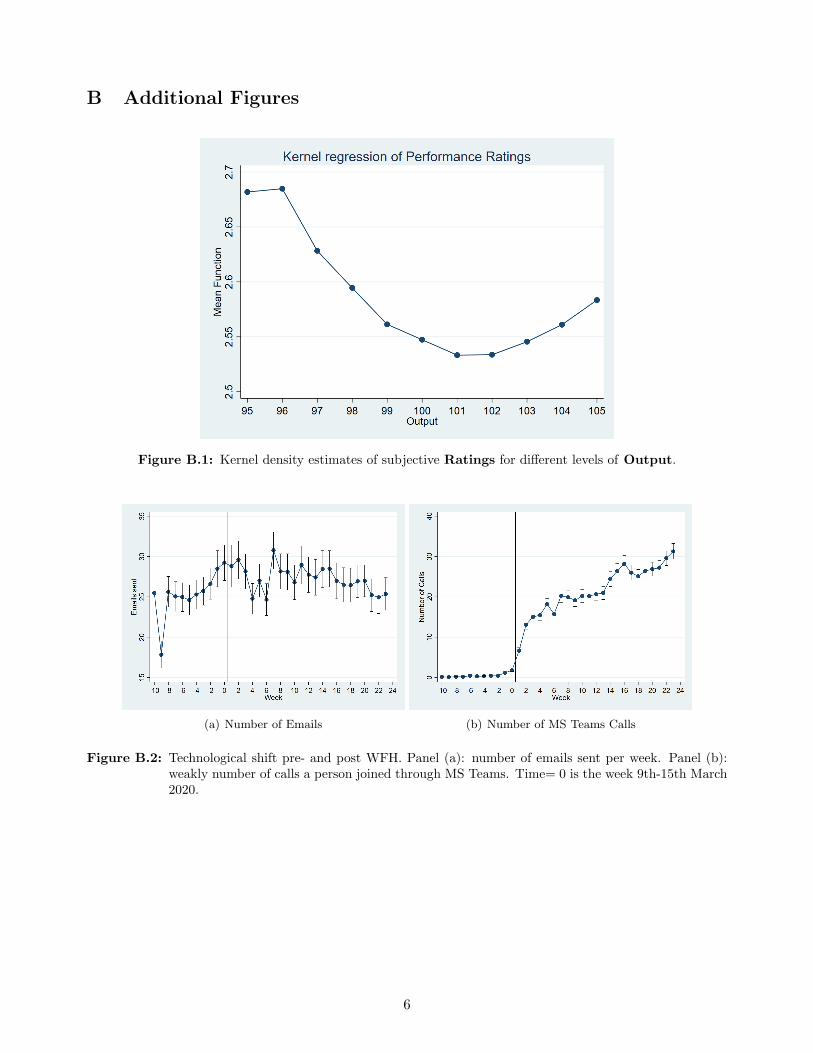
B Additional Figures
Figure B.1: Kernel density estimates of subjective Ratings for different levels of Output.
(a) Number of Emails (b) Number of MS Teams Calls
Figure B.2: Technological shift pre- and post WFH. Panel (a): number of emails sent per week. Panel (b):weakly number of calls a person joined through MS Teams. Time= 0 is the week 9th-15th March2020.
6
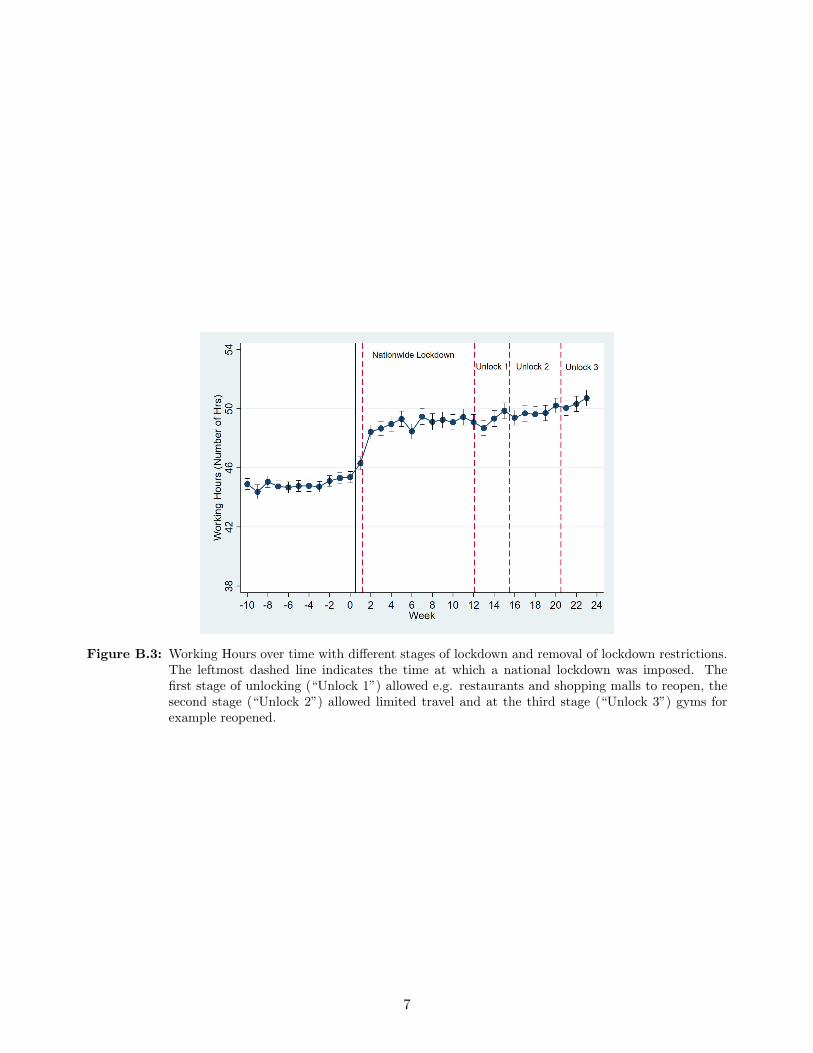
Figure B.3: Working Hours over time with different stages of lockdown and removal of lockdown restrictions.The leftmost dashed line indicates the time at which a national lockdown was imposed. Thefirst stage of unlocking (“Unlock 1”) allowed e.g. restaurants and shopping malls to reopen, thesecond stage (“Unlock 2”) allowed limited travel and at the third stage (“Unlock 3”) gyms forexample reopened.
7