WOMEN AND MEN IN ALBANIA BURRAT DHE GRATË NË ...
132
WOMEN AND MEN IN ALBANIA BURRAT DHE GRATË NË SHQIPËRI
-
Upload
khangminh22 -
Category
Documents
-
view
0 -
download
0
Transcript of WOMEN AND MEN IN ALBANIA BURRAT DHE GRATË NË ...

WOMEN AND MEN IN ALBANIA
BURRAT DHE GRATË NË SHQIPËRI

2
BURRAT DHE GRATË NË SHQIPËRI NË 2018
Burrat dhe Gratë në Shqipëri
Women and Men in Albania
2018
Drejtor Botimi / Director of Publication:
Delina Ibrahimaj
Përpunimi Statistikor / Statistical processing:
Ledia Thomo
Isida Gorçe
Rudin Hoxha
Albana Berbiu
© Copyright INSTAT 2018
Ky botim është mbështetur financiarisht dhe teknikisht nga:
UN Women dhe Agjencia Austriake për Zhvillim
This publication is financially and technically supported by:
UN Women and Austrian Development Agency
Botimi:
“Burrat dhe Gratë në Shqipëri, 2018”
“Women and Men in Albania, 2018”
Gjuha e librit: Shqip – Anglisht
Autori: INSTAT
Ndalohet riprodhimi i këtij botimi apo transmetimi i tij në cilëndo formë,
pa autorizimin paraprak me shkrim të mbajtësit të së drejtës së autorit.
No part of this publication can be reproduced or transmitted in any form or by
any means without the prior written permission of the copyright holder.
INSTITUTI I STATISTIKAVE
Blv. “Zhan d’Ark”, Nr.3, Tiranë / Albania
Tel: + 355 4 2222411 / 2233356
Fax: + 355 4 228300
E-mail: [email protected]
Web: www.instat.gov.al

G

4
BURRAT DHE GRATË NË SHQIPËRI NË 2018 Pasqyra e Lëndës
Hyrje \ Introduction . . . . . . . . . . . . . . . . . . . . . . . . . . . . . . . . . . . . . . . . . . . . . . . . . . . . . . . . . . . . 8Popullsia \ Population . . . . . . . . . . . . . . . . . . . . . . . . . . . . . . . . . . . . . . . . . . . . . . . . . . . . . . . . . 14Dinamikat e popullsisë \ Population dynamics . . . . . . . . . . . . . . . . . . . . . . . . . . . . . . . . . . . . 15Lindjet \ Births . . . . . . . . . . . . . . . . . . . . . . . . . . . . . . . . . . . . . . . . . . . . . . . . . . . . . . . . . . . . . . . 15Vdekjet \ Deaths . . . . . . . . . . . . . . . . . . . . . . . . . . . . . . . . . . . . . . . . . . . . . . . . . . . . . . . . . . . . . . 17Lëvizjet e brendshme \ Internal movements . . . . . . . . . . . . . . . . . . . . . . . . . . . . . . . . . . . . . . 17Martesat dhe Divorcet \ Marriages and Divorces . . . . . . . . . . . . . . . . . . . . . . . . . . . . . . . . . . 17Njësitë ekonomike familjare \ Household Economic Units . . . . . . . . . . . . . . . . . . . . . . . . . . 18
Shëndeti \ Health . . . . . . . . . . . . . . . . . . . . . . . . . . . . . . . . . . . . . . . . . . . . . . . . . . . . . . . . . . .36Shkaqet e vdekjeve \ Causes of death . . . . . . . . . . . . . . . . . . . . . . . . . . . . . . . . . . . . . . . . . . . . 37Abortet \ Abortion . . . . . . . . . . . . . . . . . . . . . . . . . . . . . . . . . . . . . . . . . . . . . . . . . . . . . . . . . . . . 37Sëmundjet Seksualisht të TransmetueshmeHIV/AIDS \ Sexually transmitted diseases (STD) . . . . . . . . . . . . . . . . . . . . . . . . . . . . . . . . . . 38
Arsimi \ Education . . . . . . . . . . . . . . . . . . . . . . . . . . . . . . . . . . . . . . . . . . . . . . . . . . . . . . . . . .48Pjesëmarrja në arsim sipas niveleveArsimore \ Educational participation by education levels . . . . . . . . . . . . . . . . . . . . . . . . . . . 49Të diplomuarit \ Graduates . . . . . . . . . . . . . . . . . . . . . . . . . . . . . . . . . . . . . . . . . . . . . . . . . . . . . 49Trupi mësimor sipas niveleve arsimore \ Academic body by education levels . . . . . . . . . . 50Studentë me aftësi të kufizuar sipas cikleve Mësimore \Students with disabilities by education level . . . . . . . . . . . . . . . . . . . . . . . . . . . . . . . . . . . . . . 51 Anketa e Arsimimit të të të Rriturve \ Adult education survey . . . . . . . . . . . . . . . . . . . . . . . 51
Tregu i punës dhe Mbrojtja Sociale \ Labour market . . . . . . . . . . . . . . . . . . . . . . . . . . . . .62Pjesëmarrja në forcën e punës \ Labour Force Participation . . . . . . . . . . . . . . . . . . . . . . . . . 63 Punësimi dhe struktura e punësimit \ Employment and employment structure . . . . . . . . 63Papunësia \ Unemployment . . . . . . . . . . . . . . . . . . . . . . . . . . . . . . . . . . . . . . . . . . . . . . . . . . . . 64Hendeku Gjinor në Paga (HPGJ) \ Gender pay gap (GPG) 64Pensionet \ Pensions . . . . . . . . . . . . . . . . . . . . . . . . . . . . . . . . . . . . . . . . . . . . . . . . . . . . . . . . . . 65Politikat e punësimit \ Employment Policies . . . . . . . . . . . . . . . . . . . . . . . . . . . . . . . . . . . . . . 65
Tabela e permbajtjesTable of Contents

5
WOMEN AND MEN IN ALBANIA IN 2018Table of Contents
Statistikat juridike \ Juridical Statistics . . . . . . . . . . . . . . . . . . . . . . . . . . . . . . . . . . . . . . . .80Autorë të veprave penale \ Perpetrators of criminal offences . . . . . . . . . . . . . . . . . . . . . . . . . 81Të dëmtuar nga veprat penale \ Damaged persons from the criminal offence . . . . . . . . . . 81Të burgosur \ Prisoners . . . . . . . . . . . . . . . . . . . . . . . . . . . . . . . . . . . . . . . . . . . . . . . . . . . . . . . . 82
Gratë në vendimarrje \ Women in Decision-making . . . . . . . . . . . . . . . . . . . . . . . . . . . . .96a- Pjesëmarrja e gruas në vendimarrje \ a- Women Participation in Decision-making . . 97Vendim-marrja në nivel vendor \ Decision-Making at local level . . . . . . . . . . . . . . . . . . . . 98Aksesi i grave dhe burrave në Strukturat e Policisë \Access of women and men to police structures . . . . . . . . . . . . . . . . . . . . . . . . . . . . . . . . . . . . 98b- Vendim-marrja dhe biznesi \ b- Decision-making and business . . . . . . . . . . . . . . . . . . . 99Ndërmarrjet aktive sipas aktivitetit ekonomik \ Active enterprises by economic activity . 99Ndërmarrjet aktive sipas qarqeve \ Active enterprises by region . . . . . . . . . . . . . . . . . . . . . 99Aksesi në kredi-marrje i grave dhe burrave \ Access of women and men to lending . . . . 100
Indeksi i Pabarazisë Gjinore \ Gender Inequality Index . . . . . . . . . . . . . . . . . . . . . . . . .114Access of women and men to lending \ Reproductive health . . . . . . . . . . . . . . . . . . . . . . . 115Fuqizimi \ Empowerment . . . . . . . . . . . . . . . . . . . . . . . . . . . . . . . . . . . . . . . . . . . . . . . . . . . . . 116Tregu i punës \ Labor market . . . . . . . . . . . . . . . . . . . . . . . . . . . . . . . . . . . . . . . . . . . . . . . . . . 116
Përkufizime \ Definition . . . . . . . . . . . . . . . . . . . . . . . . . . . . . . . . . . . . . . . . . . . . . . . . . . . .122Popullsia: \ Population: . . . . . . . . . . . . . . . . . . . . . . . . . . . . . . . . . . . . . . . . . . . . . . . . . . . . . . . 123Lindjet: \ Births: . . . . . . . . . . . . . . . . . . . . . . . . . . . . . . . . . . . . . . . . . . . . . . . . . . . . . . . . . . . . . 123Vdekjet: \ Mortality: . . . . . . . . . . . . . . . . . . . . . . . . . . . . . . . . . . . . . . . . . . . . . . . . . . . . . . . . . . 124Martesa dhe Divorcet \ Marriages and divorces: . . . . . . . . . . . . . . . . . . . . . . . . . . . . . . . . . . 124Arsimi: \ Education . . . . . . . . . . . . . . . . . . . . . . . . . . . . . . . . . . . . . . . . . . . . . . . . . . . . . . . . . . 124Krimet: \ Crimes . . . . . . . . . . . . . . . . . . . . . . . . . . . . . . . . . . . . . . . . . . . . . . . . . . . . . . . . . . . . . 126Punësimi: \ Employment: . . . . . . . . . . . . . . . . . . . . . . . . . . . . . . . . . . . . . . . . . . . . . . . . . . . . . 128
Indeksi i Pabarazisë Gjinore: \ Gender Inequality Index: . . . . . . . . . . . . . . . . . . . . . . . . . . . 128

6
BURRAT DHE GRATË NË SHQIPËRI NË 2018 Parathënie dhe Falenderime
Kapitujt e përfshirë në botimin “Burra dhe Gra në Shqipëri, 2018”, pasqyrojnë fusha të ndryshme të të dhënave me bazë gjinore, të mbledhura si nga anketat e zhvilluara nga INSTAT si dhe nga informacioni që disponojnë instutucionet e tjera shtetërore në vend. Statistikat dhe treguesit e prezantuar në këtë publikim do t’u shërbejnë politikëbëresve, botës akademike, shoqërisë civile dhe përdoruesve të ndryshëm për të analizuar në një kontekst të gjerë arritjet në drejtim të barazisë gjinore.
Ky botim shoqërohet në faqen e INSTAT me një infografik dinamik i cili është i lehtë për tu kuptuar nga të gjithë përdoruesit e statistikave gjinore dhe synon të krahasojë shifrat e burrave dhe grave në jetën e përditshme, nëpërmjet kombinimit të tekstit, grafikëve dhe tabelave.
Treguesit janë vetëm hapi i parë në zhvillimin e politikave më të mira për burrat dhe gratë: hapi i ardhshëm është të kuptojmë pse ndodhin dallime midis tyre dhe më pas të synojnë përmirësimin e politikave gjinore në vend.
Duke qenë se vihen re dallime gjinore në arsim, në tregun e punës, si dhe në vendimmarrje, treguesit e paraqitur në këtë botim për statistikat gjinore i mundësojnë politikbërësve monitorimin e procesit të krijimit të mundësive të barabarta dhe trajtimin e barabartë të burrave dhe grave në fusha të ndryshme të jetës.
Dua të falenderoj Entitetin e Kombeve të Bashkuara për Barazinë Gjinore dhe Fuqizimin e Grave (UN Women), për partneritetin afatgjatë me INSTAT për fuqizimin e statistikave sociale. Gjithashtu një falenderim i veçantë i dedikohet stafit të INSTAT për realizimin e këtij publikimi.
Botimi “Burra dhe Gra në Shqipëri, 2018” sjell para publikut
informacion të gjithëanshëm për statistikat gjinore në Shqipëri.
Në këtë botim ndër të tjera, do të gjeni për herë të parë shkaqet e
vdekjeve dhe migrimin e brendshëm për burrat dhe gratë.

7
WOMEN AND MEN IN ALBANIA IN 2018Foreword and Acknowledgements
The chapters comprising the publication “Women and Men in Albania, 2018” include various areas of gender-based data which have been collected from several survey studies conducted by INSTAT and from the information available in other state institutions in Albania. Statistics and indicators introduced in this publication shall serve to policymakers, academics, civil society and various users to broadly analyze the achievements made towards gender equality.
This publication is followed on the INSTAT web page by a dynamic infographic, which is easy to understand by all users of gender statistics and aims to make comparisons between figures for women and men in the everyday life, through the combination of text, graphs and tables.
Indicators constitute the very first step to the development of better policies for women and men. The next step will be to understand the reason behind the differences between them and, thereafter, to improve gender policies in the country.
Gender disparities are observed in education, labour market and decision-making as well, therefore, the data from this publication will serve to the policy-makers as a way of monitoring the process of ensuring equal opportunities and of the equal treatment of women and men in various aspects of the everyday life.
I would like to express my gratitude to the United Nations Entity for Gender Equality and Empowerment of Women (UN Women) for the long-term partnership with INSTAT to strengthen social statistics. A special appreciation goes to the staff of INSTAT for the accomplishment of this publication.
The publication “Women and Men in Albania, 2018” brings to the
public comprehensive information on gender statistics in Albania.
In this publication you can find for the first time data about causes
of death and about internal migration of women and men.

8
BURRAT DHE GRATË NË SHQIPËRI NË 2018 Hyrje
HyrjeIntroduction

9
WOMEN AND MEN IN ALBANIA IN 2018Introduction
“Burrat dhe Gratë në Shqipëri 2018”
publikohet me periodicitet vjetor nga
INSTAT. Qëllimi kryesor i publikimit është të
paraqesë të dhëna të ndara sipas gjinisë duke
synuar që statistikat jo vetëm të mblidhen,
analizohen dhe prezantohen sipas gjinisë, por
dhe të reflektojnë problematikat e shoqërisë
për monitorimin e politikave ndër-sektoriale
në kuadër të arritjes së barazisë gjinore.
Programi i Statistikave Zyrtare 2017-2021, i ka përfshirë statistikat gjinore si pjesë të statistikave zyrtare, në mënyrë që në vijim, këto statistika të jenë të aksesueshme për të gjithë përdoruesit. Statistikat dhe treguesit e prezantuar në këtë publikim do t’u shërbejnë politikëbëresve, botës akademike, shoqërisë civile dhe përdoruesve të ndryshëm për të analizuar në një kontekst të gjerë arritjet në drejtim të barazisë gjinore.
Publikimi është i konceptuar në kapituj të veçantë sipas tematikës që mbulohet. Kapitulli i parë trajton statistikat e popullsisë duke paraqitur situatën dhe trendet gjinore të popullsisë. Ky kapitull mbulon statistikat e lindjeve, vdekjeve dhe martesave. Në kapitullin e dytë të publikimit “Burra dhe Gra” janë paraqitur për herë të parë në mënyrë më të detajuar të dhënat gjinore për shëndetësinë. Ky kapitull përmban të dhëna për abortet, shkaqet e vdekjeve, sëmundshmërinë nga HIV/AIDS etj. Publikimi vijon me statistika gjinore të sistemit arsimor, duke analizuar pjesëmarrjen e vajzave dhe djemve në arsimin zyrtar si dhe stafet mësimdhënëse sipas niveleve që parashikohen nga sistemi zyrtar në vend për arsimin. Kapitulli i katërt përqëndrohet në statististikat e punësimit dhe të mbrojtjes sociale duke evidentuar pjesëmarrjen në tregun e punës, punësimin, papunësinë dhe disa të dhëna administrative për punëkërkuesit e papunë sipas gjinisë. Kapitulli i pestë trajton statistikat juridike, i cili analizon veprat penale, autorët, të dënuarit dhe statistika të tjera, të ndara sipas gjinisë. Kapitulli i gjashtë paraqet të dhëna për gratë në
“Men and Women in Albania 2018” will
be yearly published by INSTAT. The
publication aims mainly at displaying
data disaggregated by gender, aiming at
the collection, analysis, and presentation
of statistics by gender, and mirroring
the social issues encountered on the
cross-cutting policies monitoring, in the
framework of achieving gender equality.
The Official Statistics Program 2017-2021 entails gender statistics in the official statistics, so that such statistics be available to all users on an ongoing basis. Statistics and indicators introduced in this publication shall serve to policymakers, academics, civil society and various users to broadly analyze the achievements made towards gender equality.
The publication was designed in separate chapters, depending on the addressed topic. The first chapter addresses population statistics, by depicting the population’s situation and gender trends. This chapter covers birth, deaths, and marriage statistics. In the second chapter of the “Men and Women” Publication, gender data on health has been introduced for the first time. This chapter contains data on abortions, death causes, HIV/AIDS etc. The publication presents further gender statistics on education system, by analyzing girls and boys, as well as academic staff participation in the education system, according to the levels foreseen by the official education system in Albania. The fourth chapter focuses on employment and social protection statistics, by highlighting labor market participation, employment, unemployment and several administrative data for job seekers by gender. The fifth chapter addresses juridical statistics, and provides further analysis on criminal offenses, offenders, convicts, and other statistics, disaggregated by gender. The sixth chapter presents data on women in decision-making and has been designed in two sections. The first section contains administrative data from the Parliament, General Directorate of State Police, Armed Forces, etc. The second section entails data from the Bank of Albania and the business register

10
BURRAT DHE GRATË NË SHQIPËRI NË 2018 Hyrje
vendimmarrje dhe është konceptuar në dy pjesë. Pjesa e parë përmban të dhëna administrative nga Parlamenti, Drejtoria e Përgjithshme e Policisë, Forcat e Armatosura etj. Pjesa e dytë përfshin të dhëna nga Banka e Shqipërisë dhe regjistri i biznesit për gratë të cilat janë pronare ose drejtojnë një biznes. Kapitulli i fundit trajton treguesin e pabarazisë gjinore i cili përfshin tregues për shëndetin riprodhues, fuqizimin e grave si dhe pjesëmarrjen në tregun e punës. Publikimi mbyllet me “Bashkësinë Minimale të Treguesve Gjinorë”, ku lista e treguesve të përfshirë është përcaktuar nga Komisioni Statistikor në bashkëpunim me UN Women për matjen e treguesve gjinore.
LegjislacioniZhvillimet që nga viti 1995 janë të shumta, por më të rëndësishmet në fushën e barazisë gjinore, antidiskriminimit dhe dhunës në familje, datojnë nga viti 2006 e në vijim.
Kuadri ligjor për promovimin e barazisë ligjore është përmirësuar në mënyrë të ndjeshme nga ratifikimi i një sërë dokumentesh të rëndësishme ndërkombëtare dhe nga amendamente të tjera. Ndryshimet më të rëndësishme janë të renditura më poshtë.
for women owning and running a business. The last chapter addresses gender inequality index, which includes reproductive health, women empowerment, and labor market participation indicators. The publication concludes with the “Minimum Set of Gender Indicators”, in which the list of included indicators has been determined by Statistics Committee in cooperation with UN Women for measuring gender indicators.
LegislationFrom 1995 there have been many developments, but the most important in the area of gender equality, antidiscrimination and domestic violence are dated after 2006.
The legal frame for the promotion of legal equality has been considerably improved by the ratification of a series of important international document and by other ammendations. The most important changes are listed below.

11
WOMEN AND MEN IN ALBANIA IN 2018Introduction
LISTA E NDRYSHIMEVE KRYESOREKOMBËTARE LIGJORE NË FUSHËN E BARAZISË GJINORE NDËR VITE(1995 – 2016)
Viti 1995:1. Ligji nr.7961 datë 12.7.1995 Kodi i Punës së Republikës së Shqipërisë [ndryshuar]2. Ligji nr. 7995 datë 20.09.1995‚’’Për nxitjen e Punësimit’’
Viti 1998:1. Kushtetuta e Republikës së Shqipërisë
Viti 1999:1. Ligji nr.8454 datë 4.02.1999 “Për Avokatin e Popullit” [ndryshuar]
Viti 2002:1. Ligji nr. 8876 datë 04.04.2002 “Për Shëndetin Riprodhues”
Viti 2004:1. Ligji. Nr.9188 datë 12.2.2004 “Për disa shtesa dhe ndryshime në Kodin Penal”2. Ligji nr 9198 datë 01.07.2004 “Për Barazinë Gjinore në Shoqëri” (i shfuqizuar)3. Strategjia Kombëtare për HIV/AIDS 2004-2010
Viti 2005:1. Ligji nr.9398/12.05.2005, “Për disa shtesa dhe ndryshime në ligjin “Për Avokatin e Popullit”
Viti 2006:1. Ligji nr. 9669, datë 18.12.2006 “Për masat ndaj dhunës në marrëdhëniet familjare”
Viti 2007:1. Strategjia e parë Kombëtare për Barazinë Gjinore dhe Eliminimin e Dhunës në Familje (SKBGJ-DHF) 2007-2010.
Viti 2008:1. Ligjin nr. 9914, datë 12.05.2008 “Për disa shtesa në ligjin nr.9669, datë 18.12.2006 “Për masa ndaj
LIST OF THE MAIN NATIONAL LAW CHANGESIN THE FIELD OF GENDER EQUALITY(1995 – 2015)
Year 1995:1.Law no. 7961, 12.7.1995 “The Code of Labour of the Republic of Albania” [changed]2.Law no. 7995, 20.09.1995 ”For the Promotion of Labour”
Year 1998:1.The Constitution of the Republic of Albania
Year 1999:1.Law no. 8454, 4.02.1999 “For the Ombudsman” [changed]
Year 2002:1. Law no. 8876, 04.04.2002 “For the Reproductive Health”
Year 2004:1.Law no. 9188, 12.2.2004 “On Some Additions and Changes in the Penal Code”2.Law no. 9198, 01.07.2004 “On Gender Equality in the Society” (repealed)3.National Strategy on HIV/AIDS 2004-2010
Year 2005:1. Law no. 9398, 12.05.2005 “On Some Additions and Changes in the Law for the Ombudsman”
Year 2006:1.Law no. 9669, 18.12.2006 “On the Measures on Do-mestic Violence”
Year 2007:1.First National Strategy for Gender Equality and the Elemination of Domestic Violence (NSGE-DV) 2007-2010.
Year 2008:1.Law nr. 9914, 12.05.2008 “On Some Changes on the Law nr.9669, 18.12.2006 “ On the Measures on

12
BURRAT DHE GRATË NË SHQIPËRI NË 2018 Hyrje
dhunës në marrëdhëniet familjare”. 2. Ligjin nr.9970, datë 24.07.2008 “Për barazinë gjinore në shoqëri”. 3. Ligji nr.10019, datë 29.12.2008 Kodi Zgjedhor i Republikës së Shqipërisë 4. Ligji Nr 10 039, datë 22.12.2008 “Për ndihmën juridike”.
Viti 2009:1. Ligji nr.10192 datë 03.12.2009 “Për parandalimin dhe goditjen e krimit të organizuar dhe trafikimit nëpërmjet masave parandaluese kundër pasurisë’.
Viti 2010:1. Ligji 10221 datë 4.2.2010 “Për Mbrojtjen nga Diskriminimi”. 2. Ligji nr.10237, datë 18.2.2010 “Për sigurinë dhe shëndetin në punë”.3. Ligji nr. 10295, datë 01.07.2010 “Për faljen”. 4. Ligji ‘Për Mbrojtjen e të Drejtave të Fëmijëve” nr 10347, dt 4.11.2010
Viti 2011:1. Ligji Nr.10.399 datë 17.03.2011,“Për ndihmën dhe shërbimet shoqërore”(i ndryshuar)
Viti 2013:1. Udhëzimi i përbashkët Nr. 21 datë 21.06.2013, midis MPÇSSHB dhe Ministrisë së Financave “Për përcaktimin e proçedurave që duhet të ndiqen për integrimin gjinor në programin buxhetor afatmesëm”.
Viti 2014:1. Plani Kombëtar i Grave Sipërmarrëseve 2014-20202. Plani Kombëtar i Burrave dhe Djemve si partner të grave dhe vajzave kundër dhunës në familje3. Programi i nxitjes së punësimit ‘‘Për punëkërkuesit e papunë në vështirësi’’.VKM nr. 48, dt. 11.01.2012, ndryshuar meVKM nr. 192, dt. 02.04.2014.4. Programi i nxitjes së punësimit nëpërmjet formimit në punë.VKM nr. 47, dt. 16.01.2008, ndryshuar meVKM nr. 193, dt. 02.04.2014.
Domestic Violence”. 3.Law no.9970, 24.07.2008 “On Gender Equality in the Society”. 4.Law no.10019, 29.12.2008 “Electoral Code of the Republic of Albania” 5.Law no. 10039, 22.12.2008 “For juridical assis-tance”.
Year 2009:1.Law no.10192, 03.12.2009 “On the Prevention and Elimination of Organized Crime and Trafficking Through Preemptive Measures on Personal Wealth”
Year 2010:1.Law no. 10221, 4.2.2010 “On the Protection from Discrimination”. 2.Law no.10237, 18.2.2010 “On Health Security at Work”.3.Law no. 10295, 01.07.2010 “On Pardoning”. 4.Law no. 10347, 4.11.2010 “On the Protection of Children’s Rights”
Year 2011:1.Law no.10399, 17.03.2011, “On assistance and social services” (changed)
Year 2013:1. Common Instruction No. 21 dated 21.06.2013, between MoLSAO and the Ministry of Finance “on definition of procedures that must be followed for gender integration in medium term budget program”.
Year 20141. National Action Plan for women entrepreneur-ship 2014-20202. National Action Plan for the involvement of men and boys as partners of women and girls in actions for gender equality and against gender based and domestic violence.3. Employment Promotion Program “For unem-ployed jobseekers in difficulty”no.48, 11.01.2012, amended with no. 192, 02.04.2014.4. Employment Promotion Program through Job Training. nr. 47, dt. 16.01.2008, amended byno.193, 02.04.2014.

13
WOMEN AND MEN IN ALBANIA IN 2018Introduction
Viti 20151. Ndryshimet në Kodin zgjedhorë për vendosjen e kuotës 50% burra dhe 50% gra në listat e kandidatëve për këshillëtar/ret në zgjdhjet vendore 2015.
Viti 20161. Strategjia Kombëtare e Barazisë Gjinore dhe plani veprimit 2016-2020.2. Ligji Nr.70/2016 “Për zejtarinë në Republikën e Shqiperisë”- Miratuar nga Kuvendi i Shqipërisë me 30.06.20163. Kuadrit ligjor (ligj nr. 44/2016, datë 21.04.2016 “Për disa ndryshime dhe shtesa në ligjin nr. 9355, datë 10.3.2005, “Për ndihmën dhe shërbimet shoqërore”, të ndryshuar)
Year 20151. Amendments introduced to the Electoral Code with the Law 74/2012 to ensure 50% women at local councils at the new LGU.
Year 20161. National Strategy on Gender Equality and Action Plan 2016-2020.2. Law No.70 / 2016 “On Craftsmanship in the Republic of Albania” - Adopted by the Assembly of Albania on 30.06.20163. Legal Framework (Law No. 44/2016, 21.04.2016 “On some Amendments and addenda to Law Nr. 9355, 10.3.2005,” On Social Assistance and Services “, as amended)

14
BURRAT DHE GRATË NË SHQIPËRI NË 2018 Popullsia
PopullsiaPopulation

15
WOMEN AND MEN IN ALBANIA IN 2018Population
Statistikat e popullsisë paraqesin
situatën, trendet gjinore të popullsisë si
dhe statistikat mbi komponentët kryesorë
të saj: lindjet, vdekjet dhe martesat.
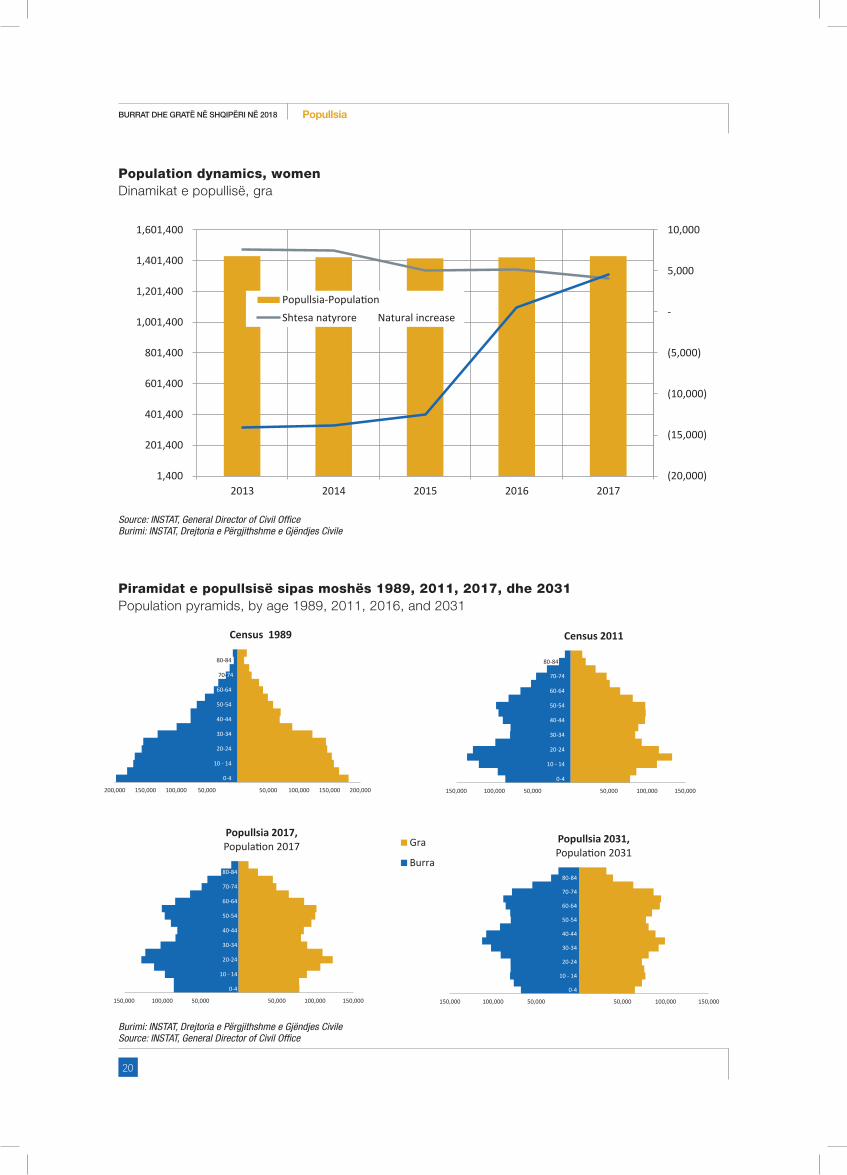
Dinamikat e popullsisëPopullsia e Shqipërisë është 2.870.324 persona me rënie prej 0,22 % gjatë vitit 2017. Gjatë këtij viti, numri i grave në Shqipëri ka vijuar të rritet, me një normë edhe më të shpejtë se vitin e kaluar, 0,61 % ndërsa popullsia e burrave ka rënë në mënyrë të ndjeshme me normë 1,0 %. Në vitin 2017, gratë përbëjnë 49,9 % të popullsisë gjithsej. Shtesa natyrore gjatë vitit 2017 ka qënë më e lartë për burrat sesa për gratë, përkatësisht 4.598 dhe 4.039. Migracioni neto i grave në 2017 është pozitiv dhe shënon 4.628 gra të migruara në 2017, nga 587 në 2016. Ndërsa migracioni neto i burrave ka shënuar një rënie të konsiderueshme, - 19.530 burra të migruar nga -10.060 në 2016. Migracioni neto negativ i burrave ka ndikuar në rënien e përgjithshme të popullsisë.
Raporti gjinor sipas grupmoshave tregon se ka një mbizotërim të gjinisë mashkullore deri në grupmoshën 35-39 vjeç. Mosha medianë për burrat në vitin 2017, është 34 vjeç ndërsa për gratë është 37 vite. Mosha medianë më e lartë tek gratë shpjegohet me jetëgjatësinë më të lartë të tyre. Në vitin 2017, jetëgjatësia në lindje është llogaritur të jetë 77,1 vite për burrat dhe 80 vite për gratë. Kjo do të thotë se gratë jetojnë rreth 3 vite më shumë se burrat.
LindjetNumri i lindjeve gjatë vitit 2017 është rreth 31 mijë lindje. Raporti gjinor në lindje është 1,11 që tregon se për çdo 100 vajza të lindura, lindin 111 djem. Ky raport është më i lartë se raporti natyral, i cili është 1,05. Në vlera absolute, rënia e numrit të lindjeve krahasuar me vitin 2016, është 864 lindje. Për lindjet meshkuj kemi një rënie prej 1,2 %, ndërsa për lindjet femra rënia është 4,4 %.
Population statistics showing the situation
of gender trends of the population, and
statistics on its main components: births,
deaths and marriages.
Population dynamicsAlbania’s population in 2017, unlike the previous year, decreased by 0.22%. However, the number of women in Albania continued to increase at a faster rate compared to the previous year, by 0.61% on an annual basis. The decline of population is due to the significant decline of the number of men by about 1.0 % from the previous year. The women population accounts for 49.9%, compared to 50.1% of the men population. Natural supplement during 2017 has been higher for men than for women, respectively with 4,598 and 4,039 units. Net women’s migration continues to be positive, which experiences a significant increase from 587 in 2016 to 4,628 in 2017. Meanwhile, net migration of men significantly decreased from -19,530 in 2016 to -10,060 in 2017.
The gender ratio by age group indicates a prevalence of the men population up to the age group 35-39 years. Then this ratio reverses in favour of the women population. For men, the median age in 2017 is 34, while for women 37 years old. The higher median age of women is due to their highest life expectancy. In 2017, life expectancy at birth was estimated at 77.1 years for men and 80 for women. This means that women live about 3 years longer than men.
BirthsIn 2017, the number of births was approximately 31,000 births. The gender ratio at birth is 1.11, which indicates that for every 100 born girls, 111 boys are born. This ratio is higher than the natural ratio, which is 1.05, thus showing a preference for the births of men. In absolute terms, there is a decline of 864 births compared to 2016. Male births have decreased by 1.2%, while female births have decreased by 4.4%.

16
BURRAT DHE GRATË NË SHQIPËRI NË 2018 Popullsia
Indeksi sintetik i fekonditetit (ISF) i cili tregon numrin mesatar të fëmijëve që pritet të lindë një grua në moshë riprodhuese, shënon, 1,48 fëmijë për vitin 2017. Kjo do të thotë se në 100 femra pritet të lindin 148 fëmijë, nëse normat e lindshmërisë sipas grupmoshave janë ato të vitit referues, 2017. Ky indeks është nën normën e zëvendësimit, 2,1 fëmijë për grua, që do të thotë se një çift nuk arrin të zëvendësojë veten. Lindshmëria ka rënë për grupmoshat 20 – 24 dhe 25 – 29, ndërsa për grupmoshat më të vjetra ka pësuar rritje të lehtë. Në vitin 2017, mosha mesatare në lindje ishte 28,4 vjeç, krahasuar me moshën mesatare të meshkujve 34 vjeç. Koeficientët specifikë të lindshmërisë sipas gjinisë për 2017, tregojnë dhe mbështesin faktin se burrat e fillojnë aktivitetin e të paturit fëmijë relativisht më vonë se gratë, afërsisht një 5 vjeçar më vonë, ndërkohë që normat e lindshmërisë pas të 30-ave, i kanë më të larta se gratë.
Koefiçienti bruto i riprodhimit (KBR) është një tregues i mirë për matjen e rritjes së brezave të ardhshëm. Ai mat normën me të cilën gratë zëvëndësojnë veten e tyre gjatë viteve të jetës riprodhuese. Mënyra e llogaritjes së KBR është e njëjtë me atë të ISF-së, por në këtë rast merren parasysh vetëm lindjet femra. Në vitin 2017, KBR është 0,7 që do të thotë se gratë në Shqipëri janë rreth 30 përqind larg zëvendësimit të vetvetes. Ky tregues ndikohet direkt nga sjellja riprodhuese e grave e shprehur nga ISF dhe nga raporti gjinor në lindje. Duke supozuar një ISF konstante, rënia e raportit gjinor në lindje do të sillte rritjen e KBR-së. Nga ana tjetër rritja e ISF-së presupozon edhe rritjen e KBR-së.
Lindshmëria në adoleshencë është zvogëluar në krahasim me një vit më parë. Në vitin 2017 ka 16,1 lindje për çdo 1000 vajza të grupmoshës 15–19 vjeç nga 17,5 lindje që ishin në 2016. Për çdo moshë teke të grupmoshës 15–19 vjeç është llogaritur përqindja e vajzave të cilat kanë patur lindje dhe përqindja e atyre që nuk kanë bërë një lindje. Përqindjet janë të vogla deri në moshën 17 vjeç ku 1,1% e vajzave kanë një lindje. Ky trend vjen në rritje duke arritur 3,9 % në moshën 19 vjeç.
The synthetic fertility index (ISF) in 2017, a standard indicator showing the average number of children that a woman at reproductive age is expected to give birth was 1.48 children, which means that out of 100 women 148 children are expected to be born, according to 2017 fertility rates. This index is below the replacement rate of 2.1 children per woman, which means that a couple is unable to replace itself. If we view fertility by age group, it has decreased significantly for age groups of 20-24 and 25-29, while older age groups have experienced a slight increase. In 2017, the average age at birth was 28.4 years, compared to the average age of men 34 years. Age group specific fertility rate for 2017 demonstrate and indicate that men become parents approximately five years later than women. Meanwhile, men’s post-30 fertility rates are higher than women’s.
The gross reproduction rate (GRR) is a useful indicator for measuring the growth of future generations. It measures the rate at which women substitute themselves during the reproductive years of their life. The GRR calculation method is equivalent to that of the ISF, but only female births are taken into account. During 2017, GRR is 0.7, which indicates that women in Albania are about 30 % away from their self-replacement. This indicator is directly influenced by women’s reproductive behaviour, expressed by ISF and the gender ratio at birth. Assuming ISF stable, the collapse of the gender ratio at birth would cause the increase of GRR. On the other hand, the increase of ISF presumes the increase of GRR.
Adolescent birth rate has decreased compared to the previous year. In 2017, there are 16.1 births per 1000 girls of the 15-19 age groups, as compared to 17.5 births per 1000 girls of the same age group in 2016. For each age of the 15-19 years old age group the percentage of girls who have and haven’t given birth is calculated. Percentages are low for the age of 17 as only 1.1% of girls have given birth. However, this trend increases according to the age, and for the age of 19 stands at 3.9%.

17
WOMEN AND MEN IN ALBANIA IN 2018Population
DeathsThe number of deaths in 2017 for men is 11,610, while for women it is 10 622, thus indicating an increase compared to the previous year for both sexes. Deaths by age groups indicate that in all age groups, men have a higher death rate, with the exception of the over 84 years old age group. This is caused by the lower life expectancy of men compared to women’s. In 2017, men live about 3 years less than women in Albania.
Infant mortality is about 8 deaths per 1,000 births for both boys and girls. This indicator has declined compared to the previous year, for both sexes. However, the decline has been mostly evident for the infant mortality of boys.
Internal movementsDuring 2017, 21,235 men and 29,181 women have changed their place of residence within the country. In this year, the number of internal men migrants increased by 5.3%, while domestic female migrants decreased by about 22.7 %. Throughout the period 2014-2017, the number of internal women migrants has been higher than internal migrants men, standing at 57.9 % in 2017.
Marriages and DivorcesDuring 2017, about 22,600 marriages were registered in Albania. 55.0 % of women get married up to the age of 24, and up to 83.0 % of them by the age of 29. This explains the relatively young age for marriage at 26.5 years old for women. On the other hand, 48.0 % of men get married up to the age of 29, and 74.0 % of them get married by the age of 34. The average age for marriage is 31.5 years for men .The change of marriage rate by age groups over years indicates a decline in the marriage rate up to the age of 24 years old, which explains the slight increase of the average age women get married. Compared to 10 years ago, women marry relatively three years older. In the above mentioned publication, early marriages for both girls and boys have been calculated for odd ages of the 15-19 years old age group. The number of married girls before the age of 18 in 2017 was 38. This number has increased compared to the previous year when there were
VdekjetGjatë vitit 2017, numri i vdekjeve të burrave është 11.610 ndërsa për gratë është 10.622 duke shënuar rritje nga viti i kaluar për të dyja gjinitë. Vdekjet sipas grupmoshave tregojnë se burrat kanë një përqindje më të lartë të vdekjeve, duke përjashtuar grupmoshën e fundit mbi 84 vjeç. Kjo ndodh pasi jetëgjatësia e burrave është më e ulët se ajo e grave. Për vitin 2016 meshkujt jetojnë rreth 3 vite më pak se gratë.
Vdekshmëria foshnjore është rreth 8 vdekje për një mijë lindje si për djemtë ashtu edhe për vajzat. Ky tregues ka pësuar rënie krahasuar me një vit më parë, për të dyja gjinitë. Megjithatë rënia ka qënë më e theksuar për vdekshmërinë foshnjore të djemve.
Lëvizjet e brendshmeGjatë vitit 2017, 21.235 burra dhe 29.181 gra kanë ndryshuar vendbanimin e tyre brenda vendit. Në këtë vit, numri i migrantëve të brendshëm burra u rrit me 5,3 % ndërsa ai i migranteve të brendshme gra u zvogëlua me rreth 22,7%. Përgjatë gjithë periudhës 2014–2017, numri i migranteve të brendshme gra ka qënë më i lartë se migrantët e brendshëm burra duke shënuar 57,9 % në vitin 2017.
Martesat dhe DivorcetGjatë vitit 2017, në vendin tonë janë regjistruar rreth 22,6 mijë martesa. Tek gratë më shumë se 55,0 % e martesave realizohen deri në moshën 24 vjeç, dhe deri në moshën 29 vjeç janë kryer 83,0 % e tyre. Kjo shpjegon dhe moshën relativisht të re në martesë për gratë e cila është 26,5 vjeç. Për burrat 48,0 % e martesave realizohen deri në moshën 29 vjeç, dhe 74,0 % e martesave deri në moshën 34 vjeç. Mosha mesatare e martesës për burrat është 31,5 vjeç. Norma e martesave të grave sipas grupmoshave ndër vite tregon se ka një rënie të normës së martesës deri në moshën 24 vjeç. Kjo shpjegon dhe rritjen e moshës mesatare në martesë të vajzave. Krahasuar me 10 vite më parë gratë martohen relativisht tre vite më të mëdha. Në këtë publikim janë llogaritur martesat e hershme për vajzat dhe djemtë në mosha teke për grupmoshën 15-19 vjeç. Numri i vajzave të martuara para moshës 18 vjeç, gjatë vitit 2017,

18
BURRAT DHE GRATË NË SHQIPËRI NË 2018 Popullsia
only 10 marriages. Meanwhile, the ratio of married girls at the age of 18 is 9% and 7.8% for the age of 19. On the other hand, there are no marriages for boys before the age of 18 and the percentage of married boys of 18-19 years of age is insignificant.
Household Economic UnitsFrom the Household Budget Survey data, it results that in 2016 there were 768,311 HUs in Albania, of which 642,707 were headed by men, while 125,000 by women. Additionally, these data indicate that the number of women living alone is 2.2 times higher than men’s. For group ages younger than 44, the number of men living alone is higher than that of women, while for age groups over 44 years the ratio changes and the number of women living alone is 2.7 times higher than men’s. The number of women living alone with their children is about 12 times higher than the number of men under the same conditions. These differences are significant for all age groups, with the exception of ages over 75 years old.
është 38. Ky numër është rritur në krahasim me një vit më parë, kur u regjistruan vetëm 10 martesa të vajzave nën 18 vjeç. Përqindja e vajzave të martuara në moshat 15 deri 17 vjeç është shumë e ulët ndërsa shënon vlerat më të larta në moshën 18 dhe 19 vjeç, përkatësisht 9,0 dhe 7,8 %. Ndërsa djemtë nuk kanë martesa para moshës 18 vjeç dhe përqindja e djemve të martuar në moshën 18-19 vjeç është e papërfillshme.
Njësitë ekonomike familjareNga të dhënat e Anketës së Buxhetit të Familjeve, rezulton se në vitin 2016 kishte 768.311 NjEF në Shqipëri prej të cilave 83,7 % me kryefamiljarë burra dhe 16,3 % me kryefamiljare gra. Sipas anketës, numri i grave të cilat jetojnë vetëm është 2,2 herë më i madh se ai i burrave. Për grupmoshat e reja nën 44 vjeç, numri i burrave të cilët jetojnë vetëm është më i madh se ai i grave, ndërsa për grupmoshat mbi 44 vjeç raportet ndryshojnë dhe numri i grave që jetojnë vetëm është 2,7 herë më i madh se ai i burrave. Numri i grave që jetojnë të vetme me fëmijët e tyre është rreth 12 herë më shumë se numri i burrave në të njëjtat kushte. Këto diferenca janë të konsiderueshme për të gjitha grupmoshat, me përjashtim të moshave mbi 75 vjeç.

19
WOMEN AND MEN IN ALBANIA IN 2018Population
Ndryshimet në popullsi 2011-2017Changes in population 2011-2017Gjendja në fund të vitit /000 - At the end of the year /000
Vitet Years
Popullsia-Population Shtesa natyrore
Natural increaseMigracioni neto
Net migrationNorma e rritjes
vjetore Annual growth rateBurra Gra Burra Gra Burra Gra
Men Women Men Women Men Women
2013 1.461.567 1.430.827 7.671 7.637 -6.731 -14.070 -0,19
2014 1.461.199 1.424.597 7.572 7.532 -7.974 -13.811 -0,23
2015 1.458.451 1.417.141 5.266 5.031 -8.052 -12.549 -0,35
2016 1.453.541 1.423.050 5.118 5.227 -10.060 587 0,03
2017 1.438.609 1.431.715 4.598 4.039 -19.530 4.628 -0,22
Burimi: INSTAT, Drejtoria e Përgjithshme e Gjëndjes CivileSource: INSTAT, General Director of Civil Office
Burimi: INSTAT, Drejtoria e Përgjithshme e Gjëndjes CivileSource: INSTAT, General Director of Civil Office
(20,000)
(15,000)
(10,000)
(5,000)
-
5,000
10,000
1,400
201,400
401,400
601,400
801,400
1,001,400
1,201,400
1,401,400
1,601,400
2013 2014 2015 2016 2017
Popullsia-Popula�onShtesa natyrore Natural increaseMigracioni neto Net migra�on
Population dynamics, menDinamikat e popullsisë, burra
20
BURRAT DHE GRATË NË SHQIPËRI NË 2018 Popullsia
200,000 150,000 100,000 50,000 50,000 100,000 150,000 200,000
0-4
10 - 14
20-24
30-34
40-44
50-54
60-64
70-74
80-84
Census 1989
Gra Women
Burra Men
150,000 100,000 50,000 50,000 100,000 150,000
0-4
10 - 14
20-24
30-34
40-44
50-54
60-64
70-74
80-84
Popullsia 2017, Popula�on 2017
Gra Women
Burra Men
Burimi: INSTATSource: INSTAT
150,000 100,000 50,000 50,000 100,000 150,000
0-4
10 - 14
20-24
30-34
40-44
50-54
60-64
70-74
80-84
Popullsia 2031, Popula�on 2031
Gra
Burra
150,000 100,000 50,000 50,000 100,000 150,000
0-4
10 - 14
20-24
30-34
40-44
50-54
60-64
70-74
80-84
Census 2011
Gra Women
Burra Men
Piramidat e popullsisë sipas moshës 1989, 2011, 2017, dhe 2031Population pyramids, by age 1989, 2011, 2016, and 2031
Burimi: INSTAT, Drejtoria e Përgjithshme e Gjëndjes CivileSource: INSTAT, General Director of Civil Office
(20,000)
(15,000)
(10,000)
(5,000)
-
5,000
10,000
1,400
201,400
401,400
601,400
801,400
1,001,400
1,201,400
1,401,400
1,601,400
2013 2014 2015 2016 2017
Popullsia-Popula�onShtesa natyrore Natural increase
Population dynamics, womenDinamikat e popullisë, gra
Source: INSTAT, General Director of Civil OfficeBurimi: INSTAT, Drejtoria e Përgjithshme e Gjëndjes Civile
Burimi: INSTATSource: INSTAT
150,000 100,000 50,000 50,000 100,000 150,000
0-4
10 - 14
20-24
30-34
40-44
50-54
60-64
70-74
80-84
Popullsia 2031, Popula�on 2031
Gra
Burra

21
WOMEN AND MEN IN ALBANIA IN 2018Population
Piramidat e popullsisë sipas moshës 1989, 2011, 2017, dhe 2031Population pyramids, by age 1989, 2011, 2016, and 2031
0.50
0.60
0.70
0.80
0.90
1.00
1.10
1.20
Grupmosha 2011 2017 2031 Age group
Burra - Men %
Gjithsej 100 100 100 Total
0-14 22% 18% 16% 0-14
15-64 67% 69% 64% 15-64
65+ 11% 13% 20% 65+
Gra - Women %
Gjithsej 100 100 100 Total
0-14 20% 17% 16% 0-14
15-64 68% 69% 62% 15-64
65+ 12% 14% 23% 65+
Source: INSTATShënim: Të dhënat për vitin 2031 i referohen projeksioneve të popullsisëNote: Data for 2031 refer the projection of population
Raporti gjinor i popullsisë sipas grupmoshës, 2017Sex ratio by agegroup, 2017
Popullsia sipas grupmoshës , 2011,2017, 2031Population by agegroup 2011,2017, 2031
Source: INSTATBurimi: INSTAT

22
BURRAT DHE GRATË NË SHQIPËRI NË 2018 Popullsia
Vitet Years
Mosha medianë - Median age
Burra Gra Gjithsej
Men Women Total
2013 32 35 33
2014 33 35 34
2015 33 36 34
2016 34 36 35
2017 34 37 35
Të lindur gjallë sipas gjinisëLive births by sex
Vitet Years
BurraMen
GraWomen
Raporti gjinor në lindjeSex ratio at birth
Vajza te munguara* Missing girls
2013 18.661 17.089 1,09 683
2014 18.683 17.077 1,09 716
2015 17.103 15.612 1,10 677
2016 16.401 15.332 1,07 288
2017 16.208 14.661 1,11 775
Burimi: INSTAT, Drejtoria e Përgjithshme e Gjëndjes CivileSource: INSTAT, Albanian Civil Office* Ky tregues eshte llogaritur nese raporti gjinor ne lindje do te ishte 1.05* This indicator is calculated if the sex ratio at birth it would be 1:05
Burimi: INSTATSource: INSTAT
Mosha mediane e popullsisë sipas gjinisëMedian age of the population by sex

23
WOMEN AND MEN IN ALBANIA IN 2018Population
Raporti gjinor në lindjeSex ratio at birth
1,11
1,13 1,13
1,09 1,091,09 1,09 1,10
1,07
1,11
1,00
1,02
1,04
1,06
1,08
1,10
1,12
1,14
2008 2009 2010 2011 2012 2013 2014 2015 2016 2017
Rapor� natyror Natural ra�o Rapor� gjinor në lindje Sex ra�o at birth
Raporti gjinor sipas rradhës së lindjes, 2017Sex ratio by birthorder, 2017
Rradha e lindjes Birthorder Djem Vajza Raporti gjinor
Boys Girls Sex ratio
1 6,729 6,186 108.8
2 5,548 5,061 109.6
3 2,021 1,717 117.7
4+ 623 496 125.6
Mungojnë Missing 1,287 1,201 107.2
Burimi: INSTAT, Drejtoria e Përgjithshme e Gjëndjes CivileSource: INSTAT, Albanian Civil Office

24
BURRAT DHE GRATË NË SHQIPËRI NË 2018 Popullsia
Vitet Years
Lindje Live
births
Lindshmëria sipas grupmoshës për 1.000 gra
ISF* TFR*
Mosha
mesatare në lindje
Mean age at birth
Age group specific fertility rate per 1,000 womenKBR** GRR**
15 - 19 20 - 24 25 - 29 30 - 34 35 - 39 40 - 44 45 - 49
2013 35.750 20,4 108,2 124,0 69,2 25,3 4,3 0,5 1,76 0,84 27,3
2014 35.760 21,7 109,3 125,9 69,7 25,2 4,4 0,3 1,78 0,85 27,2
2015 32.715 20,2 102,5 119,2 64,0 24,0 3,4 0,4 1,67 0,80 26,7
2016 31.733 17,5 74,0 106,9 74,6 29,4 5,0 0,2 1,54 0,74 27,0
2017 30.869 16,1 67,0 99,9 76,8 30,5 5,0 0,4 1,48 0,70 28,4
Koeficientët specifikë të fertilitetit sipas grupmoshësAge group specific fertility rate
Burimi: INSTATSource: INSTAT
0
20
40
60
80
100
120
140
15 - 19 20 - 24 25 - 29 30 - 34 35 - 39 40 - 44 45 - 49
2009
2013
2017
Koeficientët specifikë të fertilitetit sipas grupmoshës dhe indeksi sintetik i fekonditetitAge group specific fertility rate and total fertility rate
Koefiçientët specifikë të fertilitetit sipas grupmoshësAge specific fertility rate
Burimi: INSTAT, Drejtoria e Përgjithshme e Gjëndjes CivileSource: INSTAT, Albanian Civil Office *Indeksi Sintetik i Fekonditetit - Total Fertility Rate **Koefiçienti bruto i riprodhimit - Gross Reproduction Rate

25
WOMEN AND MEN IN ALBANIA IN 2018Population
Indeksi sintetik i fertilitetit,Total fertility rate
Koefiçientët specifikë të fertilitetit sipas grupmoshws dhe gjinisë, 2017Age specific fertility rate by sex, 2017
Koeficientët specifikë të lindshmërisë sipas gjinisë, 2017
Burimi: INSTATSource: INSTAT
Specific fertility rate by sex, 2017
0
20
40
60
80
100
120
15 - 19 20 - 24 25 - 29 30 - 34 35 - 39 40 - 44 45 - 49
Burra-Men
Gra-Women
TFRb = 1.53
TFRg = 1.48
Burimi: INSTATSource: INSTAT
1,58 1,63 1,63 1,65 1,72 1,76 1,78 1,67
1,54 1,48
0,00
0,50
1,00
1,50
2,00
2,50
2008 2009 2010 2011 2012 2013 2014 2015 2016 2017
Indeksi sinte�k i fer�lite�t, Total fer�lity rate

26
BURRAT DHE GRATË NË SHQIPËRI NË 2018 Popullsia
Vdekjet sipas gjinisë Deaths by sex
Vdekjet nën 1 vjeç sipas gjinisë Infant deaths by sex
Vitet Burra Gra Gjithsej Vitet Burra Gra Gjithsej
Years Men Women Total Years Men Women Total
2013 10.990 9.452 20.442 2013 171 111 282
2014 11.111 9.545 20.656 2014 145 136 281
2015 11.837 10.581 22.418 2015 134 99 233
2016 11.283 10.105 21.388 2016 146 131 277
2017 11.610 10.622 22.232 2017 130 118 248
Burimi: INSTAT, Drejtoria e Përgjithshme e Gjëndjes CivileSource: INSTAT, General Director of Civil Office
Lindshmëria në adoleshencë, sipas moshaveAdolescent birth rate by single age
Source: INSTAT, General Director of Civil OfficeBurimi: INSTAT, Drejtoria e Përgjithshme e Gjëndjes Civile
99,7% 99,5% 98,9%97,9%
96,1%
0,3%0,5% 1,1%
2,1%
3,9%
90,0%
92,0%
94,0%
96,0%
98,0%
100,0%
15 16 17 18 19
% e vajzave që kanë një lindje/ % of girls that have given birth
% e vajzave që nuk kanë një lindje/ % of girls that have not given birth

27
WOMEN AND MEN IN ALBANIA IN 2018Population
Vdekshmëria foshnjore për 1000 lindje Infant deaths per 1000 live births
Burimi: INSTATSource: INSTAT
2008 2009 2010 2011 2012 2013 2014 2015 2016 2017Burra Men 11.6 10.7 10.0 9.2 9.5 9.2 7.8 7.8 8.9 8.0Gra Women 10.6 9.9 9.2 8.2 8.0 6.5 8.0 6.3 8.5 8.0
0
2
4
6
8
10
12
14
Vdekshmëria foshnjore për 1000 lindjeInfant deaths per 1000 live births
Burimi: INSTAT, Drejtoria e Përgjithshme e Gjëndjes CivileSource: INSTAT, General Director of Civil Office

28
BURRAT DHE GRATË NË SHQIPËRI NË 2018 Popullsia
Vdekshmëria sipas grupmoshave dhe gjinisë, 2017Deaths by age group and sex, 2017
2% 4%
19%
38% 37%
2% 2%
11%
31%
54%
-10%
0%
10%
20%
30%
40%
50%
60%
0-19 20-44 45-64 65-79 80+
Meshkuj Men
Femra Women
Jetëgjatësia mesatare në lindjeAverage life expectancy at birth
Burimi: INSTATSource: INSTAT
2008 2009 2010 2011 2012 2013 2014 2015 2016 2017Burra-Men 73.2 73.9 74.7 75.4 75.5 75.9 76.4 76.3 77.0 77.1Gra-Women 78.6 78.8 79.4 79.8 79.6 80.1 80.1 79.7 80.1 80.0
70
72
74
76
78
80
82
Vdekshmëria sipas grupmoshave dhe gjinisë, 2017Deaths by age group and sex, 2017
Jetëgjatësia mesatare në lindje, 2008 – 2017Average life expectancy at birth, 2008 - 2017

29
WOMEN AND MEN IN ALBANIA IN 2018Population
Lëvizjet e brendshme sipas moshës, burratInternal movements by age, men
Grupmoshat Age group
2014 2015 2016 2017
0-4 686 765 1,370 1,471
5-9 736 923 1,545 1,391
10-14 669 759 1,253 1,199
15-19 721 862 1,275 1,290
20-24 1,316 1,561 1,673 2,065
25-29 1,894 2,262 2,784 2,887
30-34 1,627 1,966 2,448 2,451
35-39 1,295 1,521 1,604 1,693
40-44 965 1,152 1,194 1,342
45-49 768 955 1,015 1,159
50-54 673 775 866 952
55-59 603 696 866 986
60-64 564 541 782 806
65-69 426 507 766 805
70-74 247 268 374 405
75-79 125 135 209 194
80-84 63 76 104 93
85+ 22 27 33 46
Gjithsej - Total 13,400 15,751 20,161 21,235
Burimi: INSTAT, Drejtoria e Përgjithshme e Gjëndjes Civile Source: INSTAT, General Director of Civil Office
Lëvizjet e brendshme sipas moshës, gratëInternal movements by age, women
Grupmoshat Age group
2014 2015 2016 2017
0-4 675 748 1,207 1,426
5-9 740 797 1,372 1,340
10-14 653 752 1,253 1,092
15-19 1,969 2,107 4,453 2,946
20-24 4,875 5,563 9,997 6,067
25-29 3,655 4,262 7,608 5,369
30-34 1,752 2,115 3,667 2,860
35-39 1,001 1,080 1,877 1,682
40-44 620 810 1,318 1,239
45-49 531 631 1,015 1,072
50-54 576 627 966 1,001
55-59 703 563 967 924
60-64 515 578 1,001 1,050
65-69 198 249 407 513
70-74 115 186 288 248
75-79 96 103 166 186
80-84 56 77 115 99
85+ 47 57 79 67
Gjithsej - Total 18,777 21,305 37,756 29,181
Burimi: INSTAT, Drejtoria e Përgjithshme e Gjëndjes Civile Source: INSTAT, General Director of Civil Office

30
BURRAT DHE GRATË NË SHQIPËRI NË 2018 Popullsia
Lëvizjet e brendshme sipas moshës dhe gjinisë, 2017Internal movements by age and sex, 2017
Burimi: INSTAT, Drejtoria e Përgjithshme e Gjëndjes CivileSource: INSTAT, General Director of Civil Office
-
1,000
2,000
3,000
4,000
5,000
6,000
7,000
Burra-Men Gra-Women
Përqindja e martesave sipas grupmoshave dhe gjinisë, 2017Percentage of marriages by age group and sex, 2017
17%
39%
27%
10%
4% 2% 1% 1% 1%
14%
41%
27%
10%
4% 2% 2%
0%
5%
10%
15%
20%
25%
30%
35%
40%
45%
Deri 19 20 - 24 25 - 29 30 - 34 35 - 39 40 - 44 45 - 49 Mbi 50
Femra Women Meshkuj Men
Përqindja e martesave sipas grupmoshave dhe gjinisë, 2017Percentage of marriages by age group and sex, 2017
Burimi: INSTAT, Drejtoria e Përgjithshme e Gjëndjes Civile Source: INSTAT, General Director of Civil Office
Lëvizjet e brendshme sipas moshës dhe gjinisë, 2017 Internal movements by age and sex, 2017
Burimi: INSTATSource: INSTAT

31
WOMEN AND MEN IN ALBANIA IN 2018Population
Martesat sipas gjinisë dhe grupmoshësMarriages by sex and age
Grupmosha 2013 2014 2015 2016 2017 Age group
Nuset - Bride
Gjithsej 23,820 23,769 24,997 22,562 22,641 Total
Deri 19 5,632 5,319 5,342 3,339 3,827 Up to 19
20 - 24 10,043 9,917 10,407 9,052 8,836 20 - 24
25 - 29 5,275 5,413 5,842 6,342 6,024 25 - 29
30 - 34 1,709 1,855 2,009 2,210 2,182 30 - 34
35 - 39 643 712 746 819 899 35 - 39
40 - 44 249 276 345 427 399 40 - 44
45 - 49 125 147 164 194 239 45 - 49
Mbi 50 144 130 142 179 235 Over 50
Të panjohur 0 0 0 0 0 UnknownDhëndurët - Bridegroom
Gjithsej 23,820 23,769 24,997 22,562 22,641 Total
Deri 19 154 139 169 88 120 Up to 19
20 - 24 4,204 4,022 4,241 2,787 3,225 20 - 24
25 - 29 10,358 10,128 10,466 9,051 9,188 25 - 29
30 - 34 5,727 5,833 6,273 6,600 6,179 30 - 34
35 - 39 1,903 2,063 2,108 2,256 2,155 35 - 39
40 - 44 748 793 843 915 857 40 - 44
45 - 49 313 360 434 408 432 45 - 49
Mbi 50 413 431 463 457 485 Over 50
Të panjohur 0 0 0 0 0 Unknown
Burimi: Drejtoria e Përgjithshme e Gjëndjes Civile Source: Albanian Civil Office

32
BURRAT DHE GRATË NË SHQIPËRI NË 2018 Popullsia
Normat e martesave sipas grupmoshës së graveMarriage rates by age group of women
Burimi: INSTATSource: INSTAT
0.00
0.10
0.20
0.30
0.40
0.50
Deri 19 20 - 24 25 - 29 30 - 34 35 - 39 40 - 44 45 - 49
2017
2013
2009
100,0 % 100,0 % 99,9 %
92,2%91,0%
9,0% 7,8%
90,0%
92,0%
94,0%
96,0%
98,0%
100,0%
15 16 17 18 19
% e vajzave që janë të martuara/% e girls that are married
% e vajzave që nuk janë të martuara/% of girls that are not married
0,0% 0,0% 0,1%
Normat e martesave sipas grupmoshës së graveMarriage rates by age group of women
Martesat e hershme për vajzatEarly marriages of girls

33
WOMEN AND MEN IN ALBANIA IN 2018Population
Burimi: INSTATSource: INSTAT
15 16 17 18 19
% e djemve që janë të martuara/% e boys that are married
% e djemve që nuk janë të martuara/% of boys that are not married
100,0 % 100,0 % 100,0 % 99,9 % 99,6 %
90,0%
92,0%
94,0%
96,0%
98,0%
100,0%0,0% 0,0% 0,0% 0,1% 0,4%
Mosha mesatare e martesës sipas gjinisë
Burimi: INSTATSource: INSTAT
Mean age of marriage by sex
20
22
24
26
28
30
32
34
2008 2009 2010 2011 2012 2013 2014 2015 2016 2017
Burra Men Gra Women
Martesat e hershme tek djemtëEarly marriages of boys
Mosha mesatare e martesës sipas gjinisë Mean age of marriage by sex
Burimi: INSTAT, Drejtoria e Përgjithshme e Gjëndjes CivileSource: INSTAT, General Director of Civil Office

34
BURRAT DHE GRATË NË SHQIPËRI NË 2018 Popullsia
Mosha mesatare e martesës sipas gjinisë dhe diferenca moshore në martesëMean age of marriage by sex and the age diference in marriage
Vitet Burra Gra Diferanca e moshës mesatare në martesë
Difference of the meanage in marriage
Years Men Women
2008 28.1 23.1 5.0
2009 29.2 23.2 6.0
2010 29.2 23.4 5.8
2011 29.3 23.6 5.7
2012 29.1 23.5 5.6
2013 29.3 23.7 5.6
2014 29.5 24.0 5.6
2015 29.6 24.1 5.5
2016 30.4 25.1 5.3
2017 31.5 26.5 5.0
Burimi: INSTATSource: INSTAT
Numri i NjEF sipas tipologjisë, madhësisë së NjEF dhe Gjinisë së KryefamilajritNumber of Housholds by typology, size of household and sex of the head of the household.
Tipologjia e NjEF / houshold Typology
Madhësia e NjEF / Household Size
Një person /One Person
2 persona /2 persons
3 persona /3 persons
4 persona /4 persons
5+ persona /5+ persons
Gjinia e kryefamiljarit / Sex of head of houshold
Burra / Men
Gra / Women
Burra / Men
Gra / Women
Burra / Men
Gra / Women
Burra / Men
Gra / Women
Burra / Men
Gra / Women
Person i vetëm / Lone person
18,582 40,522 - - - - - - - -
Person i vetëm me fëmijë në varësi / Lone person with kids
- - 640 5,340 161 5,381 153 648 - 160
Dy të rritur pa fëmijë / Couple without kids
- - 133,241 20,810 - - - - - -
Dy të rritur me fëmijë / Couple with kids
- - - - 40,131 4,871 63,783 2,031 25,692 520
Tre ose më shumë të rritur pa fëmijë / Three or more adults without kids
- - - - 80,093 11,918 61,273 5,909 26,081 754
Tre ose më shumë të rritur me fëmijë / Three or more adults with kids
- - - - - - 43,295 5,696 149,581 21,044
Gjithsej / Total 18,582 40,522 133,881 26,151 120,385 22,170 168,505 14,284 201,354 22,478
Burimi: Anketa e Buxhetit të Familjes, 2016 Source: Household Budget Survey. 2016

35
WOMEN AND MEN IN ALBANIA IN 2018Population
Njësitë ekonomike familjare sipas moshës dhe gjinisë së kryefamiljaritHouseholds by age and sex of head of household
Gjinia e kryefamiljarit / Sex of head of houshold
Burra / Men Gra / Women
Mosha e kryefamilajrit / Age of Head of Household
Nën 25 vjeç / under 25 years 4,287
4,902
25 - 34 44,353
7,687
35 - 44 91,164
15,922
45 - 54 174,220
18,389
55 - 64 168,434
26,651
65 - 74 111,142
28,089
Mbi 74 vjeç / Over 74 years 49,107
23,964
Gjithse j / Total 642,707
125,604
Burimi: Anketa e Buxhetit të Familjes, 2016Source: Household Budget Survey. 2016*Vlera të fshehura për arsye konfidencialiteti. **Hidden values for confidentiality reasons.
Personat e vetëm dhe personat e vetëm me fëmijë sipas moshës dhe gjinisë së kryefamiljaritLone persons and lone persons with kids by age and sex of head of hoesehold
Burra / Men Gra / Women
Person i vetëm / Lone person
Person i vetëm me fëmijë në varësi / Lone person with
kids
Person i vetëm / Lone person
Person i vetëm me fëmijë në varësi / Lone person with
kids
Mosha e kryefamilajrit / Age of Head of Household
Nën 25 vjeç / under 25 years
1,115 40 504 366
25 - 34 2,747 * 1,463 3,709
35 - 44 907 560 656 5,063
45 - 54 1,180 97 2,749 1,635
55 - 64 3,263 ** 9,572 204
65 - 74 4,966 61 14,198 368
Mbi 74 vjeç / Over 74 years
4,403 194 11,381 184
Gjithsej / Total 18,582 954 40,522 11,529 Burimi: Anketa e Buxhetit të Familjes, 2016Source: Household Budget Survey. 2016Vlera të fshehura për arsye konfidencialiteti. **Hidden values for confidentiality reasons.

36
BURRAT DHE GRATË NË SHQIPËRI NË 2018 Shëndeti
ShëndetiHealth

37
WOMEN AND MEN IN ALBANIA IN 2018Health
Statistikat e shëndetit paraqesin të dhëna
të detajuara mbi diferencat gjinore në
fushën e shëndetësisë, si abortet, shkaqet e
vdekjeve, sëmundshmërinë nga HIV/AIDS
etj, bazuar në klasifikimin Ndërkombëtar
“ICD-9” të shkaqeve të vdekjes.
Shkaqet e vdekjeveShkaqet kryesore të vdekjeve si tek gratë ashtu dhe tek burrat vijojnë të jenë “grupsëmundjet e aparatit të qarkullimit të gjakut”, të cilat shkaktojnë 56,8 % të vdekjeve tek gratë dhe 50,7 % të vdekjeve tek burrat. Dy shkaqet e tjera më të rëndësishme janë “simptomat shenjat dhe sëmundje të papërcaktuara”, që shkaktojnë vdekjen për 18,9 % të grave dhe 13,4 % të burrave, dhe tumoret nga të cilët vdesin 13,1 % e grave dhe 19,4 % e burrave.
Analiza sipas grupmoshave për sëmundjet e aparatit të qarkullimit të gjakut, të cilat janë shkaku kryesor i vdekjeve, tregon për diferenca të larta gjinore për moshat nën 65 vjeç, ku numri i vdekjeve të burrave nga këto sëmundje për 100.000 banorë është afërsisht dy herë më i lartë se ai i grave, 85 kundrejt 40,8. Për moshat mbi 65 vjeç, ky tregues është pothuajse i barabartë për të dyja gjinitë. Rreth 63,0 % e vdekjeve të burrave nga sëmundjet e qarkullimit të gjakut ndodhin në grupmoshën 65 – 84 vjeç, kundrejt 58,0 % të vdekjeve të grave të kësaj grupmoshe. Nga ana tjetër, në moshat më të mëdha se 85 vjeç ndodhin rreth 19,0 % e vdekjeve të burrave, kundrejt 34,0 % të vdekjeve të grave.
Në vitin 2017, numri i vetëvrasjeve të burrave është më i lartë se numri i vetëvrasjeve të grave. Përqindja e grave ndaj totalit të vetëvrasjeve në vitin 2017, ishte 32,0 %, me një rënie prej 10 pikë përqindje krahasuar me vitin 2016.
AbortetKa dy kategori abortesh spontane dhe të provokuara. Aborti i provokuar ka për origjinë një veprim të ndërmarrë me qëllim për të ndërprerë barrën. Të gjitha abortet e tjera konsiderohen spontane. Numri i aborteve në vitin 2017 ka pësuar rënie duke arritur në 5.265 dhe po kështu edhe raporti i abortit. Në
The health statistics based on the “ICD-
9” international classification of causes
of death, display detailed data on sex
differences regarding health, such as:
abortions, causes of death, HIV/AIDS
morbidity etc.
Causes of deathThe main causes of death for both women and men remain “cardiovascular system diseases”, which cause 56.8% of female deaths and 50.7% of male deaths. Two other important causes are “unspec-ified symptoms, signs and diseases”, which cause 18.9% of female deaths and 13.4% of male deaths, as well as “tumours”, which cause 13,1% of female deaths and 19,4% of male deaths.
The age group analysis on cardiovascular system diseases, which are the main causes of death, reveals high sex differences for people under 65 years of age, in whic h the number of male deaths per 100,000 people is approximately two times higher than female deaths, specifically 85 (men) and 40,8 (women). For people over 65 years of age, this indicator is nearly equal for both sexes. Approximately 63.0% of male deaths and 58.0% of female deaths caused by cardiovascular system diseases occur at 65-84 years of age. On the other hand, for people older than 85 years of age, male deaths are 19.0%, while females death are 34,0%.
The number of male suicides for 2017 is higher than that of females. The percentage of female suicides for 2017 was 32,0%, 10 percentage points lower than that of 2016.
AbortionThere are two categories of abortion: spontaneous and induced. Induced abortion is mainly caused by an action, aiming to end the pregnancy. All other abortions are considered to be spontaneous. The number of abortions in 2017 decreased to 5265, as did the abortion rate. In 2017, for every 1.000 live

38
BURRAT DHE GRATË NË SHQIPËRI NË 2018 Shëndeti
vitin 2017, për çdo 1.000 lindje tw gjalla ka patur 171 aborte. Raporti lindje-abort tregon se për çdo 5,9 lindje, ka ndodhur paralelisht edhe një abort. Abortet spontane mbajnë peshën më të madhe të aborteve duke përbërë në vitin 2017, 77,4 % të totalit.Pjesa më e madhe e aborteve kryhen nga gratë e grupmoshës 20-34 vjeç, e cila është dhe grupmosha më riprodhuese e gruas. Në këtë grupmoshë, 8,1 % kryejnë një lindje dhe 1,11 % kryejnë një abort. Ndërsa për grupmoshën mbi 34 vjeç 1,13 % e grave bëjnë një lindje dhe 0,53 % kryejnë një abort.
Raporti i abortit për grup-moshën 15-19 vjeç është analizuar në mosha teke, ku në moshën 17 vjeçare kemi vlerën më të lartë të këtij treguesi, 146 aborte për 1.000 lindje tw gjalla.
Pjesa më e madhe e aborteve, gjatë vitit 2017, është kryer nga gratë me nivel arsimor 9-vjeçar dhe të mesëm, përkatësisht 37,1 % dhe 36,0 %. Peshën më të vogël e zënë gratë me nivel arsimi fillor, ndërsa përqindja e aborteve nga gratë me nivel arsimor të lartë zë 21,1 % të totalit.
Sipas statusit martesor, 92,0 % e aborteve janë kryer nga gratë e martuara dhe 6,3 % nga gratë beqare. Abortet nga gratë e divorcuara ose të veja janë në nivele shumë të ulëta.
Abortet e kryera nga gratë e papuna ose të pasiguruara, ndër vite, ndjekin të njëjtin trend dhe nivele të përafërta, duke përbërë më shumë se 70,0 % të aborteve gjithsej. Në vitin 2017, përqindja e aborteve të kryera nga gratë e punësuara rritet me 5,9 pikë përqindje duke arritur në 27,6 % kundrejt 71,6 % të aborteve të kryera nga gratë e papuna.
Sëmundjet Seksualisht të Transmetueshme HIV/AIDSNumri i grave dhe burrave të prekur nga sëmundjet seksualisht të transmetueshme, HIV/AIDS për vitin 2017 është 69 burra dhe 25 gra. Nga 25 gra të prekura nga Hiv/Aids, 2 janë shtatzënë.
births there were 171 abortions. Birth-abortion ratio shows that for 5.9 live births, there is also one abortion. Spontaneous abortions are the most common type, and in 2017 marked a rate of 77.4%. Most of the abortions happen for women 20 – 34 years old, which is also the most fertile age group. In this age group, 8.1 % of women give birth, while 1.11 % of them have an abortion. While 1.13% of women older than 34 years give birth to a child, 0.53% of them have an abortion.
Abortion rate for the 15-19 years old age group has been analysed for single ages, where 17 year old girls show the highest value for this indicator, 146 abortions for 1000 live births
Most of the abortions in 2017 were carried by women just with compulsory education and those with secondary education, respectively 37.1% and 36%. Women with only primary education had the lowest share of the total number of abortions, while women with higher education had 21.1% of the abortions.
According to the civil status, it results that 92% of abortions were carried out by married women, and only 6,3 % by single women. Abortions performed by divorced or widows are at a very low percentage.
Abortions by unemployed or uninsured women, through the years, follow the same trend on nearly equal levels, consisting of over 70.0% of the total number of abortions. In 2017 the percentage of abortions by employed women increased by 5.9 percentage points, reaching 27.6%, while 71.6% of the abortions were from unemployed women.
Sexually transmitted diseases (STD) The number of women and men with the sexually transmitted disease HIV/AIDS, in 2017 was 69 men and 25 women. Out of the 25 women with HIV/AIDS only 2 of them were pregnant.

39
WOMEN AND MEN IN ALBANIA IN 2018Health
Shkaqet e vdekjeve sipas gjinisë për 100.000 banorë, 2017 Causes of death by sex per 100,000 inhabitant, 2017
Grup semundjet
2017
Diseace groups of deaths<65 65+ Gjithsej-Total
Gra-Women Burra-Men Gra-Women Burra-Men Gra-Women Burra-Men
Semundje infektive e parazitare
0.3 0.8 6.1 5.9 1.1 1.5Infectious and parasitic
diseases
Tumoret 46.3 60.5 416.6 802.4 97.7 155.6 Tumors
Semundjet endokrine te ushqyerit
1.5 1.7 73.1 66.4 11.4 10.0Endocrine Disease of
Nutrition
Semundjet e gjakut dhe te organeve formuese te gjakut
0.4 0.6 6.6 9.7 1.3 1.7Diseases of lood and blood
forming organs
Semundje mendore 0.5 0.9 24.7 18.3 3.9 3.1 Mental illness
Semundje e sistemit nervor qendror dhe organeve te shqisave
3.5 5.6 47.9 73.9 9.7 14.4Diseases of the central
nervous system and the organs of the senses
Semundje e aparatit te qarkullimit
40.8 85.0 2790.9 2600.5 422.8 407.4 Diseases of the bloodstream
Semundje e aparatit te frymemarjes
3.3 4.4 114.0 179.7 18.7 26.9 Respiratory diseases
Semundje e aparatit te aparatit te tretjes
1.8 9.6 35.3 55.6 6.4 15.5Diseases of the digestive
tract
Semundje te organeve urogenitale
1.2 2.8 45.9 57.7 7.4 9.8Diseases of the urogenital
organs
Nderlikime ne barre,te lindjes dhe te periudhes se paslindjes
2.4 2.5 0.0 0.0 2.1 2.1Complications of burden,
birth and postnatal period
Semundje te lekures dhe te indit qelizor ne qelize
0.0 0.0 0.5 0.5 0.1 0.1Diseases of skin and skin
tissue disorders in the skin
Semundje te sistemit te kockavedhe te kyceve
0.9 0.2 10.1 2.2 2.2 0.4Diseases of the bone and
joint system
Anomali te bashkelindura 1.2 0.7 0.0 0.0 1.1 0.6 Congenital anomalies
Semundje qe shfaqen ne periudhen rreth lindjes
3.6 4.2 0.0 0.0 3.1 3.7Diseases that occur in the
period around birth
Simptoma shenja dhe semundje te papercaktuara
7.0 18.6 970.5 712.9 140.8 107.6Symptoms, signs and
diseases not well defined
Demtime traumatike 10.9 36.2 36.3 85.3 14.4 42.5Traumatic damage and
poisoning
Burimi: Drejtoria e Përgjithshme e Gjendjes Civile Source: General Directorate of Civil Status

40
BURRAT DHE GRATË NË SHQIPËRI NË 2018 Shëndeti
Shpërndarja e vdekjeve sipas gjinisë dhe grupsëmundjeve kryesore në %, 2017Distribution ofdeaths by sex and major disease groups in %, 2017
Vdekjet nga sëmundjet e sistemit të qarkullimit të gjakut, sipas moshës dhe gjinisë, 2017Deaths from diseases of the blood circulation system, by age and sex, 2017
Burimi:INSTATSource:INSTAT
0% 2% 6%
58%
34%
1% 3%
14%
63%
19%
0%
10%
20%
30%
40%
50%
60%
70%
"0-14 15-49 50--64 65--84 85+
Gra-Women Burra-Men
Vdekjet nga sëmundjet e sistemit të qarkullimit të gjakut, sipas moshes dhe gjinise, 2017Deaths from diseases of the blood circulation system, by age and sex, 2017
Burimi:INSTATSource:INSTAT
56,8%
18,9%
13,1%
2,5% 1,9% 1,5% 1,3% 1,0% 0,9% 0,5%
50,7%
13,4%
19,4%
3,4% 5,3%
1,2% 1,8% 1,2% 1,9%
0,4% 0,0%
10,0%
20,0%
30,0%
40,0%
50,0%
60,0%
1 2 3 4 5 6 7 8 9 10
Gra-Women Burra-Men
1 . Sëmundje të aparatit të qarkullimit të gjakut/Diseases of the bloodstream2 . Simptoma, shenja dhe sëmundje të papërcaktuara mirë/Symptoms, signs and diseases not well defined3 . Tumore/Tumors4 . Sëmundje të aparatit të frymëmarrjes/Respiratory diseases5 . Dëmtime traumatike dhe helmime/Traumatic damage and poisoning6 . Sëmundje endokrine të të ushqyerit/Endocrine Disease of Nutrition7 . Sëmundje të sistemit nervor qendror dhe të organeve të shqisave/Diseases of the central nervous system and the organs of the senses8 . Sëmundje të organeve urogenitale/Diseases of the urogenital organs9 . Sëmundje të aparatit të tretjes/Diseases of the digestive tract10. Sëmundje mendore/Mental illness

41
WOMEN AND MEN IN ALBANIA IN 2018Health
Numri i vetëvrasjeseve sipas gjinisëNumber of suicide by sex
148 159
191
154 131 135
63
91 71 67
94
64
0
50
100
150
200
250
2012 2013 2014 2015 2016 2017
Burra-Men Gra-Women
Numri i vetëvrasjeseve sipas gjinisëNumber of suicide by sex
Burimi:INSTATSource:INSTAT
Lindjet dhe abortet Live births and abortions
VitetYears
LindjeLive births
AborteAbortions
Raporti i abortitAbortion rate
Lidhja: Lindje/ AborteThe Relation: Births/
Abortions
2013 35,750 6,638 186 5.4 :1
2014 35,760 5,892 165 6.1:1
2015 32,715 5,880 180 5.6:1
2016 31,733 5,410 170 5.9:1
2017 30,869 5,265 171 5.9:1
Burimi: INSTAT, Drejtoria e Përgjithshme e Gjëndjes Civile, Instituti i Shëndetit Publik (ISHP)Source: INSTAT, Albanian Civil Office, Institute of Public Health (IPH)Përditësim sipas të dhënave më të fundit nga (ISHP)According to the last data updates by (IPH)

42
BURRAT DHE GRATË NË SHQIPËRI NË 2018 ShëndetiBurimi: INSTAT, Drejtoria e Përgjithshme e Gjëndjes Civile, Instituti i Shëndetit Publik (ISHP)
Source: INSTAT, Albanian Civil Office, Institute of Public Health (IPH)Përditësim sipas të dhënave më të fundit nga (ISHP)According to the last data updates by (IPH)
Burimi: INSTATSource: INSTAT
237 242 221
186 165
180 170 171
0
50
100
150
200
250
300
0
5,000
10,000
15,000
20,000
25,000
30,000
35,000
40,000
2010 2011 2012 2013 2014 2015 2016 2017
Lindje Live births Aborte Abor�ons Rapor� i abor�t Abor�on rate
Burimi:INSTATSource:INSTAT
Numri i aborteve dhe përqindja e aborteve të kryera sipas llojit The number andpercentage of executed abor�ons according to the kind of abor�on
40 37 34 33
29 24 22 23
60 64 66 67
72 76 78 77
8085 8307 7846
6638
5892 5880 5410 5265
0
2000
4000
6000
8000
10000
20
30
40
50
60
70
80
90
2010 2011 2012 2013 2014 2015 2016 2017
Nderprerje Pregnancyinterrup�on
Abort Spontan SpontaneousAbor�on
Aborte
Numri i aborteve dhe përqindja e aborteve të kryera sipas llojit The number andpercentage of executed abortions according to the kind of abortion

43
WOMEN AND MEN IN ALBANIA IN 2018Health
Raporti i lindjeve dhe raporti i aborteve për grua sipas grup moshës, në (%) Births ratio and abortion ratio for women by age group, in (%)
Rapor� i lindjeve dhe rapor� i aborteve për grua sipas grupmoshës në %, 2017Births ra�o and abor�on ra�o for women by age group in %, 2017
Burimi: Instituti i Shëndetit PublikSource: Institute of Public Health
1,61%
8,09%
1,13% 0,24%
1,11% 0,53%
0,00%
1,00%
2,00%
3,00%
4,00%
5,00%
6,00%
7,00%
8,00%
9,00%
14-19 20-34 34+
Lindje - Live births Aborte-Abor�ons
Burimi: Instituti i Shëndetit PublikSource: Institute of Public Health

44
BURRAT DHE GRATË NË SHQIPËRI NË 2018 Shëndeti
Mosha e vajzave Age of woman
Numri i aborteve Number of abortion
Numri i lindjeve Number of births
Raporti abortit Abortion rate
15 3 54 56
16 13 112 116
17 41 281 146
18 59 553 107
19 102 952 107
Numri i aborteve sipas moshës së gruas, 2017Abortion number by age of woman, 2017
Burimi: Instituti i Shëndetit PublikSource: Institute of Public Health
56
116
146
107 107
0
20
40
60
80
100
120
140
160
15 16 17 18 19
Raporti abortit Abortion rate
Burimi: Instituti i Shëndetit PublikSource: Institute of Public Health

45
WOMEN AND MEN IN ALBANIA IN 2018Health
Niveli arsimor i gruas
Vitet Year Education level of woman2010 2011 2012 2013 2014 2015 2016 2017
Fillor 2.3 2.3 2.8 3.2 3.8 3.7 3.6 3.7 Basic or less
9- vjeçar 43.7 47.4 45.9 50.1 48.9 44.8 41.8 37.1 Primary
I mesëm 36.8 35.8 34.9 31.7 29.1 32.6 34 36.0 Secondary Vocation
I lartë 15.6 13.5 14.8 13.7 15.2 16.4 18.5 21.1 University
Pa deklaruar 1.6 1 1.6 1.3 3 2.5 2.1 2.1 Not declaring
Përqindja e aborteve sipas viteve dhe shkallës arsimore të gruasPercentage of abortions by year and education level of woman
Burimi: Instituti i Shëndetit PublikSource: Institute of Public Health
3,7
37,1
36,0
21,1
2,1
Fillor 9- vjeçar I mesëm I lartë Pa deklaruar
3,7
37,1
36,0
21,1
2,1
Fillor 9- vjeçar I mesëm I lartë Pa deklaruar
Burimi: Instituti i Shëndetit PublikSource: Institute of Public Health
Përqindja e aborteve sipas viteve dhe shkallës arsimore të gruasPercentage of abortions by year and education level of woman

46
BURRAT DHE GRATË NË SHQIPËRI NË 2018 Shëndeti
Përqindja e aborteve sipas statusit martesor të gruasThe percentage of abortions by marital status of women
Vitet YearStatusi martesor i gruas - Marital status of women
BeqareSingle
E martuarMarried
E ndarë Separated
WidowE Ve
MungonMissing
2013 6.3 92.8 0.6 0.1 0.2
2014 6 92.4 0.5 1 0.1
2015 5.8 93.1 0.7 0.4 0
2016 5.7 92.3 0.8 0.1 1.1
2017 6.3 92.0 0.8 0.2 0.7
Përqindja e aborteve sipas statusit martesor të gruas, 2017 The percentage of abortions by marital status of women, 2017
Përqindja e aborteve sipas statusit martesor të gruas, 2017The percentage of abor�ons by marital status of women, 2017
Burimi: Instituti i Shëndetit PublikSource: Institute of Public Health
6,3%
92%
Beqare Single
E martuar Married
E ndarë Separated
Widow E Ve
Përqindja e aborteve sipas statusit të punësimit dhe sigurimeve shëndetësore të gruasThe percentage of abortions by the status of employment and health insurance of women
Burimi: Instituti i Shëndetit PublikSource: Institute of Public Health
10
30
50
70
90
2010 2011 2012 2013 2014 2015 2016 2017
E punësuar Employed E papunë Unemployed E siguruar Insured E pasiguruar Uninsured
Përqindja e aborteve sipas statusit të punësimit dhe sigurimeve shëndetësore të gruas The percentage of abortions by the status of employment and health insurance of women
Burimi: Instituti i Shëndetit Publik Source: Institute of Public Health
Burimi: Instituti i Shëndetit PublikSource: Institute of Public Health

47
WOMEN AND MEN IN ALBANIA IN 2018Health
VitetYears
Numër-Number %
BurraMen
GraWomen
BurraMen
GraWomen
2013 83 41 67 33
2014 63 21 75 25
2015 74 29 72 28
2016 105 23 82 18
2017 69 25 73 27
Shpeshtësia e SST-ve, HIV/AIDS-it sipas viteve dhe gjinisë Incidence of SST & HIV/AIDS by years and sex
Shpeshtësia e SST-ve, HIV/AIDS-it sipas viteve dhe gjinisë Incidence of SST & HIV/AIDS by years and sex
Burimi: Instituti i Shëndetit PublikSource: Institute of Public Health
67% 75% 72%
82%
73%
33% 25%
28% 18%
27%
0
10
20
30
40
50
60
70
80
90
2013 2014 2015 2016 2017
Burra Men Gra Women
Burimi: Instituti i Shëndetit PublikSource: Institute of Public Health

48
BURRAT DHE GRATË NË SHQIPËRI NË 2018 Arsimi
ArsimiEducation

49
WOMEN AND MEN IN ALBANIA IN 2018Education
Statistikat e arsimit paraqesin të dhëna
mbi pjesëmarrjen e vajzave dhe djemve
duke filluar nga arsimi parashkollor deri
në arsimin e lartë, gjatë atij zyrtar apo jo
zyrtar, si dhe stafet mësimdhënëse sipas
niveleve që parashikohen nga sistemi
zyrtar në vend për arsimin.
Sistemi arsimor në vend kërkon që e gjithë popullsia banuese të përfundojë arsimin bazë prej nëntë vitesh, duke përfshirë këtu pesë vitet e ciklit të ulët (Klasa 1-5) dhe katër vite (Klasa 6-9) në ciklin e lartë pjesë e arsimit bazë. Ndërkohë baza ligjore garanton aksesin universal në arsim nga MARS (Ministria e Arsimit, Sportit dhe Rinisë) e cila ka për detyrë të sigurojë mundësi të barabarta.
Pjesëmarrja në arsim sipas niveleve arsimoreDuke analizuar pjesëmarrjen në arsim sipas nivelit (GER), vihet re se rreth 81,8 % e fëmijëve djem dhe 81,3 % e vajzave shkojnë në kopësht pa diferenca gjinore. Niveli i pjesëmarrjes bruto në arsimin e detyrueshëm është 101,6 % për djemtë dhe 99,2 % për vajzat. Edhe pjesëmarrja në nivelin e mesëm të studimeve është më e lartë për djemtë se për vajzat, përkatësisht 98,0 dhe 91,1 %, ndërsa në nivelin universitar raporti përmbyset, dhe pjesëmarrja është më e lartë për vajzat 67,9 % sesa për djemtë, 44,6 %.
Pjesëmarrja sipas gjinisë në ciklet arsimore tregon për ekzistencën e diferencave gjinore në nivelet e ndryshme të arsimit. Ka një raport më të lartë të djemve krahasuar me vajzat në arsimin parauniversitar ndërkohë që në arsimin e lartë 59,2 % e studentëve të këtij cikli janë vajza. Kjo reflektohet dhe në indeksin e barazisë gjinore (mbi GER) që për arsimin e lartë ka vlerën 1,5.
Të diplomuarit Gjatë vitit akademik 2016/17 në arsimin e detyruar u diplomuan 36 mijë nxënës nga të cilët 52,7 % ishin djem dhe 47,3 % vajza. Në këtë vit akademik, ka një ulje të lehtë të numrit të nxënësve që marrin
Education statistics present data on
girls and boys, as well as academic staff
participation from pre-school education
to higher education, in both formal and
informal, according to the levels foreseen
by the official education system in the
country.
The education system in the country requires to the residing population to complete the basic 9-year education, including the primary (1-5 grade) and the lower secondary (6-9 grade) education. In the meantime, the legal basis guarantees universal access to education from MESY (Ministry of Education, Sports and Youth), the duty of which is to ensure equal opportunities.
Educational participation by education levelsFrom the analysis conducted on educational participation by levels (GER), it is noted that approximately 81.8% of male children and 81.3% of female children attend kindergarten with no gender differences. The gross compulsory educational participation level is 101.6% for boys and 99.2 % for girls. Participation in the upper secondary education is higher for boys than girls, namely 98.0% and 91.1%, whereas the ratio for higher education is rather reversed, as the participation scores higher for girls 67.9% than boys 44.6%.
Educational participation by gender in the education cycles indicates the existence of gender differences at various education levels. The ratio of boys attending pre-university education is higher compared to girls’, whereas 59.2% of students in higher education are girls. This is reflected in the gender equality index (GER), amounting to 1,5 for higher education.
Graduates During the academic year 2016/2017, 36,000 students were successfully graduated after having completed the compulsory education, of which 52.7% were boys and 47.3% girls. This academic

50
BURRAT DHE GRATË NË SHQIPËRI NË 2018 Arsimi
diplomë të arsimit të mesëm krahasuar me vitin paraardhës. Nxënësit e diplomuar në arsimin e mesëm sipas gjinisë ishin 49,4 % djem dhe 50,6 % vajza.
Numri i të diplomuarve në arsimin e lartë në vitin 2016/17 ishte 35 mijë studentë ndër të cilët vajzat përbënin 64,2 %. Numri i të diplomuarve vajza në krahasim me një vit më parë është rritur me 2,4 mijë.
Trupi mësimor sipas niveleve arsimoreNë vitin 2016/2017, në trupin mësimor mbizotërojnë gratë në ciklin e ulët dhe atë të mesëm, përkatësisht 73,4 dhe 65,7 % e mësuesve të secilit nivel. Në nivelin e arsimit të lartë mbizotërojnë burrat, përqindja ndaj grave e të cilëve rritet me rritjen e gradës në trupin akademik. Gratë me titull Profesor janë 45,2 %, ato me titull Doktor janë 61,5 dhe Docentë dhe Pedagogë pa tituj janë 59,5 % krahasuar me burrat. Të dhënat nga rektoratet e universiteteve publike në vitin 2017, tregojnë se në trupin akademik drejtues, gratë zënë 38,1 % ndaj totalit dhe rektore grua ka vetëm një.
Peshën kryesore në diplomat e marra sipas fushave të studimit në arsimin e lartë, e zë ajo e shkencave të biznesit, administrimit dhe ligjit për të dyja gjinitë.
Fushat e studimit ku femrat diplomohen më shumë janë biznes, administrim dhe ligj (27,2 %), shëndet dhe mirëqënie (16,3 %), shkenca sociale, gazetari dhe informacion (13,6 %) dhe arte dhe humanitare (13,5 %). Ndërsa fushat e studimit, ku diplomohen më së shumti djemtë, janë biznes administrim dhe ligj (33,7 %), inxhinieri, prodhim dhe ndërtim (13,8 %), shkenca sociale, gazetari dhe informacion (9,7 %).
Fusha e studimit, më e dominuar nga vajzat e diplomuara është fusha e shkencave të arsimit në të cilën 80,5 % e studentëve të diplomuar janë vajza, ndjekur nga ajo e shëndetit dhe mirëqënies me 76,9 % të studentëve të diplomuar vajza, dhe arte dhe shkenca humane (75,0 %). Ndërsa djemtë dominojnë më shumë në fushën e shërbimeve (72,0 % e të diplomuarve janë djem), ndjekur nga inxhinieri, prodhim dhe ndërtim (60,2 %).
year was marked by a slight decrease in the number of students obtaining an upper secondary education degree, compared to the previous year. Students graduated upon completion of upper secondary education by gender were 49.4% boys and 50.6% girls.
The number of graduates from higher education in the academic year 2016/2017 amounted to 35,000 students, of whom 64.2% were girls. The number of graduate girls increased by 2,400 compared to the previous year.
Academic body by education levelsIn 2016/2017, the academic body in the primary and secondary education was preponderantly composed of women, namely 73.4% and 65.7% of teachers in each level. Men prevail in the higher education, whose percentage towards women increases upon obtaining higher academic titles. Women holding the title Professor amount to 45.2%, women holding the title Doctor amount to 61.5%, whereas women Docents and Lecturers are as high as 59.5% compared to men.
Data from public universities rectories in 2017 indicate that 38.1% of the governing academic bodies are women, and there is only one woman in the rector’s capacity.
The majority of diplomas were obtained in the following fields of study for both genders: business sciences, administration, and law. Fields of study women graduate the most are business, administration, and law (27.2%); health and wellbeing (16.3%); social sciences, journalism, and information (13.6%), arts, and human sciences (13.5%). On the other hand, the fields of study men graduate the most are business, administration, and law (33.7%); engineering, manufacturing, and construction (13.8%); social sciences, journalism, and information (9.7%).
The most pursued field of study by graduated females is the field of education sciences, in which 80.5% of graduated students are girls, followed by health and wellbeing with 76.9% of women graduates, and arts, and human sciences (75.0%). Meanwhile men prevail in the field of services (72.0% of graduates are boys), followed by engineering, manufacturing, and construction (60.2%).

51
WOMEN AND MEN IN ALBANIA IN 2018Education
Gratë mbi 65 vjeç me arsim bazë janë 79,5 % ndërsa burrat 62,3 %. Vetëm 4,8 % e grave në këtë grupmoshë janë me arsim të lartë, kundrejt 14,1 % të burrave. Në popullsinë 25-39 vjeç, gratë me arsim të lartë janë 29,8 % ndërsa burrat 21,7 %. Në këtë grupmoshë, 48,5 % e grave janë me arsim bazë ndërsa tek burrat kjo përqindje është 43,7.
Studentë me aftësi të kufizuar sipas cikleve mësimorePër vitin 2016/17, përqindja e vajzave ndaj nxënësve me aftësi të kufizuar në arsimin 9-vjeçar dhe të mesëm është më e ulët se ajo e djemve, 31,7 dhe 43,6 %, ndërsa në arsimin e lartë është 58,5 %.
Pjesëmarrja më e lartë e studentëve me aftësi të kufizuar vitin akademik 2016/2017 është në Universitetin e Tiranës, ku janë regjistruar 30,0 % e djemve dhe 25,8 % e vajzave me aftësi të kufizuar. Në Universitetin e Elbasanit, të Vlorës, të Durrësit, atë Politeknik të Tiranës dhe Universitetin Bujqësor të Tiranës, pjesëmarrja e vajzave me aftësi të kufizuar është më e lartë se ajo e djemve.
Anketa e Arsimimit të të të RriturveNë këtë publikim paraqiten të dhëna mbi të mësuarit gjatë gjithë jetës bazuar në të dhënat e Anketës së Arsimimit të të Rriturve 2017. Gjatë këtij viti 9,5 % e grave të grupmoshës 25–64 vjeç, dhe 8,8 % e burrave të kësaj grupmoshe morën pjesë në arsim zyrtar ose jo-zyrtar. Përsa i përket të mësuarit informal, morën pjesë në aktivitete të tilla 66,1 % e grave dhe 69,4 % e burrave.
Women older than 65 years old that have completed the basic education amount to 79.5%, whereas men to 62.3%. Only 4.8% of women belonging to this age group have completed the higher education, compared to 14.1% of men. For the 25-39 years old population, 29.8% of women have completed the higher education compared to 21.7% of men. For the same age group, 48.5% of women have completed the basic education, as compared to 43.7% of men.
Students with disabilities by education levelFor the academic year 2016/2017, the ratio of girls out of the disabled students’ in the 9-year education system and upper secondary education is lower than boys’, namely 31.7% and 43.6%, whereas the figure for higher education is as high as 58.5%.
Higher participation of students with disabilities for the academic year 2016/2017 is noted in the University of Tirana, in which 30.0% of boys and 25.8% of girls with disabilities have been enrolled. In the University of Elbasan, Vlora, Durrës, Polytechnic University of Tirana and the Agricultural University of Tirana, the participation of disabled girls is higher compared to men’s.
Adult education survey This publication presents data on lifelong learning, based on the data of the Adults Education Survey in 2017. During this year, 9.5% of women belonging to the 25-64 years age group, and 8.8% of men belonging to the same age group pursued formal and informal education. Regarding formal education, 66.1% of women and 69.4% of men participated in such activities.

52
BURRAT DHE GRATË NË SHQIPËRI NË 2018 Arsimi
Pjesëmarrja në arsim sipas niveleve arsimore / rapoti i regjistrimit bruto Participation in education by education level /gross enrolment ratio(GER)
2013-14 2014-15 2015-16 2016-17
DjemBoys
VajzaGirls
DjemBoys
VajzaGirls
DjemBoys
VajzaGirls
DjemBoys
VajzaGirls
Kopshte/ Pre-Primary 80.3 79.8 82.3 82.3 83.3 83.3 81.8 81.3
9 vjeçare/Primary+Lower Secondary 103.3 101.0 104.0 101.9 102.8 100.8 101.6 99.2
Të mesme/Upper secodary 106.5 93.3 102.3 91.4 96.7 89.6 98.0 91.1
Të lartë/Tertiary 54.3 74.5 51.0 70.4 46.5 67.8 44.6 67.9
Nxënës në shkolla sipas programit dhe gjinisëPupil in schools by programmes and sex
Programi2013-14 2014-15 2015-16 2016-17
ProgrammeDjemBoys
VajzaGirls
DjemBoys
VajzaGirls
DjemBoys
VajzaGirls
DjemBoys
VajzaGirls
Parashkollor 42,677 38,771 43,266 39,228 43,242 39,891 42,295 38,899 Pre-Primary
Fillore 103,111 92,609 99,627 88,744 94,737 84,827 92,380 82,456 Primary
Cikli i lartë i 9 vjeçares 95,359 85,995 91,873 83,164 86,554 77,381 80,842 72,422 Lower secondary
Mesme 83,636 69,301 75,548 64,494 69,219 61,161 67,528 59,586 Upper secondary
Burimi: INSTATSource: INSTAT
Pjesëmarrja në arsim sipas niveleve arsimore / raporti i regjistrimit brutoParticipation in education by education level /gross enrolment ratio(GER) )
81,8
101,6 98,0
44,6
81,3
99,2 91,1
67,9
40,0
60,0
80,0
100,0
Parashkollor/ Pre-Primary 9 vjeçare/Primary+LowerSecondary
I mesëm/Upper secodary I lartë/Ter�ary
Djem Boys Vajza Girls

53
WOMEN AND MEN IN ALBANIA IN 2018Education
Indeksi i Barazise Gjinore (mbi GER)Gender Parity Index (on GER)
Programi 2013-14 2014-15 2015-16 2016-17 Programme
9 vjeçare/fillore 0.98 0.98 0.98 0.98 Primary+Lower Secondary
I mesëm 0.88 0.89 0.93 0.93 Upper secondary
I lartë 1.37 1.38 1.46 1.52 Tertiary
Burimi: Ministria e Arsimit Sportit dhe RinisëSource: Ministry of Education Sports and Youth
Nxënës dhe studentë sipas nivelit dhe gjinisë 2016-2017,Pupils and studnets by level of education and sex 2016-2017
52,1%
47,2%
47,3%
46,9%
59,2%
47,9%
52,8%
52,7%
53,1%
40,8%
0,0% 20,0% 40,0% 60,0% 80,0% 100,0%
Kopshte/ Pre-Primary
Fillore/ Primary
Cikli I larte I 9 vjecares/Lower Secondary
Te mesme/Upper secodary
Te larte/Ter�ary
Vajza-Girls Djem-Boys
Nxenes te regjistruar sipas niveleve arsimore 2015- 2016
0,98
0,93
1,52
0,00 0,20 0,40 0,60 0,80 1,00 1,20 1,40 1,60
9 vjeçare/fillore
I mesëm
I lartë
Indeksi i Barazise Gjinore (mbi GER), 2016-17Gender Parity Index (on GER), 2016-17
Burimi: Ministria e Arsimit Sportit dhe RinisëSource: Ministry of Education Sports and Youth

54
BURRAT DHE GRATË NË SHQIPËRI NË 2018 Arsimi
Studentë të diplomuar në numër dhe sipas gjinisëGraduated students Number and sex distribution
Vitet - YearsNumër/Number Sipas gjinisë/Sex distribution
Burra-Men Gra-Women Burra-Men Gra-Women
2012-13 10,641 19,724 35.0 65.0
2013-14 9,963 19,174 34.2 65.8
2014-15 11,960 21,569 36.0 64.0
2015-16 11,415 20,115 36.2 63.8
2016-17 12,607 22,566 35.8 64.2
Nxënës që mbaruan dhe u diplomuanPupils graduated
Nxënës 2013-14 2014-15 2015-16 2016-17 Pupils
Nxënës që morën dëftesë lirimi Arsimi 9 vjeçar
44,139 44,001 43,290 36,546 Pupils graduated on
basic education
Burra 22,845 22,610 22,318 19,254 Men
Gra 21,294 21,391 20,972 17,292 Women
Nxënës morën Çertifikata në arsimin profesional
5,691 5,672 5,243 6,173Pupils Certified on
secondary technical
Burra 4,910 4,918 4,705 5,431 Men
Gra 781 754 538 742 Women
Nxënës diplomuarnë arsimib e mesem
35,254 39,629 37,721 36,436 Pupils graduated on
upper secondary education
Burra 16,372 19,249 18,262 18,000 Men
Gra 18,882 20,380 19,459 18,436 Women
Diplomuar pas të mesmejo te lartë
164 125 335 215Graduated on post
secondary non tertiary
Burra 64 75 139 110 Men
Gra 100 50 196 105 Women
Burimi: Ministria e Arsimit Sportit dhe RinisëSource: Ministry of Education Sports and Youth

55
WOMEN AND MEN IN ALBANIA IN 2018Education
Studentë të diplomuar në arsimin e lartë, sipas fushave të studimit, 2016-17Students graduates on tertiary by field of study, 2016-17(Number and sex distribution in %)
Burimi: INSTATSource: INSTAT
Shënim: Sipas Manualit te Fushave te Studimit 2013Note: ISCED Fields of Education and Training 2013 (ISCED-F 2013)
-80 -60 -40 -20 0 20 40 60 80 100
Djem
Vajza
Studentë të diplomuar në arsimin e lartë, sipas fushave të studimit, 2016-17Students graduates on tertiary by field of study, 2016-17 (Number and sex distribution in %)
Burimi: INSTAT Source: INSTAT Shënim: Sipas Manualit te Fushave te Studimit 2013 Note: ISCED Fields of Education and Training 2013 (ISCED-F 2013)
1%
2%
4%
5%
5%
12%
13%
14%
16%
27%
0 0.05 0.1 0.15 0.2 0.25 0.3
Sherbimet/ Services
Bujqesi, Pyje, Peshkim dhe veterinari/Agriculture, forestry,…
Teknologjite e Informacionit dhe komunikimit/Informa�on and…
Inxhinjerite,prodhim dhe nder�m/Engineering, manufacturing…
Shkenca natyrore, matema�ke dhe sta�s�ke/ Natural sciences,…
Arsim/Educa�on
Arte dhe humanitaret /Arts and humani�es
Shkenca sociale, Gazetari dhe informacion/ Social sciences,…
Shendet dhe mirqenie/Health and welfare
Biznes, administrim dhe ligj/ Business, administra�on and law
Studentë të diplomuar sipas fushave femra, 2016-17Fields of study for females students, 2016-17

56
BURRAT DHE GRATË NË SHQIPËRI NË 2018 Arsimi
Burimi: Ministria e Arsimit Sportit dhe RinisëSource: Ministry of Education Sports and Youth
4%
4%
4%
5%
8%
9%
9%
10%
14%
34%
0 0.05 0.1 0.15 0.2 0.25 0.3 0.35 0.4
Sherbimet/ Services
Bujqesi, Pyje, Peshkim dhe veterinari/Agriculture, forestry,…
Shkenca natyrore, matematike dhe statistike/ Natural…
Arsim/Education
Arte dhe humanitaret /Arts and humanities
Shendet dhe mirqenie/Health and welfare
Teknologjite e Informacionit dhe komunikimit/Information…
Shkenca sociale, Gazetari dhe informacion/ Social sciences,…
Inxhinjerite,prodhim dhe ndertim/Engineering,…
Biznes, administrim dhe ligj/ Business, administration and…
Studentë të diplomuar sipas fushave djem, 2016-17 Fields of study for males students, 2016-17
Studentë të diplomuar sipas fushave djem, 2016-17Fields of study for males students, 2016-17
Source: Ministry of Education Sports and YouthBurimi: Ministria e Arsimit Sportit dhe Rinisë
Niveli arsimor i popullsisë në % Educational attainment of population in %
Popullsia 25 vjeç e lart
Grupmosha - Age group
Population 25 years old and
over
25-39 40-64 65 +Gjithsej (25+) -
Total (25+)
Burra - Men
Gra - Women
Burra - Men
Gra - Women
Burra - Men
Gra - Women
Burra - Men
Gra - Women
44% 48% 44% 54% 62% 79% 47% 57%
Me arsim të mesëm
35% 22% 45% 36% 24% 16% 37% 27% Upper Secondary
Me arsim të lartë
22% 30% 12% 11% 14% 5% 15% 16% Tertiary
Gjithsej 100 100 100 100 100 100 100 100 Total
Burimi: Anketa e Forcave të Punës, 2017 Source: Labour Force Survey, 2017
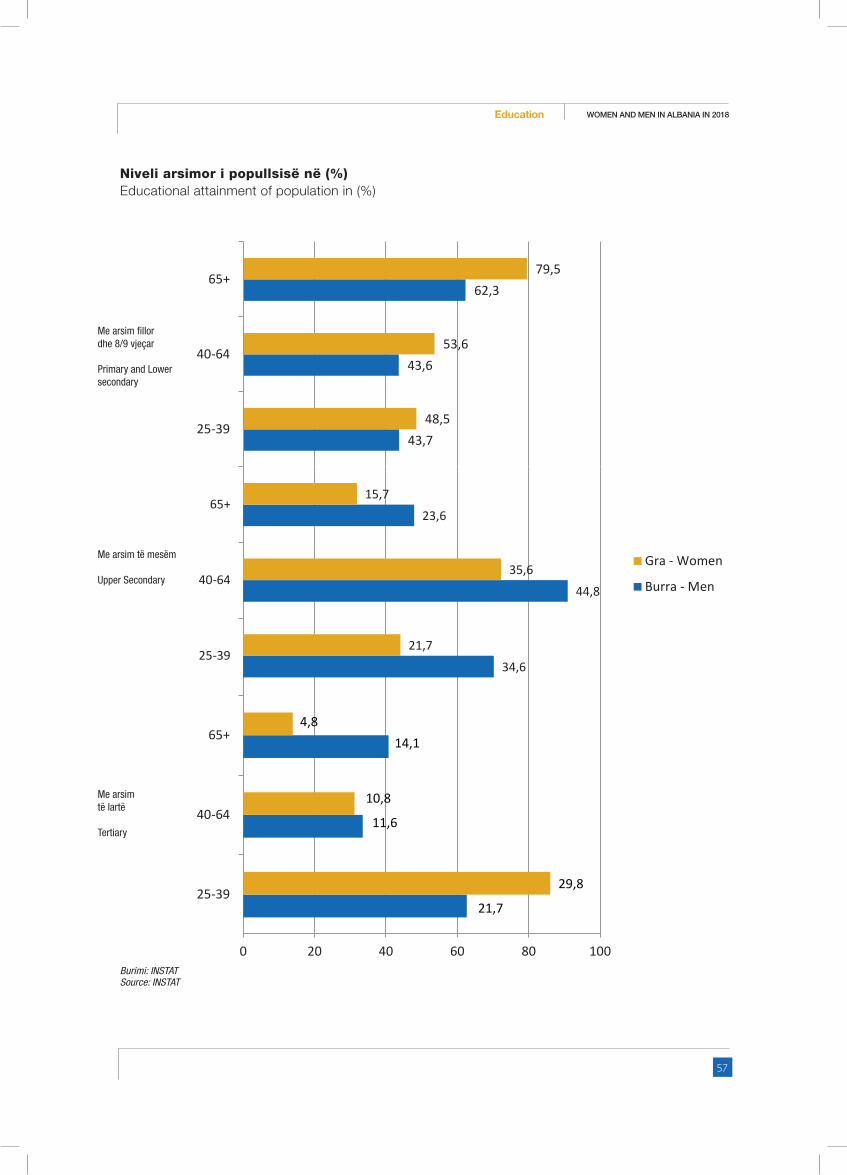
57
WOMEN AND MEN IN ALBANIA IN 2018Education
43,7
43,6
62,3
48,5
53,6
79,5
25-39
40-64
65+
Gra - Women
Burra - Men
34,6
44,8
23,6
21,7
35,6
15,7
25-39
40-64
65+
25-39
40-64
65+
0 20 40 60 80 100
21,7
11,6
14,1
29,8
10,8
4,8
Me arsim fillordhe 8/9 vjeçar
Primary and Lowersecondary
Me arsim të mesëm
Upper Secondary
Me arsimtë lartë
Tertiary
Niveli arsimor i popullsisë në (%)Educational attainment of population in (%)
Burimi: INSTATSource: INSTAT
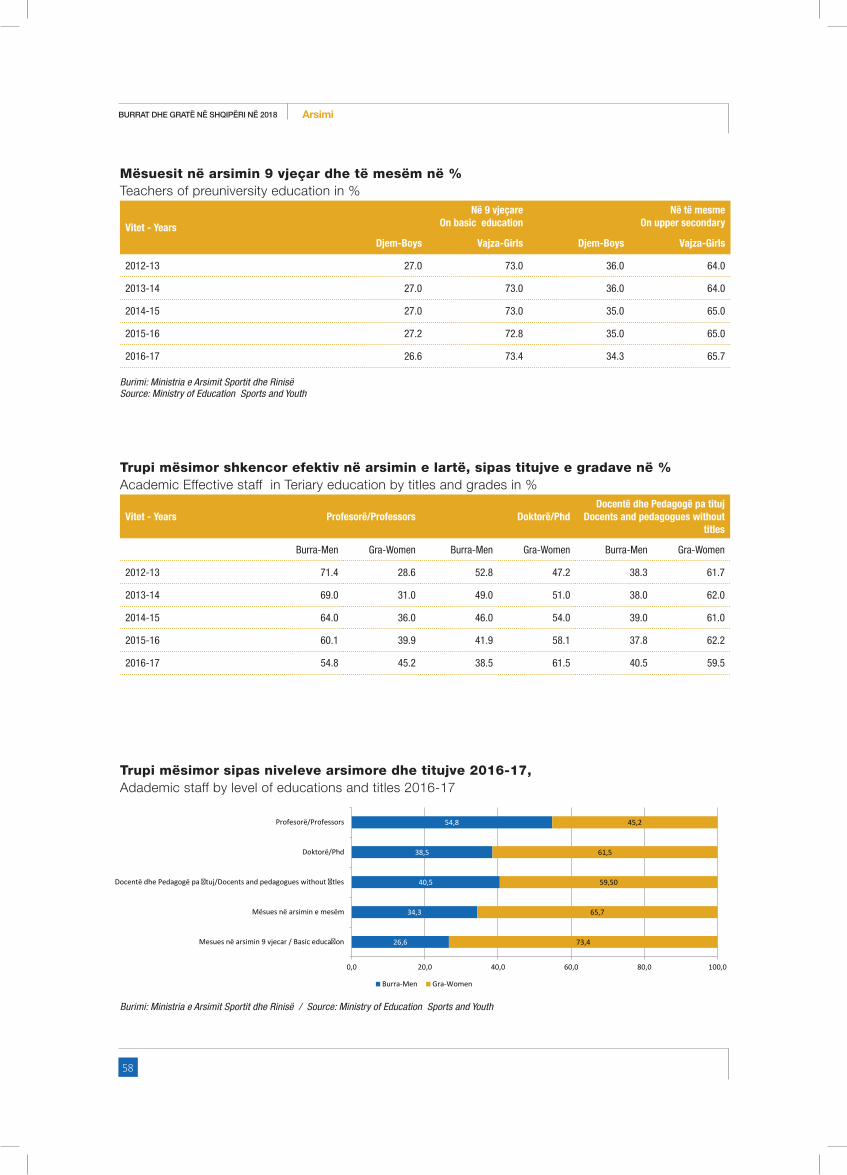
58
BURRAT DHE GRATË NË SHQIPËRI NË 2018 Arsimi
Mësuesit në arsimin 9 vjeçar dhe të mesëm në % Teachers of preuniversity education in %
Vitet - Years
Në 9 vjeçareOn basic education
Në të mesmeOn upper secondary
Djem-Boys Vajza-Girls Djem-Boys Vajza-Girls
2012-13 27.0 73.0 36.0 64.0
2013-14 27.0 73.0 36.0 64.0
2014-15 27.0 73.0 35.0 65.0
2015-16 27.2 72.8 35.0 65.0
2016-17 26.6 73.4 34.3 65.7
Burimi: Ministria e Arsimit Sportit dhe RinisëSource: Ministry of Education Sports and Youth
Trupi mësimor shkencor efektiv në arsimin e lartë, sipas titujve e gradave në %Academic Effective staff in Teriary education by titles and grades in %
Vitet - Years Profesorë/Professors Doktorë/PhdDocentë dhe Pedagogë pa tituj
Docents and pedagogues without titles
Burra-Men Gra-Women Burra-Men Gra-Women Burra-Men Gra-Women
2012-13 71.4 28.6 52.8 47.2 38.3 61.7
2013-14 69.0 31.0 49.0 51.0 38.0 62.0
2014-15 64.0 36.0 46.0 54.0 39.0 61.0
2015-16 60.1 39.9 41.9 58.1 37.8 62.2
2016-17 54.8 45.2 38.5 61.5 40.5 59.5
Trupi mësimor sipas niveleve arsimore dhe titujve 2016-17,Adademic staff by level of educations and titles 2016-17
Burimi: Ministria e Arsimit Sportit dhe Rinisë / Source: Ministry of Education Sports and Youth
26,6
34,3
40,5
38,5
54,8
73,4
65,7
59,50
61,5
45,2
0,0 20,0 40,0 60,0 80,0 100,0
Mesues në arsimin 9 vjecar / Basic educa�on
Mësues në arsimin e mesëm
Docentë dhe Pedagogë pa �tuj/Docents and pedagogues without �tles
Doktorë/Phd
Profesorë/Professors
Burra-Men Gra-Women

59
WOMEN AND MEN IN ALBANIA IN 2018Education
Stafi Universitar sipas gjinisë, 2017Universities staff by sex, 2017
PostiNumër - Number %
PositionBurraMen
GraWomen
BurraMen
GraWomen
Rektor 10 1 91 9 Rector
Zv/Rektor 14 6 70 30 Deputy Rector
Anëtarë Senati 156 77 67 33 Member of Senate
Dekanë 37 12 76 24 Dean
Zv/Dekan 34 35 49 51 Deputy Dean
Përgjegjës Departamenti 107 89 55 45 Chef of department.
Burimi: Rektoratet e Universiteteve PublikeSource: Rectorates of Public UniversityShënim: Për vitin 2017 të dhënat e datajuara të stafit i referohen Universiteteve Publike.76 refers personel only in public University.
Përqindja e nxënësve dhe studentëve me aftësi të kufizuar sipas niveleve arsimore dhe gjinisëPercentage of pupils and students with disabilities by educations level and sex
2014-15 2015-16 2016-17
Vajza Djem Vajza Djem Vajza Djem
Cikli i 9 vjeçares/Lower Secondary 35.0 65.0 35.1 64.9 31.7 68.3
Të mesme/Upper secodary 44.2 55.8 40.6 59.4 43.6 56.4
Të lartë/Tertiary 46.2 53.8 45.5 54.5 58.5 41.5
Burimi: Ministria e Arsimit Sportit dhe RinisëSource: Ministry of Education Sports and Youth

60
BURRAT DHE GRATË NË SHQIPËRI NË 2018 Arsimi
Përqindja e nxënësve dhe studentëve me aftësi të kufizuar sipas niveleve arsimore dhe gjinisë, 2016-17Percentage of pupils and students with disabilities by educations level and sex, 2016-17
Source: INSTAT / Burimi: INSTATShënim: Në arsimin 9-vjeçar janë të pëfshira dhe shkollat speciale / Note: In the basic education are included special school
31,7
43,6
58,5
68,3
56,4
41,5
0 10,0 20,0 30,0 40,0 50,0 60,0 70,0 80,0 90,0 100,0
Cikli i 9 vjeçares/Lower Secondary
Të mesme/Upper secodary
Të lartë/Ter�ary
Vajza Girls Djem Boys
26%
23%
10%
9%
7%
7%
6%
5%
4%
2%
1%
30%
19%
6%
7%
3%
14%
6%
3%
0%
10%
1%
0% 5% 10% 15% 20% 25% 30%
Universite� i Tiranës
Universite� Aleksandër Xhuvani Elbasan
Universite� Isamil Qemali Vlorë
Universite� i Durrësit
Universite� Politeknik i Tiranës
Universite� i Korçës
Universite� Luigj Gurakuqi Shkodër
Universite� Eqerem Çabej Gjirokastër
Universite� Bujqësor i Tiranës
Universite� Mjekësor i Tiranës
Universite� i Arteve Tiranë
Djem-Boys Vajza-Girls
Përqindja e studentëve me aftësi të kufizuar sipas gjinisë në Universitete Publike, 2016-17Percentage of students with disabilities by sex in Public Universities, 2016-17
Burimi: Rektoratet e Universiteteve Publike / Source: Rectorates of Public University
Shënim: Për vitin 2017 të dhënat e datajuara i referohen Universiteteve Publike. / Note: Data for year 2017 refers to only in public University.

61
WOMEN AND MEN IN ALBANIA IN 2018Education
Pjesëmarrja në të mësuarit gjatë gjithë jetës sipas llojit të arsimit, 25-64 vjeçParticipation in lifelong learning by types of education and learning, 25-64 years oldPjesëmarrja në arsimin zyrtar dhe jo-zyrtarParticipation in formal or non-formal education
Pjesëmarrja në të mësuarit informal Participation in informal learning
Gjithsej 9.2 67.8 Total
Burra 8.8 69.4 Men
Gra 9.5 66.1 Women
Burimi: Anketa e Edukimit të të rriturve, 2017Source: Adult Education Survey, 2017

62
BURRAT DHE GRATË NË SHQIPËRI NË 2018 Tregu i punës dhe Mbrojtja Sociale
Tregu i punës dhe Mbrojtja SocialeLabour market

63
WOMEN AND MEN IN ALBANIA IN 2018Labour Market
Statistikat e tregut të punës sigurojnë një
pamje në pozicionin që mbartin burrat dhe
gratë në tregun e punës. Ky këndvështrim
është shumë i rëndësishëm për rritjen
ekonomike dhe produktivitetin ekonomik
të një vendi, si dhe për jetesën e individëve
dhe të familjeve të tyre. Të dhënat e këtij
seksioni i referohen të dhënave të marra
nga Anketa e Forcës së Punës, duke u
fokusuar në diferencat gjinore dhe ndikimi
i tyre në punësimin e burrave dhe grave.
Të dhënat e punësimit mblidhen për
popullsinë 15 vjeç e lart e cila kategorizohet
në tre kategori përjashtuese: të punësuar,
të papunë dhe ato jashtë forcës së punës
(ekonomikisht inaktive).
Pjesëmarrja në forcën e punësSipas anketës së forcave të punës, gratë kanë më pak gjasa të marrin pjesë në tregun e punës. Përsa i përket popullsisë 15-64 vjeç diferenca e pjesëmarrjes së burrave dhe grave në forcat e punës në 5 vitet e fundit ka qenë pothuaj i pandryshuar me një përmirësim të pjesëmarrjes së grave në tregun e punës, 57,7 % në vitin 2017 nga 50,1 % që ishte në vitin 2013.
Sipas arsyeve të inaktivitetit, gratë mbesin jashtë forcës së punës kryesisht pasi janë duke përmbushur detyrat shtëpiake (31,6 %) ose sepse janë duke ndjekur shkollën (29,0 %). Ndërsa vetëm 2,1 % e burrave kanë si arsye të inaktivitetit të tyre përmbushjen e detyrave shtëpiake dhe 53,1 % e tyre janë studentë ose nxënës.
Punësimi dhe struktura e punësimitShkalla e punësimit për popullsinë 15-64 vjeç është 64,3 % për burrat dhe 50,3 % për gratë e kësaj grupmoshe. Struktura e të punësuarve sipas statusit të aktivitetit tregon se 42,0 % e grave janë të punësuara me pagë, ndërsa 23,0 % e tyre janë
Labour market statistics provide an
overview of the gender situation in the
labour market. This perspective is very
important for both a country’s economic
growth and productivity, as well as for the
life of individuals and their families. Data
in this section refer to the information
obtained from the Labour Force Survey,
focusing on gender differences and
their impact on the employment of
men and women. Employment data
are collected for the population aged
15 and over, which is categorized into
three exclusionary categories: employed,
unemployed, and those out of the labour
force (economically inactive).
Labour Force Participation According to the labour force survey, women are less likely to participate in the labour market. Men employment in the 15-64 years old population has been relatively stable, while women’s participation in the labour market in 2017 has increased to 57.7% compare to 50.1% in 2013.
According to causes of inactivity, generally speaking, women remain out of the labour force mostly because they are busy with unpaid work at home (31,6%), or are attending school (29.0%). On the other hand, only 2.1% of men declare homework as the reason behind their inactivity, while 51.3% are students or pupils.
Employment and employment structureEmployment rate for the population aged 15-64 is 64.3% for men and 50.3% for women. The structure of employees shows that 42.0% of women in the labour force are employed in paid positions while 23.0% of them engage in unpaid work in the family business. For employed men, these figures are respectively 37.0% and 12.0%. However, a significant

64
BURRAT DHE GRATË NË SHQIPËRI NË 2018 Tregu i punës dhe Mbrojtja Sociale
punëtore pa pagesë në biznesin e familjes. Për burrat e punësuar këto shifra janë përkatësisht 37,0 % dhe 12,0 %. Megjithatë, një pjesë e konsiderueshme e burrave që punojnë janë të vetëpunësuar, 36,0 %, ndërsa gratë e vetëpunësuara janë 23,0 %.
Për gratë dhe burrat e moshës 15-64 vjeç mbizotëron punësimi në sektorin e bujqësisë, por përqindja e burrave në këtë sektor është më e ulët sesa për gratë. Në vitin 2017, në sektorin bujqësor janë punësuar 42,5 % të të punësuarave gra, duke pësuar një rënie krahasuar me një vit më parë. Sektori i dytë që zë peshën më të madhe në punësimin e grave pas sektorit të bujqësisë është ai i administrimit publik, shërbimeve sociale, dhe aktiviteteve dhe shërbimeve të tjera, 22,4 %. Për burrat, sektori i dytë që zë peshën më të madhe në punësimin e tyre është sektori i tregtisë, transportit, hotelerisë, shërbimeve të biznesit dhe administrative, me 28,8 %.
Të dhëna të përllogaritura mbi numrin e orëve të punës, tregojnë se 34,0 % e grave punojnë nën 40 orë në javë kundrejt 24,0 % të burrave. Pjesa më e madhe e grave, 52,0 % e tyre, punojnë 40-48 orë në javë përkundrejt 49,0 % të burrave. Kur orët e punës rriten mbi 48 orë në javë, përqindja e grave që punon është shumë më e ulët se ajo e burrave, 14,0 % për gratë dhe 26,0 % për burrat.
PapunësiaNë vitin 2017, sipas të dhënave të anketës së forcave të punës, shkalla e papunësisë për burrat në moshën 15-64 vjeç është 15,1 %, kundrejt 12,8 % të grave. Shkalla e papunësisë për të dy gjinitë ka pësuar një rënie krahasuar me një vit më parë. Situata e papunësisë për gratë është përmirësuar më shumë krahasuar me burrat, duke pësuar një rënie prej 1,8 pikë përqindje krahasuar me 2016, ndërsa për burrat rënia është 1,3 (pikë përqindje).
Hendeku Gjinor në Paga (HPGJ)Gjatë vitit 2017, bazuar në të dhënat nga Drejtoria e Përgjithshme e Tatimeve, hendeku gjinor në paga arriti në 10,5 % nga 6,3 % që ishte një vit më parë. Në këtë vit, sektori ekonomik, në të cilin hendeku gjinor në paga është më i lartë, është sektori i prodhimit, ku vlera e HGjP arrin në 22,7 %. Ndërsa sektori ekonomik ku HGjP arrin vlerën më të ulët, prej 3,3 %, është sektori i tregtisë, transportit, hotelerisë,
percentage of men-namely 36%- in the labour force are self-employed, compared to 23.0% of women.
Women and men belonging to the 15-64 years old age group are mostly employed in the agriculture sector, but men’s percentage employed in this sector is lower compared to women’s. In 2017, the agricultural sector employed 42.5% women of employees, marking a reduction compared to 2016. Public administration, social services, and other activities and activities are the second sector with the highest share of women’s employment after the agriculture sector with 22.4%.The second highest employment sector for men is trade, transport, hospitality, business and administrative services with 28.8%.
Calculations of the number of working hours indicate that 34.0% of women work less than 40 hours per week versus 24.0% of men. The majority of women, about 52.0%, work 40-48 hours a week versus 49.0% of men. When working hours increase to 49 hours per week, the percentage of women is much lower than of men, respectively 14.0% versus 26.0%.
UnemploymentIn 2017, according to labour force survey data, unemployment rate for men aged 15-64 is 15.1% versus 12.8% for women. Unemployment rate has declined for both compared to the previous year. However, unemployment rate has greatly improved for women compared to men, decreasing by almost 1.8 point percentage, while for men only by 1.3 point percentage.
Gender pay gap (GPG)During 2017, based on the data of the General Tax Directorate, the gender pay gap amounted to 10.5% compared to 6.3% in 2016. During this year, in the economic sector, the sector with the highest GPG, namely 22.7%, is the manufacturing sector, while the economic sector the GPG is the lowest is the commerce, transport, hospitality, as well as business and administrative services, by 3.3%. Viewed from the main groups and professions perspective, the gender pay gap is highest for craftsmen and equipment and machinery monitoring employees, by 28.4%. The lowest GPG is noted for the armed forces employees, the gender differences among which are practically zero.

65
WOMEN AND MEN IN ALBANIA IN 2018Labour Market
shërbime të biznesit dhe administrative. I parë sipas grup–profesioneve kryesore, hendeku gjinor në paga arrin vlerën më të lartë për zejtarët, dhe punonjësit e montimit të pajisjeve dhe makinerive, me 28,4 %. Vlerën më të ulët HGjP e arrin për punonjësit e forcave të armatosura, për të cilët diferencat gjinore në pagë janë praktikisht zero.
PensionetNga përfituesit e pensioneve urbane, në vitin 2017, 46,6 % janë gra. Raporti gjinor për përfituesit e pensioneve rurale ndryshon ndjeshëm, me 62,9 % të të siguruarve, gra. Në këtë vit, numri i kontribuesve vullnetarë arrin në 4.786 persona të siguruar, ndër të cilët 61,9 % janë gra.
Politikat e punësimitTë dhënat e Shërbimit Kombëtar të punësimit tregojnë se gjatë vitit 2017, numri i punëkërkuesve të papunë të regjistruar për përfitimin e kurseve të formimit profesional dhe në programet e nxitjes së punësimit është rritur. Në vitin 2017, gratë punëkërkuese të papuna marrin pjesë më shumë se burrat në programet e nxitjes së punësimit ndërsa burrat punëkërkues të papunë marrin pjesë më shumë në kurset e formimit profesional. Numri i grave punëkërkuese të papuna është më i ulët se ai i burrave dhe në përgjithësi rritet me rritjen e moshës, ndërsa e kundërta ndodh për burrat. Të dhënat tregojnë se rreth gjysma e grave dhe burrave punëkërkues të papunë kanë vetëm arsim 8/9 vjeçar.
Pensions 46.6% of people benefiting from urban pensions are women. The gender ratio for rural pension beneficiaries significantly differs, of whom 62.9% are women.This year, the number of volunteer contributors is as high as 4.786 insured persons, of whom 61.9% are women.
Employment PoliciesData from the National Employment Service show that during 2017, the number of unemployed job seekers registered to benefit from vocational training and employment promotion programs has increased. Unemployed women job-seekers continue to benefit from employment promotion programs more than men. The number of unemployed women job-seekers increases with age, while the data show the opposite for men. Data show that half of unemployed women and men job seekers have pursued only the primary and lower secondary education.

66
BURRAT DHE GRATË NË SHQIPËRI NË 2018 Tregu i punës dhe Mbrojtja Sociale
Shkalla e pjesëmarrjes në forcat e punës sipas moshës dhe gjinisë Labour force participation rate by age and sex
Grup-moshaAge-group
Burra - Men Gra- Women Gjithsej - Total
2016 2017 2016 2017 2016 2017
Total (15 +) 65.0 66.8 49.9 49.8 57.5 58.3
15-64 74.1 75.8 58.3 57.7 66.2 66.8
20-64 82.5 84.3 64.2 63.5 73.3 73.9
15-24 36.9 37.8 25.8 24.5 31.8 31.8
25-29 84.2 87.0 66.4 61.9 75.8 74.6
25-54 88.7 90.9 73.1 72.2 80.7 81.3
55-64 76.3 77.4 45.8 45.2 61.4 61.3
65+ 14.5 16.1 6.1 8.8 10.2 12.3
Burimi : Anketa e Forcave të Punës Source : Labour Force Surveys
Shkalla e pjesëmarrjes në forcat e punës (15-64 vjec) (%)Labor force participation rate (15-64 years) (%)
70,2
72,2 73,4 74,1 75,8
50,151,3
55,1
58,357,7
0,0
10,0
20,0
30,0
40,0
50,0
60,0
70,0
80,0
2013 2014 2015 2016 2017
Burra - Men Gra-Women
Hendeku gjinor/ Gender Gap

67
WOMEN AND MEN IN ALBANIA IN 2018Labour Market
50,1 51,3 55,1 58,3 57,7
0,0
20,0
40,0
60,0
80,0
100,0
2013 2014 2015 2016 2017
Jo në forcën e punës / Not in labor force
Pjesëmarrja në forcën e punës / Par�cipa�on in labor force
70,2 72,2 73,0 74,1 75,8
0,0
20,0
40,0
60,0
80,0
100,0
2013 2014 2015 2016 2017
Jo në forcën e punës / Not in labor force
Pjesëmarrja në forcën e punës / Par�cipa�on in labor force
Shkalla e pjesëmarrjes në forcat e punës, burratLabour force participation rate, women
Shkalla e pjesëmarrjes në forcat e punës, gratëLabour force participation rate, women
Burimi : Anketa e Forcave të PunësSource : Labour Force Surveys

68
BURRAT DHE GRATË NË SHQIPËRI NË 2018 Tregu i punës dhe Mbrojtja Sociale
Popullsia joaktive 15 vjeç e lart (statusi në bazë të vetëdeklarimit)Inactive population 15 years old and over (status by self-declaration)
Burra Men
Gra Women
Gjithsej Total
Nxënës/Student 53% 29% 38% Pupil/Student
Në pension/pension të parakohshëm 6% 15% 12% In retirement/early retirement
Në paaftësi të përhershme Permanently disabled
14% 7% 9% Permanently disabled
Duke përmbushur detyrat shtëpiake 2% 32% 21% Fulfilling domestic tasks
Të dekurajuar 12% 6% 8% Discouraged
Tjetër inaktivë 13% 12% 12% Other inactiveBurimi: Anketa Tremujore e Forcave të Punës Source: Quarterly Labour Force Survey
Popullsia joaktive 15+ (statusi në bazë të vetëdeklarimit) sipas gjinisë dhe arsyes, 2017Inactive population 15 + (status by self-declaration) by sex and reason, 2017
Burimi: Anketa Tremujore e Forcave të Punës / Source: Quarterly Labour Force Survey
53,1%
29,0%
6,1%
14,8%
14,0%
6,6%
2,1%
31,6%
11,6%
6,2%
13,1%
11,8%
0% 10% 20% 30% 40% 50% 60% 70% 80% 90% 100%
BurraMen
GraWomen
Nxënës/StudentPupil/Student
Në pension/pension të parakohshëmIn re�rement/early re�rement
Në paa�ësi të përhershmePermanently disabled
Duke përmbushur detyrat shtëpiakeFulfilling domes�c tasks
Të dekurajuarDiscouraged
Tjetër inak�vëOther inac�ve

69
WOMEN AND MEN IN ALBANIA IN 2018Labour Market
Shkalla e punësimit sipas gjinisë dhe grupmoshësEmployment rate sex and age grup
Grup-mosha Age-group
Burra - Men Gra- Women Gjithsej - Total
2016 2017 2016 2017 2016 2017
Total (15 +) 54.7 57.1 42.8 43.5 48.7 50.3
15-64 61.9 64.3 49.7 50.3 55.9 57.4
20-64 69.4 72.1 55.0 55.6 62.1 63.9
15-24 23.1 24.9 16.8 17.7 20.2 21.6
25-29 65.4 69.6 51.8 48.8 59.0 59.4
25-54 76.3 79.0 63.4 63.4 69.7 71.1
55-64 67.1 69.1 42.0 41.7 54.8 55.5
65+ 14.3 15.9 6.0 8.4 10.1 12.0Burimi i informacionit: Anketa e Forcave të PunësSource of information: Labour Force Survey
57,358,0 60,5 61,9 64,3
43,1 43,445,5 49,7
50,3
0,0
10,0
20,0
30,0
40,0
50,0
60,0
70,0
80,0
2013 2014 2015 2016 2017
Burra-Men Gra-Women
Burimi: Anketa e Forcave të PunësSource: Labour Force Survey
(15 - 64 vjec) (% )- Shkalla e punësimit(15 - 64 years) (%) - Employment rate
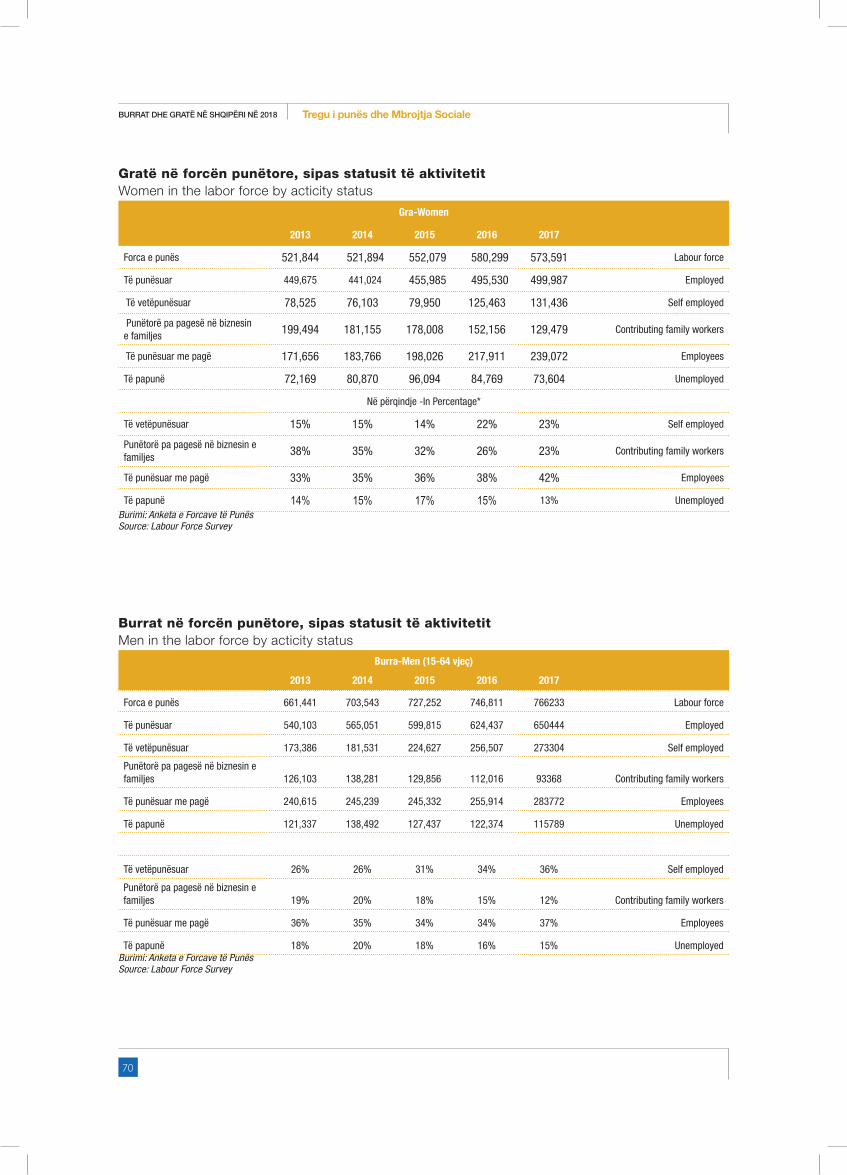
70
BURRAT DHE GRATË NË SHQIPËRI NË 2018 Tregu i punës dhe Mbrojtja Sociale
Gratë në forcën punëtore, sipas statusit të aktivitetitWomen in the labor force by acticity status
Gra-Women
2013 2014 2015 2016 2017
Forca e punës 521,844 521,894 552,079 580,299 573,591 Labour force
Të punësuar 449,675 441,024 455,985 495,530 499,987 Employed
Të vetëpunësuar 78,525 76,103 79,950 125,463 131,436 Self employed
Punëtorë pa pagesë në biznesin e familjes 199,494 181,155 178,008 152,156 129,479 Contributing family workers
Të punësuar me pagë 171,656 183,766 198,026 217,911 239,072 Employees
Të papunë 72,169 80,870 96,094 84,769 73,604 Unemployed
Në përqindje -In Percentage*
Të vetëpunësuar 15% 15% 14% 22% 23% Self employed
Punëtorë pa pagesë në biznesin e familjes 38% 35% 32% 26% 23% Contributing family workers
Të punësuar me pagë 33% 35% 36% 38% 42% Employees
Të papunë 14% 15% 17% 15% 13% UnemployedBurimi: Anketa e Forcave të PunësSource: Labour Force Survey
Burrat në forcën punëtore, sipas statusit të aktivitetitMen in the labor force by acticity status
Burra-Men (15-64 vjeç)
2013 2014 2015 2016 2017
Forca e punës 661,441 703,543 727,252 746,811 766233 Labour force
Të punësuar 540,103 565,051 599,815 624,437 650444 Employed
Të vetëpunësuar 173,386 181,531 224,627 256,507 273304 Self employed
Punëtorë pa pagesë në biznesin e familjes 126,103 138,281 129,856 112,016 93368 Contributing family workers
Të punësuar me pagë 240,615 245,239 245,332 255,914 283772 Employees
Të papunë 121,337 138,492 127,437 122,374 115789 Unemployed
Të vetëpunësuar 26% 26% 31% 34% 36% Self employed
Punëtorë pa pagesë në biznesin e familjes 19% 20% 18% 15% 12% Contributing family workers
Të punësuar me pagë 36% 35% 34% 34% 37% Employees
Të papunë 18% 20% 18% 16% 15% UnemployedBurimi: Anketa e Forcave të PunësSource: Labour Force Survey

71
WOMEN AND MEN IN ALBANIA IN 2018Labour Market
36%
12%
37%
15%
Burra-Men
Të vetëpunësuar Selfemployed
Punëtorë pa pagesë nëbiznesin e familjesContribu�ng familyworkers
Të punësuar me pagëEmployees
23%
23%42%
13%
Gra-Women
Të vetëpunësuar Selfemployed
Punëtorë pa pagesë nëbiznesin e familjesContribu�ng familyworkers
Të punësuar me pagëEmployees
100 50 0 50 100
1
4
7
10
13
16
19
22
25
28
31
34
37
40
43
46
49
52
55
58
61
64
67
70
73
76
79
82
85
88
91
94
97100
Bujqësi
Prodhim
Administrim publik, Shërbimet Sociale, dhe aktivitete e shërbime të tjera
Ndërtim
Industri nxjerrëse, Energji, Gaz dhe ujë
Tregti, Transport, Hoteleri, Shërbime të biznesit dhe administrative
Agriculture
Public Administration, Community, Social and other Services and Activities
Manufacturing
Trade, Transportation, Accommodation and Food, and Business and Administrative Services
Mining, quarring, Electricity, Gas and water supply
Construction
Gra-Women: 516 170Burra-Men: 678 798
Punësimi 15+ sipas gjinisë dhe statusit në punësim, 2017Employment 15+ by sex and status in employment, 2017
Të punësuar sipas sektorëve, 2017Employed by sector 2017
Burimi i informacionit: Anketa e Forcave të Punës 2017 / Source of information: Labour Force Survey 2017
Burimi i informacionit: Anketa e Forcave të PunësSource of information: Labour Force Surveys

72
BURRAT DHE GRATË NË SHQIPËRI NË 2018 Tregu i punës dhe Mbrojtja Sociale
Struktura e punësimit sipas gjinisë dhe aktivitetit ekonomik në përqindjeEmployment structure by sex and economic activity in percent
Gjithsej 2013 2014 2015 2016 2017 Total
Bujqësi 44.2 42.7 41.3 40.2 38.2 Agriculture
Prodhim 7.5 8.6 9.3 10.1 10.1 Manufacturing
Ndërtim 7.1 6.4 6.9 6.6 6.9 Construction
Industri nxjerrëse, Energji, gaz dhe furnizimi me ujë 2.2 2.4 2.4 2.6 2.4 Mining and quarrying; Electricity, gas
and water supply
Tregti, Transport, Hoteleri, Shërbime të biznesit dhe administrative 21.9 22.6 22.9 24.3 25.0
Trade, Transportation, Accommodation and Food, and
Business and Administrative ServicesAdministrim publik, Shërbimet Sociale, dhe aktivitete e shërbime të tjera
17.0 16.8 17.0 16.2 17.4Public Administration, Community,
Social and other Services and Activities
Burra Men
Bujqësi 37.1 36.9 36.5 36.2 34.9 Agriculture
Prodhim 6.2 7.3 7.2 7.8 7.2 Manufacturing
Ndërtim 12.6 11.1 11.6 11.2 11.8 Construction
Industri nxjerrëse, Energji, gaz dhe furnizimi me ujë 3.4 3.6 3.3 3.9 3.7 Mining and quarrying; Electricity, gas
and water supply
Tregti, Transport, Hoteleri, Shërbime të biznesit dhe administrative 25.9 26.9 27.4 27.8 28.8
Trade, Transportation, Accommodation and Food, and
Business and Administrative ServicesAdministrim publik, Shërbimet Sociale, dhe aktivitete e shërbime të tjera
14.7 13.7 13.7 13.1 13.7Public Administration, Community,
Social and other Services and Activities
Gra Women
Bujqësi 53.0 50.2 47.7 45.4 42.5 Agriculture
Prodhim 9.1 10.4 11.9 13.1 14.0 Manufacturing
Ndërtim 0.4 0.4 0.7 0.6 0.5 Construction
Industri nxjerrëse, Energji, gaz dhe furnizimi me ujë 0.7 0.9 1.2 1.0 0.6 Mining and quarrying; Electricity, gas
and water supply
Tregti, Transport, Hoteleri, Shërbime të biznesit dhe administrative 17.0 17.0 16.9 19.9 20.0
Trade, Transportation, Accommodation and Food, and
Business and Administrative ServicesAdministrim publik, Shërbimet Sociale, dhe aktivitete e shërbime të tjera
19.8 20.8 21.4 20.0 22.4Public Administration, Community,
Social and other Services and Activities
Burimi: Anketa e Forcave të PunësSource: Labour Force Survey

73
WOMEN AND MEN IN ALBANIA IN 2018Labour Market
Punësimi sipas gjinisë dhe orëve aktuale të punës në javëEmployment by sex and weekly hours actually worked
Intervalet e Orëve2015 2016 2017
Hour bands% % %
Gjithsej 100.0 100.0 100 Total
Nuk ka orë pune 2.5 2.7 2 No hours actually worked
01-14 3.7 3.3 3 01-14
15-29 15.7 13.5 12 15-29
30-34 8.5 9.6 8 30-34
35-39 4.3 5.1 4 35-39
40-48 46.8 47.8 50 40-48
49+ 16.7 17.9 21 49+
Të pacaktuara 1.9 0.2 1 Not stated
Burra 100.0 100.0 100 Men
Nuk ka orë pune 2.3 2.7 1 No hours actually worked
01-14 2.7 2.6 2 01-14
15-29 12.8 11.9 10 15-29
30-34 8.1 8.8 7 30-34
35-39 4.2 4.3 4 35-39
40-48 46.4 46.3 49 40-48
49+ 21.5 23.1 26 49+
Të pacaktuara 1.8 0.3 1 Not stated
Gra 100.0 100.0 100 Women
Nuk ka orë pune 2.7 2.6 2 No hours actually worked
01-14 5.1 4.1 4 01-14
15-29 19.5 15.6 14 15-29
30-34 8.9 10.7 9 30-34
35-39 4.4 6.1 5 35-39
40-48 47.3 49.6 52 40-48
49+ 10.2 11.2 14 49+
Të pacaktuara 2.0 0.1 1 Not statedBurimi: Anketa e Forcave të PunësSource: Labour Force Survey

74
BURRAT DHE GRATË NË SHQIPËRI NË 2018 Tregu i punës dhe Mbrojtja Sociale
2
10 7
4
49
26
4
14
9
5
52
14
10
20
30
40
50
60
01-14 15-29 30-34 35-39 40-48 49+
Burra Men Gra Women
Shkalla e papunësisë sipas moshës dhe gjinisë, %Unemployment rate by age and sex, %
Niveli arsimor Educational level
Grup-mosha Age-group
Burra - Men Gra- Women Gjithsej - Total
2016 2017 2016 2017 2016 2017
Gjithsej Total
Total (15 +) 15,9 14,6 14,4 12,6 15,2 13,7
15-64 16,4 15,1 14,6 12,8 15,6 14,1
20-64 15,8 14,5 14,4 12,5 15,2 13,6
15-24 37,4 34,1 34,9 27,7 36,5 31,9
25-29 22,3 20,0 21,9 21,2 22,1 20,5
25-54 14,0 13,0 13,4 12,1 13,7 12,6
55-64 12,1 10,7 8,3 7,6 10,7 9,6
65+ … … … … … …
Burimi: Anketa e Forcave të PunësSource: Labour Force Survey
Punësimi sipas gjinisë dhe orëve aktuale të punës në javë, 2017Employment by sex and weekly hours actually worked, 2017
Burimi : Anketa e Forcave të Punës / Source : Labour Force Surveys

75
WOMEN AND MEN IN ALBANIA IN 2018Labour Market
Hendeku gjinor i pagave sipas aktivitetit ekonomik, 2017Gender pay gap by economic activity, 2017
Aktiviteti ekonomik Burra Men Women Gra HGjP GPG Economic activity
Gjithsej 57% 43% 10.5% Total
Bujqësi 52% 48% 7.7% Agriculture
Prodhim 40% 60% 22.7% Production
Ndërtim 97% 3% 14.0% Construction
Industri nxjerrëse, Energji, gaz dhe furnizimi me ujë
88% 12% 10.4%Mining and quarrying, electricity, gas and
water supply
Tregti, Transport, Hoteleri, Shërbime të biznesit dhe administrative
65% 35% 3.3%Trade, transportation, accomodation, bussiness
administrative services
Administrim publik, Shërbimet Sociale dhe aktivitete e shërbime të tjera
45% 55% 7.3%Public administration, social and other services
and activities
0,0
5,0
10,0
15,0
20,0
25,0
15,218,3
19,717,5
16,415,1
12,0 13,815,5
14,6 12,8
2012 2013 2014 2015 2016 2017
Burra-Men Gra-Women
Hendeku gjinor i pagave sipas grup profesioneve, 2017Gender pay gap by profession, 2017
Grup - Profesionet Burra Men Women Gra HGjP GPG Professions
Gjithsej 57% 43% 10.5% Total
Drejtues, profesionistë dhe teknikë 49% 51% 17.4% Managers, professionals and technicians
Nëpunës, Punonjës të shitjeve dhe shërbimeve
61% 39% 10.0% Clercks, services and sales workers
Punonjës të bujqësisë, pyjeve dhe peshkimit 59% 41% 7.1% Skilled agriculture workers
Zejtarë, Punonjës të montimit të pajisjeve dhe makinerive
55% 45% 28.4% Plants and machine operators and assemblers
Profesione elementare 52% 48% 7.1% Elementary occupations
Forcat e armatosura 85% 15% 0.0% Armed forces
Unemployment rate (15-64 years) (%)Shkalla e papunësisë(15-64 vjec) (%)
Burimi : Anketa e Forcave të Punës / Source : Labour Force Surveys

76
BURRAT DHE GRATË NË SHQIPËRI NË 2018 Tregu i punës dhe Mbrojtja Sociale
Pensione urbane në skemën e sigurimeve shoqërore, 2013-2017Urban pensions in social insurance scheme, 2013-2017 (gjendje në fund- end of period)
Emërtimi 2013 2014 2015 2016 2017 Description
Pensione urbane Urban pensions
Gjithsej 418,399 436,337 454,165 472,390 488,408 Total
Burra 225,680 233,996 240,863 253,527 261,012 Men
Gra 192,719 202,341 213,302 218,863 227,396 Women
nga të cilët: of which:
Pensione pleqërie Old-age pensions
Gjithsej 311,382 327,604 345,315 363,664 379,349 Total
Burra 160,980 170,924 177,581 190,692 199,918 Men
Gra 150,402 156,680 167,734 172,972 179,431 Women
Pensione invaliditeti Invalidity pensions
Gjithsej 59,241 61,200 62,101 61,938 62,412 Total
Burra 36,307 36,432 37,100 36,746 36,843 Men
Gra 22,934 24,768 25,001 25,192 25,569 Women
Pensione familjare Survivors pensions
Gjithsej 47,776 47,533 46,749 46,788 46,647 Total
Burra 28,393 26,640 26,182 26,089 24,251 Men
Gra 19,383 20,893 20,567 20,699 22,396 WomenBurimi: Instituti i Sigurimeve ShoqëroreSource: Social Insurance Institute

77
WOMEN AND MEN IN ALBANIA IN 2018Labour Market
Kontribuesit në skemën e sigurimit vullnetar sipas gjinisë, 2013-2017Contributors to the voluntary insurance scheme by sex, 2013-2017
Emërtimi 2013 2014 2015 2016 2017 Description
Kontribues të vitit raportues
Contributors of the
reporting year
Gjithsej 4,805 4,925 4,809 4,676 4,786 Total
Burra 2,100 1,848 1,828 1,802 1,824 Men
Gra 2,705 3,077 2,981 2,874 2,962 Women
nga të cilët: of which:
Kontribues të rinj New Contributors
Gjithsej 1,694 1,822 1,716 1,639 1,780 Total
Burra 747 715 660 604 637 Men
Gra 947 1,107 1,056 1,035 1,143 Women
Kontribues në vazhdim Contributors to the
continuation
Gjithsej 3,111 3,103 3,093 3,037 3,006 Total
Burra 1,353 1,133 1,168 1,198 1,187 Men
Gra 1,758 1,970 1,925 1,839 1,819 WomenBurimi: Instituti i Sigurimeve Shoqërore Source: Social Insurance Institute
Pensione rurale në skemën e sigurimeve shoqërore, 2013-2017Rural pensions in social insurance scheme, 2013-2017
Emërtimi 2013 2014 2015 2016 2017 Description
Pensione rurale Rural pensions
Gjithsej 152,024 149,146 144,769 139,154 132,778 Total
Burra 57,982 57,202 55,734 53,192 49,293 Men
Gra 94,042 91,944 89,035 85,962 83,485 Women
nga të cilët: of which:
Pensione pleqërie Old-age pensions
Gjithsej 135,904 133,132 129,160 124,378 118,794 Total
Burra 49,483 48,919 47,612 45,476 41,914 Men
Gra 86,421 84,213 81,548 78,902 76,880 Women
Pensione invaliditeti Invalidity pensions
Gjithsej 7,229 7,579 7,764 7,456 7,304 Total
Burra 4,249 4,342 4,364 4,229 4,131 Men
Gra 2,980 3,237 3,400 3,227 3,173 Women
Pensione familjare Survivors pensions
Gjithsej 8,891 8,435 7,845 7,320 6,680 Total
Burra 4,250 3,941 3,758 3,487 3,248 Men
Gra 4,641 4,494 4,087 3,833 3,432 Women

78
BURRAT DHE GRATË NË SHQIPËRI NË 2018 Tregu i punës dhe Mbrojtja Sociale
Punëkërkues të papunë sipas grupmoshave dhe gjinisë në %, 2017Job-seekers unemployed by age group and sex in %, 2017
Burimi: Shërbimi Kombëtar i PunësimitSource: National Employment Service
40
49 52 5658 59
48
60
51 4844 42
38 41
52
0
10
20
30
40
50
60
15 - 19 vjeç/year
20 - 24 vjeç/year
25 - 29 vjeç/year
30 - 34 vjeç/year
35 - 39 vjeç/year
40 - 44 vjeç/year
45 - 50 vjeç/year
mbi 50 vjeç/year
Femra Women Meshkuj Men Linear (Femra Women ) Linear (Meshkuj Men)
Numri total i punë kërkuesve të papunë , të regjistruar në kurse formimi profesional dhe në programe të nxitjes së punësimitTotal number of job-seekers unemployed, enrolled in professional training courses and programs for encouragement of employment
Emërtimi 2013 2014 2015 2016 2017 Description
Numri i punë kërkuesve të papunë - Number of job-seekers unemployed
Gjithsej 144,427 141,342 145,147 93,889 83,497 Total
Gra 74,551 71,710 73,208 49,735 44,220 Women
Burra 69,876 69,632 71,939 44,154 39,277 Men
Punëkërkues të papunë të regjistruar në kurse formimi profesional Job-seekers
unemployed enrolled in professional training courses
Gjithsej 9,254 13,893 18,126 12,710 17,297 Total
Gra 5,358 7,597 10,723 7,032 6,200 Women
Burra 3,896 6,296 7,403 5,678 11,097 Men
Punëkërkues të papunë pjesëmarrës në programe të nxitjes së punësimit Job-
seekers unemployed participating in programs for encouragement of employment
Gjithsej 834 3,969 5,805 5,211 5,264 Total
Gra 313 1,322 2,016 2,293 3,239 Women
Burra 521 2,647 3,789 2,918 2,025 MenBurimi: Shërbimi Kombëtar i PunësimitSource: National Employment Service
Punëkërkues të papunë sipas grupmoshave dhe gjinisë në %Job-seekers unemployed by age-group and sex in %
Burimi: Shërbimi Kombëtar i PunësimitSource: National Employment Service

79
WOMEN AND MEN IN ALBANIA IN 2018Labour Market
Punëkërkues të papunë pjesëmarrës në programe të nxitjes së punësimitUnemployed job-seekers par�cipa�ng in programs for encouragement of employment
Burimi: Shërbimi Kombëtar i PunësimitSource: National Employment Service
1,170 919 834
3,969
5,805
5,211 5,264
-
1,000
2,000
3,000
4,000
5,000
6,000
7,000
0,0%
10,0%
20,0%
30,0%
40,0%
50,0%
60,0%
70,0%
80,0%
2011 2012 2013 2014 2015 2016 2017
Femra-Women Meshkuj-Men Totali Total
Punëkërkues të papunë të regjistruar në kurse formimi profesionalJob-seekers unemployed enrolled in professional training courses
8,949 8,703 9,254
13,893
18,126
12,710
17,297
-
2,000
4,000
6,000
8,000
10,000
12,000
14,000
16,000
18,000
20,000
0,0%
10,0%
20,0%
30,0%
40,0%
50,0%
60,0%
70,0%
2011 2012 2013 2014 2015 2016 2017
Femra-Women Meshkuj-Men Totali Total
Punëkërkues të papunë sipas nivelit arsimor dhe gjinisë në %, 2017 Job-seekers unemployed by level of educa�on and sex in %, 2017
3.1% 4.3%
50.1%
27.0%
11.2%
4.3%2.7%4.9%
48.8%
27.4%
9.0%7.2%
0.0%
10.0%
20.0%
30.0%
40.0%
50.0%
60.0%
Më pak se fillor Lessthan primary
Fillor Primary 9 vjeçar LowerSecondary
Mesme përgjithshmeGeneral secodary
Mesme profesionaleVoca�onal educa�on
Universitare Ter�ary
Burra Men
Gra Women
Punëkërkues të papunë të regjistruar në kurse të formimit profesionalJob-seekers unemployed enrolled in professional training courses
Punëkërkues të papunë pjesëmarrës në programe të nxitjes së punësimitUnemployed job-seekers participating in programs for encouragement of employment
Punëkërkues të papunë sipas gjinisë dhe nivelit arsimorJob-seekers unemployed by sex and level of education
Burimi: Shërbimi Kombëtar i PunësimitSource: National Employment Service

80
BURRAT DHE GRATË NË SHQIPËRI NË 2018 Statistikat juridike
Statistikat juridikeJuridical Statistics

81
WOMEN AND MEN IN ALBANIA IN 2018Juridical Statistics
Statistikat juridike të paraqitura në
këtë kapitull pasqyrojnë të dhëna të
disagreguara në bazë gjinore për çdo hallkë
të sistemit të Drejtësisë, Polici-Prokurori-
Ministria e Drejtësisë-Shërbimi i Provës
dhe Burgjet. Të dhënat japin informacion
me perspektivë gjinore për autorët dhe të
dëmtuarit nga veprat penale, personat e
pandehur, të dënuarit dhe të burgosurit.
Të dhënat mbi autorët bazohen në persona të dyshuar në kryerjen e një vepre penale dhe sigurohen nga Drejtoria e Përgjithshme e Policisë. I pandehur, cilësohet personi të cilit i atribuohet vepra penale me aktin e njoftimit të akuzës, në të cilin tregohen të dhënat e mjaftueshme për marrjen si të pandehur. Të dhënat mbi të dënuarit pasqyrojnë numrin e individëve të dënuar, ndaj të cilëve janë aplikuar sanksione penale të cilat konsistojnë në marrjen apo kufizimin e disa të drejtave të cilat i kanë gëzuar deri në momentin e kryerjes së veprës penale. Numri i të burgosurve tregon gjendjen e të burgosurve në një vit të caktuar duke përfshirë hyrjet e reja dhe daljet që ndodhin për periudhën vjetore dhe llogaritet si një mesatare e numrit të burgosurve për çdo muaj.
Autorë të veprave penaleNë vitin 2017, numërohen 36.051 autorë të veprave penale, prej të cilëve 2.637 janë gra. Krahasuar me vitin e kaluar, në total janë 1,9 % më pak autore të veprave penale gra kundrejt 4,5 % më shumë autorë burra. Në raport me popullsinë, në vitin 2017, janë 231,1 autorë burra dhe 18,5 autore gra për 10 mijë banorë, që dyshohen se kanë kryer vepra penale.
Të dëmtuar nga veprat penaleTë dëmtuarit nga veprat penale, në vitin 2017, janë 19.062 persona, prej të cilëve 5.154 janë gra që përbëjnë rreth 27,0 % të totalit. Ndër personat e dëmtuar, numërohen 1.340 të mitur, nga të cilët 393 janë vajza dhe 947 janë djem.
Në vitin 2017, numërohen në terma absolutë 3.243 gra të dhunuara. Përqindja më e lartë e grave që
Juridical statistics presented in this
chapter reflect sex disaggregated data,
focusing mainly on each stage of the
Justice system, Police - Prosecutor’s Office
- Ministry of Justice - Probation Service
and Prisons. Below are presented data
on perpetrators, persons damaged from
criminal offences, defendants, convicted
persons and prisoners.
Data on perpetrators are based on persons suspected of having committed a criminal offence, not in judgments which are within the jurisdiction of the justice authorities to render the verdict. A defendant is considered the person to whom the criminal offence has been attributed through the act of notification of accusation, which contains sufficient evidence for holding the person as a defendant. Data on convicts reflect the number of convicted persons against whom criminal sanctions have been applied which in turn, consist in banning, or restricting certain rights that they enjoyed until the moment of perpetrating the criminal offence. The number of prisoners shows the situation of prisoners’ in a given year, including new admissions and releases that occur during the period concerned, and is calculated as an average of the number of prisoners per month.
Perpetrators of criminal offencesIn 2017, there were 36,051 perpetrators of criminal offences, of whom 2,637 females. Compared to the last year there are 1.9 % less women perpetrators versus 4.5 % more men perpetrators. If we were to express these data as a ratio in relation with population, in 2017 231,1 male perpetrators and 18,5 female perpetrators were suspected of having committed criminal offenses per 10 thousand inhabitants.
Damaged persons from the criminal offenceRegarding the persons injured from criminal offences, 2017 data show that there are 19,062 injured persons, of whom 5,154 are women, approximately 27 % of the total. Meanwhile 1,340 are juveniles, 393 are girls and 947 are boys.
82
BURRAT DHE GRATË NË SHQIPËRI NË 2018 Statistikat juridike
përjetojnë dhunë në familje, është në qarkun e Tiranës me 35,8 % gra të dhunuara, ndjekur nga qarku i Durrësit me 13,9 %, ndërsa qarku i Kukësit dhe ai i Dibrës kanë përqindjen më të ulët, përkatësisht, 0,9 dhe 1,5 % gra të dhunuara. Numri i grave të dhunuara në raport me numrin e popullsisë është më i lartë në qarkun e Durrësit, Vlorës dhe Tiranës me normë përkatësisht 32,0, 26,6 dhe 26,3 të dhunuara për 10 mijë banore gra. Ndërsa Kukësi, Dibra dhe Shkodra janë qarqet me normën më të ulët, 7,6, 8,2 dhe 15,0 gra të dhunuara për 10 mijë banore gra të secilit qark. Rastet e dhunës në familje pasqyrojnë numrin e raportimeve të bëra në polici, dhe përfshijnë edhe rastet në të cilat ky fenomen ka shkaktuar vdekjen e personit. Në vitin 2017, nga 50 vrasje të ndodhura, 26,0 % e tyre kanë ardhur si rezultat i vrasjeve për shkak të marrëdhënieve në familje.
Të burgosurTë dhënat mbi të burgosurit pasqyrojnë statistika lidhur me numrin e të burgosurve sipas gjinisë, nivelit arsimor të ndjekur, grupmoshës, veprave penale për të cilat janë dënuar si dhe rreth kurseve të formimit professional që ndjekin në burgje. Në vitin 2017, numërohen 5.418 të burgosur nga të cilët 5.323 janë burra dhe 95 gra. Grupmoshat që dominojnë në burgje si për gratë dhe për burrat janë 30-59 dhe 18-29 vjeç. Të burgosurit e mitur janë 39 dhe të gjithë djem. Si për gratë ashtu dhe për burrat, ka një numër më të madh të të burgosurve me arsim 9 vjeçar, ndjekur nga personat me arsim të mesëm. Për vitin 2017, përqindjen më të lartë në totalin e burrave dhe grave të burgosura e zënë ata me arsim 9 vjeçar, përkatësisht 54,7 dhe 46,3 %. Të burgosurit me arsim të mesëm kanë përafërsisht të njëjtën përqindje ndaj totalit respektiv si për burrat dhe për gratë, 25,4 dhe 24,2 %. Ndërsa, të burgosurat me arsim të lartë zënë një përqindje më të lartë, 20,0 % krahasuar me burrat, 5,3 %.
Në burgje ushtrohen aktivitete rehabilituese dhe kurse të formimit profesional, të cilat janë shumë të rëndësishme për integrimin dhe rehabilitimin e të burgosurve. Në vitin 2017, ndjekin kurse të formimit profesional 23,1 % nga gratë e burgosura ndërsa nga burrat vetëm 3,2 % e tyre. Nga të burgosurit e mitur, ndjekin kurse të formimit profesional 26 prej tyre.
In absolute terms, there is a total of 3,243 violated women in Albania. The highest percentage of women subject to domestic violence is noted in the Tirana region with 35,8 % violated women, followed by Durrësi with 13,9 %, while the regions of Kukës and Dibra marked the lowest percentage with respectively 0,9 % and 1,5 % violated women. If we express the number of violated women as a proportion of their population, the rate of violated women in prefectures of Durrës, Vlora and Tirana accounts for the highest rate of violated women, respectively with 32,0 26,6 and 26,3 expressed per 10 thousand women inhabitants. Meanwhile, the regions of Kukës (7,6), Dibra (8,2) and Shkodra (15,0) constitute the prefectures with the lowest rate. Cases of domestic violence reflect the number of denunciations made to the police, a phenomenon which may even cause a person’s death. Thus in 2017, out of 50 homicides, about 26.0 % of them are homicides as a result of family relations.
PrisonersData on prisoners illustrate statistics regarding the number of prisoners by sex, educational level, age group, criminal offenses for which they were convicted, and vocational training courses followed in prisons. For 2017, there are 5,418 prisoners in total, of whom 5,323 are males and 95 females. Age groups that dominate in prison both for females and males range from 30-59 years old, followed by 18-29 age groups. Juvenile prisoners are 39 and they are all boys. Over the years, the largest number of prisoners both for males and females concerns those who have completed the primary and lower secondary education, followed by persons who have completed the upper secondary education. For 2017, out of the total of all prisoner males, the highest percentage is occupied by those with primary and lowers secondary education, respectively 54.7 and 46.3 %, while upper secondary education has roughly the same percentage for both males and females. As regards university level, women are noted to occupy a higher percentage of about 20 %, compared to 5.3 % of male convicts.
Prisons provide rehabilitation activities as well as professional training courses, which are very important for the integration and rehabilitation of prisoners. In 2017, 23.1 % of women prisoners attend professional training courses, while men prisoners only 3.2 %. Out of 39 juvenile prisoners in total, 26 of them exercise professional training courses.

83
WOMEN AND MEN IN ALBANIA IN 2018Juridical Statistics
Autorë sipas veprave penale dhe gjinisëPerpetrators by criminal offences and sex
Vepra penale2015 2016 2017
Criminal offencesBurraMen
GraWomen
BurraMen
GraWomen
BurraMen
GraWomen
Vrasje me dashje 77 4 78 2 47 1 Intentional homicide
Vrasje të mbetura në tentativë 188 2 162 2 154 2 Attempted murder
Krime me dashje kundër shëndetit 3,439 226 3,061 221 3,299 188 Intentional crimes against health
Krime seksuale 163 0 125 2 111 0 Sexual crime
Vjedhje banese 774 33 794 30 597 32 Burglary
Vjedhje automjetesh 129 2 122 1 157 0 Car theft
Vjedhje lokale tregtie 446 28 330 24 361 20 Theft of business promises
Vjedhje duke shpërdoruar detyrën 128 36 63 25 103 27 Theft through abuse of office
Tentativë Vjedhje pasurie 359 17 348 7 309 5 Attempted theft
Mashtrime 727 128 891 195 950 191 Fraud
Fallsifikim monedhash 84 18 60 10 77 4 Counterfeit
Dhuna në familje (neni 130/a) 1,254 105 1,443 143 1,370 137 Domestic violence
Krime në fushën e drogës 2,135 54 2,441 48 2,417 65 Drug crimes
Shkelja e rregullave të qarkullimit rrugor
4,771 174 4,706 166 4,781 180 The violation of road traffic rules
Tjetër 19,769 1,842 17,363 1,811 18,681 1,785 Other
Gjithsej 34,443 2,669 31,987 2,687 33,414 2,637 TotalBurimi:Drejtoria e Përgjithshme e Policisë së ShtetitSource: General Directorate of State Police
Autorë të veprave penale shprehur për 10 mijë banorë, 2017Perpetrators expressed per 10 thousand inhabitants, 2017
Burimi:Drejtoria e Përgjithshme e Policisë së Shtetit, INSTATSource: General Directorate of State Police, INSTAT
Autorë të veprave penale shprehur për 10 mijë banorë, 2017Perpetrators expressed per 10 thousand inhabitants, 2017
Burimi:Drejtoria e Përgjithshme e Policisë së Shtetit, INSTATSource: General Directorate of State Police, INSTAT
235,9219,7
231,1
18,8 18,9 18,5
2015 2016 2017
Burra-Men Gra-Female

84
BURRAT DHE GRATË NË SHQIPËRI NË 2018 Statistikat juridike
Të dëmtuar sipas veprave penale dhe gjinisëThe damaged persons by criminal offences and sex
Vepra Penale 2015 2016 2017 Criminal offences
Gjithsej 20,168 19,078 19,062 Total
Vrasje me dashje 82 99 68 Intentional Homicide
Vrasje në tentativë 155 168 164 Attempted homicide
Krime me dashje kundër shëndetit 3,334 2,983 3,219 Intentional crime against health
Krime seksuale 146 121 114 Sexual crimes
Vjedhje banese 1,396 1,218 1,153 Burglary
Vjedhje automjetesh 276 291 329 Car theft
Vjedhje lokale tregtie 692 552 464 Theft of business promises
Vjedhje duke shpërdoruar detyrën 130 49 47 Theft through abuse of office
Tentativë Vjedhje pasurie 360 367 364 Attempted theft
Mashtrime 666 816 791 Fraud
Fallsifikim monedhash 85 46 44 Counterfeit
Dhuna në familje (neni 130/a) 1,376 1,616 1549 Domestic violence
Shkelja e rregullave të qarkullimit rrugor
3,148 3,300 3,142 The violation of road traffic rules
Tjetër 8,322 7,452 7,614 Other
Burra 14,887 13,595 13,908 Men
Vrasje me dashje 66 82 56 Intentional Homicide
Vrasje në tentativë 147 158 150 Attempted homicide
Krime me dashje kundër shëndetit 2,839 2,523 2,786 intentional crime against health
Krime seksuale 27 13 12 Sexual crimes
Vjedhje banese 1,117 931 907 Burglary
Vjedhje automjetesh 264 274 307 Car theft
Vjedhje lokale tregtie 591 431 372 Theft of business promises
Vjedhje duke shpërdoruar detyrën 113 32 36 Theft through abuse of office
Tentativë Vjedhje pasurie 288 296 297 Attempted theft
Mashtrime 507 569 568 Fraud
Fallsifikim monedhash 72 34 30 Counterfeit
Dhuna në familje (neni 130/a) 384 462 440 Domestic violence
Shkelja e rregullave të qarkullimit rrugor
2,358 2,389 2,306 The violation of road traffic rules
Tjetër 6,114 5,401 5,641 Other
Gra 5,281 5,483 5,154 Women
Vrasje me dashje 16 17 12 Intentional Homicide
Vrasje në tentativë 8 10 14 Attempted homicide
Krime me dashje kundër shëndetit 495 460 433 intentional crime against health
Krime seksuale 119 108 102 Sexual crimes
Vjedhje banese 279 287 246 Burglary

85
WOMEN AND MEN IN ALBANIA IN 2018Juridical Statistics
Vjedhje automjetesh 12 17 22 Car theft
Vjedhje lokale tregtie 101 121 92 Theft of business promises
Vjedhje duke shpërdoruar detyrën 17 17 11 Theft through abuse of office
Tentativë Vjedhje pasurie 72 71 67 Attempted theft
Mashtrime 159 247 223 Fraud
Fallsifikim monedhash 13 12 14 Counterfeit
Dhuna në familje (neni 130/a) 992 1,154 1,109 Domestic violence
Shkelja e rregullave të qarkullimit rrugor
790 911 836 The violation of road traffic rules
Tjetër 2,208 2,051 1,973 Other
Burimi:Drejtoria e Përgjithshme e Policisë së ShtetitSource: General Directorate of State Police
Të dëmtuar sipas gjinisë dhe veprave penale të trafikimit dhe dhunës në familje Damaged persons by sex and offences like trafficking and domestic violence
Trafikimi i qënieve njerëzore-Trafficking in human beingsDhuna në familje-Domestic Violence
2016 2017 2016 2017
Burra Men
Të dëmtuar të rritur 4 5 420 404 Adult persons damaged
Të dëmtuar të mitur 5 4 42 36 Juvenile persons damaged
Gra Female
Të dëmtuar të rritur 22 16 1,104 1,051 Adult persons damaged
Të dëmtuar të mitur 14 14 50 58 Juvenile persons damaged
Gjithsej 45 39 1,616 1,549 Total
Burimi:Drejtoria e Përgjithshme e Policisë së Shtetit / Source: General Directorate of State PoliceShënim: Dhuna në familje i referohet nenit 130/a të Kodit Penal / Note: Domestic violence refers article 130/a of Penal Code
Të dëmtuarit sipas veprave penale dhe gjinisë në %, 2017The damaged persons by criminal offences and sex in %, 2017
Burimi:Drejtoria e Përgjithshme e Policisë
Source: General Directorate of Police
82,491,5 86,5
10,5
78,793,3
80,2 76,6 81,671,8 68,2
28,4
73,4 74,1 73,0
17,68,5 13,5
89,5
21,36,7
19,8 23,4 18,428,2 31,8
71,6
26,6 25,9 27,0
0
10
20
30
40
50
60
70
80
90
100
Gjithsej Vrasje medashje
Vrasje nëtenta�vë
Krime medashjekundër
shënde�t
Krimeseksuale
Vjedhjebanese
Vjedhjeautomjetesh
Vjedhjelokale treg�e
Vjedhje dukeshpërdoruar
detyrën
Tenta�vëVjedhjepasurie
Mashtrime Fallsifikimmonedhash
Dhuna nëfamilje
Shkelja erregullave tëqarkullimit
rrugor
Tjetër
Burra-Men Gra- Women
Të dëmtuarit sipas veprave penale dhe gjinisë në %, 2017The damaged persons by criminal offences and sex in %, 2017
Burimi:Drejtoria e Përgjithshme e Policisë së ShtetitSource: General Directorate of State Police

86
BURRAT DHE GRATË NË SHQIPËRI NË 2018 Statistikat juridike
Të mitur të dëmtuar nga veprat penale sipas gjinisë, 2017Juvenile victims of criminal offences by sex, 2017
Vepra penale Djem-Boys Vajza-Girls Gjithsej-Total Criminal offences
Kanosje 31 16 47 Threat
Plagosje e lehtë me dashje 123 4 127 Intentional slight damage
Dëmtime të tjera me dashje 130 16 146 Other intentional damage
Marrëdhënie seksuale ose homoseksuale me të mitur
2 16 18Sexual or homosexual relations/ intercourse with minors/children
Marrëdhënie seksuale ose homoseksuale me dhunë me të mitur të moshës 14-18 vjeç
2 4 6 Sexual or homosexual intercourse by
violence with a minor who is 14-18 years old
Vepra të turpshme 7 18 25 Serious immoral acts
Ngacmim seksual 0 15 15 Sexual harassment
Shtrëngimi me anë të kanosjes ose dhunës për dhënien e pasurisë
0 4 4 Forcing through blackmail or violence
for submission of the wealth
Heqja e paligjshme e lirisë 0 3 3 Illegal Removal of Freedom
Përndjekja 3 21 24 Persecution
Braktisja e fëmijëve të mitur 63 3 66 Abandonment of minor children
Keqtrajtimi i të miturit 32 9 41 Maltreatment of minors
Marrja e padrejtë e fëmijës 3 3 6 Unlawfully taking the child
Trafikimi i të miturve 4 10 14 Trafficking of Minors
Dhuna në familje 36 58 94 Domestic violence
Shkelja e rregullave të qarkulllimit rrugor
327 114 441 Violation of traffic rules
Të tjera 184 79 263 Other
Gjithsej 947 393 1,340 Total Burimi:Drejtoria e Përgjithshme e Policisë së ShtetitSource: General Directorate of State Police
Viktima të vrasjeve me dashje sipas gjinisë Victims of intentional homicide by sex
Gjithsej-Total Gra-Women Burra-Men
Nr Tregues-Rate Nr Tregues-Rate Nr Tregues-Rate
2015 82 2,8 16 1,1 66 4,5
2016 99 3,4 17 1,2 82 5,6
2017 68 2,4 12 0,8 56 3,9Burimi:Drejtoria e Përgjithshme e Policisë së Shtetit, INSTATSource: General Directorate of State Police, INSTAT

87
WOMEN AND MEN IN ALBANIA IN 2018Juridical Statistics
Numri i vrasjeve me dashje dhe vik�mat prej tyre sipas gjinisëNumber of inten�onal homicide and vic�ms of this crimes by sex
Burimi:Drejtoria e Përgjithshme e Policisë së ShtetitSource: General Directorate of State Police
80,5 82,8 82,4
19,5 17,2 17,6
54
71
50
0
10
20
30
40
50
60
70
80
0,0
20,0
40,0
60,0
80,0
100,0
2015 2016 2017
Burra-Men Gra-Women Krime të evidentuara-Recorded crimes
Përqindja e vrasjeve për shkak të marrëdhënieve familjarePercentage of murders causes by family rela�onship
26,922,4
33,322,5 26,0
0
20
40
60
80
100
120
2013 2014 2015 2016 2017
Numri i vrasjeve me dashje /Number of inten�onal homicide % e vrasjeve për shkak të mardhënieve familjare / % of murders causes by family rela�onship
Numri i vrasjeve me dashje dhe viktimat prej tyre sipas gjinisëNumber of intentional homicide and victims of these crimes by sex
Përqindja e vrasjeve për shkak të mardhënieve familjarePercentage of murders causes by family relationship
Burimi:Drejtoria e Përgjithshme e Policisë së ShtetitSource: General Directorate of State Police
Burimi:Drejtoria e Përgjithshme e Policisë së ShtetitSource: General Directorate of State Police

88
BURRAT DHE GRATË NË SHQIPËRI NË 2018 Statistikat juridike
Vik�mat e vrasjeve për shkak të marrëdhënieve familjare sipas gjinisë, në %Vic�ms of murders causes by family rela�onship by sex, in %
Burimi:Drejtoria e Përgjithshme e Policisë së ShtetitSource: General Directorate of State Police
50,0
31,6
35,7
50,0
68,4
64,3
0,0 20,0 40,0 60,0 80,0 100,0 120,0
2015
2016
2017
Burra-Men
Gra-Women
Gra që përjetojnë dhunë në familje sipas qarqeve, 2017 Women who experience domes�c violence by prefectures, 2017
Burimi:Drejtoria e Përgjithshme e Policisë së ShtetitSource: General Directorate of State PoliceShënim: grafiku tregon përqindjen e femrave të dhunuara për çdo qark në raport me totalin e gjithë femrave të dhunuara për një vit të caktuarNote: figure ilustate percentage of battered women of each prefecture in relation with total of all battered women in a specifik year
35,8
13,9
8,7 7,7 7,7 7,35,0 4,8 4,5
2,2 1,5 0,90
5
10
15
20
25
30
35
40
Tira
në
Durr
ës
Fier
Korç
ë
Vlor
ë
Elba
san
Bera
t
Shko
dër
Lezh
ë
Gjir
okas
tër
Dibë
r
Kukë
s
Përqindja e vrasjeve për shkak të mardhënieve familjare sipas gjinisëPercentage of murders causes by family relationship by sex
Gra që përjetojnë dhunë në familje sipas qarqeve, 2017Women who experience domestic violence by prefectures, 2017
Burimi:Drejtoria e Përgjithshme e Policisë së ShtetitSource: General Directorate of State Police
Burimi:Drejtoria e Përgjithshme e Policisë së ShtetitSource: General Directorate of State PoliceShënim: grafiku tregon përqindjen e grave të dhunuara për çdo qark në raport me totalin e gjithë grave të dhunuara për një vit të caktuarNote: figure illustrates percentage of battered women of each prefecture in relation with total of all battered women in a specific year

89
WOMEN AND MEN IN ALBANIA IN 2018Juridical Statistics
Lidhja viktimë-autorë të veprës dhunë në familjeRelation victim-suspects of domestic violence
Bashkëshortja-
WifeBashkëshorti-
HusbandPrindi-Parent FëmijaChild
Familjarë të tjerë- Other relative
Totali I personave të dëmtuar-Total
number of victims
2015 466 79 203 97 531 1,376
2016 591 22 280 115 608 1,616
2017 549 39 269 120 572 1,549
Burimi:Drejtoria e Përgjithshme e Policisë së Shtetit / Source: General Directorate of State PoliceShënim: Dhunë në familje, neni 130/a / Note: Domestic violence, article 130/a
Norma e grave që denoncojnë dhunë në familje shprehur për 10 mijë banorë sipas qarqeve, 2017The rate of women who denounce domes�c violence per 10 thousand inhabitants by prefectures, 2017
Burimi:Drejtoria e Përgjithshme e Policisë së Shtetit, INSTATSource: General Directorate of State Police, INSTAT
7,6
8,2
15,0
17,1
19,2
22,0
23,1
23,8
24,8
26,3
26,6
32,0
22,7
0,0 10,0 20,0 30,0 40,0
Kukës
Dibër
Shkodër
Elbasan
Fier
Gjirokastër
Lezhë
Korçë
Berat
Tiranë
Vlorë
Durrës
Gjithsej / Total
Lidhja vik�më-autorë të veprës dhunë në familje, 2017 Rela�on vic�m-suspects of domes�c violence, 2017
Burimi: Drejtoria e Përgjithshme e Policisë së Shtetit / Source: General Directorate of State PoliceShënim: Dhunë në familje, neni 130/a / Note: Domestic violence, article 130/a
Bashkëshortja-Wife
Bashkëshor�-Husband
Prindi-Parent
Fëmija- Child
Familjarë të tjerë- Other rela�ve
35%
3%
17%8%
37%
Norma e grave që denoncojnë dhunë në familje shprehur për 10 mijë banorë sipas qarqeve, 2017The rate of women who denounce domestic violence per 10 thousand inhabitants by prefectures, 2017
Lidhja viktimë-autorë të veprës dhunë në familje, 2017Relation victim-suspects of domestic violence, 2017
Burimi:Drejtoria e Përgjithshme e Policisë së Shtetit / Source: General Directorate of State PoliceShënim: Dhunë në familje, neni 130/a / Note: Domestic violence, article 130/a
Burimi:Drejtoria e Përgjithshme e Policisë së Shtetit, INSTATSource: General Directorate of State Police, INSTAT

90
BURRAT DHE GRATË NË SHQIPËRI NË 2018 Statistikat juridike
Të pandehur sipas gjinisë dhe grupmoshës, 2014-2017Defendants by sex and age group, 2014-2017
2014 2015 2016 2017
Gjithsej 19,322 19,983 11,725 10,003 Total
Burra Men
Të dënuar të rritur 17,567 17,900 10,486 8,961 Adult defendants
Të dënuar të mitur 937 974 610 463 Juvinal defendants
Gra Women
Të dënuar të rritur 797 1,080 613 568 Adult defendants
Të dënuar të mitur 21 29 16 11 Juvinal defendants
Burimi:Prokuroria e PërgjithshmeSource: General Prosecution
Të pandehur sipas gjinisë dhe grupmoshës, 2014-2017Defendants by sex and age group, 2014-2017
Burimi:Prokuroria e PërgjithshmeSource:General Prosecution
95,8
94,5
94,6
94,2
4,2
5,5
5,4
5,8
91% 92% 93% 94% 95% 96% 97% 98% 99% 100%
2014
2015
2016
2017
Burra-Men Gra-Women
Burimi:Prokuroria e PërgjithshmeSource: General Prosecution

91
WOMEN AND MEN IN ALBANIA IN 2018Juridical Statistics
Numri i të dënuarve me dënime alternative Number of convicted persons with alternative sanctions
2015 2016 2017
Burra Men
Të dënuar të rritur 4,971 4,358 5,148 Adult convicted
Të dënuar të mitur 384 371 242 Juvenile convicted
Gra Female
Të dënuar të rritur 572 625 586 Adult convicted
Të dënuar të mitur 19 14 70 Juvenile convicted
Gjithsej 5,946 5,368 6,046 Total
Burimi: Shërbimi i ProvësSource:Probation
Të dënuar me burg sipas dy ndarjeve kryesore moshore dhe gjinisëPrisoners by two broad age groups and sex
2013 2014 2015 2016 2017
Burra Men
Të burgosur të rritur 2,865 2,788 2,825 2,995 3,023 Adult prisoners
Të burgosur të mitur 19 9 12 14 7 Juvenile prisoners
Gra Women
Të burgosur të rritur 58 41 58 42 53 Adult prisoners
Të burgosur të mitur 0 0 0 0 0 Juvenile prisoners
Burimi: Drejtoria e Përgjithsme e Burgjeve / Source: General Directorate of PrisonsShënim: Përfshihen vetëm të dënurit me burg, jo të paraburgosurit / Note: Are includen only prisoners, not detainnes
Të paraburgosurit sipas dy ndarjeve kryesore moshore dhe gjinisë Detainees by criminal offences and sex
2013 2014 2015 2016 2017
Burra Men
Të paraburgosur të rritur 1,946 2,478 2,916 2881 2,261 Adult detainees
Të paraburgosur të mitur 79 84 72 44 32 Juvenile detainees
Gra Women
Të paraburgosur të rritur 31 53 49 54 42 Adult detainees
Të paraburgosur të mitur 0 0 2 1 0 Juvenile detainees
Burimi: Drejtoria e Përgjithsme e Burgjeve / Source: General Directorate of PrisonsShënim: Përfshihen vetëm të paraburgosurit / Note: Are included only detainees

92
BURRAT DHE GRATË NË SHQIPËRI NË 2018 Statistikat juridike
Përqindja e të burgosurve sipas grupmoshës dhe gjinisë ,2017Percentage of prisoners by age group and sex, 2017
Burimi: Drejtoria e Përgjithsme e Burgjeve Source: General Directorate of Prisons
Të burgosur sipas veprave penale dhe gjinisëPrisoners by criminal offences and sex
Vepra penale2014 2015 2016 2017
Criminal offencesBurra-Men
Gra-Women
Burra-Men
Gra-Women
Burra-Men
Gra-Women
Burra-Men
Gra-Women
Vjedhje 1,485 6 1,200 12 960 6 1,034 12 Robbery
Vrasje 1,318 24 1,447 23 1,192 23 974 18 Homicide
Plagosje 186 0 218 0 203 1 100 1 Injury
Marrëdhënie seksuale me dhunë
111 1 134 0 99 0 48 0 Sexual crime
Krime në fushën e drogës
1,127 15 1,307 22 1,284 17 1,586 16 Drug crimes
Organizata kriminale 17 0 28 0 37 0 26 0 Criminal organizations
Mashtrim 65 9 53 15 46 17 85 14 Fraud
Shfrytëzim prostitucioni 81 12 70 9 54 13 75 15 Exploitation of
prostitution
Të tjera 969 27 1,554 36 1,968 26 1,395 19 Other
Gjithsej 5,359 94 6,011 117 5,843 103 5,323 95 Total
Burimi: Drejtoria e Përgjithsme e Burgjeve / Source: General Directorate of PrisonsShënim: Përfshihen të dënuarit me burg dhe të paraburgosur / Note: Are included prisoners and detainees
Përqindja e të burgosurve sipas grupmoshës dhe gjinisë, 2017 Percentage of prisoners by age group and sex, 2017
Burimi: Drejtoria e Përgjithshme e Burgjeve Source: General Directorate of Prisons
0,7
50,246,6
2,4
34,7
61,1
4,2
0,0
10,0
20,0
30,0
40,0
50,0
60,0
70,0
14-17 18-29 30-59 60+
Burra-Men Gra -Women

93
WOMEN AND MEN IN ALBANIA IN 2018Juridical Statistics
Gra të burgosura sipas veprave penale në %, 2017Prisoner’s women by criminal offences in %, 2017
Burimi: Drejtoria e Përgjithsme e BurgjeveSource: General Directorate of Prisons
Të burgosur sipas nivelit arsimor dhe gjinisëPrisoners by level of education and sex
Grupmosha2016 2017
Age-groupBurra-Men Gra-Women Burra-Men Gra-Women
Gjithsej 5,843 103 5,323 95 Total
Pa arsim 236 8 195 2 Illiterate
I ulët 546 27 578 7 Low
Arsim 9 vjeçar 2,954 26 2,913 44 Primary
Arsim i mesëm 1,631 23 1,353 23 Secondary
Arsim i lartë 431 19 284 19 University
Të panjohur 45 0 0 0 UnknownBurimi: Drejtoria e Përgjithshme e Burgjeve / Source: General Directorate of PrisonsShënim: Përfshihen të dënuarit me burg dhe të paraburgosur / Note: Are included prisoners and detainees
Të burgosurit sipas nivelit arsimor dhe gjinisë, 2017Prisoners by level of education and sex, 2017
Burimi: Drejtoria e Përgjithshme e Burgjeve / Source: General Directorate of PrisonsShënim: Përqindja e të burgosurve burra(gra) për çdo nivel arsimi ndaj totalit të të burgosurve burra (gra)Note: Percentage of male (female) prisoners of level of education in relation with all men (female) prisoners
Gra të burgosura sipas veprave penale në %, 2017 Prisoner’s women by criminal offences in %, 2017
Burimi: Drejtoria e Përgjithshme e BurgjeveSource: General Directorate of Prisons
20,0 18,9 16,8 15,8 14,7 12,6 1,10,0
5,0
10,0
15,0
20,0
25,0
Të tjera-Other Vrasje -Homicide Krime në fushën edrogës-Drug crimes
Shfrytëzimpros�tucioni-
Exploita�on ofpros�tu�on
Mashtrim-Fraud Vjedhje-The� Plagosje-Injury
Gra-Women
Të burgosurit sipas nivelit arsimor dhe gjinisë, 2017 Prisoners by level of educa�on and sex, 2017
3,710,9
54,7
25,4
5,32,1
7,4
46,3
24,220,0
0,0
10,0
20,0
30,0
40,0
50,0
60,0
70,0
Pa arsim-Illiterate I ulët-Low Arsim 9 vjeçar-Primary
Arsim i mesëm-Secondary
Arsim i lartë-University
Burra-Men Gra-Women

94
BURRAT DHE GRATË NË SHQIPËRI NË 2018 Statistikat juridike
Personeli në burgje, 2013-2017Prison personnel, 2013-2017
Personeli-Personnel
Personeli në burgjet e të rriturvePrison personnel in adult prisons
Personeli në burgjet e të miturvePrison personnel in juvenile prisons
Burra-Men Gra-Women Burra-Men Gra-Women
2013 3,039 473 57 15
2014 3,059 544 65 11
2015 3,454 598 63 14
2016 3,309 580 67 11
2017 3,186 517 59 13
Burimi: Drejtoria e Përgjithshme e BurgjeveSource: General Directorate of Prisons
Të burgosur sipas kurseve të formimit profesional në Institucionet e Ekzekutimit të Vendimit Penal, 2017Prisoners by proffesional training courses in Prison, 2017
IEVP (Burgje)
Lloji i kurseve të formimit profesional
Numri i të burgosurveqë ndjekin kurset
PrisonProfessional training courses
Number of prisonerswho attend courses
IM Kavajë ( Mitur)Punë me dru, hidraulikë, saldaturë
26 IM Kavajë ( Juvenile)Wood work, hydraulics, Saldatura
Ali Demi (Gra)
Kujdestari fëmijësh, asistencë sociale 22 Ali Demi (Women)
Child care, social assistance
Fushë- KrujëAnglisht, Turizëm familjar
12 Fushë- KrujëEnglish, Family Tourism
Mine PezaAnglisht, hidraulikë
21 Mine PezaEnglish, hydraulics
VlorëHidraulikë, elektricistë, berber
33 VlorëPlumbers, electricians, barber
Korcëkuzhinier
70 KorcëChief
RrogozhinëAnglisht, Turizëm familjar
9 RrogozhinëEnglish, Family Tourism
Burimi: Drejtoria e Përgjithshme e BurgjeveSource: General Directorate of Prisons

95
WOMEN AND MEN IN ALBANIA IN 2018Juridical Statistics
Përqindja e të burgosurve që ndjekin kurse të formimit profesionalPercentage of prisoners who attend professional training courses in prison
Burimi: Drejtoria e Përgjithsme e Burgjeve Source: General Directorate of Prisons Shënim: Në total janë 190 të burgosur që ndjekin kurse, ndërkohë janë 3453 të burgosur që ndjekin aktivitete rehabilituese Note: In total are 190 prisoners who attend courses, while are 3453 prisoners who attend rehabilities activities
Numri i te vrarëve dhe i të plagosurve në aksidente rrugore sipas gjinisëNumber of murderd and injured in road accidents by sex
Aksidentet rrugoreTë vrarë - Murdered Të plagosur - Injured
Burra-Men Gra-Women Burra-Men Gra-Women
2013 237 58 1,861 642
2014 208 56 1,656 697
2015 223 47 1,739 683
2016 218 51 1,737 772
2017 180 42 1,666 723
Burimi:Drejtoria e Përgjithshme e Policisë Source: General Directorate of Police
Përqindja e të burgosurve që ndjekin kurse të formimit profesionalPercentage of prisoners who a�end proffesional training couses in prison
Burimi: Drejtoria e Përgjithsme e BurgjeveSource: General Directorate of PrisonsShënim: Në total janë 190 të burgosur që ndjekin kurse, ndërkohë janë 3453 të burgosur që ndjekin aktivitete rehabilitueseNote: In total are 190 prisoners who attend courses, while are 3453 prisoners who attend rehabilities activities
6,12,8 3,2
29,928,2
23,1
2015 2016 2017
Meshkuj-Men Gra-Women

96
BURRAT DHE GRATË NË SHQIPËRI NË 2018 Gratë në vendimarrje
Gratë në vendimarrjeWomen in Decision-making

97
WOMEN AND MEN IN ALBANIA IN 2018Women in Decision-making
Ky kapitull paraqet të dhëna për gratë në
vendimmarrje dhe është konceptuar në
dy pjesë. Pjesa e parë përmban të dhëna
administrative nga Parlamenti, Drejtoria e
Përgjithshme e Policisë, Forcat e Armatosura
etj. Pjesa e dytë përfshin të dhëna nga Banka
e Shqipërisë dhe regjistri i biznesit për
gratë të cilat janë pronare ose drejtojnë një
biznes. Grupet e të dhënave për këtë temë
tregojnë sjelljen e burrave dhe grave në
fusha të ndryshme në nivel vendimarrje.
a- Pjesëmarrja e gruas në vendimarrje Të dhënat e para në lidhje me përbërjen e Parlamentit të Shqipërisë vijnë nga legjislacioni i vitit 1920. Gjatë kësaj periudhe Parlamenti i Shqipërisë është përbërë vetëm nga burra. Pasi gratë në Shqipëri morën të drejtën e votës, anëtaret e para gra në Parlament u zgjodhën në legjislacionin e vitit 1945, duke zënë një peshë prej 7,0 %. Shkalla e pjesëmarrjes së grave në Parlamentin Shqiptar ka qënë konstante gjatë legjislacioneve të 1997, 2001 dhe 2005 nën nivelin 10,0 %.
Përmirësimi i ndjeshëm i rritjes së grave anëtare në Parlamentin e Shqipërisë u bë i mundur pas përfshirjes së kuotës 30 % në ndryshimet e kodit elektoral, në vitin 2008. Në Zgjedhjet Parlamentare të vitit 2009, pjesëmarrja e grave në parlament u rrit me më shumë se dyfish, nga 7,0 në 16,0 %. Tendenca në rritje vihet re edhe në zjedhjet parlamentare 2013, ku arriti në 18,0 %. Nga viti 2013 deri në vitin 2017, tendenca në rritje e numrit të grave dhe vajzave në parlament ka vazhduar si efekt i zëvendësimit të burrave deputetë me gra deputete, si pasojë e lënies së mandateve. Si rezultat i këtij zëvendësimi në vitin 2017, ka 29,0 % gra, anëtare në Parlament. Ndër tetë komisionet parlamentare, pjesëmarrja më e madhe e grave është në “Komisionin për punën, çështjet sociale dhe shëndetësinë” dhe Komisioni për politikën e jashtme, me rreth 50,0 %.
Në Sistemin e Drejtësisë vihet re që në pozicionet e larta, si Kryetar i Gjykatës së Lartë, Kryetar i Gjykatës Kushtetuese, Kryetar i Gjykatës së
This chapter presents data on women in
decision-making and has been separated
into two parts. The first part contains
administrative data from the Parliament,
General Directorate of State Police, Armed
Forces, etc. The second part includes data
from the Bank of Albania and Business
Register for Women who own or manage a
business. The data groups on this subject
display the behaviour of men and women
in various decision-making levels.
a- Women Participation in Decision-makingThe first data on the composition of the Albanian Parliament trace back to the legislation of 1920. During that period, the Albanian Parliament was composed only of men.
The first women MPs were elected in the legislature of 1945. The participation rate of women in Parliament has been increasing, with exception of years 1997, 2001 and 2005 that it had been less than 10.0 %.
A significant enhancement in increasing women’s MPs in Albania was made possible upon the inclusion of 30% quota in amendments made to the Electoral Code in 2008. In parliamentary elections of 2009, the participation of women in parliament more than doubled, from 7.0 % to 16.0 %. This increasing trend is also noticed for the 2013 parliamentary elections, in which there was 18% participation. From 2013 to 2017, the increasing trend of women and girls in the parliament has continued because of the replacement of male MPs with women MPs due to resignation of men from their mandates. In 2017, it was 29.0 %, because of the replacement of male MPs with women MPs due to resignation of men from their mandates.
Among the eight parliamentary commissions, women participation rate is over 10%. The largest participation rate, which is 50%, pertains to the “Commission on Legal Issues, Public Administration and Human Rights” and to the “Commission on Education and Public Information”.

98
BURRAT DHE GRATË NË SHQIPËRI NË 2018 Gratë në vendimarrje
Apelit Administrativ, pjesëmarrja e grave është zero përqind, ndërsa duke filluar nga pozicionet e tjera në një rend hierarkik zbritës, pjesëmarrja e grave vjen duke u rritur. Pjesëmarrja e gruas në misionet diplomatike në vitin 2017, ka qenë në nivele të krahasueshme me burrat, ku përqindja e ambasadorëve gra ishte 27,0 % ndërsa gratë në pozicionin e Ministrit Fuqiplotë ishin 57,0 %. Për postin e Sekretarit të Parë dhe Sekretarit të Tretë pjesëmarrja e grave ishte 63,0 dhe 67,0 %.
Në Administratën Publike, pjesëmarrja e grave në pozicionet e menaxhimit, është në total gati e njëjtë me burrat, 49,7 %. Pjesëmarrja më e madhe e grave është në pozicionet e nivelit të ulët të menaxhimit me 53,2 % ndërsa pjesëmarrja më e ulët është në pozicionet e nivelit të mesëm të menaxhimit, 39,2 %.
Vendim-marrja në nivel vendorNdryshimet në kodin elektoral bënë të mundur që të përmirësohet ndjeshëm përfaqësimi gjinor edhe në organet e qeverisjes vendore. Në përbërje të listave me kandidatë në zgjedhjet për kryetar bashkie të vitit 2015, kishte 10,0 % gra. Kandidatët/et fitues për kryetar bashkie ishin 15,0 % gra dhe kjo përqindje mbetet e tillë edhe sipas vlerësimit në dhjetor 2017. Përbërja e listave në zgjedhjet për Këshillat Bashkiakë në vitin 2015, ishte 49,0 % gra. Përqindja e grave ndër kandidatët fitues në zgjedhjet vendore të atij viti ishte 35,0 %, ndërsa sipas vlerësimit të bërë në dhjetor 2017, përqindja e grave ndërmjet këshilltarëve të bashkive është 36,9 %.
Aksesi i grave dhe burrave në Strukturat e PolicisëNë strukturat e policisë, numri i punonjëseve gra është shumë i ulët dhe nuk ka ndryshime të konsiderueshme në tre vitet e fundit. Për vitin 2017, ndër 10.629 punonjës të policisë, klasifikuar sipas gradave dhe gjinisë, 14,2 % janë gra. Në nivelet e larta drejtuese, asnjë grua nuk ka qënë në pozicionin Drejtues Madhor ose Drejtues i Parë. Vetëm 1 grua zë nivelin e Drejtuesit të Lartë në vitin 2017 dhe nga 122 Drejtues, gratë përbëjnë 8,2 %. Numri i punonjëseve gra vjen duke u rritur me uljen e nivelit të gradave duke arritur nivelet më të larta për Nënkomisar dhe Inspektor, ku gratë janë 12,0 dhe 9,5 %. Numri i burrave në këto struktura është shumë i lartë
It is observed that, in the Justice System higher positions, such as Head of the Supreme Court, Head of the Constitutional Court, Head of the Administrative Court of Appeal, the women participation is still missing. Women are increasingly seen in other lower positions in a descending hierarchy. Women participation in diplomatic missions in 2017 was at satisfactory levels, with 27.0 % Ambassadors being women, whereas in the positions such as Minister Plenipotentiary, First Secretary and Third Secretary, women’ participation was over 57.0%. For the position of First Secretary and Third Secretary, women participation was 63.0 and 67.0 %.
Regarding Public Administration, women participation in management positions is nearly the same as men, 49.7%. The largest share of women is in low management positions by 53.2%, while the lower participation is in medium-level management positions by 39.2%.
Decision-Making at local levelThe amendments to the Electoral Code made possible that 10.0 % of candidates running for mayors in the local election of 2015 were women. The winning candidates for mayor were 15.0% women and 85% men at the end of December 2017. Such amendment to the electoral code significantly improves the gender representation in decision-making that has taken place since the democratic developments in the country. The lists in elections 2015 for the Municipal Councils were composed of 49.0% women. The winning candidates referring to the new advisors were 35.0%, whereas according to the estimation made in December 2017, 36.9 percent of municipal council advisors were women and girls.
Access of women and men to police structuresThe number of female employees is very low in police structures and it has not undergone major changes during the last three years. In 2017, out of 10,629 police employees, classified according to grades and gender, 14.2% are women. No woman has held the job position Major Leader or Senior Leader in the senior management levels. In 2017, out of 122 leaders in total, only 8.2% are women, with only one woman holding the Senior Leader position. The number of women employed in police structures is gradually increasing for the lower-grade employees, thus reaching the highest levels, which are

99
WOMEN AND MEN IN ALBANIA IN 2018Women in Decision-making
krahasuar me numrin e grave, me përjashtim të nivelit Civil ku numri i grave tejkalon atë të burrave duke zënë 54,8 %.
Aksesi i grave dhe burrave në forcat e armatosuraNë vitin 2017, përqindja e grave ndër punonjësit në forcat e armatosura ishte 16,0 %. Ndryshimet kanë të vogla në periudhën 5 vjeçare, 2013-2017, për të dyja gjinitë.
b- Vendim-marrja dhe biznesiNë vitin 2017, përqindja e grave ndërmjet pronarëve apo administratorëve të ndërmarrjeve është rritur në 29,7 % nga 26,8 % që ishte në vitin 2016. Përqindja e pronareve/administratoreve gra është më e lartë në ndërmarrjet e vogla (me 1-4 të punësuar), 30,2 % por ka pësuar rritje në të gjitha kategoritë krahasuar me vitin paraardhës. Rritja më e madhe në vitin 2017, është regjistruar në ndërmarrjet me mbi 10 të punësuar, ku ka 5,0 % më shumë gra pronare ose administratore se një vit më parë.
Ndërmarrjet aktive sipas aktivitetit ekonomikNumri i pronareve gra ose administratore në vitin 2017, është rritur si përsa i përket bizneseve me aktivitet ekonomik prodhues ashtu dhe sektorit të shërbimeve. Numri i bizneseve me pronare ose administratore gra është më i madh në Sektorin e Shërbimit sesa në Sektorin Prodhues, përkatësisht 36,3 dhe 16,1 %. Por, rritja më e madhe ka ndodhur në Sektorin e Shërbimeve, me 9,0 % krahasuar me një vit më parë.
Ndërmarrjet aktive sipas qarqeveNë vitin 2017, shpërndarja sipas qarqeve e ndërmarrjeve aktive tregon se ndërmarrjet me pronare apo administratore gra janë të përqëndruara në qarkun e Tiranës, 35,6 % ndjekur nga qarku i Durrësit, 32,5 %. Përqindja e ndërmarrjeve të zotëruara apo të drejtuara nga gratë në vitin 2017, ka pësuar rritje në të gjitha qarqet krahasuar me një vit më parë. Përqindja e ndërmarrjeve të zotëruara/drejtuara nga gratë është më e madhe në Sektorin e Shërbimit krahasuar me atë të Prodhimit, në të gjitha qarqet, por përqëndrimi më i lartë i atyre që prodhojnë shërbime është në Tiranë, 37,9 % ndërsa përqëndrimi më i lartë i prodhueseve të të mirave është në Elbasan, 21,7 %.
Deputy Commissioner and Inspector, namely 12.0% and 9.5%. The number of men within this structure is higher compared to women, where the number of women is higher compared to that of men, specifically 54.8%.
Access of women and men to the armed forcesIn 2017, the percentage of women among employees in the armed forces was 16.0%. Since 2013 to 2017, differences have been minor for both sexes.
b- Decision-making and businessThe share of women owners/administrators increased to 29.7% in 2017 compared to 26.8% in 2016. The percentage of women owners or administrators in small enterprises (1-4 employees) is 30.2%, which is higher than in other categories. In 2017, the percentage of women owners/ administrators has increased in all categories, with the largest increase falling under the 10 employee’s category, where number of women administrators or owners compared to the previous year is 5.0% higher.
Active enterprises by economic activityThe number of women owners or administrators of businesses in manufacturing and service sector has increased in 2017. The number of businesses with women owners or administrators is greater in the Service Sector than in the Production Sector, 36.3% and 16.1% respectively. The largest increase is observed in the Services Sector by 9%, compared to the previous year.
Active enterprises by regionIn 2017, the distribution of active enterprises by region indicates that enterprises with women owners or managers are largely concentrated in Tirana region (35.6%). Tirana is followed by Durrës (32.5%). In comparison to the previous year, the percentage of enterprises owned or run by women in 2017 has increased in all regions. The share of women-run enterprises in all regions is higher in the Service Sector rather than in the Manufacturing Sector, with service providers concentrated in Tirana (37.9%), while manufacturers in Elbasan (21.7%).
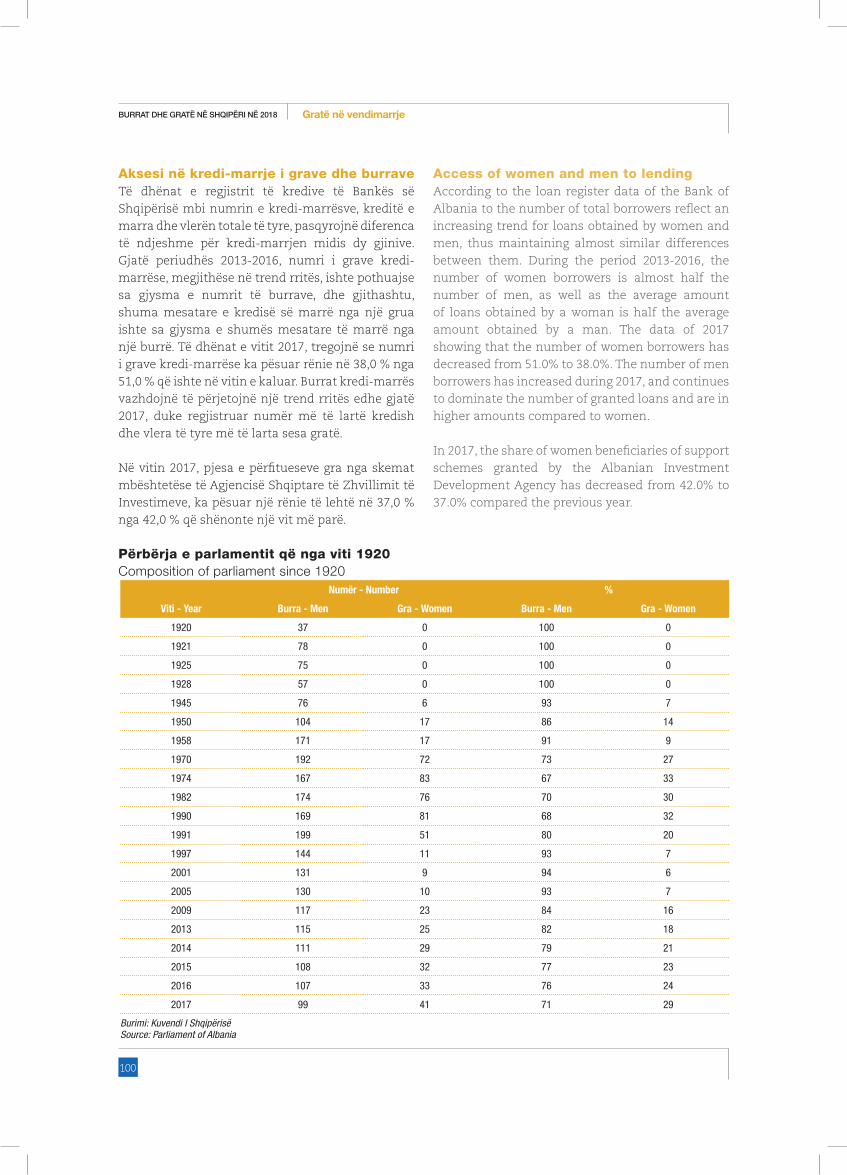
100
BURRAT DHE GRATË NË SHQIPËRI NË 2018 Gratë në vendimarrje
Aksesi në kredi-marrje i grave dhe burraveTë dhënat e regjistrit të kredive të Bankës së Shqipërisë mbi numrin e kredi-marrësve, kreditë e marra dhe vlerën totale të tyre, pasqyrojnë diferenca të ndjeshme për kredi-marrjen midis dy gjinive. Gjatë periudhës 2013-2016, numri i grave kredi-marrëse, megjithëse në trend rritës, ishte pothuajse sa gjysma e numrit të burrave, dhe gjithashtu, shuma mesatare e kredisë së marrë nga një grua ishte sa gjysma e shumës mesatare të marrë nga një burrë. Të dhënat e vitit 2017, tregojnë se numri i grave kredi-marrëse ka pësuar rënie në 38,0 % nga 51,0 % që ishte në vitin e kaluar. Burrat kredi-marrës vazhdojnë të përjetojnë një trend rritës edhe gjatë 2017, duke regjistruar numër më të lartë kredish dhe vlera të tyre më të larta sesa gratë.
Në vitin 2017, pjesa e përfitueseve gra nga skemat mbështetëse të Agjencisë Shqiptare të Zhvillimit të Investimeve, ka pësuar një rënie të lehtë në 37,0 % nga 42,0 % që shënonte një vit më parë.
Përbërja e parlamentit që nga viti 1920Composition of parliament since 1920 Numër - Number %
Viti - Year Burra - Men Gra - Women Burra - Men Gra - Women
1920 37 0 100 0
1921 78 0 100 0
1925 75 0 100 0
1928 57 0 100 0
1945 76 6 93 7
1950 104 17 86 14
1958 171 17 91 9
1970 192 72 73 27
1974 167 83 67 33
1982 174 76 70 30
1990 169 81 68 32
1991 199 51 80 20
1997 144 11 93 7
2001 131 9 94 6
2005 130 10 93 7
2009 117 23 84 16
2013 115 25 82 18
2014 111 29 79 21
2015 108 32 77 23
2016 107 33 76 24
2017 99 41 71 29
Burimi: Kuvendi I ShqipërisëSource: Parliament of Albania
Access of women and men to lendingAccording to the loan register data of the Bank of Albania to the number of total borrowers reflect an increasing trend for loans obtained by women and men, thus maintaining almost similar differences between them. During the period 2013-2016, the number of women borrowers is almost half the number of men, as well as the average amount of loans obtained by a woman is half the average amount obtained by a man. The data of 2017 showing that the number of women borrowers has decreased from 51.0% to 38.0%. The number of men borrowers has increased during 2017, and continues to dominate the number of granted loans and are in higher amounts compared to women.
In 2017, the share of women beneficiaries of support schemes granted by the Albanian Investment Development Agency has decreased from 42.0% to 37.0% compared the previous year.

101
WOMEN AND MEN IN ALBANIA IN 2018Women in Decision-making
Shpërndarja e grave në parlament ndër vite në (%)Distribution of women in parliament by year in (%)
Deputetët sipas partive politike dhe gjinisë, 2017Members of parliament by political parties and sex, 2017
Numër-Number %
Subjekti politik Burra - Men Gra - Women Burra - Men Gra - Women Subject
Partia Socialiste (PS) 52 22 70 30 Socialist Party
Partia Demokratike (PD) 32 11 74 26 Democratic Party
Lëvizja Socialiste për Integrim (LSI) 13 6 68 32 Socialist movement for Integra-tion
Partia Social Demokrate 1 0 100 0 Republican Party
Partia Drejtësi,Integrim dhe Unitet 1 2 33 67 Justice, Integration and Unity Party
Gjithsej 99 41 71 29 Total
Burimi: Kuvendi I ShqipërisëSource: Parliament of Albania
Përbërja e parlamentit sipas pozicionit, 2017Composition of parliament by position 2017
Numër-Number %
Posti Burra - Men Gra - Women Burra - Men Gra - Women Position
Kryetar Parlamenti 1 0 100 0 Head of Parliament
Nënkryetar Parlamenti 1 1 50 50 Spokesperson of Parliament
Deputete 99 41 71 29 Member of Parliament (MP)
Kryetarë të Komisioneve Parlamentare
5 3 63 38 Chairs of Parliamentarian Comm.
Kryetarë të Grupeve Parlamen-tare 4 0 100 0 Chairs of Parlamentarian Groups
Burimi: Kuvendi I ShqipërisëSource: Parliament of Albania
Shpërndarja e grave në parlament ndër vite në (%)Distribution of women in parliament by year in (%)
Burimi: Kuvendi i ShqipërisëSource: Parliament of Albania
6 7
1618
29
0
5
10
15
20
25
30
35
2001 2005 2009 2013 2017
Vendosja e kuotës 30% për gjininë më pak të përfaqësuar.Se�ng the 30% quota for the less represented gender.

102
BURRAT DHE GRATË NË SHQIPËRI NË 2018 Gratë në vendimarrje
Përbërja e komisioneve parlamentare sipas gjinisë, 2017Composition of parliamentary commissions by sex, 2017
Numër-Number
Komisionet Burra - Men Gra - Women Commissions
Komisioni i çështjeve ligjore, administratës 15 5 Commission for legal issues, public
publike dhe të drejtave të njeriut administration and human rights
Komisioni për integrim europian 11 5 Commission for european integration
Komisioni për politikën e jashtme 8 8 Commission for foreign affairs
Komisioni për ekonominë dhe financat 12 7 Commission for economy and finance
Komisioni për sigurinë kombëtare 16 2 Commission for national security
Komisioni për veprimtarinë prodhuese, tregtinë dhe mjedisin
16 3Commission for productiv activity, trade and
environment
Komisioni për punën, çështjet sociale dhe shëndetësinë
9 9 Commission for labour, social affairs and health
Komisioni për edukimin dhe mjetet e informimit publik 10 8 Commission for education and public Information
Burimi: Kuvendi I ShqipërisëSource: Parliament of Albania
Përbërja e komisioneve parlamentare sipas gjinisë, 2017 (në %)Composition of parliamentary commissions by sex, 2017 (in %)
75
69
50
63
89
84
50
56
25
31
50
37
11
16
50
44
0% 10% 20% 30% 40% 50% 60% 70% 80% 90% 100%
Komisioni i çështjeve ligjore, administratës publike dhe të drejtavetë njeriut// Commission for legal issues, public administra�on and…
Komisioni për integrim europian/Commission for europeanintegra�on
Komisioni për poli�kën e jashtme/Commission for foreign affairs
Komisioni për ekonominë dhe financat/Commission for economyand finance
Komisioni për sigurinë kombëtare/Commission for na�onal security
Komisioni për veprimtarinë prodhuese, treg�në dhemjedisin/Commission for produc�v ac�vity, trade and environment
Komisioni për punën, çështjet sociale dheshëndetësinë/Commission for labour, social affairs and health
Komisioni për edukimin dhe mjetet e informimit publik/Commissionfor educa�on and public Informa�on
Burra Men Gra Women
Përbërja e komisioneve parlamentare sipas gjinisë, 2017 (në %)Composition of parliamentary commissions by sex, 2017 (in %)
Burimi: Kuvendi I ShqipërisëSource: Parliament of Albania

103
WOMEN AND MEN IN ALBANIA IN 2018Women in Decision-making
Pozicionet sipas nivelit të të menaxhimit në institucionet e administratës publike, 2017Positions by management level in public administration Institutions, 2017
Numër-Number %
PostiBurraMen
GraWomen
BurraMen
GraWomen
Position
Prokuroria e Përgjithshme Prosecutor's Office
Prokuroria e Përgjithshme 11 4 73 27 General Procurator
Prokuroritë pranë Gjykatave të Apelit
25 4 86 14 Prosecutors at the Court of Appeal
Prokuroria pranë Gjykatës së Krimeve të Rënda
2 0 100 0Prosecutors at the Court of Serious
Crimes
Prokuroria pranë Gjykatës së shkallës së parë për Krimet e Rënda
15 5 75 25Prosecutors at the Court of Serious
Crimes
Prokuroritë pranë Gjykatave të Shkallës së parë
174 83 68 32Prosecutors at the Court of First
Instance
Gjykata e Larte Supreme Court
Kryetar i Gjykates se Larte 1 0 100 0 Head of Supreme Court
Anetare te Gjykates se Larte 8 0 100 0 Member of Supreme Court
Gjykatat e Apelit Appel Court
Kryetar i Gjykates se Apelit 5 2 71 29 Head of Court Appeal
Gjyqtaret e Gjykatave te Apelit 51 30 63 37 Judges of Court Appeal
Gjykatat e Rretheve Gjyqesore Districts Courts
Kryetar te Gjykatave te Rrethit 15 8 65 35 Head of District Court
Gjyqtaret e Gjykatave te Rrethit 108 113 49 51 Judges of District Court
GjykatatAdministrative AdministrativeCourt
Kryetar te Gjykatave Administrative 4 2 67 33 Head of Administrative Court
Gjyqtaret e Gjykatave Administrative 15 14 52 48 Judges of Administrative Court
Gjykata e Apelit Administraiv The Court of Appeal Administra-tive
Kryetar i Gjykates se Apelit Administrativ
1 0 100 0Head at the Court of Appeal Asmin-
istrative
Gjyqtaret e Gjykates se Apelit Administrativ
5 8 38 62Judges at the Court of Appeal As-
ministrative
Gjykata Kushtetuese High Council of Justice
Kryetar të Gjykatës Kushtetuese 1 100 0 Head of Supreme Council of Justice
Anëtarë të Gjykatës Kushtetuese 4 2 67 33 Member of Supreme Council of
Justice
Shkolla e Magjistraturës School of Magistrates
Bordi i drejtimit 11 5 69 31 Steering Council
Drejtori 1 0 100 0 Director
Studentë 32 24 57 43 Student
Burimi i informacionit: Prokuroria e Përgjithshme, Ministria e Drejtësisë, Këshilli i Lartë I Drejtësisë, Shkolla e Magjistraturës
Source of information: Prosecutor’s Office, Ministry of Justice, Member of Supreme Council of Justice, School of Magistrates

104
BURRAT DHE GRATË NË SHQIPËRI NË 2018 Gratë në vendimarrje
Pjesëmarrja e gruas në misionet diplomatike, 2017 Percentage of women in diplomatic missions, 2017
Numër-Number %
Posti Burra - Men Gra - Women Burra - Men Gra - Women Position
Ambasador 35 13 73 27 Ambassador
Ministër Fuqiplotë 3 4 43 57 Minister Powerful
Ministër Këshilltar 12 7 63 37 Minister Counsellor
Këshilltar 18 11 62 38 Counsellor
Sekretar i Parë 12 20 38 63 Secretary, First
Sekretar i Dytë 12 9 57 43 Secretary. Second
Sekretar i Tretë 2 4 33 67 Secretary, Third
Burimi: Ministria e Punëve të Jashtme Source: Ministry of Foreign a Affairs
Numri i punonjësve në strukturat e policisë sipas gradave dhe gjinisëNumber of employers in policy by grades and sex
Punonjesit ne polici sipas gradave
2015 2016 2017Number of employers in
Policy by gradesBurraMen
GraWomen
BurraMen
GraWomen
BurraMen
GraWomen
Drejtues Madhor 1 - 1 - 1 - Major Director
Drejtues i Lartë 6 - 6 - 4 1 High Director
Drejtues 112 12 114 11 112 10 Director
Drejtues i Parë 22 - 27 - 33 - First Director
Kryekomisar 264 30 270 26 293 29 Head commissar
Komisar 473 37 457 37 445 36 Commissar
Nënkomisar 1,219 154 1,303 169 1,352 184 Vice commissar
Inspektor 6,701 715 6,404 678 6,401 674 Inspector
Civil 446 515 464 569 476 578 Civilian
Gjithsej 9,244 1,463 9,046 1,490 9,117 1,512 Total
Burimi: Drejtoria e Përgjithshme e Policisë së Shtetit Source: General Directorate of State Police

105
WOMEN AND MEN IN ALBANIA IN 2018Women in Decision-making
Numri i punonjësve në forcat e armatosura sipas gjinisëNumber of employers in armed forces by sex
Numër-Number %
Viti - Year Meshkuj - Men Femra - Women Meshkuj - Men Femra - Women
2013 6,895 1,354 84 16
2014 6,497 1,397 82 18
2015 6,549 1,456 82 18
2016 6,562 1,389 83 17
2017 6,513 1,364 83 17
Burimi: Ministria e Mbrojtjes / Source: Ministry of Defense
Të dhëna gjinore për kandidimin në zgjedhjet për organet e qeverisjes vendore për Këshillin Bashkiak, 2015The Gender data for candidature in elections to local government bodies for the Municipal Council, 2015
Zgjedhjet vendore, 2015Numër - Number %
Local Elections, 2015BurraMen
GraWomen
BurraMen
GraWomen
Kandidatë për Kryetar Bashkie 142 16 90 10 Candidates for Mayor of Municipality
Fitues Kryetar Bashkie 52 9 85 15 Winning Mayor of Municipality
Kryetarë Bashkie dhjetor 2017 52 9 85 15 Mayor of Municipality december 2017
Kandidatë për Këshillat Bashkiak 18,404 17,937 51 49 Candidates for Municipal Councils
Fitues Këshilltarë Winning Advisor
1,040 555 65 35 Winning Advisor
Këshilltarë Bashkie dhjetor 2017 1,006 589 63 36.9 Advisor of Municipality december 2017
Burimi: Komisioni Qendror i ZgjedhjeveSource: The Central Elections Commission
90 %
85 %
85 %
51 %
65 %
63 %
10 %
15 %
15 %
49 %
35 %
37%
- 20 40 60 80 100 120
Kandidatë për Kryetar BashkieCandidates for Mayor of Municipality
Fitues Kryetar Bashkie Winning Mayor of Municipality
Kryetarë Bashkie dhjetor 2017Mayor of Municipality december 2017
Kandidatë për Këshillat BashkiakCandidates for Municipal Councils
Fitues Këshilltarë Winning Advisor
Këshilltarë Bashkie dhjetor 2017Advisor of Municipality december 2017
Burra Men Gra Women
Burimi: Komisioni Qendror i ZgjedhjeveSource: The Central Elections Commission

106
BURRAT DHE GRATË NË SHQIPËRI NË 2018 Gratë në vendimarrje
Pozicionet sipas nivelit të të menaxhimit në institucionet e administratës publike, 2017Positions by management level in public administration Institutions, 2017
Numër-Number %
Pozicionet në administratën Publike Burra Men
Gra Women
Burra Men
Gra Women
Positions in public administration
Sekretar i përgjithshëm 7 3 70,0 30,0 General Secretary
Drejtorët e departamenteve 1 2 33,3 66,7 Heads of departments
Drejtorët e drejtorive të përgjithshme 29 23 55,8 44,2 Directors of General Directorates
Pozicionet ekuivalente 153 154 49,8 50,2 Equivalent positions
Pozicionet totale të nivelit të lartë të menaxhimit
190 182 51,1 48,9 Total high-level management
positions
Drejtorët e drejtorive 278 177 61,1 38,9 department directors
Pozicionet ekuivalente 13 11 54,2 45,8 Equivalent positions
Pozicionet totale të nivelit të mesëm të menaxhimit
291 188 60,8 39,2 Total middle management level
positions
Shef sektori 399 497 44,5 55,5 Head of sector
Pozicionet ekuivalente 69 36 65,7 34,3 Equivalent positions
Totali i pozitave të nivelit të ulët të menaxhimit
468 533 46,8 53,2 Total positions to lower-level
management
Specialist 3,405 3,589 48,7 51,3 Specialist
Pozicionet e përgjithshme të menaxhimit
865 642 57,4 42,6 General management positions
Pozicionet ekuivalente 180 191 48,5 51,5 Equivalent positions
Pozicionet totale të nivelit ekzekutiv 4.450 4.422 50,2 49,8 Total positions of executive level
Totali 5.399 5.325 50,3 49,7 Total
Burimi: Departamenti i Administratës PublikeSource: Department of Public Administration
0 10 20 30 40 50 60 70
Sekretar i përgjithshëm
Drejtorët e departamenteve
Drejtorët e drejtorive të përgjithshme
Pozicionet ekuivalente
Drejtorët e drejtorive
Pozicionet ekuivalente
Shef sektori
Pozicionet ekuivalente
Specialist
Pozicionet e përgjithshme të menaxhimit
Pozicionet ekuivalente
Gra Women Burra Men
Burimi: Departamenti i Administratës PublikeSource: Department of Public Administration

107
WOMEN AND MEN IN ALBANIA IN 2018Women in Decision-making
Ndërmarrjet aktive sipas gjinisë së pronarit/administratorit dhe numrit të të punësuarve, në %Active enterprises by sex of owner/administrator and number of emplyed, in %
Grupuar sipas numrit të të punësuarve
Group by the number
of employed2016 2017
Burra Men Gra Women Burra Men Gra Women
Gjithsej 73,2 26,8 70.3 29.7 Total
1-4 72,6 27,4 69.8 30.2 1-4
5-9 78,2 21,8 74.0 26.0 5-9
10-49 80,8 19,2 75.8 24.2 10-49
50+ 80,8 19,2 75.8 24.2 50+
Burimi: Regjistri i ndërmarrjeve Source: Business register
Nr. punonjësve-Number of employed
Burimi: Regjistri i ndërmarrjeve Source: Business register
69,8
74,0
75,8
75,8
30,2
26,0
24,2
24,2
0,0 10,0 20,0 30,0 40,0 50,0 60,0 70,0 80,0 90,0 100,0
1-4
5-9
10-49
50+
Nr, punonjësve-Number of employed
Burra Men Gra Women
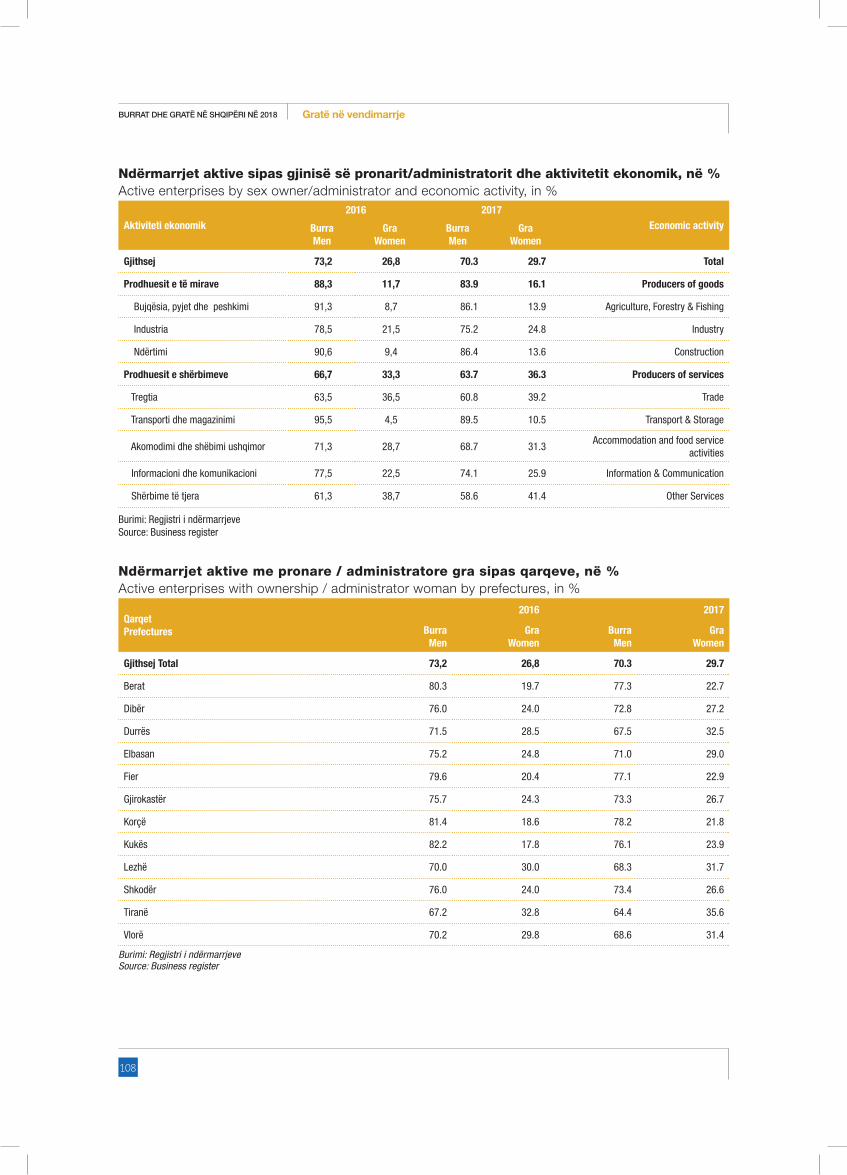
108
BURRAT DHE GRATË NË SHQIPËRI NË 2018 Gratë në vendimarrje
Ndërmarrjet aktive sipas gjinisë së pronarit/administratorit dhe aktivitetit ekonomik, në %Active enterprises by sex owner/administrator and economic activity, in %
Aktiviteti ekonomik2016 2017
Economic activityBurra Men
Gra Women
Burra Men
Gra Women
Gjithsej 73,2 26,8 70.3 29.7 Total
Prodhuesit e të mirave 88,3 11,7 83.9 16.1 Producers of goods
Bujqësia, pyjet dhe peshkimi 91,3 8,7 86.1 13.9 Agriculture, Forestry & Fishing
Industria 78,5 21,5 75.2 24.8 Industry
Ndërtimi 90,6 9,4 86.4 13.6 Construction
Prodhuesit e shërbimeve 66,7 33,3 63.7 36.3 Producers of services
Tregtia 63,5 36,5 60.8 39.2 Trade
Transporti dhe magazinimi 95,5 4,5 89.5 10.5 Transport & Storage
Akomodimi dhe shëbimi ushqimor 71,3 28,7 68.7 31.3 Accommodation and food service
activities
Informacioni dhe komunikacioni 77,5 22,5 74.1 25.9 Information & Communication
Shërbime të tjera 61,3 38,7 58.6 41.4 Other Services
Burimi: Regjistri i ndërmarrjeve Source: Business register
Ndërmarrjet aktive me pronare / administratore gra sipas qarqeve, në %Active enterprises with ownership / administrator woman by prefectures, in %
Qarqet Prefectures
2016 2017
BurraMen
GraWomen
BurraMen
GraWomen
Gjithsej Total 73,2 26,8 70.3 29.7
Berat 80.3 19.7 77.3 22.7
Dibër 76.0 24.0 72.8 27.2
Durrës 71.5 28.5 67.5 32.5
Elbasan 75.2 24.8 71.0 29.0
Fier 79.6 20.4 77.1 22.9
Gjirokastër 75.7 24.3 73.3 26.7
Korçë 81.4 18.6 78.2 21.8
Kukës 82.2 17.8 76.1 23.9
Lezhë 70.0 30.0 68.3 31.7
Shkodër 76.0 24.0 73.4 26.6
Tiranë 67.2 32.8 64.4 35.6
Vlorë 70.2 29.8 68.6 31.4
Burimi: Regjistri i ndërmarrjeve Source: Business register

109
WOMEN AND MEN IN ALBANIA IN 2018Women in Decision-making
Përqindja e ndërmarrjeve aktive sipas vitit dhe gjinisë së pronarit/administratoritPercentage of newly enterprises by year and sex owner/administrator
Burimi: Regjistri i ndërmarrjeve Source: Business register
Ndërmarrjet aktive sipas qarqeve, aktivitetit ekonomik dhe gjinisë së pronarit/administratorit, 2017Active enterprises by prefectures, economic activity and sex of owner/administrator, 2017
Prodhuesit e të miraveProducers of goods
Prodhuesit e shërbimeveProducers of services
Burra Men Gra Women Burra Men Gra Women
Gjithsej -Total % 83.9 16.1 63.7 36.3
Berat 87.2 12.8 64.5 35.5
Dibër 84.4 15.6 67.6 32.4
Durrës 80.5 19.5 64.4 35.6
Elbasan 78.3 21.7 65.7 34.3
Fier 88.2 11.8 63.6 36.4
Gjirokastër 80.0 20.0 67.0 33.0
Korçë 86.8 13.2 67.1 32.9
Kukës 80.9 19.1 72.7 27.3
Lezhë 81.3 18.7 63.3 36.7
Shkodër 84.4 15.6 65.9 34.1
Tiranë 79.6 20.4 62.1 37.9
Vlorë 82.7 17.3 63.0 37.0
Përqindja e ndërmarrjeve aktive sipas vitit dhe gjinisë së pronarit/administratoritPercentage of newly enterprises by year and sex owner/administrator
70,3
73,2
29,7
26,8
0,0 20,0 40,0 60,0 80,0 100,0
2017
2016
Burra Men Gra Women

110
BURRAT DHE GRATË NË SHQIPËRI NË 2018 Gratë në vendimarrje
Përqindja e ndërmarrjeve të reja me pronare/administratore gra sipas qarqevePercentage of new enterprises with women as owners/administrators by prefecture
Burimi: Regjistri i ndërmarrjeveSource: Business register
Ndërmarrjet e reja sipas qarqeve dhe gjinisë, 2017New enterprises by prefectures by sex, 2017
Qarqet - Prefectures
Shpërndarja sipas qarqeve në %Distribution by prefecture in %
Shpërndarja sipas gjinisë për çdo qark në % Distribution by sex for every prefecture in %
Burra - Men Gra - Women Burra - Men Gra - Women
Gjithsej - Total 100.0 100.0 69.6 30.4
Berat 5.5 3.5 78.2 21.8
Dibër 1.6 1.4 71.7 28.3
Durrës 7.6 8.7 66.8 33.2
Elbasan 6.3 6.6 68.6 31.4
Fier 10.0 7.7 74.7 25.3
Gjirokastër 3.2 2.5 74.4 25.6
Korçë 6.9 5.7 73.4 26.6
Kukës 1.6 1.7 68.5 31.5
Lezhë 3.3 3.2 69.9 30.1
Shkodër 6.7 6.1 71.4 28.6
Tiranë 37.7 44.5 65.9 34.1
Vlorë 9.6 8.3 72.6 27.4
Shpërndarja e ndërmarrjeve të reja me pronar/administrator grua sipas gjinisë për çdo qark, në %
Distribution of new enterprises with owner/administrator women by prefecture, in %
12,815,6
19,521,7
11,8
20,0
13,2
19,1 18,715,6
20,417,3
35,532,4
35,634,3
36,4
33,0 32,9
27,3
36,734,1
37,9 37,0
0,0
10,0
20,0
30,0
40,0
Berat Dibër Durrës Elbasan Fier Gjirokastër Korçë Kukës Lezhë Shkodër Tiranë Vlorë
Prodhuesit e të mirave / Producers of goods Prodhuesit e shërbimeve/Producers of services

111
WOMEN AND MEN IN ALBANIA IN 2018Women in Decision-making
Burimi: Regjistri i ndërmarrjeve Source: Business register
Ndërmarrjet aktive sipas qarqeve dhe gjinisë së pronarit/administratorit, 2017Active enterprises by prefectures and sex of owner/administrator, 2017
QarqetPrefectures
Shpërndarja sipas qarqeve në %Distribution by prefecture in %
Shpërndarja sipas gjinisë për çdo qark në % Distribution by sex for every prefecture in %
Burra - Men Gra - Women Burra - Men Gra - Women
Gjithsej - Total 100.0 100.0 70.3 29.7
Berat 5.7 3.8 77.3 22.7
Dibër 1.9 1.6 72.8 27.2
Durrës 8.1 8.8 67.5 32.5
Elbasan 8.5 7.7 71.0 29.0
Fier 13.9 9.7 77.1 22.9
Gjirokastër 3.0 2.6 73.3 26.7
Korçë 9.7 6.1 78.2 21.8
Kukës 1.2 0.7 76.1 23.9
Lezhë 3.3 3.9 68.3 31.7
Shkodër 7.3 6.3 73.4 26.6
Tiranë 30.5 40.7 64.4 35.6
Vlorë 6.9 8.1 68.6 31.4
Burra Men
Gra Women
Berat 78,2 21,8Fier 74,7 25,3Gjirokastër 74,4 25,6Korçë 73,4 26,6Vlorë 72,6 27,4Dibër 71,7 28,3Shkodër 71,4 28,6Lezhë 69,9 30,1Elbasan 68,6 31,4Kukës 68,5 31,5Durrës 66,8 33,2Tiranë 65,9 34,1
78,2
74,7
74,4
73,4
72,6
71,7
71,4
69,9
68,6
68,5
66,8
65,9
21,8
25,3
25,6
26,6
27,4
28,3
28,6
30,1
31,4
31,5
33,2
34,1
0,0 20,0 40,0 60,0 80,0 100,0
Berat
Fier
Gjirokastër
Korçë
Vlorë
Dibër
Shkodër
Lezhë
Elbasan
Kukës
Durrës
Tiranë
BurraMen
GraWomen
Shpërndarja e ndërmarrjeve të reja me pronar/administrator grua sipas gjinisë për çdo qark, në %
Distribution of new enterprises with owner/administrator women by prefecture, in %

112
BURRAT DHE GRATË NË SHQIPËRI NË 2018 Gratë në vendimarrjeShpërndarja sipas gjinisë të ndërmarrjeve aktive për çdo qark in (%) Distribution by sex a active enterprisese for every prefecture in (%)
Burimi: Regjistri i ndërmarrjeve Source: Business register
78,2
77,3
77,1
76,1
73,4
73,3
72,8
71,0
68,6
68,3
67,5
64,4
21,8
22,7
22,9
23,9
26,6
26,7
27,2
29,0
31,4
31,7
32,5
35,6
0,0 20,0 40,0 60,0 80,0 100,0
Korçë
Berat
Fier
Kukës
Shkodër
Gjirokastër
Dibër
Elbasan
Vlorë
Lezhë
Durrës
Tiranë
Burra Men Gra Women
Përfituesit e skemave mbështetëse nga Agjencia Shqiptare e Zhvillimit të Investimeve sipas gjinisëBeneficiaries of supporting schemes by the Albanian Investment Development Agency by sex
Viti - YearNumër - Number %
Burra - Men Gra - Women Burra - Men Gra - Women
2015 39 9 81 19
2016 49 36 58 42
2017 17 10 63 37
Shpërndarja e ndërmarrjeve të reja me pronar/administrator grua sipas gjinisë për çdo qark, në %Distribution of new enterprises with owner/administrator women by prefecture, in %
16.1
20.0
27.1
21.1
16.719.7
16.5
13.3
28.2
20.8
31.328.1
21.8
28.3
33.231.4
25.3 25.6 26.6
31.530.1
28.6
34.127.4
0.0
5.0
10.0
15.0
20.0
25.0
30.0
35.0
40.0
Berat Dibër Durrës Elbasan Fier Gjirokastër Korçë Kukës Lezhë Shkodër Tiranë Vlorë
2016 2017
Burimi: Regjistri i ndërmarrjeve / Source: Business register
Burimi: Regjistri i ndërmarrjeve Source: Business register

113
WOMEN AND MEN IN ALBANIA IN 2018Women in Decision-making
Kreditë e marra në bankat e nivelit të dytë të ndara sipas gjinisë së kredimarrësitLoans obtained in second level banks divided by sex, of borrower
Viti - Year
Gra-Women Burra-Men
Numri i femrave Numer of
women
Numri i kredive Number of
loans
Kreditë e marra* Loans obtained
Numri i meshkujve
Number of men
Numri i kredive Number of
loans
Kreditë e marra Loans obtained
2013 159,252 217,636 93,477,830,577 261,426 351,458 266,313,210,841
2014 185,148 270,426 109,350,172,468 294,663 422,995 304,516,288,530
2015 205,336 320,991 126,145,469,265 321,994 487,805 333,494,463,888
2016 240,632 307,763 97,945,376,315 232,796 513,968 220,731,488,338
2017 242,487 463,583 62,802,321,086 399,783 742,888 143,849,875,490
81%
58%63%
19%
42%37%
0
10
20
30
40
50
60
70
80
90
2015 2016 2017
Burra Men Gra Women
2011 37% 63% 2977132012 37% 63% 3601262013 38% 62% 4206782014 39% 61% 4798112015 39% 61% 5273302016 51% 49% 4734282017 38% 62% 642270
37% 37% 38% 39% 39%51%
38%
63% 63% 62%61%
61%49%
62%
0
100000
200000
300000
400000
500000
600000
700000
0%
20%
40%
60%
80%
100%
2011 2012 2013 2014 2015 2016 2017
Gra-Women Burra-Men Numri I kredimarrësve / Number of loan takers
Burimi: Agjencia Shqiptare e Zhvillimit të InvestimeveSource:Albanian Investment Development Agency (AIDA)
Numri i kredive të marra dhe përqindja e kredimarrësve sipas gjinisëNumber of borrower by sex
Burimi: Banka e Shqipërisë / Source: Bank of Albania*Shuma e aprovuar e kredisë / *The amount approved loanShënim: Të dhënat janë në monedhën (Lekë) / Note: The data are in the currency (Lekë)

114
BURRAT DHE GRATË NË SHQIPËRI NË 2018 Indeksi i Pabarazisë Gjinore
Indeksi i Pabarazisë GjinoreGender Inequality Index

115
WOMEN AND MEN IN ALBANIA IN 2018Gender Inequality Index
Indeksi i Pabarazisë Gjinore (IPGJ), është një
tregues i përbërë, i modeluar në mënyrë të
tillë që të paraqesë nga ana sasiore humbjen
në zhvillimin njerëzor të mundshëm në
një vend, si rezultat i pabarazive gjinore. Ky
indeks jep një bazë empirike për analizat
e politikave gjinore dhe për fushat se ku
duhen të fokusohen përpjekjet për arritjen e
barazisë gjinore. IPGJ paraqet disavantazhet
gjinore në tre dimensione – shëndetin
riprodhues, fuqizimin dhe tregun e punës.
Ky indeks tregon humbjen potenciale në
zhvillimin njerëzor si rezultat i pabarazive
ndërmjet arritjeve të grave dhe burrave në
këto dimensione. IPGJ mund të marrë vlera
nga 0, ku arritjet e grave dhe burrave janë
të barabarta, në 1, ku njëra nga gjinitë ka
rezultatet më të këqija të mundshme në të
gjitha dimensionet. [Human Development
Report, Kombet e Bashkuara, 2015].
Më poshtë listohen të gjithë treguesit e nevojshëm për llogaritjen e Indeksit të Pabarazisë Gjinore sipas dimensionit të cilit i përkasin dhe burimin e të dhënave.
Shëndeti riprodhuesVdekshmëria amtare për 100.000 lindje [9,70 në vitin 2017] (INSTAT, Ministria e Shëndetësisë).Norma e lindshmërisë së adoleshenteve[16,12 për mijë, në vitin 2017 ] (INSTAT).
Prioriteti që i jepet shëndetit të grave gjatë periudhës së shtatzanisë dhe lindjes është një shenjë e qartë e statusit të tyre në shoqëri. Rreziku i vdekjes së grave në lindje mund të reduktohet nëpërmjet edukimit të tyre dhe përmirësimit të kujdesit shëndetësor që u ofrohet. Gjithashtu, lindja në moshë të re përveç se paraqet një rrezik të lartë për shëndetin e nënës dhe të fëmijës, e bën më të vështirë për gratë që të
The Gender Inequality Index (GII) is
an index for measurement of gender
disparity in terms of human development
of a country, as a result of gender
inequalities. In addition, this index serves
as an empirical base for the analyses of
gender policies, and areas where efforts
for reaching gender equality should focus.
GII presents gender disadvantages from
three perspectives: reproductive health,
empowerment and the labor market.
This index marks potential loss in human
development, as a result of inequalities
between achievements of females versus
males in these aspects. GII may have a
value of 0, when achievements of females
and males are equal, to 1 where one of
the genders has the worst possible results
in all dimensions. [Human Development
Report, United Nations, 2015].
Below is a list of the indicators necessary for the calculation of the Gender Inequality Index, according to the dimension they belong to, and the respective source of data.
Reproductive healthMaternal mortality rates for 100.000 births [9.70 in 2017] (INSTAT, Ministry of Health).Adolescent fertility rate [16.12 per thousand, in 2017] (INSTAT)
The priority that is given to women’s health during their pregnancy and birth is a clear indicator of their status in the society. In many countries worldwide, including Albania, the risk of maternal death may be reduced through education, and by improving health care. In addition, giving birth at a tender age, besides presenting high risk for the maternal health and the health of the child makes it more difficult for women to have better education results, which

116
BURRAT DHE GRATË NË SHQIPËRI NË 2018 Indeksi i Pabarazisë Gjinore
arrijnë nivele më të larta arsimimi, të cilat janë të nevojshme për suksesin e tyre në tregun e punës.
FuqizimiPërqindja e vendeve në parlament sipas gjinisë [29,29 % gratë; 70,71 % burrat, në vitin 2017]
(Kuvendi i Shqipërisë).Kryerja e arsimit të mesëm ose më të lartë, sipas gjinisë për moshat mbi 25 vjeç [88,20 % gratë; 92,30 % burrat, në vitin 2017](Anketa e Forcave të Punës, INSTAT).Gratë kanë qënë tradicionalisht të disavantazhuara në fushën politike, në të gjitha nivelet e qeverisjes dhe të përfaqësimit. Përqindja e grave në parlament është një vlerësim për shkallën në të cilën gratë mund të mbajnë poste të larta drejtuese në një shoqëri. Nga ana tjetër, gratë me nivele më të larta arsimimi kanë më shumë mundësi të jenë më të suksesshme në tregun e punës, janë më të afta të kujdesen për shëndetin e tyre dhe atë të familjes, si dhe e kanë më të lehtë të ndërmarrin iniciativa, përfshirë dhe ato politike.
Tregu i punësShkalla e pjesëmarrjes në tregun e punës [50,0 % gratë; 67,0 % burrat, në vitin 2017]
(Anketa e Forcave të Punës, INSTAT).
Shkalla e pjesëmarrjes në tregun e punës paraqet gatishmërinë e personave për të marrë pjesë në tregun e punës si dhe perceptimin që ata kanë rreth mundësive të punësimit. Një aspekt i rëndësishëm për gratë dhe pjesëmarrjen e tyre në tregun e punës është mundësia e kombinimit të punës produktive me jetën riprodhuese. Mungesa e kësaj mundësie mund të detyrojë një pjesë të mirë të grave të tërhiqen tërësisht nga forcat e punës.
Sipas llogaritjeve, për vitin 2017, Indeksi i Pabarazisë Gjinore është rritur në 0,14 nga 0,09 që shënonte një vit më parë. Kjo tregon një humbje në zhvillimin njerëzor si rezultat i pabarazisë gjinore prej 14,0 %. Përkeqësimi i Indeksit të Pabarazisë Gjinore në krahasim me vitin paraardhës, ka ardhur si rezultat i përkeqësimit të treguesit të vdekshmërisë amëtare, megjithëse treguesit e tjerë në përgjithësi janë përmirësuar. Ndër vite, të gjithë treguesit e përdorur
are necessary for their further prospective success in the labor market.
Empowerment Proportion of seats held in Parliament according by sex [29.29 % women; 70.71 % men, in 2017]
(Albanian Parliament).Completion of secondary or higher education for ages above 25 years [88.2 % women; 92.3 % men, in 2017](Labor Force Survey, INSTAT).Traditionally, women have been at a disadvantage in the political arena, at all levels of governance and representation. The proportion of seats held by women in the parliament is a token of appreciation for women that hold senior leading positions in society. On the other hand, women with higher educational attainment have more chances for success in the labor market, are more capable to tend after their health, and that of their family, and find it easier to undertake initiatives, including political ones.
Labor marketLabor market participation rates [50 % women; 67 % men, in 2017]
(Labor Force Survey, INSTAT).
Labor market participation rates demonstrate the willingness of persons to participate in the labor market, as well as their perception about the employment opportunities. An important aspect about women and their participation in the labor market is the possibility for the combination of productive labor with reproductive life. The absence of such opportunity may force a good share of women to withdraw entirely from the labor force.
According to the calculations of INSTAT, during 2017 the value of the Gender Inequality Index is increased from 0.09 to 0.14, compared to last year. This speaks of a loss in human development as a result of a gender inequality of 14 %. This deterioration of the Gender Inequality index compared to previous years comes as a result of the deterioration of all the indicators used in its calculation. It has to be stressed that in general all the indicators used in the

117
WOMEN AND MEN IN ALBANIA IN 2018Gender Inequality Index
në llogaritjen e GII, kanë patur përmirësime të lehta, përveç vdekshmërisë amëtare e cila me luhatjet e saj gjatë viteve, ka luajtur edhe rolin kryesor në luhatjen e këtij treguesi.
calculation of GII have shown slight but constant improvements, except maternal mortality which with its oscillations has played the main role in the changes of this indicator.
Indeksi i Pabarazisë Gjinore Gender Inequality Index
Indeksi i Pabarazisë Gjinore Gender Inequality Index
Shëndeti riprodhuesHealth
FuqizimiEmpowerment
Tregu i punësLabour market
Vdekshmëria amtare për
100.000 lindje Maternal mortality
ratio (deaths per 100,000 live
births)
Norma e lindshmërisë së
adoleshenteve Adolescent birth
rate
Përqindja e vendeve në parlament
Parliamentary representation
Kryerja e arsimit sekondar ose më
të lartë Attainment at secondary and higher education
Shkalla e pjesëmarrjes në tregun e punës Labour market
participation rate
2012
Gra- Women 5,70 20,95 16,43 0,85 0,49
Burra- Men 83,57 0,90 0,66
Indeksi i Pabarazisë Gjinore - Gender Inequality Index
0,16
2013
Gra- Women 11,20 20,44 17,86 0,85 0,44
Burra- Men 82,14 0,89 0,62
Indeksi i Pabarazisë Gjinore - Gender Inequality Index
0,20
2014
Gra- Women 3,00 21,91 20,71 0,85 0,44
Burra- Men 79,29 0,90 0,64
Indeksi i Pabarazisë Gjinore - Gender Inequality Index
0,11
2015
Gra- Women 6,80 20,21 22,86 0,86 0,47
Burra- Men 77,14 0,91 0,64
Indeksi i Pabarazisë Gjinore - Gender Inequality Index
0,14
2016
Gra- Women 3,15 18,98 23,57 0,87 0,50
Burra- Men 76,43 0,91 0,65
Indeksi i Pabarazisë Gjinore - Gender Inequality Index
0,09
2017
Gra- Women 9,70 16,12 29,29 88,20 0,50
Burra- Men 70,71 92,30 0,67
Indeksi i Pabarazisë Gjinore - Gender Inequality Index
0,14
Burimi: INSTAT
Source: INSTAT

118
BURRAT DHE GRATË NË SHQIPËRI NË 2018 Indeksi i Pabarazisë Gjinore
Seti minimal i treguesve gjinorMinimal set of Gender indicators
Treguesit gjinorë Gender indicator
Viti/Year 2015 Viti/Year 2016 Viti/Year 2017Viti/burimi
Year/sourceGra - Women
Burra - Men
Gra - Women
Burra - Men
Gra - Women
Burra - Men
I"Strukturat ekonomike, pjesëmarrja në aktivitete produktive dhe aksesi në burime (14 nga 19) -Economic structures, participation in productive activities and access to resources (14 out of 19)"
1
”Numri mesatar i orëve të shpenzuara në punën e brendshme të papaguar sipas gjinisë -Average number of hours spent on unpaid domestic work by sex”
5:43 hours
2:06 hours
5:43 hours
2:06 hours
5:43 hours
2:06 hours
2010/ TUS
2
“Numri mesatar i orëve të shpenzuara në punën e paguar dhe të papaguar (barra totale e punës), sipas gjinisë -Average number of hours spent on paid and unpaid work combined (total work burden), by sex”
9:45 hours
11:54 hours
9:45 hours
11:54 hours
9:45 hours
11:54 hours
2010/ TUS
3"Norma e pjesëmarrjes në forcën e punës për grupmoshën 15-29, sipas gjinisë -Labour force participation rates for 15-29, by sex"
35,4% 52,8% 38,8% 51,7% 37,2% 52,8% LFS
3"Norma e pjesëmarrjes në forcën e punës për grupmoshën 15-29, sipas gjinisë -Labour force participation rates for 15-29, by sex "
35,4% 52,8% 38,8% 51,7% 37,2% 52,8% LFS
3.1"Norma e pjesëmarrjes në forcën e punës për grupmoshën 15+, sipas gjinisë -Labour force participation rates for 15+, by sex"
47,2% 64,3% 49,90% 65,3% 49,8% 66,8% LFS
4
"Përpjesa e të punësuarëve që janë të vetpunësuar, sipas gjinisë (15+) -Proportion of employed who are own-account workers, by sex (15+)"
17,6% 37,9% 24,4% 38,3% 26,3% 42,0% LFS
5
"Përpjesa e të punësuarëve që janë duke punuar si punëtorë kontribues në familje, sipas gjinisë -Proportion of employed who are working as contributing family workers, by sex"
39,8% 22,3% 31,2% 18,2% 25,9% 14,4% LFS
6"Përpjesa e të punësuarëve që janë punëdhënës, sipas gjinisë -Proportion of employed who are employer, by sex"
0,97% 3,40% 1,3% 3,8% 4,0% 2,0% LFS
7"Përqindja e firmave në pronësi të femrave,në total -Percentage of firms owned by women, in total"
31,3% 26,8% 29,7%Regjistri i Biznesit -
Bisness register
7.1"Përqindja e firmave në pronësi të femrave, deri ne 4 punonjes -Percentage of firms owned by women, with 0 to 4 employees"
32,7% 27,4% 30,2%Regjistri i Biznesit -
Bisness register
7.2"Përqindja e firmave në pronësi të femrave, 05-09 punonjes -Percentage of firms owned by women, with 05 to 09 employees"
22,1% 21,8% 26,0% Regjistri i Biznesit -
Bisness register
7.3"Përqindja e firmave në pronësi të femrave, 10-49 punonjes -Percentage of firms owned by women, with 10 to 49 employees"
19,4% 19,2% 24,2%Regjistri i Biznesit -
Bisness register
7.4"Përqindja e firmave në pronësi të femrave, 50 + punonjes -Percentage of firms owned by women, 50 + employees"
20,4% 19,2% 24,2%Regjistri i Biznesit -
Bisness register
8"Përqindja e shpërndarjes së të punësuarve sipas sektorëve për cdo gjini -Percentage distribution of employed population by sector, each sex"
8.1 "Bujqësi-Agriculture" 47,7% 36,5% 45,4% 36,2% 42,5% 34,9% LFS
8.2 "Prodhim-Manufacturing" 11,9% 7,2% 13,1% 7,8% 14,0% 7,2% LFS
8.3 "Ndërtim-Construction" 0,7% 11,6% 0.6%
8.4"Industi nxjerrëse, energji, gaz dhe furnizim me ujë -Mining and quarring & Electricity, Gas and Water supply"
1,2% 3,3% 1,0% 3,9% 0,6% 3,7% LFS
8.5 "Shërbime të tregut-Market Services" 16,9% 27,4% 19,9% 27,8% 20,0% 28,8% LFS
8.6 "Shërbime jo të tregut - Non market Services" 21,4% 13,7% 20,0% 13,1% 22,4% 13,7% LFS
9
"Punësimi jo formal si një përqindje e totalit të punësimit jo bujqësor, sipas gjinisë -Informal employment as a percentage of total non-agricultural employment, by sex"
n/a n/a n/a n/a n/a n/a n/a

119
WOMEN AND MEN IN ALBANIA IN 2018Gender Inequality Index
Treguesit gjinorë Gender indicator
Viti/Year 2015 Viti/Year 2016 Viti/Year 2017Viti/burimi
Year/sourceGra - Women
Burra - Men
Gra - Women
Burra - Men
Gra - Women
Burra - Men
10"Papunësia e të rinjve sipas gjinisë -Youth unemployment by sex"
32,3% 34,7% 27,8% 29,7% 24,0% 27,0% LFS
11"Pjesa e popullsisë me akses në kredi, sipas gjinisë -Proportion of population with access to credit, by sex"
39% 61% 51% 49% 38% 62%Bank of Albania/ credit
register
12"Pjesa e popullsisë së rritur që zotërojnë tokë, sipas gjinisë -Proportion of adult population owning land, by sex"
n/a n/a n/a n/a n/a n/a
Treguesit gjinor - Gender indicator
13 "Hendeku gjinor në paga - Gender gap in wages" 6,9% 6,3% 10,5%DPT/General Directorate
of taxation, INSTAT
14"Pjesa e të punësuarëve (15+) që punojnë me kohë të pjesshme, sipas gjinisë -Proportion of employed (15+) working part-time, by sex"
26,8% 21,8% 24,5% 21,2% 25,5% 17,0% LFS
15
"Norma e punësimit e personave të moshës 25-49 vjec me një fëmijë nën 3 vjeç që jeton në familje dhe pa fëmijë që jetojnë në familje, sipas gjinisë -Employment rate of persons aged 25-49 with a child under age 3 living in a household and with no children living in the household, by sex"
n/a n/a n/a n/a n/a n/a
16"Pjesa e fëmijëve nën moshën 3 vjec në kujdes formal -Proportion of children under age 3 in formal care"
n/a n/a n/a n/a n/a n/a
17"Pjesa e individëve që përdorin internetin, sipas gjinisë -Proportion of individuals using the Internet, by sex"
19,3% 25,7% 19,3% 25,7% 19,3% 25,7% LSMS
18
"Pjesa e individëve që përdorin telefon/telefona celular, sipas gjinisë -Proportion of individuals using mobile/cellular telephones, by sex"
n/a n/a n/a n/a n/a n/a
19"Pjesa e familjeve që kanë akses në media (radio, TV, internet), sipas gjinisë së kryefamiljarit -Proportion of households with access to mass media (radio, TV, Internet), by sex of household head"
19.1"Pjesa e familjeve me akses në TV, sipas gjinisë së kryfamiljarit -Proportion of households with access to mass media TV, by sex of household head"
91% 93% 91% 93% 91% 93% Census 2011
19.2"Pjesa e familjeve me akses në cel, sipas gjinisë së kryefamiljarit -Proportion of households with access to mass media cel, by sex of household"
80% 88% 80% 88% 80% 88% Census 2011
19.3
"Pjesa e familjeve me akses në internet, sipas gjinisë së kryefamiljarit -Proportion of households with access to mass media internet, by sex of household head"
12% 12% 12% 12% 12% 12% Census 2011
II Arsimi (7 nga 11)/ Education (7 out of 11)
20"Norma e alfabetizmit në grupmoshën 15-24 vjec, sipas gjinisë -Literacy rate of persons aged 15-24 years old, by sex"
96,1% 98,4% 96,1% 98,4% 96,1% 98,4% LSMS 2012
21"Raporti i rregulluar neto i regjistrimit në arsimin fillor, sipas gjinisë -Adjusted net enrolment ratio in primary education by sex"
n/a n/a n/a n/a n/a n/a
22"Raporti i regjistrimit bruto sipas gjinisë -Gross enrolment ratio by sex"
22.1"Raporti i regjistrimit bruto, cikli I ulët I 9 vjeçares -Gross enrolment ratio in primary education by sex"
103,7 103,0 102,4 103,6 102,8 105,0 INSTAT
22.2"Raporti i regjistrimit bruto, cikli I lartë I 9 vjeçares -Gross enrolment ratio in lower secondary education by sex"
102,2 100,7 99,2 101,9 95,4 97,9 INSTAT
22.3"Raporti i regjistrimit bruto në arsimin e mesëm -Gross enrolment ratio in upper secondary education by sex"
91,4 102,3 89,6 96,7 91,1 98 INSTAT
23"Raporti i regjistrimit bruto në arsimin e lartë, sipas gjinisë -Gross enrolment ratio in tertiary education, by sex"
70,4 51 67,8 46,5 67,9 44,6 INSTAT

120
BURRAT DHE GRATË NË SHQIPËRI NË 2018 Indeksi i Pabarazisë Gjinore
Treguesit gjinorë Gender indicator
Viti/Year 2015 Viti/Year 2016 Viti/Year 2017Viti/burimi
Year/sourceGra - Women
Burra - Men
Gra - Women
Burra - Men
Gra - Women
Burra - Men
24 "Indeksi I barazisë gjinore - Gender parity index"
24.1"Indeksi i barazisë gjinore, cikli I ulët I 9 vjeçares -Gender parity index in primary education by sex"
1.01 0.99 0.98 INSTAT
24.2"Indeksi i barazisë gjinore, cikli I lartë I 9 vjeçares -Gender parity index in lower secondary education by sex"
1.01 0.97 0.97 INSTAT
24.3"Indeksi i barazisë gjinore në arsimin e mesëm -Gender parity index in upper secondary education by sex"
0.89 0.93 0.93 INSTAT
24.4"Indeksi i barazisë gjinore në arsimin e lartë, sipas gjinisë -Gender parity index in tertiary education, by sex"
1.38 1.46 1.52 INSTAT
25
"Pjesa e femrave të diplomuara në arsimin e lartë në shkencë, inxhinieri, prodhim dhe ndërtim -Share of female science, engineering, manufacturing and construction graduates at tertiary level"
41,70% 58,30% 41,3% 58,7% 49,4% 50,6% INSTAT
26
"Pjesa e femrave në mesin e mësuesve të arsimit të lartë dhe profesorëve -Proportion of females among tertiary education professors"
36% 64% 39,9% 60,1% 45,2% 54,8% INSTAT
27"Regjistrimi neto në klasën e parë të arsimit fillor, sipas gjinisë -Net intake in first grade of primary education, by sex"
n/a n/a n/a n/a n/a
28"Shkalla e përfundimit të arsimit fillor, sipas gjinisë -Primary education completion rate, by sex"
n/a n/a n/a n/a n/a
29"Diplomimi nga arsimi i mesëm i ulët, sipas gjinisë -Graduation from lower secondary education, by sex"
n/a n/a n/a n/a n/a
30"Norma e tranzicionit për arsimin e mesëm, sipas gjinisë -Transition rate to secondary education, by sex"
n/a n/a n/a n/a n/a
31"Niveli i arsimit për popullsinë e moshës 25 dhe lart, sipas gjinisë -Education attainment of population aged 25 and over, by sex"
31.1 Me arsim fillor dhe 8/9 vjeçar Primary and Lower secondary 57% 47% 58% 48% 57% 47% LFS
31.2 Me arsim të mesëm Upper Secondary 29% 38% 28% 38% 27% 37% LFS
31.3 Me arsim të lartë Tertiary 15% 15% 14% 14% 16% 15% LFS
IIIShëndeti dhe shërbimet e lidhura me të (4 nga 11)/ Health and related services (4 out of 11)
32
"Përhapja e kontraceptivëve në mesin e grave që janë të martuara osë në një marrëdhënie, mosha 15-49 vjec -Contraceptive prevalence among women who are married or in a union, aged 15-49"
n/a n/a n/a n/a n/a n/a
33"Shkalla e vdekshmërisë nën 5, sipas gjinisë -Under-five mortality rate, by sex"
7,88 10,06 10,2 10,3 9,13 9,25 INSTAT
34"Shkalla e vdekjeve të nënave -Maternal mortality ratio"
6,8 3,15 9,7 INSTAT
35"Mbulimi i kujdesit gjatë shtatzanisë -Antenatal care coverage"
n/a n/a n/a n/a n/a n/a
36"Pjesa e lindjeve ku kanë marrë pjesë profesionistë të kualifikuar të shëndetit -Proportion of births attended by skilled health professional"
n/a n/a n/a n/a n/a n/a
37"Përhapja e pirjes së duhanit mes personave të moshës 15 e lart, sipas gjinisë -Smoking prevalence among persons aged 15 and over, by sex"
34,5% 67% 34,5% 67% 34,5% 67% LSMS 2012
38"Përqindja e të rriturve që janë obezë, sipas gjinisë -Proportion of adults who are obese, by sex"
n/a n/a n/a n/a n/a n/a
39"Pjesa e femrave të moshës 15-49 vjec që jetojnë me HIV/AIDS -Women’s share of population aged 15-49 living with HIV/AIDS"
n/a n/a n/a n/a n/a n/a
40"Aksesi në drogërat anti-retroviral, sipas gjinisë -Access to anti-retroviral drug, by sex"
n/a n/a n/a n/a n/a n/a
41"Jetëgjatësia në moshën 60 vjecare, sipas gjinisë -Life expectancy at age 60, by sex"
22,19 vjeç/ years
20,6 vjeç/ years
22,6 vjeç/ years
20,8 vjeç/ years
22,5 vjeç/ years
21,0 vjeç/ years
INSTAT
42"Vdekshëmria e të rriturve, sipas shkakut dhe grupmoshës -Adult mortality by cause and age groups"
n/a n/a n/a n/a n/a n/a

121
WOMEN AND MEN IN ALBANIA IN 2018Gender Inequality Index
Treguesit gjinorë Gender indicator
Viti/Year 2015 Viti/Year 2016 Viti/Year 2017Viti/burimi
Year/sourceGra - Women
Burra - Men
Gra - Women
Burra - Men
Gra - Women
Burra - Men
IVJeta publike dhe vendim-marrja (4 nga 5)/ Public life and decision-making (4 out of 5)
43"Përqindja e femrave në pozita ministrore në qeveri -Women’s share of government ministerial positions"
35% 65% 47% 53% 46% 54%Keshilli Ministrave/
Minister Council
44"Përqindja e ulëseve të mbajtura nga femrat në parlamentin kombëtar -Proportion of seats held by women in national parliament"
23% 77% 24% 76% 29% 71%Parlamenti Shqiperise Parlament of Albania
45"Përqindja e femrave në pozicione menaxheriale -Women’s share of managerial positions"
n/a n/a n/a n/a n/a n/a n/a
46"Përqindja e femrave police -Percentage of female police officers"
9,7% 90,3% 9,7% 90,3% 9,8% 90,2%Drejtoria e Pergjithshme
e Policise - General Directory of Police
47"Përqindja e femrave gjykatëse -Percentage of female judges"
42,4% 57,6% 44,4% 55,6% 45,1% 54,9%Prokuroria e Përgjithshme General Prosecutor office
VTë drejtat e njeriut të grave dhe të vajzave (3 nga 6)/ Human rights of women and girl children (3 out of 6)
48
"Përqindja e femrave të moshës 15-49 vjec të dhunuara fizikisht në 12 muajt e fundit nga partneri -Proportion of women aged 15-49 subjected to physical in the last 12 months by an intimate partner"
14,7% 14,7% 14,7%Anketa e Dhunës në
familje /Domestic Violence survey 2013
49
"Përqindja e femrave të moshës 15-49 vjec të dhunuara seksualisht në 12 muajt e fundit nga partneri -Proportion of women aged 15-49 subjected to sexual violence in the last 12 months by an intimate partner"
5% 5% 5%Anketa e Dhunës në
familje /Domestic Violence survey 2013
50
"Përqindja e femrave të moshës 15-49 vjec të dhunuara fizikisht ose seksualisht në 12 muajt e fundit nga persona që nuk janë partnerët e tyre -Proportion of women aged 15-49 subjected to physical or sexual violence in the last 12 months by persons other than an intimate partner"
n/a n/a n/a n/a n/a n/a n/a
51
"Përhapja e gjymtimit/ prerjes të organeve gjenitale të femrave (vetëm për vendet përkatëse) -Prevalence of female genital mutilation/ cutting (for relevant countries only)"
n/a n/a n/a n/a n/a n/a n/a
52
"Përqindja e femrave të moshës 20-24 vjec që janë martuar ose hynë në një marrëdhënie para moshës 18 vjec -Percentage of women aged 20-24 years old who were married or in a union before age 18"
n/a n/a n/a n/a n/a n/a n/a
53"Shkalla e lindshmërisë të adoleshenteve -Adolescent fertility rate"
20,2% 17,5% 16,1% INSTAT
Burimi: Banka e Shqipërisë / Source: Bank of Albania*Shuma e aprovuar e kredisë / *The amount approved loanShënim: Të dhënat janë në monedhën (Lekë) / Note: The data are in the currency (Lekë)

122
BURRAT DHE GRATË NË SHQIPËRI NË 2018 Përkufizime
PërkufizimeDefinitions

123
WOMEN AND MEN IN ALBANIA IN 2018Definitions
Barazia gjinore përshkruan konceptin sipas
të cilit të gjitha qëniet njerëzore, si gratë
dhe burrat, janë të lirë të zhvillojnë aftësitë
e personalitetit të tyre dhe të bëjnë zgjedhje
pa kufizime të vendosura nga stereotipat,
rolet e ngurta gjinore apo paragjykimet.
Barazi gjinore do të thotë se sjelljet,
aspiratat dhe nevojat e ndryshme të grave
dhe burrave konsiderohen, vlerësohen dhe
favorizohen në mënyrë të barabartë. Ajo
nuk do të thotë se gratë dhe burrat duhet të
bëhen njëlloj, por se të drejtat, përgjegjësitë
dhe mundësitë e tyre nuk do të varen nga
fakti nëse janë lindur femra apo meshkuj.
(UN Women, 2011)
Popullsia:Shtesa natyrore e popullsisë është diferenca e numrit të lindjeve të gjalla me numrin e vdekjeve gjatë një periudhe kohe, zakonisht 1 vit.
Migracioni neto është diferenca e imigracionit (numrit të të ardhurve) dhe emigracionit (numit te të larguarve) gjatë një periudhe kohe, zakonisht 1 vit.
Lindjet: Raporti gjinor në lindje është numri i lindjeve të gjalla djem për 100 vajza të lindura gjallë.
Indeksi Sintetik i Fekonditetit (ISF) është numri mesatar i fëmijëve që do t’i lindin gjallë një gruaje gjatë gjithë jetës së saj në qoftë se ajo do t’i kalonte të gjithë vitet e riprodhimit në përputhje me koeficientët specifikë të lindshmërisë së një viti të dhënë. E thënë ndryshe: ISF e një viti të dhënë tregon numrin total të fëmijëve që do t’i lindin një gruaje në qoftë se ajo do të sillej gjatë gjithë jetës ashtu si gratë gjatë atij viti.
Aborte për 1.000 lindje është numri i aborteve për 1.000 lindje të gjalla në një vit të dhënë.
Gender equality describes the concept
that all human beings, both women and
men, are free to develop their personal
abilities and make choices without any
limitations set by stereotypes, rigid
gender roles, or prejudices. Gender
equality means that the different
behaviors, aspirations and needs of
women and men are equally accounted
for, valued and favored. It does not
mean that women and men have to
become the same, but that their rights,
responsibilities and opportunities shall
not depend on whether they are born
female or male. (UN Women, 2011)
Population:Natural increase is the difference between live births and deaths during a time period, usually 1 year.
Net migration is the difference between immigration and emigration in a certain area during a specified timeframe, usually 1 year.
Births:The sex ratio at birth refers to the number of boys born alive per 100 girls born alive.
Total fertility rate is the average number of children that would be born alive to a woman during her lifetime, if she would spend all her reproductive years in accordance with the age specific coefficients of fertility of a given year. In other words, the total fertility rate of a given year shows the total number of children that would be born to a woman, if she would behave during her whole life as women during that year.
Abortions for 1000 births shows the number of abortions per 1.000 live births in a given year.

124
BURRAT DHE GRATË NË SHQIPËRI NË 2018 Përkufizime
Aborti është ndërprerja e barrës që ka ndodhur para javës së 28-të të barrës dhe kur ky produkt është fetus i vdekur. Ka dy kategori abortesh, spontane dhe të provokuara. Abort i provokuar ka në origjinë një veprim të ndërmarrë me qëllim për të ndërprerë barrën. Të gjitha abortet e tjera konsiderohen spontane.
Raporti i Abortit është numri i aborteve për 1.000 lindje të gjalla në një vit të dhënë.
Vdekjet:Jetëgjatësia është një vlerësim i numrit mesatar të viteve shtesë që një person mund të presë të jetojë, bazuar në koeficientët specifikë të vdekshmërisë së një viti të dhënë.
Vdekshmëria foshnjore është është numri i vdekjeve të fëmijëve nën një vjeç për 1.000 lindje të gjalla në një vit të dhënë.
Martesa dhe DivorcetNumri i divorceve për 100 martesa është numri i divorceve për 100 martesa në një vit të dhënë.
Koeficienti Bruto i Martesave është numri i martesave për 1.000 banorë në një vit të dhënë.
Arsimi:Ndjekja dhe regjistrimi janë matës të pjesëmarrjes në sistemin arsimor. Ndodh që një person të regjistrohet dhe të mos e ndjekë një nivel të caktuar arsimor, si dhe e kundërta. Në këtë kuptim, këto dy koncepte masin dy dukuri të ndryshme, dhe janë të dy të rëndësishëm për të kuptuar situatën. Regjistrimi në shkolla merret nga burime administrative dhe i referohet të gjithë sistemit arsimor në vend.
Normat neto dhe bruto të regjistrimit janë matës të standartizuar të pjesëmarrjes në arsim.
Normat neto të regjistrimit llogariten duke pjestuar numrin e fëmijëve në moshën e arsimit zyrtar (psh 6-10 vjeç për shkollën fillore) të cilët janë duke e ndjekur këtë nivel, me numrin total të fëmijëve në atë grupmoshë. Ky matës nuk mat nëse fëmija është në shkollë, por nëse është në nivelin arsimor të përshtatshëm për moshën e tij.
Abortion is the termination of pregnancy that occurs before the 28th week of the pregnancy and when the fetus is dead. There are two types of abortions, in particular miscarriage and provoked abortion. A provoked abortion implies an undertaken action in order to end the pregnancy. All the other abortions are considered spontaneous.
Abortion Ratio The number of abortions per 1.000 live births in a given year.
Mortality:Life expectancy at birth is an estimate of the average number of additional years a person is expected to live based on the mortality coefficient specific to a given year.
Infant mortality rate is the number of deaths of children under one year old per 1.000 live births in a given year.
Marriages and divorces:Number of divorces for 100 marriages is the number of divorces per 100 marriages in a given year.
Gross Marriage Rate is the number of marriages per 1.000 people in a given year.
EducationAttendance and enrolment these are indicators of participation in the education system. It may happen that a person is enrolled but does not attend a certain education cycle and also the opposite. In that sense, these two concepts measure two different phenomena, and are important to have a clear understanding of the situation. Data on school enrolment are obtained from administrative sources and refer to the whole education system of the country.
Gross and net enrolment ratios are standardized indicators of participation in education.
Net enrolment ratios are calculated by dividing the number of children at the age of official education (e.g. 6-10 year old for primary education), who are attending this education level, with the total number of children of the same age group. This indicator does not measure whether a child is

125
WOMEN AND MEN IN ALBANIA IN 2018Definitions
Normat bruto të regjistrimit llogariten me të njëjtin koncept si normat neto, por përfshin të gjthë popullatën e regjistruar në një nivel të caktuar, pavarësisht moshës, duke e pjestuar me numrin e fëmijëve në moshën për atë nivel arsimor. Normat bruto zakonisht janë më të larta se ato neto, kur në një nivel të caktuar shkolle ka fëmijë nën moshën e përcaktuar ose mbi moshën e përcaktuar.
Indeksi i barazisë gjinore krahason meshkujt dhe femrat bazuar në normën bruto të regjistrimit (p.sh., numri i fëmijëve të çdo moshe që janë regjistruar në arsimin primar mbi numrin total të fëmijëve 6-10 vjeç). Një indeks i barabartë me 1 tregon barazi gjinore, më pak se 1,0 tregon pabarazi në favor të meshkujve dhe më i madh se 1,0 pabarazi në favor të femrave.
Arsimi zyrtar është përcaktuar si arsimi i institucionalizuar, i qëllimshëm dhe i planifikuar, përmes institucioneve publike dhe atyre private, të njohura (liçensuara) nga autoriteti kombëtar arsimor, të cilët në tërësinë e tyre përbëjnë sistemin arsimor zyrtar të një vendi. Programet e arsimit zyrtar janë të njohura si të tilla nga autoritetet përkatëse të arsimit kombëtar, ato ekuivalente ose vartëse të tij. Arsimi zyrtar konsiston në tepër në arsimin që fillon nga klasa e parë dhe vazhdon rregullisht vit pas viti, kryesisht në sistemin pa shkëputje nga puna full- time (përpara se të bëhen pjesë e tregut të punës), në atë profesional, arsimin për nevoja të veçanta dhe disa pjesë të arsimit për të rritur, shpesh janë të njohura si pjesë e sistemit arsimor zyrtar.
Arsimi jo-zyrtar është përcaktuar si arsimi i institucionalizuar, i qëllimshëm dhe i planifikuar nga një ofrues i arsimit. Karakteristika përcaktuese e arsimit jo-zyrtar është se ajo është një shtesë, dhe/ose alternativë plotësuese e arsimit zyrtar në kuadër të proçesit të të mësuarit gjatë gjithë jetës së individëve. Ajo shpesh garanton të drejtën e qasjes në arsim për të gjithë, shërben për njerëz të të gjitha moshave, por nuk strukturohet detyrimisht në mënyrë të vazhduar; mund të jetë e shkurtër në kohëzgjatje dhe/ose me intensitet të ulët, dhe në mënyrë tipike ofrohet në formën e kurseve të shkurtra, ëorkshope apo seminare. Arsimi jo-zyrtar çon kryesisht në kualifikime që nuk janë të njohura
attending school, but if he/she is attending the education level that is appropriate for his/her age.
Gross enrolment ratios are calculated following the same concept as net enrolment ratios, but they include the whole population enrolled in a certain level, regardless of their age, by dividing it with the number of children of that education level age. Gross ratios are usually higher than net ratios, when in a certain education levels there are children under and above the determined age.
Gender equality index compares men and women based on gross enrolment ratio (e.g. number of children of any age enrolled in primary education compared to the total number of 6-10 year old children). An index equal to 1 indicates gender equality; lower than 1.0 indicates inequality in favour of men, while higher than 1.0 indicates inequality in favor of women.
Formal education: is defined as “Education that is institutionalized, intentional and planned through public organizations and recognized private bodies and – in their totality – constitute the formal education system of a country. Formal education programs are thus recognized as such by the relevant national education authorities or equivalent authorities, e.g. any other institution in cooperation with the national or sub-national education authorities. Formal education consists mostly in initial education. Vocational education, special needs education and some parts of adult education are often recognized as being part of the formal education system.”
Non-formal education: is defined as education that is institutionalized, intentional and planned by a service provider. Its distinguishing characteristic is that such education is additional, and/or alternative and complementary to formal education in the frame of the learning process throughout the life of an individual. It usually guarantees the right to access to education for all, serves people of all ages, but it is not necessarily structured in a continuous manner, hence it may be short-term and/or low intensity and it is typically provided through short-term courses, workshops or seminars. Non-formal education mainly provides qualifications that are

126
BURRAT DHE GRATË NË SHQIPËRI NË 2018 Përkufizime
si zyrtare nga autoritetet kombëtare përkatëse të arsimit, ose ato nën varësinë e tyre, ose nuk njihen fare. Ky lloj arsimi mund të mbulojë programet që kontribuojnë për të rritur, për fëmijët jashtë shkolle, si dhe programet për aftësitë jetësore, aftësitë e punës dhe zhvillimin social kulturor.
Arsimi informal është përcaktuar si i qëllimshëm, por më pak i organizuar dhe më pak i strukturuar se arsimi zyrtar ose jo zyrtar. Të mësuarit informal mund të përfshijë aktivitete mësimore që ndodhin në familje, vendin e punës, komunitet dhe jetën e përditshme, në bazë të iniciativës së vetë personit, drejtuar nga familja apo shoqëria.
KrimetAutorë të krimeve janë persona të cilët me veprimin ose mosveprimin e tyre lejojnë që të ndodhë një vepër penale, pra shkaktojnë pasojën e veprës penale. Autorët mbi 14 vjeç kanë përgjegjësi penale ndërkohë fëmijët nën 14 vjeç janë të përjashtuar nga përgjegjësia penale.
I dëmtuar është personi të cilit çfarëdo e drejtë personale ose pasurore i është shkelur ose i është rrezikuar me veprën penale.
Në Vrasjet me dashje përfshihen: Neni 76 vrasje me dashje, Neni 77 vrasje me dashje në lidhje me një krim tjetër, Neni 78 vrasje me paramendim, Neni 78/a vrasje për gjakmarrje, Neni 79 vrasje në rrethana cilësuese, Neni 79/a vrasje e funksionarëve publikë, Neni 79/b vrasja e punonjësve të policisë së shtetit, Neni 79/c vrasje për shkak të marrëdhënieve familjare, Neni 81 vrasje e foshnjës.
Në Krimet seksuale përfshihen: Nenet 100-108/a të Kodit Penal.
Në Krimet me dashje kundër shëndetit përfshihen: Neni 87 tortura me pasoja të rënda, Neni 88 plagosje rëndë me dashje, Neni 89 plagosje e lehtë me dashje, Neni 89/a shitblerje transplantesh dhe Neni 90 dëmtime të tjera me dashje.
Në Vjedhjet e pasurisë përfshihen: Neni 134 Vjedhja, Neni 135 Vjedhja e kryer duke shpërdoruar detyrën, Neni 136 Vjedhja e bankave dhe arkave të kursimit, Neni 137 Vjedhja e energjisë elektrike ose
not officially recognized by the relevant national educational authorities or their subordinated, or at not recognized at all. Such education may cover programs for adults, out-of-school children and vital skills programs, job skill and social cultural development
Informal learning is always intentional, but is less organized and less structured than formal and non-formal education and training (it is not institutionalized). It may include for instance learning events (activities) that occur in the family, in the workplace, and in the daily life of every person, on a self-directed, family-directed or socially-directed basis.
CrimesPerpetrators are persons whose action or inaction allows a criminal offence to be committed, thus bringing about the consequences of the offence. Suspected persons over 14 years old must hold criminal responsibility, while perpetrators under 14 years old are excluded from criminal responsibility.
Damaged person are any person, to whom any personal or property right has been violated or endangered by a criminal act.
Intentional homicide: Article 76 of Criminal Code, Murder, Article 77, Murder connected with another crime, Article 78 Intentional homicide, Article 78/a Murder for blood feud, Article 79 Homicides committed in other specific circumstances, Article 79/a Public officials murder, Article 79/b Police murder, Article 79/c Murder on grounds of family relationship, Article 80 Infanticide.
Sexual crimes: fall under Articles 100-108/a of Criminal Code of Albania.
Intentional crime against health: falls under Article 87, Torture resulting into serious consequences, Article 88 Serious intentional injury, Article 89 Non-serious intentional injury, Article 90 other intentional harm.
Theft of property: falls under Article 134 Theft, Article 135 Theft through abuse of office, Article 136 Bank robbery and savings banks robbery, Article

127
WOMEN AND MEN IN ALBANIA IN 2018Definitions
impulseve telefonike, Neni 137/a Vjedhja e rrjetit të komunikimeve elektronike, Neni 138 Vjedhja e veprave të artit e kulturës, Neni 139 Vjedhja me dhunë, Neni 140 Vjedhja me armë, Neni 141 Vjedhja me pasojë vdekjen.
Në Mashtrime përfshihen: Nenet 143-149/b të Kodit Penal.
Në Fallsifikim monedhash përfshihet: Neni 183 i Kodit Penal.
Në Krimet në fushën e drogës përfshihen: Neni 283 prodhimi dhe shitja e narkotikëve, Neni 283/a trafikimi i narkotikëve, Neni 284 kultivimi i bimëve narkotike, Neni 284/c prodhimi dhe fabrikimi i lëndëve narkotike dhe psikotrope.
Në Shkeljen e rregullave të qarkullimit rrugor përfshihen: Neni 290 Shkelje e rregullave të qarkullimit rrugor, Neni 291 Shkelje e rregullave të qarkullimit rrugor në gjendje të dehur, pa dëshmi
Në Trafikimin e qënieve njerëzore përfshihen: Neni 110/a Trafikimi i personave të rritur, Neni 128/b Trafikimi i të miturve.
I pandehur cilësohet personi të cilit i atribuohet vepra penale me aktin e njoftimit të akuzës, në të cilën tregohen të dhëna të mjaftueshme për marrjen si të pandehur.
I dënuar cilësohet personi, i cili me veprat apo sjelljet e tij, ka cënuar apo ka dëmtuar të mirat juridike që mbrohen me ligj. Ndaj këtyre personave aplikohen sanksione penale të cilat konsistojnë në marrjen apo kufizimin e disa të drejtave të cilat i kanë gëzuar deri në momentin e kryerjes së veprës penale.
Numri i të burgosurve tregon numrin e personave të mbajtur në ambjentet e burgjeve, institucione të tjera, institucionet e burgosjes së të miturve, spitalet psikiatrike ose spitale të tjera. Ky numër përfshin si të dënuarit me burg ashtu dhe të paraburgosurit.
I dënuar me burg është çdo person, shtetas shqiptar, i huaj apo pa shtetësi, i dënuar me burgim me vendim të formës së prerë të gjykatave shqiptare dhe, në përputhje me marrëveshjet ndërkombëtare, edhe të gjykatave të huaja, duke respektuar kërkesat përkatëse proceduriale.
137 Stealing electrical power or telephone impulses, Article 137/a Theft of the electronic communications network, Article 138 Stealing works of art or culture, Article 139 Robbery, Article 140 Robbery with the use of weapons, Article 141 Robbery resulting in death.
Fraud: falls under Articles 143-149/b of Criminal Code of Albania.
Counterfeit: falls under Article183 of Criminal Code of Albania.
Drug crimes: falls under Article 283 Manufacturing and selling narcotics, Article 283/a Traffic of narcotics, Article 283/b Facilitating drugs intake and use, Article 284 Cultivating narcotic plants, Article 284/a Organizing and leading criminal organizations, Article 284/c Producing and manufacturing narcotic and psychotropic substances.
Violation of traffic rules: falls under Article 290 - Breach of traffic regulations, Article 291 - Driving while inebriated or without a license.
Trafficking of human beings: falls under Article 110/a Trafficking in adult persons, Article 128/b Trafficking of minors.
Defendant: a person to whom the criminal offence has been attributed through the act of accusation notice, which contains sufficient evidence for taking the person as the accused.
Convicted person: a person whose behavior has affected or damaged legal goods protected by law. For such persons criminal sanctions apply consisting of removing or restricting certain rights that they enjoyed until the commission of the offence.
Number of prisoners: is the number of persons held in prisons, in other institutions, in juvenile detention institutions, in psychiatric hospitals or other hospitals, which includes both inmates and pre-detainees.
Inmate: is any person, Albanian or foreigner, punished by final sentence of imprisonment and pursuant to international agreements, punished by a foreign decision, in compliance with the respective procedural requirements.

128
BURRAT DHE GRATË NË SHQIPËRI NË 2018 Përkufizime
I paraburgosur cilësohet personi, shtetas shqiptar, i huaj apo pa shtetësi, ndaj të cilit është marrë masë sigurimi “arrest në burg”.
Punësimi:Shkalla e pjesëmarrjes në forcat e punës është raporti i forcës së punës kundrejt popullsisë në moshë pune.
Forca e punës përfshin personat e punësuar dhe të papunë.
Shkalla e punësimit është raporti i të punësuarve 15-64 vjeç kundrejt popullsisë të kësaj grupmoshe.
Shkalla e papunësisë është raporti i të papunëve kundrejt forcës së punës.
Indeksi i Pabarazisë Gjinore:Indeksi i Pabarazisë Gjinore: IPB tregon humbjen potenciale në zhvillimin njerëzor, si rezultat i pabarazive ndërmjet arritjeve të burrave dhe grave. Ky indeks bazohet në tre dimensione, atë të shëndetit riprodhues, fuqizimit dhe tregun e punës.
Detainee: is a person, citizen, foreign or stateless, against whom the security measure “detention or arrest in prison” has been taken.
Employment:The labour force participation rate is calculated as the ratio of the population in the labour force to the working age population.
The labour force includes all persons that are employed and unemployed.
Employment rate is calculated as the ratio of employees from 15-64 years of age to the population of this age group.
Unemployment rate is calculated as the ratio of unemployed persons to the labour force.
Gender Inequality Index:Gender Inequality Index: GII shows the potential loss in human development due to inequalities between women and men. This index is based on three dimensions: reproductive health, empowerment and labour market.


Blv. “Zhan d’Ark”, Nr.3, Tiranë / Albania
Tel: + 355 4 2222411 / 2233356
Fax: + 355 4 228300
E-mail: [email protected]
Web: www.instat.gov.al