With extensive reference to the comparative literature and the theories of comparative politics,...
12
Page 1 of 12 POL40540 Comparative European Politics Dr. Niamh Hardiman and Dr. Erin Baumann 13203862 16/5/14
Transcript of With extensive reference to the comparative literature and the theories of comparative politics,...
Page 1 of 12
POL40540
Comparative European Politics
Dr. Niamh Hardiman and Dr. Erin Baumann
13203862
16/5/14
Page 2 of 12
With extensive reference to the comparative literature and the theories of comparative politics, examine the implications of the country’s party system and electoral system for the pattern of electoral turnout, and the logic of the subsequent government/ coalition formation.
I have chosen Sweden as the European country I will examine in this essay. I believe
Sweden's most recent election, the general election of 2010, highlighted some interesting
trends that one may not expect of a Scandinavian country but, rather, had a more
continental European twist to the elections. Considering that Sweden is also due to have
another general election this year, I believe that now would be the ideal time to cast an eye
back on the previous election with another election looming around the corner, as a timely
reminder of the events of the previous election. The parliamentary election of 2010 was an
enormously interesting affair, as it highlighted the fact that even the tolerant Scandinavian
countries could not escape the growing presence of far-right parties throughout Europe. The
parliamentary election resulted in the entry into parliament of the Sweden Democrats, an
historical high point for the Moderate Party and an equally low point for the Social
Democrats. The four-party centre-right Alliance coalition stayed in office, but lost its
outright majority. The results of the election can be seen on Table 1, which can be seen
below. The main focus of this essay will revolve around the threshold that Sweden
implements and that parties have to surpass in order to gain seats. This feature of their
electoral system has produced some rather suspect results in the previous election and I will
show that if just this one element of the Swedish electoral system was changed then the
results of the election and the subsequent government formation could have been
drastically different. Ironically, I will show that if this element had been changed then the
position that the Swedish far-right party found itself in, would not have been so worrisome
to the other parties contesting the election and the Swedish electorate in general.
The party system that is present in Sweden is another reason why I chose Sweden as the
focus of this essay. It is clear that Sweden operates a multiparty system but outside of that
general classification it has some rather interesting difficulties. It is characterised by two
main parties, however the relevance and strength of other parties within this system,
considering the qualifications that parties must meet in order to gain seats, is rather
Page 3 of 12
noteworthy. It must be highlighted that the two main parties are by no means completely
dominant as they now rely, to a great extent, on the smaller parties to gain the seats
necessary to form a government. What is also of interest, in this regard, is that it is not
unusual for a Swedish government to have a minority in the parliament. With so many
parties in contention for the votes of the electorate, it is interesting to look at the
interaction between these parties and the effects that such interaction can have on the
formation of government.
Unproportional Representation
The Swedish parliament is comprised of 349 seats that are divided into 310 "permanent"
seats, and the remaining 39 seats are allocated as "compensatory" seats. The permanent
seats are assigned to parties that have participated in one of the 29 constituencies and only
once they have surpassed a threshold of 4% of the total nationwide vote or accumulated
12% of the vote in a constituency, according to the modified Sainte-Lague method. This
method considers some comparative numbers calculated, in the first step, by dividing the
number of votes of every party by 1.4. The party with the largest quotient is allotted the
first seat. Then, the comparative number of this party is replaced with its number of votes
divided by 3, and the party with the largest comparative number is allotted the second seat.
In this way, every time a party is allotted a new seat, its comparative number is replaced by
the number of votes divided by the next odd number. The method finishes when the last
seat is allotted (Ramírez-González et al, 2014: 287).
Compensatory seats, on the other hand, are used to obtain a more proportional allotment
among the parties at the expense of disproportionate representation of the constituencies .
Assigning compensatory seats results in two additional problems. The first of which is the
problem of the number of seats to assign as "compensatory"? If too many are awarded then
it could result in a bigger government but smaller local representation and if not enough are
awarded then the result would be insufficient proportionality. The second problem arises
from the fact that the allocation of compensatory seats may result in some constituencies
being over-represented and others being under represented. However, if it is discovered
that a party has been overrepresented, then it is still entitled to receive those seats, i.e.
once seats have been allotted then they cannot be reduced during the correction. This
Page 4 of 12
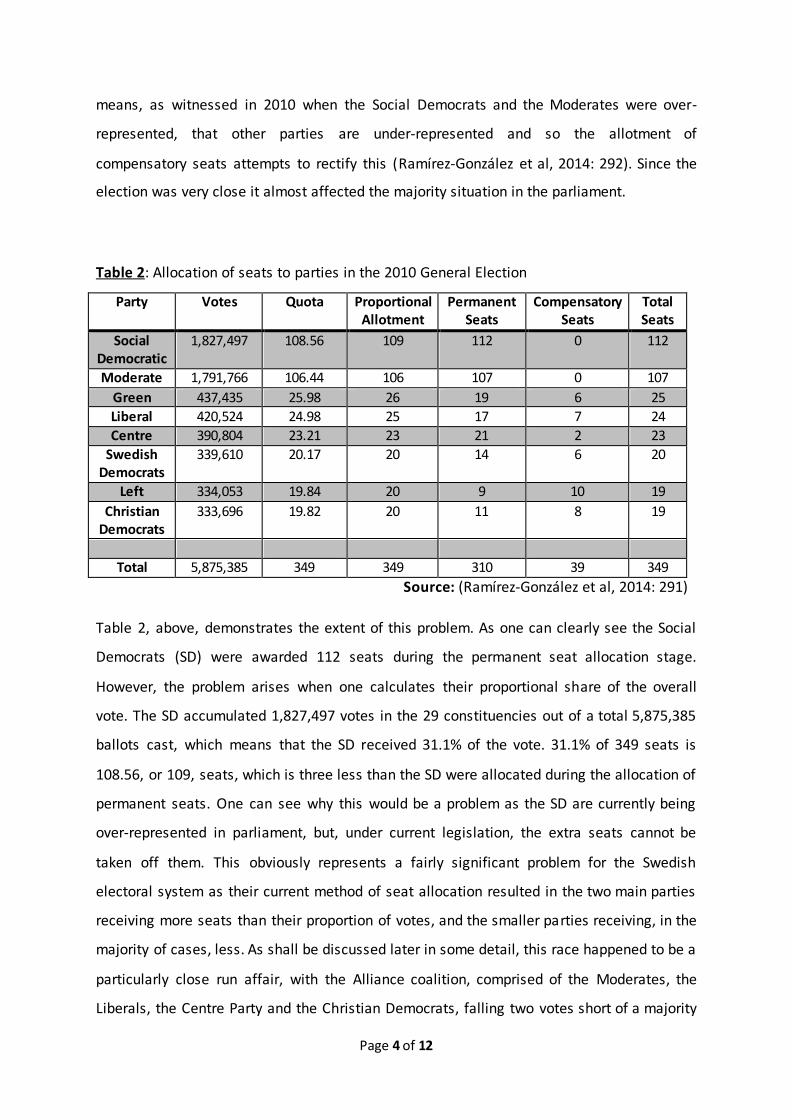
means, as witnessed in 2010 when the Social Democrats and the Moderates were over-
represented, that other parties are under-represented and so the allotment of
compensatory seats attempts to rectify this (Ramírez-González et al, 2014: 292). Since the
election was very close it almost affected the majority situation in the parliament.
Table 2: Allocation of seats to parties in the 2010 General Election
Party Votes Quota Proportional Allotment
Permanent Seats
Compensatory Seats
Total Seats
Social Democratic
1,827,497 108.56 109 112 0 112
Moderate 1,791,766 106.44 106 107 0 107
Green 437,435 25.98 26 19 6 25
Liberal 420,524 24.98 25 17 7 24
Centre 390,804 23.21 23 21 2 23
Swedish Democrats
339,610 20.17 20 14 6 20
Left 334,053 19.84 20 9 10 19
Christian Democrats
333,696 19.82 20 11 8 19
Total 5,875,385 349 349 310 39 349
Source: (Ramírez-González et al, 2014: 291)
Table 2, above, demonstrates the extent of this problem. As one can clearly see the Social
Democrats (SD) were awarded 112 seats during the permanent seat allocation stage.
However, the problem arises when one calculates their proportional share of the overall
vote. The SD accumulated 1,827,497 votes in the 29 constituencies out of a total 5,875,385
ballots cast, which means that the SD received 31.1% of the vote. 31.1% of 349 seats is
108.56, or 109, seats, which is three less than the SD were allocated during the allocation of
permanent seats. One can see why this would be a problem as the SD are currently being
over-represented in parliament, but, under current legislation, the extra seats cannot be
taken off them. This obviously represents a fairly significant problem for the Swedish
electoral system as their current method of seat allocation resulted in the two main parties
receiving more seats than their proportion of votes, and the smaller parties receiving, in the
majority of cases, less. As shall be discussed later in some detail, this race happened to be a
particularly close run affair, with the Alliance coalition, comprised of the Moderates, the
Liberals, the Centre Party and the Christian Democrats, falling two votes short of a majority
Page 5 of 12
government. While, admittedly, the Alliance would still of been one vote short of gaining
the majority threshold of 175 votes if the proportional allotment had been the final
dispersion of seats, it still raises an interesting question about the fairness of the Swedish
system of proportional representation as in the final allocation of seats, the Red-Green
coalition, comprised of the SD, the Green Party and the Left Party, had one extra seat more
than they were proportionally entitled to, which, quite possibly, may of made a big
difference in subsequent interaction of the government and opposition.
Fortunately the Swedish model of proportional representation rescues itself through its high
levels of voter participation. As Lijphart (1999: 284, cited in Doorenspleet, 2005: 38) points
out that while high turnout means more equal participation and hence greater political
equality, low turnout spells unequal participation and hence more inequality. In this regard,
Sweden does rather well as it boasts a turnout rate of 84.2% for the 2010 general election.
This is considered a very healthy standard of electoral participation and there can be no
doubt that the Swedish system of proportional representation has a helping hand in
facilitating such turnout, as Doorenspleet (2005; 42) proves that the system of proportional
representation has significantly more favourable voter participation rates than other
systems such as mixed member proportional systems.
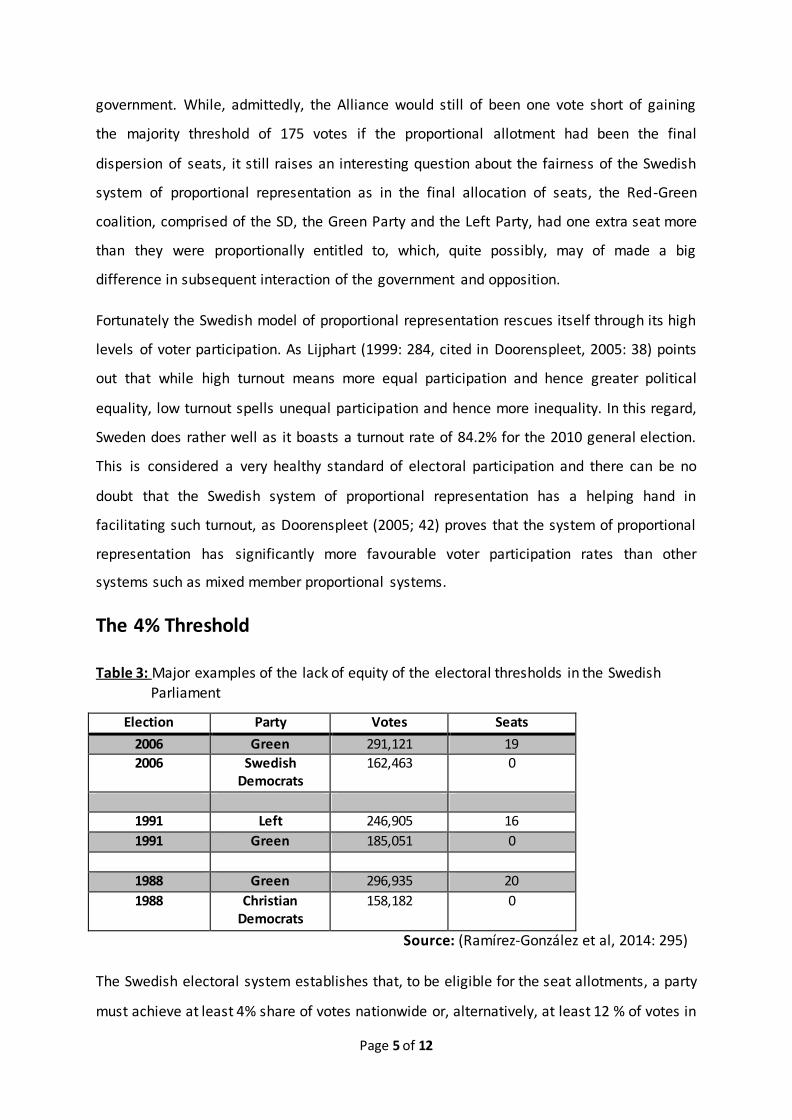
The 4% Threshold
Table 3: Major examples of the lack of equity of the electoral thresholds in the Swedish
Parliament
Election Party Votes Seats
2006 Green 291,121 19
2006 Swedish Democrats
162,463 0
1991 Left 246,905 16
1991 Green 185,051 0
1988 Green 296,935 20
1988 Christian Democrats
158,182 0
Source: (Ramírez-González et al, 2014: 295)
The Swedish electoral system establishes that, to be eligible for the seat allotments, a party
must achieve at least 4% share of votes nationwide or, alternatively, at least 12 % of votes in
Page 6 of 12
a certain constituency. The 4% threshold is significant in the Swedish electoral system and,
for a given party, the difference between exceeding the threshold or remaining slightly
below is equivalent to receiving at least 14 seats or none at all. As can be seen in Table 3,
above, this has had a dramatic impact on the performance of medium and small parties in
general elections. Considering one of the main controversies of the most recent election,
the success of the far-right party the Sweden Democrats, this threshold can be held
accountable for having the most profound effect on election of 2010 and subsequent
government and coalition formation.
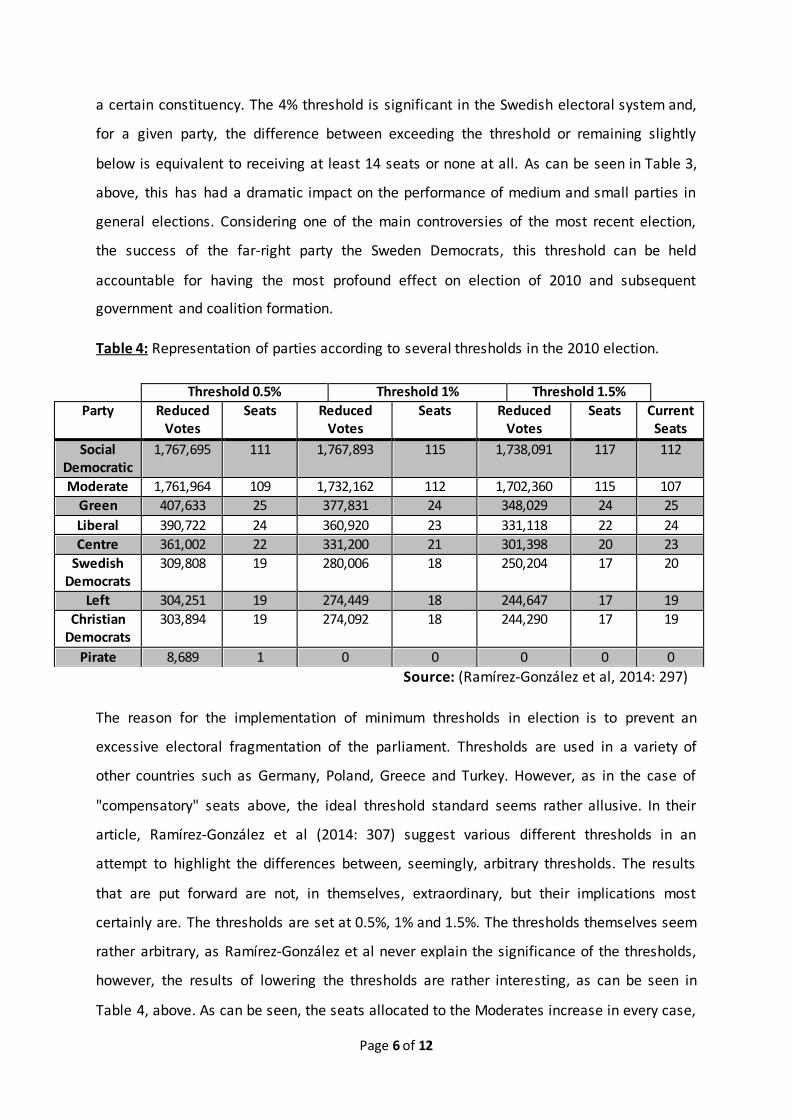
Table 4: Representation of parties according to several thresholds in the 2010 election.
Source: (Ramírez-González et al, 2014: 297)
The reason for the implementation of minimum thresholds in election is to prevent an
excessive electoral fragmentation of the parliament. Thresholds are used in a variety of
other countries such as Germany, Poland, Greece and Turkey. However, as in the case of
"compensatory" seats above, the ideal threshold standard seems rather allusive. In their
article, Ramírez-González et al (2014: 307) suggest various different thresholds in an
attempt to highlight the differences between, seemingly, arbitrary thresholds. The results
that are put forward are not, in themselves, extraordinary, but their implications most
certainly are. The thresholds are set at 0.5%, 1% and 1.5%. The thresholds themselves seem
rather arbitrary, as Ramírez-González et al never explain the significance of the thresholds,
however, the results of lowering the thresholds are rather interesting, as can be seen in
Table 4, above. As can be seen, the seats allocated to the Moderates increase in every case,
Threshold 0.5% Threshold 1% Threshold 1.5%
Party Reduced Votes
Seats Reduced Votes
Seats Reduced Votes
Seats Current Seats
Social Democratic
1,767,695 111 1,767,893 115 1,738,091 117 112
Moderate 1,761,964 109 1,732,162 112 1,702,360 115 107
Green 407,633 25 377,831 24 348,029 24 25
Liberal 390,722 24 360,920 23 331,118 22 24
Centre 361,002 22 331,200 21 301,398 20 23
Swedish Democrats
309,808 19 280,006 18 250,204 17 20
Left 304,251 19 274,449 18 244,647 17 19
Christian Democrats
303,894 19 274,092 18 244,290 17 19
Pirate 8,689 1 0 0 0 0 0
Page 7 of 12
and significantly when the threshold is lowered to 1.5%. If the 4% threshold was lowered to
1.5%, ceteris paribus, then the Alliance could of increased their s hare of the overall
allocation of seats to 174, which would of just been one seat off the requirement for a
majority government. In all cases, however, the results of the election will remain, more or
less, the same. The Alliance will still not make a majority but will still enter government. This
is true for every case except for when the threshold is lowered to 0.5%. In this case a new
party enters parliament, the Pirate Party. The Pirate Party, is a single-issue party and
generally stays neutral on the tradition left-right divide. Because of this quality, the Pirate
Party could have, realistically, entered government as part of the Alliance. This extra seat
would have enabled the Alliance party to cross the elusive 175 majority threshold. One must
wonder what other small change could of been made to give the Alliance a majority.
There is, however, another very important reason why the 4% threshold produces a very
real problem in Sweden and that is due to the far-right Sweden Democrats party. If the
threshold was lowered to the 0.5% mark, then all of the parties in parliament would remain
the same with the only difference being the fact that the Pirate Party would be a member of
government also. This would mean that the governing Alliance coalition or the opposing
Red-Green coalition would not have to deal with the Sweden Democrat Party. As it stands,
with the minority coalition, the only way for the Red-Green coalition to get the votes to
defeat the government in any legislation that it wants to pass is to strike a deal with the
Sweden Democrat Party, which would be unacceptable. Before the election, both coalitions
agreed not to deal with the far-right party, and went so far as to publically announce that
neither coalition would actively deal with the Sweden Democrats in parliament (Freden,
2014: 6).
Threshold Insurance Voting
In this section I will focus on the phenomenon of threshold insurance voting in proportional
representational systems. Threshold insurance voting occurs in systems where there is an
electoral threshold to the parliament, such as the 4% threshold that is outlined above. Here
outcome oriented voters may cast a vote for a small party that is included in an expected
coalition in order to make the coalition as a whole succeed. When a voter may be worried
that a party that has agreed, before the election, to form a coalition with other parties, will
Page 8 of 12
not gain enough votes to bring them over the threshold, then that voter may vote for the
party in order to protect the viability of the coalition, despite the fact that that party may
not be the voters first preference (Cox, 1997, cited in Freden, 2014: 3). Some hold the view
that these sorts of calculations are simply too complex for voters in a proportional
representational system to make and that voters generally just stick with their first
preference and do not pay attention to possible government outcomes (Downs, 1957: 152,
cited in Freden, 2014: 3). However, Freden (2014: 6) outlines that in the days and weeks
leading up to the election in Sweden, opinion polls were frequently presented in the media
which showed the half of the coalition partners, the Christian Democrats and the Centre
Party, were in danger of not reaching the threshold of 4%, which would of put the Alliance
coalition in serious jeopardy. These polls also highlighted the fact that the far-right party,
the Sweden Democrats, were poised to enter parliament for the first time. This pushed the
Prime Minister, Fredrik Reinfeldt of the Moderate Party, to publically call for voters to
strategically vote for a majority Centre-Right government and to keep the Sweden
Democrats out of power.
The very public attempt of the Prime Minister to encourage voters to vote strategically goes
a long way to highlight the fact that strategic voting is not beyond the capabilities of a
proportional representation electorate. A study of first preference vote choice for the
general election of 2010 in Sweden, shows that a sizeable section of the Moderate Party
supports voted strategically for the Christian Democrats. The Moderate Party electorate
seemed the most likely to vote strategically as all of the coalition partners ranked highly on
their vote choice (Freden, 2014: 11). The analyses show that threshold insurance incentives
had a considerable impact in support for the Christian Democrats. It is clear that if threshold
insurance voting had not played a big part in garnishing support for the struggling Christian
Democrats Party, then the make-up of the subsequent government would of been radically
different. It is hard to imagine the effects that threshold insurance voting had but as the
Christian Democrats Party only managed 5.7% of the vote, it is clear that the coalition would
of been one member short and, quite possibly, 19 seats down; although one would have to
imagine the coalition would of retained a number of these seats so it would be unlikely to
see a dramatic change (Aylott, 2010: 5).
Page 9 of 12
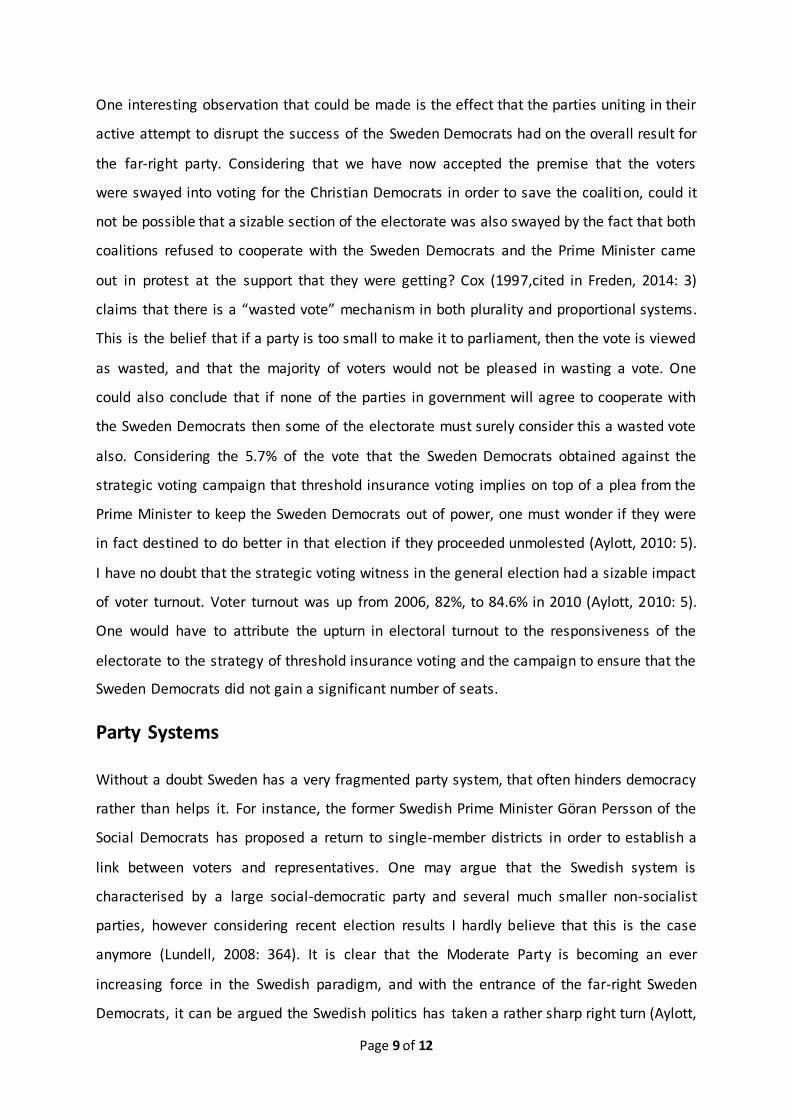
One interesting observation that could be made is the effect that the parties uniting in their
active attempt to disrupt the success of the Sweden Democrats had on the overall result for
the far-right party. Considering that we have now accepted the premise that the voters
were swayed into voting for the Christian Democrats in order to save the coalition, could it
not be possible that a sizable section of the electorate was also swayed by the fact that both
coalitions refused to cooperate with the Sweden Democrats and the Prime Minister came
out in protest at the support that they were getting? Cox (1997,cited in Freden, 2014: 3)
claims that there is a “wasted vote” mechanism in both plurality and proportional systems.
This is the belief that if a party is too small to make it to parliament, then the vote is viewed
as wasted, and that the majority of voters would not be pleased in wasting a vote. One
could also conclude that if none of the parties in government will agree to cooperate with
the Sweden Democrats then some of the electorate must surely consider this a wasted vote
also. Considering the 5.7% of the vote that the Sweden Democrats obtained against the
strategic voting campaign that threshold insurance voting implies on top of a plea from the
Prime Minister to keep the Sweden Democrats out of power, one must wonder if they were
in fact destined to do better in that election if they proceeded unmolested (Aylott, 2010: 5).
I have no doubt that the strategic voting witness in the general election had a sizable impact
of voter turnout. Voter turnout was up from 2006, 82%, to 84.6% in 2010 (Aylott, 2010: 5).
One would have to attribute the upturn in electoral turnout to the responsiveness of the
electorate to the strategy of threshold insurance voting and the campaign to ensure that the
Sweden Democrats did not gain a significant number of seats.
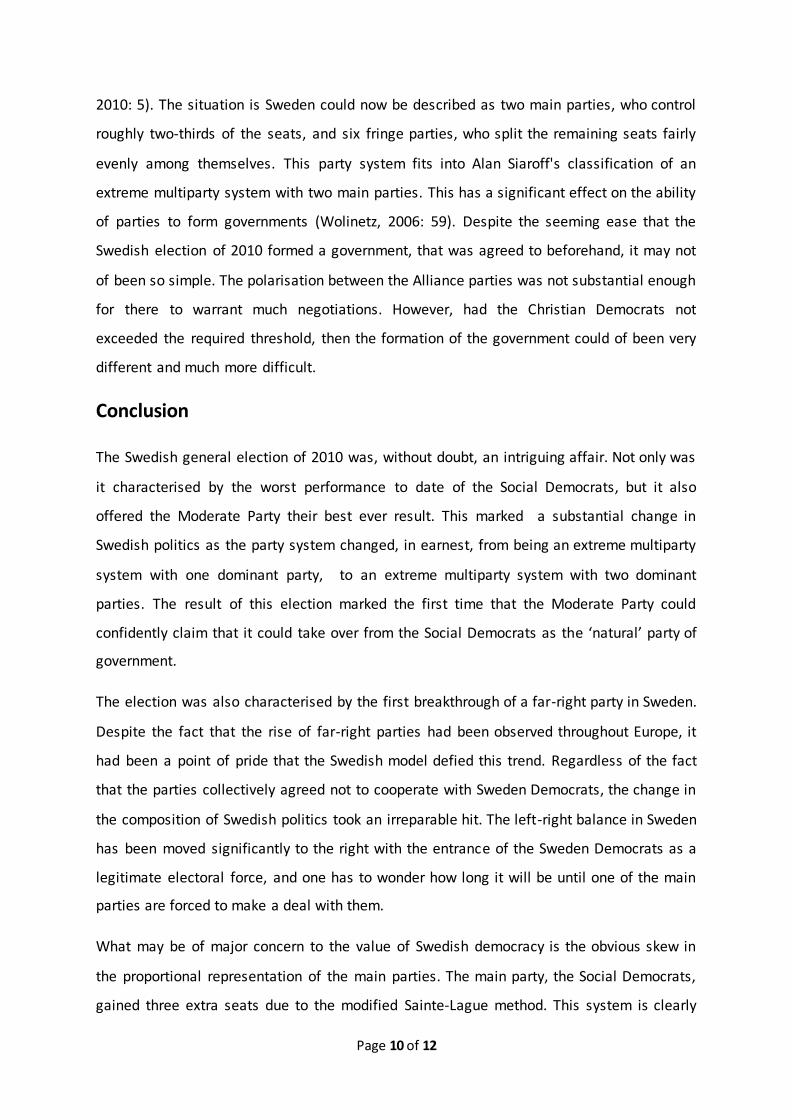
Party Systems
Without a doubt Sweden has a very fragmented party system, that often hinders democracy
rather than helps it. For instance, the former Swedish Prime Minister Göran Persson of the
Social Democrats has proposed a return to single-member districts in order to establish a
link between voters and representatives. One may argue that the Swedish system is
characterised by a large social-democratic party and several much smaller non-socialist
parties, however considering recent election results I hardly believe that this is the case
anymore (Lundell, 2008: 364). It is clear that the Moderate Party is becoming an ever
increasing force in the Swedish paradigm, and with the entrance of the far-right Sweden
Democrats, it can be argued the Swedish politics has taken a rather sharp right turn (Aylott,
Page 10 of 12
2010: 5). The situation is Sweden could now be described as two main parties, who control
roughly two-thirds of the seats, and six fringe parties, who split the remaining seats fairly
evenly among themselves. This party system fits into Alan Siaroff's classification of an
extreme multiparty system with two main parties. This has a significant effect on the ability
of parties to form governments (Wolinetz, 2006: 59). Despite the seeming ease that the
Swedish election of 2010 formed a government, that was agreed to beforehand, it may not
of been so simple. The polarisation between the Alliance parties was not substantial enough
for there to warrant much negotiations. However, had the Christian Democrats not
exceeded the required threshold, then the formation of the government could of been very
different and much more difficult.
Conclusion
The Swedish general election of 2010 was, without doubt, an intriguing affair. Not only was
it characterised by the worst performance to date of the Social Democrats, but it also
offered the Moderate Party their best ever result. This marked a substantial change in
Swedish politics as the party system changed, in earnest, from being an extreme multiparty
system with one dominant party, to an extreme multiparty system with two dominant
parties. The result of this election marked the first time that the Moderate Party could
confidently claim that it could take over from the Social Democrats as the ‘natural’ party of
government.
The election was also characterised by the first breakthrough of a far-right party in Sweden.
Despite the fact that the rise of far-right parties had been observed throughout Europe, it
had been a point of pride that the Swedish model defied this trend. Regardless of the fact
that the parties collectively agreed not to cooperate with Sweden Democrats, the change in
the composition of Swedish politics took an irreparable hit. The left-right balance in Sweden
has been moved significantly to the right with the entrance of the Sweden Democrats as a
legitimate electoral force, and one has to wonder how long it will be until one of the main
parties are forced to make a deal with them.
What may be of major concern to the value of Swedish democracy is the obvious skew in
the proportional representation of the main parties. The main party, the Social Democrats,
gained three extra seats due to the modified Sainte-Lague method. This system is clearly
Page 11 of 12
flawed and the Swedish legislators would be well advised to rectify this imbalance in the
interest of proportional representation. Other problems in the system remain prevalent
also. The 4% threshold for entry into parliament would be an example of this. It is not clear
whether or not this arbitrary figure is indeed at the optimal level to insure that the Swedish
party system is not fragmented further by the entry of an abundance of smaller, single-
issue, parties. As shown above, this threshold can be the difference between parties with
similar shares of the vote gaining seats in the parliament and being excluded altogether.
Page 12 of 12
Bibliography
Aylott, N. (2010) 'Election Briefing no 59: Europe and the Swedish Election of September 19th 2010', Briefing for the European Parties Elections and Referendums Network (EPERN).
Doorenspleet, R. (2005) 'Electoral Systems and Democratic Quality: Do Mixed Systems Combine the Best or the Worst of Both Worlds? An Explorative Quantitative Cross -national
Study', Acta Politica, 40(1), 28–49.
Freden, A. (2014) 'Threshold Insurance Voting in the PR System: A Study of Voters’ Strategic Behaviour in the 2010 Swedish General Election', Journal of Elections, Public Opinion and
Parties, [Online]. Available at: http://dx.doi.org/10.1080/17457289.2013.872118, (Accessed: 12 May 2014).
Lundell, K. (2008) 'Electoral Reform and Party System Change: An Analysis of Nordic Elections with Two Different Electoral Systems', Scandinavian Political Studies, 31(4), 363-
385.
Ramirez-González, V., Delgado-Márquez, B. L., Palomares, A. and López-Carmona, A. (2013) 'Evaluation and Possible Improvements of the Swedish Electoral System', Annals of
Operations Research, 215(1), 285-307.
Widfeldt, A. (2011) 'Sweden', European Journal of Political Research, 50(7/8), 1145-1154.
Wolinetz, S. B. (2006) 'Party System and Party System Types', in Katz, R. S. and Crotty, W. (ed) 'Handbook of Party Politics', London: Sage Publications, 51-61.