William A. Vega · Jacqueline L. Angel Luis Miguel F. Gutiérrez ...
392
William A. Vega · Jacqueline L. Angel Luis Miguel F. Gutiérrez Robledo Kyriakos S. Markides Editors Contextualizing Health and Aging in the Americas Effects of Space, Time and Place
-
Upload
khangminh22 -
Category
Documents
-
view
0 -
download
0
Transcript of William A. Vega · Jacqueline L. Angel Luis Miguel F. Gutiérrez ...

William A. Vega · Jacqueline L. Angel Luis Miguel F. Gutiérrez Robledo Kyriakos S. Markides Editors
Contextualizing Health and Aging in the AmericasEffects of Space, Time and Place

William A. Vega • Jacqueline L. AngelLuis Miguel F. Gutiérrez RobledoKyriakos S. MarkidesEditors
Contextualizing Healthand Aging in the AmericasEffects of Space, Time and Place
123

EditorsWilliam A. VegaUniversity of Southern CaliforniaLos Angeles, CA, USA
and
Florida International UniversityMiami, FL, USA
Jacqueline L. AngelLBJ School of Public AffairsThe University of Texas at AustinAustin, TX, USA
Luis Miguel F. Gutiérrez RobledoInstituto Nacional de GeriatríaMexico City, Mexico
Kyriakos S. MarkidesDepartment of Preventive Medicineand Community Health
The University of Texas Medical BranchGalveston, TX, USA
ISBN 978-3-030-00583-2 ISBN 978-3-030-00584-9 (eBook)https://doi.org/10.1007/978-3-030-00584-9
Library of Congress Control Number: 2018954034
© Springer Nature Switzerland AG 2019This work is subject to copyright. All rights are reserved by the Publisher, whether the whole or partof the material is concerned, specifically the rights of translation, reprinting, reuse of illustrations,recitation, broadcasting, reproduction on microfilms or in any other physical way, and transmissionor information storage and retrieval, electronic adaptation, computer software, or by similar or dissimilarmethodology now known or hereafter developed.The use of general descriptive names, registered names, trademarks, service marks, etc. in thispublication does not imply, even in the absence of a specific statement, that such names are exempt fromthe relevant protective laws and regulations and therefore free for general use.The publisher, the authors and the editors are safe to assume that the advice and information in thisbook are believed to be true and accurate at the date of publication. Neither the publisher nor theauthors or the editors give a warranty, express or implied, with respect to the material contained herein orfor any errors or omissions that may have been made. The publisher remains neutral with regard tojurisdictional claims in published maps and institutional affiliations.
This Springer imprint is published by the registered company Springer Nature Switzerland AGThe registered company address is: Gewerbestrasse 11, 6330 Cham, Switzerland

Preface
This volume is part of a continuing series of research publications on older Latinoadult health and the social experiences of aging in the United States and Mexico.More recently, the scope of the International Conference on Aging in the Americas(ICAA) research program was expanded to include Latinos living in other nationsin Latin America. The series (Conference Series on Aging in the Americas: Mexicoand the U.S.) has progressed with support from the National Institute on Aging(NIA) of the National Institutes of Health (grant award no. 2R13-AGO29767-06).We believe the conferences series and publications—which alternate betweenpeer-reviewed journals and edited collections—have contributed new knowledgeand important scientific training to scholars interested in aging, and more specifi-cally, in Latino health and aging. Vast improvement to both the quality of researchstudies and the information available to scholars has come with time, especiallyevident when directly compared to the scarcity of information that was available onLatino older adult health pre-1980. The ICAA program has progressively built theresearch program in keeping with trends in new scientific knowledge and nationalpriorities of a rapidly aging American nation. The current conference iterations(2016, 2017, and 2018) focus on place and health of older-adult Latinos.
The idea of place as a focus for health research is not new, and is now appliedwidely in U.S. and international research using advanced methods to assess healthindices and disparities. Place is also being used to investigate social determinants,as these affect environmental conditions for human development; these environ-mental conditions include exposures to actual material conditions including toxicexposures, built environment, public safety, quality of basic educational and healthservices, home health care, and very importantly, the social and cultural processesof daily life affecting health. This renewed and elaborated interest in place andsocial determinants does not impose any uniform methodological operationalizationof place. Rather the research question provides the rationale for the method ofinquiry. The way the term is used and applied in research is evolving conceptuallyand methodologically. For instance, place is sometimes used in specific referencesto a bounded geographic area, while at other times it is used as social context, areference point, or for studies centered on effects of social determinants. The current
v

usage in this volume is illustrative: place may be used as a social construct, aspecific geo-spatial unit, or a broad geographic category (e.g., region).
In this fourth volume of the series on Aging in the Americas, the editors decidedto treat place primarily as contextual, with place influencing proximal factors,including social determinants, and affecting Latino aging and health. This approachis similar to trends in community health research that view place as an organizingframework for assessing social determinants and disease patterns, and as aninformation tool for building policies and programs that improve health bystrengthening communities. Recent expert consensus views of the NationalAcademies of Science, the Robert Wood Johnson Foundation, and national publichealth directors have designated place as a critical building block for improvinghealth in American society. Yet, the field continues to evolve. The ultimate goal ofplace-based research and practice is to support the transformation of under-resourced communities in a deliberate way that consciously supports optimal healthacross the life span. Our volume takes this perspective in addressing how placeaffects the health of Latino older adults.
This volume illustrates how place can be used for building theory and generatinghypotheses in a wide variety of applications. There are various examples ofmethodological applications for cross-sectional and longitudinal research in thesechapters that are used for addressing very different research questions. We joininternational efforts to advance place-based research at all levels frommicro-communities, to nations and world regions. This evolution has provided newchallenges and opportunities for social science research—especially comparativeresearch—in Latino aging. Historically, there has been an inadequate coverage ofLatino older adults in population data sets to support finer sub-group analysis byplace. Furthermore, important variables were not covered, such as language use anddescriptors of immigrant or native-born statuses. However, this situation is rapidlychanging—researchers continue to investigate a long list of important questions thathave never been satisfactorily resolved. Issues around health equity are fundamentalto this volume given the disproportionate poverty levels and social disadvantagesthat U.S. Latinos have experienced. As of this publication, there is renewed interestin social, behavioral, and biological adaptations to life-span exposures, especially toextreme disadvantages of place; a new generation of researchers is investigatinghow social determinants of place are influencing Latino trends such as brain health,and how health equity is affected by the burden of disease on families and care-givers. Our mission will always include ways to improve the methods of definingand measuring social constructs that will help to advance this challenging researchagenda of Latino aging.
vi Preface

The ICAA Research Program
The ICAA research program spans more than 15 years of scholarship accumulatedfrom previous installments. Since 2005, ICAA has held nine NIA-sponsoredinternational conferences on Aging in the Americas, each of which builds on aseminal set of U.S.–Mexico meetings, bridging discussions from previous work-shops. Each iteration has a distinctive focus, resulting in peer-reviewed books orspecial journal issues, as published on the CAA website which can be found at(http://sites.utexas.edu/caa/publications/). In addition to established scientists, theICAA research portfolio also includes emerging scholars, with the aim of increasingthe latter’s exposure to this body of knowledge, development opportunities for theirrespective individual research, and career mentoring. The ultimate goal of ICAA isto provide a forum for developing, reviewing, synthesizing, and analyzing thecontemporary social and biobehavioral health research on Latinos in the Americas,with a special emphasis in and comparison of the United States and Mexico.
Book Organization
As previously mentioned, our newest agenda focuses on “place”—of which themajor dimensions are physical, cultural, and economic—as it relates to supportingthe health of aging Latinos. In this volume, 17 chapters are presented in four sections(“The Role of Place and Environment,” “Place and Unmet Needs,” “ContextualElements for Successful Aging,” and “Caregiving and Family Dynamics”). Thesechapters provide new evidence and empirical insights of place effects on physicalhealth and mental health, general functioning, disability, and mortality of Latinoelders in the United States, Mexico, Brazil, and Cuba. Collectively, the chaptersidentify key conceptual frameworks, comparative approaches, and methodologicalissues that contribute to transnational research on place effects on the health andfunctioning of older Latinos. The sections begin with an introduction outlining theircontent, encompassing a thematic statement regarding the relevance of the sectiontheme to Latino aging as well as a brief summary of each chapter in the section. Thevolume ends with a discussion of future issues of consideration.
Many of these lingering issues and recent advances in the field will be examinedin the tenth installment of the series at a meeting hosted by The University ofArizona, Tucson on September 18–20, 2018—Latino Aging and Health in Social,Institutional, and Environmental Context: Foundations and Frontiers. Scholarsfrom the United States, Mexico, and other Latin American countries will partici-pate. The meeting builds on previous installments of the ICAA by addressing theestablished foundations of socioeconomic inequality and broader health disparitiesin aging Latino populations. Additionally, researchers will specifically address thesocial determinants of late-life health in Mexico and the United States, includinghealth impacts of environmental risk, religious involvement, and dementia
Preface vii

caregiving on health. The ICAA makes every effort in its conference series to coversubstantive trends and methodological developments and resolving longstandingresearch questions in the field of Latino aging.
Miami/Los Angeles, USA William A. Vega, Ph.D.Lead Editor
Austin, USA Jacqueline L. Angel, Ph.D.Co-Editor
Mexico City, Mexico Luis Miguel F. Gutiérrez Robledo, MD, Ph.D.Co-Editor
Galveston, USA Kyriakos S. Markides, Ph.D.Co-Editor
viii Preface

Acknowledgements
We would like to thank each individual who has contributed to the success of theseries of international conferences of Aging in the Americas, including invitedspeakers, emerging-scholar poster presenters, presiders, discussants, rapporteurs,and assisting staff. Our conference and research programs are made possible thanksin part to the support of the National Institute on Aging (NIA) of the NationalInstitutes of Health under grant award no. 2R13-AGO29767-06. Deserving ofprofound appreciation are our partners and supporters. They include: the LBJSchool of Public Affairs at The University of Texas at Austin, the Edward R.Roybal Institute on Aging at the University of Southern California, the NationalInstitute of Geriatrics of the Mexican National Institutes of Health, the Departmentof Preventive Medicine and Community Health at The University of Texas MedicalBranch, and AARP.
Additional thanks must be given to our peer-reviewers:
Elaine Acosta González, Ph.D., Cuban Research Institute, Florida InternationalUniversityMarcela Agudelo-Botero, Ph.D., Center for Research in Policies, Population, andHealth, School of Medicine, National Autonomous University of MexicoFlávia Cristina Drumond Andrade, Ph.D., Department of Kinesiology andCommunity Health, University of Illinois at Urbana-ChampaignRonald J. Angel, Ph.D., Department of Sociology, The University of Texas atAustinGeorgiana Bostean, Ph.D., Department of Sociology and Environmental Science &Policy Program, Chapman UniversityRosana L. Bravo, Ph.D., UCLA Center for Health Policy Research, University ofCalifornia, Los AngelesBrian Downer, Ph.D., Division of Rehabilitation Sciences, The University of TexasMedical BranchMartha Liliana Giraldo Rodríguez, Ph.D., National Institute of Geriatrics, NationalInstitutes of Health of Mexico
ix

Víctor Manuel Mendoza-Núñez, MD, Ph.D., Research Unit in Gerontology, FESZaragoza, National Autonomous University of MexicoVerónica Montes-de-Oca Zavala, Ph.D., Institute of Social Research, NationalAutonomous University of MexicoStipica Mudrazija, Ph.D., Income and Benefits Policy Center, Urban InstituteAnna Maria Nápoles, Ph.D., National Institute on Minority Health and HealthDisparities, National Institutes of HealthWassim Tarraf, Ph.D., Eugene Applebaum College of Pharmacy and HealthSciences, Wayne State UniversityValentine M. Villa, Ph.D., School of Social Work, California State University, LosAngeles, and UCLA Fielding School of Public Health, University of California,Los Angeles
Special thanks to Sofia G. Ayala, Ph.D., for expert assistance in the production ofall phases of this volume.
This research was made possible by funding from the St. David’s Foundation andCentral Health, Austin, Texas, USA.
x Acknowledgements

Contents
Part I The Role of Place and EnvironmentWilliam A. Vega and Sofia G. Ayala
1 Population Aging and Health in Puerto Rico . . . . . . . . . . . . . . . . . 7Brian Downer, Michael Crowe and Kyriakos S. Markides
2 Regional Disparities in ADL Limitations Among Older Latinos,Blacks, and Whites in the United States . . . . . . . . . . . . . . . . . . . . . 19William A. Vega, William M. Sribney and Sofia G. Ayala
3 ¿Importa Dónde Vivimos? How Regional Variation InformsOur Understanding of Diabetes and Hypertension PrevalenceAmong Older Latino Populations . . . . . . . . . . . . . . . . . . . . . . . . . . 39Catherine García and Jennifer A. Ailshire
4 Latino and Alzheimer’s: Social Determinants and PersonalFactors Contributing to Disease Risk . . . . . . . . . . . . . . . . . . . . . . . 63Shinyi Wu, Francisca Rodriguez, Haomiao Jin and William A. Vega
5 Cognitive Functioning of U.S. Adults by Race and HispanicOrigin . . . . . . . . . . . . . . . . . . . . . . . . . . . . . . . . . . . . . . . . . . . . . . . 85Carlos Díaz-Venegas, Brian Downer, Kenneth M. Langaand Rebeca Wong
Part II Place and Unmet NeedsKyriakos S. Markides
6 Immigration Enforcement, Older Latino Immigrants,and Implications for Health . . . . . . . . . . . . . . . . . . . . . . . . . . . . . . 111Nestor Rodriguez, Cristian L. Paredes and Jacqueline Maria Hagan
xi
7 Medicaid Long-Term Community Care in Californiaand Texas: A Growing Fiscal Challenge in a New Era . . . . . . . . . . 137Jacqueline L. Angel, Ronald J. Angel and Selena M. Caldera
8 Strengthening Solidarity: A Theoretical Inquiry into the Rolesof Civil Society Organizations in the Support of Elderly Citizensin Mexico City . . . . . . . . . . . . . . . . . . . . . . . . . . . . . . . . . . . . . . . . 159Ronald J. Angel, Verónica Montes-de-Oca Zavalaand Vicente Rodríguez Rodríguez
9 The Magnitude of Health Inequalities Among Older Adultsin Brazil and Mexico . . . . . . . . . . . . . . . . . . . . . . . . . . . . . . . . . . . . 181Flávia Cristina Drumond Andrade and Mariana López-Ortega
Part III Contextual Elements for Successful AgingLuis Miguel F. Gutiérrez Robledo
10 Lessons Learned from the Positive Minds—Strong Bodies Trialon Disability Prevention for Racial/Ethnic Minority Elders . . . . . . 203Naomi Ali, Margarita Alegría, Esther Velásquez, Kathleen Tang,Lizbeth Herrera Duran and Karissa DiMarzio
11 Older Latinos’ Financial Security: Resources, Needs,and Future Prospects . . . . . . . . . . . . . . . . . . . . . . . . . . . . . . . . . . . 225Richard W. Johnson, Stipica Mudrazija and Claire Xiaozhi Wang
12 Disability and the Immigrant Health Paradox: Genderand Timing of Migration . . . . . . . . . . . . . . . . . . . . . . . . . . . . . . . . 249Marc A. Garcia, Adriana M. Reyes and Sunshine Rote
13 Limited but not Disabled: Subjective Disability VersusObjective Measurement of Functional Status and MortalityRisk Among Elderly Mexican Americans . . . . . . . . . . . . . . . . . . . . 271Phillip A. Cantu and Ronald J. Angel
Part IV Caregiving and Family DynamicsJacqueline L. Angel
14 Neighborhood Cohesion and Caregiver Well-Being Amongthe Mexican-Origin Population . . . . . . . . . . . . . . . . . . . . . . . . . . . . 295Sunshine Rote, Jacqueline L. Angel, Kyriakos S. Markidesand Terrence D. Hill
15 Population Aging in Cuba: Coping with Social Care Deficit . . . . . . 311Blandine Destremau
xii Contents

16 Determinants of Informal Care Supply for Older Adultsin Yucatan, Mexico . . . . . . . . . . . . . . . . . . . . . . . . . . . . . . . . . . . . . 337Sean Angst, Emma Aguila and Mariana López-Ortega
17 The Caregiving Experience of Older Mexican Americansand their Caregivers . . . . . . . . . . . . . . . . . . . . . . . . . . . . . . . . . . . . 359David V. Flores, Sunshine Rote, Jacqueline L. Angeland Kyriakos S. Markides
Epilogue: Looking to the Future—Priorities for CreatingNew Knowledge . . . . . . . . . . . . . . . . . . . . . . . . . . . . . . . . . . . . . . . . . . . 377Steven P. Wallace
Contents xiii

Contributors
Emma Aguila Sol Price School of Public Policy, University of SouthernCalifornia, Los Angeles, CA, USA
Jennifer A. Ailshire Andrus Gerontology Center, Leonard Davis School ofGerontology, University of Southern California, Los Angeles, CA, USA
Margarita Alegría Disparities Research Unit, Department of Medicine,Massachusetts General Hospital, Boston, MA, USA; Departments of Medicine andPsychiatry, Harvard Medical School, Boston, MA, USA
Naomi Ali Disparities Research Unit, Department of Medicine, MassachusettsGeneral Hospital, Boston, MA, USA
Flávia Cristina Drumond Andrade Department of Kinesiology and CommunityHealth, University of Illinois at Urbana-Champaign, Champaign, IL, USA
Jacqueline L. Angel Lyndon B. Johnson School of Public Affairs and Departmentof Sociology, The University of Texas at Austin, Austin, TX, USA
Ronald J. Angel Department of Sociology, The University of Texas at Austin,Austin, TX, USA
Sean Angst Sol Price School of Public Policy, University of Southern California,Los Angeles, CA, USA
Sofia G. Ayala Independent Researcher, Washington, DC, USA
Selena M. Caldera Lyndon B. Johnson School of Public Affairs, The Universityof Texas at Austin, Austin, TX, USA
Phillip A. Cantu Department of Sociology and Population Research Center, TheUniversity of Texas at Austin, Austin, TX, USA
xv

Michael Crowe Department of Psychology, The University of Alabama atBirmingham, Birmingham, AL, USA
Blandine Destremau Institut interdisciplinaire pour les enjeux sociaux(Iris/EHESS), Centre national de la recherche scientifique (CNRS, French NationalCenter for Scientific Research), Paris, France
Carlos Díaz-Venegas Max Planck Institute for Demographic Research(Max-Planck-Institut für Demografische Forschung), Rostock, Germany
Karissa DiMarzio Disparities Research Unit, Department of Medicine,Massachusetts General Hospital, Boston, MA, USA
Brian Downer Division of Rehabilitation Sciences, The University of TexasMedical Branch, Galveston, TX, USA
David V. Flores Department of Preventive Medicine and Community Health, TheUniversity of Texas Medical Branch, Galveston, TX, USA
Catherine García Andrus Gerontology Center, Leonard Davis School ofGerontology, University of Southern California, Los Angeles, CA, USA
Marc A. Garcia Department of Sociology and Institute for Ethnic Studie,University of Nebraska-Lincoln, Lincoln, NE, USA
Luis Miguel F. Gutiérrez Robledo National Institute of Geriatrics (InstitutoNacional de Geriatría), National Institutes of Health of Mexico (InstitutosNacionales de Salud de México), Mexico City, Mexico
Jacqueline Maria Hagan Department of Sociology, The University of NorthCarolina at Chapel Hill, Chapel Hill, NC, USA
Lizbeth Herrera Duran Disparities Research Unit, Department of Medicine,Massachusetts General Hospital, Boston, MA, USA
Terrence D. Hill Department of Sociology, The University of Arizona, Tucson,AZ, USA
Haomiao Jin USC Edward R. Roybal Institute on Aging, University of SouthernCalifornia, Los Angeles, CA, USA; Suzanne Dworak-Peck School of Social Work,University of Southern California, Los Angeles, CA, USA
Richard W. Johnson Income and Benefits Policy Center, Urban Institute,Washington, DC, USA
Kenneth M. Langa Division of General Medicine, University of Michigan, AnnArbor, MI, USA
Mariana López-Ortega Research Department, National Institute of Geriatrics,Instituto Nacional de Geriatría), National Institutes of Health of Mexico (InstitutosNacionales de Salud de México), Mexico City, Mexico
xvi Contributors

Kyriakos S. Markides Department of Preventive Medicine and CommunityHealth, The University of Texas Medical Branch, Galveston, TX, USA
Verónica Montes-de-Oca Zavala Institute of Social Research (Instituto deInvestigaciones Sociales), National Autonomous University of Mexico,Universidad Nacional Autónoma de México), Mexico City, Mexico
Stipica Mudrazija Income and Benefits Policy Center, Urban Institute,Washington, DC, USA
Cristian L. Paredes Department of Sociology, Loyola University Chicago,Chicago, IL, USA
Adriana M. Reyes Policy Analysis and Management, Cornell University, Ithaca,NY, USA
Francisca Rodriguez USC Edward R. Roybal Institute on Aging, University ofSouthern California, Los Angeles, CA, USA; Center for Cognitive Science,University of Kaiserslautern, Kaiserslautern, Germany; Institute of SocialMedicine, Occupational Health and Public Health, University of Leipzig, Leipzig,Germany
Nestor Rodriguez Department of Sociology, The University of Texas at Austin,Austin, TX, USA
Vicente Rodríguez Rodríguez Institute of Economics, Geography andDemography (Instituto de Economía, Geografía y Demografía), Center for Humanand Social Sciences (Centro de Ciencias Humanas y Sociales), Spanish NationalResearch Council (Consejo Superior de Investigaciones Científicas), Madrid, Spain
Sunshine Rote Kent School of Social Work, University of Louisville, Louisville,KY, USA
William M. Sribney Third Way Statistics, College Station, TX, USA
Kathleen Tang Disparities Research Unit, Department of Medicine,Massachusetts General Hospital, Boston, MA, USA
William A. Vega Academic Health Center, Florida International University,Miami, FL, USA; USC Edward R. Roybal Institute on Aging, University ofSouthern California, Los Angeles, CA, USA
Esther Velásquez Disparities Research Unit, Department of Medicine,Massachusetts General Hospital, Boston, MA, USA
Steven P. Wallace Department of Community Health Sciences and UCLA Centerfor Health Policy Research, UCLA Fielding School of Public Health, University ofCalifornia, Los Angeles, CA, USA
Claire Xiaozhi Wang Income and Benefits Policy Center, Urban Institute,Washington, DC, USA
Contributors xvii

Rebeca Wong Department of Preventive Medicine and Community Health, SealyCenter on Aging, WHO/PAHO Collaborating Center on Aging and Health, theUniversity of Texas Medical Branch, Galveston, TX, USA
Shinyi Wu USC Edward R. Roybal Institute on Aging, University of SouthernCalifornia, Los Angeles, CA, USA; Suzanne Dworak-Peck School of Social Work,University of Southern California, Los Angeles, CA, USA
xviii Contributors
Part IThe Role of Place and Environment
William A. Vega and Sofia G. Ayala
The Intellectual Legacy of Place and Health Research
The intellectual legacy of place as a social context for human development was aseminal contribution of Emile Durkheim. His ideas have been elaborated in thesocial sciences through the many decades that followed. Contemporary theories andhypotheses used in Latino health research, including aging research, often reflectaspects of his earlier observations.
Emile Durkheim focused his analysis of human adaptation based upon observingthe rapid changes in social order between the late nineteenth and early twentiethcenturies. The viability of agrarian village life was waning and people in industri-alizing nations were moving in very large numbers to cities. The old social order ofstagnant social structure, rigid social roles, and epic inequality was being replaced bya society that was dynamic and offered promise of a better life. The new urbanpopulations, and subsequent generations, faced adjustment to social roles in a new“normal” of an economic marketplace, segmented role relationships in a complexdivision of labor, weakened mores regulating human behavior, and inadequate socialstructure to provide social incorporation and normative integration. Durkheimfocused on how people in an emerging industrialized urban society responded andadapted to a “megatrend” that challenged people to find safe harbor under frequentlyadverse conditions. Although the potential for negative effects was self-evident tosocial scientists of that era, Durkheim was optimistic that these new societies coulddevelop institutions to bind people together by providing greater social cohesion.And greater social incorporation was needed to foster optimal human development.
W. A. VegaAcademic Health Center, Florida International University, Miami, FL, USA
W. A. VegaUSC Edward R. Roybal Institute on Aging, University of Southern California,Los Angeles, CA, USA
S. G. AyalaIndependent Researcher, Washington, DC, USA

The task of creating an adequate institutional capacity, in Durkheim’s view, was ashared burden of civil society and government. There are significant parallels in thisthinking to current U.S. Latino social science research about social adjustments andsocial determinants of health, and how best to create place-based and contextuallyappropriate solutions imposed by an aging Latino population.
One hundred years ago, the Chicago School of Sociology developed contextualanalysis using spatial methodologies. These approaches were called “ecological”models, and used for assessing and comparing different indices of social- andhealth-related behaviors and well-being in diverse areas of Chicago. The Chicagoscholars used quantitative social indices for comparative analyses. Of relevance tocurrent Latino aging research, their conceptual insights and methods foreshadowedthe development and use of empirical methods for geographic area investigations inhealth research, social epidemiology, and policy applications. They proposed anovel concept; social behaviors and urban blight, including health-endangeringbehaviors and social deviance, observed in the “zone in transition” in the urban coreof Chicago were not a product of individual moral defects but a function of socialadaptation and lack of opportunity combined with environmental conditions andsubcultures that typified a specific place. When people moved out of the “high risk”zone to other areas of Chicago, the “high risk” behaviors were mitigated suggestingsocial factors were determinant. Another early observation originating with theChicago scholars was intergenerational changes in social behaviors amongAfrican-American families from Southern states moving to the slums, and Latinoimmigrant families who were arriving in Chicago ghettos of that period. Theypresaged much of the social science research of our time focused on health behaviorslinked to poverty, social deviance, and addictions, and the production of disease tosocial determinants of under-resourced communities. Chicago School scholars wereinsightful in focusing on why individuals exhibited different behaviors in environ-ments with different characteristics, and why people’s behavior could respond dif-ferentially to living in the same “high risk” environment, such as immigrantscontrasted with their children.
As we think about contemporary life span and life-course research in theinvestigation of Latino aging, the seminal contributions of these earlier scholars arecertainly worth revisiting. These earlier scholars never fully made the theoretical linkto how social determinants and opportunity structures affect health. Today, wecontinue to broaden the investigation of Latino aging research enriched by the earliertradition of place and social context research. We are benefitted by the availability ofvery sophisticated tools to advance our methods of observation, including demo-graphic geo-coding, automated data manipulation, and many large population andhealth datasets that are designed to support a much finer gradient of older-adultLatino population research.
A major shift in the contemporary perspective on social science, health, and placeis that research is encouraged to have proactive value for improving public healthand health care. The new paradigm of research requires deeper insights into howsocial determinants operate as risk factors and impediments to changing healthbehaviors and improving health in different environments. Often these types of
2 Part I: The Role of Place and Environment

determinants are not traditional medical ones, and involve structural factors such aseducation and income, housing conditions, food sufficiency, or lack of healthinsurance. These determinants are primary or cofactors for proximal factors affectingbiologic resilience in specific environments, such as lifestyle, diet, exercise, toxicexposures, and disease infectivity. In Latino aging research, the examination ofsocial determinants investigates how disease gets into the body via environmentalconditions and exposures occurring over the life span. Our goal is reducing the ratesof biological aging, preventing or remediating chronic disease and disabilities, andsupporting retention of cognition and brain health. The chapters in this sectionpresent models of research that touch upon a number of these issues.
Overview of Chapters
Downer, Crowe, and Markides provide a comprehensive review of population agingand health in Puerto Rico, focusing on the short- and long-term implications thatrecent economic and political events as well as natural disasters have had on olderadults and population aging in this U.S. territory. As elsewhere in the United States,the population of Puerto Rico is rapidly aging. But contrary to states in the U.S.mainland, rapid aging in Puerto Rico has not only been the result of increasing lifeexpectancy and lower fertility rates, but also of the large outmigration of young- andmiddle-aged adults to the mainland in part as a direct consequence of the territory’songoing economic crisis and recent natural disasters. This chapter highlights howPuerto Rico’s unique social, cultural, economic, and political contexts contribute to aconsiderably different aging experience to that in the U.S. mainland. Augmentingtheir discussion, the authors further analyze the impact of interactions betweendepression and common chronic health conditions on the likelihood for disability inactivities of daily living and mortality in Puerto Ricans. Results provide evidencethat conditions like hypertension, arthritis, and heart attacks are associated withincreased odds for becoming ADL disabled and dying subsequently, but primarilyamong older Puerto Ricans who are also depressed. In this context, the authorsdiscuss the need for targeted policy interventions as well as the importance ofcontinued research to understand the effects of Puerto Rico’s distinctive contextualenvironment on the quality of life of its residents.
In the chapter by Vega, Sribney, and Ayala, the authors examine functionaldeclines of older Latinos, Blacks, and Whites across U.S. regions. Theirspatial-comparative approach focuses in understanding if and how two knownstructural determinants of overall health disparities—income and race/ethnicity—interact with geographic space to influence the functional status of older adults in theUnited States. The analysis offered by this chapter is of importance given how littlewe still know of how the health of older adults, and among discrete Latino sub-groups, varies spatially within nations, and in the context of an increasingly agingU.S. population whose healthcare needs will only intensify with age. The authors’examination of the spatial variation of older Latinos’ functional decline is of par-ticular significance as it is an area of research that has been burdened by data
Part I: The Role of Place and Environment 3

limitations. Their findings document major differences within and across U.S.regions among racial/ethnic groups in their risk of developing limitations in activ-ities of daily living (ADLs). These differences are narrowed, but not eliminated, byaccounting for socioeconomic status. Importantly, the spatial differences observedamong Latinos offer an insight into the accelerated rates of declining health of olderadults across Latino subgroups.
In another contribution to the limited body ofwork available on spatial variations inolder Latino health, and particularly among Latino subgroups, the chapter by Garcíaand Ailshire examines regional health variations among five Latino subgroups:Cubans, Mexicans, Dominicans, Puerto Ricans, and Central/South Americans.Specifically, their focus is to compare the prevalence of diabetes and hypertensionbetween White and Latino older adults across U.S. regions. Their research centers onthe perspective that historical, cultural, and demographic contexts, bounded by geo-graphic space, affect health in later life. And indeed, their study shows that geographicspace matters in the analysis of health disparities among older Latino communities—results parallel those presented by Vega and colleagues. In their chapter, García andAilshire highlight how social contexts serve as pathways influencing disease risk andalso provide insights into remedies for Latino health disparities.
Latinos are believed to be at a much higher risk than non-Latino Whites ofdeveloping Alzheimer’s disease (AD). Research attributes this outcome in part toLatinos’ lower socioeconomic status, especially lower educational attainment, inaddition to higher rates of medical conditions associated with inflammation markers,such as diabetes and cardiovascular diseases. It is with this context in mind that Wu,Rodriguez, Jin, and Vega used quantitative methods to forecast the impact over thenext four decades—in number of cases as well as in direct and indirect care costs—ofAD in the Latino population of theUnited States. The authors project not only numberof cases that surpass those observed for the African-American population but alsoproject accelerating care costs related to the presence of the disease. Notably, as theauthors report, AD is themost expensive disease in the United States considering bothhealthcare and caregiving costs. The chapter further examines how place and changesto embedded social conditions within this space may influence Latinos’AD risk. Theauthors underline the importance of addressing modifiable lifestyle factors linked tobrain health, such as exercise, diet, social engagement, and cognition, in the pursuit ofLatino AD risk mitigation.
Díaz-Venegas, Downer, Langa, and Wong provide in their chapter a compre-hensive examination of disparities in cognitive functioning across non-HispanicWhites, non-Hispanic Blacks, and Hispanics. Their research offers several importantcontributions to the available empirical knowledge. For example, contrary to the focusof earlier literature on older-age adults, this analysis includes middle-aged adults asresearch suggests both that cognitive limitations are becoming increasingly morecommon in this age group and that Hispanics develop cognitive impairments at ayounger age than, for instance, their non-Hispanic White counterparts. Their analysisalso examines differences across three cognitive domains—verbal memory, workingmemory, and numeracy—as opposed to using a global measure of cognitive func-tioning. Furthermore, and significant for Latino aging research, their analysis
4 Part I: The Role of Place and Environment

differentiates Hispanics by ethnic origin, looking specifically at four distinct sub-groups: Mexicans, Cubans, Puerto Ricans, and other Hispanics. Their findings showthat all Hispanic subgroups, except Cubans, have on average significantly lowerscores on all cognitive domains compared to non-Hispanic Whites, and that PuertoRicans show the lowest scores among Hispanics. As in other chapters, these resultsunderscore the relevance of the contextual environment to an aging population’shealth.
Part I: The Role of Place and Environment 5

Chapter 1Population Aging and Health in PuertoRico
Brian Downer, Michael Crowe and Kyriakos S. Markides
Abstract The population of Puerto Rico is rapidly aging and in 2015 nearly 20% ofthe population was 65 years of age or older. Puerto Rico is a territory of the UnitedStates, and Puerto Ricans are U.S. citizens. But the unique social, cultural, economic,and political contexts mean that population aging in Puerto Rico is considerablydifferent than the U.S. mainland. This chapter provides a comprehensive review ofpopulation aging and health in Puerto Rico. Emphasis is placed on the short- andlong-term implications that recent economic and political events and natural disastersmay have on older adults and population aging in Puerto Rico.We also present resultsfrom analyses of data from the Puerto Rican Elderly: Health Conditions study thatinvestigate the impact of interactions between depression and common chronic healthconditions on the likelihood for disability in activities of daily living and mortalityover a four-year period. The chapter concludes with recommendations for futureareas of research that can help to address the substantial need for aging research inPuerto Rico.
B. Downer (B)Division of Rehabilitation Sciences, The University of Texas Medical Branch, Galveston, TX,USAe-mail: [email protected]
M. CroweDepartment of Psychology, The University of Alabama at Birmingham, Birmingham, AL, USAe-mail: [email protected]
K. S. MarkidesPreventive Medicine and Community Health, The University of Texas Medical Branch,Galveston, TX, USAe-mail: [email protected]
© Springer Nature Switzerland AG 2019W. A. Vega et al. (eds.), Contextualizing Health and Aging in the Americas,https://doi.org/10.1007/978-3-030-00584-9_1
7

8 B. Downer et al.
Introduction
Puerto Rico is a territory of the United States with a population of 3.5 million in 2015(U.S. Census Bureau 2015). The percentage of adults in Puerto Ricowho are 65 yearsof age or older has increased from 11.2% in 2000 to 18.9% in 2016. The dramaticrate of population aging is due largely in part to increased life expectancy and lowerbirth rates. However, a unique contribution to population aging in Puerto Rico is pooreconomic conditions have led to considerable out migration of young and middle-aged adults who are pursing formal work opportunities in the mainland United States(Abel and Deitz 2014). This outmigration has had a substantial impact on the numberof people living in Puerto Rico and since 2006 the total population has declined bynearly 400,000 people (Kaiser Family Foundation 2016; U.S. Census Bureau 2016).The ongoing healthcare crisis and insufficient social support programs mean manyolder adults in Puerto Rico rely on adult children and other family members forassistance with meeting financial, housing, and healthcare needs. Consequently, theoutmigration of young- and middle-aged adults means many older adults may losea potentially critical source of informal support.
Health of Older Adults in Puerto Rico
Limited research has been conducted on the health characteristics of older PuertoRican adults.Approximately 14%ofPuertoRicans aged65 andolder have limitationsin 1 or more activities of daily living (ADL), 25% have a BMI over 30 kg/m2, and50% of the population have self-reported hypertension and arthritis (Payne 2015).The prevalence of type II diabetes is also high and 32% of older adults are livingwith type II diabetes (Salas et al. 2016). When compared to older adults living inthe U.S. mainland, Puerto Rico has higher prevalence of hypertension and type IIdiabetes (Pérez and Ailshire 2017). However, the prevalence of heart disease, stroke,lung disease, and cancer are lower in Puerto Rico compared to the U.S. mainland(Pérez and Ailshire 2017).
As U.S. citizens, Puerto Ricans are eligible for Medicare insurance after turning65 years of age. While access to Medicare coverage means a large proportion ofthe older adult population has health insurance, preventive care and managementof chronic health conditions, such as type II diabetes is poor (Centers for DiseaseControl and Prevention 2004; Allende-Vigo et al. 2014). Poor disease managementlikely contributes to type II diabetes being a leading cause of death in Puerto Rico(Murphy et al. 2015). In terms of causes of death, people in Puerto Rico have highermortality from type II diabetes and Alzheimer’s disease compared to U.S. mainland,but lower mortality from cancer and heart disease (Puerto Rico Primary Care Office2016). Diabetes is a clear health disparity for Puerto Ricans (Chowdhury 2016;Johnson et al. 2017b), but there has been little research on cognitive impairmentor Alzheimer’s disease in Puerto Rico. In the Boston Puerto Rican Health Study

1 Population Aging and Health in Puerto Rico 9
(Tucker et al. 2010), prevalence of conditions such as type II diabetes, depressivesymptoms, and hypertension were higher than previously published rates of theseconditions in similarly-aged non-Hispanic whites and Mexican Americans. In turn,each of these conditions is related to higher risk of cognitive decline and dementiain older adulthood (Andel et al. 2005; Hughes and Ganguli 2009). There is alsoevidence suggesting that older Puerto Ricans have particularly high rates of cognitiveimpairment among subgroups ofHispanics (Sosa et al. 2012). However, data from the2015 Behavioral Risk Factor Surveillance System (BRFSS), which includes PuertoRico, found less self-reported cognitive decline for adults age 45+ in Puerto Rico(6.6%) compared to the U.S. mainland (11.6%) (Behavioral Risk Factor SurveillanceSystem 2017).
Ongoing Economic Crisis
Puerto Rico became an unincorporated U.S. territory in 1898. While Puerto Ricanshave been recognized as U.S. citizens since 1917, they are unable to vote in Presi-dential elections and representation in the U.S. Congress is limited to a nonvotingdelegate. Consequently, Puerto Ricans have little to no influence on the policies thatdirectly impact all aspects of daily life, including employment, education, healthcare, food expenses, and cost of living.
The Great Recession that crippled the U.S. economy also had a severe impact onthe Puerto Rican economy. While the U.S. economy has steadily recovered over thepast several years, the Puerto Rican economy has continued to decline. The grossdomestic product (GDP) has decreased from $112 billion in 2005 to $106 billionin 2010 (Perreira et al. 2017b). Over 90% of Puerto Rico’s GDP is generated bymanufacturing and service industries (Perreira et al. 2017b). In 2006, long-standingtax benefits offered to U.S. companies operating in Puerto Rico completed a periodof phasing out. As a result, manufacturers, particularly those in the pharmaceuticalindustry, began closing plants and eliminating many jobs. In 2014, the unemploy-ment rate in Puerto Rico was 14%, the median household income was less than$20,000, and 41%of the population had an income that was below the federal povertylevel (U.S. Census Bureau 2014). The consequences of the declining economy arecomplicated by Puerto Rico having over $100 billion in debt, which limits govern-ment investments in infrastructure, healthcare, and education (Hexner andMacEwan2017).
Limited Healthcare System
The severe economic crisis has negatively impacted Puerto Rico’s healthcare systemand the government’s ability to meet effectively the needs of an aging population.Puerto Rican residents are eligible for Social Security benefits, but are excluded from

10 B. Downer et al.
Supplemental Security Income, which provides monetary assistance and healthcareinsurance coverage to low-income individuals who are aged 65 and older, blind, ordisabled. Nearly half of Puerto Rican residents are enrolled in Medicaid (Perreiraet al. 2017b). Unlike the U.S. mainland in which the amount of federal funds avail-able to stateMedicaid programs is unlimited, the amount of funds available to PuertoRico’sMedicaid is capped. In 2010 only 18%of PuertoRico’sMedicaid expenditureswere covered by the federal government compared to between 50 and 75% for theU.S. mainland (Annie et al. 2016). The substantial underfunding of Puerto Rico’sMedicaid program limits the benefits that are available, such as dental coverage,outpatient prescriptions, and inpatient mental health (Perreira et al. 2017a). Further-more, prior research has shown that Puerto Rican’s receive lower quality healthcarecompared to the U.S. mainland (Rivera-Hernandez et al. 2016; Perreira et al. 2017c).
Puerto Rico is also experiencing a substantial shortage of physicians, especiallyin areas outside of San Juan (Perreira et al. 2017c) and physicians with specializedtraining in geriatrics (Roman 2015). This shortage is attributed largely in part tophysicians leaving Puerto Rico because of limited training opportunities, low pay,and challenges in contracting with health insurance plans (Perreira et al. 2017c).Physicians from Puerto Rico are often actively recruited by hospitals and healthcareproviders on the U.S. mainland because of the growing demand for highly trainedbilingual physicians who can provide care toHispanic patients (Perreira et al. 2017a).
Multiple National Disasters
Puerto Rico was devastated by two hurricanes in 2017. Hurricane Irma was a Cat-egory 5 hurricane when it passed just north of Puerto Rico in September. WhileHurricane Irma did not make direct landfall, the storm caused an estimated 1 millionpeople to lose power and over 56,000 people were without water (Johnson et al.2017a). Hurricane Irma was closely followed by HurricaneMaria, which made land-fall on September 20th, 2017. Maria was a strong Category 4 hurricane when it madeland fall with sustained winds of 65 mph, gusts exceeding 100 mph, and torrentialrainfall that caused widespread flooding (Samenow 2017). The damage from Hurri-cane Irma only two-weeks earlier and aging infrastructure meant Puerto Rico was illequipped to prepare for a natural disaster of this magnitude and recovery has beenan excruciatingly slow and frustrating process.
Hurricane Maria caused 100% of Puerto Rico to be without power. According tothe website status.pr, as of early December 2017, just over 61% of Puerto Rico hadpower, including 69 out of 78 municipalities. The prolonged power outages have hada substantial impact on healthcare systems in Puerto Rico. Diesel generators wereable to provide power to hospitals and clinics in the immediate aftermath ofHurricaneMaria, but this was intended to be only a short-term solution. Infectious and parasiticdiseases have been a major public health concern, but treating and managing chronichealth conditions, in particular type II diabetes, has also been a substantial challenge.Diesel shortages have limited the ability of dialysis units to meet the treatment needs

1 Population Aging and Health in Puerto Rico 11
of patients with diabetes. Reports indicate that patients who typically receive 12 hof dialysis treatment per week now only receive treatment for 9 h a week (Robles2017).
The official death toll from Hurricane Maria was 64 deaths, but this may be asubstantial underestimate after considering the number of deaths indirectly causedby the hurricane. Using historical mortality data, researchers have estimated that 518and 567 more deaths occurred in September and October 2017, respectively, whencompared to the average number of deaths in September and October for 2010–2016(Santos and Howard 2017). The leading causes of death in September and October2017 have included type II diabetes and Alzheimer’s disease (Robles et al. 2017).
Impact of Mental and Physical Health Conditionson Disability and Mortality
We have previously published results from the Puerto Rican Elderly: Health Condi-tions (PREHCO) study that indicate depression and type II diabetes are important riskfactors for disability in activities of daily living (ADL) andmortality over a four-yearperiod (Downer et al. 2017). We have conducted further analyses using data from thePREHCO study to investigate the impact that interactions between depression andother highly prevalent health conditions (hypertension, arthritis, heart attack) haveon the odds of developing ADL disability and mortality. For these analyses, we usedmultivariable logistic regression models to estimate the odds for ADL disability andmortality in 2006–07 associated with depression, hypertension, arthritis, and heartattack.
Descriptions of the study design, instruments, and sampling procedures of thePREHCO study have been published previously (McEnry and Palloni 2010; Palloniet al. 2013). Also, the details of the sample selection, measures, and statistical meth-ods for the present analysis have been provided (Downer et al. 2017). Briefly, theanalytic sample included 3419 participants, of which 2175 did not have limitationsin one or more ADLs at baseline. Measures for arthritis, hypertension, and heartattack were based on self-report. These conditions were selected because of the highprevalence in the PREHCO study and known associations with depressive symp-toms (Dunlop et al. 2004; Egede et al. 2005; Garcia-Fabela et al. 2009). Participantswho scored 5-points or higher on an abbreviated version of the Geriatric DepressionScale (Yesavage et al. 1982)were classified as having clinically significant depressivesymptoms (D’Ath et al. 1994). Participants who reported having difficulty complet-ing one or more ADLs (eating, dressing, toileting, walking, getting up or layingdown in bed, or bathing) because of a health problem were classified as ADL dis-abled. Baseline measures for age, gender, education, marital status, race/ethnicity,health insurance plan, hypertension, heart attack, stroke, arthritis, and cognition wereincluded in multivariable logistic regression models.

12 B. Downer et al.
Table 1.1 Impact of interactions between depression, hypertension, arthritis, and heart attack onodds for ADL disability and mortality
ADL disability (N=2175) Mortality (N=3419)
Odds ratio (95% CI) Odds ratio (95% CI)
Hypertension and depression
Neither Ref Ref
No depression, hypertension 1.13 (0.83–1.56) 1.27 (0.96–1.70)
Depression, no hypertension 1.49 (0.91–2.39) 1.72 (1.16–2.53)**
Depression and hypertension 3.08 (2.11–4.50)** 1.31 (0.91–1.86)
Arthritis and depression
Neither Ref Ref
No depression, arthritis 1.92 (1.40–2.63)** 0.97 (0.74–1.29)
Depression, no arthritis 2.47 (1.57–3.83)** 1.56 (1.08–2.23)*
Depression and arthritis 3.99 (2.73–5.82)** 1.00 (0.71–1.40)
Heart attack and depression
Neither Ref Ref
No depression, heart attack 1.59 (0.94–2.60) 1.90 (1.28–2.78)**
Depression, no heart attack 2.12 (1.58–2.84)** 1.26 (0.95–1.65)
Depression and heart attack 4.71 (2.49–8.77)** 2.27 (1.41–3.58)**
All analyses controlled for age, gender, education, race, health insurance, and self-reported healthconditions*p < 0.05; **p < 0.01
The findings from multivariable logistic regression models are presented inTable 1.1. Participants with comorbid depression and hypertension had significantlyhigher odds for becoming ADL disabled (OR � 3.08, 95% CI � 2.11–4.50) but notmortality at follow-up in 2006–07. Participants with depression and no hyperten-sion had significantly higher odds for mortality (OR � 1.72, 95% CI � 1.16–2.53),but the increased odds for mortality among participants with comorbid depressionand hypertension were not statistically significant. Participants with arthritis but nodepression had 1.92 higher odds for ADL disability (95% CI � 1.40–2.63), whereasparticipants with comorbid arthritis and depression had nearly 4 times higher oddsfor becoming ADL disabled (95% CI � 2.73–5.82) compared to participants withneither depression nor arthritis. However, comorbid arthritis and depression was notassociatedwith higher odds formortality. Finally, the highest odds forADLdisabilityand mortality were associated with comorbid depression and heart attack.

1 Population Aging and Health in Puerto Rico 13
The Need for Continued Aging Research in Puerto Rico
The older adult population in Puerto Rico is growing rapidly. This is partly due toincreasing life expectancy, but outmigration of young- and middle-aged adults tothe U.S. mainland is an important cause of population aging in Puerto Rico. Theongoing economic crisis and recent natural disasters have contributed to a surge inthe number of young-adults leaving Puerto Rico for the U.S. mainland.
While the prevalence of some health conditions among older adults in Puerto Ricoare lower compared to the U.S. mainland, depression, diabetes, and hypertensionare major health concerns. The high prevalence of depression and type II diabetesamong older adults is especially concerning given that these frequently comorbidconditions are associated with ADL disability and mortality (Downer et al. 2017).Also, this chapter presents evidence that hypertension, arthritis, and heart attack areassociated with increased odds for becoming ADL disabled and mortality at follow-up, but primarily among older Puerto Ricans who are also depressed. These findingsindicate the need for culturally appropriate interventions that can prevent late-lifedepression and improved access to mental health services for older adults in PuertoRico.
It is important for continued research to be conducted on population aging andhealth in Puerto Rico. A better understanding of the current aging and health chal-lenges among older adults in Puerto Rico is crucial for developing interventions andhealth care policies to improve the lives of disadvantaged older adult populations inthe United States and Caribbean. Future research is needed to investigate the poten-tial impact that migration of young- and middle-aged adults to the U.S. mainlandhas on the health and quality of life for older adults. Older adults are less likely thanyounger people tomigrate fromPuerto Rico and how factors such as disrupted familystructure and social support networks including availability of informal caregivingresources for the older adult population in Puerto Rico is unknown. But it is highlyplausible that these trends will have negative effects for older people.
Of particular concern for aging in Puerto Rico is the current exodus of youngerhealth care professionals who are needed to provide medical care for an aging pop-ulation (Perreira et al. 2017c). Lower reimbursement rates for physicians in PuertoRico compared to U.S. mainland are thought to be a major contributor to this prob-lem (Roman 2015). The consequences of fewer health care providers are just nowbecoming apparent through increased wait times for medical appointments. In 2015,the estimated wait for an appointment in the Medicare population was already overa week (Puerto Rico Primary Care Office 2015). The long-term effects of the healthcare crisis remain to be seen but threaten to reverse some of the positive changes inlongevity during the 20th century in Puerto Rico.
Puerto Rico’s recovery from Hurricane Maria will be over the course of yearsand possibly decades. A major concern in the aftermath of natural disasters is long-term effects on mental health. The most common mental health outcome examinedin prior disaster research is symptoms of posttraumatic stress disorder (PTSD). Arecent meta-analysis of six natural disaster studies found that older adults were twice

14 B. Downer et al.
as likely to experience PTSD symptoms compared to younger adults (Parker et al.2016), although this effect is contentious (Rodriguez-Llanes et al. 2013). In terms ofsymptom duration, a population-based study of adults affected by Hurricane Katrinafound that symptoms of PTSD and suicidal ideation actually increased from 5 to8 months after the hurricane to two years later (Kessler et al. 2008). In this sample,estimated prevalence of PTSD two years after Katrina was 22.5%, and predictors ofPTSD included female gender, hurricane-relatedfinancial loss, post-disaster stressors(e.g., displaced from home, shortage of food or water, unsanitary conditions), lowsocial support, and post-disaster traumatic events (Galea et al. 2008). Post-disasterstressors and social support were more closely related to long-term PTSD symptomsthan exposure to Katrina-related traumatic events (Galea et al. 2008). In terms ofpsychological resilience, typically defined in these studies as absence ofmental healthproblems following a natural disaster, there is strong evidence for social support andmale gender as predictors of resilient outcomes (Rodriguez-Llanes et al. 2013).
Finally, the devastation inPuertoRico fromHurricaneMaria is likely to exacerbatethe economic and health care problems on the island, further reducing the availabilityand quality of health care for older adults. Furthermore, the current stressors faced byolder Puerto Ricans, many of whom have been without power, water, and basic needsfor over two months could have negative long-term effects on health and quality oflife in Puerto Rico. A better understanding of the current aging and health challengesin this population is crucial for developing interventions and health care policies toimprove the lives of disadvantaged older adult populations in the United States andCaribbean.
There are several challenges and barriers to conducting aging research in PuertoRico. Most notably is the limited availability of current data sources that can be usedto conduct aging research. The PREHCO study is a representative longitudinal studyof aging in PuertoRico that is highly comparablewith theU.S.Health andRetirementStudy. However, the most recent wave of data collection was completed in 2007–08.While PREHCO is a valuable data source for studying aging in Puerto Rico, the lackof recent data prevents research from investigating the impact that recent economicand healthcare crises and natural disasters have on population aging and health. Thismakes it critical for new data to be collected.
Conclusions
PuertoRico is aging rapidly. Prior research indicates that older PuertoRican adults areliving with several chronic health conditions, in particular diabetes and hypertension.These health conditions can contribute to increased ADL disability and mortality,in particular for older adults with high depressive symptoms. Puerto Rico has beendevastated by multiple ongoing crises and older adults are especially vulnerable tothe impacts of natural disasters, physician shortages, and poor living conditions. The

1 Population Aging and Health in Puerto Rico 15
challenges and hardships currently facing Puerto Rico are unprecedented. Contin-ued research is necessary to increase understanding of modifiable factors related toresiliency in older adults, which is important for developing interventions strategies,public policy, and resource allocation during the recovery period.
Acknowledgements This work was supported by the National Institutes of Health, National Insti-tute on Aging (grant number 5 R21 AG045722 02).
References
Abel, J. R., &Deitz, R. (2014). The causes and consequences of Puerto Rico’s declining population.Federal Reserve Bank of New York. Second District. Current Issues in Economics and Finance,20(4), 1–8.
Allende-Vigo, M. Z., Gonzalez-Rosario, R. A., Gonzalez, L., Sanchez, V., Vega, M. A., Alvarado,M., et al. (2014). Inpatient management of diabetes mellitus among noncritically ill patients atUniversity Hospital of Puerto Rico. Endocrine Practice, 20(5), 452–460. https://doi.org/10.4158/EP13199.OR.
Andel, R., Hughes, T. F., & Crowe, M. (2005). Strategies to reduce the risk of cognitive decline anddementia. Aging and Health, 1, 107–116.
Annie, M. L., Davis, P. A., Donovan, S. A., Hahn, J., Kirchhoff, S. M., Mitchell, A. et al. (2016).Puerto Rico and health care finance: Frequently asked questions (Report R44275). Washington,DC: Congressional Research Service.
Behavioral Risk Factor Surveillance System, B. (2017). BRFSS cognitive module. https://www.alz.org/publichealth/data-collection.asp.
Centers for Disease Control and Prevention. (2004). Preventive-care practices among adults withdiabetes–Puerto Rico, 2000–2002. MMWR Morbidity and Mortality Weekly Report, 53(44),1047–1050. https://www.ncbi.nlm.nih.gov/pubmed/15538321.
Chowdhury, P. P. (2016).Surveillance for certain health behaviors, chronic diseases, and conditions,access to health care, and use of preventive health services among states and selected localareas—Behavioral Risk Factor Surveillance System, United States, 2012 (Vol. 65). MMWRSurveillance Summaries.
D’Ath, P., Katona, P., Mullan, E., Evans, S., & Katona, C. (1994). Screening, detection and man-agement of depression in elderly primary care attenders. I: The acceptability and performance ofthe 15 item Geriatric Depression Scale (GDS15) and the development of short versions. FamilyPractice, 11(3), 260–266. https://www.ncbi.nlm.nih.gov/pubmed/7843514.
Downer, B., Crowe, M., &Markides, K. S. (2017). Influence of type II diabetes and high depressivesymptoms on the likelihood for developing activities of daily living (ADL) disability andmortalityin older Puerto Ricans. Journal of Aging and Health, 29(6), 1079–1095.
Dunlop, D. D., Lyons, J. S., Manheim, L. M., Song, J., & Chang, R. W. (2004). Arthritis and heartdisease as risk factors for major depression: The role of functional limitation. Medical Care,42(6), 502–511. https://www.ncbi.nlm.nih.gov/pubmed/15167318.
Egede, L. E., Nietert, P. J., & Zheng, D. (2005). Depression and all-cause and coronary heart diseasemortality among adults with andwithout diabetes.Diabetes Care, 28(6), 1339–1345. http://www.ncbi.nlm.nih.gov/pubmed/15920049.
Galea, S., Tracy, M., Norris, F., & Coffey, S. F. (2008). Financial and social circumstances and theincidence and course of PTSD in Mississippi during the first two years after Hurricane Katrina.Journal of Traumatic Stress, 21(4), 357–368.
16 B. Downer et al.
Garcia-Fabela, L., Melano-Carranza, E., Aguilar-Navarro, S., Garcia-Lara, J. M., Gutierrez-Robledo, L. M., & Avila-Funes, J. A. (2009). Hypertension as a risk factor for developingdepressive symptoms among community-dwelling elders.Revista de InvestigacionClinica, 61(4),274–280. http://www.ncbi.nlm.nih.gov/pubmed/19848303.
Hexner, J. T., & MacEwan, A. (2017). Should the U.S. government do more? Why Puerto Rico’seconomic conditions matters to the United States. http://www.queensjdiexec.org/publications/qed_dp_3111.pdf.
Hughes, T. F., & Ganguli, M. (2009). Modifiable midlife risk factors for late-life cognitive impair-ment and dementia. Current Psychiatry Reviews, 5(2), 73–92. http://www.ncbi.nlm.nih.gov/pubmed/19946443.
Johnson, A., Arkin, D., Cumming, J., & Karins, B. (2017a). Hurricane Irma skirts Puerto Rico,leaves 1 million without power. https://www.nbcnews.com/storyline/hurricane-irma/hurricane-irma-skirts-puerto-rico-lashing-it-powerful-winds-flooding-n799086; https://www.nbcnews.com/storyline/hurricane-irma/hurricane-irma-skirts-puerto-rico-lashing-it-powerful-winds-flooding-n799086. Accessed December 10, 2017.
Johnson, J. A., Cavanagh, S., Jacelon, C. S., & Chasan-Taber, L. (2017b). The diabetes disparityand Puerto Rican identified individuals: A systematic literature review. The Diabetes Educator,43(2), 153–162.
Kaiser Family Foundation, H. (2016). 8 questions & answers about Puerto Rico. https://www.kff.org/disparities-policy/fact-sheet/8-questions-and-answers-about-puerto-rico/.
Kessler, R. C., Galea, S., Gruber, M. J., Sampson, N. A., Ursano, R. J., &Wessely, S. (2008). Trendsin mental illness and suicidality after Hurricane Katrina.Molecular Psychiatry, 13(4), 374–384.
McEnry,M.,&Palloni,A. (2010).Early life exposures and the occurrence and timingof heart diseaseamong the older adult Puerto Rican population. Demography, 47(1), 23–43. https://www.ncbi.nlm.nih.gov/pubmed/20355682.
Murphy, S. L., Kochaneck, K. D., Xu, J., & Heron, M. P. (2015). Deaths: Final data for 2012.National Vital Statistics Reports, 63(9). Centers for Disease Control and Prevention, NationalCenter for Health Statistics, National Vital Statistics System.
Palloni, A., Davila, A. L., & Sanchez-Ayendez,M. (2013).Puerto Rican Elderly: Health Conditions(PREHCO) Project, 2002–2003, 2006–2007.
Parker, G., Lie, D., Siskind, D. J., Martin-Khan, M., Raphael, B., Crompton, D., et al. (2016).Mental health implications for older adults after natural disasters—A systematic review andmeta-analysis. International Psychogeriatrics, 28(1), 11–20.
Payne, C. F. (2015). Aging in the Americas: Disability-free life expectancy among adults aged 65and older in the United States, Costa Rica, Mexico, and Puerto Rico. Journals of Gerontology.Series B, Psychological Sciences and Social Sciences. https://doi.org/10.1093/geronb/gbv076.
Pérez, C.,&Ailshire, J.A. (2017).Aging in PuertoRico:A comparison of health status among IslandPuerto Rican and mainland U.S. older adults. Journal of Aging and Health, 29(6), 1056–1078.
Perreira, K. M., Jones, D. K., & Oberlander, J. (2017a). Capping Medicaid funding-lessons fromPuerto Rico. American Journal of Public Health, 107(12), 1900–1901. https://doi.org/10.2105/AJPH.2017.304138.
Perreira, K. M., Lallemand, N., Napoles, A., & Zuckerman, S. (2017b). Environmental scan ofPuerto Rico’s health care infrastructure. Washington, DC: Urban Institute.
Perreira, K. M., Peters, R., Lallemand, N., & Zuckerman, S. (2017c). Puerto Rico health careinfrastructure assessment. Washington, DC: Urban Institute.
Puerto Rico Primary Care Office, P.-P. (2016). 2015 Puerto Rico primary care needs assess-ment. http://www.salud.gov.pr/Estadisticas-Registros-y-Publicaciones/Publicaciones/2015/PuertoRicoPrimaryCareNeedsAssesment.pdf.
Rivera-Hernandez, M., Leyva, B., Keohane, L. M., & Trivedi, A. N. (2016). Quality of care forwhite and hispanic medicare advantage enrollees in the United States and Puerto Rico. JAMAInternal Medicine, 176(6), 787–794. https://doi.org/10.1001/jamainternmed.2016.0267.

1 Population Aging and Health in Puerto Rico 17
Robles, F. (2017). Puerto Rico’s health care is in dire condition, three weeks after Maria. https://www.nytimes.com/2017/10/10/us/puerto-rico-power-hospitals.html; https://www.nytimes.com/2017/10/10/us/puerto-rico-power-hospitals.html.
Robles, F., Davis, K., Fink, S., &Almukhtar, S. (2017). Official death toll in Puerto Rico: 64. Actualdeaths may be 1,052. New York Times. https://www.nytimes.com/interactive/2017/12/08/us/puerto-rico-hurricane-maria-death-toll.html.
Rodriguez-Llanes, J. M., Vos, F., & Guha-Sapir, D. (2013). Measuring psychological resilience todisasters: Are evidence-based indicators an achievable goal. Environmental Health, 12, 115.
Roman, J. (2015). The Puerto Rico healthcare crisis. Annals of the American Thoracic Society,12(12), 1760–1763. https://doi.org/10.1513/AnnalsATS.201508-531PS.
Salas, A., Acosta, D., Ferri, C. P., Guerra, M., Huang, Y., Jacob, K. S., et al. (2016). The prevalence,correlates, detection and control of diabetes among older people in low and middle income coun-tries. A 10/66 Dementia research group population-based survey. PLoS ONE, 11(2), e0149616.https://doi.org/10.1371/journal.pone.0149616.
Samenow, J. (2017). Hurricane Maria sweeps across Puerto Rico with destructive winds andtremendous rainfall. https://www.washingtonpost.com/news/capital-weather-gang/wp/2017/09/19/category-5-hurricane-maria-is-a-disaster-scenario-for-puerto-rico-and-virgin-islands-jose-to-brush-by-new-england/?utm_term=.df3fd92a0c79; https://www.washingtonpost.com/news/capital-weather-gang/wp/2017/09/19/category-5-hurricane-maria-is-a-disaster-scenario-for-puerto-rico-and-virgin-islands-jose-to-brush-by-new-england/?utm_term=.df3fd92a0c79.
Santos,A.R.,&Howard, J. T. (2017).Estimates of excess deaths inPuertoRico followingHurricaneMaria. https://osf.io/preprints/socarxiv/s7dmu.
Sosa, A. L., Albanese, E., Stephan, B. C., Dewey, M., Acosta, D., Ferri, C. P., et al. (2012). Preva-lence, distribution, and impact of mild cognitive impairment in Latin America, China, and India:A 10/66 population-based study. PLoS Med, 9(2), e1001170. https://doi.org/10.1371/journal.pmed.1001170.
Tucker, K. L., Mattei, J., Noel, S. E., Collado, B. M., Mendez, J., Nelson, J., et al. (2010). TheBoston Puerto Rican Health Study, a longitudinal cohort study on health disparities in PuertoRican adults: challenges and opportunities. BMC Public Health, 10, 107. https://doi.org/10.1186/1471-2458-10-107.
U.S. Census Bureau. (2014). Selected economic characteristics: 2010–2014 American CommunitySurvey 5-Year Estimates. American FactFinder. https://factfinder.census.gov/.
U.S. Census Bureau. (2015). Annual estimates of the resident population for selected age groupsby sex for the United States, counties, and Puerto Rico Commonwealth and municipios: April 1,2010 to July 1, 2015. Washington, DC. https://www.census.gov/popest/index.html.
U.S. Census Bureau. (2016). QuickFacts: Puerto Rico. https://www.census.gov/quickfacts/fact/table/PR/IPE120216.
Yesavage, J. A., Brink, T. L., Rose, T. L., Lum, O., Huang, V., Adey, M., & Leirer, V. O. (1982).Development and validation of a geriatric depression screening scale: a preliminary report. Jour-nal of Psychiatric Research, 17(1), 37–49. http://www.ncbi.nlm.nih.gov/pubmed/7183759.

Chapter 2Regional Disparities in ADL LimitationsAmong Older Latinos, Blacks,and Whites in the United States
William A. Vega, William M. Sribney and Sofia G. Ayala
Abstract This chapter presents original research on within and across regionaldisparities in the prevalence and onset of ADL limitations among Latino, Black,and White older adults in the United States. We also present a summary analysisand discussion about how social determinants, such as income, are structuring asso-ciations between aging and declining functional status in the United States. Thisanalysis is relevant at a historical crossroads in U.S. public health when spatial unitshave taken on greater significance as habitats and units of analysis for investigat-ing disease risk and fundamental causes of health and disease. Using data from theHealth and Retirement Study, we find major differences across regions in ADL-limitation risk, also large differences within and across regions in ADL-limitationrisk by racial/ethnic group, and accounting for socioeconomic status greatly reduces,but does not eliminate, differences among racial/ethnic groups in their risk of devel-oping an ADL limitation within and across regions. We also find a nearly 17-yeardifference in a 50% risk probability level for first onset of ADL limitations on averagebetween individuals of any race or ethnic group in the lowest and highest incomequartiles.
W. A. Vega (B)Academic Health Center, Florida International University, Miami, FL, USAe-mail: [email protected]
W. A. VegaUSC Edward R. Roybal Institute on Aging, University of Southern California, Los Angeles, CA,USA
W. M. SribneyThird Way Statistics, College Station, TX, USAe-mail: [email protected]
S. G. AyalaIndependent Researcher, Washington, DC, USAe-mail: [email protected]
© Springer Nature Switzerland AG 2019W. A. Vega et al. (eds.), Contextualizing Health and Aging in the Americas,https://doi.org/10.1007/978-3-030-00584-9_2
19

20 W. A. Vega et al.
Introduction
In this chapter, we review research on spatial health disparities and present originalresearch onU.S. regional differences in the percentage of older adultswith limitationsin Activities of Daily Living (ADL) among Latinos of any race, Black non-Latinos,and White non-Latinos—henceforth, referred to as Latinos, Blacks, and Whites,respectively. In addition, we present a summary analysis and discussion about howsocial determinants, such as income, are structuring associations between aging anddeclining functional status in the United States. This comparison is relevant at ahistorical crossroads in U.S. public health when spatial units, such as regions, havetaken on greater significance as habitats and units of analysis for investigating diseaserisk and fundamental causes of health and disease.
This chapter presents a series of questions: how are variations in older-adultfunctional declines distributed across U.S. regions, and how are functional declinesaffecting Latino older adults compared to Blacks and Whites across regions? A finalquestion is whether respective regional distributions of ADL limitations are actuallyexplained by race and ethnicity, or does income fully explain ADL-limitation riskdifferences in regions? These are critical and enmeshed health and public policyissues.
The initial premise of spatial research in health disparities is predicated on the find-ing that “unfair and unjust” conditions have rendered some people across geographicspace more vulnerable to disease. The risk factors may be associated with populationand area characteristics in a systematic way. The challenge is distinguishing betweenthe two issues in a way that has utility for identifying vectors of disease, precursorsof health declines, and mitigating risk factors. Finding patterns of unequal burden ofdisease, and possibly some linkages to proximal and modifiable causal factors, is anessential starting point for the discovery and ultimate remediation of putative causesof disease and promotion of health. Spatial research on health offers an opportunityto look comprehensively at the interplay of putative causes. However, the start pointis mapping the distribution of risk, in this instance of ADL limitations.
There are many studies in public health that define the notion of health and placein a variety of ways ranging from purely spatial coordinates based on geographically-meaningful areas such as states, counties, cities, and both larger and smaller units ofanalysis such as regions, zip codes, communities, and neighborhoods. These variousapproaches to examine the role of place in health all have potential relevance becausethey facilitate critical comparisons of health indices that have value for developinganalyses for improving health by focusing on how residents and subgroups respondto specific environments. They also allow contrasts of health indices among “places”that are geographically and socially diverse, which is a priority theme in currenthealth disparities research.

2 Regional Disparities in ADL Limitations Among Older Latinos … 21
What Can We Learn from Previous Empirical ApproachesAbout Place and Health?
That population health varies across geographic space is not a novel concept.Research has increasingly documented variations in population health across geo-graphical space for several decades now, examining the magnitude and nature ofdisease patterns within numerous countries and for a variety of health outcomes.In the international context, research for Japan, for example, shows difference inmortality rates for all causes (Fukuda et al. 2004a) or for selected causes like stroke(Fukuda et al. 2004b) across the country’s municipalities. A study has also identifiedgeographical inequality in life expectancy across New Zealand’s 21 District HealthBoards (Pearce and Dorling 2006). Rosenberg and Wilson (2000) reports that thelikelihood of having a chronic disease in Canada varies significantly by province.Most recently, researchers analyzing the national and subnational burden of diseasesand injuries using the Global Burden of Disease Study 2013 find evidence of markedspatial health inequalities across regions in England (Newton et al. 2015), states inMexico (Gómez-Dantés et al. 2016), and provinces in China (Zhou et al. 2016).
For the United States, a large body of research exists that explores and evidencessignificant spatial health disparities that have been shown to be not the result of dif-ferences in how individuals assess their own health in surveys but rather reflect actualdifferences in health (Berchick and Lynch 2017). Earlier research often focused onexamining mortality rates (for all or specific causes) across states, with results high-lighting themortality disadvantage of individuals residing in southern states compareto those residing anywhere else in the country (Zopf 1992; Lanska and Kryscio 1994;Centers for Disease Control and Prevention 1995; Schneider et al. 1997; Kawachiet al. 1999). While mortality spatial differentials are still analyzed and observed(Tencza et al. 2014; Montez et al. 2016), recent research has expanded the scopeof health measures, although results still point to the health disadvantage of thesouthern United States, particularly the Southeast or a region commonly referred toas the Deep South. Montez et al. (2017), for instance, observed marked variationacross states in disability prevalence as well as variation in the probability of hav-ing a disability that is attributed to state-level characteristics; in this research, thesoutheastern state of West Virginia reports the highest disability prevalence amongall states. Other research reports large disparities in life expectancy across U.S. states(Wilmoth et al. 2010) and counties (Ezzati et al. 2008), underlining the relativelylower life expectancy of individuals in southeastern states.
Considering the ever more extensive body of work exploring health disparitiesover geographic space, our knowledge of how the health of older adults varies spa-tially within countries remains surprisingly fragmentary given its importance for theplanning, distribution, and implementation of healthcare resources in the contextof an increasingly aging population—in the United States and elsewhere—whosehealthcare needs and requirements will intensify expectedly with age. The available

22 W. A. Vega et al.
knowledge relies on static methodologies1 that examine within-country spatial dis-parities from measures like healthy (or disability-free) life expectancy (Gutiérrez-Fisac et al. 2000; Groenewegen et al. 2003; Liu et al. 2010) or the prevalence offunctional limitations (Kington et al. 1998; Lin 2000; Lin and Zimmer 2002; PorellandMiltiades 2002; Chuang et al. 2008;Montez et al. 2017), but little is known aboutwithin-country spatial variations on the onset of health conditions in older age. Thistype of analysis is crucial for two reasons. First, it allows for a longitudinal consider-ation of the changing profiles of individuals, which is important since research tellsus that health conditions in old age are a function of life-course exposure to health-compromising factors (Elo and Preston 1992; Freedman et al. 2008). The availableresearch accounts at most for health conditions at birth (Gutiérrez-Fisac et al. 2000;Groenewegen et al. 2003) or the presence of chronic medical conditions (Porell andMiltiades 2002); what are not accounted for in prior research are changes to an indi-vidual’s social and/or economic conditions, such as marital, employment, or healthstatus. Second, knowing the timing of onset of health limitations among regional pop-ulations has implications for intervention development and configuration of regionalhealthcare infrastructure.
Compounding this knowledge limitation is our inadequate understanding of spa-tial health patterns in older adults across population subgroups defined by sociode-mographic characteristics, particularly for the United States as it pertains to racialand ethnic identity. Simply put, more research by gender and income status existsdue to data limitations from the under-sampling of minority populations across geo-graphical units, particularly the U.S. Latino population. This knowledge would berelevant given that socio-economic and demographic compositional characteristicsof a population—such as percentage of females, percentage of elderly, percentageof minorities, and income, among others—have been shown to explain (state-level)spatial variations in health for the case of the United States (Xu 2006).
Evidence of spatial (within-country) variations in the health of older adults extendsto multiple geopolitical contexts. Chuang et al. (2008), for example, observes a sig-nificant variation in the prevalence of functional disability in ADL among individualsaged 65 years and older across Taiwan’s 23 administrative districts that cannot beattributed to the age and sex structure of the population. Spatial variations in thehealth of older adults, measured using healthy or disability-free life expectancy atage 60 or 65, are also observed across 31 administrative divisions in China (Liu et al.2010), 27 healthcare regions in the Netherlands (Groenewegen et al. 2003), and 50provinces in Spain (Gutiérrez-Fisac et al. 2000).
Multiple factors are found to contribute to the observed spatial variations in thehealthy or disability-free life expectancy of older adults in these countries. Liu et al.(2010), for instance, explores regional variation in disability-free life expectancy(DFLE) at age 60 in China and finds that regional economic conditions (per capitaGross Domestic Product, GSP), the level of urbanization in the region (the proportionof urban residents), and access to health care (hospital beds per 10,000 residents)
1Methodologies that employ linear, logistic, or logit regression analysis on individual-level cross-sectional or pooled data.

2 Regional Disparities in ADL Limitations Among Older Latinos … 23
are the primary factors associated with this variation, with regional DFLE rangingfrom 11.2 to 20.8 years in 2006. Interestingly, Liu et al. (2010) observes that spatialdisparities in DFLE in China reflect a pattern of regional economic development inthe country, with the eastern administrative divisions which are the most developedhaving the highest DFLE and the western divisions which are the least developedhaving the lowest DFLE.
Regional socioeconomic conditions, such as the level of education and unem-ployment rate, and lifestyle factors, such as the percentage of smokers in the region,both similarly contribute to spatial variation in DFLE in Spain (Gutiérrez-Fisac et al.2000) and healthy life expectancy in the Netherlands (Groenewegen et al. 2003).Likewise, but contrary to the results observed for China, access to health care isfound to be not a contributing factor of spatial disparities in healthy/disability-freelife expectancy in both countries. Groenewegen et al. (2003) further finds differentpatterns in the spatial distribution of male and female healthy life expectancy in theNetherlands.
Research for the United States indicates that the probability of older adults ofhaving a functional limitation, including ADL and IADL limitations, varies signifi-cantly across states (Montez et al. 2017) and regions (Lin 2000; Porell and Miltiades2002; Lin and Zimmer 2002). This research also indicates that this spatial variationpersists even after accounting for the demographic and socioeconomic character-istics of the population as well as by lifestyle characteristics and chronic medicalconditions. Montez et al. (2017) offers a unique insight of the possible sources of thispersistent spatial variation. Using data from the American Community Survey forthe years 2010–2014 and multilevel logistic models on multiple age cohorts, includ-ing a cohort of individuals aged 65–94 years, the authors find that the probability ofhaving a disability is lower in states with stronger economic output (per capita GSP),more income equality (GINI coefficient, particularly for older women), and longerhistories of tax credits for low-income workers (years with EITC).
The available research further agrees that older adults in the American South, par-ticularly in the Southeast, have a higher estimated probability of having a functionallimitation than their peers in other U.S. regions regardless of socioeconomic status,gender, or race (i.e., White or Black). For women, for example, Porell and Miltiades(2002) estimates with data from the Medicare Current Beneficiary Survey for the1992–1995 period that the odds of having a functional limitation (ADL or IADL)at the time were between 20% and 55% lower if they resided in any region of thecountry other than the Deep South. These results are not surprising given the poorerhealth profile and poorer access to healthcare resources, described by research else-where, of individuals in southeastern states compared to individuals in other regions(Zopf 1992; Lanska and Kryscio 1994; Centers for Disease Control and Prevention1995; Schneider et al. 1997; Barnett and Vornovitsky 2016). Porell and Miltiades(2002), however, finds that the harmful effects of living in the Deep South affectolder women more than older men, and attributes tentatively this result to a higherprevalence of older women residing in counties in the Deep South characterized bya higher concentration of poverty and/or by a lower population density. In addition,based on analysis using data from the 1990 U.S. Census of Population for individuals

24 W. A. Vega et al.
aged 65 and over, Lin (2000), and Lin and Zimmer (2002) find that being born inthe South, carries a functional disability burden in older age for both Whites andBlacks that follows them when they migrate away from the South. A similar burdenhas been identified by earlier research describing higher mortality rates for Blackswho have migrated from the South (Mancuso and Redmond 1975; Greenberg andSchneider 1992, 1995; Fang et al. 1996; Schneider et al. 1997).
Conceptual Model
Researchers have come to understand that inequalities in population health arise fromcomplex multidimensional, multifactorial, and longitudinal processes that moderatean individual’s exposure to health risks and health care resources over their life cycle,interacting to generate health patternswithin the population thatmay transcend acrossgenerations. Synthesizing earlier research, Solar and Irwin (2010) describes theseprocesses in a framework where health inequalities are derived from the interactionof two sets of mechanisms, denoted by the authors as structural and intermediarydeterminants of health. The structural determinants of health inequalities encompassthe socioeconomic and policy contexts that shape the functioning of a society (e.g.,its governance, cultural and social values, economic structure, social protection poli-cies, among others) as well as the stratification systems that these contexts generateand reinforce, and which position members of society within a social hierarchy thatranks individuals according to factors such as a person’s race and ethnicity, socioe-conomic resources (e.g., education, occupation, and income), and/or gender. Thesestructural mechanisms configure the social, economic, and health opportunities andoutcomes of individuals in a society based on their placement within the social hier-archy—opportunities and outcomes which vary across contexts.
Whereas the structural determinants of a person’s health—both the societal con-text and the person’s socioeconomic position within society—are considered thebasic determining factors of the well-being of individuals, it is individual-level inter-mediary factors that serve as the modulating agents that determine the actual magni-tude of their impact. Several elements in a person’s life are considered intermediarydeterminants of health as described in Solar’s and Irwin’s (2010) stylized frame-work, including material circumstances (e.g., housing and working conditions, theneighborhood setting, food availability, access to health care resources), psychosocialcircumstances (e.g., life stressors and responses), behavioral factors (e.g., cigarettesmoking, physical activity), and biological factors (e.g., genetics). Intermediary fac-tors, therefore, modulate a person’s exposure and vulnerability to health risks, withaccess to health-promoting and health care resources being intermediary factors thatminimize this health-risk exposure and vulnerability.
From this perspective, population health inequalities arise from differential con-sequences on the population from different socioeconomic and policy contexts andfrom the unequal distribution of intermediary factors among the population livingwithin these contexts. Implicit in this analytical framework is the role that geography
2 Regional Disparities in ADL Limitations Among Older Latinos … 25
plays in the determination of population health and health disparities: geographicalspace bounds the structural and intermediary mechanisms and processes that con-tribute to the differential allocation of health across social groups within space. Associal contexts and conditions vary across geographic space, the distribution of healthand health outcomes also varies across such space, bringing about spatial disparitiesin health. Not considered in this framework is the role that the physical characteris-tics of the geographic space play on health determination. Yet research suggests thatthe structural determinants of health may not only be social, but that the physicalenvironment—weather and climate, hydrography, or orography, among other charac-teristics—of the geographical unit also have an effect on the health of individuals and,thus, on the configuration of health patterns across geographic spaces (e.g., Elo andPreston 1992; Lajinian et al. 1997; Curtis and Jones 1998; McDonald et al. 2015).We have yet to understand fully, however, how the physical environment of geo-graphic space interacts with the social conditions, both structural and intermediary,of individuals to modulate health outcomes and spatial health disparities.
Implicit within this context is also the role of age, specifically the role of time,in the determination and distribution of health within and across space. The frame-work (Simon and Irwin 2010) adopts a life-course perspective in which individualhealth, population health, and health disparities across individuals and populationgroups within and across geographic space are a product—cumulative, additive, ormultiplicative—of life-course exposures to contextual factors, health-compromisingbehaviors, and protective factors. Indeed, exposure need not be a single occurrencebut may be an accumulation of exposures at different stages of an individual’s lifecourse and may also be socially patterned (Smith and Morris 1994). Likewise, out-comes need not be limited to individuals within a single generation butmay transcendacross generations (Ben-Shlomo and Kuh 2002) or even across geographic space iftaking into account the geographic migration of individuals (Lin 2000; Lin andZimmer 2002).
Figure 2.1 reproduces the analytical framework of the social determinants ofhealth presented in Solar and Irwin (2010) incorporating the role of geography inthe model and modifying for clarity. We adopt this framework in our subsequentanalysis of the functional declines of older adults across U.S. regions to understandif and how two known structural determinants of overall health disparities—income,and race and ethnicity—influence specifically the differential risk of developing anADL limitation among Latinos, Blacks, and Whites across multiple regions of theUnited States.
Methods
The data come from the Health and Retirement Study (HRS), a nationally repre-sentative longitudinal household survey of retirement and health among the elderlyover the age of 50 years residing in the United States, sponsored by the NationalInstitute on Aging (NIA U01AG009740) and the Social Security Administration.

26 W. A. Vega et al.
Fig. 2.1 Social determinants of health disparities in geographic space. Source Adapted reproduc-tion from Solar and Irwin (2010)
We used data for persons, starting in Wave 2 in 1993 to Wave 11 in 2012, whoanswered questions on Activities of Daily Living (ADL) on at least one interview.We omitted all persons from three regions (Census-defined regional divisions) ofthe United States that had few Black respondents or few Latino respondents (NewEngland, West North Central, and East South Central). This yielded an analysis sam-ple of N � 23,433 respondents with a total of 125,235 interviews on which ADLlimitations were assessed.
Table 2.1 presents the samples by wave of the HRS used in the analyses shownin Figs. 2.2 and 2.3, showing replacement due to mortality and years in which thesample was enlarged. Table 2.2 displays the sample characteristics. The distributionof anyADLdeficit or limitation acrossU.S. regions by racial/ethnic groups, includingLatinos, Blacks, and Whites, is shown in Fig. 2.2, and by income groups in Fig. 2.3.Prevalences in Figs. 2.2 and 2.3 were computed by calculating age-sex adjustedprevalences for each wave of the survey and then averaging across waves.
Longitudinal results in Figs. 2.4, 2.5 and 2.6 are from Cox regressions (propor-tional hazards models) of the outcome of any ADL deficit in functioning for per-sons who at their first interview had no ADL deficits. After being assessed with anADL deficit, subsequent interviews were omitted from the analysis. In other words,Figs. 2.4, 2.5 and 2.6 are looking at the transition as persons go from no deficits toany deficit. The analysis sample consisted of 20,803 persons with an average of fourHRS data points per respondent. “Time” in the Cox regressions of Figs. 2.4, 2.5 and

2 Regional Disparities in ADL Limitations Among Older Latinos … 27
Table 2.1 Sample by wave of HRS
Wave Year Already in survey New to survey Total N
N N
2 1993–1994 0 10,815 10,815
3 1995–1996 10,169 338 10,507
4 1998 9,436 4,899 14,335
5 2000 12,952 211 13,163
6 2002 11,855 160 12,015
7 2004 10,791 2,399 13,190
8 2006 11,940 172 12,112
9 2008 11,141 78 11,219
10 2010 10,024 4,361 14,385
11 2012 13,494 0 13,494
Total 23,433 125,235
Fig. 2.2 Percentage of persons aged >50 years with any ADL deficit by region and race/ethnicity.Note Standardized by age and sex. Source HRS 1993–2012
2.6 is age, and the curves shown in Fig. 2.6 are “failure” curves, i.e., the probabilityof “failure” (any deficit) occurring prior to the age shown.2
2Averaging across waves as well as fitting survival models with time being age both mask possiblecohort effects. We tried limiting the waves in our analysis sample to the most recent cohorts, but itdid not give a large enough sample to look at effects by ethnicity. We recognize that the possibilityof cohort effects and not being able to assess them is a limitation of our analysis.

28 W. A. Vega et al.
Fig. 2.3 Percentage of persons aged >50 years with any ADL deficit by region and income. NoteStandardized by age and sex. Source HRS 1993–2012
Each figure legend includes information on statistical adjustments used. All analy-ses account for samplingweights and the complex survey design, andwere computedusing the Stata Statistical Software, Release 14 (StataCorp 2015).
Table 2.2 presents the weighted distribution of interviews by sex, living with aspouse or partner, education, household income, BMI, and region, averaged acrosswaves of the survey. These variables are each contrasted across racial/ethnic groups.The notable differences are higher levels of education and income, and lower BMI, inWhites compared to Blacks and Latinos. Blacks are the least likely to be living withpartners. Regional distributions across six regions of racial/ethnic groups are markedby higher percentages of Blacks in the West South Central region, and Whites in theEast North Central and South Atlantic regions.
Findings
Age-and sex-adjusted percentages of people with any ADL limitation across six U.S.regions are shown in Fig. 2.2, calculated by averaging across the waves of HRS. Inevery region, the percentages of people with ADL deficits are higher for Latinosand Blacks and lowest for Whites, except in one region (East North Central) where
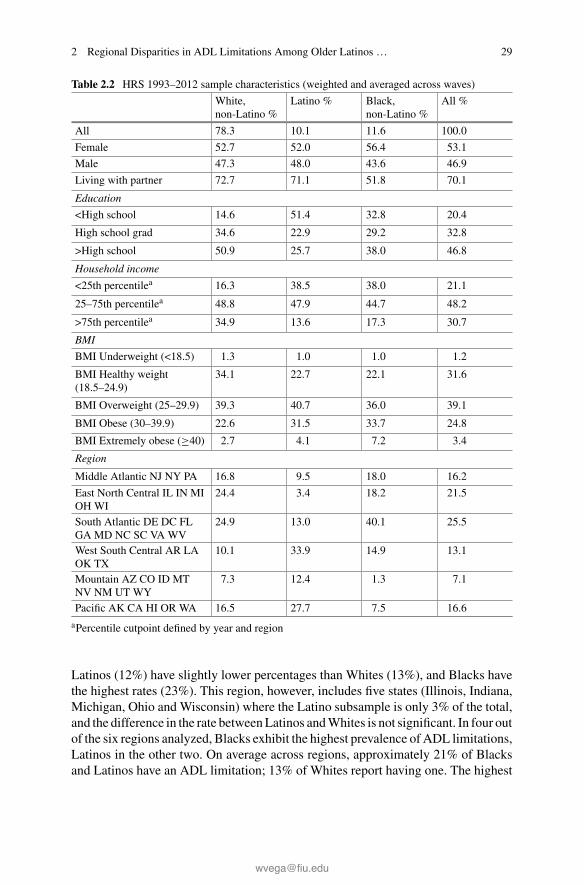
2 Regional Disparities in ADL Limitations Among Older Latinos … 29
Table 2.2 HRS 1993–2012 sample characteristics (weighted and averaged across waves)
White,non-Latino %
Latino % Black,non-Latino %
All %
All 78.3 10.1 11.6 100.0
Female 52.7 52.0 56.4 53.1
Male 47.3 48.0 43.6 46.9
Living with partner 72.7 71.1 51.8 70.1
Education
<High school 14.6 51.4 32.8 20.4
High school grad 34.6 22.9 29.2 32.8
>High school 50.9 25.7 38.0 46.8
Household income
<25th percentilea 16.3 38.5 38.0 21.1
25–75th percentilea 48.8 47.9 44.7 48.2
>75th percentilea 34.9 13.6 17.3 30.7
BMI
BMI Underweight (<18.5) 1.3 1.0 1.0 1.2
BMI Healthy weight(18.5–24.9)
34.1 22.7 22.1 31.6
BMI Overweight (25–29.9) 39.3 40.7 36.0 39.1
BMI Obese (30–39.9) 22.6 31.5 33.7 24.8
BMI Extremely obese (≥40) 2.7 4.1 7.2 3.4
Region
Middle Atlantic NJ NY PA 16.8 9.5 18.0 16.2
East North Central IL IN MIOH WI
24.4 3.4 18.2 21.5
South Atlantic DE DC FLGA MD NC SC VA WV
24.9 13.0 40.1 25.5
West South Central AR LAOK TX
10.1 33.9 14.9 13.1
Mountain AZ CO ID MTNV NM UT WY
7.3 12.4 1.3 7.1
Pacific AK CA HI OR WA 16.5 27.7 7.5 16.6
aPercentile cutpoint defined by year and region
Latinos (12%) have slightly lower percentages than Whites (13%), and Blacks havethe highest rates (23%). This region, however, includes five states (Illinois, Indiana,Michigan, Ohio and Wisconsin) where the Latino subsample is only 3% of the total,and the difference in the rate betweenLatinos andWhites is not significant. In four outof the six regions analyzed, Blacks exhibit the highest prevalence of ADL limitations,Latinos in the other two. On average across regions, approximately 21% of Blacksand Latinos have an ADL limitation; 13% of Whites report having one. The highest

30 W. A. Vega et al.
Fig. 2.4 Probability of onset of any ADL deficit before age 75 years by race/ethnicity. NoteRace/ethnicity differences significant at p < 0.01. Source HRS 1993–2012
Fig. 2.5 Probability of onset of any ADL deficit before age 75 years for household income<25thpercentile by region and race/ethnicity. Note Regional and race/ethnicity differences significant atp < 0.01, controlled for BMI, current smoking, sex, and living with a spouse/partner. Source HRS1993–2012

2 Regional Disparities in ADL Limitations Among Older Latinos … 31
Fig. 2.6 Age of first onset of any ADL deficit by income. Note All income pairwise differencessignificant at p < 0.001, controlled for sex and living with a spouse/partner. SourceHRS 1993–2012
rate for any racial/ethnic group in any region occurs for Latinos in theMiddleAtlanticregion (31%), an area that includes New York, New Jersey, and Pennsylvania. Thehighest overall percentages by region occur inWest SouthCentral, a region consistingof Arkansas, Louisiana, Oklahoma, and Texas. In this region, high percentages ofolder Blacks and Latinos have ADL limitations, 28% and 25% respectively, whereas15.2% of olderWhites have an ADL limitation. The lowest percentages overall occurin the Mountain region. Percentages of Latinos with an ADL limitation range from ahigh of 31% in the Mid-Atlantic region, followed by 25% in the West South Centralregion, to a low of 12% in the East North Central region.
Figure 2.3 presents the age- and sex-adjusted distribution of ADL limitations byregion and by household income quartiles (with the two central quartiles combined).As anticipated, the highest income quartile shows the lowest percentages of preva-lence of ADL limitations in every region (7.5% on average), and the lowest incomequartile shows the highest rates (27% on average), with the peak occurring in theWest South Central Region that includes Texas, a state with the second largest Latinopopulation in the United States after California. The range in percentages of individ-uals with ADL limitations is dramatic; for example, in theWest South Central regionfor the highest income quartile, the percentage of individuals with any ADL deficitis only about 8.7%, and the lowest income-quartile percentage is about 33.2%. How-ever, the differences in ADL-deficit percentages by income are large in every region,with the lowest variation by income quartile occurring in the Mountain region.
In Fig. 2.4, we present a general comparison by race and ethnicity for proba-bility of onset of any ADL deficit occurring before age 75 across different model

32 W. A. Vega et al.
specifications. We observe that, in general, Latinos exhibit overall the highest onsetprobabilities, followed by Blacks, and then Whites. In Fig. 2.5, we extend our anal-ysis and present region by race and ethnicity comparisons for probability of onset ofany ADL deficit occurring before age 75, but in this instance showing only the resultsfor the lowest income quartile. The onset probabilities come from a Cox regressionthat accounts for BMI, current smoking, sex, and living with a spouse or partner. Weobserve persistent regional variations within as well as across racial/ethnic groupsin onset probabilities. Whereas these differences (within and across racial/ethnicgroups) are much narrower, patterns are reminiscent of some of those observed inFig. 2.2 on the age- and sex-adjusted prevalence of ADL limitations. Onset differ-ences by region and race/ethnicity are statistically significant at p < 0.01, and inevery region, Blacks or Latinos alternate for having the highest probability of anyADL-deficit onset before age 75.
Figure 2.5 further shows that Latinos in the Mid-Atlantic region have the highestprobability of onset, at 71%, of any ADL limitation before the age of 75 comparedto Latinos in other regions or to any other group. In fact, Latinos in the Mid-Atlanticregion have 12% points of higher probability of onset of ADL limitations before age75 than Blacks and 16% points higher than Whites in the same region. The secondhighest onset probability overall, at 68%, is also observed for Latinos in the WestSouth Central region; however, in this region, Blacks and Whites also report thehighest onset probabilities within their racial group, at 67% and 63% respectively.The Pacific region also shows similar onset probabilities for the three racial/ethnicgroups: 54% for Blacks, 55% forWhites, and 59% for Latinos. In every other region,the probability of onset of an ADL limitation before the age of 75 for Whites andLatinos is below 60%, while for Blacks is above, between 63% and 66%.
Figure 2.6 presents a Cox regression model of onset of any ADL deficit by agetiered by income quartiles for a subsample of HRS respondents who did not haveany ADL deficits at baseline. All pairwise differences among the curves shown aresignificant at p < 0.001, controlled for sex and livingwith a spouse or partner. The ageof onset pattern is very clear, the lowest income quartile of older adults experiencea much earlier onset of one or more ADL limitations. For example, a probability of0.5 of an ADL-limitation onset occurs approximately 17 years earlier for people inthe lowest income quartile compared to the highest quartile, age 69 versus age 86.At the 0.6 probability level, the gap in age of onset is still about the same at 16 years.
Elsewhere, we presented a different Cox regression model comparing the ageof onset of any ADL limitation by income quartiles and BMI levels ranging fromhealthy weight to extremely obese using the same database (Vega and Sribney 2017).The most poignant finding was that extremely obese people in the lowest quartileof income reached a probability of 0.5 for an ADL-limitation onset about 10 yearsearlier than people in the highest quartile of income who were extremely obese,at 59 years compared to 69 years. At 0.6 probability, the age of onset differencesbetween people in the highest and lowest income quartiles whowere extremely obesewidened to about 12 years, illustrating the accelerating pace of functional decline inthe lowest income tier even among people at the highest health-risk status.

2 Regional Disparities in ADL Limitations Among Older Latinos … 33
Discussion
This chapter explored within and across regional disparities in the prevalence andonset of ADL limitations among Latino, Black, and White older adults in the UnitedStates, examining whether their socioeconomic status, as determined by their racialand ethnic identity as well as household income, is a driver of this variation. Ulti-mately, our findings illustrate that both elements are important and interrelated inunderstanding spatial effects on the risk of ADL limitations but do not fully explainregional variation. We observe major differences across regions in ADL-limitationrisk, also large differences within and across regions in ADL-limitation risk byracial/ethnic group, and accounting for the socioeconomic status (looking at house-hold income quartiles) greatly reduces, but does not eliminate, differences amongracial/ethnic groups in their risk of developing an ADL limitation within and acrossregions. In addition, our analysis points to large differences in ADL-limitation riskbetween lower-income and higher-income older adults of any race or ethnic groupin our sample. Specifically, we found a nearly 17-year difference in a 50% risk prob-ability level for first onset of ADL limitations on average between individuals inthe lowest and highest income quartiles. Notably, a larger relative share of Latinosand Blacks in our sample are from households with income in the lowest quartilecompared to Whites.
Latinos are at higher risk ofADL limitations before age75 thanWhites acrossmostregions, except in the East North Central and South Atlantic regions, where Whiteshave a slightly higher risk than Latinos. Overall, Latinos have only somewhat lowerrisk than Blacks, alternating across regions for the group with the highest risk. TheSouth Atlantic and West South Central regions present the highest ADL-limitationrisk forBlacks.Our results correspond to earlier researchpointing to the overall healthdisadvantage of Blacks in the United States (e.g., Dressler et al. 2005) and of bothWhites and Blacks in the American South, as discussed earlier in this chapter. Priorresearch on the poorer health conditions of individuals residing in Southern statescompared to other regions in fact tells us that these individuals are less likely to accessmedical care (Lanska and Kryscio 1994) or to have health insurance (Barnett andVornovitsky 2016) than individuals who live elsewhere in the United States, and thatindividuals in southeastern states have inferior health and lower access to healthcare(Lin 2000; Porell and Miltiades 2002).
There is an emerging literature that has addressed the associations of economicdevelopment with spatial indices of health, which may explain some of the patternsof regional variation in risk of ADL limitations that we observe for Whites andBlacks. Liu et al. (2010), for example, has examined regional variation in disability-free life expectancy and finds this variation to reflect patterns of regional economicdevelopment in China. European researchers are also increasingly using a similarlens to understand how regional economic factors impact health and functional sta-tus in comparative area analyses using large data sets (Gutiérrez-Fisac et al. 2000;Groenewegen et al. 2003). But probably most related to our research findings is therecent work of Montez et al. (2017) who assess how the socioeconomic and policy

34 W. A. Vega et al.
contexts of U.S. states influence the probability of having a disability. The authorsfind that this probability is lower in states with stronger economic output (per capitaGSP) and more income equality, among other related findings. Not surprising, someof the highest age-adjusted disability rates for adults aged 24–94 years are reportedin southeastern states (Montez et al. 2017), and the southeast region of the UnitedStates is consistently ranked lowest (8th) of all regions in per capita GSP accordingto data of the Bureau of Economic Analysis for the years 1987–2016.
Two regions stand out in ADL-limitation risk for Latinos in our analysis, theMid-Atlantic region, which includes the states of New York, Pennsylvania, and NewJersey, and the West South Central region that includes Texas, Arkansas, Oklahoma,and Louisiana. Indeed, the highest risk of ADL limitations for Latinos was reportedin the Mid-Atlantic region and the second highest in the West South Central region.Results in both regions, however, may be driven by the disproportionally large Latinopopulation in the states of Texas (38%), New York (18%), and New Jersey (18%)compared to other states in the same region (Brown and Lopez 2013). This under-scores the importance of the national population distribution in understanding healthpatterns of Latino subgroups as evidenced by the different compositional structure ofthe Latino population in these diverse regions. Unfortunately, an analysis of Latinosubgroups by region is limited by their undersampling in the earliest iterations ofthe HRS, but based on American Community Survey data for 2011, we know thatthe largest Latino subgroup in Texas is of Mexican descent, and the largest Latinosubgroup in both New Jersey and New York is of Puerto Rican descent followed byLatinos of Dominican descent (Brown and Lopez 2013; Brown and Patten 2013).
ThatMid-Atlantic older Latinos, whowe know from other research to be predom-inantly of Puerto Rican andDominican descent, exhibit the highest risk of developinga functional limitation by age 75 compared to older Latinos in the West South Cen-tral region and elsewhere resemble results from a considerable number of researchreports that show significant health disadvantages among these Latino subgroups(e.g., Zsembik and Fennell 2005; Lara et al. 2006; Pabon-Nau et al. 2010; Castaneda-Sceppa et al. 2010). Results for Latinos in the West South Central region—and tosome extent in the Pacific region where Latinos are also predominantly of Mexicandescent and risk of ADL limitations is relatively high—also correspond to researchreports about older Mexican Americans. Despite better health in mid adulthood andlonger life expectancy than is normative in the United States, Mexican Americansexperience rapid declines in health and functional status after 55 years of age.
What is unique of these results from our perspective is that the “Hispanic para-dox” in health, originally reported byMarkides and Coreil (1986), of superior healthand longevity among Latino immigrants compared to the native-born Whites drasti-cally recedes in later adulthood to a very high-risk profile for health and functionaldeclines in the relatively early stages of aging. Subsequent research reported that thishealth advantage weakens amongMexican Americans notwithstanding the longevityadvantage (González et al. 2009). This poses a second paradox to explain why thesedeclines are not uniformly distributed across regions and Latino ethnic groups. TheMid-Atlantic region, which as noted is primarily consisting of older adults of PuertoRican and Dominican ethnic origins, shows much higher ADL-limitation risk than

2 Regional Disparities in ADL Limitations Among Older Latinos … 35
the Pacific region, which is primarily populated byMexican Americans. On the otherhand, two regions primarily populated by Mexican Americans, the Pacific and WestSouth Central regions, also have markedly different levels of ADL-limitation risk.Are these differences attributable to variations in Latino-composition factors and/ordifferences in sociocultural and social structural factors? These are critical issuesfor developing linked public health and spatial development strategies for improvingthe life course for Latino populations currently at very high risk for rapid later-lifehealth declines and deteriorating functional status.
Recent research reports underscore a 50% higher risk of Alzheimer’s disease forU.S. Latinos associated with high rates of metabolic syndrome, obesity, diabetes,cardiovascular disease, and other modifiable health risk factors that increase inflam-mation. This issue is examined in a separate chapter in this volume. Public healthefforts to concentrate on spatial-area approaches to lowering this background ofexcessive health risks, such as the Robert Wood Johnson “Culture of Health” initia-tive, are demonstrating how balanced development strategies can improve life coursedeterminants in vulnerable communities. Yet even beyond the health-compromisingeducation and income gap factors affecting the well-being of Latinos, there are otherspatial-area structural and intermediary factors that are also operative in increasingpeople’s exposure to negative health outcomes—factors such as violence, racism,and concentrated poverty as well as deficits in health care access and social mobilityopportunities.
The research presented in this chapter is a direct response to the lack of spatial-area studies of Latino health in the United States, as most previous research hasprimarily focused on Black and White comparisons. Our analysis finds a higheroverall risk, and earlier onset, of ADL limitations for Latinos compared to Whites inmost regions of the United States. The highest risk for any racial/ethnic group wasamong Latinos in the Mid-Atlantic region. An additional innovation of this researchis the use of longitudinal modeling to demonstrate how low socioeconomic statusaccelerates earlier onset of ADL limitations compared to higher-income older adults.However, one limitation of our research was the inadequacy of subsample sizes toallow longitudinal modeling of the data for specific Latino racial/ethnic subgroupsby region.
Conclusion
The data used in this study are from the HRS, a sentinel survey of aging healthin the United States. Unfortunately, the HRS in its earliest iterations did not haveadequate sampling of Latino subgroups by region for intensive subgroup analysiswithin regions, which is a limitation of this investigation. In the current era, it is wellestablished that the Latino population is heterogeneous and that regional variations inhealth are intertwined with Latino-subgroup population distributions. This clarifiesthe necessity for greater specificity in area studies to circumvent these limitationsand potential confounders. Challenges in spatial research remain because of the

36 W. A. Vega et al.
multilevel nature of social environments that systematically expose people nested incultural networks to complex demands for successful adaptation that support healthylives. The research challenge also has evolved from simply cataloging disease riskto undertaking the much more difficult task of discovering how to modify relativelyunique habitats to enable people to thrive, not simply to survive.
Acknowledgements This research was sponsored by the Edward R. Royal Institute on Aging atthe University of Southern California.
References
Barnett, J. C., & Vornovitsky, M. S. (2016). Health insurance coverage in the United States: 2015.Washington, DC: U.S. Government Printing Office.
Ben-Shlomo, Y., & Kuh, D. (2002). A life course approach to chronic disease epidemiology: Con-ceptual models, empirical challenges and interdisciplinary perspectives. International Journal ofEpidemiology, 31(2), 285–293.
Berchick, E. R., & Lynch, S. M. (2017). Regional variation in the predictive validity of self-ratedhealth for mortality. SSM-Population Health, 3, 275–282.
Brown, A., & Lopez, M. H. (2013). Mapping the Latino population, by state, county and city.Washington, DC: Pew Research Center.
Brown, A., & Patten, E. (2013). Hispanics of Dominican origin in the United States, 2011. Wash-ington, DC: Pew Research Center.
Castaneda-Sceppa, C., Price, L. L., Noel, S. E., Bassett Midle, J., Falcon, L. M., & Tucker, K. L.(2010). Physical function and health status in aging Puerto Rican adults: The Boston Puerto Ricanhealth study. Journal of Aging and Health, 22(5), 653–672.
Centers for Disease Control and Prevention. (1995). The health of the nation: 1995 report onprogress. Washington, DC: U.S. Department of Health and Human Services, U.S. GovernmentPrinting Office.
Chuang, K. Y., Chuang, Y. C., Chen, L. J., & Wu, S. C. (2008). Geographical variations in elderlydisability in Taiwan. Journal of Nursing Research, 16(1), 47–54.
Curtis, S., & Jones, I. R. (1998). Is there a place for geography in the analysis of health inequality?Sociology of Health and Illness, 20(5), 645–672.
Dressler, W. W., Oths, K. S., & Gravlee, C. C. (2005). Race and ethnicity in public health research:Models to explain health disparities. Annual Review of Anthropology, 34, 231–252.
Elo, I. T., & Preston, S. H. (1992). Effects of early-life conditions on adult mortality: A review.Population Index, 58(2), 186–212.
Ezzati,M., Friedman,A. B., Kulkarni, S. C., &Murray, C. J. (2008). The reversal of fortunes: Trendsin county mortality and cross-county mortality disparities in the United States. PLoS Medicine,5(4), e66.
Fang, J.,Madhavan, S.,&Alderman,M.H. (1996). The association betweenbirthplace andmortalityfrom cardiovascular causes among black and white residents of New York City. New EnglandJournal of Medicine, 335(21), 1545–1551.
Freedman, V. A., Martin, L. G., Schoeni, R. F., & Cornman, J. C. (2008). Declines in late-lifedisability: the role of early-and mid-life factors. Social Science and Medicine, 66(7), 1588–1602.
Fukuda, Y., Nakamura, K., & Takano, T. (2004a). Municipal socioeconomic status and mortality inJapan: Sex and age differences, and trends in 1973–1998. Social Science and Medicine, 59(12),2435–2445.
Fukuda,Y.,Nakamura,K.,&Takano,T. (2004b).Cause-specificmortality differences across socioe-conomic position of municipalities in Japan, 1973–1977 and 1993–1998: Increased importance

2 Regional Disparities in ADL Limitations Among Older Latinos … 37
of injury and suicide in inequality for ages under 75. International Journal of Epidemiology,34(1), 100–109.
Gómez-Dantés, H., Fullman, N., Lamadrid-Figueroa, H., Cahuana-Hurtado, L., Darney, B., Avila-Burgos, L., et al. (2016). Dissonant health transition in the states of Mexico, 1990–2013: Asystematic analysis for the Global Burden of Disease Study 2013. The Lancet, 388(10058),2386–2402.
González, H. M., Ceballos, M., Tarraf, W., West, B. T., Bowen, M. E., & Vega, W. A. (2009). Thehealth of older Mexican Americans in the long run. American Journal of Public Health, 99(10),1879–1885.
Greenberg, M., & Schneider, D. (1992). Region of birth andmortality of blacks in the United States.International Journal of Epidemiology, 21(2), 324–328.
Greenberg, M., & Schneider, D. (1995). The cancer burden of southern-born African Americans:Analysis of a social-geographic legacy. The Milbank Quarterly, 73(4), 599–620.
Groenewegen, P. P., Westert, G. P., & Boshuizen, H. C. (2003). Regional differences in healthy lifeexpectancy in the Netherlands. Public Health, 117(6), 424–429.
Gutiérrez-Fisac, J. L., Gispert, R., & Solà, J. (2000). Factors explaining the geographical differencesin disability free life expectancy in Spain. Journal of Epidemiology andCommunity Health, 54(6),451–455.
Kawachi, I., Kennedy, B. P., Gupta, V., & Prothrow-Stith, D. (1999). Women’s status and the healthof women and men: A view from the states. Social Science and Medicine, 48(1), 21–32.
Kington, R., Carlisle, D., McCaffrey, D., Myers, H., & Allen, W. (1998). Racial differences infunctional status among elderly U.S. migrants from the south. Social Science and Medicine,47(6), 831–840.
Lajinian, S., Hudson, S., Applewhite, L., Feldman, J., & Minkoff, H. L. (1997). An associationbetween the heat-humidity index and preterm labor and delivery: A preliminary analysis. Amer-ican Journal of Public Health, 87(7), 1205–1207.
Lanska, D. J., & Kryscio, R. (1994). Geographic distribution of hospitalization rates, case fatality,and mortality from stroke in the United States. Neurology, 44(8), 1541–1541.
Lara, M., Akinbami, L., Flores, G., & Morgenstern, H. (2006). Heterogeneity of childhood asthmaamong Hispanic children: Puerto Rican children bear a disproportionate burden. Pediatrics,117(1), 43–53.
Lin, G. (2000). Regional assessment of elderly disability in the U.S. Social Science and Medicine,50(7), 1015–1024.
Lin, G., & Zimmer, Z. (2002). A geographical analysis of spatial differentials in mobility andself-care limitations among older Americans. Population, Space and Place, 8(6), 395–408.
Liu, J., Chen, G., Chi, I., Wu, J., Pei, L., Song, X., et al. (2010). Regional variations in and corre-lates of disability-free life expectancy among older adults in China. BMC Public Health, 10(1),446–453.
Mancuso, T. F., & Redmond, C. K. (1975). Heart disease mortality among black migrants: A studyof Ohio residents (1960–1967). American Heart Journal, 90(3), 380–388.
Markides, K. S., & Coreil, J. (1986). The health of Hispanics in the southwestern United States:An epidemiologic paradox. Public Health Reports, 101(3), 253–265.
McDonald, Y. J., Grineski, S. E., Collins, T. W., & Kim, Y. A. (2015). A scalable climate healthjustice assessment model. Social Science and Medicine, 133, 242–252.
Montez, J.K., Zajacova,A.,&Hayward,M.D. (2016). Explaining inequalities inwomen’smortalitybetween U.S. states. SSM-Population Health, 2, 561–571.
Montez, J. K., Hayward, M. D., & Wolf, D. A. (2017). Do U.S. states’ socioeconomic and policycontexts shape adult disability? Social Science and Medicine, 178, 115–126.
Newton, J. N., Briggs, A. D., Murray, C. J., Dicker, D., Foreman, K. J., Wang, H., et al. (2015).Changes in health in England, with analysis by English regions and areas of deprivation,1990–2013: A systematic analysis for the Global Burden of Disease Study 2013. The Lancet,386(10010), 2257–2274.
38 W. A. Vega et al.
Pabon-Nau, L. P., Cohen, A., Meigs, J. B., & Grant, R. W. (2010). Hypertension and diabetesprevalence among U.S. Hispanics by country of origin: The National Health Interview Survey2000–2005. Journal of General Internal Medicine, 25(8), 847–852.
Pearce, J., & Dorling, D. (2006). Increasing geographical inequalities in health in New Zealand,1980–2001. International Journal of Epidemiology, 35(3), 597–603.
Porell, F. W., & Miltiades, H. B. (2002). Regional differences in functional status among the aged.Social Science and Medicine, 54(8), 1181–1198.
Rosenberg, M. W., & Wilson, K. (2000). Gender, poverty and location: How much difference dothey make in the geography of health inequalities? Social Science and Medicine, 51(2), 275–287.
Schneider, D., Greenberg, M. R., & Lu, L. L. (1997). Region of birth and mortality from circulatorydiseases among black Americans. American Journal of Public Health, 87(5), 800–804.
Smith, G. D., &Morris, J. (1994). Increasing inequalities in the health of the nation. BritishMedicalJournal, 309(6967), 1453–1454.
Solar, O., & Irwin, A. (2010). A conceptual framework for action on the social determinantsof health. Social Determinants of Health Discussion Paper 2 (Policy and Practice). Geneva,Switzerland: World Health Organization.
StataCorp. (2015). Stata Statistical Software: Release 14. College Station, TX: StataCorp LP.Tencza, C., Stokes, A., & Preston, S. (2014). Factors responsible for mortality variation in theUnited States: A latent variable analysis. Demographic Research, 21(2), 27–70.
Vega, W. A., & Sribney, W. M. (2017). Growing economic inequality sustains health disparities.American Journal of Public Health, 107(10), 1606–1607.
Wilmoth, J. R., Boe, C., & Barbieri, M. (2010). Geographic differences in life expectancy at age50 in the United States compared with other high-income countries. In E. M. Crimmins, S. H.Preston, & B. Cohen (Eds.), International differences in mortality at older ages: Dimensions andsources (pp. 333–366). National Research Council (US) panel on understanding divergent trendsin longevity in high-income countries. Washington, DC: National Academies Press (US).
Xu,K.T. (2006). State-level variations in income-related inequality in health and health achievementin the U.S. Social Science and Medicine, 63(2), 457–464.
Zhou, M., Wang, H., Zhu, J., Chen, W., Wang, L., Liu, S., et al. (2016). Cause-specific mortality for240 causes in China during 1990–2013: A systematic subnational analysis for the Global Burdenof Disease Study 2013. The Lancet, 387(10015), 251–272.
Zopf, P. E. (1992). Mortality patterns and trends in the United States. Westport, CT: GreenwoodPress.
Zsembik, B. A., & Fennell, D. (2005). Ethnic variation in health and the determinants of healthamong Latinos. Social Science and Medicine, 61(1), 53–63.

Chapter 3¿Importa Dónde Vivimos? How RegionalVariation Informs Our Understandingof Diabetes and Hypertension PrevalenceAmong Older Latino Populations
Catherine García and Jennifer A. Ailshire
Abstract A substantial body of research has found aging Latinos to be dispropor-tionately affected by diabetes and hypertension. However, less research has examinedwhether these health conditions vary by region among Latino subgroups. We arguethat the health of older Latinos varies considerably by region as each geographi-cal location reflects unique historical, cultural, and demographic contexts that mayaffect health in later life. Consequently, our study builds on previous research bydistinguishing five Latino subgroups by national-origin to examine regional varia-tion in diabetes and hypertension among adults aged 50 and older using data fromthe 2000–2015 National Health Interview Survey. Our results find region to be animportant factor for the prevalence of diabetes and hypertension amongolder Latinos.Specifically, we find that Mexicans exhibited a higher prevalence of diabetes in theMidwest, South, andWest regions compared to theirWhite counterparts, and a higherprevalence of hypertension in the South than Whites. Puerto Ricans have a higherprevalence of diabetes in all regions compared to Whites, and a higher prevalence ofhypertension in theNortheast thanWhites.Dominicans in theNortheast have a higherprevalence of diabetes and hypertension than Whites. Central/South Americans inthe South and West have a higher prevalence of diabetes than Whites. Conversely,Cubans did not differ fromWhites in the prevalence of diabetes or hypertension. Ourwork shows that for older Latinos, themechanisms throughwhich geographic contextinfluences health should be at the forefront in unveiling Latino health disparities.
C. García (B) · J. A. AilshireAndrus Gerontology Center, Leonard Davis School of Gerontology, University of SouthernCalifornia, Los Angeles, CA, USAe-mail: [email protected]
J. A. Ailshiree-mail: [email protected]
© Springer Nature Switzerland AG 2019W. A. Vega et al. (eds.), Contextualizing Health and Aging in the Americas,https://doi.org/10.1007/978-3-030-00584-9_3
39

40 C. García and J. A. Ailshire
Introduction
Latinos aged 65 and over represent the fastest-growing population of older adultsin the United States. The percentage of older Latinos is projected to increase 5-foldbetween 2012 and 2050, and is expected to compose more than 18% of the olderpopulation (Ortman et al. 2014). These demographic trends highlight the importanceof research on the health of older Latinos. For instance, prior research analyzingnational data has found older Latinos to be disproportionately affected by diabetesand hypertension relative to non-Latino Whites (hereafter, Whites) (Carson et al.2011; Heiss et al. 2014; Valencia et al. 2016). Furthermore, recent research showsLatinos experience an earlier onset of diabetes—approximately seven years earlierthan Whites - which suggests that the adverse impacts of diabetes, such as cardio-vascular and kidney damage, begin accumulating earlier in the life course (Angeland Angel 2015; Strauss et al. 2014). The unequal burden of these two diseasesamong Latinos contributes to poor quality of life and increased health care costsfor individuals, families, and local, state, and federal governments (Umpierrez et al.2007).
Diabetes and hypertension represent significant health challenges and are majorcontributors to functional loss, disability, and mortality among older adults (Gregget al. 2000; Knopman et al. 2001; Sahyoun et al. 2001; Hassing et al. 2004; U.S.Department of Health and Human Services 2003; Wray et al. 2005). The onset ofdiabetes and hypertension develops through a combination of genetic risk factors (e.g.family history), non-modifiable risk factors (e.g. race/ethnicity), and modifiable riskfactors (e.g. diet and smoking). Health patterns of Latinos are largely shaped bysocial and economic factors that influence their ability to accumulate resources thatmay be protective of health throughout the life course. For instance, Latinos havelower levels of education, income, and accumulated assets, and are less likely tohave health insurance compared to Whites (Nguyen et al. 2014). Moreover, Latinosare more likely to face significant socioeconomic adversity throughout the adult lifecourse than Whites (Ruiz et al. 2016). Research shows that low income individualsare more likely to experience chronic (and toxic) stress, poor nutrition, barriers tohealthcare access, and poor quality medical care (DeVoe et al. 2007; Seligman et al.2010; Santiago et al. 2011). The constellation of these factors can contribute to theincreased risk of diabetes and high blood pressure that has been observed in priorstudies of middle-aged and older Latinos (Markides et al. 1997; Wray et al. 2006;Villa et al. 2012;Mitchell et al. 2018). In fact, it has been found amongLatinos ages 40and older that they have higher metabolic and inflammatory risk factors than Whites(Crimmins et al. 2007), which are linked to diabetes and cardiovascular disease.These differences, however, mostly disappear after accounting for socioeconomicstatus, which suggests that the high levels of risk among Latinos is related to theirsocioeconomic disadvantage (Crimmins et al. 2007). This is particularly concerningfor aging Latinos since socioeconomic disadvantage among middle-aged and olderLatinos have serious implications for health care and the early diagnosis of diabetesand hypertension (Markides 2007).

3 ¿Importa Dónde Vivimos? How Regional Variation Informs … 41
Latinos have a lower likelihood of seeking out and receiving health care ser-vices than the rest of the U.S. population (Ortega, Rodriguez, and Bustamante 2015;Rodriguez, Bustamante, and Ang 2009). This suggests Latinos may be less likely toreceive screening for chronic conditions which can result in late diagnosis and dif-ficulty in treating and controlling diabetes and hypertension. For older Latinos thatdo have health insurance, issues related to availability and accessibility to healthcarepresent major barriers in obtaining care (Ortega et al. 2007). Latinos are more likelythan Whites to: (1) live in areas that lack adequate numbers of health professionalsto serve the population; (2) experience shortages of medical services; and (3) havedifficulties in obtaining medical services (Wallace and Villa 2003). For low-incomeolder Latinos, the costs ofmedical care can lead to decisions to delay or forgomedicalvisits and treatments. Despite older Latinos who have access to Medicare, Medicaredoes not cover all services, and have much higher copayments and deductibles thanHMO’s (Wallace and Villa 2003). However, low-income older Latinos do qualifyfor Medicaid to supplement their Medicare coverage. Though, evidence shows thatLatinos are less likely than Whites to have this supplemental coverage (Wallace andVilla 2003). The consequences for these patterns of disadvantage in access, avail-ability, and accessibility of healthcare can be seen in the disease patterns and healthmanagement of Latinos. Boltri and colleagues (2005) have found that more than60% of Latinos with diabetes had uncontrolled values of glycosylated hemoglobin(HbA1c)—the average blood glucose level over the past three months. This find-ing has been attributed to Latinos having poor self-management of the disease (Huet al. 2013). Successful self-management of disease is dependent on individualshaving a usual source of care and having one doctor for regular care (Lopez-Classand Jurkowski 2010). This is difficult for Latinos who do not have health insuranceand have inadequate access to care. Adults with health insurance coverage are morelikely to have greater use of health services, better disease control, and increasedsurvival (McWilliams et al. 2009). For example, lack of health insurance coveragehas been associated with higher rates of microvascular complications among Latinoswith diabetes (Pugh et al. 1992; López and Golden 2014). Other correlates such aslower levels of education, income, acculturation, as well as lack of knowledge in glu-cose monitoring, healthy nutrition, and engagement in physical activity have beenshown to be factors associated with managing diabetes among Latinos (Gonzálezet al. 2009; Ghaddar et al. 2010).
An extensive body of research has established that geography matters for U.S.population health. Overall, findings indicate that populations living in the SouthernUnited States have worse health (e.g. stroke belt) and lower life expectancies com-pared to other regions (Chandra and Skinner 2004; Glymour et al. 2007; Gennusoet al. 2016). Several states in the South have among the highest poverty rates in thenation (Kaiser Family Foundation 2016). Individuals living in the South are also lesslikely to be insured than individuals living in the rest of the country (Kaiser FamilyFoundation 2016). Further, individuals living in theSouth have higher rates of obesity,a larger percentage of cigarette smokers, and are among the least happy states in thecountry, which influence health and well-being (Schoeborn et al. 2013; U.S. Depart-ment of Health and Human Services 2014; Altman 2016). In addition to the above

42 C. García and J. A. Ailshire
disadvantages observed in the South, research has documented geographic variationby race/ethnicity, place, and income in health, disability and mortality (Murray et al.2006). The importance of region on health suggests that disparities in diabetes andhypertension by race/ethnicity may vary across place. Regions differ in their demo-graphic, socioeconomic, and policy contexts that may be salient for health of olderadults. For instance, older adults who have spent decades living in environments withsocial, material, economic, and physical deprivation can produce disparities in healthand well-being across the life course and accumulate into older adulthood (Yen et al.2009; Clarke and Nieuwenhuijsen 2009; Population Reference Bureau 2017).
While the above research has identified geographic variation in health disparitiesamong subpopulations of the U.S., less research has focused on how geographiccontextual factors may affect the health of older Latinos. Regional differences in thecharacteristics of Latino subpopulations may contribute to racial and ethnic dispari-ties in diabetes and hypertension. For instance, Latinos residing in each of the fourmajor Census regions have unique historical, sociodemographic, and socioeconomiccontexts that can affect health. Historical, cultural, and sociopolitical factors influ-ence where Latino subgroups reside in the United States. These factors also affect theformation of group identification based on (self/other) perceived similarities amongmembers of their communities. Using data from the American Community Surveyfive-year estimates (2011–2015), we illustrate concentrations of Latino adults aged18 and older living in each state, by country of origin (see Fig. 3.1). Although thelargest concentration of Latinos resides in the Southwest, this population is mainlycomprised of Mexican-origin individuals. Puerto Ricans and Dominicans are largelyconcentrated in the Northeast, whereas Cubans are heavily concentrated in SouthFlorida. Conversely, Central and South Americans are widely dispersed across thecontinental United States. Geographic clustering of Latino subgroups by country oforigin may help researchers better understand regional disparities in diabetes andhypertension among older Latinos as: (1) clusters of groups tend to share social,cultural, and behavioral attitudes that may affect health; and (2) geographic-relatedexposures throughout the life course may shape morbidity patterns. A major gap inour current understanding of Latino health is being able to characterize accurately thehealth of the Latino population. The lack of detailed characterization of this popula-tion presents barriers in translating evidence into practice when providing care to thelarge and increasingly diverse Latino population in the United States. Not consider-ing where Latinos reside may limit our ability to design public health strategies andinterventions to reduce health risks for diabetes and hypertension at the communitylevel.
In this study, we examine regional differences in diabetes and hypertension in anationally representative sample of older U.S. Latinos andWhites aged 50 and older.We use the National Health Interview Survey, a nationally representative survey ofU.S. adults aged 18 and older, to document: (1) regional differences in diabetes and

3 ¿Importa Dónde Vivimos? How Regional Variation Informs … 43
Fig. 3.1 Total Latino population in the United States. Note Darker shades represent a larger per-centage of the Latino subgroup. Source American Community Survey 2015 (5-Year Estimates)
hypertension among Latinos andWhites, and (2) regional differences in diabetes andhypertension among Mexicans, Puerto Ricans, Cubans, Dominicans, Central/SouthAmericans, andWhites, and (3) individual-level factors thatmay account for regionaldifferences in diabetes and hypertension.
Methods
Data
We used data from the National Health Interview Survey (NHIS), an annual house-hold interview survey of the noninstitutionalized civilian population conducted bythe National Center for Health Statistics to estimate diabetes and hypertension differ-ences by race and Latino subgroups among older adults aged 50 and older. We choseto focus on adults aged 50 or older because we recognize that people age differentlyand develop conditions differently over the course of their lives. Data are pooledacross 16 years (2000–2015) to obtain a large sample of five Latino subgroups bynational origin. The annual response rate of the NHIS is approximately 80% of eli-gible households. The data were downloaded from the Integrated Health InterviewSeries (IHIS). The IHIS contains harmonized variables from the NHIS from 1963 tothe present, as well as provides appropriate weights for the complex survey design.The total sample for the 16 years of data for ages 50 and above was 338,770.
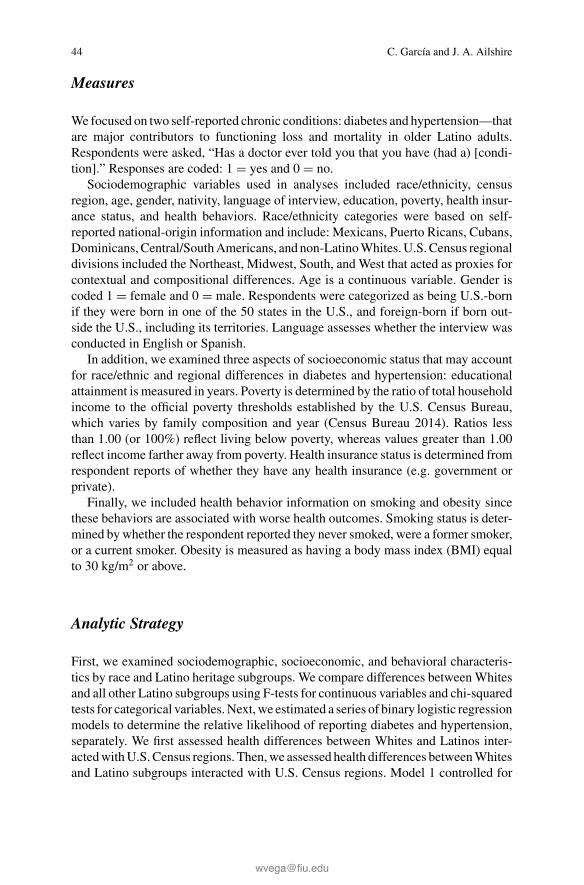
44 C. García and J. A. Ailshire
Measures
We focused on two self-reported chronic conditions: diabetes and hypertension—thatare major contributors to functioning loss and mortality in older Latino adults.Respondents were asked, “Has a doctor ever told you that you have (had a) [condi-tion].” Responses are coded: 1 � yes and 0 � no.
Sociodemographic variables used in analyses included race/ethnicity, censusregion, age, gender, nativity, language of interview, education, poverty, health insur-ance status, and health behaviors. Race/ethnicity categories were based on self-reported national-origin information and include: Mexicans, Puerto Ricans, Cubans,Dominicans,Central/SouthAmericans, andnon-LatinoWhites.U.S.Census regionaldivisions included the Northeast, Midwest, South, and West that acted as proxies forcontextual and compositional differences. Age is a continuous variable. Gender iscoded 1 � female and 0 � male. Respondents were categorized as being U.S.-bornif they were born in one of the 50 states in the U.S., and foreign-born if born out-side the U.S., including its territories. Language assesses whether the interview wasconducted in English or Spanish.
In addition, we examined three aspects of socioeconomic status that may accountfor race/ethnic and regional differences in diabetes and hypertension: educationalattainment is measured in years. Poverty is determined by the ratio of total householdincome to the official poverty thresholds established by the U.S. Census Bureau,which varies by family composition and year (Census Bureau 2014). Ratios lessthan 1.00 (or 100%) reflect living below poverty, whereas values greater than 1.00reflect income farther away from poverty. Health insurance status is determined fromrespondent reports of whether they have any health insurance (e.g. government orprivate).
Finally, we included health behavior information on smoking and obesity sincethese behaviors are associated with worse health outcomes. Smoking status is deter-mined bywhether the respondent reported they never smoked, were a former smoker,or a current smoker. Obesity is measured as having a body mass index (BMI) equalto 30 kg/m2 or above.
Analytic Strategy
First, we examined sociodemographic, socioeconomic, and behavioral characteris-tics by race and Latino heritage subgroups. We compare differences betweenWhitesand all other Latino subgroups using F-tests for continuous variables and chi-squaredtests for categorical variables.Next,we estimated a series of binary logistic regressionmodels to determine the relative likelihood of reporting diabetes and hypertension,separately. We first assessed health differences between Whites and Latinos inter-actedwithU.S.Census regions. Then,we assessed health differences betweenWhitesand Latino subgroups interacted with U.S. Census regions. Model 1 controlled for

3 ¿Importa Dónde Vivimos? How Regional Variation Informs … 45
age and sex. Model 2 additionally controlled for nativity, language use, education,poverty, health insurance, smoking, and obesity. Additional analyses (results notshown) controlled for demographic, socioeconomic, and behavioral characteristicsin separate models; however, including these covariates separately did not signifi-cantly change the estimates that are presented in Model 2. Predicted probabilitieswere obtained frommodel estimates to generate population disease prevalence graphsfor ease of interpretation.
Sample weights provided by NHIS/IHIS were used to correct for differentialselection, non-response bias and include a post-stratification adjustment to makethe sample representative of the age, race/ethnicity, and sex distribution of the U.S.population. We also accounted for the complex survey design of the NHIS by usingStata’s svy commands, which adjusts for population stratification, primary samplingunit, and sample weights.
Results
Sample Characteristics
Demographic and health characteristics are presented in Table 3.1 to show the pat-tern of risk factors associated with diabetes and hypertension by race and Latinoheritage subgroups. Among Latinos, Mexicans comprise 60.6% of the sample. Cen-tral/SouthAmericans (15.7%)were the next largest group, followed by PuertoRicans(10.8%), Cubans (9.5%), and Dominicans (3.4%). While Mexicans primarily residein the West (54.0%) and South (36.3%) regions, Puerto Ricans primarily reside inthe Northeast (54.0%) andMidwest (29.7%), Cubans in the South (82.5%), Domini-cans in the Northeast (78.7%), and Central/South Americans in the South (41.1%),West (29.5%) and Northeast (25.3%). All Latinos (except for Cubans) tended tobe younger than Whites. All race and Latino heritage subgroups had a majority offemale respondentswithDominicans having the highest percentage of female respon-dents (62.5%). Over 90% of Cuban, Dominican, and Central/South Americans wereforeign-born, whereas 53.3% ofMexicans and 73.6% of Puerto Ricans were foreign-born. All Latinos reported less education and greater poverty than Whites. However,education and poverty levels varied significantly by Latino heritage. For instance,Mexicans, Dominicans, and Puerto Ricans reported lower levels of education andhigher poverty compared to other Latinos, whereas Cubans exhibited more favorablesocioeconomic conditions. While most respondents reported health insurance cover-age, Mexicans and Central/South Americans reported lower rates compared to othergroups. Except for Cubans, all Latinos were more obese than Whites. However, allLatinos (apart from Puerto Ricans) reported lower rates of smoking than Whites.
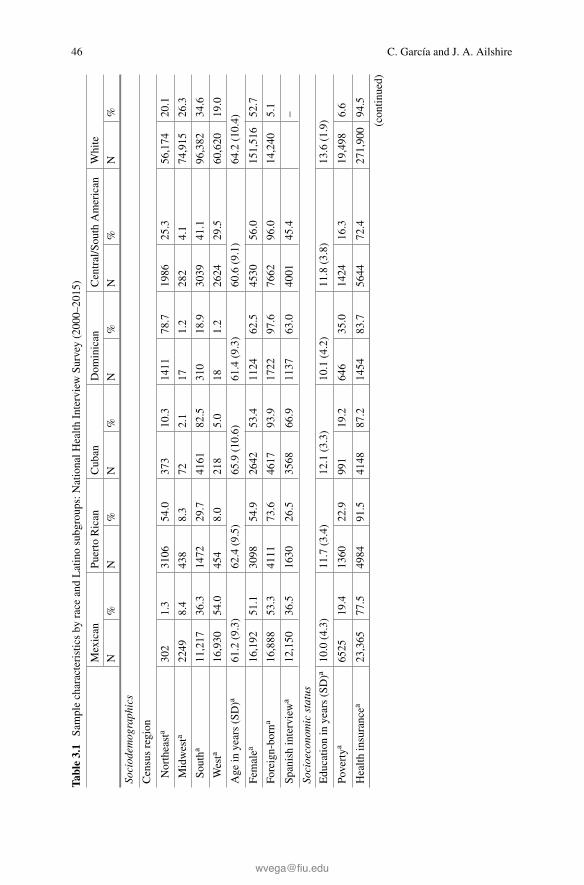
46 C. García and J. A. Ailshire
Table3.1
Samplecharacteristicsby
race
andLatinosubgroups:NationalH
ealth
InterviewSu
rvey
(2000–2015)
Mexican
Puerto
Rican
Cuban
Dom
inican
Central/Sou
thAmerican
White
N%
N%
N%
N%
N%
N%
Sociodem
ographics
Censusregion
Northeasta
302
1.3
3106
54.0
373
10.3
1411
78.7
1986
25.3
56,174
20.1
Midwesta
2249
8.4
438
8.3
722.1
171.2
282
4.1
74,915
26.3
Southa
11,217
36.3
1472
29.7
4161
82.5
310
18.9
3039
41.1
96,382
34.6
Westa
16,930
54.0
454
8.0
218
5.0
181.2
2624
29.5
60,620
19.0
Age
inyears(SD)a
61.2
(9.3)
62.4
(9.5)
65.9
(10.6)
61.4(9.3)
60.6
(9.1)
64.2
(10.4)
Femalea
16,192
51.1
3098
54.9
2642
53.4
1124
62.5
4530
56.0
151,516
52.7
Foreign-born
a16,888
53.3
4111
73.6
4617
93.9
1722
97.6
7662
96.0
14,240
5.1
Spanishinterviewa
12,150
36.5
1630
26.5
3568
66.9
1137
63.0
4001
45.4
–
Socioeconomicstatus
Educatio
nin
years(SD)a
10.0
(4.3)
11.7
(3.4)
12.1
(3.3)
10.1(4.2)
11.8
(3.8)
13.6
(1.9)
Povertya
6525
19.4
1360
22.9
991
19.2
646
35.0
1424
16.3
19,498
6.6
Health
insurancea
23,365
77.5
4984
91.5
4148
87.2
1454
83.7
5644
72.4
271,900
94.5
(contin
ued)

3 ¿Importa Dónde Vivimos? How Regional Variation Informs … 47
Table3.1
(contin
ued)
Mexican
Puerto
Rican
Cuban
Dom
inican
Central/Sou
thAmerican
White
N%
N%
N%
N%
N%
N%
Healthbeha
viors
Smoking
Never
a26,127
84.7
4264
78.2
4026
83.3
1560
88.1
6940
87.3
213,263
74.1
Form
era
2930
10.1
740
13.9
510
11.2
141
8.8
727
9.5
51,605
17.9
Current
a1641
5.3
466
7.9
288
5.5
553.1
264
3.2
23,223
8.0
Obese
a4217
13.9
942
16.8
525
11.1
222
13.2
816
9.7
38,648
13.2
Chronicconditions
Diabetesa
3119
18.9
3948
13.9
385
7.9
198
11.5
528
6.6
20,035
6.9
Hypertensiona
5709
10.5
1,522
27.0
1113
23.2
470
27.5
1229
15.6
69,132
24.0
N30,698
5470
4824
1756
7931
288,091
NoteUnw
eightedN’s,w
eightedpercentages
a SignificantraceandLatinosubgroupsdifferencesatp<0.05

48 C. García and J. A. Ailshire
Latino-White Differences in Diabetes
Results from binary logistic regression models for Latino-White differences in dia-betes are shown inTable 3.2.Odds ratios are presentedwith 95%confidence intervals.Odds ratios between zero and one indicate less risk for having diabetes, and ratiosgreater than one indicate greater risk of having diabetes. Model 1 controls for ageand gender. Model 2 controls for all individual-level covariates—sociodemographic,socioeconomic, and behavioral characteristics.
The results from Model 1 show that diabetes risk varies by region and Latinoethnicity. Diabetes risk was higher in the Midwest (odds ratio [OR] � 1.30, 95%confidence interval [CI] [1.23, 1.38]) and South (OR � 1.25, 95% CI [1.18, 1.32]),relative to the Northeast. In addition, Latinos (OR � 2.27, 95% CI [2.06, 2.51])were more likely to report diabetes than Whites. However, Latinos in the Midwest
Table 3.2 Logistic regression models for diabetes: National Health Interview Survey (2000–2015)
Model 1 Model 2
OR 95% CI OR 95% CI
Region
Northeast (ref)
Midwest 1.30 *** (1.23, 1.38) 1.23 *** (1.16, 1.30)
South 1.25 *** (1.18, 1.32) 1.28 *** (1.21, 1.35)
West 0.97 (0.91, 1.04) 1.04 (0.97, 1.10)
Ethnicity/Region
Latino 2.27 *** (2.06, 2.51) 2.39 *** (2.13, 2.68)
Latino*Midwest 0.79 ** (0.66, 0.94) 0.87 (0.72, 1.05)
Latino*South 0.63 *** (0.56, 0.72) 0.66 *** (0.59, 0.75)
Latino*West 0.82 ** (0.72, 0.92) 0.82 ** (0.72, 0.92)
Covariate controls
Age 1.03 *** (1.03, 1.03) 1.04 *** (1.04, 1.04)
Female 0.89 *** (0.86, 0.92) 0.91 *** (0.88, 0.94)
Foreign-born 0.89 ** (0.84, 0.96)
Spanish interview 1.04 (0.96, 1.13)
Education (years) 0.96 *** (0.96, 0.97)
Below poverty 1.52 *** (1.44, 1.60)
Health insurance 1.39 *** (1.29, 1.49)
Never smoked (ref)
Former smoker 2.64 *** (2.53, 2.75)
Current smoker 2.64 *** (2.50, 2.79)
Obese 7.19 *** (6.92, 7.46)
Note *p < 0.05; **p < 0.01; ***p < 0.001

3 ¿Importa Dónde Vivimos? How Regional Variation Informs … 49
(OR � 0.79, 95% CI [0.66, 0.94]), South (OR � 0.63, 95% CI [0.56, 0.72]), andWest (OR � 0.82, 95% CI [0.72, 0.92]) were less likely to report diabetes relativeto Latinos residing in the Northeast. In Model 2, adjusting for sociodemographic,socioeconomic, and behavioral characteristics, Latinos in the Midwest no longerdiffered from their Northeastern counterparts, whereas Latinos residing in the Southand West were still less likely to report diabetes.
Table 3.3 shows the results from binary logistic regression models for diabetesrisk by Latino subgroups—Mexicans, Puerto Ricans, Cubans, Dominicans, and Cen-tral/South Americans. Model 1 shows that diabetes risk varies by Latino heritage.While Mexicans and Cubans were no more likely to report diabetes than Whites,Puerto Ricans, Dominicans, and Central/South Americans were more likely to reportdiabetes than Whites. Further, there is variation among Latino subgroups by region.Among Mexicans, those residing in the Midwest, South, and West regions weretwo times more likely to report diabetes than their Northeastern counterparts. PuertoRicans residing in theMidwest andSouthwere less likely to report diabetes comparedto Puerto Ricans residing in the Northeast region. Further, Central/South Americansresiding in the South were less likely to report diabetes than those in the Northeast.There were no significant regional differences within Cubans and Dominicans.
InModel 2, adjusting for sociodemographic, socioeconomic, and behavioral char-acteristics reduced some of the observed regional differences. Particularly, for Mex-icans, the observed disparity observed in the South were no longer significant. ForMexicans residing in the Midwest and West, the effect is attenuated, although theywere still twice as likely to report diabetes. Among Puerto Ricans, the health advan-tage observed in the Midwest is no longer significant. Further, the relative healthadvantage observed for Puerto Ricans in the South was reduced (from 50% inModel1 to 38% in Model 2). Central/South Americans residing in the South reported arelative health advantage, net of other covariates.
Figure 3.2 used the predicted probabilities obtained from Model 2 to graph thedistribution of diabetes prevalence across U.S. Census regions by race and Latinosubgroups. Statistically significant differences fromWhites in each region are notedbased on 95 percent confidence intervals (seeAppendix 1).Mexicans in theMidwest,South, andWest were more likely to report diabetes relative toWhites. Puerto Ricansacross all U.S. Census regions were more likely to report diabetes compared toWhites. Conversely, Cubans did not differ fromWhites in the prevalence of diabetes.A larger proportion of Dominicans (11.3%) living in the Northeast were more likelyto report diabetes compared to Whites (6.1%). Central/South Americans living inthe South (8.6%) and West (8.8%) regions were more likely to report diabetes thanWhites (7.4 and 6.1%, respectively).

50 C. García and J. A. Ailshire
Table 3.3 Logistic regression models for diabetes: National Health Interview Survey (2000–2015)
Model 1 Model 2
OR 95% CI OR 95% CI
Region
Northeast (ref)
Midwest 1.30 *** (1.23, 1.38) 1.23 *** (1.16, 1.30)
South 1.25 *** (1.18, 1.32) 1.28 *** (1.21, 1.35)
West 0.97 (0.91, 1.04) 1.03 (0.97, 1.10)
Ethnicity/Region
Mexican 0.92 (0.55, 1.52) 1.01 (0.60, 1.72)
Mexican*Midwest 1.97 * (1.16, 3.36) 1.94 * (1.11, 3.39)
Mexican*South 1.92 * (1.15, 3.21) 1.70 (1.00, 2.90)
Mexican*West 2.11 ** (1.27, 3.52) 1.93 * (1.13, 3.28)
Puerto Rican 3.23 *** (2.88, 3.61) 2.83 *** (2.49, 3.22)
PuertoRican*Midwest
0.64 ** (0.48, 0.86) 0.81 (0.58, 1.14)
Puerto Rican*South 0.50 *** (0.41, 0.60) 0.62 *** (0.50, 0.77)
Puerto Rican*West 0.73 (0.53, 1.01) 0.79 (0.55, 1.13)
Cuban 1.42 (0.90, 2.26) 1.57 (0.96, 2.57)
Cuban*Midwest 1.36 (0.58, 3.17) 1.50 (0.51, 4.41)
Cuban*South 0.69 (0.43, 1.10) 0.67 (0.40, 1.12)
Cuban*West 0.90 (0.45, 1.80) 0.69 (0.32, 1.48)
Dominican 2.22 *** (1.78, 2.77) 2.20 *** (1.77, 2.75)
Dominican*Midwest 0.14 (0.02, 1.09) 0.22 (0.03, 1.82)
Dominican*South 0.95 (0.61, 1.49) 1.14 (0.74, 1.78)
Dominican*West 0.90 (0.24, 3.41) 0.67 (0.20, 2.22)
Central/SouthAmerican
1.32 ** (1.08, 1.61) 1.70 *** (1.33, 2.16)
Central/SouthAmerican*Midwest
1.06 (0.60, 1.89) 1.27 (0.66, 2.43)
Central/SouthAmerican*South
0.69 ** (0.53, 0.90) 0.71 * (0.53, 0.96)
Central/SouthAmerican*West
0.98 (0.75, 1.28) 0.90 (0.67, 1.21)
Covariate controls
Age 1.03 *** (1.03, 1.03) 1.04 *** (1.04, 1.04)
Female 0.89 *** (0.86, 0.92) 0.91 *** (0.88, 0.94)
Foreign-born 0.92 * (0.86, 0.99)
Spanish interview 1.11 * (1.02, 1.20)
Education (years) 0.97 *** (0.96, 0.97)
(continued)

3 ¿Importa Dónde Vivimos? How Regional Variation Informs … 51
Table 3.3 (continued)
Model 1 Model 2
OR 95% CI OR 95% CI
Below poverty 1.52 *** (1.44, 1.60)
Health insurance 1.39 *** (1.29, 1.49)
Never smoked (ref)
Former smoker 2.64 *** (2.53, 2.75)
Current smoker 2.64 *** (2.50, 2.79)
Obese 7.18 *** (6.92, 7.45)
Note *p < 0.05; **p < 0.01; ***p < 0.001
Fig. 3.2 Distribution (%) of respondents reporting diabetes, by race/ethnicity and U.S. CensusRegion. Note In tests of statistical significance Whites are the reference group for each region (*p< 0.05)
Latino-White Differences in Hypertension
Results frombinary logistic regressionmodels for Latino-White differences in hyper-tension are shown in Table 3.4. The results fromModel 1 show that hypertension riskvaries by region and Latino ethnicity. Hypertension risk was higher in the Midwest(OR � 1.18, 95% CI [1.14, 1.22]) and South (OR � 1.16, 95% CI [1.11, 1.20]),relative to the Northeast. In addition, Latinos (OR� 1.24, 95% CI [1.15, 1.34]) weremore likely to report hypertension than Whites. However, Latinos in the Midwest(OR� 0.73, 95%CI [0.64, 0.82]), South (OR� 0.66, 95%CI [0.60, 0.72]), andWest(OR � 0.71, 95% CI [0.65, 0.79]) were less likely to report hypertension relativeto the Northeast. In Model 2, adjusting for sociodemographic, socioeconomic, andbehavioral characteristics does not attenuate the estimates reported in Model 1. Infact, there is evidence of suppression for Latinos.

52 C. García and J. A. Ailshire
Table 3.4 Logistic regression models for hypertension: National Health Interview Survey(2000–2015)
Model 1 Model 2
OR 95% CI OR 95% CI
Region
Northeast (ref)
Midwest 1.18 *** (1.14, 1.22) 1.13 *** (1.09, 1.18)
South 1.16 *** (1.11, 1.20) 1.19 *** (1.15, 1.24)
West 0.98 (0.94, 1.02) 1.02 (0.98, 1.06)
Ethnicity/region
Latino 1.24 *** (1.15, 1.34) 1.42 *** (1.30, 1.56)
Latino*Midwest 0.73 *** (0.64, 0.82) 0.75 *** (0.65, 0.86)
Latino*South 0.66 *** (0.60, 0.72) 0.65 *** (0.59, 0.72)
Latino*West 0.71 *** (0.65, 0.79) 0.71 *** (0.64, 0.79)
Covariate controls
Age 1.04 *** (1.04, 1.05) 1.06 *** (1.05, 1.06)
Female 1.13 *** (1.11, 1.15) 1.27 *** (1.24, 1.30)
Foreign-born 0.89 *** (0.85, 0.93)
Spanish interview 1.16 *** (1.10, 1.23)
Education (years) 1.00 (0.99, 1.00)
Below poverty 1.45 *** (1.39, 1.50)
Health insurance 1.35 *** (1.28, 1.43)
Never smoked (ref)
Former smoker 4.63 *** (4.51, 4.76)
Current smoker 4.87 *** (4.71, 5.04)
Obese 7.47 *** (7.26, 7.69)
Note *p < 0.05; **p < 0.01; ***p < 0.001
Table 3.5 shows the results from binary logistic regression models for hyperten-sion risk by Latino subgroups—Mexicans, Puerto Ricans, Cubans, Dominicans, andCentral/SouthAmericans.Model 1 shows that hypertension risk varies by Latino her-itage. While Mexicans and Cubans were no more likely to report hypertension thanWhites, on the other hand, Puerto Ricans and Dominicans were more likely to reporthypertension. Central/South Americans were less likely to report hypertension thanWhites. Further, there is variation among Latino subgroups by region. Among PuertoRicans, those residing in the Midwest, South, and West regions were less likely toreport hypertension than their Northeastern counterparts. Central/South Americansin the South were less likely to report hypertension relative to those living in theNortheast. There were no significant regional differences within Mexicans, Cubans,and Dominicans.
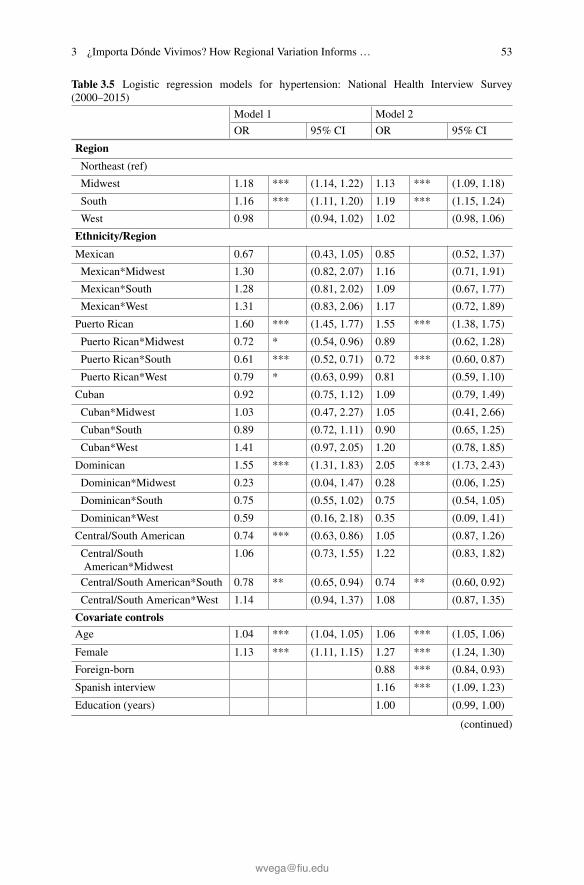
3 ¿Importa Dónde Vivimos? How Regional Variation Informs … 53
Table 3.5 Logistic regression models for hypertension: National Health Interview Survey(2000–2015)
Model 1 Model 2
OR 95% CI OR 95% CI
Region
Northeast (ref)
Midwest 1.18 *** (1.14, 1.22) 1.13 *** (1.09, 1.18)
South 1.16 *** (1.11, 1.20) 1.19 *** (1.15, 1.24)
West 0.98 (0.94, 1.02) 1.02 (0.98, 1.06)
Ethnicity/Region
Mexican 0.67 (0.43, 1.05) 0.85 (0.52, 1.37)
Mexican*Midwest 1.30 (0.82, 2.07) 1.16 (0.71, 1.91)
Mexican*South 1.28 (0.81, 2.02) 1.09 (0.67, 1.77)
Mexican*West 1.31 (0.83, 2.06) 1.17 (0.72, 1.89)
Puerto Rican 1.60 *** (1.45, 1.77) 1.55 *** (1.38, 1.75)
Puerto Rican*Midwest 0.72 * (0.54, 0.96) 0.89 (0.62, 1.28)
Puerto Rican*South 0.61 *** (0.52, 0.71) 0.72 *** (0.60, 0.87)
Puerto Rican*West 0.79 * (0.63, 0.99) 0.81 (0.59, 1.10)
Cuban 0.92 (0.75, 1.12) 1.09 (0.79, 1.49)
Cuban*Midwest 1.03 (0.47, 2.27) 1.05 (0.41, 2.66)
Cuban*South 0.89 (0.72, 1.11) 0.90 (0.65, 1.25)
Cuban*West 1.41 (0.97, 2.05) 1.20 (0.78, 1.85)
Dominican 1.55 *** (1.31, 1.83) 2.05 *** (1.73, 2.43)
Dominican*Midwest 0.23 (0.04, 1.47) 0.28 (0.06, 1.25)
Dominican*South 0.75 (0.55, 1.02) 0.75 (0.54, 1.05)
Dominican*West 0.59 (0.16, 2.18) 0.35 (0.09, 1.41)
Central/South American 0.74 *** (0.63, 0.86) 1.05 (0.87, 1.26)
Central/SouthAmerican*Midwest
1.06 (0.73, 1.55) 1.22 (0.83, 1.82)
Central/South American*South 0.78 ** (0.65, 0.94) 0.74 ** (0.60, 0.92)
Central/South American*West 1.14 (0.94, 1.37) 1.08 (0.87, 1.35)
Covariate controls
Age 1.04 *** (1.04, 1.05) 1.06 *** (1.05, 1.06)
Female 1.13 *** (1.11, 1.15) 1.27 *** (1.24, 1.30)
Foreign-born 0.88 *** (0.84, 0.93)
Spanish interview 1.16 *** (1.09, 1.23)
Education (years) 1.00 (0.99, 1.00)
(continued)

54 C. García and J. A. Ailshire
Table 3.5 (continued)
Model 1 Model 2
OR 95% CI OR 95% CI
Below poverty 1.44 *** (1.39, 1.49)
Health insurance 1.34 *** (1.27, 1.42)
Former smoker 4.63 *** (4.51, 4.75)
Current smoker 4.87 *** (4.71, 5.04)
Obese 7.47 *** (7.26, 7.69)
Note *p < 0.05; **p < 0.01; ***p < 0.001
Fig. 3.3 Distribution (%) of respondents reporting hypertension, by race/ethnicity andU.S. CensusRegion. Note In tests of statistical significance Whites are the reference group for each region (*p< 0.05)
InModel 2, adjusting for sociodemographic, socioeconomic, and behavioral char-acteristics reduced some of the observed regional differences among Puerto Ricans.The relative health advantage reported by Puerto Ricans in the Midwest and Westwere attenuated, whereas, the relative health advantage observed for Puerto Ricansin the South was reduced (from 39% in Model 1 to 28% in Model 2).
Figure 3.3 used the predicted probabilities obtained from Model 2 to graph thedistribution of diabetes prevalence across U.S. Census regions by race and Latinosubgroups. Statistically significant differences fromWhites in each regionwere notedbased on 95 percent confidence intervals (see Appendix 2). Puerto Ricans (28.4%)and Dominicans (32.8%) in the Northeast were more likely to report hypertensionthanWhites (22.3%). Central/South Americans (21.1%) living in the South were lesslikely to report hypertension compared toWhites (24.6%). There were no significantracial/ethnic differences found for hypertension in the Midwest and West regions.
3 ¿Importa Dónde Vivimos? How Regional Variation Informs … 55
Discussion
Rapid growth and aging among U.S. Latinos underscores the importance of researchon the morbidity patterns of older Latinos. To better comprehend the prevalence ofdiabetes and hypertension among this population, it is important to integrate informa-tion on sociocultural and regional contexts that affect late-life health outcomes (Katz2005). Understanding how these factors influence disease can help inform interven-tions and public policy that address the health needs of minority populations, controlhealth care costs, and improve the quality of life for older Latinos. Using data from anationally representative sample of older Americans, the purpose of our study was todocument regional variation in diabetes and hypertension among Latino subgroupsrelative to Whites. Consistent with previous research, our results show that Latinoshad a greater prevalence of diabetes and hypertension than Whites at the nationallevel (Carson et al. 2011; Heiss et al. 2014; Valencia et al. 2016), independent ofsociodemographic, cultural, and behavioral characteristics. However, the magnitudeof reporting diabetes and hypertension varied by region. Latinos residing in the SouthandWest regions were less likely to report diabetes compared to Latinos living in theNortheast. Furthermore, Latinos residing in the Midwest, South, and West regionswere less likely to report hypertension than Latinos in the Northeast.
As regional differences in diabetes and hypertension may be a product of theheterogeneous composition of older Latinos, due to clustering of groups in specificgeographic locations, we examinedLatino subgroups, defined by national origin. Ourfindings indicate that Mexicans residing in the Midwest, South, and West regionshave a higher prevalence of diabetes compared to their White counterparts, and havea higher prevalence of hypertension in the South than Whites. Puerto Ricans have ahigher prevalence of diabetes in all regions compared to Whites, and a higher preva-lence of hypertension in theNortheast thanWhites. Dominicans in theNortheast havea higher prevalence of diabetes and hypertension than Whites. Central/South Amer-icans in the South and West have a higher prevalence of diabetes relative to Whites,and have a lower prevalence of hypertension in the South than Whites. Conversely,Cubans did not differ from Whites in the prevalence of diabetes or hypertension.Overall, the places where Latino groups have a higher prevalence of diabetes andhypertension thanWhites are places where Fig. 3.1 shows there is greater populationdensity of that Latino group. Prior research suggests greater Latino-White segrega-tion in these places, especially in the Northeast and Midwest, (Iceland and Scopilliti2008) may serve to concentrate the effects of poverty that limit the opportunities ofLatino residents to live healthier lives (Sandoval and Jennings 2012). Residents ofsegregated neighborhoods have less access to quality jobs, housing, education, andsocial networks, which can result in less access to health resources and care thatcan impact diagnosis, treatment, and control for diabetes and hypertension (Hood2005; Gaskin et al. 2012; Kwan 2013). Although the pathways that link race/ethnicsegregation to health have been hypothesized (Acevedo-Garcia, Lochner, Osypuk,and Subramanian 2003), less research has focused on how shared places are linkedto health across Latino subgroups (e.g. Dominicans in the Northeast vs. Dominican

56 C. García and J. A. Ailshire
in the South). Using data from the American Community Survey and U.S. Census,Burgos and Rivera (2012) examined a multi-level context linking residential segre-gation to disability among Puerto Ricans. They found that for Puerto Ricans living incounties that are highly segregated and have higher concentrations of neighborhoodpoverty had worse health status (Burgos and Rivera 2012). Conversely, among olderMexican-Americans, living in high-density Mexican neighborhoods confers advan-tages in health despite the negative effects of neighborhood poverty (Eschbach et al.2004; Ostir et al. 2003). Hypothesized protective effects of high-density Mexicanneighborhoods include a lower prevalence of smoking, drinking, better nutrition, andhigher levels of social support (Abraído-Lanza et al. 2016). Future research assess-ing determinants of diabetes and hypertension among Latino subpopulations shouldinclude multi-level determinants such as: neighborhood segregation and isolation,neighborhood socioeconomic disadvantage, and neighborhood social environments.
In addition, the regional disparities observed were not explained by individual-level factors that included sociodemographic, cultural, and behavioral characteristics.It is possible there are factors we are not accounting for that could explain someof the regional variation in diabetes and hypertension such as nutrition, physicalactivity, and environmental toxins (e.g. arsenic, dioxin, and endocrine-disruptingpersistent organic pollutants). Moreover, there are complex interactions betweenindividual-level factors and environmental exposures that contribute to race/ethnicdisparities in health. Many aspects of the physical and social environment play animportant role in generating race/ethnic differences in health. Factors in the physicalenvironment such as air pollution, access to health-related resources (e.g. medicalcare, healthy food, recreational resources), and the built environment (e.g. urbanplanning, transportation) influence morbidity. Social environmental resources thatare related to social cohesion, social capital, social integration, and safety are alsoimportant factors related to morbidity. It is possible that in unhealthy physical andsocial environments, such as the South, Latinos are more susceptible to poorerhealth outcomes. These may be spaces where Latinos lack the social connectionsand political power that can help remedy adverse conditions. A comprehensiveunderstanding of the causes of Latino subgroup health disadvantages will requirerecognizing how the environment interacts with individual-level factors and how ithelps perpetuate the disadvantage in diabetes and hypertension.
There are several limitations to the current study. First, we pooled NHIS data over16 years to obtain a sufficiently large sample ofLatino subgroups by country of origin.The benefit of using a pooled sample is to increase the reliability and precision ofestimates for differences in health status that would otherwise be difficult to achieveusing a cross-sectional sample with small sample sizes. However, in pooling dataacross yearswe assume that population characteristics are similar across the 16 years.Although, socioeconomic, cultural, and health profiles may vary across cohorts, theamount of cohort variation is likely relatively small over this 16-year period. Second,the use of the Central/South American ethnic grouping is problematic given that twodifferent regions of Latin America, representing a diverse and heterogeneous groupof Latinos, are combined. The Central/South American region encompasses over 20Latin countries that represent 25% of the total Latino population in the United States.

3 ¿Importa Dónde Vivimos? How Regional Variation Informs … 57
The NHIS does not provide detailed information on country of origin for Latinosfrom Central/South America, so we were unable to determine if there was additionalheterogeneity in this subgroup of Latinos. Nonetheless, we included this category inour analyses to demonstrate the diversity of the Latino population. In addition, healthdata for this study are based on self-reports, which may introduce bias. Self-reportedconditions are based on diagnosis and thus require interaction with the health caresystem. The vast majority of respondents in our study, however, had health insurance,though having insurance may not result in greater interaction with the health caresystem. In fact, older Latinos are less likely than Whites to seek care despite havinginsurance due to cost of care such as high copayments and deductibles (Wallace andVilla 2003). Finally, this analysis uses aggregate U.S. Census regions rather than finergeographies, such as tracts and block groups, counties, and clusters of ZIP codes thatmay be more appropriate for identifying health disparities. Although, there is noconsensus on a fundamental unit of geography in measuring health disparities in theUnited States (Ricketts 2002).
Despite these limitations, this study makes an important contribution to knowl-edge on the complex patterns of race/ethnicity, region, and older adult health in theUnited States. By including a broad range of Latino subgroups by region, we haveuncovered patterns of diabetes and hypertension that may be attributed to contextualand compositional differences—a factor that is often overlooked in shaping Latinohealth. Not all geographic environments are created equal with respect to oppor-tunities for healthy living and the development of health inequalities. Geographiclocation is associated with wide variations in access, health care use, and healthstatus and researchers should be mindful of the various experiences, sociopoliticalhistories, and cultural factors of individuals from different countries of origin thatinfluence where Latinos reside in the United States. With a rapidly changing demo-graphic profile of the U.S., which includes a large number of aging Latinos, themechanisms through which environment context influences health should be at theforefront in unveiling Latino health disparities. This can lead to targeted and locallytailored interventions and public policies to improve communities and health forolder Latinos, especially as current policy efforts encourage aging in place (Clarkeand Nieuwenhuijsen 2009).
Acknowledgements This research was supported by the National Institute on Aging (NIA) of theNational Institutes of Health (NIH), under award number R00AG039528 to Jennifer A. Ailshire,the NIAMultidisciplinary Training Grant award in Gerontology under award number T32AG0037,and the NIA Aging Research Dissertation Award to Increase Diversity under award numberR36AG057949 to Catherine Pérez.

58 C. García and J. A. Ailshire
Appendix 1
Prevalence estimates of diabetes obtained from predicted probabilities of logisticregression models, NHIS (2000–2015)
Diabetes prevalence by race and Latino subgroups, NHIS 2000–2015
Panel A: Prevalence adjusted by age and sex
Mexican PuertoRican
Cuban Dominican Central/SouthAmerican
White
% 95%CI
% 95%CI
% 95%CI
% 95%CI
% 95%CI
% 95%CI
Northeasta 5.6 [3.0,8.2]
16.9 [15.4,18.4]
8.3 [4.8,11.8]
12.4 [10.0,14.7]
7.8 [6.4,9.2]
6.0 [5.7,6.3]
Midwesta 13.1 [11.1,15.1]
14.5 [11.2,17.8]
13.9 [5.5,22.4]
2.7 [−2.6,7.9]
10.4 [5.5,15.3]
7.7 [7.4,7.9]
Southa 12.2 [11.4,13.1]
11.3 [9.8,12.8]
7.2 [6.5,7.9]
14.3 [9.6,19.0]
6.8 [5.7,7.9]
7.4 [7.2,7.6]
Westa 10.7 [10.0,11.4]
12.7 [9.4,15.9]
7.4 [3.9,10.8]
10.9 [−1.7,23.5]
7.5 [6.4,8.6]
5.8 [5.6,6.1]
Panel B: Prevalence adjusted by sociodemographic, socioeconomic and health characteristics
Mexican PuertoRican
Cuban Dominican Central/SouthAmerican
White
% 95%CI
% 95%CI
% 95%CI
% 95%CI
% 95%CI
% 95%CI
Northeasta 6.2 [3.5,8.8]
13.5 [12.3,14.8]
8.7 [5.4,12.0]
11.3 [9.4,13.1]
9.3 [7.6,11.0]
6.1 [5.8,6.3]
Midwesta 12.2 [10.5,13.9]
13.5 [10.4,16.6]
13.9 [4.4,23.3]
4.0 [−3.3,11.4]
12.9 [7.2,18.6]
7.2 [7.0,7.4]
Southa 11.3 [10.6,12.0]
11.5 [10.0,13.1]
7.7 [6.8,8.6]
14.9 [10.8,19.0]
8.6 [7.3,9.9]
7.4 [7.3,7.6]
Westa 10.6 [9.9,11.3]
11.7 [8.9,14.5]
6.6 [3.5,9.8]
8.5 [1.0,16.4]
8.8 [7.6,10.0]
6.3 [6.0,6.5]
aNote The wide confidence intervals (CIs) observed are due to small cell sizes
Appendix 2
Prevalence estimates of hypertension obtained frompredicted probabilities of logisticregression models, NHIS (2000–2015)

3 ¿Importa Dónde Vivimos? How Regional Variation Informs … 59
Hypertension prevalence by race and Latino Heritage, NHIS 2000–2015
Panel A: Prevalence adjusted by age and sex
Mexican PuertoRican
Cuban Dominican Central/SouthAmerican
White
% 95%CI
% 95%CI
% 95%CI
% 95%CI
% 95%CI
% 95%CI
Northeasta 16.4 [10.4,22.4]
31.0 [29.1,33.0]
21.0 [17.8,24.3]
30.5 [27.2,33.7]
17.7 [15.6,19.8]
22.2 [21.7,22.7]
Midwesta 22.9 [21.0,24.7]
27.7 [22.4,33.0]
24.4 [10.8,38.0]
11.6 [−6.9,30.0]
20.9 [15.5,26.4]
25.1 [24.7,25.4]
Southa 22.2 [21.1,23.2]
24.5 [22.4,26.5]
21.4 [20.2,22.5]
27.6 [22.6,32.6]
16.2 [14.8,17.5]
24.7 [24.4,25.1]
Westa 20.0 [19.0,20.9]
26.1 [22.3,29.9]
26.4 [20.6,32.2]
20.4 [0.1,40.7]
19.3 [17.8,20.9]
22.0 [21.5,22.4]
Panel B: Prevalence adjusted by sociodemographic, socioeconomic and health characteristics
Mexican PuertoRican
Cuban Dominican Central/SouthAmerican
White
% 95%CI
% 95%CI
% 95%CI
% 95%CI
% 95%CI
% 95%CI
Northeasta 20.2 [14.4,26.0]
28.4 [26.7,30.1]
23.6 [19.4,27.8]
32.8 [30.2,35.5]
22.9 [20.5,25.2]
22.3 [21.9,22.7]
Midwesta 23.8 [21.9,25.6]
28.5 [23.3,33.7]
25.8 [13.1,38.4]
17.4 [1.1,33.7]
27.3 [22.1,32.6]
23.9 [23.6,24.2]
Southa 23.5 [22.6,24.5]
26.3 [24.2,28.4]
24.3 [22.9,25.6]
31.1 [26.3,35.9]
21.1 [19.7,22.6]
24.6 [24.3,25.0]
Westa 22.4 [21.5,23.3]
25.6 [21.5,29.6]
26.0 [21.7,30.3]
18.3 [2.6,33.9]
24.2 [22.3,26.0]
22.5 [22.2,22.8]
aNote The wide confidence intervals (CIs) observed are due to small cell sizes
References
Abraído-Lanza, A. F., Echeverría, S. E., & Flórez, K. R. (2016). Latino immigrants, acculturation,and health: Promising new directions in research. Annual Review of Public Health, 37, 219–236.
Acevedo-Garcia, D., Lochner, K. A., Osypuk, T. L., & Subramanian, S. V. (2003). Future directionsin residential segregation and health research: a multilevel approach.American Journal of PublicHealth, 93(2), 215–221.
Altman, D. (2016). Will poor health status in the south be an issue in 2016 pri-maries? https://www.kff.org/disparities-policy/perspective/will-poor-health-status-in-the-south-be-an-issue-in-2016-primaries/.
Angel, R., & Angel, J. L. (2015). Latinos in an aging world: Social, psychological, and economicperspectives. New York: Routledge, Taylor & Francis Group.
Boltri, J. M., Okosun, I. S., Davis-Smith, M., & Vogel, R. L. (2005). Hemoglobin A1c levels indiagnosed and undiagnosed Black, Hispanic, and White persons with diabetes. Results fromNHANES 1999–2000. Ethnicity and Disease, 15(4), 562–567.
Burgos, G., & Rivera, F. I. (2012). Residential segregation, socioeconomic status, and disability: Amulti-level of Puerto Ricans in the United States. El Centro Journal, 24(2), 14–46.

60 C. García and J. A. Ailshire
Carson, A. P., Howard, G., Burke, G. L., Shea, S., Levitan, E. B., & Muntner, P. (2011). Ethnicdifferences in hypertension incidence among middle-aged and older adults: The multi-ethnicstudy of atherosclerosis. Hypertension, 57(6), 1101–1107.
Chandra, A., & Skinner, J. S. (2004). Geography and racial health disparities. In N. B. Anderson,R. A. Bulatao, & B. Cohen (Eds.), Critical perspectives on racial and ethnic differences in healthin later life. Washington, DC: National Academies Press.
Clarke, P., & Nieuwenhuijsen, E. R. (2009). Environments for healthy ageing: A critical review.Maturitas, 64(1), 14–19.
Crimmins, E.M., Kim, J. K., Alley, D. E., Karlamangla, A., & Seeman, R. (2007). Hispanic paradoxin biological risk profiles. American Journal of Public Health, 97, 1305–1310.
DeVoe, J. E., Baez, A., Angier, H., Krois, L., Edlund, C., & Carney, P. A. (2007). Insuranceaccess �� health care: Typology of barriers to health care access for low-income families. Annalsof Family Medicine, 5(6), 511–518.
Eschbach, K., Ostir, G. V., Patel, K. V., Markides, K. S., & Goodwin, J. S. (2004). Neighborhoodcontext and mortality among older Mexican Americans: Is there a barrio advantage? AmericanJournal of Public Health, 94, 1807–1812.
Gaskin, D. J., Dinwiddie, G. Y., Chan, K. S., & McClearly, R. (2012). Residential segregation anddisparities in healthcare services utilization.Medical Care Research and Review, 69(2), 158–175.
Gennuso, K. P., Jovaag, A., Catlin, B. B., Rodock, M., & Park, H. (2016). Assessment of factorscontributing to health outcomes in the eight states of the Mississippi Delta region. PreventingChronic Disease, 13(E33), 1–13.
Ghaddar, S., Brown, C. J., Pagán, J. A., & Diaz, V. (2010). Acculturation and healthy lifestylehabits among Hispanics in the United States-Mexico border communities. Pan American Journalof Public Health, 28(3), 190–197.
Glymour, M.M., Avendano,M., & Berkman, L. F. (2007). Is the ‘stroke belt’ worn from childhood?Risk of first stroke and state of residence in childhood and adulthood. Stroke, 38(9), 2415–2421.
González, H., Vega, W., Rodríguez, M., Tarraf, W., & Sribney, W. (2009). Diabetes awareness andknowledge among Latinos: Does a usual source of healthcare matter? Journal of General InternalMedicine, 24, 528–533.
Gregg, E. W., Beckles, G. L., Williamson, D. F., Leveille, S. G., Langlois, J. A., Engelgau, M. M.,et al. (2000). Diabetes and physical disability among older U.S. adults. Diabetes Care, 23(9),1272–1277.
Hassing, L. B., Hofer, S. M., Nilsson, S. E., Berg, S., Pedersen, N. L., McClearn, G., et al. (2004).Comorbid Type 2 diabetes mellitus and hypertension exacerbates cognitive decline: Evidencefrom a longitudinal study. Age and Ageing, 33(4), 355–361.
Heiss, G., Snyder, M. L., Teng, Y., Schneiderman, N., Llabre, M. M., Cowie, C., et al. (2014).Prevalence ofmetabolic syndromeamongHispanics/Latinos of diverse background:TheHispanicCommunity health study/study of Latinos. Diabetes Care, 37(8), 2391–2399.
Hood, E. (2005). Dwelling disparities: How poor housing leads to poor health. EnvironmentalHealth Perspectives, 113(5), A310–A317.
Hu, J., Amirehsani, K., Wallace, D., & Letvak, S. (2013). Perceptions of barriers in managingdiabetes: perspectives of Hispanic immigrant patients and their families. The Diabetes Educator,39(4), 494–503.
Iceland, J., & Scopilliti, M. (2008). Immigrant residential segregation in U.S. metropolitan areas,1990–2000. Demography, 45(1), 79–94.
Kaiser Family Foundation. (2016). Health and health coverage in the South: A data update (June09, 2016). https://www.kff.org/disparities-policy/issue-brief/health-and-health-coverage-in-the-south-a-data-update/.
Katz, S. (2005). Cultural aging: Life course, lifestyle, and senior worlds. Toronto, Canada: Univer-sity of Toronto Press.
Knopman, D., Boland, L. L., Mosley, T., Howard, G., Liao, D., Szklo, M., et al. (2001). Cardiovas-cular risk factors and cognitive decline in middle-aged adults. Neurology, 56(1), 42–48.

3 ¿Importa Dónde Vivimos? How Regional Variation Informs … 61
Kwan, M. (2013). Geographies of health, disease, and well-being: recent advances in theory andmethod. Abingdon, Oxon: Routledge.
López, L., & Golden, S. H. (2014). A new era in understanding diabetes disparities among U.S.Latinos—All are not equal. Diabetes Care, 37(8), 2081–2083.
Lopez-Class, M. & Jurkowski, J. (2010). The limits of self-management: community and healthcare system barriers among Latinos with diabetes. Journal of Human Behavior in the SocialEnvironment, 20(6), 808–826.
Markides, K. S. (2007). Encyclopedia of health & aging. Los Angeles, CA: Sage Publications.Markides, K. S., Rudkin, L., Angel, R. J., & Espino, D. (1997). Health status of Hispanic elderly. InL. G. Martin & B. J. Soldo (Eds.), Racial and ethnic differences in the health of older Americans(pp. 285–300). Washington, DC: National Academies Press.
McWilliams, J. M., Meara, E., Zaslavsky, A.M., & Ayanian, J. Z. (2009). Differences in control ofcardiovascular disease and diabetes by race, ethnicity, and education: U.S. trends from 1999 to2006 and effects of Medicare coverage. Annals of Internal Medicine, 150(8), 505–515.
Mitchell, U. A., Ailshire, J. A., & Crimmins, E. M. (2018). Change in cardiometabolic risk amongblacks, whites, and Hispanics: Findings from the health and retirement study. The Journals ofGerontology Series A: Biological Sciences and Medical Sciences. [Epub ahead of print].
Murray, C. J. L., Kulkarni, S. C., Michaud, C., Tomijima, N., Bulzacchelli, M. T., Iandiorio, T. J.& Ezzati, M. (2006). Eight Americas: Investigating mortality disparities across races, counties,and race-counties in the United States. PLOS Medicine, 3(9):1–12.
Nguyen, A. B., Moser, R., & Chou, W. Y. (2014). Race and health profiles in the United States: Anexamination of the social gradient through the 2009 CHIS adult survey. Public Health, 128(12),1076–1086.
Ortega, A. N., Fang, H., Perez, V. H., Rizzo, J. A., Carter-Pokras, O., Wallace, S. P., et al. (2007).Health care access, use of services, and experiences among undocumented Mexicans and otherLatinos. Archives of Internal Medicine, 167(21), 2354–2360.
Ortega, A. N., Rodriguez, H. P., & Bustamante, A. V. (2015). Policy dilemmas in Latino healthcare and the implementation of the Affordable Care Act. Annual Review of Public Health, 36,525–544.
Ortman, J. M., Velkoff, V. A., & Hogan, H. (2014). An aging nation: The older population in theUnited States. U.S. Census Bureau: https://www.census.gov/prod/2014pubs/p25-1140.pdf.
Ostir, G. V., Eschbach, K., Markides, K. S., & Goodwin, J. S. (2003). Neighbourhood composi-tion and depressive symptoms among older Mexican Americans. Journal of Epidemiology andCommunity Health, 57, 987–992.
Population Reference Bureau. (2017). Today’s research on aging: How neighborhood affect thehealth and well-being of older Americans. http://www.prb.org/Publications/Reports/2017/todays-research-aging-neighborhoods-health.aspx.
Pugh, J. A., Tuley, M. R., Hazuda, H. P., & Stern, M. P. (1992). The influence of outpatient insur-ance coverage on the microvascular complications of non-insulin-dependent diabetes in MexicanAmericans. Journal of Diabetes and Its Complications, 6(4), 236–241.
Ricketts, T. C. (2002). Geography and disparities in health care.Guidance for the National Health-care Disparities Report (pp. 149–180). Washington, DC: National Academies Press.
Rodriguez, M. A., Bustamante, A. V., & Ang, A. (2009). Perceived quality of care, receipt ofpreventive care, and usual source of health care among undocumented and other Latinos. Journalof General Internal Medicine, 24(Supplement 3), 508–513.
Ruiz, M. E., Phillips, L. R., Kim, H., & Woods, D. L. (2016). Older Latinos: Applying the ethno-cultural gerontological nursing model. Journal of Transcultural Nursing, 27(1), 8–17.
Sahyoun, N. R., Lentzner, H., Hoyert, D., & Robinson, K. N. (2001). Trends in causes of deathamong the elderly. Aging Trends, 1. Hyattsville, MD: National Center for Health Statistics.
Sandoval, J. S., & Jennings, J. (2012). Barrios and hyper barrios: How Latino neighborhoodschanged the urban built environment. Journal of Urbanism: International Research on Place-making and Urban Sustainability, 5(2–3), 111–138.

62 C. García and J. A. Ailshire
Santiago, C. D. C., Wadsworth, M. E., & Stump, J. (2011). Socioeconomic status, neighborhooddisadvantage, and poverty-related stress: Prospective effects on psychological syndromes amongdiverse low-income families. Journal of Economic Psychology, 32(2), 218–230.
Schoeborn, C., Adams, P., & Peregoy, J. (2013). Health behaviors of adults: United States,2008–2010. https://www.cdc.gov/nchs/data/series/sr_10/sr10_257.pdf.
Seligman, H. K., Laraia, B. A., & Kushel, M. B. (2010). Food insecurity is associated with chronicdisease among low-income NHANES participants. The Journal of Nutrition, 140(2), 304–310.
Strauss, S. M., Vega, M., Clayton-Jeter, H. D., Deren, S., Rosedale, M., & Rindskopf, D. M. (2014).Latinas with elevated fasting plasma glucose: An analysis using NHANES 2009–2010 data.Hispanic Health Care International, 12(1), 16–23.
Umpierrez, G. E., Gonzalez, A., Umpierrez, D., & Pimentel, D. (2007). Diabetesmellitus in the His-panic/Latino population: An increasing health care challenge in the United States. The AmericanJournal of the Medical Sciences, 334(4), 274–282.
U.S. Department of Health and Human Services. (2003). National health care disparities report.https://archive.ahrq.gov/qual/nhdr03/nhdr2003.pdf.
U.S. Department of Health and Human Services. (2014). 2014 Surgeon General’s report: The healthconsequences of smoking—50 years of progress. https://www.cdc.gov/tobacco/data_statistics/sgr/50th-anniversary/index.htm.
Valencia, W. M., Oropesa-Gonzalez, L., Hogue, C., & Florez, H. J. (2016, August 16). Diabetesin older Hispanic/Latino Americans: Understanding who is at greatest risk. http://www.asaging.org/blog/diabetes-older-hispaniclatino-americans-understanding-who-greatest-risk. AccessedDecember 31, 2017.
Villa, V. M., Wallace, S. P., Bagdasaryan, S., & Aranda, M. P. (2012). Hispanic baby boomers:Health inequities likely to persist into old age. The Gerontologist, 52(2), 166–176.
Wallace, S. P., & Villa, V. M. (2003). Equitable health systems: Cultural and structural issues forLatino elders. American Journal of Law and Medicine, 29(2–3), 246–267.
Wray, L. A., Ofstedal, M. B., Langa, K. M., & Blaum, C. S. (2005). The effect of diabetes ondisability in middle-aged and older adults. The Journals of Gerontology Series A: BiologicalSciences and Medical Sciences, 60(9), 1206–1211.
Wray, L. A., Alwin, D. F., McCammon, R. J., Manning, T., & Best, L. E. (2006). Social status,risky behaviors, and diabetes in middle-aged and older adults. Journal of Gerontology: SocialSciences, 61B(6), S290–S298.
Yen, I. H., Michael, Y. L., & Perdue, L. (2009). Neighborhood environment in studies of health ofolder adults. American Journal of Preventive Medicine, 37(5), 455–463.
Chapter 4Latino and Alzheimer’s: SocialDeterminants and Personal FactorsContributing to Disease Risk
Shinyi Wu, Francisca Rodriguez, Haomiao Jinand William A. Vega
Abstract This chapter forecasts the impact of Alzheimer’s disease on the Latinopopulation of theUnited States and examines the role of place and social determinantsfor increasing or decreasing disease risk. Latinos are believed to be at much higherrisk than non-Latino Whites, attributable in part to key social determinants such asvery low income and educational attainment and high rates of medical conditionsassociated with inflammation especially excess diabetes rates and cardiovascular dis-ease (CVD). Using complex statistical modeling and limited information availableabout the prevalence of Alzheimer’s disease in the U.S. population, statistical trendscovering increases in number of cases anticipated and care related costs over thenext 4 decades were estimated. Results show that Latinos will have vastly increasingtotal volume of cases, surpassing African Americans, and accelerating care costs.
S. Wu (B) · F. Rodriguez · H. Jin · W. A. VegaUSC Edward R. Roybal Institute on Aging, University of Southern California, Los Angeles, CA,USAe-mail: [email protected]
F. Rodrigueze-mail: [email protected]
H. Jine-mail: [email protected]
W. A. Vegae-mail: [email protected]
S. Wu · H. JinSuzanne Dworak-Peck School of Social Work, University of Southern California, Los Angeles,CA, USA
F. RodriguezCenter for Cognitive Science, University of Kaiserslautern, Kaiserslautern, Germany
F. RodriguezInstitute of Social Medicine, Occupational Health and Public Health, University of Leipzig,Leipzig, Germany
W. A. VegaAcademic Health Center, Florida International University, Miami, FL, USA
© Springer Nature Switzerland AG 2019W. A. Vega et al. (eds.), Contextualizing Health and Aging in the Americas,https://doi.org/10.1007/978-3-030-00584-9_4
63
64 S. Wu et al.
Simulations were conducted to estimate disease rates if educational attainment anddiabetes rates were equalized with non-Latino Whites, and reduction in total caseswas significant. The chapter examines the role of “place” and embedded environmen-tal factors that predispose lower SES Latinos to higher risk of Alzheimer’s diseaseover the life span, and the importance of addressingmodifiable factors linked to brainhealth such as high school completion rates, exercise, diet, social engagement, andcognition. Research recommendations are presented.
Introduction
Alzheimer’s disease (AD) prevalence is expanding in U.S. society (Alzheimer’sAssociation 2016). Expert reports suggest Latinos are disproportionately affectedcompared to non-Latino whites (Chin, Negash, and Hamilton 2011; Alzheimer’sAssociation 2016; Mehta and Yeo 2017). If true, it represents a dramatic exampleof an emergent health disparity in America that will increase with the rapid agingof U.S. society. Alzheimer’s disease causes a devastating decline in personal func-tioning and ultimately leads to death (Tomaszewski Farias et al. 2009). It is the mostexpensive disease in the United States in total care costs (Takizawa et al. 2015) andplaces an enormous burden of time and resources on caregivers and society (Joneset al. 2015; Vega et al. 2018).
The causes for this escalation of AD cases are multiple; influenced in part byincreasing longevity, life span exposure to multiple social determinants and relatedenvironmental exposures, and preexisting health conditions (Mattson 2004; Reitzet al. 2011; Vega et al. 2017). In this chapter, we examine the impact of AD on theU.S. Latino population with precision, nonetheless within limits imposed by today’sknowledge of AD. Increases in AD cases for Latinos are estimated over severaldecades. In addition,we have simulated possible decreases inADcases across severaldecades under conditions wherein two putative social and disease risk factors of ADare reduced that occur disproportionately in Latinos, specifically diabetes and loweducational attainment (Letenneur et al. 1999; Elfassy et al. 2018).
Brief Overview of Latino Health Patterns in Aging and ADRisk
Research reports suggest that Latino immigrants generally have good health untilmid- adulthood and subsequently experience extensive deterioration of health statusand onset of health problems and disabilities thereafter in the last third of the lifespandespite a longevity advantage (González et al. 2009). Latinos born in theUnitedStateshave higher risk for poor physical and mental health in adulthood than immigrantsarriving in early adulthood, especially substance abuse including smoking (Singh
4 Latino and Alzheimer’s: Social Determinants … 65
and Miller 2004; Vega et al. 2009). This pattern is modified for some Latinos bysocial mobility and upward assimilation that affects exercise and dietary behaviors(Castro et al. 2010).
Latinos have lower all-cause mortality (Sorlie et al. 1993; Wong et al. 2005;Cortes-Bergoderi et al. 2013; Heron 2015). The longer life expectancy of about3 years than the U.S. population promises a greater chance of living to the oldeststages of life, 80 years and older, when AD onset is most prevalent. Latinos havelower levels and slower accumulation of serious health conditions including lowerincidence rates of lung and breast cancer and lower mortality attributable to cardio-vascular disease than the overall U.S. population (Quiñones et al. 2011; DeSantiset al. 2014). The lower overall death rate is partially offset by excess mortality forspecific diseases, notably diabetes, obesity related medical conditions, chronic liverdisease, and somewhat less so for premature death from HIV, and premature mortal-ity such as traumatic events like accidents and homicides (Sorlie et al. 1993; Wonget al. 2005; Vega et al. 2009).
Latinos over the age of 65 are projected to increase from 6.7% today to 18.1%in 2060 (Wu et al. 2016). The aging and lower SES of the Latino population willpresumably intensify their risk of AD and burden of dementia on families. Recentfindings suggest that earliest signs of AD brain pathology begin about 20 years beforemild cognitive decline is manifested, presaging the ultimately fatal stage (Insel et al.2017). There is urgency to investigate possible contributory factors to reduce Latinorisk of AD and population interventions to interrupt the accelerating impact of ADin Latinos.
Accurate information about AD risk, awareness, and treatment among Latinos islimited for a variety of reasons. Put simply, the field requires greater depth of research,rigor and uniformity of methods. We have gone to great lengths to describe themethods used in this report as an example of the complexity to be encountered whenso much is not well understood. Thus, our quantitative estimates should be read andused with these caveats in mind, and we have provided an extensive documentationof methods to fully inform our audience.
Methods
In order to model the impact of AD in Latinos with an acceptable level of rigor, weused available data from multiple data sets to estimate the expansion of cases overtime and the accelerating costs of formal and informal care. Although the detailsregarding population increases are taken from the U.S. Census, other factors used inour estimateswere taken from the scientific literature. These data are an elaboration ofprevious research that readers can consult if they seek greater detail on the approach(Wu et al. 2016).

66 S. Wu et al.
The Basis for Estimating AD Among Latinos
We searched through the annual Alzheimer’s Disease Facts and Figures reports from2010 to 2015 (U.S. Department of Health and Human Services 2011; Hispanics inPhilantrophy 2011; Gaskin et al. 2013; Alzheimer’s Foundation of America 2013;National Hispanic Council onAging 2015) and the literature referred to in the reportsto identify studies that used a standardized type evaluation to identify people withAD and determine the prevalence of AD in age-specific subgroups of older Latinos(Alzheimer’s Association 2011, 2012, 2013, 2014, 2015). The only study that useda standardized form of evaluation to identify people with AD that was based on anationally representative sample is the Aging, Demographics, and Memory Study(ADAMS; Plassman et al. 2007). However, the number of Latinos in ADAMS wastoo small to get valid estimates of the prevalence of AD for that group (Gaskin et al.2013). Two studies with a larger community sample were identified: the Washing-ton Heights-Inwood Columbia Aging Project (WHICAP) and the Sacramento AreaLatino Study on Aging (SALSA). WHICAP identified AD cases from nursing homeresidents and through a house-to-house survey of 13 adjacent census tracts in thenorth Manhattan area. TheWHICAP sample consisted of mostly Caribbean Latinos.SALSA used door-to-door neighborhood enumeration to identify AD cases from fivecontiguous counties in the Sacramento area. In contrast toWHICAP,Mexican-originLatino constitute a major proportion of the SALSA sample.
We adjusted and pooled the results of WHICAP and SALSA to estimate theprevalence of AD for Latinos in three age-specific subgroups: 65–74, 75–84, and 85or older. SALSA reported AD prevalence in four age-specific subgroups (i.e. 60–69,70–79, 80–84, and 85 or older). We assumed the age of AD cases were distributeduniformly within each of the four reported age groups and calculated the prevalenceof AD in the three age-specific subgroups desired. We pooled results from the twostudies by calculating the weighted mean of AD prevalence in each age-specificsubgroup. We used weights 6 and 4 for the SALSA and the WHICAP respectively.We put a higher weight on SALSA because Mexican-origin Latinos constitute about60% of all U.S. Latinos.
Both the SALSA and the WHICAP were carried out before 2000. We used theweighted mean calculated above as an estimate of the prevalence of AD for Latinosin 2000. There has a significant growth in the prevalence of diabetes in Latinossince 2000 (Centers for Disease Control and Prevention 2015). This growth trend isprojected to continue through 2050 (Wild et al. 2001). Based on the prevalence ofdiabetes for older Latinos adults in 2000 that was obtained from the CDC (NationalCouncil on Aging 2015), our estimated prevalence of AD for Latinos in 2000, andfindings from a meta-analysis that showed that having diabetes increased the riskof AD by 54%, we calculated the prevalence of AD for Latinos with or withoutdiabetes according to age group: 65–74, 75–84, and 85 or older. We assumed theprevalence of AD for Latinos with or without diabetes would not change over time.Information about the historical prevalence of diabetes for Latinos was taken fromthe CDC (Centers for Disease Control and Prevention 2015). In combination with

4 Latino and Alzheimer’s: Social Determinants … 67
the projections from Wild et al. we estimated the prevalence of diabetes for Latinosthrough 2050 (Wild et al. 2001). We assumed the prevalence of diabetes in Latinoswould not change from 2050 to 2060. Finally, we projected the prevalence of AD inLatinos through 2060 based on the forecast for diabetes in Latinos and our estimateof the prevalence of AD in Latinos with or without diabetes.
Estimating the Direct Costs for Latinos with AD
We used the 2012 Medical Expenditure Panel Survey (MEPS) to estimate medicalcare costs, including expenditures for office- and hospital-based care, home healthcare, dental care services, vision aid equipment, and prescriptionmedications. Adultsage 65 or older with cognitive disorders including dementia, delirium, and amnesiaand other cognitive disorders in the MEPS were identified using the clinical classi-fication system code 653. Because most adults age 65 or older in the MEPS havemedical costs larger than 0, we used generalized linear regression instead of the zero-inflated model for estimation. Specifically, we used a negative binomial regressionmodel to account for the wide dispersion of the costs and adjusted for demographics,socioeconomic status, health status and the presence of common comorbidities ofAD, and location to estimate the medical costs for Latinos with AD.
The demographic measures included age, race/ethnicity, gender, and marital sta-tus. The socioeconomic status measures were education, family income, and healthinsurance status. The common comorbidities of AD include stroke, chronic heartdisease, and diabetes. The location measures were census region and urban-ruralresidence. All statistical analyses in the study were carried out by STATA 14, whichcan appropriately incorporate design factors and sample weights in the data.
Long-term care costs include expenditures for nursing home care, adult day care,residential care facility, and hospice care. We obtained the number of Latinos whoused each type of long-term care services in 2012 from the CDC report, Long-TermCare Services in the United States: 2013 Overview. The CDC’s report provided theproportions of users with AD for each type of long-term care service. Because alltypes of long-term care service except adult day care were found to be predominantlyused by non-Latino whites and an expert panel had estimated that the prevalence ofAD in Latinos is about 50% higher than it is of non-Latino whites—a conservativeestimate given the recent lower rates reported for non-Latino whites, and we multi-plied the proportions of users with AD provided by the CDC’s report by 1.5 to getthe proportions of Latinos users with AD for each type of long-term care serviceexcept for adult day care (Alzheimer’s Association 2010). For adult day care, weassumed that the proportion of Latino users with AD was the same as the overallproportion of users diagnosed with AD. For each type of long-term care service, wemultiplied the number of Latino users by the proportion of Latino users with ADto obtain the number of Latino users with AD in 2012. We used data provided byother publications (Lu and Haase 2009; AARP Foundation 2014; National HispanicCouncil on Aging 2015) to estimate the average daily cost and average length of stay

68 S. Wu et al.
per year for each type of long-term care service and multiplied them to obtain theaverage cost per user per year for each type of long-term care service. Finally, wemultiplied the average cost per user per year by the number of Latino users who hadAD in 2012 to obtain the costs of Latino users with AD for each type of long-termcare service.
Estimating the Indirect Costs for Latinos with AD
Eighty-five percent of unpaid informal care to older adults in the United States isprovided by family members (Prohaska et al. 2012). We used a two-part model toestimate the number of days of unpaid informal care provided by people not livingwith the same person. We assume this constitutes 15% of total unpaid informal carereceived by Latinos with AD. We assume the value of the care is $114 per day (i.e.,the average cost for a six-hour visit by a home health aide) to estimate the totalcosts of informal care for Latinos with AD (John Hancock Life and Health Company2013). We used a generalized linear model to estimate the earnings lost due to ADbased on the MEPS. We adjusted for the same factors as in the estimate of directmedical costs.
Simulating AD Prevalence Assuming Changing Ratesof Educational Attainment and Diabetes
The number of AD cases through 2060 by prevalence of diabetes was estimatedbased on the projection of Hispanic AD cases byWu et al. (2016). The projection wasderived by multiplying the projected number of older Hispanic adults in age groups65–74, 75–84, and 85 or older (retrieved from U.S. Census data) with the projectedAD prevalence rate among these groups, which was estimated by pooling findingsfrom two large community studies as aforementioned: the WHICAP (Gurland et al.1999) and the SALSA (Haan et al. 2003). In addition, we adjusted the projectedAD prevalence rates by the estimated increases in diabetes among Hispanics for thesame time period (Wild et al. 2004; also see Wu et al. 2016 for details). To evaluatehypothetical scenarios due to changes in prevalence of diabetes, we first estimatedthe prevalence rate of AD for Hispanics with and without diabetes, respectively, inthe three age groups: 65–74, 75–84, and 85 or older based on the prevalence rateof diabetes for older Hispanics (Centers for Disease Control and Prevention 2003),the prevalence rate of AD among Hispanics (Wu et al. 2016), and findings from ameta-analysis that showed a 54% higher risk for ADwhen having diabetes (Profennoet al. 2010). We then simulated the number of AD cases among older Hispanic adultsin the scenario that in 2060 the prevalence rate of diabetes among Hispanics would(1) remain at the current level, (2) reduce to 150% of the rate of Non-Hispanics, (3)

4 Latino and Alzheimer’s: Social Determinants … 69
reduce to 125%of the rate ofNon-Hispanics, or (4) reduce to the same rate of diabetesas among Non-Hispanic whites. We report the projected number and percentage ofreduced AD cases in 2060.
The number of AD cases through 2060 by educational attainment was estimatedbased on the rates of high school completion among older Hispanic and non-Hispanicwhites, respectively, that were retrieved from the U.S. Census data, the prevalencerate of AD among Hispanics (Wu et al. 2016), and the AD risk estimate of oddsratio (OR) 0.42 for people who completed high school compared to those who didnot (Langa et al. 2017). We chose high school completion as a critical marker foreducational attainment because, first, it is necessary for getting access to highereducation and a better income (Perreira et al. 2006) and, second, it is a pathwayfor better health and lower mortality (Freudenberg and Ruglis 2007). To evaluatethe hypothetical scenarios due to changes in high school completion rates, we firstestimated the prevalence rate of AD among Hispanics with and without high schooleducation in the three age groups: 65–74, 75–84, and 85 or older. Then, we assumeonly Hispanics age 26 and under (born after 1991) would benefit from the beneficialeffects for AD brought by an increase in high school completion rates. As peopleborn in 1995 will be 65 years old in 2060, the beneficial effect from higher educationshould reduceAD risk in the cohort ofHispanics born from1991 to 1995 at the year of2060. We retrieved the relevant population data from the Census data and combinedit with the previously estimated prevalence rate of AD by educational group and thepercentages of Hispanics and Non-Hispanic whites that have and have not completedhigh school education. We report the simulated number and percentage of reducedAD cases in 2060.
Findings
As shown in Fig. 4.1, the incidence of Alzheimer’s disease will grow exponentially.From 379,000 Latinos living with AD in 2012, this number will increase to 3.5million by 2060 (Wu et al. 2016).
Latino older adults will exceed African-American older adults, and so will thenumber of Latinos with AD. Projections suggest that, in 2060, there will be 3.6million Latinos with AD compared to 2.7 million African-Americans with AD and6.3 million Non-Latino whites with AD (Wu et al. 2016). As numbers of individualswith AD are increasing so are the costs associated with it. As illustrated in Fig. 4.2,it is estimated that direct costs for Latinos with AD will rise from $7 billion in 2012to more than $19.6 billion in 2030.
The largest expenses are expected to be nursing home costs increasing from $2978in 2012 to $71,837 (inflation-adjusted) per case in 2060 (Wu et al. 2016). However,without Social Security benefits, more than half of all Latino older adults wouldlive below the poverty level. A majority of the Latino population will thus relyheavily on unpaid informal care. Indirect costs—caused, for instance, by familymembers not being able towork full time—are expected to rise from$3851 in 2012 to

70 S. Wu et al.
0
1000000
2000000
3000000
4000000
5000000
6000000
7000000
8000000
2012 2020 2030 2040 2050 2060
Projected Number of U.S. Latinos with AD through 2060
Age 65-74 Age 75-84 Age 85+ Total
Fig. 4.1 Projection of Latinos aged 65 or older with AD from 2012 to 2060 (Wu et al. 2016)
$-
$50,00,00,00,000
$1,00,00,00,00,000
$1,50,00,00,00,000
$2,00,00,00,00,000
$2,50,00,00,00,000
2012 2020 2030 2040 2050 2060
Total Direct & Indirect Costs of AD on U.S. Latinos
Direct Costs Total Indirect Total Costs
Fig. 4.2 Estimated direct costs for Latinos with AD from 2012 to 2060 (Wu et al. 2016)
$102,463 (inflation-adjusted) per case in 2060 (Wu et al. 2016).With an estimated 1.8

4 Latino and Alzheimer’s: Social Determinants … 71
Table 4.1 Prevalence rate of Alzheimer’s disease (AD) in Latinos with and without diabetes andwith and without high school degree
Rate of AD in Latinos
Age group Overall (%) Withoutdiabetes (%)
With diabetes(%)
Less than highschool (%)
High schoolor higher (%)
Age 65–74 4.9 4.2 6.5 7.3 3.2
Age 75–84 16.2 13.8 21.2 21.5 10.3
Age 85+ 46.8 39.7 61.1 56.8 35.6
million Latino family caregivers caring for someone with AD and other dementias,it is critical to improve access to AD caregiving resources and training for informalcaregivers in multiple languages.
It is evident that there will be dramatic effects on Latino families as suggestedby our cost estimates. The impact on informal caregiving in Latino families isespecially concerning due to their disproportionately lower socioeconomic status,notwithstanding important changes in upward mobility anticipated among Latinosin future decades. Clearly indicated is the need to improve our understanding ofeffective care-giving, improving home management of AD and co-morbid medicalconditions, and to develop a network of ancillary support in communities and socialcare agencies to supply strategic assistance to families contending with high impactcare needs that potentially strains family members.
How Changes in Educational Attainment and PreexistingChronic Disease Affect AD Risk for Latinos
Tables 4.1 and 4.2 illustrates the potential effects of risk reduction attributable totwo key risk factors for AD, education and diabetes, among Latinos using the samedatabase as the previous prevalence and cost analysis presented in this chapter. Edu-cational attainment among Latinos is low and low educational attainment has detri-mental effects on AD risk (Valenzuela and Sachdev 2006). Prevalence of diabetesmellitus, on the other hand, is twice as high in Hispanics than in Non-Latino whites(Menke et al. 2015) and diabetes is associated with a higher risk for developing AD(Cukierman et al. 2005). In our simulation, we estimated the overall AD prevalencerate of Latinos through 2060 as attributable to (i) rates of diabetes and (ii) rates ofeducational attainment and simulated the change in AD prevalence if the rates werethe same as among the Non-Latino whites.
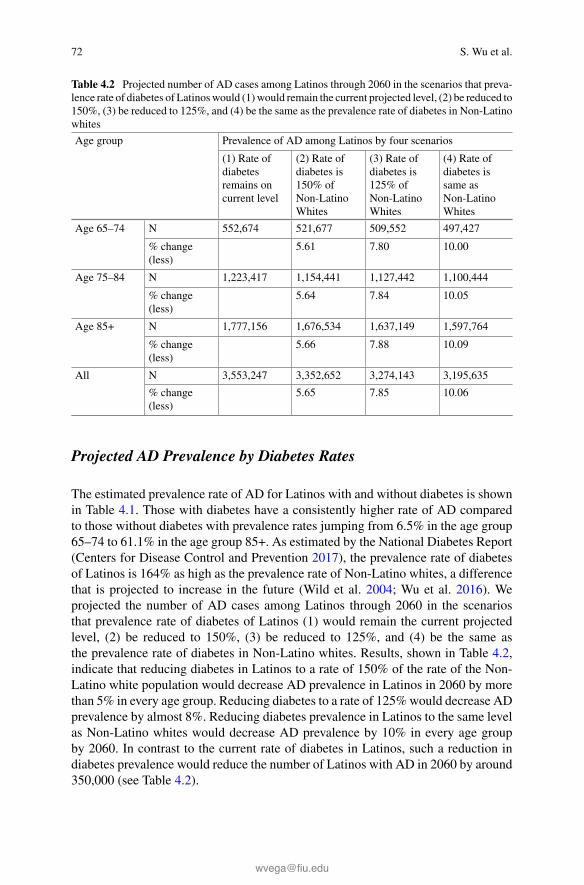
72 S. Wu et al.
Table 4.2 Projected number of AD cases among Latinos through 2060 in the scenarios that preva-lence rate of diabetes of Latinoswould (1)would remain the current projected level, (2) be reduced to150%, (3) be reduced to 125%, and (4) be the same as the prevalence rate of diabetes in Non-Latinowhites
Age group Prevalence of AD among Latinos by four scenarios
(1) Rate ofdiabetesremains oncurrent level
(2) Rate ofdiabetes is150% ofNon-LatinoWhites
(3) Rate ofdiabetes is125% ofNon-LatinoWhites
(4) Rate ofdiabetes issame asNon-LatinoWhites
Age 65–74 N 552,674 521,677 509,552 497,427
% change(less)
5.61 7.80 10.00
Age 75–84 N 1,223,417 1,154,441 1,127,442 1,100,444
% change(less)
5.64 7.84 10.05
Age 85+ N 1,777,156 1,676,534 1,637,149 1,597,764
% change(less)
5.66 7.88 10.09
All N 3,553,247 3,352,652 3,274,143 3,195,635
% change(less)
5.65 7.85 10.06
Projected AD Prevalence by Diabetes Rates
The estimated prevalence rate of AD for Latinos with and without diabetes is shownin Table 4.1. Those with diabetes have a consistently higher rate of AD comparedto those without diabetes with prevalence rates jumping from 6.5% in the age group65–74 to 61.1% in the age group 85+. As estimated by the National Diabetes Report(Centers for Disease Control and Prevention 2017), the prevalence rate of diabetesof Latinos is 164% as high as the prevalence rate of Non-Latino whites, a differencethat is projected to increase in the future (Wild et al. 2004; Wu et al. 2016). Weprojected the number of AD cases among Latinos through 2060 in the scenariosthat prevalence rate of diabetes of Latinos (1) would remain the current projectedlevel, (2) be reduced to 150%, (3) be reduced to 125%, and (4) be the same asthe prevalence rate of diabetes in Non-Latino whites. Results, shown in Table 4.2,indicate that reducing diabetes in Latinos to a rate of 150% of the rate of the Non-Latino white population would decrease AD prevalence in Latinos in 2060 by morethan 5% in every age group. Reducing diabetes to a rate of 125%would decrease ADprevalence by almost 8%. Reducing diabetes prevalence in Latinos to the same levelas Non-Latino whites would decrease AD prevalence by 10% in every age groupby 2060. In contrast to the current rate of diabetes in Latinos, such a reduction indiabetes prevalence would reduce the number of Latinos with AD in 2060 by around350,000 (see Table 4.2).

4 Latino and Alzheimer’s: Social Determinants … 73
Table 4.3 Projected number of AD cases among Latinos through 2060 in the scenarios that highschool education of Latinos would that (1) the percentage of high school education among Latinoswould remain at the current level (75.4%), (2) increases to 77.5%, (3) increases to 80%, (4) increasesto 82.5%, and (5) increases to the same level as Non-Latino whites (86.2%) by 2060
Prevalence of AD among Latinos by five scenarios
High school completion rate
(1) Currentlevel(75.4%)
(2) 77.50% (3) 80.00% (4) 82.50% (5) As Non-HispanicWhites(86.2%)
Hispanicsborn1991–1995
N 195,330 191,333 186,576 181,819 174,778
% change(less)
2.00 4.50 6.90 10.50
AllHispanics
N 3,553,247 3,549,250 3,544,493 3,539,736 3,532,695
% change(less)
0.10 0.20 0.40 0.60
Projected AD Prevalence by Educational Attainment
The estimated prevalence rate of AD for Latinos with and without high school educa-tion is shown in Table 4.1. Those without high school education have a consistentlyhigher rate of AD compared to those with high school education. In the age group65–74, the prevalence rate of AD is 7.3% for those who did not complete high schoolcompared to 3.2% for those who have a high school diploma. In the age group 85+,the prevalence rate of AD is 56.8% for those who did not complete high school com-pared to 35.6%) for those who did. We projected number of AD cases through 2060for five different scenarios based on U.S. Census data that indicated that 75.4% ofLatinos and 86.2% of Non-Latino whites completed high school education (cohortborn between 1991 and 1995). We simulated five scenarios with the percentage ofhigh school education among Latinos (1) remaining at the current level (75.4%),(2) increasing to 77.5%, (3) increasing to 80%, (4) increasing to 82.5%, and (5)increasing to the same level as non-Latino whites (86.2%) by 2060. Results, showninTable 4.3, indicate that increasing high school completion rates of Latinos to 77.5%could decrease AD prevalence in this cohort (born 1991–1995) by 2% and increasingit to 80% could decrease it by 4.5%. As shown in Table 4.3, a high school completionrate of 82.5% of adolescents today could reduce the AD prevalence by almost 7%and, if Latinos had the same rate of high school completion as Non-Latino whites,the number of AD cases could be reduced by more than 10% by 2060.
Next, we turn to an overview of Latino life course health, and the role of socialdeterminants in aging and AD risk.

74 S. Wu et al.
Place as a Fundamental Determinant of Life Course Healthand AD Risk
“Place” is a unit of investigation that can be considered as a theoretical construct (e.g.ethnic neighborhoods) and/or a bounded geographic unit with quantifiable parame-ters (e.g. zip codes, census tracks, regions, states, nations, etc.). In either instance, thecharacteristics of place are known to modulate lifespan exposures to environmentalrisk factors, including social determinants such as poverty and trauma, and ambientfactors such as toxins including lead and air pollutants. These factors pose higherrisks for declining physical and cognitive resilience and AD among individuals overthe life course (Williams and Collins 2001; Diez Roux 2001; Moulton and Yang2012; Bakulski et al. 2012). Latinos are a highly segregated population and face veryhigh poverty rates (Lichter et al. 2010). And spatial segregation disproportionatelyexposes Latinos to the highest concentrations of toxic air in the nation (Lievanos2015).
Stressful environments include persistent exposure to limited social mobility,extreme economic inequality, social pathologies such as racism, physical and sexualabuse, and predatory victimization by violence. In turn, these conditions are accom-panied by, and may be influencing, behaviors such as dietary patterns leading to veryhigh obesity rates and substance use disorders (Sinha and Jastreboff 2013). Phys-ical and safety features of residential environments, beyond toxic exposure levels,may also influence likelihood of exercise rates and social isolation, which are con-sidered critical protective and risk factors for AD (Karp et al. 2006). We illustratethese factors schematically in Fig. 4.3 as a simple casual model. The baseline islifetime exposure to environmental factors that influence the development of risk forchronic disease and functional declines in activities of daily living rapidly in lateradulthood. For example, early life exposures to poverty, physical and psychologicaltrauma, and toxins, may result in embedded health and brain health disadvantagesover the life span. Social factors, including disruptive immigration impacts, increasetrauma exposure and threaten the integrity of families and other informal networksfor supplying emotional and instrumental support across the life course. This is espe-cially important for understanding the life course “weathering effects” on the agingprocess in Latinos. Moreover, research is increasingly suggestive of a life coursemodel of adverse social and health conditions leading to a “chain of effects,” thatinclude greater risk of preconditions for chronic diseases in middle adulthood, suchas metabolic syndrome and inflammation, that heightens risk of diabetes, cardiovas-cular disease (CVD), and early cognitive decline (Whalley et al.. 2006).
U.S. data concerning place and health indicators and mortality has focused onmajor comparisons of areas such as aggregated zip codes, cities, national, state,or regional differences in rates of morbidity and mortality. However, AD risk hasnot had this level of epidemiologic scrutiny to date. Looking ahead, comparativeresearch linking specific place characteristics to pathological markers of diseasesuch as oxidative stress levels and brain inflammation, using biomarker linkage todemographic units of analysis, in Latinos may become available.

4 Latino and Alzheimer’s: Social Determinants … 75
Studies of regional differences in rates of U.S. disease and functional declineamong Latinos are presented in two other chapters in this volume and illustratemajor variations in health risk by “place,” variously defined, but are not definitive.The reason why? Factors related to “place” as a geo-spatial unit of study, whethermaterial or socially defined, do not account for either the inherent heterogeneity ofthe Latino population and inter-personal resiliency factors, nor the multi-level com-plexity of spatial research with its potential confounders (Diez Roux 2001). Thisdoes not mean place cannot be studied for epidemiologic disease patterns linkedto social determinants and proximal risk factors with sound results. It does meanthat simple attribution of risk to place without recognition of intermediary cofac-tors such as selection and population heterogeneity is too simplistic. This chaptercannot adequately address or resolve this conundrum. Moreover, there is abundantevidence that Latino subgroups have variable risk for diseases and functional dete-rioration such as ADL’s in different geographic areas. Chapters in this section of thevolume present data on regional variation in health conditions occurring in Latinosubgroups. In sum, while causal mechanisms of place remain under investigation, itis indisputable that place predisposes human populations to social determinants thatultimately contribute to higher or lower risk for AD.
Conversely, healthy people in higher risk environments often defy the odds ofcasual models. There are likely important reasons they do not follow trend lines ofstatistical central tendencies that also need examination.We have limited understand-ing about processes of life course exposure, especially inter-individual variation inbiological effects or adaptations to adverse environmental factors. We need moreinformation about direct and indirect effects on AD risk occurring through epigenet-ics involving exposures to common experiences such as threats, trauma, and toxicexposures, and the effects of time-sequencing, frequency, and duration of exposures.This type of information is essential for intervention development aimed at increasingbrain health and cognitive resilience, and improving control of pre-existing diseaseconditions. Below we provide selected examples of “leads” and research opportuni-ties to increase knowledge about risk factors for AD.
Social Determinants and Alzheimerís Disease Risk: Causal Chain of Effects
Environmental Context
Early LifeLower SES
High Burden Level for Daily Living and Employment
Life Chronic Stress
Unhealthy BehaviorsLow Health Care AccessDiet and Exercise Deficits
Chronic DiseaseFunctional LimitationsAlzheimerís Disease
Fig. 4.3 Social determinants of AD risk: Causal chain of effects

76 S. Wu et al.
Variations in Risk of AD
The Latino population in the United States is heterogeneous with historical ties andcultural origins in several nations of Latin America (Chavez et al. 2017). As Hispan-ics are often investigated as one unique group, the available evidence on epidemiol-ogy and risk factors of AD obscures intra-population variation in rates of cognitivedecline, as discussed below. Moreover, Hispanics are seriously underrepresented inresearch studies including epidemiologic and clinical trials research (George et al.2014), leaving a gap in evidence for deriving inferences about risk factors, and drugacceptability, adverse effects, and efficacy.
While the overall rates ofADforU.S. residentswith a high school degree, or highereducational levels, are decreasing (Langa 2015), the opposite trend of acceleratingrisk is observed for Latino AD prevalence (Wu et al. 2016). Perhaps themost relevantdemographic risk factor for AD in Latino older adults is low socioeconomic status.In 2013, themedian income of a Latino household was $40,337 compared to $61,317of Non-Latino whites and 24.7% of Latino households live in poverty or near povertycompared to 10.0% of Non-Latino whites (DeNavas-Walt et al. 2015).
In early life, socioeconomic status affects health by decreasing glucocorticoidand increasing proinflammatory signaling (Miller et al. 2009). Emotional distress isassociated with low socioeconomic status and cellular response to stress (Cole et al.2010). In addition, low educational attainment, which is rooted in childhood andearly adolescent academic failure, is an independent risk factor for AD (Stern 2012).Disease determinants of AD disparities, such as obesity and diabetes, are associatedwith social and economic cofactors routinely observed in low-income segregatedLatino residential areas (Vega et al. 2017). At the individual level, negative healthbehaviors such as poor diets, smoking, obesity, alongwith lower levels of appropriatemanagement of early stage symptoms of possible medical conditions are risk factorsfor functional impairments and disabilities that increase social isolation of olderadults (Wilkinson and Marmot 2003).
Factors Affecting Cognition in Latinos
Decades before a diagnosis of AD, people may experience neurodegeneration. Lati-nos also experience earlier onset of AD, and there is evidence of inter-group variabil-ity in risk of cognitive decline associated with place (Clark et al. 2005). A chapter inthis volume presents data on this topic. In addition, the Hispanic Community HealthStudy/Study of Latinos (HCHS/SOL) studied the course of cognitive decline in dif-ferent Hispanics groups: Central Americans, Cubans, Dominicans,Mexicans, PuertoRicans and South Americans. Findings indicate some Latino background variationsin cognitive functioning, indicating somewhat higher risk of earlier cognitive declinein Puerto Ricans and Dominicans in the Northeast compared to Mexican origin peo-ple residing in California (González et al. 2014). These differences are similar to AD

4 Latino and Alzheimer’s: Social Determinants … 77
prevalence variations observed in two population samples in California and NewYork that were quantified as weights, and used in calculating estimates of AD in thischapter. This is hardly the last word in prevalence estimation of AD in Latinos. Moreinformation is needed about intragroup and intergroup variation in AD risk beforeany firm generalizations are possible about population differences in cognition, riskfactors, or AD. A central concern is the need for using uniform case ascertainmentmeasures and biomarkers for AD in population studies.
There are cofactors affecting cognition that vary across Latino groups. For exam-ple, depressive symptoms, educational attainment, and income significantly predictedcognitive functioning across different groups (González et al. 2014). There is inten-sive scrutiny in two lines of investigation regarding variation in cognitive function-ing in Latinos: education and cardiovascular conditions. Educational attainment isof special interest among Latinos because it is so disproportionately low. More thantwo in five Latinos have not completed high school (Therrien and Ramirez 2000),and non-completion rates in older adults are even higher (Kohler and Lazarín 2007).Low education alsomay increase AD risk by life style selection and individual healthbehaviors, and through higher exposures to environmental risk factors that reduceresilience to AD risk. Low educational attainment is inversely and progressivelyassociated with detrimental effects on AD risk (Valenzuela and Sachdev 2006). Ameta-analysis suggests that every year of education can reduce AD risk by 7% (Xuet al. 2015).
Cardiovascular health, in terms of blood pressure parameters and hypertension,is related to poorer performance in cognitive tests including tests on executive func-tions, speed, verbal abilities, and cognitive status (González et al. 2016). Findingsalso suggest that the relationship between cardiovascular conditions and poor cogni-tive functioning is more pronounced in individuals with low educational attainment,thereby compounding the influence of both risk factors.
Health Services
The availability and accessibility of health services can impact the diagnosis of AD aswell as the treatments. The acceleration of treatedADcases in the futurewill require arealignment of services stressing maintenance of cognitive function and brain healthfor all older adults for prevention, and well-designed interventions for respondingto early signs of risk at the earliest intervention point of detection possible throughtesting. Timely and accurate diagnosis of AD is necessary to initiate treatment plansthat slow the deterioration of cognitive functioning, albeit without the benefit ofany effective drug therapies at this time. Practical barriers do impede care accessfor Latinos in receiving an AD diagnosis and to remain adherent to a treatment planincluding management of chronic diseases (Duthie et al. 2011). Today Latino elderlyoften receive a delayed AD diagnosis or remain undiagnosed (Sayegh and Knight2013) due to lower use of health care services (Colón and Lyke 2003).

78 S. Wu et al.
Reasons for lower use of medical care include lack of awareness of AD fea-tures, limitations in transportation and disablement (Syed et al. 2013; Cutts et al.2016) but also language barriers, stigma, and cultural uncertainties about the valueor appropriateness of care, and fear of uncovered costs of treatment and medications(Sayegh and Knight 2013; Watson et al. 2014). Latinos have the highest uninsuredand underinsured rates (McMorrow et al. 2015). Despite barriers to using health andpreventative services, Latinos appear to be willing to seek professional help if neededand are frequently optimistic about the value of treatments (Williams et al. 2010).
At this time, medical management of AD involves administration of medicationsintended to ameliorate symptoms in the absence of effective treatments to preventonset or underlying progression of cognitive decline leading to AD (Galimberti andScarpini 2011). Effective management requires accurate diagnosis since cognitivedecline and memory problems are not necessarily a sign of AD. Current practice formitigating AD progression rests on introducing exercise, dietary changes, maintain-ing social engagement, and encouraging intellectually challenging activities. Obvi-ously, this is a much bigger challenge for designing and implementing effectivepatient care than simply prescribing new medications. Yet Latinos tend to be opti-mistic about treatment (Williams et al. 2010). In one study, Latino Medicare benefi-ciaries weremore likely to initiate anti-dementiamedication thanNon-LatinoWhites(Thorpe et al. 2016). However, after initiation of anti-dementia medications, Lati-nos tend to have significantly lower adherence rates than Non-Latino whites (Poonet al. 2009; Thorpe et al. 2016). This signals a need for better patient education andself-management.
Future Directions and Conclusions
This chapter has presented estimates of the anticipated acceleration of cases in theU.S. among Latinos. However, in many ways, the forecast underestimates the acuteburden of AD for families and society. The estimates cover age cohorts, however theage-specific prevalence of AD peaks at 80 and onset rates will be much higher forthat age segment, and people in this age group are increasing more rapidly than anyyounger age segment in the US. Further, a statistical limitation of our approach insimulating potential effects on AD of improved educational attainment and reduceddiabetes rates is that both factors are correlated. We cannot infer additive effects ofameliorating these two risk factors on AD risk reduction. However, combined effectsof lowering AD risk by increasing education and lowering diabetes rates could bepowerful because there are other correlated risk factors that could be protective suchas reduced toxic exposures, improved economic mobility, and lower inflammationat an earlier age in the life span.
Social and physical environments have important direct and indirect effects onADrisk. Various research studies have shown that low socioeconomic status, ethnicityand race, and sex are correlated with higher rates of AD (Mortimer andGraves 1993).Importantly, there aremarkedly higher risk rates ofADamongwomen that are at leastdouble that of men (Ott et al. 1998). Social structures influence opportunities and

4 Latino and Alzheimer’s: Social Determinants … 79
barriers for individual and population social mobility and life styles, and influencepatterns of disease in society (Diez Roux 2001).
Presently there is no cure for AD, and it is unlikely any cure can reverse theneurodegenerative effects on the brain after onset of clinically significant cognitivedeterioration. It may be decades before we have viable pharmacologic therapies thatcan slow progression of cognitive decline. The Latino population has a longer lifeexpectancy and may have an optimistic attitude towards treatment, and strong socialcapital for caregiving. However, Latinos disproportionately experience low income,low education, and myriad environmental disadvantages associated with residing inareas of severe disadvantage and resource scarcity. For today’s older adult Latinoslow education is a fact of life, yet current trends are very promising for elevatingeducation levels in subsequent generations of Latinos. Current evidence stronglysuggests that social and individual determinates such as low socioeconomic status,poor nutrition, excess weight, and barriers to health care should be mitigated toreduce AD risk (Plassman et al. 2010). These are tangible windows of opportunityfor future generations with improving education and income.
There is growing interest and activity in U.S. society today aimed at improv-ing the “culture of health” in America, accomplished by forming public and privatepartnerships for improving the status of social determinants of health, integratingactivities of health and humans services, and improving access to tools and ser-vices that improve health status in under-resourced communities. Social, cultural,and economic resources are needed to develop sustainable healthy communities thatsupport longevity with quality of life. Some seeds of social capital already exist. Res-idence in immigrant enclaves was reported to be protective against cognitive impair-ment (Weden et al. 2017) underscoring the potential of critical social resources forstrengthening cognitive resilience for some Latinos. Other protective resources suchas small and large organizations are needed to expand programs and services pro-moting community safety, improving education and income attainment, controllingviolence and trauma, and reducing environmental risk factors for AD. Undoubt-edly, extended informal support systems will remain the fundamental and intimateresource in Latino populations for supporting brain health in older adults and ADpatient care, and they require informational and material support that is accessiblein their communities (Seeman et al. 2001).
We can anticipate that science will deliver a steady stream of dietary supplementsand pharmacologic agents to assist in the struggle against AD as our science pro-gresses. Nonetheless until the arrival of truly effective and affordable medicationsor other targeted therapies that can protect brain health and markedly reduce ADrates, mitigating AD risk requires effectively promoting health behaviors across thelife span, and preventing, eliminating, or managing social factors and environmentalconditions that contribute directly to poor community health and ultimately to earlierdeclines in brain health and AD risk.
Acknowledgements This research was sponsored by funds from UsAgainstAlzheimer’s.

80 S. Wu et al.
References
AARP Foundation. (2014). Food insecurity among older adults. Washington, DC: AARP Founda-tion.
Alzheimer’s Association. (2010). Alzheimer’s disease facts and figures. Alzheimer’s & Dementia,6(2), 158–194.
Alzheimer’s Association. (2011). Alzheimer’s disease facts and figures. Alzheimer’s & Dementia,7(2), 208–244.
Alzheimer’s Association. (2012). Alzheimer’s disease facts and figures. Alzheimer’s & Dementia,8(2), 131–168.
Alzheimer’s Association. (2013). Alzheimer’s disease facts and figures. Alzheimer’s & Dementia,9(2), 208–245.
Alzheimer’s Association. (2014). Alzheimer’s disease facts and figures. Alzheimer’s & Dementia,10(2), e47–e92.
Alzheimer’s Association. (2015). Alzheimer’s disease facts and figures. Alzheimer’s & Dementia,11(3), 332–384.
Alzheimer’s Association. (2016). Alzheimer’s disease facts and figures. Alzheimer’s & Dementia,12(4), 459–509.
Alzheimer’s Foundation of America. (2013). Alzheimer’s disease care costs add up. Alzheimer’sFoundation of America. https://alzfdn.org/wp-content/uploads/2017/04/Care_Costs_-_Alzheimer_s_Disease.pdf. Accessed April 27, 2018.
Bakulski, K. M., Rozek, L. S., & Dolinoy, D. C. (2012). Alzheimer’s disease and environmen-tal exposure to lead: The epidemiologic evidence and potential role of epigenetics. CurrentAlzheimer’s Research, 9(5), 56–573.
Castro, F. G., Marsiglia, F. F., Kulis, S., & Kellison, J. G. (2010). Lifetime segmented assimilationtrajectories and health outcomes in Latino and other community residents. American Journal ofPublic Health, 100, 669–676.
Centers for Disease Control and Prevention. (2003). National diabetes fact sheet: General informa-tion and national estimates on diabetes in the United States, 2002. Atlanta, GA: U.S. Departmentof Health and Human Services of the Centers for Disease Control and Prevention.
Centers for Disease Control and Prevention. (2015). Diabetes public health resource. Centersfor Disease Control and Prevention. http://www.cdc.gov/diabetes/statistics/prevalence_national.htm. Accessed August 28, 2015.
Centers for Disease Control and Prevention. (2017). National diabetes statistics report 2017 U.S.Department of Health and Human Services. Atlanta, GA: U.S. Department of Health and HumanServices.
Chavez, L. R., Flores, E. T., & Lopez-Garza, M. (2017). Migrants and settlers: A comparison ofundocumentedMexican and Central Americans in the United States.Frontera Norte, 1(1), 49–75.
Chin, A. L., Negash, S., & Hamilton, R. (2011). Diversity and disparities in dementia. The impactof ethnoracial differences in Alzheimer’s disease. Alzheimer’s Disease Associated Disorders, 25,187–195.
Clark, C. M., DeCarli, C., Mungas, D., Chui, H. I., Higdon, R., Nuñez, J., et al. (2005). Earlieronset of Alzheimer disease symptoms in Latino individuals compared with Anglo individuals.Archives of Neurology, 62(5), 774–778.
Cole, S. W., Arevalo, J. M., Takahashi, R., Sloan, E. K., Lutgendorf, S. K., Sood, A. K., et al.(2010). Computational identification of gene-social environment interaction at the human IL6locus. Proceedings of the National Academy of Science of the United States of America, 107(12),5681–5686.
Colón,M.,&Lyke, J. (2003). Comparison of hospice use and demographics amongEuropeanAmer-icans, African Americans, and Latinos. American Journal of Hospice and Palliative Medicine,20(3), 182–190.

4 Latino and Alzheimer’s: Social Determinants … 81
Cortes-Bergoderi, M., Goel, K., Murad, M. H., Allison, T., Somers, V. K., Erwin, P. J., et al. (2013).Cardiovascularmortality inHispanics compared to non-Hispanicwhites: A systematic review andmeta-analysis of the Hispanic paradox. European Journal of Internal Medicine, 24(8), 791–799.
Cukierman, T., Gerstein, H. C., & Williamson, J. D. (2005). Cognitive decline and dementiain diabetes—Systematic overview of prospective observational studies. Diabetologia, 48(12),2460–2469.
Cutts, T., Langdon, S., Meza, F. R., Hochwalt, B., Pichardo-Geisinger, R., Sowell, B., et al.(2016). Community health asset mapping partnership engages Hispanic/Latino health seekersand providers. North Carolina Medical Journal, 77(3), 160–167.
DeNavas-Walt, C., Proctor, B. D., & Smith, J. C. (2015). Income and poverty in the United States:2014. Suitland, MD: United States Census Bureau.
DeSantis, C., Ma, J., Bryan, L., & Jemal, A. (2014). Breast cancer statistics, 2013. CA: A CancerJournal for Clinicians, 64, 52–62.
Diez Roux, A. V. (2001). Investigating neighborhood and area effects on health. American Journalof Public Health, 91(11), 1783–1789.
Duthie, A., Chew, D., & Soiza, R. L. (2011). Non-psychiatric comorbidity associated withAlzheimer’s disease. QJM: An International Journal of Medicine, 104(11), 913–920.
Elfassy, T., Alello, A. E., Schneiderman, N., Haan, M. N., Tarraf, W., González, H. M., et al.(2018). Relation of diabetes to cognitive function in Hispanics/Latinos of diverse backgroundsin the United States. Journal of Aging and Health, Epub ahead of print. https://doi.org/10.1177/0898264318759379.
Freudenberg, N., & Ruglis, J. (2007). Reframing school dropout as a public health issue. PreventingChronic Disease, 4(4), A107–A1118.
Galimberti, D., & Scarpini, E. (2011). Disease-modifying treatments for Alzheimer’s disease. Ther-apeutic Advances in Neurological Disorders, 4(4), 203–216.
Gaskin, D. J., LaVeist, T. A., & Richard, P. (2013). The costs of Alzheimer’s disease and otherdementia for African-Americans. Chevy Chase, MD: USAgainstAlzheimer’s.
George, S., Duran, N., & Norris, K. (2014). A systematic review of barriers and facilitators tominority research participation amongAfricanAmericans, Latinos, AsianAmericans, and PacificIslanders. American Journal of Public Health, 104(2), e16–e31.
González, H. M., Cebellos, M., Tarraf, W., West, B. T., Bowen, M. E., & Vega, W. A. (2009).The health of older Mexican Americans in the long run. American Journal of Public Health, 99,1879–1885.
González, H. M., Tarraf, W., Gouskova, N., Gallo, L. C., Penedo, F. J., Davis, S. M., et al. (2014).Neurocognitive function among middle-aged and older Hispanic/Latinos: Results from the His-panic Community Health Study/Study of Latinos. Archives of Clinical Neuropsychology, 30(1),68–77.
GonzálezHM,TarrafW,GouskovaN,RodríguezCJ,RundekT,GroberE, et al. (2016). Life’s simple7’s cardiovascular health metrics are associated with Hispanic/Latino neurocognitive function:HCHS/SOL Results. J Alzheimers Dis. 18 53(3):955–65. https://doi.org/10.3233/JAD-151125.PubMed PMID: 27340845; PubMed Central PMCID: PMC5467859
Gurland, B. J., Wilder, D. E., Lantigua, R., Stern, Y., Chen, J., Killeffer, E. H., et al. (1999). Ratesof dementia in three ethnoracial groups. International Journal of Geriatric Psychiatry, 14(6),481–493.
Haan, M. N., Mungas, D. M., González, H. M., Ortiz, T. A., Acharya, A., & Jagust, W. J. (2003).Prevalence of dementia in older Latinos: The influence of type 2 diabetes mellitus, stroke andgenetic factors. Journal of the American Geriatrics Society, 51(2), 169–177.
Heron, M. (2015). Deaths: Leading causes for 2011. National Vital Statistics Reports, 64(7). U.S.Department of Health and Human Services.
Hispanics in Philanthropy. (2011).The Latino age wave: What changing ethnic demographics meansfor the future of aging in the United States. Washington, DC: Global Policy Solutions LLC.
82 S. Wu et al.
Insel, P. S., Ossenkoppele, R., Gessert, D., Jagust,W., Landau, S., Hansson, O., et al. (2017). Time toamyloid positivity and preclinical changes in brain metabolism, atrophy, and cognition: Evidencefor emerging amyloid pathology in Alzheimer’s disease. Frontiers in Neuroscience, 11, 281–289.
John Hancock Life and Health Company. (2013). Cost of care survey. Boston, MA: John HancockLife and Health Company.
Jones, R. W., Romeo, R., Trigg, R., Knapp, M., Sato, A., King, D., et al. (2015). Dependence inAlzheimer’s disease and service use costs, quality of life, and caregiver burden: The DADE study.Alzheimer’s & Dementia: The Journal of the Alzheimer’s Association, 11(3), 280–290.
Karp,A., Paillard-Borg, S.,Wang,H.X., Silverstein,M.,Winblad, B.,&Fratiglioni, L. (2006).Men-tal, physical and social components in leisure activities equally contribute to decrease dementiarisk. Dementia and Geriatric Cognitive Disorders, 21(2), 65–73.
Kohler, A. D., & Lazarín, M. (2007). Hispanic education in the United States. National Council ofLa Raza, Statistical Brief, 8(1), 7–8.
Langa, K. M. (2015). Is the risk of Alzheimer’s disease and dementia declining? Alzheimer’sResearch & Therapy, 7(1), 34.
Langa, K. M., Larson, E. B., Crimmins, E. M., Faul, J. D., Levine, D. A., Kabeto, M. U., et al.(2017). A comparison of the prevalence of dementia in the United States in 2000 and 2012. JAMAInternal Medicine, 177(1), 51–58.
Letenneur, L., Gilleron, V., Commenges, D., Orgogozo, J. M., & Dartigues, J. F. (1999). Are sexand education level independent predictors of dementia and Alzheimer’s disease? Incidence datafrom the PAQUID project. Journal of Neurology, Neurosurgery and Psychiatry, 66, 177–183.
Lichter, D. T., Parisi, D., Taquino, S. M., & Grice, S. M. (2010). Residential segregation in newHispanic destinations: Cities, suburbs, and rural communities compared. Social Science Research,39(2), 215–230.
Lievanos, R. S. (2015). Race, deprivation, and immigrant isolation: The spatial demography ofair-toxic clusters in the continential United States. Social Science Research, 54, 50–67.
Lu, Y.-F. Y., & Haase, J. E. (2009). Experience and perspectives of caregivers of spouse with mildcognitive impairment. Current Alzheimer Research, 6(4), 384–391.
Mattson, M. P. (2004). Pathways towards and away from Alzheimer’s disease. Nature, 430(7000),631–639.
McMorrow, S., Long, S. K., Kenney, G. M., & Anderson, N. (2015). Uninsurance disparities havenarrowed for Black and Hispanic adults under the Affordable Care Act. Health Affairs, 34(10),1774–1778.
Mehta, K. M., & Yeo, G. W. (2017). Systematic review of dementia prevalence and incidence inthe U.S. race/ethnic populations. Alzheimer’s & Dementia, 13, 72–83.
Menke, A., Casagrande, S., Geiss, L., & Cowie, C. C. (2015). Prevalence of and trends in diabetesamong adults in the United States, 1988–2012. Journal of the American Medical Association,314(10), 1021–1029.
Miller, G. E., Chen, E., Fok, A. K., Walker, H., Lim, A., Nicholls, E. F., et al. (2009). Low early-lifesocial class leaves a biological residue manifested by decreased glucocorticoid and increasedproinflammatory signaling. Proceedings of the National Academy of Science of the United Statesof America, 106(34), 14716–14721.
Mortimer, J. A., & Graves, A. B. (1993). Education and other socioeconomic determinants ofdementia and Alzheimer’s disease. Neurology, 43(4), S39–S44.
Moulton, P. V., &Yang,W. (2012). Air pollution, oxidative stress, and Alzheimer’s disease. Journalof Environmental and Public Health. https://doi.org/10.1155/2012/472751.
National Hispanic Council on Aging. (2015). Status of Hispanic older adults: Recommendationsfrom the field. Washington, DC: National Hispanic Council on Aging.
Ott, A., Breteler, M. M., Harskamp, F. V., Stijnen, T., & Hofman, A. (1998). Incidence and risk ofdementia: The Rotterdam Study. American Journal of Epidemiology, 147(6), 574–580.
Perreira, K. M., Harris, K. M., & Lee, D. (2006). Making it in America: High school completionby immigrant and native youth. Demography, 43(3), 511–536.
4 Latino and Alzheimer’s: Social Determinants … 83
Plassman, B. L., Langa, K. M., Fisher, G. G., Heeringa, S. G., Weir, D. R., Ofstedal, M. B., et al.(2007). Prevalence of dementia in the United States: The aging, demographics, and memorystudy. Neuroepidemiology, 29, 125–132.
Plassman, B. L., Williams, J. W., Burke, J. R., Holsinger, T., & Benjamin, S. (2010). Systematicreview: Factors associated with risk for and possible prevention of cognitive decline in later life.Annals of Internal Medicine, 153(3), 182–188.
Poon, I., Lal, L. S., Ford, M. E., & Braun, U. K. (2009). Racial/ethnic disparities in medicationuse among veterans with hypertension and dementia: A national cohort study. Annals of Phar-macotherapy, 43(2), 185–193.
Profenno, L. A., Porsteinsson, A. P., & Faraone, S. V. (2010). Meta-analysis of Alzheimer’s diseaserisk with obesity, diabetes, and related disorders. Biological Psychiatry, 67(6), 505–512.
Prohaska, T. R., Anderson, L. A., & Binstock, R. H. (2012). Public health for an aging society.Baltimore, MD: JHU Press.
Quiñones, A. R., Liang, J., Bennett, J. M., Xu, X., & Ye, W. (2011). How does the trajectory ofmultimorbidity vary across Black, White, and Mexican Americans in middle and old age? TheJournals of Gerontology Series B: Psychological Sciences and Social Sciences, 66(6), 739–749.
Reitz, C., Brayne, C., &Mayeux, R. (2011). Epidemiology of Alzheimer’s disease. Nature Reviews.Neurology, 7, 137–152.
Sayegh, P.,&Knight, B.G. (2013). Cross-cultural differences in dementia: The Sociocultural HealthBelief Model. International Psychogeriatrics, 25(4), 517–530.
Seeman, T. E., Lusignolo, T. M., Albert, M., & Berkman, L. (2001). Social relationships, socialsupport, and patterns of cognitive aging in healthy, high-functioning older adults: MacArthurstudies of successful aging. Health Psychology, 20(4), 243–255.
Singh, G. K., & Miller, B. A. (2004). Health, life expectancy, and mortality patterns among immi-grant populations in the United States. Canadian Journal of Public Health, 95(3), I14–I21.
Sinha, R., & Jastreboff, A. M. (2013). Stress as a common risk factor for obesity and addiction.Biological Psychiatry, 73(9), 827–835.
Sorlie, P. D., Backlund, E., Johnson, N. J., & Rogot, E. (1993). Mortality by Hispanic status in theUnited States. Journal of the American Medical Association, 270(20), 2464–2468.
Stern, Y. (2012). Cognitive reserve in ageing and Alzheimer’s disease. Lancet Neurology, 11(11),1006–1012.
Syed, S. T., Gerber, B. S., & Sharp, L. K. (2013). Traveling towards disease: Transportation barriersto health care access. Journal of Community Health, 38(5), 976–993.
Takizawa, C., Thompson, P. L., vanWalsem, A., Faure, C., &Maier, W. C. (2015). Epidemiologicaland economic burden ofAlzheimer’s disease: A systematic literature review of data across Europeand the United States of America. Journal of Alzheimer’s Disease, 43(4), 1271–1284.
Therrien, M., & Ramirez, R. R. (2000). The Hispanic population in the United States. Currentpopulation reports. Washington, DC: U.S. Department of Commerce.
Thorpe, C. T., Fowler, N. R., Harrigan, K., Zhao, X., Kang, Y., Hanlon, J. T., et al. (2016). Racialand ethnic differences in initiation and discontinuation of antidementia drugs by Medicare ben-eficiaries. Journal of the American Geriatrics Society, 64(9), 1806–1814.
Tomaszewski Farias, S., Cahn-Weiner, D. A., Harvey, D. J., Reed, B. R., Mungas, D., Kramer,J. H., et al. (2009). Longitudinal changes in memory and executive functioning are associatedwith longitudinal change in instrumental activities of daily living in older adults. The ClinicalNeuropsychologist, 23(3), 446–461.
U.S. Department of Health and Human Services. (2011). HHS action plan to reduce racial andethnic health disparities: A nation free of disparities in health and health care. Washington, DC:U.S. Department of Health and Human Services.
Valenzuela, M. J., & Sachdev, P. (2006). Brain reserve and dementia: A systematic review. Psycho-logical Medicine, 36(4), 441–454.
Vega, I. E., Cabrera, L. Y., Wygart, C. M., Velez-Ortiz, D., & Counts, S. E. (2017). Alzheimer’sdisease in the Latino community: Intersection of genetics and social determinants. Journal ofAlzheimer’s Disease, 58(4), 979–992.

84 S. Wu et al.
Vega, W. A., Aranda, M., & Rodriguez, F. (2018). Millennials and dementia caregiving in theUnited States. Los Angeles, CA: Edward R. Roybal Institute on Aging, University of SouthernCalifornia. https://www.usgainstalzheimers.org/sites/Dementia_Caregiver_Report_Final.pdf.
Vega, W. A., Rodriguez, M. A., & Gruskin, E. (2009). Health disparities in the Latino population.Epidemiological Reviews, 31, 99–112.
Watson, J. L., Ryan, L., Silverberg, N., Cahan, V., & Bernard, M. A. (2014). Obstacles and oppor-tunities in Alzheimer’s clinical trial recruitment. Health Affairs, 33(4), 574–579.
Weden, M. M., Miles, J. N. V., Friedman, E., Escarce, J. J., Peterson, C., Langa, K. M., et al.(2017). The Hispanic paradox: Race/ethnicity and nativity, immigrant enclave residence andcognitive impairment among older U.S. Adults. Journal of the American Geriatrics Society,65(5), 1085–1091.
Whalley, L. J., Dick, F. D., & McNeill, G. (2006). A life-course approach to the aetiology oflate-onset dementias. The Lancet Neurology, 5(1), 87–96.
Wild, S., Roglic, G., Green, A., Sicree, R., &King, H. (2001). Projection of diabetes burden through2050. Diabetes Care, 24, 1936–1940.
Wild, S., Roglic, G., Green, A., Sicree, R., & King, H. (2004). Global prevalence of diabetes:Estimates for the year 2000 and projections for 2030. Diabetes Care, 27(5), 1047–1053.
Wilkinson, R. G., & Marmot, M. (2003). Social determinants of health: The solid facts. Geneva,Switzerland: World Health Organization.
Williams, C. L., Tappen, R. M., Rosselli, M., Keane, F., & Newlin, K. (2010). Willingness to bescreened and tested for cognitive impairment: Cross-cultural comparison. American Journal ofAlzheimer’s Disease and other Dementias, 25(2), 160–166.
Williams, D. R., & Collins, C. (2001). Racial segregation: A fundamental cause of racial disparitiesin health. Public Health Reports, 116(5), 404–416.
Wong, M. D., Tagawa, T., Hsieh, H. J., Shapiro, M. F., Boscardin, W. J., & Ettner, S. L. (2005).Differences in cause-specific mortality between Latino and white adults. Medical Care, 43(10),1058–1062.
Wu, S., Vega, W. A., Resendez, J., & Jin, H. (2016). Latinos & Alzheimer’s disease: New numbersbehind the crisis. Los Angeles, CA: Edward R. Roybal Institute on Aging, University of SouthernCalifornia.
Xu,W., Tan, L.,Wang, H. F., Jiang, T., Tan,M. S., Tan, L., et al. (2015). Meta-analysis of modifiablerisk factors for Alzheimer’s disease. Journal of Neurology, Neurosurgery and Psychiatry, 86(12),1299–1306.

Chapter 5Cognitive Functioning of U.S. Adultsby Race and Hispanic Origin
Carlos Díaz-Venegas, Brian Downer, Kenneth M. Langaand Rebeca Wong
Abstract The U.S. older adult population is becoming increasingly diverse. Theevidence from research using data from diverse older adult populations indi-cates that Hispanics have poorer performance on cognitive tests than older non-Hispanic whites (NHW). However, the evidence that older Hispanics are at anincreased risk for Alzheimer’s disease or related dementia (ADRD) than NHW isless clear. Interpreting the evidence from existing research on disparities betweenNHWs and Hispanics is complicated by the fact that few studies have differen-tiated between Hispanic subgroups by country of origin. In this chapter, we usethe ethnic descriptor of Hispanic as interchangeable with Latino. We summa-rize the current evidence on disparities between Hispanics and NHW in cogni-tive functioning and ADRD, and factors that may contribute to these disparities.This summary focuses on the rationale for considering specific Hispanic popula-tions when studying differences in cognitive functioning between Hispanics andNHWs. Finally, we present and discuss the findings from an analysis of data fromthe 2010 wave of the Health and Retirement Study (n�18,982) in which we
C. Díaz-Venegas (B)Max Planck Institute for Demographic Research (Max-Planck-Institut für DemografischeForschung), Rostock, Germanye-mail: [email protected]
B. DownerDivision of Rehabilitation Sciences, The University of Texas Medical Branch, Galveston, TX,USAe-mail: [email protected]
K. M. LangaDivision of General Medicine, University of Michigan, Ann Arbor, MI, USAe-mail: [email protected]
R. WongDepartment of Preventive Medicine and Community Health, Sealy Center on Aging, WHO/PAHOCollaborating Center on Aging and Health, the University of Texas Medical Branch, Galveston,TX, USAe-mail: [email protected]
© Springer Nature Switzerland AG 2019W. A. Vega et al. (eds.), Contextualizing Health and Aging in the Americas,https://doi.org/10.1007/978-3-030-00584-9_5
85

86 C. Díaz-Venegas et al.
examine differences in three cognitive domains by race/ethnicity, including fourHispanic subgroups. In this analysis, all Hispanic subgroups, except Cubans, hadsignificantly lower scores for all cognitive domains compared to NHWs, with PuertoRicans showing the lowest scores among Hispanics.
Cognitive Functioning of U.S. Adults by Race and HispanicOrigin
Extensive research has studied racial and ethnic differences in cognitive functioning,as well as disparities in the prevalence and incidence of Alzheimer’s disease andrelated dementias (ADRD). While older Hispanics have consistently been foundto have poorer performance on cognitive tests than non-Hispanic whites (NHW)(Zsembik and Peek 2001; Schwartz et al. 2004; Sloan and Wang 2005; Brewsteret al. 2014; Díaz-Venegas et al. 2016), the evidence that older Hispanics are morelikely than NHW to develop ADRD is less consistent (Gurland et al. 1999; Tanget al. 2001; Mayeda et al. 2014, 2016). The inconsistent findings may be due in partto studies not differentiating between Hispanic subgroups or by only studying U.S.Hispanics who live in specific geographic regions. The objective of this chapter isto provide an overview of prior research on disparities in cognitive functioning andADRD between older Hispanics and NHW. We also summarize the evidence fromprior research on factors that may contribute to these disparities. Finally, we usedata from the 2010 wave of the Health and Retirement Study to demonstrate theimportance of differentiating between Hispanic subgroups when studying cognitivedisparities between Hispanic and NHW older adults.
Diversity Within the U.S. Older Hispanic Adult Population
Hispanics are the largest minority group in the United States (Jacobsen et al. 2011)and are a rapidly aging segment of the population. The number of Hispanic adultsaged 65 and older increased from approximately 1.7 million in 2000 to 2.8 millionin 2009 (U.S. Census Bureau 2011). Hispanic ethnicity includes individuals whodescribe themselves as Mexican, Cuban, Puerto Rican, South or Central American,or other Spanish culture or origin, regardless of race (Henao-Martínez and Castillo-Mancilla 2013). In 2012, over 60%ofHispanics in theUnited States were ofMexicanorigin but a growing proportion of the Hispanic population includes individuals ofPuerto Rican, Central and South American, and Cuban descent (González-Barreraand Lopez 2013). As a result, Hispanics are a culturally and socially diverse subset ofthe U.S. population. This diversity contributes to differences between Hispanic sub-groups in educational attainment (Everett et al. 2011), socioeconomic status (Arias2010), and health (Dominguez et al. 2015).

5 Cognitive Functioning of U.S. Adults by Race and Hispanic Origin 87
Education and Socioeconomic Characteristics
Disparities between Hispanics and NHW in educational attainment and other mea-sures of socioeconomic status are well established. In 2014, 59% of Hispanics aged55 or older reported having completed 12 years or more of formal education com-pared to nearly 90% of NHW (U.S. Census Bureau 2014). However, data from theNational Health Interview Survey indicates that educational attainment varies widelybetween Hispanic subgroups with 52.7% of Mexican Americans aged 18–85 havinga high school or higher level of education compared to 69.6% of Puerto Ricans and73.5% of Cuban Americans (Arroyo-Johnson et al. 2016). Mexican American adultshave also been found to have lower annual income and to be less likely to have healthinsurance when compared to Puerto Ricans and Cuban Americans (Arroyo-Johnsonet al. 2016).
Chronic Health Conditions
Substantial differences betweenU.S.Hispanic subgroups in the prevalence of chronichealth conditions have been reported. An analysis of the National Health InterviewSurvey by Pabon-Nau et al. (2010) revealed that the prevalence of hypertensionamong Hispanics aged 18–85 ranged from 12% for Central/South Americans to 24%for Puerto Ricans and 25% for Cubans. Similarly, the overall prevalence of diabeteswas lowest for Central/South Americans (4%) and highest for Puerto Ricans (11%).These findings are consistent with other research indicating that Puerto Ricans havea higher prevalence of obesity and high cholesterol than other Hispanic subgroups(Daviglus et al. 2012).
Health Behaviors
A person’s health behaviors are largely influenced by cultural values and beliefs(Unger and Schwartz 2012). The cultural diversity of U.S. Hispanics makes it impor-tant to consider differences in health behaviors between Hispanic subpopulations.TheHispanic Community Health Study/Study of Latinos (HCHS/SOL) has providedvaluable data on differences betweenHispanic subgroups on several health behaviorsthat may positively or negatively impact cognitive functioning in old age, includingdiet, alcohol consumption, smoking, and physical activity. TheHCHS/SOL is a large,population-based study of Mexican, Puerto Rican, Dominican, Cuban, Central andSouth American Hispanics living in San Diego CA, Chicago IL, Bronx NY, andMiami FL (Lavange et al. 2010; Sorlie et al. 2010).
A study by Corsino et al. (2017) that investigated adherence to the DietaryApproaches to Stop Hypertension (DASH) diet revealed substantial differences

88 C. Díaz-Venegas et al.
across Hispanic subgroups in the consumption of grains, dairy, vegetables, fruit,nuts, meat, and sweets. In this study, HCHS/SOL participants of Mexican descentconsumed the most total grains, vegetables, and low-fat dairy, Cuban participantsreported the highest consumption of total dairy, South American participants hadthe highest consumption of sweets, and Dominican participants were identified asconsuming the most fruits but also having the lowest consumption of meats, poultry,eggs, and fish. A second dietary study revealed that nearly 90% of Cuban participantsreported their diet consisted of mainly Hispanic foods whereas approximately 75%of Mexican participants and 65% of Puerto Rican participants reported consumingmainly Hispanic foods (Casagrande et al. 2018).
Substantial differences in alcohol consumption, smoking, and physical activityhave also been identified among HCHS/SOL participants. For Dominican partici-pants, 13.1% reported never consuming alcohol whereas 51.3% reported that theycurrently consumed alcohol (Vidot et al. 2016). Conversely, 30.9% of Central Amer-ican participants reported never consuming alcohol and 39.8% were current alcoholconsumers (Vidot et al. 2016). For smoking, less than 15% of Dominican, CentralAmerican, and South American participants reported that they currently smokedcigarettes compared to 32.7% of Puerto Ricans and 26.3% of Cubans. Finally, ananalysis of physical activity revealed that while over 50% of all participants did notmeet the recommended guidelines for aerobic physical activity, this percentage wassubstantially higher for Dominicans (71.2%) and Cubans (65.2%).
Racial and Ethnic Disparities in Cognitive Functioningand Dementia
Hispanic and non-Hispanic black (NHB) older adults have consistently been foundto have lower performance on cognitive tests when compared to NHW (Zsembik andPeek 2001; Schwartz et al. 2004; Sloan and Wang 2005; Brewster et al. 2014). Theprevalence of cognitive impairment and ADRD has also been observed to be higheramong NHB and Hispanic older adults compared to NHW (Plassman et al. 2007,2008; Langa et al. 2008, 2009, 2017). However, evidence for disparities in the riskfor incident ADRD is less clear with NHB being reported to have higher risk forADRD compared to NHW in some (Gurland et al. 1999; Tang et al. 2001) but notall (Fitzpatrick et al. 2004; Katz et al. 2012) studies.
The evidence for disparities in ADRD risk for Hispanics compared to NHW isalso inconsistent (Gurland et al. 1999; Tang et al. 2001; Mayeda et al. 2014, 2016). Afactor that may contribute to the inconsistent results is that prior research has studiedHispanic populations from different geographic regions in the United States. Studiesthat have reported Hispanics to be at greater risk for ADRD have used data fromHispanics living in the eastern United States who are predominately of Puerto Ricanand Dominican descent (Gurland et al. 1999; Tang et al. 2001). Studies that havefound no significant difference in ADRD risk have included populations in which the

5 Cognitive Functioning of U.S. Adults by Race and Hispanic Origin 89
majority of Hispanics were of Mexican descent (Mayeda et al. 2014, 2016). Whilethere is less evidence that Mexican Americans are at greater risk for ADRD thanNHW, Mexican Americans have been observed to be diagnosed with ADRD at ayounger age and to have more severe symptoms upon receiving an ADRD diagnosisthan NHW (O’Bryant et al. 2007, 2013).
Factors that Contribute to Ethnic Disparities in CognitiveFunction
Extensive research has been conducted to identify factors that contribute to theobserved disparities in cognitive functioning between older Hispanics and NHW.One contributing factor is that Hispanics have a high prevalence of chronic healthconditions associated with poor cognition, most notably type II diabetes (Centersfor Disease Control and Prevention 2014), hypertension (Carson et al. 2011), andobesity (Ogden et al. 2010).
A second contributing factor is the large disparity in education between Hispanicsand NHW (U.S. Census Bureau 2014). Formal education is strongly associated withgreater cognitive functioning in old age and lower risk for ADRD (Caamano-Isornaet al. 2006). The benefits of formal education for preserving cognitive function in oldage have been attributed to greater cognitive reserve among more highly educatedolder adults (Roe et al. 2007; Meng and D’Arcy 2012). Cognitive reserve describesthe brain’s ability to maximize cognitive performance through the use of alternativeneural networks and cognitive strategies (Stern 2002, 2003; Scarmeas et al. 2003).Highly educated older adults may also be able to maintain high cognitive function bycompensating for the presence of damage to the brain caused by stroke, ADRD, orother neurodegenerative disease through the activation of neural networks that havenot been damaged (Stern 2002).
Advances in genetic sequencing technology have increased research on geneticrisk factors for ADRD among older Hispanic populations. The e4 variant of theAPOE gene is the strongest genetic risk factor for late onset ADRD (Corder et al.1993; Saunders et al. 1993). Compared to older adults who carry zero copies of the e4allele, those with one copy of the e4 allele have nearly three times higher odds to haveADRD whereas individuals who carry two copies have twelve times higher odds tohaveADRD (Bertram et al. 2007). However, there is growing evidence that theAPOEe4 allele is not as strong of a genetic risk factor for ADRD among Hispanics andNHB (Tang et al. 1998; Reitz and Mayeux 2014). A meta-analysis of the associationbetween APOE genotype and ADRD by race and ethnicity revealed that 36.7% ofNHW ADRD cases carried at least one copy of the e4 allele compared to 32.2% forNHB and 19.2% for Hispanics (Farrer et al. 1997). Furthermore, the increased oddsfor ADRD associated with the e4/e4 genotype were 12.5 (95% CI�8.8–17.7) forNHW, 5.7 (95% CI�2.3–14.1) for NHB, and 2.2 (95% CI�0.7–6.7) for Hispanics(Farrer et al. 1997). Several other genetic risk factors for ADRD among NHW have

90 C. Díaz-Venegas et al.
not been associated with ADRD among Hispanics (Jun et al. 2010). These findingshave important implications for understanding the etiology of ADRD in minoritypopulations and suggests that potentially modifiable risk factors may play a largerrole than genetic factors in influencing disease risk among minority populations(Haan et al. 2003).
Finally, it is important to consider the potential impact that biases in cognitiveassessmentsmay have on observed differences in cognition between racial and ethnicgroups. Cognitive screening instruments such as the Mini-Mental State Examination(MMSE) are commonly used in large epidemiological studies to identify participantswho may be cognitively impaired. A limitation of the MMSE and similar screeninginstruments is that question items may be culturally biased for Hispanics (Ramirezet al. 2006). MMSE items for orientation have been found to be more difficult forSpanish speaking participants, whereas items for repeating a phrase and 3-wordrecall are less difficult for Spanish speaking participants (Jones 2006). The differ-ences in item difficulty for Spanish versus English speakers may reflect issues intranslating items into Spanish, which may decrease the accuracy of the MMSE foridentifying older Hispanic adults who are cognitively impaired (Jones 2006; Ramirezet al. 2006). Many population-based longitudinal studies use cognitive tests that canbe administered over the telephone to evaluate changes in participants’ cognitivefunctioning. Some telephone-based assessments have high false positive rates fordementia among Hispanics (Manly et al. 2011).
Racial and Ethnic Differences in Cognitive Functionby Hispanic Subgroups: An Analysis of the Healthand Retirement Study
The social and cultural diversity of Hispanic subgroups may contribute to differencesin cognitive function. However, an important feature of the extant literature on racialand ethnic disparities in cognitive functioning is that Hispanics are often not sepa-rated by country or region of origin. This prevents differences in cognitive function-ing between Hispanic subgroups relative to NHW from being examined. A notableexception is an analysis of data from the HCHS/SOL that indicated middle-aged andolderMexican participants had significantly higher scores on tests of verbal learning,verbal recall, verbal fluency, and attention than Cuban, Dominican, and Puerto Ricanparticipants (Gonzalez et al. 2015).
In the present study,we used data from the 2010wave of theHealth andRetirementStudy (HRS) to examine cognitive functioning in specific domains (verbal memory,working memory, and numeracy) by race and Hispanic subpopulation (Mexican,Cuban, Puerto Rican, and other Hispanic). We also examined if the positive asso-ciation between greater educational attainment and cognition for racial and ethnicgroups vary by cognitive domain.

5 Cognitive Functioning of U.S. Adults by Race and Hispanic Origin 91
The present analysis will address important gaps in existing research on racialand ethnic disparities in cognitive functioning. First, prior research has generallyfocused on older adults and middle-aged participants are often excluded from anal-yses. Our analysis includes adults aged 50–64, which in 2010 is the age group thatcomprises the baby boomer generation. Also, cognitive limitations are becomingincreasingly common among middle-aged adults (Choi et al. 2018). And, Hispanicsmay develop cognitive impairment at a younger age than NHW (Livney et al. 2011;O’Bryant et al. 2013). Second, prior research that has studied cognitive disparitieshas generally focused on global cognitive functioning. Domain specific analysesare important because age related changes in cognitive functioning occur in a het-erogeneous pattern (Nilsson et al. 2009). Cognitive domains that involve recallingfactual information and knowledge acquired throughout the life span remain rela-tively intact into advanced age (Schaie 1994), whereas processing speed (Finkel et al.2007), episodic memory (Grady and Craik 2000), and cognitive tasks that require aperson to manipulate, process, and learn new information begin to decline as earlyas middle age (Schaie 1994). Examining distinct cognitive domains as opposed toglobal cognition can also provide insight into whether population-level disparitiesin cognitive functioning are caused by poor functioning in a specific domain (e.g.memory, perceptual speed) or if disparities are consistent across multiple cogni-tive domains. Finally, the association between educational attainment and cognitiveperformance may differ according to the cognitive domain that is being assessed.
We hypothesize the following: (a) NHB and Hispanic older adults will have lowercognitive function compared to NHW; (b) there will be differences in cognitivefunctioning between Hispanic subpopulations and these differences will be relatedto the level of education, and (c) greater educational attainment will be associatedwith higher cognitive function in all racial and ethnic groups, but the differences incognitive function will remain significant after controlling for education.
Methods
Sample
We used data from the 2010 wave of the Health and Retirement Study (HRS). TheHRS is a nationally representative cohort of Americans aged 50 or older in the con-tiguous United States. Baseline data collection began in 1992 (82% response rate)and follow-up interviews have been conducted every 2 years. New cohorts of adultshave been added approximately every 6 years (Health and Retirement Study 2011).The HRS has included an oversampling of NHB and Hispanics at a rate of approx-imately 2–1 at each wave (Health and Retirement Study 2008). This oversamplingwas affected by the baby boomer cohorts, which increased the available pool ofNHWand, consequently, reduced the relative sample size of minority participants (Healthand Retirement Study 2011). This problem was addressed in 2010 by increasing

92 C. Díaz-Venegas et al.
the oversampling of NHB and Hispanics in the baby boomer cohorts, resulting inadditional respondents for each minority group (Ofstedal andWeir 2011). Hence, weonly use data from the 2010 observation wave in our analyses as the over-sampling inthis wave allowed us to examine differences in specific cognitive domains betweenrace and the different Hispanic subpopulations (Mexican, Cuban, Puerto Rican, andother Hispanics).
A total of 20,101 respondents were interviewed during the 2010 observation wave(Health and Retirement Study 2010). For the purposes of the present analysis, weonly considered non-institutionalized respondents aged 50 or older who completedthe interview without the help of a proxy, completed the cognitive questionnaire, andprovided information on race and ethnicity. For the regression analysis, we furtherexcluded88 subjectswithmissing information for one ormore covariates (seeSection“Measures”). The final sample consisted of 18,982 subjects. The 1119 respondentswho were excluded were, on average, slightly older, predominantly NHW, and hada lower total cognition score than the analytic sample.
Measures
Cognitive functioning has been assessed in the HRS using a modified version of theTelephone Interview for Cognitive Status (TICS-M) (Brandt et al. 1988). The TICS-M is comprised of 12 items with a possible score of 0–35 points. We used a furthermodified version of the TICS-M with a score range of 0–27 because participantsyounger than 65 were not asked to recall several orientation and other basic items(Langa et al. 2009; Crimmins et al. 2011). The 27-point version of the TICS-Mincludes measures for verbal memory (immediate and delayed recall of a 10-itemword list, 0–20 points), working memory (serial 7’s, 0–5 points), and numeracy(counting backwards for ten continuous numbers, 0–2 points). The HRS employsbilingual interviewers and Spanish-speaking participants can choose to complete thecore HRS interview, including the TICS, in Spanish or English (Ofstedal and Weir2011).
Covariates
Age: Age was included as a continuous variable. A quadratic term for age was alsoincluded in the regression models to account for non-linear associations of cognitionwith older age. Education: extant literature has found that educational attainmentis a key component of cognitive functioning as more years of formal schooling isassociated with delayed cognitive decline (Amieva et al. 2014). For descriptive anal-ysis, we included years of education as a continuous variable. For the regressionanalyses, participants were grouped into three categories: (1) less than high school(reference category); (2) high school degree; and (3) more than high school.Gender:

5 Cognitive Functioning of U.S. Adults by Race and Hispanic Origin 93
male-female differences due to culturally-assigned roles are known to influence cog-nitive functioning (Maurer 2011). Hence, we have included a dichotomous variableto control for gender (women�1). Race/Ethnicity: We have included race/ethnicityas seven dichotomous variables for NHW (reference category), NHB, other non-Hispanic races (Asian, Pacific Islander, or Native American), Mexicans, Cubans,Puerto Ricans, and other Hispanics. Marital Status: Unmarried respondents havebeen observed to be at an increased risk of developing cognitive impairment andAlzheimer’s disease compared to married individuals (Håkansson et al. 2009). Also,married men have slower cognitive decline than unmarried men (van Gelder et al.2006). We have included a dichotomous variable controlling for marital status (mar-ried or living in a consensual union�1). Chronic conditions: cognitive function andchronic conditions normally have a synergistic relationship that increases the riskof morbidity by reducing adherence to treatments due to impaired and/or delayedcommunication of symptoms and more hospitalizations (Working Group on HealthOutcomes for Older Persons with Multiple Chronic 2012). We have included fourseparate dichotomous variables indicating if the respondent has ever been diagnosedwith hypertension, diabetes, heart condition, or stroke (yes�1). Finally, we includedinteraction terms between the categories of educational attainment and race/ethnicity.
Statistical Analysis
Ordinary Least Squares (OLS) regression models were used to estimate the adjustedcognition scores for verbal memory, workingmemory, and numeracy. The raw scoresfor each cognitive domain were transformed into z scores based on the sample meanand standard deviation (SD). This was done to account for differences in the range ofpossible scores on each task when making comparisons across domains (Cagney andLauderdale 2002). Interaction terms for education by race/ethnicity were includedto examine if the effects of education on cognition varied by race/ethnic group.
The multivariable models that included the education by race/ethnicity interac-tions were used to estimate the marginal effects of educational attainment on z scoresfor each cognitive domain according to race and ethnicity. All analyses were con-ducted using STATA/SE version 14.2 (StataCorp 2015).
Results
Sample Characteristics
Table 5.1 presents the baseline descriptive characteristics of the final sample stratifiedby race and ethnicity. Cubans were the oldest on average (68.1 years) andwere nearlyeight years older than respondents of other non-Hispanic races (60.9 years) and other

94 C. Díaz-Venegas et al.
Hispanics (60.9 years), three years older thanNHW (65.0 years), and nearly six yearsolder than NHB (62.4 years). On average, NHW and those of other non-Hispanicraces had 13.5 years of schoolingwhileNHBwere about a year below,with 12.6 yearsof education. Cubans and Puerto Ricans completed approximately two fewer yearsof education compared to NHW (11.1 and 11.5 years, respectively). Mexicans werethe least educated on average, having completed 9.1 years of education.
NHW had the highest average scores for total cognition (16.3 points) followed bythose of other non-Hispanic races (15.0 points) and other Hispanics (14.1 points).Puerto Ricans had the lowest total cognition, with an average score of 13.1 points,which was followed by NHB at 13.3 points. All other racial and ethnic groups scoredapproximately three fewer points than NHW for total cognition. NHW also had thehighest average scores for each cognitive domain. Puerto Ricans scored the lowest onthe immediate and delayed verbal recall assessments. On average, NHW had nearlyfour correct responses on the working memory task whereas NHB and Puerto Ricansscored the lowest, with fewer than three correct responses on average. All racial andethnic groups had similar scores in the numeracy assessment, and no race or ethnicgroup had an average below 1.7 points out of a possible two points.
Regarding main self-reported chronic diseases, Mexicans had the highest preva-lence of diabetes (36.7%), whereas NHW had the lowest prevalence at 18.1%. Theprevalence of hypertension was above 50% for all racial and ethnic groups, but NHBhad the highest prevalence at 71.7%.NHWhad the highest prevalence of heart diseaseat 22.8% and NHB had the highest prevalence of stroke at 9.5%.
Racial and Ethnic Differences for Verbal Memory, WorkingMemory, and Numeracy
Table 5.2 shows the OLS results corresponding to the z scores for verbal mem-ory, working memory, and numeracy. Age and age-squared were associated with allthree cognitive domains. Being female was associated with higher scores on verbalmemory, but lower scores for working memory. Males and females did not differsignificantly in mean z scores for numeracy. Being married was associated with con-siderably higher mean z scores for verbal memory and working memory, but notfor numeracy. Stroke was associated with significantly lower mean z scores for allthree cognitive domains, whereas diabetes and hypertension were associated withlower mean z scores for verbal memory and working memory. Self-reported heartconditions were associated with lower mean z scores for verbal memory only.
The effect of education varied across verbal memory, working memory, andnumeracy. It is worth pointing out that the results we present are the combinationof both the main effects of educational attainment and race/ethnicity as well as theinteraction terms, so the following numbers might differ slightly from the ones onTable 5.2. Having a high school degree or more than a high school degree had greatereffects on verbal memory and working memory compared to numeracy. Compared

5 Cognitive Functioning of U.S. Adults by Race and Hispanic Origin 95
Table 5.1 Descriptive characteristics ofAmericans older than50years in theHealth andRetirementStudy by race, Hispanic group, and gender, 2010
Variables Overall White Black Otherraces
MexicansPuertoRicans
Cubans OtherHispan-ics
Sociodemographic
Age*** 64.3(10.4)
65.0(10.7)
62.4(9.3)
60.9(9.2)
61.5(8.6)
61.0(8.5)
68.1(11.7)
60.9(8.9)
Female (%)*** 53.9 53.5 57.3 51.1 53.3 55.6 53.6 57.5
Education** 13.2(3.0)
13.6(2.5)
12.6(2.9)
13.6(3.1)
9.2(4.7)
11.5(3.9)
11.1(3.7)
10.9(4.6)
Marital status(%)
65.6 67.9 44.9 67.6 71.3 60.4 53.4 64.0
Cognitive function
Total cognitionscore (0–27)*
15.7(4.3)
16.3(4.1)
13.3(4.4)
15.0(4.2)
13.6(4.2)
13.1(4.5)
13.8(4.4)
14.1(4.3)
Immediateverbal recall(0-10)
5.6(1.6)
5.7(1.6)
5.1(1.6)
5.4(1.6)
5.0(1.6)
4.8(1.7)
5.0(1.6)
5.3(1.6)
Delayed verbalrecall (0–10)
4.6(1.9)
4.7(1.9)
3.8(1.9)
4.3(1.9)
4.1(1.8)
3.9(1.8)
4.0(2.0)
4.2(1.8)
Serial 7’s (0–5) 3.7(1.6)
3.9(1.4)
2.7(1.8)
3.5(1.6)
2.8(1.7)
2.7(1.8)
2.9(1.8)
2.9(1.7)
Countingbackwards (0–2)
1.9(0.5)
1.9(0.4)
1.7(0.7)
1.8(0.5)
1.8(0.6)
1.7(0.7)
1.8(0.5)
1.8(0.6)
Chronic conditions
Diabetes(%)***
20.6 18.1 29.0 26.8 36.7 32.7 28.0 22.9
Hypertension(%)***
55.6 53.5 71.7 56.2 57.1 55.6 69.0 52.6
Heart (%) 21.9 22.8 20.7 20.9 12.9 21.6 22.1 15.5
Stroke (%)** 6.9 6.7 9.5 8.0 5.5 7.0 4.8 3.5
Unweighted N 18962 12430 3637 581 1310 234 111 659
NotesWeighted data and unweighted sample size totals. All three covariates are expressed as aver-ages. Cognition refers to the total cognitive score (0–27). Standard deviations are shown in paren-thesis and some are omitted. Stars signify the variable is statistically significant by race/ethnicityexcept for Cubans and Puerto Ricans. *p ≤0.05; **p ≤0.01; ***p ≤0.001Source Author’s own elaboration with data from the 2010 Health and Retirement Study

96 C. Díaz-Venegas et al.
Table 5.2 Ordinary least squares coefficients for z-scores of verbal memory, workingmemory, andnumeracy
Variables Verbal memory Working memory Numeracy
Age 0.13***(0.12, 0.14)
0.04***(0.03, 0.06)
0.03**(0.01, 0.04)
Age squared −0.001***(−0.001, −0.001)
−0.0004***(−0.000, −0.000)
−0.0002***(−0.000, −0.000)
Female 0.33***(0.31, 0.36)
−0.21***(−0.24, −0.19)
0.02(−0.01, 0.05)
Married 0.08***(0.05, 0.10)
0.07***(0.04, 0.10)
0.03(−0.002, 0.06)
High school degree 0.33***(0.28, 0.38)
0.48***(0.42, 0.54)
0.12***(0.06, 0.18)
More than high school 0.63***(0.58, 0.68)
0.72***(0.66, 0.77)
0.16***(0.10, 0.21)
Race/Ethnicity (Ref.: Non-Hispanic Whites)
Non-Hispanic Blacks(NHB)
−0.40***(−0.47, −0.33)
−0.72***(−0.81, −0.64)
−0.54***(−0.65, −0.42)
Other races −0.45***(−0.62, −0.29)
−0.49***(−0.71, −0.27)
−0.45**(−0.76, −0.14)
Mexicans −0.24***(−0.31, −0.17)
−0.40***(−0.49, −0.31)
−0.26***(−0.37, −0.15)
Puerto Ricans −0.65***(−0.83, −0.48)
−0.83***(−1.02, −0.65)
−0.71***(−1.06 −0.37)
Cubans −0.04(−0.28, 0.20)
−0.53***(−0.80, 0.26)
−0.28(−0.70, 0.14)
Other Hispanics −0.34***(−0.35, −0.14)
−0.42***(−0.55, −0.29)
−0.37***(−0.55, −0.20)
Chronic conditions
Diabetes −0.07***(−0.10, −0.04)
−0.07***(−0.10, −0.04)
−0.02(−0.06, 0.02)
Hypertension −0.06***(−0.09, −0.03)
−0.06***(−0.09, −0.04)
−0.02(−0.05, 0.01)
Heart condition −0.07***(−0.10, −0.04)
−0.01(−0.05, 0.02)
−0.02(−0.06, 0.02)
Stroke −0.22***(−0.27, −0.17)
−0.19***(−0.24, −0.14)
−0.14***(−0.21, −0.08))
Constant −3.90***(−4.38, −3.42)
−1.25***(−1.75, −0.75)
−0.77**(−1.36, −0.19)
Unweighted N 18,890 18,890 18,890
R2 0.26 0.24 0.05
Notes 95%confidence intervals appear in parentheses. *p≤0.05; **p≤ .0.01; ***p≤0.001.Regres-sion also controls for interaction terms but results are omittedSource Author’s own elaboration with data from the 2010 Health and Retirement Study
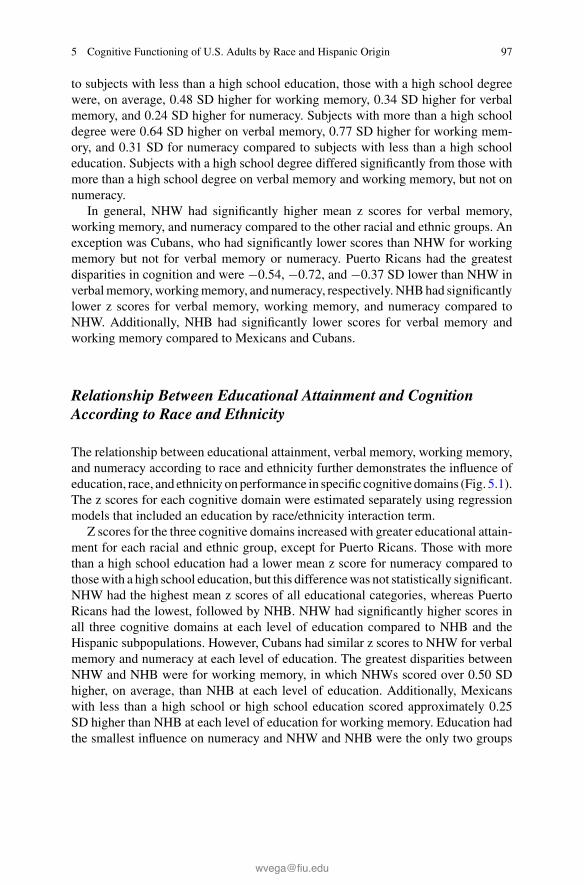
5 Cognitive Functioning of U.S. Adults by Race and Hispanic Origin 97
to subjects with less than a high school education, those with a high school degreewere, on average, 0.48 SD higher for working memory, 0.34 SD higher for verbalmemory, and 0.24 SD higher for numeracy. Subjects with more than a high schooldegree were 0.64 SD higher on verbal memory, 0.77 SD higher for working mem-ory, and 0.31 SD for numeracy compared to subjects with less than a high schooleducation. Subjects with a high school degree differed significantly from those withmore than a high school degree on verbal memory and working memory, but not onnumeracy.
In general, NHW had significantly higher mean z scores for verbal memory,working memory, and numeracy compared to the other racial and ethnic groups. Anexception was Cubans, who had significantly lower scores than NHW for workingmemory but not for verbal memory or numeracy. Puerto Ricans had the greatestdisparities in cognition and were −0.54, −0.72, and −0.37 SD lower than NHW inverbalmemory,workingmemory, and numeracy, respectively.NHBhad significantlylower z scores for verbal memory, working memory, and numeracy compared toNHW. Additionally, NHB had significantly lower scores for verbal memory andworking memory compared to Mexicans and Cubans.
Relationship Between Educational Attainment and CognitionAccording to Race and Ethnicity
The relationship between educational attainment, verbal memory, working memory,and numeracy according to race and ethnicity further demonstrates the influence ofeducation, race, and ethnicity onperformance in specific cognitive domains (Fig. 5.1).The z scores for each cognitive domain were estimated separately using regressionmodels that included an education by race/ethnicity interaction term.
Z scores for the three cognitive domains increased with greater educational attain-ment for each racial and ethnic group, except for Puerto Ricans. Those with morethan a high school education had a lower mean z score for numeracy compared tothosewith a high school education, but this differencewas not statistically significant.NHW had the highest mean z scores of all educational categories, whereas PuertoRicans had the lowest, followed by NHB. NHW had significantly higher scores inall three cognitive domains at each level of education compared to NHB and theHispanic subpopulations. However, Cubans had similar z scores to NHW for verbalmemory and numeracy at each level of education. The greatest disparities betweenNHW and NHB were for working memory, in which NHWs scored over 0.50 SDhigher, on average, than NHB at each level of education. Additionally, Mexicanswith less than a high school or high school education scored approximately 0.25SD higher than NHB at each level of education for working memory. Education hadthe smallest influence on numeracy and NHW and NHB were the only two groups

98 C. Díaz-Venegas et al.
Fig. 5.1 Differences in z-scores for verbalmemory,workingmemory, and numeracy by educationalattainment and race and Hispanic groups
in which subjects with more than a high school education had higher scores fornumeracy compared to subjects with a high school education.
Figure 5.1 also shows differences in cognitive function within the Hispanic sub-populations. Puerto Ricans had significantly lower mean z scores for verbal memory

5 Cognitive Functioning of U.S. Adults by Race and Hispanic Origin 99
and working memory compared to Cubans, Mexicans, and other Hispanics, in par-ticular for subjects with less than a high school education. Puerto Ricans with lessthan a high school education also had lower mean z scores for numeracy comparedto Mexicans. In general, Cubans had the highest mean z scores for all three cognitivedomains across education levels.
Discussion
In this chapter, we present evidence for differences in verbal memory, working mem-ory, and numeracy by race, ethnicity, and Hispanic subgroups. Consistent with ourfirst hypothesis, we observed that NHB had significantly lower scores for verbalmemory, working memory, and numeracy compared to NHW.We also observed thatall Hispanic subgroups had lower scores for each cognitive domain relative to NHW.However, the magnitude of this difference varied according to Hispanic subgroup.NHW had significantly higher scores for each cognitive domain compared to Mexi-cans, Puerto Ricans, and other Hispanics. NHW had significantly higher scores forworking memory compared to Cubans, but not for verbal memory or numeracy. Thelack of significant differences in cognition between Cubans and NHW may reflectsimilar levels of cognitive functioning between these two groups, but these resultsshould be interpreted with caution because of the small sample size of Cubans avail-able in the HRS.
Our analysis produced mixed evidence in support of the second hypothesis thatthere will be differences in cognitive functioning between Hispanic subgroups andthat these differences will be related to level of education. In general, Cubans andMexicans had similar scores for each cognitive domain and theseHispanic subgroupshad higher scores for each cognitive domain than Puerto Ricans. The higher cognitivescores for Mexican participants than Puerto Rican participants is contrary to ourhypothesis because Puerto Ricans had 2 years more of education on average thanMexicans.
Finally, consistent with our third hypothesis, we observed that greater educationwas associated with higher scores on each cognitive domain. However, the resultsfrom the OLS regression indicated that education had a significantly greater effectfor verbal memory and working memory than for numeracy. The differential effectsof educationmay be partly due to the fact that immediate and delayed word-list recall(for verbal memory) and serial 7’s (for workingmemory) represent more challengingcognitive tasks than counting backwards (for numeracy).
This study has a number of limitations. The first two are linked and have to dowith the sample size and the use of only one wave of a longitudinal study. The2010 wave of the Health and Retirement Study has been the only one that includesan over-sampling of NHB and Hispanics making these numbers double from theoriginal sampling sizes in previous and subsequent waves. However, the sample

100 C. Díaz-Venegas et al.
sizes for the Hispanic subgroups remain relatively small, especially for Cubans andPuerto Ricans. Thus, the statistical power to detect significant differences withinthe Hispanic subpopulations and the ability to use longitudinal data were limited asthe numbers were further narrowed by those lost to follow-up, those who died, andbecause the Hispanic population returned to the usual sampling, reducing the size ofthis population back to half of the 2010 wave.
Third, only one cognitive assessmentwas used tomeasureworkingmemory (serial7’s) and numeracy (counting backwards), whereas verbal memory was scored usinga combined measure of two assessments. Thus, our findings should be validated bystudies that use several different cognitive assessments with varying degrees of diffi-culty to measure verbal memory, working memory, and numeracy. Another potentiallimitation is that adults living in an institutional setting or who required a proxy tocomplete the interview were excluded from the analysis. This may limit the gener-alizability of the findings.
Areas for Future Research
Years of formal education and educational attainment account for a large proportionof racial and ethnic disparities in cognition, but disparities often remain statisticallysignificant even after adjusting for education. It is widely recognized that years ofeducation or educational attainment does not account for differences in educationalquality, which can impact cognitive functioning later in life (Crowe et al. 2013;Sisco et al. 2015). Controlling for reading ability and other measures of educationalquality have been shown to have a greater impact on attenuating disparities in cog-nition (Manly et al. 2002) and are stronger predictors of cognitive decline (Manlyet al. 2003, 2005) than years of education. Future research should investigate poten-tial differences in measures of educational quality between Hispanic subgroups anddetermine if adjusting for educational quality accounts for differences in cognitivefunctioning between Hispanic subgroups.
An additional limitation of this analysis is that we did not consider potentialdifferences between NHW, NHB, and Hispanic subgroups for the prevalence ofcognitive impairment and dementia. Future research should examine if there aredifferences in the prevalence and incidence of dementia betweenHispanic subgroups.The findings from some (Gurland et al. 1999; Tang et al. 2001) but not all (Mayedaet al. 2014, 2016) studies thatHispanics are at a greater risk for dementia thanNHWissuggestive evidence that disparities for dementia between NHW and Hispanics mayvary for Hispanic subgroups. However, to our knowledge, no studies that includea diverse sample of Hispanics have investigated if the risk for dementia amongHispanics relative to NHW varies between Hispanic subgroups.
Finally, future research should consider nativity differences in cognitive function-ingwithinHispanic subgroups. TheHispanic paradoxhas heavily influenced researchon the aging and health of older U.S. Hispanics, being used to describe the counter-intuitive findings for Mexican Americans to have similar or longer life expectancy

5 Cognitive Functioning of U.S. Adults by Race and Hispanic Origin 101
than NHW despite a high burden of chronic health conditions and socioeconomicdisadvantages (Markides andCoreil 1986;Markides andEschbach 2005). The longerlife expectancy for U.S. Hispanics compared to NHW has been attributed to Mexi-can immigrants being positively selected from the general population according tohealth characteristics (Markides and Gerst 2011; Bostean 2013) as well as selectionin return migration to Mexico later in life (Palloni and Arias 2004)
However, many studies that have examined the relationship between nativity andcognitive functioning have not identified significant differences between foreign-born andU.S.-bornHispanics (Nguyenet al. 2002;Collins et al. 2009;Sachs-Ericssonet al. 2009; Miranda et al. 2011). But this may be because the association betweennativity and cognitive functioning may vary by gender and by age of migration tothe United States of foreign-born individuals. Specifically, foreign-born MexicanAmerican men who migrated to the United States as middle-aged adults have beenshown to have lower risk for cognitive impairment, higher cognitive functioning,and less cognitive decline compared to U.S.-bornMexican American men (Hill et al.2012a, b; Downer et al. 2017; Garcia et al. 2018).
Summary and Conclusions
Hispanics living in the United States are a socially and culturally diverse population.Our analysismakes an important contribution to research into cognitive disparities byexamining functioning in specific cognitive domains and by stratifyingHispanics intodistinct subpopulations. This analysis revealed some differences in each cognitivedomain by Hispanic subpopulation. The results of this analysis extend the evidencefrom prior research that Hispanics have lower cognition compared to NHW anddemonstrates the importance of considering country of origin when studying thecognitive function of middle-aged and older U.S. Hispanics.
Acknowledgements This work was supported in part by the National Institute on Aging of theNational Institutes of Health (grant number R01 AG018016 to R.W.). The authors have no conflictof interest to report.
References
Amieva, H., Mokri, H., Le Goff, M., Meillon, C., Jacqmin-Gadda, H., Foubert-Samier, A., et al.(2014). Compensatory mechanisms in higher-educated subjects with Alzheimer’s disease: Astudy of 20 years of cognitive decline. Brain: A Journal of Neurology, 137(Pt 4), 1167–1175.https://doi.org/10.1093/brain/awu035.
Arias, E. (2010). United States life tables by Hispanic origin. National Vital Statistics Reports,2(152).Centers forDiseaseControl andPrevention,NationalCenter forHealthStatistics,NationalVital Statistics System.
Arroyo-Johnson, C., Mincey, K. D., Ackermann, N., Milam, L., Goodman, M. S., & Colditz, G.A. (2016). Racial and ethnic heterogeneity in self-reported diabetes prevalence trends across

102 C. Díaz-Venegas et al.
Hispanic subgroups, National Health Interview Survey, 1997–2012. Prev Chronic Dis, 13, E10.https://doi.org/10.5888/pcd13.150260.
Bertram, L., McQueen, M. B., Mullin, K., Blacker, D., & Tanzi, R. E. (2007). Systematic meta-analyses of Alzheimer disease genetic association studies: The AlzGene database. Nature Genet-ics, 39(1), 17–23. http://www.ncbi.nlm.nih.gov/pubmed/17192785.
Bostean, G. (2013). Does selective migration explain the Hispanic paradox? A comparative analysisof Mexicans in the U.S. andMexico. Journal of Immigrant and Minority Health, 15(3), 624–635.https://doi.org/10.1007/s10903-012-9646-y.
Brandt, J., Spencer, M., & Folstein, M. F. (1988). The telephone interview for cognitive status.Neuropsychiatry, Neuropsychology, and Behavioral Neurology, 1, 111–117.
Brewster, P. W., Melrose, R. J., Marquine, M. J., Johnson, J. K., Napoles, A., MacKay-Brandt, A.,et al. (2014). Life experience and demographic influences on cognitive function in older adults.Neuropsychology, 28(6), 846–858. http://www.ncbi.nlm.nih.gov/pubmed/24933483.
Caamano-Isorna, F., Corral, M., Montes-Martinez, A., & Takkouche, B. (2006). Education anddementia: A meta-analytic study. Neuroepidemiology, 26(4), 226–232. http://www.ncbi.nlm.nih.gov/pubmed/16707907.
Cagney, K. A., & Lauderdale, D. S. (2002). Education, wealth, and cognitive function in laterlife. The Journals of Gerontology Series B: Psychological Sciences and Social Sciences, 57(2),P163–P172. https://doi.org/10.1093/geronb/57.2.P163.
Carson, A. P., Howard, G., Burke, G. L., Shea, S., Levitan, E. B., & Muntner, P. (2011). Ethnicdifferences in hypertension incidence among middle-aged and older adults: The multi-ethnicstudy of atherosclerosis. Hypertension, 57(6), 1101–1107. https://doi.org/10.1161/HYPERTENSIONAHA.110.168005.
Casagrande, S. S., Sotres-Alvarez, D., Aviles-Santa, L., O’Brien, M. J., Palacios, C., Perez, C.M., et al. (2018). Variations of dietary intake by glycemic status and Hispanic/Latino heritagein the Hispanic Community Health Study/Study of Latinos (HCHS/SOL). BMJ Open DiabetesResearch and Care, 6(1), e000486. https://doi.org/10.1136/bmjdrc-2017-000486.
Centers for Disease Control and Prevention. (2014). National diabetes statistics report: Estimatesof diabetes and its burden in the United States. Atlanta, GA: U.S. Department of Health andHuman Services. http://www.cdc.gov/diabetes/pubs/statsreport14/national-diabetes-report-web.pdf.
Choi, H., Schoeni, R. F., Martin, L. G., & Langa, K. M. (2018). Trends in the prevalence anddisparity in cognitive limitations of Americans 55–69 years old. The Journals of GerontologySeries B: Psychological Sciences and Social Sciences, 73(suppl_1), S29–S37. https://doi.org/10.1093/geronb/gbx155.
Collins, N., Sachs-Ericsson, N., Preacher, K. J., Sheffield, K. M., & Markides, K. (2009). Smokingincreases risk for cognitive decline among community-dwelling older Mexican Americans. TheAmerican Journal of Geriatric Psychiatry: Official Journal of the American Association forGeriatric Psychiatry, 17(11), 934–942. https://doi.org/10.1097/JGP.0b013e3181b0f8df.
Corder, E. H., Saunders, A. M., Strittmatter, W. J., Schmechel, D. E., Gaskell, P. C., Small, G. W.,et al. (1993). Gene dose of apolipoprotein E type 4 allele and the risk of Alzheimer’s diseasein late onset families. Science, 261(5123), 921–923. https://www.ncbi.nlm.nih.gov/pubmed/8346443.
Corsino, L., Sotres-Alvarez, D., Butera, N. M., Siega-Riz, A. M., Palacios, C., Perez, C. M., et al.(2017). Association of the DASH dietary pattern with insulin resistance and diabetes in U.S.Hispanic/Latino adults: Results from the Hispanic Community Health Study/Study of Latinos(HCHS/SOL). BMJ Open Diabetes Research and Care, 5(1), e000402. https://doi.org/10.1136/bmjdrc-2017-000402.
Crimmins, E. M., Kim, J. K., Langa, K. M., & Weir, D. R. (2011). Assessment of cognition usingsurveys and neuropsychological assessment: The Health and Retirement Study and the Aging,Demographics, and Memory Study. The Journals of Gerontology Series B: Psychological Sci-ences and Social Sciences, 66(Suppl 1), i162–i171. http://www.ncbi.nlm.nih.gov/pubmed/21743047.

5 Cognitive Functioning of U.S. Adults by Race and Hispanic Origin 103
Crowe, M., Clay, O. J., Martin, R. C., Howard, V. J., Wadley, V. G., Sawyer, P., et al. (2013).Indicators of childhood quality of education in relation to cognitive function in older adulthood.The Journals ofGerontology Series A:Biological Sciences andMedical Sciences, 68(2), 198–204.https://doi.org/10.1093/gerona/gls122.
Daviglus, M. L., Talavera, G. A., Aviles-Santa, M. L., Allison, M., Cai, J., Criqui, M. H., et al.(2012). Prevalence of major cardiovascular risk factors and cardiovascular diseases among His-panic/Latino individuals of diverse backgrounds in the United States. JAMA: The Journal of theAmerican Medical Association, 308(17), 1775–1784. https://doi.org/10.1001/jama.2012.14517.
Díaz-Venegas, C., Downer, B., Langa, K. M., & Wong, R. (2016). Racial and ethnic differences incognitive function among older adults in the USA. International Journal of Geriatric Psychiatry,31(9), 1004–1012. https://doi.org/10.1002/gps.4410.
Dominguez, K., Penman-Aguilar, A., Chang, M.-H., Moonesinghe, R., Castellanos, T., Rodríguez-Lainz, A., et al. (2015). Vital signs: Leading causes of death, prevalence of diseases and riskfactors, and use of health services among Hispanics in the United States—2009–2013.Morbidityand Mortality Weekly Report, 64(17), 469–478.
Downer, B., Garcia, M. A., Saenz, J., Markides, K. S., &Wong, R. (2017). The role of education inthe relationship between age of migration to the United States and risk of cognitive impairmentamong older Mexican Americans. Research on Aging, Jan 1: 164027517701447(Epub ahead ofprint), 164027517701447. https://doi.org/10.1177/0164027517701447.
Everett, B. G., Rogers, R. G., Hummer, R. A., & Krueger, P. M. (2011). Trends in educationalattainment by race/ethnicity, nativity, and sex in the United States, 1989–2005. Ethnic and RacialStudies, 34(9), 1543–1566. https://doi.org/10.1080/01419870.2010.543139.
Farrer, L. A., Cupples, L. A., Haines, J. L., Hyman, B., Kukull, W. A., Mayeux, R., et al. (1997).Effects of age, sex, and ethnicity on the association between apolipoprotein E genotype andAlzheimer disease. A meta-analysis. APOE and Alzheimer Disease Meta Analysis Consortium.JAMA: The Journal of the American Medical Association, 278(16), 1349–1356. https://www.ncbi.nlm.nih.gov/pubmed/9343467.
Finkel, D., McArdle, J. J., Reynolds, C. A., & Pedersen, N. L. (2007). Age changes in processingspeed as a leading indicator of cognitive aging. Psychology and Aging, 22(3), 558–568.
Fitzpatrick, A. L., Kuller, L. H., Ives, D. G., Lopez, O. L., Jagust, W., Breitner, J. C., et al. (2004).Incidence and prevalence of dementia in theCardiovascularHealth Study. Journal of theAmericanGeriatrics Society, 52(2), 195–204. https://www.ncbi.nlm.nih.gov/pubmed/14728627.
Garcia, M. A., Reyes, A. M., Downer, B., Saenz, J. L., Samper-Ternent, R. A., & Raji, M. (2018).Age of migration and the incidence of cognitive impairment: A cohort study of elder Mexican-Americans. Innovation in Aging, in press, 1–11. https://doi.org/10.1093/geroni/igx037.
Gonzalez, H. M., Tarraf, W., Gouskova, N., Gallo, L. C., Penedo, F. J., Davis, S. M., et al. (2015).Neurocognitive function among middle-aged and older Hispanic/Latinos: Results from the His-panic Community Health Study/Study of Latinos. Archives of Clinical Neuropsychology: TheOfficial Journal of the National Academy of Neuropsychologists, 30(1), 68–77. https://doi.org/10.1093/arclin/acu066.
González-Barrera, A., & Lopez,M. H. (2013).A demographic portrait ofMexican-origin Hispanicsin the United States. Washington, DC. http://www.pewhispanic.org/2013/05/01/a-demographic-portrait-of-mexican-origin-hispanics-in-the-united-states.
Grady, C. L., & Craik, F. I. (2000). Changes in memory processing with age. Current Opinion inNeurobiology, 10(2), 224–231.
Gurland, B. J.,Wilder, D. E., Lantigua, R., Stern, Y., Chen, J., Killeffer, E. H., &Mayeux, R. (1999).Rates of dementia in three ethnoracial groups. International Journal of Geriatric Psychiatry,14(6), 481–493. http://www.ncbi.nlm.nih.gov/pubmed/10398359.
Haan, M. N., Mungas, D. M., Gonzalez, H. M., Ortiz, T. A., Acharya, A., & Jagust, W. J. (2003).Prevalence of dementia in older Latinos: The influence of type 2 diabetes mellitus, stroke andgenetic factors. Journal of the American Geriatrics Society, 51(2), 169–177. http://www.ncbi.nlm.nih.gov/pubmed/12558712.

104 C. Díaz-Venegas et al.
Håkansson, K., Rovio, S., Helkala, E. L., Vilska, A. R., Winblad, B., Soininen, H., et al. (2009).Association between mid-life marital status and cognitive function in later life: Population-basedcohort study. BMJ, 339, b2462. https://doi.org/10.1136/bmj.b2462.
Health and Retirement Study. (2008). Survey design. http://hrsonline.isr.umich.edu/sitedocs/surveydesign.pdf.
Health and Retirement Study. (2010). 2010 Core Final, Version 1.0, Data description and usage.Ann Arbor, MI.
Health and Retirement Study. (2011). Sample sizes and response rates. http://hrsonline.isr.umich.edu/sitedocs/sampleresponse.pdf.
Henao-Martínez, A. F., & Castillo-Mancilla, J. R. (2013). The Hispanic HIV epidemic. CurrentInfectious Disease Reports, 15(1), 46–51. https://doi.org/10.1007/s11908-012-0306-0.
Hill, T. D., Angel, J., & Balistreri, K. S. (2012a). Does the “healthy immigrant effect” extend tocognitive aging? In J. Angel, F. Torres-Gil, & K. Markides (Eds.), Aging, health, and longevityin the Mexican-origin population (pp. 19–33). New York: Springer Publishing Company.
Hill, T. D., Angel, J. L., Balistreri, K. S., & Herrera, A. P. (2012b). Immigrant status and cognitivefunctioning in late-life: An examination of gender variations in the healthy immigrant effect.Social Science and Medicine, 75(12), 2076–2084. https://doi.org/10.1016/j.socscimed.2012.04.005.
Jacobsen, L. A., Kent, M., Lee, M., & Mather, M. (2011). America’s aging population. PopulationBulletin, 66(1).
Jones, R. N. (2006). Identification of measurement differences between English and Spanish lan-guage versions of the Mini-Mental State Examination. Detecting differential item functioningusing MIMIC modeling.Med Care, 44(11 Suppl 3), S124–S133. https://doi.org/10.1097/01.mlr.0000245250.50114.0f.
Jun, G., Naj, A. C., Beecham,G.W.,Wang, L. S., Buros, J., Gallins, P. J., et al. (2010).Meta-analysisconfirms CR1, CLU, and PICALM as Alzheimer’s disease risk loci and reveals interactions withAPOE genotypes. Archives of Neurology, 67(12), 1473–1484. https://doi.org/10.1001/archneurol.2010.201.
Katz, M. J., Lipton, R. B., Hall, C. B., Zimmerman, M. E., Sanders, A. E., Verghese, J., et al.(2012). Age-specific and sex-specific prevalence and incidence of mild cognitive impairment,dementia, and Alzheimer’s dementia in blacks and whites: A report from the Einstein AgingStudy. Alzheimer Disease and Associated Disorders, 26(4), 335–343. https://doi.org/10.1097/WAD.0b013e31823dbcfc.
Langa, K. M., Kabeto, M., &Weir, D. (2009). Report on race and cognitive impairment using HRS.2010 Alzheimer’s Disease Facts and Figures. http://www.alz.org/documents_custom/report_alzfactsfigures2010.pdf.
Langa, K. M., Larson, E. B., Crimmins, E. M., Faul, J. D., Levine, D. A., Kabeto, M. U., et al.(2017). A comparison of the prevalence of dementia in the United States in 2000 and 2012. JAMAIntern Med, 177(1), 51–58. https://doi.org/10.1001/jamainternmed.2016.6807.
Langa, K.M., Larson, E. B., Karlawish, J. H., Cutler, D.M., Kabeto, M. U., Kim, S. Y., & Rosen, A.B. (2008). Trends in the prevalence and mortality of cognitive impairment in the United States: Isthere evidence of a compression of cognitive morbidity? Alzheimer’s & Dementia: The Journalof the Alzheimer’s Association, 4(2), 134–144. http://www.ncbi.nlm.nih.gov/pubmed/18631957.
Lavange, L. M., Kalsbeek, W. D., Sorlie, P. D., Aviles-Santa, L. M., Kaplan, R. C., Barnhart, J.,et al. (2010). Sample design and cohort selection in the Hispanic Community Health Study/Studyof Latinos. Annals of Epidemiology, 20(8), 642–649. https://doi.org/10.1016/j.annepidem.2010.05.006.
Livney, M. G., Clark, C. M., Karlawish, J. H., Cartmell, S., Negron, M., Nunez, J., et al. (2011).Ethnoracial differences in the clinical characteristics of Alzheimer’s disease at initial presentationat an urban Alzheimer’s disease center. The American Journal of Geriatric Psychiatry: OfficialJournal of the American Association for Geriatric Psychiatry, 19(5), 430–439. https://doi.org/10.1097/JGP.0b013e3181f7d881.

5 Cognitive Functioning of U.S. Adults by Race and Hispanic Origin 105
Manly, J. J., Jacobs, D. M., Touradji, P., Small, S. A., & Stern, Y. (2002). Reading level attenuatesdifferences in neuropsychological test performance between African American andWhite elders.Journal of the International Neuropsychological Society: JINS, 8(3), 341–348. http://www.ncbi.nlm.nih.gov/pubmed/11939693.
Manly, J. J., Schupf, N., Stern, Y., Brickman, A. M., Tang, M. X., &Mayeux, R. (2011). Telephone-based identification ofmild cognitive impairment and dementia in amulticultural cohort.Archivesof Neurology, 68(5), 607–614. https://doi.org/10.1001/archneurol.2011.88.
Manly, J. J., Schupf, N., Tang, M. X., & Stern, Y. (2005). Cognitive decline and literacy amongethnically diverse elders. Journal of Geriatric Psychiatry and Neurology, 18(4), 213–217. https://doi.org/10.1177/0891988705281868.
Manly, J. J., Touradji, P., Tang, M. X., & Stern, Y. (2003). Literacy and memory decline amongethnically diverse elders. Journal ofClinical andExperimentalNeuropsychology, 25(5), 680–690.https://doi.org/10.1076/jcen.25.5.680.14579.
Markides, K. S., & Coreil, J. (1986). The health of Hispanics in the southwestern United States:An epidemiologic paradox. Public Health Reports, 101(3), 253–265. http://www.ncbi.nlm.nih.gov/pubmed/3086917.
Markides, K. S., & Eschbach, K. (2005). Aging, migration, andmortality: Current status of researchon the Hispanic paradox. The Journals of Gerontology Series B: Psychological Sciences andSocial Sciences, 60(Spec No. 2), 68–75. http://www.ncbi.nlm.nih.gov/pubmed/16251594.
Markides, K. S., & Gerst, K. (2011). Immigration, aging, and health in the United States. In R.A. Settersten & J. L. Angel (Eds.), Handbook of sociology of aging (pp. 103–116). New York:Springer.
Maurer, J. (2011). Education and male-female differences in later-life cognition: International evi-dence from Latin America and the Caribbean. Demography, 48(3), 915–930. https://doi.org/10.1007/s13524-011-0048-x.
Mayeda, E. R., Glymour, M. M., Quesenberry, C. P., & Whitmer, R. A. (2016). Inequalities indementia incidence between six racial and ethnic groups over 14 years. Alzheimer’s & Dementia:The Journal of the Alzheimer’s Association. https://doi.org/10.1016/j.jalz.2015.12.007.
Mayeda, E. R., Karter, A. J., Huang, E. S., Moffet, H. H., Haan, M. N., & Whitmer, R. A. (2014).Racial/ethnic differences in dementia risk among older type 2 diabetic patients: The diabetes andaging study.Diabetes Care, 37(4), 1009–1015. http://www.ncbi.nlm.nih.gov/pubmed/24271192.
Meng, X., & D’Arcy, C. (2012). Education and dementia in the context of the cognitive reservehypothesis: A systematic review with meta-analyses and qualitative analyses. PLoS ONE, 7(6),e38268. https://doi.org/10.1371/journal.pone.0038268.
Miranda, P. Y., González, H. M., & Tarraf, W. (2011). Pathways between acculturation and health:Does the measure matter? Hispanic Journal of Behavioral Sciences, 33(4), 524–539.
Nguyen, H. T., Black, S. A., Ray, L. A., Espino, D. V., & Markides, K. S. (2002). Predictors ofdecline in MMSE scores among older Mexican Americans. The Journals of Gerontology SeriesA: Biological Sciences and Medical Sciences, 57(3), M181–M185. http://www.ncbi.nlm.nih.gov/pubmed/11867656.
Nilsson, L. G., Sternäng, O., Rönnlund, M., & Nyberg, L. (2009). Challenging the notion of anearly-onset of cognitive decline. Neurobiology of Aging, 30(4), 521–524; discussion 530–533.
O’Bryant, S. E., Humphreys, J. D., Schiffer, R. B., & Sutker, P. B. (2007). Presentation of MexicanAmericans to a memory disorder clinic. Journal of Psychopathology and Behavioral Assessment,29, 137–140.
O’Bryant, S. E., Johnson, L., Balldin, V., Edwards, M., Barber, R., Williams, B., et al. (2013).Characterization ofMexicanAmericanswithmild cognitive impairment andAlzheimer’s disease.Journal of Alzheimer’s Disease: JAD, 33(2), 373–379. http://www.ncbi.nlm.nih.gov/pubmed/22976076.
Ofstedal, M. B., &Weir, D. R. (2011). The recruitment and retention of minority participants in thehealth and retirement study. The Gerontologist, 51(Suppl. 1), S8–S20.
106 C. Díaz-Venegas et al.
Ogden, C. L., Lamb, M. M., Carroll, M. D., & Flegal, K. M. (2010). Obesity and socioeconomicstatus in adults: United States, 2005–2008. NCHS Data Brief (50), 1–8. http://www.ncbi.nlm.nih.gov/pubmed/21211165.
Pabon-Nau, L. P., Cohen, A., Meigs, J. B., & Grant, R. W. (2010). Hypertension and diabetesprevalence among U.S. Hispanics by country of origin: The National Health Interview Survey2000–2005. Journal of General Internal Medicine, 25(8), 847-852. https://doi.org/10.1007/s11606-010-1335-8.
Palloni, A., & Arias, E. (2004). Paradox lost: Explaining the Hispanic adult mortality advantage.Demography, 41(3), 385–415. http://www.ncbi.nlm.nih.gov/pubmed/15461007.
Plassman, B. L., Langa, K. M., Fisher, G. G., Heeringa, S. G., Weir, D. R., Ofstedal, M. B., et al.(2007). Prevalence of dementia in the United States: The aging, demographics, and memorystudy. Neuroepidemiology, 29(1–2), 125–132. http://www.ncbi.nlm.nih.gov/pubmed/17975326.
Plassman, B. L., Langa, K. M., Fisher, G. G., Heeringa, S. G., Weir, D. R., Ofstedal, M. B., et al.(2008). Prevalence of cognitive impairment without dementia in the United States. Annals ofInternal Medicine, 148(6), 427–434. http://www.ncbi.nlm.nih.gov/pubmed/18347351.
Ramirez, M., Teresi, J. A., Holmes, D., Gurland, B., & Lantigua, R. (2006). Differential itemfunctioning (DIF) and the Mini-Mental State Examination (MMSE). Overview, sample, andissues of translation. Med Care, 44(11 Suppl 3), S95–S106. http://www.ncbi.nlm.nih.gov/pubmed/17060840.
Reitz, C., &Mayeux, R. (2014). Genetics of Alzheimer’s disease in CaribbeanHispanic andAfricanAmerican populations. Biological Psychiatry, 75(7), 534–541. https://doi.org/10.1016/j.biopsych.2013.06.003.
Roe, C. M., Xiong, C., Miller, J. P., & Morris, J. C. (2007). Education and Alzheimer’s diseasewithout dementia: Support for the cognitive reserve hypothesis. Neurology, 68(3), 223–228.http://www.ncbi.nlm.nih.gov/pubmed/17224578.
Sachs-Ericsson, N., Corsentino, E., & Cougle, J. R. (2009). Problems meeting basic needs predictcognitive decline in community-dwelling Hispanic older adults. Journal of Aging and Health,21(6), 848–863. https://doi.org/10.1177/0898264309340689.
Saunders, A. M., Strittmatter, W. J., Schmechel, D., George-Hyslop, P. H., Pericak-Vance, M. A.,Joo, S. H., et al. (1993). Association of apolipoprotein E allele epsilon 4 with late-onset familialand sporadic Alzheimer’s disease. Neurology, 43(8), 1467–1472. https://www.ncbi.nlm.nih.gov/pubmed/8350998.
Scarmeas, N., Zarahn, E., Anderson, K. E., Hilton, J., Flynn, J., Van Heertum, R. L., et al. (2003).Cognitive reserve modulates functional brain responses during memory tasks: A PET study inhealthy young and elderly subjects. NeuroImage, 19(3), 1215–1227. https://www.ncbi.nlm.nih.gov/pubmed/12880846.
Schaie, K. W. (1994). The course of adult intellectual-development. American Psychologist, 49(4),304–313.
Schwartz, B. S., Glass, T. A., Bolla, K. I., Stewart, W. F., Glass, G., Rasmussen, M., et al. (2004).Disparities in cognitive functioning by race/ethnicity in the Baltimore Memory Study. Environ-mental Health Perspectives, 112(3), 314–320. http://www.ncbi.nlm.nih.gov/pubmed/14998746.
Sisco, S., Gross, A. L., Shih, R. A., Sachs, B. C., Glymour, M. M., Bangen, K. J., et al. (2015).The role of early-life educational quality and literacy in explaining racial disparities in cognitionin late life. The Journals of Gerontology Series B: Psychological Sciences and Social Sciences,70(4), 557–567. https://doi.org/10.1093/geronb/gbt133.
Sloan, F. A., &Wang, J. S. (2005). Disparities among older adults in measures of cognitive functionby race or ethnicity. The Journals of Gerontology Series B: Psychological Sciences and SocialSciences, 60(5), P242–P250.
Sorlie, P.D.,Aviles-Santa, L.M.,Wassertheil-Smoller, S., Kaplan, R.C.,Daviglus,M.L.,Giachello,A. L., et al. (2010). Design and implementation of the Hispanic Community Health Study/Studyof Latinos. Annals of Epidemiology, 20(8), 629–641. https://doi.org/10.1016/j.annepidem.2010.03.015.
StataCorp. (2015). Stata Statistical Software: Release 14. College Station, TX: StataCorp LP.

5 Cognitive Functioning of U.S. Adults by Race and Hispanic Origin 107
Stern, Y. (2002). What is cognitive reserve? Theory and research application of the reserve concept.Journal of the International Neuropsychological Society: JINS, 8(3), 448–460. https://www.ncbi.nlm.nih.gov/pubmed/11939702.
Stern, Y., Zarahn, E., Hilton, H. J., Flynn, J., DeLaPaz, R., & Rakitin, B. (2003). Exploring theneural basis of cognitive reserve. Journal of Clinical and Experimental Neuropsychology, 25(5),691–701. https://doi.org/10.1076/jcen.25.5.691.14573.
Tang,M.X., Cross, P., Andrews, H., Jacobs, D.M., Small, S., Bell, K., et al. (2001). Incidence of ADin African-Americans, Caribbean Hispanics, and Caucasians in northern Manhattan. Neurology,56(1), 49–56. http://www.ncbi.nlm.nih.gov/pubmed/11148235.
Tang, M. X., Stern, Y., Marder, K., Bell, K., Gurland, B., Lantigua, R., et al. (1998). The APOE-epsilon4 allele and the risk of Alzheimer’s disease among African Americans, Whites, and His-panics. JAMA: The Journal of the AmericanMedical Association, 279(10), 751–755. http://www.ncbi.nlm.nih.gov/pubmed/9508150.
Unger, J. B., & Schwartz, S. J. (2012). Conceptual considerations in studies of cultural influenceson health behaviors. Preventive Medicine, 55(5), 353–355. https://doi.org/10.1016/j.ypmed.2012.09.024.
U.S. Census Bureau. (2011). Table 9: Resident population by race, Hispanic origin, and age: 2000and 2009. Washington, DC. http://www.census.gov/prod/2011pubs/11statab/pop.pdf.
U.S. Census Bureau. (2014). Table 1: Educational attainment of the population 18 years andover, by age, sex, race, and Hispanic origin: 2014. Current Population Survey: Annual Socialand Economic Supplement. http://www.census.gov/hhes/socdemo/education/data/cps/2014/tables.html.
van Gelder, B. M., Tijhuis, M., Kalmijn, S., Giampaoli, S., Nissinen, A., & Kromhout, D. (2006).Marital status and living situation during a 5-year period are associated with a subsequent 10-year cognitive decline in older men: The FINE Study. The Journals of Gerontology Series B:Psychological Sciences and Social Sciences, 61(4), P213–P219. https://www.ncbi.nlm.nih.gov/pubmed/16855033.
Vidot, D. C., Stoutenberg, M., Gellman, M., Arheart, K. L., Teng, Y., Daviglus, M. L., et al.(2016). Alcohol consumption and metabolic syndrome among Hispanics/Latinos: The HispanicCommunity Health Study/Study of Latinos. Metabolic Syndrome and Related Disorders, 14(7),354–362. https://doi.org/10.1089/met.2015.0171.
Working Group on Health Outcomes for Older Persons withMultiple Chronic, C. (2012). Universalhealth outcome measures for older persons with multiple chronic conditions. Journal of theAmerican Geriatrics Society, 60(12), 2333–2341. https://doi.org/10.1111/j.1532-5415.2012.04240.x.
Zsembik, B. A., & Peek, M. K. (2001). Race differences in cognitive functioning among olderadults. The Journals of Gerontology Series B: Psychological Sciences and Social Sciences, 56(5),S266–S274. http://www.ncbi.nlm.nih.gov/pubmed/11522808.

Part IIPlace and Unmet Needs
This section focuses on place and unmet needs. As has been well established, olderHispanics in the United States as well as older people in Mexico, Brazil, and otherLatin American countries have serious unmet needs related to generally lowsocioeconomic status as well as poor housing and living environments, safety, andaccess to health care and home health services. The following four chapters indicatethat contextual issues like living environments and the broader sociopoliticalcontext are associated with fear of immigration enforcement among older Latinos inthe United States, differences in long-term care needs and state policies in Texasand California and how they influence availability of services, the role of CivilSociety Organizations in promoting the health, economic well-being, and basichuman rights among older people in Mexico, and similarities and differences inhealth inequalities among older people in Mexico and Brazil. Below are briefsummaries of each chapter.
Rodriguez, Paredes, and Hagan tackle the issue of fear of immigrationenforcement by older Latinos. Analysis of PEW Research Center data suggests thatsuch fear by Latinos aged 50 and over who are not citizens or permanent residentsis not negligible. It is not uncommon for older immigrants, especially those who areundocumented, to fear separation from other family as they approach retirement agedue to possible repatriation and uncertainty about what the future will bring. Suchfears are exacerbated by the current U.S. Administration’s actions and policies.
J. L. Angel, Angel, and Caldera undertake the issue of trends in long-term careneeds of older Latinos and the growing cost to states of Medicaid-financedlong-term care in Texas and California, two states with large Latino populations anddifferent approaches to community care. For both states, cost containment chal-lenges are promoting innovation in financing and healthcare delivery models. Yet,the current U.S. Administration and current U.S. Congress could very well intro-duce policies that are likely to reduce Medicaid funding with significant implica-tions for many older Latinos and other lower income groups.
Kyriakos S. Markides
K. S. MarkidesDepartment of Preventive Medicine and Community Health, The University of TexasMedical Branch, Galveston, TX, USA

R. J. Angel, Montes-de-Oca Zavala, and Rodríguez propose a theoreticalframework related to the role of Civil Society Organizations. Qualitative data froma convenience sample of organizations in Mexico City suggest that such organi-zations focus on (1) self-development, health, and quality of life of older people;(2) their material needs and economic security; and (3) older people’s social andpolitical rights. The chapter discusses how Civil Society Organizations can providesocial services to older people as well as advocate for maintaining and improvingtheir basic rights.
Finally, Andrade and Lopez-Ortega use national survey data from Brazil andMexico to examine the extent of health inequalities among older people. Theyfound high prevalence in both countries of obesity, diabetes, hypertension, andheart disease. They also found that the prevalence was higher among more affluentolder people, which is not uncommon in developing countries. The chapter dis-cusses public health efforts by both countries to address the rising burden of obesityand related chronic conditions, in older as well as younger people.
110 Part II: Place and Unmet Needs

Chapter 6Immigration Enforcement, Older LatinoImmigrants, and Implications for Health
Nestor Rodriguez, Cristian L. Paredesand Jacqueline Maria Hagan
Abstract The passage of the 1996 Illegal Immigration Reform and ImmigrantResponsibility Act (IIRIRA) and other subsequent restrictive immigration policieshave escalated deportations and created stress and fear among Latino immigrants.In this article, we conceptualize migration as a process that can negatively affect thephysical or mental health of immigrants during their journeys and long after theysettle in a foreign land. Using Pew Research Center data and regression analyses,we find that the predicted probabilities of fearing immigration enforcement amongforeign-born individuals aged 50 and over without citizenship or permanent resi-dence are not negligible. Moreover, we find evidence of a direct association betweenthe disapproval of enforcement measures and fear of immigration enforcement. Wediscuss the implications of fear of immigration enforcement for the wellbeing ofolder immigrants.
Introduction
Since the mid-1990s, the United States enacted a series of laws and programs thatexpanded the authority of the federal government to arrest, detain, and deport non-citizens. Scholars who study immigration policy and deportation trends in the UnitedStates have long recognized the effects of immigration enforcement programs onimmigrants and the communities in which they live and work. Research corrob-orates that enforcement programs and initiatives disperse fear and tension among
N. Rodriguez (B)Department of Sociology, The University of Texas at Austin, Austin, TX, USAe-mail: [email protected]
C. L. ParedesDepartment of Sociology, Loyola University Chicago, Chicago, IL, USAe-mail: [email protected]
J. M. HaganDepartment of Sociology, The University of North Carolina at Chapel Hill, Chapel Hill, NC, USAe-mail: [email protected]
© Springer Nature Switzerland AG 2019W. A. Vega et al. (eds.), Contextualizing Health and Aging in the Americas,https://doi.org/10.1007/978-3-030-00584-9_6
111

112 N. Rodriguez et al.
immigrant communities (Hagan et al. 2003; Lopez et al. 2013). The deportationof co-ethnics reduces important sources of human and social capital in immigrantcommunities throughout the United States (Hagan et al. 2015). Scholars also pointto the consequences of restrictive immigration policies and programs for particu-lar immigrant groups, finding that they disproportionately target Mexican migrants,especially working-age men, who are frequently characterized as the “prototypicalillegal alien” (Ngai 2003: 89; Hagan, Rodriguez, and Castro 2011; Golash-Boza andHondagneu-Sotelo 2013). Other studies focus on the economic and psychologicaleffects of restrictive policies and for members of mixed status and binational fam-ilies, who experience prolonged forced separation, economic hardship, and trauma(Dreby 2010; Abrego 2014; Zayas 2015; Menjívar et al. 2016; Weissman et al.,Forthcoming). More recently, a number of scholars have focused on the effects ofour immigration policy system and limited incorporation programs, such as DifferedAction for Childhood Arrivals (DACA), for immigrant youth who live in precariousstatuses and thereby face fear and frustration on a daily basis as they navigate thetransition to adulthood (Gonzales 2016; Silver 2018).
We examine how restrictive immigration policies and programs affect the well-being of an understudied social group—older Latinos. Migrants older than 50 yearsconstitute small percentages of immigrant populations. In the aggregate, however,they are large numbers of people who are mainly concentrated in immigrant com-munities, predominantly in urban centers. Older immigrants are not usually personswho migrated at older ages. They include persons who have aged in the seeminglypermanent unauthorized population of an estimated 11.1 million immigrants in thecountry (Krogstad et al. 2016). The 11.1million population of unauthorizedmigrantsincludes younger migrants who are advancing in age into older adulthood and endur-ing uncertain political and policy circumstances. It is important to gain a sense of thepopulation significance of 11.1 million unauthorized immigrants, of whom 52% arefromMexico (Krogstad et al. 2016). Eleven million people is roughly the populationsizes of Rwanda, Somalia, and Haiti, and larger than the population sizes of Bolivia,the Dominican Republic, Paraguay, and Uruguay. If the 11.1 million unauthorizedmigrants were a Central American country, they would be the second largest Cen-tral American country, second only to the Guatemalan population of 16.0 million(Population Reference Bureau 2016).
Our theoretical approach to the study of fear among older Latinos viewsmigrationas being more than the movement of individuals seeking economic gain. For manymigrants, especially the undocumented, migration can be laden with dangers acrossmigratory spaces and during settlement in the new country. Many of the millionsof undocumented Latinas and Latinos who have journeyed to the United States inthe past few decades, for example, have faced physical and psychological healthdangers, and even death, in encounters with criminal actors, corrupt police, andstringent enforcement policies during and after the migration (Eschbach et al. 1999;Rodriguez 2007; Donnelly and Hagan 2014). Moreover, some forced migrants travelwith physical wounds or psychosocial trauma produced by violent events in theirhome countries and on the northbound journey (Martin-Baro 1989;Urrutia-Rojas andRodriguez 1997; Arbona et al. 2010). From this perspective of health risks associated

6 Immigration Enforcement, Older Latino Immigrants … 113
with migration, we join with other studies (e.g., Torres and Wallace 2013; Alarcónet al. 2016) that seek to understand the health conditions and vulnerabilities of Latinoimmigrants, associated with structural restrictions and dangers in the environmentswhere migrants travel and settle. In this article, we address health risks and pressuresbrought to bear on older Latino immigrants by restrictive immigration policy.
Immigration Policy Background
For the greatest part of U.S. history, restrictive measures have characterized theimmigration policies of the country. The Chinese Exclusion Act of 1882, the BarredZone Act of 1917, the National Origins Quota Act of 1924 all illustrate exclusionisttendencies of U.S. immigration policy (Rodriguez and Hagan 2016). While the earlyhistory of the country’s development depended significantly on immigration for laborand businesses, not all national origins were equally accepted. Under immigrationquota polices adopted in the 1920s, immigrants from northern and western Europewere favored, while immigrants from southern and eastern Europe were limited tomuch smaller numbers, and Asian immigration was ultimately banned altogether. Tosave a large part of its labor force from exclusion, agribusiness lobbied successfullyto prevent the placing of Mexicans (and other Latin Americans) in the quota system(Rodriguez and Hagan 2016).
It was not until 1965 that the U.S. government repealed the immigration quotasystem through amendments made to the Immigration and Nationality Act, which isthe immigration statue of the country. The 1965 amendments introduced a new policyof preference categories based on family relationships and immigrant specialties asthemeans to regulate immigration.While unauthorized immigration surged primarilyfromMexico after the 1964 termination of a labor importation program of temporaryMexican workers, in 1986 Congress passed the Immigration Reform and Control Act(IRCA) to provide amnesty and legalization to unauthorized migrants who had livedcontinuously in the country for five years, for which 3.1 million immigrants applied(U.S. Department of Labor 1992).
Congress again increased opportunities for immigration, and temporary legal pres-ence in theUnited States, through the ImmigrationAct of 1990. This act increased theimmigration cap from 270,000 to 675,000, created a visa lottery for 55,000 “diversityimmigrants” annually, created new admission non-immigrant categories for tempo-rary workers, authorized the U.S. Attorney General to issue temporary protectedstatus to undocumented migrants with deportation orders to countries experienc-ing social or natural calamities, and repealed measures to exclude immigrants andtemporary migrants for political or ideological reasons (U.S. INS 1997).
The passage of the Illegal Immigration Reform and Immigrant Responsibility Act(IIRIRA) in 1996, however, dramatically reversed 25 years of congressional immi-gration legislation favorable to immigrants. Passed by Congress in the context ofrising unauthorized immigration in the mid-1990s, IIRIRA provisions included (1)increasing the number of offenses for which non-citizen migrants could be deported,

114 N. Rodriguez et al.
(2) making deportable offenses retroactive without limit, (3) drastically reducingthe discretionary power of immigration judges to cancel deportation, (4) requir-ing mandatory detention for most deportable cases, and (5) changing the criterionfor cancellation of deportation from the previous criterion of hardship to “excep-tional and extremely unusual hardship” for family members (Hagan et al. 2008).In addition, IIRIRA provided funding to elevate border enforcement by increas-ing the number of Border Patrol agents and by constructing a physical barrier onthe southwestern border. The pressure on immigrant communities increased withthe passage of two additional laws in 1996 affecting immigrants and their fami-lies. The Personal Responsibility and Work Opportunity Reconciliation Act of 1996(PRWORA) created restrictions of five years for new legal immigrants to participatein federally-funded welfare support, and excluded unauthorized immigrants fromwelfare support altogether (Kullgren 2003). The Anti-Terrorism and Effective DeathPenalty Act strengthened the immigration enforcement power of the U.S. govern-ment by adding to IIRIRA’s new powers to reduce judicial review of deportation(Hagan et al. 2008). Clearly, the 1996 restrictive immigration policies renewed animmigrant enforcement intensity not seen since the massive government roundupsof unauthorized migrants in the late 1940s and early 1950s, which terminated withOperation Wetback in 1954 (Hagan et al. 2015).
Following the terrorist attacks of September 11, 2001, immigration becameincreasingly linked to national security, and not surprisingly subsequent congres-sional actions further elevated the enforcement power of the federal government.The USA PATRIOT Act passed in October 2001 increased the administrative powerto detain and deport immigrants. The official formation of the Department of Home-land Security on March 1, 2003, ushered the Bureau of Immigration and CustomEnforcement (ICE) with the primary mission of enforcing the restrictive measuresof IIRIRA. ICE became a national deportation police force that separated familiesand instilled fear and tension in immigrant communities throughout the country(Hagan et al. 2008; Dreby 2010; Zayas 2015; Berger Cardoso et al. 2016; Menjívaret al. 2016). While the weight of enhanced immigration enforcement initially fellmainly on immigrants younger than 40 years of age, over time older immigrants intheir forties, fifties, and older who had not become U.S. citizens were also affectedby enforcement policies at the federal, state, and local levels. Economic hardshipindirectly affected older household members as breadwinners of the family werepermanently removed through formal deportation orders.
Older Immigrants
International migration is a selective process, and most migrants constituting theseflows are young adults of working age (Lundquist et al. 2015). Consequently, rela-tively little is studied about older migrants, specifically individuals aged 50 and over.Older persons do notmigrate asmuch as younger people for several reasons. They areeither past the prime of their income-earning years and less fit for intensive physical

6 Immigration Enforcement, Older Latino Immigrants … 115
labor occupations, or have retired and thus lessened their role as family providers.Yet, while older migrants do not constitute a majority of migrant streams, their pres-ence is documented in studies of migration flows, and they constitute significantnumbers in immigrant populations.
The periodic migrant surveys (e.g., Encuestas Sobre Migración en la FronteraNorte de México/EMIF) conducted by the Mexican government and research agen-cies find sizeable numbers of persons aged 50 and over migrating to the United States(SEGOB 2013). The 2011 EMIF calculated that 87,507 persons aged 50 and overwere part of the Mexican migrant stream of 317,105 headed to the United States thatyear, and estimates for 2013 give about 74,000 Mexican migrants aged 50 years andover headed to the United States. According to this survey, Mexican females aged55–59 migrated more than the males of the same age cohort (SEGOB 2013).
Concerning the immigrant population in theUnitedStates, theU.S.CensusBureaureports that among Latino immigrants 21% were aged 55 and over in 2010–2014,and among Mexican immigrants, 17% were in this age group (U.S. Census Bureau2016). In 2013, the Migration Policy Institute reported that 663,600 (6%) of the 11.1million unauthorized population in the United States were aged 55 and over (Cappset al. 2013).
As mentioned above, these sizeable figures are not entirely due to the arrival ofolder migrants. The figures of older immigrants also represent the aging of immi-grants residing in the country. A study by the Pew Research Center finds that theshare of the unauthorized immigrant population that has been in the United Statesfor 10 or more years is rising. In 2000, 35% of the unauthorized population had beenin the country for 10 or more years, and, by 2012, 62% had been in the country for10 or more years (Passel et al. 2014). Moreover, 21% had been in the United Statesfor 20 years or more by 2012.
Concerning unauthorized immigrants, the hardening of border control has lockedunauthorized immigrants inside the country who in earlier years of less rigid borderenforcement could have returned home periodically (Massey 2006). Consequently,every young unauthorized immigrant is a potential older immigrant if the unautho-rized immigrant can avoid deportation. But survival from detection for deportationdoes not remove the stress and depression that can come from long-term separationfrom the family (Arbona et al. 2010).
It is a situation of very tenuous security, i.e., an unauthorized immigrant canincrease employment security by remaining inside the United States and thus avoidrisking detection in return trips from visits to the home county, but prolonged familyseparation increases the potential for stress and depression. Moreover, security canonly be relative and not absolute, since the immigrant runs the constant risk of arrestin enforcement sweeps at workplaces, shopping centers, and neighborhoods, amongothers. Thus, while security is tenuous, risk and its associated stress are ever-presentfor non-citizen immigrants.
116 N. Rodriguez et al.
Fear and Stress in Immigrant Populations
The implementation of immigration enforcement measures beginning in the mid-1990 s brought sudden fear and stress to Latino immigrant populations (e.g., seeRodriguez and Hagan 2004; Hagan et al. 2011; Salas et al. 2013). Even legal immi-grants and U.S. citizens worried about negative impacts as the restrictive measures ofIIRIRA and other new immigration legislation affected legal immigrants in additionto unauthorized migrants, and as IIRIRA indirectly affected U.S. citizens living infamilies with non-citizen immigrants in the United States. The sudden toughing ofimmigration law, and the new administrative regulations to arrest and detain moreimmigrants than ever before, contrasted sharplywith the previous liberal immigrationmeasures of the preceding two decades.
From 33 to 57% of U.S.- and foreign-born Latinos have reported worrying aboutdeportation in national Latino surveys of the Pew Research Center in the years 2007,2008, 2010, 2013, and 2017 (Pew Research Center 2016; Lopez and Rohal 2017).Not surprisingly, foreign-born Latinos report worrying about deportation in greaterpercentages than U.S.-born Latinos. The foreign-born category of Latinos containsnon-citizen immigrants who are vulnerable to deportations, since only U.S. citizensare not deportable. Moreover, in the 2017 survey, the percentages of Latinos whoreported worrying “a lot/some” about deportations were high for all foreign-borncategories. About half (52%) of foreign-born Latinos who are U.S. citizens and two-thirds of legal or undocumented Latino immigrants reported worrying a lot or someabout deportations (Lopez and Rohal 2017).
Results of surveys of IIRIRA effects in five Texas cities, i.e., El Paso, Hidalgo,Houston, Fort Worth, and Laredo, during 1997–1998 found immigrant communitiesin stress, and more so in the interior cities of Houston and Fort Worth than in theborder cities of Laredo,Hidalgo, andEl Pasowhere residents experience immigrationenforcement as part of daily life given that the sites are in an international borderzone (Rodriguez and Hagan 2004). The surveys of 100 interviews of Mexican-originrespondents in each of the five cities found immigrants shying away from health andmedical facilities after the implementation of IIRIRA (Hagan et al. 2003; Capps et al.2004). In Houston and FortWorth, health care workers reported that more immigrantwomenwere havingbabies at homewithmidwives thanbefore the passageof IIRIRA.In Houston, a mobile clinic director told of older Latinos changing their identity fromthe previous designation of “Hispanic” to “white” on medical intake forms. (Haganet al. 2003).
The enactment of IIRIRA included more resources for enforcement, whichincreased the number of Border Patrol agents and immigration investigators. Con-sequently, federal immigration agents became more visible in communities, andaccording to reported statements, the agents became more aggressive. In Houston,half of the respondents reported seeing more immigration agents involved in suchactivities as raids of day-laborer street-corner pools and workplaces. A dispropor-tionately larger percentage of respondents in the three border survey sites of Laredo,

6 Immigration Enforcement, Older Latino Immigrants … 117
Hidalgo, and El Paso, reported being stopped and questioned by Border Patrol agentsthan in the two interior sites of Houston and FortWorth (Rodriguez andHagan 2004).
Another study, a non-random survey on acculturative stress and psychologicalwell-being conducted with 416 Mexican and Central American documented andundocumented immigrants in two major Texas cities provided specific empiricalmeasures of the degree of stress experienced in the environments targeted by IIRIRApolicy implementation (Arbona et al. 2010). Undocumented-immigrant respondentsreported greater difficulties with family separation than legal immigrants, but bothundocumented and legal immigrants reported similar levels of fear of deportation,and only fear of deportation uniquely predicted acculturative stress related to carryingout both external and internal family functions (Arbona et al. 2010). Undocumentedmen reported significantly higher levels of fear of deportation than undocumentedwomen, and 80% of undocumented migrants reported avoiding at least one activity(e.g., going to a public park) due to fear of deportation, while only 32% of legalimmigrants gave a similar response. The authors of the acculturative stress studysummarize their findings of immigration-enforcement impacts as follows: “Fear ofdeportation, in addition to being a source of stress and anxiety, may discourageundocumented immigrants from seeking help for employment, health, and languageskills difficulties they encounter…further compounding the stress they experiencerelated to immigration-related challenges” (Arbona et al. 2010: 377).
The participation of state and local police departments in immigration enforce-ment, which was first made possible by Section 287(g) of IIRIRA, added to theenforcement pressures facing Latino populations. Section 287(g) added another layerof immigration enforcement by providing federal training for state and local policedepartments thatwanted to partnerwith federal immigration enforcement. In additionto the involvement of state and local police in immigration enforcement, state legis-latures and local governments have passed many measures to restrict undocumentedimmigrants in their jurisdictions. In just 2010 and 2011, state legislatures passed 164laws to restrict immigrants (Gordon and Raja 2012). The combined weight of fed-eral, state, and local measures placed great stress on immigrant populations, causingmany immigrants to become fearful for the security and safety of their families (e.g.,see Hagan et al. 2011; Hardy et al. 2012). Included in the immigrant families areolder immigrants whose welfare can be affected by the threat of deportation or bythe deportation of an income-earning household member.
Enactments of new restrictive laws are invariably passed with the assertion thatthe measures protect the economic health and security of jurisdictions (e.g., see U.S.DHS 2015, 2017), even when research is not offered to support the claim. The policymakers do not consider consequent effects of the enacted measures on the mental-health conditions of families, including small children, torn apart by apprehensionsand deportations (Zayas 2015).
Older immigrants, especially Latino immigrants, may be more vulnerable to thestress of heightened immigration enforcement. One study using a national repre-sentative sample of 7345 older persons in the United States has found that elderlyimmigrants report “poorer physical and mental health outcomes than non-immigrantelderly,” in contrast to the well-established Hispanic Paradox (Lum and Vanderaa

118 N. Rodriguez et al.
2010: 750). Research also indicates that less acculturated elderly Hispanics are morelikely to be depressed than more acculturated elderly immigrants (Mui and Kang2006), and thus fear of heightened enforcement can add to an already problematicmental-health condition, although the relationship between acculturation and mentalhealth among immigrants has not been clearly established (Lum andVanderaa 2010).
According to theWorld Health Organization’s (WHO) Commission on the SocialDeterminants of Health, the political context and public policy directly and indi-rectly influence health by affecting social conditions through which the structuraldeterminants of health function (CSDH 2008). Using this WHO perspective, a studyconducted with 1493 Latino respondents found that respondents who worried thata friend or family member could be deported were 1.6 times more likely (p < 0.01)than respondents who did not have a similar worry to respond needing to seek helpfor emotional problems of anxiety, sadness, or nervousness, after controlling forindividual variables (Vargas et al. 2017). Moreover, Latino respondents who viewedtheir state as having an anti-immigrant environment were also 1.6 times (p < 0.05)more likely to say they needed to look for help to deal with anxiety, sadness, ornervousness (Vargas et al. 2017).
These findings of mental health problems among less acculturated older Latinomigrants and older Latino migrants who worry about deportation indicate anothersource of stress affecting older migrants related to immigration enforcement. Whilefamily support and therapy can help reduce the stress of immigrating into a newsocial environment, they minimal control over their circumstances to reduce thestress of having undocumented status besides receiving some form of amnesty, whichthousands of older Latino immigrants are unlikely to see in the near future.
Research Focus
In the analysis below, we examine whether the fear of immigration enforcement issocially significant among older foreign-born individuals without citizenship or legalpermanent residence. It is reasonable to expect that fear of immigration enforcementamong older immigrants is lower compared to the fear of younger immigrants, whoare likely more exposed to enforcement measures at work, or less experienced inavoiding these measures. Nevertheless, lower fear of immigration enforcement maynot be negligible among older immigrants. Fear of immigration enforcement canrestrict access to health-care resources as some migrants worry about detection orapprehension if they try to access health care or social services in public agencies(Hagan et al. 2003). This fear also may have a negative impact on the wellbeing andquality of life of older immigrants.
In this article, we also examine whether the disapproval of immigrant enforce-ment policies is directly associated with fear of immigration enforcement. Thishypothesized association would indicate whether the disapproval of immigrationpolicies—another possible determinant of health and wellbeing (Vargas et al.2017)—crystallizes in fear.
6 Immigration Enforcement, Older Latino Immigrants … 119
Data and Methods
The data used in this analysis come from the 2007, 2008, 2010 rounds of the NationalSurvey of Latinos (NSL) and the 2013 Survey of Hispanics, both conducted by thePew Research Center. These annual telephone surveys include adult Latino respon-dents residing in the United States with a telephone (either landline or cellularphone). Interviews were conducted in English or Spanish. Overall response rateswere low (below 50%). However, these surveys are still informative of Latinos in theUnited States due to their unique questions about disapproval and fear of immigrationenforcement, and U.S. Citizen and permanent residence status. In this study, we usedcross-sectional regressionmodels to estimate the probabilities of fearing immigrationenforcement among foreign-born individuals without citizenship or legal permanentresidence by age group as well as the association between disapproval and fear ofimmigration enforcement. We applied sampling weights to these surveys to obtainnationally representative profiles of Latino adults in the United States.
Dependent Variable
The dependent variable measures whether respondents are afraid of immigrationenforcement. Particularly useful in our analysis is a question included in every yearof the National Survey of Latinos about fear of deportation (Lopez et al. 2013).The question reads, “Regardless of your own immigration or citizenship status, howmuch, if at all, do you worry that you, a family member, or a close friend could bedeported? Would you say that you worry a lot, some, not much, or not at all?” Wecreated a binary dependent variable by collapsing options “a lot” and “some,” andoptions “not much” and “not at all.”
Independent Variables
We created binary variables for age by collapsing individuals aged 18–29, 30–49,50–64, and 65 and over. We also created a binary variable for U.S. citizens andpermanent residents using the questions “Were you born on the island of PuertoRico, in the United States, or in another country?” “Are you a citizen of the UnitedStates?” and “Earlier you said you are not a citizen of the U.S. Do you have a greencard or have you been approved for one?” This variable distinguishes U.S. citizensand permanent residents (individuals with green cards) versus individuals who donot have these statuses.
Moreover, we created binary variables that indicate whether respondents disap-prove of immigration enforcement measures. These variables refer to respondentsthat at least disapprove one of the immigration enforcement questions mentioned

120 N. Rodriguez et al.
below included in the questionnaire every year. We used the questions “Do youapprove or disapprove ofworkplace raids to discourage employers fromhiring undoc-umented or illegal immigrants?” (NSL 2007, 2008, 2010), “Do you approve or dis-approve of states checking for immigration status before issuing driver’s licenses?”(NSL 2007), “Do you approve or disapprove a requirement that employers checkwith a federal government database to verify the legal immigration status of any jobapplicant they are considering hiring?” (NSL 2008), “Do you approve or disapprovethe criminal prosecution of employers who hire undocumented immigrants?” (NSL2008), “Do you approve or disapprove building more fences on the nation’s borders”(NSL 2010), “Do you approve or disapprove increasing the number of border patrolagents” (NSL 2010), and “Please tell me if you approve or disapprove increasingenforcement of immigration laws at U.S. borders” (NSL 2013). We acknowledgethat these questions likely capture distinct dimensions of disapproval of immigra-tion enforcement. Nonetheless, we opted to create yearly binary variables due to ourchoice of methods.
In addition, we included several control variables to account for the potentialinfluence of unobserved confounding variables. We added a binary variable thatindicates whether respondents have children under 18 living in their households(except in NSL 2013). Adults with young dependents are likely more afraid thanadults with no dependents, especially if parents and children are undocumented(Salas et al. 2013). Moreover, we included a binary variable that measures whetherrespondents lived in the United States 10 years or more (only significant in 2013),and a binary variable that indicates whether Spanish is the dominant language ofthe respondent as measures of acculturation (Lum and Vanderaa 2010). The Spanishdominant variable is not the same in every year. This variable was created usingan aggregated proficiency measure included in the survey, which was obtained withdifferent questions about language use in 2007 and 2010. These questions were notincluded in the 2008 and 2013 NSL surveys. Instead, we used language spokenduring the interview as a proxy for Spanish dominant. Furthermore, we added binaryvariables for human and material capital: educational attainment (high school orless, some college or technical school, and college degree or more), and householdincome (less than $30,000, $30,000 to less than $50,000, and $50,000 or more). Wealso added binary variables for region (Northeast, North Central, South, and West).1
Analytic Plan
In this study, we used two different cross-sectional regression models for binarydependent variables.We used seemingly unrelated bivariate probit regressionmodelsto examine whether there is evidence of reverse causation between disapproval and
1We also controlled for sex (female), marital status, and other measures for time living in the UnitedStates in alternative regressionmodels not presented in this study. The coefficients of these variableswere statistically insignificant.

6 Immigration Enforcement, Older Latino Immigrants … 121
fear of immigration enforcement. These recursive simultaneous-equations modelswith correlated errors are useful to predict together disapproval and fear of immi-gration enforcement using bivariate dependent variables (Greene 2003). We createdbinary variables for disapproval of immigration enforcement—the dependent vari-ables of the second equations—because of this methodological choice under theassumption that these variables capture at least certain aspects of disapproval ofimmigration enforcement.We found evidence of significant correlations between theerrors of the equations in the NSL 2008 and 2010 surveys. However, we found no evi-dence of significant correlations between the errors in 2007 and 2013. Alternatively,we fitted logistic regression models predicting fear of immigration enforcement, andtreated disapproval of immigration enforcement as an exogenous variable in the NSL2007 and 2013 surveys.
We opted to fit cross-sectional regression models instead of pooling the databecause the variables for disapproval of immigration enforcement and Spanish as aprimary language are not the same over the years. We chose the regression modelspresented in Table 6.1 after comparing each model with alternative regression mod-els fitted with the same yearly data using the Bayesian Information Criterion (BIC).2
These yearly differences in data characteristics likely account for our different modelspecifications by year (see Table 6.1). We are particularly interested in estimatingthe probabilities of fearing immigration enforcement among foreign-born individu-als without citizenship or legal permanent residence by age group, and in examiningwhether the association between fear and different measures of disapproval of immi-gration enforcement is positive and significant.
Results
Table 6.1 presents weighted percentages of the variables used in the analyses. Asthe table shows, individuals aged 30–49 are overall more afraid of immigrationenforcement, except in 2013 (no difference). Except in 2008 and 2013, individualsaged 18–29 are slightly more afraid of immigration enforcement. These descriptiveresults match our initial expectation: fear of immigration enforcement is relativelyhigher among younger immigrants. Differences in fear of immigration enforcementamong other age groups are not as great in magnitude.
Table 6.2 presents selected coefficients of cross-sectional regression models pre-dicting fear of immigration enforcement. We found some evidence of significant(and marginally significant) differences in fear of immigration enforcement by agegroup (noteworthy in 2010 and 2013), as well as significant (and marginally signif-icant) coefficients of interaction terms between age and disapproval of immigrationenforcement (noteworthy in 2008 and 2010). Overall, these findings follow the logic
2Differences between values of these model-fit statistics are useful to find the model that receivesmost support from the data. Lower values of BIC with at least a different of six indicate better fit(Fox 2008).

122 N. Rodriguez et al.
Table 6.1 Summary statistics (weighted percentages) for the variables used in the analysis
Fear of immigrationenforcementa
2007 2008 2010 2013
No Yes No Yes No Yes No Yes
Age
Aged 18–29 14.51 15.61 11.80 18.73 14.63 15.37 15.27 14.73
Aged 30–49 18.63 24.49 17.95 24.98 18.30 25.60 21.33 21.24
Aged 50–64 6.87 8.18 8.47 6.52 9.18 8.13 10.61 6.47
Aged 65 and over 6.52 5.19 6.41 5.15 5.08 3.72 6.35 4.00
Do not disapprove immigrationenforcement measures
13.91 5.48 10.62 3.81 10.01 3.02 41.97 31.34
Disapprove immigrationenforcement measuresb
32.63 47.99 34.01 51.56 37.18 49.80 11.59 15.10
Not a U.S. citizen/permanentresident
4.37 14.69 3.38 16.57 2.76 13.18 8.48 24.09
U.S. citizen and permanentresident
42.16 38.77 41.25 38.81 44.43 39.63 45.07 22.35
No children under 18 living inhousehold
26.70 23.82 26.55 25.49 26.80 23.27 Unavailable
Children under 18 living inhousehold
19.83 29.65 18.08 29.89 20.38 29.55
Spanish is not a primary language 36.18 24.02 32.64 17.99 37.32 24.67 38.79 19.92
Spanish as a primary languagec 10.35 29.44 11.99 37.39 9.86 28.14 14.76 26.53
Region
Northeast 7.68 7.03 7.91 6.51 7.00 7.35 8.30 6.50
North Central 3.45 4.12 3.83 3.87 4.00 3.61 4.77 3.39
South 16.05 20.41 16.92 19.97 18.17 19.09 17.78 17.89
West 19.36 21.90 15.98 25.03 18.01 22.76 22.71 18.67
Did not live in the U.S. 10 yearsor more
5.19 13.77 3.72 15.56 2.67 8.95 4.62 5.59
Lived in the U.S. 10 years ormored
15.70 27.32 14.80 27.26 15.67 29.71 17.14 26.17
Educational attainmentd
High school or less 27.45 39.69 23.34 43.23 25.30 38.01 28.97 34.80
Some college, technical school 10.46 9.05 12.79 6.59 14.18 9.51 15.70 7.73
College degree or more 7.38 3.18 7.06 3.35 7.31 4.86 8.89 3.92
(continued)

6 Immigration Enforcement, Older Latino Immigrants … 123
Table 6.1 (continued)
Fear of immigrationenforcementa
2007 2008 2010 2013
No Yes No Yes No Yes No Yes
Incomed
Less than $30,000 19.15 29.37 16.87 33.55 15.65 25.63 Unavailable
$30,000 to less than $50,000 7.38 9.92 7.37 8.75 9.49 8.98
$50,000 or more 12.34 5.36 12.45 3.77 12.41 6.27
Notes The sum of the percentages of all the categories of each variable equals 100% except whenindicated. This table also includes the percentages of variables that were not included in everyregression analysisaWe collapsed options “not at all” and “not much” (category “No” in the table), and options “some”and “a lot” (category “Yes” in the table)bThis variable is not the same in every year. It is a binary variable that includes different measureseach year (see Section “Data and Methods”)cThis variable is not the same in every year. It is a variable based on a set of questions about languageuse in the 2007 and 2010 analyses. We used language spoken during the interview as a proxy forSpanish dominant in the 2008 and 2013 analysesdThe sum of the percentages of all the categories of these variables does not equal 100% due tothe omitted category “missing values,” except in educational attainment in 2013 (one missing valueremoved for the analysis)
of our original expectations: younger adults are more afraid of immigration enforce-ment compared to older immigrants. Younger adults are possiblymore afraid becausethey are likely more exposed to these measures, or less experienced in avoiding thesemeasures.
Regardless of these differences, the predicted probabilities of fearing immigra-tion enforcement by age group among foreign-born individuals without citizenshipor permanent residence, depicted in Fig. 6.1, are noteworthy. In 2007, for instance,the probability of fearing immigration enforcement of foreign-born individuals with-out citizenship or permanent residence is 0.56 for individuals aged 65 and over. In2008 and 2010, these probabilities are 0.58 for individuals aged 50–64. In 2007, theprobability of fearing immigration enforcement of foreign-born individuals withoutcitizenship or permanent residence is 0.56 for individuals aged 65 and over. Theseare the lowest predicted probabilities.
Moreover, we found evidence of a direct association between the disapprovalof different immigration enforcement measures (by year) and fear of immigrationenforcement. This association is positive and significant (marginally significant in2013) even when we found evidence of reverse causation (using the 2008 and 2010data). This association suggests that the disapproval of enforcement likely contributesto the crystallization of fear. Although the coefficients presented in Table 6.2 areuseful to identify whether the associations of the independent variables and fear ofimmigration enforcement are positive or negative, they are not comparable in mag-nitude. Alternatively, Fig. 6.2 depicts the average marginal effects of the disapprovalof different immigration enforcement measures (by year) on fear of immigration
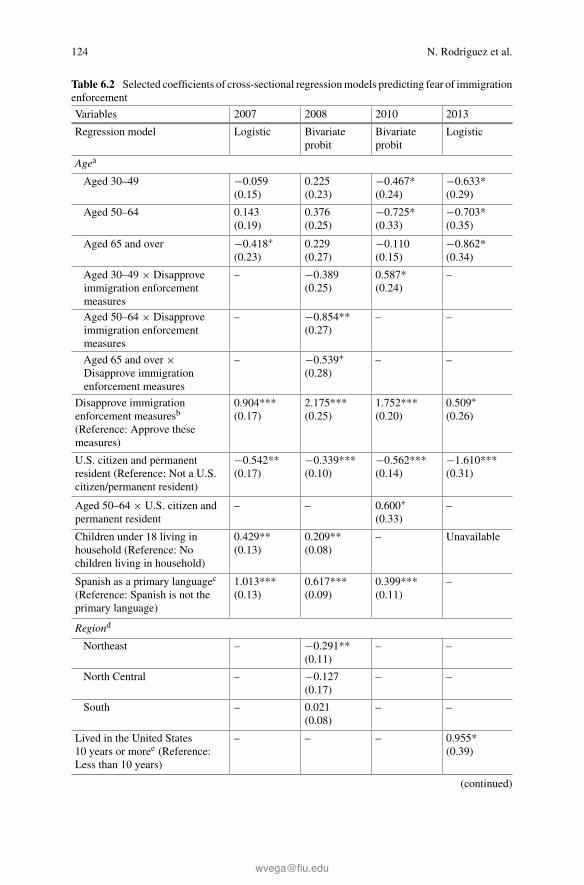
124 N. Rodriguez et al.
Table 6.2 Selected coefficients of cross-sectional regressionmodels predicting fear of immigrationenforcement
Variables 2007 2008 2010 2013
Regression model Logistic Bivariateprobit
Bivariateprobit
Logistic
Agea
Aged 30–49 −0.059(0.15)
0.225(0.23)
−0.467*(0.24)
−0.633*(0.29)
Aged 50–64 0.143(0.19)
0.376(0.25)
−0.725*(0.33)
−0.703*(0.35)
Aged 65 and over −0.418+
(0.23)0.229(0.27)
−0.110(0.15)
−0.862*(0.34)
Aged 30–49 × Disapproveimmigration enforcementmeasures
– −0.389(0.25)
0.587*(0.24)
–
Aged 50–64 × Disapproveimmigration enforcementmeasures
– −0.854**(0.27)
– –
Aged 65 and over ×Disapprove immigrationenforcement measures
– −0.539+
(0.28)– –
Disapprove immigrationenforcement measuresb
(Reference: Approve thesemeasures)
0.904***(0.17)
2.175***(0.25)
1.752***(0.20)
0.509+
(0.26)
U.S. citizen and permanentresident (Reference: Not a U.S.citizen/permanent resident)
−0.542**(0.17)
−0.339***(0.10)
−0.562***(0.14)
−1.610***(0.31)
Aged 50–64 × U.S. citizen andpermanent resident
– – 0.600+
(0.33)–
Children under 18 living inhousehold (Reference: Nochildren living in household)
0.429**(0.13)
0.209**(0.08)
– Unavailable
Spanish as a primary languagec
(Reference: Spanish is not theprimary language)
1.013***(0.13)
0.617***(0.09)
0.399***(0.11)
–
Regiond
Northeast – −0.291**(0.11)
– –
North Central – −0.127(0.17)
– –
South – 0.021(0.08)
– –
Lived in the United States10 years or moree (Reference:Less than 10 years)
– – – 0.955*(0.39)
(continued)

6 Immigration Enforcement, Older Latino Immigrants … 125
Table 6.2 (continued)
Variables 2007 2008 2010 2013
Educational attainmentf
Some college, technical school −0.160(0.16)
– – −0.548*(0.27)
College degree or more −0.640***(0.19)
– – −0.507(0.35)
Incomeg
$30,000 to less than $50,000 0.238(0.18)
−0.091(0.11)
−0.225*(0.11)
Unavailable
$50,000 or more −0.494**(0.19)
−0.355**(0.12)
−0.375**(0.12)
Intercept −0.532*(0.27)
−1.590***(0.26)
−0.970***(0.24)
0.850*(0.37)
N 1979 1988 1342 693
Notes Robust standard errors are in parentheses. Dashes indicate that variables were not included inthe model because they were statistically insignificant. We only present the coefficients of the firstequations in the 2008 and 2010 analyses. We used age, U.S. citizen/Permanent Resident, region,Spanish as a primary language, educational attainment, and income as regressors that predictedthe disapproval of immigration enforcement measures in 2008 (second equation). Moreover, weused age, Spanish as a primary language, U.S. citizen/Permanent Resident, and have a partner (vs.married, widowed, divorced, separated, never married) as regressors that predicted the disapprovalof immigration enforcement in 2010 (second equation)aReference: Aged 18–29bThis variable is not the same in every year. It is a binary variable that includes different measureseach year (see Section “Data and Methods”)cThis variable is not the same in every year. It is a variable based on a set of questions about languageuse in the 2007 and 2010 analyses. We used language spoken during the interview as a proxy forSpanish dominant in the 2008 and 2013 analysesdReference: WesteEstimated coefficient of category “missing values” is omitted from the tablefReference: High School or Less. Estimated coefficient of category “missing values” is omittedfrom the table except in the 2013 model (one missing value removed for the 2013 analysis)gReference: Less than $30,000. Estimated coefficient of category “missing values” is omitted fromthe table+p < 0.1; *p < 0.05; **p < 0.01; ***p < 0.001 (two-tailed tests)
enforcement. These estimates vary by year, and are notably higher in the 2008 and2010 bivariate probit models. These variations reveal how these yearly different vari-ables likely refer to different dimensions of disapproval of immigration enforcement.

126 N. Rodriguez et al.
Fig. 6.1 Predicted probabilities of fearing immigration enforcement by age among foreign-bornindividuals without citizenship or permanent residence
Fig. 6.2 Averagemarginal effects of differentmeasures of disapproval of immigration enforcementon fearing immigration enforcement by citizenship/permanent residence status
Limitations
A key limitation of the analysis is that nonresponse could have biased the estimatespresented due to the low response rates of the Pew National Survey of Latinos in2007, 2008, 2010 and 2013. This is a common challenge for contemporary telephonesurvey research due to the growing unwillingness of the public to participate in these

6 Immigration Enforcement, Older Latino Immigrants … 127
surveys. However, several studies point out that nonresponse does not necessarilyintroduce substantial biases into the analyses (Keeter et al. 2006; Pew ResearchCenter 2012; Massey and Tourangeau 2013; Oropesa et al. 2016). Furthermore, it isnecessary to point out that the significant coefficients in our regression models onlysuggest meaningful associations between fear of immigration enforcement and theindependent variables. These results do not support specific explanations about thedirection of the association (the causal nature of the association).
In addition, the regression models presented in Table 6.2 do not have the samespecification each year. In certain cases, we did not include the variable in the finalmodel according to the BIC. In other cases, we did not include the variable becauseit was not available for a specific year. Similarly, the data do not offer the samevariables for disapproval of immigration enforcement every year. Regardless of theselimitations, our goal was to take advantage of the available data to point out that fearof immigration enforcement is also noteworthy among older immigrants withoutcitizenship or permanent residence.
Discussion
The probabilities of fear of immigration enforcement among foreign-born individ-uals presented in this study reveal that, regardless of significant differences by age,older Latino immigrants are afraid of immigration enforcement. Consequently, it isnecessary to build on recent studies on health and immigration (e.g., Vargas et al.2017) and analyze whether fear of immigration enforcement has a distinct and signif-icant impact on the health and well-being of older undocumented Latino immigrants.Empirical examinations of this topic will require that health surveys of immigrantsinclude questions that measure fear of immigration enforcement, and differentiateindividuals with U.S. citizen and permanent residence status. The operationalizationof the variable fear of immigration enforcement should include behavioral measures(e.g., “Have you stopped doing certain activities to reduce possible detection bythe authorities?” and “How often do you talk about immigration enforcement withfriends or family members?”). In addition, efforts should be made to include and per-haps even oversample immigrant respondents without citizenship or visas in healthsurveys.
It also would be useful to gather data on disapproval of immigration enforcement.Disapproval may have a direct impact on the health and well-being of immigrantsas well as an indirect effect mediated by fear of immigration enforcement. Evidenceof the impact of disapproval on well-being would serve to demonstrate the negativehealth effects of anti-immigrant policies, and to challenge the discourses and beliefsthat support these policies. It would be preferable to use several questions in surveysto gather data for the creation of scales keeping in mind that the disapproval ofimmigration enforcement is likely multidimensional.
128 N. Rodriguez et al.
Increased Risk for Older Immigrants
Fear of immigration enforcement is a logical outcome of the implementation ofIIRIRA given that this law raised annual deportations from about 50,000 in 1995 tomore than 400,000 by 2012 (U.S. DHS 2016, Table 39). IIRIRA especially increasedthe risk of deportation for older migrants through its retroactive measure of mak-ing deportations applicable to immigration violations that occurred even before itsenactment in 1996 and through its reclassification ofmany previously non-deportableoffenses to aggregated felonies, which are grounds for removal. Through these newmeasures, many non-citizen legal immigrants in their sixties, seventies, and olderfaced deportation for offenses they committed and pled guilty to decades earlier ata time when the offenses were not deportable. Some migrants pled guilty in pleadeals in which they were sentenced to probation with no jail time, and some of thesecases involved being arrested for small amounts of marijuana (Rodriguez and Hagan2004). The IIRIRA-impact survey in the five Texas cities received family reports oflosing elderly family members to deportations to Mexico decades after the deportedfamily member had completed serving sentences for offenses (Rodriguez and Hagan2004). Some of the families indicated that prior to their deportations the elderly fam-ily members had provided important support with their presence and participation inthe family.
According to recent data (TRAC 2016), immigrants aged 50 and over accountfor only five percent of deportations, but in absolute numbers they have numberedbetween 13,000 and 16,000 annually, and hundreds of these elderly deportees havebeen age 70 and older. The numbers of older immigrants at risk of deportation becausethey have unauthorized status in the United States will remain substantial and likelygrow as the unauthorized immigrant population of some 11.1 million continues toage. From our theoretical perspective, this population will age with risks to mentalhealth as enforcement becomes more aggressive under the Trump administration(U.S. DHS 2017).
Risk of being deported is not the only IIRIRA-related threat to the security ofmanyoldermigrants. The removal of othermembers of a family, especially income earners,can affect the stability of the rest of the household, including older immigrants.Research conducted among deported immigrants in El Salvador in 2002 found thatamong the sample of 300 deported immigrants 25% had lived in multigenerationalhouseholds with some arrangements involving older migrants, e.g., parents, aunts,or uncles (Hagan et al. 2008). Among the deported immigrants who had lived in theUnited States for over five years, 70% had lived in households with members of anolder generation.
Deportation of a family household member can have a serious impact on olderimmigrants should they depend on the family household for survival. The sharplyrising numbers of deportations to more than 400,000 by 2012 (U.S. DHS 2016,Table 39), involves large numbers of immigrants that are important sources of socialcapital for their families and communities. Analysis of the sample of 300 deportedmigrants in El Salvador found that many had been key sources of social capital

6 Immigration Enforcement, Older Latino Immigrants … 129
needed to help connect families and communities to mainstream institutions (Haganet al. 2008). A third of the sample had settled in the United States for more than10 years, and among these 67% had legal status in the United States when arrested,64% were fluent in English, 94% had been employed, and 74% had incomes rangingfrom $14,400 to more than $46,000 per year (Hagan et al. 2008). The deportation ofimmigrants with substantial levels of social capital thus creates “collateral damage”for families and communities left behind (Hagan et al. 2015).
The questionmay be raisedwhy oldermigrants do not return to their home countryif they are facing problematic and restrictive policy situations in the United States.The EMIF surveys in Mexico find that at least a quarter of the returning migrantsare age 50 or older, and the majority of these are males. While Mexico does nothave a vastly improved economy with abundant chances for upward social mobilityand prosperity, it does appear to offer social and economic alternatives to living inthe United States under enforcement pressures (Wheatley 2017). The same is nottrue for most countries in Central American, particularly El Salvador, Guatemalaand Honduras. Populations in these Central American countries face daily problemswith violent crimes and restricted chances for economic prosperity, thus, for manyCentral American immigrants in the United States returning to their home countriesis not a favorable alternative to stressful enforcement conditions in the United States(UNHCR 2015; International Crisis Group 2016). One can only imagine how muchmore challenging it would be for older migrants to return to El Salvador, Guatemala,or Honduras if they no longer have an income-earner role and have to depend on thesupport of families that are already facing hardships.
Restrictions for Health Care Access
Given that migrants tend to be young and that foreign-born Latinos are often reportedto have favorable health conditions (Vega et al. 2009), the argument could be madethat access to health care should not be a major issue regarding older membersof Latino immigrant populations. The Legalized Population Survey administeredin 1989 among former unauthorized migrants enables a view of health-care usageamong the older Mexican immigrants, that is, those aged 50 and over (U.S. Depart-ment of Labor 1989). Only 8% of the 149 Mexican immigrants aged 50 and overin the sample reported having been hospitalized in the year prior to the survey. Tendifferent reasons were given for being hospitalized, with “treatment for long-termillness” receiving the highest frequency with three respondents. When the 149 Mex-ican immigrants age 50 and over were asked about their usual place for health ormedical care in the United States before applying for amnesty and legalization, onlytwo responses registered more than 10% of the subsample: doctor’s office or a pri-vate clinic (43%) and never used health care services in the United States (28%).Hospital outpatient clinics and community family health centers ranked third placewith 7% each, although 11% of the female respondents cited community familyhealth centers as their usual place for health care (U.S. Department of Labor 1989).

130 N. Rodriguez et al.
These findings suggest that, while older unauthorized immigrants do not have a highrate of health-care usage, they have not completely disappeared from the health-caresector. Moreover, their numbers are likely to grow as age cohorts in the long-termunauthorized immigrant population continue to advance through the life course inthe United States.
In the study of IIRIRA impacts in five Texas cities, community health direc-tors and survey respondents reported that immigrants feared health care providerswould share information with police and immigration officials, and that this fear keptmany immigrants away from public health care services, including legal immigrantswho lived in mixed-status households with unauthorized immigrant family members(Hagan et al. 2003). This fear was not unfounded. In several cases, public hospitalsdid attempt to share information of immigrant patients with federal officials, sincethis information was seen by hospital staff as useful for the Department of State andthe Immigration service to determine immigration eligibility and to determine if animmigrant had become a public charge, which are grounds for denial of citizenship.In El Paso, one public hospital shared a list with the U.S. consular office in CiudadJuarez in Mexico of immigrants who had received medical services without payingfor them (Hagan et al. 2003). In Houston, a public hospital official offered a printoutto visiting Immigration service officials of persons who had not paid for medical ser-vices they received at the hospital and thus were considered unauthorized immigrants(Rodriguez 1996).
An investigation by a team of legal and immigration experts and immigrant advo-cates in 1998 revealed many cases across the country where immigrants had gonewithout much needed medical attention because they feared being reported by healthfacilities as a public charge to federal officials and consequently expelled from thecountry or restricted from future citizenship (Schlosberg and Wiley 1998). In the2000s, concerns for the ethics of health care facilities grew to include hospital depor-tations, that is, cases where hospitals took the initiative to repatriate poor, nonpayingpatients to their countries with or without the consent of the patients. After hundredsof such cases were reported, in 2014 The New England Journal of Medicine pub-lished an article, “Undocumented Injustice? Medical Repatriations and the End ofHealth Care,” to examine a new ethical problem in immigrant health care (Youngand Lehmann 2014). This collective research supports our findings and argument thatmigrants encounter health risks and restrictions within the context of policy enforce-ment, including through actions undertaken by health-care agencies not charged withenforcement.
Two cases of medical emergency of immigrants in Houston observed by twoof the co-authors of this article illustrate how not having medical insurance andbeing an unauthorized immigrant can delay seeking medical care to the point of neardeath. In one case, Guatemalan brothers of a young immigrant man passing bloodfrom advanced stomach cancer offered to pay cash to a highly reputable hospital forhis medical care, but the hospital insisted that their brother needed to have healthinsurance to be admitted for treatment. The brothers then took the ill brother to acharity hospital where they were told a bed was not available. Feeling dejected and

6 Immigration Enforcement, Older Latino Immigrants … 131
suffering in pain the young immigrant decided to return to Guatemala, where he diedshortly after arriving.
In the second case, an unauthorized immigrant daughter from Mexico finallymanaged to gain the attention of community nurses to help her immigrant motherwho was stricken in bed suffering from an advanced stage of spinal cancer. Becausethe mother was an unauthorized immigrant without insurance needing acute care,the nurses felt she had few or no chances of being admitted by a large county publichospital already overcrowded with poor patients. Instead, the nurses helped her beadmitted into a small suburban hospital from where she was then transferred tothe county hospital through an emergency room entrance, bypassing the restrictive,intake screening at the main entrance. The mother spent a lengthy spell receivingtreatment at the hospital, but finally returned to Mexico with very little expectationof survival.
These two cases represent drastic situations in which being an immigrant andnot having health insurance, or having unauthorized status, restricted prompt accessto critically needed medical care. These illustrative cases suggest that time lost inseeking hospital care because of fear or lack of access to health care probably wouldnot have made a difference for the final outcomes of the two immigrants given theseriousness of their illnesses, but painmedication andother relief could have providedsome comfort in their acute conditions.
Conclusion
We opened this presentation with the theoretical perspective that international migra-tion transpires across social and policy conditions that produce health risks formany immigrants, especially for undocumented Latino migrants. Most evident inthis regard is the U.S. border policy of redirecting unauthorized border crossers atthe southwest border to desolate areas, costing the lives of thousands of migrantswho have perished from heat exposure or other dangers in the deserts since the1990s (Eschbach et al. 1999; De León 2015). The health risks of migration do notjust affect the young, who make up the largest numbers of migrants; pressures andrisks of immigration enforcement also impact older immigrants. Older Latino immi-grants residing in the United States also fear the possibility of deportation, but atlower levels than younger immigrants. As described above, older immigrants con-stitute approximately one-fifth of all foreign-born in the country, one-third of allLatino immigrants, and over 660,000 of the 11 million unauthorized population inthe country. The replenishment of immigration from Latin America, along with theaging of America’s immigrant population, are gradually replacing age cohorts ofolder Latino immigrants in the country.
Restrictive immigration measures enacted since the 1990s have created an atmo-sphere of distress in which many immigrants live precarious lives fearing for thesecurity of themselves and their families. In these environments, immigrants andtheir families curtail family activity, sometimes withdrawing from needed institu-

132 N. Rodriguez et al.
tional assistance, such as health care, for fear that they could be apprehended anddeported or cause the deportation of a family member (Hagan et al. 2003). More-over, many immigrant families live with the stress and anxiety of not knowing whatthe future will bring regarding family security, a situation that will become moreprecarious as the Trump administration increases enforcement activity.
Restrictive immigration policies pressure aging Latino immigrant populations,and within these population older immigrants can face considerable stress. The stresscan come from being a dependent in an immigrant family and thus being at risk ofhaving an income earner in the family deported. In this situation, older immigrantswho are not U.S. citizens may advance into their later years not looking forward toa comfortable retirement, but to the possibility of family separation or even a forcedrepatriation to the country of origin, where in some cases few close relatives remain,since former family ties in nation of origin may have been disrupted and some familymembers may be residing in the United States.
References
Abrego, L. J. (2014). Sacrificing families: Navigating laws, labor, and love across borders. Stanford,CA: Stanford University Press.
Alarcón, R. D., Parekh, A., Wainberg, M. L., Duarte, C. S., Araya, R., & Oquendo, M. A. (2016).Hispanic immigrants in the USA: Social and mental health perspectives. The Lancet Psychiatry,3(9), 860–870.
Arbona, C., Olvera, N., Rodriguez, N., Hagan, J., Linares, A., &Wiesner, M. (2010). Acculturativestress among documented and undocumented Latino immigrants in the United States. HispanicJournal of Behavioral Sciences, 32(3), 362–384.
Berger Cardoso, J., Hamilton, E. R., Rodriguez, N., Eschbach, K., & Hagan, J. (2016). Deportingfathers: Involuntary transnational families and intent to remigrate among Salvadoran deportees.International Migration Review, 50(1), 197–230.
Capps, R., Bachmeier, J. D., Fix, M., & Van Hook, J. (2013). A demographic, socioeconomic,and health coverage profile of unauthorized immigrants in the United States. Washington, DC:Migration Policy Institute. http://www.migrationpolicy.org/research/demographic-socioeconomic-and-health-coverage-profile-unauthorized-immigrants-united-states.
Capps, R., Hagan, J., & Rodriguez, N. (2004). Implementing immigration and welfare reform inTexas. In P. Kretsedemas & A. Aparicio (Eds.), Immigrants, welfare reform, and the poverty ofpolicy (pp. 229–249). Westport, CT: Praeger Publishers.
Commission on Social Determinants of Health, CSDH. (2008). Closing the gap in a generation:Health equity through action on the social determinants of health. Final Report of theCommissionon Social Determinants of Health. Geneva: World Health Organization. http://apps.who.int/iris/bitstream/10665/43943/1/9789241563703_eng.pdf.
De León, J. (2015). The land of open graves: Living and dying on the migrant trail. Oakland, CA:University of California Press.
Donnelly, R., & Hagan, J. (2014). Dangerous journeys. In L. A. Lorentzen (Ed.), Hidden livesand human rights: Understanding the controversies and tragedies in undocumented immigration(pp. 71–106). Santa Barbara, CA: Praeger Press.
Dreby, J. (2010).Divided by borders: Mexican migrants and their children. Berkeley,CA:Universityof California Press.
Eschbach, K., Hagan, J., Rodriguez, N., Hernandez-Leon, R., & Bailey, S. (1999). Death at theborder. International Migration Review, 33, 430–454.

6 Immigration Enforcement, Older Latino Immigrants … 133
Fox, John. (2008).Applied Regression Analysis and Generalized Linear Models (2nd ed). ThousandOaks, CA: Sage.
Golash-Boza, T., & Hondagneu-Sotelo, P. (2013). Latino immigrant men and the deportation crisis:A gendered racial removal program. Latino Studies, 11(3), 271–292.
Gonzales, R. G. (2016). Lives in limbo: Undocumented and coming of age in America. Oakland,CA: University of California Press.
Gordon, I., & Raja, T. (2012, March/April). 164 Anti-immigration laws passed since 2010? AMoJoanalysis. Mother Jones. http://www.motherjones.com/politics/2012/03/anti-immigration-law-database.
Greene, W. H. (2003). Econometric analysis (5th ed.). Upper Saddle River, NJ: Prentice Hall.Hagan, J., Eschbach, K., & Rodriguez, N. (2008). US deportation policy, family separation, andcircular migration. International Migration Review, 42(1), 64–88.
Hagan, J., Leal, D., & Rodriguez, N. (2015). Deporting social capital: Implications for immigrantcommunities in the United States. Migration Studies, 3(3), 370–392.
Hagan, J. M., Rodriguez, N., & Castro, B. (2011). Social effects of mass deportations by the UnitedStates government, 2000–10. Ethnic and Racial Studies, 34(8), 1374–1391.
Hagan, J., Rodriguez, N., Capps, R., & Kabiri, N. (2003). The effects of recent welfare and immi-gration reforms on immigrants’ access to health care. International Migration Review, 37(2),444–463.
Hardy, L. J., Getrich, C. M., Quezada, J. C., Guay, A., Michalowski, R. J., & Henley, E. (2012).A call for further research on the impact of state-level immigration policies on public health.American Journal of Public Health, 102(7), 1250–1253.
International Crisis Group. (2016, July 28). Easy prey: Criminal violence and Central Americanmigration. Latin America Report N°57. Brussels, Belgium. https://d2071andvip0wj.cloudfront.net/057-easy-prey-criminal-violence-and-central-american-migration.pdf.
Keeter, S., Kennedy, C., Dimock,M., Best, J., &Craighill, P. (2006). Gauging the impact of growingnonresponse on estimates from a national RDD telephone survey. Public Opinion Quarterly,70(5), 759–779.
Krogstad, J. M., Passel, J. S., & Cohn, D. (2016, November 3). 5 facts about illegal immigrationin the U.S. Washington, DC: Pew Research Center. http://www.pewresearch.org/fact-tank/2016/11/03/5-facts-about-illegal-immigration-in-the-u-s/.
Kullgren, J. T. (2003). Restrictions on undocumented immigrants’ access to health services:The public health implications of welfare reform. American Journal of Public Health, 93(10),1630–1633.
Lopez, M. H., & Rohal, M. (2017, February 23). Latinos and the new Trump Administration.Washington, DC: Pew Research Center. http://assets.pewresearch.org/wp-content/uploads/sites/7/2017/02/24094450/Latinos_Trump_FULLREPORT.pdf.
Lopez, M. H., Taylor, P., Funk, C., & Gonzalez-Barrera, A. (2013, December 18). Views aboutunauthorized immigrants and deportation worries. Washington, DC: Pew Research Cen-ter. http://www.pewhispanic.org/2013/12/18/3-views-about-unauthorized-immigrants-and-deportation-worries/.
Lum, T. Y., & Vanderaa, J. P. (2010). Health disparities among immigrant and non-immigrantelders: The association of acculturation and education. Journal of Immigrant Minority Health,12(5), 743–753.
Lundquist, J. H., Anderton, D. L., & Yaukey, D. (2015). Demography: The study of human popu-lation. Long Grove, IL: Waveland Press Inc.
Martin-Baro, I. (1989). Political violence and war as causes of psychological trauma in El Salvador.Journal of La Raza Studies, 2(1), 5–13.
Massey,D. S. (2006,April 4). Thewall that keeps illegalworkers in.New York Times, Opinion Pages.http://www.nytimes.com/2006/04/04/opinion/the-wall-that-keeps-illegal-workers-in.html.
Massey, D. S., & Tourangeau, R. (2013). Where do we go from here? Nonresponse and socialmeasurement. The Annals of the American Academy of Political and Social Science, 645(1),222–236.

134 N. Rodriguez et al.
Menjívar, C., Abrego, L. J., & Schmalzbauer, L. C. (2016). Immigrant families. New Jersey: Wiley.Mui, A. C., & Kang, S. Y. (2006). Acculturation stress and depression among Asian immigrantelders. Social Work, 51(3), 243–255.
National Survey of Latinos. 2007. Dataset. Pew Research Center. Washington, D.C.National Survey of Latinos. 2008. Dataset. Pew Research Center. Washington, D.C.National Survey of Latinos. 2010. Dataset. Pew Research Center. Washington, D.C.National Survey of Latinos. 2013. Dataset. Pew Research Center. Washington, D.C.Ngai,MaeM. (2003). The strange career of the illegal alien: Immigration restriction and deportationpolicy in the United States, 1921–1965. Law & History Review, 21(1), 69–107.
Oropesa, R. S., Landale, N. S., & Hillemeier, M. M. (2016). Legal status and health care:Mexican-origin children inCalifornia, 2001–2014.Population Research and Policy Review, 35(5),651–684.
Passel, J. S., Cohn, D., Krogstad, J. M., & Gonzalez-Barrera, A. (2014, April 3). As growth stalls,unauthorized immigrant population becomes more settled.Washington,DC:PewResearchCenterHispanic’s Trend Project. http://www.pewhispanic.org/2014/09/03/as-growth-stalls-unauthorized-immigrant-population-becomes-more-settled/.
Pew Research Center. (2012). Assessing the representativeness of public opinion surveys. Washing-ton,DC. http://www.people-press.org/2012/05/15/assessing-the-representativeness-of-public-opinion-surveys/.
Pew Research Center. (2016). Datasets: National Survey of Latinos, 2007, 2008, 2010, 2013. Wash-ington, DC. http://www.pewhispanic.org/category/datasets/.
Population Reference Bureau. (2016). 2016 World population data sheet. Washington, DC. http://www.prb.org/pdf16/prb-wpds2016-web-2016.pdf.
Rodriguez, N. (1996). Personal communication with Immigration official. Houston, TX.Rodriguez, N. (2007). Mexican and Central Americans in the present wave of U.S. Immigration.In J. L. Falconi & J. A. Mazzoti (Eds.), The other Latinos: Central and South Americans in theUnited States (pp. 81–100). Cambridge, MA: Harvard University Press.
Rodriguez, N., & Hagan, J. (2016). US policies to restrict immigration. In D. Leal & N. Rodriguez(Eds.), Migration in an era of restriction (pp. 27–38). Switzerland: Springer International Pub-lishing.
Rodriguez, N., & Hagan, J. M. (2004). Fractured families and communities: Effects of immigrationreform in Texas, Mexico, and El Salvador. Latino Studies, 2(3), 328–335.
Salas, L. M., Ayón, C., & Gurrola, M. (2013). Estamos traumados: The effect of anti-immigrantsentiment and policies on themental health ofMexican immigrant families. Journal of CommunityPsychology, 41(8), 1005–1020.
Schlosberg, C., & Wiley, D. (1998, May 22). The impact of INS public charge determinations onimmigrant access to health care. Los Angeles, CA: National Health Law Program.
Secretaría de Gobernación, SEGOB. (2013). Encuesta Sobre Migración en la Frontera Norte deMéxico, 2011. Ciudad de México, México. https://www.colef.mx/emif/resultados/publicaciones/publicacionesnte/pubnte/EMIF%20NORTE%202011.pdf.
Silver, A. (2018). Shifting boundaries: Immigrant youth negotiating national, state, and small townpolitics. Stanford, CA: Stanford University Press.
Torres, J. M., & Wallace, S. P. (2013). Migration circumstances, psychological distress, and self-rated physical health for Latino immigrants in the United States. American Journal of PublicHealth, 103(9), 1619–1627.
Transactional Records Access Clearinghouse, TRAC. (2016). ICE deportation: Gender, age, andcountry of citizenship. New York: Syracuse University. http://trac.syr.edu/immigration/reports/350/.
United Nations High Commissioner on Refugees, UNHCR. (2015, October). Women on the run:First-hand accounts of refugees fleeing El Salvador, Guatemala, Honduras, and Mexico. Wash-ington, DC.
Urrutia-Rojas, X., & Rodriguez, N. (1997). Unaccompanied migrant children from Central Amer-ica: Sociodemographic characteristics and experiences with potentially traumatic events. In A.
6 Immigration Enforcement, Older Latino Immigrants … 135
Ugalde & G. Cardenas (Eds.), Health and social services among international labor migrants:A comparative perspective (pp. 151–166). Austin: Center for Mexican American Studies, Uni-versity of Texas Press.
U.S. Census Bureau. (2016). American Fact Finder. 2014 American Community Survey (ACS),5-year estimates. Washington, DC.
U.S. Department of Homeland Security, DHS. (2015, July 30). Priority Enforcement Pro-gram—How DHS is focusing on deporting felons. Washington, DC. https://www.dhs.gov/blog/2015/07/30/priority-enforcement-program-—how-dhs-focusing-deporting-felons.
U.S. Department of Homeland Security, DHS. (2016). 2014 Yearbook of immigration statistics.Washington, DC. https://www.dhs.gov/sites/default/files/publications/ois_yb_2014.pdf.
U.S. Department of Homeland Security, DHS. (2017, February 20). Enforcement ofthe immigration laws to serve the national interests. Memorandum. Washington,DC. https://www.dhs.gov/sites/default/files/publications/17_0220_S1_Enforcement-of-the-Immigration-Laws-to-Serve-the-National-Interest.pdf.
U.S. Department of Labor. (1989). The legalized population survey. Washington, DC. http://mmp.opr.princeton.edu/LPS/LPSpage.htm.
U.S. Department of Labor. (1992, March). Immigration Reform and Control Act: Report of thelegalized alien population. Washington, DC. https://catalog.hathitrust.org/Record/002590134.
U.S. Immigration and Naturalization Service, INS. (1997). 1995 Statistical yearbook of the Immi-gration and Naturalization Service. Washington, DC: U.S. Government Printing Office.
Vargas, E. D., Sanchez, G. R., & Juárez, M. (2017). Fear by association: Perceptions of anti-immigrant policy and health outcomes. Journal of Health Politics, Policy and Law, 42(3),459–483.
Vega, W. A., Rodriguez, M. A., & Gruskin, E. (2009). Health disparities in the Latino population.Epidemiologic Reviews, 31(1), 99–112.
Weissman, D. M., Hagan, J. M., Martinez-Schuldt, R., & Peavey, A. (Forthcoming). The politics ofimmigrant rights: Between political geography and transnational interventions. Michigan StateLaw Review.
Wheatley, C. (2017). Driven “home”: Stories of voluntary and involuntary reasons for returningamong migrants in Jalisco and Oaxaca, Mexico. In B. Roberts, C. Menjívar, & N. Rodriguez(Eds.), Deportation and return in a border-restricted world (pp. 67–86). New York: Springer.
Young, M. J., & Lehmann, L. S. (2014). Undocumented injustice? Medical repatriation and theends of health care. The New England Journal of Medicine, 370(7), 669–673.
Zayas, L. H. (2015). Forgotten citizens: Deportation, children, and the making of American exilesand orphans. New York: Oxford University Press.

Chapter 7Medicaid Long-Term Community Carein California and Texas: A GrowingFiscal Challenge in a New Era
Jacqueline L. Angel, Ronald J. Angel and Selena M. Caldera
Abstract This study compares alternative approaches to providing community-based long-term care to low-incomeMedicaid eligible elders in California and Texas,two states with large Mexican-origin populations. As smaller families, the migrationof children away from their parent’s communities, the need for women to work, andother factors undermine the family’s traditional role as the sole provider of all of thecare an infirm elderly parent needs new experiments with publicly funded commu-nity care become necessary. Given the growing cost to states of Medicaid-financedlong-term care various experimental Medicaid waiver programs have been intro-duced in both states. Yet the current mix of approaches to community care differs,with potentially significant implications for state expenditures, costs to families, andquality of life for elderly parents. While Texas has focused on consolidating mostof its waiver programs into a single state wide capitated managed care program,California continues to experiment with a more diverse set of local programs. Thechapter ends with a discussion of the implications of these differences for long-termcare policy and the potential consequences of proposals by the current administrationto give states more latitude in developing new approaches to offset the rising costsof Medicaid.
J. L. Angel (B)Lyndon B. Johnson School of Public Affairs and Department of Sociology, The University ofTexas at Austin, Austin, TX, USAe-mail: [email protected]
R. J. AngelDepartment of Sociology, The University of Texas at Austin, Austin, TX, USAe-mail: [email protected]
S. M. CalderaLyndon B. Johnson School of Public Affairs, The University of Texas at Austin, Austin, TX, USAe-mail: [email protected]
© Springer Nature Switzerland AG 2019W. A. Vega et al. (eds.), Contextualizing Health and Aging in the Americas,https://doi.org/10.1007/978-3-030-00584-9_7
137

138 J. L. Angel et al.
Introduction
The United States, like the nations of Latin America, confronts a future in whichthe proportion of older individuals will increase rapidly, placing ever greater strainson already strained social and community support systems. At the beginning of the20th Century, older individuals with few assets and low incomes had no choice butto turn to children, family, or charity for support. Today, social and demographicchanges, as well as changing expectations that have accompanied the expansion ofthe welfare state, means that responsibility for the financial support of the elderlyhas increasingly shifted to the state. In this chapter, we discuss state policies relatedto the financing of long-term community care for older individuals with seriouslycompromised autonomy and independence. Even for highly familistic groups, suchas the Mexican-origin populations of California and Texas, longer lifespans andprotracted periods of disability mean that families will increasingly be forced to lookto the state for financial and other assistance in the care of aging parents.
This new social and demographic reality ushers in a new policy reality for states.We focus on California and Texas to illustrate different responses to that new reality.These are two large states with large Latino populations but very different politicalcultures and approaches to community long-term care. Like all states, their major lia-bility arises from the fact that state expenditures for Medicaid, the primary financingmechanism for long-term care for the frailest indigent older citizens, is growing atan alarming pace (Hagen 2013). Like all states, California and Texas are faced withthe reality of growing numbers of Medicaid-eligible Medicare recipients who arereferred to as “dual-eligible” since they qualify for both programs (Couture 2005).This population consists of disabled individuals under the age of 65 who qualifyfor Medicare, as well as frail individuals over 65 with low incomes and few assetswho cannot afford long-term care. For both groups, Medicaid pays for some or all ofthe expenses that Medicare does not cover. Although low-income pregnant womenand children make up the majority of Medicaid beneficiaries, low-income elderlyand disabled beneficiaries account for the majority of program expenditures (Trufferet al. 2016). Over half of institutional long-term care costs are paid by Medicaid(Reaves and Musumeci 2015). This growing fiscal burden forces states to seek waysof curtailing the cost of providing long-term care services and to growing disabledand frail elderly populations through their Medicaid programs.
The financing of long-term care challenges everyone since families and societyat large must pay the bill. Yet many individuals and families, even those close toretirement, have little or no savings, and many do not own generous employment-based retirement plans. Even among those with retirement plans, assets, and savingsmany have far too little saved to deal with protracted periods of functional incapacity(Crystal et al. 2016). The problem for states is seriously compounded by greatlyincreased life spans. As the result of bettermedical care and generally higher qualitiesof life, today the average 65 year old male can expect to live to 84.3 and the averagefemale to 86.6 (Social Security Administration 2017). Many individuals will in factlive well into their 90s. In order to maintain even a modest lifestyle for those 20 or

7 Medicaid Long-Term Community Care in California and Texas … 139
more years, and to pay for even a few years of long-term care, one would need toannuitize a million dollars or more at a fairly high interest rate (AnnunityCalC.org2017). If one were to need extended long-term care, even those assets might beinsufficient. In reality, many individuals and couples approaching retirement havefar less, and some have almost nothing (Crystal 2016). In the event of a seriousdecline in health and functional capacity, the little they do have will be consumedquickly.
High-Risk Groups: Hispanics and African Americans
Because of lower lifetime earnings and impaired asset accumulation Hispanics andAfrican American are at higher risk than non-Hispanic whites of entering the lateryears of life with inadequate resources (Mudrazija and Angel 2014). Traditionally,and even today, elderly Hispanics tend to remain in the community cared for by theirfamilies even after they become seriously incapacitated. However, demographic andsocial changes including lower fertility, divorce, the need for adult daughters to work,and migration away from the parent’s place of residence are rapidly diminishing thecapacity of Hispanic families to provide all of the care elderly parents need (Angeland Angel 2015). Increasingly, low-incomeminority families will have no choice butto resort to Medicaid-funded community and institutional long-term care, creatingfurther pressures on strained state budgets.
Inwhat follows,we focus on the dual-eligible populations of California andTexas,with a particular focus on those over 65. The dual-eligible population consists of twosegments, those individuals who are termed “partially dual-eligible” and those whoare “fully dual-eligible.” Partial duals consist of individuals with some resourcesor limited need for whom Medicaid serves as a Medigap policy that pays Part BMedicare premiums and the patient’s portion of acute care costs, but not long-termservices and supports (LTSS), including nursing home care, adult day centres, homehealth aide services, personal care services, transportation, supported employment,or assistance provided by a family caregiver (Reaves and Musumeci 2015). For fullduals, Medicaid covers institutional long-term care and community long-term carein certain cases. In 2011, 21% of Medicare recipients were dual-eligible (Henry J.Kaiser Family Foundation 2016), and sixty-two percent of Medicaid expenditures($91.8 billion) were for full duals (Reaves andMusumeci 2015). Toward that end, wedescribe the approaches California and Texas are taking in the use of majorMedicaidcommunity care waivers and the Medicare mandated Program of All-Inclusive Careof the Elderly (PACE) option.
We focus on California and Texas as they are the most populous states in thenation with large low-income populations, including large numbers of high-risk,low-income Latinos, primarily of Mexican origin (Brown and Lopez 2016). As aconsequence, both states face serious challenges resulting fromgrowing dual-eligiblepopulations. While both states face many similar challenges, they are approachingthe problem in different ways that have potentially profound implications for state

140 J. L. Angel et al.
Medicaid expenditures, as well as for elderly individuals and their families. Thissituation results in clear motivations to control Medicaid expenditures and, as wediscuss below, leads to attempts by state to shift costs from Medicaid to Medicare,and for providers to avoid or shift the cost of the most expensive clients to otherproviders.
The classification of dual-eligible beneficiaries is one potential means of reducingstate Medicaid expenditures. States have significant discretion in how they classifydual-eligible elders. In general, disabled individuals are far more likely than elderlyindividuals to be classified as full duals (Watts et al. 2016). As we document below,Texas categorizes a much higher proportion of its dual-eligible population as partialthan California, in which nearly all dual-eligibles are classified as fully dual-eligible.This difference in the classification of the dual-eligible population has importantimplications for state Medicaid expenditures (Medicare Payment Advisory Com-mission 2015b). Since Medicaid does not pay for institutional care for partial duals,a higher proportion of partials reduces the burden on Medicaid.
Although all states are searching for cost savings in their Medicaid programs,the differences between California and Texas provides an example of variation inthe approaches they take to coverage of those in need. California, for example, hasexpanded Medicaid coverage under the Affordable Care Act, while Texas has not.The two states also differ in other aspects of their approach to dual-eligibles andLTSS, which we discuss below. First, though, we compare the demographics of thetwo states to assess the nature of the fiscal burdens they face. These are based onpopulation projection data from the state of California’s Demographic Research Unitand from the Texas Demographic Centre, as well as data from the 2014 AmericanCommunity Survey and the 2010 United States Census.
Demography of California and Texas
The demographics of California and Texas illustrate the population-age risk profile.In both states, the number of residents over 65 is expected to more than doubleover the next 30 years, while the overall state populations are expected to increase atmuch slower rates (Texas State Data Center 2014; Beck and Johnson 2015). Table 7.1presents population characteristics of the population 65 and older in California andTexas.
California is themost populous state in the nation, with over 39.2million residentsin 2016. The population 65 and over represents almost 14% of the state’s populationand is expected to increase from approximately to 8.4 million in 2030 (Liu 2015).Although smaller than California, Texas is the second largest state in the nation with27.9 million inhabitants in 2016. Like California, Texas is rapidly aging and has thethird largest population of adults sixty-five and older in the nation. Between 2000and 2014, only California added more older people 65 and over than Texas (TexasDemographic Center 2016).
The data in Table 7.1 also compare key demographic and economic character-istics of adults age 65 and older. Both states are highly diverse in terms of race and

7 Medicaid Long-Term Community Care in California and Texas … 141
Table 7.1 Characteristics of population 65 and older, 2016
Characteristics California Texas
Total Population 39,250,017 27,862,596
Persons 65 years and above 5,348,439 3,352,843
Percent 65 and over (%) 13.6 12.0
Race and Hispanic Ethnicity (%)
Non-Hispanic White (%) 58.0 63.9
African American (%) 5.2 9.1
Hispanic (%) 19.6 22.5
Asian (%) 15.3 3.6
Education Less than High School (no degree) (%) 20.5 21.8
Household Income (mean earnings) ($) 70,956 58,504
Poverty Status (Under 150% Poverty) (%) 19.9 20.3
Foreign born (%) 33.3 15.8
English spoken at home (%) 64.3 74.0
Not a U.S. Citizen (%) 25.1 38.7
Percent on Supplemental Security Income (SSI) (%) 9.8 7.0
SSI amount $9292 $8617
Percent with any disability (%) 35.6 38.7
Source 2016 American Community Survey 1-Year Estimates: California and Texas
ethnicity. In California, Hispanic and Asian residents and in Texas, Hispanic andAfrican American residents account for over one-third of the total older population.In both states, Hispanics, the majority of whom are Mexican origin, are the largestpopulation subgroup and their number and population proportion are increasing(Potter and Hoque 2014; Schwarm 2016). California’s elderly population includesa larger fraction of foreign-born residents and a larger proportion of non-Englishspeaker households than Texas. Texas, on the other hand, has more non-U.S. citizenresidents than California. Both states are similar in terms of education and povertylevel. In 2016, approximately one fifth of older residents in both states had incomesunder 150% of the federal poverty level. A major difference between the two statesis the higher percentage of California participants eligible for the SupplementalSecurity Income (SSI) and a state supplemented cash assistance program forlow-income seniors, and the higher amount received than Texas (Graves 2017).
The problem of long-term care is compounded by the fact that a large fractionof Hispanics in both states have sizeable rural populations (Staples 2013). In bothstates Hispanics account for about one-third of the rural population, and reside indisadvantaged areas (Housing Assistance Council 2012). For example, Starr County,Texas-which borders-Mexico, is nearly 98%Mexican-origin and is one of the poorestcounties in the nation with over half of its residents live in poverty. Older individualsin rural areas often lack access to the acute and long-term care services they need
142 J. L. Angel et al.
(Tyler and Fennell 2015). This situation is particularly serious given the fact thaton average older Hispanics spend half or more of the years they live past sixty-fivewith serious disabilities (Angel andAngel 2015). The growing elderly populations ofthese poor rural areas will place growing demands on both families and state servicesin years to come.
Public Options in Long-Term Care
State Eligibility for Medicaid. Although Medicare is often viewed as the sole healthinsurance program for older adults, Medicaid is a state program that provides manyof a state’s poorest seniors with vital health insurance coverage, including long-termcare benefits. To qualify for Medicaid an applicant must be functionally disabled andrequire assistance with activities of daily living. A major factor that explains statevariation between California and Texas is eligibility determination for Medicaidprogram participation for persons with disabilities. States are required to provideMedicaid to Supplemental Security Income (SSI) beneficiaries. California, alongwith twenty other states, provides Medicaid full-dual coverage to seniors and peoplewith disabilitieswhose incomes exceed theSSI limit but fall below the federal povertylevel ($981 per month for an individual and $1328 for a couple in 2015) (Watts et al.2016). In Texas, an individual receives full dual benefits if their income falls below75% of the federal poverty threshold or $733 for an individual or $1100 for a couple(Watts et al. 2016). In addition, California operates a Medically Needy Programthat extends Medicaid eligibility to older individuals and persons with disabilitieswho have incomes above those normally used to qualify for Medicaid but havehigh medical expenses (Watts et al. 2016). In 2015, Texas did not have a MedicallyNeedy Program. As we discuss later, these two factors account for differences in thecomposition of the dual-eligible populations of the two states. The lower proportionof full duals in Texas has important implications for state Medicaid spending.
Long-term care experiments. States and local government are experimenting withoptions in community-based care for the elderly and people with disabilities (Gleck-man 2012). These experiments in community support are being carried out underwaiver programs that are part of the Social SecurityAct of 1935.Waivers, as the nameimplies, allows states and local areas to petition relevant agencies of the federal gov-ernment for exemptions from formal program requirements in order to experimentwith new ways of delivering services on a cost neutral basis. Under federal law, allwaiver programs must be cost neutral (Scan Foundation 2011). Historically, Medi-caid has funded long-term care that was provided mostly in nursing homes and largeinstitutions. In 1981, a new section of the Social Security Act was signed into lawthat established the Medicaid Home and Community-Based Services waivers, oftenreferred to as HCBS or 1915 waivers. Although there are many waiver categoriesdealing with all areas of social services, there are two main categories of waivers anddemonstration projects that relate to the aged.

7 Medicaid Long-Term Community Care in California and Texas … 143
The first option consists of Section 1115 Research and Demonstration Projectsthat allow states to apply for program flexibility to test new or existing approachesto financing and delivering Medicaid and CHIP. Both California and Texas cur-rently employ 1115 Research and Demonstration Project waivers. Research andDemonstration Project waivers (1115) allow states to engage in experimental, pilot,or demonstration projects that promote the objectives of the Medicaid using novelapproaches. Home and Community-Based Services waivers allow states to providehome and community based services instead of institutional care. In 2014, the TexasSTAR + PLUS Home and Community-Based Services 1115 managed care waiverreplaced the 1915(c) Community-based Alternatives waiver program for older adults(Eiken et al. 2016). Table 7.2 displays a list of Medicaid long-term services and sup-ports (LTSS) waiver programs in both states.
The second option, Section 1915(c) Home and Community-Based ServicesWaivers allows states and other levels of government to experiment with newways ofdelivering services with an emphasis on maximizing participant choice (Centers forMedicare and Medicaid Services 2014). In addition to maximizing an older person’sability to remain in the community, such waivers offer important opportunities todevelop cost-effective and potentially culturally appropriate community options toinstitutional care.
Onemajor waiver demonstration programwith which some readers may be famil-iar is the Money Follows the Person (MFP), in which both California and Texasparticipate. This program was motivated by the Americans with Disabilities Actrequirement that care be provided in the least restrictive environment (Martone andEnglish 2013). The program was created by the Deficit Reduction Act of 2005 (P.L.109-171) and helps states rebalance their Medicaid long-term care systems by mov-
Table 7.2 Examples of Medicaid waivers for older adults
California Texas
1115 Medicaid “Duals” DemonstrationWaiver, e.g., Community Care Initiative (CCI)
Medicaid 1115 Waiver, e.g., Star of TexasAccess Reform (STAR + PLUS), Health Careand Long-Term Care Services and Supports
1915(b) Medi-Cal Specialty Mental HealthServices WaiverAssisted Living Waiver (ALW)
Home and Community-Based Alternatives(HCBA) Waiver (formerly NF/AH Waiver)
In-Home Operations (IHO)
Multipurpose Senior Services Program(MSSP)
Source California Department of State Health Services, List of Medi-Cal Waivers (2017)(http://www.dhcs.ca.gov/services/medi-cal/Pages/Medi-CalWaiversList.aspx)).Texas Health andHuman Services Commission, Texas Long-Term Service and Supports (LTSS) Waiver Pro-grams (2017) (https://hhs.texas.gov/sites/default/files/documents/doing-business-with-hhs/providers/resources/ltss-waivers.pdf)
144 J. L. Angel et al.
ing elderly nursing homes residents out of nursing homes and back into their ownhomes (Morris et al. 2014). The MFP program is appealing to states because it pro-vides an enhanced federal match for individuals moving from institutional servicesto community services. Those community services themselves are typically com-munity care waivers—either 1915(c) or 1115 demonstrations. Since older Hispanicsenter nursing homes at such low rates, few are affected and this program is not asimportant to this population as others on which we focus and we mention it only toacknowledge its existence. As we discuss next, one possibility that has been offeredis to focus more on keeping individuals from entering nursing homes in the first placerather than releasing them once they are institutionalized.
Medicaid Long-Term Services and Supports (LTSS)Program Options
LTSS options. Although older individuals might prefer to remain in their own homes,as life spans increase a growing number of seriously impaired individuals will haveno choice but to enter a nursing home. This is true even for elderly Latinos whohave traditionally remained in the community with the help of family members.The demographic, economic, and social changes that are affecting all groups mean,though, that fewer children are available to care for infirm parents who may livefor many years in declining health (Wolf and Amirkhanyan 2010). In response tothis growing need states are exploring options that permit older individuals whomight need some assistance to remain in their own homes and communities (Meyer2012). States, including Texas and California, are changing their financing modelsfor community-based LTSS from fee-for-service to managed care in an effort tocontain costs (Saucier et al. 2012). Texas offers a managed care model, referredto as STAR + PLUS, that consists of basic medical services, LTSS with servicecoordination, and as of 2015 nursing facility coverage (Dial 2015). In 2014 STAR +PLUS was expanded statewide to including rural areas and now serves all dual-eligible Texans not enrolled in PACE. The program has proven to be more costeffective than fee-for-service alternatives, potentially resulting in substantial savings(Angel 2016).
As we discuss next, California’s experimentation with managed LTSS involvesmore options that focus on the county and regional levels, rather than on the stateas a whole (Tatar et al. 2016). Texas no longer employs a fee-for-service model forcommunity-based services and has eliminated 1915(c) waivers for its adult nurs-ing facility eligible population. California, however, has begun to adopt approachesthat are similar to those in Texas. In 2013, the state implemented the CoordinatedCare Initiative (CCI) under the state’s Bridge to Reform 1115 Medicaid demon-stration waiver (California Department of Health Care Services 2015b). The CCIincludes the Cal MediConnect program, discussed below, and Medi-Cal ManagedLTSS (MLTSS), which is similar to Texas’s STAR + PLUS plan. These plans were
7 Medicaid Long-Term Community Care in California and Texas … 145
designed to test the integration of both Medicare andMedicaid services. In 2014, theCCI moved more home and community-based LTSS, including In-Home SupportiveServices and Community-Based Adult Services, into the MLTSS plans (The ScanFoundation 2012). It also required that all dual eligible’s in the CCI counties enrollin a managed care plan.
Community Care Demonstrations
California and Texas recently implemented managed long-term care demonstrationprojects for dual eligible’s in specified counties (California Department of HealthCare Services 2016b; Texas Legislative Budget Board 2015). California’s MediCon-nect (dual demonstration), the financial integration demonstration for dual eligibles,is a three-year, voluntary pilot demonstration introduced in 2014 that combinesMedi-care and Medicaid medical, behavioral, long-term and home-and community-basedservices in one health plan. The MediConnect program is available to dual eligible’sin seven counties: Los Angeles, Orange, Riverside, San Bernardino, San Diego, SanMateo, and Santa Clara (California Department of Health Care Services 2016b). In2015, roughly one-quarter (118,096) of the dual-eligible population was enrolled inthe seven demonstration programs (California Department of Health Care Services2015c).
Similarly, the Texas Dual Eligible Integrated Care Project, or Dual Demonstration(“Dual Demo”), introduced in 2015, is designed to improve care for Texas’ duallyeligible seniors and people with disabilities by moving them into a single healthplan that provides case management and coordinates all Medicare and Medicaidbenefits. TheDualDemo (calledSTAR+PLUSMedical-MedicaidPlan is a voluntaryprogram that covers six counties with a current enrollment of 41,182 dual eligible’s(Integrated Care Resource Center 2016).
Potential Cost-Control Alternatives
The shift to managed care for dual eligible’s is potentially motivated by other aspectsof Medicare and Medicaid funding (Hayford and Noda 2013). A shift to managedcare could help states integrateMedicare andMedicaid paymentmechanisms inwaysthat could allow them to reduce their Medicaid expenditures (Grabowski 2010). Aswe mentioned earlier, states are clearly motivated to shift LTSS costs fromMedicaidto Medicare, and individual providers are motivated to shift costs from, for example,home health care to nursing homes, and from chronic to acute care settings.Managedcare could potentially allow states to manage such cost shifting in ways that savesmoney without undermining the quality care, although there is little evidence thateither objective has been achieved (Dickson2016).As costs to states increase, though,
146 J. L. Angel et al.
such shifting will no doubt becomemore attractive to states and individual providers.In response, the federal government will no doubt be forced to introduce controls.
Other cost control methods are more direct. Medicaid serves as the secondarypayer for dual eligible’s, which means that it covers the 20% of medical expendituresnot covered by Medicare (Medicare Payment Advisory Commission (MACPAC)2015a).Yet states are not required to pay this entire amount. TheBalancedBudgetActof 1997 upheld the rights of states not to reimburse providers for the full coinsuranceamount. As a result, in 2012 39 states restricted theirMedicare cost-sharing payments(MACPAC 2015b). Even as they reduce costs such copayment restrictions result infewer outpatient physician visits and potentially inadequate medical care (Haberet al. 2014). Full-dual eligibles are not required to pay any portion of Medicare PartA or Part B (Medicare Payment Advisory Commission (MACPAC) 2015b).
The PACE Program
Both California and Texas operate Programs of All-Inclusive Care for the Elderly(PACE). PACE is an option under theMedicaid State Plan that supports dual-eligibleenrollees whose health qualifies them for Medicaid nursing facility services. Partic-ipants must be 55 or older, live in a PACE service delivery area, and be able to livesafely in the community at the time of enrollment. Although most participants livein the community, PACE must manage services across a continuum of institutionaland non-institutional settings to achieve cost-effective results (Chatterji et al. 1998;Grabowski 2006). States put existing caps on the number of PACE organizationsbecause they are unsure of cost savings. A systematic review of the literature pointsto the mixed evidence with some studies showing fewer in-patient hospitalizationsthan fee-for-service participants, but a higher number of nursing home admissions(U.S. Department of Health and Human Services 2014). In California, the cap isfifteen centers and in Texas the number varies by state budget appropriations (Cali-fornia Legislative Information 2011; Texas Legislative Budget Board 2015). In 2015there were 12 PACE plans in California and three PACE organizations in Texas(Texas Legislative Budget Board 2015; California Department of Health Care Ser-vices 2016a). Although California PACE continues to grow at a rate much fasterthan anticipated, legislative caps reduce opportunities for PACE organizations andthe opportunity to align with ongoing state efforts to transition to a statewide man-aged care delivery system (Department of Health Care Services 2012). Several ofthese sites serve large numbers of ethnic elders. Los Angeles county serves a largenumber of older Latino participants and San Francisco county serves a large numberof older Asian participants (California Health Care Foundation 2010).
In Texas PACE, expansion has been far more limited. Notwithstanding the statelegislature’s authorization for six new programs in 2001, 11 sites in 2003, and 16in 2004 there are still only three PACE sites in operation (Texas Legislative BudgetBoard 2015). Despite the fact that the program has not expanded in Texas, datasuggest that over the last fifteen years, the state has benefitted from considerable cost

7 Medicaid Long-Term Community Care in California and Texas … 147
savings in PACE. These savings result from the fact that by law PACE receives acapitation rate that is ten percent lower than that for individuals in long-term nursingcare (Setiawan 2011). The rate setting process in Texas allows the state legislatureto decide on final capitation rates which can be reduced as needed to remain withappropriated funds (Texas Legislative Budget Board 2015).
Despite apparently favorable outcomes for participants and potential savings tostates, a major question remains as to whether the model can be expanded statewide,including rural and underserved communities. Many rural communities and low-income urban areas lack adequate infrastructure and non-profit organizations withexperience in providing care to frail elders. While PACE may represent the idealmodel in terms of benefits, it only reaches a small fraction of those in need.
Fee-for-Service LTSS Options in California
While states are moving toward managed LTSS, serious concerns that certain short-comings of these initiatives might result in inadequate coverage. In response to con-cerns over denial of LTSS under managed care that were previously provided underthe Medicaid fee-for-service system, California offers an array of alternative fee-for-service community-based LTSS options for beneficiaries not enrolled in managedcare alternatives. These programs offer services such as transportation to health andsocial service providers, as well as special events. The In-Home Operations (IHO)and Nursing Facility/Acute Care (NF/AH) Waivers allows family members, includ-ing adult children, to receive payment for providing assistance to elderly parents. Asmentioned earlier, in 2015Texas eliminated fee-for-service options for dual eligible’s(Dial 2015).
Althoughmost waivers focus on older individuals living in their own homes, someprograms, such as California’s Assisted Living Waiver (ALW), offer assistance toindividuals eligible for nursing homes but prefer assisted living facilities (CaliforniaDepartment of Health Care Services 2015a). This program offers assistance withbasic and instrumental activities of daily living, medication management, social ser-vices, recreational activities, meals, housekeeping and laundry, and transportation.Medi-Cal reimburses for the services provided to residents enrolled in the ALW, butthe resident is responsible for paying his or her own room and board. Like most ofthe waivers, it is only available in a few counties. This waiver along with the IHOand NF/AH is excluded from the integrated Medi-Cal Managed care plan.
Capitation in California and Texas
Having examined basic structural aspects of LTSS services in the two states let usmove on to an examination of the proportions of partial and dual-eligible programparticipants in each state, as well as an examination of capitation rates and what these

148 J. L. Angel et al.
might imply for cost containment. In order to do so we employ data on dual-eligibleenrollment and capitation rate data for PACE and managed care LTSS programs inboth states. This information is drawn from several sources including the Henry J.Kaiser Family Foundation’sMedicaid andCHIP data center, California’sDepartmentof Health Care Services, and the Texas Health and Human Services Commission.
Table 7.3 presents differences in the composition of the dually-eligible populationsof California and Texas. In both states, themajority of dual eligible’s are 65 and older,although disabled individuals under 65 make up a significant fraction of the total.
In 2012, 26% of Medicare enrollees in California and 21% in Texas were dualeligible. What is striking, though, are state differences in the relative proportion ofpartial and full duals. While in California 97% of duals are full, only 57% of dualsin Texas are full. These differences are reflected in the proportion of total Medi-caid spending that goes to duals, 34% in California and 27% in Texas. Variationsin the percentage of partial duals largely reflect state policies that affect the extentof Medicaid coverage available (Medicare Payment Advisory Commission 2015b).California extends full coverage to a larger fraction of the disabled and elderly pop-ulation than Texas, with significant implications for cost. By designating a largerfraction of its dual-eligible population as partial, Texas avoids the higher costs asso-ciated with the classification of full dual. Of course, such a policy may well denymany seriously impaired individuals essential care that they need.
PACE and Other Program Comparisons
We next turn to an analysis of capitation rates in PACE and other community long-term care programs. In both California and Texas both a PACE program and a man-aged care program are available in a few counties, although there are far more inCalifornia than Texas. An examination of capitation rates in those counties that havemore than one program allows us to compare capitation rates for various programs.We are particularly interested in comparing PACE capitation rates to those of otherprograms. PACE operates under fairly stringent capitation rules. The Centers for
Table 7.3 Characteristics of dual eligibles in California and Texas, 2011–12
United States California Texas
Proportion of Duals Under 65a (%) 41.4a 30 35
Medicare Enrollees who are Dualsb (%) 21b 26 21
Proportion of Duals who are Fullb (%) 72 97 57
Percent of Medicaid Spent on Dualsc (%) 36 34 27
Source aYoung et al. (2013)bMedicare Payment Advisory Commission (2017)cHenry J. Kaiser Family Foundation (2017)

7 Medicaid Long-Term Community Care in California and Texas … 149
Medicare and Medicaid Services requires that each state establishes a rate-settingmethodology, consistent with their own policy objectives, that pays PACE no morethan 95% of the cost of an equivalent fee-for-service arrangement (National PACEAssociation 2009). The rate may be adjusted further to keep costs within the state’sbudget appropriations.
In Texas, the costs are derived from claims data for clients 55 and older receivingnursing facility services or Home and Community-Based Services in three countieswith PACE programs (Texas Health and Human Services Commission 2016a). InCalifornia, there are different capitation rates for PACE organizations in rural andurban areas. Rural facilities are exempt from the 10% discount due to access limi-tations. In 2015–16, the state adopted the PACE Modernization Act which requiresthe development of a new rate methodology that recognizes the range of servicesthat PACE provides as well as adequate funding for capital needs and protection foroutlier risk (National PACE Association 2016).
Data compare in Table 7.4 compares capitation rates (per member per month)between the PACE sites and for the Coordinated Care Initiative (CCI) dual demon-stration for five counties in which both programs operate in California. Neither pro-gram is available statewide. The capitation rates for PACE are lower than those forinstitutional care under the managed care option. In Los Angeles, California PACEpayments are $3734.44 per person per month compared to $5205.44 in a CCI nursinghome. The rates for PACE in Los Angeles County, however, are higher than the ratesfor the home and community-based services (HCBS), $1784.06. Similar rates arefound in the other California Counties. These differences in capitation rates reflectsthe fact that PACE enrollees are less likely to be institutionalized or to be disabled.
Table 7.5 presents capitation rates for Texas counties in which at least two of threeprograms are offered. Only one county, El Paso, has all three. In El Paso, the datareveal that the capitation rates for PACE are higher than those for the Dual Demo.On the other hand, STAR + PLUS capitation payments for nursing home care arehigher than those for the Dual Demo. In the rest of state, Dual Demo capitation ratesfor home and community-based services and nursing care are lower than STAR +PLUS in those counties in which both are offered.
Long-Term Care Cost Control Strategies
Clearly, all states including California and Texas face rapidly growing Medicaidoutlays as their populations age and live longer. As we have demonstrated, Californiahas chosen to cover a larger fraction of its dual-eligible population at the full duallevel. This choice has serious long-term fiscal implications and the state may in thefuture be forced to resort to similar actions as Texas, which clearly has a differentwelfare tradition. As the number of duals increases there may be little choice but torestrict the full dual category to only the most disabled. Such a policy of course risksdenying services to individuals with real need, but providing comprehensive care to

150 J. L. Angel et al.
Table 7.4 Capitation rates for full-dual eligibles in California, 20141
Program
CCIa
Risk adjustment group PACEb
Country HCSB Nursing facility
Los Angeles 1784.06 5205.44 3734.44
Riverside 2011.40 5066.19 3946.57
San Bernardino 1599.27 5390.03 3666.32
San Diego 1710.28 5679.84 3777.54
Santa Clara 2066.69 – 4090.86
1Per member, per monthNotes aThis mandatory managed care program for long-term services and supports was initiated in2014 as part of the state’s Coordinated Care Initiative (CCI). Lower bound of rate ranges for CCIDuals (MLTSS—Draft Blended Non-MediConnect) Rate Ranges (April 22, 2014—December 31,2014)bProposed upper payment limits for CY 2015, California Department of Health Care Services,Overview of UPL Methodology letter, May 18, 2015Source California Department of Health Care Services, Capitation Rate Summary (http://clpc.ucsf.edu/sites/clpc.ucsf.edu/files/CalMediConnectCapitationRates2014.pdf)
Table 7.5 Capitation rates for full-dual eligibles in Texas, 2016
Country Home andcommunity-based servicesSTAR + PLUSa
Nursingfacilityb
Dual democ PACE
Bexar 1804.11 4600.70 1977.66 –
Dallas 1632.93 4747.04 1778.85 –
El Paso 1921.98 4113.85 2106.30 2834.74
Harris 1779.50 4386.62 1927.76
Hidalgo 2057.96 4973.78 2268.02
Lubbock 1271.21 5037.89 – 2600.93
Tarrant 1552.46 4411.79 1709.27 –
Potter & Randall 1271.21 3561.98 2317.45
Notes aSTAR + PLUS is the statewide managed Medicaid programbBeginning in March 2015, nursing facility care was wrapped into STAR + PLUS. These rates arethe premium rates for the expansion of STAR + PLUScThe Texas Dual Eligibles Integrated Care Demonstration Project is a financial alignment and carecoordination demonstration for dual eligibles in Texas; STAR + PLUS data for Potter/RandallCounty Texas Department of Health and Human Services, Table 12 Medicaid Costs and ClientOutcomes in the Programs of All-Inclusive Care for the Elderly and STAR + PLUS Managed CareProgram in Texas

7 Medicaid Long-Term Community Care in California and Texas … 151
everyone in need is probably impossible. This reality leads us to review potentialoptions in controlling costs related to dual eligibles.
There are several ways to achieve significant cost savings in managed LTSS forstates and for individual providers. Let us mention a few. For states, the primarycost control mechanisms include restrictions in the classification of dual eligible,and specifically as in the case of Texas, restrictions on the classification of fulldual. Another major state-level cost control mechanism includes a complete shift tomanaged care and aggressive capitation rate setting. For individual providers costcontrols include avoiding the costliest clients or shifting the cost of their care to otheragencies or providers. This involves selective enrollment or “creaming,” a term thatrefers to the avoidance of adverse selection. In order to survive financially under fixedcapitation avoiding the sickest and costliest potential enrollees is essential since theprovider assumes the risk of excess costs (Irvin et al. 1997).
Certain studies find that PACE sites may focus on lower-risk enrollees to pro-duce savings, reducing financial losses. In a recent study comparing PACE programswith Managed LTSS the Texas Health and Human Services Commission researchersfound that PACE participants reported better self-assessed health than STAR+ PLUSmembers, 47.5%versus 31.4% respectively (TexasHealth andHumanServicesCom-mission 2016a). These data reflect an attempt tomarket to a healthier, more profitablegroup of participants (Grabowski 2007). These findingsmust be employed cautiouslybecause they are based on self-assessments of health rather than clinical data (TexasHealth and Human Services Commission 2016a). In the absence of collecting patientdiagnosis codes, it is not possible to adjust for the conditions that drive potential risk(Jones et al. 2013).
Another option available to providers includes involuntary disenrollment. Thisis possible in STAR + PLUS when staff makes a reasonable attempt of correctiveaction of a member’s offensive acts or behaviors prior to requesting disenrollment.While Texas PACE organizations are required to submit monthly disenrollment datato HHSC and quarterly to CMS, the regulations for involuntary disenrollment donot call for mandatory intervention strategies to address noncompliant behaviors.Studies show potential cost savings for states with less enforcement of CMS regula-tions related to involuntary disenrollment in managed care organizations (Newhouse2006). STAR + PLUS organizations have more restrictions on involuntary disenroll-ment (Texas Health and Human Services Commission 2016b). In addition, a STAR +PLUS organization cannot request a disenrollment based on any changes in overallhealth status. Involuntary disenrollment is rare for both PACE and STAR + PLUSorganizations (Texas Health and Human Services Commission 2016b).
Conclusion: A Tale of Two States
While these are probably not the best of times for either California or Texas, neitherare they the worst of times. Both states, though, face serious challenges posed byrapidly aging and diverse populations. In the relatively near term, older low-income

152 J. L. Angel et al.
residents will place new demands on publicly funded health and long-term careprograms. This is largely due to the fact that in both states one-quarter of older adultsare dual-eligible beneficiaries who tend to be sicker and poorer than other Medicarerecipients (Meyer 2012). In the nation as a whole nearly forty percent of all Medicaidspending in 2014 was for dual eligible’s, mostly for long-term care (Paradise 2015).The growth of the dual-eligible population leads to competition for funding withprograms focused on children and poor families (Angel and Angel 2015).
The data we have presented clearly demonstrate that the specifics of Medicaidpolicy in each state shapes the composition of the dual eligibles population.Californiahas a very small percentage of partial dual eligibles, reflecting the state’s more liberalMedicaid policies. Unlike Texas, California expanded Medicaid under the PatientProtection and Affordable Care Act (ACA) (Henry J. Kaiser Family Foundation2017). In Texas one in three dual eligible’s is classified as a partial dual, reflectingmore restrictive Medicaid policies aimed at aggressive cost control (Dial 2015).
Given this new realitymore efficient and cost-effectiveways of providing services,as well as outreach and education about various LTSS options, must be developed.Toward that end, Texas may serve as a model, or at least as an example of what statesmight be forced to consider. State and federal governments are currently coordinatingcare to address these serious fiscal issues. The federal Balancing Incentive Program(BIP) provided $2.4 billion dollars in grants from October 2011 to September 2015to encourage states to shift long-term care from institutional to community-basedLTSS. Participation in BIP was limited to states that spent less than 50% of theirtotal Medicaid long-term care expenditures on non-institutional LTSS in 2009.
States that spent under one-quarter of total LTSS expenditures on non-institutionalcare could receive a 5% enhancement to their Federal Matching Assistance Percent-age (FMAP) to achieve the target of 25% spending on non-institutional care bythe program’s end date. States that spent between 25 and 50% on non-institutionalcare received a 2% enhanced FMAP to reach a target of 50% of spending on non-institutional care (Legislative Budget Board 2013). Texas was a recipient of BIPgrants and has used these funds to implement infrastructure and service improve-ments in LTSS programs (Texas Department of Aging and Disability Services 2014).The objective of this initiative is to increase access to LTSS for people potentiallyeligible by employing screening procedures that includes in-person, telephone, andinternet contact. California does not participate in BIP.
While California has continued to make use of waivers to experiment with severallocal community-based arrangements for the support of the elderly using a county-based approach since the early 1970s, Texas has moved more quickly and decisivelyto a single statewide waiver intended to provide a similar package of services to alldual-eligible elders using a capitatedmanaged caremodel (Capretta et al. 2012). Bothstates continue in principle to support and even expand PACE programs, althoughexpansion has been slow, in Texas’ nearly nonexistent.
In Texas, PACE programs are by statute reimbursed at a lower rate than standardMedicaid financed long-term care. As our results reveal, PACE capitated rates arehigher than home and community-basedmanaged care LTSS rates, but lower than thenursing facility rate. This reflects the differences in health status among participants

7 Medicaid Long-Term Community Care in California and Texas … 153
in the various programs (Grabowski 2006; Ghosh et al. 2015). The data revealed asimilar pattern in capitation rates in California.
Both California and Texas include dual demonstrations (in California the Coordi-nate CareDemonstrationCalMediConnect, and in Texas theDual Eligible IntegratedCare Project) that are financially similar to PACE in that they coordinate services forMedicare andMedicaid beneficiaries to achieve efficiencies (Gonzalez 2017). Givengrowing Medicaid expenditures, managed LTSS is both logical and inevitable, eventhough some providers resist the move frommore traditional fee-for-service arrange-ments. California insures choice in plans and contracts with nonprofit communityentities, whereas in Texas, LTSS managed care plans are largely limited to for-profitproviders. Both states, however, are focused on consolidation and cost containment.Recent research suggests that for-profit PACE provides the same quality of care asexisting nonprofit operators (Gonzalez 2017).
We end by asking what the causes and consequences of California’s fragmentedapproach and Texas’ more unified system for vulnerable, low-income elders mightbe. Clearly California and Texas have different political cultures, yet both have con-stitutional requirements for balanced budgets (“NCSL Fiscal Brief: State BalancedBudget Provisions” 2010). Texas, however, has no state income tax to provide addi-tional revenue for balancing budgets in economic downturns, while California does.The 2017-18 California legislative budget includes a provision to terminate all CCIprograms that do not result in General Fund savings (California Legislative Analyst’sOffice 2017).
Again, the need in both states for cost containment is driving innovations in caredelivery and financing models. Given the savings possibilities of capitation and man-aged care that it is possible that California will replicate Texas’s statewide expansionof LTSS Medicaid managed care. Evidence suggests that community-based man-aged long-term care programs could be more economical than institutionally-basedoptions, especially on a statewide basis (Fox-Grage and Walls 2013). Yet the cost-savings potentials of different approaches may differ and experiments will no doubtcontinue. Thenumber of states employingMedicaidmanaged long-termcare doubledfrom eight to 16 between 2004 and 2012 (Saucier et al. 2012; Centers for Medicaidand CHIP Services 2017). Even though these programs are expanding, evidence forsignificant cost savings is limited (Wiener et al. 2017). Evaluations of the cost sav-ings of complex care management (CCC) programs for heavy users are inconclusive(Wiener et al. 2017). Certain evaluations suggest that Medicaid Health Homes Pro-grams, which improve linkages to community and LTSS for duals, reduce utilizationof unnecessary in-patient hospitalization (Englehardt 2017). However, evaluationsof the cost savings of other programs suggest limited savings (Henry J. Kaiser Fam-ily Foundation 2011). As of yet, we lack the data or long enough experience todefinitively determine how much, if any, savings can be achieved.
In addition to cost-effectiveness, many other questions remain, especially withrespect to how best to bring local experimental models up to scale to provide com-munity support on a statewide basis. In both California and Texas, comprehensivecommunity services are unavailable in many areas and many programs have longwaiting lists. In the future economic realities will exert evermore pressure on states to

154 J. L. Angel et al.
contain Medicaid expenditures. Economic shocks—such as the 2008 recession thatare an inevitable part of the business cycle—will no doubt also force states to developnew approaches. A potentially important new reality may greatly increase financialpressures on states. The new administration and the Republican dominated Houseand Senate might well introduce changes to Medicaid, including block granting andother mechanisms, which could reduce the federal portion of Medicaid funding. It isclear that the next few years will see important changes in federal and state Medicaidpolicies.
The traditional nursing home model of long-term care has never addressed theneeds nor the preferences of the increasingly diverse elderly population. Hispanicsenter nursing homes at very low rates, although given longer lives and changes inthe families’ capacity to provide care to seriously frail elderly parents, that numberwill inevitably grow. The community-based waiver experiments that we have dis-cussed offer a unique opportunity to test new methods of providing services in non-institutional contexts that allow individuals to remain in the community for as longas possible, hopefully at lower cost, andmay be better able to address the preferencesof specific communities and groups. Home and community-based LTSS alternatives,however, are not without potential pitfalls. The attempt to extract savings and eco-nomic efficiency could introduce barriers, such as excessive out-of-pocket costs andeligibility restrictions for low-income seniors. In addition, if these waiver programscannot be scaled up effectively and efficiently, many older vulnerable participantsoutside of the experimental area may be left out.
States clearly cannot provide all of the benefits and services that all segments oftheir populationsmight need or desire. Even the generouswelfare states of Europe arefinding that theymust restrict certain services in order to dealwith fiscal reality.Whilea universal and comprehensive welfare state may not be possible or even compatiblewith our nation’s basic values, assuring equity and access to the basics of a dignifiedlife clearly are. California and Texas provide two timely and relevant examples ofdifferent ways that states with similar low-income populations are dealing with theneeds of growing dual-eligible populations. It will be interesting to observe the extenttowhich federal policies and economic realities lead the two states to similar solutionsand the extent to which they retain their unique approaches.
Acknowledgments This research was made possible by funding from the St. David’s Foundationand from Central Health, Austin, Texas, USA.
References
Angel, J. L. (2016). Policy Research Project 188: A better life for low-income elders in Austin.Austin: Lyndon B. Johnson School of Public Affairs, The University of Texas at Austin.
Angel, R. J., & Angel, J. L. (2015). Latinos in an aging world: Social, psychological, and economicperspectives. New York: Routledge.
AnnunityCalC.org. (2017). Annuity calculator. http://www.annuitycalc.org/. Accessed May 9,2017.
7 Medicaid Long-Term Community Care in California and Texas … 155
Beck, L., & Johnson, H. (2015). Planning for California’s growing senior population: Technicalappendices. http://www.ppic.org/content/pubs/other/815LBR_appendix.pdf. Accessed April 15,2018.
Brown, A., & Mark, H. Lopez. (2016). Pew research center: Hispanic trends mapping the Latinopopulation, by state, country and city. http://www.Pewhispanic.org/2013/08/29/mapping-the-latino-population-by-state-country-and-city/. Accessed April 13, 2017.
California Department of Health Care Services. (2015a). The Assisted Living Waiver (ALW) Pro-gram: Fact sheet for new participants. http://www.dhcs.ca.gov/services/ltc/Documents/ProgramdescriptandElig.pdf. Accessed May 4, 2017.
California Department of Health Care Services. (2015b). Coordinated Care Initiative Overview.http://www.dhcs.ca.gov/provgovpart/Pages/CoordinatedCareInitiative.aspx. Accessed April 20,2017.
California Department of Health Care Services. (2015c). Total active enrollments effective October1, 2015 by county. http://calduals.org/wp-content/uploads/2015/10/CMC-Enrollment-Dashboard-October-Final-102015.pdf. Accessed September 9, 2017.
California Department of Health Care Services. (2016a). California Program of All-InclusiveCare for the Elderly (PACE) Plans. http://www.dhcs.ca.gov/individuals/Pages/PACEPlans.aspx.Accessed May 8, 2017.
California Department of Health Care Services. (2016b). Dual Eligibles Coordinated Care Demon-stration—Cal MediConnect. http://www.dhcs.ca.gov/pages/use.aspx. Accessed April 27, 2017.
California Health Care Foundation. (2010). Aging in PACE: The case for California Expansion.http://www.chcf.org/publications/2010/07/aging-in-pace-the-case-for-california-expansion.Accessed May 1, 2017.
California LegislativeAnalyst’s Office. (2017).The Coordinated Care Initiative: A critical juncture.http://www.lao.ca.gov/Publications/Report/3585#Background. Accessed May 17, 2017.
California Legislative Information. (2011). AB-574 Program of All-Inclusive Care for theElderly. http://leginfo.legislature.ca.gov/faces/billStatusClient.xhtml?bill_id=201120120AB574. Accessed April 30, 2017.
Capretta, J., Croshaw, A., Deily, M., & Summers, L. (2012). Assuring a future for long-term careservices and supports in Texas. Austin: Texas Public Policy Foundation.
Centers for Medicaid and CHIP Services. (2017). Summary essential elements of managed longterm services and supports program. https://www.medicaid.gov/medicaid-chip-program-informtion/by-topics/delivery-systems/downloads/mltss-summary-elements.pdf. Accessed September9, 2017
Chatterji, P., Burstein, N., Kidder, D., & White, A. (1998). Evaluation of the Program forAll-Inclusive Care of the Elderly (PACE) Demonstration: The impact of PACE on participantoutcomes. Baltimore: Health Care Financing Administration.
Couture, B. L. (2005). Navigating Medicare and Medicaid: Interaction between Medicare andMedicaid. Henry J. Kaiser Family Foundation. http://kff.org/other/navigating-medicare-and-medicaid-interaction-between-medicare/. Accessed April 8, 2017.
Crystal, S. (2016). Late-life inequality in the Second Gilded Age: Policy choices in a new context.Public Policy and Aging Report, 26(2), 42–47.
Crystal, S., Shea, D. G., & Reyes, A. M. (2016). Cumulative advantage, cumulative disadvantage,and evolving patterns of late-life inequality. The Gerontologist, 57(5), 910–920.
Department of Health Care Services. (2012). Proposed Trailer Bill Language to Coordinated CareInitiative. http://acsquantum.com/calpace/DHCS-TBL-Fact-Sheet-PACE-Modernization.pdf.Accessed May 6, 2017.
Dial, E. L. (2015). State of Texas, Medicaid Managed Care STAR+PLUS Program Rate Setting:State Fiscal Year 2016. http://legacy-hhsc.hhsc.state.tx.us/rad/managed-care/downloads/2015-09-star-plus.pdf. Accessed April 11, 2017.
Dickson, V. (2016). Managed-care plans increasingly taking over Medicaid long-term care. Noteveryone is happy about it. http://www.modernhealthcare.com/article/20161126/MAGAZINE/311269984. Accessed September 15, 2017.

156 J. L. Angel et al.
Eiken, S., Burwell, B., Sredl, K., & Saucier, P. (2016). Medicaid expenditures for section 1915(c)waiver programs in FY 2014. https://www.medicaid.gov/medicaid/ltss/downloads/1915c-expenditures-fy2014.pdf. Accessed April 16, 2018.
Englehardt, T. (2017). CMS Federal Coordinated Health Care Office. https://www.cms.gov/Medicare-Medicaid-Coordination/Medicare-and-Medicaid-Coordination/Medicare-Medicaid-Coordination-Office/FinancialAlignmentInitiative/Downloads/FAExtensionMemo011917.pdf.Accessed September 9, 2017.
Fox-Grage, W., & Walls, J. (2013). State studies find home and community-based services to becost-effective. Washington: AARP Public Policy Institute.
Ghosh, A., Schmitz, R., & Brown, R. (2015). Office of Assistant Secretary for Planning andEvaluation. Effect of PACE on costs, nursing home admissions, and mortality: 2006–2011.https://aspe.hhs.gov/legacy-page/effect-pace-costs-nursing-home-admissions-and-mortality-2006-2011-executive-summary-142061.
Gleckman, H. (2012). States expand their Medicaid community-based services but their benefitsvary widely. Forbes Magazine. http://www.forbes.com/sites/howardgleckman/2012/12/10/states-expand-their-medicaid-community-based-services-but-their-benefits-vary-widely/.
Gonzalez, L. (2017). A focus on the Program of All-Inclusive Care for the Elderly (PACE). Journalof Aging & Social Policy, 29(5), 475–490.
Grabowski, D. C. (2006). The cost-effectiveness of noninstitutional long-term care services: Reviewand synthesis of the most recent evidence. Medical Care Research and Review, 63(1), 3–28.
Grabowski, D. C. (2007). Medicare and Medicaid: Conflicting incentives for long-term care. TheMilbank Quarterly, 85(4), 579–610. https://doi.org/10.1111/j.1468-0009.2007.00502.x.
Grabowski, D. C. (2010). Post-acute and Long-term care: A primer on services, expenditures andpayment methods. https://aspe.hhs.gov/basic-report/post-acute-and-long-term-care-primer-services-expenditures-and-payment-methods#NF. Accessed August 20, 2010.
Graves, S. (2017). SSI/SSP assists low-income seniors and people with disabilities in every countyin California, but could face cuts. http://calbudgetcenter.org/wp-content/uploads/Fact-Sheet_SSI-SSP-Seniors-Disabilities-Every-County-Face-Cuts_1-19-2017.pdf. Accessed April 16, 2018.
Haber, S., Zheng, N. T., Hoover, S., & Feng, Z. (2014). Effect of state Medicaid payment policies forMedicare cost sharing on access to care for dual eligibles. FinalReport. https://www.macpac.gov/wp-content/uploads/2015/01/Medicaid-Payment-for-Cost-Sharing.pdf. Accessed May 5, 2017.
Hagen, S. (2013). Rising demand for long-term services and supports for elderly people.Washington, DC: Congressional Budget Office.
Hayford, T., & Noda, A. (2013). Dual-eligible beneficiaries of Medicare and Medicaid. Washing-ton, DC: Congressional Budget Office. https://www.cbo.gov/sites/default/files/113th-congress-2013-2014/reports/44308dualeligibles2.pdf. Accessed May 3, 2017.
Henry J. Kaiser Family Foundation. (2011). Examining Medicaid Managed Long-term Service andSupport Programs: Key issues to consider. https://kaiserfamilyfoundation.files.wordpress.com/2013/01/8243.pdf. Accessed September 16, 2017.
Henry J. Kaiser Family Foundation. (2017). Dual eligibles’ share of Medicaid spending. http://kff.org/medicaid/state-indicator/duals-share-of-medicaid-spending/?currentTimeframe=0&sortModel=BcolId:Location,sort:ascD. Accessed May 7, 2017.
Henry J. Kaiser Family Foundation (Producer). (2016, June 22). Dual eligibles as a percent oftotal medicare beneficiaries. http://kff.org/medicaid/state-indicator/duals-as-a-of-medicare-beneficiaries/.
Housing Assistance Council. (2012). Race & ethnicity in rural America. http://www.ruralhome.org/storage/research_notes/rrn-race-and-ethnicity-web.pdf. Accessed April 15, 2018.
Irvin, C. V., Massey, S., & Dorsey, T. (1997). Determinants of enrollent among applicants to PACE.Health Care Financ Rev, 19(2): 135–53.
Integrated Care Resource Center. (2016). Monthly enrollment in Medicare-Medicaid plans by planand by state, August 2016 to August 2017. Baltimore, MD: Centers for Medicare and MedicaidServices’ Medicare-Medicaid Coordination Office.
7 Medicaid Long-Term Community Care in California and Texas … 157
Jones, D., Duda, N., Schmitz, B., Nelson, S., Swete, C., Bryce, A., Coopersmith, J., & CyBulski,K. (2013). Study of Access and Quality of Care in For-Profit PACE: Final Report. Cambridge,MA: Mathematica Policy Research.
Legislative Budget Board. (2013). Balancing Incentive Program. http://www.tcdd.texas.gov/wp-content/uploads/2013/01/2013_Feb_handout_07_BIP.pdf. Accessed May 11, 2017.
Liu, C. (2015). A Report by the Senate Select Committee on aging and long terrm care. Sacramento,CA: California State Senate.
Martone, K., & English, K. (2013). Supporting community living: Olmsteaad and Money Followsthe Person. In D. o. H. a. U. D. a. H. a. H. Services (Ed.), Housing Capacity Building Initiativefor Community Living Project. Baltimore, MD: Centers for Medicare and Medicaid Services.
Medicare Payment Advisory Commission. (2015a). Effects of Medicaid coverage of Medicare costsharing on access to care. https://www.macpac.gov/wp-content/uploads/2015/03/Effects-of-Medicaid-Coverage-of-Medicare-Cost-Sharing-on-Access-to-Care.pdf. Accessed May 5, 2017.
Medicare Payment Advisory Commission. (2015b). Improving care for Medicare beneficiarieswith chronic conditions. http://www.medpac.gov/docs/default-source/congressional-testimony/testimony-improving-care-for-beneficiaries-with-chronic-conditions-senate-finance-.pdf?sfvrsn=0. Accessed May 5, 2017.
Medicare Payment Advisory commission. (2017). Data Book: beneficiaries Dually Eligible forMedicare and Medicaid. http://www.medpac.gov/docs/default-source/publications/jan17medpacmacpacdualsdatabook.pdf?sfvrsn=0. Accessed May 7, 2017.
Meyer, H. (2012). The coming experiments in integrating and coordinating care for ‘dual eligibles’.Health Affairs, 31(6), 1151–1155.
Morris, E., Orshan, B. G., Brown, N. D., Lester, R. S., Kehn, M., Peebles, V., et al. (2014). Moneyfollows the person demonstration: Overview of state grantee progress, July to December 2013.Cambridge, MA: Mathematica Policy Research.
Mudrazija, S., & Angel, J. L. (2014). Diversity and the economic security of older Americans. TheNew Politics of Old Age Policy (Vol. Third, pp. 138–154). Baltimore: Johns Hopkins UniversityPress.
National PACE Association. (2009). PACE Medicaid rate-setting: Issues and considerationsfor states and PACE organizations. http://pace.techriver.net/website/download.asp?id=2871.Accessed May 6, 2017.
National PACE Association. (2016). CalPACE enews. http://www.calpace.org/fileadmin/documents/July_2016.pdf. Accessed May 6, 2017.
NCSL Fiscal Brief: State Balanced Budget Provisions. (2010). National Conference of StateLegislatures. http://www.ncsl.org/research/fiscal-policy/state-balanced-budget-requirements-provisions-and.aspx.
Newhouse, J. P. (2006). Reconsidering the moral hazard-risk aversion tradeoff. Journal of HealthEconomics, 25(5), 1005–1014.
Paradise, J. (2015). Medicaid moving forward. Henry J. Kaiser Family Foundation. http://kff.org/health-reform/issue-brief/medicaid-moving-forward/.
Potter, L. B., & Hoque, N. (2014). Texas population projections, 2010 to 2050. http://osd.texas.gov/Resources/Publications/2014/2014-11-ProjectionBrief.pdf. Accessed May 9, 2017.
Reaves, E. L., & Musumeci, M. (2015). Medicaid and long-term services and supports: Aprimer. http://kff.org/medicaid/report/medicaid-and-long-term-services-and-supports-a-primer/.Accessed 21 March 2017.
Saucier, P., Kasten, J., Burwell, B., & Gold, L. (2012). The growth of Managed Long-Term Servicesand Supports (MLTSS) Programs: A 2012 Update. Baltimore, MD: Centers for Medicare andMedicaid Services. https://www.medicaid.gov/medicaid-chip-program-information/by-topics/delivery-systems/downloads/mltssp_white_paper_combined.pdf.
Scan Foundation. (2011). What is a Medicaid Waiver. http://www.thescanfoundation.org/sites/default/files/ltcfundamental8.0.pdf. Accessed September 3, 2017.
Schwarm, W. ( 2016). Demographic research unit projections. http://www.dof.ca.gov/research/demographic/projections/. Accessed May 9, 2017.

158 J. L. Angel et al.
Setiawan, D. (2011). PACE-d Progress for Program to Help Elderly Stay at Home. https://www.texasobserver.org/pace-d-progress-for-program-to-help-elderly-stay-at-home/. Accessed May 1,2017.
Social Security Administration. (2017). Retirement & survivors benefits: Life expectancy. https://www.ssa.gov/OACT/population/longevity.html. Accessed March 22, 2017.
Staples, T. (2013). Texas rural impact report. https://texasagriculture.gov/Portals/0/Publications/RED/RuralAdvisoryCouncil/TDARuralReportFinal2013.pdf. Accessed April 15, 2017.
Texas Demographic Center. (2016). Aging in Texas: Introduction. http://demographics.texas.gov/Resources/publications/2016/2016_06_07_Aging.pdf. Accessed April 14, 2017.
Texas Department of Aging and Disability Services. (2014). Texas: 2014 Revised BalancingIncentive Program Work Plan. https://www.dads.state.tx.us/providers/pi/bip/bipworkplan2-7-14.pdf. Accessed May 9, 2017.
Texas Health and Human Services Commission. (2016a). Medicaid costs and client outcomes inthe Programs of All-Inclusive Care for the Elderly and STAR+PLUS Managed Care Programin Texas. https://hhs.texas.gov/sites/hhs/files//Medicaid-Costs-and-Client-Outcomes-in-the-Programs-of-All-Inclusive-Care.pdf. Accessed April 27, 2017.
Texas Health and Human Services Commission. (2016b). Texas Medicaid and CHIP: Texas DualEligible Integrated Care Project. https://hhs.texas.gov/reports/2016/12/medicaid-costs-client-outcomes-program-all-inclusive-care. Accessed September 16, 2017.
Texas Legislative Budget Board. (2015). Texas State Government effectiveness and efficiencyreport: Selected issues and recommendations.
Texas State Data Center. (2014). Population projections for the State of Texas and Counties. SanAntonio, TX: Texas State Data Center.
The Scan Foundation. (2012). California’s Coordinated Care Initiative: Background and overview.https://www.thescanfoundation.org/sites/thescanfoundation.org/files/track_4_–_ca_coordinatedcareinitiative_sep2012_fs.pdf. Accessed May 10, 2017.
Truffer, C. J., Wolfe, C. J., & Rennie, K. E. (2016). 2016 Actuarial report on the financial outlookfor Medicaid. Washington, DC: Centers for Medicare and Medicaid Services.
U.S. Department of Health and Human Services, Office of Disability, Aging and Long-TermCare Policy. (2014). Evaluating PACE: A review of the literature. https://aspe.hhs.gov/system/files/pdf/76976/PACELitRev.pdf.
Watts, M. O. M., Cornachione, E., & Musumeci, M. (2016). Medicaid financial eligibility forseniors and people with disabilities in 2015. http://kff.org/report-section/medicaid-financial-eligibility-for-seniors-and-people-with-disabilities-in-2015-report/.
Wiener, J. M., Romaire, M., Thach, N. T., Collins, A., Kim, K., Pan, H. et al. (2017). Strategies toreduce Medicaid spending: Findings from a literature review. http://files.kff.org/attachment/Issue-Brief-Strategies-to-Reduce-Medicaid-Spending-Findings-from-a-Literature-Review.
Wolf,D.A.,&Amirkhanyan,A.A. (2010).Demographic change and its public sector consequences.Public Administration Review, 70, s12–s23. https://doi.org/10.1111/j.1540-6210.2010.02242.x.
Young, K., Rachel, G., MaryBeth, M., Lisa, C., & Emily, L. (2013). Medicaid’s role for dualeligible beneficiaries: Issues brief. https://kaiserfamilyfoundation.files.wordpress.com/2013/08/7846-04-medicaids-role-for-dual-eligible-beneficiaries.pdf. Accessed May 7, 2018.

Chapter 8Strengthening Solidarity: A TheoreticalInquiry into the Roles of Civil SocietyOrganizations in the Support of ElderlyCitizens in Mexico City
Ronald J. Angel, Verónica Montes-de-Oca Zavalaand Vicente Rodríguez-Rodríguez
Abstract In this chapter, we present a theoretical framework related to the role ofCivil Society Organizations (CSOs) in advocating for and providing basic social ser-vices to elderly citizens. We present preliminary qualitative data from a conveniencesample of organizations in Mexico City to begin to understand how such organi-zations frame their missions. Initial observations lead us to theorize three potentialfoci around which these organizations frame their objectives: (1) A focus on qualityof life, health, and self-development; (2) a focus on material needs and economicsecurity; and (3) a focus on social and political rights. These foci are not mutu-ally exclusive, and organizational characteristics and membership determine whichspecific focus or foci dominate. Our initial observations reveal a wide range of orga-nizations whose effectiveness in furthering the rights and welfare of their membersreflects the human and political capital of their membership. Certain organizationswhose members consists primarily of women who have low levels of education andlittle formal work experience promote social participation and physical activity but
R. J. Angel (B)Department of Sociology, The University of Texas at Austin, Austin, TX, USAe-mail: [email protected]
V. Montes-de-Oca ZavalaInstitute of Social Research (Instituto de Investigaciones Sociales), National AutonomousUniversity of Mexico, Universidad Nacional Autónoma de México), Mexico City, Mexicoe-mail: [email protected]
V. Rodríguez-RodríguezInstitute of Economics, Geography and Demography (Instituto de Economía, Geografía yDemografía), Center for Human and Social Sciences (Centro de Ciencias Humanas y Sociales),Spanish National Research Council (Consejo Superior de Investigaciones Científicas), Madrid,Spaine-mail: [email protected]
© Springer Nature Switzerland AG 2019W. A. Vega et al. (eds.), Contextualizing Health and Aging in the Americas,https://doi.org/10.1007/978-3-030-00584-9_8
159
160 R. J. Angel et al.
have little ability to extract benefits and services from the State. Other organizations,which tend to be predominantly male, many of whom are ex-government employeesor retired members of powerful unions, are more able to leverage their experiencesin dealing with the State to further their own interests, as well as to influence publicpolicy more broadly. Throughout we discuss the potential role of such organizationsboth as providers of needed social services and as advocates and collective politicalactors that focus on furthering the basic rights of the elderly.
Introduction: An Accelerated Demographic Transition
At the beginning of the 20th Century life expectancy at birth in Mexico was approx-imately 30 years (CONAPO 2002), compared to approximately 50 years in theUnited States (Kinsella 1992). By the beginning of the 21st Century, the gap inlife expectancy betweenMexico and the United States nearly disappeared. Althoughbecause of past high fertility the population of Mexico is relatively young, the nationis aging rapidly. In 2010 the median age in Mexico was 26; by 2050 it is projected torise to 42, making older than the United States where the median age is projected tobe 41 (Kochhar 2014). Today individuals 60 and over make up the fastest growingsegment of the Mexican population (INEGI 2010).
A rapidly aging population presents Mexico with serious short and long-termchallenges since relatively few individuals have retirement plans (Mesa-Lago 2008;Cotlear 2011; Hujo 2014). Although health care access is formally universal,and non-contributory retirement income is provided to all older individuals,Mexico’s old-age welfare state lags behind those of developed nations in terms of theadequacy of coverage. In Mexico the family and local community continue to playtheir traditional roles as the main source of economic support and care for frail olderparents. In this chapter, we address the question of the potential role of civil societyorganizations (CSOs), a category that includes secular non-governmental organi-zations (NGOs), faith-based organizations (FBOs), and other voluntary groups, inadvocating for and providing services and assistance to the growing population ofelders in Mexico City. Although we focus on Mexico City, the theoretical and prac-tical issues we raise apply to all aging societies. As we discuss, in Mexico social anddemographic changes, including among other factors greatly increased life spans,smaller families, the migration of children away from their parents’ community, andthe need for women to work, are undermining the capacity of the family to provideall of the care and support that frail aging parents need. Given the fact that the federal,state, and municipal governments are limited in what they can provide, the potentialcomplementary role of CSOs could be significant. As of yet, though, we know littleof how these organizations frame their missions, who they serve, how they are orga-nized, and whether or not they are effective. Yet given the magnitude of the need,exploring their potential role is imperative.

8 Strengthening Solidarity: A Theoretical Inquiry into the Roles … 161
The Support of the Elderly: A Universal Challenge
Our investigation of the potential role of CSOs is motivated by three factors that sug-gest a potential major role for these organizations in both developed and developingnations as complements to the formal old-age welfare state. The first is the dramaticincrease in the number of CSOs, both secular and faith-based, that focus on theneeds of vulnerable segments of the population (Boli and Thomas 1997, 1999; Hall-Jones 2006; Lee 2010). In Latin America regional CSO forums on aging and humanrights organized by the Economic Commission for Latin America and the Caribbean(ECLAC), allow various groups of older people to engage in debates related to theirsituations and to convey their suggestions to ECLAC (CEPAL 2017). The secondfactor relates to the fact that, although a better quality of life and effective medicalcare have increased life expectancies at birth and at age 65, morbidity has not beendramatically compressed. Recent evidence based on a longitudinal study of olderMexican-origin adults in the Southwestern United States indicates that on averagenearly half of the years lived past 65 are characterized by poor health and seriousfunctional limitations (Angel et al. 2014). In reality, then, it appears that extendedlifespans increase the proportion of life duringwhich one suffers fromchronic diseaseand serious functional limitations, creating the need for extensive care and support.
The third factor relates to the nature of the needs of older individuals. Muchof the assistance frail older individuals need is routine and includes the need forcompanionship, assistance with basic activities of daily living such as dressing,bathing, and going to the toilet, as well as assistance with more complex instru-mental activities, such as managing money, maintaining a home, and taking medi-cations. Currently, family and community networks remain the main economic andsocial support systems for older Mexicans (Montes de Oca Zavala et al. 2014). Asincreasing life spans and demographic and social changes alter the family’s abilityto provide extensive care, though, and as state budgets reach their limits, non-familyand non-governmental options offer an additional possibility. Determining whethercivil society organizations can serve as a truly significant complement to family andstate efforts in different cultural, economic, and political contexts represents a majorresearch agenda.
A Major but Limited Role for the State
Before proceeding, though, let us begin by summarizing the State’s role in provid-ing for the elderly as it has evolved over the 20th Century in order to frame thepotential complementary role of civil society organizations. During the last centurytraditional patterns of eldercare changed in most nations, as have expectations con-cerning the relative role of the State. With the growth of the modern welfare state, theresponsibility for the economic support of aging parents has shifted from a completereliance on the family to a greater reliance on the State. As part of its shift from a

162 R. J. Angel et al.
traditional rural and village society to a more urban and industrial economyMexico,like most Latin American nations and the United States, introduced a pay-as-you-go employment-based retirement system in which current retirees are paid directlyfrom the contributions of current workers (Mesa-Lago 2008). This retirement systemwas plagued from the start by serious problems and required fundamental reform.High rates of informality and serious structural problems meant that only workersin the formal sector or government employees ever received an adequate pension(Mesa-Lago 2008; Villagómez and Ramírez 2013). Even as late as 2000 only 22%of the labour force was covered (Willmore 2014). Even with limited coverage, theold pay-as-you-go arrangement faced serious fiscal crises as the number of retireesrelative to the number of workers increased. In recognition of the fiscal limitations oftraditional pay-as-you go arrangements most Latin American nations have adoptedvarious forms of defined-contribution arrangements in which workers are responsi-ble for their own retirement savings (Mesa-Lago 2008; Flores-Castillo 2013). Again,though, since these reforms apply only to workers in the formal labour market theydo little to address problems of informality and limited contributions.
Non-contributory Pensions
Although privatized pension plans address the long-term fiscal crises of pensionsystems, they cannotwithout other reforms address problemsof incomplete coverage,gender inequity, or episodic contribution which results from frequent movementbetween the formal and informal sectors. If twenty-five or more years of contributionare required to receive a full pension, workers who spend many years in the informalsector, thosewho are unemployed for long periods, orwomenwhomust raise childrenor care for aging parents are unlikely to qualify. To address these problems LatinAmerican countries have introduced various forms of non-contributory pensions oradopted more flexible rules for qualification for state pensions (Rofman et al. 2013).
InMexico the introduction of non-contributory pensions has made pension cover-age nearly universal (Willmore 2014). The Pensión para Adultos Mayores (Pensionfor Seniors) program provides a non-contributory pension of 525 pesos (US $40) toapproximately six million recipients who do not have another pension (Bravo 2015).Although this program has greatly reduced the number of elderly individuals withno income, the level of support is minimal and a large fraction of Mexican elderslive in poverty and many continue to work after 65 (Aguila et al. 2011). In addition,the reliance on public funding reintroduces the long-term fiscal risks for nationaleconomies that older pay-as-you-go pension systems involved (Filgueira and Manzi2017).

8 Strengthening Solidarity: A Theoretical Inquiry into the Roles … 163
The Role of Civil Society Organizations
The situations in both Mexico and the United States reflect the new reality of post-traditional societies in which the traditional family support systems upon whicholder parents relied can no longer bear the entire burden (Angel 2011). Yet as wehave noted, the State faces serious limitations in what it can provide in terms ofmaterial and social support. As we also mentioned earlier, one clear advantage oflocal voluntary efforts arises from the fact that many of the needs of frail eldersare routine and personal and require the sort of close and frequent contact that thefamily has traditionally provided. Organized and concerted non-governmental effortsto assist individuals who would otherwise suffer severe isolation and perhaps worse,represent a potentially effective addition to formal state programs. The challenge forall nations, then, is to determine how best to combine the efforts of non-governmentalactors and organizations with those of official agencies. What seems clear is that therole of non-governmental organizations is potentially great, especially in areas thatare hard to reach or among populations with unique needs, cultures, languages, orbeliefs.
Althoughwehave little hard evidence on the effectiveness or value ofCSOactivity,there is ample evidence of the importance of social networks and social support inlater life (Krause 2006; Moren-Cross and Lin 2006). To the extent that secular non-governmental and faith-based organizations foster or directly provide social supportand integration, they could potentially greatly enhance the quality of life of olderindividuals and their families. Such efforts could conceivably reduce the need forfrequent and expensivemedical interventions or long-term care. Such informal socialsupport is provided by community members to one another every day. A study ofvolunteerism in Mexico reveals that neighbours and community members providesignificant amounts of support and assistance to those in need, either as members offormal groups such as churches or voluntary organizations, or informally in termsof personal assistance (Burcher 2008). The questions of whether such informal andspontaneous efforts could be fostered by a more organized approach remains to beanswered.
Advocates or Direct Service Providers
In terms of social welfare and active citizenship, we might categorize CSO activ-ities in terms of two broad categories, advocacy and service delivery (Pereira andAngel 2009). Elsewhere we have characterized CSOs potential roles as those of“adversary” or “ally” of the State. These terms refer to two distinct positions suchorganizations can assume with reference to the status quo. The contrast derives fromthe evolution of the missions of many CSOs in Latin America from the period ofdictatorships to the restoration of democratic regimes. During the period of dictator-ships, CSOs of necessity focused on human rights and political oppression. With the

164 R. J. Angel et al.
restoration of democratic governments these organizations were forced to redefinetheir missions, often to include closer ties to more democratic and representativegovernments (Pereira et al. 2007; Pereira and Angel 2009). Today, the role of CSOsis framed by a different set of political and economic circumstances. In terms of theold-age welfare state CSO advocacy and political activity focuses on such “socialrights” as the extension of social pensions and assuring that the State addresses theneeds of older individuals. In the role of service providers such organizations com-plement the State and provide companionship, help with activities of daily living,transportation, meals, and other routine services that are most efficiently provided atthe local level by those more familiar with an older person’s needs.
Eldercare as a Social Movement
With the restoration of democracy in Latin American nations and with new freedomfor action by civil society organizations a new discourse related to the role of civilsociety in governance has emerged. The limited success of previous social welfarereforms and the continuing problem of serious inequities in access to high-qualitysocial services has given rise to the concept of “active citizenship,” a term that refersto the active involvement of citizens in the defense of their basic rights and decisionsconcerning the distribution of services. The serious inequality that continued evenafter the initial neoliberal reforms of health and pension systems have convinced evenearly supporters of the need to involve citizens in governance and fiscal decisionmak-ing in order to assure the legitimacy and sustainability of reform efforts (Tussie et al.1997; Chiara 2005). Although the need for citizen involvement is widely recognized,how to accomplish that objective remains unclear.
One clear possibility is to mobilize elderly citizens themselves to engage in col-lective action and participate in civic life. A number of studies find that Mexicans,including older adults, provide a significant amount of voluntary unpaid aid and sup-port to family and community members (Burcher 2008; HSBC 2015). The NationalSurvey on Health and Aging in Mexico (Enasem 2013) found that 15.8% of those55 and over (men 13.8% and women 17.2%) participate in voluntary unpaid workat least once a week. CSOs could clearly play a major role in the mobilization ofthe elderly. There are simply few alternative collective actors. This possibility leadsus to raise an important theoretical and practical question as to whether increasingCSO activity related to the rights and welfare of the elderly reflects the emergenceof a new transnational social movement, much like the women’s, the human rights,or the environmental movements (Keck and Sikkink 1998).

8 Strengthening Solidarity: A Theoretical Inquiry into the Roles … 165
CSOs in Mexico City
Given the limited availability of formal old-age supports, the role of family house-holds has been a major focus of research on the welfare of older Mexicans (Garayet al. 2014; Montes de Oca Zavala et al. 2014). Many studies have focused descrip-tively on the status and social condition of the elderly, but few have looked beyondthe family to examine the institutional context of the social and political engagementof the elderly. Meanwhile, new paradigms, such as that of active aging, that empha-sizes the importance of social participation and the social construction of citizenshiphave been proposed (WHO 2002). The objective of initiatives motivated by suchparadigms is to create environments in which people at different life course stagesare empowered to fully defend and exercise their human rights at the individual andcollective level. Theoretically and practically, then, social participation representsa core aspect of active aging. Social participation has been conceptualized in dif-ferent ways. For our purposes, though, we conceive of it broadly as consisting ofnot only the interaction among individuals but also interactions among those indi-viduals and their institutional and socially-defined environments. Communication,dialogue, and “face-to-face” interactions are necessary preconditions for effectivesocial participation (Madariaga 2005).
Framing the Issue: Human Rights Rather Than Charity
In a classic article, Snow et al. draw upon Goffman’s Frame Analysis (1974) toelaborate what they term “frame alignment processes,” a phrase that refers to waysin which social movement organizations, in our case CSOs, convince a sufficientlylarge audience of the movement’s or organization’s interpretation of reality (Snowet al. 1986). Citing Turner (1969) they note that the basic process involves alteringpublic perceptions of some problematic aspect of one’s own or someone else’s lifefrom one that attributes it to misfortune to one in which it is seen as the resultof injustice, which calls for a very different response, largely geared toward theelimination of the injustice. We will not go into the details of Snow’s theoreticalelaboration of frame alignment processes. Rather we will discuss how the processin general applies to the role of CSOs in defending the rights of elderly citizens inMexico City and elsewhere.
CSOs can either treat the elderly as the victims of misfortune, or portray themmore as victims of injustice. In the first case, the solution is compassion and charity;in the second case, it involves active political action to change the basic rules ofthe game that disadvantage certain segments of the elderly population. One majorframe realignment movement that we find particularly salient involves altering theperception of the elderly as superannuated and incapable of active involvement incommunity life to one that portrays them as autonomous agents with basic socialand political rights, as well as a recognition of their right to support as a result of

166 R. J. Angel et al.
their life-long contributions to society. In 2015 the Inter-AmericanConvention for theProtection of theHumanRights ofOlder Persons issued amajor reportwhich affirmedthe right of older persons to social participation, as well as political participationand non-discrimination (OAS 2015). The right to participation is conceived of ascentral to the recognition and development of other human rights. Theoretically andpractically, then, the question that the report leads us to pose is how best to mobilizecitizens and to create social and political environments in which they can act aseffective agents in furthering their own interests and those of others.
In order to begin addressing these questions we draw on qualitative researchwith different types of organizations in Mexico City. Our conclusions are basedon information from various sources, including public records, focus groups, andinterviews with key informants. What one discovers immediately is that there is alarge number of organizations, and that they differ profoundly in the framing of theirmissions and objectives, as well as the degree to which they focus on advocacy asopposed to service provision. The structural location of the elderly, as well as theirdifferent cultural, social, and political profiles based on schooling, work experience,political culture, and socio-political traditions informs the discourse related to agingand human rights and results in great heterogeneity in perspectives related to activecitizenship and social participation.
Among our most significant and novel discoveries is the important role of orga-nizations that have fought for the rights of labourers in strategic sectors that havebeen threatened by the economic policy of neoliberalism and privatization. Theseorganizations possess a great deal of human and political capital given their mem-bers’ experiences in struggling for their basic rights as workers and state employees.These organizations do not frame their agendas in terms of issues related to aging,but rather articulate their missions around the right to employment and economicsecurity. This perspective, though, is highly salient to the situation of the elderlysince the situation of many older persons reflects a lifetime of social marginality,labour force informality, and collective political powerlessness.
Other groups are organized without specifically stated political agendas but ratherfocused on specific needs, such as access to institutional care and other communityresources. Some focus on such practical assistance in ways that reinforce traditionalconceptualizations of the elderly as vulnerable and needy. Other organizations focuson the defensed of the rights of local government pensioners who make up largesegments of their memberships. These various organizations, then, differ greatly inthe past social and political engagement of their members, their stated missions, andthe resources that they are able to bring to the table.
Framing the Issue as One of Basic Rights
Although several new laws that affirm the rights of the elderly have been passedin various nations in Latin America, they have been difficult to put into practice.Laws related to the rights of the elderly have been introduced since the early 1990s

8 Strengthening Solidarity: A Theoretical Inquiry into the Roles … 167
(Huenchuan 2013) and have been reinforced by institutional commitments and struc-tures (Huenchuan 2016). The specific objectives of these laws differ substantially,and many continue to affirm an assistance perspective which is based on concep-tualizations of those over a certain age as unproductive and in need of care andassistance (Huenchuan 2016). More recent laws have begun affirming a rights per-spective, which include the right to a dignified life, a dignified death, equality andnon-discrimination, physical, psychological and emotional autonomy, and the rightto participate in the social, cultural and political life of the community (Huenchuan2013). These principles and rights were fully consolidated in the Inter-AmericanConvention for the Protection of the Human Rights of Older Persons (OAS 2015).
In Mexico, a number of laws dealing with the welfare of older adults have beenintroduced at the national and sub national levels. These largely reaffirm the family’sresponsibility for aging parents while extending and standardizing the provision ofdiverse services and assistance. Without minimizing the significant advance that thislaw represents in affirming the rights of the elderly, we must note that it does notspecifically address the rights of ethnic elders, nor does it deal directly with economicsecurity or pensions. Rather, it reaffirms the right to social assistance and the rightto be supported by the family (Article 9), rather than affirming the right to a publicpension or support. Despite its shortcomings, though, this reform strengthens allsub national laws and constitutes a substantial move forward in the reframing of thejustification for social programs and public policies focused on the elderly as basicsocial rights. It is important to note that these basic principles were reaffirmed atthe Fourth Regional Intergovernmental Conference on aging and the rights of olderpersons held in Asunción, Paraguay in 2017 (CEPAL 2017).
The Study: A Grounded Theoretical Approach
Preliminary data that informs our grounded theory approach, which focuses on therole of civil society organizations in advocating for and providing services to olderadults,was collected as part of a larger project entitled “ActiveAging andCitizenship:Government Mechanisms for Social Inclusion, Poverty Reduction and Inequality ofOlder Adults in Mexico,” which is funded by the General Directorate of AcademicPersonnel of the UNAM Project IG300517. Additional funding is provided by thePolicy Research Institute—International Program of the Lyndon B. Johnson Schoolof Public Affairs at The University of Texas at Austin. The ultimate objective of thisproject is to identify the institutional contexts of social participation by older adultsin Mexico City, as well as the economic, political, and cultural factors that structureindividuals’ and groups’ framing of their interests and objectives.
In its initial phases, the project employs a qualitative approach focused on a pur-posive sample of CSOs. Data collection involves personal interviews with leaders ofthese organizations, and focus groupsmade up of the organization’smembers. At thispoint, we are in the beginning stages of developing a grounded theoretical descriptionof the organizational structuring of members’ behaviours and the social construc-

168 R. J. Angel et al.
tion of various institutions eldercare and advocacy missions through the actions ofindividuals and groups. These initial theoretical constructions are reflected in thecore organizational foci we identify in this chapter. These theoretical descriptionsare evolving as part of our grounded theoretical approach and will be elaborated withfurther analysis.
The specific CSOs were selected based on the nature of their functions related toolder adults, their composition, and their locations. They are located in different del-egations of Mexico City, which vary in terms of their socioeconomic profiles, theiraverage levels of education, and the need profiles of their populations. Nine groupswere identified in the delegations of Iztapalapa, Gustavo A.Madero, Coyoacán, Ben-ito Juárez, Tlalpan, andCuauhtémoc. Socioeconomically, these neighbourhoods varyfrom medium high, to medium low and low. The composition of the organizationswe contacted vary in terms of the age and sex of their membership. Most were mixedin terms of gender, although certain organizations were predominantly male whileothers were predominantly female. As we describe below, these gender differenceshave significant implications for the organization’s objectives and effectiveness.
Informed consent was obtained for all interviews and focus groups, which wereconducted at their organizational locations from April to October 2016. Initial find-ings are from 53 interviews and 7 focus groups. Interviews and focus group dis-cussions were transcribed and coded thematically using Atlas.Ti qualitative analysissoftware. The interpretation of the narrative material is guided by a general the-ory of social constructionism that emphasizes the relational and historical characterof all aspects of social reality. From this perspective, individual and organizationalbehaviour and ideology reflect rational actions that are influenced by historical, lin-guistic and cultural factors.
Specific CSOs in Mexico City
Civil society organizations are a crucial part of political and social life of MexicoCity. Certain of these organizations are sponsored or supported by political parties,while others are closely tied to the government. Today one can observe a growingdiversity of organizations that respond to increasing politicalmobilization and citizendemands. These organizations mobilize around demands for public services, accessto adequate health care, and basic pensions, which have not been democratically oruniversally accessible. The political struggle for greater equity and democracy hasencouraged political and social participation. With the aging of the population, olderpeople have become much more active participants.
The organization and structure of these groups corresponds to the profile of theelderly population they represent, the economic sector in which they operate, theproblems they address, but perhapsmost importantly, to historical practices related tocharacteristics of particular occupational and social sectors involved. Since the 1980s,citizens have begun to organize in different spheres ranging from informal groups atthe neighbourhood and community level, to more formal civil society organizations,
8 Strengthening Solidarity: A Theoretical Inquiry into the Roles … 169
such as Civil Associations (CA) or Private Assistance Institutions (IAP) as they arelegally established in Mexico. These organizational developments are not unique toMexico but have emerged elsewhere, including Spain, Argentina, Uruguay, Bolivia,and Brazil. In these nations, various groups promote and exercise their rights throughnew ways of conceptualizing and constructing citizenship (Wanderley 2009). Thisnew approach includes a completely different perspective on aging, more focused onactive aging and social and political participation, but also one that affirms autonomyand the ability of older citizens to act as effective agents in the defense of theirindividual and collective political and social rights. Increasingly, older individualsplay a determining role in building institutional connections between social actorsand government.
In Mexico, older people are increasingly empowered with the support of CSOs,the academy, and recognition by the government. Increasingly, older citizens arecoming to recognize their capacity to control important aspect of their lives and thatof their communities. This has resulted in a renewed relationship with governmentalagencies and public officials. It is not only CSOs that advocate for older citizens areengaging in a discourse focused on rights. Other groups are engaging in the demandfor social rights for all age groups, and consequently the State finds itself forced toredefine its ways of governing and legislating (Das and Poole 2004). Ultimately, thisdialectical relationship between CSOs, citizens, and the State obliges all parties toredefine and aspire to greater social justice.
Undoubtedly, the present age characterized by globalization, neoliberalism, andpost-traditional societywill force bothCSOs and the State to reconstitute themselves;at times, the State and its practices will appear more visible and intrusive, at othertimes they will appear less effective and relevant (Trouillot 2001). CSOs will alsohave their ups and downs. Increasingly, but to varying degrees depending on variousfactors we have alluded to, older people are consolidating themselves as collec-tive competitive and dynamic social actors that demand specific rights (OAS 2017).Ultimately, only the State can guarantee such rights, but their actual implementa-tion requires the constant prodding of non-governmental, faith-based, and other civilsociety organizations.
Different Ways of Aging and Different Types of Organizations
The fieldwork related to the project entitled “Active aging and citizenship; govern-mental mechanisms for the social inclusion of older adults in Mexico1” is beingcarried out with nine groups and civil society organizations in different neighbour-hoods of Mexico City. During the initial phases of the study, we have identified a
1Funding provided by the Dirección General de Apoyo al Personal Académico as part of projectPAPIIT (IG300517). In addition, the authors would like to thank Rosaura Avalos, Ilse Hernández,Alejandra Santiago and Patricia Rea for their assistance with interviews of certain organizationsand older persons.

170 R. J. Angel et al.
variety of ways of aging and forms of organization among the elderly. Alfama et al.(2013) identify three frames of reference that inform public policies, programs, andnational and international publications related to the rights of older people. Theseinclude (1) a frame that emphasizes the quality of life and self-development of theelderly; (2) another that focuses on human rights; and (3) yet, another that stresseseconomic sustainability. These frames are not mutually exclusive. Rather they rep-resent ideal types that serve primarily as analytic or heuristic tools. Each of theseframes of reference draws attention to the consequences of diversity and inequal-ity and emphasizes basic needs and the right to autonomy and participation. Let usdescribe various groups in terms of their frames of reference and the focus of theirorganizational efforts.
A Group Focused on the Quality of Life and Self-development
In our studywefind organizations such asAmanecerVeracruzana (Dawn inVeracruz,AMV), located in the Iztapalapa district onMexico City’s east side, which is focusedon quality of life and self-help. The Iztapalapa district is characterized by a highdegree of marginalization, which is reflected in the low level of physical, cultural,or social capital among the organization’s participants. AMV is composed mainlyof women 75 and older. They are mostly widows, many are migrants, and almostnone are in good health. The vast majority suffer from diabetes and hypertension.Most spent their lives as homemakers, have extremely low levels of education, andhave no pension income. Despite these physical and social limitations, though, theaging experience of the AMV women can be described as active, centered in theneighbourhood, and focused on recreational activities that are intended to maintainoptimal physical functioning in the face of the rising incidence of chronic diseaseand disability among its members.
The organization clearly enhances the quality of life of its members, but their lowlevels of education and income, and consequently of humanand cultural capital, resultin limited capacity to influence the State. Amanecer has applied for government sup-port but its applications have met with little success. Given the organization’s focuson the old and infirm, younger generations are not involved, perhaps contributing tothe organization’s inability to obtain governmental support. Similar groups with littleability to influence governmental policy or actions are common inMexico City. Theirpowerlessness derives from the particular condition of the older population itself, butalso from the high degree of marginalization of many districts and neighborhoods inthe city, and a general lack of programs targeted to the elderly.
Given the organization’s focus on physical health and countering the negativemental and physical effects of age-related disease this group can clearly be placed inthe quality of life and self-development frame. From interviews and focus groups itbecame clear that physical and artistic activities are not only forms of entertainmentand social participation, they protect against the negative effects of isolation. Perhapsmost importantly, though, the organization’s emphasis on participatory and active

8 Strengthening Solidarity: A Theoretical Inquiry into the Roles … 171
aging helps transform the image of old age as a time of disease and serious functionaldecline to one that portrays older individuals as active agents in control of their lives.Although the organization’s activities clearly reflect frame alignment, they do notinvolve direct political action. Two participants described their experiences in thefollowing way:
It helps me not to think about things I should not, it helps my health because we spend anice time because then we are rehearsing, or we are exercising … (Esther, 68, AMV, 2016)
Because they keep us active and we keep the body…in motion, so that we will not ‘becomecrippled’… (Amparo, 74, AMV, 2016)
A Group that Combines Quality of Life with Human Rights
We encountered other groups with broader objectives or more inclusive frames. Onesuch organization is the Renueva (Renew, REN) group, which foster a high degreeof autonomy, independence, and personal mobility. Renueva focuses on intellectualand physical development based on a philosophy that active aging is part of everydaylife. The organization’s frame is based on a clear awareness of the aging process, butit emphasizes the individual’s responsibility for controlling it to the extent possible.The exercise of rights is central to Renueva’s philosophy and it has been able putpressure on governmental authorities in order to obtain locations suitable for theexercise of its member’s citizenship. Through their own efforts and with resourcesthey obtain from the authorities they sponsorworkshops, talks, recreational activities,conferences, a cinema club, and more.
Renueva’s membership consists predominantly of women. They differ fromAmanecer’s membership in that they have higher levels of education and many havework experience. This greater human and social capital no doubt contributes to theirgreater success in obtaining concessions from government agencies. Although thesewomen have some history of employment, not all enjoy economic security in oldage. Most are married and many have taken informal courses that have allowed themto organize in the Center for Social and Cultural Development “Carmen Aristegui”located in the Gustavo A. Madero district of Mexico City. Although the organiza-tion adopts a quality of life and self-development framework for its activities, it alsoemphasizes a human rights framework, reflecting the membership’s higher educa-tional level and leadership experience. The organization’s philosophy emphasizesthe principle that the maintenance of autonomy and independence is central to ahigh quality of life. Two informants told us of their experiences. One expressed anacceptance of the inevitability of aging, but also emphasized personal control andinterdependence.
(…) in the best way possible, being aware of…what we have to do, without straining. I thinkthat that is it, to grow old in a better way with enthusiasm because that also helps us a lotbecause it opens our understanding…[of] ourselves and also others. To help ourselves andhelp others. That’s what I mean by active aging, being aware of oneself and taking careof yourself, because then there are people who are a little abandoned and they get mad at

172 R. J. Angel et al.
everything because they are cooped up and have no other vision, they do not leave theirhouse, because they do not want to get involved or maybe they can’t because they alreadyhave a disability … But this aging is a process that slowly … It is slow and we accept it andhow better than with that spirit … “(Elisa, 66, REN, 2016)
The second informant emphasized the beneficial health effects of the social supportthe organization offers. As she said,
The fact that people feel more cheerful is something that one notices immediately, partici-pation, also health (and the improvement of everyone’s health) because I have been touchedto see people who arrive almost unable to walk because they are fat. Others are not fat buttheir bones and their muscles hurt. It is simply that there is someone whom one approacheswith whom one can talk about different things that are happening, feel support, feel one thatthere is understanding and that comforts the soul, the spirit feels good, one does not feel thateverything has to be kept and I am getting sicker because I do not have … I feel cornered, orI feel alone … one finds that warmth, that shelter where one is supported … “(Magdalena,70, REN, 2016)
An Organization Focused on Quality of Life and EconomicIssues
We also find organizations such as Un Granito de Arena, A.C (A Little Grain ofSand), which served the elderly people with cognitive impairment and little personalmobility. The organization provides residential care and serves both men and womenwho can no longer live alone, although given the clients’ ages, more women thanmenparticipate. GDA stands out for being sponsored and run by caregivers and staff whowork at the organization, rather than by the older clients themselves, who because ofserious functional and cognitive impairments lack autonomy and are not capable oforganizing to protect their own interests or place demands on the authorities. Conse-quently, the caretakers act as their proxies. The staff focuses onmultiple areas, includ-ing health, recreation, social security, education, culture, personal mobility, safetyand protection from violence, fulfilling family and community relations, and more.GDA and other organizations like it address an increasing need for attention amongolder people who live alone but who are losing their autonomy. At some point, livingalone is no longer possible. For individuals with no family there is no alternative butinstitutional care. The shock of being removed from one’s traditional environment,though, can be very painful. Two informants recounted their experiences:
I suffered a lot because I did not plan to come here. Who was going to think that I was goingto end up here … that made me very sad and I cried a lot but … because my daughter onlyhas a child and he already works and she supports me and I could not help her in any wayother than by coming here. I have a pension but very little. (Lucía, 75, GDA, 2016)
I was defenseless, I lost weight, I vomited up everything because I had a terrible gastritis andeverything I ate came back but I had the esophagus damaged from vomiting and not beingable to eat. They injected me in the veins, they gave me serum, and I spent fifteen days inthe hospital, but while I was in the hospital, my sister met someone from here who told herabout this place. (Victoria, 78, GDA, 2016)
8 Strengthening Solidarity: A Theoretical Inquiry into the Roles … 173
Particularly Effective Groups Focused on Economic Issuesand Worker Rights
One particularly effective group of organizations represents retired union membersand government workers. We focus on three such groups, including (1) pensioners ofthe Institute of Security and Social Services of State Workers (PISSSTE: Pensionar-ios del Instituto de Seguridad y Servicios Sociales de los Trabajadores del Estado),(2) retirees of the Mexican Electrical Union, (JPSME: Jubilados y Pensionados delSindicatoMexicano deElectricistas), and (3) former employees of theNationalCoor-dinating Committee of Education Workers, (JPCNTE: Jubilados y Pensionados dela Coordinadora Nacional de los Trabajadores de la Educación). These retiree orga-nizations are characterized by strong political organization based on their member’sexperience in the governmental and public sectors. Their memberships have mediumto high levels of education, which enhances their organizational capacities and abil-ity to act collectively. Although these organizations are predominantly male, theyincreasingly include women, reflecting the gradual increase in female labor forceparticipation since the 1980s. They also include individuals who retired early andwho are highly active. Two quotes from focus group interviews with retirees of theelectrical union illustrate the fact that for these retirees their past activities informtheir current active stance:
I am retired from [a] power and light company that is no longer operating. I belong to theMexican electrician’s union … we are still participating in the union, we are representativesand we are trying to keep up with the policies that are governing the country and those thatconcern retirees. Here we engage in different activities including sports and recreational andfamily events. (José, 67, JPSME, 2016)
What the union has given me and also Power and Light, is a stable life fortunately withoutserious economic [hardship]. We cooperate with the union; they call us to advise the boys.That helps us to be active, to participate and to interact with our fellow workers. We are likea family because we all know each other and talk as if we were a family, even though wewere from different departments. We met at meetings, and we learned to interact with theyoung people too. (Roberto, 66, JPSME, 2016)
A retiree of the StateWorkers Union (PISSSTE) explained his role and the objectivesof the retiree’s organization of state workers as follows:
It has been four years since we began this organization of retired persons in order to maketwo demands of the government… I worked in theMinistry of Finance for 37 years…we feelthat as workers of this city and in light of the needs related to the third age …we made tworequests of the government that have not yet been granted… I am the coordinator, I am theleader of everything…We form commissions…a group of 200 or 300 members participateand they name a commission so that together with me they identify the problem; the subwayworkers have a commission…all the branches of the federal government [are represented].(Alberto, 71, PISSSTE, 2016)
A member of the retired teachers’ association (JPCNTE) told us the following:
We are teachers [in] DF. This organization consists of primary, preschool and special edu-cation teachers…As a democratic organization we have had several…even within the same

174 R. J. Angel et al.
union there are different points of view. We are the democratic part, the counterpart is theRevolutionary Vanguard [led by] Jonguitud, then by Elba Esther and now by Diaz de laTorre…The union [has been functioning] since the forties…We [have made requests of]several government institutions of…D.F or the ISSSTE, and engage in cultural events, out-ings, promotions, everything that [can be done to help those co-workers] who are close toretirement. (Enrique Enríquez, 64, JPCNTE, 2016)
These organizations do not frame their missions in terms of aging or quality of lifeassociated with active aging. For many, old age came after retirement, since becauseof differences in pension schemes many retired early. The membership of these orga-nizations worked in strategic sectors of the economy in situations in which the Stateassured their security. They were socialized into a traditional economic model, basedon solidarity, defined benefits, and patronage that characterized the period prior tothe contemporary neoliberal era. In earlier decades, many of the members of theseorganizations were part of the struggle for better working conditions as membersof trade unions or similar organizations. Today, they continue organizing to makedemands with respect to their individual and collective rights that many see as threat-ened by various reforms to the retirement system. These involve important changesin pensions. In 1997 the IMSS and in 2010 the ISSSTE replaced their traditionaldefined-benefit pension plans with defined-contribution plans. The older defined-benefit plans were funded collectively and guaranteed a set retirement income; thenew defined-contribution arrangements require that the worker save for his or herown retirement, severing the bond of solidarity between generations. The privatiza-tion of the electric sector and actual and planned reforms in the education sector havealso mobilized those workers.
We might observe that although the members of these groups do not frame theirobjectives in terms of objectives related to aging per se, they are actually aging quiteactively since they are highly engaged and socially involved. Rather than framingtheir objectives in terms of aging issues, they frame them in terms of the struggleagainstwhat they see as unjust social and political conditions,much as they did duringtheir working years. The vast majority of members have higher levels of education,and most are married and have a retirement income. Their health tends to be good,althoughwhen they become ill their organizational activity tends to decrease or ceasealtogether. The active advocacy focus of these organizations appears to select thoseindividuals who are most healthy and active.
The dominant discourse, then, emphasizes political action in addition to self-help.This approach reinforces the struggle for economic and human rights, related not onlyto the union in question but to the nation as a whole. This struggle is framed in termsof economic security and demands for the rights of ex-workers, including adequatemedical care. These organizations have a clear trade union origin and perspective, andmost focus on their own membership, although we observed some limited attemptsto forge bonds with other unions or groups of older people. More than other groups,though, their discourse focuses on the protection of economic rights rather than issuesrelated to the elderly, although the economic struggle has clear implications for olderworkers and the older population in general. As one respondent noted,

8 Strengthening Solidarity: A Theoretical Inquiry into the Roles … 175
Well, it is what they owe [us]… the benefits we have [and that we are fighting to retain andimprove.] [A] pension increase…a bonus and that they respect us because although we areretired we are still workers. (José, 72, PISSSTE, 2016)
In Mexico, unions are important political players, often closely affiliated with politi-cal parties and specific governments. As we have mentioned, organizations of retiredworkers retain that politicized perspective. The electrical workers union (SME) isa particularly relevant example. These already politicized workers were forced todeal with the privatization of the industry during the Felipe Calderón administration.In response, the union framed its mission as not only to protect the benefits of itsmembers but also to combat the adoption of undemocratic practices that harm thecountry’s workers. The retirees organization (JPSME) reflects this experience andembodies an identity and mentality focused on the exercise of democratic rightsand participation in decision-making related to important social issues. Because oftheir political experience as union members and the highly politicized discourse theyexperienced, this group and groups like it represent important actors in the politicalculture of the country. However, their influence could be seriously diminished in thefuture if the union culture is seriously weakened. Labour reforms and neoliberal eco-nomics more generally may weaken powerful unions and their bosses (Valenzuela2016). How such forces will affect union retiree organizations and their ability toengage politically remains to be seen.
Like the electrical workers, retired teachers possess a high level of human andcultural capital. The union of retired teachers (JPCNTE) displays another uniquecharacteristic. It is highly democratic in its approach to furthering the demands ofteachers. The organization is the most generative of the associations of older personsin Mexico City. JPCTNE engages in a social justice discourse, emphasizing activeengagement and advocacy for educators. In terms of aging, their discourse alsoreflects a concern for functioning, but above all for social integration and an activelife. These foci reflect a consciousness of the traditional trade union struggle, and aconcern for solidarity with and ties to younger generations. Yet one must be realisticabout the possibilities. As three informants told us,
Above all, think of goals and still be able to realize them. Fortunately, they can be realized,but we also have to be realistic [about] what we can still [do], what influence do we have?… (Maximino, 79, JPISSSTE, 2016)
We cooperate with the union, they call us to advise the boys…that helps us to be active,to participate and to live with our companions; we learn to live with young people too …(Ramiro, 68, JPSME, 2016)
It means having a project already…what I’m going to do, what I’m going to dedicate myselfto…[how] I’m going to use my time, how I’m going to live with my family, how I’m goingto integrate with them … (Oscar, 57, JPCNTE, 2016)

176 R. J. Angel et al.
An Organization that Combines Quality of Life, EconomicIssues, and Human Rights
We find groups such the one made up of retirees and pensioners of the AutonomousUniversity of Mexico (UNAM). This group named PICRELI (Pioneros Creativos enLibertad: Creative Pioneers in Freedom) is characterized by a low degree of socialorganization but a high degree of citizenship. That is, although it is not organizedaround a defined objective, the elevated educational levels of the members, mostof whom have professional and advanced degrees, gives them extensive knowledgeof multiple ways of exercising their rights. The members are primarily women withdoctorate degrees and a substantial work history. The group’s objectives are to engagein group activities and to communicate, but above all to remain informed. As oneinformant explained, the members feel a high degree of empowerment and genera-tively:
We are trying to help the new retirees so that it does not cost them as much work as it costus…it cost us from the formalities in the ISSSTE that leave you sitting [for] hours, they bringyou back again and again eeeeh … At least for me it was a disaster, they want to continue…at UNAM and suddenly we realize that we arrived at the UNAM and then because ouroffice already disappeared, our job…[has been given] to another person, we no longer have,we can no longer park because our credentials disappeared, they took them away, then we nolonger have a place to …come and visit, to see, and we feel that [our time has been] wastedbecause we have more than 30 years of experience…Ah… everyone is worth it, right? Andwhen we could consult, we could give tips, we could advise…give some seminar, give sometalk, give some workshop…most of us have a lucid mind, out there if there are some othersthat already have begun to have mental problems, but most of us because we have a clearmind…are struggling to be given a place … (Omara, 78, PICRELI, 2016)
To propose to the University that [it benefits from] our experience to do some things, wehave proposed many things that we could do but also that the University, as I understandit, has a place for us and some considerations since many of us, since we [have worked] atUNAM for a long time … (Víctor, 73, PICRELI, 2016)
Active aging has a lot to do with transmitting all the experience one has acquired throughoutone’s life … “(Guadalupe, 75, PICRELI, 2016)
I think it’s also an attitude of not simply to wait for death or to [wait for visits from] childrenor grandchildren…I have a good relationship with my son and my granddaughters. [Butthat can’t be everything. One needs], economic independence, intellectual independence,the ability to make decisions, to own one’s own life … (Laura, 77, PICRELI, 2016)
Conclusion: The State, Community, and Civil Society
The rapid aging of the population of Mexico introduces serious challenges fornational, state, and municipal governments. The dominance of a neoliberal market-based economic model based on privatization occurs at a time when the social andeconomic needs of an aging population are growing and when the role of the Statebecomes ever more central. As we have argued, no level of government is capable ofaddressing all of the needs of an aging population. Universal health care and the avail-
8 Strengthening Solidarity: A Theoretical Inquiry into the Roles … 177
ability of noncontributory pensions have clearly helped, but government programsalone cannot address all of the need that exists. Given increased life expectancy, thesituation will only get worse. In this chapter, we have argued that in this context,the potential of civil society organizations in advocacy, service delivery, and perhapseven more must be optimized.
Our initial exploration into this area in Mexico City reveals the emergence ofnumerous civil society organizations that address issues at least partially related toactive aging. Unfortunately, we have no complete census of such organizations, butit is clear that their number is growing (Rodríguez-Dorantes 2015). Understandingthe potential benefits, as well as the shortcomings, of these organization’s effortsrequires new multimethod approaches that employ administrative records, informalobservations, surveys, and formal ethnographies. Although our observations are onlypreliminary, the growth in the number of CSOs in the decades after the SecondWorldWar suggests that they will play an increasingly important role. Although we haveno direct evidence, it is likely that new organizations will form in the future andthat existing organizations will add an aging component to their agendas, given thegrowing level of need.
As we discussed, CSOs can assume one of two roles or some combination ofboth. They can directly provide services such as companionship and assistance withactivities of daily living, or they can adopt the role of advocates for the elderly inthe struggle to force federal, state, and municipal governments to respect the socialrights of the elderly and to provide them the resources necessary for a dignifiedexistence. As our data illustrate, some organizations focus primarily on the health,social participation, and the quality of life of older individuals. Others, includingthose made up of retired union members, may not address aging issues directly, butdo so indirectly through a focus on economic rights and justice. Although manyorganizations focus solely on the welfare of their members or of individuals in aparticular age group, others are beginning to develop an intergenerational perspectiveand are attempting to forge contacts with other organizations and groups in order tobroaden their reach and enhance their political effectiveness.
In our discussion, we have focused on “frame alignment,” a phrase that refers tothe attempt to present the problems that one is dealing with in ways that make one’ssolutions seem plausible. Frames function to convince others of one’s interpretationof a problem area and the best way to address it.We identified frames related to healthand personal enhancement, social participation, economic security, and social as wellas political rights. Individual organizations and groups frame their missions in termsof one or more of these objectives.We have suggested that the greater focus on issuesrelated to agingmay, in fact, reflect the emergence of a transnational socialmovementfocused on the rights of the elderly. Such a movement involves the introduction offrames and discourses based human rights, and a shift in portrayals of the elderlyas dependent and superannuated to the view that for most of life individuals remainactive and effective agents who can act in their own and their community’s behalf.
One potential problem associated with CSOs and other organizations and groupsthat are based on identity or narrow social categorizations is the potential for isolationor narrowness in their agendas. Such a focus on identity politics can undermine amore

178 R. J. Angel et al.
inclusive worker’s or citizen’s perspective. Many of the organizations we identifiedmanifest a narrow generational focus and do not connect their interests to those ofother groups. An excessive focus on individual aging or individual characteristics canlead one to ignore the larger social and political contexts in which aging occurs and inwhich basic human rights are defined. Clearly, social integration and social justice arecore frames in many organizations, but those cannot be defined or fostered narrowly.Justice requires that everyone be treated equitably and have access to basic resources.We end by emphasizing that despite the potential narrowness of identity politics, theimportance of an ethnic and multicultural perspective, as well as the importance ofa major focus on education as the basis of human rights, is imperative in discussionsof all aspects of the institutional context of active aging. The imperative, though, isthat active aging not be framed or viewed solely as an individual process or only afamily matter. Rather it must be recognized as a social process involving the State,the community, and civil society and one that affects everyone since, if we do notdie unnaturally at an early age, we all get old.
References
Aguila, E., Díaz, C., Fu,M.M., Kapteyn, A., & Pierson, A. (2011). Living longer in Mexico: Incomesecurity and health. Washington, DC: AARP.
Alfama, E., Canal, R., & Cruells, M. (2013). Las políticas de envejecimiento activo en el Estadoespañol (2002–2012): ¿Promoviendo la ciudadanía y la participación de las personas mayores?España.
Angel, R. J. (2011). Civil society and eldercare in post-traditional society. In R. A. Settersten & J.L. Angel (Eds.), Handbook of sociology of aging (pp. 549–581). New York, NY: Springer.
Angel, R. J., Angel, J. L., & Hill, T. D. (2014). Longer lives, sicker lives? Increased longevity andextended disability among Mexican-origin elders. Journals of Gerontology. Series B, Psycho-logical Sciences and Social Sciences, 70(4), 639–649. https://doi.org/10.1093/geronb/gbu158.
Boli, J., & Thomas, G. M. (1997). World culture in the world polity: A century of internationalnon-governmental organization. American Sociological Review, 62(2), 171–190.
Boli, J., & Thomas, G. M. (Eds.). (1999). Constructing world culture: International nongovern-mental organizations since 1875. Stanford, CA: Stanford University Press.
Bravo, J. (2015). Ageing and retirement security: United States of America and Mexico. In W. A.Vega, K. S. Markides, J. L. Angel, & F. M. Torres-Gil (Eds.), Challenges of latino aging in theAmericas (pp. 77–89). New York, NY: Springer Science.
Burcher, J. (Ed.). (2008). México solidario: Participación ciudadana y voluntaiado. Mexico, D.F.:Limusa.
CEPAL. (2017). Derechos de las persona mayores: Retos para la interdependencia y autonomía.Santiago, Chile: Naciones Unidas, Comisión Económica para América Latina y el Caribe(CEPAL). https://www.cepal.org/es/publicaciones/41471-derechos-personas-mayores-retos-la-interdependencia-autonomia. Accessed September 15, 2017.
Chiara, M., & Virgilio, M. D. (2005). Gestión social y municipios. De los escritorios del BancoMundial a los barrios del Gran Buenos Aires. Buenos Aires: Prometeo Libros-UNGS.
CONAPO. (2002). Figure 3. Life expectancy at birth by sex, Mexico, 1900–2050.Cotlear, D. (Ed.). (2011). Population aging: Is Latin America ready?. Washington, DC: The WorldBank.
Das, V., & Poole, D. (2004). Anthropology in the margins of the state. Santa Fe, NM: School ofAmerican Research Press.

8 Strengthening Solidarity: A Theoretical Inquiry into the Roles … 179
Enasem. (2013). Encuesta Nacional sobre Salud y Envejecimiento en México. http://www.mhasweb.org/index_Esp.aspx. Accessed December 5, 2017.
Filgueira, F., & Manzi, P. (2017). Pension and income transfers for old age Inter- and intra-generational distribution in comparative perspective. Santiago, Chile: Naciones Unidas,Comisión Económica para América Latina y el Caribe (CEPAL). http://repositorio.cepal.org/bitstream/handle/11362/42087/1/S1700520_en.pdf. Accessed December 14, 2017.
Flores-Castillo, A. (2013). Transferencias no contributivas a personas mayores. Análisis compar-ativo de dos programas: 70 y Más y Pensión Alimentaria de la Ciudad de México. http://repositorio.cepal.org/bitstream/handle/11362/27172/M20130036_es.pdf?sequence=1.
Garay Villegas, S., Montes de Oca Zavala, V., & Guillén, J. C. (2014). Social support and socialnetworks among the elderly in Mexico. Journal of Population Ageing, 7(2), 143–159.
Goffman, E. (1974). Frame analysis. Cambridge, MA: Harvard University Press.Hall-Jones, P. (2006). The rise and rise of NGOs. New York, NY: Global Policy Forum. https://www.globalpolicy.org/component/content/article/176/31937.html. Accessed December 6, 2017.
HSBC. (2015). El futuro del retiro. Decisiones para la tercera edad. Informe de México. London:HSBC Holdings plc. https://www.hsbc.com.mx/1/PA_esf-ca-appcontent/content/inicio/ofertas/retiro/estudio_futuro_retiro.pdf. Accessed December 6, 2017.
Huenchuan, S. (2013). Los derechos de las personas mayores. Santiago, Chile: Naciones Unidas,Comisión Económica para América Latina y el Caribe (CEPAL). https://www.cepal.org/celade/noticias/documentosdetrabajo/8/51618/Derechos_PMayores_M2.pdf. Accessed December 5,2017.
Huenchuan, S. (Ed.) (2016). Envejecimiento e institucionalidad pública en América Latina yel Caribe: Conceptos, metodologías y casos prácticos. Santiago, Chile: Naciones Unidas,Comisión Económica para América Latina y el Caribe (CEPAL).
Hujo, K. (Ed.). (2014). Reforming pensions in developing and transition countries, United Nations,UNRISD. United Kingdom: Pelgrave.
INEGI. (2010). Censo de Población y Vivienda 2010. http://www.inegi.org.mx/lib/olap/consulta/general_ver4/MDXQueryDatos.asp?proy=cpv10_pt. Accessed December 6, 2017.
Keck, M., & Sikkink, K. (1998). Activists beyond borders: Advocacy networks in internationalpolitics. Ithaca, NY: Cornell University Press.
Kinsella, K. G. (1992). Changes in life expectancy 1900–1990. The American Journal of ClinicalNutrition, 55(6), 1196S–1202S.
Kochhar, R. (2014). 10 projections for the global population in 2050. Washington, DC: PewResearch Center. http://www.pewresearch.org/fact-tank/2014/02/03/10-projections-for-the-global-population-in-2050/. Accessed September 7, 2015.
Krause, N. (2006). Social relationships in later life. In R. H. Binstock & L. K. George (Eds.),handbook of aging and the social sciences (6th ed., pp. 181–200).NewYork,NY:Academic Press.
Lee, T. (2010). The rise of international nongovernmental organizations: A top-down or bottom-upexplanation? VOLUNTAS: International Journal of Voluntary and Nonprofit Organizations,21(3), 393–416. https://doi.org/10.1007/s11266-010-9137-5.
Madariaga, A. V. (2005). Lecciones sobre envejecimiento y participación social. La FederaciónIberoamericana de Asociaciones de Personas Adultas Mayores (FIAPAM). http://fiapam.org/wp-content/uploads/2013/11/Lecciones.pdf. Accessed December 7, 2017.
Mesa-Lago, C. (2008). Reassembling social security: A survey of pensions and health care reformsin Latin America. New York, NY: Oxford University Press.
Montes de Oca Zavala, V., Garay, S., Rico, B., & García, S. J. (2014). Living arrangements andaging in Mexico: Changes in households, poverty and regions, 1992–2009. International Journalof Social Sciences Studies, 2(4), 61–74.
Moren-Cross, J. L., & Lin, N. (2006). Social networks and health. In R. H. Binstock & L. K.George (Eds.), Handbook of aging and the social sciences (6th ed., pp. 111–126). New York,NY: Academic Press.

180 R. J. Angel et al.
OAS. (2015). Inter-American convention on protecting the human rights of older persons. NewYork, NY: Organization of American States. http://www.oas.org/en/sla/dil/docs/inter_american_treaties_A-70_human_rights_older_persons.pdf. Accessed September 16, 2017.
OAS. (2017). Inter-American convention on protecting the human rights of older persons (A-70).Washington, DC: Organization of American States. http://www.oas.org/en/about/who_we_are.asp. Accessed December 6, 2017.
Pereira, J., & Angel, R. J. (2009). From adversary to ally: The evolution of non-governmentalorganizations in the context of health reform in Santiago and Montevideo. In S. Babones (Ed.),Social inequality and public health. Bristol, UK: Polity Press.
Pereira, J., Angel, R. J., & Angel, J. L. (2007). A case study of the elder care functions of a Chileannon-governmental organization. Social Science and Medicine, 64, 2096–2106.
Rodríguez-Dorantes, C. (2015). Participación de las organizaciones de la sociedad civil en laatención a personas adultas mayores. Seminario-Taller Internacional Sistemas de Apoyo Formale Informal para Personas Adultas Mayores en México y Estados Unidos, en el contexto de lasreformas en salud y seguridad social. Mexico DF: INGER, SSA, CONACYT. https://www.youtube.com/watch?v=MGeFqpZ-50E. Accessed December 5, 2017.
Rofman, R., Apella, I., & Vezza, E. (Eds.). (2013). Más allá de las pensiones contributivas:Catorce experiencias en América Latina (82724th ed.). Buenos Aires: Banco Mundial.
Snow,D.A., Rochford Jr, E. B.,Worden, S.K.,&Benford, R.D. (1986). Frame alignment processes,micro mobilization, and movement participation. American sociological review, 464–481.
Trouillot, M. R. (2001). The anthropology of the state in the age of globalization: Close encountersof the deceptive kind. Current Anthropology, 42(1), 125–138. https://doi.org/10.1086/318437.
Turner, R. H. (1969). The theme of contemporary social movements. British Journal of Sociology,20, 390–405.
Tussie, D., Mendiburu, M., &Vázques, P. (1997). Los nuevos mandatos de los bancos multilateralesde desarrollo: Su aplicación al caso de Argentina. In O. d. P. d. CBC/FLACSO-Argentina (Ed.),El BID, el Banco Mundial y la sociedad civil sus nuevas modalidades de financiamientointernacional. Buenos Aires: FLACSO.
Valenzuela, P. (2016). Mexico’s reforms and the prospects for growth. Washington, DC: WilsonCenter: Mexico Institute. https://www.wilsoncenter.org/sites/default/files/mexicos_reforms_and_the_prospects_for_growth_final.pdf. Accessed December 9, 2017.
Villagómez, F. A., & Ramírez, G. D. (2013). México. In R. Rofman, I. Apella, & E. Vezza (Eds.),Más allá de las pensiones contributivas: Catorce experiencias en América Latina (pp. 313–349).Buenos Aires: Banco Mundial.
Wanderley, F. (2009). Prácticas estatales y el ejercicio de la ciudadanía: encuentros de la poblacióncon la burocracia en Bolivia. Iconos, 34, 67–79.
WHO. (2002). Active ageing. A policy framework. Geneva: World Health Organization. http://apps.who.int/iris/bitstream/10665/67215/1/WHO_NMH_NPH_02.8.pdf. Accessed December 5,2017.
Willmore, L. (2014). Old Age pensions in Mexico: Toward universal coverage. Rochester, NY:Social Science Research Network. http://dx.doi.org/10.2139/ssrn.2383768. Accessed September11, 2015.

Chapter 9The Magnitude of Health InequalitiesAmong Older Adults in Braziland Mexico
Flávia Cristina Drumond Andrade and Mariana López-Ortega
Abstract This chapter assesses the magnitude of wealth-related inequalities onfive health outcomes (obesity, abdominal obesity, diabetes, hypertension, and heartdisease) among older adults in Brazil and Mexico. Analyses were based on cross-sectional data from the 2013 Brazilian National Health Survey and the 2012MexicanNational Health and Nutrition Survey. Socioeconomic status was based on a wealthindex. We calculated wealth-related inequalities in the prevalence of five health out-comes by calculating the concentration index (CI) and horizontal index (HI). Dataanalyses were performed in STATA SE 14 and ADePT (6.0). Results indicated thatprevalence of obesity, abdominal obesity, diabetes, hypertension, and heart diseasewere higher in the central wealth-quintiles. The concentration indices were all posi-tive, indicating a higher concentration of these health conditions among older adultswho aremore affluent.Wealth inequalities in health conditionsweremainly explainedby socioeconomic factors, such as place of residency and educational attainment,rather than demographic factors, such as age and sex. Nonetheless, in both countries,strong inequities in health prevail. Brazil and Mexico have expanded public healthactions aimed at improving health behaviours, diagnosis, and access to treatmentof chronic conditions. However, prevalence of obesity, abdominal obesity, diabetes,hypertension and heart disease is high in both countries, and among older adults, evenmore concentrated among those with higher wealth. Prevention and early detectionstrategies, including improving lifestyle behaviours, such as physical activity anddietary habits, could benefit both countries.
F. C. D. Andrade (B)Department of Kinesiology and Community Health, University of Illinois at Urbana-Champaign,Champaign, IL, USAe-mail: [email protected]
M. López-OrtegaResearch Department, National Institute of Geriatrics (Instituto Nacional de Geriatría), NationalInstitutes of Health (Institutos Nacionales de Salud), Mexico City, Mexicoe-mail: [email protected]
© Springer Nature Switzerland AG 2019W. A. Vega et al. (eds.), Contextualizing Health and Aging in the Americas,https://doi.org/10.1007/978-3-030-00584-9_9
181

182 F. C. D. Andrade and M. López-Ortega
Introduction
The influence of socioeconomic status on health is well-documented (Black 1982;Whitehead et al. 1992; Smedley and Syme 2001; Wilkinson andMarmot 2003; Mar-mot et al. 2012), and diverse conceptual models have been developed in order toexplain the direct and indirect pathways of the socioeconomic conditions on popu-lation health. Most early studies concentrated on access and quality of health careservices as themain determinants, while later studies found that associations betweenwealth, education, occupation, income, andwork environment, and the onset and pro-gression of disease, functional limitations, and disability persisted even in studiesthat controlled for health care services (Marmot et al. 2008).
While equity has been considered a main indicator of health system perfor-mance, inequalities among the population reflect differences in access and constraintsbetween the better andworse-off, where lower incomes, higher time costs, less accessto health insurance, and adverse living conditions encourage bad health outcomes(Whitehead et al. 1992; Braveman et al. 2001). In studying such inequalities, wealthhas been shown to be a sound indicator, and more sensitive than income in predict-ing inequality in health-related outcomes (Baum 2005; Pollack et al. 2007). Findingsshow that people live longer in nations with lower levels of inequality, while coun-tries with high economic inequality generally present poor health outcomes in mainindicators like life expectancy and infant mortality. In addition, studies have shownthat people who live in low income countries have shorter life expectancy and higherlevels of disability than those living in countries with higher income (Murray et al.2015).
Several mechanisms link health and wealth. Public health scientists tend to focuson how socioeconomic status creates health disparities, while economists have exam-ined how poor health earlier in life impacts economic resources, such as education,income andwealth (Smith 1999). Lower wealth is often associated with worse accessto health care or lower quality of care.Wealth indicators are also associated with edu-cation, occupation and income, all of which are associated with health outcomes aswell. For instance, higher education is associated with safer occupations and higherincomes (Glymour et al. 2014). Over the life course, those in poor health not onlyshow worse financial resources, but they also tend to show smaller gains in wealth(Smith 1999).
Within a particular country, high economic or income inequalities translateinto better health outcomes for those with higher income. This has been describedas the social gradient in health meaning that as individuals go up the economicladder; their health outcomes will improve (Marmot 2010). On the other hand, theunequal distribution of access to health care, schools, education, work conditionsand leisure, adequate housing conditions and environments generate poor healthoutcomes (Marmot et al. 2008).
This study investigates the magnitude of wealth-related inequalities on five healthconditions in older adults in twomiddle-income countries,Brazil andMexico, the twolargest economies inLatinAmerica. The use ofwealth as ameasure of socioeconomic

9 The Magnitude of Health Inequalities Among Older Adults … 183
status remain uncommon in Latin America. Previous studies in Brazil and Mexicohave examined socioeconomic differences in health status, but most have focusedon education or income differences (Oliveira et al. 1996; Dressler and Santos 2000;Torquato et al. 2003; Theme-Filha et al. 2005; Smith and Goldman 2007; Bosi et al.2009;Longo et al. 2009; Fillenbaumet al. 2013; Schmidt et al. 2014;Ortiz-Hernándezet al. 2015; Beltrán-Sánchez and Andrade 2016). However, given the magnitudeof wealth-inequalities in both countries, it is important to evaluate how wealth isassociated with health outcomes in these countries.
Brazil and Mexico have experienced economic growth and increases in nationalwealth in the last three decades (UNDP 2011), but both have persistent high povertyrates and social inequality (Gasparini et al. 2009). Gross national income per capita(current international purchasing power parity) has increased in Brazil from US$6510 in 1990 to US $14,840 in 2016. The increase was even more acute in Mex-ico—from US $5840 to US $17,760 in the same period (World Bank 2018). BothBrazil and Mexico, however, are marked by socioeconomic inequalities (Gaspariniet al. 2009). The Gini coefficient, which ranges between 0 (complete income equal-ity) and 1 (complete income inequality), was 0.53 in Brazil in 2011 and 0.48 inMexico in 2010 (World Bank 2018).
In the last four decades, Brazil andMexico have experienced intense urbanizationand socioeconomic changes which influenced lifestyle behaviours, such as diet andphysical activity (Monteiro et al. 2007; Moura and Claro 2012; Albrecht et al. 2014).Shifts in diet are marked by higher intake of sugar and refined carbohydrates, whilephysical activity levels have decreased. These changes have been associated with anincrease in the prevalence of obesity (Monteiro et al. 2007; Moura and Claro 2012;Albrecht et al. 2014) and related chronic non-communicable diseases, particularlydiabetes, hypertension, and cardiovascular disease (Schmidt et al. 2011; Bertoldiet al. 2013). Due to their population size and the growth of obesity-related healthconditions, Brazil and Mexico are expected to experience the largest number ofdeaths in Latin America related to obesity, diabetes and heart disease (Lim et al.2013; Lozano et al. 2013).
Studies in Latin America show associations between low socioeconomic statusand both lower life expectancy (Messias 2003; Szwarcwald et al. 2011; Camaranoet al. 2014) and lower self-rated health (Chiavegatto Filho et al. 2012). Other studieshave examined the associations between socioeconomic status and prevalence ofchronic conditions, with some inconsistent results depending on the measure ofsocioeconomic status and age groups used (Oliveira et al. 1996; Torquato et al.2003; Theme-Filha et al. 2005; Bosi et al. 2009; Almeida et al. 2013; Schmidt et al.2014).
In a context of rapid population aging and persistent socioeconomic inequalitiesin Brazil andMexico, we expect the prevalence of health conditions to vary bywealthstatus. In this paper, we examine wealth-related inequalities in five health conditionsamong older adults in Brazil andMexico, using a Concentration Index, which allowsfor an analysis of themagnitude of the impact of socioeconomic related inequalities in

184 F. C. D. Andrade and M. López-Ortega
a health variable. We focus on health conditions associated with metabolic syndromeand cardiovascular conditions—obesity, abdominal obesity, diabetes, hypertension,and heart disease, which research has generally shown correlates with age.
Methods
Brazilian Survey and Setting
Individual-level data came from the2013PesquisaNacional deSaúde (PNS). PNS is across-sectional probabilistic population-based surveywith amulti-stage and stratifiedsampling structure. TheMinistry of Health carried out the survey in partnership withtheBrazilianCensusBureau, drawing on a subsample of theBrazilianCensusBureau(Instituto Brasileiro de Geografia e Estatística, IBGE) master sample of the SistemaIntegrado de Pesquisas Domiciliares (Integrated System of Household Surveys).PNS is a household-based survey that covers a wide range of health and nutritionissues, as well as demographic and socioeconomic information at the individual andhousehold levels. The PNS project was approved by the National Commission ofEthics in Research Regulation No. 328.159. All participants signed an informedconsent agreement. For greater detail about the sampling and survey design of thePNS, see Szwarcwald et al. (2014) or Fundação Instituto Oswaldo Cruz’s descriptionof the questionnaires, survey design, and datasets (www.pns.fiocruz.br).
Mexican Survey and Setting
The National Health and Nutrition Survey 2012 (Encuesta Nacional de Salud yNutrición, ENSANUT 2012), a nationally representative data of the Mexican pop-ulation and part of the Mexican National System of Health Surveys, supplied thedata (Romero-Martínez et al 2013). ENSANUT is a cross-sectional probabilisticpopulation-based survey with amulti-stage and stratified sampling structure. Trainedinterviewers conducted face-to-face interviews. For each selected individual in thehousehold, the protocol consists of in-person interviews followed by anthropometricmeasures carried out by trained personnel who followed standard international proto-cols and procedures (Sepúlveda et al. 2007; Gutierrez et al. 2012). ENSANUT 2012covers a wide range of health and nutrition issues, in addition to demographic dataand socioeconomic information at the individual and household levels. The Ethics,Biosecurity, and Research Commissions at the National Institute of Public Health(Instituto Nacional de Salud Pública, INSP) reviewed and approved all operative pro-cedures for ENSANUT 2012. An informed consent document was obtained for allparticipants. For additional information about the sampling design and methodology
9 The Magnitude of Health Inequalities Among Older Adults … 185
for the survey, see Gutierrez et al. (2012) or the INSP’s own documentation (www.insp.mx/ensanut.html).
Participants
The 2013 PNS has general information on 45,010 individuals 50–94 years of age, butmorbidity data are only available for one selected adult resident in each household(N� 20,151). The ENSANUT 2012 final sample included 14,961 adults 50–94 yearsold. However, only some of these individuals had data on body mass index (n �11,411), abdominal obesity (n � 11,394), and only a subsample of participants hadblood pressure measurements (n � 3,963).
Health Outcomes
Body mass index (BMI) and obesity. In both countries, personnel measured height,weight, and waist circumference (WC) with participants wearing light clothingand no shoes. They calculated BMI as weight (kg)/height (m2) and used theseBMI categories: underweight, < 18.5 kg/m2; normal, 18.5–24.9 kg/m2; overweight,25.0–29.9 kg/m2, and obese: ≥ 30.0 kg/m2 (Jensen et al. 2014).
Optimal waist circumference. In Brazil, WC was measured using a metric tapeaccording to a standardized protocol: patients stood without their shoes, with noclothes around the waist area, feet apart and breathing normally. WC was measuredin the midpoint between the 10th rib and the iliac crest, and at the end of the patient’snormal expiration as the World Health Organization suggests (WHO 2008). Person-nel measured WC twice and the average value was used in the analysis. ENSANUTpersonnel used a glass fiber metric tape with 200 cmmaximum length and a precisionof 1 mm for all circumference measurements. WC was measured at the narrowestpart of the trunk. In highly obese individuals where nowaist or narrowing of the trunkwas present, personnel measured the minimal circumference of the abdomen in thezone between the inferior border of the ribs and the iliac crests (López-Ortega andArroyo 2016). Optimal WC was taken to be < 90 cm in men and < 80 cm in women,respectively. The WC cut points are based on the International Diabetes Federation(IDF) for South and Central Americans (Alberti et al. 2005).
Hypertension. PNS personnel measured seated systolic and diastolic blood pres-sure (SBP and DBP) using an automatic blood pressure monitor (G-TECH modelMA 100), properly calibrated, three times. The average of each participant’s read-ings were used for the analyses. ENSANUT personnel measured SDP and DBPtwice using a mercury sphygmomanometer and a digital monitor (Omrom HEM-907 XL) (Campos-Nonato et al. 2013) and averaged the two readings. Hypertensionwas defined as systolic BP ≥ 140 mm Hg, diastolic BP ≥ 90 mm Hg, or taking anant hypertension medication (self-reported).

186 F. C. D. Andrade and M. López-Ortega
Self -reported diabetes and heart disease. PNS personnel asked their Brazil-ian sample “Has a doctor has given you a diagnosis of (health condition)?” whileENSANUT personnel asked Mexicans, “Has a doctor told you that you have (healthcondition)?” Data list those who responded affirmatively as having the chronic con-dition and those who responded negatively as not having it. Women who reportedhaving been diagnosed with diabetes only during pregnancy were not considered tohave diabetes.
Wealth
We used a wealth score index that was obtained using the International Wealth Index(IWI) approach for estimating wealth based on household ownership of durablegoods, access to basic services, and dwelling characteristics. The IWI index was con-structed using principal component analysis and its scale ranges from 0 to 100, withhigher values indicating better quality of housing and services, and more durablesgoods. We used the approach developed by Smits and Steendijk (2015). We usedmicrowave as the ‘cheap utensil’ and washer and computer for ‘expensive utensil’.To allow for the comparability between Mexico and Brazil, we used motorcyclerather than bike in the estimation of the indices. The score was categorized intoquintiles.
Other Characteristics
The following demographic characteristicswere controlled in the analyses: a dichoto-mous variable for female (male as the reference group) and a continuous variablefor age in years. Socioeconomic characteristics included a dichotomous variable forurban (urban vs. rural residence), a dichotomous variable for health insurance (hav-ing insurance vs. not insured), and educational achievement no education, primaryincomplete, primary complete or secondary, and at least some college or more.
Statistical Analysis
Table 9.1 presents descriptive statistics for each survey. We used t-tests to comparegroup means for continuous variables, and chi-square for categorical data. Table 9.2presents age-adjusted prevalence rates of health conditions bywealth-quintiles. Next,we estimated the concentration indices (CI) to quantify the magnitude of wealth-related inequalities in the prevalence of health conditions. The value of the CI variesbetween −1 and 1, with zero indicating there is no inequality. A negative value indi-cates that the health outcome is concentrated among individuals with lower socioeco-

9 The Magnitude of Health Inequalities Among Older Adults … 187
nomic conditions (poorer), whereas positive values indicate that the health outcomeis concentrated among those who are of higher socioeconomic conditions (wealth-ier) (Wagstaff et al. 1991; Van Doorslaer and Wagstaff 1992; Kakwani et al. 1997;O’Donnell and Wagstaff 2008). Inequity was measured using the horizontal index(HI), which measures the degree of socioeconomic inequity in health outcomes forindividuals that have similar health needs based on their demographic character-istics. HI was estimated based on the difference between CI and the contributionof demographic factors (i.e., age and sex) (Wagstaff et al. 1991). Next, the CI wasdecomposed to assess the contribution of demographic and socioeconomic factorsto wealth-related inequity in health outcomes. Results are presented for each healthoutcome, given that results may indicate different strategies to addressing the socialdisparities.
All analyses included sample weights that account for the unequal probabilities ofselection and nonresponse. The concentration index was estimated using the ADePTsoftware version 6.0 developed by the World Bank (Wagstaff 2011). All other statis-tical analyses were performed in Stata/SE 14.2 version (StataCorp, College Station,TX).
Results
As Table 9.1 shows, mean wealth is higher among Brazilians thanMexicans (78.7 vs.70.4, p<0.0001), but a higher proportion ofBrazilians has no formal education (32%)as compared to Mexicans (25%). Prevalence of chronic conditions differs acrosscountries, except for heart disease.Compared toBrazilian older adults,Mexican olderadults have higher prevalence of obesity, abdominal obesity and diabetes. However,prevalence of hypertension is higher in Brazil.
Table 9.2 provides age-adjusted prevalence of health conditions by wealth quin-tiles and country. In both countries, older adults in the lowest quintile have the lowestprevalence rates of health conditions. Prevalence rates tend to be higher in the sec-ond, third and fourth quintiles, reducing afterwards. Nonetheless, older adults inthe highest quintile have higher rates of health conditions than those in the lowestquintile.
Table 9.3 presents the wealth-related CI of the diseases. Results based on bothcountries show that CI are positive for all health outcomes in both countries, indi-cating that all health conditions are more concentrated among older adults who aremore affluent in these societies. Results based on the HI highlight that most of theinequalities are not justified by different needs defined by age and gender, but ratherdue to socioeconomic inequities. When evaluating the results of the decomposition,results indicate that most of the explained portion of the CI is due to socioeconomicfactors, particularly residency and insurance in Brazil, and residency and educationin Mexico.

188 F. C. D. Andrade and M. López-Ortega
Table 9.1 Descriptive statistics by year, Brazil and Mexico (weighted estimates)
Brazil (n � 11,121) Mexico (n � 8516) p-value
Wealth (mean, sd) 78.65, 16.26 70.40, 21.31 < 0.001
Education (%)
No education 31.98 24.97 < 0.001
Primary incomplete 38.63 35.72
Primary complete and secondary 19.20 31.59
Some college or more 10.19 7.71
Age (mean, sd) 69.67, 7.78 70.23, 7.94 < 0.001
Sex (%)
Male 43.73 46.04 < 0.001
Female 56.27 53.96
Urban-Rural (%)
Rural 14.81 24.65 < 0.001
Urban 85.19 75.35
Health insurance (%)
No 67.92 15.93 < 0.001
Yes 32.08 84.07
Obesitya (%)
No 76.58 69.94 < 0.001
Yes 23.42 30.06
Abdominal obesitya (%)
No 19.74 18.53 0.001
Yes 80.26 81.47
Hypertensiona (%)
No 33.93 42.19 < 0.001
Yes 66.07 57.81
Self -reported diabetesb (%)
No 80.88 76.21 < 0.001
Yes 19.12 23.79
Self -reported heart disease (%)
No 88.59 88.47 0.699
Yes 11.41 11.53
Notes aIn Mexico, sample size for BMI was 6491, 6478 for abdominal obesity, and 2444 forhypertensionbIn Brazil, sample size was 10,534 for self-reported diabetes

9 The Magnitude of Health Inequalities Among Older Adults … 189
Table9.2
Age-stand
ardizedprevalence
(%)of
health
cond
ition
s,stratifi
edby
wealth
quintiles:B
raziland
Mexico
Obesity
Abdom
inalobesity
Hypertension
Diabetes
Heartdisease
Brazil
23.3
(21.9,
24.7)
80.2
(79,
81.5)
66.2
(64.7,
67.7)
19.1
(17.8,
20.4)
11.4
(10.3,
12.6)
Wea
lth
quin
tile
Low
estq
uintile
15.4
(13.5,
17.4)
69.8
(67.1,
72.5)
63.6
(60.9,
66.2)
16.4
(14.0,
18.9)
8.1
(6.2,1
0.1)
2nd
24.4
(21.7,
27.1)
81.6
(79.2,
83.9)
67.8
(64.9,
70.6)
19.3
(16.8,
21.8)
11.8
(9.9,1
3.8)
3rd
24.9
(22.0,
27.8)
83.1
(80.4,
85.7)
67.1
(64.0,
70.3)
19.2
(16.6,
21.8)
12.7
(10.5,
14.9)
4th
26.7
(23.1,
30.4)
84.1
(81.3,
86.9)
66.8
(63.2,
70.4)
19.8
(16.5,
23.0)
12.5
(9.4,1
5.7)
Highestqu
intile
25.4
(21.6,
29.3)
83.2
(79.9,
86.6)
65.5
(61.5,
69.4)
20.6
(17.2,
24.0)
12.2
(9.2,1
5.3)
Mexico
30.2
(28.6,
31.7)
81.5
(80.3,
82.8)
57.6
(55.0,
60.2)
23.9
(22.6,
25.2)
11.3
(10.4,
12.3)
Wea
lth
quin
tile
Low
estq
uintile
18.1
(15.7,
20.6)
68.5
(65.5,
71.5)
48.2
(43.0,
53.3)
15.7
(13.5,
17.9)
6.0
(4.7,7
.2)
2nd
32.0
(29.0,
35.0)
81.9
(79.5,
84.3)
53.0
(47.2,
58.9)
24.5
(21.6,
27.4)
10.9
(8.8,1
2.9)
3rd
33.9
(30.4,
37.4)
86.0
(83.5,
88.6)
64.5
(59.6,
69.4)
25.5
(22.4,
28.5)
11.8
(9.8,1
3.8)
4th
37.4
(33.3,
41.5)
87.2
(84.2,
90.2)
65.1
(59.0,
71.1)
29.4
(26.1,
32.7)
15.7
(13,
18.3)
Highestqu
intile
30.9
(27.2,
34.7)
87.4
(84.4,
90.3)
57.2
(49.5,
64.9)
24.8
(21.7,
27.8)
12.5
(10.1,
14.9)

190 F. C. D. Andrade and M. López-Ortega
Table9.3
Decom
positio
nanalysisof
wealth
-related
inequalityin
health
outcom
esam
ongolderadultsin
Braziland
Mexico
Obesity
Abdom
inalobesity
Hypertension
Diabetes
Heartdisease
a CCI
b%
CCI
%CCI
%CCI
%CCI
%
Bra
zil
Age
0.003
3.4
0.000
1.3
−0.002
−16.6
−0.001
−2.2
−0.003
−3.1
Male/Fe
male
0.002
1.5
0.001
2.1
0.000
1.2
0.000
−0.3
−0.001
−0.8
(1)To
tald
emograph
icfactors
0.005
4.9
0.001
3.4
−0.002
−15.4
−0.001
−2.5
−0.003
−3.9
Educatio
n(N
oeducation)
Prim
aryincomplete
0.001
1.3
0.000
0.5
0.000
2.0
0.000
0.0
0.000
0.3
Prim
arycompleteandsecondary
0.004
4.2
0.001
4.1
−0.004
−42.0
−0.010
−17.7
−0.015
−16.9
Somecollege
ormore
−0.008
−7.4
0.003
6.9
−0.006
−55.6
−0.021
−38.6
−0.016
−18.6
Insurance(not
insured)
0.020
19.0
0.004
12.1
0.001
13.6
0.007
12.0
0.029
33.7
Urban
residence(rural)
0.024
23.0
0.010
27.2
0.007
73.3
0.029
53.4
0.041
48.1
(2)To
talS
ES
0.041
40.1
0.018
50.8
−0.001
−8.7
0.005
9.0
0.040
46.5
(3)To
tal(1)+(2)
0.046
45.0
0.020
54.2
−0.002
−24.2
0.004
6.5
0.037
42.6
(4)Residua
l0.057
55.0
0.017
45.8
0.013
124.2
0.051
93.5
0.049
57.4
(5)CI(3)+
(4)c
0.103
100.0
0.036
100.0
0.010
100.0
0.054
100.0
0.086
100.0
(6)HI(5)−
(1)d
0.098
0.035
0.012
0.056
0.090
Mex
ico
Age
0.012
11.4
0.003
5.2
−0.002
−5.0
0.004
3.8
−0.011
−7.9
Male/Fe
male
−0.002
−2.1
−0.001
−1.6
−0.001
−1.6
0.000
−0.2
0.000
−0.1
(1)To
tald
emograph
icfactors
0.010
9.3
0.002
3.5
−0.003
−6.6
0.003
3.6
−0.011
−8.0
(contin
ued)

9 The Magnitude of Health Inequalities Among Older Adults … 191
Table9.3
(contin
ued)
Obesity
Abdom
inalobesity
Hypertension
Diabetes
Heartdisease
a CCI
b%
CCI
%CCI
%CCI
%CCI
%
Educatio
n(N
oeducation)
Prim
aryincomplete
−0.007
−6.6
−0.001
−2.8
−0.004
−7.5
−0.002
−2.3
0.002
1.1
Prim
arycompleteandsecondary
0.014
12.8
0.005
9.5
0.019
39.3
−0.005
−5.7
0.026
18.2
Somecollege
ormore
−0.001
−0.9
0.004
7.0
0.007
14.3
−0.001
−0.9
0.015
10.7
Insurance(not
insured)
0.002
2.3
0.002
4.0
0.005
10.4
0.009
9.0
0.012
8.3
Urban
residence(rural)
0.031
28.3
0.011
20.2
−0.006
−13.1
0.043
44.6
0.032
22.7
(2)To
talS
ES
0.039
35.8
0.020
38.0
0.021
43.4
0.043
44.7
0.086
61.0
(3)To
tal(1)
+(2)
0.049
45.1
0.022
41.5
0.017
36.8
0.046
48.3
0.075
53.1
(4)Residua
l0.060
54.9
0.031
58.5
0.030
63.2
0.049
51.7
0.066
46.9
(5)CI(3)+(4)
0.109
100.0
0.052
100.0
0.048
100.0
0.095
100.0
0.141
100.0
(6)HI(5)−
(1)
0.099
0.050
0.051
0.092
0.152
Not
esa C
CI—
Con
tributionto
concentrationindex
b%—Percento
ftheconcentrationindexexplainedby
thevariable
c CI—Concentratio
nIndex,
and
dH
I—HorizontalInequality
Index

192 F. C. D. Andrade and M. López-Ortega
Discussion
In the past decades, many countries have obtained better health status and increasedlife expectancy.This achievedprogress, however, has not been even and large inequal-ities exist between countries, and between population groups within each country.Health inequalities are a consequence of diverse socioeconomic factors such as livingconditions, educational attainment, employment and working conditions as well ashealth insurance, access to and quality of health care available.
In a context of increasing rates of chronic diseases, most countries affected havestarted towork on strategies to prevent chronic diseases and decrease risk factors suchas unhealthy diets and sedentary lifestyles in an additional effort to curve increasingrates of overweight and obesity, main causes of diseases like diabetes and hyper-tension. Brazil and Mexico are not an exception. In recent years, both governmentshave implemented actions to overcome the epidemic of chronic diseases, and publichealth campaigns and strategies are being developed to tackle increasing prevalenceof obesity, diabetes and hypertension.Nonetheless, health inequalities andwealth dif-ferences in health status prevail. TheBrazilianMinistry ofHealth has been improvingthe surveillance systems for non-communicable diseases and investing in programsaimed at improving diagnosis and access to treatment (Bertoldi et al. 2013). TheMexican Ministry of Health (Secretaría de Salud 2012) on the other hand, imple-mented a national strategy to combat overweight, obesity, and diabetes through acomprehensive strategy that includes health promotion, prevention, and access toeffective treatment, along with changes to fiscal policy (special tax for sugary bev-erages) and sanitary regulations regarding food labels and advertisement. Recentefforts have improved access to health care in the last 10 years and have reducedinequity in health (Gutiérrez et al. 2014; Valle et al. 2014), but those who remainuninsured still have worse medical service utilization (Salinas 2015).
In this study, we investigated the magnitude of wealth-related health inequali-ties by exploring multiple dimensions of health such as obesity, abdominal obesity,and chronic diseases among older adults in Brazil and Mexico. Based on nationallyrepresentative data of older adults from both countries, we demonstrated that Mex-icans show higher levels of obesity, abdominal obesity, and self-reported diabetesthan Brazilians, but the latter have higher rates of hypertension.We found that higherwealth was associated with poorer health outcomes among older adults in both coun-tries. Results indicate that wealth-related inequalities in health outcomes are mostlyexplained by socioeconomic conditions, particularly residence in urban versus ruralareas, education, and health insurance coverage.
The high prevalence of diabetes identified in this study likely reflects the impact ofexcessive weight. In Brazil, studies have shown that as nutrition transitioned towardsa higher intake of sugar and refined carbohydrates, women of low socioeconomicconditions tended to gain weight in earlier stages of this nutrition transition, whereasmen of lower socioeconomic conditions gained weight at later stages (Monteiroet al. 2004). In this study, we found that obesity among older adults was moreconcentrated among those with higher socioeconomic conditions, with men in Brazil

9 The Magnitude of Health Inequalities Among Older Adults … 193
positively contributing to this disparity. In Mexico, older adults who were moreaffluent had higher prevalence of obesity, whereas previous findings from a study,which focused on adults 20 and older andwas based onENSANUT2006, found lowerlevels of obesity among those with higher education (Beltrán-Sánchez et al. 2016).A review of socioeconomic inequality and health conditions in Mexico, however,found that adults in households that spend more had a higher rate of obesity thantheir poorer counterparts (Ortiz-Hernandez et al. 2014). Another study with adults50years of age andolder found an association betweenhigher incomeandhigher ratesof obesity, smoking, and excessive consumption of alcohol, which is similar to ourstudy (Smith and Goldman 2007). Patterns identified in our study contradict patternsin more developed countries (Hajat et al. 2010), but are in agreement with globalestimates that point to a positive association between higher gross domestic productand obesity (Wells et al. 2012). These differences indicate that obesity prevalenceincreases in earlier stages of economic development. This may explain why theassociation between wealth and obesity is positive among older adults, but seems toreverse among younger cohorts in these countries. Thus, socioeconomic differentialsin obesity differ across cohorts, and different socioeconomic indicators may play adifferent role in diagnosis and treatment of health conditions.
Previous studies in Brazil and Mexico have identified socioeconomic differencesin diabetes prevalence, with higher prevalence rates of diabetes among those withlower educational levels (Torquato et al. 2003; Rull et al. 2005; Theme-Filha et al.2005;Bosi et al. 2009; Schmidt et al. 2014).However, studies fromBrazil andMexicohave shown that prevalence of chronic conditions in both countries are higher amongthose with higher levels of income, which parallel our findings based on wealth(Almeida et al. 2013; Barraza-Lloréns et al. 2013). In fact, even though adults withhigher income report having more chronic conditions, they have better access tohealth care and self-report better health than thosewith lower income levels (Almeidaet al. 2013; Barraza-Lloréns et al. 2013). Similarly to the findings related to obesity,findings for Brazil andMexico differ from studies in developed countries where thereis a negative relationship between household wealth and metabolic syndrome (Perelet al. 2006).
Related to hypertension and cardiovascular disease, this study found that preva-lence of self-reported hypertension and heart disease in Brazil and Mexico seemsmore concentrated on wealthier older adults. These results are similar to those foundin India where cardiovascular disease was more concentrated among more affluentgroups (Vellakkal et al. 2013), but in conflict with studies from developed coun-tries, which indicate that hypertension and heart disease are more common amongindividuals with lower wealth (Avendano et al. 2009). Older adults in Brazil andMexico who are more affluent have higher prevalence of obesity and hypertension,but hypertension treatment and control tend to have a pro-rich distribution. Findingsfrom Palafox et al. (2016) found pro-rich (i.e., negative CI) wealth inequalities inawareness, treatment, and control of hypertension among adults in Brazil.
InBrazil, differences in health outcomesweremostly explained by socioeconomicconditions, particularly access to private health care and education. This is similar tofindings reported by Almeida et al. (2013) based on data from the Brazilian National

194 F. C. D. Andrade and M. López-Ortega
Household Surveys from1998 to 2008. InBrazil, everyone can use the public nationalhealth care system, but individuals who are exclusive users of public services, whoare often less-educated and poor, have to wait longer for treatment than those whoalso have access to private health insurance (Gouveia et al. 2005).
In Mexico, differences in health outcomes were also mostly explained by socioe-conomic factors such as health insurance, area of residence, and education. Resultsbased on previous data fromENSANUT indicate that variables, such as education andhealth insurance, are stronger determinants of health inequalities in health care uti-lization than need variables, such as age, gender, and health status (Barraza-Llorénset al. 2013). These findings confirm previous studies which highlighted the importantrole of access and quality of health care services in acting as important determinantsof health outcomes (Marmot et al. 2008).
Few limitations of the study should be noted. First, information on chronic dis-eases in both countries relies on self-report of such conditions. This may be subject todiagnosis bias,mostly in the formof underreporting due to unawareness (Burgard andChen 2014). Diabetes tends to be underreported, which suggests that our results mayundercount diabetes incidence among the samples. Accuracy, primarily underreport-ing, of self-reported health conditions may also vary depending on socioeconomiccharacteristics, such as educational level and access to health insurance (Burgard andChen 2014). Second, differences between countries regarding anthropometric mea-surements may also limit our findings. In Brazil, waist circumference was measuredin the midpoint between the lowest rib and iliac crest, whereas, in Mexico, waist cir-cumference was based on the narrowest area of the trunk. Thus, rates of abdominalobesity are not comparable across the two countries. In addition, the IDF-set cut-offpoints for abdominal obesity may be inappropriate to predict health risks at olderages and age-specific cutoffs (Turcato et al. 2000; Heim et al. 2011). There are alsoimportant ethnic variations in waist circumference (Shi et al. 2017). Additionally,our study is focused on older adults, and their health experiences may differ fromthose of younger cohorts. In addition, at older ages, wealth indicates how individualswere able to accumulate resources over the life course. This accumulation dependsnot only on their occupation and income, but also on their health experiences. Aparticularly severe condition may result in lower savings as individuals may have touse their resources to cope with the costs of the disease. Finally, other socioeconomicmeasures not included in the present study, such as main occupation across the lifes-pan and working conditions could help understand the health disparities found bywealth in Brazil and Mexico.
Given the persistent health inequalities in Brazil andMexico, regardless of currentstrategies, future studies of Mexican and Brazilian older adults should explore theimpact of different occupations and working conditions throughout the life course,on health status. In addition, longitudinal studies would help disentangle the long-term effects of childhood conditions, education, and main occupation throughoutadulthood. Given the impact of place of residency (urban vs. rural) in explaining alarge part of the CI, both in Brazil andMexico, further studies on the negative effectsof urbanization should be considered as factors explaining observed differences inhealth through its social determinants.

9 The Magnitude of Health Inequalities Among Older Adults … 195
In both countries, targeting lifestyle behaviours, such as physical inactivity andpoor dietary habits, which improve cardio metabolic conditions, such as waist cir-cumference and body fat (Oliveira et al. 2014), would be of great benefit. Whiledifferent social groups respond differently to interventions and policies dependingon their cultural norms and beliefs, and in particular, given the differences found inboth countries; ad hoc strategies targeted at different regions and age groups mayhave better results.
References
Alberti, K. G., Zimmet, P., & Shaw, J. (2005). The metabolic syndrome—A new worldwide defini-tion. The Lancet, 366(9491), 1059–1062. https://doi.org/10.1016/S0140-6736(05)67402-8.
Albrecht, S. S., Barquera, S., & Popkin, B. M. (2014). Exploring secular changes in the associationbetween BMI and waist circumference in Mexican-Origin and white women: A comparison ofMexico and the United States. American Journal of Human Biology, 26(5), 627–634.
Almeida, G., Sarti, F. M., Ferreira, F. F., Diaz, M. D. M., & Campino, A. C. C. (2013). Analysisof the evolution and determinants of income-related inequalities in the Brazilian health system,1998–2008. Revista Panamericana de Salud Pública, 33(2), 90–97.
Avendano, M., Glymour, M. M., Banks, J., & Mackenbach, J. P. (2009). Health disadvantage in USadults aged 50 to 74 years: A comparison of the health of rich and poor Americans with that ofEuropeans. American Journal of Public Health, 99(3), 540–548.
Barraza-Lloréns, M., Panopoulou, G., & Díaz, B. Y. (2013). Income-related inequalities andinequities in health and health care utilization in Mexico, 2000–2006. Revista Panamericanade Salud Pública, 33(2), 122–130.
Baum, F. (2005). Wealth and health: The need for more strategic public health research. Journal ofEpidemiology and Community Health, 59(7), 542–545.
Beltrán-Sánchez, H., & Andrade, F. C. (2016). Time trends in adult chronic disease inequalities byeducation in Brazil: 1998–2013. International Journal for Equity in Health, 15(1), 139.
Beltrán-Sánchez, H., Palloni, A., Riosmena, F., &Wong, R. (2016). SES gradients amongMexicansin the United States and in Mexico: A new twist to the Hispanic paradox? Demography, 53(5),1555–1581.
Bertoldi, A. D., Kanavos, P., França, G. V., Carraro, A., Tejada, C. A. O., Hallal, P. C., et al. (2013).Epidemiology, management, complications and costs associated with type 2 diabetes in Brazil:A comprehensive literature review. Globalization and Health, 9(1), 1.
Black, S. D. (1982). Inequalities in health: The Black report.Bosi, P. L., Carvalho, A. M., Contrera, D., Casale, G., Pereira, M. A., Gronner, M. F., et al. (2009).Prevalence of diabetes and impaired glucose tolerance in the urban population of 30 to 79 yearsof the city of São Carlos, São Paulo. Arquivos Brasileiros de Endocrinologia & Metabologia,53(6), 726–732.
Braveman, P., Starfield, B., & Geiger, H. J. (2001). World Health Report 2000: How it removesequity from the agenda for public health monitoring and policy. BMJ British Medical Journal,323(7314), 678.
Burgard, S. A., & Chen, P. V. (2014). Challenges of health measurement in studies of healthdisparities. Social Science and Medicine, 106, 143–150.
Camarano, A. A., Kanso, S., & Fernandes, D. (2014). Menos jovens e mais idosos no mercado detrabalho? InA.A. Camarano (Ed.),Novo Regime Demográfico uma nova relação entre populaçãoe desenvolvimento? (pp. 377–406). Rio de Janeiro, Brazil: Ipea: Instituto de Pesquisa EconomicaAplicada.

196 F. C. D. Andrade and M. López-Ortega
Campos-Nonato, I., Hernández-Barrera, L., Rojas-Martínez, R., Pedroza, A., Medina-García, C.,& Barquera-Cervera, S. (2013). Hipertensión arterial: Prevalencia, diagnóstico oportuno, controly tendencias en adultos mexicanos. Salud Pública de México, 55, S144–S150.
Chiavegatto Filho, A. D. P., Lebrão, M. L., & Kawachi, I. (2012). Income inequality and elderlyself-rated health in São Paulo. Brazil. Annals of Epidemiology, 22(12), 863–867.
Dressler, W. W., & Santos, J Ed. (2000). Social and cultural dimensions of hypertension in Brazil:A review. Cadernos de Saúde Pública, 16(2), 303–315.
Fillenbaum, G. G., Blay, S. L., Pieper, C. F., King, K. E., Andreoli, S. B., & Gastal, F. L. (2013).The association of health and income in the elderly: Experience from a southern state of Brazil.PLoS ONE, 8(9), e73930.
Gasparini, L., Cruces, G., Tornarolli, L., & Marchionni, M. (2009). A turning point? Recent devel-opments on inequality in Latin America and the Caribbean.
Glymour, M. M., Avendano, M., & Kawachi, I. (2014). Socioeconomic status and health. SocialEpidemiology, 2, 17–63.
Gouveia, G. C., Souza, W. V., Luna, C. F., Souza-Júnior, P. R. B., & Szwarcwald, C. L. (2005).Health care users’ satisfaction in Brazil, 2003. Cadernos de Saúde Pública, 21, S109–S118.
Gutiérrez, J. P., García-Saisó, S., Dolci, G. F., & Ávila, M. H. (2014). Effective access to healthcare in Mexico. BMC Health Services Research, 14(1), 186.
Gutierrez, J. P., Rivera-Dommarco, J., Shamah-Levy, T., Villalpando-Hernández, S., Franco, A.,Cuevas-Nasu, L. et al. (2012). Encuesta nacional de salud y nutrición 2012. In ResultadosNacionales. (pp. 1–196). Cuernavaca, México: Instituto Nacional de Salud Pública.
Hajat, A., Kaufman, J., Rose, K., Siddiqi, A., & Thomas, J. (2010). Do the wealthy have a healthadvantage? Cardiovascular disease risk factors and wealth. Social Science and Medicine, 71(11),1935–1942.
Heim, N., Snijder, M. B., Heymans, M. W., Deeg, D. J. H., Seidell, J. C., & Visser, M. (2011).Optimal cutoff values for high-risk waist circumference in older adults based on related healthoutcomes. American Journal of Epidemiology, 174(4), 479–489. https://doi.org/10.1093/aje/kwr093.
Jensen, M. D., Ryan, D. H., Apovian, C. M., Ard, J. D., Comuzzie, A. G., Donato, K. A. et al.(2014). 2013 AHA/ACC/TOS guideline for the management of overweight and obesity in adults:A report of the American College of Cardiology/American Heart Association Task Force onPractice Guidelines and The Obesity Society. Journal of the American College of Cardiology,63(25_PA).
Kakwani, N., Wagstaff, A., & Van Doorslaer, E. (1997). Socioeconomic inequalities in health:Measurement, computation, and statistical inference. Journal of Econometrics, 77(1), 87–103.
Lim, S. S., Vos, T., Flaxman, A. D., Danaei, G., Shibuya, K., Adair-Rohani, H., et al. (2013). Acomparative risk assessment of burden of disease and injury attributable to 67 risk factors andrisk factor clusters in 21 regions, 1990–2010: A systematic analysis for the Global Burden ofDisease Study 2010. The Lancet, 380(9859), 2224–2260.
Longo, G. Z., Neves, Jd, Luciano, V. M., & Peres, M. A. (2009). Prevalence of high blood pressurelevels and associated factors among adults in Southern Brazil. Arquivos Brasileiros de Cardiolo-gia, 93(4), 387–394.
López-Ortega, M., & Arroyo, P. (2016). Anthropometric characteristics and body composition inMexican older adults: Age and sex differences. British Journal of Nutrition, 115(03), 490–499.
Lozano, R., Naghavi, M., Foreman, K., Lim, S., Shibuya, K., Aboyans, V., et al. (2013). Global andregional mortality from 235 causes of death for 20 age groups in 1990 and 2010: A systematicanalysis for the Global Burden of Disease Study 2010. The Lancet, 380(9859), 2095–2128.
Marmot, M. (2010). Fair society, healthy lives: The Marmot review. Final report.Marmot, M., Allen, J., Bell, R., Bloomer, E., & Goldblatt, P. (2012). WHO European review ofsocial determinants of health and the health divide. The Lancet, 380(9846), 1011–1029.
Marmot, M., Friel, S., Bell, R., Houweling, T. A., Taylor, S., & Health, C. O. S. D. (2008). Closingthe gap in a generation: health equity through action on the social determinants of health. TheLancet, 372(9650), 1661–1669.
9 The Magnitude of Health Inequalities Among Older Adults … 197
Messias, E. (2003). Income inequality, illiteracy rate, and life expectancy in Brazil. AmericanJournal of Public Health, 93(8), 1294–1296.
Monteiro, C. A., Conde, W. L., & Popkin, B. M. (2007). Income-specific trends in obesity in Brazil:1975 2003. American Journal of Public Health, 97(10), 1808–1812. https://doi.org/10.2105/AJPH.2006.099630.
Monteiro, C. A., Moura, E. C., Conde, W. L., & Popkin, B. M. (2004). Socioeconomic status andobesity in adult populations of developing countries: A review. Bulletin of the World HealthOrganization, 82(12), 940–946.
Moura, E. C.,&Claro, R.M. (2012). Estimates of obesity trends inBrazil, 2006–2009. InternationalJournal of Public Health, 57(1), 127–133.
Murray, C. J., Barber, R. M., Foreman, K. J., Ozgoren, A. A., Abd-Allah, F., Abera, S. F., et al.(2015). Global, regional, and national disability-adjusted life years (DALYs) for 306 diseasesand injuries and healthy life expectancy (HALE) for 188 countries, 1990–2013: quantifying theepidemiological transition. The Lancet, 386(10009), 2145–2191.
O’Donnell, O. A., & Wagstaff, A. (2008). Analyzing health equity using household survey data: Aguide to techniques and their implementation: World Bank Publications.
Oliveira, A., Cocate, P. G., Hermsdorff, H. H. M., Bressan, J., de Silva, M. F., Rodrigues, J. A., et al.(2014). Waist circumference measures: Cutoff analyses to detect obesity and cardiometabolicrisk factors in a Southeast Brazilian middle-aged men population-a cross-sectional study. Lipidsin Health and Disease, 13(1), 1.
Oliveira, J. E., Milech, A., & Franco, L. J. (1996). The prevalence of diabetes in Rio de Janeiro,Brazil. The Cooperative Group for the Study of Diabetes Prevalence in Rio De Janeiro. DiabetesCare, 19(6), 663–666.
Ortiz-Hernández, L., Pérez-Salgado, D., & Tamez-Gonzáleza, S. (2015). Desigualdad socioe-conómica y salud en México. Revista Médica del Instituto Mexicano del Seguro Social, 53(3),336–347.
Palafox, B., McKee, M., Balabanova, D., AlHabib, K. F., Bahonar, A., Ismail, N., et al. (2016).Wealth and cardiovascular health: A cross-sectional study of wealth-related inequalities in theawareness, treatment and control of hypertension in high-, middle-and low-income countries.International Journal for Equity in Health, 15(1), 199.
Perel, P., Langenberg, C., Ferrie, J., Moser, K., Brunner, E., & Marmot, M. (2006). Householdwealth and the metabolic syndrome in theWhitehall II study. Diabetes Care, 29(12), 2694–2700.
Pollack, C. E., Chideya, S., Cubbin, C., Williams, B., Dekker, M., & Braveman, P. (2007). Shouldhealth studies measure wealth? A systematic review. American Journal of Preventive Medicine,33(3), 250–264.
Romero-Martínez M, Shamah-Levy T, Franco-Núñez A, Villalpando S, Cuevas-Nasu L, GutiérrezJP, et al. (2013). Encuesta Nacional de Salud y Nutrición 2012: diseño y cobertura. Salud PublicaMex, 55(2):S332–S340.
Rull, J. A., Aguilar-Salinas, C. A., Rojas, R., Rios-Torres, J. M., Gomez-Perez, F. J., & Olaiz,G. (2005). Epidemiology of type 2 diabetes in Mexico. Archives of Medical Research, 36(3),188–196.
Salinas, J. J. (2015). Preventive health screening utilization in older Mexicans before and afterhealthcare reform. Salud Pública de México, 57, s70–s78.
Schmidt, M. I., Duncan, B. B., E Silva, G. A., Menezes, A. M., Monteiro, C. A., Barreto, S. M.et al. (2011). Chronic non-communicable diseases in Brazil: Burden and current challenges. TheLancet, 377(9781), 1949–1961. https://doi.org/10.1016/s0140-6736(11)60135-9.
Schmidt, M. I., Hoffmann, J. F., Diniz, M. F. S., Lotufo, P. A., Griep, R. H., Bensenor, I. M., et al.(2014). High prevalence of diabetes and intermediate hyperglycemia—The Brazilian Longitudi-nal Study of Adult Health (ELSA-Brasil). Diabetology & Metabolic Syndrome, 6(1), 1.
Secretaría de Salud (2012). Estrategia nacional para la prevención y el control del sobrepeso, laobesidad y la diabetes. http://promocion.salud.gob.mx/dgps/interior1/estrategia.html.
Sepúlveda, J., Tapia-Conyer, R., Velásquez, O., Valdespino, J. L., Olaiz-Fernández, G., Kuri, P.,et al. (2007). Diseño y metodología de la Encuesta Nacional de Salud 2000. Salud Pública deMéxico, 49, s427–s432.
198 F. C. D. Andrade and M. López-Ortega
Shi, W., Neubeck, L., & Gallagher, R. (2017). Measurement matters: A systematic review of waistmeasurement sites for determining central adiposity. Collegian, 24(5), 513–523.
Smedley, B. D., & Syme, S. L. (2001). Promoting health: Intervention strategies from social andbehavioral research. American Journal of Health Promotion, 15(3), 149–166.
Smith, J. P. (1999). Healthy bodies and thickwallets: The dual relation between health and economicstatus. The Journal of Economic Perspectives: A Journal of the American Economic Association,13(2), 144.
Smith, K. V., & Goldman, N. (2007). Socioeconomic differences in health among older adults inMexico. Social Science and Medicine, 65(7), 1372–1385.
Smits, J., & Steendijk, R. (2015). The international wealth index (IWI). Social Indicators Research,122(1), 65–85.
Szwarcwald, C. L., Correa da Mota, J., Damacena, G. N., & Sardinha Pereira, T. G. (2011). Healthinequalities in Rio de Janeiro, Brazil: Lower healthy life expectancy in socioeconomically disad-vantaged areas. American Journal of Public Health, 101(3), 517–523. https://doi.org/10.2105/AJPH.2010.195453.
Szwarcwald, C. L., Malta, D. C., Pereira, C. A., Vieira, M. L. F. P., Conde, W. L., Souza Junior, PR Bd, et al. (2014). National Health Survey in Brazil: Design and methodology of application.Ciencia & Saude Coletiva, 19(2), 333–342.
Theme-Filha, M. M., Szwarcwald, C. L., & Souza-Júnior, P R Bd. (2005). Socio-demographiccharacteristics, treatment coverage, and self-rated health of individuals who reported six chronicdiseases in Brazil, 2003. Cadernos de Saúde Pública, 21, S43–S53.
Torquato, M. T., Montenegro Junior, R. M., Viana, L. A., de Souza, R. A., Lanna, C. M., Lucas,J. C., et al. (2003). Prevalence of diabetes mellitus and impaired glucose tolerance in the urbanpopulation aged 30–69 years in Ribeirao Preto (Sao Paulo). Brazil. Sao Paulo Medical Journal,121(6), 224–230.
Turcato, E., Bosello, O., Di Francesco, V., Harris, T. B., Zoico, E., Bissoli, L., et al. (2000). Waistcircumference and abdominal sagittal diameter as surrogates of body fat distribution in the elderly:their relationwith cardiovascular risk factors. International Journal of Obesity, 24(8), 1005–1010.
United Nations Development Programme, UNDP. (2011). Human development report2011—Sustainability and equity: A better future for all.
Valle, A. M., Terrazas, P., & Alvarez, F. (2014). How to reduce health inequities by targetingsocial determinants: The role of the health sector in Mexico/Como reducir las inequidades desalud actuando sobre sus determinantes sociales: el papel del sector salud en Mexico. RevistaPanamericana de Salud Pública, 35(4), 264–270.
Van Doorslaer, E., & Wagstaff, A. (1992). Equity in the delivery of health care: Some internationalcomparisons. Journal of Health Economics, 11(4), 389–411.
Vellakkal, S., Subramanian, S., Millett, C., Basu, S., Stuckler, D., & Ebrahim, S. (2013). Socioe-conomic inequalities in non-communicable diseases prevalence in India: Disparities betweenself-reported diagnoses and standardized measures. PLoS ONE, 8(7), e68219.
Wagstaff, A. (2011). Health equity and financial protection: Streamlined analysis with ADePTsoftware. World Bank Publications.
Wagstaff, A., Paci, P., & Van Doorslaer, E. (1991). On the measurement of inequalities in health.Social Science and Medicine, 33(5), 545–557.
Wells, J. C.,Marphatia, A.A., Cole, T. J.,&McCoy,D. (2012).Associations of economic and genderinequality with global obesity prevalence: Understanding the female excess. Social Science andMedicine, 75(3), 482–490.
Whitehead, M., Townsend, P., & Davidsen, N. (1992). Inequalities in health: The Black report: Thehealth divide. Penguin.
WHO. (2008). Waist circumference and waist-hip ratio (pp. 8–11). Report of a WHO Expert Con-sultation. Geneva: World Health Organization.
Wilkinson, R. G., & Marmot, M. (2003). Social determinants of health: The solid facts. WorldHealth Organization.
World Bank. (2018). World development indicators. Washington, DC: The World Bank.

Part IIIContextual Elements for Successful Aging
The conditions of modern aging are strikingly diverse. Although the average personnow lives a longer, healthier life, that does not hold true for everyone. Behind theaverage health are noticeable differences originating from income, education,genetics, lifestyle, and environment. And as more people age, these disparitiesgrow. We define Healthy Aging as the process of developing and maintaining thefunctional ability that enables well-being in older age, following the World Reporton Ageing and Health 2015 by the World Health Organization. Unlike the originalsuccessful aging model, on which central aspects of aging better than usual includelow rates and risks of disease, high levels of physical and cognitive functioning, andengagement in productive activities, healthy aging means that it would be possibleto have a health condition and still enjoy health.
Central to this conceptualization of healthy aging is an understanding that nei-ther intrinsic capacity nor functional ability remains constant. Although both tend todecline with increasing age, economic and social determinants, life choices, orinterventions at different points during the life course will determine the path ofeach individual. Healthy Aging remains relevant to every older person because theirexperience of Healthy Aging may always become more or less positive if they haveaccess to well-being and health care that optimizes their capacity and if they live insupportive environments.
In terms of physical functioning, nearly 20% of men and 30% of women olderthan 65 years in the United States experience some form of functional limitation.Moreover, being disabled exacerbates the risk of mortality, and increases healthcarecosts. Thus, identifying determinants and ways to limit disability while aging isimportant to help reduce excess mortality as well as individual and public healthexpenditures, and is clearly central to healthy aging.
Unlike the healthy aging model, the disablement process model emphasizes bothdisease and physical functioning. The disablement processes model, however,specifies a particular temporal arrangement between disease and physical
Luis Miguel F. Gutiérrez Robledo
L. M. F. Gutiérrez RobledoNational Institute of Geriatrics (Instituto Nacional de Geriatría), National Institutes of Healthof Mexico (Institutos Nacionales de Salud de México), Mexico City, Mexico

functioning. According to the disablement process model, disability begins withdiseases that elevate the risk for restrictions in performing fundamental physicalactivities. Functional limitations, in turn, subsequently elevate the risk for activitiesof daily living limitations which, also in turn, increases the risk of mortality.Although mortality represents the final stage of the process, the pathway fromdisease, usually chronic conditions, to functional limitation is particularly importantas it is profoundly influenced by the milieu, and thus, at this intermediary stage,place and environment play a central role.
It is increasingly clear that certain factors may attenuate the progression towarddisablement. For instance, the influence of suffering from a new chronic conditionon activities of daily living limitations is smaller among those engaging in physicalexercises, and the influence of chronic conditions on subsequent level of functionallimitations is smaller among those who are married.
Optimizing functional ability might be achieved in several strongly intercon-nected domains that are essential for enabling older people to do the things that theyvalue; these are the abilities to: meet their basic needs; learn, grow, and makedecisions; be mobile; build and maintain relationships; and contribute. What olderpeople can do is only part of their potential. What they are actually able to do, theirfunctional ability, will depend on the fit between them and their environment.Pervasive ageist stereotypes also tend to limit our ability to appreciate and releasethe human potential inherent in older persons. The effect of environments will alsoinfluence one older person differently from the next depending on factors such asgender, migration status, ethnicity, or level of education. This may result in unequalaccess to material or psychological support, or limit behavioral options and, thus,affect a person’s ability to experience healthy aging.
In this context, we gather here a series of papers which relate to disparities inhealthy aging and disability. First, the chapter entitled: Lessons Learned from thePositive Minds—Strong Bodies Trial on Disability Prevention for Racial/EthnicMinority Elders (Chap. 10) by Ali and colleagues, which addresses the issue ofminority elders who suffer significant health disparities, such as a higher prevalenceof late-life depression and worse access to quality mental health care than theirwhite counterparts. The intervention described aimed to develop collaborativepartnerships to evaluate the capacity of community-based organizations and clinicsto provide disability prevention services, to evaluate the acceptability and efficacyof a combined behavioral health and disability prevention intervention, and todetermine the organizational feasibility and sustainability of the intervention.Several challenges undermine and put in risk the feasibility of the intervention dueto specific challenges related to participant recruitment and retention, includingmedical comorbidity and time commitments issues, as well as high staff turnoverand logistical issues with intervention delivery.
The next chapter: Older Latinos’ Financial Security: Resources, Needs, andFuture Prospects (Chap. 11) by Johnson and colleagues assessed Latinos’ retire-ment security, including their financial resources and retirement needs, showing
200 Part III: Contextual Elements for Successful Aging

past trends and future prospects. With data from several reliable sources, theycompared poverty rates, income and wealth, health and disability, relationshipstatus, and household composition for Latinos and non-Latinos ages 65 and older.The use of the Urban Institute’s Dynamic Simulation of Income Model allowed forprojecting income and wealth for future generations. The results are disappointingas they show how older Latinos receive less income, hold less wealth, and are morelikely to be impoverished than their non-Latino white counterparts. Financial out-comes are significantly worse for older foreign-born Latinos than for those born inthe United States. However, projections indicate that the gaps will somehow narrowin the nearby future.
This is worrisome for we know that lack of financial security in older age is amajor obstacle to healthy aging and to reducing health inequity. The prevalence ofpoverty among older people compared to that in the general population variessignificantly across the world. In Europe, one in every five older persons has anincome below the poverty line, with people older than 80 years being the mostseverely affected. This suggests that local policies make a significant difference. Inhigh-income countries in general, an individual’s level of financial security tends tochange little across the life course. In countries in Latin America, householdscomprising only older people generally have less financial security than householdscomprising a mix of ages; but poverty rates among older people tend to be lowerthan among the general population. Specific groups are at greater risk of not beingable to meet their basic need for financial security.
Disability and the Immigrant Health Paradox: Gender and Timing of Migration(Chap. 12) by Garcia and colleagues. Research has documented better health andlonger life expectancy among the foreign-born compared to their U.S.-bornMexican-origin immigrant population. The healthy immigrant effect likely varies bykey structural and demographic factors such as gender, migration history, andduration in the United States. A life course framework, using data from theHispanic Established Populations for the Epidemiologic Study of the Elderly,demonstrates how age of migration is an important determinant for disabilityamong both men and women. The healthy immigrant hypothesis only happensamong mid- and late-life migrant men, while among immigrant women, late-lifemigrants are more likely to have IADL impairments, putting them at a healthdisadvantage. This is probably due indeed to a later arrival of functionally impairedwomen that reach toward their families for support in old age.
Cantu and Angel follow with the paper: Limited but Not Disabled: SubjectiveVersus Objective Measurement of Functional Status and Mortality Risk amongElderly Mexican Americans (Chap. 13). Here, the authors specifically address threequestions: Are there significant discrepancies between objectively measured func-tional limitations and self-reported disability? How does mortality vary by differentsorts of discrepancy? And finally, is the association between discrepancies andmortality affected by psychological, cultural, and social factors net of physicalillness? Differences between “Optimists” and “Realists” reveal that the association
Part III: Contextual Elements for Successful Aging 201

between optimism and mortality is mediated by differences in the number anddegree of severity of instrumental activities of daily living impairment and theindependent living capacities these measures represent, raising the issue of potentialunderlying environmental differences.
New social constructs arise as the authors contribute to advance the challengingresearch agenda of Latino healthy aging illustrating how place can be used forbuilding theory and generating hypotheses in a wide variety of applications.
202 Part III: Contextual Elements for Successful Aging
Chapter 10Lessons Learned from the PositiveMinds—Strong Bodies Trial on DisabilityPrevention for Racial/Ethnic MinorityElders
Naomi Ali, Margarita Alegría, Esther Velásquez, Kathleen Tang,Lizbeth Herrera Duran and Karissa DiMarzio
Abstract Racial/ethnic minority elders (60+) have a higher prevalence of late lifedepression (LLD) and worse access to and quality of mental health care than theirwhite counterparts. Past research has linked LLD to a decline in cognitive function-ing and an increased risk of developing dementia and chronic physical conditions.Our Positive Minds-Strong Bodies (PM-SB) program aims to address the significantprevalence of physical and mental disability among racial/ethnic minority elders, agroup that is projected to represent 40% of the US population by 2050. The inter-vention aimed to: (1) develop collaborative partnerships to evaluate the capacityof community-based organizations and clinics to provide disability prevention ser-vices; (2) evaluate the acceptability and efficacy of a combined behavioral healthand disability prevention intervention; and (3) determine the organizational feasi-
N. Ali · M. Alegría (B) · E. Velásquez · K. Tang · L. H. Duran · K. DiMarzioDisparities Research Unit, Department of Medicine, Massachusetts General Hospital, Boston,MA, USAe-mail: [email protected]
N. Alie-mail: [email protected]
E. Velásqueze-mail: [email protected]
K. Tange-mail: [email protected]
L. H. Durane-mail: [email protected]
K. DiMarzioe-mail: [email protected]
M. AlegríaDepartments of Medicine and Psychiatry, Harvard Medical School, Boston, MA, USA
© Springer Nature Switzerland AG 2019W. A. Vega et al. (eds.), Contextualizing Health and Aging in the Americas,https://doi.org/10.1007/978-3-030-00584-9_10
203

204 N. Ali et al.
bility and sustainability of the intervention. The chapter begins with a backgroundon the epidemiology of LLD and late-life anxiety, the difficulties in diagnosis andtreatment engagement, and racial/ethnic disparities among elders. The backgroundalso highlights previous literature on the efficacy of mental health treatments andrecent efforts to adapt culturally and linguistically community health worker (CHW)programs to improve mental health wellness among elders. Next, we describe thespecific challenges in our CHW-based program related to participant recruitmentand retention, including medical comorbidity and time commitments issues, as wellas high staff turnover and logistical issues with intervention delivery. The chapterconcludes with suggestions for future directions in mental health promotion withracial/ethnic minority elders in community-based settings.
Background
Late-Life Depression and Anxiety in Minority Elders
Elders (ages 65+) are projected to total 83.7 million by 2050, with almost 40%expected to be racial/ethnic minorities (United States Census Bureau 2014a). One infive elders has one psychiatric or substance abuse diagnosis (Blazer et al. 2012). Latelife depression (LLD) refers to the onset of depression in later life, typically definedas ages 60–65 years and above. Yet, studies vary in age cutoffs, with some stipulatingages 55 and above and others characterizing elders as ages 70 and above (Büchtemannet al. 2012; Ismail et al. 2013; Reynolds et al. 2015). Given the varying definitions,the estimated prevalence of mental illness among this population varies (Rodda et al.2011). While some epidemiological studies have shown depression and anxiety tobe less prevalent among older age adults, they are still common—respondents, ages55 and above, to the National Comorbidity Survey Replication reported 12-monthprevalence rates of 5 and 12% for mood and anxiety disorders, respectively (Byerset al. 2010). Similarly, a recent analysis of data from the National EpidemiologicSurveyonAlcohol andRelatedConditions found the prevalence of anymooddisorderto be 6.77% and any anxiety disorder to be 11.39% among elders, ages 55 and above(Reynolds et al. 2015). A review of prevalence studies on anxiety in elders foundestimates ranging from 1.2 to 15% and 1 to 28% in community and clinical settings,respectively. Estimates of feelings of anxiety symptoms were higher: 15–52.3% incommunity samples and 15–56% in clinical samples (Bryant et al. 2008).
Compared to their non-Latino white counterparts, racial/ethnic minority eldersare more likely to experience greater symptom severity and worse access to care(Sorkin et al. 2009). Racial/minority elders are significantlymore likely to experienceincreasingly elevated depressive symptoms over time from middle life to older age(Liang et al. 2011). One in five minority elders have reported that they do not receiveneeded emotional and social support compared to one in ten white elders (Centersfor Disease Control and Prevention 2010).

10 Lessons Learned from the Positive Minds—Strong Bodies Trial … 205
Differences in the Prevalence of Depression and Anxiety Symptoms and Disorders
Previous studies in the United States have found differences in the prevalence ofpsychiatric disorders and symptoms across racial/ethnic subgroups of elders. Forexample, the prevalence of severe depressive symptoms ranges from 4 to 28% amongMexicans (Kwag et al. 2012; Hernandez et al. 2013) and from 4 to 44% among PuertoRicans (Yang et al. 2008). A 2015 analysis of a nationally representative sample ofelders found lifetime prevalence rates of anxiety and mood disorders to be 34.5% forLatino elders in contrast to 17.7% for Asian elders. Similarly, 12-month prevalencerates of anxiety and mood disorders were 14.3% for Latino elders and 7.4% forAsian elders (Guo et al. 2015). In a different analysis of a national sample from2011, stratified by age and race, Latino and non-Latino white elders had higher ratesof depressive and anxiety disorders as compared to other racial and ethnic groups(Woodward et al. 2012). Comparatively, AfricanAmerican elders were found to havelower rates of depression and dysthymia, and Asian elders were generally less likelyto have depressive or anxiety disorders as contrasted to their white counterparts(Woodward et al. 2012). Yet other studies find African Americans and Asians tohave comparable or higher rates of LLD (Pickett et al. 2013; Kim et al. 2015).With no national data on the prevalence of depression among American Indians, itis subsequently difficult to determine strategies to reduce mental health problemsamong this population (Garrett et al. 2015). These divergent results suggest the lackof precise estimates of mental illness for the elder ethnic/racial subgroups.
LLD/LLAD and Cognitive and Physical Outcomes
LLD has been associated with cognitive deficits in episodic memory, executive func-tioning, andmental processing speed that can persist years after depression onset andis independent of current mood, remission, age of onset, and antidepressant treat-ment (Köhler et al. 2010). Along with cognitive deficits, LLD is associated with anincreased risk in developing dementia and linked to the early stages of Alzheimer’sdisease (Panza et al. 2010; Barnes et al. 2012). Furthermore, recurring depressionamong elders has been shown to increase dementia risk, and thus underscores theimportance of developing effective treatment for LLD among elders (Dotson et al.2010). Additionally, experiencing a Major Depressive episode may be increasinglycomorbid with other mental health disorders over the life course (Kessler et al. 2010).There appears to be a strong link between depressive symptoms and subsequent dis-ability as well as cognitive decline among racial/ethnic minority elders. For example,studies of older African American adults with LLD have shown an increased likeli-hood of disability (Thorpe et al. 2016) and cognitive decline (Turner et al. 2015).
According to the United States Census Bureau, almost 40% of elders have a dis-ability (United States Census Bureau 2014b). Late-life disability has been shownto be associated with chronic physical conditions like hypertension and cardiovas-cular disease, as well as depression symptoms and suicidal behavior (Manini 2011;Verhaak et al. 2014; Fässberg et al. 2016). In turn, late-life depression is heavilycomorbid with physical illnesses (Comijs et al. 2015). Cross-sectional and longitu-dinal studies have found that chronic diseases among elders, like stroke, poor hearing
206 N. Ali et al.
or vision, cardiac disease, and lung disease, are risk factors for LLD (Huang et al.2010). LLD is also associated with general physical frailty, with greater depres-sion severity and older age separately predicting greater frailty, defined as physicalslowness and weakness (Mezuk et al. 2012; Collard et al. 2014).
While research is less advanced on anxiety disorders over the life course (Bryantet al. 2013), studies have found links between LLAD and physical conditions as wellas dementia and cognitive decline. Elders who have chronic physical conditions arealso more likely to have LLAD, and having a greater number of physical conditionsis associated with an increased likelihood of LLAD (Gould et al. 2016; Ramos andStanley 2018). LLAD is also associatedwith dementia and cognitive decline (Gulperset al. 2016) and may increase the likelihood of poor quality of life among elders withdementia (Seignourel et al. 2008) as well as the progression from mild cognitiveimpairment to Alzheimer’s disease among elders (Palmer et al. 2007).
Mental Health Care Disparities Among Elders
Nationally, perceived need for mental health treatment has been shown to be highestamong young adults, while 47.1%of elderswith psychiatric disorders do not perceiveneed for treatment (Mackenzie et al. 2010), perhaps reflecting underlying attitudestoward mental illness among elders as simply old age or minimization of symptomseverity. Qualitative studies have found that elders may not view depression as a sig-nificant enough problem to visit their primary care physician (Burroughs et al. 2006;Chew-Graham et al. 2012). Elders may also normalize symptoms of mental healthconditions through belief and behavior (Bryant 2010). In a randomized controlledtrial of collaborative care for elders with depression, some participants passivelyviewed depression as an inevitability of physical health conditions (Overend et al.2015). Elders may also have trouble detecting symptoms of mental health problems(Overend et al. 2015), andmay be less accurate in identifying emotional symptoms ofsadness, worthlessness/guilt, worry, and fear as symptoms of depression or anxietycompared to younger adults (Wetherell et al. 2009).
Studies have also shown that primary care providers have more difficulty detect-ing depression among elders than depression among younger adults (Mitchell et al.2010). Clinicians may also promote negative stereotypes toward aging that preventproper diagnosis of depression and anxiety among elders, such as a perception thatavoiding activities is normal at an older age (Bryant 2010; Bryant et al. 2013).Detection of LLD and LLAD may be further complicated by differences in symp-tom presentation in elders due to changes in emotional experience over the lifecourse. Elders may reinforce and internalize negative affect and be less aroused byheightened emotions than younger adults (Wolitzky-Taylor et al. 2010). Studies ofmeasures commonly used to assess depression and anxiety have found that lowercutoff scores on the scales reflect significant depression and anxiety levels amongelders in the general population (Chachamovich et al. 2008; Wild et al. 2014). Lowerscores associated with these levels of symptomatology are in turn associated with

10 Lessons Learned from the Positive Minds—Strong Bodies Trial … 207
meaningful disruption in mental health quality of life. Thus, the nature of depres-sion and anxiety symptomatology among elders may differ compared to youngeradults (Bryant 2010). In fact, there has been a recent call to revise the DSM to reflectthe intricacies of diagnosing LLD and LLAD related to potential comorbidity withdementia/cognitive decline and differential symptom presentation due to age (Bryantet al. 2013; Mohlman et al. 2012).
While meaningful reductions in symptom severity have previously been foundamong racial/ethnic minority elders in collaborative care settings (Penkunas andHahn-Smith 2015), disparities remain in detection of LLD and LLAD and engage-mentwithmental health services. Diagnosis rates among community-dwelling eldershave been shown to differ across racial/ethnic groups, with racial/ethnic minoritiessignificantly less likely to receive a diagnosis of depression and subsequent (Akin-cigil et al. 2012). Compared to non-LatinoWhites, racial/ethnic minority elders withLLD or LLAD may be even less likely to identify their emotional problems as anindicator for underlying mental health problems (Kim et al. 2011; Jang et al. 2014).
Stigma may also play a significant role in disparities to access needed mentalhealth treatment. American Indian elders access mental health care significantlyless than non-Latino white elders (Moon et al. 2017), with increased age associatedwith increasingly negative attitudes toward mental health services (Roh et al. 2015).African American elders are more likely to internalize stigma and are less amenableto engaging in treatment than non-Latino white elders (Conner et al. 2010a). Thisbarrier is further exacerbated by general mistrust of the efficacy of mental healthtreatments and fear of being stereotyped as a minority with depression (Conneret al. 2010b). In previous research, Asian-American and Latino older adult patientshave also reported more shame and embarrassment related to having a mental healthproblem than non-Latino whites (Jimenez et al. 2013a). Compared to non-Latinowhites, African American and Latino elders initiate and receive adequate care whenaccessing mental health services at significantly lower rates (Jimenez et al. 2013b).Importantly, the nature of visits in mental health care may vary across race/ethnicityin older adult patients. Jimenez et al. (2013a, b) found that African American eldershad greater episodes of only outpatient care, while Latino elders had greater rates ofmedication-related and outpatient visits.
Favorable attitudes toward mental health treatment and the use of medicationcould be related to cultural beliefs (Jimenez et al. 2012; Park et al. 2018). Park et al.(2018) found that older KoreanAmericanswho viewed depression as a health-relatedcondition were more willing to attend mental health counseling and take antidepres-sants than those who associated depression with family shame. Many Latino eldersmay hold similar negative views about engaging with mental health treatment due toa fear of disappointing their family or that treatment would unnecessarily stir up feel-ings of anger and sadness (Jang et al. 2011). Mental health literacy may also preventracial/ethnic minority elders from engaging with mental health treatment (Jang et al.2009; Kim et al. 2017). Preferences for therapeutic processes seem to vary acrossracial/ethnic groups, with Asian American elders being unwilling to speak to anyoneabout mental health concerns while Latino elders being more receptive to speakingabout mental health problems with psychologists (Jimenez et al. 2012).

208 N. Ali et al.
Interventions to Improve Mental Health and Care AmongElders
Per a recent meta-analysis, psychosocial interventions, especially cognitive behav-ioral therapy and problem-solving therapy, may be effective in reducing depressivesymptoms among elders (Cuijpers et al. 2014). Yet, Cuijpers et al. (2014) cautionagainst strong interpretation of their findings due to a paucity of high quality studies.Both psychosocial and pharmacological treatments have been shown to be effective inimproving mental health among elders with generalized anxiety disorder (Gonçalvesand Byrne 2012). Cognitive behavioral therapy could significantly improve worryseverity, depressive symptoms, and general mental health among elders with gener-alized anxiety disorder (Stanley et al. 2009).
Given the significant comorbidity between mental health problems and medicalillness among elders, current interventions often work with populations with co-occurring medical illness and mental health problems or in promoting integration ofgeneral health services with mental health services. Assertive community treatmentreflects integration of social, medical, and mental health services (Bond and Drake2015), and has preliminarily been shown to improve engagement with mental healthservices among elders (Stobbe et al. 2014). Gallo et al. (2016) conducted a caremanager intervention in 20 primary care practices randomized to a depression caremanager intervention or usual care. The depression care manager worked with pri-mary care physicians to provide depression care to older adult patients with multiplemedical conditions and depression, including psychotherapy, medication manage-ment, symptom monitoring, and treatment adherence. Over the course of two years,they found that patients with the highest level of medical comorbidity and depressionwere not at significantly greater risk of mortality compared to patients with the leastmedical comorbidity and depression. Since greater severity of depression is corre-lated with greater unmet need among elders, individually tailored care is especiallyimportant to improving the efficacy of treatment (Houtjes et al. 2010). Researchersin previous randomized controlled trials have also examined the effect of structuredexercise programs on mental health among elders. A meta-analysis found that par-ticipation in these programs significantly reduced depression severity as evaluatedwith depression assessments scales (Bridle et al. 2012).
Despite the significant prevalence of LLD and LLAD among racial/ethnic minor-ity elders, few trials exist to determine the efficacy of evidence-based therapeuticinterventions with minority elders (Fuentes and Aranda 2012; Gitlin et al. 2013;Jimenez et al. 2015; Gitlin et al 2018; Jimenez et al. 2018), including Latino (Alvarezet al. 2014) Asian (Kim et al. 2015) and American Indian elders (Roman et al.2012). In Table 10.1, we briefly describe several of the tested interventions forethnic/racial minority elders. The Happy Older Latinos are Active (HOLA) is acurrently-active community health worker (CHW) intervention to promote healthamong older Latinos who may be at-risk for depression and/or anxiety and targetsboth physical and psychosocial functioning (Jimenez et al. 2015). The multicom-ponent intervention is especially novel for its culturally-informed program design.

10 Lessons Learned from the Positive Minds—Strong Bodies Trial … 209
The intervention includes CHW sessions to motivate social engagement and self-efficacy as well as scheduled physical activity to lessen stigmatization of mentalhealth problems by incorporating group walk activities associated with subsequentsocial events (Jimenez et al. 2018). If interventions like HOLA show positive effectson mental health, preventative health promotion programs may be especially usefulin improving the mental health of racial/ethnic minority elders in a culturally com-patible way without the costs and burden of engaging in traditional psychotherapy orpharmacology treatments (Jimenez et al. 2018). Additionally, a recent meta-analysisfound that CHW interventions were significantly able to reduce mental health prob-lem symptomatology among underserved populations in low and middle-incomecountries (Barnett et al. 2018). CHW interventions may especially be promising forimproving the mental health of racial/ethnic minority elders, as they can be cultur-ally adaptive and delivered by people of the same racial/ethnic background (Jimenezet al. 2018). Since research on psychosocial interventions among elders with LLDis limited, it is important for current researchers to evaluate challenges with feasi-bility and implementation of these programs in the community (Forsman, Nordmyr,and Wahlbeck 2011). Our Positive Minds-Strong Bodies intervention sought to fillthis void by providing a multi-level intervention that addresses LLD, LLAD, andfunctional disability in community agencies serving minority elders.
Positive Minds—Strong Bodies Intervention
The Positive Minds-Strong Bodies (PM-SB) intervention is a community healthworker-delivered intervention that aims to provide mental and disability preventiontreatments in collaboration with exercise trainers in community-based organizations(CBOs) that serve minority and immigrant elders. The exercise trainers providea progressive resistance-training program using weighted vests for resistance withexercises designed to be specific to mobility tasks, while the CHWs provide a briefcognitive behavioral intervention. Through partnerships with CBOs and hospitals,PM-SB utilizes bilingual community health workers who are fluent in English, Span-ish, Mandarin, or Cantonese to deliver the intervention in the participants’ primarylanguage. Given the complexity of working with a socioeconomically diverse groupof community-dwelling elders with depression and/or anxiety and mild to moderatemobility limitations, we have identified and now describe opportunities and chal-lenges to conduct such interventions in community-based settings.

210 N. Ali et al.
Table10.1
Interventio
ntrialsrelatedto
mentalh
ealth
treatm
entw
ithracial/ethnicminority
elders
Interventio
nPlace/setting
Samplesize
Stud
ypo
pulatio
nOutcomes
Interventio
ncompo
nents
Studydesign
and
measures
Results
Beissneretal.
(2012)
6senior
centersin
New
YorkCity
providing
services
toAfrican
American
seniors,older
Hispanics,and
older
non-Hispanicwhites
69participants
Seniorswith
chronicback
pain
African
Americans(n
�24),Hispanics
(n�
25),
andno
n-Hispanicwhites
(n�
20)
Prim
aryou
tcom
e:Manage
chronicback
pain
through
interventio
nas
measured
bytheRolandMorris
Disability
Questionn
aire
(RMDQ)
SecondaryOutcomes:
Depressivesymptom
s,pain
intensity,socialactivity,
activ
ities
ofdaily
living
8weeklygroupbased
self-m
anagem
entsessionswhich
includ
edexercise,w
eeklyinpu
tby
phoneon
theirperceived
understandingandusefulness
ofprogram
components,anda
3-month
follo
wup
assessment
byphone
Non
-rando
mized
feasibility
and
effic
acytrial
Significant
decreasesin
RMDQ
scores
werefoundfor
non-Hispanicwhite,A
frican
American,and
Hispanic,
participants(−
3.53;p
<0.001).
Sign
ificant
improvem
entsin
secondaryoutcom
esobserved
for
Hispanicparticipants
Chavez-
Korelletal.
2012
Com
mun
itycentersserving
olderLatino
232participants
Older
Latinoadultsages
60andolderthathave
depressive
disorders
Prim
aryou
tcom
e:Reduce
depressive
symptom
smeasuredwith
PHQ-9
Secondaryoutcom
es:
increase
physicalfunctio
nandqu
ality
oflife(Q
OL)
UnNuevo
Aman
ecer
(UNA)
interventio
n:acultu
rally
adapted
evidence-based
practic
econtaining
IMPA
CTwith
6and
12-m
onth
follo
wup
Implem
entatio
ntrial
Statistic
ally
sign
ificant
redu
ctionin
depressive
symptom
son
PHQ-9
scale(m
ean
�−6
.39;
p�
0.01).
Statistic
ally
sign
ificant
improvem
entsin
thephysical
functio
ning
(p�
0.01)andoverall
QOL(p
<0.001)
Bruce
etal.
(2015)
6ho
mehealthcare
agencies
natio
nwide
306participants
MedicareHom
eHealth
patie
ntsage65
yearsand
olderthatscreened
positiv
efordepression
Black
(n�
55)and
Hispanic(n
�49)
Prim
aryou
tcom
e:Depressionseverity
asmeasuredby
the24-item
Ham
ilton
Scalefor
Depression(H
AM-D
)
Assignedpreexistingnurse
team
sto
aninterventio
n(12
team
s)or
toenhanced
usualcare
(9team
s)The
interventio
n(D
epression
CAREPA
TH)includ
edmanagem
ento
fdepression
throug
hweeklysymptom
assessment,medication
managem
ent,care
coordinatio
n,education,andgo
alsetting
with
follo
wup
assessmentsperformed
at3,
6,and12
months
Cluster
rand
omized
effectivenesstrial
Inthefullsample,theinterventio
nhadno
effect.
Interventio
nvs.con
trol
patie
ntsdid
notd
ifferat3or
6mon
thfollo
wup
fordepression,but
didat
12months(8.7vs.1
0.6HAM-D
scores,p
�0.05).
How
ever,the
interventio
nwas
effectivein
208participantswith
aHAM-D
scoreof
10or
higher,
show
inglower
scores
at3months
(p�
0.04),6months(p
�0.02),
and12
months(p
�0.005)
months
(contin
ued)

10 Lessons Learned from the Positive Minds—Strong Bodies Trial … 211
Table10.1
(contin
ued)
Interventio
nPlace/setting
Samplesize
Stud
ypo
pulatio
nOutcomes
Interventio
ncompo
nents
Studydesign
and
measures
Results
Gallo
etal.
(2016)
20prim
arycare
practic
esacross
New
YorkCity,
Phila
delphia,and
Pittsburgh
1,20
4participants
Adu
ltsaged
60andolder
with
depressive
symptom
sas
measuredby
theCES-D
scale
“Ethnicminority
”(n
�193)
Prim
aryou
tcom
e:Depressivesymptom
sSecondaryoutcom
es:
Medicalcomorbidity,vita
lstatus,other
covariates
Practic
e-rand
omized
Preventio
nof
Suicidein
Prim
aryCare
Elderly:C
ollabo
rativ
eTrial
(PROSP
ECT):A2-year
interventio
nwith
implem
entatio
nof
algo
rithm
basedcare
fordepression,
psychotherapy,increasing
antid
epressantd
osage,
mon
itoring
symptom
s,medicationadverseeffects,and
treatm
entadherence
through
physiciancare
Cluster-
rand
omized
controltrial
Intheinterventio
ngroup,those
who
initially
hadthehigh
estlevel
ofmultim
orbidity
anddepression
wereno
tatsignific
antly
increased
risk
ofmortalitycomparedto
those
with
minim
alcomorbidity
and
depression
over
thefollo
w-up
period
(hazardratio
1.73,9
5%CI,
0.86
to3.96).
Whilein
theusualcarecond
ition
,thosewith
thehigh
estlevelof
comorbidity
anddepression
show
edan
increasedrisk
ofmortalitycomparedto
thosewith
thelowestlevelsof
morbidity
and
depression
(hazardratio
3.02,95%
CI,1.32–8.72)
Jimenez
etal.
(2015)
Com
mun
ityat-large
inMiami,Florida
60participants
Older
Latinos
aged
60and
olderwith
depression
asmeasuredwith
PHQ-2,
GAD-2,and
MMSE
Prim
aryou
tcom
e:Reductio
nof
newand
recurrentm
ajor
depressive
andanxiety
disorders,change
indepressive
andanxiety
symptom
severity
Secondaryoutcom
es:
Changein
physical
functio
ning
,social
engagement,andsedentary
behaviors,change
inself-efficacy,and
change
insleepqu
ality
Happy
Older
Latinos
areActive
(HOLA)interventio
ncombined
physicalactiv
ity,event
schedulin
g,socialengagement,
andworkwith
commun
ityhealth
workers,m
oodratin
gs,and
pedo
meters
Rando
mized
controltrial
Ong
oing
(contin
ued)

212 N. Ali et al.
Table10.1
(contin
ued)
Interventio
nPlace/setting
Samplesize
Stud
ypo
pulatio
nOutcomes
Interventio
ncompo
nents
Studydesign
and
measures
Results
Gitlin
etal.
(2018)
In-H
omeSu
pportP
rogram
andthecommun
ityat-large
208participants
African
Americansaged
55andoldershow
ing
depression
asmeasuredby
PHQ-9
Prim
aryou
tcom
e:Reduced
depressive
symptom
sthroug
hValuatio
nof
Life
(VOL)scale
Secondaryoutcom
es:
redu
cedanxietyand
functio
nald
isability,
improved
quality
oflife,
andenhanced
depression
know
ledg
eandbehavioralactiv
ation
Participantscompleted
2depression
screenings
using
PHQ-9
then
wererand
omized
toreceiveGetBusyGetBetter
(GBGB)im
mediately
or4monthslater;assessed
at4and
8months
GBGBinterventio
n:ho
me-based
interventio
nwith
101-hsessions
over
4mon
thswith
case
managem
ent,referralandlin
age,
depression
education,stress
reductiontechniques,and
behavioralactiv
ation
Sing
le-blin
dparalle
lrand
omized
trial
Improved
VOLat4-mon
thfollo
w-upforinterventio
nparticipantscomparedto
participantsthatreceived
GBGB
later(differencein
meanchanges
from
baselin
e�
4.67,9
5%CI,
2.53–6.80)
Hernand
ezetal.(2018)
27senior
centersin
greater
Los
Ang
eles
572participants
Older
Latinoadultsaged
60yearsandolder
Prim
aryou
tcom
e:Depressivesymptom
sSecondaryoutcom
es:
Cog
nitiv
efunctio
n,covariates
Exerciseinterventio
n:4weekly
1-hgrou
pfollo
wed
bymon
thly
reinforcem
entsessionsfor
11months,and
sessions
every2monthsforthe
follo
wing12
mon
ths
Control
groupreceived
4weekly
1-hhealth
educationlectures
Participantsin
both
grou
psparticipated
ina1-hexercise
class
Rando
mized
controltrial
Participantsin
theinterventio
n(p
�0.04)andcontrolg
roups(p
<0.001)
both
experienced
reductionin
depressive
symptom
scomparedto
theirbaselin
elevels

10 Lessons Learned from the Positive Minds—Strong Bodies Trial … 213
The Positive Minds—Strong Bodies Program: Opportunitiesand Challenges to Program Delivery
Our specific aims for PM-SB include: (1) developing collaborative partnerships toevaluate the capacity of CBOs and clinics to provide disability prevention services toracial/ethnic minority elders; (2) evaluating the acceptability and efficacy of a com-bined behavioral health and disability prevention intervention for minority elders;and (3) determining the organizational feasibility and sustainability of the interven-tion. Before study implementation, we conducted a pre-intervention capacity assess-ment of CBOs. Research team members conducted qualitative interviews with staffmembers (administrators and clinicians) and clients fromCBOs serving racial/ethnicminority elders in different locations in the United States. The interviews provided awindow into the organizations’ operation through the eyes of current staff membersand their perspectives on the status of physical and mental health services; the degreeto which they believed our program would align with clients’ needs as well as theorganizations’ current programming and mission; and their expectations of how theprogram could meet its goal of improving the organizations’ long-term capacity toaddress their elder clients’ mental and physical health needs.
From the pre-intervention capacity assessment, we found that these organiza-tions provided limited mental health services and that, of the services provided,none offered direct mental health services like counseling, psychotherapy, or psy-chiatric services. Yet, staff responses demonstrated an organizational desire to offermore mental health services, making remarks such as “If I had the money, I wouldwant to have a clinical person here on staff” or “So if I had money, I would hiremore qualified social workers or counselors or therapists who can talk in fluent Chi-nese, Cantonese, or Mandarin…” and “…to increase more mental health cliniciansthat can do more intervention and do more education in terms of mental health toraise awareness of mental health…health education.” Staff responses reflected theneed for an intervention such as PM-SB that was both linguistically-adapted for adiverse group of racial/ethnic minorities, so this represented an opportunity to bringevidence-based interventions for disability prevention. They also were interested in apsychoeducation and life-skills-evidenced based intervention that could be deliveredby community health workers, who have proven successful to service underservedpopulations in understaffed settings (Barnett et al. 2018). Kim et al. (2015) contendedthat intervention programs tailored to racial/ethnic minority elders have previouslybeen successful for illness management of chronic medical conditions because ofthe formation of partnerships with CBOs and the use of linguistically concordantCHWs (Han et al. 2006; Kim et al. 2014; Kim et al. 2015). This represented a win-win opportunity to train CBO staff to deliver the intervention and build capacity forsustainability.
The pre-intervention capacity assessment provided insight into potential chal-lenges encountered during recruitment and retention of participants and staff reten-tion in PM-SB. Specifically, staff informants highlighted the importance of modify-ing the presentation of the intervention in a way that would not turn away clients by

214 N. Ali et al.
Fig. 10.1 Staff turnover throughout the current project period
immediately introducing the program as a mental health and disability intervention.Recruitment materials were changed to better characterize the intervention as oneto improve well-being and reduce disability. CHW staff turnover also represented aserious challenge. As shown in Fig. 10.1, staff turnover required training 2–3 timesas many CHWs as needed since salaries are low in the agencies and turnover ofpersonnel is common. None of the CHWs reported the program as the reason forleaving, but rather described the new skills as an asset to secure better jobs. Timecommitment was also an issue raised by CBO staff along with technological chal-lenges and coordinating both the Positive Minds and Strong Bodies programs, andthus may be related to high turnover among PM-SB staff.
The Positive Minds (PM-) component involves 10 sessions of a manualized indi-vidual cognitive-behavioral therapy intervention delivered by community healthworkers, and the Strong Bodies (-SB) component is comprised of 36 sessions ofgroup exercise delivered by exercise trainers over the course of 12 weeks to buildstrength and improve mobility. This intensive training proved challenging for CBOstaff because the training supplemented their regular CBO-related responsibilities,as CBOs often do not have enough resources to hire additional staff to deliver thePM-SB program. CHWs have particularly struggled with balancing the demands ofdelivering the program to multiple clients while managing other responsibilities, assessions are conducted individually rather than in groups. Additionally, staff havehighlighted the difficulty of accessing materials at a distance via the computer due tosetting up secure and remote access to study materials and data. High staff turnoveralso leads to supervisors devoting extensive time to training newCHWswhile contin-uing supervision for active CHWs. It also took time away from staff in understaffedorganizations that had to fulfill licensing requirements.
Informed by the pre-intervention capacity assessment, we continued to gatherfeedback during the intervention period through annual partnership evaluations with
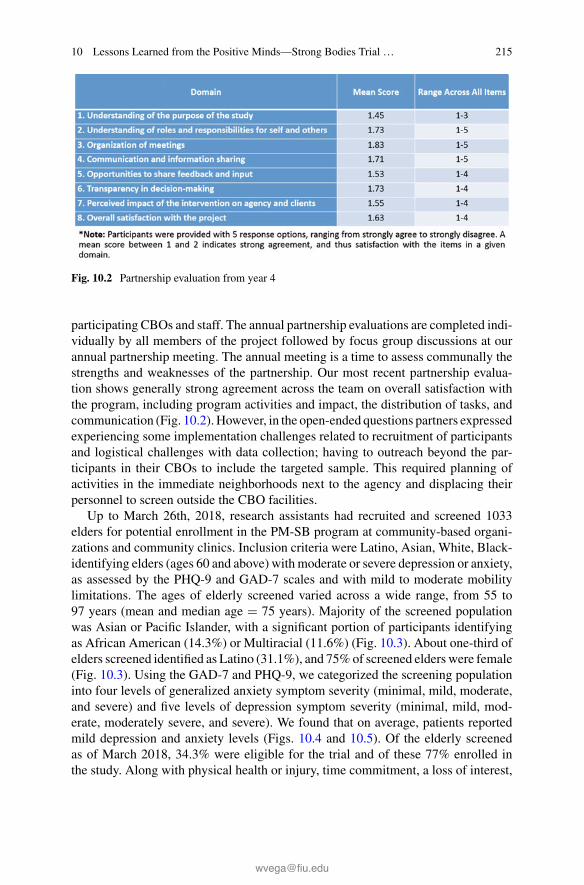
10 Lessons Learned from the Positive Minds—Strong Bodies Trial … 215
Fig. 10.2 Partnership evaluation from year 4
participating CBOs and staff. The annual partnership evaluations are completed indi-vidually by all members of the project followed by focus group discussions at ourannual partnership meeting. The annual meeting is a time to assess communally thestrengths and weaknesses of the partnership. Our most recent partnership evalua-tion shows generally strong agreement across the team on overall satisfaction withthe program, including program activities and impact, the distribution of tasks, andcommunication (Fig. 10.2). However, in the open-ended questions partners expressedexperiencing some implementation challenges related to recruitment of participantsand logistical challenges with data collection; having to outreach beyond the par-ticipants in their CBOs to include the targeted sample. This required planning ofactivities in the immediate neighborhoods next to the agency and displacing theirpersonnel to screen outside the CBO facilities.
Up to March 26th, 2018, research assistants had recruited and screened 1033elders for potential enrollment in the PM-SB program at community-based organi-zations and community clinics. Inclusion criteria were Latino, Asian, White, Black-identifying elders (ages 60 and above) with moderate or severe depression or anxiety,as assessed by the PHQ-9 and GAD-7 scales and with mild to moderate mobilitylimitations. The ages of elderly screened varied across a wide range, from 55 to97 years (mean and median age � 75 years). Majority of the screened populationwas Asian or Pacific Islander, with a significant portion of participants identifyingas African American (14.3%) or Multiracial (11.6%) (Fig. 10.3). About one-third ofelders screened identified as Latino (31.1%), and 75%of screened elders were female(Fig. 10.3). Using the GAD-7 and PHQ-9, we categorized the screening populationinto four levels of generalized anxiety symptom severity (minimal, mild, moderate,and severe) and five levels of depression symptom severity (minimal, mild, mod-erate, moderately severe, and severe). We found that on average, patients reportedmild depression and anxiety levels (Figs. 10.4 and 10.5). Of the elderly screenedas of March 2018, 34.3% were eligible for the trial and of these 77% enrolled inthe study. Along with physical health or injury, time commitment, a loss of interest,
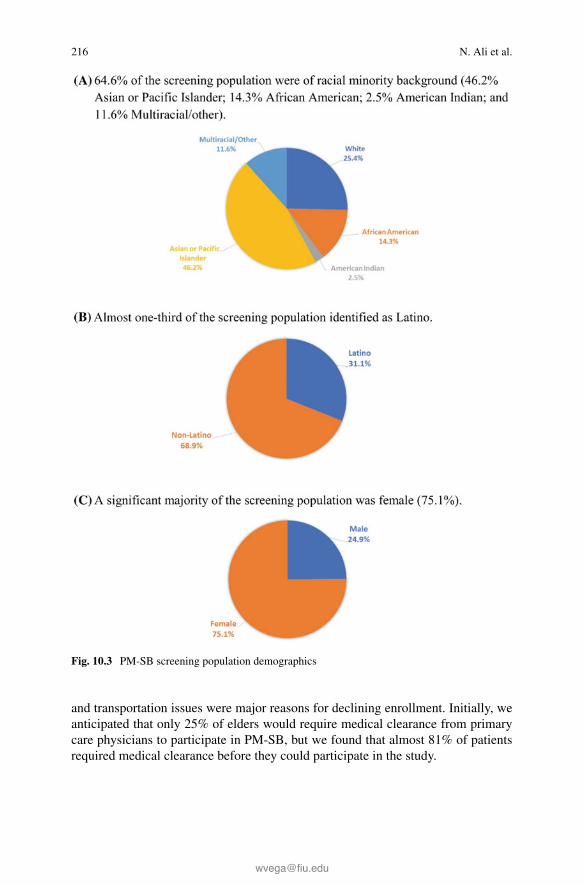
216 N. Ali et al.
Fig. 10.3 PM-SB screening population demographics
and transportation issues were major reasons for declining enrollment. Initially, weanticipated that only 25% of elders would require medical clearance from primarycare physicians to participate in PM-SB, but we found that almost 81% of patientsrequired medical clearance before they could participate in the study.
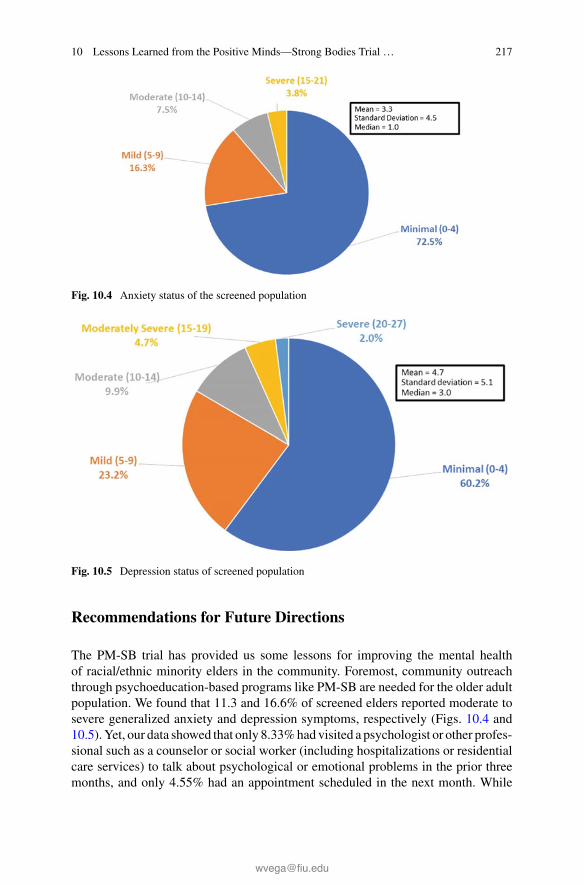
10 Lessons Learned from the Positive Minds—Strong Bodies Trial … 217
Fig. 10.4 Anxiety status of the screened population
Fig. 10.5 Depression status of screened population
Recommendations for Future Directions
The PM-SB trial has provided us some lessons for improving the mental healthof racial/ethnic minority elders in the community. Foremost, community outreachthrough psychoeducation-based programs like PM-SB are needed for the older adultpopulation. We found that 11.3 and 16.6% of screened elders reported moderate tosevere generalized anxiety and depression symptoms, respectively (Figs. 10.4 and10.5).Yet, our data showed that only 8.33%had visited a psychologist or other profes-sional such as a counselor or social worker (including hospitalizations or residentialcare services) to talk about psychological or emotional problems in the prior threemonths, and only 4.55% had an appointment scheduled in the next month. While

218 N. Ali et al.
most screened elders reported minimal and mild symptoms, it is possible that thesesymptoms could transition into more severe symptomatology over time. Feedbackfrom previous program participants further supports the benefits of such a program:“I felt empowered for the changes in my behavior;” “I feel good about myself, I feel Ihave made accomplishments;” and “I had some feelings of frustration, some feelingsof helplessness, some feelings of insecurity. Once I set my little detective with themagnifying glass and began to look at the evidence I began to see that red flags havebeen pulled up but I had ignored them.”
To facilitate awareness of depression and anxiety symptoms and the benefits ofthe PM-SB program among racial/ethnic minority elders, an awareness campaignof videos with elders from the community who have participated in the programcould help to reframe the program as an opportunity to not resign oneself to chronicsuffering and instead take an active role in their everyday wellness. Encouraging peersupport groups in CBOs would in turn bolster the long-term effects of programs likePM-SB to improve community support for elders’ individual mental health. Since81%of the elders screened requiredmedical clearance from a primary care physician,wider availability of visitingphysicians to community-basedprogramscould improvethe integration of medical care resources into community-based settings.
The logistical challenges related to high staff turnover and time commitmentamong staff also warrant future consideration in designing programs like PM-SB.While we could train CHWs across multiple sites, frequent re-training of staff dueto staff turnover demonstrates the importance of creating a train-the-trainer modelin these organizations. Given that staff raised time commitment was a significantconcern, we recommend that CHW-based programs structure the time for the CHWsto offer these services, reducing their workload and redirecting some of their servicetime to continuous ongoing supervision. Additionally, providing phone-based ses-sions for the Positive Minds components and offering video instruction of the StrongBodies exercise component may lessen the burden of time and resources on CBOsto offer PM-SB.
Through the PM-SB project, we have come to see the importance of offering ser-vices that reflect the diversity of patients. It is important for mental health treatmentto not only be linguistically tailored to multicultural communities, but also cultur-ally tailored to account for differences in patients’ attitudes, beliefs, customs, andsymptomatology. This flexibility is also significant given the infrastructural fragilityof CBOs, which can struggle to perform scientifically rigorous research because ofthe limited resources and funding available to them. The balance between feasibil-ity and scientific rigor is difficult in community settings for this reason, and futureefforts need to concentrate on how to make programs scalable and sustainable inthese settings. The fact that the PM-SB program is patient-centered, linguistically-and culturally-aligned to participants explains why almost 80% of participants arewilling to engage in the program, demonstrating the immense opportunity such ser-vices present in extending disability prevention services and closing the disparitiesgap for racial/ethnic minority elders.

10 Lessons Learned from the Positive Minds—Strong Bodies Trial … 219
References
Akincigil, A., Olfson, M., Siegel, M., Zurlo, K. A., Walkup, J. T., & Crystal, S. (2012). Racialand ethnic disparities in depression care in community-dwelling elderly in the United States.American Journal of Public Health, 102(2), 319–328.
Alvarez, P., Rengifo, J., Emrani, T., & Gallagher-Thompson, D. (2014). Latino elders and mentalhealth: A review and commentary. Clinical Gerontologist, 37(1), 33–48.
Barnes, D. E., Yaffe, K., Byers, A. L., McCormick, M., Schaefer, C., & Whitmer, R. A. (2012).Midlife vs late-life depressive symptoms and risk of dementia: Differential effects for Alzheimerdisease and vascular dementia. Archives of General Psychiatry, 69(5), 493–498.
Barnett, M. L., Gonzalez, A., Miranda, J., Chavira, D. A., & Lau, A. S. (2018). Mobilizing commu-nity health workers to addressmental health disparities for underserved populations: A systematicreview. Administration and Policy in Mental Health andMental Health Services Research, 45(2),195–211.
Beissner, K., Parker, S., Henderson, C. R., Jr., Pal, A., Papaleontiou, M., & Reid, M. C. (2012).Implementing a combined cognitive-behavioral + exercise therapy protocol for use by elders withchronic back pain: Evidence for a possible race/ethnicity effect. Journal of Aging and PhysicalActivity, 20(2), 246–265.
Bond, G. R., & Drake, R. E. (2015). The critical ingredients of assertive community treatment.World Psychiatry, 14(2), 240–242.
Blazer, D., Le, M., Maslow, K., & Eden, J. (2012). The mental health and substance use workforcefor elders: In whose hands? National Academies Press.
Bridle, C., Spanjers, K., Patel, S., Atherton, N. M., & Lamb, S. E. (2012). Effect of exercise ondepression severity in older people: Systematic review and meta-analysis of randomised con-trolled trials. The British Journal of Psychiatry, 201(3), 180–185.
Bruce, M. L., Raue, P. J., Reilly, C. F., Greenberg, R. L., Meyers, B. S., Banerjee, S., et al. (2015).Clinical effectiveness of integrating depression care management into medicare home health: TheDepression CAREPATH Randomized trial. JAMA Internal Medicine, 175(1), 55–64.
Bryant, C., Jackson, H., & Ames, D. (2008). The prevalence of anxiety in elders: Methodologicalissues and a review of the literature. Journal of Affective Disorders, 109(3), 233–250.
Bryant, C. (2010). Anxiety and depression in old age: Challenges in recognition and diagnosis.International Psychogeriatrics, 22(4), 511–513.
Bryant, C., Mohlman, J., Gum, A., Stanley, M., Beekman, A. T., Wetherell, J. L., et al. (2013).Anxiety disorders in elders: Looking to DSM5 and beyond. The American Journal of GeriatricPsychiatry, 21(9), 872–876.
Büchtemann, D., Luppa, M., Bramesfeld, A., & Riedel-Heller, S. (2012). Incidence of late-lifedepression: A systematic review. Journal of Affective Disorders, 142(1), 172–179.
Burroughs, H., Lovell, K., Morley, M., Baldwin, R., Burns, A., & Chew-Graham, C. (2006). ‘Jus-tifiable depression’: How primary care professionals and patients view late-life depression? Aqualitative study. Family Practice, 23(3), 369–377.
Byers, A. L., Yaffe, K., Covinsky, K. E., Friedman, M. B., & Bruce, M. L. (2010). High occurrenceof mood and anxiety disorders among elders: The National Comorbidity Survey Replication.Archives of General Psychiatry, 67(5), 489–496.
Centers forDiseaseControl andPrevention. (2010).The state ofmental health and aging inAmerica.Atlanta, GA: National Association of Chronic Disease Directors https://www.cdc.gov/aging/pdf/mental_health.pdf.
Chachamovich, E., Fleck, M., Laidlaw, K., & Power, M. (2008). Impact of major depression andsubsyndromal symptoms on quality of life and attitudes toward aging in an international sampleof elders. The Gerontologist, 48(5), 593–602.
Chavez-Korell, S., Rendón, A. D., Beer, J., Rodriguez, N., Garr, A. D., Pine, C. A., et al. (2012).Improving access and reducing barriers to depression treatment for Latino elders: Un NuevoAmanecer (A New Dawn). Professional Psychology: Research and Practice, 43(3), 217–226.

220 N. Ali et al.
Chew-Graham, C., Kovandžic, M., Gask, L., Burroughs, H., Clarke, P., Sanderson, H., et al. (2012).Why may older people with depression not present to primary care? Messages from secondaryanalysis of qualitative data. Health and Social Care in the Community, 20(1), 52–60.
Collard, R. M., Comijs, H. C., Naarding, P., & Oude Voshaar, R. C. (2014). Physical frailty: Vulner-ability of patients suffering from late-life depression. Aging & Mental Health, 18(5), 570–578.
Comijs, H. C., Nieuwesteeg, J., Kok, R., van Marwijk, H. W., van der Mast, R. C., Naarding, P.,et al. (2015). The two-year course of late-life depression: Results from the Netherlands study ofdepression in older persons. BMC Psychiatry, 15(1), 20.
Conner, K. O., Copeland, V. C., Grote, N. K., Koeske, G., Rosen, D., Reynolds, C. F., et al. (2010a).Mental health treatment seeking among elders with depression: The impact of stigma and race.The American Journal of Geriatric Psychiatry, 18(6), 531–543.
Conner, K. O., Copeland, V. C., Grote, N. K., Rosen, D., Albert, S., McMurray, M. L., et al.(2010b).Barriers to treatment and culturally endorsed coping strategies amongdepressedAfrican-American elders. Aging and Mental Health, 14(8), 971–983.
Cuijpers, P., Karyotaki, E., Pot, A. M., Park, M., & Reynolds, C. F. (2014). Managing depressionin older age: Psychological interventions.Maturitas, 79(2), 160–169.
Dotson, V. M., Beydoun, M. A., & Zonderman, A. B. (2010). Recurrent depressive symptoms andthe incidence of dementia and mild cognitive impairment. Neurology, 75(1), 27–34.
Fässberg,M.M., Cheung, G., Canetto, S. S., Erlangsen, A., Lapierre, S., Lindner, R., et al. (2016). Asystematic review of physical illness, functional disability, and suicidal behaviour among elders.Aging & Mental Health, 20(2), 166–194.
Fuentes, D., & Aranda, M. P. (2012). Depression interventions among racial and ethnic minorityelders: A systematic review across 20 years. The American Journal of Geriatric Psychiatry,20(11), 915–931.
Forsman, A. K., Nordmyr, J., &Wahlbeck, K. (2011). Psychosocial interventions for the promotionof mental health and the prevention of depression among elders.Health Promotion International,26(suppl_1), i85–i107.
Gallo, J. J.,Hwang, S., Joo, J.H.,Bogner,H.R.,Morales,K.H.,Bruce,M.L., et al. (2016).Multimor-bidity, depression, and mortality in primary care: Randomized clinical trial of an evidence-baseddepression care management program on mortality risk. Journal of General Internal Medicine,31(4), 380–386.
Garrett,M.D.,Baldridge,D.,Benson,W.,Crowder, J.,&Aldrich,N. (2015).Mental health disordersamong an invisibleminority: Depression and dementia amongAmerican Indian andAlaska nativeelders. The Gerontologist, 55(2), 227–236.
Gonçalves, D. C., & Byrne, G. J. (2012). Interventions for generalized anxiety disorder in elders:Systematic review and meta-analysis. Journal of Anxiety Disorders, 26(1), 1–11.
Gitlin, L. N., Harris, L. F., McCoy, M. C., Chernett, N. L., Pizzi, L. T., Jutkowitz, E., et al. (2013).A home-based intervention to reduce depressive symptoms and improve quality of life in olderAfrican Americans: A randomized trial. Annals of Internal Medicine, 159(4), 243–252.
Gitlin, L. N., Parisi, J. M., Huang, J., Winter, L., & Roth, D. L. (2018). Valuation of life as outcomeand mediator of a depression intervention for older African Americans: The Get Busy Get BetterTrial. International Journal of Geriatric Psychiatry, 33(1), e31–e39.
Gould, C. E., O’hara, R., Goldstein, M. K., &Beaudreau, S. A. (2016). Multimorbidity is associatedwith anxiety in elders in the health and retirement study. International Journal of GeriatricPsychiatry, 31(10), 1105–1115.
Gulpers, B., Ramakers, I., Hamel, R., Köhler, S., Voshaar, R. O., & Verhey, F. (2016). Anxietyas a predictor for cognitive decline and dementia: A systematic review and meta-analysis. TheAmerican Journal of Geriatric Psychiatry, 24(10), 823–842.
Guo, M., Li, S., Liu, J., & Sun, F. (2015). Family relations, social connections, and mental healthamong Latino and Asian older adults. Research on aging, 37(2), 123–147.
Han, H.-R., Kim, K., & Kim, M. (2006). Evaluation of the training of Korean community healthworkers for chronic disease management. Health Education Research, 22(4), 513–521.

10 Lessons Learned from the Positive Minds—Strong Bodies Trial … 221
Hernandez,R., Prohaska, T.R.,Wang, P.-C.,&Sarkisian,C.A. (2013). The longitudinal relationshipbetween depression and walking behavior in older Latinos: The “¡ Caminemos!” study. Journalof Aging and Health, 25(2), 319–341.
Hernandez, R., Andrade, F. C. D., Piedra, L. M., Tabb, K. M., Xu, S., & Sarkisian, C. (2018). Theimpact of exercise on depressive symptoms in older Hispanic/Latino adults: Results from the‘¡Caminemos!’ study. Aging & Mental Health, 1–6.
Houtjes, W., Van Meijel, B., Deeg, D. J. H., & Beekman, A. T. F. (2010). Major depressive disorderin late life: A multifocus perspective on care needs. Aging & Mental Health, 14(7), 874–880.
Huang, C.-Q., Dong, B.-R., Lu, Z.-C., Yue, J.-R., & Liu, Q.-X. (2010). Chronic diseases and risk fordepression in old age: A meta-analysis of published literature. Ageing Research Reviews, 9(2),131–141.
Ismail, Z., Fischer, C., &McCall, W. V. (2013). What characterizes late-life depression. PsychiatricClinics of North America, 36(4), 483–496.
Jang, Y., Chiriboga, D. A., & Okazaki, S. (2009). Attitudes toward mental health services: Age-group differences in Korean American adults. Aging & Mental Health, 13(1), 127–134.
Jang, Y., Chiriboga, D. A., Herrera, J. R., Tyson, D. M., & Schonfeld, L. (2011). Attitudes towardmental health services in Hispanic elders: The role of misconceptions and personal beliefs. Com-munity Mental Health Journal, 47(2), 164–170.
Jang, Y., Park, N. S., Kang, S.-Y., & Chiriboga, D. A. (2014). Racial/ethnic differences in the asso-ciation between symptoms of depression and self-rated mental health among elders. CommunityMental Health Journal, 50(3), 325–330.
Jimenez, D. E., Bartels, S. J., Cardenas, V., & Alegría, M. (2013a). Stigmatizing attitudes towardmental illness among racial/ethnic elders in primary care. International Journal of GeriatricPsychiatry, 28(10), 1061–1068.
Jimenez, D. E., Cook, B., Bartels, S. J., & Alegría, M. (2013b). Disparities in mental health serviceuse of racial and ethnic minority elderly adults. Journal of the American Geriatrics Society, 61(1),18–25.
Jimenez, D. E., Bartels, S. J., Cardenas, V., Dhaliwal, S. S., & Alegría, M. (2012). Cultural beliefsand mental health treatment preferences of ethnically diverse older adult consumers in primarycare. The American Journal of Geriatric Psychiatry, 20(6), 533–542.
Jimenez, D. E., Reynolds, C. F., Alegría, M., Harvey, P., & Bartels, S. J. (2015). The Happy OlderLatinos are Active (HOLA) health promotion and prevention study: Study protocol for a pilotrandomized controlled trial. Trials, 16(1), 579.
Jimenez, D. E., Syed, S., Perdomo-Johnson, D., & Signorile, J. F. (2018). ¡HOLA, Amigos! Towardpreventing anxiety and depression in older Latinos.TheAmerican Journal ofGeriatric Psychiatry,26(2), 250–256.
Kessler, R. C., Birnbaum, H., Bromet, E., Hwang, I., Sampson, N., & Shahly, V. (2010). Agedifferences in major depression: Results from the National Comorbidity Survey Replication(NCS-R). Psychological Medicine, 40(2), 225–237.
Kim, G., DeCoster, J., Chiriboga, D. A., Jang, Y., Allen, R. S., & Parmelee, P. (2011). Associa-tions between self-rated mental health and psychiatric disorders among elders: Do racial/ethnicdifferences exist? The American Journal of Geriatric Psychiatry, 19(5), 416–422.
Kim, K. B., Han, H.-R., Huh, B., Nguyen, T., Lee, H., & Kim, M. T. (2014). The effect of acommunity-based self-help multimodal behavioral intervention in Korean American seniors withhigh blood pressure. American Journal of Hypertension, 27(9), 1199–1208.
Kim, Y. S., Rhee, T. G., Lee, H. Y., Park, B. H., & Sharratt, M. L. (2017). Mental health liter-acy as a mediator in use of mental health services among older korean adults. Internationalpsychogeriatrics, 29(2), 269–279.
Kim, M. T., Kim, K. B., Han, H.-R., Huh, B., Nguyen, T., & Lee, H. B. (2015). Prevalence andpredictors of depression in Korean American elderly: findings from theMemory andAging Studyof Koreans (MASK). The American Journal of Geriatric Psychiatry, 23(7), 671–683.
Köhler, S., Thomas,A. J., Barnett, N.A.,&O’Brien, J. T. (2010). The pattern and course of cognitiveimpairment in late-life depression. Psychological Medicine, 40(4), 591–602.
222 N. Ali et al.
Kwag, K. H., Jang, Y., & Chiriboga, D. A. (2012). Acculturation and depressive symptoms inHispanic elders: Does perceived ethnic density moderate their relationship? Journal of Immigrantand Minority Health, 14(6), 1107–1111.
Liang, J., Xu, X., Quiñones, A. R., Bennett, J. M., & Ye, W. (2011). Multiple trajectories ofdepressive symptoms in middle and late life: Racial/ethnic variations. Psychology and Aging,26(4), 761.
Mackenzie, C. S., Pagura, J., & Sareen, J. (2010). Correlates of perceived need for and use ofmental health services by older adults in the collaborative psychiatric epidemiology surveys. TheAmerican Journal of Geriatric Psychiatry, 18(12), 1103–1115.
Manini, T. (2011). Development of physical disability in elders. Current Aging Science, 4(3),184–191.
Mezuk, B., Edwards, L., Lohman, M., Choi, M., & Lapane, K. (2012). Depression and frailty inlater life: A synthetic review. International Journal of Geriatric Psychiatry, 27(9), 879–892.
Mitchell, A. J., Rao, S., & Vaze, A. (2010). Do primary care physicians have particular difficultyidentifying late-life depression? A meta-analysis stratified by age. Psychotherapy and Psychoso-matics, 79(5), 285–294.
Mohlman, J., Bryant, C., Lenze, E. J., Stanley, M. A., Gum, A., Flint, A., et al. (2012). Improvingrecognition of late life anxiety disorders in diagnostic and statistical manual of mental disorders:Observations and recommendations of the advisory committee to the lifespan disorders workgroup. International Journal of Geriatric Psychiatry, 27(6), 549–556.
Moon, H., Lee, Y.-S., Roh, S., & Burnette, C. E. (2017). Factors associated with American Indianmental health service use in comparison with White elders. Journal of Racial and Ethnic HealthDisparities, 1–13.
Overend, K., Bosanquet, K., Bailey, D., Foster, D., Gascoyne, S., Lewis, H., et al. (2015). Revealinghidden depression in older people: A qualitative study within a randomised controlled trial. BMCFamily Practice, 16(1), 142.
Palmer, K., Berger, A., Monastero, R., Winblad, B., Bäckman, L., & Fratiglioni, L. (2007). Pre-dictors of progression from mild cognitive impairment to Alzheimer disease. Neurology, 68(19),1596–1602.
Panza, F., Frisardi,V.,Capurso,C.,D’introno,A.,Colacicco,A.M., Imbimbo,Bp, et al. (2010). Late-life depression, mild cognitive impairment, and dementia: Possible continuum? The AmericanJournal of Geriatric Psychiatry, 18(2), 98–116.
Park, N. S., Jang, Y., & Chiriboga, D. A. (2018). Willingness to use mental health counseling andantidepressants in older Korean Americans: The role of beliefs and stigma about depression.Ethnicity & Health, 23(1), 97–110.
Penkunas, M. J., & Hahn-Smith, S. (2015). An evaluation of IMPACT for the treatment of late-life depression in a public mental health system. The Journal of Behavioral Health Services &Research, 42(3), 334–345.
Pickett, Y. R., Bazelais, K. N., & Bruce, M. L. (2013). Late-life depression in older African Amer-icans: A comprehensive review of epidemiological and clinical data. International Journal ofGeriatric Psychiatry, 28(9), 903–913.
Prevention, T. C. f. D. C. a. (2012). Diabetes and depression among American Indian and Alaskanative elders. https://www.cdc.gov/aging/pdf/hap-issue-brief-aian.pdf.
Ramos, K., & Stanley, M. A. (2018). Anxiety disorders in late life. Psychiatric Clinics, 41(1),55–64.
Reynolds, K., Pietrzak, R. H., El-Gabalawy, R., Mackenzie, C. S., & Sareen, J. (2015). Prevalenceof psychiatric disorders in U.S. elders: Findings from a nationally representative survey. WorldPsychiatry, 14(1), 74–81.
Rodda, J., Walker, Z., & Carter, J. (2011). Depression in elders. BMJ-British Medical Journal,343(8), d5219.
Roh, S., Brown-Rice, K. A., Lee, K. H., Lee, Y.-S., Yee-Melichar, D., & Talbot, E. P. (2015).Attitudes toward mental health services among American Indians by two age groups. CommunityMental Health Journal, 51(8), 970–977.

10 Lessons Learned from the Positive Minds—Strong Bodies Trial … 223
Roman, S. P., Jervis, L. L., & Manson, S. M. (2012). Psychology of older American Indians andAlaska natives: Strengths and challenges to maintaining mental health. Handbook of Race andDevelopment in Mental Health (pp. 127–146). Springer.
Seignourel, P. J., Kunik, M. E., Snow, L., Wilson, N., & Stanley, M. (2008). Anxiety in dementia:A critical review. Clinical Psychology Review, 28(7), 1071–1082.
Sorkin, D. H., Pham, E., & Ngo-Metzger, Q. (2009). Racial and ethnic differences in the mentalhealth needs and access to care of elders in California. Journal of the AmericanGeriatrics Society,57(12).
Stanley, M. A., Wilson, N. L., Novy, D. M., Rhoades, H. M., Wagener, P. D., Greisinger, A. J., et al.(2009). Cognitive behavior therapy for generalized anxiety disorder among elders in primarycare: A randomized clinical trial. JAMA, 301(14), 1460–1467.
Stobbe, J., Wierdsma, A. I., Kok, R. M., Kroon, H., Roosenschoon, B. J., Depla, M., et al. (2014).The effectiveness of assertive community treatment for elderly patients with severemental illness:A randomized controlled trial. BMC Psychiatry, 14(1), 42.
Thorpe, R. J., Jr., Wynn, A. J., Walker, J. L., Smolen, J. R., Cary, M. P., Szanton, S. L., et al. (2016).Relationship between chronic conditions and disability in African American men and women.Journal of the National Medical Association, 108(1), 90–98.
Turner, A. D., Capuano, A. W., Wilson, R. S., & Barnes, L. L. (2015). Depressive symptoms andcognitive decline in older african americans: Two scales and their factors. The American Journalof Geriatric Psychiatry, 23(6), 568–578.
United States Census Bureau. (2014a). An aging nation: The older population in the United States.https://www.census.gov/prod/2014pubs/p25-1140.pdf.
United States Census Bureau. (2014b).Mobility is most common disability among older Americans(CensusBureaReports). https://www.census.gov/newsroom/press-releases/2014/cb14-218.html.
Verhaak, P. F.M., Dekker, J. H., DeWaal,M.W.M., VanMarwijk, H.W. J., & Comijs, H. C. (2014).Depression, disability and somatic diseases among elderly. Journal of Affective Disorders, 167,187–191.
Wetherell, J. L., Ayers, C. R., Sorrell, J. T., Thorp, S. R., Nuevo, R., Belding, W., et al. (2009).Modular psychotherapy for anxiety in older primary care patients. The American Journal ofGeriatric Psychiatry, 17(6), 483–492.
Wild, B., Eckl, A., Herzog, W., Niehoff, D., Lechner, S., Maatouk, I., et al. (2014). Assessinggeneralized anxiety disorder in elderly people using the GAD-7 and GAD-2 scales: Results of avalidation study. The American Journal of Geriatric Psychiatry, 22(10), 1029–1038.
Wolitzky-Taylor, K. B., Castriotta, N., Lenze, E. J., Stanley,M. A., &Craske,M. G. (2010). Anxietydisorders in elders: A comprehensive review. Depression and Anxiety, 27(2), 190–211.
Woodward, A. T., Taylor, R. J., Bullard, K. M., Aranda, M. P., Lincoln, K. D., & Chatters, L.M. (2012). Prevalence of lifetime DSM-IV affective disorders among older African Americans,Black Caribbeans, Latinos, Asians and Non-Hispanic White people. International Journal ofGeriatric Psychiatry, 27(8), 816–827.
Yang, F. M., Cazorla-Lancaster, Y., & Jones, R. N. (2008). Within-group differences in depres-sion among older Hispanics living in the United States. The Journals of Gerontology Series B:Psychological Sciences and Social Sciences, 63(1), P27–P32.

Chapter 11Older Latinos’ Financial Security:Resources, Needs, and Future Prospects
Richard W. Johnson, Stipica Mudrazijaand Claire Xiaozhi Wang
Abstract This study assessed Latinos’ retirement security, including their financialresources and retirement needs, showing past trends and future prospects. Usingdata from the American Community Survey, decennial censuses, and Health andRetirement Study, tabulations compared poverty rates, income and wealth, healthand disability, relationship status, and household composition for Latinos and non-Latinos ages 65 and older. The Urban Institute’s Dynamic Simulation of IncomeModel also projected income and wealth for future generations. The results showthat older Latinos receive less income, hold less wealth, and are more likely to beimpoverished than older non-Latino whites. Financial outcomes are significantlyworse for older foreign-born Latinos than for those born in the United States. How-ever, projections indicate that the gaps will narrow somewhat in coming decades.Various policy options, such as workforce development initiatives, efforts to pro-mote education and retirement savings, and Social Security reforms that increasebenefit progressivity could improve financial security for future Hispanic retirees.
Introduction
Older Americans are generally more financially secure than younger people. Theyhave exhibited lower poverty rates than the overall population for the past fewdecades(DeNavas-Walt and Proctor 2015), and they are less likely than younger people tobe impoverished even when the comparisons account for older adults’ relativelyhigh out-of-pocket health care spending and the noncash benefits received by manyyounger low-income families (Short 2015). Most older adults weathered the 2008
R. W. Johnson (B) · S. Mudrazija · C. X. WangIncome and Benefits Policy Center, Urban Institute, Washington, DC, USAe-mail: [email protected]
S. Mudrazijae-mail: [email protected]
C. X. Wange-mail: [email protected]
© Springer Nature Switzerland AG 2019W. A. Vega et al. (eds.), Contextualizing Health and Aging in the Americas,https://doi.org/10.1007/978-3-030-00584-9_11
225

226 R. W. Johnson et al.
financial crisis and subsequent recession better than working-age adults (Johnsonand Smith 2016). Although recent wage stagnation and eroding employer-sponsoreddefined benefit (DB) pension coverage are raising concerns about retirement securityfor future generations (Munnell et al. 2014; Helman et al. 2015), older Americansare now twice as likely to receive high incomes—at least 400% of the federal povertyline (FPL)—than 40 years ago (Federal Interagency Forum on Aging-Related Statis-tics 2016). However, averages mask significant variation in later-life outcomes, andcertain subgroups of the older population continue to face widespread economichardship. For example, poverty rates remain high for older African Americans andolder unmarried women (Social Security Administration 2016).
Older Latinos, one of the fasting growing population groups in the nation, facespecial financial challenges (Angel and Mudrazija 2015). Many (but certainly notall) received little schooling and worked at low-paying jobs that offered few fringebenefits, limiting their ability to save for retirement. Many were born outside theUnited States, creating additional obstacles for retirement security (Menjívar andEnchautegui 2015). Indeed, a majority of Latinos ages 25 and older immigrated totheUnited States, including 56%of those ages 65 and older (Johnson,Mudrazija, andWang 2016). Because immigrants usually start their US careers relatively late, theyhave less time to accumulate Social Security credits and amass wealth in employer-sponsored retirement plans than US-born workers. Many Hispanic immigrants alsostruggle in the US labor market because many came from countries with relativelylow levels of educational attainment and their skills are not always transferable tothe Unites States (Borjas 1999, 2006; Capps et al. 2007; Duleep and Dowhan 2008;Favreault and Nichols 2011). Language barriers and employment discriminationcan create additional hurdles. Employment prospects are particularly limited forimmigrants residing in the United States without legal authorization (Passel andCohn 2009).
Retirement-security challenges facing current and future older Latinos are ofincreasing policy relevance as Latinos have become one of the largest and fastestgrowing population groups in the nation. A strong influx of immigrants in the 1980sand 1990s and relatively high fertility rates pushed the Hispanic population growthrate substantially above the growth rate for non-Latino whites and non-Latino blacks(Stepler andBrown2015).Although theHispanic population is comparatively young,it is aging rapidly. Between 1980 and 2014, the number of Latinos ages 65 and oldermore than quintupled, to 3.5 million (Johnson et al. 2016). The US Census Bureau(2016) projects that the older Hispanic population will more than triple over the next25 years. Although Latinos now make up less than 8% of the US population ages65 and older, they will account for over 15% of the older population by 2040 (U.S.Census Bureau 2016).
This chapter examines Latinos’ retirement security, using nationally representa-tive household survey data from multiple sources, including the American Commu-nity Survey (ACS), decennial censuses, and Health and Retirement Study (HRS).It compares income, poverty rates, and wealth at ages 65 and older across racialand ethnic groups, and examines how differences in health, relationship status, andhousehold composition between Latinos and non-Latinos help shape their retirement

11 Older Latinos’ Financial Security: Resources, Needs … 227
security. The analysis highlights differences betweenUS-bornLatinos and those bornoutside the country. Because the Latino population in the United States is changingrapidly, as average educational attainment improves and the foreign-born share falls(Blau andMackie 2017; Flores 2017), coming generations of older Latinoswill likelybe more financially secure than the current generation. The chapter also examineshow Latinos’ retirement security will likely evolve in the coming decades by pro-jecting age-70 income and wealth for the 1940–49 through 1970–79 birth cohorts,using the Urban Institute’s Dynamic Simulation of Income Model (DYNASIM4).
Data and Methods
Much of our analysis used data from the 2014 ACS, supplemented by the 2010 ACSand the 5% sample of the 1980, 1990, and 2000 decennial censuses to examine trendsin outcomes. These data are available through the Integrated Public Use MicrodataSeries (Ruggles et al. 2015). The ACS and decennial censuses are nationwide house-hold and institutional surveys that collect information on demographic, housing,social, and economic characteristics. The millions of interviews conducted by thesesurveys generated large enough sample sizes for meaningful comparisons betweenUS-born and foreign-born Latinos. The ACS, begun in 2005, interviews about 2 mil-lion households every year. The 2014 ACS collected data on about 251,900 Latinos,including 118,900 respondents born in the United States and 133,000 born outsidethe United States. The 1980 census interviewed about 335,600 Latinos, including193,400 respondents born in the United States and 139,300 born outside the UnitedStates.
We used ACS and decennial census data to estimate median income levels, thecomposition of income, and poverty rates and describe basic demographics, includingnativity, educational attainment, marital status, andmultigenerational living arrange-ments. The decennial censuses collected income data from the previous year, andthe ACS asked respondents to report the income they received over the previous12 months, which we interpreted as the previous calendar year. Thus, our analysiscomputed income and poverty measures for 1979, 1989, 1999, 2009, and 2013.1
Because census surveys appear to undercount pension benefits and income fromretirement accounts (Bee and Mitchell 2017), these estimates likely overestimateincome and overestimate the poverty rate at older ages.
The study also used data from the HRS, a national, longitudinal survey of olderAmericans, to examine wealth and health status, which are not available in thelarger ACS and decennial censuses. Conducted by the University of Michigan withprimary funding from the National Institute on Aging, the HRS began in 1992 with
1We adjusted income amounts for household size by dividing family income by the square root ofthe number of family members. This is a common approach in the literature (e.g., Litwin and Sapir2009; Bremer 2014), which enabled us to more accurately approximate the resources availableto families given racial and ethnic differences in household size and the economies of scale inhousehold production that favor larger households.

228 R. W. Johnson et al.
interviews of about 12,600 adults ages 51–61 and their spouses. These respondentshave been reinterviewed every other year. Additional cohorts were added to thestudy in 1998, 2004, and 2010, so that the HRS now collects data every two yearsfrom more than 22,000 adults older than age 50. It oversamples African Americans,Latinos, and Florida residents. In 2012, the HRS collected complete informationfrom 10,061 respondents ages 65 and older, including 405 US-born Latinos and 536foreign-born Latinos. Most of our analysis used the cleaned HRS data release fromRAND (version O) (Chien et al. 2015).
We compared how outcomes at ages 65 and older varied in the HRS by race andethnicity in 1998, 2004, and 2012. Our measure of net household wealth includedthe value of a home, other real estate, businesses, financial assets, and other assets(primarily vehicles), minus housing and other debt. The HRS asked respondents torate their overall health status as excellent, very good, good, fair, or poor. It alsoasked respondents whether they had any difficulty with everyday activities becauseof a physical, mental, emotional, or memory problem expected to last at least threemonths. The survey collected information on limitationswith activities of daily living(ADLs) and instrumental activities of daily living (IADLs). ADLs included dressing,walking across a room, bathing or showering, eating, getting in or out of bed, andusing the toilet. IADLs included preparing a hotmeal, shopping for groceries,makingphone calls, taking medication, and using a map.
Finally, we used DYNASIM4 to project the financial security of future gener-ations of older Latinos. Income levels for upcoming waves of Latino retirees willdiffer from current levels as the characteristics of the nonretired Latino populationevolve, with higher levels of education, changes in the share of the population bornoutside the United States and in the mix of immigrants’ origin countries, and shifts inemployment and earnings. Recent economic and demographic trends and develop-ments in employer-sponsored retirement plans that affect all racial and ethnic groupswill also shape Latinos’ future retirement security.
DYNASIM4 starts with a representative sample of individuals and families fromthe 2004 and 2008 SIPP panels and ages them year by year, simulating key demo-graphic, economic, and health events. For example, DYNASIM4 projects that, eachyear, some people in the sample get married, have a child, or find a job. The modelprojects that other people become divorced or widowed, stop working, begin col-lecting Social Security, become disabled, or die. These transitions are based onprobabilities generated by carefully calibrated equations estimated from nationallyrepresentative household survey data. The equations take into account important dif-ferences in how likely various experiences are depending on sex, education, earnings,and other characteristics. Other equations in DYNASIM4 project annual earnings,savings, and home values. The model uses program rules—combined with projec-tions of lifetime earnings, disability status, and household income and wealth—toproject Social Security retirement and disability benefits andMedicaid coverage. Forconsistency with Social Security’s projections about system finances, we generallyused the same assumptions as the Social Security and Medicare trustees.2
2For more information about DYNASIM, see Urban Institute (2015) and Favreault et al. (2015).

11 Older Latinos’ Financial Security: Resources, Needs … 229
Using DYNASIM4, we projected family income and wealth at age 70 through2049. The analysis computed median family cash income, median total familyincome, and median family net worth. Family cash income includes Social Securitybenefits, Supplemental Security Income (SSI), DB pension income, other govern-ment and nongovernment benefits (such as unemployment insurance benefits andpayments from private disability insurance policies), withdrawals from retirementaccounts, earnings, interest, dividends, and rental income. Total family income addsto cash income the annual payment a family could receive from annuitizing 80% oftheir financial wealth, using actuarially fair rates. Family net worth includes housingwealth, financial assets (including the value of individual retirement accounts anddefined contribution (DC) retirement accounts), and the value of businesses, vehicles,and nonhousing real estate, net of outstanding debt (including mortgages). We alsocomputed the share of people holding a DC retirement account balance or receivingincome fromaDBpension and themedian value of account balances and the expectedpresent discounted value at age 70 of future DB pension payments for those withpositive amounts. We compared age-70 outcomes by race and ethnicity and nativityfor four 10-year birth cohorts: 1940–1949 (who turned age 70 between 2010 and2019), 1950–1959, 1960–1969, and 1970–1979 (who turned age 70 between 2040and 2049). All amounts were expressed in inflation-adjusted 2015 dollars.
Results
We compared financial resources (income, poverty rates, and wealth) and retirementneeds (health anddisability,marital status andhousehold composition, and retirementtiming) for older Latinos and non-Latinos. We also compared income projections atolder ages for future generations of retirees.
Financial Resources Available to Older Adults
Income
Latinos ages 65 and older receive significantly less income than older non-Latinowhites. In 2013, median family income, adjusted for family size, was one-third lowerfor older Latinos than older non-Latino whites ($24,400 vs. $36,300) (Fig. 11.1).Median income was nearly one-fifth higher for older US-born Latinos than olderforeign-born Latinos ($26,800 vs. $22,600). The median older non-Latino blackreceived about as much income in 2013 as the median older US-born Latino andabout one-sixth more than the median older foreign-born Latino.
Median income for US-born Latinos ages 65 and older has grown rapidly overthe past three and a half decades. Between 1979 and 2013, real median familyincome, adjusted for family size, increased 51% for older US-born Latinos, com-

230 R. W. Johnson et al.
Fig. 11.1 Realmedian family income adjusted for family size, age 65+, by year (Constant 2014 dol-lars). Source Authors’ tabulations from the U.S. decennial censuses and the American CommunitySurvey (ACS)
pared with 38% for older non-Latino whites and only 11% for older foreign-bornLatinos. Median income increased most rapidly over the period—55%—for oldernon-Latino blacks. Older foreign-born Latinos are the only group whose real medianincome fell between 1999 and 2013.
Nearly 9 in 10 non-Latino white adults ages 65 and older received Social Securitybenefits in 2013, but significantly smaller shares of people of color collected benefits(Table 11.1). Only 75% of all older Latinos and 69% of older foreign-born Latinosreceived benefits in 2013. The relatively low receipt rate for foreign-born Latinosreflects the relatively short US careers completed by many people who arrived in theUnited States at older ages. Eighty-one percent of older non-Latino blacks collectedSocial Security.
Older Latinos are much less likely than older non-Latino whites to receive incomefrom employer-sponsored pensions or interest or dividend income, but they are morelikely to receive need-based government transfers, primarily SSI. For example, only22% of Latinos ages 65 and older and only 14% of those born outside the UnitedStates received employer-sponsored pension income in 2013, compared with 39%of older non-Latino whites. Moreover, 12% of older Latinos received need-basedgovernment transfers in 2013, compared with only 4% of non-Latino whites.
Among older adults collecting different types of income, the median amountsreceived in 2013 were higher for non-Latino whites than for US-born Latinos andnon-Latino blacks, who generally received comparable amounts, which in turn aretypically higher than for foreign-born Latinos. For example, median 2013 SocialSecurity income, among recipients, was $14,200 for non-Latino whites aged 65 andolder, $12,200 for non-Latino blacks, $11,600 for US-born Latinos, and $9100 forforeign-born Latinos. Although relatively few older adults received any earnings,median earnings for workers were substantial, reaching $20,000 for Latinos in 2013,about twice the median Social Security and employer-sponsored pension income.Income from need-based transfers and interest and dividend was much lower.

11 Older Latinos’ Financial Security: Resources, Needs … 231
Table 11.1 Receipt of personal income and inflation-adjusted median amount among recipientsby source and race and ethnicity, 2013
Adults ages 65 and older
Latino
All US born Foreign born Non-Latino white Non-Latino black
Social Security income
Percent receiving 75 83 69 88 81
Median amount ($) 10,200 11,600 9100 14,200 12,200
Pension income
Percent receiving 22 32 14 39 37
Median amount ($) 10,200 12,100 8500 13,300 12,200
Earnings
Percent receiving 17 17 18 21 18
Median amount ($) 20,000 20,300 19,300 22,700 20,200
Interest or dividends
Percent receiving 10 12 8 33 9
Median amount ($) 3700 2700 5100 3700 1500
Need-based government transfers
Percent receiving 12 10 13 4 9
Median amount ($) 5700 6100 5500 7300 6100
Source Authors’ calculations from the American Community Survey (ACS) for 2013NotesMedian amount estimates are reported in constant 2014 dollars, as adjusted by the change inthe consumer price index, rounded to the nearest $100, and restricted to adults who received incomefrom a given source
Poverty rates
Poverty rates are substantially higher for older Latinos than older non-Latino whites.In 2013, 19% of Latinos ages 65 and older had incomes below the FPL, comparedwith only 7% of non-Latino whites (Table 11.2). Foreign-born Latinos, with a 2013poverty rate of 22%, fared worse than US-born Latinos, 16% of whom lived inpoverty. By comparison, the 2013 poverty rate was 18% for non-Latino blacks.
Old-age poverty rates fell noticeably for all groups from 1979 to 1999. Non-Latino blacks and US-born Latinos experienced the largest improvement over theperiod. The poverty rate continued to fall through 2009 for these two groups, but notfor foreign-born Latinos or non-Latino whites. None of the groups experienced anyreduction in poverty between 2009 and 2013.
Across all racial and ethnic groups, poverty rates are especially high for unmarriedolder women. For example, among Latinos ages 75 and older, 25% of widowedwomen, 33% of divorced or separated women, and 40% of never married womenhad incomes below the FPL in 2013 (Table 11.3). By contrast, the 2013 poverty

232 R. W. Johnson et al.
Table 11.2 Poverty and near poverty rates by race and ethnicity, 1979–2013 (%)
Adults ages 65 and older
Latino
All US born Foreign born Non-Latino white Non-Latino black
Family income below the federal poverty line
1979 25 27 24 12 34
1989 24 25 23 10 32
1999 20 19 20 8 23
2009 19 16 21 7 18
2013 19 16 22 7 18
Family income below 125% of the federal poverty line
1979 36 38 33 20 47
1989 33 34 32 17 43
1999 28 27 29 12 32
2009 27 23 29 12 27
2013 27 23 30 12 25
Source Authors’ calculations from the U.S. decennial censuses for 1979, 1989, and 1999, and theAmerican Community Survey (ACS) for 2009 and 2013
Table 11.3 Poverty rates by sex, marital status, and race and ethnicity, 2013 (%)
Adults ages 75 and older
Latino
All USborn
Foreign born Non-Latinowhite
Non-Latinoblack
Men
Married 16 10 20 6 10
Divorced or separated 33 26 44 17 28
Widowed 25 23 26 15 23
Never married 33 33 33 25 45
Women
Married 15 11 18 7 13
Divorced or separated 33 34 33 22 30
Widowed 25 24 26 19 29
Never married 40 42 39 32 41
Source Authors’ calculations from the U.S. decennial censuses for 1979, 1989, and 1999, and theAmerican Community Survey (ACS) for 2009 and 2013
rate was only 15% for married Hispanic women ages 75 and older, 7% for marriednon-Latino white women ages 75 and older, and 3% for married non-Latino whitewomen ages 65–74.
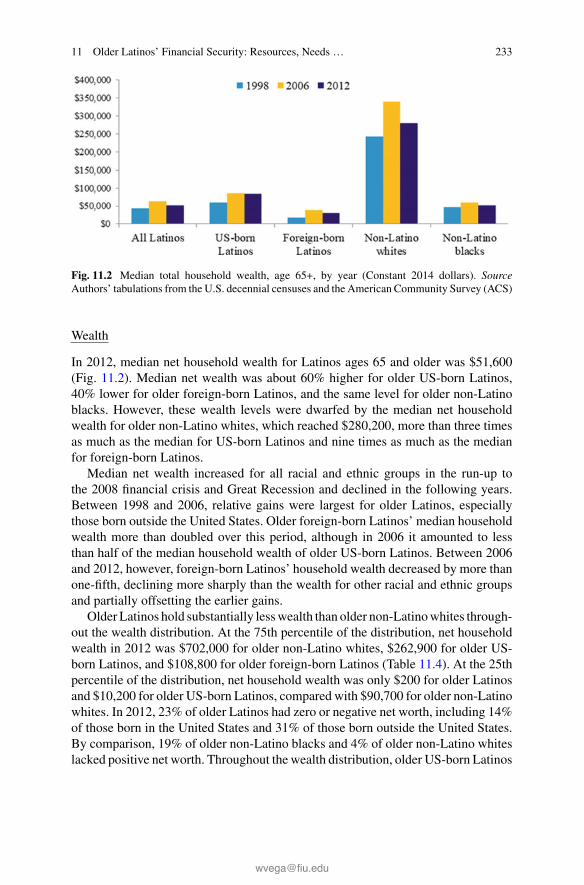
11 Older Latinos’ Financial Security: Resources, Needs … 233
Fig. 11.2 Median total household wealth, age 65+, by year (Constant 2014 dollars). SourceAuthors’ tabulations from the U.S. decennial censuses and the American Community Survey (ACS)
Wealth
In 2012, median net household wealth for Latinos ages 65 and older was $51,600(Fig. 11.2). Median net wealth was about 60% higher for older US-born Latinos,40% lower for older foreign-born Latinos, and the same level for older non-Latinoblacks. However, these wealth levels were dwarfed by the median net householdwealth for older non-Latino whites, which reached $280,200, more than three timesas much as the median for US-born Latinos and nine times as much as the medianfor foreign-born Latinos.
Median net wealth increased for all racial and ethnic groups in the run-up tothe 2008 financial crisis and Great Recession and declined in the following years.Between 1998 and 2006, relative gains were largest for older Latinos, especiallythose born outside the United States. Older foreign-born Latinos’ median householdwealth more than doubled over this period, although in 2006 it amounted to lessthan half of the median household wealth of older US-born Latinos. Between 2006and 2012, however, foreign-born Latinos’ household wealth decreased by more thanone-fifth, declining more sharply than the wealth for other racial and ethnic groupsand partially offsetting the earlier gains.
Older Latinos hold substantially lesswealth than older non-Latinowhites through-out the wealth distribution. At the 75th percentile of the distribution, net householdwealth in 2012 was $702,000 for older non-Latino whites, $262,900 for older US-born Latinos, and $108,800 for older foreign-born Latinos (Table 11.4). At the 25thpercentile of the distribution, net household wealth was only $200 for older Latinosand $10,200 for older US-born Latinos, compared with $90,700 for older non-Latinowhites. In 2012, 23% of older Latinos had zero or negative net worth, including 14%of those born in the United States and 31% of those born outside the United States.By comparison, 19% of older non-Latino blacks and 4% of older non-Latino whiteslacked positive net worth. Throughout the wealth distribution, older US-born Latinos

234 R. W. Johnson et al.
Table 11.4 Distribution of total size-adjusted household wealth by race and ethnicity, 2012
Adults ages 65 and older
Latino
All USborn
Foreign born Non-Latino white Non-Latino black
25th percentile 200 10,200 0 90,700 2100
50th percentile(median)
51,600 84,600 30,900 280,200 51,600
75th percentile 188,200 262,900 108,800 702,000 148,300
Percentage withoutpositive wealth
23 14 31 4 19
Source Authors’ calculations from the Health and Retirement Study (HRS)Notes Estimates are reported in constant 2014 dollars, as adjusted by the change in the consumerprice index, and rounded to the nearest $100. The family size adjustment divides total family incomeby the square root of the number of people in a family
have more net worth than older non-Latino blacks, and older foreign-born Latinoshave less.
Although the majority of older adults own a home, homeownership rates varysubstantially by race and ethnicity. In 2012, the homeownership rate among adultsages 65 and older was 85% for non-Latino whites, 75% for US-born Latinos, 67%for non-Latino blacks, and 58% for foreign-born Latinos (Table 11.5). Relative tohomeownership, housing debt in 2012 was most common among non-Latino blacks,with 39% of homeowners holding housing debt (26% divided by 67%), and leastcommon among foreign-born Latinos (31%).
Older adults of color are much less likely to hold financial assets than older non-Latinowhites. In 2012, only 9%of foreign-born Latinos and 19%ofUS-born Latinosheld an IRA or Keogh, compared with 46% of non-Latino whites. Similarly, only33% of foreign-born Latinos and 62% of US-born Latinos held other financial assets,compared with 92% of non-Latino whites. Non-Latino blacks were more likely thanother groups to hold non-housing debt in 2012.
Among asset holders, the median value of a home exceeds the median value ofany other asset across all racial and ethnic groups. Aside from the home, the mostsignificant asset is IRA and Keogh accounts.
Factors Affecting the Demand for Resources in Old Age
Health
The adequacy of older adults’ current income and accumulated wealth depends onhow much they need to live comfortably. Needs depend partly on health status,because out-of-pocket spending on medical care and especially long-term services
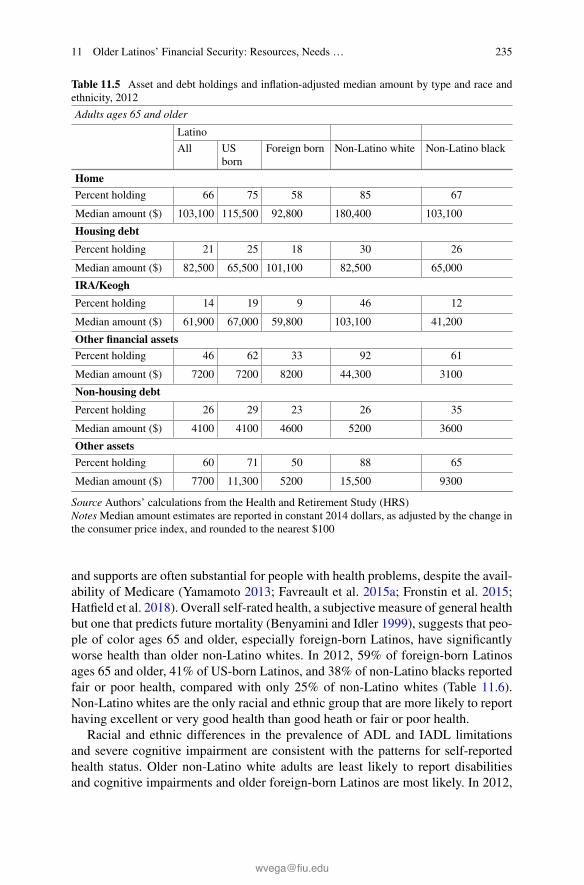
11 Older Latinos’ Financial Security: Resources, Needs … 235
Table 11.5 Asset and debt holdings and inflation-adjusted median amount by type and race andethnicity, 2012
Adults ages 65 and older
Latino
All USborn
Foreign born Non-Latino white Non-Latino black
Home
Percent holding 66 75 58 85 67
Median amount ($) 103,100 115,500 92,800 180,400 103,100
Housing debt
Percent holding 21 25 18 30 26
Median amount ($) 82,500 65,500 101,100 82,500 65,000
IRA/Keogh
Percent holding 14 19 9 46 12
Median amount ($) 61,900 67,000 59,800 103,100 41,200
Other financial assets
Percent holding 46 62 33 92 61
Median amount ($) 7200 7200 8200 44,300 3100
Non-housing debt
Percent holding 26 29 23 26 35
Median amount ($) 4100 4100 4600 5200 3600
Other assets
Percent holding 60 71 50 88 65
Median amount ($) 7700 11,300 5200 15,500 9300
Source Authors’ calculations from the Health and Retirement Study (HRS)NotesMedian amount estimates are reported in constant 2014 dollars, as adjusted by the change inthe consumer price index, and rounded to the nearest $100
and supports are often substantial for people with health problems, despite the avail-ability of Medicare (Yamamoto 2013; Favreault et al. 2015a; Fronstin et al. 2015;Hatfield et al. 2018). Overall self-rated health, a subjective measure of general healthbut one that predicts future mortality (Benyamini and Idler 1999), suggests that peo-ple of color ages 65 and older, especially foreign-born Latinos, have significantlyworse health than older non-Latino whites. In 2012, 59% of foreign-born Latinosages 65 and older, 41% of US-born Latinos, and 38% of non-Latino blacks reportedfair or poor health, compared with only 25% of non-Latino whites (Table 11.6).Non-Latino whites are the only racial and ethnic group that are more likely to reporthaving excellent or very good health than good heath or fair or poor health.
Racial and ethnic differences in the prevalence of ADL and IADL limitationsand severe cognitive impairment are consistent with the patterns for self-reportedhealth status. Older non-Latino white adults are least likely to report disabilitiesand cognitive impairments and older foreign-born Latinos are most likely. In 2012,

236 R. W. Johnson et al.
Table 11.6 Self-rated health status and prevalence of disabilities and severe cognitive impairmentby race and ethnicity, 2012 (%)
Latino
All US born Foreign born Non-Latinowhite
Non-Latinoblack
Self-rated health (65 and older)
Excellent orvery good
21.8 28.2 16.3 42.6 24.6
Good 27.8 30.9 25.2 32.6 37.4
Fair or poor 50.4 40.9 58.5 24.8 38.0
Any IADL limitation
65 and older 25.3 23.6 26.8 15.5 25.9
75 and older 37.0 40.2 34.6 23.0 35.0
Any ADL limitation
65 and older 28.5 24.3 32.0 16.4 27.6
75 and older 40.7 33.9 45.9 22.8 35.5
Two or more ADL limitations
65 and older 17.6 14.7 20.1 7.8 14.4
75 and older 28.6 25.9 30.6 11.3 20.4
Severe cognitive impairment
65 and older 6.8 6.5 7.1 2.4 6.0
75 and older 13.5 14.8 12.6 4.3 12.6
Two or more ADL limitations or severe cognitive impairment
65 and older 19.7 17.3 21.7 8.9 17.3
75 and older 32.2 30.8 33.3 13.4 26.3
Source Authors’ calculations from the Health and Retirement Study (HRS)
among adults ages 65 and older, 22% of foreign-born Latinos, 17% of US-bornLatinos and non-Latino blacks, and 9% of non-Latino whites reported two or moreADL limitations or severe cognitive impairment.
The need for long-term services and supports among older people of color isespecially pronounced at ages 75 and older. Among adults in that age group, 33%of foreign-born Latinos, 31% of US-born Latinos, and 26% of non-Latino blacksreported two or more ADL limitations or severe cognitive impairment in 2012, com-pared with only 13% of non-Latino whites. The high prevalence of disabilities andcognitive impairment among older Latinos can create financial hardship. Althoughmost of the help received by older people with disabilities is still provided by unpaidfamily caregivers (Johnson and Weiner 2006; Wolff et al. 2016), some frail olderadults receive assistance from paid helpers at home or in other residential settings,such as assisted living facilities or nursing homes. Paid care is expensive, and muchof the cost is paid out of pocket, because Medicare provides only limited coverageand only in special circumstances, few people have private long-term care insur-

11 Older Latinos’ Financial Security: Resources, Needs … 237
ance coverage (Johnson 2016b), and Medicaid pays only for people with virtuallyno assets (or people who have already spent nearly all of their assets on care). Asa result, household wealth often declines sharply when older people develop dis-abilities (Venti and Wise 2004; Johnson et al. 2006; Poterba et al. 2010; Johnson2016a).
Relationship Status and Household Composition
Relationship status helps shape well-being at older ages. Married people gain finan-cially because they can economize on living expenses through shared living arrange-ments and they can obtain access to spousal Social Security benefits. During workingyears, marriage buffers the impact of unemployment and other adverse labor marketoutcomes, as one spouse can work more to offset the losses experienced by the other(Kawano and LaLumia 2014). Moreover, married men tend to earn more than singlemen, perhaps because marriage allows them to specialize in employment activities(rather than housekeeping activities) or signals to employers that they are produc-tive (Ginther and Zavodny 2001; Pollmann-Schult 2010).3 Spouses and partners alsoprovide emotional support to each other and typically serve as the primary caregiverin the event of disability (Johnson and Wiener 2006; Wolff et al. 2016).
Older Latinos are somewhat less likely to be married/partnered than older non-Latino whites and more likely to be married/partnered than older non-Latino blacks.In 2014, 69% of Latino men ages 65 and older were married or partnered, comparedwith 73% of non-Latino white men and 56% of non-Latino black men (Table 11.7).Older foreign-born Latino men are more likely to be married or partnered than olderUS-born Latino men.
Older women are much less likely to be married/partnered than older men, pri-marily because they tend to live longer and thus are more likely to be widowed. In2014, 41% of Latino women ages 65 and older were married or partnered, comparedwith 48% of older non-Latino white women and only 27% of older non-Latino blackwomen. Compared with older non-Latino white women, older Latino women aremore likely to be never married. Marital status for older Latino women does not varymuch by nativity.
Multigenerational households economize on living expenses and facilitate thesharing of resources between parents and adult children (Swartz 2009). Older Lati-nos, especially those born outside the country, are much more likely to live in multi-generational households than older non-Latinos. In 2014, 44% of all Latinos ages65 and older and 52% of older foreign-born Latinos lived in a multigenerationalhousehold.4 By contrast, only 33% of older non-Latino blacks and 16% of oldernon-Latino whites lived in multigenerational households.
3Alternatively, married men may earn more than single men not because marriage raises earningsbut because the same qualities rewarded by the labor market are also valued by potential spouses(Dougherty 2006; Killewald and Lundberg 2017).4Multigenerational households are defined here as a household that includes three or more gener-ations, two nonadjacent generations (such as a grandparent and grandchild without the presenceof the grandparent’s child) or two adjacent generations in which some members of the youngergenerations are married or older than 17.

238 R. W. Johnson et al.
Table 11.7 Relationship status by gender, race and ethnicity, and share of older adults living inmultigenerational households, 2014 (%)
Adults ages 65 and older
Latino
All USBorn
Foreign Born Non-Latino White Non-Latino Black
Marital statusMen
Married 69 66 73 73 56
Divorced or separated 14 15 12 11 20
Widowed 11 12 10 11 15
Never married 6 7 5 5 9
Women
Married 41 41 41 48 27
Divorced or separated 18 19 17 13 23
Widowed 33 33 34 35 41
Never married 8 7 8 4 10
Living in amultigenerationalhousehold
44 35 52 16 33
Source Authors’ calculations from the American Community Survey (ACS) for 2014
Projected Outlook for Future Retirees
Although Latinos receive much less income in retirement today than non-Latinowhites, DYNASIM4 projections show that the gap will narrow over the next threedecades. Median family cash income at age 70 is projected to reach $24,800 (in2015 inflation-adjusted dollars) for Latinos born in the 1970s, who will turn 70 inthe 2040s (Table 11.8). Their median income will be 32% higher than the medianincome for Latinos born in the 1940s, who turned 70 in the 2010s. Median age-70incomewill grow 42% over the period for US-born Latinos and 38% for foreign-bornLatinos, according to our projections. Nonetheless, non-Latino whites will continueto receive muchmore retirement income than Latinos in the 2040s, with their medianage-70 income exceedingUS-bornLatinos’median income by 42%and foreign-bornLatinos’ median income by 155%. Total age-70 income, which adds to cash incomethe annual payment a family could receive from annuitizing 80% of their financialwealth, using actuarially fair rates, will grow slightly more rapidly over the nextthree decades than cash income, but the ethnic and racial patterns are similar, withboth US-born Latinos and foreign-born Latinos experiencing more rapid gains thannon-Latino whites and non-Latino blacks.

11 Older Latinos’ Financial Security: Resources, Needs … 239
Table 11.8 Projected median family income at age 70 by birth cohort and race and ethnicity
Inflation-adjusted 2015 dollars
Latino
All US Born Foreign Born Non-LatinoWhite
Non-LatinoBlack
Cash income
1940–49 18,800 25,600 14,700 49,300 28,600
1950–59 21,000 29,100 16,300 48,500 26,800
1960–69 22,900 32,800 19,000 48,100 28,900
1970–79 24,800 36,400 20,300 51,800 31,600
Total income
1940–49 19,600 26,900 15,700 55,900 30,000
1950–59 22,400 32,800 18,000 55,000 28,700
1960–69 25,100 36,500 20,900 55,100 31,400
1970–79 27,100 39,600 22,200 58,900 33,900
Source Authors’ calculations from DYNASIM4, run 941Notes Total income adds to cash income the annual payment a family could receive from annuitizing80% of their financial wealth, using actuarially fair rates. Estimates were rounded to the nearest$100
Table 11.9 Projected median total family net worth at age 70 by birth cohort and race and ethnicity
Inflation-adjusted 2015 dollars
Latino
All US Born Foreign Born Non-LatinoWhite
Non-LatinoBlack
1940–49 11,600 14,200 10,100 139,800 16,800
1950–59 28,000 50,500 20,000 196,200 27,800
1960–69 40,700 86,400 27,100 209,000 48,600
1970–79 52,000 98,500 37,300 240,200 71,100
Source Authors’ calculations from DYNASIM4, run 941Note Estimates were rounded to the nearest $100
DYNASIM4 projections show much stronger growth in median net worth at age70 for people of color than for non-Latino whites through the 2040s. Median age-70net worth will reach $98,500 for US-born Latinos born in the 1970s, nearly seventimes as high as for US-born Latinos born in the 1940s (Table 11.9). Age-70 networth will not grow quite as rapidly for other people of color, quadrupling for non-Latino blacks and nearly quadrupling for foreign-born Latinos. However, non-Latinowhites will continue to enjoy a substantial wealth advantage over other groups, witha median age-70 net worth that is more than twice as high as the median level forUS-born Latinos andmore than six times as high as the median level for foreign-bornLatinos.

240 R. W. Johnson et al.
One reason for the substantial projected increase in Latinos’ income and wealthat age 70, especially for those born in the United States, is their strong growth inemployer-sponsored retirement plan coverage. The share of 70-year-olds receivingincome from aDBpension is projected to fall over the next three decades for all racialand ethnic groups (Table 11.10), reflecting a shift by employers from DB pensionplans to DC retirement accounts that began in the 1980s. However, Latinos willexperience a smaller decline inDBpension coverage than non-Latinowhites and non-Latino blacks because Latinos—especially those born outside the United States—aremuch less likely than non-Latinos to have DB coverage today (Johnson et al. 2016).Moreover, the share of US-born Latinos with a DC retirement account at age 70is projected to increase by 24 percentage points over the next three decades, whilegrowing by just 9 percentage points for non-Latino whites and by 8 percentage pointsfor foreign-born Latinos. Consequently, the share of US-born Latinos receiving DBpension income or holding a DC retirement account at age 70 will rise from 41percentage among those born in the 1940s to 62% among those born in the 1970s,a 16 percentage point increase. By contrast, the rate will grow by only 2 percentagepoints for foreign-born Latinos and by 1 percentage point for non-Latino whites.
Not only will DB pension income become less prevalent over the next threedecades, the value of lifetimeDB pension benefits among retirees still receiving themwill fall sharply. The projected decline is similar across racial and ethnic groups, withmedian lifetime pension benefits among adults turning age 70 in the 2040s fallingbetween 64% and 74% below themedian value among adults turning 70 in the 2010s.However, DC retirement accounts will grow, with the median age-70 value amongaccount holders increasing 74% for US-born Latinos, 41% for foreign-born Latinos,37% for non-Latino whites, and 90% for non-Latino blacks. Overall, however, thecombined value of DB pensions and DC accounts among people receiving DB pen-sion income or holding a DC account will fall over time across all racial and ethnicgroups, because DB pensions are now worth much more than DC accounts, amongthose who have them.
More fundamentally, the improvement in the financial position of future Latinoretirees relative to their non-Hispanic white and black counterparts can primarilybe attributed to strong gains in educational attainment among the current Latinoworking-age population. As an illustration, between 1980 and 2014, the share ofLatinos ages 25–44 without a high school diploma decreased 21 percentage points(Fig. 11.3). The educational gains in this age group have been particularly impressivefor US-born Latinos, among whom the share without a high school diploma at ages25–44 declined by more than two thirds, or 27 percentage points, over the observedperiod. Simultaneously, the share of US-born Latinos in the total Latino popula-tion has been increasing, especially among younger cohorts (Johnson et al. 2016).Since Latinos still lag substantially behind non-Latinos in educational attainment,despite recent gains, our projections account for their expected continued educationalconvergence with other racial and ethnic groups.

11 Older Latinos’ Financial Security: Resources, Needs … 241
Table 11.10 Projected percentage of adults with DB pension income or DC retirement accountbalances and their expected lifetime conditional median value at age 70 by birth cohort and raceand ethnicity
Latino
All US Born Foreign Born Non-LatinoWhite
Non-LatinoBlack
DB Pension or DC Retirement Account1940–49
Percent 36 46 29 73 56
Conditional median value ($) 148,500 263,600 99,500 309,900 216,200
1950–59
Percent 41 53 33 76 56
Conditional median value ($) 102,800 123,900 83,600 230,100 151,900
1960–69
Share 45 61 36 74 60
Conditional median value ($) 85,700 128,800 58,000 169,200 112,200
1970–79
Percent 42 62 31 74 62
Conditional median value ($) 66,100 84,600 51,900 160,700 91,100
DB Pension1940–49
Percent 23 33 16 43 42
Conditional median value ($) 225,400 287,300 149,600 333,500 256,300
1950–59
Percent 19 25 15 37 32
Conditional median value ($) 122,400 157,500 96,200 242,000 192,100
1960–69
Percent 18 25 14 31 28
Conditional median value ($) 105,900 131,000 83,600 145,500 115,700
1970–79
Percent 12 19 8 25 22
Conditional median value ($) 66,100 77,900 54,200 83,100 65,700
DC Retirement Account1940–49
Percent 25 32 20 60 32
Conditional median value ($) 37,800 40,600 35,300 95,800 40,700
1950–59
Percent 34 44 28 69 44
Conditional median value ($) 53,500 56,900 48,300 116,400 65,600
(continued)

242 R. W. Johnson et al.
Table 11.10 (continued)
Latino
All US Born Foreign Born Non-LatinoWhite
Non-LatinoBlack
1960–69
Percent 38 54 30 68 53
Conditional median value ($) 57,700 85,000 43,400 116,300 66,700
1970–79
Percent 38 56 28 69 55
Conditional median value ($) 59,700 70,700 49,700 130,900 77,400
Source Authors’ calculations from DYNASIM4, run 941NotesMedian values are reported in inflation-adjusted 2015 dollars and rounded to the nearest $100
Fig. 11.3 Percentage of adults ages 25-44 without a high school diploma. Source Authors’ tabu-lations from the U.S. decennial censuses and the American Community Survey (ACS)
Discussion
Older Latinos receive much less income, hold much less wealth, and are much morelikely to be impoverished than older adults overall. Financial outcomes are signifi-cantly worse for older foreign-born Latinos than for those born in the United States,because workers who spend part of their careers outside the United States have lesstime to accumulate Social Security and employer-sponsored retirement benefits thanthose who spent their entire careers in the country. In general, older US-born Latinosfare better than older non-Latino blacks, whereas older foreign-born Latinos fareworse than older non-Latino blacks.
Educational differences partly account for these racial and ethnic disparities inretirement incomes and retirement wealth. Among adults ages 65 and older in 2014,45%of Latinos lacked a high school diploma, including 55%of foreign-born Latinos,compared with 27% of non-Latino blacks and 11% of non-Latino whites (Johnsonet al. 2016). Health problems create additional challenges for many older Latinos.Although most people with disabilities or cognitive impairment rely on help with

11 Older Latinos’ Financial Security: Resources, Needs … 243
everyday activities from unpaid family caregivers, some must turn to paid helpersat home or in other residential settings, such as assisted living facilities or nursinghomes, when they need round-the-clock care. Paid care is expensive and much ofthe cost is paid out of pocket, because Medicare provides only limited coverageand only in special circumstances, few people have private long-term care insurancecoverage, and Medicaid pays only for people with virtually no assets (or peoplewho have already spend nearly all of their assets on care). As a result, the need forlong-term services and supports often leads to financial hardship.
Despite these challenges, older US-born Latinos’ median income has grown sub-stantially over the past three decades, and our DYNASIM4 projections suggest thatretirement incomes will grow over the next three decades for both US-born andforeign-born Latinos. The projected growth in income for future Latino retireesreflects recent educational gains made by younger Latinos and the growing shareof US-born adults in the Latino population. As younger Latinos’ high school andcollege graduation rates have increased, working-age Latinos are now able to earnmore, save more for retirement, and accumulate more future Social Security andpension benefits than previous generations, boosting future retirement incomes. Inaddition, the children of immigrants—the second generation—generally fare bet-ter in the labor market than their parents, because of improved English-languageskills, better education, and greater access to informal job markets (Blau andMackie2017). Moreover, the children of immigrants generally spend their entire careersin the United States; they tend to accumulate more Social Security benefits thantheir parents. Thus, Latinos’ retirement incomes will rise over time as the share offoreign-born adults in the older Latino population shrinks.
Various policy options might further improve retirement security for future Latinoretirees. Workforce development initiatives and efforts to promote education couldenhance skills and raise earnings, boosting future Social Security benefits and allow-ingmore Latinos to save for retirement. Raisingminimumwage levels and extendingliving wage laws (which exist in certain localities and require employers that receivegovernment contracts to pay above-market wages) could also increase earnings forsome Latinos. Policy initiatives that promote retirement savings could help narrowracial and ethnic disparities in retirement savings. For example, several states are con-sidering requiring employers that do not provide employees with a retirement plan tooffer automatic payroll deductions that would fund retirement accounts. These man-dates are moving forward in California, Connecticut, Illinois, New Jersey, Oregon,Washington, and other states (Scott and Blevins 2016).
Social Security reforms could also safeguard Latinos’ retirement security. Manyolder Latinos, like other groups, receive the bulk of their income fromSocial Security.However, the system now pays out more benefits than it collects in payroll taxes, andthe Social Security trustees project that the trust fund that now covers the funding gapwill be depleted in the early 2030s (Board of Trustees, FederalOld-Age andSurvivorsInsurance and Federal Disability Insurance Trust Funds 2017). Once the trust fundis depleted, the system could afford to pay only about three-quarters of scheduledbenefits. Thus, efforts to shore up Social Security’s financing, such as by increasingthe cap on annual earnings subject to Social Security’s payroll taxes, are critical to
244 R. W. Johnson et al.
ensuring long-termfinancial security for older Latinos. Other Social Security reformsthat increase benefit progressivity or create a meaningful minimum benefit wouldraise retirement incomes for people with low lifetime earnings (Favreault et al. 2007).
Finally, supports for family caregivers and better financing options for paid long-term services and supports could help the many older Latinos with disabilities andcognitive impairment receive the care theyneed and ease thefinancial burdens on theirfamilies. Most care received by older adults with disabilities is provided at home byunpaid family caregivers (Wolff et al. 2016). Care responsibilities sometimes forcecaregivers to reduce their labor supply or exit the labor force, jeopardizing theirretirement security. Providing caregivers with tax and Social Security credits couldoffset some of these losses (AARP 2017). When older people with disabilities needadditional care, they often enter expensive nursing homes or other residential caresettings, which are generally expensive; lifetime costs average $138,000 for someoneturning 65 today, and 15% of 65-year-olds will incur at least $250,000 in future costs(Favreault and Dey 2015). Because relatively few people have private long-term careinsurance (Johnson 2016b) andMedicare does not generally cover long-term servicesand supports, most care recipients pay for nursing home stays out of pocket until theyexhaust their resources and then turn to Medicaid. Creating a national program tofinance long-term services and supports or providing better insurance options couldsignificantly improve financial security for older adults, including the many Latinoswho develop disabilities in later life.
References
AARP. (2017). The credit for caring act. Washington, DC: AARP. https://www.aarp.org/caregiving/financial-legal/info-2017/credit-for-caring-act.html.
Angel, J. L., & Mudrazija, S. (2015). Economic security of older Hispanics: The role of socialsecurity and employer-sponsored plans. In N. Morrow-Howell & M. S. Sherraden (Eds.), Finan-cial capability and asset holding in later life: A life course perspective (pp. 69–86). New York:Oxford University Press.
Bee, A., & Mitchell, J. (2017). Do older Americans have more income than we think? (SESHDWorking Paper No. 2017-39). Washington, DC: U.S. Census Bureau. https://www.census.gov/content/dam/Census/library/working-papers/2017/demo/SEHSD-WP2017-39.pdf.
Benyamini, Y., & Idler, E. L. (1999). Community studies reporting association between self-ratedhealth and mortality: Additional studies, 1995 to 1998. Research on Aging, 21(3), 392–401.
Blau, F. D., & Mackie, C. (Eds.). (2017). The economic and fiscal consequences of immigration.Washington, DC: The National Academies Press.
Board of Trustees, Federal Old-Age and Survivors Insurance and Federal Disability InsuranceTrust Funds. (2017). The 2017 annual report of the Board of Trustees of the Federal Old-Age andSurvivors Insurance and Federal Disability Insurance Trust Funds. Washington, DC: Board ofTrustees. https://www.ssa.gov/oact/tr/2017/.
Borjas, G. J. (1999). Heaven’s door: Immigration policy and the American economy. PrincetonUniversity Press.
Borjas, G. J. (2006). Wage trends among disadvantaged minorities. In R. M. Blank, S. H. Danziger,& R. F. Schoeni (Eds.), Working and poor: How economic and policy changes are affectinglow-wage workers. New York: Russell Sage Foundation.

11 Older Latinos’ Financial Security: Resources, Needs … 245
Bremer, P. (2014). Forgone care and financial burden due to out-of-pocket payments within theGerman health care system. Health Economics Review, 4(1), 1–9.
Capps, R., Fortuny,K.,&Fix,M. (2007).Trends in the low-wage immigrant labor force, 2000–2005.Washington, DC: Urban Institute and Migration Policy Institute.
Chien, S., Campbell, N., Chan, C., Hayden, O., Hurd, M., Main, R., et al. (2015). RAND HRS datadocumentation, version O. Santa Monica, CA: RAND. http://hrsonline.isr.umich.edu/modules/meta/rand/randhrso/randhrs_O.pdf.
DeNavas-Walt, C., & Proctor, B. D. (2015). Income and poverty in the United States: 2014 (CurrentPopulation Reports, P 60-252). Washington, DC: Government Printing Office. https://www.census.gov/content/dam/Census/library/publications/2015/demo/p60-252.pdf.
Dougherty, C. (2006). The marriage earnings premium as a distributed fixed effect. Journal ofHuman Resources, 41(2), 433–443.
Duleep, H. O., & Dowhan, D. J. (2008). Research on immigrants earnings. Social Security Bulletin,68(1), 31–50.
Favreault, M., & Dey, J. (2015). Long-term services and supports for older Americans: Risksand financing. Washington, DC: U.S. Department of Health and Human Services, Office of theAssistant Secretary for Planning and Evaluation. http://aspe.hhs.gov/basic-report/long-term-services-and-supports-olderamericans-risks-and-financing-research-brief.
Favreault, M. M., Gleckman, H., & Johnson, R. W. (2015a). Financing long-term services andsupports: Options reflect trade-offs for older Americans and federal spending. Health Affairs,34(12), 2181–2191.
Favreault, M.M., Smith, K. E., & Johnson, R.W. (2015). The Dynamic Simulation of IncomeModel(DYNASIM): An overview. Washington, DC: Urban Institute. http://www.urban.org/research/publication/dynamic-simulation-income-model-dynasim-overview.
Favreault, M. M., Mermin, G. B. T., & Steuerle, C. E. (2007).Minimum benefits in social security.Washington, DC: Urban Institute. https://www.urban.org/research/publication/minimum-benefits-social-security.
Favreault, M. M., & Nichols. A. (2011). Immigrant diversity and social security: Recent patternsand future prospects. Washington, DC: Urban Institute. http://www.urban.org/research/publication/immigrant-diversity-and-social-security-recent-patterns-and-future-prospects.
Federal Interagency Forum on Aging-Related Statistics. (2016). Older Americans 2016: Key indi-cators of well-being.Washington, DC: U.S. Government Printing Office. http://www.agingstats.gov/docs/LatestReport/OlderAmericans2016.pdf.
Flores, A. (2017). How the U.S. Hispanic population is changing. Washington, DC: Pew ResearchCenter. http://www.pewresearch.org/fact-tank/2017/09/18/how-the-u-s-hispanic-population-is-changing/.
Fronstin, P., Salisbury, D., & VanDerhei, J. (2015). Amount of savings needed for health expensesfor people eligible for Medicare: Unlike the last few years, the news is not good. EBRI Notes,36(10), 2–8 (Washington, DC: Employee Benefit Research Institute).
Ginther, D. K., & Zavodny, M. (2001). Is the male marriage premium due to selection? The effect ofshotgun weddings on the return to marriage. Journal of Population Economics, 14(2), 313–328.
Hatfield, L. A., Favreault, M. M., McGuire, T. G., & Chernew, M. E. (2018). Modeling health carespending growth of older adults. Health Services Research, 53(1), 138–155.
Helman, R., Copeland, C., & VanDerhei, J. (2015). The 2015 retirement confidence survey: Havinga retirement savings plan a key factor in Americans’ retirement confidence (EBRI Issue BriefNo. 413). Washington, DC: Employee Benefit Research Institute. https://www.ebri.org/pdf/briefspdf/ebri_ib_413_apr15_rcs-2015.pdf.
Johnson,R.W. (2016).Later-life householdwealth before andafter disability onset (ASPEResearchBrief). Washington, DC: U.S. Department of Health and Human Services, Office of the AssistantSecretary for Planning and Evaluation.
Johnson, R. W. (2016b). Who is covered by private long-term care insurance? Washington, DC:Urban Institute. http://www.urban.org/research/publication/who-covered-private-long-term-care-insurance.

246 R. W. Johnson et al.
Johnson, R.W.,Mermin, G. B. T., &Uccello, C. E. (2006).When the nest egg cracks: Financial con-sequences of health problems, marital status changes, and job layoffs at older ages. Washington,DC: Urban Institute. http://www.urban.org/research/publication/when-nest-egg-cracks.
Johnson, R. W., Mudrazija, S., & Wang, C. X. (2016). Hispanics’ retirement security: Past trendsand future prospects. Washington, DC: Urban Institute. http://www.urban.org/research/publication/hispanics-retirement-security.
Johnson, R. W., & Smith, K. E. (2016). The Great Recession, the social safety net, and olderAmericans’ financial security: Evidence from multiple national surveys. Washington, DC: UrbanInstitute.
Johnson, R. W., & Wiener, J. M. (2006). A profile of frail older Americans and their caregivers(Retirement Project Occasional Paper No. 8). Washington, DC: Urban Institute. http://www.urban.org/url.cfm?ID=311284.
Kawano, L., & LaLumia, S. (2014). The added worker effect revisited: Differential responses byhusbands and wives. http://popcenter.uchicago.edu/events/LaLumia_paper.pdf.
Killewald, A., & Lundberg, I. (2017). New evidence against a causal marriage wage premium.Demography, 54(3), 1007–1028.
Litwin, H., & Sapir, E. V. (2009). Perceived income adequacy among older adults in 12 countries:Findings from the Survey of health, ageing, and retirement in Europe. The Gerontologist, 49(3),397–406.
Menjívar, C., & Enchautegui, M. E. (2015). Confluence of the economic recession and immigrationlaws in the lives of Latino immigrant workers in the United States. In M. Aysa-Lastra, & L.Cachón (Eds.), Immigrant vulnerability and resilience. International perspectives on migration(pp. 105–216). Cham, Switzerland: Springer.
Munnell, A. H., Hou, W., & Webb, A. (2014). NRRI update shows half still falling short. ChestnutHill, MA: Center for Retirement Research at Boston College. http://crr.bc.edu/wp-content/uploads/2014/12/IB_14-20-508.pdf.
Passel, J. S., & Cohn, D. (2009). A portrait of unauthorized immigrants in the United States.Washington, DC: Pew Hispanic Center.
Pollmann-Schult, M. (2010). Marriage and earnings: Why do married men earn more than singlemen? European Sociological Review, 27(2), 147–163.
Poterba, J. M., Venti, S. F., & Wise, D. A. (2010). The asset cost of poor health (NBER WorkingPaper No. w16389). Cambridge, MA: National Bureau of Economic Research.
Ruggles, S., Genadek, K., Goeken, R., Grover, J., & Sobek, M. (2015). Integrated public use micro-data series: Version 6.0 [Machine-readable database]. Minneapolis: University of Minnesota.
Scott, J., & Blevins, A. (2016). More states look to help workers save for retirement in 2016.Washington, DC: Pew Charitable Trusts. http://www.pewtrusts.org/en/research-and-analysis/analysis/2016/03/24/more-states-look-to-help-workers-save-for-retirement-in-2016.
Short, K. (2015). The supplemental poverty measure: 2014 (Current Population Reports, P 60-254).Washington, DC: U.S. Census Bureau. https://www.census.gov/content/dam/Census/library/publications/2015/demo/p60-254.pdf.
Social Security Administration. (2016). Income of the population 55 or older, 2014. Washington,DC: Social Security Administration. https://www.ssa.gov/policy/docs/statcomps/income_pop55.
Stepler, R., & Brown, A. (2015). Statistical portrait of Hispanics in the United States, 1980–2013.Washington, DC: Pew Research Center. http://www.pewhispanic.org/2015/05/12/statistical-portrait-of-hispanics-in-the-united-states-1980-2013/.
Swartz, T. T. (2009). Intergenerational family relations in adulthood: Patterns, variations, and impli-cations in the contemporary United States. Annual Review of Sociology, 35, 191–212.
Urban Institute. (2015). DYNASIM: Projecting older Americans’ future well-being. Washington,DC:Urban Institute. http://www.urban.org/sites/default/files/alfresco/publication-pdfs/2000370-DYNASIM-Projecting-Older-Americans-Future-Well-Being.pdf.
U.S. Census Bureau. (2016). 2014 National population projections. Washington, DC: U.S. Cen-sus Bureau. http://www.census.gov/population/projections/data/national/2014/downloadablefiles.html.

11 Older Latinos’ Financial Security: Resources, Needs … 247
Venti, S. F., & Wise, D. A. (2004). Aging and housing equity: Another look. In D. A. Wise (Ed.),Perspectives on the economics of aging (pp. 127–180). Chicago, IL: University of Chicago Press.
Wolff, J. L., Spillman, B. C., Freedman, V. A., & Kasper, J. D. (2016). A national profile of familyand unpaid caregivers who assist older adults with health care activities. JAMA InternalMedicine,176(3), 372–379.
Yamamoto, D. H. (2013). Health care costs—From birth to death (Independent Report Series,Report 2013-1). Health Care Cost Institute. http://www.healthcostinstitute.org/files/Age-Curve-Study_0.pdf.

Chapter 12Disability and the Immigrant HealthParadox: Gender and Timingof Migration
Marc A. Garcia, Adriana M. Reyes and Sunshine Rote
Abstract Although research has documented better health and longer lifeexpectancy among the foreign-born relative to their U.S.-born counterparts, the U.S.Mexican-origin immigrant population is diverse and the healthy immigrant effectlikely varies by key structural and demographic factors such as gender, migrationhistory, and duration in the United States. Using a life course framework, we usedata from the Hispanic Established Populations for the Epidemiologic Study of theElderly (H-EPESE 1993–2013) which includesMexican-American individuals aged65 and older to assess the heterogeneity in the immigrant health advantage by ageof migration and gender. We find that age of migration is an important delineatingfactor for disability among both men and women. The healthy immigrant hypothesisis only observable among mid- and late-life migrant men for ADL disability. Whileamong immigrant women, late-life migrants are more likely to have an IADL dis-ability putting them at a health disadvantage. These findings illustrate that Mexicanimmigrants are not a homogeneous group and migrant health selectivity depends onboth gender and when migrants arrived in the United States.
Introduction
The Latino population in the United States has experienced unprecedented growthin the past several decades, surpassing African Americans as the nation’s largest
M. A. Garcia (B)Department of Sociology and Institute for Ethnic Studies, University of Nebraska-Lincoln,Lincoln, NE, USAe-mail: [email protected]
A. M. ReyesPolicy Analysis and Management, Cornell University, Ithaca, NY, USAe-mail: [email protected]
S. RoteKent School of Social Work, University of Louisville, Louisville, KY, USAe-mail: [email protected]
© Springer Nature Switzerland AG 2019W. A. Vega et al. (eds.), Contextualizing Health and Aging in the Americas,https://doi.org/10.1007/978-3-030-00584-9_12
249

250 M. A. Garcia et al.
minority group.While the Latino population is generally young, Latinos aged 65 andolder represent the fastest-growing segment of the population in the United Statescurrently at or near retirement age (Ortman et al. 2014). In 2016, approximately 63%of Latinos in the United States were of Mexican-origin (U.S. Census Bureau 2017),themajority ofwhich areU.S.-born (Flores 2017). However,more than a third ofU.S.Mexican-Americans were born in Mexico (Gonzalez-Barrera and Lopez 2013). Therapid growth and aging of this population suggests both U.S.-born andMexican-bornLatinos will play an increasingly central role in shaping future health and longevitypatterns among older adults in the U.S.
There has been a growing interest in the disability profiles of older Latinos byresearchers and policy makers (Garcia et al. 2017). Studies consistently show olderLatinos experience lower mortality and greater longevity than non-Latino Whites(Arias et al. 2017; Fenelon et al. 2017; Garcia et al. 2017). However, Latinos 65 andolder also have a higher prevalence and are at an increased risk for disability anddisabling conditions relative to non-Latino Whites (Markides et al. 2007; Melvinet al. 2014; Sheftel 2017). Therefore, older Latinos spend more years and a largerproportion of their life after age 50 with a disability than non-Latino Whites (Hay-ward et al. 2014). Longer durations of disability have been attributed to structuralfactors across the life course including inequality in social and economic resources,engagement in physically demanding labor, substandard medical care, and exposureto social and economic stressors (Markides and Rote 2015). This is of particularconcern as the social benefits of increased longevity are undermined by additionalyears of life characterized by high levels of disability and dependency (Markideset al. 2007).
Furthermore, mounting evidence suggests that age alone does not account forhealth differentials as nativity, immigrant selectivity, age of migration, and genderhave been shown to be important factors that influence the disability profiles of olderLatinos (Hayward et al. 2014;Melvin et al. 2014;Garcia et al. 2015, 2017;Garcia andChiu 2016; Garcia and Reyes 2017, 2018; Sheftel 2017). Consequently, we assess thevariability of disability among older Mexican-Americans by nativity and biologicaltiming of migration to elucidate potential health differentials that may emerge inlater life. We pay particular attention to the role of gender given the higher risk fordisability among Latina women due to greater longevity and gendered patterns inmotivations for immigration (Angel et al. 2001; Massey et al. 2006; Donato 2010;Hayward et al. 2014).
Thus, the current study contributes to prior research in two key ways. First, draw-ing from a life course framework, we build on the immigrant health literature byproviding a more comprehensive documentation of nativity differentials by assess-ing the heterogeneity of this rapidly aging and growing population. Specifically,we examine the extent to which the immigrant health advantage varies by genderand biological timing of migration among older Mexican-Americans residing in thesouthwestern United States. Second, rather than focusing solely on one form of dis-ability we include two separate measures that capture self-care and household tasksconsidered important for living independently: Activities of Daily Living (ADLs)and Instrumental Activities of Daily Living (IADLs).
12 Disability and the Immigrant Health Paradox: Gender and Timing … 251
Background
The Healthy Immigrant Effect and Disability
A large body of research has supported the phenomenon coined the “healthy immi-grant effect” in which foreign-born individuals residing in the United States tend toshow favorable health, mortality, and life expectancy profiles relative to their U.S.-born counterparts (Palloni and Arias 2004; Singh and Hiatt 2006; Akresh and Frank2008; Bostean 2013). The healthy immigrant effect has been attributed to two fac-tors: (1) health selection, that is, individuals who migrate tend to be healthier, onaverage, than non-migrants (Jasso et al. 2004) and therefore arrive in the UnitedStates in better health and; (2) social and cultural factors that influence health andlifestyle behaviors such as a diet that originates in their country of origin and socialsupport that enables immigrants to cope with stress (Palloni and Arias 2004; Jassoet al. 2004; Markides and Gerst 2011).
Most research indicates that the immigrant health advantage observed amongrecent arrivals dissipates as immigrants spend more time in their country of destina-tion.WhileMexican immigrants appear healthywhen they arrive in theUnited States,after 10–20 years in the United States their health deteriorates to the level of or belowtheir U.S.-born counterparts (Markides and Eschbach 2005; Markides and Rote2015). Recent findings confirm a crossover effect for disability rates among olderMexican immigrants relative to the U.S.-born Mexican-Americans. For example,studies show foreign-born Mexicans have a disability advantage compared to U.S.-born Mexican-Americans until older ages when this advantage disappears (Melvinet al. 2014; Sheftel 2017; Sheftel and Heiland 2018).
Research suggests several reasons why immigrant health likely deteriorates withtime spent in theUnited States. First, a lack of health insurance and inadequate accessto health care, particularly for undocumented migrants, may lead to health deteriora-tion and contribute toworse health and higher rates ofmorbidity and disability amongthis segment of the population (Markides and Eschbach 2005; Teruya and Bazargan-Hejazi 2013). Second, evidence suggests that foreign-born Latinos are more likelyto engage in negative health behaviors (smoking, alcohol consumption, and unfa-vorable dietary changes) with longer length of residence and greater acculturationin the United States (Antecol and Bedard 2006; Turra and Goldman 2007; Kimbro2009). Finally, Mexican immigrants may live and work under unhealthy conditionsthat expose them to infectious diseases, environmental toxins, physical injuries, andother health related conditions that place them at disproportionate risk of physicaldifficulties and disabilities at older ages (Kandel and Donato 2009; Holmes 2013;Hummer and Hayward 2015).
Gender and the Healthy Immigrant Effect
Prior research indicates nativity and gender interact in unique ways to affect thedisability profiles of older Mexican-Americans based on type of disability measured(Melvin et al. 2014; Nam et al. 2015; Garcia et al. 2015; Sheftel 2017; Garcia andReyes 2018). In particular, immigrant advantages in disability have been found to
252 M. A. Garcia et al.
vary across different measures of disability for men and women (Markides et al.2007; Cantu et al. 2013; Hayward et al. 2014; Angel, Angel, and Hill 2014; Garciaet al. 2015). Two common measures of disability are: Activities of Daily Living(ADL) and Instrumental Activities of Daily Living (IADL). These measures capturedifferent dimensions of self-care and household management limitations. ADLs aregenerally considered more severe and capture basic self-care tasks such as eating,bathing, and grooming that are less influenced by culture and environmental factors(Katz et al. 1963). In contrast, IADLs are conceptualized as capturing the abilityto live independently by asking about day to day household tasks and are thoughtto occur relatively late in the disablement process, but also capture elements of theenvironment (Lawton and Brody 1969).
Research shows that older foreign-bornMexicanwomenhave a higher prevalence,and spend a larger fraction of their late life years with disability than both U.S.-born women and U.S.- and foreign-born Mexican-American men; which has beenattributed to negative health selection, inequalities in access to resources, low levelsof acculturation, and increased longevity (Warner and Brown 2011; Garcia et al.2015; Garcia and Reyes 2018). Overall, these studies document a nativity advantagein ADL disability among foreign-born men and disadvantage in IADL disabilityamong foreign-born women relative to their U.S.-born co-ethnics. IADL tasks maycapture traditional gender division in the household by asking about food preppingand shopping (Sheehan and Tucker-Drob 2017). Among older Mexican-Americanssome IADL tasks (i.e. driving/obtaining transportation) have also been found to beassociated with acculturation (Garcia et al. 2015).
Overall, there is evidence that the healthy immigrant effect is more reflectiveof health patterns for men than women (Read and Reynolds 2012) and among theMexican-origin population in particular (Angel et al. 2014;Melvin et al. 2014;Garciaet al. 2015; Nam et al. 2016; Sheftel 2017; Garcia and Reyes 2018). Observed genderdifferences in the healthy immigrant effect may be attributed to patterns of selectivemigration. The decision to migrate is based on both larger structural factors thatallow for migration flows as well as individual agency and certain capacities/skillsthat allow individuals to effectively navigate moving their lives (Jasso et al. 2004).The life course concept of linked lives states that individuals’ lives are interdependentand interconnected (Treas and Gubernskaya 2016). Social relationships influence themotivations and ability to move to another country. Among foreign-born Mexicans,men tend tomigrate for employment opportunities while women tend tomigrate withtheir husbands based on their employment needs or for family purposes (Markideset al. 2007). Since immigrant women are migrating for family rather than occupa-tional reasons, they may be less selected on health than their male counterparts.
Timing of Migration and Disability
While many older Mexican-Americans were born in the United States and othersarrived during the early parts of the 20th century when they were young, many othersimmigrated as adults, including thosewho entered the country during their elder years(O’Neil and Tienda 2015). According to Garcia et al. (2017), biological timing ofmigration is an important early-life risk factor that influences late-life disability. For

12 Disability and the Immigrant Health Paradox: Gender and Timing … 253
instance, age of migration can be useful for understanding the physical functioninganddisability profiles of older immigrants by incorporating life course information ontype of migration (i.e., labor vs. family reunification) and degree of health selectivityamong older immigrants. Differences in motivation for immigration and selectionmechanisms might be found between younger and older immigrants and within theolder immigrant population (Angel et al. 2010; Treas 2015).
For instance, late-life immigrants’ major motivation for migration tends to befamily reunification rather than occupational opportunities (Angel et al. 2001; TreasandMazumbdar 2002). In addition, age of migration captures the importance of bio-logical timing in the life course as it shapes age-graded opportunities for social andeconomic incorporation, which has implications for immigrants’ ability to accumu-late resources that may be protective of health in later life (Angel et al. 2001, 2010;Treas and Gubernskaya 2016). Furthermore, age of migration indicates the length ofexposure to hazardous environmental conditions in countries of origin, which mayaffect health throughout the life course (Gubernskaya et al. 2013; Garcia and Reyes2017). Finally, among older adults, age of migration approximates the historicalera of migration, which may influence migration outcomes through the social andpolitical landscape during migration.
From a life course perspective, we argue that the life experiences of older foreign-born Mexicans are shaped by the age at which they immigrated to the United States.Research shows health selection varies by age group and sex (Garcia and Chiu2016). For example, migration selectivity may be strongest in young and early mid-dle age (20–49), when foreign-born Mexicans migrate to the United States to pursueemployment opportunities in physically demanding jobs in agriculture, construction,and the service sector (Angel et al. 2010; Gubernskaya et al. 2013). Labor migrantsare by definition healthy enough to migrate, work when they arrive, and are thusself-selected on the basis of good health and the desire to improve their situations(Angel et al. 2010). Older foreign-born Mexicans who migrated in midlife, largelycame during the Bracero Era (1942–1964) to fill labor shortages in agriculture andthe expansion of the U.S. railroad (Gonzalez 2017). The opportunities of the Braceroprograms were almost exclusively open to men, with women either staying behind inMexico ormigrating to theUnited States with their husbandswithout legal authoriza-tion (Gonzalez 2017). These historical patterns suggest gender differences in bothmotivations for migration from structural forces as well as a political difference instatus for men and women migrating during this era.
In contrast, foreign-born Mexicans who migrated in early-life (ages 0–19) aschildren or adolescents are more likely to have migrated with parents or relatives.Therefore, early-life migrants have little or no health selection since their migra-tion reflects their parents’ characteristics, and they do not necessarily have to meetthe demands required for migration by themselves (Angel et al. 2010; Gubernskaya2015). In addition, these migrants are more likely to have an experience that resem-bles that of their U.S.-born counterparts, given that most of their development andexperiences occur in the United States (Rumbaut 2004; Burr et al. 2008; Treas 2015).With longer duration of residence, foreign-born individuals increase their opportu-nities to adapt and incorporate into U.S. society (Angel et al. 2001; Treas 2015).

254 M. A. Garcia et al.
For instance, those migrating in early-life may have greater opportunities for incor-poration in U.S. mainstream social institutions through educational attainment andlabor force participation (Burr et al. 2008; Gubernskaya et al. 2013). Thus, early-life migration may be associated with a greater opportunity to accumulate higherlevels of income, pension and other retirement benefits as a consequence of longerduration in the United States (Angel et al. 1999; Burr et al. 2008; Treas and Gubern-skaya 2016). Older Mexican-born adults, who came to the United States at earlyages, primarily migrated in the “Post-Mexican Revolution” era (1918–1928). Politi-cal turmoil and economic problems in Mexico, coupled with relaxed enforcement ofimmigration policies increasedmigration to United States. In addition, many of thesemigrants were able to legalize either during their initial migration or later throughthe Immigration Reform and Control Act (IRCA) of 1986 (Durand et al. 2001).
Similarly, health selectivity may be weaker among those who migrate in late-life(after age 50) as older Mexican migrants are more likely to migrate for family reuni-fication rather than employment opportunities (Angel et al. 2010; Treas 2015). Inaddition, thosemigrating in late-life have fewer opportunities for social and economicincorporation and tend to experience greater difficulty with accumulating socioeco-nomic resources that would benefit health later in life (Angel et al. 1999; Treas andMazumbdar 2002; Burr et al. 2008). Furthermore, late-life immigrants are less likelyto qualify for Social Security or Medicare and more likely to be dependent uponfamily than their U.S.-born counterparts or those immigrating earlier in life (Angelet al. 1999; Burr et al. 2008; O’Neil and Tienda 2015). However, migrants whocome to the United States in late-life are likely to retain social and cultural factorsthat influence health and lifestyle behaviors, and are unlikely to acculturate rapidlyinto U.S. society (Kimbro 2009; Garcia et al. 2015). Moreover, exposure to envi-ronmental factors, health risks, and poorer access to health care in their country oforigin may also play a significant role in the health of older migrants (Akresh 2007;Gubernskaya 2015). Older migrants who have migrated in recent years have comeduring the era of undocumented migration, a period of often hostile reception withthe fear of deportation and limited access to government programs for immigrantswith the passage of the Illegal Immigration Reform and Immigrant ResponsibilityAct (IIRIRA) in 1996. Though many older immigrants migrate to the United Stateslegally through family reunification, their ability to incorporate into U.S. societymaybe hampered by negative attitudes towards immigrants in their communities (Treasand Mazumbdar 2002).
Gender Differences in the Timing of Migration
More recent findings by Garcia and Chiu (2016) suggest nativity advantages anddisadvantages in the disability profiles of older foreign-born Mexican-Americansvary by time of migration and gender. Specifically, this study found midlife andlate-life migrant men exhibited an immigrant advantage in the number of yearsafter age 65 spent ADL disability-free compared to U.S-born Mexican-Americans,whereas early-life migrants exhibited no health advantage. In addition, their findingsshowed all foreign-born immigrant women to be at a significant disadvantage in the

12 Disability and the Immigrant Health Paradox: Gender and Timing … 255
number of years after age 65 spentwith IADLdisability relative to their U.S.-born co-ethnics. Among foreign-bornwomen, late-lifemigrants were themost disadvantagedspending approximately 78% of their elderly years with an IADL limitation.
Potential explanations for these gender differences are that health selectivityamong migrants is not as strong for women (Markides et al. 2007) or that the conver-gence process happens at a more rapid pace forMexican immigrant women thanmen(Antecol and Bedard 2006). This more rapid decline may be attributable to genderinequalities in factors that lead to disability. For both men and women, it appears thatacculturation is a key factor that influences nativity differences in disability (Garciaet al. 2015). In the current study, we document gender, nativity, and age of migrationdifferences in both ADL and IADL disability.
Conceptual Framework
We utilize a life course perspective to link gender, timing of migration, and disabilityamong older Mexican-Americans. The life course framework focuses on how earlylife experiences can have lasting effects on individuals as they age and move throughthe lifespan (Dannefer 2003; Elder et al. 2003). Migration is an important life coursetransition that alters an individual’s long-term path in terms of career, family life,and health (Angel and Angel 1992; Treas and Gubernskaya 2016). For voluntaryimmigrants, motivations for migration are based on both structural factors includingsocial and financial resources and agency in terms of perceived opportunity andability to migrate all of which vary by gender and age at migration (Angel et al.1999).
The connection between immigration and health is complex, and a host of factorsrelated to themigratory process, in terms of the initial migration fromMexico (healthselection) and subsequent adaptation and incorporation into the United States, pro-duce a variety of health outcomes (Palloni and Morenoff 2001). Although migrationfrom Mexico to the United States is recognized as an important social, political andeconomic phenomenon, past research has overlooked how age, period, and cohortdistinctly influence disability risk. Additionally, relatively little research has exam-ined how gender and migration-related factors combine to effect various aspectsof disability among older Mexican-Americans. By focusing on health disparitiesby nativity, the “healthy immigrant effect” literature downplays disability differen-tials within the older foreign-born population. This is a crucial factor consideringone of the most unique features of the foreign-born Mexican population is theirrange of immigration experiences by gender, timing of migration, and incorporationinto mainstream U.S. society; disregarding these key factors results in an incom-plete understanding of the disability profiles of older Mexican immigrants. Thus,the current analysis aims to add to the literature on the healthy immigrant effect byexamining the association between timing of migration and gender on self-care andhousehold disabilities among older Mexican-Americans.

256 M. A. Garcia et al.
Data and Methods
Data
We employ data from the Hispanic Established Populations for the EpidemiologicStudy of the Elderly (H-EPESE). The H-EPESE is a large, multi-stage probabilitysample of Mexican-Americans age 65 and older living in Arizona, California, Col-orado, New Mexico, and Texas (Markides et al. 1997). Aggregated individual leveldata is used for a total of up to eight observations. The present study used base-line data (1993/1994, n=3050) and 2-year (1995/1996), 5-year (1998/1999), 7-year(2000/2001), 11-year (2004/2005), 13-year (2006/2007), 17-year (2010/2011), and20-year (2012/2013) follow-up assessments. Due to attrition in the original cohort,a new cohort of 902 individuals aged 75 and older was added in 2004 to increasesample size and statistical power. Note that we omitted respondents (n=411) fromthe analytic sample due to missing information on nativity and age of migrationvariables. The final analytic sample includes 3541 unique individuals and 11,445cases.
Measures
Disability is defined as difficulty or the inability to individually perform activitiesdue to health and lasting for some time (Verbrugge 2016). We use two different mea-sures of disability that capture personal care tasks of everyday life and householdmanagement/independent living tasks: Activities of Daily Living (ADLs) and Instru-mental Activities of Daily Living (IADLs). To assess ADL disability, respondentswere asked if they needed help from another person or special equipment/deviceto perform the following tasks: walk across a small room; bathing (either a spongebath, tub bath, or shower); personal grooming (brush hair/teeth or washing face);dressing (putting on a shirt or shoes, buttoning and zipping); eating (holding a fork,cutting food, or drinking from a glass); transferring from a bed to a chair; and usingthe toilet (Katz et al. 1963; Branch et al. 1984). ADL disability was dichotomized as“no help needed” vs. “unable to do/needed help” in one or more of the tasks. Instru-mental activities of daily living (Rosow and Breslau 1966; Lawton and Brody 1969;Fillenbaum et al. 1988) are self-reported measures that are crucial for living inde-pendently in the community. Ten IADL activities were measured: using telephonewithout assistance; driving a car or traveling alone on buses or taxis; shopping forgroceries or clothes, preparing ownmeals; light housework (dishwashing andmakingthe bed); taking medicine; managing finances (write checks/pay bills); heavy house-work (washing windows, walls, and floors); walk up and down the stairs; and walk ahalf mile. Respondents were asked to indicate if he/she were unable to perform theactivity without help. IADL disability was dichotomized as “no help needed” versus“unable to do/needed help” in one or more of the tasks.
Our main variable of interest is life-course age at migration. Following previousresearch (Angel et al. 2010; Garcia and Reyes 2017) we create four categories:(1) U.S.-born respondents; (2) early-life migrants (born in Mexico and migrated tothe United States before the age of 20); (3) mid-life migrants (born in Mexico and

12 Disability and the Immigrant Health Paradox: Gender and Timing … 257
migrated to the United States between the ages of 20 and 49 years); and (4) late-lifemigrants (born in Mexico and migrated to the United States at age 50 or older).Additional sociodemographic variables used in the analysis include gender, age, andyears of education. Gender corresponds to female or male. Education is measuredby the number of years of schooling the respondent has completed. In addition,we include several morbidity items that have been shown to influence disability(Patel et al. 2006). Morbidity is measured with six self-reported questions regardingwhether an individual has ever been diagnosed with one of the following medicalconditions: (a) heart attack; (b) stroke; (c) cancer of any type; (d) high blood pressure;(e) arthritis or rheumatism; or (f) diabetes. Response categories for each item werecoded dichotomously: 1 for “yes” and 0 for “no.”
Analytic Approach
In the descriptive analysis, we draw comparisons using chi-square and z-tests forindependent proportions to assess nativity, and for immigrants, age of migrationdifferentials by gender and age. For the multivariate models, random effects Pois-son regression with normally distributed individual level random effects is used toaccount for repeated measurements on the same individual for up to 8 waves of dataand estimate risk ratios to quantify the association between nativity, age ofmigration,and disability by gender. Models are specified with robust standard errors, resultingin a modified Poisson regression, which has been shown to be a valid method toestimate relative risk in binary response data (Zou 2004). Moreover, the standarderrors are adjusted since individuals can contribute more than one observation to thedata set during the period under study. That is, the individual measures are clusteredby subject and this specification takes that aspect of the data structure into accountin a general way to produce the appropriate standard errors for a design such as this.The models are further stratified by gender because of the widely varying patternsof disability by sex.
Results
Descriptive Statistics
Table 12.1 reports descriptive characteristics of the sample by age of migration andgender. Approximately 59% of women and 55% of men are U.S.-born. Among theforeign-born, 9.4% of female respondents report that they migrated during early-life(0–19), 22.3% in mid-life (20–49), and 9.3% in late-life (50 and older), respectively.Conversely, 10.6% of male respondents report migrating in early-life, 25.9% in mid-life, and 8.1% in late-life. Note that among the foreign-born, mid-life migrants makeup a majority of the sample for men and women. There are no major gender differ-ences in the distribution of older adults across age of migration categories. Nonethe-less, women are slightly more likely than men to have migrated to the United States

258 M. A. Garcia et al.
Table12.1
Socio-demographiccharacteristicsam
ongMexican-origineldersage65
andolderby
gender
andnativ
ity
Females
Males
U.S.-born
Foreign-Born
U.S.-born
Foreign-born
Age
ofmigratio
n0–19
20–49
50+
0–19
20–49
50+
N(%
)4051
(59.1)
645
(9.4)
1529
(22.3)
635
(9.3)
2538
(55.4)
485
(10.6)
1189
(25.9)
373
(8.1)
Age
(SD)
77.6
(7.0)
80.3
(7.7)
77.4
(7.2)
78.9
(7.4)
76.6
(6.6)
80.1
(7.7)
77.9
(6.9)
77.9
(7.3)
Educatio
n(SD)
6.0
(4.1)
4.9
(3.4)
4.4
(3.5)
2.9
(3.2)
6.5
(6.5)
4.2
(3.7)
3.8
(3.3)
2.2
(2.6)
Heartattack
8.0
7.9
7.6
6.4
12.8
7.6
5.9
12.0
Stroke
5.9
6.6
4.5
3.9
7.1
5.2
4.7
4.7
Cancer
8.9
3.9
6.4
4.2
8.2
7.7
6.3
6.2
Hypertension
59.1
61.5
60.9
59.5
48.4
41.2
49.4
43.9
Arthritis
58.4
64.4
61.2
59.3
39.7
40.8
45.6
35.9
Diabetes
32.7
31.1
28.1
25.2
29.6
25.8
24.2
29.8
Eng
lish
36.1
16.9
5.3
2.7
37.3
16.0
5.6
2.7
Smoke
30.3
33.6
29.2
25.6
67.0
56.4
68.8
63.0
Drink
36.3
39.6
32.0
29.1
79.4
81.5
83.2
81.5
Obese
34.2
28.8
33.3
29.6
24.4
25.5
26.4
27.1
Source
H-EPE
SEWaves
1–8(1993–2013).NoteTo
talN
�11,445;
unweightedN’s’weightedpercentagesandmeans

12 Disability and the Immigrant Health Paradox: Gender and Timing … 259
in late-life (50 years or older). The mean age for U.S.-born women (77.6 years) isslightly lower than early-life and late-lifemigrantwomen (80.3 years, and78.9 years).Similarly, the mean age of U.S.-born men (76.6 years) is slightly lower than that offoreign-born men (80.1 years, 77.9 years, and 77.9 years). In addition, U.S.-bornrespondents report more years of education than foreign-born respondents, regard-less of gender. Education levels decrease with older age of migration consistentwith expectations that early-life and mid-life migrants have more opportunities toincorporate into U.S. mainstream institutions than late-life migrants.
Disability
Regression Models
The multivariate analysis is designed to examine the relationship between nativity,timing ofmigration, and disability by gender among olderMexican-Americans resid-ing in the southwest United States. The analysis is stratified by gender because of thewidely varying patterns of disability by sex. Table 12.2 shows the results fromPoissonregression models predicting any ADL and any IADL disability. Model 1 documentsthe overall association between nativity, age of migration and disability, independentof age. In Model 2, we add controls for education to assess whether this key socialfactor is associated with disability. Model 3 includes six self-reported chronic healthconditions that are associated with disability. Finally, Model 4 includes languageof interview and health behaviors (smoking, drinking, and obesity) that have beenshown to influence health and mortality.
ADL Disability
The results in Table 12.2 (Models 1 and 2) for women illustrate that nativity and ageof migration are not associated with any ADL disability, whereas advancing age isassociated with an increased risk, and greater educational attainment is associatedwith a decreased risk of anyADL disability. InModel 3, womenwho reported havinga heart attack, stroke, hypertension, arthritis, or diabetes were between 24 and 56%more likely to report any ADL disability. Conversely, cancer was not associated withany ADL disability among women. In Model 4, smoking and drinking were notassociated with any ADL disability. However, taking the survey in English and beingobese increased the odds of any ADL disability by 21 and 22% respectively.
For men Table 12.3 a different pattern emerges. Nativity, age of migration, andage are positively related to any ADL disability. Mid-life and late-life migrant menhave a significantly lower risk of any ADL disability compared to their U.S.-borncounterparts. For example, late-life migrant men are 27% less likely and mid-lifemigrant men 23% less likely than U.S.-born men to report any ADL disability.Consistent with a life course perspective, there are no significant differences in anyADL disability between early-life migrant men and U.S-born men. While early-lifemigrant men report lower odds of any ADL disability, their disability profile reflectsa similar health experience as their U.S.-born co-ethnics. When education is addedto Model 2, age of migration remains significant with mid-life and late-life migrant

260 M. A. Garcia et al.
Table12.2
Poissonregression
(rateratio
s)predictin
gADL/IADLdisabilityam
ongMexican-originWom
enages
65andolder
Any
ADL
Any
IADL
Predictorvariablesa
Model1
Model2
Model3
Model4
Model1
Model2
Model3
Model4
Age
ofmigration
0–19
0.88
0.85
0.86
0.86
1.12
*1.09
1.09
1.1
20–49
1.03
0.98
1.02
0.97
1.11
**1.07
1.07
1.08
50+
1.08
0.99
1.05
0.97
1.23
***
1.15
**1.18
***
1.18
***
Age
1.10
***
1.10
***
1.10
***
1.10
***
1.03
***
1.03
***
1.03
***
1.03
***
Edu
catio
n0.97
***
0.97
**0.99
0.98
***
0.98
***
0.98
***
Morbidities
Heartattack
1.44
***
1.36
***
1.16
**1.16
**
Stroke
1.33
**1.53
***
1.15
*1.14
*
Cancer
1.06
1.01
1.06
1.06
Hypertension
1.24
***
1.18
**1.09
**1.09
**
Arthritis
1.51
***
1.57
***
1.23
***
1.22
***
Diabetes
1.56
***
1.44
***
1.14
***
1.13
***
Language
1.21
**0.99
Smoke
1.00
1.05
Drink
0.95
0.95
Obese
1.22
***
1.03
N6860
a The
referencecategory
inthePo
issonregression
isU.S.-born
Mexican
Americans
*Significantatthe
0.05
level.**Significant
atthe0.01
level.***S
ignificance
atthe0.001level
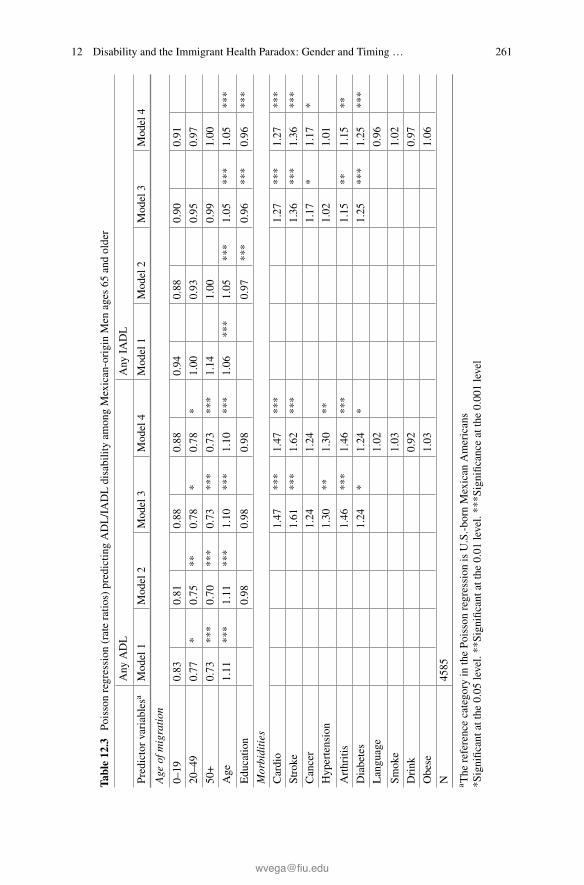
12 Disability and the Immigrant Health Paradox: Gender and Timing … 261
Table12.3
Poissonregression
(rateratio
s)predictin
gADL/IADLdisabilityam
ongMexican-originMen
ages
65andolder
Any
ADL
Any
IADL
Predictorvariablesa
Model1
Model2
Model3
Model4
Model1
Model2
Model3
Model4
Age
ofmigration
0–19
0.83
0.81
0.88
0.88
0.94
0.88
0.90
0.91
20–49
0.77
*0.75
**0.78
*0.78
*1.00
0.93
0.95
0.97
50+
0.73
***
0.70
***
0.73
***
0.73
***
1.14
1.00
0.99
1.00
Age
1.11
***
1.11
***
1.10
***
1.10
***
1.06
***
1.05
***
1.05
***
1.05
***
Edu
catio
n0.98
0.98
0.98
0.97
***
0.96
***
0.96
***
Morbidities
Cardio
1.47
***
1.47
***
1.27
***
1.27
***
Stroke
1.61
***
1.62
***
1.36
***
1.36
***
Cancer
1.24
1.24
1.17
*1.17
*
Hypertension
1.30
**1.30
**1.02
1.01
Arthritis
1.46
***
1.46
***
1.15
**1.15
**
Diabetes
1.24
*1.24
*1.25
***
1.25
***
Language
1.02
0.96
Smoke
1.03
1.02
Drink
0.92
0.97
Obese
1.03
1.06
N4585
a The
referencecategory
inthePo
issonregression
isU.S.-born
Mexican
Americans
*Significantatthe
0.05
level.**Significant
atthe0.01
level.***S
ignificance
atthe0.001level
262 M. A. Garcia et al.
men 25 and 30% less likely to report any ADL disability compared to their U.S.-born counterparts. In Model 3, heart attack, stroke, cancer, hypertension, arthritisand diabetes are all positive predictors (between 24 and 61%) of any ADL disabilityamongolderMexican-Americanmen.After these controls are added, nativity and ageof migration remain significant for mid-life and late-life migrants. Mid-life migrantsare 22% less likely and late-life migrants are 27% less likely to report any ADLdisability relative to U.S.-born men. In sum, the healthy immigrant effect on anyADL disability is evident only among mid-life and late-life migrant men. No healthselectivity is observed among early-life migrant men relative to U.S.-born men.
IADL Disability
The results in Model 1 show the association between nativity, age of migration andIADLdisability. AmongTable 12.2women, early-lifemid-life, and late-lifemigrantsare more likely to report any IADL disability compared to U.S.-born women (12, 11,and 23%, respectively). Older age is also associated with an increased risk. Includingyears of education in Models 2 attenuates the relationship between age of migrationand any IADL disability, however late-life migrant women continue to be at a sig-nificant disadvantage relative to U.S.-born women. Higher educational attainment isassociatedwith decreased risk of any IADLdisability.Morbidities are added inModel3 and late-life migrant women continue to be significantly more likely to report anIADL compared to their U.S.-born co-ethnics. Having reported a heart attack, stroke,hypertension, arthritis, or diabetes increased the risk of any IADL disability between9 and 23%. As with ADLs, there was no association between reporting cancer andany IADL disability among women. In the fully adjusted model, late-life migrantwomen continue to exhibit and increased risk of any IADL disability relative toU.S.-born women, independent of socioeconomic and health characteristics. How-ever, results indicate smoking, drinking, and obesity were not associated with anyIADL disability among older Mexican-American women.
Amongmales Table 12.3, nativity and age ofmigration are not associatedwith anyIADLdisability. However, increasing age and fewer years of education are associatedwith an increased risk of IADL disability (Models 1 and 2). Furthermore, Models 3and 4, showmen who reported a heart attack, stroke, cancer, arthritis, or diabetes had15–36% higher risk of having any IADL disability. Conversely, drinking, smoking,and being obese were not significantly related to having any IADL disability. Ourresults indicate there is no healthy immigrant effect among foreign-born males byage of migration for any IADL disability.
Discussion
We propose that mechanisms throughout the life course shape the disability status ofolder Mexican-Americans, namely, nativity, gender, and timing of migration. Thisanalysis contributes to ongoing discussions related to the heterogeneity in types ofdisability risk within the older Mexican-origin population in the United States. We
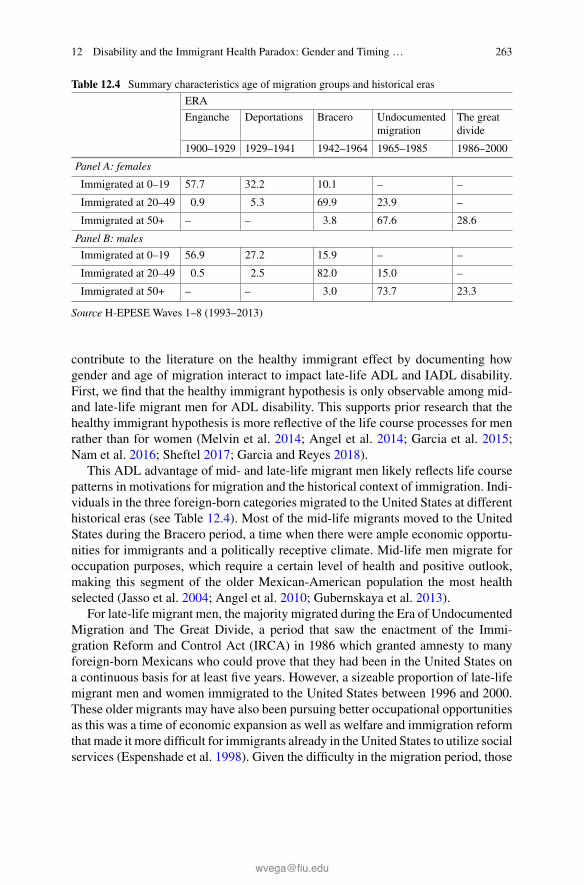
12 Disability and the Immigrant Health Paradox: Gender and Timing … 263
Table 12.4 Summary characteristics age of migration groups and historical eras
ERA
Enganche Deportations Bracero Undocumentedmigration
The greatdivide
1900–1929 1929–1941 1942–1964 1965–1985 1986–2000
Panel A: females
Immigrated at 0–19 57.7 32.2 10.1 – –
Immigrated at 20–49 0.9 5.3 69.9 23.9 –
Immigrated at 50+ – – 3.8 67.6 28.6
Panel B: males
Immigrated at 0–19 56.9 27.2 15.9 – –
Immigrated at 20–49 0.5 2.5 82.0 15.0 –
Immigrated at 50+ – – 3.0 73.7 23.3
Source H-EPESE Waves 1–8 (1993–2013)
contribute to the literature on the healthy immigrant effect by documenting howgender and age of migration interact to impact late-life ADL and IADL disability.First, we find that the healthy immigrant hypothesis is only observable among mid-and late-life migrant men for ADL disability. This supports prior research that thehealthy immigrant hypothesis is more reflective of the life course processes for menrather than for women (Melvin et al. 2014; Angel et al. 2014; Garcia et al. 2015;Nam et al. 2016; Sheftel 2017; Garcia and Reyes 2018).
This ADL advantage of mid- and late-life migrant men likely reflects life coursepatterns in motivations for migration and the historical context of immigration. Indi-viduals in the three foreign-born categories migrated to the United States at differenthistorical eras (see Table 12.4). Most of the mid-life migrants moved to the UnitedStates during the Bracero period, a time when there were ample economic opportu-nities for immigrants and a politically receptive climate. Mid-life men migrate foroccupation purposes, which require a certain level of health and positive outlook,making this segment of the older Mexican-American population the most healthselected (Jasso et al. 2004; Angel et al. 2010; Gubernskaya et al. 2013).
For late-life migrant men, the majority migrated during the Era of UndocumentedMigration and The Great Divide, a period that saw the enactment of the Immi-gration Reform and Control Act (IRCA) in 1986 which granted amnesty to manyforeign-born Mexicans who could prove that they had been in the United States ona continuous basis for at least five years. However, a sizeable proportion of late-lifemigrant men and women immigrated to the United States between 1996 and 2000.These older migrants may have also been pursuing better occupational opportunitiesas this was a time of economic expansion as well as welfare and immigration reformthat made it more difficult for immigrants already in the United States to utilize socialservices (Espenshade et al. 1998). Given the difficulty in the migration period, those

264 M. A. Garcia et al.
healthy enough at age 50 for migration may also be selected on several aspects ofphysical and mental health.
Whereas early-life migrant men and women generally arrived in the UnitedStates between the Mexican Revolution and the Great Depression during the erasof Enganche and Deportations. However, these early-life migrants were mostly chil-dren traveling with parents and were able to assimilate and adapt potentially negativehealth behaviors. Given this long period of assimilation and minimal health selectionfor the children of immigrants it is not surprising that early-life migrants have similarlevels of ADLs and IADLs as their U.S.-born co-ethnics.
Similar to previous studies, we also find that the healthy immigrant effect isnot observed for disability among older Mexican-American women (Hayward et al.2014; Melvin et al. 2014; Angel et al. 2014; Garcia et al. 2015; Garcia and Reyes2018). In fact, the results point to an IADL disadvantage for foreign-born womenin later-life, particularly for those who arrived in the United States after the age of50. The reasons for this finding may also be based on motivations for migration.Since women are more likely to migrate to the United States for family reunificationpurposes (Markides et al. 2007; Angel et al. 2010; Treas 2015), late-life immigrantwomen migrating to join their children may not need the same level of physicalhealth required among those migrating without family reunification.
In addition, older foreign-born women may be migrating due to poor health. Out-migration selectivity, also known as the “salmon bias effect,” posits that foreign-bornMexicans who have become ill or are in poor health to return to their country oforigin, particularly at older ages (Palloni and Arias 2004; Markides and Eschbach2005; Turra and Elo 2008; Riosmena et al. 2013). However, our findings may reflectthat late-life migrant womenmaymove to be with adult children or family caregiversin the United States especially those with initial limited functional ability such asbeing able to shop for groceries or using the telephone which tends to exhibit itselfearlier in the disablement process.
Timing of migration is associated with how space (living inMexico vs. the UnitedStates) and time (both historical and biological) shape the lives of migrants acrossseveral dimensions including employment, health care access and quality, healthbehaviors, and immigrant receptivity. Late life migrants spend more years in Mexicoexposed to worse health care but with potentially better access than immigrants in theU.S. depending on their migration status. More years spent living in Mexico is alsoassociated with better dietary practices, less smoking, and less exposure to discrim-ination. While being a migrant in the United States may improve many aspects ofliving conditions, it also brings stress from ethnic discrimination and sometimes pre-carious legal status. Additionally, manymigrants work in very physically demandingjobs and hazardous work conditions. These examples demonstrate a few of the manyways in which space and place are important for understanding health disparities,especially among older immigrants.
In the present analysis, we use age atmigration, to get at one aspect of these dimen-sions of how space and time relate to disabilities among older Mexican-Americans.Unfortunately, we are unable to examine directly how period of migration is associ-ated with disability due to data limitations. However, as demonstrated in Table 12.4,

12 Disability and the Immigrant Health Paradox: Gender and Timing … 265
there is significant overlap between historical era of migration and age at migrationfor our sample. Therefore, we argue that age of migration can proxy for some aspectsof historical era for this group of migrants.
Our results clearly indicate that a better understanding of the work histories ofthe elderly is necessary, so that disability status can be contextualized. For example,if a Mexican male arrived in the United States under the Bracero Program it is fairlysafe to assume that he was exposed to pesticides and other agents that can have bothshort and long-term health effects. In addition, this type of work requires taxingphysical assertion that may be related to their disabilities in later life. However, atwhat point in the life course does an “epidemiological crossover” take place sincebirthplace, age of immigration, and time in the United States (as individual factorsor in combination) no longer serve as protective factors for those of Mexican-origin?This is an important question that is particularly paramount nowmore than ever withthe recently established Affordable Care Act, current anti-immigrant sentiments, andthe economic insecurities that are all part of the national discourse.
The current study represents an important contribution to knowledge of the com-plex relationship between nativity, immigration and gender for agingMexican-originindividuals.With a rapidly changingdemographic profile that includes a large numberof aging Mexican-origin immigrants, the policy implications of these results cannotbe overstated, especially in light of the heavy burden of large and persistent healthinequalities across U.S.-born and foreign-born Mexican-American sub-groups. Thefindings here detail the needs for culturally-competent tailored intervention effortsfor disability and caregiver support to focus specifically on supporting families andcommunities who are providing disability-related assistance for late life migrantwomen and U.S.-born Mexican males.
Acknowledgements Wegratefully acknowledge financial support for this research provided by theNational Institute on Aging (R01 AG10939-10, P30AG043097, T32AG000221, and 5T32AG270),and the Nebraska Tobacco Settlement Biomedical Research Development Funds through the Uni-versity of Nebraska-Lincoln. The authors declare no conflict of interest.
References
Akresh, I. R. (2007). Dietary assimilation and health among Hispanic immigrants to the UnitedStates. Journal of Health and Social Behavior, 48(4), 404–417. https://doi.org/10.1177/002214650704800405.
Akresh, I. R., & Frank, R. (2008). Health selection among new immigrants. American Journal ofPublic Health, 98(11), 2058–2064. https://doi.org/10.2105/ajph.2006.100974.
Angel, J. L., & Angel, R. J. (1992). Age at migration, social connections, and well-being amongelderly Hispanics. Journal of Aging and Health, 4(4), 480–499.
Angel, J. L., Buckley, C. J., & Sakamoto, A. (2001). Duration or disadvantage? Exploring nativity,ethnicity, and health in midlife. The Journals of Gerontology Series B: Psychological Sciencesand Social Sciences, 56(5), S275–S284.

266 M. A. Garcia et al.
Angel, R. J., Angel, J. L., Díaz Venegas, C., & Bonazzo, C. (2010). Shorter stay, longer life: Ageat migration and mortality among the older Mexican-origin population. Journal of Aging andHealth, 22(7), 914–931. https://doi.org/10.1177/0898264310376540.
Angel, R. J., Angel, J. L., & Hill, T. D. (2014). Longer lives, sicker lives? Increased longevityand extended disability among Mexican-origin elders. The Journals of Gerontology Series B:Psychological Sciences and Social Sciences, 70(4), 639–649.
Angel, R. J., Angel, J. L., Lee, G.-Y., & Markides, K. S. (1999). Age at migration and familydependency among older Mexican immigrants: Recent evidence from the Mexican AmericanEPESE. The Gerontologist, 39(1), 59–65. https://doi.org/10.1093/geront/39.1.59.
Antecol, H., & Bedard, K. (2006). Unhealthy assimilation: Why do immigrants converge to Amer-ican health status levels? Demography, 43(2), 337–360. https://doi.org/10.1353/dem.2006.0011.
Arias, E., Heron, M., & Xu, J. (2017). United States life tables, 2013. In National Vital StatisticsReports (Vol. 66, Issue NO 3). Centers for Disease Control and Prevention, National Center forHealth Statistics, National Vital Statistics System.
Bostean, G. (2013). Does selective migration explain the Hispanic paradox? A comparative analysisof Mexicans in the U.S. and Mexico. Journal of Immigrant and Minority Health/ Center forMinority Public Health, 15(3), 624–635. https://doi.org/10.1007/s10903-012-9646-y.
Branch, L. G., Katz, S., Kniepmann, K., & Papsidero, J. A. (1984). A prospective-study offunctional status among community elders. American Journal of Public Health, 74(3), 266–268.https://doi.org/10.2105/Ajph.74.3.266.
Burr, J., Gerst, K., Kwan, N., & Mutchler, J. (2008). Economic well-being and welfare programparticipation among older immigrants in the United States. Generations, 32(4), 53–60.
Cantu, P., Hayward, M., Hummer, R., & Chiu, C.-T. (2013). New estimates of racial/ethnicdifferences in life expectancy with chronic morbidity and functional loss: Evidence from theNational Health Interview Survey. Journal of Cross-Cultural Gerontology, 28(3), 283–297.https://doi.org/10.1007/s10823-013-9206-5.
Dannefer, D. (2003). Cumulative advantage/disadvantage and the life course: Cross-fertilizing ageand social science theory. The Journals of Gerontology Series B: Psychological Sciences andSocial Sciences, 58(6), S327–S337. https://doi.org/10.1093/geronb/58.6.S327.
Donato, K. M. (2010). U.S. migration from Latin America: Gendered patterns and shifts. Annalsof the American Academy of Political and Social Science, 630, 78–92. https://doi.org/10.1177/0002716210368104.
Durand, J., Massey, D. S., & Zenteno, R. M. (2001). Mexican immigration to the United States:Continuities and changes. Latin American Research Review, 36(1), 107–127.
Elder, G. H., Jr., Johnson, M. K., & Crosnoe, R. (2003). The emergence and development of lifecourse theory. In Handbook of the life course (pp. 3–19). Springer.
Espenshade, T. J., Baraka, J. L., & Huber, G. A. (1998). Immigration reform, welfare reform, andfuture patterns of U.S. immigration. In Defense of the Alien, 21, 26–48.
Fenelon, A., Chinn, J. J., & Anderson, R. N. (2017). A comprehensive analysis of the mortalityexperience of hispanic subgroups in the United States: Variation by age, country of origin, andnativity. SSM-Population Health, 3, 245–254.
Fillenbaum, G. G., Hughes, D. C., Heyman, A., George, L. K., & Blazer, D. G. (1988). Relation-ship of health and demographic characteristics to Mini-Mental State Examination score amongcommunity residents. Psychological Medicine, 18(03), 719–726. https://doi.org/10.1017/S0033291700008412.
Flores, A. (2017). How the U.S. Hispanic population is changing. Washington, DC: Pew ResearchCenter.
Garcia, M. A., Angel, J. L., Angel, R. J., Chiu, C.-T., & Melvin, J. (2015). Acculturation, gender,and active life expectancy in the Mexican-origin population. Journal of Aging and Health, 27(7),1247–1265.
Garcia, M. A., & Chiu, C.-T. (2016). Age at migration and disability-free life expectancy amongthe elder Mexican-origin population. Demographic Research, 35, 1523–1536.

12 Disability and the Immigrant Health Paradox: Gender and Timing … 267
Garcia, M. A., Downer, B., Chiu, C.-T., Saenz, J. L., Rote, S., & Wong, R. (2017). Racial/ethnicand nativity differences in cognitive life expectancies among older adults in the United States.The Gerontologist, https://doi.org/10.1093/geront/gnx142.
Garcia, M. A., Downer, B., Crowe, M., & Markides, K. S. (2017). Aging and disability amongHispanics in the United States: Current knowledge and future directions. Innovation in Aging,1(2), igx020–igx020. https://doi.org/10.1093/geroni/igx020.
Garcia, M. A., & Reyes, A. M. (2017). Physical functioning and disability trajectories by age ofmigration among Mexican elders in the United States. The Journals of Gerontology Series B:Psychological Sciences and Social Sciences, gbw167.
Garcia, M. A., & Reyes, A. M. (2018). Prevalence and trends in morbidity and disability amongolder Mexican Americans in the Southwestern United States, 1993–2013. Research on Aging,40(4), 311–339. https://doi.org/10.1177/0164027517697800.
Gonzalez-Barrera, A., & Lopez,M. H. (2013).A demographic portrait ofMexican-origin Hispanicsin the United States. Washington, DC: Pew Research Hispanic Center. http://www.pewhispanic.org/files/2013/05/2013-04_Demographic-Portrait-of-Mexicans-in-the-US.pdf.
Gonzalez, G. (2017). Guest workers or colonized labor? Mexican labor migration to the UnitedStates. Routledge.
Gubernskaya, Z. (2015).Age atmigration and self-rated health trajectories after age 50:Understand-ing the older immigrant health paradox. The Journals of Gerontology Series B: PsychologicalSciences and Social Sciences, 70(2), 279–290.
Gubernskaya, Z., Bean, F. D., & Van Hook, J. (2013). (Un)healthy immigrant citizens: Naturaliza-tion and activity limitations in older age. Journal of Health and Social Behavior, 54(4), 427–443.https://doi.org/10.1177/0022146513504760.
Hayward, M. D., Hummer, R. A., Chiu, C.-T., González-González, C., & Wong, R. (2014). Doesthe Hispanic paradox in U.S. adult mortality extend to disability? Population Research andPolicy Review, 33(1), 81–96. https://doi.org/10.1007/s11113-013-9312-7.
Holmes, S. (2013). Fresh fruit, broken bodies: Migrant farmworkers in the United States (Vol. 27).University of California Press.
Hummer, R. A., & Hayward, M. D. (2015). Hispanic older adult health & longevity in the UnitedStates: Current patterns & concerns for the future. Daedalus, 144(2), 20–30. https://doi.org/10.1162/DAED_a_00327.
Jasso, G., Massey, D., Rosenzweig,M., & Smith, J. (2004). Immigrant health: Selectivity and accul-turation. InN.Anderson, R.Bulatao,&B.Cohen (Eds.),Critical perspectives on racial and ethnicdifferences in health in late life (pp. 227–266). Washington, D.C.: National Academies Press.
Kandel, W. A., & Donato, K. M. (2009). Does unauthorized status reduce exposure to pesticides?Evidence from the National Agricultural Workers Survey. Work and Occupations, 36(4),367–399. https://doi.org/10.1177/0730888409347599.
Katz, S., Ford, A. B., Moskowitz, R. W., Jackson, B. A., & Jaffe, M. W. (1963). Studies of illnessin the aged. The Index of ADL: A standardized measure of biological and psychosocial function.JAMA Journal of the American Medical Association, 185(12), 914–919.
Kimbro, R. T. (2009). Acculturation in context: Gender, age at migration, neighborhood ethnicity,and health behaviors. Social Science Quarterly, 90(5), 1145–1166.
Lawton, M. P., & Brody, E. M. (1969). Assessment of older people—Self-maintaining andinstrumental activities of daily living. The Gerontologist, 9(3p1), 179–186.
Markides, K., & Gerst, K. (2011). Immigration, aging, and health in the United States. In R. A. Set-tersten & J. L. Angel (Eds.),Handbook of sociology of aging (pp. 103–116). New York: Springer.
Markides, K. S., & Eschbach, K. (2005). Aging, migration, andmortality: Current status of researchon the Hispanic paradox. The Journals of Gerontology Series B: Psychological Sciences andSocial Sciences, 60, 68–75.
Markides, K. S., Eschbach, K., Ray, L. A., & Peek, M. K. (2007). Census disability rates amongolder people by race/ethnicity and type of Hispanic origin. In The health of aging Hispanics(pp. 26–39). Springer.

268 M. A. Garcia et al.
Markides, K. S., & Rote, S. (2015). Immigrant health paradox. In Emerging trends in the socialand behavioral sciences. New York: John Wiley & Sons, Inc.
Markides, K. S., Rudkin, L., Angel, R. J., & Espino, D. V. (1997). Health status of Hispanicelderly. In Racial and ethnic differences in the health of older Americans (pp. 285–300). NationalAcademies Press.
Massey, D. S., Fischer, M. J., & Capoferro, C. (2006). International migration and gender in LatinAmerica: A comparative analysis. International Migration, 44(5), 63–91.
Melvin, J., Hummer, R., Elo, I., & Mehta, N. (2014). Age patterns of racial/ethnic/nativitydifferences in disability and physical functioning in the United States. Demographic Research,31, 497–509.
Nam, S., Al Snih, S., & Markides, K. S. (2015). Sex, nativity, and disability in older MexicanAmericans. Journal of the American Geriatrics Society, 63(12), 2596–2600. https://doi.org/10.1111/jgs.13827.
Nam, S., Al Snih, S., & Markides, K. S. (2016). A concordance of self-reported and performance-based assessments of mobility as a mortality predictor for older Mexican Americans. Geriatrics& Gerontology International, 17(3), 433–439. https://doi.org/10.1111/ggi.12734.
O’Neil, K., & Tienda, M. (2015). Age at immigration and the incomes of older immigrants,1994-2010. The Journals of Gerontology Series B: Psychological Sciences and Social Sciences,70(2), 291–302. https://doi.org/10.1093/geronb/gbu075.
Ortman, J. M., Velkoff, V. A., & Hogan, H. (2014). An aging nation: The older population in theUnited States. Washington, DC: United States Census Bureau.
Palloni, A., & Arias, E. (2004). Paradox lost: Explaining the Hispanic adult mortality advantage.Demography, 41(3), 385–415.
Palloni, A., & Morenoff, J. D. (2001). Interpreting the paradoxical in the Hispanic paradox:Demographic and epidemiologic approaches. Annals of the New York Academy of Sciences, 954,140–174.
Patel, K. V., Peek, M. K., Wong, R., & Markides, K. S. (2006). Comorbidity and disability inelderly Mexican and Mexican American adults—Findings from Mexico and the SouthwesternUnited States. Journal of Aging and Health, 18(2), 315–329. https://doi.org/10.1177/0898264305285653.
Read, J. N. G., & Reynolds, M. M. (2012). Gender differences in immigrant health: The case ofMexican and Middle Eastern immigrants. Journal of Health and Social Behavior, 53(1), 99–123.
Riosmena, F., Wong, R., & Palloni, A. (2013). Migration selection, protection, and acculturationin health: A binational perspective on older adults. Demography, 50(3), 1039–1064. https://doi.org/10.1007/s13524-012-0178-9.
Rosow, I., & Breslau, N. (1966). A Guttman health scale for the aged. Journal of Gerontology,21(4), 556–559.
Rumbaut, R. G. (2004). Ages, life stages, and generational cohorts: Decomposing the immigrantfirst and second generations in the United States. International Migration Review, 38(3),1160–1205. https://doi.org/10.1111/j.1747-7379.2004.tb00232.x.
Sheehan, C. M., & Tucker-Drob, E. M. (2017). Gendered expectations distort male–female differ-ences in instrumental activities of daily living in later adulthood. The Journals of GerontologySeries B: Psychological Sciences and Social Sciences, https://doi.org/10.1093/geronb/gbw209.
Sheftel, M. G. (2017). Prevalence of disability among Hispanic immigrant populations: Newevidence from the American Community Survey. Population Review, 56(1).
Sheftel, M., & Heiland, F. W. (2018). Disability crossover: Is there a Hispanic immigrant healthadvantage that reverses from working to old age? Demographic Researc, 39, 209–250.
Singh, G. K., & Hiatt, R. A. (2006). Trends and disparities in socioeconomic and behaviouralcharacteristics, life expectancy, and cause-specific mortality of native-born and foreign-bornpopulations in the United States, 1979-2003. International Journal of Epidemiology, 35(4),903–919. https://doi.org/10.1093/ije/dyl089.
12 Disability and the Immigrant Health Paradox: Gender and Timing … 269
Teruya, S. A., & Bazargan-Hejazi, S. (2013). The immigrant and Hispanic paradoxes: A systematicreview of their predictions and effects.Hispanic Journal of Behavioral Sciences, 35(4), 486–509.https://doi.org/10.1177/0739986313499004.
Treas, J. (2015). Incorporating immigrants: Integrating theoretical frameworks of adaptation. TheJournals of Gerontology Series B: Psychological Sciences and Social Sciences, 70(2), 269–278.https://doi.org/10.1093/geronb/gbu067.
Treas, J., & Gubernskaya, Z. (2016). Immigration, aging, and the life course. InHandbook of agingand the social sciences (8th ed., pp. 143–161). Elsevier.
Treas, J., & Mazumbdar, S. (2002). Older people in America’s immigrant families: Dilemmas ofdependence, integration, and isolation. Journal of Aging Studies, 16(3), 243–258. https://doi.org/10.1016/s0890-4065(02)00048-8.
Turra, C. M., & Elo, I. T. (2008). The impact of salmon bias on the Hispanic mortality advantage:New evidence from social security data. Population Research and Policy Review, 27(5), 515.
Turra, C. M., & Goldman, N. (2007). Socioeconomic differences in mortality among U.S. adults:Insights into the Hispanic paradox. The Journals of Gerontology Series B: PsychologicalSciences and Social Sciences, 62(3), S184–S192.
U.S. Census Bureau. (2017). Table B03001: 2016 American Community Survey. Washington, DC.https://www.census.gov/newsroom/facts-for-features/2017/hispanic-heritage.html.
Verbrugge, L. M. (2016). Disability experience and measurement. Journal of Aging and Health,28(7), 1124–1158.
Warner, D. F., & Brown, T. H. (2011). Understanding how race/ethnicity and gender defineage-trajectories of disability: An intersectionality approach. Social Science and Medicine, 72(8),1236–1248. https://doi.org/10.1016/j.socscimed.2011.02.034.
Zou, G. (2004). A modified poisson regression approach to prospective studies with binary data.American Journal of Epidemiology, 159(7), 702–706.

Chapter 13Limited but not Disabled: SubjectiveDisability Versus Objective Measurementof Functional Status and Mortality RiskAmong Elderly Mexican Americans
Phillip A. Cantu and Ronald J. Angel
Abstract In this paper, we examine the degree of concordance among subjective andmore objective measures of functional capacity and disability among older Mexican-origin Hispanics. We address three questions: (1) Are there significant discrepanciesbetween objectively measured functional limitations and self-reported disability? (2)How ismortality affected by discrepancies between self-reported disability andmoreobjective functional limitations? (3) Finally, is the association between discrepanciesand mortality affected by psychological, cultural, and social factors net of physicalillness? We use data from the Hispanic Established Populations for EpidemiologicStudies of the Elderly Waves 1 and 5 (N�863). We examine individuals who haveobjective functional limitations measured by POMAs and label those who also reporthaving ADL disability as “Realists” while those who report no ADLs are labeled“Optimists.” Results show that the association between “optimism” and mortality ismediated by differences in the number and degree of severity of IADL disabilitiesand the independent living capacities these measures represent.
Introduction
Today, the oldest-old, those age 85 and over make up the fastest-growing segmentof the older population are projected to increase threefold from 6 million in 2016to 20 million by 2060 (Ortman et al. 2014). As the baby boomers age, both theabsolute and relative number of the oldest old will invariably have profound practicalimplications for the old-age support system. If increased life expectancy at age 65is accompanied by significantly protracted periods of morbidity and disability, the
P. A. Cantu (B)Department of Sociology and Population Research Center, The University of Texas at Austin,Austin, TX, USAe-mail: [email protected]
R. J. AngelDepartment of Sociology, The University of Texas at Austin, Austin, TX, USAe-mail: [email protected]
© Springer Nature Switzerland AG 2019W. A. Vega et al. (eds.), Contextualizing Health and Aging in the Americas,https://doi.org/10.1007/978-3-030-00584-9_13
271

272 P. A. Cantu and R. J. Angel
old-age dependency burden and the social and political costs could grow rapidly. Addto that uncertainty in how disability is measured and defined and the future needs ofa growing elderly population become harder to predict.
Increasing longevity, and differential longevity based on race, ethnicity, and socialclass, could be accompanied by a differential protraction of morbidity for Hispanicsand non-Hispanics, which could vary by gender. Ideally, of course, we would liketo see a compression of morbidity, a term that refers to the postponement of seriousillness and functional incapacity to a short period before death (Fries 2002). Unfortu-nately, that ideal appears not to hold. In the U.S., while life expectancy has increasedover the previous century, rates of disability and functional limitation have increased(Seeman et al. 2010). Recent evidence suggests that among Mexican-origin elders,longer lives may be accompanied by substantial protraction (more years in poorhealth) rather than compression of morbidity (Cantu et al. 2013; Angel et al. 2014;Hayward et al. 2014; Garcia et al. 2015, 2018). A potentially serious uncertaintyin the interpretation of findings on the compression of morbidity arises from uncer-tainty in the measurement of disability and functional limitations, especially wheninformation is collected in different languages. Researchers in this area raise con-cerns that the translation of survey questions into Spanish may be problematic giventhat seemingly similar responses may actually have substantively different mean-ings (Finch et al. 2002; Angel 2013). The suspicion that language and social classmight affect perceptions and survey responses is increased by the fact that foreignMexican-Origin respondents have been shown to report different types and levels ofcertain disabilities than the native-born (Garcia et al. 2015).
In this paper, we examine issues related to the objectivemeasurement of functionalcapacity and subjective assessment of disability, andwe investigate the consequencesof discrepancies between them for survival over a 17-year period using a uniquelongitudinal data set, theHispanicEstablishedPopulations forEpidemiologic Studiesof theElderly (H-EPESE) (Markides et al. 1999).We address the following questions:
(1) How common are discrepancies between objective measures of functioning andsubjective reports of disability?
(2) Do discrepancies between objective measures of functioning and subjectivereports of disability predict mortality?
(3) Is the relationship between discrepancies in measurements of functional capac-ity and mortality mediated by psychological, cultural, and social factors?
Although the concept of the compression of morbidity might seem straightforward,referring to the period between the onset of morbidity and death, its operational-ization is far more complicated. A basic problem arises in the operationalization ofthe period of ill health or functional incapacity. A more detailed understanding ofthe measurement and operational characteristics of self-reported disability and moreobjective measures of functional limitation represent a potentially important theo-retical and practical contribution. We add to the literature on aging and disability byexploring how multiple measurements of disability and functioning are associatedwith mortality.

13 Limited but not Disabled: Subjective Disability Versus … 273
Measuring Functional Limitation and Disability
Disability is commonly measured using survey questionnaires that assess one’s abil-ity to perform basic Activities of Daily Living (henceforth ADL) and more complexInstrumental Activities of Daily Living (henceforth IADL) (Spector and Fleishman1998). ADLs gauge one’s ability to care for oneself and include activities such asbathing and feeding, while IADLs assess one’s capacity to carry out more complextasks related to independent living, such as dealing with finances. ADLs are moreclosely related to physical wellbeing and disability while IADLs are more closelyrelated to the home environment and independent living. Functional limitations thatlead to disability have been measured subjectively using survey items named NAGIitems and directly through observation using PerformanceOrientedMobility Assess-ments (POMA). POMA and NAGI items do not directly assess disability, but ratherthe physical limitations that result in disability (Nagi 1976; Tager et al. 1998). Thekey difference between disability and functional limitation we examine in this paperis the role of self-assessment of health vs. objective measurement of health and howthese different measurements correlate with mortality.
Discrepancies between functional ability and disability status can reflect whatVerbrugge and Jette call “quaternary prevention,” which refers to individuals whoexperience functional limitations but do not become disabled, either because theyexperience different task demands or are simply higher functioning (Verbrugge andJette 1994). Individuals who experience quaternary prevention do not have fewerphysical limitations; rather, they are situated in environments where their limitationsdo not affect their ability to perform necessary tasks. It is easy to imagine a situationin which two elderly individuals with similar physical limitations report differentdegrees of disability because one is in a home that has more accommodations fortheir limited physical capacity and the other is not.
Self-assessment of Health
One example of the predictive utility of self-assessments of health for mortality is thecase of self-rated health status (henceforth SRHS) (Idler andBenyamini 1997). SRHShas been shown to have a consistent association with mortality: individuals withpoorer self-rated health experience higher rates of mortality (Idler and Angel 1990;Idler et al. 2004; DeSalvo et al. 2006; Jylhä 2009). The association between SRHSand mortality has been theorized to be related to accuracy of the self-assessment, e.g.the correlation between SRHS and disease/disability/disease (Johnson andWolinsky1993), its ability to approximate a trajectory of health rather than a snapshot of healthat a given moment (Miller and Wolinsky 2007) and its association with functionallimitations (Benyamini et al. 2000; Mora et al. 2008). Ultimately, the relationshipbetween SRHS and other objective measurements “health” suggests that respondentsintuitively understand their situations in ways that can only be assessed subjectively.

274 P. A. Cantu and R. J. Angel
Extending these ideas to self-assessment of disability motivates a theoretical asso-ciation: the self-assessment of disability should be associated with higher rates ofmortality than objective measurements of functional limitation.
Discordance of Subjective and Objective Measures
As with other multi-dimensional constructs, disability can be defined in an exces-sively simplisticmanner as the ability to carry out basic physical tasks. Operationally,the self-assessment of disability involves both the ability to perform a particular activ-ity and the degree of impairment or help needed to perform it. For present purposes,we categorize measures of disability into two broad categories: those that involve theobservation of an individual carrying out specific tasks (POMAs), and self-reportsof one’s ability to carry out basic ADLs or more complex IADLs.
Performance-based measures reflect the direct observation by an outside observerwho rates the subject’s performance based on a priori criteria. The assessment is,therefore, objective in the sense that it does not involve the perceptions of the subject.A person’s self-assessment of his or her ability to perform a task, on the other hand,reflects other aspects of personality and the cultural, social, and physical environmentin which one lives that can affect one’s sense of being able to perform a task. Theresponse to questions concerning one’s ability to perform a specific task involvescomplex cognitive processes. If someone is asked if she can walk across a room orclimb stairs, a reasonable person could structure her answer in terms of being able tohold on to railings or to take as much time as needed. An individual with a physicalimpairment could simply reinterpret the question to make it more appropriate to theircondition. A timed observation is, of course, very different and does not involve suchreinterpretation of the question. At the same time, self-assessments of disabilityshare many of the same measurement issues as more general self-assessments ofhealth. Like self-assessed health, which reflect many potential social and culturalfactors other than actual physiological status, self-assessments of disability are, toan unknown degree, socially and culturally influenced.
The discordance/concordance between functional limitation and disability statushas been observed in previous research (Linn andLinn 1980;Angel et al. 2000;Angeland Frisco 2001; Nam et al. 2016). The concordance between assessed functionallimitation and one’s self-assessment of disability status has found that what wemightcall “positive discordance,” i.e., a situation in which functional disability is presentat assessment, but individuals report no disability (“optimism”). Such “optimism”was associated with a lower probability of mortality in a two-year follow-up relativeto agreement between the two measures (Angel et al. 2000) and a recent updatedanalysis has shown that even relative to individuals with no measured functionallimitation “optimists” enjoy a mortality advantage, though examinations as to whyhave yet to be explored (Nam et al. 2016).
The process by which individuals come to self-assess the label disability helpsus to understand the reasons why previous research has seen disparities in mortality

13 Limited but not Disabled: Subjective Disability Versus … 275
between discordant measurements. The self-assessment of disability is related tofunctional limitations, changes in ability to drive, and changes in the type of healthcare received (Kelley-Moore et al. 2006). An additional wrinkle to understandingdisability measurement for elderly Mexican Americans comes from research show-ing that immigrants have higher rates of IADL disability but lower rates of ADLdisability compared to US-born Mexican Americans (Garcia et al. 2015). Theseresults demonstrate how the more complex IADLs are important in elderly adults’self-assessment of disability.
In the following analysis, we examine how concordance between an objectivemeasure (POMA)and amore subjectivemeasure of functional capacity (self-reportedADL) are related to mortality over a 14-year follow-up period. In multivariate anal-yses, we employ a third measure of disability based on more complex instrumentalmeasures of functioning (IADLs) to investigate the potential moderating effect ofsocial context on the impact of the discrepancy or agreement between POMAs andADLs on mortality.
Data and Methods
The data we use are from the Hispanic Established Populations for EpidemiologicStudies of the Elderly (H-EPESE) (Markides et al. 1999). TheH-EPESE is a prospec-tive cohort household-based sample that, at baseline, is representative of MexicanAmericans aged 65 and above living in the southwestern states of Arizona, Cali-fornia, Colorado, New Mexico, and Texas. The original baseline sample of 3050was interviewed between September 1993 and June 1994, and a secondary refresh-ing sample of 902 was interviewed during the fifth follow up between September2004 and June 2005. Interviews took place both in person and via proxy. Currently,mortality links are available through December 31, 2015.
Measurements
Disability
Since our focus is on discrepancies between measures of functional capacity anddisability, our analytical sample includes only individuals with POMA limitations.POMA limitations are measured by the interviewer, removing the respondent’s sub-jective component. In the H-EPESE, POMAs include three items: (1) the ability todo chair sit and stands with crossed arms, (2) the speed to walk across a room, and(3) the ability to balance while standing. Each of these three POMA items is scoredfrom 0 to 4, 4 representing full functionality and 0 representing unable to completethe task. We limit our sample to individuals who were tested and scored a 0 on atleast one POMA item. POMA limitations are the most common measurement oflimitation at baseline, with 1032 of the 3952 respondents having at least one POMA.
We label respondents as “optimists” or “realists” based on self-reports of diffi-culties with ADLs. ADLs are a series of seven items assessing whether individuals

276 P. A. Cantu and R. J. Angel
need help from another person or special equipment or a device for: (1) walkingacross a small room, (2) bathing, (3) personal grooming, (4) dressing, (5) eating,(6) getting from a bed to a chair, and (7) using a toilet. Respondents were asked ifthey “need help,” “don’t need help,” or “are unable” to do each task. Anyone whoresponded “unable to do” or “needs help” is considered to have an ADL disability.Among individuals with at least one POMA limitation, anyone who did not reporthaving difficulty with any ADLs was labeled an “optimist,” and anyone with one ormore ADL was labeled a “realist.” Due to attrition and proxy reports lacking POMAmeasures, we limit our sample to in-person respondents from the first wave and therefresher sample at Wave 5. We do not look at individuals who have discordant func-tional limitation and disability for “pessimists,” i.e., those who have no POMAs butreport having ADLs, of which there are 85 cases. Importantly, the labels “optimist”and “realist” are for illustrative purposes and are distinct from psychological con-cepts. “Optimism” in our sample refers to positive discordance or someone who isphysically limited but not disabled.
Demographic Measures
It is possible that observed mortality differences between “optimists” and “realists”reflect differences in demographic composition. To control for this possibility, allanalyses include controls for age, sex, and nativity.
Global Health Measures
Another possible source of variation between “optimists” and “realists” are othermeasurements of physical health and mental wellbeing. For other measurements ofhealth, we used morbidity status at baseline. Morbidity status referred to whetheror not an individual had been told by a doctor/health professional if they had hadany one of six health conditions; (1) arthritis, (2) cancer, (3) diabetes, (4) heartattack, (5) hypertension, or (6) stroke. We control for mental status at baseline usingthe Center for the Epidemiologic Studies of Depression (CES-D) scale. The CES-D depression scale includes 20 questions about personal relations and orientationtowards the world. Questions are scored 0–3, with 0 being no depressive symptomand 3 being a strong indicator of depression. These items are then added togetherfor a composite score. A score of 16 or above on the CES-D is a cut-off for risk ofclinical depression, though not a clinical diagnosis. We dichotomize the CES-D toless than 16 and greater than or equal to 16. Additionally, we control for self-ratedhealth status at baseline. We compare those who say they have fair or poor health tothose who report having good or excellent health.
Other Subjective Measures of Ability
Variation inmortality between “optimists” and “realists” may also be associated withother types of functional limitation; the difference in mortality between “optimists”and “realist” may operate through specific tasks that “optimists” are able to do that“realists” are not. We examine this possibility by controlling for IADL limitations.IADLs are self-assessed measures of a respondent’s ability to perform 10 different

13 Limited but not Disabled: Subjective Disability Versus … 277
activities: (1) use a telephone, (2) drive a car or travel alone, (3) go shopping, (4)cook meals, (5) do light housework, (6) take medicine, (7) handle money, (8) doheavy work around the house, (9) walk up a flight of stairs, and (10) walk half a mile.We employ IADLs in a number of different ways: we look at the effect of havingany IADL limitations, the effect of the number of IADL limitations, and the effectof specific IADL limitations.
Analytic Strategy
Our final analytical sample is limited to individuals who have POMA limitationsand for whom we have comprehensive information for all variables at baseline: 863total, 446 “optimists” with 375 deaths and 417 “realists” with 356 deaths. We firstexamine the sample descriptively using appropriate weights from Wave 1 and Wave5. Next, we examine the relationship between explanatory variables and “optimism”using logistic regression where:
log(Odds of “Optimism”) � B0 + B1x1 + · · · + Bkxk
controlling for demographic characteristics, other globalmeasurements of health, andother subjective measurements of ability. Logistic regression models are weightedusing appropriate weights from Wave 1 and Wave 5.
We model the rate of mortality a Gompertz model so that:
log(Death) � B0 + B1x1 + · · · + Bkxk + log(exposure)
using person-years observed until death or loss to follow up to account for exposure(years lived). Offsetting for exposure allows our model to include information forindividuals who are lost to follow up or do not experience death over the follow-upperiod so that we can include as much data from our sample as possible. Exposureis defined as one year for each age that a respondent is observed being alive and apartial year for the final year of life (proportion of age lived in last year of life) or halfa year for the year a respondent is lost to follow up. This model specification allowsus to account for differences in survival time from baseline as well as differences inage distribution for “optimists” and “realists”. We control for demographic charac-teristics, other global measurements of health, and other subjective measurements ofability. Using person-year data in the Gompertz model does not allow for weightingof the data; since person-year data does not have a meaningful survey weight, we donot weight this analysis. Table 13.1 presents our sample characteristics for Hispanicadults with at least one POMA disability at baseline.

278 P. A. Cantu and R. J. Angel
Table 13.1 Sample characteristics of Hispanic adults with at least one POMA disability at baseline(Wave 1 or Wave 5)
Optimist Realist Total
Age 75.19 80.12 77.57***
(6.75) (7.33) (7.45)
Male 36% 34% 35%
US Born 52% 55% 53%
Fair/poor health 75% 84% 79%***
Morbidity conditions 83% 90% 87%***
CESD≥16 27% 37% 32%***
Any IADL 76% 98% 87%***
IADL count 2.65 6.64 4.58***
(2.29) (2.50) (3.12)
Deaths 375 356 731
Observations 417 446 863
Person years 6080 3784 9864
SourceHispanic Established Populations for Epidemiologic Study of the Elderly (H-EPESE)Waves1 and 5∗p <0.05, ∗∗ p <0.01, ∗∗∗ p <0.001
Results
Individuals with POMAs disabilities who do not report having an ADL disabilityat baseline (“Optimists” n�417) differ from those who report having an ADL dis-ability at baseline (“Realists” n�446) on demographic measures. “Optimists” aresignificantly younger (75.19 vs. 80.12) than “realists.” There are a greater propor-tion of male “optimists” than “realists” (36% vs. 34%), but these differences arenot statistically significant. Each group is more likely to be US-born (52% vs. 55%)than foreign-born. There are significant differences in other physical/mental healthmeasures for “optimists” and “realists.” “Realists” are more likely to report fair/poorself-reported health: 84% of “realists” report fair or poor health compared to 75%of “optimists.” Ninety (90) percent of “realists” report having at least one morbiditycondition compared to 83 percent of “optimists.” “Realists” report significantlymoredepressive symptoms compared to “optimists” (36% vs. 27%). Other measurementsof disability also show significant differences between “optimists” and “realists.”Nearly all “realists” also report having at least one IADL limitation (98%) and reporthaving more IADL limitations on average than “optimists” (6.64 vs 2.65). Whileboth groups have similar percentages of death during the follow up (84% of “opti-mists” and 85% of “realists”), descriptive statistics do not give a full sense of howmortality disparities operate net of age differences. When the data is converted to theperson-year format, “optimists” have more life year observations (6080 vs. 3784)due to younger baselines and longer life expectancies.

13 Limited but not Disabled: Subjective Disability Versus … 279
Table 13.2 presents results of models for the relationship between explanatoryvariables and “optimism”. In Model 1, age has a significant relationship with “opti-mism”; older people are less likely to be “optimists”. The logistic regression resultsdo not show significant differences in the likelihood of being an “optimist” by sex ornativity.Mirroring the descriptive table,Model 2 shows that both physical andmentalhealth assessments are all significantly related to “optimism”: people with poor orfair health (OR 0.53, p ≤ 0.01), depressive symptoms (OR 0.62, p ≤ 0.05) and mor-bidity conditions (OR 0.03, p≤ 0.001) are less likely to be “optimists”. These resultssuggest that “optimists” have better health than “realists”, either through self-reports,professionally diagnosed conditions, or mental status.
Having an IADL limitation decreases the likelihood of being an “optimist”.Model3 shows that having any IADL is associated with a 92% reduction in the odds ofbeing an “optimist” (OR 0.08, p <0.001). The relationships between “optimism” anddepressive symptom/self-rated health are no longer significant when controlling forIADL conditions, whilemorbidity conditions remain significant.When including thenumber of IADLs in Model 4, each additional IADL disability decreases the oddsof “optimism” by 47% (OR 0.53, p <0.001). Controlling for each specific IADLindependently yields interesting patterns. It is worth noting that including all IADLitems individually makes the reference category for each item individuals who haveno IADL’s. All but one IADL is negatively associated with the odds of “optimism”.Five of the 9 IADLs have statistically significant relationshipswhen controlling on allIADLs simultaneously. Not being able to walk half a block (OR 0.36, p <0.01), walkup stairs (OR 0.24, p<0.001), being able to shop (OR 0.49, p<0.05), takemedication(OR 0.39, p <0.05), or do housework (OR 0.25, p <0.001) are all associated withsignificantly lower odds of being “optimistic”, net of other IADL measures.
These results suggest that net of other measures of health, the IADLs are animportant aspect of how individuals label themselves as disabled. Another way tothink about this is that in order for someone to move from a POMA disability toa self-report of at least one ADL disability he or she must perceive and self-reportat least one IADL disability. This appears to be the case for 98% of the “realists”.Only 2% of individuals who have POMA limitations and report an AD do not alsoreport an IADL. Further, the more IADLs a person with POMAs disability reports,the more likely they are to report ADL disabilities.
Table 13.3 shows the results for modeling mortality. All models include age as acovariate. Model 1 provides evidence of a difference in the rate of mortality between“optimists” and “realists”. In Model 1, net of the age differences, the rate of deathover the follow-up period for “optimists” is 24% lower than that for “realists” (IRR0.76, p <0.01). Model 2 includes demographic characteristics which do not explainaway the association between “optimism” and mortality. The association between“optimism” and mortality is relatively unchanged in Model 2 (IRR 0.76, p <0.01).“Optimism’s” continued statistical and practical significance (IRR 0.78, p <0.05) inModel 3, despite controlling for self-rated health, morbidity conditions and depres-sive symptom, suggests that “optimism” is related to mortality net of these othermeasurements of health and wellbeing.

280 P. A. Cantu and R. J. Angel
Table13.2
Logistic
regression
predictin
goptim
ism
(oddsratio
)
Dem
ographics
Health
andmentalstate
Any
IADL
IADLcount
SpecificIA
DL’s
(1)
(2)
(3)
(4)
(5)
Age
0.91
***
0.90
***
0.91
***
0.95
**0.94
**
(−7.13)
(−7.22)
(−6.30)
(−3.24)
(−3.16)
Men
0.85
0.98
1.14
1.15
1.00
(−0.77)
(−0.09)
(0.63)
(0.57)
(0.01)
USborn
0.84
0.84
0.81
0.651
0.72
(−0.92)
(−0.91)
(−1.06)
(−1.85)
(−1.39)
Morbidity
conditions
0.33
***
0.35
***
0.49
*0.49
(−3.70)
(−3.34)
(−2.09)
(−1.93)
Depression
0.62
*0.71
1.47
1.48
(−2.31)
(−1.60)
(1.49)
(−1.40)
Fair/poo
rhealth
0.53
**0.64
0.89
0.94
(−2.67)
(−1.77)
(−0.36)
(−0.19)
Any
IADL
0.08
***
(−5.97)
IADLcount
0.53
***
(−13.74)
Phone
0.60
(−1.09)
Walkhalfablock
0.36
**
(−3.08)
(contin
ued)

13 Limited but not Disabled: Subjective Disability Versus … 281
Table13.2
(contin
ued)
Dem
ographics
Health
andmentalstate
Any
IADL
IADLcount
SpecificIA
DL’s
(1)
(2)
(3)
(4)
(5)
Walkup
stairs
0.24
***
(−4.62)
Take
med
0.39
*
(−2.12)
Cook
0.81
(−0.54)
Shop
0.49
*
(−2.10)
Managemoney
0.73
(−0.89)
Housework
0.25
***
(−4.30)
Drive
1.28
(0.71)
Constant
3158
***
15,986
***
47,608
***
2604
***
6.17
(7.01)
(7.67)
(8.13)
(5.18)
(5.06)
N863
863
863
863
863
Log
likelihoo
d−5
52−5
27−4
92−3
59−3
38
BIC
1132
1100
1039
773
783
Source
HispanicEstablishedPo
pulatio
nsforEpidemiologicStudyof
theElderly
(H-EPE
SE)Waves
1and5
tstatistic
sin
parentheses,*p
≤0.05
**p
≤0.01;*
**p
≤0.001

282 P. A. Cantu and R. J. Angel
Table13.3
Gom
pretzmod
elpredictin
gmortality(incidence
rateratio
s)
Baseline
Dem
ographics
Health
andmentalstate
Any
IADL
IADLcount
(1)
(2)
(3)
(4)
(5)
Optim
ism
0.76
**0.76
**0.80
*0.79
*0.93
(−2.70)
(−2.71)
(−2.28)
(−2.31)
(−0.70)
Age
1.07
***
1.07
***
1.07
***
1.07
***
1.07
***
(8.89)
(8.93)
(9.3)
(9.17)
(8.9)
Male
0.75
**0.72
**0.72
**0.70
***
(−2.83)
(−3.27)
(−3.15)
(−3.59)
USborn
1.20
1.19
1.19
1.24
*
(1.80)
(1.74)
(1.74)
(2.12)
Fair/poo
rhealth
1.27
*1.27
*1.23
(1.96)
(1.98)
(1.67)
Morbidity
condition
1.16
1.16
1.13
(0.95)
(0.95)
(0.81)
Depression
1.18
1.19
1.13
(1.65)
(1.67)
(1.18)
Any
IADL
0.96
(−0.23)
IADLcount
1.17
*
(2.33)
Observatio
ns8168
8168
8168
8168
8168
Log
likelihoo
d−2
998.1
−2988.8
−2980.6
−2980.6
−2976.2
BIC
6023.3
6022.6
6033.3
6042.2
6033.4
Source
HispanicEstablishedPo
pulatio
nsforEpidemiologicStudyof
theElderly
(H-EPE
SE)Waves
1and5
tstatistic
sin
parentheses,
∗p<0.05,∗
∗p<0.01,∗
∗∗p<0.001

13 Limited but not Disabled: Subjective Disability Versus … 283
Table 13.4 Predicting the relationship between mortality and optimism controlling for IADL con-ditions separately (incidence rate ratios)+
IADL Optimism
IRR (t) IRR (t)
Baseline (no IADL’s) 0.81 * (−2.28)
Manage money 1.02 (0.17) 0.80 * (−2.25)
Use phone 1.08 (0.51) 0.81 (−2.18)
Walk up a flight of stairs 1.04 (0.31) 0.81 (−1.65)
Do heavy work 1.22 (1.38) 0.84 (−1.72)
Drive 1.21 (1.71) 0.84 (−1.75)
Take medication 1.21 (1.47) 0.84 (−1.62)
Walk half a block 1.14 (1.09) 0.85 (−1.58)
Cook 1.24 (1.74) 0.88 (−1.07)
Shop 1.31 * (2.37) 0.91 (−0.92)
Do house work 1.39 * (2.91) 0.93 (−0.64)
SourceHispanic Established Populations for Epidemiologic Study of the Elderly (H-EPESE)Waves1 and 5+Each row is a separate model; each IADL compared individuals who cannot complete the task tothose who can; all models control on age, sex, nativity, self-rated health, depression, and morbidityconditions∗p <0.05, ∗∗p <0.01, ∗∗∗p <0.001
The relationship between mortality and “optimism” is complicated by the inclu-sion of IADLs. The inclusion of any IADL disability in Model 4 does not explainaway the association between “optimism” and mortality (IRR 0.79, p <0.05). How-ever, controlling for the number of IADL limitations (Model 5) or the specific IADLlimitations (Table 13.4) renders the association between “optimism” and mortalitystatistically nonsignificant. This suggests that unmeasured personality, contextual, orsocial factors influence an individual’s ability to live independently with a significantphysical limitation. Evidence in Table 13.4 suggests IADL measurement acts as aproxy for independent living.
Controlling for any of the specific IADLs makes the relationship between “opti-mism” andmortality nonsignificant, but three stand out as contributing to the greatestreduction in the odds of death: cooking, shopping, and housework. Not being able tocook reduces themortality advantage for “optimists” from IRR 0.81 to IRR 0.88. Notbeing able to shop has a statistically significant association with mortality (IRR 1.31,p <0.05) that operates net of “optimism.” Likewise, not being able to do houseworkreduces the “optimist” advantage to IRR 0.91 and has an independent associationwithmortality (IRR 1.39, p <0.05). Results fromTable 13.4 show that the associationbetween mortality and “optimism” is influenced by measurements of independentliving. Likewise, the results from Table 13.3 (Model 4 and Model 5) suggest thatthe association between “optimism” and mortality is not a result of individuals

284 P. A. Cantu and R. J. Angel
simply having an IADL disability but rather the number of IADLs. “Optimists”are more capable of living independently than “realists”, and this differentiates theself-assessment of disability and ultimately mortality experience of the two groups.
Limitations
The estimates presented here must be taken with caution because there are a numberof limitations that need to be addressed in future analyses. Some, however, simplycannot be addressed with available data. For one, the current model estimation treatsthe data essentially as cross-sectional and does not take advantage of the repeatedmeasures of POMA limitation and ADL disability. The reason we have not yetaddressed this issue is that different waves’ response rates vary for proxy respon-dents and deaths. For waves for which we only have proxy respondents for someindividuals, we may have ADL measures, but we do not have POMA measures.Dealing with missing interviews would require making a separate set of assumptionsfor each pattern of missing interviews. By assuming a constant state of “optimism”from the baseline, we need only make one assumption. Also of concern is the differ-ence in age distribution of “optimists” and “realists”. The relatively older “realist”sub-sample could imply that “optimism” and “realism” are part of a shared trajectoryrather than distinct states.
Discussion
ADL disability is considered one of the essential measures required for the optimalassessment of independence in later life. The objective of this study was to establishthe concordance among the widely used subjective assessments of disability andobjective measures of function among older Mexican-origin individuals. In addition,we analyzed mortality differences for physically limited individuals who do notreport disability (“optimists”) and those who do (“realists”).
The results presented here indicate that individuals with better health were morelikely to be included in the “optimist” group than the “realist” group, but even net ofhealth, reports of independent living disabilitieswere key differences in the likelihoodof being an “optimist.” The lower rates of mortality for “optimists” makes sense asa logical extension of other research finding an association between positive SRHSand mortality (Idler and Angel 1990; Idler and Benyamini 1997; DeSalvo et al.2006). SRHS status is a subjective measure of global health while self-assessmentsof disability appear to be tapping different dimensions of individuals understandingtheir capacity to function in specific contexts. Both are measuring some aspect ofhealth that cannot be ascertained by a third party. Individuals are able to report abouttheir health status and disability status inways that are consequential formortality andcannot be externally assessed by methods currently available. Put another way, while

13 Limited but not Disabled: Subjective Disability Versus … 285
objective measurements of disability such as POMAs attempt to give a clear pictureof the functional limitations individuals face, subjective measurements of health anddisability are situated within social/physical/cultural/psychological realities that areimportant and predictive of mortality in different ways.
While the association between “optimism” and mortality maintained significancewhen controlling for demographic characteristics, global health measurements, andthe presence of at least one IADL, its association was ultimately diminished tonon-significance in our models when controlling for the number of IADLs and spe-cific IADLs. In other words, controlling for the number of IADLs an individualhas eliminated the association between “optimism” and mortality statistically andpractically. When controlling for specific IADLs, shopping, doing housework andcooking diminished the association betweenmortality and “optimism” the most. Theinterpretation of the number of IADL finding and specific IADL finding lead us tosimilar conclusions. The number of IADLs tells a story of the possibility of sociallyand environmentally constructed disability. IADLs are measures of an individual’sability to perform tasks that are necessary for independent living; thus being fur-ther removed from independent living (higher IADL scores) is what the associationbetween “optimism” and mortality is actually picking up. Likewise, when lookingat the change in the association between “optimism” and mortality when controllingfor specific IADLs, we find that the IADLs most closely associated with indepen-dent living are the most powerful in explaining away the focal association. Beingable to cook, shop, and maintain a household are all vital to independent living. Ouranalysis suggests that the ability to live independently reflects unmeasured factorsthat help explain the association between “optimism” and mortality. The ability tolive independently and maintain one’s own place appears to be crucial to how olderadults understand their health. While our models control for gender, it is important tonote IADL disability measurement is complicated by the fact that women are morelikely to preform and similarly report not being able to do specific IADL’s (Garciaet al. 2015; Sheehan and Tucker-Drob 2018).
Like explanations for the association between SRHS and mortality, the relation-ship between self-assessment of disability and mortality may be mediated by a rangeof factors. Our results suggest that the association between self-assessed disabilityand mortality for elderly Mexican Americans experiencing functional limitations isrelated to both temporal ordering of disability and personal/social resources. Self-assessment of disability also appears to be a more valid measurement of health andhealth trajectories than objective functional limitation alone. The self-assessmentof disability reflects the fact that the ability to function depends on more than justphysical status. While objective measurements of functional status allow us to assessexternally health, a nuanced understanding of the aging process requires a greaterunderstanding of the social construction of subjective assessments of health as well.
286 P. A. Cantu and R. J. Angel
Conclusion
In this study, we assess the relationship between self-perceptions of functioning andmortality risk among elderly Mexican Americans. We found that, among individualswith objectivelymeasures limitations, thosewho perceived themselves as beingmorefunctional (“optimists”) live longer than those whose perception of their functioningmore closely mirrored their objective reality. We examined possible explanations forthis disparity. The differences in mortality rates were not a result of demographiccharacteristics, such as the age, gender, or nativity. Nor did we find that the differ-ences inmortalitywere due to other globalmeasurements of health orwellbeing, suchas morbidity conditions, self-rated health, or depressive symptoms. The differencewas explained away through secondary measurements of functioning: instrumentalactivities of daily living. Our analysis leads to the conclusion that much of the differ-ence in mortality between people with objectively measured functional limitationsand self-report disability and those with objectively assessed limitations who do notreport disability operates through the ability to live independently. Our models donot explicitly test whether or not living independently is what is driving these differ-ences. Future research will need to address whether or not the discrepancy betweenperception and functioning and its relationship with mortality is related to indepen-dent living. The policy implications of this research point to the potential benefit ofenhancing elderly people’s perceived independence in living arrangements. Whetheror not being actually capable of living independently is necessary for “optimism” toexert a positive effect on morality is yet to be empirically tested.
References
Angel, R. J. (2013). After Babel: Language and the fundamental challenges of comparative agingresearch. Journal of Cross-Cultural Gerontology, 28(3), 223–238.
Angel, R. J., Angel, J. L., & Hill, T. D. (2014). Longer lives, sicker lives? Increased longevityand extended disability among Mexican-origin elders. The Journals of Gerontology Series B:Psychological Sciences and Social Sciences, 70(4), 639–649.
Angel, R. J., & Frisco, M. L. (2001). Self-assessments of health and functional capacity amongolder adults. Journal of Mental Health and Aging, 7(1), 119–136.
Angel, R. J., Ostir, G. V., Frisco, M. L., & Markides, K. S. (2000). Comparison of a self-reportedand a performance-based assessment of mobility in the Hispanic Established Population forEpidemiological Studies of the Elderly. Research on Aging, 22(6), 715–737.
Benyamini, Y., Idler, E. L., Leventhal, H., & Leventhal, E. A. (2000). Positive affect and functionas influences on self-assessments of health expanding our view beyond illness and disability. TheJournals of Gerontology Series B: Psychological Sciences and Social Sciences, 55(2), 107–116.
Cantu, P. A., Hayward, M. D., Hummer, R. A., & Chiu, C. (2013). New estimates of racial/ethnicdifferences in life expectancy with chronic morbidity and functional loss: Evidence from theNational Health Interview Survey. Journal of Cross-Cultural Gerontology, 28(3), 283–297.
DeSalvo, K. B., Bloser, N., Reynolds, K., He, J., & Muntner, P. (2006). Mortality prediction with asingle general self-rated health question. Journal of General Internal Medicine, 21(3), 267–275.
13 Limited but not Disabled: Subjective Disability Versus … 287
Finch, B. K., Hummer, R. A., Reindl, M., & Vega,W. A. (2002). Validity of self-rated health amongLatino(a)s. American Journal of Epidemiology, 155(8), 755–759.
Fries, J. F. (2002). Aging, natural death, and the compression of morbidity. Bulletin of the WorldHealth Organization, 80(3), 245–250.
Garcia, M. A., Angel, J. L., Angel, R. J., Chiu, C., & Melvin, J. (2015). Acculturation, gender,and active life expectancy in the Mexican-origin population. Journal of Aging and Health, 27(7),1247–1265.
Garcia, M. A., Downer, B., Crowe, M., Markides, K. S., & Suitor, J. J. (2018). Aging and disabilityamong Hispanics in the United States: Current knowledge and future directions. Innovation inAging, 1(2). https://doi.org/10.1093/geroni/igx037.
Hayward, M. D., Hummer, R. A., Chiu, C., González-González, C., & Wong, R. (2014). Does theHispanic paradox in U.S. adult mortality extend to disability? Population Research and PolicyReview, 33(1), 81–96.
Idler, E. L., & Angel, R. J. (1990). Self-rated health and mortality in the NHANES-I epidemiologicfollow-up study. American Journal of Public Health, 80(4), 446–452.
Idler, E. L., & Benyamini, Y. (1997). Self-rated health and mortality: A review of twenty-sevencommunity studies. Journal of Health and Social Behavior, 38(1), 21–37.
Idler, E. L., Leventhal, H., Mclaughlin, J., & Leventhal, E. (2004). In sickness but not in health:Self-ratings, identity, and mortality. Journal of Health and Social Behavior, 45(3), 336–356.
Johnson, R. J., &Wolinsky, F. D. (1993). The structure of health status among older adults: Disease,disability, functional limitation, and perceived health. Journal of Health and Social Behavior,34(2), 105–121.
Jylhä, M. (2009). What is self-rated health and why does it predict mortality? Towards a unifiedconceptual model. Social Science and Medicine, 69(3), 307–316.
Kelley-Moore, J. A., Schumacher, J. G., Kahana, E., & Kahana, B. (2006). When do older adultsbecome ‘disabled’? Social and health antecedents of perceived disability in a panel study of theoldest old. Journal of Health and Social Behavior, 47(2), 126–141.
Linn, B. S., & Linn, M.W. (1980). Objective and self-assessed health in the old and very old. SocialScience & Medicine Part A: Medical Psychology & Medical Sociology, 14(4), 311–315.
Markides, K. S., Stroup-Benham, C. A., Black, S. A., Satish, S., Perkowski, L. C., & Ostir, G.(1999). The health of Mexican American elderly: Selected findings from the Hispanic EPESE.Serving minority elders in the 21st century (pp. 72–90). New York: Springer.
Miller, T. R., & Wolinsky, F. D. (2007). Self-rated health trajectories and mortality among olderadults. The Journals of Gerontology Series B: Psychological Sciences and Social Sciences, 62(1),S22–S27.
Mora, P. A., DiBonaventura, M. D., Idler, E., Leventhal, E. A., & Leventhal, H. (2008). Psycholog-ical factors influencing self-assessments of health: Toward an understanding of the mechanismsunderlying how people rate their own health. Annals of Behavioral Medicine, 36(3), 292–303.
Nagi, S. Z. (1976). An epidemiology of disability among adults in the United States. The MilbankMemorial Fund Quarterly. Health and Society, 54(4), 439–467.
Nam, S., Snih, S. A., & Markides, K. S. (2016). A concordance of self-reported and performance-based assessments of mobility as a mortality predictor for older Mexican Americans. Geriatrics& Gerontology International, 17(3), 433–439.
Ortman, J. M, Velkoff, V. A., & Hogan, H. (2014). An aging nation: The older population in theUnited States (Current Population Reports, pp. 25–1140). Washington, DC: U.S. Census Bureau.
Seeman, T. E., Merkin, S. S., Crimmins, E. M., & Karlamangla, A. S. (2010). Disability trendsamong older Americans: National Health and Nutrition Examination Surveys, 1988–1994 and1999–2004. American Journal of Public Health, 100(1), 100–107.
Sheehan, C. M., & Tucker-Drob, E. M. (2017). Gendered expectations distort male–female differ-ences in instrumental activities of daily living in later adulthood. The Journals of GerontologySeries B: Psychological Sciences and Social Sciences, https://doi.org/10.1093/geronb/gbw209.
288 P. A. Cantu and R. J. Angel
Spector, W. D., & Fleishman, J. A. (1998). Combining activities of daily living with instrumentalactivities of daily living to measure functional disability. The Journals of Gerontology Series B:Psychological Sciences and Social Sciences, 53(1), S46–S57.
Tager, I. B., Swanson, A., & Satariano, W. A. (1998). Reliability of physical performance andself-reported functional measures in an older population. The Journals of Gerontology Series A:Biological Sciences and Medical Sciences, 53(4), M295–M300.
Verbrugge, L. M., & Jette, A. M. (1994). The disablement process. Social Science and Medicine,38(1), 1–14.

Part IVCaregiving and Family Dynamics
Caregiving imposes a complex mixture of incentives and demands on those whoprovide it. Demands associated with caregiving can deplete financial resources,make it impossible to maintain paid work, and may undermine the mental andphysical health of the caregiver (Aranda and Knight 1997; Herrera et al. 2013; Rote,Angel, and Markides 2015). Families provide a great deal of informal support tofrail and disabled elderly relatives, as previous chapters in this volume havedemonstrated older Hispanics and people of Mexican origin suffer particularlyserious health and socioeconomic disadvantages. These result in a potential seriousburden for their families. In this section, four chapters delve into the consequencesof caregiving burdens for the health and well-being of caregivers.
The section is motivated by profound demographic and social changes that haveaffected families’, and especially female family members’, ability to provide all ofthe care older relatives need. These changes require a closer and more sophisticatedunderstanding of the nature, extent, and quality of Latino family caregiving in lightof the limitations in what the state can provide. As with other groups, greater laborforce participation by women, geographic mobility, marital disruption, and non-traditional family configurations pose new challenges for caregivers (J. L. Angel,Rote, and Markides 2017). Although Mexican-origin individuals enjoy long lives,many suffer protracted periods of poor health and functional incapacity (Garcia andReyes 2018). The reality is that for this population morbidity has not been com-pressed. Mexican-origin men spend approximately one-half of the years past 65 inextremely impaired states. Mexican-origin women spend over 60% of their addi-tional years with serious physical and cognitive limitations (R. J. Angel, Angel, andHill 2015). Despite this higher need, Latinos tend to underuse formal supportiveservices (Herrera et al. 2013; Thomeer, Mudrazija, and Angel 2015).
These social and demographic changes are giving rise to new role expectationsand caregiving obligations of adult children and grandchildren as Latinos age (R.J. Angel and Angel 2015). As the Mexican-origin family comes under the samepressures that affect non-Latino families, its members may become less able or
Jacqueline L. Angel
J. L. AngelLyndon B. Johnson School of Public Affairs and Department of Sociology,The University of Texas at Austin, Austin, TX, USA
willing to provide all of the care elderly relatives need in the community. Grownchildren taking care of parents with Alzheimer’s disease and related disorders maybe particular vulnerable (Apesoa-Varano, Gomez, and Hinton 2016; Rote, Angel,and Markides 2017). Studies have shown that elderly Latinos are at higher risk ofdementia compared to other ethnic groups (Dilworth-Anderson, Williams, andGibson 2002). Latino caregivers have historically cared for their relatives withdementia for protracted periods without utilizing outside community resources. Asa result, Latino caregivers may be at higher risk for the stress associated withintensive caregiving.
Black and Hispanic women engage in caregiving for impaired elders more often,for longer periods, and at more medically intense levels than non-Latino whites.Given that they have lower incomes and many are in poor health themselves, theseadditional duties may add up to an even greater burden for older Latinos (Wolf,Freedman, and Soldo 1997). Evidence shows that high time commitments arerequired in Mexican-origin caregiving in the United States. Time spent caring forelderly parents, including travel time and visit time, are associated with an increasedrisk of the care receiver’s institutionalization (J. L. Angel et al. 2004). Previousresearch suggests that the time that grown children spend caring for elderly parentsincreases the risk of an aging parent’s admission to formal long-term care. A recentAssociated Press (AP) poll of Latino adults aged 40 and older indicates, however,that while formal care is needed, only 20% of Latinos believe that nursing homesand assisted living facilities would conform to their cultural preferences in food andhealthcare practices (Brown, Herrera, and Angel 2013; Trielli 2017). The APsurvey revealed that almost half of the sample had difficulty communicating withhealthcare providers due to language barriers. In addition to cultural barriers, Latinomen and women follow distinct pathways after discharge from a nursing home,partly because of the availability and use of family support (Mudrazija, Thomeer,and Angel 2015). Women are more likely than men to be discharged from nursinghomes, and they tend to live alone or with family after discharge, while men aremore likely to live with a spouse or to transfer to another institution. This studyunderscores the Latinas’ need for home care, and a heavy and persistent reliance onLatino family caregivers.
The four chapters in this section speak directly to the importance of both timeand place with regard to addressing the complex issues associated with caregiving.Rote and colleagues investigate how patterns of compromised health and economicdisadvantage among aging Mexican Americans have far-reaching consequences forcaregiver well-being. The chapter contributes to the expanding literature on thepotential overburden of the Mexican-American family in balancing work andfamily life and the care of dependent elders. The study on which the chapter isbased tests a well-known hypothesis in the literature on social integration andmental health. Using the H-EPESE, the longitudinal cohort study shows the pro-tective mental health effect of social cohesion in later life for family caregivers inthe Mexican-American community. The results correspond squarely with whatGlen Elder continues to remind us in his examination of the relevance of agency aswell as time (cohort) and place (neighborhood) and emphasize the important role of
290 Part IV: Caregiving and Family Dynamics

neighbors and potential adverse health consequences of caregivers working inisolation and without the support of friends or family. Research shows that sociallydisengaged neighbors appear to be less knowledgeable about services and, thus,less likely to access them (Herrera et al. 2008). As family caregivers are overrun bycompeting demands and the network of family support declines, their access to anduse of respite care and ancillary community-based services may be the key deter-mining factor in the decision to support their loved one’s aging in place.
The chapter by Destremau examines specific long-term care challenges in Cubaand documents the fact that family continues to assume primary responsibility forthe care of frail and dependent elders. Cuba is growing older than both the UnitedStates and Mexico, with 14.9% of its 11.2 million inhabitants over the age of 65.The country is aging faster than any other Latin American country, and by 2050,adults 65 and over will comprise almost one-third (28.3%) of the total Cubanpopulation (He, Goodkind, and Kowal 2016). Older Cubans are rapidly agingthemselves, and the fraction of the aged 80 and over will quadruple by the middleof the century (He et al. 2016). The government recognizes that these aging trendswill cause a strain on both the healthcare system in the very near future within all ofthe nations and on other community resources. Over the last 30 years, Cuba hassupported a comprehensive primary care system and innovative responses to pro-mote healthful aging. However, the social policy does not extend to long-term care.Family continues to assume primary responsibility for frail and dependent elders.
Angst, Aguila, and López-Ortega illustrate the important effects that gender andnon-contributory old-age income support have on informal care in Mexico by thestate of Yucatan. The Mexican government has responded to the need for healthcare and income support by expanding programs such as Seguro Popular and 70 yMás which have potentially changed the relationship between formal and informalcaregiving in ways that have as yet not been evaluated. This is one of the firststudies to employ a local household survey to assess the effect of pension benefitson caregiver well-being. Like other caregivers in the Americas, the data reveal thatsocial security benefits are a critical source of income for caregivers, especially forwomen who spend more time than men assisting their frail and disabled parentswith activities of daily living.
These data resemble the caregiver experiences of other countries in theAmericas, including the United States. Social security retirement income protectsmost low-income Latina caregivers in the United States who spend a significantperiod of time outside of the workforce, which leads to a shorter work history andlower lifetime average earnings than those with uninterrupted work histories(J. L. Angel, Prickett, and Angel 2014). Given that women are more likely to adoptthe role of a family caregiver and caregiving obligations that involve providingmore personal care, it will be necessary to expand affordable options incommunity-based care and guarantee a basic income for older adults. Providing thiscompensation will not only help caregivers but enable elderly parents to age inplace in the future. Invariably, the state will need to develop institutions andpolicies that balance the needs of the young and the old, while enhancing itseconomic productivity.
Part IV: Caregiving and Family Dynamics 291

The study of caregiving in the Latino population is at a crossroads. Previousresearch on caregiving and support in Latin American countries, as well as amongracial/ethnic minorities in the United States, especially Mexican Americans, oftendraws upon the concept of familism, a term that refers to the supposed culturallybased normative tendency for individuals to give greater importance to the duty tofamily than to one’s individual needs or desires. Although there is evidence thatsuggests that strong family ties reduce the probability of institutionalization, Floresand colleagues argue that future work must assess the claim that Mexican andMexican-American families are similarly unified in the capacity of families to copewith caregiving responsibilities. In a 1982 article on the determinants of householdextension, Angel and Tienda concluded that the effects of culture and economicneed could not be empirically separated (R. J. Angel and Tienda 1982). Theyconcluded that it may in fact be impossible to parse the effects of culture andstructure in explaining living arrangements. Assertions that cultural factors aredetrimental or preservative of caregiver health and well-being may misattributewhat are in fact structural factors to culture. Culture is not independent of structure,and both concepts are inextricably linked; one concept does not subsume or takeprecedence over the other. Indices of culture are to varying degrees proxies forstructure.
As the caregiving examples make clear, Mexico, Cuba, and the United Statesface many social, economic, and policy challenges. The readings in this sectionoffer new evidence to understand these prospects for family caregiving and forlong-term care and identify possible solutions for both families and the government.In addition to proposing directions for future research, they demonstrate how muchwe can learn from cross-cultural comparisons of caregiving research.
References
Angel, J. L., Angel, R. J., Aranda, M. P., & Miles, T. P. (2004). Can the family still cope? Socialsupport and health as determinants of nursing home use in the older Mexican-originpopulation. Journal of Aging and Health, 16(3), 338–354. doi: https://doi.org/10.1177/0898264304264203
Angel, J. L., Prickett, K., & Angel, R. J. (2014). Sources of retirement security for Black,non-Hispanic White, and Mexican-origin women: The changing roles of marriage and work.Journal of Women, Politics and Policy, 35(3), 222–241.
Angel, J. L., Rote, S., & Markides, K. (2017). The role of the Latino family in late-life caregiving.In J. M. Wilmoth, & M. D. Silverstein (Eds.), In later-life social support and service provisionin diverse and vulnerable populations. New York, NY: Taylor and Francis.
Angel, R. J., & Tienda, M. (1982). Determinants of extended household structure: Cultural patternor economic need? American Journal of Sociology, 87(6), 1360–1383. doi: https://doi.org/10.1086/227597.
Angel, R. J., & Angel, J. L. (2015). Latinos in an aging world: Social, psychological, andeconomic perspectives. New York: Routledge.
292 Part IV: Caregiving and Family Dynamics

Angel, R. J., Angel, J. L., & Hill, T. D. (2015). Longer lives, sicker lives? Increased longevity andextended disability among Mexican-origin elders. The Journals of Gerontology Series B:Psychological Sciences and Social Sciences, 70(4), 639–649. doi: https://doi.org/10.1093/geronb/gbu158.
Apesoa-Varano, E. C., Gomez, Y., & Hinton, L. (2016). Dementia informal caregiving in Latinos:What does the qualitative literature tell us? In W. A. Vega, K. S. Markides, J. L. Angel, & F.M. Torres-Gil (Eds.), Challenges of Latino aging in the Americas (pp. 141–169). New York:NY: Springer.
Aranda, M. P., & Knight, B. G. (1997). The influence of ethnicity and culture on the caregiverstress and coping process: A sociocultural review and analysis. The Gerontologist, 37(3), 342–354.
Brown, H. S., Herrera, A. P., & Angel, J. L. (2013). Opportunity costs associated with caring forolder Mexican-Americans. Journal of Cross-Cultural Gerontology, 28(3), 375–389.
Dilworth-Anderson, P., Williams, I. C., & Gibson, B. E. (2002). Issues of race, ethnicity, andculture in caregiving research: A 20-year review (1980–2000). The Gerontologist, 42(2),237–272.
Garcia, M. A., & Reyes, A. M. (2018). Prevalence and trends in morbidity and disability amongolder Mexican Americans in the Southwestern United States, 1993–2013. Research on Aging,40(4), 311–339. doi: https://doi.org/10.1177/0164027517697800.
He, W., Goodkind, D., & Kowal, P. (2016). An aging world: 2015. International PopulationReports (P95/16-1). Washington, DC: United States Census Bureau. Retrieved from http://cdn.cnsnews.com/attachments/census_bureau-an_aging_world-2015.pdf
Herrera, A. P., Lee, J. W., Palos, G., & Torres-Vigil, I. (2008). Cultural influences in the patternsof long-term care use among Mexican-American family caregivers. Journal of AppliedGerontology, 27, 141–165.
Herrera, A. P., George, R., Angel, J. L., Markides, K., & Torres-Gil, F. (2013). Variation in OlderAmericans Act caregiver service use, unmet hours of care, and independence among Hispanics,African Americans, and Whites. Home Health Care Services Quarterly, 32(1), 35–56. doi:https://doi.org/10.1080/01621424.2012.755143.
Mudrazija, S., Thomeer, M. B., & Angel, J. L. (2015). Gender differences in institutionallong-term care transitions. Women’s Health Issues, 25(5), 441–449.Rote, S., Angel, J. L., &Markides, K. (2015). Health of elderly Mexican American adults and family caregiver distress.Research on aging, 37(3), 306–331.
Rote, S., Angel, J. L., & Markides, K. (2015). Health of elderly Mexican American adults andfamily caregiver distress. Research on aging, 37(3), 306–331.
Rote, S., Angel, J. L., & Markides, K. (2017). Neighborhood context, dementia severity, andMexican American caregiver wellbeing. Journal of Aging and Health (Special issue) , 29(6),1039–1055. doi:https://doi.org/10.1177/0898264317707141
Thomeer, M. B., Mudrazija, S., & Angel, J. L. (2015). How do race and hispanic ethnicity affectnursing home admission? evidence from the health and retirement study. The Journals ofGerontology Series B: Psychological Sciences and Social Sciences, 70(4), 628–638. doi:https://doi.org/10.1093/geronb/gbu114.
Trielli, D. (2017). AP-NORC poll: Hispanics lack confidence in nursing homes. RetrievedNovember 12, 2017, from http://www.apnorc.org/news-media/Pages/AP-NORC-poll-Hispanics-lack-confidence-in-nursing-homes.aspx.
Wolf, D. A., Freedman, V., & Soldo, B. J. (1997). The division of family labor: Care for elderlyparents. The Journals of Gerontology Series B: Psychological Sciences and Social Sciences 52(Special Issue), 102–109.
Part IV: Caregiving and Family Dynamics 293

Chapter 14Neighborhood Cohesion and CaregiverWell-Being Among the Mexican-OriginPopulation
Sunshine Rote, Jacqueline L. Angel, Kyriakos S. Markidesand Terrence D. Hill
Abstract When facedwith functional and cognitive impairment, older Latino adultsrely primarily on family for care. Little is known about the role of neighborhoodstructures on the well-being of the family members tasked with delivering care fortheir elders. Data on care recipients and family caregivers is drawn from the His-panic Established Population for the Epidemiologic Study of the Elderly, or HEP-ESE (2010/2011, N�483). Mexican-American caregivers who provide support tofamily members and who report high levels of neighborhood cohesion—especially,neighborhoods characterized by helpful and trustworthy neighbors—report fewerdepressive symptoms than those who provide care to older adults in less cohesiveneighborhoods. A lack of close-knit ties in the neighborhood is especially distressingfor caregivers who do not reside in the same household as their older family member.Among caregivers that live in neighborhoods characterized by a low level of willing-ness to help others, caregivers to U.S.-born family members report more depressivesymptoms than caregivers to immigrant older adults. Because neighborhood charac-teristics play an important role in Latino caregiver well-being and stress processes,targeting neighborhood structures should be the focus of intervention strategies thataim to address caregiver burden among the Mexican-origin population.
S. Rote (B)Kent School of Social Work, University of Louisville, Louisville, KY, USAe-mail: [email protected]
J. L. AngelLyndon B. Johnson School of Public Affairs and Department of Sociology, The University ofTexas at Austin, Austin, TX, USAe-mail: [email protected]
K. S. MarkidesDepartment of Preventive Medicine and Community Health, The University of Texas MedicalBranch, Galveston, TX, USAe-mail: [email protected]
T. D. HillDepartment of Sociology, The University of Arizona, Tucson, AZ, USAe-mail: [email protected]
© Springer Nature Switzerland AG 2019W. A. Vega et al. (eds.), Contextualizing Health and Aging in the Americas,https://doi.org/10.1007/978-3-030-00584-9_14
295
296 S. Rote et al.
Introduction
In general, previous studies on the Mexican-origin population indicate that homoge-nous neighborhoods, regardless of their respective poverty rates, protect inhabitantsfrom frailty (Aranda et al. 2011), cognitive impairment (Sheffield and Peek 2009),depressive symptoms (Ostir et al. 2003; Gerst et al. 2011), and premature mortality(Eschbach et al. 2004). The benefit of residing in co-ethnic neighborhoods or ethnicenclaves has been attributed to such aspects as sociocultural resources, social sup-port, and strong community institutions, all of which promote social cohesion.Whilewe typically associate providing care for older Latino adults with family support;neighbors, however, may also play an important role in Latino healthy aging (Vegaand González 2012; Angel and Angel 2015).
Engaged neighbors allow older adults to age in place with additional support(Cantor 1979). They may provide the basis of emotional closeness and assist withinstrumental tasks such as transportation to the grocery store or help with yard work,both of which can facilitate social attachment and cohesion. Studies have shownthat support from family and friends reduces caregiver strain (Zarit et al. 1985;Haley 1997; Pinquart and Sörensen 2007) and that cohesive neighborhoods buffer theimpact that adversity and daily burdens have on psychological well-being (Robinetteet al. 2013).Wepropose that cohesive neighborhoods are integral to support processesthat allow Mexican American caregivers to manage care tasks and their possiblesecondary role strains on family and career life, therefore protecting against caregiverpsychological distress.
The current study goes beyond individual and family-level factors and placesMexican American caregivers in a community context. First, we describe previousstudies on Latino caregivers and how neighborhood factors fit into extant caregiverstress models. Second, we use data on Mexican-origin caregivers and care recipi-ents from the Hispanic Established Population for the Epidemiologic Study of theElderly, or H-EPESE (2010/2011), to determine whether older adults’ perception ofneighborhood solidarity is associated with caregiver depressive symptoms.
Mexican American Family Caregivers
National estimates show that Latino caregivers, especially those of Mexican ori-gin, report more time-intensive caregiving situations than non-Latino White care-givers (Rote and Moon Forthcoming). This is due to a greater number of years spentwith limited cognitive and functional capacity among Latino elders relative to otherracial/ethnic older adults (Beard et al. 2009; Markides et al. 2013; Hayward et al.2014; Angel et al. 2014). These factors often entail longer, more time-intensive care-giving careers. Time-intensive care work can compromise caregiver mental health.Furthermore, while there is a need for more research on racial/ethnic differences incaregiver mental health in extant population-based samples, research tends to showthat Latino caregivers report more psychological distress than their non-caregivingcounterparts (Hernandez and Bigatti 2010; Hahn et al. 2011; Herrera et al. 2013)and non-Latino White and non-Latino Black caregivers (Adams et al. 2002; Aranda
14 Neighborhood Cohesion and Caregiver Well-Being Among the … 297
et al. 2003; Roth et al. 2008; Sörenson and Pinquart 2005; but for an exception, see:Coon et al. 2004).
Caregiver stress and coping models suggest that distress and burden arise frombackground characteristics, exposure to stressorswithin and outside of the caregivingdomain, and cultural values that shape social support and coping processes (Haleyet al. 1987; Pearlin et al. 1990; Dilworth-Anderson and Anderson 1994; Aranda andKnight 1997; Dilworth-Anderson et al. 2002; Knight and Sayegh 2009). Further-more, care recipient health is closely associated with caregiver well-being. Whilethe estimated life expectancy of the Latino population is higher than that of the non-Latino white population (Arias 2014), older Latino adults often live with higher ratesof morbidity (Markides and Eschbach 2011). This translates into earlier transitionsinto the caregiving role and longer caregiving careers for family caregivers. Further-more, a majority of elderly Latinos rely on family for care, which has been attributedboth to traditional cultural values that emphasize family interest, obligation, and reci-procity (Angel et al. 1996; Aranda and Knight 1997; Dilworth-Anderson et al. 2002;Shurgot and Knight 2005; Crist et al. 2006; Hernandez and Bigatti 2010; Losadaet al. 2010; Sayegh and Knight 2011; Hahn et al. 2011; Herrera et al. 2013) and tohigh rates of poverty that limit the ability to afford formal care services.
Neighborhoods and Caregiving
Previous studies on the potential relationship between neighborhood characteristicsand health in the Mexican-origin population have relied on objective indicators suchas socioeconomic disadvantage or percent immigrant, both of which are derived fromCensus data. Since objective, structural indicators are proposed to exert influence onindividual health through stress or coping processes (Sampson 2003; Aneshenselet al. 2007; Hill and Maimon 2013), subjective assessments or the meaning derivedfrom the neighborhood may be more closely linked to mental health outcomes.Subjective indicators such as collective efficacy reflect neighborhood cohesion andthe willingness of residents to use social control to maintain neighborhood safety(Sampson et al. 1997). Neighborhood cohesion, in particular, reflects the perceptionthat neighbors get alongwith each other and arewilling to help one another in times ofneed. These subjective indicators reflect neighborhood perceived support processesand are likely tied to both care recipient and caregiver health and coping abilities.
Caregiving stress and coping models emphasize the role of supportive socialconnections in reducing strain and benefiting caregiver well-being. Caregivers withhigh levels of support from friends and family report better physical and emotionalhealth and lower levels of caregiver burden (e.g., Pinquart and Sörensen 2007). Inaddition, caregivers and care recipients often live within similar environments; assuch, factors that enable older adults to remain in the community and maintain goodhealth, such as high levels of neighborhood cohesion, likely have consequencesfor caregivers. Due to the increased risk of physical and cognitive impairment andthe concomitant impediment on life space and social network size, neighborhoodcontext is especially important in late life (Aneshensel et al. 2007; Cagney et al.2013). Neighborhood cohesion and safety, then, promote survival and positivemental

298 S. Rote et al.
health among older adults (Browning et al. 2006; Wilson-Genderson and Pruchno2013).
Social resources available in a given neighborhood offset emotional, instrumen-tal, and financial burden by allowing elders to distribute care tasks across multi-ple domains and develop better coping skills. Among Latinos, neighborhood socialcohesion has been shown to facilitate positive mental health outcomes by increasingsocial support from family and friends (Alegria et al. 2007). Neighborhood socialconnections also offset isolation and loneliness (Subramanian et al. 2008), increasepsychological resources such as trust and control (Ortiz et al. 1999) and, positivehealth behaviors such as adequate sleep, and improve overall physiological func-tioning (Hill et al. 2005; Hill and Maimon 2013). Because both care recipient andcaregiver would benefit from this support, neighborhood cohesion may be particu-larly protective for caregivers residing in the same home as the care recipient.
In addition, Latino caregivers’ experiences are often influenced by migration-related factors (Hinton et al. 1999). Older immigrants often live with their adultchildren in multigenerational households, and immigration-related factors mayshape the extent to which neighbors are seen as convoys of support (Antonucci andJackson 2003). Immigrants tend to live in neighborhoods with dense populations andfewer socioeconomic resources (Iceland 2009); however, there is some indicationthat homogenous, immigrant-dense neighborhoods provide social resources to theirinhabitants that protect against health decline (Markides et al. 2013). Almeida et al.(2009) found that Latinos in high immigrant density areas report more supportiveand more expansive social networks, and Vega et al. (2011) show that neighborhoodcollective efficacy is protective of psychological distress for Latino immigrants.
However, in contrast, in their in-depth interviews, Viruell-Fuentes and Schulz(2009) find that Latino immigrants tend to have small social networks of about two tofive close friends. Given the high reliance on a few significant others, if one of theselinks become broken, they argue, Latino immigrants may be especially vulnerableto loneliness and isolation. Recently, we found that Mexican-born elderly are moredependent on a smaller circle of care recipients (blinded for review Rote et al. 2015)than the U.S.-born and, as such, these caregivers may be especially vulnerableto distress or burnout. In their study of caregivers in the REACH intervention,Coon et al. (2004) found that less acculturated Latina caregivers provide moretime-intensive care activities and report higher levels of depressive symptoms thanmore acculturated caregivers. Taken together, it appears that living in cohesiveneighborhoods may be especially beneficial to caregivers of immigrants.
The Current Study
The review of the literature has led to the following hypotheses (Fig. 14.1). Wepropose that while controlling for caregiver and care recipient background and healthfactors that:

14 Neighborhood Cohesion and Caregiver Well-Being Among the … 299
Neighborhood CohesionClose-Knit Neighborhoods Helpful Neighbors Neighbors Same Values Neighbors Can be
Caregiver Depressive Symptoms
Background and ContextCG: Health, Gender, Age, Relationship to CR, Household Income CR: Health, Gender, Age, Marital Status, Years of Education
Nativity Status and Lives with CG
Fig. 14.1 Conceptual Model Linking Neighborhood Cohesion and Caregiver Psychological Dis-tress
H1: Those providing care to an older family member in a neighborhood with higherlevels of cohesion will report lower depressive symptoms.H2: Cohesive neighborhoods will be especially beneficial for caregiver well-beingwhen the caregiver and recipient reside in the same household.H3: Cohesive neighborhoods will be more protective for the health of caregivers tothose born in Mexico than those born in the United States.
Methods
Data are drawn from the Hispanic Established Population for the EpidemiologicalStudy of the Elderly (HEPESE), a longitudinal study of elderly Mexican Americanadults residing in five southwestern states: Texas, New Mexico, Colorado, Arizonaand California (for more information on sampling procedures). In 1993/1994 (N�3050), data were collected on subjects 65 years and older. Follow-up interviewswere conducted every two years with an additional 1167 subjects the same age asthe original subjects added to the sample in Wave 5. For Wave 7 (2010/2011), 1078subjects aged 80 and over were re-interviewed. At this time, the subjects were askedto provide contact information for the person they are “closest to” or “depend on themost for help.” These informants (N�925) were interviewed regarding the health,finances, and general situation of themselves and the elderly subject. We focus ourattention to relatives of elderly respondents (N�850), dropping friends (N�33)and employees (N�42) of the elderly respondent from the sample size. Informantswere asked whether the older adult needs help or is mostly responsible for their ownpersonal care, financial tasks, or household maintenance. We dropped older adultsubjects who were mostly responsible for their own personal care and financial andhouseholdmaintenance tasks (N�150), aswell as thosemissingon theneighborhoodcohesion indicators, leaving 483 caregiver and care recipient dyads.

300 S. Rote et al.
Measures
Dependent Variable
The Center for Epidemiologic Studies Depression Scale (CES-D), an index of theseverity of 20 items experienced in the past week that ranges from 0 to 60, is usedto assess depressive symptoms in family caregivers (Radloff 1977).
Independent Variable
Neighborhood social cohesion is based on five commonly used items developed bySampson et al. (1997). In Wave 5, older adults were asked the extent to which theyagreed (strongly disagree to strongly agree on a five point scale) with the followingstatements: (a) this is a close-knit neighborhood, (b) people around here are willingto help their neighbors, (c) people in this neighborhood can be trusted, (d) people inthis neighborhood generally don’t get along with each other, and (e) people in theirneighborhood do not share the same values. The last two items are reverse-coded andall items were summed to create a neighborhood solidarity scale with high scoresreflecting more perceived neighborhood cohesion.
Living Arrangements Caregivers were asked if they currently reside in the samehousehold as the elderly subject (1� lives together, 0� lives in different homes).
Nativity Status distinguishes between elderly subjects born in Mexico (=1) andelderly subjects born in the United States (=0).
Control Variables
Selected demographic and background factors include the caregiver’s gender(female�1), age (in years), household income, and relationship to care recipient(child�1). Caregiver physical health is assessed by a count of self-reported diagno-sis of chronic conditions including arthritis, cancer, heart attack, stroke, hypertension,diabetes, or broken hip (top coded at 4). We also control for number of hours thecaregiver assists with activities of daily living (ADLs) and instrumental activitiesof daily living (IADLs) per day. For cognitive functioning, elderly subjects wereasked to take the Mini Mental State Examination or MMSE (Folstein et al. 1975), ascreening tool for cognitive impairment that measures orientation, recall, attention,and calculation, with higher scores indicating better cognitive functioning. Elderlysubjects who were unable to participate in the MMSE due to reports of dementiaor Alzheimer’s disease were considered impaired and assigned a score of “0.” Wealso control for elderly subject’s gender (female�1), age (in years), current maritalstatus (1�married; 0�unmarried), and years of formal education. For the 6% ofthe sample missing on years of education and the 10% of the sample missing onincome, we used a regression-based imputation procedure (impute) in Stata to retainmissing values for these two variables.
14 Neighborhood Cohesion and Caregiver Well-Being Among the … 301
Results
Table 14.1 presents the description of themain study variables. For family caregivers,the mean for past week depressive symptoms is 4.53, and caregivers, on average,report about 1 chronic condition. For background characteristics, the average ageof family caregivers is 56 years old. About three-quarters of family caregivers arefemale and about three quarters are children of the care recipient. Around half ofthe caregivers currently reside in the same household as the elderly respondent, andtwo-thirds of caregivers report an annual household income between $10,000 and$39,999.
Overall, elderly respondents report high levels of neighborhood cohesion (M �19). A majority of care recipients agree or strongly agree that: their neighbors arewilling to help one another (86%), they reside in a close-knit neighborhood (82%),their neighbors can be trusted (81%), their neighbors get along with each other(74%), and their neighbors share the same values (62%). For care recipient health,the average number of limitations for activities of daily living is 2, and the meanfor MMSE is indicative of mild cognitive impairment (M �19). For care recipientbackground characteristics, about 40% were born in Mexico, more than two-thirdsare female, 33% are currently married, and the mean age is 86 years old. The sampleis characterized by low levels of formal education (about 5 years).
Table 14.2 presents OLS regressions of caregiver depressive symptoms on neigh-borhood cohesion, living arrangements, and nativity status holding constant caregiverand care recipient health and background characteristics.Model 1 (column 1) shows astatistically significant and inverse relationship between neighborhood cohesion andcaregiver depressive symptoms, thus supporting hypothesis 1. For example, eachincrease on the neighborhood cohesion scale is associated with a 0.24 decrease indepressive symptoms for family caregivers (p�0.01).While living arrangements andcare recipient nativity status are not associated with caregiver depressive symptoms,caregiver chronic conditions, income, and care recipient marital status are signifi-cantly associated with caregiver depressive symptoms in the expected directions (notshown).
For the individual indicators of neighborhood cohesion, living close to neighborswith the same values is marginally significantly associated with caregiver depres-sive symptoms (b�−1.13; p �0.055). In addition, helpful neighbors and neighborsthat can be trusted are statistically significantly associated with caregiver depressivesymptoms. As an illustration, caregivers to elderly family members living in neigh-borhoods they perceived as trustworthy report 1.50 less depressive symptoms thanthose providing to care to family members in neighborhoods characterized by highlevels of mistrust (p <0.05). Next, we assess whether the effects of neighborhoodcohesion on caregiver depressive symptoms are conditional on living arrangements(M2) and care recipient nativity status (M3).
We expected that living in the same house would amplify the effects of neighbor-hood cohesion on caregiver depressive symptoms. Overall, however, we do not findsupport for this hypothesis. There was only one neighborhood * living arrangements

302 S. Rote et al.
Table 14.1 Description of main study variables (HEPESE, N�483)
Range Mean(SD)/Percent
Caregiver
Depressive symptoms (α �0.89) 0–45 4.53 (6.37)
Chronic conditions 0–4 1.00 (1.09)
Female 0, 1 75%
Age 18–89 56.08 (12.30)
Child of care recipient 0, 1 74%
Lives with care recipient 0, 1 52%
Household income
Less than $10,000 0, 1 17%
$10,000–$19,0000 0, 1 37%
$20,000–$39,999 0, 1 30%
$40,000 or more 0, 1 17%
Hours I-ADL assistance per day 0–24 4.84(5.68)
Hours ADL assistance per day 0–24 3.73(6.12)
Care recipient
Neighborhood cohesion (α�0.72)
7–25 19.14 (3.05)
Close-knit neighborhood 0, 1 82%
Helpful neighbors 0, 1 86%
Neighbors get along 0, 1 73%
Neighbors same values 0, 1 62%
Neighbors can be trusted 0, 1 81%
MMSE 0–30 18.95 (9.60)
Mexican born 0, 1 40%
Female 0, 1 63%
Age 80–102 86.15 (4.22)
Married 0, 1 33%
Years formal education 0–17 4.83 (3.99)
interaction that was significant: the interaction between close knit neighborhoods andliving together (b�2.92; p�0.05). The predicted estimates of depressive symptomsare presented in Fig. 14.2. Little variation exists in caregiver depressive symptoms byliving arrangements for those living in a close-knit neighborhood. However, caringfor a familymember in a neighborhood lacking close-knit ties is especially distressingfor caregivers that did not live in the same residence as the care recipient.
In addition to living arrangements, we also expected that caregivers to immigrantsmay be especially vulnerable to low levels of neighborhood cohesion. Our results donot support this hypothesis. There was one significant interaction of helpful neigh-
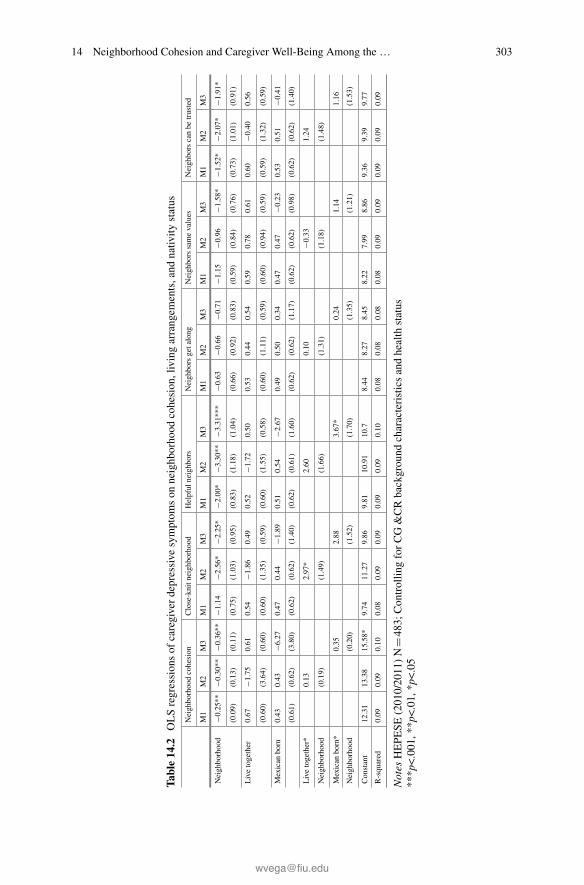
14 Neighborhood Cohesion and Caregiver Well-Being Among the … 303
Tabl
e14
.2OLSregressionsof
caregiverdepressive
symptom
son
neighborhood
cohesion,livingarrangem
ents,and
nativ
itystatus
Neighborhoodcohesion
Close-knitn
eighborhood
Helpful
neighb
ors
Neigh
borsgetalong
Neigh
borssamevalues
Neighborscanbe
trusted
M1
M2
M3
M1
M2
M3
M1
M2
M3
M1
M2
M3
M1
M2
M3
M1
M2
M3
Neighborhood
−0.25**
−0.30**
−0.36**
−1.14
−2.56*
−2.25*
−2.00*
−3.30**
−3.31***
−0.63
−0.66
−0.71
−1.15
−0.96
−1.58*
−1.52*
−2.07*
−1.91*
(0.09)
(0.13)
(0.11)
(0.75)
(1.03)
(0.95)
(0.83)
(1.18)
(1.04)
(0.66)
(0.92)
(0.83)
(0.59)
(0.84)
(0.76)
(0.73)
(1.01)
(0.91)
Livetogether
0.67
−1.75
0.61
0.54
−1.86
0.49
0.52
−1.72
0.50
0.53
0.44
0.54
0.59
0.78
0.61
0.60
−0.40
0.56
(0.60)
(3.64)
(0.60)
(0.60)
(1.35)
(0.59)
(0.60)
(1.55)
(0.58)
(0.60)
(1.11)
(0.59)
(0.60)
(0.94)
(0.59)
(0.59)
(1.32)
(0.59)
Mexican
born
0.43
0.43
−6.27
0.47
0.44
−1.89
0.51
0.54
−2.67
0.49
0.50
0.34
0.47
0.47
−0.23
0.53
0.51
−0.41
(0.61)
(0.62)
(3.80)
(0.62)
(0.62)
(1.40)
(0.62)
(0.61)
(1.60)
(0.62)
(0.62)
(1.17)
(0.62)
(0.62)
(0.98)
(0.62)
(0.62)
(1.40)
Livetogether*
0.13
2.97*
2.60
0.10
−0.33
1.24
Neighborhood
(0.19)
(1.49)
(1.66)
(1.31)
(1.18)
(1.48)
Mexican
born*
0.35
2.88
3.67*
0.24
1.14
1.16
Neighborhood
(0.20)
(1.52)
(1.70)
(1.35)
(1.21)
(1.53)
Constant
12.31
13.38
15.58*
9.74
11.27
9.86
9.81
10.91
10.7
8.44
8.27
8.45
8.22
7.99
8.86
9.36
9.39
9.77
R-squared
0.09
0.09
0.10
0.08
0.09
0.09
0.09
0.09
0.10
0.08
0.08
0.08
0.08
0.09
0.09
0.09
0.09
0.09
Notes
HEPE
SE(2010/2011)N
�483
;Con
trollin
gforCG&CRbackgrou
ndcharacteristicsandhealth
status
***p<.001,*
*p<.01,
*p<.05

304 S. Rote et al.
Fig. 14.2 Predicted depressive symptoms by neighborhood cohesion and living arrangements
Fig. 14.3 Predicted depressive symptoms by neighborhood cohesion and nativity status
borhood * nativity status (b�3.67; p <0.05), which is illustrated in Fig. 14.3. Thepredicted mean for depressive symptoms is higher for caregivers to the U.S.-bornthan that of caregivers to the Mexican-born, though only in the context of low levelsof perceived availability of help from neighbors. Additionally, we assessed three-way interactions of neighborhoods * living arrangements * nativity (not shown) butfound no significant interaction effects.

14 Neighborhood Cohesion and Caregiver Well-Being Among the … 305
Discussion
Given the protective role that neighborhood characteristics play in declining healthand mortality (see Eschbach et al. 2004) and the critical role that social supportplays in caregiver well-being (e.g., Pinquart and Sörensen 2007), we expected tofind that perceived neighborhood cohesion among care recipients would negativelyassociate with caregiver depressive symptoms. Building on previous studies that relyon objective neighborhood conditions and incorporating the caregiver stress processmodel, we find support for our first hypothesis that perceived neighborhood cohesionis linked to family caregiver depressive symptoms.
Previous research on non-Latino caregivers indicates that caregiving interactswithneighborhood factors to influence caregiver health. Using a sample of African Amer-ican and non-Latino white caregivers and non-caregivers, Brummett et al. (2005)showed that caregivers had higher levels of fasting plasma glucose and HbA1c com-pared to non-caregivers when living in neighborhoods with high levels of crime.Multiple sources of stress (i.e., caregiving and neighborhood states), therefore, com-bine to influence individual health. We argue that neighborhood cohesion entailssocial and psychological resources that help buffer life burdens and consequentlyfoster healthy behaviors and assistance with caregiving duties. This likely occurs asa result of the impact that these factors have on caregiverwell-being and physiologicalfunctioning (Vitaliano et al. 2002, 2004).
Our research contributes to the caregiving literature by identifying aspects ofneighborhoods that are most protective of Mexican American caregiver depressivesymptoms—namely, helpful exchange between neighbors andmutual trust. This sup-ports our first hypothesis, which posits that exchanges of support and the ability torely on neighbors in times of need as key reasons neighborhoods are protective forcaregivers’ well-being. Our results indicate that trust and safety also influence care-givers’ well-being, concerns about public safety due to a high incidence of crime—achronic environmental stressor—can stifle mutual trust among elder neighbors andhave a negative impact on health (Wilson-Genderson and Pruchno 2013). It alsoappears that these conditions effect the caregiving experience. Future research onboth objective and subjective neighborhood environments will better elucidate thepathways through which neighborhood cohesion and socioeconomic status impactthe health of Mexican-American care recipients and caregivers.
Siegler et al. (2010) indicate that living arrangements ought to be taken intoaccount when attempting to understand caregiver stress processes. Elder Mexican-Americans aremore likely to reside in the community and the same household as theircaregivers than non-Latino elders are. As such, we expected to find that living in thesame household would amplify the effects of neighborhood cohesion on Mexican-American caregiver well-being. We found partial support for this hypothesis. Livingapart is distressing only when the care recipient perceives their neighborhood aslacking close-knit ties. Thismay reflect different stages in the caregivingprocess,withcare recipients living on their own and only recently showing signs of impairmentand trouble completing life activities independently. However, we control for care

306 S. Rote et al.
recipients’ functional status. Caring for a loved one in a neighborhood with lowlevels of support, therefore, likely impedes on care recipients’ sense of lonelinessand isolation and caregivers ability to manage care tasks. Ancillary analyses (notshown) show that a majority of the caregivers in this sample would like to spendmore (rather than less or the same amount) of their time with their care recipients.
Immigration-related factors also influence caregiving situations (Hinton et al.1999). While previous research shows support for protective effects of immigrantenclaves on individual health, it has also been shown that Latino immigrants reportsmaller caregiving networks (Angel et al. 2014a) than do the U.S.-born. Viruell-Fuentes et al. (2013) also found that living in a neighborhood with more Latinosresulted in larger and more diverse ties for the U.S.-born when compared with immi-grant Latinos. Therefore, it appears that neighborhood context may exert a greaterforce on U.S.-born Latinos than on immigrant families.
Still, more information is needed on the composition of the neighborhoods inquestion and whether there is a barrio advantage—a high proportion of Mexicanimmigrants in these neighborhoods. These objective data would help better capturethe net effect of specific neighborhoods on individual health and functioning. Inaddition, neighborhood cohesion is based on reports from older family members inWave 5 (Patel et al. 2004); yet the study is cross-sectional and differences in caregiverwell-being over time are not addressed. It is possible that care recipients’ percep-tion of the neighborhood can fluctuate over the years and more recent data on theinterplay between care recipient perceived neighborhood quality such as low crimerates or culturally appropriate services, caregiver perceived neighborhood quality,and depressive symptoms over time would better elucidate the relationship betweenneighborhood conditions and caregiver health.
Moreover, because older adults may provide childcare for grandchildren or evensome financial assistance to their children (Markides et al. 1986), there tends to bea high degree of reciprocity between the oldest generation and their middle-agedchildren among this population. More attention on the reciprocal role of supportor intergenerational transfers is needed, especially among this population. If elderlyfamily members are contributing time, money, and support to their children or grand-children, this may also instill a sense of duty and feelings of reciprocity and may beadvantageous to the mental well-being of the caregiver.
The REACH caregiver intervention has shown that education and training canresult in marked improvements in Latino caregiver mental health and coping(Gallagher-Thompson et al. 2008). As such, interventions and policies that placeLatino caregivers in a larger community context, including efforts that (1) educatecaregivers on how to effectivelymobilize neighborhood support networks, (2) reducesocial isolation and crime, (3) build strong community resources, and (4) alter the builtenvironment to encourage social interactions, are important to offset the financial andemotional costs of caregiving among a population characterized by a high relianceon family members for care. Overall, this study speaks to the importance of bothtime (cohort) and place (neighborhoods) for the Latino caregiver stress processes.

14 Neighborhood Cohesion and Caregiver Well-Being Among the … 307
References
Adams, B., Aranda, M. P., Kemp, B., & Takagi, K. (2002). Ethnic and gender differences in distressamong Anglo American, African American, Japanese American, andMexican American spousalcaregivers of persons with dementia. Journal of Clinical Geropsychology, 8(4), 279–301.
Alegria, M., Sribney,W., &Mulvaney-Day, N. E. (2007). Social cohesion, social support and healthamong Latinos in the United States. Social Science and Medicine, 64(2), 477–495. https://doi.org/10.1016/j.socscimed.2006.08.030.
Almeida, J., Kawachi, I., Molnar, B. E., & Subramanian, S. V. (2009). A multilevel analysis ofsocial ties and social cohesion among Latinos and their neighborhoods: results from Chicago.Journal of Urban Health, 86(5), 745–759.
Aneshensel, C. S., Wight, R. G., Miller-Martinez, D., Botticello, A. L., Karlamangla, A. S., &Seeman, T. E. (2007). Urban neighborhoods and depressive symptoms among older adults. TheJournals of Gerontology Series B: Psychological Sciences and Social Sciences, 62(1), S52–S59.
Angel, J. L., Angel, R. J., McClellan, J. L., & Markides, K. S. (1996). Nativity, declining health,and preferences in living arrangements among elderly Mexican Americans: Implications forlong-term care. The Gerontologist, 36(4), 464–473.
Angel, J. L., Rote, S. M., Brown, D. C., Angel, R. J., & Markides, K. S. (2014a). Nativity statusand sources of care assistance among elderly Mexican-origin adults. Journal of Cross-CulturalGerontology, 29(3), 243–258.
Angel, R. J., & Angel, J. L. (2015). Latinos in an aging world. New York, NY: Routlege.Angel, R. J., Angel, J. L., & Hill, T. D. (2014b). Longer lives, sicker lives? Increased longevityand extended disability among Mexican-origin elders. The Journals of Gerontology Series B:Psychological Sciences and Social Sciences, https://doi.org/10.1093/geronb/gbu158.
Antonucci, T. C., & Jackson, J. S. (2003). Ethnic and cultural differences in intergenerational socialsupport. In Global aging and challenges to families (pp. 355–370).
Aranda, M. P., & Knight, B. G. (1997). The influence of ethnicity and culture on the caregiver stressand coping process: A sociocultural review and analysis. Gerontologist, 37(3), 342–354.
Aranda, M. P., Ray, L. A., Snih, S. A., Ottenbacher, K. J., & Markides, K. S. (2011). The protectiveeffect of neighborhood composition on increasing frailty among older Mexican Americans: Abarrio advantage? Journal Aging Health, 23(7), 1189–1217. https://doi.org/10.1177/0898264311421961.
Aranda, M. P., Villa, V. M., Trejo, L., Ramírez, R., & Ranney, M. (2003). El Portal LatinoAlzheimer’s Project: Model program for Latino caregivers of people with Alzheimer’s disease.Social Work, 48(2), 259–271.
Arias, E. (2014). United States Life Tables, 2010. http://www.cdc.gov/nchs/data/nvsr/nvsr63/nvsr63_07.pdf.
Beard, H. A., Al Ghatrif, M., Samper-Ternent, R., Gerst, K., & Markides, K. S. (2009). Trendsin diabetes prevalence and diabetes-related complications in older Mexican Americans from1993–1994 to 2004–2005. Diabetes Care, 32(12), 2212–2217.
Browning, C. R., Wallace, D., Feinberg, S. L., & Cagney, K. A. (2006). Neighborhood socialprocesses, physical conditions, and disaster-related mortality: The case of the 1995 Chicago heatwave. American Sociological Review, 71(4), 661–678.
Brummett, B. H., Siegler, I. C., Rohe, W. M., Barefoot, J. C., Vitaliano, P. P., Surwit, R. S., et al.(2005). Neighborhood characteristics moderate effects of caregiving on glucose functioning.Psy-chosomatic Medicine, 67(5), 752–758. https://doi.org/10.1097/01.psy.0000174171.24930.11.
Cagney, K. A., Browning, C. R., Jackson, A. L., & Soller, B. (2013). Networks, neighborhoods, andinstitutions: An integrated “activity space” approach for research on aging. In L. J. Waite & T. J.Plewes (Eds.), New directions in the sociology of aging. Washington, DC: National AcademiesPress.
Cantor, M. H. (1979). Neighbors and friends: An overlooked resource in the informal supportsystem. Research on Aging, 1(4), 434–463.

308 S. Rote et al.
Coon, D. W., Rubert, M., Solano, N., Mausbach, B., Kraemer, H., Arguelles, T., et al. (2004).Well-being, appraisal, and coping in Latina and Caucasian female dementia caregivers: Findingsfrom the REACH study. Aging & Mental Health, 8(4), 330–345.
Crist, J. D., García-Smith, D., & Phillips, L. (2006). Accommodating the stranger en casa: HowMexican American elders and caregivers decide to use formal care. Research and Theory forNursing Practice, 20(2), 109–126.
Dilworth-Anderson, P., & Anderson, N. B. (1994). Dementia caregiving in blacks: A contextualapproach to research. In Light, E., Niederehe, G., & Lebowitz, B. D. (Eds.), Stress effects onfamily caregivers of Alzheimer’s patients: Research and interventions (pp. 385–409). New York,NY, US: Springer Publishing.
Dilworth-Anderson, P., Williams, I. C., &Gibson, B. E. (2002). Issues of race, ethnicity, and culturein caregiving research: A 20-year review (1980–2000). The Gerontologist, 42(2), 237–272.
Eschbach, K., Ostir, G. V., Patel, K. V., Markides, K. S., & Goodwin, J. S. (2004). Neighborhoodcontext and mortality among older Mexican Americans: Is there a barrio advantage? AmericanJournal of Public Health, 94(10), 1807–1812.
Folstein, M. F., Folstein, S. E., & McHugh, P. R. (1975). “Mini-mental state”: A practical methodfor grading the cognitive state of patients for the clinician. Journal of Psychiatric Research,12(3), 189–198.
Gallagher-Thompson, D., Gray, H. L., Dupart, T., Jimenez, D., & Thompson, L. W. (2008). Effec-tiveness of cognitive/behavioral small group intervention for reduction of depression and stressin non-Hispanic White and Hispanic/Latino women dementia family caregivers: Outcomes andmediators of change. Journal of Rational-Emotive & Cognitive-Behavior Therapy, 26(4), 286.
Gerst, K., Miranda, P. Y., Eschbach, K., Sheffield, K. M., Peek, M. K., & Markides, K. S. (2011).Protective neighborhoods: Neighborhood proportion of Mexican Americans and depressivesymptoms in very old Mexican Americans. Journal of the American Geriatrics Society, 59(2),353–358. https://doi.org/10.1111/j.1532-5415.2010.03244.x.
Markides, K. S., & Coreil, J. (1986). The health of Hispanics in the southwestern United States:an epidemiologic paradox. Public health reports, 101(3), 253.
Hahn, E. A., Kim, G., & Chiriboga, D. A. (2011). Acculturation and depressive symptoms amongMexican American elders new to the caregiving role: Results from the Hispanic-EPESE. JournalAging Health, 23(3), 417–432.
Haley, W. E. (1997). The family caregiver’s role in Alzheimer’s disease. Neurology, 48(5 Suppl 6),S25–S29.
Haley, W. E., Levine, E. G., Brown, S. L., & Bartolucci, A. A. (1987). Stress, appraisal, coping, andsocial support as predictors of adaptational outcome among dementia caregivers. Psychologyand Aging, 2(4), 323.
Hayward, M. D., Hummer, R. A., Chiu, C.-T., González-González, C., & Wong, R. (2014). Doesthe Hispanic paradox in US adult mortality extend to disability? Population Research and PolicyReview, 33(1), 81–96.
Hernandez, A. M., & Bigatti, S. M. (2010). Depression among older Mexican American caregivers.Cultur Divers Ethnic Minor Psychol, 16(1), 50–58. https://doi.org/10.1037/a0015867.
Herrera, A. P., Mendez-Luck, C. A., Crist, J. D., Smith, M. L., Warre, R., Ory, M. G., et al.(2013). Psychosocial and cognitive health differences by caregiver status among older MexicanAmericans. Community Mental Health Journal, 49(1), 61–72. https://doi.org/10.1007/s10597-012-9494-1.
Hill, T. D., & Maimon, D. (2013). Neighborhood context and mental health. In Handbook of thesociology of mental health (pp. 479–501). Springer.
Hill, T. D., Ross, C. E., & Angel, R. J. (2005). Neighborhood disorder, psychophysiologicaldistress, and health. Journal of Health and Social Behavior, 46(2), 170–186.
Hinton,W. L., Fox,K.,&Levkoff, S. (1999). Introduction: Exploring the relationships among aging,ethnicity, and family dementia caregiving. Culture, Medicine and Psychiatry, 23(4), 403–413.
Iceland, J. (2009). Where we live now: Immigration and race in the United States. University ofCalifornia Press.
14 Neighborhood Cohesion and Caregiver Well-Being Among the … 309
Knight, B. G., & Sayegh, P. (2009). Cultural values and caregiving: The updated socioculturalstress and coping model. The Journals of Gerontology Series B: Psychological Sciences andSocial Sciences, https://doi.org/10.1093/geronb/gbp096.
Losada, A., Márquez-González, M., Knight, B. G., Yanguas, J., Sayegh, P., & Romero-Moreno,R. (2010). Psychosocial factors and caregivers’ distress: Effects of familism and dysfunctionalthoughts. Aging & Mental Health, 14(2), 193–202.
Markides, K. S., & Eschbach, K. (2011). Hispanic paradox in adult mortality in the United States.In International handbook of adult mortality (pp. 227–240). Springer.
Markides, K. S., Peek, M., & Angel, R. (2013). Aging, health, and families in the Hispanicpopulation. In Kinship and cohort in an aging society (pp. 314–331).
Ortiz, A., Simmons, J., & Hinton, W. L. (1999). Locations of remorse and homelands of resilience:Notes on grief and sense of loss of place of Latino and Irish-American caregivers of dementedelders. Culture, Medicine and Psychiatry, 23(4), 477–500.
Ostir, G. V., Eschbach, K., Markides, K. S., & Goodwin, J. S. (2003). Neighbourhood compositionand depressive symptoms among older Mexican Americans. Journal of Epidemiology andCommunity Health, 57(12), 987–992.
Patel, K. V., Eschbach, K., Ray, L. A., & Markides, K. S. (2004). Evaluation of mortality datafor older Mexican Americans: Implications for the Hispanic paradox. American Journal ofEpidemiology, 7, 707–715.
Pearlin, L. I., Mullan, J. T., Semple, S. J., & Skaff, M. M. (1990). Caregiving and the stressprocess—An overview of concepts and their measures. Gerontologist, 30(5), 583–594.
Pinquart, M., & Sörensen, S. (2007). Correlates of physical health of informal caregivers: A meta-analysis. The Journals of Gerontology Series B: Psychological Sciences and Social Sciences,62(2), P126–P137.
Radloff, L. S. (1977). The CES-D scale a self-report depression scale for research in the generalpopulation. Applied Psychological Measurement, 1(3), 385–401.
Robinette, J. W., Charles, S. T., Mogle, J. A., & Almeida, D. M. (2013). Neighborhood cohesionand daily well-being: Results from a diary study. Social Science and Medicine, 96, 174–182.https://doi.org/10.1016/j.socscimed.2013.07.027.
Rote, S., Angel, J. L., & Markides, K. (2015). Health of elderly Mexican American adults andfamily caregiver distress. Research on Aging, 37(3), 306–331.
Roth, D. L., Ackerman, M. L., Okonkwo, O. C., & Burgio, L. D. (2008). The four-factor model ofdepressive symptoms in dementia caregivers: A structural equation model of ethnic differences.Psychology and Aging, 23(3), 567–576. https://doi.org/10.1037/a0013287.
Sampson, R. J. (2003). The neighborhood context of well-being. Perspectives in Biology andMedicine, 46(3), S53–S64.
Sampson, R. J., Raudenbush, S. W., & Earls, F. (1997). Neighborhoods and violent crime: Amultilevel study of collective efficacy. Science, 277(5328), 918–924.
Sayegh, P., & Knight, B. G. (2011). The effects of familism and cultural justification on the mentaland physical health of family caregivers. The Journals of Gerontology Series B: PsychologicalSciences and Social Sciences, 66(1), 3–14.
Sheffield, K. M., & Peek, M. K. (2009). Neighborhood context and cognitive decline in olderMexican Americans: Results from the Hispanic Established Populations for EpidemiologicStudies of the Elderly. American Journal of Epidemiology, 169(9), 1092–1101. https://doi.org/10.1093/aje/kwp005.
Shurgot, G. R., & Knight, B. G. (2005). Influence of neuroticism, ethnicity, familism, and socialsupport on perceived burden in dementia caregivers: Pilot test of the transactional stress andsocial support model. The Journals of Gerontology Series B: Psychological Sciences and SocialSciences, 60(6), P331–P334.
Siegler, I. C., Brummett, B. H., Williams, R. B., Haney, T. L., & Dilworth-Anderson, P. (2010).Caregiving, residence, race, and depressive symptoms. Aging & Mental Health, 14(7), 771–778.https://doi.org/10.1080/13607861003713257.

310 S. Rote et al.
Sörensen, S., & Pinquart, M. (2005). Racial and ethnic differences in the relationship of caregivingstressors, resources, and sociodemographic variables to caregiver depression and perceived phys-ical health. Aging Ment Health, 9(5), 482–495. https://doi.org/10.1080/13607860500142796.
Subramanian, S., Elwert, F., & Christakis, N. (2008). Widowhood and mortality among the elderly:The modifying role of neighborhood concentration of widowed individuals. Social Science andMedicine, 66(4), 873–884.
Vega, W. A., Ang, A., Rodriguez, M. A., & Finch, B. K. (2011). Neighborhood protective effectson depression in Latinos. American Journal of Community Psychology, 47(1–2), 114–126.
Vega, W. A., & González, H. M. (2012). Latinos “aging in place”: Issues and potential solutions.In Aging, health, and longevity in the Mexican-origin population (pp. 193–205). Springer.
Viruell-Fuentes, E. A., & Schulz, A. J. (2009). Toward a dynamic conceptualization of social tiesand context: Implications for understanding immigrant and Latino health. American Journal ofPublic Health, 99(12), 2167.
Vitaliano, P. P., Scanlan, J. M., Zhang, J., Savage, M. V., Hirsch, I. B., & Siegler, I. C. (2002). A pathmodel of chronic stress, the metabolic syndrome, and coronary heart disease. PsychosomaticMedicine, 64(3), 418–435.
Vitaliano, P. P., Young, H. M., & Zhang, J. (2004). Is caregiving a risk factor for illness? CurrentDirections in Psychological Science, 13(1), 13–16.
Wilson-Genderson, M., & Pruchno, R. (2013). Effects of neighborhood violence and perceptionsof neighborhood safety on depressive symptoms of older adults. Social Science and Medicine,85, 43–49.
Zarit, S., Orr, N. K., & Zarit, J. M. (1985). The hidden victims of Alzheimer’s disease: Familiesunder stress. NYU Press.

Chapter 15Population Aging in Cuba: Copingwith Social Care Deficit
Blandine Destremau
Abstract Demographic aging represents a major social and economic challenge forCuba. This chapter examines the responses and coping mechanisms developed inCuba over the past decades with regards to aging within Fassin’s (Ann Hist Soc Sci6(64):1237–1266, 2009) conceptual framework of moral economy. It demonstratesthat the moral economies of social justice and homecare tend to conflict in a contextof care deficit (Hochschild in Soc Polit 2(3):333–346, 1995). The chapter is basedon several rounds of ethnographic fieldwork, participant observation, and interviewsconducted between 2009 and 2016 in Havana and other parts of Cuba. It first ana-lyzes the components of demographic aging, namely the increase of life expectancy,the decrease of fertility, and migration. It then delves into public policies aiming torespond to the health care needs of the elderly, to foster their community integration,and to mitigate their impoverishment. Finally, it highlights how households developstrategies to cope with the care needs of aging relatives, in a context where marketprovision and institutional long-term care supplies are still incipient. Although con-structed as a public problem and widely documented in Cuba, the pressure agingexerts on care systems has received little attention from social scientists. In thisregard, this chapter contributes to comparative knowledge on aging in post-Soviet,Latin American and Caribbean countries.
Introduction
Demographic aging is amajor challenge for health care and solidarity mechanisms inCuba. It tests the social justice principles implemented by the revolutionary regimesince 1959, particularly in a context aggravated by shrinking public budgets andincreased emigration. This chapter deals with the intensified needs for health andsocial care spurring fromdemographic aging inCuba,which could be considered “the
B. Destremau (B)Institut interdisciplinaire pour les enjeux sociaux (Iris/EHESS), Centre national de la recherchescientifique (CNRS, French National Center for Scientific Research), Paris, Francee-mail: [email protected]
© Springer Nature Switzerland AG 2019W. A. Vega et al. (eds.), Contextualizing Health and Aging in the Americas,https://doi.org/10.1007/978-3-030-00584-9_15
311

312 B. Destremau
burden of triumph” (Dilnot 2017). It examines the responses and copingmechanismsdeveloped in Cuba over the past decades and demonstrates that the moral economiesof social justice, women’s emancipation, and homecare tend to conflict in a contextof care deficit (Hochschild 1995).
Coping with aging in Cuba is framed within a two-level moral economy (at macroand micro levels). In this chapter, I adopt Fassin’s (2009:1255) re-conceptualizeddefinition of moral economy conceived as:
the production, distribution, circulation, and use of moral sentiments, emotions and values,and norms and obligations in social space […], the former referring to judgments as towhat is right or wrong (or better or worse), and the latter referring to rules, principles, andobligations (or what to do or not do). In reality, if evaluative and prescriptive statements canbe distinguished analytically, the distinction is much more difficult to establish empiricallyand is probably irrelevant because values arise at least in part from norms, and norms dependpartially on values.
Fassin further adds that different realms or segments of society may have differentmoral economieswhichmayconflict or generate tension. Iwill showhow this actuallyoccurs in the case of providing for the elderly’s needs in Cuba.
Analyzing care with a moral economy perspective takes it out of the private realmand places it in the public and political domain. It allows us to think jointly aboutpolitical economy and moral economy and to tackle the challenges of aging andelderly care separately at bothmacro andmicro levels. Thiswill shed light on thewaysthey converge in producing tensions, particularly in a context of social care deficit(Hochschild 1995). Care deficit, in the perspective of this chapter, is not a natural fact,but rather constructed by conflicting historical trends, among them Cuban women’semancipation, family solidarity, aging, and public budget restrictions.
At the macro level, the Cuban Revolution was founded on social justice principlesthat have accompanied andprovided justification formanyof the sacrifices undergoneby the Cuban people. These principles are at the root of social and economic policiesaimed at leveling income inequality as well as providing equal access to education,health, decent living conditions, and opportunities. The elderly occupy a special placein this context, since they are the generation that actually implemented the revolutionin the 1960s and 1970s. Public and social services developed thanks to their laborand dedication. However, the 1990 dissolution of the Soviet Union, Cuba’s majorally, triggered a deep economic crisis that spurred reform policies the country is stillcontending with today. The 1990s are, thus, a key period in Cuban history, markedby the deterioration of social advances, and by a series of policies liberalizing theeconomy. Despite the challenges that Cuba faces, it has taken steps to maintain basicservices (particularly education and health), and it has made significant efforts tocompensate for the cumulating effects of reform and liberalization on the socialcondition of vulnerable groups, such as the elderly.
At themicro level, Cuban society has a strong culture of solidarity and interdepen-dence kept alive in neighborhoods and particularly within families. As I will show,it is based on necessity, stemming from a shortage and scarcity economy, but alsoon a moral economy, based on principles, values, and norms, that constitute an ethicof care (Gilligan 1982; Tronto 1993). At this level, elderly-care needs weigh heavily
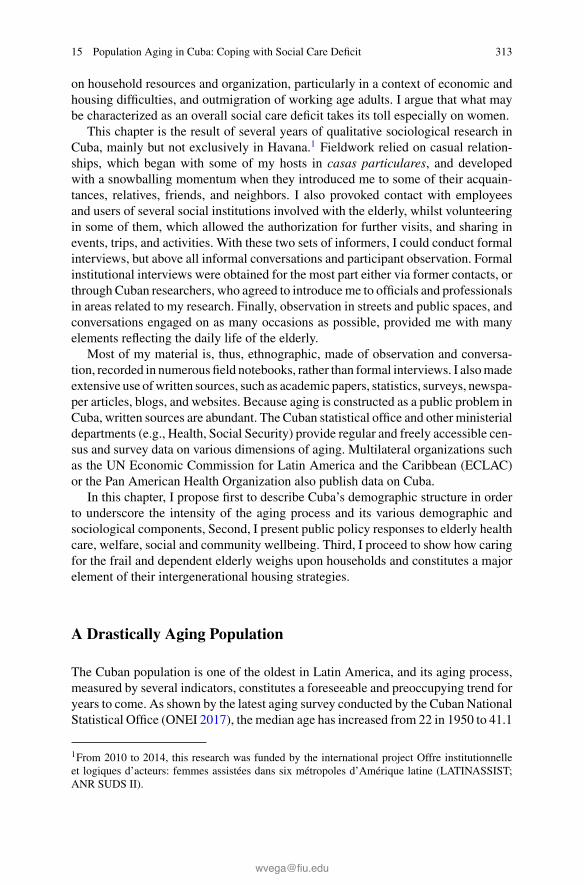
15 Population Aging in Cuba: Coping with Social Care Deficit 313
on household resources and organization, particularly in a context of economic andhousing difficulties, and outmigration of working age adults. I argue that what maybe characterized as an overall social care deficit takes its toll especially on women.
This chapter is the result of several years of qualitative sociological research inCuba, mainly but not exclusively in Havana.1 Fieldwork relied on casual relation-ships, which began with some of my hosts in casas particulares, and developedwith a snowballing momentum when they introduced me to some of their acquain-tances, relatives, friends, and neighbors. I also provoked contact with employeesand users of several social institutions involved with the elderly, whilst volunteeringin some of them, which allowed the authorization for further visits, and sharing inevents, trips, and activities. With these two sets of informers, I could conduct formalinterviews, but above all informal conversations and participant observation. Formalinstitutional interviews were obtained for the most part either via former contacts, orthrough Cuban researchers, who agreed to introduceme to officials and professionalsin areas related to my research. Finally, observation in streets and public spaces, andconversations engaged on as many occasions as possible, provided me with manyelements reflecting the daily life of the elderly.
Most of my material is, thus, ethnographic, made of observation and conversa-tion, recorded in numerous field notebooks, rather than formal interviews. I alsomadeextensive use ofwritten sources, such as academic papers, statistics, surveys, newspa-per articles, blogs, and websites. Because aging is constructed as a public problem inCuba, written sources are abundant. The Cuban statistical office and other ministerialdepartments (e.g., Health, Social Security) provide regular and freely accessible cen-sus and survey data on various dimensions of aging. Multilateral organizations suchas the UN Economic Commission for Latin America and the Caribbean (ECLAC)or the Pan American Health Organization also publish data on Cuba.
In this chapter, I propose first to describe Cuba’s demographic structure in orderto underscore the intensity of the aging process and its various demographic andsociological components, Second, I present public policy responses to elderly healthcare, welfare, social and community wellbeing. Third, I proceed to show how caringfor the frail and dependent elderly weighs upon households and constitutes a majorelement of their intergenerational housing strategies.
A Drastically Aging Population
The Cuban population is one of the oldest in Latin America, and its aging process,measured by several indicators, constitutes a foreseeable and preoccupying trend foryears to come. As shown by the latest aging survey conducted by the Cuban NationalStatistical Office (ONEI 2017), the median age has increased from 22 in 1950 to 41.1
1From 2010 to 2014, this research was funded by the international project Offre institutionnelleet logiques d’acteurs: femmes assistées dans six métropoles d’Amérique latine (LATINASSIST;ANR SUDS II).
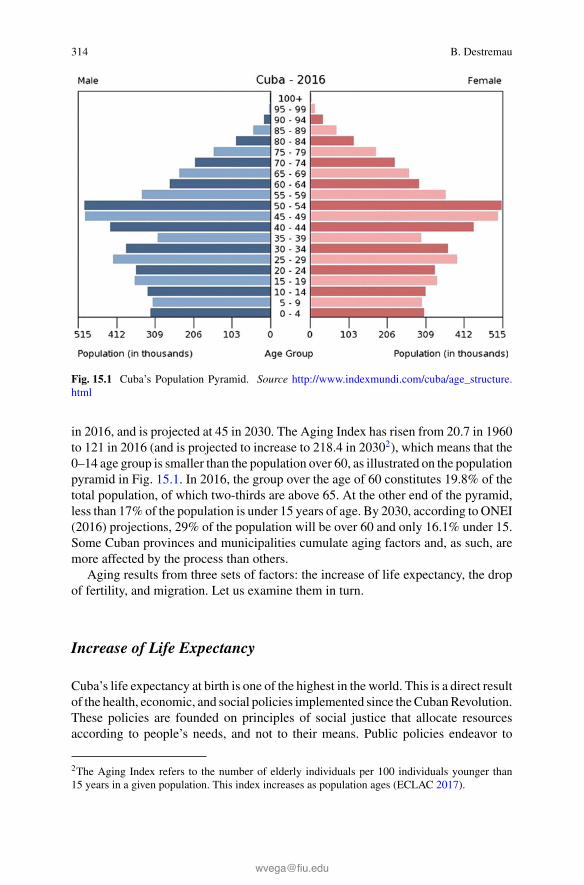
314 B. Destremau
Fig. 15.1 Cuba’s Population Pyramid. Source http://www.indexmundi.com/cuba/age_structure.html
in 2016, and is projected at 45 in 2030. The Aging Index has risen from 20.7 in 1960to 121 in 2016 (and is projected to increase to 218.4 in 20302), which means that the0–14 age group is smaller than the population over 60, as illustrated on the populationpyramid in Fig. 15.1. In 2016, the group over the age of 60 constitutes 19.8% of thetotal population, of which two-thirds are above 65. At the other end of the pyramid,less than 17% of the population is under 15 years of age. By 2030, according to ONEI(2016) projections, 29% of the population will be over 60 and only 16.1% under 15.Some Cuban provinces and municipalities cumulate aging factors and, as such, aremore affected by the process than others.
Aging results from three sets of factors: the increase of life expectancy, the dropof fertility, and migration. Let us examine them in turn.
Increase of Life Expectancy
Cuba’s life expectancy at birth is one of the highest in the world. This is a direct resultof the health, economic, and social policies implemented since theCubanRevolution.These policies are founded on principles of social justice that allocate resourcesaccording to people’s needs, and not to their means. Public policies endeavor to
2The Aging Index refers to the number of elderly individuals per 100 individuals younger than15 years in a given population. This index increases as population ages (ECLAC 2017).

15 Population Aging in Cuba: Coping with Social Care Deficit 315
Fig. 15.2 Life expectancy at birth, 1960–2020. Source Computed from ECLAC (2017)
provide the whole population, whatever their race, gender, standard of living, placeof residence, age, and type of pathology, with good quality public services, on adecommodified, universalistic, and egalitarian basis. The health sector, in particular,benefits from considerable public investment3 in buildings and equipment, and hasdeveloped a dense network of hospitals, polyclinics, and neighborhood clinics. Itdevotes substantial resources to training doctors, nurses and technicians and it investsin research. All of these assets translate into policies, and concrete programs andcampaigns that cover all dimensions of health (Feinsilver 1993; Brotherton 2011;Chaufan 2014).
Many recent health indicators place Cuba at the same level as developed countrieswith advanced healthcare benefits. Infant andmaternalmortality have dropped signif-icantly; mortality due to infectious diseases has almost disappeared; life expectancyat birth has increased to 79.6 years in 2015–2020 (Fig. 15.2), i.e., fourteen yearsabove its 1960–1965 level (ECLAC 2017). These performances are a testimony tothe drastic reduction of health inequalities between classes, racial origins, lifestyles,education levels, territories, and gender (Whiteford and Branch 2007).
It is important to note that the multifaceted healthcare investments have alsoresulted in a specific form of citizenship, characterized by the Cubans’ acute con-sciousness of their health and physical wellbeing (Brotherton 2005). The family doc-tor has become an archetypical figure of the revolutionary hero (Brotherton 2013).Health is a highly politicized issue (Kath 2010). The results and performances of theCuban health system are widely promoted on the national and international scales(Feinsilver 2008, 2010). They are a flagship emphasizing the attainment of the rev-olutionary regime and contribute to its legitimacy. The medical industry, including
3Health and social assistance expenditures represent 10.4% of Cuban GDP in 2015 (ONEI 2016).

316 B. Destremau
Fig. 15.3 Total fertility rate, 1965–2010. Source Computed from ECLAC (2017)
services, research, and pharmaceuticals, has also become Cuba’s primary export sec-tor (Leleu 2017). It is against this backdrop that health policies directed at the elderlyhave been promoted as we will see below.
The Decline of Fertility
Fertility decline is another ingredient of population aging. InCuba, the global fertilityrate has dropped from 4.7 children per woman (15–49) in 1960–1965 to 1.63 in 2016(ONEI 2016), and is the lowest in Latin America (Fig. 15.3). This phenomenon canbe explained by three major factors. On the one hand, women have been grantedindividualized and equal social rights. They have benefited from incentives to attaineducational and skill levels equal to those of men, and they have entered the labormarket at all occupational and professional levels. Schools and childcare institutionshave contributed to emancipate parents—and especially women—from social rolesthat confined them to domestic paid or unpaid labor, so that they could engage inprofessional careers and political activities.4 Family planning and abortion services,freely accessible and free of charge, have helped couples or women to decide thenumber of children they want (Andaya 2014).
On the other hand, birth reduction is also the result of self-limited child conceptiongrounded in economic difficulties and housing shortages. As we will see below, alarge proportion of households face home overcrowding, poor maintenance, and lackof equipment, all contributing to deter child rearing.When resources are lacking—in-come, time, work, presence, care, and particularly space at home—couples tend to
4The discrepancy between men’s and women’s official activity rates—about 20 percentagepoints—demonstrates, however, that this process has been inhibited by sturdy underlying patri-archal social structures (see Destremau 2017a).

15 Population Aging in Cuba: Coping with Social Care Deficit 317
postpone, or even drop, their project to conceive a child (idem). Additionally, in spiteof consistent policy adjustments over the last decades, tensions in work-life balancehave not been solved satisfactorily. Women especially find themselves overburdenedand torn between their responsibilities at work, at home, their engagement in politicaland social organizations, and the time required for provisioning (Destremau 2015a,2018). Relatedly, at the time of the 2012 census, 55.5% of all households above oneperson were comprised of no child under 15 years of age, and 69% of householdswith children had only one (ONEI 2012).
Finally, the drop in fertility is also the result of the 1960–1970 Baby Boomersadvancing past their conception years as they enter their 40s and 50s. Also, fewerchildren have been born by the following reduced-in-number generations, especiallysince they came to fertile age in the midst of the 1990s economic crisis. This, com-bined with the effects of outmigration of adults in childbearing age, translates into acontinuous drop in the percentage of childbearing women since 1990.
Fertility indicators have remained below replacement level since the end of the1970s with a gross reproduction rate below 1. Public authorities have addressedthis issue by conducting a national fertility survey (ONEI 2009), which analyzedthe reasons and parameters of fertility drop. They have endeavored to reinforce sup-port to infertile couples, offering them assisted reproductive technologies. They haveimproved the follow-up of pregnantwomen, to the effect that, in 2016, 56.2%of birthstook place within maternal homes, demonstrating a constant increase over preced-ing years (ONEI 2016). They also explicitly attempted to fight an alarmingly highabortion rate, which concerns, on average, as many as half of initiated pregnancies(ONEI 2009; Andaya 2014).
Outmigration
Declining fertility combined with outmigration has reduced Cuba’s populationgrowth, which has tended to be negative since 2006 (ONEI 2016). Migration con-tributes to demographic structure imbalances. Since the Revolution, migration bal-ance has steadily been negative, except for 2013 and 2014. As illustrated in Fig. 15.4,emigration has been continuous, although its rates vary from year to year dependingupon the severity of restrictions imposed by domestic policies and the relationshipbetween Cuba and the United States. Emigration primarily affects working-age andchildbearing-age adults, who may leave behind older members of the family as wellas children. Impoverished rural areas are particularly subject to combined internalmigration and outmigration. This phenomenon is responsible for significant popula-tion decline and consequently intensifies demographic aging.
On the contrary, immigration has been scarce and composed principally by theforeign spouses of Cubanmenworking or studying abroad (CruzCabrera et al. 2016).The slightly positive balance that appears for 2013 and 2014 is an exception and canbe explained by recent developments in Cuba’s international relations and domes-tic legislative steps that constitute favorable circumstances for return and pendular

318 B. Destremau
Fig. 15.4 Evolution of total population, 1960–2020. Source Computed from ECLAC (2017)
migratory movements. Part of the returnees are elderly people leaving their placeof residence abroad, primarily the United States, to end their life in Cuba, wherethey can expect to enjoy good and free healthcare as well as an attractive value fortheir retirement income (sourced from own research; Havana Times 2014). With fewprospects of return migration of working-age adults, this trend will more than likelyaccelerate demographic aging (García Quiñones and Alfonso de Armas 2014).
The Dependency Ratios
Aging affects the dependency ratio to the point that it outweighs the effect of adiminishing proportion of children in the population. The growing weight of theelderly has resulted in rising dependency ratios since 2002, which means that a lowershare of economically active adults has to provide for the needs of an increasing shareof aging and economically dependent population. In 2016, the global dependencyratio was at 56.4%. This means that two people of working age (15–59) support morethan one dependent (child or elderly person).When considering the aged-dependencyratio separately, the ratio of the elderly to working age population is 30.9%, higherthan that of children (ONEI 2017). If the aging trend continues as predicted, in 2030,the dependency ratio will reach 82.3%—25.9 for children and 56.5 for the elderly(ECLAC 2017). Dependency ratios are reflected at the household level in Cuba.According to the 2012 census, 40% of all households are comprised of at least oneperson over 60, with 27% having only one elderly person, and 13% more than one(ONEI 2012).
These statistics should, however, be interpreted with some caution given that thepressure on the active population is likely to be lighter than what the figures indicate.
15 Population Aging in Cuba: Coping with Social Care Deficit 319
Indeed, a considerable number of people over the age of 60 may not be able to afford,nor may they wish to stop being economically active. Also, these figures concernonly the resident population and do not take into account the number of emigrantswho support their relatives back home.
Aging and its various components have become a major preoccupation for Cubanauthorities, and have been constructed as a public issue. In the following section,I will focus on policies directly addressing the needs of the elderly, leaving asidemigratory policies that concern them indirectly.
Providing for the Wellbeing of an Aging Population: PublicPolicies and Programs
The Cuban revolutionary regime began implementing cultural, health, and welfareprograms to tackle aging issues in the early 1970s. The Plan Nacional de Atenciónal Anciano (National Plan for the Care of the Elderly) was introduced in 1974. It wasdeveloped in subsequent years, substantiated by studies and surveys assessing themedical and social needs of the elderly. Although it evolved in a context of economicand social crises, it came to full fruition in 1997as thePrograma Nacional de AtenciónIntegral al Adulto Mayor (National Program for the Comprehensive Care of theElderly). Implementing the program requires the participation of all administrativelevels, i.e., national, provincial, municipal, and local, and addresses not only healthissues but also social security, sports, and culture (García Quiñones and Alfonso deArmas 2014).
The Programa Nacional de Atención Integral al Adulto Mayor includes threecomponents: Hospital Care, Institutional Care, and Community Care. The first worksin coordination with local healthcare institutions, such as medical practitioners andclinics, and is restricted to certain cases and meant for short stays only. The sec-ond, or Institutional Care, is conceived of as complementary to family, commu-nity, and social organizations. It includes nursing homes and medical-psychological-pedagogical centers. Finally, Community Care encompasses attention provided byday-care centers as well as cultural, sports, and community socialization activities,and the services of Multidisciplinary Teams for Geriatric Care (EMAG).
Addressing the Health Care Needs of the Elderly
A decisive step in the intensification of health care policies was taken with the imple-mentation of the program Médicos y Enfermeros de la Familia (Family Doctors andNurses) in 1984. It improved elderly access to health facilities and follow-up care.Since that time, outpatient offices have been set up in each health zone (comprisingaround 120 families or 600–700 people). They provide a general practitioner and

320 B. Destremau
nursing care to the neighboring population, including home and institutional care,with the support ofmultidisciplinary geriatric care teams, attached to the district poly-clinics. These outpatient offices are the gatekeepers of a hierarchical referral system.A total of 451 polyclinics distributed over the territory attend to more complex casesoffering specialized care and medical exams, i.e., lab analysis and X-rays, amongothers. Furthermore, local health care is coordinated with social work. Neighboringfamilies are monitored and receive professional and semi-professional follow-upsand assistance that are embedded in a tightly woven system of communication, rela-tions, and collaboration between practitioners, social workers, mass organizations,and more or less formalized social networks (Kath 2010).
Health care supply has adapted with the evolution of pathologies in Cuba. Whileinfectious diseases have been eradicated for themost part, chronic pathologies—suchas cancer, cardiovascular diseases, obesity, diabetes, and pathologies related to dete-riorated living conditions, poor nutrition, smoking and alcoholism—are on the rise.More importantly, with regards to this chapter, the Cuban healthcare system hasevolved so as to respond to needs related to the country’s aging population.
In 2012, 80%ofmortalitywas concentrated in the over 60 age group,with the threeleading causes of death being heart disease, malignant neoplasms, and cerebrovascu-lar diseases (Pan American Health Organization 2012). To attend to this age group,family doctors are assisted by multidisciplinary medical teams dedicated to geriatricattention. These teams, comprised of specialized physicians, social workers, and psy-chologists, are trained in gerontology. In the 1980s, all general hospitals developedgeriatric programswith adapted specializations and technology. In 1992, theMinistryof Health founded the Centro Iberoamericano de la Tercera Edad (Ibero-AmericanCenter for the Elderly) in Havana, dedicated to epidemiological research and med-ical assistance. One of its outcomes has been the 2005 Proyecto Salud Bienestary Envejecimiento de los Adultos Mayores en América Latina y el Caribe (Health,Wellbeing, and Aging of the Elderly in Latin America and the Caribbean Project;Pan American Health Organization, and University of Wisconsin). Since 2012, theMinistry of Health has prioritized the “geriatrization” of its institutions to facilitateelderly access.
These orientations have taken place against the backdrop of economic tensionsin the health sector. Investment and the coverage of current expenditures have beenaffected by public spending restrictions since the 1990s.5 Buildings and equipmentare decaying, facility maintenance is delayed, and supplies of consumable goodsand medicines are disrupted. To face these shortages, alternative and palliative carepractices developed and/or are reactivated, such as manual diagnosis, and variousnatural and plant-based treatment methods.
Furthermore, expatriation of medical personnel has intensified within the frame-work of government cooperation programs with foreign states. The drain of medicalprofessionals to transactional humanitarianism (Brotherton 2013) disrupts the regu-lar service provided by neighborhood family doctors, district polyclinics, and hospi-
5This is notwithstanding that investment in “marketable” health services and the development ofclinics dedicated to “health tourism” has considerably expanded (Brotherton 2013).

15 Population Aging in Cuba: Coping with Social Care Deficit 321
tals. In 2012, about 20% of medical doctors were expatriated (idem). Over the periodof 2009–2015, the number of trained Cuban medical doctors continuously increased(+17%), but the number of family doctors drastically decreased going from 34,261in 2009 to 12,883 in 2015 (ONEI 2016). One of the incentives for them to engage ininternational missions is that, although doctors and health personnel are among themore privileged of the professional branches and have seen their wages significantlyadjusted over the years, they have lost much of their purchasing power. The drasticcutbacks of subsidized goods and services since the 1990s make their salaries insuf-ficient for maintaining a decent standard of living. Additionally, my fieldwork showsthat many doctors are tempted to quit or reduce their service to engage in emergingand more lucrative activities such as hosting tourists.
All these factors have impacted neighborhood and local health care networks.Although the family doctor to patient ratio remains around 1:1000, dissatisfaction isrising. Criticism about limited access, long wait lines, and deficient health and socialservices is increasingly heard. Budgetary constraints led authorities to launch a planin 2010 aimed at reducing excess supply and adapting it to an evolving demand. Tothat effect, some facilities are being closed, which may imply that patients will haveto travel or walk longer distances to reach a physician. The access of the elderly tohealth care has and will undoubtedly be affected, particularly in rural settings.
Consolidating Community Integration Facilitiesfor the Able-Bodied Elderly
Cuba has developed a holistic approach to health andwellbeing, which combines bio-logical, psychological, environmental, and social factors (Brotherton 2013). Withinthis framework, the program known as Atención Comunitaria (Community Care)was launched for the elderly in 1978, under the auspices of the Ministry of Health.Its purpose was to coordinate various local, social, health, and academic institutions,and foster cultural, educational, sport, psychosocial, and socializing activities in favorof the aging population. This program was reinforced in 1997 with the ProgramaNacional de Atención Integral al Adulto Mayor (National Program for the Compre-hensive Care of the Elderly). “Senior universities” and “senior circles” have been setup in most municipalities for aging adults that are still physically and mentally able.While the former represents a formal institution, attached to a nearby University,which supervises the courses and the delivery of graduation certificates, the latterresults from individual or institutional initiatives. Thanks to the voluntary work ofa wide range of (retired and active) professionals and academics, they offer visits,workshops, debates, lectures, study seminars, physical activities, parties, choirs, andtrips, among others. They function on a local basis, and weave networks of socia-bility, support and stimulation. They aim to encourage active aging, and to offer theelderly opportunities for autonomous socializing apart from family demands, and in

322 B. Destremau
so doing, deepen their integration within their neighborhood. According to a 2010survey, half of the elderly attend them (ONEI 2011).
The Community Care Program and the National Program for the ComprehensiveCare of the Elderly have also resulted in setting up Casas del Adulto Mayor (Housesof the Elderly). These day-care facilities are at the intersection of health and socialcare. Isolated elders, who do not have the facilities or means to cook, who are subjectto depression, or to falling or hurting themselves, are candidates who can be orientedto a casa. Their number has significantly grown over the past ten years, i.e., +37%.Two hundred and one existed in 2005 and two hundred seventy-six in 2016 (ONEI2017).
Statistical scrutiny, however, shows that, due to the ratio between the number ofaging adults and the number of available spaces in the casas program, only a limitednumber actually succeeds in registering. Additionally, the Cuban territory is dividedin 168municipalities, some covering extended geographical areas (especially in ruralzones), while others are very densely populated (in urban settings). Most municipiosonly contain one casa, although some host more than one. In any case, beyond thetheoretical ratio, the elderly can only commute to and from the casa on a daily basisif they live close by, or if an effective pick-up service exists, which is only the casefor a small minority of casas. Thus, whatever their need, in practice most elderlycannot enjoy day-care services. Also, the elderly are only allowed to remain in thecasa as long as they are mobile and do not develop a physical or mental handicapapart from those natural to aging.
All community facilities restrict their access de facto to able-bodied and able-minded elderly. What then occurs when an elder becomes dependent? As I willhighlight below, because of cultural patterns and social norms, shaping the moraleconomy of care, most will remain in their homes, depending on the care of theirrelatives.
Reinforcing Targeted Welfare Schemes
Public programsmore specifically targeted for the destitute have also been developed.As other social categories in Cuba, the effects of the post-Soviet crisis have hurt theelderly, and in general, they have seen their living conditions deteriorate. Since the1990s, the real value of retirement pensions and of public wages has dwindled.It decreased in half between 1989 and 2010 (Mesa-Lago 2012). The reason for theconsiderable loss of value is rampant inflation, caused by simultaneous liberalizationand marketization of goods and services such as food, transportation, and clothing,combined with the parallel curtailing of public subsidies (Mesa-Lago 2012, 2014;Destremau 2015b, 2018). In 2008, the revolutionary regime undertook a reform ofthe pension system with the aim of securing the balance of pension schemes whileincreasing the purchasing power of pensioners, but these efforts did not restore pre-1990 pension levels. In fact, elderly that are subsisting solely with their pension are,
15 Population Aging in Cuba: Coping with Social Care Deficit 323
for the most part, economically destitute, and their poverty has become a visibleproblem.
According to a surveyon aging and the elderly, conducted by theCubanPopulationCenter in 2010 (ONEI 2011), 60% of the elderly interviewed declared living withdeprivation and shortages. The study, however, does not specify to what extent thefact of being old is responsible for this state of affairs. In an effort to remain afloat,about 20% of respondents of retirement age declared that they continued to work inorder to keep perceiving their salary, or that they took up new jobs so as to increasetheir income. In any event, a considerable portion of the aging population engagesin economic activities either informally or within the family business, even if thatactivity is limited to maintaining the household while the other members engage inlucrative occupations. Thus, the proportion of economically active elderly is certainlyhigher than what the statistics indicate.
The luckier ones, 15% of interviewees in the same 2010 survey, declares that theyreceived remittances from abroad. Sending and receiving remittances, primarily fromthe United States, has been progressively liberalized since 1993 and supported by theObama administration as a measure of normalizing US-Cuban relations. A door-to-door survey conducted in 2015with 1200 Cubans found that a third of those surveyedreceived remittances from family members abroad, with over half of them receivingless than US $1000.00 a year. Ninety-four percent of them used the money for dailyexpenditures and only 11% invested funds in a business.6 Cojimar (2008) and myown fieldwork confirm that money received from abroad is used first and foremost tosecure daily provisions and to cover basic needs.Nevertheless, remittances regardlessof their importance or quantity also remain the principal source of investment capitalin Cuban market-economy businesses.
In order to mitigate impoverishment and destitution, Cuban authorities have rein-forced welfare mechanisms targeting social cases characterized by their dependencyon specific assistance and the absence of necessary solidarity networks (Domínguez2008; Espina Prieto 2010, 2011; Destremau 2017b, c). Door-to-door neighborhoodsurveys led by social workers, providing measures and classifications, particularlyabout the condition of the elderly have been used for the development and introduc-tion of various schemes and programs. Certain programs are targeted specifically forpeople living alone, in dependency situations without adequate assistance or homeequipment; others attempt to reach people suffering chronic, degenerative, or otherdiseases. Between 2000 and 2010, some 40,000 “emerging” social workers havebeen trained to provide individual caseload follow-up and home visits to at-risk pop-ulation in their district (see Destremau 2017b, c). These professionals, attached tothe Ministry of Labor and Social Security, provide more systematic assistance thanthe voluntary and neighborhood networks that had prevailed until then.
My fieldwork demonstrates that the elderly are the first recipients of distributedhouseholdmaterials and appliances, such asmattresses, bed sheets, and electric cook-ers, with the worst off receiving shoes and clothing as well. While budgetary con-straints have reduced social assistance, i.e., expenditures dropped by 10% between
6Refer to https://assets.documentcloud.org/documents/1785002/cuba-final-toplines.pdf.

324 B. Destremau
2005 and 2010, spending has become more targeted. And although the number ofbeneficiaries has been cut by half, especially by limiting the number of recipients perhousehold, the proportion of the elderly benefitting from social welfare has been con-solidated: from 21.8% in 2005 to 30.2% in 2010.7 Notwithstanding, the 2010–2011survey reported that only 2.6% of elders interviewed declared receiving financialassistance from public programs (ONEI 2011).
Living conditions tend to degenerate when housing conditions deteriorate. InCuba 85% of households own their homes and the rest hold long-term leases withthe state. However, the construction of housing units has drastically dropped since the1990s. The number of missing dwellings is considerable, leading to overcrowding,particularly for modest families and in city centers. Furthermore, the housing stockis often in a very bad state of maintenance, since neither private nor public resourceshave been sufficient to cope with the upkeep requirements of urban households.According to the 2012 census (ONEI 2012), half of Cuban dwellings are in a stateof dilapidation. Houses and buildings crumble at a recurrent rate particularly whenhurricanes and storms hit the island, which results in further reducing housing supply.Welfare schemes have therefore endeavored to provide labor assistance and buildingmaterials for home repair to people devoid of necessary financial or human resources,and mainly elderly.
Welfare schemes also operate in the domain of food. The libreta de abastec-imientos is a ration book that every household, depending on the number, age, andcondition of family members, receives. It provides access to given quantities of foodand other basic items. The elderly receive reinforced food rations, adapted to theirpathologies. But since the 1990s, these rations have tended to diminish and only covera reduced share of basic needs. Today, the elderly represent 60% of the beneficiariesof comedores comunitarios (community canteens), whose numbers have soared inrecent years. These very inexpensive canteens serve three meals a day to those whoare too poor, too disoriented, or whose home equipment is too decayed to be able toprepare their own meals. Since breakfast and lunch are usually eaten at the canteens,these places also constitute opportunities for sociability, and are a pretext to go outof one’s home. In situations where an elderly person is no longer capable of makingthe trip to the comedor, a neighbor can help to carry meals to their home in plasticcontainers.
7Last data found.

15 Population Aging in Cuba: Coping with Social Care Deficit 325
Social Care Deficit and Family Burden
Care and Presence for the Disabled Elderly, a HouseholdResponsibility
Cultural norms and moral patterns in Cuba lay the responsibility for the care of theelderly on family members, especially those sharing the elderly person’s lodgings.8
Agingwell inCuba as inmany countries of theworld, implies agingwithin one’s fam-ily. Over 90% of Cubans aged 60 and over live in independent houses or apartments.Approximately half of them live with their children9 and this situation intensifies asthey get older. A significant number share their home with siblings or grandchildren.However, aging women tend to live more with their children than men. A 10% pointdifference (ONEI 2011) is revealing of couple and family dynamics.
Able-bodied and able-minded aging adults represent a precious source of laborfor households under time tension. They help with the work-life balance by pickingup young children from the nursery or school, by preparing their meals, and bystaying with them when they are sick. They contribute to the time consuming tasksof provisioning for food and household necessities, waiting in lines, running errands,cooking, cleaning, staying at home when, for example, fumigation brigades comeby, among other activities. In return, they benefit from their relatives’ presence andassistance with heavy chores they can no longer perform, and they experience a senseof being useful and surrounded by family.
Thus, living in a household comprised of diverse age groups ideally optimizes thedivision of labor between genders and generations, and simplifies life for everyone.Inevitably, however, as an aging parent’s autonomy decreases, so does his or hercontribution of labor. Concurrently, his or her need for care, presence, and supportincreases.10 The elderly person tends progressively to requiremore of the household’stime andwork (Duràn 2010), which adds pressure on his or her children and relatives.
The burden of care and presence tends to become heavier as family caregiversbecome old themselves, resulting in several aging adults living together. This isespecially true in a context of liberalized and intensified outmigration of workingage adults. According to the 2012 census (ONEI 2012), 58% of the elderly over theage of sixty who live in two- to three-person households share this space with one ormore aging adult. This means that small households may be composed of a majority,
8The Constitution of the Republic of Cuba and the country’s Family Code also establish the rightsand duties of the family in a more formal way.9In 2010–2011, 92.5% of Cuban elders declared having living children (ONEI 2011).10The Health, Wellbeing and Aging 2001 Survey (Salud, Bienestar y Envejecimiento) conductedin Havana (where 20% of the country’s elderly population lived at the time) shows that: 6.6%of the elderly face limitations to accomplish 3 or more basic activities of daily life; 12.5% facelimitations to accomplish 1 or 2 basic activities; 28.5% have a vision impairment; 24.9% have ahearing impairment; and 11.1% of the total number of elderly live alone. Another study conductedover dementia in Cuba shows that 10% of all elderly suffer some form of cognitive deterioration(Peláez and Palloni 2001).
326 B. Destremau
or exclusively consist of persons, above retirement age. This ratio increases for largerhouseholds.
The elderly’s need for family solidarity is not limited to care and presence. It isalso largely economic. As demonstrated above, neither pension nor welfare schemessucceed in providing the elderly with financial autonomy, particularly when they arenot in adequate physical condition to perform lucrative occupations. Their survivaldemands forms of solidarity and redistribution of resources within families. Physicaldependency aggravates economic dependency at a timewhen the elderly are less ableto enter into reciprocal relationships, which renders them particularly vulnerable.
Caring for the frail elderly tends to translate into a heavier demand and workloadfor women than for men. Research tends to show that patterns of sexual divisionof domestic and care labor have not been substantially modified over the decades.Research tends to show that patterns of sexual division of domestic and care laborhave not been substantially modified over the decades (Lutjens 1995; Peciña 2008;Proveyer et al. 2010; Destremau 2015a, 2017a).11 The situation is exacerbated bycouples’ instability and men’s migration as these leave many households headedsolely by women. Adult men tend to mobility and join their current partner’s house-hold. Family structures are, thus, marked by matrifocal practices, in which severalgenerations of women team together to become the backbones of the household (VeraEstrada and Diaz Canals 2008; Vera Estrada and Socarrás 2008; Zabala 2010).12
“Cuban women’s life cycle is that of care, that moves on from children to elderly,”aswell as to grandchildren.However, “in the conditions of a domestic economyweak-ened by the scarcity of goods on the market, taking care of the elderly, among whomthe occurrence of diseases such as Alzheimer’s increases, turns into a heroic goal”(Proveyer et al. 2010: 65). Men, however, are not exempt from care responsibility.My research tends to show that sons share in providing care and assistance to theirparents.
Women overloaded by care obligations frequently undergo disruptions in theirprofessional commitments, and may decide to retire early, which affects the level oftheir pensions (see Destremau 2015a, 2017a for a review of the literature). In orderto supplement their income, they tend to engage in activities that allow for sched-ules that are more flexible. These home-based private occupations often resembledomestic chores and require few qualifications. They include work such as hostingtourists, preparing and selling food, petty production, hairdressing, and manicure,among others (Peciña 2008; Echevarría and Lara 2012; Romero Almodóvar 2014).
11Studies underscore the fact that sexual division of domestic labor tends to bemore unequal in low-income households where educational and income levels are lower, and more equal when coupleshave higher levels of education.12According to a fertility study conducted in 2009 by the Cuban Statistical Office, men betweenthe ages of 15 and 54 declare to be “single” one third times more often than women (1.064 million,or 31.4% of the total, versus 667,020, or 20.1%; ONEI 2009).

15 Population Aging in Cuba: Coping with Social Care Deficit 327
In the end, there is a threat that women would forfeit their professional skills andcommitments to go “back to the stove front.”13
Family caregivers have become a concern for public institutions, and their burdenacknowledged. In response, “schools for caregivers of elderly living in a state ofdependency” are developing. Caregivers may also benefit from specialized geriatricconsultation and training, psychotherapeutic focus groups, television productions,and book publications. For the most part, these actions attempt to improve the qualityof caregiving. They teach about degenerative diseases and the nature of aging; theysuggest right gestures and attitudes, and attempt to develop caregiver’s sensitivity tothe condition and special needs of the elderly. They also recognize the difficultiesinvolved in caregiving and teach participants how to avoid excessive stress, pain,frustration, and depression. Awareness is also being raised about the risk of elderlyabuse, particularly in the context of overcrowded housing where several generationslive together in small spaces. Public discourse does not, however, question the normoffamily responsibility for care. Nor has it raised the issue of the patriarchal foundationof the gendered division of labor that makes caregiving weigh disproportionately onwomen.
Family Care and Housing Arrangements
One central concern for Cuban families is to formulate effective intergenerationalstrategies with regards to the precious resources of both care and housing. Thesestrategies tend to combine diversification with securing resources to meet the variousneeds of all family members, among them care for the children and the elderly.
The configuration I encountered in most of my fieldwork, which I will present asan ideal-type, is that of a continuing intergenerational and gendered family solidarity.The typical profile would be that of a woman, at forty, (and possibly her spouse) whohas remained in (or returned to) her parent’s apartment. Most likely she lives alonewith her mother—her father is deceased, or separated and has moved elsewhere.Her mother, recently retired and around sixty, takes care of her daughter’s childrenafter school, does part of the shopping and the cooking. Twenty years later, the samewoman is herself retired or engaged in home-based self-employed activities. Sheis still taking care of her then dependent mother (who, by now, has turned eighty),as well as helping her own daughter with her children. For these live-in familycaregivers, retirement thus means the start of an intensified second career dedicatedto one’s parent and grandchildren. Care thus rolls on from one generation to the next,with the caregiver remaining in the same household.
13“Back to the ‘stove front’: An oral history project about Cuban housewives” aims at documentingthis trend (https://blog.oup.com/2015/09/cuba-oral-history-project/).

328 B. Destremau
Within this archetypical pattern, upon the death of the owner, the house is trans-ferred to the caring daughter, protected as a continuous occupier, while her siblings(if there are any) relinquish their share. This has become a widespread practice sup-ported by successive Housing Acts aimed at eradicating real estate speculation andprotecting resident rights. Until today, Cuban revolutionary laws systematically pro-tected occupiers of any given dwelling. They had priority over legal owners whenthey remained living continuously in a home for ten years. This period was laterreduced to five years, a period after which they were eventually granted ownershipright.14 Additionally, according to the 1960 Urban ReformAct, amended by Law 48,which passed in 1984, and then by Law 65 of 1988, state authorities must superviseall real estate sales and purchases on the basis of an almost symbolic frozen assetvalue. Furthermore, property was limited to one residence per person, except fordwellings located in resort areas. And, until the 1990s, people who chose to leaveCuba, saw their property confiscated by the state, which allocated it as full propertyor granted a permanent usufruct right to families in need of housing. Thus, untilrecently the stakes for legal heirs of relinquishing ownership shares has been almostnon-existent. In 2011, this configuration changed with the passage of Law 288 whichliberalized real estate purchases and sales between individuals at prices freely agreedupon between the parties.15
When a real estate property becomes “liberated” by the death of its owner, itmust be transferred to the other occupiers of the dwelling, provided they do not yetown another accommodation. In such a framework, family housing and real estateownership strategies have been closely entangled with care arrangements. Becausedaughters or granddaughters are more liable than their brothers to remain or to returnhome as a caregiver of their aging parents and grandparents, they are also more liableto inherit the property. Male family members tend to move out when they find apartner, until the relationship breaks up, and then they come back to their parentalhome, if it offers enough space. Matrifocality is, thus, the result of both social andmoral norms, and legal provisions.
As I will explain below, in certain cases, occupiers that become owners are in factnon-related caregivers.
Getting Help from Outside the Family
Households may obtain external assistance to take on the care burden. In 2002, theMinistry of Labor and Social Security instituted a scheme according to which adestitute dependent person who is sick, disabled, or elderly, and who has no neces-sary home care may be allocated the services of a state-paid caregiver. The scheme
14Refer to http://www.cubanet.org/htdocs/ref/dis/vivienda.htm.15The recent liberalization of the housing market (2011) mainly benefits families receiving remit-tances and/or disposing of foreign funds. It is expected to have an evicting effect on poorer house-holds living in coveted city centers.

15 Population Aging in Cuba: Coping with Social Care Deficit 329
reached a high of some 17,000 beneficiary households, before decreasing toward201016 (ONEI 2011). The figures show that existing needs are far from being satis-fied because of budgetary constraints, and also because low wages make the occu-pation unappealing in the face of the parallel development of a care market. Womenwould tend to prefer commodified domestic employment or any other opportunity,including migration, over this form of public employment.
For its part, the market for domestic services is in full expansion. This type ofwork was suppressed by the Revolution, and domestic workers were then trained invarious occupations deemed more respectable and in line with women’s emancipa-tion and dignity. Nevertheless, paid and/or unpaid domestic employment persistedcovertly until 1993, when the occupation was legalized. It was designated “domesticpersonnel” and categorized with other branches of self-employment. Henceforth, itflourished in parallel with the development of tourism, growing socio-economic dis-crepancies, and aging, to the point that domestic employment reached unprecedentedlevels of “explosive growth” (Romero Almodóvar 2014). The recent development ofthe Internet on the island has helped to expand this industry. Posting and circulatingadvertisements, even to the United States, is now a simple matter. Nevertheless, hir-ing a home caregiver at market rate remains a luxury. It is accessible only to familiesreceiving remittances from abroad, or conducting a lucrative activity in the newmar-ket economy. In and of itself, the development of this marketable service cannot beconsidered a public policy response to social care needs, exacerbated by aging andemigration. Thus, inequalities are on the rise, not only in terms of material wellbeingand consumption, but also in terms of households’ capacities to receive necessaryassistance.
A parallel arrangement has apparently been widespread,17 although its frequencyis difficult to assess. It typically concerns urban middle-class households wherechildren have migrated and an elderly relative is left alone in a relatively well-maintained and large dwelling. Given the very low birth rate in Cuba, it is often thecase that when one child moves, he/she leaves an aging parent behind to finish his orher days alone. In these cases, children sometimes invite a relative, or even a stranger,to come and stay with the elderly parent in need of presence and care. In exchange,they propose a viager “home for care” deal, whereby the caregiver receives an oraland sometimes legal promise in the form of a will to inherit the dwelling when theparent passes away. In these cases, legal heirs relinquish their claim on the house,especially when, having migrated, they have already lost their right to property orwhen they already own a home and have reached the allowed quota of one dwellingper person.
During the time of my fieldwork, I met several individuals, both women andcouples, which thanks to this system moved from rural areas to settle in Havana.Some of them did this with the intervention of a Church organization. Today, afterseveral years of cohabitation, care, and service to the original elderly owner, theyown property in sought-after areas. In recent years, these arrangements have become
16Last estimates found.17According to my fieldwork findings.

330 B. Destremau
less common. The commodification of real estate allowed by the 2011 law detersheirs from relinquishing an inheritance. Live-in caregivers today tend to be paid, butthe risk still exists that they can claim occupiers’ rights to stay in the dwelling afterthe owner’s death.
Care Tensions and the Risk of Abuse
The various configurations and arrangements described above may combine not onlyaccording to household structures and resources but also to various times of the lifecycle. They are structured by crises, tensions, and turning points, such as a badfall, a health issue, a change of job, migration, with the departure of relatives whileothers return home, a desire for a child frustrated by lack of living space, and others.Difficulties, disappointments, and challenges of various sorts arise throughout life,and it is at those times that abuse, the dark side of care, can emerge.
Abuse of the elderly is a growing concern for public authorities and individuals.The subject is evoked in daily conversation, researched by academics from health andpsychosocial fields, and discussed in television programs and internet posts. Abusemay be economic/financial, psychological, physical, or social18 (RodríguezMirandaet al. 2002; Griñan Peralta et al. 2012). Suspicion about abuse target firstly externalcaregivers, coming from the countryside and readily considered as opportunists grab-bing to obtain housing in exchange for care, doing their job without love or genuineconcern. Suspicion probably feeds on the children’s absence or distance from theiraging relatives, and is a well-known narrative of attitudes towards domestic workers.Interviewees recount their experience of the difficulty of finding the “right person,”meaning the one who can care for their parent with filial love and attention.
But abuse is not restricted to non-family members. Stories of intergenerationalconflicts in overcrowded households are increasingly recounted. The youth fight toliberate themselves from their parents’ social norms to forge their own way, culture,and forms of consumption. Elderly abuse may also be a sign of a shifting homecaremoral economy.
Another kind of social and public issue that is often mentioned in the variousmedia and collected narratives is that of the isolation experienced by aging adultsthat live alone.
18Social abuse includes situations such as obstacles to walking on sidewalks due to potholes and treeroots poking through the pavement, impediments to crossing streets because of poorly coordinatedtraffic lights, or the absence of adapted public transportation.

15 Population Aging in Cuba: Coping with Social Care Deficit 331
Isolated Elderly: Nursing Homes as a Residual Response
According to census data, in 2012, 14% of all adults over the age of 60 were livingalone, that is over 130,000 individuals with an average age of 69, and representing39.6% of the total of one-person households19 (ONEI 2012). Intensified migratorymovement has recently tended to exacerbate isolation. It is a complicated social issuewhen the elderly lose their capacity to take care of themselves, and all the more sowhen they are destitute. As seen above, most public policies and social initiativesconcern able-bodied and able-minded individuals, and are conceived as complemen-tary to family and/or community solidarity and sociability. Nursing homes do exist,nonetheless, to compensate for families without the means to provide the necessarycare or to employ caregivers.
According to official statistics, 148 heavily subsidized public nursing homesexisted in Cuba in 2016, offering 11,771 beds (ONEI 2017).20 This means that lessthan one out of 16 people over the age of 85 may claim a place in a nursing home. Atthe end of the 2000s, men represented 71% of elderly individuals hosted in nursinghomes. This may be interpreted—especially in a classic demographic context wherewomen outlive men—as the consequence of their residential instability during theiractive life, and their relative marginalization from family solidarity and the dwellingwhere it is expressed.
In order to qualify for a place in a nursing home, a person must require permanentcare and have no possibility of remaining within the community. The majority ofthose acceptedpresentmultiple chronic diseases, andphysical andmental disabilities.Those patientswith degenerative diseases, particularly those affected byAlzheimer’s,are not accepted in nursing homes. The first specialized institution dedicated topersons affected by cognitive deterioration and dementia opened in Havana in 2014.
Nursing homes are regulated by a set of resolutions adopted at the beginning ofthe 1980s, in the framework of the National Program for the Comprehensive Care ofthe Elderly. This program understands nursing homes to be an expedient substitutefor families in extreme cases. It echoes the cultural and moral norm of “keepingthem at home.” Nursing homes on the whole have dreadful reputations. Often heardnarratives recount the shortage of qualified personnel, working there for lack of otheropportunity, with no incentive or motivation, and stealing food and other suppliesto sell them on the black market or for their personal consumption. People speak ofbuilding decay, of lack of supplies and equipment, of poor and insufficient food, ofneglect of hosted persons, and absence of entertainment or activities. My interviewsshow that taking or accepting the decision to place a relative in a nursing homeis generally perceived with regret and some shame at what may be interpreted asabandonment of family.
19The proportion of one-person households in the total number of households increased from 13.9%in 2002 to 18.7% in 2012, according to census results.20Despite contradictions between various sources and the economic challenges during the worstyears of the crisis, the number of beds has been relatively stable since the 1990s.

332 B. Destremau
Improving both the quantity and quality of residential nursing homes has recentlyemerged as a necessity. After a task force was created in 2011, the Ministry ofPublic Health launched an important program of rehabilitation, repair, and extensionof nursing homes to improve what is considered a crucial weakness of the Cubansocial system. Repair and improvement of Houses of the Elderly and nursing homesis taking place in some locations, sometimes with the cooperation of internationalNGOs or in the framework of a historical city center rehabilitation consortium, suchas the UNDP in Cienfuegos. Some experimental protected residencies were openedin Old Havana, with the help of international cooperation,21 to increase the options ofisolated elderly people, or to offer alternatives to those who do not wish to stay withtheir families. The few religious institutions that remained during the revolutionaryperiod are now heralded as examples of good practices. It is difficult to evaluate theperspectives of this expansion and rehabilitation program in a context that still holdsthe ultimate value as that of family care.
Conclusion
This chapter has dealt with the intensified needs for health and social care spurringfromdemographic aging inCuba,which could be considered “the burden of triumph”(Dilnot 2017). It has examined the responses and coping mechanisms developed inCuba over the past decades, and demonstrated that the moral economies of socialjustice, women’s emancipation, and homecare tend to conflict in a context of caredeficit (Hochschild 1995).
I have shown that Cuba’s population is undergoing a severe aging process dueto extended life expectancy, reduced fertility, and migration. As a result, the aged-dependency ratio has reached alarming rates, both at macro and households levels.Next, I have highlighted how public policies, particularly in the areas of healthcare and community integration, have developed to maintain the elderly in a stateof physical, mental, and social wellbeing. I have also reviewed welfare schemesattempting to mitigate the impoverishment and destitution of the elderly hard-hit bythe social effects of market-oriented reforms and the reduction of public subsidies.The third part of the chapter shows how an overarching moral economy of homecareand family love explains the configuration of intergenerational households. Mostelderly adults in Cuba live with their descendants and demand increasing amountsof work and attention as they age, and become less able, more frail, and dependent.Care tensions become acute when families are diminished by low birth rates andmigration, when the caregivers themselves become old, and when the elderly sufferchronic or degenerative diseases.
I have chosen to mobilize Fassin’s (2009) moral economy framework to highlighta series of moral and practical dilemmas (Angel and Angel 2017) that confrontpublic policy and private strategies. The elderly are valued in Cuba, especially for
21The Basque Foundation Euskal Fondoa, in this case.

15 Population Aging in Cuba: Coping with Social Care Deficit 333
their contribution to the Revolution. Their efforts and sacrifices have permitted theestablishment of public services aswell as educational, social, political and economicachievements, and social entitlements. At the macro level, however, in a context ofstrong budgetary constraints, reinforcing investments and redistribution in favor ofthe elderly has to be balancedwith other competing demands. Productive sectors needstrengthening and support. The youth in particular require better training, housing,and job prospects if only to encourage them not to leave the country. Furthermore, asthe new generations grow in an increasingly commodified and individualistic society,their attachment to the Revolution dwindles. Social justice and solidarity are losingground tomore pragmatic and individualistic values. Setting priorities, thus, emergesas a strongly politicized issue of intergenerational justice, intersecting with gender,racial, class, and territorial discrepancies.
At a micro level, I have shown that keeping in line with cultural and moral normsand values of homecare tends to assign one or several family members to caregiving.Traditional and persistent patterns of gender labor division make it more accept-able for women to quit or to alter their professional commitment to fulfill their filialobligations. Alternatively, a homecare service market is developing, but it is onlyaffordable for the most affluent. This places women, especially, in a dilemma: keep-ing in line with the moral economy of homecare and engaging in a “care career”may entail jeopardizing some of their social conquests towards effective equality ofopportunity and emancipation. In this regard, developing nursing homes with higherstandards may accompany a shift in the moral economy of homecare. The boundarybetween health and social care needs to be carefully managed.
Although constructed as a public problem and widely documented in Cuba, thepressure aging exerts on care systems has received little attention by social scien-tists. In this regard, this chapter contributes to comparative knowledge on agingin post-Soviet Latin American and Caribbean countries. In particular, it calls for aclose examination of converging and diverging trends in aging, coping mechanisms,and moral economies in countries exposed to processes of economic liberalization,migration, impoverishment, and growing inequalities.
References
Andaya, E. (2014). Conceiving Cuba: Reproduction, women, and the state in the post-Soviet era.USA: Rutgers University Press.
Angel, R. J.,&Angel, J. L. (2017).Family, intergenerational solidarity, and post-traditional society.UK: Taylor & Francis.
Brotherton, P. S. (2005). Macroeconomic change and the biopolitics of health in Cuba’s specialperiod. The Journal of Latin American and Caribbean Anthropology, 10(2), 339–369.
Brotherton, P. S. (2011). Health and health care in Cuba. History after the Revolution: Key phasesand overviews of health development. In A.West-Duran (Ed.), Cuba: People, culture, and history(pp. 478–485). New York: Charles Scribner’s Sons.
Brotherton, P. S. (2013). Fueling laRevolución: Itinerant physicians, transactional humanitarianism,and shifting moral economies in post-Soviet Cuba. In N. Burke (Ed.), Health travels: Cuban

334 B. Destremau
health(care) on and off the island (pp. 129–153). University of California Medical HumanitiesPress.
Chaufan, C. (2014). Unraveling the “Cuban miracle:” A conversation with Dr. Enrique BeldarrainChaple. Medicina Social, 8(2), 93–98.
Cojimar, J. (2008). Bienestar Ficticio y Malestar Real En Cuba. Los Vázquez: Etnografía De UnaEconomía Familiar En La Habana. Nuevo Mundo Mundos Nuevos. https://journals.openedition.org/nuevomundo/30675. Accessed August 28, 2018.
Cruz Cabrera, J., Cano Orúe, M. R., & Prieto Samsónov, D. (2016). (Post)-Soviet diaspora in Cuba.Special Issue, culture and institutions: Cuban dynamics of change. International Journal of CubanStudies, 8(2), 263–295.
Destremau, B. (2015a). Crise de la reproduction sociale et refamilialisation de l’État social à Cuba:Adieu la “femme nouvelle”? Revue Interventions économiques, 53. http://interventionseconomiques.revues.org/2637. Accessed September 1, 2015.
Destremau, B. (2015b). L’extension du marché à Cuba: Une “nouvelle transformation”? InJ. M. Servet, & I. Hillenkamp (Eds.), Comprendre autrement le marché. Marchés réels et marchéfantasmé (pp. 251–274). Paris, Classiques Garnier, collection Ecrits sur l’Economie.
Destremau, B. (2017a). Effets de genre à Cuba: Paradoxes de l’émancipation féminine et résistancedu patriarcat. In L. Granchamp, & R. Pfefferkorn (Eds.), Résistances et émancipation de femmesau Sud. Travail et luttes environnementales. L’Harmattan, Collection Logiques sociales.
Destremau, B. (2017b). Universalité, inégalités, famille. Du tournant des politiques d’assistancecubaines. In B. Destremau,& I. Georges (Eds.), Le gouvernement des pauvres en Amérique latine.La police du genre. Paris, Aix-en-Provence, Karthala – Cherpa, coll. Questions transnationales.
Destremau, B. (2017c). ¿Hacia el mínimo? Perspectivas de la protección social universal en Cuba.In O. Rodríguez (Ed.), La protección social bajo el imperio del mercado (pp. 301–326). Bogotá,Colombia: Universidad Nacional.
Destremau, B. (2018). Universal income and the re-commodification turn in Cuba. In A. Ivo,C. Midaglia, A. Barrantes, C. Barba, & A. Cimadamore (Eds.), Welfare states, labour rights andbasic income in Latin America. Siglo XXI Colección Sciencias Sociales: CROP.
Dilnot, A. (2017). The burden of triumph: meeting health and social care needs. The Lancet,390(10103), 1630–1631.
Domínguez,M. I. (2008). La política social cubana: Principales esferas y grupos específicos. Temas,56(Oct.-Dic.), 85–94.
Duràn,A. (2010). Transformaciones sociales y familias enCuba:Desafíos para las políticas sociales.In C. Castilla, C. L. Rodriguez, & Y. Cruz (Eds.), Cuadernos CIPS 2009: Experiencias de inves-tigación social en Cuba (pp. 80–109). La Habana, Cuba: Publicaciones Acuario.
Echevarría, D. & Lara, T. (2012). Cambios recientes: ¿Oportunidad para las mujeres? In P. VidalAlejandro, & O. E. Pérez Villanueva (Eds.), Miradas a la economía cubana. El proceso deactualización (pp. 123–138). La Habana, Cuba: Editorial Caminos.
Economic Commission for Latin America and the Carribbean (ECLAC), Population Division(CELADE). (2017). Estimaciones y proyecciones de población total, urbana y rural, y económi-camente activa. Cuba. Naciones Unidas, Comisión Económica para América Latina y el Caribe(CEPAL). https://www.cepal.org/es/temas/proyecciones-demograficas/estimaciones-proyecciones-poblacion-total-urbana-rural-economicamente-activa.
Espina Prieto, M. (2010). La política social cubana para el manejo de la desigualdad. Cuba Studies,41(1), 20–38.
Espina Prieto, M. (2011). Polémicas actuales sobre enfoques y estilos de política social. El casocubano. In J. Valdés Paz, & M. Espina Prieto (Eds.), América Latina y el Caribe: La políticasocial en el nuevo contexto—Enfoques y experiencias (pp. 25–68). UNESCO: FLACSO.
Fassin, D. (2009). Moral economies revisited. Annales. Histoire, Sciences Sociales, 6(64),1237–1266. https://www.cairn-int.info/article-E_ANNA_646_1237–moral-economies-revisited.htm.
Feinsilver, J. M. (1993). Healing the masses. Cuban health politics at home and abroad: Universityof California Press.

15 Population Aging in Cuba: Coping with Social Care Deficit 335
Feinsilver, J.M. (2008).Cuba’smedical diplomacy. InM.Font (Ed.),A changing Cuba in a changingworld (pp. 273–285). New York: The Cuba Project, Bildner Center for Western HemisphereStudies.
Feinsilver, J. M. (2010). Fifty years of Cuba’s medical diplomacy: From idealism to pragmatism.Cuban Studies, 41(1), 85–104.
GarcíaQuiñones,R.&AlfonsodeArmas,M. (2014).Envejecimiento, políticas sociales y sectorialesen Cuba. Naciones Unidas, Comisión Económica para América Latina y el Caribe (CEPAL).http://www.cepal.org/celade/noticias/paginas/3/40183/RolandoGarc%C3%ADapdf.pdf.
Gilligan, C. (1982). In a different voice. Cambridge: Harvard University Press.Griñan Peralta, I. A., Cremé Lobaina, E., & Matos Lobaina, C. (2012). Maltrato intrafamiliar enadultos mayores de un área de salud. Medisan, 16(8), 1241–1248. http://scielo.sld.cu/scielo.php?script=sci_arttext&pid=S1029-30192012000800008.
Havana Times. (2014, January 17). El otoño de Cuba. http://www.havanatimes.org/sp/?p=93151.Hochschild, A. (1995). The culture of politics: Traditional, post-modern, cold-modern and warm-model ideals of care. Social Politics, 2(3), 333–346.
Kath, E. (2010). Social relations and the Cuban health miracle. USA: Transaction Publishers.Leleu, J. (2017). Les defies du développement économique cubain. Questions Internationales,
84(mars-avril), 74–82.Lutjens, S. L. (1995). Reading between the lines: Women, the state, and rectification in Cuba. Latin
American Perspectives, 22(2), 100–124.Mesa-Lago, C. (2012). Sistemas de protección social en América Latina y el Caribe: Cuba.Comisión Económica para América Latina y el Caribe (CEPAL): Naciones Unidas.
Mesa-Lago, C. (2014). Institutional changes of Cuba’s economic-social reforms. State andmarket roles, progress, hurdles, comparisons, monitoring and effects. University of Pitts-burgh. http://www.brookings.edu/~/media/research/files/papers/2014/08/cubas-economic-social-reform-mesalago/cubaseconomicsocialreformsmesalago.pdf.
Oficina Nacional de Estadística e Información de Cuba (ONEI). (2009). Encuesta Nacional deFecundidad. Informe de Resultados. http://www.one.cu/publicaciones/cepde/enf/Completa/Anexo.Tablas%20de%20resultados.pdf.
Oficina Nacional de Estadística e Información de Cuba (ONEI). (2011). Encuesta Nacional deEnvejecimiento de Cuba y sus Territorios. http://www.one.cu/encuestaenvejecimiento.htm.
Oficina Nacional de Estadística e Información de Cuba (ONEI). (2012). Censo de Población yViviendas. http://www.one.cu/cifraspreliminares2012.htm.
Oficina Nacional de Estadística e Información de Cuba (ONEI). (2016). Anuario Demográfico deCuba. http://www.one.cu/anuariodemografico2016.htm.
Oficina Nacional de Estadística e Información de Cuba (ONEI). (2017). El envejecimiento de laPoblación Cubana. Cuba y sus Territorios. http://www.one.cu/publicaciones/cepde/envejecimiento/envejecimiento2016.pdf.
Peláez, M. & Palloni, A. (2001). Encuesta sobre salud, bienestar y envejecimiento. Washington,DC: División de Promoción y Protección de la Salud, Organización Panamericana de la Salud.http://envejecimiento.csic.es/documentos/documentos/paho-salud-01.pdf.
Pan American Health Organization. (2012). Cuba report. http://www.paho.org/salud-en-las-americas-2012/index.php?option=com_docman&view=download&category_slug=hia-2012-country-chapters-22&alias=125-cuba-125&Itemid=125&lang=en.
Peciña,M. (2008). Les femmes cubaines à l’épreuve de la crise économique.Cahiers des Amériqueslatines, 57–58, 159–172.
Proveyer, C., Fleitas, R., González, G., Munster, B., & César, M. (2010). 50 años después: Mujeresen Cuba y cambio social (p. 28). OXFAM Internacional: Informe de Investigación.

336 B. Destremau
Rodríguez Miranda, E., Olivera Álvarez, A., Garrido García, R. J., & García Roque, R. (2002).Maltrato a los ancianos: Estudio en el Consejo Popular de Belén, Habana Vieja. Revista Cubanade Enfermería, 18(3), 144–153. http://scielo.sld.cu/scielo.php?script=sci_arttext&pid=S0864-03192002000300003.
Romero Almodóvar, M. (2014). De lo simbólicamente exacto a lo simbólicamente verdadero.Domésticas y revolución en Cuba: Entre cambios y desafíos (Documento de Trabajo). BuenosAires: CLACSO. http://biblioteca.clacso.edu.ar/clacso/becas/20141128035630/ensayomagelaromero.pdf.
Tronto, J. C. (1993). Moral boundaries: A political argument for an ethic of care. Psychology Press.Vera Estrada, A., & Diaz Canals, T. (2008). Family, marriage and households in Cuba. In C. B.Hennon&S.M.Wilson (Eds.),Families in a global context (pp. 465–491). NewYork: Routledge.
Vera Estrada, A. & Socarrás, E. (2008). ¿Modelos de familia en Cuba? Una aproximación desdela cultura. In A. Vera Estrada, & D. Robichaux (Eds.), Familias y culturas en el espacio lati-noamericano (pp. 63–102). La Habana, Cuba: Instituto Cubano de Investigación Cultural JuanMarinello; Ciudad de México, México: Universidad Iberoamericana.
Whiteford, L. M., & Branch, L. G. (2007). Primary health care in Cuba: The other revolution.Rowman & Littlefield Publishers.
Zabala Argüeles, M. D. C. (2010). Familia y pobreza en Cuba. Estudio de casos. La Habana, Cuba:Publicaciones Acuario, Centro Félix Varela.

Chapter 16Determinants of Informal Care Supplyfor Older Adults in Yucatan, Mexico
Sean Angst, Emma Aguila and Mariana López-Ortega
Abstract In this study, we analyze factors that determine the likelihood of an indi-vidual undertaking caregiving responsibilities as well as the time spent providingassistance. We utilize a large sample of older adults (N � 2821) from a surveywith rich information at the child and household member level (N � 16,014) inthe State of Yucatan, Mexico. We define caregivers as those that provide assistancewith activities of daily living (ADLs) to an older adult—both those living inside andoutside the household—and non-caregivers as any person living in the householdas well as children living outside that do not provide care. The Heckman two-stepprocedure is employed to account for sample selection bias in the analysis. We findthat 77.7% of caregivers were women and 22.3% were men. In addition, daugh-ters were most likely to take on the role as caregiver. A larger proportion of menin comparison to women worked while providing care, and women provided morehours of care work per month on average than men. We find that caregivers havelower educational attainment, a lower proportion worked, and a higher proportionlived with the older adult in comparison to non-caregivers. Also, non-caregiversprovide a higher amount of monetary and in-kind transfers to older adults on aver-age. The oldest adults—80 years and older—and those with the worst health statusare more likely to receive care and received higher amounts of caregiving time.Moreover, older women are more likely to receive care than older men. Taking upcaregiving activities reflects a two-way decision-making process consisting of older
S. Angst (B) · E. AguilaSol Price School of Public Policy, University of Southern California, Los Angeles, CA, USAe-mail: [email protected]
E. Aguilae-mail: [email protected]
M. López-OrtegaResearch Department, National Institute of Geriatrics, Instituto Nacional de Geriatría), NationalInstitutes of Health of Mexico (Institutos Nacionales de Salud de México), Mexico City, Mexicoe-mail: [email protected]
© Springer Nature Switzerland AG 2019W. A. Vega et al. (eds.), Contextualizing Health and Aging in the Americas,https://doi.org/10.1007/978-3-030-00584-9_16
337

338 S. Angst et al.
adult needs and caregiver characteristics influenced by societal and economic struc-tures. Taking into account the increasing needs for older adult caregiving in Mexicodue to changes in life expectancy and family composition, this model of informalcaregiving is unsustainable and requires intervention.
Introduction
As a result of demographic transition, the older adult population inMexico—definedas those 60years andolder by theLawof theRights ofOlderAdults (DOF2002)—hasbegun to expand rapidly and will continue to do so in the future. Specifically, theratio of older adults to those of working age is predicted to increase from 7.6 in 2000to 30.0 in 2050—growing to roughly 35 million people (Aguila et al. 2011). Thistrend is especially important to consider as the poverty rate for older adults is almost30% (Aguila et al. 2011). Most workers in Mexico are in the informal sector anddo not contribute to a social security system (Perry et al. 2007). Consequently, theymust depend on family support or government programs such as non-contributorypensions or supplemental income for older adults, which offer significantly smallerbenefits than social security (García and de Oliveira 2001; Escandón 2006, 2011;García Guzmán 2007; Aguila et al. 2011).
This demographic transition is taking place amidst changes in the epidemio-logical profile of the population characterized by increasing rates of chronic non-communicable diseases, decreasing number of children and changing family struc-tures, increased women’s participation in education and economic activities outsidethe household, and changes in cultural norms and values—all of which pose impor-tant challenges for adequate support and care for older persons (Angel et al. 2014).
First among these challenges are the growing number of older adults andincreasing prevalence of chronic diseases. Consequences from this trend includefunctional disability most directly and generate more complex care needs. However,public health and social care services for older adults is scarce and formal publiclong-term care services are not included in the Mexican health care system, whichremains highly segmented despite improvements in the recent decade. Mexico’spublic insurance option, Seguro Popular, has worked to alleviate disparities inaccess to care but it does not include the provision of formal care for the olderadult population (Gutiérrez Robledo, López-Ortega, and Arango Lopera 2012). Thissituation puts increasing pressure on non-paid familial caregiving, predominantlywomen, who already take up most care for older adults (Robles Silva 2001, 2005;Pelcastre-Villafuerte et al. 2011; López-Ortega 2014; Mayston et al. 2017).
Secondly, most informal care for older adults is provided by a spouse/partner andadult children. Thus, changes in family structure, levels of marital dissolution, andcomplex family relations may further effect the availability of care. In Mexico, as inother countries, decreased fertility implies fewer children and limits the availabilityof children to provide unpaid care in the near future. Fertility decline has broughtsmaller family size where members are less able to substitute monetary and in-kind

16 Determinants of Informal Care Supply for Older Adults in Yucatan, Mexico 339
transfers to older adults for caregiving responsibilities. In Mexico, the organizationof caregiving responsibilities is governed primarily by the availability of potentialcaregivers and gender relations (Rivero 2011). Consequently, caregivers have beenobligated to take on additional care time as family size has decreased and fewersiblings are available to share in responsibilities (Gutiérrez Robledo et al. 2012;López-Ortega 2014).
In regards to the availability of spousal caregiving, marriage dissolution wasuncommon among current generations of older adults and divorce rates very low(Quilodrán de Aguirre 1974; Sosa Márquez 2011; INMUJERES 2015). Currently,most adults 60 years and older are married or partnered—with only 8% of womenand 5.4% of men in this age group reporting being divorced or separated in 2010(INMUJERES 2015). Therefore, care support by the spouse is still highly available,but there are important differences betweenmen and women. Given women’s greaterlife expectancy compared to men and their lower probability of remarriage, spouseor partner care for women is much less available. This is clearly seen in the propor-tion of women that are widowed compared to men—34% versus 13% respectivelyin 2012 (Wong et al. 2015).
Beyond the total number of potential caregivers available to an older adult, abilityand willingness to provide unpaid care are also determined by filial obligation andgender relations. In Mexico, strong family ties have created a cultural preference forfamily care (Radina 2007; Pelcastre-Villafuerte et al. 2011; Robles and Pérez 2012).While filial obligation remains high, intergenerational differences and competingresponsibilities are changing perceptions on who is responsible for older adults andwho should provide such care. A recent survey showed that while approximately60% of Mexicans are willing to care for their parents when they are old, between60 and 70% report that children care for their parents less frequently than before(Lopez-Ortega and Gutiérrez Robledo 2015). Other studies have shown that whileyounger generations are still willing to care for their parents, they think care givingis the responsibility of all children—regardless of their gender—and should be ashared task (Robles and Pérez 2012). Therefore, current norms and conditions mayhinder future ability and willingness to provide care.
Finally, societal institutions and cultural beliefs shape gender relations and setpreferences related to women’s participation in care work (De Oliveira and Ariza1999; Sanchís 2011; García and de Oliveria 2007). These normative standardsbecome internalized and used to designate the role of caregiver as a natural extensionof femininity (Mendez-Luck et al. 2008). Traditionally, women have been viewedas holding intrinsic qualities that make them more adept for care work while malechildren have been held as sub-optimal options (Evans et al. 2012; Robles and Pérez2012). This obfuscates the power dynamics and socialization that sort women intocaregiving roles (Folbre 2012). Social pressure and gender expectations from bothfamily and society begin in early childhood and increase the likelihood that womenparticipate in care work from a young age (Clark and Huttlinger 1998; Mendez-Lucket al. 2009). Further, women face heightened stigma when opting out of care workwhile men are readily accepted for engaging in external opportunity and provid-ing monetary assistance rather than physical and emotional support (Radina 2007;

340 S. Angst et al.
Mendez-Luck et al. 2009; Friedemann and Buckwalter 2014). This socialization pro-cess and resulting belief structure leads to asymmetric determinants of taking up careactivities between men and women. These asymmetries are clear in Mexico wheremultiple studies have shown that domestic work and informal care are performedmostly by women—independent of their work or employment status—and their par-ticipation in extra-domestic activities has increased, while men have scarcely corre-sponded to increasing participation in household work and care for other householdmembers (Merino Dorantes 2010; INEGI 2014; Galindo Vilchis et al. 2015; Santoyoand Pacheco 2016).
The effect of these gender dynamics and familial relationships on older adultcaregiving has been evidenced in research throughout Mexico. Studies continuallyfinds that women—specifically spouses and daughters—disproportionally providecare (Spitze andLogan1990;Varley andBlasco2000;BergstromandHeymann2005;Mendez-Luck et al. 2008; Henz 2010; Gutiérrez Robledo et al. 2012; López-Ortega2014). Using the National TimeUse Survey in 2012, López-Ortega (2014) found thatwomen comprised 63% of older adult caregivers in Mexico and were the primarysource of assistance for all activities except accompanying older adults to medicalvisits.Moreover, roughly 78%of caregiverswere between the ages of 20 and 59 yearsof age—a period in which women may be responsible for their own dependentchildren as well as providing older adult care. In contrast, men’s support appearsmainly limited to financial assistance. Previous studies have also documented thathigher income family members, particularly men, opt out of caregiving by providingfinancial assistance instead of physical support (Folbre 2012).
In the economics literature, on the other hand, the decision to care has beenframed through time and budget constraints from which human capital decisionsare made. This model was first proposed by Gary Becker and acknowledges thatparent’s investment in children early in life results in altruistic pressure and life coursereciprocity (Becker 1965). In turn, this allows for reliance on children in later yearsand insulates parents from risk (Becker 1981). Further, the division of labor within ahousehold or family may be viewed as a problem of time allocation and opportunitycosts. Family members with more time availability and lower opportunity costs maybe more likely to take caregiver roles. Family members face varying degrees ofcomparative advantage in deciding how to distribute limited time among caregiving,employment, recreation time, and other activities in order to maximize their utility(Stone and Short 1990; Shelton and John 1996; White-Means and Rubin 2004). Thiseconomic model, however, fails to fully recognize the particular constraints facingwomen as social and economic actors previously reviewed.
This chapter has two primary research goals. First, to analyze how older adultcaregiving is distributed among families by gender and relationship. Second, to deter-mine how individual and older adult characteristics affect the process of assumingcaregiver roles and time allocated to caregiving. This study provides evidence ofthe characteristics that impact the likelihood of providing care as well as time spentassisting with ADLs along the dimensions of gender, familial relationship, educa-tion, labor force participation, family income and transfers, age, health, and livingarrangements. Our unique data set allows for a more thorough examination of the

16 Determinants of Informal Care Supply for Older Adults in Yucatan, Mexico 341
role family structures play in caregiving decisions. Furthermore, we include a rangeof health and disability indicators for older adults that have not previously beenavailable and are crucial to decision making processes regarding care work. Thisavailability of new data combined with a large sample size opens up our ability totease out the drivers of caregiving, which will allow for better understandings offuture needs and key sites of potential interventions.
For the purpose of this study, we employ the Heckman selection model, whichallows for a more thorough investigation into the specific mechanisms governingolder adult care provision. Research focusing on informal caregiving in Mexico hasnot considered sample selection issues that can lead to biased results (Varley andBlasco 2000; Bergstrom and Heymann 2005; López-Ortega et al. 2008; Mendez-Luck et al. 2008, 2009; López-Ortega 2014). Examining care time at the family levelpresents a unique opportunity to examine the ways caregiving decisions are madewithin familial structures and the differing factors that influence men’s and women’sparticipation in care work. The model allows for the estimation of determinantsleading to the role of caregiver as well as the provision of care time allowing for amore robust and nuanced understanding of the mechanisms in play.
Methods
We use baseline data from a longitudinal survey aimed at investigating the effects ofa non-contributory pension program for adults age 70 and older. The survey was col-lected in August–November 2008 in the Mexican state of Yucatan. The surveys wereconducted in households with individuals 70 years old or older in the cities of Val-ladolid (45,868 inhabitants) and Motul (21,508 inhabitants) and include extensiveinformation on individual, household, and family characteristics regarding social,economic, and health indicators. Response rates computed using American Associ-ation for Public Opinion Research guidelines (The American Association for PublicOpinion Research 2011) were 91.5% in Valladolid and 95.3% in Motul. The institu-tional review board of Rand Corporation and the State of Yucatan approved the studyprocedures (Protocol approval number 2008-0513-CR07). Complete descriptions ofthe protocols of the implementation for the research project are available elsewhere(Aguila et al. 2014, 2015a, b).
In Valladolid and Motul, a total of 2821 individuals were surveyed—1580 and1241 participants in each city respectively. At baseline, 1375 respondents—48.7%of the total respondents—reported difficulty performing Activities of Daily Living(ADLs), with women reporting slightly higher prevalence than men at 51.0 and46.2% respectively. In addition, those over the age of 80 were most likely to reportdifficulties. Among those reporting difficulty performingADL’s, only 40% (n� 550)stated that they had received help from a caregiver, leaving the other 60% withoutassistance and possible unmet needs. Of respondents with difficulties, 44.3% ofwomen received help compared to 34.5% of men. Additionally, data was collectedon family structure and relationships as well as personal information and caregiving
342 S. Angst et al.
obligations for the children of participants inside and outside the household as wellas other household members. Data was gathered on 16,796 family and householdmembers. In total, data was collected on 707 ADL caregivers at baseline. The sampleutilized is at the caregiver level and therefore restricted to individuals providingassistance with ADLs.
Outcomes
The dependent variables for our study were a binary indicator for whether or notan individual was a caregiver (1 � yes, 0 � no) and a continuous variable withthe number of caregiving hours provided each month. Caregivers were defined asindividuals providing an older adult with assistance on activities of daily living(ADLs) which includes eating, bathing, getting in and out of bed, using the toilet,and dressing. ADLs were chosen as the focus for this work because they typicallyrequire the most significant amount of care time and have the highest intensity inregard to effort. In addition, ADLs are more precisely reported than instrumentalactivities of daily living (IADLs) such as preparing meals, shopping for groceries,taking medications, and managing money.
In the survey, participants were asked several questions related to ADLs. First,respondents were asked if they have difficulty performing an ADL activity. Whenrespondents reported having an ADL difficulty, they were asked whether theyrequired assistance. Then, participants were given the opportunity to list any per-son who assisted them with the activities falling into this designation and the totalamount of care time provided by that individual. Care time was reported in twoways,number of days the caregiver assisted in the previous month and average hours pro-vided on those days. These measures were multiplied and top-coded to determinethe total amount of time spent on assisting the older adult each month. The totalamount of caregiving hours for a given month was top-coded at 480 h, or 16 h perday. We define caregivers as those that provide assistance with activities of dailyliving (ADLs) to an older adult—both those residing inside and outside the house-hold—and non-caregivers as any person living in the household as well as childrenliving outside that do not provide care.
Covariates
We include covariates that capture dimensions relevant to the decision to care andthe number of hours spent assisting with ADLs.
Time Availability External time constraints play an important role in caregivers’ability to provide assistance. To reflect this notion, employment and living arrange-

16 Determinants of Informal Care Supply for Older Adults in Yucatan, Mexico 343
ments were used. Employment was represented by a dummy variable indicatingwhether an individual worked at the time of observation, work (1 � yes, 0 � no).Living arrangements were measured by a dummy variable indicating whether anindividual lived in the same home as the participant, lives inside the household (1 �yes, 0 � no).
Relationship to Caregiver The relationship between care-giver and older adult wasrepresented using a categorical variable indicating whether the caregiver was aspouse, son, daughter, grandson, granddaughter, or other relation.
Relative Resources and Intergenerational Transfers To measure caregiverresources, education level was used as a proxy for economic and social sta-tus. Education level was measured with the number of years of schooling. Fourcontinuous variables were used to capture intergenerational monetary transmissionrepresenting older adult-to-caregiver and caregiver-to-older adult monetary andin-kind transfers over the past month. These variables capture aspects of reciprocity.Caregivers receiving transfers are expected to provide more care in return whereasthose providing transfers to the older adult substitute away from care time.
Older Adult Characteristics Determinants of caregiving are composed of caregivertraits as well as attributes of the older adult. The needs and vulnerability of olderadults influence the amount and intensity of assistance required. We included thefollowing: gender (1 � woman, 0 � men), marital status (1 � married or consensualunion, 0 � single, divorced, separated or widowed), monthly income of the selectedrespondent andher/his partner or spouse, number of chronic diseases (1� twochronicconditions or more, 0 � up to 1 chronic condition), frailty (not frail, pre-frail, andfrail), and number of ADL limitations (eating, bathing, getting in and out of bed,using the toilet, and dressing).
Chronic conditions and ADL limitations are self-reported. Chronic conditionsinclude cancer, hypertension, diabetes, respiratory problems, liver disease, stroke,and heart disease. Frailty was measured using a slight modification of Fried’s frailtyphenotype (Fried et al. 2001) based on performance measurements of grip strengthand walking speed, and self-reported survey of weight loss, exhaustion, and physicalactivity. After generating a summary measure of deficits (0–5), following Fried andcolleagues, those who scored 0 on the summary measure were classified as not frail,those who scored 1 or 2 as pre-frail, and those who scored 3 or higher as frail (Aguilaet al. 2018).
Limitations
Although the study presented utilizes a large sample of older adults and a rich setof health and socioeconomic variables for caregivers some limitations remain. First,data on time spent providing assistance with ADLs is based on information self-reported by older adult’s rather than by the caregiver directly. The questions pertain

344 S. Angst et al.
to the days assisted in a regular month and hours provided on a regular day so weare unable to capture fluctuations or changes in caregiver responsibilities within thetime period. This has the potential for over-reporting as time spent caring may beembedded into other domestic activities or care of other people within the household.Second, data on the caregiver characteristics is somewhat limited as we do not haveinformation on occupation, marital status, or number of children. This informationwould allow for more detailed analysis that includes competing responsibilities tocare time.
Statistical Analysis
We calculated descriptive statistics of the sample in order to differentiate older adultsthat receive assistance with ADLs and those that do not receive assistance in additionto characterizing caregivers and non-caregivers among children and other householdresidents. Tests for differences between these groups were performed using t-test forcontinuous variables and the chi-square test for categorical variables.
Heckman two-step procedure was employed to accurately model the sequenceof decisions made between families, caregivers, and the older adult when allocatingcare time (Heckman 1976, 1977, 1979). For an unbiased OLS model, an assump-tion is required that caregivers are randomly selected or completely absent in thesample (Duan et al. 1984; Briggs 2004). Non-random selection becomes a point ofconcern because individuals chosen to become caregivers may differ in unobservableways from those whom were not. Instead, the Heckman method captures the initialmechanism, which leads particular individuals to be selected as caregivers, followedby a secondary process determining the amount of time provided under individualconstraints (Chari et al. 2015).
The two-step procedure is conducted to take into account the truncated natureof our sample, which has the potential to introduce selection bias into estimates(Heckman 1976, 1977, 1979). This bias results from the fact that data on care timeis only available for individuals that provided assistance with ADLs thus censoringthe sample at zero. This would present less of an issue if unobserved factors relatedtaking on the role of caregiver were not correlated to the amount of time allocatedto caregiving. Characteristics such as motivation or empathy make this conditionuntenable, however, as their effects would be present in both instances causing theerror term to be correlated between the selection and outcome equation.
First, a selection equation was developed to describe the process of taking on therole of caregiver. Estimates were made using a probit model with dependent variable,z, equal to 1 if the individual provided assistance with ADLs and 0 otherwise. Theselection equation was modeled as:
z′i � α0 + α1C
′i + α2P
′i + ui
16 Determinants of Informal Care Supply for Older Adults in Yucatan, Mexico 345
z∗i �
{1 if z′
i ≥ 0
0 otherwise
where Ci is a vector of observed attributes for caregivers consisting of age, rela-tionship to the older adult, employment status, educational attainment, and livingarrangements. Individual-level characteristics have dual interpretation—they mayreveal the traits that influence processes of taking up caregiving activities or theeffects of social conditioning that these decisions reinforce. The vector Pi representsinformation related to the older adult’s age, gender, education, income, chronic dis-ease, and frailty. These older adult attributes are particularly important as observed inprevious literature because they define the circumstances that necessitate care. Thestochastic error term is represented as ui.
Next, a structural equation was estimated to predict the total time provided forADL assistance by caregivers each month, yi. This equation uses the estimated prob-abilities of being selected from the first stage to compute the Mill’s ratio, �, andadjust for the sample structure issues previously discussed. The equation was writtenas:
yi �{
β0 + β1X′i + β2W
′i + β�� + εi if z∗
i ≥ 0
missing otherwise
where Xi is a vector of caregiver traits including gender, employment status, educa-tional attainment, living arrangement, and family member-to-older adult transfers,Wi represents a vector for older adults characteristics including their marital status,older adult-to-caregiver transfers, and the number of ADLs for which the older adultreceives assistance, and εi is the error term.
The inverse Mill’s ratio captures the covariance between error terms such thatE( 2i|ui) � β�ui . This ratio utilizes coefficient estimates produced in the selectionequation to adjust for the probability of assuming the role of caregiver. By includingthe inverse Mill’s ratio as an additional regressor in the structural equation, sampleselection bias is corrected allowing for more consistent estimates. Importantly, thesignificance of the inverse Mill’s ratio indicates whether selection bias was present.This is determined by interpreting the correlation between the omitted variables inthe selection and structural equations (Heckman 1976, 1977, 1979). If theMill’s ratiois significant, then, OLS estimates are presumed biased without correction becausethere are unobserved differences between those who provide care and those that donot. That is, there are specific characteristics that make individuals more or less likelyto provide assistance with ADLs.
Estimates were produced using OLS and corrected for the selected sample ofcaregivers. The variables for caregiver relationship and age were eliminated fromthe structural regression to satisfy the exclusion restriction laid out by Heckman(1979). This restriction states that if the outcome equation’s caregiver traits, Xi, con-tains one or more variables not included in the selection equations caregiver traits,Ci, concerns around multi-collinearity of the Mill’s ratio are significantly alleviated

346 S. Angst et al.
Table 16.1 Sample characteristics and test of differences between care recipients and non-carerecipients
Variables Care recipient Non-care recipient P-value
Age groups (%)
Less than 70 27.3 48.4 0.000
75–79 23.1 26.0
80 or older 49.6 25.6
Spouse/Partner (1 � yes, 0 � no) (%) 44.0 52.8 0.000
Female (1 � yes, 0 � no) (%) 61.8 51.1 0.000
Years of Schooling (mean, sd) 1.9 (0.1) 2.3 (0.1) 0.001
Monthly Transfers from Older Adult toFamily Member ($MXN) (mean, sd)
Money transfer 42.7 (11.5) 34.9 (6.0) 0.547
In-kind transfer 5.4 (3.5) 8.5 (2.1) 0.443
Monthly income: older adult and spouse/partner (%)
Less than 100 $MXN 36.4 30.7 0.007
100–1200 $MXN 35.6 34.8
More than 1200 $MXN 28.0 34.6
Chronic Conditions (1 ≥ 2, 0 � 0–1) (%) 23.1 11.9 0.000
Frailty (%)
Not frail 6.2 24.2 0.000
Prefrail 79.8 67.2
Frail 14.0 8.6
No. of ADL Limitations (mean, sd) 3.2 (0.1) 1.0 (0.0) 0.000
Observations 550 2271
and identification strengthened. The validity of this exclusion depends on a theoret-ical backing that caregiver relationship and age have a substantially greater impacton caregiver selection than overall caregiving time. These theoretical assumptionsappear valid based on previous research that asserts daughters and spouses are mostlikely to take on caregiving responsibilities and that caregivers are typically prox-imate in age to the older adult—young enough to provide care, yet old enough tohave reduced likelihood of dependents or other sizeable time commitments. Theo-retically, these variables influence the likelihood of becoming caregiver and proxyfamilial dynamics, but once an individual takes on the role, these attributes hold farless impact on the amount of time provided (Table 16.1).
Relationship and age take on a diminished role in the amount of care time pro-vided as competition among potential caregivers is sharply reduced after selectionbecause the majority of caregiving responsibilities are typically allocated to a sin-gle individual. For example, daughters are more likely to serve as caregiver thansons, but this designation will not affect the time allocated after the role is assumed.

16 Determinants of Informal Care Supply for Older Adults in Yucatan, Mexico 347
Instead, care time is governed by the extent to which help is required by the olderadult, reciprocity, time availability, and schedule flexibility of the caregiver. Thesethemes are reflected in the variables included in the outcome equation. The exclusionof the relationship and age variables is substantiated through the descriptive data thatdisplays statistically significant differences between caregivers and non-caregiversalong these dimensions (Table 16.2).
We estimated three models. First, a model including the full sample of non-caregivers and caregivers (Table 16.3, Model 1). Then, models were estimated forwomen andmen caregivers separately in order to capture possible gender differences(Table 16.3, Models 2 and 3). These models not only allow for estimations of thedeterminants related to taking on caregiving, but also the amount of time allocatedto these activities. The Heckman selection model better replicates the real-worldscenario of caregiving and the life-cycle events that affect these choices. Initially, themodel estimates the likelihood of a particular family member providing caregiving.Then, the amount of care provided by each individual is estimated utilizing caregivercharacteristics and attributes of the older adult that further impact availability andresult in more or less demand for time.
Results
Descriptive Statistics
The older adults in the study totalled 2821 individuals, 53% were women and aver-age age was 76.9 years (with standard deviation of 6.8). Data indicates that withthe exception of transfers from older adults to other family members, there are sta-tistically significant differences (p � 0.000) between older adults receiving care forADLs and thosewho did not. Care recipients are largely concentrated amongwomen,the oldest adults, those without a spouse, individuals with lower educational attain-ment and those with worse health status—difficulty performing a higher number ofADLs, stating two or more chronic conditions, and frailty diagnoses (Table 16.1).
After taking into account missing data on the indicators utilized, data was col-lected on 16,014 children and other household members, of which 692 (4.3%) pro-vided ADL care. Among caregivers, 77.7% were women and 22.3% men. In exam-ining the relationship between caregivers and their respective respondent, daughterswere found to be the most heavily represented group composing 40.5% of the sam-ple followed by wives, sons, and grandchildren whom represented 16.0, 12.2, and8.4% respectively. The proportion of caregivers that were employed varied sharplybetweenmen andwomen— this difference is statistically significant (p� 0.000) withonly 21.2% of women working and providing care compared to 59.3% of men (seeTable 16.2). Among caregivers, those assisting with ADL activities devoted 208.8 hper month on average—women providing a mean of 213.4 h and men 183.2 h. More-over, significant differences were four between employed caregivers average time

348 S. Angst et al.
Table16.2
Childrenandho
useholdmem
bercharacteristics,by
gend
er
Variables
Wom
enMen
p-valueforgend
erdifferences
Caregivers
Non
-caregivers
P-value
Caregivers
Non
-Caregivers
P-value
Fullsample
Caregivers
Non
-caregivers
Age
grou
p(%
)
12–1
94.3
4.9
0.00
08.4
8.1
0.000
0.00
00.00
00.00
0
20–2
95.8
8.1
8.4
20.0
30–3
914
.920
.617
.531
.8
40–4
921
.231
.118
.220
.9
50–5
920
.820
.612
.36.5
60–6
918
.88.3
28.6
6.7
70or
older
14.3
6.4
30.3
6.0
Relationshipto
samplerespon
dent
(%)
Spouse
21.0
8.9
0.00
030
.36.0
0.000
0.00
00.00
00.00
0
Daughter/son
53.3
76.0
51.0
78.3
Grand
daug
hter/grand
son
10.2
8.5
11.0
10.0
Other
15.4
6.7
7.6
5.7
Work(1
�yes,0
�no
)(%
)21
.230
.70.00
059
.381
.90.000
0.00
00.00
00.00
0
Yearsof
Scho
oling(m
ean,
sd)
5.0(0.2)
5.7(0.0)
0.00
05.5(0.3)
6.6(0.1)
0.002
0.00
00.15
30.00
0
Lives
Inside
Hou
seho
ld(1
�yes,0
�no
)(%
)78
.432
.70.00
077
.930
.00.000
0.00
00.89
10.00
0
Mon
thlytran
sfersfrom
familymem
berto
olderad
ult($M
XN)(m
ean,
sd)
Mon
eytransfer
2.4(1.9)
8.2(2.9)
0.09
51.3(1.3)
22.8(9.0)
0.018
0.27
10.76
20.28
0
In-kindtransfer
1.1(0.9)
1.0(0.5)
0.93
60.0(0.0)
0.5(0.2)
0.015
0.32
50.52
90.37
3
HoursPermonth
assistingwith
ADLs(m
ean,
sd)
213.4(8.3)
––
183.2
(15.0)
––
0.00
00.08
3–
No.
ofob
servations
538
7697
154
7625

16 Determinants of Informal Care Supply for Older Adults in Yucatan, Mexico 349
Table 16.3 Hours of caregiving for ADLs and selection equation results by sex of caregiver
Total Women Men
Model 1 Model 2 Model 3
(1) Hours of caregiving b SE b SE b SE
Caregiver characteristics
Female (1 � yes, 0 � no) 3.029 (19.438)
Work (1 � yes, 0 � no) −16.146 (18.172) −27.915 (21.496) 0.787 (35.434)
Years of Schooling −4.112* (1.834) −4.636* (2.088) 0.290 (4.187)
Lives Inside Household(1 � yes, 0 � no)
26.070 (30.869) 84.815* (35.869) −97.850 (66.671)
Transfers from family member to older adult ($MXN)
Money transfer −0.226 (0.174) −0.156 (0.177) −0.797 (0.908)
In-kind transfer −0.115 (0.360) −0.064 (0.361)
Older adult characteristics
Spouse (1 � yes, 0 � no) 23.406 (15.958) 7.317 (18.721) 45.101 (34.538)
Monthly transfers from older adult to family member ($MXN)
Money transfer 0.013 (0.034) 0.044 (0.074) 0.031 (0.041)
In-kind transfer 0.020 (0.049) 0.024 (0.053) −0.573 (0.363)
Monthly income: older adult and spouse
100–1200 $MXN −19.981 (17.469) −26.395 (19.472) −9.621 (40.847)
More than 1200 $MXN 5.424 (18.829) −5.880 (21.925) −10.378 (40.415)
No. of ADL limitations 24.492*** (4.896) 29.011*** (5.645) 12.747 (10.118)
Constant 209.279** (69.674) 80.249 (69.595) 562.748*** (170.310)
Number of observations 13,996 7210 6786
(2) Selection equation:caregiver (1 = yes, 0 = no)
b SE b SE b SE
Caregiver characteristics
Age groups
12–19
20–29 0.068 (0.121) 0.046 (0.153) 0.000 (0.204)
30–39 0.262* (0.131) 0.390* (0.161) −0.148 (0.238)
40–49 0.299* (0.134) 0.411* (0.166) −0.031 (0.238)
50–59 0.308* (0.140) 0.440* (0.173) −0.021 (0.249)
60–69 0.531*** (0.148) 0.672*** (0.182) 0.204 (0.267)
70 or older 0.286 (0.162) 0.430* (0.195) 0.159 (0.302)
Relationship
Spouse −0.215* (0.104) −0.079 (0.122) 0.094 (0.221)
Son −0.418*** (0.068) (0.000) (0.000)
Grandson −1.033*** (0.144) (0.000) −0.671*** (0.200)
Granddaughter −0.490*** (0.118) −0.459*** (0.132) (0.000)
(continued)

350 S. Angst et al.
Table 16.3 (continued)
Total Women Men
Model 1 Model 2 Model 3
Other −0.459*** (0.079) −0.263** (0.091) −0.475** (0.160)
Work (1 � yes, 0 � no) −0.274*** (0.051) −0.212** (0.067) −0.162 (0.093)
Years of schooling 0.003 (0.006) 0.003 (0.008) 0.006 (0.011)
Lives inside household(1 � yes, 0 � no)
1.302*** (0.059) 1.424*** (0.072) 1.036*** (0.107)
Older adult characteristics
Age groups
75–79 0.152** (0.058) 0.155* (0.071) 0.129 (0.104)
80 or older 0.351*** (0.058) 0.378*** (0.070) 0.279** (0.108)
Spouse (1 � yes, 0 � no) −0.158** (0.054) −0.123 (0.065) −0.185 (0.101)
Female (1 � yes, 0 � no) 0.211*** (0.049) 0.388*** (0.066) 0.064 (0.096)
Years of schooling 0.021* (0.009) 0.013 (0.011) 0.034* (0.016)
Monthly income: older adult and spouse
100–1200 $MXN −0.073 (0.052) −0.100 (0.062) −0.010 (0.098)
More than 1200 $MXN −0.076 (0.055) −0.163* (0.067) 0.107 (0.098)
Chronic conditions (1 > �2, 0 � 0–1)
0.223*** (0.055) 0.277*** (0.067) 0.116 (0.102)
Frailty
Prefrail 0.553*** (0.077) 0.534*** (0.089) 0.596*** (0.156)
Frail 0.573*** (0.096) 0.580*** (0.113) 0.563** (0.186)
Constant −3.100*** (0.168) −3.386*** (0.205) −3.161*** (0.306)
Mills ratio (λ) −50.253* (24.751) 2.651 (27.664) −174.682** (59.563)
Number of observations 13,996 7210 6786
Notes *p < 0.05, **p < 0.01, ***p � 0.000. Reference categories are: 0–100 $MXN, 12–19 years old, daughteror son, less than 75 years old, and not frail
caregiving, 171.6 h, compared to those that were unemployed at 223.0 h. Similarly,caregivers living outside the household provided significantly less time, 162.9 h, thancaregivers co-residing with the holder adult, 216.8 h.
In the full sample, additional statistically significant differences were foundbetween men and women caregivers with respect of their age, relationship to theolder adult, work status, educational attainment, living arrangements, and time spentassisting with caregiving activities (p � 0.000). Within each gender, differencesbetween caregivers and non-caregivers emerged in regards to age, relationship toolder adult, work status, years of schooling, and living arrangements (p ≤ 0.005).It is worth highlighting that men have higher years of schooling than women andnon-caregivers have higher years schooling than caregivers among men and women.

16 Determinants of Informal Care Supply for Older Adults in Yucatan, Mexico 351
Model Estimations
Findings display clear differences betweenmen andwomen in the factors influencingthe role of caregiver as well as the time provided for ADL assistance. Daughters aremost likely to take on the role of caregiver, with sons, grandsons, granddaughters,spouses and other relations being significantly less likely to provide care (Table 16.3,Model 1). Employment affects the likelihood that an individual partakes in caregiv-ing responsibilities negatively with statistically significant results, while educationappears insignificant in the process. For those living inside the household, a positiveand statistically significant effect is observed. Also, as caregivers get older—up tothe age of 69—a positive and statistically significant effect is observed, especially forwomen. In regards to the older adult characteristics, an individual’s likelihood of tak-ing part in caregiving increased with the older adult’s age and educational attainmentas well as for those assisting older women. Income was not found to be statisticallysignificant, although it did have an increasingly negative correlation in the selectionequation. In addition, the probability of caregiving was reduced for those connectedto an older adult that had a living spouse.Metrics related to older adult health were allfound to have a statistically significant and positive effect in the selection equation.Individuals attached to an older adult with two or more chronic diseases, or definedas pre-frail or frail were more likely to take on the role of caregiver.
For the full sample, Table 16.3 Model 1 indicates that only the caregiver’s yearsof schooling and the number of ADLs for the older adult have a statistical signifi-cant impact on caregiving hours. For each additional ADL, caregiving increases byroughly 24.5 h per month on average, and for each additional year of school care-giving hours decreased by 4.1 h. The remainder of variables were not statisticallysignificant.Women caregivers were positively correlated with care time as was livingwithin the older adult household and transfers from the older adult to caregiver, whileemployment and transfers from caregiver to older adults were negatively associated.
Examining Model 2 in Table 16.3—the women only sample—comparable pointsof significance and trends are observed in the selection equation. Older womenwere most likely to take on the role of caregiver with the largest magnitude forthose between the ages of 60 and 69. Living in the household of an older adultsignificantly increased the likelihood of providing carewhereas employment reducedthe likelihood. Interestingly, the men only sample shown in Model 3 of Table 16.3contrasts these results by finding no statistical significance or clear pattern in regardsto caregiver age and employment status. Moreover, the impact of living within thesame household as the older adult had a lower impact for men than for women.
Examining the effect of older adult characteristics on the caregiver selection equa-tion reveals a similar pattern.Women largelymap the results found in the full sample,with greater likelihood of caregiving responsibilities associatedwith the oldest adultsas well as for those attached to older adult women. Furthermore, chronic disease andfrailty again proved to be influential in determining selection. In the women onlysample, we also note that for those assisting older adults within the highest incomebracket there is a statistically significant decrease in the likelihood of providing care

352 S. Angst et al.
(see Table 16.3, Model 2). Conversely, few variables proved statistically significantfor men—connection to the oldest adults, older adult educational attainment, andfrailty. High income and chronic disease were positively correlated to selection, yet,did not hold statistical significance for the men-only group (Table 16.3, Model 3).By interpreting the mills ratio in each model, we are able to discern whether thereis sample selection bias in the data. We find statistically significant selection in themen equation, but not for women (Table 16.3, Models 2 and 3). This suggests thatmen go through a specific selection process that depends primarily on the physicalcondition of the older adult whereas the selection of women varies along a numberof attributes—somewhat randomly—that are not as easily discerned due to socialconditioning and expectations.
In regards to the outcomeequations, that is, time spent assisting in caregiving activ-ities, we observe that the coefficients of caregiver characteristics have the expectedsign though most are not statistically significant. Similar patterns differentiating menand women are noted in the as observed in selection. In Table 16.3, Model 2 dis-plays that women living in the household provide 84.8 additional hours per monthof caregiving while men living inside were found to have a statistically insignificantcorrelation to care time. While women with higher educational attainment and thosethat were employed were negatively correlated to caregiving hours, men’s educa-tional attainment and work status had a weak positive correlation—although onlywomen’s education was significant. The latter may indicate that womenwith a higheropportunity cost in terms of human capital, provide a lower number of caregivinghours. Regarding monetary transfer from caregivers to the older adult, women expe-rienced a reduction in caregiving time of 9.4 min per month for each peso transferredwhereas men’s caregiving time decreased by 47.8 min per peso—this result however,was not statistically insignificant. In the end, no variables in the men only samplewere found to be statistically significant in determining care hours—including thetotal number of ADLs (Table 16.3, Model 3).
Discussion
This study advances research on informal care of older adults in Mexico by usinga large, representative sample from urban localities in the state of Yucatan. Thisdata allows for a richer characterization of caregiver determinants than provided bynational level studies or smaller qualitative research in the past. First, we describe dif-ferences in sociodemographic and health status characteristics by caregiving needsof the older adult respondents in the study. Then, we characterize children and house-holdmembers—that is, current and potential caregivers—in order to identifywhetherthey share similar characteristics or significant differences between groups. Last,following the Heckman selection model, we estimate the determinants of taking upcaregiving activities and time spent caring for older adults with difficulty performing

16 Determinants of Informal Care Supply for Older Adults in Yucatan, Mexico 353
ADLs. Given expected gender differences in taking up care giving and time spentassisting with care, we estimate the model separately for men and women.
Consistent with expectations, our findings provide clear evidence of genderinequalities in caregiving for older adults supporting previous studies on informalhealth care in Mexico (Robles Silva 2001, 2005; López-Ortega et al. 2007; López-Ortega 2014). Although employment, lower educational attainment, and co-residingwith older adults are significant in determining the role of caregiver, once caregivingresponsibilities are taken on, the dominant factor impacting time spent providingcare is the total limitations of the older adult. Additionally, co-residing with theolder adult has significant influence on time allocated to caregiving for women inparticular. Our findings suggest that, as women are more likely to take on caregivingroles, they represent a less selected sample thanmen.We also found that womenwithhigher opportunity costs in terms of higher years of schooling take on less caregivinghours. This result is in line with the predictions in the economics literature of theBecker model. Furthermore, our results suggest that independent of children’s timeconstraints or competing responsibilities—as laid out in the economics literatureand Becker model—when the need for care arises due to deteriorating older adulthealth, families must accommodate caregiving responsibilities and the time requiredto fulfil the needed assistance. This is particularly true for individuals residing withinthe same household as an older adult. The pattern is clearer for men where the maindriver of taking on a higher number of caregiving hours is older adult health. Theseresults are in line with previous studies suggesting that functional limitations andhealth status promote co-residence of children with the older adult in order to helpwith daily activities (Silverstein et al. 2006). Additionally, we do note older adultwomen are also more likely to receive care giving from a non-spouse as comparedto men reinforcing demographic trends that highlight the differences in caregiveravailability between genders. In a context of increasing incidence and prevalenceof chronic diseases, comorbidities, and consequent functional limitations, the typeand intensity of care is expected to increase posing additional challenges to alreadystrained informal caregivers. Therefore, appropriate and corresponding formal sup-port measures should be considered.
The results of our selection model suggest different dynamics between men andwomen. Men go through a specific process when taking on caregiving responsibili-ties that depends primarily on the physical condition of the older adult. Women, onthe other hand, assume the role of caregiver most often and the selection process doesnot appear to unfold according to specific caregiver characteristics—or at least thoseavailable in our sample. This suggests that women are typically the first option forolder adult care regardless of individual attributes due to socialization and culturalexpectations. Further, the descriptive statistics support the notion that once someonetakes on the role of caregiver, they become responsible for the majority of hours ofADL assistance provided overall, which contributes to the disproportionate relega-tion of older adult care responsibilities to women. In addition, the magnitude andsignificance of daughters in the selection model suggest that societal expectationscontinue to play an important role in caregiving preferences. These results reinforceprevious research that shows in addition to feelings of filial obligation, gender social-

354 S. Angst et al.
ization as well as cultural and social norms play a significant role in determining whoshould take up caregiving activities within families (Bengtson 2001). In turn, womenare againmuchmore prone to take up caregiving activities and spend a higher amountof time caring as previous studies inMexico have indicated (Robles Silva 2001, 2005;López-Ortega et al. 2007; López-Ortega 2014).
Differentiation between men and women in our regression results may be furtherrelated to higher substitution of caregiving between women as compared to men.Descriptive statistics provide some evidence for this hypothesis as men provide alarger number of hours in households with women present as opposed to those werethere are not—159 h versus 137 h respectively. Another possible explanation comesfrom men needing to take on more responsibilities when the older adult has greaterphysical disability or longer history of severe care needs, which each often requiresignificant time and physical effort. Health shocks and other household shocks there-fore nudge men to step up as caregivers and influence differentiation for these cases.The lack of significance for the female coefficients may follow this trend given thesignificantly smaller sample of males who may only engage in caregiving situationswhere their help is the only alternative whereas females are the usual caregivers thatare first called upon (Mentzakis et al. 2009).
As other studies on informal care in Mexico have shown, significant health andpersonal care occurs within the household. Therefore, the physical and psychologicalburdens as well as opportunity costs involved are seldom recognised by health andgovernment institutions. The outlook for Mexico suggests that the demand for olderadult caregiverswill only continue to expandgiven theon-going trends in comorbidityand disability, and lack of formal publicly-funded long-term services. Moreover,changes related to the availability of family caregivers in the future creates a priorityfor information on the individuals providing care, the type of care provided, and timerequired for care in order to plan for highly needed services based at the household andfamily level. With older adult care demands stemming primarily from physical need,improved pension and health-care programs offer potential interventions that couldhavewide-spread effects not only onquality of life for older adults, but also care giversby improving older adult health and thereby reducing caregiving responsibilitiesrequired (Aguila et al. 2015a, b). New support must consider care provision andimproving the conditions of informal caregivers. National level strategies are hardto achieve, especially given the financial resources required, and the use of localdata such as the findings presented for the state of Yucatan allows for the evaluationand development of local level interventions. Future challenges must be addressedin order to develop optimal, targeted support for older adults, which will have thepotential for far reaching impact among family members and caregivers.

16 Determinants of Informal Care Supply for Older Adults in Yucatan, Mexico 355
References
Aguila, E., Cervera, M. D., Martinez, H., & Weidmer, B. A. (2015a). Developing and testinginformed-consent methods in a study of the elderly in Mexico.
Aguila, E., Diaz, C., Fu, M. M., Kapteyn, A., & Pierson, A. (2011). Living longer in Mexico.Aguila, E.,Kapteyn,A.,Robles,R.,Vargas,O.,&Weidmer,B.A. (2014).Anoncontributory pensionprogram for older persons in Yucatan, Mexico: Implementing and designing the evaluation of theprogram in Valladolid. (Technical Reports). Santa Monica, CA: RAND Corporation.
Aguila, E., Kapteyn, A., & Smith, J. P. (2015b). Effects of income supplementation on health ofthe poor elderly: The case of Mexico. Proceedings of the National Academy of Sciences, 112(1),70–75.
Aguila, E., López-Ortega, M., & Gutierrez-Robledo, L. M. (2018). Non-contributory pension pro-grams and frailty of older adults: Evidence from Mexico. Mimeo: University of Southern Cali-fornia.
American Association for Public Opinion Research. (2011). Standard definitions 2011: Final dis-positions of case codes and outcome rates for surveys (7th Ed.).
Angel, J. L., Vega, W., & López-Ortega, M. (2017). Aging in Mexico: Population trends andemerging issues. The Gerontologist, 57(2), 153–162.
Barraza-Llorens, M., Bertozzi, S., Gonzalez-Pier, E., & Gutierrez, J. P. (2002). Addressing inequityin health and health care in Mexico. Health Affairs, 21(3), 47–56.
Becker, G. S. (1965). A theory of the allocation of time. The Economic Journal, 75(299), 493.Becker, G. S. (1981). Altruism in the family and selfishness in the market place. Economica,48(189), 1.
Bengtson, V. L. (2001). Beyond the nuclear family: The increasing importance of multigenerationalbonds. Journal of Marriage and Family, 63(1), 1–16.
Bergstrom, C. A., & Heymann, S. J. (2005). Impact of gender disparities in family carework onwomen’s life chances in Chiapas, Mexico (Vol. 36).
Bookman, A., & Kimbrel, D. (2011). Families and elder care in the twenty-first century. The Futureof Children, 21(2), 117–140.
Briggs, D. C. (2004). Causal inference and the Heckman model. Journal of Educational andBehavioral Statistics, 29(4), 397–420.
Chari, A. V., Engberg, J., Ray, K. N., & Mehrotra, A. (2015). The opportunity costs of informalelder-care in the United States: New estimates from the American Time Use Survey. HealthServices Research, 50(3), 871–882.
Clark, M., &Huttlinger, K. (1998). Elder care amongMexican American families.Clinical NursingResearch, 7(1), 64–81.
Colello, K. (2007). Family caregiving to the older population: Background, federal programs, andissues for Congress. Federal Publications.
Correll, S. J., Benard, S., & Paik, I. (2007). Getting a job: Is there a motherhood penalty? AmericanJournal of Sociology, 112(5), 1297–1339.
Quilodrán de Aguirre, J. (1974). Evolución de la nupcialidad en México, 1900–1970. Demografíay Economía, 8(1), 34–49.
de Oliveira, O., & Ariza, M. (1999). Perspectivas de análisis sobre trabajo, familia y condición dela mujer. Papeles de Población, 5(20), 89–127.
Diario Oficial de la Federación (DOF). (2002). Ley de los Derechos de las Personas AdultasMayores. DOF 25-06-2002. Cámara de Diputados del H. Congreso de la Unión.
Duan, N., Manning, W. G., Morris, C. N., & Newhouse, J. P. (1984). Choosing between the sample-selection model and the multi-part Model. Journal of Business & Economic Statistics, 2(3), 283.
Escandón, S. (2006). Mexican American intergenerational caregiving model. Western Journal ofNursing Research, 28(5), 564–585.
Escandón, S. (2011). Validating the Mexican American intergenerational caregiving model. TheQualitative Report, 16(2), 377.
356 S. Angst et al.
Ettner, S. L. (1995). The impact of “parent care” on female labor supply decisions. Demography,32(1), 63–80.
Ettner, S. L. (1996). The opportunity costs of elder care. The Journal of Human Resources, 31(1),189.
Evans, B. C., Belyea, M. J., Coon, D. W., & Ume, E. (2012). Activities of daily living in MexicanAmerican caregivers: The key to continuing informal care. Journal of Family Nursing, 18(4),439–466.
Folbre, N. (Ed.). (2012). For love and money: Care provision in the United States. New York:Russell Sage Foundation.
Fried, L. P., Tangen, C. M., Walston, J., Newman, A. B., Hirsch, C., Gottdiener, J., et al. (2001).Frailty in older adults: Evidence for a phenotype. The Journals of Gerontology Series A:Biological Sciences and Medical Sciences, 56(3), M146–M157
Friedemann, M.-L., & Buckwalter, K. C. (2014). Family caregiver role and burden related togender and family relationships. Journal of Family Nursing, 20(3), 313–336.
Galindo, Vilchis L., García, Gutiérrez G., & Rivera, Hernández P. (2015). El trabajo de cuidadosen los hogares: ¿Un trabajo sólo de mujeres?. México: INMUJERES.
García, B., & de Oliveira, O. (2001). Cambios socioeconómicos y división del trabajo en lasfamilias mexicanas. Investigación Económica, 61(236), 137–162.
García, B., & de Oliveria, O. (2007). Trabajo extradoméstico y relaciones de género: Una nuevamirada. In María Alicia Gutiérrez (coord.)Género, familias y trabajo: Rupturas y continuidades.Desafíos para la Investigación Pública (pp. 49–87). Buenos Aires, Consejo Latinoamericano deCiencias Sociales (CLACSO).
García Guzmán, B. (2007). Cambios en la división del trabajo familiar en México. Papeles dePoblación, 13(53), 23–45.
Grigoryeva, A. (2014). When gender trumps everything: The division of parent care amongsiblings. Princeton, NJ: Center for the Study of Social Organization.
Gutiérrez Robledo, L. M., López-Ortega, M., & Arango Lopera, V. E. (2012). The state of eldercare in Mexico. Current Translational Geriatrics and Experimental Gerontology Reports, 1(4),183–189.
Guzmán, V. (2003). Gobernabilidad democrática y género, una articulación posible (Vol. 48).United Nations Publications.
Heckman, J. (1976). The common structure of statistical models of truncation, sample selectionand limited dependent variables and a simple estimator for such models (NBER Chapters)(pp. 475–492). National Bureau of Economic Research, Inc.
Heckman, J. J. (1977). Sample selection bias as a specification error (with an application to theestimation of labor supply functions) (Working Paper No. 172). National Bureau of EconomicResearch.
Heckman, J. J. (1979). Sample selection bias as a specification error. Econometrica, 47(1), 153.Henz, U. (2010). Parent care as unpaid family labor: How do spouses share? Journal of Marriageand Family, 72(1), 148–164.
INEGI/ INMUJERES. (2014). Uso del tiempo, una perspectiva estadística de género, 2009. Méx-ico: Instituto Nacional de Estadística y Geografía (INEGI), Instituto Nacional de las Mujeres,(INMUJERES).
INMUJERES. (2015). Situación de las personas mayores en México. México: Instituto Nacionalde las Mujeres.
López-OrtegaM., & Gutiérrez Robledo LM. (2015). Percepciones y valores en torno a los cuidadosde las personas adultas mayores. In L. M. Gutiérrez Robledo, & L. Giraldo Rodríguez (coord.)Realidades y expectativas frente a la nueva vejez. Encuesta Nacional de Envejecimiento. México:Universidad Nacional Autónoma de México (UNAM).
López-Ortega, M., Matarazzo, C., & Nigenda, G. (2008). Household care for the elderly and theill in Mexico: An analysis from a gender perspective. Exploring the gender dimensions of globalhealth (pp. 59–90). Cambridge, MA: Global Equity Initiative, Harvard University.

16 Determinants of Informal Care Supply for Older Adults in Yucatan, Mexico 357
López-Ortega, M., Nigenda, G., Matarazzo, C., & Juárez-Ramírez, C. (2007). La atención de losenfermos y discapacitados en el hogar: Retos para el sistema de salud mexicano. Salud Públicade México, 49(4), 286–294.
López-Ortega, M. (2014). The family household and informal old age care in Mexico: A researchnote. International Journal of Sociology of the Family, 40(2)
Mayston, R., Lloyd-Sherlock, P., Gallardo, S., Wang, H., Huang, Y., Montes de Oca, V., et al.(2017). A journey without maps—Understanding the costs of caring for dependent older peoplein Nigeria, China, Mexico and Peru. PloS one, 12(8), e0182360.
Mendez-Luck, C. A., Kennedy, D. P., & Wallace, S. P. (2008). Concepts of burden in giving careto older relatives: A study of female caregivers in a Mexico City neighborhood. Journal ofCross-Cultural Gerontology, 23(3), 265–282.
Mendez-Luck, C. A., Kennedy, D. P., &Wallace, S. P. (2009). Guardians of health: The dimensionsof elder caregiving among women in a Mexico City neighborhood. Social Science and Medicine,68(2), 228–234.
Mentzakis, E., McNamee, P., & Ryan, M. (2009). Who cares and how much: Exploring the deter-minants of co-residential informal care. Review of Economics of the Household, 7(3), 283–303.
Merino, A. (2010). La pobreza multidimensional y de tiempo en las mujeres mexicanas (p. 22).Cuadernos de Trabajo: INMUJERES/ONU Mujeres.
Montgomery, R. J. V., & Kosloski, K. D. (2013). Pathways to a caregiver identity and implicationsfor support services. In R. C. Talley & R. J. V. Montgomery (Eds.), Caregiving across thelifespan: Research · practice · policy (pp. 131–156). New York, NY: Springer, New York.
Perry, B. L., Pescosolido, B. A., Martin, J. K., McLeod, J. D., & Jensen, P. S. (2007). Comparisonof public attributions, attitudes, and stigma in regard to depression among children and adults.Psychiatric Services, 58(5), 632–635.
Pelcastre-Villafuerte, B. E., Treviño-Siller, S., González-Vázquez, T., & Márquez-Serrano, M.(2011). Apoyo social y condiciones de vida de adultos mayores que viven en la pobreza urbanaen México. Cad. Saúde Pública, 27(3), 460–470.
Pinquart, M., & Sörensen, S. (2003). Differences between caregivers and noncaregivers in psycho-logical health and physical health: A meta-analysis. Psychology and Aging, 18(2), 250–267.
Radina, M. E. (2007). Mexican American siblings caring for aging parents: Processes of caregiverselection/designation. Journal of Comparative Family Studies, 38(1), 143–168.
Rivero, E. (2011). Gender and intra-household organization for the care of people with disabilitiesin Mexico. International Journal of Sociology, 41(1), 48–66.
Robles, L., & Pérez, A. C. (2012). Expectativas sobre la obligación filial: Comparación de dosgeneraciones enMéxico.Revista Latinoamericana de Ciencias Sociales, Niñez y Juventud, 10(1).
Robles Silva, L. (2001). El fenómeno de las cuidadoras: Un efecto invisible del envejecimiento.Estudios Demográficos y Urbanos, 16(3(48)), 561–584.
Robles Silva, L. (2005). La relación cuidado y envejecimiento: Entre la sobrevivencia y ladevaluación social. Papeles de Población, 11(45), 49–69.
Sanchís, N., comp. (2011). Aportes al debate del desarrollo en América Latina : Una perspectivafeminista. Red De Género Y Comercio.
Santoyo, L., & Pacheco, E. (2014). El uso del tiempo de las personas en México según el tipo dehogar. Una expresión de las desigualdades de género. In B. García, & E. Pacheco (coords.), Usodel tiempo y trabajo no remunerado en México, México, El Colegio de México.
Shelton, B. A., & John, D. (1996). The division of household labor. Annual Review of Sociology,22(1), 299–322.
Silverstein, M., & Giarrusso, R. (2006). Intergenerational support to aging parents: The role ofnorms and needs. Journal of Marriage and Family Issues, 72(5), 1068–1084.
Sosa Márquez, M. V. (2011). La nupcialidad en México vista a través de las estadísticas vitales dematrimonios y divorcios. InValdés (coord.)Conmemoración del 150 aniversario del registro civil.Fundamentos y reflexiones. México: Instituto de Investigaciones Jurídicas, UNAM: 175–214.
Spitze, G., & Logan, J. (1990). Sons, daughters, and intergenerational social support. Journal ofMarriage and the Family, 420–430.

358 S. Angst et al.
Stone, R. I., & Short, P. F. (1990). The competing demands of employment and informal caregivingto disabled elders.Medical Care, 28(6), 513–526.
Varley, A., & Blasco, M. (2000). Intact or in tatters? Family care of older women and men in urbanMexico. Gender & Development, 8(2), 47–55.
White-Means, S. I., & Rubin, R. M. (2004). Trade-offs between formal home health care andinformal family caregiving. Journal of Family and Economic Issues, 25(3), 335–358.
Wong, R., Michaels-Obregón, A., Palloni, A., Gutiérrez-Robledo, L. M., González-González, C.,López-Ortega, M., et al. (2015). Progression of aging in Mexico: The Mexican Health and AgingStudy (MHAS) 2012. Salud Pública de México, 57, s79–s89.

Chapter 17The Caregiving Experience of OlderMexican Americans and their Caregivers
David V. Flores, Sunshine Rote, Jacqueline L. Angeland Kyriakos S. Markides
Abstract According to the U.S. Census Bureau, the older adult population isprojected to increase by 56% from 40.3 million in 2010 to 72.1 million by 2030,and among the elderly, the fastest growing segment consists of those eighty andabove. At the forefront of these demographic trends changes is the aging Hispanicpopulation, which is projected to be the largest and are the second fastest growingolder adult cohort in the United States, with those of Mexican origin leading theway. This chapter examines the degree to which Mexican American caregiving isinfluenced by caregiving structure, health of the care recipient, disability, cognitiveimpairment/dementia, culture, the “positive caregiving experience” as well as otherfactors associated with caregivers of very old Mexican Americans. Mexican Amer-ican families’ disability, diminished cognitive impairment, caregiver stress, lack ofresources, and dementia may take an increased toll on caregivers. The need to iden-tify respite services, mental health resources, and community services for caregiversis of paramount importance to alleviate burden.
D. V. Flores (B) · K. S. MarkidesDepartment of Preventive Medicine and Community Health, The University of Texas MedicalBranch, Galveston, TX, USAe-mail: [email protected]
K. S. Markidese-mail: [email protected]
S. RoteKent School of Social Work, University of Louisville, Louisville, KY, USAe-mail: [email protected]
J. L. AngelLyndon B. Johnson School of Public Affairs and Department of Sociology, The University ofTexas at Austin, Austin, TX, USAe-mail: [email protected]
© Springer Nature Switzerland AG 2019W. A. Vega et al. (eds.), Contextualizing Health and Aging in the Americas,https://doi.org/10.1007/978-3-030-00584-9_17
359

360 D. V. Flores et al.
Introduction
According to the U.S. Census Bureau, the older adult population is projected toincrease by 56% from 40.3 million in 2010 to 72.1 million by 2030 and among theelderly the fastest growing segment consists of those above eighty and above (U.S.Census Bureau 2018). More specifically, those 85 and older will more than triplefrom 5.4 million to 19 million of the oldest of old by 2050 (Kalapatapu and Sullivan2010; U.S. Census Bureau 2010a, b). The older U.S. population is also becomingincreasingly diverse. At the forefront of these demographic trends changes is theaging Hispanic population, which is projected to be the largest and are second fastestgrowing older adult cohort in the U.S., with those of Mexican origin leading theway (Federal Interagency Forum on Aging-Related Statistics 2012; Anthony et al.2017). More specifically and according to the U.S Census Bureau, older Hispanicsare one of the largest segments of the growing minority population and are projectedto suffer from greater disease burden than other racial ethnic populations as well asfrom increases in labor force participation among Latinas combined with culturalpreferences to “age in place” thus, we can expect increased strain and dependencyon family members, especially women (Apesoa-Varano et al. 2016; Anderson et al.2018;Wan et al. 2018). By 2060, Hispanics, currently the largest minority group, willgrow to comprise 28.6%of theU.S. population, a nearly twofold increase from17.4%in 2014 (Pew Hispanic Center 2015). Between 2000 and 2014, Hispanics accountedfor more than half of the total U.S. population growth (Pew Hispanic Center 2015).Based on current trends in the health of older Hispanics as well as older MexicanAmericans (Markides and Eschbach 2011), growth of the population’s older segmentis likely to significantly increase caregiving burden on family members, mostly onLatina women whose labor force participation rates have been rising (Wan et al.2018).
These age-related trends raise serious questions about a lack of geriatric specificfacilities, services, and professionals, which renders an increasingly disproportionateamount of older individuals reliant on friends, family and informal support systemsfor care (National Alliance on Caregiving 2015). Most older individuals, particularlyolder Hispanics, are “aging in place” due to cultural or structural factors (e.g., lim-ited financial resources). This, in turn, places increased caregiving responsibilitieson spouses, adult children and other family members (Aranda et al. 2001; Rote et al.2015).MexicanAmerican families are less likely than non-Hispanicwhite families toutilize long-term care facilities and hospice, despite an apparent need for such formalcare (Apesoa-Varano et al. 2016). Thus, Hispanic caregivers may feel an increasedsense of obligation due to tradition and cultural expectations associated with care-giving (Villatoro et al. 2014; Mendez-Luck and Anthony 2016). In this chapter, weexamine the effects of caregiver and care recipient health and other factors as theycontribute to the dyadic caregiving experience. In this manuscript, we provide anoverview of recent literature on aging and caregiving among Hispanics, with specialfocus on Mexican Americans who are by far the largest Hispanic subpopulation.

17 The Caregiving Experience of Older Mexican Americans and their … 361
Hispanic Informal Caregiving Structures
Informal (unpaid) caregivingmay include any number of tasks associated withActiv-ities of Daily Living (bathing, dressing, toileting, eating, etc.) and/or InstrumentalActivities of Daily Living (assistance with finances, driving to doctor’s appointments,cooking and cleaning etc.) (National Alliance on Caregiving 2015). Existing liter-ature shows that activities of daily living are more “burdensome” and more highlycorrelated with depressive symptoms in caregivers than instrumental activities ofdaily living (Angel et al. 2004; Caskie et al. 2010; Evans et al. 2012). Loss of ADLcapacity also results in higher rates of institutionalization and mortality than does theloss of instrumental activities of daily living (Angel et al. 2004; Caskie et al. 2010;Evans et al. 2012). The National Alliance of Caregiving reports that roughly 34.2million American adults have served as an informal caregiver to someone 50 years orolder in the last year. On average, caregivers are 50 years of age, female (60%), and86% provide care for a relative. One in four provides care for the oldest-old (85+)and on average care recipients are 75 years old. Findings affirm that “higher hour”caregivers (those who provide car for 21 h or more per week) provide care for 5½years, on average, and expect to continue for at least 5 more years. Caregivers as awhole report providing on average 24.4 h per week of care. About one-third (32%)of caregivers report providing 62 h of care per week and 38% report high emotionalstress from caregiver burden (National Alliance on Caregiving 2015).
Informal caregivers are typically spouses, adult children, friends, relatives, or part-ners. Assuming the role of providing care may include any combination of personalcare, household tasks, or complex health services (National Alliance on Caregiving2015). Caregiving can be costly, especially for Hispanic families; indirect costs ofcaregiving for Hispanics with dementia (including hours caregiving and earnings lostfrom work) are projected to increase from $3.9 billion in 2012 to $39.8 billion by2060–a ten-fold increase (Latinos & Alzheimer’s disease: New numbers behind thecrisis 2016). In a systematic review of 24 studies, Apesoa-Varano et al. (2016) foundthat the impact of informal caregiving on Hispanics greatly affected their physicaland mental health status. They also found that the caregiving experience caused atremendous amount of stress and strain leading to burden. Caregivers reported feelingoverwhelmed, neglected, distrustful, and unprepared to deal with the tasks associ-ated with providing care. This was explained as resulting directly from an inabilityto communicate with or navigate formal healthcare systems as well as a general frus-tration with the way that clinicians treated them. Communication barriers and a lackof translation services were further cited as key contributors to caregiver displeasure(Apesoa-Varano et al. 2016).
Caregivers’ insufficient knowledge of and lack of understanding regarding theprogression of disease were also significant factors. This lack of “biomedical knowl-edge,” coupled with a strong belief in the “cultural interpretation” of the diseasefurther contributed greatly to burden (Apesoa-Varano et al. 2016). Moreover, a lackof knowledge regarding formal support services and a reluctance to seek out these ser-vices were associated with emotional stress (National Alliance on Caregiving 2015;
362 D. V. Flores et al.
Rote et al. 2015). Lastly, the familial division of labor in providing care and proxim-ity to the care recipient were cited as significant stressors. Primary caregivers whowere sole caregivers and lived greater distances from the care recipients reportedsignificantly more burden than those with familial assistance who lived closer tothe care recipient (Apesoa-Varano et al. 2016). Studies of Mexican American care-givers indicate that most tend to be female, single, and typically work outside thehome (Espino et al. 2001; Evans et al. 2012). Mexican American caregivers arealso more likely to be the child of the care recipient and typically live with the carerecipient or within a 20 minute distance from him or her (National Alliance on Care-giving 2015). On average, Mexican American caregivers typically provide care forroughly two activities of daily living and four instrumental activities of daily liv-ing for roughly 31 h a week and has been providing care for four years (NationalAlliance on Caregiving 2015). The caregiver generally has a high school education,is the primary unpaid care provider, and does so without assistance of paid (formal)help (Pinquart and Sorensen 2003; National Alliance on Caregiving 2015). MexicanAmerican caregivers are also less likely to seek out formal respite care resources orany institutionalized care, resulting in expectations that friends and family functionas caregivers (Angel et al. 2004; Hansen and Aranda 2012; Weiss et al. 2005).
The Health Burden of Older Mexican Americans
Despite the abundance of research on caregiver burden in the generalU.S. population,we still know little about the inherent risks and/or benefits associated with providingcare for Mexican Americans at advanced ages (Aranda et al. 2001; Adelman et al.2014). As disability rates among older Mexican Americans increase, the need forcaregiving is expected to rise concurrently (Schneider and Shardell 2008; Evanset al. 2012; Apesoa-Varano et al. 2016). As such, understanding these mechanismsis becoming increasingly crucial.
Researchers find that lack of insurance, poor finances, and insufficient preven-tive healthcare maintenance contribute to greater rates of comorbidity and disabilityamong older Mexican Americans than among older non-Hispanic Whites. Thesefactors, in turn, place the burden of caregiving on individuals who may not be pre-pared to assume the role of caregiver (Neary and Mahoney 2005; Beard et al. 2009,2012; Evans et al. 2012; Rote and Markides 2014). Hispanics, particularly MexicanAmericans, suffer from higher rates of diabetes and other related chronic diseasescompared to non-Hispanic Whites (Patel et al. 2006; Markides et al. 2013; O’Bryantet al. 2013; Downer et al. 2015; Garcia and Reyes 2018). There is also evidence thatolder Mexican Americans particularly women have higher rates of disability thatnon-Hispanic Whites (Beard et al. 2009; Garcia et al. 2017).
Additionally, Mexican Americans have high rates of dementia, are more likely to,report more depression, are less educated, and perform poorly on the Mini-MentalStatus Exam than other racial and ethnic groups (O’Bryant et al. 2007, 2013). In gen-eral, Mexican Americans are more likely to be diagnosed at later stages in the disease
17 The Caregiving Experience of Older Mexican Americans and their … 363
due to lack of medical insurance, poor healthcare utilization, and cultural perceptionsof “normal aging” despite the fact that the vast majority of Mexican American indi-viduals have Medicare at ages 65 and over (Clark et al. 2005; O’Bryant et al. 2007,2013; Salazar et al. 2015; Apesoa-Varano et al. 2016). Moreover, rates of demen-tia among Hispanics 55–64 years old indicate earlier onset of dementia comparedto non-Hispanic Whites (O’Bryant et al. 2007, 2013; The Alzheimer’s Association2014). Understanding these mechanisms of health becomes crucial because as dis-ability and dementia rates among older Mexican Americans increase, the need forcaregiving is concurrently expected to rise (Schneider and Shardell 2008; Evans et al.2012; Apesoa-Varano et al. 2016).
Mexican American Caregiver Burden
Over the past several decades, many studies have validated the physical and psy-chological toll that caregivers of an older family member experience (Pinquart andSorensen 2003, 2005; Rote et al. 2015). Due to increased life expectancy, caregiversare now providing dementia-related care for longer periods of time and are experi-encing the physiological and psychological consequences associated with caregiverburden for longer periods of time (Parks and Pilisuk 1991; Rote et al. 2015). Thecumulative toll of time spent and degree of physical, social, and emotional stressequate to burden (Parks and Pilisuk 1991; Collins and Jones 1997; Deeken et al.2003). Caregiver burden is understood as “The extent to which caregivers perceivethat caregiving has had an adverse effect on their emotional, social, financial, phys-ical, and spiritual functioning” (Adelman et al. 2014:1053). This definition empha-sizes the multidimensional toll caregiving may exact on care providers and thatcaregiving is a highly individualized experience (Gillick 2013). Caregiver burdennegatively impacts caregiver health and in severe cases increases risk for mortality(Zarit et al. 1986; Bastawrous 2013). Caregiver burden has been associated withdepression, social isolation, sleep disturbance, fatigue, stress, difficulty in coping,and financial difficulties (Aranda et al. 2001). Moreover, caregiver burden is shownto be highly correlated with depression among Mexican American (Hernandez andBigatti 2010). For some caregivers, role-conflict, interference in daily activities (i.e.,working), and adverse physical-psycho-social symptoms increased self-perceivedcaregiver burden (Annerstedt et al. 2000).
The Influence of Dementia
Another a significant contributor of caregiver burden among Mexican Americans isdementia-related neuropsychiatric symptoms. Depending on the stage of dementia,neuropsychiatric symptoms can be debilitating and can cause a tremendous amountof distress for both the caregiver and the care recipient (Salazar et al. 2016). Presen-
364 D. V. Flores et al.
tation of neuropsychiatric symptoms and the resultant neurobehavioral disturbancescan commence at the onset of cognitive changes and have been found to be asso-ciated with early institutionalization and increased caregiver burden (Gaugler et al.2000; Liken 2001; Hwang et al. 2004; Ortiz et al. 2006). Roughly one-third ofcommunity-dwelling elders with dementia have been found to experience neuropsy-chiatric symptoms (Lyketsos et al. 2000; Salazar et al. 2015). Studies suggest thatmild cognitive impairment, neuropsychiatric symptoms, and cognitive dysfunctionoften go unrecognized in older Mexican Americans due to lower levels of education,perception of “normal aging behaviors,” traditional values, and family caregivingexpectations (Espino et al. 2002; Hinton et al. 2003; O’Bryant et al. 2007).
Salazar and colleagues found that Hispanics presented with higher proportions ofneuropsychiatric symptoms than non-HispanicWhites did (Salazar et al. 2016). Roteand colleagues found significant correlations between neuropsychiatric symptomsand high levels of increased depression among caregivers of Mexican Americanolder adults (Rote et al. 2015). Dementia associated neuropsychiatric symptomsamong older Mexican Americans often goes unrecognized due to lower levels ofeducation, perception of “normal aging behaviors,” traditional values, and familycaregiving expectations (Espino et al. 2002; Hinton et al. 2003; O’Bryant et al.2007). Unfortunately, gaps in the literature remain on neuropsychiatric symptomsof older Mexican Americans. Studying the deleterious effects of neuropsychiatricsymptoms on caregivers can inform efficacious interventions.
Positive Aspects of Caregiving
Contrary tomost research, which typically focuses on the negative aspects of caregiv-ing, recent studies have focused on the positive benefits associated with caregiving,including increased life satisfaction, bonding with the care recipient or other fam-ily members, the reinforcement of traditional values, a sense of accomplishment,personal satisfaction, and increased self-esteem (Aranda and Knight 1997; Tarlowet al. 2004; Pinquart and Sorensen 2005; Werth and Blevins 2006; Roberto andJarrott 2008; Rote et al. 2015). Kruithof and colleagues found that roughly half ofcaregivers gain “positive utility” from caregiving activities and that their happinesswould decline if they were not able to continue their caregiving or if someone elsewere assume their role or if the care recipient died (Kruithof et al. 2012; Kruithofet al. 2015). They also find that positive caregiver experiences were linked to bettermental and physical status (Kruithof et al. 2012). Others have found that negativeand positive caregiving experiences can co-occur; positive experiences can attenu-ate or “buffer” the effects of negative caregiving experiences (Kruithof et al. 2015).Spousal and/or male gender caregivers derived more positive caregiving experiencescompared to female non-spousal caregivers (Lin et al. 2012).

17 The Caregiving Experience of Older Mexican Americans and their … 365
Cultural Factors
Cultural values may also function as protective factors by providing caregivers witha “sense of accomplishment.” Cultural values are defined as the contextual moresand traditions that inform, frame, and shape a communities perceptions to events,behaviors, and interactions (Zambrana 1995; Delgado 2007; Flores et al. 2014). Rothand colleagues found that in five population-based studies, caregivers reported pos-itive attributes from caregiving and little caregiver strain, indicating that positivecaregiving in some aspects may attenuate negative risk factors associated with care-giving (Lawton et al. 1991; Roth et al. 2015). As in many familistic cultures, womenhistorically care for the children, spouses, and aging family members. Marianismo,the unwavering devotion to caring for a loved one, is claimed by some researchersto be grounded in the veneration of the Virgin Mary and is a strong Mexican Amer-ican cultural value (Hubbell 1993; Flores et al. 2014; Mendez-Luck and Anthony2016). Among Mexican American women, socialization begins in early childhoodand emphasizes prioritizing the needs of others even at the expense of their own phys-ical and mental health needs. For these women, caregiving is viewed as a privilege,an obligation, and is perceived positively as opposed to a burden. Among MexicanAmericans, degree of disability, cognitive impairment, and caregiver depression inand of themselves are not significantly associated with increased institutionalizationof the care recipient (Rote et al. 2015; Flores et al. 2018). However, research hasfound that care recipients with neuropsychiatric disturbances and associated dys-functional behaviors consistently resulted in increased depressive symptoms amongtheir caregivers, thus, negating the positive effects of caregiving and increasing thepossibility of institutionalization (Rote et al. 2015; Flores et al. 2018).
The emphasis of cultural values from respective countries of origin may be hon-ored or varied depending on degree of assimilation and acculturation (World HealthOrganization 2006; Crist et al. 2009). As individuals assimilate into American cul-ture, their “collectivist” familial values are often displaced by “individualistic” val-ues. One such value among Mexican Americans is that of familismo, which is anexemplar of traditional cultural constructs that influence health-seeking behaviors(Aranda et al. 2001; World Health Organization 2006; Flores et al. 2014). The tra-ditional cultural value of familismo is a steadfast obligation and prioritization ofthe family that attenuates focus on the individual (Smith et al. 2009). Familismoprovides social support and resources as well as networks of tangible and intangiblesystems of support for friends and family members (Zambrana 1995; Delgado 2007).Familismo is a cultural factor that influences interpersonal and intrapersonal behav-iors (Zambrana 1995; Delgado 2007). These behaviors influence perceived familialresponsibility for taking action, degree of action, and ultimately the definition ofcaregiving and caregiver burden.
Familismo may not be present to the same degree in all communities or families,but when present it plays a critical role in daily life. These cultural beliefs impactreactions to health status and the subsequent health-related consequences of thosebehaviors. These beliefs in “taking care of parents” are shared by other racial and

366 D. V. Flores et al.
ethnic groups clearly share this “cultural belief” but are influenced by health andeconomic constraints (Gil et al. 1994, 2000). Moreover, these traditional culturalvalues may serve as both risk and protective factors for a variety of health behav-iors. There exists a “dichotomization of cultural values” paradigm in which culturalvalues influence both positive and negative directionality of health behaviors (Floreset al. 2014). This is particularly true for caregiver burden resulting from a sense offamily responsibility and commitment to provide care at any cost—even when com-promising the physical and mental health welfare of the caregiver. Although sharedby other racial and ethnic groups there is a moral and cultural obligation to care forelderly or disabled relatives with institutionalization seen as socially unacceptable(Black et al. 1998; Crist et al. 2009; Knight and Sayegh 2010; Carpiano and Fitterer2014; Flores et al. 2014; Rote andMarkides 2014). Canino and colleagues found thatstrong family relationships (familismo) are protective among Hispanics, but dishar-monious family relationships served as risk factors for poor health related behaviors(Canino et al. 2008). Cultural values and traditional beliefs functioned as positiveprotective factors for participants who reported strong familial relationships, whilethose who reported disjointed, disorganized, or absent familial relationships, were atsignificantly higher risk for poor health behaviors and decision making (Canino et al.2008). It is expected that these familial cultural bonds, along with other psychoso-cial support and increased access to social structure and assistance in the community(i.e., healthcare access, prescription drugs, geriatric specialists and clinicians), willprovide the impetus and sustainability for Hispanic caregivers of Mexican origin.
Conceptual Framework
Figure 17.1 depicts the way in which culture impacts perceptions of one’s environ-ment and personal responsibility towards caregiving (Unger et al. 2002; Prado et al.2008; Hongjie et al. 2010). An adequate theory of the impact of culture on individu-als’ beliefs concerning one’s duty to care for aging family members must deal withthe potentially complex interconnections among what Pierre Bourdieu theorizes ascultural, social, and economic capital (Bourdieu 1986). Without delving deeply intoBourdieu’s theory of habitus, we can summarize the basic argument as observing thatcultural capital includes education and other social competencies that are influencedby economic and social capital. For our purposes, social capital refers to the powerand influence inherent in one’s social network (Putnam 2000). The importance andutility of Bourdieu’s conceptualization is that it grounds culture and its impact onbeliefs and practices in one’s life experiences as they are influenced by one’s socialsituation, which is clearly influenced by and influences one’s economic situation. Forour purposes, then, a system of cultural beliefs reflects learned orientations that areclearly influenced by the beliefs transmitted to one by one’s parents and communityas shown in Fig. 17.1.
What is imperative, though, is not to treat culture as a disembodied essence, orsomething that exists apart from society, politics, and the economy. As explained in

17 The Caregiving Experience of Older Mexican Americans and their … 367
Fig. 17.1 Conceptual framework of cultural values of caregiving
the overview to this section, it is imperative not to essentialize culture or to attributeto supposedly “cultural” factors effects that are strongly influenced by structuralfactors. The actions of individuals who do not place their aging parents in nursinghomes to varying degrees reflect material constraints as well as any culturally-basednorms or preferences. Indeed, in reality structural constraints may bemore influentialin actual outcomes than anything we might conceive of as culture. With this in mind,we note that the literature demonstrates that caregiving has both positive and negativeaspects.
Researchers have found that caregivers who maintained closer relationships withsocially supportive families were more successful in maintaining greater mentalhealth than those who maintained “disconnected relationships with families” (Laveeand Altus 2001; Flores et al. 2013, 2014). Because cultural beliefs may dictate thatcaregiving be viewed as a private family matter, families and social structures mayeither enable or inhibit “effective” caregiving. In such cases, professional help andoutside respite resources may not be considered (Soriano et al. 1994; Cuadrado andLieberman 2002; Valdez et al. 2008; Flores et al. 2013, 2014). Moreover, strongfamily cohesion or familismo has been associated with overall better mental healthamongHispanics (Rivera et al. 2008). Conversely, distressed home environments canfoster and contribute to negative health behaviors (Glick and Moore 1990; Valdezet al. 2007). Familismo, then, may discourage seeking help, but also may serve as aprotective factor regarding caregivers’ health and quality of life.
Individuals clearly feel some degree of obligation to care for aging parents, a sen-timent which probably reflects the quality of the parent/child relationship over time.Even if the instrumental and material burden is great, a sense of filial responsibil-ity probably exerts some influence. Of course, we must always keep the problem ofsocial desirability in mind since both cognitive dissonance and the social expectationthat one do right by one’s parents can influence the response to survey probes.
“Cultural Collective Consciousness”
Culture influences the perceptions and interpretations of life’s events and how they arecommunicated between individuals and throughout the community. Cultural beliefsand related knowledge endure and are disseminated because of the importance theyprovide to the greater social group (Lynch 1996). These concepts progress from indi-vidual attitudes to communal memes, and finally culminate in a “social mind” or a“collective consciousness” regarding the acceptance or rejection of certain behav-ioral norms (Durkheim 1893; Lynch 1996). Social norms, traditions, and mores areestablished within the socialization of family and the greater community regarding

368 D. V. Flores et al.
the acceptability of behaviors and actions. Thus, caregiving activities are then con-textualized according to an individual’s environment, upbringing, and to a greaterextent the characteristics of the community. A socialized “cultural lens” is thenformed that defines acceptable behaviors in communities. Therefore, activities suchas caregiving are viewed through the socialized cultural lens of that community. Inthis example, “the collective consciousness” informs the community’s perspectiveon the origins of, responses to, and remedies vis-à-vis of caregiving (Cunninghamet al. 2010; Flores et al. 2013; Flores et al. 2014).
In economically challenged families, a “cultural collective consciousness” of apa-thy and helplessness may develop in reaction to negative environmental forces suchas lack of resources, disconnected families, and poor familial connections to the carerecipient (Durkheim 1893; Mead 1934; Kerr 2008). In this regard, individuals learnto act and react to certain stimuli through learned experiences, “significant symbols,”and conversations in contextualized societal relations (Mead 1934; Kerr 2008). If the“significant symbols” and conversations are negative in nature, individuals may par-ticipate in the negative behaviors (i.e., neglect of the care recipient) or withdraw fromparticipation in the community (i.e., unwilling to seek assistance in the communitywhen assistance is readily available from governmental agencies or social networks).
Families with high rates of poverty and psychosocial strife, encompassed by highrates of crime and poor neighborhood infrastructure, may become less cohesive andare reluctant to engage in the monitoring necessary for the promotion of healthycaregiving and self-care activities for the caregiver (Rosenfeld et al. 2001). Classicdisorganization theory supports these assertions in that weak informal social con-trols foster disjointed communities (Kornhauser 1978; Rosenfeld et al. 2001; Streeten2002). Individuals live in disjointed and closed, but interconnected enclaves.A cultureof “negotiated co-existence” among conventional and isolated residents is achievedthrough extensive neighborhood networks (Sampson and Raudenbush 1997; Roseand Clear 1998; Browning 2009). Studies have observed that in poverty-riddenminority communities “collective coping behaviors” regarding poorer health-relatedactivities in the community help to perpetuate the isolation and deterioration of thecommunity and family networks for ensuing generations (Kuo 2012).
Transactional Nature of Caregiving Vulnerabilityand Cultural Values
Recent studies illustrate significant associations between caregiver burden andsocial/economic effects on the quality of life of caregivers. Thesefindings corroboratecurrent literature on the deleterious effects of caregiving (Gaugler et al. 2000; Liken2001; Hwang et al. 2004; Ortiz et al. 2006). This is noteworthy partly because ofthe prioritization of “family” in caregiving among Mexican Americans and becausemost caregivers are the children of the care recipient means that the familial bondsare becoming strained despite the existence of a significant positive aspect of care-
17 The Caregiving Experience of Older Mexican Americans and their … 369
giving. Angel and colleagues found that Mexican origin elders are more dependenton their adult children for care and are more reluctant to call on family, friends, orthe community for help (Angel et al. 2014). This highlights the importance of iden-tifying risk factors for caregiver depression and burden among caregiver children ofolder Mexican Americans.
Recent studies have found that “unmarried” caregivers typically report moredepressive symptoms compared to “married” caregivers. These findings are expected,as prior studies have demonstrated the importance of spousal, familial and exter-nal social support for abating or attenuating caregiver burden (Angel et al. 2014;Rote et al. 2015; Flores et al. 2018). Unmarried caregivers do not have the supportof significant others and possibly lack support from other family members (Angelet al. 2014; Rote et al. 2015; Flores et al. 2018). Research has found that supportivespouses/partners provide emotional support as well as tangible physical support incaregiving (Annerstedt et al. 2000; Aranda et al. 2001; Crist et al. 2009; Knight andSayegh 2010; National Alliance on Caregiving 2015). In many cases, the primarycaregivers credit their spouse/partnerwith providing essential respite fromcaregivingresponsibilities.
In recent literature, neuropsychiatric disturbance appears to be a predominantfactor associated with caregiver depression and burden. In a recent study, neuropsy-chiatric disturbance was significantly associated with depressive symptoms, evenafter adjusting for caregiver demographics, caregiver health conditions, and carerecipient nativity, disability, and cognition (Rote et al. 2015; Flores et al. 2018).These results are consistent with current literature on neuropsychiatric symptoms,degree of dysfunction, and their association with depression and caregiver burden inthe general population (Gaugler et al. 2000; Liken 2001; Hwang et al. 2004; Ortizet al. 2006). This is a particularly important finding given that theMexican-Americanpopulation over 80 is aging rapidly and bears a greater risk of early onset cognitiveimpairment than other racial and ethnic groups (National Research Council 2004;Clark et al. 2005; O’Bryant et al. 2007, 2013; Dilworth-Anderson et al. 2008; Salazaret al. 2015).
Neuropsychiatric dysfunction considerably impacts the quality of life of both thecaregiver and the care recipient, and is thus, a matter of significant concern. AlthoughMexican American caregivers tend to be resilient and determined in their obligationand commitment to care for older family members, many are simply unprepared todeal with neuropsychiatric disturbance. Mexican American families have also beenfound to significantly underutilize hospice, long-term care facilities, and professionalservices, therefore compounding depression and frustration with their inability toprovide care. Studies have found that, in many cases, caregivers lack experience andare unprepared to deal with behavioral dysfunction (Apesoa-Varano et al. 2016).Unfortunately, this inability to provide care coupled with a reluctance to seek outhelp for increased neurobehavioral disturbances leads to higher probabilities of earlyinstitutionalization (Gaugler et al. 2000; Liken 2001; Hwang et al. 2004; Ortiz et al.2006).

370 D. V. Flores et al.
Discussion
Individuals today are increasingly undertaking the role of the informal caregiving.Caregiving projections suggest that a greater portion of individuals will soon beproviding more care for elders than for children (Abramson 2016). Further, morethan ever elders are choosing to “age in place” and due to rising life expectanciesand the high costs of formal caregiving (including institutionalization) some familieshave no choice but to take care of a family member at home (Collins and Jones 1997;Deeken et al. 2003; Bastawrous 2013).
Older individuals are projected to outnumber children for the first time in U.S.history and adult Mexican American children like other ethnic groups may spendmore years caring for their elderly parents than caring for their children (U.S. CensusBureau 2018). In the future Mexican American communities will need and demandmore and better long-term care services since caregiving burdens faced by the familywill increase at a time when social and demographic changes make it more difficultfor the family to meet those demands. Although, Mexican Americans underuse theseservices, they may have no alternative in the future and thus, in the absence of familysupport, the need for culturally-appropriate formal resourcesmerits serious attention.Respite care and geriatric primary care aswell as specialized services should bemadeavailable, easily accessible, and affordable (Wan et al. 2018).
Future directions should include increased research that expands our understand-ing of clinical and social determinants of mental and physical disability in olderminority populations. Health industry, governmental agencies and communitiesmustwork together to develop culturally tailored community engagement and interven-tion to prevent, delay and/or reduce the severity of disability and its complications.Improving access to caregiving resources and training for informal caregivers shouldtake place at the local, regional, state, and national levels. We must improve diag-nosis rates, treatment utilization, surveillance, and monitoring of disability amongMexican Americans and other Hispanics and employ scientific evidence to informnew and novel interventions.
Finally, it is imperative to actively recruit underrepresented Mexican Americansand other Hispanics in clinical research so that we have a better understanding ofmechanisms andmethods of intervening with the goal of increasing quality of life foraging Hispanics and those who care for them. The need to provide respite services,mental health resources and community services for caregivers of older people withdementia is of paramount importance in order to alleviate caregiver burden. Withoutsuch services, we are likely to observe rising rates of institutionalization in the nearfuture.

17 The Caregiving Experience of Older Mexican Americans and their … 371
References
Abramson, C. M. (2016). Unequal aging: Lessons from inequality’s end game. Public Policy &Aging Report, 26(2), 68–72.
Adelman, R. D., Tmanova, L. L., Delgado, D., Dion, S., & Lachs, M. S. (2014). Caregiver burden:A clinical review. JAMA, 311(10), 1052–1060. https://doi.org/10.1001/jama.2014.304.
Anderson, K. A., Dabbelko-Schoeny, H. I., & Fields, N. L. (2018). Home- and community-basedservices for older adults: Aging in context. New York: Columbia University Press.
Angel, J. L., Angel, R. J., Aranda, M. P., & Miles, T. P. (2004). Can the family still cope? Socialsupport and health as determinants of nursing home use in the older Mexican-origin population.Journal of Aging and Health, 16(3), 338–354. https://doi.org/10.1177/0898264304264203.
Angel, J. L., Rote, S. M., Brown, D. C., Angel, R. J., & Markides, K. S. (2014). Nativity statusand sources of care assistance among elderly Mexican-origin adults. Journal of Cross-CulturalGerontology, 29(3), 243–258. https://doi.org/10.1007/s10823-014-9234-9.
Annerstedt, L., Elmstahl, S., Ingvad, B., & Samuelsson, S. M. (2000). Family caregiving in demen-tia—An analysis of the caregiver’s burden and the “breaking-point” when home care becomesinadequate. Scandinavian Journal of Public Health, 28(1), 23–31.
Anthony, K. P., Geldhof, G. J., & Mendez-Luck, C. A. (2017). Characterizing caregiving intensityamong Mexican-origin women caregivers. Gerontologist, 57(6), 1084–1092. https://doi.org/10.1093/geront/gnw256.
Apesoa-Varano, E. C., Gomez, Y., & Hinton, L. (2016). Dementia informal caregiving in Latinos:What does the qualitative literature tell us? In W. A. Vega, K. S. Markides, J. L. Angel, & F. M.Torres-Gil (Eds.), Challenges of Latino aging in the Americas (pp. 141–169). New York: NY:Springer.
Aranda, M. P., Castaneda, I., Lee, P. J., & Sobel, E. (2001). Stress, social support, and coping aspredictors of depressive symptoms: Gender differences among Mexican Americans. Social WorkResearch, 25(1), 37–48.
Aranda, M. P., & Knight, B. G. (1997). The Influence of ethnicity and culture on the caregiver stressand coping process: A sociocultural review and analysis. The Gerontologist, 37(3), 342–354.
Bastawrous, M. (2013). Caregiver burden—A critical discussion. The International Journal ofNursing Studies, 50(3), 431–441. https://doi.org/10.1016/j.ijnurstu.2012.10.005.
Beard, H. A., Al Ghatrif, M., Samper-Ternent, R., Gerst, K., & Markides, K. S. (2012). Trendsin diabetes prevalence and diabetes-related complications in older Mexican Americans from1993–1994 to 2004–2005. Diabetes Care, 35(3), 660.
Beard, H. A., Ghatrif, M. A., Samper-Ternent, R., Gerst, K., & Markides, K. S. (2009). Trendsin diabetes prevalence and diabetes-related complications in older Mexican Americans from1993–1994 to 2004–2005. Diabetes Care, 32, 2212+.
Black, S. A., Markides, K. S., & Miller, T. Q. (1998). Correlates of depressive symptomatologyamong older community-dwelling Mexican Americans: The Hispanic EPESE. The Journals ofGerontology Series B: Psychological Sciences and Social Sciences, 53B(4), S198–S208.
Bourdieu, P. (1986). The forms of capital: Handbook of theory and research for the sociology ofeducation. New York, NY: Greenwood.
Browning, C. R. (2009). Illuminating the downside of social capital: Negotiated coexistence,property crime, and disorder in urban neighborhoods. American Behavioral Scientist, 52(11),1556–1578. https://doi.org/10.1177/0002764209331526.
Canino, G., Vega, W. A., Sribney, W. M., Warner, L. A., & Alegria, M. (2008). Social relationships,social assimilation, and substance use disorders among adult Latinos in the U.S. Journal of DrugIssues, 38(1), 69–101. https://doi.org/10.1177/002204260803800104.
Carpiano, R. M., & Fitterer, L. M. (2014). Questions of trust in health research on social capital:What aspects of personal network social capital do they measure? Social Science & Medicine,116, 225–234. https://doi.org/10.1016/j.socscimed.2014.03.017.
372 D. V. Flores et al.
Caskie, G. I., Sutton, M. C., & Margrett, J. A. (2010). The relation of hypertension to changes inADL/IADL limitations of Mexican American older adults. J Gerontol B Psychol Sci Soc Sci,65B(3), 296–305. https://doi.org/10.1093/geronb/gbq001.
Clark, C. M., DeCarli, C., Mungas, D., et al. (2005). Earlier onset of Alzheimer’s disease symptomsin Latino individuals compared with Anglo individuals. Archives of Neurology, 62(5), 774–778.https://doi.org/10.1001/archneur.62.5.774.
Collins, C., & Jones, R. (1997). Emotional distress and morbidity in dementia carers: A matchedcomparisonof husbands andwives. International Journal of Geriatric Psychiatry, 12, 1168–1173.
Crist, J. D., McEwen, M. M., Herrera, A. P., Kim, S., Pasvogel, A., & Hepworth, J. T. (2009).Caregiving burden, acculturation, familism, and Mexican American elders’ use of home careservices. Research & Theory for Nursing Practice, 23(3), 165–180.
Cuadrado, M., & Lieberman, L. (2002). Traditional family values and substance abuse. New York:Kluwer Academic / Plenum Publishers.
Cunningham, P. B., Foster, S. L., &Warner, S. E. (2010). Culturally relevant family based treatmentfor adolescent delinquency and substance abuse:Understandingwithin-sessionprocesses. Journalof Clinical Psychology, 66(8), 830–846. https://doi.org/10.1002/jclp.20709.
Durkheim, E. (1893). The division of labor in society (L. A. Coser, Trans.). New York: Free Press.Deeken, J. F., Taylor, K. L., Mangan, P., Yabroff, K. R., & Ingham, J. M. (2003). Care for thecaregivers: A review of self-report instruments developed to measure the burden, needs, andquality of life of informal caregivers. Journal of Pain and SymptomManagement, 26(4), 922–953.https://doi.org/10.1016/s0885-3924(03)00327-0.
Delgado, M. (2007). Social work with Latinos: A cultural assets paradigm. Oxford; New York:Oxford University Press.
Dilworth-Anderson, P., Hendrie, H. C., Manly, J. J., Khachaturian, A. S., Fazio, S., Social, B., et al.(2008). Diagnosis and assessment of Alzheimer’s disease in diverse populations. Alzheimer’s &Dementia, 4(4), 305–309. https://doi.org/10.1016/j.jalz.2008.03.001.
Downer, B., Mukaila, R. A., & Markides, K. S. (2015). Relationship betweeen metabolic andvascular conditions and cognitive decline among olderMexicanAmericans. International Journalof Geriatric Psychiatry, 31, 213–221. https://doi.org/10.1002/gps.4313.
Espino, D. V., DelAguila, D., Mouton, C. P., Alford, C., Parker, R. W., Miles, T. P., & Olivares, O.(2002). Characteristics of Mexican-American elders with dementia presenting to a community-based memory evaluation program. Ethicity and Disease, 12(4).
Espino, D. V., Mouton, C. P., Del Aguila, D., Parker, R. W., Lewis, R. M., & Miles, T. P. (2001).MexicanAmerican elderswith dementia in long termcare.ClinicalGerontologist, 23(3/4), 83–96.
Evans, B. C., Belyea, M. J., Coon, D. W., & Ume, E. (2012). Activities of daily living in MexicanAmerican caregivers: The key to continuing informal care. The Journal of Family Nursing, 18(4),439–466. https://doi.org/10.1177/1074840712450210.
Federal Interagency Forum on Aging-Related Statistics. (2012). Older Americans 2012: Key indi-cators of well-being. Washington, DC: U.S. Government Printing Office.
Flores, D. V., Rote, S., Angel, J. L., Chen, N., Downer, B., & Markides, K. S. (2018). Depressivesymptoms in child caregivers of very old Mexican Americans. Aging and Mental Health (InPress).
Flores, D. V., Torres, L. R., Bordnick, P. S., Ren, Y., & Haider, A. (2013). “El lado oscuro”: “Thedark side” of social capital in Mexican-American heroin using men. Journal of Ethnicity andSubstance Use, 12(2), 124–139. https://doi.org/10.1080/15332640.2013.788897.
Flores, D. V., Torres, L. R., Torres-Vigil, I., Bordnick, P. S., Ren, Y., Torres, M. I. M., et al.(2014). From “kickeando las malias” (kicking the withdrawals) to “staying clean”: The impactof cultural values on cessation of injection drug use in aging Mexican-American men. SubstanceUse & Misuse, 49(8), 941–954. https://doi.org/10.3109/10826084.2013.776084.
Garcia, M. A., & Reyes, A. M. (2018). Prevalence and trends in morbidity and disability amongolder Mexican Americans in the southwest United States, 1993–2013. Research on Aging, 40(4),311–339. https://doi.org/10.1177/0164027517697800.

17 The Caregiving Experience of Older Mexican Americans and their … 373
Garcia, M. A., Valderrama-Hinds, L. M., Chiu, C., Mutambudzi, M. S., Chen, N., & Raji, M.(2017). Age of migration life expectancy: With functional limitations and morbidity in MexicanAmericans. Journal of the American Geriatrics Society, 65, 1591–1596. https://doi.org/10.1111/jgs.14875.
Gaugler, J. E., Edwards, A. B., Femia, E. E., Zarit, S. H., Stephens, M. A., Townsend, A., et al.(2000). Predictors of institutionalization of cognitively impaired elders: Family help and thetiming of placement. The Journals of Gerontology Series B: Psychological Sciences and SocialSciences, 55(4), 247–255.
Gil, A., Vega, W., & Biafora, F. (1994). Temporal influences of family structure and risk factorson drug initiation in a multiethnic sample of adolescent boys. Journal of Youth & Adolescence,27(3), 373–392.
Gil, A. G., Wagner, E. F., & Vega, W. A. (2000). Acculturation, familism, and alcohol use amongLatino adolescent males: Longitudinal relations. Journal of Community Psychology, 28(4),443–458.
Gillick, M. R. (2013). The critical role of caregivers in achieving patient-centered care. JAMA,310(6), 575–576. https://doi.org/10.1001/jama.2013.7310.
Glick, R., & Moore, J. W. (1990). Drugs in Hispanic communities. New Brunswick: Rutgers Uni-versity Press.
Hansen, M. C., & Aranda, M. P. (2012). Sociocultural influences on mental health service useby Latino older adults for emotional distress: Exploring the mediating and moderating role ofinformal social support. Social Science & Medicine, 75(12), 2134–2142. https://doi.org/10.1016/j.socscimed.2012.06.029.
Hernandez, A. M., & Bigatti, S. M. (2010). Depression among older Mexican American caregivers.Cultural Diversity & Ethnic Minority Psychology, 16(1), 50–58. https://doi.org/10.1037/a0015867.
Hinton, L., Haan, M., Geller, S., & Mungas, D. (2003). Neuropsychiatric symptoms in Latinoelders with dementia or cognitive impairment without dementia and factors that modify theirassociation with caregiver depression. The Gerontologist, 43(5), 669–677.
Hongjie, L., Jian, L., Zhouping, L., Wei, L., & Zhiyong, Z. (2010). Does Chinese culture influencepsychosocial factors for heroin use among young adolescents in China? A cross-sectional study.BMC Public Health, 10, 563–570. https://doi.org/10.1186/1471-2458-10-563.
Hubbell, L. J. (1993). Values under seige in Mexico: Strategies for sheltering traditional valuesfrom change. Journal of Anthropological Research, 49(1), 1–16.
Hwang, T. J., Masterman, D. L., Ortiz, F., Fairbanks, L. A., & Cummings, J. L. (2004). Mild cogni-tive impairment is associated with characteristic neuropsychiatric symptoms. Alzheimer Disease& Associated Disorders, 18(1), 17–21. https://doi.org/10.1097/00002093-200401000-00004.
Kalapatapu, R. K., & Sullivan, M. A. (2010). Prescription use disorders in older adults. AmericanJournal on Addictions, 19(6), 515–522. https://doi.org/10.1111/j.1521-0391.2010.00080.x.
Kerr, K. (2008). The intersection of neglected ideas: Durkheim, Mead, and the postmodernists.Sociological Inquiry, 78(1), 121–140.
Knight, B. G., & Sayegh, P. (2010). Cultural values and caregiving: The updated socioculturalstress and coping model. The Journals of Gerontology Series B: Psychological Sciences andSocial Sciences, 65B(1), 5–13. https://doi.org/10.1093/geronb/gbp096.
Kornhauser, R. R. (1978). Social sources of delinquency: An appraisal of analytic models. Chicago,IL: University of Chicago Press.
Kruithof, W. J., Post, M. W., & Visser-Meily, J. M. (2015). Measuring negative and positivecaregiving experiences: A psychometric analysis of the Caregiver Strain Index Expanded.Clinical Rehabilitation, 29(12), 1224–1233. https://doi.org/10.1177/0269215515570378.
Kruithof,W. J., Visser-Meily, J. M., & Post, M.W. (2012). Positive caregiving experiences are asso-ciated with life satisfaction in spouses of stroke survivors. The Journal of Stroke & Cerebrovas-cular Diseases, 21(8), 801–807. https://doi.org/10.1016/j.jstrokecerebrovasdis.2011.04.011.

374 D. V. Flores et al.
Kuo, B. C. H. (2012). Collectivism and coping: Current theories, evidence, and measurements ofcollective coping. International Journal of Psychology, 1–15. https://doi.org/10.1080/00207594.2011.640681.
Latinos & Alzheimer’s disease: New numbers behind the crisis. (2016). USC Edward R. RoybalInstitute on Aging and Latinos Against Alzheimer’s Network.
Lavee, Y., & Altus, D. (2001). Family relationships as a predictor of post-treatment drug abuserelapse: A follow-up study of drug addicts and their spouses. Contemporary Family Therapy:An International Journal, 23(4), 513–530.
Lawton,M.P.,Moss,M.,Kleban,M.H.,Glicksman,A.,&Rovine,M. (1991).A two-factormodel ofcaregiving appraisal and psychological well-being. The Journals of Gerontology, 46(4), 181–189.
Liken, M. A. (2001). Critical incidents precipitating institutionalization of a relative withAlzheimer’s. Western Journal of Nursing Research, 23(2), 163–178. https://doi.org/10.1177/019394590102300205.
Lin, I. F., Fee, H. R., & Wu, H. S. (2012). Negative and positive caregivng experiences: A closerloot at the intersection of gender and relationship. Family Relations, 61, 343–358. https://doi.org/10.1111/j.1741-3729.2011.00692.x.
Lyketsos, C. G., Steinberg, M., Tschanz, J. T., Norton, M. C., Steffens, D. C., & Breitner, J. C. S.(2000). Mental and behavioral disturbances in dementia: Findings from the Cache County Studyon Memory in Aging. American Journal of Psychiatry, 157(5), 708–714. https://doi.org/10.1176/appi.ajp.157.5.708.
Lynch, A. (1996). Thought contagion: How belief spreads through society (1st ed.). New York,NY: Basic Books.
Markides, K. S., Angel, R. J., & Peek, M. K. (2013). Aging, health and families in the Hispanicpopulation: Evolution of a paradigm. In M. Silverstein & R. Giarruso (Eds.), Kinship and cohortin an Aging Society (pp. 314–331). Baltimore: John Hopkins University Press.
Markides, K. S., & Eschbach, K. (2011). Hispanic paradox in adult mortality in the United States.In International handbook of adult mortality (pp. 227–2240). Netherlands: Springer.
Mead, G. H. (1934). Mind, self and society. Chicago, IL: University of Chicago Press.Mendez-Luck, C. A., & Anthony, K. P. (2016). Marianismo and caregiving role beliefs amongU.S.-born and immigrant Mexican women. The journals of gerontology. Series B, Psychologicalsciences and social sciences, 71(5), 926–935. https://doi.org/10.1093/geronb/gbv083.
National Alliance on Caregiving. (2015). Caregiving in the U.S. http://www.aarp.org/content/dam/aarp/ppi/2015/caregivers-of-older-adults-focused-look.pdf.
National Research Council. (2004). Ethnic differences in dementia and Alzheimer’s disease. InN. A. Anderson, R. A. Bulatao, & B. Cohen (Eds.), Critical perspectives on racial and ethnicdifferentials in health in late life (pp. 95–141). Washington, DC: National Academies Press.
Neary, S. R., & Mahoney, D. F. (2005). Dementia caregiving: The experiences of Hispanic/Latinocaregivers. Journal of transcultural nursing, 16(2), 163–170. https://doi.org/10.1177/1043659604273547.
O’Bryant, S. E., Humphreys, J. D., Schiffer, R. B., & Sutker, P. B. (2007). Presentation of MexicanAmericans to a memory disorder clinic. Journal of Psychopathology and Behavioral Assessment,29(3), 137–140. https://doi.org/10.1007/s10862-006-9042-9.
O’Bryant, S.E., Johnson,L.,Balldin,V., Edwards,M.,Barber,R.,Williams,B., et al. (2013).Charac-terization of Mexican Americans with mild cognitive impairment and Alzheimer’s disease. Jour-nal of Alzheimer’s Disease: JAD, 33(2), 373–379. https://doi.org/10.3233/JAD-2012-121420.
Ortiz, F., Fitten, L. J., Cummings, J. L., Hwang, S., & Fonseca, M. (2006). Neuropsychiatric andbehavioral symptoms in a community sample of Hispanics with Alzheimer’s disease. AmericanJournal of Alzheimer’s Disease and Other Dementias, 21(4), 263–273.
Parks, S. H., & Pilisuk,M. (1991). Caregiver burden: Gender and the psychological costs of caregiv-ing. American Journal of Orthopsychiatry, 61(4), 501–509. https://doi.org/10.1037/h0079290.
Patel, K. V., Peek, M. K., Wong, R., & Markides, K. S. (2006). Comorbidity and disability inelderly Mexican and Mexican American adults: Findings from Mexico and the southwestern
17 The Caregiving Experience of Older Mexican Americans and their … 375
United States. Journal of Aging and Health, 18(2), 315–329. https://doi.org/10.1177/0898264305285653.
Pew Hispanic Center. (2015). U.S. population estimates and projections 2014–2060. Washington,DC.
Pinquart, M., & Sorensen, S. (2003). Differences between caregivers and noncaregivers inpsychological health and physical health: A meta-analysis. Psychol Aging, 18(2), 250–267.
Pinquart, M., & Sorensen, S. (2005). Ethnic differences in stressors, resources, and psychologicaloutcomes of family caregiving: A meta-analysis. Gerontologist, 45(1), 90–106.
Prado, G., Szapocznik, J., Maldonado-Molina, M. M., Schwartz, S. J., & Pantin, H. (2008). Druguse/abuse prevalence, etiology, prevention, and treatment in Hispanic adolescents: A culturalperspective. Journal of Drug Issues, 38(1), 5–36.
Putnam, R. (2000). Bowling alone: The collapse and revival of American community. New York,NY: Simon & Schuster.
Rivera, F. I., Guarnaccia, P. J., Mulvaney-Day, N., Lin, J. Y., Torres, M., & Alegria, M. (2008).Family cohesion and its relationship to psychological distress among Latino groups. HispanicJournal of Behavioral Sciences, 30(3), 357–378.
Roberto, K. A., & Jarrott, S. E. (2008). Family caregivers of older adults: A life span perspective.Family Relations, 57(1), 100–111.
Rose, D. R., & Clear, T. R. (1998). Incarceration, social capital, and crime: Implications for socialdisorganization theory. Criminology, 36(3), 441–479.
Rosenfeld, R., Messne, S. F., & Baumer, E. P. (2001). Social capital and homicide social forces,80(1), 283–310.
Rote, S., Angel, J. L., & Markides, K. S. (2015). Health of elderly Mexican American adults andfamily caregiver distress. Research on Aging, 37(3), 306–331.
Rote, S., &Markides, K. S. (2014). Aging, social relationships, and health among older immigrants.Generations, 38(1), 51–57.
Roth, D. L., Fredman, L., & Haley, W. E. (2015). Informal caregiving and its impact on health: Areappraisal from population-based studies. Gerontologist, 55(2), 309–319. https://doi.org/10.1093/geront/gnu177.
Salazar, R., Dwivedi, A. K., & Royall, D. R. (2016). Cross-ethnic differences in the severity ofneuropsychiatric symptoms in persons with mild cognitive impairment and Alzheimer’s disease.The Journal of Neuropsychiatry and Clinical Neurosciences, appineuropsych15120423. https://doi.org/10.1176/appi.neuropsych.15120423.
Salazar, R., Royall, D. R., & Palmer, R. F. (2015). Neuropsychiatric symptoms in community-dwelling Mexican-Americans: Results from the Hispanic Established Population for Epidemi-ological Study of the Elderly (HEPESE) study. International Journal of Geriatric Psychiatry,30(3), 300–307. https://doi.org/10.1002/gps.4141.
Sampson, R. J., & Raudenbush, S. W. (1997). Neighborhoods and violent crime: A multilevel studyof collective efficacy. Science, 277(5328), 918.
Schneider, M. G., & Shardell, M. (2008). Parkinson’s disease and functional decline in olderMexican Americans. Parkinsonism Relat Disord, 14(5), 397–406. doi:https://doi.org/10.1016/j.parkreldis.2007.11.015.
Soriano, M., Soriano, F. I., & Jimenez, E. (1994). School violence among culturally diverse popula-tions: Sociocultural and institutional considerations. School Psychology Review, 23(2), 216–235.
Streeten, P. (2002). Reflections on social and antisocial capital. Journal of Human Developmentand Capabilities, 3(1), 7–22. doi: https://doi.org/10.1080/14649880120105362.
Smith, A. K., Sudore, R. L., & Perez-Stable, E. J. (2009). Palliative care for latino patients andtheir families: Whenever we prayed, she wept. JAMA: The Journal of the American MedicalAssociation, 301(10), 1047–1057. https://doi.org/10.1001/jama.2009.308.
Tarlow, B. J., Wisniewski, S. R., Belle, S. H., Rubert, M., Ory, M. G., & Gallagher-Thompson, D.(2004). Positive aspects of caregiving: Contributions of the REACH Project to the developmentof new measures for Alzheimer’s caregiving. Research on Aging, 26(4), 429–453. https://doi.org/10.1177/0164027504264493.
376 D. V. Flores et al.
The Alzheimer’s Association. (2014). 2014 Alzheimer’s disease facts and figures. http://www.alz.org/downloads/facts_figures_2014.pdf.
U.S. Census Bureau. (2010a). The next four decades, the older population in the United Sates:2010 to 2050 population estimates and projections. Washington, DC: Economics and StatisticsAdministration.
U.S. Census Bureau. (2010b). The next four decades: The older population in the United States:2010 to 2050, current population reports. Washington DC.
U.S. Census Bureau. (2018). Older people projected to outnumber children for first time in U.S.history. https://www.census.gov/newsroom/press-releases/2018/cb18-41-population-projections.html.
Unger, J. B., Ritt-Olson, A., Teran, L., Huang, T., Hoffman, B. R., & Palmer, P. (2002). Culturalvalues and substance use in a mutiethnic sample of California adolescents.Addiction Research& Theory, 10(3), 257–279. https://doi.org/10.1080/16066350290025672.
Valdez, A., Neaigus, A., & Kaplan, C. D. (2008). The influence of family and peer risk networks ondrug use practices and other risks among Mexican American noninjecting heroin users. Journalof Contemporary Ethnography, 37(1), 79–107. https://doi.org/10.1177/0891241607309476.
Valdez, A., Neaigus, A., & Cepeda, A. (2007). Potential risk factors for injecting among MexicanAmerican non-injecting heroin users. Journal of Ethnicity in Substance Abuse, 6(2), 49–73.https://doi.org/10.1300/J233v06n02_05.
Villatoro, A. P., Morales, E. S., &Mays, V. M. (2014). Family culture in mental health help-seekingand utilization in a nationally representative sample of Latinos in the United States: The NLAAS.American Journal of Orthopsychiatry, 84(4), 353–363. https://doi.org/10.1037/h0099844.
Wan, H., Weingartner, R. M., & Sayer, L. C. (2018). Subjective well-being of eldercare providers:2012–2013. Washington, DC: U.S. Government Priniting Office.
Weiss, C. O., González, H. M., Kabeto, M. U., & Langa, K. M. (2005). Differences in amount ofinformal care received by non-Hispanic Whites and Latinos in a nationally representative sampleof older Americans. Journal of the American Geriatrics Society, 53(1), 146–151. https://doi.org/10.1111/j.1532-5415.2005.53027.x.
Werth, J. L., & Blevins, D. (2006). Psychosocial issues near the end of life: A resource forprofessional care providers (1st ed.). Washington, DC: American Psychological Association.
World Healh Organization. (2006).WHO facts on: Elder abuse and alcohol. Geneva: Switzerland.Zambrana, R. E. (1995). Understanding Latino families: Scholarship, policy and practice.Thousand Oaks: Sage Publications.
Zarit, S. H., Todd, P. A., & Zarit, J. M. (1986). Subjective burden of husbands and wives ascaregivers: A longitudinal study. Gerontologist, 26(3), 260–266.

Epilogue: Looking to the Future—Priorities for Creating New Knowledge
Steven P. Wallace
There are about 1000 publications listed in PubMed every year that include cov-erage of Latino elders, a number that has been increasing each year. While that maysound impressive, this total has not yet reached 1% of all articles publishedannually on older adults. Given the comparatively small numbers of us whoresearch Latino aging issues, what are the most important areas for research? Thefollowing is one set of possible research agendas that address space, time, and placefor this growing population.
The Structural Context Across Space, Time, and Place
Taking a socioecological framework, we should look first at overarching andsystem-level determinants of health including political factors, social determinants,and built environments, all areas where research on older Latinos is particularlylacking. The political rhetoric about Latin American immigrants has ebbed andflowed over the past century between exclusionary and inclusionary (Wallace andYoung 2018). Today’s 80 year old will have grown up and come of age during theBracero program. Today’s 60 year old was in her or his late 20s when PresidentReagan signed amnesty legislation in 1986 that provided a pathway to citizenshipfor those who were undocumented immigrants at the time. Those who have aged inthe United States will have lived through virulently anti-Latin American immigrantperiods such as when Proposition 187 passed in California in 1994 and threatenedto bar undocumented immigrants from all public services in the state (it was neverimplemented), the Congressional passage of the Personal Responsibility and WorkOpportunity Reconciliation Act of 1996 (PRWORA) that expanded the discretionof states to bar recent legal immigrants from many public benefits, the militarizationof the border post-9/11, and the deportation regimes of the 2010s. These were not
S. P. WallaceDepartment of Community Health Sciences and UCLA Center for Health Policy Research,UCLA Fielding School of Public Health, University of California, Los Angeles, CA, USAe-mail: [email protected]
© Springer Nature Switzerland AG 2019W. A. Vega et al. (eds.), Contextualizing Health and Aging in the Americas,https://doi.org/10.1007/978-3-030-00584-9
377

aging policies, per se, but impacted the life courses of millions of Latin Americanimmigrants and shaped their family and economic resources for support available inold age.
It is particularly important to document the impacts of public policies, bothhistoric and contemporary, on the health and well-being of Latino elders so that wecan identify gaps and ways to buffer the impacts of policies during exclusionarytimes, and promote helpful policies during inclusionary times. This includes studiesof how changes in public policies and programs impact older Latinos. Whileprograms such as Medicaid and SSI benefit all low-income elders, Latino elders,especially immigrants, are the most dependent of all racial/ethnic groups nationallyon Medicaid and among the most reliant on SSI as shown in Table A.1. It isimportant politically to note that more older non-Latino whites depend on both ofthose programs than the other ethnic groups, but their adverse impact on com-munities is heaviest in communities of color. Antigovernment politicians alsoroutinely call for the privatization or weakening of Social Security. Most olderadults receive Social Security (Table A.1), and about half of all races/ethnicitiesdepend on it for half or more of their family income. Low income populations areparticularly dependent on Social Security, with about two-thirds of the poorest fifthof the population depending on Social Security for over 90% of their total income.
Table A.1 Public benefits used by race/ethnicity and nativity, persons ages 65 and over, UnitedStates, 2016
US-bornLatinos
Foreign-bornLatinos
AfricanAmericana
Asiana AmericanIndian/AlaskaNative
Whitea
NumberreceivingMedicaid (inthousands)
429 812 1140 608 133 4290
Percent of groupwith Medicaid(%)
24.1 37.7 25.9 28.5 24.3 11.3
Numberreceiving SSI (inthousands)
153 234 344 251 41 1182
Percent of groupwith SSI (%)
8.6 10.9 7.8 11.8 7.5 3.1
Numberreceiving socialsecurity (inthousands)
1465 1487 3567 1431 462 33,316
Percent of groupwith socialsecurity (%)
82.3 69.0 81.2 67.2 84.1 87.5
aNon-LatinoSource 2016 American Community Survey (Ruggles et al. 2017)
378 Epilogue: Looking to the Future—Priorities for Creating New Knowledge

Beyond any specific public programs, the Robert Wood Johnson Foundation hassummarized a wide body of research on the determinants of health that show thatabout 40% of health results from social and economic factors experienced over thelife course. They have estimated that another 10% is attributable to the physicalenvironment. There is an estimated 30% contribution from health behaviors (e.g.,tobacco, diet, and sexual activity), and 20% from where we invest the vast majorityof our public resources, clinical care (Hood et al. 2016). While this framework canhelp prioritize where we conduct research to improve health outcomes, it still tendsto focus on causes that are more proximal; see the framework in the Wu et al.chapter in this volume that discusses life course health risks affecting risk ofAlzheimer’s disease in older Latino adults.
Structural solutions to more proximal health behaviors can be seen, for example,in the diets of older Latinos that often contain unhealthy levels of sodium. We canfocus solely on the education of individuals, but it can be more effective to tar-get also policies that make the healthy choice the easy choice. In this model, usefulresearch would identify the most effective policies that would lead to reductions insodium consumption among older Latinos, such as modifying the sodium contentof commercial baked goods. There is already a literature about policy approachesthat reduce sodium consumption based on domestic and international experiences(Mohan et al. 2009), but little of the work focuses specifically on older adults, andthere does not appear to be any that studies the dietary intake patterns of olderLatinos in general. Similar research is needed that identifies contexts relevant toolder Latinos that make other healthy behaviors easier as well, such as physicalactivity and seeking preventive health care services.
Strengthening Research on Structural Factors,Discrimination, and Health
Policy and politics are just two of the many social determinants of health.Throughout our life courses, we experience both limitations and opportunities basedon our interactions with the criminal justice system, educational system, labormarkets, housing markets, and other social systems. Our racialized society operatesthrough these social institutions and will have differential impacts on Latinos.While we often “control” for characteristics such as education and income in ouranalyses, we need to problematize those more and identify how structured oppor-tunities across these institutions create inequalities in education and income thatolder Latinos experience (Wallace 2015). Immigrants, in particular, often havedifferent (intersectional) experiences across institutional sectors in their communi-ties of origin and communities of settlement, which we need to understand better.There is an emerging body of work that looks at how immigrant policies nottypically associated with health outcomes shape the health profile of both immi-grant and U.S.-born Latinos. They tend to look at acute threats caused by depor-tations and highly visible anti-immigrant policy changes. Much of the limited
Epilogue: Looking to the Future—Priorities for Creating New Knowledge 379

research on the health impact of these policies has been on the acute stress it causesLatinos, including older adults (Rodriguez et al. 2017). But it is also likely toinfluence access to health care and other resources over the long-term, in addition toshaping other determinants of health.
We also need research about whether older Latinos may be less reactive to thesethreats based on witnessing similar situations earlier in life or whether they areparticularly impacted because of their concern over the potential fate of their family.In addition, older Latinos have experienced long lives with the constant stress ofimmigration and racial discrimination. There is a large body of research showingthat racism is bad for your health over the life course, but we are only starting toexamine how immigration and citizenship status discrimination impact bothimmigrants and their U.S.-born family over the life course. The Rodriguez, Paredes,and Hagan chapter in this volume provides valuable information in this area.
A particularly unstudied subgroup of Latino elders are those who live in the UnitedStates without authorization. This is currently a small group; it is estimated that 6% ofthe undocumented population in the United States is age 55 and over (Baker 2017),much smaller than the 37% of all U.S.-born adults who are age 55 and over. The 1986Amnesty signed by Republican President Ronald Reagan provided an estimatedtwo-thirds of the then undocumented immigrants legal status. But the 1990s saw alarge influx of unauthorized arrivals and 9/11 led to a sealing of the border, largelyending circular migration and making those who arrived without documents “per-manent” but unauthorized residents. With the tightening of the process for citizenchildren sponsoring parents’ immigration in the 1996 immigration laws (AmericanImmigration Council 2016), it has become increasingly difficult for U.S.-born childrento sponsor their undocumented parents for green cards. If we assume that the averageage of undocumented Latinos at arrival in the 1990s was 30, they will start turning 65in 2025, just around the corner. This is a group that will have spent their adult livesliving and working in the United States while raising their families, but who will haveno access to the Social Security or Medicare benefits they typically contributed to, norwill they be eligible for Medicaid or SSI. We have no information about howundocumented older Latinos currently manage, how their needs impact their familiesand communities, and what the likely consequences of this will be as their numbersincrease rapidly in coming years.
Attention to Family and Community Levels
This leads to another understudied yet critical area of research. When looking athow contexts impact Latino elder health across time and place, we should also lookat those impacts on the health of families and communities in which older Latinosare embedded. With 40% of noncitizen Mexican-immigrant elders living inthree-generation households (compared to 4% of non-Latino U.S.-born whites), thefamily is a key unit of analysis that is usually overlooked.
380 Epilogue: Looking to the Future—Priorities for Creating New Knowledge

Right now, there is a rapidly growing interest in Alzheimer’s disease, includingin the area of caregiving. The caregiving literature has a heavy emphasis on theburdens and stresses of caregiving on the individual caregiver. A NationalAcademies of Sciences, Engineering, and Medicine (2016) report notes we alsoneed to identify sources of resilience, which are likely found in the broader family,community, and culture. Unless we widen the scope of our research, we are likelyto overlook important resources that can be reinforced to provide assistance to thecaregiving unit. In addition, we need to look for unanticipated consequences ofthese family strengths, such as when young Latinas delay college to help theirgrandmothers and end up with truncated educational careers as a result. On abroader level, Latino older adults are more likely than non-Latino whites to live inmultigenerational families (Gurak and Kritz 2010), making a better understandingof family-level outcomes particularly important.
And immigrants commonly live in ethnic enclaves; about half of older MexicanAmericans in the H-EPESE live in census tracts that are majority Mexican American.This is where they will experience their built environments, so having a healthycommunity is key to healthy families and older adults. Given the importance ofhousing in the health of older Latinos and others, it is surprising that there is not moreattention paid to this key community feature (Vega andWallace 2016). The concept of“life-space” provides a useful tool to conceptualize place and how spatial boundariesexperienced by the individual (or family) can be both a cause and/or result of healthand other characteristics (e.g., Silberschmidt et al. 2017). In addition, there is researchthat shows that there is a protective effect of immigrant neighborhoods on Latinomortality that is more than an artifact of healthy immigrant selection. There are alsoindications that an enclave near the border is different than one further inland (Patelet al. 2003). But we have only scarce data to explain how immigrant communitiespromote the health of Latino adults and elders. There are hypotheses that enclaveshave stronger social networks, better access to culturally responsive services, lessneed for a car leading to more physical activity, less stress due to living nearlike-minded people, and more. We are at the point now where we need less research“that” enclaves promote health and more research on the “how and why” they do so.As with the Hispanic Paradox, this is likely to be a topic that can fill a career.
Follow the Money
Finally, when looking for funding for research, the National Institutes of Aging(NIA) at the National Institutes of Health has received several budget increases forfunding Alzheimer’s disease research and pay lines are almost reasonable in thisarea now. Several of the chapters in this book provide analyses of cognitive healthissues for older Latinos and offer suggestions for future directions in research thatcould be both productive and fundable. More broadly, NIH’s interest in simplydocumenting disparities is waning and their interest is increasingly focused onmechanisms and possible interventions. The NIA continues to have a strong interest
Epilogue: Looking to the Future—Priorities for Creating New Knowledge 381
in health equity through its strategic directions that include to “understand healthdisparities and develop strategies to improve the health status of older adults indiverse populations” (NIA 2016). NIA has also published a framework to helpresearchers think through approaches to identify factors producing health disparitiesand approaches to reducing disparities (Hill et al. 2015). While the most fundabletopics continue to be biological and behavioral determinants of health, as notedabove behaviors are made more or less easy to follow because of the context: social,economic, and cultural. Rigorously designed observational studies that providerelevant information on how systems impact behaviors can get funded.
There are plenty of NIH priority areas with funding that would also benefit from afocus on Latino older adults. NIA has a number of initiatives where they are trying tobuild out new research areas, often starting with supporting networks and workshopsthat inform RFAs (see https://www.nia.nih.gov/research/dbsr/networks-develop-priority-areas-behavioral-and-social-research). For example, at a GSA/RCMARpreconference workshop on the National Alzheimer’s Project Act a few years agothere was a striking shortage of well-designed research on older Latinos (www.rcmar.ucla.edu/content/gsa-2014). Similarly, at a recent workshop on the growing area ofReversibility and Mutability Research, none of the leading researchers in this areafocused on Latinos (http://www.rcmar.ucla.edu/content/gsa-2017). In sum, there isno shortage of important topics for future research, whether in the area of socialdeterminants of health including policy and place, or in the more focused emergingtopics, such as Alzheimer’s disease and chronic health conditions, being funded byNIH and NIA.
Summary
The relative paucity of research on older Latinos relative to their growing importancein the population means that almost any research that puts the older Latino populationin the center of the analysis will provide a contribution to new knowledge. But if ourgoal is not only to understand the world but to change it, then we need to include afocus on fundamental causes of health and inequities. To do so will require that wepay increased attention to institutional factors that have shaped the life courses ofLatino elders, and situate them in their communities and families. And by improvingthe health of the families and communities where Latinos age, we will improve thehealth of Latinos of all ages and potentially of all races and ethnicities.
References
American Immigration Council. (2016, October). The three- and ten-year bars—How new rulesexpand eligibility for waivers. https://www.americanimmigrationcouncil.org/sites/default/files/research/three_and_ten_year_bars.pdf. Accessed May 6, 2018.
382 Epilogue: Looking to the Future—Priorities for Creating New Knowledge
https://www.nia.nih.gov/research/dbsr/networks-develop-priority-areas-behavioral-and-social-research

Baker, B. (2017). Estimates of the unauthorized immigrant population residing in the UnitedStates: January 2014. Washington, DC: U.S. Department of Homeland Security, Office ofImmigration Statistics. https://www.dhs.gov/sites/default/files/publications/Unauthorized%20Immigrant%20Population%20Estimates%20in%20the%20US%20January%202014_1.pdf.Accessed May 6, 2018.
Gurak, D. T., & Kritz, M. M. (2010). Elderly Asian and Hispanic foreign-and native-born livingarrangements: Accounting for differences. Research on Aging, 32(5), 567–594.
Hill, C. V., Pérez-Stable, E. J., Anderson, N. A., & Bernard, M. A. (2015). The National Instituteon Aging health disparities research framework. Ethnicity & Disease, 25(3), 245–254.
Hood, C. M., Gennuso, K. P., Swain, G. R., & Catlin, B. B. (2016). County HealthRankings. American Journal of Preventive Medicine, 50(2), 129–135.
Mohan, S., Campbell, N. R., & Willis, K. (2009). Effective population-wide public healthinterventions to promote sodium reduction. Canadian Medical Association Journal, 181(9),605–609.
National Academies of Sciences, Engineering, and Medicine. (2016). Families caring for an agingAmerica. Washington, DC: The National Academies Press.
National Institutes of Aging (NIA). (2016). Aging well in the 21st century: Strategic directions forresearch on aging. Bethesda, MD. https://www.nia.nih.gov/sites/default/files/2017-07/nia-strategic-directions-2016.pdf. Accessed May 20, 2018.
Patel, K. V., Eschbach, K., Rudkin, L. L., Peek, M. K., & Markides, K. S. (2003). Neighborhoodcontext and self-rated health in older Mexican Americans. Annals of Epidemiology, 13(9),620–628.
Rodriguez, N., Paredes, C. L., & Hagan, J. (2017). Fear of immigration enforcement among olderLatino immigrants in the United States. Journal of Aging and Health, 29(6), 986–1014.
Silberschmidt, S., Kumar, A., Raji, M. M., Markides, K., Ottenbacher, K. J., & Al Snih, S. (2017).Life space mobility and cognitive decline among Mexican Americans aged 75 years andolder. Journal of the American Geriatrics Society, 65(7), 1514–1520.
Ruggles, S., Genadek, K., Goeken, R., Grover, J., & Sobek, M. (2017). Integrated public usemicro data series: Version 7.0 [dataset]. Minneapolis: University of Minnesota. https://doi.org/10.18128/D010.V7.0.
Wallace, S. P. (2015). Equity and social determinants of health among older adults. Generations,38(4), 6–11.
Wallace, S. P., & Young, M. E. D. T. (2018). Immigration versus immigrant: The cycle ofanti-immigrant policies. American Journal of Public Health, 108(4), 436–437.
Vega, W. A., & Wallace, S. P. (2016). Affordable housing: A key lever to community health forolder Americans. American Journal of Public Health, 106(4), 635–636.
Epilogue: Looking to the Future—Priorities for Creating New Knowledge 383