Wife abuse in Esfahan, Islamic Republic of Iran, 2002
291
-
Upload
khangminh22 -
Category
Documents
-
view
0 -
download
0
Transcript of Wife abuse in Esfahan, Islamic Republic of Iran, 2002


860 La Revue de Santé de la Méditerranée orientale, Vol. 11, No 5/6, 2005
�ملجلة �لصحية لشرL �ملتوسط، منظمة �لصحة �لعاملية، �ملجلد �حلا�E عشر، �لعد��� ٥-٦، ٢٠٠٥
Wife abuse in Esfahan, Islamic Republic of Iran, 2002S.M. Mousavi1 and A. Eshagian2
1Department of Health and Community Medicine, Medical College, Shahid Beheshti University of Medical Sciences, Tehran, Islamic Republic of Iran (Correspondence to S.M. Mousavi: [email protected]).2Fatemieh Medical University, Qom and Esfahan Family Clinic, Esfahan, Islamic Republic of Iran.Received: 29/02/04; accepted: 06/07/04
ABSTRACT We carried out a cross-sectional study with cluster random sampling to study the status of wife abuse in Esfahan from April to July 2002. We interviewed 386 married women using a standard questionnaire. Mean age was 35.7 years (range 15–78 years). Prevalence of wife abuse was 36.8%; incidence was 29.3%. Types of abuse included inattention to wife’s feelings 44.8%, threatening to pre-vent communicating with the wife’s family 38.1%, slapping 31.9% and beating 27.2%. Husband’s age, use of drugs or alcohol, smoking, income and number of children were all associated with wife abuse (P < 0.05). We recommend further investigation to detect the risk factors for wife abuse in this commu-nity along with mass education concerning sexual responsibility and conduct towards wives. We also advocate the promotion of supportive measures for abused women.
La maltraitance conjugale à Ispahan (République islamique d’Iran), 2002RÉSUMÉ Nous avons réalisé une étude transversale avec échantillonnage aléatoire par grappes sur la situation de la maltraitance conjugale à Ispahan d'avril à juillet 2002. Nous avons interrogé 386 femmes mariées à l’aide d’un questionnaire standard. L’âge moyen était de 35,7 ans (extrêmes : 15-78 ans). La prévalence de la maltraitance conjugale était de 36,8 % ; l’incidence était de 29,3 %. Les types de maltraitance comprenaient le mépris des sentiments de l’épouse (44,8 %), la menace d'empê-cher tout contact avec la famille de l'épouse (38,1 %), les gifles (31,9 %) et les coups (27,2 %). L’âge du mari, l’usage de drogues ou d’alcool, le tabagisme, le revenu et le nombre d’enfants étaient tous associés à la maltraitance conjugale (p < 0,05). Nous recommandons d'autres études pour identifier les facteurs de risque de la maltraitance conjugale dans cette communauté parallèlement à une éducation de masse concernant la responsabilité sexuelle et la conduite envers l'épouse. Nous préconisons en outre la promotion de mesures de soutien pour les femmes maltraitées.
Eastern Mediterranean Health Journal, Vol. 11, Nos 5/6, 2005 861
�ملجلة �لصحية لشرL �ملتوسط، منظمة �لصحة �لعاملية، �ملجلد �حلا�E عشر، �لعد��� ٥-٦، ٢٠٠٥
Introduction
Wife abuse is a negative attempt to control the behaviour of a wife. Wife abuse oc-curs when a husband threatens or harms his spouse to gain power and control over her. This includes emotional, physical and sexual abuse.
In the United States of America, between 1 million and 4 million women experience serious assault by an intimate partner each year [1,2]; 47% of the men who beat their wives do so at least 3 times per year [3]. Nearly 1 in 3 American women experience at least 1 physical assault by a partner dur-ing adulthood [2]. It has been estimated that 1 in every 10 women in Canada is abused by her partner every year [4].
Recognizing wife abuse as an issue that impacts on the community is a new idea in the Islamic Republic of Iran. Till recently, it has been believed that wife abuse was not a major problem, that it happened to only a minority of women and that it was a private family matter.
There have been only a few reports on wife abuse in the Islamic Republic of Iran [5–10], however, it happens among every socioeconomic group [11]. Reports from emergency rooms of many hospitals and le-gal medical centres suggest there are many cases of trauma due to physical spouse abuse [12–15].
Now, with the increased awareness of the pervasiveness of this phenomenon and its devastating psychological and physical impact it is important to determine the ex-tent of the problem in the community. We, therefore, carried out a cross-sectional study to determine the prevalence of wife abuse and associated factors in Esfahan in the Islamic Republic of Iran. Our main aim was to gather basic data which may be useful in reducing this problem in the community.
Methods
We carried out a cross-sectional study of a sample of married women in Esfahan, se-lected using cluster random sampling. The study was carried out from April to July 2002. Using a map of Esfahan, the city was divided into 495 blocks and we selected 50 blocks randomly. Then we selected 4 resi-dential units randomly in each of these 50 blocks; the total number of homes was 458. The total number of married women living in these homes was 434. We explained the study to the women and invited them to participate; 11.1% refused to participate. The main reasons given were their husbands would not agree or they were satisfied with their relationship. Oral consent to take part in the study was given by 386 women. They were interviewed in their homes by trained interviewers using a standardized question-naire. In some cases, other family members were present during the interview, but in no case was the husband present.
Using variables based on our goals, we drew up a questionnaire. This was utilized after its validity, reliability and objecti-vity were tested on a random sample of 30 women from the clustered random sample. We used 24 closed questions to collect in-formation about demographic variables and the socioeconomic situation of participants and 38 closed questions to detect the preva-lence, incidence and types of wife abuse.
We used SPSS, version 11.0, to ma-nage the data and perform descriptive and inferential statistical tests. The data were analysed using the Pearson chi-squared test; P < 0.05 was considered significant.
The age group of the sample was re-presentative of the population of Esfahan according to the latest census (Statistical Centre of Iran, 1996) [16]. There was no sta-tistically significant difference between the

862 La Revue de Santé de la Méditerranée orientale, Vol. 11, No 5/6, 2005
�ملجلة �لصحية لشرL �ملتوسط، منظمة �لصحة �لعاملية، �ملجلد �حلا�E عشر، �لعد��� ٥-٦، ٢٠٠٥
age group of married women in the sample and in the general population (P < 0.05).
Results
The mean age of the women in the study was 35.7 years [standard deviation (SD) 10.88; range 15–78 years]) and that of their husbands was 41.6 years (SD 12.64; range 18–82 years). Mean age at marriage for the women was 19.3 years (SD 4.85; range 9–44 years) and for their husbands was 25.2 years (SD 5.2; range 14–58 years). Non-Iranians constituted 2.4% of the sample; 1.8% were Christians and the others were Muslims, 75.6% were natives of Esfahan and 7.5% had migrated there within the past 10 years. Mean number of children was 2.28 (range 0–9). Mean family income per month was US$ 179 (range US$ 0–3614). Most of the participants had some education, only 7.5% of the women and 6.5% of their husbands were uneducated. Prevalence of smoking was 1.8%, alcohol use 0.5% and drug use 0.5% in the women and 33.7%, 7.8% and 5.7% respectively in husbands. Only 26.9% of the participants were employed outside the home; 1.8% stated their husbands were unemployed. About 57% of the families were householders and about 30% rented their home (Table 1).
Reported prevalence of wife abuse during the marriage was 36.8%, with an incidence rate of 29.3%. There was a sta-tistically significant association between history of spouse abuse in the marriage and the following characteristics of the husband (P < 0.05): history of smoking, using alcohol or using drugs; nationality; and age. It was also associated with being a family native to Esfahan; immigration of the family to Esfahan; family income; and number of children (Table 2). The typical time for abuse was at night.
More than 70% of wives of alcohol users and drug users said they were abused. Prevalence of wife abuse was also very high if the husband was of non-Iranian nationa-lity; 32.5% of husbands who were natives of Esfahan and 50.0% of non-natives were wife abusers (Table 3). Of husbands who were immigrants to Esfahan, 55.2% of those who had been there < 10 years were wife abusers compared to 35.3% of those who had been there ≥ 10 years.
Increasing age of the husband was as-sociated with an increase in the prevalence of wife abuse, 28.8% for those < 35 years, 40.1% for those 35–45 years and 48.8% for husbands ≥ 45 years. Also, prevalence of wife abuse was significantly related to family size. For families with 0 children, wife abuse was 21.3%; for those with 1–2 children, it was 37.4% and for those with ≥ 3 children, 42.2% of wives reported being abused.
Physical abuse was reported to be in the form of beating 27.2% [with history of ec-chymosis (16.3%) bleeding (7.3%) fracture (3.1%) and hospitalization (2.6%)]. Other forms of physical abuse were reported such as slapping (31.9%), stabbing (3.4%) and throwing objects at the victim (23.6%).
Psychological and emotional abuse was mainly reported to be insulting (32.4%). Abuse in the form of threats to: isolate the woman from her family (38.1%), or leave (l7.6%), divorce (15.3%), beat (24.1%), attack with a knife (5.7%), shoot (1.6%) or kill (7.0%) her were also reported.
About 45% of the participants reported that they did not get any attention from their husbands regarding their feelings. Aggres-sion was reported by 43.8% and 15.8% said they did not feel secure inside their house. Other types of abuse included belittling the woman, 31.6%; not responding to her feelings, 31.3%; intentionally refusing to
Eastern Mediterranean Health Journal, Vol. 11, Nos 5/6, 2005 863
�ملجلة �لصحية لشرL �ملتوسط، منظمة �لصحة �لعاملية، �ملجلد �حلا�E عشر، �لعد��� ٥-٦، ٢٠٠٥
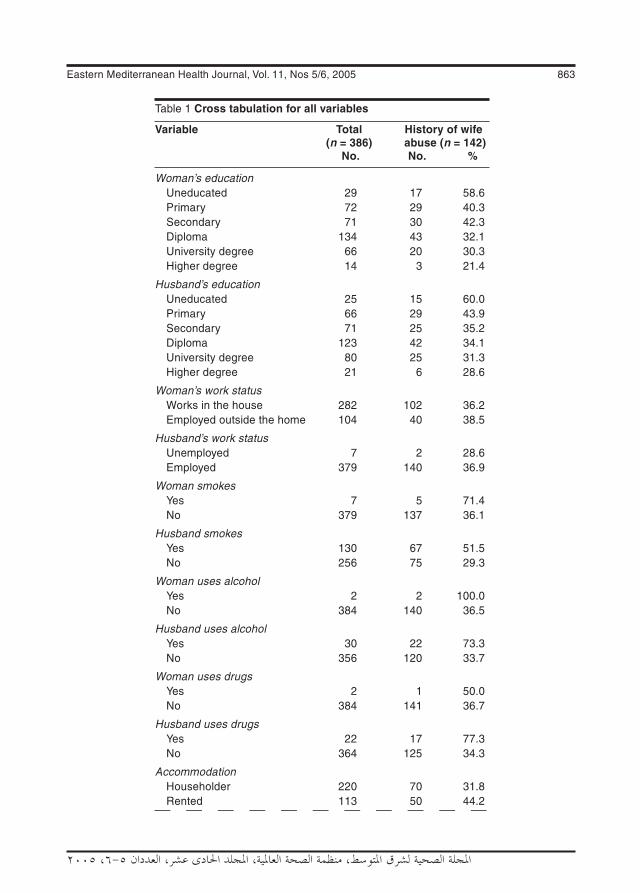
Table 1 Cross tabulation for all variables
Variable Total History of wife (n = 386) abuse (n = 142) No. No. %
Woman’s education Uneducated 29 17 58.6 Primary 72 29 40.3 Secondary 71 30 42.3 Diploma 134 43 32.1 University degree 66 20 30.3 Higher degree 14 3 21.4
Husband’s education Uneducated 25 15 60.0 Primary 66 29 43.9 Secondary 71 25 35.2 Diploma 123 42 34.1 University degree 80 25 31.3 Higher degree 21 6 28.6
Woman’s work status Works in the house 282 102 36.2 Employed outside the home 104 40 38.5
Husband’s work status Unemployed 7 2 28.6 Employed 379 140 36.9
Woman smokes Yes 7 5 71.4 No 379 137 36.1
Husband smokes Yes 130 67 51.5 No 256 75 29.3
Woman uses alcohol Yes 2 2 100.0 No 384 140 36.5
Husband uses alcohol Yes 30 22 73.3 No 356 120 33.7
Woman uses drugs Yes 2 1 50.0 No 384 141 36.7
Husband uses drugs Yes 22 17 77.3 No 364 125 34.3
Accommodation Householder 220 70 31.8 Rented 113 50 44.2

864 La Revue de Santé de la Méditerranée orientale, Vol. 11, No 5/6, 2005
�ملجلة �لصحية لشرL �ملتوسط، منظمة �لصحة �لعاملية، �ملجلد �حلا�E عشر، �لعد��� ٥-٦، ٢٠٠٥
Table 1 Cross tabulation for all variables (continued)
Variable Total History of wife (n = 386) abuse (n = 142) No. No. %
Family house 51 22 43.1 Government apartment house 2 – –
Husband’s nationality Iranian 377 135 35.8 Afghan 6 5 83.3 Other 3 2 66.7
Esfahan native (husband) Yes 292 95 32.5 No 94 47 50.0
Husband migrated to Esfahan (years) < 10 29 16 55.2 ≥ 10 or native 357 126 35.3
Religion Muslim 379 139 36.7 Christian 7 3 42.9
Woman’s age (years) 15–24 3 2 66.7 25–34 206 71 34.5 35–44 109 42 38.5 45–54 50 18 36.0 55–64 14 8 57.1 65–78 4 1 25.0
Woman’s age at marriage (years) 9–17 189 74 39.2 18–34 193 67 34.7 35–44 4 1 25.0
Husband’s age (years) 18–24 1 1 100.0 25–34 148 42 28.4 35–44 192 77 40.1 55–64 27 13 48.1 65–82 18 9 50.0
Husband’s age at marriage (years) 14–17 16 8 50.0 18–34 358 128 35.8 35+ 12 6 50.0
Eastern Mediterranean Health Journal, Vol. 11, Nos 5/6, 2005 865
�ملجلة �لصحية لشرL �ملتوسط، منظمة �لصحة �لعاملية، �ملجلد �حلا�E عشر، �لعد��� ٥-٦، ٢٠٠٥
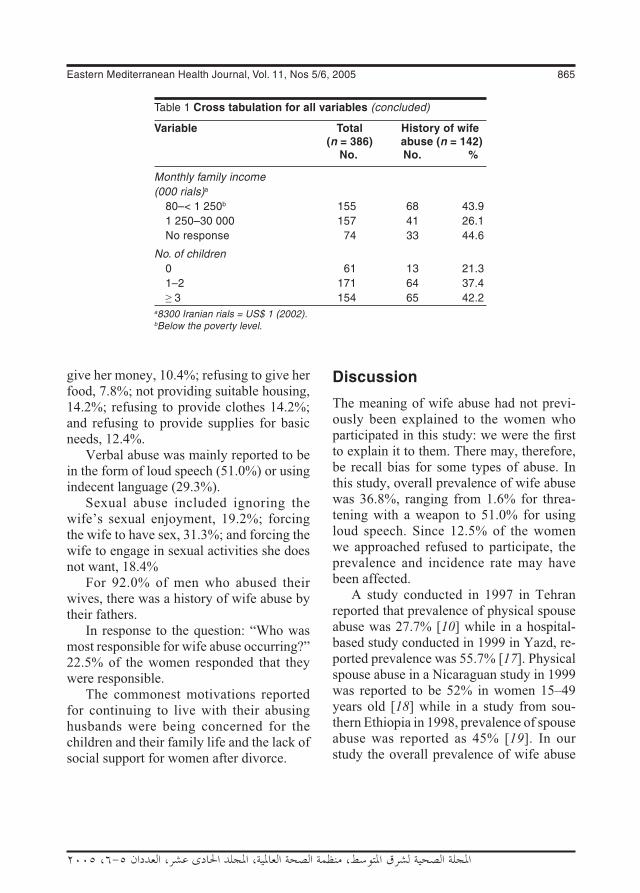
give her money, 10.4%; refusing to give her food, 7.8%; not providing suitable housing, 14.2%; refusing to provide clothes 14.2%; and refusing to provide supplies for basic needs, 12.4%.
Verbal abuse was mainly reported to be in the form of loud speech (51.0%) or using indecent language (29.3%).
Sexual abuse included ignoring the wife’s sexual enjoyment, 19.2%; forcing the wife to have sex, 31.3%; and forcing the wife to engage in sexual activities she does not want, 18.4%
For 92.0% of men who abused their wives, there was a history of wife abuse by their fathers.
In response to the question: “Who was most responsible for wife abuse occurring?” 22.5% of the women responded that they were responsible.
The commonest motivations reported for continuing to live with their abusing husbands were being concerned for the children and their family life and the lack of social support for women after divorce.
Discussion
The meaning of wife abuse had not previ-ously been explained to the women who participated in this study: we were the first to explain it to them. There may, therefore, be recall bias for some types of abuse. In this study, overall prevalence of wife abuse was 36.8%, ranging from 1.6% for threa-tening with a weapon to 51.0% for using loud speech. Since 12.5% of the women we approached refused to participate, the prevalence and incidence rate may have been affected.
A study conducted in 1997 in Tehran reported that prevalence of physical spouse abuse was 27.7% [10] while in a hospital-based study conducted in 1999 in Yazd, re-ported prevalence was 55.7% [17]. Physical spouse abuse in a Nicaraguan study in 1999 was reported to be 52% in women 15–49 years old [18] while in a study from sou-thern Ethiopia in 1998, prevalence of spouse abuse was reported as 45% [19]. In our study the overall prevalence of wife abuse
Table 1 Cross tabulation for all variables (concluded)
Variable Total History of wife (n = 386) abuse (n = 142) No. No. %
Monthly family income (000 rials)a 80–< 1 250b 155 68 43.9 1 250–30 000 157 41 26.1 No response 74 33 44.6
No. of children 0 61 13 21.3 1–2 171 64 37.4 ≥ 3 154 65 42.2a8300 Iranian rials = US$ 1 (2002). bBelow the poverty level.

866 La Revue de Santé de la Méditerranée orientale, Vol. 11, No 5/6, 2005
�ملجلة �لصحية لشرL �ملتوسط، منظمة �لصحة �لعاملية، �ملجلد �حلا�E عشر، �لعد��� ٥-٦، ٢٠٠٥
Table 2 Statistical relationship between some variables and history of wife abuse in the marriage, Esfahan, 2002
Variable Pearson chi-squared test r df P-value
Woman’s education 11.119 5 0.049
Husband’s education 9.779 6 0.134
Woman’s work status 0.172 1 0.679
Husband’s work status 0.207 1 0.649
Wife smokes 3.679 1 0.055
Husband smokes 18.341 1 < 0.001
Wife uses alcohol 3.455 1 0.063
Husband uses alcohol 18.682 1 0.000
Woman uses drugs 0.151 1 0.698
Husband uses drugs 16.444 1 < 0.001
Accommodation 7.089 3 0.690
Nationality 6.897 2 0.032
Esfahan native 9.328 1 0.002
Migrated to Esfahan 4.558 1 0.033
Religion 0.113 1 0.737
Woman’s age 4.519 5 0.477
Woman’s age at marriage 1.050 2 0.591
Husband’s age 9.977 4 0.041
Husband’s age at marriage 2.266 2 0.322
Family income 12.975 2 0.002
No. of children 8.258 2 0.016
was 36.8%, with physical abuse ranging from 3.4% to 31.9% for different types. For almost all the men who abused their wives, there was a history of wife abuse in their parents. Similar results have been reported in other studies [18–20].
Studies done in Lebanon [21], the United States of America [22,23] and Norway [24] have found an association between alcohol consumption and history of spouse abuse. In our study also, the association was sig-nificant (P < 0.001).
Association between age of the husband and history of spouse abuse has been previ-
ously reported [25] but in a study from Ni-caragua no such association was found [18]. In our study, increasing age of the husband was associated with increased prevalence of wife abuse but another study found it was related to the age of the wife, being much more in women aged 16–24 years [26].
For the question about monthly family income, 19.1% of the women in our study didn’t respond. In these cases, therefore, we used the best case–worst case analysis. When family income was < 1 250 000 rials per month (below the poverty line), 43.9% of men were spouse abusers; this figure was

Eastern Mediterranean Health Journal, Vol. 11, Nos 5/6, 2005 867
�ملجلة �لصحية لشرL �ملتوسط، منظمة �لصحة �لعاملية، �ملجلد �حلا�E عشر، �لعد��� ٥-٦، ٢٠٠٥
26.1% for family income ≥ 1 250 000 rials per month.
As in our study, reports from Lebanon [21] and Nicaragua [18] found an asso-ciation between family income and spouse abuse.
Our results also show that the greater the number of children in the family, the greater the prevalence of history of wife abuse but the causes of this were not determined.
We found no association between hus-band’s education level and history of spouse abuse. The results of a number of other studies support this finding [18–23].
Conclusion
One of the neglected health problems in the Islamic Republic of Iran is wife abuse. In this study, we found a high prevalence of this problem in Esfahan city.
Since the prevalence of wife abuse in this community is high, we recommend:• carrying out analytic studies to deter-
mine the risk factors for wife abuse using case–control studies;
• planning for the prevention of wife abuse based on the risk factors determined from such studies;
• mass education in the field of sexual responsibility, conduct towards a wife, a wife’s rights in regard to support and protection from abusive husbands;
• promotion and revision of supportive laws for abused women.
Acknowledgements
This work was carried out with the permis-sion and support of Fathemieh Medical University We would like to thank Ms. Zinat Sadat Mousavi for her comments and correcting the English text. We would also like to express our appreciation to the staff of Esfahan Family Clinic for their support and assistance to this project.
Table 3 Prevalence of wife abuse according to some characteristics of husbands, Esfahan, 2001
Characteristic of husband Wife abusers (%)
Smoker 51.5
Non-smoker 29.3
Uses alcohol 73.3
Does not use alcohol 33.7
Uses drugs 77.3
Does not use drugs 34.3
Iranian 35.8
Non-Iranian 77.7
Native of Esfahan 32.5
Non-native of Esfahan 50.0
Migrated to Esfahan < 10 years ago 55.2
Migrated to Esfahan ≥ 10 years ago 35.3
Family income < 1 250 000/ month 43.9
Family income ≥ 1 250 000/ month 26.18300 Iranian rials = US$ 1 (2002).
References
1. Bachman R, Saltzman L. Violence against women: estimates from the redesigned survey. Bureau of Justice Statistics special
report. Washington DC, United States De-partment of Justice, 1995 (NCJ–154348).
2. Violence and the family: report of the American Psychological Association
868 La Revue de Santé de la Méditerranée orientale, Vol. 11, No 5/6, 2005
�ملجلة �لصحية لشرL �ملتوسط، منظمة �لصحة �لعاملية، �ملجلد �حلا�E عشر، �لعد��� ٥-٦، ٢٠٠٥
Presidential Task Force on violence and the family. Washington DC, American Psychological Association, 1996:10.
3. Diagnostic & treatment guidelines on do-mestic violence. Chicago, American Med-ical Association, 1994 (SEC: 94-677:3M: 9/94).
4. Wife abuse/assault. In: Let's break the silence [pamphlet]. Toronto, Canada, On-tario Women's Directorate (http://crisis.vianet.on.ca/wife.htm, accessed 1 Janu-ary 2004).
5. Nazparvar B. Prevalence of spouse abuse in Tehran [thesis]. Tehran, University of Tehran, 1997 [in Farsi].
6. [Anonymous]. Women in Tehran exposed to spouse abuse more than other women in Iran. Hayat-e-Noo (Tehran), 20 July 2002 [in Farsi].
7. [Anonymous]. Education and job of men who abuse their wives in Iran. Hamshahri (Tehran), 22 June 2002 [in Farsi].
8. [Anonymous]. 36% of women in Iran are silent in spouse abuse. Resalat (Tehran), 22 September 2001 [in Farsi].
9. Poorafkari N. Spouse abuse in Iran. An-nual congress of the Iranian Psychiatry Association, Shiraz, Iran, 18–23 October 1985 (Abstracts of papers). Shiraz, 1985.
10. Babaei N, Rostami MR, Mofidi A. Spouse abuse in Tehran. 1st congress of the Iranian Psychology Association, Tehran, 21–23 September 1997 (Abstracts of pa-pers).
11. Inanlo-Ochlaghloo M, Oskooei F. Study of couples and its relation with type and se-verity of spouse abuse in women referred to the family court of justice in Tehran 1999 [thesis]. University of Health and Medical Sciences, 1999 [in Farsi].
12. Ardekani SMY, Rohani AS. Spouse abuse in Karegar’s Shohada Hospital in Yazd city [thesis]. Yazd, Yazd University of
Health and Medical Sciences, Faculty of Psychiatry, 1999.
13. Nasr M. Personality in spouse abuse couples at the Legal Medical Center in Esfahan, 1999 [thesis]. Esfahan, Esfahan University of Health and Medical Sci-ences, 1999 [in Farsi].
14. Nazparvar B, Daneshparvar H, Tofighi H. Spouse abuse leading to death of wife. Scientific journal of the Legal Medicine Organization of Iran, 1997, 12:48–58.
15. Freshte A. Psychosomatic survey in phys-ical abused women referred to the Legal Medicine Center of Tehran in 1996 [the-sis]. Tehran, Tehran University of Health and Medical Services, 1996.
16. Estimation of Esfahan population by age and sex, 2002, according to the last cen-sus in Iran (1996). Esfahan, Esfahan Province Office (http://www.sci.org.ir/far-si/default.htm, accessed 1 May 2002) [in Farsi].
17. Rohani AS. Spouse abuse in women who were referred to Yazd Karegran Hospi-tal, 1999 (http://database.irandoc.ac.ir/scripts/wxis.exe, accessed 1 October 2005).
18. Ellsberg MC et al. Wife abuse among women of childbearing age in Nicaragua. American journal of public health, 1999, 89(2):24–4.
19. Deyessa N et al. Magnitude, type and outcomes of physical violence against married women in Butajira, southern Ethi-opia. Ethiopian medical journal, 1998, 36(2):83–92.
20. Plichta SB, Duncan MM, Plichta L. Spouse abuse, patient–physician communication, and patient satisfaction. American journal of preventive medicine, 1996, 12(5):297–303.
21. Ky r i acou DN e t a l . Emergency department-based study of risk factors for acute injury from domestic violence
Eastern Mediterranean Health Journal, Vol. 11, Nos 5/6, 2005 869
�ملجلة �لصحية لشرL �ملتوسط، منظمة �لصحة �لعاملية، �ملجلد �حلا�E عشر، �لعد��� ٥-٦، ٢٠٠٥
against women. Annals of emergency medicine, 1998, 31(4):502–6.
22. Abbott J. Injuries and illnesses of domes-tic violence. Annals of emergency medi-cine, 1997, 29(6):781–5.
23. Silva C et al. Symptoms of post-traumatic stress disorder in abused women in a primary care setting. Journal of women’s health, 1997, 6(5):543–52.
24. Hydle I. Skader, kvinner og vold i Ber-gen [Injuries, women and violence in Bergen]. Tidsskr nor leageforen, 1997, 117(25):3633.
25. Marais A et al. Domestic violence in patients visiting general practitioners—prevalence, phenomenology and asso-ciation with psychopathology. South Afri-can medical journal, 1999, 89(6):635–40.
26. Rennision C, Welchans S. Bureau of Justice Statistics special report: intimate partner violence. Washington DC, United States Department of Justice, 2000 (NCJ 178247).
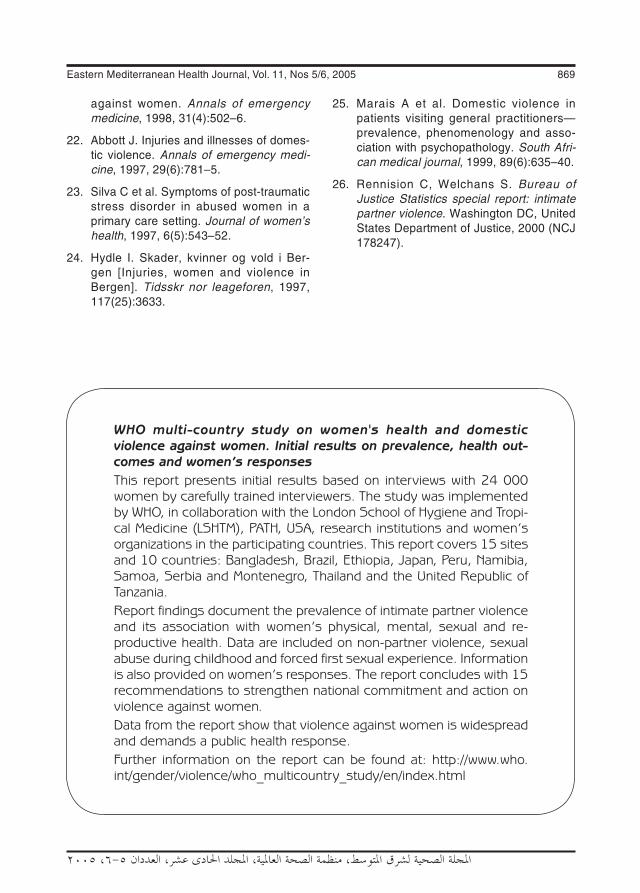
WHO multi-country study on women's health and domestic violence against women. Initial results on prevalence, health out-comes and women’s responsesThis report presents initial results based on interviews with 24 000 women by carefully trained interviewers. The study was implemented by WHO, in collaboration with the London School of Hygiene and Tropi-cal Medicine (LSHTM), PATH, USA, research institutions and women’s organizations in the participating countries. This report covers 15 sites and 10 countries: Bangladesh, Brazil, Ethiopia, Japan, Peru, Namibia, Samoa, Serbia and Montenegro, Thailand and the United Republic of Tanzania. Report findings document the prevalence of intimate partner violence and its association with women’s physical, mental, sexual and re-productive health. Data are included on non-partner violence, sexual abuse during childhood and forced first sexual experience. Information is also provided on women’s responses. The report concludes with 15 recommendations to strengthen national commitment and action on violence against women.Data from the report show that violence against women is widespread and demands a public health response.Further information on the report can be found at: http://www.who.int/gender/violence/who_multicountry_study/en/index.html

870 La Revue de Santé de la Méditerranée orientale, Vol. 11, No 5/6, 2005
�ملجلة �لصحية لشرL �ملتوسط، منظمة �لصحة �لعاملية، �ملجلد �حلا�E عشر، �لعد��� ٥-٦، ٢٠٠٥
Prevalence and determinants of intimate partner violence in Babol city, Islamic Republic of IranM. Faramarzi,1 S. Esmailzadeh2 and S. Mosavi3
1Department of Midwifery; 2Department of Obstetrics and Gynaecology; 3Department of Psychiatry, Babol University of Medical Sciences, Babol, Islamic Republic of Iran (Correspondence to M. Faramarzi: [email protected]).Received: 28/12/03; accepted: 17/05/04
ABSTRACT To determine the prevalence and determinants of intimate partner violence, 2400 married women attending public clinics in Babol, Islamic Republic of Iran, were screened for domestic violence. Overall, 15.0% of women had suffered physical abuse from their husbands in the previous year, 42.4% sexual abuse and 81.5% various degrees of psychological abuse. A significant association with intimate partner violence was found for women with low income, age ≤ 20 years, unemployed, low education, non-pregnant and non-hous-eowners. There was no significant relationship between violence and parity or length of marriage. On multi-variate regression, the strongest predictor of physical abuse was unemployment of the woman, whereas for psychological and sexual abuse it was rural residence. Empowering women through promoting employment and improving education may reduce the risk of intimate partner violence.
Prévalence et déterminants de la violence exercée par le partenaire intime dans la ville de Babol (Ré-publique islamique d’Iran)RÉSUMÉ Afin de déterminer la prévalence et les facteurs de la violence exercée par le partenaire intime, on a interrogé 2400 femmes mariées qui fréquentaient les centres publics de consultations d'obstétrique, de gynécologie et de planification familiale à Babol (République islamique d’Iran) pour chercher à savoir si elles avaient fait l’objet de violence familiale. En tout, 15,0 % des femmes avaient subi des violences physiques de la part de leur conjoint dans les 12 mois précédant l’enquête, 42,4 % des violences sexuelles et 81,5 % des violences psychologiques à des degrés divers. On a trouvé une association significative avec la violence exercée par le partenaire intime pour les femmes ayant de faibles revenus, âgées de 20 ans, ne travaillant pas, ayant un faible niveau d’instruction, non enceintes et non propriétaires de leur logement. Il n’y avait pas de relation significative entre la violence et le nombre d’enfants ou la durée du mariage. À l’analyse de régression multivariée, le facteur prédictif de violence physique le plus fort était l’inactivité professionnelle de la femme tandis que pour la violence psychologique et sexuelle, c’était la résidence rurale. L’autonomisation des femmes par la promotion de l’emploi et l’amélioration de l’éducation peut réduire le risque de violence exercée par le partenaire intime.
Eastern Mediterranean Health Journal, Vol. 11, Nos 5/6, 2005 871
�ملجلة �لصحية لشرL �ملتوسط، منظمة �لصحة �لعاملية، �ملجلد �حلا�E عشر، �لعد��� ٥-٦، ٢٠٠٥
Introduction
Violence against women is a major health and human rights issue. Worldwide, at least 1 in 5 of the world’s female population has been physically or sexually abused by a man or men at sometime in their life. It has been estimated that violence against women is as serious a cause of death and incapa-city among women of reproductive ages as cancer, and a greater cause of ill health than traffic accidents [1]. Domestic violence or intimate partner violence is one of the most common forms of violence against women. The deleterious effects of domestic violence on women’s health are so serious that it has been recognized as a public health crisis with far-reaching effects on society [2].
Intimate partner violence has long-term negative health consequences for survivors, even after the abuse has ended [3,4]. These effects can manifest as poor health status, poor quality of life and high use of health services [5–7]. Intimate partner violence is one of the most common causes of injury in women [8]. Women who are abused are frequently treated within the health care system. However, they generally do not present with obvious trauma, even in ac-cident and emergency departments [9]. Recent studies have demonstrated that screening women for domestic violence can predict future violence [10]. By ignoring the issue, health care professionals may be losing an opportunity to reduce or prevent the consequences of domestic violence. It is important, however, to recognize that inept domestic violence screening may put battered women in danger and that women who leave their partner are at increased risk [11].
Obstetrics, gynaecology and family planning health services typically serve both healthy and sick women and provide a unique opportunity for routine domestic
violence screening to all clients receiving services. This study aimed to screen for, and estimate the prevalence of, 3 types of intimate partner violence among women at-tending public obstetrics, gynaecology and family planning health services in Babol city, Islamic Republic of Iran. We also identified the personal, socioeconomic and family function characteristics associated with domestic violence.
Methods
The projectIn a collaboration between the obstetrics and gynaecology department, midwifery department and psychology department of Babol University of Medical Sciences, a project was set up to screen for domestic violence among women attending public obstetrics, gynaecology and family plan-ning health services in Babol city, Islamic Republic of Iran. The goal was to provide information for a policy calling for routine screening for domestic violence. The first stage of the project was a 4-hour in-service education for midwifery staff which trained midwives in project clinics to screen and identify of victims of domestic violence and to prevent intimate partner violence among women through identifying possible victims and counselling them. The second stage was to implement a screening ques-tionnaire for domestic violence. For this study, a sample of women attending clinics of the public heath services in Babol city were interviewed about their experiences with intimate partner violence.
SampleBabol city was divided into 3 areas accor-ding to the socioeconomic status (SES) of the population (high, middle and low status areas) and 1 public health service clinic was

872 La Revue de Santé de la Méditerranée orientale, Vol. 11, No 5/6, 2005
�ملجلة �لصحية لشرL �ملتوسط، منظمة �لصحة �لعاملية، �ملجلد �حلا�E عشر، �لعد��� ٥-٦، ٢٠٠٥
selected from each of those 3 areas. We recruited patients attending obstetrics and gynaecology and family planning clinics. The inclusion criteria were married women who had a husband during the past year and who gave written informed consent to enter the study. Women are used to attending such clinics and often attend alone. Thus the refusal rate among the women was low. We started screening at the 3 clinics at the same time and continued until 800 women in each clinic were entered in the study. Thus, we recruited 2400 women from November 2002 to August 2003. The women were interviewed at the clinic by the midwife in a private room. The interview lasted be-tween 30 and 50 minutes. The women were unaccompanied by either the husband or a female friend; women attending with their husbands were not entered in the study. As they were familiar with the midwives and they were interviewed in private, the women were generally free from fear.
Screening questionnaireAfter obtaining informed consent, mid-wifery staff interviewed the sample of women attending the clinics and completed a questionnaire for each participant. The abuse assessment form was developed in the department of obstetrics with the col-laboration of the departments of midwifery and psychiatry. We adapted the abuse asses-sment screening from the 2001 American College of Obstetricians and Gynaecolo-gists form [12], but added many questions about different types of violence which were culturally adapted. A pilot study was carried out to determine the validity and reliability of this form before the start of the project.
The abuse assessment form consisted of questions that cover the woman’s personal characteristics and 3 sections about her
experiences of physical, sexual and psycho-logical abuse. Women were asked to indi-cate which, if any, of various kinds of abuse they had experienced from their partner in the year prior to the interview. Nine ques-tions covered the experiences of physical abuse, 3 questions about sexual abuse and 15 questions about emotional/psychologi-cal abuse (question items were the same as Table 1). If a woman responded positively to any item, we considered her to be abused. A non-abused woman was one who had no experience of any item of violence. We esti-mated the severity of violence by assigning a score of 1 for every item checked. Thus, the range of scores for physical, sexual and psychological abuse were 0–9, 0–3 and 0–15 respectively. We also added the scores of the 3 types of violence and calculated the total score of violence for each woman (range 0–27).
At the end of every visit, the midwifery staff assessed the degree of risk for that woman and if necessary counselled her about the best intervention strategy for primary prevention and referred her to ad-vocacy services. All victims of physical or sexual violence or moderate and severe psychological abuse were referred for psy-chiatric consultation.
AnalysisThe data was anlaysed using SPSS, ver-sion 10 software. The correlation between independent variables such as education, job and residence were tested using Pearson χ2-test (2-sided). We considered P < 0.05 as significant. We applied ANOVA test for comparing of the mean of scores of violence and age of groups or the length of mar-riage. Multivariate regression was applied to predict the factors that affected the risk of violence from husbands.

Eastern Mediterranean Health Journal, Vol. 11, Nos 5/6, 2005 873
�ملجلة �لصحية لشرL �ملتوسط، منظمة �لصحة �لعاملية، �ملجلد �حلا�E عشر، �لعد��� ٥-٦، ٢٠٠٥
Table 1 Prevalence of physical, psychological and sexual abuse experienced by married women attending clinics in different socioeconomic status areas of Babol city, Islamic Republic of Iran
Type of abuse High Middle Low Total P-
status status status valuea
area area area (n = 800) (n = 800) (n = 800) (n = 2400) % % % %
Physical abuse Slapping 7.8 9.1 14.1 10.3 < 0.001 Pushing 5.5 6.9 10.3 7.5 < 0.001 Shooting 3.1 8.5 10.6 7.4 < 0.001 Punching 3.9 7.6 10.3 7.3 < 0.001 Kicking 4.1 6.5 9.0 6.5 < 0.001 Whipping 0.9 1.5 2.5 1.6 0.03 Choking 0.3 1.1 1.4 1.0 0.1 Stabbing 0 1.1 1.3 0.8 0.008 Burning 0 0.1 0.5 0.2 0.07
Sexual abuse Forced sexual intimacy 10.5 50.1 31.4 30.7 < 0.001 Forced intercourse 1.3 42.9 32.5 25.6 < 0.001 Forced non-vaginal sex 11.1 17.0 22.4 16.8 < 0.001
Psychological abuse Shouting 37.3 39.8 46.8 41.3 < 0.001 Preventing wife’s employment 37.1 40.3 41.4 39.6 0.1 Insulting 37.3 21.0 38.5 32.3 < 0.001 Claiming ownership right to wife 10.1 37.3 27.6 25.0 < 0.001 Showing contempt in public 9.6 31.5 25.1 22.1 < 0.001 Criticizing 14.8 23.5 25.8 21.3 < 0.001 Giving threatening looks 10.5 17.1 18.6 15.4 < 0.001 Restricting wife’s leaving house 5.4 19.0 18.0 14.1 < 0.001 Restricting communication 5.8 16.8 15.4 12.7 < 0.001 Inquiring about wife’s expenses 4.8 15.8 14.3 11.6 < 0.001 Ridiculing in public 5.8 12.8 16.0 11.5 < 0.001 Making threats to leave house 5.6 9.3 12.1 9.0 < 0.001 Refusing to give money 3.0 13.1 11.0 9.0 < 0.001 Pursuing 1.0 5.0 7.5 4.5 < 0.001 Making threats to property 0.9 4.6 7.0 4.2 < 0.001n = total number of women attending clinics in these areas. aP-value for difference between frequencies of abuse in different types of clinic.
874 La Revue de Santé de la Méditerranée orientale, Vol. 11, No 5/6, 2005
�ملجلة �لصحية لشرL �ملتوسط، منظمة �لصحة �لعاملية، �ملجلد �حلا�E عشر، �لعد��� ٥-٦، ٢٠٠٥
Results
A total of 2400 patients made 2715 visits during the study period. We recruited 800 patents at clinics in high SES areas, 800 patients from clinics in middle SES areas and 800 patients from clinics in low SES areas. The mean (SD) age of the women was 28.2 (6.6) years and mean (SD) parity was 1.7 (1.1). Of the women, 71.3% were seen for family planning and the remainder were seen for gynaecology (15.5%) and prenatal care visits (13.2%).
Prevalence of abuseThe prevalence of abusive experiences during the preceding 12 months is shown in Table 1. Physical violence was expe-rienced by 15.0% of the women, sexual abuse by 42.4% (forced sexual intimacy 30.8%, forced intercourse 28.1% and forced nonvaginal sex 16.8%) and psychologi-cal/emotional abuse by 81.5% (mild 68.4%, moderate 10.6%, severe 2.5%). The fol-lowing kinds of violence were more com-mon for physical abuse: slapping, pushing, shooting and punching (Table 1). For psy-chological abuse, the most common actions were shouting, preventing the woman’s employment, insulting, criticizing, clai-
ming ownership right to wife and showing contempt in public.
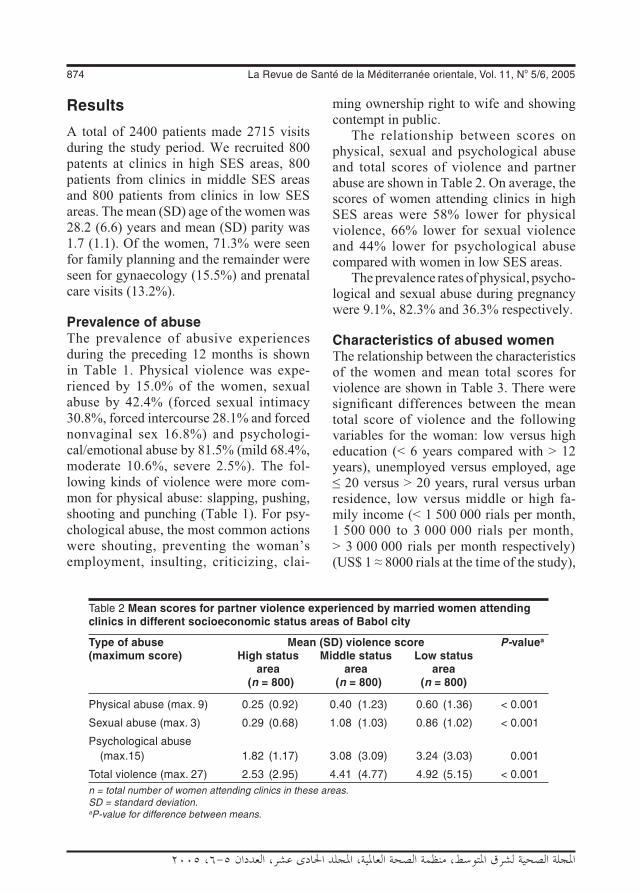
The relationship between scores on physical, sexual and psychological abuse and total scores of violence and partner abuse are shown in Table 2. On average, the scores of women attending clinics in high SES areas were 58% lower for physical violence, 66% lower for sexual violence and 44% lower for psychological abuse compared with women in low SES areas.
The prevalence rates of physical, psycho-logical and sexual abuse during pregnancy were 9.1%, 82.3% and 36.3% respectively.
Characteristics of abused womenThe relationship between the characteristics of the women and mean total scores for violence are shown in Table 3. There were significant differences between the mean total score of violence and the following variables for the woman: low versus high education (< 6 years compared with > 12 years), unemployed versus employed, age ≤ 20 versus > 20 years, rural versus urban residence, low versus middle or high fa-mily income (< 1 500 000 rials per month, 1 500 000 to 3 000 000 rials per month, > 3 000 000 rials per month respectively) (US$ 1 ≈ 8000 rials at the time of the study),
Table 2 Mean scores for partner violence experienced by married women attending clinics in different socioeconomic status areas of Babol city
Type of abuse Mean (SD) violence score P-valuea
(maximum score) High status Middle status Low status area area area (n = 800) (n = 800) (n = 800)
Physical abuse (max. 9) 0.25 (0.92) 0.40 (1.23) 0.60 (1.36) < 0.001
Sexual abuse (max. 3) 0.29 (0.68) 1.08 (1.03) 0.86 (1.02) < 0.001
Psychological abuse (max.15) 1.82 (1.17) 3.08 (3.09) 3.24 (3.03) 0.001
Total violence (max. 27) 2.53 (2.95) 4.41 (4.77) 4.92 (5.15) < 0.001n = total number of women attending clinics in these areas. SD = standard deviation. aP-value for difference between means.

Eastern Mediterranean Health Journal, Vol. 11, Nos 5/6, 2005 875
�ملجلة �لصحية لشرL �ملتوسط، منظمة �لصحة �لعاملية، �ملجلد �حلا�E عشر، �لعد��� ٥-٦، ٢٠٠٥
Table 3 Relationship between women’s characteristics and mean total score of violence for married women attending clinics in Babol city
Characteristic Mean (SD) total P-value violence score
Woman’s education High education (< 6 years) 3.03 (3.17) < 0.001 Low education (> 12 years) 4.71 (5.22)
Woman’s employment Employed 3.48 (4.30) < 0.001 Unemployed 4.27 (4.80)
Residence Urban 4.09 (4.72) < 0.001 Rural 5.48 (5.25)
Woman’s age (years) ≤ 20 5.40 (5.60) 21–30 4.20 (4.10) < 0.001 31–40 3.90 (4.60) > 40 3.50 (3.60)
Length of marriage (years) ≤ 5 4.37 (4.80) 6–10 4.36 (5.20) > 0.05 11–15 3.96 (4.80) 16–20 3.60 (3.50) > 20 2.20 (5.50)
Parity 0 4.50 (4.90) 1–2 4.20 (4.80) > 0.05 ≥ 3 3.70 (3.70)
Family’s monthly income Low (< 1500000 riala) 4.71 (5.22) Middle (1500000–3000000 rial) 3.12 (3.13) < 0.001 High (> 3000000 rial) 2.84 (3.26)
Pregnancy Pregnant 3.59 (3.68) 0.001 Non-pregnant 4.31 (4.91)
Houseownership Non-houseowner 4.63 (5.12) < 0.001 Houseowner 3.85 (4.42)
aUS$ 1 ≈ 8000 rials at the time of the study.SD = standard deviation.
pregnant versus non-pregnant, and non-houseowner versus houseowner (P < 0.05).
There were no significant differences be-
876 La Revue de Santé de la Méditerranée orientale, Vol. 11, No 5/6, 2005
�ملجلة �لصحية لشرL �ملتوسط، منظمة �لصحة �لعاملية، �ملجلد �حلا�E عشر، �لعد��� ٥-٦، ٢٠٠٥
tween the mean total scores of violence and length of marriage or parity (P > 0.05).
On univariate analysis, the variables that were significantly (P < 0.05) associated with an increase in physical, sexual and psychological abuse were: low woman’s education, rural residence, non-pregnancy, non-houseowner, woman’s age ≤ 20 years, length of marriage > 5 years and woman’s unemployment. The variable which not significantly (P > 0.05) associated with violence on univariate analysis was parity.
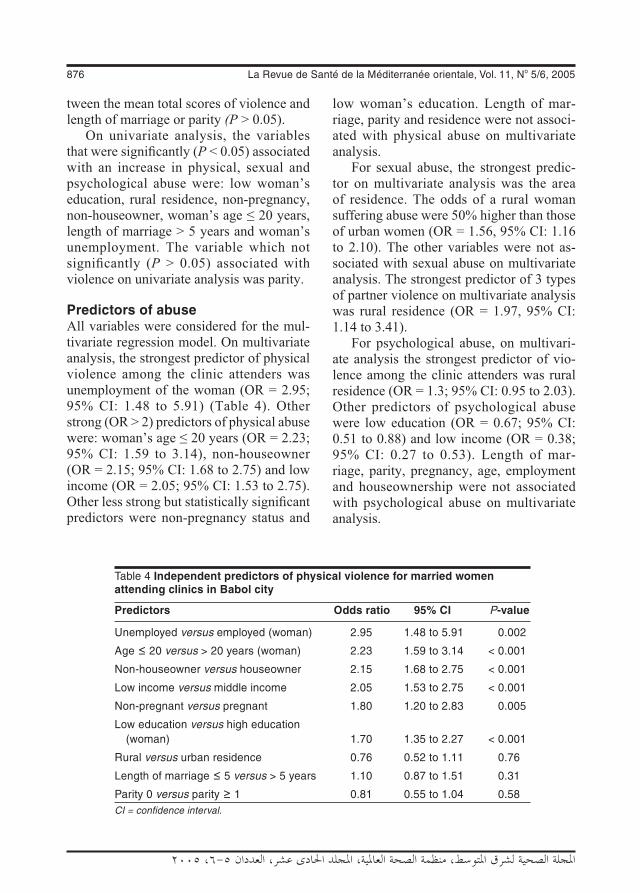
Predictors of abuseAll variables were considered for the mul-tivariate regression model. On multivariate analysis, the strongest predictor of physical violence among the clinic attenders was unemployment of the woman (OR = 2.95; 95% CI: 1.48 to 5.91) (Table 4). Other strong (OR > 2) predictors of physical abuse were: woman’s age ≤ 20 years (OR = 2.23; 95% CI: 1.59 to 3.14), non-houseowner (OR = 2.15; 95% CI: 1.68 to 2.75) and low income (OR = 2.05; 95% CI: 1.53 to 2.75). Other less strong but statistically significant predictors were non-pregnancy status and
low woman’s education. Length of mar-riage, parity and residence were not associ-ated with physical abuse on multivariate analysis.
For sexual abuse, the strongest predic-tor on multivariate analysis was the area of residence. The odds of a rural woman suffering abuse were 50% higher than those of urban women (OR = 1.56, 95% CI: 1.16 to 2.10). The other variables were not as-sociated with sexual abuse on multivariate analysis. The strongest predictor of 3 types of partner violence on multivariate analysis was rural residence (OR = 1.97, 95% CI: 1.14 to 3.41).
For psychological abuse, on multivari-ate analysis the strongest predictor of vio-lence among the clinic attenders was rural residence (OR = 1.3; 95% CI: 0.95 to 2.03). Other predictors of psychological abuse were low education (OR = 0.67; 95% CI: 0.51 to 0.88) and low income (OR = 0.38; 95% CI: 0.27 to 0.53). Length of mar-riage, parity, pregnancy, age, employment and houseownership were not associated with psychological abuse on multivariate analysis.
Table 4 Independent predictors of physical violence for married women attending clinics in Babol city
Predictors Odds ratio 95% CI P-value
Unemployed versus employed (woman) 2.95 1.48 to 5.91 0.002
Age ≤ 20 versus > 20 years (woman) 2.23 1.59 to 3.14 < 0.001
Non-houseowner versus houseowner 2.15 1.68 to 2.75 < 0.001
Low income versus middle income 2.05 1.53 to 2.75 < 0.001
Non-pregnant versus pregnant 1.80 1.20 to 2.83 0.005
Low education versus high education (woman) 1.70 1.35 to 2.27 < 0.001
Rural versus urban residence 0.76 0.52 to 1.11 0.76
Length of marriage ≤ 5 versus > 5 years 1.10 0.87 to 1.51 0.31
Parity 0 versus parity ≥ 1 0.81 0.55 to 1.04 0.58CI = confidence interval.

Eastern Mediterranean Health Journal, Vol. 11, Nos 5/6, 2005 877
�ملجلة �لصحية لشرL �ملتوسط، منظمة �لصحة �لعاملية، �ملجلد �حلا�E عشر، �لعد��� ٥-٦، ٢٠٠٥
Discussion
The results of this study show that the preva-lence of psychological, physical and sexual abuse is high in this sample of Iranian wo-men (15.0%, 81.5% and 42.4% respec-tively). Studies of health centre attendees in other countries show the prevalence of intimate partner violence varies between 4% and 33% [13–15]. The wide discrepan-cies in the prevalence of violence against women may reflect different definitions of violence in every society, the method of screening, religious beliefs and cultural is-sues [16].
The findings of this research as well as many other studies supports the view that poverty and its associated stress are key contributors to intimate partner violence. Although violence occurs in all SES groups, it is more frequent and severe in lower SES groups [17–27]. The results of this study suggest that low education, being unem-ployed and residence in a rural area are strong predictors of risk of intimate partner violence for women. In many studies, high educational attainment of women is associ-ated with low levels of violence [26–31]. Education confers social empowerment via social networks, self-confidence and abil-ity to use information and resources avail-able in society, and may also translate into wealth. Some previous studies suggest that financial independence of women is protec-tive against violence [32,33], although in other studies, employment of women did not have a protective role against partner abuse [18,29]. Circumstances in which the woman but not her partner is working convey additional risks [34]. The results of Maziak’s study on the association of residence with partner abuse is similar to
this study [17], but in some studies urban or rural residence are not risk factors [18,27].
In this study, the prevalences of physi-cal, psychological and sexual abuse during pregnancy were 9.1%, 82.3% and 36.3% respectively. Some previous studies show that partner violence decreases during preg-nancy. Saltzman found that the prevalence of abuse across 16 states of the United States of America was 7.2% during the 12 months before pregnancy, 5.3% during pregnancy, and 8.7% around the time of pregnancy [35]. Kramek found that the prevalence of physical and psychological abuse during pregnancy was 25% [36].
There are several implications of this study. Public health services can play an important role in the detection of domestic violence and improve their responses to the victims. Abused women may present to health services before they present to criminal justice or social service agencies, and if abuse is identified, they can receive interventions that increase their safety and improve their health. This project demon-strated the efficacy of screening in detecting the victims of partner violence by the staff of health services in the Islamic Republic of Iran and is an important first step in addres-sing the problem of partner violence in this community. Thus, assessment for intimate partner violence of all women should be considered in all health care services. An-other implication is that partner violence is often predictable and preventable. This study suggests that major strategies for pre-vention of partner violence are empowering women and improving their status in society with the promotion of sexual equality in all rights especially in employment and education.
878 La Revue de Santé de la Méditerranée orientale, Vol. 11, No 5/6, 2005
�ملجلة �لصحية لشرL �ملتوسط، منظمة �لصحة �لعاملية، �ملجلد �حلا�E عشر، �لعد��� ٥-٦، ٢٠٠٥
References
1. Violence against women. WHO Fact Sheet No. 239. Geneva, World Health Organization, 2001 (http://www.who.int/mipfiles/2269/239-ViolenceAgainstWom-enforMIP.pdf, accessed 5 May 2005).
2. Shattuck SR. A domestic violence screen-ing program in a public health department. Journal of community health nursing, 2002, 19(3):121–32.
3. Wisner CL et al. Intimate partner violence against women: do victims cost health plans more? Journal of family practice, 1999, 48:439–43.
4. McCauley J et al. The “battering syn-drome”: prevalence and clinical charac-teristics of domestic violence in primary care internal medicine practices. Annals of internal medicine, 1995, 123:737–46.
5. Rand MR. Violence-related injuries trea-ted in hospital emergency departments. Bureau of Justice Statistics special report. Washington DC, US Department of Jus-tice, 1997.
6. Grisso JA et al. Violent injuries among women in an urban area. New England journal of medicine, 1999, 341:1899–905.
7. Kyriacou DN et al. Risk factors for in-jury to women from domestic violence. New England journal of medicine, 1999, 341:1892–8.
8. Koss MP, Koss PG, Woodruff WJ. Del-eterious effects of criminal victimization on women’s health and medical utiliza-tion. Archives of internal medicine, 1991, 151:342–7.
9. Tollestrup K et al. Health indicators and intimate partner violence among women who are members of a managed care organization. Preventive medicine, 1999, 29:431–40.
10. Koziol-McLain J, Coates CJ, Lowenstein SR. Predictive validity of a screen for partner violence against women. Ameri-can journal of preventive medicine, 2001, 21(2):93–100.
11. Ganley AL. Understanding domestic vio-lence. In: Warshaw C, Ganley AL, eds. Improving the health care response to domestic violence: a resource manual for health care providers. San Francisco, California, Family Violence Prevention Fund, 1999:15–8.
12. Horn DL et al. Domestic violence scree-ning practices of obstetrican–gynecolo-gists. Obstetrics and gynecology, 1998, 92 (5):785–9.
13. Wijma B et al. Emotional, physical, and sexual abuse in patients visiting gynae-cology clinics: a Nordic cross-sectional study. Lancet, 2003, 361:2107–13.
14. Scholle SH et al. Routine screening for intimate partner violence in an obstetrics and gynecology clinic. American journal of public health, 2003, 93(7):1070–2.
15. Jones AS et al. Annual and lifetime pre-valence of partner abuse in a sample of female HMO enrollees. Women’s health issues, 1999, 9(6):295–305.
16. Gorey KM, Leslie DR. The prevalence of child sexual abuse: integrative review ad-justment for potential response and mea-surement biases. Child abuse & neglect, 1997, 21:391–8.
17. Maziak W, Asfar T. Physical abuse in lo-wincome women in Aleppo, Syria. Health care for women international, 2003, 24(4):313–26.
18. Ellsberg MC et al. Wife abuse among women of childbearing age in Nicaragua. American journal of public health, 1999, 89:241–4.

Eastern Mediterranean Health Journal, Vol. 11, Nos 5/6, 2005 879
�ملجلة �لصحية لشرL �ملتوسط، منظمة �لصحة �لعاملية، �ملجلد �حلا�E عشر، �لعد��� ٥-٦، ٢٠٠٥
19. Martin SL et al. Domestic violence in northern India. American journal of epide-miology, 1999, 150:417–26.
20. Bachman R, Saltzman LE. Violence against women: estimates from the rede-signed National Crime Victimization Sur-vey. Washington DC, Bureau of Justice Statistics, National Institute of Justice, 1995.
21. Ratner PA. The incidence of wife abuse and mental health status in abused wives in Edmonton, Alberta. Canadian journal of public health, 1993, 84:246–9.
22. Hotaling GT, Sugarman DB. An analy-sis of risk markers in husband to wife violence: the current state of knowledge. Violence and victims, 1986, 1:101–24.
23. Gelles RJ, Straus MA. Intimate violence: the causes and consequences of abuse in the American family. New York, Simon and Schuster, 1998.
24. Gelles RJ. The violent home. Beverley Hills, Sage, 1974.
25. Coser LA. Continuities in the study of so-cial conflict. New York, Free Press, 1967.
26. Steinmetz SK. Family violence: past, present and future. In: Sussman MB, Steinmetz SK, eds. Handbook of mar-riage and the family. New York, Plenum Press. 1987:725–65.
27. Straus MA, Gelles RJ, Steinmetz SK. Be-hind closed doors: violence in the Ameri-can family. New York, Anchor Press, 1980.
28. Wadman MC, Muelleman RL. Domestic violence homicides: ED use before victi-
mization. American journal of emergency medicine, 1999, 17, 689–91.
29. Jewkes R, Levin J, Penn-Kekana L. Risk factors for domestic violence: findings from a South African cross-sectional study. Social science and medicine, 2002, 55(9):1603–17.
30. McCall GJ, Shields NM. Social and struc-tural factors in family violence. In: Lystad M, ed. Violence in the home: interdisci-plinary perspectives. New York, Brun-ner–Mazel, 1986.
31. Okun L. Woman abuse: facts replacing myths. Albany, State University of New York Press, 1986.
32. Schuler SR et al. Credit programmes, patriarchy and men’s violence against women in rural Bangladesh. Social sci-ence and medicine, 1996, 43:1729–42.
33. Rao V. Wife-beating in rural south In-dia: a qualitative and econometric analy-sis. Social science and medicine, 1997, 44:1169–80.
34. International Clinical Epidemiologist Net-work. Domestic violence in India. A sum-mary report of a multi-site household survey. Washington DC, International Centre for Research on Women, 2000.
35. Saltzman LE et al. Physical abuse around the time of pregnancy: an examination of prevalence and risk factors in 16 states. Maternal and child health journal, 2003, 7(1):31–43.
36. Kramek J et al. Przemoc wobec ko-biet w ciazy. [Violence towards preg-nant women.] Ginekologia polska, 2001, 72(12):1042–8.
880 La Revue de Santé de la Méditerranée orientale, Vol. 11, No 5/6, 2005
�ملجلة �لصحية لشرL �ملتوسط، منظمة �لصحة �لعاملية، �ملجلد �حلا�E عشر، �لعد��� ٥-٦، ٢٠٠٥
Domestic violence: a cross-sectional study in an Iranian cityA. Ghazizadeh1
1Department of Epidemiology and Social Medicine, Medical Sciences University of Kurdistan, Sanandaj, Islamic Republic of Iran (Correspondence to A. Ghazizadeh: [email protected]).Received: 14/11/02; accepted: 06/07/04
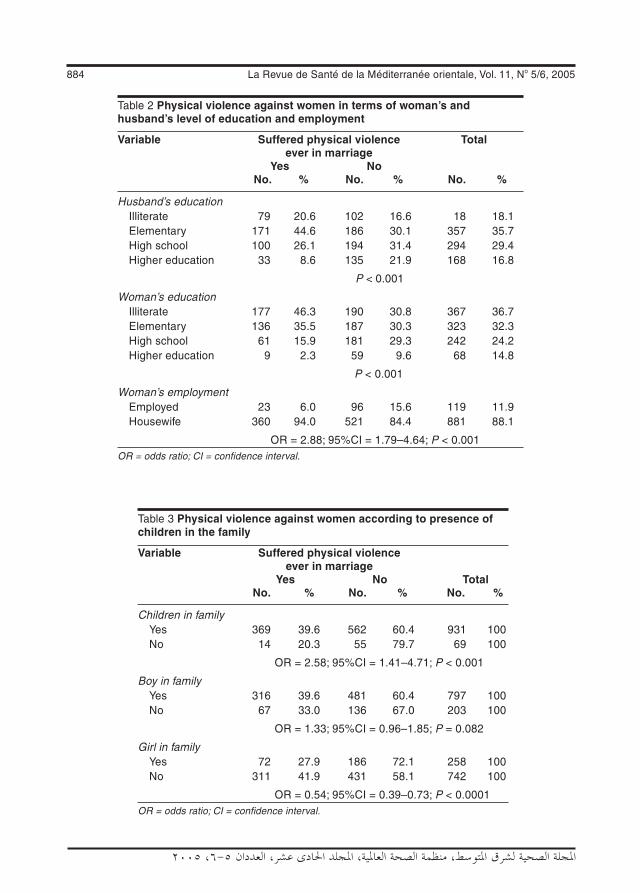
ABSTRACT To determine the prevalence of domestic physical violence against women and its as-sociated factors in Sanandaj city, Islamic Republic of Iran, a random sample of 1000 married women completed a questionnaire. Of the respondents, 15% had been assaulted by their husbands at least once in the previous year and 38% at some time during the marriage. Economic problems were the most frequent cause of domestic quarrels. There was a significant association between husbands’ educational level and violence against wives. Physical violence against housewives was significantly more frequent than against employed women. Husband’s job was also significantly associated with violence. The existence of a child or daughter in the family was associated with less domestic physical violence against women.
Violence familiale : étude transversale dans une ville iranienneRÉSUMÉ Afin de déterminer la prévalence de la violence familiale physique à l’encontre des femmes et les facteurs qui y sont associés dans la ville de Sanandaj (République islamique d’Iran), un échantil-lon aléatoire de 1000 femmes mariées a rempli un questionnaire. Quinze pour cent (15 %) des répon-dantes avaient été agressées par leur mari au moins une fois au cours des douze mois précédents et 38 % à un moment ou un autre de leur mariage. Les problèmes économiques étaient la cause la plus fréquente des querelles conjugales. Il y avait une association significative entre le niveau d’instruction du mari et la violence envers la femme. La violence physique contre les femmes au foyer était signifi-cativement plus fréquente que contre les femmes ayant un emploi. La situation professionnelle du mari était également associée de manière significative à la violence. L’existence d’un enfant, garçon ou fille, dans la famille était associée à une moindre violence familiale physique envers la femme.

Eastern Mediterranean Health Journal, Vol. 11, Nos 5/6, 2005 881
�ملجلة �لصحية لشرL �ملتوسط، منظمة �لصحة �لعاملية، �ملجلد �حلا�E عشر، �لعد��� ٥-٦، ٢٠٠٥
Introduction
Physical violence against women is a world-wide problem, crossing all ethnic, economic and social strata. According to the UN dec-laration at the Fourth World Conference on Women in Beijing in 1995, violence against women is an obstacle to the achievement of the objectives of equality, development and peace [1]. Historically, women have not been legally protected from battering. In many cultures, abuse has been an accepted, even legally sanctioned, fact of marriage. In the United States of America (USA), a man had the legal right to strike his wife until 1884 [2], and even now, by a conservative estimate, 2 million American women are severely assaulted by their partner each year [3].
A World Health Organization study of 24 000 women from 10 different countries and cultures reported that 15%–71% had experienced physical or sexual violence from their partner at some time in their lifetime [4].
In the past few years, violence against wives has become documented with in-creasing frequency [5,6]. It is a common type of crime, which is seldom reported to the police. It occurs at all social levels, though some authors have claimed that it is more frequent in families of low socioeco-nomic status [7]. Similarly, specific cultures and laws may have important roles, and hence the pattern of domestic violence may be different in developing countries from those in industrialized countries. Moreover, such influences may differ between the developing countries themselves, and thus it is important to establish the pattern for individual nations. Researching the phe-nomenon of violence and evaluating its aetiology is essential for any attempts to prevent the problem.
Iranian women suffer many types of violence, the consequences of which are
exacerbated by specific cultural traditions and laws. Married women are fearful of the prospect of separation or divorce, the difficulties of living a single life, losing custody rights or even being unable to visit their children following divorce [8]. For this reason we conducted a study of married women living in Sanandaj city, Islamic Republic of Iran, to determine the preva-lence of domestic physical violence against women and socioeconomic factors that predicted it.
Methods
This was a cross-sectional study of married women resident in Sanandaj city during the year 2000.
Sample The subjects were 1040 women selected by multistage cluster random sampling. The health care of the city is divided into 16 urban health centres, each of which has a health file for every individual household under its coverage. The number of subjects selected from each was proportional to the size of the population served by each centre. A total of 40 women (3% of the sample) refused to participate in the research, giving a final sample of 1000.
The sample size was calculated from the formula n = Z2 PQ/d2, where P = Q = 0.5,d = 0.05, n = 520. Given the cluster sam-pling method, this number was doubled. The power of the study was 80%, β = 0.20.
Questionnaire A 23-part locally constructed questionnaire collected demographic data about: woman’s age, education level of the woman and her husband, woman’s job, number of children, age of husband and wife at marriage, dura-tion of marriage and number of previous marriages for the woman and her husband.
882 La Revue de Santé de la Méditerranée orientale, Vol. 11, No 5/6, 2005
�ملجلة �لصحية لشرL �ملتوسط، منظمة �لصحة �لعاملية، �ملجلد �حلا�E عشر، �لعد��� ٥-٦، ٢٠٠٥
The questionnaire asked the woman: “In your opinion, what are the reasons for domestic quarrels?” (answers were pre-coded in 8 categories plus other) and “What are the reasons for physical violence against women?” (11 categories plus other). The woman was asked to pick the most impor-tant reasons for violence from the list (they could mention as many as they wished). “What is the best way to prevent physical violence against women?” (5 categories plus other). The woman was then asked if she had been beaten during the last year, and at any time in their marriage, and if so how many times and her opinion about the reason for the violence. Participants were interviewed by students of the Faculty of Medical Sciences of Kurdistan University who had been specifically trained for the task.
The pre–post-test reliability coefficient of the questionnaire was 0.82, tested on 30 women and repeated after a month.
Data analysisThe correlates of current domestic physical violence within the previous 12 months and at any time within the marriage were deter-mined using the variables: age, woman’s and husband’s education level, woman’s and husband’s job, number of children, woman’s and husband’s number of previ-ous marriages. Chi-squared tests (univari-ate analyses) and forward stepwise logistic regression analyses (multivariate analyses) were applied using SPSS, version 10.05 and STATA, version 6 software.
Results
Of the 1000 women who answered the ques-tionnaire, 150 (15%) had suffered physical violence from their husbands in the year be-fore the study and 380 (38%) at some time during their marriage. Of the 150 women
who had been exposed to violence in the previous year, 22 (15%) had experienced 1 to 5 episodes of violence and 10 (1%) had suffered 11 or more episodes.
All age groups of women reported suf-fering violence at some time during the marriage but violence but was more fre-quent against women aged 30–39 years old (32.4%) (Table 1). The prevalence of physi-cal violence ever in the marriage was lower in marriages of longer duration: 30–39 years (15.4%) and 40+ years (6.2%). The highest prevalence was in marriages of 10–19 years (29.5%) and 20–29 years (26.6%). The association between physical violence and the woman’s age and marriage duration were statistically significant (P = 0.025 and P < 0.001, respectively). There was no association between ever suffering physical violence and the husband’s age at marriage. Physical violence against women with a history of previous marriages was relatively higher than for women without it, and the association was statistically significant (P = 0.012) (Table 1).
Of the husbands, 18% were illiterate, but 10% had completed higher degrees. There was a significant association be-tween physical violence in the previous year and the educational level of the wife and the husband (Table 2). The husband’s job had an association with domestic physical violence, with violence significantly more common among men working as piece workers and drivers (P < 0.001).
Physical violence ever in the marriage was more common against housewives than against employed women and the as-sociation between physical violence and women’s employment was statistically sig-nificant (P < 0.001) (Table 2).
There were no association between the occurrence of violence ever in the marriage and whether there were sons in the family or not, but the association between physi-

Eastern Mediterranean Health Journal, Vol. 11, Nos 5/6, 2005 883
�ملجلة �لصحية لشرL �ملتوسط، منظمة �لصحة �لعاملية، �ملجلد �حلا�E عشر، �لعد��� ٥-٦، ٢٠٠٥
cal violence and existence of any child or daughter in family was statistically sig-nificant (P < 0.001). Domestic physical violence was more frequent in families without a child (Table 3) and with a girl, whereas the risk factor for physical violence in families without a child was 2.5 times that of families with a child (OR = 2.58).
As to opinions on the best way to deal with a probable assault, there was a clear
difference between wives of differing edu-cational levels; 71.0% of illiterate women believed that remaining silent was the best way, whereas this figure was only 41.0% for those with a higher degree. There was also a clear difference between women of different employment status; 57.4% of housewives believed that remaining silent was the best way of coping, whereas 35.3% of employed women believed that establishing a law
Table 1 Physical violence against women according to woman’s age and duration of marriage and number of times woman and her husband have been married
Variable Suffered physical violence Total ever in marriage Yes No No. % No. % No. %
Woman’s age < 20 10 2.6 18 2.9 28 2.8 20–29 92 24.0 164 26.6 256 25.6 30–39 124 32.4 218 25.3 342 34.2 40–49 97 25.3 103 16.7 200 20.0 50+ 60 15.7 114 19.5 174 17.4
P = 0.025 Duration of marriage < 10 85 22.3 192 31.1 277 27.7 10–19 113 29.5 193 31.3 306 30.6 20–29 102 26.6 116 18.8 218 21.8 30–39 59 15.4 67 10.9 126 12.6 40+ 24 6.2 49 7.9 73 7.3
P < 0.001 No. of times man married 1 340 88.8 562 91.1 902 90.2 > 1 43 11.2 55 8.9 98 9.8
OR = 1.29; 95%CI = 0.85–1.97; P = 0.231
No. of times woman married 1 349 91.1 587 95.1 936 93.6 > 1 34 8.9 30 4.9 64 6.4
OR = 1.96; 95%CI = 1.15–0.17; P = 0.012OR = odds ratio; CI = confidence interval.
884 La Revue de Santé de la Méditerranée orientale, Vol. 11, No 5/6, 2005
�ملجلة �لصحية لشرL �ملتوسط، منظمة �لصحة �لعاملية، �ملجلد �حلا�E عشر، �لعد��� ٥-٦، ٢٠٠٥
Table 2 Physical violence against women in terms of woman’s and husband’s level of education and employment
Variable Suffered physical violence Total ever in marriage Yes No No. % No. % No. %
Husband’s education Illiterate 79 20.6 102 16.6 18 18.1 Elementary 171 44.6 186 30.1 357 35.7 High school 100 26.1 194 31.4 294 29.4 Higher education 33 8.6 135 21.9 168 16.8
P < 0.001 Woman’s education Illiterate 177 46.3 190 30.8 367 36.7 Elementary 136 35.5 187 30.3 323 32.3 High school 61 15.9 181 29.3 242 24.2 Higher education 9 2.3 59 9.6 68 14.8
P < 0.001 Woman’s employment Employed 23 6.0 96 15.6 119 11.9 Housewife 360 94.0 521 84.4 881 88.1
OR = 2.88; 95%CI = 1.79–4.64; P < 0.001OR = odds ratio; CI = confidence interval.
Table 3 Physical violence against women according to presence of children in the family
Variable Suffered physical violence ever in marriage Yes No Total No. % No. % No. %
Children in family Yes 369 39.6 562 60.4 931 100 No 14 20.3 55 79.7 69 100
OR = 2.58; 95%CI = 1.41–4.71; P < 0.001
Boy in family Yes 316 39.6 481 60.4 797 100 No 67 33.0 136 67.0 203 100
OR = 1.33; 95%CI = 0.96–1.85; P = 0.082
Girl in family Yes 72 27.9 186 72.1 258 100 No 311 41.9 431 58.1 742 100
OR = 0.54; 95%CI = 0.39–0.73; P < 0.0001OR = odds ratio; CI = confidence interval.
Eastern Mediterranean Health Journal, Vol. 11, Nos 5/6, 2005 885
�ملجلة �لصحية لشرL �ملتوسط، منظمة �لصحة �لعاملية، �ملجلد �حلا�E عشر، �لعد��� ٥-٦، ٢٠٠٥
to support women would the best way of preventing domestic physical violence.
From the women’s point of view, the most important etiological factors for do-mestic violence were household economic problems, the existing patriarchy laws, “wrong culture” (folklore) and distrust. Women who were employed outside the home considered the patriarchy law to be the most important factor (55.0%), whereas housewives mentioned domestic economic problems as the leading cause (32.0%).
In regression analysis, the occurrence of domestic physical violence was entered with the demographic and interview variables in a forward stepwise Wald procedure, but only woman’s age, number of children, man’s education and woman’s job remained as significant predictors of domestic physical violence. The logit regression model of this study for prediction of physical violence against women (Y) during the marriage was: Y = 0.014 –0.029 woman’s age +0.199 number of children –0.238 husband’s edu-cation +0.589 woman’s employment.
Discussion
The prevalence of domestic physical vio-lence is high in Sanandaj city, as it is in other communities of the Islamic Republic of Iran [8]. The percentage of women in this study who reported a history of physical violence ever in their marriage (38%) was greater than that reported in a South African study [9] and greater than the prevalence of physi-cal violence among female medical students in the USA [10]. It is higher than the rate reported by Egyptian adult women who had been physically assaulted by an intimate partner in 1991–99 [11,12]. This prevalence is consistent with the findings of Nicaragua (38.5%) [10]. Also the 1-year prevalence of physical violence (15%) was greater than the annual rates of husband–wife violence
found in a 1985 national survey in America (11.6%) [13], but is consistent with the fin-dings in South Dakota (15%) [14]. The differences are probably due to the different cultures and populations.
It was found that women aged 30–39 years were more likely to be at risk of violence from their partner than were older women and this is consistent with an Aus-tralian study in 1996 [15]. The multivariate analysis showed a significant correlation between domestic physical violence and age, which was also found in Neuberger’s study [16]. Husband’s education emerged as an independent predictor of current physical violence. Factors that aggravate the physical violence, such as illiteracy, unemployment and lower education, for both men and women, placed our popula-tion at greater risk, suggesting that the topic of the outcome of domestic violence must be incorporated into the high school and medical education curricula.
A weakness of the study was the po-tential for recall or reporting bias. Women that experience domestic violence may be reluctant to acknowledge this because of shame or embarrassment. A small propor-tion of women refused to participate in the research, perhaps from shame or fear-ing further reprisals for revealing “family secrets”. There were a number of strengths of this study, however, in that our findings are consistent with those of other studies. Further research is necessary to explore the prevalence of domestic physical violence in other populations of the Islamic Republic of Iran to enhance our understanding of the relationship between socioeconomic status and domestic physical violence.
Our study supports the need for the development of a screening protocol for the detection of domestic violence, perhaps based in family planning programmes, and that counselling and intervention initiatives

886 La Revue de Santé de la Méditerranée orientale, Vol. 11, No 5/6, 2005
�ملجلة �لصحية لشرL �ملتوسط، منظمة �لصحة �لعاملية، �ملجلد �حلا�E عشر، �لعد��� ٥-٦، ٢٠٠٥
should be considered. The high prevalence of physical violence found in this study, together with the etiological factors of physical violence mentioned by the women themselves, argue for a law to established to give more support for women’s rights for protection against violence in the home.
Acknowledgements
Financial support for the study was received from Medical Sciences University of Kur-distan, Sanandaj, Islamic Republic of Iran.
References
1. Summary of the Fourth World Confe-rence on Women, 4–15 September 1995. Earth negotiations bulletin, 1995, 14 (21) (www.iisd.ca/download/pdf/enb1421e.pdf, accessed 15 November 2005).
2. Chambliss LR. Domestic violence: a pu-blic health crisis. Clinical obstetrics and gynecology, 1997, 40(3):630–8.
3. Stewart DE, Cecutti A. Physical abuse in pregnancy. Canadian Medical Associa-tion journal, 1993, 149:1257–63.
4. WHO multi-country study on women's health and domestic violence against women. Geneva, World Health Organiza-tion, 2005.
5. Levinger G. Sources of marital dissa-tisfaction among applicants for divorce. American journal of orthopsychiatry, 1966, 36:803–7.
6. Lieberman Research Inc. Domestic vi-olence advertising campaign tracking survey (Wave IV). Conducted for the Ad-vertising Council and the Family Violence Prevention Fund, July–October, 1996.
7. DeLahunta EA, Tulsky AA. Personal ex-posure of faculty and medical students to family violence. Journal of the American Medical Association, 1996, 275:1903–6.
8. Amin AF. Violence against women. Sanandaj, Islamic Republic of Iran, Wom-en’s Participation Research Center of Kurdistan Province, 2000.
9. Jewkes R et al. Prevalence of emotional, physical and sexual abuse of women in three South Africa provinces. South Afri-can medical journal, 2001, 91(5):421–8.
10. Ellsberg MC et al. Women’s strategic res-ponses to violence in Nicaragua. Journal of epidemiology and community health, 2001, 55(8):547–55.
11. The world’s women 2000. Trends and statistics. New York, United Nations Sta-tistics Division, 2000.
12. Marcus R. Violence against women in Bangladesh, Pakistan, Egypt, Sudan, Senegal and Yemen. Brighton, UK, In-stitute of Development Studies, 1993. (BRIDGE Gender Report No.10).
13. Straus MA, Gelles RJ. How violent are American families? Estimates from the National Family Violence Resurvey and other studies. In: Straus MA, Gelles RJ, eds. Physical violence in American fami-lies: risk factors and adaptations to vio-lence in 8,145 families. New Brunswick, New Jersey, Transaction Publishers, 1990:95–112.
14. Rath GD, Jarrett LG, Leonardson G. Rates of domestic violence against adult women by men partners. Journal of the American Board of Family Practice, 1989, 2:227–33.
15. McLennan W. Women’s safety. Aus-tral ia 1996 . Canberra, Austral ian Bureau of Statist ics, 1996 (www.

Eastern Mediterranean Health Journal, Vol. 11, Nos 5/6, 2005 887
�ملجلة �لصحية لشرL �ملتوسط، منظمة �لصحة �لعاملية، �ملجلد �حلا�E عشر، �لعد��� ٥-٦، ٢٠٠٥
a u s s t a t s . a b s . g o v . a u / A u s s t a t s /subscriber.nsf/Lookup/F16680629-C465E03CA256980007C4A81/$File/41280_1996.pdf, accessed 5 Sep-tember 2005).
16. Newberger EH et al. Abuse of pregnant women and adverse birth outcome. Cur-rent knowledge and implications for prac-tice. Journal of the American Medical Association, 1992, 267:2370–2.
CorrectionKnowledge of and attitudes towards family planning by male teachers in the Islamic Republic of Iran. R. Tavakoli and H. Rashidi-Jahan. Eastern Mediterranean Health Journal, 2003, Vol. 9 Nos 5/6, pages 1019–1025.
The name in Arabic of the second author should read: حجت �� جها�
888 La Revue de Santé de la Méditerranée orientale, Vol. 11, No 5/6, 2005
�ملجلة �لصحية لشرL �ملتوسط، منظمة �لصحة �لعاملية، �ملجلد �حلا�E عشر، �لعد��� ٥-٦، ٢٠٠٥
Reproductive health knowledge, attitudes and practices of Iranian college studentsM. Simbar,1 F.R. Tehrani 2 and Z. Hashemi 3
1Department of Midwifery, Shaheed Beheshti Medical University, Tehran, Islamic Republic of Iran(Correspondence to M. Simbar: [email protected]). 2National Research Centre for Reproductive Health, Tehran, Islamic Republic of Iran.3Centre of Education and Research on Population and Family Planning, Medical University of Qazvin, Qazvin, Islamic Republic of Iran. Received: 18/04/04; accepted: 14/06/04
ABSTRACT To study reproductive health knowledge, attitudes and practices of youth in the Islamic Republic of Iran, 1111 university students completed a questionnaire with 43 closed questions. The overall mean knowledge score was 54%. Knowledge of males and females, and of married and single students, was similar. Of 664 students answering questions about reproductive health behaviour, 54 (8%) reported having sexual intercourse before marriage; 16% of males and 0.6% of females; 48% of them had used condoms. The majority of students believed that the risk of AIDS and other sexually transmitted infections was moderate but that youth had a low ability to practise healthy behaviour. The majority believed in the benefits of reproductive health knowledge for youth but felt that services were inadequate.
Connaissances, attitudes et pratiques des étudiants iraniens concernant la santé génésiqueRÉSUMÉ Afin d’étudier les connaissances, attitudes et pratiques des jeunes concernant la santé génésique en République islamique d’Iran, un questionnaire composé de 43 questions fermées a été rempli par 1111 étudiants universitaires. Le score général moyen pour les connaissances était de 54 %. Les connaissances des garçons et des filles, et celles des étudiants mariés et célibataires, étaient similaires. Sur les 664 étudiants ayant répondu aux questions sur les comportements liés à la santé génésique, 54 (8 %) déclaraient avoir eu des relations sexuelles avant le mariage : 16 % de garçons et 0,6 % de filles ; 48 % d’entre eux avaient utilisé des préservatifs. La majorité des étudiants pensaient que le risque de SIDA et d’autres infections sexuellement transmissibles était modéré mais que les jeunes avaient une faible capacité à adopter un comportement sain. La majorité des étudiants consi-déraient qu'il y avait des avantages pour les jeunes à avoir des connaissances en matière de santé génésique mais estimaient que les services étaient insuffisants.

Eastern Mediterranean Health Journal, Vol. 11, Nos 5/6, 2005 889
�ملجلة �لصحية لشرL �ملتوسط، منظمة �لصحة �لعاملية، �ملجلد �حلا�E عشر، �لعد��� ٥-٦، ٢٠٠٥
Introduction
The sexual reproductive health needs of young people in the Islamic Republic of Iran are one of the most under-researched aspects of our population. This is concer-ning at a time when all communities in the world are threatened by morbidity and mortality due to the spread of the acquired immune deficiency syndrome (AIDS) [1]. The latest report of the Joint United Na-tions Programme on HIV/AIDS (UNAIDS) reveals that almost 60 million people are globally infected by human immunodefi-ciency virus (HIV), of whom 20 million are expected to die due to complications of the disease [1]. Currently there is no solution except prevention.
The Ministry of Health and Medical Education in Tehran recorded more than 14 000 HIV positive cases by 2003; 60% of these were infected from injecting drug use and 25% from sexual relations [1]. How-ever, it is predicted that the figures could be much higher than reported and there is evidence that the rate of HIV is growing rapidly [2].
Youth are a particular concern for reproductive health. More than half the world’s youth are initiating their sexual activity during their adolescence years [1]. Every year, half of new HIV infected cases and one-third of the 340 million new sexually transmitted infections (STIs) occur in people aged under 25 years. Each year, more than 1 in 20 adolescents contracts a curable STI [3]. Every minute, 10 female adolescents around the world undergo unsafe abortion [4].
While religious teaching and cultural norms in the Islamic Republic of Iran em-phasize abstinence from sexual activity un-til permanent marriage [5], in reality sexual activity before, and outside, marriage occurs in Islamic societies as well as non-Islamic ones. Unfortunately, little is known about
this aspect of our community. The few studies of the knowledge, attitude, beliefs and behaviours about sexual reproductive health of Iranian youth have demonstrated poor knowledge about reproductive health [6–10]. It is the task of health researchers to identify the needs for reproductive health promotion and to plan and implement the necessary educational programmes that might include prevention of STIs/HIV/AIDS and unwanted pregnancies.
This descriptive study aimed to study the knowledge, attitudes and behaviour of a group of university students in rela-tion to the health belief model, in order to identify the sexual reproductive health needs of students and to clarify the future vision of health promotion programmes in the Islamic Republic of Iran.
Methods
Quota sampling was used to recruit 1117 female and male students studying medi-cal science, engineering, science or human sciences in Qazvin University of Medical Sciences and Imam Khomeini International University.
Questionnaires were distributed in the university classes and were filled by the stu-dents. The questionnaire included 43 closed questions covering demographic data and knowledge, behaviour and attitudes towards reproductive health.
In the knowledge section, students were given a list of contraceptive methods, type of STIs and ways of preventing HIV and asked to mark which they knew about. In the section on reproductive health behaviour, students were asked if they had had premarital intercourse, and if so, whether they had used contraceptives or condoms and if there were any occurrences of unwanted pregnancy, STIs/HIV/AIDS or unsafe abortion. The attitudes section
890 La Revue de Santé de la Méditerranée orientale, Vol. 11, No 5/6, 2005
�ملجلة �لصحية لشرL �ملتوسط، منظمة �لصحة �لعاملية، �ملجلد �حلا�E عشر، �لعد��� ٥-٦، ٢٠٠٥
comprised 10 statements (5 supportive of good practice in reproductive health and 5 non-supportive), scored from 1 to 5 from completely disagree to completely agree.
The final part of the questionnaire as-sessed the health beliefs of the students according to the health belief model, using 6 questions. They were asked their opinion of how much youth are at risk of unwanted pregnancy, HIV/AIDS and STIs; how much unwanted pregnancy or HIV/AIDS/STIs affect the life, career and social life of single young people; how much knowledge about contraception and HIV/AIDS/STIs preven-tion methods are useful for single young people; and how much youth are able to use prevention methods when they are at risk of unwanted pregnancy or HIV/AIDS/STIs [4 questions, scored from 1 (not at all) to 4 (a lot)]. They were also asked if they believed that reproductive health services and educa-tion for youth were adequate (Yes/No) and if not, were the inadequacies related to: inaccessibility of contraceptives for single young people, low knowledge of youth about reproductive health or an inappropri-ate environment to access reproductive health services.
The questionnaire validity was con-firmed by 10 reproductive health experts and its reliability was assessed by the split half method.
The data were processed using SPSS version 10 and analysed using chi-squared, Mann–Whitney, Spearman’s correlation and Kruskall–Wallis tests.
The project was approved by the ethics committee of the Deputy of Research and Technology of the Ministry of Health and Medical Education of the Islamic Republic of Iran. Written consent was taken from the representatives of the heads of both universities. The study was explained to the students in their classes and questionnaires were completed anonymously.
Results
A total of 1117 students participated in the study, 654 females and 457 males (6 stu-dents did not record their sex), with a mean (standard deviation) age of 21.4 (SD 2.4) and 22.7 (SD 3.5) years respectively. Most of the students (924/1117) were single at the time of the study.
Table 1 shows the proportion of students who knew about each type of contraceptive, types of STIs and ways of preventing HIV, in relation to their field of study, sex and marital status.
In the section about knowledge of contraceptive methods, the most familiar method was oral contraceptives (82% of all students knew about this method) and the least known was emergency contracep-tion (only 17% knew about it). The overall mean knowledge score was 55%. Medical students had a higher mean knowledge score (72%) than students studying human science (39%), science (47%) and enginee-ring (55%). Mean scores on contraception knowledge were slightly higher for females compared with males (59% versus 53% respectively) but was identical for married and single students (55% for both).
For the section about knowledge of STIs, 87% of students knew about AIDS compared with only 40% for syphilis and 46% for gonorrhoea. In the section about knowledge of HIV prevention methods, 75% of the students believed that adhering to moral principles (ethics) was a method of prevention for HIV, 67% knew about not sharing needles and blades and 49% about condoms. Few students (17%) recognized abstinence from sex as a method of preven-ting HIV.
There was no significant difference be-tween the knowledge of males and females or between single and married students about reproductive health. But knowledge

Eastern Mediterranean Health Journal, Vol. 11, Nos 5/6, 2005 891
�ملجلة �لصحية لشرL �ملتوسط، منظمة �لصحة �لعاملية، �ملجلد �حلا�E عشر، �لعد��� ٥-٦، ٢٠٠٥
Tabl
e 1
Per
cen
tag
e o
f st
ud
ents
wh
o k
new
ab
ou
t ea
ch it
em a
nd
mea
n p
erce
nta
ge
kno
wle
dg
e in
eac
h c
ateg
ory
Var
iab
le
Fie
ld o
f st
ud
y S
ex
Mar
ital
sta
tus
Tota
l
H
um
. Sci
. S
ci.
En
g.
Med
. Sci
. F
emal
e M
ale
Mar
ried
S
ing
le
%
%
%
%
%
%
%
%
%
(n =
359
) (n
= 1
45)
(n =
223
) (n
= 3
90)
(n =
654
) (n
= 4
57)
(n =
193
) (n
= 9
24)
(n =
111
7)
Con
trac
eptiv
es
Pill
s 71
76
86
92
85
80
84
81
82
C
ondo
ms
62
65
79
80
68
78
76
71
72
IUD
44
61
54
88
74
49
66
63
64
N
orpl
ant
26
32
39
69
50
35
42
49
44
Inje
ctab
les
37
37
46
72
60
43
53
51
51
Em
erge
ncy
cont
race
ptio
n 7
8 13
31
18
15
18
17
17
M
enst
rual
dia
ry
24
37
44
64
53
62
41
44
44
With
draw
al
26
27
52
57
42
43
41
42
42
Vas
ecto
my
43
61
66
82
67
59
64
64
64
Tube
ctom
y 54
67
66
85
75
61
69
70
69
M
ean
know
ledg
e sc
ore
39
47
55
72
59
53
55
55
55
Dis
ease
s
Gon
orrh
oea
27
30
35
75
39
55
49
45
46
Syp
hilis
20
23
22
74
40
40
46
38
40
A
IDS
82
87
87
92
86
89
87
87
87
M
ean
know
ledg
e sc
ore
43
47
48
80
55
61
61
57
58
HIV
pre
vent
ion
met
hods
App
lyin
g m
oral
prin
cipa
ls
67
77
75
81
75
76
76
70
75
Usi
ng c
ondo
ms
31
35
59
64
39
62
47
49
49
A
void
ing
used
syr
inge
s
and
blad
es
51
67
64
68
60
63
56
67
61
Abs
tain
ing
from
sex
8
11
18
26
23
22
14
17
17
Mea
n kn
owle
dge
scor
e 39
48
54
60
49
56
48
51
51
O
vera
ll m
ean
know
ledg
e
scor
e 40
47
53
71
56
55
55
54
54
Hum
. Sci
. = H
uman
Sci
ence
; Sci
= S
cien
ce; E
ng. =
Eng
inee
ring;
Med
. Sci
. = M
edic
al S
cien
ce.
IUD
= in
trau
terin
e de
vice
.A
IDS
= a
cqui
red
imm
une
defic
ienc
y sy
ndro
me.
HIV
= h
uman
imm
unod
efic
ienc
y vi
rus.
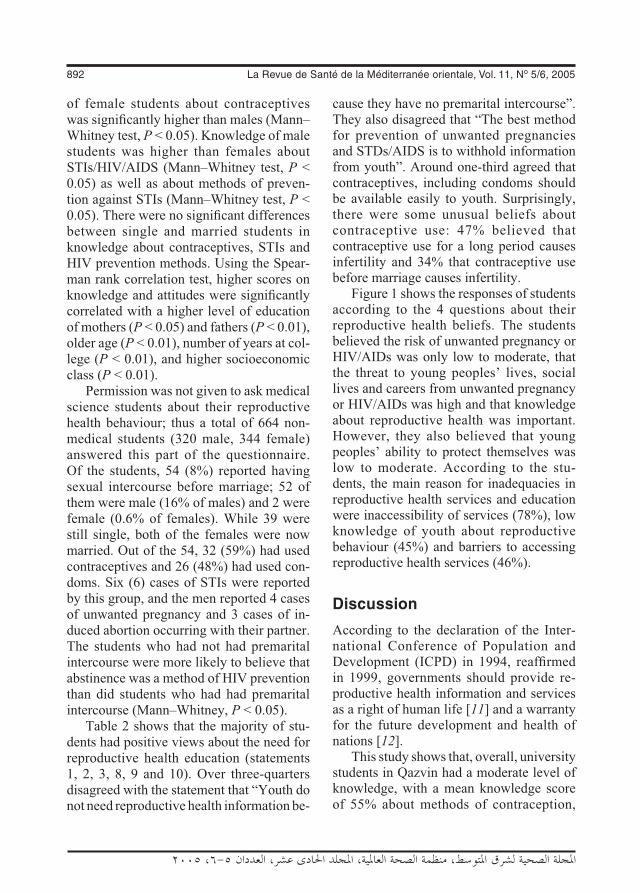
892 La Revue de Santé de la Méditerranée orientale, Vol. 11, No 5/6, 2005
�ملجلة �لصحية لشرL �ملتوسط، منظمة �لصحة �لعاملية، �ملجلد �حلا�E عشر، �لعد��� ٥-٦، ٢٠٠٥
of female students about contraceptives was significantly higher than males (Mann–Whitney test, P < 0.05). Knowledge of male students was higher than females about STIs/HIV/AIDS (Mann–Whitney test, P < 0.05) as well as about methods of preven-tion against STIs (Mann–Whitney test, P < 0.05). There were no significant differences between single and married students in knowledge about contraceptives, STIs and HIV prevention methods. Using the Spear-man rank correlation test, higher scores on knowledge and attitudes were significantly correlated with a higher level of education of mothers (P < 0.05) and fathers (P < 0.01), older age (P < 0.01), number of years at col-lege (P < 0.01), and higher socioeconomic class (P < 0.01).
Permission was not given to ask medical science students about their reproductive health behaviour; thus a total of 664 non-medical students (320 male, 344 female) answered this part of the questionnaire. Of the students, 54 (8%) reported having sexual intercourse before marriage; 52 of them were male (16% of males) and 2 were female (0.6% of females). While 39 were still single, both of the females were now married. Out of the 54, 32 (59%) had used contraceptives and 26 (48%) had used con-doms. Six (6) cases of STIs were reported by this group, and the men reported 4 cases of unwanted pregnancy and 3 cases of in-duced abortion occurring with their partner. The students who had not had premarital intercourse were more likely to believe that abstinence was a method of HIV prevention than did students who had had premarital intercourse (Mann–Whitney, P < 0.05).
Table 2 shows that the majority of stu-dents had positive views about the need for reproductive health education (statements 1, 2, 3, 8, 9 and 10). Over three-quarters disagreed with the statement that “Youth do not need reproductive health information be-
cause they have no premarital intercourse”. They also disagreed that “The best method for prevention of unwanted pregnancies and STDs/AIDS is to withhold information from youth”. Around one-third agreed that contraceptives, including condoms should be available easily to youth. Surprisingly, there were some unusual beliefs about contraceptive use: 47% believed that contraceptive use for a long period causes infertility and 34% that contraceptive use before marriage causes infertility.
Figure 1 shows the responses of students according to the 4 questions about their reproductive health beliefs. The students believed the risk of unwanted pregnancy or HIV/AIDs was only low to moderate, that the threat to young peoples’ lives, social lives and careers from unwanted pregnancy or HIV/AIDs was high and that knowledge about reproductive health was important. However, they also believed that young peoples’ ability to protect themselves was low to moderate. According to the stu-dents, the main reason for inadequacies in reproductive health services and education were inaccessibility of services (78%), low knowledge of youth about reproductive behaviour (45%) and barriers to accessing reproductive health services (46%).
Discussion
According to the declaration of the Inter-national Conference of Population and Development (ICPD) in 1994, reaffirmed in 1999, governments should provide re-productive health information and services as a right of human life [11] and a warranty for the future development and health of nations [12].
This study shows that, overall, university students in Qazvin had a moderate level of knowledge, with a mean knowledge score of 55% about methods of contraception,
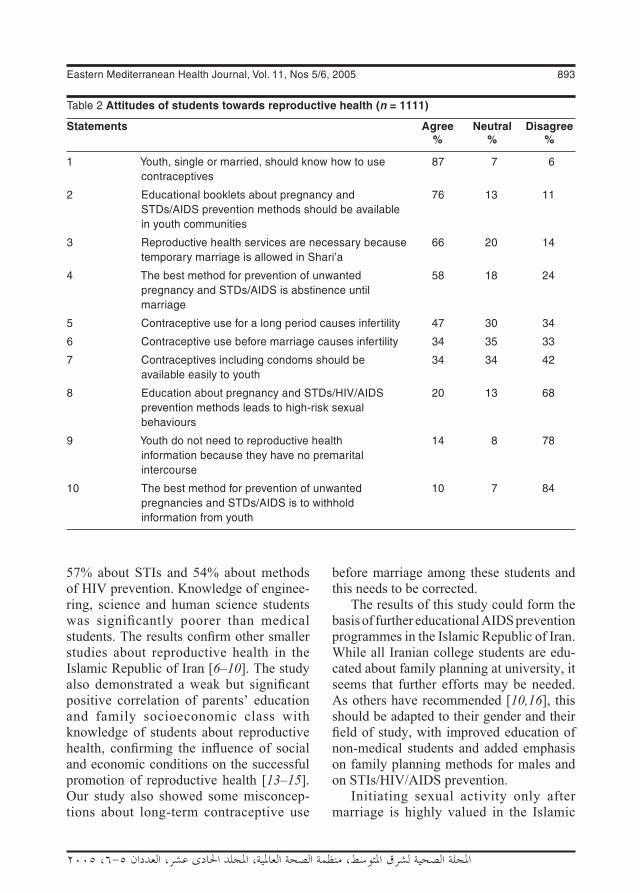
Eastern Mediterranean Health Journal, Vol. 11, Nos 5/6, 2005 893
�ملجلة �لصحية لشرL �ملتوسط، منظمة �لصحة �لعاملية، �ملجلد �حلا�E عشر، �لعد��� ٥-٦، ٢٠٠٥
57% about STIs and 54% about methods of HIV prevention. Knowledge of enginee-ring, science and human science students was significantly poorer than medical students. The results confirm other smaller studies about reproductive health in the Islamic Republic of Iran [6–10]. The study also demonstrated a weak but significant positive correlation of parents’ education and family socioeconomic class with knowledge of students about reproductive health, confirming the influence of social and economic conditions on the successful promotion of reproductive health [13–15]. Our study also showed some misconcep-tions about long-term contraceptive use
before marriage among these students and this needs to be corrected.
The results of this study could form the basis of further educational AIDS prevention programmes in the Islamic Republic of Iran. While all Iranian college students are edu-cated about family planning at university, it seems that further efforts may be needed. As others have recommended [10,16], this should be adapted to their gender and their field of study, with improved education of non-medical students and added emphasis on family planning methods for males and on STIs/HIV/AIDS prevention.
Initiating sexual activity only after marriage is highly valued in the Islamic
Table 2 Attitudes of students towards reproductive health (n = 1111)
Statements Agree Neutral Disagree % % %
1 Youth, single or married, should know how to use 87 7 6 contraceptives
2 Educational booklets about pregnancy and 76 13 11 STDs/AIDS prevention methods should be available in youth communities
3 Reproductive health services are necessary because 66 20 14 temporary marriage is allowed in Shari’a
4 The best method for prevention of unwanted 58 18 24 pregnancy and STDs/AIDS is abstinence until marriage
5 Contraceptive use for a long period causes infertility 47 30 34
6 Contraceptive use before marriage causes infertility 34 35 33
7 Contraceptives including condoms should be 34 34 42 available easily to youth
8 Education about pregnancy and STDs/HIV/AIDS 20 13 68 prevention methods leads to high-risk sexual behaviours
9 Youth do not need to reproductive health 14 8 78 information because they have no premarital intercourse
10 The best method for prevention of unwanted 10 7 84 pregnancies and STDs/AIDS is to withhold information from youth
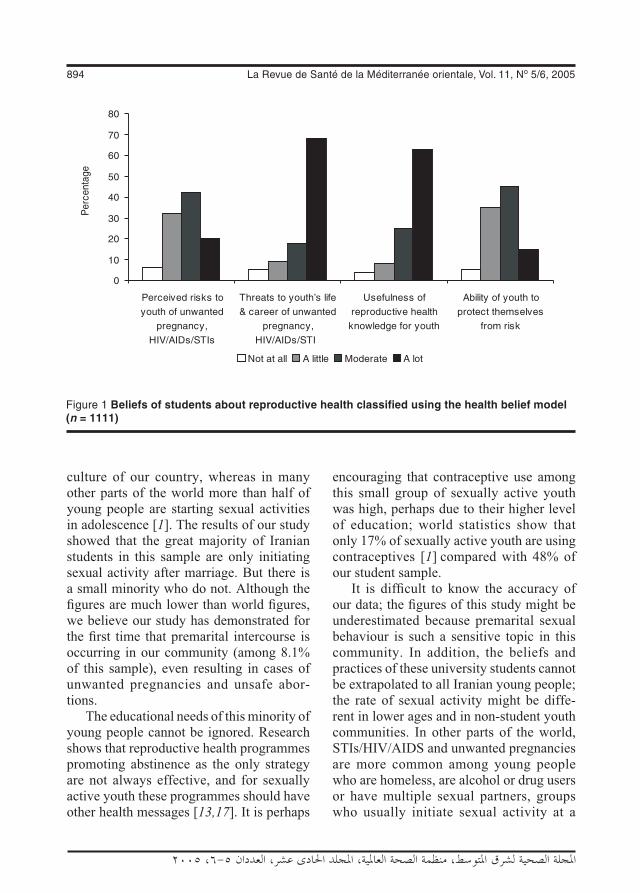
894 La Revue de Santé de la Méditerranée orientale, Vol. 11, No 5/6, 2005
�ملجلة �لصحية لشرL �ملتوسط، منظمة �لصحة �لعاملية، �ملجلد �حلا�E عشر، �لعد��� ٥-٦، ٢٠٠٥
culture of our country, whereas in many other parts of the world more than half of young people are starting sexual activities in adolescence [1]. The results of our study showed that the great majority of Iranian students in this sample are only initiating sexual activity after marriage. But there is a small minority who do not. Although the figures are much lower than world figures, we believe our study has demonstrated for the first time that premarital intercourse is occurring in our community (among 8.1% of this sample), even resulting in cases of unwanted pregnancies and unsafe abor-tions.
The educational needs of this minority of young people cannot be ignored. Research shows that reproductive health programmes promoting abstinence as the only strategy are not always effective, and for sexually active youth these programmes should have other health messages [13,17]. It is perhaps
encouraging that contraceptive use among this small group of sexually active youth was high, perhaps due to their higher level of education; world statistics show that only 17% of sexually active youth are using contraceptives [1] compared with 48% of our student sample.
It is difficult to know the accuracy of our data; the figures of this study might be underestimated because premarital sexual behaviour is such a sensitive topic in this community. In addition, the beliefs and practices of these university students cannot be extrapolated to all Iranian young people; the rate of sexual activity might be diffe-rent in lower ages and in non-student youth communities. In other parts of the world, STIs/HIV/AIDS and unwanted pregnancies are more common among young people who are homeless, are alcohol or drug users or have multiple sexual partners, groups who usually initiate sexual activity at a
Figure 1 Beliefs of students about reproductive health classified using the health belief model (n = 1111)
Eastern Mediterranean Health Journal, Vol. 11, Nos 5/6, 2005 895
�ملجلة �لصحية لشرL �ملتوسط، منظمة �لصحة �لعاملية، �ملجلد �حلا�E عشر، �لعد��� ٥-٦، ٢٠٠٥
lower age [1]. It is a reality that more than 17 million young people worldwide under 18 years old are homeless and living and working on the street, often as sex workers [1]. We have no valid data about the extent of this problem in the Islamic Republic of Iran, nor any prevention programmes for these groups.
There is a belief among many parents and communities that giving information about reproductive health encourages young people into inappropriate sexual behaviours. In our survey of attitudes and beliefs, more than 80% of students did not agree with this. Furthermore, the low level of sexual activity before marriage, and high use of contraceptives among the few who were sexually active, suggests that these young people were practising healthy behaviours. A careful assessment of the issue by the UNAIDS showed no evidence that sexual reproductive health education encourages high-risk activities, in fact that it leads to safer sexual behaviour [18]. Reproductive health education is a right of young people so that they can make informed decisions about their reproductive lives [11] before the initiation of sexual activity [18].
The health belief model showed that the majority of these students believed that re-productive health knowledge among young people is low, that services are inadequate and there are barriers to accessing services. There is no doubt that a supportive environ-ment is essential for improving reproduc-tive health programmes. Appropriate social, political and cultural supports are necessary as well as the availability and accessibi-lity of information and services. Education programmes should not only emphasize giving information but also should focus on providing youth with life skills and impro-ving the ability of youth to manage their risk (self-efficacy) [19].
Psychosocial theories have been recom-mended for the planning of educational health promotion programmes including AIDS prevention programmes [20–24]. By applying the health belief model, we showed that the majority of Iranian students believed that unhealthy reproductive health behav-iours among youth were a risk to life. How-ever, they also believed that young people had a low capability to protect themselves.The HIV epidemic has up to now had a low impact in the Islamic Republic of Iran, presumably because most of the population follow the Islamic moral code which forbids premarital sex, adultery and homosexuality [25]. This has been demonstrated in other countries of the Eastern Mediterranean Region such as Egypt [26]. Our study con-firmed that the majority of students believed that adhering to moral principals and absti-nence were the best ways for prevention of STIs/AIDS. But in the present age of more open communication between cultures, patterns of behaviour are liable to change in the future. Policy-makers and health au-thorities need to pay more attention towards retaining and strengthening those aspects of our culture that keeps our youth safe. An appropriate strategy, which has been suggested by other predominantly Muslim countries such as Malaysia [27], Oman [28] and Egypt [26], is to integrate teaching of Islamic values into reproductive health education and promotion programmes.
Acknowledgements
The authors thank Dr Hosein Malek Afzali, the Deputy Minister of Research and Tech-nology and the National Medical Sciences Research Centre, Mrs Hejazi and Mrs Ros-tami for their help in the study.

896 La Revue de Santé de la Méditerranée orientale, Vol. 11, No 5/6, 2005
�ملجلة �لصحية لشرL �ملتوسط، منظمة �لصحة �لعاملية، �ملجلد �حلا�E عشر، �لعد��� ٥-٦، ٢٠٠٥
References
1. 2004 Report on the global AIDS epidemic: 4th global report. Geneva, UNAIDS, 2004 (UNAIDS/04.16E).
2. Report of the Department of Prevention of Diseases on HIV/AIDS. Tehran, Ministry of Health and Medical Education, 2002.
3. Why are adolescents so vulnerable to sexually transmitted infections? Progress in reproductive health research, 2003, No. 64:5.
4. Greene ME et al. In this generation: sexual and reproductive health policies for a youthful world. Washington DC, Population Action International, 2002.
5. Bigomzadeh F. Children and adolescents sex educational problems. Journal of edu-cation, Tarbiat, 1991, No.5:7–12.
6. Mosleh-Uddin M et al. Adolescents data on reproductive health issues in the I.R. of Iran. Paper presented at the IUSSP Seminar in Bangkok, Thailand, 10–13 June 2002. Paris, International Union for the Scientific Study of Population, 2002. (http://www.iussp.org/Bangkok2002/S26Mosleh.pdf, accessed 26 June 2005).
7. Ramezani F. Effects of two educational methods about health of puberty, on knowledge, attitude and practice of adolescents. Report of the project, 2000. Tehran, Reproductive Health Research Centre, Ministry of Health and Medical Education, 2000.
8. Ramezani F. Reproductive health promo-tion among youth in Islamshahr. Report of the project, 2001. Tehran, Reproduc-tive Health Research Centre, Ministry of Health and Medical Education, 2002.
9. Knowledge, attitude and practice of female single and married youth about reproductive health. Report of the pro-ject, 2001. Tehran, Ministry of Health and Medical Education, 2001.
10. Akbari E. Knowledge attitude and practice of female and male (10-19 y/o) adoles-cents about health of puberty. Report of the project, 1997. Tehran, Department of Family Health, 1997.
11. United Nations International Confe-rence on Population and Development. Cairo, Egypt, 5–13 September 1994. Earth negotiations bulletin, 1994, 3 (http://www.iisd.ca/vol03/0308000e.html, ac-cessed 26 June 2005).
12. Brundtland G. Reproductive health: a health priority. Speech delivered at the ICPD + 5 Forum, The Hague, Netherlands, 8–12 February 1999 (http://www.who.int/director-general/speeches/1999/english/19990208_hague.html, ac-cessed 26 June 2005).
13. Kirby D. No easy answers: research fin-dings on programs to reduce teen preg-nancy. Washington DC, National Cam-paign to Prevent Teen Pregnancy, 1997.
14. Santelli JS et al. The association of se-xual behaviors with socioeconomic status, family structure and race/ethnicity among US adolescents. American journal of pu-blic health, 2000, 90(10):1522–8.
15. Dillard K. Adolescent sexual behaviour. II: Socio-psychological factors. Factsheet. Washington DC, Advocates for Youth, 1996.
16. Aarons SJ et al. Postponing sexual inter-course among urban junior high school students—a randomized controlled education. Journal of adolescent health, 2000, 27(4):236–47.
17. Christopher F, Roosa M. An evaluation of adolescents pregnancy prevention programs: is “just say no” enough. Family relations, 1990, 39:68–72.
18. Impact of HIV and sexual health educa-tion on the sexual behaviour of young people: a review update. Geneva, Joint
Eastern Mediterranean Health Journal, Vol. 11, Nos 5/6, 2005 897
�ملجلة �لصحية لشرL �ملتوسط، منظمة �لصحة �لعاملية، �ملجلد �حلا�E عشر، �لعد��� ٥-٦، ٢٠٠٥
United Nations Programme on HIV/AIDS, 1997 (http://www.advocatesforyouth.org/publications/factsheet/fsbehsoc.pdf, ac-cessed 26 June 2005).
19. Chandra-Mouli V. Drawing in, wor-king with and supporting communities in sexual health. Sexual health exchange, 1999 (2):1–3.
20. Rosenstock LM. The health belief model: explaining health behavior through ex-pectancies. In: Glanz K, Lewis FM, Rimer BK, eds. Health behavior and health edu-cation theory, research and practice. San Francisco, Jossey-Bass, 1995.
21. Hilltabiddle SJ. Adolescents condom use, the health belief model, and the preven-tion of sexually transmitted disease. Jour-nal of obstetrics and gynaecology and neonatal nursing, 1996, 25(1):61–6.
22. Mahoney CA, Thombs DL, Ford OJ. Health belief and self-efficacy models: their utility in explaining college students’ condom use. AIDS education and preven-tion, 1995, 7(1):32–47.
23. Gielen AC et al. Women’s perspectives about sexual behavior: a test of the health belief model. AIDS education and preven-tion, 1994, 6(1):1–11.
24. Yep GA. HIV prevention among Asian-American college students: does the health belief model work? Journal of American College of Health, 1993, 4(5):195–205.
25. Prohibition of sexual relations outside marriage. In: Al-Awwa MS. The role of religion and ethics in the prevention and control of AIDS. Chapter 4. Health education through religion series. Cairo, World Health Organization Eastern Mediterranean Regional Office, 2004 (http://www.emro.who.int/Publications/HealthEdReligion/AIDS/Chapter4.htm accessed 26 June 2005).
26. Lenton C. Will Egypt escape the AIDS epidemic? Lancet, 1997, 349:1005.
27. Oorjitham SA. Spirited response: Malay-sia’s AIDS activists woo Muslim clerics Asia week, 1999, Nov 5:37.
28 Abdullatif A. Introductory note. WHO Oman, 1998, 1(3) (http: //www.emro. who.int/emrinfo/countrynews/Oma/OmanNewsDecember98Page1.htm, accessed 26 June 2005).
898 La Revue de Santé de la Méditerranée orientale, Vol. 11, No 5/6, 2005
�ملجلة �لصحية لشرL �ملتوسط، منظمة �لصحة �لعاملية، �ملجلد �حلا�E عشر، �لعد��� ٥-٦، ٢٠٠٥
Quality of life of patients with schizophrenia 2T.K. Daradkeh1 and T. Al Habeeb2
1Division of Psychiatry, Jordan University of Science, Irbid, Jordan (Correspondence to T.K. Daradkeh: [email protected]).2Department of Psychiatry, King Saud University, Riyadh, Saudi Arabia.Received: 27/05/03; accepted: 15/07/03
ABSTRACT We studied quality of life in 211 patients with schizophrenia from 2 outpatient clinics in Irbid, Jordan and Riyadh, Saudi Arabia, using the self-reporting questionnaire SRQ-24 and the modi-fied version of the schizophrenia quality of life scale. Sex, marital status, employment, education, non- psychotic symptoms and psychotic symptoms were examined. Approximately 27% had good quality of life, 19.4% thought their general health was excellent or very good and about 30% said they had achieved their expectations. There was no significant relationship between sex and marital status and quality of life but employment and education were significantly related. Patients with less severe psy-chotic and non-psychotic symptoms were also found to have better quality of life.
Qualité de vie des patients schizophrènes – deuxième partieRÉSUMÉ Nous avons étudié la qualité de vie de 211 patients schizophrènes dans deux services de consultations externes à Irbid (Jordanie) et Riyad (Arabie saoudite) en utilisant le questionnaire direct SRQ-24 et la version modifiée de l'échelle de qualité de vie pour les patients souffrant de schizo-phrénie. Le sexe, la situation matrimoniale, l’emploi, l’instruction, les symptômes non psychotiques et les symptômes psychotiques ont été examinés. Environ 27 % avaient une bonne qualité de vie, 19,4 % pensaient que leur santé générale était excellente ou très bonne et environ 30 % déclaraient avoir réalisé leurs attentes. Il n’y avait pas de relation significative entre le sexe et la situation matri-moniale et la qualité de vie mais l'emploi et l’instruction étaient significativement liés. On a également trouvé que les patients qui avaient des symptômes psychotiques et non psychotiques moins sévères avaient une meilleure qualité de vie.
Eastern Mediterranean Health Journal, Vol. 11, Nos 5/6, 2005 899
�ملجلة �لصحية لشرL �ملتوسط، منظمة �لصحة �لعاملية، �ملجلد �حلا�E عشر، �لعد��� ٥-٦، ٢٠٠٥
IntroductionThe quality of life of the mentally ill has been a matter of concern for centuries [1]. The great reforms of the past century were prompted by this, and more recently there has been a move from institutional to com-munity care. Quality of life is now a more valued assessment, not only in psychiatry but also in many other areas, particularly those branches of medicine dealing with patients who suffer over relatively long periods of time. Patients are increasingly viewed as people and not just cases. This is indicative of a more consumer-oriented approach to medical care, in which the pa-tient’s own views are considered important rather than patients being solely the objects of expert opinion from professionals who themselves judge the effectiveness and re-levance of what they do [2].
Quality of life has been defined as a broad-ranging concept affected in a com-plex way by such things as physical health, psychological state, level of independence, social relationships and relationship to the environment [3]. This definition lays emphasis on the subjective nature of qua-lity of life, and also on the need to explore all those factors considered to have a sig-nificant impact on quality of life. Subjective well-being, in comparison, concerns itself primarily with affective states, positive and negative.
Quality of life assessment puts patients first, and recognizes the importance of their opinions. This assessment is a response to patients’ desires not to be treated merely as cases but rather as human beings who have many other concerns. Frequently, their disease or condition may not be the main factor affecting their lives; physicians at times have a tendency to reframe all problems as being related to the presenting disease. A quality of life assessment can help identify where a patient has problems
or difficulties. In the case of long-term ill-ness such as schizophrenia, overcoming any of these difficulties may make the patient feel healthier, and as a result make fewer demands on health services [1].
Data regarding the quality of life of pa-tients with schizophrenia from the develo-ping countries in the Eastern Mediterranean Region are sparse, and carrying out such assessment may help identify problems that are not visible and not dealt with by the conventional type of management, primarily consisting of pharmacotherapy. For this reason, we previously carried out a psychometric study on the modified version of the schizophrenia quality of life scale [4]. In our present paper we report on the quality of life of patients living in the community.
Methods
We did a cross-sectional study over 8 weeks (February–March 2002) on patients with a clinical diagnoses of schizophrenia atten-ding the main outpatient psychiatric clinic in Irbid, Jordan (n = 162) and patients at a private clinic in Riyadh, Saudi Arabia (n = 49). In Irbid, we selected the first 20 patients attending the Thursday clinic. If a patient refused to participate, the next one was approached. In Riyadh, the sample was selected in 2 clinic sessions in March 2002. We used samples from 2 countries to check the consistency of the findings.
All patients were receiving neuroleptic medications, mainly depot preparations. Pa-tients who agreed to take part in this study were reassessed to confirm the diagnosis of schizophrenia according to DSM-IV definition [5]. For convenience, the study included patients who attended the clinics on Thursdays, the day during which the investigators planned their time to work on this project.
900 La Revue de Santé de la Méditerranée orientale, Vol. 11, No 5/6, 2005
�ملجلة �لصحية لشرL �ملتوسط، منظمة �لصحة �لعاملية، �ملجلد �حلا�E عشر، �لعد��� ٥-٦، ٢٠٠٥
Patients selected were asked to fill in the modified version of the schizophrenia quality of life scale (SQLS) [4] and the self-reporting questionnaire (SRQ-20, the 20 non-psychotic items on the SRQ-24) [6]. Patients were also asked to rate their general health on a 4-point scale: excellent, good, fair or poor, and whether they had achieved their expectations as yes or no. The last 2 items were adopted from SF-36 health survey [7]. Patients who were illiterate were assisted by the research team.
The modified schizophrenia quality of life scale [4] consists of 30 items that tap 3 dimensions, psychosocial aspects, symptoms and side-effects of medications. Each item is answered as yes (= 1) or no (= 0). The total score ranges from 0 to 30, the higher the score, the poorer the quality of life. The scale has high reliability and validity.
The self-reporting questionnaire SRQ-24 [6] was originally developed by the World Health Organization as a screening instrument for the detection of psychiatric morbidity across different cultures [6]. It consists of 24 items that require a yes or no response according to the presence or absence of symptoms. The respondent is considered to potentially have a psychiatric disorder if the total number of positive re-sponses to the first 20 (non-psychotic) ques-tions reaches a certain value (cut-off point), or if there is at least 1 positive response to any of the 4 remaining (psychotic) items, or if both criteria are met. A variety of cut-off points, ranging from 3 to 10, have been used for the 20 (non-psychotic) items to screen for the presence or absence of a potential non-psychotic disorder. We used 11 as the cut-off point to categorize patients with a severe psychotic illness, schizophrenia, into those with severe and less severe non-psychotic symptoms.
Patients were categorized into 3 groups by their total score on the SQLS, good qua-
lity of life, SQLS score ≤ 10; intermediate quality of life, SQLS score 11–20; and poor quality of life, SQLS score ≥ 21. Patients were also grouped by their total score on the first 20 items of the SRQ into those with severe non-psychotic symptoms (SRQ-20 ≥ 11) and those with less severe non-psychotic symptoms (SRQ-20 ≤ 10). A total psychotic score from the last 4 items on the SRQ-24 was calculated (range 0–4; score of 0 = free of symptoms). The influence of selected variables (sex, marital status, educational status, employment status, non-psychotic and psychotic symptoms) on quality of life was examined.
Analysis of variance, t-test, chi-squared test and correlation coefficient were used to test for differences in the quality of life between groups of patients classified by sociodemographic and psychopathology variables, and to test the significance of any association.
Results
The sample comprised 149 (70.6%) male and 62 female patients. Mean age was 33.1 years (standard deviation 11.3). Ap-proximately 46% were never married, 36% married, and the rest were divorced, sepa-rated or widowed. Concerning employment status, 53.1% were unemployed, 20.5% were in partial employment and 6.3% were employed or performing their household duties in the case of female patients. Just under a quarter of our sample, 23.8%, were illiterate or had less than 6 years formal education, 23.3% had 7–12 years formal education and 52.9% had more than 12 years formal education.
Approximately 56% of the patients viewed their general health as acceptable with approximately 25% viewing it as poor (Table 1). Approximately 30% of the patients thought that they had achieved

Eastern Mediterranean Health Journal, Vol. 11, Nos 5/6, 2005 901
�ملجلة �لصحية لشرL �ملتوسط، منظمة �لصحة �لعاملية، �ملجلد �حلا�E عشر، �لعد��� ٥-٦، ٢٠٠٥
their expectations; the rest did not because of their illness. Table 2 shows cross-tabulation of quality of life with sever-ity of non-psychotic symptoms. It reveals that 26.6% (n = 55) had good quality of life, 37.7% (n = 78) had intermediate qua-lity of life and 35.7% (n = 74) had poor quality of life. It is interesting to note that 74.5% of patients with less-severe non-psychotic symptoms has good quality of life, compared with 25.5% with severe non-psychotic symptoms. The difference was significant (χ2 = 94.6, df = 2, P ≤ 0.001). None of the patients with less severe non-psychotic symptoms had poor quality of life. There was no significant difference in the quality of life of patients in Jordan and those in Saudi Arabia.
Regarding the psychotic profile (positive), 15.3% (n = 32) were found to be asymptomatic or free from positive symp-toms (score = 0); 24.4% (n = 51) mildly psychotic; 26.8% (n = 56) moderately psychotic, 20.6% (n = 43) severely psy-chotic and 12.9% (n = 27) very severely psychotic (score = 4). There was a sta-tistically significant positive relationship between the summed SQLS score and the global psychotic score (r = 0.64, P ≤ 0.001), indicating that the greater the psychotic symptoms, the worse the quality of life. There was no significant difference regarding quality of life between male [SQLS mean score 15.8 standard deviation
(SD) 7.9] and female (SQLS mean score 17.0, SD 6.6) patients, nor in the SQLS mean scores for different marital status (F = 0.48,P = 0.75). Table 3 shows that quality of lifeof employed patients (SQLS mean score 12.1, SD 8.6) was significantly better than that of unemployed patients (SQLS mean score 18.3, SD 6.9) (F = 12.4, P ≤ 0.001). Similarly patients with higher level of educa-tion reported a better quality of life than less-educated patients (F = 10.6, P < 0.001).
Discussion
The deinstitutionalization of psychiatric ser-vices and the drift from a more symptom-focused view on outcome of treatment to a more holistic view has increased interest in quality of life issues. Studies on subjec-tive quality of life among community-based patients with severe mental illness have indicated they have a better subjective qua-lity of life compared to patients in hospital settings. Studies of deinstitutionalization programmes have also generally reported improvement in subjective quality of life as patients move from inpatient care settings to community care [8].
An extensive MedLine search on the quality of life of patients from our Region with schizophrenia revealed no single research report that would allow us to com-pare our findings with those of others. This is the first report on the quality of life of non-institutionalized patients with schizo-phrenia, and it is legitimate to consider it the first database set on quality of life of patients with severe mental illness in this Region. Since our study is cross-sectional by design, it does not provide information on the effectiveness of our care programme as we have no baseline quality of life assess-ment ratings.
Table 1 Schizophrenic patients’ view of their general health
View of health No. %
Excellent 10 4.7
Good 31 14.7
Fair 118 55.9
Poor 52 24.7
Total 211 100

902 La Revue de Santé de la Méditerranée orientale, Vol. 11, No 5/6, 2005
�ملجلة �لصحية لشرL �ملتوسط، منظمة �لصحة �لعاملية، �ملجلد �حلا�E عشر، �لعد��� ٥-٦، ٢٠٠٥
The finding that nearly a quarter of our patients viewed their general health as excellent or good and approximately 30% achieved their expectations confirms previous reports of the good prognosis for a subset of patients with schizophrenia [9,10]. The question that needs answering is whether our findings in this regard represent the natural outcome of patients with schizo-phrenia, or if such an outcome has been influenced by our treatment programme, which mainly consists of pharmacotherapy and supportive psychotherapy. The World Health Organization international pilot study on schizophrenia and subsequent
determinants of the outcome of severe men-tal disorders has consistently shown that patients in developing countries have more favourable outcome, course of the condition and higher recovery rates than patients in industrialized countries [9,10].
The reason for the better outcome in the developing world is not completely under-stood. It may be due to the fact that many people with mental illness in villages in the developing world are better accepted, less stigmatized, and more likely to find work in the agricultural economy or to engage in meaningful labour [9,11,12]. A striking observation is that in Arab communities,
Table 2 Cross-tabulation of quality of life with severity of non-psychotic symptoms
Quality of life Non-psychotic symptoms Alla Severeb Less severeb
No. % No. % No. %
Good (SQLS ≤ 10) 55 26.6 14 25.5 41 74.5***
Intermediate (SQLS 11–20) 78 37.7 64 82.1 14 17.9
Poor (SQLS ≥ 21) 74 35.7 74 100 0 0
Total 207 100 152 73.4 55 26.6aSome values missing.bOn the self reporting questionnaire, severe = score ≥ 11, less severe = score ≤ 10.SQLS = schizophrenia quality of life scale.***P < 0.001.
Table 3 Cross-tabulation of quality of life with employment status
Employment No. Mean SQLS SDstatus score
Unemployed 109 18.3 6.9
Partial employment 42 15.3 7.3
Employed 54 12.1 12.1***
Total 205a 16.0 7.9aSome values missing.SQLS = schizophrenia quality of life scale.SD = standard deviation.***P < 0.001.
Table 4 Cross-tabulation of quality of life with educational attainment
Education (years in No. Mean SQLS SDformal education) score
≤6 49 18.9 6.3
7–12 48 18.3 7.1
≥13 109 13.9 8.1***
Total 206a 16.1 7.8aSome values missing.SQLS = schizophrenia quality of life scale.SD = standard deviation.***P < 0.001.

Eastern Mediterranean Health Journal, Vol. 11, Nos 5/6, 2005 903
�ملجلة �لصحية لشرL �ملتوسط، منظمة �لصحة �لعاملية، �ملجلد �حلا�E عشر، �لعد��� ٥-٦، ٢٠٠٥
individuals with schizophrenia are more likely to remain in the community with their families, which helps protect them from becoming socially isolated. There is a great deal of evidence for the better psychosocial adaptation and outcome of schizophrenia in Saudi Arabia and Algeria [13,14].
Despite the limited resources in terms of care in our set-up, the relatively high propor-tion of patients who perceived their quality of life as good or fair can only be explained by the psychosocial support our patients obtain from relatives. It is interesting to note that none of our patients was home-less, and a reasonable percentage of them was married and employed. To our surprise we did not find a relationship between sex, marital status and quality of life but this could be explained by the small sample size. Salokangas et al. studied the associa-tion of sex and marital status with quality of life and found that the quality of life of single men was poorer than others in almost all the areas in which it was measured [15]. Differences between single women and married men or women were much smaller. Women, independent of their marital status, were more satisfied with their life, had more close relationships and had more often done useful work than men [15].
Our findings of a positive association between the level of distress as measured by the SRQ-24 and poor of quality of life is consistent with the findings of Ritsner
et al., who found that improved quality of life of patients with schizophrenia was related to reduction of distress and of paranoid symptoms [16]. Our findings regarding employment are also consistent with the findings of Bryson, Lysaker and Bell who reported a positive association between amount of participation in paid work activity and improvement in quality of life [17]. In studies investigating predic-tors of subjective quality of life in severely mentally ill persons, the results have mostly shown weak associations between sociode-mographic characteristics and subjectively reported indicators of satisfaction [18]. Our findings regarding the association between psychopathology and quality of life supports the results of cross-sectional investigations of the relationship between psychopathology and subjective quality of life, especially concerning depressed mood and anxiety [19–21].
Finally, we believe that a collaborative effort is needed by the countries of the Region to evaluate the quality of life of patients with severe mental illness, and it would be of great interest to find out the impact of management programmes on the quality of life of these patients. We admit that our sample was relatively small to make valid generalizations, but our findings warrant further investigation by multiple centres and under the close supervision of the World Health Organization.
1. Orley J, Saxena S, Herrman H. Quality of life and mental illness: reflections from the perspective of the WHOQOL. British journal of psychiatry, 1998, 172:291–3.
2. Gill TM, Feinstein AR. A critical appraisal of the quality of life measurements. Jour-nal of the American Medical Association, 1994, 272(8):619–26.
3. The World Health Organization quality of life assessment (WHOQOL): position paper from the World Health Organiza-tion. Social science and medicine, 1995, 41(10):1403–9.
4. Al-Habeeb T, Daradkeh TK. The qual-ity of life of patients with schizophrenia 1 (Jordan–Saudi Project): the reliability and
References

904 La Revue de Santé de la Méditerranée orientale, Vol. 11, No 5/6, 2005
�ملجلة �لصحية لشرL �ملتوسط، منظمة �لصحة �لعاملية، �ملجلد �حلا�E عشر، �لعد��� ٥-٦، ٢٠٠٥
validity of the modified version of schizo-phrenia quality of life scale (SQLS). Arab journal of psychiatry, 2003, 14(1):10–18.
5. Diagnostic and statistical manual of men-tal disorders, 4th ed. Washington DC, American Psychiatric Association, 1994.
6. Harding TW et al. Mental disorders in primary health care: a study of their fre-quency and diagnosis in four developing countries. Psychological medicine, 1980, 10:231–41.
7. Ware YE, Snow KR, Kosinski M. SF-36 health survey: manual and interpretation guide. Boston, Massachusetts, New Eng-land Medical Center, 1993.
8. Barry MM, Zissi A. Quality of life as an outcome measure in evaluating mental health services: a review of the empirical evidence. Social psychiatry and psychiat-ric epidemiology, 1997, 32:38–47.
9. Sartorius N, Gulbinat W, Harrison G. Long term follow up of schizophrenia in 16 countries: a description of the interna-tional study of schizophrenia conducted by the World Health Organization. Social psychiatry and psychiatric epidemiology, 31(5):249–58.
10. World Health Organization. Schizophre-nia: an international follow up study. Chichester, England, John Wiley, 1979.
11. Al Assra A, Amin H. Hospital admission in a psychiatric division in Saudi Arabia. Saudi medical journal, 1988 9:25–33.
12. Warmer R. Recovery from schizophrenia: psychiatry and political economy, 2nd ed. London, Routledge, 1994.
13. El Gaaly A. Outpatients in Canada and Saudi Arabia: a comparison of two clinic
samples. Egyptian journal of psychiatry, 1985, 7:99–106.
14. Robert P et al. Course of psychosis in Algeria and France: about 342 cases ob-served from 1975 to 1985. Psychopathol-ogy, 1989, 22(6):301–8.
15. Salokangas PlC, et al. To be or not to be married—that is the question of quality of life in men with schizophrenia. Social psychiatry and psychiatric epidemiology, 2001, 36(8):381–90.
16. Ritsner M et al. Predictors of quality of life in major psychoses: a naturalistic follow-up study. Journal of clinical psychiatry, 2003, 64(3):308–15.
17. Bryson G, Lysaker P, Bell M. Quality of life benefits of paid work activity in schizo-phrenia. Schizophrenia bulletin, 2002, 28(2):249–57.
18. Bobes J, Gonzàles MIP. Quality of life in schizophrenia. In: Katschnig H, Free-man H, Sartorius N, eds. Quality of life in mental disorders. New York, John Wiley & Sons, 1997:165–78.
19. Browne S et al. Quality of life in schizo-phrenia: relationship to sociodemographic factors, symptomatology and tardive dys-kinesia. Acta psychiatrica scandinavica, 1996, 94(2):118–24.
20. Corrigan PW, Buican B. The construct validity of subjective quality of life for the severly mentally ill. Journal of nervous and mental disease, 1995, 183(5):281–5.
21. Dickerson FB, Ringel NB, Parente F. Sub-jective quality of life in out-patients with schizophrenia: clinical and utilization cor-relates. Acta psychiatrica scandinavica, 1998, 98(2):124–7.
�ملجلة �لصحية لشرL �ملتوسط، منظمة �لصحة �لعاملية، �ملجلد �حلا�E عشر، �لعد��� ٥-٦، ٢٠٠٥
Eastern Mediterranean Health Journal, Vol. 11, Nos 5/6, 2005 905
Patient satisfaction and related factors in Kerman hospitalsA. Bahrampour1 and F. Zolala1
1Department of Biostatistics and Epidemiology, School of Health, Kerman University of Medical Sciences, Kerman, Islamic Republic of Iran (Correspondence to A. Bahrampour: [email protected])Received: 15/04/04; accepted: 25/07/04
ABSTRACT To determine the level of patient satisfaction in hospitals in Kerman and to determine the factors affecting satisfaction, we did an analytic cross-sectional study on 3017 patients from March 2002 to March 2003. We used a 4-part questionnaire covering demographics, satisfaction, patients’ needs and mental health status. Just over 50% of the patients were female. Mean age was 37.4 years (range 1–99 years). Just under 50% of patients were satisfied. There was a significant relationship between satisfaction and type of hospital (P < 0.001), ward (P < 0.006), education level (P < 0.004), history of hospitalization (P < 0.001), need for medical services (P < 0.001), health status (P < 0.001) and dura-tion of hospitalization (P < 0.002).
Satisfaction des patients et facteurs secondaires dans les hôpitaux de KermanRÉSUMÉ Afin de déterminer le niveau de satisfaction des patients dans les hôpitaux à Kerman et les facteurs qui affectent cette satisfaction, nous avons réalisé une étude transversale analytique sur 3017 patients de mars 2002 à mars 2003. Nous avons utilisé un questionnaire en 4 parties couvrant la démographie, la satisfaction, les besoins des patients et l’état de santé mentale. Un peu plus de 50 % des patients étaient des femmes. L’âge moyen était de 37,4 ans (extrêmes : 1-99 ans). Un peu plusde 50 % des patients se déclaraient satisfaits. Il y avait une relation significative entre la satisfaction et le type d’hôpital (p < 0,001), le service d’hospitalisation (p < 0,006), le niveau d’instruction (p < 0,004), les antécédents d’hospitalisation (p < 0,001), le besoin de services médicaux (p < 0,001), l’état de santé (p < 0,001) et la durée de l’hospitalisation (p < 0,002).
�ملجلة �لصحية لشرL �ملتوسط، منظمة �لصحة �لعاملية، �ملجلد �حلا�E عشر، �لعد��� ٥-٦، ٢٠٠٥
906 La Revue de Santé de la Méditerranée orientale, Vol. 11, No 5/6, 2005
Introduction
In recent decades, determining the level of patient satisfaction has been found to be the most useful tool for getting patients’ views on how to provide care. This is based on 2 major principles: patients are the best source of information on quality and quantity of medical services provided and patients’ views are determining factors in planning and evaluating satisfaction.
Donabedian [1] has argued that client satisfaction is of fundamental importance as a measure of the quality of care because it gives information on the provider’s success in meeting client values and expectations, matters on which the client is the ultimate authority. The measurement of satisfaction is, therefore, an important tool for research, administration and planning [2]. Client sa-tisfaction is a crucial index for determining the quality of services and the way in which they are provided by medical staff [3].
Many studies have been done through-out the world to achieve these aims. The results of a study done by Demir and Celik in Turkey indicated that satisfaction with physicians, nurses, equipment and food services were the main determinants of overall satisfaction in hospitalized patients. The type of clinic in which the patients were managed was also important [4]. Jaipaul and Rosenthal found that level of satisfac-tion increased with age and then declined. Satisfaction was also greater in patients who reported they had better health [5].
In a study done by Weisman et al. in the United States of America, patient satisfaction was related to different factors for males and females [6]. Women’s overall satisfaction was more dependent than men’s on information content and continuity of care; men’s overall satisfaction was more dependent on the personal interest shown in them by providers [6].
In an Iranian survey done by Ayatollahi et al., satisfaction level of patients who were treated by male doctors was greater than in the group who were treated by female doctors and level of satisfaction increased as age increased. There was an inverse re-lationship between patient satisfaction and education. Speciality was also important: the highest satisfaction level was in patients treated by paediatricians and the lowest for dermatologists. General health condition had a positive relationship with satisfaction [3].
One of the most important problems in health system in the Islamic Republic of Iran is patient satisfaction. Despite high expenditure and adequate facilities, we have observed that patients are often not satisfied. It is crucial that the health system provides services suitable for patients and which satisfy them because they are the main cli-ents. As can be seen, level of satisfaction is associated with a number of factors, which may differ in different societies. This plays an important role in determining principles for planning and management.
The aim of this study was to establish the determining factors for patient satisfac-tion taking into account the above factors, which are of importance in planning, ma-naging and evaluating. This is the first such study done in this field in Kerman, which is the second largest province in the Islamic Republic of Iran, area 18.2 m2, population just over 2 million (1966 census).
Methods
The target population was patients who were hospitalized in Kerman province from March 2002 to March 2003. There are 2 types of hospital in Kerman province, the teaching hospitals (government hospitals), which are managed by the medical univer-
�ملجلة �لصحية لشرL �ملتوسط، منظمة �لصحة �لعاملية، �ملجلد �حلا�E عشر، �لعد��� ٥-٦، ٢٠٠٥
Eastern Mediterranean Health Journal, Vol. 11, Nos 5/6, 2005 907
sity, and non-teaching (private and social security) hospitals. The sample population was selected by systematic random sam-pling. From a pilot study, sample size was determined as 3017. The method of sam-pling was proportional cluster sampling. All 7 hospitals were selected for the first cluster and different wards in each hospital were selected as the second cluster. Sample size in each cluster was determined accor-ding to the proportion of hospitalized pa-tients in different wards. We selected every 2nd patient until the required sample size was met.
The participants were interviewed in the hospital when they were being discharged. The questionnaires were completed by the interviewer. Interviews were carried out on all days other than Fridays. If a patient who was selected refused to participate or was unable to answer the questions, the next person on the hospital registration form was selected as a replacement. There were just under 50 refusals. For children < 10 years old, parents answered the questions.
The questionnaire was developed by Ayatollahi and was in 4 parts: demographic characteristics; rate of patient needs to medical services; satisfaction (including behaviour of staff and doctors, availability of nurses and other services); and mental health status (anxiety, social behaviour and depression) [3].
For the analysis of data, descriptive statistics were used for determining indices, analysis of variance for compa-ring subgroups and logistic regression for determining factors which correlate with satisfaction. In logistic regression we have a binary variable as response and indepen-dent variables, which can be quantitative or qualitative. Using this method, the first vari-able was selected as the reference category and odds ratios were calculated for the other variables. The mathematical form [7] of this model is:
where β0 is the intercept, βi is the coef-ficient of the independent variable, χi is the independent variable and p is the probability of satisfaction.
To produce binary variables related to satisfaction, the mean of the scores was cal-culated for each patient; scores 1 and 2 were classed as unsatisfied and 4 and 5 as satisfied. For scores between 2 and 4, first the median was calculated; scores less than the median were classed as unsatisfied and the rest as satisfied, i.e. half the scores between 2 and 4 were “satisfied” and half “unsatisfied”. We applied the logistic regression and ENTER method for finding determining factors. In the ENTER method, variables are entered in the model one after another as listed and finally the model includes only significant variables. Minitab statistical software was used for data analysis. P < 0.05 was consi-dered significant.
Results
Of the total of 3017 participants, 1562 (51.8%) were females; characteristics of the participants are shown in Table 1. Mean age was 37.4 years, range 1–99 years. We found 49.4% of patients were not satisfied, 49.6% were satisfied; values were missing for 1.0%.
Looking at the significant differences between satisfied and unsatisfied catego-ries, factors such as age and sex were not significant and so were not determining factors (P > 0.05).
We used analysis of variance on original data without grouping, and logistic regres-sion on binary variables. Independent variables were: level of health, sex, job, hospital, insurance, ward, hospitalized

�ملجلة �لصحية لشرL �ملتوسط، منظمة �لصحة �لعاملية، �ملجلد �حلا�E عشر، �لعد��� ٥-٦، ٢٠٠٥
908 La Revue de Santé de la Méditerranée orientale, Vol. 11, No 5/6, 2005
history, hospitalization duration, and rate of medical care, age and education. The dependent variable was satisfaction score, a binary variable. Based on the analysis of variance, all of the independent variables except job were significant (P < 0.001). Logistic regression showed that type of hospital, ward, education, history of hospi-talization, need for medical services, health level and duration of hospitalization were significant (Table 2).
Probability of satisfaction increased with increase in health level, need for medical services, having a history of hospitalization and duration of stay in hospital (P < 0.05) (Table 2). There was no trend in odds ratio for education level but in general this factor had a significant effect (P = 0.004).
The odds ratios for teaching hospitals and the social security hospital were the same but satisfaction was significantly greater in private hospitals (P < 0.001). In gynaecology and orthopaedics wards, the level of satisfaction was greater than in other wards (Table 2).
The logistic equation is:
Y = –1.81 + 0.034x1 + 0.16x2 + 0.39x3 + 0.41x4 + 0.0039x5 + 0.76x6 + 0.508x7 – 0.018x8 + 0.0019x9 – 0.049x10 + 0.311x11
where: Y = satisfaction, x1 = type of hos-pital, x2 = sex, x3 = ward, x4 = duration of hospital stay, x5 = age, x6 = need for medi-cal services, x7 = health level, x8 = educa-tion, x9 = job, x10 = insurance, x11 = history of hospitalization (x6 and x7 were calculated from the scores on the questionnaire).
Discussion
We found no significant relationship be-tween patient satisfaction and sex; this is consistent with the survey of Weisman et al. [6]. Patient satisfaction rose with increasing need for medical services. This could be because patients with greater needs in fact use more medical services. This provides a kind of mental safety for the patients, so they may feel they were treated with more consideration and care. Providing medical equipment can also increase satisfaction, as found in a previous study [8]. We also found that satisfaction rose with increasing patient health level, and this is consistent with the findings of other studies [5,9].
The effect of the age variable on satis-faction was not significant but it showed interesting results. The greatest level of sa-tisfaction was in the group 15–24 years old, then it decreased gradually and increased again in the group who were over 60 years
Table 1 Demographic and other characteristics of participants (n = 3017)
Characteristic Participants (%)
Sex Female 51.8 Male 48.2
Work status Employed 55.3 Unemployed 44.7
Education Illiterate 17.7 < school diploma 30.6 School diploma 36.1 University degree 15.6
Duration of hospitalization (days) < 1 9.5 1–4 76.9 5 13.6
Type of hospital Teaching 74.5 Private or social security 25.5
History of hospitalization 15.0
Insured 98.5
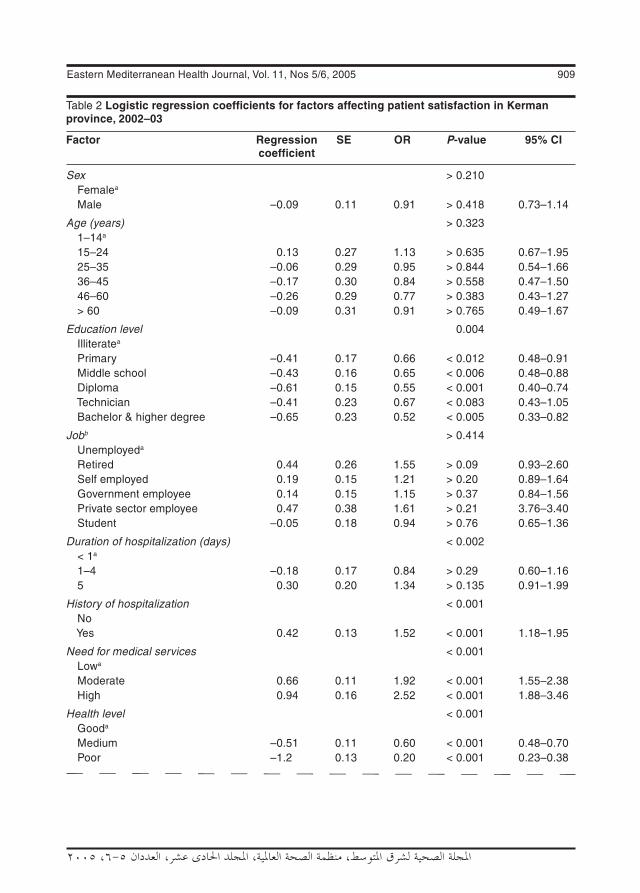
�ملجلة �لصحية لشرL �ملتوسط، منظمة �لصحة �لعاملية، �ملجلد �حلا�E عشر، �لعد��� ٥-٦، ٢٠٠٥
Eastern Mediterranean Health Journal, Vol. 11, Nos 5/6, 2005 909
Table 2 Logistic regression coefficients for factors affecting patient satisfaction in Kerman province, 2002–03
Factor Regression SE OR P-value 95% CI coefficient
Sex > 0.210 Femalea Male –0.09 0.11 0.91 > 0.418 0.73–1.14
Age (years) > 0.323 1–14a 15–24 0.13 0.27 1.13 > 0.635 0.67–1.95 25–35 –0.06 0.29 0.95 > 0.844 0.54–1.66 36–45 –0.17 0.30 0.84 > 0.558 0.47–1.50 46–60 –0.26 0.29 0.77 > 0.383 0.43–1.27 > 60 –0.09 0.31 0.91 > 0.765 0.49–1.67
Education level 0.004 Illiteratea Primary –0.41 0.17 0.66 < 0.012 0.48–0.91 Middle school –0.43 0.16 0.65 < 0.006 0.48–0.88 Diploma –0.61 0.15 0.55 < 0.001 0.40–0.74 Technician –0.41 0.23 0.67 < 0.083 0.43–1.05 Bachelor & higher degree –0.65 0.23 0.52 < 0.005 0.33–0.82
Jobb > 0.414 Unemployeda Retired 0.44 0.26 1.55 > 0.09 0.93–2.60 Self employed 0.19 0.15 1.21 > 0.20 0.89–1.64 Government employee 0.14 0.15 1.15 > 0.37 0.84–1.56 Private sector employee 0.47 0.38 1.61 > 0.21 3.76–3.40 Student –0.05 0.18 0.94 > 0.76 0.65–1.36
Duration of hospitalization (days) < 0.002 < 1a 1–4 –0.18 0.17 0.84 > 0.29 0.60–1.16 5 0.30 0.20 1.34 > 0.135 0.91–1.99
History of hospitalization < 0.001 No Yes 0.42 0.13 1.52 < 0.001 1.18–1.95
Need for medical services < 0.001 Lowa Moderate 0.66 0.11 1.92 < 0.001 1.55–2.38 High 0.94 0.16 2.52 < 0.001 1.88–3.46
Health level < 0.001 Gooda Medium –0.51 0.11 0.60 < 0.001 0.48–0.70 Poor –1.2 0.13 0.20 < 0.001 0.23–0.38
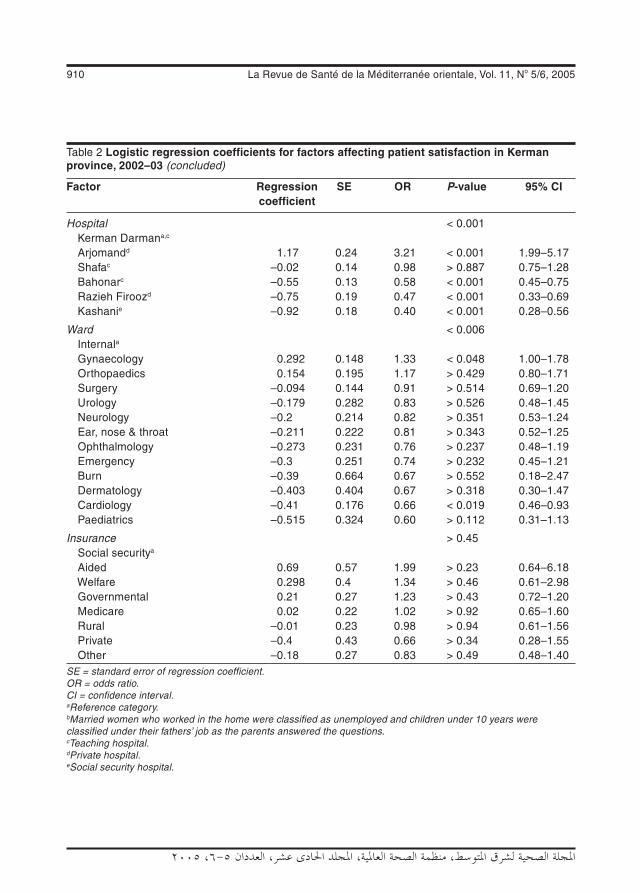
�ملجلة �لصحية لشرL �ملتوسط، منظمة �لصحة �لعاملية، �ملجلد �حلا�E عشر، �لعد��� ٥-٦، ٢٠٠٥
910 La Revue de Santé de la Méditerranée orientale, Vol. 11, No 5/6, 2005
Table 2 Logistic regression coefficients for factors affecting patient satisfaction in Kerman province, 2002–03 (concluded)
Factor Regression SE OR P-value 95% CI coefficient
Hospital < 0.001 Kerman Darmana,c Arjomandd 1.17 0.24 3.21 < 0.001 1.99–5.17 Shafac –0.02 0.14 0.98 > 0.887 0.75–1.28 Bahonarc –0.55 0.13 0.58 < 0.001 0.45–0.75 Razieh Firoozd –0.75 0.19 0.47 < 0.001 0.33–0.69 Kashanie –0.92 0.18 0.40 < 0.001 0.28–0.56
Ward < 0.006 Internala Gynaecology 0.292 0.148 1.33 < 0.048 1.00–1.78 Orthopaedics 0.154 0.195 1.17 > 0.429 0.80–1.71 Surgery –0.094 0.144 0.91 > 0.514 0.69–1.20 Urology –0.179 0.282 0.83 > 0.526 0.48–1.45 Neurology –0.2 0.214 0.82 > 0.351 0.53–1.24 Ear, nose & throat –0.211 0.222 0.81 > 0.343 0.52–1.25 Ophthalmology –0.273 0.231 0.76 > 0.237 0.48–1.19 Emergency –0.3 0.251 0.74 > 0.232 0.45–1.21 Burn –0.39 0.664 0.67 > 0.552 0.18–2.47 Dermatology –0.403 0.404 0.67 > 0.318 0.30–1.47 Cardiology –0.41 0.176 0.66 < 0.019 0.46–0.93 Paediatrics –0.515 0.324 0.60 > 0.112 0.31–1.13
Insurance > 0.45 Social securitya Aided 0.69 0.57 1.99 > 0.23 0.64–6.18 Welfare 0.298 0.4 1.34 > 0.46 0.61–2.98 Governmental 0.21 0.27 1.23 > 0.43 0.72–1.20 Medicare 0.02 0.22 1.02 > 0.92 0.65–1.60 Rural –0.01 0.23 0.98 > 0.94 0.61–1.56 Private –0.4 0.43 0.66 > 0.34 0.28–1.55 Other –0.18 0.27 0.83 > 0.49 0.48–1.40SE = standard error of regression coefficient.OR = odds ratio.CI = confidence interval.aReference category.bMarried women who worked in the home were classified as unemployed and children under 10 years were classified under their fathers’ job as the parents answered the questions.cTeaching hospital.dPrivate hospital.eSocial security hospital.

�ملجلة �لصحية لشرL �ملتوسط، منظمة �لصحة �لعاملية، �ملجلد �حلا�E عشر، �لعد��� ٥-٦، ٢٠٠٥
Eastern Mediterranean Health Journal, Vol. 11, Nos 5/6, 2005 911
old. This means that older people were more satisfied, similar to the findings of Jaipaul and Rosenthal [5].
Level of satisfaction in different types of hospital varied. The greatest level of satisfaction was observed in private hospi-tals and after that in training hospitals. The lowest level of satisfaction was in the social security hospital. These differences may be related to the kind of services provided: crowding, medical services, experience of staff, advanced equipment and better facilities. These results confirmed those of a survey done in Jordan [10].
Level of satisfaction was related to type of ward: satisfaction was greater in gynaecology and orthopaedic wards than other wards. The special circumstances of patients hospitalized in gynaecology wards (delivery and childbirth and being happy with the outcome) could be a factor. In the orthopaedic wards the reason could be related to the longer duration of hos-pitalization (confirmed in the duration of hospitalization variable); patients may have become familiar with the staff and health systems during their stay and also have acquired more knowledge about particular problems that could not be resolved as well as the better facilities and more experienced staff in this ward [11]. Level of satisfaction was significantly related to history of hos-
pitalization and duration of hospitalization, and increased with both. Patients may have become familiar with the health system and medical staff and so felt less scared than if they were in a new and strange place. This factor has not been studied in previous research.
In our study, education was a deter-mining factor in level of satisfaction (the highest satisfaction score was for those who were illiterate and the lowest for those with a university degree) but there was no trend in the odds ratio. In a study done by Ayatollahi et al., level of education was inversely correlated with satisfaction. In general, we found that patient satisfaction was more related to treatment and disease factors than demographic factors such as age, sex, and job.
In this study we had some restrictions. In the paediatric wards, parents were questioned instead of their children. The questionnaire was filled when the patients were discharged so patients who died in hospital were not included in the sample. Patients who were in intensive care could not answer the questions.
We recommend that more studies be done in this field in other provinces and countries to compare with the results of this study.
References
1. Donabedian A. The definition of quality and approaches to its assessment. Ann Arbor, Michigan, Health Administration Press, 1980.
2. Avis M, Bond M, Arthur A. Satisfying solu-tion? A review of some unresolved issues in the measurement of patient satisfac-tion. Journal of advanced nursing, 1995, 22(2):316–22.
3. Ayatollahi SMT et al. Patient satisfaction from their consultant physicians in Shiraz. Journal of Kerman University of Medical Sciences, 1999, 6(3):149–56.
4. Demir C, Celik Y. Determinants of patient satisfaction in a military teaching hospital. Journal of healthcare quality, 2002, 24(2):30–4.

�ملجلة �لصحية لشرL �ملتوسط، منظمة �لصحة �لعاملية، �ملجلد �حلا�E عشر، �لعد��� ٥-٦، ٢٠٠٥
912 La Revue de Santé de la Méditerranée orientale, Vol. 11, No 5/6, 2005
5. Jaipaul CK, Rosenthal GE. Are older patients more satisfied with hospital care than younger patients? Journal of general internal medicine, 2003, 18(1):23–30.
6. Weisman CS et al. Gender and patient satisfaction in managed care plans: analysis of the 1999 HEDIS/CAHPS 2 OH adult survey. Women’s health issues, 2001, 11(5):401–15.
7. Kleinbaum DG et al. Applied regression analysis and multivariable methods, 3rd ed. Pacific Grove, California, Duxbury Press, 1994: 656–86.
8. Andaleeb SS. Service quality percep-tions and patient satisfaction: a study of
hospitals in a developing country. Social science medicine, 2001, 52(9):1359–70.
9. Pickett SA et al. Factors predicting pa-tients’ satisfaction with managed mental health care. Psychiatric services, 1995, 46(7):722–3.
10. Mawajdeh SM et al. Patient expectation and satisfaction in different hospitals in Ir-bid, Jordan. Saudi medical journal, 2001, 22(7):625–9.
11. Meng YY et al. Satisfaction with access to and quality of health care among Medi-care enrollees in a health maintenance or-ganization. Western journal of medicine, 1997, 166(4):242–7.
Establishment of the Palestinian Medical JournalThe Human Resources Development of the Ministry of Health in Pa-lestine has recently launched the Palestinian Medical Journal. The first issue can be accessed at: http://www.moh.gov.ps/pmj/We welcome this new journal and congratulate all those who have contributed to its establishment. We wish it every success.

�ملجلة �لصحية لشرL �ملتوسط، منظمة �لصحة �لعاملية، �ملجلد �حلا�E عشر، �لعد��� ٥-٦، ٢٠٠٥
Eastern Mediterranean Health Journal, Vol. 11, Nos 5/6, 2005 913
Patient satisfaction with dental services at Ajman University, United Arab EmiratesR. Hashim1
1Department of Dental Public Health, Ajman University, Ajman, United Arab Emirates (Correspondence to R. Hashim: [email protected]).Received: 06/01/04; accepted: 01/06/04
ABSTRACT To provide information about the level of patient satisfaction with the dental care provided at the Faculty of Dentistry at Ajman University, 135 randomly selected patients, 50 males and 85 fe-males, were surveyed. A questionnaire was used to collect data on personal details and information regarding current visit and use of the dental service. Most patients were Arabs; a minority were Indian. Most were satisfied with the care provided except for explanation of treatment options and the remote-ness of the clinic. Measuring level of satisfaction is an important factor towards improving the service provided and should be monitored regularly.
La satisfaction des patients à l’égard des services dentaires à l’Université d’Ajman (Émirats arabes unis)RÉSUMÉ Afin d’obtenir des informations sur le niveau de satisfaction des patients à l’égard des soins dentaires dispensés à la Faculté de Dentisterie de l’Université d’Ajman, une enquête a été menée au-près de 135 patients choisis au hasard, dont 50 hommes et 85 femmes. Un questionnaire a été utilisé pour recueillir des données personnelles les concernant et des informations concernant la consulta-tion alors effectuée et l’utilisation des services dentaires. La plupart des patients étaient Arabes, une minorité étant Indiens. La majorité des patients étaient satisfaits des prestations fournies sauf pour l’explication des options de traitement et l’éloignement du service de consultations. La mesure du niveau de satisfaction est un facteur important pour améliorer la prestation des services et devrait être suivie régulièrement.
�ملجلة �لصحية لشرL �ملتوسط، منظمة �لصحة �لعاملية، �ملجلد �حلا�E عشر، �لعد��� ٥-٦، ٢٠٠٥
914 La Revue de Santé de la Méditerranée orientale, Vol. 11, No 5/6, 2005
Introduction
Ajman University, the only university in the Emirate of Ajman, has a history of more than 12 years teaching faculties such as en-gineering, computer science, business and pharmacy. In 1997, the Faculty of Dentistry was established as the first dental school in the United Arab Emirates. Dental services commenced from mid-September 2000.
The cost of the dental services is hea-vily subsidized by the university. Dental appointments are always fully booked and the usual waiting time to get an appointment for treatment depends on each patient’s case and on the student schedule for the clinics. Patients with acute problems can, however, make an emergency appointment and are seen on the same day.
Although the university aims at provi-ding a good dental service for its patients and spends a considerable amount of money and human resources, little information on patient satisfaction is available. Patient satisfaction with dental care is an important aspect of the quality of care [1], and will in-fluence the future utilization of the service. It is, therefore, an essential element in as-sessing the quality of care. A major issue for careful monitoring of consumer satisfaction is recognition of the complex relationship between patients’ views of the health care system and their health and illness behav-iour [2]. Dentist–patient interactions during a consultation, including cognitive and emotional aspects, have been demonstrated to affect patient compliance with clinical advice and follow-up visits.
Over the past 10 years, consumer satis-faction has gained widespread recognition as a measure of quality in many public sec-tor services. Satisfaction is the fulfilment of desire or need. Pascoe defined patient satis-faction as a health care recipient’s reaction to salient aspects of the context, process,
and result of their service experience [3]. The consumer is the central figure of ac-countability in public services. If a patient is to be adequately served, then he or she must have a voice in the process of care.
While measures of satisfaction with medical care are abundant, only a small number of dental satisfaction question-naires have been reported in the literature. Ware and Snyder [4] devised a patient satisfaction questionnaire for measuring satisfaction with medical care. The dental satisfaction questionnaire of Davies and Ware [5] was adapted from this by chan-ging item references from medical to dental and adding pain management items. It has the advantage of having a manageable number of items (19) over a broader range of subscales than other dental satisfac-tion questionnaires, and is measured on a 5-point Likert scale.
If satisfaction influences compliance, and better compliance means healthier (and less costly) patients in the long term, then perhaps the most effective way to improve compliance for younger patients is to increase their general satisfaction with the dental practice [6].
Because of the importance of these relations for obtaining patient feedback on dental services, this survey to evaluate patient satisfaction was conducted at the Dental Faculty of Ajman University.
Methods
The Davies and Ware questionnaire was considered to have items useful for the current study (pain management was not considered in this study). Accordingly, items were adapted from that instrument and used in combination with the 5-item Dental Satisfaction Scale developed for use in Australia [7].
�ملجلة �لصحية لشرL �ملتوسط، منظمة �لصحة �لعاملية، �ملجلد �حلا�E عشر، �لعد��� ٥-٦، ٢٠٠٥
Eastern Mediterranean Health Journal, Vol. 11, Nos 5/6, 2005 915
The questionnaire was designed in English and translated into Arabic and then translated back into English to ensure that the meaning of the questions stayed the same.
A pilot study was conducted on 16 patients to pre-test the data collection me-thods and the questionnaire. The participants were invited to complete a questionnaire and their opinion about the wording of that version was requested. The questionnaire appeared to be easily understood and was finalized with no changes.
As this was the first survey conducted at the university to measure level of patient satisfaction, it was decided to select at least 50% of the patients over the study period. A total of 151 patients were randomly selected from all (282) patients who had undergone care at the female dental student clinic in the Faculty of Dentistry in March 2003. Randomization was done using a computer program. Only 6 patients refused to partici-pate. Ajman University has 2 separate sec-tions, 1 for female students only, the other for male students, both sections getting their patients from the same source. The patients were distributed randomly according to the student availability.
The patients were invited to complete a questionnaire that required them to supply personal details and information regarding their current visit and use of the dental ser-vice. The items on the questionnaire were mainly categorized under 3 dimensions: ac-cess, the physical process of arranging for and getting to dental care; convenience, the location of clinics; and quality, defined as how good the care is, both in term of techni-cal and interpersonal aspects of the process. Cost of treatment was not considered as the treatment in our faculty is heavily subsi-dized by the university. Naturally, all our patients were expected to be satisfied with this item.
The questionnaire contained a list of 9 statements about various aspects of dental care and the participants were asked to indicate their degree of agreement with the statements on a 5-point Likert scale (strongly agree; agree; neutral; disagree; strongly disagree). This scaling method has been employed in other surveys [8,9] and has the advantage of being relatively easy for respondents to complete. The questions were randomly arranged and asked in either a positive or negative way to minimize the inertia response given by the respondents. The answers to the questions given a nega-tive slant were reversed by receding during analysis so the direction of all responses was the same. For young patients, their caregivers were asked to fill in the form, and for patients who were illiterate, dental students assisted in filling in the forms.
Questionnaires were not marked in any way that might permit identification of the patient. Questions were scored 1–5. The responses were coded and data were transferred to the computer for analysis using SPSS. Following the computation of the initial descriptive statistics, bivariate associations were examined using analysis of variance and chi-squared tests. Factor analysis was used to confirm the factor structure of the dental satisfaction scales. Patients with missing responses for a given question were excluded from that category in the data analysis.
Results
Questionnaires were distributed to 151 patients, and responses were received from 135 (response rate 89.4%), of whom 50 were male (Table 1). The age range was be-tween 11 and just over 60 years. A sizeable proportion (40.7%) had university level education and only 8.1% were illiterate.

�ملجلة �لصحية لشرL �ملتوسط، منظمة �لصحة �لعاملية، �ملجلد �حلا�E عشر، �لعد��� ٥-٦، ٢٠٠٥
916 La Revue de Santé de la Méditerranée orientale, Vol. 11, No 5/6, 2005
Most of the patients (65.9%) were non-Emirati Arabs.
The major reason for admission (80.0%) was relief of pain (Table 2). A high propor-tion of the patients (83.0%) visited the dentist only when they had a problem: just 7.4% came twice a year. The largest category for treatment received (23.0%) was operative treatment, followed by en-dodontic (19.3%).
There was a statistically significant association between the level of education and the dental satisfaction scale. The most highly educated patients were the least sa-tisfied with the treatment provided (Table
1). Patients who visited the clinic for pain relief were significantly more satisfied than those who visited the clinic for routine care (P < 0.01) (Table 2). The dental satisfaction levels were also significantly higher among patients who visited the clinic only when they had problems (P < 0.05).
Table 1 Dental satisfaction scale score according to sociodemographic characteristics
Characteristic No. % Mean dental (n = 135) satisfaction score (SD)
Sex Male 50 37.0 18.4 (3.4) Female 85 63.0 19.0 (3.5)
Age (years) 11–20 25 18.5 19.4 (2.8) 21–30 36 26.7 18.0 (3.6) 31–40 41 30.4 19.2 (3.8) 41–50 23 17.0 18.4 (3.6) 51–60 8 5.9 18.4 (2.5) > 60 2 1.5 22.0 (1.4)
Education Illiterate 11 8.1 20.5 (2.5)a
Primary school 29 21.5 19.4 (2.7) High school 40 29.6 20.0 (3.7) University 55 40.7 17.3 (3.3)
Nationality Emirati 15 11.1 18.0 (2.5) Non-Emirati Arab nationals 89 65.9 19.0 (3.6) Indian 9 6.7 18.8 (3.3) Other 22 16.3 18.4 (3.5)SD = standard deviation.aP < 0.01; one-way analysis of variance.
Table 2 Dental satisfaction scale score by type of patient, frequency of dental visit and type of treatment received
Variable No. % Mean dental (n = 135) satisfaction score (SD)
Type of carea Routine care 26 19.3 18.0 (4.0) Relief of pain 108 80.0 19.0 (3.3)
Frequency of dental visitb Twice a year 10 7.4 18.0 (2.3) Once a year 11 8.1 6.2 (2.7) Every 2 years 2 1.5 17.5 (2.1) Only when having a problem 112 83.0 19.2 (3.5)
Type of treatment receivedc Surgery 20 14.8 19.3 (3.5) Prosthodontic 24 17.8 17.2 (3.7) Orthodontic 5 3.7 20.4 (2.9) Periodontal 21 15.6 18.3 (3.5) Endodontic 26 19.3 18.0 (3.5) Operative 31 23.0 20.0 (3.2) Paedodontic 8 5.9 20.0 (1.5)SD = standard deviation.aSignificant at P < 0.01; one-way analysis of variance.bSignificant at P < 0.05; one-way analysis of variance (least significant difference): scores for those who visited the dentist only when they had a problem differed significantly from those who visited the dentist once a year.cSignificant at P < 0.05; one-way analysis of variance (least significant difference): those who received surgical treatment differed from those having prosthodontic and orthodontic treatment; and those who received endodontic treatment differed from those who received operative treatment, but the difference was not statistically significant. Those who received prosthodontic treatment were the least satisfied.

�ملجلة �لصحية لشرL �ملتوسط، منظمة �لصحة �لعاملية، �ملجلد �حلا�E عشر، �لعد��� ٥-٦، ٢٠٠٥
Eastern Mediterranean Health Journal, Vol. 11, Nos 5/6, 2005 917
Table 3 shows descriptive statistics of the dimensions of dental satisfaction with the university dental service. The dimen-sion on quality was split into interpersonal and technical aspects of the care process. Most of the patients were satisfied with the service provided except for dental care could be better (25.9%), explanation for treatment options (37.0%) and remoteness of the clinic (57.0%). Most participants agreed that the clinic is located too far from the city centre.
Discussion
Evaluation of the quality of health care has emerged as a key issue for all health ser-vices, and for some time it has been recog-nized that the patients’ views are an essen-tial component of such evaluations [10,11]. Patients can participate in the evaluation of quality of oral health care in 3 ways: by defining what is desirable or undesirable
(i.e. setting standards of care); by providing information that permits others to evalu-ate the quality of care; and by expressing satisfaction or dissatisfaction with care. In the present study, the patients’ contribution was in providing information and expres-sing satisfaction or dissatisfaction with oral health care.
Since the present study aimed to evaluate patient satisfaction and identify the major problems of the dental services, a response from 135 of the 151 patients selected was considered to be adequate.
It should be noted that the results of this survey are valid only for the group of patients participating in this study and not for the entire dental patient population of the United Arab Emirates. To maximize participation rate, the questionnaires were collected during patient treatment, but prior to the finalization of that treatment. It should be noted, however, that the results might have varied if the responses had been
Table 3 Respondents answering positively in the dental satisfaction questionnaire
Questionnaire item Positive response Content category(abbreviated) No. %a
Dentist explained the treatment needed well 127 94.1 Quality (interpersonal)
Dentist did not explain treatment options clearly 50 37.0 Quality (interpersonal)
Dentist treated patient with respect 113 83.7 Quality (interpersonal)
Receptionist courteous and professional 115 85.2 Quality (interpersonal)
Did not wait long in waiting room 101 74.8 Access
Dental clinic clean and tidy 124 91.9 Quality (technical)
Satisfied with dental care received 125 92.6 General satisfaction
Dental care could be better 35 25.9 General satisfaction
Dental clinic too far away 77 57.0 ConvenienceaThe answers for all items were recoded so that a higher percentage indicates higher dental satisfaction.

�ملجلة �لصحية لشرL �ملتوسط، منظمة �لصحة �لعاملية، �ملجلد �حلا�E عشر، �لعد��� ٥-٦، ٢٠٠٥
918 La Revue de Santé de la Méditerranée orientale, Vol. 11, No 5/6, 2005
collected at the end rather than during the treatment [10].
In addition, the assistance provided by our students to illiterate patients could have biased the results, but those patients were included in this study to get comprehensive responses from the randomly selected patients.
In previous studies, the effect of sociodemographic characteristics of the patients on satisfaction with general dental care has been unclear. Some reports pointed to a direct effect of sex [12–14] and age [12,14]. Others failed to show such associa-tions [13,15]. In this study, also, no signifi-cant differences were observed between the satisfaction score and background variables (sex and age) of the patients. The only significant finding observed for the dental satisfaction scale was in relation to educa-tion level; the more highly educated patients were less satisfied with the care provided. It is possible that the more-educated patients had higher expectations of the service, whereas the less-educated patients might have appreciated getting any dental care. This finding is not consistent with that of another study where it was shown that highly educated people are more satisfied than those with a lower level of education [16].
Some previous reports have shown a re-lationship between patient satisfaction and ethnicity [17,18]. Black patients tended to be the least satisfied; Hispanic patients were only moderately satisfied when compared to non-Hispanic patients. In the current study, no association was found between nationa-lity and level of patient satisfaction, so this is probably not a valid predictor of patient satisfaction.
We found that patients who visited the dentist only when having a problem tended to be more satisfied than those who visited the dentist regularly. This may be because
those patients with problems get immediate relief after treatment compared to those who come for a check-up only. Goedhart, Eijkman and ter Horst [19] and Tuominen and Tuominen [15] declared that for a sig-nificant number of patients, the ultimate goal of the treatment is “the cure.” The rest of the steps in the process contributing to this result appear to be disregarded by these patients. Thus, they prefer to see the end result to express their (dis)satisfaction, ignoring the efforts of oral diagnosticians and radiologists, and any other dental per-sonnel along the way.
In Ajman University, the dental clinics for female dental students are separated from the ones for male students, mainly for cultural reasons, although female dentists can treat both sexes. This survey was per-formed in the female dental student clinic. This might have influenced the patients to give more positive responses. Douglas, Reisine and Cipes reported that the patients responded more positively to female den-tists than to male dentists, even when they assumed non-interactive behaviour [20].
Most of the patients who participated in this study were dissatisfied with the expla-nation of treatment options received and the remoteness of the clinic. The importance of interpersonal factors for dental patient satisfaction was supported by Murtomaa and Masalin in a study in Finland [21], and by Strauss et al. in the United States of America [22]. The latter reported that the 2 issues cited by patients as most important in evaluating dental care were the dentist’s awareness of discomfort, and explanation of treatment. Similarly, Kress and Silversin found interpersonal factors (personality and communication) to be the most frequently cited by their focus groups as important to satisfaction with dental care [23]. Providing the patient with further explanation of their treatment options should be highlighted to
�ملجلة �لصحية لشرL �ملتوسط، منظمة �لصحة �لعاملية، �ملجلد �حلا�E عشر، �لعد��� ٥-٦، ٢٠٠٥
Eastern Mediterranean Health Journal, Vol. 11, Nos 5/6, 2005 919
our students to achieve high level of satis-faction with service provided.
The patients were satisfied with techni-cal aspects of the treatment, a criterion that is met fairly often in real practice [24]. It has been reported that patients prefer a caring and pleasant dentist to a skilled one alone [25]. Some patients may have difficulty evaluating the technical quality of the dental service they had received, and would base their judgment on other factors, such as physical settings and the ability to solve problems [26].
The dental care delivery system in our faculty is based on scheduled appointments, and dental interns carry out dental treatment under the supervision of experienced clini-cians. These factors probably lengthen the treatment period compared to the patient’s expectations. Additionally, as reported by Feine, Awad and Lund, disappointment with treatment assignment could also have negatively affected the mean satisfaction scores [27].
Dental service is a dynamic process between the provider and the recipient, with the goal of improving health [28], and recognition of the complex nature of this relationship by dental health care providers will enable the patients to accept
and comply with the proposed dental care, eventually leading to a successful outcome for both dentists and patients. As long as our patients are unhappy about the explanation of treatment options, the importance of establishing social relationship and verbal communication should be strongly empha-sized to our students. To obtain adequate consumer feedback in a reasonable time, regular surveys monitoring patient satisfac-tion in both male and female faculties are needed to determine the main weakness in the new service provided in Ajman University. Data from such surveys would also help in evaluating the effects of efforts made to improve the service and in monitor-ing changes in satisfaction levels.
Acknowledgements
We are grateful to Dr Saied Salman, presi-dent of Ajman University, for supporting research activities in the Faculty of Den-tistry and to Dr Salem Abu Fanas, Dean of the Dental Faculty of Ajman University. The effort made by Dr Amal Al-Safar in collecting the data is highly appreciated. All participants are thanked for their input.
References
1. Levin R. The correlation between dental practice management and clinical excel-lence. Journal of the American Dental Association, 2004, 135(3):345–6.
2. Schouten BC, Hoogstraten J, Eijkman M. Patient participation during dental consultations: the influence of patient’s characteristics and dentists’ behaviour. Community dentistry and oral epidemiol-ogy, 2003, 31(5):368–77.
3. Pascoe GC. Patient satisfaction in pri-mary health care: a literature review and
analysis. Evaluation and program plan-ning, 1983, 6(3–4):185–210.
4. Ware JE, Snyder MK. Dimensions of patient attitudes regarding doctors and medical care services. Medical care, 1975, 13(8):669–82.
5. Davies AR, Ware JE. Measuring patient satisfaction with dental care. Social sci-ence & medicine, 1981, 15(6):751–60.
6. Skaret E et al. Reliability and validity of the dental satisfaction questionnaire in

�ملجلة �لصحية لشرL �ملتوسط، منظمة �لصحة �لعاملية، �ملجلد �حلا�E عشر، �لعد��� ٥-٦، ٢٠٠٥
920 La Revue de Santé de la Méditerranée orientale, Vol. 11, No 5/6, 2005
a population of 23-year-olds in Norway. Community dentistry and oral epidemiol-ogy, 2004, 23(2):25–30.
7. Australian Institute of Health and Welfare Dental Statistics and Research Unit. Den-tal satisfaction survey 1994. Adelaide, Australia, University of Adelaide, 1995.
8. Ware JE et al. Defining and measuring patient satisfaction with medical care. Evaluation and program planning, 1983, 6(3–4):247–63.
9. Hulka BS et al. Scale for the measure-ment of attitudes towards physicians and primary medical care. Medical care, 1970, 8:429–35.
10. Gurdal P et al. Factors of patient satisfaction/dissatisfaction in a dental faculty outpatient clinic in Turkey. Com-munity dentistry and oral epidemiology, 2000, 28(6):461–9.
11. Lahti S et al. Comparison of ideal and actual behavior of patients and dentists during dental treatment. Community den-tistry and oral epidemiology, 1995, 23(6):374–8.
12. Newsome PRH, Wright GH. A review of patient satisfaction: 2. Dental patient satisfaction: an appraisal of recent litera-ture. British dental journal, 1999, 186(4):166–70.
13. Awad MA, Feine JS. Measuring patient satisfaction with mandibular prostheses. Community dentistry and oral epidemiol-ogy, 1998, 26(6):400–5.
14. Lahti S et al. Patients’ expectations of an ideal dentist and their views concern-ing the dentist they visited: do the views conform to the expectations and what determines how well they conform? Com-munity dentistry and oral epidemiology, 1996, 24:240–4.
15. Tuominen R, Tuominen M. Satisfaction with dental care among elderly Finnish men. Community dentistry and oral epi-demiology, 1998, 26(2):95–100.
16. Zastowny TR, Roghmann KJ, Hengst A. Satisfaction with medical care: replica-tions and theoretic reevaluation. Medical care, 1983, 21:294–322.
17. Handelman SL, Fan-Hsu J, Proskin HM. Patient satisfaction in four types of dental practice. Journal of the American Dental Association, 1990, 121(5):624–30.
18. Cleary PD, McNeil BJ. Patient satisfaction as an indicator of quality care. Inquiry, 1988, 25(1):29–36.
19. Goedhart H, Eijkman MAJ, ter Horst G. Quality of dental care: the view of regular attenders. Community dentistry and oral epidemiology, 1996, 24(1):28–31.
20. Douglas H, Reisine ST, Cipes MH. Char-acteristics and satisfaction of patients of male versus female dentists. Journal of the American Dental Association, 1985, 110(6):926–9.
21. Murtomaa H, Masalin K. Public image of dentists and dental visits in Finland. Com-munity dentistry and oral epidemiology, 1982, 10(3):133–5.
22. Strauss RP et al. Patients’ attitudes to-ward quality assurance in dentistry. Jour-nal of the American College of Dentistry, 1980, 47:101–109.
23. Kress GC Jr, Silversin JB. Internal mar-keting and quality assurance through patient feedback. Journal of the American Dental Association, 1985, 110(1):29–34.
24. Blinkhorn AS, Kay EJ. First impressions: Just what do my patients think of me? Dental update, 1999, 26(1):16–20.
25. Newton, T. Involving the ‘consumer’ in the evaluation of dental care: a philosophy in search of data. British dental journal, 2001, 191(12):650–3.
26. Newsome PRH, Wright GH. A review of patient satisfaction: 1. Concepts of satisfaction. British dental journal, 1999, 186(4):161–5.
�ملجلة �لصحية لشرL �ملتوسط، منظمة �لصحة �لعاملية، �ملجلد �حلا�E عشر، �لعد��� ٥-٦، ٢٠٠٥
Eastern Mediterranean Health Journal, Vol. 11, Nos 5/6, 2005 921
27. Feine JS, Awad MA, Lund JP. Rejoinder to Bradley: Patient preferences and clini-cal trial design and interpretation: appre-ciation and critique of a paper by Feine, Awad & Lund. Community dentistry and oral epidemiology, 1999, 27(2):89–92.
28. Freeman R. A psychodynamic under-standing of the dentist-patient interaction. British dental journal, 1999, 186(10):503–6.
Training package for BMJ peer reviewersWe would like to draw our readers’ attention to this very useful training pack on peer review. The material was designed by the British medi-cal journal to help reviewers to learn more about peer review, and to understand what makes a review really useful to editors and authors. The pack includes PowerPoint presentations and written exercises and much of the material relates to the general art of peer review.We hope our readers, whether reviewers or researchers, will find this website both interesting and helpful. It can be accessed at: http://bmj.bmjjournals.com/advice/peer_review/
922 La Revue de Santé de la Méditerranée orientale, Vol. 11, No 5/6, 2005
�ملجلة �لصحية لشرL �ملتوسط، منظمة �لصحة �لعاملية، �ملجلد �حلا�E عشر، �لعد��� ٥-٦، ٢٠٠٥
Compliance with good practice in prescription writing at outpatient clinics in Saudi ArabiaY.M. Irshaid,1 M. Al Homrany,2 A.A. Hamdi,1 K.K. Adjepon-Yamoah1,4 and A.A. Mahfouz3
1Department of Clinical Pharmacology; 2Department of Internal Medicine; 3Department of Family and Community Medicine, College of Medicine, King Khalid University, Abha, Saudi Arabia (Correspondence to Y. Irshaid: [email protected]).4Centre for Tropical Clinical Pharmacology and Therapeutics, University of Ghana Medical School, Accra,Ghana.Received: 15/09/03; accepted: 14/06/04
ABSTRACT A sample of prescription orders received from outpatient departments by a hospital pharmacy in Asir, Saudi Arabia, were analysed over 1 year for the essential elements of prescriptions. The prescriber’s name, address and signature were on 83.3%, 9.6% and 81.9% of prescriptions respecti-vely. The patient’s name, age and sex were on 94.6%, 77.3% and 51.3%. No prescription contained the patient’s address and weight. Generic drug names were used in only 15.1% and strength of medication and dose units were included in 26.6% and 55.6% of prescriptions. Most prescriptions (94.0%) had no quantity indicated and had only partial instructions for patient use (90.7%); the diagnosis was included in about two-thirds. The prescriber’s handwrit-ing was illegible in 64.3% of prescriptions. Measures to improve the situation are suggested.
Respect des bonnes pratiques de rédaction des ordonnances dans les services de consultations externes en Arabie saouditeRÉSUMÉ Un échantillon d’ordonnances reçues en provenance des services de consultations externes par une pharmacie hospitalière à Asir (Arabie saoudite) a été analysé sur une période d’un an en ce qui concerne les éléments essentiels des ordonnances. Le nom, l’adresse et la signature du prescrip-teur se trouvaient sur 83,3 %, 9,6 % et 81,9 % des ordonnances respectivement. Le nom, l'âge et le sexe du patient figuraient sur 94,6 %, 77,3 % et 51,3 %. Aucune ordonnance ne comportait l'adresse et le poids du patient. Les noms de génériques n’étaient utilisés que dans 15,1 % des ordonnances et la concentration des médicaments et les unités de prise n’étaient mentionnées que dans 26,6 % et 55,6 % des ordonnances. La plupart des ordonnances (94,0 %) n’avaient pas d’indications de quan-tité et ne comportaient que des instructions partielles en ce qui concerne l’utilisation par le patient (90,7 %) ; le diagnostic était inclus dans environ deux tiers des ordonnances. L’écriture du prescripteur était illisible dans 64,3 % des ordonnances. Des mesures sont suggérées pour améliorer la situation.

Eastern Mediterranean Health Journal, Vol. 11, Nos 5/6, 2005 923
�ملجلة �لصحية لشرL �ملتوسط، منظمة �لصحة �لعاملية، �ملجلد �حلا�E عشر، �لعد��� ٥-٦، ٢٠٠٥
Introduction
A drug prescription is often the endpoint of a patient’s visit to a medical practitioner. As an instruction from a prescriber to a dis-penser, it is considered to be a medicolegal document that should be written legibly, accurately and completely [1,2]. Prescri-bing physicians as well as those involved in the execution of the prescription hold legal responsibility for the prescription [1–4].
Although the prescription format may vary slightly from one country to another, most countries agree on the core elements that should be included in the prescription order [1–4]. These are: prescriber’s name, address, telephone number and signature; patient’s name, address, age and weight (important at the extremes of age); prescrip-tion date; drug name (preferably generic), formulation, strength, dose, frequency of administration, quantity prescribed, reason for prescribing and instructions for use [1–4]. In Saudi Arabia, all of these require-ments are recommended and are available in local regulations. In addition, the physi-cian is required to stamp the prescription. The stamp usually contains the name, title and address of the physician.
As good quality prescriptions are extremely important for minimizing errors in the dispensing of medications, physi-cians should adhere to the guidelines for prescription writing for the benefit of the patient [5]. Proper documentation of pre-scribing practice allows the identification of acceptable and non-acceptable prescribing habits. Such information is needed to set up continuous medical education programmes to encourage rational prescribing among physicians. It also helps in setting up moni-toring systems to ensure good pre-scribing habits and to maintain them. Health profes-sionals may also utilize this information to develop guidelines for safe and cost-effec-tive prescribing.
The purpose of this study was to screen drug prescriptions written by physicians in outpatient clinics of Asir Central Hospital for the essential elements of prescriptions mentioned above. The results would be used by health officials for health care plan-ning and monitoring at the institution.
Methods
Outpatient prescriptions kept by the phar-macy department at Asir Central Hospital during the period 8 April 2000 until 7 April 2001 were analysed retrospectively. This period was divided into 4 seasons: spring, summer, autumn and winter. Asir Central Hospital is located in Abha city and is the main referral hospital in Asir Region, which has a population of 1.2 million people. It is utilized by the College of Medicine, King Khalid University for training of medical students.
The target of the study was all outpatient prescriptions from within the hospital, irre-spective of the clinic of origin, received by and kept in the pharmacy. In each season prescriptions from one week (5 working days) were sampled systemically by taking every other prescription.
Prescriptions were analysed for the essential elements to be included in the prescription order [1–4] and the data were recorded using a coding key. Compliance with these elements was the degree to which the physician had met the obligation of including all the elements of a prescription in the prescription order. The information written within the prescription was judged “unclear” if one word or the dose unit was not written clearly and “unreadable” if none of the 3 investigators present during the screening session could read it.
Physicians did not know about the study but the local ethics committee at Asir Cen-tral Hospital gave approval.
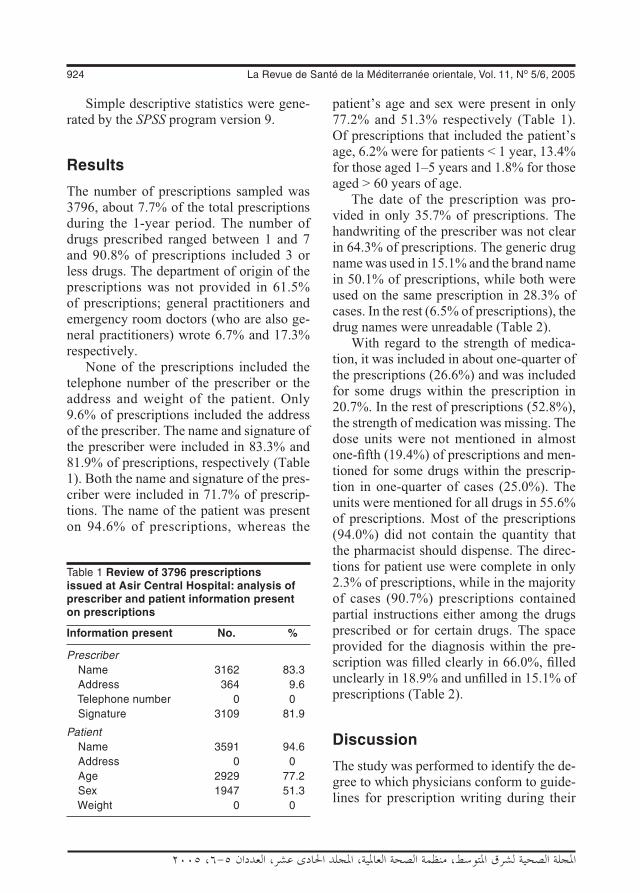
924 La Revue de Santé de la Méditerranée orientale, Vol. 11, No 5/6, 2005
�ملجلة �لصحية لشرL �ملتوسط، منظمة �لصحة �لعاملية، �ملجلد �حلا�E عشر، �لعد��� ٥-٦، ٢٠٠٥
Simple descriptive statistics were gene-rated by the SPSS program version 9.
Results
The number of prescriptions sampled was 3796, about 7.7% of the total prescriptions during the 1-year period. The number of drugs prescribed ranged between 1 and 7 and 90.8% of prescriptions included 3 or less drugs. The department of origin of the prescriptions was not provided in 61.5% of prescriptions; general practitioners and emergency room doctors (who are also ge-neral practitioners) wrote 6.7% and 17.3% respectively.
None of the prescriptions included the telephone number of the prescriber or the address and weight of the patient. Only 9.6% of prescriptions included the address of the prescriber. The name and signature of the prescriber were included in 83.3% and 81.9% of prescriptions, respectively (Table 1). Both the name and signature of the pres-criber were included in 71.7% of prescrip-tions. The name of the patient was present on 94.6% of prescriptions, whereas the
patient’s age and sex were present in only 77.2% and 51.3% respectively (Table 1). Of prescriptions that included the patient’s age, 6.2% were for patients < 1 year, 13.4% for those aged 1–5 years and 1.8% for those aged > 60 years of age.
The date of the prescription was pro-vided in only 35.7% of prescriptions. The handwriting of the prescriber was not clear in 64.3% of prescriptions. The generic drug name was used in 15.1% and the brand name in 50.1% of prescriptions, while both were used on the same prescription in 28.3% of cases. In the rest (6.5% of prescriptions), the drug names were unreadable (Table 2).
With regard to the strength of medica-tion, it was included in about one-quarter of the prescriptions (26.6%) and was included for some drugs within the prescription in 20.7%. In the rest of prescriptions (52.8%), the strength of medication was missing. The dose units were not mentioned in almost one-fifth (19.4%) of prescriptions and men-tioned for some drugs within the prescrip-tion in one-quarter of cases (25.0%). The units were mentioned for all drugs in 55.6% of prescriptions. Most of the prescriptions (94.0%) did not contain the quantity that the pharmacist should dispense. The direc-tions for patient use were complete in only 2.3% of prescriptions, while in the majority of cases (90.7%) prescriptions contained partial instructions either among the drugs prescribed or for certain drugs. The space provided for the diagnosis within the pre-scription was filled clearly in 66.0%, filled unclearly in 18.9% and unfilled in 15.1% of prescriptions (Table 2).
Discussion
The study was performed to identify the de-gree to which physicians conform to guide-lines for prescription writing during their
Table 1 Review of 3796 prescriptions issued at Asir Central Hospital: analysis of prescriber and patient information present on prescriptions
Information present No. %
Prescriber Name 3162 83.3 Address 364 9.6 Telephone number 0 0 Signature 3109 81.9
Patient Name 3591 94.6 Address 0 0 Age 2929 77.2 Sex 1947 51.3 Weight 0 0

Eastern Mediterranean Health Journal, Vol. 11, Nos 5/6, 2005 925
�ملجلة �لصحية لشرL �ملتوسط، منظمة �لصحة �لعاملية، �ملجلد �حلا�E عشر، �لعد��� ٥-٦، ٢٠٠٥
clinical practice. A total of 3796 outpatient prescriptions from a teaching hospital in south-western Saudi Arabia were screened for the essential elements of prescriptions according to published guidelines [1–4]. This is the third study reviewing prescrip-tions from hospital outpatient clinics in Saudi Arabia.
Our observations showed that pres-crip-tions were deficient. None of the prescrip-
tions contained the telephone number of the prescriber and only 9.6% had the prescriber address. These elements should be included according to WHO [1]. However, the hospital does not require that the telephone number and address of the prescriber be included in the prescription. The pharmacy department fills prescriptions coming from within the hospital, where the physician can be reached through the telephone directory or the hospital pager system. Also, in this case, the address might not be relevant be-cause physicians are required to stamp the prescription. The stamp usually contains the name, title and address of physicians. Unfortunately in many cases, the stamp was unclear. Our findings of 16.7% of prescrip-tions deficient in the prescriber name and 18.1% deficient in the prescriber signature are somewhat similar to results from other hospitals in Saudi Arabia. Balbaid and Al-Dawood [6] reported that prescriptions from some Ministry of Health hospitals in Jeddah city were deficient in physician’s name and signature in 14% and 16.3% of cases, respectively. Meyer [5] from a hospital and clinic in Texas mentioned that a survey of outside provider pharma-cies requesting information on problems related to prescriptions indicated that 96% of responders believed that failure to print the prescriber name was one of the main problems. Our finding that the prescriber was identified by both name and signature in 71.7% of prescriptions is in contrast to the 7.5% figure reported by Francois et al. [7] from a university hospital in France. Blatt et al. [8] have shown that 20%–30% of prescriptions from a central hospital in Yaounde, Cameroon, did not include the name and the function of the prescriber. Anderson and Beurling [9] from Copen-hagen University Hospital reported that among the most frequent errors of omission in prescriptions was inadequate identifica-
Table 2 Review of 3796 prescriptions issued at Asir Central Hospital: analysis of information present on prescriptions
Element No. %
Date of prescription Not provided 2441 64.3
Drug names Generic 573 15.1 Brand 1902 50.1 Mixed 1074 28.3 Not readable 245 6.5
Strength of medications Included for all drugs 1010 26.6 Included for some drugs 786 20.7 Not included for all drugs 2004 52.8
Dose units Included for all drugs 2111 55.6 Included for some drugs 949 25.0 Not included for all drugs 736 19.4
Quantity of medications Included for all drugs 125 3.3 Included for some drugs 103 2.7 Not included for all drugs 3568 94.0
Instructions for patient use Included for all drugs 87 2.3 Included for some drugs or partial instructions 3443 90.7 Missing for all drugs 270 7.1
Diagnosis Not clear 717 18.9 Missing 573 15.1
Prescriber’s handwriting Not clear 2441 64.3

926 La Revue de Santé de la Méditerranée orientale, Vol. 11, No 5/6, 2005
�ملجلة �لصحية لشرL �ملتوسط، منظمة �لصحة �لعاملية، �ملجلد �حلا�E عشر، �لعد��� ٥-٦، ٢٠٠٥
tion of the physician. These deficiencies indicate how things are made difficult for the dispensing pharmacist to contact the prescriber in case of any clarification.
Concerning patient information, our finding that prescriptions were deficient in patient’s name, age and sex in 5.4%, 22.7% and 48.7% of prescriptions, respectively, are in contrast with the results of Balbaid and Al-Dawood [6]. Their corresponding figures were 14.5%, 10% and 4.1% respec-tively. However, Bawazir [10], in a large study from 22 major hospitals from all health regions within Saudi Arabia, repor-ted that patient age was missing in 18.6% of prescriptions, while patient name and sex were missing in 0.2% of prescriptions. Our results are somewhat similar to what is reported by Makonnen et al. [11] about the quality of prescriptions at a tertiary care pharmacy in Addis Ababa, Ethiopia, where 50% of prescriptions did not contain the sex and age of the patient. Francois et al. [7] reported that complete patient information was provided in only 35.3% of prescriptions. None of the prescriptions we reviewed contained the address and weight of the patient. The address of the patient is among the elements that should be included in the prescription according to WHO [1], while inclusion of weight is recommended for patients at the extremes of age [1–4] because of the implication it has on drug pharmacokinetics and pharmacodynamics. Omission of patient address from prescrip-tions is a serious deficiency when problems in the prescription are discovered and the patient needs to be contacted to correct the problem. This is even more serious when the name of the patient is also omitted.
Our finding that almost two-thirds (64.3%) of prescriptions were not dated contrasts with Balbaid and Al-Dawood [6] and Francois et al. [7], who found that only
8.7% and 4.5% of prescriptions were not dated, respectively.
Our finding that 50.1%, 15.1% and 28.3% of prescriptions contained brand names, generic names and both generic and brand names, respectively, is peculiar in the sense that some physicians prescribed drugs within the same prescription utilizing both generic and brand names. Blatt et al. [8] reported that 16% of outpatient clinic prescriptions and 73% of emergency room prescriptions contained brand names. We did not find striking differences between prescriptions from emergency room and all other outpatient clinics in this regard. Using generic names in prescriptions gives flexibility to the dispensing pharmacist and may be of economic benefit to the patient. However, use of brand names may be acceptable when problems of drug bioavai-lability are expected [1,3].
The medication information provided in prescriptions was worse than those reported previously. Balbaid and Al-Dawood [6] reported that the dose, frequency and duration of medications were deficient in 7.6%, 6.9% and 10.2% of prescriptions, respectively. Bawazir [10] reported that the dose of the drug was missing in 4% of prescriptions. We found that more than half (52.8%) of prescriptions did not include the strength of medication, the dose units were not included in 19.4% and the quantity of medications was not included in 94.0% of prescriptions. Apparently, these parameters are left to the pharmacist to decide upon and the implications for the duration of therapy will be dependent on the individual pharmacist. The strength of medication is particularly needed when the pharmaceuti-cal product exists in more than one strength. We did not look at the proportion of drugs which are available in only one strength. Francois et al. [7] reported that medication information was complete in only 24% of

Eastern Mediterranean Health Journal, Vol. 11, Nos 5/6, 2005 927
�ملجلة �لصحية لشرL �ملتوسط، منظمة �لصحة �لعاملية، �ملجلد �حلا�E عشر، �لعد��� ٥-٦، ٢٠٠٥
cases, whereas Blatt et al. [8] recorded that medication information was stated in 85% of outpatient and 50% of emergency room prescriptions. We did not find significant differences between outpatient and emer-gency room prescriptions on this matter.
We also found that the prescriptions were seriously deficient in instructions for patient use and the majority (90.7%) contained only partial instructions, a finding that certainly will affect the adequacy of therapy. Bawazir [10] reported that instructions for use were missing in 4% of prescriptions. Our finding that the diagnosis was missing or unrea-dable in one-third (34.0%) of prescriptions is in contrast with what was found by Balbaid and Al-Dawood [6] who found the diagnosis missing in only 6.8% of prescriptions, and Bawazir [10] who found that the diagnosis was missing in 9.8% of prescriptions. Anderson and Beurling [9] reported that omitting the indication for use was among the most frequent errors in prescriptions. Also our finding that almost two-thirds (64.3%) of prescriptions suffered from poor handwriting is in contrast with what was found by Balbaid and Al-Dawood [6] who reported illegible handwriting in only 7.2% of prescriptions. The high percentage of poor handwriting we found could be due to the fact we considered the presence even of a single unclear word or a dose unit as poor handwriting for the whole prescription. Poor handwriting is a serious
problem that might lead to dispensing the wrong medication to the patient with serious or even fatal results [12]. Meyer [5] found that 15% of prescriptions studied had illegible handwriting. Furthermore, in a sur-vey of outside provider pharmacies, 69% of responders stated that illegible handwriting was one of the main problems they encoun-tered. Makonnen et al. [11] also reported illegible prescriptions in 15% of cases.
In conclusion, the prescriptions we reviewed suffered from serious deficiencies and were not properly written. The need for physician education on appropriate pre-scription writing is obvious and follow-up on the matter is needed for newly qualified physicians. Furthermore, inclusion of tuto-rials about prescription writing in the final clinical year curriculum of medical students before graduation is necessary. Administra-tive monitoring of the prescription habits of physicians is needed both to improve the process and to maintain the improvement.
Acknowledgements
The authors greatly appreciate the coopera-tion of the staff of the Pharmacy Department at Asir Central Hospital during the review of prescription, Mr Andy Rolex for entering the data into SPSS and Mr Riyad Alessa for helping revise the data entry.
References
1. De Vries TP et al., eds. Guide to good prescribing: a practical manual. Geneva, World Health Organization, 1995:51–5 (WHO/DAP/94.11).
2. Lofholm PW, Katzung BG. Rational prescribing and prescription writing. In: Katzung BG, ed. Basic and clinical phar-
macology, 8th ed. New York, McGraw Hill, 2001:1104–12.
3. Prescription writing. In: British national formulary, No. 41. London, British Medi-cal Association & Royal Pharmaceutical Society of Great Britain, 2000:4–5.

928 La Revue de Santé de la Méditerranée orientale, Vol. 11, No 5/6, 2005
�ملجلة �لصحية لشرL �ملتوسط، منظمة �لصحة �لعاملية، �ملجلد �حلا�E عشر، �لعد��� ٥-٦، ٢٠٠٥
4. Safe writing. In: Lacy CF et al., eds. Drug information handbook, 9th ed. Cleveland, Ohio, Lexi-Comp, 2001:12.
5. Meyer TA. Improving the quality of the order-writing process for inpatient orders and outpatient prescriptions. American journal of health-system pharmacy, 2000, 57(Suppl. 4):S18–2.
6. Balbaid OM, Al-Dawood KM. Assess-ment of physician’s prescribing practices at Ministry of Health Hospitals in Jeddah City, Saudi Arabia. Saudi medical journal, 1998, 19:28–35.
7. Francois P et al. Evaluation of prescrip-tion-writing quality in a French university hospital. Clinical performance and quality health care, 1997, 5:111–5.
8. Blatt A, Chambon R, Lemardeley P. Forme legale et cout des prescriptions a l’Hopital Central de Yaounde, Cameroun.
[Legal format and costs of prescriptions at the Central Hospital in Yaounde, Camer-oon.] Medecine tropicale: revue du Corps de sante colonial, 1997, 57:37–40.
9. Andersen SO, Beurling C. Recepter, receptfejl og patientsikkerhed. [Prescrip-tions, prescription-writing errors and patient safety.] Ugeskrift for laeger, 1997, 159:1454–8.
10. Bawazir S. Prescribing pattern of ambu-latory care physicians in Saudi Arabia. Annals of Saudi medicine, 1993, 13(2):172–7.
11. Makonnen E, Yoseph M, Berhane Y. Quality of prescription at a tertiary care pharmacy in Addis Ababa. Ethiopian medical journal, 2002, 40:233–9.
12. Charatan F. Family compensated for death after illegible prescription. British medical journal, 1999, 319:1456.
Eastern Mediterranean Health Journal, Vol. 11, Nos 5/6, 2005 929
�ملجلة �لصحية لشرL �ملتوسط، منظمة �لصحة �لعاملية، �ملجلد �حلا�E عشر، �لعد��� ٥-٦، ٢٠٠٥
Adherence to universal precautions among laboratory personnel in LebanonJ.G. Kahhaleh1 and A.R. Jurjus2
1Faculty of Public Health, Lebanese University, Beirut, Lebanon.2Faculty of Medicine, American University of Beirut, Beirut, Lebanon (Correspondence to A.R. Jurjus: [email protected])Received: 11/03/04; accepted: 06/07/04
ABSTRACT To evaluate the present situation and plan future directions with regard to implementation of universal precautions in laboratories testing blood samples, we carried out a national cross sectional study in 2003 on a representative sample of laboratories in Lebanon. We compared the results with those of a 1993 study. We found that the education profile of staff had improved, being now more spe-cialized in laboratory science. The discrepancies between what technicians knew, believed in and prac-tised and what was observed in the field improved to some extent in most variables. Disposal of needles and syringes had improved greatly but disposal of blood-contaminated material had not. Given the risks of improper practice, a policy of universal precautions is essential and regular training should be carried out so that staff know and practise the universal precautions and correct laboratory procedures.
Respect des précautions universelles par le personnel de laboratoire au LibanRÉSUMÉ Afin d’évaluer la situation présente et d’établir les orientations futures concernant l'application des précautions universelles dans les laboratoires qui testent les échantillons de sang, nous avons réalisé une étude transversale nationale en 2003 sur un échantillon représentatif de laboratoires au Liban. Nous avons comparé les résultats avec ceux d'une étude similaire réalisée en 1993. Nous avons constaté que le profil de formation du personnel s’était amélioré, celui-ci étant maintenant davantage spécialisé en sciences des laboratoires. Les écarts entre les connaissances, les croyances et les pra-tiques des techniciens et les observations sur le terrain se sont résorbés dans une certaine mesure pour toutes les variables. L’élimination des aiguilles et des seringues s'est beaucoup améliorée, ce qui n'a pas été le cas pour l'élimination des matériaux contaminés par du sang. Étant donné les risques que comportent des pratiques inadéquates, une politique de précautions universelles est essentielle et une formation régulière devrait être mise en œuvre de sorte que le personnel connaisse et applique les précautions universelles et les procédures de laboratoire correctes.

930 La Revue de Santé de la Méditerranée orientale, Vol. 11, No 5/6, 2005
�ملجلة �لصحية لشرL �ملتوسط، منظمة �لصحة �لعاملية، �ملجلد �حلا�E عشر، �لعد��� ٥-٦، ٢٠٠٥
Introduction
The transmission of blood-borne pathogens from patients to health care workers via oc-cupational exposure has been well known for many years [1]. The term health care worker refers to any person working in health care settings and who has the potential for expo-sure to infectious materials including body substances, contaminated medical supplies and equipment, contaminated environmen-tal surfaces or contaminated air [2]. They include, but are not limited to, physicians, nurses, technicians, therapists, pharmacists, nursing assistants, laboratory personnel, autopsy personnel, emergency medical ser-vice personnel, dental personnel, students and trainees, contractual staff not employed by the health care facility and persons not directly involved in patient care but po-tentially exposed to infectious agents (e.g. volunteer, dietary, housekeeping, mainte-nance and clerical personnel) [3]. All these people are potentially exposed, directly or indirectly, to blood-borne pathogens. As a result, health care workers are at increased risk of acquiring human immunodeficiency virus (HIV), hepatitis B virus (HBV) and hepatitis C virus (HCV), which can all be transmitted through percutaneous injury.
In this study, our concern was limited to laboratory personnel who perform blood sampling (risk of needle-sticks) and deal with blood or body fluid samples or reagents on an almost daily basis.
The true rate of sharps injuries in health care workers is not known and impossible to calculate because of differences from institution to institution in case ascertain-ment, compliance with reporting and type of service [1]. Data from EPINet, the Ex-posure Prevention Information Network of Hospitals in the United States of America, reported an overall rate of sharps injuries at 27 per 100 occupied beds [1]. Causes of
occupational sharps injuries include recap-ping needles, disassembling equipment, accessing intravenous (IV) tubing devices, disposing of contaminated sharps, disen-gaging pre-filled cartridge and needle units from reusable holders and pipetting [1,4].
Data from EPINet revealed that 68.5% of injuries were linked to hollow-bore needles (syringes, butterfly needles, phle-botomy needles, needles on IV lines and blood gas syringes) [1]. In a retrospective survey done in 1989–90 to investigate the incidence of needle-sticks and other exposures to patients’ blood or body fluids among medical students and residents, 71% of respondents had 1 or more needle-sticks or other exposures during the training year, while the surgical residents had a > 6-fold greater risk of occupational exposure [5]. Other studies reported that > 60% of residents and students had sustained contact with blood, mucous membranes and broken skin or other potentially infectious sources [5–10]. In addition, health care workers in general, and laboratory personnel in parti-cular, are at risk of acquiring a wide variety of pathogens, including HBV, HCV and HIV type I, through occupational exposure to blood and certain body fluids [11]. It was recently reported that annually worldwide injections cause an estimated 8–16 million cases of HBV infection, 2.4–4.5 million cases of HCV infection and 80 000–160 000 cases of HIV infection [12]. Laboratory-associated infections could also be caused by aerolization of specimens, mouth pipet-ting or percutaneous injury [2].
Although data in the literature indicate that the risk of acquiring a blood-borne pathogen after accidental exposure is in some cases low, approximately 0.4%, it is important to note that researchers and health care workers with frequent occupational exposure to high concentrations of viruses
Eastern Mediterranean Health Journal, Vol. 11, Nos 5/6, 2005 931
�ملجلة �لصحية لشرL �ملتوسط، منظمة �لصحة �لعاملية، �ملجلد �حلا�E عشر، �لعد��� ٥-٦، ٢٠٠٥
would be at increased risk, especially after working for many years [13]. The occupa-tional risk of contracting HIV by health care personnel is also a well-documented reality. Several studies have consistently indicated that the risk of acquiring HIV infection after percutaneous exposure to infected blood is approximately 0.4% [11,14]. In addition, 6 aggregated studies in the United States of America estimated the risk after a mucous membrane exposure at 0.1%. Despite reports of low incidence after occupational exposure, seroconversion can occur. This is a source of concern because of the high mortality rate and the current lack of cura-tive treatment, and because the overall risk is dependent on the rate of transmission per episode and cumulative exposure over time [11].
In Lebanon, the number of reported cases of HIV/AIDS has been increasing steadily since 1985, when the first locally treated case was reported [15]. By Decem-ber 1997, the cumulative number of reported cases had reached 580; by December 2001 this was 650 and by July 2003 it was 706 [14]. Therefore, the increasing prevalence of HIV in Lebanon would probably lead to an increase in the risk of exposure of health care workers to blood from patients infected with the virus, especially when blood and body fluid precautions are not followed for all patients. Thus, there is a need to consider all patients as potentially infected with HIV and other bloodborne pathogens and to adhere rigorously to infection-control pre-cautions to minimize the risk of exposure to blood and fluids [12].
Hepatitis C has a worldwide distribu-tion and an estimated overall prevalence of 3%; the prevalence in the United States of America is around 1.8% compared to more than 20% in Egypt [16]. Although the incidence of acute hepatitis C has declined from 175 000 cases per year in
1989 to about 30 000 in 1997, HCV is still the most common cause of chronic viral hepatitis in the United States of America; 85% of people infected with HCV remain persistently infected [17]. Because of the high rate of chronic infection and because many infected people are asymptomatic and unaware of their infection health care workers are at risk of infection. From a random needle-stick in the hospital the risk is about 0.1%, and from patients known to be infected the risk is 5%–10% [18]. Bizri reported that the epidemiological society of Lebanon has calculated the prevalence of HCV in the general population to be 0.7% (range 0.4%–1.0%) by screening 3000 serum specimens from major laboratories in Lebanon for antibodies to HCV [16]. He also compared that to a similar study done in 2001 on 3000 samples from blood donors and found a similar (0.7%) prevalence [16].
Hepatitis B virus was one of the first blood-borne pathogens to be recognized as an occupational risk among health care workers [19]. The risk of contracting oc-cupationally-acquired HBV in non-immune health care workers is 2%–40%, depending on the hepatitis Be-antigen (HBeAg) status in the source patient [1]. When a needle is used on a patient who is HBeAg posi-tive, the exposure-associated attack rate is 20%–40%, while in HBV-negative cases it drops to 2%.
In hepatitis C, the rate ranges between 1% and 10% and for HIV it is much lower, 0.1%–0.4 % [20,21]. These infections lead to chronic disease, disability and death. Clinical laboratory technicians, like others, if not more, are subject to occupationally-acquired infection.
Universal precautions exist to prevent transmission of infection among health care workers [22]. In Lebanon, an assessment study in 1993 showed that the willing-
932 La Revue de Santé de la Méditerranée orientale, Vol. 11, No 5/6, 2005
�ملجلة �لصحية لشرL �ملتوسط، منظمة �لصحة �لعاملية، �ملجلد �حلا�E عشر، �لعد��� ٥-٦، ٢٠٠٥
ness of health care personnel, particularly laboratory technicians, to follow universal precautions was not adequate [19]. Wide discrepancies existed between what the technicians knew, what they believed in and what they practised. Extensive training workshops and curriculum modifications followed in an attempt to improve the situation [4]. Consequently, it was felt that an update on the situation was in order to evaluate the present situation and plan future directions in light of internationally recognized data [20,21].
The objectives of this national reas-sessment study are: 1) to depict the degree of adherence of clinical laboratories in Lebanon to the implementation of universal precautions and prevention of occupational risk of transmission of pathogens which are blood-borne or associated with other body fluids, 2) to reassess knowledge, attitudes and practices of laboratory technicians regarding the implementation of universal precautions, 3) to identify unsafe practices that may lead to infection, 4) to determine whether a facility that deals with blood and body fluids meets the necessary require-ments for equipment, supplies and waste disposal, 5) to compare new data with previous data and evaluate achievements and identify lacunae, and 6) to outline educational and training needs and focus on possible activities and interventions oriented to remedial action.
Methods
This cross-sectional study included labora-tory personnel throughout Lebanon. Vari-ables included the knowledge, attitudes and practices of laboratory technicians concer-ning blood-borne pathogens (e.g. HIV, HBV and HCV) and adherence to universal safety precautions in relation to experience, formal training and workplace setting among tech-
nicians dealing with blood and body-fluids, as well as laboratory directors in hospital-based and non-hospital-based laboratories (private, governmental and those belonging to nongovernmental organizations).
To obtain a representative sample of the laboratories in Lebanon, we used a 2-stage cluster-sampling technique where self- weighting was ensured through selecting all 6 provinces of the country. Clusters were selected in proportion to the number of laboratories per province, and in respec-tive numbers of sampling units within each cluster using a list of all licensed, registered laboratories provided by the Syndicate of Laboratories in Lebanon.
In the first stage, we used the pro-vinces as administrative sections: these were non-overlapping and exhaustive (all the geographic areas were included). We determined the number of licensed labora-tories for each province using the latest list submitted from the Syndicate of Laborato-ries in Lebanon, then selected 1 cluster of 12 laboratories from each province using random numbers and an additional cluster from the provinces that had more than 50 laboratories, a total of 8 clusters (Table 1).
The sample size selected was 12 × 8 = 96 licensed laboratories out of a total of 183 and up to 3 technicians per laboratory = 288 technicians. Of the 93 laboratories, 73 actually participated. The 68 directors interviewed reported that they had 475 technicians working in their laboratories. We distributed the questionnaire to almost all of them but only 222 completed the survey form.
In order to obtain accurate information and to avoid reporting bias and observer-induced changes in practice, we used the combination of interview and structured observation.
A survey form was developed for technicians and an interview form for the

Eastern Mediterranean Health Journal, Vol. 11, Nos 5/6, 2005 933
�ملجلة �لصحية لشرL �ملتوسط، منظمة �لصحة �لعاملية، �ملجلد �حلا�E عشر، �لعد��� ٥-٦، ٢٠٠٥
laboratory directors. These were pretested in at least 5 laboratories, then adjusted and modified before running the actual survey.
Field workers visited the laboratories included in the study. They explained the purpose of the study to the respondents, interviewed the laboratory director, distri-buted the questionnaire to the technicians, and checked off on a separate observation list the availability of certain safety materi-als and equipment in the laboratory and the practices of technicians.
The information was collected by 3 instruments: structured observation of prac-tices, equipment, and supplies (observation list); structured interview on available supplies, knowledge and enforcement of implementation of universal precautions (with the laboratory owners/directors); and survey of knowledge, attitudes and practices of the laboratory technicians concerning universal precautions (self-completed by technicians). All participants signed a con-sent form before proceeding. Results were combined to address specific questions and to allow for cross verification.
The interview with the laboratory directors covered professional background, attitudes and behaviour concerning imple-mentation of universal precautions as well
as relations with patients and physicians. The questionnaire for the laboratory techni-cians consisted of 3 major sections. The first covered parameters of knowledge, attitudes, practices and safety precautions; the second section dealt with material resources avai-lable in the laboratory and the disposal of medical waste; the last section included questions about education, training and relations with patients and physicians. The observation list included items dealing with basic practices, safety precautions and waste disposal.
The proposed instruments were pilot-tested and adapted to ensure that they were suitable to the particular circumstances and that the right nomenclature was used. The data collection procedure was standardized in laboratories located in the capital city, one of the 6 provinces, because it has the largest population. Then the team was dis-tributed into groups. Data coding, computer processing and statistical analysis were done according to standard statistical me-thods. The recorded answers were cleaned, coded, processed and analysed using SPSS, version 11.0, and then compared with the data from 1993.
The questionnaire for the technicians was tested for reliability. We randomly
Table 1 Distribution of the samples by province
Province No. of No. of No. of licensed clusters laboratories laboratories included
Beirut 53 2 20
Mount Lebanon 58 2 20
North Lebanon 25 1 11
South Lebanon and Nabatieh 31 2 12
Bekaa 16 1 10
Total 183 8 73

934 La Revue de Santé de la Méditerranée orientale, Vol. 11, No 5/6, 2005
�ملجلة �لصحية لشرL �ملتوسط، منظمة �لصحة �لعاملية، �ملجلد �حلا�E عشر، �لعد��� ٥-٦، ٢٠٠٥
chose 30 technicians from Beirut and Mount Lebanon provinces. We introduced the questionnaire using different resear-chers and then matched the results for agreement.
The population proportion found in the 2003 sample was compared to that of 1999. We calculated z at 95% confidence interval; the difference was considered to be signifi-cant if computed z was ≥ 1.645.
Results
Profile of laboratory manpowerAmong the professional directors of the laboratories, 59 out of the 68 interviewed (86.8%) were full-time, i.e. always present in the laboratory, while the other 9 (13.2%) were present for only part of the day. Their educational background varied: 63 (92.6%) of the directors reported their education (we were unable to interview 5 directors) (Table 2). A far greater proportion of direc-tors had a medical background compared with those in 1993 (P < 0.0001).
The directors we interviewed (68/73) reported that out of 475 technicians in their laboratories:• 400 performed tests on blood in general• 375 performed blood sampling
• 369 performed tests on body fluids• 329 performed hepatitis testing• 244 performed HIV testing.
It was also reported that some techni-cians could be carrying out all these procedures.
The education profile of laboratory tech-nicians also varied; 195 (90.3%) had a tech-nical professional degree or higher (Table 3). Compared with 1993, the general level of education among the technicians had in-creased significantly (Table 3). It was also reported that 69 (31.1%) of the technicians had attended education sessions on AIDS and hepatitis prevention and transmission and 45 (20.3%) had training on how to perform HIV testing. In addition, of the 222 technicians, 177 (79.7%) said they would be willing to participate in future training sessions; 45 did not respond. Of the 177, 145 indicted what they would want from training—to get new information (118,66.7%), more awareness and protection at work (17, 9.6%), or more information about
Table 2 Comparison of the education profile of laboratory directors in 1993 and 2003
1993 2003 No. % No. %
Pharmacy background 25 43.1 3 4.8
Medical background 26 44.8 55 87.3
Bachelor of science 5 8.6 3 4.8
High school diploma 2 3.4 2 3.2
Total 58a 100 63b 100aInformation was missing for 1 director.bInformation was missing for 5 directors.χ2
3 = 28.01, P < 0.0001.
Table 3 Comparison of the education profile of technicians in 1993 and 2003
Education level 1993 2003a
No. % No. %
High school diploma and/or training on the job 16 13.9 21 9.7
Technical degree 27 23.4 81 37.5
Bachelor of medical laboratory science 41 35.6 96 44.4
Bachelor of Science 12 10.4
Master degree (MSc or MPH) 4 3.4 17 7.9
Doctorate degree 15 13.0 1 0.5
Total 115 100 216 100χ2
5 = 56.49, P < 0.0001. aInformation was missing for 6 technicians.
Eastern Mediterranean Health Journal, Vol. 11, Nos 5/6, 2005 935
�ملجلة �لصحية لشرL �ملتوسط، منظمة �لصحة �لعاملية، �ملجلد �حلا�E عشر، �لعد��� ٥-٦، ٢٠٠٥
the testing procedures and the protection measures (10, 5.6%)—32 did not respond.
The technicians reported that they acquired their knowledge about the various aspects of AIDS, hepatitis and the preven-tion techniques and measures mostly in discussions with physicians, from medical literature or from lectures (Table 4).
Knowledge of the technicians about universal precautions and safety measures Almost all the technicians knew that while working they should take protective measures by wearing laboratory gowns or gloves and that they should dispose of used needles and syringes in special containers (Table 5). Their level of knowledge about the modes of transmission of each of HIV (90.1%), HBV (92.3%) and HCV (88.3%) through blood and its components was also very good overall.
Only 23 (31.5%) of the laboratories had the list of universal precautions posted, and some laboratory technicians did not even know about the existence of such a list. As for deactivation of HIV, 118 (53.2%) tech-nicians considered heat the most effective method, 54 (24.3%) did not agree and 50 (23.0%) said they did not know. Similarly,
113 (50.1%) did not agree that methods that deactivate hepatitis B virus or other viruses could also deactivate HIV. In addi-tion, 216 (97.3%) knew that blood or other contaminated material must be disposed of in special containers. However, the field workers noted that only in 55 (75.3%) of the laboratories that they visited was this actually done.
Beliefs, attitudes and practices in testingThe behaviour of laboratory technicians seemed to be very much affected by the spread of AIDS and hepatitis. Most of the technicians (88.3%) reported changing their practices after hearing about AIDS or hepatitis, either by becoming more aware when performing tests on body fluids (187, 84.2%), when sampling, (168, 75.7%) or when dealing with patients (108, 48.6%). One technician reported that he stopped performing HIV or hepatitis testing. In some laboratories only 8 of the 73 (11.0%) technicians showed some behavioural laxi-ty inside the laboratory: eating, drinking, smoking or pipetting by mouth. However, 218 (98.2%) did not work with reusable syringes. With respect to disposing of con-taminated syringes and needles in a special box, a significant difference was found between what was observed in laboratories and what technicians reported they prac-tised (Table 5).
With regard to beliefs, 37 (16.7%) believed that pregnant technicians should not perform blood testing. Only 98 (44.1%) believed that virus testing should be done in specialized laboratories, 101 (45.5%) did not agree and 12 (5.4%) said they did not know; the other 11 did not respond. The great majority (90.1%) also believed that proper disinfection of all materials was an important measure for prevention and protection from disease transmission in the
Table 4 Sources of information on HIV/AIDS-related safety measures reported by the technicians
Source No. % (n = 222)
Conferences and meetings with physicians 153 68.9
Medical journals and books 140 63.1
Lectures 116 52.3
Media 97 43.7
Other sources 19 8.6Categories are not mutually exclusive.

936 La Revue de Santé de la Méditerranée orientale, Vol. 11, No 5/6, 2005
�ملجلة �لصحية لشرL �ملتوسط، منظمة �لصحة �لعاملية، �ملجلد �حلا�E عشر، �لعد��� ٥-٦، ٢٠٠٥
Tabl
e 5
Co
mp
aris
on
of
kno
wle
dg
e, u
se a
nd
ava
ilab
ility
of
pro
tect
ive
dev
ices
bet
wee
n 1
993
and
200
3
Pro
tect
ive
K
no
wle
dg
e B
elie
fs
Pra
ctic
e U
se o
f d
evic
es a
s
Ob
serv
ed
Ob
serv
ed
dev
ice
re
cord
ed in
th
e u
se o
f av
aila
bili
ty
te
chn
icia
ns’
d
evic
esa
of
dev
ices
in
qu
esti
on
nai
re
la
bo
rato
ries
a
1993
20
03
1993
20
03
1993
20
03
1993
20
03
2003
19
93
2003
No
. %
N
o.
%
No
. %
N
o.
%
No
. %
N
o.
%
No
. %
N
o.
%
No
. %
N
o.
%
No
. %
Wea
ring
lab
co
ats
115
100
219
98.6
11
3 98
.3
214
96.4
113
98
.3
214
96.4
107
93
.0
192b
86.5
63
86
.3
59 1
00
73 1
00
Wea
ring
gl
oves
10
9 94
.8
218c
98.2
10
3 89
.6
209
94.1
60
52
.2
207d
93.2
34
29
.6
82
36.9
27
37
.0
57
96.6
63
e 86
.3
Dis
posa
l of
sy
ringe
s &
need
les
in
sp
ecia
l
boxe
s 11
0 95
.7
216
97.3
–
– 20
6 92
.8 1
04
90.4
20
8 93
.7
70
60.9
16
7f 75
.2
55
75.3
34
57
.6
44
60.3
Tota
l 11
5 10
0 22
2 10
0 11
5 10
0 22
2 10
0 11
5 10
0 22
2 10
0 11
5 10
0 22
2 10
0 73
100
59
100
73
100
a We
obse
rved
eac
h la
bora
tory
(73
) to
che
ck w
hat p
rote
ctiv
e de
vice
s w
ere
avai
labl
e an
d if
all t
he te
chni
cian
s w
ere
usin
g th
em in
all
the
visi
ts a
nd s
core
d th
e la
bora
tory
acc
ordi
ngly
.b S
igni
fican
t P =
0.0
322.
c Sig
nific
ant P
= 0
.040
1.d S
igni
fican
t P >
0.0
001.
e Sig
nific
ant P
> 0
.020
2.f S
igni
fican
t P =
0.0
03.

Eastern Mediterranean Health Journal, Vol. 11, Nos 5/6, 2005 937
�ملجلة �لصحية لشرL �ملتوسط، منظمة �لصحة �لعاملية، �ملجلد �حلا�E عشر، �لعد��� ٥-٦، ٢٠٠٥
health care setting. Almost all believed in wearing laboratory coats or gloves while working. Gloves were reported to be avai-lable by 95.0% of technicians and by 92.6% of laboratory directors; these were latex in 83.3% of laboratories rather than nylon or dishwashing gloves which are sometimes used as a substitute. It was, however, observed that the technicians actually wore gloves in only 27 laboratories and labora-tory coats in only 63 (Table 5).
Sterilization, disinfection of laboratory materials and waste disposal The field workers observed that 64 (87.7%) laboratories had an adequate liquid di-sinfectant present on the bench and in 66 (90.4%) there was an autoclave available. However, only 61 (89.7%) laboratory direc-tors reported that they used the autoclave (once per week 13.2%, once per day 17.6%, 3 times per week 25.0%). The rest either did not specify, or gave different frequencies. Furthermore, 61 (83.6%) of the laboratories reported sterilizing material for repeated usage: 57 (93.4%) by autoclaving, 9 (14.8%) by boiling, 21 (34.4%) by washing and 19 (31.1%) by immersion in disinfectants.
On the other hand, 28 (46.6%) of the laboratories disposed of their blood-contaminated waste separately in their labo-ratory after autoclaving it, but they did not know how it was disposed of once it left the laboratory (Table 6). Twenty-one (35.0%) reported disposing of contaminated waste the same way as non-contaminated waste, 16 (26.7%) would incinerate it, and 10 (16.7%) said they would dump it and cover it with soil.
Dealing with blood spillageObservations showed that spillage of blood on the floor or bench was handled by pou-ring disinfectants in 48 (65.8%) of the 73
laboratories, or by cleaning with dry nap-kins in 22 (30.1%).
Management of residual blood in Vacutainer® tubes was mostly by sterilizing before disposal with normal waste or sepa-rating inside the laboratory then disposal with normal waste (Table 7). On the other hand, the handling of spillage from broken blood samples was more conservative; 52 (71.2%) of the 73 laboratories would wash and disinfect the blood, while 19 (26.0%) would clean with dry napkins without disinfecting.
Technician–patient relationsIn 28 (38.4%) laboratories, the technicians deal directly with clients, and in the other laboratories 33 (45.2%) of the technicians do not have to deal with patients; they re-ceive blood already collected in tubes. On the other hand, only 21 (9.9%) would give results directly to the patient. In the other 12 it was not specified.
Table 6 Comparison of disposal of blood-contaminated waste in the laboratories between 1993 and 2003
Disposal and 1993 2003 supervision measures (n = 59) (n = 60a) % %
Disposal of blood-contaminated waste In special containers 71.1 46.6 With non-contaminated garbage 28.9 35.0 Incineration – 26.7 Dumping in soil 16.7
Supervision of garbage disposal 30.0 91.7 Until the end (incineration or scientific dumping) – 45.0 Until the door of the laboratory – 46.7aInformation was missing for 13 laboratories.n = total number of respondents
938 La Revue de Santé de la Méditerranée orientale, Vol. 11, No 5/6, 2005
�ملجلة �لصحية لشرL �ملتوسط، منظمة �لصحة �لعاملية، �ملجلد �حلا�E عشر، �لعد��� ٥-٦، ٢٠٠٥
Discussion
The data collected in the survey indicated that the education profile of professional laboratory directors improved between 1993 and 2003. The number with a medi-cal background exceeded the number with a pharmacy background. In addition, the profile of the technicians also improved. There were more university graduates in the laboratories (43.2% in 2003 compared to 35.6% in 1993), and more had a techni-cal degree in laboratory sciences (36.5% in 2003 compared to 23.4% in 1993) [4].
Laboratory facilities for HIV and hepati-tis testing were adequate in the country, and almost all the laboratories do the testing. However, the distribution of laboratories was not equitable between the various pro-vinces. In the peripheral provinces, the fa-cilities could be increased and strengthened. In addition, many laboratories, all over Lebanon, are working illegally without be-ing registered with the Syndicate of Labora-tory Owners in Lebanon. Such laboratories are not supervised and their adherence to universal precautions is not known. Thus our results may be an underestimate of any problems that may exist.
The major findings of this study provide some interesting insights into the question of preventing the transmission of pathogens (HIV, hepatitis virus etc.) through preven-tive measures used by laboratory techni-cians in Lebanon. Despite their relatively high level of education, and the advanced level of knowledge about the modes of transmission of the pathogens, there were great disparities among technicians in knowledge, attitudes and practices [4].
On the one hand, protection techniques such as regular hand washing or use of barrier protection, including gloves of the proper quality and protective body clothing, were available and used to various extents to prevent skin and mucous membrane con-tamination with blood or body fluids. This is good laboratory practice reducing exposure from prolonged or extensive contamination of skin with infectious fluids [13,21].
On the other hand, despite the wide availability of gloves reported both by labo-ratory directors and technicians, the excel-lent knowledge of the protective efficiency of wearing gloves, the high rate of belief in this practice, and the reports by 92.8% of technicians that they practise this protection
Table 7 Comparison of management by laboratories of residual blood in Vacutainers®
Disposal 1993 2003 P (n = 59) (n = 65a) % %
Sterilization before disposal with normal waste 16.7 41.5 0.0006
Separation then disposal with general waste 0 33.8
Pouring blood into the sink 60.0 20.0 < 0.0001
Throwing with regular garbage without treatment 23.3 4.6 < 0.0001Categories are mutually exclusive.aInformation for 8 laboratories was missing.n = total number of respondents

Eastern Mediterranean Health Journal, Vol. 11, Nos 5/6, 2005 939
�ملجلة �لصحية لشرL �ملتوسط، منظمة �لصحة �لعاملية، �ملجلد �حلا�E عشر، �لعد��� ٥-٦، ٢٠٠٥
measure, it was observed that in only 37% of the laboratories the technicians actu-ally strictly follow this measure. Compared with the previous study, we noticed a slight increase (7.3%) in this practice, which is not sufficient. We noted that within a laboratory either all or none of the technicians wore gloves.
Gloves need not be changed during laboratory activities that routinely result in contaminated gloves. Rather, gloves should be changed when these tasks are completed [13,21]. Among the recom-mendations published by the Centers for Disease Control in 1987, updated in 1988 and reviewed in 1991, was “blood and body-fluid precautions” that should be used consistently for all patients [23]. This approach of “universal precautions” was added to our lexicon and has eliminated the need for the category-specific blood and body fluid isolation [13]. In our study, it was evident that such a comprehensive approach was not clear in the minds of most labora-tory staff. Therefore, the concept, use and effectiveness of universal precautions need to be clearly presented to all technicians and laboratory directors.
The practice of mouth pipetting de-creased from 43.4% to about 11% of the technicians. Although this is a low percent-age, careful consideration should also be given to this issue, particularly since HIV shares routes of infection with HBV and HCV, and in relation to the prevalence of HIV and HBV in the population. Actually, HIV, HBV and presumably HCV may be transmitted in the laboratory directly through mucous membranes [23]. Contami-nation of mucosal surfaces with infectious blood, plasma, serum or other body fluids may occur with mouth pipetting or spatter-ing of oral or nasal mucosa. For this reason mechanical pipetting devices should be used for all liquids in the laboratory and
mouth pipetting must not be practised at all [13,21].
Another problem that emerged from the survey related to the utilization and disposal of used syringes and needles. Although technicians knew that direct percutaneous transmission of HIV is possible, that it could occur by parenteral inoculation of infected blood by needle-sticks accidents, and that they should dispose of needles and syringes in special needle containers, which 93.7% of them claimed to do, observation showed that only 44 (60.3%) laboratories had containers available for this purpose as observed by us. This was higher than 10 years previously when the availability of containers was observed only in 57.6% of the laboratories. Needle containers should be available in all laboratories and accessi-ble to all technicians, since the major source of occupationally-acquired HIV infection reported is from needle-sticks [21].
There was some negligence in han-dling blood-contaminated material. It was reported that 46.6% of the laboratories disposed of their contaminated garbage in special containers, 35.0% of them discarded their contaminated waste the same way as non-contaminated and 16.7% of them dump it in soil.
Complete supervision of garbage disposal (incineration or dumping) was reported to be practised in 40.2% of labo-ratories and supervision to the door of the laboratory in 41.2%. Laboratories reported that they supervise only the disposal of proven infected material done in their labo-ratory. Comparing these results to those of 1993, there is more supervision especially inside the laboratory but the end point of waste outside the laboratory is unknown. Laboratory provision of special containers has decreased, probably due to the high cost of these items.

940 La Revue de Santé de la Méditerranée orientale, Vol. 11, No 5/6, 2005
�ملجلة �لصحية لشرL �ملتوسط، منظمة �لصحة �لعاملية، �ملجلد �حلا�E عشر، �لعد��� ٥-٦، ٢٠٠٥
Awareness should be raised about this problem, stressing the importance of deve-loping and following guidelines for correct handling of laboratory wastes, particularly contaminated waste. Medical waste could be classified into general refuse, special medical waste and potentially infectious categories and processed accordingly.
Autoclaves were available in 90.4% of the laboratories. The practice of on-site autoclaving is becoming standard. Medi-cal waste may be decontaminated on-site as long as guidelines are followed. When “potentially infectious” waste is decontami-nated, it becomes “general domestic” waste and may be disposed of with general waste. This requires a national policy that should be adopted and implemented by the health authorities.
The decontamination of spills by the technicians seemed to be inadequate. However, the management of residual blood in Vacutainers® or other containers has improved since 1993. Sterilization and separation had improved and pouring residues down the sink or throwing them out with general waste had decreased. This, along with other issues of medical waste disposal, still needs to be improved by de-veloping appropriate policies, mechanisms and monitoring.
The attitudes of the technicians towards HIV testing were not consistent. They were fully aware of the risks when dealing with body fluids or when sampling. Although 98 (44.1%) technicians said they would prefer that HIV testing be done in a specialized laboratory, less than 1% reported refusing to work with blood. Meanwhile, the same people would test for HBV, HCV or other viruses. Such attitudes and practices were not consistent with the high rate of know-ledge about the very important measures for prevention and self-protection from patho-gen transmission. Technicians also showed
some laxity in their behaviour, e.g. eating, drinking or smoking in the laboratory, as well as receiving visitors sometimes. Such practices should be limited to assigned areas in the facility.
Since in about 38% of the laboratories technicians dealt directly with patients, some pre-counselling should be provided.
The education profile of the human resources in the great majority of laborato-ries was adequate, except for the 3.2% of laboratories lacking a professional director or the 9.5% of technicians who had only a high school diploma or on-the-job ex-perience. Furthermore, the majority of the technicians did not have training on how to perform HIV testing with educational ses-sions on AIDS and hepatitis transmission and prevention. This deficiency was found mostly in peripheral/remote laboratories.
Conclusion
Discrepancies between what the techni-cians knew, believed and practised have decreased since 1993 but these should still be addressed by stressing the benefits of correct practice to the laboratory directors and administrators to enforce such mea-sures and then to technicians to make them more aware of the risks of neglecting cor-rect safety measures.
In addition, since it is known that illegal laboratories exist, the health authorities should enforce registration and licensing of laboratories as well as optimal laboratory practices. In cooperation with the profes-sional directors and administrators, they should write comprehensive guidelines promoting the implementation and moni-toring of universal precautions. They should develop policies and procedures which will effectively protect laboratory personnel from infectious diseases in general. This is

Eastern Mediterranean Health Journal, Vol. 11, Nos 5/6, 2005 941
�ملجلة �لصحية لشرL �ملتوسط، منظمة �لصحة �لعاملية، �ملجلد �حلا�E عشر، �لعد��� ٥-٦، ٢٠٠٥
consistent with the fact that the employer must provide for the employee a safe work-ing environment and appropriate barriers and ensure their appropriate use.
Implementation of a universal precau-tions policy is not without difficulties. Health care workers unaccustomed to routine use of gloves or masks may find them inconvenient and choose not to comply. Others may overreact and use bar-rier precautions unnecessarily when contact with blood or body fluids is not likely. Both problems can be addressed by providing in-service training programmes and incentives to encourage compliance. The universal precautions system will add to costs, es-pecially for disposable gloves, masks and aprons, but may also save money in laundry costs and employee workdays lost due to illness.
In short, given the current status of HIV, hepatitis and other pathogen infection and testing, a policy of universal precautions is much more likely to serve both patients’ and providers’ interests.
Lastly, regular training should include the universal precautions, initial biohazard handling, safety policies, safety activities, safety equipment and materials, ongoing monitoring and potential exposure of staff.
Acknowledgement
This study was technically and financially supported by a grant from the World Health Organization Regional Office for the Eastern Mediterranean Small Grants Pro-gramme (SGS 02/182).
References
1. APIC position paper: prevention of device-mediated blood borne infections to health care workers. American journal of infection control, 1998, 26(6):570–80.
2. Public health service guidelines for the management of health care worker ex-posures to HIV and recommendations for postexposure prophylaxis. MMWR. Mor-bidity and mortality weekly report, 1998, 47, No. RR–7:1–28.
3. Case–control study of HIV sero-conver-sion in health care workers after percu-taneous exposure to HIV-infected blood. France, United Kingdom and United States, January 1988–August 1994. New England journal of medicine, 1995, 44(50):929–33.
4. Jurjus A. Assessment of AIDS knowledge, attitude, behaviors and occupational risk of laboratory. Lebanese medical journal, 1998, 46(5):285–90.
5. Radecki S, Abbott A, Eloi L. Occupa-tional human immunodeficiency virus exposure among residents and medical students: an analysis of 5-year follow-up data. Archives of internal medicine, 2000, 160(20):3107–11.
6. Gerberding JL. Management of occupa-tional exposures to blood-borne viruses. New England journal of medicine, 1995, 312(7):444–51.
7. Rattner SL, Norman SA, Berlin JA. Per-cutaneous injuries on the “front line”: a survey of housestaff and nurses. Ameri-can journal of preventive medicine, 1994, 10(6):372–7.
8. Shalom A, Ribak J, Froom P. Needle sticks in medical students in univer-sity hospitals. Journal of occupational and environmental medicine, 1995, 37(7):845–9.

942 La Revue de Santé de la Méditerranée orientale, Vol. 11, No 5/6, 2005
�ملجلة �لصحية لشرL �ملتوسط، منظمة �لصحة �لعاملية، �ملجلد �حلا�E عشر، �لعد��� ٥-٦، ٢٠٠٥
9. De Vries B, Cossart YE. Needlestick in-jury in medical students. Medical journal of Australia, 1994, 160(7):398–400.
10. Henry K, Campbell S. Needle stick/sharps injuries and HIV exposure among health care workers. National estimates based on a survey of US hospitals. Minnesota medicine, 1995, 78(11):41–4.
11. Wong ES et al. Are universal precautions effective in reducing the number of oc-cupational exposures among health care workers? A prospective study of physi-cians on a medical service. Journal of the American Medical Association, 1991, 265(9):1123–8.
12. Centers for Disease Control and Preven-tion. HIV/AIDS surveillance report. At-lanta, Georgia, US Department of Health and Human Services 1994, 6:21.
13. Protection of laboratory workers from infectious disease transmitted by blood, body fluids, and tissue, 2nd ed. Wayne, Pennsylvania, National Committee for Clinical Laboratory Standards, 1991 (Document M29-T2).
14. National AIDS program, Lebanon: annual report 1995. Beirut, National AIDS pro-gram, 1995.
15. Mokhbat JE et al. The acquired immuno-deficiency syndrome. Lebanese medical journal, 1985, 35(4):293–319.
16. Bizri A. Epidemiology and prevention of hepatitis C. Lebanese medical journal, 2001, 49:45–6.
17. Management of hepatitis C [concensus conference]. Hepatology, 1997, 26(suppl. 1):1–155S.
18. Gross JB. Clinician’s guide to hepatitis C. Mayo Clinic proceedings, 1998, 73(4):355–61.
19. Nassar N. Epidemiology and prevention of hepatitis B. Lebanese medical journal, 2001, 49:40–2.
20. Alter MJ. Epidemiology of hepatitis C in the west. Seminars in liver disease, 1995, 15(1):5–14.
21. De Vita VT Jr, Hellman S, Rosenberg SA, eds. AIDS: biology, diagnosis, treatment and prevention, 4th ed. Philadelphia, Lip-pincott-Raven Publishers, 1997.
22. Recommendations for prevention of HIV transmission in health-care settings. MMWR. Morbidity and mortality weekly report, 1987, 36(suppl. 2):1–18S.
23. National Committee for Clinical Labora-tory Standards. Protection of laboratory workers from infectious diseases trans-mitted by blood, body fluids and tissue. Pennsylvania, National Committee for Clinical Laboratory Standards, 1991 (Document no. M29-T2).
Eastern Mediterranean Health Journal, Vol. 11, Nos 5/6, 2005 943
�ملجلة �لصحية لشرL �ملتوسط، منظمة �لصحة �لعاملية، �ملجلد �حلا�E عشر، �لعد��� ٥-٦، ٢٠٠٥
Planning dental manpower in Lebanon: scenarios for the year 2015B. Doughan,1 K. Kassak2 and D. Bourgeois3
1Faculty of Dentistry, Lebanese University, Beirut, Lebanon (Correspondence to B. Doughan: [email protected]).2Faculty of Health Sciences, American University of Beirut, Beirut, Lebanon.3Faculté d’Odontologie, Université Claude Bernard Lyon I, Lyon, France.Received: 31/03/03; accepted: 01/06/04
ABSTRACT The requirements for dentists in Lebanon for the year 2015 were estimated using the World Health Organization/World Dental Federation planning model. The aim was to help decision- and policy-makers in Lebanon to plan strategically for the supply of dental personnel in line with the recom-mendations of the Oral Health National Plan guidelines from 1995. Assumptions based on previous research in selected populations were taken to support the simulation. The number of dentists required for Lebanon in the year 2015 was estimated to be 2715 while the projected supply will be 6176. Urgent measures are needed to reduce the potential oversupply of dentists in this country.
Planifier le personnel dentaire au Liban : scénarios pour l’an 2015RÉSUMÉ On a estimé les besoins en dentistes au Liban pour l’année 2015 au moyen du modèle de planification mis au point par l'Organisation mondiale de la Santé/la Fédération dentaire internationale. L’objectif était d’aider les décideurs et responsables de l'élaboration des politiques au Liban dans la planification stratégique des effectifs dentaires conformément aux recommandations figurant dans les directives du Plan national de santé bucco-dentaire de 1995. Des hypothèses basées sur des travaux de recherche antérieurs dans certaines populations ont été utilisées pour obtenir cette simulation. On a estimé à 2715 le nombre de dentistes dont le Liban aura besoin en l’an 2015 tandis que les projections des effectifs dentaires sont de 6176. Des mesures urgentes sont nécessaires pour réduire l'excédent potentiel de dentistes dans le pays.
944 La Revue de Santé de la Méditerranée orientale, Vol. 11, No 5/6, 2005
�ملجلة �لصحية لشرL �ملتوسط، منظمة �لصحة �لعاملية، �ملجلد �حلا�E عشر، �لعد��� ٥-٦، ٢٠٠٥
Introduction
Despite the complexity of planning human resources for dental services, it is essential for a nation to adjust for the future supply of dental personnel and services [1]. Several industrialized countries have documented their experiences of dental planning, pro-jections, forecasting and evaluating dental human resources during the past 2 decades [2]. The oversupply and the underemploy-ment of dentists have been reported in many American and Scandinavian studies [3–5]. However, the topic has gained atten-tion in only a few countries of the Eastern Mediterranean Region [6]. In 1988, the World Health Organization (WHO) and the Federation Dentaire International (FDI) set guidelines as a model for the planning and monitoring of oral health services and care [7]. The model was intended to assist in the prediction of dental workforce requirements using a needs-based, demand-weighted as-sessment method.
In Lebanon, the number of dentists is in-creasing steadily. The dentist to population ratio was 1:1000 in 1994 and was described as being the highest in the Eastern Mediter-ranean Region [8]. Currently, it is estimated that there are 4111 dentists registered in the 2 Lebanese dental associations of Beirut and North Lebanon [9].
The purpose of this study was to esti-mate the need for dentists in Lebanon for the year 2015 using the WHO/FDI model. This would help decision- and policy-ma-kers in Lebanon to plan strategically for the supply of dental personnel in line with the recommendations of the Oral Health National Plan that was drawn up in 1995 after the National Workshop for Develop-ment of National Strategies on Oral Health [unpublished report].
Methods
Data were collected on the dental needs of the Lebanese population, demand for dental services in the population and the annual working time of a dental practitioner. The data for dental needs and demands were de-rived from 2 main surveys: the national oral health survey implemented in 1994 [8] and the oral health survey among 35–44-year-old adults [10]. The data for the estimates of annual working time were derived from a survey of dentists carried out in 1997 [11].
Assumptions: definitions and justificationsIn order to forecast the future needs of den-tists in Lebanon, different scenarios were tested based on the following factors:• The oral health status of the population
to be achieved according to specific ob-jectives.
• The percentage of the population to be covered by dental services.
• The annual working time of dentists.• The period of replacement of dental res-
torations and prostheses.
Oral health statusEstimates of the future oral health status of the population was based on the following assumptions:• Caries treatment: stable situation. The
Lebanese national oral health survey performed in 1994 showed that the mean decayed, missing and filled teeth (DMFT) index at 12 years of age was 5.7, the highest in the Eastern Mediter-ranean Region [8]. In the absence of any preventive strategy, it can be assumed that the DMFT index for all ages would not vary in the years following the study.

Eastern Mediterranean Health Journal, Vol. 11, Nos 5/6, 2005 945
�ملجلة �لصحية لشرL �ملتوسط، منظمة �لصحة �لعاملية، �ملجلد �حلا�E عشر، �لعد��� ٥-٦، ٢٠٠٥
• Caries treatment: improved situation. An alternative assumption was an improve-ment in the oral health of the Lebanese population, with a corresponding fall in the DMFT indices. DMFT values of the National Oral Health Plan objectives for the year 2015 estimated a DMFT of 2.0 at 12 years of age [unpublished report]. In the absence of data on the DMFT index for the 30–64-year-old cohort, values were estimated by extrapolating the theoretical curve for each level [12].
• Prostheses calculation. It is important to estimate the future needs of the popula-tion for dental prostheses. If there is an improvement in the oral health status of the population in the coming years, we can assume there will be a decrease in prosthetic needs. However, this decrease is expected to be minimal, because the high DMFT index at age 12 years means that prosthetic needs will remain impor-tant despite an improvement in the oral health of the population.
Percentage of the population to be covered by dental services Although the norms for the percentage of the population requiring dental treatment are difficult to verify, we applied the fi-gures from the WHO/FDI methodology for
developing countries [7]. Table 1 shows the results of 3 different scenarios of patient demand (maximal, intermediate and mini-mal).
Annual working time of dentistsData derived from a dentists’ survey in 1997 show that the annual working time of Lebanese dentists is on average 1050 hours a year [11]. Two scenarios were applied (a 20% underestimation and a 20% overesti-mation) resulting in a rough estimate of an-nual working times of 900 and 1200 hours respectively.
Period of replacement of dental restorations and prosthesesThe criteria for calculating the period of replacement of dental restorations and pros-theses was based on information from the literature. We assumed that the period of replacement of restorations and prosthetics could vary between 10 and 20 years.
Results
Tables 2 and 3 show the dentist to popula-tion ratio and minutes of treatment required according to different scenarios of patient demand, annual working hours and restora-tions and prostheses replacement periods.
Table 1 Percentage of patient demand per age cohort estimated according to different scenarios
Age cohort Patient demand scenario Maximal Intermediate Minimal demand demand demand (% of patients) (% of patients) (% of patients)
0–14 years 100 90 80
15–29 years 85 75 65
30–64 years 65 50 35
65–79 years 30 20 10
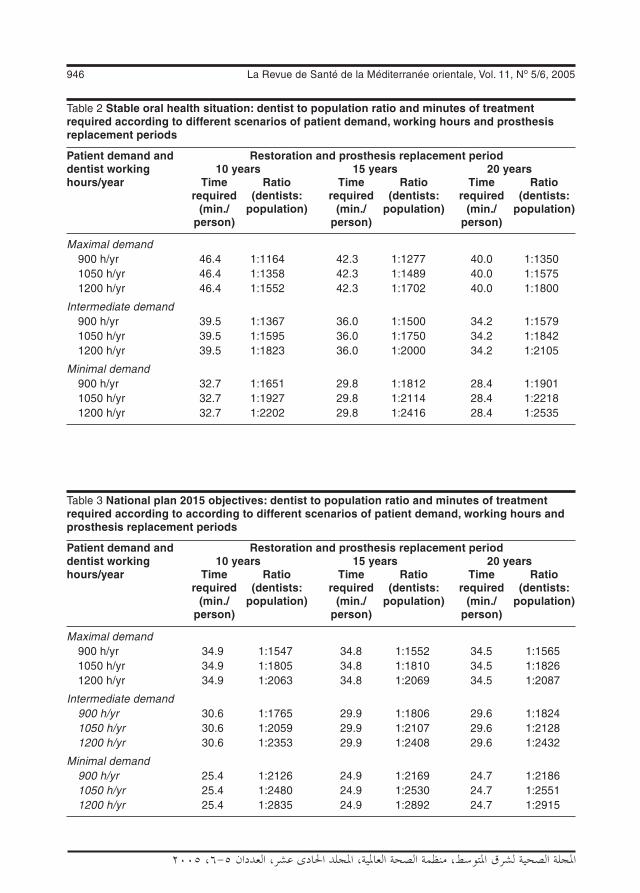
946 La Revue de Santé de la Méditerranée orientale, Vol. 11, No 5/6, 2005
�ملجلة �لصحية لشرL �ملتوسط، منظمة �لصحة �لعاملية، �ملجلد �حلا�E عشر، �لعد��� ٥-٦، ٢٠٠٥
Table 2 Stable oral health situation: dentist to population ratio and minutes of treatment required according to different scenarios of patient demand, working hours and prosthesis replacement periods
Patient demand and Restoration and prosthesis replacement period dentist working 10 years 15 years 20 years hours/year Time Ratio Time Ratio Time Ratio required (dentists: required (dentists: required (dentists: (min./ population) (min./ population) (min./ population) person) person) person)
Maximal demand 900 h/yr 46.4 1:1164 42.3 1:1277 40.0 1:1350 1050 h/yr 46.4 1:1358 42.3 1:1489 40.0 1:1575 1200 h/yr 46.4 1:1552 42.3 1:1702 40.0 1:1800
Intermediate demand 900 h/yr 39.5 1:1367 36.0 1:1500 34.2 1:1579 1050 h/yr 39.5 1:1595 36.0 1:1750 34.2 1:1842 1200 h/yr 39.5 1:1823 36.0 1:2000 34.2 1:2105
Minimal demand 900 h/yr 32.7 1:1651 29.8 1:1812 28.4 1:1901 1050 h/yr 32.7 1:1927 29.8 1:2114 28.4 1:2218 1200 h/yr 32.7 1:2202 29.8 1:2416 28.4 1:2535
Table 3 National plan 2015 objectives: dentist to population ratio and minutes of treatment required according to according to different scenarios of patient demand, working hours and prosthesis replacement periods
Patient demand and Restoration and prosthesis replacement period dentist working 10 years 15 years 20 years hours/year Time Ratio Time Ratio Time Ratio required (dentists: required (dentists: required (dentists: (min./ population) (min./ population) (min./ population) person) person) person)
Maximal demand 900 h/yr 34.9 1:1547 34.8 1:1552 34.5 1:1565 1050 h/yr 34.9 1:1805 34.8 1:1810 34.5 1:1826 1200 h/yr 34.9 1:2063 34.8 1:2069 34.5 1:2087
Intermediate demand 900 h/yr 30.6 1:1765 29.9 1:1806 29.6 1:1824 1050 h/yr 30.6 1:2059 29.9 1:2107 29.6 1:2128 1200 h/yr 30.6 1:2353 29.9 1:2408 29.6 1:2432
Minimal demand 900 h/yr 25.4 1:2126 24.9 1:2169 24.7 1:2186 1050 h/yr 25.4 1:2480 24.9 1:2530 24.7 1:2551 1200 h/yr 25.4 1:2835 24.9 1:2892 24.7 1:2915

Eastern Mediterranean Health Journal, Vol. 11, Nos 5/6, 2005 947
�ملجلة �لصحية لشرL �ملتوسط، منظمة �لصحة �لعاملية، �ملجلد �حلا�E عشر، �لعد��� ٥-٦، ٢٠٠٥
The results of the stable oral health situation are presented in Table 2. The values of the dentist to population ratio vary between 1:1164 (for a maximal demand and a period of restoration replacement of 10 years) and 1:2535 (for a minimal demand and a replace-ment period of 20 years).
The results of an improved oral health situation according to the Lebanese national plan for 2015 are presented in Table 3. As-suming that restorations and fillings should be changed every 10 years, the results show that the annual working time per dentist is 34.9 minutes for a maximal demand (100% of dental coverage for the 0–14 years), and an estimated dentist to population ratio of 1:1805 when using the average dentists’ working time. An under- or overestimation of the dentists’ working time will lead to a dentist to population ratio of 1:1547 and 1:2063 respectively.
According to the Central Administration for Statistics [13], the Lebanese population has an annual growth rate of 1.65%. The projected population will therefore be 4.2 million by the year 2015. Based on this projection, and the previous determinants
of workforce requirements, the estimated dentist to population ratio obtained using the WHO/FDI model is 1:1547, yielding a need for 2715 dentists.
Projection of the number of dentists In the absence of any health strategy, we can assume that the behaviour of dentists within their profession will not change. This situa-tion is known as status quo where the same patterns of inflow and outflow of dentists will be observed. The annual number of new dentists entering the market will be equal to the number of new graduates from national and foreign universities minus the number of dentists leaving the profession because of retirement, death or immigration. This number can be calculated graphically using a linear regression of the evolution of the number of dentists during the last 20 years (Figure 1). The results of this forecast show that the number of dentists by year 2015 will be 6176, assuming the stability of pat-terns observed, and hence an oversupply of more than 3400 dentists, with a dentist to population ratio of 1:680.
Figure 1 Forecast of the number of dentists in Lebanon by year 2015 in the “status quo” scenario

948 La Revue de Santé de la Méditerranée orientale, Vol. 11, No 5/6, 2005
�ملجلة �لصحية لشرL �ملتوسط، منظمة �لصحة �لعاملية، �ملجلد �حلا�E عشر، �لعد��� ٥-٦، ٢٠٠٥
Impact of reducing the number of new graduatesFigure 2 shows the impact of reducing the number of new graduates on the overall number of dentists. A 25% and a 50% reduction in the number of new graduates from national and foreign universities will lower the number of dentists to 5689 and 5197 respectively.
Discussion
Data analysis showed that the highest dentist to population ratio (1:1164) was obtained when applying the scenario of a stable oral health situation and a high demand for care. This ratio decreased to 1:1547 in the scenario based on the 2015 national plan. The improvement in the oral health of the population will lead to a reduced need for dental personnel.
The results showed a positive impact of the annual dentists’ working time on the dentist to population ratio. Assuming that the period of replacement for dental restorations and prostheses is constant, an increase in the annual working time of den-
tists will lead to a reduction in the number of dentists required to serve the community. It is therefore important when planning dental manpower to take into account socioeco-nomic factors that can modify the beha-viour and practice of dentistry. These factors include an increase in the number of female dentists [5], a restriction in the number of new graduates (numerus clausus), changes in taxes, changes in the administration of dental clinics and changes in the lifestyle of citizens [14].
Furthermore, the period of replace-ment for restorations and prostheses is an important factor in the planning of dental manpower. Assuming that this period va-ries between 10 to 20 years, the activity of dentists will decrease 14% in the case of a stable situation scenario. The quality of care plays a key role in the determination of the replacement period. Restorations of high quality will last longer than restora-tions of lower quality. Changes would be observed in the near future not only because of improvements in dental materials and re-search, improved training of future dentists but also because of the willingness of the
Figure 2 Impact of reducing the number of new dental graduates on the supply of dentists in Lebanon
Eastern Mediterranean Health Journal, Vol. 11, Nos 5/6, 2005 949
�ملجلة �لصحية لشرL �ملتوسط، منظمة �لصحة �لعاملية، �ملجلد �حلا�E عشر، �لعد��� ٥-٦، ٢٠٠٥
dental profession to reinforce preventive policies leading to longer lasting restora-tions [14].
Another factor that should be taken into consideration in dental manpower planning is the percentage of the population to be covered by dental care. Full coverage of children aged 0–14 years is mandatory for the improvement of the oral health of the population. Demand for dental services of 85%, 65% and 30% for the age cohorts 15–29, 30–64 and 65–79 years respectively is considered to be maximal demand and an objective to be reached. These percentages are recommended by WHO and FDI for developing countries [7].
Our results showed that dentists’ acti-vity varies according to the percentage of the population covered by dental care. In the stable oral health scenario, dentists’ activity dropped 30% when the demand moved from the maximal to the minimal level (from 46.4 to 32.7 minutes/person).
According to the data derived from the Lebanese Dental Association, 4111 dentists are registered in Lebanon. The number of dentists has increased considerably during the last 20 years, by 2.5 between 1980 and 1990 and has doubled between 1990 and 1999. The current average dentist to popu-lation ratio is 1:800, which is the highest in the Eastern Mediterranean Region [8]. In addition, a severe maldistribution of dental manpower is observed in the country. This ratio reaches 1:387 and 1:459 in Beirut, the capital, and Mount Lebanon respectively. On the other hand, the dentist population is young, with half of them aged between 32 and 46 years.
It is imperative to try to solve this gro-wing problem. The current dentist to popu-lation ratio is far different from the desired ratio obtained with the WHO/FDI model. Lebanon is facing a major oversupply of
dentists. The highest dentist to population ratio obtained using the model was 1:1164 in the most unfavourable situation, i.e. as-suming a stable oral health status, a 10-year period of restoration replacement, a maxi-mal demand and an under-estimation of dentist working time. If no action is taken to solve this problem, the number of dentists in the year 2015 will rise by 70% and the num-ber of dentists will be approximately 6176, with a dentist to population ratio of 1:680. If Lebanon adopts a national oral health stra-tegy according to the national plan for 2015, the need for dental personnel will be lower still. According to the model, the highest dentist to population ratio needed is 1:1547, when applying the hypothesis of maximal demand, the minimum annual working hours per dentist and a minimum period of restoration replacement. When adopting the graphical projection, the number of dentists needed was 2715 according to the national plan objectives for year 2015.
Although some may believe that an oversupply of dentists may benefit the public by delivering better services at lower prices in a free market [15], the imbalance in dental manpower can lead to undesir-able consequences at the professional, economic, health and social levels [16]. Dentist oversupply may adversely affect conditions of practice and patterns of work. Dentists may experience unemployment, underemployment or reduced opportunities for employment. Dentists can experience a drop in their real income. There may be increasing competition between profes-sionals. There may be a deterioration in the quality of care. There could even be a threat to ethical principles, for example if there is a temptation to over-treat patients, introduce unnecessary services or fail to refer when indicated [16].
950 La Revue de Santé de la Méditerranée orientale, Vol. 11, No 5/6, 2005
�ملجلة �لصحية لشرL �ملتوسط، منظمة �لصحة �لعاملية، �ملجلد �حلا�E عشر، �لعد��� ٥-٦، ٢٠٠٥
The imbalance in dental manpower seems to be an international issue. The oversupply of dentists has been a major concern in various industrialized countries for the last decade and several studies on dental manpower planning have been published. Lewis reported that the shortage of dentists increased from 32% in 1978 to 46% in 1984 in Canada [17]. Dental schools in North America reduced class sizes due to a perceived oversupply of dentists [18]. The oversupply of dentists in America has been described in many publications [2–4]. Bea-grie reported that Scandinavian countries have also reported severe underemployment and unemployment problems for dentists with a dentist to population ratio lower than 1:1000 [5]. However, and in contrast to developing countries, oral health in these countries has improved considerably (and dental caries decreased) during the pervious decades.
Some ideas to solve this problem have been suggested in the literature. Restric-ting the number of undergraduate students has been implemented in many countries [3,5,18,19]. This solution might prove to be insufficient in Lebanon, if it is not coupled with other measures. Projections showed that a 25% and a 50% reduction in the number of undergraduates will lead to a reduction of 8% and 16% in the number of dentists respectively in 2015. The dentist to population ratio will become 1:743 and 1:813 respectively. The oversupply can be
controlled by reducing the inflow of gradu-ates of foreign dental schools [20].
Mann et al. cited a number of solutions that can help solve the problem of oversup-ply [15]. Increasing demand for services might be the most convenient and reaso-nable approach. Financing dental services or the presence of a third party payment is an additional approach to increase demand on services. An improved geographical distribution of dentists might be considered as a short-term solution.
Because of the long training time of den-tists and because repercussions of a decision arise 6 to 10 years after it has been taken, measures should be taken urgently in order to reduce the supply of dentists [21].
Conclusion
Given the situational analysis on the uti-lization of dental services and the current oral health status in Lebanon, a theoreti-cal assessment of the need for oral health providers has been presented. Using the WHO/FDI planning model, it is believed that the country is facing an oversupply of dental human resources. As such, this calls for an urgent need to monitor closely the supply and demand for dental services. The establishment of such a monitoring and evaluation system should help the decision-makers in better formulating appropriate policies and strategies to improve the oral health of the Lebanese population.
References
1. Morgan MV et al. Workforce predictions: a situational analysis and critique of the World Health Organisation model. Inter-national dental journal, 1994, 44:27–32.
2. Goodman HS, Weyant RJ. Dental health personnel planning: a review of the li-terature. Journal of public health dentistry, 1990, 50:48–63.
3. Nash K. Looking back on the 80’s. A de-cade of change in dentistry. Journal of the American Dental Association, 1991, 122:83–4.
4. Douglass CW, Furino A. Balancing dental service requirements and supplies: epi-

Eastern Mediterranean Health Journal, Vol. 11, Nos 5/6, 2005 951
�ملجلة �لصحية لشرL �ملتوسط، منظمة �لصحة �لعاملية، �ملجلد �حلا�E عشر، �لعد��� ٥-٦، ٢٠٠٥
demiologic and demographic evidence. Journal of the American Dental Associa-tion, 1990, 121:587–92.
5. Beagrie GS. Dental manpower. An FDI/WHO viewpoint. Journal of the Canadian Dental Association, 1986, 52:52–5.
6. Ahmed AA, Fateha B, Benjamin S. De-mand and supply of doctors and dentists in Bahrain, 1998–2005. Eastern Mediter-ranean health journal, 2000, 6:6–12.
7. World Health Organization/Fédération Dentaire Internationale. Health through oral health: guidelines for planning and monitoring for oral health care. London, Quintessence Publishing Company, 1989.
8. Doughan B, Doumit M. Oral health in Lebanon: a situation analysis. Beirut, Lebanese University, 1995.
9. Naltchayan L. Panorama du système dentaire au Liban—recommandations. Association for Comparative Economic Studies bulletin, 2002, 23:65–71.
10. Doughan B, Kassak K, Bourgeois DM. Oral health status and treatment needs of 35–44-year old adults in Lebanon. Inter-national dental journal, 2000, 50:395–9.
11. Doughan B. Contribution à la planifica-tion des besoins en personnels de santé bucco–dentaire au Liban [DSO thesis]. Beirut, Lebanese University, 2003.
12. Leclercq MH, Barmes DE, Infirri JS. Oral health: global trends and projections. World health statistics quarterly, 1987, 40:116–28.
13. Bulletin no.1. Beirut, Central Administra-tion for Statistics, 2000.
14. Bourgeois D et al. The application of the theoretical model WHO/FDI planning sys-tem to an industrialized country: France. International dental journal, 1993, 43:50–8.
15. Mann J et al. Dental underemployment: a study of uncontrolled dental manpower immigration. International dental journal, 1993, 43:317–22.
16. Bankowski Z, Meija A. Health manpower out of balance. Conflicts and prospects. Geneva, Council for International Organi-zations of Medical Sciences, 1986.
17. Lewis JM, Morgan MV, Wright FAC. The validity of CPITN scoring and presenta-tion method for measuring periodontal conditions. Journal of clinical periodontol-ogy, 1994, 21:1–6.
18. Stangel I. Factors affecting the future need for dental manpower in Canada and Quebec. Journal of the Canadian Dental Association, 1992, 58:1005–14.
19. L’offre des soins. La santé bucco-dentaire en chiffres. Paris, Association Dentaire Française, 1998:20–7.
20. House RK, Johnson GC, Edwards FA. Manpower supply study scenarios for the future: dental manpower to 2001. Jour-nal of the Canadian Dental Association, 1983, 2:85–98.
21. Colombet P, Bourgeois D, Vandeputte D. Needs, demands and manpower balance. Dentists/Populations FDI Commission 1996. International dental journal, 1996, 46:543–7.
952 La Revue de Santé de la Méditerranée orientale, Vol. 11, No 5/6, 2005
�ملجلة �لصحية لشرL �ملتوسط، منظمة �لصحة �لعاملية، �ملجلد �حلا�E عشر، �لعد��� ٥-٦، ٢٠٠٥
Smoking prevalence, knowledge and attitudes among medical students in Karachi, PakistanF.M. Khan,1 S.J. Husain,1 A. Laeeq,1 A. Awais,1 S.F. Hussain1 and J.A. Khan1
1Section of Pulmonary Medicine, Aga Khan University, Karachi, Pakistan (Correspondence to J.A. Khan: [email protected]).Received: 05/10/03; accepted: 17/05/04
ABSTRACT A survey of smoking prevalence and attitudes was made among medical students ran-domly selected from classes at the Aga Khan University, Karachi, Pakistan. Of 271 respondents, 14.4% were current smokers (22.0% male and 3.8% females) and 3.3% ex-smokers. A majority of students recognized the dangers associated with active as well as passive smoking although only 55% of cur-rent smokers planned to quit in the near future. Most smokers (96%) believed that they as well as other health professionals needed training on smoking cessation and 95% of all students believed that doc-tors should play a role model in smoking cessation by not smoking themselves. Specific training and counselling should be a part of the required curriculum at medical schools.
Prévalence du tabagisme, connaissances et attitudes en la matière chez les étudiants en médecine à Karachi (Pakistan)RÉSUMÉ Une enquête sur la prévalence du tabagisme et les attitudes en la matière a été réalisée auprès d’étudiants en médecine de l’Université Aga Khan de Karachi (Pakistan) choisis au hasard. Sur les 271 répondants, 14,4 % étaient fumeurs au moment de l'enquête (22,0 % d'hommes et 3,8 % de femmes) et 3,3 % des ex-fumeurs. Une majorité d’étudiants reconnaissaient les dangers associés au tabagisme actif et passif même si seulement 55 % des fumeurs au moment de l'enquête prévoyaient d'arrêter de fumer dans un avenir proche. La plupart des fumeurs (96 %) pensaient qu'ils avaient be-soin, eux-mêmes ainsi que d'autres professionnels de la santé, d’une formation au sevrage tabagique et 95 % de l’ensemble des étudiants pensaient que les médecins devaient montrer l'exemple en ma-tière de sevrage tabagique en ne fumant pas eux-mêmes. Une formation et des conseils spécifiques devraient faire partie du programme d’études des écoles de médecine.
Eastern Mediterranean Health Journal, Vol. 11, Nos 5/6, 2005 953
�ملجلة �لصحية لشرL �ملتوسط، منظمة �لصحة �لعاملية، �ملجلد �حلا�E عشر، �لعد��� ٥-٦، ٢٠٠٥
Introduction
The harmful consequences of smoking on health have been well documented. Data from recent studies have confirmed the quantitative relationship between smoking and many diseases such as coronary artery disease, lung cancer, bladder cancer, pul-monary emphysema, peripheral vascular di-sease and neonatal mortality [1–3]. In 2000, an estimated 4.83 million premature deaths were attributable to smoking, of which al-most 50% were in developing countries [4]. Most high-income countries are showing a continuous and steady decline in the preva-lence of smoking [5]. In contrast, tobacco use in developing countries such as Pakistan continues to rise each year. Globally du-ring the past 2 decades cigarette production has increased at an average of 2.2% each year, outpacing the population growth rate of 1.7% [5]. Out of a total population of 78 million in Pakistan in 1995, 36% males and 9% females aged 15 years or older were found to be smokers [6].
Data on the smoking habits of medical students is of particular interest. As doctors, they will be responsible for providing health care to the population and can influence the future health policies of their country. A study conducted in 1993 among medi-cal students of the Aga Khan University, Karachi, showed that 11% of the medical students were smokers (males 17%, females 4%) [7]. The present study aimed to estab-lish the prevalence of smoking and know-ledge and attitude towards smoking among the students of a medical university.
Methods
A survey was conducted among medical students of the Aga Khan University, Ka-rachi, Pakistan using a modified version of the questionnaire of the International Union
Against Tuberculosis and Lung Disease (IUATLD) [8]. In February 2000, 300 medical students were randomly selected from the total number of just over 400. The aim was to obtain completed questionnaires from at least 70% of the total number of medical students studying in the university at the time of the survey. Questionnaires were distributed to 300 students and replies received from 271 students. Complete con-fidentiality was assured to all the students participating in the survey.
The modified IUATLD questionnaire sought information about tobacco use, age, sex and place of residence. Information about whether a medical student lived at home or in a hostel aimed to determine if this affected the rate of tobacco use. Students were asked about the age at which they began smoking and whether or not they had smoked at least 100 cigarettes or an equivalent amount of tobacco. They were questioned about the reasons behind the decision to start smoking as well as their perception of the most convincing reason for stopping smoking.
The questionnaire sought respondents’ views about a proposed ban on smoking in the medical school campus, in hospitals and other public places; about a ban on cigarette advertising; and about social issues associ-ated with smoking, e.g. the sale of tobacco to children and the low price of tobacco products in Pakistan (since carrying out this study a law was passed in Pakistan to ban the sale of tobacco products to under 18-year-olds). The students were asked whether smokers should have opportunities to attend smoking cessation programmes and whether health professionals should be given skills training in the core curriculum to help them with patients who wish to stop smoking. The medical students’ knowledge about the diseases caused by smoking was also tested.
954 La Revue de Santé de la Méditerranée orientale, Vol. 11, No 5/6, 2005
�ملجلة �لصحية لشرL �ملتوسط، منظمة �لصحة �لعاملية، �ملجلد �حلا�E عشر، �لعد��� ٥-٦، ٢٠٠٥
A smoker was defined as someone who continued to smoke any amount of tobacco either regularly or occasionally, a never smoker was one who had never smoked and an ex-smoker was one who had smoked either occasionally or regularly in the past but had now quit completely.
All the data were entered and analysed using the Epi-Info program for Windows, version 6.0.
Results
We received 271 completed question-naires from 300 students; 59% (n = 160) were male and 41% (n = 111) female. The mean age of the respondents was 19.9 years (range 17–28 years). Of the respondents, 39 (14.4%) were current smokers, 223 (82.3%) non-smokers and 9 (3.3%) ex-smokers (Table 1). The prevalence of smoking was much higher among males (22%) than fe-males (4%).
Over half (59%) of all respondents lived away from their homes in the university hostel on campus; a higher proportion of current smokers (72%) lived on campus.
Profile of current smokersThe mean age of starting smoking among the 39 current smokers was 17.9 (range 13–24) years, with 63% of the smokers admitting to having smoked at least 100 cigarettes or tobacco equivalent. Of current smokers, 55% were regular smokers (2–10 cigarettes/day) while 45% were occasional smokers (≤ 1 cigarettes/day). Nearly half (55%) of the smokers started smoking be-fore joining medical school and 45% during their stay in medical school. Both groups began smoking socially with friends but found it habit-forming over time.
The parental smoking habits of the current smokers were evaluated. It was noted that 38% of the parents were current smokers and 21% were ex-smokers. The majority (73%) of current smokers in our survey believed that parental habits had not influenced their decision to smoke. Over half (55%) of current smokers planned to quit smoking in the future and health reasons were the number one influencing factor (41%). Of the 45% current smokers who wanted to continue smoking, 63% said that they planned to stop within 5–10 years while the rest wanted to continue indefinitely. Of the current smokers, 46% had tried at least once in their life to quit smoking without any success.
When the ex-smokers and non-smokers were asked why they quit or did not ever take up smoking, the main reasons reported were health concerns (45%) followed by parental/family guidance or pressure (16%).
Beliefs about tobacco controlRegarding methods to control the increa-sing epidemic of tobacco use in develo-ping countries, 86% of the 271 respondents thought that smoking should be banned in offices and public places and 95% favoured a
Table 1 Smoking status of medical students in Karachi
Smoking status % of respondents (n = 271)
Current smoker 14.4
Regular (2–10 cigarettes/ day) 7.9
Occasional (≤ 1 cigarette/ day) 6.5
Never smoker 82.3
Ex-smoker 3.3
n = total number of respondents.

Eastern Mediterranean Health Journal, Vol. 11, Nos 5/6, 2005 955
�ملجلة �لصحية لشرL �ملتوسط، منظمة �لصحة �لعاملية، �ملجلد �حلا�E عشر، �لعد��� ٥-٦، ٢٠٠٥
smoking ban on the medical school campus and in the hospital (Table 2). Having a li-mited number of designated smoking areas (open 24 hours) for smokers was supported by 88% of the students. Even 54% of cur-rent smokers also supported a smoking ban on the campus and in the hospital except for a few designated areas. A complete ban on cigarette advertisements, which included television, magazines, newspapers, bill-boards, and ban on sports sponsorship was favoured by 75% of all respondents. Nearly all the 39 smokers (96%) thought that health professionals should have specific training on how to support patients who wanted to quit smoking and that sale of tobacco cigarettes to under-age children should be prohibited and punished. Health warnings on cigarette packages were supported by 85% of the responders. Nearly half (58%) of
the respondents wanted the price of tobacco products to be increased sharply in an effort to deter people from smoking cigarettes.
Knowledge and beliefs about health risksAlmost all the medical students believed that both active as well as passive smoking were injurious to health (Table 3). When questioned on the ensuing hazards related to smoking 100% of respondents recog-nized lung cancer. Nearly 5% believed that
Table 2 Opinions of medical students in Karachi about methods of controlling tobacco use
Item % agreeing (n = 271)
Smoking should be banned in offices and public places 86
Smoking should be banned on this university campus 95
Designated smoking areas should be available on campus 99
Health professionals should have special training on how to support patients quitting smoking 96
All cigarette advertising and sponsorship should be banned 75
Health warnings should be printed on cigarette packets 85
Price of tobacco products should be increased greatly 58
n = total number of respondents.
Table 3 Knowledge and beliefs of medical students in Karachi about hazards of smoking and role of physicians in helping patients to quit
Item % agreeing (n = 271)
Both active and passive smoking are injurious to health 98
Smoking is a risk for: Lung cancer 100 Oral and laryngeal cancer 95 Bladder cancer 72 Stroke and coronary artery disease 95 Neonatal death 89
Most smokers can stop if they want to 90
Physicians are responsible for educating patients to stop 90
Most people will not give up smoking even if their doctor advises it 92
Doctors should set a good example by not smoking 95
Doctors are more likely to advise people to quit if they have had adequate training 98
My own current knowledge is sufficient to counsel patients who want to quit 79n = total number of respondents.
956 La Revue de Santé de la Méditerranée orientale, Vol. 11, No 5/6, 2005
�ملجلة �لصحية لشرL �ملتوسط، منظمة �لصحة �لعاملية، �ملجلد �حلا�E عشر، �لعد��� ٥-٦، ٢٠٠٥
there was no association between tobacco use and oral cancer, laryngeal cancer, stroke or coronary artery disease. The association of smoking with neonatal death was not recognized by 11%, and bladder cancer as a consequence of smoking was not known by 22%.
Nearly 90% of all respondents agreed that most smokers could stop if they wanted to and that it is the responsibility of physi-cians who provide care to educate patients to stop smoking. On the other hand, 92% of respondents believed that most people would not give up smoking even if their physicians counselled them to do so. Nearly 95% of respondents agreed that doctors should set a good example by not smoking themselves and needed to be more active in raising the level of public awareness regar-ding the risks of cigarette smoking. Almost all of the respondents (98%) believed that doctors would be more likely to advise people to quit if they had received adequate training in smoking cessation therapy and 79% of all respondents believed that their current knowledge was sufficient to counsel patients who wanted to quit smoking.
Discussion
We took medical students as the focus of our survey as the attitudes and practices towards tobacco use of these young health professionals can influence future poli-cies and practice. If doctors and medical students are smoking then the credibility of anti-smoking messages to the public is lost. Medical students are a group that should be more aware than young people of the same age about the health hazards associated with smoking. The response rate was about 90%. The prevalence of current smokers among medical students in the year 2000 was 14.4%, which is higher than a
similar study conducted in 1993 (11%) [7]. However, this is lower than the prevalence of current smokers in studies of European medical students (21%) [9] and other Asian medical students (18%–24%) [10,11]. The prevalence of smoking in medical students of this university was lower then the ge-neral population; a recent survey recorded the overall prevalence of current smoking in adult males in Karachi, Pakistan was 34% [12].
A higher proportion of the current smokers lived in the university hostel. Li-ving away from the influence of their par-ents could have had a role in tobacco use, as 45% of smokers had started after joining university. Peer pressure also is an impor-tant reason for starting to smoke. Most of the smokers in our survey admitted to ha-ving started by smoking socially. Most of the smokers (73%) in our study did not think that their habit was influenced by pa-rental smoking habits. Their beliefs contrast with another study showing a statistically significant positive correlation between pa-rental tobacco use and the risk of smoking among students [13].
The majority of current smokers wanted to quit smoking in the future, with health reasons being the major concern. This was also the most common reason for giving up smoking among the ex-smokers and for not starting smoking among non-smokers. This shows that, probably due to the ongoing anti-smoking campaign in Pakistan, medi-cal students are aware of many, if not all, of the health risks associated with smoking. Like smokers among the general public, a high proportion (45%) of medical students had also tried to quit smoking at least once in their lives but without success. Special training is therefore required for all health professionals and medical students to assist them in giving up smoking.
Eastern Mediterranean Health Journal, Vol. 11, Nos 5/6, 2005 957
�ملجلة �لصحية لشرL �ملتوسط، منظمة �لصحة �لعاملية، �ملجلد �حلا�E عشر، �لعد��� ٥-٦، ٢٠٠٥
It was encouraging to see that almost all students thought that smoking, including passive smoking, was injurious to health. All of the students were aware of the as-sociation of lung cancer with smoking but 5% medical students thought that there was no association between tobacco use and oral cancer, laryngeal cancer, stroke or coronary artery disease. A significant minority did not associate smoking with increased risk of neonatal death (11%) and bladder cancer (22%). Better undergraduate medical trai-ning of medical students about all the health risks associated with smoking is required so that as physicians they are better prepared to counsel patients who smoke.
Nearly all the respondents agreed that physicians or medical students should not smoke as they are role models in society and it is part of their individual responsibility to curb the problem of smoking and to take an active part in raising awareness of the health risks in the general population. Medical stu-dents at the Aga Khan University Hospital were strongly in favour of having training about smoking cessation techniques and a
curriculum that addresses the medical and social consequences of tobacco abuse. The majority of medical student respondents felt that a change in the curriculum, which addressed the issue of smoking and tech-niques of smoking cessation would provide health professionals with a more informed perspective about this deadly but preven problem.
Conclusion
This study shows that despite the increasing awareness of the health problems due to to-bacco use, smoking is still common among medical students. Smoking should be banned in hospitals and other public places and specific training in counselling about smoking should be a part of the required curriculum at medical schools. Future doc-tors should be better prepared to protect themselves and their patients from tobacco smoking, the single largest preven cause of death and disease in the world today.
References
1. Dhala A, Pinsker K, Prezant DJ. Respi-ratory health consequences of environ-mental tobacco smoke. Medical clinics of North America, 2004, 88:1535–5.
2. Doll R et al. Mortality in relation to smo-king: 50 years’ observations on male Bri-tish doctors. British medical journal, 2004, 328:1519.
3. Doll R et al. Mortality from cancer in rela-tion to smoking: 50 years observations on British doctors. British journal of cancer, 2005, 92(3):426–9.
4. Ezzati M, Lopez AD. Estimates of global mortality attributable to smoking in 2000. Lancet, 2003, 362:847–52.
5. Crofton J, Simpson D. Tobacco: a global threat. London, Macmillan, 2002.
6. Alam SE. Current smoking and having smoked 100+ cigarettes, beedis, chillum or huqqa in his/her lifetime. Prevalence and pattern of smoking in Pakistan. Jour-nal of the Pakistan Medical Association, 1998, 48:64–6.
7. Hussain SF, Moid I, Khan JA. Attitudes of Asian medical students towards smoking. Thorax, 1995, 50(9):996–7.
8. Slama K, ed. Tobacco control and pre-vention: a guide for low income countries. Paris, International Union Against Tuber-culosis and Lung Disease, 1998:98–100.

958 La Revue de Santé de la Méditerranée orientale, Vol. 11, No 5/6, 2005
�ملجلة �لصحية لشرL �ملتوسط، منظمة �لصحة �لعاملية، �ملجلد �حلا�E عشر، �لعد��� ٥-٦، ٢٠٠٥
9. Tessier JF et al. Smoking habits and attitudes of medical students towards smoking and anti smoking campaigns in fourteen European countries. European journal of epidemiology, 1989, 5:311–21.
10. Tessier JF et al. Smoking habits and attitudes of medical students towards smoking and anti-smoking campaigns in nine Asian countries. International journal of epidemiology, 1992, 21:298–304.
11. Omman A, Kazmi T, Alam SE. Smoking prevalence and awareness about tobacco related diseases among medical students of Ziauddin Medical University. Journal of
the Pakistan Medical Association, 2002, 52(9):388–9.
12. Khuwaja AK, Kadir MM. Smoking among adult males in an urban community of Ka-rachi, Pakistan. Southeast Asian journal of tropical medicine and public health, 2004, 354(4):999–1004.
13. Rozi S et al. Prevalence and factors as-sociated with current smoking among high school adolescents in Karachi, Paki-stan. Southeast Asian journal of tropical medicine and public health, 2005, 36 (2):498–504.
International survey on health professionals and tobacco shows 23% of health professionals smokeIn May, the World Health Organization Regional Office for the Eastern Mediterranean announced the results of the second stage of an impor-tant survey on smoking among health professionals which was devel-oped by WHO in collaboration with the Centers for Disease Control and Prevention (USA), International Agency for Research on Cancer, Emory University (USA) and University of New South Wales (Australia).In total, 11 000 health professionals in 5 countries of the WHO Eastern Mediterranean Region (Egypt, Jordan, Libyan Arab Jamahiriya, Qatar and Saudi Arabia) completed the second round of the Health Profes-sionals Survey, the first round of which was administered in Bahrain, Islamic Republic of Iran, Kuwait, Oman and Sudan.The vast majority (97.9%) of survey participants agreed that smoking is harmful to health. However 23% reported they were current smok-ers, 10% were former smokers and 67% had never smoked. Over 75% of health professionals in the countries surveyed consistently agreed with the need to implement the elements of comprehensive tobacco control. Health professionals are well positioned to advocate for and support the implementation of such tobacco control.
Source: EMRO Press release No. 6 May 2005

Eastern Mediterranean Health Journal, Vol. 11, Nos 5/6, 2005 959
�ملجلة �لصحية لشرL �ملتوسط، منظمة �لصحة �لعاملية، �ملجلد �حلا�E عشر، �لعد��� ٥-٦، ٢٠٠٥
Prevalence and type of anaemia in young Egyptian patients with type 1 diabetes mellitusN. Salah,1 F. Abd El Hamid,2 S. Abdelghaffar1 and M. El Sayem1
1Departments of Paediatrics, Diabetic Endocrine and Metabolic Paediatric Unit (DEMPU); 2Department ofClinical Pathology, Faculty of Medicine, University of Cairo, Cairo, Egypt (Correspondence to S. Abdel Ghaffer: [email protected]). Received: 30/09/03; accepted: 15/03/04
ABSTRACT Over a 2-month period, 200 type 1 diabetic patients attending a paediatric diabetic clinic in Cairo, Egypt were screened for anaemia and other complications of diabetes. The mean age was 11.2 years and the mean duration of diabetes was 4.0 years. Anaemia was diagnosed in 75 patients (37.5%) overall: 45 had microcytic hypochromic anaemia, 18 normocytic normochromic and 12 macrocytic hy-perchromic. Of the 75, 41 patients (54.7%) had iron deficiency, 14 (18.7%) had folate deficiency and 14 (18.7%) had thalassaemia minor. Three patients (4%) had coeliac disease, and 18 patients (24%) had parasitic infections. None of the patients had hypothyroidism, renal failure or vitamin B12 deficiency.
Prévalence et type d’anémie chez de jeunes patients égyptiens atteints de diabète sucré de type 1RÉSUMÉ Sur une période de 2 mois, 200 patients diabétiques de type 1 consultant dans une clinique du diabète pédiatrique au Caire (Égypte) ont été examinés à la recherche d’une anémie et d’autres complications du diabète. L’âge moyen était de 11,2 ans et la durée moyenne du diabète était de 4,0 ans. Une anémie a été diagnostiquée chez 75 patients (37,5 %) en tout : 45 avaient une anémie hypochrome microcytaire, 18 une anémie normochrome normocytaire et 12 une anémie hyperchrome macrocytaire. Sur les 75 patients, 41 (54,7 %) avaient une carence en fer, 14 (18,7 %) avaient une carence en folates et 14 (18,7 %) avaient une thalassémie mineure. Trois patients (4 %) avaient une maladie cœliaque, et 18 patients (24 %) avaient une parasitose. Aucun des patients n’avait d’hypothyroïdie, d’insuffisance rénale ou de carence en vitamine B12.

960 La Revue de Santé de la Méditerranée orientale, Vol. 11, No 5/6, 2005
�ملجلة �لصحية لشرL �ملتوسط، منظمة �لصحة �لعاملية، �ملجلد �حلا�E عشر، �لعد��� ٥-٦، ٢٠٠٥
Introduction
The etiology of anaemia in type 1 diabetes is diverse. Diabetic patients who, through neglect or ignorance, do not follow the appropriate dietary regimes, are at-risk of developing nutritional deficiency anae-mia, especially iron and folate deficiency. Moreover, diabetics with poor glycaemic control are susceptible to recurrent attacks of ketoacidosis which may be accompanied by anorexia, severe vomiting with frequent hospitalization and excessive calorie loss [1]. The occurrence of diabetic nephropathy with ultimate renal failure is an important cause of anaemia in these patients [2]. The association of type 1 diabetes and coeliac disease has been widely reported, the latter being associated with iron, folic acid and vitamin B12 deficiencies. Hashimoto thyroi-ditis, resulting in acquired hypothyroidism, is strongly associated with type 1 diabetes and is commonly accompanied by anaemia [3]. Thalassaemia minor is relatively com-mon in the Mediterranean area and should be considered in the differential diagnosis of anaemia [4].
The aim of this study was to record the prevalence of anaemia, its type as well as its possible causes among a group of young Egyptians with type 1 diabetes attending a paediatric diabetic clinic in Cairo.
Methods
PatientsThe study was carried out at the Diabetic Endocrine and Metabolic Paediatric Unit of the University of Cairo, Children’s Hos-pital. This clinic receives patients referred from all over Egypt, all of whom are cha-racterized by being of low or intermediate social class. There is no maximum age for follow-up in the unit for type 1 diabetics, as patients who start follow-up care in the
children’s age group are allowed to con-tinue follow-up indefinitely if they wish, in order not to change the protocol of therapy. Between January and December 2002, 200 patients attending the clinic were screened for the presence of anaemia. The patients were of different age groups and had been diagnosed with type 1 diabetes for different durations.
To obtain reference values for blood le-vels, a control group of 20 normal subjects (10 male, 10 female) were recruited from healthy relatives accompanying patients to the hospital. They were living in the same area and of the same socioeconomic class and the mean (SD) age was not significantly different from the study patients [11.2 (5.1) versus 11.7 (4.7) years].
Informed consent was taken from all patients before they entered the study.
Laboratory tests: all patientsDiabetic patients were screened for the fol-lowing:• Presence and type of anaemia. Com-
plete blood count was performed on all 200 diabetic patients and 20 controls. The cut-off values for the diagnosis of anaemia were based on mean ± 2 SD values of controls. For microcytic hy-pochromic anaemia, the cut-offs were: haemoglobin (Hb) < 10.94 g/dL, mean cell volume (MCV) < 68.5 fL and mean cell haemoglobin concentration (MCHC) < 25.5 g/dL. For macrocytic hyperchromic anaemia, the cut-offs were: MCV < 84.5 fL and MCHC < 41.5 g/dL. Red cell distribution width (RDW) was calculated using an electronic cell counter utilizing the formula: RDW = SD / MCV × 100. Normal ranges of RDW were 11.5%–14.5% for children aged 0–2 years and 11.5%–15.0% for children aged 2–12 years according to
Eastern Mediterranean Health Journal, Vol. 11, Nos 5/6, 2005 961
�ملجلة �لصحية لشرL �ملتوسط، منظمة �لصحة �لعاملية، �ملجلد �حلا�E عشر، �لعد��� ٥-٦، ٢٠٠٥
values obtained from control patients and other reference values [5].
• Metabolic control. Glycosylated hae-moglobin (HbA1c) levels of diabetic patients were measured routinely every 3 months using an automated ion capture assay (Abbott IMx, Abbott Laborato-ries, Illinois, USA). Mean values over the preceding 6 months were calculated. The normal value in our laboratory is < 6.5%.
• Microvascular complications. Dia-betic patients were screened for chronic microvascular complications of type 1 diabetes: microalbuminuria (urine albumin/creatinine ratio > 30 µg/mg); retinopathy (by fundus examination); peripheral neuropathy (using electro-physiological studies); and cardiovas-cular autonomic neuropathy (using the methods of Ewing and Clarke [6].
Laboratory tests: anaemic patientsDiabetic patients with anaemia were screened for the following:• Iron deficiency. Serum iron and total
iron binding capacity (TIBC) were as-sessed using standard colorimetric kits (bioMérieux, Marcy l’Etoile, France). Cut-off points (based on ± 2 SD from the mean of control patients) were: decreased iron < 50.43 µg/dL and in-creased TIBC > 413.89 µg/dL.
• Folate deficiency. Serum folate and vita-min B12 levels were measured in patients with macrocytic or normocytic anaemia and the controls. A radioassay method designed for simultaneous measurement of both parameters in serum [7]. Cut-off points (± 2 SD of control means) for de-creased levels were: serum folate < 3.04 ng/mL and serum vitamin B12 < 68.2 pg/mL.
• Haemoglobinopathies. All anaemic patients were given haemoglobin (Hb) electrophoresis to exclude the presence of haemoglobinopathies. Normal values were defined as: HbA1 > 95%, HbA2 1.5%–3.5 % and HbF < 2%. Thalassae-mia minor was diagnosed by elevated HbA2 > 3.5%.
• Coeliac disease. All anaemic patients were assessed for the presence of anti-gliadin, anti-reticulin and anti-endomy-sium autoantibodies as a screening for coeliac disease. Anti-gliadin IgG anti-bodies were measured using an enzyme-linked immunosorbent assay (ELISA) kit (ImmuLisa, IMMCO Diagnostics, Buffalo, New York, USA). Anti-re-ticulin antibodies were analysed with an indirect immunofluorescence method using rat kidney sections (ImmuGlo, IMMCO Diagnostics,). Anti-endomy-sium antibodies (EMA) were analysed with an indirect immunofluorescence method using monkey oesophagus tis-sue sections (ImmuGlo, IMMCO Diag-nostics).
• Chronic renal failure. Serum creatinine levels were measured to exclude chronic renal failure as a cause of anaemia.
• Thyroid status. Serum thyroid stimu-lating hormone (TSH) levels were quantitatively measured using an immu-noradiometric assay kit (DSL-5300, Di-agnostic Systems Laboratories, Texas, USA). Free T3 and free T4 were quan-titatively assessed using solid phase I125 radioimmunoassay kit (Coat-A Count, Diagnostic Products Corporation, Los Angeles, USA).
• Stool analysis. Stool samples were ob-tained to test for occult blood and para-sites that may be a cause of anaemia.

962 La Revue de Santé de la Méditerranée orientale, Vol. 11, No 5/6, 2005
�ملجلة �لصحية لشرL �ملتوسط، منظمة �لصحة �لعاملية، �ملجلد �حلا�E عشر، �لعد��� ٥-٦، ٢٠٠٥
TherapyIron supplementation was given to patients with iron deficiency in a dose of 6 mg/kg/day and follow-up of Hb levels as well as mean HbA1c levels (%) were compared be-fore and 6 months after supplementation.
Statistical analysis Quantitative data were expressed as mean and standard deviation (SD), while qualita-tive data were expressed as percentages. Comparison between mean values of pa-tients and controls was done using Student t-test. P values less than 0.05 were consi-dered significant.
Results
Of the 200 diabetic patients screened, 75 patients were anaemic (37 males, 38 fe-males), giving a prevalence of anaemia among the diabetics of 37.5%. The mean (SD) age of anaemic patients was 11.2 (5.1) years (range 1.6 to 26.0 years) with a male to female ratio 1:1, while the mean (SD) age of controls was 11.7 (4.7) years (range 1.3 to 26.0 years) and their male to female ratio 1:1. There were no statistically significant differences in either mean age or sex dis-tribution between anaemic diabetic patients and the control group (P > 0.05 for each). The mean (SD) duration of diabetes was 4.0 (3.3) years (range 0.1 to 15.3 years). The mean (SD) of the standard deviation score for height was –1.0 (0.75) (range –5.0 to 1.0) and for weight was –1.2 (1.5) (range –4.2 to 2.0).
Table 1 shows the demographic and clinical data of anaemic patients, as well as the morphologic and etiologic classifica-tion of anaemia in these patients. Of the 75 patients, 41 (54.7%) had iron deficiency, 14 (18.7%) had folate deficiency and 14 (18.7%) had thalassaemia minor. Three
patients (4.0%) had coeliac disease. Among the 14 patients with thalassaemia minor, 8 (57.1%) had associated iron-deficiency anaemia.
In addition, 18 patients (24%) had evi-dence of parasitic infection in the form of Entamoeba histolytica (8 patients), Giardia spp. (4 patients) or Oxyuris spp. infection (6 patients). All patients with parasite infection had normocytic normochromic anaemia.
The mean (SD) serum iron level in iron-deficient anaemia patients was 57.0 (3.5) μg/dL, while mean (SD) serum folate in folate-deficient patients was 0.9 (1.5) ng/mL. None of the patients had vitamin B12 deficiency. The mean (SD) vitamin B12
Table 1 Demographic and clinical data and classification of 75 diabetic patients with anaemia
Variable No. %
Sex Female 38 50.7 Male 37 49.3
Pubertal stage Pre-puberty 22 29.3 Post-puberty 53 70.7
Morphologic type of anaemia Microcytic hypochromic 45 60.0 Normocytic normochromic 18 24.0 Macrocytic hyperchromic 12 16.0
Etiologic type of anaemia Iron deficiency 41 54.7 Folate deficiency 14 18.7 Coeliac disease 3 4.0 Thalassaemia minor 14 18.7
Chronic complications Microalbuminuria 6 8.0 Peripheral neuropathy 30 40.0 Autonomic neuropathy 30 40.0 Retinopathy 3 4.0 Parasitic infection 18 24.0
Eastern Mediterranean Health Journal, Vol. 11, Nos 5/6, 2005 963
�ملجلة �لصحية لشرL �ملتوسط، منظمة �لصحة �لعاملية، �ملجلد �حلا�E عشر، �لعد��� ٥-٦، ٢٠٠٥
level in serum was 371.2 (7.4) pg/mL, range 200–500 pg/mL.
By examining the red cell distribution width (RDW) in the blood picture of anae-mic patients, it was apparent that RDW was increased in 95.1% (39/41) of patients with iron deficiency, 100% of patients with fo-late deficiency and 57.1% (8/14) of patients with thalassaemia minor. The latter patients had associated iron deficiency.
By observing the degree of anaemia in relation to the presence of chronic micro-vascular complications, it was found that mean levels of Hb did not differ statistically significantly between the groups with or without chronic complications (P > 0.05). All patients were similarly anaemic (Table 2). Table 3 shows that the mean age of pa-tients with diabetic autonomic neuropathy was around 14.1 years, duration of diabetes was more than 5 years and mean HbA1c level was above 9%.
Of the 3 patients with coeliac disease, one case with normocytic normochromic anaemia had both iron and folate defi-
ciency, increased RDW and consequent stunted growth and underweight. The second case had microcytic hypochromic anaemia, severe iron deficiency, increased RDW and consequent stunted growth and underweight. The third case had microcytic hypochromic anaemia, thalassaemia minor, normal RDW, with not much effect on the height and weight. Coeliac disease was diagnosed from the laboratory and histopathology data with no evidence of malabsorption symptoms. The patients had positive anti-gliadin IgG, anti-reticulin IgA and anti-endomysial IgA antibodies and intestinal biopsy revealed absent villi and hyperplastic crypts with increased numbers of intraepithelial lymphocytes and plasma cells and lymphocytes in the lamina propria. The patients were put on a gluten-free diet and received nutritional supplementation for the deficient elements.
HbA1c levels were statistically sig-nificantly higher in iron-deficient than innon-iron-deficient patients (P < 0.01) (Table 4). However, mean random blood glucose va-lues in the previous 6 months did not show a statistically significant difference between the groups (P > 0.05). Table 4 shows that Hb concentration was statistically significantly increased after 6
Table 2 Degree of anaemia of diabetic patients according to type of complication
Variable Mean (SD) P-value haemoglobin level
Microalbuminuria Yes 10.4 (1.5) > 0.05 No 10.9 (0.7)
Peripheral neuropathy Yes 10.6 (1.1) > 0.05 No 11.0 (0.7)
Autonomic neuropathy Yes 10.6 (1.1) > 0.05 No 11.0 (0.7)
Retinopathy Yes 10.8 (0.7) > 0.05 No 10.8 (0.9)
SD = standard deviation.
Table 3 Descriptive data of diabetic patients with autonomic neuropathy
Variable Mean (SD) Range
Age (years) 14.1 (4.6) 6.75–26.0
Duration of diabetes (years) 7.0 (3.1) 5.9–15.3
Haemoglobin (g/dL) 10.6 (1.1) 7.2–11.7
Mean cell volume (fL) 114.7 (13.2) 50.0–125.0
Mean cell Hb (g/dL) 29.9 (9.1) 20.0–56.0
Glycosylated haemoglobin (%) 9.3 (1.1) 7.5–11.3
SD = standard deviation.

964 La Revue de Santé de la Méditerranée orientale, Vol. 11, No 5/6, 2005
�ملجلة �لصحية لشرL �ملتوسط، منظمة �لصحة �لعاملية، �ملجلد �حلا�E عشر، �لعد��� ٥-٦، ٢٠٠٥
months of iron supplementation in patients with iron deficiency (P < 0.01). On the other hand, HbA1c was significantly decreased after iron supplementation (P < 0.01). How-ever, there was no significant difference in mean random blood glucose values before and after iron supplementation (P > 0.05).
Discussion
To our knowledge, the prevalence of anae-mia in type 1 diabetes has rarely been pre-cisely determined. This could be attributed to the heterogeneous nature of its etiology. Moreover, anaemia is not present in diabe-tes mellitus per se unless related to another disorder or complication. In fact, anaemia in diabetes is more often than not an example of the anaemia of chronic disorders [8].
In this study, the prevalence of anaemia in type 1 diabetics was 37.5%. More than two-thirds (70.7%) of the anaemic patients were post-pubertal, a figure which reflects the increased nutritional demands in this age group and points to the need for cor-rect management of nutrition. The overall prevalence of anaemia among preschool children in a national survey of 488 children across Egypt in 1986 was 51.6%, declining
from 74.4% in the first year of life to 35.1% at school entry at 6 years. In Egyptian ado-lescents, the figure was estimated at 47%, with little variation in levels of anaemia across socioeconomic status or between the sexes [9].
The morphological classification of anaemia in the screened patients showed that microcytic, hypochromic anaemia was the most predominant type (60.0% of patients), which corresponds with the fact that iron deficiency was the most prevalent nutritional deficiency (54.7%) among the patients, followed by thalassaemia minor (18.7%). In Egypt, the prevalence of iron-deficiency anaemia was reported to be 60% in toddlers aged 18 to 24 months and 49% during the following 6 months in rural areas, and was related to low socio-economic class and deficient intake of iron from animal sources and vitamin C [10]. Similarly, another study reported a preva-lence of iron-deficiency anaemia of 48.4% in preschool age children in rural areas of Mansoura [11]. Others have reported that iron-deficiency anaemia affects approxi-mately 30% of the world’s population [12] and 27% of Egyptian children [13]. Iron deficiency in type 1 diabetics may be due
Table 4 Comparison of haemoglobin levels in diabetic patients with iron-deficiency and non-iron-deficiency anaemia, and in iron-deficiency patients before and after iron supplementation
Parameters Non-iron- Iron-deficiency anaemia (n = 41) deficiency Before After anaemia supplements supplements (n = 34)
Haemoglobin (g/dL) 9.2 (2.1) 9.8 (2.5) 11.2 (1.6)b
Glycosylated haemoglobin (%) 8.6 (0.7) 10.1 (0.7)a 8.4 (0.7)b
Random blood glucose (mg/dL) 147.0 (23.6) 145.5 (20.0) 146.8 (20.1)
Values shown are mean (standard deviation).aP < 0.01 iron-deficiency versus non-iron-deficiency patients; bP < 0.01 before versus after supplements.n = number of patients.

Eastern Mediterranean Health Journal, Vol. 11, Nos 5/6, 2005 965
�ملجلة �لصحية لشرL �ملتوسط، منظمة �لصحة �لعاملية، �ملجلد �حلا�E عشر، �لعد��� ٥-٦، ٢٠٠٥
to inadequate dietary iron intake, malabsor-ption of iron due to associated coeliac di-sease or gastric autoimmunity, chronic blood loss, intravascular haemolysis due to associated ketoacidosis or associated parasitic or other infections [14].
The proportion of patients with normo-cytic and macrocytic anaemia was 24.0% and 16.0% respectively; a total of 30 patients. All were screened for folate and vitamin B12 deficiency and only about half of them (14 patients) showed folate defi-ciency while none of the patients showed vitamin B12 deficiency. The etiology of folate deficiency can be deficient intake mostly due to dietary restrictions caused by low socioeconomic standards, and less commonly due to malabsorption associated with coeliac disease (1 patient in our series). Dietary deficiency in children occurs due to rapid growth or infection, which increase folic acid requirements. On the other hand, vitamin B12 deficiency in children is rare because vitamin B12 is present in many foods of animal origin. It may be seen in cases of extreme dietary restriction, such as strict vegetarians. Cases occur in breast-fed infants whose mothers have deficient diets or pernicious anaemia. In older children, pernicious anaemia has occasionally been reported in adolescent ages where there is vitamin B12 malabsorption, atrophy of the gastric mucosa and achlorhydria [15].
Thalassaemia minor was diagnosed by Hb electrophoresis in 18.7% of patients. These patients presented with microcytic hypochromic anaemia and 8 of them had associated iron-deficiency anaemia. In Egypt, the prevalence of thalassaemia minor had been reported to be 10%–13% in different studies. Temtami et al. studied 40 children with microcytic anaemia (MCV < 80 fL) randomly selected from a paediatric haematology outpatient clinic: 5 cases had beta-thalassaemia trait (12.5%), and the
other 35 had iron-deficiency anaemia [16]. Similarly, El Beshlawy et al. reported a rate of beta-thalassaemia trait in Egypt of 10% [17].
The RDW, a measure of red cell he-terogeneity, can be used to differentiate thalassaemia traits from other non-tha-lassaemic conditions with microcytosis due to iron deficiency [18]. In this study, RDW was high in 95% of iron-deficient patients, in 100% of folate deficient patients and in only 57.1% of patients with thalassaemia minor; the latter were mostly the patients who had associated iron-deficiency as well. This was previously confirmed by El Bardisi who found that RDW levels mea-sured in conjunction with MCV add specific information that allows the diagnosis of thalassaemia minor with almost complete certainty [19].
The prevalence of coeliac disease asso-ciated with type 1 diabetes in this study was 4%. This is in accordance with other studies reporting the prevalence of coeliac disease with type 1 diabetes at approximately 3%–8% [20,21]. It has been widely reported that nutritional deficiencies are common presentations of coeliac disease in older children and adolescents, anaemia being the most common deficiency [3]. The anaemia is most commonly due to iron deficiency, which frequently occurs in the absence of intestinal symptoms. Macrocytic anaemia due to folate deficiency is also common. Vitamin B12 concentrations are only low in patients with extensive involvement of the small intestine and so are usually normal. Although the haemoglobin level is low, the mean corpuscular volume can be low (iron deficiency), high (vitamin B12 or folate deficiency) or within a normal range due to mixed deficiency of iron and folate [22].
HbA1c levels were statistically signifi-cantly higher in iron-deficient than in non-iron-deficient patients and they decreased
966 La Revue de Santé de la Méditerranée orientale, Vol. 11, No 5/6, 2005
�ملجلة �لصحية لشرL �ملتوسط، منظمة �لصحة �لعاملية، �ملجلد �حلا�E عشر، �لعد��� ٥-٦، ٢٠٠٥
significantly after iron supplementation. These findings are in agreement with Tarim et al. who concluded that among type 1 diabetic patients with similar levels of glycaemia, iron-deficiency anaemia is associated with higher concentrations of HbA1c [23]. In addition, iron replacement therapy leads to a decline in HbA1c level in both diabetic and non-diabetic patients. Therefore, the iron status of the patient must be considered during the interpretation of HbA1c concentrations in type 1 diabetes.
We can conclude that anaemia in pa-tients with type 1 diabetes is a relatively common problem and has diverse aetiolo-
gies. Therefore, diabetic patients should be screened for the presence of anaemia yearly or at any time if they have suggestive symp-toms or predisposing causes. Nutritional programmes should assure the supply of nutritional supplements to anaemic patients and improved awareness about the need for a healthy balanced diet for prevention of anaemia in type 1 diabetes. Moreover, study of the effect of anaemia on the in-terpretation of HbA1c levels can help with better monitoring of metabolic control and hence prevention of chronic complications of diabetes with the ultimate aim of a better lifestyle for diabetic patients.
References
1. Dikow R et al. How should we manage anaemia in patients with diabetes? Ne-phrology, dialysis, transplantation, 2002, 17(suppl. 1):67–72.
2. Bosman DR et al. Erythropoietin re-sponse to hypoxia in patients with diabetic autonomic neuropathy and non-diabetic chronic renal failure. Diabetic medicine, 2002, 19(1):65–9.
3. Lorini R et al. Clinical aspects of coeliac disease in children with insulin-depen-dent diabetes mellitus. Journal of pedi-atric endocrinology & metabolism, 1996, 9(suppl. 1):101–11.
4. Schwartz E. The anemias. In: Behrman RE, Kliegman RM, Jenson HB, eds. Nel-son textbook of pediatrics, 16th ed. Phila-delphia, WB Saunders, 2000:1461–3.
5. Bessman JD, Gilmer PR Jr, Gardner FH. Improved classification of anemias by MCV and RDW. American journal of clini-cal pathology, 1983, 80:322.
6. Ewing DJ, Clarke BF. Autonomic neuro-pathy: its diagnosis and prognosis. Clinics in endocrinology and metabolism, 1986, 15:855–8.
7. Dualcount SPB. A radioassay for simulta-neous measurement of B12 and folic acid in serum. Los Angeles, Diagnostic Prod-ucts Corporation, 1995.
8. An approach to anemic patients. In: Na-than DG, Orkin SH, eds. Nathan and Os-ki’s hematology of infancy and childhood, 5th ed. Philadelphia, WB Saunders, 1998:378–83.
9. El Deeb B et al. The state of Egyptian children. Cairo, Central Agency for Public Mobilization and Statistics and United Na-tions Children’s Fund, 1988.
10. Ahmad SM. Causes and functional con-sequences of iron deficiency anemia and parasitic infestations of toddlers in an Egyptian village [PhD thesis]. Cairo, Ain Shams University, Department of Home Economics, 1997.
11. Yamama L, El-Damhougi T, Qadri Z. Prevalence of anemia among children of Egyptian villages: socioeconomic study and trial of therapy. Mansoura medical journal, 1996, 26(1):321–35.
12. Fairbankis VF, Beutler E. Iron deficiency. In: Beutler E, Lichtman MA, Coller BS,
Eastern Mediterranean Health Journal, Vol. 11, Nos 5/6, 2005 967
�ملجلة �لصحية لشرL �ملتوسط، منظمة �لصحة �لعاملية، �ملجلد �حلا�E عشر، �لعد��� ٥-٦، ٢٠٠٥
eds. William’s hematology. New York, McGraw–Hill, 2001:447–53.
13. El Beshlawy A et al. Microcytic hypochro-mic anemia in Egyptian children. Egyp-tian journal of haematology, 2000, 25(4):585–96.
14. Worwood M. The laboratory assessment of iron status: an update. Clinica chimica acta, 1997, 259(1–2):3–23.
15. Behrman RE, Kliegman RM, Jenson HB. The anemias. In: Behrman RE, Kliegman RM, Jenson HB, eds. Nelson textbook of pediatrics, 16th ed. Philadelphia, WB Saunders, 2000:1461–63.
16. Temtami SA, Aumran N, Farag MK. De-tection of thalassemia trait in Egyptian children with hypochromic microcytic anemia. Data from the National Research Centre, Giza (Egypt). Paper presented at the 1st International Conference of Hu-man Genetics and Physical Anthropology, University of Cairo, 1989.
17. El Beshlawy A et al. Thalassemia preva-lence and status in Egypt. Pediatric re-search, 1999, 46(5):102.
18. Aslan D et al. Importance of RDW value in differential diagnosis of hypochromic anemias. American journal of hemato-logy, 2002, 69(1):31–3.
19. El Bardisi HA. Discrimination between thalassemia minor and iron deficiency anemia using erythrocyte measurements [MSc thesis]. Cairo, Egypt, Faculty of Medicine, Ain-Shams University, 1991.
20. Cronin CC et al. High prevalence of celiac disease among patients with insulin-de-pendent (type I) diabetes mellitus. Ameri-can journal of gastroenterology, 1997, 92:2210–2.
21. Sjoberg K et al. Screening for coeliac di-sease in adult insulin-dependent diabetes mellitus. Journal of internal medicine, 1998, 243:133–40.
22. Cronin CC, Shanahan F. Insulin-depen-dent diabetes mellitus and celiac disease. Lancet, 1997, 349:1096–7.
23. Tarim O et al. Effects of iron deficiency anemia on hemoglobin A1c in type 1 diabetes mellitus. Pediatrics international, 1999, 41(4):257–62.

968 La Revue de Santé de la Méditerranée orientale, Vol. 11, No 5/6, 2005
�ملجلة �لصحية لشرL �ملتوسط، منظمة �لصحة �لعاملية، �ملجلد �حلا�E عشر، �لعد��� ٥-٦، ٢٠٠٥
Blood pressure distribution among healthy schoolchildren aged 6–13 years in TehranM.R. Ashrafi,1 M. Abdollahi,2 B.M. Ahranjani2 and R. Shabanian1
1Children’s Medical Centre Hospital, Tehran University of Medical Sciences, Tehran, Islamic Republic of Iran.2Department of Nutrition Research, National Nutrition and Food Technology Research Institute, Shaheed Beheshti University of Medical Sciences, Tehran, Islamic Republic of Iran (Correspondence to M. Abdollahi: [email protected]).Received: 20/01/03; accepted: 18/12/03
ABSTRACT To obtain blood pressure distribution for Iranian children, we assessed 10 288 students aged 6–13 years (4871 boys and 5417 girls) in Tehran. Mean systolic and diastolic blood pressure showed incremental increases with age, weight and height in both sexes. Mean increases in systolic blood pressure for boys and girls were 1.7 and 0.8 mmHg per year respectively and for diastolic blood pressure were 0.7 and 0.9 mmHg respectively. According to Second Task Force (STF) criteria, 4.9% of boys and 3.5% of girls had significant systolic hypertension and 10.1% of boys and 3.3% of girls had significant diastolic hypertension. Mean systolic and diastolic blood pressures were higher than STF reports, especially among boys.
Distribution de la pression artérielle chez des écoliers en bonne santé âgés de 6 à 13 ans à TéhéranRÉSUMÉ Afin d’obtenir la distribution de la pression artérielle pour les enfants iraniens, nous avons évalué 10 288 élèves âgés de 6 à 13 ans (4871 garçons et 5417 filles) à Téhéran. La pression arté-rielle systolique et diastolique moyenne montrait une augmentation progressive avec l’âge, le poids et la taille chez les deux sexes. L’augmentation moyenne de la pression artérielle chez les garçons et les filles était de 1,7 et 0,8 mmHg par an respectivement pour la pression systolique et de 0,7 et 0,9 mmHg respectivement pour la pression diastolique. Selon les critères du deuxième Groupe de travail, 4,9 % des garçons et 3,5 % des filles présentaient une hypertension systolique significative et 10,1 % des garçons et 3,3 % des filles présentaient une hypertension diastolique significative. La pression arté-rielle systolique et diastolique moyenne était supérieure aux valeurs indiquées par le deuxième Groupe de travail, notamment chez les garçons.
Eastern Mediterranean Health Journal, Vol. 11, Nos 5/6, 2005 969
�ملجلة �لصحية لشرL �ملتوسط، منظمة �لصحة �لعاملية، �ملجلد �حلا�E عشر، �لعد��� ٥-٦، ٢٠٠٥
Introduction
Systemic hypertension occurs commonly in adults and if untreated is a major risk factor for myocardial infarction, stroke and renal failure [1]. Although the prevalence of clinical hypertension is of far lesser magni-tude in children than adults, there is ample evidence to support the concept that the roots of essential hypertension extend back into childhood, and if hypertension exists, it may track into adulthood [1–4]. Children and young adolescents with blood pressure greater than the 90th percentile for age are 3 times more likely to become adults with hypertension than are children with blood pressure at the 50th percentile [1].
Blood pressure measurement of children is important. Hypertension in children is mostly secondary and this may be due to renal disease, coarctation of the aorta, en-docrine disorders or medication. The under-lying disease process should be controlled in order to prevent and treat hypertension [1]. To increase early detection of hyperten-sion, accurate blood pressure measurements should be a part of routine annual physical examinations for all children and not just isolated procedures [1].
Hypertension in children is diagnosed as high blood pressure for age, sex and body size [2]. Blood pressure increases gradu-ally with age and varies with sex; therefore, standard nomograms for each age–sex group are necessary to interpret blood pres-sure values [2]. Moreover, the distribution of blood pressure levels varies in different ethnic groups [5,6]. Using Second Task Force recommended cut-off points, many countries have established curves for diffe-rent age–sex groups [2,7–12].
Since there are only limited data avai-lable for blood pressure distribution in the Islamic Republic of Iran [13], we deter-mined the distribution of blood pressure
among schoolchildren aged 6–13 years in Tehran.
Methods
We selected 10 288 students (4871 boys and 5417 girls) by multistage cluster sam-pling from 125 schools of all the 19 depart-ments of education and training in Tehran over 18 months during the 1998–1999 and 1999–2000 school years. A protocol was established for the examination of the chil-dren according to the Second Task Force and World Health Organization guidelines [2,3]. The Ethics Committee of the Uni-versity of Tehran, the Medical Sciences Research Deputy and the Health Office of the Ministry of Education and Training ap-proved the protocol of our study.
The protocol of our study was explained to the interviewers who were either general practitioners or medical students. In 3 ses-sions of 2 hours each, one of the investiga- tors (a paediatrician) trained the intervie-wers so that they could take measure-ments in the same way and under similar circumstances. The inter-rater variation was determined to be negligible at the end of training. Four teams equipped with the necessary measuring tools visited the schools and a control set of equipment was kept at the university. At about 10-day intervals, measurements were taken with 2 sets, i.e. each team’s set and the set kept at the university, to verify consistency. During the study, differences between the readings were very small and all manometers func-tioned properly.
Measurements were taken in a quiet room in each school. The aim of the study and the procedure were described to the stu-dents. Height was measured to the nearest 0.5 cm without shoes. Weight with minimal clothing was recorded using a bath scale to

970 La Revue de Santé de la Méditerranée orientale, Vol. 11, No 5/6, 2005
�ملجلة �لصحية لشرL �ملتوسط، منظمة �لصحة �لعاملية، �ملجلد �حلا�E عشر، �لعد��� ٥-٦، ٢٠٠٥
the nearest 0.5 kg. A mercury sphygmo-manometer (Riester, Germany) was used to measure blood pressure on the student’s right arm while seated. Two measurements were taken at a 10-minute interval. Small, medium and large children’s cuffs were available to the teams to be used as appro-priate for the length and circumference of each arm. The systolic blood pressure was recorded when the first Korotkoff (K) sound was heard. Two diastolic blood pressure readings were recorded on hearing K4 and K5 sounds. Pulse rate per minute was re-corded twice. The average of the 2 readings was taken as blood pressure and pulse rate.
For children aged 6–9 years, significant hypertension and severe hypertension were defined as systolic blood pressure greater than 122 mmHg and 130 mmHg and dia-stolic blood pressure greater than 78 mmHg and 86 mmHg respectively [2]. Significant and severe hypertension in children aged 10–12 years was defined as systolic blood pressure greater than 126 mmHg and 134 mmHg and diastolic blood pressure greater than 82 mmHg and 90 mmHg respectively [2].
For each child, the data were recorded on a separate form and quality controlled by the investigators. Epi-Info, version 6 and SPSS, version 10 were used for data entry and statistical analysis.
Results
Table 1 shows the distribution of the children by age and sex. Figures 1 and 2 show that there was an overall incremental increase in diastolic and systolic blood pressure with age, height and weight for both girls and boys. However, among boys, the mean systolic blood pressure dipped slightly at 8 years. Mean systolic blood pressure in girls showed an increasing trend for all ages. Diastolic blood pressure in boys increased with age until 11 years when it dipped slightly, then rose at 12 years and dipped again at 13 years. Also among girls aged 12–13 years, mean diastolic blood pressure was less than among those aged 10 years at the 90th centile. The average increase in systolic blood pressure levels per year was 1.7 mmHg and 0.8 mmHg in girls and boys
Table 1 Distribution of 10 288 students in Tehran by age and sex
Age Boys Girls Total (years) No. % No. % No. %
6 457 9.4 350 6.5 807 7.8
7 727 14.9 717 13.2 1444 14.0
8 715 14.7 820 15.1 1535 14.9
9 774 15.9 868 16.0 1642 16.0
10 684 14.0 887 16.4 1571 15.3
11 649 13.3 817 15.1 1466 14.2
12 639 13.1 761 14.0 1400 13.6
13 226 4.6 197 3.6 423 4.1
Total 4871 100.0 5417 100.0 10288 100.0

Eastern Mediterranean Health Journal, Vol. 11, Nos 5/6, 2005 971
�ملجلة �لصحية لشرL �ملتوسط، منظمة �لصحة �لعاملية، �ملجلد �حلا�E عشر، �لعد��� ٥-٦، ٢٠٠٥
Figure 1 Systolic and diastolic percentiles of blood pressure in girls by age
50th percentile
Weight 22 23.5 25.5 29 31 36 41 41
Height 120 124 128 134 140 146.8 152.5 154.5
respectively and for diastolic blood pressure it was 0.7 mmHg and 0.9 mmHg for boys and girls respectively.
Frequencies of significant and of severe hypertension were calculated according to Second Task Force report criteria (Tables
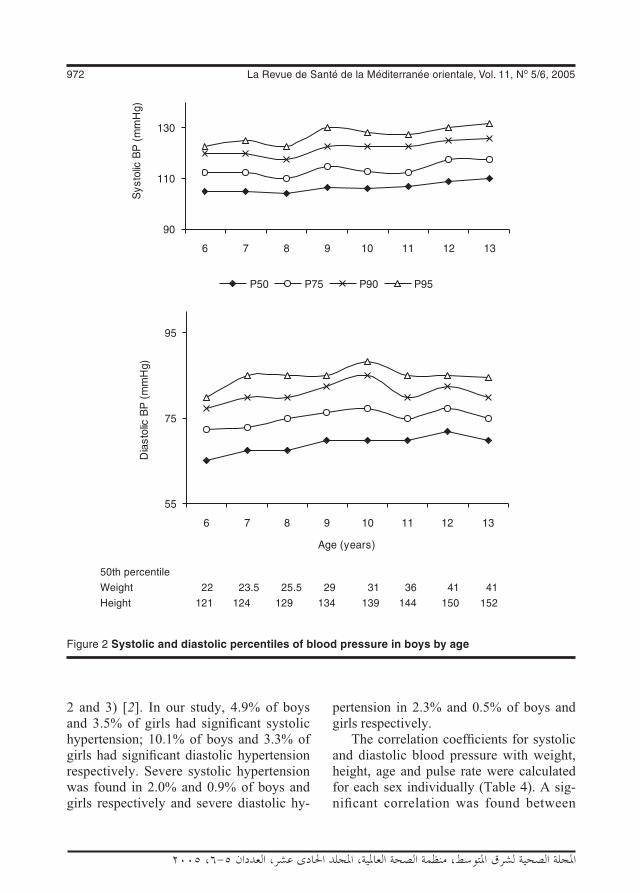
972 La Revue de Santé de la Méditerranée orientale, Vol. 11, No 5/6, 2005
�ملجلة �لصحية لشرL �ملتوسط، منظمة �لصحة �لعاملية، �ملجلد �حلا�E عشر، �لعد��� ٥-٦، ٢٠٠٥
2 and 3) [2]. In our study, 4.9% of boys and 3.5% of girls had significant systolic hypertension; 10.1% of boys and 3.3% of girls had significant diastolic hypertension respectively. Severe systolic hypertension was found in 2.0% and 0.9% of boys and girls respectively and severe diastolic hy-
pertension in 2.3% and 0.5% of boys and girls respectively.
The correlation coefficients for systolic and diastolic blood pressure with weight, height, age and pulse rate were calculated for each sex individually (Table 4). A sig-nificant correlation was found between
Figure 2 Systolic and diastolic percentiles of blood pressure in boys by age
50th percentile
Weight 22 23.5 25.5 29 31 36 41 41
Height 121 124 129 134 139 144 150 152

Eastern Mediterranean Health Journal, Vol. 11, Nos 5/6, 2005 973
�ملجلة �لصحية لشرL �ملتوسط، منظمة �لصحة �لعاملية، �ملجلد �حلا�E عشر، �لعد��� ٥-٦، ٢٠٠٥
Table 2 Frequency of significant and severe hypertension in girls
Age Number Significant hypertension Severe hypertension(years) Systolic Diastolic Systolic Diastolic
No. % No. % No. % No. %
6 350 16 4.6 13 3.7 2 0.6 4 1.1
7 717 24 3.3 33 4.6 8 1.1 8 1.1
8 820 27 3.3 36 4.4 7 0.9 3 0.4
9 868 35 4.0 44 5.1 7 0.8 6 0.7
10 887 29 3.3 20 2.3 10 1.1 3 0.3
11 817 39 4.8 19 2.3 8 1.0 1 0.1
12 761 16 2.1 11 1.4 8 1.1 1 0.1
13 197 1 0.5 1 0.5 1 0.5 0 0.0
Total 5417 187 3.5 177 3.3 51 0.9 26 0.5
Table 3 Frequency of significant and severe hypertension in boys
Age Number Significant hypertension Severe hypertension(years) Systolic Diastolic Systolic Diastolic
No. % No. % No. % No. %
6 457 31 6.8 29 6.3 5 1.1 6 1.3
7 727 36 5.0 70 9.6 13 1.8 18 2.5
8 715 29 4.1 78 10.9 8 1.1 17 2.4
9 774 57 7.4 106 13.7 24 3.1 37 4.8
10 684 24 3.5 74 10.8 17 2.5 18 2.6
11 649 25 3.9 53 8.2 10 1.5 8 1.2
12 639 32 5.0 74 11.6 18 2.8 6 0.9
13 226 3 1.3 6 2.7 2 0.9 3 1.3
Total 4871 237 4.9 490 10.1 97 2.0 113 2.3
Table 4 Correlation coefficients between developmental variables and blood pressure in boys and girls
Variable Boys Girls Weight Height Age Pulse Weight Height Age Pulse
Systolic BP 0.30 0.23 0.14 0.07 0.39 0.33 0.26 0.11
Diastolic BP (K4) 0.24 0.19 0.17 –0.12 0.27 0.21 0.15 0.08
Diastolic BP (K5) 0.24 0.20 0.18 –0.16 0.26 0.21 0.15 –0.01
BP = blood pressure.
Weight, height, age and pulse rate all were significantly correlated with both systolic and diastolic blood pressure
for both sexes (P < 0.05).

974 La Revue de Santé de la Méditerranée orientale, Vol. 11, No 5/6, 2005
�ملجلة �لصحية لشرL �ملتوسط، منظمة �لصحة �لعاملية، �ملجلد �حلا�E عشر، �لعد��� ٥-٦، ٢٠٠٥
Table 5 Mean pulse rates of boys and girls
Age (years) Mean pulse rate (beats/min) Boys Girls
6 99.97 95.18
7 99.03 92.99
8 97.01 93.04
9 94.69 91.66
10 93.40 91.18
11 90.49 89.91
12 88.97 88.67
13 88.22 88.48
Total 94.38 91.40
systolic and diastolic blood pressure and all these factors for both sexes.
Table 5 shows that the mean pulse rate of girls and boys in each age group decreased gradually with age.
Discussion
The prevention of high blood pressure may be viewed as part of the prevention of coronary artery disease and stroke. Blood pressure measurements should be included in physical examinations as part of continu-ing care for children, and not just as isolated procedures [1]. The goal in caring for chil-dren is surveillance, possible prevention and identification of fixed hypertension requiring treatment when such cases cannot be prevented [2].
In our study, blood pressure, weight, height and pulse rate of children aged 6–13 years were measured according to Second Task Force recommended cut-offs to establish normal blood pressure curves for Iranian children [2].
Blood pressure increased gradually with age for both boys and girls in our study.
This was consistent with a study in Qazvin, a city near Tehran [13]. This also agreed with the Second Task Force report that blood pressure increases with age during the pre-adult years in all study populations [2]. Others have also reported that blood pres-sure increased with age [14–17]; however, some Japanese studies have only found cor-relations between diastolic blood pressure and age [10,18].
Systolic blood pressure in our study was higher among boys of all ages than girls (chi-squared test, P < 0.01). The mean systolic blood pressure differences between boys and girls in the youngest and oldest age groups were about 5.5 mmHg and 1 mmHg respectively. In a study of children aged 8–16 years, mean blood pressure was higher among girls [16]. In contrast, Hansen et al. reported no significant difference in mean blood pressure between the sexes for children aged 8–10 years [17]. Others have reported no significant difference in blood pressure between boys and girls from 1 day to 6 years of age or among preschool children [10,14].
Blood pressure was positively corre-lated with weight and height in our study. According to the Second Task Force report in different study populations, larger chil-dren, i.e. heavier and/or taller children, had higher blood pressure than smaller children of the same age [2]. One study of children aged 8–16 years showed a positive correla-tion between blood pressure, body weight, height and an index of obesity [16]. Hansen et al. found that weight was an important determinant of blood pressure in Danish children aged 8–10 years [17]. In a 1992 study among children aged 9–11 years, those with high blood pressure, i.e. higher than or equal to the 95th percentile, were heavier and more obese than the normal group [19].
Eastern Mediterranean Health Journal, Vol. 11, Nos 5/6, 2005 975
�ملجلة �لصحية لشرL �ملتوسط، منظمة �لصحة �لعاملية، �ملجلد �حلا�E عشر، �لعد��� ٥-٦، ٢٠٠٥
In our study, pulse rate decreased gradu-ally with age. This was consistent with both the findings of a study of school children in Qazvin and a study of preschool children in Japan [10,13].
In our study, significant systolic hy-pertension was prevalent in 4.9% of boys and 3.5% of girls. In the Qazvin study, the prevalence of high blood pressure among children aged 7–12 years was 6.9% using Second Task Force recommended cut-offs [2,3]. In a study in Papua New Guinea, 5.1% of children aged 8–10 years had high blood pressure [16]. Furthermore, overall prevalence of hypertension has been reported at 2.93% among Indian children aged 5–14 years [9].
In our study, mean systolic and diastolic blood pressures of the sample were higher than reported by the Second Task Force, especially among boys. This agreed with reports of higher blood pressure among children of this age in the western part of our country and in Turkey compared with values reported by the Second Task Force [13,15]. Those 2 reports also indicated higher blood pressures and prevalence of hypertension among boys than among girls. It may be that the higher blood pres-sure of adult males compared with adult females originates from this age and may be attributed to different psycho-hormonal structures in males and females. Both the systolic and the diastolic blood pressures of Spanish children aged 2–14 years were lower than means reported by the Second Task Force [12]. However, in a study of
first-grade schoolchildren in Germany, the data fit very well with Second Task Force recommended cut-offs [8].
Conclusion
We measured blood pressure, height and weight of schoolchildren aged 6–13 years in Tehran. Blood pressure was highly as-sociated with age, height and weight. Our findings can help establish normal blood pressure curves to be used in paediatric clinics, because almost 20% of the Iranian population lives in Tehran and the sample of our study may be highly representative of Iranian children. Normal blood pressure values in our study are higher than reported by the Second Task Force, but this diffe-rence agrees with the STF recommendation regarding the importance of determining normal blood pressure in each country.
Acknowledgements
We are extremely indebted to the authorities of the Research Deputy of Tehran Univer-sity of Medical Sciences for their financial and logistic support. We thank the authori-ties of the General Office of Education and Training in Tehran for their kind coopera-tion. We would like to thank also the staffs of the school and the students for their participation. We thank M. Hajizadeh, H. Jaafari, L. Salageghe and A. Mirzapour for their cooperation with the fieldwork.
References
1. Behrman RE, Kliegman RM, Jenson HB. Nelson textbook of pediatrics. Philadel-phia, WB Saunders Company, 2000.
2. Report of the Second Task Force on Blood Pressure Control in Children—1987. Task Force on Blood Pressure Control in Chil-
dren. National Heart, Lung, and Blood Institute, Bethesda, Maryland. Pediatrics, 1987, 79:1–25.
3. Blood pressure studies in children. Report of a WHO Study Group. Geneva, World
976 La Revue de Santé de la Méditerranée orientale, Vol. 11, No 5/6, 2005
�ملجلة �لصحية لشرL �ملتوسط، منظمة �لصحة �لعاملية، �ملجلد �حلا�E عشر، �لعد��� ٥-٦، ٢٠٠٥
Health Organization, 1985 (WHO Techni-cal Report Series, No. 715).
4. Lauer RM, Clarke WR. Childhood risk factors for high adult blood pressure: the Muscatine Study. Pediatrics, 1989, 84:633–41.
5. Rosner B et al. Blood pressure nomo-grams of children and adolescents by height, sex, and age in the United States. Journal of pediatrics, 1993, 123:871–6.
6. Man SA et al. Blood pressure in child-hood: pooled findings of six European studies. Journal of hypertension, 1991, 9:109–14.
7. Buonomo E, Pasquarella A, Palombi L. Blood pressure and anthropometry in parents and children of a southern Italian village. Journal of human hypertension, 1996, 10(suppl. 3):S77–9.
8. Oetliker O et al. Blood pressure de-termination in children: normal values for a given age group. Schweizerische Medizinische Wochenschrift, 1978, 108:2033–9.
9. Laroia D. Profile of blood pressure in normal schoolchildren. Indian journal of pediatrics, 1989, 26:531–6.
10. Hashimoto N et al. Criteria of normal blood pressure and hypertension in Japanese preschool children. Journal of human hypertension, 1997, 11:351–4.
11. Macedo ME et al. Blood pressure normal values in children and adolescents ac-cording to age and height. Revista por-tuguesa de cardiologia, 1997, 16:679–82, 663.
12. Sanchez Bayle M et al. Normal blood pressure values in Spanish children. Ana-les espanoles de pediatria, 1984, 20:1–7.
13. Moteei Langeroudi SH et al. Pulse and blood pressure in school-age children in Qazvin. The journal of Qazvin University of Medical Sciences, 2000, 13:56–62.
14. Hwang B, Chu NW. Normal oscillometric blood pressure values in Chinese children during their first six years. Zhonghua Min Guo Xiao Er Ke Yi Xue Hui Za Zhi, 1995, 36:108–12.
15. Tumer N et al. Blood pressure nomo-grams for children and adolescents in Turkey. Pediatric nephrology, 1999, 13:438–43.
16. Ampofo EK. Blood pressure distribution in children at Port Moresby, Papua New Guinea. Papua and New Guinea medical journal, 1989, 32:101–8.
17. Hansen HS et al. Blood pressure distribu-tion in a school-age population aged 8–10 years: the Odense Schoolchild Study. Journal of hypertension, 1990, 8:641–6.
18. Nishiyama S et al. Blood pressure distri-bution and determinants of higher levels of blood pressure in Japanese rural ado-lescents. Japanese circulation journal, 1989, 53:7–12.
19. Hansen HS et al. Left ventricular hyper-trophy in children from the upper percent of the blood pressure distribution: the Odense Schoolchild Study. Journal of hu-man hypertension, 1992, 6:41–5.
Eastern Mediterranean Health Journal, Vol. 11, Nos 5/6, 2005 977
�ملجلة �لصحية لشرL �ملتوسط، منظمة �لصحة �لعاملية، �ملجلد �حلا�E عشر، �لعد��� ٥-٦، ٢٠٠٥
Evaluation of a programme for control of Schistosoma haematobium infection in Yemen M.A.M. Nagi1
1National Schistosomiasis and Endemic Diseases Control Programme, Sana’a, Yemen (Correspondence to M.A.M. Nagi: [email protected]).Received: 11/05/03; accepted: 17/05/04
ABSTRACT An intervention study was conducted in Khamir, north of Sana’a, for control of urinary schis-tosomiasis using chemotherapy and health education. The validity and cost–effectiveness of reagent strips as a rapid diagnostic tool to screen for Schistosoma haematobium infection was also assessed along with visible haematuria. Prevalence of S. haematobium infection 14 months post-intervention fell from 58.9% to 5.8% and frequency of heavy infection from 40.0% to 18.9%. Health education sessions resulted in significant decrease in the frequency of contact with water sources and greater adherence to preventive measures. Mass chemotherapy plus health education is a feasible and effective method for reducing S. haematobium infection in Yemen. Reagent strips and visible haematuria could be cost-effective in remote areas with limited access to health services.
Évaluation d’un programme de lutte contre l’infestation à Schistosoma haematobium au YémenRÉSUMÉ Une étude d’intervention a été réalisée à Khamir, au nord de Sanaa, pour la lutte contre la schistosomiase urinaire au moyen de la chimiothérapie et par l’éducation sanitaire. La validité et le rapport coût-efficacité des bandelettes réactives comme outil de diagnostic rapide pour la recherche d’une infestation à Schistosoma haematobium ont également été évalués parallèlement à l’hématurie visible. La prévalence de l’infestation à S. haematobium 14 mois après l’intervention a chuté de 58,9 % à 5,8 % et la fréquence de l’infestation massive a reculé, passant de 40,0 % à 18,9 %. Les sessions d’éducation sanitaire ont entraîné une diminution significative de la fréquence du contact avec les sources d’eau et un meilleur respect des mesures de prévention. La chimiothérapie de masse associée à l’éducation sanitaire constitue une méthode faisable et efficace pour réduire l’infestation à S. hae-matobium au Yémen. Les bandelettes réactives et l’hématurie visible pourraient être d’un bon rapport coût-efficacité dans les zones reculées où l’accès aux services de santé est limité.

978 La Revue de Santé de la Méditerranée orientale, Vol. 11, No 5/6, 2005
�ملجلة �لصحية لشرL �ملتوسط، منظمة �لصحة �لعاملية، �ملجلد �حلا�E عشر، �لعد��� ٥-٦، ٢٠٠٥
Introduction
Schistosomiasis is the second most preva-lent tropical disease in Yemen after malaria and is one of the most important public health problems. With the unification of the country, total population is now 20 million, of which 2–3 million are estimated to be infected [1–4]. Environmental factors and the expansion of agricultural facilities, with the associated improvement in irrigation systems and construction of dams, have generated the optimal environment for fresh-water snails, the intermediate host, resulting in an increase in the prevalence of schistosomiasis (1–4). Yemen has so far received little attention from international health organizations even though millions of its inhabitants are at risk.
The economy of the country depends mainly on agriculture, most of the popula-tion being involved directly or indirectly in this field. During the past few years, many new agricultural projects have been established and many of the previous ones extended, so the irrigation system is exten-sive. In some places these irrigation projects serve as a source of drinking water for humans. Agricultural workers are at high risk of acquiring schistosomal infection and schistosomal disease because of their daily work in the fields and a continuing contact with schistosome-infected water. The health and labour of these groups should be of paramount importance since increasing food production to meet the requirements of a rapidly increasing population is a major issue for the developing world, particularly Yemen [5–8].
High infection rates for urinary schis-tosomiasis were found in the years 1995, 1998 and 1999. An evaluation of the results of control efforts made in Yemen over the past 10 years shows a remarkable suc-cess in reducing the scale of the disease.
Infection rates have fallen in Hajah, Sana’a and Marib provinces. [5,8]. There have been no previous reports on endemicity of schistosomiasis or other intestinal parasites in Khamir, or on integrated methods for schistosomiasis control in the country.
This study was therefore conducted with the aim of evaluating the impact of inte-grated surveillance and control methods on the burden of schistosomiasis in the north of Sana’a governorate. A further aim was to assess the validity and its cost-effectiveness of using visible haematuria (macroscopic haematuria) and reagent strip tests (micro-scopic haematuria) as screening tools for Schistosoma haematobium infection.
School enrolment rates in Yemen are relatively low, especially in females, in whom enrolment is below 30% [9]. To overcome this deficiency, non-enrolled as well as enrolled children (both pre-school and school-age) were targeted in addition to the community. It is envisaged that imple-mentation of integrated methods for surveil-lance and control of schistosomiasis would assist in the development of an effective, school-based control programme sensitive to local social and cultural conditions. The study will also offer the opportunity to assess the validity of detecting urinary schistosomiasis in Yemen.
Methods
This was an intervention study targeting the community and schoolchildren in Khamir, located 90 km north of Sana’a. This is an agricultural area, depending on rain and groundwater for irrigation and domestic use.
Baseline surveyThe community and school baseline sur-veys were conducted in October 1999. A
Eastern Mediterranean Health Journal, Vol. 11, Nos 5/6, 2005 979
�ملجلة �لصحية لشرL �ملتوسط، منظمة �لصحة �لعاملية، �ملجلد �حلا�E عشر، �لعد��� ٥-٦، ٢٠٠٥
list of the houses in the study area (1000) was prepared and a random sample of 100 houses (863 individuals) was selected. Each individual was interviewed by a member of the intervention project team using a questionnaire. A urine sample was collect-ed from each participant for examination. There were no refusals to participate.
The items on the questionnaire included demographic data; medical history, inclu-ding schistosomiasis infection and treat-ment, whether participants passed blood in the urine and the results of any laboratory tests; and information on sources of water, use of water and whether they used any preventive measures. Parents supplied information for babies and young children. Urine samples were tested in the field by members of the project team.
A sample of 20% of schoolchildren (287 children), randomly selected from the 14 schools of the area was included in the study. These children were interviewed using the same questionnaire, and urine samples were collected for examination in the same way as for the community survey.
InterventionThe schistosomiasis control methods con-sisted of chemotherapy for S. haematobium and health education. Mass treatment was administered in October 1999; a total of 8540 individuals were treated with a single dose of praziquantel, 40 mg/kg body weight. These were schoolchildren, non-enrolled school-age children, and preschool children together with their parents and other com-munity members.
Health education intervention sessions were given during the period September 1999–December 2001. Schoolteachers from all 14 schools in the district partici-pated in a 2-day seminar. The teachers were educated about the disease and briefed about the study. They were also given
detailed information regarding methods of health education for different groups, che-motherapy for schistosomiasis and dosage and record keeping. One teacher from each school was appointed as coordinator for the control activities in his/her school.
The teachers gave weekly health educa-tion classes in schools in which posters were distributed. Health education sessions were also held in schools for non-enrolled children and pre-school children along with their parents. Other classes were given in khat sessions and Friday prayer sessions.
Community evaluation survey (14 months post intervention)The houses in the study area (1000) were listed and a sample of 100 houses (913 indi-viduals) was randomly selected. The evalu-ation was performed via questionnaire and urine analysis. The same questionnaire was used with the following items added:• Have you attended mass chemo-
therapy?• Have you attended a health education
session?• How did you hear about the control pro-
gramme?
School evaluation survey (14 months post intervention)A post-intervention evaluation via question-naire and urine analysis was done on 20% of all schoolchildren in the area, 323 school-children. The questionnaire was the same as that for the community evaluation survey.
Validation of reagent stripsThe reagent strips were compared to mi-croscopic urine examination to determine their validity as rapid diagnostic tools for S. haematobium. Urine was examined im-mediately in the field using the Nucleopore® filtration technique. The reagent strips used

980 La Revue de Santé de la Méditerranée orientale, Vol. 11, No 5/6, 2005
�ملجلة �لصحية لشرL �ملتوسط، منظمة �لصحة �لعاملية، �ملجلد �حلا�E عشر، �لعد��� ٥-٦، ٢٠٠٥
in this study were Hemastix (Bayer Diag-nostics, Fernwald, Germany) and Combur 9 strips (Roche Diagnostics, Mannheim, Germany) [14].
Results
Community surveyPrevalence of S. haematobium infection before the intervention measures and 14 months after intervention is shown in Table 1. Overall prevalence was 58.9% pre-inter-vention, falling to 5.8% in the post-inter-vention survey, a significant reduction. The prevalence of infection was 55.2% among people 16–39 years old, compared to 42.9% in older individuals.
The majority of infections overall (60.0%) pre-intervention were light (< 50 eggs/10 mL urine). The frequency of light infection in children ≤ 15 years was sig-
nificantly higher than heavy infection. In contrast, the frequency of heavy infection was significantly higher than light infection in the older age groups (Table 2).
There was no significant difference be-tween males and females, or between liter-ate and illiterate individuals regarding the prevalence or intensity of infection (Tables 1 and 2).
There was a significant decrease in the in the prevalence of infection 14 months post-intervention. The overall prevalence dropped to 5.8%, ranging from 4.9% among children 6–15 years old to 7.8% among those aged 16–39 years. Furthermore, the majority of infections post-intervention were light infections (81.1%), regardless of age or sex (Tables 1 and 2).
Community evaluation surveyPrevalence of infection in participants who were literate was 60.0%; this decreased to
Table 1 Prevalence of Schistosoma haematobium infection before and 14 months after intervention for inhabitants of 100 households (community-based study)
Age (years) Pre-intervention Post-intervention Males Females Total Males Females Total % % % % % %
< 6 50.5 46.2 48.3 6.5 5.3 5.9
6–15 69.2 65.7 67.6 5.0 4.8 4.9 Enrolleda 63.6 56.6 61.3 4.2 3.7 4.1 Non-enrolled 71.3 67.2 69.3 5.3 5.0 5.2
16–39 56.4 53.7 55.2 8.8 6.8 7.8 Literate 52.9 50.0 52.4 4.3 0 3.8 Illiterate 57.4 54.0 55.6 10.5 7.1 8.7
≥ 40 48.6 36.4 42.9 6.7 6.7 6.7 Literate 33.3 –b 33.3 0 –b 0 Illiterate 50.0 36.4 43.3 7.1 6.7 6.9
Total 61.2 56.3 58.9 6.1 5.4 5.8 Literate 60.5 54.8 60.0 4.1 3.3 3.9 Illiterate 61.4 56.4 58.8 6.6 5.6 6.1aEnrolled in school.bIndividuals were not available or not examined.

Eastern Mediterranean Health Journal, Vol. 11, Nos 5/6, 2005 981
�ملجلة �لصحية لشرL �ملتوسط، منظمة �لصحة �لعاملية، �ملجلد �حلا�E عشر، �لعد��� ٥-٦، ٢٠٠٥
3.9% post-intervention. Heavy infection decreased from 42.0% of those infected to 0%. Similarly, for participants who were illiterate, prevalence of infection decreased from 58.8% to 6.1% and the rate of heavy infection decreased from 39.6% to 20.8% (Tables 1 and 2).
School evaluation surveyPrevalence and intensity of infection also decreased markedly in the school-based evaluation survey. Overall prevalence was 66.9% pre-intervention and fell to 4.3% 14 months post-intervention (Tables 3 and 4).
Table 2 Prevalence of Schistosoma haematobium infection classed as heavy infection (> 50 eggs/10 mL urine) before and 14 months after intervention for inhabitants of 100 households (community-based study)
Age (years) Pre-intervention Post-intervention Males Females Total Males Females Total % % % % % %
< 6 21.6 26.5 24.0 14.3 16.7 15.4
6–15 37.3 36.4 36.9 15.4 20.0 17.4 Enrolleda 40.5 40.0 40.4 0 0 0 Non-enrolled 36.3 35.9 36.1 20.0 22.2 21.1
16–39 65.9 63.9 65.0 28.6 20.0 25.0 Literate 44.4 50.0 45.5 0 0 0 Illiterate 71.4 64.7 68.1 33.3 20.0 27.3
≥ 40 55.6 58.3 56.7 0 50.0 20.0 Literate 100b None 100 0 None 0 Illiterate 52.9 58.3 55.2 0 50.0 20.0
Total 40.1 39.7 40.0 16.7 21.7 18.9 Literate 42.3 41.2 42.0 0 0 0 Illiterate 39.6 39.6 39.6 16.7 21.7 18.9aEnrolled in school.bOne person.
Table 3 Prevalence of Schistosoma haematobium infection before and 14 months after intervention for 20% of schoolchildren (school-based study)
Age Pre-intervention Post-intervention(years) Males Females Total Males Females Total % % % % % %
6–15 71.5 62.5 69.9 5.3 3.6 4.9
≥ 16 56.1 50.0 55.7 2.9 0 2.6
Total 67.9 61.4 66.9 4.6 3.2 4.3
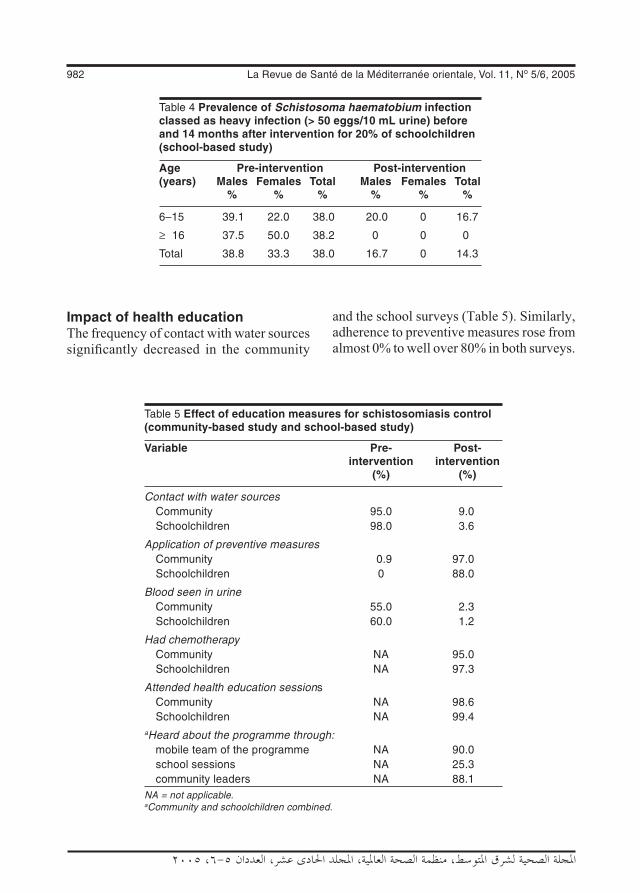
982 La Revue de Santé de la Méditerranée orientale, Vol. 11, No 5/6, 2005
�ملجلة �لصحية لشرL �ملتوسط، منظمة �لصحة �لعاملية، �ملجلد �حلا�E عشر، �لعد��� ٥-٦، ٢٠٠٥
Impact of health educationThe frequency of contact with water sources significantly decreased in the community
and the school surveys (Table 5). Similarly, adherence to preventive measures rose from almost 0% to well over 80% in both surveys.
Table 4 Prevalence of Schistosoma haematobium infection classed as heavy infection (> 50 eggs/10 mL urine) before and 14 months after intervention for 20% of schoolchildren (school-based study)
Age Pre-intervention Post-intervention(years) Males Females Total Males Females Total % % % % % %
6–15 39.1 22.0 38.0 20.0 0 16.7
≥ 16 37.5 50.0 38.2 0 0 0
Total 38.8 33.3 38.0 16.7 0 14.3
Table 5 Effect of education measures for schistosomiasis control (community-based study and school-based study)
Variable Pre- Post- intervention intervention (%) (%)
Contact with water sources Community 95.0 9.0 Schoolchildren 98.0 3.6
Application of preventive measures Community 0.9 97.0 Schoolchildren 0 88.0
Blood seen in urine Community 55.0 2.3 Schoolchildren 60.0 1.2
Had chemotherapy Community NA 95.0 Schoolchildren NA 97.3
Attended health education sessions Community NA 98.6 Schoolchildren NA 99.4aHeard about the programme through: mobile team of the programme NA 90.0 school sessions NA 25.3 community leaders NA 88.1NA = not applicable.aCommunity and schoolchildren combined.

Eastern Mediterranean Health Journal, Vol. 11, Nos 5/6, 2005 983
�ملجلة �لصحية لشرL �ملتوسط، منظمة �لصحة �لعاملية، �ملجلد �حلا�E عشر، �لعد��� ٥-٦، ٢٠٠٥
Almost all the people interviewed had been treated and had attended health education sessions (≥ 95%). Most reported that they knew about the programme from the mobile team of the intervention programme or from leaders of the community; a smaller number reported school sessions as being the source of information (Table 5).
Validation and cost–effectiveness of reagent stripsCompared to parasitological examination of urine, the reagent strips recorded low sensitivity, low specificity, limited positive predictive value and low negative predic-tive value in both surveys (Tables 6 and 7).
Compared to detection of eggs, using strips as the screening method greatly re-duced the cost of the control programme in the study area, which is a remote area with limited facilities (Table 8).
Discussion
Carefully targeted and infrequent delivery of mass chemotherapy offers a cheap and effective tool for control of schistosomiasis at low cost [10–12]. For a number of rea-sons schoolchildren have been the favoured target group in chemotherapy programmes
for schistosomiasis. They are easy to ap-proach with health education programmes, they usually carry most of the burden of infection in the community and they are easy to reach physically for chemotherapy. Moreover, schoolchildren represent the future of developing countries. Investment in their health will have a bearing on educa-tional performance and their future contri-bution to development. Schools also offer an infrastructure for control programmes in areas where infrastructure of health institu-tions is deficient.
Using strips as the screening methods has greatly reduced the cost of control programmes elsewhere [13]. Yet, we need to assess their practicability and validity in Khamir; the findings of previous reports indicate that the validity of these screening methods has varied in different settings [14,15].
Lu-Guang et al. studied the effect of selected chemotherapy combined with health education to control schistoso-miasis in marshland of the Yangtze River in China. The prevalence of schistosomiasis decreased by 82% [16]. In the present study, overall prevalence fell by 90.2% to 5.8%.
Mass chemotherapy was found to be a feasible and efficacious approach for schis-tosomiasis control in a study done in Upper
Table 6 Validation of reagent strips in Khamir, October 1999, community-based study
Eggs Strip Total No. +ve No. –ve
Present 252 (A) 96 (B) 348
Absent 194 (C) 129 (D) 323
Total 446 225 671Sensitivity = A/(A + C) = 252/446 = 56.5%.Specificity = D/(B + D) = 129/225 = 57.3 %.Positive predictive value = A/(A + B) = 252/384 = 72.2%.Negative predictive value = D/(C + D) 129/ 323 = 39.9 %.
Table 7 Validation of reagent strips in Khamir, October 1999, school-based study
Eggs Strips Total No. +ve No. –ve
Present 86 (A) 40 (B) 126
Absent 65 (C) 45 (D) 110
Total 151 85 236Sensitivity = A/(A + C) = 86/151 = 57.0%.Specificity = D/(B + D) = 45/85 = 52.9 %.Positive predictive value = A/(A + B) = 86/126 = 68.3%.Negative predictive value = D/(C + D) = 45/110 = 40.9%.

984 La Revue de Santé de la Méditerranée orientale, Vol. 11, No 5/6, 2005
�ملجلة �لصحية لشرL �ملتوسط، منظمة �لصحة �لعاملية، �ملجلد �حلا�E عشر، �لعد��� ٥-٦، ٢٠٠٥
Egypt. Baseline prevalence was reduced by 83.6%, from 23.1% to 3.8% [17]. In Mali, where mass chemotherapy with praziquan-tel was used to control S. haematobium in an area of 87 villages, overall prevalence was reduced from 68.8% to 39.4% [18].
An analysis of cost-effectiveness of S. haematobium control by chemotherapy confirmed the cost advantage of school-age targeting over vertical programmes, but emphasized the importance of school atten-dance in selecting community-based over population-based approaches [19]. The rate of school enrolment and absenteeism from schools seem to be crucial factors in the effectiveness of school-based programmes [20]. In a school-based schistosomiasis control programme in Egypt it was reported that 80% of infected girls were not treated because they were not enrolled in schools [21]. After studying the impact of school-based mass chemotherapy on helminth egg production in a community in Kenya, Olsen concluded that school-based chemotherapy misses a significant proportion of transmis-sion of schistosomiasis and intestinal hel-minths maintained by pre-school children, non-enrolled school-age children and adults
[22]. In another school-based programme to control schistosomiasis and intestinal parasites in Kenya, it was noted that in some schools the prevalence of haematuria was not affected, or actually increased, after the first year of intervention due to enrolment of untreated children after mass treatment was given [23]. Thus, the outcomes of school-based programmes seem to be easily influenced by the pool of untreated children outside the school.
Reagent strips and visible haematuria could be cost-effective screening methods for the disease only if employed in remote areas with limited accessibility to health services and limited availability of facili-ties, such as the study area.
Savioli and Mott found the development of a simplified, indirect approach to the diagnosis of S. haematobium in Tanzania (based on a combination of observation of grossly bloody urine specimens, reagent strips for measuring haematuria, and treat-ment with praziquantel) reduced costs of schistosomiasis control compared with the more accurate but time-consuming parasitological methods [24]. Chen-Hong et al. found that the rate of infection of
Table 8 Comparison of total cost of treatment using screening reagent strips (visible haematuria) and the urine filtration method (detection of eggs) for identification of infection in urban and rural areas
Variable Cost (US$) Urine filtration Strips Urban Rural Urban Rural
Screening per person 0.48 4.26 0.85 2.02
Treatment per person 1.85
Total 2.33 6.11 2.70 3.87
Screening per case detected (infected) 0.92 8.21 1.28 3.04
Treatment per infected person treated 1.00 1.25
Total 1.92 9.21 2.53 4.29
Eastern Mediterranean Health Journal, Vol. 11, Nos 5/6, 2005 985
�ملجلة �لصحية لشرL �ملتوسط، منظمة �لصحة �لعاملية، �ملجلد �حلا�E عشر، �لعد��� ٥-٦، ٢٠٠٥
residents in a community was the deter-mining factor for the cost-effectiveness of mass chemotherapy schemes [25]. Taylor et al. found that microhaematuria could be valuable in the diagnosis of S. haematobium in national control programmes and could replace parasitological examination as long as sensitivity and specificity continued to be evaluated [26].
The results of this study indicate that an integrated community and school-based programme combining chemotherapy and health education can be effective for control of S. haematobium infection in endemic areas. Reagent strips and visible haematuria could be used for screening for the disease in remote areas where there is limited access to health services. There was a significant impact on prevalence. The relative contribution of heavy infection among positive individuals was reduced and there was a change in the behaviour of the community, manifested by adopting preventive measures against the disease.
Recommendations
• Mass chemotherapy should be consi-dered for high prevalence areas.
• Personnel involved in schistosomiasis control activities should be adequately trained to ensure quality of services. An appropriate surveillance system should be in place so that data are carefully recorded in the field and reported. Data analysis should be done at all levels to guide control operations and proper feedback of data ensured.
• Since school enrolment rates are rel-atively low in Yemen, especially in
females, to be effective, any control programme must target non-enrolled as well as enrolled children.
• Health education is an important com-ponent of schistosomiasis control. The development of human resources and materials for health education must be ensured to decrease in the frequency of contact with water sources and encou-rage adherence to preventive measures.
• A national control programme must target both the community and school-children to obtain the best possible sustainable results and community par-ticipation should be incorporated into the activities of the national schistoso-miasis control programme.
• Primary health care staff should be trained in communication skills in order to conduct health education programmes at community level.
• Support from nongovernmental orga-nizations should be sought for schis-tosomiasis control activities, including chemotherapy, training, health educa-tion, sanitation and water supply.
Acknowledgements
This investigation received technical and fi-nancial support form the joint WHO Eastern Mediterranean Region (EMRO), Division of Communicable Disease (DCD) and the WHO Special Programme for Research and Training in Tropical Diseases (TDR): The EMRO/DCD/TDR Small Grants Scheme for Operational Research in Tropical and Communicable Disease.
References
1. Arfaa F. Studies on schistosomiasis in the Yemen Arab Republic. American journal
of tropical medicine and hygiene, 1972, 21(4):421–4.
986 La Revue de Santé de la Méditerranée orientale, Vol. 11, No 5/6, 2005
�ملجلة �لصحية لشرL �ملتوسط، منظمة �لصحة �لعاملية، �ملجلد �حلا�E عشر، �لعد��� ٥-٦، ٢٠٠٥
2. Nagi MAM. The present status of schisto-somiasis and the most appropriate strate-gies for its control in Yemen. In: Report on the regional workshop on comprehen-sive approaches for schistosomiasis con-trol, Alexandria, Egypt, 6–10 June 1993. Alexandria, World Health Organization Regional Office for the Eastern Mediter-ranean, 1993 (WHO-EM/PDP/29-E/L).
3. Nagi MAM. The present status of schisto-somiasis and the most appropriate strate-gies for control in Yemen. In: Report on the regional seminar on prevention and control of schistosomiasis, Cairo, Egypt, 21–23 March 1999. Alexandria, World Health Organization Regional Office for the Eastern Mediterranean, 1999 (WHO-EM/CTD/010/E/L).
4. Nagi MAM. The present status of schisto-somiasis and intestinal helminths in Ye-men. In: Report on the regional workshop on the integrated control of soil-transmit-ted helminths and schistosomiasis, Cairo, Egypt 16–18 October 2000. Cairo, World Health Organization Regional Office for the Eastern Mediterranean, 2000 (WHO-EM/CTD/017/E/L).
5. Nagi MAM. Schistosomiasis control pro-gramme and Marib Dam project. 1991, Journal of Yemen Red Crescent Society, 9:5.
6. Nagi MAM, Molan AL. Schistosomiasis in Marib Province Republic of Yemen, Jour-nal of the Islamic Medical Association of North America, 1994, 26(3):99–101.
7. Nagi MAM et al. Epidemiological, clinical and haematological profile of schisto-somiasis in Yemen. Eastern Mediterra-nean health journal, 1999, 5(1):177–81.
8. Nagi MAM. Schistosomiasis and endemic diseases control project. Report of the National Schistosomiasis and Endemic Diseases Control Programme. Sana’a, Yemen, Ministry of Public Health, 2001 (YEM/CTD/030):1–12.
9. 1994 Census report, Republic of Yemen. Sana’a, Ministry of Planning Press, 1996.
10. The control of schistosomiasis. Geneva, World Health Organization, 1993 (Techni-cal Report Series No. 830).
11. The control of schistosomiasis. Report of a WHO expert committee. Geneva, World Health Organization, 1985, (Technical Report Series No. 728).
12. Bundy DAP, Guyatt H. Antihelminthic chemotherapy: the individual and the community. Current opinion in infectious diseases, 1995, 8:466–72.
13. Lengeler C et al. Community-based ques-tionnaire and health statistics as tools for the cost-efficient identification of commu-nities at risk of urinary schistosomiasis. International journal of epidemiology, 1991, 20(3):796–807.
14. Lengeler C et al. Urinary schistosomiasis: testing with urine filtration and reagent sticks for haematuria provides a compa-rable prevalence estimate. Acta tropica, 1993, 53(1):39–50.
15. Tiemersma EW et al. Detection of urinary schistosomiasis in a low prevalence re-gion. Transactions of the Royal Society of Tropical Medicine and Hygiene, 1997, 91(3):285–6.
16. Lu-Guang Y et al. Study on the effect of selected chemotherapy combined with health education to control schistosomia-sis in marshland of the Yangtze River. Chinese journal of schistosomiasis con-trol, 1997, 9:89–92.
17. Talaat M, Miller FD. A mass chemothe-rapy trial of praziquantel on Schistosoma haematobium endemicity in Upper Egypt. American journal of tropical medicine and hygiene, 1998, 49(4):546–50.
18. Brinkmann UK. Korte R. Schmidt-Ehry B. The distribution and spread of schis-tosomiasis in relation to water resources
Eastern Mediterranean Health Journal, Vol. 11, Nos 5/6, 2005 987
�ملجلة �لصحية لشرL �ملتوسط، منظمة �لصحة �لعاملية، �ملجلد �حلا�E عشر، �لعد��� ٥-٦، ٢٠٠٥
development in Mali. Tropical medicine and parasitology, 1988, 39(2):182–5.
19. Guyatt H et al. Controlling schistosomia-sis: the cost-effectiveness of alternative delivery strategies. Health policy and planning, 1994, 9(4):385–95.
20. Nokes C, Bundy DAP. Compliance and absenteeism in school children: implica-tions for helminth control. Transactions of the Royal Society of Tropical Medicine and Hygiene, 1996, 87:148–52.
21. Husein M et al. Who misses out with school-based health programmes? A stu-dy of schistosomiasis control in Egypt. Transactions of the Royal Society of Tropical Medicine and Hygiene, 1996, 90(4):362–5.
22. Olsen A. The proportion of helminth infec-tions in a community in western Kenya which would be treated by mass chemo-therapy of school children. Transactions of the Royal Society of Tropical Medicine and Hygiene, 1998, 92(2):144–8.
23. Magnussen P et al. A school-based ap-proach to control of urinary schistosomia-sis and intestinal helminth infections in children in Matuga, Kenya: impact of a two-year chemotherapy programme on prevalence and intensity of infections. Tropical medicine and international health, 1997, 2(9):825–31.
24. Savioli L, Mott KE. Urinary schistosomia-sis on Pemba Island: low-cost diagnosis for control in a primary health care setting. Parasitology today, 1989, 5(10):333–7.
25. Chen-Hong G et al. Evaluation models of effectiveness for cost of screening and chemotherapy of schistosomiasis. Chi-nese journal of schistosomiasis control, 1996, 8:25–8.
26. Taylor P, Chandiwana SK, Matanhire D. Evaluation of the reagent strip test forhae-maturia in the control of Schistosoma haematobium infection in school children. Acta tropica, 1990, 47(2):91–100.
988 La Revue de Santé de la Méditerranée orientale, Vol. 11, No 5/6, 2005
�ملجلة �لصحية لشرL �ملتوسط، منظمة �لصحة �لعاملية، �ملجلد �حلا�E عشر، �لعد��� ٥-٦، ٢٠٠٥
Prevalence of pediculosis capitis and determination of risk factors in primary-school children in KermanF. Kamiabi1 and F. Hosain Nakhaei 2
1Division of Medical Entomology and Vector Control; 2Department of Epidemiology and Biostatistics, Faculty of Health, Kerman University of Medical Sciences, Kerman, Islamic Republic of Iran (Correspondence to F. Kamiabi: [email protected]).Received: 11/12/03; accepted: 15/08/04
ABSTRACT This descriptive, analytical study was carried out in 2003 to determine the prevalence of pediculosis capitis and some risk factors among primary-school pupils in Kerman. We selected 1200 pupils (53% girls) from 50 primary schools by multistage, systematic random sampling. Their hair was examined for head louse infestation: 45 (3.8%) were infected with lice, 43 (95.5%) girls and 2 (4.5%) boys. The highest rate of infestation was in 9-year-olds. There was a significant relationship between head louse infestation and sex (P < 0.0001), age (P < 0.05), parents’ education (P < 0.0001), father’s job (P < 0.01), family size (P < 0.01), length of hair (P < 0.0001) and having separate bathing facilities in the house (P < 0.0001).
Prévalence de la pédiculose de la tête et détermination des facteurs de risque chez des écoliers du primaire à KermanRÉSUMÉ Cette étude analytique et descriptive a été réalisée en 2003 pour déterminer la prévalence de la pédiculose de la tête et certains facteurs de risque chez des écoliers du primaire à Kerman. Nous avons sélectionné 1200 élèves (53 % de filles) dans 50 écoles primaires par échantillonnage aléatoire systématique à plusieurs degrés. Leurs cheveux ont été examinés à la recherche d’une infestation par des poux de tête : 45 (3,8 %) étaient infestés par des poux – 43 filles (95,5 %) et 2 garçons (4,5 %). Le taux d’infestation le plus élevé se trouvait chez les enfants âgés de 9 ans. Il y avait une relation significa-tive entre l’infestation par les poux de tête et le sexe (p < 0,0001), l’âge (p < 0,05), le niveau d’instruction des parents (p < 0,0001), l’emploi du père (p < 0,01), la taille de la famille (p < 0,01), la longueur des cheveux (p < 0,0001) et le fait d’avoir des salles d’eau séparées dans la maison (p < 0,0001).

Eastern Mediterranean Health Journal, Vol. 11, Nos 5/6, 2005 989
�ملجلة �لصحية لشرL �ملتوسط، منظمة �لصحة �لعاملية، �ملجلد �حلا�E عشر، �لعد��� ٥-٦، ٢٠٠٥
Introduction
Skin disorders are among the most frequen-tly diagnosed conditions in schoolchildren in both developing and industrialized coun-tries [1–5]. The school environment makes children vulnerable to cross-transmission of communicable skin diseases, which can then be passed on to family members [6]. Head louse infestation is a condition that has worldwide distribution and is seen in school-age children in many countries.
This study was carried out to determine the prevalence of pediculosis capitis and some of the factors affecting infestation among pupils in primary schools in Kerman city.
Methods
The present study was a descriptive, cross-sectional, analytical study. The study sample was selected from the students of 50 primary schools in Kerman city in the Islamic Republic of Iran, 1076 km south-east of Tehran. The sample size was 1200 students, using the formula
N = z2pq/d2
where p = 0.08 (from previous Iranian stu-dies), q = (1 – p) and d = 0.016. For 95% confidence (α = 0.05) N is 1104. Consi-dering attrition of 9%, N was calculated at 1200. In this study 50 primary schools were selected by classification cluster random sampling. First, all the primary schools in Kerman city were divided into 3 groups ac-cording to size:• Group A: 62 schools (32 boys’ schools,
30 girls’ schools) having < 150 students• Group B: 75 schools (34 boys’ schools,
41 girls’ schools) having 150–300 stu-dents
• Group C: 55 schools (32 boys’ schools, 23 girls’ schools) having > 300 studentsThen, taking into consideration the
population of each group, the number of samples from each group was determined and schools were chosen by random cluster sampling. From the first group, 144 students were selected from 10 schools, from the second group 420 students from 20 schools and from the third group 636 students from 20 schools (in total, 24 boy’s schools and 26 girl’s schools were sampled). In each cluster according to the population of the school, the number of students in the sample was determined and students were selected using simple random sampling at all levels.
At the beginning of the survey, parents were invited to the school by the principal. They were informed about the study and asked for consent for their children to participate. All agreed to give consent. The survey was carried out from 6 April to 2 June 2003.
For data collection, the students’ hair was examined carefully by one of the au-thors. The presence of nits, nymphs or adult lice in the hair were the criteria for diagno-sis of head louse infestation. The data from this physical examination were recorded for each pupil along with the demographic information that was collected from the students or from school documentation.
Analysis of the data was performed using SPSS.
Results
A total of 1200 primary-school students were examined for this study, 636 girls (53%) and 564 boys (47%). Demographic data and prevalence of infestation are shown in Table 1. Only 30 students (2.5%) were living in families with family size > 10 and only 94 (7.8%) were living in a house

990 La Revue de Santé de la Méditerranée orientale, Vol. 11, No 5/6, 2005
�ملجلة �لصحية لشرL �ملتوسط، منظمة �لصحة �لعاملية، �ملجلد �حلا�E عشر، �لعد��� ٥-٦، ٢٠٠٥
Table 1 Prevalence of head louse infestation in pupils of primary schools in Kerman city, 2002–03
Variable No. % Prevalence of P-value infestation No. (%)
Sex < 0.0001 Female 636 53.0 43 6.8 Male 564 47.0 2 0.4
Age (years) < 0.05 7 195 16.3 7 3.6 8 223 18.6 4 1.8 9 213 17.8 14 6.6 10 224 18.7 2 0.9 11 259 21.6 13 5.0 > 11 86 7.2 5 5.8
Hair length < 0.0001 Shorta 738 61.5 9 1.2 Long 462 38.5 36 7.8
Family size < 0.01 < 5 690 57.5 18 2.6 5–10 480 40.0 23 4.8 > 10 30 2.5 4 13.3
Mother’s educationb < 0.0001 Illiterate 126 10.5 9 7.1 Primary 345 28.8 23 6.7 Secondary to diploma 573 47.8 9 1.6 University education 106 8.8 0 –
Father’s educationc Illiterate 105 8.8 12 11.4 Primary 324 27.0 14 4.3 Primary to diploma 540 45.0 16 3.0 University education 165 13.8 0 –
Father’s job < 0.01 Skilled 346 28.8 8 2.3 Semi-skilled 314 26.2 21 6.7 Unskilled 467 38.9 14 3.0 Unemployed 26 2.2 1 3.8
Bathing facilities in the house < 0.0001 Yes 1106 92.2 31 2.8 No 94 7.8 14 14.9aHair which could not be collected and tied.bIn 9 cases the mother had died and data were missing for the others.cIn 21 cases the father had died and data were missing for the others.

Eastern Mediterranean Health Journal, Vol. 11, Nos 5/6, 2005 991
�ملجلة �لصحية لشرL �ملتوسط، منظمة �لصحة �لعاملية، �ملجلد �حلا�E عشر، �لعد��� ٥-٦، ٢٠٠٥
which did not have a bath. Just over 60% of the students we examined had short hair that could not be collected and fastened.
Prevalence of pediculosis capitis among the primary-school pupils we studied in Kerman city was 3.8% overall (45 pupils). Of those infected, 95.5% were females. The highest prevalence of infestation was among 9-year-olds (6.6%). Students with short hair had a lower infestation rate (1.2%). Of the 636 girls, 462 had long hair and 36 (7.8%) of these were infested. Just 7 (4.0%) of the 174 girls with short hair were infested.
Prevalence of head louse infestation among pupils who were living in large families (> 10 family members) was greater (13.3%) than among others and the rate of infestation was also greater among students whose parents’ education level was low. In addition, the infestation rate was greater among pupils who were living in families with poor socioeconomic conditions and who did not have separate facilities for bathing in their house.
Based on chi-squared tests, the relation-ship between head louse infestation and all of the variables examined was statistically significant (Table 1).
Discussion
Comparing of the prevalence of pediculosis capitis is very difficult task both between diffe-rent countries and between differ-ent areas within a country because many factors, e.g. socioeconomic, educational, hygienic, are involved.
Pediculosis capitis is the most prevalent condition in school and preschool age groups throughout the world, and espe-cially in developing countries [4]. Head lice ranked third in frequency among all skin disorders among male schoolchildren in Amman [6]. In our study prevalence of head louse infestation was 3.8% in primary-
school students in Kerman city. According to an accomplished investigation in Torine (France), more than 15% of students studied were infected [7]. Head louse infestation was 6.8% in 1007 primary-school children in Sierra Leone [8]. In a similar study in Ni-geria, of 6882 primary-school pupils, 3.7% were infected [9]. Prevalence of infestation was 9.4% in 785 primary-school children in Turkey [10]. The rate of infestation was 81.5% among schoolchildren in Argentina [11].
Overall, 13.4% of students were in-fected with nits or immature or adult lice in northern Jordan, and girls showed a higher prevalence than boys [12]. In our study, the prevalence of head lice in girls was also greater than in boys. This is in agreement with results of a number of other studies [10,13,14].
In addition, in our study the highest rate of infestation was seen in 9-year-old students. Similar findings have been reported in a number of other studies [6–8,11,12,15,16]. In our study there was a relationship between the rate of infestation and parents’ education and socioeconomic and sanitary conditions. This is in agree-ment with results of a number of previous studies [4,10,11,].
Conclusions
Improvements in socioeconomic and cultu-ral conditions may reduce the prevalence of pediculosis capitis because these are factors which affect the rate of infestation. Imple-menting health education programmes for students, and possibly parents too, may help in controlling this health problem. These measures along with curing infected students and possible cases within the fa-mily will decrease the rate of infestation and lead to greatly improved control.

992 La Revue de Santé de la Méditerranée orientale, Vol. 11, No 5/6, 2005
�ملجلة �لصحية لشرL �ملتوسط، منظمة �لصحة �لعاملية، �ملجلد �حلا�E عشر، �لعد��� ٥-٦، ٢٠٠٥
References
Journal of the National Medical Associa-tion, 1994, 86(11):861–4.
10. Inanir I et al. Prevalence of skin condi-tions in primary-school children in Turkey: differences based on socioeconomic fac-tors. Pediatric dermatology, 2002, 19(4):307–11.
11. Chouela E et al. Head louse infestations: epidemiologic survey and treatment evaluation in Argentinian schoolchildren. International journal of dermatology, 1997, 36(11):819–25.
12. Amr ZS, Nusier MK. Pediculosis capitis in northern Jordan. International journal of dermatology, 2000, 39(12):919–21.
13. Wegner Z, Racewicz M, Stanczak J. Occurrence of pediculosis capitis in a population of children from Gdansk, Sopot, Gdynia and the vicinities. Applied parasitology, 1994, 35(3):219–25.
14. Hong HK et al. Infestation rate of head lice in primary children in Inchon, Korea. Ko-rean journal of parasitology, 1995, 33(3):243–4.
15. Fan PC et al. Present status of head louse (Pediculosis capitis) infestation among schoolchildren in Yunlin County, Taiwan. Gaoxiong yi xue ke xue za zhi, 1991, 7(4):151–9.
16. Suleman M, Jabeen N. Head lice infesta-tion in some urban localities of NWFP, Pakistan. Annals of tropical medicine and parasitology, 1989, 83(5):539–47.
1. Dold S et al. Genetic risk for asthma, allergic rhinitis, and atopic dermatitis. Archives of diseases in childhood, 1992, 67(8):1018–22.
2. Markkola L, Mattila KJ, Koivikko MJ. Sauna habits and related symptoms in Finnish children. European journal of paediatrics, 1989, 149(3):221–2.
3. Huh S et al. Prevalence of head louse infestation in primary-school children in Kangwon-do, Korea. Korean journal of parasitology, 1993, 31(1):67–9.
4. Aydemir EH et al. Pediculosis capitis in Istanbul. International journal of dermato-logy, 1993, 32(1):30–2.
5. Verhagen AR et al. Skin diseases in Kenya. A clinical and histopathological study of 3168 patients. Archives of der-matology, 1968, 98:577–86.
6. Shakkoury WA, Abu-Wandy E. Prevalence of skin disorders among male school-children in Amman, Jordan. Eastern Mediterranean health journal, 1999, 5(5):955–9.
7. Combescot C. Epidémiologie actuelle de la pédiculose a Pediculus capitis [Current epidemiology of Pediculosis capitis]. Bul-letin de l’Académie Nationale de Méde-cine, 1990, 174(2):231–6.
8. Gbakima AA, Lebbie AR. The head louse in Sierra Leone: an epidemiological study among school children in the Njala area. West African journal of medicine, 1992, 11(3):165–71.
9. Ebomoyi EW. Pediculosis capitis among urban school children in Ilorin, Nigeria.
�ملجلة �لصحية لشرL �ملتوسط، منظمة �لصحة �لعاملية، �ملجلد �حلا�E عشر، �لعد��� ٥-٦، ٢٠٠٥
Eastern Mediterranean Health Journal, Vol. 11, Nos 5/6, 2005 993
Serum interleukins and urinary microglobulin in children with idiopathic nephrotic syndrome M.K. Rizk,1 A. El-Nawawy,2 E. Abdel-Kareem,3 E-S. Amer,1 D. El-Gezairy3 and A.Z. El-Shafei 2
1Department of Paediatrics, Faculty of Medicine, University of Banha, Banha, Egypt.2Department of Paediatrics; 3Department of Clinical Pathology, Faculty of Medicine, University of Alexandria, Alexandria, Egypt (Correspondence to A. El-Nawawy: [email protected]).Received: 22/03/01; accepted: 22/06/04
ABSTRACT We studied 60 children affected with idiopathic nephrotic syndrome (INS) plus 20 age and sex matched controls. The children with INS were divided into 3 groups of 20: first presentation, remission and relapse. A complete blood picture and complete urinalysis were done. Serum interleukin (IL)-1β, IL-6, tumour necrosis factor (TNF) and quantitative urinary β-2-microglobulin (β-2-m) excretion were estimated. IL-1β and IL-6 were significantly higher in the study groups, the first presentation and relapse groups having the highest concentrations. Serum TNF concentration and urinary β-2-m excretion were significantly higher in the first presentation and relapse groups. Serum IL-1β, IL-6 and TNF concentrations were able to select positively (100%) the first presentation and relapse groups, while these plus urinary β-2-m excretion selected negatively (100%) the control group.
Interleukines sériques et β microglobuline urinaire chez des enfants présentant un syndrome néph-rotique idiopathiqueRÉSUMÉ Nous avons étudié 60 enfants présentant un syndrome néphrotique idiopathique plus 20 témoins appariés selon l’âge et le sexe. Les enfants présentant un syndrome néphrotique idiopathique ont été répartis en trois groupes de 20 : première manifestation, rémission et récidive. Un hémogramme et un exa-men des urines complets ont été réalisés. On a estimé l’interleukine 1β, l’interleukine 6, la cachectine (TNF) et l’excrétion quantitative de β2-microglobuline urinaire. Les taux sériques d’interleukine 1β et d’interleukine 6 étaient significativement plus élevés dans les groupes de l'étude, les groupes de première manifestation et de récidive ayant les concentrations les plus fortes. La concentration sérique de TNF et l’excrétion de β2-micro-globuline urinaire étaient significativement plus élevées dans les groupes de première manifestation et de ré-cidive. Les concentrations sériques d’interleukine 1β, d’interleukine 6 et de TNF permettaient de sélectionner positivement (100 %) les groupes de première manifestation et de récidive alors que ces concentrations plus l'excrétion urinaire de β2-microglobuline urinaire sélectionnaient négativement (100 %) le groupe témoin.
�ملجلة �لصحية لشرL �ملتوسط، منظمة �لصحة �لعاملية، �ملجلد �حلا�E عشر، �لعد��� ٥-٦، ٢٠٠٥
994 La Revue de Santé de la Méditerranée orientale, Vol. 11, No 5/6, 2005
Introduction
Nephrotic syndrome is neither a single disease nor even a heterogeneous group of related diseases. Rather, it is a clinical state characterized by heavy proteinuria and hypoalbuminaemia, often associated with oedema, hypercholesterolaemia and gene-ralized hyperlipidaemia [1].
Idiopathic nephrotic syndrome (INS) accounts for 90% of nephrosis in child-hood; minimal change nephrotic syndrome is found in approximately 85% of INS, mesangial proliferative glomerulonephritis in 5% and focal glomerular sclerosis in 10%. In the remaining 10% of children with nephrotic syndrome, it is largely mediated by some form of glomerulonephritis, mem-branous and proliferative being the most common [2].
Idiopathic nephrotic syndrome in childhood occurs at an annual incidence of 2 cases/100 000 population under the age of 18 years [3]; minimal change nephrotic syndrome is most common in children 2–4 years old, but may occur at any age [4].
The basic pathogenic abnormality in nephrosis is proteinuria, which results from an increase in glomerular capillary wall permeability. The mechanism of the increase in permeability is unknown but may be related, at least in part, to loss of negatively charged glycoproteins within the capillary wall [2]. The glomerular lesion, especially in minimal change nephrotic syndrome, may be mediated by circulating permeability factors. They are thought to be T-lymphocyte derived cytokines, which cause podocyte swelling, alterations in charge density, and foot process efface-ment with consequent increase in vascular permeability [5].
Interleukin (IL)-1 and tumour necrosis factor (TNF) are structurally unrelated cytokines, yet their spectra of biological ef-
fects are so similar that these 2 cytokines are almost interchangeable [6]. It has been sug-gested that IL-1 has a significant role in the immunopathogenesis of proteinuria [7] and that TNF-α plays a pathogenic role in the induction and/or maintenance of glomeru-lar barrier dysfunction [8]. Interleukin-6 is involved in inflammatory responses and im-mune reactions in the host. It is produced by a variety of cells, including monocytes and mesangial cells in the kidney [9]. It is not possible at present to distinguish whether IL-6 contributes to renal dysfunction or whether it reflects renal damage [10].
β-2-microglobulin (β-2-m) is a low mo-lecular weight protein found on the surface of all nucleated cells which synthesize it. About 95% of free β-2-m is filtered by the normal glomerulus and a normal kidney is able to reabsorb 99.9% through the proxi-mal tubules. Malfunction of the proximal tubules with a normal glomerular filtration rate is accompanied by decreased tubular reabsorption and increased urinary excre-tion of β-2-m [11].
The aim of this study was the evaluation of serum concentrations of IL-1β, IL-6, TNF and urinary β-2-m in children suf-fering from idiopathic nephrotic syndrome in various situations: before treatment, during remission and on relapse before reinstitution of therapy. An additional aim was the comparison of these levels to those in a matched control group.
Methods
This study was carried out at Alexandria University Children’s Hospital from Janua-ry 1998 to December 1999 (2 years).
Eighty children were included in the study, 60 had idiopathic nephrotic syn-drome (INS) and 20 were healthy children who were randomly selected from those

�ملجلة �لصحية لشرL �ملتوسط، منظمة �لصحة �لعاملية، �ملجلد �حلا�E عشر، �لعد��� ٥-٦، ٢٠٠٥
Eastern Mediterranean Health Journal, Vol. 11, Nos 5/6, 2005 995
attending the growth and development follow-up clinic who were included as a control group. The sick children were recruited in the paediatric nephrology clinic and selected sequentially until the required number was reached. They were classified into 3 groups (20 children in each): first presentation, diagnosed as nephrotic for the first time (these were selected first owing to their small number); remission, selected as being in remission for ≥ 3 months; and relapse, selected as having had their first relapse recently but before reinstitution of therapy (after the first group was complete, we selected a child in remission and a child with relapse sequentially until the required number was reached). Informed consent was obtained from all parents and the protocol of the study was approved by the Alexandria University ethics committee. All patients with a history of recent (within the previous 6 months) infective and/or inflammatory conditions and all patients with abnormal urinary sediments (abnormal casts or crystalluria) were excluded from the study.
A detailed history of the present condi-tion of all the participants was obtained and a thorough clinical examination was performed.
A morning blood sample of 8 mL was collected; 2 mL of the sample were added to EDTA tubes for a complete blood picture. The remaining 6 mL were collected in test tubes for clinical tests. Sera were separated and collected in Eppendorf tubes. These were kept frozen (–70 °C) till the time of the specific tests. All investigations were carried out in the laboratories of the univer-sity hospital.
The specific tests performed were: complete blood picture, blood urea, serum creatinine, serum protein and serum choles-terol. Specific immunologic tests included: serum IL-1β by enzyme immunoassay u-
sing Medgenix kits (Medgenix Diagnostics, Fleurus, Belgium) [intra-assay coefficient of variation (CV) 2.8%, interassay CV 4.5%]; serum IL-6 by enzyme immunoas-say using Medgenix kits (intra-assay CV 5.1%, interassay CV 4.6%); TNF-α by enzyme immunoassay using Medgenix kits (intra-assay CV 4.8%, interassay CV 8.7%). all tests were carried out according to the manufacturer’s instructions.
An early morning sample of urine was collected, examined and centrifuged. The clear supernatant was preserved for the definitive test. Urine output was estimated by collecting all urine voided from 08.00 till 08.00 the next day. For the control group, mothers were asked to collect the urine and deliver it to the clinic for analysis. β-2-m was estimated in urine quantitatively using an enzyme-linked immunosorbent assay technique using Eurogenetics kits coated microtitre strips (Eurogenetics, Tes-senderlo, Belgium) (intra-assay CV 6.4%, inter-assay CV 8.0%).
Data were collected and tabulated using SPSS, version 6, for statistical analysis. De-scriptive measures included: count, percen-tage, minimum, maximum, arithmetic mean and standard deviation. Statistical tests included chi-squared for testing association, 1-way analysis of variance (F-test) for com-paring means of more than 2 groups, Tukey β difference test for pair-wise comparison and Kruskal–Wallis analysis of variance (χ2) for non-parametric or non-normally distributed variables. Pearson correlation was utilized to study association among quantitative variables. The selected level of significance was P ≤ 0.05.
Results
There were no statistically significant dif-ferences between the 4 groups for mean age,

�ملجلة �لصحية لشرL �ملتوسط، منظمة �لصحة �لعاملية، �ملجلد �حلا�E عشر، �لعد��� ٥-٦، ٢٠٠٥
996 La Revue de Santé de la Méditerranée orientale, Vol. 11, No 5/6, 2005
sex distribution and height percentile from 50th centile for age and sex. The weight percentiles were significantly higher in the first presentation and relapse groups than in the control and remission groups from 50th centile for age and sex. Systolic and diastolic blood pressures were significantly higher in the 3 nephrotic groups compared to the control group (Table 1).
Mean serum protein concentration was significantly lower in the 3 study groups, and in the relapse group it was significantly lower than in the other INS groups (Table
2). The serum albumin concentration was significantly lower in the 3 study groups compared to the control group, and also in the first presentation and relapse groups compared to the remission group. Mean se-rum cholesterol was significantly higher in the 3 INS groups than in the control group. Mean serum creatinine was significantly higher in the first presentation and remis-sion groups compared to the control group, but mean blood urea did not show any statistically significant difference across the 4 groups. The mean leukocyte count was
Table 1 Personal and clinical characteristics of 3 groups of children with nephrosis and a control group
Characteristic Group F First Remission Relapse Control presentation
Age (years) Range 2.1–11.5 2.3–14.3 2.4–12.6 2.3–10.2 Mean (SD) 5.7 (3.0) 6.7 (3.4) 5.7 (3.8) 4.0 (2.2) 2.4543
Sex Males [No. (%)] 11 (55) 11 (55) 14 (70) 8 (40) χ2 = 3.636a
Females [No. (%)] 9 (45) 9 (45) 6 (30) 12 (60)
Weight percentileb Range 116.4–135.1 76.5–101.7 81.2–194.5 79.3–101.8 Mean (SD) 126.5 (18.1)c,d 94.0 (6.3) 125.7 (31.8)c,d 92.6 (6.1) 20.255e
Height percentilea Range 84–144.8 86.8–160.0 84–149.7 84–138.3 Mean (SD) 111.8 (19.0) 118.3 (20.6) 111.1 (23. 9) 101.2 (14.7) 2.5238
Systolic blood pressure (mmHg) Range 100–150 100–140 80–140 90–110 Mean (SD) 105.5 (11.8)d 103.1 (12.2)d 121 (16.8)d 92.5 (5.5) 18.425e
Diastolic blood pressure (mmHg) Range 60–80 60–85 50–100 60–70 Mean (SD) 65.5 (7.2)d 64.2 (6.8)d 73.75 (12.9)d 60.5 (2.2) 9.323e
aKruskal–Wallis test.bPresented as % from 50th centile for age and sex.cSignificantly different from remission group.dSignificantly different from control group.eSignificant at P < 0.05.SD = standard deviation.

�ملجلة �لصحية لشرL �ملتوسط، منظمة �لصحة �لعاملية، �ملجلد �حلا�E عشر، �لعد��� ٥-٦، ٢٠٠٥
Eastern Mediterranean Health Journal, Vol. 11, Nos 5/6, 2005 997
Table 2 Laboratory results from blood and urine tests for 3 groups of children with nephrosis and a control group
Test Group F First Remission Relapse Control presentation
Serum protein (g/dL) Range 3.3–7.4 5.4–8.2 2.8–7.2 7.0–8.2 Mean (SD) 6.0 (0.9)a 6.1 (1.2)a 4.5 (1.3)a,b,c 7.8 (0.4) 36.092d
Serum albumin (g/dL) Range 1.2–2.0 3.1–4.2 1.4–2.0 3.0–4.5 Mean (SD) 1.7 (0.2)b,a 3.7 (0.4)a 1.8 (0.2)b,a 3.9 (0.3) 318.000d
Serum cholesterol (mg/dL) Range 120–640 140–540 216–561 145–200 Mean (SD) 401.9 (137.8)a 350.0 (129.0)a 402.9 (105.6)a 168.0 (15.3) 20.051d
Blood urea (mg/dL) Range 17–51 18–51 10–56 20–35 Mean (SD) 34.2 (10.3) 29.9 (8.6) 32.5 (14.1) 25.9 (4.3) 2.603
Serum creatinine (mg/dL) Range 0.2–1.2 0.5–1.1 0.5–1.2 0.3–0.9 Mean (SD) 0.9 (0.2)a 0.8 (0.2) 0.8 (0.3)a 0.6 (0.2) 5.669d
Leukocytes (× 1000/mm3) Range 5.7–12.3 6.9–16.2 5.4–20.7 6.2–9.4 Mean (SD) 8.9 (1.6) 10.0 (2.6)a 11.4 (3.9)a,c 7.8 (1.2) 7.589d
Haemoglobin (g/dL) Range 8.0–13.7 9.6–14.0 7.9–15.6 8.3–13.8 Mean ( SD) 10.4 (1.6) 11.8 (1.3) 12.2 (2.2)c 11.0 (1.6) 4.359d
Platelets (× 1000/mm3) Range 180–693 211–630 280–544 238–430 Mean (SD) 349.8 (103.2) 369.7 (105.1) 420.7 (71.4)a 314.8 (66.3) 5.019d
Leukocytes in urine/HPF Range 1–100 1–9 2–55 1–2 Mean (SD) 17.4 (22.1)a 3.45 (2.0) c 12.3 (13.1)a 1.36 (0.5) 6.856d
Urinary volume (mL/kg per day) Range 9.1–125.0 24.0–150.0 25.0–38.5 50.0–68.2 Mean (SD) 35.8 (27.1)a,b 60.5 (35.8) 31.0 (3.3)a,b 60.4 (4.4) 9.625d
aSignificantly different from control group.bSignificantly different from remission group.cSignificantly different from first presentation group.dSignificant at P < 0.05.SD = standard deviation.HPF = high power field.
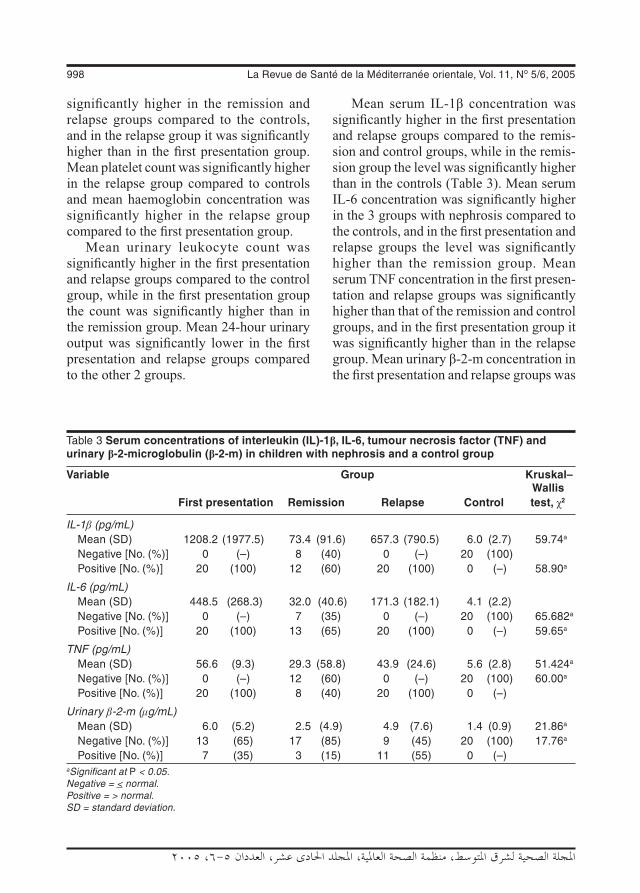
�ملجلة �لصحية لشرL �ملتوسط، منظمة �لصحة �لعاملية، �ملجلد �حلا�E عشر، �لعد��� ٥-٦، ٢٠٠٥
998 La Revue de Santé de la Méditerranée orientale, Vol. 11, No 5/6, 2005
significantly higher in the remission and relapse groups compared to the controls, and in the relapse group it was significantly higher than in the first presentation group. Mean platelet count was significantly higher in the relapse group compared to controls and mean haemoglobin concentration was significantly higher in the relapse group compared to the first presentation group.
Mean urinary leukocyte count was significantly higher in the first presentation and relapse groups compared to the control group, while in the first presentation group the count was significantly higher than in the remission group. Mean 24-hour urinary output was significantly lower in the first presentation and relapse groups compared to the other 2 groups.
Mean serum IL-1β concentration was significantly higher in the first presentation and relapse groups compared to the remis-sion and control groups, while in the remis-sion group the level was significantly higher than in the controls (Table 3). Mean serum IL-6 concentration was significantly higher in the 3 groups with nephrosis compared to the controls, and in the first presentation and relapse groups the level was significantly higher than the remission group. Mean serum TNF concentration in the first presen-tation and relapse groups was significantly higher than that of the remission and control groups, and in the first presentation group it was significantly higher than in the relapse group. Mean urinary β-2-m concentration in the first presentation and relapse groups was
Table 3 Serum concentrations of interleukin (IL)-1β, IL-6, tumour necrosis factor (TNF) and urinary β-2-microglobulin (β-2-m) in children with nephrosis and a control group
Variable Group Kruskal– Wallis First presentation Remission Relapse Control test, χ2
IL-1β (pg/mL) Mean (SD) 1208.2 (1977.5) 73.4 (91.6) 657.3 (790.5) 6.0 (2.7) 59.74a
Negative [No. (%)] 0 (–) 8 (40) 0 (–) 20 (100) Positive [No. (%)] 20 (100) 12 (60) 20 (100) 0 (–) 58.90a
IL-6 (pg/mL) Mean (SD) 448.5 (268.3) 32.0 (40.6) 171.3 (182.1) 4.1 (2.2) Negative [No. (%)] 0 (–) 7 (35) 0 (–) 20 (100) 65.682a
Positive [No. (%)] 20 (100) 13 (65) 20 (100) 0 (–) 59.65a
TNF (pg/mL) Mean (SD) 56.6 (9.3) 29.3 (58.8) 43.9 (24.6) 5.6 (2.8) 51.424a
Negative [No. (%)] 0 (–) 12 (60) 0 (–) 20 (100) 60.00a
Positive [No. (%)] 20 (100) 8 (40) 20 (100) 0 (–)
Urinary β-2-m (μg/mL) Mean (SD) 6.0 (5.2) 2.5 (4.9) 4.9 (7.6) 1.4 (0.9) 21.86a
Negative [No. (%)] 13 (65) 17 (85) 9 (45) 20 (100) 17.76a
Positive [No. (%)] 7 (35) 3 (15) 11 (55) 0 (–) aSignificant at P < 0.05.Negative = < normal.Positive = > normal.SD = standard deviation.

�ملجلة �لصحية لشرL �ملتوسط، منظمة �لصحة �لعاملية، �ملجلد �حلا�E عشر، �لعد��� ٥-٦، ٢٠٠٥
Eastern Mediterranean Health Journal, Vol. 11, Nos 5/6, 2005 999
significantly higher than in the remission and control groups.
Serum concentrations of IL-1β, IL-6 and TNF were able to select positively the first presentation and relapse groups (100%), while these 3 cytokines along with urinary β-2-m excretion could select negatively the controls (100%).
Discussion
Increased level of IL-1β encountered in a study is indicative of its significant role in the immunopathogenesis of proteinuria [7]. The effect of increased IL-1β has been ex-plained on the basis of its local and systemic effects. The main vascular effects of IL-1β are increased platelet adherence, increased capillary permeability, increased prosta-glandin synthesis and hypertension [12]. Moreover, IL-1β with TNF may stimulate increased synthesis of eicosanoids [2]. These could pass through the endothelial cells, affecting the negatively charged podo-cytes, which usually prevent the passage of albumin, leading to their neutralization and hence excessive albuminuria.
Although the mean blood pressure measurements among the INS groups in our study were significantly higher than that of the control group, they were within the normal range for age and sex in the majority of children [2]. It has been postulated that increased mesangial cellularity [13] could compromise renal afferent and/or efferent circulation in the glomeruli. Abrass reported that 19% of children remain hypertensive after induction of remission in nephrotic syndrome [14]
An important effect of increased IL-1β combined with IL-6 and TNF is the increased leukocyte count from 2 sources: bone marrow and leucocytes attached loosely to endothelial cells [15]. This high
leukocyte count could possibly indicate that the infiltrating monocytes-macrophages are the major source of inflammatory cytokines, especially IL-1β, IL-6 and TNF, rather than the resident glomerular cells. IL-1β stimulates hepatic protein synthesis due to hypoalbuminaemia and inhibits lipoprotein lipase [12], which will lead to hypercholes-terolaemia. In this study, the main cause of hypercholesterolaemia in the remission group was inhibition of lipoprotein lipase since the serum protein was within the normal range for age and sex [2]. Although IL-1β increased hepatic protein synthesis, its vascular leak effects surpass it, with a net hypoteinaemia.
The expression of TNF is amplified by IL-1β and is suppressed by immunosup-pressive drugs such as corticosteroids [16]. In renal disease, TNF expression has been found in both resident cells and infiltrating monocytes-macrophages [17]. It acts in a paracrine way to recruit monocytes and macrophages to the glomerular region, besides acting with other mediators to increase vascular permeability [18]. This would cause alteration of the barrier func-tion of the capillary wall [17] leading to pro-teinuria. In our study, TNF did not behave similar to IL-1β in the remission group, where TNF levels decreased to statistically non-significant levels compared to controls while IL-1β levels remained significantly high. This is because TNF is downregulated by corticosteroids [17] and also by the shift of CD4-T cell differentiation to TH2 instead of TH1 cells with a consequent reduction of TH1 cytokine production, especially TNF [19]. Moreover, the combined effect of IL-1β and TNF will lead to a more effective local capillary leakage and cell death than with either cytokine alone [20]. Therefore, to obtain remission there should be a disen-gagement of IL-1β and TNF. This emulates
�ملجلة �لصحية لشرL �ملتوسط، منظمة �لصحة �لعاملية، �ملجلد �حلا�E عشر، �لعد��� ٥-٦، ٢٠٠٥
1000 La Revue de Santé de la Méditerranée orientale, Vol. 11, No 5/6, 2005
IL-1β and IL-6 in its systemic effects, espe-cially bone marrow stimulation and release of neutrophils [15].
While IL-1β and TNF are stimulating mesangial cells to release IL-6 [17,20], other sources are activated: TH2 cells, antigen presenting cells and other somatic cells, especially endothelial cells [12]. Concentration of IL-6 was highest in the first presentation group and lowest in the remission group in the INS patients in this study. IL-6 is activated by the high IL-1β and TNF concentrations in the first presen-tation group, thus IL-6 seems to be able to downregulate TNF, possibly by helping in differentiating CD4-T cells into TH2 cells. Consequently, remission will occur and IL-6 will no longer be needed in the remission group and concentration will ultimately de-cline. This view is supported by the findings that long-term remission of INS is related to the increased TH2 cytokine production (especially IL-6) and the downregulation of TH1 cells [19]. Proteinuria disappears in remission since it has been shown that TNF alone is the single most important cytokine in pathogenesis in INS [21]. Moreover, the use of corticosteroids in the remission group suppressed IL-6 [22]. In the relapse group in this study, the proteinuria caused by increased TNF will need a re-increase of IL-6 expression to suppress TNF expression and its proteinuric effect.
In this study, IL-6 combined with other cytokines acted on the bone marrow to in-crease leukocyte count and haematopoiesis [12] as well as megakaryocytes [23]. The effect is latent and therefore the platelets increased in the relapse group while the leukocyte count depended more on the ef-fects of other cytokines such as IL-1β and TNF, which can be seen from the results.
The lowest haemoglobin concentration we found was in the first presentation group, possibly as a result of low level of
erythropoietin in plasma which can result from increased urinary loss in nephrotic syndrome [14]. This may have outweighed the stimulatory effects of erythropoietin production in bone marrow by the high concentrations of IL-1β and IL-6 in the first presentation group, but the reverse occurred in the relapse group.
In this study, the highest increase of urinary excretion of β-2-m was in the first presentation group because of the combined effect of glomerular and tubular dysfunc-tion. It was shown that increased urinary β-2 m excretion is present in massive glomeru-lar proteinuria and in tubular dysfunction, especially the proximal [24], with a positive correlation between them independent of the primary renal disease [25].
To sum up, significantly high con-centrations of IL-Iβ, IL-6 and TNF were uniformly found in the first presentation and relapse INS groups. They were able to positively predict them (100%) and, along with β-2-m, to negatively predict the con-trols (100%) with fair accuracy. The lower serum values for TNF and urinary β-2m excretion are important factors in defining and predicting remission. IL-1β and TNF usually work in harmony while IL-6 tries to suppress TNF and its harmful effects. It seems that the 3 months remission period used in this study is not a sufficient duration for the return of cytokines and urinary β-2-m to the basal control values. However, the clinical studies on INS in children are quite limited because of its low global incidence (2/100 000 population) [3].
Acknowledgement
We would like to thank Professor Dr Elham Abdel Karim, Professor of Clinical Pathol-ogy, for her help with laboratory investiga-tions.
�ملجلة �لصحية لشرL �ملتوسط، منظمة �لصحة �لعاملية، �ملجلد �حلا�E عشر، �لعد��� ٥-٦، ٢٠٠٥
Eastern Mediterranean Health Journal, Vol. 11, Nos 5/6, 2005 1001
1. Nash MA et al. The nephrotic syndrome. In: Edelman CM ed. Pediatric kidney di-sease, 2nd ed. Boston, Little Brown and Company, 1992:1247–66.
2. Bergstein JM. Conditions particularly as-sociated with proteinuria. In: Behrman RE, Kliegman RM, Jenson HB, eds. Nel-son textbook of pediatrics, 16th ed. Phila-delphia, WB Saunders, 2000:1590–6.
3. Salcado JR et al. Nephrosis in childhood. Nephron, 1995, 71(4): 373–85.
4. Ordonez N, Rosai J. Urinary tract. In: Rosai J, ed. Ackerman’s surgical patho-logy, 8th ed. St Louis, CV Mosby, 1996:1059–163.
5. Gibson IW, More IA. Glomerular patho-logy: recent advances. Journal of patho-logy, 1998, 184(4):123–9.
6. Oppenheim JJ, Ruscetti FW, Faltynek C. Cytokines: complement & kinin. In: Stites DP, Stobo JD, Wells VJ, eds. Basic and clinical immunology, 8th ed. Norwalk, Connecticut, Appleton & Lange, 1994:105–23.
7. Saxena S, Mittal A, Andal A. Pattern of interleukins in minimal-change nephrotic syndrome of childhood. Nephron, 1993, 65(1):56–61.
8. Suranyi MG et al. Elevated levels of tu-mour necrosis factor-αα in the nephrotic syndrome in humans. American journal of kidney disease, 1993, 21(3):251–9.
9. Ohta V et al. Detection and clinical use-fulness of urinary interleukin-6 in the di-seases of the kidney and the urinary tract. Clinical nephrology, 1992, 38(4):185–9.
10. Akutsu Y. [Study of correlation between urinary IL-6 level and mesangial lesion in childhood onset Ig A nephropathy]. Hokkaido igaku zasshi, 1994, 69(4):686–96 (in Japanese).
References
11. Cohen JJ, Harrington JT, Madias NE. Dialysis related amyloidosis. Kidney inter-national, 1992, 41:1416–29.
12. Ganong WF. Circulating body fluids. In: Ganong WF, ed. Review of medical phys-iology, 19th ed. Stamford, Connecticut, Appelton & Lange, 1999, 493–521.
13. Tesch GH et al. Role of interleukin-1 in mesangial cell proliferation and matrix deposition in experimental mesangiopro-liferative nephritis. American journal of pathology, 1997, 151(1):141–50.
14. Abrass CK. Clinical spectrum and compli-cations of the nephrotic syndrome. Jour-nal of investigative medicine, 1997, 45(4):143–53.
15. Janeway CA et al. T-cell mediated im-munity. In: Janeway CA et al., eds. Immu-nobiology: the immune system in health and disease, 4th ed. New York, Elsevier Science, 1999:363–415.
16. Baud L, Ardaillou R. Tumour necrosis fac-tor in renal injury. Mineral and electrolyte metabolism, 1995, 21:336–41.
17. Abott F et al. Interleukin-1beta stimulates human mesangial cells to synthesize and release interleukins-6 and -8. Kidney in-ternational, 1991, 40(4):597–605.
18. Gruss HJ. Molecular, structural and biological characteristics of the tumour necrosis factor ligand superfamily. Inter-national journal of clinical & laboratory research, 1996, 26(3):143–59.
19. Daniel V et al. T-lymphocyte populations, cytokines and other growth factors in se-rum and urine of children with idiopathic nephrotic syndrome. Clinical nephrology, 1997, 47(5):289–97.
20. Dinarello CA. Reduction of inflammation by decreasing production of interleukin-1 or by specific receptor antagonism. Inter-

�ملجلة �لصحية لشرL �ملتوسط، منظمة �لصحة �لعاملية، �ملجلد �حلا�E عشر، �لعد��� ٥-٦، ٢٠٠٥
1002 La Revue de Santé de la Méditerranée orientale, Vol. 11, No 5/6, 2005
national journal of tissue reactions, 1992, 14(2):65–75.
21. Kluth DC, Rees AJ. New approaches to modify glomerular inflammation. Journal of nephrology, 1999, 12(2):66–75.
22. Fukatsu A et al. Expression of interleukin-6 and major histocompatability complex molecules in tubular epithelial cells of diseased human kidneys. Laboratory in-vestigation, 1993, 69(1):58–67.
23. Hirano T. Interleukin-6 and its receptor: ten years later. International reviews of immunology, 1998, 16(3–4):249–84.
24. Fede C et al. N-acetyl-β–D-glucosami-nidase and beta-2-microglobulin: prog-nostic markers in idiopathic nephrotic syndrome. Journal of nephrology, 1999, 12(1):51–5.
25. Caleskan S et al. Urinary N-acetyl–β–D-glucosaminidase and β-2-microglobulin excretion in primary nephrotic syndrome in children. Nephron, 1994, 74(2):401–4.
Note from the EditorWe would like to inform our readers that the next special issue of the EMHJ will be on Medical Bioethics. It is scheduled to be Vol. 12 No. 5, 2006.
Eastern Mediterranean Health Journal, Vol. 11, Nos 5/6, 2005 1003
�ملجلة �لصحية لشرL �ملتوسط، منظمة �لصحة �لعاملية، �ملجلد �حلا�E عشر، �لعد��� ٥-٦، ٢٠٠٥
Acetylator phenotype in Iraqi patients with systemic lupus erythematosusR.A. Najim,1 Y.Y.Z. Farid,2 T. Abed Samad3 and S.A.R. Shihab1
1Department of Pharmacology; 3Rheumatology Section, Department of Medicine, College of Medicine, University of Baghdad, Baghdad, Iraq (Correspondence to R.A. Najim: [email protected]).2Department of Chemistry and Biochemistry, College of Medicine, Al Nahreen University, Baghdad, Iraq.Received: 09/03/04; accepted: 14/06/04
ABSTRACT The study was designed to determine the acetylator status in patients with systemic lupus erythematosus (SLE) and compare it to a matched group of healthy volunteers. Disease severity was determined using the revised American College of Rheumatology criteria for classification and the SLE disease activity index. After an overnight fast, each participant received a single oral dose of 100 mg dapsone. After 3 hours, plasma dapsone/monoacetyldapsone ratio was determined. In the control group, frequency of slow acetylators was 73.3%; frequency of rapid acetylators was 26.7%. In SLE patients, frequency of slow acetylators was 78.0%; frequency of rapid acetylators was 12.0%. However, 8.0% were non-acetylators (monoacetyldapsone not detected in plasma). There was no association between acetylator status and severity of SLE.
Phénotype d’acétylation chez des patients iraquiens atteints de lupus érythémateux systémiqueRÉSUMÉ Cette étude visait à déterminer le statut acétyleur chez des patients atteints de lupus érythé-mateux systémique et à le comparer avec un groupe apparié de volontaires sains. La gravité de la maladie a été établie au moyen des critères révisés de l’American College of Rheumatology pour la classification et le signe d’évolutivité du lupus érythémateux systémique. Après un jeûne d’une nuit, chaque participant s’est vu administrer une dose unique de 100 mg de dapsone par voie orale. Après 3 heures, on a déterminé le rapport plasmatique dapsone/monoacétyldapsone. Dans le groupe témoin, la fréquence des acétyleurs lents était de 73,3 % ; celle des acétyleurs rapides était de 26,7 %. Chez les patients atteints de lupus érythémateux systémique, la fréquence des acétyleurs lents était de 78,0 % ; celle des acétyleurs rapides était de 12,0 %. Toutefois, 8,0 % n’étaient pas acétyleurs (mono-acétyldapsone non détectée dans le plasma). Il n’y avait pas d’association entre le statut acétyleur et la gravité du lupus érythémateux systémique.
1004 La Revue de Santé de la Méditerranée orientale, Vol. 11, No 5/6, 2005
�ملجلة �لصحية لشرL �ملتوسط، منظمة �لصحة �لعاملية، �ملجلد �حلا�E عشر، �لعد��� ٥-٦، ٢٠٠٥
Introduction
Acetylation is considered a major meta-bolic pathway in the biotransformation of a number of drugs such as procainamide, hydralazine, sulphonamides, isoniazide and dapsone and a caffeine metabolite [1]. Ace-tylation exhibits a genetically controlled, bimodal distribution within any given population. Individuals can be phenotyped as either slow or rapid acetylators using a test drug. Slow acetylation is inherited in an autosomal recessive fashion [1].
Polymorphic N-acetylation has been linked to variation in drug response, suscep-tibility to adverse reactions and increased incidence of certain spontaneous disorders, including cancer [1].
In this study, we examined the acety-lator status in Iraqi SLE patients. The Iraqi population, as well as other Middle Eastern populations, is characterized by a predominance of slow acetylators [2]. It is, therefore, interesting to examine this problem in a predominantly slow acetylator population. The possible association of the acetylator state on the severity of the disease was also examined
Methods
Fifty SLE patients and 30 healthy volun-teers participated in the study. Approval to conduct this study was granted by the ethi-cal committee of the College of Medicine in the University of Baghdad. The nature of the trial was explained to the each partici-pant and the consent of each was obtained. Excluded from this study were individuals with glucose-6-phosphate dehydrogenase deficiency or allergy to sulfonamides. These were not encountered in our sample so there were no individuals excluded from the study. No attempt was made to exclude subjects with abnormal hepatic
or renal function. None of the participants had a history of drug-induced lupus prior to phenotype determination. None were taking drugs that would interfere with acetylation nor were any on any drugs known to be polymorphically N-acetylated.
We studied all 50 consecutive, unrela-ted, spontaneous SLE patients attending the Department of Rheumatology in Baghdad Teaching Hospital during the study period, October 2001 to July 2002. The hospital is a tertiary care referral centre drawing patients from all over the country. The nature of the research was explained to each patient and informed consent was obtained. There were no refusals to participate in the study.
The patients were diagnosed and evalu-ated by a consultant rheumatologist. All SLE patients fulfilled at least 4 of the 11 revised (1982) criteria for classification of SLE of the American College of Rheuma-tology [3]. A thorough detailed clinical his-tory was taken from all patients, including clinical and laboratory data.
Patients were maintained on the fol-lowing treatment: 31 patients received corticosteroid therapy (prednisolone), 3 patients were on hydroxychloroquine and 4 were on cytotoxic drugs (methotoxate and cyclophosamide); 18 patients were on no treatment. Six patients were taking more than 1 drug: 4 were on corticosteroids plus cytotoxic drugs and 2 were on hydroxychlo-roquine plus corticosteroids.
Assessment of disease activity was done using 2 methods. The first was by clas-sifying patients according to the American College of Rheumatology criteria. In this classification patients are divided into 2 groups, those who met 4 criteria out of 11 were considered to have mild disease. Pa-tients who had ≥ 4 criteria were considered to have severe disease.
The second method involved using a standard SLE Disease Activity Index (SLE-

Eastern Mediterranean Health Journal, Vol. 11, Nos 5/6, 2005 1005
�ملجلة �لصحية لشرL �ملتوسط، منظمة �لصحة �لعاملية، �ملجلد �حلا�E عشر، �لعد��� ٥-٦، ٢٠٠٥
DAI) chart [4]. Assessment was done at the time of the initial examination. A full score for a particular attribute was given when the patient’s clinical presentation met the terms for that attribute.
Healthy volunteers were recruited from the relatives of patients. None had a history of major illness and there were no abnormal physical findings during examination or investigations. They were matched for age and sex. Owing to restraints of time and funding, only 30 people were recruited. The same exclusion criteria as for the study group applied and informed consent was obtained.
After an overnight fast, each participant received a single oral dose of 100 mg dap-sone (Nile Company for Pharmaceuticals and Chemical Industries, Cairo, Egypt). Drinking of caffeine-containing beverages was not allowed during the study period. A 5 mL blood sample was obtained by venepuncture 3 hours after drug intake and transferred to a 10 mL polyethylene tube containing 50 μL of heparin (Heparin Leo 5000 IU/mL, Leo Pharmaceutical Products, Ballerup, Denmark). Plasma was separated within 1 hour of collection by centrifugation at 3000 rpm for 10 minutes. The samples were stored at –20 °C pending analysis.
A rapid, simple, 1-stage protein precipi-tation method was used for the estimation of plasma dapsone (DDS) and monoacetyldap-sone (MADDS) concentrations by high performance liquid chromatography (Shi-madzu Corporation, Kyoto, Japan) [2,5].
Statistical analyses were done using SPSS, version 10. Differences between groups were assessed by the chi-squared test. An estimate was considered to be sta-tistically significant if P-value was < 0.05. Linear correlation was tested by simple regression analysis [6].
Results
The SLE patient ages ranged from 17 years to 54 years, mean 33.1 years [standard de-viation (SD) 10.3]. The group included 42 females (84.0%), age range 17–54 years, with a mean age of 34.4 years (SD 12.5) and 8 males, age range 19–34 years, with a mean age of 28.3 years (SD 8.2).
The ages of the control group ranged from 16 years to 52 years, mean 26.3 years (SD 9.8). The group included 9 males and 21 females (70.0%).
In the SLE patient group, 39 (78.0%) were slow acetylators (MADDS/DDS ra-tios < 0.30) (Table 1). The slow acetylators included 31 females (79.5%) and 8 males (20.5%) with ages ranging from 17 to 54 years (Table 2). The plasma MADDS/DDS ratios of slow acetylators ranged from 0.01 to 0.28 (mean 0.10; SD 0.082).
Six of the 50 SLE patients, all females, were rapid acetylators (MADDS/DDS ratios > 0.35). Their ages ranged from 18 to 49 years (mean 35.8 years; SD 11.6) (Tables 1 and 2). The plasma MADDS/DDS ratios
Table 1 Frequency distribution of acetylator phenotype in healthy controls and patients with systemic lupus erythematosus (SLE)
Acetylator Control SLE Totalphenotype group patients No. % No. %
Rapida 8 26.7 6 12.0 14
Slowb 22c 73.3 39d 78.0 61
Non- 0 – 4 8.0 4
Total 30 100 49e 100 79χ2 4.73; P = 0.94.aPlasma dapsone/monoacetyldapsone ratio > 0.35.bPlasma dapsone/monoacetyldapsone ratio < 0.30.c95% confidence interval: 59.9–86.7.d95% confidence interval: 63.6–92.4.eOne patient was classed as indeterminate.
1006 La Revue de Santé de la Méditerranée orientale, Vol. 11, No 5/6, 2005
�ملجلة �لصحية لشرL �ملتوسط، منظمة �لصحة �لعاملية، �ملجلد �حلا�E عشر، �لعد��� ٥-٦، ٢٠٠٥
ranged from 0.36 to 1.61 (mean 0.81; SD 0.57). One patient with an acetylation ratio of 0.30–0.35 was considered an indetermi-nate acetylator.
Four of the SLE patients were non-acetylators (MADDS/DDS ratio 0.0). They were all females, aged 23–47 years (mean 31.8 years; SD 11.4) (Tables 1 and 2).
In the control group, there were 22 (73.3%) slow acetylators (Table 1). They included 17 females (77.3%) and 5 males (22.7%) with age range 16–52 years, (mean 27.9 years; SD 10.7) (Table 2). Their plas-ma MADDS/DDS ratios were 0.01–0.28 (mean 0.11; SD 0.09). There were 8 rapid acetylators in the control group (Table 1). They included 4 females and 4 males (Table 2). The age range was 16–29 years (mean 22.0 years; SD 4.9). Plasma MADDS/DDS ratios were 0.36–1.63 (mean 0.86; SD 0.6). There were no non-acetylators in this group (Table 1).
Analysis of the results showed that SLE patients as a group were not significantly different from the control group regarding the incidence of slow and rapid acetylator phenotypes (P > 0.05).
Using the Pearson correlation, no statis-tically significant correlation was found be-tween plasma acetylation (MADDS/DDS) ratios and American college of rheumato-logy criteria (r = 0.058; P = 0.700) in the 50 patients. In addition, the correlation be-
tween plasma acetylation (MADDS/DDS) ratio and the SLE disease activity index in SLE patients was not significant.
Discussion
In this study, the frequency of the slow acetylators in patients with spontaneous SLE did not differ significantly from that in the control group. Godeau et al. were the first to observe an increase in slow acety-lators in patients with SLE in 1973 [7]. The association of spontaneous systemic lupus erythematosus (SLE) with slow acetylator status is, however, controversial. While some reports have confirmed the associa-tion [8,9], others failed to find any relation-ship [10,11].
Our findings agreed with results pu-blished from other institutions worldwide which showed that slow acetylators are not at greater risk of developing SLE than are those who are rapid acetylators [8,10,11]. Nor do our findings support the notion of a significant association between acetylator phenotype and SLE [9]. Thus in a population with a high percentage of slow acetylators, the phenotype distribution alone seems not to be the contributing factor to the develop-ment of spontaneous SLE. This is in agree-ment with a previous report which failed to
Table 2 Frequency distribution of acetylator phenotype according to sex in healthy controls and patients with systemic lupus erythematosus (SLE)
Acetylator Control group SLE patientsphenotype Males Females Males Females No. % No. % No. % No. %
Rapida 4 50.0 4 50.0 0 – 6 100
Slowb 5 22.7 17 77.3 8 20.5 31 79.5
Non- 0 – 0 – 0 – 4 100aPlasma dapsone/monoacetyldapsone ratio > 0.35.bPlasma dapsone/monoacetyldapsone ratio < 0.30.

Eastern Mediterranean Health Journal, Vol. 11, Nos 5/6, 2005 1007
�ملجلة �لصحية لشرL �ملتوسط، منظمة �لصحة �لعاملية، �ملجلد �حلا�E عشر، �لعد��� ٥-٦، ٢٠٠٥
find an association in a predominantly rapid acetylator Chinese population [11].
More recent studies have determined the arylamine N-acetyltransferase genotype of SLE patients. These studies also failed to find an association between the slow acety-lation genotype and SLE [12,13].
An interesting finding in our study was that some SLE patients were non-acety-lators. In a previous report, about half the patients with Behçet disease were found to be non-acetylators [2]. This finding cannot be explained by a technical error in the method used since non-acetylators in this study as well as the previous one were found in patients and not in the control group. On both occasions patient and control samples were run together. The significance of this finding needs further investigation to de-termine the genotype of non-acetylators in order to understand this phenomenon.
In previous studies no attempt was made to correlate acetylator status with the seve-rity of the disease. The severity of the disease as measured by both the American College of Rheumatology criteria and the SLE disease activity index did not show any correlation with the acetylator pheno-type. This finding is in contrast to a previous report on Behçet disease, another systemic autoimmune disease, which showed a cor-relation between the severity of the disease and the acetylator phenotype [2].
In conclusion, in a population of slow acetylators, it appears that the slow acetylator phenotype cannot be considered a genetic trait predisposing to the develop-ment of spontaneous SLE. In addition, acetylator phenotype does not appear to influence disease activity. The occurrence of non-acetylators does, however, need further investigation.
References
1. Weber WW, Hein DW. N-acetylation pharmacogenetics. Pharmacological re-views, 1985, 37(1):25–79.
2. Najim RA, Sharquie KE, Al-Janabi M. Acetylator phenotype in Behçet’s disease. Journal of dermatology, 2003, 30(6):464–71.
3. Tan EM et al. The 1982 revised criteria for the classification of systemic lupus erythematosus. Arthritis and rheumatism, 1982, 25(11):1271–7.
4. Liang MH et al. Measurement of systemic lupus erythematosus activity in clinical research. Arthritis and rheumatism, 1988, 31(7):817–25.
5. Philip PA, Roberts MS, Rogers HJ. A ra-pid method for determination of acetyla-tion phenotype using dapsone. British journal of clinical pharmacology, 1983, 17(4):465–9.
6. Essex-Sorlie D. Medical biostatistics and epidemiology: examination and board review, 1st ed. Appleton and Lange, Nor-walk, Connecticut, 1995.
7. Godeau P et al. Lupus érythémateux dis-séminé et taux d'isoniazide actif [Lupus erythematosus disseminatus and active isoniazid levels.]. Annales de médecine interne, 1973, 124(3):181–6.
8. Fishbein E, Alarcon-Segovia D. Slow acetylation phenotype in systemic lupus erythematosus. Arthritis and rheumatism, 1979, 22(1):95–6.
9. Reidenberg MM et al. Acetylator phe-notype in idiopathic systemic lupus ery-thematosus. Arthritis and rheumatism, 1980, 23(5):569–73.
10. Vansant J et al. Normal distribution of acetylator phenotypes in systemic lupus
1008 La Revue de Santé de la Méditerranée orientale, Vol. 11, No 5/6, 2005
�ملجلة �لصحية لشرL �ملتوسط، منظمة �لصحة �لعاملية، �ملجلد �حلا�E عشر، �لعد��� ٥-٦، ٢٠٠٥
erythematosus. Arthritis and rheumatism, 1978, 21(2):192–5.
11. Kumana CR et al. Lack of association be-tween slow acetylator phenotype in spon-taneous systemic lupus erythematosus. Clinical pharmacology and therapeutics, 1990, 48(2):208–13.
12. Zschieschang P et al. Lack of association between arylamine N-acetyltransferase
2 (NAT2) polymorphism and systemic lupus erythematosus. Pharmacogenetics, 2002, 12(7):559–63.
13. Cooper GS et al. N-acetyl transferase genotypes in relation to risk of developing systemic lupus erythematosus. Journal of rheumatology, 2004, 31(1):76–80.
Note from the EditorWe would like to draw our readers’ attention to the evaluation form at the end of this issue. We welcome comments from our readers, which can help us improve the EMHJ. We would appreciate it there-fore if readers could kindly take the time to complete this form and return it to us. Alternatively, the form can be completed online at: http://www.emro.who.int/publications/emhj/evaluationform.asp

Eastern Mediterranean Health Journal, Vol. 11, Nos 5/6, 2005 1009
�ملجلة �لصحية لشرL �ملتوسط، منظمة �لصحة �لعاملية، �ملجلد �حلا�E عشر، �لعد��� ٥-٦، ٢٠٠٥
Role of mast cells and T-lymphocytes in pemphigus vulgaris: significance of CD44 and the c-kit gene product (CD117)N.R. Ghaly,1 O.A. Roshdy, 1 S.A. Nassar, 1 S.M. Hamad 2and A.M. El-Shafei3
1Department of Dermatology; 2Department of Clinical Pathology; Department of Pathology, University of Tanta, Tanta, Egypt (Correspondence to A.M. El-Shafei: [email protected]).Received: 18/03/04; accepted: 05/10/04
ABSTRACT Molecular mechanisms underlying the pathophysiology of pemphigus vulgaris are still not clear. We aimed to determine the significance of detecting expression of some antigens that might be pivotal to the process, namely CD44 and CD117, in patients with active pemphigus vulgaris. Seventeen patients with ac-tive pemphigus vulgaris and 19 normal healthy controls were included in the study. The immunohistochemical results showed prominent expression of CD44 in 13 of the patients and CD117 in 9 of the patients with new blister formation. CD44 percentage values in peripheral T-lymphocytes were significantly higher in patients than controls, as detected by flow cytometry. In addition, there was a significant increase in a soluble form of c-kit in sera of patients with active pemphigus vulgaris compared to controls.
Rôle des mastocytes et des lymphocytes T dans le pemphigus vulgaire : importance du CD44 et du produit du gène c-kit (CD117)RÉSUMÉ Les mécanismes moléculaires impliqués dans de la pathophysiologie du pemphigus vulgaire ne sont toujours pas clairs. Notre objectif était de déterminer l'importance de la détection de l’expression de certains antigènes pouvant jouer un rôle essentiel dans le processus, à savoir le CD44 et le CD117, chez des patients atteints de pemphigus vulgaire actif. Dix-sept patients atteints de pemphigus vulgaire actif et 19 témoins sains ont été inclus dans l’étude. Les résultats immunohistochimiques ont montré un haut niveau d’expression de CD44 chez 13 des patients et de CD117 chez 9 des patients ayant une formation de bulles récente. Le pourcentage de CD44 dans les lymphocytes T périphériques était significativement plus élevé chez les patients que chez les témoins, comme détecté par la cytométrie en flux. En outre, il y avait une aug-mentation significative de la forme soluble du c-kit dans le sérum des patients atteints de pemphigus vulgaire actif par rapport aux témoins.

1010 La Revue de Santé de la Méditerranée orientale, Vol. 11, No 5/6, 2005
�ملجلة �لصحية لشرL �ملتوسط، منظمة �لصحة �لعاملية، �ملجلد �حلا�E عشر، �لعد��� ٥-٦، ٢٠٠٥
IntroductionPemphigus vulgaris (PV) is a life-threate-ning blistering skin disease in which pa-tients’ autoantibodies are directed against desmosomal glycoproteins, resulting in the loss of keratinocyte cell–cell adhesion [1].
The CD44 family of cell surface glyco-proteins is widely expressed in epithelial, mesothelial and haemopoietic tissues and is thought to function primarily as adhe-sion molecules, involved in cell–cell and cell matrix interactions and thought to take part in cell motility [2,3]. First identified in lymphocytes in 1982, they act as co-stimu-latory molecules for T cells, leading to the induction of effector functions in these cells [4]. A relationship between activated or memory-effector lymphocyte populations and increased expression of family mem-bers of CD44 has been described and the importance of such CD44 expressing cells in the effector arm of the immune response in vivo has been reported [5]. This molecule is encoded by a single gene located on the short arm of chromosome 11 [6].
It is well known that the c-kit proto-oncogene codes for a type III tyrosine kinase receptor protein (CD117) that is structurally related to other transmembrane receptors. It is expressed in many tissues and cells and binds to stem cell factor [7]—c-kit/stem cell factor is involved in the development of several lineages of stem cells, such as germ cells, neural crest-derived melanocytes and haematopoietic precursor cells [8].
Moreover, c-kit/stem cell factor interac-tion induces mast cell adhesion to extracel-lular proteins differentiation, proliferation, migration and survival. It also activates mast cells to secrete its mediators – tumour necrosis factor α, protease, esterase, gly-cosaminoglycans and phosphogluconate dehydrogenase [9]. Thus, strong membrane reactivity for CD117 identified in mast cells
may be useful in the diagnosis of mast cell disorders and to shed a light on the role of mast cells in autoimmune diseases [7].
Little is known about molecular mecha-nisms affecting mast cell and T lympho-cytes function in PV. Therefore, we aimed to explore possible factors controlling mast cells and T-lymphocytes during blister de-velopment through assessment of CD44 and CD117 by immunohistochemical methods in order to clarify the role of the infiltrating inflammatory cells in the pathomechanisms of acantholysis in PV. We also evaluated the circulating activity of these cells in the sera of patients with PV, using flow cyto-metry for CD44-positive peripheral blood lymphocytes and enzyme-linked immuno-sorbent assay (ELISA) for CD117.
Methods
PatientsWe selected 17 patients clinically and his-tologically proven to be suffering from PV who were attending the outpatient clinic of the Department of Dermatology at Tanta University Hospital; 19 normal healthy in-dividuals were recruited as a control group. All the patients had received no treatment in the previous 5 weeks and they were ex-periencing an eruption for the first time or an exacerbation due to interrupted regimen of therapy. From each patient, 10 mL of venous blood were withdrawn; 3 mL were centrifuged to separate the serum which was kept frozen for CD117 analysis by ELISA. The remaining 7 mL were put in heparinzed tubes to separate peripheral blood lympho-cytes, which were then analysed for CD44 monoclonal antibodies by flow cytometry. A skin biopsy from new blisters and from perilesional skin was taken for all patients; 6 of the controls also had a skin biopsy taken.

Eastern Mediterranean Health Journal, Vol. 11, Nos 5/6, 2005 1011
�ملجلة �لصحية لشرL �ملتوسط، منظمة �لصحة �لعاملية، �ملجلد �حلا�E عشر، �لعد��� ٥-٦، ٢٠٠٥
ImmunohistochemistryParaffin sections of 4 mm thickness were deparaffinized in xylene and dehydrated in ethanol. The slides were incubated in methanol containing 0.03% hydrogen pe-roxidase at room temperature for 30 mi-nutes to inactivate endogenolis peroxidase and then rinsed in distilled water. The tis-sue sections were microwaved for antigen retrieval in a plastic Coplin jar filled with 0.01 M citrate buffer in distilled water (pH 6.0). The specimens were then rinsed with tris-buffered saline (TBS) and incubated for 60 minutes at room temperature with mono-clonal mouse anti-human phagocyte glyco-protein-l CD44 (Code No. M 7082). The antibody gives optimal staining when used at a dilution of 1:40-1:80. DAKO Envision System avidin peroxidase (DakoCytoma-tion, Carpinteria, California) was used as the detection system. PAP (BioGenex, San Roman, California) was used as chromogen as well as substrate.
The intensities of the staining obtained with the CD44 were assessed semi-quanti-tatively by comparing the staining intensity of a given blister area with that in the same section or with that at stratum basal and stra-tum spinosum of the perilesional epidermis, which served as an internal standard. The scale applied ranged from zero (no staining detectable) to 3 (a staining intensity greater than that of the epidermis).
Flow cytometry for CD44 on T cellsPeripheral blood was collected in preserva-tive-free heparin tubes and diluted 1:1 with phosphate buffered saline (PBS). Peri-pheral blood mononuclear cells (PBMCs) were isolated by Ficoll–Hypaque gradient centrifugation [16]. Then 106 PBMCs were incubated with 10 μL anti-CD3-PE (Becton Dickinson, USA) and 10μL and anti-CD44-FITC (Becton Dickinson) for 30 minutes at
4 °C in the dark. Cells were washed twice with PBS followed by fixation of cells in 0.5 mL 2% paraformaldehyde in PBS. Cells were acquired and analysed using flow cytometry (Becton Dickinson). For a nega-tive control, irrelevant isotype-matched dye conjugated antibodies were used to stain cells. The mononuclear cells were graded according to their typical forward and right-angle light scatter followed by their expression on a dot plot of anti-CD3 versus anti-CD44 fluorescence. The percentage of T cells expressing CD44 antigen was then calculated [11].
ELISA for CD 117A human CD117 ELISA kit (Diaclone Research, France) was used for the in vitro quantitative determination of soluble stem cell factor receptor molecule (ssCD117) in human serum.
Results
ImmunohistochemistrySkin from the controls exhibited mild in-tensity especially in basal and intermedi-ate epithelial cell layers (Figure 1). There was positive expression of CD44 in 13 out of 17 (76.5%) patients with PV. Some of the stromal cells and T-lymphocytes were distinctly positive for CD44. PV lesions had a higher positivity of CD44 expres-sion, compared to perilesional and normal skin. The epidermis exhibited variability in CD44 staining as the strongest staining was observed in the lower layers of the blister (Figure 2). The distribution of CD44 stai-ning in the perilesional skin was only slight-ly increased or resembled that of the normal epidermis (Figure 3).
Of 6 normal control specimens, 3 showed mild positive melanocytes in the basal epidermal layer and it was difficult to

1012 La Revue de Santé de la Méditerranée orientale, Vol. 11, No 5/6, 2005
�ملجلة �لصحية لشرL �ملتوسط، منظمة �لصحة �لعاملية، �ملجلد �حلا�E عشر، �لعد��� ٥-٦، ٢٠٠٥
detect mast cells in these normal specimens (Figure 4). There was positive expression of CD117 in 9 of the 17 (52.9 %) patients with PV. Some of the stromal cells and mast cells were positive for CD117. PV lesions
Figure 1 CD 44 expression in the epidermis of normal skin showing mild membranous expression in stratum basale, stratum spinosum and part of stratum granulosum (PAP with haematoxylin counter stain × 400)
Figure 2 CD 44 expression in the epidermis of pemphigus vulgaris showing strong membranous expression in stratum basale, stratum spinosum and part of stratum granulosum with positive lymphocytes in the dermis (PAP with haematoxylin counter stain× 400)
Figure 3 CD 44 expression in the epidermis near the blister of pemphigus vulgaris showing mild membranous expression with positive lymphocytes and some stromal cells in the dermis (PAP with haematoxylin counter stain × 400)
had a higher positivity of CD117 expression (Figure 5), compared to perilesional skin. CD117 staining in the perilesional skin is illustrated in (Figure 6).
Figure 4 CD117 expression in the epidermis of normal skin showing mild membranous and cytoplasmic expression of some melanocytes in stratum basale (PAP with light green counter stain × 400)

Eastern Mediterranean Health Journal, Vol. 11, Nos 5/6, 2005 1013
�ملجلة �لصحية لشرL �ملتوسط، منظمة �لصحة �لعاملية، �ملجلد �حلا�E عشر، �لعد��� ٥-٦، ٢٠٠٥
Flow cytometry (CD44)There was a significant increase in the per-centages of total lymphocytes (CD3) ex-pressing CD44 in the patient group with active PV compared to the control group. The mean in the control group was 8%–15% while in patients with PV it was 12%–23% (Table 1, Figures 7 and 8).
ELISA (CD117)There was a significant difference between patients and controls (P < 0.5) for expres-sion of CD117 (Table 2).
Discussion
Although there has been wide interest in the role of humoral immunity and autoantibo-dies in the pathogenesis of PV, the role of the cellular immune system is still unclear.
In the present study, CD44 expression was detected as an intense stain on the cell membrane of epidermal keratinocytes and some lymphocytes in the papillary dermis in active PV lesions. At the same time, nearby skin sections showed moderate positive staining. Normal skin, on the other hand, showed weak to negative staining for CD44. This concurs with Hashimoto et al. who detected positive CD44 acantholytic cells in PV [12]. This overexpression of the cell adhesion molecule CD44 in the epidermis of active PV could be explained by increased proinflammatory cytokines IL-1 alpha and TNF-alpha in an attempt to restore adhesive function between ke-ratinocytes [13,14]. Therefore this finding might be considered a result of acantholysis and not an initiating event in this process [12,14]
Figure 5 CD117 expression in the dermis of pemphigus vulgaris skin (arrow near the blister) showing strong membranous and cytoplasmic expression of some mast cells (arrow) (PAP with light green counter stain × 250)
Figure 6 CD117 expression in the perilesional skin of pemphigus vulgaris showing mild membranous and cytoplasmic expression of some mast cells (arrow) (PAP with light green counter stain 250)
Table 1 Percentage of CD44 in peripheral blood CD3 in patients with pemphigus vulgaris and the control group
Control group Pemphigus vulgaris patients (n = 19) (n = 17)
Range 8%–15% 12%–23%
Mean (SD) 10.68% (2.45) 17.29% (4.25)
t = 5.65, P < 0.05SD = standard deviation.

1014 La Revue de Santé de la Méditerranée orientale, Vol. 11, No 5/6, 2005
�ملجلة �لصحية لشرL �ملتوسط، منظمة �لصحة �لعاملية، �ملجلد �حلا�E عشر، �لعد��� ٥-٦، ٢٠٠٥
Moreover, many authors have dem-onstrated a predominant expression of CD44 on skin-infiltrating lymphocytes that indicate adhesion to inflamed dermal microvascular endothelial cells as well as keratinocytes, an important prerequisite for the development of cutaneous inflammatory and immunological diseases [2,15–17]. This finding was recently supported by the use of CD44 as a marker to evaluate activated T lymphocytes [15,18]. The presence and role of activated T lymphocytes in this study is supported by Mashkilleyson et al. who demonstrated the release of IL2 R at the site of blister formation as an indicator for ac-
tivated T lymphocytes [19]. This increased CD44 on lymphocytes infiltrating the skin in active PV could explain the mecha-nism of lymphocyte activation, with these activated T cells serving as the trigger for a cascade of events that lead to the ampli-fication of the inflammatory process with the resultant tissue damage at target sites [11,16].
In our study, there was significant in-creased percentages of CD44 expressed on total T-lymphocytes by flow cytometry in the peripheral blood of patients with active PV. This is in agreement with other stud-ies demonstrating that CD44 expressing
Figure 7 Total lymphocytes (CD3) expressing CD44 in normal controls
Table 2 Serum c-kit receptor level in patients with pemphigus vulgaris and the control group
Control group Pemphigus vulgaris patients (n = 19) (n = 17)
Range 30–58 ng/mL 42–130 ng/mL
Mean (SD) 40.16 ng/mL (8.23) 85.41 ng/mL (26.32)
t = 6.75, P < 0.05SD = standard deviation.
Figure 8 Total lymphocytes (CD3) expressing CD44 in patients with pemphigus vulgaris
Eastern Mediterranean Health Journal, Vol. 11, Nos 5/6, 2005 1015
�ملجلة �لصحية لشرL �ملتوسط، منظمة �لصحة �لعاملية، �ملجلد �حلا�E عشر، �لعد��� ٥-٦، ٢٠٠٥
cells correlate with autoimmune conditions [11,15]. In addition, Yang et al. reported that assessment of the expression patterns of surface antigen CD44 on peripheral blood T lymphocytes (using monoclonal anti-bodies directed against surface antigen by flow cytometry) is sensitive, safe, easily repeatable and controllable, and therefore can be considered a promising tool for the diagnosis of autoimmune diseases such as PV [15]. Therefore, it can be regarded more useful as a screening test or follow-up indicator rather than as an early diagnostic tool. Furthermore, indirect clinical evidence also supports the idea that T-cells may be involved in helping autoantibody produc-tion in PV [20].
It is a well known fact that mast cells are the key cells in allergic reactions and have a pivotal role in inflammation. However, the role of mast cells in blister formation of PV is still unclear.
The c-kit gene product (CD117), which is known to be expressed on tissue-anchored stromal cells, plays an important role in the development of c-kit bearing cells such as mast cells and melanocytes. In the present study, prominent membranous expression of CD117 in dermal mast cells was detected in active lesions, in contrast to the slight expression in perilesional skin. This finding supports the role of mast cells in blister formation and agrees with Caproni et al. who consistently detected granulo-cytes and mast cells that showed clear signs of activation in lesional skin of PV [20]. In addition, Kaminska et al. detected significant alterations in mast cell chymase and protease inhibitors in PV, suggesting mast–mast cell involvement in this bullous diseases [21].
Our study demonstrates that c-KIT is significantly elevated in the serum of pa-tients with active PV compared with healthy controls. A similar significant relation be-tween CD117 and disease activity has been detected in other autoimmune diseases such as psoriasis and systemic lupus erythema-tosus [20,22]. Therefore, assessment of the level of this marker provides valuable information of the probable severity of the condition. Its mechanism of action could be explained on the basis that mast cells con-tain large amounts of different proteolytic enzymes that can participate in cutaneous inflammation [23]. Moreover, mast cells could be involved in blister formation since elevated tryptic activity is formed in blister fluid of patients with PV [24]. Tryptase can activate single-chain urinary type plas-minogen activator (pro-urokinase) which in turn could activate plasminogen to plasmin resulting in acantholysis [14,21]. Tryptases induce and maintain blister formation by continuous activation of collagenolytic me-talloprotinases and degradation of fibronec-tion [14,25].
We conclude that therapeutic regimens targeting CD44 or CD117 might help ame-liorate the inflammatory process in active PV. However, all these alterations could reflect general inflammation rather than a specific reaction in PV. Further studies are necessary to define the precise nature of acantholysis and molecular factors control-ling mast cells and autoreactive lympho-cytes at the genetic level to elucidate the primary event in the pathogenesis of PV with the aim of devising new strategies for better therapeutic intervention.

1016 La Revue de Santé de la Méditerranée orientale, Vol. 11, No 5/6, 2005
�ملجلة �لصحية لشرL �ملتوسط، منظمة �لصحة �لعاملية، �ملجلد �حلا�E عشر، �لعد��� ٥-٦، ٢٠٠٥
to disease severity and bone marrow pa-thology. Blood, 2000, 96(4):1267–73.
10. Ichikawa T et al. Expression of moesin and its associated molecule CD44 in epi-thelial skin tumors. Journal of cutaneous pathology, 1998, 25:237–43.
11. Estess P et al. Functional activation of lymphocyte CD44 in peripheral blood is a marker of autoimmune disease acti-vity. Journal of clinical investigation, 1998, 102:1173–82.
12. Hashimoto K et al. Junctional proteins of keratinocytes in Grover’s disease, Hailey-Hailey’s disease and Darier’s disease. Journal of dermatology, 1995, 22(3):159–70.
13. Fitzgerald KA, O’Neill LA. Characteriza-tion of CD44 induction by IL-1: a critical role for Egr-1. Journal of immunology, 1999, 162(8):4920–7.
14. Feliciani C et al. Urokinase plasminogen activator mRNA is induced by IL-1 alpha and TNF-alpha in in vitro acantholysis. Experimental dermatology, 2003, 12(4):466–71.
15. Yang J et al. The expression patterns of CD44 and CD45RB on peripheral blood T lymphocytes in the rejection of allogeneic murine skin transplantation. Transplant immunology, 2003, 11(2):197–206.
16. Pure E, Cuff CA. A crucial role for CD44 in inflammation. Trends in molecular medi-cine, 2001, 7(5):213–21.
17. Yasuda M et al. CD44: functional re-levance to inflammation and malignancy. Histology and histopathology, 2002, 17(3):945–50.
18. Termeer C et al. Targeting dendritic cells with CD44 monoclonal antibodies selec-tively inhibits the proliferation of naive
References
1. Jamora MJ, Jiao D, Bystryn JC. Antibo-dies to desmoglein 1 and 3, and the clini-cal phenotype of pemphigus vulgaris. Journal of the American Academy of Der-matology, 2003, 48(6):976–7.
2. Johnson P et al. A role for the cell adhe-sion molecule CD44 and sulfation in leu-kocyte-endothelial cell adhesion during an inflammatory response? Biochemical pharmacology, 2000, 59(5):455–65.
3. Borland O, Ross JA, Guy K. Forms and functions of CD44. lmmunology, 1998, 93:139–48.
4. Trowhridge L et al. Biochemical cha-racterization and cellular distribution of a polymorphic, murine cell- surface gly-coprotein expressed in lymphoid tissues. Immunogenetics, 1982, 15:299–312.
5. Ariel A et al. Induction of interactions between CD44 and hyaluronic acid by a short exposure of human T cells to diverse pro-inflammatory mediators. Im-munology, 2000, 100(3):345–51.
6. Brown TA et al. Human keratinocytes ex-press a new CD44 core protein (CD44E) as a heparan-sulphate intrinsic membrane proteoglycan with additional exons. Jour-nal of cell biology, 1991, 113:207–21.
7. Arber D, Tamayo R, Weiss L. Paraffin section detection of the c-kit gene product (CD117) in human tissues: Value in the diagnosis of mast cell disorders. Human pathology, 1998, 28:498–504.
8. Natali P et al. Expression of c-kit receptor in normal and transformed humannonlym-phoid tissues. Cancer research, 1992, 52:6139–43.
9. Akin C et al. Soluble stem cell factor re-ceptor (CD117) and IL-2 receptor alpha chain (CD25) levels in the plasma of patients with mastocytosis: relationships
Eastern Mediterranean Health Journal, Vol. 11, Nos 5/6, 2005 1017
�ملجلة �لصحية لشرL �ملتوسط، منظمة �لصحة �لعاملية، �ملجلد �حلا�E عشر، �لعد��� ٥-٦، ٢٠٠٥
CD4+ T-helper cells by induction of FAS-independent T-cell poptosis. Immunology, 2003, 109(1):32–40.
19. Mash N, Kauumen T, Visa R. Local in-volvement of antigen presenting cells and activated T cell in perilesional skin in pemphigus vulgaris. Acta dermato-vene-reologica, 1989, 69:424.
20. Caproni B et al. Further support for a role for Th2-like cytokines in blister formation of pemphigus. Clinical immunology, 2001, 98(2):264–71.
21. Kaminska R et al. Mast cell in developing subepidermal bullous diseases: Empha-sis on tryptase, chymase and protease inhibitors. Acta dermato-venereologica, 1999, 79(5):351–5.
22. Yamamoto T, Katayama I, Nishioka K. Possible contribution of stem cell factor in psoriasis vulgaris. Journal of dermatologi-cal science, 2000, 24(3):171–6.
23. Kitoh T et al. Significance of stem cell factor and soluble KIT in patients with systemic lupus erythematosus. Clinical rheumatology, 1998, 17(4):293–300.
24. Levi-Schaer F et al. Increased numbers of mast cells in pemphigus vulgaris skin lesions: a histochemical study. Acta dermato-venereologica , 1991, 71:269–71.
25. Lohi J, Harvima I, Keshi-Oja J. Pericellular substrates of human mast cell tryptase; 72 000 dalton gelatinase and fibronectin. Journal of cellular biochemistry, 1992, 50:337–49.
26. DeGrendele HC et al. CD44 activation and associated primary adhesion is inducible via T cell receptor stimulation. Journal of immunology, 1997, 159:2549–53.


�ملجلة �لصحية لشرL �ملتوسط، منظمة �لصحة �لعاملية، �ملجلد �حلا�E عشر، �لعد��� ٥-٦، ٢٠٠٥
Eastern Mediterranean Health Journal, Vol. 11, Nos 5/6, 2005 1029
Specificity and sensitivity of clinical diagnosis for chronic pneumoniaM. Avijgan1,2
1Department of Infectious Diseases, Isfahan University of Medical Sciences, Isfahan, Islamic Republic of Iran (Correspondence to M. Avijgan: [email protected]).2Shahr-e-Kord University of Medical Sciences, Shahre-e-Kord, Islamic Republic of Iran.
ABSTRACT To compare clinical (non-invasive) diagnosis with bronchoscopic (invasive) diagnosis, a total of 50 patients with chronic pneumonia (sputum smear-negative for tuberculosis) were examined. Age range was 12–82 years. Sensitivity of clinical diagnosis was 100% for tuberculosis and 81.8% for lung cancer; specificity was 67.5% for tuberculosis and 89.7% for lung cancer. Clinical diagnosis was correct in 43.4% of cases suspected of tuberculosis and 69.2% of cases suspected of lung cancer. It may be reliable only for elderly women smokers. Because tuberculosis is over-diagnosed in endemic areas, bronchoscopy is strongly recommended for all cases of chronic pneumonia.
Spécificité et sensibilité du diagnostic clinique pour la pneumonie chroniqueRÉSUMÉ Afin de comparer le diagnostic clinique (non invasif) avec le diagnostic bron-choscopique (invasif), un effectif total de 50 patients souffrant de pneumonie chronique (frottis d’expectoration négatif pour la tuberculose) a été examiné. L’âge des patients était compris entre 12 et 82 ans. La sensibilité du diagnostic clinique était de 100 % pour la tuberculose et de 81,8 % pour le cancer du poumon ; la spécificité était de 67,5 % pour la tuberculose et de 89,7 % pour le cancer du poumon. Le diagnostic clinique était correct dans 43,4 % des cas suspects de tuberculose et dans 69,2 % des cas suspects de cancer du poumon. Il peut être fiable uniquement pour les femmes âgées qui fument. Étant donné que la tuberculose est surdiagnostiquée dans les zones d’endémie, la bron-choscopie est fortement recommandée pour tous les cas de pneumonie chronique.

�ملجلة �لصحية لشرL �ملتوسط، منظمة �لصحة �لعاملية، �ملجلد �حلا�E عشر، �لعد��� ٥-٦، ٢٠٠٥
1030 La Revue de Santé de la Méditerranée orientale, Vol. 11, No 5/6, 2005
Introduction
Diagnosis of pneumonia is predominantly a clinical diagnosis. Signs and symptoms of lower respiratory tract infection are, how-ever, not unique to pneumonia [1]. Pneu-monia that fails to resolve at the expected rate, e.g. when the radiograph has failed to resolve by 50% in 2 weeks, or completely in 4 weeks [2,3], or does not show significant radiographic resolution after at least 10 days of antibiotic therapy [4,5], is considered to be chronic pneumonia [3–5], a diagnosis which to many clinicians conjures up an as-sociation with underlying neoplasm or less common pathogens [6].
The cause of non-resolving pneumonias may be non-infectious or infectious and usually invasive diagnostic techniques are required for confirmation [7,8]. It remains controversial to decide when to initiate an invasive diagnostic work-up for chronic in-filtrates [9]. When clinical improvement has not occurred and chest radiographs remain unchanged or worsen, or in a situation with patients who are clinically stable or impro-ving when the rate of radiographic resolu-tion is delayed, then a more aggressive approach is warranted [9].
Fibreoptic bronchoscopy (FOB), which has minimal morbidity, is the preferred initial invasive method [7] and as the first step in the evaluation of non-resolving pneumonias after an appropriate period of observation [4,10–12].
In some conditions there is a long time between the initial and final diagnosis of chronic pneumonia, which usually occurs after failure of treatment for tuberculosis orlung cancer. Because many chronic pneu-monia patients are treated by general prac-titioners in the absence of a diagnosis, it is important that they have knowledge of the sensitivity and specificity of clinical diagnosis for chronic pneumonia as they are
the ones who gene-rally make the primary diagnosis.
In reality, very little is known regarding the sensitivity and specificity of clinical di-agnosis. In other words, how sensitive and specific is this method of diagnosis? Is it reliable? When should an invasive method of diagnosis be requested? These questions need to be answered. It is important that the reliability of the non-invasive method is assessed, particularly for tuberculosis. Additionally, it has been recommended that FOB be performed early in heavy smokers and patients > 50 years of age with slow or non-resolving pneumonia [5]. The aim of this study was, therefore, to compare the primary or clinical diagnosis with final diagnosis done by FOB and to find out how well matched they were.
Methods
This study was conducted in the infectious and tropical diseases clinic and ward of Al-Zahra Hospital, which is affiliated to Is-fahan University of Medical Sciences, with the cooperation of the pulmonology, radio-logy and pathology departments. Al-Zahra Hospital is a specialty and sub-specialty hospital which is equipped with the latest modern facilities. An evaluation study was carried out from January 2004 to June 2004 on 50 patients who were examined using FOB because of non-resolving pneumonia.
Many patients treated in private clinics of our infectious diseases clinic with acute presentation of pneumonia failed to respond to treatment. They were then referred by their physicians to the pulmonology unit for bronchoscopy.
Inclusion criteria for this study were: non-resolved signs and symptoms (cough or sputum) despite at least 10 days antibi-otic therapy against community acquired

�ملجلة �لصحية لشرL �ملتوسط، منظمة �لصحة �لعاملية، �ملجلد �حلا�E عشر، �لعد��� ٥-٦، ٢٠٠٥
Eastern Mediterranean Health Journal, Vol. 11, Nos 5/6, 2005 1031
pneumonia [3–5]; lung infiltration in chest X-ray for at least 2 weeks (indicated in 2 chest X-rays); and negative sputum smear for tuberculosis.
There were many patients with acute presentation of pneumonia such as fever, cough, sputum and lobar or segmental infiltration of the chest X-ray who had been diagnosed and treated as acute community acquired pneumonia. The usual treatment regimen was ceftriaxon 1 g every 12 hours for 10 days plus erythromycin 400 mg every 6 hours for 10 days. Patients who showed no clinical response (continuous fever, spu-tum and cough) were re-evaluated. At this stage any patients having the first criteria were sent for a second chest X-ray (second criteria) and they were also referred to the reference laboratory for tuberculosis in Isfahan to exclude tuberculosis by sputum smear (× 3) (third criteria).
The exclusion criteria were: patients with definitive diagnosis; testing positive for human immunodeficiency virus (HIV); patients without previous chest X-rays (at least 2 X-rays are needed to confirm chronic pneumonia); patients with previous bronchoscopy; and patients who did not have a complete history taken and had not had a physical examination.
We selected 50 patients consecutively during the period January 2004–June 2004 who had been diagnosed with chronic pneumonia and who met the inclusion and exclusion criteria. There were about 70 pa-tients who did not meet the criteria, mainly not showing lung infiltration in 2 chest X-rays. All of the patients who were selected for the study were informed and completed a consent form. There were no refusals to participate.
The data collected included information obtained from the patient, demographic characteristics, chief complaints, course and duration of symptoms, history of smo-
king (packs per year), previous underlying disease, previous therapy and management recorded on the base of declarations of patients. Data regarding clinical diagnosis (non-invasive method) was based on the first diagnosis of the infectious diseases specialist (history taking, physical examina-tion). The findings of chest X-ray (postero-anterior and lateral) were recorded from the radiologist’s report.
All patients had 3 negative sputum smears for acid-fast bacilli. The clinical diagnosis (non-invasive method) was based on the first diagnosis of an infectious diseases specialist (history taking, physical examination), report and suggestion of a radiologist for 2 chest X-rays. In this step, according to this diagnosis, all patients were classified as: tuberculosis, lung cancer or others (bronchectasia, chronic bronchi-tis, aspiration pneumonia and non-specific diagnosis).
All patients were then examined by FOB for a definitive diagnosis. In this study, FOB diagnosis (invasive method), which was conducted by a pulmonologist in the pul-monology unit of the hospital, was the gold standard. It included all procedures done by FOB: bronchial washing, bronchial biopsy, bronchial brushing, bronchoalveolar lavage and transbronchial biopsy. The samples obtained by FOB were sent to the hospital laboratory for cytological analysis and to the reference laboratory for tuberculosis in Isfahan for direct smear and culture for acid-fast bacilli.
All acid-fast bacilli sputum smears or cultures positive in the bronchoalveolar lavage procedure were classified as having tuberculosis. Patients with positive findings indicating cancer (cytology) in bronchoal-veolar lavage were classified as having lung cancer.
Patients were divided into 2 groups by history of smoking: non-smokers or light

�ملجلة �لصحية لشرL �ملتوسط، منظمة �لصحة �لعاملية، �ملجلد �حلا�E عشر، �لعد��� ٥-٦، ٢٠٠٥
1032 La Revue de Santé de la Méditerranée orientale, Vol. 11, No 5/6, 2005
smokers (≤ 40 packs per year) and heavy smokers (> 40 packs per year) [5].
Statistical analysis was performed using the binominal test to compare data for each method of diagnosis. The chi-squared test was used to compare the results of sex difference and type of smoking and also Fisher’s exact test to compare the results for age group (≤ 50 years and > 50 years) using SPSS, version 11. The level of significance was P < 0.05.
Results
The study sample included 23 males and 27 females (male to female ratio 0.85:1) (Table 1). In terms of age, 78% were > 50 years and 8% were ≤ 30 years. Mean (stan-dard deviation) age was 57 (20.1) years for men and 66 (15.4) years for women.
The main clinical diagnoses for these patients with chronic pneumonia were tuberculosis (23 patients) and lung cancer (13 patients) (Table 2).
Of the 23 patients who had a clinical diagnosis of tuberculosis, only 10 were confirmed by FOB (Table 3). Clinical di-agnosis of not having tuberculosis was the same. Only 9 of the 13 patients clinically diagnosed with lung cancer were confirmed by FOB (Table 4). Two of those diagnosed as not having lung cancer were eventually diagnosed with the disease and were added to lung cancer category but they are not in the group diagnosed by clinical diagnosis.
So in 23 out of 50 patients, positive diagnosis of using the non-invasive method was as the same as for the invasive method of diagnosis. The binominal test indicated a highly significant difference between the invasive and the non-invasive methods of diagnosis, indicating that the non-invasive method was not a reliable method for cases of chronic pneumonia (P < 0.001) (Table 2).
The sensitivity of clinical diagnosis for tuberculosis was 100% but specificity was 67.5% (Table 3). The sensitivity of clinical diagnosis for lung cancer was 81.8% but specificity was 89.7% (Table 4).
Overall, the correct diagnosis was found in 34.7% (8 out of 23) of males by the no-ninvasive method of diagnosis, (con-firmed by FOB) and 55.5% (15 out of 27) of females (Table 5). The difference was not significant using the chi-squared test (P = 0.142).
Ten of the males (43.4%) and 1 of the females (3.7%) (/27) were classed as heavy smokers (≥ 40 packs/year). The non-invasive method produced a correct diagno-sis in 63.6% of heavy smokers and 41.0% of non-smokers or light smokers (Table 6). However, the chi-squared test showed the difference was not significant (P = 0.184).
The non-invasive method gave the correct diagnosis in 27.2% of patients ≤ 50 years and 48.5% of patients > 50 years. Fisher’s exact test showed there was no significant difference (P = 0.189).
Table 1 Distribution of patients by age and sex
Sex Age (years) 11–20 21–30 31–40 41–50 51–60 61–70 71–80 > 80 Total No. No. No. No. No. No. No. No. No.
Male 2 1 1 3 4 5 6 1 23
Female 0 1 1 2 3 6 11 3 27
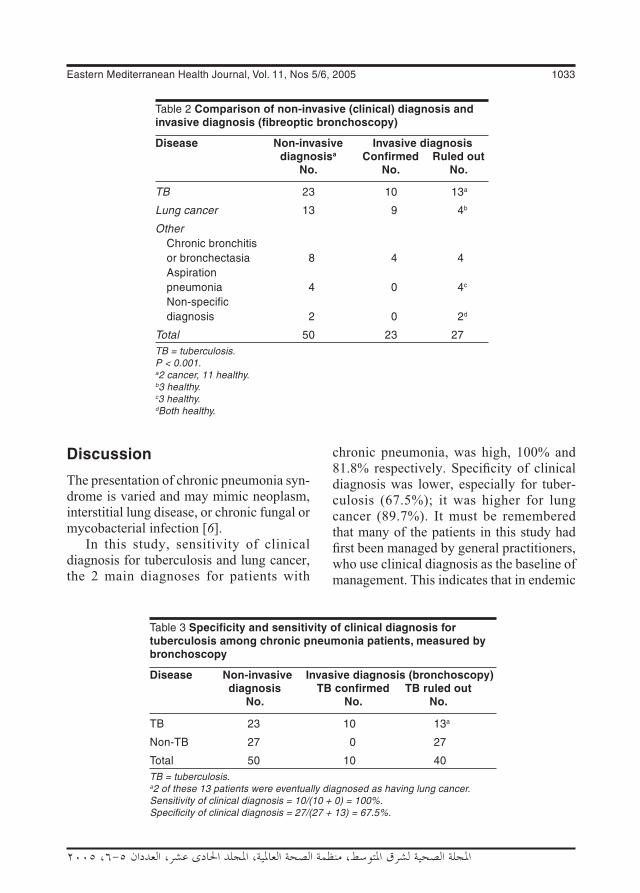
�ملجلة �لصحية لشرL �ملتوسط، منظمة �لصحة �لعاملية، �ملجلد �حلا�E عشر، �لعد��� ٥-٦، ٢٠٠٥
Eastern Mediterranean Health Journal, Vol. 11, Nos 5/6, 2005 1033
Discussion
The presentation of chronic pneumonia syn-drome is varied and may mimic neoplasm, interstitial lung disease, or chronic fungal or mycobacterial infection [6].
In this study, sensitivity of clinical diagnosis for tuberculosis and lung cancer, the 2 main diagnoses for patients with
chronic pneumonia, was high, 100% and 81.8% respectively. Specificity of clinical diagnosis was lower, especially for tuber-culosis (67.5%); it was higher for lung cancer (89.7%). It must be remembered that many of the patients in this study had first been managed by general practitioners, who use clinical diagnosis as the baseline of management. This indicates that in endemic
Table 2 Comparison of non-invasive (clinical) diagnosis and invasive diagnosis (fibreoptic bronchoscopy)
Disease Non-invasive Invasive diagnosis diagnosisa Confirmed Ruled out No. No. No.
TB 23 10 13a
Lung cancer 13 9 4b
Other Chronic bronchitis or bronchectasia 8 4 4 Aspiration pneumonia 4 0 4c
Non-specific diagnosis 2 0 2d
Total 50 23 27TB = tuberculosis.P < 0.001.a2 cancer, 11 healthy.b3 healthy.c3 healthy.dBoth healthy.
Table 3 Specificity and sensitivity of clinical diagnosis for tuberculosis among chronic pneumonia patients, measured by bronchoscopy
Disease Non-invasive Invasive diagnosis (bronchoscopy) diagnosis TB confirmed TB ruled out No. No. No.
TB 23 10 13a
Non-TB 27 0 27
Total 50 10 40TB = tuberculosis.a2 of these 13 patients were eventually diagnosed as having lung cancer.Sensitivity of clinical diagnosis = 10/(10 + 0) = 100%.Specificity of clinical diagnosis = 27/(27 + 13) = 67.5%.

�ملجلة �لصحية لشرL �ملتوسط، منظمة �لصحة �لعاملية، �ملجلد �حلا�E عشر، �لعد��� ٥-٦، ٢٠٠٥
1034 La Revue de Santé de la Méditerranée orientale, Vol. 11, No 5/6, 2005
areas, clinical diagnosis may give an over-diagnosis of tuberculosis of up to 32.5%, an alarming rate given that in some endemic areas FOB is not available and these patients are at risk of being wrongly treated.
It is important to differentiate slowly resolving from non-resolving pneumonias because the cause of each is different. In general, slowly resolving pneumonias are caused by antimicrobial or host defence factors [7] but the cause of non-resolving or
progressive pneumonia may be infectious or non-infectious [8]. Several risk factors have been established for delayed radiographic resolution of pneumonia and should be con-sidered in patient evaluation. They include coexisting medical conditions, history of smoking, advanced age, diabetes mellitus, chronic obstructive pulmonary disease and conditions that mimic pneumonia (e.g. neo-plasms) [13]. Some of the patients in this study of chronic pneumonia syndrome also
Table 4 Specificity and sensitivity of clinical diagnosis of lung cancer among chronic pneumonia patients measured by bronchoscopy
Disease Non-invasive Invasive diagnosis (bronchoscopy) diagnosis Lung cancer Lung cancer confirmed ruled out No. No. No.
Lung cancer 13 9 4
Non-lung cancer 37 2a 35
Total 50 11 39aThese 2 patients were originally diagnosed as having tuberculosis.Sensitivity of clinical diagnosis = 9/(9 + 2) = 81.8%.Specificity of clinical diagnosis = 35/(35 + 4) = 89.7%.
Table 5 Comparison of clinical diagnosis (non-invasive) and final diagnosis (invasive) by sex
Disease Non-invasive Invasive diagnosis (bronchoscopy) diagnosis Confirmed Ruled out No. No. No.
Tuberculosis 23 10 13a
Male 7 2 5 Female 16 8 8
Lung cancer 13 9 4 Male 6 4 2 Female 7 5 2
Bronchitis 8 4 4 Male 5 2 3 Female 3 2 1
Other 6 0 6 Male 5 0 5 Female 1 0 1
Total 50 23 27a2 of these 13 patients were eventually diagnosed as having lung cancer.

�ملجلة �لصحية لشرL �ملتوسط، منظمة �لصحة �لعاملية، �ملجلد �حلا�E عشر، �لعد��� ٥-٦، ٢٠٠٥
Eastern Mediterranean Health Journal, Vol. 11, Nos 5/6, 2005 1035
had underlying predisposing conditions, ad-vanced age (78% > 50 years) and history of heavy smoking: more than 20% of patients were heavy smokers.
Concerning reliability of clinical diag-nosis, FOB confirmed the diagnosis made by non-invasive methods in no more than 23 (46.0%) patients. In other words, in 54.0% of patients in this study the clinician had failed to reach a correct diagnosis. Could it be a reliable method? There was a statistically significant difference between the non-invasive and the invasive method of diagnosis (P < 0.001). So the non-invasive method of diagnosis was not a reliable method for chronic pneumonia syn-drome. This may result in over-diagnosis of tuberculosis and lung cancer.
Non-invasive methods of diagnosis may, however, be correct in some circumstances. For example, it was correct in 34.7% of men and 55.5% of women. It was correct in 63.6% of heavy smokers and 41.0% of light smokers/non-smokers. It was also diagnostic in 48.5% of patients ≥ 50 years old. But after statistical analysis, there was no significant difference.
Non-resolving or slowly resolving pulmonary infiltrates constitute a clinical diagnostic challenge for physicians [7]. Invasive techniques such as FOB with bronchoalveolar lavage and appropriate culture for bacteria, Legionella spp., fungi, and mycobacterium can also be deferred when unequivocal, albeit incomplete, ra-diographic resolution can be demonstrated [9]. The technique is extremely useful in finding a specific diagnosis for a non-resolving pneumonia (in those cases where a specific diagnosis can be made) [4]. In other words, FOB, in the absence of any indications, is rarely diagnostic and should not be routinely employed [14]; it may be required in selected cases for the diagnosis of tuberculosis [15]. It should, however, be accompanied by bronchoalveolar lavage, bronchial washings and post-bronchoscopy sputum smears.
Fibreoptic bronchoscopy procedures have provided overall diagnostic yields in 5.8% [16], 32.5% [17], 87.1% [18] and 90% [19] of patients suspected of having tuberculosis. In the present study, overall
Table 6 Comparison of clinical diagnosis (non-invasive) and final diagnosis (invasive) by smoking habit
Category Non-invasive Invasive diagnosis (bronchoscopy) diagnosis Confirmed Ruled out No. No. No.
Heavy smokera 11 7 4 TB 4 2 2 Lung cancer 5 4 1 Other 2 1 1
Non-smoker/light smokera 39 16 23 TB 19 8 11 Lung cancer 8 5 3 Bronchitis 12 3 9
Total 50 23 27TB = tuberculosis.aHeavy smoker: ≥ 40 packs/year; light smoker: < 40 packs per year.

�ملجلة �لصحية لشرL �ملتوسط، منظمة �لصحة �لعاملية، �ملجلد �حلا�E عشر، �لعد��� ٥-٦، ٢٠٠٥
1036 La Revue de Santé de la Méditerranée orientale, Vol. 11, No 5/6, 2005
diagnostic yield was 43.5%. Moreover, lung cancer was diagnosed in 2 of the patients who were ruled out for tuberculosis. As in a previous study, these results suggest that in an area with high prevalence of tuberculo-sis, FOB procedures should be performed in patients with chronic pneumonia syndrome where other conditions (such as tuberculosis or malignancy) must be ruled out [17].
Fibreoptic bronchoscopy may be the best means of evaluating the bronchial tree and adjacent lung parenchyma [20] and bronchoalveolar lavage can provide diagnostic information in cases of primary and metastatic disease of the lung [21]. Bronchoscopic material can be obtained in about 50% of primary lung cancers, with more accuracy in bronchoalveolar cell carcinoma and adenocarcinoma than in squamous cell carcinoma [21]. It is most useful (73%) in the diagnosis of broncho-genic carcinoma [12]. Of the 11 lung cancer patients in our study, 91% were diagnosed as bronchogenic carcinoma and 1 patient as adenocarcinoma, a finding which is similar those of some previous studies [12,21].
Bronchoscopic procedures in the sus-pected cancer cases in this study provided overall diagnostic yields in 69.2% (9/13) of patients. In 2 patients with suspected tu-berculosis, this was ruled out and they were finally confirmed as having lung cancer. Overall diagnostic yield was 66.7% (10/15). These results show the importance of FOB
in the diagnosis of tuberculosis and lung cancer in patients with chronic pneumonia.
To sum up, the sensitivity of the non-invasive method of diagnosis was 100% for pulmonary tuberculosis and 81.8% for lung cancer. Specificity was 67.5% for pulmonary tuberculosis and 89.7% for lung cancer. Therefore, this method may not be reliable, at least for tuberculosis. Also, it suggests that FOB is a necessary option in every chronic pneumonia patient. In fact, as indicated in a previous study, FOB must be performed early in heavy smokers and patients > 50 years of age with slow or non-resolving pneumonia [5]. In contrast, in light smokers/non-smokers or younger patients, it should only be performed after 4–8 weeks unless clinical symptoms justify an earlier intervention [6].
Acknowledgements
My sincere thanks to Dr Soleiman Kheiri of the Biostatistics Department for his critical statistical review of the manuscript. Special thanks to Dr Farid Karimi who helped in this work and Maria Gillies who helped in the final edit. Thanks also to the Research Deputy of Isfahan University of Medical Sciences and the pulmonology, radiology and pathology departments of Al-Zahra Hospital for their help in conducting this study.
References
1. Mabie M, Wunderink RG. Use and limita-tions of clinical and radiologic diagnosis of pneumonia. Seminars in respiratory infec-tions, 2003, 18(2):72–9.
2. Oreus JB, Sitrin RG, Lynch JP. The ap-proach to non-resolving pneumonia. Medical clinics of North America, 1994, 78(5):1143–72.
3. Rome L, Murali G, Lippmann M. Non-resolving pneumonia and mimics of pneu-monia. Medical clinics of North America, 2001, 85(6):1511–30.
4. Feinsilver SH et al. Utility of fiberoptic bronchoscopy in non-resolving pneumo-nia. Chest, 1990, 98(6):1322–6.
�ملجلة �لصحية لشرL �ملتوسط، منظمة �لصحة �لعاملية، �ملجلد �حلا�E عشر، �لعد��� ٥-٦، ٢٠٠٥
Eastern Mediterranean Health Journal, Vol. 11, Nos 5/6, 2005 1037
5. Gloria C, Freitas MG. Utilidade da bron-cofibroscopia no diagnóstico de neoplasia do pulmão em doentes com pneumonia arrastada [The usefulness of bron-chofibroscopy in the diagnosis of lung neoplasms in patients with protracted pneumonia]. Acta médica portuguesa, 1995, 8(9):493–6.
6. Corley DE, Winterbauer RH. Infectious diseases that result in slowly resolving and chronic pneumonia. Seminars in res-piratory infections, 1993, 8(1):3–13.
7. Cunha BA. Slowly resolving and non-resolving pneumonias. Drugs of today, 2000, 36(12):829–34.
8. Menendez R, Perpina M, Torres A. Evalu-ation of non-resolving and progressive pneumonia. Seminars in respiratory in-fections, 2003, 18(2):103–11.
9. Kuru T, Lynch JP 3rd. Non-resolving or slowly resolving pneumonia. Clinics in chest medicine, 1999, 20(3):623–51.
10. Fein AM, Feinsilver SH. The approach to non-resolving pneumonia in the elderly. Seminars in respiratory infections, 1993, 8(1):59–72.
11. Martinez Moragon E et al. Fibrobronco-scopia en el cáncer de pulmón: relación entre radiología, endoscopia, histología y rendimiento diagnóstico en una serie de 1801 casos [Fiber bronchoscopy in lung cancer: relationship between radiology, endoscopy, histology and diagnostic va-lue in a series of 1801 cases]. Archivos de bronconeumologia, 1994, 30(6):291–6.
12. Taha AS. Flexible fibreoptic bronchosco-py in Basra, Iraq: a 20-month experience. Eastern Mediterranean health journal, 2000, 6(2–3):226–32.
13. Cassiere H, Rodrigues JC, Fein AM. Delayed resolution of pneumonia. When
is slow healing too slow? Postgraduate medicine, 1996, 99(1):151–4, 157–8.
14. Feinsilver SH, Barrows AA, Braman SS. Fiberoptic bronchoscopy and pleural ef-fusion of unknown origin. Chest, 1986, 90(4):516–9.
15. De Gracia J et al. Diagnostic value of bronchoalveolar lavage in suspected pul-monary tuberculosis. Chest, 1988, 93(2):329–32.
16. Jayasundera CI, Attapattu M, Kumar-asinghe MP. Atypical presentations of pulmonary tuberculosis diagnosed by fibreoptic bronchoscopy. Postgraduate medicine, 1993, 69(814):621–3.
17. Charoenratanakul S, Dejsomritrutai W, Chaiprasert A. Diagnostic role of fiberoptic bronchoscopy in suspected smear-nega-tive pulmonary tuberculosis. Respiratory medicine, 1995, 89(9):621–3.
18. Chan HS, Sun AJ, Hoheisel GB. Bron-choscopic aspiration and bronchoalveolar lavage in the diagnosis of sputum smear-negative pulmonary tuberculosis. Lung, 1990, 168(4):215–20.
19. Caminero Luna JA et al. Rentabilidad del lavado broncoalveolar en el diagnóstico de la tuberculosis pulmonar [The efficacy of bronchoalveolar lavage in the diagnosis of pulmonary tuberculosis]. Archivos de bronconeumologia, 1994, 30(5):236–9.
20. Corsello BF, Funahashi A, Hranicka LJ. Flexible fiberoptic bronchoscopy: its role in diagnosis of lung lesions. Postgraduate medicine, 1982, 72(2):95–105, 108.
21. Rennard SI. Bronchoalveolar lavage in the assessment of primary and metastatic lung cancer. Respiration, 1992, 59 (suppl. 1):41–3.

1038 La Revue de Santé de la Méditerranée orientale, Vol. 11, No 5/6, 2005
�ملجلة �لصحية لشرL �ملتوسط، منظمة �لصحة �لعاملية، �ملجلد �حلا�E عشر، �لعد��� ٥-٦، ٢٠٠٥
Changing trends in drug resistance among typhoid salmonellae in Rawalpindi, PakistanT. Butt,1 R.N. Ahmad, 1 M. Salman1,2 and S.Y. Kazmi1
1Microbiology Department, Armed Forces Institute of Pathology, Rawalpindi, Pakistan.2National Institute of Health, Islamabad, Pakistan (Correspondence to T. Butt: [email protected]).Received:05/04/04; accepted: 08/06/04
ABSTRACT We analysed the record of blood cultures carried out at the Armed Forces Institute of Pathology, Rawalpindi between 1996 and 2003. We isolated 477 Salmonella typhi and 410 S. paratyphi A from blood of patients suffering from typhoid fever. We observed a significant shift in the distribution and antimicrobial susceptibility of typhoid salmonellae. The isolation rate of S. typhi fell significantly while S. paratyphi A is emerging as a major pathogen. Resistance to conventional antityphoid drugs in S. typhi decreased dramatically from 80% to 14%, while in S. paratyphi A resistance increased from 14% to 44%. Susceptibility to the fluoroquinolones decreased in both. No resistance to third generation cephalosporins was detected.
Évolution de la résistance aux médicaments chez les salmonelles typhiques à Rawalpindi (Pakistan)RÉSUMÉ Nous avons analysé le dossier des hémocultures réalisées à l’Institut de Pathologie des Forces armées de Rawalpindi entre 1996 et 2003 : 477 Salmonella typhi et 410 S. paratyphi A ont été isolées dans le sang de patients atteints de fièvre typhoïde. Nous avons observé un changement significatif dans la distribution et la sensibilité aux antimicrobiens des salmonelles typhiques. Le taux d’isolement de S. typhi a significativement diminué tandis que S. paratyphi A devient un agent patho-gène majeur. La résistance de S. typhi aux médicaments classiques contre la fièvre typhoide a diminué considérablement, passant de 80 % à 14 %, tandis que la résistance de S. paratyphi A a augmenté, passant de 14 % à 44 %. La sensibilité aux fluoroquinolones a diminué pour les deux. Aucune résis-tance aux céphalosporines de troisième génération n’a été décelée.

Eastern Mediterranean Health Journal, Vol. 11, Nos 5/6, 2005 1039
�ملجلة �لصحية لشرL �ملتوسط، منظمة �لصحة �لعاملية، �ملجلد �حلا�E عشر، �لعد��� ٥-٦، ٢٠٠٥
Introduction
Typhoid salmonellae are important human pathogens. They thrive in overcrowded and unsanitary conditions. While improving sanitation and introduction of antibiotics has led to control of typhoid fever in the de-veloped countries, it continues to plague the developing world, especially South Asia. The problem has been compounded by the development of plasmid-mediated antibi-otic resistance against conventional anti-typhoid drugs, which first emerged in the 1970s. Multidrug resistance, defined as si-multaneous resistance to the 3 conventional antityphoid drugs (chloramphenicol, co-trimoxazole and ampicillin), rapidly spread all over the world, and by the mid 1990s it was widespread in Salmonella typhi. The situation was saved by the introduction of the fluoroquinolones, which are now the treatment of choice for typhoid fever [1]. Widespread and uncontrolled use of these drugs has, however, led to the emergence of resistance against them also [1–3].
Several recent studies from various parts of Pakistan have reported increasing susceptibility of S. typhi to the conventional antityphoid drugs [4,5]. Similar observa-tions in our institute prompted us to review the distribution and antimicrobial drug susceptibility pattern of typhoid salmonel-lae isolated between 1996 and 2003 (T. Butt et al., unpublished data, 2003).
Methods
The study was conducted at the Armed Forces Institute of Pathology, Rawalpindi, which provides laboratory services to a 1500-bed tertiary care hospital in Rawal-pindi and is the main reference laboratory in Northern Pakistan. Data from 1996 to 2003 were retrieved from our database and
analysed for changing trends using the chi-squared test.
Blood samples were collected from pa-tients clinically suspected of having typhoid fever. The patients were of all ages and both sexes and had been referred from various civil and military hospitals in Rawalpindi and Islamabad. Five mL blood was inocu-lated into 45 mL brain heart infusion broth (Oxoid, Basingstoke, UK) and incubated aerobically at 37 °C for 7 days. Subculture on Columbia agar (Oxoid) containing 5% horse blood (blood agar) and MacConkey agar (Oxoid) was done on days 1, 2, 3 and 7. The isolates were identified by morpho-logy and standard biochemical tests using API 20E galleries (bioMerieux SA, Lyon, France) and confirmed as S. typhi and S. paratyphi A by serological tests using standard antisera (Wellcome Reagents Ltd., Beckenham, UK).
Antimicrobial susceptibility testing was done on Mueller–Hinton agar (Oxoid) by the modified Kirby–Bauer disk diffusion technique according to the National Com-mittee for Clinical Laboratory Standards criteria [6]. The antimicrobial disks used (all from Oxoid) were ampicillin (10 μg), chloramphenicol (30 μg), co-trimoxazole (1.25/23.75 μg), ciprofloxacin (5 μg) and ceftriaxone (30 μg). The sensitivity plates were incubated aerobically for 18–24 hours at 37 °C. Escherichia coli ATCC 25992 was used as the control strain. Minimum inhibi-tory concentration (MIC) of ciprofloxacin was determined by the Kirby–Bauer broth dilution technique in cases of therapeutic failure (failure of fever to settle despite 7 days of treatment with oral ciprofloxacin).
Results
A total of 477 S. typhi and 410 S. paratyphi A isolates were detected between 1996 and
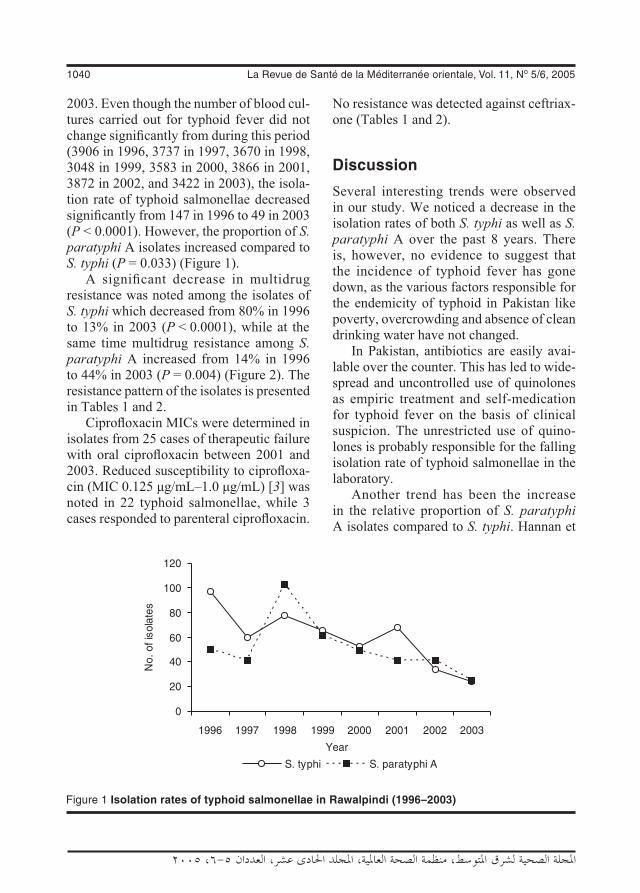
1040 La Revue de Santé de la Méditerranée orientale, Vol. 11, No 5/6, 2005
�ملجلة �لصحية لشرL �ملتوسط، منظمة �لصحة �لعاملية، �ملجلد �حلا�E عشر، �لعد��� ٥-٦، ٢٠٠٥
2003. Even though the number of blood cul-tures carried out for typhoid fever did not change significantly from during this period (3906 in 1996, 3737 in 1997, 3670 in 1998, 3048 in 1999, 3583 in 2000, 3866 in 2001, 3872 in 2002, and 3422 in 2003), the isola-tion rate of typhoid salmonellae decreased significantly from 147 in 1996 to 49 in 2003 (P < 0.0001). However, the proportion of S. paratyphi A isolates increased compared to S. typhi (P = 0.033) (Figure 1).
A significant decrease in multidrug resistance was noted among the isolates of S. typhi which decreased from 80% in 1996 to 13% in 2003 (P < 0.0001), while at the same time multidrug resistance among S. paratyphi A increased from 14% in 1996 to 44% in 2003 (P = 0.004) (Figure 2). The resistance pattern of the isolates is presented in Tables 1 and 2.
Ciprofloxacin MICs were determined in isolates from 25 cases of therapeutic failure with oral ciprofloxacin between 2001 and 2003. Reduced susceptibility to ciprofloxa-cin (MIC 0.125 μg/mL–1.0 μg/mL) [3] was noted in 22 typhoid salmonellae, while 3 cases responded to parenteral ciprofloxacin.
No resistance was detected against ceftriax-one (Tables 1 and 2).
Discussion
Several interesting trends were observed in our study. We noticed a decrease in the isolation rates of both S. typhi as well as S. paratyphi A over the past 8 years. There is, however, no evidence to suggest that the incidence of typhoid fever has gone down, as the various factors responsible for the endemicity of typhoid in Pakistan like poverty, overcrowding and absence of clean drinking water have not changed.
In Pakistan, antibiotics are easily avai-lable over the counter. This has led to wide-spread and uncontrolled use of quinolones as empiric treatment and self-medication for typhoid fever on the basis of clinical suspicion. The unrestricted use of quino-lones is probably responsible for the falling isolation rate of typhoid salmonellae in the laboratory.
Another trend has been the increase in the relative proportion of S. paratyphi A isolates compared to S. typhi. Hannan et
Figure 1 Isolation rates of typhoid salmonellae in Rawalpindi (1996–2003)

Eastern Mediterranean Health Journal, Vol. 11, Nos 5/6, 2005 1041
�ملجلة �لصحية لشرL �ملتوسط، منظمة �لصحة �لعاملية، �ملجلد �حلا�E عشر، �لعد��� ٥-٦، ٢٠٠٥
al. were among the first to test in vitro and in vivo efficacy of fluoroquinolones against typhoid salmonellae in 1986–87 and re-ported higher MICs of fluoroquinolones against S. paratyphi A even though they were within the susceptible range [7,8]. It
is possible that the indiscriminate use of quinolones, which has led to the suppres-sion of S. typhi, has allowed the relatively resistant S. paratyphi A to occupy the niche vacated by S. typhi. It is also possible that increasing awareness and higher index of
Figure 2 Trends of multidrug resistance (MDR) among typhoid salmonellae in Rawalpindi (1996–2003)
Table 1 Antimicrobial drug resistance among Salmonella typhi (1996–2003)
Year No of isolates resistant (%) to various antimicrobials Amp Cot Cap MDRa Cipb Ctxc
1996 (n = 97) 81 (83) 80 (82) 81 (83) 78 (80) – Nil
1997 (n = 60) 32 (53) 28 (47) 27 (45) 26 (43) – Nil
1998 (n = 77) 28 (36) 29 (38) 29 (38) 27 (35) – Nil
1999 (n = 65) 31 (48) 18 (28) 34 (52) 16 (25) – Nil
2000 (n = 52) 14 (27) 16 (31) 18 (35) 10 (19) – Nil
2001 (n = 68) 10 (15) 10 (15) 12 (18) 10 (15) 6 (9) Nil
2002 (n = 34) 6 (18) 6 (18) 7 (20) 6 (18) 5 (15) Nil
2003 (n = 24) 5 (21) 4 (18) 5 (21) 3 (13) 3 (13) NilMDR = multidrug resistance.aSimultaneous resistance to ampicillin (Amp), co-trimoxazole (Cot) and chloramphenicol (Cap). bReduced susceptibility to ciprofloxacin (minimum inhibitory concentration 0.125 μg/mL–1.0 μg/mL).cCeftriaxone.

1042 La Revue de Santé de la Méditerranée orientale, Vol. 11, No 5/6, 2005
�ملجلة �لصحية لشرL �ملتوسط، منظمة �لصحة �لعاملية، �ملجلد �حلا�E عشر، �لعد��� ٥-٦، ٢٠٠٥
on the salmonellae and gradual reversal of the susceptibility pattern.
However, the same was not observed in S. paratyphi A—44% of our S. paratyphi A isolates were multidrug resistant in 2003. Resistance to the conventional antityphoid drugs has seen a steady rise since 1995 when the first case of multidrug-resistant S. paratyphi A in Pakistan was isolated at our institute [16]. The increasing resistance to conventional antityphoid drugs in the absence of selective drug pressure appears paradoxical. It is possible that as the patho-gen has emerged, it is the already resistant clones that have spread. Conversely, the increasing resistance might be due to ac-quisition of resistance plasmids from other Gram-negative rods [14].
It seems that S. paratyphi A is now emerging as a major pathogen in Pakistan. Although considered to be a pathogen of low virulence, its diagnosis is also ea-sily missed due to milder and more varied clinical presentation (compared to S. typhi). As mentioned earlier, MICs of fluoroquino-lones against S. paratyphi A have been on the higher side ever since the introduction
clinical suspicion is responsible for more thorough investigation and increased diag-nosis of paratyphoid fever. Changing host susceptibility and enhanced virulence of the pathogen could also be responsible for emergence of this pathogen. The same trend has also been observed in India [9,10].
The first case of multidrug resistance S. typhi in Pakistan was reported in 1987 [8]. Over the next 8 years, multidrug resistance in S. typhi isolated at the Armed Forces Institute of Pathology, Rawalpindi, rapidly increased to 75% [11]. Our study has shown several changing trends in the antimicrobial susceptibility of typhoid salmonellae in Rawalpindi. There has been a dramatic reduction in multidrug resistance rates among S. typhi isolates (Figure 2). Similar trends have been noted in other parts of the country [4,5] and elsewhere in the world [12,13]. The rate at which bacteria acquire resistance to antimicrobials is directly related to their exposure to these drugs [14,15]. Increasing resistance to the conventional antityphoid drugs has led to their replacement with fluoroquinolones and removal of the selective drug pressure
Table 2 Antimicrobial drug resistance in Salmonella paratyphi A (1996–2003)
Year No of isolates resistant (%) to various antimicrobials Amp Cot Cap MDRa Cipb Ctxc
1996 (n = 50) 8 (16) 7 (14) 7 (14) 7 (14) – Nil
1997 (n = 41) 22 (54) 15 (37) 14 (34) 12 (29) – Nil
1998 (n = 102) 32 (34) 24 (24) 20 (20) 18 (18) – Nil
1999 (n = 61) 27 (44) 13 (21) 27 (44) 11 (18) – Nil
2000 (n = 49) 16 (33) 12 (24) 12 (24) 12 (24) – Nil
2001 (n = 41) 14 (34) 11 (27) 13 (32) 10 (24) 2 (5) Nil
2002 (n = 41) 20 (49) 19 (46) 23 (56) 19 (46) 3 (7) Nil
2003 (n = 25) 14 (56%) 11 (44) 14 (56) 11 (44) 3 (11) Nil
MDR = multidrug resistance.aSimultaneous resistance to ampicillin (Amp), co-trimoxazole (Cot) and chloramphenicol (Cap). bReduced susceptibility to ciprofloxacin (minimum inhibitory concentration 0.125 μg/mL–1.0 μg/mL).cCeftriaxone.
Eastern Mediterranean Health Journal, Vol. 11, Nos 5/6, 2005 1043
�ملجلة �لصحية لشرL �ملتوسط، منظمة �لصحة �لعاملية، �ملجلد �حلا�E عشر، �لعد��� ٥-٦، ٢٠٠٥
of these drugs into clinical practice. This, when combined with selective drug pressure of unrestricted quinolone use, might lead to the rapid spread of quinolone-resistant S. paratyphi A.
Development of quinolone resistance in typhoid salmonellae is most worrisome [3,17–19]. We reported the first case of fluoroquinolone treatment failure in typhoid salmonellae in Pakistan in 1993 [20]. Since then the incidence of such cases has been increasing: 22 of our isolates between 2001 and 2003 exhibited reduced susceptibility to ciprofloxacin. The problem is compounded by the inability to identify this reduced susceptibility by the standard disk diffusion techniques. The inadequacy of the current guidelines for detection of this resistance has prompted a reappraisal and revision of these guidelines. We have recommended revised break-point ciprofloxacin MICs of 0.125 μg/mL–1.0 μg/mL as reduced susceptibility [3]. It is interesting to note that the first case of multidrug resistance S. paratyphi A in Pakistan, isolated in 1995,
had ciprofloxacin MIC of 0.125 μg/mL [16] which would make the isolate resistant to ciprofloxacin according to the revised guidelines.
To summarize, there is a definite shift in the distribution as well as antimicro-bial susceptibility of typhoid salmonellae in Pakistan. S. paratyphi A resistant to both the conventional antityphoid drugs as well as the fluoroquinolones is emerging as a major pathogen. While resistance to the conventional antityphoid drugs in S. typhi has decreased dramatically, it is increasing against the fluoroquinolones. The common denominator in all these findings appears to be widespread and uncontrolled use of fluoroquinolones. Fluoroquinolones are the most effective antityphoid drugs avai-lable. It is imperative that these drugs are used judiciously to prevent the spread of this resistance. At the same time, the role of conventional antityphoid drugs in the treatment of S. typhi infection should be re-evaluated.
References
1. Parry CM et al. Typhoid fever. New En-gland journal of medicine, 2002, 347(22):1770–82.
2. Hooper DC. Emerging mechanisms of fluoroquinolone resistance. Emerging infectious diseases, 2000, 7(2):337–41.
3. Butt T et al. Ciprofloxacin treatment failure in typhoid fever case, Pakistan. Emerging infectious diseases, 2003, 9(12):1621–2.
4. Mahmood A. Present status of antibiotic susceptibility pattern of Salmonella ty-phi isolates at a tertiary care hospital in Karachi. Journal of the Pakistan Medical Association, 2000, 50(12):428.
5. Butt T et al. Is antibiotics susceptibility of typhoid salmonellae changing? Pakistan
Armed Forces medical journal, 2000, 50(1):2–5.
6. Performance standards for antimicrobial disk susceptibility tests, 7th ed. Approved standard. M2–A7. Wayne, Pennsylvania, National Committee for Clinical Labora-tory Standards, 2000.
7. Hannan A. In vitro activity of ofloxacin against 210 clinical isolates of typhoid salmonellae. Infection, 1986, 14(suppl. 4):S243–4.
8. Hannan A et al. Ofloxacin—a possible breakthrough in the treatment of typhoid fever caused by chloramphenicol resistant Salmonella typhi. In: Nicoletti G, Cocuzza G, eds. Proceedings of 6th Mediterranean

1044 La Revue de Santé de la Méditerranée orientale, Vol. 11, No 5/6, 2005
�ملجلة �لصحية لشرL �ملتوسط، منظمة �لصحة �لعاملية، �ملجلد �حلا�E عشر، �لعد��� ٥-٦، ٢٠٠٥
Congress of Chemotherapy, 22–27 May 1988, Taormina-Giardini Naxos, Italy. Florence, Italy, Edizioni Reviste Scienti-fiche, 1988:383–5.
9. Chandel DS et al. Drug-resistant Salmo-nella enterica serotype paratyphi A in In-dia. Emerging infectious diseases, 2000, 6(4):420–1.
10. Sood S et al. Paratyphoid fever in India: an emerging problem. Emerging infec-tious diseases,, 1999, 5(3):483–4.
11. Karamat KA et al. Problem of multi-drug resistant typhoid fever in Rawalpindi/Islamabad area. Pakistan Armed Forces medical journal, 1996, 46(2):48–54.
12. Wasfy MO et al. Trends of multiple-drug resistance among Salmonella serotype Typhi isolates during a 14-year period in Egypt. Clinical infectious diseases, 2002, 35(10):1265–8.
13. Mandal S, Mandal MD, Pal NK. Anti-microbial resistance pattern of Salmonella typhi isolates in Kolkata, India during 1991–2001: a retrospective study. Japa-nese journal of infectious diseases, 2002, 55(2):58–9.
14. Tenover FC. Development and spread of bacterial resistance to antimicrobial
agents: an overview. Clinical infectious diseases, 2001, 33(suppl. 3):S108–15.
15. Lipsitch M, Samore MH. Antimicro-bial resistance: a population perspective. Emerging infectious diseases, 2002, 8(4):347–54.
16. Karamat KA et al. Multi-resistant Sal-monella paratyphi A. Pakistan journal of pathology, 1995, 6(2):81–2.
17. Wain J et al. Quinolone-resistant Salmo-nella typhi in Viet Nam: molecular basis of resistance and clinical response to treat-ment. Clinical infectious diseases, 1997, 25(6):1404–10.
18. Threlfall EJ, Ward LR. Decreased sus-ceptibility to ciprofloxacin in Salmonella enterica serotype Typhi, United Kingdom. Emerging infectious diseases, 2001, 7(3):448–50.
19. Hakanen A et al. Reduced fluoroquino-lone susceptibility in Salmonella enterica serotypes in travelers returning from Southeast Asia. Emerging infectious dis-eases, 2001, 7(6):996–1003.
20. Hannan A, Butt T, Islam SN. First quino-lone resistant typhoid salmonella. Pakis-tan Armed Forces medical journal, 1993, 44:27–30.

�ملجلة �لصحية لشرL �ملتوسط، منظمة �لصحة �لعاملية، �ملجلد �حلا�E عشر، �لعد��� ٥-٦، ٢٠٠٥
Eastern Mediterranean Health Journal, Vol. 11, Nos 5/6, 2005 1045
Prevalence of asymptomatic bacteriuria in pregnant women in Sharjah, United Arab EmiratesA.A. Abdullah1 and M.I. Al-Moslih1
ABSTRACT To determine the prevalence of asymptomatic bacteriuria in pregnancy, midstream urine samples from 505 pregnant women in Sharjah, United Arab Emirates, were screened using urine culture and urinalysis. Urine cultures showed heavy growth (≥ 105 colony forming units/mL) in 4.8% (24/505) of the samples; 16/24 (66.7%) of these isolates were Escherichia coli. Microscopic examina-tion had the highest sensitivity (67%), while nitrite dipstick testing showed the highest specificity and positive predictive value (99% and 57% respectively). Antibiotic sensitivity tests carried out on the posi-tive culture samples showed high sensitivity to gentamicin, amoxicillin-clavulanic acid and fosfomycin.
1College of Health Sciences, University of Sharjah, United Arab Emirates (Correspondence to A.A. Abdullah: [email protected]).Received: 27/10/04; accepted: 27/04/05
Prévalence de la bactériurie asymptomatique chez les femmes enceintes à Sharjah (Émirats arabes unis)RÉSUMÉ Afin de déterminer la prévalence de la bactériurie asymptomatique pendant la grossesse, on a analysé des prélèvements d’urine recueillis par la méthode du jet de milieu de miction chez 505 femmes enceintes à Sharjah (Émirats arabes unis) par mise en culture et examen des urines. Les cultures d’urine ont montré une forte croissance (≥ 105 unités formant colonie/mL) dans 4,8 % des échantillons (24/505) ; Escherichia coli a été isolée dans 16/24 (66,7 %) de ces derniers. L’examen microscopique avait la sensibilité la plus élevée (67 %), tandis que le test « nitrite » (bandelettes réactives) présentait la spécificité la plus élevée et la meilleure valeur prédictive positive (99 % et 57 % respectivement). L’étude de la sensibilité aux antibiotiques réalisée sur les échantillons de cul-ture positifs a montré une forte sensibilité à la gentamycine, à l’amoxicilline-acide clavulanique et à la fosfomycine.
�ملجلة �لصحية لشرL �ملتوسط، منظمة �لصحة �لعاملية، �ملجلد �حلا�E عشر، �لعد��� ٥-٦، ٢٠٠٥
1046 La Revue de Santé de la Méditerranée orientale, Vol. 11, No 5/6, 2005
Introduction
Asymptomatic bacteriuria is a major risk factor for the development of urinary tract infection (UTI) [1–3]. During pregnancy, many changes occur in the structure and function of the urinary tract that predispose pregnant women to upper UTI. Although there is a small risk of development of acute episodes of UTI in early pregnancy, there will be a substantial increase risk (to 30% to 60%) during the last trimester.
MacLean found that 6% of pregnant women had asymptomatic bacteriuria and this was associated with increased prematu-rity and perinatal mortality compared with healthy pregnant women [4]. In general, the prevalence of asymptomatic bacteriuria in pregnancy was found to be 2% to 7% [3,5]. Failure to treat bacteriuria during pregnancy increases the risk of development of acute pyelonephritis by 25% and may result in complications, such as preterm labour, transient renal failure, acute respiratory dis-tress syndrome, sepsis, shock and haemato-logical abnormalities [5–7]. Woman with untreated UTI during their third trimester of pregnancy are at-risk of delivering a child with mental retardation or developmental delay [8].
Diagnosis of UTI usually depends on different screening tests: urine microscopic examination, nitrite reductase, leukocyte esterase dipstick and urine culture. Urine dipstick tests have been evaluated by many researchers but their low sensiti-vity, high false negative (specificity) and poor positive predictive value makes them unreliable [9–15]. For such reasons urine culture remains the most reliable tool for the diagnosis of UTI. Urine culture has shown Escherichia coli to be the most common bacterial isolate of UTI during pregnancy [6,16]. E. coli serotyping is important in dis-tinguishing the small number of strains that
cause disease since over 700 antigenic types of E. coli have been recognized based on O, H and k antigens [17]. E. coli serotype O5 was the most prevalent (29.3%) followed by O17 and O25 in patients with symptomatic UTI [18–21].
In Sharjah, United Arab Emirates (UAE), no data are yet available on the prevalence of asymptomatic bacteriuria during pregnancy. This study sought to investigate the prevalence of asymptomatic bacteriuria among pregnant women and to determine the most reliable diagnostic pro-cedures, the most common types of bacteria and the most suitable antibiotics to use.
Methods
This study was approved by the University Research Centre, University of Sharjah, UAE and Sharjah Medical District. All par-ticipants signed a consent form.
SampleThe sample comprised 505 asymptomatic pregnant women visiting the primary health care centre (Maternal Child Health, Main Centre, Sharjah Medical District, Sharjah, UAE) between February 2001 and April 2002. The women’s ages ranged from 15 to 41 years, with a mean age of 27.0 (standard deviation 4.9) years. None of the women had received antibiotics before screening.
TestsMidstream urine (MSU) samples were col-lected from the women and each sample was divided into two parts. One part was used for general urine examinations. Direct microscopy for white blood cell (WBC) counts was considered positive if there were > 5 WBC per high-power field. Dipstick tests were made using Comber 10 reagent test strips (Analyticon, Germany) that have

�ملجلة �لصحية لشرL �ملتوسط، منظمة �لصحة �لعاملية، �ملجلد �حلا�E عشر، �لعد��� ٥-٦، ٢٠٠٥
Eastern Mediterranean Health Journal, Vol. 11, Nos 5/6, 2005 1047
panels to detect protein, blood and nitrite and leukocyte esterase in urine.
Urine culturesThe other urine sample was cultured on the following media: McConkey agar, eosin methylene blue agar, nutrient agars, blood agars and CLED (cystine-lactose-elec-trolyte-deficient) agar. The standard loop technique was used for colony counting (LP Italiana SpA, Milan, Italy). The urine culture was defined as positive if ≥ 105 colony forming units (CFU) per mL of urine was found, regardless of the presence or absence of leukocytes [2]. Urine cultures with 103–104 CFU/mL were regarded as suspected infections, cultures with less than 103 CFU/mL were considered con-taminated, while cultures with no growth of bacteria were said to be negative. From these criteria, the sensitivity, specificity and positive predictive values were calculated for each test.
Antibiotic sensitivity tests were carried out using the antibiotic sensitivity disc method with the following antibiotics: ampicillin, amoxicillin-clavulanic acid, nitrofurantoin, ciprofloxacin, nalidixic acid, trimethoprim, cephalexin, gentamicin, as well as fosfomycin, an antibiotic which has not been used or tested in the UAE.
Serotyping of Escherichia coliSeveral kits (Mast Diagnostic, Amiens, France) were used to type the 16 E. coli strains isolated from cases of asymptomatic bacteriuria: O26, O86a, O111, O127a, O44, O119, O124, O112a, O28ac, O128, O20, O157, O55, O125, O126, O142, O114 and O18.
For comparison of serotypes from the community, the same kits were used to serotype another 16 E. coli isolates obtained from non-pregnant women with symptomatic community-acquired UTI.
Identification of bacteria was performed using a kit for API-20 (bioMérieux, Marcy-Etoile, France).
Results
Table 1 shows the prevalence of the asymptomatic bacteriuria of pregnant wo-men (CFU ≥ 105/mL); 4.8% (24/505) of the screened urine samples were positive (CFU ≥ 105/mL), while 34.1% (172/505) were suspected infections.
Table 2 shows that urinalysis by micros-copic examination was positive (> 5 WBC per high-power field) in 35.6% (180/505) of samples. However, the nitrite dipstick and esterase dipstick tests were positive in 1.4% (7/505) and 11.7% (59/505) of samples respectively.
Table 3 shows the sensitivity, specificity and positive predictive value for the leuko-cyte esterase dipstick, nitrite dipstick and microscopic urinalysis tests. Microscopic examination had the highest sensitivity (67%), while the nitrite dipstick showed the highest specificity and positive predictive value (99% and 57% respectively).
The most common bacteria isolated from the culture of the urine samples of
Table 1 Prevalence of asymptomatic bacteriuria in the urine of 505 pregnant women
Bacteriuria Colony No. of % forming isolates units (No./mL)
Positive 105 24 4.8
Suspected 104–103 172 34.1
Contaminated 102 19 3.8
Negative < 102 290 57.4
Total 505 100.0

�ملجلة �لصحية لشرL �ملتوسط، منظمة �لصحة �لعاملية، �ملجلد �حلا�E عشر، �لعد��� ٥-٦، ٢٠٠٥
1048 La Revue de Santé de la Méditerranée orientale, Vol. 11, No 5/6, 2005
the pregnant women with asymptomatic bacteriuria were E. coli in 66.7% of samples (16/24) (Table 4).
The different serotypes of E. coli iso-lated from the urine of asymptomatic bacte-riuria of pregnant women and symptomatic bacteriuria isolated from the sample from women with community-acquired infection are shown in Table 5. The main E. coli sero-type among the samples with asymptomatic bacteriuria was O112ac (25.0% of samples), while in symptomatic community-acquired bacteriuria the main serotype was O86a (31.3% of samples).
The pattern of antibiotic sensitivity of the 16 E. coli isolates is shown in Table 6. The results show that E. coli of asymptomatic bacteriuria of pregnancy were 100% (16/16) sensitive to gentamicin, ciprofloxacin and fosfomycin. The E. coli isolated from symptomatic bacteriuria showed 100% sensitivity to amoxicillin-clavulanic acid and fosfomycin. E. coli from both types of isolates were the least sensitivity to trimethoprim. The 8 non-E. coli isolates were also 100% sensitive to fosfomycin and amoxicillin-clavulanic acid.
Table 2 Comparison of different tests used for diagnosis of urinary tract infection in the urine of 505 pregnant women
Colony No. of Microscopic Nitrite Leukocyte forming units isolates examination dipstick esterase(No./mL) dipstick No. % No. % No. % +ve +ve +ve
105 24 16 66.7 4 16.7 4 16.7
104 48 30 62.5 1 2.1 15 31.3
103 124 56 45.2 2 1.6 25 20.2
102 19 7 36.8 0 0 1 5.3
< 102 290 71 24.5 0 0 14 4.8
Total 505 180 35.6 7 1.4 59 11.7
Table 3 Accuracy of urine screening tests for asymptomatic bacteriuria in the urine of pregnant women
Test Sensitivitya Specificityb Positive predictive valuec
% % %
Leukocyte esterase dipstick 17 86 7
Nitrite dipstick 17 99 57
Microscopic examination 67 66 9aPercentage of patients with a positive culture who will have a positive test.bPercentage of patients with a negative culture who will have a negative test.cPercentage of patients with a positive test who have positive urine culture.

�ملجلة �لصحية لشرL �ملتوسط، منظمة �لصحة �لعاملية، �ملجلد �حلا�E عشر، �لعد��� ٥-٦، ٢٠٠٥
Eastern Mediterranean Health Journal, Vol. 11, Nos 5/6, 2005 1049
Discussion
The prevalence of asymptomatic bacteriuria of pregnant women in our study (4.8%) is similar to other reports (4% to 10%) [8,22]. This indicates that about 5% of pregnant women are at risk of development of acute episode of UTI during pregnancy if they are not properly treated. Suspected urine cul-tures with 103–104 CFU/mL (34.1% of our sample) need to be repeated at regular inter-vals during the course of pregnancy and the cases should be followed up or treated.
Comparing the urinalysis screening tests with the results of urine culture, which is the gold standard for the diagnosis and manage-ment of UTI, these tests were shown to be unreliable. The tests had low sensitivity, high false negative (specificity) and poor positive predictive value. Similar findings were reported by other authors [9,13–15].
Table 4 Bacteria species isolated from the urine of pregnant women with asymptomatic bacteriuria
Species No. of % isolatesa
Escherichia coli 16 66.7
Staphylococcus epidermidis (coagulase-negative staphylococcus) 3 12.5
Staphylococcus aureus 2 8.3
Enterobacter saprophyticus 1 4.2
Enterococcus saprophyticus 1 4.2
Proteus mirabilis 1 4.2
Total 24 100.0aColony forming units ≥ 105/mL.
Table 5 Serotypes of E. coli isolated from urine samples of women with asymptomatic and symptomatic bacteriuria
Serotype Asymptomatic Symptomatic bacteriuriaa bacteriuriaa
(n = 16) (n = 16) No. % No. %
O112ac 4 25.0 3 18.8
O125 3 18.8 1 6.3
O26 2 12.5 1 6.3
O20 1 6.3 1 6.3
O142 1 6.3 1 6.3
O119 1 6.3 1 6.3
O28ac 1 6.3 0 0
O114 1 6.3 0 0
O69 1 6.3 0 0
O44 1 6.3 0 0
O86a 0 0 5 31.3
O124 0 0 3 18.8
O111 0 0 0 0
O55 0 0 0 0
O182 0 0 0 0aColony forming units ≥ 105/mL. n = total number of samples.
Table 6 Antibiotic sensitivity pattern for E. coli isolated from urine samples of women with asymptomatic and symptomatic bacteriuria
Antibiotic E. coli antibiotic sensitivity Asymptomatic Symptomatic bacteriuria bacteriuria (n = 16) (n = 16) No. % No. %
Fosfomycin 16 100.0 16 100.0
Gentamicin 16 100.0 15 93.8
Ciprofloxacin 16 100.0 14 87.5
Cephalexin 13 81.3 13 81.3
Amoxicillin- clavulanic acid 13 81.3 16 100.0
Nitrofurantoin 11 68.8 12 75.0
Nalidixic acid 8 50.0 13 81.3
Ampicillin 8 50.0 10 62.5
Trimethoprim 6 37.5 10 62.5n = total number of samples.

�ملجلة �لصحية لشرL �ملتوسط، منظمة �لصحة �لعاملية، �ملجلد �حلا�E عشر، �لعد��� ٥-٦، ٢٠٠٥
1050 La Revue de Santé de la Méditerranée orientale, Vol. 11, No 5/6, 2005
Therefore, a urine culture should be rou-tinely obtained from all pregnant women for screening during the first antenatal visit and repeated during the third trimester, because the urine of the treated patients may not remain sterile for the entire pregnancy.
The most common bacterial isolates from MSU samples of asymptom-atic pregnant women were E. coli in 66.7%, followed by coagulase-negative staphylococci in 12.5%. Similar findings have been reported by other researchers[5,15]. E. coli is the most common micro-organism in the vaginal and rectal area, and because of the anatomical and the func-tional changes that occur during pregnancy, the risk of acquiring UTI from E. coli is high [5].
The commonest E. coli serotypes were O112ac in the urine of pregnant women with asymptomatic bacteriuria and O86a in symptomatic bacteriuria. In India, Misra found that the commonest E. coli serotype in symptomatic UTI was O5 [18]. Other studies have found different E. coli sero-types in UTI (O1, O2, O4, O6, O18ac and O75) [18–21]. Geographical distribution and epidemiological factors may play a role in this variation [19]. Further studies are required to explore the relationship between different serotypes and virulence factors of E. coli causing UTI in different geographi-cal regions by using tissue cultures and polymerase chain reaction analysis [18,23].
The antibiotic sensitivity patterns showed that most of the bacterial isolates were sensitive to gentamicin, ciprofloxacin, amoxicillin-clavulanic acid and fosfomy-cin. However, the data were insufficient to confirm the preference of a single dose or longer duration doses in treating asymp-tomatic bacteriuria in pregnant women.
Fosfomycin (Monurol) is a new antibiotic that can be taken as a single dose and has a good margin of safety during pregnancy [24]. Single-dose treatments have lower costs and better compliance than multiple doses, but need to be evaluated further [25]. Amoxicillin-clavulanic acid (Augmentin) is also considered safe for the treatment of pregnant women with urinary tract infection and is regarded as a good choice [26]. Tri-methoprim-sulfamethoxazole was the least sensitive antibiotic in our study.
The choice of antibiotic should be based on urine culture, stage of gestation, mater-nal clinical data and the characteristics of the antibiotic [27]. However, aggressive antibiotic treatment may be necessary to reduce the risk of pyelonephritis in preg-nancy [22,28]. All pregnant women with persistent bacteriuria or recurrent infection need follow-up cultures and a urological evaluation after delivery [17].
In conclusion, this study showed that 4.8% of the pregnant women examined had a positive urine culture without any symptoms of UTI. Hence, it is important that pregnant women are screened for asymptomatic bacteriuria at the first antenatal visit.
Acknowledgements
We are grateful to Dr Aisha Al-Roomi, Director of Maternal Child Health, Main Centre, and her staff at the Sharjah Medi-cal District, Ministry of Health, UAE, for their support during the different phases of the study. We wish to thank also Mrs Muna Jawad for her microbiology techni-cal assistance. This work was sponsored by the Research Center, University of Sharjah, UAE, grant number MB 271/200.

�ملجلة �لصحية لشرL �ملتوسط، منظمة �لصحة �لعاملية، �ملجلد �حلا�E عشر، �لعد��� ٥-٦، ٢٠٠٥
Eastern Mediterranean Health Journal, Vol. 11, Nos 5/6, 2005 1051
References
1. Kass EH. Pregnancy, pyelonephritis and prematurity. Clinical obstetrics and gyne-cology, 1970, 13:239–54.
2. Stamm WE, Hooton TM. Management of urinary tract infections in adults. New England journal of medicine, 1993, 329:1328–34.
3. Kennedy E. Pregnancy, urinary tract in-fections. eMedicine (online journal) http://www.emedicine.com/emerg/topic485.htm (accessed 10 October 2005).
4. MacLean AB. Urinary tract infection in pregnancy. International journal of antimi-crobial agents, 2001, 17:273–6.
5. Mohammad M et al. Laboratory aspects of asymptomatic bacteriuria in preg-nancy. Southeast Asian journal of tropical medicine and public health, 2002, 33(3):575–80.
6. Stein G, Funfstuck R. Asymptomatic bacteriuria. Medizinische Klinik, 2000, 95:195–200.
7. Gilstrap LC, Ramin SM. Urinary tract infections during pregnancy. Obstetrics and gynecology clinics of North America, 2001, 28:581–91.
8. McDermott S et al. Perinatal risk for mortality and mental retardation asso-ciated with maternal urinary-tract infec-tions. Journal of family practice, 2001, 50:433–7.
9. Bachman JW et al. A study of various tests to detect asymptomatic urinary tract infections in an obstetric population. Jour-nal of the American Medical Association, 1993, 270:1971–4.
10. Zaman Z et al. Disappointing dipstick screening for urinary tract infection in hospital inpatients. Journal of clinical pa-thology, 1998, 51(6):471–2.
11. Kutlay S et al. Prevalence, detection and treatment of asymptomatic bacteriuria in a Turkish obstetric population. Journal
of reproductive medicine, 2003, 48(8):627–30.
12. Rehmani R. Accuracy of urine dipstick to predict urinary tract infections in an emergency department. Journal of Ayub Medical College, 2004, 16(1):4–7.
13. Millar L et al. Rapid enzymatic urine screening test to detect bacteriuria in pregnancy. Obstetrics and gynecology, 2000, 95:601–4.
14. Robertson AW, Duff P. The nitrite and leu-kocyte esterase tests for the evaluation of asymptomatic bacteriuria in obstetric pa-tients. Obstetrics and gynecology, 1988, 71(6pt1):878–81.
15. Chongsomchai C et al. Screening for asymptomatic bacteriuria in pregnant women; urinalysis versus urine culture. Journal of the Medical Association of Thailand, 1999, 82:369–73.
16. Gebre-Selassie S. Asymptomatic bacteri-uria in pregnancy: epidemiological, clinical and microbiological approach. Ethiopian medical journal, 1998, 36:185–92.
17. Patterson TF, Andriole VT. Detection, significance and therapy of bacteriuria in pregnancy. Update in the managed health care era. Infectious disease clinics of North America, 1997, 11:593–608.
18. Misra RN. Serotyping and enterotoxige-nicity of Escherichia coli isolated from urinary tract infections. Armed Forces medical journal, India, 1997, 53(2):83–6.
19. Czirok E, Herpay M, Milch H. Compute-rized complex typing of Escherichia coli strains from different clinical materials. Acta microbiologica Hungarica, 1993, 40(3):217–37.
20. Zingler G et al. K-antigen identification, hemolysin production, and hemagglutina-tion types of Escherichia coli O6 strains isolated from patients with urinary tract infections. Zentralblatt fur Bakteriologie:

�ملجلة �لصحية لشرL �ملتوسط، منظمة �لصحة �لعاملية، �ملجلد �حلا�E عشر، �لعد��� ٥-٦، ٢٠٠٥
1052 La Revue de Santé de la Méditerranée orientale, Vol. 11, No 5/6, 2005
international journal of medical microbio-logy, 1990, 274(3):372–81.
21. Westerlund B et al. Properties of Es-cherichia coli isolates from urinary tract infections in boys. Journal of infectious diseases, 1988, 158(5):996–1002.
22. Gratacos E et al. Screening and treatment of asymptomatic bacteriuria in pregnancy prevent pyelonephritis. Journal of infec-tious diseases, 1994, 169:1390–2.
23. Graham JC et al. Analysis of Escherichia coli strains causing bacteriuria during pregnancy: selection for strains that do not express type 1 fimbriae. Infection and immunity, 2001, 69:794–9.
24. Delzell JR, Lefevre ML. Urinary tract infections during pregnancy. American family physician, 2000, 61:713–21.
25. Villar J et al. Duration of treatment for asymptomatic bacteriuria during preg-
nancy. The Cochrane Database of Sys-tematic Reviews, 2005, Issue 3.
26. Van den Broek PJ. De standaard ‘Urineweginfecties’ van het Nederlands Huisartsen Genootschap; reactie vanuit de interne geneeskunde. [The Dutch Col-lege of General Practitioners’ guideline on urinary tract infections; response from the viewpoint of internal medicine.] Neder-lands tijdschrift voor geneeskunde, 2001, 145:718–20.
27. Grio R et al. Asymptomatic bacteriuria in pregnancy: a diagnostic and therapeutic approach. Panminerva medica, 1994, 36:195–7.
28. Smaill F. Antibiotics for asymptomatic bacteriuria in pregnancy. The Cochrane Database of Systematic Reviews, 2001, Issue 2.

Eastern Mediterranean Health Journal, Vol. 11, Nos 5/6, 2005 1053
�ملجلة �لصحية لشرL �ملتوسط، منظمة �لصحة �لعاملية، �ملجلد �حلا�E عشر، �لعد��� ٥-٦، ٢٠٠٥
Prévalence du virus de l’hépatite G chez les donneurs de sang enTunisieM. Mastouri,1 L. Safer,2 B. Pozzetto,3 T. Bourlet 4 et M. Khedher1
1 Faculté de pharmacie, Université de Monastir (Tunisie).2 Faculté de médecine, Université de Monastir (Tunisie).3 Faculté de médecine Jacques Lisfranc, Saint-Étienne (France).4 Laboratoire de virologie, Hôpital Nord, Saint-Étienne (France).Reçu : 10/03/04 ; accepté : 27/09/04
RÉSUMÉ Le GBV-C/HGV est un virus de découverte récente, répandu dans le monde. Aucune donnée n’est disponible sur la prévalence du GBV-C/HGV en Tunisie. Le but de notre étude était de déterminer la prévalence du GBV-C/HGV chez les donneurs de sang en Tunisie. La recherche de l’anticorps anti-E2 a été réalisée pour 912 donneurs de sang et la recherche de l’ARN par RT-PCR pour 600 don-neurs. La prévalence des marqueurs de l’infection par le GBV-C/HGV était de 5,3 % pour l’ARNémie et de 4,9 % pour l’anti-E2. Une corrélation a été notée entre l’infection par le GBV-C/HGV et le VHC (p = 0,006). La prévalence de l’infection par le GBV-C/HGV chez les donneurs de sang en Tunisie est comparable à celle rapportée dans le monde.
Prevalence of hepatitis G virus among Tunisian blood donorsHepatitis G virus (GBV-C/HGV) is a recently identified virus which occurs worldwide. The prevalence of GBV-C/HGV in Tunisia has not been previously studied. We aimed to assess the prevalence of GBV-C/HGV infection in Tunisian blood donors. A total of 912 blood donors were tested for anti-E2 antibodies of GBV-C/HGV by enzyme-linked immunosorbent assay and 600 were tested by reverse transcriptase polymerase chain reaction. GBV-C/HGV RNA was found in 5.3% of the sample and HGV antibodies occurred in 4.9%. A correlation was noticed between GBV-C/HGV infection and hepatitis C virus (P = 0.006). The prevalence of GBV-C/HGV is similar to that reported worldwide.
1054 La Revue de Santé de la Méditerranée orientale, Vol. 11, No 5/6, 2005
�ملجلة �لصحية لشرL �ملتوسط، منظمة �لصحة �لعاملية، �ملجلد �حلا�E عشر، �لعد��� ٥-٦، ٢٠٠٥
Introduction
Le GBV-C est un virus à ARN positif simple brin appartenant à la famille des Flaviviridae, décrit en 1995 par Simons et al. [1]. En 1996, l’équipe de Linnen et al. ont décrit un second virus appelé HGV qui s’est avéré être un variant du précédent [2]. C’est pourquoi cet agent est désormais désigné sous le nom de GBV-C/HGV. Souvent qualifié de virus d’hépatite, le GBV-C/HGV est un agent dont le pouvoir pathogène n’est pas clairement démontré. Les mécanismes de réplication sont encore mal connus car il n'existe pas de système de culture efficace [3]. Cependant, des travaux récents ont pu mettre en évidence des brins négatifs d'ARN du GBV-C/HGV dans les cellules mononucléées [3], mais aussi au niveau de la rate, de la moelle osseuse [4] et de l'appendice, suggérant que le GBV-C/HGV prolifère au niveau de l'appendice, puis il est transporté par voie portale jusqu'au foie [5]. Le GBV-C/HGV est loin de constituer un agent hépatotrope clas-sique. Le mode de transmission du GBV-C/HGV est également l’objet de discussions :la transmission parentérale est bien avérée [6], la transmission materno-foetale est fréquente [7], la transmission sexuelle est bien avérée et joue un rôle important dans la dissémination du virus dans la population générale [8]. Le GBV-C/HGV est large-ment répandu dans le monde, notamment chez les donneurs de sang. Pour connaître sa prévalence dans une population, il faut tenir compte à la fois des porteurs du virus (ARN GBV-C/HGV positif) et de ceux qui ont développé une immunité protectrice (anticorps anti-E2 positifs). Aucune don-née n’est disponible sur la prévalence de l’infection par le virus GBV-C/HGV dans notre pays. Le but de notre travail était de déterminer la prévalence de l’infection par le GBV-C/HGV chez les donneurs de sang
en Tunisie (région de Monastir), de préciser les modes de transmission de l’infection dans cette population et d’établir la préva-lence des co-infections par les virus VIH, VHB et/ou VHC chez les donneurs infectés par le GBV-C/HGV.
Méthodes
DonneursL’étude a porté sur 912 donneurs de sang (756 hommes et 156 femmes) de la banque de sang du C.H.U. Fattouma Bourguiba de Monastir, et ceci sur une période allant de janvier à décembre 2000. L’âge moyen des donneurs était de 27,2 ans avec des ex-trêmes allant de 18 à 58 ans. Aucun critère d’exclusion n’a été appliqué. Chaque don-neur a reçu un questionnaire portant sur les antécédents d’affections hépatiques, d’interventions chirurgicales, de transfusion de sang, de scarification et/ou de tatouage. Pour chaque donneur de sang, nous avons prélevé sur tube sec 10 mL de sang total par ponction veineuse au pli du coude. Les tubes de sang ont été centrifugés 15 minutes à basse vitesse et le sérum a été réparti en 5 aliquotes de 0,5 mL à 1 mL et congelé dans les meilleurs délais à -80 °C.
Détection des anticorps anti-E2La détection des anticorps anti-E2 a été réalisée par une technique ELISA à l’aide d’un test commercial (µPLATE anti-HGenv, Boehringer/Roche).
Détection de l’ARN du GBV-C/HGV par RT-PCRLa détection de l’ARN du GBV-C/HGV n’a concerné que 600 donneurs sans aucun biais de sélection et ceci par manque de ré-actif. La technique utilisée a été celle com-mercialisée par Boehringer/Roche ; l’ARN a été extrait à partir de 200 µL de sérum à

Eastern Mediterranean Health Journal, Vol. 11, Nos 5/6, 2005 1055
�ملجلة �لصحية لشرL �ملتوسط، منظمة �لصحة �لعاملية، �ملجلد �حلا�E عشر، �لعد��� ٥-٦، ٢٠٠٥
l’aide de la trousse High Pure viral RNA Kit selon les recommandations du fabriquant. La RT-PCR en une seule étape a été réalisée à l’aide de la trousse Titan one tube RT-PCR system. Ce système permet la synthèse de l’ADNc en même temps que la PCR sans avoir recours à l’addition de réactifs entre la synthèse de l’ADNc et la PCR. On utilise, pour la transcription inverse, l’enzyme de l’Avian Myelobaltosis Virus (AMV) et pour la PCR, l’expand high fidelity enzyme qui consiste en une Taq ADN polymérase et une Pwo ADN polymérase (polymérase thermostable isolée de archaebacterium Pyrococcus woesei). Ces enzymes sont contenues dans un seul mélange réaction-nel (Enzyme Mix de la trousse Titan one tube RT-PCR). La PCR a été réalisée à l’aide d’amorces situées dans la région 5´ non codante du génome viral : amorce 1 :5´-CGGCCAAAAGGTGGATG-3´ et amorce 2 : 5´-CGACGAGCCTGACGTCGGG-3´ (Hepatitis G virus-primer and capture Probe set, 2nd generation) et des dNTP de la trousse (PCR ELISA Dig labling Mix) permettant un marquage à la digoxigé-nine du matériel amplifié. L’amplification a été réalisée à l’aide d’un thermocycleur Perkin Elmer 9600 selon le protocole sui-vant : une transcription inverse pendant 30 min à 50 °C suivie d’une dénaturation des hybrides pendant 2 mn à 94 °C, puis 10 cycles comportant chacun 30 s à 94 °C, 30 s à 55 °C et 30 s à 68 °C, ensuite 30 cycles comportant chacun 30 s à 94 °C, 30 s à 55 °C et 30 s à 68 °C plus 5 s par cy-cle. Enfin une étape d’élongation finale de 8 mn à 68 °C. Les amplifiats ont été révélés par une technique ELISA (PCR ELISA DIG detection) utilisant une sonde biotinylée spécifique de la région amplifiée 5'-BIO-TIN-GGTAGCCACTATAGGG-3' (Hepa-titis G virus-primer and capture Probe set, 2nd generation). La sonde biotinylée a été immobilisée au fond des puits d’une
microplaque recouverte de streptavidine ; le produit d’amplification marqué à la digoxi-génine a été révélé grâce à un anticorps anti-digoxigénine marqué à la peroxydase.
Autres techniquesLes anticorps anti-VIH, anti-VHC et l’antigène HBs ont été recherchés par des techniques ELISA (Genscreen plus HIV Ag-Ab, Biorad, France, Innotest HCV Ab IV, Innogenics, Belgique et BIOELISA HBS Ag colour, biokit, Espagne, respectivement). La sérologie de la syphilis a été réalisée par technique d’hémagglutination TPHA (Syphagen, biokit, Espagne) avec les réac-tifs commerciaux utilisés en routine dans le cadre de la qualification des dons de sang.
De même ont été effectués en routine des dosages systématiques des transami-nases (ASAT et ALAT).
Analyse statistiqueL’étude statistique a été effectuée au moyen du logiciel Epi Info 6 version 6.02. La com-paraison des fréquences a été réalisée en se basant sur le test khi2, ou le test Fischer exact au seuil de 5 %.
Résultats
Parmi les 912 donneurs de sang, 45 étaient séropositifs, soit une prévalence de 4,9 %. La différence de distribution des anticorps anti-E2 en fonction de l’âge était statis-tiquement significative (p = 0,0003). La prévalence du portage sérique de l’ARN du GBV-C/HGV chez les donneurs de sang était de 5,3 %. Les tableaux 1 et 2 donnent la répartition par tranche d’âge des marqueurs de l’infection par le GBV-C/HGV.
Si on tient compte uniquement des 600 donneurs de sang qui sont analysés à la fois pour la recherche des anticorps anti-E2 et de l'ARN du GBV-C/HGV, la prévalence des
1056 La Revue de Santé de la Méditerranée orientale, Vol. 11, No 5/6, 2005
�ملجلة �لصحية لشرL �ملتوسط، منظمة �لصحة �لعاملية، �ملجلد �حلا�E عشر، �لعد��� ٥-٦، ٢٠٠٥
anti-E2 est de 5,5 % (33/600), et on aboutit ainsi à une positivité des marqueurs de l’infection par le GBV-C/HGV de 10,8 %. Aucun donneur n'est trouvé virémique pour le GBV-C/HGV (ARN positif) et en même temps porteur des anticorps anti-E2 (témoin de guérison).
L’étude des différents facteurs de risque n’a pas montré de liaison statistique-ment significative avec les marqueurs de l’infection par le GBV-C/HGV. Le tableau 3 illustre la relation entre les marqueurs de l’infection par le GBV-C/HGV (donneurs anti-E2 positifs : infection guérie et don-neurs ARN positifs : infection active) et les différents facteurs de risque.
L’étude des co-infections GBV-C/HGV avec les virus VHC, VIH, VHB, ou avec la syphilis a montré un lien statistiquement significatif entre l’infection par le GBV-C/HGV et le virus de l’hépatite C : p = 0,006 (Tableau 4).
Discussion
La séroprévalence du virus GBV-C/HGV chez les donneurs de sang en Tunisie (ré-gion du centre) atteint 4,9 %. La prévalence sérique de l’infection par le GBV-C/HGV varie beaucoup d’un pays à l’autre. En ef-fet, elle est de 9,5 % [9] à 12 % [10] en France, 12,6 % en Italie [11], 15,9 % en Allemagne [12], 10,5 % en Norvège [13], 7,3 % au Canada [14] et 9 % aux États-Unis [15]. L’approche moléculaire, c’est-à-dire la recherche de l’ARN du virus du GBV-C/HGV par RT-PCR, a montré une préva-lence de 5,3 %. Si nous prenons en compte les 600 donneurs de sang testés à la fois par RT-PCR et par sérologie, nous aboutissons à une prévalence globale de 10,8 %. Cette prévalence se rapproche de celle trouvée en France [9].
De même les résultats trouvés par biologie moléculaire sont variables d’un pays à l’autre. La prévalence est de 2,6 à 3,4 % en France [9,10], de 12,2 % en Égypte [16], de 1,9 % en Allemagne [12], de 1,1 % au Canada [14], de 2 % aux États-Unis [15], de 1,8 % en Corée [17], de 9,7 % au Brésil [18], de 2,5 % en Norvège [13], de 2,1 % à
Tableau 1 Prévalence des anticorps anti-E2 par tranche d’âge chez les donneurs de sang dans la région de Monastir (Tunisie)
Tranche d’âge Effectif Anti-E2 + (ans) Nbre %
18-25 509 14 2,7
26-30 138 4 2,9
31-35 91 9 9,9
36-40 91 6 6,6
41-45 48 6 12,5
46-50 29 4 13,8
51-55 3 1 -
> 55 3 1 -
Total 912 45 4,9p = 0,0003.
Tableau 2 Prévalence de l’acide ribonucléique (ARN) du GBV-C/HGV par tranche d’âge chez les donneurs de sang dans la région de Monastir (Tunisie)
Tranche d’âge Effectif ARN +(ans) Nbre %
18-25 333 17 5,1
26-30 98 7 7,1
31-35 61 5 8,2
36-40 58 2 3,4
41-45 30 0 0
46-50 19 1 5,2
51-55 1 0 0
> 55 0 0 0
Total 912 32 5,3p : NS (différence non significative).

Eastern Mediterranean Health Journal, Vol. 11, Nos 5/6, 2005 1057
�ملجلة �لصحية لشرL �ملتوسط، منظمة �لصحة �لعاملية، �ملجلد �حلا�E عشر، �لعد��� ٥-٦، ٢٠٠٥
Tableau 3 Étude des facteurs de risque de l’infection par le GBV-C/HGV chez les donneurs de sang dans la région de Monastir (Tunisie)
Facteur ARN + ARN - p Anti-E2 + Anti-E2 - p Nbre Nbre Nbre Nbre
Ictère + 1 7 0,35 0 8 1
- 31 560 45 859
Soins dentaires + 9 182 0,63 20 369 0,80
- 23 385 25 498
Interventions chirurgicales + 1 40 0,71 0 44 0,16
- 31 527 45 823
Scarification/ tatouage + 4 48 0,51 6 97 0,65
- 28 519 39 770
Transfusion + 0 5 1 0 5 1
- 32 563 45 862
ALAT ≥ 35 UI/L 0 14 1 4 51 0,32
< 35 UI/L 29 453 33 694
ASAT ≥ 35 UI/L 5 41 0,16 0 18 1
< 35 UI/L 24 442 38 713ALAT : alanine-aminotransférase.ASAT : aspartate-aminotransférase.
Tableau 4 Prévalence des co-infections GBV-C/HGV avec les virus VHB, VHC, VIH et la syphilis chez les donneurs de sang (n = 600) dans la région de Monastir (Tunisie)
Co-infection ARN + ARN - p
Nbre % Nbre %
VHB + 0 0 19 3,2 0,61
- 32 5,3 549 91,5
VHC + 3 0,5 5 0,8 0,006
- 29 4,8 563 93,8
VIH + 0 0 1 0,2 1
- 32 5,3 567 94,5
Treponema pallidum + 0 0 2 0,4 1
- 32 5,3 566 94,3 VHB : virus de l’hépatite B.VHC : virus de l’hépatite C.VIH : virus de l’immunodéficience humaine.
1058 La Revue de Santé de la Méditerranée orientale, Vol. 11, No 5/6, 2005
�ملجلة �لصحية لشرL �ملتوسط، منظمة �لصحة �لعاملية، �ملجلد �حلا�E عشر، �لعد��� ٥-٦، ٢٠٠٥
Taiwan [19], et de 0,5 % au Japon [20]. La technique de recherche de l’ARN du GBV-C/HGV utilisée a été la même, c’est-à-dire une transcriptase inverse, suivie d’une PCR, utilisant des amorces dans la région 5´ non codante qui est une technique plus sensible et plus spécifique que l’amplification dans d’autres régions du génome du GBV-C/HGV : NS3, E2 [21].
Nous notons que la présence d’anticorps anti-E2 augmente avec l’âge pour atteindre 13,8 % à 55 ans. La différence de distribu-tion en fonction de l’âge de ces anticorps est statistiquement significative (p = 0,0003).
L'étude des co-infections avec d'autres virus a monté une liaison statistiquement significative entre l’infection par le virus de l’hépatite C et l’infection par le GBV-C/HGV (p = 0,006). Ceci peut s'expliquer par un mode de transmission concomitant du virus de l’hépatite G avec le virus de l’hépatite C. En effet, de nombreux au-teurs font état d’une forte prévalence de l’infection au GBV-C/HGV chez les sujets HCV positifs : 16,3 % en Italie [22] et 20 % aux États-Unis [2]. Par ailleurs, le GBV-C/HGV ne constitue pas un facteur aggravant de l'infection par le VHC [23], alors que l'examen des conséquences de la co-infection VIH et GBV-C/HGV a montré que la présence du GBV-C/HGV pourrait avoir un effet bénéfique sur l’évolution de l’infection par le VIH. En effet, l’infection par le GBV-C/HGV est associée à une inhi-bition de la réplication du VIH, ou pourrait être également un marqueur de la présence d'autres facteurs conduisant à une réponse favorable au VIH [24,25].
L’étude des différents facteurs de risque n’a pas montré de lien statistique entre les antécédents d’affections hépatiques, d’interventions chirurgicales, de transfusion de sang, de scarification et/ou tatouage et les marqueurs de l’infection par le GBV-C/HGV. L’infection par le virus de l’hépatite G ne semble pas induire une augmentation des taux de transaminases. En effet, il n’y a pas de liaison statistiquement significative entre l’augmentation des transaminases et l’infection par le GBV-C/HGV. Il a été rapporté dans la littérature que si l’infection par le GBV-C/HGV pouvait être associée à des élévations des taux de transaminases sériques, cette augmentation serait modérée, souvent transitoire et non toujours corrélée avec les pics de virémie [26]. En effet, le GBV-C/HGV ne constitue pas un agent hépatotrope classique, et la multiplication du virus se fait essentiellement dans les cellules mononuclées et non dans les hé-patocytes [3] de sorte que sa classification comme « virus d'hépatite » pourrait bien avoir été quelque peu prématurée [27].
Enfin, la forte prévalence de l’infection par le GBV-C/HGV chez les donneurs de sang en Tunisie (10,8 %) révèle, outre le partage des mêmes voies de transmission que le VHC, une transmission par voie sexuelle. En effet, en dehors de la transmis-sion parentérale du virus, la transmission verticale et la transmission sexuelle constit-uent les principales voies de transmission du virus dans la population générale [8,28].
Références
1. Simons JN et al. Isolation of a novel virus-like sequences associated with human hepatitis. Nature medicine, 1995, 1(6):564–9.
2. Linnen J et al. Molecular cloning and disease association of hepatitis G virus a transfusion-transmissible agent. Science, 1996, 271:505–8.

Eastern Mediterranean Health Journal, Vol. 11, Nos 5/6, 2005 1059
�ملجلة �لصحية لشرL �ملتوسط، منظمة �لصحة �لعاملية، �ملجلد �حلا�E عشر، �لعد��� ٥-٦، ٢٠٠٥
3. Fogeda M et al. In vitro infection of human peripheral blood mononuclear cells by GB virus C/hepatitis G virus. Journal of viro-logy, 1999, 73(5):4052–61.
4. Radkowski M et al. Detection of active hepatitis C virus and hepatitis G virus/GB virus C replication in bone marrow in human subjects. Blood, 2000, 95(12):3986–9.
5. Shimizu T, Moriyama M, Arakawa Y. De-tection of HGV RNA in digestive organs. Intervirology, 2001, 44(1):14–20.
6. Lefrere JJ, Loiseau P, Pawlotsky JM. Le virus G/BV-C: de l’hépatologie à l’hématologie. Hématologie, 1996, 2:544.
7. Fischler B et al. Genetic Evidence for mother-to-infant transmission of hepatitis G virus. Journal of infectious diseases, 1997, 176:281–5.
8. Seifried C et al. High prevalence of GBV-C/HGV among relatives of GBV-C/HGV-positive blood donors in blood recipients and in patients with aplastic anemia. Transfusion, 2004, 44(2):268–74.
9. Mercier B et al. Prevalence of GBV-C/HGV RNA and GBV-C/HGV antibodies in French volunteer blood donors: results of a collaborative study. Vox sanguinis, 1999, 76(3):166–9.
10. Cantaloube JF et al. Prevalence of GB virus type C/hepatitis G virus RNA and anti-E2 among blood donors in south-eastern France. Transfusion, 1999, 39(1):95–102.
11. Villari P et al. Antibodies to the E2 protein of GB virus C/hepatitis G virus : prevalence and risk factors in different populations in Italy. Infection, 2001, 29(1):17–23.
12. Feucht HH et al. Distribution of hepatitis G viremia and antibody response to recom-binant proteins with special regard to risk factors in 709 patients. Hepatology, 1997, 26(2):491–4.
13. Nordbo SA et al. Prevalence of GB virus C (also called hepatitis G virus) markers in Norwegian blood donors. Journal of clini-cal microbiology, 2000, 38(7):2584–90.
14. Giulivi A et al. Prevalence of GBV-C/hepatitis G virus viremia and anti-E2 in Canadian blood donors. Vox sanguinis, 2000, 79(4):201–5.
15. Handa A et al. GB virus C/hepatitis G vi-rus infection is frequent in American chil-dren and young adults. Clinical infectious diseases, 2000, 30(3):569–71.
16. El-Zayadi AR et al. Prevalence of GBV-C/hepatitis G virus viraemia among blood donors, health care personnel, chronic non-B non-C hepatitis, chronic hepatitis C and hemodialysis patients in Egypt. Jour-nal of virological methods, 1999, 80(1):53–8.
17. Jeon MJ et al. TT virus and hepatitis G vi-rus infections in Korean blood donors and patients with chronic liver disease. World journal of gastroenterology, 2003, 9(4):741–4.
18. Levi JE et al. High prevalence of GB virus C/hepatis G virus RNA among Brazilian blood donors. Revista do Instituto de Me-dicina Tropical de Sao Paulo, 2003, 45(2):75–8.
19. Wang JT et al. Prevalence and infectivity of hepatitis G virus and its strain variant, the GB agent, in volunteer blood donors in Taiwan. Transfusion, 1998, 38(3):290–5.
20. Orito E et al. GB virus C/hepatitis G virus infection among Japanese patients with chronic liver diseases and blood donors. Virus research, 1996, 46(2):89–93.
21. Kao JH et al. Amplification of GB virus-C/hepatitis G virus RNA with primers from different regions of the viral genome. Journal of medical virology, 1997, 51(4):284–9.
1060 La Revue de Santé de la Méditerranée orientale, Vol. 11, No 5/6, 2005
�ملجلة �لصحية لشرL �ملتوسط، منظمة �لصحة �لعاملية، �ملجلد �حلا�E عشر، �لعد��� ٥-٦، ٢٠٠٥
22. Fabris P et al. HGV/GBV-C infection in patients with acute hepatitis of diffe-rent etiology and in patients with chronic hepatitis C. Journal of gastroenterology, 1998, 33(1):57–61.
23. Cacopardo B et al. Influence of hepatitis G virus coinfection on the clinical course of chronic hepatitis C. European journal of clinical microbiology and infectious dis-ease, 1998, 17(10):709–14.
24. Tillmann HL et al. Infection with GB virus C and reduced mortality among HIV-in-fected patients. New England journal of medicine, 2001, 345(10):715–24.
25. Xiang J et al. Effect of coinfection with GB virus C on survival among patients with
HIV infection. New England journal of medicine, 2001, 345(10):707–14.
26. Sarrazin C et al. Prevalence and clinical and histological manifestation of hepa-titis G/GBV-C infections in patients with elevated aminotransferases of unknown aetiology. Journal of hepatology, 1977, 27(2):276–83.
27. Pessoa MG et al. Quantitation of hepatitis G and C viruses in the liver: evidence that hepatitis G virus is not hepatotropic. Hepatology, 1998, 27(3):877–80.
28. Hattori J et al. Prevalence of infection and genotypes of GBV-C/HGV among homosexual men. Microbiology and im-munology, 2003, 47(10):759–63.
Le sang qui convient au bon momentLes efforts engagés partout dans le monde pour garantir un accès uni-versel à un sang sécurisé portent principalement sur l’établissement d’un réseau de donneurs volontaires, non rémunérés et réguliers. Jugés comme les plus sûrs, les donneurs de ce type ont aussi fait preuve d’un grand sens des responsabilités envers leur communauté et se sont maintenus, autant qu’ils le pouvaient, en bonne santé, pour rester en mesure de fournir un sang non contaminé.
Source : OMS Aide-mémoire N°279Révisé en juin 2005

Eastern Mediterranean Health Journal, Vol. 11, Nos 5/6, 2005 1061
�ملجلة �لصحية لشرL �ملتوسط، منظمة �لصحة �لعاملية، �ملجلد �حلا�E عشر، �لعد��� ٥-٦، ٢٠٠٥
Review
Medical ethics in the Islamic Republic of IranB. Larijani,1 F. Zahedi1 and H. Malek-Afzali2
1Endocrinology and Metabolism Research Centre, Tehran University of Medical Sciences, Tehran, Islamic Republic of Iran (Correspondence to B. Larijani: [email protected]).2Department of Research and Technology, Ministry of Health and Medical Education, Tehran, Islamic Republic of Iran.Received: 17/02/04; accepted: 01/06/04
ABSTRACT Recent trends in biomedical technologies have been associated with increasing discussion about ethical aspects of the new knowledge in many societies, including the Islamic Republic of Iran. Medical ethics has a long history in our country, and great Iranian physicians laid special emphasis on teaching and practising traditional ethics. In recent decades, great strides have been made in biomedi-cal ethics, especially in the fields of education, research and legislation. We present a brief history of medical ethics in our country. Current activities and topics of future plans are also discussed.
L’éthique médicale en IranRÉSUMÉ L’évolution récente des technologies biomédicales a été associée à des débats croissants autour des aspects éthiques des nouvelles connaissances dans de nombreuses sociétés, y compris en République islamique d’Iran. Notre pays a une longue tradition d’éthique médicale, et de grands médecins iraniens ont accordé une importance particulière à l’enseignement et la pratique de l’éthique traditionnelle. Ces dernières décennies, de grands progrès ont été accomplis dans le domaine de l’éthique biomédicale, notamment en ce qui concerne la formation, la recherche et la législation. Nous présentons un bref historique de l’éthique médicale dans notre pays. Les activités en cours et les thèmes abordés dans les plans pour l’avenir sont également examinés.
1062 La Revue de Santé de la Méditerranée orientale, Vol. 11, No 5/6, 2005
�ملجلة �لصحية لشرL �ملتوسط، منظمة �لصحة �لعاملية، �ملجلد �حلا�E عشر، �لعد��� ٥-٦، ٢٠٠٥
Introduction
Biomedical advances, new medical tech-nologies and public concern about ethics in recent decades have stimulated a renewed interest in medical ethics. Advances in ge-netics, stem cell research, and organ trans-plantation are some of the medical issues that have raised concern. An emphasis on ethics has also been expressed by members of the medical and religious professions in the Islamic Republic of Iran.
Recent major biomedical activities in the Islamic Republic of Iran, with the emphasis on medical ethics, are reviewed in this document.
The Islamic Republic of Iran and the history of medical ethics
The Islamic Republic of Iran is a Middle Eastern country with a land area of 1 648 000 km2 and a population of 67 mil-lion. The per capita gross domestic product (GDP) was about 7219 Intl $ in 2002, with health expenditure at 6% of GDP [1,2].
The Islamic Republic of Iran (the an-cient Persia), a country with one of the oldest civilizations of the world, promotes today the “dialogue among civilizations”. In a response to the proposal made by the president of the Islamic Republic of Iran in September 1998, the United Nations Ge-neral Assembly declared 2001 as the year of Dialogue among Civilizations [3]. The Ira-nian government subsequently founded the International Centre for Dialogue among Civilizations (ICDAC) in February 1999 [4].
The name Iran is associated with great scholars such as Avicenna, from whom not only the Islamic Republic of Iran but also Europe and several other countries of Asia
have benefited. The combination of Iranian culture and Islam, which emphasizes the acquisition and propagation of knowledge, led in the past to the golden period of sci-entific achievement, particularly in the field of medicine. Great Iranian Muslim scholars laid huge emphasis on teaching and practis-ing ethics. Razi (865–925 AD) was one of the foremost Iranian physicians who de-scribed the basic principles of medical eth-ics. Ali ibn Abbas Ahvazi (930–994 AD), known as Haly Abbas to the Europeans, authored a book on medicine entitled Kamil al-tana’at al-tebbiyah (The complete medi-cal art). Matters related to medical ethics are discussed in detail in the first chapter of this book [5]. Ibn Sina (Avicenna) (981–1037) also wrote valuable guidelines on teaching and practising ethics for physicians.
Medical ethics was a part of the cur-riculum for medical students in traditional Iranian medicine in medieval times, and great Iranian physicians have paid special attention to ethics in their practice, teaching and manuscripts. Persian medical ethics was “modern” in speaking not only of the cognitive but also of the characterological attributes of a good physician [6,7]. After the introduction of modern medical educa-tion in the Islamic Republic of Iran, the first college of medicine, Dar ul-Funoon, was established in the nineteenth century. With the foundation of the faculty of Medicine in Tehran University in 1934, education in medical ethics comprised a part of medical student education courses [8].
The first Farsi book of medical ethics, Medical ethics and customs, written by Dr M.N. Etemadian was published in 1963 [9]. Topics such as doctor–patient relationship, confidentiality, abortion and euthanasia were thoroughly discussed. Currently, medical ethics is taught in 19 lectures (2 credits) to medical students in Iranian medi-cal universities at national level. Books

Eastern Mediterranean Health Journal, Vol. 11, Nos 5/6, 2005 1063
�ملجلة �لصحية لشرL �ملتوسط، منظمة �لصحة �لعاملية، �ملجلد �حلا�E عشر، �لعد��� ٥-٦، ٢٠٠٥
and guidelines have been printed and are a part of the curriculum. Problem-based case studies for teaching medical ethics were in-troduced 2 years ago. A book on this topic, Pezeshk va molahezat-e akhlghi (Health care professional and ethical issues), using a detailed case study approach has recently been published in Farsi [10].
In the Islamic Republic of Iran, ethical issues are discussed among physicians, legal experts and religious scholars. The principles of bioethics and solutions to ethical problems are therefore derived from the Islamic legal rulings. They are updated in the light of the Holy Quran, the traditions of the Prophet of Islam �, the consensus of scholars, and human wisdom or intellect.
Iranian Islamic culture essentially em-phasizes altruism, benevolence to fellow human beings, seeking perfection, life after death and association of a human being with God and the universe.
Principles of Islamic ethicsSpecial attention has been paid toward moral ethics in Islam [11]. The essential core of Islamic teachings is the perfection of ethical conduct of a human being. The prophet of Islam, Muhammad �, has said, “I have been appointed as prophet of God for the completion and perfection of moral ethics,” (Ali al-Hakim al-Nisaburi (d. 405 AD), Al-Mustadrak ala al-sahihayn (The supplement), Vol. 2:282). The road to moral and spiritual perfection is described as the “quest for God” in Islam. The seekers after God must satisfy 2 conditions: their actions must be governed by the prescriptions or ordinances of the “divine law” (al-sha’r), and they must ensure that God is constantly present in their hearts [12]. Man is a being with dual aspects, soul and body. Man’s reality is not merely his physical nature. Human reality depends on the eternal soul. Man has certain perfections by virtue of his
spiritual self. Any act that is consistent with man’s spiritual perfection is valuable, and any act that is irrelevant to the higher aspect of the soul is an ordinary and mediocre act [13]. In accordance with this approach, vir-tues like honesty, truthfulness, beneficence and the like are notions which have affinity to the higher self. A most significant Islamic principle is: “Man has an innate nobility and sublimity which is the same as his spiritual being and the divine breath” [13]. Although physically and naturally all men live in dif-ferent conditions and situations and with varying physical needs, they are equally sit-uated in respect to their spiritual perfection. Inevitably, in that domain likes and dislikes and notions of what is good and evil assume a uniform, universal and permanent aspect. All perceptions of good and evil signify a thing’s relation with its perfection. Nev-ertheless such perfections of good and evil can be universal and permanent [13].
On the other hand, God gave man life and with that also gave man the freedom and the authority to do good or to indulge in evil. God also gave man the basic knowledge of good and bad at the time of his inception [14]. The Holy Quran (91:7–10) says: “The human soul—the way He moulded it and inspired it with knowledge of its evil and its good—bears witness to the fact that indeed he who cleanses it (of all impiety) shall be successful while he who corrupts it shall face doom.”
It is for this reason that ethical values like justice, honesty, trustworthiness and truthfulness have never been questioned philosophically, even if there is consider-able practical deviation from these values or a huge difference in their practical ap-plication [14].
Freedom is among the highest of human values and is above man’s animal nature and material values [15]. A human act is valuable if it is done by informed freedom.

1064 La Revue de Santé de la Méditerranée orientale, Vol. 11, No 5/6, 2005
�ملجلة �لصحية لشرL �ملتوسط، منظمة �لصحة �لعاملية، �ملجلد �حلا�E عشر، �لعد��� ٥-٦، ٢٠٠٥
From the Islamic viewpoint, people are autonomous in the decision-making process if they are able to understand and make intelligent decisions for themselves which are intentional and voluntary [16].
In conclusion, in Islamic ethics, the 4 principles of medical ethics (beneficence, non-malfeasance, autonomy and justice) and other similar values such as freedom, helping fellow human beings, etc. are com-pletely acceptable. But their interpretation and practical application may be different from those of other religions and cultures. For example, since Islam places more em-phasis on respect to all human beings, the interpretation of the principle of “respect to autonomy” may be limited in some situa-tions.
Bioethics activities in the country
In the current decade, great efforts are be-ing exerted in medical ethics education, research and legislation in the Islamic Re-public of Iran.
Research and educationRecent developments in medical ethics in the field of research started with the estab-lishment of a medical ethics research centre, since when other activities at national and local levels have been gradually carried out.
Establishment of a medical ethics research centreThe medical ethics research centre was established by the Ministry of Health and Medical Education in 1993. At present, the centre is known as the Office of Study for Humanistic and Islamic Sciences on Medi-cine and Medical Ethics [17]. The goals are:
• organizing discussions on medical eth-ics at university level;
• training specialists in medical ethics;• research on various aspects of contem-
porary medical ethics;• publication of textbooks for the medical
school curriculum;• establishment of a council to address
ethical issues in medicine and research in accordance with Islamic rules and universally recognized codes.The first international conference on
medical ethics was organized in Tehran in 1993 by the centre. Collection, organization and categorization of scientific publications on medical ethics were accomplished in the conference. The proceedings of the confer-ence were published as a series of books (7 volumes) in Farsi [18].
From 1993 onward, seminars and courses on medical ethics for physicians, nurses and pharmacists were established in different regions of the country. Weekly workshops on biomedical ethics for physi-cians and specialists were also organized about various topics related to current important issues.
The National Committee for Medical Research This committee was established in 1998 with the following responsibilities:• to apply Islamic, legal and moral prin-
ciples to biomedical research;• to guard human rights and legally pro-
tect the participants, the researchers and the institutes involved in research;
• to promote mandatory inclusion of ad-visors on ethical issues in all research projects at universities, private research foundations and industries.Members of the National Committee are
the Deputy for Research of the Ministry of

Eastern Mediterranean Health Journal, Vol. 11, Nos 5/6, 2005 1065
�ملجلة �لصحية لشرL �ملتوسط، منظمة �لصحة �لعاملية، �ملجلد �حلا�E عشر، �لعد��� ٥-٦، ٢٠٠٥
Health and Medical Education, head of the National Medical Research Council, head of the Medical Ethics Research Centre, a clergyman conversant with medical issues, 2 nationally known researchers and an epidemiologist or biostatistician.
Regional committees for ethics in medical researchThe establishment of the national commit-tee paved the way for the organization of regional committees in over 40 medical universities throughout the country. These committees undertake the supervision and observation of national and international laws on medical ethics in research. They approved over 305 graduate level research projects during 1999–2001.
Local ethics committees have also been established in over 70 research centres involved in biotechnology, molecular and cellular biology and related fields [17]. The current trend is towards approving a com-mon guideline for all ethics committees throughout the country.
National codes of ethics in biomedical researchIn 2000, a guideline comprising 26 National Codes of Ethics for biomedical researchers was prepared by Ministry of Health and Medical Education. These codes are in accordance with the international declara-tions such as the Council for International Organizations of Medical Sciences guide-lines [19] and the Helsinki Declaration [20] and have been customized according to the code of religious laws in shi’a (the official religion in the Islamic Republic of Iran) and specific cultural issues of the Iranian popu-lation. The code for the protection of human participants in medical research (to be used by the local committees of ethics in medical
research for making ethical judgments) is as follows.• Informed consent in all investigations
where human beings are involved is mandatory; in the case of interventional research, this should be in the form of a written statement.
• Nothing can justify exposing a human being to unnecessary harm or restricting his/her volition.
• The consent should be both informed and voluntary. It should be verified that there are no predictable risks to participants that are more than minimal. Behaviours such as threats, temptation and coercion will also annul the con-sent. Whenever these conditions are not observed, the scientist is accountable for any possible damage.
• In all studies where the researcher has a higher rank than the participant(s) in the study, the reason for selecting the participant(s) must be approved by the Committee of Ethics in Research. The situation requires that a trusted third person take the consent.
• In all medical research, therapeutic or non-therapeutic, the scientist is obliged to inform the participants in an appro-priate way about the duration of the research, the methods used and the pos-sible harms and benefits. The scientist should also give accurate answers to his/her participants’ questions. These should be reflected in the consent form.
• Before any medical research can be done, preliminary actions should be executed to minimize harm to research participants and to maintain health. Each participant should have his/her own in-surance in the case of a research mishap. In addition, all scientists should be co-vered by some indemnity insurance.

1066 La Revue de Santé de la Méditerranée orientale, Vol. 11, No 5/6, 2005
�ملجلة �لصحية لشرL �ملتوسط، منظمة �لصحة �لعاملية، �ملجلد �حلا�E عشر، �لعد��� ٥-٦، ٢٠٠٥
• The way that results of a study are reported should guarantee all rights of every related element (research subject, researcher, the research itself and the related institution)
• The participant should be aware that she/he can withdraw from the research project at any time. She/he should also be informed about and supported for any possible harm caused by abandonment of the research.
• If the subject’s knowledge of certain information affects the validity of re-search result, at the discretion of the researcher, the subject must be denied such information upon the approval of the ethics committee. Comprehensive arrangements must however be made to inform the subject of such information at an appropriate time.
• It is the duty of the scientist to make sure that the participant is informed; infor-ming by other persons will not obviate this responsibility.
• Including an uninformed participant is prohibited unless the participant waives his/her rights.
• In clinical trials where groups of controls and cases are necessary, par-ticipants should be aware that they are participating in an investigation where they will be placed in one of the groups by chance.
• Research on human participants is not justified unless the benefits to be derived outweigh the risks. The arbitrators who will judge the issues are committees of ethics in medical research, who will get advice from related specialists.
• In non-therapeutic research, the level of harm participants are exposed to should not surpass the level that the participant may face in everyday life.
• Exposing an individual to harm is not justified in any circumstances solely by
affirming that the procedure is practi-cal, simple, fast, comfortable, or cost-effective.
• Whenever a research project would expose participants to possible risks and the participants are of low socio-economic status or from less-educated groups of the community, the appro-priate committee should verify that the patient understands the implications of participating.
• It is the scientist’s responsibility to ensure the confidentiality of the partici-pants and to set up appropriate measures to ensure this will not be breached. If there should be any obstacle to this, the scientist must inform his/her partici-pants.
• In research in which the participant is unaware of the drug used, the scientist must establish measures to provide the required information to the participant and/or his/her physician in the event of an emergency.
• Any possible harm as a result of partici-pation in a study should be indemnified according to enacted laws.
• Research methods should not violate the accepted morals of society.
• When there is no obvious advantage, it is the committee of ethics in medi-cal research that decides which method should be applied and how the selection of participants (from prisoners or certain groups such as minors, mentally retar-ded individuals or psychotics as opposed to normal individuals) should be made.
• Participation of prisoners is not prohi-bited as long as the results of the study are exclusively applicable to those in jails. A written statement of consent should be obtained in this case.
Eastern Mediterranean Health Journal, Vol. 11, Nos 5/6, 2005 1067
�ملجلة �لصحية لشرL �ملتوسط، منظمة �لصحة �لعاملية، �ملجلد �حلا�E عشر، �لعد��� ٥-٦، ٢٠٠٥
• The scientist cannot include prisoners as “preferred subjects” merely because they are available for research projects.
• Participation of people with cognitive impairment or those who are not le-gally able to enter into contracts, such as children, is the responsibility of their guardians, who will have to give their permission. This principle will also ap-ply if a participant develops any sign of cognitive impairment or psychosis during a research project, in which case previously given consent would be void. On the other hand, when a minor reaches full legal majority, a written statement of consent must be obtained from him/her.
• Performing non-therapeutic investiga-tion on embryos (from the time of ferti-lization until the end of the eighth week of gestation) is not permitted unless such studies bring beneficial consequences to the embryo and/or its mother [21]. Writ-ten informed consent, both from the mother and the guardian of her embryo, must be obtained in this case.
• When it seems necessary, there is no prohibition against study on aborted em-bryos when it is considered necessary, provided that the legal codes of practice are observed.Approval and financial support of each
project will be confirmed only when the above code has been respected.
PublicationsA number of reference books are available for medical students in the Islamic Re-public of Iran. Medical ethics with a brief overview of medical history is one such reference book, which was published by the Ministry of Health and Medical Education in collaboration with the faculties of the Tehran University of Medical Sciences in 1991 [22].
Since 1993, great achievements have been made in authoring, translating and publishing medical ethics books and other sources. Over 30 foreign texts and books on biomedical ethics have been translated in that time. The book Ethics in medical research by Trevor Smith has been trans-lated recently (2002) [22]. In the preface, the correlation between ethics and research, history of international laws, philosophy of ethics in Islam, status of ethics and research in the Islamic Republic of Iran are discussed in detail.
A journal entitled Teb va tazkyeh (Medicine and purification) has also been published by the Ministry of Health and Medical Education since 1993. The first book in Farsi about medical, legal, ethical and religious aspects of organ transplan-tation in the Islamic Republic of Iran published in 1999 [23]. A further book on this issue was published in 2004 [24]. A problem-based approach for teaching medi-cal ethics was introduced recently in a book in Farsi on health care and professional and ethical issues using this approach [10].
National bioethics committeeThe Iranian national commission for the United Nations Educational, Scientific and Cultural Organisation is drafting a guideline for the constitution of a national bioethics committee [17]. The committee will include representation from the Ministry of Health and Medical Education; the Ministry of Science, Research and Technology; the Organization for the Protection of the Biological Environment; the Ministry of Agricultural Jihad; the Legal Medicine Or-ganization of the Islamic Republic of Iran; the Hozehelmieh (Seminary of religious ju-risprudence) of Qom; the Iranian Academic Centre for Education, Culture and Research; and the Medical Council of the Islamic Re-

1068 La Revue de Santé de la Méditerranée orientale, Vol. 11, No 5/6, 2005
�ملجلة �لصحية لشرL �ملتوسط، منظمة �لصحة �لعاملية، �ملجلد �حلا�E عشر، �لعد��� ٥-٦، ٢٠٠٥
public of Iran (a nongovernmental organi-zation). Two specialists in the philosophy of ethics, 2 lawyers, 2 biotechnologists, 2 biologists, and 1 specialist from each of immunology, genetics, pharmacology, biochemistry, psychology and epidemio-logy will comprise the permanent members [17]. This committee will discuss important issues of bioethics in the country.
Bioethics legislation in the Islamic Republic of IranThe official religion in the Islamic Republic of Iran is Shi’a, a branch of Islam, and fatwa (religious opinion about whether an action is permissible or not) of religious scholars is essential for the success and acceptability of an act by the general public. There have been positive fatwas about bioethical issues such as organ transplantation, abortion and genetic research in the Islamic Republic of Iran, some of which have been implemented into law by parliament in recent years.
Organ transplantation and brain deathOrgan transplantation has a long history in the Islamic Republic of Iran and the country
has one of the most successful programmes in the Middle East (Table 1). Data compa-ring organ transplant rates in Asia, Europe and the United States of America with those in the Islamic Republic of Iran are shown in Table 2 [25].
Ethical problems associated with organ transplantation have been important issues in recent years all over the world. In our country, altruism based on religious ethical teachings and the traditional cultural values of helping fellow human beings have a significant place in the context of organ donation. In the Holy Quran it is mentioned:“... and whosoever gives life to a soul, it shall be as if he has given life to all mankind” (5:32). In 1998, the consensus of physicians and religious leaders in the Islamic Repu-blic of Iran paved the way for advancement and rapid progress for a nationwide organ transplantation programme. In this regard, parliament approved the Deceased or Brain Dead Patients Organ Transplantation Act (Act. H/24804-T/9929, June 4 2000) (Table 3). According to the Act, cadaver organs and tissues and organs of brain-dead per-sons can be used for transplantation if the
Table 1 History and current data for organ transplantation in the Islamic Republic of Iran
Organ or tissue First transplant Total no. 2002 Total Living Cadaver donor donor
Cornea 1935 > 18 000 2581 – 2581
Kidney 1967 > 14 000 1681 1585 96
Bone marrow 1990 > 800 170 170 –
Liver 1993 55 23 1 22
Heart 1993 45 11 – 11
Lung 2001 4 1 – 1
Heart + lung 2002 1 1 – 1
Pancreas + islet cells (preliminary studies) 1999 – – – –
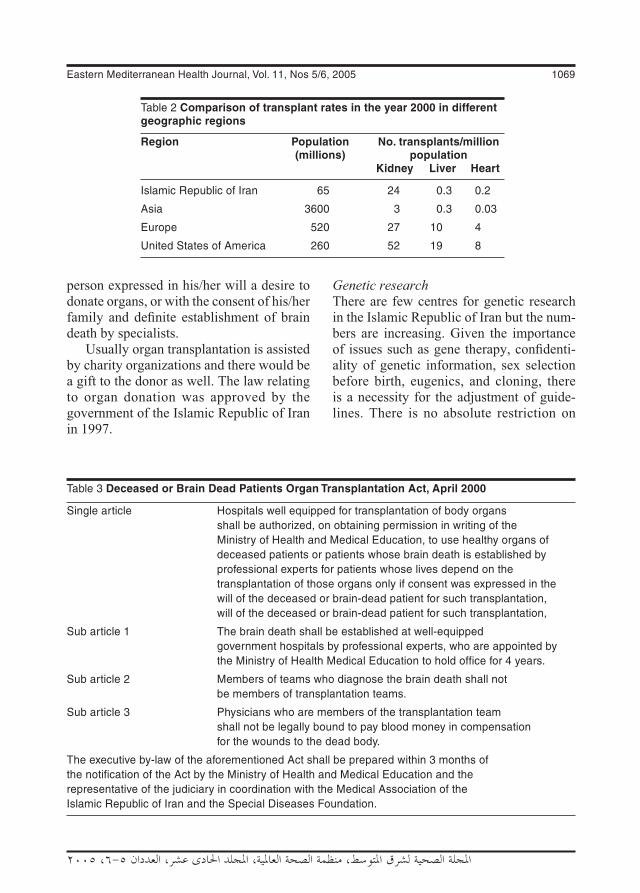
Eastern Mediterranean Health Journal, Vol. 11, Nos 5/6, 2005 1069
�ملجلة �لصحية لشرL �ملتوسط، منظمة �لصحة �لعاملية، �ملجلد �حلا�E عشر، �لعد��� ٥-٦، ٢٠٠٥
person expressed in his/her will a desire to donate organs, or with the consent of his/her family and definite establishment of brain death by specialists.
Usually organ transplantation is assisted by charity organizations and there would be a gift to the donor as well. The law relating to organ donation was approved by the government of the Islamic Republic of Iran in 1997.
Genetic researchThere are few centres for genetic research in the Islamic Republic of Iran but the num-bers are increasing. Given the importance of issues such as gene therapy, confidenti-ality of genetic information, sex selection before birth, eugenics, and cloning, there is a necessity for the adjustment of guide-lines. There is no absolute restriction on
Table 2 Comparison of transplant rates in the year 2000 in different geographic regions
Region Population No. transplants/million (millions) population Kidney Liver Heart
Islamic Republic of Iran 65 24 0.3 0.2
Asia 3600 3 0.3 0.03
Europe 520 27 10 4
United States of America 260 52 19 8
Table 3 Deceased or Brain Dead Patients Organ Transplantation Act, April 2000
Single article Hospitals well equipped for transplantation of body organs shall be authorized, on obtaining permission in writing of the Ministry of Health and Medical Education, to use healthy organs of deceased patients or patients whose brain death is established by professional experts for patients whose lives depend on the transplantation of those organs only if consent was expressed in the will of the deceased or brain-dead patient for such transplantation, will of the deceased or brain-dead patient for such transplantation,
Sub article 1 The brain death shall be established at well-equipped government hospitals by professional experts, who are appointed by the Ministry of Health Medical Education to hold office for 4 years.
Sub article 2 Members of teams who diagnose the brain death shall not be members of transplantation teams.
Sub article 3 Physicians who are members of the transplantation team shall not be legally bound to pay blood money in compensation for the wounds to the dead body.
The executive by-law of the aforementioned Act shall be prepared within 3 months of the notification of the Act by the Ministry of Health and Medical Education and the representative of the judiciary in coordination with the Medical Association of the Islamic Republic of Iran and the Special Diseases Foundation.
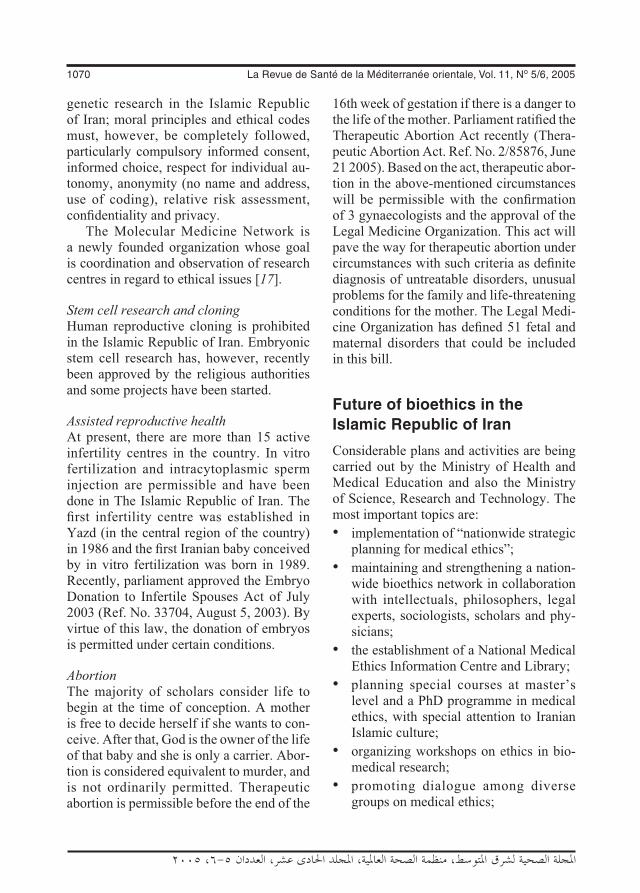
1070 La Revue de Santé de la Méditerranée orientale, Vol. 11, No 5/6, 2005
�ملجلة �لصحية لشرL �ملتوسط، منظمة �لصحة �لعاملية، �ملجلد �حلا�E عشر، �لعد��� ٥-٦، ٢٠٠٥
genetic research in the Islamic Republic of Iran; moral principles and ethical codes must, however, be completely followed, particularly compulsory informed consent, informed choice, respect for individual au-tonomy, anonymity (no name and address, use of coding), relative risk assessment, confidentiality and privacy.
The Molecular Medicine Network is a newly founded organization whose goal is coordination and observation of research centres in regard to ethical issues [17].
Stem cell research and cloningHuman reproductive cloning is prohibited in the Islamic Republic of Iran. Embryonic stem cell research has, however, recently been approved by the religious authorities and some projects have been started.
Assisted reproductive healthAt present, there are more than 15 active infertility centres in the country. In vitro fertilization and intracytoplasmic sperm injection are permissible and have been done in The Islamic Republic of Iran. The first infertility centre was established in Yazd (in the central region of the country) in 1986 and the first Iranian baby conceived by in vitro fertilization was born in 1989. Recently, parliament approved the Embryo Donation to Infertile Spouses Act of July 2003 (Ref. No. 33704, August 5, 2003). By virtue of this law, the donation of embryos is permitted under certain conditions.
AbortionThe majority of scholars consider life to begin at the time of conception. A mother is free to decide herself if she wants to con-ceive. After that, God is the owner of the life of that baby and she is only a carrier. Abor-tion is considered equivalent to murder, and is not ordinarily permitted. Therapeutic abortion is permissible before the end of the
16th week of gestation if there is a danger to the life of the mother. Parliament ratified the Therapeutic Abortion Act recently (Thera-peutic Abortion Act. Ref. No. 2/85876, June 21 2005). Based on the act, therapeutic abor-tion in the above-mentioned circumstances will be permissible with the confirmation of 3 gynaecologists and the approval of the Legal Medicine Organization. This act will pave the way for therapeutic abortion under circumstances with such criteria as definite diagnosis of untreatable disorders, unusual problems for the family and life-threatening conditions for the mother. The Legal Medi-cine Organization has defined 51 fetal and maternal disorders that could be included in this bill.
Future of bioethics in the Islamic Republic of Iran
Considerable plans and activities are being carried out by the Ministry of Health and Medical Education and also the Ministry of Science, Research and Technology. The most important topics are: • implementation of “nationwide strategic
planning for medical ethics”; • maintaining and strengthening a nation-
wide bioethics network in collaboration with intellectuals, philosophers, legal experts, sociologists, scholars and phy-sicians;
• the establishment of a National Medical Ethics Information Centre and Library;
• planning special courses at master’s level and a PhD programme in medical ethics, with special attention to Iranian Islamic culture;
• organizing workshops on ethics in bio-medical research;
• promoting dialogue among diverse groups on medical ethics;
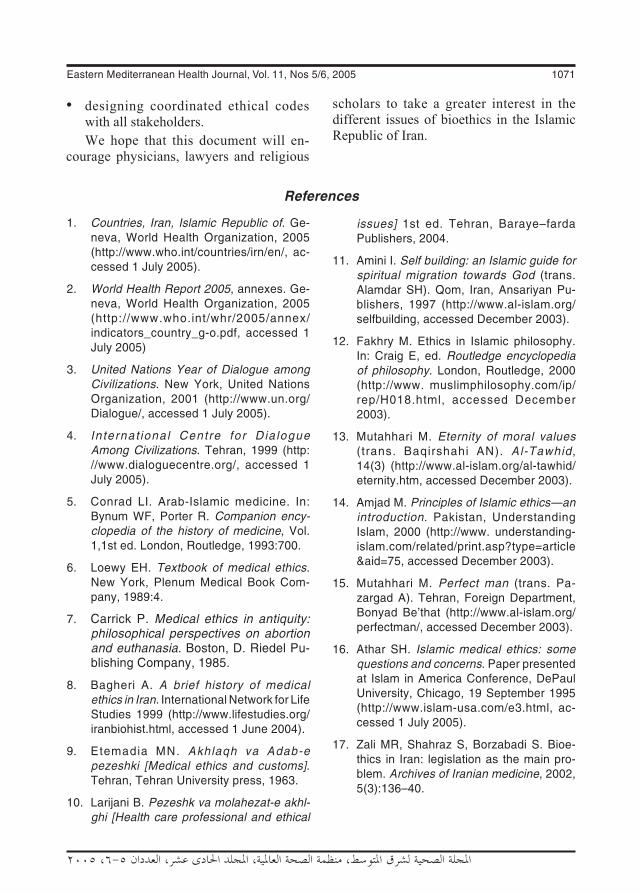
Eastern Mediterranean Health Journal, Vol. 11, Nos 5/6, 2005 1071
�ملجلة �لصحية لشرL �ملتوسط، منظمة �لصحة �لعاملية، �ملجلد �حلا�E عشر، �لعد��� ٥-٦، ٢٠٠٥
• designing coordinated ethical codes with all stakeholders.We hope that this document will en-
courage physicians, lawyers and religious
scholars to take a greater interest in the different issues of bioethics in the Islamic Republic of Iran.
References
1. Countries, Iran, Islamic Republic of. Ge-neva, World Health Organization, 2005 (http://www.who.int/countries/irn/en/, ac-cessed 1 July 2005).
2. World Health Report 2005, annexes. Ge-neva, World Health Organization, 2005 (http://www.who.int/whr/2005/annex/indicators_country_g-o.pdf, accessed 1 July 2005)
3. United Nations Year of Dialogue among Civilizations. New York, United Nations Organization, 2001 (http://www.un.org/Dialogue/, accessed 1 July 2005).
4. International Centre for Dialogue Among Civilizations. Tehran, 1999 (http://www.dialoguecentre.org/, accessed 1 July 2005).
5. Conrad LI. Arab-Islamic medicine. In: Bynum WF, Porter R. Companion ency-clopedia of the history of medicine, Vol. 1,1st ed. London, Routledge, 1993:700.
6. Loewy EH. Textbook of medical ethics. New York, Plenum Medical Book Com-pany, 1989:4.
7. Carrick P. Medical ethics in antiquity: philosophical perspectives on abortion and euthanasia. Boston, D. Riedel Pu-blishing Company, 1985.
8. Bagheri A. A brief history of medical ethics in Iran. International Network for Life Studies 1999 (http://www.lifestudies.org/iranbiohist.html, accessed 1 June 2004).
9. Etemadia MN. Akhlaqh va Adab-e pezeshki [Medical ethics and customs]. Tehran, Tehran University press, 1963.
10. Larijani B. Pezeshk va molahezat-e akhl-ghi [Health care professional and ethical
issues] 1st ed. Tehran, Baraye–farda Publishers, 2004.
11. Amini I. Self building: an Islamic guide for spiritual migration towards God (trans. Alamdar SH). Qom, Iran, Ansariyan Pu-blishers, 1997 (http://www.al-islam.org/selfbuilding, accessed December 2003).
12. Fakhry M. Ethics in Islamic philosophy. In: Craig E, ed. Routledge encyclopedia of philosophy. London, Routledge, 2000 (http://www. muslimphilosophy.com/ip/rep/H018.html, accessed December 2003).
13. Mutahhari M. Eternity of moral values (trans. Baqirshahi AN). Al-Tawhid, 14(3) (http://www.al-islam.org/al-tawhid/eternity.htm, accessed December 2003).
14. Amjad M. Principles of Islamic ethics—an introduction. Pakistan, Understanding Islam, 2000 (http://www. understanding-islam.com/related/print.asp?type=article&aid=75, accessed December 2003).
15. Mutahhari M. Perfect man (trans. Pa-zargad A). Tehran, Foreign Department, Bonyad Be’that (http://www.al-islam.org/perfectman/, accessed December 2003).
16. Athar SH. Islamic medical ethics: some questions and concerns. Paper presented at Islam in America Conference, DePaul University, Chicago, 19 September 1995 (http://www.islam-usa.com/e3.html, ac-cessed 1 July 2005).
17. Zali MR, Shahraz S, Borzabadi S. Bioe-thics in Iran: legislation as the main pro-blem. Archives of Iranian medicine, 2002, 5(3):136–40.

1072 La Revue de Santé de la Méditerranée orientale, Vol. 11, No 5/6, 2005
�ملجلة �لصحية لشرL �ملتوسط، منظمة �لصحة �لعاملية، �ملجلد �حلا�E عشر، �لعد��� ٥-٦، ٢٠٠٥
18. Proceedings of the international congress on medical ethics, Tehran, 14–16 July 1993. Tehran, Department of Educational, Legal and Parliamentary Affairs, Ministry of Health and Medical Education, 1993.
19. International ethical guidelines for biomedical research involving human subjects. World Medical Association Dec-laration of Helsinki: Ethical principles for medical research involving human sub-jects. Adopted by the 18th World Medi-cal General Assembly, Helsinki, Finland, June 1964. Geneva, Council for Interna-tional Organizations of Medical Sciences & World Health Organization, 2002.
20. Ministry of Health and Medical Educa-tion. Akhlaqe pezeshki be-enzemame mokhtasary az taurikh pezeshki [Medical ethics with a brief overview of medical his-tory]. Tehran, Sepehr Press, 1991.
21. Stem cell information, Glossary. Bethes-da, Maryland, National Institutes of
Health 2005 (http://stemcells.nih.gov/info/glossary.asp, accessed July 2005).
22. Smith T. Ethics in medical research: a handbook of good practice. Cambridge, Cambridge University Press, 1999.
23. Larijani B. Negareshi jaume’ be peyvand a’za [Comprehensive outlook on organ transplantation]. Tehran, Charity Founda-tion for Special Diseases, 1999.
24. Larijani B. Peyvand-e A’za: mabaheth elmi, akhlaghi, hoghooghi va fegh’hi [Organ transplantation: medical, ethical, legal and religious aspects]. Tehran: Ba-raye–farad Publishers, 2004.
25. Groth CG. Presidential address 2002: Or-gan transplantation as a patient service worldwide. Transplantation, 2003, 75(8):1098–100.

�ملجلة �لصحية لشرL �ملتوسط، منظمة �لصحة �لعاملية، �ملجلد �حلا�E عشر، �لعد��� ٥-٦، ٢٠٠٥
Eastern Mediterranean Health Journal, Vol. 11, Nos 5/6, 2005 1073
Review
Comparison of health care financing in Egypt and Cuba: lessons for health reform in EgyptC.A. Gericke1
1Department of Health Care Management, (WHO Collaborating Centre for Health Systems Research andManagement), Berlin University of Technology, Berlin, Germany (Correspondence to C.A. Gericke: [email protected]).Received: 31/05/04; accepted: 15/09/04
ABSTRACT Egypt and Cuba are both lower-middle income countries with a history of socialist rule, which have embarked on economic liberalization since the 1990s. Cuba has achieved exemplary health status whereas health status in Egypt is lower than could be expected for its level of income. In this ar-ticle, health care financing mechanisms in both countries are analysed on their effectiveness, efficiency, and equity, with the objective of identifying the determinants of success in the Cuban health system from which valuable lessons for current health reforms in Egypt may be derived.
Comparaison du financement des soins de santé en Égypte et à Cuba : enseignements pour la réforme de santé en ÉgypteRÉSUMÉ L’Égypte et Cuba sont deux pays à revenu moyen inférieur qui ont une histoire de régime socialiste et qui se sont engagés dans un processus de libéralisation économique depuis les années 90. Cuba est parvenu à une situation sanitaire exemplaire tandis que la situation sanitaire en Égypte est en deçà des attentes par rapport à son niveau de revenus. Cet article analyse les mécanismes de financement des soins de santé dans les deux pays pour ce qui est de leur efficacité, efficience et équité, dans le but d’identifier les déterminants du succès du système de santé cubain dont on pourrait tirer des enseignements utiles pour les réformes actuelles du système de santé en Égypte.

�ملجلة �لصحية لشرL �ملتوسط، منظمة �لصحة �لعاملية، �ملجلد �حلا�E عشر، �لعد��� ٥-٦، ٢٠٠٥
1074 La Revue de Santé de la Méditerranée orientale, Vol. 11, No 5/6, 2005
Introduction
Egypt’s health status is surprisingly poor considering its level of national income [1,2]. Cuba on the other hand achieves an extraordinarily good health status with a comparable national income [3], and was able to maintain it through a prolonged period of economic crisis in the 1990s [4]. Although both countries are located on different continents and have very dif-ferent cultures, a number of similarities exist. Notably, both countries have been under socialist rule since the 1950s/1960s and have embarked on economic reforms in the last decade. Both are lower-middle income countries according to the World Bank classification. In contrast to many other low- and middle- income countries, both countries have a tradition of training large numbers of health professionals, in particular doctors, and both are net export-ers of health professionals.
The Egyptian government is currently considering policies to reform health care financing and has started pilot projects with the help of external funding and technical assistance, notably by the World Bank, USAID, private consultancies, mainly USAID-subcontractors, and the European Commission.
In this article the Egyptian and Cuban health care financing arrangements are compared in order to determine which suc-cessful aspects of the Cuban approach could possibly be translated into the Egyptian context. Health service delivery issues are beyond the scope of this study.
The paper begins with an overview of the two health care systems and their political and socioeconomic environments. A description of the assessment criteria is followed by a comparative analysis of the health care financing mechanisms in both countries. The paper concludes with a dis-
cussion of the implications of this analysis for the current health reforms in Egypt.
Country situations
Political and socioeconomic environmentEgypt and Cuba are both lower-middle income countries [5]. Since 1990, both countries have introduced measures of economic liberalization in socialist systems without major changes to their political systems [6,7]. National income levels and income distribution are very similar, al-though national income estimates for Cuba are somewhat uncertain, as the country does not collaborate with the World Bank or the International Monetary Fund and thus has not been assessed using the same methodol-ogy (Table 1).
The demography of the two countries differs markedly. Whereas Egypt struggles to cope with high population growth and associated problems like unemployment of young people, Cuba is facing problems of an ageing society similar to the situation in many developed countries. For other socioeconomic determinants of health there is a wide discrepancy between the two countries, especially concerning gender inequality (Table 1).
Health systemsEgyptEgypt has a complex health system, with many different public and private providers and financing agents. There are four main financing agents: i) the government sector which is understood in Egypt to refer to the various ministries and departments of the government; ii) the public sector, consist-ing of financially autonomous organizations owned by the government, the largest being the Health Insurance Organization (HIO)
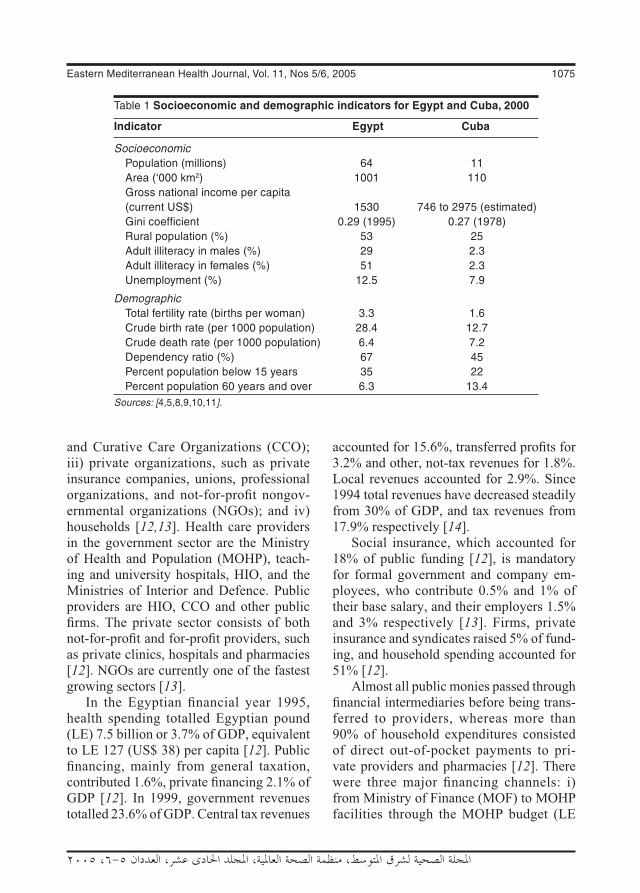
�ملجلة �لصحية لشرL �ملتوسط، منظمة �لصحة �لعاملية، �ملجلد �حلا�E عشر، �لعد��� ٥-٦، ٢٠٠٥
Eastern Mediterranean Health Journal, Vol. 11, Nos 5/6, 2005 1075
and Curative Care Organizations (CCO); iii) private organizations, such as private insurance companies, unions, professional organizations, and not-for-profit nongov-ernmental organizations (NGOs); and iv) households [12,13]. Health care providers in the government sector are the Ministry of Health and Population (MOHP), teach-ing and university hospitals, HIO, and the Ministries of Interior and Defence. Public providers are HIO, CCO and other public firms. The private sector consists of both not-for-profit and for-profit providers, such as private clinics, hospitals and pharmacies [12]. NGOs are currently one of the fastest growing sectors [13].
In the Egyptian financial year 1995, health spending totalled Egyptian pound (LE) 7.5 billion or 3.7% of GDP, equivalent to LE 127 (US$ 38) per capita [12]. Public financing, mainly from general taxation, contributed 1.6%, private financing 2.1% of GDP [12]. In 1999, government revenues totalled 23.6% of GDP. Central tax revenues
accounted for 15.6%, transferred profits for 3.2% and other, not-tax revenues for 1.8%. Local revenues accounted for 2.9%. Since 1994 total revenues have decreased steadily from 30% of GDP, and tax revenues from 17.9% respectively [14].
Social insurance, which accounted for 18% of public funding [12], is mandatory for formal government and company em-ployees, who contribute 0.5% and 1% of their base salary, and their employers 1.5% and 3% respectively [13]. Firms, private insurance and syndicates raised 5% of fund-ing, and household spending accounted for 51% [12].
Almost all public monies passed through financial intermediaries before being trans-ferred to providers, whereas more than 90% of household expenditures consisted of direct out-of-pocket payments to pri-vate providers and pharmacies [12]. There were three major financing channels: i) from Ministry of Finance (MOF) to MOHP facilities through the MOHP budget (LE
Table 1 Socioeconomic and demographic indicators for Egypt and Cuba, 2000
Indicator Egypt Cuba
Socioeconomic Population (millions) 64 11 Area (‘000 km2) 1001 110 Gross national income per capita (current US$) 1530 746 to 2975 (estimated) Gini coefficient 0.29 (1995) 0.27 (1978) Rural population (%) 53 25 Adult illiteracy in males (%) 29 2.3 Adult illiteracy in females (%) 51 2.3 Unemployment (%) 12.5 7.9
Demographic Total fertility rate (births per woman) 3.3 1.6 Crude birth rate (per 1000 population) 28.4 12.7 Crude death rate (per 1000 population) 6.4 7.2 Dependency ratio (%) 67 45 Percent population below 15 years 35 22 Percent population 60 years and over 6.3 13.4Sources: [4,5,8,9,10,11].

�ملجلة �لصحية لشرL �ملتوسط، منظمة �لصحة �لعاملية، �ملجلد �حلا�E عشر، �لعد��� ٥-٦، ٢٠٠٥
1076 La Revue de Santé de la Méditerranée orientale, Vol. 11, No 5/6, 2005
1337 million); ii) from Social Insurance Organization (LE 448 million) and MOF (LE 434 million) to HIO; and iii) from households (LE 3780 million) directly to private providers and pharmacies [12].
The use of funds at provider level is summarized in Figure 1. Less than 60% of MOF funds were actually spent in MOHP facilities [12]. The rest was transferred to teaching and university hospitals, HIO and CCO. MOHP facilities thus only received 19% of all health sector resources, or 0.7% of GDP [12]. Of all resources, 56% were spent in the private sector, most of it for the purchase of drugs (63%) or paying for private ambulatory care (17%). Less than 10% of private funds were used to purchase inpatient care [12].
Despite the radical economic policy shift, there has been little change in the overall financing and structure of the health system since 1991. The only notable chang-es were the expansion of social insurance coverage to 10 million schoolchildren in 1993 [13] and an increase in total health spending from 3.4% to 3.7% of GDP [12].
CubaCuba’s health system represents the arche-type of a public integrated system, with
funding through general taxation, public ownership of all health services, and health professionals who are direct state employ-ees [15]. Financing for the National Health System (Sistema Nacional de Salud - SNS) is almost completely covered by public funds [4]. With the Ministry of Public Health (Ministerio de Salud Pública - MIN-SAP) as steering agency, the SNS is orga-nized at three levels (national, provincial and municipal), which mirror the country’s administrative structure [15]. Coverage is universal, as all citizens have the right to all health benefits.
Health care provision is exclusively public with a ban on private practice [7]. This includes all kinds of health and social welfare provision, from primary care to drug-exporting companies [15].
In 1997, health spending totalled pesos 125.3 million or 6.7% of GDP, equivalent to US$ 139 per capita [4,10]. Financing from general taxation contributed 5.5%, and private household financing 1.2% of GDP [10]. Private financing for public health services is a new phenomenon in Cuba, which was introduced in 1990 [10]. It consists of modest out-of-pocket co-payments for drugs prescribed for out-patients, hearing, dental and orthopaedic
Figure 1 The Egyptian health expenditure: use of funds (Source: [12])

�ملجلة �لصحية لشرL �ملتوسط، منظمة �لصحة �لعاملية، �ملجلد �حلا�E عشر، �لعد��� ٥-٦، ٢٠٠٥
Eastern Mediterranean Health Journal, Vol. 11, Nos 5/6, 2005 1077
prostheses, and medical devices such as wheelchairs and crutches [4].
Before 1990, the Soviet Union and other socialist economies in Eastern Europe rep-resented Cuba’s main export markets and source of foreign aid needed because of the economic embargo imposed by the United States of America (USA) [7]. After the collapse of socialism in the Soviet Union and Eastern Europe, Cuba faced a grave economic crisis, during which its GDP decreased by as much as 35% in 1993 [4], resulting in severe shortages of various basic commodities including food, pharma-ceuticals, soap and insecticides [7]. An epi-demic of optic and peripheral neuropathy, probably caused by vitamin deficiency, hit the country in 1992/1993 and affected more than 50 000 people. To counteract the health effects of the economic crisis, the Cuban government increased health expenditure steadily as a percentage of public spending from 6.6% in 1990 to 10.9% in 1997 [16].
Assessment criteria
The analysis follows the three E’s frame-work for comparative evaluation of health systems: effectiveness, economy and equity. Here, effectiveness is defined as improvement in health status. Economy is defined as efficiency at the macro- and micro-economic level, where aspects of productive and allocative efficiency are assessed. Both vertical and horizontal eq-uity aspects will be considered. Horizontal equity will be assessed according to the ability-to-pay principle, but not the benefit principle, and according to the principle of equality of opportunity. The ability-to-pay principle requires payment to be organized not according to the benefit received, but in such a way that individuals pay according to their means, whereas the benefit principle
requires that those who benefit from a ser-vice should pay for it, and that the amount paid should in some way be related to the benefit received [17].
Comparative analysis
EffectivenessHealth status improvementThe effectiveness of health care to improve health on a population level is not directly measurable, as observed improvements in population health cannot be attributed to any single determinant. Furthermore, there is good evidence that the contribu-tion of other factors towards good health, such as education, safe water, sanitation and housing, is more important than that made by health care [1,18]. Thus, a general description of the health status in Egypt and Cuba is given here (Table 2), together with a summary of health trends over the past two decades (Table 3). This is not meant to imply that health care is necessarily the driving factor behind those changes.
Cuba and Egypt are on very different lev-els of the health development curve. Health status in Cuba was already comparable to a country belonging to the Organization for Economic Cooperation and Development (OECD) in 1978 and continued to improve at a rate comparable to OECD countries despite the severe economic crisis. In Egypt, substantial health improvements occurred in the 1980s and 1990s, such as the reduction in infant mortality by more than 60% (Table 3). The country has also been very successful in controlling infec-tious diseases [21]. However, compared to other countries at its level of income, Egypt’s health indicators were and remain poor [1,2,12], whereas Cuba’s health status still exceeds the health status of countries of comparable income and the health status of

�ملجلة �لصحية لشرL �ملتوسط، منظمة �لصحة �لعاملية، �ملجلد �حلا�E عشر، �لعد��� ٥-٦، ٢٠٠٥
1078 La Revue de Santé de la Méditerranée orientale, Vol. 11, No 5/6, 2005
regional comparators, best demonstrated by under-five mortality (Figure 2).
EfficiencyMacro-efficiencyMacro-efficiency refers to the proportion of national income devoted to health care. Ac-cording to economic theory, health services should be funded up to the point when the value of the last health intervention equals the marginal value derived from the next best alternative use to which the resources involved could be put. As in reality neither can be measured on a system level, there is considerable uncertainty about what constitutes the appropriate level of funding for a given country. Pragmatic approaches compare national health expenditure with i) regional averages or ii) averages for coun-tries with similar national income, whilst taking effectiveness into account. Table 4 summarises the two approaches for Egypt and Cuba.
With total health care spending at 3.8% of GDP, Egypt spends on the lower side
Table 2 Basic health status indicators in Egypt and Cuba
Health status indicator Year Egypt Cuba
Life expectancy at birth (years) (male) 2001 65.3 74.7
Life expectancy at birth (years) (female) 2001 67.8 79.2
Infant mortality rate (per 1000 live births) 1998 51 9
Maternal mortality ratio (per 100 000 live births) 1990 170 95
Probability of dying under age 5 years (male) (per 1000 live births) 2001 46 11 under age 5 years (female) (per 1000 live births) 2001 44 8 between ages 15 and 59 years (male) (per 1000 population) 2001 230 142 between ages 15 and 59 years (female) (per 1000 population) 2001 160 90
Healthy life expectancy (HALE) in years at birth (male) 2001 56.4 64.7
Healthy life expectancy (HALE) in years at birth (female) 2001 57.0 68.5Sources: [16,19,22].
Table 3 Health trends in Egypt and Cuba as illustrated by differences in health indicators between 1978 and 1998
Health indicator Egypt Cuba
Infant mortality rate (per 1000 live births) 1978 131 23 1998 51 9 % change (1978–1998) –61.1 –0.9
Male life expectancy at birth (years) 1978 53 71 1998 65 74 % change (1978–1998) 22.6 4.2
Female life expectancy at birth (years) 1978 55 75 1998 68 78 % change (1978–1998) 23.6 4.0Source: [19].
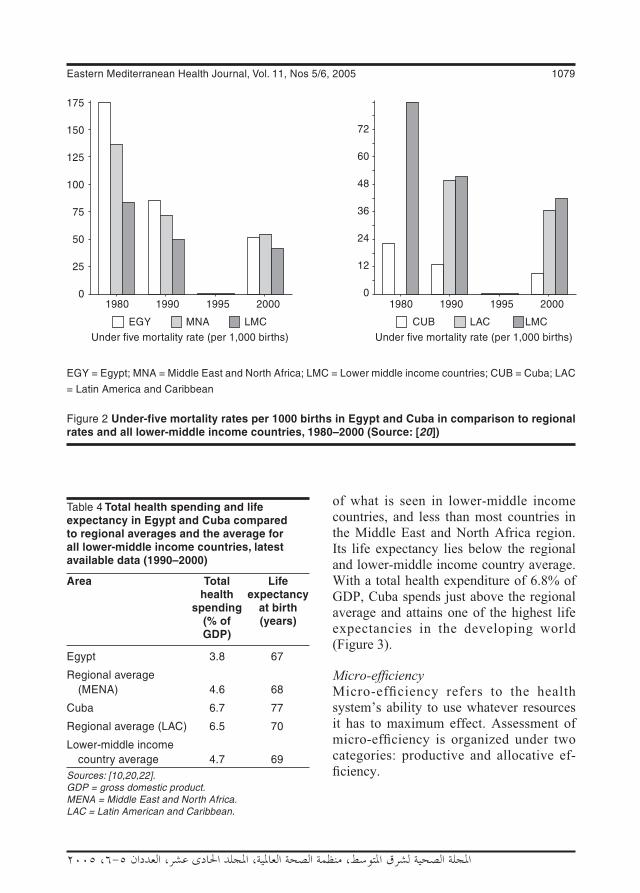
�ملجلة �لصحية لشرL �ملتوسط، منظمة �لصحة �لعاملية، �ملجلد �حلا�E عشر، �لعد��� ٥-٦، ٢٠٠٥
Eastern Mediterranean Health Journal, Vol. 11, Nos 5/6, 2005 1079
of what is seen in lower-middle income countries, and less than most countries in the Middle East and North Africa region. Its life expectancy lies below the regional and lower-middle income country average. With a total health expenditure of 6.8% of GDP, Cuba spends just above the regional average and attains one of the highest life expectancies in the developing world (Figure 3).
Micro-efficiencyMicro-efficiency refers to the health system’s ability to use whatever resources it has to maximum effect. Assessment of micro-efficiency is organized under two categories: productive and allocative ef-ficiency.
Figure 2 Under-five mortality rates per 1000 births in Egypt and Cuba in comparison to regional rates and all lower-middle income countries, 1980–2000 (Source: [20])
Table 4 Total health spending and life expectancy in Egypt and Cuba compared to regional averages and the average for all lower-middle income countries, latest available data (1990–2000)
Area Total Life health expectancy spending at birth (% of (years) GDP)
Egypt 3.8 67
Regional average (MENA) 4.6 68
Cuba 6.7 77
Regional average (LAC) 6.5 70
Lower-middle income country average 4.7 69Sources: [10,20,22].GDP = gross domestic product.MENA = Middle East and North Africa.LAC = Latin American and Caribbean.
EGY = Egypt; MNA = Middle East and North Africa; LMC = Lower middle income countries; CUB = Cuba; LAC
= Latin America and Caribbean
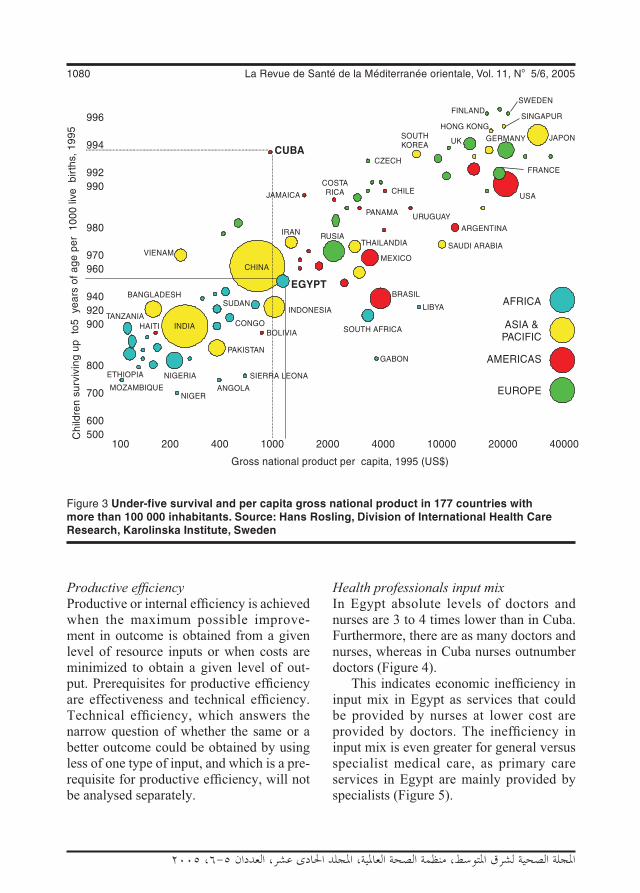
�ملجلة �لصحية لشرL �ملتوسط، منظمة �لصحة �لعاملية، �ملجلد �حلا�E عشر، �لعد��� ٥-٦، ٢٠٠٥
1080 La Revue de Santé de la Méditerranée orientale, Vol. 11, No 5/6, 2005
Productive efficiencyProductive or internal efficiency is achieved when the maximum possible improve-ment in outcome is obtained from a given level of resource inputs or when costs are minimized to obtain a given level of out-put. Prerequisites for productive efficiency are effectiveness and technical efficiency. Technical efficiency, which answers the narrow question of whether the same or a better outcome could be obtained by using less of one type of input, and which is a pre-requisite for productive efficiency, will not be analysed separately.
Health professionals input mixIn Egypt absolute levels of doctors and nurses are 3 to 4 times lower than in Cuba. Furthermore, there are as many doctors and nurses, whereas in Cuba nurses outnumber doctors (Figure 4).
This indicates economic inefficiency in input mix in Egypt as services that could be provided by nurses at lower cost are provided by doctors. The inefficiency in input mix is even greater for general versus specialist medical care, as primary care services in Egypt are mainly provided by specialists (Figure 5).
Figure 3 Under-five survival and per capita gross national product in 177 countries with more than 100 000 inhabitants. Source: Hans Rosling, Division of International Health Care Research, Karolinska Institute, Sweden

�ملجلة �لصحية لشرL �ملتوسط، منظمة �لصحة �لعاملية، �ملجلد �حلا�E عشر، �لعد��� ٥-٦، ٢٠٠٥
Eastern Mediterranean Health Journal, Vol. 11, Nos 5/6, 2005 1081
Hospital managementThe average hospital occupancy rate of 49% in Egypt is clearly inefficient [25]. This is even worse in public hospitals where rates average 40% compared to 60%–70% in private hospitals [25]. The severity of in-efficiency of such low occupancy rates in public hospitals is made clear if one takes into account that private hospitals in Egypt already struggle to remain profitable at 60%–70% occupancy rates [25]. The aver-
age occupancy rate in Cuba of 71% [16] is approaching that of many countries in Western Europe which range between 61% in the Netherlands and 84% in Switzerland [26].
Coordination between providers and across subsectorsIn Egypt, financing and management is completely fragmented with 29 different public agencies involved [25]. This pre-cludes efficient and equitable risk pool-ing as well as a consistent policy focus or consistent incentives for efficiency [25]. Duplication of services and administrative structures is common.
Cuba on the other hand has one inte-grated system under central control. This brings with it a different set of inefficiencies typically seen in large public institutions, like a mismatch between central planning and local needs resulting in waiting lists; the government tries to counterbalance this through a decentralization process and improvements in information flow between the different levels of the system [16].
Incentives for efficient institutional and pro-vider behaviourThe fragmentation and subsequent lack of coordination of the Egyptian financing system result in strategic behaviour among provider institutions [25]. On the individual provider level, public salaries are so low that multiple job-holding is quasi-universal among Egyptian doctors. The potential for earnings in the private sector is also modest given the relative over-supply of physicians [27]. There is indirect evidence that some doctors limit their commitment to public services to work in private practice [27].
Cuban health professionals are all state employees and private practice is banned. Although some perverse incentives like self-referrals to private practice are thus
Figure 4 Number of health professionals per 10 000 inhabitants in Egypt and Cuba (Source: [13,16])
Figure 5 Degree of medical specialization in Egypt and Cuba (Source: [13,16])

�ملجلة �لصحية لشرL �ملتوسط، منظمة �لصحة �لعاملية، �ملجلد �حلا�E عشر، �لعد��� ٥-٦، ٢٠٠٥
1082 La Revue de Santé de la Méditerranée orientale, Vol. 11, No 5/6, 2005
not seen, the usual inefficiencies associated with low remuneration levels and public salaries are to be expected, such as inappro-priate referrals, low motivation and reduced courtesy towards patients [28].
Availability of medical equipment, supplies and adequacy of buildingsThere are reports from both countries that both adequacy of health care facilities and supply with essential drugs or maintenance of medical equipment are problematic [16,25]. These problems have intensified in Cuba during the recent economic crisis, in particular repair of high-tech medical equipment is a considerable problem [16].
Allocative efficiencyAllocative or external efficiency refers to the way resources are divided between alternative uses within the health sector. It implies productive efficiency. The theoreti-cal foundation of allocative efficiency rests on the Pareto criterion: a resource allocation is efficient if it is impossible to move to an alternative allocation which would make some people better off and nobody worse off. Among other conceptual difficulties, strict adherence to this principle would preclude changes that would make many people much better off at the expense of a few made slightly worse off [24]. An opera-tional utilitarian decision rule is often used instead: allocative efficiency is achieved when resource allocation maximises social welfare [24].
Incentives to provide cost-effective proce-duresEconomic theory would predict that in Egypt, where most primary care services are provided by the private sector, preven-tive services with positive externalities like immunizations would be undersupplied as price signals do not reflect the social and
financial costs of production. Indeed only 79% of children receive the complete Ex-panded Programme of Immunization (EPI) schedule in Egypt [9] compared to 99% in Cuba [16]. As payments in the private sector are predominantly fee-for-service, supplier-induced demand is likely to occur in Egypt.
Other measures to encourage cost-effective behaviour are taken in Cuba. For many prevalent conditions standardized treatment plans have been developed [16]. An essential drug list with 904 compounds is applied [16], whereas in Egypt irrational and over-prescribing is an important prob-lem which is reflected in pharmaceutical consumption and spending being 50% higher than in comparable countries [25].
Distribution of expenditure on different levels of care In Egypt, public health is poorly targeted, as the focus is on expensive tertiary care [25] and primary care is largely left to the private sector. The reverse is true in Cuba, where the hallmark of the system is the integra-tion of public health into service delivery, in particular through primary care services [23]. In Cuban primary care, one family doctor, often with a nurse partner, cares for around 150 families, whom they know intimately and put as much effort in keeping them healthy as in providing care when they are sick [23].
EquityVertical equityVertical equity is concerned with the redis-tribution of income or consumption from the rich to the poor. Health care financing in Egypt is highly inequitable with 57% of expenditures being paid by households, mostly in the form of direct out-of-pocket payments to providers [12]. Out-of-pocket payments are the most regressive type of

�ملجلة �لصحية لشرL �ملتوسط، منظمة �لصحة �لعاملية، �ملجلد �حلا�E عشر، �لعد��� ٥-٦، ٢٠٠٥
Eastern Mediterranean Health Journal, Vol. 11, Nos 5/6, 2005 1083
contribution to health care. Even the dis-tribution of the 43% public spending is regressive. The poorest income quintile re-ceives 16.4% of public health expenditure compared to 23.6% for the richest quintile [29]. Less than 40% of the general popula-tion, and only 15% of those over 15 years of age benefit from social insurance cover-age [13,25]. Social insurance with nearly 50% contribution from general revenues resembles more a subsidized public finance scheme than a true insurance that only ben-efits formal sector workers [12], and even excludes spouses and children of employees [13]. As with other forms of insurance, both adverse selection and patient and provider moral hazard are likely to occur in Egyp-tian health insurance schemes. A positive feature is the protection from catastrophic illness costs through the safety net offered by MOHP services.
Cuba on the other hand finances 83% of health services out of general taxation [10], which is the most progressive way to finance health care. User charges only exist in the form of modest co-payments for drugs and medical supplies. User fees were only put in place during the economic crisis to raise funding and not as a measure to curb demand. Payments are very limited to avoid catastrophic illness costs and minimize fi-nancial barriers to access, and an exemption scheme for the poor is operated [16].
Horizontal equityHorizontal equity concerns goals like mini-mum standards for goods or services, for which supply in a free market would not meet social demand because of failure of one or more of the standard assumptions as is the case in health care, or equal access to these goods and services and the closely related concept of equality of opportunity.
For Egypt, there is plenty of evidence of horizontal inequity by income, gender and
geography. Because of the high percentage of out-of-pocket payments, ability to pay is a major barrier to accessing health services. MOHP, the different social insurance or-ganizations, and private providers all offer different benefit packages, which is counter to the goal of equal treatment for equal need. Public spending is strongly biased towards males, who receive 20% more per capita funding than females, although utilization rates are higher for women as in most countries [29]. This is largely due to the pronounced pro-male bias in HIO spending, where males receive almost three times the level of benefits as women [29]. Per capita public spending is 67% higher in richer urban areas compared to poorer rural regions [25].
There is also an important geographic disparity of service delivery in Egypt. Uti-lization rates for ambulatory and hospital care are nearly double in urban compared to rural regions [30]. These inequities in financing and delivery are certainly one reason for infant and child mortality being three times higher, and maternal mortality being five times higher in rural compared to urban areas [25].
Cuba on the other hand is one of the few developing countries achieving real universal coverage. This is exemplified by 100% of women receiving prenatal care and attended deliveries by trained personnel [16] compared to 39% of mothers receiving prenatal care and 46% attended deliveries in Egypt [9]. There is little variation in health indicators and health care utilization between urban and rural populations. For instance, in 2001 infant mortality ranged from 4.4 to 9 deaths per 100 000 births in the 14 provinces and the Isla de la Juven-tud, with urban rates (Habana City with 6.7 deaths) close to the average of 6.2 deaths [31]. Data on health expenditure or health status variation by income class are not

�ملجلة �لصحية لشرL �ملتوسط، منظمة �لصحة �لعاملية، �ملجلد �حلا�E عشر، �لعد��� ٥-٦، ٢٠٠٥
1084 La Revue de Santé de la Méditerranée orientale, Vol. 11, No 5/6, 2005
available. However, major disparities are unlikely given the overall social structure in Cuba.
Implications of key findings
From the comparison between Egypt’s and Cuba’s health systems, valuable lessons can be derived for health sector reform in Egypt. Although both countries made a rhetoric commitment to universal coverage and ac-cess to care [13,16], – after the revolution and again in the 1980s in Cuba and in the 1980s in Egypt – only Cuba designed its health system to achieve these goals.
The first lesson is that it is possible to achieve excellent health status which is equitably distributed in a lower-middle income country. This was only possible because the Cuban government committed sufficient public funds to health care.
Egypt’s current total and public spend-ing on health is clearly macro-inefficient, and to overcome this, the government would have to raise public spending on health substantially. At the same time, it would have to make sure that the prevailing inequities in financing are reduced. Verti-cal equity can only be improved through a reduction in out-of-pocket payments and an increase in the provision of services funded through mechanisms based on solidarity and risk pooling. From the two main options that already exist in Egypt, general taxation and social insurance, funding through taxa-tion is more progressive and was the route chosen in Cuba.
The second lesson is that the current fragmented financing and provision system creates more inefficiencies than a single, public integrated system, which of course is not without problems. Parallel subsystems are clearly micro-inefficient as they create perverse incentives, duplication of services and higher administration costs as well as
lower purchasing power of fund-holders. This is best exemplified by the 40% oc-cupancy rate in public hospitals, which are often located side-by-side with health insurance organization hospitals and private hospitals.
The third lesson is that if too much lee-way is left to the private sector, services will not be provided in an externally efficient or equitable way. Cuba went to the extreme of banning private medical practice, suc-cessfully. The political feasibility of such an extreme measure in Egypt is probably low. However, much stronger regulation of the private sector is urgently needed. An impressive amount of resources in this under-funded system is wasted for inap-propriate and expensive pharmaceuticals and for providing tertiary care of low cost–effectiveness, whereas the most basic, highly cost-effective interventions are not available to everyone. The emphasis on cost-effective, basic public health interven-tions in primary care has been very success-ful in Cuba. Prospective provider payments, both on an institutional and individual level, that provide incentives for efficient behaviour have to be implemented. Other measures, such as treatment guidelines, essential drug lists and quality assurance mechanisms, which are all in place in Cuba, should also be instituted.
The fourth lesson is that horizontal equity in financing and delivery is key to good health. Cuba made a particular effort to overcome financial and geographic barri-ers to accessing health care. This involves again the minimization of out-of-pocket payments, but also a process of active redistribution of funds and delivery to disadvantaged regions and groups.
Finally, health care cannot be seen in isolation. Equitable investment in other sectors, in particular education, housing, water and sanitation, and improved traffic

�ملجلة �لصحية لشرL �ملتوسط، منظمة �لصحة �لعاملية، �ملجلد �حلا�E عشر، �لعد��� ٥-٦، ٢٠٠٥
Eastern Mediterranean Health Journal, Vol. 11, Nos 5/6, 2005 1085
regulation are certainly equally important to improve population health in Egypt and
in other countries in the Eastern Mediter-ranean region.
References
1. Hertz E, Hebert JR, Landon J. Social and environmental factors and life expectan-cy, infant mortality, and maternal mortality rates: results of a cross-national compari-son. Social science and medicine, 1994, 39:105–14.
2. World Bank. World Development Report 1993: Investing in health. New York, Ox-ford University Press, 1993.
3. Halstead SB, Walsh JA, Warren KS. Good health at low cost. New York, The Rockefeller Foundation, 1985.
4. Perfil del sistema de servicios de salud de Cuba. [Profile of the health services system of Cuba.] Washington DC, Pan American Health Organization, 2001:1–21.
5. World Bank. World development indica-tors database. Washington DC, World Bank, 2002.
6. A survey of Egypt: new and old. The Economist, 1999, March 20th:S1–18.
7. Mesa-Lago C. Social welfare reform in the context of economic-political liber-alization: Latin American cases. World development, 1997, 25(4):497–517.
8. Eastern Mediterranean Region Country Profiles: Egypt. Cairo, World Health Organization/Eastern Mediterranean Regional Office, 2000. Available at: h t tp : / /www.emro.who. in t /emr in fo /CountryProfiles-egy.htm (accessed 11 September 2005).
9. Rannan-Eliya RP et al. Expenditures for reproductive health and family planning services in Egypt and Sri Lanka. Wa-shington DC, The POLICY Project, The Futures Group International Inc., 2000:1–84.
10. Health expenditures for Latin America and the Caribbean. Washington DC, Pan American Health Organization, 2002.
11. World Health Report 2000. Health sys-tems: improving performance. Geneva, World Health Organization, 2000.
12. Rannan-Eliya RP et al. Egypt national health accounts 1994/95. Cairo and Boston: Department of Planning, Ministry of Health and Population, Arab Republic of Egypt, and Data for Decision Making Project, Harvard School of Public Health, 1998.
13. Rafeh N. Private health insurance in Egypt. In: Schieber GJ, ed. Innovations in health care financing. Washington DC, (World Bank Discussion Paper No. 365), 1997:115–25.
14. Monthly economic digest Feb. 2000. Cairo, Arab Republic of Egypt, Ministry of Economy, 2000.
15. Health in the Americas: Cuba, Vol. II. Washington DC, Pan American Health Organization, 1998.
16. Profile of the health system of Cuba. Washington DC, Pan American Health Organization, 1999.
17. Le Grand J. Financing health care. In: Feachem Z, Hensher M, Rose L, eds. Im-plementing health sector reform in Central Asia. Washington DC, World Bank, 1998:75–85.
18. Cochrane AL, Saint-Leger AS, Moore F. Health service “input” and mortality “output” in developed countries. Journal of epidemiology and community health, 1978, 32:200–5.

�ملجلة �لصحية لشرL �ملتوسط، منظمة �لصحة �لعاملية، �ملجلد �حلا�E عشر، �لعد��� ٥-٦، ٢٠٠٥
1086 La Revue de Santé de la Méditerranée orientale, Vol. 11, No 5/6, 2005
19. The World Health Report 1999. Making a difference. Geneva, World Health Orga-nization, 1999.
20. HNP Stats. Washington DC, World Bank, 2002.
21. Sallam I. Health care in Egypt. Lancet, 1998, 352:1632.
22. World Health Report, 2002: Reducing risks, promoting healthy life. Geneva, World Health Organization, 2002.
23. Bourne PG. Asking the right questions: lessons from the Cuban healthcare system. Health Equity Network Lecture. London School of Economics and Politi-cal Science, 2003.
24. Palmer S, Torgerson DJ. Definitions of ef-ficiency. British medical journal, 1999;318:1136.
25. Project appraisal document for a pro-posed credit in the amount of SDR 66.8 million (US$90.0 million equivalent) to the Arab Republic of Egypt for a health sector reform program. Washington DC, World Bank, 1998.
26. Busse R. Health care systems in transi-tion: Germany. Copenhagen, European Observatory on Health Care Systems, 2000.
27. Berman P. Understanding the supply-side: a conceptual framework for descri-bing and analysing the provision of health care services with an application to Egypt. Boston, Harvard School of Public Health, 1999:1–34.
28. Saltman RB, Figueras J. European health care reform. Analysis of current strate-gies. Copenhagen, World Health Organi-zation Regional Office for Europe, 1997.
29. Rannan-Eliya RP, Blanco-Vidal C, Nan-dakumar AK. The distribution of health care resources in Egypt: Implications for equity. Boston, Harvard School of Public Health, 2000.
30. Department of Planning/Ministry of Health and Population/Arab Republic of Egypt and Data for Decision Making Project/Harvard School of Public Health. Health care utilization and expenditures in the Arab Republic of Egypt 1994–95. Cairo and Boston, Ministry of Health and Population, Arab Republic of Egypt, and Harvard School of Public Health, 1998.
31. Anuario Estadístico, 2001. [Statistical yearbook, 2001.] La Habana, Ministerio de la Salud Publica [Havana, Ministry of Public Health], 2001.
Eastern Mediterranean Health Journal, Vol. 11, Nos 5/6, 2005 1087
�ملجلة �لصحية لشرL �ملتوسط، منظمة �لصحة �لعاملية، �ملجلد �حلا�E عشر، �لعد��� ٥-٦، ٢٠٠٥
Review
Management of source and drinking-water quality in PakistanJ.A. Aziz1
1Faculty of Civil Engineering, Bahauddin Zakariya University, Multan, Pakistan (Correspondence to J.A. Aziz: [email protected]).Received: 19/10/03; accepted: 25/05/04
ABSTRACT Drinking-water quality in both urban and rural areas of Pakistan is not being managed properly. Results of various investigations provide evidence that most of the drinking-water supplies are faecally contaminated. At places groundwater quality is deteriorating due to the naturally occurring subsoil contaminants or to anthropogenic activities. The poor bacteriological quality of drinking-water has frequently resulted in high incidence of waterborne diseases while subsoil contaminants have caused other ailments to consumers. This paper presents a detailed review of drinking-water quality in the country and the consequent health impacts. It identifies various factors contributing to poor water quality and proposes key actions required to ensure safe drinking-water supplies to consumers.
Gestion de la source et de la qualité de l’eau de boisson au PakistanRÉSUMÉ La qualité de l’eau de boisson dans les zones urbaines et rurales au Pakistan n’est pas gérée correctement. Les résultats de diverses études fournissent des preuves d’une contamination fécale de la plupart des approvisionnements en eau de boisson. Dans certains endroits, la qualité de l'eau souterraine se détériore à cause des contaminants présents à l'état naturel dans le sous-sol ou d’activités anthropogènes. La mauvaise qualité bactériologique de l'eau de boisson entraîne fréquem-ment une forte incidence de maladies à transmission hydrique, les contaminants souterrains causant d’autres troubles aux consommateurs. Cet article présente une analyse détaillée de la qualité de l'eau de boisson dans le pays et des répercussions sur la santé. Il identifie différents facteurs qui contribuent à la mauvaise qualité de l'eau et propose des mesures essentielles pour garantir aux consommateurs un approvisionnement sûr en eau de boisson.
1088 La Revue de Santé de la Méditerranée orientale, Vol. 11, No 5/6, 2005
�ملجلة �لصحية لشرL �ملتوسط، منظمة �لصحة �لعاملية، �ملجلد �حلا�E عشر، �لعد��� ٥-٦، ٢٠٠٥
Introduction
Pakistan’s population has a current water supply coverage of 79% [1]. This inade-quate supply of water also poses health risks to the consumers because of its poor qua-lity. Faecally-contaminated water is a ma-jor contributor to waterborne diseases. With rapid urbanization, the chemical aspects of water quality have also become a cause of increasing concern as toxic chemicals in industrial effluents pose a high risk to hu-man health. Unfortunately, little attention is being paid to drinking-water quality issues and quantity remains the priority focus of water supply agencies. There is a lack of drinking-water quality monitoring and sur-veillance programmes in the country. Weak institutional arrangements, lack of well equipped laboratories and the absence of a legal framework for drinking-water quality issues have aggravated the situation. Above all public awareness of the issue of water quality is dismally low. This paper presents an overview of the prevailing situation re-garding source and drinking-water quality and its impact on human health, and deli-neates management strategies to ensure safe drinking-water supplies to consumers.
Water quality
In Pakistan, drinking-water supplies are generally obtained from surface water sources (such as rivers, canals or lakes) or the underground aquifers. The quality of surface water is deteriorating as a result of the disposal of untreated municipal and industrial wastewaters and saline drainage effluent from agricultural areas [2]. The river waters have very high suspended solids, particularly during high flow condi-tions. Many rivers have stretches which do not support aquatic life. The range of water quality characteristics in some of the major
rivers in Pakistan as reported by Aziz is pre-sented in Table 1 [2]. Table 2 summarizes the range of water quality characteristics of some important lakes in Pakistan, which are used as raw water sources for drinking sup-plies [3]. It is evident that these waters are faecally contaminated and require elaborate treatment for human consumption. Only a few major urban cities in Pakistan use surface water sources; these include Kara-chi, Hyderabad, Islamabad and Rawalpindi. In rural areas, where the groundwater is saline, irrigation canal water after treat-ment is supplied for domestic use. Unfor-tunately the surface water quality has not been monitored on a routine basis as a raw water source for domestic supplies and no reliable data are available in this respect. Furthermore, no detailed investigations on biological characteristics of waters inclu-ding algae and parasitic stages have ever been undertaken.
There is a reliance on groundwater as opposed to surface water sources for drin-king-water supplies in most areas of Pakis-tan [2]. Around 70% of drinking-water sup-plies come from aquifers [4]. This reliance at present is growing. However, groundwa-ters in Pakistan are being contaminated by raw sewage irrigation and land disposal of industrial effluents, and through the use of deep soakage pits and heavy application of fertilizers and pesticides. The intrusion of saline water into the fresh water zone as a result of over-pumping has also caused the deterioration of groundwater quality. The quality of groundwater ranges from fresh near the major rivers to highly saline farther away. The general distribution of fresh and saline groundwater in the country is well known and mapped. Cholistan area, Makran coastal zone, Thar, Nara and Kohistan are reported to contain highly brackish ground-water [2].
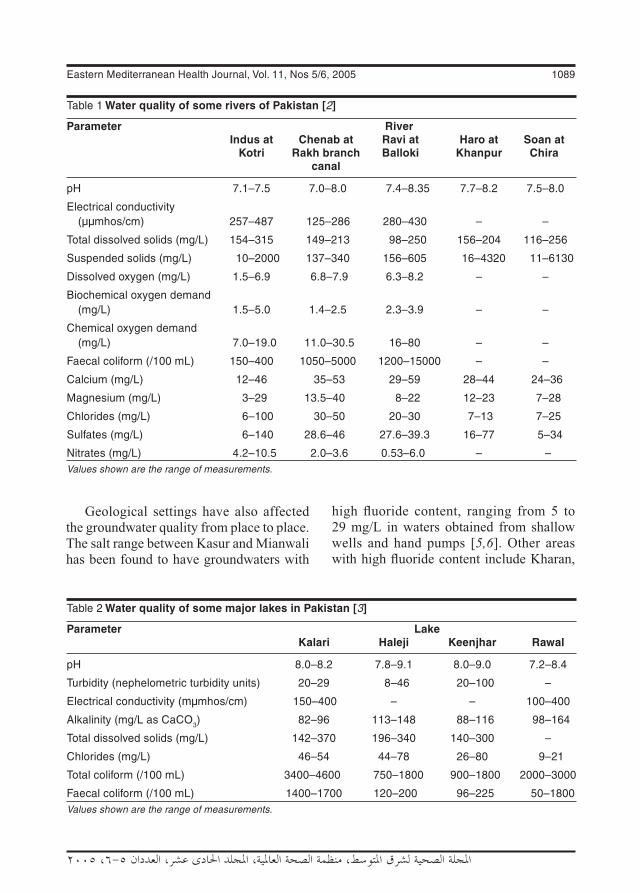
Eastern Mediterranean Health Journal, Vol. 11, Nos 5/6, 2005 1089
�ملجلة �لصحية لشرL �ملتوسط، منظمة �لصحة �لعاملية، �ملجلد �حلا�E عشر، �لعد��� ٥-٦، ٢٠٠٥
Table 1 Water quality of some rivers of Pakistan [2]
Parameter River Indus at Chenab at Ravi at Haro at Soan at Kotri Rakh branch Balloki Khanpur Chira canal
pH 7.1–7.5 7.0–8.0 7.4–8.35 7.7–8.2 7.5–8.0
Electrical conductivity (µμmhos/cm) 257–487 125–286 280–430 – –
Total dissolved solids (mg/L) 154–315 149–213 98–250 156–204 116–256
Suspended solids (mg/L) 10–2000 137–340 156–605 16–4320 11–6130
Dissolved oxygen (mg/L) 1.5–6.9 6.8–7.9 6.3–8.2 – –
Biochemical oxygen demand (mg/L) 1.5–5.0 1.4–2.5 2.3–3.9 – –
Chemical oxygen demand (mg/L) 7.0–19.0 11.0–30.5 16–80 – –
Faecal coliform (/100 mL) 150–400 1050–5000 1200–15000 – –
Calcium (mg/L) 12–46 35–53 29–59 28–44 24–36
Magnesium (mg/L) 3–29 13.5–40 8–22 12–23 7–28
Chlorides (mg/L) 6–100 30–50 20–30 7–13 7–25
Sulfates (mg/L) 6–140 28.6–46 27.6–39.3 16–77 5–34
Nitrates (mg/L) 4.2–10.5 2.0–3.6 0.53–6.0 – –Values shown are the range of measurements.
Table 2 Water quality of some major lakes in Pakistan [3]
Parameter Lake Kalari Haleji Keenjhar Rawal
pH 8.0–8.2 7.8–9.1 8.0–9.0 7.2–8.4
Turbidity (nephelometric turbidity units) 20–29 8–46 20–100 –
Electrical conductivity (mμmhos/cm) 150–400 – – 100–400
Alkalinity (mg/L as CaCO3) 82–96 113–148 88–116 98–164
Total dissolved solids (mg/L) 142–370 196–340 140–300 –
Chlorides (mg/L) 46–54 44–78 26–80 9–21
Total coliform (/100 mL) 3400–4600 750–1800 900–1800 2000–3000
Faecal coliform (/100 mL) 1400–1700 120–200 96–225 50–1800Values shown are the range of measurements.
Geological settings have also affected the groundwater quality from place to place. The salt range between Kasur and Mianwali has been found to have groundwaters with
high fluoride content, ranging from 5 to 29 mg/L in waters obtained from shallow wells and hand pumps [5,6]. Other areas with high fluoride content include Kharan,

1090 La Revue de Santé de la Méditerranée orientale, Vol. 11, No 5/6, 2005
�ملجلة �لصحية لشرL �ملتوسط، منظمة �لصحة �لعاملية، �ملجلد �حلا�E عشر، �لعد��� ٥-٦، ٢٠٠٥
Makran Coast, Mastung Valley, Umar Kot and Tharparkar (AA Khan, unpublished data, 1999). Sampling of groundwater in Jhelum, Gujrat and Sargodha districts by the United Nations Children’s Fund has shown concentrations of arsenic in some samples above the World Health Organiza-tion (WHO) guideline value of 10 μ/L (B.A. Chandio, A. Majeed, R. Aftab, unpublished report, 1995). A recent survey conducted by the Pakistan Council of Research for Water Resources (PCRWR) has also indicated arsenic concentrations in some groundwater samples obtained from Baha-walpur, Multan, Lahore and Shekhupura are above the WHO guideline value (M.A. Kahlown, unpublished data, 2002). Heavy use of fertilizers has raised nitrate levels in groundwater at various places including Is-lamabad, Gujar Khan, Faisalabad and many areas in southern Punjab [6]. Groundwaters in Karachi, Faisalabad and Raiwind have been found to contain pesticide residues [7]. In the city of Kasur, disposal of tan-nery effluent on the land has caused high total dissolved solids, chromium and sulfide content in groundwater [6].
Groundwater quality data for some cities in Pakistan as reported through vari-ous investigations are presented in Table 3 [6,8, M.A. Kahlown, unpublished data, 2002]. It is evident that a vast concentra-tion range of various quality parameters occurs in groundwaters at different places and WHO guidelines are often exceeded. More recently, detailed investigation on sub-soil water has been undertaken in 14 main districts of the Punjab province [9]. In this study, 280 samples of water were collected from existing wells, tube wells, hand pumps and motor pumps. Depth of water for the samples taken varied from 10 to 150 metres. Bacteriological quality of sub-soil water was found to be very poor as 180 samples were contaminated with co-
liform bacteria. Table 4 presents details of the limits exceeded for various parameters detected in different samples.
Invariably groundwaters are supplied for human consumption without any treat-ment at all or after disinfection only. From the reported results it is evident that the contamination of groundwater sources, if not controlled, may cause substantial damage or irreversible deterioration of the groundwater quality in future.
Drinking-water quality is largely influ-enced by the source water quality, the extent and efficacy of the treatment rendered and the integrity of the distribution system. In many areas where the groundwater is saline and a surface water source is not available, people have no choice but to use such waters for drinking purposes. Poor microbial qua-lity of drinking-water is the most pressing issue. No urban water supply meets WHO drinking-water quality guidelines [10]. The major reasons for this are the intermittent supply through leaking pipes and cross-connections with nearby sewer lines. In ru-ral areas, where surface waters are supplied after slow sand filtration, arrangements for chlorination at many installations do not exist. In addition pre-treatment facilities such as roughing filters have not been provided. This inadequacy often results in shorter filter runs and poor quality of treated water. Hand pumps and wells in rural areas are invariably not protected from contami-nation resulting from surface drainage and flooding. In rural areas there is no system in place to assess the quality of water. The institutions responsible for water quality monitoring maintain that there is not much point in monitoring the quality of water where alternative sources of supply do not exist. Estimates suggest that 90% of the country’s population is exposed to unsafe drinking-water [11].
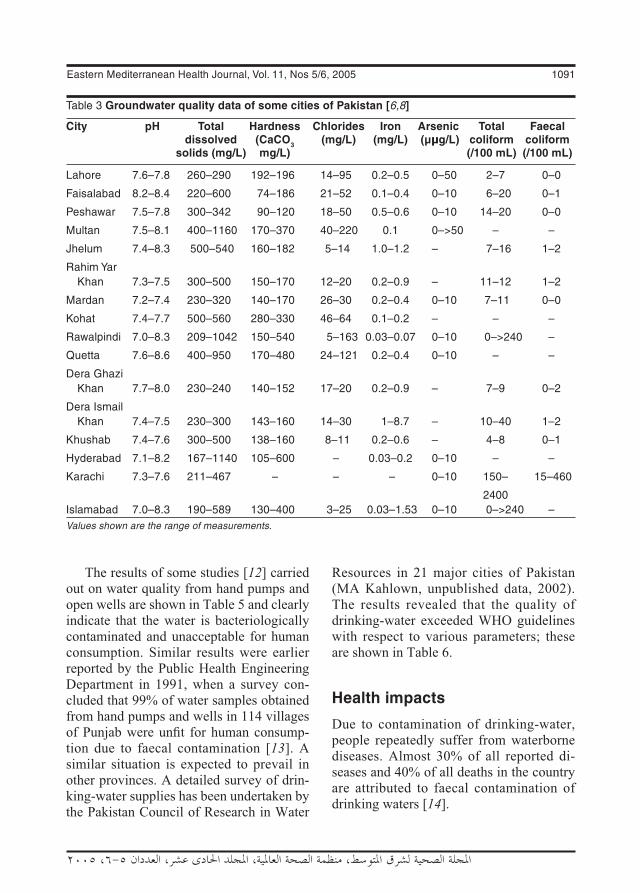
Eastern Mediterranean Health Journal, Vol. 11, Nos 5/6, 2005 1091
�ملجلة �لصحية لشرL �ملتوسط، منظمة �لصحة �لعاملية، �ملجلد �حلا�E عشر، �لعد��� ٥-٦، ٢٠٠٥
The results of some studies [12] carried out on water quality from hand pumps and open wells are shown in Table 5 and clearly indicate that the water is bacteriologically contaminated and unacceptable for human consumption. Similar results were earlier reported by the Public Health Engineering Department in 1991, when a survey con-cluded that 99% of water samples obtained from hand pumps and wells in 114 villages of Punjab were unfit for human consump-tion due to faecal contamination [13]. A similar situation is expected to prevail in other provinces. A detailed survey of drin-king-water supplies has been undertaken by the Pakistan Council of Research in Water
Resources in 21 major cities of Pakistan (MA Kahlown, unpublished data, 2002). The results revealed that the quality of drinking-water exceeded WHO guidelines with respect to various parameters; these are shown in Table 6.
Health impacts
Due to contamination of drinking-water, people repeatedly suffer from waterborne diseases. Almost 30% of all reported di-seases and 40% of all deaths in the country are attributed to faecal contamination of drinking waters [14].
Table 3 Groundwater quality data of some cities of Pakistan [6,8]
City pH Total Hardness Chlorides Iron Arsenic Total Faecal dissolved (CaCO3 (mg/L) (mg/L) (µμg/L) coliform coliform solids (mg/L) mg/L) (/100 mL) (/100 mL)
Lahore 7.6–7.8 260–290 192–196 14–95 0.2–0.5 0–50 2–7 0–0
Faisalabad 8.2–8.4 220–600 74–186 21–52 0.1–0.4 0–10 6–20 0–1
Peshawar 7.5–7.8 300–342 90–120 18–50 0.5–0.6 0–10 14–20 0–0
Multan 7.5–8.1 400–1160 170–370 40–220 0.1 0–>50 – –
Jhelum 7.4–8.3 500–540 160–182 5–14 1.0–1.2 – 7–16 1–2
Rahim Yar Khan 7.3–7.5 300–500 150–170 12–20 0.2–0.9 – 11–12 1–2
Mardan 7.2–7.4 230–320 140–170 26–30 0.2–0.4 0–10 7–11 0–0
Kohat 7.4–7.7 500–560 280–330 46–64 0.1–0.2 – – –
Rawalpindi 7.0–8.3 209–1042 150–540 5–163 0.03–0.07 0–10 0–>240 –
Quetta 7.6–8.6 400–950 170–480 24–121 0.2–0.4 0–10 – –
Dera Ghazi Khan 7.7–8.0 230–240 140–152 17–20 0.2–0.9 – 7–9 0–2
Dera Ismail Khan 7.4–7.5 230–300 143–160 14–30 1–8.7 – 10–40 1–2
Khushab 7.4–7.6 300–500 138–160 8–11 0.2–0.6 – 4–8 0–1
Hyderabad 7.1–8.2 167–1140 105–600 – 0.03–0.2 0–10 – –
Karachi 7.3–7.6 211–467 – – – 0–10 150– 15–460
2400Islamabad 7.0–8.3 190–589 130–400 3–25 0.03–1.53 0–10 0–>240 –Values shown are the range of measurements.

1092 La Revue de Santé de la Méditerranée orientale, Vol. 11, No 5/6, 2005
�ملجلة �لصحية لشرL �ملتوسط، منظمة �لصحة �لعاملية، �ملجلد �حلا�E عشر، �لعد��� ٥-٦، ٢٠٠٥
Cases of cholera, typhoid, hepatitis and dysentery are consistently reported in urban and rural areas. However, such cases are hard to quantify because of under-repor-ting of disease and the fact that no regular records are maintained in health clinics
and hospitals regarding illness due to poor water quality. In Punjab, diarrhoea ranks second amongst 15 priority infectious diseases in children under 5 years of age, clearly indicating the faecal contamination of drinking-water supplies [15]. In Islam-
Table 4 Analysis of 280 Punjab groundwater samples [9]
Parameter WHO Maximum Minimum Mean No. guidelines exceeding WHO guidelines
pH – 8.86 6.51 7.6 –
Turbidity (nephelometric turbidity units) 5 100 0 2.6 25
Total dissolved solids (mg/L) 1000 4530 140 817 59
Hardness (as CaCO3) (mg/L) – 1900 42 282 –
Chlorides (mg/L) 250 1740 10 148 45
Sulfates (mg/L) 250 1500 19 202 60
Total iron (mg/L) 0.3 1.15 0.01 0.07 9
Nitrates (mg/L) 50 30.12 0.01 4.8 0
Fluorides (mg/L) 1.5 11.60 0.02 0.7 28
Total coliform bacteria (/100 mL) 0 –a –a –a 180aNot reported.WHO = World Health Organization.
Table 5 Water quality from hand pumps and open wells in Punjab [12]
Cluster No. Ground- Public hand pumps Private hand pumps Open wells water Coliform E. coli Coliform E. coli Coliform E. coli level (m) (/100 mL) (/100 mL) (/100 mL) (/100 mL) (/100 mL) (/100 mL)
1 20 – – 9–800 0–0 600–5000 80–2000
2 10 10–240 1–10 14–72 0–0 200–4100 82–1500
3 3 81–690 9–10 125–1400 4–300 570–2000 40–4000
4 3 2–180 9–10 48–125 6–10 290–600 30–80
5 5 31–109 0–20 21–100 6–10 54–150 3–6
6 10 13–51 6–20 9–225 0–10 29–300 1–20
7 10 0–14 0–3 0–12000 0–150 23100–31200 30–8000
8 7 10–700 0–10 0–70 0–0 2000–2100 20–100
9 5 0–4000 0–200 0–9000 0–2000 450 200
10 7 0–200 0–10 0–4000 0–166 400 1700Values shown are the range of measurements.

Eastern Mediterranean Health Journal, Vol. 11, Nos 5/6, 2005 1093
�ملجلة �لصحية لشرL �ملتوسط، منظمة �لصحة �لعاملية، �ملجلد �حلا�E عشر، �لعد��� ٥-٦، ٢٠٠٥
Tabl
e 6
Sta
tist
ical
an
alys
is o
f d
rin
kin
g-w
ater
qu
alit
y in
urb
an c
entr
es
Cit
y N
o. o
f
Sam
ple
s ex
ceed
ing
Wo
rld
Hea
lth
Org
aniz
atio
n g
uid
elin
e va
lues
(%
)
sa
mp
les
Co
l-
Od
- Ta
ste
Turb
i-
Ars
e-
Ch
lo-
Har
d-
Flu
o-
Iro
n
Mag
ne-
N
itra
- P
ota
s-
So
d-
Su
lf-
TD
S
MA
co
llect
ed
ou
r o
ur
d
ity
nic
ri
des
n
ess
rid
es
si
um
te
s si
um
iu
m
ate
Isla
m-
ab
ad
27
– –
– 4
– –
– –
4 –
– –
– –
– 74
Bah
awa-
lp
ur
25
16
– 4
16
60
4 12
4
60
– –
4 8
12
16
96
Fais
al-
ab
ad
14
– –
29
– –
36
21
– –
– –
36
43
36
43
79
Guj
ran-
w
ala
14
– –
14
7 –
– –
7 –
– –
7 7
– 7
29
Guj
rat
9 –
– –
33
30
– –
– –
– –
11
11
11
11
100
Kas
ur
10
– 21
10
–
31
– –
30
– –
– 20
30
20
30
40
Laho
re
16
– –
– –
– –
– –
6 –
– –
– –
– 12
Mul
tan
16
– –
– 6
75
– –
– 31
–
– –
– –
– 87
Raw
al-
pi
ndi
15
13
–
20
– –
7 –
7 –
– –
– –
7 87
She
khu-
pu
ra
11
–
– –
45
– 9
– –
– –
– 27
9
18
55
Sia
lkot
10
10
10
–
– –
10
– –
– –
– –
10
10
10
40
Hyd
er-
ab
ad
16
25
25
25
69
6 6
6 –
56
6
6 6
6 6
75
Kar
achi
28
–
– –
11
– 4
4 7
21
4 4
– 7
– 4
61
Suk
kur
12
8 –
– 58
–
– –
– 75
–
– –
25
– 25
84
Khu
zdar
8
– –
– 12
–
– –
– –
– –
– –
– –
100

1094 La Revue de Santé de la Méditerranée orientale, Vol. 11, No 5/6, 2005
�ملجلة �لصحية لشرL �ملتوسط، منظمة �لصحة �لعاملية، �ملجلد �حلا�E عشر، �لعد��� ٥-٦، ٢٠٠٥
abad and Rawalpindi, the 1993 epidemic of hepatitis, resulting in 4000 cases, was linked to pollution of the raw water source and inadequate water treatment [16]. Some cases of methaemoglobinaemia in southern Punjab have been reported [17]. Dental fluorosis is quite evident in Kasur, Pattoki and Raiwind [18]. In Manga Mandi, near Lahore, limb deformities in more than 100 patients have been attributed to high fluoride groundwater, although this link is not confirmed [18]. In Kasur, contamina-tion of groundwater with tannery effluent has caused diseases such as skin irritation, nausea and abdominal disorders (UNIDO, unpublished data, 1999).
Management strategies
To ensure the safety of drinking-water supplies, a management strategy should be based on multibarriers of protection from source to the point of use [19]. These barriers include: source protection, water treatment, distribution system integrity, monitoring/surveillance and public infor-mation. Effective programmes for drink-ing-water quality management would require adequate legislation, institutional strengthening and coordination, provision of analytical laboratories and data-handling facilities. All these issues are discussed in this section to formulate an effective ma-nagement strategy.
LegalIn the first instance there is lack of adequate legislation covering drinking-water sup-plies in Pakistan. Legislation should make provisions for the establishment of drink-ing-water quality standards/guidelines as well as regulations for the development of drinking-water sources and the produc-tion, maintenance and distribution of safe
Tabl
e 6
Sta
tist
ical
an
alys
is o
f d
rin
kin
g-w
ater
qu
alit
y in
urb
an c
entr
es (
conc
lude
d)
Cit
y N
o. o
f
Sam
ple
s ex
ceed
ing
Wo
rld
Hea
lth
Org
aniz
atio
n g
uid
elin
e va
lues
(%
)
sa
mp
les
Co
l-
Od
- Ta
ste
Turb
i-
Ars
e-
Ch
lo-
Har
d-
Flu
o-
Iro
n
Mag
ne-
N
itra
- P
ota
s-
So
d-
Su
lf-
TD
S
MA
colle
cted
o
ur
ou
r
dit
y n
ic
rid
es
nes
s ri
des
siu
m
tes
siu
m
ium
at
e
Lora
lai
11
9 –
– 18
–
– 9
55
36
– –
– –
– 10
10
0
Que
tta
38
5 –
3 16
–
3 13
42
8
3 –
– 5
8 13
50
Zia
rat
8 12
–
– 25
–
– 12
12
–
– –
– –
– –
100
Man
gora
10
–
– –
– –
– –
– –
– –
– –
– –
60
Mar
dan
12
– –
– 8
– –
8 –
– –
– –
– –
– 84
Pes
ha-
w
ar
13
– –
– 8
– –
8 –
– –
– –
– –
8 69
TD
S =
tota
l dis
solv
ed s
olid
s; M
A =
mic
robi
olog
ical
age
nts.

Eastern Mediterranean Health Journal, Vol. 11, Nos 5/6, 2005 1095
�ملجلة �لصحية لشرL �ملتوسط، منظمة �لصحة �لعاملية، �ملجلد �حلا�E عشر، �لعد��� ٥-٦، ٢٠٠٥
drinking-water. The water supply agencies should be authorized to initiate legal action to protect their water sources and distribu-tion system from sources of pollution. There is also a need to establish a groundwater regulatory framework to avoid intrusion of saline water into the fresh groundwater zone. A legal ban also needs to be placed on the disposal of wastewaters on land. All these issues could be addressed by introduc-ing new relevant clauses in the 1997 Envi-ronmental Protection Act [20].
GovernancePresently, no agency is involved in routine monitoring of drinking-water quality. To ensure safe water supply, the concerned agencies need to design and initiate water-quality monitoring programmes. In urban centres, sampling could be done twice a year for chemical analysis before and af-ter the monsoon. Bacteriological analysis could be done on the basis of the popula-tion as proposed in the WHO guidelines [10]. In urban areas monitoring of shallow groundwater should be given priority as it is extensively used for private supplies.
For rural areas, bacteriological quality could be monitored on a needs basis. How-ever, sanitary inspection of their schemes, e.g. wells, hand pumps, stand posts, etc., should be done according to the frequency proposed in the WHO guidelines. To sup-port water source option consideration in water scheme planning and to assess the impact of fertilizer and pesticide use, there is a need to initiate survey and mapping of rural groundwater quality. This could be done by the public health engineering departments, local government and rural development departments, or their succes-sors in the devolution plan.
Presently, no surveillance of drinking-water quality is undertaken by any agency. For effective management purposes, there
is a need for a comprehensive surveillance programme. The responsibility of surveil-lance could be entrusted to the provincial environmental protection agencies (EPAs). EPAs should also check the illegal practice of disposal of industrial effluent on land. Strict compliance with the National Envi-ronmental Quality Standards is also needed under the 1997 Act to protect water bodies from pollution [21].
InstitutionalFor effective water quality management, there is a need to strengthen the capacity of the administration at the district and tehsil (sub-district) levels. Technical assistance will be needed at the tehsil level for col-lection of samples for transport to district laboratories, use of field test kits and ini-tiation of sanitary inspections. District level administration would require strengthening to start water quality monitoring projects and upgrade water supply systems. Analyti-cal laboratories present at the district level would have to be upgraded in terms of staff and equipment to undertake water quality testing. Technical assistance would also be needed for installing roughing filters and chlorination equipment at treatment plants. Water supply providers (public health en-gineering departments, water and sanitation agencies, development authorities, munici-pal committees, local government, rural de-velopment authorities, cantonment boards, etc) in urban areas would require funding to shift from an intermittent system to a sys-tem of continuous supply and for effective maintenance of the distribution network.
Presently various institutions involved in collecting water quality data do not col-laborate and share data with each other. This practice needs to be changed by enhancing the data generation capacity and sharing trends of related institutions. For easy access to the water quality data required

1096 La Revue de Santé de la Méditerranée orientale, Vol. 11, No 5/6, 2005
�ملجلة �لصحية لشرL �ملتوسط، منظمة �لصحة �لعاملية، �ملجلد �حلا�E عشر، �لعد��� ٥-٦، ٢٠٠٥
to formulate strategies and monitoring pro-grammes, it is recommended that a national database on water quality be established at the Pakistan Environmental Protection Agency (PEPA) in Islamabad. Data rela-ting to drinking-water quality should be retained at the district level so that water quality problems can be dealt with and also forwarded to the PEPA database.
There is need to develop and provide for special treatment facilities for waters with high fluoride, nitrate or arsenic content. Research institutions could therefore be funded to undertake research to devise low-cost water treatment technologies.
GeneralThere is need to launch public awareness campaigns to educate people about the importance of safe drinking-water sup-plies. Nongovernmental organizations can play a pivotal role in this aspect. Building awareness should also be carried out at the primary education level. Rural communi-ties should be advised to adopt suitable measures for protecting stored water from possible contamination inside the house and about simple techniques for disinfection of the drinking water.
Conclusions
It is clear that both urban and rural drin-king-water supplies in Pakistan are largely contaminated and pose serious health risks to the consumers. To ensure safe water sup-
plies for drinking, there is need to formulate an effective management strategy. The key actions for such a strategy should comprise of the following strategies.• Establish drinking-water quality stan-
dards.• Establish a groundwater regulatory
framework.• Ban land disposal of wastewaters.• Strictly enforce national environmental
quality standards.• Initiate mapping of the rural groundwa-
ter quality.• Define the type of monitoring for urban
and rural drinking-water quality.• Set up district-level drinking-water
quality monitoring projects.• Assign surveillance responsibilities to
EPAs.• Conduct sanitary inspection of rural wa-
ter sources.• Strengthen district and tehsil adminis-
tration for drinking-water quality moni-toring.
• Upgrade analytical laboratories in terms of staff and equipment.
• Establish a national database on water quality at PEPA.
• Assist research institutions to develop appropriate water treatment technolo-gies.
• Raise public awareness at all levels about the issues of drinking-water qua-lity.
References
1. Pakistan integrated household survey (PIHS). Islamabad, Federal bureau of statistics, Government of Pakistan, 2000.
2. Chilton PJ et al. Pakistan water qua-lity mapping and management project.
Scoping study – draft final report. Lough-borough, UK, Water, Engineering and Development Centre, Loughborough University & London School of Hygiene

Eastern Mediterranean Health Journal, Vol. 11, Nos 5/6, 2005 1097
�ملجلة �لصحية لشرL �ملتوسط، منظمة �لصحة �لعاملية، �ملجلد �حلا�E عشر، �لعد��� ٥-٦، ٢٠٠٥
& Tropical Medicine, 2001 (WELL Task 568).
3. Ahmad K. Water quality of potential sources in Pakistan. Journal of science technology and development, 1994, 12:36–43.
4. Tahir MA et al. Drinking water quality monitoring in the rural areas of Rawal-pindi. In: Proceedings of the national workshop on quality of drinking water. Islamabad, Pakistan Council of Research in Water Resources, 1998:35–9.
5. Tariq MN et al. Survey of fluorides and their removal. Journal of the Pakistan So-ciety of Public Health Engineers, 1981, 7:73–84.
6. Aziz JA. Drinking water quality in Punjab. In: Proceedings of the 68th annual ses-sion of the Pakistan Engineering Con-gress. Lahore, Pakistan Engineering Congress, 2001:241–9 (Paper No. 616).
7. Afzal S et al. Nitrate, faecal coliform and pesticides in shallow groundwater of La-hore, Pakistan. In: Environmental protec-tion and research conservation, vol. XXV. Lahore, Pakistan Engineering Congress, 1998:14–22.
8. Hashmi SK, Shahab S. The need for water quality guidelines for Pakistan. In: Proceedings of the National Workshop on Water Sources: achievements and issues in the 20th century and challenges for the next millennium. Islamabad, Pakistan Council of Research in Water Resources, 1999:317–25.
9. Sub-soil water quality monitoring in the districts of Punjab. Lahore, Environment Protection Department, 2003 (Report 203).
10. Guidelines for drinking-water quality, 2nd ed. Geneva, World Health Organization, 1995
11. Shuja S, Jaffar M. Drinking water quality guideline values, chemical and physical
aspects. In: Proceedings of the national workshop on quality of drinking water, Islamabad, 7 March 1998. Islamabad, Pakistan Council of Research in Water Resources & Chemical Society of Pakis-tan, 1998:25–8.
12. Ali W, Ahmad K. Pakistan country report. Paper presented at the WHO training course/workshop on GEMS/WATER qua-lity monitoring. Amman, Jordan, 1994.
13. Monitoring of water quality from commu-nity handpumps and wells in sweetwater areas of Punjab, Pakistan. Lahore, Public Health Engineering department, Central Research Laboratories, 1991.
14. Draft South Asia–water vision 2025, Country Report, Pakistan. Maharashtra, India, Global Water Partnership, South Asia Technical Advisory Committee Re-gional Office, 2000.
15. Health management information system. Lahore, Punjab, Department of Health, 1997.
16. Dil AS. 100 communicable diseases as-sociated with water. In: Hanif J, Hanif MI. Environmental pollution. Islamabad, Scientific Information Division, Pakistan Institute of Nuclear Science & Techno-logy, 1997.
17. Bashir MT. Investigations of nitrate contents in drinking-water sources of southern Punjab [MSc thesis]. Lahore, Institute of Environmental Engineering and Research, University Of Engine-ering & Technology Lahore, 1998
18. Aziz JA. National water quality strategy. Islamabad, Ministry of Water and Power, 2002 (Report submitted to the Asian Development Bank as part of water re-sources strategy study) (ADB, TA 3130 PAK).
19. Understanding the safe drinking-water act. Washington DC, United States Environmental Protection Agency,
1098 La Revue de Santé de la Méditerranée orientale, Vol. 11, No 5/6, 2005
�ملجلة �لصحية لشرL �ملتوسط، منظمة �لصحة �لعاملية، �ملجلد �حلا�E عشر، �لعد��� ٥-٦، ٢٠٠٥
1999. Available at: http://www.epa.gov/ogwdw000/sdwa/30th/factsheets/under-stand.html (accessed: 19/05/05).
20. Pakistan environmental protection acts. Islamabad, The Gazette of Pakistan, Ministry of Law and Parliamentary Affairs, Government of Pakistan, 1997.
21. National environmental quality standards. Islamabad, Pakistan Environmental Pro-tection Agency, Government of Pakistan, 1996.
Second meeting for the WHO technical committee for the prepara-tion of the guidance document on desalination for safe water sup-plyThe World Health Organization (WHO) organized the above-mentioned meeting in Kuwait from 12 to 14 November 2005. The objectives of the meeting were: to review content and completeness of draft background and analysis documents that have been prepared by each technical group; to share information between groups to ensure that each document contains the essential information and interrelates with the other group documents; to prepare revised and expanded drafts of each group’s documents; to recommend specific points and principles to be included in the WHO guidance; to work on editorial and format requirements; and to agree on the plan of work and schedule to complete any remaining needs for the draft guidance after the meeting. Experts from Australia, Canada, Cyprus, Denmark, Egypt, Germany, Japan, Kuwait, United Arab Emirates, UK, and USA, UNEP/ROWA, ROPME, as well as WHO concerned staff and members of the Steering Committee of the Initiative on Desalination Guidelines from Spain and the Cayman Islands attended the meeting.
Eastern Mediterranean Health Journal, Vol. 11, Nos 5/6, 2005 1099
�ملجلة �لصحية لشرL �ملتوسط، منظمة �لصحة �لعاملية، �ملجلد �حلا�E عشر، �لعد��� ٥-٦، ٢٠٠٥
Review
Burn and scald injuriesH.A-L. Mousa1
1College of Medicine, University of Basra, Basra, Iraq (Correspondence to H.A-L. Mousa: haideramousa@ hotmail.com).Received: 23/09/02; accepted: 01/06/04
SUMMARY Burns are one of the most harmful physical and psychological traumas. Infection is the ma-jor cause of morbidity and mortality in burns. Infections acquired from hospital or from the patient’s own endogenous flora have a significant prevalence after burns. Pseudomonas aeruginosa and Staphylo-coccus aureus are the most frequent colonizing agents whereas group A beta-haemolytic streptococci are the most virulent bacteria. Anaerobic bacteria and fungi are also prevalent. Viral infection is less frequent. Aggressive resuscitation, nutritional support, thorough surgical excision of infected wounds, early wound closure, grafting and the development of effective topical and systemic chemotherapy have largely improved morbidity and mortality rates of burn patients.
Brûlures par liquide bouillant et autresRÉSUMÉ Les brûlures constituent l’un des traumatismes physiques et psychologiques les plus dom-mageables. L’infection est la cause majeure de morbidité et de mortalité chez les brûlés. Les infec-tions contractées à l’hôpital ou provenant de la flore endogène du patient après des brûlures ont une prévalence non négligeable. Pseudomonas aeruginosa et Staphylococcus aureus sont les agents colonisants les plus fréquents, les streptocoques bêta-hémolytiques du groupe A étant les bactéries les plus virulentes. Les bactéries anaérobies et les champignons sont également courants. L’infection virale est moins fréquente. La réanimation agressive, la prise en charge nutritionnelle, l’excision chirur-gicale complète des plaies infectées, la fermeture rapide des plaies, les greffes et la mise au point d’une chimiothérapie locale et systémique efficace ont permis d’améliorer grandement le taux de morbidité et de mortalité chez les patients brûlés.
1100 La Revue de Santé de la Méditerranée orientale, Vol. 11, No 5/6, 2005
�ملجلة �لصحية لشرL �ملتوسط، منظمة �لصحة �لعاملية، �ملجلد �حلا�E عشر، �لعد��� ٥-٦، ٢٠٠٥
Introduction
The skin is the largest organ of the body. It functions as the first line of defence protec-ting against the invasion of foreign bodies and organisms. It has specific immune and metabolic functions and is important in regulating body temperature, fluid and electrolytes. Loss of the functional skin barrier after thermal injury results in in-creased susceptibility to infection, which is the major cause of morbidity and mortality following burns. In addition, factors such as extent and depth of injury, patient age, associated conditions and the presence of inhalation injury can adversely affect clini-cal outcomes [1].
Burns are one of the most harmful and complex physical injuries [2]. They often happen unexpectedly and have the potential to cause death, lifelong disfigurement and dysfunction [3]. It is also commonly as-sumed that hospitalized patients for burn treatment will experience some level of depression. It has been found that 1 month after hospital discharge, 54% of patients showed symptoms of moderate to severe depression and 2 years after discharge, 43% of patients still reported moderate to severe depression. Women had higher depression scores than men in both cases [4].
It is important to ascertain the cause of the burn because this may be helpful in determining burn depth. Scalds are the most common cause of thermal injury in children. They commonly occur in the kitchen or bathroom, are usually due to brief contact with hot water, and are usually partial-thickness in nature. Tar, grease, or contact burns typically result in deep-partial or full-thickness injury owing to their higher temperature and longer cutaneous exposure. Flame burns may be of variable depth de-pending on the patient’s clothing and level of consciousness at the time of injury, and
are often associated with smoke inhalation injury. Electrical burns may be associ-ated with cardiac arrhythmias, neurological damage and significant long and short-term morbidity. Burns caused by household cur-rent rarely involve tissues beneath the skin; high voltage (> 1000 volts) exposure may, however, cause damage to deeper tissues such as muscle, nerves, blood vessels and bone despite the absence of a major cutane-ous injury. Limb loss is not an infrequent consequence of this type of injury [1].
Bacterial colonization and invasive bacterial infection are still major problems in the treatment of burn victims. The standard procedures for bacterial monito-ring of the burn are swab-culture, which is non-invasive but only detects bacteria at the very surface; biopsy-culture, which gives a more complete view but has the disadvantage of being invasive; and a new technique of dermabrasion of the upper la-yers of the wound, which is performed using a small rotating carbon-steel disc of defined roughness [5]. This procedure is superior to the swab culture in identifying different bacterial species. It can be compared with the biopsy technique, but has the advantage of being less invasive. Nevertheless, several investigators have found that the ratios of various species of organisms from the surface burn wounds were roughly pro-portional to those from blood specimens or from biopsy cultures [6,7]. Because of this, in most centres surface microbial growth is routinely monitored, enabling evaluation of the effect of therapy and prediction of those microbial strains that may become involved in sepsis.
The development of effective topical chemotherapy, prompt burn wound exci-sion, timely closure of burn wounds and the use of biological dressings have signifi-cantly decreased the incidence of invasive burn wound infection and have contributed
Eastern Mediterranean Health Journal, Vol. 11, Nos 5/6, 2005 1101
�ملجلة �لصحية لشرL �ملتوسط، منظمة �لصحة �لعاملية، �ملجلد �حلا�E عشر، �لعد��� ٥-٦، ٢٠٠٥
to the improvement in survival that has oc-curred over the past 4 decades [8,9]. This review discusses the recent advances in burn wound care.
Resources
The Medline database, Biomedical Refe-rence Collection: Comprehensive, and the Index Medicus for the World Health Orga-nization, Eastern Mediterranean Region were searched through 2002 using the keywords “burn, burn wound infection, burn injuries”. The type of search used was “standard and all words” and was limited to human studies. Some other related refe-rences were manually searched.
Pathophysiology
Tissue loss following thermal injury is a consequence of coagulation necrosis. The depth of injury is related to heat of exposure and tissue conductance. The classic patho-logic description considers the burn wound as having 3 concentric zones [10]. The zone of coagulation represents the area of most intense thermal injury. It is surrounded by a zone of stasis, or ischaemia, which may or may not survive. The outer layer, or zone of hyperaemia, is the least injured area and may confuse the inexperienced caregiver into thinking that cellulitis is present. This hyperaemia typically resolves within 7 to 10 days post-injury.
The injury process remains dynamic during the 24 to 48 hours after the bur-ning process has been arrested. Capillary occlusion can progress during this time and supports the clinical impression that skin necrosis progresses during the first 48 hours post-burn. This phenomenon is not considered a continuation of the burning process but a pathophysiological event that
may be the consequence of tissue oedema, dermal ischaemia or desiccation. This oc-currence is clinically very important. If the zone of coagulation is above the level of the dermal appendages, spontaneous healing is expected; if this zone extends below this level, however, a deep, partial or full-thick-ness wound results and skin grafting is usually required [1].
Burns covering more than 10% of the total body surface area are responsible for systemic complications which in very severe cases can represent a vital risk and in all cases affect the wound evolution. Among these general complications, fluid volume and electrolyte changes, leading eventually to burn shock, have the most dramatic consequences. Burn shock is still today a vital risk and can also, in the case of inadequate early fluid resuscitation, results in secondary morbidity and mortality. Fluid replacement during the very first hours after injury is key to the management of severe burn cases [11]. Major burn injury is a lesion where the inflammatory reaction is exported to the whole body. After a short period of haemodynamic changes, the inflammation is sustained by necrotic tissues, persistence of an open wound and the pulmonary and gut reactions. When infection starts, it be-comes difficult to distinguish its symptoms among the inflammatory signals [12].
The burn patient is highly susceptible to infection due to the loss of the skin as a bar-rier to microorganisms. Immune defences are activated in response to the burn injury; however, some of these defences are altered. Neutrophil chemotaxis is compromised by decreased perfusion caused by hypovol-aemia and the formation of microthrombi. Chemotaxis and phagocytosis are depen-dent on complement components that are reduced in a large burn wound. Neutrophil intracellular killing power is reduced as oxygen delivery to the wound is decreased.

1102 La Revue de Santé de la Méditerranée orientale, Vol. 11, No 5/6, 2005
�ملجلة �لصحية لشرL �ملتوسط، منظمة �لصحة �لعاملية، �ملجلد �حلا�E عشر، �لعد��� ٥-٦، ٢٠٠٥
Humoral immunity is altered with the drop in IgG levels. Cell-mediated immunity is depressed and T-cell lymphocyte counts are decreased. Suppressor T-cells are gene-rated.
Specific sources of infection for the burn patient include the patient’s own bacterial flora, hospital personnel, respiratory equip-ment and catheters, both urinary and intra-vascular [13]. It has been shown in children that in extensive burn wounds, bacterial antigens may not be recognized properly owing to the decreased proportion of CD4 cells and increased proportion of CD8 cells, which enhances bacterial growth in these wounds [14]. Patients with severe burns have a very high metabolic rate, which can lead to a deep nutritional deficit and im-munological suppression. It is then of major importance to provide adequate nutritional support [11].
Burn injuries, by their very nature, tend to produce further ischaemia and infection. Both these factors may mean that what is initially considered superficial damage may ultimately affect deeper levels [15]. The mechanism of post-burn pyrexia is not completely understood. Proposed mechanisms include dysfunction of the thermoregulatory system, increased meta-bolic rate that produces a hypermetabolic state, production of cytokines due to tissue injury, release of endogenous pyrogens and excessive release of endotoxins from the gut or wound [16–18]. The most common cause of death in burn patients is multiple organ failure, despite the clinical absence of uncontrolled infection at the time of death [19].
The post-traumatic response to burn in-jury leads to marked and prolonged skeletal muscle catabolism and weakness, which persist despite standard occupational and physical therapy rehabilitation programmes. However, the researchers found that the participation of children with thermal injury
in a resistance exercise programme resulted in a significant increase in muscle strength and power and lean body mass relative to a standard rehabilitation programme without exercise [20].
Burn wound assessment
Extent The “rule of nines” is a rough method of estimating body surface area, assuming adult body proportions. The head and neck are roughly 9%, the anterior and posterior chest are 9% each, the anterior and posterior abdomen (including buttocks) are 9% each, each upper extremity is 9%, each thigh is 9%, each leg and foot is 9%, and the remai-ning 1% represents the genitals. The palmar surface of the hand (excluding the fingers) is approximately 0.5% of body surface area over all age groups [21].
Depth First degreeThis type of burn damages only the outer layer of skin (epidermis), which is composed entirely of epithelial cells. These burns are pink or red, dry and painful, sloughing the next day. The skin does not blister, although slight swelling may occur.
Second degreeThis injury damages epidermis and a small portion of the underlying dermis, which contains blood vessels, nerve endings, sweat glands, hair follicles, and sebaceous glands. This is also where new skin cells are produced. Blisters are common with this type of burn. This burn blanches slowly and capillary refill is slow. These are red, wet and very painful.
Third degreeThis burn completely destroys both epider-mis and dermis. The skin is dry, leathery in

Eastern Mediterranean Health Journal, Vol. 11, Nos 5/6, 2005 1103
�ملجلة �لصحية لشرL �ملتوسط، منظمة �لصحة �لعاملية، �ملجلد �حلا�E عشر، �لعد��� ٥-٦، ٢٠٠٥
consistency, and firm, and can look white, red, brown or black. The burn does not blanch when pressed, is insensitive to touch and looks waxy.
Fourth degreeThese wounds involve underlying sub-cutaneous tissue, tendon or bone. Such burns frequently have a charred appearance [2,21].
Causative agents of burn wound infection
The usual cause of burn infection is bacteria, and less frequently fungi or yeasts. Viruses can also cause infection on rare occasions. The surface of every burn wound is con-taminated to some degree by bacteria [22]. Burn wound infection is, however, defined as burn wound bacterial proliferation at a density ≥ 105 bacteria/g tissue [23]. Of the deaths that do occur in adult burn patients, 50%–75% result from infection [24]. In pre-vious studies, the most common colonizing organisms were Pseudomonas aeruginosa, Staphylococcus aureus, Klebsiella spp., Proteus spp., Escerichia coli, and other Enterobacteriaceae [23,25–32].
Historically, group A beta-haemolytic streptococcal burn wound infection has been a major source of morbidity and mor-tality in burn patients, and has prompted the prophylactic administration of antibiotics to patients with burns. These infections in burn patients result in severe cellulitis and sepsis. Recent studies have suggested that routine penicillin prophylaxis of burn wounds was not effective in further reducing the incidence of wound infection involving group A beta-haemolytic streptococci [33,34]. The L-form of S. aureus occurring in burn wounds has been reported where the infection was attributed to a decrease in
host immunological function and repeated administration of antibiotics [35]. Anaero-bic bacteria were isolated from 55.1% of patients with burn wound infection, and were found to have a significant role in burn wound sepsis, especially Bacteroides spp. They were also more commonly found in patients who were treated with open wound dressings than those who were treated with occlusive dressings [25]. There are many factors that render burn wounds susceptible to infection with anaerobic organisms. The wounds themselves are composed of necrotic, relatively avascular tissue from which anaerobes are frequently isolated in other clinical settings [36].
Prior to the advent of topical antimi-crobials, invasive fungal infections were not common. With the use of these agents, 25% of burn wounds seen post-mortem will harbour fungi [37]. Many fungal species were isolated in previous studies, but the most frequent ones were Aspergillus spp. [25,38–40]. Fungal infection was more fre-quent in patients treated with open dressings than those treated with occlusive dressings [40]. It was established that there was a correlation between fungi infecting burned patients and fungi which were located in burn care units. This indicated there is a potential risk that fungal infection could be acquired from these units [41]. Several spe-cies of yeasts, such as Candida tropicalis, C. krusei, C. albicans and C. rugosa, have been reported in burn wound infection and were regarded as significant pathogens [42,43]. Yeasts from burn wounds may invade deep organs via the bloodstream, leading to severe complications [43].
Type I herpes simplex virus has been reported as a cause of burn wound infection or activated elsewhere in non-burned skin or, rarely, systemic visceral dissemination. Many people harbour herpes simplex virus, often where there is a known history of cold
1104 La Revue de Santé de la Méditerranée orientale, Vol. 11, No 5/6, 2005
�ملجلة �لصحية لشرL �ملتوسط، منظمة �لصحة �لعاملية، �ملجلد �حلا�E عشر، �لعد��� ٥-٦، ٢٠٠٥
sores. During the relatively immunosup-pressed state associated with a serious burn, reactivation of such infections can occur. Herpes simplex virus infection is thought to occur relatively frequently in the burn patient. Most commonly, children with significant burns, particularly involving the head and neck, are affected [44–46].
Management
Appropriate first aid treatment of burns can lessen the physical and psychological im-pact of injury. Eliminating the heat source is the single most important action to be taken at the scene of the injury. A secure airway with adequate ventilation is an abso-lute priority. Any clothing involved should be removed, as well as rings, watches, and other jewellery. Cold water is regarded as the only suitable substance to stop the bur-ning process, remove heat or chemical agents from the skin and relieve pain. Coo-ling and/or neutralization with tepid water may also be appropriate to stop the initial burning process; however, once the heat source has been removed, cooling is no longer of benefit and may result in signifi-cant hypothermia.
Chemical burns should be copiously irrigated with water; dry chemicals should, however, be gently brushed off the skin before irrigation is begun. Tar burns should be cooled but no attempt should be made at removing the tar from the wound until the patient is evaluated. A petrolatum-based ointment or solvent may be applied to fa-cilitate tar removal. During the resuscitation period, it is also important to assess circum-ferential burns since tissue perfusion may become restricted as oedema forms beneath the eschar. A surgical escharotomy, pro-perly performed in a timely manner, may be limb-saving or prevent the development of a peripheral neurovascular compromise.
All patients with high-voltage exposure should be admitted for cardiac monitoring and careful observation of the wound for at least 24 hours [1,47].
The most frequent mistake of pre-hospital management of burn patients was ina-dequate airway management (no intubation) and a lack of an intravenous line and vo-lume resuscitation [48]. Fluid re-suscitation with a balanced salt solution by continuous infusion is the mainstay of burn treatment. Extravasation of intravascular plasma into the soft tissue in the form of oedema produces a relative hypovolaemia. Oedema accumulates rapidly during the first 8 hours post-burn and continues more slowly for the next 16 hours. If the loss of intravascular volume is inadequately treated, tissue perfusion pressures diminish and multiple organ system function may become impaired.
It should also be remembered that inha-lation injury is associated with increased fluid loss and may have a significant impact upon resuscitation requirements [49]. Intravenous replacement therapy should be initiated promptly via one or more large-bore peripheral intravenous lines if the burn exceeds 10% of total body surface area in children, or 15%–20% in adults. Urine out-put is a useful tool to monitor the adequacy of resuscitation and should be maintained at 0.5–1.0 mL/kg body weight per hour in children and 30–50 mL/hour in adults. A Foley catheter may need to be inserted if hourly measurements are necessary [1].
Traditional management of the burn wound involves careful debridement of loose necrotic tissue, gentle cleansing of the wound with a bland soap and the applica-tion of dressings [50]. The periphery of the burn wound should be shaved to remove hairs that can harbour bacteria. Controversy still exists over the management of blisters. Blisters can be debrided, left intact, or

Eastern Mediterranean Health Journal, Vol. 11, Nos 5/6, 2005 1105
�ملجلة �لصحية لشرL �ملتوسط، منظمة �لصحة �لعاملية، �ملجلد �حلا�E عشر، �لعد��� ٥-٦، ٢٠٠٥
aspirated (leaving the epithelium to act as a biological dressing). In general, however, blisters greater than 1 to 2 cm in diameter should be debrided. Many investigators have found that occlusive dressings are beneficial in speeding the rate and quality of wound healing [25,51–53]. In contrast, in open dressing there is drying of the burn wound which leads to progressive thrombosis of previously intact vasculature, tissue dehydration, cell death and decreased breakdown of dead tissue and fibrin [53,54]. These changes tend to produce an environ-ment that will encourage the growth of anaerobic bacteria and fungi [25,40].
Early, aggressive and thorough surgical excision of infected burn wounds followed by sound and complete covering of the area with grafting at a suitable time play a crucial role [11–13,27,55–58]. Early cove-ring of the open wound is essential to limit bacterial colonization and prevent infection, and to reduce fluid and electrolyte and heat loss [57].
Topical antimicrobial therapy remains the single most important component of wound care in hospitalized burn patients. The goal of prophylactic topical antimi-crobial therapy is to control microbial colonization and prevent burn wound in-fection. In selected clinical circumstances, topical agents may be used to treat incipient or early burn wound infections. Silver sulfadiazine is the most frequently used topical prophylactic agent; it is relatively inexpensive, easy to apply, well tolerated by patients and has good activity against most burn pathogens. In patients with large burns the addition of cerium nitrate to silver sulfadiazine may improve bacterial control. Mafenide acetate has superior eschar-penetrating characteristics, making it the agent of choice for early treatment of burn wound sepsis. However, the duration and area of mafenide application must be li-
mited because of systemic toxicity as-sociated with prolonged or extensive use [59]. Other agents, such as nitrofurazone or chlorhexidine preparations, may be useful in isolated clinical situations. The undesirable side effects of silver nitrate solution limit its use by most clinicians [59]. Systemic antibiotics are a valuable therapeutic modality in the burned patient when properly used. Injudicious use, how-ever, may not only fail to be beneficial to the patient but also may produce harmful effects, either through direct toxicity or by contributing to the emergence of resistant strains of microorganisms. General guide-lines and principles for systemic antibiotic use include the following: • The burned patient, despite all efforts,
will be exposed to microorganisms. • No single agent or combination of
agents can destroy all the organisms to which the burned patient is exposed.
• Treatment involves first identifying the organism responsible for clinical sepsis, then choosing appropriate agents.
• Combinations of antibiotics are not always synergistic, or even additive, in effect.
• Multiagent therapy may have the un-toward effect of predisposing to supe-rinfection by yeast, fungi or resistant organisms.
• Antibiotics should be used for a long enough period to produce an effect, but not long enough to allow for emergence of opportunistic or resistant organisms. In general, prophylactic systemic anti-
biotics are indicated in only a few clinical situations including the immediate preo-perative and postoperative periods associ-ated with excision and autografting, and possibly in the early phases of burns in children [60]. A study in 1999 revealed that ciprofloxacin was the most effective

1106 La Revue de Santé de la Méditerranée orientale, Vol. 11, No 5/6, 2005
�ملجلة �لصحية لشرL �ملتوسط، منظمة �لصحة �لعاملية، �ملجلد �حلا�E عشر، �لعد��� ٥-٦، ٢٠٠٥
antibacterial agent: 42.9% of bacteria which were encountered in burn sepsis were susceptible [31]. Metronidazole, if administered to patients with burns, besides offering protection against anaerobic infec-tions, might also protect the patients from some aspects of burn-induced oxidative stress, and has promoted healing in partial-thickness burn wounds [61]. Vancomycin-resistant enterococci are multi-resistant microorganisms that have emerged as important nosocomial pathogens during the past decade. Emergence of these organisms has been blamed mainly on the increased and inappropriate use of antibiotics, in particular, the cephalosporins and the glycopeptide, vancomycin. Linezolid has a spectrum of activity against Gram-positive bacteria, including methicillin-resistant S. aureus (MRSA) and vancomycin-resistant enterococci, and can provide a useful treat-ment alternative to the glycopeptides [62]. Treatment of an established herpes simplex virus infection includes use of intravenous acyclovir, meticulous wound care, and ef-forts to prevent nosocomial spread. The vast majority of cases resolve without sequelae unless complicated by systemic, multiorgan herpes simplex virus infection [46].
Advances in burn wound care
Thirty years ago, someone with a 40% burn had little chance of survival. Today, burn care can save 50% of those who sustain an 80% burn [63]. The development of effec-tive topical and systemic chemotherapy, nu-tritional support, early burn wound excision and closure, and the use of biological dres-sings have significantly improved survival rates of burn patients [8,64]. The currently available skin substitutes are imperfect, and research endeavours continue in an effort
to develop a nonantigenic, disease-free, readily available, physiologically effec-tive tissue that will promptly effect wound closure, reduce scar formation (and thereby improve cosmetic results) and reduce the need for reconstructive surgery. As moni-toring and physiological support techniques improve and additional advances in wound care occur, morbidity and mortality in burn patients will be further reduced [8].
In the field of technological advances in the area of plastic surgery, burn surgery may be the most progressive, with the evo-lution of biological, tissue-engineered skin substitutes and the research into growth factors in healing. Further improvements in tissue engineering and technology should result in even more effective skin substitutes and hence more functional and aesthetic outcomes in large burns, in a more economically efficient way [57]. An encouraging therapeutic effect of the silicone elastomer TopiGel® was noticed by a group of investigators. They found that it had a positive effect on the reduc-tion, stabilization and normalization of hypertrophic scars. The study revealed no positive therapeutic effect of the silicone sheet on the painfulness of scars or on old, mature, hypertrophic scars [65].
On the other hand, the increasing number of new antimicrobial agents has presented a new dilemma to the practising clinician because many of these agents have not been evaluated thoroughly in the burned population. With further studies, the arma-mentarium of the burn treatment team will inevitably increase. It is in this manner only that so many of the unanswered questions will be solved, and that infection will start to decline as the major cause of death in the burned population [60].

Eastern Mediterranean Health Journal, Vol. 11, Nos 5/6, 2005 1107
�ملجلة �لصحية لشرL �ملتوسط، منظمة �لصحة �لعاملية، �ملجلد �حلا�E عشر، �لعد��� ٥-٦، ٢٠٠٥
References
1. Kagan RJ, Smith SC. Evaluation and treatment of thermal injuries. Dermato-logy nursing, 2000, 12(5):334–47.
2. Wiebelhaus P, Hansen SL. Burns. Handle with care. RN, 1999, 62(11):52–7.
3. Morgan ED, Bledsoe SC, Barker J. Am-bulatory management of burns. American family physician, 2000, 62(9):2015–26, 2029–30, 2032.
4. Wiechman SA et al. Rates, trends, and severity of depression after burn injuries. Journal of burn care and rehabilitation, 2001, 22(6):417–24.
5. Pallua N et al. A new technique for quantitative bacterial assessment on burn wounds by modified dermabrasion. Journal of hospital infection, 1999, 42(4):329–37.
6. Li GH. [Analysis of microbiological flora in the blood and wounds of burn patients]. Zhonghua zheng xing shao shang wai ke za zhi, 1989, 5(3):199–200, 238–9 [in Chinese].
7. Herruzo-Cabrera R et al. Diagnosis of lo-cal infection of a burn by semi-quantitative culture of the eschar surface. Journal of burn care and rehabilitation, 1992, 13(6):639–41.
8. Greenfield E, Jordan B. Advances in burn wound care. Critical care nursing clinics of North America, 1996, 8(2):203–15.
9. Pruitt BA Jr, McManus AT. The changing epidemiology of infection in burn patients. World journal of surgery, 1992, 16(1):57–67.
10. Jackson DM. The diagnosis of the depth of burning. British journal of surgery, 1953, 40:588–96.
11. Wassermann D. Les répercussions gé-nérales des brûlures étendues [Systemic complications of extended burns]. Anna-
les de chirurgie plastique et esthetique, 2001, 46(3):196–209.
12. Carsin H et al. Réaction inflammatoire et infection chez le brûlé grave [Inflam-matory reaction and infection in severe burns]. Pathologie-biologie, 2002, 50(2):93–101.
13. Robins EV. Immunosuppression of the burned patient. Critical care nursing cli-nics of North America, 1989, 1(4):767–74.
14. Andrzejewska E, Niewiadomska H, Nawrot E. Mechanism of impaired immu-nologic response to bacterial antigens in burn wounds in children. Pediatric surgery international, 2000, 16(1–2):85–8.
15. Fowler A. Burns care and management. Journal of tissue viability, 1994, 4(1):3–9.
16. Childs C. Fever in burned children. Burns, including thermal injury, 1988, 14(1):1–6.
17. Childs C, Little RA. Acute changes in oxy-gen consumption and body temperature after burn injury. Archives of disease in childhood, 1994, 71(1):31–4.
18. Caldwell FT Jr, Graves DB, Wallace BH. Pathogenesis of fever in a rat burn model: the role of cytokines and lipopolysaccha-ride. Journal of burn care and rehabilita-tion, 1997, 18(6):525–30.
19. Sheridan RL et al. Death in the burn unit: sterile multiple organ failure. Burns, 1998, 24(4):307–11.
20. Suman OE et al. Effects of a 12-wk re-sistance exercise program on skeletal muscle strength in children with burn inju-ries. Journal of applied physiology, 2001, 91(3):1168–75.
21. Sheridan RL. Evaluating and managing burn wounds. Dermatology nursing, 2000, 12(1):17–26.

1108 La Revue de Santé de la Méditerranée orientale, Vol. 11, No 5/6, 2005
�ملجلة �لصحية لشرL �ملتوسط، منظمة �لصحة �لعاملية، �ملجلد �حلا�E عشر، �لعد��� ٥-٦، ٢٠٠٥
22. Lawrence JC, Lilly HA. A quantitative method for investigating the bacteriology of skin: its application to burns. British journal of experimental pathology, 1972, 53(5):550–9.
23. Ollstein RN, McDonald C. Topical and systemic antimicrobial agents in burns. Annals of plastic surgery, 1980, 5(5):386–92.
24. Luterman A, Dacso CC, Curreri PW. In-fections in burn patients. American journal of medicine, 1986, 81(1A):45–52.
25. Mousa HA. Aerobic, anaerobic and fungal burn wound infections. Journal of hospital infection, 1997, 37(4):317–23.
26. Ozumba UC, Jiburum BC. Bacteriology of burn wounds in Enugu, Nigeria. Burns, 2000, 26(2):178–80.
27. Chai J, Sheng Z, Yang H. [Treatment of invasive burn wound infection with sepsis: a clinical study]. Zhonghua yi xue za zhi, 1999, 79(12):908–10 [in Chinese].
28. Karyoute SM. Burn wound infection in 100 patients treated in the burn unit at Jordan University Hospital. Burns, 1989, 15(2):117–9.
29. Lari AR, Alaghehbandan R. Nosocomial infections in an Iranian burn care center. Burns, 2000, 26(8):737–40.
30. Ram S et al. Prevalence of multidrug resistant organisms in an intensive care burn unit. Indian journal of medical re-search, 2000, 111:118–20.
31. Nagoba BS et al. Bacteriological analysis of burn sepsis. Indian journal of medical sciences, 1999, 53(5):216–9.
32. Revathi G, Puri J, Jain BK. Bacteriology of burns. Burns,1998, 24(4):347–9.
33. Sheridan RL et al. Antibiotic prophylaxis for group A streptococcal burn wound infection is not necessary. Journal of trauma, 2001, 51(2):352–5.
34. Bang RL et al. Beta-haemolytic Strepto-coccus infection in burns. Burns, 1999, 25(3):242–6.
35. Jiang HQ et al. Clinical burn wound infec-tion caused by L-forms of Staphylococcus aureus. Burns, 1994, 20(1):83–4.
36. Murray PM, Finegold SM. Anaerobes in burn-wound infections. Review of infectious diseases, 1984, 6(suppl. 1):S184–6.
37. Nash G et al. Fungal burn wound infec-tion. Journal of the American Medical As-sociation, 1971, 215(10):1664–6.
38. Guangxia X et al. Early diagnosis of burn wound infection with aspergillus by the use of tissue silver culture. In: Chang T, Shi J, Yang C, eds. Recent advances in burns and plastic surgery—the Chinese experience. Lancaster, United Kingdom, MTP Press Ltd, 1985:287–90.
39. Chakrabarti A et al. Surveillance of noso-comial fungal infections in a burn care unit. Infection, 1992, 20(3):132–5.
40. Mousa HA. Fungal infection of burn wounds in patients with open and occlu-sive treatment methods. Eastern Mediter-ranean health journal, 1999, 5(2):333–6.
41. Mousa HA, Al-Bader SM, Hassan DA. Correlation between fungi isolated from burn wounds and burn care units. Burns, 1999, 25(2):145–7.
42. Mousa HA, Al-Bader SM. Yeast infection of burns. Mycoses, 2001, 44(5):147–9.
43. Dube MP et al. Fungemia and colonization with nystatin-resistant Candida rugosa in a burn unit. Clinical infectious diseases, 1994, 18(1):77–82.
44. Zhou L, Zhang K, Sun T. [Clinical inves-tigation of burn wound infection with type I herpes simplex virus]. Zhonghua shao shang za zhi, 2001, 17(2):105–7 [in Chi-nese].
Eastern Mediterranean Health Journal, Vol. 11, Nos 5/6, 2005 1109
�ملجلة �لصحية لشرL �ملتوسط، منظمة �لصحة �لعاملية، �ملجلد �حلا�E عشر، �لعد��� ٥-٦، ٢٠٠٥
45. Sheridan RL et al. Cutaneous herpetic in-fections complicating burns. Burns, 2000, 26(7):621–4.
46. McGill SN, Cartotto RC. Herpes simplex virus infection in a paediatric burn patient: case report and review. Burns, 2000, 26(2):194–9.
47. Constable JD. The state of burn care past, present and future. Burns, 1994, 20(4):316–24.
48. Cupera J et al. Quality of prehospital ma-nagement of patients with burn injuries—a retrospective study. Acta chirurgiae plas-ticae, 2002, 44(2):59–62.
49. Navar PD, Saffle JR, Warden GD. Effect of inhalation injury on fluid resuscitation requirements after thermal injury. Ameri-can journal of surgery, 1985, 150(6):716–20.
50. Craft B, Kagan RJ. Current management of burns. Medical update for psychiatrists, 1998, 3(2):53–7.
51. Hermans MHE. Treatment of burns with occlusive dressing: some pathophysi-ological and quality of life aspects. Burns, 1992, 18(suppl. 2):S15–18.
52. Smith DJ et al. Microbiology and heal-ing of the occluded skin graft donor site. Plastic and reconstructive surgery, 1993, 91(6):1094–7.
53. Field CK, Kerstein MD. Overview of wound healing in a moist environment. American journal of surgery, 1994, 167(1A):2–6S.
54. Zawacki BE. Reversal of capillary stasis and prevention of necrosis in burns. An-nals of surgery, 1974, 180(1):98–102.
55. Chai J et al. Successful treatment of inva-sive burn wound infection with sepsis in
patients with major burns. Chinese medi-cal journal, 2000, 113(2):1142–6.
56. Pruitt BA Jr et al. Burn wound infections: current status. World journal of surgery, 1998, 22(2):135–45.
57. Stanton RA, Billmire DA. Skin resurfacing for the burned patient. Clinics in plastic surgery, 2002, 29(1):29–51.
58. Chai J, Sheng Z, Guo Z. [The experience of the management of burn sepsis with different strategies in our department during the past 29 years]. Zhonghua shao shang za zhi, 2000, 16(2):78–81 [in Chi-nese].
59. Monafo WW, West MA. Current treat-ment recommendations for topical burn therapy. Drugs, 1990, 40(3):364–73.
60. Dacso CC, Luterman A, Curreri PW. Sys-temic antibiotic treatment in burned pa-tients. Surgical clinics of North America, 1987, 67(1):57–68.
61. Mallikarjuna-Rao C et al. Does metroni-dazole reduce lipid peroxidation in burn injuries to promote healing? Burns, 2002, 28(5):427–9.
62. Atkins JL et al. The use of linezolid in the treatment of vancomycin-resistant entero-coccal septicaemia in two patients with burn injuries. Burns, 2002, 28(2):185–8.
63. Senior K. A positive approach to burn care. Lancet, 1999, 353(9160):1248.
64. Demling RH. Improved survival after massive burns. Journal of trauma, 1983, 23(3):179–84.
65. Hamanova H, Broz L. Topigel in the treat-ment of hypertrophic scars after burn injuries. Acta chirurgiae plasticae, 2002, 44(1):18–22.

�ملجلة �لصحية لشرL �ملتوسط، منظمة �لصحة �لعاملية، �ملجلد �حلا�E عشر، �لعد��� ٥-٦، ٢٠٠٥
1110 La Revue de Santé de la Méditerranée orientale, Vol. 11, No 5/6, 2005
Short communication
Anti-smoking campaign in Multan, PakistanM. Mohsin1
1Department of Community Medicine, Nishtar Medical College, Multan, Pakistan (Correspondence to M. Mohsin: [email protected]).Received: 09/03/03; accepted 06/07/04
ABSTRACT Smoking is a serious public health concern, particularly among young people. This com-munication describes an anti-smoking campaign targeted at the students of Nishtar Medical College and Bahauddin Zakariya University in Multan. The aim was to promote sports and discourage smoking though community participation and mobilization. A mixed media strategy was adopted and informa-tion and education materials were developed. A seminar was held giving information on smoking, its hazards, quitting strategies and experiences. This was followed by a cricket match played between the students at which further brochures were distributed and slogans displayed. The activity was very suc-cessful and succeeded in mobilizing the community and putting over the anti-smoking message. Such events could be used to promote other issues related to lifestyle.
Campagne antitabac à Multan (Pakistan)RÉSUMÉ Le tabagisme constitue une grave préoccupation de santé publique. La présente commu-nication décrit une campagne antitabac destinée aux étudiants de la Faculté de Médecine Nishtar et de l’Université Bahauddin Zakariya de Multan. Le but était de promouvoir le sport et de décourager le tabagisme par la participation et la mobilisation de la communauté. Une stratégie mixte médiatique a été adoptée et des matériels d’information et d’éducation ont été élaborés. Un séminaire d’information sur le tabagisme, les risques qu’il comporte, les stratégies pour arrêter de fumer et les expériences de sevrage tabagique a été organisé, suivi d’un match de cricket entre étudiants à l’occasion duquel d’autres brochures ont été distribuées et des slogans arborés. Cette activité a été un franc succès et a permis de mobiliser la communauté et de faire passer le message antitabac. De telles occasions pourraient être utilisées pour promouvoir d’autres questions liées au mode de vie.

�ملجلة �لصحية لشرL �ملتوسط، منظمة �لصحة �لعاملية، �ملجلد �حلا�E عشر، �لعد��� ٥-٦، ٢٠٠٥
Eastern Mediterranean Health Journal, Vol. 11, Nos 5/6, 2005 1111
Introduction
Many people smoke and are therefore at risk of developing tobacco-related illness such as cancer, heart disease, emphysema and respiratory disease. Those who do not smoke may have colleagues, friends or family members who do, and they risk prematurely losing a friend or relative to a tobaccorelated disease. Each year, tobacco causes some 4 million premature deaths, with 1 million of these occurring in coun-tries that can least afford the health-care burden [1]. This epidemic is predicted to kill 250 million children and adolescents who are alive today, a third of whom live in developing countries [1]. By the year 2030, tobacco is likely to be the world’s lead-ing cause of death and disability, killing more than 10 million people annually and claiming more lives than HIV, tuberculosis, maternal mortality, motor vehicle accidents, suicide and homicide combined [2].
Tobacco is a risk factor for some 25 diseases and while its effects on health are well known, the sheer scale of its impact on the global disease burden may still not be fully appreciated. No single disease is ex-pected to make such a huge claim on health as this 1 risk factor. Estimates indicate that tobacco is already responsible for about 2.6% of the total death and disease burden, and that this figure is projected to triple [3].
Smoking is one of the most serious public health issues in Pakistan and the increasing trend amongst youth is of grave concern. The bulk of the huge promotion budget of the tobacco companies is spent on advertising to attract youth. Cultural events and sports are also exploited for the same purpose.
It has been experimentally and epidemi-ologically proven that smoking is crucially injurious to sportsmen and sportswomen [4]. Young people who smoke cannot per-
form well on the playing field and are at higher risk of contracting smoking-related diseases [4]. The exploitation of sports by the tobacco companies through sponsor-ship and by targeting youth is immoral and should be discouraged at the national level.
Taking this into account, the Department of Community Medicine, Nishtar Medical College in Multan devised a plan to launch a target-oriented anti-smoking campaign using the slogans “Smoking is injurious to health” and “Promote sports, discou-rage smoking”. The aims were to promote sports and discourage smoking through community participation and mobilization of resources and to combat the advertising campaigns of tobacco companies by intro-ducing national and international celebrities campaigning against smoking.
Students at Bahauddin Zakariya Uni-versity and the medical students at Nishtar Medical College, Multan were targeted. Official permission was obtained from both establishments to approach the students. The Department of Mass Communication at Bahauddin Zakariya University was contacted and invited to participate.
Methodology
A mixed media strategy (including bro-chures, banners, leaflets, a seminar, radio, newspapers) was adopted to communicate the anti-smoking message. The relevant information, education and communication materials were developed through a series of brainstorming sessions with medical students and doctors. The outcome of this exercise was a number of anti-smoking slogans; a brochure detailing the important aspects of smoking; and lecture materials covering smoking as a world-wide epide-mic, promotional issues, hazards of active and passive smoking, alternatives to be

�ملجلة �لصحية لشرL �ملتوسط، منظمة �لصحة �لعاملية، �ملجلد �حلا�E عشر، �لعد��� ٥-٦، ٢٠٠٥
1112 La Revue de Santé de la Méditerranée orientale, Vol. 11, No 5/6, 2005
adopted for quitting smoking and the need for action against this social evil. The slo-gans were used on cloth banners and in the brochure.
A cricket team was formed from the medical students and all the necessary equipment for the cricket match was col-lected. To encourage active participation, formal prizes comprising certificates of appreciation, trophies and books were obtained and labelled with the campaign slogans.
A staunch effort was made for social mo-bilization. Repeated visits to the university by the medical college delegation, compri-sing both teachers and students, motivated the target group very much. The senior staff at Bahauddin Zakariya University and the editor of the daily newspaper Osaaf agreed to actively participate in the campaign.
It was decided that the seminar would be held at Bahauddin Zakariya University fol-lowed by the cricket match. The university sports were also being held during that time, so the tying of the anti-smoking campaign with this health promoting exercise gave further significance to the activities.
The seminar was attended by senior staff from the university and the medical college, the editor of Osaaf, the chairman of Al-Shifa Medical City, lecturers from all the university departments and teachers of community medicine at Nishtar Medical College. The audience comprised a large number of students from the university and medical college.
The seminar included an address by the professor of the chest ward at Nishtar Medical College and a detailed account of smoking presented by some of the medi-cal students. Pathogenesis, the hazards of smoking, withdrawal and epidemiological aspects were described in detail. All the speakers showed serious concern about the
increasing incidence of smoking and the availability of cigarettes.
It was emphasized that the government should take strong steps to discourage smoking. It should discount the revenue from tobacco and take bold steps to ban smoking. In the closing address, the Vice Chancellor of Bahauddin Zakariya Univer-sity recounted his own experience of quit-ting smoking. He highlighted the findings of the medical professionals concerning the hazards of smoking, what symptoms appeared after quitting smoking and what techniques should be adopted to give up smoking. He has introduced a ban on the sale of cigarettes on university premises as a step towards encouraging students to quit smoking and to encourage others to do so.
The brochure was distributed to all who attended the seminar. The chairperson also announced a special prize for those who volunteered to quit smoking. Under this stimulus, many students announced they would give up smoking for ever. They threw away their packets of cigarette and destroyed them.
After the seminar, a friendly cricket match was played between the students of Nishtar Medical College Multan and Students of Mass Communication. The boundary of the ground was decorated with a display of “No smoking” banners. Many other cricket lovers joined the spectators and enjoyed the activity. The anti-smoking brochure was also distributed among the spectators.
Discussion
The activity was highly successful in achieving the basic objective: communicat-ing the no smoking message. It also suc-ceeded in mobilizing the community, evi-denced by the active participation of senior

�ملجلة �لصحية لشرL �ملتوسط، منظمة �لصحة �لعاملية، �ملجلد �حلا�E عشر، �لعد��� ٥-٦، ٢٠٠٥
Eastern Mediterranean Health Journal, Vol. 11, Nos 5/6, 2005 1113
university staff, students and the media. Most of the participants were keen to con-tribute in the overall organization and ma-nagement of the seminar. The Osaaf people provided full sponsorship for the activity, including the banners and trophies.
The target group (youth) who were approached not only actively participated in the activity and showed enthusiasm to discourage smoking at every level but also enjoyed playing in the cricket match. The trophies with the no smoking slogan will remain a memory for ever and will be a reminder to continue the effort against smoking.
The quit smoking message was immedi-ately followed by an alternative to smoking (sports), an example for youth who indulge in smoking as an exciting activity. This cricket match gave them message of real excitement and heroism. The slogan to quit smoking and adopt sports is ideal for the promotion of a healthy lifestyle: it has been rightly said, “Where you find the playing grounds in full swing, there you will find silent and functionless hospitals.”
The university students and medical college students are the select youth of the nation, examples for others. In society, they are often taken as ideals for children and illiterate people. The involvement and mobilization of this group will have a significant effect in the community. In the university and medical college we find students who are representative of a wide variety of communities and areas. If these
are well mobilized against smoking, then the message can be communicated to iso-lated communities as well.
The cricket match developed a per-manent, friendly relationship between the medical students and the mass communica-tion students. These friendship ties will be helpful in future to maintain the impetus for organizing health education activities as many of the mass communication students will work in public media and the medical students will have comprehensive technical knowledge.
Resource constraint was the major pro-blem faced in the campaign. Although we had sufficient human resources, managing the project required financial support, which was insufficient and caused some difficul-ties organizing such a high level activity. However the concentrated efforts of the students, staff members and others made it possible to conduct a successful seminar and hold a unforgettable cricket match.
Conclusion
Promotion of healthy lifestyles amongst youth by exploiting sports and formal edu-cational forums like colleges and universi-ties is an efficient strategy and is strongly recommended. Agencies involved in health topics such as smoking, HIV/AIDS and sexually transmitted infection could ex-ploit similar events to achieve their goals.
References
1. International consultation of environmen-tal tobacco smoke (ETS) & child health, 11–14 January 1999, Geneva, Switzer-land. Consultation report. Geneva, Swit-zerland, World Helath Organization, 1999 (NCD/TFI/ETS/99.2).
2. Report of the Scientific Committee on Tobacco and Health. London, Stationery Office Ltd., 1998.
3. Involuntary smoking. Summary of data reported & evaluation. Lyon, France,
�ملجلة �لصحية لشرL �ملتوسط، منظمة �لصحة �لعاملية، �ملجلد �حلا�E عشر، �لعد��� ٥-٦، ٢٠٠٥
1114 La Revue de Santé de la Méditerranée orientale, Vol. 11, No 5/6, 2005
International Agency for Research on Cancer, 2002 (IARC monographs on the evaluation of carcinogenic risks to humans, Volume 83).
4. Lader D, Meltzer H. Smoking related be-haviour & attitudes, 1999. London, Office for National Statistics, 2000.
World No Tobacco Day 2005World No Tobacco Day (WNTD) 2005 focused on the role of health pro-fessionals in tobacco control. Health professionals have a prominent role to play in tobacco control as they have the trust of the population, the media and opinion leaders, and their voices are heard across a vast range of social, economic and political arenas.At the individual level, they can educate the population on the harms of tobacco use and exposure to second hand smoke. They can also help tobacco users overcome their addiction. At the community level, health professionals can be initiators or supporters of some of the policy measures described above, by engaging, for example, in efforts to promote smoke free workplaces and extending the availability of tobacco cessation resources. At the society level, health profession-als can add their voice and their weight to national and global tobacco control efforts like tax increase campaigns and become involved at the national level in promoting the WHO Framework Convention on Tobacco Control (WHO FCTC).Further information on the Tobacco Free Initiative at the WHO Re-gional Office for the Eastern Mediterranean can be found at: http://www.emro.who.int/tfi/tfi.htm
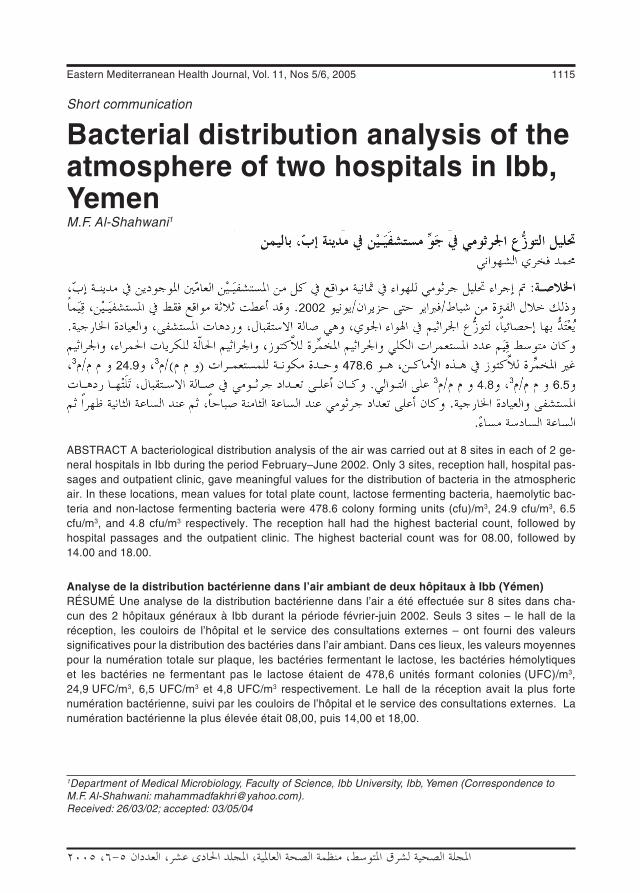
Eastern Mediterranean Health Journal, Vol. 11, Nos 5/6, 2005 1115
�ملجلة �لصحية لشرL �ملتوسط، منظمة �لصحة �لعاملية، �ملجلد �حلا�E عشر، �لعد��� ٥-٦، ٢٠٠٥
Short communication
Bacterial distribution analysis of the atmosphere of two hospitals in Ibb, YemenM.F. Al-Shahwani1
1Department of Medical Microbiology, Faculty of Science, Ibb University, Ibb, Yemen (Correspondence to M.F. Al-Shahwani: [email protected]).Received: 26/03/02; accepted: 03/05/04
ABSTRACT A bacteriological distribution analysis of the air was carried out at 8 sites in each of 2 ge-neral hospitals in Ibb during the period February–June 2002. Only 3 sites, reception hall, hospital pas-sages and outpatient clinic, gave meaningful values for the distribution of bacteria in the atmospheric air. In these locations, mean values for total plate count, lactose fermenting bacteria, haemolytic bac-teria and non-lactose fermenting bacteria were 478.6 colony forming units (cfu)/m3, 24.9 cfu/m3, 6.5 cfu/m3, and 4.8 cfu/m3 respectively. The reception hall had the highest bacterial count, followed by hospital passages and the outpatient clinic. The highest bacterial count was for 08.00, followed by 14.00 and 18.00.
Analyse de la distribution bactérienne dans l’air ambiant de deux hôpitaux à Ibb (Yémen)RÉSUMÉ Une analyse de la distribution bactérienne dans l’air a été effectuée sur 8 sites dans cha-cun des 2 hôpitaux généraux à Ibb durant la période février-juin 2002. Seuls 3 sites – le hall de la réception, les couloirs de l’hôpital et le service des consultations externes – ont fourni des valeurs significatives pour la distribution des bactéries dans l’air ambiant. Dans ces lieux, les valeurs moyennes pour la numération totale sur plaque, les bactéries fermentant le lactose, les bactéries hémolytiques et les bactéries ne fermentant pas le lactose étaient de 478,6 unités formant colonies (UFC)/m3, 24,9 UFC/m3, 6,5 UFC/m3 et 4,8 UFC/m3 respectivement. Le hall de la réception avait la plus forte numération bactérienne, suivi par les couloirs de l’hôpital et le service des consultations externes. La numération bactérienne la plus élevée était 08,00, puis 14,00 et 18,00.
1116 La Revue de Santé de la Méditerranée orientale, Vol. 11, No 5/6, 2005
�ملجلة �لصحية لشرL �ملتوسط، منظمة �لصحة �لعاملية، �ملجلد �حلا�E عشر، �لعد��� ٥-٦، ٢٠٠٥
Introduction
Hospitals have a notorious reputation for infection and septic infection has been well documented [1]. Despite dramatic develop-ments in surgical and medical techniques, infection acquired in hospitals remains a major cause of morbidity and mortality, leading directly or indirectly to an enor-mous increase in the cost of hospital care and to the emergence of new health hazards for the community [2].
Infection may be spread by airborne transmission from the respiratory tract, from the skin by natural shedding of skin scales, during wound dressing or during bed ma-king, and by aerosols from equipment such as respiratory apparatus and air-con-ditioning plants. Infectious agents may be dispersed in the air as small particles or droplets over long distances [2].
Quantitative and qualitative micro-biological measurements are required in premises where safe working depends on the microorganism content of the air be-ing kept at a very low level, e.g. surgical theatres and premises where certain food and pharmaceutical materials are prepared. In hospital wards in which cross-infection is possible, it may be necessary to examine the air for a particular pathogen. The type and number of microorganisms in the air at any time depend on a variety of factors, the most important of which are number of persons present, degree of body movement and amount of disturbance of their clothing [3].
Most of the data available in this field are concerned with fungi [4]; there is little or no data in the literature concerning bacterial load of hospital air. This survey is, therefore, an attempt to assess the bacterial distribution in ambient air in 2 hospitals.
Methods
Sampling sites and timesAir samples were collected weekly during the period February–June, 2002, from Al-Thawra and Al-Nasir general hospitals, the only government hospitals in Ibb City, Ye-men, which is located 190 km south of the capital, Sana’a.
Al-Thawra Hospital has a mean of 233 outpatients and 75 admissions per day; the corresponding figures for Al-Nasir Hospital are 60 outpatients and 15 admissions. At both hospitals, air samples were collected from the following sites: operating the-atre, male surgical ward, female internal ward, refreshment room, clinical labora-tory, outpatient clinic, hospital passages and reception hall. From each site, samples were collected at 3 times, morning (08.00), afternoon (14.00) and evening (18.00). These times were chosen to correspond with patient crowdedness (which is directly proportional to the bacterial atmospheric pollution) in the hospital wards: before working hours (i.e. morning), rush hours (i.e. afternoon) and after working hours (i.e. evening). At each sampling, 3 replicate samples were collected (1 for each type of plate). The time between sample collection and receiving the sample in the laboratory never exceeded 1 hour.
Sample collection and bacteriological mediaThe samples were collected using a micro-biological air sampler, MAS-100 (Merck, Darmstadt, Germany). The air sampler was loaded with Petri dishes that had previ-ously been prepared under sterile condition with the following media: plate count agar (CM0325, for total aerobic bacteria); blood
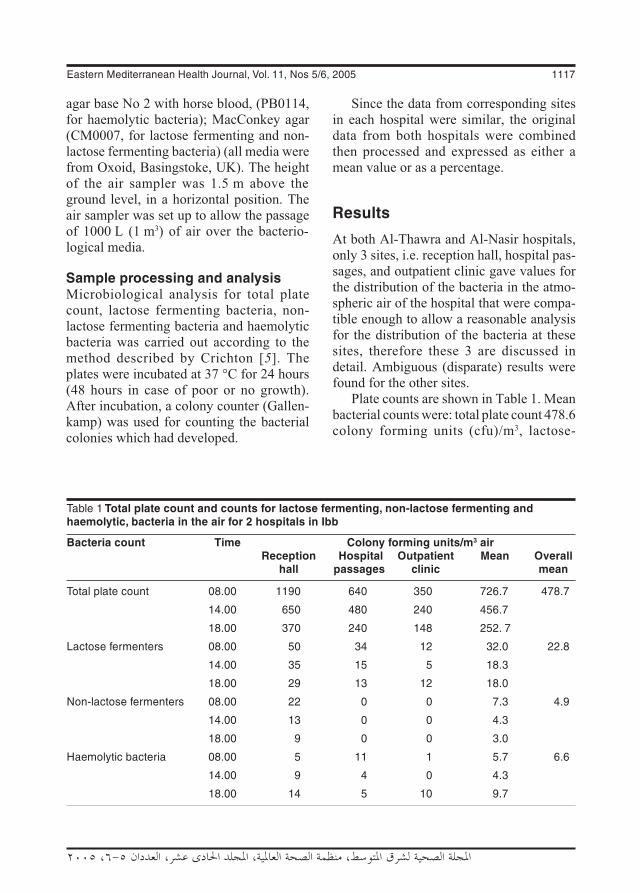
Eastern Mediterranean Health Journal, Vol. 11, Nos 5/6, 2005 1117
�ملجلة �لصحية لشرL �ملتوسط، منظمة �لصحة �لعاملية، �ملجلد �حلا�E عشر، �لعد��� ٥-٦، ٢٠٠٥
agar base No 2 with horse blood, (PB0114, for haemolytic bacteria); MacConkey agar (CM0007, for lactose fermenting and non-lactose fermenting bacteria) (all media were from Oxoid, Basingstoke, UK). The height of the air sampler was 1.5 m above the ground level, in a horizontal position. The air sampler was set up to allow the passage of 1000 L (1 m3) of air over the bacterio-logical media.
Sample processing and analysisMicrobiological analysis for total plate count, lactose fermenting bacteria, non-lactose fermenting bacteria and haemolytic bacteria was carried out according to the method described by Crichton [5]. The plates were incubated at 37 °C for 24 hours (48 hours in case of poor or no growth). After incubation, a colony counter (Gallen-kamp) was used for counting the bacterial colonies which had developed.
Since the data from corresponding sites in each hospital were similar, the original data from both hospitals were combined then processed and expressed as either a mean value or as a percentage.
Results
At both Al-Thawra and Al-Nasir hospitals, only 3 sites, i.e. reception hall, hospital pas-sages, and outpatient clinic gave values for the distribution of the bacteria in the atmo-spheric air of the hospital that were compa-tible enough to allow a reasonable analysis for the distribution of the bacteria at these sites, therefore these 3 are discussed in detail. Ambiguous (disparate) results were found for the other sites.
Plate counts are shown in Table 1. Mean bacterial counts were: total plate count 478.6 colony forming units (cfu)/m3, lactose-
Table 1 Total plate count and counts for lactose fermenting, non-lactose fermenting and haemolytic, bacteria in the air for 2 hospitals in Ibb
Bacteria count Time Colony forming units/m3 air Reception Hospital Outpatient Mean Overall hall passages clinic mean
Total plate count 08.00 1190 640 350 726.7 478.7
14.00 650 480 240 456.7
18.00 370 240 148 252. 7
Lactose fermenters 08.00 50 34 12 32.0 22.8
14.00 35 15 5 18.3
18.00 29 13 12 18.0
Non-lactose fermenters 08.00 22 0 0 7.3 4.9
14.00 13 0 0 4.3
18.00 9 0 0 3.0
Haemolytic bacteria 08.00 5 11 1 5.7 6.6
14.00 9 4 0 4.3
18.00 14 5 10 9.7
1118 La Revue de Santé de la Méditerranée orientale, Vol. 11, No 5/6, 2005
�ملجلة �لصحية لشرL �ملتوسط، منظمة �لصحة �لعاملية، �ملجلد �حلا�E عشر، �لعد��� ٥-٦، ٢٠٠٥
fermenting bacteria 24.9 cfu/m3, haemolytic bacteria (e.g. Streptococcus pyogenes) 6.5 cfu/m3and non-lactose fermenting bacteria 4.8 cfu/m3. The counts were generally highest in the morning (08.00) followed by afternoon and evening.
The reception hall had the highest over-all count, followed by the hospital passages and the outpatient clinic.
Discussion
The highest count, for total plate count, was expected since plate count agar is known to allow the growth of a wide range of sapro-phytic and other bacteria.
The count for lactose-fermenting bacteria was higher than for non-lactose-fermenting bacteria. This result was also expected since a number of studies have demonstrated that lactose-fermenters are more widely distributed than non-lactose-fermenters [6,7].
The count for haemolytic bacteria (6.6 cfu/m3) was fairly high, unfortunately, no data were noted in the literature for com-parison with this value. Haemolytic bacteria are known to be involved in infection of the upper respiratory tract [8]. However, Senior reported that in studies concerned with airborne infection in man, the particles encountered are those that carry bacteria capable of growth on blood agar during aerobic incubation for 24 or 48 hours at 37 °C [9], incubation conditions which also applied in our study.
The highest bacterial count was in the reception hall, followed by the hospital pas-sages and finally the outpatient clinic. The variation could be related to differences in the degree of crowding; the reception hall is usually more crowded than the other locations. Moreover, internal movement produces an increase in both humidity and
temperature, which are known to be im-portant factors affecting bacterial viability [10]. Ambiguous results that were found for the other sites may be because of the oscil-lation of the variables that affect bacterial concentration.
Table 1 also shows that counts were highest in the morning, followed by the afternoon and the evening. This observa-tion may be related to the busy period of the day. The hospitals are usually at their busi-est at 08.00, gradually becoming less busy through the afternoon and the evening.
Unlike the other bacteria examined, the distribution of haemolytic bacteria at diffe-rent hospital locations and different times of the day did not show a clear pattern. Since many virulent strains belong to this bacterial group, further, more extensive, studies are required to determine distribution of these bacteria in the ambient air of hospitals.
It has been reported that most of the contaminants are harmless saprophytes and commensals, and even when carriers or infected students are present, usually less than 1%, and commonly only 0.01%–0.1%, of the airborne bacteria are pathogens [9]. In rooms occupied by patients with tonsil-litis or infected wounds, Streptococcus pyo-genes may be present at a level of 0.1–50 cfu/m3 [5]. This level of contamination may seem small, but it must be remembered that a normal adult inhales about 15 m3 of air/24 hours. The probability of a person becoming infected will be greater if he is exposed to a high concentration of airborne pathogens, but no level of contamination, however low, can be regarded as safe. Infection is usu-ally initiated by the deposition of a single infected particle at a favourable site in the respiratory tract, although the probability of any one such particle initiating infection is likely to be low for common pathogens, e.g. 10–2 to 10–5 for Staphylococcus aureus

Eastern Mediterranean Health Journal, Vol. 11, Nos 5/6, 2005 1119
�ملجلة �لصحية لشرL �ملتوسط، منظمة �لصحة �لعاملية، �ملجلد �حلا�E عشر، �لعد��� ٥-٦، ٢٠٠٥
in the nose [11]. It may be high for some, e.g. for Mycobacterium tuberculosis in the lung [12].
Finally, the removal of air contaminants and the control of room temperature and humidity are necessary. Recommendations for air treatment in hospital ambient air include:• the use of filtration, electronic cleaners,
chemical treatment with activated char-coal or other sorbents;
• temperature control in the range of 20.0–24.5 °C;
1. Ayliffe GAJ, Collins BJ, Taylor LJ. Hos-pital acquired infection, 2nd ed. Wright, Bristol, 1990:312.
2. Simpson RA. Hospital infection. In: Greenwood D, Slack RCB, Peutherer JF, eds. Medical microbiology, 15th ed. Edin-burgh, Churchill Livingstone, 1997:644.
3. May KR. Physical aspects of sampling air-borne microbes. In: Gregory PH, Monteith JL, eds. Airborne microbes. 17th sympo-sium of the Society for General Microbio-logy. Cambridge, Cambridge University Press, 1967:60–80.
4. Kirkland TN, Fierer J. Coccidioidomy-cosis: a re-emerging infectious disease. Emerging infectious diseases, 1996, 2:192–9.
5. Crichton PB. Enterobacteriaceae: Es-herichia, Klebsiella, Proteus and other genera. In: Collee JG et al, eds. Practical medical microbiology, 14th ed. Edinburgh, Churchill Livingstone, 1996:361.
6. Tarr PI. Escherichia coli O157: H7 clinical, diagnostic and epidemiological aspects of human infection. Clinical infectious dis-eases, 1995, 20:1–10.
• humidity control in the range of 20%–60%.
Acknowledgement
I would like to thank Abdulla Al-Wajeeh and Mohammad A. Al-Tayeb of the Depart-ment of Medical Microbiology, Faculty of Science, Ibb University for their technical assistance.
References
7. Lewis MJ. Escherichia. In: Greenwood D, Slack RCB, Peutherer JF, eds. Medi-cal microbiology, 15th ed. Edinburgh, Churchill Livingstone, 1997:267.
8. Johnson AG et al. Microbiology and immunology, 3rd edn (Middle East edn). Philadelphia, Lippincott Williams & Wilkins, 1996:39.
9. Senior BW. Examination of water, milk, food and air. In: Collee JG et al, eds. Practical medical microbiology, 14th ed. Edinburgh, Churchill Livingstone, 1996:883.
10. Indoor bioaerosols. New Jersey, United States of America, Public employees safety and health program, Department of Health, 1997.
11. Lidwell OM. Some aspects of the transfer and acquisition of Staphylococcus aureus in hospitals. In: Macdonald A, Smith G, eds. The staphylococci. Aberdeen, Aber-deen University Press, 1981:175–202.
12. Riley RP. Aerial dissemination of pulmo-nary tuberculosis. American review of tuberculosis, 1957, 76:931–41.
1120 La Revue de Santé de la Méditerranée orientale, Vol. 11, No 5/6, 2005
�ملجلة �لصحية لشرL �ملتوسط، منظمة �لصحة �لعاملية، �ملجلد �حلا�E عشر، �لعد��� ٥-٦، ٢٠٠٥
Short communication
Effect of Ramadan fasting on secretion of sex hormones in healthy single malesB. Mesbahzadeh,1 Z. Ghiravani1 and H. Mehrjoofard1
ABSTRACT To determine the effects of Ramadan fasting on the secretion of sex hormones in single healthy males, we measured blood hormone levels of testosterone, luteinizing hormone (LH) and follicle-stimulating hormone (FSH) in 52 single male students aged 18–24 years who were fasting for ≥12 hours during Ramadan. Four blood samples were taken from each, one 2 days before and the others on 10, 20 and 28 Ramadan. Testosterone level was lower, significantly so for the 20th and 28th of the month (P < 0.05); FSH was increased, significantly for the 20th (P < 0.05); LH did not change significantly.
1Department of Physiology, School of Medicine, Birjand University of Medical Sciences, Khorasan, Islamic Republic of Iran (Correspondence to B. Mesbahzadeh: [email protected]).Received: 14/01/03; accepted: 08/06/04
Effet du jeûne du ramadan sur la sécrétion d’hormones sexuelles chez des hommes célibataires en bonne santéRÉSUMÉ Afin de déterminer les effets du jeûne du ramadan sur la sécrétion d’hormones sexuelles chez des hommes célibataires en bonne santé, nous avons mesuré les concentrations sanguines de testostérone et d’hormones lutéinisante (LH) et folliculostimulante (FSH) chez 52 étudiants célibataires âgés de 18 à 24 ans qui jeûnaient pendant 12 heures ou plus pendant le ramadan. Quatre prélève-ments sanguins ont été effectués sur chacun des sujets, le premier 2 jours avant le début du ramadan et les autres au 10e, 20e et 28e jour du ramadan. La concentration de testostérone était plus faible, et ce de manière significative pour le 20e et le 28e jour du mois (p < 0,05) ; la FSH avait augmenté, et ce de manière significative pour le 20e jour (p < 0,05) ; la LH n’avait pas significativement changé.
Eastern Mediterranean Health Journal, Vol. 11, Nos 5/6, 2005 1121
�ملجلة �لصحية لشرL �ملتوسط، منظمة �لصحة �لعاملية، �ملجلد �حلا�E عشر، �لعد��� ٥-٦، ٢٠٠٥
Introduction
Fasting, a principal obligation of Islam, is practised over a vast area of the globe by over 1 billion Muslims for a complete month. In the Islamic Republic of Iran, which has a population of more than 70 million people, the vast majority of the adult population fast in Ramadan. The fast involves abstaining from eating and drin-king from early morning to sunset.
The study of the impacts of this act of worship from different angles can offer solutions to hygiene and psychological pro-blems. During the past 2 decades resear-chers have found that abstinence from eating and drinking accompanied by a change in sleeping and waking pattern may cause changes in the physiology and functioning of the body’s hormonal system [6,8,10].
The main concern of this study was to determine the effects of Islamic fasting on the secretion of sex hormones in single healthy males.
Methods
This study was carried out in Birjand Uni-versity of Medical Sciences on 52 volunteer students. Criteria for inclusion were being single, male, aged 18–24 years, in good health, not taking any medicines and not being on a diet. The length of daily fas-ting was ≥ 12 hours and all participants had the same ordinary diet (from the university catering service). There were no drop-outs during the study.
The study was carried out in 2002. There were 4 stages, 1 before Ramadan, and 3 during Ramadan. Four blood samples were taken from each participant by a technician from the University research laboratory. The first sample (control) was taken 2 days before Ramadan; the other 3 (experimental)
on 10, 20 and 28 Ramadan. All samples were taken at 16.00, after ≥ 12 hours of fas-ting. Samples were analysed immediately at Imam Reza Hospital in Birjand.
At the end of each stage an enzyme-linked immunosorbent assay (Stat Fax 2001 ELISA reader; Stat Fax 2600 incubator and washer, Awareness Technology, Palm City, Florida) was used to measure hormone levels. Standard luteinizing hormone (LH), follicle-stimulating hormone (FSH) (Radim SpA, Pomezia, Italy) and testosterone (DRG Diagnostics, Italy) kits were used for estimating hormone levels using the standard manufacturer’s methods, supplied with the kits.
The data were statistically evaluated using the analysis of variance method using SPSS, version 11.5. The level of signifi-cance was P < 0.05.
Results
Mean blood hormone levels are shown in Table 1. Mean testosterone levels decreased in all 3 test samples. The decrease was sig-nificant for the samples from 20 and 28 Ramadan (P < 0.05).
Mean FSH levels increased during Ra-madan but the increase was only significant in the sample from 20 Ramadan (P < 0.05). In contrast, mean LH level did not change significantly in comparison with the control sample (2 days before Ramadan).
Discussion
Previous studies have demonstrated that abstinence from eating and drinking during the Ramadan fast, which is accompanied by variations in the sleeping and waking pattern, and the psychological effects of fasting may bring about rhythmic changes

1122 La Revue de Santé de la Méditerranée orientale, Vol. 11, No 5/6, 2005
�ملجلة �لصحية لشرL �ملتوسط، منظمة �لصحة �لعاملية، �ملجلد �حلا�E عشر، �لعد��� ٥-٦، ٢٠٠٥
in the secretion of most of the body’s hor-mones [4,5].
From the findings of our study and those of other studies [2,6–8], it is clear that levels of sex hormones and gonadotrophins, as well as other hormones, vary in healthy single males during the Islamic fasting month of Ramadan.
Besides, the significant decrease in testosterone on the 20th and 28th days of Ramadan (compared with before Ramadan) occurs simultaneously with significantly increases in FSH levels. This is understan-dable considering the negative feedback system that controls testosterone secre-tion: following a decrease in testosterone secretion from the testes, the secretion of gonadotrophin-releasing hormone from the hypothalamus increases and this hormone enters the anterior pituitary through the blood of the hypothalamus–pituitary portal system, thus stimulating the secretion of FSH and LH from the anterior pituitary [7,9].
Moreover, the results of experiments by other researchers confirm the findings of the above study. Studies on a great number of healthy fasting men and women have shown that all quantitative variations observed in gonadotrophin-releasing hormone and sex hormones are within the normal range and
do not cause specific clinical changes [7,9]. Experiments carried out on other hormones such as thyroxin, prolactin, cortisol and endorphin during fasting indicate that their variation is within the normal range [10–13]. It has been reported that despite the disturbance of biological processes of the body caused by the change in the times of eating and sleeping, the endocrine system does not change the concentration of pituitary, thyroid, parathyroid and sex hormones [8,12].
Islamic fasting is a unique form of ab-stinence recurring over a definite period of time. On the other hand, biological rhythms are factors that create physiological balance. This balance, according to many resear-chers, is maintained by the neuroendocrine system [5,14,15].
To sum up, Ramadan fasting produces variations in the secretion of gonadotro-phins and sex hormones among healthy single men. These variations are within the normal range.
Acknowledgement
We wish to thank our laboratory technicians Mr Ali Eftekhari and Mr Ali Akbar Hesami for their kind cooperation.
Table 1 Variation in mean blood/serum/plasma testosterone, follicle stimulating hormone and luteinizing hormone levels before and during Ramadan
Hormone Mean (SD) hormone level 2 days before 10 Ramadan 20 Ramadan 28 Ramadan Ramadan
Testosterone (ng/mL) 7.17 (0.3) 6.59 (0.3) 5.68a (0.2) 5.92a (0.3)
Follicle stimulating hormone (mIU/mL) 5.46 (0.4) 5.80 (0.4) 5.90a (0.3) 5.80 (0.3)
Luteinizing hormone (mIU/mL) 6.75 (0.9) 5.78 (0.4) 6.15 (0.5) 7.35 (0.4)aSignificantly different from before Ramadan.SD = standard deviation.
Eastern Mediterranean Health Journal, Vol. 11, Nos 5/6, 2005 1123
�ملجلة �لصحية لشرL �ملتوسط، منظمة �لصحة �لعاملية، �ملجلد �حلا�E عشر، �لعد��� ٥-٦، ٢٠٠٥
References
1. Bogdan A, Bouchareb B, Touitou Y. Ramadan fasting alters endocrine and neuroendocrine circadian patterns. Life sciences, 2001, 68(14):1007–15.
2. Hosain R, Ismil R. Effect of Ramadan on plasma renin, aldosterone and cortisol concentration in Malaysian Moslems. Paper presented at the 2nd International congress on health and Ramadan, 1–3 December, 1997. Istanbul, Turkey, 1977:37.
3. McHardy DA, Ephraim M. The fast of Ramadan. British medical journal, 1992, 304(6834):1114–8.
4. Irak L et al. Ramadan diet restrictions modify the circadian time structure in hu-mans. A study on plasma gastrin, insulin, glucose, and calcium and on gastric pH. Journal of clinical endocrinology and me-tabolism, 1997, 82(4):261–73.
5. Fedail SS et al. Changes in certain blood constituents during Ramadan. American journal of clinical nutrition, 1995, 36(2):350–3.
6. Sajid KM, Akhtar M, Malik GO. Ramadan fasting and thyroid hormone profile. Jour-nal of the Pakistan Medical Association, 1991, 41(9):213–6.
7. Abbas SM, Basalamah AH. Effects of Ra-madan fasting on male fertility. Archives of andrology, 1989, 16:161–6.
8. Bakir SM et al. The effect of Ramadan fast on the diurnal change of total cal-
cium, parathyroid hormone and calcitonin. Medical journal of Cairo University, 1994, 62 (2):485–90
9. Bakir SM et al. The effects of Ramadan fasting on the levels of gonadotrophins. Journal of the Islamic Medical Associa-tion, 1992, 24:30–40.
10. Sulemani RA. The effects of Ramadan fasting on thyroid functions in healthy male subjects. Nutrition research, 1988, 8(5):549–52.
11. Ch’ng SL et al. Endocrine changes in Asiatic Moslems during Ramadan. Clini-cal and biochemical reviews, 1993, 14(4):247–53.
12. Bakir SM et al. The effect of Ramadan fast on corticotrophin and B-endorphins. Medical journal of Cairo University, 1994, 62(2):463–8.
13. Azizi F, Rasouli HA. Serum glucose, bi-lirubin, calcium, phosphorus, protein and albumin concentrations during Ramadan. Medical journal of the Islamic Republic of Iran, 1992, 6(3):43–5.
14. Azizi F. Medical aspects of Islamic fasting. Medical journal of the Islamic Republic of Iran, 1996, 10(3):241–6.
15. Azizi F. Serum levels of prolactin, thyro-tropin, thyroid hormones male reproduc-tive function and TRH responsiveness in intermittent Islamic fasting. Medical jour-nal of the Islamic Republic of Iran, 1991, 5(3,4):145–8.

1124 La Revue de Santé de la Méditerranée orientale, Vol. 11, No 5/6, 2005
�ملجلة �لصحية لشرL �ملتوسط، منظمة �لصحة �لعاملية، �ملجلد �حلا�E عشر، �لعد��� ٥-٦، ٢٠٠٥
Short communication
Human development index adjusted for environmental indicators: case study in one Egyptian village M.M. Gamal El-Din1
1Department of Environmental Health, University of Alexandria, Alexandria, Egypt (Correspondence to M.M. Gamal El-Din: [email protected]).Received: 28/12/04; accepted: 18/04/05
ABSTRACT The Egypt Human Development Report 2003 does not take account of the impact of the environment on human development indicators. A case study was made in one village in El-Montaza district, Alexandria governorate, Egypt. The environmental indicators used for calculating the human development index were access to safe water, access to sanitation and environment surrounding the house. The human development index for this village decreased from 0.622 to 0.595 after adjustment for environmental factors.
L’indice de développement humain ajusté en fonction d’indicateurs environnementaux : étude de cas dans un village égyptienRÉSUMÉ Le Rapport sur le développement humain en Égypte de 2003 ne prend pas en compte l’impact de l’environnement sur les indicateurs du développement humain. Une étude de cas a été réalisée dans un village du district de Montaza, Gouvernorat d’Alexandrie (Égypte). Les indicateurs environnementaux utilisés dans le calcul de l’indice de développement humain sont les suivants : l’accès à l’eau saine, l’accès à l’assainissement et l’environnement immédiat des habitations. L’indice de développement humain pour ce village a diminué, passant de 0,622 à 0,595 après ajustement en fonction des facteurs d’environnement.

Eastern Mediterranean Health Journal, Vol. 11, Nos 5/6, 2005 1125
�ملجلة �لصحية لشرL �ملتوسط، منظمة �لصحة �لعاملية، �ملجلد �حلا�E عشر، �لعد��� ٥-٦، ٢٠٠٥
Introduction
The Egypt National Human Development Report 2003 is the seventh in the series is-sued since 1994 by the Institute of National Planning in collaboration with the United Nations Development Programme (UNDP) [1]. The methodology, concepts, and indi-cators of these reports have been continu-ously and steadily adapted to the nature and condition of Egyptian society through the valuable contributions and efforts of na-tional and international specialists in human development. Using the same methodology and indicators, Alexandria governorate, in collaboration with the UNDP, the Ministry of Local Development and the Organization of Reconstruction and Development of the Egyptian Village issued the Alexandria Hu-man Development Report 2003 [2].
However, neither these human develop-ment reports utilize any indicators that mea-sure the impact of a poor environment on human development indicators. We believe this leads to a bias in the structure of the human development indicators [2].
El-Prince southern village is located in El-Montaza district of Alexandria gover-norate. It was selected as a case study to develop its human development indicators and to recalculate the human development index (HDI) adjusted for relevant environ-mental factors.
Methods
The data for El-Prince village were col-lected by filling precoded questionnaires through house-to-house surveys in all 349 houses in the village during 2002–03.
The precoded questionnaire sheet included information about the family and the house, such as family size, number of rooms per house, dwelling type, water sup-
ply, type of toilet, wastewater disposal and solid waste disposal.
Human development index Standard methods were used for calcula-ting the HDI, which is a simple average of 3 indicators: life expectancy at birth (number of years a newborn infant would live if pre-vailing patterns of mortality at the time of its birth were to stay the same throughout its life); adult illiteracy rate (percentage of adults ages 15+ years who cannot, with un-derstanding, read and write a short, simple statement about their everyday life); gross domestic product (GPD) per capita (GDP divided by mid-year population growth calculated from constant price GDP data in local currency) [5].
Environmental index We calculated an environmental index using some important environmental indicators which affect the human development index: access to safe water, access to sanitation and environmental conditions surrounding the houses [3].
Three environmental indicators were defined:• Safe water. A household is considered
to have access to improve water supply, if it has sufficient amount of water for family use, at an affordable price, avai-lable to household members without being subject to extreme effort espe-cially to women and children.
• Sanitation. A household is considered to have adequate access to sanitation if an excreta disposal system, either in the form of a private toilet or a public toilet shared with a reasonable number of peo-ple is available to household members.
• Environmental context. The environ-mental conditions surrounding the houses.

1126 La Revue de Santé de la Méditerranée orientale, Vol. 11, No 5/6, 2005
�ملجلة �لصحية لشرL �ملتوسط، منظمة �لصحة �لعاملية، �ملجلد �حلا�E عشر، �لعد��� ٥-٦، ٢٠٠٥
The environmental index was calculated by assuming that safe water represents 25% of the environmental indicators, sanitation (type of toilet) represents 25% of the en-vironmental indicators and environmental context represents 50% of the environ-mental indicators. Thus the environmental index was calculated to be: 1/4 (safe water indicator) + 1/4 (sanitation indicator) + 1/2 (environmental context indicator).
The adjusted HDI was calculated from the formula: (HDI + environmental index)/2.
Results
Table 1 shows the distribution of house-holds in El-Prince village according to the 3 environmental variables. From this we calculate:• Safe water indicator = (97.7–0.0)/(100–
0.0) = 0.98• Sanitation indicator = (99.4–0.0)/(100–
0.0) = 0.99• Environmental context indicator =
(14.9–0.0)/(100–0.0) = 0.149From the logical weightings of the items, the environmental index is calculated to be: 1/4 (0.98) + 1/4 (0.99) + 1/2(0.149) = 0.245 + 0.248 + 0.037 = 0.568.
Thus the adjusted human development index (including environmental indicators) for El-Prince village becomes: (0.622 + 0.568)/2 = 1.19/2 = 0.595.
This compares with the original human development index for El-Prince village of 0.622 [5].
Discussion
By adjusting the HDI using an environ-mental index, the HDI for El-Prince village
decreased from 0.622 to 0.595. This de-crease of only 5% shows the link between the environmental indicators and the other indicators: education, longevity and GDP. It is expected that an increase in the previous indicators would improve the human envi-ronmental index, consequently improving the overall health of the people.
This case study highlights the impor-tance of including environmental indicators when calculating the HDI.
Table 1 Distribution of households in El-Prince village according to environmental variables [4]
Variable No. of % households (n = 349)
Water supply Tap water inside the house 324 92.8 Shared tap water 17 4.9 From neighbour 8 2.3
Type of toilet Eastern 248 71.1 European 86 24.6 Eastern and European 13 3.7 No sanitation facility 2 0.6
Environmental context Dry area 118 14.9 Morass or moor 153 19.3 Domestic waste water 99 12.5 Solid wastes 154 19.4 Animals and birds 214 27.0 Other 55 6.9 n = total number of households.

Eastern Mediterranean Health Journal, Vol. 11, Nos 5/6, 2005 1127
�ملجلة �لصحية لشرL �ملتوسط، منظمة �لصحة �لعاملية، �ملجلد �حلا�E عشر، �لعد��� ٥-٦، ٢٠٠٥
References
1. Egypt human development report 2003. Cairo, Egypt, United Nations Develop-ment Programme and the Institute of National Planning, 2003.
2. Alexandria human development report 2003. Cairo, Egypt, United Nations De-velopment Programme, 2003.
3. Improving the lives of 100 million slum dwellers. Guide to monitoring target 11. Progress towards the Millennium De-
velopment Goals, Nairobi, May 2003. Nairobi, Kenya, United Nations Human Settlements Programme, 2003.
4. Environmental demographical and hy-giene survey report. Alexandria, Egypt, High Institute of Public Health, 2003.
5. World development indicators 2002. Washington DC, USA, World Bank, 2002.
Note of appreciationWe would like to draw our readers’ attention to the list of reviewers at the end of this issue. The scientific integrity and standard of the information disseminated through EMHJ depends greatly on the criti-cal judgement of our reviewers. We would like to extend our sincere thanks and gratitude to them all for giving voluntarily of their time so willingly.