Why were some La Niñas followed by another La Niña?
16
1 23 Climate Dynamics Observational, Theoretical and Computational Research on the Climate System ISSN 0930-7575 Volume 42 Combined 3-4 Clim Dyn (2014) 42:1029-1042 DOI 10.1007/s00382-013-1917-3 Why were some La Niñas followed by another La Niña? Zeng-Zhen Hu, Arun Kumar, Yan Xue & Bhaskar Jha
-
Upload
independent -
Category
Documents
-
view
0 -
download
0
Transcript of Why were some La Niñas followed by another La Niña?

1 23
Climate DynamicsObservational, Theoretical andComputational Research on the ClimateSystem ISSN 0930-7575Volume 42Combined 3-4 Clim Dyn (2014) 42:1029-1042DOI 10.1007/s00382-013-1917-3
Why were some La Niñas followed byanother La Niña?
Zeng-Zhen Hu, Arun Kumar, Yan Xue &Bhaskar Jha

1 23
Your article is protected by copyright and
all rights are held exclusively by Springer-
Verlag (outside the USA). This e-offprint is
for personal use only and shall not be self-
archived in electronic repositories. If you wish
to self-archive your article, please use the
accepted manuscript version for posting on
your own website. You may further deposit
the accepted manuscript version in any
repository, provided it is only made publicly
available 12 months after official publication
or later and provided acknowledgement is
given to the original source of publication
and a link is inserted to the published article
on Springer's website. The link must be
accompanied by the following text: "The final
publication is available at link.springer.com”.

Why were some La Ninas followed by another La Nina?
Zeng-Zhen Hu • Arun Kumar • Yan Xue •
Bhaskar Jha
Received: 28 September 2012 / Accepted: 11 August 2013 / Published online: 29 August 2013
� Springer-Verlag (outside the USA) 2013
Abstract This paper investigates why some La Nina
events are followed by another La Nina and some others
are not. We propose two preconditions that result in con-
tinuation of a La Nina. The first one is that La Nina must be
a strong event (a major La Nina). This ensures that the
reflected Rossby wave signal at the eastern boundary of the
Pacific has a strong westward propagating cold ocean
temperature anomaly over the off-equatorial region. The
off-equator cold anomaly may not be conducive to the
equatorial recharge process, and as a result, may favor the
persistence of cold ocean subsurface temperature anomaly
and prevent the transition from La Nina to El Nino. The
second precondition is whether there are eastward propa-
gating downwelling Kelvin waves during the decay phase
of a major La Nina. Eastward propagating downwelling
Kelvin waves could lead to demise for a tendency for a
follow-up La Nina. The equatorial Kelvin wave activities
are associated with fluctuations of surface wind in the
equatorial far-western Pacific. The analysis suggests that
both the surface wind in the equatorial far-western Pacific
and the recharge/discharge of the equatorial Pacific are
indicators for occurrence or no occurrence of a follow-up
La Nina event.
Keywords Multi-year La Nina � Oceanic Kelwin
wave � Surface wind stress divergence in far-western
Pacific � Recharge and discharge processes
1 Introduction
As the leading mode of seasonal-to-interannual variability
in the tropical climate system, El Nino-Southern Oscilla-
tion (ENSO) has significant impacts on global weather and
climate anomalies (e.g., Glantz 2000). Interestingly, the El
Nino and La Nina, together with their global impacts, are
not symmetric in many aspects. For example, tropical sea
surface temperature (SST) anomalies (SSTAs) for El Nino
and La Nina are asymmetric in their magnitude (Hoerling
et al. 1997; Burgers and Stephenson 1999; Okumura et al.
2011; Kumar and Hu 2013), their meridional extension
(Zhang et al. 2009), zonal phase propagation (McPhaden
and Zhang 2009), and associated atmospheric response and
teleconnection patterns (Hoerling et al. 1997).
The temporal evolution associated with El Nino and La
Nina events is also not symmetric (Kessler 2002; Kug et al.
2005; Ohba and Ueda 2009; Okumura et al. 2011). Kessler
(2002) reported a distinct break in the transition from La
Nina to El Nino leading to departure from the concept of
ENSO as a cycle. Statistically, after the mature phase, El
Nino tends to decay rapidly by next summer, but La Nina
event normally persists through the following year, and at
times, re-emerges in the subsequent winter, occurring twice
or even multiple times over consecutive years. Thus, some
La Ninas are followed by another La Nina instead of El
Nino as the concept of ‘‘ENSO cycle’’ may warrant.
There have been attempts to explain the asymmetry in
the temporal evolution between El Nino and La Nina. Ohba
and Ueda (2009) argued that the process responsible for the
asymmetry is the nonlinear atmospheric response to SSTs,
which originates from the distribution of climatological
SST and its seasonal cycle. The atmospheric response to El
Nino was shown to go through a rapid reduction (or
relaxation) in the eastern Pacific westerly anomalies at the
Z.-Z. Hu (&) � A. Kumar � Y. Xue � B. Jha
NCEP/NWS/NOAA, Climate Prediction Center, 5830 University
Research Court, College Park, MD 20740, USA
e-mail: [email protected]
B. Jha
WYLE Science, Technology and Engineering Group, Houston,
TX, USA
123
Clim Dyn (2014) 42:1029–1042
DOI 10.1007/s00382-013-1917-3
Author's personal copy
end of boreal winter, leading to thermocline adjustment via
generation of eastward propagating upwelling oceanic
Kelvin wave (Ohba and Ueda 2009). However, the eastern
Pacific easterly anomalies in the cold phase persist into the
subsequent spring, and in the absence of rapid change in
the surface wind forcing, La Nina SSTAs continue. In
addition to the asymmetric atmospheric response to El
Nino and La Nina as a cause for their asymmetric temporal
evolution, possible influence from the Indian Ocean (Kug
et al. 2005; Okumura et al. 2011) has also been proposed as
a candidate mechanism. In this hypothesis, the eastward
displacement of the convection anomalies during El Nino
enables surface winds in the equatorial western Pacific to
be more affected by remote forcing from the Indian Ocean
leading to a faster termination of the Pacific warm events.
All of the previous work has led to significant progress
in the understanding of ENSO mechanisms during the past
decade. Nevertheless, significant challenges remain in real-
time prediction of different aspects of an ENSO cycle in
the state-of-the-art coupled general circulation models
(CGCM) (e.g., Guilyardi et al. 2009; Barnston et al. 2012;
Kumar and Hu 2012). For example, except for a few
models (Zhang et al. 2013), a majority of ENSO predic-
tion models were unable to predict the follow-up La
Nina in 2011–2012 (http://iri.columbia.edu/climate/ENSO/
currentinfo/archive/index.html). The lack of skill in pre-
dicting the follow-up La Nina events was consistent with
the observational evidence that during the decay phase of
La Nina, recharge of the equatorial Pacific is not robust and
equatorial heat content no longer carries the memory of the
ENSO cycle forward (Kessler 2002; Kug et al. 2005).
The recharge/discharge of equatorial heat content during
an ENSO cycle reflects the oceanic heat exchange between
the equator and off-equatorial oceans (Wyrtki 1985; Jin
1997; Wang 2001; Clarke et al. 2007; Wang et al. 2013).
During an El Nino, discharge of equatorial heat content
occurs and results in heat transportation from the equator to
the off-equator. This discharge not only leads to termina-
tion of the warm event, but also results in a shallower than
normal equatorial thermocline. The anomalous vertical
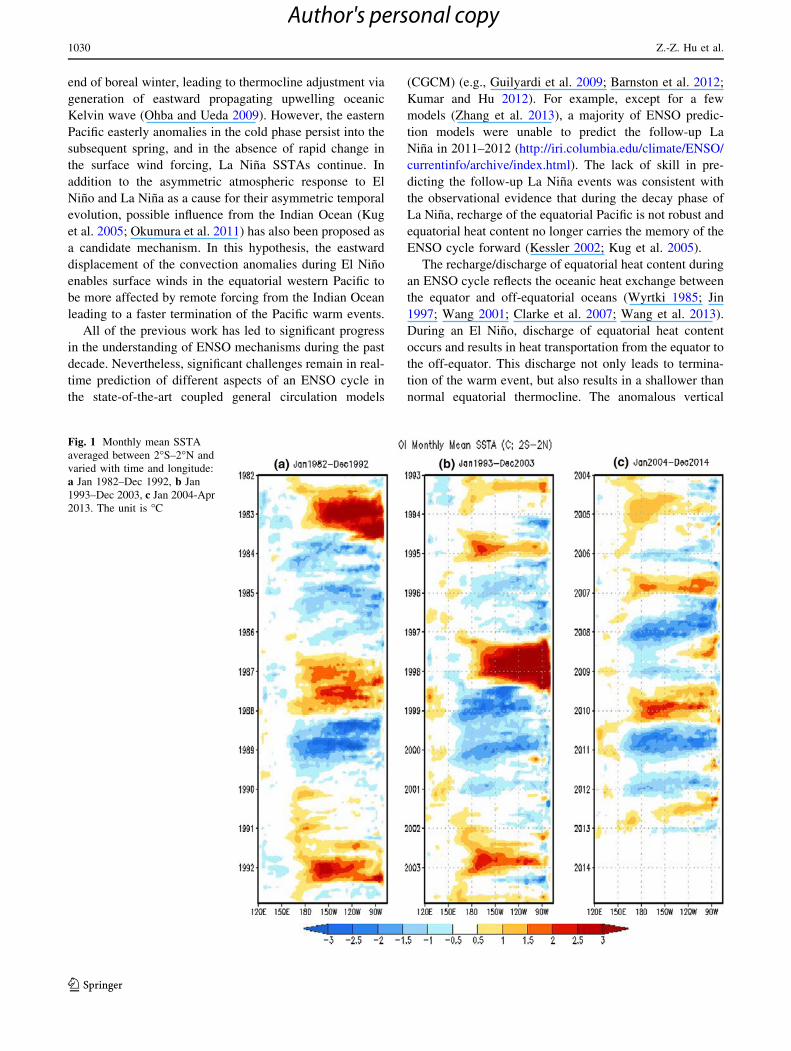
Fig. 1 Monthly mean SSTA
averaged between 2�S–2�N and
varied with time and longitude:
a Jan 1982–Dec 1992, b Jan
1993–Dec 2003, c Jan 2004-Apr
2013. The unit is �C
1030 Z.-Z. Hu et al.
123
Author's personal copy
advection of the colder sub-surface ocean temperature
anomalies by mean upwelling (i.e., thermocline feedback),
and zonal advection of the mean SST by anomalous
westward zonal currents (i.e., zonal advective feedback),
lead to La Nina conditions. The reverse happens during a
La Nina, reverting the equatorial oceanic conditions back
to an El Nino. The recharge/discharge process makes the
coupled ocean atmosphere system oscillate on interannual
time scales. Details about the recharge/discharge process
can be found in Jin (1997), Wang (2001), Clarke et al.
(2007), Wang et al. (2013), and references therein.
According to the recharge/discharge mechanism (and
other proposed ENSO mechanisms, e.g., delayed oscilla-
tor), ENSO is anticipated to be a cyclic oscillation between
El Nino and La Nina conditions. However, observed evi-
dence of frequent occurrence of second-year La Nina is a
discrepancy from the cyclic behavior of these theories, and
its physical mechanism has not been fully understood. For
example, 1999–2000 and 2007–2008, 2010–2011 La Ninas
are followed by weaker second-year La Ninas, but 1988-89
La Nina was not (Fig. 1). It is expected that through
examining the differences between La Nina that are fol-
lowed or not followed by another La Nina, we may further
our understanding in the behavior of ENSO, and eventually
improve our predictive ability, and is the focus of this
paper.
In this note, using observational data, we analyze the
evolution of the oceanic anomalies in the tropical Pacific
and the impact of tropical convection and surface winds in
the tropical western Pacific in conjunction with the evo-
lution of La Nina in an attempt to understand the differ-
ences between La Nina event that is followed by another
La Nina and the one that is not. The rest of the paper is
organized as follows: we introduce the data used in this
work in Sect. 2. The results are shown in Sect. 3, followed
by a summary and discussion in Sect. 4.
2 Data
Monthly mean heat content between the ocean surface and
300 m (HC300), monthly and pentad mean depth of 20 �C
isotherm (D20), monthly mean surface wind stress, ocean
temperature and current, and pentad mean surface wind
stress and ocean temperature are from the Global Ocean
Data Assimilation System (GODAS) (Behringer and Xue
2004). We also analyze monthly mean warm water volume
(WWV index), which was defined as average of D20 in
(120�E–80�W, 5�S–5�N) (Meinen and McPhaden 2000).
To measure oceanic Kelvin wave activity, we adopt an
oceanic Kelvin wave index, which is defined as standard-
ized projections of GODAS pentad (5-day) mean ocean
temperature anomalies (OTAs) onto a first mode of an
extended empirical orthogonal function (EEOF). The
EEOF is computed using OTAs of the upper 300 meters
along the equator between 135.5�E–94.5�W for each 14
contiguous pentad mean from GODAS. The methodology
of defining oceanic Kelvin wave index using EEOF with
OTAs is similar to that with D20 in Seo and Xue (2005).
The index has been used to routinely monitor equatorial
oceanic Kelvin wave activity at the Climate Prediction
Center (CPC) of National Oceanic and Atmospheric
Administration (NOAA) (http://origin.cpc.ncep.noaa.gov/
products/people/yxue/ocean_briefing/EDD/OKV_index.gif).
We also utilize observation-based analyses of version 2
of the optimum interpolation (OIv2) monthly mean SST
(Reynolds et al. 2002), and outgoing long-wave radiation
(OLR) (Liebmann and Smith 1996), both on a 2.5� 9 2.5�grid.
All monthly mean data are from Jan 1982-Apr 2013 for
the OIv2 SST and Jan 1979-Apr 2013 for the GODAS and
OLR data and the pentad mean data are from 03 Jan,
1979–29 Dec, 2011. The climatologies are computed using
data from Jan 1982–Dec 2011 for the monthly means and
from 1982–2004 using harmonic analysis for the pentad
mean data.
3 Results
3.1 SSTA evolution associated with La Nina
We focus on La Nina events after Jan 1982 because of the
availability of both OIv2 SST and GODAS data. First, we
note that unlike El Nino that normally has a single peak
during boreal winter, La Nina events usually have more
than one peak in their evolution and extend beyond a single
year as depicted by SSTA along the equator (Fig. 1). For
example, there were multiple peaks of SSTA for La Nina
events occurred in 1983–1986, 1995–1997, 1998–2001,
2007–2009, and 2010–2012, but no multiple peaks for
almost all El Nino events during Jan 1982–Apr 2013. This
Table 1 SSTA in the Nino3.4 region averaged in Dec, Jan and Feb
(DJF) of the peak years and the following years. The Nino3.4 SSTA is
adopted from CPC of NOAA (http://www.cpc.ncep.noaa.gov/
products/analysis_monitoring/ensostuff/ensoyears.shtml)
DJF of peak year (SSTA) DJF of the following year (SSTA)
1984/1985 (-1.0 �C) 1985/1986 (-0.5 �C)
1988/1989 (-1.7 �C) 1989/1990 (0.1 �C)
1995/1996 (-0.9 �C) 1996/1997 (-0.5 �C)
1999/2000 (-1.7 �C) 2000/2001 (-0.7 �C)
2005/2006 (-0.9 �C) 2006/2007 (0.7 �C)
2007/2008 (-1.5 �C) 2008/2009 (-0.9 �C)
2010/2011 (-1.4 �C) 2011/2012 (-0.9 �C)
La Ninas followed by another La Nina? 1031
123
Author's personal copy
asymmetric feature of the SSTA evolution between El
Nino and La Nina events has been noted in previous lit-
erature (e.g., Kessler 2002; Okumura et al. 2011).
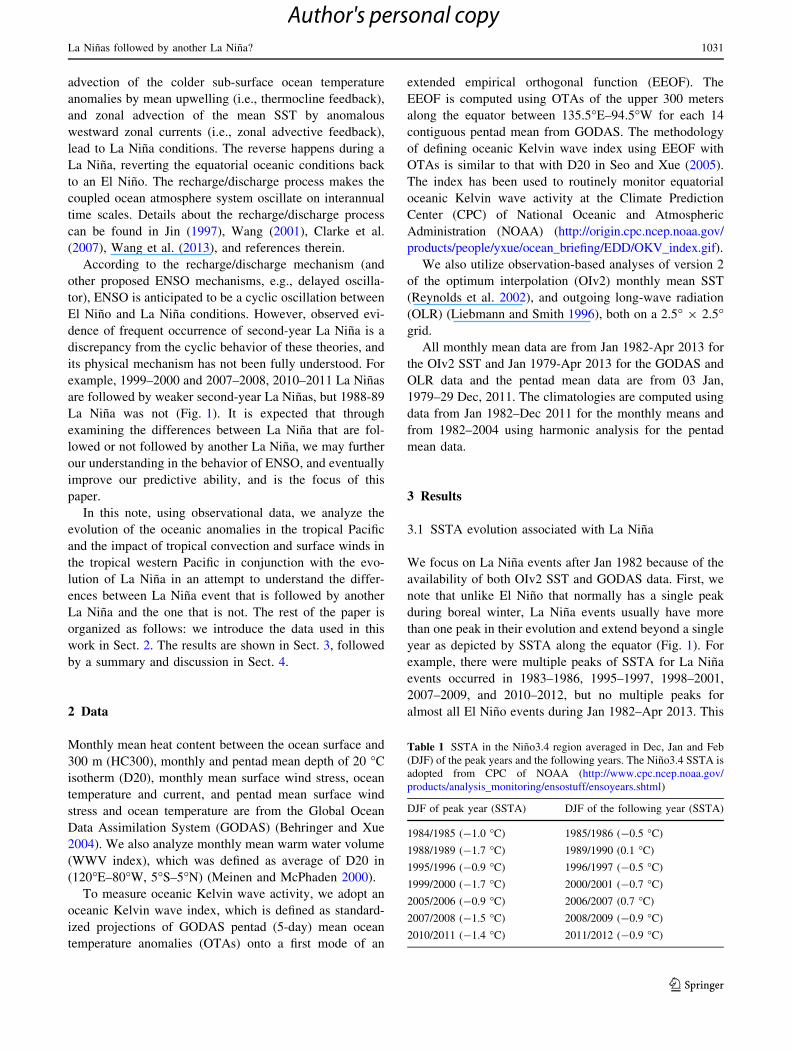
From Fig. 1 and Table 1, we also note that although
sometimes the Nino3.4 SST becomes above normal in the
following year for some La Ninas, for most La Ninas it
remains below normal but with reduced amplitude. After
Jan 1982, there were four strong La Nina events with
amplitude of monthly mean SSTA averaged in the Nino3.4
region larger than 1.0 �C: 1988–1989, 1999–2000,
2007–2008, and 2010–2011 (Fig. 2, Table 1), and except
for 1988–1989, all the other three strong La Nina events
were multi-year events. To distinguish the peaks in a multi-
year event, we refer to major peak as the first-year La Nina
and the post peak as the follow-up La Nina. There are some
other La Nina events when amplitude of monthly mean
SSTA averaged in the Nino3.4 region was smaller than
1.0 �C, and which are also associated with extended period
of negative SSTAs, such as 1984–1986 and 1995–1997
(Fig. 1, Table 1). For these events, the SSTA in the
Nino3.4 region doesn’t reach -0.5 �C in second peak, and
they have not been categorized as multi-year La Nina
events following the CPC definition. Thus, the analysis
suggests that a strong La Nina is one of the necessary (but
not sufficient) preconditions for a La Nina to become a
multi-year La Nina event. Possible differences in physical
Fig. 2 Monthly mean Nino3.4 index during a Jan 1988–Apr 1990, b Jan 1999–Apr 2001, c Jan 2007–Apr 2009, and d Jan 2010–Apr 2012. The
index is defined as the SSTA averaged in (5�S–5�N, 170�W–120�W)
1032 Z.-Z. Hu et al.
123
Author's personal copy
process linked to the intensity of a La Nina responsible for
occurrence and no occurrence of a follow-up La Nina, are
discussed next.
3.2 Heat content anomaly propagation and recharge/
discharge processes
The linkage of the intensity of a La Nina with the occur-
rence of follow-up La Nina may be due to the fact that a
strong La Nina is likely to ensure that the associated off-
equatorial oceanic heat anomalies are strong when they are
reflected at the oceanic east boundary and propagate
westward as Rossby waves. The stronger westward prop-
agating anomalies have a better chance for maintaining
their identity, and create the off-equatorial cold ocean
temperature anomalies that may negatively affect the
recharge of equatorial heat content, thereby leading to the
persistence of cold SST anomalies in the following year.
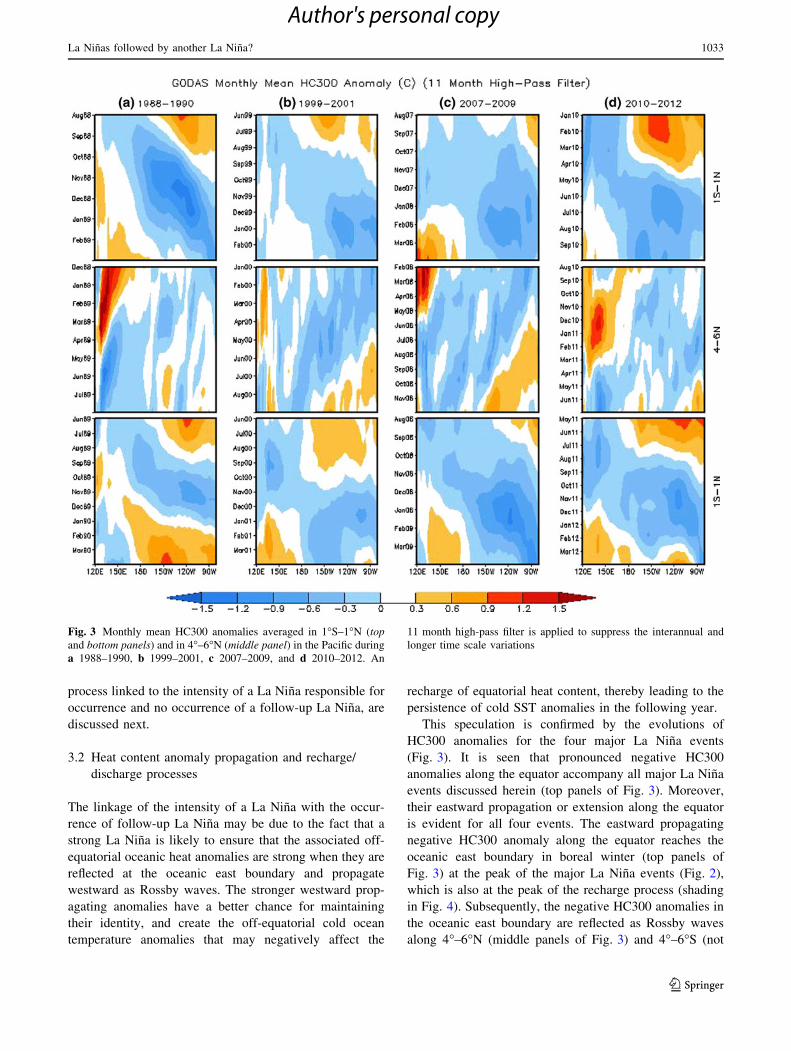
This speculation is confirmed by the evolutions of
HC300 anomalies for the four major La Nina events
(Fig. 3). It is seen that pronounced negative HC300
anomalies along the equator accompany all major La Nina
events discussed herein (top panels of Fig. 3). Moreover,
their eastward propagation or extension along the equator
is evident for all four events. The eastward propagating
negative HC300 anomaly along the equator reaches the
oceanic east boundary in boreal winter (top panels of
Fig. 3) at the peak of the major La Nina events (Fig. 2),
which is also at the peak of the recharge process (shading
in Fig. 4). Subsequently, the negative HC300 anomalies in
the oceanic east boundary are reflected as Rossby waves
along 4�–6�N (middle panels of Fig. 3) and 4�–6�S (not
Fig. 3 Monthly mean HC300 anomalies averaged in 1�S–1�N (top
and bottom panels) and in 4�–6�N (middle panel) in the Pacific during
a 1988–1990, b 1999–2001, c 2007–2009, and d 2010–2012. An
11 month high-pass filter is applied to suppress the interannual and
longer time scale variations
La Ninas followed by another La Nina? 1033
123
Author's personal copy
shown) and propagate westward towards the central Pacific
in the spring and summer following the first peak of La
Nina. Here, the two latitude belts (4�–6�N and 4�–6�S) are
chosen based on the HC300 anomaly propagation in the
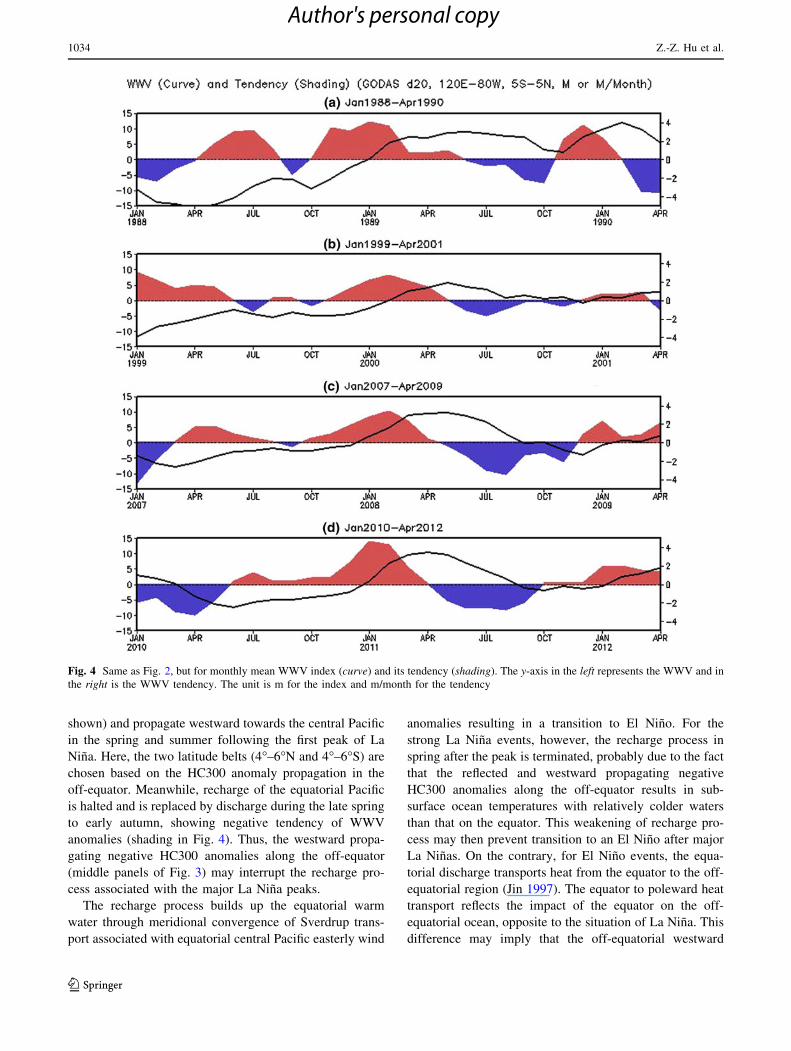
off-equator. Meanwhile, recharge of the equatorial Pacific
is halted and is replaced by discharge during the late spring
to early autumn, showing negative tendency of WWV
anomalies (shading in Fig. 4). Thus, the westward propa-
gating negative HC300 anomalies along the off-equator
(middle panels of Fig. 3) may interrupt the recharge pro-
cess associated with the major La Nina peaks.
The recharge process builds up the equatorial warm
water through meridional convergence of Sverdrup trans-
port associated with equatorial central Pacific easterly wind
anomalies resulting in a transition to El Nino. For the
strong La Nina events, however, the recharge process in
spring after the peak is terminated, probably due to the fact
that the reflected and westward propagating negative
HC300 anomalies along the off-equator results in sub-
surface ocean temperatures with relatively colder waters
than that on the equator. This weakening of recharge pro-
cess may then prevent transition to an El Nino after major
La Ninas. On the contrary, for El Nino events, the equa-
torial discharge transports heat from the equator to the off-
equatorial region (Jin 1997). The equator to poleward heat
transport reflects the impact of the equator on the off-
equatorial ocean, opposite to the situation of La Nina. This
difference may imply that the off-equatorial westward
Fig. 4 Same as Fig. 2, but for monthly mean WWV index (curve) and its tendency (shading). The y-axis in the left represents the WWV and in
the right is the WWV tendency. The unit is m for the index and m/month for the tendency
1034 Z.-Z. Hu et al.
123
Author's personal copy
propagating signals due to the reflection at the oceanic
eastern boundary play an important role for occurrence of
follow-up La Nina, but not for El Nino, and may be a
reason why major La Nina is normally followed by another
La Nina, but El Nino is normally not followed by another
El Nino (Kessler 2002).
In fact, the overall propagation features of the oceanic
heat content anomalies are similar between the weak La
Nina events (such as 1984–1986, and 1995–1997, not
shown) and the four strong La Nina events (Fig. 3).
Although on average, the oceanic heat content anomalies
are weaker and the propagation is less obvious for weaker
La Nina events, the propagation features shown in Fig. 3
are generally evident for all weak or strong La Nina events.
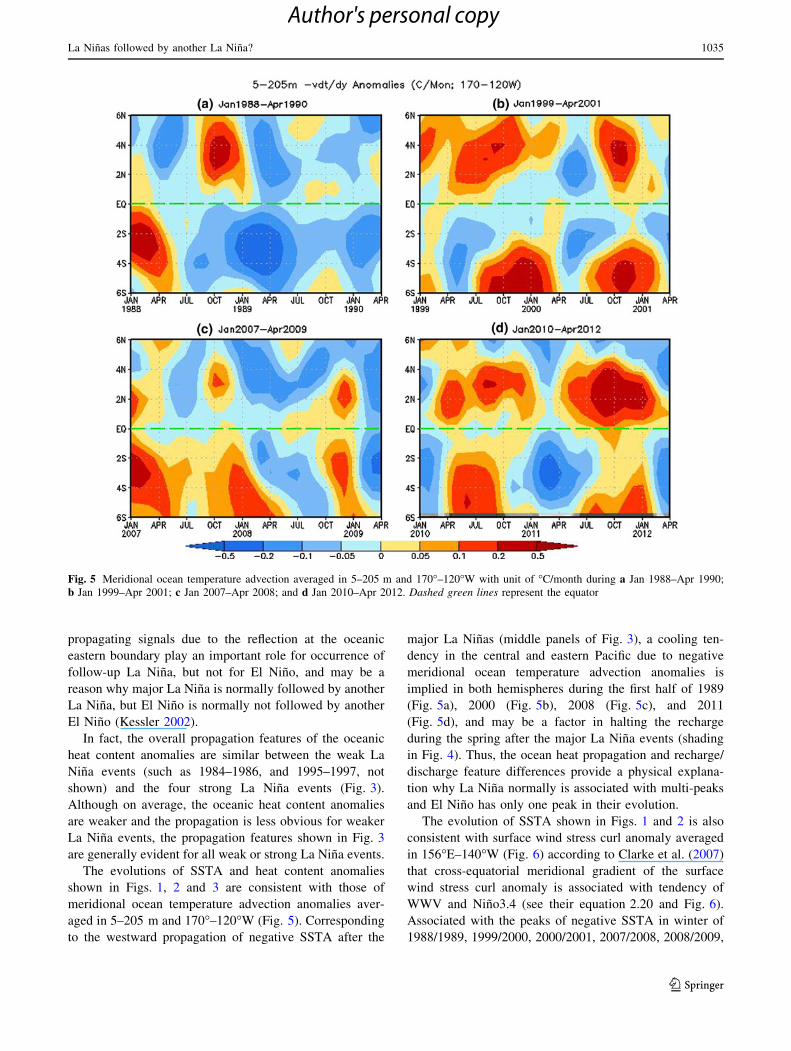
The evolutions of SSTA and heat content anomalies
shown in Figs. 1, 2 and 3 are consistent with those of
meridional ocean temperature advection anomalies aver-
aged in 5–205 m and 170�–120�W (Fig. 5). Corresponding
to the westward propagation of negative SSTA after the
major La Ninas (middle panels of Fig. 3), a cooling ten-
dency in the central and eastern Pacific due to negative
meridional ocean temperature advection anomalies is
implied in both hemispheres during the first half of 1989
(Fig. 5a), 2000 (Fig. 5b), 2008 (Fig. 5c), and 2011
(Fig. 5d), and may be a factor in halting the recharge
during the spring after the major La Nina events (shading
in Fig. 4). Thus, the ocean heat propagation and recharge/
discharge feature differences provide a physical explana-
tion why La Nina normally is associated with multi-peaks
and El Nino has only one peak in their evolution.
The evolution of SSTA shown in Figs. 1 and 2 is also
consistent with surface wind stress curl anomaly averaged
in 156�E–140�W (Fig. 6) according to Clarke et al. (2007)
that cross-equatorial meridional gradient of the surface
wind stress curl anomaly is associated with tendency of
WWV and Nino3.4 (see their equation 2.20 and Fig. 6).
Associated with the peaks of negative SSTA in winter of
1988/1989, 1999/2000, 2000/2001, 2007/2008, 2008/2009,
Fig. 5 Meridional ocean temperature advection averaged in 5–205 m and 170�–120�W with unit of �C/month during a Jan 1988–Apr 1990;
b Jan 1999–Apr 2001; c Jan 2007–Apr 2008; and d Jan 2010–Apr 2012. Dashed green lines represent the equator
La Ninas followed by another La Nina? 1035
123
Author's personal copy
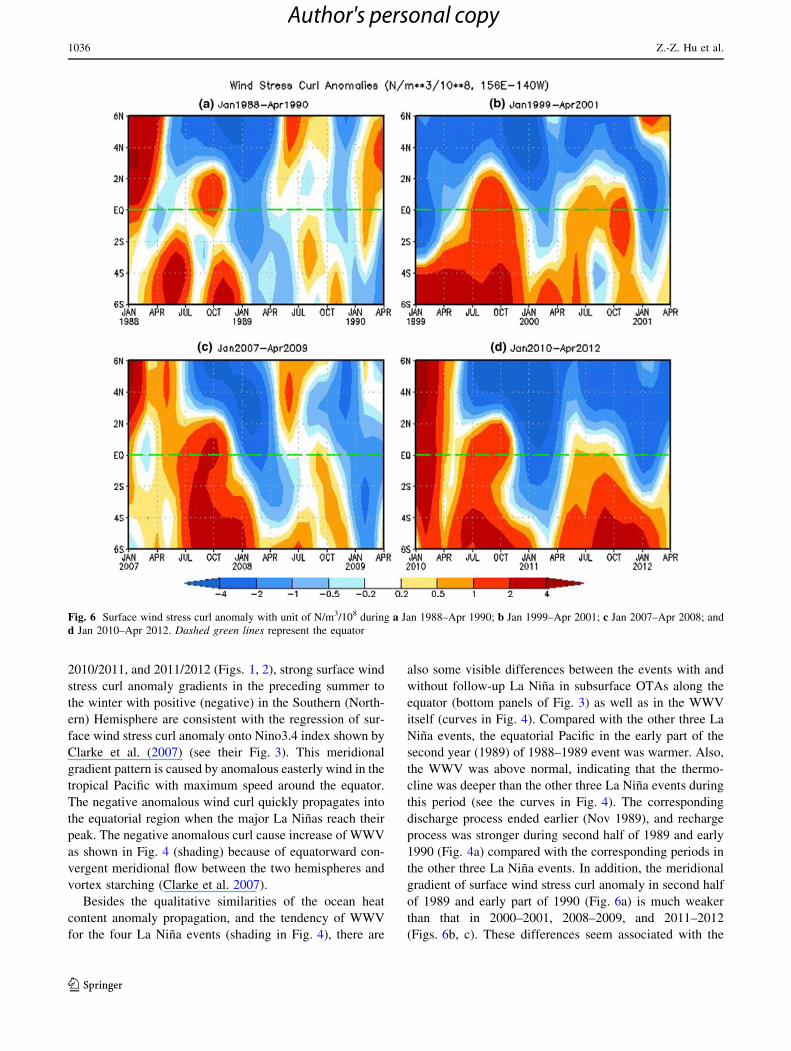
2010/2011, and 2011/2012 (Figs. 1, 2), strong surface wind
stress curl anomaly gradients in the preceding summer to
the winter with positive (negative) in the Southern (North-
ern) Hemisphere are consistent with the regression of sur-
face wind stress curl anomaly onto Nino3.4 index shown by
Clarke et al. (2007) (see their Fig. 3). This meridional
gradient pattern is caused by anomalous easterly wind in the
tropical Pacific with maximum speed around the equator.
The negative anomalous wind curl quickly propagates into
the equatorial region when the major La Ninas reach their
peak. The negative anomalous curl cause increase of WWV
as shown in Fig. 4 (shading) because of equatorward con-
vergent meridional flow between the two hemispheres and
vortex starching (Clarke et al. 2007).
Besides the qualitative similarities of the ocean heat
content anomaly propagation, and the tendency of WWV
for the four La Nina events (shading in Fig. 4), there are
also some visible differences between the events with and
without follow-up La Nina in subsurface OTAs along the
equator (bottom panels of Fig. 3) as well as in the WWV
itself (curves in Fig. 4). Compared with the other three La
Nina events, the equatorial Pacific in the early part of the
second year (1989) of 1988–1989 event was warmer. Also,
the WWV was above normal, indicating that the thermo-
cline was deeper than the other three La Nina events during
this period (see the curves in Fig. 4). The corresponding
discharge process ended earlier (Nov 1989), and recharge
process was stronger during second half of 1989 and early
1990 (Fig. 4a) compared with the corresponding periods in
the other three La Nina events. In addition, the meridional
gradient of surface wind stress curl anomaly in second half
of 1989 and early part of 1990 (Fig. 6a) is much weaker
than that in 2000–2001, 2008–2009, and 2011–2012
(Figs. 6b, c). These differences seem associated with the
Fig. 6 Surface wind stress curl anomaly with unit of N/m3/108 during a Jan 1988–Apr 1990; b Jan 1999–Apr 2001; c Jan 2007–Apr 2008; and
d Jan 2010–Apr 2012. Dashed green lines represent the equator
1036 Z.-Z. Hu et al.
123
Author's personal copy
differences of Kelvin activity and are discussed in the next
subsection.
3.3 Kelvin wave activity and surface wind stress
divergence in the equatorial western Pacific
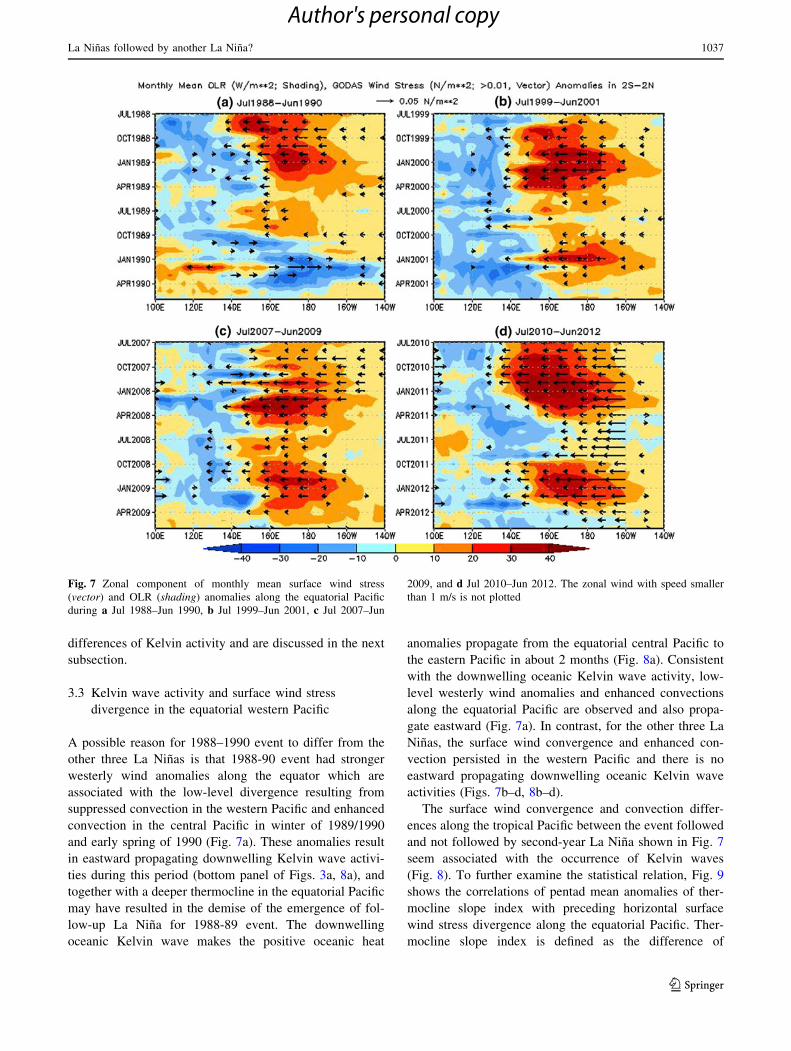
A possible reason for 1988–1990 event to differ from the
other three La Ninas is that 1988-90 event had stronger
westerly wind anomalies along the equator which are
associated with the low-level divergence resulting from
suppressed convection in the western Pacific and enhanced
convection in the central Pacific in winter of 1989/1990
and early spring of 1990 (Fig. 7a). These anomalies result
in eastward propagating downwelling Kelvin wave activi-
ties during this period (bottom panel of Figs. 3a, 8a), and
together with a deeper thermocline in the equatorial Pacific
may have resulted in the demise of the emergence of fol-
low-up La Nina for 1988-89 event. The downwelling
oceanic Kelvin wave makes the positive oceanic heat
anomalies propagate from the equatorial central Pacific to
the eastern Pacific in about 2 months (Fig. 8a). Consistent
with the downwelling oceanic Kelvin wave activity, low-
level westerly wind anomalies and enhanced convections
along the equatorial Pacific are observed and also propa-
gate eastward (Fig. 7a). In contrast, for the other three La
Ninas, the surface wind convergence and enhanced con-
vection persisted in the western Pacific and there is no
eastward propagating downwelling oceanic Kelvin wave
activities (Figs. 7b–d, 8b–d).
The surface wind convergence and convection differ-
ences along the tropical Pacific between the event followed
and not followed by second-year La Nina shown in Fig. 7
seem associated with the occurrence of Kelvin waves
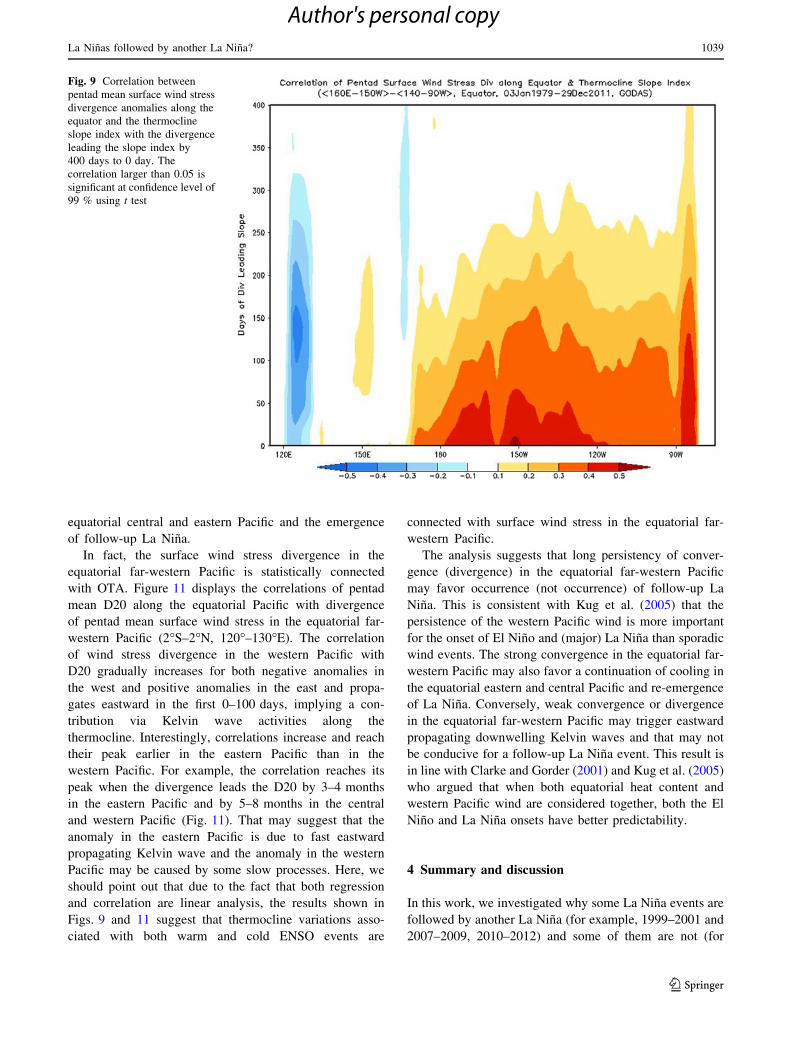
(Fig. 8). To further examine the statistical relation, Fig. 9
shows the correlations of pentad mean anomalies of ther-
mocline slope index with preceding horizontal surface
wind stress divergence along the equatorial Pacific. Ther-
mocline slope index is defined as the difference of
Fig. 7 Zonal component of monthly mean surface wind stress
(vector) and OLR (shading) anomalies along the equatorial Pacific
during a Jul 1988–Jun 1990, b Jul 1999–Jun 2001, c Jul 2007–Jun
2009, and d Jul 2010–Jun 2012. The zonal wind with speed smaller
than 1 m/s is not plotted
La Ninas followed by another La Nina? 1037
123
Author's personal copy

anomalous D20 between the western (160�E–150�W) and
eastern (90�–140�W) Pacific (Meinen and McPhaden
2000). Positive (negative) slope index corresponds to
negative (positive) phase of ENSO.
A negative correlation is found in the equatorial far-
western Pacific around 120�–130�E going back to preced-
ing 320 days (Fig. 9). Negative correlation peaks at about
100–150 days lead and is consistent with the zonal com-
ponent of surface wind stress anomalies shown in Fig. 7.
For the case without follow-up La Nina, the surface wind
stress anomalies reversed from easterly to westerly after
Oct 1989 (Fig. 7a), while for the cases with follow-up La
Nina, the easterly surface wind stress anomalies persisted,
and further, enhanced after Oct 2000, Oct 2008, Oct 2011,
respectively (Figs. 7b-d). We also note that the zonal sur-
face wind stress anomalies are mainly located to the east of
120�–130�E, that generate the divergence/convergence in
the 120�–130�E. Positive correlations are present over the
central and eastern Pacific and peak at zero lead. These
results suggest that the remote influence of surface wind
stress convergence (divergence) in the equatorial far-wes-
tern Pacific leads the thermocline slope variation by about
3–5 months. Thus, the convergence (divergence) in the
equatorial far-western Pacific has the potential to be used
as a predictor for the subsequent ENSO evolution (Clarke
and Gorder 2001; Kug et al. 2005; Zhang and McPhaden
2010; Wang et al. 2011).
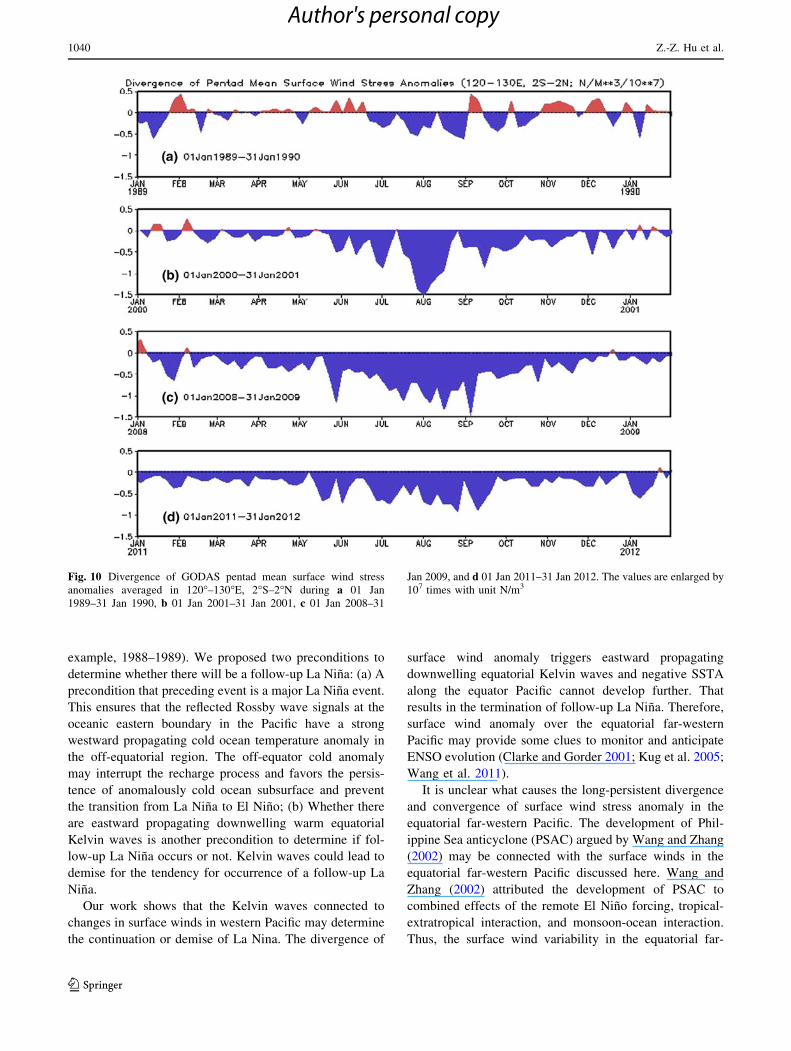
We next investigate the differences of the surface wind
stress divergence averaged in the equatorial far-western
Pacific (2�S–2�N, 120�–130�E) for the individual La Nina
events. The evolution of convergence and divergence in
the far-western Pacific was similar for the three La Nina
events (Fig. 10b–d), but was different from the
1989–1990 case (Fig. 10a). Using 2007–2009 event as an
example (Fig. 10c) for comparison, we note that for
1989–1990 there was no extended period of surface
convergence, while persistent and pronounced conver-
gence dominated during Jan 2008–Jan 2009. Extended
period of strong convergence in the tropical western
Pacific favor the persistency of the cold waters in the
Fig. 8 Standardized projection of pentad mean OTAs along the
equator onto 1st mode of EEOF in a Oct 1989–Jan 1990, b Oct 2000–
Jan 2001, c Oct 2008–Jan 2009, and d Oct 2011–Jan 2012. X-axis
represents the longitude location of maximum positive loading in the
14 contiguous pentad OTAs of 1st EEOF. See Seo and Xue (2005) for
the details of the EEOF calculation
1038 Z.-Z. Hu et al.
123
Author's personal copy
equatorial central and eastern Pacific and the emergence
of follow-up La Nina.
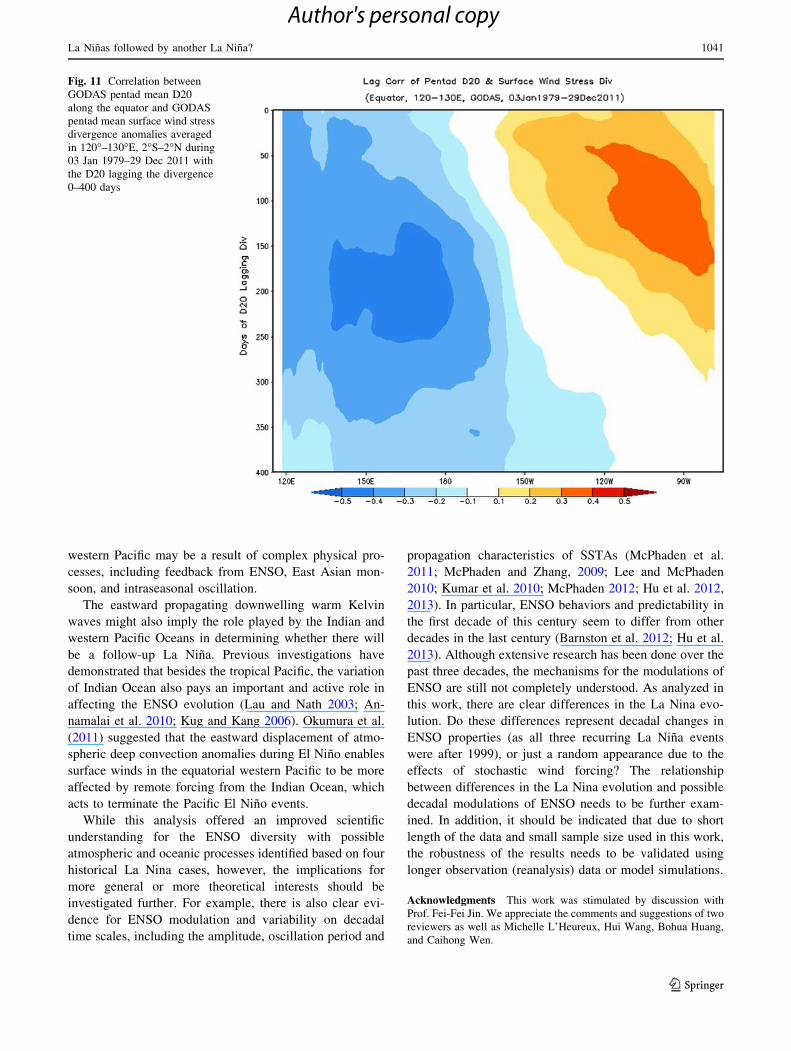
In fact, the surface wind stress divergence in the
equatorial far-western Pacific is statistically connected
with OTA. Figure 11 displays the correlations of pentad
mean D20 along the equatorial Pacific with divergence
of pentad mean surface wind stress in the equatorial far-
western Pacific (2�S–2�N, 120�–130�E). The correlation
of wind stress divergence in the western Pacific with
D20 gradually increases for both negative anomalies in
the west and positive anomalies in the east and propa-
gates eastward in the first 0–100 days, implying a con-
tribution via Kelvin wave activities along the
thermocline. Interestingly, correlations increase and reach
their peak earlier in the eastern Pacific than in the
western Pacific. For example, the correlation reaches its
peak when the divergence leads the D20 by 3–4 months
in the eastern Pacific and by 5–8 months in the central
and western Pacific (Fig. 11). That may suggest that the
anomaly in the eastern Pacific is due to fast eastward
propagating Kelvin wave and the anomaly in the western
Pacific may be caused by some slow processes. Here, we
should point out that due to the fact that both regression
and correlation are linear analysis, the results shown in
Figs. 9 and 11 suggest that thermocline variations asso-
ciated with both warm and cold ENSO events are
connected with surface wind stress in the equatorial far-
western Pacific.
The analysis suggests that long persistency of conver-
gence (divergence) in the equatorial far-western Pacific
may favor occurrence (not occurrence) of follow-up La
Nina. This is consistent with Kug et al. (2005) that the
persistence of the western Pacific wind is more important
for the onset of El Nino and (major) La Nina than sporadic
wind events. The strong convergence in the equatorial far-
western Pacific may also favor a continuation of cooling in
the equatorial eastern and central Pacific and re-emergence
of La Nina. Conversely, weak convergence or divergence
in the equatorial far-western Pacific may trigger eastward
propagating downwelling Kelvin waves and that may not
be conducive for a follow-up La Nina event. This result is
in line with Clarke and Gorder (2001) and Kug et al. (2005)
who argued that when both equatorial heat content and
western Pacific wind are considered together, both the El
Nino and La Nina onsets have better predictability.
4 Summary and discussion
In this work, we investigated why some La Nina events are
followed by another La Nina (for example, 1999–2001 and
2007–2009, 2010–2012) and some of them are not (for
Fig. 9 Correlation between
pentad mean surface wind stress
divergence anomalies along the
equator and the thermocline
slope index with the divergence
leading the slope index by
400 days to 0 day. The
correlation larger than 0.05 is
significant at confidence level of
99 % using t test
La Ninas followed by another La Nina? 1039
123
Author's personal copy
example, 1988–1989). We proposed two preconditions to
determine whether there will be a follow-up La Nina: (a) A
precondition that preceding event is a major La Nina event.
This ensures that the reflected Rossby wave signals at the
oceanic eastern boundary in the Pacific have a strong
westward propagating cold ocean temperature anomaly in
the off-equatorial region. The off-equator cold anomaly
may interrupt the recharge process and favors the persis-
tence of anomalously cold ocean subsurface and prevent
the transition from La Nina to El Nino; (b) Whether there
are eastward propagating downwelling warm equatorial
Kelvin waves is another precondition to determine if fol-
low-up La Nina occurs or not. Kelvin waves could lead to
demise for the tendency for occurrence of a follow-up La
Nina.
Our work shows that the Kelvin waves connected to
changes in surface winds in western Pacific may determine
the continuation or demise of La Nina. The divergence of
surface wind anomaly triggers eastward propagating
downwelling equatorial Kelvin waves and negative SSTA
along the equator Pacific cannot develop further. That
results in the termination of follow-up La Nina. Therefore,
surface wind anomaly over the equatorial far-western
Pacific may provide some clues to monitor and anticipate
ENSO evolution (Clarke and Gorder 2001; Kug et al. 2005;
Wang et al. 2011).
It is unclear what causes the long-persistent divergence
and convergence of surface wind stress anomaly in the
equatorial far-western Pacific. The development of Phil-
ippine Sea anticyclone (PSAC) argued by Wang and Zhang
(2002) may be connected with the surface winds in the
equatorial far-western Pacific discussed here. Wang and
Zhang (2002) attributed the development of PSAC to
combined effects of the remote El Nino forcing, tropical-
extratropical interaction, and monsoon-ocean interaction.
Thus, the surface wind variability in the equatorial far-
Fig. 10 Divergence of GODAS pentad mean surface wind stress
anomalies averaged in 120�–130�E, 2�S–2�N during a 01 Jan
1989–31 Jan 1990, b 01 Jan 2001–31 Jan 2001, c 01 Jan 2008–31
Jan 2009, and d 01 Jan 2011–31 Jan 2012. The values are enlarged by
107 times with unit N/m3
1040 Z.-Z. Hu et al.
123
Author's personal copy
western Pacific may be a result of complex physical pro-
cesses, including feedback from ENSO, East Asian mon-
soon, and intraseasonal oscillation.
The eastward propagating downwelling warm Kelvin
waves might also imply the role played by the Indian and
western Pacific Oceans in determining whether there will
be a follow-up La Nina. Previous investigations have
demonstrated that besides the tropical Pacific, the variation
of Indian Ocean also pays an important and active role in
affecting the ENSO evolution (Lau and Nath 2003; An-
namalai et al. 2010; Kug and Kang 2006). Okumura et al.
(2011) suggested that the eastward displacement of atmo-
spheric deep convection anomalies during El Nino enables
surface winds in the equatorial western Pacific to be more
affected by remote forcing from the Indian Ocean, which
acts to terminate the Pacific El Nino events.
While this analysis offered an improved scientific
understanding for the ENSO diversity with possible
atmospheric and oceanic processes identified based on four
historical La Nina cases, however, the implications for
more general or more theoretical interests should be
investigated further. For example, there is also clear evi-
dence for ENSO modulation and variability on decadal
time scales, including the amplitude, oscillation period and
propagation characteristics of SSTAs (McPhaden et al.
2011; McPhaden and Zhang, 2009; Lee and McPhaden
2010; Kumar et al. 2010; McPhaden 2012; Hu et al. 2012,
2013). In particular, ENSO behaviors and predictability in
the first decade of this century seem to differ from other
decades in the last century (Barnston et al. 2012; Hu et al.
2013). Although extensive research has been done over the
past three decades, the mechanisms for the modulations of
ENSO are still not completely understood. As analyzed in
this work, there are clear differences in the La Nina evo-
lution. Do these differences represent decadal changes in
ENSO properties (as all three recurring La Nina events
were after 1999), or just a random appearance due to the
effects of stochastic wind forcing? The relationship
between differences in the La Nina evolution and possible
decadal modulations of ENSO needs to be further exam-
ined. In addition, it should be indicated that due to short
length of the data and small sample size used in this work,
the robustness of the results needs to be validated using
longer observation (reanalysis) data or model simulations.
Acknowledgments This work was stimulated by discussion with
Prof. Fei-Fei Jin. We appreciate the comments and suggestions of two
reviewers as well as Michelle L’Heureux, Hui Wang, Bohua Huang,
and Caihong Wen.
Fig. 11 Correlation between
GODAS pentad mean D20
along the equator and GODAS
pentad mean surface wind stress
divergence anomalies averaged
in 120�–130�E, 2�S–2�N during
03 Jan 1979–29 Dec 2011 with
the D20 lagging the divergence
0–400 days
La Ninas followed by another La Nina? 1041
123
Author's personal copy

References
Annamalai H, Kida S, Hafner J (2010) Potential impact of the tropical
Indian Ocean-Indonesian seas on El Nino characteristics. J Clim
23:3933–3952
Barnston AG, Tippett MK, L’Heureux ML, Li S, DeWitt DG (2012)
Skill of real-time seasonal ENSO model predictions during
2002–2011: is our capability increasing? Bull Amer Meteor Soc
93(5):631–651
Behringer DW, Xue Y (2004) Evaluation of the global ocean data
assimilation system at NCEP: the Pacific Ocean. Preprints,
eighth symposium on integrated observing and assimilation
systems for atmosphere, oceans, and land surface, Seattle, WA.
Amer Meteor Soc
Burgers G, Stephenson DB (1999) The ‘‘normality’’ of El Nino.
Geophys Res Lett 26:1027–1030
Clarke AJ, Gorder SV (2001) ENSO prediction using an ENSO
trigger and a proxy for western equatorial Pacific warm pool
movement. Geophys Res Lett 28(4):579–582
Clarke AJ, Van Gorder S, Colantuono G (2007) Wind stress curl and
ENSO discharge/recharge in the equatorial Pacific. J Phys
Oceanogr 37(4):1077–1091
Glantz MH (2000) Currents of change: impacts of El Nino and La
Nina on climate and society. Cambridge University Press,
Cambridge, p 266, ISBN 052178672X
Guilyardi E, Wittenberg A, Fedorov A, Collins M, Wang C,
Capotondi A, van Oldenborgh GJ, Stockdale T (2009) Under-
standing El Nino in ocean–atmosphere general circulation
models: progress and challenges. Bull Amer Meteor Soc
90:325–340
Hoerling M, Kumar A, Zhong M (1997) El Nino, La Nina, and the
nonlinearity of their teleconnections. J Clim 10:1769–1786
Hu Z-Z, Kumar A, Jha B, Wang W, Huang B, Huang B (2012) An
analysis of warm pool and cold tongue El Ninos: air-sea
coupling processes, global influences, and recent trends. Clim
Dyn 38(9–10):2017–2035. doi:10.1007/s00382-011-1224-9
Hu Z-Z, Kumar A, Ren H-L, Wang H, L’Heureux M, Jin F-F (2013)
Weakened interannual variability in the tropical Pacific Ocean
since 2000. J Clim 26(8):2601–2613. doi:10.1175/JCLI-D-12-
00265.1
Jin F-F (1997) An equatorial ocean recharge paradigm for ENSO. Part
I: conceptual model. J Atmos Sci 54:811–829
Kessler WS (2002) Is ENSO a cycle or a series of events? Geophys
Res Lett 29(23):2125. doi:10.1029/2002GL015924
Kug J-S, Kang I-S (2006) Interactive feedback between ENSO and
the Indian Ocean. J Clim 19:1784–1801
Kug J-S, An S-I, Jin F-F, Kang I-S (2005) Preconditions for El Nino
and La Nina onsets and their relation to the Indian Ocean.
Geophys Res Lett 32:L05706. doi:10.1029/2004GL021674
Kumar A, Hu Z-Z (2012) Uncertainty in the ocean-atmosphere
feedbacks associated with ENSO in the reanalysis products.
Clim Dyn 39(3–4):575–588. doi:10.1007/s00382-011-1104-3
Kumar A, Hu Z-Z (2013) Interannual variability of ocean temperature
along the equatorial Pacific in conjunction with ENSO. Clim
Dyn (online release). doi:10.1007/s00382-013-1721-0
Kumar A, Jha B, L’Heureux M (2010) Are tropical SST trends
changing the global teleconnection during La Nina? Geophys
Res Lett 37:L12702. doi:10.1029/2010GL043394
Lau N-C, Nath MJ (2003) Atmosphere-ocean variations in the Indo-
Pacific sector during ENSO episodes. J Clim 16:3–20
Lee T, McPhaden MJ (2010) Increasing intensity of El Nino in the
central equatorial Pacific. Geophys Res Lett 37:L14603. doi:10.
1029/2010GL044007
Liebmann B, Smith CA (1996) Description of a complete (interpo-
lated) outgoing long wave radiation dataset. Bull Amer Meteor
Soc 77:1275–1277
McPhaden MJ (2012) A 21st century shift in the relationship between
ENSO SST and warm water volume anomalies. Geophys Res
Lett 39:L09706. doi:10.1029/2012GL051826
McPhaden MJ, Zhang X (2009) Asymmetry in zonal phase propa-
gation of ENSO sea surface temperature anomalies. Geophys
Res Lett 36:L13703. doi:10.1029/2009GL038774
McPhaden MJ, Lee T, McClurg D (2011) El Nino and its relationship
to changing background conditions in the tropical Pacific Ocean.
Geophys Res Lett 38:L15709. doi:10.1029/2011GL048275
Meinen CS, McPhaden MJ (2000) Observations of warm water
volume changes in the equatorial Pacific and their relationship to
El Nino and La Nina. J Clim 13:3551–3559
Ohba M, Ueda H (2009) Role of nonlinear atmospheric response to
SST on the asymmetric transition process of ENSO. J Clim
22:177–192
Okumura YM, Ohba M, Deser C, Ueda H (2011) A proposed
mechanism for the asymmetric duration of El Nino and La Nina.
J Clim 24:3822–3829. doi:10.1175/2011JCLI3999.1
Reynolds RW, Rayner NA, Smith TM, Stokes DC, Wang W (2002)
An improved in situ and satellite SST analysis for climate.
J Clim 15:1609–1625
Seo K-H, Xue Y (2005) MJO-related oceanic Kelvin waves and the
ENSO cycle: a study with the NCEP Global Ocean Data
Assimilation System. Geophys Res Lett 32:L07712. doi:10.
1029/2005GL022511
Wang C (2001) A unified oscillator model for the El Nino-Southern
Oscillation. J Clim 14:98–115
Wang B, Zhang Q (2002) Pacific-East Asian teleconnection, part II:
how the Philippine Sea anticyclone established during develop-
ment of El Nino. J Clim 15:3252–3265
Wang W, Chen M, Kumar A, Xue Y (2011) How important is
intraseasonal surface wind variability to real-time ENSO
prediction? Geophys Res Lett 38:L13705. doi:10.1029/
2011GL047684
Wang C, Deser C, Yu J-Y, DiNezio P, Clement A (2013) El Nino-
Southern Oscillation (ENSO): a review. In: Glymn P, Manzello
D, Enochs I (eds) Coral reefs of the eastern Pacific. Springer
Science Publisher (in press)
Wyrtki K (1985) Water displacements in the Pacific and the genesis
of El Nino cycles. J Geophys Res 90(C4):7129–7132
Zhang X, McPhaden MJ (2010) Surface layer heat balance in the
eastern equatorial Pacific Ocean on interannual time scales:
influence of local versus remote wind forcing. J Clim
23:4375–4394. doi:10.1175/2010JCLI3469.1
Zhang W-J, Li J-P, Jin F-F (2009) Spatial and temporal features of
ENSO meridional scales. Geophys Res Lett 36:L15605. doi:10.
1029/2009GL038672
Zhang R-H, Zheng F, Zhu J, Wang ZG (2013) A successful real-time
forecast of the 2010–11 La Nina event. Sci Rep 3:1108. doi:10.
1038/srep01108
1042 Z.-Z. Hu et al.
123
Author's personal copy