WHY IS LATIN AMERICA DEINDUSTRIALIZING
48
WHY IS LATIN AMERICA DEINDUSTRIALIZING?* David Brady Yunus Kaya Duke University University of North Carolina-Wilmington Gary Gereffi Duke University September 4, 2008 Word Count: 11,813 Running Head: Latin American Deindustrialization * The first two authors are listed alphabetically, each contributed equally. Please direct correspondence to David Brady, Department of Sociology, Duke University, Durham, NC, 27708, email: [email protected]. We thank Karen Remmer for suggestions.
Transcript of WHY IS LATIN AMERICA DEINDUSTRIALIZING

WHY IS LATIN AMERICA DEINDUSTRIALIZING?*
David Brady Yunus Kaya Duke University University of North Carolina-Wilmington
Gary Gereffi
Duke University
September 4, 2008
Word Count: 11,813
Running Head: Latin American Deindustrialization
* The first two authors are listed alphabetically, each contributed equally. Please direct correspondence to David Brady, Department of Sociology, Duke University, Durham, NC, 27708, email: [email protected]. We thank Karen Remmer for suggestions.
1
WHY IS LATIN AMERICA DEINDUSTRIALIZING?
ABSTRACT
Despite conditions favoring manufacturing employment in less developed countries, Latin America has surprisingly experienced deindustrialization in the past few decades. The average manufacturing share of employment has declined since about 1985, and quite substantially since the mid-1990s. Benefiting from recently available comparable data on manufacturing employment from 1980 through 2006, we use fixed effects models and a panel dataset of 20 Latin American countries to explain this trend. Specifically, we consider three theoretical explanations: productivity/ comparative advantage, institutionalism, and dependency/ world-systems. Our analyses demonstrate that the prevailing productivity/ comparative advantage explanation has limited value. By contrast, our final model of institutional and dependency/ world-systems variables effectively explains the trend. In particular, the deindustrialization of Latin America has been mainly driven by the negative effects of (in order of magnitude) the Mercosur trade agreement, mineral and ore exports, the duration of the current political regime, military spending, and inward foreign direct investment flows. We conclude by advocating for the value of uniting Weberian- and Marxian-inspired economic sociology to understand development and the global economy. Latin America faces the dual challenges of dependency in the global economy and burdensome institutions.

2
WHY IS LATIN AMERICA DEINDUSTRIALIZING?
In recent decades, the developing world has experienced a surge of industrialization. As
exemplified by the ascent of East Asian countries like South Korea and China, manufacturing
employment has expanded considerably in many less developed countries (LDCs) (Amsden
2001). For example, in his analysis of 64 LDCs, Kaya (2006) shows that on average, the
manufacturing share of employment expanded from 15 to 22 percent from 1980 to 2003. This
industrialization reflects a deepening integration of the global economy via international trade
and investment, changing institutions, and a new international division of labor. While many
affluent democracies experienced deindustrialization since the 1960s, the industrialization of
LDCs provides what some regard as a success story of the contemporary era of globalization
(Amsden 2001, 2003; Firebaugh 2004).
Yet, among LDCs, at least one region stands out for paradoxically departing from this
pattern. Since 1980, Latin America has actually experienced deindustrialization (Barros 1989;
Portes and Roberts 2005). As Figure 1 reveals, the manufacturing share of employment of the
average Latin American country (of our sample of 20 described below) rose from 22.7 percent in
1980 to 25.5 in 1985 and 24.5 in 1990. Since then, however, the mean fell to 21.0 percent in
2003 and 21.6 in 2006. Although the overall mean manufacturing share of employment (22.9)
was generally high relative to most LDCs, the trend is clear. The bivariate correlation between
the manufacturing share of employment and time is significantly negative (r=-.21) (see Appendix
I). Moreover, a fixed effects (FE) model of manufacturing share results in a significant negative
effect of time (t=-2.97). If we allow time to have a non-linear relationship, a FE model shows
that manufacturing employment did not change significantly from 1980 to 1995. However,
dummies for 2000, 2003 and 2006 are significantly negative compared to the reference of 1995.

3
Thus, even under careful inspection, a trend of a declining manufacturing employment appears to
be real (see Appendix I for details).1
[ FIGURE 1 ABOUT HERE ]
Of course, within this broad trend, there was intra-regional variation (see Appendix II).
Some relatively more industrialized countries like Argentina, Colombia and Trinidad and
Tobago had average manufacturing shares above 26 percent. Yet, Figure 1 reveals that even the
maximum value in the sample declined from 36.9 percent in 1980 (Trinidad and Tobago) to 31.5
in 1995 (Colombia) to 28-31 percent after 2000 (Trinidad and Tobago). On balance, a few Latin
America countries like Jamaica, Panama and Nicaragua industrialized over the period. Figure 1
shows that the minimum rose from 13 percent in 1980 (Nicaragua) to 16.7 in 1995 (Paraguay).
But even the minimum fell to 15.8-16.1 after 2003 (Paraguay). The most visible
deindustrialization occurred perhaps in Colombia where the manufacturing share fell from 34
percent to 18.8 percent in 2006. This was no anomalous exception, however. In all 20 Latin
American countries in our sample, the manufacturing share of employment was lower in 2006
than it was at its peak (which varied across countries, see Appendix II).2
The deindustrialization of Latin America presents an important theoretical puzzle. For
Latin America is proximate to the richest and largest consumer market in the world. As the U.S.
has deindustrialized itself and reduced its barriers to imports from LDCs, Latin America has a
huge comparative advantage in cheap labor. Latin America’s average worker productivity and
skill level have risen just as technology for international communication and transportation have
1 It would be reasonable to interpret this trend as consistent with convergence. In 1980, the coefficient of variation across the 20 countries was .29. In 1990, it was .23, and in 2006, it was .15. Although this convergence across countries is consistent with decline, it is not our research question. 2 The countries with the smallest within-country ranges (the difference between maximum and minimum) were Guatemala (3.3, peak in 2000), Panama (3.5, peak in 1995), and Jamaica (3.8, peak in 1995). All other countries had a within-country range in excess of 4.5 and 12 countries exceeded 7.
4
improved. Over the past 10-15 years, political stability in the region has improved as well –
producing a more attractive and secure market for investment. Thus, one should have expected
Latin America to have undergone rising industrialization over the past few decades. Moreover,
Latin American industrialization has always occupied the attention of theorists of development
(e.g. Gereffi and Wyman 1990). Indeed, more than thirty years ago, Bairoch (1975) noticed that
Latin America had the highest rates of industrialization in the developing world. Just as
industrialization was central to Marx, Weber and other founders of sociology, contemporary
classics by the likes of A.O. Hirschman (1958, 1968) and Evans (1979) treated Latin American
industrialization as a as a crucial testing ground for social theory.
The deindustrialization of Latin America is important not only as a puzzle for scholars,
however. For with industrialization, LDCs tend to experience economic development and
democratization, a rise in well-being and an expansion of public programs. In our panel of 20
Latin American countries, manufacturing share of employment is positively correlated with
female and male life expectancy, secondary school enrollment, and democracy. Manufacturing
is also negatively associated with infant and under-5 mortality. Most clearly, industrialized Latin
American countries tend to be more economically developed as gross domestic product per
capita correlates strongly with manufacturing share.3 Although industrialization is no panacea
for LDCs and certainly can be linked with social problems like inequality and pollution, it may
provide a successful path for navigating the global economy (Amsden 2001; Firebaugh 2003).
Therefore, the deindustrialization of Latin America presents an important challenge to the
aspirations for development and improved well-being in the region.
3 All of these are simply bivariate correlations (details available upon request), and do not incorporate country fixed effects or confirm causality.

5
This study assesses the evidence for three theoretical explanations of international
variation in manufacturing employment to explain the deindustrialization of Latin America. We
consider the evidence for what we call the “productivity and comparative advantage”
explanation, which is the leading model in development economics and even in sociological
studies of industrialization and deindustrialization (Alderson 1999; Brady and Denniston 2006).
Reflecting influential currents in economic sociology, we then evaluate institutional sources of
manufacturing employment. Last, we draw upon longstanding arguments from world-systems/
dependency theory. Our analyses are based on fixed effects models of recently available
comparable data on the manufacturing share of employment in 20 Latin America countries from
1980 to 2006. Ultimately, we seek to explain why Latin America has experienced
deindustrialization since the 1980s.
THEORIES OF INDUSTRIALIZATION AND DEINDUSTRIALIZATION
Productivity and Comparative Advantage
In order to industrialize, it has long been clear that LDCs would need to meet basic
conditions of urbanization, schooling and capital investment.4 Reflecting modernization theory
and textbook economics, many scholars optimistically expected that LDCs would certainly
industrialize once these basic conditions were met (Kerr et al. 1960; Levy 1966; Moore 1960).
In his influential theory of industrial employment, Clark ([1940] 1957) proposed that as an
economy develops, the price and relative demand for agricultural products decline, while the
4 On urbanization, Hirschman (1968: 23) argues that industrialization is more likely “to spill from one industry to another” when there are several urban centers in a country (also Bairoch 1975). As well, urbanization proxies how much a country has moved away from agriculture. Wood (1994) stresses that the developing countries need to provide at least basic levels of education to their labor forces in order to utilize their comparative advantage. Robinson and Briggs (1991) emphasize the role of investment as substantially more important than even rising worker productivity.
6
demand for manufacturing increases. As a result, manufacturing employment almost
mechanically increases.
In recent decades, the prevailing view has basically adopted Clark’s explanation by
highlighting the role of worker productivity. This leading model for explaining industrialization
(as well as deindustrialization) has focused on the abundance and productivity of relatively cheap
skilled workers (Alderson 1999; Brady and Denniston 2006; Dasgupta and Singh 2006; Fligstein
2001; Grant and Wallace 1994; Pieper 2000; Rowthorn and Wells 1987). As a country develops
economically, agricultural employment is naturally replaced by industrial employment (Bairoch
1975; Bluestone and Harrison 2000). This occurs until a country reaches a point of industrial
maturity, after which service jobs replace manufacturing jobs and service sector growth outpaces
that of the industrial sector (Alderson 1999). Hence, deindustrialization mainly occurs because
fewer manufacturing workers are needed to produce the same quantity of manufacturing goods
(Bluestone and Harrison 2000: 227-229). Therefore, one should be able to explain the
deindustrialization of Latin America as a result of those basic conditions and the rising
productivity of workers, which leads to less need for high quantities of labor.
Beyond productivity, the prevailing view typically incorporates the comparative
advantages of LDCs. Rising productivity does have a deterministic influence, and LDCs must
also maintain a favorable position in the global economy (Biggart and Guillén 1999; Guillén
2001; Wolf 2004). LDCs should specialize in manufactured goods for which they have a
comparative advantage, and LDCs should keep currency cheap so that those manufactured
products sell at a cheaper price internationally. Of course, this idea of specialization and
comparative advantage reflects the Heckscher-Ohlin (or H-O) model of trade, which also
stipulates that LDCs must be open to trade with other countries (Gilpin 2001: 206; Rodrik 1997).

7
An LDC should be able to increase manufacturing employment in durable goods if
manufacturing firms can acquire raw materials or parts at cheaper prices from other countries.
Because of such transactions, manufacturers should be able to retain employees and invest in
personnel, equipment and facilities (Bair and Gereffi 2001). In turn, manufacturing employment
should swell as worker productivity rises. In this account, industrialization requires a committed
export-orientation because exports cushion industries against declines in domestic consumption,
boost financial reserves, and contribute to economies of scale which favor sustainable
manufacturing sectors (Amsden 2001; Bairoch 1975; Londero and Teitel 1998). For example,
using Heckscher-Ohlin theory (HO), Wood (1994) claims that manufacturing exports trigger
manufacturing employment in LDCs as the abundance of low-skilled labor creates a comparative
advantage and lessens the “manufacturing autarky” of developed countries. Dodzin and
Vamvakidis (1999) show that increasing trade led to greater manufacturing employment in what
were previously agriculture-oriented LDCs. Similarly, Bollen and Appold (1993) demonstrate
that manufacturing exports significantly increases manufacturing employment.
This combination of basic conditions, productivity and comparative advantage might help
explain why the Import-Substitution Industrialization (ISI) era in Latin America was ultimately
counterproductive.5 More to the point, higher productivity as well as a weakening position in the
global economy plausibly may explain Latin American deindustrialization. Deindustrialization
may have occurred as workers productivity continued to grow beyond some point of maturity,
currency became expensive, and countries failed to export manufactured goods. All the while,
5 The ISI phase, which occurred after World War II until roughly the 1970s, was when Latin American countries set up barriers to manufacturing imports in order to shelter domestic industry (Cardoso and Faletto 1979; Evans 1979, 1995; Gereffi and Wyman 1990; Hirschman 1968). By closing off to foreign trade and investment, this phase ultimately was counterproductive as domestic industries were inefficient, had little access to technology, and reflected political patronage more than economic efficiency. Nevertheless, this era was characterized by protected domestic manufacturing that contributed to greater manufacturing employment (Portes and Roberts 2005).

8
those key initial basic conditions may have even deteriorated if urbanization has plateaued, and
schooling and domestic investment have stagnated.
Institutionalism
In the past few decades, economic sociology has called greater attention to the role of
institutions in shaping economic development (Biggart and Guillén 1999; Portes 2006).
Institutions can be thought of as stable agreements and historical settlements that channel,
constrain and regulate the economic behavior of firms and actors, and hence, explain the
economic patterns of industries and nation-states (Campbell 2004). Institutions include formal
and informal rules, laws, and even cultural norms that define the range of legitimate actions of
market actors. Thus, an institutional explanation should illustrate influences on
deindustrialization beyond the standard model of productivity and comparative advantage
(Biggart and Guillén 1999; Evans 1995). In the case of Latin American manufacturing, there are
four likely sets of institutions that may affect deindustrialization.
First, one striking feature of Latin American political economy is the widespread
existence of regional trade agreements (RTAs). For decades, Latin America has had a broad
array of legal-political institutions facilitating and regulating international economic exchange
(Hirschman 1968). By 1995, every Latin American country in our sample was a member of at
least two RTAs, and the median and mean country was a member of three (Schiff and Winters
2003). In Latin America, RTAs regulate the international flow of people, goods, services, and
capital. Particularly unique to this region is that the ascent and diffusion of RTAs grew out of
ISI, yet reflects the influence of neoliberalism (Phillips 2004; Rosen 2002). Countries
aggressively sought to partner with neighbors and within the region as they opened up to the
global economy, yet sought to also protect favored domestic industries to satisfy domestic elites

9
and key political constituencies (Phillips 2004). As a result, RTAs in Latin America are a
complex and imperfect patchwork of overlapping and competing institutions. Thus, one should
reasonably expect that distinct RTAs have potentially contradictory effects on Latin American
industry (Fligstein 2005).
Some RTAs may boost manufacturing employment as they facilitate greater access to
consumption markets and encourage capital investment and trade across borders (Bairoch 1975).
The enactment of the North America Free Trade Agreement (NAFTA), for example, encouraged
even greater investment in and contracting with Mexican firms and further opened U.S. markets
to Mexican exports (Bair and Gereffi 2001; Gereffi et al. 2002). Although manufacturing was
widespread in export-processing zones near the U.S. border and there had been several prior
initiatives (e.g. the Caribbean Basin) to facilitate trade, NAFTA and Chile’s free trade agreement
with the U.S. may have triggered even greater manufacturing job growth (Rosen 2002). By
contrast, other RTAs might undermine manufacturing employment because they remove
protections for domestic manufacturing firms, tie countries to the policies of their partners and
enact even greater barriers to those outside the RTA (Bhagwati 1999). Although RTAs were
supposed to be part of a broader opening to the global economy, many RTAs like Mercosur
actually established tighter restrictions outside the trade bloc itself. Weaker members of RTAs
are often forced to acquiesce to the demands and policies of the stronger members. For example,
Schiff and Winters (2003) point out that the other members of Mercosur (Argentina, Uruguay
and Paraguay) faced a significant disadvantage in manufacturing as Brazil devalued its currency.
Ultimately, the effects of various RTAs on Latin American manufacturing are an empirical
question (Fligstein 2005). Potentially, different RTAs have different effects.

10
Second, as part of structural adjustment reforms brought on by the debt crisis, the
International Monetary Fund (IMF) signed agreements with many Latin American countries,
which forced an implementation of neoliberal policies of free markets, fiscal austerity and
monetarism (Stiglitz 2002). These IMF agreements severely undermined the power of labor
(Martin and Brady 2007), and thus may have curtailed labor’s capacity to resist cutbacks in
manufacturing jobs and the closing of manufacturing facilities. If countries accepted IMF
charges and received funds to alleviate balance of payment and currency crises or to make
programmatic change, the IMF had tremendous leverage over the country (Vreeland 2003). As a
result, many Latin American countries were forced to liberalize markets and dismantle
protections for domestic industry (Barros 1989). Portes and Hoffman (2004) explain that the
neoliberalism brought on partly by the IMF has led to a weaker manufacturing sector and far
fewer of the stable, secure working class jobs traditionally available in manufacturing. Thus,
there are good reasons to suspect that countries that received IMF credits were more prone to
suffer losses in manufacturing employment (Harvey 2005).
Third, Latin American states have been particularly influenced by the military, and Latin
American industrialization reflects this influence (Cardenas et al. 2000; Centeno 2002).
Potentially, large and expensive militaries have had a damaging effect on the manufacturing
sector, and may have hastened deindustrialization. In his earlier study of Brazilian industry,
Evans (1979) stresses how the military often had a counterproductive relationship with foreign
investors and spent enormous resources on inefficient and wasteful state-sponsored
manufacturing enterprises. In his more recent study of developmental states, Evans (1995)
highlights military regimes as a clear example of predatory states that undermine the

11
industrialization of an LDC.6 In his classic account of “bureaucratic-authoritarian” military
regimes in Latin America, O’Donnell (1973) explains that although these regimes were
ideological nationalists for industrialization, they were corrupt/ ineffective managers of state-
sponsored industries. Interestingly, these generally negative portrayals of military effects on
industrialization seem to be at odds with studies showing the beneficial effects of military
spending in the U.S. (e.g. Hooks and Bloomquist 1992). Unlike military spending in developed
democracies that contributed to manufacturing growth, Latin American militaries have been
more likely to import equipment and provide little employment for domestic workers.
Moreover, these military regimes are less democratically responsive. Because military spending
has such a different political context than in developed democracies, military spending is less
likely to be channeled to invest in manufacturing employment (Centeno 2002).
Fourth, a central institutional influence on industrialization might be the durability and
stability of the political regime governing an LDC. On one hand, a central claim in economic
sociology has been that firms seek stability in their external environments (Fligstein 2001).
Although firms might prefer a liberalized market and a minimalist state, what manufacturers
really need is the predictability and certainty of stable institutions. As Hirschman (1968: 28)
wrote about Latin America 40 years ago, “An industrialist will consider exporting only when he
can be sure either that the basic institutions and policies which vitally affect his foreign
operations are highly stable.” More recently, Guillén (2001: 178) offers the following diagnosis:
“The Argentine automobile industry suffered from the zigzags in policymaking and the country’s
extreme degree of political and economic instability.” On the other hand, durable regimes might
6 Evans (1995) treats Brazil as an “intermediate” developmental state that was a “rough approximation of the Weberian ideal” of bureaucracy and one that was able to make some progress industrializing partly because of “pockets of efficiency” in the state regime. Like Evans, we find that Brazil was actually moderately successful in avoiding deindustrialization – declining only from 24.7% in 1980 to 21% in 2006 (with a low of 19.3% in 2000).
12
be durable because they have protected themselves against political challengers and dominate the
political arena (Evans 1995). With that dominance, regimes might become ossified, corrupt with
favoritism for certain industries and firms regardless of their inefficiencies (Evans and Rauch
1999). Indeed, Evans (1995) stresses that the stability and durability of a state is much less
likely to influence industrialization than the character of state-society relations and the
bureaucratic organization of state agencies. Moreover, the most durable regimes might, because
of historical time, be further along in the process of dismantling ISI and establishing
neoliberalism (Barros 1989; Chibber 2003; Harvey 2005; Portes and Roberts 2005). In turn,
deindustrialization may simply result as more politically-insulated durable states have more time
to dismantle the protections for domestic industry.
Dependency/ World-Systems
Dependency and world-systems (henceforth “dependency”) theories have long
challenged the optimism of those expecting industrialization in LDCs. Scholars in this tradition
advanced the view that there is a relationship of exploitation between LDCs and rich countries
(Cardoso and Faletto 1979; Evans 1979; Frank 1969; Gereffi 1983). For example, Wallerstein
(1974) argued that a European-centered world system was established in the long sixteenth
century, and continued in subsequent cycles. This system is organized around the core and the
periphery (and a small semi-periphery). Powerful industrialized countries constitute the core and
most LDCs constitute the periphery, and a country’s location in this “world-system” determines
development outcomes. Core countries do most of the industrial production and use peripheral
countries as markets, and the source for raw materials (Bairoch 1975; Bunker 1985).
Chase-Dunn and Grimes (1995) explain that, in the post-colonial world, the maintenance
of the world-system is achieved through “market mechanisms” like trade and foreign investment,
13
rather than direct threat and military might. Foreign trade composition, in which peripheral
countries export raw materials and resource-based products and import manufactured goods, is
an indicator of dependence on the core (Kentor and Boswell 2003). Therefore, dependency
theorists view open trade as detrimental to the periphery and favor protectionism or
disengagement as a better policy for industrialization (Cardoso and Faletto 1979). For example,
Schwartzman (1995) argues that trade dependence hurt industrialization in Brazil and Mexico,
and Schoonmaker (1995) shows that trade dependence, especially with the U.S., constrains the
Brazilian state’s attempts to cultivate domestic industry. Bollen and Appold (1991) find that
mineral and agricultural exports as well as manufacturing imports reduce the percent of the labor
force in industry.7 More recently, scholars have argued that dependence on raw material exports
can impede industrialization, a phenomenon referred to as the “resource curse” (Auty 2000;
Collier 2007). In an argument anticipated by Bunker (1985), dependence on raw material
exports fails to produce economic linkages into manufacturing, lead to ephemeral and
unsustainable boom-bust cycles that actually hinder subsequent industrialization, and distorts
development by forcing the government subsidization of distant outposts of extraction
disconnected from urban population and economic centers.8
In the 1980s, foreign direct investment (FDI) became a focus of inquiry for dependency
scholars (Firebaugh 1997). Many claimed that FDI into peripheral countries creates “investment
dependence,” which impedes development (Bornschier and Chase-Dunn 1985; Jorgenson et al.
2007; London and Smith 1988). The argument was that FDI tended to be capital-intensive, and
7 In a study particularly relevant to ours, Bollen and Appold (1991: 298) write, “The most critical and widespread factors explaining variation in the structure of industrialization are the composition of exports and imports.” 8 Schurman (2001) somewhat challenges the view that resource-based trade undermines industrialization, and argues that Chile benefited from a agricultural and natural resource export-boom that lead to industrial upgrading and industrial processing of such commodities. However, Schurman also emphasizes that Chile entered a third phase in the 1990s that was much less favorable to manufacturing employment. Consistent with Schurman, we identify 1995 as Chile’s peak for manufacturing employment and provide evidence of subsequent deindustrialization.

14
therefore failed to trigger employment growth and hindered what were called “linkages” to other
industries and sectors (i.e. what Evans [1995] refers to as “multidimensional conspiracies” of
interactive economic dynamism and expansion that diffuses growth).
Despite providing an interesting test of theory, these scholars focused on economic
growth and development, not industrialization. However, it could be reasonable to expect FDI in
LDCs to undermine industrialization as well (Frank 1969). Indeed, Cardoso and Faletto (1979)
argued that the initial dependence on foreign capital paralyzed Latin American industrialization
in the long run. Perhaps one can extend the arguments based on development generally, and
expect that dependence on foreign capital impedes the development of domestic capabilities for
industrialization and prevents a country from industrializing fully (Schrank 2004).9 For example,
Evans and Timberlake (1980) found that FDI triggers a rapid growth in service employment.
They argue that FDI exacerbates urban overcrowding due to the flight from rural areas, and that
even manufacturing FDI tends to be capital-intensive (yielding limited employment). Paus and
Gallagher (2008) show that FDI has been ineffective in promoting diversified industrialization in
Mexico and Costa Rica (the two biggest recipients of FDI in Latin America). Based on the case
of the Dominican Republic, Schrank (2008) argues that foreign investors are far less committed
and stable than “indigenous” investors and thus contribute much less to industrial development.
In sum, dependency theory expects that trade dependence and FDI should have negative
effects on manufacturing employment in Latin America. In particular, manufacturing imports,
exports to the U.S. (as the dominant core country for the region; see Kentor and Boswell 2003),
and agricultural and resource-based exports should all be negatively associated with
industrialization. In addition, FDI should have a negative effect on manufacturing employment.
9 We also emphasize this distinction to make clear that Firebaugh’s (1992) critique (of the denominator effects problem of predicting the level of economic development) should not apply. So long as manufacturing employment is not the denominator of the independent variable, our analysis does not suffer from this methodological problem.

15
Therefore, deindustrialization in Latin America should be driven by an increase in these
measures of dependency theory.
DATA AND METHODS
To examine the deindustrialization of Latin America, we analyze a panel of 20 Latin
American countries from 1980 to 2006: Argentina, Bolivia, Brazil, Chile, Colombia, Costa Rica,
Dominican Republic, Ecuador, El Salvador, Guatemala, Honduras, Jamaica, Mexico, Nicaragua,
Panama, Paraguay, Peru, Trinidad and Tobago, Uruguay, and Venezuela. To be included in our
sample, a country had to have a population of at least 500,000, data on manufacturing
employment for at least two time points.10 Data have been collected for 1980, 1985, 1990, 1995,
2000, 2003, and 2006. The unit of analysis is the country-year. Because of occasional missing
country-years, there is an average of 6.7 observations per country and the total number of
observations is 134.11 Appendix I presents descriptive statistics and sources for all variables.
Dependent Variable
The dependent variable is the manufacturing share of employment, calculated as the
percentage of total employment in a country-year. The manufacturing share of employment is
the standard indicator of industrialization in a country and is used routinely in similar studies
(Alderson 1999; Brady and Denniston 2006; Kaya 2007; Rowthorn and Wells 1987).
Unfortunately, data is not available for this dependent variable prior to 1980, so this is the basis
for beginning the analysis at that time point. Moreover, data is not available on annual basis, so
a full pooled time series (including all years) is not possible.
10 Unfortunately, because of data unavailability, Cuba and Haiti are not included. The population cutoff excludes the small Caribbean countries like Guyana and Dominica. 11 The six missing cases for the dependent variable are in 1985: Bolivia, Dominican Republic, Guatemala, Jamaica, Nicaragua, and Peru. Also, data is not available on an annual basis.
16
Independent Variables
We organize our analysis of deindustrialization in Latin America around the three
theoretical explanations. We test all three explanations separately before we combine variables
from all three explanations in final models. Because some independent variables exhibit skew
and have outliers, we used a decision rule that whenever a variable had a skew statistic above
2.0, we converted the variable to a natural log. To increase confidence in the causal time order
of the relationship with the dependent variable, we lag all independent variables one time period.
Thus, the first observation for each independent variable is in 1975 to predict manufacturing
employment in 1980 (and 2003 independent variables predict manufacturing in 2006).
Primarily, we examine eight measures for the productivity and comparative advantage
explanation. The first variable is Real GDP Per Capita (World Bank 2008). GDP is an
indicator of the level of economic development and productivity. Because Latin America has
traditionally been more industrialized, a point of industrial maturity may have passed, and even
greater productivity may have negative effects. To explore if GDP has an inverse U-shaped
relationship with manufacturing employment, we also consider the Real GDP Per Capita
Squared (Alderson 1999). Both GDP and its square are logged to control for outliers and skew.
Next, we include Inflation to indicate the price structure affecting industrialization including the
cost of labor and other production factors as well as the value of the currency. This variable is
also logged. Secondary School Enrollment is measured as net enrollment, and gauges the effect
of the skill-level within a country. Urbanization is measured as the percent of the population
living in urban areas. Gross Fixed Capital Formation as a percent of GDP is also included. This
is measured as the gains in fixed assets plus the net change in the inventory levels, and is
considered a measure of the domestic investment rate (WDI 2008). Finally, Exports measured as

17
a percent of GDP and Manufacturing Exports calculated as a percent of all exports are included
to assess the outward trade orientation and comparative advantage.
Secondly, we examine seven variables for the institutional explanation. The first set of
institutional variables identifies membership in regional trade agreements (RTAs). Membership
in RTAs may have significant albeit conflicting effects on manufacturing employment, and we
include a series of binary variables to indicate the key RTAs. The first is Membership in the
Central American Group of Four. The group includes El Salvador, Guatemala, Honduras and
Nicaragua. Second, Membership in MERCOSUR is a regional trade agreement among Brazil,
Argentine, Paraguay, and Uruguay. Although Venezuela is in the process of becoming a full
member, and Bolivia, Chile, Colombia, Ecuador, and Peru are associate members (Schiff and
Winters 2003), we only include the four full members. Third, we add Membership in the
Association of Caribbean States, which is an association of 28 independent and commonwealth
states aimed at strengthening regional co-operation. Next, we include a dummy for having a
Free Trade Agreement with the US. The US historically played a major role in the
industrialization of Latin America and having strong economic ties with the US might have a
defining effect. In addition to Mexico’s tie through the North American Free Trade Agreement
(NAFTA) since 1994, we code Chile in 2006 positively.12 The fifth institutional variable
assesses the impact of receiving an IMF Credit. This variable measures not only having a stand-
by agreement, but also actually receiving financing from the IMF. Rather than simply having an
agreement (Vreeland 2003), the lending of funds gives the IMF the most leverage to encourage
neo-liberal policies.13 Sixth, Military Expenditures as a % of GDP are included, and this
12 In sensitivity analyses available upon request, we decomposed this variable and assessed the precise effect of NAFTA. The results and conclusions were robust. 13 In analyses available upon request, we also tested whether a country was under an IMF agreement, had recently signed an IMF agreement, the cumulative years under IMF agreements (Vreeland 2003), as well as debt service as a
18
variable is logged. Finally, Duration of the Current Political Regime in measured in years since
the existing constitution was implemented. Although some argue that the stability of a political
regime may create a more suitable and risk-free environment for businesses, others suggest that
longer-lasting regimes might actually accelerate deindustrialization.
Thirdly, to test dependency theory, we consider eight variables. We first analyze
international trade and its technological composition. The first two examine inward trade:
Imports as a Percent of GDP and Manufacturing Imports as Percent of All Exports, which could
potentially undermine manufacturing employment. Next, we examine outward trade while
controlling for Exports as a Percent of GDP. We examine the product composition of exports
with Agricultural Exports, Fuel Exports, and Mineral and Ore Exports as a percent of all exports
(food and services exports are the omitted reference). These three measures of export
composition are logged. In the dependency model, peripheral countries export raw materials,
natural resources, and agricultural commodities and import manufactured products. According
to dependency theory, these three should have negative effects on manufacturing employment
(especially net of the level of exports). In addition, we add Exports to the US as a Percent of All
Exports, which is logged. The US has historically been the largest trade partner for most Latin
American countries.14 Trade partner concentration has always been a focus of dependency
scholars, and as a result, this variable should have a negative effect. Finally, we add logged
percent of exports or gross national income. None of these alternative measures of the debt crisis had significant effects, and all were less significant than the IMF Credit variable we report. 14 The exceptions are generally the smaller and landlocked Latin American countries like Paraguay, which rely more on trade with larger intraregional neighbors. As well, several countries have extensive intra-regional trade as well as trade with the European Union. An alternative would be to identify the largest trade partner within each country-year. However, we would argue that this could be deceptive and neglect the potentially longer-lasting, more durable and hegemonic consequences of trade with the largest economy in the hemisphere (indeed world).
19
Foreign Direct Investment Flows as a Percent of GDP (FDI).15 According to our interpretation
of dependency theory, one should expect a negative effect on manufacturing employment.
Models
Ordinary least squares (OLS) is not appropriate because panel data violate the assumption
of zero correlation between error terms (Wooldridge 2003). Because of the possible existence of
unmeasured time-invariant cross-national heterogeneity, we utilize fixed effects (FE) models
(Woolridge 2003). Halaby (2004) explains that FE models effectively control for unobserved
unit effects, which if ignored trigger bias and inconsistency. FE models are also more effective
against reverse endogeneity (Winship and Morgan 1999). FE models run OLS after differencing
variables from their country-specific means. The FE model can be represented as:
Yit = αiCi + βX it-1 + εit, which is then estimated by:
(Y it-Y i) = αi (Cit–C i) + β (Xit-1- X i) + (εit-ε i)
The subscript i represents a country and t represents a year (t-1 represents lagged values). Y
represents manufacturing employment, C is a vector of country-dummies (which drop out in the
second model), and X represents a vector of independent variables. Since the FE model
differences each observation from its country-mean ( X i), all cross-national differences are
removed. However, the reasonable number of observations per country in our sample (6.7 on
average) and the moderate number of countries (20 countries) makes the use of FE models
15 Unfortunately, FDI stock data are not available for the comprehensive scope of our sample’s country-years. Manufacturing (i.e. sector-specific) FDI data is available from the United Nations. However, that data is not available for the majority of our sample’s country-years. Moreover, the available data mixes FDI stock and flow across countries and years, and as a result it is not feasible to create a consistent and comparable time series for all countries. Hence, sector-specific FDI analyses are not presently feasible within our research design.
20
feasible. Finally, given our theoretical interest in over-time trends in manufacturing
employment, especially the trend of deindustrialization, FE models are most appropriate.16
RESULTS
To examine the evidence for the three explanations, we first specify models for the
productivity/ comparative advantage explanation. Then, retaining the most important variables
from this prevailing explanation, we examine the institutional and dependency explanations
separately. Finally, we combine the key significant variables from each explanation into one
model. Although we focus on statistical significance in the initial tables, we interpret both
statistical and substantive significance in the final models.
Productivity and Comparative Advantage Models
Table 1 presents the models of manufacturing share of employment on the productivity
and comparative advantage variables. Model 1 includes both GDP per capita and its square.
This model reveals that rising worker productivity has a significant negative effect on
manufacturing employment at the .05 level. Because GDP per capita squared is insignificant, we
find no evidence that there is a curvilinear inverse U-shaped relationship with manufacturing
employment as has been shown in developed countries (Alderson 1999; Brady and Denniston
2006). Surprisingly, rising worker productivity linearly reduces the manufacturing share of
employment. Perhaps Latin America was already at a point of industrial maturity before 1980,
and subsequent increased worker productivity resulted in fewer manufacturing jobs; and/ or
16 We do not correct for autocorrelation. This decision is partly theoretically-driven as we intend our models to explain (rather than correct for) temporal changes. With 6.7 average time points, the estimation of rho is not likely to be stable. Moreover, FE-AR1 models sacrifice the first time point in each panel, which results in a substantial loss of precious degrees of freedom. To be certain our models did not suffer from serious autocorrelation however, we estimated the final models with an AR1 correction. The estimates of rho would be .22, .19 and .19 across Table 4 (N=114). These low rhos demonstrate that autocorrelation is not a significant problem.

21
rising worker productivity simply does not enhance industrialization as it did in developed
countries. The second model includes only the linear term, and confirms that GDP per capita has
a significant linear negative effect. Model 2 also fits the data better than model 1. The next two
models consider both specifications as alternatives.
[ TABLE 1 ABOUT HERE ]
Model 3 includes GDP and its square and the remaining productivity/ comparative
advantage variables. Inflation is the only variable with a significant effect (+), although gross
fixed capital formation is nearly significant (t>1.5). This suggests some advantages for the
manufacturing sector when currency is cheaper. In model 3, both GDP and its square are
insignificant. In addition to the insignificance of secondary school enrollment and urbanization,
it is quite noteworthy that neither total exports nor manufacturing exports has a significant
effect.17 Unlike the well-documented East Asian successes, export-driven development does not
appear to have effectively facilitated recent industrialization in Latin America. These results are
entirely robust when GDP-squared is removed in Model 4.
The final models in this table include GDP, inflation, and gross fixed capital formation.
Although only inflation had robust significant effects, these three are the most promising
indicators of the productivity/ comparative advantage account. In model 5, gross fixed capital
formation becomes significant at the .10 level, and inflation still has a significant positive effect.
GDP is negatively signed but is not quite statistically significant (t=-1.2). Henceforth, we retain
these three as the key indicators of this explanation.18
17 In sensitivity analyses available upon request, we found that exports and manufacturing exports remained insignificant when added individually or with any combination of the other variables in model 3. 18 In analyses available upon request, we experimented with removing GDP per capita throughout and with including its square throughout. The results and conclusions were robust in these sensitivity analyses, and this is only partly because these productivity variables end up being less relevant in the final models.

22
Institutional Models
Table 2 presents the models of manufacturing share of employment on those three
variables, plus the variables for the institutional explanation. Model 1 features indicators for the
four RTAs. Similar to the previous table, inflation has a significant positive effect. Among the
RTAs, membership in the Central American Four has a significant positive effect on
manufacturing employment and a free trade agreement with the U.S. has a near significant
positive effect (t=1.6). By contrast, memberships in MERCOSUR and the Association of
Caribbean States have significant negative effects on manufacturing employment at the .001 and
.05 level, respectively. Interestingly, and somewhat anticipated by the literature (Fligstein 2005),
we find that different RTAs have different effects on manufacturing employment. The second
model demonstrates that receiving an IMF credit does not have a significant effect. Model 3
shows that military expenditures have a significant negative effect at the .1 level. This illustrates
the harmful influence of the military on development in Latin America. In models 2 and 3,
inflation (p<.01) and gross fixed capital formation (p<.10) now have significant positive effects.
Model 4 demonstrates that the duration of the current political regime has a significant negative
effect at the .05 level. This result challenges claims that regime durability and stability enhance
industrialization, and supports claims that longer tenures for political regimes allow for
ossification and the dismantling of ISI and enactment of neoliberalism.
[ TABLE 2 ABOUT HERE ]
Model 5 includes all variables except the IMF credit. Inflation has slightly less
significant positive effect (p<.1), while GDP per capita and gross fixed capital formation are
insignificant. Among the RTAs, only membership in MERCOSUR has a significant negative

23
effect (p<.001), and none of the others are significant.19 Military expenditures and the duration
of the current political regime still have significant negative effects. We retain these three
significant variables as the key institutional indicators in the final models below.
Dependency/ World-Systems Models
Table 3 presents the models of manufacturing employment on the productivity/
comparative advantage and dependency variables. Model 1 focuses on the structure of imports.
Similar to the previous two tables, inflation and gross fixed capital formation have significant
positive effects. The extent of imports (as a % of GDP) does not have a significant effect, while
manufacturing imports have a significant negative effect (p<.10). This suggests that inflowing
manufacturing imports specifically undermine domestic manufacturing employment, while there
is no effect of imports generally. The second model examines the structure of exports. Inflation
now has a very significant positive effect. Among export variables, exports to the US has a
significant positive effect, while mineral and ore exports have a very significant negative effect.
Interestingly, the overall level of exports (as a % of GDP), and agricultural and fuel exports do
not have significant effects.20 The significant negative effect of mineral and ore exports reveals
support for dependency theory, which argues that peripheral countries suffer from trade
dependency in which they rely upon the extraction of natural resources. However, the significant
positive effect of exports to the US provides contrary evidence to the claims regarding
dependence through partner concentration. This suggests that exports to the U.S. actually
facilitate industrialization in Latin America.
[ TABLE 3 ABOUT HERE ]
19 Although membership in the Association of Caribbean States is nearly significant (t=-1.6) in model 5, it would not be even near significant if retained in the final models. For example, if included in model 1 or 2 of Table 4, the t-score for this variable would not exceed -.2. Therefore, we chose to not retain it despite its near significance here. 20 The results are robust if the overall level of exports (or any of the export composition measures) is omitted.
24
Model 3 tests the effect of foreign direct investment into Latin America on manufacturing
employment. FDI flows have a significant negative effect, which supports the claims of
dependency scholars. Also consistent with dependency scholars, gross fixed capital formation
now has a larger and more significant positive effect in this model, plausibly reflecting the
distinctly beneficial effects of domestic investment – which become more apparent when
controlling for foreign investment.
Model 4 includes the productivity/ comparative advantage variables and the significant
dependency variables from models 1-3. In Model 4, none of the productivity/ comparative
advantage variables is significant. Among the trade variables, manufacturing imports now
becomes insignificant. However, the effects of exports to the US (+) and mineral and ore exports
(-) remain significant. Finally, FDI inflows continue to have a significant negative effect on
manufacturing employment. In turn, we retain these last three variables for the final models.
Final Models
Table 4 combines the most important variables from Tables 1-3 in a set of final models.
In this table, we also calculate and report standardized coefficients (semi-standardized for binary
independent variables). The first model demonstrates that all three of the productivity and
comparative advantage variables are insignificant and would have small effects. None of the
standardized effects would exceed .101 and none are even near statistical significance (t<|1.3|).
In turn, we estimated an F-test of the joint significance of these three variables to assess if they
affected manufacturing employment share as a group. The F-test failed to reject the hypothesis
that these variables were collectively equal to zero (p=.78). In sum, this model shows that there
is no support for the productivity/ comparative advantage explanation. Although these variables
were occasionally significant in earlier models, their effects are ultimately not robust.

25
[ TABLE 4 ABOUT HERE ]
In this first model, all three of the institutional variables have significant effects.
Membership in Mercosur has a negative effect on manufacturing employment. With
memberships in Mercosur, manufacturing employment should decline by about .64 standard
deviations (holding all other variables constant at their means). Military expenditures and the
duration of the current political regime again have significant negative effects. With a standard
deviation increase in logged military expenditures, manufacturing employment should decline by
.28 standard deviations. For a standard deviation in the length of the current political regime
(~17 years), manufacturing employment is expected to decline by about .34 standard deviations.
Thus, each of the institutional variables has both statistically and substantively significant
effects. An F-test reveals that their effects are collectively significantly different from zero
(p=.002). The institutional explanation clearly outperforms the productivity/ comparative
advantage explanation.
In the first model, two of the three dependency variables are statistically significant.
Although positively signed, logged exports to the US is now insignificant. Even if it was
significant, it would have a modest effect (beta<.15). Thus, this apparent challenge to
dependency theory in Table 3 turns out to be not robust in these final models. In support of
dependency theory, both mineral and ore exports and FDI have significant negative effects on
manufacturing employment. With a standard deviation increase in logged mineral and ore
exports (as a percent of total exports), manufacturing employment should decline by .43 standard
deviations. With a standard deviation increase in logged FDI flows (as a percent of GDP),
manufacturing employment should decline by .18 standard deviations. An F-test reveals that
these dependency effects are collectively significantly different from zero (p=.0002). As with
26
the institutional explanation, the dependency explanation is clearly more useful than the
productivity/ comparative advantage explanation.
Model 2 removes the productivity/ comparative advantage variables to provide a more
parsimonious final model.21 In this final model, the size and significance of a few effects
fluctuate, but the main conclusions are consistent (indeed the effects of three of the five
significant variables are slightly more pronounced). In order of magnitude, membership in
Mercosur, mineral and ore exports, the duration of the current political regime, military
expenditures and FDI flows all significantly reduce manufacturing employment. Therefore, the
deindustrialization of Latin America is due to a combination of institutional and dependency
variables.22 By contrast, the productivity/comparative explanation does not contribute to
explaining this trend.
The third and the final model in the table add a year variable (coded 0-6) to Model 2.
The year variable does not have a significant effect on manufacturing employment and the others
results are nearly identical to Model 2. This suggests that there is no residual trend in
manufacturing employment that cannot be explained by the key institutional and dependency
variables. The insignificance of year can be contrasted with the second model in Appendix I,
where this year variable was significant.23 Moreover, the robustness of the significance of the
21 In analyses available upon request, we also removed the exports to the U.S. variable. All of the results and conclusions are robust. We retain this variable simply to present the dependency variables together. 22 It could be that some of these significant effects occur because the independent variables are endogenous to manufacturing employment. Our use of FE models with lagged independent variables should partially alleviate this concern (Winship and Morgan 1999). Nevertheless, in analyses available upon request (1980-2003), we made each independent variable the dependent variable in an FE model containing lagged manufacturing employment. Manufacturing employment failed to have a significant effect on all independent variables except Mercosur. Therefore, it is possible that Mercosur’s significant effect owes partly to the fact that less industrialized countries were more likely to join Mercosur. In the first year of Mercosur (1995), the four member countries had a slightly lower mean manufacturing employment (22.5) than the 16 non-member countries (24.1), but t-tests reveal this difference was not significant. 23 In analyses available upon request, we added dummies for time periods like the third model in Appendix I. In this model, the institutional and dependency variables are consistent and none of the period dummies is statistically significant.

27
key variables even with year included in the model provides evidence that these variables are not
simply proxying time and that their effects are actual. Apparently, this combination of
institutional and dependency variables can explain the previously identified significant trend of
declining manufacturing employment.
Although there is substantial cross-national variation within each year, temporal trends in
the central tendencies of these key variables can be informative to explaining the
deindustrialization trend. The median and mean value of mineral and ore exports, FDI flows,
and regime durability were higher in 2000 and 2003 than 1995, so the rise of these three has
contributed to deindustrialization. Mercosur was zero for all cases prior to 1995, and 1 for four
countries after, which also contributed to declining manufacturing. By contrast, military
expenditures declined since at least 1990, so this has partly alleviated the decline caused by the
other factors.
To illustrate how effectively our final model (Model 2) explains the actual values of our
dependent variable, we generated predicted values based on the model plus country fixed effects.
The predicted values from Model 2 correlate quite well with the actual values of manufacturing
employment 1980-2006 (r=.84, N=134). In Figure 2, we plot the predicted and actual values.
As Figure 2 reveals, there are no obvious outliers from our model. Perhaps our model slightly
overestimates a few country-years for Brazil, Ecuador and Bolivia, and slightly underestimates a
few country-years for the Dominican Republic, Honduras and Paraguay. Nevertheless, Figure 2
demonstrates that our model explains actual manufacturing employment reasonably well.
[ FIGURE 2 ABOUT HERE ]

28
DISCUSSION
In the past few decades, Latin America has experienced a substantial decline in the
manufacturing share of employment. This is a surprising development, especially given the
worldwide trend of industrialization across LDCs and the visible successes in East Asia. Even
though a few have called attention to the unexpected deindustrialization of certain LDCs (e.g.
Dasgupta and Singh 2006; Pieper 2000), and others note the precariousness of manufacturing
jobs in Latin America (e.g. Barros 1989; Moreira 2007; Portes and Roberts 2005); our study
might be the first empirical analysis of the question including a comprehensive sample of data on
manufacturing employment in Latin America. Our results demonstrate that the
deindustrialization of Latin America is not just the unfortunately common cyclical oscillations in
expansion and contraction that many LDCs have experienced. Moreover, Latin America’s
deindustrialization does not fit leading accounts from the development literature. Latin America
has an enormous comparative advantage in cheap labor, has experienced rising productivity, is
proximate to the world’s biggest consumer market, and has access to useful natural resources.24
For many years, Latin America had been regarded as an industrialization success story, having
industrialized earlier and more fully than other developing regions (Gereffi and Wyman 1990).
Nevertheless, the deindustrialization of Latin America appears to be real.
The prevailing explanation in economic and even in sociological studies of
industrialization and deindustrialization has been the productivity/ comparative advantage
explanation (Alderson 1999; Brady and Denniston 2006; Dasgupta and Singh 2006; Pieper
24 Given our mentions of Latin America’s proximity to the U.S., it might be surprising that we have not devoted attention to immigration. In analyses available upon request, however, we found that several measures of net migration (as a percent of population) and migrant remittances (logged as a percent of GDP) did not have even near significant effects on the manufacturing share of employment. These insignificant effects probably owe to countervailing impacts of migration. Although migrants can invest or send capital back in the sending country, which might foster manufacturing employment, the flight of young workers erodes the consumption base and the pool of laborers.

29
2000). According to this view, industrialization should occur after basic conditions of
urbanization, schooling and investment have been met. Then, rising worker productivity,
cheaper currency, and an export-orientation should boost manufacturing employment.
Deindustrialization should only occur when those factors decline or when much higher
productivity levels are achieved. Despite the broad support for this explanation in the literature,
we find little evidence that these factors are shaping manufacturing in Latin America. GDP per
capita does not exhibit an inverse U-shaped relationship, and there is only weak evidence that
rising productivity had a surprising linear negative effect. There was some evidence that
inflation and gross fixed capital formation enhanced manufacturing employment, but these
effects were not robust. Importantly, manufacturing exports (as a percent of exports) and exports
(as a percent of GDP) both increased substantially over the period and throughout the region.
Even though export-oriented development has clearly benefited the industrialization of East
Asia, it failed to encourage manufacturing employment in the region. Ultimately, this study
illustrates the limitations of this prevailing explanation for understanding patterns of
industrialization and deindustrialization outside the affluent democracies and East Asia.
In the past few decades, institutions have received more attention in debates about
development. Our study reveals several important institutional influences on manufacturing
employment in Latin America. In particular, we demonstrate that the Mercosur RTA, military
spending and regime durability powerfully contributed to deindustrialization. Since the onset of
Mercosur, Brazil maintained relatively stable or only modestly declining manufacturing
employment. However, the other and smaller partners suffered dramatic deindustrialization.
Prior to Mercosur in 1990, manufacturing was 31.6 percent of Argentina’s total employment and
33 percent of Uruguay’s total employment. By 2003, both had fallen below 22 percent. Even

30
though this RTA may have boosted trade among partners, it also enacted barriers to those outside
the RTA. To some economic sociologists, the negative effect of regime durability may be
surprising. After all, several scholars have argued that institutional stability is crucial to business
expansion and investment. Nevertheless, like Evans (1995) implies, we find that the stability of
a state is less consequential than the character of state-society relations and the bureaucratic
organization of state agencies. Durable regimes are often protected against challengers, loyal to
established elites, and favoring of inefficient firms and industries. At the same time, such
politically-insulated regimes might also be further along in dismantling ISI and removing
protections for domestic industry (Barros 1989). The most vivid example of the
deindustrialization of a durable regime would be Colombia, which fell from 34 percent
manufacturing in 1980 to below 19 percent, and had one of the oldest regimes in the region. By
contrast, Nicaragua actually industrialized from the 1980s to the 1990s despite having a nascent
regime. Any observer of Latin American history cannot miss the prominent role of the military.
Our analyses show that extensive military spending has undermined manufacturing employment.
The corrosive effect of military spending is perhaps best illustrated by Trinidad and Tobago’s
very small military and relatively high manufacturing employment, and Guatemala’s growing
manufacturing as military spending declined in the 1990s. One positive development in the past
few decades has been the decline of military budgets in the average Latin American country.
This development has partially offset the other significant factors that have driven
deindustrialization. Altogether, institutions have clearly played a fundamental role in the
industrialization and deindustrialization of Latin America.
Traditionally, dependency theory has been focused on economic development and
economic growth generally. Our study demonstrates that a potentially valuable direction for

31
examining the deleterious consequences of global capitalism is to decompose development into
sectoral and industrial changes. We demonstrate that at least two key dimensions of dependency
theory have contributed to the deindustrialization of Latin America: mineral and ore exports and
FDI. As countries increasingly relied on mineral and ore exports in the 1990s, and began to
receive much more FDI, deindustrialization ensued. For example, in the 1980s, Paraguay
received very little FDI, yet FDI grew rapidly in the 1990s as Paraguay fell from nearly 28
percent manufacturing employment to about 16 percent by 2003. Both Colombia and Peru
experienced rapidly growing FDI in the late 1990s, and experienced deindustrialization during
the same period. Bolivia and Peru, always had high levels of mineral and ore exports and
experienced substantial deindustrialization after 1990. In contrast to dependency theory, there
was some evidence that trade with the U.S. benefited Latin American industrialization.
However, this effect was not robust and there was at least as much evidence that manufacturing
imports contributed to deindustrialization. Therefore, our analyses generally support dependency
theory’s central claims about the periphery’s counterproductive exchanges focused on receiving
investment from and exporting raw materials to the affluent core.
Overall, our study illustrates how economic sociologists potentially can offer fruitful
explanations by uniting arguments inspired by both Marx and Weber (Portes 2006). Our
evidence of institutional effects is consistent with Weberian-oriented economic sociology, and
our evidence for dependency effects is consistent with Marxist critiques of global capitalism. In
part, this uniting of Marx and Weber reflects Evans’ (1979, 1995) dual contributions to
understanding industrialization in Latin America. In 1979, Evans conceptualized Brazilian
industrialization as somewhat distinct from the more classic forms of dependency. Evans (p.32)
defined “dependent development” as “cases where capital accumulation and diversified
32
industrialization of a more than superficial sort are not only occurring in a peripheral country, but
are dominating the transformation of its economy and social structure.” Thus, dependent
development meant that a country was actually industrializing and developing to semi-peripheral
status. Given the findings of our study – especially of deindustrialization due to the influence of
resource trade and foreign investment – one might wonder if Latin America is sliding backwards
towards economies based on classical dependency. Perhaps, Latin America is regressing from
dependent development to classic dependency. These patterns might suggest that dependent
development was not a long-term solution for Latin America. Coupling this conclusion with
Evans’ 1995 book, our study illustrates his focus on institutions within and around a state. Latin
American states were hindered by large militaries and counterproductive RTAs, and appear to
gain little from durability and stability. Hence, Latin America faces challenges that are identified
by both Marxian- and Weberian-inspired economic sociology.
Despite these conclusions, there are several questions that our study has not been able to
address and are best the domain of future research. First, Latin America’s deindustrialization
appears to have occurred at the same time that China experienced rapid industrialization
(Moreira 2007). Perhaps Latin America’s decline owes partly to the ascent of China. We urge
caution with this interpretation, however for two reasons. Primarily, Latin America’s
deindustrialization was already underway by the mid-1990s, prior to China’s entry into the
World Trade Organization and certainly before China’s most notable industrialization (which
most date since 2000). Secondly, if such a generalized effect of China existed, it probably would
have manifested in a significant effect of time/ year. As we show in Table 4, however, there was
no effect of year (or any unobserved temporally increasing factor like China’s rise) in our final
models. Second, although we examine regime durability and military spending, we cannot truly

33
analyze within the state as is encouraged by Evans (1995) and others. Future research should
combine our cross-national approach with a deeper interrogation of state bureaucracy and
institutions.25 Perhaps once the World Bank’s “Cost of Doing Business” dataset includes a
longer period of time, our analyses can be updated with this potentially crucial factor. Finally,
our analyses treat all kinds of manufacturing employment as equivalent. It would be valuable for
scholars to examine precise industries, ranging from automobiles to textiles to food processing,
while maintaining our cross-national approach. Although the global value chains literature
offers many rich case studies of specific manufacturing industries (Gereffi 2005), this literature
rarely examines a large sample of countries over several decades. Attempts to integrate the
scope of cross-national studies like ours and the rich case-specific detail of industries studies
would be productive.
After World War II, Latin America slowly emerged from a relationship of classic
dependency characterized by foreign investors extracting and exporting natural resources. This
set the region on a path of industrialization shaped by ISI and products like textiles, food, and
basic machinery (Gereffi and Wyman 1990). Subsequently, Latin America diversified their
export promotion and continued a secondary stage of ISI. Even though Latin America stagnated
economically in the 1980s, many were optimistic about Latin America’s potential
industrialization heading into the 1990s. It was thought that Latin America could emulate the
East Asian success stories and experience industrialization and rapid economic growth.
Unfortunately, however, since at least the mid-1990s, Latin America has experienced an
unmistakable decline of manufacturing employment. In addition to burdensome institutions, this
25 It might be reasonable to consider democracy or government expenditures (or the interaction of the two), as general measures of state efficacy (what Evans calls Weberianness), which could contribute to manufacturing employment. However, these variables would most likely suffer from reverse causality as there is an extensive scholarly literature claiming that democracy and state size are endogenous to industrialization.

34
deindustrialization appears to be driven by classical dependency influences of FDI and natural
resources extraction and exports. Hence, it appears Latin America might be regressing from
what seemed like a promising development path only a few decades ago. Whether Latin
America can rebound and renew optimistic projections for development remains to be seen.

35
REFERENCES
Alderson, Arthur S. 1999. “Explaining Deindustrialization: Globalization, Failure, or Success?” American Sociological Review 64: 701-721.
Amsden, Alice H. 2003. “Good-bye Dependency Theory, Hello Dependency Theory.” Studies in Comparative International Development 38: 32-38.
_____. 2001. The Rise of the Rest. Oxford, UK: Oxford University Press. Auty, Richard M. 2000. “How Natural Resources Affect Economic Development.” Development
Policy Review 18:347–364. Bair, Jennifer and Gary Gereffi. 2001. “Local Clusters in Global Chains: The Causes and
Consequences of Export Dynamism in Torreon’s Blue Jeans Industry.” World Development 29: 1885-1903.
Bairoch, Paul. 1975. The Economic Development of the Third World Since 1900 Berkeley, CA: University of California Press.
Barros, Jaime Gatica. 1989. Deindustrialization in Chile Boulder, CO.: Westview Press. Bhagwati, Jagdish. 1999. “Regionalism and Multilateralism: An Overview.” Pp. 3-32 in Trading
Blocs, edited by J. Bhagwati, P. Krishna, and A. Panagariya. Cambridge, MA: MIT Press.
Biggart, Nicole Woolsey and Mauro F. Guillén. 1999. “Developing Difference: Social Organization and the Rise of the Auto Industries of South Korea, Taiwan, Spain, and Argentina.” American Sociological Review 64: 722-747.
Bluestone, Barry and Bennett Harrison. 2000. Growing Prosperity New York: Houghton Mifflin. Bollen, Kenneth A. and Stephen J. Appold. 1993. “National Industrial Structure and the Global
System” American Sociological Review 58: 283-301. Bornschier, Volker and Christopher Chase-Dunn. 1985. Transnational Corporations and
Underdevelopment. New York: Praeger. Brady, David and Ryan Denniston. 2006. “Economic Globalization, Industrialization and
Deindustrialization in Affluent Democracies, 1960-2001.” Social Forces 85: 297-329. Bunker, Stephen G. 1985. Underdeveloping the Amazon Chicago: University of Chicago Press. Cardenas, Enrique, Jose Antonio Ocampo, and Rosemary Thorp. 2000. An Economic History of
Twentieth-Century Latin America, Volume 3: Industrialization and the State in Latin America: The Postwar Years New York: Palgrave.
Cardoso, Fernando and Enzo Faletto. 1979. Dependency and Development in Latin America Berkeley, CA: University of California Press.
Centeno, Miguel A. 2002. Blood and Debt State College, PA: Pennsylvania State University Press.
Clark, Colin. 1957[1940]. The Conditions of Economic Progress. London: Macmillan. Collier, Paul. 2007. The Bottom Billion New York: Oxford University Press. Dasgupta, Sukti and Ajit Singh. 2006. “Manufacturing, Services and Premature
Deindustrialization in Developing Countries.” United Nations University-World Institute for Development Economics Research Paper No. 2006/49.
Dodzin, Sergei, and Athanasios Vamvakidis. 1999. Trade and Industrialization in Developing Agricultural Economies. IMF Working Paper, WP/99/145. Washington, DC: International Monetary Fund.
ECLA. Various Years. Statistical Yearbook for Latin America and the Caribbean: Economic Commission of Latin America Santiago, Chile: United Nations Publication.

36
Evans, Peter. 1995. Embedded Autonomy Princeton: Princeton University Press. _____. 1979. Dependent Development Princeton: Princeton University Press. Evans, Peter and James E. Rauch. 1999. “Bureaucracy and Growth: A Cross-National Analysis
of the Effects of ‘Weberian’ State Structures on Economic Growth.” American Sociological Review 64: 748-765.
Evans, Peter B. and Michael Timberlake. 1980. “Dependence, Inequality, and the Growth of the Tertiary: A Comparative Analysis of Less Developed Countries.” American Sociological Review 45: 531-552.
Firebaugh, Glenn. 2004. “Does Industrialization No Longer Benefit Poor Countries? A Comment on Arrighi, Silver and Brewer.” Studies in Comparative International Development 39: 99-105.
_____. 2003. The New Geography of Global Income Inequality Cambridge, MA: Havard University Press.
_____. 1997. “Development Sociology as We Approach the 21st Century.” International Journal of Sociology and Social Policy 17: 90-96.
_____. 1992. “Growth Effects of Foreign and Domestic Investment.” American Journal of Sociology 98:105-130. Fligstein, Neil. 2005. “The Political and Economic Sociology of International Economic
Arrangements.” Pp. 183-204 in The Handbook of Economic Sociology, 2nd Edition, edited by N.J. Smelser and R. Swedberg. Princeton: Princeton University Press.
_____. 2001. The Architecture of Markets Princeton: Princeton University Press. Frank, Andre Gunder. 1969. Capitalism and Underdevelopment in Latin America New York:
Monthly Review Press. Gereffi, Gary. 2005. “The Global Economy: Organization, Governance, and Development.”
Pp.160-182 in The Handbook of Economic Sociology, 2nd Edition, edited by N. J. Smelser and R. Swedberg Princeton: Princeton University Press.
_____. 1983. The Pharmaceutical Industry and Dependency in the Third World. Princeton: Princeton University Press.
Gereffi, Gary, David Spener and Jennifer Bair. 2002. Free Trade and Uneven Development Philadelphia, PA: Temple University Press.
Gereffi, Gary and Donald Wyman. 1990. Manufacturing Miracles Princeton: Princeton University Press.
Gilpin, Robert. 2001. Global Political Economy Princeton: Princeton University Press. Grant II, Don Sherman and Michael Wallace. 1994. “The Political Economy of Manufacturing
Growth and Decline Across the American States, 1970-1985.” Social Forces 73: 33-63. Guillén, Mauro F. 2001. The Limits of Convergence Princeton: Princeton University Press. Halaby, Charles N. 2004. “Panel Models in Sociological Research: Theory and Practice” Annual
Review of Sociology 30:507-44. Harvey, David. 2005. A Brief History of Neoliberalism New York: Oxford University Press. Hirschman, Albert O. 1968. “The Political Economy of Import-Substituting Industrialization in
Latin America.” Quarterly Journal of Economics 82: 1-32. _____. 1958. The Strategy of Economic Development New Haven, CT: Yale University Press. Hooks, Gregory and Leonard E. Bloomquist. 1992. “The Legacy of World War II for Regional
Growth and Decline: The Cumulative Effects of Wartime Investments on U.S. Manufacturing, 1947-1972.” Social Forces 71: 303-337.
37
IMFa. Various Years. International Financial Statistics Washington, D.C.: International Monetary Fund.
IMFb. Various Years. Direction of Trade Statistics Washington, D.C.: International Monetary Fund.
Jorgenson, Andrew; Christopher Dick and Matthew C. Mahutga. 2007. “Foreign Investment Dependence and the Environment: An Ecostructural Approach.” Social Problems 54: 371–394.
Kaya, Yunus. 2006. “Globalization and Industrialization in 64 Developing Countries, 1980-2003.” Paper presented at Annual Meeting of American Sociological Association.
Kentor, Jeffrey and Terry Boswell. 2003. “Foreign Capital Dependence and Development: A New Direction.” American Sociological Review 68: 301–13.
Kerr, Clark, and John T. Dunlop, and Frederick Harbison, and Charles A. Myers. 1960. Industrialism and Industrial Man Cambridge, MA: Harvard University Press.
Lall, Sanjaya. 2000. “The Technological Structure and Performance of Developing Country Manufactured Exports, 1985-1998.” Oxford Development Studies 28: 337-369.
Levy, Marion J. Jr. 1966. Modernization and the Structure of Society. Princeton: Princeton University Press.
Londero, Elio and Simon Teitel. 1998. Resources, Industrialization and Exports in Latin America New York: St. Martins Press.
London, Bruce and David A Smith. 1988. “Urban Bias, Dependence, and Economic Stagnation in Noncore Nations.” American Sociological Review 53: 454-463.
Martin, Nathan and David Brady. 2007. “Workers of the Less Developed World Unite? A Multi-Level Analysis of Unionization in Less Developed Countries.” American Sociological Review 72: 562-584.
Moore, Wilbert E. 1965. The Impact of Industry. Englewood Cliffs, NJ: Prentice-Hall. Moreira, Mauricio Mesquita. 2007. “Fear of China: Is There a Future for Manufacturing in Latin
America?” World Development 35: 355-376. O’Donnell, Guillermo. 1973. Modernization and Bureaucratic-Authoritarianism Berkeley, CA:
Institute of International Studies. Paus, Eva A. and Kevin P. Gallagher. 2008. “Missing Links: Foreign Investment and Industrial
Development in Costa Rica and Mexico.” Studies in Comparative International Development 43: 53-80.
Phillips, Nicola. 2004. The Southern Cone Model New York: Routledge. Pieper, Ute. 2000. “Deindustrialization and the Social Economic Sustainability Nexus in
Developing Countries: Cross-Country Evidence on Productivity and Employment.” The Journal of Development Studies 36: 66-99.
Marshall, Monty G., Keith Jaggers, and Ted Robert Gurr. 2005. Polity IV Dataset. Computer file version p4v2003. College Park, MD: Center for International Development and Conflict.
Moreira, Mauricio Mesquita. 2007. “Fear of China: Is There a Future for Manufacturing in Latin America?” World Development 35: 355-376.
Portes, Alejandro. 2006. “Institutions and Development: A Conceptual Reanalysis.” Population and Development Review 32: 233-262.
Portes, Alejandro and Kelly Hoffman. 2003. “Latin American Class Structures: Their Composition and Change During the Neoliberal Era.” Latin American Research Review 38: 41-82.

38
Portes, Alejandro and Bryan S. Roberts. 2005. “The Free-Market City: Latin American Urbanization in the Years of the Neoliberal Experiment.” Studies in Comparative International Development 40: 43-82.
Rodrik, Dani. 1997. Has Globalization Gone Too Far? Washington, D.C.: Institute for International Economics.
Robinson, Robert V. and Carl M. Briggs. 1991. “The Rise of Factories in Nineteenth-Century Indianapolis.” American Journal of Sociology 97: 622-656.
Rosen, Ellen Israel. 2002. Making Sweatshops Berkeley, CA: University of California Press. Rowthorn, Robert and John R. Wells. 1987. De-Industrialization and Foreign Trade New York:
Cambridge University Press. Schiff, Maurice and L. Alan Winters. 2003. Regional Integration and Development Washington,
D.C.: The World Bank and Oxford University Press. Schwartzman, Kathleen C. 1995. “The Historical and Global Nature of Dependent Development:
A Time-Series Analysis of Brazil and Mexico” Review 18:589-631. Schoonmaker, Sara. 1995. “High-Tech Development Politics: New Strategies and Persistent
Structures in Brazilian Informatics.” The Sociological Quarterly 36: 369-395. Schurman, Rachel A. 2001. “Uncertain Gains: Labor in Chile’s New Export Sectors.” Latin
American Research Review 36: 3-29. Schrank, Andrew. 2008. “Homeward Bound? Interest, Identity, and Investor Behavior in a Third
World Export Platform.” American Journal of Sociology 114: 1-34. _____. 2004. “Ready-to-Wear Development? Foreign Investment, Technology Transfer, and
Learning by Watching in the Apparel Trade.” Social Forces 83: 123-156. SIPRI. Various Years. Armaments, Disarmament and International Security: Stockholm
International Peace Research Institute Yearbook New York: Oxford University Press. Stiglitz, Joseph E. 2002. Globalization and Its Discontents New York: Norton. Vreeland, James. 2003. The IMF and Economic Development New York: Cambridge University
Press. Wallerstein, Immanuel. 1974. The Modern World-System, vol. 1: Capitalist Agriculture and the
Origin of the European World-Economy in the Sixteenth Century. New York: Academic Press.
WDI. 2008. World Development Indicators Online: World Bank Retrieved from http://devdata.worldbank.org/dataonline/
Winship, Christopher and Stephen L. Morgan. 1999. “The Estimation of Causal Effects from Observational Data” Annual Review of Sociology 25:259-706.
Wolf, Martin. 2004. Why Globalization Works New Haven: Yale University Press. Wood, Adrian. 1994. North-South Trade, Employment and Inequality. Oxford, UK: Clarendon
Press. Wooldridge, Jeffrey M. 2003. Introduction to Econometrics. Cambridge, MA: MIT Press.
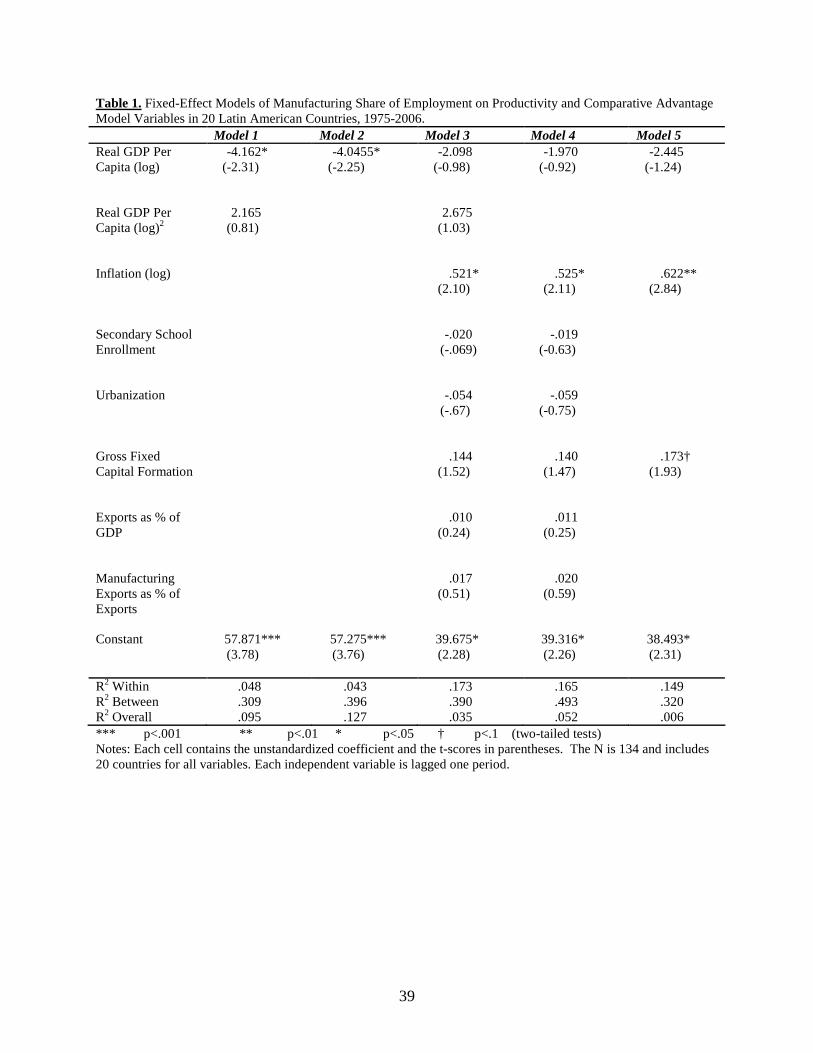
39
Table 1. Fixed-Effect Models of Manufacturing Share of Employment on Productivity and Comparative Advantage Model Variables in 20 Latin American Countries, 1975-2006. Model 1 Model 2 Model 3 Model 4 Model 5 Real GDP Per Capita (log)
-4.162* (-2.31)
-4.0455* (-2.25)
-2.098 (-0.98)
-1.970 (-0.92)
-2.445 (-1.24)
Real GDP Per Capita (log)2
2.165 (0.81)
2.675 (1.03)
Inflation (log) .521* (2.10)
.525* (2.11)
.622** (2.84)
Secondary School Enrollment
-.020 (-.069)
-.019 (-0.63)
Urbanization
-.054 (-.67)
-.059 (-0.75)
Gross Fixed Capital Formation
.144 (1.52)
.140 (1.47)
.173† (1.93)
Exports as % of GDP
.010 (0.24)
.011 (0.25)
Manufacturing Exports as % of Exports
.017 (0.51)
.020 (0.59)
Constant
57.871*** (3.78)
57.275*** (3.76)
39.675* (2.28)
39.316* (2.26)
38.493* (2.31)
R2 Within .048 .043 .173 .165 .149 R2 Between .309 .396 .390 .493 .320 R2 Overall .095 .127 .035 .052 .006 *** p<.001 ** p<.01 * p<.05 † p<.1 (two-tailed tests) Notes: Each cell contains the unstandardized coefficient and the t-scores in parentheses. The N is 134 and includes 20 countries for all variables. Each independent variable is lagged one period.

40
Table 2. Fixed-Effect Models of Manufacturing Share of Employment on Institutional Model Variables in 20 Latin American Countries, 1975-2006. Model 1 Model 2 Model 3 Model 4 Model 5 Real GDP Per Capita (log)
-1.405 (-0.72)
-2.653 (-1.34)
-2.576 (-1.32)
-1.361 (-0.68)
-.710 (-0.36)
Inflation (log) .432† (1.93)
.608** (2.77)
.711** (3.20)
.537* (2.46)
.413† (1.88)
Gross Fixed Capital Formation
.060 (0.67)
.169† (1.89)
.159† (1.79)
.143 (1.61)
.026 (0.29)
Membership in Central American Four
3.332* (2.17)
1.887 (1.19)
Free Trade Agreement with the US
3.186 (1.57)
2.195 (1.07)
Membership in MERCOSUR
-4.783*** (-3.62)
-4.865*** (-3.78)
Membership in Association of Caribbean States
-1.775* (-1.98)
-1.499 (-1.60)
Received IMF Credit
-.666 (-0.96)
Military Expenditures as a % of GDP (log)
-1.082† (-1.83)
-1.393* (-2.22)
Duration of Current Political Regime
-.079* (-2.27)
-.073* (-2.07)
Constant
32.911* (2.01)
40.544* (2.42)
39.963* (2.42)
31.389† (1.89)
29.452† (1.82)
R2 Within .285 .156 .174 .187 .337 R2 Between .189 .343 .347 .231 .217 R2 Overall .011 .008 .006 .002 .008 *** p<.001 ** p<.01 * p<.05 † p<.1 (two-tailed tests) Notes: Each cell contains the unstandardized coefficient and the t-scores in parentheses. The N is 134 and includes 20 countries for all variables. Each independent variable is lagged one period.

41
Table 3. Fixed-Effect Models of Manufacturing Share of Employment on Dependency Model Variables in 20 Latin American Countries, 1975-2006. Model 1 Model 2 Model 3 Model 4 Real GDP Per Capita (log)
-1.092 (-0.53)
-1.196 (-059)
-2.43 (-1.25)
-.961 (-0.50)
Inflation (log) .510* (2.29)
.731*** (3.41)
.373 (1.48)
.344 (1.43)
Gross Fixed Capital Formation
.170† (1.85)
.089 (1.00)
.200* (2.24)
.122 (1.40)
Imports as % of GDP
-.032 (-0.73)
Manufacturing Imports as % of Exports
-.086† (-1.92)
-.068 (-1.61)
Exports as % of GDP
-.003 (-0.10)
Exports to US as % of Exports (log)
1.215† (1.72)
1.207† (1.87)
Agricultural Exports as % of Exports (log)
-.323 (-0.87)
Fuel Exports as % of Exports (log)
-.127 (-0.63)
Mineral and Ore Exports as % of Exports (log)
-1.097*** (-3.53)
-1.059*** (-3.59)
Foreign Direct Investment Flows as % of GDP (log)
-.687† (-1.93)
-.753* (-2.23)
Constant
34.363* (2.07)
26.083 (1.57)
38.842* (2.36)
29.027† (1.89)
R2 Within .183 .273 .177 .314 R2 Between .033 .0002 .328 .0002 R2 Overall .027 .056 .001 .061 *** p<.001 ** p<.01 * p<.05 † p<.1 (two-tailed tests) Notes: Each cell contains the unstandardized coefficient and the t-scores in parentheses. The N is 134 and includes 20 countries for all variables. Each independent variable is lagged one period.
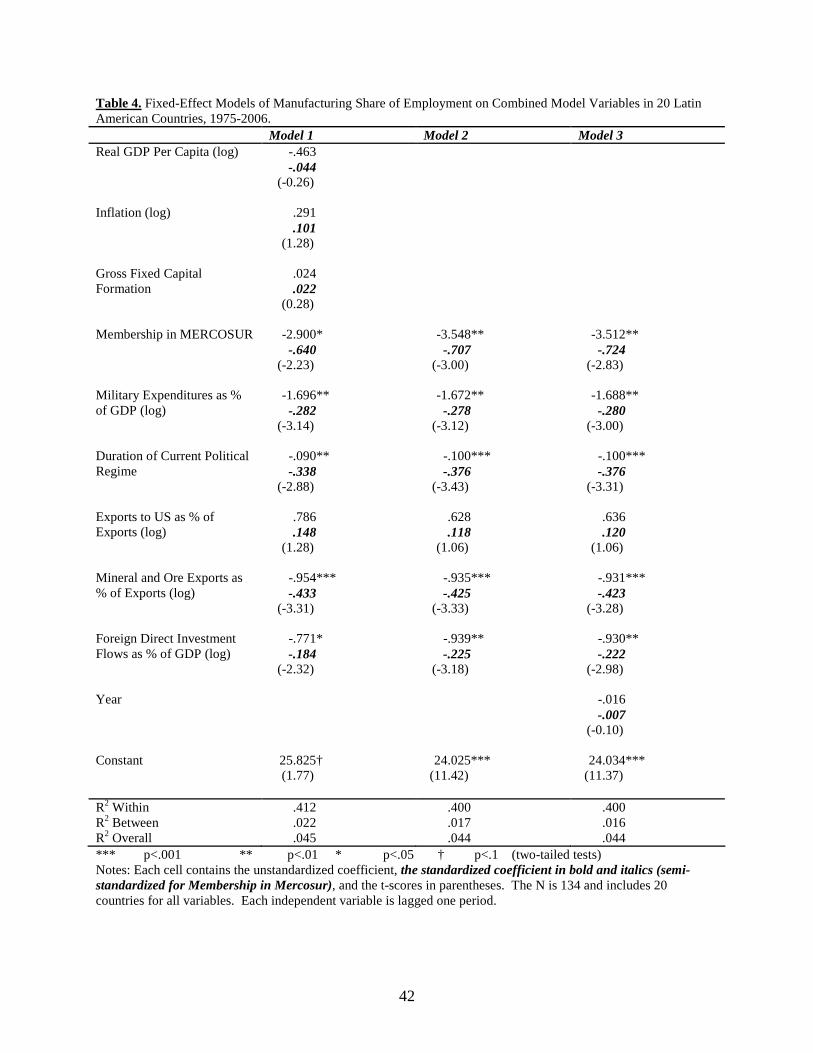
42
Table 4. Fixed-Effect Models of Manufacturing Share of Employment on Combined Model Variables in 20 Latin American Countries, 1975-2006. Model 1 Model 2 Model 3 Real GDP Per Capita (log)
-.463 -.044
(-0.26)
Inflation (log) .291 .101
(1.28)
Gross Fixed Capital Formation
.024
.022 (0.28)
Membership in MERCOSUR -2.900* -.640
(-2.23)
-3.548** -.707
(-3.00)
-3.512** -.724
(-2.83)
Military Expenditures as % of GDP (log)
-1.696** -.282
(-3.14)
-1.672** -.278
(-3.12)
-1.688** -.280
(-3.00)
Duration of Current Political Regime
-.090** -.338
(-2.88)
-.100*** -.376
(-3.43)
-.100*** -.376
(-3.31)
Exports to US as % of Exports (log)
.786
.148 (1.28)
.628
.118 (1.06)
.636
.120 (1.06)
Mineral and Ore Exports as % of Exports (log)
-.954*** -.433
(-3.31)
-.935*** -.425
(-3.33)
-.931*** -.423
(-3.28)
Foreign Direct Investment Flows as % of GDP (log)
-.771* -.184
(-2.32)
-.939** -.225
(-3.18)
-.930** -.222
(-2.98)
Year -.016 -.007
(-0.10)
Constant
25.825† (1.77)
24.025*** (11.42)
24.034*** (11.37)
R2 Within .412 .400 .400 R2 Between .022 .017 .016 R2 Overall .045 .044 .044 *** p<.001 ** p<.01 * p<.05 † p<.1 (two-tailed tests) Notes: Each cell contains the unstandardized coefficient, the standardized coefficient in bold and italics (semi-standardized for Membership in Mercosur), and the t-scores in parentheses. The N is 134 and includes 20 countries for all variables. Each independent variable is lagged one period.
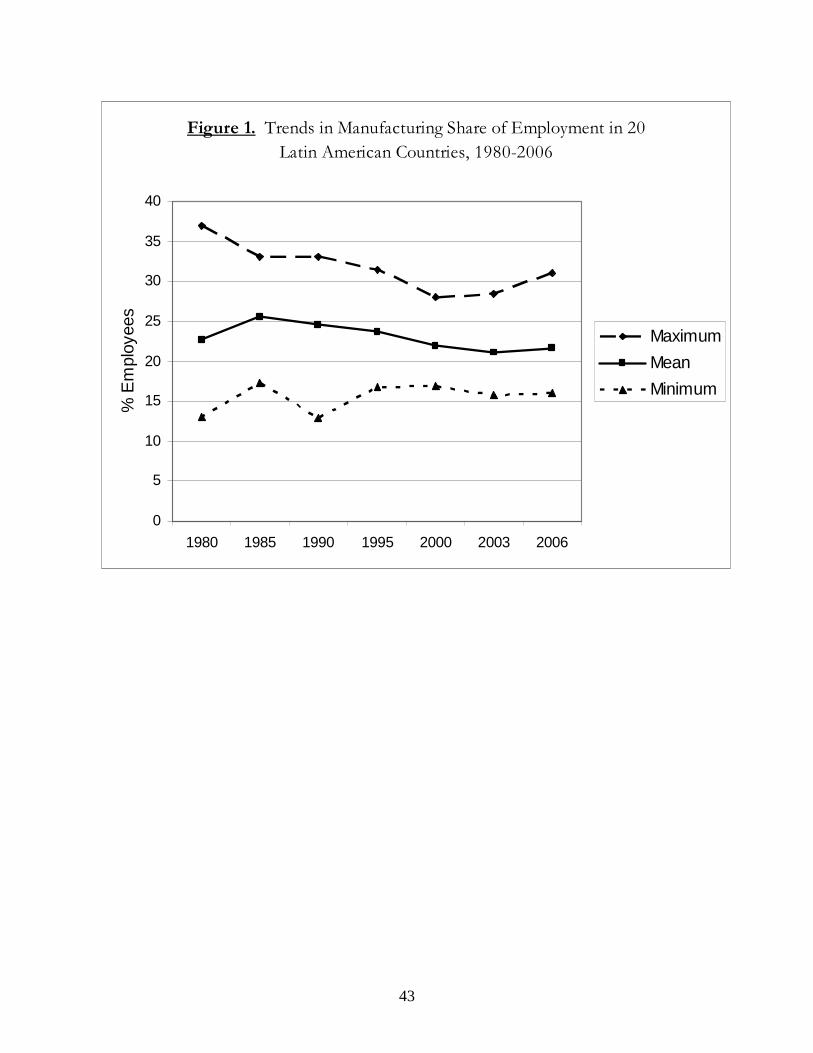
43
Figure 1. Trends in Manufacturing Share of Employment in 20
Latin American Countries, 1980-2006
0
5
10
15
20
25
30
35
40
1980 1985 1990 1995 2000 2003 2006
% E
mpl
oyee
s
Maximum
Mean
Minimum

44
ARG
ARGARG
ARG
ARGARG
ARG
BOL
BOL
BOL
BOLBOL
BOL
BRA
BRA BRA
BRABRA
BRABRA
CHL
CHL
CHLCHL
CHLCHLCHL
COL
COL
COLCOL
COL
COLCOL
COR
COR
COR
COR
CORCORCOR
DOR
DORDORDOR
DORDOR
ECU
ECU
ECU
ECU
ECU
ECUECU ELSELS
ELS
ELS
ELSELSELS
GUAGUA
GUAGUAGUA GUA
HON
HON
HON
HON
HONHONHON
JAM
JAMJAM
JAMJAMJAM
MEX
MEXMEX
MEX
MEX
MEXMEX
NICNIC
NIC
NICNICNICPANPAN
PAN
PANPANPANPAN
PAR
PARPAR
PARPAR
PARPAR
PER
PER
PER
PER
PER
PER
TTB
TTB
TTB
TTB
TTBTTB
TTBURG
URG
URG
URG
URG
URGURG
VEN
VENVEN
VENVEN
VEN
VEN
1020
3040
Act
ual V
alue
s
15 20 25 30 35Predicted Values
Figure 2. Actual and Predicted Manufacturing Employment in 20 Latin American Countries (1980-2006)
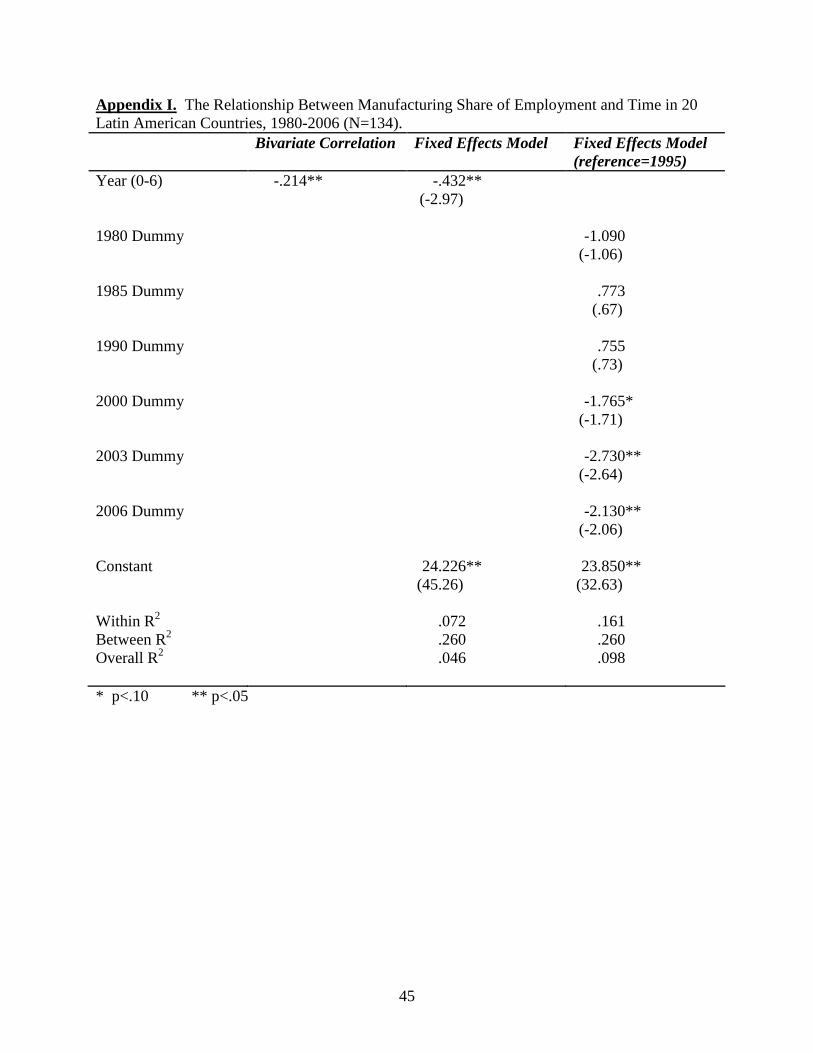
45
Appendix I. The Relationship Between Manufacturing Share of Employment and Time in 20 Latin American Countries, 1980-2006 (N=134). Bivariate Correlation Fixed Effects Model Fixed Effects Model
(reference=1995) Year (0-6)
-.214** -.432** (-2.97)
1980 Dummy
-1.090 (-1.06)
1985 Dummy
.773 (.67)
1990 Dummy
.755 (.73)
2000 Dummy
-1.765* (-1.71)
2003 Dummy
-2.730** (-2.64)
2006 Dummy
-2.130** (-2.06)
Constant
24.226** (45.26)
23.850** (32.63)
Within R2 .072 .161 Between R2 .260 .260 Overall R2
.046 .098
* p<.10 ** p<.05

46
Appendix II. Trends in Manufacturing Share of Employment in 20 Latin American Countries, 1980-2006. 1980 Value Peak Value (Year) 2006 Value Argentina 29.3 31.6 (1990) 23.5 Bolivia 19.7 28.7 (1995) 21.6 Brazil 24.7 24.7 (1980) 21.0 Chile 23.7 26.1 (1995) 23.0 Colombia 34.0 34.0 (1980) 18.8 Dominican Republic 15.5 23.8 (2000) 22.3 Ecuador 19.8 26.8 (1990) 21.2 El Salvador 21.0 29.1 (1990) 23.7 Guatemala 17.1 20.4 (2000) 20.2 Honduras 16.9 25.9 (1985) 20.9 Jamaica 16.4 20.2 (1995) 17.7 Mexico 20.6 27.8 (1990) 25.7 Nicaragua 13.0 24.2 (1995) 18.4 Panama 17.9 18.1 (1995) 17.2 Paraguay 26.4 28.7 (1985) 16.1 Peru 18.3 27.3 (1990) 23.8 Trinidad and Tobago 36.9 36.9 (1980) 31.0 Uruguay 30.2 33.0 (1990) 21.9 Venezuela 27.7 27.7 (1980) 22.8

47
Appendix III. Descriptive Statistics and Sources for Variables (N=134). Mean Std. Dev. Sources Manufacturing Share of Employment
22.892 4.582 World Bank (WDI); Economic Commission of Latin America (ECLA)
Real GDP Per Capita (log) 8.499 .431 WDI Real GDP Per Capita (log)2 .185 .214 WDI Inflation (log) 2.931 1.678 WDI Secondary School Enrollment 55.105 21.741 WDI Urbanization 63.052 15.517 WDI Gross Fixed Capital Formation 19.413 4.357 WDI Exports as % of GDP 29.280 17.545 WDI Manufacturing Exports as % of Exports
26.122 19.362 WDI
Membership in Central American Four
.090 .287 Schiff and Winters (2003)
Free Trade Agreement with the US
.030 .171 Schiff and Winters (2003)
Membership in MERCOSUR .090 .287 Schiff and Winters (2003) Membership in Association of Caribbean States
.269 .445 Schiff and Winters (2003)
Received IMF Credit .269 .449 International Monetary Fund (IMFa) Military Expenditures as % of GDP (log)
.329 .751 Stockholm International Peace Research Institute (SIPRI)
Duration of Current Political Regime
16.149 17.388 Polity IV (Marshall et al. 2005)
Imports as % of GDP 31.186 17.316 WDI Manufacturing Imports as % of Exports
68.857 10.638 WDI
Exports to US as % of Exports (log)
3.400 .884 International Monetary Fund (IMFb)
Agricultural Exports as % of Exports (log)
.756 1.809 WDI
Fuel Exports as % of Exports (log)
1.025 2.601 WDI
Mineral and Ore Exports as % of Exports (log)
.506 2.151 WDI
Foreign Direct Investment Flows as % of GDP (log)
.318 1.096 WDI
Notes: Please see References for full citations. Each independent variable is lagged one period.