The Enemy of Environmentalism: Struggles in Divergent Convergence

1
Who struggles most in making a career choice and why?
Findings from a cross-sectional survey of Australian high-school
students
Natal’ya Galliott1, Linda J. Graham2 and Naomi Sweller3
1Department of Education, Faculty of Human Sciences, Macquarie University, New South Wales, Australia,
Email: [email protected]
2School of Cultural & Professional Learning, Faculty of Education, Queensland University of Technology
(QUT), Queensland, Australia, Email: [email protected]
3Department of Psychology, Faculty of Human Sciences, Macquarie University, New South Wales, Australia,
Email: [email protected]
Abstract
This paper reports findings from an empirical study examining the influence of student background
and educational experiences on the development of career choice capability. Secondary school
students attending years 9-12 (N = 706) in New South Wales, Australia, were invited to participate
in an online survey that sought to examine factors influencing their readiness to make a career
choice. The survey included questions relating to student demographics, parental occupation,
attitudes to school and to learning, career aspirations, and students’ knowledge of the further
education or skills required to achieve their desired goal. We found no significant differences in the
proportions of students who were ‘uncertain’ of their future career aspirations with respect to their
individual characteristics such as age and gender. There were, however, significant differences in
relation to students’ family background, and their perceptions associated with own academic
abilities and self-efficacy.
Keywords
Youth aspirations, career education, career development, career guidance and counselling,
post-school transitions, student background, Australia.
Author pre-proof. Cite as: Galliott, N., Graham, L.J. and Sweller, N. (2015). Who Struggles Most in Making a
Career Choice and Why? Findings From a Cross-Sectional Survey of Australian High-School Students. Journal
of Psychologists and Counsellors in Schools, available on CJO2015. doi:10.1017/jgc.2015.7

2
Background
Five years after the Global Financial Crisis (GFC), high levels of youth unemployment
remain the focus of intensive debate in many developed countries (Brotherhood of St
Laurence, 2014; Featherstone, 2013; The Economist, 2013). Off-shore transfer of low-
skilled jobs to developing countries has contributed to this problem (Down, 2006), forcing
governments to pay closer attention to the educational attainment and career aspirations of
young people (Tomlinson, 2012). Australia has not escaped this phenomenon. Whilst the
national unemployment rate at the end of 2014 was 6.3 percent, the rate of unemployed 15-
19 year olds who are not in full-time education was 15.6 percent. Australia’s most
populous state, New South Wales, had the highest rate of youth unemployment (17.8%)
(Australian Bureau of Statistics, 2014). The research literature suggests that students from
disadvantaged backgrounds, low attainers and early school leavers are the most affected
(Dockery, 2010; Sikora & Saha, 2011; Tomlinson, 2012), leading to increased policy focus
on these groups (Graham, Van Bergen & Sweller, 2015).
Government response
Governments at both state and federal levels have sought to address low attainment, early
school leaving and youth unemployment through policies designed to raise student
aspirations and to increase knowledge about post-school options (Gale, 2010; Gale &
Parker, 2015). One such example is the National Partnership Agreement on Youth
Attainment and Transitions (Department of Education Employment and Workplace
Relations, 2011), which aims to increase educational engagement and post-school
transition to higher education, training and employment for 15-24 year olds (Keating,
Savage, & Polesel, 2012). One of the objectives of the agreement between the Federal and
state and territory governments is to achieve 90% Year 12 (or its equivalent) attainment
nationally by 2015 (Council of Australian Governments, 2009), as a means to improve

3
young people’s capacity to enter the workforce or to engage in further education and
training. Another, related, objective has been to achieve uniformity across the states and
territories in terms of school leaving ages, whilst also extending the compulsory years of
schooling. The aim of this change has been to increase participation in senior schooling, to
drive attainment and qualifications, and to reduce early school leaving. As a result of this
agreement, the New South Wales (NSW) state government increased the age at which
students can legally leave school from 15 to 17 years old (Reid & Young, 2012) with some
exceptions. Consequently, students in NSW are now required to remain in school until they
complete Year 10, after which they must – until the age of 17 – either be:
1. in school, or registered for home schooling, or
2. in approved education or training (eg TAFE, traineeship, apprenticeship) or
3. in full-time, paid employment (average 25 hours/week) or
4. in a combination of work, education and/or training.
Impact of school completion
Although some studies have shown that students who complete school fare better in the
labour market than early school leavers (Access Economics, 2002; Lamb & McKenzie,
2001), the majority of these studies are based on ‘the implicit assumption that if those who
currently do not finish school were instead to go on and complete Year 12, they would then
achieve outcomes similar to those observed for youth who currently do complete Year 12’
(Dockery, 2005, p. 39). Such an assumption neglects the contribution to outcomes made by
individual characteristics, such as academic ability and career preferences, as well as the
quality of the school education those individuals have received (Lamb, Walstab, Teese,
Vickers, & Rumberger, 2004). In other words, the research that shows positive benefits for
additional years of schooling is predominantly based on the effects that additional years of

4
schooling have for those with the desire and capacity to benefit from them (Dockery,
2005).
Government policies that have been developed on back of such studies, such as
changes to the compulsory school leaving age in a bid to increase retention, are also
problematic. Not only do such measures assume that additional years of schooling will be
of benefit to all students, but they leave important questions as to why some young people
have difficulty in schools or in adapting to changes in the current labour market
unanswered (Down, 2006). Policy discourse often sweeps such complexities away but, in
doing so, glosses over the contribution that has been made by the quality and type of
education that these young people have received. This is evident in the way in which the
New South Wales Department of Education and Communities (NSW DEC) conceptualizes
the problem of youth unemployment in their statement on youth attainment and transitions:
Studies here and overseas have found that teenagers who leave school early are two
and a half times more likely to be unemployed, earn lower wages and have poorer
health. And every year in Australia around 50,000 young people aged from 15 to
19 drop out of education and training and are unemployed. There was a time - and
not that long ago, too - when a teenager could finish school at 15 and walk straight
into a job or start a trade. But the times have changed. Technology has changed the
nature of work and 21st century teenagers now compete for jobs and study
opportunities in a globalised environment, against other young people in other
countries. But the more things change, the more opportunities open up. A better
education, more training and work experience means more choices for life after
school (New South Wales Government Education and Communities, 2014, para.
3-8).

5
In the above excerpt, both education and social background are unexamined: education is
accepted as universally ‘good’, while social background is not raised at all. Yet we know
that the effects of ‘dropping out’ are different for different student groups (McMillan &
Marks, 2003), with those from advantaged backgrounds more able to access post-school
opportunities through more extensive social networks (Lamb & McKenzie, 2001). We also
know that educational experiences differ between student groups (Duke, 2000) for varied
and complex reasons. For example, individual student characteristics – such as gender,
culture, geographic location, and social and economic capital – can influence students’
interpretation of and relationship to the curriculum, as can the content of the curriculum
and the ways in which it is taught, by whom and how well (Anyon, 1981; Apple, 1972,
2004). As one arguably influences the other over time, neither children nor education are
‘things’ that can or should be analysed as though the other does not exist or has had no
impact. In other words, what children bring to school matters but so too does the quality of
what they experience when they are there.
Conceptual framework
To better conceptualise and encompass this interplay between the individual and the
educational context, this study is informed by Amartya Sen’s (Sen, 1995, 1999, 2004)
theory of human capability with a specific focus on the kinds of educational resources
available to various individuals. Sen (1995) recognises the differences between individuals
in terms of their ability to make use of the resources they can access. He argues that even
when persons are provided with equal resources it does not necessarily mean that they have
access to equal opportunities (Saito, 2003). For instance, a disabled person will usually
require additional resources to be able to have equal opportunities to a person without
disability.

6
Not only are there differences between individuals but there can be differences in
resources as well. School education is one such case in point. Unterhalter (2003), for
example, suggests that education and schooling should be distinguished from each other. In
her conceptualisation, education is an abstract good, a concept that is operationalised
through the process of ‘schooling’. Differences in this process and in the quality of
schooling can lead to differences in learning outcomes. Therefore, whilst ‘education’ might
play a significant role in capability enhancement (Walker, 2005); schooling, as a process,
can, in some cases, provide a poor quality of education. Lower quality schooling can even
limit a person’s capability by, for example, discouraging students from desiring things that
are perceived as unattainable or by limiting their exposure to key information and advice.
Lower quality schooling can also affect students’ academic achievements over time,
leading to a loss of confidence and difficulties accessing the academic school curriculum.
Such difficulties may eventually impact how students perceive their suitability for careers
requiring degree qualifications, negatively affecting their future career aspirations.
The ability to envision and enact a viable career choice is thus a developmental
outcome, one that is influenced by personal characteristics and background, as well as
educational experiences. Student career choice ‘capability’ should therefore be analysed by
placing ‘equal emphasis on the interaction between individual students and the nature and
quality of the education they receive’ (Galliott & Graham, 2014, p. 280). To do this, we
examine students’ relative freedom to achieve career determination by measuring
differences in the personal (individual background) and educational resources (educational
experiences) that have been made available to them. We begin this process here by
investigating which students report the most difficulty in career determination and what
personal factors are of most influence.

7
Method
Sample
The target population of our cross-sectional survey was secondary school students
attending Years 9 to 12 in New South Wales, Australia. In 2011 there were nearly 159,000
students studying in Years 9-12, including full-time and part-time students in government
and non-government schools in NSW (Australian Bureau of Statistics, 2010). Following
the recommendations of Krejcie and Morgan (1970), we required a sample size of not less
than 384 respondents to reach a 95% confidence level with a 5% margin of error.
However, as previous international research findings in the area of career choices counted
non-response rates of up to 30% (Sikora & Saha, 2009), we aimed for a minimum of 500
respondents.
Table 1. Percentage of participants completing the survey by type of school.
ICSEA
Value
School
Code School Sector
Selective/Non-
selective
Single sex/
Co-
educational
% of
participants
1101-1200
(Median+2
Std.Dev.)
School 12 Non-government Non-selective Single sex
43.59 School 11 Government Selective Co-educational
School 10 Non-government Non-selective Single sex
School 9 Government Selective Co-educational
1001-1100
(Median+1
Std.Dev.)
School 8 Non-government Non-selective Single sex
25.64 School 7 Non-government Non-selective Single sex
School 6 Government Non-selective Co-educational
Mean = 1000
901-1000
(Median-1
Std.Dev.)
School 5 Government Non-selective Co-educational
20.8 School 4 Government Non-selective Co-educational
School 3 Government Non-selective Co-educational
800-900
(Median-2
Std.Dev.)
School 2 Government Non-selective Co-educational
9.97 School 1 Government Non-selective Co-educational

8
Participants
Participating schools were selected using stratified simple random sampling. New South
Wales (NSW) is Australia’s largest state comprising one third of the national population.
In 2011, there were 1,128,317 school-aged students, 34% of whom attended non-
government schools (Australian Bureau of Statistics, 2013). The government school sector
educates 66% of the K-12 schooling population with over 744,392 students (Australian
Bureau of Statistics, 2013). In an effort to represent this split between government and
non-government enrolments, we invited 8 government schools and 4 non-government
schools from both urban and rural areas of NSW to participate in the study.
To ensure participation of students of different socioeconomic backgrounds, we
drew on the Index of Community Socio-Educational Advantage (ICSEA), developed by
the Australian Curriculum Assessment and Reporting Authority (2012). Each school in
Australia has an ICSEA value on a scale ranging from 500 ‘extremely educationally
disadvantaged backgrounds’ to 1300 ‘very educationally advantaged backgrounds’. The
scale has a mean of 1000 and a standard deviation of 100 (Australian Curriculum
Assessment and Reporting Authority, 2012) with the majority of Australian schools in the
801-900, 901-1000, 1001-1100 and 1101-1200 bands. Potential schools with ICSEA
values within these bands were invited to participate (see Table 1 below).
The final sample included 706 students in Years 9-12 from 12 schools: six schools
were within +/- one standard deviation of the mean (three schools just below and three
schools just above) and six were within +/- two standard deviations (two schools below
and four schools above) of the mean (see Table 1 below). Students responded to the survey
in the period from October 2012 to December 2012 during the final term of the school
year. The sample was representative of enrolment share between the government and non-

9
government sectors with 65.3% of respondents from government schools and 34.7% of
participants from non-government schools. Two of the government schools were
academically selective1, comprising 28.6% of respondents. All four non-government
schools were single sex (13.7% from boys’ schools and 21% from girls’ schools). The
remaining schools were co-educational (see Table 1).
Figure 1. Age of respondents in years.
Figure 2. Survey respondents by Year grouping.
Figures 1 and 2 demonstrate age and Year grouping compositions of the sample.
The majority of the respondents were 15- 17 years old with the largest proportions of them
being in Years 10 and 12 and the least involved students being from Year 11. The majority
0%
5%
10%
15%
20%
25%
30%
<15 15 16 17 18 19+
Pe
rce
nt
of
resp
on
de
nts
Age in years
0%
5%
10%
15%
20%
25%
30%
35%
Year 9 Year 10 Year 11 Year 12
Pe
rce
nt
of
resp
on
de
nts
Year grouping

10
of the respondents were female (64.4%), were born in Australia (81%), and had one or
both parents born overseas (60.9%). The most popular language spoken in the respondents’
homes was English, with 59.1% reporting speaking English only and 26.8% speaking
English and other language(s). The main language groups other than English were Asian
(24.5%), Middle Eastern (9.5%), European (3.4%) and Pacific (3.3%).
Instrument
The online survey contained an information cover sheet, 29 main questions which were
compulsory for all participants, and 37 ‘skip/display logic’ questions that were displayed
(or not) to students depending on their previous response. A variety of scales such as
nominal, interval and ratio were used. In addition, some open-ended response formats were
added. Variety in the response scales and creativity of visual illustrations (when
appropriate) increased the overall quality of the survey instrument, making it more
interesting and engaging for participants (Burns & Bush, 2010), with the intention of
positively affecting the participation rate and reducing drop-outs. This paper aims to
provide analysis of the survey variables related to participants’ career decisiveness and
their personal circumstances in relation to the following constructs:
• Career certainty was assessed by two variables. Students were first asked ‘What
would you like to do after finishing school?’ The participants could select from get
a job, get an apprenticeship, go to TAFE/College, go to University, not sure,
nothing or other with the comment box. Later in the questionnaire students were
asked an additional question ‘How much certainty do you have in choosing your
future career?’ and could respond on a sliding bar: ‘I’m this much sure of what I
want to do: 0% - 100%’;
• Demographics of participants were examined through a number of questions
related to students’ home language, age, school grade, gender, participants’ and
11
their parents’ place of birth, as well as parents’ occupational status (whether each
parent had a job and if yes, what he/she did in their job);
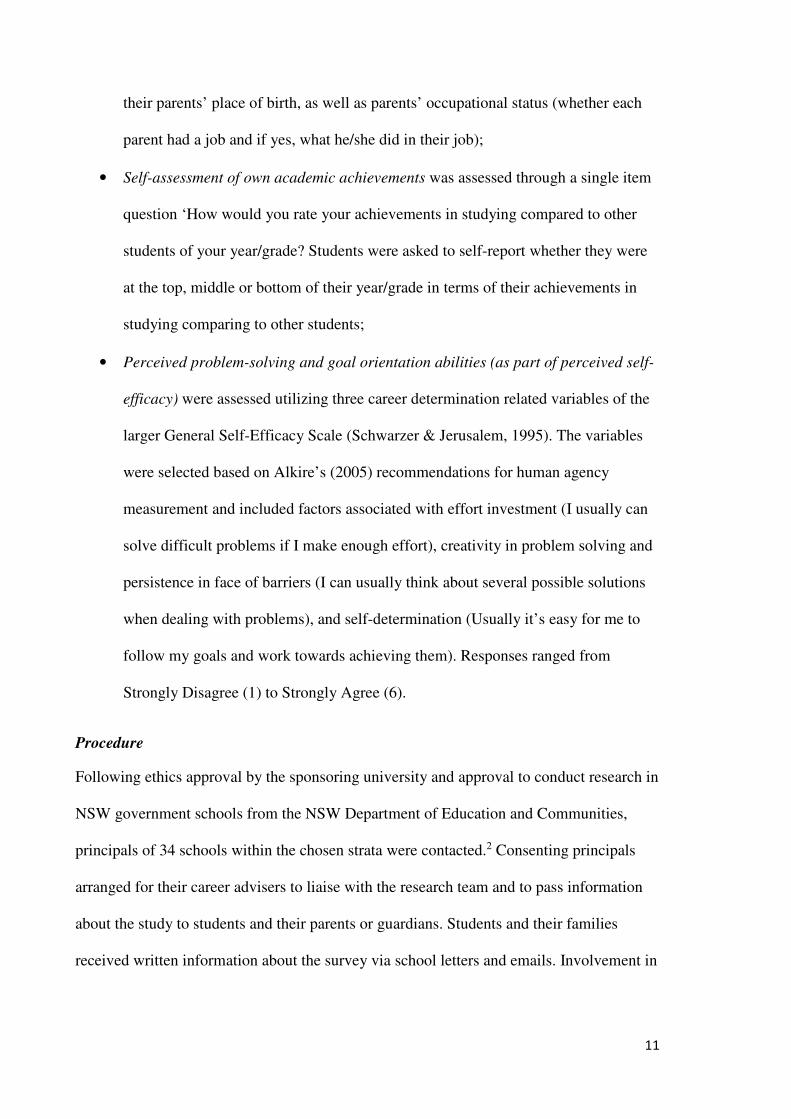
• Self-assessment of own academic achievements was assessed through a single item
question ‘How would you rate your achievements in studying compared to other
students of your year/grade? Students were asked to self-report whether they were
at the top, middle or bottom of their year/grade in terms of their achievements in
studying comparing to other students;
• Perceived problem-solving and goal orientation abilities (as part of perceived self-
efficacy) were assessed utilizing three career determination related variables of the
larger General Self-Efficacy Scale (Schwarzer & Jerusalem, 1995). The variables
were selected based on Alkire’s (2005) recommendations for human agency
measurement and included factors associated with effort investment (I usually can
solve difficult problems if I make enough effort), creativity in problem solving and
persistence in face of barriers (I can usually think about several possible solutions
when dealing with problems), and self-determination (Usually it’s easy for me to
follow my goals and work towards achieving them). Responses ranged from
Strongly Disagree (1) to Strongly Agree (6).
Procedure
Following ethics approval by the sponsoring university and approval to conduct research in
NSW government schools from the NSW Department of Education and Communities,
principals of 34 schools within the chosen strata were contacted.2 Consenting principals
arranged for their career advisers to liaise with the research team and to pass information
about the study to students and their parents or guardians. Students and their families
received written information about the survey via school letters and emails. Involvement in

12
the study was voluntary and parents could withdraw their child/children from participation
at any point.
Data analyses
The survey was conducted online using Qualtrics software, which is similar to Survey
Monkey, and is designed for online survey design and administration. Data were exported
into IBM SPSS Statistics 22 software for further statistical analysis. Out of 706
respondents, 80 participants dropped out of the questionnaire prior to its full completion
and their responses were not included in the statistical analysis. Responses to three open-
ended questions were coded categorically: 1) postcodes were coded using the Socio-
Economic Indexes for Areas (SEIFA) developed by the Australian Bureau of Statistics
(Pink, 2013), 2) fathers’ and mothers’ occupations were coded using the Australian Bureau
of Statistics’ occupational categories (Australian Bureau of Statistics, 2011) and the
Australian Socioeconomic Index 2006 (AUSEI06) (McMillan, Beavis, & Jones, 2009), and
3) responses to .the question ‘What would you like to do when you finish school’ were
coded as ‘certain’ or ‘uncertain’. We then performed descriptive statistics as well as
inferential tests to examine the association between career certainty and a variety of other
variables. Chi square tests of independence were used when variables were categorical, and
independent samples t-tests were used when variables were continuous. When significant
differences were found for the overall chi square tests, follow-up tests comparing the
column proportions were conducted, using a z-test with Bonferroni adjustment for multiple
comparisons (Hochberg, 1988). This procedure allowed us to control the false discovery
rate at alpha = .05 and to identify on which questions the proportions of career certain vs.
career uncertain participants differed for each response category. Measures of effect size
are given by Cohen’s d for t-tests and by Cramér’s V for chi-square tests. Odds ratios are
given for significant chi-square tests.

13
Results
From the total 626 participants who fully completed the questionnaire, 582 expressed a
clear intention regarding their post-school career plans and 44 did not. The relationship
between the ‘certain’/ ‘uncertain’ grouping and students’ own articulation of certainty in
career decision making was examined further using an independent samples t-test
comparing participant responses on the question ‘How much certainty do you have in
choosing your future career? Please indicate on a sliding bar… (0% - 100%)’. Students in
the ‘uncertain’ group had significantly lower certainty in their career choice (M = 38.73%,
SD = 31.14) compared with those who said they had made a decision about what they
would like to do after finishing school (M = 64.68%, SD = 29.27), t(624) = 5.65, p < .0005,
d = 0.86 (a large effect, (Cohen, 1988)).
Demographics
Characteristics of participants. Relationships between career certainty and participant
characteristics were examined using chi square and independent samples t-test analyses.
Table 2 gives the results of the chi square tests, where the only significant relationship was
found between language spoken at home and career indecisiveness. Follow-up tests
showed that a higher proportion of career uncertain than career certain students spoke only
English at home, whereas a higher proportion of career certain than career uncertain
students spoke English and another language at home (both p < .05, small effect size ).
Based on the odds ratio, the odds (or risk) of being career uncertain was 3.22 times higher
for students speaking English only at home compared with those using English and another
language. There was no difference between the proportion of career certain and career
uncertain students who spoke only a language other than English at home (p > .05).

14
Students’ age, year group, gender, location of birth (both participants’ location of birth and
that of their parents), and employment status of father and mother were not significantly
associated with career (un)certainty (see Table 2 below). Note that 5 participants who
indicated they did not know where their parents were born were excluded from the analysis
of parents’ birth country.
Table 2. Number (and percentage) of career ‘certain’ and career ‘uncertain’ participants by various students’ characteristics.
Characteristics of participants
Number (and
%) within
Career
‘Certain’
Number (and
%) within
Career
‘Uncertain’
χ2 value P value Cramér’s V
Home language: English
Home language: Other than English
Home language: English and other language
334 (57.5)
79 (13.6)
168 (28.9)
32 (72.7)
7 (15.9)
5 (11.4)
6.334 .042*
.101
15 years and under
16 years old
17 years old
18 years and over
218 (37.5)
161 (27.7)
148 (25.4)
55 (9.5)
16 (36.4)
14 (31.8)
13 (29.5)
1 (2.3)
2.891 .409 .068
Year 9
Year 10
Year 11
Year 12
119 (20.4)
180 (30.9)
94 (16.2)
189 (32.5)
13 (29.5)
12 (27.3)
3 (6.8)
16 (36.4)
4.273 .233 .083
Male
Female
205 (35.2)
377 (64.8)
20 (45.5)
24 (54.5) 1.860 .173 .055
Born in Australia
Born overseas
467 (80.2)
115 (19.8)
39 (88.6)
5 (11.4) 1.861 .173 .055
Both parents born in Australia
One of the parents is not born in Australia
Both parents born overseas
214 (37.1)
100 (17.3)
263 (45.6)
20 (45.5)
9 (20.5)
15 (34.1)
2.192 .334 .059
Father has a job
Father does not have a job
N/A
467 (80.4)
61 (10.5)
53 (9.1)
36 (81.8)
5 (11.4)
3 (6.8)
0.282 .869 .021
Mother has a job
Mother does not have a job
N/A
375 (64.4)
182 (31.3)
25 (4.3)
28 (63.6)
12 (27.3)
4 (9.1)
2.246 .325 .060
* p < .05.

15
In order to examine socioeconomic status (SES), we used students’ postcodes and parents’
occupations as proxy indicators. We drew on the coded postcode data to examine the
relationship between the SES of the area where participants lived and their ‘career
certainty’ using independent samples t-test, however, the relationship between these
variables was not statistically significant (t(616) = 1.905, p = .057).
Relationships between career certainty and parental occupation SES were also examined
with independent samples t-tests. Students in the ‘uncertain’ group tended to have lower
mothers’ SES scores (M = 56.19, SD = 24.47) compared with career ‘certain’ participants
(M = 66.08, SD = 22.18), t(624) = 2.013, p = .045, d = 0.24 (small effect size). There was
an even stronger association between fathers’ SES scores and career (un)certainty,
whereby ‘uncertain’ students had fathers with lower SES scores (M = 43.24, SD = 24.52)
compared with career ‘certain’ students (M = 58.34, SD = 25.30), t(624) = 3.161, p = .002,
d = 0.61 (medium effect).
Self-assessment of own academic achievements
The relationship between students’ beliefs regarding their academic achievements and
career certainty was analysed using a chi square analysis comparing participants’ ranking
of themselves as being in the top, middle or bottom of their year/grade academically. Being
‘career uncertain’ was significantly related to self-evaluation of academic achievement in
comparison with other students χ2(2) = 19.25, p < .0005, Cramér’s V = .175, small to
medium effect size. While 49.5% of career certain students ranked themselves in the top
third of their year, only 22.7% of career uncertain students did the same (p < .05).
Conversely, a significantly higher proportion of career uncertain students (18.2%) ranked
themselves in the bottom third of their year, compared to just 5.2% of students in the career
certain group (p < .05). The risk of being career ‘uncertain’ was therefore 7.68 times higher

16
for students ranking themselves in the bottom third of their year academically than for
students ranking themselves in the top third of their year. There was no difference in the
proportion of career certain vs career uncertain students who ranked themselves in the
middle third of their year (45.4% and 59.1% for career certain and uncertain respectively, p
> .05).
Perceived problem-solving and goal orientation abilities
The relationship between career certainty and self-assessed problem solving skills and
goal-orientedness were assessed via responses to three items (listed in Table 3 below)
relating to effort, ingenuity and determination. After comparing levels of agreement on a 6-
step agreement scale, group responses were then examined using independent samples t
tests. Students in the ‘career uncertain’ group were significantly less likely to agree with all
three statements than students in the ‘career certain’ group (medium size effect).
Table 3. Self-assessment of problem solving skills and goal orientedness of career ‘certain’
and ‘uncertain’ students.
Career
‘Certain’
Career
‘Uncertain’ t value P value
Effect size
(Cohen’s d) M SD M SD
I usually can solve difficult problems if
I make enough effort
5.02 1.12 4.30 1.25 4.114 <.0005** 0.61
I can usually think about several
possible solutions when dealing with
problems
4.74 1.17 4.05 1.36 3.744 <.0005** 0.54
Usually it’s easy for me to follow my
goals and work towards achieving them
4.56 1.15 4.09 1.18 2.594 .010* 0.40
* p < .05. ** p < .0005.
Discussion
The goal of the study on which this paper is based was to investigate the influences of
individual backgrounds and educational experiences on students’ career choice

17
capabilities. This paper engages with the first half of the project aims by examining the
influence of personal factors, including students’ socio-demographic backgrounds, self-
assessment of own academic achievements, and perceived problem-solving and goal
orientation abilities (as part of self-efficacy). Findings revealed significant differences
between students in terms of career readiness. When compared ‘career uncertain’ students
were more likely to speak English as their only home language, while ‘career certain’
participants were more likely to speak other languages when at home. There were no
differences in parents’ participation in employment, however, a significantly higher
proportion of ‘career uncertain’ students reported parental occupations associated with
lower SES, than ‘career certain’ participants. Another significant difference between the
two groups is that ‘career uncertain’ students provided lower self-ratings of academic,
problem solving and goal orientation abilities. We will discuss each of these findings in
turn.
Language background
This is not the first study to find an association between students’ language background
and post-school aspirations. For example, research into attitudes to school and post-school
intentions that draws on data from the Longitudinal Survey of Australian Youth (LSAY)
has found that students from a language background other than English were more likely to
participate in Year 12 and more likely to continue on to university (Khoo & Ainley, 2005).
One explanation for this is provided by Dockery (2005) who explains that ‘increases in the
proportion of migrants entering Australia under the skilled migration category has resulted
in a pool of recent settlers who have relatively strong preferences for higher educational
attainment for their children’ (p. 17). Therefore, whilst it might be assumed that English
language-learner status is a disadvantage, in some cultural groups this disadvantage is
more than outweighed by a highly effective disposition towards academic learning (Mu,

18
2014).
For example, in their analysis of the relation of ethnicity and disposition to
academic achievement, Noble and Watkins (2009) found that various socio-cultural groups
have different approaches to learning. They argue that different cultures encourage certain
home and school practices, such as self-discipline and ‘stillness’, which can foster
academic achievement and goal-orientation. Watkins and Noble (2008) found that Chinese
students were required to do more academic work outside the school and were more
physically disciplined or ‘still’ during class, in comparison with Anglo and Pacifica
children (the other two ethnic groups in their research project). This highlights that
schooling does not necessarily provide the same benefit to everyone and that students with
certain educational practices promoted at home may receive more value from their school
education than children who do not receive the same level of support.
Our results resonate with these findings. The largest percentage of students from a
Language Background Other Than English (LBOTE) in our sample were students from an
Asian language background (24.44%), however only 4.55% of students in this group were
uncertain as to what they want to do when they leave school, compared to 14.13% of
students who only spoke English. Following Watkins and Noble’s (2008) recommendation
that researchers focus on the educational practices encouraged by different ethnic groups
rather than ethnicity itself, it is important that future research investigates the kinds of
career related educational experiences that students of various cultural backgrounds have at
home and school.
SES of students’ families
When we looked at students’ SES, defined by their residential postcodes, there were no
differences between the two groups. Therefore, instead of using a geographical approach,
19
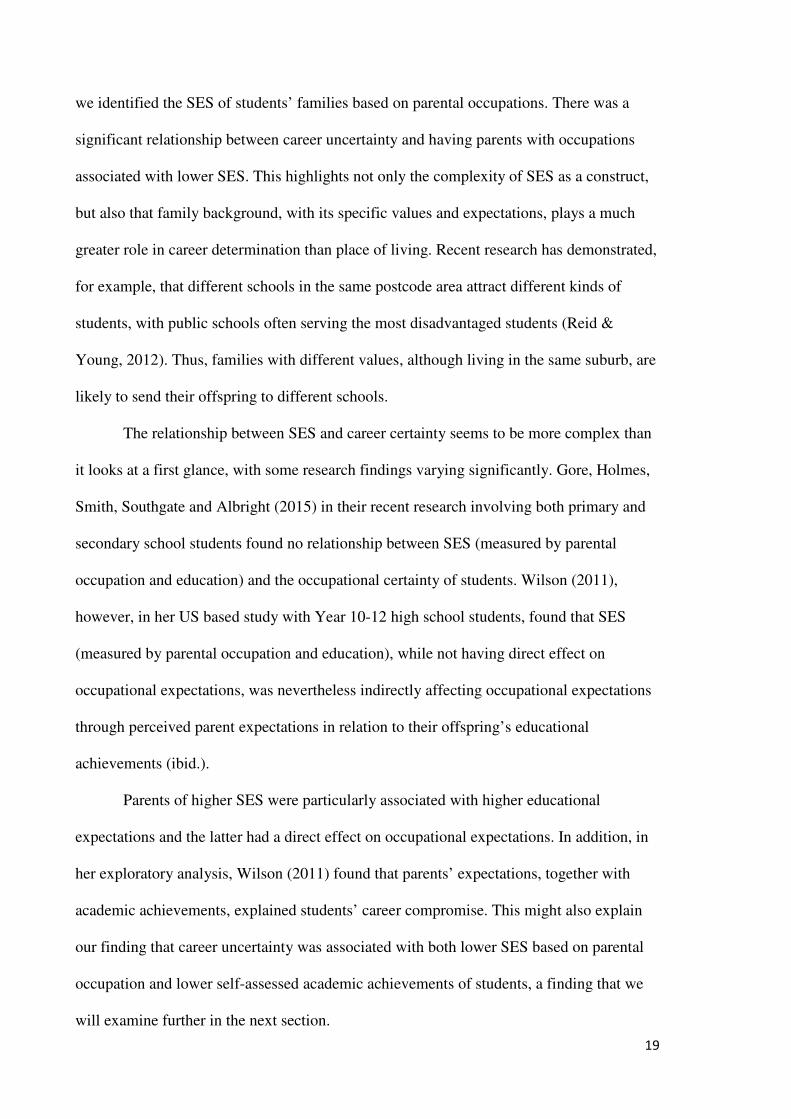
we identified the SES of students’ families based on parental occupations. There was a
significant relationship between career uncertainty and having parents with occupations
associated with lower SES. This highlights not only the complexity of SES as a construct,
but also that family background, with its specific values and expectations, plays a much
greater role in career determination than place of living. Recent research has demonstrated,
for example, that different schools in the same postcode area attract different kinds of
students, with public schools often serving the most disadvantaged students (Reid &
Young, 2012). Thus, families with different values, although living in the same suburb, are
likely to send their offspring to different schools.
The relationship between SES and career certainty seems to be more complex than
it looks at a first glance, with some research findings varying significantly. Gore, Holmes,
Smith, Southgate and Albright (2015) in their recent research involving both primary and
secondary school students found no relationship between SES (measured by parental
occupation and education) and the occupational certainty of students. Wilson (2011),
however, in her US based study with Year 10-12 high school students, found that SES
(measured by parental occupation and education), while not having direct effect on
occupational expectations, was nevertheless indirectly affecting occupational expectations
through perceived parent expectations in relation to their offspring’s educational
achievements (ibid.).
Parents of higher SES were particularly associated with higher educational
expectations and the latter had a direct effect on occupational expectations. In addition, in
her exploratory analysis, Wilson (2011) found that parents’ expectations, together with
academic achievements, explained students’ career compromise. This might also explain
our finding that career uncertainty was associated with both lower SES based on parental
occupation and lower self-assessed academic achievements of students, a finding that we
will examine further in the next section.

20
Given the potential for students from lower socioeconomic backgrounds to
experience more difficulty in making a career choice, it is vital that schools provide
appropriate career information and guidance not only to students, but also to their parents
or guardians, communicating the relevance of subject content to the world of real career
opportunities and arranging access to various career role-models. This should be pursued
in a culturally appropriate, respectful and engaging way to insure use and application of the
received information.
However, research evidence shows that schools often reproduce existing social
differences by teaching what is thought to be relevant for different student groups (Nolan
& Anyon, 2004). The problem arises when what used to be relevant is no longer applicable
in a modern job market or when different students receive different information. Future
research should therefore investigate the kinds of career-related experiences, school
subjects and career role-models that ‘career uncertain’ students have access to, as well as
their level of satisfaction with available choices.
Self-assessment of academic, problem-solving and goal orientation abilities
The final group of significant findings provided in the results section of this paper
identified that ‘career uncertain’ students ranked their current academic, problem-solving
and goal orientation abilities lower than their ‘career certain’ peers. There may be various
reasons for lower self-assessment of academic performance and these personal reflections
might not necessarily represent a full picture of the actual abilities of the individuals
involved.
According to Correll (2001) ‘widely shared cultural beliefs attached to various
tasks’ not only affect self-evaluation in occupationally relevant activities, but also ‘how
individuals are channeled into particular activities and subsequent career trajectories by
others’ (p. 1725). In her longitudinal study following young people from Year 8 to two

21
years post-school completion, Correll (2001) found that certain groups of students assess
their academic achievements lower than others regardless of their actual performance.
This, she found, was due to certain societal expectations and cultural beliefs relevant to the
student groups identified in her research.
Whether accurate or not, subjective judgment of academic achievement has been
found to influence students’ attitudes to school, post-school aspirations and/or decisions to
leave school early (Marks, 1998). Interestingly, Marks found significant differences
between states with students going to school in the Australian Capital Territory, Victoria,
Western Australia and Tasmania reporting higher levels of self-rated achievement than
students in New South Wales, which suggests that ‘states somewhat differ in the
perceptions that they give to students on how well they are doing’ (Marks, 1998, p. 10).
This may well have been an effect of the NSW academic curriculum – which, before
national adoption of the Australian Curriculum, was widely acknowledged to be the most
highly-defined and prescriptive in Australia (Luke, Graham, Sanderson, Voncina, & Weir,
2006) – together with that state’s early adoption of standardized assessment and reporting
(Bruniges, 2001).
Although Marks (2010) has found that student ability – as measured by literacy and
numeracy in year 9 – has greater impact on university entrance and participation than
student socioeconomic background or course type, student ‘ability’ is additive. As we
described in our introduction, academic ability is affected by what students’ have and have
not learned at school over time, by the ideas and concepts to which they have been
introduced, and how well those ideas and concepts have been taught. Whilst our findings
suggest that self-perceptions of academic achievement (or ability), and family background
(which includes cultural norms and family educational practices) bear greater influence
than the individual characteristics (such as age and gender) that are often assumed to have

22
the greatest weight, each of these is arguably affected by prior educational experience.
Further research is therefore needed to determine whether there are differences between
‘career certain’ and ‘career uncertain’ groups in terms of their educational experiences, as
well as in the quality and relevance of those experiences. It is also important to identify
and utilise information in regard to what interests less academically inclined students in
terms of school curriculum and the world of work.
Recommendations
As our findings indicate a strong influence of family background on students’ career
determination, we recommend that schools:
• Work to build closer relationships with students’ families and surrounding
communities through career guidance meetings, career information expos, social
activities and interactions with local business;
• Educate students and their families about the best home practices for developing
high academic achievements, problem-solving and gaol orientation abilities;
• Provide career guidance to both students and their families in creative and engaging
ways for various cultural and socioeconomic groups, perhaps with provision of real
life examples and role-models especially for those with less social capital and
networking opportunities;
• Implement programmes which allow for mixing of different groups of students and
opportunities for students to exchange their ideas and experiences of learning
strategies and career pathways.
Working with families can potentially provide students with a better navigational capacity
in the world of post-school career trajectories and help them to achieve better
understanding of the connections between what is studied at school and real life career

23
opportunities. However, knowing that career uncertain students tend to rate their academic,
problem solving and goal orientation abilities lower than career certain students, it is
important that we:
• understand what kind of career education experiences are made available to young
people, the comparative quality of those experiences, and their relevance to
different student groups;
• identify and support the educational and career interests of less confident or
academically capable students, as they now have to remain for longer at school due
to current educational policies.
Limitations
There are a number of limitations to this study. First, the study was conducted only with
students from one state of Australia (NSW), and these findings may not hold for students
in other states or countries. Second, students attending Catholic systemic schools, while
representing 18.2% of the NSW school education sector, were not present in our data set.
In an attempt to address this issue, two Catholic non-systemic schools were included in the
sample, however, it has to be acknowledged that the opinions of the students in those
schools may vary from those in Catholic systemic schools. Third, the participants of the
survey self-selected. It is possible that students who were most struggling with career
determination might consider that participation in a ‘career choice’ survey is not for them
and therefore chose not to participate. Fourth, online questionnaires, while being a very
time-saving and flexible tool for researchers, might not be the best option for all
participants. This may be partly because some students might have limited access to the
Internet and digital devices such as computers and smart phones; and partly, because for
some students, due to different levels of academic achievement, oral responses could have
been preferred. Finally, the data of the survey was self-reported by students, which

24
unavoidably brought a certain level of subjectivity. In order to maximize the authenticity of
responses, we ensured anonymity and confidentiality of all information being provided.
Conclusion
Young people currently face a number of challenges in their transition from school to
work, study or training. While both financial and labour markets are experiencing radical
transformation, there is little evidence that educational systems are successfully adapting to
these challenges. Despite attempts to raise young persons’ aspirations and to broaden
participation in higher education, a sizeable minority of high school students have
difficulty imagining their future career trajectories. Government initiatives encouraging
potential early school leavers to remain at schools for an increased number of years do not
necessarily improve occupational outcomes for those young people. This leaves
effectiveness of such initiatives questionable and urges for a better understanding behind
reasons and factors associated with career indecisiveness.
Recent research findings show that not all students equally benefit from the increased
number of years of schooling. Our study demonstrates no increase in career certainty
associated with an increase in the number of years spent at school. We did find, however,
some demographic characteristics common for career uncertain young people in our
sample. Those students who were significantly more uncertain in their post-school careers
were more likely to have English as the only language spoken at home and their parents
were more likely to work in occupations associated with lower SES. Career uncertain
students were also significantly more likely to rate themselves lower in academic,
problem-solving and goal orientation abilities.

25
Endnotes
1 Students are admitted to these schools based on academic merit. The NSW government
school system has 34 selective entry high schools (12 fully selective and 22 partially
selective).
2 Approval to conduct research in independent non-government schools is determined by
individual school principals.
References
Access Economics. (2002). Young persons’ education, training and employment outcomes with
special reference to early school leavers: Dusseldorp Skills Forum and the Business
Council of Australia.
Alkire, S. (2005). Subjective Quantitative Studies of Human Agency. Social Indicators Research,
74(1), 217-260. doi: 10.1007/s11205-005-6525-0
Anyon, J. (1981). Social Class and School Knowledge. Curriculum Inquiry, 11(1), 3-42. doi:
10.2307/1179509
Apple, M. W. (1972). Community, Knowledge, and the Structure of Disciplines. The Educational
Forum, 37(1), 75-82. doi: 10.1080/00131727209339142
Apple, M. W. (2004). Ideology and Curriculum: Taylor & Francis.
Australian Bureau of Statistics. (2010). Schools, Australia. Canberra: Australian Bureau of
Statistics.
Australian Bureau of Statistics. (2011). Census Dictionary, 2011. Canberra.
Australian Bureau of Statistics. (2013). Schools, Australia, 2012. Canberra.
Australian Bureau of Statistics. (2014). Labour Force, Australia, Nov 2014 (L. Force, Trans.).
Canberra.
Australian Curriculum Assessment and Reporting Authority. (2012). My School: Guide to
understanding ICSEA. Sydney: Retrieved from
http://www.acara.edu.au/verve/_resources/Guide_to_understanding_ICSEA.pdf.
Brotherhood of St Laurence. (2014). Australian youth unemployment 2014: snapshot My Chance,
Our Future Youth Employment Campaign. Fitzroy, Victoria, Australia: Brotherhood of St
Laurence.
Bruniges, M. (2001, July). The relationship between assessment and curriculum in improving
teaching and learning. Paper presented at the Australasian curriculum assessment and
certification authorities conference: bringing assessment and curriculum issues together.
Burns, A. C., & Bush, R. F. (2010). Marketing research: Prentice Hall.
Cohen, J. (1988). Statistical power analysis for the behavioral sciences (2 ed.). Hillsdale, NJ:
Lawrence Earlbaum Associates.
Council of Australian Governments. (2009). National Partnership Agreement on Youth Attainment
and Transitions. Retrieved from

26
http://www.federalfinancialrelations.gov.au/content/npa/skills/youth_attainment_transi
tions/national_partnership.pdf.
Department of Education Employment and Workplace Relations. (2011). National Partnership on
Youth Attainment and Transitions. from
http://www.deewr.gov.au/youth/YouthAttainmentandTransitions/Pages/Home.aspx
Dockery, A. M. (2005). Assessing the value of additional years of schooling for the non
academically inclined. Longitudinal Survey of Australian Youth Research Reports.
Dockery, A. M. (2010). Education and happiness in the school-to-work transition (C. f. L. M.
Research, Trans.) Longitudinal Survey of Australian Youth: Curtin University of
Technology.
Down, B. (2006). A critical pedagogy of vocational education and training in schools and
communities struggling with shifts in the global economy. Learning communities:
international journal of learning in social contexts(3), 94-120.
Duke, N. K. (2000). For the rich it's richer: Print experiences and environments offered to children
in very low-and very high-socioeconomic status first-grade classrooms. American
Educational Research Journal, 37(2), 441-478.
Featherstone, T. (2013, 11 May 2013). Gen why: the jobless generation, The Sydney Morning
Herald. Retrieved from
http://aap.newscentre.com.au/cpsunat/130511/library/higher_education/31052031.html
Gale, T. (2010). Let them eat cake: Mobilising appetites for higher education. Paper presented at
the Professorial Address: Knowledge Works Public Lecture Series, Bradley Forum, Hawke
Building, University of South Australia.
Gale, T., & Parker, S. (2015). To aspire: a systematic reflection on understanding aspirations in
higher education. The Australian Educational Researcher, 42(2), 1-15. doi:
10.1007/s13384-014-0165-9
Galliott, N., & Graham, L. J. (2014). A question of agency: applying Sen’s theory of human
capability to the concept of secondary school student career ‘choice’. International
journal of research and method in education, 37(3), 270-284.
Gore, J., Holmes, K., Smith, M., Southgate, E., & Albright, J. (2015). Socioeconomic status and the
career aspirations of Australian primary and high school students. The Australian
Educational Researcher, 42(2), 155-177.
Hochberg, Y. (1988). A sharper Bonferroni procedure for multiple tests of significance. Biometrika,
75, 800-802.
Keating, J., Savage, G. C., & Polesel, J. (2012). Letting schools off the hook? Exploring the role of
Australian secondary schools in the COAG Year 12 attainment agenda. Journal of
Education Policy, 28(2), 268-286. doi: 10.1080/02680939.2012.730628
Khoo, S. T., & Ainley, J. (2005). Attitudes, intentions and participation Longitudinal Survey of
Australian Youth research reports: Australian Council for Educational Research.
Krejcie, R. V., & Morgan, D. W. (1970). Determining sample size for research activities. Educational
and Psychological Measurement, 30(3), 607-610.
Lamb, S., & McKenzie, P. (2001). Patterns of success and failure in the transition from school to
work in Australia Longitudinal Surveys of Australian Youth Research Report.
Lamb, S., Walstab, A., Teese, R., Vickers, M., & Rumberger, R. (2004). Staying on at school:
Improving student retention in Australia. : Queensland Department of Education & the
Arts.
Luke, A., Graham, L. J., Sanderson, D., Voncina, V., & Weir, K. (2006). Curriculum and Equity: A
review of the international research. Adelaide, Australia: Department of Education and
Community Services.
Marks, G. (1998). Attitudes to school life: their influences and their effects on achievement and
leaving school. Longitudinal Survey of Australian Youth Research Reports.

27
Marks, G. (2010). School sector and socioeconomic inequalities in university entrance in Australia:
the role of the stratified curriculum. Educational Research and Evaluation: An
International Journal on Theory and Practice, 16(1), 23-37.
McMillan, J., Beavis, A., & Jones, F. L. (2009). The AUSEI06: A new socioeconomic index for
Australia. Journal of Sociology, 45(2), 123-149.
McMillan, J., & Marks, G. (2003). School leavers in Australia: Profiles and pathways. LSAY Research
Reports (pp. 132). Victoria, Australia: The Australian Council for Educational Research Ltd.
Mu, G. (2014). Chinese Australians’ Chineseness and their mathematics achievement: the role of
habitus. The Australian Educational Researcher, 41(5), 585-602. doi: 10.1007/s13384-014-
0152-1
New South Wales Government Education and Communities. (2014, 10 September). The new
school leaving age: a guide for parents. Retrieved 02 March, 2015, from
http://www.schools.nsw.edu.au/leavingschool/schoolleaveage/investingfuture.php
Noble, G., & Watkins, M. (2009). On the Arts of Stillness: For a Pedagogy of Composure. M/C
Journal, 12(1).
Nolan, K., & Anyon, J. (2004). Learning to Do Time: Willis's Model of Cultural Reproduction in an
Era of Postindustrialism, Globalization, and Mass Incarceration. In N. Dolby & G.
Dimitriadis (Eds.), Learning to Labor in New Times (pp. 133-149). London: Taylor & Francis
Books.
Pink, B. (2013). Socio-Economic Indexes for Areas (SEIFA) 2011 (pp. 92). Canberra, Commowealth
of Australia: Austalian Bureau of Statistics.
Reid, C., & Young, H. (2012). The new compulsory schooling age policy in NSW, Australia:
ethnicity, ability and gender considerations. Journal of Education Policy, 27(6), 795-814.
doi: 10.1080/02680939.2012.664287
Saito, M. (2003). Amartya Sen's Capability Approach to Education: A Critical Exploration. Journal
of Philosophy of Education, 37(1), 17-33.
Schwarzer, R., & Jerusalem, M. (1995). Generalized Self-Efficacy scale. In J. Weinman, S. Wright &
M. Johnston (Eds.), Measures in health psychology: A user’s portfolio. Causal and control
beliefs. (pp. 35-37). Windsor, UK: NFER-NELSON.
Sen, A. (1995). Inequality reexamined: Oxford University Press.
Sen, A. (1999). Development as freedom: Oxford University Press.
Sen, A. (2004). Elements of a theory of human rights. Philosophy & Public Affairs, 32(4), 315-356.
Shelley J. Correll. (2001). Gender and the Career Choice Process: The Role of Biased Self‐Assessments. American Journal of Sociology, 106(6), 1691-1730. doi: 10.1086/321299
Sikora, J., & Saha, L. J. (2009). Gender and professional career plans of high school students in
comparative perspective. Educational Research and Evaluation: An International Journal
on Theory and Practice, 15(4), 385 - 403.
Sikora, J., & Saha, L. J. (2011). Lost talent? The occupational ambitions and attainments of young
Australians Longitudinal Survey of Australian Youth: Australian National University.
The Economist. (2013, April 27th 2013). Generation jobless. The Economist, 9, 49.
Tomlinson, S. (2012). The Irresistible Rise of the SEN Industry. Oxford Review of Education, 38(4).
Unterhalter, E. (2003). The Capabilities Approach and Gendered Education: An Examination of
South African Complexities Theory and Research in Education, 1(1), 7-22. doi:
10.1177/1477878503001001002
Walker, M. (2005). Amartya Sen's capability approach and education. Educational Action
Research, 13(1), 103-110. doi: 10.1080/09650790500200279
Watkins, M., & Noble, G. (2008). Cultural Practices and Learning: Deversity, discipline and
dispositions in schooling. Penrith South, Australia: University of Western Sydney and NSW
Department of Education and Training.
Wilson, S. L. (2011). Direct and Indirect Effects of Social Class on Career Expectations and
Likelihood of Compromise in an Adolescent Sample. (Doctor of Philosophy), University of
Northern Colorado, USA. (UMI 3498446)

28
Copyright © 2022 FDOKUMEN