Who are NEET - Analysis of the Unproductive (2014)
38
Università degli Studi di Urbino “Carlo Bo” Who are NEET? Analysis of the Unproductive Angelo Mosca (263492) Corso di laurea magistrale LM-87 Fondamenti delle Società del Benessere e Politiche Sociali Comparate Relatore: Yuri Kazepov A.A. 2013/2014
Transcript of Who are NEET - Analysis of the Unproductive (2014)

Università degli Studi di Urbino “Carlo Bo”
Who are NEET? Analysis of the Unproductive
Angelo Mosca (263492)
Corso di laurea magistrale LM-87
Fondamenti delle Società del Benessere e Politiche Sociali Comparate
Relatore: Yuri Kazepov
A.A. 2013/2014

PAGINA 1
Contents
Introduction .................................................................................. 2
Who are NEET? Genealogy of the unproductive ....................... 4
1.1. Deconstructing and defining the category. ......................... 4
1.2. European NEET ..................................................................... 11
1.3. Zooming on NEET, Italy: the last ........................................ 17
Needs of NEETs .......................................................................... 20
2.1.Italy and Spain, usual problem/unusual case ..................... 21
2.2. Sweden and Germany , usual case/unusual problem ....... 23
NEETs’ policies, the category or the person? ........................... 28
Conclusions .................................................................................. 33
Bibliography ................................................................................. 35

PAGINA 2
Introduction
The topic of this work is the emerging phenomenon of NEET. This acronym
means, “young people Not engaged in Employment, Education or Training”. This
essay is based on the content emerged during the Intensive Programme Erasmus (IPE)
held in Urbino from the 10th of March to the 21th, a two week lectures involving
students and teachers from four European Universities: the University of Urbino
(Italy), the University of Darmstadt (Germany), the University of Madrid (Spain) and
University of Stockholm (Sweden). Within this programme we discussed about many
issues concerning the topic of “Social Policy and Social Work in Contemporary
Europe”. We focused mainly on changes, challenges and comparisons. During these
two weeks we talked also about the NEET phenomenon and how the social services
can answer to these needs. Otherwise, after the research – useful for the comparison
with other students – I decided to develop the theme. It was not easy study in deep
this phenomenon, firstly due to the lack of bibliography and because it is an emerging
topic. Nevertheless, the principal European agency – like Eurofound, Eurostat, OECD
– have produced interesting and useful database for statistical data and paper for
conceptual analysis.
In the first chapter I will try to analyse the NEET concept, the definitions and
who really are the people we call NEET. Otherwise, if we look deep this category we
can understand the complexity and the different shades of vulnerability of being
NEET. I will try to discompose the concept to view better at the single categories. This
can also help to understand how the policies must be addressed. Sometimes we see
policies addressed to the entire category, otherwise for NEET we need another kind
of approach, not the one-size first-all. Instead, the personalized program is
recommended. Moreover I will describe the trends and the numbers about the
phenomenon at European level, furthermore I will focus upon Italian situation
because is one of the countries whit the highest NEET rate.

PAGINA 3
Second chapter focuses on IPE work. I will present the “vignette” of young
NEET that we have given to social workers. Then I will report the results of all the
countries that participated to IPE trying to compare the most interesting
characteristics of these countries that have different welfare systems. For Spain and
Italy it will seems easy because usually we consider these two countries similar. We
will see that it is not true and there are many differences even if they seem similar. On
the other hand, Sweden and Germany have different welfare systems (one social
democratic and one conservative-corporate), but they look similar in the management
of young NEET.
At last, the third chapter focuses on the possible policies that may be useful for
NEETs. I will describe the structure of the “Youth Guarantee” a new set of policies
included in Europe 2020 strategy. This is a 10-year strategy proposed by the European
Commission on 3 March 2010 for advancement of the economy of the European Union.
It aims at "smart, sustainable, inclusive growth" with greater coordination of national
and European policy. Youth Guarantee fits in this strategy and tries to elaborate
policies structured for the individual and not for the entire category.
In the last years the NEET phenomenon is growth with impressive rhythm
(from 17.2% to 20.6% in nine years (Eurostat), to understand and explain NEETs is an
assignment for those are interested to social reality and social policies.

PAGINA 4
Chapter 1
Who are NEET? Genealogy of the unproductive
1.1. DECONSTRUCTING AND DEFINING THE CATEGORY.
What do we really mean when we talk about NEETs? When we think at NEETs
category our imagination just stop to a boy or a girl that does not want to study or
work, someone that is doing nothing in his life, and usually we blame him of being a
cost for the society, in economic and social terms. Indeed some Italian politicians and
newspapers define the NEET in discriminating sense, e.g. “Né – Né” (Il Secolo XIX,
2011), “bamboccioni” (La Voce, 2012) or “Neet fannulloni” (Actainrete, 2011)1. However
if we look at this category with a different lens we can understand the complexity and
the different shades of vulnerability. Looking deeper in the NEET category is useful,
of course, for the comprehension of the different levels of needs and vulnerability, but
not only, but also to understand how to define policies and the good practices. For
example, the one-size first-all approach must be avoided (Eurofound, 2012, p.25)
because it does not consider the person but the entire category, we will see an example
of target policies in the last chapter about the Europe 2020strategy. Now it is necessary
to go ahead step by step and we must begin the analysis from the beginning, to
understand what NEET means and where it came from.
Traditionally the acronym NEET refers to young people not engaged in
employment, education or training. The term NEET was already used in the late
80’s but the word spread after it was used in 1999 with the publication of the
1 Né – Né and fannulloni are a journalistic and informal term used to those joung people who do not study or work. Otherwise, bamboccioni is similar to plump child. This last term was used by the minister Padoa Schioppa, the guilty of being NEET is spread also from political institutions not only the media.

PAGINA 5
government’s Bridging the gap2 report under the Tony Blair’s labour govern. The term
rapidly gained importance and now almost all EU Member State have their own
definition. For this reason, the term has a high level of complexity and the comparison
results difficult because every state and every statistical agency has its own definition,
so I think that beginning with the definition is a good method to try to move inside
this work. The differences about the terms are significant and concern four different
requirements for the NEET status (Italialavoro, 2011, 136):
The age. Should we consider the minor until 18, the youth standard class from
15 to 24, the next level of 29 to consider also the “young” people ‘till 34?
The condition in the labour market. Unemployed, inactive or just the ones who
do not belong to labour forces?
The kind of training and education courses. Just the formal training or also the
non-formal and informal training. The first one is about a structured and
organized training, there’s the intention to participate from the learner; the
non-formal training has more or less the same characteristics of the first one
but the learning activities are not a real learning (such as swimming sessions
for toddlers, community-based sports programs and conference style seminars,
which do not either have the level of curriculum, syllabus, accreditation and
certification associated with formal learning). At last, informal training are all
those daily activities related with the family, the free time and aren’t not
organized or structured and the learning is not voluntary (Cedefop, 2009).
The voluntary choice to not work. We should exclude the people that spend
their time helping at home or more in general the inactive people that declare
they do not want to work?
2http://webarchive.nationalarchives.gov.uk/+/http://wwwcabinetoffic.e.gov.uk/media/cabinetoffice/social_exc
lusion_task_force/assets/publications_1997_to_2006/bridging_gap.pdf

PAGINA 6
All these characteristics define a NEET but as I said before every country or
statistical agency has his own definition. The United Kingdom was the first country
to use the term, it referred to young unemployed and inactive people that are not
engaged in any form of training or education, the age class firstly was 16-18 and then
they extended to 24 years. In this country, the NEET phenomenon is relevant because
it is correlate to youth criminality and young mothers (Italialavoro, 2011). Also
interesting, even if is not a European country, is the Japan situation about the NEET
issue. They discern the ones that do not have a job and the others that are socially
excluded and are not a potential labour force. The first one, they call Freeter, is a
composed word. Free the English word and Arbeiter the German word that means
“worker”. Therefore, the Freeter are young people free from work, just
unemployed.Therefore the Japan definition includes the young people 13-34 (we
should discuss a lot if 34 old people are “young” or not) not engaged in employment,
training or education. They also include the civil status in the definition; afterwards if
you are not married you could be a NEET in Japan. Other Asian countries adopted this
definition (South Korea, China e.g.). This reflect the Asian society, in particular the
Japanese one, where life is structured by “compulsory” steps (Italialavoro, 2011). OECD
definition for NEET is obtained from the reading of its publications because they have
not a precise definition. The young NEETs are those people from 15 to 29 years old
that do not work and do not attend education or non-formal or formal training course.
Eurostat definition is different from OECD’s. For Eurostat the NEETs are those that
are not employed (unemployed or inactive) and that do not attend any education or
training course (formal, informal and non-formal). For this reason, the Eurostat
definition is more restrictive than OECD’s, they exclude all of those young people that
attend non-formal and informal training. In the other hand Eurostat consider all the
age segments from 15 to 34 years old. At last, according to Istat the NEETs are the
young people not employed or inactive, they also do not attend any regular education

PAGINA 7
courses or professional training. Consequently, young NEET computed on Istat
definition are more than the ones computed on Eurostat’s. Istat includes those that
do not work or study even if they attend any kind of training. In 2009 the NEET
percentage on young Italians (15-29 years old) was 20.6% according to Eurostat, while
21.2% according to Istat (Italialavoro, 2011). In this work, I used Eurostat definition for
European analysis while ISTAT definition for Italian analysis.
Figure 1. Differences between youth unemployment and NEET
We have already seen the differences between the definitions, these differences
lead us to understand that the comparison results difficult, and so this first part is
maybe boring but fundamental because it is easy to make a mess. Another distinction
must be done between the youth unemployment rate and NEET rate. According to
the International Labour Organization (ILO) the unemployment rate is a measure of
those who are out of work, but have looked for work in the past month and are able
Source: Eurofound, 2012, p.23

PAGINA 8
to start in the next two weeks. Following Figure 1, the youth unemployment rate is
computed as the share of the economically active population who is not able to find a
job while the NEET rate is computed as the share of the young population who is not
in employment, education or training. This is why the number of young people who
are NEET in Europe is higher than the number of those who are unemployed
(Eurofound, 2012). This distinction is important to understand what the NEET
category is, as we said we have many levels of vulnerability that requires a type of
intervention not addressed to the entire category but to every single individual. For
that is important to discern Neet and unemployed; of course, many of young NEET
are unemployed, but not only.
We have a concept but different needs that requires different answers. Studying
NEETs is an opportunity to better understand the entire factor that intervene in the
process of the construction of disadvantage. Effectively with the NEET concept we
think that the individual responsibility of the choice has more count than the social
differences. In this way, the condition of NEET, not the differences, is perceived as a
cost of society in economic and social terms (IRPET, 2012). The NEET indicator is
useful but very fragile because of its heterogeneity. It Is a category that contains a
variety of subgroups, some of whom are vulnerable and some which are not. Five main
subgroups within the NEET population may be identified (Eurofound, 2012, p.24):
The conventionally unemployed, the largest subgroup, which can be further
subdivided into long-term and short-term unemployed;
The unavailable, which includes young carers, young people with family
responsibilities and young people who are sick or disabled;
The disengaged: those young people who are not seeking jobs or education and
are not constrained to do so by other obligations or incapacities, and takes in
discouraged workers as well as other young people who are pursuing dangerous
and asocial lifestyles;

PAGINA 9
The opportunity-seekers: young people who are actively seeking work or
training, but are holding out for opportunities that they see as befitting their
skills and status;
The voluntary NEETs: those young people who are travelling and those
constructively engaged in other activities such as art, music and self-directed
learning.
Figure 2. The heterogeneity of the NEET population
Source: Eurostat 2013, p. 25
The five categories include a mix of vulnerable and non-vulnerable young
people. The opportunity seekers tend to be a non-vulnerable group because they have
a more privileged background and they will more easily find a job. The same thing
may apply to the voluntary NEET who has decided to follow alternative trajectories
and is constructively engaged in other non-formal activities. Conversely, the group of
disengaged workers and those who have unsuccessfully tried to enter the labour
NEETs
Conventionally unenployed
Unavailable
disengagedOpportunity
seeker
Voluntary NEETs

PAGINA 10
market and have later given up their attempts are more likely to be vulnerable, with
very complex situations and needs. This group is also more at risk of pursuing
dangerous and asocial lifestyles. Finally, the unavailable group includes a mix of
vulnerable and non-vulnerable people: young people with disabilities who need
support in order to participate in the labour market or education, young mothers who
are unable to afford childcare, as well as young mothers with a high household income
who voluntarily decide to exit the labour market to take care of their children
(Eurofound, 2012). However on the one hand, support and assistance policies, like
activation or engagement in education system, intervene on the less urgent, namely
the ones with more possibilities and more motivations on being "active" again; on the
other hand, the ones living with difficulties, including very hard situations, simply
known as NEETs, aren't helped properly in order to overcome their situation of risk,
and they found themselves thrown in the labour market without an accurate
resolution of the underlying fallacies like social inequality. (IRPET, 2012). Exactly for
this heterogeneity NEET population needs designed policies to re-engage NEETs with
the labour market or with education.
Nonetheless this heterogenic young NEET share a set of similar characteristics.
They are out of education system, and for that reason they are not accumulating
human capital and this could be a barrier in the research of job. They are also excluded
from labour market and very exposed to poverty. All these characteristics led us to
understand that young NEET are more at risk of social exclusion. However, the costs
are not only in social term but also economic; in 2012 Eurofound estimated that the
unemployment and the other types of exclusion cost €163 billion, which is equivalent
to the 1.26% of the European GDP. All of these numbers and characteristics referred
to the European level, but there are deep differences in every state. Considering this,
we can start to analyse the numbers and the characteristics of NEET in European
countries.

PAGINA 11
1.2. EUROPEAN NEET
Ending the previous paragraph, we tried to explain and analyse the concept of
NEET, not the trends or numbers, but some guidelines useful to do not make a mess
because it is easy to get confused inside this complex issue. Recapping, we talked
about the definitions of NEET, the subgroups and the cost of being NEET in social and
economic terms. Nevertheless, these costs and effects are different among the
European countries. We have states that were hit less than others by the economic
crisis of 2008. Otherwise, the economic crisis is not the only factor of the growth of
NEET phenomenon. The asset of youth policies is also important. There are many
states (e.g. the Continental and Scandinavian ones) that had provided to develop
programs and projects focused on youth and the labour market before the “Youth
Guarantee” (Chapter 4), so they was adequately prepared to face the NEET
phenomenon.
According to Eurostat (Table 1) the European average NEET rate is at 15.8%.
Therefore, if we consider all the young European people among 15-29 old, the 15.8% of
these are NEET.

PAGINA 12
Table 1. %NEET on 15-29 young European
Source: Eurostat 2013, own elaboration
Firstly, the situation appears drastic for these countries that the economics
newspaper “ironically” calls PIIGS (Portugal, Ireland, Italy, Greece and Spain).
Moreover, it is easy to observe, just below the EU average, the continental countries
like France or Germany. At last, at the end of the table the Scandinavian countries
have the lowest rate. In particular, for the countries analysed during the IP, I
highlighted Italy and Spain, Germany and Sweden (we will examine in deep these
countries in the next Chapter). Italy presents the highest NEET rate with 26%, also for
Spain the rate is alarming, 22.8%. These countries have been hit hardest by economic
crisis. While, Sweden and Germany, respectively 7.9% and 8.9%, have a lower NEET
rate. Superficially, most people could say that is easy for Sweden, with only 9milion
31,3
29,3
28,9
26,0
25,7
22,8
20,9
19,6
18,6
16,7
16,2
15,8
14,9
14,7
13,8
12,8
10,9
8,7
8,3
7,9
7,7
7,5
7,2
7,1
7,0
6,4
Mk
Tu
Gr
Ital
y
Bg
Sp
ain
Hr
Ro Ir Pt
Po
EU
27 Be
UK Fr
Cz Fi
Ger
man
y At
Sw
eden Ch
Dk
Lu Nl
No Is

PAGINA 13
inhabitants, to manage the situation. Otherwise, this reasoning, even if it is superficial,
does not stand for Germany, with its 80 million inhabitants.
Table 2. NEET's gender gap
Source: Eurostat 2013, own elaboration
It’s also interesting the trend analysis of the gender gap among the NEET
category (Table 2). We can observe a high gap in 2004 between male and female, the
two lines come closer in time, indeed, if we look at 2013 the trend shows us a different
gap. At one hand, the male trend showed a decreasing before the economic crisis.
After 2008 the male rate increased rapidly, while the female trend decreased. The
decreasing of the female trend is explained also by the participation of female in
education (Carbone, Cervarolo, 2009). In the Table 3 it is possible to see the numbers
8,0
10,0
12,0
14,0
16,0
18,0
20,0
2004 2005 2006 2007 2008 2009 2010 2011 2012 2013
Male
FamaleFemale
PAGINA 14
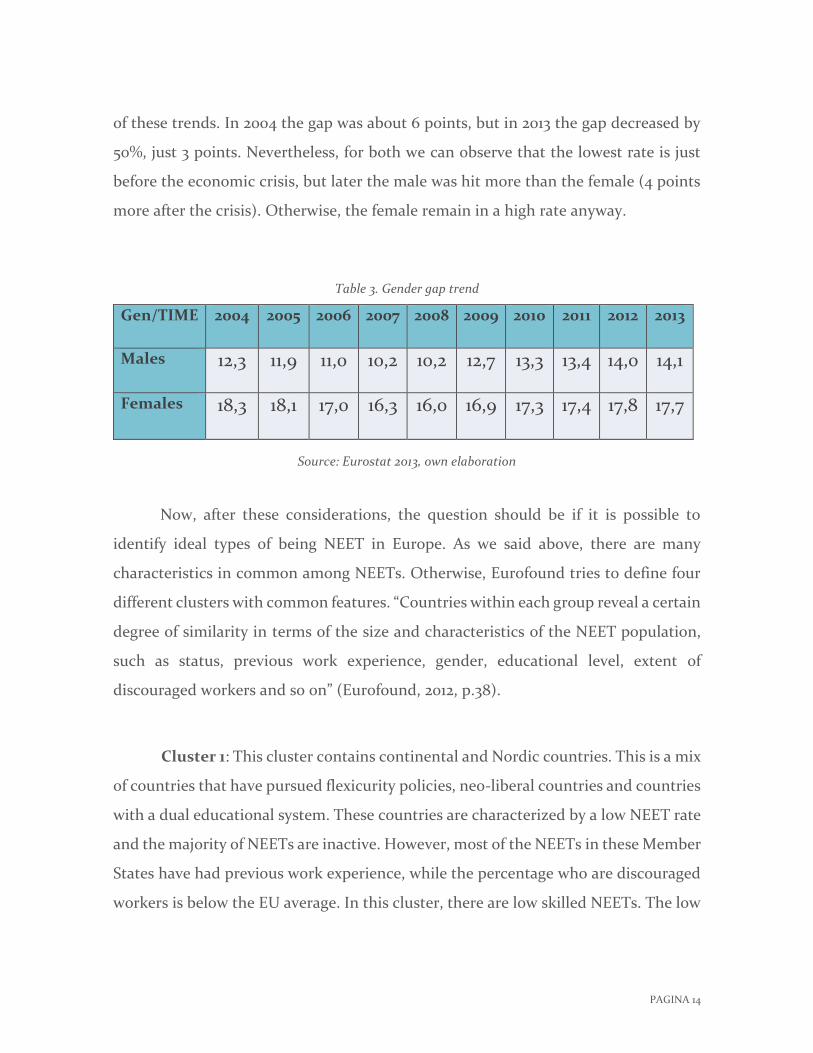
of these trends. In 2004 the gap was about 6 points, but in 2013 the gap decreased by
50%, just 3 points. Nevertheless, for both we can observe that the lowest rate is just
before the economic crisis, but later the male was hit more than the female (4 points
more after the crisis). Otherwise, the female remain in a high rate anyway.
Table 3. Gender gap trend
Gen/TIME 2004 2005 2006 2007 2008 2009 2010 2011 2012 2013
Males 12,3 11,9 11,0 10,2 10,2 12,7 13,3 13,4 14,0 14,1
Females 18,3 18,1 17,0 16,3 16,0 16,9 17,3 17,4 17,8 17,7
Source: Eurostat 2013, own elaboration
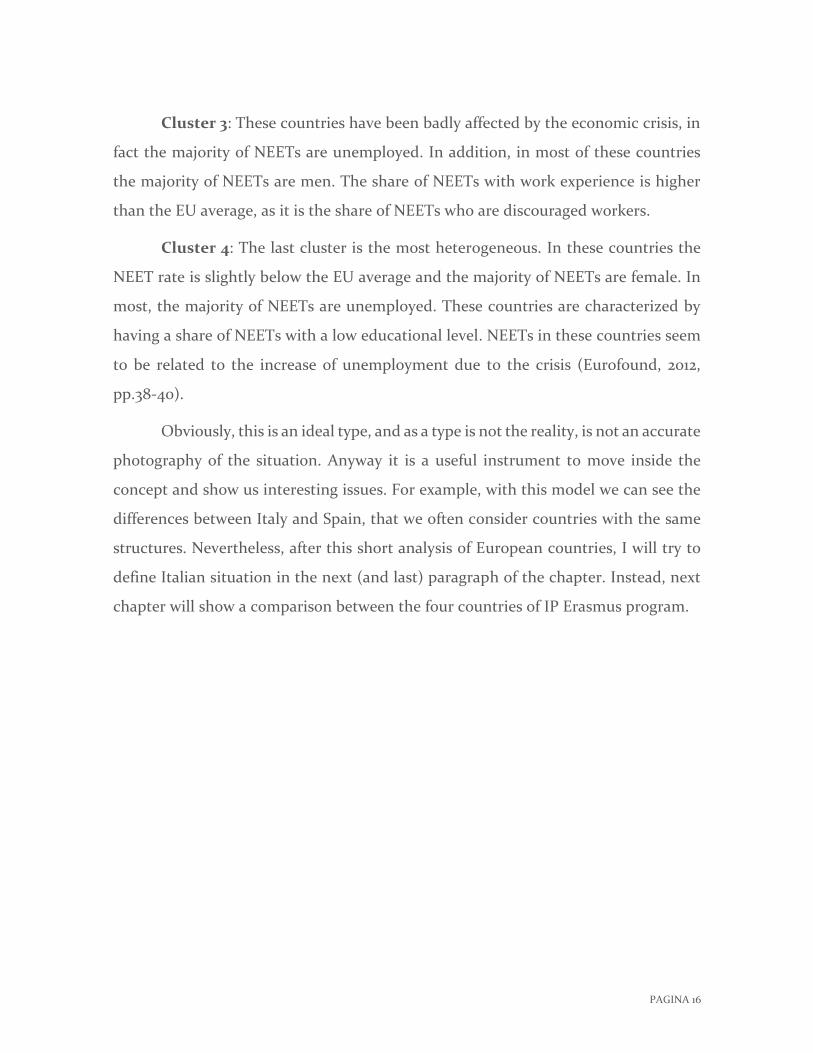
Now, after these considerations, the question should be if it is possible to
identify ideal types of being NEET in Europe. As we said above, there are many
characteristics in common among NEETs. Otherwise, Eurofound tries to define four
different clusters with common features. “Countries within each group reveal a certain
degree of similarity in terms of the size and characteristics of the NEET population,
such as status, previous work experience, gender, educational level, extent of
discouraged workers and so on” (Eurofound, 2012, p.38).
Cluster 1: This cluster contains continental and Nordic countries. This is a mix
of countries that have pursued flexicurity policies, neo-liberal countries and countries
with a dual educational system. These countries are characterized by a low NEET rate
and the majority of NEETs are inactive. However, most of the NEETs in these Member
States have had previous work experience, while the percentage who are discouraged
workers is below the EU average. In this cluster, there are low skilled NEETs. The low

PAGINA 15
share of discouraged workers indicates that in most cases this decision might have
been voluntary, probably to take over family, and not as a sign of structural barriers
for young people accessing the labour market.
Cluster 2: The second cluster is characterized by having a majority of NEETs
who are inactive. It includes southern Mediterranean and eastern European countries.
The countries in this cluster are those with the highest NEET rates in Europe. The
share of NEETs who are women is higher than the EU average. The majority of NEETs
are inactive. In addition, in most of these countries, the share of discouraged workers
is higher. The characteristics of this cluster indicate structural problems in the
transitions from the education system to the labour market. Here, ending up as NEET
seems to be involuntary and the result of various barriers that hinder a successful
transition.
Figure 3. Neet population clusters in the EU
Source: Eurofound 2012, p.38
PAGINA 16
Cluster 3: These countries have been badly affected by the economic crisis, in
fact the majority of NEETs are unemployed. In addition, in most of these countries
the majority of NEETs are men. The share of NEETs with work experience is higher
than the EU average, as it is the share of NEETs who are discouraged workers.
Cluster 4: The last cluster is the most heterogeneous. In these countries the
NEET rate is slightly below the EU average and the majority of NEETs are female. In
most, the majority of NEETs are unemployed. These countries are characterized by
having a share of NEETs with a low educational level. NEETs in these countries seem
to be related to the increase of unemployment due to the crisis (Eurofound, 2012,
pp.38-40).
Obviously, this is an ideal type, and as a type is not the reality, is not an accurate
photography of the situation. Anyway it is a useful instrument to move inside the
concept and show us interesting issues. For example, with this model we can see the
differences between Italy and Spain, that we often consider countries with the same
structures. Nevertheless, after this short analysis of European countries, I will try to
define Italian situation in the next (and last) paragraph of the chapter. Instead, next
chapter will show a comparison between the four countries of IP Erasmus program.

PAGINA 17
Figure 4. Characteristics of four NEET clusters in Europe
Cluster1
AT, DE, DK, FI, NL, SE, UK
- low NEET rate
- inactive
- whit work experience
- low skilled
- no discouraged
Cluster2
BG,GR,HU,IT,PL,RO,SK
- high NEET rate
- female
- inactive
-without work experience
- high skilled
- disouraged
Cluster4
BE, CY, CZ, FR, LU, SI
- average NEET rate
- unemployed
- with work experience
- medium skilled
Cluster3
EE, ES, IE, LV, LT, PT
- high NEET rate
- male
- unemployed
- with work experience
- high skilled
- discouraged
Source: Eurofound, 2012, own elaboration

PAGINA 18
1.3. ZOOMING ON NEET, ITALY: THE LAST
- Senti che lavoro, me n'ero dimenticato, che lavoro fai?
- Be', mi interesso di molte cose: cinema, teatro, fotografia, musica, leggo...
- E concretamente?
- Non so cosa vuoi dire.
- Come non sai, cioè che lavoro fai?
- Nulla di preciso.
- ... Come campi?
- Mah... te l'ho detto: giro, vedo gente, mi muovo, conosco, faccio delle cose.3
(N. Moretti, Ecce Bombo, 1978)
Just few words to present the Italian situation, it appears the most alarming
after Macedonia, Turkey and Greece. According to Eurostat (2013) in 2013, the NEET
rate is 26%. More than 2million young people in the 15-29 age. The numbers are
alarming especially for women that live in the south of the country. The gender gap
in 2004 was 9 percentage points, while now the gap is just 3 points, about 75% less. As
in Europe, also in Italy the numbers show a bad trend for men (from 15% in 2004 to
24.4% in 2013), with a growth of 9.4% points. Otherwise, the females are in highest
ranking but with a less growth (from 23.9% in 2004 to 27.7% in 2013), just 3.3 points.
The females are in a disadvantaged situation also for the educational qualification.
The 26% of female NEET have a degree, while the NEET men with the same
qualification are 20%. Clearly when the educational qualifications, and the skills you
3 "What's your job?" "I'm interested in many things: movies, theater, photography, music... I read..." "And in practice?" "Well, I go around, I see people, I do things..."

PAGINA 19
have acquired, are correlated with the NEET situation you perceive as useless your
skills and qualifications. In this case the discouragement intervenes. Otherwise, the
territorial differences are deep. Female NEET with a degree in the south are about
35.2% while the men in the north, with the same qualification, are just the 16.3%. In
general terms the NEET in the south are almost twice as much the northern ones.
Table 4. Italian NEET rate % on 15-29
Italy 26,02
North 18,98
South 35,41
Source: Istat, 2013, own elaboration
These differences are enormous; we have the region Trentino, with the 13.3%,
below the UE average. In the other hand Sicily region has a drastic NEET rate, 39.67%.4
Sicily is a big problem for entire national situation; all the south of Italy has a shocking
situation in comparison with the north.
Trying to recap, we have seen that the situation has a high level of complexity
and in sociological terms – NEET – is a fragile instrument to use with care because
inside this there are many kinds of questions and needs. It is an ideal type, (Weber,
1904, trad. 2001, p. 112). Moreover I tried to analyze the European situation but it is not
sufficient the macro point of view because all countries have different policies and
welfare settings. For this reason, in the next chapter, we will see the answers that the
“services” give to the NEET case.
4 Unfortunately, this is not the worst rate in Europe. “Mardin-Batman-Sirnak-Siirtthe” a Turkish region has the highest NEET rate: 54.5%.
PAGINA 20
Chapter 2
Needs of NEETs
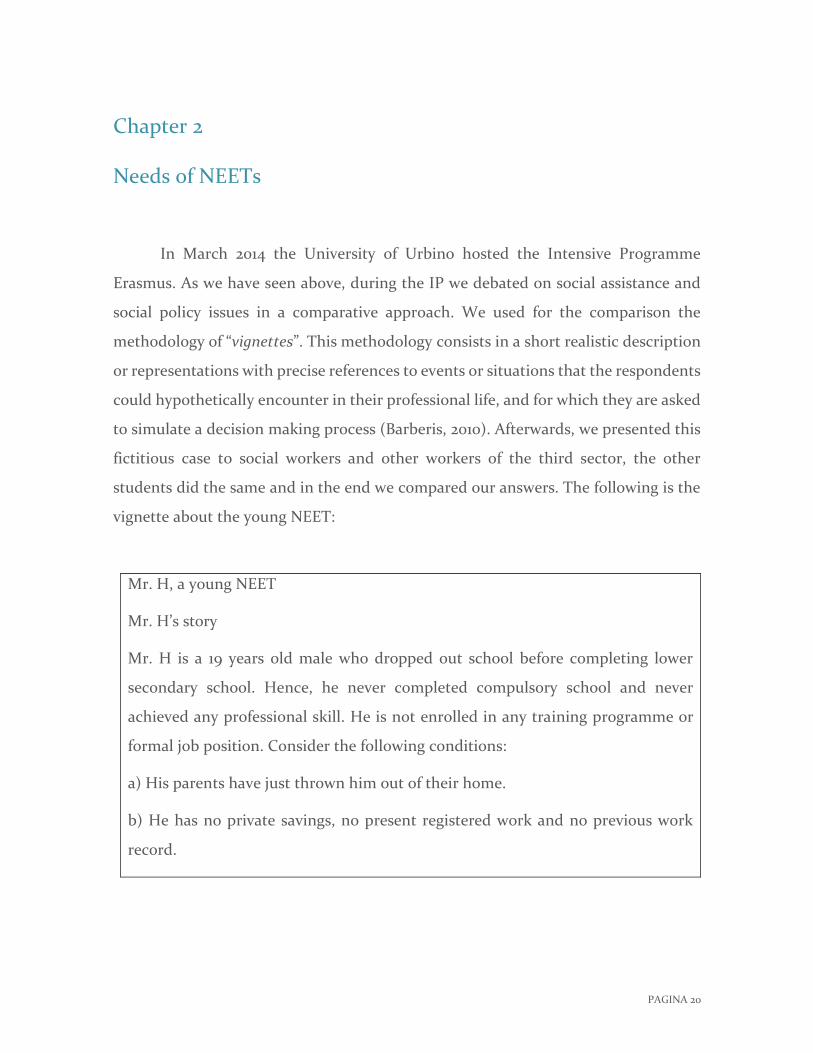
In March 2014 the University of Urbino hosted the Intensive Programme
Erasmus. As we have seen above, during the IP we debated on social assistance and
social policy issues in a comparative approach. We used for the comparison the
methodology of “vignettes”. This methodology consists in a short realistic description
or representations with precise references to events or situations that the respondents
could hypothetically encounter in their professional life, and for which they are asked
to simulate a decision making process (Barberis, 2010). Afterwards, we presented this
fictitious case to social workers and other workers of the third sector, the other
students did the same and in the end we compared our answers. The following is the
vignette about the young NEET:
Mr. H, a young NEET
Mr. H’s story
Mr. H is a 19 years old male who dropped out school before completing lower
secondary school. Hence, he never completed compulsory school and never
achieved any professional skill. He is not enrolled in any training programme or
formal job position. Consider the following conditions:
a) His parents have just thrown him out of their home.
b) He has no private savings, no present registered work and no previous work
record.

PAGINA 21
c) He says he lives by begging and by informal loans from friends. He has no formal,
registered income. He may have some unregistered income by working in the
informal economy, but this cannot be substantiated.
d) He is a defaulting tenant in a small flat in the periphery of the city. Given the
above conditions, Mr. H applies to the public authorities in order to obtain support
for himself.
Questions and key-points:
- What public authority would consider the demand? A local welfare office? A local
social security office? A local labour market office? Another type of office? Several
offices? Please specify.
- Is there a case management? If so, who is responsible for the case management?
- Is Mr. H entitled for any cash allowance? If yes, how much and for how long?
- Which other forms of help (beside financial benefits) are given to him (training,
self-help, housing…) – if any – and how long does they last?
- If yes, are these measures centred on a contractual basis and what happens in
case of refusal?
- Which kind of activation program could be proposed to him? Would he be
involved in the design of his personal activation program?
- Have there been any change in the access chances to services since the last reform
of this policy area?
2.1.ITALY AND SPAIN, USUAL PROBLEM/UNUSUAL CASE
In these countries, characterized by a familistic welfare, social policies are used
to gain politic consensus, and this leads to a clientelar management of the

PAGINA 22
redistribution mechanism. Family has an important role as a social security cushion
strongly correlated with the catholic tradition. In Italy the role of primary network is
recognized by law but not economically supported. Otherwise the discretion level is
high because of the weak institutional assets. The local level has a major role in the
management, in fact these countries are defined like “regionally framed policies”
(Mingione, 1997; Ferrera, 1998; Kazepov, 2002; Barberis, Sabatinelli, Bieri, 2010).
Otherwise, as we will see in the answers of social workers there are differences even
in the countries that belong to the same system; in fact in Spain there are measures
that are not implemented in Italy.
Italy
Considerating the vignette, when there is a need, a low complexity level
network is activated. The offices involved are “Caritas” (third sector), Job Centre of
Province (PU) and social services of social district (ATS4). There isn’t any specific law
or program for this case. Otherwise, for the immediate subsistence the help comes
from Caritas, while for a more structured path is the Job Centre that manages the case
without providing any cash allowance or other benefits, the main deal is the search of
the job. . The discretion is very high, because of the lack of law. They try to use other
laws to “cover” this case (e.g. the regional law 30/1998 for family household). This
shows the level of discretion, the weak national frame, and a strong local and regional
role. The potential problems for this case are the limited resources, also because the
case is not a priority at all. Another problem is the claimants “Ping-Pong” because the
user do not know well where to go.
About the economic help, the young NEET has not any guarantee, also because
it’s not clear if there is any cash allowance. Otherwise there is a guarantee for some
in-kind measures like food packages, tickets for primary needs, benefits for public
transport mainly from Caritas. Instead, the Job Centre guarantees stages and training

PAGINA 23
courses. Anyway, there isn’t a defined procedure for this demand and third sector is
involved in a welfare mix management. The most alarming problem is the ignorance
about the case for two reasons mainly. Firstly because the NEET do not turn to social
workers but primarily to their family. Secondly (and this is connected to the first
reason) because of the lack of resources, social workers try to solve the case involving
the family or some relatives.
Spain
For the Spanish case there isn’t a structured network. At first seems that could
be possible to have access to many activities and programs like training courses,
cultural promotion. But as a matter of fact there are no resources. Actually the case
could be managed from national social services but, because of the lack of resources
the case is managed by a private association, “La Calle”. It provides with 35€ per month
of cash allowance only if the young NEET follows training or education courses. There
are in-kind measures like training organizations, social support, food and clothes. A
compromise is established with the young NEET. These measures are linked to
monitoring.5
2.2. SWEDEN AND GERMANY , USUAL CASE/UNUSUAL PROBLEM
In this paragraph we observe two countries with two different welfare systems.
The social democratic and the conservative-corporate one. Germany is usually
associated to the conservative-corporate welfare system. The social and productive
framework is characterized by high differentiation established over the time, so the
state intervention could not have been extended with universalistic policies.
5 As we have seen in Italy, the NEET case – even if the rate is one of the highest in Europe – is unusual.

PAGINA 24
Small producers and smallholders are still strategic social groups for the
economy from the time of industrialization, who consolidated the mechanisms of
support and protection often created for the category itself.
Germany is an example of conservative-corporative model, of an
institutionalist kind (there is a high normative role of the State, which supports a high
quality productive system based on high wages and direct support to families) and,
moreover, the State has an important role in the mechanisms of social protection.
Compared to the social-democratic model, here we have a lower level of
defamilization.
Defined as centrally framed countries, they still give to the central level a major
role in the definition and implementation of social policies, even if the local level is
gradually becoming more important.
The social democratic welfare system, is characterized by a high presence of
state’s interventionism among the normative process is facilitated by the socio-
demographic characteristics of the population (not very large and quite homogeneous
– immigration processes not relevant) and by the marginal position of Scandinavian
countries compared to the centre of the international economic market.
Accordingly, the social-democratic normative model has been steadied
without internal conflicts and the risks have been managed by social coalitions
politically represented by social-democratic parties that put the attention not only on
the workers’ interests but also on the entrepreneurs’’.
The welfare system has high standards of quality and is guaranteed to the
whole population.
There is a high level of defamilialization. These countries are defined as
countries with a centrally framed local autonomy, namely the local level has high
competences but they are identified inside an institutional frame, precisely defined
and stable, which guarantees a minimum standard of assistance and common
procedures to follow (Ivi.).

PAGINA 25
Germany
There are two main offices involved in the network. The Municipal youth
welfare office that provides for families, young people and children in need with
assistance (counselling, educational assistance, financial support) according to the
Social Code Book VIII (the social services practices are managed by these books). The
Job Centre that guarantees basic income support according to SGB II (Social Code
Book II) if the person in need reports himself as looking for work; it also give assistance
to get an education degree. Instead, about the source of legitimacy the SGB II is
regulated and principally managed at the federal level (Bundesagentur für Arbeit), but
the benefit payment, the service provision and the activation is managed at the local
level.
In Germany the young NEET receives313€ per month but he has to report
himself as job seeking and has to cooperate. The Job Centre gives some in-kind
measures like career counselling, vocational orientation and training. It is interesting
that is a common case even if the NEET phenomenon is not high. The main problem
emerged in the German case is to contact young people.
Sweden
This case, for the Swedish social workers, does not appear problematic. After
the first contact with the social welfare board the client is addressed to the social
services in collaboration with the section of financial assistance. Together, these
offices manage the case. The main problem do not seems to be the job but the lack of
income, indeed this isn’t a problem neither because it is provided a minimum income
of 420€ per month which will provide reasonable standard of living. Rent and
electricity are not included in this amount of money, but it is granted separately. The
PAGINA 26
client must be signed up to the Job Centre and follow the guidelines that they give to
him in the job seeking. He receives all the benefits until he gets employed.
It’s important for the Swedish case to highlight the variation: “Whether Mr. H
has no relatives”? this variation does not effect his entitlement to financial assistance.
In Sweden relatives do not have responsibility to provide for one other. Neither
parents if he is over the age 18. In addition, the computing of the family household is
not on a family base but on the singular person. Almost everything is guaranteed, so
the parents are not obliged to afford the situation.
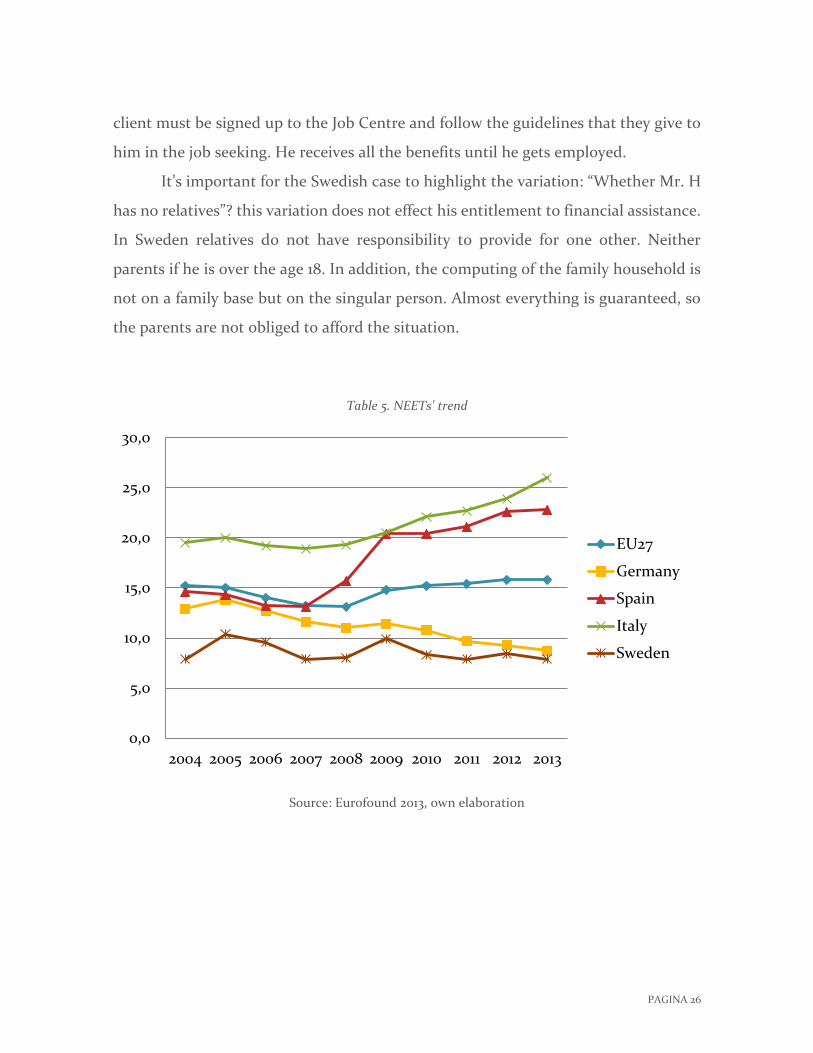
Table 5. NEETs' trend
Source: Eurofound 2013, own elaboration
0,0
5,0
10,0
15,0
20,0
25,0
30,0
2004 2005 2006 2007 2008 2009 2010 2011 2012 2013
EU27
Germany
Spain
Italy
Sweden

PAGINA 27
Table 6. Usual, unusual and cash allowance
Mr. H Germany Italy Spain Sweden
cash 313€ 0 35€ 420€+rent+electricity
frequency usual unusual unusual usual
Data results from IPE comparison
It is interesting to observe that the countries with a high NEET rate are the
ones that declare uncommon the NEET case and do not guarantee any support, or
when it is guaranteed it is not enough. Otherwise for continental – Scandinavian ones,
with a low NEET rate, the supports are generous. This lack of attention from the
countries in drastic situations lead us to discuss and reflect much more about young
NEETs. It seems that European Union is moving in this direction, and this will be the
focus of the next chapter.

PAGINA 28
Chapter 3.
NEETs’ policies, the category or the person?
In this last chapter I will try to put the focus upon European youth policies.
There is a long history of European recommendations on youth issues, the first
programmes to promote the youth mobility come from the late 80s, but they never
talk about NEETs phenomenon. The recommendations about youth were always
focused on unemployment, promoting the entrance in the labour market or on the
reduction of the school drop-out:
2005/600/CE for employment
2010 promoting the entrance in the labour market
2010 youth on movement
2011 reducing the school drop-out
Otherwise, the newest programmes are inside the Europe 2020 strategy. It is a
10-year strategy proposed by the European Commission on the 3rd March 2010 for the
advancement of the economy of the European Union. It aims at "smart, sustainable,
inclusive growth" with greater coordination of national and European policies. It
follows the Lisbon Strategy for the period 2000–2010.Europe 2020 wants to intervene
also on the NEETs situation, more in general the aim of the strategy is on the human
capital investment to permit an economic sustainable growth, trying to avoid the cost
of those that are out of labour market and education. The targets, for this set of
policies, are:

PAGINA 29
Bring into the labour market at least the 75% of all the people in the 20-64 age.
Reduce the school drop-out under the 10%.
Lift out of poverty and social exclusion 20million people.
Europe 2020,has also targets like environment development and green
economy issues. Nevertheless, we point out that the NEET phenomenon is highly
considered, also because the recommendation on youth polices opens in this way:
“Investing now in the human capital of young Europeans will deliver long-term
benefits and contribute to sustainable and inclusive economic growth. The Union will
be able to reap the full benefits of an active, innovative and skilled workforce while
avoiding the very high costs of having young people neither in employment, education
or training (‘NEETs’), currently put at 1,2 % of GDP” (c2013/C 120/01).
The fact that young people have been hit particularly hard during the crisis have
been understood, also the situation of young women that are more likely to be affected
by low pay and precarious employment, while young parents, primarily young
mothers, lack adequate work-life balance measures. In this frame starts the Youth
Guarantee.
The Council of European Union recommends the institutions of a Guarantee for
Youth. The “Youth Guarantee” provides to all young people under 25 a qualitatively
valid offer of employment, to continue their studies, starting an apprenticeship or
training. All these opportunities must be guaranteed within four months of
registration in the programme.
In Europe only seven countries are currently developing national Youth
Guarantee Implementation Plans: Austria, Denmark, Germany, Ireland, Italy, Latvia
and Spain. In this last part of the paper, we will analyze the Implementation Plans of
Italy.
Italy accepted EU recommendation on the 04/22/2013 and the Youth Guarantee
began on the 1st of May, 2014. Italy received from YEI (Youth Employment Initiative)

PAGINA 30
and ESF (European Social Found) an amount of €1.513million. It means that for every
single Italian NEET it is guaranteed a service equal to €671,25. Anyway, this amount is
shared in a non-equal way, in every region of the country. Indeed, the regions with
the highest Neet rate received more money than others. The regions, in the activation
of Youth Guarantee, play an important role because they have the main authority
according to the subsidiarity principle. However, they will not be alone, the regions
will work together in a network with the third sector, and the Job Centres will manage
the cases.
Firstly, it is necessary to give to all people the possibility to use the service with
an informative system. The access of young NEET will be possible through the web or
Job Centres. This first step provides a universal and basic information, in which the
NEET can concord an appointment with someone who works in the Job Centre. Then,
he can define with an operator his personalized program, based on his personal skills.
At last he will be addressed to one of the possibilities that include: work placement,
apprenticeship, training, education programs, self-entrepreneurship or civil service.

PAGINA 31
Figure 5. Youth Guarantee, which services?
Source: Italian implementation plan of the Youth Guarantee
Youth Guarantee may appear as the answer we were always looking for,
however it has many points of instability, especially in Italy. In this country the Youth
Guarantee is arrived when the parliament decided to put off the local administration
level known as Province. This is a substantial problem, because the Province has
always managed the Job Centre in Italy. Now with the suppression of this level they
don’t know the consequences upon the Job Centre. In this state of undefined it is
difficult to let the Job Centre start a program like the youth guarantee. Not only for
the regions that traditionally have many administrative problems like Calabria or
Sicily. Emilia-Romagna, usually defined as a virtuous region, also has this kind of
Universal
Basic services and informations
To concord with users
Welcome and
profiling
Personalized programme
Orientation
Skill consolidati
on (training)
Monitoring and evaluation
work placement
apprenticeship
training
education programmes
self-entrepreneurship
civil service

PAGINA 32
problems. Otherwise, someone sees this Guarantee as a way to give money to private
enterprises for employing young people.
Now it is difficult to evaluate the Youth Guarantee, because it has just been
born, so maybe in some months (when the first groups of young people will be called
to define their program) we will better understand the scheduling and the progress of
the works. Meanwhile, the Department for Social Polices has published some data. At
the 29th of May 2014 (one month after the start), 67.751 young people have joined the
Youth Guarantee (DG politiche dei servizi per il lavoro, 2014). The hope is that in four
months, they will be called to start their program.

PAGINA 33
Conclusions
As we have seen, the NEET phenomenon is alarming. The numbers and data
that we saw in the first chapter should make us reflect, especially for some countries
like Italy and Spain where the NEET rate is over the 20% (26% for Italy). Otherwise,
the lack of knowledge about the NEET in the countries with a high rate is another
question that policies must answer. Anyway, the data has not to be read in this way.
The countries with the lowest NEET rate (and where the phenomenon is known) have
been working on this issues since several years, while Italy and Spain started to work
in this direction only during the last years, when the numbers became alarming.
Nevertheless, we do not need just numbers and data to understand young
NEETs. Even if some agency tries to calculate the cost in GDP terms of the NEET
inactivity, much more interesting should be to calculate how much we gain with
labour market integration. Moreover, the NEET is considered guilty of his condition.
This vision of NEET is given by a blind consideration of the phenomenon. Being NEET
is much more than this. The only guilty part is the social inequality to which the
policies do not provide answer.
Beyond the numbers we have a lot of characteristics that define the NEET
status: the conventionally unemployed, the unavailable, the disengaged, opportunity-
seekers and voluntary NEETs. These are heterogeneous populations with different
needs. We can’t manage the needs of the entire NEETs category, simply because it’s
impossible. You can’t give the same answer to the conventionally unemployed and the
disengaged. So, as we said many times, the one-size first-all approach is avoided, while
the individualized intervention could be more useful.
In this sense, the Youth Guarantee might be the right tool. The central part of
the program is the profiling and the “scanner” of young’s skills. Otherwise, as we saw
in the last chapter, only seven countries are currently developing national Youth
Guarantee Implementation Plans. In particular the country with more difficulties

PAGINA 34
seems to be Italy. With the cut down of the Province the administrators do not know
well how to manage the situation and the fate of the Job Centres. As a matter of fact,
the Italian Minister of Social Policies and Work, Giuliano Poletti, four days before the
beginning of Youth Guarantee, confirmed that only four regions out of twenty are
ready to start the program.
PAGINA 35
Bibliography
Assirelli G. (2013), The NEET phenomenon. A comparative analysis.
http://www.unitn.it/files/download/20468/researchproposal.pdf
Barberis E. (2010), Methods and Contexts in the Study of Rescaling, in Kazepov (2010),
pp.431-69.
Barberis E., Sabatinelli S., Bieri A. (2010), Social Assistance Policy Models in Europe:A
Comparative Perspective, in Kazepov (2010), pp. 177-202.
Carbone D., Ceravolo F.A. (2009), Una società lenta. Mutamenti e mobilità sociale in
provincia di Alessandria, Franco Angeli, Milano.
Cedefop. (2009), European guidelines for validating non‑formal and informal
learning, Publications Office of the European Union, Luxembourg.
http://www.cedefop.europa.eu/en/Files/4054_EN.PDF
Esping-Andersen. (1990), The three worlds of welfare capitalism, Cambridge, Polity
Press.
Eurofound. (2012), NEETs – Young people not in employment, education or training:
Characteristics, costs and policy responses in Europe, Publications Office of the
European Union, Luxembourg.
European Commission, (2010), Recent developments in the EU27 labour market for
young peopleaged 15-29.

PAGINA 36
Ferrera M. (1998), Le trappole del welfare, Il Mulino, Bologna.
Hirschman O. (2002), Lealtà, defezione, protesta. Rimedi alla crisi delle imprese, dei
partiti e dello stato. Bompiani, Milano.
IRPET. (2012), I giovani che non lavorano e non studiano - I numeri, i percorsi, le
ragioni. http://www.irpet.it
ISTAT. (2013), Noi Italia - 100 statistiche per capire il Paese in cui viviamo.
http://www.istat.it/it/files/2013/03/Noi-Italia-2013.pdf
Italia Lavoro. (2011), Neet - i giovani che non studiano, non frequentano corsi di
formazione e non lavorano. Caratteristiche e cause del fenomeno e analisi delle
politiche per contenerlo e ridurlo. http://www.lavoro.gov.it/Lavoro/Europalavoro/
Italia Lavoro. (2013), Rapporto annuale – Famiglie e lavoro.
Kazepov Y. (2010), Rescaling Social Policies: Towards Multilevel Governance in
Europe, Ashgate, Farnham.
Kazepov Y. Carbone D. (2012), Che cos’è il welfare state. Carocci, Roma.
Kazepov Y., Sabatinelli S. (2002), Il caso italiano, in “Assistenza Sociale”, 2, pp. 187-
214.
Mingione E. (1997), Sociologia della vita economica, Carocci, Roma.

PAGINA 37
Ministero del Lavoro e delle Politiche Sociali. (2010), Italia 2020. Piano di azione per
l’occupabilità dei giovani attraverso l’integrazione tra apprendimento e lavoro.
OECD. (2013), Education at a Glance 2013: OECD Indicators.
Robson K. (2008), Becoming NEET in Europe: A Comparison of Predictors and Later-
Life Outcomes, Global Network on Inequality Mini-Conference, New York.
The Moving Project. (2010), Research Report. Neet- Understanding young people
who are not in Education, Employment or Training.
http://www.movingproject.eu/pdf/Research_Report_-Understanding_NEETs.pdf
Weber M. (2001), Saggi sul metodo delle scienze storico-sociali, Einaudi, Torino.