White Knights or Machiavellians? Understanding the ...
25
1 White Knights or Machiavellians? Understanding the motivation for reverse takeovers in Singapore and Thailand Pantisa Pavabutr 1 Thammasat University This draft: October 2017 Abstract We analyze the characteristics, return, and financial performance of 47 RTO sample firms in Singapore and Thailand between 2007‐2015. Given the existing regulatory screens imposed by Singapore and Thai exchanges, we cannot find evidence that firms choosing to list via RTOs signals a separating equilibrium of low type firms seeking a listing short‐cut. We argue that RTOs should not be evaluated as a choice of listing per se, but as part of the parcel of long‐term corporate strategy. Analysis in this paper yields important in sights on reverse takeovers from both investor and regulator perspectives. JEL Classification: G14, G34. Keywords: Reverse takeovers, Back‐door listings, Emerging markets. 1. Introduction Equity markets have both an allocation and monitoring role. The challenge for regulators is striking a delicate balance between overseeing transparency and fair rules governing listings for efficient allocation of resources and investor protection without delineating potential firms from entering organized exchanges. The dual paths to listing can be direct through an initial public offering (IPO) or indirect through a reversed takeover (RTO). An IPO is traditionally seen as a young company with full listing qualification coming of age and offering shares to the public. A reversed takeover is the process whereby a private company acquires a controlling stake in a public company in order to obtain listing status. In doing so, RTOs allows private firms to list and seek out growth opportunities by merging with public firms and to seek listing without too much dilution and vulnerability to market conditions. However, anecdotal and some selected empirical evidence suggests a dark side to RTOs as they are often referred to as “back‐door listings” with transactions associated with opaque firms wanting to bypass stringent listing rules or a method in which is a holding company of the shell firm tries to get rid of non‐performing assets by passing it along to the next uninformed investor. Under this setting, there are two issues where reversed takeovers are subject to debate. First, should reverse takeovers be allowed or should regulations be tightened? The second issue, is why should firms choose RTOs instead of IPOs? The drawbacks of RTOs is that their speed and cost saving benefits are often overestimated in particular with on‐going trends towards more regulatory scrutiny 1 Associate Professor of Finance, Thammasat Business School, [email protected]. The author wishes to thank the National Research Council, and Thailand Research Fund for grant support. The author appreciates research assistance from Sippapon Ithiprachayaboon, Prasit Sutthikamolsakul, and Nina Taphunwong. Comments welcomed.
-
Upload
khangminh22 -
Category
Documents
-
view
1 -
download
0
Transcript of White Knights or Machiavellians? Understanding the ...

1
White Knights or Machiavellians? Understanding the
motivation for reverse takeovers in Singapore and Thailand
Pantisa Pavabutr1
Thammasat University
This draft: October 2017
Abstract
We analyze the characteristics, return, and financial performance of 47 RTO sample firms in Singapore
and Thailand between 2007‐2015. Given the existing regulatory screens imposed by Singapore and Thai
exchanges, we cannot find evidence that firms choosing to list via RTOs signals a separating equilibrium
of low type firms seeking a listing short‐cut. We argue that RTOs should not be evaluated as a choice of
listing per se, but as part of the parcel of long‐term corporate strategy. Analysis in this paper yields
important in sights on reverse takeovers from both investor and regulator perspectives.
JEL Classification: G14, G34.
Keywords: Reverse takeovers, Back‐door listings, Emerging markets.
1. Introduction
Equity markets have both an allocation and monitoring role. The challenge for regulators is
striking a delicate balance between overseeing transparency and fair rules governing listings for efficient
allocation of resources and investor protection without delineating potential firms from entering
organized exchanges. The dual paths to listing can be direct through an initial public offering (IPO) or
indirect through a reversed takeover (RTO). An IPO is traditionally seen as a young company with full
listing qualification coming of age and offering shares to the public. A reversed takeover is the process
whereby a private company acquires a controlling stake in a public company in order to obtain listing
status. In doing so, RTOs allows private firms to list and seek out growth opportunities by merging with
public firms and to seek listing without too much dilution and vulnerability to market conditions.
However, anecdotal and some selected empirical evidence suggests a dark side to RTOs as they are
often referred to as “back‐door listings” with transactions associated with opaque firms wanting to
bypass stringent listing rules or a method in which is a holding company of the shell firm tries to get rid
of non‐performing assets by passing it along to the next uninformed investor.
Under this setting, there are two issues where reversed takeovers are subject to debate. First,
should reverse takeovers be allowed or should regulations be tightened? The second issue, is why
should firms choose RTOs instead of IPOs? The drawbacks of RTOs is that their speed and cost saving
benefits are often overestimated in particular with on‐going trends towards more regulatory scrutiny
1 Associate Professor of Finance, Thammasat Business School, [email protected]. The author wishes to thank the National Research Council, and Thailand Research Fund for grant support. The author appreciates research assistance from Sippapon Ithiprachayaboon, Prasit Sutthikamolsakul, and Nina Taphunwong. Comments welcomed.
2
pertaining RTOs in equity markets around the world (Sjostrom, 2008; Vermeulen , 2014). Pavkov (2006)
suggests that a complete analysis of benefits and costs of RTOs should include all stakeholders involved.
Our study contributes to the almost non‐existing research on RTOs in ASEAN. Using 47 RTO
sample firms in Singapore and Thailand between 2007‐2015, this paper addresses the above questions
through discussion of existing listing regulations on RTOs and empirical analysis return and financial
accounting performance. More specifically, it first briefly reviews existing regulations in Singapore and
Thailand whether they are conducive for firms to list by RTOs rather than by IPOs. Second, it empirically
analyzes the RTO samples by posing these questions 1), What are the characteristics of RTOs
transactions? 2) What is the investors’ experience in RTO transactions over short and long‐term periods,
and 3) What is the financial accounting performance of merged entity.
The paper finds that given the existing regulatory screens imposed by Singapore and Thai
exchanges, we cannot find evidence that firms choosing to list via RTOs signals a separating equilibrium
of low type firms seeking a short‐cut to listing. This is because both exchanges require the newly merged
entity to file a reapplication and comply with the same minimum standards as IPO listings. From
company circulars and financial advisors report of sample firms, the number of days to completing the
RTO transaction can be up to one year. In fact, about half of the RTO samples involve listing on the main
boards of Singapore Stock Exchange (SGX) and Stock Exchange of Thailand (SET); the other half on the
second boards of Catalist (CAT), and Market for Alternative Investment (MAI). If a RTO is a venue for
easy listing, then surely more transactions would have occurred on secondary boards where listing
requirement is more flexible, in particular on CAT. Second, after examining the characteristics of sample
RTO deals, we find 32 firms or 68% of the sample firms are classified by the auditor as financially
distressed, and approximately half of the transactions occur across firms with different industries. This
implies that outsider firms intend to takeover a “shell” or non‐performing firm in an unrelated industry.
Next, we examine the investor’s experience by measuring short‐term abnormal returns around RTO
announcements and long‐term 12 months return post‐announcement. The cumulative abnormal return
(CAR) of distressed firm RTOs during event window [‐10,10] around RTO announcement (MOU date), is
28.8% significantly higher than 8.4% of non‐distressed firms. Over a holding period of 12 months in
which the buy‐and‐hold abnormal return (BHAR) is evaluated, much of the original short‐term gain
reverted primarily because of continuing capital increases. Even so, the mean BHAR of RTO samples are
higher than the mean BHAR of control firm sample. Looking at financial performance, distressed firms’
net profit margins and return on assets improved after RTO completion, but non‐distressed firm
performance remains relatively superior to distressed ones.
In sum, in our analysis of short‐term and long term return performance we do not find evidence
that our sample RTOs transactions are causing market instability through fraud and pump‐and‐dump
schemes. If the ease of listing is not a reason for choosing RTO, then why do firms engage in these
transactions? From our analysis, we view that RTOs should not be perceived as a listing tool alone but
part of the parcel of long‐term corporate strategies where (i) the private firm can become a public
company without immediate large dilution in ownership and still have an option to raise more funds
later (many RTO transactions have warrant issue plans contingent on successful restructuring plans
post‐transaction); (ii) the private firm wishes to takeover a distressed or non‐distressed target public
firm by obtaining a bargain price since the target is substantially smaller and trading at a value weighted
average price (VWAP) in the bottom decile trading range of the exchanges; (iii) the public firm
controlling shareholders wishes to exit and is offered an attractive price to the private firm. RTO

3
transactions do provide a more liquid trading environment which facilitates exit, and iv), the motivation
could be unique to the firms themselves. 2
There are altogether five sections in this paper. Section 2 provides background discussions on
RTOs including deal structure, regulations, and related literature. Section 3 describes the sample data
and describes key features of RTO transactions. In section 4, both descriptive and empirical methods
are used to analyze the motivation for RTOs. Finally, section 5 concludes and discuss policy
implications for capital market development.
2. Background on RTOs
2.1 Deal structure
In a typical RTO the private company acquires a controlling stake in a public company in order
to obtain listing status by allowing the listed firm to acquire its assets or equity and in return receive
issued shares of the listed company.
Figure 1: Illustration of reverse takeover
Before transaction
After transaction
2 We also expect that by acquiring a loss‐making public firm, the private firm gains from tax shield.
However, we do not have unconsolidated financial statements of private firms to evaluate this conjecture. In Singapore’s case, some foreign outsider firms are already listed overseas, but explain that they prefer to list on
the Singapore exchanges to increase their international profile in Asian markets. With RTOs they do not need to
pay underwriting fees. Other outsider firms conduct RTOs as a short‐cut to international diversification (Perrenial
China Retail Trust transaction with St. James Holding) or a short‐cut to business diversification (Singha Estate
transaction with Rasa Property on SET).
Shareholders of
listed firm
Listed firm
Shareholders of
private firm
Private firm
Transfer assets
Cash transfer, private
placement or share swap
Shareholders of
listed firm
Merged firm
Shareholders of
private firm
(with more than
50% control)

4
Figure 1 illustrates the reverse takeover process. In exchange for assets transfer of private firm,
the listed firm may choose from one or combination of payment in cash, new shares issue through
private placement, borrow, or issue new shares to swap with private firm. In a RTO, the listed firm is
often referred to as a shell firm if it has the following properties: (a) no or nominal operations; and (b)
either: (1) no or nominal assets; (2) assets consisting solely of cash and cash equivalents; or (3) assets
consisting of any amount of cash and cash equivalents and nominal other assets.
Not all firms in our Singapore and Thai samples start out as “shell” firms; however, in the reverse
takeover process they can become one by liquidating their businesses or by agreeing to spin off its
current assets and liabilities at the time of the reverse merger. Some listed firms are profitable but are
struggling with poor business growth opportunities and seek reverse merger partners to strengthen
their industry positions through diversification and synergy.
Figure 2: Controlling structure in reverse take‐overs
Figure 2 shows a reverse take‐over between a public shell firm valued at $600,000 with share
priced at $0.1 and 6 million old shares outstanding and a private firm valued at $10 mn with 50 mn
shares outstanding at $0.2 per share. The financial advisor expects the merged entity to require $2mn
addition funds for restructuring process and issues 10 mn shares at $0.2 as private placement. Assume
for simplicity the combined firm value is estimated to remain at $0.2 per share (post‐consolidation issue
price). The public shell shareholders are offered pre‐consolidation issue price of $0.1 per share and then
Merged firm
Combined value $12.6 mn (63 mn
shares x $0.2
Private firm
value $ 10 mn
(50 mn shares
x $0.2)
Public firm
value $ 0.6
mn (3 mn new
shares x $0.2)
Private
placement $
2 mn (10 mn
shares x $0.2)
Value $
mn
No of
shares % Own
Private firm
shareholders 10 50 79%
Private
placement 2 10 16%
Public firm
shareholders 0.6 3 5%
12.6 63 100%
1:1 2:1
5
given share swap at a rate of 2 to 1 such deriving a post‐consolidated issue price3 of $0.2 per share and
that their original ownership value is set at $600,000. As a result, the new combined value of the firm
is $12.6 mn with private firm owners accounting for 79% (50/63) of merged firm control whereas private
investors account for 16% (10/63) and public shell shareholders account for 5% (3/63).
2.2 Reverse takeover regulations and process
An RTO is perceived as a “short‐cut” for a private (outsider) firm to achieve listing status and
bypass the lengthy process of an IPO and hence often referred to as “backdoor listing.” We discuss the
legal of definition of RTO and compare and contrast the IPO and RTO process next.
Both Singapore and Thai Exchanges apply bright line tests for two specific types of RTOs which
are transactions involving a change in control of a listed issuer and a very substantial acquisition (VSA).4
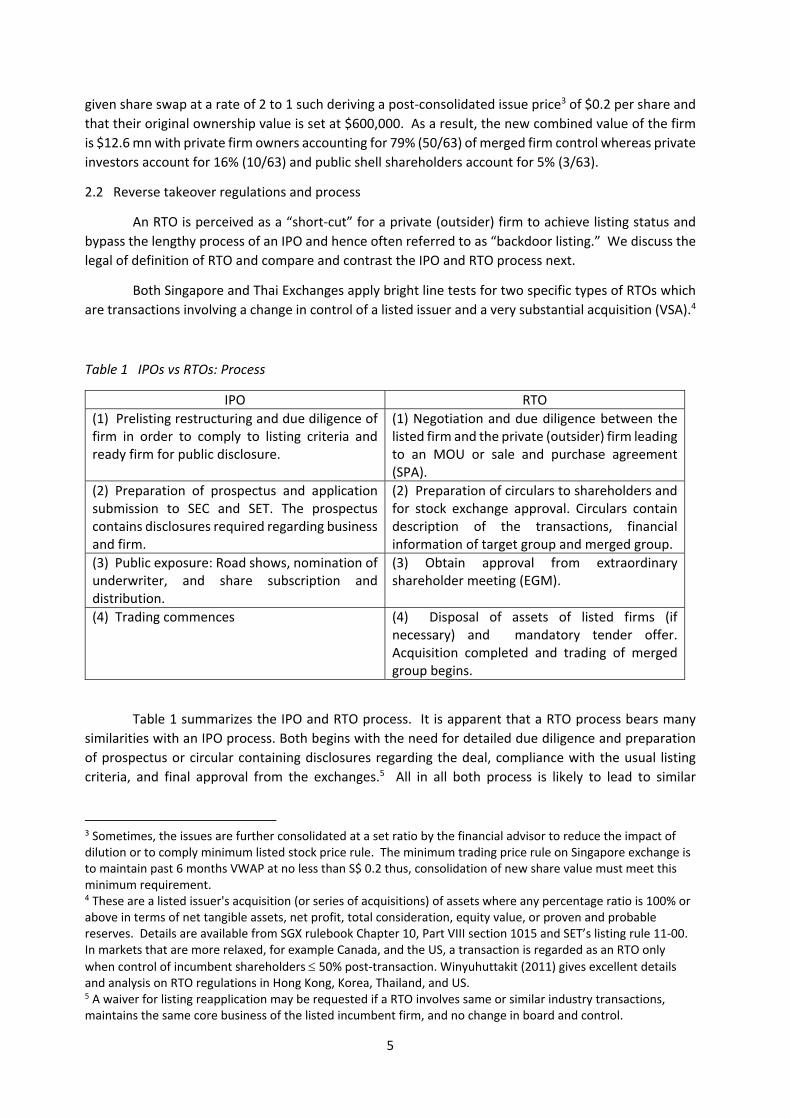
Table 1 IPOs vs RTOs: Process
IPO RTO
(1) Prelisting restructuring and due diligence of firm in order to comply to listing criteria and ready firm for public disclosure.
(1) Negotiation and due diligence between the listed firm and the private (outsider) firm leading to an MOU or sale and purchase agreement (SPA).
(2) Preparation of prospectus and application submission to SEC and SET. The prospectus contains disclosures required regarding business and firm.
(2) Preparation of circulars to shareholders and for stock exchange approval. Circulars contain description of the transactions, financial information of target group and merged group.
(3) Public exposure: Road shows, nomination of underwriter, and share subscription and distribution.
(3) Obtain approval from extraordinary shareholder meeting (EGM).
(4) Trading commences (4) Disposal of assets of listed firms (if necessary) and mandatory tender offer. Acquisition completed and trading of merged group begins.
Table 1 summarizes the IPO and RTO process. It is apparent that a RTO process bears many
similarities with an IPO process. Both begins with the need for detailed due diligence and preparation
of prospectus or circular containing disclosures regarding the deal, compliance with the usual listing
criteria, and final approval from the exchanges.5 All in all both process is likely to lead to similar
3 Sometimes, the issues are further consolidated at a set ratio by the financial advisor to reduce the impact of dilution or to comply minimum listed stock price rule. The minimum trading price rule on Singapore exchange is to maintain past 6 months VWAP at no less than S$ 0.2 thus, consolidation of new share value must meet this minimum requirement. 4 These are a listed issuer's acquisition (or series of acquisitions) of assets where any percentage ratio is 100% or above in terms of net tangible assets, net profit, total consideration, equity value, or proven and probable reserves. Details are available from SGX rulebook Chapter 10, Part VIII section 1015 and SET’s listing rule 11‐00. In markets that are more relaxed, for example Canada, and the US, a transaction is regarded as an RTO only
when control of incumbent shareholders 50% post‐transaction. Winyuhuttakit (2011) gives excellent details and analysis on RTO regulations in Hong Kong, Korea, Thailand, and US. 5 A waiver for listing reapplication may be requested if a RTO involves same or similar industry transactions, maintains the same core business of the listed incumbent firm, and no change in board and control.

6
timeframe to completion. However, dating the length of time required for the RTO process is not
straightforward as Table 1 may suggest.
A RTO transaction can be complicated further with more parties involved. As a matter of fact, it
begins with negotiation and due diligence process both public and private firms potentially adding time
and cost to the transaction and represents and “double‐lemons” problem. Once the terms and price are
agreed, upon board approval, a memorandum of understanding (MOU) is signed. The terms in the MOU
are disclosed to the exchange for reapplication of the merged entity for listing. Then after the parties
received the go ahead from the exchange, an extraordinary shareholder meeting (EGM) is called
requiring a super majority support. The merger can then legally begin as consolidated trading of shares
can start and hence the shares of the new entity can take on new value from that point.
With the process described above, we can say that there are two important event dates in the
process, the MOU date, which contains most information impact, and the EGM date that marks the
beginning of consolidated trading of shares of the merged entity. However, the true completion of the
acquisition can be lengthened as the merged firm may continue to carry separate share placement
exercise to meet capital needs or listing requirements on free float.
2.3 Related literature
RTOs have been used as an alternative means to list on an exchange for decades. Historically,
no significant regulatory review was required resulting in a shorter timeframe for listing completion and
substantial costs saved in terms of underwriting fees as the process requires neither a prospectus nor
an underwriter. In addition, timing of RTOs are not subject to market conditions as in IPOs. New
controlling owners of the firm generally suffer less share dilution, obtain the public firm at a relatively
economic price as opposed to regular mergers as well as an option to raise funds in the future.
Incumbent shareholders of the public firm benefit from a clearly defined exit strategy through the public
market.
Given a history of flexible regulatory environment, early research on RTOs tend to suggest a
separating equilibrium where high quality firms choose listing via IPOs and low quality firms choose
listing via RTOs. In Arellano‐Ostoa and Brusco (2002), a high type firm, distinguished by greater
probability of obtaining positive NPV projects, choose to signal with IPO whereas low quality firm with
low probability of positive NPV projects choose RTOs. The necessary conditions for a separating
equilibrium in the model is that the expected NPV of the high type firm is greater than that of the low
type firm and that the cost of completing IPO is higher than completing RTOs. A number of empirical
papers mainly based on US evidence support a separating equilibrium in listing choice as they find firms
choosing to list via RTOs instead of regular IPOs tend to be smaller firms with relatively higher level of
information asymmetry. Gleason et al. (2005) studies 121 RTO cases between 1987‐2001 AMEX, NYSE,
NASDAQ and find that they tend to be speculative in nature and fail to generate long‐term wealth gains.
In their sample, 46% RTO firms survived after first two years of listing. Using a slightly different period
on US market between 1990‐2002, Adjei, Cyree, and Walker (2005) document 42% of their sample firms
become delisted in first three years. Floros and Shastri (2009) find that firms choosing to list via RTOs
instead of regular IPOs tend to be smaller firms with relatively higher level of information asymmetry.
Thus, the authors view that RTOs cannot be compared to regular IPOs but rather to penny stocks IPOs.
Floros and Sapp (2011) focuses on valuation of shell firms traded on OTC or pink‐sheets that go through
RTOs. They find up to 48% in abnormal return in RTO announcements, but the long term performance
erases the gains as surviving firms earn post‐even annual return of ‐91%. The Canadian experience

7
with RTOs is similar as Carpentier, Cumming, and Suret (2009) documented lower quality firms opt for
the less regulated RTOs to obtain public listing . Wan‐Hussin (2002) documents the case of high profile
reverse take‐over completed in 1995 in Malaysia that resulted in a backdoor listing of a private
company, Jaya Tiasa Plywood, via listed Berjaya Textiles. The author finds increase wealth effects of
both minority shareholders and the former controlling shareholders. However, the work is limited to
one particular case and only short‐term wealth effects were documented.
Absence of early regulatory oversight has led to abuses and fraudulent conduct leading to
tightened RTO regulations. In US, increased reports of fraudulent activities in late 2000s has prompted
SEC to apply more stringent listing rules to list publicly. These additional requirements include minimum
share price maintenance, complying to filing requirements of financial reports, and a seasoning rule that
requires the merged entity to trade on OTC prior to official listing. Following fraudulent cases of Chinese
firms backdoor listing, the Hong Kong Exchange introduce the Main Board RTO Rules in March 2004
which virtually eliminated the practice of injecting non‐listed assets without a suitable track record for
listing into a listed shell in conjunction with a change of control. 6
Is the verdict out on RTOs? A look at RTO critique from legal and regulatory point of view offer
other perspectives. Pavkov (2006) encourages more empirical analysis of RTOs to help settle the policy
debate whether more regulatory intervention is necessary. Vermeulen (2014), notes that in recent
years, there is a dramatic increase in RTOs on ASEAN exchanges. Existing work on RTOs are primarily
limited to the US experience and cannot be comparable to the ASEAN experience where demand‐supply
and regulatory environments are very different. For example, the Canada and the US applied a laissez‐
faire approach towards RTOs in the past in order to support small and micro‐cap companies who were
unlikely to be able to afford the underwriter necessary for an IPO.
Singapore and Thailand on the other hand adopt a more conservative approach towards
regulating such that firms that undergo RTOs must undergo reapplication process to list on the exchange
and must meet the same minimum listing requirement as IPO firms. This means that the cost of
conducting RTOs in Singapore and Thailand is likely to be quite high. Although the direct costs of
underwriting fees present in regular IPOs is absent in RTOs, private firms engaging in such transactions
face numerous indirect costs. For example, the risk of overpaying for the shell firm if the financial
advisors’ place the value of the shell firm too high. There is also cost of restructuring the shell firm and
the risk that synergy value of the merged entity in a vertical or horizontal merger within firms of the
same industry does not materialize. Sjotrom (2008) argues that the costs of RTOs is underestimated,
after factoring in indirect costs, he finds that actual costs of IPOs and RTOs are in fact not that much
different. In the case of Singapore and Thailand, the reapplication requirement and disclosure effort
means that the speed advantage is unlikely to be that great. Thus, if the regulatory costs and indirect
costs are high, then why do firms still choose to go public with RTOs? Hsieh, Lyandres, and Zhdanov
(2009) propose a model that link’s a firm’s decision to go public with subsequent takeover strategy.
Completing an IPO reduces valuation uncertainty leading to a more efficient acquisition strategy.
6 See Rules on Backdoor Listings: a Global Survey, OECD, December 2014 and Charltons Solicitors, www.chartonslaw.com.

8
3. Sample Data Analysis
Between 2007‐2015, we identify RTO cases from stock exchange and SEC websites. A list of
Singapore RTO cases can be found of SGX website under the “Catalodge” page where important firm
disclosure information is publicized. Thai RTO cases can be tracked from SEC’s website where tender
offers, material asset acquisitions and disposals of listed firms are reported. 7 Details of individual RTO
deals are gathered from a combination of financial advisor reports and minutes of shareholders
meeting. We collect a total of 42 RTO cases in Singapore and 17 cases in Thailand. We find that ten
RTO transactions of the 42 in Singapore were aborted whereas two transactions of 17 were unsuccessful
in Thailand. The search is biased towards successful cases as information is more readily accessible.
Data is collected from various sources. We obtain market trading data from Datastream and
listed company accounting information from Worldscope. Our sample includes firms listed on both the
main and secondary boards in which case it is the Singapore Exchange (SGX) and Catalist (CAT) for the
Singapore sample and Stock Exchange of Thailand (SET) and Market for Alternative Investment (MAI)
for the Thai sample.
Table 2 Distribution of RTO activities 2007‐2015
The RTO sample reports the distribution of RTO activities announced by Singapore and Thailand
exchanges. This table report the RTO activities and the proportion of transactions along side with SGX
and SET year end index level and annual return. The sample includes firms on the main boards (SGX and
SET) and secondary boards (CAT and MAI).
Year No of firms
% of
sample Market index
Market return
All Singapore Thailand All Singapore Thailand Singapore Thailand
2007 1 0 1 2%
3,466
858 19% 26%
2008 1 1 0 2%
1,762
450 ‐49% ‐48%
2009 3 1 2 5%
2,898
735 64% 63%
2010 10 8 2 17%
3,190
1,033 10% 41%
2011 6 5 1 10%
2,646
1,025 ‐17% ‐1%
2012 10 8 2 17%
3,167
1,392 20% 36%
2013 16 13 3 27%
3,167
1,299 0% ‐7%
2014 10 4 6 17%
3,365
1,498 6% 15%
2015 2 2 0 3%
2,883
1,288 ‐14% ‐14%
Total 59 42 17 100%
7 http://infopub.sgx.com and https://www.set.or.th/set publishes Singaporean and Thai listed firms’ important announcements and circulars. Day of MOU of VSA appears here, where MOU date is unavailable we use date when first circular is publicly available from firms’ website or news sources.

9
Table 2 presents descriptive statistics for the sample RTO transactions in Singapore and Thailand
by sample year. The number of RTO activities for Singapore is highest in 2013 with 13 transactions
whereas for Thailand it is highest in 2014 with six transactions. The last four columns of Table 2 provide
end of year market index level and annual market return. There seems to be no apparent association
between market performance and intensity of RTO activities in Singapore. For example, in 2009 when
the annual market return on SGX surged by 64% only one RTO transactions came through. In the
following years 2010‐2011 when the market rose 10% and dropped 17% the number of transactions
was eight and five respectively. In Thailand’s case, RTO transactions appear to pick up when market
performance improves. As shown in 2014, the SET gained 15% following a 7% loss in 2013. The number
of reported transactions increased from three to six between 2013‐2014.8
Table 3 reports successful deal firm statistics which are segmented by country of listing and
then by distress or non‐distress status. Where relevant we report both average values and median
values in parentheses below. There are a total of 47 successful cases of which 32 are listings on
Singapore exchange and 15 on the Thai exchange. Approximately half of the entire sample firms (51%)
are declared financially distressed by the listed firm’s auditors. Data of the two markets combined
shows that RTO transactions are quite evenly split between main and secondary boards and between
transactions that occur within the same industry and across industries. Singapore sample firms are
slightly in favor of secondary board transactions (56% of all Singapore RTOs) and cross industry
transactions (also 56% of all Singapore RTOs). However, looking closely at the sample, only 10 out of
18 transactions on CAT are between cross industry firms.
8 Rank correlation between number of RTO transactions and market performance for Singapore and Thailand is 0.02 and 0.58, respectively.

10
Table 3 Characteristics of RTOs
The sample consists of 59 sample RTOs firms of which only 47 are successful cases and used in further
empirical analysis. The statistics reported in Table 3 are for success RTOs only. Deal value is in millions
of local currency (LCY). Relative deal size is computed from deal size divided by listed firms’ assets in
pre‐MOU year. Premium is pre‐consolidation issue price relative to 3‐month pre‐MOU value weighted
average closing price (VWAP) of listed firm. A foreign counter party is defined as a counter party firm
outside the listing sample that is incorporated or listed overseas. The table reports both mean and
median values. Median values where applicable are shown in parentheses. A firm is categorized as
financially distressed if the listed firms’ auditors report says so.
Singapore Thailand
Characteristics: All Distress Non‐
distress P‐value diff All Distress
Non‐distress
P‐value diff
Main board 14 9 5 8 6 2
% Main Board 44% 28% 16% 53% 40% 13%
Secondary 18 13 5 7 4 3
% Secondary 56% 41% 16% 47% 27% 20%
Same industry 14 7 7 8 3 5
Different industry 18 15 3 7 5 2
% Different industry 56% 47% 9% 47% 33% 13%
Deal value (LCY mn) 279 324 151 0.124 2,701 1,185 4,349 0.063
(141) (150) (35.6) 0.086 (1,725) (763) (3,187) 0.032
Relative size 12.17 14.6 5.61 0.213 7.36 7.98 5.48 0.390
(1.96) (2.49) (0.58) 0.079 (6.15) (8.55) (2.97) 0.224
Premium* 42% 35.7% 9.3% 0.517 149% 13.8% ‐15.5% 0.325
(‐6.9%) (11.2%) (‐14.1%) 0.432 (‐7.1%) (‐2.1%) (‐12.7%) 0.245
VWAP (LCY) 0.12 0.08 0.19 0.017 7.86 3.69 9.66 0.396
(0.09) (0.05) (0.15) 0.0008 (1.87) (1.75) (2.00) 0.648Days from MOU to EGM 260 222 79 65 Day from MOU to completion 321 371 217 88
Stock swap 22 15 7 5 4 1
%Stock swap 69% 47% 22% 33% 27% 7% Stock swap with cash/warrants 10 7 3 10 4 6 %Stock swap with cash/warrants 31% 22% 9% 67% 27% 40% Foreign counter‐party 18 15 3 None None None
% Foreign 56% 47% 9% %EPS growth 3 year pre‐MOU 111% ‐153.1% ‐83.6% 0.542 ‐176% ‐237.3% ‐154.3% 0.463
(‐79.7%) (‐86.1%) (‐52.4%) 0.075 (‐92%) (‐
232.5%) (‐91.7%) 0.648%Rev growth 3 year pre‐MOU ‐7.4% ‐11.6% 1.2% 0.433 ‐33.1% ‐46.5% ‐16.2% 0.171
(‐14.19%) (‐31.5%) (0.03%) 0.086 (‐30.5%) (‐
30.5%) (‐17.4%) 0.196

11
Note: Two outliers are removed from Singapore and Thai sample; namely Kyodo Allied Industries which was offered a tender
price four times its VWAP; and E for L which was offered a tender price of THB 25 compared to VWAP of only THB 1.54.
There are some notable commonalities between the characteristics of Singaporean and Thai
RTOs. First, the relative deal size computed from deal size divided by listed firms’ assets in pre‐MOU
year is larger for distressed samples both Singapore and Thai where the ratios are 14.6 and 7.98 times,
respectively. Relative deal size ratios for non‐distressed Singapore and Thai samples are 5.61 and 5.48.
We note that deal value in local currency terms of distressed firms are higher than non‐distressed in
Singapore transactions, but the reverse is true in Thai samples. In any case, we view that the relative
deal size is more important in understanding the bargaining power that outsider firms is likely to have
over distressed firms. Second, we note that distressed firm’s premiums are relatively higher than non‐
distressed firms. We define premium as the percentage difference between pre‐consolidation issue
price and 3‐month pre‐MOU value weighted average closing price (VWAP) of listed firm. In Singapore
RTOs, premiums of distressed firms are 35.7% compared to 9.3% of non‐distressed firms. In Thai RTOs,
non‐distressed firms are offered an average of 15% discount their historical VWAP.9 Third, we find that
distressed firms have substantially lower average 3‐year pre‐MOU EPS growth rates as well as
considerably lower average 3‐year pre‐MOU revenue growth. However, in general neither groups in
RTOs samples are doing well in both profitability and revenue generation prospects. For example, in
the Singapore distressed and non‐distressed groups, the %EPS growth is ‐153% and ‐84%; whereas the
% revenue growth is ‐11.6% and 1.2%. Fourth, we report two date intervals; time in days from MOU
date to EGM, and time in days from MOU to completion of capital raising. We focus on days from MOU
to EGM which usually marks the consolidated trading of shares of the merged entity. Usually, this takes
on average a little over six months or over 200 days for Singapore samples but around two to three
months for Thai samples. For some transactions that requires sizable capital raising, the entire process
takes up to six months to about one year. Thus, it is clear that RTOs are not exactly a short‐cut in terms
of time requirement to list and raise the necessary capital compared to IPOs.
There are also some differences between Singapore and Thai RTO samples in terms of outsider
firms of foreign origin and method of payment. From Table 3, more than half of RTO counter parties
on the Singapore exchange have foreign origin (incorporated outside Singapore). Some of these foreign
firms are located in off‐shore tax havens like British Virgin Islands, however, some are established and
even already listed overseas firms.
Based on the characteristics of the data observed, we offer a few analytical points about RTOs.
First, unlike what the popular press may suggest, it appears that RTOs are not short‐cuts to getting listed
given the length of time to completion. Neither are outsider firms small and of poor quality otherwise
the transaction would not have passed the re‐listing requirements of the exchange and the bulk of the
transactions would have occurred on secondary boards in particular given Singapore’s listing flexibility
on CAT which does not require a minimum market capitalization or profit history as long as there is
listing sponsor supporting the firm. Second, some foreign outsider firms prefer to list on the Singapore
exchange to increase its international footprint in Asian markets. For example, the Chaswood Group is
a large Food & Beverage holding company listed on Bursa Malaysia before signing RTO deal with Asia
Silk Group to list on CAT. Another example is India’s leading architectural services firm, RSP Architects
9 It is important not to overly interpret these premiums as being solely in favor for the incumbent listed firms. For example, St. James Holdings for example was offered a tender price approximately the same value as current trading price by outsider firm Perrenial China Trust. However, based on value of property appraisal, the value of the offer is worth 52% discount to appraised NAV of St. James.

12
Planners transaction with Rowsley which is an SGX listed firm engage in renewable energy. Third unlike
regular takeovers where the listed target firm have bargaining power enforcing acquirers to submit
higher bids (Stulz, 1988; Chiarella and Gatii, 2013), listed firms in reverse takeovers are substantially
smaller than the counter party outsiders if we consider the relative deal value of asset size of listed firm
is around 11 times and 7 times for Singapore and Thai samples. In any case, distressed firms are offered
fairly generous premiums above their VWAPs ensuring that incumbent shareholders can benefit from
the share swap.
Finally, we cannot assume that RTO transactions are in general a one‐sided gain in which the
outsider firm with stronger prospects and substantially larger size determines the terms limited
downside risk for outsider firms otherwise we would probably see transactions predominantly based on
share exchange. The use of solely share exchange makes the terms of the exchange contingent on the
target and potential synergy value and both incumbent and incoming shareholders both shares gains
and losses from the deal (Hansen, 1987). We observe that up to 31% and 67% of the RTO firms in
Singapore and Thailand use mixed mode of payment which involves combination of share swap with
cash and/or warrants. The use of mixed payment suggests that the outsider firm is unsure of merged
value. From our sample, more than half of RTO transactions in Singapore are based on share exchange
only. In the Thai sample more firms use combination of share exchange with cash and warrants. Listed
firms normally use additional cash raised from new private shareholders to pay for outsider firms’
assets. Thus, we expect the cash component indicates the incoming firm needs to retain immediate
value. The warrant issue component helps alleviate the impact of immediate dilution and provide a
delayed option to raise capital in the future if things go well.
4. Methods and results
4.1 Announcement reactions and short‐term performance
In this section we measure short‐term reactions to MOU announcements. The short‐term
reaction captures the short‐term wealth impact for incumbent shareholders. We also explore how RTO
transaction characteristics will have different wealth impact for investors. The standard event study
method (Mackinlay, 1997) is used to calculate abnormal return (AR), cumulative abnormal return (CAR)
from the market model, and relevant statistics
tititit RERAR | (1)
where itAR , itR , and titRE | are the abnormal, actual, and normal returns respectively. The
conditioning information, t is the market return.

13
Figure 1 Plot of cumulative market model abnormal return for RTO announcements (MOU date)
This figure plots the cumulative market model abnormal return for RTO announcements (MOU date).
Define abnormal return as tititit RERAR | where itAR , itR , and titRE | are the
abnormal, actual, and normal returns respectively. The conditioning information, t is the market
return.
Figure 1 a All sample and by market Figure 1 b Distressed vs non‐distressed
Figure 1 c Low vs high premium Figure 1 d Low vs high relative deal size
Figure 1a plots CARs for all firms, Singapore firms, and Thai firms combined 20 days before and after
the MOU date centered at day zero. The plot shows that the market gradually learns about the
forthcoming MOU and CAR drifts up to 28.5% by day 20 after MOU date. The plot also reveals the
announcement is quite unexpected in Singapore, unlike the Thai market where CARs has already drifted
up to almost 19% in days ‐20 to 0. Figures 1b), 1c), and 1d) illustrate CARs of firms separated by distress
status, premium level, and relative deal size level. By day 20, we can see that CAR differences is largest
with distress status where CAR of firms in distress rises to 43% compared to firms that are non‐distress
which sees CAR edging up only to around 10% The CAR of low premiums firms is 21% about half of CAR
of high premium firms which is 43%. When firms are separated by relative deal size, the differences in
CARs are quite small.

14
Table 4 Cumulative market model abnormal return around event windows
The sample consists of 47 firms on Singapore and Thai exchanges. The table reports cumulative market
model abnormal return for RTO announcements (MOU date). Define abnormal return as tititit RERAR | where itAR , itR , and titRE | are the abnormal, actual, and normal
returns respectively. The conditioning information, t is the market return. Cumulative abnormal return
between days 1 and 2 is derived from
kT
kTtitit ARCAR . The standard cumulative abnormal return
is 21
2121 ,
,,
i
ii
CARSCAR . T‐test statistics are tests for the null that CAR and SCAR are equal to
zero. P‐values relating tests of group mean and median differences are in italics.
Event window CAR t‐CAR SCAR t‐SCAR
All [‐10, 10] 0.204 3.31*** 1.402 2.46**
[‐20, 20] 0.218 2.82*** 1.119 2.63**
[‐10, 0] 0.095 2.37** 0.731 2.59**
[‐20, 0] 0.085 1.55 0.589 2.44**
[0, 10] 0.132 2.22** 1.328 2.15**
[0, 20] 0.156 2.74** 1.063 2.44**
Distress [‐10, 10] 0.288 2.99*** 1.796 1.98*
Non distress [‐10, 10] 0.084 1.81* 0.796 2.11*
Distress‐Non‐distress [‐10, 10] 0.204 1.00
Diff p‐value 0.0673 0.3194
Diff p‐value Wilcoxon 0.0990 0.3370
Low relative deal size [‐10, 10] 0.207 2.40** 1.731 1.68*
High relative deal size [‐10, 10] 0.201 2.22** 1.092 1.94*
High‐Low ‐0.006 ‐0.64
Diff p‐value 0.5604 0.5918
Diff value Wilcoxon 0.5677 0.5522
Low Premium [‐10, 10] 0.135 1.75* 0.769 2.31**
High Premium [‐10, 10] 0.306 3.00*** 2.19 1.97**
High‐Low 0.171 1.42
Diff p‐value 0.1798 0.2369
Diff value Wilcoxon 0.2311 0.3391
Table 4 formally tests the significance of CAR and the standardized cumulative abnormal return
(SCAR). Since SCAR is derived from CAR divided by the variance of CAR over the event window, extreme
observations are given less weight. We first report overall sample averages CAR and SCAR over different
windows and provide relevant test statistics (MacKinlay, 1997). The averages reaffirms that the market

15
gradually learns about the news and in general RTO are perceived as good news since both CARs and
SCARs are positive and significant at 1% level at windows [‐10, 10] and [‐20, 20]. Over both these
intervals, RTO firms’ CAR is slightly above 20%. We also find that the responses are stronger post‐MOU
since CAR and SCAR over [0, 10], and [0, 20] intervals are about twice as high (13% and 16%) as those
around windows [‐10, 0], and [‐20, 0].
The remainder of Table 4 tests differences in CAR and SCAR when firms are divided by RTO
characteristics as identified in Figure 1. Since the interval [‐10, 10] displays strongest reactions, the tests
are carried out and reported for this interval only. We find distress firms’ CAR is significantly higher than
those non distress. Average CAR and SCAR of distress firms over the event window is 28.8% and 1.79
compared to 8.4% and 0.79 of distressed firms. High RTO premiums firms also exhibit higher CAR and
SCAR though the statistical significance is weak. Firms with high or low relative deal size have very similar
abnormal return responses confirming Figure 1 d plot.
Overall the short‐term announcement results indicates that the market responds positively to
MOU announcements of RTO transactions. Distress firms cumulative returns are substantially higher
than non‐distress firms. This could be because they are trading at pre‐MOU VWAP that are very low or
because distress firms in general receive higher RTO offer premiums and thus investors look at size of
premium as positive signal for the newly merged firm.
4.2 Long term performances of RTO firms
4.2.1 Buy‐and‐hold abnormal returns (BHAR)
Buy‐and‐hold abnormal returns have come the standard of measuring long‐term abnormal
performances of corporate announcements (Barber and Lyon, 1997; Khotari and Warner, (2006). BHARs
measure the average multi‐period return from a strategy of investing in firms that are affected by an
event compared to investment in benchmark portfolios which can be the market or a controlled group
of similar non‐event firms. We calculate a one year BHAR for RTO firms in our sample compared to the
BHAR of an equal weighted averages buy and hold return of firms in the controlled group. The choice
of one‐year is to avoid increasing skewness and upward bias in measuring BHAR that is increasing the
holding period. Too long a holding period can cause the result to be confounded by other corporate
announcements or market events. We calculate a one‐year BHAR (from day T1 to T2 or 240 trading
days) for each RTO firm compared to a benchmark BHAR of non‐RTO firms. Define,
ititT
TtitT
TtTTi RERBHAR |11 2
1
2
121 ), , (2)
where the mean BHAR is the equal weighted average of individual firm BHARs and the conditioning
information, t is again the market return. The benchmark portfolio is selected by first excluding RTO
firms, then we eliminate firms in the top third market capitalization of the Singapore and Thai
exchanges. In an independent sort, we allocate firms into decile groups based on annual trading price
range. The top decile (most expensive) trading price range are eliminated. Our choice of control group
is preferred over a benchmark based on the entire market return which is influenced by performance
of large firms. The size of RTO targets are below the median market capitalization of each exchange and
they are typically “penny” stocks or are trading the a price range below the median trading price range
of the exchange (Pavabutr et. al, 2014). Small trading price range and small caps typically exhibits larger

16
price movements. The screening results in a control firm sample of 501 from the Singapore exchange
and 398 from the Thai exchange.
We can assume further that event‐firm abnormal returns are independent as occurrence is
quite random and spread out, there is little risk of threat that abnormal returns will be overly‐stated
as Mitchell and Stafford (2000) and Brav (2000) point out given a sample size of 47 firms spread out
over nine years.
Table 5 Mean BHARs for RTO firms
Panel A of the table reports 12 months BHARs of RTO and controlled portfolio group. BHARs for each
group are calculated as the difference between the equal weighted BHARs of event firms and controlled
portfolio group. The controlled portfolio group is selected by first separating firms on each stock
exchange then eliminated the top third market capitalization firms on both exchanges, Singapore and
Thailand. In a separate sort of decile trading price rankings, trading prices in the top decile (most
expensive stocks) are deleted. The column two‐sided p‐values report the parametric p‐value and non‐
parametric Wilcoxon p‐values (in parentheses) for differences between RTO sample BHAR and control
sample BHAR. The bootstrap p‐value is based on an empirical distribution created by simulating 1,000
pseudo samples. The p‐value is the fraction of mean BHARs from the pseudo samples in larger
magnitude than the original RTO sample mean. Panel B reports 12 month buy‐and‐hold returns (BHRs),
112
121 ), itT
TtTTi RBHR and BHAR of firms classified by distressed and non‐distressed status.
Similar p‐values described in Panel A test for differences between distressed and non‐distressed with
control sample BHARs.
Panel A
RTO sample Control Sample Two‐sided Bootstrap
BHAR BHAR p‐values p‐value
Mean 0.006 ‐0.008 0.1992 < 0.0001
Median ‐0.176 ‐0.189 (0.2516)
SD 0.816 0.758
Skewness 7.380 9.580
Panel B
Two‐sided Bootstrap
Distressed BHR BHAR p‐value p‐value
Mean 0.0127 ‐0.0601 0.6228 0.366152
Median ‐0.1269 ‐0.242 (0.7245)
SD 0.9900 1.025
Skewness 2.157 2.895
Non‐distressed
BHR BHAR
Mean 0.1878 0.0840 0.0538 < 0.0001
Median ‐0.0596 ‐0.0521 (0.0731)
SD 0.6929 0.4849
Skewness 1.643 2.2335

17
Panel A of Table 5 reports 12 months BHARs of RTO and controlled portfolio group. We can see
that both the RTO and controlled sample distributions have high positive skewness as usually
documented with long‐term abnormal returns. Figure 2a plots the empirical distribution of BHAR of
RTO firms illustrating the skewness. The mean BHAR of RTO firms are 0.6% compared to ‐0.8% of
controlled firms. The median BHAR of both groups shows overall underperformance relative to the
market at large. For the control samples, this is probably due to dominance of smaller firms as they
tend to underperform large caps in emerging markets. A two‐tailed test of difference between BHAR
of RTO and control sample firm groups using both parametric p‐values and non‐parametric p‐values
show that we cannot reject the null that RTO sample firms perform differently from the control sample.
The result points that while median RTO firms do not perform differently from controlled non‐RTO firms
relative to the entire market, there seems to be a general decline in price impact over the long‐term
relative to short‐term accumulated over 20 days post‐MOU.
Figure 2 Empirical and bootstrap distributions of BHARs
Figure 2a plots the empirical distribution of BHARs from sample RTO firms as described in equation 2.
Figure 2b plots the bootstrap distribution 1,000 from pseudo samples created by random selection of
control firms’ BHAR over the same event period as RTO firms. The vertical lines in Figure 2b are the
upper and lower confidence intervals at 5% based on the bootstrap estimates.

18
Given the skewness of the distribution and high return volatility, we also provide statistical
inference for the mean BHAR based on a simulated distribution. In a similar framework as in Ikenberry,
Lakonishok, and Vermaelen (1995) and Mitchell and Stafford (2000), we assign the evaluation date to a
randomly selected control group firms as described in the screening process earlier, we then compute
the mean BHAR for this pseudo sample in the same way as the original RTO sample group. This results
in one pseudo sample mean. We repeat this step to generate 1,000 BHAR mean and a bootstrap
distribution under the null. A bootstrap p‐value in the last column of Table 5 is calculated as a fraction
of the mean of the BHAR from the pseudo samples that are larger than the original RTO mean. Figure
2 b provides the distribution plot of the simulated sample mean BHAR. The one‐sided boot‐strap p‐
value indicates that the RTO sample mean of 0.06 is significantly different from the pseudo sample
mean.
Panel B of Table 5 reports BHR and BHAR of RTO firms classified by distressed and non‐
distressed status. We find that the average BHR and BHAR of non‐distressed firms are notably larger
than distressed firms. BHR of distressed firms are 0.0127 compared to 0.1878 of non‐distressed. This
points to the fact that distressed firm stock prices must be declining over 12 month period compared to
the short‐run response. In contrast, the BHR of non‐distressed firms remains close to CAR of
approximately 20% after the MOU announcement. Once again we report to test if distressed and non‐
distressed group average BHARs are different from controlled group average BHAR as well as the boot‐
strap p‐values. We find significant difference in the non‐distressed group.
4.2.2 What explains differences in BHARs?
The result in 4.2.2 is intriguing. Does the poor average BHAR performance of distressed firms
imply that distressed firm RTO are unsuccessful and losing value over time? To answer this question,
we run a linear model using the sample of 47 RTO firms. In each OLS model the dependent variable is
12 month BHAR post‐MOU. Explanatory variables in model 1 are those associated with RTO
characteristics; namely, relative deal size and premium both of which have shown important in
explaining differences in CAR. In model 2, we include on top of RTO characteristics, accounting variables
which are one year post‐MOU percentage changes in book value of equity, return on assets (ROA), and
net profit margins (NPM). The change in book value of equity controls for possible share offerings post‐
MOU. Since many RTO deals involved capital increases and new share offerings, which will ultimately

19
affect the book value of equity. In fact, on average RTO sample firms sees the number of shares doubled
and book value of equity on average increased over 10 folds due to merging with a bigger entity over
the course of 12 months post‐MOU. In model 3, we include natural log of turnover (number of shares
traded/total number of shares outstanding) and a distress status dummy. We find that three variables
which are relative deal size, change in book value of equity, and turnover are most important in
explaining differences in BHARs. BHAR is declining in relative deal size and percent change in book value
of equity. This is not surprising as large deals relative to listed firm pre‐transaction asset values requires
larger capital increase. The correlation between relative deal size ratio and book value of equity
increase is 0.86. We do not find premiums having a significant impact on BHAR even though they
generate very strong CAR response over the first 20 days of announcements. However, we do find that
firms that received high premiums do not experience as much large a change in book value of equity
and number of shares. The correlation between premium levels and change in book value is actually
negative (‐0.15). The distress dummy does not help explain the differences in BHAR well as this is
already reflected in relative deal size and change in equity book value. We believe there is no need to
add a country dummy to the model since RTO characters of Singapore and Thai firms are similar as
discussed in section 3.
Table 6 Determinants of BHARs
This table reports the coefficients from three OLS models with white corrected t‐statistics. The
dependent variable is BHARs of 47 RTO sample firms from Singapore and Thai exchanges. Relative deal
size is computed from deal size divided by listed firms’ assets in pre‐MOU year. Premium is pre‐
consolidation issue price relative to 3‐month pre‐MOU value weighted average unadjusted closing price
(VWAP) of listed firm. Percentage changes in return on assets (ROA) and net profit margin (NPM) is iss
change over one year from MOU. Turnover is computed from average annual turnover (number of
shares traded/total number of shares outstanding).
Model 1 Model 2 Model 3
Estimate t‐value Estimate t‐value Estimate t‐value
Relative deal size ‐0.0239 ‐2.63** ‐0.0203 ‐2.65*** ‐0.0209 ‐2.94***
Premium ‐0.0387 ‐0.64 ‐0.0352 ‐0.52 0.0159 0.22
%Chg. Book Equity ‐0.0049 ‐6.03*** ‐0.0048 ‐3.47*** ‐0.0037 ‐2.49**
%Chg. ROA ‐0.0242 ‐0.27 ‐0.1001 ‐0.91
%Chg. NPM ‐0.0326 ‐0.29 0.0928 0.51
lnTurnover 0.1283 2.06**
Distress 0.0706 0.31
AdjRsq 0.1892 0.1429 0.2452
Pr > F 0.0376 0.1203 0.0598
Note: **, and *** denotes statistical significance at 5% and 1% confidence.
4.2.3 Post‐RTO earnings performance
Long term evaluation of corporate announcements using returns is not a straight forward tasks
given that we are unable to control other changing information environment as well as the upward bias
documented in longer term computations of BHAR. Furthermore, using BHAR to evaluate the success
of RTO transactions alone are further complicated the fact that the an RTO event does not really have a
definitive completion date because of continuing recapitalization plan via private offerings, and warrant

20
exercise, and thus the length of holding periods of 6 months, 1 year or more can be deemed arbitrary.
Thus, as an alternative to merely examining BHAR, we evaluate long term financial performance of RTO
firms 3‐years post‐MOU. As we are still interested in the varying performance between the distressed
and non‐distressed group, Table 7 produce a two‐way mean comparison (within groups over different
time and between groups over the same time period) between distressed and non‐distressed firms over
before MOU and 3 years post‐MOU. The ratios selected measures general liquidity (cash ratio),
leverage (debt to assets, and debt to equity ratios), revenue generation and cost control (EPS and NPM),
and returns to investments (ROA, and ROE). 10
We find that all firms have lower cash holdings, but distressed firms must have taken more debt
as debt to assets has risen even though debt to equity has dropped given large positive change in equity.
Despite the book value of equity that has increased, the ROE of distressed firms has increased compared
to pre‐MOU periods. We find that distressed firms have significantly inferior NPM and ROA pre‐MOU
compared to non‐distressed firms. However, this gap has closed in 3 years after.
10 Only the cash ratio is chose to measure general liquidity since the our RTO samples are spread out over across varying industries 26% in finance and property, 11% in mining, 30% in technology, and the remainder spread out other industries such as consumer, retail, and manufacturing goods.

21
Table 7 Key financial ratios of distressed and non‐distressed firms
This table reports the key financial ratios of RTO sample firms classified by distressed and non‐
distressed status at end of MOU signing calendar year (referred to as before) and 3‐years after MOU
signing. ***,**,* denotes significance at 1%, 5%, and 10%, respectively.
Distressed Non‐ distressed Difference t‐stat p‐value
Cash ratio
Before 0.296 0.204 0.092 1.20 0.238
3 years after 0.113 0.114 0.001 0.00 0.996
Paired mean diff ‐0.169 ‐0.126
t‐stat (p‐value) ‐2.67 (0.018)*** ‐1.95 (0.087)*
Debt to assets
Before 0.173 0.237 ‐0.064 ‐0.98 0.332
3 years after 0.251 0.301 ‐0.050 ‐0.96 0.3467
Paired mean diff 0.159 0.107
t‐stat (p‐value) 2.73 (0.016)*** 1.52 (0.166)
Debt to equity
Before 1.449 0.698 0.751 1.18 0.2488
3 years after 0.683 0.981 ‐0.298 ‐0.86 0.407
Paired mean diff ‐0.6883 0.5097
t‐stat (p‐value) ‐0.53 (0.609) 1.89 (0.095)*
EPS
Before 0.017 0.202 ‐0.186 0.83 0.4193
3 years after 0.067 0.193 ‐0.125 ‐0.81 0.4398
Paired mean diff 0.018 ‐0.251
t‐stat (p‐value) 0.75 (0.473) ‐0.9 (0.399)
Net profit margin
Before ‐0.196 ‐0.026 ‐0.170 ‐1.96 0.061
3 years after 0.001 ‐0.007 0.008 0.12 0.9031
Paired difference 0.204 0.054
t‐stat (p‐value) 1.55 (0.181) 0.69 (0.519)
Return on assets
Before ‐0.152 0.055 ‐0.207 ‐2.61 0.0129
3 years after ‐0.004 0.061 ‐0.066 ‐1.94 0.0068
Paired difference 0.234 0.005
t‐stat 2.52 (0.026) 0.16 (0.881)
Return on equity
Before ‐0.128 0.138 ‐0.266 ‐3.37 0.0022
3 years after 0.014 0.154 ‐0.139 ‐1.86 0.0784
Paired difference 0.207 0.006
t‐stat (p‐value) 1.94 (0.094) 0.09 (0.934)

22
4.3 Liquidity of RTO firms
So far in this paper, we have examined how RTO deals have made an impact on short‐term and
long‐term return as well as financial performance. Returns measure the overall impact of investors’
wealth whereas financial performance measures how the transaction has altered the newly merged
entity. We finally explore liquidity of RTO firms before and after the transaction marked by the MOU
date as before. Liquidity has an important role in reducing the cost of capital for the firm as Acharya
and Pederson (2005) has shown theoretically and empirically in Liu (2006). Liquidity also plays an
important part in improving information efficiency as numerous papers in market microstructure argue
(see Stoll, 2000; O’Hara, 2003; and Chordia, Roll, and Subrahmanyam, 2008) and thus they are variables
that are monitored closely by regulators. Since there are numerous ways to measure liquidity, we select
the ubiquitous percentage bid‐ask spreads, and turnover. Bid‐ask spreads are typically strongly
associated with price impact or how a change in a unit trading volume can move price. Larger spreads
are also associated with asymmetric information. Table 8 report percentage bid‐ask spreads and
turnover, 12 months before and 12 months after MOU. The averages are derived from daily data
frequency. Both percentage spreads and turnover are significantly reduced. The largest reduction is
the Singaporean spread going down to 8.68% from a high of 13.99% pre‐MOU. Turnover has doubled
in the Singapore RTO firms increasing from 0.4% to 0.8% whereas turnover rise around 64% for Thai
RTO firms. Despite these increases, the post‐MOU liquidity improvement still place RTO stocks in the
bottom decile turnover compared to the rest of the Singapore and Thai exchanges (Pavabutr et al. 2014)
Table 8 Liquidity of RTO firms by exchange
This table reports liquidity measures of RTO sample firms. Percentage day‐ end bid‐ask spreads
computed from (ask‐bid)/closing price 12 months worth of daily averages and median (in parentheses)
before MOU and 12 months after MOU. Turnover is defined as percentage daily average number of
shares traded divided by total number of shares outstanding. Daily outlier observations at 1% and
99% are removed. Parametric p‐values and non‐parametric p‐values (in parentheses) are provided.
All Singapore Thailand
Measure Liquidity p‐value Liquidity p‐value Liquidity p‐value
% Bid‐ask spread
12 months before 10.67% 13.99% 1.39%
(5.00%) (8.33%) (1.09%)
12 months after 9.84% 0.0378 8.68% (0.0937) 0.95% < .0001
(2.94%) (< .0001) (5.47%) (< .0001) (0.75%) (< .0001)
% Turnover
12 months before 0.82% 0.40% 1.58%
(0.08%) (0.03%) (0.38%)
12 months after 1.10% (< .0001) 0.85% < .0001 2.59% 0.0002
(0.10%) (< .0001) (0.03%) (< .0001) (0.65%) (< .0001)

23
Conclusion and policy discussion
Using a sample of 47 firms on Singapore and Thai stock exchanges between 2007‐2015, we seek
to understand the motivation to list using reverse takeovers by comparing the RTO to IPO listing process,
analyzing the characteristics of RTO listed participants, evaluating the post‐transaction short‐term and
long‐term return performance, and examining post‐transaction financial performance. While the
popular press often treat these transactions with suspicion as they associate reverse takeovers as a
“back‐door” listing process where opportunistic private or outsider firms seek a short‐cut to listing and
create speculative hype on small caps, we find no evidence that such parable in our sample RTOs.
Can we regard outsider firms as White Knights? Perhaps so for shareholders of listed firms as
we find that RTO transactions provide an exit opportunity for incumbent listed shareholders as they can
gain from short‐term returns and improved liquidity of an otherwise forgotten illiquid stock. But do
these private investors succeed in rescuing troubled firms and turning the businesses around. Analyzing
the post‐transaction financial performance suggests some improvement in distressed firm performance,
but not without costs of tremendous dilution from continuous recapitalization. What is not so definitive
is why outside firms would want to list this way, if they are already of caliber to list via IPO with their
own profile? Our analysis suggests that we should not view outsider firm decisions to conduct RTO as a
means to list per se but as a corporate transaction strategy to achieve other ends such as becoming a
public company without immediate large dilution in ownership and still have an option to raise more
funds later, obtaining a distressed or non‐distressed target public firm at a bargain price especially those
with valuable property (see Circular of Perrenial Holdings transactions with St. James holdings in
Singapore), and finally, the motivation could be unique to the firms themselves. For example, the
Chaswood Group, already listed on Bursa Malaysia decides to reverse takeover Asia Silk Group to list on
CAT and explain that the choice of listing on the Singapore exchanges is to increase their international
profile in Asian markets. On the Thai exchange, Singha Estate choose to complete a RTO with Rasa
property as a short‐cut process to diversify the group’s business from food and beverage into real estate.
Going forward, the benefits are costs of RTOs should be studied on a case‐by‐case basis since they are
very unique transactions.
Should the regulators loosen requirements on RTOs? Indeed, reverse mergers can be predicted
to cause huge percentage‐wise increases in the stock price of a public firm upon the release of news as
we might find in any merger news. However, for small cap stocks with very low trading price, even if its
stock price rose from virtually zero to only a few cents, the gain could be enormous. Without investor
savvy and adequate enforcement, the combination of potentially huge gains and relatively
unsophisticated players is a recipe for market abuse. In the end, a totally unobtrusive approach towards
RTOs is likely to attract opportunistic Machiavellian behavior.
Fortunately, current rules in place impose the same minimum listing requirement on listings via
RTOS as on IPOs. So either way, we expect firms listing directly or indirectly are at par in terms of firm
quality. However, if RTOs are to be used as a means to attract potentially strong private firms to help
provide rehabilitation, and exit for incumbent public firms then perhaps some concessions should be
made on selected listing rules. This observation is probably more applicable in the Thai case as MAI is
subject to relatively tighter listing rules with both size and profit requirement unlike CAT listing where
neither requirement is present. In addition, it is important to provide investors and media education
that RTOs are well regulated transactions and that SEC and Stock Exchange approved deals are not
pump‐and‐dump schemes to avoid investor misunderstanding.

24
References
Adjei, F., K. Cyree, and M. Walker, 2008, The determinants and survival of reverse mergers vs. IPOs,
Journal of Economics and Finance 32: 176‐194.
Archarya, VV., and Pedersen OH., 2005. Asset pricing with liquidity risk, Journal of Financial Economics,
77(2), 375‐410.
Arellano‐Ostoa, A. and Brusco, S., 2002. Understanding reverse mergers: A first approach, Working
paper, Universidad Carlos III de Madrid.
Barber BM., and Lyon JD., 1997. Detecting long‐run abnormal stock returns: The empirical power and
specification statistics, Journal of Financial Economics, 43(3), 341‐372.
Berger, A.; Demsetz, R.; and Strahan, P. 1999. The consolidation of the financial services industry:
Causes, consequences, and implications for the future. Journal of Banking and Finance, 23 (February):
135–94.
Brav, A., 2000. Inference in long‐horizon event studies: A Bayesian approach with application to initial
public offerings, Journal of Finance, 55(5), 1979‐2016.
Carpentier, C., Cumming, D ., and Suret, JM., 2009. The value of capital market regulation: IPO versus
reverse mergers, Working Paper, CIRANO.
Chiarella C., and Gatti, S., 2013. How much to pay, and how, for opacity? Negotiating premiums and
method of payment in M&A, Working Paper, University of Bocconi.
Chordia, T., Roll, R., and Subrahmanyam, A., 2008. Liquidity and market efficiency, Journal of Financial
Economics, 87(2), 249‐268.
Floros, IV., and Sapp, TRA., 2011. Shell games: On the value of shell companies, Journal of Corporate
Finance, 17, 850‐867.
Floros, IV., and Shastri, K., 2009. A comparison of penny stock initial public offerings and reverse
mergers as alternative mechanisms for going public, SSRN.
Gleason, KC., Rosenthal, L., and Wiggins, RA., 2005. Backing into being public: an exploratory analysis
of reverse takeovers, Journal of Corporate Finance, 12, 54‐79.
Hansen, R., 1987. A theory of medium of exchange in mergers and acquisitions, Journal of Business,
60, 75‐96.
Hseih, J., Lyandres, E., and Zhdanov, A., 2009. A theory of merger‐driven IPOs, Working paper.
Khotari, S.P., and Warner, J.B., 2006. Econometrics of Event Studies, Handbook of Corporate Finance:
Empirical Corporate Finance. Vol A (Handbooks in Finance Series, Elsevier/North‐Holland) Ch. 1.
Ikenberry, D., Lakonishok J., and Vermaelen, T., 1995. Market underreaction to open market share
repurchases, Journal of Financial Economics, 39(2), 181‐208.
Liu, W., 2006. A liquidity‐augmented capital asset pricing model, Journal of Financial Econonomics,
82(3), 631‐671.

25
MacKinlay, AG., 1997. Event studies in economics and finance, Journal of Economic Literature, 34, 13‐
39.
Mitchell, L., and Stafford, E., 2000. Managerial decisions and long‐term stock price performance 73(3),
287‐329.
O’Hara, M., 2003, Liquidity and price discovery, Journal of Finance, 58(4), 1335‐1354.
Pakov, AR., 2006. Ghouls and Godsends? A critique of reverse merger policy, Berkeley Business Law
Journal, 3(2). 474‐513.
Pavabutr, P., Ghon, R., Sirodom, K., and Tian, G., 2014. Asian pennies are not like US pennies,
Development Bank of Japan, Discussion paper series, 1402.
Sjostrom, W., 2008. The truth about reverse mergers, Entrepreneurial Business Law Journal, 2(2) , 744‐
759.
Stoll, HR., 2000. Friction, Journal of Finance, 55(4), 1479‐1514.
Stulz, RM, 1988. Managerial control of voting rights: Financing policies and the market for corporate
control, Journal of Financial Economics, 20(1) 25‐54.
Vermeulen, EPM., 2014. Rules on backdoor listings: A global survey, Indonesia‐OECD Corporate
Governance Policy Dialogue.
Wan‐Hussin, WN., 2002. The reverse takeover of Berjaya Textiles and back‐door listing of Jaya Tiasa: A
Malaysian case.
Winyuhuttakit, P., 2011. Asset acquisition from unlisted company regarded as backdoor listing, Master
of Law Thesis, Chulalongkorn University.