Where the Rubber Hits the Road - Polity.org
174
Strengthening Africa’s economic performance FUTURE OF AFRICAN CITIES PROJECT SPECIAL REPORT – JANUARY 2020 Olusegun Obasanjo, Juan Carlos Pinzón, Greg Mills, Ray Hartley, Nchimunya Hamukoma, Sarah Calburn, Nicola Doyle, Dianna Games, Archimedes Muzenda, Emily van der Merwe, David Kilcullen, Dickie Davis Where the Rubber Hits the Road
-
Upload
khangminh22 -
Category
Documents
-
view
1 -
download
0
Transcript of Where the Rubber Hits the Road - Polity.org

Strengthening Africa’s economic performance
FUTURE OF AFRICAN CITIES PROJECT
S P E C I A L R E P O R T – J A N U A R Y 2 0 2 0
Olusegun Obasanjo, Juan Carlos Pinzón, Greg Mills, Ray Hartley, Nchimunya Hamukoma, Sarah Calburn, Nicola Doyle, Dianna Games, Archimedes Muzenda, Emily van der Merwe, David Kilcullen, Dickie Davis
Where the Rubber Hits the Road
Contents
Forewords .. .. .. .. .. .. .. .. .. .. .. .. .. .. .. .. .. .. .. .. .. .. .. .. .. .. .. .. .. .. .. .. .. .. .. .. .. .. .. .. .. .. .. .. .. .. .. .. .. .. .. .. .. .. .. .. .. .. .. .. .. 3Olusegun Obasanjo .. .. .. .. .. .. .. .. .. .. .. .. .. .. .. .. .. .. .. .. .. .. .. .. .. .. .. .. .. .. .. 3Juan Carlos Pinzón. .. .. .. .. .. .. .. .. .. .. .. .. .. .. .. .. .. .. .. .. .. .. .. .. .. .. .. .. .. .. .. 5About the Contributors. .. .. .. .. .. .. .. .. .. .. .. .. .. .. .. .. .. .. .. .. .. .. .. .. .. .. .. .. .. 7
Preface and Acknowledgements .. .. .. .. .. .. .. .. .. .. .. .. .. .. .. .. .. .. .. .. .. .. .. 9Introduction: The Rise and Rise of the African City .. .. .. .. .. .. .. .. .. .. .. .. .. .. .. 11Section One: International Comparisons .. .. .. .. .. .. .. .. .. .. .. .. .. .. .. .. .. .. .. .. .. .. .. .. .. .. .. .. .. .. .. .. .. .. .. .. 22The Asian Experience . .. .. .. .. .. .. .. .. .. .. .. .. .. .. .. .. .. .. .. .. .. .. .. .. .. .. .. 24
The Singapore Story .. .. .. .. .. .. .. .. .. .. .. .. .. .. .. .. .. .. .. .. .. .. .. .. .. .. .. .. .. .. .. 24Indonesia: Infrastructure and Iconography .. .. .. .. .. .. .. .. .. .. .. .. .. .. .. .. .. .. .. .. .. 31
Latin America .. .. .. .. .. .. .. .. .. .. .. .. .. .. .. .. .. .. .. .. .. .. .. .. .. .. .. .. .. .. .. 36Security in Recife – Pact for Life .. .. .. .. .. .. .. .. .. .. .. .. .. .. .. .. .. .. .. .. .. .. .. .. .. .. 36The Security Challenges of Rio. .. .. .. .. .. .. .. .. .. .. .. .. .. .. .. .. .. .. .. .. .. .. .. .. .. .. 38Curitiba and the Bus Rapid Transport . .. .. .. .. .. .. .. .. .. .. .. .. .. .. .. .. .. .. .. .. .. .. .. 41The Transformation of Medellín .. .. .. .. .. .. .. .. .. .. .. .. .. .. .. .. .. .. .. .. .. .. .. .. .. .. 44Honduras: Urban Overstretch in San Pedro Sula .. .. .. .. .. .. .. .. .. .. .. .. .. .. .. .. .. .. .. 52Summary of Observations .. .. .. .. .. .. .. .. .. .. .. .. .. .. .. .. .. .. .. .. .. .. .. .. .. .. .. .. 58
Section Two: African City Case-Studies .. .. .. .. .. .. .. .. .. .. .. .. .. .. .. .. .. .. .. .. .. .. .. .. .. .. .. .. .. .. .. .. .. .. .. .. .. .. 60Lagos: The Relentless City .. .. .. .. .. .. .. .. .. .. .. .. .. .. .. .. .. .. .. .. .. .. .. .. .. .. .. .. 60Hargeisa: Invisible City.. .. .. .. .. .. .. .. .. .. .. .. .. .. .. .. .. .. .. .. .. .. .. .. .. .. .. .. .. .. 74Buffalo City: From Lifeless Economy to Lifestyle Opportunity. .. .. .. .. .. .. .. .. .. .. .. .. .. 88Mombasa: Gateway City .. .. .. .. .. .. .. .. .. .. .. .. .. .. .. .. .. .. .. .. .. .. .. .. .. .. .. .. .. 99Cape Town: A Tale of Two Transitions.. .. .. .. .. .. .. .. .. .. .. .. .. .. .. .. .. .. .. .. .. .. .. .. 116Rabat and Salé: Bridging the Gap. .. .. .. .. .. .. .. .. .. .. .. .. .. .. .. .. .. .. .. .. .. .. .. .. .. 133Conclusion: Between Wakanda and Dystopia .. .. .. .. .. .. .. .. .. .. .. .. .. .. .. .. .. .. .. .. 145
Endnotes .. .. .. .. .. .. .. .. .. .. .. .. .. .. .. .. .. .. .. .. .. .. .. .. .. .. .. .. .. .. .. .. .. .. .. .. .. .. .. .. .. .. .. .. .. .. .. .. .. .. .. .. .. .. .. .. .. .. .. .. .. .. 155
Published in January 2020 by The Brenthurst Foundation
The Brenthurst Foundation (Pty) Limited
PO Box 61631, Johannesburg 2000, South Africa
Tel +27–(0)11 274–2096
Fax +27–(0)11 274–2097
www.thebrenthurstfoundation.org
All rights reserved. The material in this publication may not be reproduced, stored, or transmitted without the prior permission of the publisher. Short extracts may be quoted, provided the source is fully acknowledged.
Layout and design by Sheaf Publishing, Benoni.
Where the Rubber Hits the Road

3S P E C I A L R E P O RT – JA N UA RY 2 0 2 0
WHERE THE RUBBER HITS THE ROAD
Forewords
Olusegun ObasanjoAfrica’s cities are on the rise. By 2100, Lagos is expected to be the world’s largest metrop-olis with a population touching 90 million people. Not far behind will be Kinshasa and Dar es Salaam.
Already some 500 million people live in Africa’s cities. Another 800 million are pro-jected to join them by 2050 as the continent shifts to an urban majority.
How these cities develop, grow and provide a liveable home for their swell-ing populations is the key to Africa’s future success or despair.
If cities fail to provide jobs, water, elec-tricity, sanitation and transport, they will become places of conflict and insecurity. If they grow and develop their infrastructure, they will become places where there is a better life for Africans.
The Brenthurst Foundation’s Future of African Cities project set out to explore how six African cities were facing the challenges of providing for their growing citizenry, and the policy options they require to meet their people’s needs. The cities – Lagos, Rabat-Salé, Cape Town, Mombasa, Hargeisa and Buffalo City – are very different from one another.
Yet they face many of the same challenges.
What they have in common is an absence of rational spatial planning. They have not been designed to provide services and opportunities in the most efficient and cost-effective way to their ever-growing populations.
The reasons for this are very different in each case.
Lagos has grown rapidly, outpacing urban planning with the result that it does not have an efficient transport, water and elec-tricity grid. The effect of this unchecked
organic growth is to make living there more expensive than it needs to be.
In the case of Cape Town and Buffalo City in South Africa, the spatial problems are the result of deliberate planning to keep races apart during the apartheid era, resulting in long distances between places of residence and work, which add to the transport burden.
In most of the cities studied, high transport costs are contributing to the impoverishment of residents and, along with poor regulation and property regimes, make the cost of doing business too high.
Mombasa and Rabat-Salé have tackled their legacy of uneven development aggres-sively, improving housing stock and showing that a concentrated effort by moti-vated authorities can make a big difference.
The world is looking to Africa with its youthful population as the continent that will provide economic growth, markets and investment opportunities in an otherwise stagnant global economy.
It is up to the governments of Africa – national, regional and local – to channel investment into making cities better places to live where there are more opportunities.
The key to this, as we outlined in detail in our book Democracy Works, is good, account-able, democratic governance.
The pyramid, which places national gov-ernment at the top and local government at the bottom, needs to be inverted. National government is vitally important in setting the agenda, but it is at local government level that the biggest difference can be made most rapidly to the lives of ordinary people. This requires leadership, strong project manage-ment and engineering skills and the ability to rapidly roll out services as cities expand.

4S P E C I A L R E P O RT – JA N UA RY 2 0 2 0
WHERE THE RUBBER HITS THE ROAD
Local government that is connected to regional and national government, sharing resources and skills, will make an immediate difference to the lives of Africa’s people.
Conversely, a failure to build effective, accountable local government and failure to meet citizens’ expectations will open the way for increased crime and insecurity, leading to mass migration away from Africa’s cities, to Europe and beyond.
It is our hope that this volume will make a modest contribution to increasing the under-standing of how our cities are developing and how we can make them better.
Olusegun ObasanjoPresident of the Federal Republic of Nigeria, 1999–2007Chairman: The Brenthurst Foundation

5S P E C I A L R E P O RT – JA N UA RY 2 0 2 0
WHERE THE RUBBER HITS THE ROAD
Juan Carlos PinzónProviding security, safety and democratic accountability to all citizens was a central aspect of Colombia’s fight against guerrillas and paramilitaries in the first part of the 21st century. Cities were central to this effort, none more so than in Medellín, which had been beset by violence, organised crime, and illegal armed groups across the political spectrum.
A close partnership between the govern-ment, the city government, and local civil society and community groups was the key to our effort to stabilise and secure Medellín. Our approach was to turn the guerrillas’ strategy – the ‘combination of all forms of struggle’ that treated armed action, agitation and propaganda, economic action and politi-cal negotiation simply as facets of a unified struggle – against them through our concept of ‘democratic security’.
Under our government, and a series of talented and capable mayors of Medellín, the city went from widespread insecurity to expanding normality. As in earlier periods of our history, international assistance helped – but the talent, energy and leadership that drove success were all Colombian, and the outcome in Medellín was a direct result of engaging local leaders and communities directly in solving their own problems.
The initial success of this pro-gramme of Democratic Security was in generating a dramatic fall in crime, initially by the government occupying and patrol-ling the municipalities – and, in Medellín, by incorporating better infrastructure and governance tools to bring outlying neigh-bourhoods and districts that had been controlled by illegal armed groups, into a more inclusive relationship with the city. We also promoted demobilisation and reintegration of guerrillas, infrastructure improvement and popular dialogue through-out the countryside, and in marginalized areas of Medellín and other major cities.
The effect was dramatic. Homicides halved; kidnappings plummeted by 90%; and car theft more than halved. The reduction in kidnappings, in particular, brought a sense of relief and progress to all Colombians. Security improvements helped Medellín’s economy develop, creating a virtuous cycle of governance, growth and stability. Foreign direct investment rose, enabling further spending on security. Economic growth across Colombia averaged 5% during the ten years from 2002, enabling fresh investment in infrastructure, and funding improvements in public safety. A positive cycle was estab-lished. Security begat economic prosperity, and prosperity, in turn, security.
During my tenure as Minister of Defence, we partnered closely with then Mayor of Medellín, Anibal Gaviria (recently elected as Governor of Antioquia), to take meas-ures to reduce violence in the city, and to stop a worrisome deterioration in security. We increased the police force by 2 000 and directed specific interventions in the most difficult neighbourhoods still influenced by the ghosts of the Cartel era. The mayor did his part by enhancing security infrastructure (stations), mobility, communications, and a very effective effort in education and sports programs with youth in fragile communities.
We also created a working committee with the Attorney General’s office to enhance Intelligence gathering. Finally, we estab-lished an innovative hot spots program that included data scientists, information gather-ing and police deployment. The results were clear and concrete, a reduction in homicide rate to the lowest in recorded history for the city of Medellín by the end of year 2014; we struck hard by capturing and in some cases extraditing the main drug lords ‘Mi Sangre’, ‘Sebastian’, and ‘Carlos Pesebre’ among oth-ers. Most importantly, Medellín was declared the most innovative city in the world, and several major international conferences and events made Medellín known worldwide
6S P E C I A L R E P O RT – JA N UA RY 2 0 2 0
WHERE THE RUBBER HITS THE ROAD
as a city that supports technology, social advancement, and industrial progress. My perspective is that you have to keep working even after you have had success.
The role of the successful policy maker is to quickly identify what works, plan solutions, and operationalise them in collab-oration with local and international partners. Learning and acting on lessons, good and bad, is thus critical. This important special report shows how many of the lessons we learned in Colombia are also very relevant
for cities across Africa. It illustrates clearly how the combination of social, economic, security, infrastructure and public engage-ment processes that we put in place could have similar positive effects for those African cities facing many of the same challenges.
Juan-Carlos PinzónMinister of Defence of Colombia, 2011–2015Member: Advisory Board, The Brenthurst Foundation

7S P E C I A L R E P O RT – JA N UA RY 2 0 2 0
WHERE THE RUBBER HITS THE ROAD
About the ContributorsDr Greg Mills heads the Johannesburg-based Brenthurst Foundation, established in 2005 by the Oppenheimer family to strengthen African economic performance. He holds degrees from the Universities of Cape Town and Lancaster and was the National Director of the SA Institute of International Affairs from 1996 to 2005. He has directed numer-ous reform projects in more than a dozen African governments, sat on the Danish Africa Commission and on the African Development Bank’s high-level panel on frag-ile states, and has served four deployments to Afghanistan with NATO. A member of the advisory board of the Royal United Services Institute, he is the author, inter alia, of the bestselling books Why Africa Is Poor, Africa’s Third Liberation (with Jeffrey Herbst), and with the chairman of the Foundation, President Olusegun Obasanjo, Dr Herbst and Major General Dickie Davis, Making Africa Work: A Handbook for Economic Success. His most recent book is Democracy Works authored with Obasanjo, Herbst and Tendai Biti, the former finance minister of Zimbabwe.
Ray Hartley is the Research Director of The Brenthurst Foundation. Before that he worked as a journalist from 1993, serving as editor of BusinessLIVE, and of South Africa’s largest circulation newspaper, The Sunday Times. Prior to journalism, Ray was an anti-apartheid activist in the United Democratic Front and worked as an administrator in the constitutional negotiations that ended apartheid. He covered the Nelson Mandela presidency, travelling the world with him and witnessed the birth of the new, democratic South Africa. Ray is the author of Ragged Glory: The rainbow nation in black and white, which tells the story of the first two decades of democracy in South Africa, The Big Fix: How South Africa stole the 2010 World Cup, and Ramaphosa: The Man Who Would be King.
Nchimunya Hamukoma is based at the School of Collective Intelligence at Mohammed VI Polytechnic University in Morocco. She previously worked at The Brenthurst Foundation on its Future of African Cities project and was an Assistant Lecturer at the Nelson Mandela School of Governance at the University of Cape Town where she supported the creation of the MPhil in Development Policy & Practice.
Nicola Doyle is a graduate of the University of Cape Town and was a Machel-Mandela Fellow at The Brenthurst Foundation. She is currently studying towards a Master’s in Development Studies at the University of the Witwatersrand.
Archimedes Muzenda was The Brenthurst Foundation’s Machel-Mandela Fellow for 2018. He is a Zimbabwean scholar and urban planner who authored Dystopia, a book that criticises the rise of specialist town plan-ning and the destruction it is causing to the liveability of cities in Africa. Archimedes is a senior research associate at the African Urban Institute. He holds a Master’s in Public Administration from Central University and is studying for a PhD in Urban Management at the University of the Witwatersrand.
Sarah Calburn runs an architectural prac-tice in Johannesburg. A graduate of Wits University and the Melbourne Institute of Technology, she has also worked as an architect in Paris, Hong Kong, Sydney and Melbourne. Sarah is responsible for several iconic South African buildings and is a prize winner in the Zurich Urbaninform Design Contest for her joint work on social housing.
Dianna Games is the Chief Executive of the business advisory consultancy Africa @ Work, and is a leading commentator on business issues, trends and developments in Africa. She has contributed many published

8S P E C I A L R E P O RT – JA N UA RY 2 0 2 0
WHERE THE RUBBER HITS THE ROAD
reports and book chapters on African busi-ness issues and is the author of Doing Business in Africa: Corporate Insights (Penguin: 2013). She is also a columnist for Business Day newspaper in South Africa and African Business magazine and a director of the SA–Nigeria Business Chamber run out of Johannesburg. Dianna also works with sev-eral of South Africa’s leading business schools.
Emily van der Merwe is an Environmental and Development Economist at The Brenthurst Foundation. Emily completed an MSc in Environmental Economics and Climate Change at the London School of Economics. Prior to this, she graduated from Stellenbosch University with an under-graduate degree in Law, and an Honours in Economics as a Mandela Rhodes Scholar. Before joining The Brenthurst Foundation, she worked for the Hoffmann Centre for Sustainable Resource Economy at Chatham House in London.
Dr David Kilcullen is a Professor in the School of Humanities and Social Sciences at the University of New South Wales in Canberra, Australia. He is CEO of the research firm Cordillera Applications Group, and has been an associate of The Brenthurst Foundation since 2012. He is a former Australian Army officer, intelligence officer and diplomat, who served as senior counter-insurgency advisor to US command-ers in Iraq and Afghanistan, and has served in Somalia, Libya and several countries in North-West and East Africa as a counterter-rorism official. He is the author of several
well-regarded books on urbanisation, con-flict, guerrilla warfare and terrorism. With Greg Mills, Dickie Davis and David Spencer, he co-authored A Great Perhaps: Colombia, Conflict and Convergence, a detailed study of Colombia and its transition from insurgency to post-conflict reconstruction, drawing on The Brenthurst Foundation’s research on lessons for Africa from Latin America.
Dickie Davis is the Managing Director of Nant Enterprises Ltd and Chairman of Water to Go Ltd. Since leaving the British Army in 2015, where he served for 32 years, reaching the rank of Major General, he has worked as a special advisor to The Brenthurst Foundation, mainly in sub-Saharan Africa. During his military career he served extensively on operations in the Balkans (1995–2002) and in Afghanistan (2003–2010). In the UK he served as Director Plans, Land Forces (2007–2009), Director General, Army Recruiting and Training (2011–2013) and Director General, Personnel (2013–14). He is a Vice President of the Institution of Royal Engineers, Chairman of the Royal Engineers’ Museum, and is Honorary Colonel of the Royal Monmouthshire Royal Engineers. He holds a first degree in civil engineer-ing, a Master’s in Defence Technology, and is a Fellow of the Chartered Management Institute. He is the co-author, with, Greg Mills, Jeffrey Herbst and Olusegun Obasanjo of Making Africa Work (Tafelberg 2017), and with David Kilcullen, Greg Mills and David Spencer of A Great Perhaps? Colombia: Conflict and Convergence (Hurst, 2015), both of which are based on extensive fieldwork in sub-Saharan Africa and Latin America.
9S P E C I A L R E P O RT – JA N UA RY 2 0 2 0
WHERE THE RUBBER HITS THE ROAD
Preface and AcknowledgementsThe statistics are astounding. Africa’s urban areas are already home to almost 500 mil-lion people and will more than double in size in the next 25 years, with the most popu-lous cities growing annually by 4%.1 By 2030, most Africans will live in cities. By 2050, the number of people living in Africa’s cities is expected to top 1.3 billion, the same popula-tion as that in the entire continent in 2020.
To give you an idea of how African cities are at the forefront of global urban growth, consider the fact that by 2100, it is projected that the world’s three largest cities will be in Africa. Lagos will be the globe’s largest metropolis with a population of 88.3 million, followed by Kinshasa and Dar es Salaam with 83.5 and 73.7 million residents respec-tively.2 As such, the future of African cities is really the future of global cities.
This is not bad news, far from it. Cities have been the engines of economic growth throughout modern history, and this is increasingly so in today’s industrialised and globalised world because higher density and greater connectivity allows for econo-mies of scale in infrastructure and social services, and concentrations of workers for industry and other economic purposes. Most of the world’s population, by 2019 some 55%, lives in urban areas. Such agglomera-tions also however amplify risks around health, sanitation, poverty, human insecu-rity and inequality, and create enormous bureaucratic and resource burdens for local authorities.
Nowhere is this contradiction more visible than in Africa’s exploding urban areas. The three main drivers of African urbanisation – organic population growth, rural-to-urban migration and modern information flow – have dramatic consequences for African societies. If there is no plan to manage these changes, the outcome could be developmen-tally and politically disastrous. Success or failure will hinge on four main factors:
› The quality of governance; › The extent to which inclusive economic
growth can be generated, ensuring that a ‘constituency of losers’ does not become the dominant group;
› Improvements to infrastructure, planning and service provision; and
› The harnessing of new technology and innovation.
Success or failure is, however, not preor-dained. The international case studies in this volume illustrate how seemingly desper-ate situations of crisis can be quickly turned around with clear and decisive leadership, planning and directed execution. The rapid growth of the African city will, if properly managed, ensure the reality of the ‘Africa Rising’ narrative; if not, it will be a lost oppor-tunity and a source of chronic instability.
Enabling sustainable and equitable growth in African cities hinges on ensur-ing that economic development at the very least maintains, or preferably surpasses, population growth and urbanisation rates, something that has failed to occur for much of the period since independence. More than that, it requires careful and intelligent long-term planning, innovative use of technology and skills, new forms of governance, and action on key sectors such as infrastructure, housing and the provision of public services. In short, it needs a new approach.
If governments fail to act, the prospect of African cities as centres of prosperity will fade against the grinding reality of slums, disease, crime, chronic and burgeoning unemployment, populism and even violent radicalism, where those left out and behind are easy prey for political prophets. This is the lesson of the Arab Spring.
Building on its work with governments at the national, sub-national and local level, in 2015 The Brenthurst Foundation launched its Future of African Cities research and media
10S P E C I A L R E P O RT – JA N UA RY 2 0 2 0
WHERE THE RUBBER HITS THE ROAD
project, which planned to identify how the African city can become a node of develop-ment rather than a site of despair. The aim of the project was to identify the policy options and path for a positive outcome of the demo-graphic spike Africa will experience over the next generation, especially in its cities. It asked several key questions:
› What needs to be done to ensure Africa experiences a demographic dividend?
› What can be done to transform a city in terms of governance, infrastructure, and security?
› What is the role of technology, skills, lead-ership, values, media, youth, and policy?
› What is the balance between tools (the ‘what’), organisational theory (the ‘how’), and will (the ‘why’)?
The project aimed to outline where, why and how the city has been a central part of the development story in developing countries, and where it has been a brake on progress. Finally, the projected aimed to conclude with a series of policy recommendations for gov-ernments and citizens.
The Future of African Cities project has both synced with and spawned a number of other long-term studies at the Foundation, including those which resulted in the book-length publications of A Great Perhaps? (Hurst: 2016), Making Africa Work (Tafelberg: 2017), Democracy Works (Picador: 2019) and the forthcoming Asian Aspiration (2020). Over four years between 2015 and 2019, the Foundation conducted in-depth research with over 500 qualitative interviews and polled 2 500 respondents.
In each of these case studies, the Foundation has worked with local part-ners and policymakers. In Lagos the office
of then Governor Akinwunmi Ambode; in East London, Mayor Xola Pakati; in Rabat-Salé, the Policy Center for the New South; in Mombasa the office of Governor Hassan Ali Joho; in Cape Town, then Premier Helen Zille; and in Hargeisa the government of President Muse Bihi Abdi. Any project of this scope hinges on collaboration, in this case between researchers, both internal and external to the Foundation, participants at the two major conferences at which this research was presented at Tswalu in the Kalahari and in Mombasa, and many research institutions, in African elsewhere. Special appreciation is expressed to Ambassador Barry Desker for his role in facilitating interviews in Singapore, the Embassy of the Republic of Indonesia to South Africa, former Defence Minister Juan-Carlos Pinzón in Colombia, and Lyal White for his assistance in Curitiba, Salvador and Recife in Brazil.
None of this would have been possi-ble without the leadership role of Jonathan Oppenheimer along with the backroom staff of the Foundation who enabled the research visits and events, including Leila Jack, Ghairoon Hajad, Mariam Cassoojee, and three of the Foundation’s Machel-Mandela Fellows, Wendy Trott, Marie-Noelle Nwokolo, and Luveshni Odayar.
Finally, in assessing the prospects of posi-tive growth and change in African cities, and the role of the citizen, it is important to restate the words of Jane Jacobs, author of The Death and Life of Great American Cities: ‘Cities have the capability of providing some-thing for everybody, only because, and only when, they are created by everybody.’
Ray Hartley and Greg MillsJohannesburgNovember 2019

11S P E C I A L R E P O RT – JA N UA RY 2 0 2 0
WHERE THE RUBBER HITS THE ROAD
Introduction: The Rise and Rise of the African CityAfrica’s cities are growing fast – by some measures, too fast. The creation of jobs, and the provision of housing, electricity, water and security is not keeping pace with the volume of people streaming in from the countryside.
The scale of the challenge is therefore enormous. Cities will need to provide homes, roads, water, power and, perhaps most importantly, employment, for hundreds of millions of new city dwellers over the next few decades.3
The development of the continent’s metropoles will be pushed by the mega-trends of population growth and rapid urbanisation, together with global connectiv-ity and information flow.
Cities ought to be places of rapid development and growth because of the ‘agglomeration effect’4 –the economies of scale they offer. It is much less expensive to build and maintain infrastructure for a dense neighbourhood than it is for scattered dwellings and it is much more efficient to conduct business if suppliers are close by than far away. The concentration of labour also offers opportunities for mass employ-ment in a way that is impossible in the rural setting. However, many African cities have developed organically with limited planning and intervention. They miss out on many of the associated benefits of agglomeration because they were not designed for scale.
According to a recent World Bank report on African cities, the consequences of poorly planned development are largely economic. It notes that ‘African cities are not economi-cally dense or efficient enough to promote scale economies and attract capital invest-ment. In principle, cities should benefit businesses and people through increased economic density. Firms clustered in cities
should be able to access a wider market of inputs and buyers, with reduced production costs thanks to scale economies.’5
But they don’t. As a result, there is a chance that Africans may miss out on the many benefits of urbanisation.
Population GrowthOf the additional 2.4 billion people estimated by the United Nations to be added to the global population by 2050, about 1.3 billion will be born in Africa.6 As the statistician Hans Rosling observed, ‘The reason the population is growing in Africa is the same reason that [saw] population growth first in Europe, then in the Americas, then in Asia. It’s when the population goes from a phase where you have many children born and many who are dying. Then the death rate goes down and [some time later] the birth rate follows.’7 This notion – encapsulated in the idea of a ‘demographic transition’ where increasing per capita GDP correlates with a declining birth rate in industrialising coun-tries – is key to understanding the future growth of African cities.
To illustrate the disruptive nature of the population growth that Africa will expe-rience, the following table* displays the growth of three countries: Burundi (relatively small), Ghana (a medium-sized country), and Nigeria (the continent’s behemoth).8
National Population in Selected Years (millions of people)Country 1950 2015 2025 2050Burundi 2.3 10.8 14.4 26.7Ghana 5.0 27.0 32.5 45.7Nigeria 37.9 183.5 240.0 440.0
* Unattributed photographs, tables and graphics
are the authors’ own or were provided with
permission.

12S P E C I A L R E P O RT – JA N UA RY 2 0 2 0
WHERE THE RUBBER HITS THE ROAD
Each have grown by an order of magni-tude between 1950 and 2015 – Burundi by 370%, Ghana by 440% and Nigeria by 384%. In the relatively short period (by demo-graphic standards) between 2015 and 2025, they will grow between 20% (Ghana) and 33% (Burundi) and 31% (Nigeria). Even with growth rates slowing, the continent will be radically different in ten or 20 years’ time from what it is today.
As the table, below, illustrates, all African countries except for some island nations and a few Southern African countries will grow by at least 37% in the next 20 years.9
All of the major African countries will experience significant population growth over this timeframe, except South Africa.10 While South Africa has already lost its standing as one of the largest African coun-tries demographically, Tanzania – currently one of Africa’s more populous states but not thought of as a giant – will become a nota-ble player on the continent by 2035 because of its high fertility rate, even when its birth rate is only the 12th highest on the continent (and simultaneously in the world). At the same time, Nigeria’s large population and significant growth means that it will become one of the most demographically significant nations globally. By 2050, Nigeria will sur-pass both the United States and Indonesia in population, making it the world’s third most
populous country, behind India and China. As a result, Nigeria’s fate will become intrin-sically linked to the world’s as it increasingly represents one of the largest concentrations of people.
Since high birth rates are closely correlated with extreme poverty, such rapid population growth can create a vicious cycle that feeds into further disadvantages of poor education, limited access to contracep-tion and health care, and the suppression of reproductive, political and civil rights of women. But this picture can change quickly, as it has done in a few places in Africa and large parts of Southeast Asia, where the demographic tide has been turned into a dividend by improving skills and providing the policy and infrastructure necessary for inclusive economic growth and employment.
In its April 2015 Sub-Saharan Regional Outlook, the IMF estimated that in order to maximise this population dividend, the region will need to produce an average of 18 million high-productivity jobs per year until 2035. This would represent an unprec-edented rate of employment growth. The IMF also noted that over this period policies will be required that can gradually transi-tion jobs from the informal sector, which accounts for about 90% of the 400 million jobs in low income sub-Saharan African
Projected Increase in Population, 2015 to 2035 (%)Niger 116 Burkina Faso 67 Mayotte 57 Sierra Leone 37
Zambia 87 Senegal 63 Guinea 55 Namibia 35
Mali 86 Congo 63 Togo 54 Djibouti 25
Uganda 81 DRC 63 Ethiopia 52 Swaziland 24
Gambia 77 Eritrea 62 Guinea Bissau 52 Botswana 19
Chad 75 Mozambique 61 Mauritania 52 Lesotho 19
Tanzania 73 Rwanda 58 Comoros 52 Réunion 18
Angola 73 Liberia 58 CÔte d’Ivoire 51 Cabo Verde 17
Somalia 73 Benin 58 São Tomé 51 St. Helena 12
Burundi 72 Kenya 58 Gabon 49 South Africa 11
Malawi 70 Equatorial Guinea 57 Zimbabwe 45 Seychelles 06
Nigeria 69 South Sudan 57 CAR 43 Mauritius 02
Madagascar 67 Cameroon 57 Ghana 41
13S P E C I A L R E P O RT – JA N UA RY 2 0 2 0
WHERE THE RUBBER HITS THE ROAD
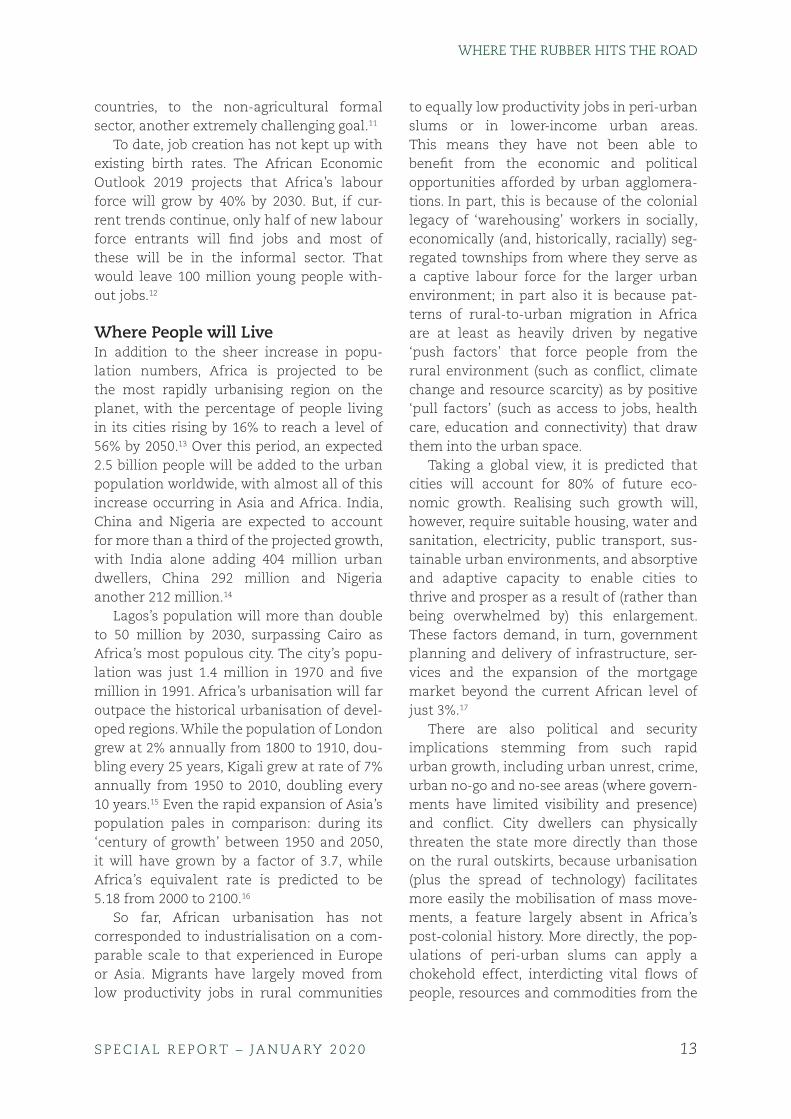
countries, to the non-agricultural formal sector, another extremely challenging goal.11
To date, job creation has not kept up with existing birth rates. The African Economic Outlook 2019 projects that Africa’s labour force will grow by 40% by 2030. But, if cur-rent trends continue, only half of new labour force entrants will find jobs and most of these will be in the informal sector. That would leave 100 million young people with-out jobs.12
Where People will LiveIn addition to the sheer increase in popu-lation numbers, Africa is projected to be the most rapidly urbanising region on the planet, with the percentage of people living in its cities rising by 16% to reach a level of 56% by 2050.13 Over this period, an expected 2.5 billion people will be added to the urban population worldwide, with almost all of this increase occurring in Asia and Africa. India, China and Nigeria are expected to account for more than a third of the projected growth, with India alone adding 404 million urban dwellers, China 292 million and Nigeria another 212 million.14
Lagos’s population will more than double to 50 million by 2030, surpassing Cairo as Africa’s most populous city. The city’s popu-lation was just 1.4 million in 1970 and five million in 1991. Africa’s urbanisation will far outpace the historical urbanisation of devel-oped regions. While the population of London grew at 2% annually from 1800 to 1910, dou-bling every 25 years, Kigali grew at rate of 7% annually from 1950 to 2010, doubling every 10 years.15 Even the rapid expansion of Asia’s population pales in comparison: during its ‘century of growth’ between 1950 and 2050, it will have grown by a factor of 3.7, while Africa’s equivalent rate is predicted to be 5.18 from 2000 to 2100.16
So far, African urbanisation has not corresponded to industrialisation on a com-parable scale to that experienced in Europe or Asia. Migrants have largely moved from low productivity jobs in rural communities
to equally low productivity jobs in peri-urban slums or in lower-income urban areas. This means they have not been able to benefit from the economic and political opportunities afforded by urban agglomera-tions. In part, this is because of the colonial legacy of ‘warehousing’ workers in socially, economically (and, historically, racially) seg-regated townships from where they serve as a captive labour force for the larger urban environment; in part also it is because pat-terns of rural-to-urban migration in Africa are at least as heavily driven by negative ‘push factors’ that force people from the rural environment (such as conflict, climate change and resource scarcity) as by positive ‘pull factors’ (such as access to jobs, health care, education and connectivity) that draw them into the urban space.
Taking a global view, it is predicted that cities will account for 80% of future eco-nomic growth. Realising such growth will, however, require suitable housing, water and sanitation, electricity, public transport, sus-tainable urban environments, and absorptive and adaptive capacity to enable cities to thrive and prosper as a result of (rather than being overwhelmed by) this enlargement. These factors demand, in turn, government planning and delivery of infrastructure, ser-vices and the expansion of the mortgage market beyond the current African level of just 3%.17
There are also political and security implications stemming from such rapid urban growth, including urban unrest, crime, urban no-go and no-see areas (where govern-ments have limited visibility and presence) and conflict. City dwellers can physically threaten the state more directly than those on the rural outskirts, because urbanisation (plus the spread of technology) facilitates more easily the mobilisation of mass move-ments, a feature largely absent in Africa’s post-colonial history. More directly, the pop-ulations of peri-urban slums can apply a chokehold effect, interdicting vital flows of people, resources and commodities from the
14S P E C I A L R E P O RT – JA N UA RY 2 0 2 0
WHERE THE RUBBER HITS THE ROAD
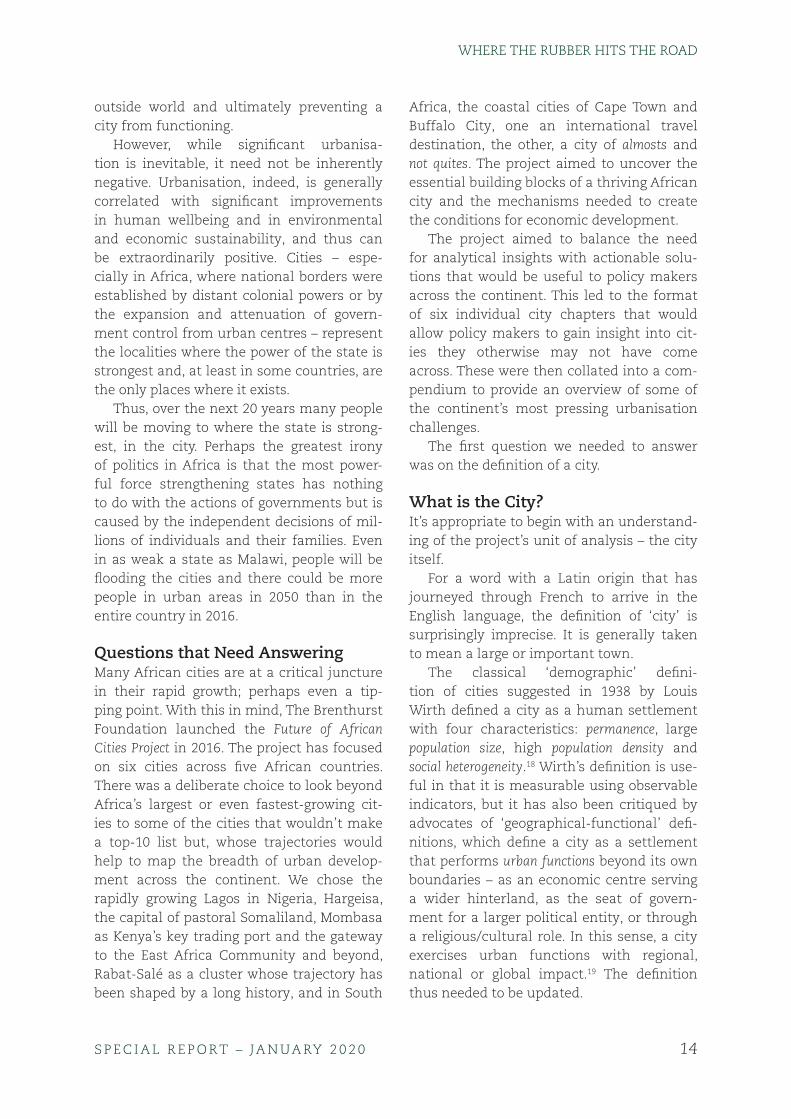
outside world and ultimately preventing a city from functioning.
However, while significant urbanisa-tion is inevitable, it need not be inherently negative. Urbanisation, indeed, is generally correlated with significant improvements in human wellbeing and in environmental and economic sustainability, and thus can be extraordinarily positive. Cities – espe-cially in Africa, where national borders were established by distant colonial powers or by the expansion and attenuation of govern-ment control from urban centres – represent the localities where the power of the state is strongest and, at least in some countries, are the only places where it exists.
Thus, over the next 20 years many people will be moving to where the state is strong-est, in the city. Perhaps the greatest irony of politics in Africa is that the most power-ful force strengthening states has nothing to do with the actions of governments but is caused by the independent decisions of mil-lions of individuals and their families. Even in as weak a state as Malawi, people will be flooding the cities and there could be more people in urban areas in 2050 than in the entire country in 2016.
Questions that Need AnsweringMany African cities are at a critical juncture in their rapid growth; perhaps even a tip-ping point. With this in mind, The Brenthurst Foundation launched the Future of African Cities Project in 2016. The project has focused on six cities across five African countries. There was a deliberate choice to look beyond Africa’s largest or even fastest-growing cit-ies to some of the cities that wouldn’t make a top-10 list but, whose trajectories would help to map the breadth of urban develop-ment across the continent. We chose the rapidly growing Lagos in Nigeria, Hargeisa, the capital of pastoral Somaliland, Mombasa as Kenya’s key trading port and the gateway to the East Africa Community and beyond, Rabat-Salé as a cluster whose trajectory has been shaped by a long history, and in South
Africa, the coastal cities of Cape Town and Buffalo City, one an international travel destination, the other, a city of almosts and not quites. The project aimed to uncover the essential building blocks of a thriving African city and the mechanisms needed to create the conditions for economic development.
The project aimed to balance the need for analytical insights with actionable solu-tions that would be useful to policy makers across the continent. This led to the format of six individual city chapters that would allow policy makers to gain insight into cit-ies they otherwise may not have come across. These were then collated into a com-pendium to provide an overview of some of the continent’s most pressing urbanisation challenges.
The first question we needed to answer was on the definition of a city.
What is the City?It’s appropriate to begin with an understand-ing of the project’s unit of analysis – the city itself.
For a word with a Latin origin that has journeyed through French to arrive in the English language, the definition of ‘city’ is surprisingly imprecise. It is generally taken to mean a large or important town.
The classical ‘demographic’ defini-tion of cities suggested in 1938 by Louis Wirth defined a city as a human settlement with four characteristics: permanence, large population size, high population density and social heterogeneity.18 Wirth’s definition is use-ful in that it is measurable using observable indicators, but it has also been critiqued by advocates of ‘geographical-functional’ defi-nitions, which define a city as a settlement that performs urban functions beyond its own boundaries – as an economic centre serving a wider hinterland, as the seat of govern-ment for a larger political entity, or through a religious/cultural role. In this sense, a city exercises urban functions with regional, national or global impact.19 The definition thus needed to be updated.

15S P E C I A L R E P O RT – JA N UA RY 2 0 2 0
WHERE THE RUBBER HITS THE ROAD
The Organisation for Economic Co-operation and Development (OECD) and the European Community produced a short paper in 2012 that attempted to resolve the issue of the definition of cities. Focusing on cities in Europe they concentrated on the concept of an ‘urban centre’ sup-ported by commuting zones (together called larger urban zones). A city was defined as a contiguous geographical area with a popu-lation density of greater than 1.500 people per km2, where the total population exceeds 50 000 and which is matched with an exist-ing municipal boundary. A commuting area was defined as an area in which more than 15% of the employed population commuted to the city. Applying this methodology across the whole of the EU results in a finding that 40% of EU residents live in cities and 20% live in commuting zones.
Of course, this definition also does not take account of the history, location, func-tion, or cultural significance of such a settlement. These factors are important for cities as they are often regarded as the high-est form of social organisation, combining economic, political and cultural develop-ment, and are viewed as drivers of growth.
The United Nations uses the concept of urban agglomeration, defined as a concen-tration of population in a given urbanised area (similar to the geographical ‘metro-politan area’ as distinct from ‘city limits’).20 This is more useful for analysts consid-ering urban issues and systems that are wider than the more restrictive political-administrative construct of the ‘city’. For example, Washington DC metropolitan area (population 5.95 million) covers portions of Northern Virginia and Maryland in a contigu-ous urbanised zone encapsulating the much smaller District of Columbia – the ‘city’ of Washington – with a population of only 659 000 in 2014.21 This area, though compris-ing several political units known as ‘cities’, is a single urban agglomeration. The same is true for Manila, among other cities.
Military doctrine defines cities as contigu-ous zones of urbanised terrain or ‘built-up areas’. US Joint Doctrine, JP 3-06 Joint Urban Operations (2013) describes cities as ‘an urban triad consisting of complex man-made physi-cal terrain, a population of significant size and density and varying sociocultural groupings, and an infrastructure.’22 This combines elements of Wirth’s classic definition, while recogniz-ing that socio-cultural groupings vary within agglomerations, and adding the element of human-made (anthropogenic) terrain and infrastructure.
Other studies have broadened this anal-ysis. David Kilcullen’s work on the ‘city as a system’ takes a systems-modelling approach, adding connectedness (especially electronic connectivity, which is far greater in urban than in rural areas, enabling urban agglomerations to develop a dense, com-plex informational terrain alongside their physical and human terrain), and treating urban centres as subsystems within broader complex adaptive systems that behave like biological systems.
By this definition, urban agglomera-tions nest in a networked pattern of flows, interactions and interdependencies across a rural, peri-urban and urban continuum.23 Urbanisation, in this context, is a process of ‘connection’: where population, land use, and economic activity become part of a greater whole, with information, goods and service flowing freely between individuals.
What is the pattern of African Urbanisation?The second question relates to historical dynamics that have shaped Africa’s cities.
In the immediate pre-colonial and colonial periods, between the mid-17th and late-19th centuries (as far as can be determined, given the limits of data and modelling) it appears that the population of sub-Saharan Africa was broadly stable at between 90 and 100 million, and it was only in the 1920s that Africa saw a sharp resump-tion of population growth.24 It’s worth noting
16S P E C I A L R E P O RT – JA N UA RY 2 0 2 0
WHERE THE RUBBER HITS THE ROAD
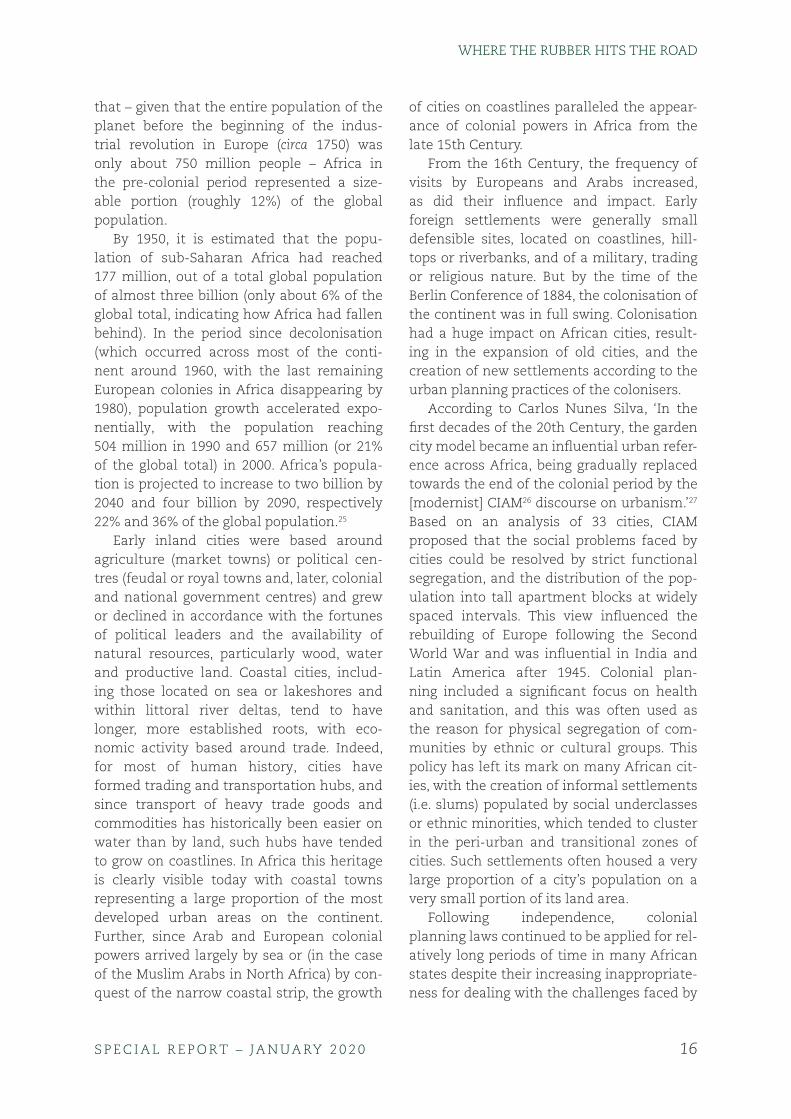
that – given that the entire population of the planet before the beginning of the indus-trial revolution in Europe (circa 1750) was only about 750 million people – Africa in the pre-colonial period represented a size-able portion (roughly 12%) of the global population.
By 1950, it is estimated that the popu-lation of sub-Saharan Africa had reached 177 million, out of a total global population of almost three billion (only about 6% of the global total, indicating how Africa had fallen behind). In the period since decolonisation (which occurred across most of the conti-nent around 1960, with the last remaining European colonies in Africa disappearing by 1980), population growth accelerated expo-nentially, with the population reaching 504 million in 1990 and 657 million (or 21% of the global total) in 2000. Africa’s popula-tion is projected to increase to two billion by 2040 and four billion by 2090, respectively 22% and 36% of the global population.25
Early inland cities were based around agriculture (market towns) or political cen-tres (feudal or royal towns and, later, colonial and national government centres) and grew or declined in accordance with the fortunes of political leaders and the availability of natural resources, particularly wood, water and productive land. Coastal cities, includ-ing those located on sea or lakeshores and within littoral river deltas, tend to have longer, more established roots, with eco-nomic activity based around trade. Indeed, for most of human history, cities have formed trading and transportation hubs, and since transport of heavy trade goods and commodities has historically been easier on water than by land, such hubs have tended to grow on coastlines. In Africa this heritage is clearly visible today with coastal towns representing a large proportion of the most developed urban areas on the continent. Further, since Arab and European colonial powers arrived largely by sea or (in the case of the Muslim Arabs in North Africa) by con-quest of the narrow coastal strip, the growth
of cities on coastlines paralleled the appear-ance of colonial powers in Africa from the late 15th Century.
From the 16th Century, the frequency of visits by Europeans and Arabs increased, as did their influence and impact. Early foreign settlements were generally small defensible sites, located on coastlines, hill-tops or riverbanks, and of a military, trading or religious nature. But by the time of the Berlin Conference of 1884, the colonisation of the continent was in full swing. Colonisation had a huge impact on African cities, result-ing in the expansion of old cities, and the creation of new settlements according to the urban planning practices of the colonisers.
According to Carlos Nunes Silva, ‘In the first decades of the 20th Century, the garden city model became an influential urban refer-ence across Africa, being gradually replaced towards the end of the colonial period by the [modernist] CIAM26 discourse on urbanism.’27 Based on an analysis of 33 cities, CIAM proposed that the social problems faced by cities could be resolved by strict functional segregation, and the distribution of the pop-ulation into tall apartment blocks at widely spaced intervals. This view influenced the rebuilding of Europe following the Second World War and was influential in India and Latin America after 1945. Colonial plan-ning included a significant focus on health and sanitation, and this was often used as the reason for physical segregation of com-munities by ethnic or cultural groups. This policy has left its mark on many African cit-ies, with the creation of informal settlements (i.e. slums) populated by social underclasses or ethnic minorities, which tended to cluster in the peri-urban and transitional zones of cities. Such settlements often housed a very large proportion of a city’s population on a very small portion of its land area.
Following independence, colonial planning laws continued to be applied for rel-atively long periods of time in many African states despite their increasing inappropriate-ness for dealing with the challenges faced by

17S P E C I A L R E P O RT – JA N UA RY 2 0 2 0
WHERE THE RUBBER HITS THE ROAD
African cities. For example, in Guinea-Bissau, the colonial building code, adopted in 1956 and revised in 1971, was only replaced in 2006.28 Urban planning tended to be regarded – in an echo of its colonial origins, but by no means uniquely to Africa – as a techni-cal activity which required little input from citizens and was, generally, both highly centralised and under-resourced. In the post-independence environment, shortages of local, technically competent, planners often led to the provision of external technical assistance.
But this solution had two major limita-tions; first it often tried to apply western solutions to African problems and, second, the plans devised were often, at best, par-tially resourced. Only since the start of the 21st Century has Africa started to break with its colonial urban planning past and introduce new ideas, concepts and planning methods aimed at solving the challenges faced by its cities.
But, arguably, the vast majority of African countries do not yet have a credible national set of urban policies to provide the guid-ance needed by both the central and local government authorities.
A Theoretical FrameworkIt’s not just urban planning in practice that has followed western models for most of the last two centuries, but also theories of urban development and the related academic dis-cipline in its entirety. The third and final unanswered question was, ‘Could we find or design a framework that accurately describes African cities?’
One strand of western urban develop-ment theory has at its heart the concepts of democracy, delegation and competitiveness.29 This includes the notion that the population of a city elects a mayor and councillors based on what these representatives aim to deliver for the population in terms of services and economic development, in return for their taxes; and the notion that a national govern-ment devolves to the city government the
regulatory and fiscal tools to do the job. Once elected, the governing party on a city council seeks to compete with other cities to attract economic benefit and there is a real incen-tive to engage citizens in the urban planning process. In other words, to be successful, a city needs to be competitive, both with its near neighbours and internationally, and responsive to its population.
Some economists have questioned whether the term ‘competitiveness’ can really be applied to anything other than private firms. But for businesses to be competitive their operating environment matters, and local governments can choose to improve that environment thorough the adoption of policies that provide a competi-tive advantage and encourage innovation. This, in turn, enhances tax revenue and pro-vides increased employment opportunities.
But what happens when democracy is only in its infancy and there is a weak culture of the payment of taxes and the expecta-tion of the delivery of services; where the prevailing culture is more one of patronage and payment? What happens when cultural norms of impunity, exclusivity and clan- or tribe-based power structures collide with modern state-based rule-of-law systems in a rapidly modernising society? What happens when elites within an urban environment establish patron-client relationships with special interest groups (including, in some cases, criminal groups) whose interests may diverge from those of the city as a whole?
This pattern, known as clientelism in many urban contexts, is one of the chal-lenges many African cities face. It also renders the ‘competitive’ model of urban development ill-suited to the African con-text. If it is just the city government and the business elite who call the shots, or if these elites have exclusive client relationships with key sub-groups of the urban popula-tion, how can they be persuaded to adopt a more inclusive approach? Faced with rapid population growth and urbanisation, many governments tend to adopt a more directed,

18S P E C I A L R E P O RT – JA N UA RY 2 0 2 0
WHERE THE RUBBER HITS THE ROAD
top down approach, but this must take account of the need to motivate city lead-ers and managers to improve the city for the benefit of all. These top-down approaches also often fail for the simple reason that planning and implementation of citywide solutions – even with the best will in the world – takes time, and solutions to the problems of a rapidly-growing urban area may often (even repeatedly) be overtaken by events as the pace of growth renders ini-tiatives impracticable before they can be implemented.
The Brenthurst Foundation project team’s initial analysis of challenges facing African cities over the next 35 years involved an assessment of the elements needed for suc-cessful urban growth. Success is measured by whether growth can improve the standard of living for inhabitants, lifting marginal-ised and at-risk populations out of poverty, enabling inclusive political and economic participation, and allowing vulnerable and excluded groups to become productive members of a broader, more integrated soci-ety. Some of the elements needed for such growth include: an inclusive historical narra-tive or political legacy, natural endowments, urban infrastructure (both physical and non-physical), essential services, human capital, effective governance, responsive institutions, a regulatory environment conducive to business growth, and security – both for indi-viduals (human security) and for the city and the state (public safety and national security).
Of this range of factors, four key mech-anisms stand out as being of primary importance: quality governance which cre-ates an enabling environment, security, infrastructure and service delivery, and harnessing technology and innovation.
Governance. The quality of city, provin-cial and national governance has often been highlighted as critical because it sets much of the microclimate for economic, political and social development. Aspects of
commercial and civil law (and the general regulatory environment for private industry) are strongly correlated with successful urban growth. The ability of an individual to start a business, obtain relevant licences, establish land title and employ workers is key.
Studies have found that the lower the barriers to business entry, the faster under-developed urban and peri-urban areas are able to develop and to catch up to more prosperous areas. Individuals and families who can see a pathway to prosperity and improved social standing within the frame-work of the city and the state are much less likely to seek to undermine or destroy it, thereby reducing the risk of unrest and vio-lence. Cities with sound governance have also often been successful because there has been a development vision, a plan and the leadership ability and management skills to deliver on that plan. This is a huge area in its own right; this study focuses slightly more narrowly on answering the following ques-tions: what are the underlying principles for effective urban governance? Where are the quick wins likely to be for African cities in the 21st Century? Where is long-term investment needed?
Security: Many African cities suffer from reputations for violence and insecurity, real or perceived, which discourage investors, impose costs on doing business, hamper government penetration and regulation of society, and reduce the quality of life for inhabitants. In 2015 the Mexico Citizens Council for Public Security, for example, rated Cape Town, Durban, Nelson Mandela Bay Municipality and Johannesburg as being among the 50 most violent cities in the world.30 Improving security – especially, human security for individuals and public safety for cities themselves – is therefore, an essential element for successful urban growth and one that often needs to be tack-led up front to signal a change in direction and establish positive momentum. What economists recognize as the ‘shadow of the
19S P E C I A L R E P O RT – JA N UA RY 2 0 2 0
WHERE THE RUBBER HITS THE ROAD
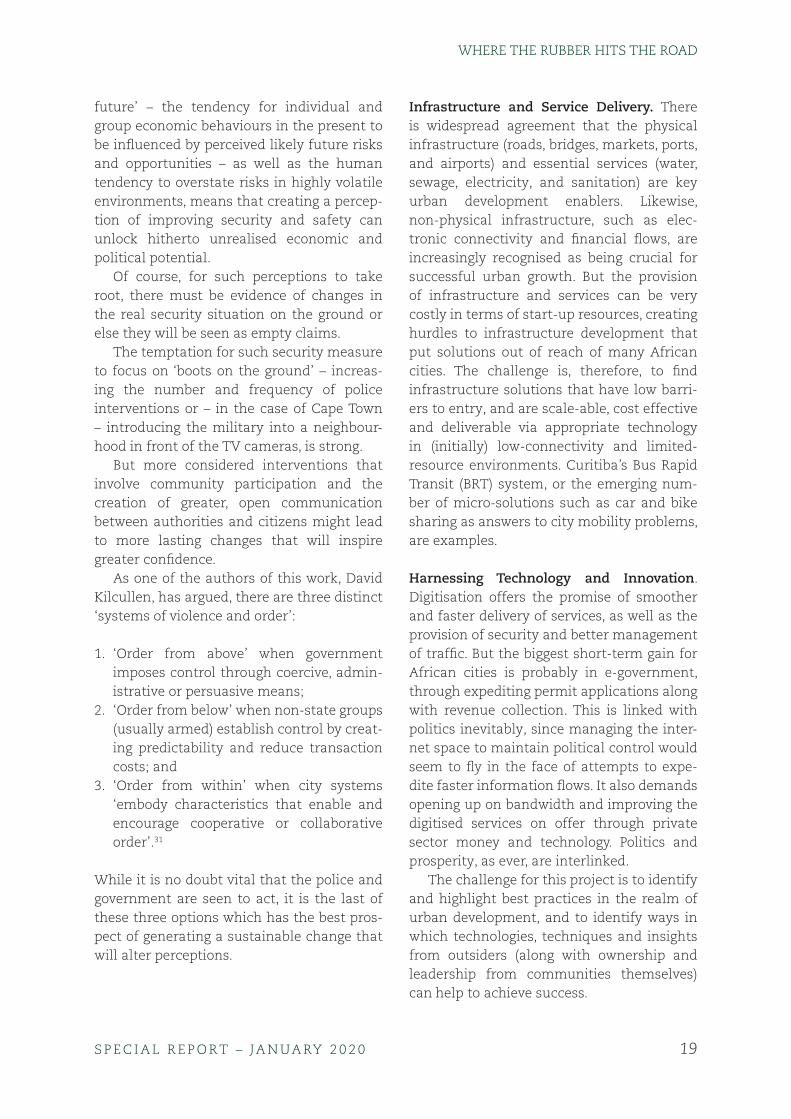
future’ – the tendency for individual and group economic behaviours in the present to be influenced by perceived likely future risks and opportunities – as well as the human tendency to overstate risks in highly volatile environments, means that creating a percep-tion of improving security and safety can unlock hitherto unrealised economic and political potential.
Of course, for such perceptions to take root, there must be evidence of changes in the real security situation on the ground or else they will be seen as empty claims.
The temptation for such security measure to focus on ‘boots on the ground’ – increas-ing the number and frequency of police interventions or – in the case of Cape Town – introducing the military into a neighbour-hood in front of the TV cameras, is strong.
But more considered interventions that involve community participation and the creation of greater, open communication between authorities and citizens might lead to more lasting changes that will inspire greater confidence.
As one of the authors of this work, David Kilcullen, has argued, there are three distinct ‘systems of violence and order’:
1. ‘Order from above’ when government imposes control through coercive, admin-istrative or persuasive means;
2. ‘Order from below’ when non-state groups (usually armed) establish control by creat-ing predictability and reduce transaction costs; and
3. ‘Order from within’ when city systems ‘embody characteristics that enable and encourage cooperative or collaborative order’.31
While it is no doubt vital that the police and government are seen to act, it is the last of these three options which has the best pros-pect of generating a sustainable change that will alter perceptions.
Infrastructure and Service Delivery .. There is widespread agreement that the physical infrastructure (roads, bridges, markets, ports, and airports) and essential services (water, sewage, electricity, and sanitation) are key urban development enablers. Likewise, non-physical infrastructure, such as elec-tronic connectivity and financial flows, are increasingly recognised as being crucial for successful urban growth. But the provision of infrastructure and services can be very costly in terms of start-up resources, creating hurdles to infrastructure development that put solutions out of reach of many African cities. The challenge is, therefore, to find infrastructure solutions that have low barri-ers to entry, and are scale-able, cost effective and deliverable via appropriate technology in (initially) low-connectivity and limited-resource environments. Curitiba’s Bus Rapid Transit (BRT) system, or the emerging num-ber of micro-solutions such as car and bike sharing as answers to city mobility problems, are examples.
Harnessing Technology and Innovation. Digitisation offers the promise of smoother and faster delivery of services, as well as the provision of security and better management of traffic. But the biggest short-term gain for African cities is probably in e-government, through expediting permit applications along with revenue collection. This is linked with politics inevitably, since managing the inter-net space to maintain political control would seem to fly in the face of attempts to expe-dite faster information flows. It also demands opening up on bandwidth and improving the digitised services on offer through private sector money and technology. Politics and prosperity, as ever, are interlinked.
The challenge for this project is to identify and highlight best practices in the realm of urban development, and to identify ways in which technologies, techniques and insights from outsiders (along with ownership and leadership from communities themselves) can help to achieve success.
20S P E C I A L R E P O RT – JA N UA RY 2 0 2 0
WHERE THE RUBBER HITS THE ROAD
In the urban development context, suc-cess hinges on a combination of the personal abilities of policy makers, the context in which those energies are funnelled and organised, and the application of financial resources. In this regard, a set of concepts that originates from a completely separate field of research may be of use in under-standing the importance of these key drivers of successful urban growth. Martin Van Creveld, an Israeli military historian and theorist, studied the relative performance of the United States and German armies in the Second World War32 in an attempt to deduce what made armies effective when fight-ing. His thesis (outlined in his book Fighting Power) has influenced the doctrine of sev-eral western militaries. Van Creveld defined ‘fighting power’ across three components: physical (the resources with which to fight), conceptual (the ideas on how to fight) and moral (the will to fight). His studies of military forces – engaged, like cities, in a competitive endeavour for success in a highly dynamic environment – suggested that to be effective, a fighting force needed all three components; a serious deficit in any one component could lead to disaster. Clearly, cities are not armies, and urbanists draw on a different set of con-ceptual tools from those used by military theorists. Nevertheless, because of the simi-larities between the circumstances of a city experiencing rapid growth and overstretch with those of a military force in combat, Van Creveld’s model might be readily adapted and applied to the development of cities, especially those in the African context.
Our own attempt at an ‘African theo-retical framework’ for looking at cities and urban development looks at ‘hardware’ and ‘software’. Our research focused on the components of urbanisation including Governance, Economic Growth and Security, which we identified as ‘software’, as well as Electricity, Housing, Transportation and Waste Management which we would call ‘hardware’.
The initial thesis was that for a city to thrive and grow economically, it would need a healthy balance of the factors above. The real challenge was in finding out which fac-tors were the most influential for economic growth and prosperity.
Mobilising capital. It goes without saying that the best laid plans have no chance of succeeding if the financial and technical resources needed to execute them are una-vailable in sufficient quantity. This is all the more important in Africa, where low revenue collection and, in many cases, the inability of users of services to pay for them, means that government has to find ways to bring private capital into infrastructure development.
What is concerning is that investment rates in productive assets in Africa have fallen since the global financial crisis
Exactly how private money – and in many cases financial aid from external state actors – is managed to produce the best and most cost-effective result is critical. The danger is that loans from foreign countries may cre-ate long-term debt and dependency and a default may even result in the forfeiture of the asset.
In addition to this, cities need to under-stand that private capital will only flow where the return is competitive and the risks are known and manageable. Legal and regulatory certainty are as important as incentives and tax breaks in this battle to attract capital.
Conclusion: Differentiation but Common Lessons?The combination of a rigorous research methodology, a multi-year research time-line (allowing, in rapidly-changing urban environments, for the project team to directly observe changes and trends in Africa’s urbanisation) and a comprehensive approach to desktop, fieldwork and opinion survey data, has produced a thorough and well-documented set of analytical insights.

21S P E C I A L R E P O RT – JA N UA RY 2 0 2 0
WHERE THE RUBBER HITS THE ROAD
Africa’s cities are growing rapidly, but each city we examined is managing this growth in very different ways. From the cha-otic and sometimes anarchic sprawl of Lagos to the regimented and controlled urbani-sation of Rabat-Salé, there are important lessons to be learned.
But, as this introductory chapter aims to illustrate, such insights are not enough, in themselves, to make a practical difference to the way African governments and people manage the unprecedented pace and scale of urbanisation on the continent.
This study is divided into three sections. The first is a series of international case studies from Latin America and Asia, which illus-trate how others have responded to similar challenges, whether these be in security or development.
Six African case studies form the second section: Lagos, Hargeisa, East London,
Mombasa, Cape Town and Rabat-Salé. Despite different histories, endowments, size and geographies, these cities speak to issues common across other African (and some international) locales: Lagos shows the consequences of unchecked migration and unplanned urbanisation; Hargeisa’s story highlights the cost of isolation; South Africa’s Buffalo City shows the need to match hard-ware with software, without which the former has much less value; Mombasa is an example of a city that can exploit its prime location – as the logistics gateway to East Africa – principally through policy and technology; Cape Town shows the need to address spatial and wealth opportunities to create an inclusive city; and Rabat-Salé flags the powerful development possibili-ties presented by a healthy dose of foresight, proper planning and urgent execution.
Finally, the conclusion offers policy observations and suggestions.

22S P E C I A L R E P O RT – JA N UA RY 2 0 2 0
WHERE THE RUBBER HITS THE ROAD
Section One International ComparisonsThe 16th Battalion of Brazil’s Military Police is based at a former bus station in Recife in the north-east region. The 490 officers under the command of Colonel Cruz work four shifts, thinly stretched over 14km2 of some of the most dangerous areas of the city.33
Armed with shotguns, side-arms and Tasers, the eight-man section of the elite anti-drug unit Grupo Tactico, were menacing in their black uniforms, the ‘GATI’ stencilled across the front of their caps confirming their affiliation to any doubters. They were joined by the yellow-capped Guarda Municipal, known as GTO, the unit’s badge an unlikely Darth Vader mask.
The Colonel briefed us on the likely patrol circuit.
A vehicle movement through the ‘dealer spots’ would be followed by a foot-patrol around the bus station. Mounted up, as we turned into the barrio of San Jose, the doors in the leading Duster were flung open, the GATI bundled out, handguns at the ready. A group of men, drinking, were instantly up against the wall, patted down, hands behind their necks. ‘Just looking for drugs, guns …,’ explained our driver, Tiago.
And on we bumped, through the tight alleyways of Coelhos, passing mounds of gar-bage, food barrows, small kids, and staring young men lounging about, shirts off, crude tattoos on display. The lead vehicle came to a sudden stop again, two GATI policemen, guns in their hands, fingers on the trigger guard, moving quickly down an alleyway. ‘A dealer spot’ said the Colonel walking over. More men patted down.
Tiago admitted that he had never been to these areas. ‘Too dangerous’ he said. He had been in the force for just a month, following three months of training, attracted by the regular monthly income of R$3 000,
or $800,** a ‘more steady’ income than that from his previous job as a driving instructor. He was studying law at night school, aspir-ing to become a member of the Civil Police, the investigative branch of the police force.
Such ambition was expected from a squad which, while tough and a little macho, was professional, avoiding displays of unnec-essary force. Cruz proudly explained that Pernambuco was rated third among the Brazil’s 32 states for killing the fewest people. ‘If you do not display respect and courtesy towards citizens,’ he says, ‘they won’t trust you.’
The unit put up a temporary roadblock at the Santa Amaro intersection, under-neath the Metro rail-line, between two pillars bedecked with gaudy graffiti. At our backs was a favela urban slum, the inhabitants just faint smudges in the deepening dusk. With flashing lights and unfurled collapsible traffic cones advertising our fresh presence, suddenly a bus hissed to a stop, the inhab-itants yelling and waving from the windows. ‘Two men got up when they saw the road-block,’ explained the interpreter, Charles, ‘leapt through the windows, and ran off.’
The GATI set off in pursuit, only to return ten minutes later empty handed. The Colonel pointed in the general direction of the sub-urb of Juana Bezerra from whence we had come. ‘There is no way we can find them in there,’ he shrugged.
Brazil suffers an estimated 52 000 mur-ders a year, ‘more than most wars’ admits Pernambuco’s Secretary for Public Security Rodrigo Bastos. Indeed, the US lost 58 000 service personnel in Vietnam. This trans-lates into an annual rate of 29 murders per
* The $ symbol denotes United States dol-
lars throughout this volume unless otherwise
indicated.

23S P E C I A L R E P O RT – JA N UA RY 2 0 2 0
WHERE THE RUBBER HITS THE ROAD
100 000 people. At 90.4/100 000, Honduras is ranked as the world’s worst; at 31/100 000, South Africa ranks 11th34. Brazil also, accord-ing to the Mexican Citizens Council for Public Safety 2018 report, contains 14 of the 50 most violent cities in the world.35
Brazil’s woes with crime, unemployment and social dislocation do not augur well for Africa, on the cusp of a massive increase in its urban population. If a country as sophisti-cated as Brazil is struggling, how will African countries fare with comparatively less diver-sified economies and educated populations?
The aim of this section is to highlight both the good practices and the challenges faced by others as they have wrestled with the challenges of increasingly large popula-tions, rapid urbanisation, and the need to achieve matching economic growth. It is not intended to be a comprehensive review of all that has been learnt in this area, but it offers keen observations from a range of studies conducted and commissioned by The Brenthurst Foundation in the course of this project. These were presented at the first cit-ies’ conference convened at Tswalu Kalahari Reserve in May 2016, based on field-work in Latin America and Asia.

24S P E C I A L R E P O RT – JA N UA RY 2 0 2 0
WHERE THE RUBBER HITS THE ROAD
The Asian Experience
The Singapore StoryLiu Thai Ker returned from his studies in Sydney and at Yale and a stint working under the renowned architect IM Pei36 to serve, first, as the Deputy CEO then CEO of Singapore’s Housing Development Board (HDB) for 20 years from 1969 and, then, the Chief Planner and CEO of the Urban Redevelopment Authority (URA). In 2008 he was appointed as the Chairman of the Centre for Liveable Cities within the Ministry of National Development.
His career has provided a unique window on Singapore’s transformation: from a city where, at independence in 1965, two-thirds of its 1.6 million people lived in overcrowded
slums, most without water-borne sewer-age, and many without employment, on a tiny island-state of just 580km2. Fast forward 50 years, 83% of the 5.5 million pop-ulation lives in publicly-supplied Housing Development Board (HDB) apartments, 90% own their own homes, the rivers are clean, the island is 15% larger as a result of land reclamation, and despite the population increase, green cover has increased to 47% of the territory.
Thai Ker observes that this extraordinary transition has hinged on the government’s credibility among its population. And that, in turn, has depended on delivery and, ‘behind
JurongJurong
SeletarSeletar
PulauTekongPulau
Tekong
PulauBukumPulau
Bukum SenlosaSenlosa
BedokBedok
SINGAPORESINGAPORE
S I N G A P O R ES I N G A P O R E
M A L AY S I AM A L AY S I A
I N D O N E S I AI N D O N E S I A
ChangiChangi
WoodlandsWoodlands
Singapore Strait
Main Strait
Pulau UbinPulau Ubin
Sung
ai Jo
hor
Johore Strait
Johore Strait

25S P E C I A L R E P O RT – JA N UA RY 2 0 2 0
WHERE THE RUBBER HITS THE ROAD
that’, he says, ‘is its record of transparency, frugality and the absence of corruption’.
The pace and scale of Singapore’s tran-sition from urban slum to global city has probably been unparalleled. Despite the common narrative of critics and wannabe autocrats that this action was down to authoritarianism, the ability to get things done, as Thai Ker argues, has relied prin-cipally on the government’s record and commitment to popular welfare. Success has depended, too, not on a few big or iconic infrastructure projects or even the provi-sion of necessary funding, housing and land, even though all these were all necessary aspects, but fundamentally on ensuring a complete cycle of economic growth, govern-ance and job creation within an overarching ‘can do’ political framework. In this regard, reflects the URA’s CEO Peter Ho, Singapore’s urban success ‘all boils down to pragmatic leadership’ led at the outset by Lee Kuan Yew, citing Lee’s comment to him personally (paraphrasing George Bernard Shaw) that ‘Reasonable men adapt, unreasonable men change the world’.37
The Immutable Value of LocationContemporary Singapore is a metaphor for world-class best practice.
The city-state’s skyline reflects a con-tinuous, driving reinvention and fast-paced expansion; one year an idea, the next a Singapore Flyer, Marina Bay Sands, Art Science Museum, 42 million tonnes of under-ground oil bunkering, a US$1 billion Gardens by the Bay, and so on. ‘It is because we don’t want to fail,’ one official reflected. ‘We also have no natural resources to fall back on’ she added. It is the epitome of globalisa-tion, possessing the world’s second busiest container port, which handles more than 34 million containers annually, a ship arriv-ing or leaving every 2 to 3 minutes. Changi Airport is consistently ranked as the world’s best airport,38 handling 150 000 passengers and 6 700 flights daily. This is more than logistics. By 2017, Singapore was home to
121 foreign banks and 7 000 multinational companies, two-thirds of which had their Asian headquarters on the island.
At US$64 581, Singapore’s GDP per cap-ita is at least 150 times more than it was (in nominal terms) in 1960,39 and higher today than its former colonial master, Britain.
Employing the benefits of its geography has always been at the heart of modern Singapore, and so has its people’s industri-ousness. The founder of modern Singapore, Sir Stamford Raffles, commented that ‘it is impossible to conceive of a place com-bining more advantages’ referring to its proximity to China and its positioning in the Malay Archipelago. Or as Lee noted in 2012, ‘We became a hub because of the con-venience. For shipping, you have to pass Singapore, it’s the southernmost point [of continental Asia] … we were poor and we were underdeveloped, so we had to work hard.’
Following its birthing in 1819 by Raffles and Major William Farquhar as a free port which Raffles declared would be ‘open to ships and vessels of every nation free of duty’, the towkays (Chinese mer-chants) quickly came to dominate regional commerce.
As the British Empire flourished, so did Singapore, its growth powered by trade and its role, not unlike today, as an international financial centre. The front page of the first issue of The Straits Times on 15 July 1845, for example, is filled with notices on shipping activity, lists of foreign goods for sale, market reports from around the world and ware-houses to let.40
With prosperity, Singapore’s population grew quickly. From just 5 000 inhabitants in 1819, it had doubled in size by 1825 by which times trade had reached US$22 million, more than the established port of Penang. By the turn of the 19th Century Singapore housed an estimated 225 000, more than 550 000 by 1930, and touching a million by 1950. This reflected the growth in commerce. The US

26S P E C I A L R E P O RT – JA N UA RY 2 0 2 0
WHERE THE RUBBER HITS THE ROAD
Treasury estimated the trade of Singapore at US$210 million in 1898, more than Japan and the Dutch East Indies. Between 1873 and 1913, Singapore’s volume of trade increased eightfold, at the time making it the world’s second busiest port after Liverpool.41
Jewel of the British Empire it may have been, it was a site of great hardship, of callous division, a world of European tuans and coolies, bumboats and memsahibs, two cities and societies: one driven by interna-tional finance, steam and the telegraph that enjoyed lifestyles of leisure; the other a rick-shaw society, marginalised, violent, poor, disease- and drug-ridden, and for whom laws and justice did not equally apply.
Those rickshaw pullers, often Chinese migrants, would work up to 12-hour shifts for as little as 60 cents a day, much of which would, invariably given the levels of addiction among pullers, be consumed on chandu, opium. As the National Museum of Singapore notes, ‘Because of the physical toll on their bodies, coolies usually worked for five to seven years before returning to China’. This hardship occasionally flared into vio-lence, such as the Post Office Riots of 1876 or the Verandah/five-foot-way riots of 188842. In 1896 Dr Lim Boon Keng led an enquiry into the ‘four social evils’: gambling, alcoholism, prostitution, and ‘chasing the dragon’ (opium smoking). After the Second World War these frustrations found voice in the expressions of Merdeka (‘freedom’ in Malay) and the pan-Malayan independence movement.
Still, after its departure from the short-lived Malaysian Federation in August 1965, independent Singapore was faced with fewer resources in meeting the aspirations of its people. To do so, Lee’s team of ‘founding fathers’43 and subsequent governments relied on gathering and deploying efficiently the scarce resources available. Their suc-cess exactly illustrates the value of decisive domestic leadership concerned less with grand visions, governance frameworks and mobilising aid, than the things they were
themselves in control of – policy tools, tax revenue and execution.
The challenges at independence seemed formidable: high levels of poverty and inequality, limited infrastructure, limited literacy (just 60%) and widespread squalor with half a million living in slums, and high unemployment. Goh Keng Swee, regarded as the father of Singapore’s modern economy, learnt from the 1952 Social Survey that of the 1 814 people who lived in Upper Nanking Street close to his own home, just three households had their own toilet, bath and kitchen. The others shared open-bucket toi-lets and open coal fires to cook. As a result, ‘[H]e decided that his priority should be to provide jobs. And the best way to do this was to encourage capitalism and private enterprise.’44
The government’s response was to align the economic, social, international and legal context to the nation’s needs: land, housing, jobs and investment were the priorities.
Land, Housing, Jobs and InvestmentTo support the priority of urban renewal, Lee’s government enacted the Land Acquisition Act in 1966 which granted the power to acquire land quickly and at rea-sonable rates of compensation. This was followed, later, by an amendment of the Foreshores Act of 1964, which enabled the government to embark both on reclamation and to build the East Coast Parkway linking Changi Airport, in particular, with the city centre. By 1979, 80% of land belonged to the government to be sold on long-term (usually 99-year) leases to developers. ‘Without land,’ says Cheng Tong Fatt, Permanent Secretary in the Ministry of National Development in the 1970s, and later Ambassador to China, ‘you can’t talk about planning’.
Today 12% of Singapore’s land is allocated to roads, and just 17% to residential areas.
Land acquisition was sometimes only grudgingly accepted. ‘Government had a vision,’ reminds Peter Ho, ‘and knew what had to be done, even if unpopular, for the
27S P E C I A L R E P O RT – JA N UA RY 2 0 2 0
WHERE THE RUBBER HITS THE ROAD
greater good of the people.’ But it was more palatable with the payment of compensation and promise of resettlement.
The resulting resettlement of those liv-ing in the Central Business District (CBD) required alternative housing from the Housing Development Board (HDB). At the end of the HDBs first decade in 1970, one-third of the population lived in pub-lic housing, and it had built 120 669 units, compared to the 23 019 constructed by its predecessor, the Singapore Improvement Trust (SIT), in 32 years. Now apartments are funded through a combination of home-owner grants and loans, the latter both commercial and from the Central Provident Fund (CPF), a mandatory savings scheme in which employers and employees contrib-ute (a maximum of) 16% and 20% of salary respectively. CPF loans, in 2016, were at 2.6%, repayable over 30 years, with the aim now, as in the 1960s’, says the HDB’s chairman, ‘to provide affordable housing’.
Home ownership, emphasises the HDB’s Sng Cheng Keh, gave the population a ‘stake in their society, building a strong work ethic, a store of value to be monetised, and a sense of belonging’.45 Effectively, it turned a radical discontented society into one with conservative values and suspicious of pop-ulist solutions as they saw themselves as owners.
The son of a ‘mother who survived as a hawker and taught me the value of multi-tasking and hard work’, Alan Choe, 85 in 2016, was the first architect-planner of the HDB and the founder of the Urban Renewable Authority. Having returned with a town planning degree from Melbourne University in 1959, he was quickly recruited into the nascent HDB. After the failure of the SIT to deliver more than 1 000 units a year due to, he says, a lack of empathy with local culture and needs, the HDB was tasked with delivering 50 000 units in five years.
‘My first job was to finish off [the devel-opment of] Queenstown. My Master’s thesis on small scale industrial cities had
not prepared me for this’ he laughs. ‘We had nowhere to turn to for ideas, since there was no internet, no-one had done public hous-ing on this scale, and since in those days a trip to Sentosa,’ a ten-minute cab ride from the city centre today, ‘let alone overseas, was regarded as a long journey. To take on a job like this you have to have a brave and dynamic leader, as we had.’ The team learned to bring down costs by using louvre rather than casement windows and having lifts stopping at every fifth floor. ‘We required a political solution to the problem. If you had people who were aesthetically inclined then you would never solve the housing problem, except perhaps only for the elite.’ Cheaper building techniques were developed, the byword being ‘no frills’.
After Queenstown the next major project was Toa Payoh, situated on 600 hectares in the central part of the island. ‘The land was full of squatters with their thatch and tin-roofed shacks, and infested with gangsters, who unofficially provided different services to the community. It was dangerous to go in and to try to remove them, and there was a lot of resistance. To achieve this,’ he recalls, ‘we needed to resettle the residents to other, nearby flats. Changing the culture of the people used to living in such kampongs, with animals out the back and fruit trees, into a high-rise was also challenging.’ Aside from the compensation paid under the Land Acquisition Act, ‘our most formidable weapon was that this was for the good of the nation, and no one could challenge the order.’
By 1963, having completed ‘about 20 000 units, ‘Lee Kuan Yew realised that just rehousing squatters was not enough, and shifted focus to the city centre. I was asked to shadow a UNDP (UN Development Programme) expert to learn about how we should go about this. Additionally, I took study-tours organised by the Ford Foundation to the US, the British Council to the UK, and to Germany and Japan to under-stand urban renewal. In all cases, with the

28S P E C I A L R E P O RT – JA N UA RY 2 0 2 0
WHERE THE RUBBER HITS THE ROAD
exception of only the US, it was urban recon-struction that they were involved with. And in the US, urban renewal was a dirty word, seen as corrupt.’
The resulting four-year ‘Urban Development and Renewal Project’, started in 1967 cost around Sing$15 million (US$11 million at today’s exchange rate), of which a third was contributed by the UN. The concept envisioned a circle of high-den-sity development around three sides of the central water catchment area, as well as a southern development belt that ran from the industrial area of Jurong to the airport at Changi.
Cheng Tong Fatt joined government in 1957 fresh from his veterinarian studies at Glasgow University. ‘Then the city was just 15km2 under the City Council, the rest of the territory being under the control of the Rural Board. Nothing much,’ he recalled of nearly 60 years ago, ‘was going on. There were no big buildings and very limited authority. Things changed when the People’s Action Party came in in 1959, merging the two boards into a single administration.’ In the run-up to the Federation in 1963 he spent a lot of time in the company of Lee Kuan Yew canvassing support in the rural areas. ‘I bought a new car with a government loan on my return,’ he smiles. ‘Within three years it was gone already, destroyed by the poor rural roads and the demands of getting things done.’
After the merger with Malaysia ‘things were still very poor, very haphazard, with very few resources, with most develop-ment still within a 30km2 area around the city centre.’ His record in turning Singapore into a self-sufficient food producer led to his appointment in 1971 as the Permanent Secretary in the Ministry of National Development. ‘There were eight new PS’s appointed at the same time. I inherited a more-or-less complete five-year masterplan which the UNDP had assisted in drafting, which provided for different types of land usage – residential, defence, commercial, recreational, industrial, transport – across
the island. With continuous reviews and adjustments, this remains the basis of devel-opment in Singapore today,’ he notes.
The plan was intended to ensure the opti-mal use of limited land resources to meet the residential, economic and recreational needs of a population projected to reach four million by 1992. It provided for the location of the airport at Changi, the construction of the Mass Rapid Transit (MRT) system and the network of expressways.46
In all of this, Cheng recalls, Lee Kuan Yew was ‘in absolute control. He was always send-ing me notes. Although he learnt from other cities, he formed in his own mind a vision what Singapore should be, and he imple-mented this step-by-step, throughout his life, learning all the time as he went along.’
This was not without its tense moments. ‘In the mid-1970s we were working on what has become the Marina Sands area. Lee Kuan Yew wanted to know why we had narrowed the entrance to the River with the reclama-tion, when he believed that a wider mouth was necessary to remove the pollution. When I explained to him why, he went very quiet for a while. He was thinking. He then came up with a solution, which was to clean the river up at the source of the problem, rather than try to deal with the consequences of pollution. That is where his clean-up pro-gramme for the rivers came from.’ As Lee put it publicly at the time, ‘It should be a way of life to keep the water clean, to keep every stream, every culvert, every rivulet, free from unnecessary pollution. In ten years let us have fishing in the Singapore River and in the Kallang River. It can be done.’
Frugality required taking a long view. Although Marina Sands reclamation was completed by 1980, the building develop-ment only took off 20 years later.
Under Lim Kim San, known as ‘Mr HDB’, a Public Utilities Board was set up in 1965 to oversee the provision of water, electricity and gas, ensuring better sanitation and ameni-ties. This included the ‘Clean and Green’ Singapore programme, and the clean-up of

29S P E C I A L R E P O RT – JA N UA RY 2 0 2 0
WHERE THE RUBBER HITS THE ROAD
the Kallang River Basin and Singapore River, which took ten years from Lee’s statement in 1977 that he wanted fishing on both water-ways.47 It was a signal, also, of Singapore’s economic transition from the lightermen who plied their trade on the creek to a new stage of development, from a heavily polluted port to a fashionable commercial and residential neighbourhood.
This was not the only major water initia-tive. In addition to securing its potable water provision from Malaysia through a treaty, Singapore focused on developing its own resources including converting more than one-third of the island into a water catch-ment area for desalination and reclamation.
The HDB and URA were not the only ‘action-oriented agencies’ set up to get things moving. The Economic Development Board (EDB) was established in 1961 to attract investors and sustain competitiveness.
Leadership, Application and ContextIn the foyer of the Urban Renewal Authority is a display outlining ‘ten qualities of a good city: Good transport, good amenities, clean and green, good governance, ease of business, liveable, people-centric, 24-hour activity, vibrant and unique.’ This display forms part of an attempt to engage the pub-lic, reflecting the long road travelled since the more draconian days of the 1960s. Achieving these qualities is more complex. Throughout interviews with the politicians, planners and doers (an unusually inseparable bunch in Singapore’s case) of the 1960s, the following issues came up time and time again:
› The centrality of leadership, political will, and the integrity of government. As Ngiam Tong Tow said: ‘Investors are attracted by the integrity of government.’
› The importance of leading from the front and attending to the detail. Again, in Ngiam’s words: ‘If you are the Chief Surgeon, then you must operate on the most difficult cases, otherwise the
other doctors, the nurses, they will never respect you’.
› The establishment of priorities. Singapore’s growth centred on the need to create jobs, ensure economic growth and provide housing, all with the aim of building a harmonious multi-racial, multi-religious society.
› The importance of a whole of govern-ment approach, where compromise and co-operation is expected as a matter of course, and where there is constant communication ‘up and down’ between politicians and civil servants.
› Employing the sense of desperation and crisis in driving Singaporeans to action.
› The necessity of matching execution with ideas. ‘Policy is implementation and implementation is policy’.
› The alignment of the regulatory and legal environment, such as with the Land Acquisition Act and Foreshores Act.
› The need to pick an appropriate solution to your particular circumstances, and not to reach for ‘first world’ answers.
› Spending frugally. › Establishing an overall plan and design. › The necessity of action-oriented
institutions and agencies. › Aiming to be ‘as good as your competitors,
or the money will go elsewhere’. › Don’t aim for incremental improvements,
but for whatever radical step-change the situation demands.
Overall, Singapore’s continuous trans-formation and development speak to the importance of matching deeds with words and of careful planning. It illus-trates the necessity of rooting actions in the population’s principal needs. Jobs and housing were the priorities in the 1960s, and better infrastructure and urban renewal those of the 1970s. It has required security, achieved through local capacity and interna-tional diplomacy.

30S P E C I A L R E P O RT – JA N UA RY 2 0 2 0
WHERE THE RUBBER HITS THE ROAD
More than anything Singapore’s transfor-mation illustrates the necessity of getting the overall environment right. You can’t do
big infrastructure without building an econ-omy, and you can’t do that without security, savings, both local and foreign, and skills.
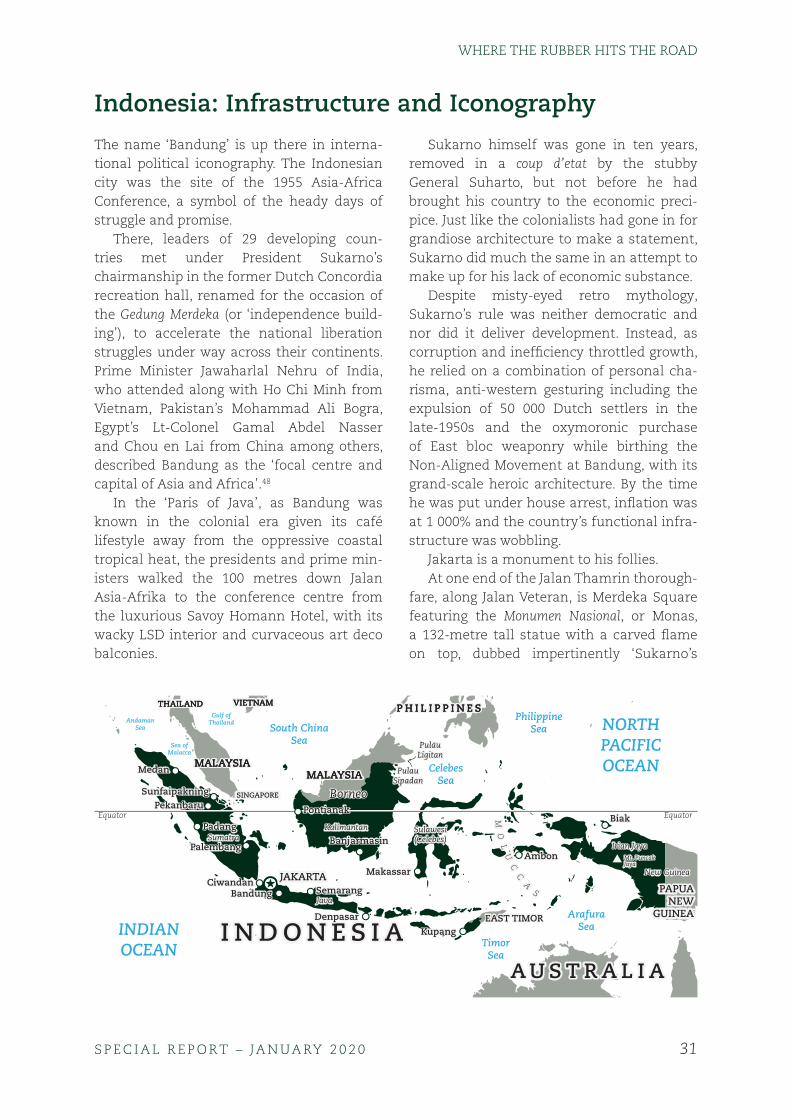
31S P E C I A L R E P O RT – JA N UA RY 2 0 2 0
WHERE THE RUBBER HITS THE ROAD
JAKARTA
SINGAPORE
MALAYSIAMALAYSIAMALAYSIAMALAYSIAMALAYSIAMALAYSIA
P H I L I P P I N E SP H I L I P P I N E SP H I L I P P I N E STHAILANDTHAILANDTHAILAND VIETNAMVIETNAMVIETNAM
PAPUANEW
GUINEA
PAPUANEW
GUINEA
KalimantanKalimantanSumatraSumatra
JavaJava
BorneoBorneo
Sulawesi(Celebes)Sulawesi(Celebes)
PulauSipadanPulau
Sipadan
PulauLigitanPulauLigitan
A U S T R A L I AA U S T R A L I A
I N D O N E S I AI N D O N E S I AINDIANOCEAN
NORTHPACIFICOCEAN
South ChinaSeaSea of
Malacca
AndamanSea
Gulf ofThailand
CelebesSea
ArafuraSea
TimorSea
PhilippineSea
PontianakPontianak
PadangPadang
SemarangSemarang
AmbonAmbon
CiwandanCiwandan
PalembangPalembang
PekanbaruPekanbaruSunfaipakningSunfaipakning
MedanMedan
BandungBandung
DenpasarDenpasar
MakassarMakassar
KupangKupangEAST TIMOREAST TIMOR
BiakBiak
New GuineaNew Guinea
Irian JayaIrian JayaMt. PuncakJayaMt. PuncakJaya
BanjarmasinBanjarmasin
MO
LU
CC
A
S
MO
LU
CC
A
S
Equator Equator
Indonesia: Infrastructure and IconographyThe name ‘Bandung’ is up there in interna-tional political iconography. The Indonesian city was the site of the 1955 Asia-Africa Conference, a symbol of the heady days of struggle and promise.
There, leaders of 29 developing coun-tries met under President Sukarno’s chairmanship in the former Dutch Concordia recreation hall, renamed for the occasion of the Gedung Merdeka (or ‘independence build-ing’), to accelerate the national liberation struggles under way across their continents. Prime Minister Jawaharlal Nehru of India, who attended along with Ho Chi Minh from Vietnam, Pakistan’s Mohammad Ali Bogra, Egypt’s Lt-Colonel Gamal Abdel Nasser and Chou en Lai from China among others, described Bandung as the ‘focal centre and capital of Asia and Africa’.48
In the ‘Paris of Java’, as Bandung was known in the colonial era given its café lifestyle away from the oppressive coastal tropical heat, the presidents and prime min-isters walked the 100 metres down Jalan Asia-Afrika to the conference centre from the luxurious Savoy Homann Hotel, with its wacky LSD interior and curvaceous art deco balconies.
Sukarno himself was gone in ten years, removed in a coup d’etat by the stubby General Suharto, but not before he had brought his country to the economic preci-pice. Just like the colonialists had gone in for grandiose architecture to make a statement, Sukarno did much the same in an attempt to make up for his lack of economic substance.
Despite misty-eyed retro mythology, Sukarno’s rule was neither democratic and nor did it deliver development. Instead, as corruption and inefficiency throttled growth, he relied on a combination of personal cha-risma, anti-western gesturing including the expulsion of 50 000 Dutch settlers in the late-1950s and the oxymoronic purchase of East bloc weaponry while birthing the Non-Aligned Movement at Bandung, with its grand-scale heroic architecture. By the time he was put under house arrest, inflation was at 1 000% and the country’s functional infra-structure was wobbling.
Jakarta is a monument to his follies.At one end of the Jalan Thamrin thorough-
fare, along Jalan Veteran, is Merdeka Square featuring the Monumen Nasional, or Monas, a 132-metre tall statue with a carved flame on top, dubbed impertinently ‘Sukarno’s

32S P E C I A L R E P O RT – JA N UA RY 2 0 2 0
WHERE THE RUBBER HITS THE ROAD
final erection’. Nearby is a 120 000-capacity national mosque, Mesjid Istiqlal, the largest in South-East Asia on which Sukarno was the technical chief supervisor; and the Senayan sports complex, host to the 1962 Asian Games.
Along the way are myriad other simi-larly unsuppressed nationalistic urges, including the swish glass and aluminium Hotel Indonesia (now the Kempinski) whose roundabout on Jalan Sudirman features the Welcome Statue, the Sarinah depart-ment store (promoted as ‘The Indonesian Emporium’), the Semanggi clover-leaf bridge interchange, and various other monuments.
Such eccentricities alone were not the source of the economic problem. It was that Sukarno lacked a plan for the devel-opment of Indonesia. His attempt at a ‘development’ bank was illustrative of this failing. It did not promote exports or, for that matter, any industries. Rather it lent to traders. At the same time the government pursued an affirmative action programme known as Benteng – or ‘fortress’ – to encour-age indigenous merchants.
Trading was – and is – not however an investment in making things to sell and thus a route to prosperity. As Joe Studwell49 put it, by the early 1960s, with ramping political pressures caused by the worsen-ing economic situation, Indonesia ‘became a zero-discipline fiscal environment’ with the central bank ‘feeding the beast of credit demand unquestioningly’. The issue is not that nation-building was unimportant; it’s whether it was best achieved through growth or architecture; architecture or infrastructure.
Java, the most prosperous and popu-lated of Indonesia’s 13 500 islands, is home to 60% of Indonesians, living on just 7% of the land mass. The country’s average den-sity of nearly 130 people per km2 – nearly three times the global average and five times that of sub-Saharan Africa’s – highlights Indonesia’s status as the world’s fourth most populous nation with 260 million people.
At independence in 1945, the population was just 70 million.
Mayor Emil to Ground Control?Numbers aside, Indonesia’s infrastructure is weak as a result of its dispersed geography, mountainous topography, funding, govern-ance and politics, among other things. In the capital, Jakarta, these challenges are com-pounded by the size of its population, the sheer volume of commuters, and frequent flooding.
Indonesia’s urban dwellers comprise 53% of the population, with the rate of migra-tion to the capital estimated at about 4%.50 Still, the government has been caught, constantly, in a number of infrastructure investment binds: between investing in transport between the innumerable islands and on them, the result being unsatisfac-tory in both respects; and between plans and projects by both the central government and the 34 provinces and 502 city and regency authorities countrywide.
Dr Oswar Mungkasa is the Deputy Governor of the State of Jakarta with respon-sibility for spatial and environmental affairs.51 He identifies three major challenges in the capital city.
The first is the provision of public trans-portation. Current actions to redress this challenge, he says, are ‘five years too late’. This shortfall is epitomised by the antics of ancient, smoking trucks and elderly white-green Kopaja buses, and some 80 million motor bebek (literally, ‘ducks-bike’) – the ever-present snorting, tooting motorcycle.
With four million daily commuters, transport requires extensive co-ordination between the local and central government both for funding and planning. Currently there are four plans under way for improv-ing the network: the US$1.5 billion Jakarta MRT (Mass Rapid Transport, the under-ground) funded by the local government, with the first line due for completion in 2018; the US$900 million Jakarta Light Rapid Transport (LRT) Monorail, with one aspect

33S P E C I A L R E P O RT – JA N UA RY 2 0 2 0
WHERE THE RUBBER HITS THE ROAD
of construction now under way funded by central government, another in the plan-ning stages by the local government; and the proposed LRT airport link to be funded by a private consortium.52
The provision of public housing is the sec-ond major challenge.
Jakarta currently has a backlog of 40 000 public housing units. The current strategy is to build 50 000 new units, or 38 new high-density towers, by 2017. These will be let at a subsidised price of Rp10 000 ($80c) per day to poor families. However, land is expensive and scarce. ‘Even though this is the govern-ment’s number one priority,’ he states, ‘and funding is not a problem, we cannot find the land.’ He speaks wistfully of Singapore’s early land appropriation strategy, and Indonesia’s attempts now to try to introduce a land bank. ‘The difference is that while 95% of the land there is owned by the government, the reverse is true here in Jakarta.’ Regardless, he considers Singapore’s history of development as a model to be emulated.
The third challenge is to sync short-term expediencies with longer-term needs, and equally, ‘to try to put spatial and develop-ment issues into one single plan’. Not only do these plans require careful integration with the existing networks if they are to be suc-cessful, but careful co-ordination. ‘We need to have one single system to run Jakarta and the surrounding areas, where there are cur-rently nine municipalities, three provinces, and one central government.’ His comments hint at a tension between the pull of central government and the effectiveness of decen-tralised systems of governance.
To the south-east, Bandung is, too, clogged, with 2.7 million inhabitants (or more than eight million if one includes the wider metro) packed at 14 000 per km2 (Jakarta is at 9 000, and by compari-son London 4 000 and New York 2 000 per km2) and with an infrastructure that is lit-tle improved than from the Dutch colonial period. There is no shortage of economic dynamism and growth in the capital of the
West Java region, with Bandung being vari-ously known as a ‘Smart City’, ‘Culinary City’ (given the variety of specialist restaurants), ‘Factory Outlet City’ (for the throngs of Malaysian budget shoppers looking for labels and bargains) and, with 78 higher learn-ing institutions including the prestigious Institute for Technology (attended by presi-dents Sukarno and BJ Habibie among other grandees), ‘Students City’.
Indonesia’s third-largest city is seen as a model in incubating small- and medium-sized industries, with more than 500 successfully scaling their operations in areas from clothing to gaming, as well as app and web design.
Averaging nearly 9% during the 2000s, 50% more than the national average, Bandung’s economic growth has compounded its infrastructure deficit, pollution and traf-fic congestion. There has historically been no shortage of plans to undo the gridlock, including a metro, monorail, cable-car, and Bus Rapid Transit-type system. Shelters were even built for the latter, but this stalled due to resistance from the angkot (minibus) drivers.
Under Mayor Ridwan Kamil, widely known as ‘Emil’, there was a plan to build a new satellite city, Teknopolis, on an 800-hectare site about 12kms from Bandung’s city cen-tre. Elected mayor of the city in June 2013, in 2004 he co-founded the architectural practice Urbane Indonesia, which has worked on a number of signature projects worldwide including Singapore’s Marina Bay Gardens.53 In 2018 Emil successfully ran for governor of West Java Province instead of seeking a sec-ond mayoral term, though he still aims to deliver his dream.
On the surface the Teknopolis plans are impressive, as is the high-tech city ‘Command Centre’ which uses a wall of monitors to track progress with projects and monitor traffic and other incidents, integrating 100 CCTVs with social media feeds. The aim is to have 4 000 cameras across the city.

34S P E C I A L R E P O RT – JA N UA RY 2 0 2 0
WHERE THE RUBBER HITS THE ROAD
Despite his ambitions, Emil apparently found running a city tougher than design-ing one. He planned Singapore-style laws banning street vendors to reduce the traf-fic chaos, showing he meant business. He wanted to create a ‘transport legacy’ with a monorail integrated with an urban cable car system in the style of Medellín, a Hong Kong-modelled elevated pedestrian skywalk and the expansion of the number of bikes in city’s bike rental scheme from 75 to 15 000, plus 100 new parks and playgrounds. Yet delivery of this vision proved much more challenging, as progress stumbled on a com-bination on local die-hard habits (which his staff refer to as ‘local culture’), politicking and Jakarta’s funding intransigence. Budget issues mean his high-tech Command Centre is not staffed round the clock. He referred to the ‘low morality of the bureaucracy’ as one of his biggest frustrations.54
From Heroic to PracticalIf Sukarno was big on gestures, the current crop of politicians is more inclined to the practical, but imperfectly so.
Emil represents a new generation of Indonesian politician, not from the military or the traditional elites. But he is not the first. Indonesia’s President Joko Widodo, popularly known as Jokowi, is from humble origins. His father was a furniture maker, the sector in which the future president made his busi-ness career. Jokowi’s politics were shaped by his family’s three evictions from their home. While still at school, at 12, he started in his father’s workshop.
During his seven years as the Mayor of Solo (2005–2012), Jokowi set what is now a familiar agenda for action. He became known for delivery of new infrastructure including the building of markets and walkways, the revitalisation of public parks, the promotion of the city as an exhibition centre, improved public transportation, the establishment of a techno-park, and the promotion of health care insurance. Emil, it seems, is not alone.
How Jokowi did all this, however, was more important than simply the statement of his ambitions. In part he won support through his blusukan culture, his impromptu walkabouts to gather the views of citizens. No carefully staged and staggered imbizo, these frequent visits were key to his popu-lar support and, he claimed, policies.55 His personal punya gaye (’can-do’) style strength-ened his public bond. Setting a personal example on corruption, he also forbade his family to bid on public projects.
Jokowi continued with this outgoing style as Governor of Jakarta from October 2012, again backing it up with delivery. To assist poorer students with the payment of essentials including books and uniforms, he introduced the ‘Smart Jakarta Card’ in 2012. The following year, he inaugurated the construction of the much-delayed Jakarta MRT, and a week later restarted the stalled construction of the capital’s LRT.56
This was matched by actions on govern-ance. During his time as Governor, Jokowi managed to double the region’s tax-take, encouraging greater transparency through publicising his monthly salary and pro-vincial budget, and through e-purchasing. Street vendors were rehoused, helping traffic flows, while he initiated major new dredg-ing projects aimed at reducing Jakarta’s omnipresent danger of regular flooding. And despite his political origins in the Partai Demokrasi Indonesia Perjuangan (Indonesian Democratic Party of Struggle – PDI-P) of former president Megawati Sukarnoputri, daughter of the founding father, he has tried to reign in the subsidy culture, which, while politically popular, constrains capital projects, not least by increasing fuel prices.
The ‘express’ rail service from Bandung to Jakarta winds its way through the Tangkuban Parahu (‘upside down boat’) volcanic range, over lime-green rice terraces and muddy brown rivers, pocked with the red roofs of countless settlements. There were signifi-cant improvements in the national Kereta Api

35S P E C I A L R E P O RT – JA N UA RY 2 0 2 0
WHERE THE RUBBER HITS THE ROAD
railways during the tenure of its CEO Ignasius Jonan, later appointed by Jokowi as the coun-try’s transport minister. But the journey still takes more than three-and-a-half hours. The basic rail infrastructure is still much the same as it was during the Dutch colo-nial period, hence ambitious schemes for a high-speed national network, and the com-mencement of the construction of Jakarta’s underground and light-rail systems in 2014.
This experience contrasts with the group of Chinese dignitaries waiting outside the museum to the historic Gerdang Merdeka in January 2016. They were in Bandung to break ground for a US$5.5 billion high-speed railway connecting to Jakarta, which it is envisaged will reduce the harrowing road journey from three hours to just 40 minutes. Bandung’s cable-car project was supposed to have been kicked off at the same time, but as the mayor’s office explained, ‘there is a problem with land’.
Yet while Indonesia’s infrastructure is ropey, and along with all the other above-mentioned constraints, may discount growth by as much as two to three percentage points annually, it has not derailed the economy. Growth has been driven by a combination of continuous plans for improved prosperity,
and execution against such plans. This began with the Suharto government (for all of its ills) reducing inflation at the start and stead-ily improving and extending governance. The Indonesian plan for prosperity has been focused on providing the general framework for prosperity to occur, in this case through what is termed in Indonesia as MSMEs – Micro, Small and Medium Enterprises – responsible for more than half of GDP.
The plan also centred on agricultural growth, which was disappointing during the colonial sector. Under Suharto, the focus was on improving agricultural yields, thereby increasing demand for services and goods and enabling the division of labour. Indonesia produced its first rice surplus in 1983. This went hand in hand with the gradual lib-eralisation and internationalisation of the economy to secure international investment in setting-up export-oriented manufactur-ing industries. As a result, by the late 1980s, Indonesia had not only become an agricul-tural exporter, but also exported textiles, footwear, apparel and consumer goods.
Indonesia thus teaches us that just as infrastructure is no silver bullet for success, and vanity projects should be avoided, it is seldom the sole reason for failure.
36S P E C I A L R E P O RT – JA N UA RY 2 0 2 0
WHERE THE RUBBER HITS THE ROAD
Latin America
Security in Recife – Pact for LifeFaced with a mounting murder rate in Recife that, by the beginning of 2007, had reached nearly 400 deaths per month, the Pernambuco State Governor Eduardo Campos put together Pacto Pela Vida, a ‘Pact for Life’, which was the first public safety plan in the state’s history. A two-term gov-ernor, Campos was killed in an aircraft accident in August 2014 while campaigning for president.
Encompassing all government agen-cies, the aim of the Pacto Pela Vida was to reduce violent deaths by improving cross government co-ordination, increasing polic-ing numbers, deploying technology (mainly CCTV), extending community outreach, engaging more actively in drug prevention, and paying bonuses to police officers linked to targets for crime reduction. At its heart was the realisation that violence was not just a police problem nor one to be solved only by the federal government or by the state; all levels, including municipalities, had to have a role. Normally, ‘mayors in Brazil avoid the issue of violence like the plague’, reflected one municipal official, because it is the state government that has the lead.
To kick start the initiative, the Governor created a Public Security Special Advisory Office in January 2007 which was given just five months to produce an analysis of the state’s security problems and a plan to tackle the issues identified. While the plan was being developed, the military and civil-ian police were tasked with confronting the gangs responsible for large numbers of violent crimes.
A State Public Security Forum was created to engage the public in debate and a series of technical groups, comprising a range of experts, civil society leaders and government
officials, were created to focus on specific issues such as violence against women and the impact of drugs. This forum gave rise to over 100 projects which were then organised into a plan that contained six lines of action. Considerable emphasis was placed on moni-toring and evaluation mechanisms that were incorporated into the plan at all levels to drive progress.
The result was a significant decline in vio-lent and other crimes. Recife’s murder rate, which at 73.6/100 000 ranked alongside the peak experienced by Colombia’s Bogota in the 1990s, declined by 54% between 2007 and 2014 to 34/100 000. The state of Pernambuco’s shrank by 30% from 56/100 000 to 39/100 000 over the same period.
Not only was this decline impressive, but it occurred at a time when the crime rate increased nationally by 10%. However, there were significant regional variations. For example, further south, in the state of Bahia, the murder rate rose by 347% over the period 2000 to 2014 and, in Bahia’s capital Salvador, by 370%.57
The improvement in Recife occurred despite a police force thinly spread and structurally divided. The complex split of security responsibilities between military, civil and municipal police, forensic special-ists and the paramilitary fire department reflects Brazil’s history and federal make-up, and shapes both decision-making and funding.
Despite the obvious downsides of such an arrangement there are positive, empow-ering, aspects. Because the state – and not the federal government in Brasilia – is prin-cipally responsible for funding security and development among other administra-tive activities, there is considerable policy

37S P E C I A L R E P O RT – JA N UA RY 2 0 2 0
WHERE THE RUBBER HITS THE ROAD
latitude. Ultimately the reasons Pact for Life made such progress in reducing crime were because of strong leadership from the state governor and a sound, widely consulted and co-ordinated plan which was underpinned by
a robust monitoring system. Thus, there was a transparent and common understanding of both progress and setbacks, which enabled the parties to continuously improve the way they tackled Recife’s security challenges.
SURINAMESURINAME
FRENCHGUIANA(FRANCE)
FRENCHGUIANA(FRANCE)
GUYANAGUYANAVENEZUELAVENEZUELA
PARAGUAYPARAGUAY
URUGUAYURUGUAY
COLOMBIACOLOMBIA
PERUPERU
BOLIVIABOLIVIA
ARGENTINAARGENTINA
CHILECHILE
B R A Z I L
BoaVista
Manaus
Belem
Teresina
Fortaleza
Natal
Maceió
Salvador
TubaraoTubaraoRio deJaneiro
BeloHorizonte
BeloHorizonte
VitóriaVitória
SantosSantos
SãoPaulo
Curitiba
PortoAlegre
CampoGrande
SepetibaTerminalSepetibaTerminal
Recife
São LuísSão LuísPico daNeblina
Equator
NORTH ATLANTICOCEAN
SOUTH ATLANTICOCEAN
SOUTH
PACIFIC
OCEAN
RioBranco
A m a z o n R .
Pa
ra
ná R.
BRASÍLIA

38S P E C I A L R E P O RT – JA N UA RY 2 0 2 0
WHERE THE RUBBER HITS THE ROAD
The Security Challenges of RioWhilst Recife and the state of Pernambuco have made progress, other cities in Brazil are still struggling. We spoke to Pedro Strozenberg, Ombudsman of Rio de Janeiro and previous executive secretary of the Instituto de Estudos da Religiáo (Institute for the Study of Religion, ISER), which was estab-lished during the period of military rule as a cloak to pursue social issues. ‘The problem is structural,’ he says. ‘We need much more of a solid strategic response to address the prob-lem that opportunities in society are deeply unequal.’ Across the 21 municipalities that make up the Rio metropolitan area, there are great variances in murder rates. For example, whereas the state of Rio suffered 39 murders per 100 000 people in 201858, in the munici-pality of Paracambi it was 68/100 000.59 This aspect correlates with differences in access to basic services, from transport to health-care, education and sanitation. ISER’s Inés Gotari notes that more than a quarter of Rio’s inhabitants spend more than an hour travelling to work, and in some municipali-ties, it is as high as half their population.
It is little surprise then that insecurity remains a problem in many of the favelas, of which there are an estimated 785 in Rio. Together, they house one in five of the wider Rio metro’s 12 million residents, being fed by a continuous stream of migrants, especially from Brazil’s poor northeast. With space to expand outwards constrained, existing dwellings instead simply build up.
Deep inside the favela Rocinha, where access is poor, and the environment is both dark and very hot, rental rates are perhaps as low as US$80 a month. Down the hill where there are wider streets and better shops, favela prices can be ten times as high.
The favelas have become metaphors for drug trafficking and murder. The relationship between the police, drug gangs and delin-quent politicians remains a core civil society concern, as is the level of violence displayed by both police and criminals. According
to Robert Muggah of Instituto Igarapé, one in 38 arrests in Brazil ends in a killing. The comparable figure in New York is one in 37 000.
‘Rocinha is under the control of the drug dealers,’ says a local guide called Edson. ‘The UPPs, the pacification police’, he laments, ‘don’t do much at all.’ The number of UPPs in the favelas has more than doubled in four years, from 18 areas in 2011 to 42 by the end of 2015, while UPP officers deployed has increased fourfold since 2010, now numbering 9 000.
The UPPs, or Unidade de Polícia Pacificadora, were deliberately established with an eye on the 2014 World Cup as a response to fac-tional gang and police violence. This had steadily worsened since the 1980s with the arrival of the cocaine trade. The favelas pro-vided perfect operating and hiding places for the gangs, given their poor layout, access challenges and the availability of potential recruits. Three major drug gangs – Comando Vermelho (Red Command), Teceiro Comando (Third Command), and ADA (Amigos dos Amigos, Friends of Friends) – were able to seize control of these areas where the state had no presence, policing or services.
Despite high levels of ongoing violence, the statistics showed an overall improve-ment across Rio, particularly in the number of killings by the police. Between 2008 and 2015, for example, there was a 78% reduc-tion in the number of intentional homicides in the areas that hosted pacification units, more than 40% fewer murders, and a 76% reduction in gang shootings.
By 2018, however, the overall murder rate was back up from a low of 17.7/100 000 in 2015 to 39/100 000, chasing its 1994 peak of 72.8/100 000.
Whilst policing is important, it is not an end in itself. In this regard, the parallels from Rio with some African and other cities are clear. Government lacks legitimacy, despite democracy, in the poorest communities. It is

39S P E C I A L R E P O RT – JA N UA RY 2 0 2 0
WHERE THE RUBBER HITS THE ROAD
seen as an unreliable and often antagonis-tic partner where governance is fraught with institutional and economic instability. One lesson is that small steps can help a great deal, including improving the training and accountability of the police, the judges and the prisons. Brazil’s prisons house 812 000 inmates, the third largest prison population in the world.60
The government in Brazil recognises the importance of extending governance and service provision into the favelas; but deliv-ering these much-needed improvements is challenging. To address strategic discon-tinuities and to improve co-ordination, a Metropolitan Chamber for Development was established in 2015. Its four initial goals were: first, to devise a way to manage the conflict between the need for longer-term planning and budgeting matched against a short-term, four-year political cycle; second, to introduce private sector expertise and funding in the infrastructure and manage-ment processes; third, to better integrate the actions of government agencies; and finally, the establishment of a development plan with clearly prioritised actions.
Improving sanitation has already been identified as the most important area of action: just 30% of waste is treated and 70% goes into Guanabara Bay. The past failure to link unused, new treatment facilities with municipalities is held as an example of bad management, which could conceivably be addressed by public private partnerships. Improving mobility is the next priority, given that 75% of metropolitan residents work in the city but only half live there.
Rio has put together a city masterplan to try to realise the plans outlined above and also better land use. It is sign of their intent that Jaime Lerner, the eminence grise town-planner-politician from Curitiba in Brazil’s south, was part of this team.
Infrastructure: The Limits of Big ProjectsBrazil has tended to seek answers through silver bullets and big schemes, which have usually only compounded existing problems.
Vargas’ Estado Novo, or ‘New State’, sought to transform Brazil from a planta-tion-based agricultural economy into an industrial powerhouse through government intervention, both by the creation of state-financed and run monopolies, for example, in oil (Petrobras), mining (Vale), steelmaking (Companhia Siderúrgica Nacional), aviation (Embraer) and cars (National Motors Factory) and by offering protection and preferential contracting to domestic industries.
Brazil’s fascination with big development schemes and its propensity for political mel-odrama did not die, however, with Vargas. Cue President Juscelino Kubitschek who started building a new capital at Brasilia the year after Vargas’ demise as a symbol of the country’s ambition and determination.
Brazil’s first republican constitution, of 1891, contained an article that stated that the capital should be moved from Rio de Janeiro to ‘a place closer to the centre of the country’, giving official weight to an idea first suggested by José Bonifácio in 1827. But it took until 1956 for Kubitschek to order its construction. Designed by Lúcio Costa and Oscar Niemeyer, the core of the city was built in 41 months and was officially inaugurated on 21 April 1960.
From the outset, it was clear that the growth of Brasília was going to be greater than the designers had envisaged. Even dur-ing the construction period, Brazilians from all over the country migrated to the city in search of jobs. At the close of the 20th Century, Brasília had earned the distinction of becoming the largest city in the world that had not existed at the start of the century and, with a growth rate of 2.82% per year, had one of the highest growth rates in Brazil. Designed as a city for government, it now has a burgeoning private sector.

40S P E C I A L R E P O RT – JA N UA RY 2 0 2 0
WHERE THE RUBBER HITS THE ROAD
Forty-five years later it is apparent that designing a city from scratch with a spe-cific idea of its function brings its own challenges. The original master plan was based on a concept of a central core of gov-ernment buildings surrounded by satellite cities where people would live. Vincente Lima Neto, from the State Secretary’s Department of Territorial Management, remarks that 67% of the jobs are in the central zone but just 200 000 of the city’s more than 2.6 mil-lion people live there. With no subway and a planning assumption that people would come to work by car, there are now consid-erable mobility problems. The normal mixing of social and economic development that occurs when cities grow is only now starting to happen on the outskirts of Brasilia.
Reflecting on what he would do if he had another blank piece of paper he remarked: ‘Having all the houses on the outside was a bad plan. You need to sectorise. Also, we should not have been so car orientated, we need a much bigger focus on public trans-port. The ideology of the city has accidentally led to more exclusion. They did not realise how it would grow.’
But perhaps the biggest challenge facing those trying to regulate the growth of the
city is the issue of land ownership or, more specifically, illegal occupation. According to a leading official within TERRCAP, the body responsible for the administration of fed-eral land in the city, a staggering 80% of the population lives in ‘illegal areas’, a problem that has existed since the city’s inception. ‘Initially the government was disorganised, and this was exploited; now people want it this way.’ The consequences are considerable. Illegal occupants only pay partial taxes as they can’t be forced to pay tax on land where the ownership is in dispute, yet local authori-ties remain obliged to provide essential services and there are significant environ-mental issues. Mass legalisation seems the obvious solution but the sheer numbers, potential for individual legal actions and the political toxicity of the issue make this a challenging prospect. This issue is not just confined to the poor. A quick look at Google maps shows that a sizeable number of the illegally occupied areas have big houses complete with swimming pools. Wrapped up in this is a cultural element. As one official remarked, ‘Brazilians don’t want to obey the law – they think that other people should obey the law.’

41S P E C I A L R E P O RT – JA N UA RY 2 0 2 0
WHERE THE RUBBER HITS THE ROAD
Curitiba and the Bus Rapid TransportCuritiba is the capital of the southern Brazil state of Paraná with a population of two mil-lion. In 2010 Curitiba was awarded the Global Sustainable City Award on account of its excellence in urban development. The city deserved it because it really did innovate and integrate.
‘We have many visitors from China, South Africa, Colombia and other countries,’ says Silvia Ramos of URBS (Urbanuzacao de Curitiba), the transport regulator.
It’s little wonder. Curitiba founded a now popular surface transport system known as Bus Rapid Transport. The system has become an international role model for public trans-port that others have sought to replicate. Now more than 250 cities worldwide have BRTs.
Getting this to work involves more than just mobility. Curitiba has success-fully used a relatively cheap surface public transport system to transform the city, not just in terms of the movement of people, but also through the use of land and pub-lic spaces. Integration has been achieved through connecting people, and this has been key to economic progress.
Back in 1966, when the city was drawing up a masterplan, officials looked at models from France and the UK among others. But the cost of an underground train system was deemed prohibitive for the city, despite its relative wealth based on farming. So, it opted for a surface transport system with dedi-cated bus lanes, at about a tenth of the cost of an underground railway.
When the system was first implemented in 1974 it moved just 50 000 passengers annually. Today the BRT carries over two million people a year along 81.4km across six lines in an operating fleet of 1 368 buses, some capable of carrying 250 passengers, pausing at 6 500 stops.61 The buses drive 328 066km each day and are supplied and run by private companies who are paid by the kilometre.62 Passengers pay a standard
fare of just under a dollar regardless of the length of the journey. This fee cross-subsidises those, mostly the poor, living far from the city centre.
Jaime Lerner has been a pivotal figure in this system. He was part of the original team which decided on the winning bid for the masterplan and, in 1965, helped create the Instituto de Pesquisa e Planejamento Urbano de Curitiba (Institute of Urban Planning and Research of Curitiba, IPPUC), a research, monitoring and implementation body funded by the municipality.
Lerner was elected mayor three times, the first time in 1971. Although he instituted sev-eral important changes to the city, including building more parks, creating an apprentice-ship system for deprived young people, and establishing a successful recycling scheme, the BRT remains his greatest achievement, and Curitiba’s gift to the world.
‘You need to think of the BRT,’ he says, ‘not just as a transport system, but as a city design. It has been the engine of the city’s growth. We started small, but for each stage to solve each problem, we have used innovation.’
Not only have the number of lanes and buses increased exponentially, but the ser-vices have radically improved. More than 90% of the fleet is adapted for disabled users. Various feeder lines are fully integrated, with a range of bus types and sizes. Tubular stations have improved the passenger expe-rience. An increasing number of buses use biofuel, while the electric and ‘Hibribus’ is imminent.
‘Everything in Brazil is dedicated to the car,’ says Lerner. ‘For example, there are at least five million cars in Sao Paolo alone, each car taking up 25m² of space on the road and in parking. This is the size of a small housing unit. Even if half this was dedicated instead to housing, we could house another 2.5 million people closer to their place of work. But to do this, we have to provide
42S P E C I A L R E P O RT – JA N UA RY 2 0 2 0
WHERE THE RUBBER HITS THE ROAD
public transport, to turn the space for cars from private to public.’
‘Back in the 1970s when we did it, it was said that every city which achieved a popu-lation of one million should have a subway. As we did not have the money, instead we asked: What is a subway? The answer was, it is a system that has to be fast and have a good frequency so you don’t have to wait. Since we did not have the resources, we asked ‘why not the surface’. So, we took the existing streets, and linked them to the structure of growth of the city – where we linked and integrated living, working, leisure and mobility.
‘This is why Curitiba,’ he notes, ‘is differ-ent. It involved the renovation and evolution of the existing system.’
The BRT has led to about 27 million fewer car trips annually, and a per capita reduction in fuel use of about 30% in the city, and its air quality is significantly better that that of other similar sized Brazilian cities. It also has the highest rate of garbage recycling separa-tion in the world, at nearly 70% according to Lerner.
Given such efficiencies, Curitiba’s growth has been above 7% over the past three dec-ades, while per capita income is 30% higher than the national average. Ironically, Curitiba is now the second largest producer of cars in Brazil and has a lively services and high-tech sector.
The city has been able to make dramatic inroads into the perennial challenges fac-ing Brazil’s cities of transport, governance, infrastructure and security. Yet remarkably few Brazilian cities have sought to emu-late its success. Lerner says the reason for this is, very simply, ‘politics’. The problem, he reflects, is ‘that decisions today are closely tied to having consensus, but democracy is not consensus, but rather conflict wisely managed.’ Rather than attempting a per-fect solution, the city officials have opted for pragmatism. ‘Improvement needs a start,’ he observes. ‘You need to have a demonstration effect sometimes to get things moving.’
A key reason for Curitiba’s compara-tive success is consistency of planning and implementation.
Daniele Moraes is an architect at IPPUC. She reminds that the 1965 masterplan was not the first one in Curitiba’s history. The first city plan was back in 1853, which was followed 90 years later by the Agache Plan, which laid out a high-density city centre with suburbs radiating outwards – the design trend of the time – for the population of 180 000. The winning bid for the 1965 plan, when the city housed 500 000 inhabitants, built on the Agache scheme but focused on a combination of land use, roads and public transport to deliver a better environment, and social and economic development. Since then there have been two further revisions, in 2004 and 2014.
It has not just been about plans, but conti-nuity of people. She points out that ‘Curitiba has enjoyed six mayoral terms – 24 years – of mayors from IPPUC. Jaime Lerner, who served for three terms, Rafael Greca, who still works at IPPUC, and Cassio Taniguchi, who served two terms. They were all also from the same political group which ran the munici-pality for 40 years.’ She adds, ‘Jaime Lerner was a shrewd politician and diplomat. He taught children about recycling, for example, and in so doing created a whole generation concerned about urban planning and the environment. He created a lot of support for change.’
And critical mass is important too. A municipal-funded institution, IPPUC has a staff of 160, of which half are architects and engineers.
Of course, there are challenges. Local economist Carlos Guimaeres of FESP, a pri-vate university with a focus on commerce, observes that there is a difference between the IPPUC team and the ‘professors now in City Hall who are very theoretical about things, but they don’t know how to make them happen’. His colleague Luis Fernando Ferreira da Costa adds that there are always funding shortages since ‘Brazil remains a

43S P E C I A L R E P O RT – JA N UA RY 2 0 2 0
WHERE THE RUBBER HITS THE ROAD
very centralised country. Taxes go from the cities to the states to the Federal centre, but the amount that comes back depends partly on politics. It also reflects the size of the Federal government: everyone in Brazil wants to work for the government. We need greater decentralisation and greater auton-omy, like the United States, so that the states can raise and spend their own taxes.’
A final word should go to Lerner: ‘Solving problems,’ he says, ‘is not related to scale, or the size of the city, or financial resources. The challenge is in organisation, and in creating shared responsibility between citi-zens and government, and the public and private sectors. Otherwise you won’t get the outcome you need.’
Clusters – Encouraging Innovation and EntrepreneurshipRecife enjoyed a relatively prosperous past, at the centre of the north-east’s economy. The warehouses lining the city’s old port along the River Capibaribe hint at its pros-perity when, as the capital of Holland’s 17th Century Brazilian empire, Recife’s wealth grew quickly along with the state’s sugar exports.
South of the city is Pernambuco’s main industrial area, housing all manner of manu-facturing firms from textiles to electronics. To the north, in Goiana, 70km from Recife, is a state-of-the-art US$2 billion Fiat-Chrysler auto plant, building the latest Jeep Renegade and Fiat pick-ups, drawing together a clus-ter of component suppliers, in the process providing jobs for 6 500 workers.
Within Recife’s city limits, the ‘Porto Digital’, founded in 2000, has attracted
250 high-tech companies including multi-nationals like Motorola, Samsung, Dell and Sun, generating 7 500 jobs and US$350 mil-lion in annual revenues. The pool of talent is fed by four public universities.
As a result, between 2007 and 2013, for example, Pernambuco grew its economy at 4.4% annually, above the national average of 3.4%.
Brazil has been pursuing a cluster approach aimed at encouraging innovation, entrepreneurship and growth since the 1950s and has used cluster-based development as a tool to reduce well-known regional inequi-ties. Santa Rita do Sapucail, now considered one of the main hubs for Brazil’s electronics industry owes its origin to the establishment of an educational Institute for Electronics in 1959 and is now home to more than 150 companies in the sector employing over 14 000 people. São Paulo’s plastic cluster was started in 1949 with a single manufac-turer and has now grown into an industrial cluster that provides more than 150 000 jobs. Dominated by Petrobras and Braskem (a company in which Petrobras has consider-able equity), the cluster’s development has not been without challenges, but it has been fortunate to benefit from strong growth in domestic demand for its products.
A 2013 Inter-American Development Bank study of the economic performance of industrial clusters in Brazil concluded that ‘Overall, the results suggest that clus-ters are positively correlated with economic performance.’63 Hardly a surprising conclu-sion, but one that bears more than a passing consideration as African cities continue their rapid rate of growth.

44S P E C I A L R E P O RT – JA N UA RY 2 0 2 0
WHERE THE RUBBER HITS THE ROAD
The Transformation of MedellínMedellín is Colombia’s second-largest city and the capital of the country’s most pros-perous department, Antioquia. Lying about five thousand feet above sea level in the Val de Aburrá, an elongated north-south val-ley in the central cordillera of the northern Andes ranges, the city has a wonderful cli-mate – the famous ‘eternal spring’ – and is known for entrepreneurial people, innova-tive culture, lively street life, and prosperous businesses.
Medellín was also, for a time, the dead-liest, most violent city on the planet: a murderous streetscape of drug deal-ers, gangs, urban decay, marginalised slum-dwellers and crumbling infrastructure – the stomping-ground of Pablo Escobar and his notorious Medellín drug cartel.
In the 1980s and 1990s, the city passed through a period of crisis that seemed to take it to the edge of chaos. But in the early 2000s, a series of security interventions transformed urban public safety, triggering a massive drop in violence. By 2013, a suc-cession of innovative mayors and engaged publics (assisted by a dynamic national gov-ernment focused on defeating FARC and ELN guerrillas and drug lords) had transformed the city. In 2013 the Urban Land Institute selected Medellín as the world’s most inno-vative city, and Harvard University awarded the city its Verónica Rudge Urbanism Award. In 2014, Medellín hosted the 7th World Urban Forum of the United Nations, and in 2016, the city was awarded the Lee Kuan Yew World City Prize.
From the edge of chaos, the city trans-formed itself from a crime-ravaged, failing metropolis into a self-renewing, increasingly stable and prosperous symbol of the new Colombia. That transformation was not with-out its controversies, nor is Medellín today without problems. But in the city’s journey of renewal, there are many insights for African cities.
Medellín itself is a city of roughly 380km2 and 2.5 million people, but Metro Medellín – the greater metropolitan area surrounding it – is a much larger urban agglomeration that includes an additional 1.2 million people and another nine municipalities. Altogether, Metro Medellín covers about 1 100km2 of the Aburrá valley floor. The city is divided into four more or less equal sectors by the Medellín River, which flows south to north, and a series of east-west tributary streams. The city – and the identity of its inhabitants – is thus based on very localised neighbour-hoods that are relatively self-contained.
Medellín is a key economic hub, one of the most important in Colombia. It is an important banking centre, housing the headquarters of Bancolombia, one of the largest banks in Latin America, and sev-eral large industrial and manufacturing firms and financial businesses (syndicated into the Antioquia Enterprise Group, Grupo Empresarial Antioqueno). The city’s products include steel, textiles, cement, processed food and beverages, financial and insurance services, chemicals and pharmaceuticals, and cut flowers (mainly produced for exter-nal distribution).
Indeed, much of Medellín’s production is for export, with a significant proportion going to global or inter-American trade, including manufactured goods from the urban zone itself, agricultural commodities (including cash crops like coffee) from the city’s hinter-land, and petroleum products refined from oil extracted in the wider region. The fashion industry, airlines and trucking businesses are also major players in the city’s licit econ-omy, while the illicit economy – coca and marijuana cultivation, cocaine and heroin processing, illegal mining and the regional and global export of narcotics – has also played a key role in the city’s development.
Medellín is organised into 16 communes (comunas) or municipal districts, each with its own representative council, city manager

45S P E C I A L R E P O RT – JA N UA RY 2 0 2 0
WHERE THE RUBBER HITS THE ROAD
Equator
C O L O M B I A
ECUADORECUADOR BRAZILBRAZIL
VENEZUELAVENEZUELAPANAMAPANAMA
PERUPERUA m a z o n R
.
BOGOTÁ
Cali
Pasto
Buenaventura
A
N
D
E
S
Ibagué
Pereira
Leticia
Medellín
Bucaramanga
Cúcuta
Mitú
Turbo
PicoCristóbel
Colón
Puerto BolivarPuerto BolivarThe islands of Malpelo, Providence and San Andrés are not shown
The islands of Malpelo, Providence and San Andrés are not shown
CartagenaCartagena
BarranquillaBarranquillaSanta MartaSanta Marta
NORTH
PACIFIC
OCEAN
Caribbean SeaGorro de V
en
ezue
la
46S P E C I A L R E P O RT – JA N UA RY 2 0 2 0
WHERE THE RUBBER HITS THE ROAD
and development board, and five townships (corregimientos, outlying self-administered districts). The town is further sub-divided into 271 barrios (urban sub-districts) while the comunas are grouped in turn into six urban zones.
Districts and sub-districts differ widely in terms of industrial and economic activity levels, socio-economic status, effectiveness of governance, and degree of security. The comunas also vary in racial makeup: while the city’s population is overwhelmingly white or mestizo (in the most recent census, 93.4% of the population identified with no ethnic minority, suggesting they were of European ancestry) with small Afro-Colombian (6.5%) and indigenous (0.1%) communities mainly congregated in slums and squatter shanty towns that cluster along the city’s northern, western and southern extremities.
Medellín’s slums are mostly found along a series of outlying hillside neighbourhoods in the communes of Popular, Manrique, Santa Cruz and Villa Hermosa on the city’s north-ern outskirts, in Commune 13 (San Javier) in the city’s far south, on the outer edges of the communes of 12 de Octubre and Robledo, and in the unincorporated peri-urban space between Commune 13 and the Corregimiento de San Cristóbal in the south-west. Because of the city’s mountainous terrain, there are finger-like extensions of the urbanised area, running from the Aburrá val-ley floor up gullies into the hills. Road and rail networks follow valley bottoms, so trans-port infrastructure (along with habitation and industry) is concentrated in low-lying areas surrounded by lightly populated, rural and unserviced high ground.
Further from the urban core (and outside the city’s municipal boundary) are tran-sitional districts and exurbs that serve as dormitory communities for the parent city or as centres for rural production. Some are beginning to merge with the greater urban agglomeration of Metro Medellín, forming a contiguous built-up area constrained mainly by topography – the eastern and western
edges of the Aburrá valley, the bed of the Medellín river and its tributary streams.
Urban Growth in MedellínThe first area of Medellín to be urbanised was el Poblado (‘the village’), a district located on the northeast edge of today’s city, now part of Commune 14. In the second half of the 17th Century, the main centre of settlement shifted west to the area of La Candelaria, Commune 10, now in the centre of the urban core. Medellín grew throughout the 17th and 18th centuries via a process of clearing and development of countryside downstream (mainly to the west and north) of the initial settlement, and through the urbanisation of farming and ranching lands. Medellín’s history is one of an expanding urban core surrounded by transitional zones of light industry, agriculture and informal settlements. The city has progressively incor-porated and gentrified outlying settlements, absorbing agricultural land and separating the urban core from key sources of food, fuel, water, and labour.
In the 19th Century, Medellín emerged as a mining centre after the discovery of gold at Anori in 1851. This accelerated the city’s growth, as did the development of coal mines to the south of the city. The arrival of the railway in 1875 facilitated export and trade and enabled easier migration to Medellín, and the construction of hydroelectric plants in the late 19th Century, which brought elec-tricity to the city, enabled rapid development in industries such as textiles.
In the 20th Century, Medellín became a hub for Colombia’s main export earner, coffee. The cultivation, processing and dis-tribution of coffee for Latin America and the rest of the world attracted migrants and rural dwellers to the city. On the back of this, Medellín grew rapidly in the second half of the 20th Century, with the city’s population tripling between 1905 and 1938 but grow-ing by a factor of more than 13 from 1939 to 2005.

47S P E C I A L R E P O RT – JA N UA RY 2 0 2 0
WHERE THE RUBBER HITS THE ROAD
The growth of the city in the 20th Century illustrates the reinforcing effect of push factors (negative conditions in rural areas that drive populations out of the countryside into cities) and pull factors (positive conditions that draw migrants in from both the coun-tryside and from other parts of Colombia and worldwide) in rural-to-urban migra-tion. The combined effect of these two sets of factors generated a self-reinforcing flow of people from rural to urban environments. Pull factors included industrialisation, the lure of relatively well-paying and less labori-ous non-agricultural jobs, a better standard of nutrition, education and public health for those able to access such benefits, and the city’s role as a portal connecting isolated areas to the rest of the world. Push factors included rural poverty, poor public health in remote areas, lack of access to education and employment in the countryside, and rural conflict.
A century of accellerating population growth in Medellín, 1905–2018
0
1
2
3
4
1905
1912
1918
1928
1938
1951
1964
1973
1985
1993
2005
2018
Conflict has long been a key driver of devel-opment in Colombia – unsurprisingly so, in a country that has seen endemic conflict (often reaching surprisingly high levels of violence) for almost the entire period since its independence from Spain in 1810. Indeed, one major reason for the dramatic spike in Medellín’s urban growth after 1948 was La Violencia, a diffuse but extremely violent civil conflict that killed more than 200 000 Colombians, most of them rural civilians, between 1948 and 1958.
Antioquia suffered particularly heavily in this conflict, in which Colombia’s two domi-nant political groupings, the Liberals and the Conservatives, recruited and unleashed armed political militias on each other’s supporters in an intense wave of rural mas-sacres, assassinations and riots. Communist militias and paramilitary criminal gangs emerged on the fringes of the main politi-cal blocs and engaged in serious bloodletting of their own. In common with many such conflicts, the original causes of the conflict became less important over time, and the violence took on a life of its own, charac-terised by score-settling, use of violence as a tool in economic rivalry, and the manipu-lation of violent actors by local populations seeking to improve their position vis-à-vis other groups.
Intense violence in the countryside drove farmers and rural workers to the city for safety, where they settled in huge numbers in hillside barrios on the upland outskirts. This resulted in rapid unplanned growth on the outskirts of Medellín, which progres-sively filled in the open space between the existing city and neighbouring towns such as Envigado, Bello and Itagüí, creating a con-tiguous metropolitan area much larger than the original city.
By the 1960s, these areas had evolved into under-serviced, under-governed, under-resourced and over-crowded slums. Despite the creation of a Medellín Master Plan (MMP) for urban development in 1950, which led to significant modernisation and infrastructure development in downtown areas during the 1950s and 1960s, this massive influx of peo-ple to the city overstressed the urban fabric, invalidated urban planners’ calculations and overwhelmed city services.
People living in these areas experienced high levels of urban poverty and unemploy-ment, poor access to education and public health, political and social marginalisation, exclusion from the licit economy, and high levels of unemployment. This meant that, despite a formal urban planning mechanism

48S P E C I A L R E P O RT – JA N UA RY 2 0 2 0
WHERE THE RUBBER HITS THE ROAD
and an urban master plan characterised by a high degree of rationalism and modernism, in practice, much of Medellín’s development took place in an ad hoc, bottom-up, emer-gent manner similar to what Edgar Pieterse has described (in the context of African con-text) as ‘rogue urbanism’ and Richard Norton and David Kilcullen have explored as ‘urban ferality’.
Organised crime, violence, involvement in illegal mining, extortion and racketeer-ing, and narcotics trafficking flourished in the feral, informal settlements of the hill-side barrios. From the middle of the 1960s Colombia suffered from multiple insurgen-cies – descendants of the Communist militias of la Violencia such as the FARC, ELN, EPL and M-19. This prompted a spike in recruitment by guerrillas and terrorist groups in these areas. M-19, as an urban terrorist group, was particularly active on the urban fringes and among radicalised urban elites such as uni-versity students and leftist labour activists. Urban fronts, underground cells and subver-sive networks emerged in all sectors of the city as a result.
As in African cities such as Rabat and Nairobi (or European cities such as Brussels and Paris) the emergence of a large, under-employed, socially and politically marginalised and economically excluded population in depressed urban areas made people highly vulnerable to recruitment by activists offering a utopian ideology of lib-eration from poverty and exclusion through armed struggle against a ‘rigged’ system.
By the 1970s, a more sophisticated and larger-scale version of the traditional mari-juana business had begun to flourish in Colombia, responding to increased market demand from the United States and Europe. By the 1980s, marijuana had been overtaken by a new, hugely lucrative illicit cash crop: cocaine. The combination of this huge new illicit industry with a marginalised urban population and the emergence of drug cartels under entrepreneurial leaders like
Pablo Escobar was a transformational event in the history of Medellín.
Escobar’s role was not purely a criminal or economic one: his ability to manipulate and mobilise poor urban dwellers through a combination of coercion and intimidation, lucrative employment and social welfare projects in under-served barrios enabled the rapid rise of his drug empire and a collapse of public safety and public morals in the city. Escobar constructed entire barrios, provided employment and family assistance, settled disputes and played the role of both govern-ment administrator and urban developer in barrios that had become both ‘no-go areas’ (where representatives of the government could not go) and ‘no-see areas’ (districts, to use James C. Scott’s term, that had become illegible to the state).
Escobar’s ability to co-opt security services, bribe police, and intimidate or control city authorities undermined public confidence in state and city institutions. His rivalry with other narco-trafficking groups, and his violent feud with M-19 contributed to a spate of kidnappings, assassinations, car-bombings and violent incidents over a 20-year period from the 1970s until the mid-1990s, directed by narcos against the state and among rival cartels (as in the infamous terror war between Escobar’s Medellín cartel and the rival Cartel del Valle in the mid-1980s, which resulted in a spike in bombings, shootings and kidnappings across the city). Politically motivated groups such as the leftist FARC and the right-wing paramili-tary autodefensas, along with rogue elements of the Colombian government and security services, used coercive violence to control the population and the drug trade, forming a shifting series of alliances of convenience in order to defeat their adversaries.
It was this pattern of drug-fuelled violence, triggered by the combination of a charismatic and entrepreneurial leader (Escobar), and a hugely lucrative illicit industry (cocaine) with a city already expe-riencing serious overstretch due to rapid

49S P E C I A L R E P O RT – JA N UA RY 2 0 2 0
WHERE THE RUBBER HITS THE ROAD
unplanned population growth and urbanisa-tion – that hastened Medellín’s descent into decay.
Medellín’s RecoveryMedellín reached its nadir in the 1990s, when the murder rate placed the metropolitan area high on the list of the world’s most dan-gerous cities. In 1991, for example (as shown below) the city experienced an astoundingly high murder rate of 381 per 100 000 people, the highest in its history, a level of urban violence close to the worst ever recorded out-side a war zone, and quite high even for cities at war (by comparison, the rate of violent death in Baghdad at the height of the Iraq troop surge of 2007 was only 48 per 100 000 people). An improvement began after 1991 as Escobar’s influence declined. It gained pace after police killed him in 1993.
Medellin Homicides (1975–2018)
1975
1978
1981
1984
1987
1990
1993
1996
1999
2002
2005
2008
2011
2014
2017
0
100
200
300
400
Source: Colombia Reports64
This, together with subsequent military and police efforts, backed by the United States and European countries, to break up the Medellín cartel contributed to a continu-ing decline in urban violence. Nevertheless, throughout the 1990s violent crime (including kidnapping, murder and extor-tion) remained common. The murder rate declined significantly from its peak of the early 1990s but continued to hover at a still very high 150 per 100 000 people.
In part this reflected the fact that, even though the breakup of the cartel improved government access and control in the city’s
no-go areas and reduced cartel violence, Escobar’s dominance had in fact also con-strained criminal activity. Once he was removed, a large number of smaller gangs and criminal groups began a struggle for dominance over what remained of the drug trade in a more fragmented conflict eco-system within the city and the wider metro area. Heavily armed militias took over many informal districts after Escobar’s death, turn-ing Commune 13 into a stronghold, while competing drug gangs (‘La Terraza’ and oth-ers) took over much of the drug trade.
In addition, from 1996 onward, a string of FARC victories set the national government back, brought leftist guerrilla forces into peri-urban districts of major cities, and prompted insurgent violence in outlying comunas of Medellín along with a series of terrorist attacks in the urban core. These were con-ducted both by FARC urban fronts and by paramilitary groups – the so-called bloque metro. Similar attacks on other key cities – including the capital, Bogotá, and the city of Cali (hub of the prosperous Cauca region and home of Escobar’s powerful rivals, the Cali drug cartel) triggered a national crisis. After a failed peace process under President Andres Pastrana in the late 1990s, this crisis resulted in a national mobilisation, the election of President Alvaro Uribe, and his introduction of a new policy of ‘Democratic Security.’
Medellín was one of the first urban cen-tres to experience the benefits of the new policy. In October 2002, the Colombian Army and National Police launched ‘Operation Orion’ to defeat FARC urban militias and force the disbandment and demobilisation of right-wing paramilitary autodefensas. The initial goal of the Colombian operation was to push the FARC back from the cities, and relieve pressure on the urban, industrialised and most heavily populated core of the coun-try. By 2005, the combination of enhanced counterinsurgency measures against FARC and the demobilisation, disarming and rein-tegration (DDR) of autodefensas had reduced violence in Medellín significantly. This set

50S P E C I A L R E P O RT – JA N UA RY 2 0 2 0
WHERE THE RUBBER HITS THE ROAD
the scene for a series of urban interven-tions driven by Medellín’s new mayor, Sergio Fajardo, elected in 2003.
Fajardo and his team diagnosed the problems of Medellín as being related to five key issues – a ‘systematic crisis of gov-ernability’, high levels of poverty, growing inequality, obsolescence of the city’s eco-nomic and social structure, and insufficient integration between Medellín, the rest of Colombia and the wider world. Fajardo’s approach to addressing these problems emphasised close and systematic engage-ment with local populations, especially in the poorest neighbourhoods. He focused on improving inclusion and dignity for mar-ginalised populations by involving them in – indeed, by letting them take the lead on – all key decisions about projects in their districts. This emphasis on local ownership and leadership proved critical and, combined with improved security and the expertise of urban planning experts, architects, trans-port engineers and specialists in essential services engaged by Fajardo as part of his team, gave rise to a series of Proyectos Urbanos Integral (Integral Urban Projects, PUI).
PUI projects prioritised three key issues – inequality, violence and corruption – but left specific planning and operationalisa-tion of projects to address these issues to local community leaders, assisted by exter-nal technical specialists. This bottom-up approach, characterised by intensive engagement between citizens and local gov-ernment, and an emphasis on promoting the emergence of small and medium enterprises within marginalised neighbourhoods, has become known as Social Urbanism.
The city-owned electricity company (Empresas Publicas de Medellín, EPM) was man-dated to allocate 30% of its revenue to PUI projects. This model of local revenue gen-eration meant that PUI programmes, unlike those of PRIMED in the 1990s, were able to become sustainable over the long term, removing any dependence on donations from external sponsors or national-level
programmes. Recognising the cyclic inter-action (noted earlier) between the physical environment and conflict, Social Urbanism (and PUI in particular) was designed to use improvements in the physical environment to trigger transformational shifts in the social and economic environment that had given rise to violence.
In Medellín, initial PUI programmes focused on two of the most dangerous areas of the city – the northwest comunas (Communes 1 and 2, a slum area previously dominated by Escobar’s cartel and subse-quently a battleground for smaller gangs, paramilitaries and local militias) and Commune 13, which was a key access point for weapons and drug smuggling and a militia stronghold. PUI in the northwest com-munes focused on improving connectivity, transport access, access to drinking water and education. PUI in Commune 13 included construction of the Parque-Biblioteca (Library Park) San Javier, a new school, public green spaces, improved transportation through the Metrocable project initiated under Mayor Perez, along with escalators and stairs to connect Commune 13 to the urban core.
Mayor Fajardo served one term between 2004 and 2007, and in accordance with Colombian law was not eligible for re-elec-tion. However, the integrated development plan he initiated was subsequently updated and continued by successive mayors, up to the present. Medellín has continued to improve – although improvements have been unequal across areas of the city and at times (as in 2006-2009) there have been setback in public safety, linked in part to nationwide patterns in the fight against the FARC and the evolution of paramilitary autodefensas into heavily armed organised crime groups bandas criminales, BACRIM.
BACRIM activities still afflict parts of the city, and squatter settlements, informal and poorly serviced areas still exist, along with the poverty-stricken barrios on the outskirts of Medellín. But across most indi-cators – poverty, mobility, access to health

51S P E C I A L R E P O RT – JA N UA RY 2 0 2 0
WHERE THE RUBBER HITS THE ROAD
and education, transportation, small and medium business development, infrastruc-ture and political integration – Medellín has seen significant improvements since the darkest days of the 1990s. The change is most evident in violence statistics, with a drop of about 80% in homicides across the city from 1991 to 2012.
Interpretations and ObservationsThe experience of Medellín suggests that three key factors are needed for urban trans-formation efforts of this kind. These are local ownership and leadership, with communi-ties having a decisive say in all programmes affecting their area and being involved from the outset in key planning decisions; exter-nal expertise in which impartial technocratic specialists can offer local leaders educated options and informed choices about the impact of these decisions; and a foundation of security in which communities, police and security forces work together to generate an atmosphere of public safety within which
communities feel secure enough to peace-fully address their problems and technical experts can work safely in key districts.
Clearly, sequencing also matters. Security seems to be the essential prerequisite for urban transformation, but security pro-grammes must be followed up as soon as possible with social, economic and physical infrastructure initiatives so that progress in security is not allowed to slip away. Similarly, economic or transportation programmes alone will not be effective unless they are accompanied by security improvements, and unless mechanisms for locally sustainable funding and long-term government attention are developed. Anti-corruption measures, efforts to reduce inequality and reform gov-ernment to offer justice, inclusion and equal access to state services appear to be criti-cal. Finally, a focus on enabling small and medium business enterprises, as a key indi-cator of improving conditions in a given city, seems to be key.

52S P E C I A L R E P O RT – JA N UA RY 2 0 2 0
WHERE THE RUBBER HITS THE ROAD
Honduras: Urban Overstretch in San Pedro SulaSome five hours’ flying time northwest of Medellín, on the northern coastline of the Republic of Honduras, lies the city of San Pedro Sula. With a population of between 800 000 and 1.2 million people in the city itself, and nearly 1.5 million in its wider metro area, San Pedro Sula is the second city and business centre of the country – and in this sense analogous to Medellín. It accounts for two- thirds of Honduras’ GDP, and 18% of the country’s total population of eight million. But unlike Colombia’s second city, which has succeeded in transforming itself over the past decade, San Pedro Sula is mired in violence, unflatteringly known as ‘the most dangerous city on the planet’.65
Covering an area of 840kms2, the city fills the floor of the coastal Sula valley (Valle del Sula) and is divided into sectors by several rivers, flowing south to north. Like Medellín, the city is bordered by hills and its peri-urban slum settlements extend along valleys into the mountains and up onto the hillsides overlooking the town on the city’s western side. Unlike Medellín, San Pedro Sula also incorporates numerous streamside shanty towns: informal settlements strung out along the edges of creeks and rivers in the metro area and on its outskirts.
Founded in 1536 by Spanish and mestizo settlers, the city was well established by the late 16th Century as a trading hub for prod-ucts from the hinterland, importing trade
TEGUCIGALPATEGUCIGALPA
EL SALVADOREL SALVADOR
GUATEMALAGUATEMALA
BELIZEBELIZE
NICARAGUANICARAGUA
HONDURASHONDURASHONDURASJuticalpaJuticalpa
CholutecaCholuteca
San LorenzoSan Lorenzo
Puerto CastillaPuerto Cortés
San Pedro SulaSan Pedro Sula
La CeibaLa Ceiba
Santa Rosade CopánSanta Rosade Copán
Puerto LempiraPuerto Lempira
TelaTela
NORTH PACIFIC OCEAN
Caribbean Sea
Golfo deFonseca
Gulf ofHonduras
Islas de la BahíaIslas de la Bahía
SwanIslandsSwan
Islands

53S P E C I A L R E P O RT – JA N UA RY 2 0 2 0
WHERE THE RUBBER HITS THE ROAD
goods from Europe and exporting cash crops (including agricultural products, precious metals and timber) to Spain. The city’s rural hinterland was originally farming country, producing food for the town and agricultural products for export. In the 1870s, roughly 50 years after Central America achieved independence from Spain in 1821, and under the influence of expanding US commercial engagement across the region, the area was transformed into one of the original ‘banana republics’ by the arrival of a US-owned railway.
The railroad, originally intended to trav-erse the entire country, was a failure in its original concept as a transoceanic transport corridor (a role filled by the Panama Canal a generation later), but it enabled the open-ing up of northern Honduras to American agricultural firms such as the Cuyamel Fruit Company, United Fruit and Vaccaro Fruit. They negotiated a series of lucrative deals with concessions with local governments and landowners allowing them to grow bananas on an industrial scale in land bor-dering the railway, and then exported the bananas to the United States. Besides play-ing a dominating role in Honduras’ economy – and imposing a pseudo-colonial mono-crop, export-driven system on the country, cementing its dependence on the US market – the banana companies involved themselves heavily in manipulating Honduran poli-tics. By the late 1880s, the international fruit companies had expanded to the entire northern coast of Honduras, all shipping fruit to the United States via San Pedro Sula. Roads were constructed to move imported consumer goods from San Pedro Sula across the northern coast of Honduras and west-ward into Guatemala, cementing the city’s role as an export hub by the 1890s. In the 20th Century, the city continued to expand and assumed its modern shape.
Politically, San Pedro Sula is organ-ised into six sectors. As in Medellín, these are based on cardinal compass points, and divided into colonias, and then barrios
(neighbourhoods). The northern and west-ern zones of the city (Sectors 1, 2 and 3) are relatively modern, integrated and function-ing urban areas, with relatively high levels of government presence and adequate urban and social services. Sector 1 is the most affluent district in the city, while much of the San Pedro Sula’s professional and busi-ness class is concentrated in Sectors 2 and 3. Further south, Sectors 4, 6 and 8, along with the western part of Sector 5 (border-ing the mountains and known as Satelité) are transitional areas with limited govern-ment presence, high levels of gang influence (described below), variable services and poor infrastructure. Sector 7, along with Rivera Hernandez (the eastern side of Sector 5 bor-dering Satelité) is essentially a no-go area, with virtually no government presence, lim-ited government awareness of conditions in the barrios, and what amounts to autono-mous self-government by militia groups and transnational gangs who provide services (along with minimal protection according to a brutal but effective code of conduct) and often fight to keep the government and its agencies out of their areas.
This is a city experiencing severe stress.
The Tyranny of Rapid Unplanned Population GrowthThis stress largely results from inadequate capacity on the part of cities in Honduras to deal with explosive population growth. Partly driven by the export economy and its attraction effect, which drew popu-lation into the cities, Honduras’ urban population ballooned in the second half of the 20th Century. The country had the highest birth rate in Latin America between 1950 and 1975, with much higher fertility in rural areas than in cities, and far higher birth rates among poorer populations than the middle class. As a result, cities like San Pedro Sula have been swamped by a massive influx of poor rural migrants, overwhelmed by a youth bulge, and unable to provide health, education, employment or security
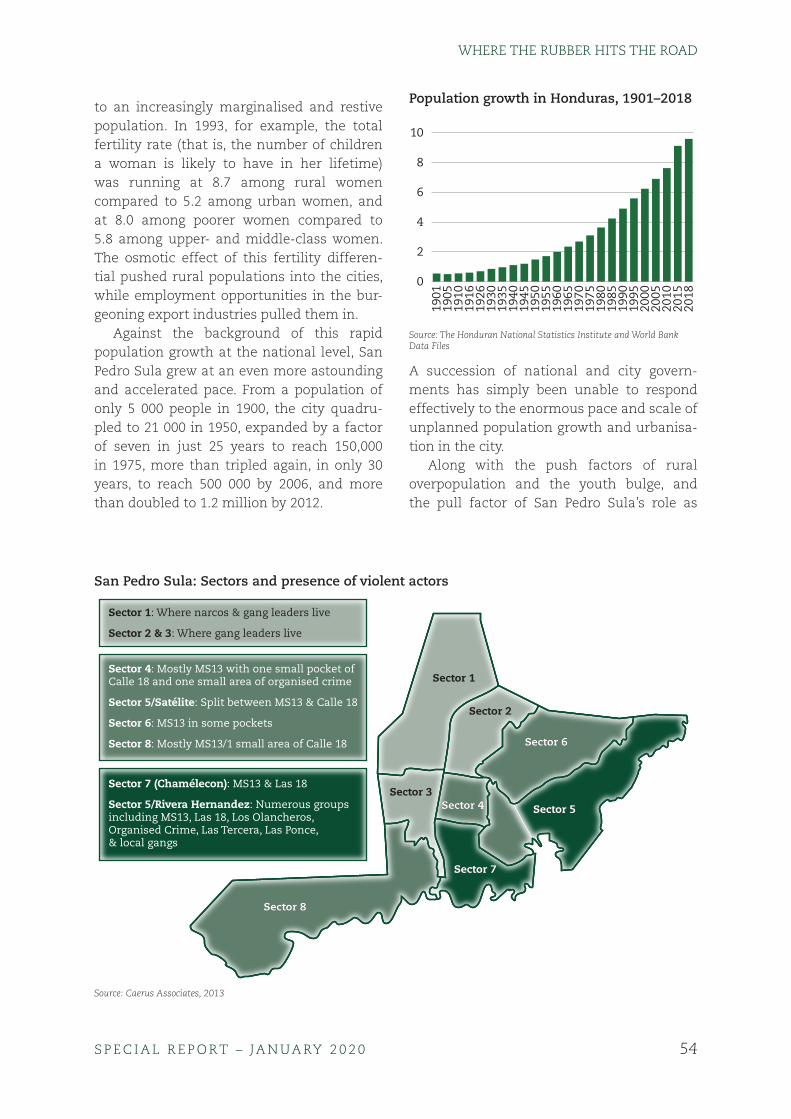
54S P E C I A L R E P O RT – JA N UA RY 2 0 2 0
WHERE THE RUBBER HITS THE ROAD
to an increasingly marginalised and restive population. In 1993, for example, the total fertility rate (that is, the number of children a woman is likely to have in her lifetime) was running at 8.7 among rural women compared to 5.2 among urban women, and at 8.0 among poorer women compared to 5.8 among upper- and middle-class women. The osmotic effect of this fertility differen-tial pushed rural populations into the cities, while employment opportunities in the bur-geoning export industries pulled them in.
Against the background of this rapid population growth at the national level, San Pedro Sula grew at an even more astounding and accelerated pace. From a population of only 5 000 people in 1900, the city quadru-pled to 21 000 in 1950, expanded by a factor of seven in just 25 years to reach 150,000 in 1975, more than tripled again, in only 30 years, to reach 500 000 by 2006, and more than doubled to 1.2 million by 2012.
Population growth in Honduras, 1901–2018
0
2
4
6
8
10
1901
1905
1910
1916
1926
1930
1935
1940
1945
1950
1955
1960
1965
1970
1975
1980
1985
1990
1995
2000
2005
2010
2015
2018
Source: The Honduran National Statistics Institute and World Bank Data Files
A succession of national and city govern-ments has simply been unable to respond effectively to the enormous pace and scale of unplanned population growth and urbanisa-tion in the city.
Along with the push factors of rural overpopulation and the youth bulge, and the pull factor of San Pedro Sula’s role as
San Pedro Sula: Sectors and presence of violent actors
Sector 1
Sector 2
Sector 6Sector 6
Sector 5Sector 5Sector 4Sector 4Sector 3
Sector 7Sector 7
Sector 8Sector 8
Sector 1: Where narcos & gang leaders live
Sector 2 & 3: Where gang leaders live
Sector 4: Mostly MS13 with one small pocket of Calle 18 and one small area of organised crime
Sector 5/Satélite: Split between MS13 & Calle 18
Sector 6: MS13 in some pockets
Sector 8: Mostly MS13/1 small area of Calle 18
Sector 7 (Chamélecon): MS13 & Las 18
Sector 5/Rivera Hernandez: Numerous groups including MS13, Las 18, Los Olancheros, Organised Crime, Las Tercera, Las Ponce, & local gangs
Source: Caerus Associates, 2013

55S P E C I A L R E P O RT – JA N UA RY 2 0 2 0
WHERE THE RUBBER HITS THE ROAD
an economic hub, industrialisation (espe-cially around the apparel industry serving American consumers) triggered massive rural-to-urban migration in the last quarter of the 20th Century, attracting immigrants from all over Honduras who lacked other employment opportunities, and leaving hun-dreds of thousands of people stranded in slum settlements around the city’s periphery. These population flows, along with the city’s spatial layout, its geographic location as the country’s main transportation hub, and local conditions in a series of urban microhabitats around the city, account for the huge level of violence in San Pedro Sula.66
Both the import of raw materials and the export of finished clothes rely on ship-ping and harbour facilities, making the San Pedro Sula-Puerto Cortes corridor – the part of the metro area between the maquilas and the port – the most valuable economic ter-rain in the country. The city itself is shaped like a flattened arrowhead pointing at the port, with inflows of people, goods, money and traffic coming from the south-east, south and south-west, and the major outflow to the north towards Puerto Cortes. Anyone dominating this ‘corner’ has a chokehold on Honduras’s economy – and, unsurprisingly, a large proportion of violence in the city takes place among gangs who are fighting each other for control of this critical economic terrain.
The Most Violent City in the WorldThe result of all this is that, for several years running, San Pedro Sula has topped the list of the world’s most violent cities, with an astonishingly high murder rate of 169 homi-cides per 100 000 inhabitants in 2013.67 The city was the primary source of children flee-ing Central America for the United States during the horrendous child migrant cri-sis of 2014–2015. In 2014, the US Border Patrol apprehended almost 2 600 children travelling alone from San Pedro Sula, more than 2.5 times as many as the next largest source of child migrants, Tegucigalpa,
Honduras’s capital, with just under 1 000. The vast majority were fleeing violence. In 2014 ‘Honduras alone had more homicides than the 28 states of the European Union combined’.68
Existing in parallel with the violent struggle to feed off the legal economy, the competition to control illicit trade is even more violent. Like the banana trade of the 20th Century, or today’s sweatshop economy of T-shirts, sneakers and cheap clothes for the US market, there is a large illicit economy in San Pedro Sula also focused on American consumers – the export of cocaine. But it is not primarily produced inside the country. Rather, cocaine flows into Honduras from Colombia, Bolivia, Venezuela and Ecuador, by land, air and sea. Mexico’s Sinaloa cartel and Las Zetas dominate the drug trade, sub-contracting Honduran gangs to move drugs for them. The Sinaloa cartel largely controls ground-based trafficking into Guatemala and on to Mexico, while other groups – including networks linked to the Venezuelan military and National Guard – dominate sea-based trafficking.
From the early 2000s onward, the surge in the cocaine trade has transformed the pre-existing pattern of gang and criminal violence in San Pedro Sula, which had pri-marily been driven by urban overstretch in the face of Honduras’ massive population growth. Narco-trafficking gangs displaced traditional street gangs, drawn from margin-alised unemployed (or unemployable) youth from the barrios.
The narcos increasingly began to use the city (with its central location, transportation links and excellent access to the US market) as a smuggling hub. The trade and its associ-ated violence surged in 2004–2005 as cocaine traffickers responded to counter-narcotics successes in Colombia (the destruction of the Medellín and Cali cartels and President Alvaro Uribe’s successful demobilisation of the paramilitaries, discussed earlier) along with an increase in US coastal and mari-time interdiction of drug trafficking in the

56S P E C I A L R E P O RT – JA N UA RY 2 0 2 0
WHERE THE RUBBER HITS THE ROAD
Caribbean. In response to these setbacks, narco-traffickers opened new land-based Central American routes through Honduras, El Salvador, Guatemala and Mexico into the US. In Honduras, the narcos took advan-tage of the existing gang structure, and hired local groups – pandillas – as enforc-ers. Transnational cartels paid local gangs in cocaine, creating a domestic drug market in San Pedro Sula, and competition to con-trol this new domestic market became yet another driver of violence in the city.
Violence surged from the mid-2000s onward, as different groups (local street gangs, narcos, and deportees linked to North American gangs) engaged in a bloody turf war across all Honduras’s major cities – including San Pedro Sula – as they vied to control territory and dominate key trans-port routes and hubs. Controlling territory is the key to exploiting the city’s licit economy (the flow of textiles in, and finished clothing out), taking advantage of the city’s central position in the Honduran economy, and also dominating its illicit economy (the flow of cocaine through the city, as well as the local drug smuggling, money laundering and extortion rackets).
The high level of violence in San Pedro Sula is thus, in effect, a toxic by-product of the massive influx of drugs, weapons, money and deportees, on top of existing licit eco-nomic flows driven by the city’s role as a key littoral and business hub. The city is already under pressure to deal with governance and infrastructure challenges. The result is seen in symptoms such as urban disloca-tion, violence, crime and social breakdown. Importantly, these effects aren’t evenly spread: they’re concentrated in at least a dozen micro-habitats, with some city sectors relatively peaceful and quiet, and others the scene of intensely violent competition for control among the various non-state groups, some of them in ‘no-go areas’ outside all government control.
Responding to the ViolenceIn facing the massive upsurge in violence over the past decade, the government in San Pedro Sula simply has simply lacked the capacity to handle the massive influx of thousands of weapons and new gang combatants per year, along with billions of dollars in cocaine, while sustaining a city whose population and area are rapidly grow-ing, but without adequate infrastructure, resources and support systems.
City leaders have limited ability to influ-ence the Honduran criminal justice system, which is administered by the central gov-ernment (based in Tegucigalpa, hundreds of miles away, across jungle-covered mountain ranges). Historically, the central government has operated the justice system in a way that suits its own interests, rather than those of the city. Business leaders in the city, for example, complain that they are required to pay a security tax to the central government supposedly to cover the cost of improve-ments in public safety and business security, but in fact these funds are often held in Tegucigalpa and used for national costs or security measures in other parts of the coun-try, with little of the money ever making its way back to San Pedro Sula.
As another example, the mano dura (‘hard hand’ or ‘iron fist’) policy of 2003–2004, driven by elite-level politics at the central government level, involved an aggressive military and police-led crackdown on gangs. This dramatically backfired, actually increasing violent activity, and driving gangs underground. From operating openly, in the daylight, sporting gang tattoos and identify-ing colours, the gangs tried to blend in. Thus mano dura turned the gangs into dark net-works that were much harder to see and deal with, and created prison fraternities that became training and radicalisation engines for the gangs, so that what had once been a disparate collection of competing groups became much more organised and were

57S P E C I A L R E P O RT – JA N UA RY 2 0 2 0
WHERE THE RUBBER HITS THE ROAD
primed for action, just in time to exploit the influx of drugs when it began to spike in 2005.
Aside from government organisations, the San Pedro Sula Chamber of Commerce is influential in responding to the high level of violence, in part because of the city’s impor-tance in the overall economy of Honduras, but also because its co-chairs are commit-ted to improving the security situation and have formed a Security Committee to work with the government. For the business com-munity in this booming city, extortion and security are major concerns, given the effect on their enterprises. Like small business owners and transport operators, big busi-nesses are forced to pay extortion fees either directly to gangs, or indirectly via bribes and kickbacks to corrupt members of the security services co-opted by narcos or gang leaders. Even more damagingly, the threat of vio-lence against a company’s owners, workforce or facilities forces them to pay high security costs, which amount to an informal tax on every kind of enterprise.
Insights and ObservationsSan Pedro Sula is thus clearly not a good example of best practice in response to urban overstretch and violence – rather, it is offered here as a counterpoint to Medellín, an example of how, given different leader-ship and a different set of national and local circumstances, one city can take a radically different direction from another.
At one level, the sources of San Pedro Sula’s crisis of governance are rather simi-lar to the crisis that afflicted Medellín in the 1990s – rampant criminality, weak state institutions, a large marginalised and unem-ployed population living in peri-urban slums, a youth bulge and poor social and urban
services. At another level, however, the two cities’ situations are quite different. The sheer pace and scale of rapid unplanned urbanisation in Honduras during the 20th Century, and the massive rate of population growth both within the city and via rural-to-urban migration, dwarf anything seen in Colombia. Likewise, the scale of the city’s youth bulge, the extent of its failure of car-rying capacity, and the collapse of city and state institutions in San Pedro Sula is much worse than what occurred in Medellín even at the height of the drug war.
Another aspect of the national envi-ronment with which local leaders have to contend is lack of control over security tools – policing, the justice system, security spend-ing. These are controlled by a distant national government that often acts in its own inter-ests rather than those of the city and tends to ignore the input of local leaders such as the Chamber of Commerce, local community leaders and local elected officials. Given this lack of control, it’s scarcely surprising that Honduras’s security-led (as distinct from security-enabled) approach – epitomised by the mano dura and the deployment of mili-tarised police and security services in harsh crackdowns in violence-afflicted urban areas – has failed to significantly reduce the vio-lence, and in some ways made the situation considerably worse.
Far from the social urbanism of Medellín, with its focus on social inclusion, local own-ership and leadership of initiatives, and improving the physical space to reduce violence in slum settlements and under-resourced neighbourhoods, San Pedro Sula’s top-down, military-led, kinetic approach to ‘cleaning up’ the city is perhaps most clearly an example of what not to do.

58S P E C I A L R E P O RT – JA N UA RY 2 0 2 0
WHERE THE RUBBER HITS THE ROAD
Summary of ObservationsGovernanceThe key observations from this chapter with respect to governance point to the role of national governments in setting the context, particularly the economic conditions and legislative framework, needed for positive city development.
Indonesia’s progress over the past 50 years highlights the importance of eco-nomic growth. In 1970 its per capita income was US$75, less than Nigeria’s at US$209. In the early 1980s it overtook Nigeria and since the late-1990s it has grown rapidly. In 2018, Nigeria’s GDP per capita (measured in constant 2010 terms) was US$2 396 while Indonesia’s stood at US$4 284.69 With growth has come opportunity and development. At the core of this transformation has been economic diversification, job creation, and the leveraging of increasing urbanisation by business. It is this long-term growth that separated Indonesia’s development trajec-tory from those of many African countries and without such growth, city development becomes much more challenging.
Brazil likewise points to the need for con-tinuous reforms. This is highlighted by the success of the reforms that brought hyperin-flation under control, widened social welfare and developed robust institutions, thus sup-porting much of the progress made in recent years. But this also includes those reforms still required to deal with Brazil’s current ‘moral crisis’ and the corruption that lies at its core.
InfrastructureOne of the major challenges for cities as they start to grow rapidly is how to ensure mobil-ity for their populations: the traffic jams in Nairobi and Lagos, to name just two African cities, are already legendary. Curitiba’s now world famous ‘Bus Rapid Transport’ and Medellín’s system of cable cars illustrates how such mobility can be achieved without the need to resort to the huge expense of
retrofitting a city metro system. As Indonesia demonstrates, light, over-ground rail also offers a cost-effective solution. Such sys-tems, however, need both clever thinking in their application and design, discipline in their operation and the imperative to remain conscious of the huge taxi and minibus sys-tems that have grown up in their absence.
Brazil has demonstrated a love for grand schemes and big projects, though its results have been mixed and expensive. The pro-gress of Brasília is thought provoking in this respect: a new city designed to a grand plan with the car as the assumed means of transport and a city centre light on accom-modation, an approach that is flawed in the light of the realities 60 years later.
Jakarta offers another approach where individual architectural follies appear to have been substituted for a city plan. Now behind the curve of a growing population, the city is trying to catch up. Its triple chal-lenge of lack of both public transport and public housing combined with the need to sync short-term expediencies with longer-term needs are challenges to which many African cities can relate.
Human CapitalThe huge progress made by Singapore since independence, when its starting point was similar to many African countries, is both thought provoking and thoroughly studied. The key to Singapore’s success appears to lie in the soft issue of human capital.
First, Lee Kuan Yew was a strong leader with a clear vision of what was needed and the leadership qualities to drive change. Second, the people of Singapore bought into the concept of ‘national good’ and were pre-pared to sacrifice personal gain for national advancement. The land reform undertaken to ensure city development clearly dem-onstrates this aspect. The contrast with Brasília’s land ownership difficulties could not be starker. Finally, when the skills
59S P E C I A L R E P O RT – JA N UA RY 2 0 2 0
WHERE THE RUBBER HITS THE ROAD
required for planning and development did not exist, the government was not afraid to bring them in from outside. This is quite the opposite of an approach, sometimes seen in Africa, of technical expertise working on iso-lated projects in the absence of a plan.
The success of Curitiba also seems to have stemmed from continuity of both leader-ship and planning. Jaime Lerner’s view bears serious consideration: ‘Solving problems is not related to scale, or the size of the city, or financial resources. The challenge is in organisation, and in creating shared respon-sibility between citizens and government, and public and private sectors. Otherwise you won’t get the outcome you need.’
SecurityThe Latin American experience has been that when the rate of urban growth outstrips planning and informal settlements, with lit-tle in the way of government presence and service delivery, are allowed to spring up around the city, security challenges follow. When this uncontrolled growth is combined with the spread of the drugs trade, such security challenges are greatly magnified, primarily due to corrupting effect of large amounts of money.
In the case of San Pedro Sula, a heavy-handed security operation in reaction to a surge in violent crime merely drove the
problem deeper underground, making it harder to see and thus tackle.
Meanwhile, the relative successes of Medellín and Recife in dealing with their considerable security challenges owe their origins to an approach that recognised that the violence was a symptom of deep social issues, of communities that felt excluded from and antagonistic towards government. Their approach was to combine a better coor-dinated and resourced security operation with attempts to tackle the underlying social issues. Their plans recognised the impor-tance of local identification and ownership of both the problems and the solutions. As a result, the governments of both Medellín and Recife consulted extensively with the local communities in order to develop solu-tions and backed this up with the allocation of resources.
Such methods represented a break with more traditional central planning approaches used previously. The resultant reduction in violence was dramatic and was only reversed, in the case of Recife, when the economy deteriorated leading to more economic pressure on the communities and fewer resources available to government. In both cases, government plans were under-pinned by comprehensive assessment and monitoring designed to ensure the leadership was aware of both progress and setbacks.

60S P E C I A L R E P O RT – JA N UA RY 2 0 2 0
WHERE THE RUBBER HITS THE ROAD
Section Two African City Case-Studies
Lagos: The Relentless City
Quick Facts
Population: The Lagos population increased from 1.4 million in 1970 to 21 million in 2019, and is predicted to reach 88 million in 2100, making Lagos the world’s largest city.Energy: 45% have access to electricity.Housing: There is a shortage of at least two million housing units. The mortgage rate is 38%.Transport: Lagosians spend nearly 3 billion hours in traffic annually.Revenue: Lagos accounts for 37% of Nigeria’s revenue.
The stilt houses of the Makoko commu-nity on the edge of Lagos lagoon have long been a centrepiece of western poverty porn. Around 100 000 people, most of whom are children, live in appallingly unhealthy con-ditions, where malaria and typhoid are rife. The water is a petrol black, full of faeces and much else. Yet the community retains a strong attachment to the area and each other, partly because of its ethnic homo-geneity (most are Egun), its shared fishing dependency, its 100-year history, and because of the absence of viable options for improvement. Whatever the promises of gov-ernment are about new housing and a better life, the inhabitants prefer to hang onto what they have.
Africa’s largest city, Lagos70 represents both the promise and the fear of the inter-section of demography and urbanisation.71 Despite two-thirds of the city’s people already living in slum conditions, its popu-lation has more than doubled to around 21 million over the last 20 years, and it is estimated that it will double again over the next three decades. Unless things change, this will increase to a staggering 88 million by 2100. This rapid growth has placed an inordinate strain on already faltering infra-structure, especially housing, transport and
electricity. Fixing these legacy problems will not be easy; preparing for future growth magnifies these challenges.
Attempts to reduce the housing deficit, estimated to be at least two million units, are made more difficult by limited mortgage options and interest rates of about 38%, a reflection both of heavy government bor-rowing in the market to fund its own needs and high risk. The barriers to ownership are compounded by the high cost of building materials, legendary difficulties in determin-ing land title, opaque building regulations and a sedentary legal system.
An opinion survey commissioned by The Brenthurst Foundation in the course of this study showed that just 21% of Lagosians find housing in the city affordable.
This has hampered the introduction of low-cost housing schemes. Upgrades to slum areas have been hobbled, too, by a lack of continuity between governments. A pet pro-ject for one governor is not necessarily the same for another.
As a result, many people live in extremely tough conditions, amidst open sewers and strewn plastic garbage. Up to 60% of Lagos State experiences floods each year. The city produces 210 million litres of water per day against a requirement of 794 million litres.
61S P E C I A L R E P O RT – JA N UA RY 2 0 2 0
WHERE THE RUBBER HITS THE ROAD
Nearly 70% of households lack access to sanitation and a million-plus families do not receive any waste collection services.
Unsurprisingly, some 86% of Lagosians agree that water and sanitation urgently need to be improved.
A poorly integrated transport system, and a failure to fully employ the city’s numer-ous waterways, means that Lagosians spend nearly three billion hours in traffic annu-ally, an average of four hours each per day. The main port of Apapa has long been ham-strung by work to upgrade the access road, requiring trucks to queue for up to a month to collect containers. Yet no less than 90% of daily passenger movement in Lagos is still by road. Promises to improve the transport sys-tem have outweighed delivery even though the state government has introduced a Bus Rapid Transport system alongside its Lagbus network, is building a monorail and plans to introduce a new ferry system.
There is little doubt that Lagosians deserve better than the service provided by 50 000 yellow minibus Danfos, famous for their lack of road manners (even by Nigerian standards) and touts hanging out of the open doors of dilapidated vehicles.
Little wonder that 87% of the city believes that transport urgently needs to be tackled.
Life is made tougher by a serious lack of electricity. Despite Nigeria’s status as Africa’s largest oil producer, with some 2 mil-lion barrels per day of production in 2018, the country has an installed power capac-ity of just 7 100 MW, of which 4 100 MW is available for generation. On average Lagos receives just 700MW of this capacity. A low 45% of the population has access to the power grid. As a result, 80% of households rely on diesel generators. At the core of the problem is neglected infrastructure, a cul-ture of non-payment and a practice of illegal connections, with just 20% paying their bills. Some 82% of Lagosians surveyed say that electricity provision needs to urgently be improved.
Lagos epitomises the future challenges that African cities face, but on a scale that
amplifies the stresses and strains of urbani-sation. At the same time, the city offers insights on how cities can create systems of self-governance in the absence of formal structures and provides a cautionary tale about how necessity has led to the building of informal governance methods that pro-vide more legitimacy than due process. The city encapsulates the continent’s challenges in urban development and presents les-sons on what drives change. While Lagos is Africa’s Everest, understanding how it works will help to prepare us for the continent’s increasingly urban future.
GovernanceRapid population growth, poor service deliv-ery, high levels of informality, and a history of military dictatorship have combined to make Lagos almost ungovernable. But it’s the almost that’s important, because amidst its complexity and dysfunction, Lagos remains one of Nigeria’s best-performing states.
Lagos operates under Nigeria’s three-tier federal system as a city-state. Created in 1999 at the end of military rule, the system places the federal government on top with the primary legislative authority, the state government, beneath it and the local govern-ment as the final tier, linking citizens to the bureaucracy.72 The head of the state is the Governor, supported by a 40-member House of Assembly that enacts legislative decisions.
The country’s 36 states form part of a rev-enue-sharing arrangement with the Federal Government that disburses funds from the national pot, mostly raised through oil and gas exports, to the states, with the amount based on various formulas. The state gov-ernments have wide administrative powers, one of which is to generate their own reve-nues. Lagos’s Internally Generated Revenues significantly surpass those raised by other Nigerian states.
The restoration of civilian governance and democratic elections in 1999 promoted political competition and strong incentives for reform. Historically, Lagos has been an opposition-led state. This changed in 2015
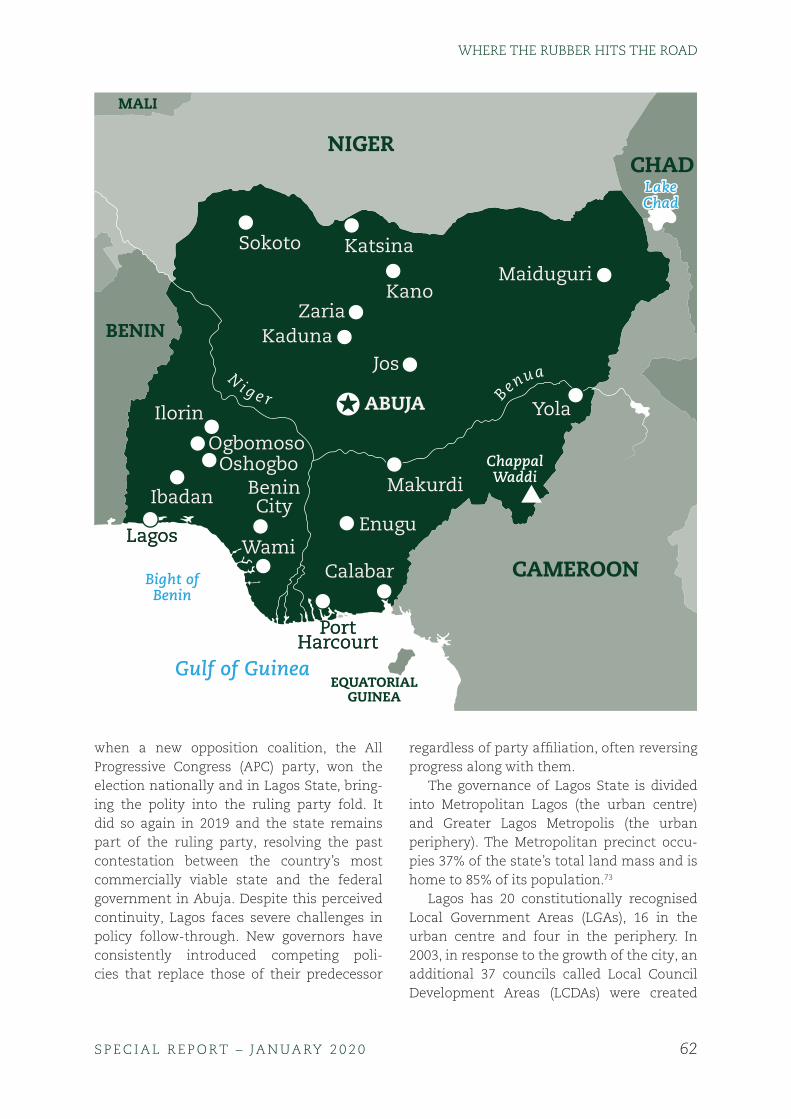
62S P E C I A L R E P O RT – JA N UA RY 2 0 2 0
WHERE THE RUBBER HITS THE ROAD
when a new opposition coalition, the All Progressive Congress (APC) party, won the election nationally and in Lagos State, bring-ing the polity into the ruling party fold. It did so again in 2019 and the state remains part of the ruling party, resolving the past contestation between the country’s most commercially viable state and the federal government in Abuja. Despite this perceived continuity, Lagos faces severe challenges in policy follow-through. New governors have consistently introduced competing poli-cies that replace those of their predecessor
regardless of party affiliation, often reversing progress along with them.
The governance of Lagos State is divided into Metropolitan Lagos (the urban centre) and Greater Lagos Metropolis (the urban periphery). The Metropolitan precinct occu-pies 37% of the state’s total land mass and is home to 85% of its population.73
Lagos has 20 constitutionally recognised Local Government Areas (LGAs), 16 in the urban centre and four in the periphery. In 2003, in response to the growth of the city, an additional 37 councils called Local Council Development Areas (LCDAs) were created
NIGERCHAD
CAMEROON
BENIN
MALI
EQUATORIALGUINEA
ABUJAABUJA
JosJos
ZariaZaria
SokotoSokoto KatsinaKatsina
MakurdiMakurdi
EnuguEnuguWamiWami
BeninCity
BeninCity
CalabarCalabar
PortHarcourt
PortHarcourt
LagosLagos
KanoKano
YolaYola
KadunaKaduna
OshogboOshogboOgbomosoOgbomoso
IlorinIlorin
IbadanIbadan
MaiduguriMaiduguri
Gulf of Guinea
Bight ofBenin
LakeChad
ChappalWaddi
BenuaNi g e r

63S P E C I A L R E P O RT – JA N UA RY 2 0 2 0
WHERE THE RUBBER HITS THE ROAD
under the administration of Governor Bola Tinubu. This decision was highly controver-sial because it brought the total number of local government entities to 57 and frag-menting the city74 and led then-president Olusegun Obasanjo to cut Lagos’s access to funds from the federal account.
Lagos’ institutional framework presents a major challenge for the fiscal and admin-istrative autonomy of its LGAs. While there are high expectations for service delivery at the local level, the LGAs are perceived to lack real autonomy within the federal system.
Constitutionally, LGAs are mandated to provide primary health care and basic edu-cation, water supply and sewer reticulation, public infrastructure upgrades and agricul-ture services. However, at least 60% of LGA budgets are allocated to capital projects, leaving scant resources for critical servic-es.75 LGA chairmen complain about their budgets being far too small to deliver against their mandate. While they are permitted to raise funds of their own, LGA fundraising is restricted to 20 sources listed in the Lagos State Local Government Levies Law. On the public end, the budgetary information of LGAs is often not published, nor transparent, which limits public access to spending pat-terns and undermines democracy.
The Local Chairman of Lagos Island, Tijani Adetoyese Olusi, has remarked, ‘We are closest to the people on the ground, yet we cannot afford to fulfil our responsibilities. Lagos State needs to work out how best to use LGAs efficiently and effectively.’
CorruptionPublic sector corruption is a constant challenge in Lagos, making the city’s devel-opment all the more difficult. Corruption drains funds for key projects and deters international investors. Some 72% of ordinary Nigerians perceive the level of cor-ruption to have increased significantly in Nigeria in recent years, particularly among civil servants.76
The continued governance of Lagos by the APC77 has raised concerns about the depth of political patronage networks within the party and the State itself.78 Corruption in the Lagos State Police Command of the Nigerian Police Force is perceived to one of the worst problem areas. More than 80% of survey respondents admitted to bribing the police in 2016, followed by 22% to the tax services and 24% to the Judiciary.79
The private sector battles to engage with the government of Lagos and its agencies. Despite being Nigeria’s commercial hub, the city ranks 37 out of 37 states for dealing with construction permits on the World Bank’s 2018 Doing Business in Nigeria report.80 The process for allocating urban land is unclear, with regulations such as the State Building Code rarely enforced while over-regulation occurs elsewhere.
Urban FinanceLagos is Nigeria’s most financially independ-ent state. In 2016, only 21.7% of the State’s revenue came from the federal government.81 Its collections accounted for 37% of state-level internally generated revenues across Nigeria. Most revenue collections come from the formal sector, with limited penetration into Lagos’s informal sector, which accounts for most business activity, seriously under-mining the overall potential collections in the state.
The Nigerian Constitution mandates that state governments provide social services and infrastructure, resulting in over a quar-ter of all federal revenue from the Federal Accounts Allocation Committee (FAAC) being channelled to these administrations, com-monly known as the federal allocation.82 This funding is intended to supplement the revenue collected through state taxes, although very few states’ IGRs surpass or even equal the amount provided by the fed-eral allocation.83
Lagos, however, is the exception. Not only does the state generate nearly 80% of its revenue internally, its inter-governmental

64S P E C I A L R E P O RT – JA N UA RY 2 0 2 0
WHERE THE RUBBER HITS THE ROAD
revenue (IGR) is nearly seven times the national IGR per capita.84 This is largely because of the relative weight of the private sector in Lagos, which is home to most of the multinational companies operating in the country and the headquarters of the major-ity of Nigerian corporations.
Despite advances in collections, the infor-mal sector remains largely untouched. While informal operators in Lagos’ commercial and transportation sectors often report having to pay ‘taxes’ daily to various entities, these collections do not make it into the official funds and are not part of the LIRS formal payment system. Lagos has an estimated ten million eligible taxpayers, yet only 5.8 million currently pay formal taxes. The city is constantly looking for ways to bring thou-sands of small traders into the net and the Federal Government has introduced a new identity card and is making its use manda-tory for essential services, which will help to formally capture citizens’ details. The last census was in 2012.
In the 2017 Lagos State Budget, the high-est percentage of expenditure was dedicated to capital investment, which the city des-perately needs. However, Lagos’ budget statements are notorious for being purpose-fully vague and lacking the detail that would allow policy makers and citizens to hold the state accountable for its expenditure.85 The governance of Lagos State is a study in opac-ity, managing to be sophisticated, achieving the complex feat of generating revenue through taxes in a challenging environment, and yet failing to provide basic services to residents. Citizens and the private sector have come to see the tiers of government as being driven by patronage and self-interest of officials rather than prioritising the deliv-ery of their service mandate. There will need to be a distinct change in the social contract between the state and individuals if Lagos is to achieve its full potential as one of Africa’s megacities, because in 2018, 37% of survey respondents were not able to list a single achievement of government.
Economic GrowthIn 2014, Lagos was ranked as the continent’s seventh largest economy ahead of Kenya and Côte d’Ivoire,86 a position that inures investors to the considerable challenges of doing business, most notably, inadequate infrastructure, expensive power and a sticky bureaucracy.
Lagos has strong services and manufac-turing sectors, and its relatively high internal revenues make its economy significantly less dependent on Federal revenues, funded mostly by oil and gas exports, than other states in Nigeria. Many large businesses, such as Tata Motors, have set up assembly plants in and around the city, operating alongside the existing 3.2 million small, medium and micro enterprises. Lagos has an estimated GDP of US$136.6 billion.87
Once the capital of Nigeria, Lagos has been a longstanding entry point for for-eign investment in the country, and in 2017, received US$5.49 billion in foreign investment in the telecommunications, financial services and real estate sectors. Approximately 60% of industrial investments in Nigeria are directed to Lagos, while 90% of companies across Nigeria have chosen to locate their headquarters in the city.
Lagos is also home to Nigeria’s largest port, which contributes the lion’s share of the country’s N232.42 billion annual revenue from its ports.88 To leverage its position, the state is developing free trade zones inside and on the perimeters of the city. The Lekki Free Trade Zone, the largest of the projects, is finally coming to life after years of delays, with Africa’s largest oil refinery currently being erected on the site by Nigeria’s biggest company, the Dangote Group.
The Lagos State Development Plan for 2012–2025 aims to build on the city’s eco-nomic prowess and develop Lagos as ‘Africa’s model mega-city and global, economic and financial hub by 2025.’ These efforts have resulted in a notable improvement for Lagos on the World Bank’s Ease of Doing Business, ranked 169th in 2017 and jumping to 145th

65S P E C I A L R E P O RT – JA N UA RY 2 0 2 0
WHERE THE RUBBER HITS THE ROAD
in 2018, and registering as a top ten improver across all global cities assessed by the Bank.89 As the economy keeps growing, and policy reforms are implemented to expand key productive sectors, Lagos is set to surpass Johannesburg by 2035 and become Africa’s second-largest city by GDP behind Cairo.90 A key question is whether the Lagos of the future will be ready to absorb the growing number of workers.
The city’s success attracts the best and brightest of the country’s labour force, with 21% of Lagosians holding at least one degree from a tertiary institution. One sector that has shown labour absorptive growth is the informal economy. In the last quarter of 2015, 95.4% of new jobs were created in the informal sector, relative to 5.5% in the for-mal sector.91 Some 65% of Lagos’ working population is in the informal sector and it accounts for an estimated 42% of all eco-nomic activities.92
The informal economy is resilient, with its own efficient rules and procedures that have evolved over time to keep the wheels of commerce turning. The informal economy accounts for much of the transportation, manufacturing, real estate, building and construction, retail and wholesale and Nollywood sectors. In fact, with the low lev-els of government service provision it would be impossible for Lagos residents to com-mute without the services of the informal transportation industry, made up of the Danfos, Okadas and Keke Mawras. The infor-mal economy is the backbone of the city’s economic prowess, providing nimble solu-tions to the bureaucratic stickiness that holds Lagos hostage.
Lagos is a city where US$600 swimsuits are sold on a street filled with potholes and poor drainage. It is a city where, depending on which part of town you’re in, you’re just as likely to bump into a Harvard educated millionaire as you are to someone living on less than a dollar a day. Lagos doesn’t fit eas-ily into any traditional narratives. The high density, mobility and purchasing power of its
market are enough to warrant investment. As the head of Investor relations at Africa Capital Alliance, Kikelomo Longe, said, ‘Lagos is looking to be the financial hub of West Africa, and investors are ready to come; they just need to find bankable projects.’
HousingNigeria suffers from a massive housing defi-cit, currently estimated at 17 million units. In Lagos alone, the shortfall varies between two and five million units, with about 70% of Lagosians living informally without access to basic services.93 This problem is compounded by the fact that 3 000 migrants move to the city each day, or an estimated 86 per hour.94 This section examines the nature of Lagos’ housing crisis and the possibility for state-sanctioned, self-build initiatives to change the city’s housing landscape.
The provision of housing in Lagos is dominated by the private sector, with public provision at just 20%.95 Property prices mirror the city’s inequality, ranging from US$4 000/m² (N1.4 million)96 on the Eko Atlantic estate, to monthly rentals of US$8 (N2 880) in an informal settlement.
The polarisation of the housing market has led the private sector to invest heavily in medium- to high-end property development, leaving few options for low-income families. Lekki is one such example – a few decades ago, most of the area was thick forest. Today, it is packed with housing estates and office blocks, envisioned as Lagos’s new commer-cial centre for the needs of high-income residents. ‘The low end of the market is not profitable,’ shares Lamre Sola-Olumofe of Brook Assets and Resources Ltd, ‘We are not charities. Building materials and land cost the same, and we have to build to sell.’
On the supply side, the provision of affordable housing is marred by difficulty at all levels of the building process. Financing is onerous to acquire, with high lending rates across the board. The official procedures for proper building approvals are incredibly slow and many developers are encouraged
66S P E C I A L R E P O RT – JA N UA RY 2 0 2 0
WHERE THE RUBBER HITS THE ROAD
to pay bribes to smooth the process. Lagos produces very few of its own building mate-rials, leading to input costs that are at least double what they would be elsewhere. The city also suffers from a shortage of skilled labour and artisans who are often brought in from neighbouring countries. There are also land shortages with so much of the city surrounded by water. As a member of the Ministry of Physical Planning remarked, ‘Land supply is fixed but demand for land keeps growing, we need to densify but that also comes with issues.’
Lagos also faces acute challenges on with housing demand. Whilst demand for hous-ing exists at all income levels, earners on the minimum wage are unable to afford housing contributions above US$15 (N5 400) a month. In addition, Lagos’ poorly developed mort-gage market limits access to well-priced, long-term mortgages. So, even people who can access loans are deterred by exorbitant interest rates of up to 24%. This has created a dynamic where residents are unable to buy property unless they can provide the full cost of the house upfront. As one survey respond-ent noted, ‘If the economy continues the way that it is … they may not afford to live in Lagos. People will actually have to go back.’
The Lagos Housing Ministry has not been able to provide a public solution to the hous-ing shortage. Between 1979 and 2017, only 25 880 housing units were constructed by the Ministry,97 the majority of which occurred during the tenure of Governor Jakande (1979–1983).98
Building the required 2–5 million houses falls outside the government’s financial scope. In 2017, the allocated budget for Housing and Community Amenities was N50.344 billion (US$140 million), 6.2% of the State’s N813 billion (US$2.26 billion) budget. New government units are priced well out of the average low-income family’s reach. These range from N3 to N15 million, with a minimum bond repayment of over N60 000/month on a 20-year loan. It appears even
state-driven housing solutions crowd out many Lagosians.
Governor Akinwunmi Ambode, who served between 2015 and 2019, had an ambi-tious agenda to transform the city into the continent’s third-largest economy. Several housing initiatives were launched during his tenure. One such programme is a state mort-gage scheme operated by the Lagos Building Investment Company (LBIC). Yet, this pro-duced only 27 mortgages, mainly due to underfunding and underspending.
In the absence of a housing market that caters to their needs, most Lagosians are left to build housing on their own. For low-income residents, this often means informal and unsafe building practices in areas where secure tenure is unheard of. For wealthier residents, the self-build process is more for-mal and relies on houses being built over years as both funds and building permis-sions trickle in.
The Lagos Urban Renewal Authority (LASURA) has driven a different approach to housing that looks at options for in situ upgrading. ‘The government should not be in the business of building houses from scratch,’ says its Director Lateef Sholebo. ‘It must create an enabling environment for others to do so. If best practices are used, there is room for improvement,’ assures Sholebo.
The problem of suitable housing is one that is too complex for government to solve alone. Lagos needs to develop the means to deal with its current backlog as well as pre-pare for its future growth. The state system in place has been to promise new housing developments at the start of each Governor’s term, with limited commitment to complete the housing projects already under construc-tion. The response of the private sector has been to create high-cost housing with guar-anteed returns. Whilst both strategies have been pragmatic in terms of political and financial expediency, they have led to the enormous shortage we see today. Until the city taps into the self-build model currently
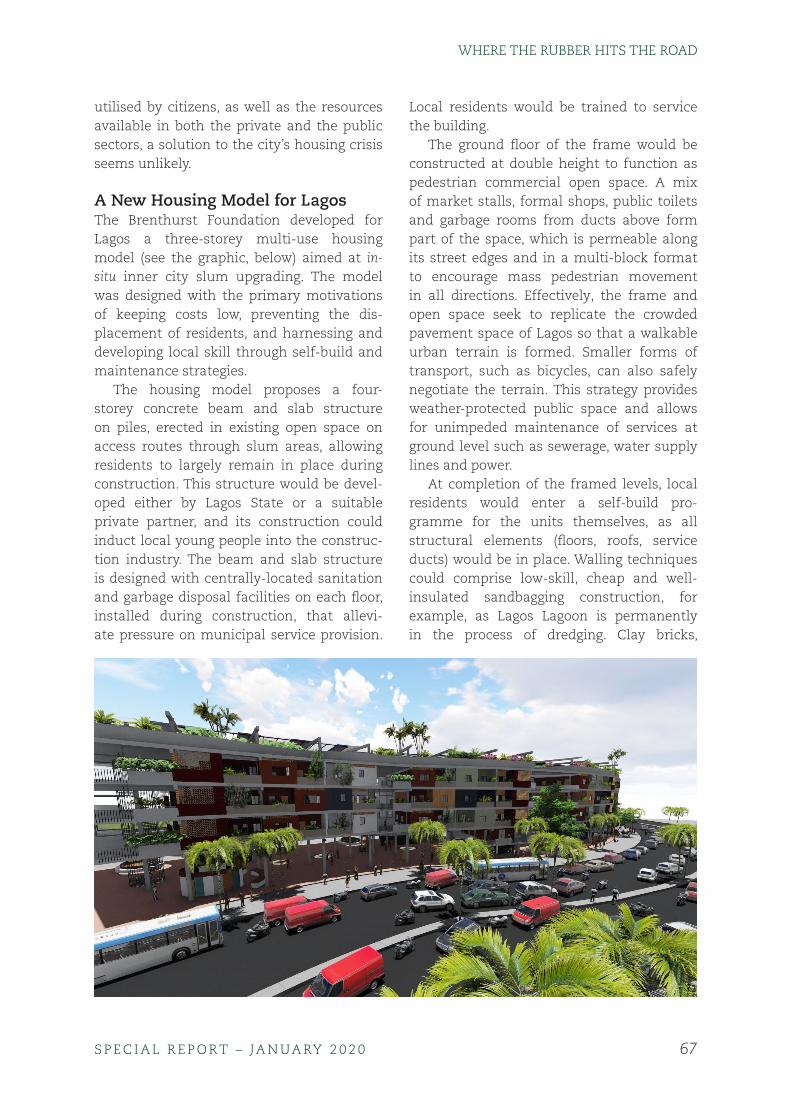
67S P E C I A L R E P O RT – JA N UA RY 2 0 2 0
WHERE THE RUBBER HITS THE ROAD
utilised by citizens, as well as the resources available in both the private and the public sectors, a solution to the city’s housing crisis seems unlikely.
A New Housing Model for LagosThe Brenthurst Foundation developed for Lagos a three-storey multi-use housing model (see the graphic, below) aimed at in-situ inner city slum upgrading. The model was designed with the primary motivations of keeping costs low, preventing the dis-placement of residents, and harnessing and developing local skill through self-build and maintenance strategies.
The housing model proposes a four-storey concrete beam and slab structure on piles, erected in existing open space on access routes through slum areas, allowing residents to largely remain in place during construction. This structure would be devel-oped either by Lagos State or a suitable private partner, and its construction could induct local young people into the construc-tion industry. The beam and slab structure is designed with centrally-located sanitation and garbage disposal facilities on each floor, installed during construction, that allevi-ate pressure on municipal service provision.
Local residents would be trained to service the building.
The ground floor of the frame would be constructed at double height to function as pedestrian commercial open space. A mix of market stalls, formal shops, public toilets and garbage rooms from ducts above form part of the space, which is permeable along its street edges and in a multi-block format to encourage mass pedestrian movement in all directions. Effectively, the frame and open space seek to replicate the crowded pavement space of Lagos so that a walkable urban terrain is formed. Smaller forms of transport, such as bicycles, can also safely negotiate the terrain. This strategy provides weather-protected public space and allows for unimpeded maintenance of services at ground level such as sewerage, water supply lines and power.
At completion of the framed levels, local residents would enter a self-build pro-gramme for the units themselves, as all structural elements (floors, roofs, service ducts) would be in place. Walling techniques could comprise low-skill, cheap and well-insulated sandbagging construction, for example, as Lagos Lagoon is permanently in the process of dredging. Clay bricks,
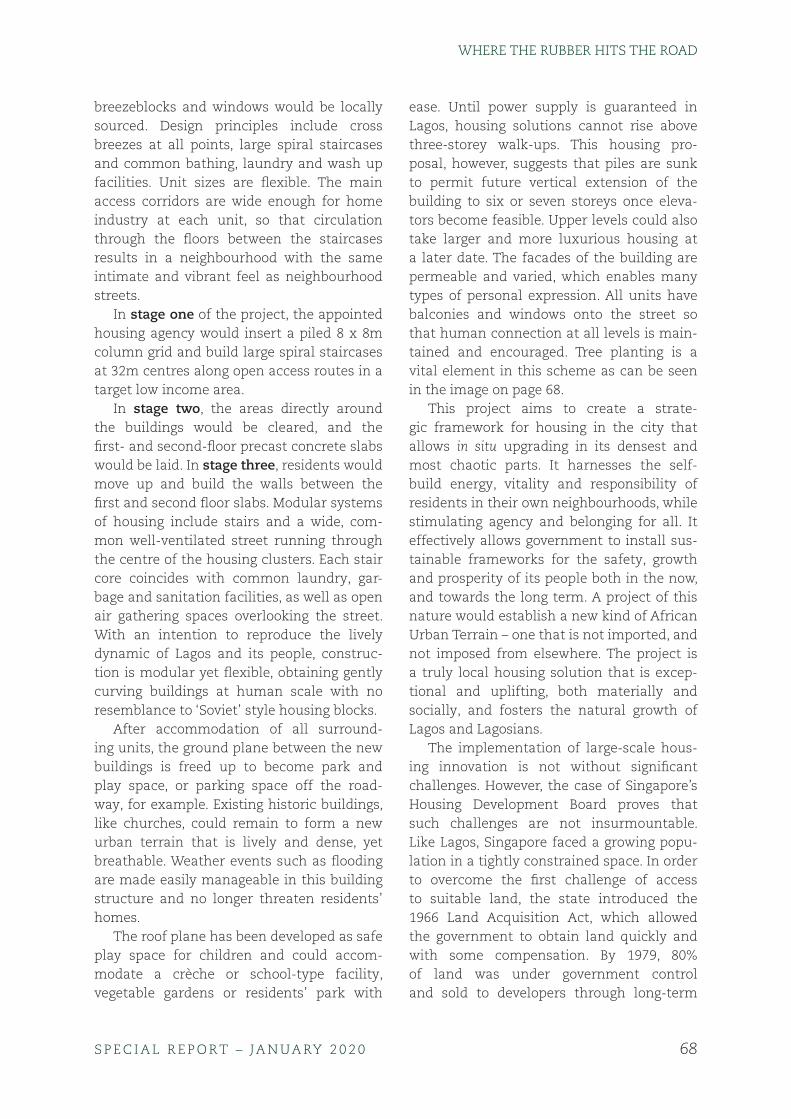
68S P E C I A L R E P O RT – JA N UA RY 2 0 2 0
WHERE THE RUBBER HITS THE ROAD
breezeblocks and windows would be locally sourced. Design principles include cross breezes at all points, large spiral staircases and common bathing, laundry and wash up facilities. Unit sizes are flexible. The main access corridors are wide enough for home industry at each unit, so that circulation through the floors between the staircases results in a neighbourhood with the same intimate and vibrant feel as neighbourhood streets.
In stage one of the project, the appointed housing agency would insert a piled 8 x 8m column grid and build large spiral staircases at 32m centres along open access routes in a target low income area.
In stage two, the areas directly around the buildings would be cleared, and the first- and second-floor precast concrete slabs would be laid. In stage three, residents would move up and build the walls between the first and second floor slabs. Modular systems of housing include stairs and a wide, com-mon well-ventilated street running through the centre of the housing clusters. Each stair core coincides with common laundry, gar-bage and sanitation facilities, as well as open air gathering spaces overlooking the street. With an intention to reproduce the lively dynamic of Lagos and its people, construc-tion is modular yet flexible, obtaining gently curving buildings at human scale with no resemblance to ‘Soviet’ style housing blocks.
After accommodation of all surround-ing units, the ground plane between the new buildings is freed up to become park and play space, or parking space off the road-way, for example. Existing historic buildings, like churches, could remain to form a new urban terrain that is lively and dense, yet breathable. Weather events such as flooding are made easily manageable in this building structure and no longer threaten residents’ homes.
The roof plane has been developed as safe play space for children and could accom-modate a crèche or school-type facility, vegetable gardens or residents’ park with
ease. Until power supply is guaranteed in Lagos, housing solutions cannot rise above three-storey walk-ups. This housing pro-posal, however, suggests that piles are sunk to permit future vertical extension of the building to six or seven storeys once eleva-tors become feasible. Upper levels could also take larger and more luxurious housing at a later date. The facades of the building are permeable and varied, which enables many types of personal expression. All units have balconies and windows onto the street so that human connection at all levels is main-tained and encouraged. Tree planting is a vital element in this scheme as can be seen in the image on page 68.
This project aims to create a strate-gic framework for housing in the city that allows in situ upgrading in its densest and most chaotic parts. It harnesses the self-build energy, vitality and responsibility of residents in their own neighbourhoods, while stimulating agency and belonging for all. It effectively allows government to install sus-tainable frameworks for the safety, growth and prosperity of its people both in the now, and towards the long term. A project of this nature would establish a new kind of African Urban Terrain – one that is not imported, and not imposed from elsewhere. The project is a truly local housing solution that is excep-tional and uplifting, both materially and socially, and fosters the natural growth of Lagos and Lagosians.
The implementation of large-scale hous-ing innovation is not without significant challenges. However, the case of Singapore’s Housing Development Board proves that such challenges are not insurmountable. Like Lagos, Singapore faced a growing popu-lation in a tightly constrained space. In order to overcome the first challenge of access to suitable land, the state introduced the 1966 Land Acquisition Act, which allowed the government to obtain land quickly and with some compensation. By 1979, 80% of land was under government control and sold to developers through long-term
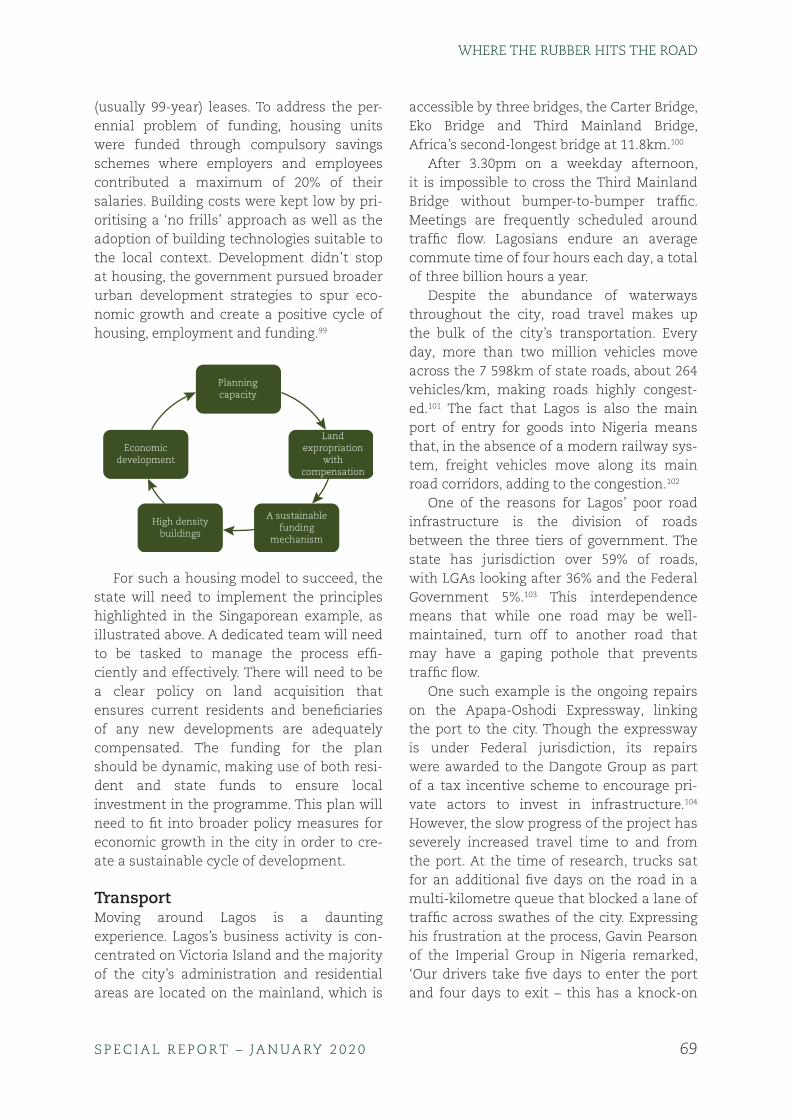
69S P E C I A L R E P O RT – JA N UA RY 2 0 2 0
WHERE THE RUBBER HITS THE ROAD
(usually 99-year) leases. To address the per-ennial problem of funding, housing units were funded through compulsory savings schemes where employers and employees contributed a maximum of 20% of their salaries. Building costs were kept low by pri-oritising a ‘no frills’ approach as well as the adoption of building technologies suitable to the local context. Development didn’t stop at housing, the government pursued broader urban development strategies to spur eco-nomic growth and create a positive cycle of housing, employment and funding.99
Planningcapacity
Landexpropriation
withcompensation
A sustainablefunding
mechanism
High densitybuildings
Economicdevelopment
For such a housing model to succeed, the state will need to implement the principles highlighted in the Singaporean example, as illustrated above. A dedicated team will need to be tasked to manage the process effi-ciently and effectively. There will need to be a clear policy on land acquisition that ensures current residents and beneficiaries of any new developments are adequately compensated. The funding for the plan should be dynamic, making use of both resi-dent and state funds to ensure local investment in the programme. This plan will need to fit into broader policy measures for economic growth in the city in order to cre-ate a sustainable cycle of development.
TransportMoving around Lagos is a daunting experience. Lagos’s business activity is con-centrated on Victoria Island and the majority of the city’s administration and residential areas are located on the mainland, which is
accessible by three bridges, the Carter Bridge, Eko Bridge and Third Mainland Bridge, Africa’s second-longest bridge at 11.8km.100
After 3.30pm on a weekday afternoon, it is impossible to cross the Third Mainland Bridge without bumper-to-bumper traffic. Meetings are frequently scheduled around traffic flow. Lagosians endure an average commute time of four hours each day, a total of three billion hours a year.
Despite the abundance of waterways throughout the city, road travel makes up the bulk of the city’s transportation. Every day, more than two million vehicles move across the 7 598km of state roads, about 264 vehicles/km, making roads highly congest-ed.101 The fact that Lagos is also the main port of entry for goods into Nigeria means that, in the absence of a modern railway sys-tem, freight vehicles move along its main road corridors, adding to the congestion.102
One of the reasons for Lagos’ poor road infrastructure is the division of roads between the three tiers of government. The state has jurisdiction over 59% of roads, with LGAs looking after 36% and the Federal Government 5%.103 This interdependence means that while one road may be well-maintained, turn off to another road that may have a gaping pothole that prevents traffic flow.
One such example is the ongoing repairs on the Apapa-Oshodi Expressway, linking the port to the city. Though the expressway is under Federal jurisdiction, its repairs were awarded to the Dangote Group as part of a tax incentive scheme to encourage pri-vate actors to invest in infrastructure.104 However, the slow progress of the project has severely increased travel time to and from the port. At the time of research, trucks sat for an additional five days on the road in a multi-kilometre queue that blocked a lane of traffic across swathes of the city. Expressing his frustration at the process, Gavin Pearson of the Imperial Group in Nigeria remarked, ‘Our drivers take five days to enter the port and four days to exit – this has a knock-on

70S P E C I A L R E P O RT – JA N UA RY 2 0 2 0
WHERE THE RUBBER HITS THE ROAD
effect on our logistics service and the cred-ibility of our assets.’
In addition to its dilapidated road infra-structure, Lagos also suffers from poor public transport. Public transport services in Lagos account for less than 3% of daily mobility. The State’s Lagos Metropolitan Area Transport Authority (LAMATA) has tried to improve this figure by introduc-ing two bus services: the Lagos Bus Rapid Transit (BRT) with dedicated lanes on main transport corridors, and LAGBUS, a feeder system on smaller routes. But these have failed to take off.
Nearly half of Lagosians use Danfos – the often rickety and sometimes downright dan-gerous yellow vehicles that dot the city’s landscape – while some 40% walk to work, and 11% use private cars. These journeys are supported by motorcycles called Okadas or tricycles known as Keke Marwas for shorter distances. Ride-sharing apps such as Uber and Taxify are starting to make a dent in the market but face challenges of mapping, traf-fic congestion and driver relations.105
The state has attempted to introduce non-motorised transport in the form of its rapid rail network. Construction of the rail began in 2009, with the aim of building a seven-line network named after various col-ours – red, blue, green, yellow, purple, brown and orange. The Blue Line, the first phase, was scheduled to be operational by 2016 but by 2019 had yet to be completed.
Funding was mobilised through a mix-ture of Lagos State and Chinese state-owned enterprise funds, notably from the China Civil Engineering Construction Corporation. However, construction on the rail has stalled indefinitely106 and explanations for the delays have lacked detail. Critics have said that railway development is more expensive and complex than an upgrade of the cur-rent BRT system, although much of the first phase of the rail network is already built.
A Lagos Icon: The DanfoDanfos are privately owned and operated, offering the cheapest and most efficient way for Lagosians to commute. There are cur-rently 50 000 vehicles registered.107 ‘Danfos are flexible and they can navigate the dif-ficult, narrow roads of informal settlement areas,’ observes Lookman Oshodi of Arctic Infrastructure.
However, the vehicles are poorly regu-lated and often poorly maintained, with reckless drivers at the wheel who cause accidents and contribute to the city’s wide-spread traffic friction. A plan is in motion to phase out the Danfos by introducing a new fleet of 5 000 buses.108 This fleet is envi-sioned as an entirely new public bus service that will run alongside the existing LAGBUS and Lagos BRT. It reflects the State’s modus operandi of replacing competitive informal service providers with one formalised entity – an approach that has so far yielded mixed results. As Oshodi quips, ‘you can’t surrender the transportation mandate of a city as big as Lagos to just one company.’
At present, there are plans under way to provide more infrastructure for water travel. Thirty ferry routes have been identified for dredging, and a few private operators are already offering a water taxi service. The poor condition of water transport options has kept Lagosians on the roads for now but as services improve and become better regulated, the hope is that more commuters will take to the water.109 In late 2018, mobile
71S P E C I A L R E P O RT – JA N UA RY 2 0 2 0
WHERE THE RUBBER HITS THE ROAD
operator MTN Nigeria donated a ferry termi-nal to Lagos State as part of a public-private partnership to increase the use of water transport.110 However, it is too soon to predict future levels of public uptake.
Moving around Lagos is a process that is fraught with frictional costs and the need for specialised knowledge on which routes to take and when to take them. The state has acknowledged the problem. However, the current policies in place do little to address the backlog. The private sector has been a champion in the city’s transport network but, Lagos’s traffic woes show the need for a co-ordinated transport policy across the city.
ElectricityDespite its status as Africa’s largest oil pro-ducer, with some 2 million barrels per day in 2018, Nigeria is electricity poor. As noted above, the country has an installed capacity of just 7 100MW, of which 4 100MW is avail-able for generation to supply 190 million people. This is well below the international rule of thumb of one Gigawatt (GW) per one million residents and lagging regional counterparts such as Ghana that has simi-lar capacity for a country of 30 million and South Africa with an installed capacity of 44GW111 for a population of 55 million.112
Just 45% of the population has access to the power grid. Despite this, more than 50% of Nigeria’s manufacturing sector is located in Lagos.113
Most of the city’s electricity comes from generators. Power from the national grid costs approximately N30/kwH but, because it is notoriously unreliable most people gen-erate their own electricity at a rate at more than three times this cost, driving up the cost of goods and services within the city.
Lagos’ power woes are part of a larger Nigerian problem. In 2001, the National Electric Power Policy was the beginning of the unbundling and privatisation of Nigeria’s electricity supply industry with generation and distribution privatised and transmission remaining a national asset.114
However, privatisation failed to address the root causes of the country’s electricity back-log as a result of an inability to guarantee cost-reflective payments across the sup-ply chain and to secure available gas and gas supply infrastructure.115 This has left Nigeria unable to develop a functional elec-tricity supply industry that meets the needs of all citizens.
Until recently, Nigeria’s legislation pre-vented individual states from generating their own electricity. Power was conceived as nationally significant and thus placed on the exclusive list of services provided only by the federal government.116 State authorities, like Lagos, could do very little.
All on-grid power was sent from the national generator and distributed regionally through private distribution companies, for Lagos, the Eko Electricity Distribution Plc on the island and Ikeja Electricity Distribution Company on the mainland. However, there was a provision for embedded power/own-use generation and the state government was permitted to contract independent power producers (IPPS) to provide 48MW of supplementary power for Lagos’ main government offices.
In 2017, Governor Ambode presented the ambitious Lagos State Electric Power Sector Reform Bill as part of his ‘Light Up Lagos’ initiative to provide 3 000MW of additional power to the city by 2022. Power generated from the plan would bypass the transmis-sion networks and be supplied directly to the distribution companies, classifying it as ‘embedded power’. The power would be generated from a number of independently owned power barges fuelled by liquefied natural gas (LNG). Lagos State would act as a guarantor for both the fuel inputs and the generation infrastructure. A special purpose vehicle would administer the tariff collection process and ensure that the various stake-holders were given their appropriate share. There were ambitious plans to expand, should the first 3 000MW be successful.
72S P E C I A L R E P O RT – JA N UA RY 2 0 2 0
WHERE THE RUBBER HITS THE ROAD
‘Light Up Lagos’ was born from multi-stakeholder engagement meetings, over 19 months, with concerned actors in the electricity supply industry including IPPs, Distribution Companies, regulatory authori-ties and others. But once Governor Ambode was removed from office in the 2019 election, the streets went dark once more, apparently because the diesel generators used to power the street lights were unsustainable.117
Waste Not, Want Not: Public-Private Plans Go AwryLagos generates approximately 17 000 met-ric tonnes of waste per day. At present, more than 1.2 million Lagosians do not have access to waste collection services. The waste collection deficit chokes storm water drains, contributing to serious flooding in the rainy season.
In 2016, Governor Ambode introduced the Cleaner Lagos Initiative (CLI), inspired by global cities like London and Dubai. Under the terms of this scheme, CLI would centralise the majority of the city’s waste management services under a single opera-tor, Visionscape Sanitation Solutions, who would be responsible for the collection of all household waste and the manage-ment of all landfills. CLI was introduced by an Executive Order with the tender given to Visionscape quickly and non-competitively, without stakeholder engagement or public consultation.
Prior to CLI, a system known as ‘Operation Clean Lagos’ was in place. Introduced in 2000 during the Tinubu administration (1999–2007) and continued under Governor Fashola (2007–2015), Operation Clean Lagos employed 450 small- to medium-sized pri-vate sector participants (PSPs) contracted through the Lagos Waste Management Authority (LAWMA) to collect household waste. This was augmented by an abun-dant informal community of scavengers and waste pickers, many of whom are trade association members. In this system, 10% of LAWMA’s role was to regulate the PSPs,
and the remaining 90% was operational, managing the transfer loading stations and dumpsites, cleaning public areas.
The 2016 overhaul transferred responsi-bility from multiple individual actors to the privately operated Visionscape. Some 27 500 workers were employed using 600 trucks, LAWMA’s primary role was to regulate the system and informal waste collectors were no longer recognised as a part of the waste economy.
By 2017, challenges of poor co-ordina-tion and incapacity in the CLI system had emerged as rubbish began to pile up on Lagos’ streets. As a member of the Waste Management Society of Nigeria (WAMASON) remarked, ‘Waste doesn’t wait for govern-ment bureaucracy, … its collection and management is a 24-hour business.’
In October 2018, the Lagos Assembly voted to scrap Visionscape completely and reinstate the PSP operators. The Speaker of the Assembly, Mudashiru Obasa, stated, ‘We insist that we don’t know anything about Visionscape because we were not consulted before they started work.’118 Proper vetting might have prevented this problem.
Conclusion: A Model for Africa?The most impressive aspect of Lagosians is in their relentless energy, driven by a knowledge that no-one will help them but themselves. ‘The guy selling things in the traffic,’ says one hotel manager, ‘will make 350 naira in the morning, perhaps, with which he will buy lunch. And he will run around for another five hours in the after-noon to make the same for his dinner.’ This is a tremendous asset, often parodied and overlooked in caricatures of urban chaos, risk and corruption: its people.
It’s likely to get more difficult for Lagosians without a change of government attitude and capacity. Lagos is not only the largest city in Africa, surpassing Cairo in 2012, but also the fastest growing one. In the three years since 2015, Lagos’s population has grown by a staggering 1.7 million.119

73S P E C I A L R E P O RT – JA N UA RY 2 0 2 0
WHERE THE RUBBER HITS THE ROAD
Unless there is a significant reset in the manner in which politicians approach the task of governance from revenue collec-tion to delivery, attempts to resolve the city’s infrastructure challenges, in this envi-ronment, are unlikely to significantly and positively alter the city’s trajectory. As it is, the sheer volume of migrants presents a vicious cycle of influx and infrastructure. The more there is provided, the more the demand will remain given the stupendous rates of population increase. But underlying these problems is a complex and corrosive politi-cal economy: a cocktail of weak governance, widespread corruption, a time-consuming legal system, and anaemic economic growth highly vulnerable to the vagaries of oil prices.
Future growth at the rate Lagos requires will be dependent on moving goods and peo-ple cheaper and quicker, giving people both a
stake in the system with a better launch pad through improved housing, and by adding value through increased electricity supply. Underpinning all of this will be Nigeria’s success in attracting the necessary capital. That will depend on ensuring a rate of return commensurate with risk. Currently investors expect a return of investment at around 25% precisely because of the risk; for the econ-omy to grow, this needs to be reduced.
Turning Nigeria’s oil into wealth has so far worked well for a tiny elite. Translating the widespread energy of Nigerians into wealth for the wider population is much more dif-ficult, depending on resolute political will, better governance, government planning, persistence and execution.
If only Nigeria’s government would give its people a chance.

74S P E C I A L R E P O RT – JA N UA RY 2 0 2 0
WHERE THE RUBBER HITS THE ROAD
Hargeisa: Invisible City
Quick Facts
Population: 1.2 millionRemittances: US$700 million in remittances flowed into Hargeisa in 2019.Transport: The city’s central avenue, running from the downtown area past the Presidential Palace and government ministries, is the ‘only decent tarmac road’ in the capital city.Services: Fewer than 1% of households have access to piped water.Energy: Nearly all electricity generated comes from diesel generators running on imported fuel.Jobs: The youth unemployment rate is 75%.
When Afrah and her family left Hargeisa in 1988 she was just seven years old; like many townspeople who fled that year, she remembers a very different city.120 The for-mer seat of government of Britain’s colonial Somaliland Protectorate and (for five days in June 1960) capital of the independent State of Somaliland, and by the late 1980s Hargeisa – then a provincial city under socialist dic-tator Siad Barre’s epically dysfunctional Somali Republic – was rapidly collapsing. At least 80% of the town’s buildings had been reduced to rubble, and more than 50 000 members of the region’s majority Isaaq clan had been massacred by government death squads in what observers later dubbed the ‘Isaaq genocide’.121 Even today, unmarked graves of dozens killed in the 1980s are still being discovered near Hargeisa.122 By late 1988, most of the city’s population of 500 000 had fled, running from bombs dropped on the area by jets from their own Somali Air Force.123
Eyewitnesses told of warplanes launch-ing from Hargeisa Airport on the city’s southern outskirts, turning back to bomb the town from which they’d just taken off, then landing at the same airport to rearm and repeat.124 It was one of Barre’s last acts of large-scale violence and repression before his brutal regime collapsed and he too was swept away. A regime MiG shot down in the fighting by local guerrillas of the Somali National Movement (SNM) now serves as a war memorial, perched on a plinth in
downtown Hargeisa’s appropriately named Freedom Square.
Looking out the aircraft window as you land today at Hargeisa Airport, with its modernised terminal and newly extended runway, you see an almost completely rebuilt city. Driving into town you pass wel-come signs from the Republic of Somaliland, official buildings bearing the government’s banner, neatly uniformed, unarmed traffic police directing a bustling flow of vehicles, and a series of thriving shops, hotels, cafes and restaurants. Hargeisa’s population today is 1.2 million, roughly a quarter of the total population of Somaliland.125 The city has a safe, open, friendly vibe, even after dark – almost unbelievably so for anyone who has spent time in Mogadishu, or even in other East African cities such as Mombasa, Maputo or Dar es-Salaam.
Many buildings are under construction, market stalls line the roads, stocked with fresh fruit and vegetables (mostly imported from Ethiopia) and manufactured goods (from Vietnam and China). To be sure, those roads are terrible; sheep and goats graze on the streets and a fine grey dust covers almost every surface. In the afternoons, the streets are busy. Trucks distributing the popular nar-cotic khat plant arrive from Ethiopia at about 2pm, through checkpoints where officials collect excise, and vehicles stop randomly in the street while satisfied customers wan-der about with leafy-topped bunches of the tightly-wrapped twigs.126 But modern malls

75S P E C I A L R E P O RT – JA N UA RY 2 0 2 0
WHERE THE RUBBER HITS THE ROAD
and supermarkets are also springing up; billboards advertise banks, boarding schools and universities, and the MiG monument – which, in photographs taken as recently as 2012 appears to sit in an empty square – is surrounded by stalls and overshadowed by bank buildings and telecoms offices.
Given all that, you could be forgiven for thinking you’d arrived in the thriving capital of a rapidly developing, well-governed, inde-pendent sovereign country, a town focused on commerce and construction, and deter-mined – 30 years after its destruction by Barre – to put the past behind it. But you’d be wrong, for Hargeisa is an invisible city.
Invisible CityThe sovereign Republic of Somaliland appears on no maps. It is listed in no offi-cial register of the world’s countries, has no seat at the United Nations and no interna-tional country code. Government officials are forced to use personal email addresses
because there is no internationally-approved Somaliland internet domain, and the coun-try is unrecognised by the international postal union, so the only way to mail some-thing from Hargeisa is via the slow and expensive DHL shipping service.127 The country is described as the ‘self-declared but internationally unrecognised repub-lic of Somaliland’ and is considered by the international community to be a breakaway region of the Federal Republic of Somalia. This is the entity that succeeded Barre’s regime; it was inaugurated in 2012 after dec-ades of lethal anarchy in the south, cobbled together by the international community with UN supervision and under the guns of an African Union peacekeeping force.
Everything in Hargeisa – from the peace treaty pulled together by visionary elders in 1991, to the city’s self-financed rebuild-ing, to the unrecognised state of which it forms a part, to the largely informal econ-omy and homegrown political system that
HARGEISAHARGEISA
BerberaBerbera
DJIBOUTIDJIBOUTI
ETHIOPIAETHIOPIA SOMALIASOMALIA
S O M A L I L A N DS O M A L I L A N DS O M A L I L A N D
Gulf of Aden
76S P E C I A L R E P O RT – JA N UA RY 2 0 2 0
WHERE THE RUBBER HITS THE ROAD
sustains it – is a bottom-up, do-it-yourself enterprise. This enterprise, evolving over the past 28 years through a remarkable process of civic self-help, emerged not only without much international assistance but, at times, against active opposition from the world’s self-appointed nation-builders and doers of good.
Even as the world was watching Somalia shred itself in a clan bloodbath and apoca-lyptic famine in 1991-93 (the setting for the book and movie Black Hawk Down, the defining image of Somalia for many western-ers), an extraordinary process of grassroots peacebuilding was quietly taking place in the north. Over many months during the 1991–1993 period, Somalilanders met in the Burao, Berbera, Sheikh, and Boorame peace conferences, a series of local reconciliation meetings brokered by traditional elders. This resulted in peace agreements which then proliferated throughout the former territory of British Somaliland, and its mostly Isaaq and Darod clan groups.128
A constitutional convention, and subse-quent regional reconciliation agreements formalised the establishment of an executive presidency accountable to a bicameral legis-lature, with a lower House of Representatives elected by the people, and an upper House of Elders elected by clans. A constitutional convention later confirmed this setup. Somaliland’s governance structure, which has been described as a ‘hybrid political order’, may sound exotic, but the House of Elders has essentially the same function as the British House of Lords, or the Senate in Australia or the US.129 It plays a key role maintaining balance among the clans and geographic regions that form an essential element of Somaliland (and indeed greater Somali)130 life. This serves to contain the destabilising, often lethal, escalation of zero-sum competition among clan factions that has occurred elsewhere.
This practical experiment in state-building has proven remarkably robust: Somaliland today possesses an independent
judiciary and a free press, and peaceful transfer of power between presidents fol-lowing free and fair elections has become the norm. It is also enduring, with 28 years of homegrown stability and internal peace offering a stark contrast to the interna-tionally enabled chaos and violence in south-central Somalia.
As the capital of a country that officially doesn’t exist, Hargeisa has no formal sta-tus. Yet, as a practical reality, it’s a thriving commercial hub, the seat of a government that considers itself sovereign, it is regarded as legitimate by its population, and admin-isters one of the more stable, peaceful and democratic states in Africa. Hargeisa has consulates from Turkey, Ethiopia and Denmark, and a special envoy from the United Kingdom. It receives international flights from Dubai and Addis Ababa, and hosts UN agencies, international aid mis-sions and Chinese, Kuwaiti and Emirati businesses. Invisible they may be, but Hargeisa – and Somaliland – are very real.
But there’s another, even more important, sense in which Hargeisa is an invisible city.
If one thought of it as simply a piece of urbanised terrain, ‘Hargeisa’ is a town of roughly 1.2 million people in the north-west-ern Horn of Africa, its streets laid out in a grid pattern over about 33km², situated on a cool plateau 4 400 feet above sea level, in a rough hourglass shape astride the usually dry Maroodi Jeex (‘Elephant Creek’) and con-nected by road to the port of Berbera, two hours’ drive away on the Gulf of Aden. But the real city is vastly more than that.
If, instead, we consider Hargeisa as a sys-tem, with the city’s relatively small area of urbanised terrain sitting at the centre of a vast social, political and economic ecosys-tem that includes not just the town itself but also its diaspora – the thousands of Hargeisans who live in Europe, America, Ethiopia, Kenya, Canada, Australia, the Gulf states and elsewhere, connected to their city through remittances, e-banking, mobile telephones, Skype, social media, family ties,

77S P E C I A L R E P O RT – JA N UA RY 2 0 2 0
WHERE THE RUBBER HITS THE ROAD
business deals, visits and investments – then we have a much clearer idea of what the city is and how its political economy works.
Take Afrah as an example. Growing up in the United Arab Emirates and US, she is well-educated, with degrees in hospitality and tourism. She is also an experienced man-ager and businesswoman who moved back to Hargeisa several years ago to look after her elderly mother and ended up launch-ing a business with savings cobbled together during her time overseas. Today her tearoom employs 25 people and does a lively trade serving civil servants from nearby ministries and she has reluctantly turned down offers to franchise her brand in other parts of the region. Like many business owners (and, seemingly, most of the officials who patron-ise her café) she holds two passports, has relatives in several countries, speaks multi-ple languages, and travels regularly to Dubai for banking and to supervise shipments for her business or meet investors. Far from being a theoretical construct, the Hargeisan diaspora is an ever-present social, political and economic reality.
Somalilanders in the diaspora account for more than US$700 million in annual remit-tances – and much of that money flows to or through Hargeisa.131 (For comparison, the total national government budget of Somaliland for 2018 was US$382 million, just over half the value of remittances.)132 In effect, the human and communication networks and financial flows centred on the city, invisible though they may be, are its lifeblood, even though many nodes in these networks are not physically in Hargeisa at all. On a map of this real but invisible Hargeisa (see the map page 76) significant parts of the city, much of its population and most of its wealth are in Amsterdam, Cape Town, Copenhagen, Dubai, Durban, Düsseldorf, Helsinki, London, Minneapolis, Nairobi, Oslo, Portland, Seattle, Sydney and Toronto. Understanding Hargeisa-in-Africa (Hargeysa ee-Afrika) in this way, as the tip of an iceberg, or one tree in a grove of trees
with a single root system, is the key to see-ing the real, invisible, Hargeisa-the-city (magaalada-Hargeysa).
Clan and CamelWhile Hargeisa’s global connectivity is a new phenomenon, emerging in about the year 2000 as a result of the increasing ease of air travel and money transfers, the proliferation of smartphones, penetration of the inter-net providing closer ties to the diaspora, it is utterly traditional for Somali city-dwellers to maintain social and economic links to a rural hinterland, and to the pastoralist nomads who tend flocks and herds in the interior. Of Somaliland’s population of 4.5 million (an estimate only, since the most recent census, conducted by the Barre regime back in 1981, almost certainly under-counted the country’s northern population) about 55% are nomadic or semi-nomadic, while 45% are urban.
Pastoral nomadism – the tending of seasonally-roaming herds of camels by men and boys who follow the rainfall (and there-fore pasture) patterns, or of sheep and goats in static camps by women and girls – is the traditional, and in many ways the defining feature, of Somali life and culture. Droughts in 2011–2012 and in 2017 severely depleted livestock, particularly camel herds, in the interior and drove many pastoralists off the land and into slums on the city’s edges. Rains in 2018, though better than in recent years, have not yet enabled a rebound.133 Yet Somaliland’s only significant export remains the live animal trade to Saudi Arabia and the Gulf states, while the four noble clans of the ethnic Somali region (including the majority Isaaq clan of Somaliland) are all pastoralists. Fishing villages, farming communities and urban artisan and merchant centres do exist, but these sedentary populations were tradi-tionally the object of pastoralist contempt, and of periodic plundering by desert raid-ers. Somalilanders’ way of life is still, even in 2018, closely tied to the herd and, above all, to the prestige and power of camel and clan.
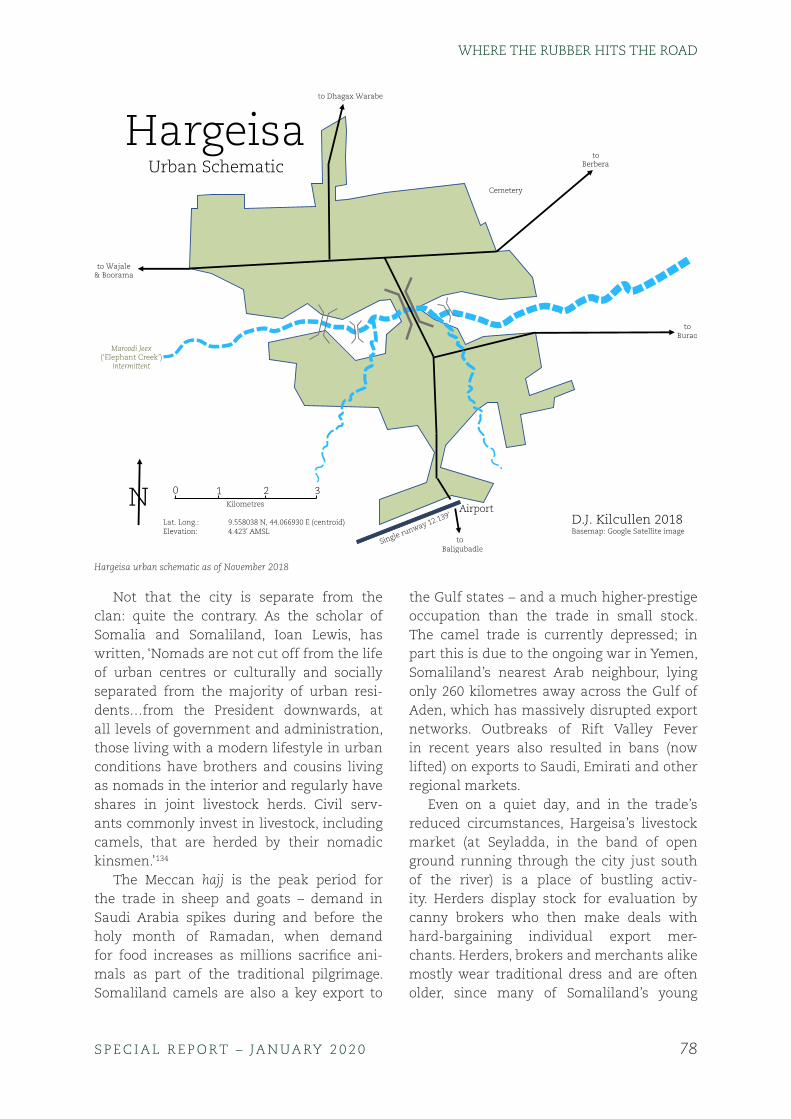
78S P E C I A L R E P O RT – JA N UA RY 2 0 2 0
WHERE THE RUBBER HITS THE ROAD
Not that the city is separate from the clan: quite the contrary. As the scholar of Somalia and Somaliland, Ioan Lewis, has written, ‘Nomads are not cut off from the life of urban centres or culturally and socially separated from the majority of urban resi-dents…from the President downwards, at all levels of government and administration, those living with a modern lifestyle in urban conditions have brothers and cousins living as nomads in the interior and regularly have shares in joint livestock herds. Civil serv-ants commonly invest in livestock, including camels, that are herded by their nomadic kinsmen.’134
The Meccan hajj is the peak period for the trade in sheep and goats – demand in Saudi Arabia spikes during and before the holy month of Ramadan, when demand for food increases as millions sacrifice ani-mals as part of the traditional pilgrimage. Somaliland camels are also a key export to
the Gulf states – and a much higher-prestige occupation than the trade in small stock. The camel trade is currently depressed; in part this is due to the ongoing war in Yemen, Somaliland’s nearest Arab neighbour, lying only 260 kilometres away across the Gulf of Aden, which has massively disrupted export networks. Outbreaks of Rift Valley Fever in recent years also resulted in bans (now lifted) on exports to Saudi, Emirati and other regional markets.
Even on a quiet day, and in the trade’s reduced circumstances, Hargeisa’s livestock market (at Seyladda, in the band of open ground running through the city just south of the river) is a place of bustling activ-ity. Herders display stock for evaluation by canny brokers who then make deals with hard-bargaining individual export mer-chants. Herders, brokers and merchants alike mostly wear traditional dress and are often older, since many of Somaliland’s young
Airport
toBerbera
toBaligubadle
toBurao
to Wajale& Boorama
N
Cemetery
to Dhagax Warabe
Maroodi Jeex(‘Elephant Creek’)
intermittent
0 1 2 3Kilometres
D.J. Kilcullen 2018Basemap: Google Satellite image
Single runway 12.139'Lat. Long.: 9.558038 N, 44.066930 E (centroid)Elevation: 4.423' AMSL
HargeisaUrban Schematic
Hargeisa urban schematic as of November 2018
79S P E C I A L R E P O RT – JA N UA RY 2 0 2 0
WHERE THE RUBBER HITS THE ROAD
people have abandoned the austere herd-ing lifestyle over the past generation for jobs (or non-jobs) in and around Hargeisa.135
Appearances are deceptive though. Despite leathery faces, traditional walk-ing sticks and travel-stained garments, each herder carries at least one mobile phone and is intimately familiar with the current inter-national market rate for each type and grade of animal, changing minute by minute and continuously updated via text message.136 He negotiates with brokers while simul-taneously checking in – on WhatsApp or other social media – with his extended kin, whether sitting in makeshift tents in the interior, air-conditioned offices in downtown Hargeisa, or internet cafés in Rotterdam, Oslo or Minneapolis. This family network – part-owners and co-investors in the live-stock being traded – must be satisfied before he can seal the deal. Again, traders haggling over Somali tea in the shade of a row of eucalypts along the edge of the market may appear, to the casual observer, to be throw-backs to a simpler age, but these are really international businessmen navigating com-plex multi-party deals, in a global market, with a floating exchange rate, under the close scrutiny of a stakeholder network that exists in the invisible, global Hargeisa – not just the physical one.
This means that cities like Hargeisa are not now (nor in fact have they ever been) islands of settlement in a sea of nomads, as are some towns in Yemen, Oman or Central Asia. Rather, Somali cities are closely tied to their hinterlands and to the diurnal and sea-sonal flows of wealth, commerce and labour that eddy around and through them. In Somaliland in particular, even more than in other parts of the Horn of Africa, a longstand-ing tradition of individual labour migration also exists, with locals working abroad as seafarers, labourers or traders across the region and further afield.137 When the city emptied under Barre’s bombs in 1988, peo-ple fleeing Hargeisa were able to plug into a pre-existing web of external connections
and support networks – the starting point for a process of chain migration that helped to create today’s massive diaspora.
Hargeisa is far from being the only city in Africa that has suffered under conflict, and (as already noted) its dense network of connections with its rural hinterland and diaspora are entirely typical. As a result, there is much that other African cities can learn from Hargeisa, especially in its efforts to improve agricultural security. Other cit-ies might wish to study, and perhaps copy, the Somaliland government’s recent, sen-sible move to create a National Cereals and Produce Board, to co-fund a 767-hectare agri-cultural project west of Hargeisa that grows wheat, millet, maize, beans and sesame, and to construct silos to stockpile produce as an insurance against famine in both rural and urban areas.
Diaspora and DevelopmentOne effect of the diaspora today is that Somalis are now the world’s largest per cap-ita recipients of remittances. Traditionally, livestock exports accounted for most of Somaliland’s inward cash flow – and as we’ve seen, the live animal trade still represents the country’s largest source of export dollars, though the government is urgently seeking to diversify the economy in the face of drought and regional instability.138 Nevertheless, in terms of raw financial flows, as of 2018 more than 60% of the country’s income derives from the diaspora. Between 25% and 40% of Somaliland households receive remittances from relatives overseas; total annual remit-tance inflows in 2013–2014 totalled US$780 million, of which 70% went to individuals and families and 30% to capital or finan-cial investments.139 This makes remittances the single biggest inflow to Somaliland: bigger than aid, humanitarian assistance and trade combined and, as noted earlier, roughly twice the size of the entire national budget. Remittances mostly go to servic-ing household costs and recurrent expenses although some contribute to diaspora-owned

80S P E C I A L R E P O RT – JA N UA RY 2 0 2 0
WHERE THE RUBBER HITS THE ROAD
businesses which create jobs in Hargeisa and other towns.
Remittance transfers are made using tra-ditional hawala networks, via Islamic banks such as Dahabshiil (the dominant player in Hargeisa’s financial sector) and distributed across platforms such as WorldRemit, which use smartphone technology and are increas-ingly preferred for security and speed.140 In a city that lacks a modern conventional (i.e. non-Islamic) banking system, within a country that is unrecognised and therefore only tenuously connected to global banks, mobile money transfers are a common pay-ment method for everything from food and fuel to payroll and business purchases. Popular platforms include e-Dahab (affiliated with Dahabshiil but administered as a sepa-rate business, and partnered with Dahabshiil subsidiary Somtel) and ZAAD, pioneered in 2009 by Somaliland’s Telesom mobile phone company. ZAAD is a direct system in which merchants (rather than agents, as for sys-tems such as M-Pesa) form the principal access point for customers and users. A user may purchase Telesom airtime with cash from a merchant, add cash as needed to finance purchases, store money, and receive or transfer funds internationally through ZAAD’s connection with WorldRemit.
As Claire Pénicaud and Fionán McGrath noted in a July 2013 case study, since its creation in 2009 ZAAD has gained signifi-cant traction: ‘in June 2012, almost 40% of Telesom [mobile phone] subscribers were active users of Telesom ZAAD. What is most striking about the service is the level of activity on the mobile money platform. Active Telesom ZAAD users perform over 30 transactions per month on average, far above the global average of 8.5 per month. The World Bank’s Global Financial Inclusion Database (Findex) recently revealed that Somalia [and Somaliland, as a whole] was one of the most active mobile money mar-kets: 26% of the population reported using mobiles to pay bills, which is the highest rate in the world, and 32% to send and receive
money. Most of this mobile money activ-ity has been driven by Telesom ZAAD.’141 As Pénicaud and McGrath note, Telesom learned from the experience of pioneers like M-Pesa in Kenya to focus on building a peer-to-peer payment ecosystem, which has succeeded in encouraging users to store money for pay-roll and business transactions, not solely for short-term transfers. Five years on, ZAAD is increasingly being challenged by competition from e-Dahab (owned by Dahabshiil).
One problem with this system is another artefact of the reality that Somaliland is unrecognised, namely that mobile phone users cannot call phones on other networks. Somtel users, for example, cannot reach the mobile number of someone on the Telesom network, since the two networks have incom-patible numbering systems and work on the Somali (as distinct from Somaliland) country code. As a consequence, many Somalilanders carry two phones or go through the awkward process of continually swapping SIM cards between phones in order to communicate.142
Further, counterintuitively, the use of electronic money underscores just how cash-based (as distinct from credit-driven) Hargeisa’s economy is. Islamic banks like Dahabshiil do not offer credit cards, though they do furnish fee-paying debit and ATM cards, and their deposit accounts do not carry interest. So, many people work in cash, withdrawing notes from ATMs then either paying cash or loading value into ZAAD or e-Dahab accounts on their phones by buy-ing airtime from merchants, even though it is also possible to buy airtime and internet data online. Somaliland maintains its own currency – the Somaliland Shilling (SlSh) – as yet another indicator of its real though unrecognised sovereign status, and small purchases are often made in SlSh. But to a surprising extent the country’s real economy is based on the United States dollar.
In part this is because Somaliland’s unrecognised status makes it hard to con-duct in SlSh the international transactions that form the bulk of the country’s financial

81S P E C I A L R E P O RT – JA N UA RY 2 0 2 0
WHERE THE RUBBER HITS THE ROAD
flows; in part consumer confidence in US dollars reflects recent instability and inflationary pressure on the Shilling. The Somaliland shilling, indeed, has been histori-cally unstable and not widely trusted; there were currency crashes in 1994 when the gov-ernment introduced the Shilling to finance a conflict against rebellious clans in the east-ern region, and again in 2002–2003 when the government printed huge amounts of money to finance a constitutional referendum and parliamentary elections. The Rift Valley Fever crisis, when Gulf countries banned livestock imports from Somaliland, created further currency pressure. Either way, though ATMs have proliferated in the past few years, and it is technically feasible to use international credit cards for an increasing range of trans-actions, hard currency – overwhelmingly, American dollars – is the basis for commerce in the city.
Although money transfers and remit-tances may seem like a success story – and indeed, they do represent remarkable inno-vation in inclusive banking, they highlight a key structural issue in Hargeisa’s economy as is also highlighted by the reliance on US dollars. Because Somaliland imports virtu-ally all products, from food and fuel to cars and clothing, remittances operate much like foreign assistance in a war zone: like so-called ‘aeroplane aid’ in Afghanistan, remittances come into Hargeisa, touch down briefly, then fly right out of the coun-try again as they are used to purchase goods that are overwhelmingly imported. Only a small proportion of financial remittances – that percentage used to create jobs or finance businesses – remains in Somaliland to help build economic capacity. Moreover, since the government levies no tax on remit-tances, this primary financial inflow (and the largest single source of private income for Somalilanders) generates no income for the public.
But financial remittances are not the only inflow from the diaspora. In addi-tion, intellectual remittances – technology,
skills and knowledge transfer to Somaliland from people who have lived and been edu-cated overseas—help to build Hargeisa’s human capital. Returnees from the dias-pora are over-represented within elites in Hargeisa, including civil servants, political and business leaders, heads of community organisations and entrepreneurs. This can help build capacity, as the ‘brain gain’ from returnees – visiting or moving back to Hargeisa, helping establish businesses, schools and clinics, or representing the country’s interests overseas – contributes to Somaliland’s development.143
For many families, sending a child over-seas for work – or more recently, committing family members to the dangerous gamble of emigration to the Middle East or Europe – is a strategic calculation aimed at diversifying the family’s income or improving its human capital.144 Still, from a social and political standpoint, the return of Somalilanders from the diaspora is not always uncontroversial. Hargeisans, who have spent the past three decades dealing with the fallout from war and state collapse, can sometimes cast a sceptical eye over returnees who have lived comparatively comfortable lives overseas, the more so since their presence drives up housing, commodity and real estate prices (already extremely high, by local standards, in Hargeisa) while their deeper pockets and access to overseas cash exert upward pres-sure on essential consumer goods.145
There are subtle but significant linguistic differences between returnees and locals, which (along with the returnees’ dress and standard of living) sets them apart, and some – particularly those seeking senior political or civil service roles while holding dual nation-ality – can even be seen as opportunistic carpetbaggers. This, of course, is a common problem in cities experiencing a post-conflict return of refugees, and that return is in itself a good thing, as it contributes to the city’s human and financial capacity and helps unlock opportunities for growth that benefit
82S P E C I A L R E P O RT – JA N UA RY 2 0 2 0
WHERE THE RUBBER HITS THE ROAD
everyone, not just the returnees. But manag-ing it is neither simple nor risk-free.
Two-Speed CityDriving or walking around Hargeisa, one is struck by the contrast between a pri-vate economy that is clearly thriving, and a lagging public sector – including, particu-larly, urban infrastructure. While not a true reflection of John Kenneth Galbraith’s ‘pri-vate affluence and public squalor’ – since even the private sector is far from opulent in Hargeisa – this is a two-speed city.146 The reasons for this are not simple and neither is dealing with their consequences, but one clear cause is the lack of a broad tax base.
The government does not tax income, nor does it levy duties on remittances. It collects excise on khat imports, and duties on other goods coming in through ports and airports, as well as collecting landing fees and other payments from users of those points of entry. Businesses are taxed at 12%, payrolls at 6% and sales at 5%, but these rates sustain only a very austere and limited government struc-ture, one that lacks the resources to invest in public goods that could jump-start private development. Somaliland’s six regions and 23 city governments raise taxes from their own localities and then plough this back (with varying degrees of probity and compe-tence) into development at the city level, and cities such as Hargeisa and Berbera, which operate international points of entry, are allowed to keep a portion of their earnings.147 The lack of income tax is understandable in a country whose economy is largely infor-mal or subsistence-based. But the failure to tax remittances (or offer Somalilanders in the diaspora opportunities to contribute to a public investment fund) is one clear area for consideration.
Roads are an obvious example where the lack of resources for public investment hampers Hargeisa’s economic activity and social development. The city’s central ave-nue (running through the downtown area, past the Presidential palace and government
ministries) is the only decent tarmac road in the city. Virtually every other paved street is potholed, and outside the business district many roads are gravel or dirt. There are few gutters and no properly constructed drain-age system, so that on the rare occasions when significant rain falls, large areas of the city are flooded, and mud makes the roads impassable.
The resulting wear-and-tear on cars and trucks (mostly Toyotas and Nissans imported second-hand by ship from ports in the Arabian Gulf) imposes a drag on busi-ness and household economies, while the time and cost of moving goods and people about the city is multiplied manyfold. Well-constructed houses and businesses (built, almost without exception, since the 1990s) sit on pitted and poorly drained roads, in a physical reminder of the mismatch between a thriving private sector and a bare-bones public purse.
But the city’s two-speed nature emerges most obviously in terms of basic household necessities such as water, electricity and fuel, where government investment in essen-tial services lags private enterprise which provides – for those who can pay – a rela-tively high standard of service. Fewer than one in 100 households in Hargeisa has access to running water, with access dropping off sharply as one moves out of the city cen-tre. Most middle-class households purchase plastic or metal water tanks which they place on the roadside and replenish by pur-chasing water from donkey-driven carts that roam the streets at most hours of the day. One thousand litres of water costs roughly US$6 as of late 2018, and lasts a family of four about ten days.148 The carts are regu-lated by government, and their water comes from state-owned rigs and pipes in the city, but the water itself often originates from reservoirs and wells many miles from the city.149 Frequently, landowners commercial-ise public water pipelines on their properties, selling the water directly to consumers, and

83S P E C I A L R E P O RT – JA N UA RY 2 0 2 0
WHERE THE RUBBER HITS THE ROAD
the government is paid by calculating the amount of water used.
In poorer areas, such as the informal set-tlements peopled by new (or not-so-new) arrivals from the countryside, women and children gather around plastic water drums dropped by trucks every few days and haul the water away in jerrycans for household use.
A private consortium, as part of a project under way since mid-2018 with funding from the German aid agency KfW (Kreditanstalt für Wiederaufbau) and limited public funds, is installing a water distribution pipeline and a system of household water supply, as well as public taps. The project, expected to take three to five years, will go a long way towards ameliorating this situation.150
Still, given how arid Somaliland is, and the known correlation between water insecu-rity and urban unrest, the precarious water situation for ordinary Hargeisans – particu-larly those in informal settlements who are already the city’s most vulnerable – is one of the major risks facing Hargeisa, and a key obstacle to growth and stability. Likewise, extended periods of future drought (and the inevitable depletion of artesian and surface water over time) pose a national-level risk to the stability of Somaliland and the entire region, and the amount of time and effort Hargeisa’s residents are forced to put into basic tasks like hauling water imposes a severe productivity burden on the economy.
Electricity and fuel supply in turn are closely linked, since virtually all electric-ity generated in Hargeisa comes from diesel-fuelled generators running on imported petroleum. Some are large-scale generators owned by corporate entities from which businesses and households purchase their electricity via a private metering sys-tem; others are household generators run on petrol or diesel bought from service stations across town. These stations are serviced by fuel tanker trucks running overland from Djibouti or up the road from Berbera, which has an oil storage terminal. Somaliland, of
course, has ample sunlight with more than 340 sunny days per year, and the Hargeisa region has been assessed as one of the most promising locations for wind energy in Africa; small-scale solar installations are common and a pilot wind energy project exists on the city’s outskirts.151 But for now, most citizens depend on imported fuel, cre-ating vulnerabilities at city and national level, and hampering commercial devel-opment through lack of lighting, assured cold-chain storage, and air conditioning.
Fuel for cooking presents a similar pattern. More than 80% of people in Hargeisa cook with charcoal, produced by local char-coal-burners who cut down and burn off the tree cover – mostly acacia thorn-scrub – from areas 20 to 100 kilometres from the city. Bags of charcoal are then bought and collected by companies who transport them to Hargeisa and sell them to shop owners and small merchants. People purchase bags of charcoal with their groceries from mar-kets. At the upper end of the socio-economic scale, another 10% of Hargeisa’s population cooks with small propane bottles purchased through container-exchange schemes from local shops, or from companies like Somgas, while a further 10% or less have access to large propane tanks filled directly from gas deposits. Tanker trucks also transport large propane tanks into the town for distribution to retailers. Again, major supply-chain assur-ance risks (and associated costs) result from this dependence on commodities imported from the countryside, in the case of charcoal, or from overseas in the case of natural gas.
The charcoal trade carries additional vul-nerabilities, since it has been banned by the UN because the al-Qaeda affiliated Somali guerrilla group al-Shabaab makes so much money from it. There is little evidence of Shabaab in Somaliland at present – the group is largely restricted to south-central Somalia, and in any case, many Shabaab belong to the Hawiye clan which has no significant presence in Somaliland. Still, Shabaab have started rebranding Somali

84S P E C I A L R E P O RT – JA N UA RY 2 0 2 0
WHERE THE RUBBER HITS THE ROAD
charcoal as coming from somewhere else in order to sidestep the UN embargo, and this may have disruptive effects in Somaliland and elsewhere. Likewise, for an arid country with unreliable rainfall and sparse tree cover at best, continuing to burn trees for fuel is not a sustainable approach.
Hargeisa’s dependence on diesel fuel and gasoline, all of which is imported from outside Somaliland, to operate electrical generators is another key challenge. Moving away from diesel-powered generators toward wind, solar and other renewables is one option; developing the country’s oil and gas reserves is another. Household-level solar panels and wind turbines represent the lowest tier on the renewables ladder, with larger-scale projects (like the wind turbine farm under construction near Hargeisa air-port, or the installation of larger fields of solar panels in and around the city or on rooftops) are the next step up.
Other cities can also learn from the issues related to the use of charcoal and bottled gas for most household cooking in Hargeisa. Apart of the environmental degradation resulting from the charcoal trade, the UN embargo makes charcoal supply precarious and its contribution to air pollution from cooking also makes it a public health issue. These issues apply equally in many African cities, especially in informal settlements.
Ports and BasesThe discussion of international recognition may seem off-topic for a city-level analy-sis of Hargeisa. In fact, it is central to the city’s future, since besides being the capi-tal and by far the largest city in Somaliland, Hargeisa forms a key node in the largest, and most potentially transformative infra-structure project in Somaliland’s history. This is the major upgrade of the port of Berbera and the associated construction of a Berbera-Hargeisa highway corridor. This has the potential to make Hargeisa a hub for a regional transport and trading network that would transform the city while opening
major economic development opportunities for the region’s major power, Ethiopia. Dubai Ports World signed a US$442 million agree-ment with Somaliland in 2017, forming a joint venture (DP World Berbera) with the government of Somaliland, with Ethiopia as a 19% shareholder. The company was awarded a 30-year concession, with an automatic ten-year extension, on the port of Berbera, in return for a commitment to double its size and transform it from a manual stevedoring operation into a modern container termi-nal.152 Work commenced in October 2018, and involves ‘building a 400-metre quay and 250 000m² yard extension as well as the development of a free zone to create a new regional trading hub’.153
The deal included a commitment to upgrade the road between Berbera and Hargeisa into a modern highway, turn-ing Hargeisa into a major transport hub for traffic from across the Horn of Africa to Berbera, which in turn would become a key import-export terminal for goods and commodities. This investment, one of the main achievements of the current govern-ment in Hargeisa, has the potential to bring significant revenue to the state, enabling infrastructure upgrades for both Berbera and Hargeisa, with flow-on effects for ancil-lary industries, and potential for increased employment. The Berbera project will cre-ate access for economic improvement in Somaliland while its demonstration effect is likely to bring further foreign direct invest-ment, increasing impetus for international recognition.
Likewise, the airport in Berbera – a mili-tary airfield designed in the 1960s by the Soviet Union and rented by NASA through-out the 1980s as a backup landing strip for the Space Shuttle – is, at 13 582 feet long, one of the two longest airstrips in Africa. Its size and proximity to the port gives it potential as both an air cargo terminal and passenger hub, creating the possibility for a multi-modal terminal and an associated free trade zone in and around Berbera.

85S P E C I A L R E P O RT – JA N UA RY 2 0 2 0
WHERE THE RUBBER HITS THE ROAD
Further up the coast, the United Arab Emirates is constructing a military and naval base. This base, conceived as part of a net-work of regional outposts being constructed by the UAE to support its ongoing engage-ment in the Saudi-led conflict in Yemen, brings a formal, permanent international military presence to Somaliland for the first time in its history. There is likely to be a mod-est local economic boost from the new base, but its real importance is political, placing Somaliland firmly in the Saudi-Emirati camp (rather than of Turkey, China, Iran or any of the other powers jockeying for advantage in the region). While some Somalilanders are understandably apprehensive about this, it is worth recognising that Somaliland has always – because of its dependence on animal exports to the Arabian Peninsula – been in this sphere of influence: the Emirati presence is a formalisation, rather than a revision, of the status quo.
Nonetheless, a Hargeisa connected by highway to a modern port in Berbera, with a permanent international military pres-ence (with the implied security guarantee) and strong transport links to regional and international trading hubs, will be a very different – and far less invisible – city than the Hargeisa of today. While this develop-ment carries huge potential benefits for Somaliland, it also embodies risks that will need careful management.
Human CapitalNeither Somaliland nor Somalia is listed in the latest Global Human Capital Report (GHCR, 2017), nor is Somaliland likely to be listed while it remains unrecognised. Still, the framework established in this bench-mark global report, which categorises human capital across capacity, development, deployment and know-how, was recognised by several participants in the study as a useful model for developing human capi-tal at the national and city level, as well as for comparison with other countries in
the region (including Somalia and Djibouti, currently not measured in the GHCR, and Ethiopia which currently ranks lowest among large-population countries in sub-Saharan Africa).154 Hargeisa is considering benchmarking its human capital against this report, as a way of tracking progress even in advance of Somaliland’s international rec-ognition – and this is something other cities may also wish to consider.
Another lesson that others can learn from Hargeisa is in the development of vocational and technical skills in the urban population. Hargeisa’s ongoing construction programme (including several commercial properties as well as residential structures) and the road construction and transportation industry opportunities associated with the Berbera project, provide an opportunity to develop a base of vocational and technical skills in the city’s workforce, with the potential for other opportunities in the future, according to some of our respondents.
Education in Somaliland has seen signifi-cant growth, with several universities and higher-education colleges in Hargeisa and numerous language schools, vocational skills institutes and private schools. This sector is ripe for further development, but respond-ents recognised that without an economy capable of absorbing higher-skilled gradu-ates, improvements in educational capacity may simply result in higher rates of emigra-tion since graduates will have no jobs to go to. In a worst-case scenario, it may lead to unrest and agitation as a large class of edu-cated but unemployable youth emerges. For Hargeisa, as for other cities in simi-lar circumstances, sequencing education and skills creation in an integrated fashion with economic development is likely to be an essential element of any sustainable national or city-level education and work-force development plan.
Likewise, most respondents recognised that efforts in the public health sector would need to be coordinated with economic and
86S P E C I A L R E P O RT – JA N UA RY 2 0 2 0
WHERE THE RUBBER HITS THE ROAD
educational developments, lest improve-ments in infant mortality (currently one of the highest in Africa) lead to a youth bulge, with negative consequences for educa-tional and employment opportunities and social cohesion. Other cities have experi-enced similar effects and may wish to watch Hargeisa’s development here. No respondent thought that the risk of a youth bulge was a reason to delay action on public health – on the contrary, all felt that public and private medical and hospital services, health exten-sion programmes and clinics needed greater investment for humanitarian reasons. But these efforts need to be synchronised with increases in educational and, subsequently, employment capacity.
The Diaspora ‘Brain Gain’155
As noted earlier, the ‘brain drain’ of indi-viduals leaving Hargeisa for the diaspora, being educated overseas, acquiring human and financial capital and then returning to assist in the city’s development, creates the opportunity for a ‘brain gain’. Workforce skills, economic and investment capi-tal, and entrepreneurship within the city could be jump-started by carefully leverag-ing returnees (or by establishing ongoing supportive relationships with Hargeisans remaining in the diaspora). However, as also noted, the return of wealthy and edu-cated Hargeisans from the diaspora, and their dominance of political, civil service and business roles, creates the potential for resentment and marginalisation of those citizens who remained and suffered through several decades of conflict and reconstruc-tion. Again, this is issue is far from unique to Hargeisa and other cities facing simi-lar challenges can learn from Hargeisa’s experience here. National ownership of the diaspora issue, involving harmonisation of both groups and their different devel-opment pathways, is probably the right approach at this point. A conscious, thought-through and carefully socialised policy on
leveraging diaspora capabilities in order to benefit all Somalilanders was an idea that most respondents fully supported.
Conclusion: Trapped in the Diplomatic Mist?This chapter has not sought to tell Hargeisans, who know their own city best, how to develop their city or what to do about the many problems and opportuni-ties that face the city. On the contrary, the strongest impression gained during our months of research and fieldwork was of a city, and of a group of townspeople, officials, community elders and business leaders who are justly proud of what they have achieved, know exactly where they want to go, and have a good idea how to get there. In each section so far, we have included specific observations that might be of use to other cities seeking to learn from Hargeisa’s experience.
Hargeisa – both the physical city in Somaliland, and the larger invisible city with a global presence and a worldwide network – is a growing, dynamic, safe and vibrant place. The city is confident, building on 28 years of self-help and boot-strapping, and is ready to take its place as a major regional economic and trading hub. While the issues and problems associated with lack of recognition are real, the city’s future is bright, and there are many things Hargeisa can do to accelerate economic and social development without waiting for the world to recognise its progress. For those in the diaspora who fled in the 1980s or grew up overseas since, the city is a welcom-ing presence; for the region and the world, Hargeisa is open for business. With engage-ment, patience, and a recognition that Somalilanders have done extremely well on their own, the opportunities for growth, development and resilience in this city are clear and waiting.
It would be easy to dismiss Hargeisa as a unique case given Somaliland’s lack of

87S P E C I A L R E P O RT – JA N UA RY 2 0 2 0
WHERE THE RUBBER HITS THE ROAD
international recognition. It is true that this has led to a dearth of resources, even more so than other African urban centres. But in facing the enormous infrastructure challenges of a fast-growing population, boosted by its record of relative stability and
prosperity, Hargeisa illustrates the necessity of self-reliance and local ownership.
Other cities, both in Africa and through-out the developing world, can learn a lot from Hargeisa in this regard.

88S P E C I A L R E P O RT – JA N UA RY 2 0 2 0
WHERE THE RUBBER HITS THE ROAD
Buffalo City: From Lifeless Economy to Lifestyle Opportunity
Quick Facts
Population: The population of the metro is 775 000 (according to the 2011 Census); 834 997 (according to the 2016 Community Survey).Revenue: Council revenue collection was R6.6bn in 2018/19 compared to R4.5bn in 2013/14. The metro houses one of eight national Special Economic Zones, which offer a 15% corporate tax rate.Housing: There are 154 informal settlements that needed to be provided with access to municipal services.Industry: The number of unionised workers has dropped to just over 1 000 from a peak of close to 50 000. The so-called ‘border industries’ have essentially ceased to exist.Transport: High dependency on public transport, with taxis accounting for 60% of public transport use; bus and train journeys together account for 9% of public transport use. The poor spend up to 25% of their incomes on public transport. Trans-shipment or haulage of containers to inter-continental ports adds a premium of around R12 000 per container.Energy: Buffalo City has the third highest tariffs of all South African metros. Only 60% of residents pay for electricity consumption; there are over 100 000 illegal connections. 87% of the population has access to electricity for lighting.
The Eastern Cape is South Africa’s third-larg-est province by population, with 6.5 million inhabitants in 2018.156 However, it has the lowest per capita income, and has star-tling rates of migration to other parts of South Africa. The Buffalo City Metropolitan Municipality (BCMM) is one of two metropol-itan municipalities in the province.
Once a beacon of industry, the region has suffered major economic setbacks due to the contraction of the manufacturing sec-tor after 1994. This was, in part, due to the decision to abandon special economic zones in the Transkei and Ciskei homelands, which were incorporated into the province after the end of apartheid, and, in part, due to the absence of an effective plan to make up for these losses. By 2018, the number of workers signed up to the Metal Industry Bargaining Council in the Border area dropped to just over 1 000 from a peak of close to 50 000 in 1994.
Dimbaza and Wilsonia illustrate the impact of de-industrialisation on Buffalo City. Now largely derelict, Dimbaza once hosted some 200 factories employing 16 000
workers prior to 1994. When government did away with the subsidies that initially attracted investors, the decline was precipi-tous with only a few factories still operating now. Wilsonia in East London continues to host industry, but its road and other infra-structure are in urgent need of renewal to persuade investors to remain. The region’s industry is also highly vulnerable to high logistics and other operating costs.
Dimbaza, originally known as Mnxesha, was created as dumping ground for apart-heid in 1967, a place where people were moved out of South Africa into a designated homeland, a place then as now of grinding poverty. Today, with a population estimated at over 30 000, Dimbaza is a scrappy collec-tion of spaza and other, slightly larger shops along a main road that parallels the R63 to Alice and Fort Beaufort in the Eastern Cape. This is one of the poorest areas of South Africa, the source of migrants to Cape Town and elsewhere. Dimbaza’s main road leads straight into the old industrial centre, established during the apartheid years as one of the decentralised ‘border industries’
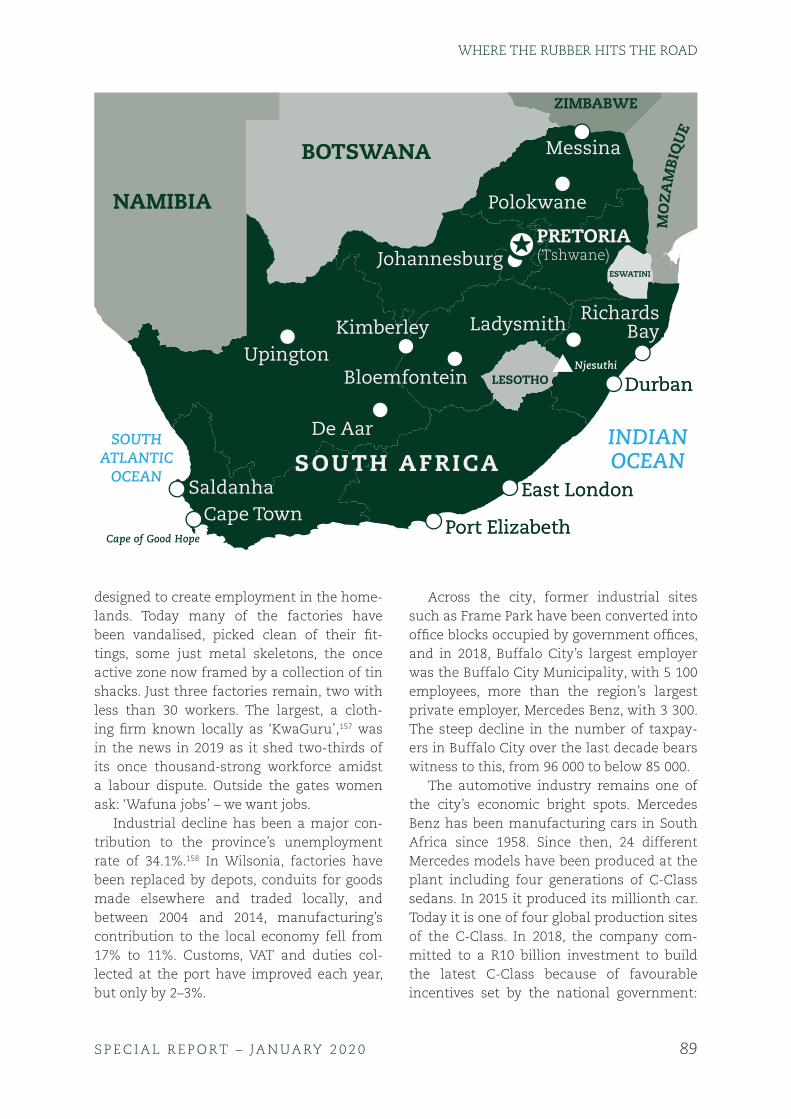
89S P E C I A L R E P O RT – JA N UA RY 2 0 2 0
WHERE THE RUBBER HITS THE ROAD
designed to create employment in the home-lands. Today many of the factories have been vandalised, picked clean of their fit-tings, some just metal skeletons, the once active zone now framed by a collection of tin shacks. Just three factories remain, two with less than 30 workers. The largest, a cloth-ing firm known locally as ‘KwaGuru’,157 was in the news in 2019 as it shed two-thirds of its once thousand-strong workforce amidst a labour dispute. Outside the gates women ask: ‘Wafuna jobs’ – we want jobs.
Industrial decline has been a major con-tribution to the province’s unemployment rate of 34.1%.158 In Wilsonia, factories have been replaced by depots, conduits for goods made elsewhere and traded locally, and between 2004 and 2014, manufacturing’s contribution to the local economy fell from 17% to 11%. Customs, VAT and duties col-lected at the port have improved each year, but only by 2–3%.
Across the city, former industrial sites such as Frame Park have been converted into office blocks occupied by government offices, and in 2018, Buffalo City’s largest employer was the Buffalo City Municipality, with 5 100 employees, more than the region’s largest private employer, Mercedes Benz, with 3 300. The steep decline in the number of taxpay-ers in Buffalo City over the last decade bears witness to this, from 96 000 to below 85 000.
The automotive industry remains one of the city’s economic bright spots. Mercedes Benz has been manufacturing cars in South Africa since 1958. Since then, 24 different Mercedes models have been produced at the plant including four generations of C-Class sedans. In 2015 it produced its millionth car. Today it is one of four global production sites of the C-Class. In 2018, the company com-mitted to a R10 billion investment to build the latest C-Class because of favourable incentives set by the national government:
BOTSWANA
ZIMBABWE
LESOTHO
ESWATINI
NAMIBIA
PRETORIA(Tshwane)PRETORIA(Tshwane)
SOUTH AFRICASOUTH AFRICA
JohannesburgJohannesburg
PolokwanePolokwane
UpingtonUpingtonKimberleyKimberley
BloemfonteinBloemfontein
LadysmithLadysmith RichardsBay
RichardsBay
De AarDe Aar
Cape TownCape TownEast LondonEast London
DurbanDurban
Port ElizabethPort Elizabeth
SaldanhaSaldanha
MessinaMessina
INDIANOCEAN
SOUTHATLANTIC
OCEAN
MO
ZA
MBI
QU
E
Njesuthi
Cape of Good Hope

90S P E C I A L R E P O RT – JA N UA RY 2 0 2 0
WHERE THE RUBBER HITS THE ROAD
a rebate for imports based on its exports, a capex rebate on its investment, and lower electricity costs. Without that, its executives admit, they would not have done so.
Buffalo City in a Comparative ContextA 2018 World Bank report showed that the ease of doing business in major South African cities varies significantly, with slow reforms since the last report three years before.
The report, Doing Business in South Africa 2018,159 surveyed nine major munici-palities, namely Cape Town, Buffalo City, Ekurhuleni, eThekwini, Johannesburg, Mangaung, Msunduzi, Nelson Mandela Bay and Tshwane. It measured the regulatory environment for small- and medium-sized enterprises, such as time frames for obtaining construction permits, electric-ity connection, property registration and trade across borders for port cities. No city performed well across any areas meas-ured, although Cape Town showed a major improvement in the time it takes to obtain construction permits for projects and get-ting electricity. Cape Town outperformed the average for Organisation for Economic Co-operation and Development (OECD) high-income economies. By contrast, Tshwane’s score placed it in the bottom half of global economies, behind Eswatini and just ahead of Namibia.160 Buffalo City’s ranking across the four indicators (dealing with construc-tion permits, getting electricity, registering property and enforcing contracts) was 6, 5, 6, and 9.
Doing Business in South Africa 2018 – Where is it Easier?The urban governance challenge is immense. In 2018, the Auditor General reported that Buffalo City was one of five Eastern Cape municipalities that regressed from an unqualified audit opinion with findings in the previous year to a qualified audit opin-ion161. While it was by no means the worst
performer in the province, where only 29% of municipalities were able to produce reports that were ‘useful and reliable’, the regression was concerning.
Pinpointing the ChallengesAs the above hints, Buffalo City is not inves-tor friendly. The city faces major hardware and software challenges.
The former range from unrepaired pot-holes to logistical challenges such as an inability to effectively utilise the port due to its size limitation. A premium on mov-ing containers from the R10+billion port of Coega built this century just 300km away towards Port Elizabeth (which remains half empty) pushes up the cost of selling and bringing in goods. The city also faces high costs and poor-quality delivery for munici-pal services such as electricity and waste management.
More important are the software chal-lenges, centring around policy, government integration (between its different levels of national, provincial and municipal) and its ability to match promises with action, and undo red tape. The metro leadership is per-ceived to be out of touch with business needs and unable to service properly the facilities that are designed to encourage investment, such as industrial parks.
There is a long list of specific, additional complaints by business. For example, it requires six steps to obtain an electricity connection in the city, compared with four steps elsewhere.
At a meeting between Mayor Pakati and industrialists in the neglected Wilsonia area convened by The Brenthurst in November 2019, many of the challenges faced by manu-facturers were laid bare.
The meeting took place as the appliance manufacturer, Defy, contemplated leav-ing the metro due to relatively high costs when compared to those of its operation in Kwa-Zulu Natal. The ‘death spiral’ – as one participant put it – was put down to:

91S P E C I A L R E P O RT – JA N UA RY 2 0 2 0
WHERE THE RUBBER HITS THE ROAD
› Large rates and electricity increases; › The failure to allow sustainable independ-
ent power production; › The absence of incentives which are only
applied to the IDZ and Mercedes Benz; › The slow pace with which the council
dealt with project approvals; and › The high cost of logistics including having
to use distant ports and truck goods to the interior.
Foreign investors cite security as their big-gest issue. Additionally, they are critical of the city government’s ability to project a positive brand, to act on the concerns of business, to focus on productivity as a driver of competitiveness, and to ensure an incentive scheme that at least makes up for the distance and cost to market. There is a perceived difference between macro-level economic policy (which has generally been sound) and micro-level actions (which have generally been poor).
Unless changes are made, business feels that Buffalo City will remain trapped in the cycle of despair along the lines of that described below:
Buffalo City’s Cycle of Despair
Weakly integratedgovernment
Poor service deliveryand cumbersome
processes
Loss of business
Lack of newinvestment
Stagnanteconomic growth
Poor revenuecollection
There is, however, some hope.The metro has a number of strong
selling points like its pristine beaches, life-style attributes such as medical facilities and top performing schools, an untapped tourism market, the ease of local access
encapsulated in the term the ‘Ten Minute City’ label which has been applied to the East London portion of the metro. This describes the short distance between key parts of the city such as its city centre and the suburbs. BCMM also has receptive political leadership and a strong emotional commitment of the business community to the city, as well as the co-location of its Industrial Development Zone/Special Economic Zone (IDZ/SEZ) with a large labour pool, agriculture and services sector, and unlimited sporting potential, from motor-racing to triathlons.
Some of the challenges the city faces are due to the broader South African macro-context, such as globalisation and the influx of cheap goods from Asia. There are also infrastructure failures such as the erratic supply of electricity which cannot be reme-died at a metro level. In the words of Buffalo City Mayor, Xola Pakati, ‘How do you attract investment when here is no guarantee of electricity supply?’
There are, however, some things that it is within the city’s power to change, includ-ing revenue collection, the cost of rates and electricity, the level of service delivery to businesses and investors, and the way the city is viewed by outsiders.
Government’s Ability to Address ChallengesRevenue remains scarce, and it is question-able how well it is spent in the metro.
In 2018, the metro had a debtor’s collec-tion rate of over 130%. The cost coverage ratio – a measure of business or govern-ment entity’s ability to meet its financial obligations – was about 1.5 times higher than for similar municipalities national-ly.162 On the flip side, as noted above, the city faces a decreasing tax base. In munici-pal services such as electricity and water, only 60% of residents pay for their services whereas the remaining 40% are a combina-tion of non-paying registered indigents and boycotters. Some 76 891 households out of a total of 253 477 were registered as indigent
92S P E C I A L R E P O RT – JA N UA RY 2 0 2 0
WHERE THE RUBBER HITS THE ROAD
in 2015,163 and therefore exempt from paying for municipal services. Municipal revenue continues to face problems of stagnation as the proportion of residents unable to pay increases with population growth and indus-trial stagnation. In electricity alone, there are over 100 000 illegal connections, which poses a revenue challenge, given that electricity sales make up the bulk of municipal income.
Over the last 20 years the city has been unable to implement the large-scale policy solutions needed to address the revitalisa-tion of its industrial zones such as Dimbaza and Wilsonia.
In Dimbaza, grounds owned by the Eastern Cape Development Corporation (ECDC) were supposed to become a turn-key site for new industrialists. In Wilsonia, just 15kms from the Mayor’s offices, the metro was supposed to provide security and reliable electricity to the zone. These pro-grammes have however failed to take off in part because of the inability of the munici-pal, provincial and national governments to co-ordinate their efforts on hardware and the software of costs, from labour to incen-tives. In the case of municipal services such as electricity, the municipality has placed a major burden on customers who do pay their bills in order to cross subsidise those who can’t. In East London, this has led to a mark-up of 40% above the price set by the national utility, Eskom, though some businesses have been able to negotiate pref-erential rates.
The failure to provide adequate and reli-able waste removal services or to upgrade infrastructure such as roads and sanitation contributes to the non-payment of munici-pal accounts as cynicism sets in about the value of making such payments. It is firmly within the grasp of the metro to alter this dynamic by prioritising service delivery and punishing failure through the proper management of city departments and employees.
Five case-studies below provide a snapshot of the problems and potential of the city.
Case Study 1: Da Gama TextilesDa Gama Textiles, the only makers world-wide of authentic Shweshwe cloth, which is extremely popular as the material for tra-ditional clothing in South Africa, is situated in Zwelitsha near King William’s Town. It has a long history of more than seven dec-ades in the region, and once employed 8 000 people. The term isiShweshwe originally came from the noise that the starched fab-ric made in the wind, the starch originally being employed to preserve the material on the long sea journeys from Britain. In 2005, Da Gama was delisted and sold by SA Breweries to a foreign investor. By 2014 it was teetering on the edge of bankruptcy, under threat from cheap foreign imports and suffering from poor management practices.
At the start of 2019 Da Gama employed 750 people. It is the industrial mainstay of the northern region of the Buffalo City metro, with an annual turnover of R600 million. But its existence is precarious. It depends on highly geared loans from a state funder, the Industrial Development Corporation (IDC), to survive. The failure of national govern-ment to police a 22% duty on products from inferior imported competitors – some of which brazenly pilfer Da Gama’s renowned Three Cats trademark with impunity – places pressure on the business.
It goes without saying that the loss of the 750 jobs at the plant would be a huge blow to the metro’s economy, particular in the ultra-depressed area of Zwelitsha. There are a further 12 000 to 16 000 hawkers who use the material to make bespoke outfits, which they sell for a living, who would similarly be affected.
Despite its importance to the sub-regional economy, Da Gama has little or no relation-ship with the metro administration. It has begun work on a new water treatment plant

93S P E C I A L R E P O RT – JA N UA RY 2 0 2 0
WHERE THE RUBBER HITS THE ROAD
and was unaware that the metro was build-ing a similar plant down the road.
A more proactive relationship with the metro could reduce the costly duplication of infrastructure and open discussions on how to reduce the factory’s overheads by subsi-dising water and electricity supply.
In addition, an unused portion of the Da Gama factory is to be developed into a new commercial zone. Co-ordination and the sharing of costs on infrastructure here could create many job opportunities for the area.
Case Study 2: Port BuffaloThe docks of Port Buffalo are situated on the Buffalo River and include a special dock for the movement of vehicles manufactured by Mercedes Benz. This is the largest and most active part of the dock complex.
However, the rest of the dock suffers from several serious design problems. The con-tainer facility is on the opposite side of the river to the SEZ, so cargo has to be moved some way by road, adding time and expense. In addition, the harbour is not large enough to allow for the docking of large inter-continental container vessels. As a result, containers destined for abroad are loaded or landed at Nelson Mandela Bay’s above-mentioned Coega Port or in Durban, adding anything upwards of R12 000 per container for them to be moved to or from Buffalo City by road or by sea in smaller container vessels.
Plans for the revamping of the dock have been drafted by state utility Portnet and include proposals for two large (inter-continental) container docks on the same side of the river as the IDZ with a rail link to the IDZ as well as the restoration of rail to East London to ‘main line’ status. This would substantially improve the competitiveness of the port and reduce the cost of importing and exporting in Buffalo City, with obvious benefits for industry.
The proposed upgrade, which will need capital of more than R20 billion, is being considered by the board of Transnet,
the government’s transport parastatal. The possibility of private sector involvement in the port – currently not official policy – is now being considered. Transnet should be held to account on these plans. If it decides not to go ahead, then the city should push for the facility’s concessioning.
Case Study 3: Latimer’s LandingThe Latimer’s Landing jetty on the Buffalo River is an historic landmark with great tourist potential, but it has been neglected because of a lengthy stand-off between the metro and Heritage Council, which will only allow it to be rebuilt using a wooden struc-ture identical to the original jetty which has been closed to tourists since 2009.
As a result, potential development of this area – which could include a waterfront hotel, creating a leisure precinct attracting tourists and providing locals with a desti-nation – has been put on hold even though decisions have been to replace the original structure.
If the Portnet revamp of the harbour takes place, including the rebuilding of the bridge, it could become a dock for larger cruise liners and a major tourism selling point. Currently it is a blight, proof of the city’s decay, and not the asset it could be. The metro should facili-tate the immediate reconstruction of the landing by expediting the necessary approv-als and putting it out to tender.
Case 4: Border IndustriesDimbaza, like other so-called ‘border’ industries including those at Butterworth, Queenstown, Zwelitsha, and Umtata (now Mthatha), were founded on tax and, other, direct incentives. For example, in the late 1970s, investors were offered a R95 monthly wage subsidy (at a time when the wage was just 15c per hour), along with a training levy, free housing for the investor, a flat 15% tax, and subsidised transport costs. Many of these factories were run by Taiwanese inves-tors given the close relationship enjoyed between that country and the apartheid

94S P E C I A L R E P O RT – JA N UA RY 2 0 2 0
WHERE THE RUBBER HITS THE ROAD
state which had gone out of its way to attract this group. By 2019, of the original 500 bor-der factories there were just five remaining. While the subsidies dried up, the problems of competitiveness continued to mount. In apparel, for example, the comparative costs in neighbouring Lesotho are: 50% for electric-ity, and one-third for labour. The net result, including greater labour efficiencies and a 10% flat rate of tax, is that the cost per unit is just 20% of that of South African produc-tion. In the words of one industrialist who has moved his manufacturing business away from Buffalo City, ‘the government has to give us a reason to be here. At the moment, there is no reason to stay.’
It is critical for the government to pro-tect the remaining industries by acting on their challenges in the areas that the metro can do something about, such as electricity and logistics, less Buffalo soldier than give us hope Joanna.
Case Study 5: East London’s Grand Prix CircuitHistoric motorsport is the fastest-growing category of international motor racing, and a significant economy in its own right. There are more than 40 global historic motorsport festivals. The largest, at Goodwood in the UK, attracts 100 000 spectators per day, and contributes over £100 million to the local economy through just two annual events.164 The value of the car restoration industry in the UK alone is estimated to be worth around £5.5 billion annually, employing 35 000 people.165 This grew nearly 28% over the five years to 2016. There were just over one million registered historic vehicles in Britain in 2016, worth a staggering £17.8 billion. This would place the value of the global historic vehicle industry, including trading, restora-tion, racing, the manufacture of parts, and the staging of festivals and events north of R1.5 trillion. The value of trade in classic cars alone has almost doubled globally in ten years since 2008.166
East London is uniquely poised to ben-efit from this burgeoning ‘new’ industry, but only if it can position itself to promote events attractive to a wealthy international clientele.
Nearly six decades ago, on 29 December 1962, BRM clinched its one and only World Formula One Championship, with Graham Hill winning the final GP of the season at East London. Although South Africa had staged Grandes Epreuves before, the 1962 event in East London was the first time the race carried World Championship status. It was a day of high drama, well covered in the international media, Graham Hill snatching victory only laps from the end when his great rival Jimmy Clark’s Lotus failed. As his son, Damon Hill, himself a World Formula One champion in 1996, comments, ‘It is impos-sible to imagine how different our family’s lives would be if Dad had not won the World Championship in East London in 1962, 50 years ago. I had just turned two years old so can remember nothing of it, but … I can imagine the tensions and drama that must have visited East London on that momentous day.’
The East London Grand Prix track was the latest iteration in several circuits in the area, the first being the 15.2-mile Marine Drive Circuit running along the coastal road, where the First SA Grand Prix – labelled ‘The Border 100’, South Africa’s longest running motor-race – was staged in December 1934, inspired by the enthusiasm of the motor-ing editor of the local newspaper, the Daily Dispatch, Brud Bishop. With a strong interna-tional representation of competitors making the intrepid journey by sea and land, the event quickly became a feature on the global motor-racing calendar. A second GP was held in January 1936 on a shortened 11-mile course. With a range of contemporary GP stars participating, East London’s population swelled from 22 000 people and 5 000 cars to 100 000 and 25 000 cars. By 1937 the event was attended by the factory Auto Union team, the F1 uber-stars of the day.
95S P E C I A L R E P O RT – JA N UA RY 2 0 2 0
WHERE THE RUBBER HITS THE ROAD
Motorsport returned after the war, initially to the Esplanade track in the city centre, and in 1959 to the existing track which incorporated elements of the old Prince George Circuit, built then at a not inconsiderable cost of £30 000. The Sixth South African Grand Prix followed in 1960, won by Paul Frere from Stirling Moss, the legendary English driver going one better in winning the 1961 race in a star-studded cast. The GP continued until 1965 when it moved to the Kyalami track in Johannesburg, ‘finan-cial considerations’ and having ‘outgrown the small holiday city’ forcing ‘a switch to the far more populous Witwatersrand.’167
Remarkably, the 1962 track is still in its original form, providing a commercial opportunity to establish an annual historic festival, potentially in conjunction with Killarney circuit in Cape Town, which is also unaltered since it staged the 1960 Cape Grand Prix. There are three other comple-mentary aspects.
First, South Africa’s only Formula One champion, Jody Scheckter, hails from East London. This provides a notable global branding opportunity, one simply that money could not buy. As he writes: ‘My fam-ily has a bond with East London and the Grand Prix track. It’s where my uncle partici-pated in pre-war GPs. It is where I used to go and watch my heroes … and where I started my racing career. The famous circuit is a key part of our motoring history and, indeed, of South African heritage.’
Second, the virtual co-location of Mercedes Benz offers another motoring dimension, given the success of the company in global motorsport.
And third, South Africa’s southern hemi-sphere weather offers competitors an opportunity for a warm holiday and racing when northern hemisphere tracks are wet and many closed.
Moving from Planning to ActionAlthough Buffalo City is facing a mas-sive challenge to turn back the tide of de-industrialisation and find new ways to attract investors, there is hope. The city’s cycle of despair can be turned into a virtuous cycle of growth, investment and job creation.
To retain and expand the industrial sec-tor and agriculture under current adverse economic conditions is an enormous chal-lenge, but the alternative – continuing the present trajectory of city stagnation and inevitable decline – is far worse and will cause the metro’s finances ultimately to col-lapse as unemployment and instability rise and the revenue from tax and property rates declines.
There is an imperative to produce a virtuous circle of city improvement and investment in four priority areas.
The cycle of economic stagnation, rising numbers of indigent households and grow-ing unemployment does not bode well for the metro’s financial sustainability. No revi-talisation of the city will take place without a strong, goal-directed and financially healthy metro. The city will have to confront those households which do not pay their rates, water and electricity bills. The enforcement of the rule to promptly cut off non-paying customers is key, and to incentivise payment by improving the quality of municipal service provision by attending to road maintenance, waste collection and the reliable provision of electricity and water. The municipal balance sheet can also be improved by more aggres-sive harvesting of national and provincial financing that is made available, for exam-ple, for the Strategic Integrated Projects that are relevant to the metro.
Despite the erosion of the metro’s indus-trial base, several industrial enterprises continue to operate successfully in Buffalo City. Some 16% of the gross value added (essentially the value of goods and services) in the metro derives from manufacturing.168
96S P E C I A L R E P O RT – JA N UA RY 2 0 2 0
WHERE THE RUBBER HITS THE ROAD
The stabilisation of the business envi-ronment to secure the retention – and the expansion – of these businesses, which employ many people and sustain a net-work of service and supplier industries, is vital. It is important to develop an effective relationship with the largest employers – Mercedes Benz, Aspen, Johnson & Johnson and Da Gama – so they can be encouraged to expand their investments and see Buffalo City as competitive with alternative invest-ment destinations. Our discussions with some of these employers have shown that there is poor communication with officials and a lack of sympathy for their problems.
In addition, many established businesses operate in very poorly maintained envi-ronments, disincentivising expansion and growth. The inadequate port facility and the attendant need for cargo to move from Coega by land or sea at an additional sig-nificant cost, undermines the attraction of locating near a port.
And then there is the question of incentives.
Incentivising BusinessIndustrialists in the region are understand-ably keen for the return of an aggressive incentive regime, one of course not based on the political premise of the past, but rather the geographic disadvantage and thus cost of its relative distance from markets.
Government is understandably reluctant to engage in a structure that would poten-tially, at least in the short-term, diminish its revenue stream, even though in the longer-term this is anyway threatened if the rate of business closure is any indication. Without something changing, on the current trajec-tory, there will be no revenue to worry about anyway. Moreover, the nearly R10 billion effective subsidisation of the new Mercedes Benz facility undermines this argument.
The government has rather preferred to pursue a policy aimed at creating Special
Economic Zones countrywide. The East London IDZ is one of eight such SEZs.169 Like others, it offers a discounted corpo-rate tax rate of 15%, compared to the usual 28%. The record so far illustrates the power of incentives. By the start of 2019, the IDZ had a attracted a total of 23 tenants accord-ing to its web site.170 These measures can be extended to other manufacturing businesses in the metro to encourage new investment in labour intensive industries, rather than be geographically constrained. One use-ful criteria for such status would be relative employment numbers. And the IDZ/SEZ ben-efits can be more aggressively extended to sectors outside of automotive, which domi-nates the facility, including Business Process Outsourcing, which provides 4 500 jobs in the area and enjoys the advantage of high-speed fibre.
The conversion of the IDZ to a fully-fledged SEZ creates the overall opportunity to attract new investors to Buffalo City. The metro is competing with other South African cities and, indeed, many global alternatives for this investment and the case must be made aggressively. The first port of call for a new investor will be existing industry. The city must leverage its existing strengths and its unique features to make its investment case.
The priority for the city must be the stim-ulation of investment and the expansion of the activities of the current investors. A 21st century incentive scheme should look at the following key aspects:
› Tariff protection for textiles and related labour-intensive industries.
› A SA Revenue Service unit dedicated to addressing smuggling.
› Corporate tax rates aligned with those offered by the SEZs.
› Electricity tariffs and capex support at the same level as those available to Mercedes Benz.

97S P E C I A L R E P O RT – JA N UA RY 2 0 2 0
WHERE THE RUBBER HITS THE ROAD
Other longer-term specific initiatives could include the establishment of a waterfront hotel as a part of a wider redevelopment along the lines of (but on a smaller scale to) Cape Town, and the creation of a new, high-tech automotive university, offering specialist engineering education, the first of its kind in Africa.
One of Buffalo City’s key competitive advantages in the fight for investment is that it is perfectly positioned to become a high-tech ‘lifestyle’ city. It has a mild cli-mate with 12 months of sunshine and rainfall of 850mm.171 It has a beachfront with enviable potential and, as noted above, one of the world’s last remaining ‘untouched’ historical Grand Prix circuits. It hosts international surfing competitions and the Iron Man event and is (relatively) crime free. It hosts several prestigious schools which have strong academic and sporting records. It has attractive, estab-lished ‘garden suburbs’.
The city enjoys river frontage with tourism potential and a small but well-resourced private conferencing venue. The cost of living is favourable. You would need to earn R36,852 in Johannesburg to main-tain the lifestyle you can get for R29 000 in East London,172 assuming property is rented. Consumer prices are 21% higher in Johannesburg, grocery prices are 34% more expensive and rentals are 48% higher. In December 2019, the IDZ will land a new undersea cable that has the potential to provide the metro with some of the fastest internet in South Africa, which will add to its lifestyle credentials and, more importantly, open opportunities for new investment in technology-related businesses.
Buffalo City: A Fresh Cycle of Growth
Well-integratedgovernment vertically
(and horizontally)
Good service deliveryand incentives
for business
Clean city, attractiveinvestment
environment
Newinvestment
Newindustries
Multisectoremployment andeconomic growth
opportunities
Conclusion: Lifeless Economy to Lifestyle City?Buffalo City is at an inflexion point. Slowing revenue, declining municipal service provi-sion and disillusioned investors threaten to pull the metro into a downward spiral of urban decline where jobs are lost, city rev-enues decline, service provision deteriorates, and social unease grows. This can become a self-perpetuating cycle of despair as inves-tors become more disillusioned.
The case of Defy illustrates perfectly this inflexion. In late 2019 the 200 jobs in the Turkish-owned fridge manufacturer based in Wilsonia were threatened by a combina-tion of high transport and electricity costs, and relatively low volumes in the stuttering South African market worsening economies of scale. Whereas the East London Defy plant produces 200 units per day, Chinese com-petitors churned out 50 000. Cost cutting and improved efficiencies at the plant have helped but there has inevitably been a push to consolidate the operations at Defy’s much larger Ladysmith factory. Not only would this cost jobs at Defy in Wilsonia, but across a range of suppliers and service providers, from plastic injection moulders to transport haulers. Retaining these jobs would at a min-imum require the metro reducing electricity costs and rates.
98S P E C I A L R E P O RT – JA N UA RY 2 0 2 0
WHERE THE RUBBER HITS THE ROAD
The economic future of Buffalo City can be summarised as: How can labour intensive and service sector industries best and cost-efficiently be promoted?
Competitiveness should not be measured exclusively in labour costs; to the contrary, government has a whole range of levers to pull relating to the cost of doing business that have no bearing on labour inputs and may, indeed, if handled correctly, raise the return to labour. The inevitable comparison between the City of Cape Town and Buffalo City is moot. The difference seems to be down fundamentally to a government that is focused overwhelmingly on doing ‘stuff’, the other on politicking. The disruptive cost of the latter aspect can be seen in the tumult around Cape Town’s mayoral leadership in 2018, throwing Cape Town off its relatively
positive development track. In East London the need to maintain political factions has led to delivery inertia.
Buffalo City has much within its grasp: a large labour pool, solid infrastructure and access via sea and air, tourism opportuni-ties, and a rump of existing investors. Many cities, in Africa and farther afield, would be delighted at this inheritance and the stock of comparative advantages. Yet much potential has been squandered amidst government inertia and vested interests.
Buffalo City is ripe for change. As a first step, the municipality should develop a pack-age that makes Buffalo City an attractive business destination and by developing the softer sport and leisure elements that make Buffalo City South Africa’s Lifestyle City.

99S P E C I A L R E P O RT – JA N UA RY 2 0 2 0
WHERE THE RUBBER HITS THE ROAD
Mombasa: Gateway City
Quick Facts
Population: The population increased from 200 000 in 1960 to 1.4 million in 2019.Logistics: Mombasa’s annual throughput was doubled from the 2012 figure to 32 million tonnes. The Standard Gauge Railway moves 12–13 trains daily from the port facility; 80% of the containers that arrive in Mombasa by sea leave the harbour within four days.Transport: 95% of motorised commuters commute by matatu – this represents 60% of Mombasa’s transport. Some 30% of the population experiences a gap between availabil-ity and utilisation of public transport (attributed either to unaffordability, lack of route coverage, or poor service frequency); 30% of commuters walk.Energy: 75% of the population have access to electricity (2016 estimate by Mombasa County Government).
In 1593, King Philip II of Spain, at that time also King of Portugal, ordered his subjects to build a fortress guarding the wonderful natu-ral harbour at Mombasa on Africa’s Indian Ocean coast. Philip was still smarting from the defeat of the Spanish Armada in 1588; having put off earlier plans, he now renewed his push to control Mombasa, with its food and fresh water supplies, and its strategic location as an ancient commercial hub trad-ing as far afield as Persia, India, China and Oman.173 Given Philip’s geopolitical competi-tion with England and the Netherlands, both now seeking to exploit his Armada defeat, it made sense to secure a forward position on Africa’s east coast.174 A base at Mombasa would allow him to control waters north to the Horn and south to the Cape, trade with the Swahili Coast, and protect communica-tions with the Portuguese colony at Goa in India, while securing for Philip (and denying to his rivals) the Indian Ocean trade.
Philip never visited Africa; he thought of Mombasa as many have done, before and since: as a gateway to other places. But the town and its people were there for centu-ries before the Portuguese, Arabs or British arrived, and even since independence in 1963, the insider’s perspective has often been very different from that of outsiders. Philip’s fortress – Fort Jesus, today a United Nations World Heritage site – has changed hands many times since its completion in 1596.
It anchored a new city on Mombasa Island, turning a cluster of fishing huts into the core of a dynamic urban area that today houses 1.4 million people and is one of the most important ports on Africa’s east coast.
Gateway to AfricaThe Republic of Kenya’s second-largest city and only major port, Mombasa is also the largest commercial harbour in East Africa and a logistics and infrastructure hub for the western Indian Ocean. The city’s con-tainer terminals, at Kilindini Harbour and Port Reitz, along with the newly-completed, Chinese-funded Standard Gauge Railway (SGR) to Nairobi, connect Kenya to Uganda, Rwanda, Burundi and the wider African Great Lakes region. This makes Mombasa a critical node in the global supply chain, and gives the city access to an international mar-ket of more than 500 million people across the central region of the world’s fastest-growing continent.175 Likewise, four (soon to be six) submarine cables – fibre-optic telecommunications links whose landing stations in East Africa are all at Mombasa – make the city a digital hub with cheaper and faster internet, cable and telephone access than the rest of Kenya, and indeed many other parts of Africa.176
Mombasa is indeed a gateway to Africa. It is also a vibrant and diverse cultural, residential and commercial centre in its own

100S P E C I A L R E P O RT – JA N UA RY 2 0 2 0
WHERE THE RUBBER HITS THE ROAD
right with its own interests and needs. The city remains deeply affected by its trading role, its strategic location on the East African seaboard, historic tensions between inland and coastal regions and religions, and global great-power competition. Today that compe-tition plays out, not among the long-decrepit European empires of the past, but between the rising global power of China, its rivals in
India and the Middle East, and its principal geopolitical rival, the US.
This chapter draws on documentary research conducted throughout 2018–2019, on fieldwork during 2019 in Mombasa and surrounding coastal districts, and on sur-veys, polls and focus groups conducted in the city. It examines Mombasa through the lens of its gateway role, and the tension between
Kisumu
Mombasa
Machakos
NAIROBI
KENYAGRE
AT RIF
T VALL
EY
SERE
NGET
I PLA
INLakeTurkana
LakeVictoria
MountKenya
H I G H L A N D S
TANZANIA
UGANDA
SOUTHSUDAN
SOMALIA
ETHIOPIA
INDIANOCEAN
Nakuru
Malindi
EldoretMeru
Garissa
Wajir
Marsabit
MoyaleLodwar
Ilemitriangle

101S P E C I A L R E P O RT – JA N UA RY 2 0 2 0
WHERE THE RUBBER HITS THE ROAD
that role and the interests of the city itself. The chapter explores the contrast between coast and hinterland, the trade-off between hardware and software, and between practi-cal and aspirational goals. Finally, it suggests ways in which other African cities might learn from Mombasa.
A History of Connection and ExploitationThe Portuguese cared little for Mombasa’s hinterland. When they were expelled from Mombasa in December 1698, it was by another seafaring empire: the Omani Arabs.177 Sailing trading dhows and fighting ships from strongholds in Muscat and Suhar, the Omanis had built a commercial network across the Indian Ocean by the 10th Century CE, bringing spices, dried fruits, salt fish, grains and nuts to Mombasa from Arabia, and trans-shipping dates, carpets, saffron, rice, coffee, textiles and ceramics from India, China and elsewhere in Africa.178 Coastal traders exchanged seaborne goods for gold, ivory, slaves and commodities from the hin-terland.179 Mombasa – sitting on an island at the junction of two large estuarine inlets, each with its own freshwater creek and mul-tiple access points into the hinterland – was ideally placed as an intermodal transporta-tion hub to connect inland producers with overseas markets.
Mombasa under the SultanThe city’s growth under the Omani sultan-ate reflected this trading role, enhanced by the emergence of Islam as a major religion along the entire coastline of East Africa: many Mombasa merchants converted to Islam (which in East Africa, as in Southeast Asia, was a trader’s religion, spread more by commerce than the sword).180 Although these converts were undoubtedly sincere, there were also distinct commercial advan-tages to the new religion. Conversion allowed merchants to avoid the jizya tax levied on non-Muslims, enabled them to prove their
trustworthiness to trading partners, and let them access globalised financial services – including the ability to write a cheque in Mombasa and cash it in Morocco, Cordoba or Bandar Aceh – only available to Muslims.181
Swahili city-dwellers in Mombasa, Muslim by religion and of mixed Afro-Arab descent, created trading routes into the interior, seek-ing upcountry commodities for onward sale to Zanzibar and Oman.182 In 1832, under Seyyid Said, the sultanate relocated its capi-tal from Oman to the island of Zanzibar, establishing a clove-growing industry, raiding inland for slaves to work the new plantations, and creating the slave-trading entrepot (with an outpost at Mombasa) for which Zanzibar became infamous.183 Swahili traders penetrated east and central Africa: they built bases, stationed armed retainers to protect caravan routes and established representatives at the courts of inland rulers. But, like the Portuguese before them, they did not seek to govern upcountry regions.184
The slave trade drew the ire of the British, who, having outlawed it throughout their dominions in 1807, spent much of the 19th Century hunting down East African slav-ers and reducing their strongholds.185 It was the unilateral action of one British naval officer – Captain William Fitzwilliam Owen of Her Majesty’s Sloop Leven – that first brought Mombasa, whose local Mazrui rul-ers were then in a power struggle with the Busaidi Sultan of Zanzibar – under British protection.186
Without Admiralty permission, Owen sailed into Mombasa harbour in February 1824, agreed to a Mazrui request for a pro-tectorate (thereby helping the locals fend off Zanzibari control) and extracted in return a promise from local leaders to end the slave trade.187 The crew of Owen’s ship established itself in a house – today named for the ship and registered as a national monument – in the Old Town, only for British authorities to rescind Owen’s unauthorised protectorate in 1826.188 But Mombasa, in part because British
102S P E C I A L R E P O RT – JA N UA RY 2 0 2 0
WHERE THE RUBBER HITS THE ROAD
ships continued their anti-slavery blockade, remained relatively independent of Zanzibar despite the Sultan’s nominal sovereignty.
Gateway to the Scramble for AfricaIn 1884, another unauthorized adventurer upended this balance. German explorer Carl Peters penetrated inland and, without per-mission from Berlin, signed treaties with rulers in the hinterland of today’s Tanzania and Rwanda; prompted by pro-imperialist public opinion, the Kaiser extended a protec-torate over the area.189 The challenge having been raised, Britain moved immediately to block Germany. In the ‘Scramble for Africa,’ Britain acquired inland colonies and eventu-ally colonised Kenya, but Mombasa was still seen as a gateway – an access point to more important inland areas such as Lake Victoria, the Rift Valley or the fertile highlands around Mount Kenya – rather than as a key centre in its own right. Indeed, ‘the territory now known as Kenya was for some years to figure in the minds of British statesman only as the site of a railway, the Uganda Railway.’190
That railway (construction of which began in 1896 and was completed in 1901) con-nected Uganda to the coast at Mombasa. It sparked massive urban and commercial growth in Mombasa, and enabled the devel-opment of Nairobi and the highlands, which, by reason of their temperate climate, fer-tile soil and abundant agricultural labour, became the centre for British colonial rule and the dominant economic and political region within the new Kenya Colony. Indeed, by one estimate, virtually all development in Kenya throughout the country’s history has taken place within 200 miles of the railway.191
The railway made Mombasa, establish-ing it as the critical intermodal transport hub linking a vast inland area of Africa to the global economy. The development of Kenya can be explained (in spatial, economic and ethnic-political terms) through the impact of Mombasa’s railway and the port. Infrastructure became the skeleton around
which the colony, and later independent Kenya, took shape over multiple generations.
This development also brought a power shift – influence flowed from coastal to inland regions, from Mombasa to Nairobi, and from coastal Swahili populations to upcountry population groups. These groups, who spearheaded the push for independ-ence from Britain and led the Mau Mau uprising of the 1950s, have dominated Kenya since Independence in 1963, contributing to regional tensions that still affect Mombasa today.
Growing while losing influenceDespite rapid growth in Mombasa, the even-faster growth of inland regions caused a power shift, from coastal to inland areas and from Arab and Afro-Arab coastal populations to inland Africans, with implications that still resonate for Mombasa today.192 Whereas coastal Swahili traders, backed by the Sultan of Zanzibar, had held the upper hand over upcountry populations for decades, under British rule Mombasa – along with a ten-mile strip running the length of Kenya’s coastline, which still fell under the Sultan’s sovereignty – rapidly lost influence even as the city grew.
Mombasa’s urban footprint and demo-graphic makeup shifted significantly during the 68 years of British rule, with rapid growth and the emergence of commercial agricul-ture and shipping industries transforming the city and its peri-urban areas.193 An influx of Indian and Middle Eastern workers and businesspeople, encouraged by colonial authorities, increased social and residential diversity, with the Old Town now surrounded by administrative, residential and industrial districts. The local fishing industry – always a staple activity in Mombasa – expanded rapidly, while a belt of agricultural and mar-ket-garden cultivation emerged around the city to supply food for its growing population.
The urban area expanded well beyond its original footprint on Mombasa Island, with new port and rail facilities appear-ing at Kilindini Harbour west of the island
103S P E C I A L R E P O RT – JA N UA RY 2 0 2 0
WHERE THE RUBBER HITS THE ROAD
and at Port Reitz further up the same inlet, and informal settlements proliferated.194 Factories, warehouses and marshalling yards sprung up around the docks and the rail-way. Newcomers flooded in from other parts of Kenya, drawn by better-paying jobs, free-dom from the exploitative contract labour arrangements that were prevalent in many parts of the rural hinterland, and by the energy and prosperity of the gateway city.195
The first big problem triggered by this growth appeared in Mombasa’s water supply.
The city had traditionally relied on wells bored into the coral rock of Mombasa Island.196 But by the early 20th Century, rapid urban expansion depleted these wells, mak-ing water and sanitation major concerns. This too was an effect of the city’s gate-way role, with water shortage caused by ‘the enormous increase in commercial and industrial use associated with the railway’.197
As a consequence, the colonial govern-ment undertook a major infrastructure project in 1911 to 1918 – at considerable cost in lives lost to disease, and in labour unrest – to pipe water from the Shimba Hills, 33km southwest of the city, to Mombasa Island. Ironically, the flood of inland people fleeing coercive labour recruiters for that project, along with improved water supply and sani-tation in Mombasa, only accelerated the rural-to-urban migration whose effects the project was designed to ameliorate.198
An urban explosionFrom a population (centred on Mombasa Island) of just 15,000-20,000 people in 1897, the population had reached 40,000 by 1931, double its pre-colonial level.199 By the 1950s, 4 000 new African immigrants were arriv-ing each year in Mombasa, attracted by the city’s opportunities, or fleeing upcountry violence generated by the Mau Mau insur-gency, and by British measures to suppress it – notably the ‘villagisation’ programme, which displaced a million Kenyans from inland settlements.200 Mombasa’s urban population swelled, reaching almost 200 000
by 1965. This skyrocketing growth (a tenfold increase in just two generations) led to fears by coastal Arab and Swahili populations that they would be swamped by upcountry immigrants.201
Demographic change also disrupted land tenure, with unprecedented numbers of squatters occupying the estates of absentee landlords in Mombasa and along the coastal strip, a problem that has persisted into the modern era.202 As one recent analysis noted, ‘people at the coast can feel a shared sense of grievance against upcountry people [but] there are multiple tensions within this imag-ined coast community – notably over land. Many people at the coast are squatters, and while some denounce upcountry people, others are equally quick to accuse Arabs of having dispossessed them, especially on the southern half of the coast.’203
The most obvious impact of this pattern of land tenure in Mombasa has been the spread of informal (slum) settlements. A system where land ‘is owned by a few individuals, who rent out land on condition that only temporary structures can be developed…has caused the establishment of informal set-tlements, causing significant environmental degradation’ and leading many urban-dwell-ers, if not an outright majority of people in Mombasa, to be officially considered ‘squat-ters’.204 This has been a major concern for Mombasans: one man told our team in 2016 that ‘land should be prioritised. People are living on the land which they don’t own. Even the owner of the land can come and say I am going to demolish this house and you won’t [be able to] do anything because you have built on someone else’s land, and most of the time the lands on which people are building don’t have leases.’205
Coast versus HinterlandAs a practical matter, until independence Mombasa and the coastal strip were gov-erned from Nairobi under the Kenya Colony, but in legal terms the coast remained a separate Protectorate of Kenya, leased from
104S P E C I A L R E P O RT – JA N UA RY 2 0 2 0
WHERE THE RUBBER HITS THE ROAD
the Sultan of Zanzibar and administered by Britain on his behalf.206 In the early 1960s, as independence approached, this became a source of serious tension in and around Mombasa. ‘Arabs and other coastal African groups fearing upcountry domination of the ocean-side region mobilised around the idea of coastal ‘autonomy,’ or mwambao, and vari-ously theorised that the area could become an autonomous province of Kenya, Zanzibar or an East African confederation.’207 This spooked people in Mombasa, ‘many of them migrants from upcountry, who saw mwambao as ‘a political issue aimed at Arabs dominat-ing the Africans in this town.’208
Kenya since independence has been dom-inated by a series of political coalitions and patronage networks that draw support from powerful upcountry populations. Inhabitants of coastal regions – including Mombasa – have felt disenfranchised politically, even as the city has played a critical role in ensur-ing global trading and economic access for the rest of Kenya. Indeed, as one researcher noted in 2017, in some areas, ‘feeling is widespread that the upcountry has, since independence, lived parasitically off of the coast… The sense of a coastal sovereignty separate from mainland Kenya has survived and offers coastal residents an emotionally attractive, if thus far impractical, alternative to [what some see as] the ignoble patronage competitions of Kenyan national politics.’209
Discontent and DevolutionFor Kenya’s first 50 years of independence, from 1963 until 2013, Mombasa was the capi-tal of Coast Province, an area that included the city itself, the 10-mile coastal strip of the old Protectorate, certain inland areas, and coastal cities such as Diani, Malindi, Kilifi, Watamu and Lamu.210 Mombasa formed the political, educational, commercial and transportation hub for the province. But fol-lowing inter-communal violence that threw Kenya into turmoil in 2007–2008, a process of constitutional reform culminated in the drafting of a new constitution in 2010, and its
adoption in 2013.211 At its core was the devo-lution of authority from national to local level. Under Devolution, the provincial level of government was abolished and 47 coun-ties replaced the eight former provinces. Mombasa city became Mombasa County, an area that covers the urban zone itself and its peri-urban areas, with the former city limits of Mombasa expanding slightly to become the new county boundary. Apart from shrinking the geographical reach of officials in Mombasa, the new arrangement merged the mayoral with the provincial administra-tion, turning the Mayor of Mombasa into the Governor of Mombasa County – Kenya’s only fully urban county, and its smallest by area (though one of its most developed and heav-ily populated).212
Devolution was intended to address several problems that had emerged since independence, and which many Kenyans believed had contributed to the violence of 2007–2008. These included decision-mak-ing remote from local communities and realities; perceived neglect and marginali-sation of some areas (including Mombasa) and minority populations; centralisation of resources at the national level, leaving cities and provinces without the means to address infrastructure shortfalls such as dilapidated hospitals and roads; and victimisation based on political affiliation. If an area did not support the government of the time, [it] did not receive any attention [and] had limited resources.’213
In response, the 2010 constitution placed administrative functions under a county executive council or public service board, with the county headed by an elected gov-ernor and responsive to a county assembly including both elected and appointed mem-bers. A county commissioner was responsible for day-to-day administration of services. Devolution was generally popular among those who spoke with our researchers: in particular, decentralisation of decision-mak-ing made many Mombasans feel closer to their government. Still, competition between
105S P E C I A L R E P O RT – JA N UA RY 2 0 2 0
WHERE THE RUBBER HITS THE ROAD
the county commissioner and the governor struck some respondents as bad for security, while others were concerned about cost- and resource-sharing between different levels of government.214 The constitution mandated sharing of resources between national and county-level governments, with the central government collecting revenues then return-ing 15% of revenue to counties to meet their expenses.215 As we will see, in the case of the highly-lucrative Port of Mombasa and the SGR, both of which generate significant funds for the national government, this allocation leaves many in Mombasa dissatisfied.216
Conflict on the CoastDevolution coincided with a spike of violence driven by religious, ethnic and regional dif-ferences founded in the distinct history of the coastal region.217 After the 1998 bomb-ing of US embassies in Nairobi and Dar es Salaam, Mombasa became a focus of coun-terterrorism efforts ‘after security agents traced the bombers’ movements to the metropolis and other coastal spots. Four years later…actionable leads were discov-ered’ following the April 2002 bombing of a Jewish-owned hotel at Kikambala, 34 kilome-tres up the coast road from Mombasa (which killed 13 and injured 80) and the attempted shoot-down of an Israeli-chartered airliner, using surface-to-air missiles, as it took off from Mombasa’s Moi Airport.218
Crackdown and BacklashThe 2002 attack, with its sharply negative impact on Mombasa’s important tourism industry, prompted a harsh crackdown by police and security services, which in turn led to a public backlash and the emergence of ‘no-go areas’, with alienated communities and individuals willing to offer sanctuary to armed actors in some parts of the city. By the time of the Devolution debate in 2010–2013, the anti-terror campaign (directed from Nairobi and conducted by national agencies) had prompted human-rights groups to accuse the central government
of extra-judicial ‘gangland-style’ killings of suspected extremists.219 Radical clerics, inhabitants of informal settlements and majority-Muslim constituencies saw heavy-handed security.220 Somalis and Kenyans of Somali descent were targeted after the surge in terrorism that followed Kenya’s interven-tion in Somalia, which began in mid-October 2011.221 A string of grenade attacks, attempt-ing bombings, weapon-smuggling incidents and other terrorism struck Mombasa in 2011–2014, leading to police and intelligence operations in Mombasa and other coastal towns.222
These operations targeted radical cler-ics, transnational jihadists including British citizen Samantha Lewthwaite (linked to the 2005 London bombing and the 2013 Nairobi Westgate Mall attack) whose last-known location was a flat in Kisauni’s Bakarani Estate, and returnees from the war in Somalia.223 Mosques such as Masjid Musa in the Mombasa Island neighbour-hood of Majengo, linked to slain extremist cleric Aboud Rogo, saw police sweeps, mass arrests and large-scale protests during this period, including a major raid in November 2014 in which 250 young men were arrest-ed.224 A month later, Kenyan police allegedly admitted to conducting a campaign of up to 500 extra-judicial killings in and around Mombasa, according to Al-Jazeera.225 They claimed to have received British and Israeli assistance under a programme directed at the highest level from Nairobi. The Kenyan government disputes this account and has denied the claims.226
Mombasa Republican CouncilDuring the same timeframe, a revival of coastal separatist sentiment led to another surge of violence in Mombasa.227 Local sepa-ratists, loosely organised under the umbrella of the Mombasa Republican Council (MRC) and including Muslim and Christian groups, engaged in street violence and alleged acts of terrorism, prompting another harsh gov-ernment crackdown.228 MRC leaders wrote

106S P E C I A L R E P O RT – JA N UA RY 2 0 2 0
WHERE THE RUBBER HITS THE ROAD
to the British government, the UN and oth-ers, claiming distinct legal rights due to the coast’s former Protectorate status, and alleging these had been betrayed dur-ing Kenya’s independence process in the 1960s.229 The group was outlawed; several leaders were killed and the MRC’s head, Omar Hamisi Mwamnuadzi, was arrested in October 2012.230 In the lead-up to the March 2013 election, ‘a series of lethal, if localised attacks raised the possibility of widespread violence’ or an MRC boycott; in the event, there were ‘savage attacks on police and poll-ing stations the night before the polls’ but large-scale unrest did not materialise.231
Countering Violent ExtremismOnce the 2013 election was over and Devolution began to be implemented, the new government of Mombasa County moved quickly to reverse this history in which local violence was exacerbated by harsh responses driven from Nairobi. The new County Government, under Governor Hassan Joho, instituted a strategy for preventing and countering violent extremism (CVE) through partnership with local communities, seeking to break the vicious cycle of crackdown and backlash that had doomed past efforts. The County worked closely with several civil soci-ety groups, including HAKI Africa, a human rights organisation working to improve livelihoods and enhance human rights in Kenya.232
Founded at the height of the violence in 2012, and based on Mikindani Road in the heart of old Mombasa, HAKI promotes part-nership between state and non-state actors, and ‘seeks to agitate for the recognition and empowerment of local communities in Kenya to fully participate in rights and devel-opment initiatives, with a view to improving the standards of living amongst all includ-ing the poor and marginalized.233 HAKI’s goals, which fitted well with the objectives of Devolution, made the group a natural part-ner for Governor Joho’s new government, which created a CVE Directorate and began
working with HAKI and other civil society organisations to develop a plan that would not only reduce jihadist and separatist vio-lence, but also reconcile alienated and marginalised populations within the city. The British government funded and supported the effort through local implementing part-ners.234 The result was the Mombasa County Action Plan for Preventing and Countering Violent Extremism, developed over months of consultation among stakeholders, and launched in May 2017.235
The process was guided by the National Strategy for CVE, developed by the cen-tral government through its National Counterterrorism Centre in Nairobi. The new strategy emphasised soft approaches (‘encouragement of dialogue, rehabilitation and a multi-sectorial approach to counter-ing violent extremism’)236 rather than hard methods based on arrest, punishment ‘or even execution of individuals suspected of involvement in violent extremism’.237 In effect, it was a repudiation of the previous approach that had done so much to alien-ate local communities. The action plan built on the nine pillars of the national CVE strategy (psychosocial, education, security, faith-based/ideological, training/capacity building, arts/culture, legal/political and media/online) alongside two additional ele-ments: an economic pillar and a women’s pillar. These were developed through a process of dialogue with civil society organi-sations and the public; they recognised the role of economic inequality in driving youth toward extremism, and the fact that ‘women were identified as both victims and perpetra-tors of violent extremism in Mombasa’.238
Largely as a result of this consultative approach, the Mombasa action plan has become a model for other counties in Kenya. One woman in Mombasa told a focus group conducted for this project that ‘concern-ing radicalisation, I think going forward it may improve because our brothers from the Muslim community are doing some-thing to enlighten their kids not to join the

107S P E C I A L R E P O RT – JA N UA RY 2 0 2 0
WHERE THE RUBBER HITS THE ROAD
Al Shabaab and they are telling them the right way to go for a Muslim. I think that has really assisted, plus the government also.‘239 and indeed cities across Africa and else-where could learn much from Mombasa’s experience, both in building the strategy and in continuously monitoring its implemen-tation and engaging with the community to ensure transparency. This has been done through periodic mapping reports and com-munity consultative summits.
There is thus no doubt that hard counter-terrorism methods, including military and police operations led by national agencies, will remain part of the CVE mix in Mombasa for the foreseeable future. Still, in compari-son to the violence that threatened the city in 2011–2014, it seems clear that the new approach, with its themes of consultation, dignity, access to justice, building resilience, and enhancing cohesion and integration, has contributed to significantly improved pub-lic safety in Mombasa. As one man told our focus group, ‘for the last two years I think [in] Mombasa we are having challenges with Al Shabaab and everything but it has gradu-ally improved. You will hear less cases of Al Shabaab in Mombasa, you can just hear them in other towns…security has been beefed up which impact[s] more on tour-ism and even the investors they are coming more, they feel Mombasa is a safe place for people to do business.’240
Upgrading the Urban FabricOne of the first things one notices, walking or driving around Mombasa, is the blue-and-white colour scheme of virtually every downtown building, contrasting with the beige and pink of Old Town and the world heritage area around Fort Jesus. Locals smile wryly at this newly uniform paint job, part of an effort by the County Government to fos-ter civic pride and a sense of progress, and thereby prompt broader improvements in Mombasa’s cityscape – a sort of urban-fabric version of the crime-reduction strategy known as ‘broken windows theory’.241 Under
a policy announced following public consul-tations in March 2018, property owners in the city were given only 14 days to imple-ment the colour scheme at their own expense, prompting some complaints.242 The programme has undeniably given Mombasa a much-needed facelift: one youth from Nyali neighbourhood noted, ‘We complain but comply, and it’s actually not bad. It does give a sense of pride.’243
A related change has been the new county government’s effort to clean up the city’s sanitation and trash problems. As one woman told us, ‘Mombasa used to be a dirty town by the way. Garbage was being thrown all over...Nowadays at least there are trucks, so there is a central place where people dump the garbage … cleanliness in town has really improved. Also the county officials are also implementing it because there are some areas where people used to dump but they are always there to check who is dumping their trash there.’244 This is the most visible aspect of a suite of programmes to upgrade Mombasa’s urban fabric, intended to help the tourism industry recover, promote eco-nomic and social development as part of a national growth strategy, and address the urban marginalisation, inequality and alien-ation identified as drivers for extremism. Improving informal settlements (slums) is a key aspect of urban upgrading.245
Informal settlementsMombasa’s rapid growth and industrialisa-tion, described earlier, inevitably led to the emergence of informal settlements, espe-cially since under colonialism domestic and industrial workers were corralled into unser-viced ‘African housing estates’ that were excluded from formal urban planning.246 In many cases, slums offered the only avail-able housing for workers in local industries and factories, or for those offering essen-tial goods and services as part of the jua kali (literally, ‘hot sun’) informal sector, which accounts for 95% of Kenya’s businesses and entrepreneurs.247

108S P E C I A L R E P O RT – JA N UA RY 2 0 2 0
WHERE THE RUBBER HITS THE ROAD
One 2012 study of an informal settle-ment in Changamwe constituency noted that ‘60–80% of Kenya’s urban population lives in slums [with] lack of access to water and sanitation, insecure tenure, lack of adequate housing, poor environmental con-ditions, and high crime rates. For instance, in Mombasa, about 40% of the population lives in slums that [occupy] only five per-cent of the total land area and the growth of Mombasa’s slums is unprecedented; the population living in slums is expected to double within the next 15 years.’248 To address this problem, Mombasa County, in conjunction with the national govern-ment, the World Bank, UN Habitat and other partners, is implementing an informal settle-ment improvement programme, as part of a national campaign.249
The Case of KindunguniAs with CVE, Mombasa’s approach has been strongly consultative, even though invol-untary resettlement of some residents did turn out to be necessary. One recent effort in Kindunguni, a settlement in the southern mainland constituency of Likoni, involved working closely with a Settlement Executive Committee (SEC) chosen by local resi-dents (and with mandatory participation by women, who make up a significant propor-tion of householders and small business owners in Kindunguni) in a series of planning and surveying activities to develop a base map of the settlement and identify struc-tures needing to be redeveloped or moved to ensure safety, access and sanitation.250
As a first step, residents were issued ‘title deeds for the plots they occupy [as a means to give them secure legal tenure of their property]. This involved the develop-ment of a Local Physical Development Plan and surveying of the settlement where 524 beneficiaries owning 505 plots [were] issued with title deeds.’251 Individuals who were required to relocate in order to open road access to the settlement were given ‘appro-priate compensation for their affected
assets at full replacement cost [along with compensation payments as] livelihood res-toration measures while at the same time providing support to the [one affected resi-dent] identified as vulnerable due to chronic illness ... Additionally, a Grievance Redress Mechanism was established to receive and resolve grievances arising from titling com-pensation’ and other issues.252
Mombasa’s participative approach to urban upgrading is something from which other African cities – facing the same set of challenges – could learn. Giving residents proof of ownership of the land parcels they occupy is a key idea, understanding that with secure tenure, people are more likely to make long-term investments on their land. As the county’s plan for Kindunguni notes, ‘persons living in the informal settlements with no legal ownership of land parcels they occupy do not invest in permanent hous-ing units for fear of demolitions or evictions [and] few of them take the risk and invest in modern structures ... Secured land tenure will cause improvements in settlement infra-structure, increases in housing values/rents, access to credit, and access to infrastructure, ownership and titling. With the tenure of the land secured, it is expected that the benefi-ciaries in the settlement will invest in better housing for their families.’ Or as one woman told us, ‘You know before you could buy land and there were no title deeds. At least at the moment there are title deeds, you go pur-chase land and you get a real title deed and you invest whatever you want to. At least you know that land belongs to you so you have the confidence of investing whatever you want to. I think that one has given most peo-ple confidence of staying in Mombasa and at least knowing that you are at home.’253
Hardware versus SoftwareMombasa is increasingly matching its long-standing emphasis on hardware – road and bridge infrastructure; the SGR and its asso-ciated container terminal, highway and station complex; and the urban upgrading
109S P E C I A L R E P O RT – JA N UA RY 2 0 2 0
WHERE THE RUBBER HITS THE ROAD
programme – with a focus on software. This is true both literally, in the growth of com-puter-enabled systems and tech businesses across Mombasa, and figuratively in the city’s emphasis on business improvement, education, health and human capital.
Digital GatewayMombasa is not just a physical and commer-cial gateway; it is the primary East African access point for the fibre-optic cables that enable global high-speed data telecom-munications and form the backbone of the internet.254 Mombasa has four submarine cable landing stations, connecting to four independent fibre-optic networks, with two more to be ready for service by 2021. Of the existing cable landing stations, three are in the city itself and one is in the northern urban district of Nyali. One station is owned by a private consortium that includes South African, Indian, European and Middle Eastern investors, and was the first to establish a landing station at Mombasa, in July 2009.255 SEACOM owns the East Africa portion of the consortium’s network, with landing sta-tions in South Africa, Mozambique, Tanzania, Kenya and Djibouti.256
As the first company to establish a cable station in Mombasa, and the first to set up as an internet service provider, SEACOM domi-nates the Mombasa market for data and internet services, reflecting its multi-year head start over slower, government-owned competitors. The company’s cable land-ing station, on the south-eastern edge of Mombasa Island, gives SEACOM an inter-net and data transmission Point of Presence in Mombasa, and links to Nairobi, Kampala and Kigali, thereby providing digital con-nectivity for upcountry Kenya, Uganda and Rwanda, much as Mombasa provides road and rail connections to the same places.257 Unlike the infrastructure that supports those physical connections, however, the benefits to Mombasa of this digital connectivity are immediate and direct.
Less than 200 metres from the SEACOM station is Swahilipot Hub, a technology incu-bator established in April 2016, which offers a collaborative workspace for Mombasa-based internet start-ups, artists and social enterprises. The hub ‘focuses on inspiring and developing upcoming innovative tech-nology ideas and art through networking, technical training, support, professional mentoring and coaching. The goal is to ‘promote a conducive environment for all community members to learn, share, explore, experiment, and build sustainable and income-generating solutions, to encourage cooperation and interaction between Entities with similar interests, both within and out-side Mombasa (Coastal Region at large) … [and] to advance Arts and Technology initiatives.’258 The hub addresses a clear need: as one Mombasa-based respondent told us, ‘[if] you have an idea, a technological idea, [you need] a hub actually like in Nairobi we have one, in Mombasa we are lacking that so we have good guys with ideas [but] they cannot mature their ideas because we don’t have that infrastructure.’259
Swahilipot is co-sponsored by SEACOM, the National Museums of Kenya (NMK), the US computer company Cisco, and Kenya’s Ministry of Information, Communications and Technology. It targets software develop-ers with links to universities in Mombasa, as a way of connecting government, busi-ness and educational institutions to improve human capital in the coastal region. NMK donates office space to the hub, SEACOM provides free high-speed internet data and web-hosting services, while computers, wi-fi routers and other systems are provided by Cisco. Applications developed at Swahilipot are ‘designed to help users solve their day to day problems, ranging from linking farmers to produce buyers to monitoring if a patient is taking a prescribed drug to locating a restaurant.’260 As Mombasa’s first tech incu-bator, Swahilipot gives the city’s start-ups a much-needed space to grow and commer-cialise their ideas. In this, as in other areas,
110S P E C I A L R E P O RT – JA N UA RY 2 0 2 0
WHERE THE RUBBER HITS THE ROAD
Mombasa is beginning to catch up with Nairobi, which currently houses most of Kenya’s technology incubators, serving thou-sands of developers whose smartphone apps have helped Africans leap-frog a generation of mobile technology, attracting global firms such as Nokia and Samsung, and bringing foreign investors to Kenya.261
Mobile Banking, Lending and TradingThis innovation is most visible in Mombasa through mobile money transfer apps, the ride-sharing service Uber, and mobile lending apps that help small businesses, unbanked populations and jua kali operators access credit and banking services. Fully 95 percent of Mombasa residents surveyed by our team in 2016 owned one or more mobile phones.262
Safaricom, Kenya’s dominant mobile phone provider, is well-known for its M-Pesa mobile money system, which offers money transfer, and for M-Shwari, an M-Pesa deriv-ative that enables savings and loans for a population with limited access to banking.263 For businesses and their customers in high-crime or poorly serviced areas, M-Pesa avoids the need to travel long distances to bank branches or ATMs, and (perhaps most impor-tantly) to store or carry cash which might make them vulnerable to theft or assault.
Mobile lending services, which track user spending patterns and creditworthi-ness by monitoring their use of M-Pesa and mobile phone payment history, can pre-cisely tailor loan amounts and repayment terms to customers’ capacity, resulting in higher repayment rates and enabling micro-businesses who would otherwise lack access to credit. In this way, software-enabled smart banking systems help alleviate the credit shortages constrain the growth of small and micro-businesses.264
Similarly, Uber, widely used in Mombasa, lets travellers move easily about the city by car, tuk-tuk (the brightly painted, three-wheeled motorcycle taxis ubiquitous across East Africa) or boda-boda (as a pillion passenger on a motorcycle or
scooter). Like M-Pesa, Uber offers cashless transactions, reduces the risk of crime, and lets unbanked businesses and customers participate in the economy. It also enables boda-boda or tuk-tuk drivers to monetise their vehicles, build income and savings, and participate in the formal economy in ways that would not otherwise be open to them.
The Government of Kenya, with the Mombasa County government, has made use of technology to enable an ‘e-governance’ programme that has significantly reduced corruption for citizens interacting with gov-ernment agencies, and improved ease of access and use of government services; Mombasa has established a similar portal for county-level business services.265 As the government’s ‘Vision 2030’ policy proudly affirms, ‘By leveraging technology, govern-ment has revolutionised how citizens access its services, making it much easier to bring services closer to the people, cutting deliv-ery time and securing revenues paid for such services. As a gateway to all govern-ment services, the eCitizen portal has seen the progressive addition of different agencies enabling Kenyans and foreign nationals to access services digitally. There are 197 differ-ent public services offered under the eCitizen portal and these include passport appli-cations, visa applications, driving licence renewals, vehicle registration, business registration, company searches and appli-cations for certificates of good conduct.’266 The impact on ease of doing business has been significant: one woman told us that nowadays ‘it is easier to open a business in Mombasa because I think with the govern-ment, county government, they have not put a lot of regulations to face us out. What they want is just your money and you pay your licenses, just that.’ Another man noted that ‘right now coming up with a business and getting all the licenses and everything, it has become easy because previously we used to go physically to the office and obtain those papers but right now you can get the papers from the comfort of your phone or laptop.’267

111S P E C I A L R E P O RT – JA N UA RY 2 0 2 0
WHERE THE RUBBER HITS THE ROAD
Although Nairobi dominates the tech hub and software development space at present, Mombasa is catching up. The public-private partnership model, inherent in Swahilipot Hub and in the broader growth of mobile money transfer, savings, lending and equi-ties trading platforms, and ride-hailing apps such as Uber, has enabled informal-sector businesses and individuals to access a modern national and global economy. In so doing Mombasa has leap-frogged a gen-eration of technology, and its e-governance and e-business approaches offer signifi-cant lessons for cities in Africa, and in other countries.
Geopolitics on RailsNot all infrastructure investments in Mombasa benefit businesses and local peo-ple, and the insider’s view often differs sharply from that of outsiders. By far the best illustration of this is the Chinese-funded Standard-Gauge Railway, the 21st Century’s version of the Uganda Railway that put Mombasa on the imperial map more than a century ago.
By the early 2000s, Kenya’s original British-built railway was in deep disrepair, with dilapidated rolling stock, unsafe and poorly maintained tracks, unsanitary stations and a reputation for massive delays, with trains sometimes departing 8 to 12 hours late and taking a full day to cover a distance that should take five hours at most.268 No new railway track had been laid in Kenya since the completion of the original narrow-gauge Mombasa-Kampala line in 1901.269 The rail-way was rapidly losing money, as businesses shifted from rail to road transport to ship goods from Mombasa to Nairobi and beyond. Massive 18-wheel semi-trailer cargo trucks clogged the Mombasa-Nairobi highway, generating traffic jams and damaging the road surface. The railway’s failure became a development bottleneck, limiting growth at the Port of Mombasa, where cargo volumes had been increasing since the 1980s. By 2013, the year when Devolution came into effect,
the port was handling 20 million tonnes of cargo per year, compared to 7 million in the 1980s, well above the 3.5 million tonnes han-dled in the rival port of Dar es Salaam.270 Conversely, the increasing demand for inland cargo distribution overwhelmed the railway, despite periodic attempts to fix the problem through state investment.
In 2014, the central government in Nairobi signed a memorandum of understanding with China, under which the Export-Import Bank of China loaned Kenya US$3.24 bil-lion to finance 90% of the construction cost for a standard-gauge railway connecting Mombasa to Nairobi and running parallel to the old railway. Kenya agreed to finance the remaining 10%, or $360 million, for an (Initial) total project cost of US$3.6 billion.271 China Road and Bridge Corporation was engaged as prime contractor to construct the railway, which became the largest infra-structure project undertaken in Kenya since independence. The Chinese contractor hired 25 000 Kenyans to build the railway, with construction commencing in 2016 and com-pleted on 31 May 2017.
The first passenger trains began running in June 2017, sharing the route with freight services from the Port of Mombasa after January 2018. The system is dramatically more efficient than its predecessor: clean, fast and reliable, with two trains to Nairobi each day. Hundreds of thousands of passen-gers have ridden on the railway, while the new freight service has relieved the trans-modal bottleneck that had developed at the Port of Mombasa, enabling a massive improvement in the city’s cargo throughput capacity. The ultimate cost of the project was US$4.2 billion, even though the original deal signed by Kenya’s Unity government before the 2013 election was just US$2.5 billion.272
Despite concerns about China’s pattern of so-called ‘debt-trap diplomacy,’ worries about Kenya’s sovereignty being compro-mised by such a large and heavily-leveraged project, and complaints about the failure of the Chinese contractor to replace expatriate

112S P E C I A L R E P O RT – JA N UA RY 2 0 2 0
WHERE THE RUBBER HITS THE ROAD
senior management and technical person-nel with Kenyans as required in the original agreement, the general outsider perspective on the SGR has been hugely positive.273
Combined with expanded container-handling and cranage capacity at the Port of Mombasa, the SGR has enabled growth at Mombasa’s harbour and container termi-nals (some of the city’s largest employers), relieved overcrowding on the Mombasa-Nairobi highway, and generated significant additional revenue for Kenya as a result of increased customs-and-excise payments. The proposed continuation of the railway from Nairobi to Uganda, Rwanda, Tanzania and Burundi under the next phase of the East African Railways Master Plan will fur-ther expand Mombasa’s reach as a gateway for central Africa, bringing a market of more than 550 million people within the city’s distribution network. All this seems like une-quivocally good news.
But the view from Mombasa is very dif-ferent. Mombasa’s economy, pre-SGR, relied heavily on storage, warehousing and truck-ing companies – dozens of local firms, mostly small and medium enterprises, who ran the warehouses and operated the semi-trailers and container trucks that had stepped in to replace the failing railway in the late 1990s and early 2000s. One estimate suggests that roughly 43% of the city’s economy, prior to the SGR, relied on transport and logistics.274 The SGR put many trucking and ware-housing companies out of business, while others moved to Nairobi. Youth unemploy-ment (for individuals under 35) averages 21% across Kenya as a whole, according to local officials; in Mombasa the rate is now 44%, including a 30–50% increase directly attributable to the SGR.275 Absorbing these newly-unemployed young people into other lines of work—and finding employment and support for their families – is a key priority for the county government, which is focus-ing on the city’s new Special Economic Zone, the Japanese-funded port facility (which employs 8 000 people), light manufacturing,
and value-added processing in industries such as apparel, fisheries, agriculture, and automobiles to make up the difference.276 But this easier said than done, especially since a great deal of retraining and vocational and technical education is required, and now that construction is complete, the SGR can absorb only a tiny fraction of the workforce employed to build it. Hence, in employment terms – and given the loss of economic activ-ity occasioned by the closure of so many local firms – the SGR has been a net negative for Mombasa.
It might seem that increased throughput at the port, and growth in landing and bun-kerage fees and customs-and-excise income, might make up for this. But as Kenya’s only port, Mombasa is a national asset and administered by the Kenya Ports Authority directly from Nairobi, with revenue going straight to the capital and only a small pro-portion returning to Mombasa.277 Unlike other harbour cities in Africa, which keep an agreed portion of the revenue they gener-ate, Mombasa is not permitted to do so. And then there is the matter of customs clear-ance, which takes place in Nairobi – formally considered the point of entry for foreign shipping containers – rather than Mombasa.
The impact on local Mombasa businesses is dire. As the CFO of a local chain of coffee shops (which, tellingly, was until recently a transport and warehousing company but was forced to lay off most of its staff and convert to the café business as a result of the SGR) points out, beverages or foodstuffs imported through the port of Mombasa can’t be accessed by the Mombasa-based busi-nesses who paid for them until first being shipped to Nairobi and clearing customs there.278 They must then be shipped back at the company’s expense to Mombasa, adding an estimated 17.5% onto the cost of food and beverages, which – for this café chain, as for most restaurants and tourist businesses in the coastal region – are largely imported. The manager of a restaurant and hotel near the northern coastal town of Malindi confirms

113S P E C I A L R E P O RT – JA N UA RY 2 0 2 0
WHERE THE RUBBER HITS THE ROAD
that the SGR has brought increased costs, shipping delays, and loss or spoilage issues for many tourism businesses on the coast.279 Given the history of coastal versus inland rivalry, and the perception (ill-founded or not) of corruption on the part of govern-ment officials, this understandably generates resentment on the coast, especially when the SGR’s benefits accrue mostly to Nairobi.
Gateway to the Future?Despite these tensions, as Mombasa looks to the future, county officials, business people and local communities seem upbeat about the city, its people and its gateway role. At the national level, the Kenyan Government’s ‘Vision 2030’ concept, launched in 2008, aims to transform Kenya into a ‘newly-industri-alising, middle-income country providing a high quality of life to all its citizens by 2030 in a clean and secure environment.’280 The gov-ernment’s recently-announced ‘Big 4 Agenda’ – an accelerated five-year development plan to fast-track Vision 2030 – comprises four pil-lars: Manufacturing, Food Security, Universal Public Health, and Affordable Housing. The plan includes an impressively long list of highly specific goals, covering everything from industry, housing, health, food secu-rity, ease of doing business, manufacturing, agricultural processing and foreign direct investment, to farmers’ income, home own-ership and construction. Enablers identified in the plan include macro-economic stabil-ity, completing major infrastructure projects, investing in security to support a 24-hour economy, fighting corruption and increasing accountability, leveraging technology and innovation to improve government services, ensuring a competitive cost of energy and equipping youth with vocational skills.281
It’s hard to dispute that these are the right goals – the issue for Kenya is whether such extraordinarily aspirational objectives are achievable across a nation with such diverse levels of regional development and such rapid population growth, within the mere five years envisaged in the government’s
Big 4 plan. Vision 2030 also seems to be more a political document, designed to offer some-thing to everyone as a way of unifying the country after the 2007–2008 violence, than a serious planning tool.
For Mombasa’s leaders, living a city that expects to have 2.3 million people by 2035 (adding roughly one million residents, or slightly less than the city’s entire current population, in just the next 16 years), and constrained by terrain and county bounda-ries to an area of only 134km², the clear practical needs are for urban renewal and redevelopment. The phenomenal projected growth in the city’s population (along with its already high traffic congestion and unem-ployment) means that development planners in the Mombasa County government are focused on meeting the demand for almost 400 000 new housing units, and the needs of a growing, dynamic gateway city. Increased tourism – largely from non-traditional sources such as Ethiopia, Russia, Turkey and Eastern Europe – and the growth of mining in neighbouring Kwale County, which relies on Mombasa for most support services and accommodation, are simultaneously putting pressure on the city’s urban system while opening new growth opportunities.282
With its more practical orientation, the county government’s vision of the future is focused on housing, transportation, infrastructure, parks and recreation, and urban design. That said, the county’s inte-grated strategic urban development plan, ‘Mombasa Vision 2035’, can still sound at least as ambitious and aspirational as the national-level goals outlined in Vision 2030.283 Its objectives include achieving bal-anced urban growth, turning Mombasa into a world-class commercial hub, creating well-distributed employment opportunities, quality living for all residents, seamless connectivity through transport upgrades, infrastructure excellence, a well-nurtured environment including an extensive green network, and conserving the city’s natural and built heritage. An impressive animated
114S P E C I A L R E P O RT – JA N UA RY 2 0 2 0
WHERE THE RUBBER HITS THE ROAD
video fly-through of the city of 2035, devel-oped by Nairobi design studio Vertex Studio, depicts a Mombasa international stadium in the northern coastal district of Mtwapa, planned to seat 60 000 spectators, a passen-ger ferry system, complementing a renewed Nyali bridge connecting Mombasa island to the southern mainland, an upgraded Likoni ferry in the south, proposed new Tudor Creek ferries and water buses from the island to other parts of the county; a proposed new Likoni bridge over Kilindini Harbour, con-structed with sufficient elevation for major ships to pass under it, and the construction of a series of new urban zones including an Eco City, Knowledge City, Petro City, New Jomvu City and a Special Economic Zone, linked by a ring road and public transport system.284
Although it can seem similarly aspira-tional on the surface, the Mombasa county plan is significantly more practical than the national-level plan, reflecting the high degree of public consultation that pre-ceded it. Governor Joho’s team conducted more than three years of public consulta-tion and community discussions as they developed the city master plan, created new financial mechanisms and civil ser-vice structures to support it, and rolled it out only after first focusing on pressing issues identified as priorities by the com-munity, including health services, closure of a dangerous landfill dump, and upgrad-ing of informal settlements.285 The county government created a department of Lands, Planning and Housing to focus on urban upgrading, redevelopment and land tenure issues.286
The Mombasa team then worked closely with the Japanese International Cooperation Agency (JICA) to translate the broad vision of Mombasa 2035 into a more practicable, fully-funded master plan, the Mombasa Gate City Master Plan.287 This plan integrates all exist-ing infrastructure plans within Mombasa, and included urban transport, railways, the airport, power and water supply, sewage,
telecommunications and solid waste man-agement. A lengthy consultative and stakeholder engagement process during 2016–2017 involved public meetings in every affected constituency, as well as a county-wide consultation process.288
The way that Mombasa County has pur-sued these plans, and is now executing them, offers positive lessons to other cit-ies. A strongly consultative, engaged and transparent process has ensured public and stakeholder participation in the plan-ning process and has ensured the plans align with community priorities. Likewise, Governor Joho focused on resolving imme-diate, pressing everyday concerns for Mombasa’s residents before launching the plan (which might otherwise have seemed naively detached from reality). Cooperating with multiple partners on these projects – including the British, Japanese and Chinese governments, private investors, multi-national corporations and international institutions such as the UN and World Bank – has also ensured that Mombasa’s unique vision has not been derailed by any single partner’s priorities, allowing the city and county to maintain significant autonomy.
Conclusion: Finding the BalanceMombasa will remain a gateway to Africa into the future, as it has been throughout its history, and as the SGR extends its reach further inland, the county pursues its Gate City master plan, and the harbour and con-tainer terminals continue to grow, the city will maintain its status as a trading and transport hub and a vibrant cultural and commercial centre in a changing Africa. As this history indicates, the city’s gateway role has often been in tension with the interests of Mombasa itself, and of its citizens.
As the city has grown, the balance between hardware – transport, infrastruc-ture, the urban fabric – and software, including health, education and, more recently, digital telecommunications and computing, has become a key issue. Coastal

115S P E C I A L R E P O RT – JA N UA RY 2 0 2 0
WHERE THE RUBBER HITS THE ROAD
and religious tensions, founded in the unique historical, religious and ethnic char-acter of the coastal region, led groups of separatists and jihadist cells in Mombasa to engage in violence and terrorism in the early 21st Century, prompting harsh government crackdowns, spearheaded by national agen-cies headquartered in Nairobi, which only exacerbated the problem.
Since Devolution, under Kenya’s 2010 Constitution, the reorganized County Government of Mombasa has emphasised inclusive, locally consultative means to pre-vent and counter violent extremism, with considerable (though not total) success. The same consultative approach infuses the city’s approach to urban upgrading, infrastructure development, and the improvement of eco-nomic opportunities as it seeks to overcome
the negative legacies of colonialism while building on the benefits of its gateway role.
At the same time, insider-outsider, and coastal-inland tensions still remain, notably in the uneven (and in many ways quite nega-tive) impact of the Standard Gauge Railway. Highly aspirational plans for Mombasa’s growth out to 2035 can seem quite unrealis-tic in this context, but the city’s track record since Devolution of consultative engage-ment, public consultation and practical, realistic approaches to funding and imple-menting of projects, suggests that Mombasa will offer many lessons for other African cit-ies in the future, even as its history offers both positive and negative insights about what it means to be a Gateway City.
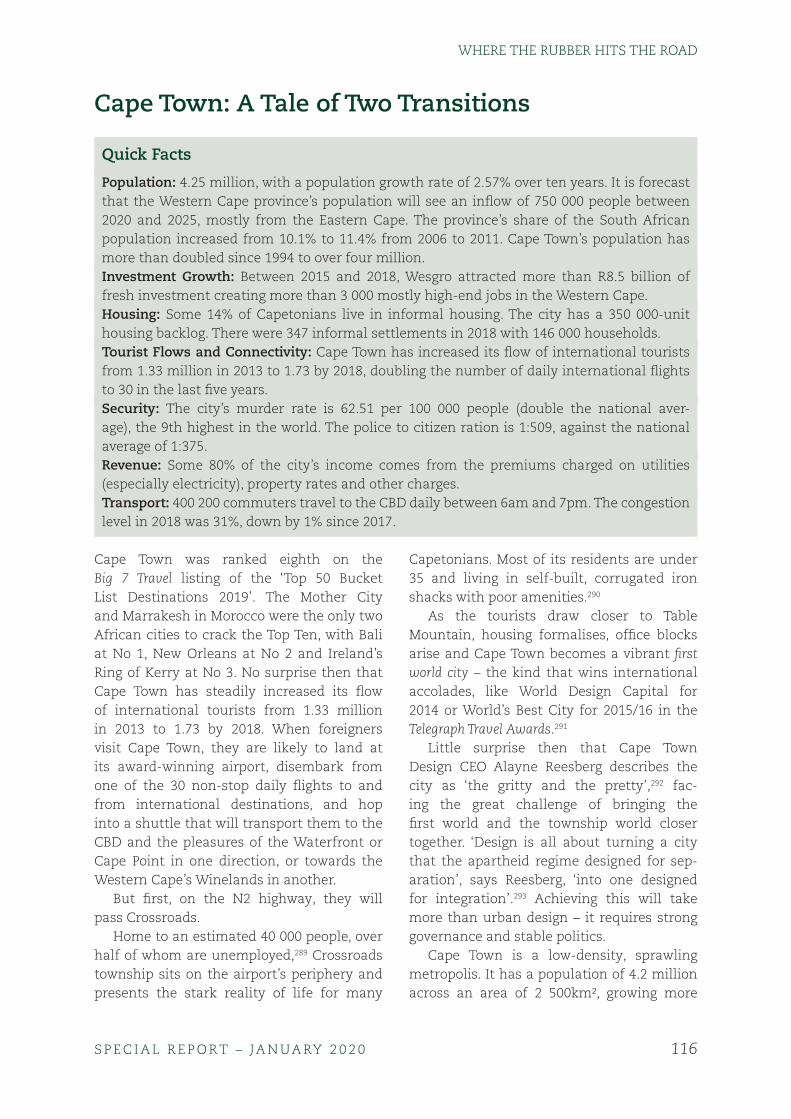
116S P E C I A L R E P O RT – JA N UA RY 2 0 2 0
WHERE THE RUBBER HITS THE ROAD
Cape Town: A Tale of Two Transitions
Quick Facts
Population: 4.25 million, with a population growth rate of 2.57% over ten years. It is forecast that the Western Cape province’s population will see an inflow of 750 000 people between 2020 and 2025, mostly from the Eastern Cape. The province’s share of the South African population increased from 10.1% to 11.4% from 2006 to 2011. Cape Town’s population has more than doubled since 1994 to over four million.Investment Growth: Between 2015 and 2018, Wesgro attracted more than R8.5 billion of fresh investment creating more than 3 000 mostly high-end jobs in the Western Cape.Housing: Some 14% of Capetonians live in informal housing. The city has a 350 000-unit housing backlog. There were 347 informal settlements in 2018 with 146 000 households.Tourist Flows and Connectivity: Cape Town has increased its flow of international tourists from 1.33 million in 2013 to 1.73 by 2018, doubling the number of daily international flights to 30 in the last five years.Security: The city’s murder rate is 62.51 per 100 000 people (double the national aver-age), the 9th highest in the world. The police to citizen ration is 1:509, against the national average of 1:375.Revenue: Some 80% of the city’s income comes from the premiums charged on utilities (especially electricity), property rates and other charges.Transport: 400 200 commuters travel to the CBD daily between 6am and 7pm. The congestion level in 2018 was 31%, down by 1% since 2017.
Cape Town was ranked eighth on the Big 7 Travel listing of the ‘Top 50 Bucket List Destinations 2019’. The Mother City and Marrakesh in Morocco were the only two African cities to crack the Top Ten, with Bali at No 1, New Orleans at No 2 and Ireland’s Ring of Kerry at No 3. No surprise then that Cape Town has steadily increased its flow of international tourists from 1.33 million in 2013 to 1.73 by 2018. When foreigners visit Cape Town, they are likely to land at its award-winning airport, disembark from one of the 30 non-stop daily flights to and from international destinations, and hop into a shuttle that will transport them to the CBD and the pleasures of the Waterfront or Cape Point in one direction, or towards the Western Cape’s Winelands in another.
But first, on the N2 highway, they will pass Crossroads.
Home to an estimated 40 000 people, over half of whom are unemployed,289 Crossroads township sits on the airport’s periphery and presents the stark reality of life for many
Capetonians. Most of its residents are under 35 and living in self-built, corrugated iron shacks with poor amenities.290
As the tourists draw closer to Table Mountain, housing formalises, office blocks arise and Cape Town becomes a vibrant first world city – the kind that wins international accolades, like World Design Capital for 2014 or World’s Best City for 2015/16 in the Telegraph Travel Awards.291
Little surprise then that Cape Town Design CEO Alayne Reesberg describes the city as ‘the gritty and the pretty’,292 fac-ing the great challenge of bringing the first world and the township world closer together. ‘Design is all about turning a city that the apartheid regime designed for sep-aration’, says Reesberg, ‘into one designed for integration’.293 Achieving this will take more than urban design – it requires strong governance and stable politics.
Cape Town is a low-density, sprawling metropolis. It has a population of 4.2 million across an area of 2 500km², growing more

117S P E C I A L R E P O RT – JA N UA RY 2 0 2 0
WHERE THE RUBBER HITS THE ROAD
than 2% each year.294 Over the past decade, the city has enjoyed a minor economic boom, posting an average growth rate of close to three percent, double the national aver-age. Today it comprises one-tenth of South Africa’s economy, even though its population is just 7.5% of the national total.295
Still, Cape Town’s inequality is visible and high.296
In part, this is down to infrastructure legacy. The government faces significant challenges in delivering decent housing and crucial transport links and addressing the city’’s water insecurity.
Some of it is political. The relationship with the national government has occa-sionally been fraught, with the Western Cape Province the only one of South Africa’s nine provinces controlled by an opposition party, in this case the official opposition, the Democratic Alliance. And while many of the city’s challenges predate the advent of South Africa’s democracy in 1994, they are com-plicated today by the effects of fast-paced urbanisation, South Africa’s substandard
education system, the social malaise of crim-inal violence, and high unemployment.
Cape Town has thus faced two simultane-ous transitions. One from apartheid-induced isolation to a globalised city; the other between those communities divided by South Africa’s racial past. This chapter exam-ines how the City of Cape Town297 has tackled its apartheid legacy and planned for the next quarter century of urban development across the issues of governance, security, economic growth, housing, transport and service delivery. Since the end of apartheid, Cape Town has made significant headway in integrating its multiple worlds, but ques-tions remain: What more can be done? What could be done better? Why is it so difficult to overcome this legacy?
The Context of GovernanceIn part the answer to the above questions lie in the duration and deep roots of colonial division, the foundation of which was laid in the 1600s with the arrival of the Dutch East India Company at the Cape of Good Hope.298
CAPE TOWN
Melkbosstrand
Lambert’s Bay
Velddrif
VredenburgSaldanhaLangebaan
Fish Hoek
Kleinmond
GansbaaiStruisbaai
WildernessKnysna
Plettenberg Bay
Cape Agulhas
StrandHermanus
Riviersonderend
George
Oudtshoorn
Beaufort West
Mosselbay
Bredasdorp
Somerset WestStellenbosch
Worcester
Citrusdal
Clanwilliam
Vredendal
PaarlBloubergstrand
INDIAN OCEAN
SOUTH ATLANTIC
OCEAN

118S P E C I A L R E P O RT – JA N UA RY 2 0 2 0
WHERE THE RUBBER HITS THE ROAD
A trade and slave-based economy under the name ‘Dutch Cape Colony’ evolved.
From the early 20th century black resi-dents began to be pushed out of the city centre, evictions that peaked during the 1950s and 1960s during the height of apart-heid, with the relocation of thousands of black residents to the Cape Flats on the city’s outskirts. This created issues of social cohe-sion and security that continue to bedevil low-income settlements across the Cape Flats.
Legislated racial inequality affected all spheres of Cape Town life. The Western Cape was the only region in South Africa to implement the Coloured Labour Preference Area Policy (CLPAP), entrenching the linkage between race and economic opportunity. The CLPAP created areas where coloured labourers were given preference for jobs thereby preventing black Africans from living and working within the Western Cape. Enacted in 1955, the CPLAP was a formali-sation of historical sentiments that viewed black Africans as foreigners within the Cape, further deepening inequalities between the races.
The abolition of apartheid in 1994 did not offer an immediate solution to these longstanding economic and spatial inequali-ties. Historical labour patterns entrenched inequality, with black African, Indian and Coloured residents overrepresented in low- and middle-income manufacturing jobs and White residents in the high-paying services sector. Black South Africans ended up liv-ing further from their places of work than their white counterparts. This has placed a premium on transport efficiencies and on efforts to decentralise economic activity.
As a consequence, Cape Town is no differ-ent to the rest of South Africa in that one’s place of birth still has an inordinate impact on one’s life. As Edgar Pieterse, Head of the African Centre for Cities, said, ‘90% of black kids born in the township in Cape Town have no future economic prospects’. As a result, the city’s history and subsequent
spatial inequality sets the direction for what city administrations have prioritised post-apartheid.
The Legal FrameworkFinalised in 1996, the South African Constitution sought to undo the damage wrought by apartheid era laws and create a legislative framework that supported the development of a free and fair society. The country adopted a multi-tier govern-ance system with a national, provincial and local level. The system rests on the princi-ple of co-operation across these three tiers and supporting legislation formally organ-ises functions, responsibilities and revenue division.299
The national government sets the long-term vision and agenda of the state in a National Development Plan, the current one running until 2030.300 While the majority of departments are replicated at the provin-cial level, Defence, Foreign Affairs, Water and Forestry, Science and Technology, Trade and Industry, Mineral and Energy, Public Enterprises, Home Affairs, and Public Service and Administration remain the exclusive purview of national government.301
Provinces are responsible for develop-ing the Provincial Growth and Development Strategy (PGDS), frameworks to grow the provincial economy and improve ser-vice delivery. Each province is headed by a Premier who appoints Members of the Executive Council (MECs) to lead each pro-vincial department.302 The MEC and the Department of Local Government in each province are responsible for oversight of the various municipalities.303
The municipal level is the final tier of government. Cape Town is categorised as a metropolitan municipality with over 500 000 voters.304 The city’s core function is to coor-dinate and deliver basic services to the metropolitan area, according to a munici-pal budget and development plan. Its work is driven through a Municipal Council, led by an Executive Mayor. According to the
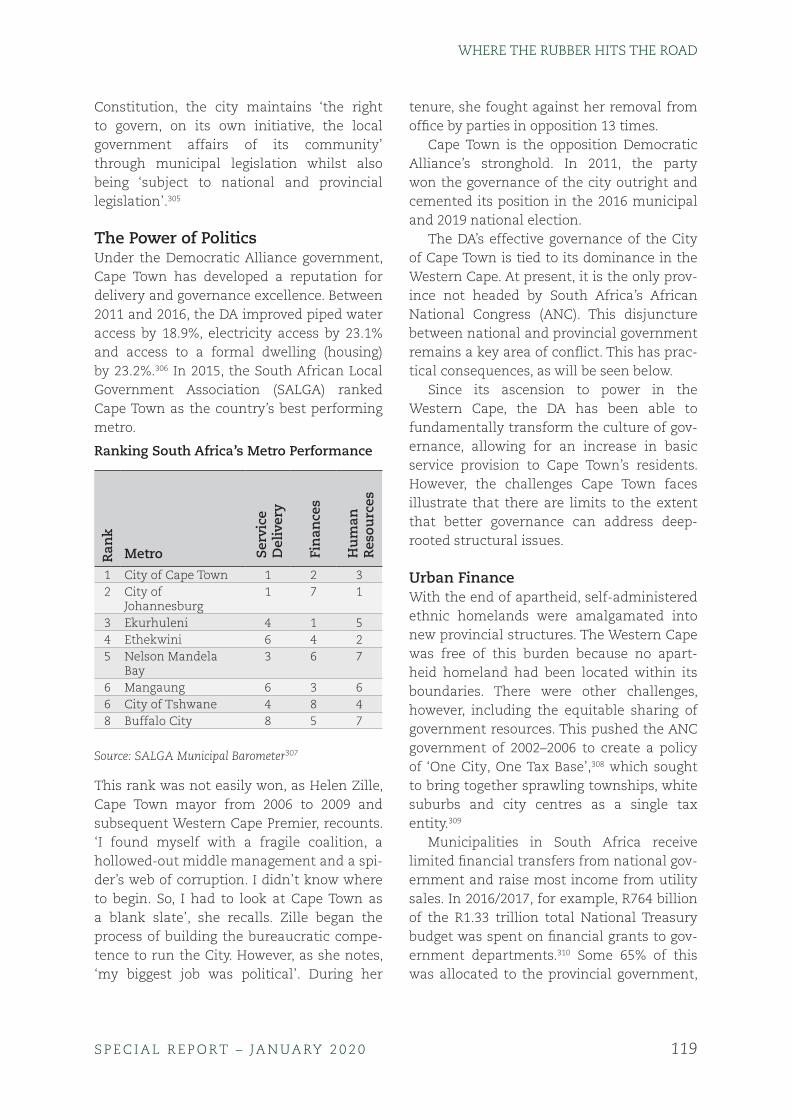
119S P E C I A L R E P O RT – JA N UA RY 2 0 2 0
WHERE THE RUBBER HITS THE ROAD
Constitution, the city maintains ‘the right to govern, on its own initiative, the local government affairs of its community’ through municipal legislation whilst also being ‘subject to national and provincial legislation’.305
The Power of PoliticsUnder the Democratic Alliance government, Cape Town has developed a reputation for delivery and governance excellence. Between 2011 and 2016, the DA improved piped water access by 18.9%, electricity access by 23.1% and access to a formal dwelling (housing) by 23.2%.306 In 2015, the South African Local Government Association (SALGA) ranked Cape Town as the country’s best performing metro.
Ranking South Africa’s Metro Performance
Ran
k
Metro Serv
ice
Del
iver
y
Fin
ance
s
Hu
man
Re
sou
rces
1 City of Cape Town 1 2 32 City of
Johannesburg1 7 1
3 Ekurhuleni 4 1 54 Ethekwini 6 4 25 Nelson Mandela
Bay3 6 7
6 Mangaung 6 3 66 City of Tshwane 4 8 48 Buffalo City 8 5 7
Source: SALGA Municipal Barometer307
This rank was not easily won, as Helen Zille, Cape Town mayor from 2006 to 2009 and subsequent Western Cape Premier, recounts. ‘I found myself with a fragile coalition, a hollowed-out middle management and a spi-der’s web of corruption. I didn’t know where to begin. So, I had to look at Cape Town as a blank slate’, she recalls. Zille began the process of building the bureaucratic compe-tence to run the City. However, as she notes, ‘my biggest job was political’. During her
tenure, she fought against her removal from office by parties in opposition 13 times.
Cape Town is the opposition Democratic Alliance’s stronghold. In 2011, the party won the governance of the city outright and cemented its position in the 2016 municipal and 2019 national election.
The DA’s effective governance of the City of Cape Town is tied to its dominance in the Western Cape. At present, it is the only prov-ince not headed by South Africa’s African National Congress (ANC). This disjuncture between national and provincial government remains a key area of conflict. This has prac-tical consequences, as will be seen below.
Since its ascension to power in the Western Cape, the DA has been able to fundamentally transform the culture of gov-ernance, allowing for an increase in basic service provision to Cape Town’s residents. However, the challenges Cape Town faces illustrate that there are limits to the extent that better governance can address deep-rooted structural issues.
Urban FinanceWith the end of apartheid, self-administered ethnic homelands were amalgamated into new provincial structures. The Western Cape was free of this burden because no apart-heid homeland had been located within its boundaries. There were other challenges, however, including the equitable sharing of government resources. This pushed the ANC government of 2002–2006 to create a policy of ‘One City, One Tax Base’,308 which sought to bring together sprawling townships, white suburbs and city centres as a single tax entity.309
Municipalities in South Africa receive limited financial transfers from national gov-ernment and raise most income from utility sales. In 2016/2017, for example, R764 billion of the R1.33 trillion total National Treasury budget was spent on financial grants to gov-ernment departments.310 Some 65% of this was allocated to the provincial government,

120S P E C I A L R E P O RT – JA N UA RY 2 0 2 0
WHERE THE RUBBER HITS THE ROAD
14% to the local government and 11% for extra-budgetary spending in crises.
At least 80% of the city’s income as a result comes from the premiums charged on utilities (especially electricity), prop-erty rates and other charges. The remainder comes from three sources: a tranche from the national government determined accord-ing to a countrywide formula; conditional grants from the Treasury (which remove the discretion for municipalities to spend as they may need to); and a portion of the fuel levy raised on sales within the municipal bound-ary. The vast proportion of these funds (like other municipal budgets) is spent on main-taining and expanding infrastructure, and delivering basic services, including water, electricity and refuse removal, on the back of that infrastructure. The shortage of funding is worsened by ‘unfunded mandates’, includ-ing library services and clinics.
This underscores once again, the impor-tance of a good working relationship with the national government, which has been at best ambivalent and at worst schizophrenic in its relationship with Cape Town especially over the distribution of security resources.
Economic GrowthFixing the challenges of legacy and inequal-ity requires a springboard of sound economic management and growth. Cape Town has managed to achieve this, moving beyond its moniker as ‘Slaapstad’,311 or ‘sleepy city’, and surpassing Durban to become South Africa’s second largest economy.312 As one survey respondent said, ‘Even if there is no employment; somewhere, somehow there are more opportunities in terms of business’. Three quarters of respondents to the poll conducted by The Brenthurst Foundation in May-June 2018 agreed that economic growth had led to tangible improvements in Cape Town.
Three-quarters of the city’s GDP is gen-erated from service-based activities. Cape Town has managed to position itself as a top tourist, events and conference destination,313
and attracts niche companies in film production, fashion and advertising.
Cape Town’s growth has been the result of a deliberate focus from both provincial and local governments since 2006, through an infrastructure-led economic development programme. ‘The first few years were annoy-ing, as the city was gridlocked’, notes the head of the Western Cape’s Tourism, Trade & Investment Promotion Agency (Wesgro), Tim Harris. ‘But we used the goodwill of a new government to do the hard stuff, the unsexy stuff’. Investments were funnelled to improve roads, electricity and water, allow-ing the city to establish itself as being open for business. Now, Cape Town’s Doing Business indicators are some of the best in South Africa: 1st for Dealing with Construction Permits; 2nd for Getting Electricity; and 4th for Starting a Business.314
The city has managed to leverage development opportunities through a three-pronged approach that included public sector investments, public-private partner-ships and government support of private investors. Three initiatives stand out as hav-ing influenced the economic growth of the city: Wesgro; the CCID, a community-based programme to provide cleaning and security services to businesses based in the Central Business District (CBD); and the Victoria and Albert (V&A) Waterfront, a private enterprise that occupies a central role in the public life of the city.
Wesgro started in 1983 as a joint initiative between the province, city and the private sector, a public body steered by a private sector board. The venture was invigorated when the DA came into power in the City in 2006. Wesgro exemplifies what a good invest-ment body can achieve. The organisation seats multiple actors at one table to pro-mote and integrate efforts around tourism and economic development. Between 2015 and 2018, for example, Wesgro attracted more than R8.5 billion in investment that created more than 3 000 mostly high-end jobs in the Western Cape.315 It spearheaded

121S P E C I A L R E P O RT – JA N UA RY 2 0 2 0
WHERE THE RUBBER HITS THE ROAD
a campaign to increase the number of direct flights to the city, which have doubled in the five years from 2014. In the process, Wesgro has become a model for brand management, investment promotion and job creation, an outstanding South African institutional example of what a dedicated investment promotion agency can achieve. That this institutional role is now being replicated at the city level by ‘Invest Cape Town’, while perhaps costly and unnecessarily duplica-tive, is an indication of Wesgro’s success.
Harris says that this performance is down to ‘fixing the basics, which is infrastructure, in building it out and deepening it. Politicians should not,’ he notes, ‘get distracted by the shiny strategies and policy documents and objectives, but rather just make things work – water, electricity, transport and ICT, which is now an important element of infrastruc-ture.’ While Cape Town’s lifestyle is a selling point, ‘there are beautiful cities everywhere which don’t work. If Cape Town was dysfunc-tional, its natural beauty would not help.’316
If building out and maintaining economic infrastructure is the ‘ultimate horizontal intervention’, another such intervention is ‘to remove blockages to investment (a la the province’s Red Tape Reduction Unit, or the approach of our Investment One Stop Shop).’ Harris also highlights the need for ‘horizontal interventions to grow exports by intervening at firm level to help build their capacity for export, or dramatically increasing the num-ber of export missions conducted where large and small firms ‘hunt as a pack’ to grow their global sales.’
Fixing the basics, however, does not fix everything. The ‘weight of history’ is another constraint, whereby Johannesburg’s com-mercial and consumer strength remains a significant business incentive. This explains, Harris says, why Cape Town has focused on new sectors such as renewables and Business Process Outsourcing. Moreover, that East London, Bloemfontein, Port Elizabeth, Cape Town and Durban are challenging
Johannesburg ‘should be a spur,’ he observes, ‘to national growth’.
Now, says James Vos, the councillor in charge of the City’s economic opportuni-ties, there is an ambitious agenda to become the ‘go-to city globally and locally for trade and investment.’ The city has identified high growth sectors for the largest return on investment in terms of skills, training, jobs and commercial growth, namely boat build-ing, tech, tourism and clothing and textiles. The city has identified several initiatives to improve skills and the need to ‘take eco-nomic opportunities to where people live’ including the use of incentives in certain ‘key nodes’. In particular, Vos wants to ‘use tour-ism as a tool for business transformation ... to create many more opportunities.’317
There are constraints, however, especially in terms of available resources.
Like most African cities Cape Town has very limited scope to act independently of central government in dealing with its spe-cific challenges – or, more positively, to play to its strengths. The reasons for this, as in other areas, come down to money and auton-omy. This fiscal and political environment severely limits the room for manoeuvre of Cape Town and other South African cities, to act independently in designing strong invest-ment incentives. It can offer ‘non-financial’ incentives: accelerated planning approvals, biodiversity offsets, an investment facilita-tion touch-point in the mayor’s office, and the overall ‘lifestyle’ advantages.
On the financial side to support invest-ments, the city has been able to offer discounted electricity tariffs and waive various application fees and develop-ment contributions that would normally be incurred by infrastructure projects. It can also offer discounted rates and land leases, though this is controversial within the administration, not least given the budgetary funding imperative.
Cape Town’s safe, clean and thriving CBD similarly stands out both in South Africa and the continent. In 2015, it became South

122S P E C I A L R E P O RT – JA N UA RY 2 0 2 0
WHERE THE RUBBER HITS THE ROAD
Africa’s most visited tourist destination. But this was not always the case. In the late 1990s ‘crime and grime’ was rife and inner cities across South Africa faced dilapida-tion and capital flight. The Cape Town City Manager Andrew Boraine, at the time under an ANC government, identified certain prac-tical steps to revive the CBD.
The Central City Improvement District (CCID) was started with the support of the Cape Town Partnership aiming to partner with the private sector to help restore the CBD. Extra levies were charged to inner city businesses for the provision of dedicated services by the CCID. Their focus was on the practical elements of keeping the streets clean and providing security guards to police petty crime.
As one measure of the CCID’s suc-cess, property values in the CBD rose from R6.5 billion in 2006 to R43 billion in 2018.318 Other CIDs have opened elsewhere to attempt to replicate Cape Town’s success.
There were other, headline projects. The Victoria and Albert (V&A) Waterfront is a private venture which has brought extraor-dinary public benefit. The vision was simple: to convert the activities of the historic 19th century port into a tourist attraction. Today, the V&A provides 56 000 jobs both directly and indirectly, allows for the operation of 850 small businesses and welcomes over 24 million annual visitors. The Waterfront’s management works closely with agencies such as Wesgro so that it is perceived as pub-lic space. The V&A illustrates how the private sector is instrumental to addressing public issues such as unemployment and economic growth.
The impressive expansion of Cape Town’s economy has given investors and citizens alike hope of an economic future within the city and laid the foundations for infra-structure redress. As Harris confirmed, ‘the economic and the social are two sides of the same coin’.
Safety and SecurityThe racialised and spatial nature of inequal-ity in Cape Town carries into its experience of safety and security, creating a dynamic where crime in one part of the city bears no relation to an area just a few kilometres away.
Most of Cape Town’s crime occurs in the Cape Flats, an area beset with violent gangsterism. With deep networks, large memberships and access to weapons, the gangs are largely responsible for Cape Town’s record murder rates. Drugs and substance abuse problems feature prominently, too. In 2018, for example, reminds JP Smith, the city councillor in charge of safety and secu-rity, nearly half of Cape Town’s murders were gang-related.319
The once coloured-only township of Hanover Park, one of the most violent areas in the world with a murder rate in and around its cinder-block two-story flats of around 100 deaths per 100 000. Due to simi-larly high rates of violence in the townships of Lavender Hill, Langa, Manenberg and Philippi, Cape Town has one of the world’s highest murder rates at 62.51 per 100 000 people, putting it in ninth place among the world’s most dangerous cities, in the com-pany of Caracas, San Pedro Sula in Honduras, and San Salvador.320
Hanover Park, an area of just 2km2, is formally divided by the police into two sec-tors; in reality, it is fragmented into several gang-run communities: Cowboy Town, Back Streets, The States, The Taliban Area, The Valley of the Plenty, and The Jungle. Each is controlled by a grouping that is essen-tially an affiliate of two predominant major gangs, the Mongrels (under the ‘British flag’) and the ‘Americans’. Gangs are a way of life among Hanover Park’s 55 000 people where unemployment is endemic, despite the City’s relatively low rate (20.41%) of jobless-ness compared to the South African average (29%). Gang members often leave school early, earning their ‘rank’ in prison – known as ‘the University of Crime’ – in a strict

123S P E C I A L R E P O RT – JA N UA RY 2 0 2 0
WHERE THE RUBBER HITS THE ROAD
hierarchy defined by ‘generals, ‘captains’ and ‘shooters’. Violent activities centre on the borders between ganglands, where there is little movement of people, or where lighting is poor at night.
Cape Flats’ residents say that the govern-ment is not doing enough. In October 2018, there was a march by mothers in the Cape Flats protesting against the effects of gun violence on their children.321 As one respond-ent from the survey noted, ‘For us living out that side, there is no protection at all from the government’.
In stark contrast, Cape Town’s CBD, Southern Suburbs and tourist areas appear relatively safe havens, permitting residents to walk the streets freely and enjoy public spaces. This has been attributed to a com-bination of heavy private investment and public-private interventions such as the CCID.
Cape Town’s safety and security problems can be traced to the creation of perverse social dynamics in the Cape Flats as a result of apartheid forced removals. According to Don Pinnock, a renowned local security expert, ‘the Ghetto Act, the Bantustans and the Group Areas Act moved the City from class divisions to racial ones. It destroyed Lower Claremont, Wynberg and District Six. It suddenly ‘‘ghettoised’’ poor people accord-ing to their skin colour’. Previous familial dynamics, with extended families living together in well-established community structures that provided a distinct sense of safety, were destroyed by the forced remov-als. Families were scattered across various locations in the Cape Flats. As Pinnock noted, ‘They built the townships for nuclear fami-lies with no regard for how people lived. Townships fostered isolation and increased violence with one-third of all children grow-ing up in single parent families.’
The number of young, unemployed people living in the Cape Flats is high. In Khayelitsha alone, Cape Town’s biggest township with a population touching half a million people, half of residents are under 19 years of age.
The unemployment rate is 70%.322 With few economic or education prospects, gangster-ism seems like the next best bet.
As a consequence, bloodshed on the Cape Flats officially reached crisis proportions in 2019. Mortuary statistics indicated that 900 people were murdered in gang violence between January and June 2019, almost double the previous year’s toll. Much of the violence occurs in a small area of the Cape Flats. Nearly half of murders in 2018/19 occurred, for example, in just ten police stations.323
Police stations with the most murders reported (WC) 2018/2019
0 50 100 150 200 250 300
NyangaDelft
KhayelitshaPhilippi East
HarareGugulethu
MfuleniKraaifontein
Mitchells PlainBishop Lavis
289
247
221
185
166
155
154
151
148
144
Source: WC Provincial Government
Poor and unprofessional policing with grave disparities in the allocation of police resources does little to mitigate criminal-ity. Across Cape Town, the ratio of police per 100 000 ranges from 139 in Harare township in Khayelitsha, to 1 708 in Cape Town Central precinct. Policing, however, is a national function and outside of the jurisdiction of the municipal or provincial government, and the failure to deploy sufficient police to the province has been a perennial source of ten-sion with the national government.
In April 2019, then Western Cape Security MEC (and premier after May 2019) Alan Winde declared a formal intergovernmental dispute as a result of the national govern-ment ignoring the province’s urgent policing needs and priorities. He said the national Minister of Police, Bheki Cele, had ‘failed to respond to our urgent requests,’ noting

124S P E C I A L R E P O RT – JA N UA RY 2 0 2 0
WHERE THE RUBBER HITS THE ROAD
that ‘The Minister of Police is obliged by the Constitution to consult and take account of the specific needs of our province when determining policy. By ignoring these needs and priorities, Minister Cele is violating the Constitution.’
Winde said that the Western Cape urgently needed more police officers, adding that the ANC government has given the DA led province fewer resources to fight crime compared to other provinces. The province, he noted, ‘is dramatically under resourced compared to other provinces.’ While one officer must protect 375 people on average nationally, in the Western Cape, the ratio is 1:560. Yet the murder-to-population ratio in the Western Cape is 60 per 100 000, almost double the national average; put differently, the province has 11.6% of South Africa’s population but 18.9% of its murders. Ideally, globally, the police: citizen ratio should be around 1:220.
As a result, in July 2019 the Western Cape Premier took the step of requesting the army’s deployment to seize back control of certain areas of the Cape Flats. While a sig-nal that the worsening situation could not continue, the army have, however, not con-tributed positively to safety and security, given the absence of crime intelligence which should drive the policing operations. Rather than a police or army presence, the prob-lem with criminality more generally lies in the lack of prosecutions, which reflects skills and resources. Alderman JP Smith says that critical to this situation is the low conviction rate, especially of gang-related crimes, which are around 2–3%. In Hanover Park, he points out, there were some 86 murders over three years, 51 arrests relating to those murders, and no convictions. ‘If that is the case, then I am afraid those criminals have long and prosperous careers, until they are murdered by another criminal.’
In disputing the ‘poverty equals crime’ thesis, Smith contends that the city is faring much better in terms of growth and social spending, with 6% less unemployment on
average than other metros and the highest level of access to basic services. Rather he argues that Cape Town’s crime plague relates predominantly to the prevalent gang culture. The answer to the violence thus in the short-term lies in a combination of focusing on a handful of ‘gang [affected police] stations’, of which 16 are affected by such gang activity, and of which just seven produce nearly half of violent crime.
The Premier in 2019 set an ambitious role in attempting to halve the murder rate through replicating an intervention con-ducted in Bonteheuwel and Delft, which provides dedicated resources, including plac-ing an officer in every school known as the School Resource Officer, a programme copied from the US, and several social interven-tion packages including the identification of youths at risk, copied from Toronto, all of which is backed up by a R1 billion urban regeneration infrastructure initiative includ-ing lighting and better work spaces.
‘I can tell you,’ warns Smith, ‘that if do not get the conviction rates up, I don’t believe that these other gains are sustain-able.’ Hence the need to increase the number of detectives in the city to reduce the case load and drive up conviction rates. There is also a related effort to increase the num-bers of Metro Police. Currently there are 500 Metro Police, 600 Law Enforcement and 500 Traffic Officers, plus another 300 contract staff. ‘Ideally,’ says Smith, ‘we should have around 5 000 Metro Police. The new joint venture between the City of Cape Town and the Western Cape government will add,’ he said in October 2019, ‘add a further 1 000 per year thereafter which will give us the enforcement staff numbers to compensate for the 4 500 SAPS officers which have been lost to this Province in the last four years at the hands of national government.’
Cape Town’s government has realised the importance of tailoring public security solutions to specific areas. While the CCID has worked in the CBD, for example, it is unlikely to be appropriate across the entire

125S P E C I A L R E P O RT – JA N UA RY 2 0 2 0
WHERE THE RUBBER HITS THE ROAD
Cape Town metro as it requires heavy private sector support, which is absent in the Cape Flats.
Safety and security cannot be treated out-side of a wider socio-economic environment, including addressing the overall economic conditions, education and healthcare. Smarter, area-based solutions that combine local knowledge with security expertise and an active creation of strong communities offer some possibilities.
HousingThe township of Khayelitsha, Xhosa for ‘Our New Home’, was laid down 35-kms from the Cape Town CBD in the mid-1980s in three initial sites, a last attempt at apartheid spatial planning, and a solution to a then burgeoning problem of migrants, especially from the Eastern Cape, which had resulted in the creation of informal settlements like Crossroads. Such pressures increased with the scrapping of pass laws by 1987 as the apartheid system unwound.
Khayelitsha spreads over several sites, from the arrival station of new migrants to the southeast at Nkaneni, to the outlying ‘suburbs’ of Harare and Monwabini. The pop-ulation totals 800,000 in a location designed for 250 000. It is young (just 7% of residents were over 50 in the 2011 census), and mostly comprises recent migrants (nearly two-thirds are rural to urban migrants), lending the township to the term ‘Rural in an Urban Setting’.324 Set out across 43km2, it’s one of the poorest areas of Cape Town, where the average income per family is R20 000, about half of the average of the city. Half of the set-tlements are informal ‘shanties’. It costs a worker daily R40 (about one-fifth of a daily casual wage) to commute to the Cape Town city centre where most of the jobs are. This high cost reflects the geography: most peo-ple don’t live where they work. Even so, this is below the norm across South Africa, where workers commute an average of two hours a day, with 40% of their wages spent on transport.
There are several initiatives funded by the City government to try to improve skills, security and business opportunities around Khayelitsha’s key arteries. In adjoining Harare and Kusaya townships, for example, this involves building a series of rental sites close to the rail station, featuring some of the township’s 3 000 spaza (small) shops, with a well-patronised library at the centre. It is, reflects one official, ‘an externalised shop-ping mall’. Through the Violence Prevention through Urban Upgrading (VPUU) project the city has spent R1 billion in the area between Harare police and rail stations, the highest crime area in Khayelitsha, providing paving and lighting, adult education facilities, astro-turf for sports facilities, and business spaces.
These initiatives have been enthusias-tically taken up by business people, if at a considerable financial cost to the City: In 2016 nearly R200 million was being spent on the above improvements in Harare and Kusaya alone, and a further R627 million was earmarked for the crime ridden area of Hanover Park. But they remain complicated by issues of trust and leadership within the communities themselves (who speaks for whom, and with what agenda), and by the cultural baggage from the rural communi-ties, including a preference for single story dwellings. There is also little way around the realisation that Cape Town requires 350 000 new dwellings, some in so-called ‘integra-tion zones’ closer to the city, along corridors and through improved efficiencies. ‘Over the next generation’, estimates one City official, ‘80% of the population increase will be urban poor.’ Without action on housing, poverty will be ingrained into these townships, where houses are sub-let and ‘backyarders’ build their own shelters in existing properties.
There are considerable benefits to improv-ing housing provision and access, which go beyond having a comfortable, easily accessi-ble and warm place to stay. For one, there has been a global correlation between urbanisa-tion and GDP growth, because of higher rates of productivity, better infrastructure and

126S P E C I A L R E P O RT – JA N UA RY 2 0 2 0
WHERE THE RUBBER HITS THE ROAD
services such as education through popula-tion density and economies of scale, and the congregation of a large consumer market.
The crossroads at Khayelitsha’s ‘Site C’ Nolungile Station where Japhta K Masemola and Solomon Tshuku roads intersect, near the ‘Kuwait’ taxi-rank, is a hub-bub of activ-ity, mamas shrouded in smoke, fanning braais of chicken, offal, tripe, and other cuts amidst the containers housing funeral services, hair salons, surgeries and tailors. Despite its poverty, the area is, however, relatively safe because it’s busy, not least because vendors keep an eye out for their own goods all the time. Business inevitably congregates around the flow of feet and money.
But the structural problem of Cape Town’s housing is less about shanty dwellings. Some 14% of Capetonians live in informal housing. This can be solved. But where they live is a deeper constraint to inclusive growth and prosperity.
‘Capetonians inherited a little box far from the city’, said then Deputy Mayor Ian Neilson in 2018, ‘and to change this land use pattern of low density and long commuter distances takes years’. With a population density of 1 530 people per km2 compared, for example, to Lagos’ 18 800/km2, Cape Town’s demography geography is of a sprawling city, complicating the provision of housing and transport.
Zille says the provision of housing and the imperative of densification is exacerbated by a number of other factors less related to the past than the present: First, when you go up to achieve greater density, you ‘very quickly reach the limits of any state subsidy, which means people have to pay something to make up the balance. The whole of Joe Slovo’, she says, ‘the strip alongside the N2 next to Langa, is made up of those type of houses. Many other places too. They become unviable very quickly because of (often) a refusal to pay. People reckon, ‘why should I pay to live in a flat (which I don’t want to do) when other people are getting a free house’. Wealthier areas, where purchasers have the
means to pay, are more likely to undergo densification because there is a high demand and large return in the property market for commercial developers.
A second challenge is that ‘if someone living in an informal settlement is not going to benefit personally, they are unlikely to move’. Squatters that already benefitted from a State-provided house, are not going to move if they are not eligible to benefit a sec-ond time.
Third, zoning regulations are quite inflex-ible, initiating a change from one type of dwelling to another. There is, fourth, a long lead time in housing projects. And finally, at a macro level, the previous philosophy of ‘housing people where they are’, turned settlements into townships, reinforcing the apartheid model. ‘There is’, she notes, ‘massive demand, and almost any supply in the affordable market meets a demand. We cannot match the supply to the demand, hence the ceaseless land invasions.’325
In 1994 the government inherited a hous-ing sector that was in crisis – a land use pattern emblematic of apartheid spatial planning, and limited, poor quality housing stock. Across South Africa, the number of families without adequate housing was esti-mated at 2.2 million and growing by 200 000 each year.326
The response was to provide as many houses as quickly and as cheaply as pos-sible.327 Five broad housing projects were implemented: government subsidy housing (commonly known as RDP houses); com-munity residential units (CRU); upgrading of informal settlements; emergency housing; finance-linked individual subsidy (or ‘gap’ housing) and social housing.328 The most prominent policy has been the construction of fully-subsidised RDP housing for low-income families earning less than R3 500 per month.329 Between 1994 and 2015 2.9 million RDP homes were delivered, averaging out at under 150 000 annually.330 The private sec-tor has delivered an additional 2.7 million homes over this 20-year period,331 though

127S P E C I A L R E P O RT – JA N UA RY 2 0 2 0
WHERE THE RUBBER HITS THE ROAD
amounting to a fraction of the construction sector’s capacity utilisation, with the total value of the sector down from R947 billion in 2017/18 to around R220 billion in 2018/19, according to industry specialists.332 This would seem to tell a story less about skills than government resources and will.
Number of housing units built in South Africa per year, 1995–2018 (thousands)
0
50
100
150
200
250
1995
1996
1997
1998
1999
2000
2001
2002
2003
2004
2005
2006
2007
2008
2009
2010
2011
2012
2013
2014
2015
2016
2017
2018
Source: Department of Human Settlements, via BBC333
Moreover, the RDP’s emphasis on quantity has resulted in deficits in housing quality by the national government’s own admission.334 RDP policy has also entrenched the govern-ment as the national housing provider – an unsustainable position given South Africa’s weak economic growth. Demand for quality housing far outstrips supply, and families are left precariously on housing waiting lists.
And RDP houses have been accused of reinforcing apartheid spatial policy. In order to encourage the delivery of mass housing, cheap land on the periphery of cities, like Cape Town, was allocated to RDP builds. This land was far from amenities and economic opportunities, and often prone to annual flooding or fires.
Cape Town’s central areas have undergone a housing price boom, pushing low-income families even further away from economic opportunity and leading to increased hous-ing activism. Reflecting a level of disquiet, the Reclaim the City social movement seeks to mobilise popular support for the better assignment of prime land within Cape Town towards affordable housing.
Cape Town is a victim of its own success: between 1996 and 2011, the population grew by over 1.2 million and is expected to hit 4.5 million by 2023.335 Most migrants come from neighbouring rural areas searching for better job and education prospects, while some move for a lifestyle improvement, placing inordinate strain on Cape Town’s housing. Three quarters of of respondents not born in Cape Town felt that their living conditions in the city were either moderately better or much better than their place of ori-gin, but only 38% of respondents to our poll felt there was sufficient housing in the city.
There is a double whammy in the difficul-ties in delivering housing, since low wealth leads to a failure to invest, and a failure to grow other economic sectors. Just 15% of South Africa’s 15 million households are estimated to be able to afford a mortgage.336 Yet the multipliers are potentially tremen-dous: the building of a single house in Africa creates an estimated five jobs.337
To realise these job and other advan-tages demands, at its core, investment. That requires creating the right conditions for growth on the one hand, and systems of payment on the other. It demands planning. It also requires dealing with several aspects at once, including traffic congestion and pol-lution. It needs land and title. It requires partnerships to bring in expertise, technol-ogy and funding. And it demands dealing with policy impediments.
The simple acceptance of the principle and practice of densification offers some of the solutions. Many of Cape Town’s town-ships are already jam-packed: the 150 000 inhabitants of Delft, for example, near Khayelitsha, is at 14 000 people/km2; the 17 000 people of Sweet Home Farm, one of Cape Town’s 347 informal settlements, located near Hanover Park and started on a rubbish dump, is estimated at 33 000/km2.338 Mumbai, to make a comparison, is at 21 000/km2.

128S P E C I A L R E P O RT – JA N UA RY 2 0 2 0
WHERE THE RUBBER HITS THE ROAD
Acceptance of the principle of density in housing, land availability, the provision of bulk services especially electricity, and the capacity of construction companies to build in volume are all required to manage the backlog.
TransportTravelling away from the Cape Town city centre towards the city’s Southern Suburbs on De Waal Drive at 3pm is not a place you want to be. The traffic is painfully slow; ‘one downside of relative growth’, says Tim Harris. But it’s also because public transport has not kept pace, and because this sector has become a target of political and commercial vandalism.
Transport has been a city development priority for over decade, with significant investment in MyCiTi and a push to integrate trains, buses and minibus taxis modes into one efficient system.339 Despite 1 014 km of rail network and 32km of dedicated bus rapid transit (BRT) lanes, known locally as MyCiTi, it’s still not working well enough to be con-sidered a success. This tension is felt by the residents, with 40% of poll respondents stating that improvements to either infra-structure or public transport are viewed as the greatest achievements of the municipal government. Two-thirds also felt that public transport required urgent improvement.
On average, Capetonians endure an extra travel time of 45 minutes per day and 163 hours per year, making Cape Town South Africa’s most congested city.340 More than 50% of Capetonians use private vehicles to get to work.341 Low-income households make up the majority of the 47% of residents who use public transport.342 The concentration of economic activity means that, on average, low-income workers travel more than an hour to work one way and spend 43% of their monthly income on transport.343
Premier Alan Winde dealing with the spatial legacy is a very ‘difficult conun-drum’ to deal with, given the solution is
invariably about who gets resources and opportunities, and why. Dealing with it requires trying to improve the extent of eco-nomic opportunities. This requires fixing the transport system, in which the train net-work is ‘our biggest blockage’ which should help in dealing with the poorest people living the furthest from economic opportunities. Rather than carrying its capacity of 650 000 people per day, the most cost-effective sys-tem of public transport in the train system is carrying 200 000, the net effects flowing over into the overstretched bus system and on the roads. ‘I believe,’ he states, ‘we should take over control of the train system’.
RailCape Town hosts over half of South Africa’s Metrorail system.344 The service is crucial to the city’s functioning, though it is managed nationally by PRASA, South Africa’s notori-ously corrupted rail company.
Unsurprisingly, Cape Town’s rail is in a state of crisis. As one survey respondent shared, ‘It is always either delayed or they have stolen the cables or burned stuff’. Since 2015, 175 train carriages have been dam-aged by fires and in October 2018 alone, eight carriages were destroyed.345 Cape Town is currently operating well below capacity with less than half of the required 88 train sets in usage.
In an attempt to address the issues of vandalism and passenger safety, the City and Metrorail joined together to launch a 100-member Rail Enforcement Unit, an armed task force, to patrol trains across the metro.
‘Rail is of great significance for Cape Town’, says Roger Behrens of the Centre for Transport Studies. ‘If it ceases to exist it will be a huge blow to our economy.’ The launch of the Rail Enforcement Unit is a step in the right direction, but for rail to succeed there will need to be greater coordination across all three government tiers.

129S P E C I A L R E P O RT – JA N UA RY 2 0 2 0
WHERE THE RUBBER HITS THE ROAD
Buses and TaxisCape Town has sought to alleviate its trans-portation bottlenecks through the flagship MyCiTi BRT system. MyCiTi was launched in 2010 using targeted funds from National Treasury’s Public Transport Infrastructure Systems Grant (PTISG). The grants covered the building of stations and dedicated bus lanes, and the buses themselves. In turn, the city was responsible for the system’s operat-ing costs.
‘MyCiTi has been an important advance, but lessons have been learned about the need to adapt international best practice to local conditions,’ reflects one transport pro-fessional. The MyCiTi system was based the Curitiba BRT model. But, Cape Town’s popu-lation density, the x-factor that makes BRTs viable, is 1 530/km²,346Curitiba’s 4 405/km².347 Bogota’s, to take another successful BRT rollout, is 4 300/km².348
Cape Town’s density issues are further compounded by the sheer size of the city. ‘The viability of public transport in Cape Town is driven by distance,’ says Behrens, ‘because average travel distance is twice that of international standards’. The number of kilometres travelled by the MyCiTi is a key component of the operating costs, which are now higher than what can be recouped from ticket sales.
In addition, the Public Transport Infrastructure and System Grant (PTISG) has been declining in real terms over the last few years, putting MyCiTi’s grand expansion plan on hold. ‘It doesn’t make financial sense to grow the MyCiTi system now, but BRTs move the most people the most efficiently’, insisted Claire Holderness, a transport plan-ner in the TDA. However, again, this raises concern about the ability of the BRT system to cater for all Capetonians. Some of the first routes actioned by MyCiTi went from the city centre to Sea Point and Camps Bay, affluent parts of Cape Town.
Like other African cities, privately owned minibus taxis have stepped in to fill the gaps. They are more flexible and responsive to
passenger demands, playing a substantial role by moving more than 300 000 passengers each day.349 The taxi drivers are members of 119 associations under the Western Cape branch of the South African National Taxi Council (SANTACO), an organisation with lobbying power that gives the city constant headaches.350
Cape Town’s transportation inheritance was one of abundance. However, complex governance structures and poorly imple-mented global models have prevented an integrated, efficient and affordable public transport system. In order to address this, the city has adopted a transport-oriented development strategy that aims to coordi-nate policy through the Transport and Urban Development Authority (TDA). There is hope that this initiative will improve coordina-tion and remove the stickiness that governs large-scale investments.
Water ServicesIn 2018 Cape Town made global headlines as it nearly became the first city to run out of water. Brought on by a relentless drought351, in mid-2017 Cape Town’s six major dams were at a combined capacity of 23.3% – enough water to last 88 days. It was predicted that ‘Day Zero’ would hit the city in March 2018, with household, school and business taps shut off and residents sent to commu-nal water collection points. Cape Town was in disaster-mode and had to act fast.352
The City responded by creating a water resilience task team of academics, members of civil society and government officials. The team actioned an aggressive campaign of demand-side management that restricted residents’ water use to 50 litres per day. This was largely directed at middle- to high-income residents, who consume 65% of Cape Town’s water,353 and achieved through meth-ods of public advocacy and penalties for overconsumption.
In six months, Cape Town’s water usage dropped to 50 million litres per day, with residents across the city working together
130S P E C I A L R E P O RT – JA N UA RY 2 0 2 0
WHERE THE RUBBER HITS THE ROAD
to reduce water consumption in both pub-lic and private life.354 The resilience task team drew on the global experiences of urban drought in cities like Melbourne and Los Angeles to create a long-term strategy for water supply that included desalination plants, wastewater treatment works and groundwater extraction projects.355 However, these changes were not without cost and 54% of survey respondents claimed that the qual-ity of water and sanitation had negatively impacted on the health of their families.
The rains returned to Cape Town in the winter of 2018 and the dams reached 75% capacity, allaying immediate concerns of a Day Zero.356 ‘The story I often get asked when I am overseas is how did Cape Town reduce its water consumption so drastically?’ said Lance Greyling, then the City’s Trade and Investment Director, ‘and the answer is that policymakers, businesses and Capetonians all worked together’.
Many have questioned how a disaster of this magnitude came to be in the first place. While climate change must be considered, South Africa’s water governance structures played a prominent role, too. The supply of potable water is a municipal responsibility. However, like many other urban services, the planning and implementation of large-scale water infrastructure falls to national government, with provincial government pro-viding oversight and support. Disaster relief is a mandate of all three levels, but it is up to the City to raise concern and the national Department of Water and Sanitation to react accordingly.
Public discussion about Cape Town’s possibility of losing water had been swirl-ing since the 1990s,357 but unusually low levels of rain in the 2015 winter raised this to a level of municipal and provincial, con-cern. In January 2016, these concerns were taken by the Western Cape government to the National Disaster Management Centre (NDMC) in the form of a disaster declaration and application for relief funds. The NDMC
turned the application down, refusing to acknowledge the potential for crisis.358
As rain was low for 2016, the Western Cape government continued its appeals to the NDMC for dam funding, even though studies predicted a one-in-1 000-year chance of the 2017 rainfall being low. The predictions were incorrect, and a third year of drought ensued. Then Mayor of Cape Town, Patricia de Lille, appealed to the national government to declare Cape Town a local disaster area. Rashid Khan, regional director of the national Department of Water Affairs, rejected the request and responded by saying ‘although the water situation is concerning, it is not yet at crisis level as has been widely reported. We still have time for intervention’.359 No such intervention was forthcoming and in February 2018, Premier Zille criticised the national government for not making the necessary funding available.360
Politics, as in transport and policing, trumped people’s needs. More positively, the nature of the response and the success of the water rationing measures exemplified both the city’s resilience and the efficacy of its governance structures.
Electricity – The Politics of PowerCape Town’s electricity challenges aren’t what you’d expect from a growing urban metropolis. Post-1994, the city has been able to achieve full electrification for formal dwellings and 94% for the total number of households in the city.361 However, its conun-drum lies in the fact that electricity demand from wealthier residents and industry is falling, thus challenging the viability of the system to provide electricity for all.
In South Africa, electricity generation and transmission are controlled by the national electricity utility, Eskom. At the provincial level, independent power producers (IPPs) are permitted to generate under 1MW of power. Eskom retains a monopoly on larger electricity generation and, until now, on transmission. Distribution rights are shared between Eskom and municipalities.

131S P E C I A L R E P O RT – JA N UA RY 2 0 2 0
WHERE THE RUBBER HITS THE ROAD
As a result of these regulatory changes, there are 3 000 small IPPS pushing around 126MW into the system in 2019. If the limit per IPP was to be increased to 10MW, believes WInde, there would be 100 suppliers will-ing to sign up, quickly ending the province’s power problems.
The City of Cape Town accounts for 45% of all provincial electricity distribution in the Western Cape and 6% of national dis-tribution. In 2013, the estimated demand for maximum electricity consumption was just over 1 900MW, three quarters of which is distributed by the City with the remainder supplied directly by Eskom.362
Though Cape Town has a near total elec-trification and doesn’t struggle with supply issues beyond those caused by the national system,363 the cost of energy as a percent-age of income for lower income families is a major issue. Some 38% of the city’s residents would be described as energy poor, falling into the group of low-income households that spend up to 25% of their income to meet energy demands. Only 34% of The Brenthurst Foundation’s survey respondents felt that electricity supply is reliable, while 42% felt that electricity supply is sufficient.
In order to address this, the City has taken considerable steps to ensure that all house-holds have access to at least some basic forms of energy. These include the provision of individual metering to backyard dwell-ers so that residents can access the national free basic electricity (FBE) subsidy. FBE uses funds from the national ‘lifeline tariff’ to provide poor households, those already con-nected to the electricity system and using less than 450 kWh per month. It is an elec-tricity voucher that covers the first 50 kWh, valid for one month only to cover basic light-ing and water heating.364 Once the 50kWh has been exhausted, qualifying house-holds must begin paying for their electricity consumption.
In recent years, electricity usage in Cape Town has been declining due to a decoupling
of the relationship between electricity demand and economic growth. Historically, economic growth was spurred by indus-tries such as manufacturing, with 60% of all city consumption from the commercial and industrial sectors.365 This has changed over the past two decades, with the manu-facturing sector shrinking and Cape Town’s economic growth being led by the tertiary sector. The shift from heavy-duty industrial activities to lighting, heating and ventila-tion of office buildings has led to a decrease in electricity usage. So, despite economic growth of 2.5% between 2012 and 2016, the energy consumption of large power users did not grow.366
In addition to a changing economic cli-mate, Cape Town households have shown significant price elasticity with consump-tion decreases after electricity tariff hikes, and the introduction of prepaid meters.367 Residents are also moving towards renew-able energy solutions as the costs of these rapidly decrease. Studies predict that a 4.5% loss of the city’s total revenue will occur over ten years as a direct result of residents choosing solar PV interventions, such as solar water heaters.368
Technology – Data is Falling, The Possibilities are GreatIn terms of telephony, South Africa has not issued access to low-band spectrum (700–800 Mhz), which enables companies to cover large areas without densification. While there is 99% call coverage in South Africa, there is probably only 75% 3G coverage, and 55–60% high-speed 4G.
There is an urgent need to release the low-band spectrum, as has been done in much of the rest of the continent. There is however a fear on the part of government that once liberalised, the opportunity is gone, and will benefit all companies equally. The failure to issue licences for this spectrum has led to a system which is four times more expensive than the low-band option.

132S P E C I A L R E P O RT – JA N UA RY 2 0 2 0
WHERE THE RUBBER HITS THE ROAD
Beyond liberalisation, this requires electri-cal power for this roll-out, which stresses the need for solar or diesel generation of towers.
There is also a need to open the environ-ment up to more than the extant duopoly to enable price competitiveness.
These problems apply of course to all areas of South Africa, of course, but more especially affect those cities aggressively pursuing the high-tech sector, though the more data is used, the cheaper it is in South Africa. This would likely open up new pos-sibilities in health-care, education, pensions and other welfare payments, agriculture, e-government, systems of water reticulation (and leakage), and crime prevention.
Winde sees three immediate benefits of improved connectivity for the province: con-necting consumers to information, economic development, and innovative and responsive government. Data and digitisation will drive cities of the future, and South Africa is no different.
Conclusion: Transitioning from Two Cities?Cape Town has been cited as a case of South African exceptionalism. This is true of its governance and growth record. But this argu-ment also fails to consider how much of the city’s challenges are those of any growing African urban space.
The Premier, Alan Winde, says Cape Town’s success is in part down to the ‘place that we have … We have a great place [which] is interesting for international
investors. And really we have worked very hard over the last few years to enable the economy, to look at what was missing in the economy, red tape reduction, making sure that we are cutting wherever possible in making it easy to do business, making sure that we are open for business, really going that extra mile … which I think has definitely made a big impact on investment coming to the region … .’
The lessons for others are clear. Use your comparative advantage well. In Cape Town’s case this is about tourism, lifestyle and the migrants who flow with it. Improve your gov-ernance institutions, and create new levers for delivery. Wesgro has been instrumental in facilitating a dynamic and tech-centred economy, even though by its own admission more could be done if it were given greater national policy latitude on matters like visas, investment incentives, and exchange controls. Build on fragile political coali-tions. The city has shown how government and private sector actors can proactively form successful partnerships in pushing Cape Town’s economy from ‘Slaapstad’ to a hub for services, deepening the basis of co-operation as the benefits accrued. And act on spatial constraints, in Cape Town’s case the legacy of apartheid living and work. Even though this particular challenge is as diffi-cult to overcome as it is socially deep-rooted, consistency is key.
In so doing, Cape Town has demonstrated that where you begin should not determine where you end up.

133S P E C I A L R E P O RT – JA N UA RY 2 0 2 0
WHERE THE RUBBER HITS THE ROAD
Rabat and Salé: Bridging the Gap
Quick Facts
Population: 580 000 (Rabat), 890 000 (Salé)Housing: 150 000 new units were built over five years. The Villes sans Bidonvilles (Cities without Slums) programme, introduced nationally in 2004, achieved a nearly 50% reduction in the number of slum dwellers as a proportion of the urban population.Jobs: Over 13 000 direct jobs were created through new industry over a ten-year period in Salé.Energy: 98% of the population have access to electricity.
When Ridley Scott was looking for a loca-tion for his 2001 film Black Hawk Down, which depicts the 1993 US mission to capture a Somali warlord that went disastrously wrong, the original site of the event, Mogadishu, was deemed to be far too dangerous. Instead they shot the film in Morocco, with Salé’s Sidi Moussa district being transformed into the Somali capital and the 17th Century Rabat medina becoming Mogadishu’s ‘Bakara Market’.
Today they would have to go else-where. Morocco’s slum removal initiative Program National d’Action pour l’Urbaine Fabric, launched in 2001, and the subsequent Villes Sans Bidonvilles programme ‘Cities without Slums’, launched in 2004, combined with an aggressive industrialisation and job creation strategy, are dramatically changing the face of cities across the country. Such initiatives have been underpinned by strong growth in the economy which was expected to average 3.3% in 2020-2021.369
For Africa, where population numbers will double to 2.5 billion by 2050 of which nearly two-thirds are projected to live in cities, Morocco’s experience is instructive.
At independence in 1956, Morocco’s pop-ulation was 10.5 million. Sixty years later it has more than tripled to 34.8 million. This trend is flattening with population growth falling from a high of 3.3% per annum in the late 1950s to 1.4% in 2016. Urbanisation has been similarly rapid. At independence 29% of the population lived in cities, now it is close to 60%.
With a young, sometimes restive popula-tion, Morocco has had to work hard to create the opportunities needed for social stability.
Such challenges are nothing new. The focus following independence in 1956 was to deliver political stability and territorial consolidation along with basic infrastruc-ture. In the process the government, led by the monarchy, had to confront huge social challenges. By 1981 as much as 60% of the population lived below the poverty line, unemployment was at 20% (perhaps twice as high among the youth), and 20% of those in the cities lived in shanties.
There were bread riots and other popular protests. Improved economic growth (driven by privatisation), multiparty elections and a 1996 trade agreement with Europe alleviated some of the building social pressure.
King Mohammed VI, who succeeded his father King Hassan II in 1999, embarked on widespread social and political reforms, free-ing political prisoners, improving the position of women under the law, improving social conditions, and stimulating the economy.
Nowhere can this be seen more than in Salé, on the north side of the Bouregreg River from the capital Rabat.
Once a haven for pirates, Salé was the target of western navies retaliating for attacks on European traders crossing the Atlantic. Today its function is somewhat less dramatic; a satellite town to the nation’s capital. In its transition from pirate town to dormitory, its one million inhabitants largely got left behind and, by the end of the

134S P E C I A L R E P O RT – JA N UA RY 2 0 2 0
WHERE THE RUBBER HITS THE ROAD
20th Century, conditions were more akin to Mogadishu than Rabat: large slums, high unemployment, lack of economic diversifi-cation – with textile factories providing the majority of jobs – and poor water supply and sanitation.
Now another transition is in progress as a result of which, in just ten years, the city has changed beyond recognition.
A smart, modern tram links Salé to Rabat, the cost of a single ticket being just 6 MAD (or $0.60). The slums have now largely been cleared and replaced with five-storey blocks of flats through a mix of public and private funding.
Salé now boasts a new ‘technopark’ modelled on the success of similar pub-lic-private enterprises designed to spur start-ups in Casablanca and Tangier. At the mouth of the Bouregreg River is a new
Marina development, with high-priced apart-ments, restaurants, shops, sports facilities and, critically, fresh jobs. With a need to cre-ate jobs for 200,000 graduates every year, the pressure is on not just to plan, but to do.
The development of Rabat and Salé pro-vides a dynamic case study of what it means to actively tackle the challenges of urbanisa-tion and rapid population growth in the 21st Century. This chapter examines the twin cities’ turnaround, following each sector of governance, economic growth, transport, housing and service delivery.
From the scale of development, it is dif-ficult now to imagine how such a modern looking city like Salé could, less than two decades ago, have been selected as a stand-in for battle-weary Mogadishu. Today, it’s a city, like the country, in a hurry.
RABAT
MOROCCOMOROCCO
WESTERN SAHARAWESTERN SAHARAMAURITANIAMAURITANIA
ALGERIAALGERIA
NORTHATLANTIC
OCEAN
MediterraneanSea
Strait of Gibraltar
CasablancaCasablanca
AgadirAgadir
TarfayaTarfaya
MohammediaMohammedia
KenitraKenitraNadorNador
OujdaOujda
Bou ArfaBou Arfa
MarakechMarakech
Sebkha TahSebkha Tah
JebelToubkal
JebelToubkal
Sa�Sa�
OuarzazatOuarzazat
FèsFès
MeknèsMeknès
TangierTangierCeuta (Sp.)Ceuta (Sp.)
Melilla (Sp.)Melilla (Sp.)TétouanTétouan
!
SPAINSPAIN
!
!
135S P E C I A L R E P O RT – JA N UA RY 2 0 2 0
WHERE THE RUBBER HITS THE ROAD
Setting the SceneAlthough separated by the common Bouregreg estuary, Rabat and Salé took dif-ferent historical paths. Rabat was made the centre of economic and political power, while Salé embodied the rebel city and la ville doirtoir – the place where workers go to sleep. Nearly two decades later, efforts have been made to change the power dynam-ics and bring the cities closer together through means such as integrated service delivery. Yet, these have not been enough. ‘It is difficult to undo 200 years of neglect in 20 years of development,’ observes historian Mohammed Krombi.
At its founding in 1030, Salé was the dom-inant city, boasting a tight-knit community led by prominent Moroccan elites. Things changed at the turn of the 20th Century when French colonisers introduced la ville nouvelle370 policy, choosing which cities would advance into the new era. ‘Salé had strong thinkers that drove a resistance against the French,’ said Hassan Benzalla, Director of the Salamoustaqbal Association – an organisa-tion representing residents in Salé. ‘This is why it was historically isolated’. Salé did not receive a ville nouvelle status. Rabat, in con-trast, did – it was dubbed Morocco’s capital and enjoyed an injection of fresh investment, enticing the relocation of many of Salé’s elites. ‘Salé only survived and grew because of its proximity to Rabat,’ noted Krombi. Many Moroccan cities that were not villes nouvelles have since perished.
By the 1990s, post-independence, Rabat grew into a concentrate of jobs and ser-vices with a network of satellite cities fast developing on its periphery, including Salé, Temara, Tamesna and Kénitra. Today these cities are reservoirs of skilled human capi-tal, offering cheaper property and living costs than Rabat, but fewer amenities and services. This dynamic has spurred a daily commuter-culture into Rabat, justifying the need for strong transport links like the tramway. Interestingly, the population of the satellite cities continues to rise, while Rabat’s
population, constrained by city boundaries and restrictive planning regulations, has remained stagnant.
Rabat remains Morocco’s showpiece; Salé exists in its shadows. This is embodied in the 2014 naming of Rabat as La Ville Lumière371 by King Mohammed VI, a 450 million MAD (Moroccan Dirham) cultural project from which Salé will benefit by proximity. Still, the Moroccan government has had to actively temper the disparities and tensions between its cities. One such response has been to ensure that Morocco remains secure from violent extremism.
The Security ImperativeIn a post-9/11 global order, security has been a key driver of Morocco’s development suc-cess. The 2003 Casablanca bombings, the deadliest attack in the Kingdom’s history, followed by an Arab Spring in 2010 raised insecurity to a level of national imperative, forcing the King to take action. This set in motion a series of policy changes to tackle the basics.
Morocco sits in a region prone to insta-bility and Islamic terrorist activity.372 On 16 May 2003, Casablanca was hit with co-ordi-nated suicide bombings across five different locations. The attacks killed 33 civilians and 12 of the attackers, injuring hundreds more. The terrorists, reportedly members of the Al-Qaeda-aligned Moroccan Islamic Combatant Group (MICG), were in their early twenties and lived in the slums of Sidi Moumen, Thomasville and Carriere Thomas on Casablanca’s periphery. Most of them were poorly educated and unemployed.373 This event shone a spotlight on the vulner-ability of low-income Moroccans living in bidonvilles374 to radicalism, placing human development at the centre of anti-terrorism.
Within weeks of the attack, dozens of suspected extremists were arrested and the country’s religious system was restructured to embody moderate Islam.375 The King then launched the National Initiative for Human Development (INDH) in 2005 to uplift poor
136S P E C I A L R E P O RT – JA N UA RY 2 0 2 0
WHERE THE RUBBER HITS THE ROAD
Moroccans and limit their vulnerability to terrorist groups.376 INDH comprised targeted programmes through public-private part-nerships. The Villes sans Bidonvilles is one such programme. Five years after launching, INDH had improved 264 urban areas and 403 rural.377
In December 2010, after Tunisian street vendor Mohammed Bouazizi’s self-immo-lation, the Arab Spring erupted across the region. The following May, thousands of Moroccans took to the streets to protest the country’s social ills. The King quickly announced major democratic reforms, including a new constitution and the choice of a Prime Minister from the opposition Islamist Justice and Development Party (PJD).378 King Mohammed VI’s moderate stance and proactive administration assisted Morocco in dodging the Arab Spring.
Underlying this shift has been a policy focus on economic growth and spending on key infrastructure. The poll conducted of Rabat-Salé by The Brenthurst Foundation in 2018 shows that 85% of respondents linked economic growth to the improvements in the city, in spite of continued concerns about crime, healthcare and unemployment.
The lesson from the transformation of Rabat- Salé is that clear, robust policies can affect real change, even if the odds seem stacked against you.
GovernanceChanges to Morocco’s governance structures have facilitated this change. The 2000s were marked by active reform and decentralisa-tion ushering in a more democratic model whilst retaining a strong central state.
Officially, Morocco is a parliamen-tary constitutional monarchy with both appointed and elected officials. The country has gone through three major governance reforms over the last half century, first in 1976 when municipalities were recognised as legal entities, then in 1997, when regions were established and, most recently, in 2011 when the new constitution launched the first
stage of la régionalisation avancée (advanced regionalisation), a process of decentralisa-tion. This reduced the number of regions to 12 and created commissions to coordinate the many actors in the process. The King recently announced his intent to move to the second stage, which gives even more auton-omy to the lower levels of government.379
The Ministry of Interior remains the back-bone of governance in Morocco. It supervises urban development and other strategic sec-tors of the economy and oversees various officials and local government institutions. The Ministry sets the long-run development vision for the nation, with its head appointed directly by the King. As the Director General of Local Communities, Wali Khalid Safir, said, ‘Politicians, when they come into power, they have programmes and clear objectives that they need to achieve as soon as possible. The representative of the government has no deadlines, they are there to protect and serve citizens and make sure that what is going on is equitable.’
Morocco now comprises 12 regions, 62 provinces, 13 préfectures380 and 1 503 municipalities, known as communes. At each level there are both elected and appointed government officials. Notably, in 2011, democratic reforms to the constitution placed much greater authority and financial resources in the hands of elected officials. The graphic, below, illustrates Morocco’s gov-ernance framework.381
At the municipal level, the fourth layer in the table, urban agencies have been established to manage the administration of services and projects in Moroccan cities. These agencies each have a specific goal, allocated resources and are given consider-able freedoms to achieve their objectives.
Urban planning is centralised through the Conseil Supérieur de l’Aménagement du Territoire (Higher Council for Territorial Development),382 the second layer of Figure 3, which retains decision-making prerogatives for the entire region, operating under the Ministry of Interior. Elected local officials
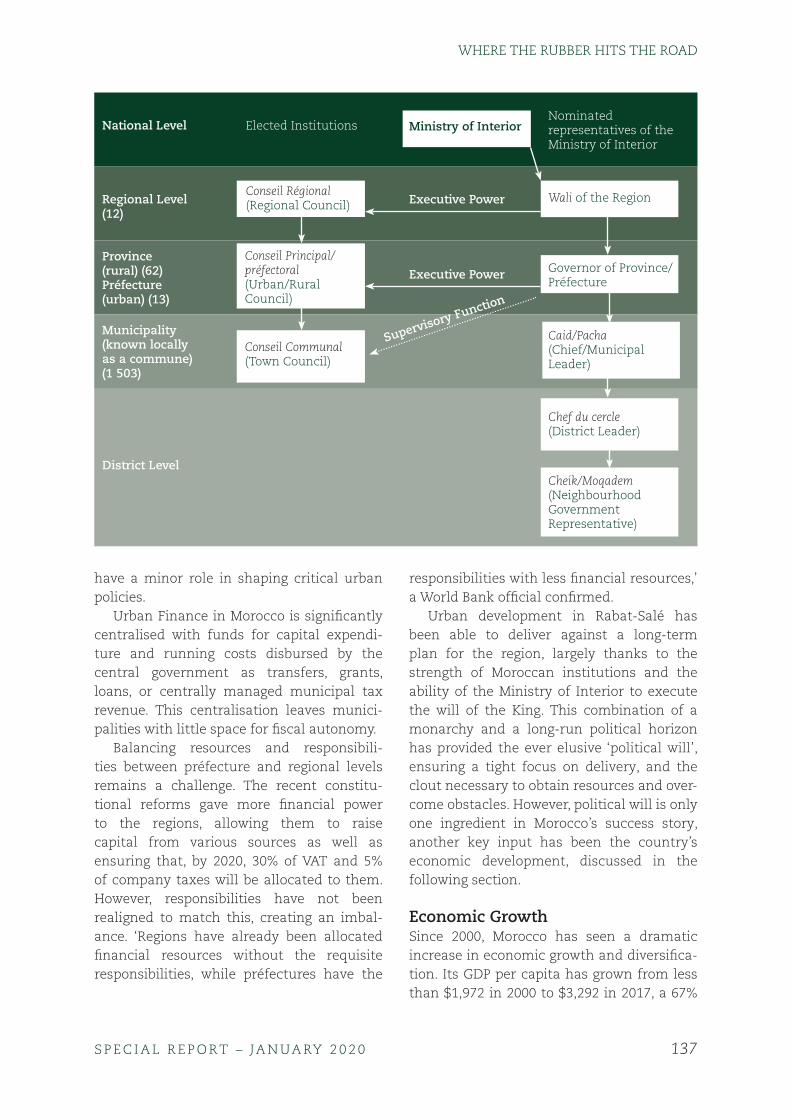
137S P E C I A L R E P O RT – JA N UA RY 2 0 2 0
WHERE THE RUBBER HITS THE ROAD
have a minor role in shaping critical urban policies.
Urban Finance in Morocco is significantly centralised with funds for capital expendi-ture and running costs disbursed by the central government as transfers, grants, loans, or centrally managed municipal tax revenue. This centralisation leaves munici-palities with little space for fiscal autonomy.
Balancing resources and responsibili-ties between préfecture and regional levels remains a challenge. The recent constitu-tional reforms gave more financial power to the regions, allowing them to raise capital from various sources as well as ensuring that, by 2020, 30% of VAT and 5% of company taxes will be allocated to them. However, responsibilities have not been realigned to match this, creating an imbal-ance. ‘Regions have already been allocated financial resources without the requisite responsibilities, while préfectures have the
responsibilities with less financial resources,’ a World Bank official confirmed.
Urban development in Rabat-Salé has been able to deliver against a long-term plan for the region, largely thanks to the strength of Moroccan institutions and the ability of the Ministry of Interior to execute the will of the King. This combination of a monarchy and a long-run political horizon has provided the ever elusive ‘political will’, ensuring a tight focus on delivery, and the clout necessary to obtain resources and over-come obstacles. However, political will is only one ingredient in Morocco’s success story, another key input has been the country’s economic development, discussed in the following section.
Economic GrowthSince 2000, Morocco has seen a dramatic increase in economic growth and diversifica-tion. Its GDP per capita has grown from less than $1,972 in 2000 to $3,292 in 2017, a 67%
National Level
Regional Level (12)
Province (rural) (62)Préfecture (urban) (13)
Municipality (known locally as a commune) (1 503)
District Level
Elected Institutions
Conseil Régional(Regional Council)
Conseil Principal/préfectoral(Urban/Rural Council)
Conseil Communal(Town Council)
Ministry of Interior
Executive Power
Executive Power
Supervisory Function
Nominated representatives of the Ministry of Interior
Wali of the Region
Governor of Province/Préfecture
Caid/Pacha(Chief/Municipal Leader)
Chef du cercle(District Leader)
Cheik/Moqadem(Neighbourhood Government Representative)

138S P E C I A L R E P O RT – JA N UA RY 2 0 2 0
WHERE THE RUBBER HITS THE ROAD
increase.383 A significant part of this growth can be attributed to the focus on opening up Morocco to the world. Between 2000 and 2016, the rate of the economic openness increased from 49% to 62.2% – higher than other middle income countries like South Africa, Turkey and Brazil, with rates of 57%, 42% and 19%.384 This was achieved through macro-economic policies that focused on diversifying exports to include textiles and manufactured goods, attracting foreign investment through agreements with major economic centres such as the EU and the US, promoting tourism and subsidising the development of offshoring industries and incubators.385
These changes were implemented at both the national and local level. The cities of Rabat and Salé show how Morocco’s eco-nomic reforms have been implemented in an urban context.
The Bouregreg Valley Development Agency‘The divisions existed in people’s minds, a result of historical rivals in the Kingdom where rebellious royal cousins fought for the throne from Salé,’ asserts archaeologist and historian Mohammed Es-Semmar. Though Rabat and Salé are separated by a river, they have always operated as one. This idea cap-tured King Mohammed VI’s attention and supported his 2004 vision of bringing the two cities together again through the birth of the Agence pour L’Aménagement de la Vallée du Bouregreg (AAVB).
Established by Dahir (royal decree) in November 2005, the AAVB is governed and funded by an administrative council386 under the supervision of the Ministry of Interior. 387 It has authority over the Bouregreg Valley territory that lies between the two cities, and a mandate to bring Rabat and Salé together through major investment in infrastructure and cultural projects.
The AAVB is an agency mandated by the state, but outside of traditional hierarchies and processes that hamper government
departments. It is a quick and nimble unit with the authority and means to pursue complex tasks such as the development of seven new bridges between Rabat and Salé, the Oudayas tunnel, the Rabat-Salé tramway and the Bouregreg Marina.
The AAVB has been used as a mecha-nism to pursue the high-profile projects that require coordination across a number of government departments and they cur-rently spearhead the development of Rabat and Salé’s newest cultural landmarks, Zaha Hadid-designed Grand Théâtre de Rabat and the tallest tower in Africa, dubbed the ‘Rabat Tower’.
The Agency acts as a developer and inves-tor, with the prerogative for urban planning at the municipal level. It has the authority to issue development permits and to regulate all land transactions. The only exception is that AAVB does not appropriate land belong-ing to Rabat and Salé, and local taxes from the valley are still paid to the respective municipalities.
The AAVB has turned the Bouregreg Valley into a tourist destination and a commercial enclave. However, some critics have raised concerns that the agency has prioritised van-ity projects that fail to address the pressing social needs of the region. Nevertheless, the organisation’s key benefit has been in its ability to mobilise funds and complete com-plex infrastructure projects.
Rabat has historically been the heart of economic activity in the region. Its economy is largely services- and education-based, boasting numerous higher education institu-tions, with almost all government offices and foreign missions choosing the city for their headquarters. Almost two thirds of Rabat’s residents who responded to our surveys agreed that the quality of state education was better than elsewhere in the country and the availability of skilled labour was listed by the majority of respondents (71%) as the main facilitator for starting a business in Rabat or Salé.
139S P E C I A L R E P O RT – JA N UA RY 2 0 2 0
WHERE THE RUBBER HITS THE ROAD
However, the high cost of land within city limits has prevented the development of non-service-based industries. As such, the city has leveraged its comparative advantage to become the regional services hub with most of its economic output coming from Government Administration and the services industry.
In contrast, the satellite towns surround-ing Rabat, such as Salé, have been identified as sites to expand industrial activities, with production in textiles, construction materi-als and food processing sectors.
Salé once boasted a vibrant textile industry. However, at the onset of growing competition from low-cost Asian manufac-turers, many operators in Salé’s textile sector were unable to survive and between 2006 and 2010, nearly 20,000 jobs were lost.
Some companies however, such as Thirteen AMP Morocco, a member of SOMITEX Textile Group and the largest textile com-pany in Salé, were able to find innovative ways to withstand tough market conditions.
Abdelhai Bessa and Wafaa Benchekroun have been working together as a husband and wife duo since 1991, employing 1 400 workers in two Salé factories and produc-ing 1.2 million garments a year. Their staying power lies in being selective on products and ensuring high quality. ‘We have to choose what we do and do it well,’ said Bessa – these efforts have rendered Thirteen AMP the last textile company in Morocco to supply Marks and Spencer (M&S).
But while the duo would never leave Salé, the challenge is ‘to consistently develop and grow. We want to keep the business for our sons to take over.’
King Mohammed VI has adopted a pro-business approach that aims to achieve a balance between the public and private sec-tor. Dari Couspate in Salé can attest to this change. A family business in couscous and pasta products started by Mohamed Khalil, now run by his son Hassan, Dari Couspate has been operating in Salé for the last 15 years. Although it was originally tough
trying to run a 24-hour food processing fac-tory in a region where very few businesses operate at such scale, Mohamed notes they stuck it out because, ‘our DNA is in this area. We would never move.’ Things under the new government have eased so much that Hassan feels business owners are no longer ‘just viewed as a taxpayer. There is more mutual respect’. This has enabled the busi-ness to open of a new factory.
Technopolis, alongside the Université Internationale de Rabat (located in Salé) and large-scale projects by the Bouregreg Valley Development Agency on the Salé side of the river, show the efforts to diversify economic activity across the region. Opened in 2008, Technopolis comprises internationally com-petitive office spaces for outsourcing services and high-tech industry as well as a manu-facturing free zone in the Rabat-Salé-Kenitra area. In ten years the park has been able to attract international companies like LEAR, Amazon, as well as to create over 13 000 jobs. Operated by Casanearshore, a private company, on the edge of Salé, Technopolis has been able to expand into a second phase with government support.
Some 85% of residents polled believed that economic growth has led to improve-ments in the city over the last four years. Through its strategy to replicate national goals at the local level, Morocco has been able to create the conditions for sustained economic growth.
InfrastructureThe development of these twin cities has largely been propelled by housing and trans-port projects that, not without their flaws, have enabled greater access to decent amen-ities and better economic opportunities for low-income residents. Rabat and Salé have developed a clever concessionary system that integrates the private sector to deliver municipal services, from which other African cities could learn. Inaugurated in 2004 by King Mohammed VI, the Villes sans Bidonvilles (VSB), or Cities
140S P E C I A L R E P O RT – JA N UA RY 2 0 2 0
WHERE THE RUBBER HITS THE ROAD
without Slums, is an ambitious plan to rid Moroccan cities of squatter settlements by 2010.388 Bidonvilles have been a feature of Moroccan urbanism since 1918. Despite various attempts since 1948, the 2003 ter-rorist attacks placed urban housing on the national agenda.
During a speech in 2006, the King expounded on his vision for the VSB; ‘What we definitively envision is not just cit-ies without slums, nor to substitute slums with soulless concrete blocks, impervi-ous to sociable lifestyles. We understand, rather, that it is to transform our towns into spaces apt for social interaction, warmth and dignity and, while turning cities into invest-ment and growth poles, we ensure that they remain attached to their own specific and original style.’389
Administered through the Ministry of Housing and Planning alongside Al Omrane, a state-owned housing utility, VSB aimed to eradicate slums in 83 cities. The plans were initially scaled according to need. It was estimated that 30% of current housing struc-tures were in sufficient condition to qualify for in-situ upgrading, but the remaining 70% would require relocations on new plots. Initial provisions were made for the reset-tlement of 150,000 families over five years. Very low-income residents (10%) were pro-vided with completely free housing, while the remaining 90% received housing units at a subsidised rate, paid directly or through a mortgage.390 $3 billion was set aside for the project, with the Moroccan state providing $1.2 billion and the rest mobilised though investment. UN Habitat, the World Bank and the Agence Développement Française (AFD) offered support.391 Almost half of our poll respondents agree that housing in Rabat and Salé is better than elsewhere in Morocco.
By 2010, VSB had only been able to clear 32 cities, decreasing the slum population from 8.2% of total urban population in 2004 to 3.9%. This resulted in the project’s exten-sion to 2015. At present, there are 58 cities that have been declared ‘slum-free’ and the
project has been further extended with no clear end date.
Overall, the VSB programme has faced some major challenges in its process of resettlement. VSB actively pursued a policy of involuntary removals that have displaced communities today. Plans have often fallen short due to the inability of Al Omrane to enforce the contractual obligations of private actors. Nearly 90% of our poll respondents felt that housing projects urgently need to be improved.
VSB is a programme that has been lauded internationally for its ability to deliver decent quality housing to citizens who would have otherwise been excluded. The programme utilised the power of PPPs to increase the level of housing stock available to low-income residents – a lesson worth learning for other African cities facing lim-ited housing stock. However, it also points to the dangers of failing to get the social fac-tors of mass housing right. This can create a ticking time bomb of unrest. Housing is a complex sector that requires nuanced solu-tions that the VSB did not quite provide.
TransportTransport lies at heart of the twin cities’ suc-cess. The Rabat-Salé Tramway, introduced in 2007 has changed the way residents move, with 77% of poll respondents reporting that public transport is affordable. The Tramway illustrates that with proper planning and clever private sector collaboration, large scale transport infrastructure can be built in African cities to improve urban mobility and unlock benefits for local economies. In turn, smaller scale transport providers will adjust to fill the gaps.
In 2008, Morocco’s new national strategy for urban transport allowed transport opera-tions to be agglomerated.392 This led to the creation of Local Development Companies (LDCs) and the expansion of private sector investment through organisations such as Tramway Company of Rabat-Salé and Stareo, a Moroccan bus company. Public funds were

141S P E C I A L R E P O RT – JA N UA RY 2 0 2 0
WHERE THE RUBBER HITS THE ROAD
made available, in particular the Hassan II Fund and a special urban transport fund known as FART.393
In 2009, bus contracts were concessioned to a subsidiary of Veolia Transport. It was an ambitious project to provide new buses and dedicated bus lanes, as well as train and employ 3,000 staff. However, this did not go as planned. After operating for 18 months, Veolia withdrew from the contract and a new operator, Stareo, took over the 15-year con-tract. Stareo absorbed the existing vehicles and staff, renewed the bus fleet and restruc-tured the bus network routes. However, after a failed attempt to renegotiate tariffs, Stareo was forced to file for bankruptcy, leaving the bus system in the control of Al Assima, a local government agency.394
In 2005, as part of the transport devel-opment mandate of the AAVB, new transportation studies were conducted for the Rabat-Salé region. According to Mohammed Souafi, a member of the Commission Consultative de la Régionalisation, 2007 was the first time that the elements of political will, financing and operational tools such as PPPs came together to create a viable opportunity for large-scale investment in transport.
Construction began on the tramline in 2007. A subsidiary of the AAVB, the Société du Tramway de Rabat Salé (STRS), was formed in 2009 to manage the implementation of the tram project and subsequent expansions. Houda Drissi, the Project Manager for STRS, has noted that ‘at the start of the study, it was thought that transportation was only needed in the Bouregreg region but dur-ing the study, we realised that it needed to expand to the general areas of Rabat and Salé.’
The financing for the tram was secured through a 50:50 split of government fund-ing and international development loans. The money from the government came through the FART fund, while global funds were acquired through the EU Bank, EIB and
AFD with Natixis financing the tram wagons. Repayment began five to seven years later, with a term of 20 to 25 years.
One of the keys successes of the tram has been the concession agreement developed with Transdev, a French company with a 30-year contract to operate the tram system. Enacted in 2011, the contract gave Transdev the responsibility to operate the tram, from ticket sales to wagon maintenance. The con-tract stressed training and skills transfer. Now, only six years later, engineers such as Mohammed Ihrou feel that local operators have developed the technical skills to oper-ate the tram successfully. ‘Six years since the tram started operating, we are now compe-tent on our own … the trams are assembled here, and we also manufacture some of the spare parts locally,’ he said.
Transdev runs 22 trams, acquired for 40 to 45 million MAD each, with a lifespan of 30 years. Tickets can be purchased at each tram stop with conductor checks per waggon. In 2017, Transdev was able to cover over 96% of operational cost from ticket sales alone. The tram services about 110,000 passengers a day and more than 32 million passengers a year.
The tram is widely viewed as a success. It is one of the projects that has been able to strike the balance between promoting the vision of a world class city and serving the needs of its citizens. A plan is currently underway to expand the tram by 7km to serve all the main routes into the city and its surrounding areas, such as Hay Riad, Temara and Salé El Jadida, at an estimated cost of 1.7 billion MAD. Rabat-Salé has largely got urban transport right, with the Rabat-Salé Tramway as the beacon of excellence in the sector. The management and capacity of public transport systems have largely been improved by the creation of transport enti-ties and the right financing mechanism. This combined public and private funding, mobilised through concessions to private companies.

142S P E C I A L R E P O RT – JA N UA RY 2 0 2 0
WHERE THE RUBBER HITS THE ROAD
Developing local technical capacity has been crucial to the outcome of projects, seen in the failure of the bus system versus the success of the Rabat-Salé tramway, which is now self-sustaining just six years after its launch.
Nevertheless, Rabat and Salé still face the challenge of densifying to support effective, efficient and affordable public transporta-tion. As Fathallah Oualalou, former mayor of Rabat, noted, ‘the deficit of the bus sys-tem encouraged the growth of the informal sector … They will remain until there’s a suc-cessful modern transportation system, the tramway isn’t enough. The tram costs more than informal measures, so it’s important to develop transport.’
Service DeliveryIn order to address the need for effective service delivery in urban centres, Morocco has experimented with private sector con-cessions as the main mode of delivery for municipal services, such as electricity, water and waste management.395
Casablanca was the first Moroccan city to adopt concessions in the late 1990s, followed by Rabat by the early 2000s. The region of Rabat-Salé and Kénitra developed the novel solution of a regional coordination body, Établissement de Coopération Intercommunale (ECI) Al Assima (henceforth Al Assima), to manage the concession process.
Founded in 2011 by a royal decree, Al Assima manages the contracts for munici-pal service delivery, providing clarification on the different roles of the municipality and concessionaire. It oversees concession-aires’ performance and implements various penalties for non-compliance. Al Assima is a division of the Ministry of Interior and reports to the regional municipalities. It is directed by a 43-member council consist-ing of the 17 elected presidents from the municipalities, as well as 26 members that are proportionally representative of each municipality.
The introduction of private contractors in the final stage of service delivery has improved the quality of services provided to citizens. However, the trend has also led to an increase in the cost of service provision to municipalities. Wali Khalid Safir reiterated however, ‘If we had continued to self-man-age, it would be worse, in terms of quality.’
ElectricityThe electrification rate is 98.96% and the final 1.04% who cannot access the service are in rural areas and served by off-grid energy solutions. Our poll revealed that 77% of resi-dents reported an improvement in electricity supply over the last four years, and 89% felt that it is sufficient.
Generation and transmission within the Moroccan electricity supply industry is con-trolled by the national operator ONEE. In the case of Rabat and Salé, however, distribution has been contracted to the private French company Redal, a subsidiary of Veolia. In 2000, Redal won a 30-year contract to pro-vide the distribution services for Rabat and Salé. Pricing is calculated as a fixed per-centage of the tariff over the period of the contract, with the tariff set by the Ministry of Interior and subject to review upon upstream changes in production costs. The contract is performance-based and reviewed by Al Assima every five years. Redal oper-ates a metered system with very few prepaid meters. Nevertheless, it has been able to obtain a 100% collection rate for private citi-zens due to their ability to cut off buildings and households for non-payment.
The process of concessioning public infra-structure services was one of considerable trial and error. As one Redal employee men-tioned it was only possible through, ‘clear fixed objectives, adequate control mecha-nisms, sufficient indicators and detailed contracts.’ Prior to the concessionary system, municipalities held the distributor role, but this led to significant challenges as many municipalities, especially smaller ones, did

143S P E C I A L R E P O RT – JA N UA RY 2 0 2 0
WHERE THE RUBBER HITS THE ROAD
not have the technical ability to deal with complex distribution issues.
When the private companies entered the market, they had to make significant invest-ments to the distribution and customer service infrastructure. These investments have proved profitable in the long run.
Rabat and Salé have been able to crack the code of efficient distribution by providing cost-reflective tariffs to consumers that ena-ble the smooth functioning of the electricity supply system.
Water ServicesMorocco sits in a desert region. Yet, the coun-try’s water supply is relatively secure, as a result of its aggressive national dam-building initiative 25 years ago. The Sidi Mohamed Ben Abdellah Dam on the Bouregreg River supplies Rabat, Salé and their satellite towns, and neighbouring Casablanca and Kénitra. In 2003, the dam was heightened by five metres to increase resilience to drought. As an additional resilience measure, the coun-try has invested heavily in desalination and a project is currently under way to build the world’s largest desalination plant in Agadir, 550km from Rabat.
The administration of water resources in Morocco is split across four ministries: the Ministry of Interior responsible for munici-pal water supply with a legal responsibility to provide drinking water; the Ministry of Equipment, Logistics and Water, responsible for dams and water-related infrastructure; the Ministry of Agriculture, Forestry and Water, responsible for irrigation and soil erosion; and the Ministry of Energy, Mines, Water and Environment, responsible for pollution control and water resource man-agement. ‘Despite this setup, there is little conflict between Ministries,’ an interviewee at the GIZ Water Programme confirmed, ‘as the roles in the environmental side and the user side of water are clearly defined.’
The supply of bulk water services in urban areas across Morocco is conducted solely by Office National de l’Eau Potable (ONEP),
a subsidiary of ONEE. ONEP also distributes water to 500 small towns across Morocco, as well as creating the piped water network and treating sewage and wastewater. In Rabat, Casablanca, and three other large cit-ies, however, water is supplied by ONEP and distributed by Redal through a concession.
Water supply was previously co-ordinated by an Inter-Ministerial Committee that was chaired and supported by the former King. But the Committee is defunct and has been replaced. The new Commission is working to decide on water priority issues but remains committed to the supply of fresh drinking water to the urban poor as instructed by the King in his National Human Development Initiative (INDH).
As a country on the edge of the Saharan Desert, Morocco has long taken the manage-ment and preservation of its water resources very seriously. It has, so far, been able to keep pace with increasing demand. While rapid population growth is now levelling off, rising living standards and increased urbanisation will continue to drive higher demand. But there are still long-term initiatives in the pro-gramme to meet these challenges. Ensuring a viable water supply is both a national and a city responsibility, and governance arrangements need to reflect this reality. The arrangements in Morocco appear complex, but they have worked to provide adequate supply in a challenging region. In 2018, Cape Town nearly became the first modern city to run out of water. As those in office attempt to avert this situation, they would do well to study the Moroccan experience.
What the Rabat-Salé metropolis has achieved is to boost the role of multiple, small concessions to provide a public urban service instead of one large, overarching contract as is found in many other African countries. Small concessions allow many actors to operate in one sector, encour-aging competition and efficiency, whilst minimising the effects of opaque, and often overpriced, public tenders. The introduction of Al Assima as a regional oversight body
144S P E C I A L R E P O RT – JA N UA RY 2 0 2 0
WHERE THE RUBBER HITS THE ROAD
is an incredible initiative that removes the barriers that prevent government from nego-tiating effectively with the private sector and ensuring quality service provision.
Conclusion: Do Interventions Matter?The story of Rabat and Salé reflects the changes that have shaped Morocco over the last 20 years. Theirs remains the tale of what happens when the process of development is conceived and led by local actors. Morocco’s staggering growth marks the kind of progress that can only be achieved through consistent policy and fixed objectives.
The security threats of the early 2000s, with 9/11 and the Casablanca bombings, were the driving force to implement radi-cal changes in the country’s urban policy. The local bidonvilles had become breeding grounds for Islamic extremism and terrorist recruitment. Through extensive infrastruc-ture projects in housing, Morocco was able to declare 58 cities as slum free and drastically reduce the number of urban residents living in slums.
Not only was there considerable effort to move citizens out of slums, but the last 17 years have also seen investment into building cities where people want to live, with modern transport like the Rabat-Salé tramway, clean water and functional waste management. Rabat and Salé have managed to introduce these changes by harnessing the power of concessions in the delivery of municipal services.
The 2011 constitutional reforms paved the way for more democratic measures at the local government level. In the most recent iteration of advanced regionalisation, the Kingdom’s commitment to increasing democratic participation and building a solid base of local government is deeply evident. However, Rabat and Salé continue to balance power between the bureaucracy, elected
officials and ordinary citizens. The historical patterns of power embedded in the monar-chy and state bureaucracy will take a while to undo.
Very few of these changes would have been possible without the economic growth Morocco has witnessed over the last two decades. In opening up the economy and focusing on diversifying exports and attract-ing foreign investment, Morocco has been able to source the capital needed to pay for large scale infrastructure investment. The application of those goals at the regional level has been an additional boon and allowed for sustained growth over time.
The key factor shaping positive outcomes in Morocco is the high level of political will. With the vision set by King Mohammed, the Ministry of Interior has enjoyed the authority across all spheres of governance. As Fathallah Oualalou, former Morrocan Minister of Finance and Mayor of Rabat, has noted: Morocco did something unique when there was a planning shift from ‘focusing on the small things to focusing on long term modernisation strategies.’
There are aspects to Morocco’s reform process which have failed, not least what one senior adviser calls the ‘crisis’ of the judicial system, public health, and public educa-tion. At the same time, he notes, there is ‘no reason why’ with ‘political will’ this cannot be turned around quickly. It’s this attitude that has enabled the progress visible in Salé.
The scenes from Black Hawk Down bear no resemblance to contemporary Salé. The city has transformed from a warzone proxy to a thriving urban hub, catalysed by govern-ment action. The sheer scale and rapidity of this change in half a generation is something that few cities across the world have been able to achieve. It is the scale and speed of change in Morocco from which other African cities can learn and take heart.
145S P E C I A L R E P O RT – JA N UA RY 2 0 2 0
WHERE THE RUBBER HITS THE ROAD
Conclusion: Between Wakanda and DystopiaThemesElectricity: Solving the problem of electric-ity supply depends on a complex system of issues, including getting the pricing right and achieving generation efficiencies. There is a need to find private partners mandated to deliver low cost electricity, and expand-ing the grid, especially through renewable energy projects. While unbundling may help to improve efficiencies, the challenge of elec-tricity supply in Africa’s cities centres on generation, not transmission or distribution.
Governance: Plans need to be imple-mented and regulations enforced fairly, speedily and free from political intrigue and corruption. Match planning ambition with resources. The institutional software should be improved and regulatory space provided to give investors the confidence to fund the hardware.
Housing: Overwhelmingly neglected. Greater focus on in-situ upgrading schemes. Densification to be encouraged as a corollary of efficiency, especially for transport. Need for more focus on workable Public Private Partnerships; land and service provision matched with investment in housing.
Political Economy: Without economic growth, and the better policy choices and institutional structures that give rise to it, cities will not prosper. Attention must be paid to the kernel of reforms that will deter-mine the future growth and prosperity path of African cities. Until now this has been largely exclusive, not inclusive.
Security: Resource and technology-driven, but not dependent on these. Solutions have to link to wider economic opportunities and social infrastructure. Requires national, regional, and metropolitan organisational collaboration.
Technology: Data and digitisation will drive cities of the future, and Africa is no different. Mobile telephony remains a sig-nificant and underexploited opportunity to deliver ‘e-governance’, by expediting
transactions, revenue collection and permits. This will depend on bandwidth availability and private sector participation. New cities are largely an elite preoccupation and solution.
Transport: The efficiency of public trans-port, including BRTs, hinges on encouraging density, and careful integration. Bolster regu-lation and management of private commuter services to ensure safety and affordability. No silver bullet solution is likely, and expen-sive schemes can often be elusive without the necessary governance underpinnings – the hardware and the software have to match.
‘I dream of a South Africa where the first entirely new city built in the demo-cratic era rises, with skyscrapers, schools, universities, hospitals and factories,’ South Africa’s President Cyril Ramaphosa said as he concluded his 2019 State of the Nation address.396 He also spoke of his dream of a bullet train linking all major South African cities. The President said that his ambition had been fuelled by several conversations inter alia with Chinese leader Xi Jinping, ‘whose account of how China is building a new Beijing has helped to consolidate my dream’.397
With a projected 70% of South Africans living in urban areas by 2030, the President said, ‘The cities of Johannesburg, Tshwane, Cape Town and Ethekwini are running out of space to accommodate all those who throng to the cities. Has the time not arrived for us to be bold and reach beyond ourselves and do what may seem impossible? Has the time not arrived to build a new smart city founded on the technologies of the fourth industrial revolution?’
Ramaphosa is not the first to dream of such an advanced city. Canberra, Washington and Brasilia were all prod-ucts of such imagination. Africa has had its own share, including Yamoussoukro in Cote d’Ivoire, Abuja and Eko-Atlantic in Nigeria,

146S P E C I A L R E P O RT – JA N UA RY 2 0 2 0
WHERE THE RUBBER HITS THE ROAD
New Cairo in Egypt, Konza Technology City in Kenya, Senegal’s $2 billion Diamniadio Lake City, Tanzania’s Dodoma, or Vision City in Rwanda. There are at least 18 new cities planned in Africa.
Africa’s planned new city projects
0 5 10 15 20
Centenary City, NigeriaTatu, Kenya
Konze Tech City, KenyaModderfontein, SA
Eko Atlantic, NigeriaDiamniadio Lake City, Senegal
Nkwashi, ZambiaAsokoro Island, Nigeria
Kiswishi, DRCKing City, Ghana
Visionary, tech-driven mega-city ventures are routinely touted by both public and pri-vate sectors as panaceas for Africa’s urban problems. But they are unlikely to solve any of the pressing issues beyond perhaps those experienced by the elites. The minimum price for a home unit in Kigali’s Vision City is about $160,000 while up to 80% of the city’s population live in slums.398
Instead, the solutions to Africa’s con-temporary urban problems lie in creating sustainable financing and revenue models to fund not only new cities, but upgrades and expansions of existing ones; of the skills needed to engineer solutions to waste and water, and of the governance standards required to ensure high-tech connectivity.
Hardware and SoftwareAt the start of the project, the thesis seemed clear: there was a set of essential building blocks to create a thriving African city. The initial inclination was that the end results of the research would show which of those blocks to prioritise in order to translate the sites of despair of many African urban milieus into poles of prosperity, and in as short a time as possible. The blocks were divided into a framework of hardware and software: the latter (software) comprising governance, security and policy; the former (hardware),
in terms of transportation, technology, housing, electricity, waste and sanitation. We applied this framework to the six cities we researched with varying results.
In some cities we were able to instantly gain access to high ranking security officials and theorists who helped us decode patterns in the city. In others, the work of diligent NGOs provided the key to understanding how informal transactions have shaped the formal market. In some, a lack of accessible data meant that whilst we spoke to a variety of stakeholders, data was difficult to access, not least on rates of migration. It confirmed that many African governments, especially local governments, struggle with a data problem.
The process highlighted the variance of cities across the continent and that attempt-ing to devise a one-size-fits-all methodology would be severely misguided.
Most African cities are battling to build new infrastructure fast enough to cope with the flood of new residents. The complex-ity of the demands – of sanitation, potable water, roads, electricity, public transport, health services, education – are overwhelm-ing to most governments, especially where they are under-resourced and under-capital-ised. Nowhere are the problems of hardware more apparent than in Lagos, a city which has grown at a rate that has far outstripped infrastructure development.
African cities – in contrast to those in East Asian countries – have lower capital invest-ment budgets, with only about 20% of GDP allocated to rolling out new infrastructure. China’s capital investment allocation rose from 35% to 48% of GDP between 1980 and 2011 as rapid urbanisation got under way.399 In East Asia as a whole, capital expenditure was an average of 40% of GDP – twice as much as the African allocation – during this period.400
But it is not just the budgets that are problematic. Allocating capital expenditure to infrastructure without effective city man-agement, financial controls and governance
147S P E C I A L R E P O RT – JA N UA RY 2 0 2 0
WHERE THE RUBBER HITS THE ROAD
– the appropriate software – leads to poor execution of projects and, in some cases, no outcome at all.
Africa’s cities are struggling to cope with rapid urbanisation because, in the words of the World Bank ‘the urbanisation of people is not accompanied by an urbanisation of capital’.401 This lends itself to inefficient and expensive transport, housing, electricity and water supply.
As one consequence, city economies underperform and fail to provide the vol-ume of jobs to meet the rising number of work seekers. Instead of benefitting from the economies of scale that result from urban agglomeration, these environments become inefficient and expensive places to live, buckling under services and infrastruc-ture backlogs, and unattractive to investors. As one measure, manufacturers in African cities pay higher wages than those in other developing regions.402 The World Bank report finds, for example, ‘Manufacturing firms in African cities pay higher nominal wages than urban firms in other countries at compara-ble development levels: unit labour costs are three times higher in Djiboutiville, Djibouti, than in Mumbai, India and 20% higher in Dar es Salaam, Tanzania than in Dhaka, Bangladesh.’
The resultant lack of investment ensures a vicious cycle of low growth, scant resources, weak management, negligible capital expenditure, expensive and time-consuming governance transactions, and few jobs, all of which limits the money available to deal with infrastructure.
Lagos also illustrates how the roll-out of infrastructure depends on software – in this instance a combination of good governance and the delivery of plans, which requires proper financial controls, managerial over-sight, and technical skills. Perhaps most emblematic of an infrastructure project stuck in the mire of poor software is Lagos’ ‘blue line’ train project which was supposed to provide public rail transport to allevi-ate the city’s traffic congestion but remains
unfinished after years of delays. The serial ferry schemes are fated, it seems, to go much the same way, victims of a deadly combina-tion of ‘transactionalism’, little attention to the software of integration, a lack of leader-ship in providing oversight and attention to detail, and weak governance.
While we have focused on best (and some bad) practice examples in Asia and Latin America, there are examples worth study-ing closer to home. Cape Town’s Wesgro investment and tourism agency has enjoyed remarkable success in facilitating invest-ment and, notably, air connections with the Western Cape province. Morocco also offers hope in the manner in which government interventions have delivered almost immedi-ate results.
This reminds that geography and even demography is not destiny. While Rabat may be just four hours flying time from Lagos, it’s a world away.
Instead of paralysing traffic, transport moves quickly on a multilane highway, not a pothole in sight. Instead of sprawling tin and wooden slums, the expressway offers views of cranes atop new multi-story housing set-tlements stretching out towards the horizon. Instead of clusters of yellow Lagosian danfo taxis clustered at informal stops hindering traffic flows, Morocco’s roadside amenities and its péage would not be out of place in Europe; nor would Casablanca’s surly immi-gration officers.
As you leave the city, instead of bush and mounds of garbage there are ploughed fields, acres of which are under a different sort of plastic — greenhouses producing for Europe’s tables just 14 kms away across the Gibraltar Strait from Tangier. For a while the 350km road from Casablanca to Tangier hugs the TGV rail-line, which was opened in November 2018 after ten years of planning and construction, cutting the journey to a fuss-free two hours.
Traditions remain. Women in jellaba and men in Obi Wan Kenobi-style pointy-hatted
148S P E C I A L R E P O RT – JA N UA RY 2 0 2 0
WHERE THE RUBBER HITS THE ROAD
amama tend sheep on the verges of the motorway.
This merging of European modernity and Berber tradition, which has so far worked to Morocco’s advantage, the economy touch-ing 5% growth for nearly 15 years, has been driven by foreign investors and they, in turn, by a sweated combination of good policy and governance, an enabling environment (supported by stability) and infrastructure and service delivery, and a healthy openness to technology and innovation.
Four Threads of ReformWe have learnt much about what works and what does not, in Africa and further afield. From all of this, four reform threads emerge.
First and, the most essential, is that poli-tics and governance have to be aligned and right.
There are many examples where vested short-term interests were preventing pro-gress and driving investment away. Big infrastructure projects that take longer than the political cycle are of particular concern and often expand in time and cost accord-ingly, something that Africans can ill afford. There is also a political attraction to large services projects, such as the Private Finance Initiative for refuse collection in Lagos, when such a large-scale approach is very difficult, perhaps impossible to deliver, and fraught with transactional opportunity rather than guaranteeing the prospect of delivery.
By getting the politics right we mean set-ting an environment that is supportive to citizens and investors alike, one that gains their trust and instils confidence that pro-gress against such colossal challenges can and is being made. It is about active messag-ing backed up with substantive actions. In such an environment it is likely that many small steps taken together offer a better prospect for delivering more radical change than large projects.
We also found several examples of city, regional and national governments not co-operating on key issues. This can produce
surprising effects. Ironically, the initial reason behind Lagos’s success in collect-ing revenue was the Federal Government reducing funding to the city. Also in Lagos, a drive for centralisation and a lack of trust has severely limited the role for local gov-ernment and communities are suffering as a result. For cities to be successful, consid-erable thought needs to be applied to the governmental arrangements so that they are reinforcing rather than inhibiting.
Ensuring an Enabling EnvironmentSecond, inclusive governance and prosperity requires both growth and security. Much can be done to set the right environment for development so that when it does occur, its effect is multiplied in a positive direction. Africa is blessed with an abundance of ener-getic young people, who, properly enabled and supported, have the potential to drive significant change. Principally this is about planning and regulation, but it is also about security.
Security is of key importance for a city to develop and thrive. Provision of a secure environment is a major challenge in every sub-Saharan African city we studied. It is a complex area where national, regional, and metropolitan organisations often compete, instead of co-operating. Both Lagos and Cape Town have put considerable efforts into securing their central business districts but have struggled to make an impact beyond these areas.
As was noted in the international section, Latin America offers interesting lessons in how improvements can be quickly achieved with decisive action, a merit shared by Rabat.
Security is invariably a casualty of systemic economic crises and the under-resourcing of police and other security services. Medellín in Colombia, in particular, provides an example of how the combination of credible policing plus intelligence, tech-nology (notably CCTV) and infrastructure spending can transform an area where these

149S P E C I A L R E P O RT – JA N UA RY 2 0 2 0
WHERE THE RUBBER HITS THE ROAD
are combined with a bottom-up community approach to address the underlying social causes of the problem. These examples are transferable.
Recife, the fourth largest city in Brazil with a population of four million, has copied the Medellín approach with some success, though Brazil’s inner-city woes with crime, unemployment and social dislocation do not augur well for Africa. If a country as edu-cationally and economically sophisticated as Brazil is struggling, how can countries in Africa cope with the coming challenge given comparatively less diversified economies and educated populations?
What makes the security dilemma appar-ently so intractable in the cities we studied were the large-scale nature of youth unem-ployment and the lack of resource with which to fund the required measures. These issues make it all the more imperative to achieve unity of effort between all stake-holders engaged in this area, both public and private.
Our studies reinforced how difficult it was for many to set up and run small and medium sized businesses. Problems range from the number of permits required, to the challenges of intermittent electricity and internet access, to dealing with corrupt prac-tices and low productivity. Such issues drive up costs. A consequence of poor urban devel-opment that is frequently overlooked is the high cost that must be borne by residents due to such inefficiencies.
Delivering InfrastructureThe third thread relates to the delivery of infrastructure and services to the benefit of urban populations.
It is essential to have a realistic, clear long-term view of how the city needs to develop and then to put in place the regu-lations to support delivery of the plan. The lesson from Curitiba, the birthplace of the Bus Rapid Transport (BRT) system, Colombia and elsewhere, is that public transport
is cost-effective with population density. Any regulation that limits building height, and thus density, as we observed in Rabat, has consequences for public transport. Sprawling development, such as in Cape Town, does not lend itself to public transport. Most cities possess plans of varying detail and ambition, but they usually lack match-ing regulations, funding and institutional resources. In many cases, we observed that the building and planning regulations bore distinct colonial hallmarks and were charac-terised by stultifying bureaucratic inertia. All too often, we found the process open to cor-ruption and political intrigue.
Africa’s urban living costs are higher than those of comparable cities elsewhere. Food, rents, goods and services are all more expen-sive. African city dwellers pay 35% more for food than low or middle-income countries elsewhere. Housing is 55% more expensive and transport 42% more costly. ‘Overall, urban households pay 20% to 31% more for goods and services in African countries than in other developing countries,’ a World Bank study found.403 Anything that can be done, however small, to chip away at this issue to reduce the costs of the operating environ-ment is vital.
Across Africa, as we noted in the Cape Town chapter, acceptance of the principle of density in housing, land availability, the provision of bulk services – especially elec-tricity – and the capacity of construction companies to build to scale are all required to manage future housing challenges.
Three further things will need to happen to deliver African housing that meets the demands of citizens, and which will in turn assist in creating employment.404
First, given the complexity of land title and the prioritisation of funding, there needs to be a political push in this sector. Success will necessarily have to be multifaceted. Financing options must include greater autonomy for local authorities to generate and spend revenue. Without this, they have

150S P E C I A L R E P O RT – JA N UA RY 2 0 2 0
WHERE THE RUBBER HITS THE ROAD
little interest in promoting economic growth and nor can they afford essential infrastruc-ture, without which ‘sensible plans become idle dreams’.405 This requires the banks, developers and governments to come up with funding schemes that share risk and reward.
Second, as is hinted above, housing needs to be made affordable, both in terms of build-ing and financing. The Centre for Affordable Housing Finance in Africa (CAHF) has cal-culated that the price of the least expensive newly built house by a formal, private devel-oper in select countries is $31 085, while the mean per capita income is $1 764. This compares to the standard global affordabil-ity measure of three to five times the annual household income.406 Little wonder then that most move instead into the informal sector, where costs range from 2% (in Malawi) to 15% (Zambia) of the cheapest formal unit. This requires building in a manner that keeps costs to appropriate levels, as well as through innovative financing models, includ-ing subsidised houses and loans. Moreover, Africa’s mortgage market, for example, is hopelessly underserviced. Typical terms on African mortgages are an interest rate of around 22% and a term of only ten years, catering thus to a ‘to a tiny income elite’.407
Third, there needs to be clarity on legal title and rights. There are a number of positive ways in which government might become involved. It could be by relaxing by-laws to allow residences to legally become businesses, making land available for high-employment businesses in tough areas at peppercorn rentals or for the building of high-rises. There is a related need to address not only the ownership of land, including the promotion of sectional title, but also its avail-ability, through state intervention. Currently most cities are locked into a ‘straitjacket of insufficient space’.408 Those opportunities not
requiring large amounts of regulatory over-sight or financial burden, are preferable.
Government has to improve bureaucratic efficiencies to leverage housing opportuni-ties. The average waiting time in Africa for a construction permit is 162.2 days, while registering property costs 8.3% of the value.409
Job creation in Africa would be greatly assisted by allowing people to live within easy access to the places they work. Much of low-tech, high-labour manufacturing can-not, by definition, be done virtually. Equally, the growth of Africa’s middle class will occur through home ownership, which increases their stake in economic, policy and political stability. To achieve this future, the provision of housing in Africa will have to involve both the private and public sectors. It will unques-tionably be a marathon with no finishing line, a self-licking lollipop, since the more one gets things right in the city, the more people will come, and the more difficult it will be to achieve success. It will be closely tied in with land title and banking systems, and the establishment of credit through careful profiling.
The Thread of Technology and InnovationFourth, and finally, new technology and smart use of data offer the prospect of some devel-opmental shortcuts but no silver bullet. For example, Africa has jumped over fixed, wired phones straight into mobile commu-nications, circumventing weak and predative government.
At an early point in our research we vis-ited the Building Research Establishment in the UK. It is an impressive organisation that is driving real change and betterment. But it was not, unsurprisingly, focused on African issues. If donors wanted to make a real impact in helping Africans deliver suc-cessful urbanisation in a more sustainable way, funding research into building methods

151S P E C I A L R E P O RT – JA N UA RY 2 0 2 0
WHERE THE RUBBER HITS THE ROAD
and techniques applicable to the continent would be a useful contribution. Urbanisation on its current track will bring with it a huge demand for electricity and consequent car-bon emissions; this does not have to be the case. Our work on affordable housing in Lagos, as part of this project, hints at possible alternative, or homegrown approaches. Many of these advantages are private sector driven, including the growth impact of mobile bank-ing, still to be fully exploited.
Innovation, in turn, relies on accurate data for planning and troubleshooting. In many of the cities in which we worked, lack of accurate data for city planning was a sig-nificant issue. Yet we are equally convinced that a lot of useful data did exist or could be acquired relatively easily. For example; Uber, Google and MTN must all have data on traffic flows in Lagos. This could be used to ensure that best use is made of existing infrastructure. In Mombasa when the flow of traffic over the bridges was optimised to allow more lanes going into the city in the morning and more coming out in the evening, traffic congestion was eased consid-erably. Our contention is that by focusing on the holistic collection of data and its analy-sis, considerable improvements can be made in the way existing infrastructure is used.
The drive to ‘Smart Cities’ is taking this idea many steps further. London, with its stated aim of becoming the ‘smartest city in the world’, has been experimenting. For example, in 2018 Transport for London adapted onboard bus CCTV to conduct accu-rate passenger counts, and it also recorded how many passengers were using their smart phones to connect to Wi-Fi. Their aim was to better understand how their customers use their network. The British Department of Transport has funded a trial using Artificial
Intelligence to predict when trees might fall across train tracks using data from the cameras in the drivers’ cabs, their aim being to reduce delays by better targeting maintenance.
For western cities, the move to ‘smart’ status offers the prospect of incremental gains; for African cities it could offer some step changes. It is the very lack of legacy structures and linear development that avails these environments to the prospect of leapfrogging, but it will require consider-able mental agility. Data would be useful, for instance, in evaluating the value of informal systems of service delivery that have grown to cover for the lack of formal provision. In an environment where there is often a chronic lack of trust in all forms of govern-ment, such advances will need to be handled extremely carefully.
Digitisation offers the promise of smoother and faster delivery of services. But the biggest short-term gain for African cities is probably in e-government, more a con-temporary buzzword than an African city operating system. On one side of the ledger, cashless banking also offers enormous gains, estimated by Visa at $12 trillion over 15 years until 2032.410 Citi estimates, for example, that even a 10% increase in digital money readiness could help up to 220 million indi-viduals enter the formal global financial sector with an annual gain of $1 trillion. On the other, smart city benefits are possible across a number of areas, from transport to commerce. The benefits of this approach are estimated for a mid-size city (1.5 million peo-ple) to be in the order of $100–$110 million in direct value and $275–$500 million in indirect value annually.411
The areas of potential gain are highlighted in the table, below:412
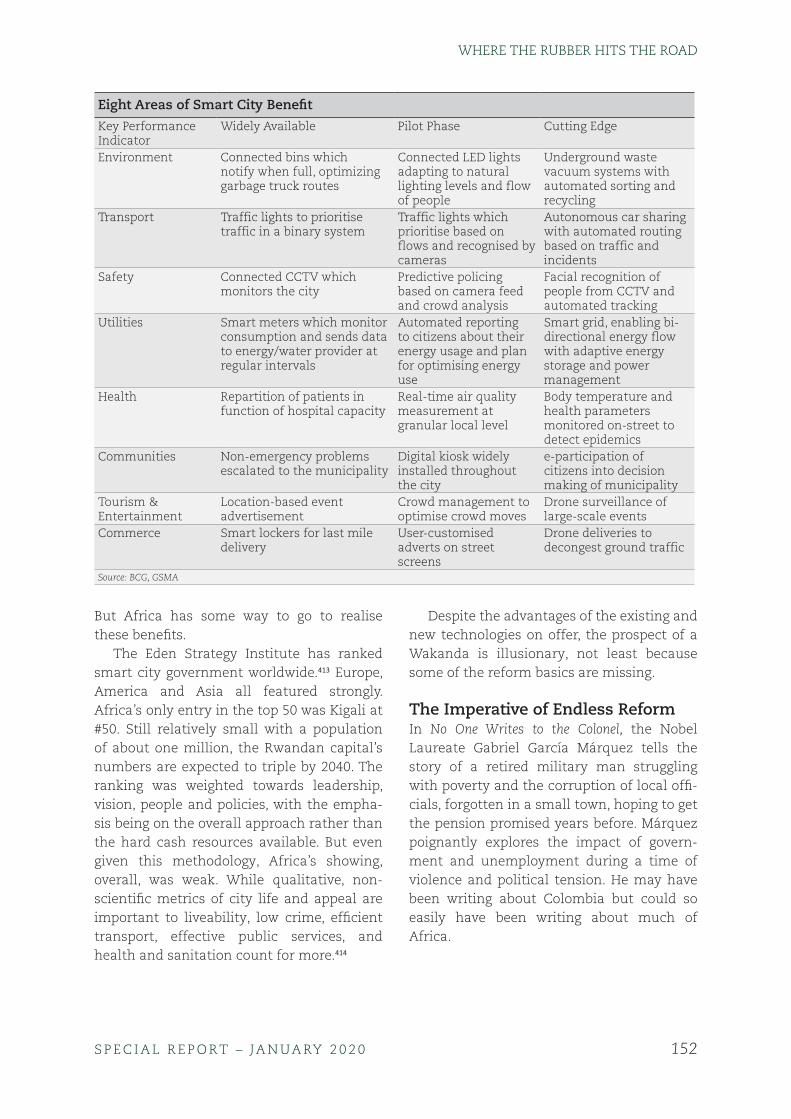
152S P E C I A L R E P O RT – JA N UA RY 2 0 2 0
WHERE THE RUBBER HITS THE ROAD
Eight Areas of Smart City BenefitKey Performance Indicator
Widely Available Pilot Phase Cutting Edge
Environment Connected bins which notify when full, optimizing garbage truck routes
Connected LED lights adapting to natural lighting levels and flow of people
Underground waste vacuum systems with automated sorting and recycling
Transport Traffic lights to prioritise traffic in a binary system
Traffic lights which prioritise based on flows and recognised by cameras
Autonomous car sharing with automated routing based on traffic and incidents
Safety Connected CCTV which monitors the city
Predictive policing based on camera feed and crowd analysis
Facial recognition of people from CCTV and automated tracking
Utilities Smart meters which monitor consumption and sends data to energy/water provider at regular intervals
Automated reporting to citizens about their energy usage and plan for optimising energy use
Smart grid, enabling bi-directional energy flow with adaptive energy storage and power management
Health Repartition of patients in function of hospital capacity
Real-time air quality measurement at granular local level
Body temperature and health parameters monitored on-street to detect epidemics
Communities Non-emergency problems escalated to the municipality
Digital kiosk widely installed throughout the city
e-participation of citizens into decision making of municipality
Tourism & Entertainment
Location-based event advertisement
Crowd management to optimise crowd moves
Drone surveillance of large-scale events
Commerce Smart lockers for last mile delivery
User-customised adverts on street screens
Drone deliveries to decongest ground traffic
Source: BCG, GSMA
But Africa has some way to go to realise these benefits.
The Eden Strategy Institute has ranked smart city government worldwide.413 Europe, America and Asia all featured strongly. Africa’s only entry in the top 50 was Kigali at #50. Still relatively small with a population of about one million, the Rwandan capital’s numbers are expected to triple by 2040. The ranking was weighted towards leadership, vision, people and policies, with the empha-sis being on the overall approach rather than the hard cash resources available. But even given this methodology, Africa’s showing, overall, was weak. While qualitative, non-scientific metrics of city life and appeal are important to liveability, low crime, efficient transport, effective public services, and health and sanitation count for more.414
Despite the advantages of the existing and new technologies on offer, the prospect of a Wakanda is illusionary, not least because some of the reform basics are missing.
The Imperative of Endless ReformIn No One Writes to the Colonel, the Nobel Laureate Gabriel García Márquez tells the story of a retired military man struggling with poverty and the corruption of local offi-cials, forgotten in a small town, hoping to get the pension promised years before. Márquez poignantly explores the impact of govern-ment and unemployment during a time of violence and political tension. He may have been writing about Colombia but could so easily have been writing about much of Africa.
153S P E C I A L R E P O RT – JA N UA RY 2 0 2 0
WHERE THE RUBBER HITS THE ROAD
International experience shows that the most progress against the twin challenges of population growth and urbanisation, at any level, has been made when there has been both a clear vision and strong leadership.
It is possible to tackle such huge challenges, and keep moving forward, with unified action across government across departments and between local, provincial and national levels. A long-term boost via upfront investment in education is vital, as is a short-term focus on getting the security and rule of law, infrastructure and business regulation pieces right. Ultimately it will be, as Jaime Lerner, the father of the BRT system, has pointed out, creating a sense of shared responsibility between the government and its citizens and between the public and private sectors that will provide the momen-tum to turn population growth and increasing urbanisation into a force for eco-nomic empowerment. And this will require pushing on with reforms that aim to trans-form the nature of the political-economy – the system of who gets what, when and how (the core questions of the discipline of politics) in the context of scarcity (the issues or patterns of production and distribution alongside the key questions of the discipline of economics). The nature of the political economy sets the boundaries for reform and growth.415
Whether Africa’s changing demography presents more apparently unassailable prob-lems, or a great opportunity will to a great extent depend on how governments respond – in a phrase, on the breadth and depth of their institutional and policy reforms.
Until now most African countries have continued with the economic structures inherited at independence, based on com-modities, where a greater effort was made post-independence to share the spoils, but among the elites. This has not spurred higher productivity even if it ensured a meas-ure of political buy-in and stability. Rather this system has generally perpetuated
protectionism and subsidisation – rent-seeking – and discouraged the inclusive investment in institutions and regimes necessary to ensure the high-growth devel-opment path seen elsewhere.
Certainly, Africa can learn from oth-ers who have attempted to rebalance elite interests in promoting reforms. Fernando Henrique Cardoso devised ‘Plan Real’ as Finance Minister to rid Brazil of hyperinfla-tion, which had hit 2,000% annually, in part by curbing monetary indiscipline in pegging the new currency to the US dollar. It was impossible to address policies for growth and inclusion without underlying macro-stability.
There are lessons the two-time president says apply to reformers outside Brazil too. ‘I think the key question for any reformer is how to build a political constituency and sound system at the same time,’ he says. ‘To do this, you have to promote good lead-ership, and you have to have a vision about what is happening around the world, with which you can integrate your policies and efforts. You also have to have sound eco-nomic policies. And you have to keep tabs on crony capitalists. If you do all of this, you will have a chance to get things done.’
This is sage advice from a president who did things few have attempted and even fewer successfully so in stabilising a large hyperinflating economy and instituting tough reforms within a fractious democratic environment. As Africa’s leaders ponder the challenges of rapid urbanisation, changing demography and the linked imperative to create jobs, they would do well to heed such experience – of the importance of match-ing redistributive impulses with continuous reforms, investing less in mega-projects than in services and security, and avoiding the costs to competitiveness of capture by busi-ness of the state, and vice versa.
The challenges are enormous. African cit-ies are a highly complex mix of formal and informal systems and economies. Each city
154S P E C I A L R E P O RT – JA N UA RY 2 0 2 0
WHERE THE RUBBER HITS THE ROAD
has its own distinct character and issues. Whilst there is no one answer, after all this work we are inclined to suggest an approach that seeks to improve the software in order to give investors the confidence to fund
the hardware. Clever thinking, a common purpose, unity of effort, a determination to make effective use of Africa’s greatest asset in its young work force, all have a key role to play in tackling Africa’s urban dilemma.
155S P E C I A L R E P O RT – JA N UA RY 2 0 2 0
WHERE THE RUBBER HITS THE ROAD
EndnotesPreface and Acknowledgements1 Somik Vinay Lall, J Vernon Henderson and
Anthony J. Venables, Africa’s Cities: Opening Doors to the World, Washington, D.C.: World Bank Publications, 2017, p. 11.
2 Jeff Desjardins, ‘By 2100 none of the world’s biggest cities will be China, the US or Europe’, Published online by The World Economic Forum, 2018, https://www.weforum.org/agenda/2018/07/by-2100-none-of-the-worlds-biggest-cities-will-be-in-china-the-us-or-europe.
Introduction: The Rise and Rise of the African City3 Ibid, p. 26.4 Edward L Glaeser, Agglomeration Economics,
Chicago and London: The University of Chicago Press, 2007, p. 1.
5 Africa’s Cities, op cit, p. 10.6 Steve Connor, ‘Global population will
soar to 11.2bn by 2100 – with Africa accounting for much of the growth, says UN forecast’, Published online by The Independent, 2015, http://www.independent.co.uk/news/world/africa/global-population-will-soar-to-112bn-by-2100-with-africa- accounting-for-much-of-the-growth-says-un-10448880.html.
7 AfrAsia Bank and New World Wealth reports that Johannesburg is home to 23 400 millionaires, 30% of the African total, with Egypt second on 10 200, Lagos third with 9 100, Cape Town with 8 900, and Nairobi with 6 200. See ‘The richest city in South Africa’, Published online by the BBC, 2015,https://www.bbc.com/news/world-africa-34138610.
8 United Nations Department of Economic and Social Affairs, ‘World Population Prospects: The 2012 Revision’, Working Paper No. ESA/P/WP.228, 2013.
9 Ibid.
10 Max Fischer, ‘The Amazing, Surprising, Africa-Driven Demographic Future of the Earth, in 9 Charts.’ Published online by The Washington Post, 2013, http: //www.washingtonpost .com/blogs/worldviews/wp/2013/07/16/the-amazing-surprising-africa-driven-demographic -future-of-the-earth-in-9-charts.
11 International Monetary Fund, ‘Regional Economic Outlook: Sub-Saharan Africa’, ISBN-13: 978-1-47551-995-2, 2015.
12 African Development Bank Group, African Economic Outlook 2019. ISBN 978-9938-882-87-2, 2019.
13 Mark Anderson and Achilleas Galatsidas, ‘Urban population boom poses massive challenges for Africa and Asia’, Published online by The Guardian, http://www.theguardian.com/global-development/2014/jul/10/urban-population-growth-africa-asia-united- nations, 2014.
14 United Nations Department of Economic and Social Affairs, ‘World Urbanisation Prospects: The 2014 Revision’, http://www.un.org/en/development/desa/news/population/worldurbanization- prospects-2014.html. See also http://www.prb.org/publications/datasheets/2013/2013-world-population-data- sheet/data-sheet.aspx.
15 Remi Jedwab, Luc Christaensen and Marina Gindelsky, ‘The Speed of Urbanization and Economic Development: A Comparison of Industrial Europe and Contemporary Africa,’ Presented to the World Bank-GWU Conference on Urbanization and Poverty Reduction, http://siteresources.worldbank.org/INTIE/Resources/475495-1368648404460/ Jedwab_The_Speed_of_Urbanization_Tales_from_ Europe_and_Africa.pdf.
16 Max Fischer, op cit.

156S P E C I A L R E P O RT – JA N UA RY 2 0 2 0
WHERE THE RUBBER HITS THE ROAD
17 We are grateful to Paul Collier for this insight.
18 Louis Wirth, ‘Urbanism as a Way of Life’, American Journal of Sociology, Vol. 44, 1938, pp. 1–24.
19 For discussion of geographic-functional definitions of the city, see Richard G. Fox, Urban Anthropology: Cities in their Cultural Settings, Englewood Cliffs: Prentice-Hall, 1977; Smith, Michael E. (1989), ‘Cities, Towns, and Urbanism: Comment on Sanders and Webster’, American Anthropologist, Volume 91, pp. 454–461; and Michael E. Smith, Aztec City-State Capitals, Gainesville: University Press of Florida, 2008 .
20 United Nations, Department of Economic and Social Affairs, Population Division, World Urbanization Prospects: The 2014 Revision, Highlights., New York: United Nations, p. 5, 2014.
21 Washington DC Government, ‘District’s Population Continues to Grow: Census Figures Show District Gained 9 782 Residents over Year that Began July 2013’, Press Release, 23 December 2014, http://dc.gov/release/district’s-population-continues-grow. For Greater DC Metro Area demographic data see Montgomery College, DC-VA-MD-WV Metropolitan Area Demographic Data, online at http://cms.montgomerycollege.edu/EDU/Department.aspx?id=45952.
22 United States Department of Defense, ‘JP 3-06 Joint Urban Operations’, 2013, p. 7.
23 David Kilcullen, ‘The City as a System: Future Conflict and Urban Resilience’, The Fletcher Forum of International Affairs, Vol. 36 No. 2, 2012, pp. 19–39. See also David J. Kilcullen, Out of the Mountains: The Coming Age of the Urban Guerrilla. New York: Oxford University Press, 2013, Chapter 1 and Appendix A.
24 For an in-depth study of the population grow dynamics of this period see: D Tabutin and B Schoumaker, ‘La démographie de l’Afrique au sud du Sahara des années 1950 aux années
2000: Synthèse des changements et bilan statistique’, Population, vol. 59, no. 3, 2004, pp. 455–555.
25 See https://populationpyramid.net/world/2090/ and on African figures, and https://www.washingtonpost.com/blogs/worldviews/wp/2013/07/16/the-amazing-.
26 The Congrès internationaux d’architecture moderne (CIAM), or International Congresses of Modern Architecture, was a hugely influential organization founded in 1928 and disbanded in 1959. It was responsible for a series of conferences in Europe attended by the most prominent architects of the era, aimed at developing the view that building design and urban planning were economic and political tools that could be used to improve the world.
27 Carlos Nunes Silva, Urban Planning in Sub-Saharan Africa; Colonial and Post Colonial Planning Cultures. New York: Routledge, 2015 p. 9.
28 Ibid p. 21.29 For example see: Paul E Peterson, City
Limits. Chicago and London: The University of Chicago Press, 1981.
30 See http://www.seguridadjusticiaypaz.org.mx/biblioteca/prensa/send/6-prensa/231-caracas-venezuela-the-most-violent-city-in-the-world, Accessed 28 January 16.
31 David Kilcullen presentation to The Brenthurst Foundation’s Future of African Cities conference in Mombasa, Kenya, November 2019
32 Martin van Creveld, Fighting Power: German and US Army performance, 1939–1945. Westport, Conn.: Greenwood Press, 1982.
Section One: International Comparisons33 This section is based on a research trip to
Recife, Suape, Salvador, Brasilia, Curitibe, São Paolo and Rio de Janeiro in November 2015. Unless otherwise indicated, the quotations and statistics are derived from interviews conducted during that visit.

157S P E C I A L R E P O RT – JA N UA RY 2 0 2 0
WHERE THE RUBBER HITS THE ROAD
34 See https://www.worldatlas.com/articles/murder-rates-by-country.html.
35 At https://www.pulse.ng/bi/politics/these-were-the-50-most-violent-cities-in-the-world-in-2018/rl5n5yj , last accessed 24 October 2019.
36 IM Pei, who inter alia had designed the pyramid at the Louvre, and Kenzo Tange were roped in to improve the cityscape of Singapore in the 1970s. Lee had met Tange when receiving an honorary degree at the University of Hong Kong in 1970, and the following year invited him to the Istana. Tange redesigned the United Overseas Bank building, while Pei designed the Raffles City complex and rebuilt the Overseas Chinese Banking Corporation.
37 This and the other interviews cited here were conducted on 18-20 January 2016 in Singapore, unless otherwise indicated. See also Remarks by Peter Ho at the Public Conference on ‘Lee Kuan Yew and the Physical Transformation of Singapore’, 18 September 2013. See ‘Liveable Sustainable Cities’. Singapore: Centre for Liveable Cities, 2014.
38 See for example, http://www.worldairportawards.com/awards/world_airport_rating.html.
39 http://data.worldbank.org/indicator/NY.GDP.PCAP.CD?page=6.
40 See Huang Lijie and Joyce Fang, Front Page Stories of Singapore Since 1845. Singapore: Strait Times Press, 2015.
41 Shanghai is the world’s busiest port in 2019. See Nick Routley, ‘Here are the twenty busiest ports on the planet’, World Economic Forum, 5 February 2019, at https://www.weforum.org/agenda/2019/02/visualizing-the-world-s-busiest-ports. On the history of Singapore, see Iain Manley, Tales of Old Singapore. Hong Kong: Earnshaw Books, 2010, p. 9.
42 See https://www.thetropicalist.press/2015/12/theverandahriots/
43 Commonly held to be: Lee Kuan Yew, lawyer David Marshall, unionist Devan Nair, lawyer Eddie Barker, Goh Keng Swee the economist, Lim Kim San, Ong Pang Boon, Othman Wok, S Rajaratnam, and Toh Chin Chye.
44 Cited in ‘Founding Fathers’. Singapore: The New Paper, 2015, p. 123.
45 Discussion, HDB, Singapore, 5 December 2013.
46 At http://eresources.nlb.gov.sg/history/events/c4c0b6bf-d674-4851-a3d4-fcc0b9d785d2.
47 See Stephen Dobbs, The Singapore River: A Social History, 1819-2002. Singapore: Singapore University Press, 2003.
48 This is based, in part, on two trips to Indonesia: to Jakarta, Semarang, Yogykarta and Japara in August 2014; and Bandung and Jakarta in January 2016.
49 See Joe Studwell, How Asia Works. Profile: London, 2014. See also Elizabeth Pisani, Indonesia Etc. WW Norton: New York, 2014.
50 The rate of urbanisation was provided by the Government of Jakarta, 26 January 2016.
51 Discussion, Jakarta, 26 January 2016.52 The first phase of the LRT project
construction will cost around US$900 million for three covering 17.9 kms.
53 See for example, ‘Top architect uses role as mayor to transform Indonesian city’, Financial Times, 7 April 2014, at http://www.ft.com/intl/cms/s/0/0820c7c4-b358-11e3-b09d-00144feabdc0.html#axzz3y1vJAR2I.
54 See http://vanmediagroup.com/blog/wp-content/uploads/2017/07/Siemens-Bandung-Cities_Magazin-Final_17June17_use-this.pdf.
55 See, for example, http://www.thejakartapost.com/news/2014/03/23/blusukan-essential-jokowi-s-bid.html.
56 The first phase of the LRT project construction will cost around US$900 million for three covering 17.9 kms.
57 Ibid.

158S P E C I A L R E P O RT – JA N UA RY 2 0 2 0
WHERE THE RUBBER HITS THE ROAD
58 See https://www.ozy.com/fast-forward/why-rio-is-brazils-new-murder-capital/95015/.
59 See ‘SDGs in the Rio de Janeiro Metropolitan Area and in Brazil’, https://issuu.com/casafluminense/docs/caderno_ingl__s, accessed 24 October 2019
60 At https://www.americasquarterly.org/content/qa-why-prison-violence-so-bad-brazil
61 See https://urban-leds.org/wp-content/uploads/2019/resources/case_studies/ICLEI_cs_190_Curitiba_Urban-LEDS.pdf.
62 See https://onlinepubs.trb.org/onlinepubs/tcrp/tcrp90v1_cs/Curitiba.pdf.
63 ‘Inter-American Development Bank Report: Industrial Clusters and Economic Performance in Brazil’, October 2013 http://idbdocs.iadb.org/wsdocs/getdocument.aspx?docnum=38216320, last accessed 3 April 2016.
64 At https://colombiareports.com/medellin-crime-security-statistics/, last accessed 24 October 2019
65 See Fox News Latino, ‘Honduran City is World Murder Capital; Juarez Drops for Second Year in a Row’, 6 February 2013, online at http://latino.foxnews.com/latino/news/2013/02/08/honduran-city-is-world-murder-capital-juarez-drops-for-second-year-in-row/#ixzz2KuzDXdTH.
66 This section draws on original research produced by a Caerus Associates field team led by Stacia George and Dr. Christopher Johnson, which conducted fieldwork in 2012-2013 in San Pedro Sula. See Caerus Associates, ‘The City as A System: Understanding Illicit and Licit Networks in San Pedro Sula, Honduras’, (Washington DC: unpublished research paper, 6 February 2013).
67 James Bargent, ‘Latin America Dominates World’s Most Dangerous Cities List’, Insight Crime, Friday, 8 February 2013, online at http://www.insightcrime.org/news-briefs/latin-america-dominates-worlds-most-dangerous-cities-list.
68 Ignatian Solidarity Network, ‘Central American Migration’, January 2016.
69 At https://data.worldbank.org/indicator/NY.GDP.PCAP.KD?locations=IN-ID-NG.
70 Lagos is both a city and a state. Under Nigerian legislation, it is one of 36 states in the federal republic. However, as the smallest state geographically, it also operates as a single metropolis.
71 The introduction is extracted from Greg Mills and Dickie Davis, ‘Lagos, the Relentless City’. Daily Maverick, October 2017
72 This setup created one Federal Capital Territory (FCT) in Abuja, 36 states, and 768 LGAs across Nigeria, embodied in the 1999 Constitution, to distribute national revenue fairly and devolve administrative duty where necessary.
73 See, ‘The History of Lagos’ available at lagosat50.org.ng.
74 Fabienne Hoelzel (ed), Urban Planning Processes in Lagos, Heinrich Böll Stiftung and Fabulous Urban, 2016, at https://ng.boell.org/sites/default/files/160206_urban_planning_processes_digital_new.pdf.
75 See ‘Governance Institutions: Local Government in Lagos’. CPPA Research, 2015
76 See Transparency International: ‘Global Corruption Barometer’ at https://www.transparency.org/gcb2013/country?country=nigeria.
77 The All Progressive Congress is a merger of three of Nigeria’s main opposition parties, Action Congress of Nigeria, the Congress for Progressive Change and the All Nigeria Peoples Party.
78 See Transparency International: ‘Global Corruption Barometer’ at https://www.transparency.org/gcb2013/country?country=nigeria.
79 Ibid.80 World Bank: ‘Doing Business in
Nigeria 2018’, World Bank Group, 2018, at https://www.doingbusiness.org/content/dam/doingBusiness/
159S P E C I A L R E P O RT – JA N UA RY 2 0 2 0
WHERE THE RUBBER HITS THE ROAD
media/Subnational-Reports/DB_in_Nigeria_2018_w-bookmarks.pdf.
81 BudgIT. 2017. ‘Lagos State 2017 Budgit’ at http://yourbudgit.com/wp-content/uploads/2017/07/Lagos-State-Budget-2017.pdf.
82 R.A Adams, Public Sector Accounting and Finance. Lagos: Corporate Publishers Venture, 2006
83 Lagos Internal Revenue Service (LIS), at http://www.lirs.gov.ng/.
84 See https://www.vanguardngr.com/2012 /06/self-assessment-practice-in-nigeria/.
85 BudgIT, 2017, op cit. 86 See Yomi Kazeem, ‘Lagos is Africa’s 7th
largest economy and is about to get bigger with its first oil finds’, Quartz Africa, https://qz.com/africa/676819/lagos-is- africas-7th-largest -economy-and-is-about-to-get-bigger-with-its-first-oil-finds/.
87 Lagos Global: Office of Overseas Affairs and Investment. 2017. See http://www.lagosglobal.org/about-lagos-state/.
88 Nigerian Port Authority: Budget and Statement, 2017, at http://yourbudgit.com/wp-content/uploads/2017/12/NIGERIAN-PORT-AUTHORITY-2017-Financial-Report-Analysis.pdf.
89 World Bank. 2018. ‘Doing Business in 2018: Reforming to Create Jobs’ at http://www.doingbusiness.org/content/dam/doingBusiness/media/Annual-Reports/English/DB2018-Full-Report.pdf.
90 Carin Smith, ‘Lagos set to overtake Johannesburg as 2nd largest African city by GDP’, fin24, December 2017 at https://www.fin 24.com/ Economy/lagos-set-to-overtake-johannesburg-as- 2nd-largest-african-city-by-gdp-20171 224.
91 Heinrich Boll Stiftung, ‘Lagos’ Informal Sector: Taxation and Contribution to Economy’ at https://ng.boell.org/sites/default/files/uploads/2017/02/budgit_final_report_30.1.17.pdf.
92 Ibid.93 The deficit depends on how estimates are
calculated.
94 Charles Kumolu and Prince Okafor, ‘86 migrants enter Lagos every hour – Ambode’, Vanguard, February 2017, at https://www. vanguardngr.com/2017/02/86-migrants-enter-lagos-every-hour- amb ode/
95 CO Olatubara, Fundamentals of Housing. Housing Development and Management, a Book of Reading. 2007
96 Currency conversion was done at the exchange rate at the time of writing, US$1 = N360.
97 Lagos State Government Ministry of Housing. ‘Number of Houses Built between 1979–2017.’
98 Governor Jakande was Lagos’s last civilian governor before the advent of military rule in 1983.
99 Greg Mills, ‘Up the Creek with a Paddle: Building Modern Singapore’, Brenthurst Foundation Discussion Paper, 3/2016, available at http://www.thebrenthurstfoundation.org/workspace/files/brenthurst-paper-201603.pdf.
100 Segun Adewole, ‘15 things to know about third mainland bridge in Lagos’, Kemi Filani News, April 2018 at https://www.kemifilani.com/2018/04/third-mainland-bridge-lagos.html.
101 Jointly published by the Heinrich Böll Stiftung Nigeria and Fabulous Urban. 2016. ‘Urban Planning Processes in Lagos: policies, laws, planning instruments, strategies and actors of urban projects, urban development and urban services in Africa’s largest city’.
102 Lagos State Government: ‘Towards Reforming Lagos’ Transport Sector’, 2016 at https://lagosstate.gov.ng/blog/2017/03/28/towards-reforming-lagostransport-sector/.
103 Urban Planning Processes in Lagos, 2016.104 ‘FG Hands Over 35km Apapa-
Oworonshoki Expressway to Dangote for Repair’, This Day, 16 September 2016, at https://www.thisdaylive.com/index.php/2017/09/16/

160S P E C I A L R E P O RT – JA N UA RY 2 0 2 0
WHERE THE RUBBER HITS THE ROAD
fg-hands-over-35km-apapa-oworonshoki-expressway-to-dangote-for-repair/.
105 Emmanuel Okogba, ‘Uber monthly passenger base in Nigeria hits 267,000’, Vanguard, August 2018 at https://www.vanguardngr.com/2018/08/uber-monthly-passenger-base -in-nigeria-hits-267000/.
106 Urban Planning Processes in Lagos, 2016.107 Ibid.108 Lagos State Government:
‘Towards Reforming Lagos’ Transport Sector’, 2016 at https://lagosstate.gov.ng/blog/2017/03/28/towards-reforming-lagostransport-sector/.
109 ‘Ambode orders dredging ferry routes’, This Day, at https://businessday.ng/news/article/ambode-orders-dredging-4-ferry-routes/.
110 ‘MTN Nigeria gives Lagos State an ultra-modern ferry terminal’, This is Lagos, September 2018 at http://thisislagos.ng/mtn-nigeria-gives-lagos-state-an-ultra-modern-ferry-terminal/.
111 Department of Energy: ‘2018 South African Energy Sector Report’, 2018, at http://www.energy.gov.za/files/media/explained/2018-South-African-Energy-Sector-Report.pdf
112 I Lewis, ‘Lagos eyes LNG imports to launch private power plan’, Petroleum Economist, 2018 at https://www.petroleum-economist.com/articles/politics-economics/africa/2018/lagos-eyes-lng-imports-to-launch-private-power-plan.
113 Jointly published by the Heinrich Böll Stiftung Nigeria and BudgIT. 2017, Lagos’ Informal Sector: Taxation and Contribution to the Economy. Available: https://ng.boell.org/2017/02/22/ working-poor-informal-sector-and-their-contribution-urban-economy.
114 AN Nnenne, ‘Remedying the power sector for service delivery,’ The Nation. Available Online: http://thenationonlineng.net/remedying-the-power-sector-for-service-delivery/.
115 OU Paul, Obanor Albert and Aliu Sufianu Adeiza. 2015. ‘Electricity Crisis in Nigeria: The Way Forward.’ American Journal of Renewable and Sustainable Energy, Vol. 1, No. 4: 180–186.
116 ‘Nigeria: Exclusive Legislative List, a Great Impediment to Regional Development’, Elombah, June 2017, https://elombah.com/nigeria-exclusive-legislative-list-a-great-impediment-to-regional-develop ment/.
117 Jude Egbas, ‘Lagos govt says your dead street lights will soon be back on’, Pulse, October 2019, at https://www.pulse.ng/news/local/lagos-govt-says-your-dead-street-lights-will-soon-be-back-on/ 44cq60l
118 ‘Lagos Assembly disowns Visionscape, orders PSP back to work’, Pulse, October 2018, at https://www.pulse.ng/news/local/lagos-assembly-disowns-visionscape-orders-psp-back-to-work-id8993684.html.
119 World Population Review: ‘Lagos Population 2019’, May 2019, at http://worldpopulationreview.com/world-cities/lagos/.
120 This chapter is based on documentary and archival research conducted from January to November 2018 in the United Kingdom and the United States, and on a series of direct observations and interviews conducted during fieldwork in Hargeisa in October-November 2018. Where respondents’ names are given, these are used with permission; where names have been changed this is footnoted in the text.
121 For a contemporaneous report see United States Government Accountability Office, ‘Somalia: Observations Regarding the Northern Conflict and Resulting Conditions’, May 1989, GAO/NSIAD-89/159, Washington DC: GAO, at https://www.gao.gov/assets/220/211267.pdf.
122 Kilcullen, interview with Somaliland government official, Hargeisa, 12 November 2018

161S P E C I A L R E P O RT – JA N UA RY 2 0 2 0
WHERE THE RUBBER HITS THE ROAD
123 Mohamed Haji Ingiriis, ‘We Swallowed the State as the State Swallowed Us’: The Genesis, Genealogies, and Geographies of Genocides in Somalia’ in African Security Vol. 9 Issue 3, 2016, pp. 237–258.
124 Scott Peterson, Me Against My Brother: At War in Somalia, Sudan and Rwanda. London: Routledge, 2014, p. 14; see also Africa Watch Committee (1990) ‘Somalia: A Government at War with its own people – Testimonies About the Killings and the Conflict in the North’, London: Human Rights Watch, online at https://www.hrw.org/sites/default/files/reports/somalia_1990.pdf
125 Estimate based on discussions with four government officials in Hargeisa, November 2018.
126 Kilcullen, personal observation and discussion with local customers, Hargeisa, 14 November 2018.
127 Kilcullen, interview with business leaders, Hargeisa 14 November 2018.
128 See Ahmad Yasin Farah and I.M Lewis (1997) ‘Peace-Making Endeavors of Contemporary Lineage Leaders in ‘Somaliland’’ in Hussein M. Adam and Richard Ford (eds), ‘Mending the Rips in the Sky’, Lawrenceville, NJ: Red Sea Press, pp. 317–325.
129 See Nubar Piriyeva (2015) ‘Hybrid Political Orders: in the case of Somaliland’ at https://www.transcend.org/tms/2015/02/hybrid-political-orders-in-the-case-of-somaliland/ and Volker Boege, Anne Brown, Kevin Clements and Anna Nolan, ‘Hybrid Political Orders and Emerging States: What is Failing – States in the Global South or Research and Politics in the West?’ in Sabine Fischer and Beatrix Schmelzle (eds) Building Peace in the Absence of States: Challenging the Discourse on State Failure. Berlin: Berghof Research Centrer, 2009, pp. 15–36.
130 In this chapter, ‘Somalilander’ denotes a citizen of the Republic of Somaliland, ‘Somali’ a member of the Somali ethnic group that is widespread across the Horn
of Africa, ‘af-Somali’ the Somali language, and ‘Somalia’ the internationally-recognised Federal Republic of Somalia with its capital in Mogadishu.
131 Kilcullen, interview with Somaliland Ministry of Finance, Hargeisa 6 November 2018 and interview with branch manager, Dahabshiil Bank, Hargeisa, 12 November 2018.
132 Kilcullen, interview with Somaliland Ministry of Finance, Hargeisa 6 November 2018
133 Kilcullen, interview with government officials in Hargeisa 5 November 2018 and with urban livestock partners, 14 November 2018.
134 Ioan Lewis, ‘Understanding Somalia and Somaliland’, London: Hurst & Co, 2008, p. 56
135 Kilcullen, discussion with livestock traders from Hargeisa and Berbera, 14 November 2018.
136 Kilcullen, personal observation at Saylada livestock market, 12 and 14 November 2018, and discussion with livestock traders from Hargeisa and Berbera.
137 Lewis, op cit, p. 57138 Scott Peterson, ‘Amid persistent drought,
a nation of camel-herders plots a new course’ in Christian Science Monitor, 27 July 2017, online at https://www.csmonitor.com/World/Africa/2017/0727/Amid-persistent-drought-a-nation-of-herders-plots-a-new-course.
139 Omar Jama Diriye, ‘Somaliland Diaspora: Contribution to Development’, Ås, Norway: Norwegian University of Life Sciences, Masters Dissertation, 2014, p. 4.
140 See https://www.dahabshiil.com and https://www.worldremit.com/en/how-it-works.
141 Claire Pénicaud and Fionán McGrath, ‘Innovative Inclusion: How Telesom ZAAD Brought Mobile Money to Somaliland’, 2013, at https://www.gsma.com/mobilefordevelopment/wp-content/uploads/2013/07/Telesom-Somaliland.pdf.
162S P E C I A L R E P O RT – JA N UA RY 2 0 2 0
WHERE THE RUBBER HITS THE ROAD
142 Kilcullen, direct observation, Hargeisa 5 and 14 November 2018 and Berbera, 12 November 2018.
143 Omar Jama, op. cit.144 Pénicaud and McGrath op. cit. p. iii.145 Kilcullen, interviews with two civil
servants and three business leaders, Hargeisa, 11 and 13 November 2018.
146 John Kenneth Galbraith, The Affluent Society. Fortieth Anniversary Edition, New York: Houghton Mifflin Company, 1998, first published 1958.
147 Kilcullen, interview with Somaliland Finance Ministry officials, Hargeisa, 6 November 2018.
148 Kilcullen, interview with OH, Hargeisa, 5 November 2018.
149 Ibid.150 Kilcullen, interviews with local business
leaders, Hargeisa, 11 and 14 November, 2018.
151 Matthew Newsome and Nicholas Parkinson, ‘Somaliland gets wind in its sails for revamping power sector’ in The Guardian, 15 April 2013, online at https://www.theguardian.com/global-development/2013/apr/15/somaliland-wind-power-sector.
152 See DP World, Berbera—Somaliland at https://www.dpworld.com/en/what-we-do/our-locations/Middle-East-Africa/berbera-somaliland
153 DP World, ‘Groundbreaking Ceremony Marks Start of Work at DP World Berbera in Somaliland’, press release, 11 October 2018, at https://www.dpworld.com/en/media/media-centre/Groundbreaking-Ceremony-Marks-Start-of-Work-at-DP-World-Berbera-in-Somaliland.
154 See World Economic Forum, ‘Global Human Capital Report 2017’, at https://weforum.ent.box.com/s/dari4dktg4jt2g9xo2o5pksjpatvawdb
155 The author is indebted to Omar Jama Diriye for this insight.
156 StatsSA mid-year population estimates, 2018, https://www.statssa.gov.za/publications/P0302/P03022018.pdf.
157 At https://www.dispatchlive.co.za/news/2019-01-24-736-fired-in-dimbaza-for-unlawful-strike/.
158 See https://www.dispatchlive.co.za/news/2017-11-01-stats-reveal-province-has-highest-unemployment-rate/.
159 See http://www.doingbusiness.org/content/dam/doingBusiness/media/Subnational-Reports/DB18_South-Africa.pdf.
160 At https://www.fin24.com/Economy/South-Africa/slow-progress-in-business-environment-reforms-for-sa-cities-world-bank-2018 0919.
161 Auditor General’s report, 2017–18, Provincial overviews, at https://www.agsa.co.za/Portals/0/Reports/MFMA/2019.06.25/MFMA2017-18%20-%20Section%206%20-%20Provincial%20overviews.pdf?ver=2019-06-25-165522-903.
162 Municipal Money – Buffalo City: https://municipalmoney.gov.za/profiles/municipality-BUF-buffalo-city.pdf.
163 Buffalo City Metro Municipality socio economic review and outlook 2017, Ecsecc, p 10.
164 See https://www.telegraph.co.uk/cars/news/goodwood-festival-speed-contributes-69m-economy /.
165 At https://www.classicandsportscar.com/news/general-classic-car-news/classic-car-industry-worth-five-and-a-half-billion-pound s.
166 At https://www.businessinsider.com/the-classic-car-market-is-a-perfect-example-of-how-bubbles-collapse-2017-5?IR=T.
167 Ken Stewart and Norman Reich, Sun on the Grid. London: Bookmarque, 1998 (second edition).
168 Ibid.169 These are: Coega, Richards Bay, Saldanha
Bay, East London, Dube Tradeport, Maluti-a-Phofung in the Free State, OR Tambo IDZ, and Atlantis in the Western Cape. At https://www.iol.co.za/business-report/economy/gallery-view-the-list-of-special-economic-zones-in-sa-11183315.
170 See http://www.elidz.co.za/.
163S P E C I A L R E P O RT – JA N UA RY 2 0 2 0
WHERE THE RUBBER HITS THE ROAD
171 Buffalo City Metro Municipality, op cit.172 Cost of living comparison between
Johannesburg and East London, at https://www.numbeo.com/cost-of-living/compare_cities.jsp?country1=South+Africa&city1=East+London&country2=South+Africa&city2=Johannesburg.
173 Geoffrey Parker, The Military Revolution: Military Innovation and the Rise of the West, 1500–1800. Cambridge: Cambridge University Press, 1996, p. 104.
174 Ibid. See also Rudolf Said‐Ruete, ‘The Al‐Bu‐Said Dynasty in Arabia and East Africa’ in Journal of The Central Asian Society, Volume 16, No.4 , July 1929, p. 418.
175 Kilcullen, discussion with county government infrastructure officials, Mombasa, 11 June 2019.
176 Government of Kenya, ‘2009 – Transforming Connectivity and Vision’ at Kenya Vision 2030, https://vision2030.go.ke. For a list of current and planned submarine cables linking to Mombasa, see also Telegeography, Submarine Cable Map – Mombasa, Kenya, online at https://www.submarinecablemap.com/#/landing-point/mombasa-kenya
177 See Arye Oded, ‘The Omani Sultanate in Zanzibar And East Africa – Historical, Political, Economic and Religious Aspects’ in RIMA Historical Papers, Vol. 5, Number 2, April 2017.
178 Omani House inscription, Fort Jesus, Mombasa, June 2019.
179 See Gwyn Campbell and Edward A. Alpers, ‘Introduction: Slavery, Forced Labour and Resistance in Indian Ocean Africa and Asia’ in Slavery and Abolition, Volume 25, No. 2, August 2004, p. xv.
180 See Nazeer Ahmed, ‘Islam in East Africa’ in History of Islam: An Encyclopedia of Islamic History, at https://historyofislam.com/contents/the-modern-age/islam-in-east-africa/
181 See Maniraj Sukdaven and Ensieh Bagheri, ‘Spreading of Islam without any violence in Central, East and West Africa as a case
study’ in Hervormde Teologiese Studies, Vol. 74, No. 3, 2018. See also Iqbal Akhtar, ‘South Asian Muslims in East Africa’ in Routledge Handbook of Africa–Asia Relations. London: Routledge, 2017, pp. 60–73.
182 Robin Hallett, Africa to 1875: A Modern History. Ann Arbor, MI: University of Michigan Press, 1970, p. 277.
183 Said-Ruete, op. cit. p. 424.184 Roland Oliver, ‘Some Factors in the British
Occupation of East Africa, 1884–1894’ in The Uganda Journal, Journal of the Uganda Society, Vol. 15 No. 1, March 1951, p. 51. online at https://ufdc.ufl.edu/UF00080855/00029/59j
185 For an account of the Royal Navy’s role in this effort, see Christopher Lloyd, The Navy and the Slave Trade: The Suppression of the African Slave Trade in the Nineteenth Century, London: Routledge, 1968.
186 See Mark Hobbs, ‘Mombasa: Britain’s Shortest-Lived Protectorate’ at Qatar Digital Library, online at https://www.qdl.qa/en/mombasa-britain’s-shortest-lived-protectorate
187 Chris McIntyre, ‘Early anti-Slaving’ in Zanzibar Travel Guide, London: Bradt Guides (6th Edition), pp. 158–9 at http://www.zanzibar-travel-guide.com/bradt_guide.asp?bradt=1589
188 Hobbs, op. cit. 189 See Carola Frentzen, ‘Ein Privatmann
erwarb die größte deutsche Kolonie’ in Die Welt, 25 May 2014, online at https://www.welt.de/geschichte/article128383715/Ein-Privatmann-erwarb-die-groesste-deutsche-Kolonie.html.
190 Oliver, op. cit. p. 63.191 Kilcullen, discussion with Mombasa
County economic planning officials, Mombasa, 11 June 2019.
192 See James R. Brennan, ‘Lowering the Sultan’s Flag: Sovereignty and Decolonization in Coastal Kenya’, Comparative Studies in Society and History, Vol. 50 No. 4, 2008, p. 851.

164S P E C I A L R E P O RT – JA N UA RY 2 0 2 0
WHERE THE RUBBER HITS THE ROAD
193 London declared an East Africa Protectorate in 1895, assuming control from the financially-foundering British East Africa Company; it proclaimed the Kenya Colony in 1920, with a ten-mile coastal strip, the Kenya Protectorate, administered by Britain under the suzerainty of the Sultan of Zanzibar, until both colony and the protectorate were granted independence in June 1963 – meaning that Kenya experienced a relatively short-lived period of colonialism, only 68 years (counting the Protectorate) or 43 years (counting only the Colony).
194 For a series of images and maps documenting the port’s development see Friends of Mombasa, ‘Historic Old Port of Mombasa, in the 1890s lack of facilities to offload Railway equipment led to the development of Kilindini as a port on the west side of the island’, at http://www.friendsofmombasa.com/historic-areas-entry-exit-points/kilindini-makupa/.
195 Justin Willis, ‘‘Men on the Spot,’ Labor, and the Colonial State in British East Africa: The Mombasa Water Supply, 1911–1917,’ International Journal of African Historical Studies, Vol. 28, No. 1, 1995.
196 Ibid.197 Ibid.198 Ibid.199 Willis op. cit. p. 31.200 See David French, The British Way in
Counter-Insurgency, 1945–1967. Oxford: Oxford University Press, 2011, p. 120.
201 Brennan, op. cit. p. 851.202 Karuti Kanyinga, ‘Re-distribution from
Above: The Politics of Land Rights and Squatting in Coastal Kenya’, Research Report no. 115, 2000, Uppsala: Nordiska Afrikainstitutet, pp. 31–45.
203 Justin Willis and Ngala Chome, ‘Marginalization and political participation on the Kenya coast: the 2013 elections’ in Journal of Eastern African Studies, Volume 8 No. 1, 2014, pp. 115–134.
204 Mohamed Omar Said Mohamed, J.G, Kairo, Farid Dahdouh-Guebas and Nico Koedam, ‘How Sustainable is the Utilization of Mangrove Products in Peri-Urban Mombasa, Kenya?’ in Ecology and Society, Manuscript #: ES-2008–2617, Version 1, p. 61, 76.
205 Sabi Strategy Group, African Cities – Mombasa and Kisumu: Quantitative and Qualitative Research, December 2016, p. 57
206 Brennan, op. cit.207 Devin Smart, ‘Developing the racial city:
conflict, solidarity and urban traders in late-colonial Mombasa’ in Journal of Eastern African Studies, Volume 11 No. 3, 2017, pp. 429–30.
208 Ibid.209 Ibid. pp. 859, 860.210 For a historical political map of
Kenya showing former Coast Province Boundaries, see U.S. Government (1988) Kenya Political, at http://legacy.lib.utexas.edu/maps/africa/kenya_pol88.jpg
211 See Eric Kramon and Daniel N. Posner, ‘Kenya’s New Constitution’ in Journal of Democracy, Vol. 22, No. 2, March 2011, pp. 89–103.
212 For the full text of the Constitution see Constitution of Kenya, 2010, at http://www.kenyalaw.org:8181/exist/kenyalex/actview.xql?actid=Const2010.
213 Julie Kwach, ‘Challenges facing Devolution in Kenya, 2019’ at https://www.tuko.co.ke/264362-challenges-facing-devolution-kenya.html#264362.
214 Sabi strategy group, op. cit. pp. 72–73.215 Ibid.216 See International Crisis Group, ‘Kenya’s
Coast: Devolution Disappointed’, Brussels: Crisis Group Africa Briefing No. 121, 13 July 2016.
217 Paul Goldsmith, ‘Digital radicals on the Swahili coast’, New African, April 2016, pp. 52–55.
218 Wanjohi Kabukuru, ‘How idyllic Mombasa lost its groove to ‘war on terror’, New African, June 2015, p. 15.
219 Ibid. p. 21.

165S P E C I A L R E P O RT – JA N UA RY 2 0 2 0
WHERE THE RUBBER HITS THE ROAD
220 See Andrew Kasuku, ‘Majengo and Kisauni: Mombasa’s terror hubs’ in The Star, 5 February 2019, at https://www.the-star.co.ke/news/big-read/2019-02-05-majengo-and-kisauni-mombasas-terror-hubs/ and William R. Patterson, ‘Islamic Radicalization in Kenya’ in Joint Forces Quarterly, Vol. 78 No. 3, 3rd Quarter, 2015, pp. 16–23.
221 See Daniel Wesangula, ‘The Unseen War’ in The Standard, Special Report, 2019, at https://www.standardmedia.co.ke/special-report/the-unseen-war/ (Part 1) and https://www.standardmedia.co.ke/special-report/the-unseen-war-part2/ (Part 2).
222 For details of attacks during this period see William Maclean, Noor Khamis and Mohamed Ahmed, ‘Special Report: In Africa, a militant group’s growing appeal,’ Reuters, 30 May 2012, at https://www.reuters.com/article/us-shabaab-east-africa/special-report-in-africa-a-militant-groups-growing-appeal-idUSBRE84T0NI20120530, David Ochami and Philip Mwakio, ‘Three killed, 30 hospitalised in Mombasa blast’ in The Standard, 25 June 2012, at https://www.standardmedia.co.ke/article/2000060541/n-a, Philip Mwakio and Cyrus Ombati, ‘Sunday grenade attacks in Mombasa, Nairobi leave 15 injured’ in The Standard, 10 June 2013, at https://www.standardmedia.co.ke/article/2000085594/n-a, James Macharia, ‘Bombings threaten Kenya growth goals, open new strains with wary West,’ Reuters, 1 June 2014, at https://uk.reuters.com/article/uk-kenya-security-tourism/bombings-threaten-kenya-growth-goals-open-new-strains-with-wary-west-idUKKBN0EC1D720140601 and Tom Burridge, ‘Funding jihad: Al-Shabab cash lures in young Kenyans’ in BBC News, 12 December 2014, at https://www.bbc.com/news/world-africa-30419987?print=true.
223 See Kasaku, op. cit., Galgalo Bocha, ‘Mombasa: 4 killed Aboud Rogo Style’ in The Nation, 4 October 2013
at https://www.nation.co.ke/news/Sheikh-Abubakar-Sheriff-alias-Makaburi-/1056-2018322-u8gbkt/index.html and Weldon Kipkemoi, ‘Former Al Shabaab, gang members, recruited to combat terrorism at the Coast’ in The Standard, 13 February 2019, at https://www.standardmedia.co.ke/article/2001312951/al-shabaab-returnees-ex-gang-members-join-war-on-terr orism.
224 Kasuku, op. cit. See also K24 Television, ‘125 People Arrested At Masjid Musa Arraigned In Court, Remanded For 5 Days’, 3 February 2014, at https://www.youtube.com/watch?v=3bcRUDLG570 and Wachira Mwangi and Daniel Tsuma Nyassy, ‘One shot dead in mosque raid as 250 arrested’ in The Nation, 17 November 2014, at https://www.nation.co.ke/news/Masjid-Musa-Sakina-Mosques-Raid-Police/1056-2525964-mql7w1/index.html
225 Al Jazeera Africa, ‘Kenyan counter-terrorism police confess to extra judicial killings’ in Modern Ghana, 7 December 2014, at https://www.modernghana.com/news/585087/1/kenyan-counter-terrorism-police.html.
226 Ibid.227 Parselelo Kantai, ‘Kenya’s Mombasa
Republican Council : The Coast calls for freedom’ in Africa Report, 17 May 2012, at https://web.archive.org/web/20120702202413/http://www.theafricareport.com/index.php/20120517501811752/east-horn-africa/kenya-s-mombasa-republican-council%E2%80%A9-the-coast-calls-for-freedom-501811752.html.
228 For a discussion of the MRC and its underlying grievances see Justin Willis and George Gona, ‘Pwani C Kenya? Memory, Documents and Secessionist Politics in Coastal Kenya’ in African Affairs, Vol. 112 No. 446, December 2012, pp. 48–71.
229 Kantai, op. cit.230 See ‘The Swahili Coast: Contagion of
Discontent’ in The Economist, 3 November 2012, at https://www.economist.com/
166S P E C I A L R E P O RT – JA N UA RY 2 0 2 0
WHERE THE RUBBER HITS THE ROAD
news/middle-east-and-africa/21565641-muslim-extremism-spreads-down-east-africa’s-coastline-contagion-discontent.
231 Justin Willis and Ngala Chome, ‘Marginalization and political participation on the Kenya coast: the 2013 elections’ in Journal of Eastern African Studies, 2014, Vol. 8, No. 1, p. 115.
232 For a full list of civil society organizations involved in the CVE effort, see Mombasa County Government, Mombasa County Commissioner’s Office and HAKI Africa (2017), Mombasa County Action Plan for Preventing and Countering Violent Extremism 2017–2022, p. iii.
233 See ‘About HAKI Africa’ at http://hakiafrica.or.ke/about-haki/
234 Mombasa County Government (2017) op. cit., p. 9.
235 Government of Kenya, Mombasa County Countering Violent Extremism (CVE) Mapping Report, July 2018, p. 8. at http://www.mombasa.go.ke/wp-content/uploads/2018/10/FINAL-REVISED-MAPPING-REPORT.pdf.
236 Ibid, p. 3.237 Ibid. p. 4.238 Mombasa County Government (2017), op.
cit. pp. 10–11.239 Sabi Strategy Group, African Cities –
Mombasa and Kisumu: Quantitative and Qualitative Research, December 2016, p. 62
240 Ibid. p. 87241 For details of the theory see George
Kelling and Catherine Coles, Fixing Broken Windows: Restoring Order and Reducing Crime in Our Communities. New York: Touchstone Press, 1997. For a more recent application to crime hotspots see Anthony Braga and Brenda Bond, ‘Policing Crime and Disorder Hot Spots: A Randomized Controlled Trial’ in Criminology, Vol. 46 No. 3, 2008, pp. 577–607.
242 Mohamed Ahmed, ‘Paint town houses white, orders Mombasa county’ in The Nation, 10 March 2018, at https://www.nation.co.ke/counties/mombasa/
Paint-town-houses-white/1954178-4335940-10mqqr3z/index.html.
243 David Kilcullen, interview, Nyali district, Mombasa, 16 June 2019.
244 Sabi Strategy Group, op. cit. p. 126245 Kenya has two distinct programs for
upgrading of informal settlements – the Kenya Slum Upgrading Project (KENSUP) and Kenya Informal Settlements Improvement Program (KISIP). For a historical background and overview of these programs, see Mark Anderson and Keziah Mwelu (2013), ‘Kenyan Slum Upgrading Programs: KISIP & KENSUP’ at http://healthycities.berkeley.edu/uploads/1/2/6/1/12619988/kenya.pdf.
246 Ibid.247 See World Bank, ‘Informal Enterprises
in Kenya’, World Bank Group, 2016, p. 1. online at https://www.enterprisesurveys.org/~/media/GIAWB/EnterpriseSurveys/Documents/ResearchPapers/Informal-Enterprises-in-Kenya-2016.pdf.
248 Righa Edwin Mwacharo, ‘Factors Influencing Growth of Informal Settlements: A Case of Bangladesh Slum, Changamwe Constituency, Mombasa County, Kenya’, Master’s thesis, University of Nairobi, 2012, p.3, at http://erepository.uonbi.ac.ke:8080/xmlui/bitstream/handle/11295/6672/Righa_Factors%20influencing%20growth%20of%20informal%20settlements.pdf;sequence=1.
249 Hellen Ndaiga, ‘Kenya to speed up its slum upgrading programme’ in Construction Kenya, 2 May 2017, at https://www.constructionkenya.com/2435/kenya-slum-upgrading/.
250 Republic of Kenya, Ministry of Transport, Infrastructure, Housing and Urban Development, ‘Kenya Informal Settlements Improvement Project (KISIP) Abbreviated Resettlement Action Plan (ARAP) For Mombasa County Kindunguni Informal Settlement’, March 2019, p. 10. Online at http://www.housingandurban.go.ke/wp-content/
167S P E C I A L R E P O RT – JA N UA RY 2 0 2 0
WHERE THE RUBBER HITS THE ROAD
uploads/2019/06/1-DISCLOSURE-COPY-RAP-Report-Kindunguni-WB-FINAL.pdf.
251 Ibid. p. 2.252 Ibid. p. 3.253 Sabi Strategy Group, op. cit. p. 241254 See TeleGeography, ‘Submarine Cable
Map: Landing Point Mombasa Kenya’, at https://www.submarinecablemap.com/#/landing-point/mombasa-kenya and Submarine Cable Map: Landing Point Nyali Kenya at https://www.submarinecablemap.com/#/landing-point/nyali-kenya.
255 See SEACOM, ‘Our History: July 2009’, at https://seacom.com/#history and TeleGeography, ‘SEACOM/Tata-TGN Eurasia’ at https://www.submarinecablemap.com/#/submarine-cable/seacomtata-tgn-eurasia.
256 TeleGeography, op. cit.257 SEACOM, ‘Our Global Network’, at https://
seacom.com/network. 258 Ibid.259 Sabi Strategy Group, op. cit. p. 116260 See ‘SEACOM, Cisco partnership sets up
technology hub in Mombasa’ in Business Daily Africa, 5 April 2016, at https://www.businessdailyafrica.com/corporate/technology-hub-in-Mombasa/539550-3147390-n6i1s5z/index.html.
261 Ibid.262 Sabi Strategy Group, op. cit. p. 247263 Ndunge Kiiti and Monique Hennink, The
Use and Impact of M-Shwari as a Financial Inclusion Banking Product in Urban and Rural Areas of Kenya. Irvine, CA: University of California Irvine, Institute for Money, Technology and Financial Inclusion, 2016, at https://www.imtfi.uci.edu/files/docs/2015/M-Shwari%20Final%20Report_Final-Feb%2028%202017-CLN.pdf.
264 Ibid. p. 6.265 For the national version, see https://
www.ecitizen.go.ke. For the Mombasa government’s similar portal, focused on business services, see https://ebusinesspermit.mombasa.go.ke/index.php?id=1.
266 See Government of Kenya, ‘Public Service Reform’ at Kenya Vision 2030: The Progress So Far, timeline entry for 2014, at https://vision2030.go.ke.
267 Sabi Strategy Group, op. cit. p. 241268 Knowles, op. cit.269 David Mugwe, ‘Rail Transport Makes a
Comeback’ in The Daily Nation, 19 August 2013, at https://www.nation.co.ke/business/infrastructure/Rail-transport-makes-a-comeback/1959776-1959748-9h58gcz/index.html.
270 Ibid.271 The Nation, ‘Kenya, China sign standard
gauge railway agreement’ in The Nation, 11 May 2014, at https://www.nation.co.ke/news/East-Africa-China-Standard-Gauge-Railway/1056-2310836-vvl2cjz/index.html
272 Discussion, Raila Odinga, Nairobi, October 2019.
273 For some of these concerns see Eyder Peralta, ‘A New Chinese-Funded Railway In Kenya Sparks Debt-Trap Fears,’ 8 October 2018 at https://www.npr.org/2018/10/08/641625157/a-new-chinese-funded-railway-in-kenya-sparks-debt-trap-fears, Paul Wafula, ‘Behind the SGR Walls’ in The Nation, 8 July 2018 at https://www.standardmedia.co.ke/article/2001287119/behind-the-sgr-walls and Paul Wafula, ‘Revealed: the 5000-strong Chinese Army powering the SGR’, The Nation, 15 July 2018, at https://www.standardmedia.co.ke/article/2001288060/exclusive-5000-strong-chinese-army-behind-sgr-walls
274 Kilcullen, interview with senior Mombasa County officials, 11 June 2019, Mombasa.
275 Ibid.276 Ibid.277 Kilcullen, interview with senior Mombasa
County officials, 11 June 2019, Mombasa.278 Kilcullen, interview, 19 June 2019, Nyali.279 Kilcullen, interview, 13 June 2019, Vipingo.280 See Government of Kenya, ‘Big 4 Agenda’,
at https://big4.president.go.ke/281 Ibid.
168S P E C I A L R E P O RT – JA N UA RY 2 0 2 0
WHERE THE RUBBER HITS THE ROAD
282 Brian Munene, ‘Mombasa Vision 2035: A City Reinventing Itself’ in Buildesign Kenya, 6 November 2017, at http://buildesign.co.ke/mombasa-city-vision-2035/.
283 See Mombasa County Government, ‘Mombasa Vision 2035 Master Plan: Integrated Strategic Urban Development Plan (ISUDP)’, 17 August 2017, at https://lead-innove.blogspot.com/2017/08/mombasa-vision-2035-master-plan.html.
284 See Vertex Studios, ‘Mombasa Vision 2035’ at https://www.vertexstudio.co.ke/animation; see also https://www.youtube.com/watch?v=TWW13UxJlY8.
285 See Winnie Atieno, ‘Joho explains why it took over five years to give Mombasa a new look’ in The Nation, 19 September 2018, at https://www.nation.co.ke/counties/mombasa/Hassan-Joho-says-why-it-took-five-years-to-give-Mombasa-new-look/1954178-4765926-gfgqsnz/index.html.
286 Mombasa Government, ‘Lands, Housing and Physical Planning’, at https://www.mombasa.go.ke/lands-planning/.
287 Mombasa County Government, ‘Mombasa Gate City Master Plan: A Premier Gateway Port City that Upholds Diversity and Heritage’, 2017, at http://gatecitymp.mombasa.go.ke/sites/default/files/Mombasa%20Gate%20City%20Master%20Plan%20Pamphlet_light_2.pdf.
288 Mombasa County Government, ‘Mombasa Gate City Master Plan’ at http://gatecitymp.mombasa.go.ke.
289 Crossroads’ unemployment rate is 54%.290 Picture source: https://onlineimages.
smugmug.com/Places/South-Africa/Cape-Town/i-LVF2jzr.
291 Telegraph Travel, ‘Telegraph Travel Awards: your favourite airlines, hotel groups, tour operators and destinations’, 12 April 2016 at https://www.telegraph.co.uk/travel/news/telegraph-travel-awards-2015-16-winners/
292 Rob Wilson, ‘The Gritty and the Pretty – Cape Town: World Design Capital
2014’, 13 December 2013 at http://www.uncubemagazine.com/blog/11762959
293 ‘Cape Town: World Design Capital 2014’, Financial Times, 2014 at https://www.ft.com/content/e8abc21c-b371-11e3-bc21-00144feabdc0.
294 Stats SA, ‘The City of Cape Town’, 2018 at http://www.statssa.gov.za/?page_id=1021&id=city-of-cape-town municipality
295 ‘City of Cape Town Socio-Economic Profile’, 2017 at https://www.westerncape.gov.za/assets/departments/treasury/Documents/Socio-economic-profiles/2017/city_of_cape_town_2017_socio-economic_profile_sep-lg_-_26_january_2018.pdf.
296 Cape Town’s Gini Coefficient is 0.61. It measures income inequality on a level of 0 to 1, with 0 being the most equal and 1 being the most unequal. See Jason Felix, ‘Inequality levels in Cape Town the highest in 10 years’, IOL, 1 October 2018 at https://www.iol.co.za/capeargus/news/inequality-levels-in-cape-town-the-highest-in-10-years-17288968.
297 Hereafter, City (capital C) refers to the City of Cape Town government, while city refers to Cape Town itself.
298 Vereenigde Landsche Ge-Oktroyeerde Oostindische Compagnie in Dutch.
299 This includes the Intergovernmental Fiscal Relations Act (1997); Municipal Structures Act (1998); Municipal Systems Act (2000); Intergovernmental Relations Framework Act (2005).
300 SA Government, ‘National Development Plan 2030’ at https://www.gov.za/issues/national -development-plan-2030.
301 ‘The three spheres of Government’, ETU toolbox, at http://www.etu.org.za/toolbox/docs/govern/spheres.html.
302 The number of departments varies between provinces. However, they generally consist of a combination of 12 of the following departments; Finance, Economic Development, Tourism, Housing, Education, Health, Social Development, Transport, Public Works, Planning and

169S P E C I A L R E P O RT – JA N UA RY 2 0 2 0
WHERE THE RUBBER HITS THE ROAD
Environment, Sport, Recreation, Art & Culture, Agriculture, Local Government, Safety and Security or Community Safety.
303 ‘The three spheres of Government’, ETU toolbox, at http://www.etu.org.za/toolbox/docs/govern/spheres.html.
304 Ibid.305 Chapter 7: Local Government. 1996
Constitution of the Republic of South Africa.
306 City of Cape Town,‘ Socio-Economic Profile’, 2016, at https://www. westerncape.gov.za/assets/departments/ treasury/Documents/Socio-economicprofiles/2016/City-of-Cape-Town/ city_of_cape_town_2016_socio-economic_ profile_sep-lg.pdf.
307 SALGA, ‘The Municipal Barometer’, at http://www.municipalbarometer. co.za/CrossCompare.
308 This fell under the Municipal Structures Act of 1998.
309 Dominique Wooldridge, ‘Introducing Metropolitan Government in South Africa’, 2002, p. 128.
310 Stats SA, ‘National government funding allocations: who are the main beneficiaries?’, June 2018 at http://www.statssa.gov. za/?p=11277.
311 Sleep City.312 City of Cape Town, ‘Cape Town comes
after Johannesburg’, 2017. Available: https:// www.westerncape.gov.za/assets/ departments/treasury/Documents/ Socio-economic-profiles/2017/ city_of_cape_town_2017_socio-economic_ profile_sep-lg_-_26_january_2018.pdf.
313 ibid314 World Bank, Ease of Doing Business in
Cape Town, World Bank Group, 2018 at http://www.doingbusiness.org/data/exploreeconomies/south-africa/sub/cape-town.
315 Correspondence with Tim Harris, 26 October 2019.
316 This is based on several exchanges, including an interview and email correspondence on Sunday 17 February.
317 The meetings with Alderman Vos, Premier Winde, and Alderman Smith were held on 28 and 29 October 2019 in Cape Town.
318 ‘Central City Improvement District. The State of Cape Town Central City Report 2017 – A Year in Review’, 2017, at https://propertywheel.co.za/2018/05/ the-2017-state-of-cape-town- central-city report-released/.
319 Approximately 107 379 crimes were drug-related.
320 For the international ‘league table’ on violent cities, go to http://www.worldatlas.com/articles/most-dangerous-cities-in-the-world.html.
321 Sune Payne, ‘If it takes me until I die, I will seek justice for my son – anguished Cape Flats mothers‘, Daily Maverick, 4 October 2018 at https://www.dailymaverick.co.za/ article/2018-10-04-if-it-takes-me-untili-die-i-will-seek-justice-for-my-sonanguished-cape-flats-mothers/.
322 Beyond Our Borders, ‘The Khayelitsha Project’ at http://beyondourborders.net/ the-khaye litsha-project/.
323 At https://www.dailymaverick.co.za/article/2019-07-12-army-deployed-as-gang-violence- escalates-to- un precedented-levels-and-residents-cry-out-for-help/. The table is sourced from https://www.timeslive.co.za/news/south-africa/ 2019-09-12-crimestats-cops-have-lost-the- war-says-western-cape-premier/.
324 This section is based on a research trip to Khayelitsha, Harare, Langa, and Hanover Park in June 2016 arranged by the office of the mayor of the City of Cape Town. See also https://www.capetown.gov.za/en/stats/2011CensusSuburbs/2011_Census_CT_Suburb_Khayelitsha_Profile.pdf.
325 This is based on a meeting with the Premier in April 2018, and subsequent email correspondence.
326 The Fuller Centre for Housing, ‘Housing Delivery in South Africa’, 2014 at https://fullercenter.org/wp-content/
170S P E C I A L R E P O RT – JA N UA RY 2 0 2 0
WHERE THE RUBBER HITS THE ROAD
uploads/sites/default/files/Housing%20 delivery%20-%20South%20Africa.pdf.
327 The strategies of the Housing White Paper were: 1. Stabilising the housing environment; 2. Mobilising housing credit; 3. Providing subsidy assistance; 4. Supporting the Enhanced People’s Housing Process; 5. Rationalising institutional capacities; 6. Facilitating the speedy release and servicing of land; 7. Co-ordinating government investment in development.
328 GroundUp, ‘Everything you need to know about government housing’, 20 July 2017, at https://www.groundup.org.za/article/everything-you-need-know-about-government-housing/.
329 The criteria includes: A South African citizen; over 21 years old; married or living with a partner, single or with dependents; earning less than R3 500 per household; first-time home owner.
330 See Africa Check at https://www.thesouthafrican.com/news/no-the-anc-has-not-built-five-mil lion-houses-since-1994/.
331 See https://www.sanews.gov.za/south-africa/housing-delivery-sa-how-have-we-fared. The table is sourced from https://www.bbc.com/news/world-africa-48093711
332 See http://www.sabuilder.co.za/2018/08/22/state-of-the-construction-industry/
333 See https://www.bbc.com/news/world-africa-48093711
334 At https://www.news24.com/SouthAfrica/ News/Sexwale-Housing-backlog-at-21m20130607.
335 Statistics South Africa, ‘Population Dynamics in South Africa’, 2011 at http://www.statssa.gov.za/publications/ Report-03-01-67/Report-03-01-672011.pdf.
336 At https://fullercenter.org/wp-content/uploads/sites/default/files/Housing%20delivery%20-%20South%20Africa.pdf.
337 See http://www.worldbank.org/content/dam/Worldbank/document/Africa/Report/
stocktaking-of-the-housing-sector-in-sub-saharan-africa-summary-report.pdf.
338 Go to http://mnrowland.blogspot.co.za/2010/07/scandal-of-sweet-home-farm.html.
339 See ‘Integrated Public Transport Network Plan 2032’ at https:// tdacontenthubfunctions.azurewebsites. net/Document/13.
340 TomTom Index at https://www.tomtom. com/en_gb/trafficindex/city/cape-town.
341 53% of workers Cape Town use private transport.
342 Low to low-middle income households make up 95% of public transport users, approximately 2 528 000 daily passengers.
343 City of Cape Town, ‘Cape Town’s Transport Picture’, 2016.
344 ibid345 ‘Expect delays after Cape Town train fire’,
IOL, 9 October 2018, at https://www.iol.co.za/news/ south-africa/western-cape/expect-delaysafter-cape-town-train-fire-17411502.
346 ‘Cape Town Population 2019’, World Population Review, at http://worldpopulationreview.com/world-cities/cape-town-population/.
347 ‘Brazil – South Region’, City Population, at https://www.citypopulation.de/php/brazil-regiaosud-admin.php?adm2id=4106902.
348 See http://worldpopulationreview.com/world-cities/bogota-population/.
349 City of Cape Town, ‘Cape Town’s Transport Picture’, 2016.
350 Tshego Lepule, ‘Neglected’ taxis threaten to wreak havoc on Cape’s transport system’, IOL, 3 June 2018 at https://www.iol.co.za/weekend-argus/neglected-taxis-threaten -to-wreak-havocon-capes-transport-system-15287632.
351 In 2017, Cape Town had the worst rainfall in 84 years, the worst in recorded history.
352 Picture source: Planet Labs Inc.353 Gopolang Makou, ‘Do formal residents
use 65% of Cape Town’s water, with half going to gardens & pools?’, Africa Check,
171S P E C I A L R E P O RT – JA N UA RY 2 0 2 0
WHERE THE RUBBER HITS THE ROAD
21 August 2017, at https://africacheck.org/reports/do-formal-residents-use-65-of-cape-towns-water-with-half-going-to-gardens-pools/.
354 Krista Mahr, ‘How Cape Town was saved from running out of water’, The Guardian, 4 May 2018, at https://www.theguardian.com/world/2018/may/04/back-from-the-brink-how-cape-town -cracked-its-water-crisis.
355 Gina Ziervogel, ‘Cape Town’s Bid to Lock Down the Water Crisis’, Daily Maverick, 20 December 2017 at https://www.dailymaverick.co.za/ article/2017-12-20-op-ed-cape -towns-bidto-lock-down-the-water-crisis/.
356 City of Cape Town, Dam Levels, at http://www.capetown.gov.za/Family%20and%20home/residential-utility-services/residential-water-and-sanitation-services/this-weeks-dam-levels.
357 Lisa Isaacs, ‘#WaterCrisis: 1990 article shows Day Zero plans should’ve began years ago’, IOL, 1 February 2018 at https://www.iol.co.za/capetimes/ news/watercrisis-1990-article-showsday-zero-plans-shouldve-began-yearsago-13044464.
358 ‘The Cape Water Crisis – FAQs and honest answers’, Western Cape Government, 30 October 2017 at https://www.westerncape.gov.za/news/water-crisis.
359 Ibid.360 Bekezela Phakathi, ‘Zille criticises national
government for turning its back on drought-ravaged Cape Town’, Business Live, at https://www.businesslive.co.za/bd/national/2018-02-23-zille-criticises-national-government-for-turning-its-back-on-drought-ravaged-cape-town/.
361 City of Cape Town State of Energy, 2015 at http://www.africancityenergy. org/uploads/resource_22.pdf.
362 ibid363 Historically, a lack of timely investment in
infrastructure by Eskom has led to cyclical energy shortages, as seen in 2007 and 2014.
364 ‘Faqs: Free Basic Electricity’, Department of Energy, at http://www.energy.gov.za/files/faqs/faqs_freebasic.html.
365 City of Cape Town, State of Energy, 2015.366 Ibid.367 Ibid.368 A Janisch, M Euston-Brown and M
Borchers, ‘The Potential Impact of Efficiency Measures and Distributed Generation on Municipal Electricity Revenue: Double Whammies and Death Spirals,’ at http://www.cityenergy.org.za/uploads/resource_23.pdf.
369 ‘World Bank: Morocco’s Economic Growth to Rise to 3.3 in 2020-2021’, North Africa Post, 12 October 2019, at http://northafricapost.com/34631-world-bank-moroccos-economic-growth-to-rise-to-3-3-in-2020-2021.html
370 Literally meaning ‘the new town.’371 Meaning ‘the City of Light.’372 With a contingent of approximately 1, 500,
Morocco is considered one of the main exporters of foreign fighters to ISIS.
373 July 2008. Combatting Terrorism Centre at West Point. Uncovering Extremist Violence in Morocco. Available: https://ctc.usma. edu/uncovering-extremist-violence-in-morocco/.
374 Bidonville is a French/North African term meaning an impoverished, informal dwelling, built largely with tin.
375 Article 41 of the Moroccan Constitution decrees the King Amir Al Mouminine, or Commander of the Faith. This tasks him to oversee national respect for Islam and guarantee free exercise of religious/ cultural beliefs.
376 Assia Bensalah Alaoui, ‘Morocco’s security strategy: preventing terrorism and counter extremism’, Sage Journals, 7 July 2017, at http://journals.sagepub.com/doi/ full/10.1007/s12290-017-0449-3
377 Ministere de l’Inerieur, ‘Investir dans le Capital Humain pour relever les défis de demain’, at http://www.indh.ma/en/presentation
172S P E C I A L R E P O RT – JA N UA RY 2 0 2 0
WHERE THE RUBBER HITS THE ROAD
378 Nicolas Pelham, ‘How Morocco Dodged the Arab Spring’, The New York Review of Books, 5 July 2012 at https:// www.nybooks.com/daily/2012/07/05/ how-morocco-dodged-arab-spring/.
379 See articles on this at http://northafricapost.com
380 A prefecture is predominantly urban; a province is a predominantly rural, they both sit directly under the regional level of government.
381 The progress in decentralisation realised so far was strengthened by the launch of National Plan for Strengthening Decentralisation (NRDP) in 2010 and dedication of funds and expertise for implementation.
382 This replaced the former Inter-Ministerial Committee for Planning
383 The administrative council is represented by all key government officials; Minister of Interior, Wali, governors of prefectures, council presidents and director of the AURS.
384 Koenraad Bogaert, ‘New State Space Formation in Morocco: The Example of the Bouregreg Valley’, Sage Journals, 2012 at http://journals.sagepub.com/ doi/10.1177/0042098011400770
385 World Bank Data, see https://data. worldbank.org/indicator/NY.GDP.PCAP.KD
386 See, Summary of the 2018 Economic and Financial Report, at https://www.finances.gov. ma/Docs/depf/2018/summary_ref_plf2018. Pdf.
387 Steven, J. Freidman, ‘A Tale of Two Economic Developments: Tunisia and Morocco’, University of Pennsylvania, 2010 at https://repository.upenn.edu/ curej/120/
388 World Bank, ‘Cluster Project Performance Assessment Report. People’s Democratic Republic of Algeria Mortgage Finance Technical Assistance Project’, 2010 http:// documents.worldbank.org/curated/ en/713801468052844398/pdf/554270PPAR0 Box1ficial0Use0Only01061.pdf
389 World Bank, ‘Cluster Project Performance Assessment Report. People’s Democratic
Republic of Algeria Mortgage Finance Technical Assistance Project’, at http:// documents.worldbank.org/curated/ en/713801468052844398/pdf/554270PPAR0 Box1ficial0Use0Only01061.pdf. Accessed: 15 August 2018.
390 Ibid.391 UN Habitat, ‘Kingdom of Morocco, Al
Omrane – Leading Actor for Settlements Upgrading’, 2010
392 Third United Nations Conference on Housing and Sustainable Urban Development, Morocco National Report, 2014
393 FART: Fonds d’Accompagnement des Réformes du Transport routier urbain et interurbain.
394 World Bank, ‘Urban Transport Sector Development Policy Loan’, World Bank Group, 14 June 2016 at http://documents.worldbank. org/curated/en/632691468304811669/ pdf/106390-ppar-P115659-PUBLICmorocco-2016.pdf
395 In the case of water and electricity, the concessionaire contracts are for distribution at the local level with the generation, transmission and purification administered by the government utility, Office National de l’Electricité et de l’Eau Potable (ONEE).
396 Cyril Ramaphosa, ‘State of the Nation Address 2019’, South African Government, 20 June 2019 at https://www.gov.za/speeches/2SONA2019.
397 https://www.businesslive.co.za/bd/national/2019-06-20-in-full-president-cyril-ramaphosas-state-of-the-nation-address/.
398 At https://qz.com/africa/1461626/eko-atlantic-diomniadio-tatu-africas-new-billion-dollar-cities/.
399 Africa’s cities, op cit, p. 11.400 Ibid, p. 11.401 Ibid, p. 10.402 Ibid, p. 19.403 Ibid, p. 17.404 This draws on Greg Mills, Olusegun
Obasanjo, Dickie Davis and Jeffrey Herbst,

173S P E C I A L R E P O RT – JA N UA RY 2 0 2 0
WHERE THE RUBBER HITS THE ROAD
Making Africa Work. Cape Town: Tafelberg, 2017.
405 Ibid. 406 Cited in http://www.worldbank.org/
content/dam/Worldbank/document/Africa/Report/stocktaking-of-the-housing-sector-in-sub-saharan-africa-summary-report.pdf.
407 See Paul Collier and Anthony Venables, ‘Housing and Urbanization in Africa: unleashing a formal market process,’ CSAE Working Paper WPS/2013 01, Department of Economics, Oxford University. 9 January 2013. At http://www.csae.ox.ac.uk/workingpapers/pdfs/csae-wps-2013-01.pdf.
408 Discussion, Andrew Charman, Muizenberg, June 2016.
409 At http://www.worldbank.org/content/dam/Worldbank/document/Africa/Report/stocktaking-of-the-housing-sector-in-sub-saharan-africa-summary-report.pdf.
410 For details, please see Citibank, Digitising Government: The Journey to Enacting a Digital Agenda, Citi GPS Global Perspective and Solutions, October 2019.
411 Ibid.412 See ibid. This table was assembled by
GMSA – the association of global mobile network operators – and the Boston Consulting Group.
413 See https://www.smartcitygovt.com, accessed 9 September 2019.
414 See the rankings, for example, of liveable cities in ‘What does it take to make a city both liveable and lively?’, Monocle, 45, 5, July/August 2011.
415 This issue is explored further in Greg Mills, Olusegun Obasanjo, Hailemariam Desalegn, and Emily van der Merwe, The Asian Aspiration. Johannesburg: Panmacmillan, 2020 (forthcoming).

174S P E C I A L R E P O RT – JA N UA RY 2 0 2 0
WHERE THE RUBBER HITS THE ROAD
The Asian Experience
The Singapore Story
Indonesia: Infrastructure and Iconography
Latin America
Security in Recife – Pact for Life
The Security Challenges of Rio
Curitiba and the Bus Rapid Transport
The Transformation of Medellín
Honduras: Urban Overstretch in San Pedro Sula
Summary of Observations
Section Two: African City Case-Studies
Lagos: The Relentless City
Hargeisa: Invisible City
Buffalo City: From Lifeless Economy to Lifestyle Opportunity
Mombasa: Gateway City
Cape Town: A Tale of Two Transitions
Rabat and Salé: Bridging the Gap
Conclusion: Between Wakanda and Dystopia