When the Going Gets Tough: Should Customer Service Get Going
40
When the Going Gets Tough: Should Customer Service Get Going? Tor W. Andreassen *) and Line L. Olsen Abstract Building on theory from consumer behavior this paper investigates the impact customer service may have on customer satisfaction, relative attractiveness, and commitment (affective and calculative). The findings indicate that independent of level of customer service its impact on all constructs is significant. Interestingly, customers who report a low score on customer service have the strongest correlations but lowest construct scores and vice versa for customers reporting high customer service scores. Whereas customers who report a high score in customer service have a stronger affective commitment, customers who report a low score have a more balanced commitment. The latter indicates that these customers are more likely to switch. For managers these findings imply that customer service is a key driver of consumers’ behavioral intentions. It is a revenue generating activity. Following this, customer service is an area in which managers should invest rather than cutting when the going gets tough. DETTE PAPERET ER SENDT TIL JOURNAL OF THE ACADEMY OF MARKETING SCIENCE. IKKE SITER ELLER REFERER UTEN SAMTYKKE FRA FORFATTERE. Tor Wallin Andreassen is an Associate Professor of Marketing at the Norwegian School of Management, P.O.Box 580, N-1301 Sandvika, Norway. E-mail: [email protected], Tel: +47 67 55 73 27, Fax: +47 67 55 76 76. *) Corresponding author. Line L. Olsen Is a PhD-candidate at the Norwegian School of Management. The authors would like to thank companies associated with the Center for Market Oriented Management at the Norwegian School of Management for their support in this project. Data provided by the Norwegian Customer Satisfaction Barometer is greatly appreciated.
-
Upload
independent -
Category
Documents
-
view
0 -
download
0
Transcript of When the Going Gets Tough: Should Customer Service Get Going

When the Going Gets Tough: Should Customer Service Get Going?
Tor W. Andreassen *) and Line L. Olsen
Abstract
Building on theory from consumer behavior this paper investigates the impact customer service
may have on customer satisfaction, relative attractiveness, and commitment (affective and
calculative). The findings indicate that independent of level of customer service its impact on all
constructs is significant. Interestingly, customers who report a low score on customer service
have the strongest correlations but lowest construct scores and vice versa for customers reporting
high customer service scores. Whereas customers who report a high score in customer service
have a stronger affective commitment, customers who report a low score have a more balanced
commitment. The latter indicates that these customers are more likely to switch. For managers
these findings imply that customer service is a key driver of consumers’ behavioral intentions. It
is a revenue generating activity. Following this, customer service is an area in which managers
should invest rather than cutting when the going gets tough.
DETTE PAPERET ER SENDT TIL JOURNAL OF THE ACADEMY OF MARKETING SCIENCE. IKKE SITER ELLER REFERER UTEN SAMTYKKE FRA FORFATTERE.
Tor Wallin Andreassen
is an Associate Professor of Marketing at the Norwegian School of Management,
P.O.Box 580, N-1301 Sandvika, Norway. E-mail: [email protected], Tel: +47 67
55 73 27, Fax: +47 67 55 76 76. *) Corresponding author.
Line L. Olsen
Is a PhD-candidate at the Norwegian School of Management.
The authors would like to thank companies associated with the Center for Market Oriented
Management at the Norwegian School of Management for their support in this project. Data
provided by the Norwegian Customer Satisfaction Barometer is greatly appreciated.
2
Introduction
In the aftermath of the dotcom area the world is experiencing an economic down turn. Fuelled by
the September attack on the World Trade Center in the USA this development has taken a steeper
turn. Following a tight labor market in the USA and in most economies in Europe and Asia they
all report an increase in unemployment and an expected reduction in GDP. During 2001 The
Conference Board’s Consumer Confidence in the USA has fallen to its lowest reading since 1994.
According to Dismal Economist the Economic sentiment for Europe has also experienced a major
fall during 2001. Finally, most stock exchanges around the world report a significant fall during
2001 reflecting a substantial potential loss for shareholders. Based on this scenario it is fair to say
that most business mangers are under attack from various stakeholders. Action is called for!
Faced with reduced demand and increased competition service companies can focus cost cutting
activities or revenue generating activities to maintain short term profitability. Layoffs and the
search for leaner and meaner business models based on electronic commerce have been the
dominant response so far. Independent of the effect cost cutting will have on the bottom line in
the short run, the question remains as to what may happen to the top line if people is taken out of
the service value equation. The American Customer Satisfaction Index (ACSI) at University of
Michigan reports a continued reduction in perceived quality (as opposed to increased
expectations). Consequently the consolidated customer satisfaction score is down by 2.0
percentage points from 4Q 1994 to 2Q 2001. However insignificant this change may seem on the
aggregate level the critical part of this development becomes apparent when we link customer
satisfaction with customer expenditure and business performance. Recent data give strong
evidence for the impact a change in customer satisfaction in one quarter has on real personal
consumption expenditure (ACSI August 20, 2001) and corporate earnings (ASCI May 21, 2001)
in the following quarter. For service companies perceived quality is a function of both core
service and human interaction. According to ACSI (2001) service industries relative to ACSI
3
average experience a larger drop in customer satisfaction from 1994 to 1Q 2001, e.g. airlines –
15.3%, Hotels – 5.3%, Banks –5.4%, Life Insurance – 7.4%, and Utilities – 8%. Based on the
above we may claim that the majority of service industries suffer from a negative reduction in
perceived quality, followed by a reduced customer satisfaction and finally reduced profitability.
Short term cost cutting activities for service companies is to a large extent synonymous with
layoffs of onstage and backstage personnel. With fewer hands onboard service experience as
perceived by the customers may be threatened causing a further reduction in perceived quality,
satisfaction and revenue. Given this outlook the following question begs to be answered: What is
the importance of customer service for customer loyalty?
The purpose of this paper is to examine the impact of customer service on customer satisfaction,
relative attractiveness, and commitment (affective and calculative). A conceptual model treating
customer service, customer satisfaction, relative attractiveness and commitment as latent
variables with multiple attributes is proposed. Next, the results of an empirical study from the
banking industry testing the model are presented. Finally the implications of the findings are
discussed.
4
The conceptual model
Both profitability and ability to compete is dependent on how companies balance their short term
and long term cost cutting and revenue generating activities. Using productivity as an indicator of
effective cost cutting implies that companies are successful when they can produce more/ same
amount of output with the same/less amount of input. Whereas output is often associated with
volume (e.g. number of customers served per day) input for service organizations is more often
than not associated with salaries. Improving productivity by reducing costs that are linked to
customers’ service experience (e.g. reduced customer service) may prove to be counterproductive
in the long run. The challenge is to cut costs without reducing the service experience.
Redesigning the underlying processes which support upstream activities, i.e. operation, or
introducing self-service technology in down stream activities, i.e. customer interaction, are two
examples of effective cost cutting activities. Indicators of effective revenue generating activities
may include positive changes in customer satisfaction, corporate image and customers’
commitment to the company. When service managers reengineer the business model or introduce
self-service technology they very often free up human resources and capacity. Employing these
people in other areas valued by the customers (e.g. increased customer service) is an example of
effective revenue generating activities.
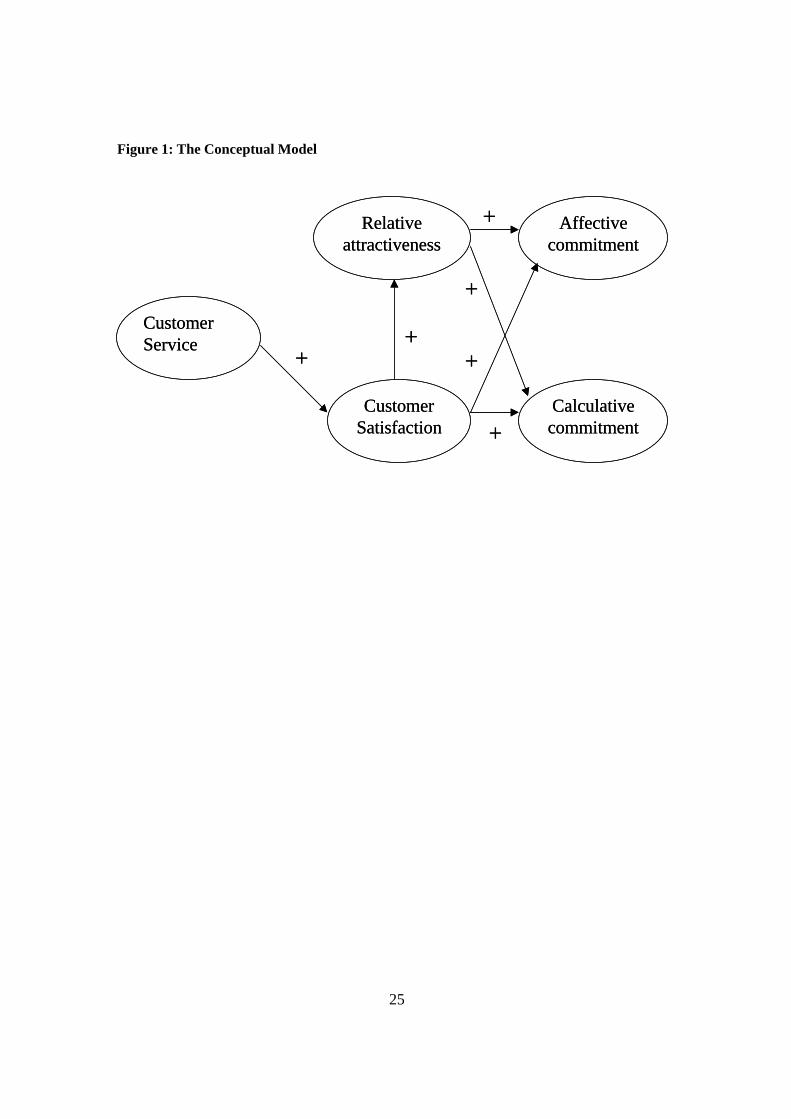
In our model we argue that customer service of high quality is positively linked to customers’
satisfaction judgment. We believe that the relationship is described as a classic ideal point or a
feasible ideal point (Parasuraman 1994) implying that customer service is a monovalent
dissatisfier (Oliver 1997, p 157), i.e. enough is enough after a certain point. Second, in keeping
with contemporary ROQ-literature (see for example Rust 1994; 2000) we argue that cumulative
customer satisfaction is linked to both affective and calculative commitment. Third, we argue that
cumulative satisfaction will update customers’ perception of the service provider’s relative
attractiveness. In our model relative attractiveness contains two dimensions, i.e. value
5
attractiveness and image attractiveness. Customers who report good/bad experience with
customer service will update their perception of the value delivered by the provider and their
overall attitude toward the provider. Customers may update their perceived relative attractiveness
of the supplier based on what the company does in society at large. For example if the supplier is
involved in illegal activities this may update customers’ image attractiveness of the supplier. A
change in either value or image attractiveness is believed to impact future behavior through loss
of relative attractiveness. Loss of relative attractiveness may stimulate exit or switching behavior.
Support for this argument is found in the least mean square learning model offered by Gluck and
Bower (1988 ). Finally, and in keeping with recent research using regret theory (see for example
Inman 1997) we argue that customers’ perception of the supplier’s relative attractiveness is
positively linked to consumer behavior, i.e. customers’ affective and calculative commitment.
The conceptual model is illustrated in Figure 1.
Place Figure 1 about here
Since relative attractiveness and commitment (calculative and affective) is not well established in
the service marketing and management literature we will elaborate on these two constructs in the
following section. We begin by investigating the link between customer satisfaction and relative
attractiveness.
Customer Satisfaction and Relative Attractiveness
Since the first article on customer satisfaction by Cardozo in 1965, customer satisfaction has
been subjected to comprehensive investigation. The definitions of customer satisfaction tend to
fall into two different categories; customer satisfaction as a process or as an end-state (Oliver
1993). For example Bearden (1983, p. 21) consider customer satisfaction “a positive outcome
6
from the outlay of scarce resources”, a view reflecting customer satisfaction as an end-state-of-
mind. However, it seems like most researchers define customer satisfaction in terms of a process.
Whereas Hunt (1977) defines customer satisfaction as “the evaluation of emotions”(p. 460),
Westbrook defines satisfaction as the “favorability of the individual's subjective evaluation”
(Westbrook 1980, p 49). Further, customer satisfaction may also be understood as “summary
psychological state resulting when the emotion surrounding disconfirmed expectations is coupled
with the consumer's prior feelings about the consumption experience” (Oliver 1981, p 27). The
most widely accepted of the process theories of satisfaction seems however to be that of
“expectancy disconfirmation, in which customer satisfaction is viewed as largely based on
meeting or exceeding expectations” (Rust, 1994, p 4). Based on this paradigm (Oliver, 1997, p
13) formulated the following definition of customer satisfaction, which serves as the frame of
reference for our understanding of the construct: “Satisfaction is the consumer's fulfillment
response. It is a judgment that a product or service feature, or the product or service itself,
provided (or is providing) a pleasurable level of consumption-related fulfillment, included levels
of under- or overfulfillment”.
From the above definitions it is understood that customer satisfaction is related to providing what
is being sought to the point where fulfillment is reached, resulting in a subjective evaluation of
emotions. The emotion occurs as a function of disconfirmation and relative output to input. The
end result is a positive or negative feeling of fulfillment.
In the following we will argue that fulfillment is not only absolute (that is meeting or exceeding
expectations) but also relative to other real alternatives.
Regret and satisfaction
A business professor takes a student to lunch. In the past she has always been satisfied with her
choice of salad. However, seeing what the student orders and receives makes her regret her
7
choice. Discovering that a forgone alternative would have led to a better outcome than the one
chosen is an unpleasant experience (Landman 1987). The experienced regret feeling is a
consequence of decision making under risk and can occur when customers appear, even after the
fact, to have made the wrong decision. For the customer each decision may have appeared to be
the right one at the time it was made. In this respect regret offers a 20-20-hindsight vision that
may impact future decisions. In a recent study (Inman, 1997) documented that performance
information about alternatives that were not chosen, can have a significant impact on post-choice
valuation. Satisfaction with one service encounter may turn into dissatisfaction when the
customer learns about the quality of the other supplier, which was forgone. Regret may stimulate
variety seeking or exit behavior (Hirschman 1970) if customers have information about a similar,
but better offer (Loomes 1982; Bell 1982).
Satisfaction and relative attractiveness
Over the past decade, a new set of models has been developed to explain how people learn,
remember, and react to stimuli. In a recent article Janiszewski and Osselaer (2000) elaborates on
Gluck and Bower’s (1988) adaptive learning model with the least mean squares (LMS) learning
rule. From these authors we can learn that LMS learning rule occurs when “the activation of a set
of sensory cues is passed on directly to a layer of output units, which in turn map onto a
response. After each response, feedback is received regarding the experienced outcome (e.g. what
really happened) for that set of cues. The system then adjusts the connection weights between the
sensory cues and the output units so that the discrepancy between expected outcome and
experienced outcome for each set of sensory cues is reduced.” Applying this to our setting means
that a change in customer satisfaction will over time be reflected in perceived relative
attractiveness. Whereas an increase will reinforce the relationship, a reduction may create
switching incentives.
8
Based on the above discussion we propose the following hypotheses for empirical testing:
H1: Customer service is positively correlated with customer satisfaction.
H2: Customer satisfaction is positively correlated with Relative attractiveness.
In the following section we will elaborate on affective and calculative commitment.
Commitment
The enduring desire of parties to maintain a relationship is at the core of commitment definitions
(Morgan and Hunt 1994). Recently, commitment has been introduced as one of the central
variables to ongoing service exchanges (Morgan and Hunt 1994). Based on the works of (Kumar
et al. 1994; Meyer and Allen 1984; Samuelsen 1997, Samuelsen and Sandvik 1997) two
dimensions of commitment are introduced to satisfaction modeling, i.e. calculative and affective
commitment. While calculative commitment is “colder”, more economical and rational,
affective commitment is a less rational, more affectionate and emotional based bond that ties the
customer to the service provider (Johnson et al. 2001). Findings indicate that customer
satisfaction is positively associated with both calculative and affective commitment (Kelley and
Davis 1994; Kelley et al. 1993; Samuelsen 1997; Samuelsen and Sandvik 1997) across industries
(Johnson et al. 2001). While, research on the relationship between customer satisfaction and
commitment slowly is taking form, the relationship between perceived relative attractiveness and
commitment remains less explored in marketing. Although, there are studies supporting the
positive effect of attraction of salespersons to customers on customers’ commitment to service
provider Jacobs et al. (2000), while Crosby and Johnson (2001) discuss the importance of
perceived relative attractiveness when building customers commitment to a brand and when
developing customer relationship management strategies. Finally, Andreassen and Lervik (1999)
found that perceived relative attractiveness today has a positive effect on customers’ loyalty to
9
service providers in both business to business and business to consumer markets, but future
relative attractiveness has an effect on customer loyalty only in business to consumer markets.
This is in keeping with Heide and Miner who claim (1992) that shadow of past interactions cast
shadows onto future interaction.
Despite the fact that relative attractiveness should be of most relevance to every service marketer
as a key factor in keeping up with the increasing competition, further research on the effect of
perceived relative attractiveness on behavioral intentions should be conducted. As service
marketers are in dire need to tie the customers to their business in different ways we should focus
on other aspects or phases of customer loyalty like, affective and calculative commitment (Oliver
1997). From this we can draw that:
H3: Customer satisfaction is positively correlated with affective and calculative
commitment.
H4: Relative attractiveness is positively correlated with affective and calculative
commitment.
Following hypothesis H1 through H4 we will anticipate that due to the positive correlations among
the constructs that each construct score will be different between customers who perceive the
quality of customer service to be high and low. Further, we believe that customers reporting low
scores in customer service are characterized by having a somewhat less affectionate relationship
with the supplier. In keeping with this we propose the following hypothesis for empirical testing.
10
H5: Customers reporting low scores on customer service are more likely to
report significantly lower scores on customer satisfaction, relative
attractiveness and affective commitment than customers reporting high
scores on customer service.
Since customers who report a low customer service score are believed to have a somewhat colder
relationship with the supplier than customers reporting high scores we propose the following:
H6: Customers reporting low scores on customer service are more likely to
report higher scores on calculative commitment than customers reporting
high scores on customer service and vice versa.
Initially we believe that customer service is important for relative attractiveness and both forms of
commitment to the supplier. However, for customers who report a low score in perceived
customer service we anticipate that because it is important to them and because the supplier is not
doing a good enough job, we believe that the correlation coefficient between customer service à
customer satisfaction; customer satisfaction à relative attractiveness; relative attractiveness à
affective and calculative commitment to be stronger thus reflecting a higher importance than for
the other group. In keeping with this we propose the following hypothesis for empirical testing.
H7: For customers reporting low scores on customer service the correlations
between constructs are significant stronger than for those who report a high
score for customer service.
11
Methods:
Banking industry is chosen as the context of investigation for this study. There are several
reasons for this. First, banking is among the most technological advanced services today.
Customers can choose in how they want to interact with the bank or its employees, e.g. calling the
bank, visiting the bank, ATMs, pay by phone or pay over the Internet, etc. Second, banking
industry around the world is under reorganization, changing from smaller to larger units as well
as constantly seeking new and more efficient businesses models. Through mergers and
acquisition and intensive use of technology in both upstream and down stream activities
numerous employees have been given notice over the years. According to the ACSI customer
satisfaction with banks is down by 5 percentage points since 1994.
A cross-sectional study was chosen for the purpose of this study. The data was collected through
the annual data collection for the Norwegian Customer Satisfaction Barometer. The collection
was conducted by a professional marketing research bureau and took place the winter of 2000.
The respondents were interviewed by telephone. Prospective respondents who were not available
on the first call were called back three times before a substitute was picked. Each interview lasted
approximately 15 minutes. This subsample consists of the banking industry represented by the
four most important banks in Norway.
Measures:
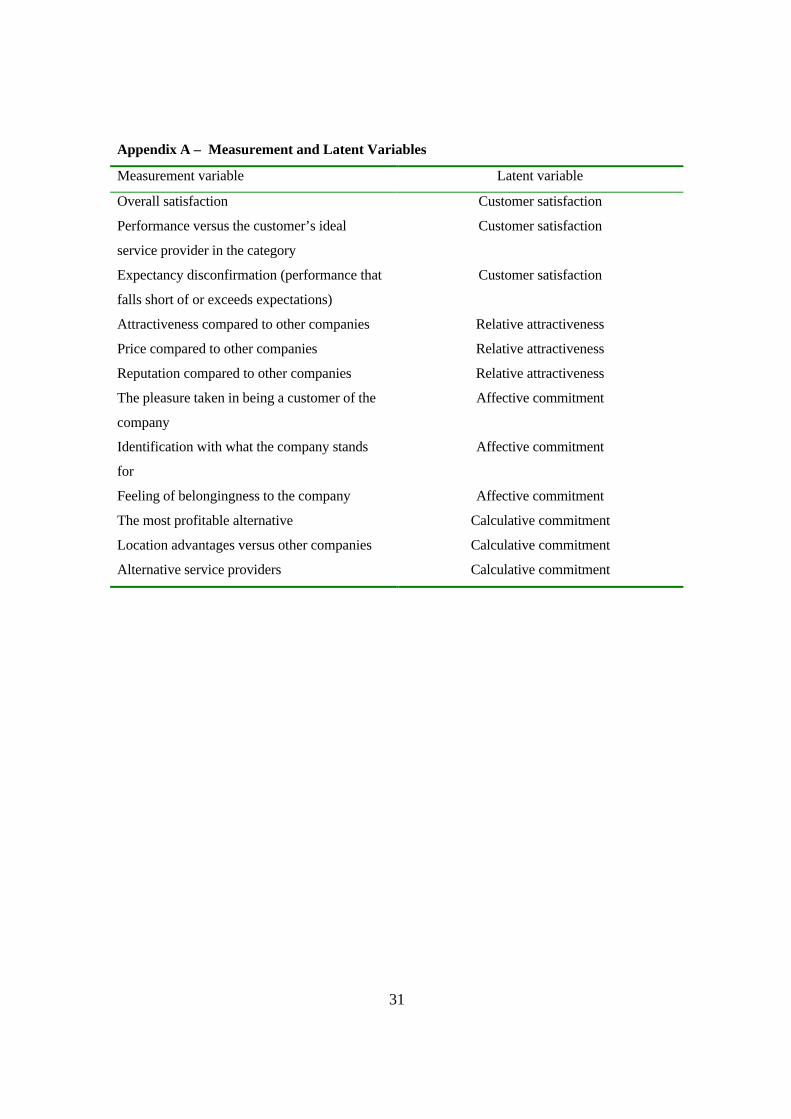
Customer satisfaction is operationalized in accordance with the national customer satisfaction
indexes (Johnson et al. 2001), and by three indicators, see appendix A. Building on Andreassen
and Lervik’s (1999) operationalization of relative attractiveness the construct is extended by three
indicators (see appendix A). Affective and calculative commitment is operationalized as
suggested by Kumar et al. (1994) and Samuelsen (1997) with minor adjustments to this context
and measured by 3 items each (see appendix A). A 10 point Likert-type scale was applied,
12
exclusively with positive values ranging from 1 to 10. The questionnaire consisted of two
different scales anchored by “disagree” to “agree” and “dissatisfied” to “satisfied”. Respondents
were provided with a “don’t know” and “and cannot answer” in case of indifference or lack of
knowledge.
Reliability and validity:
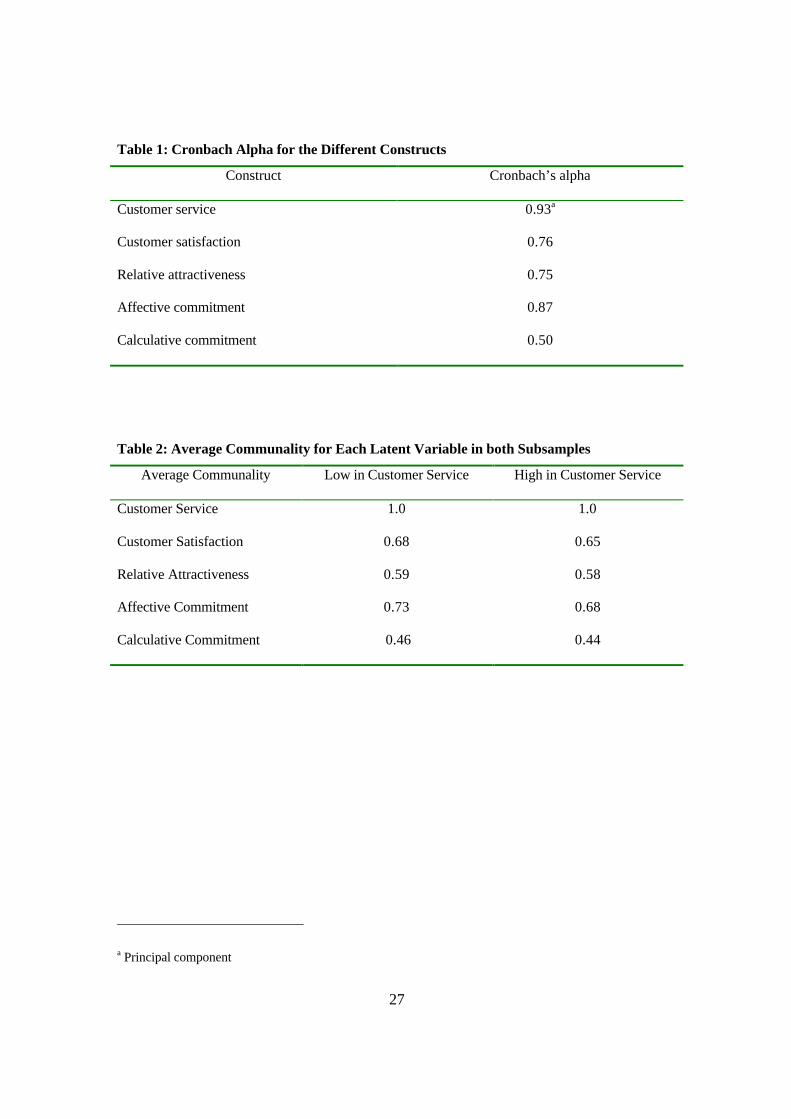
Place Table 1 about here
From Table 1 we learn that the Cronbach’s alpha coefficients for all constructs but calculative
commitment (.50) are well above the recommended .70 level (Nunnally 1978).
Customer service:
For the purpose of the rest of the analyses we use a principal component for customer service.
We identified this factor by running a principal component analysis (using SPSS) on all of the
customer service measures. The program saved the first factor as another variable in the data set.
Consequently customer service is a standardized variable, with a standard deviation of 1 and a
mean of 0 (SPSS 2001).
13
Sample Descriptives: high versus low score on customer service
The total sample consists of 899 respondents. Of these respondents 378 report a low score (< 8 on
a 10 point scale) on Customer Service and 578 report a high score (= or > 8 on a 10 points scale).
There were no particular demographic characteristics distinctive to either group. In the low score
sample, 52 % of the respondents are men and 48 % women. In the high score group, 48 % are
men and 52 % women. The average duration of the customer bank relation is 15 years in the low
score group, and 17 years in the high score sample. In the low score group 26 % of the
respondents reported that they have their “personal” contact person in the bank, i.e. 74 % report
that they do not have such a contact person. In the high score sample 51 % report that they do not
have a personal contact person. In the low score group, 53 % have a degree from a university,
while only 37 % have a degree from a university in the high score sample. In the low score
sample, the average score on the ease of evaluating services is 4.58 (on a 10 points scale), in the
high on customer service group the same average is 5.54.
Model Results: PLS Analysis
The proposed model was estimated using two different estimation methods. We use PLS (Wold
1989) following the procedure suggested by (Fornell 1992; Fornell et al. 1996; Johnson et al.
2001) as the primary estimation method following Fornell and Jaesung (1994), Steenkamp and
Trijp (1996). We add covariance analysis using LISREL (Jöreskog and Sörbom 1999), to make
sure that the model we test is robust following Kujala and Johnson (1993).
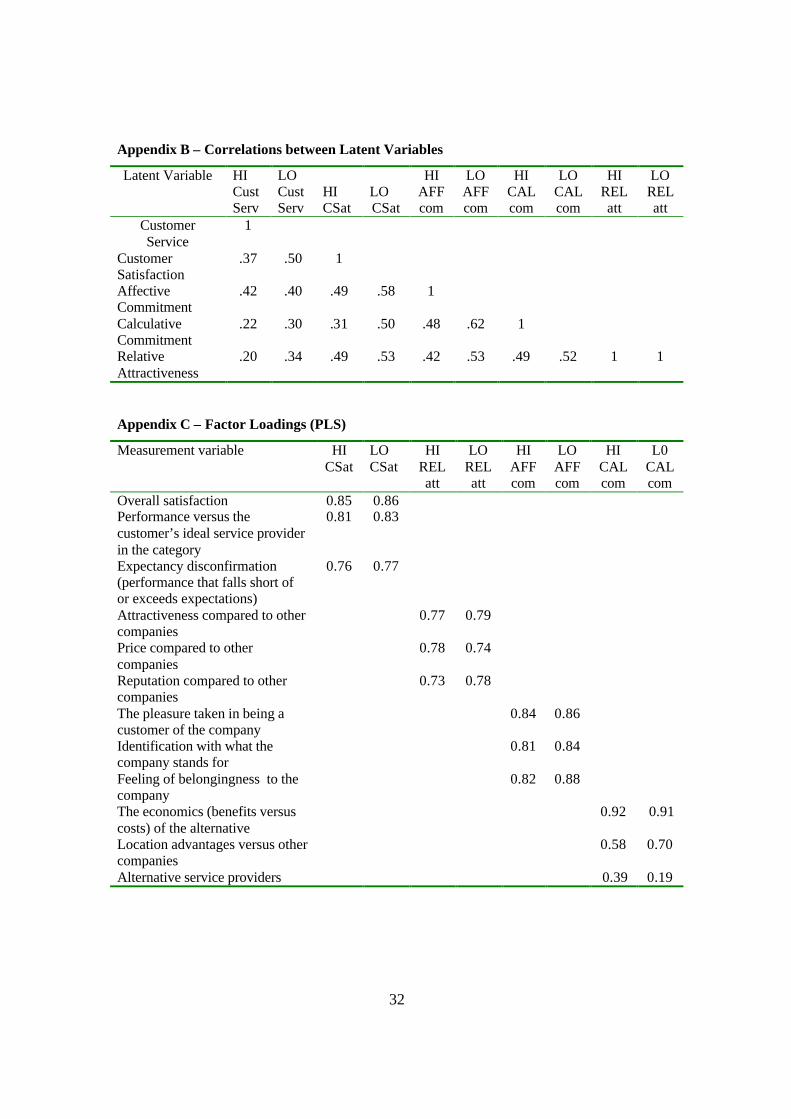
Overall, the measurement variable (MV) loadings in each of the two samples are relatively large
and positive. In both samples 11 of 13 indicators (84 %) have correlations coefficients
exceeding .707. Thus sharing more than 50 % of the variance with their respective constructs e.g.

14
Johnson et al. (2001). This is referred to as communality (Fornell and Cha 1994). Table 2 reports
the average communality for each latent variable in the two samples.
Place Table 2 about here
The average communality should be >.50. From Table 2 we see that there is only one latent
variable falling below in each subsample, i.e. calculative commitment. Still, the values are very
close to .50 (.46 and .44). The rest of the latent variables are all exceeding the 0.5 criterion.
Validity: following Fornell (1992), Fornell et al. (1996) and Johnson et al. (2001) we explored
whether each latent variable shares more variance with its indicators than it does with other
constructs in the model. This is examined by looking at the percentage of LV loadings (see
Appendix B for correlations between the latent variables) that exceed the MV correlations (see
Appendix C for factor loadings provided by PLS). When conducting this examination we see that
6 of 104 MVs (6 %) are falling below the correlation between the LVs. All indicators falling
below are used to measure calculative commitment. We therefore conclude that both the
convergent and discriminant validity in the model is strong. Any weaknesses are concentrated in
the calculative commitment part of the model.
To evaluate the latent variable results, we examine the size and the significance of the predicted
path coefficient. We then evaluate the model’s ability to explain variation in the endogenous
variables, relative attractiveness, satisfaction, calculative and affective commitment. Again,
following Fornell et al. (1996); Johnson et al. (2001) Jackknife estimates were generated to

15
evaluate the significance of the paths. As most of the path coefficients are significant only those
paths that are not significant p>.05 are marked in the table. Out of the 12 paths (6 paths * 2
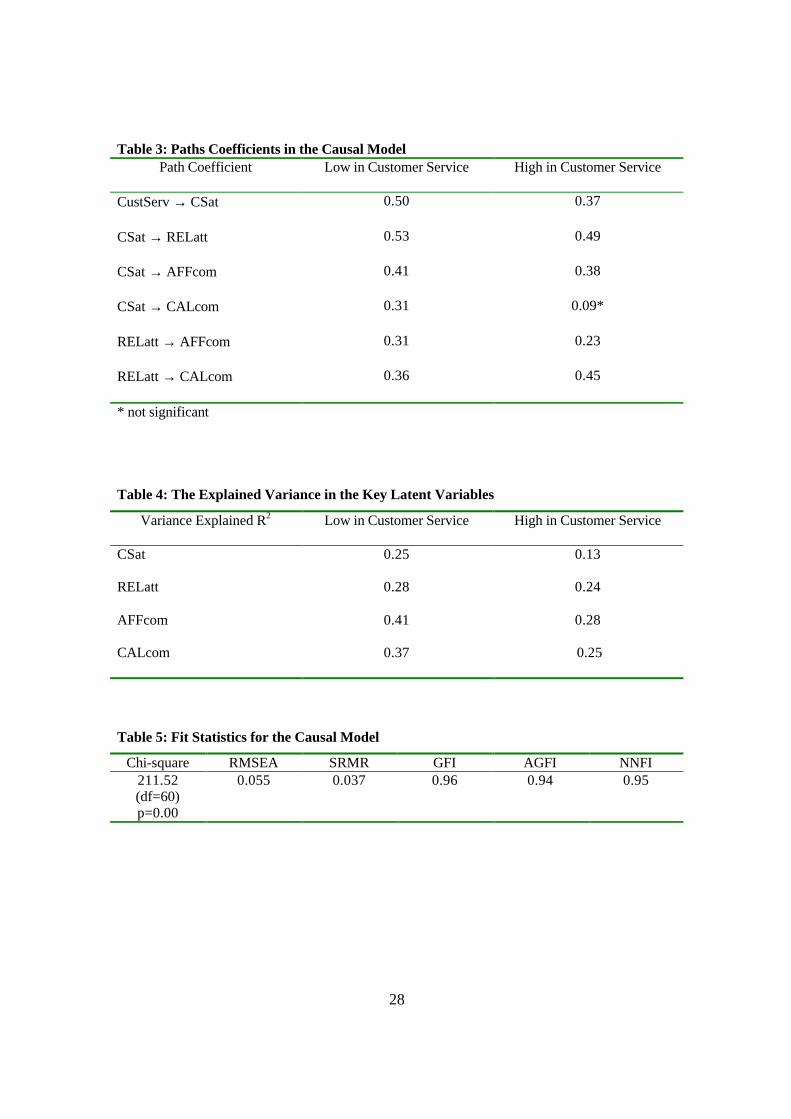
samples) only 1 was insignificant (8 %). Table 3 reports the size and significance of each path for
each sample.
Place Table 3 about here
The only insignificant path is the path between customer satisfaction and calculative
commitment, found in the subsample reporting a high score on customer service.
The second indicator of the model’s performance is its ability to explain the important latent
variables in the model. Explained variance in the endogenous variables by subsample is reported
in Table 4.
Place Table 4 about here
From Table 4 we see that the explained variance is varying somewhat across the two groups.
Customer satisfaction is only explained by 13 % in the group reporting a high score on customer
16
service, in the group reporting a low score on customer service, customer satisfaction is explained
by 25 %. Whereas the differences between the two groups are smaller concerning the explained
variance of relative attractiveness (28 and 24 %), the differences are larger concerning affective
and calculative commitment across the two groups. It seems to be a consistent pattern across the
constructs that explained variance is lower in the sample reporting high scores on customer
service than in the sample reporting a lower score on customer service. We see that explained
variance is ranging from 13 to 28 % (23% on average) in the sample reporting high scores on
customer service and from 25 to 41 % (33 % on average) in the sample reporting a low score on
customer service. Explained variance is somewhat low in the sample reporting a high score on
customer service but in line with previous research (see for example Fornell 1996) in the sample
reporting a low score on customer service. The relative small amount of variance explained in
the latent variables may be due to few antecedents in the model (Johnson et al. 2001). Making the
model more complex by adding constructs would improve explained variance.

17
Model Results: LISREL Analysis
In order to make sure that the model is robust, we analyzed the data using covariance structure
analysis (LISREL) as well. As the data are truncated into two different samples both samples are
highly skewed and violate the main assumption for running LISREL analyses. Realizing that non
normality may cause problems to our analysis we transformed the data set using PRELIS based
on Jöreskog and Sörbom's (1999) recommendations. We tested the conceptual model using the
two-step approach suggested by Anderson and Gerbing (1988). First, we tested the measurement
models and then the causal model. As recommended by Anderson and Gerbing (1988), we
looked at all factors and their respective error terms (factor + 2 * error term) and checked that
they do not include the number 1. Next, we conducted chi square differences tests on whether or
not two constructs belong to the same factor or are different from each other. Our factors and
constructs all pass these tests. Although, it should be mentioned that one of the indicators
measuring calculative commitment is very high (.99), and that calculative and affective
commitment are very close yet distinct constructs. All in all, and based on the measurement
models and the tests we conducted, we can draw that the convergent and discriminant validity
both are satisfactorily. In between the first and the second step, as recommended by Anderson
and Gerbing (1988), we added another step where we entered all the constructs in the model at
the same time and computed them as exogenous variables (ksis). We did this in order to reveal
any potential conflicts between the constructs before we tested the structural model. This model
provided acceptable fit statistics and did not reveal any particular problems between the
constructs. Finally, we run the structural model, which provides assessments of nomological
validity (Anderson and Gerbing 1988). In Table 5 the fit statistics for the causal model are
reported.
18
Place Table 5 about here
In Table 5 both absolute and incremental fit statistics (Bollen 1989; Gerbing and Anderson 1993;
Marsh et al. 1988) are reported. Of the absolute fit statistics we examine the chi-square (Jöreskog
and Sörbom 1989), GFI (Jöreskog and Sörbom 1989), SRMR (Bentler 1995), the RMSEA
(Browne and Cudeck 1992; Steiger 1989). Of the incremental fit statistics we review AGFI
(Jöreskog and Sörbom 1989; Bentler 1983) and NNFI (Bentler and Bonett 1980). According to
the different cut off criteria (see Hu and Bentler 1998; 1999 for an overview), we can draw that
our causal model is within the acceptable range of all fit statistics but the chi-square. The
RMSEA is below .08, the SRMR is low, GFI is well above .90, as is AGFI and NNFI. As the
chi-square is sensitive to the sample size and both samples in this study are larger than 250, this is
not a very good indicator of model fit, as minor misspecifications may become significant due to
sample size. In summary we will claim that the model fits the data reasonably well.
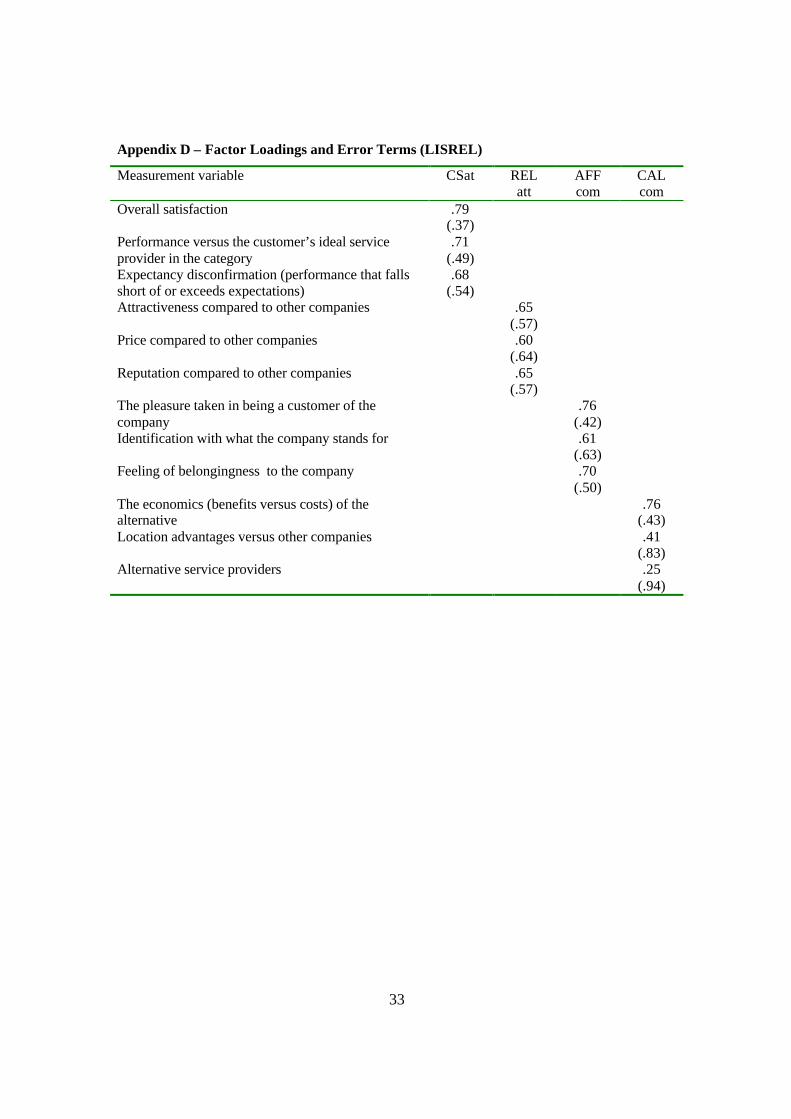
Factor loadings and error terms:
Besides examining these fit statistics we also looked at the factor loadings and the error terms.
While the factor loadings are similar to the ones provided by PLS, they are somewhat lower. The
error terms are all positive and significant. Most of them are within an acceptable range. Some
high terms were found for the measures operationalizing calculative commitment (see Appendix
D). Despite some high error terms for two of the calculative commitment indicators, we included
19
these indicators in the model for theoretical reasons, which is in line with what Anderson and
Gerbing (1988) suggest. We then examine the paths and if they were consistent with the PLS
results. All in all we conclude that the LISREL analysis support the PLS findings. All of the
paths are significant, but the path between customer satisfaction and calculative commitment,
although it is only true for the high in customer service sample in the PLS analyses.
Testing Hypotheses:
Before testing the hypotheses, we tested for the differences between the two groups. In order to
do so we ran independent t-tests. The results from these tests are reported in Table 6.
Place Table 6 about here
From Table 6 we can see that there are significant differences between the two groups and how
they score on customer satisfaction, relative attractiveness, affective and calculative commitment.
In all cases, the customers reporting high on customer service score significantly higher than
those reporting low on customer service.
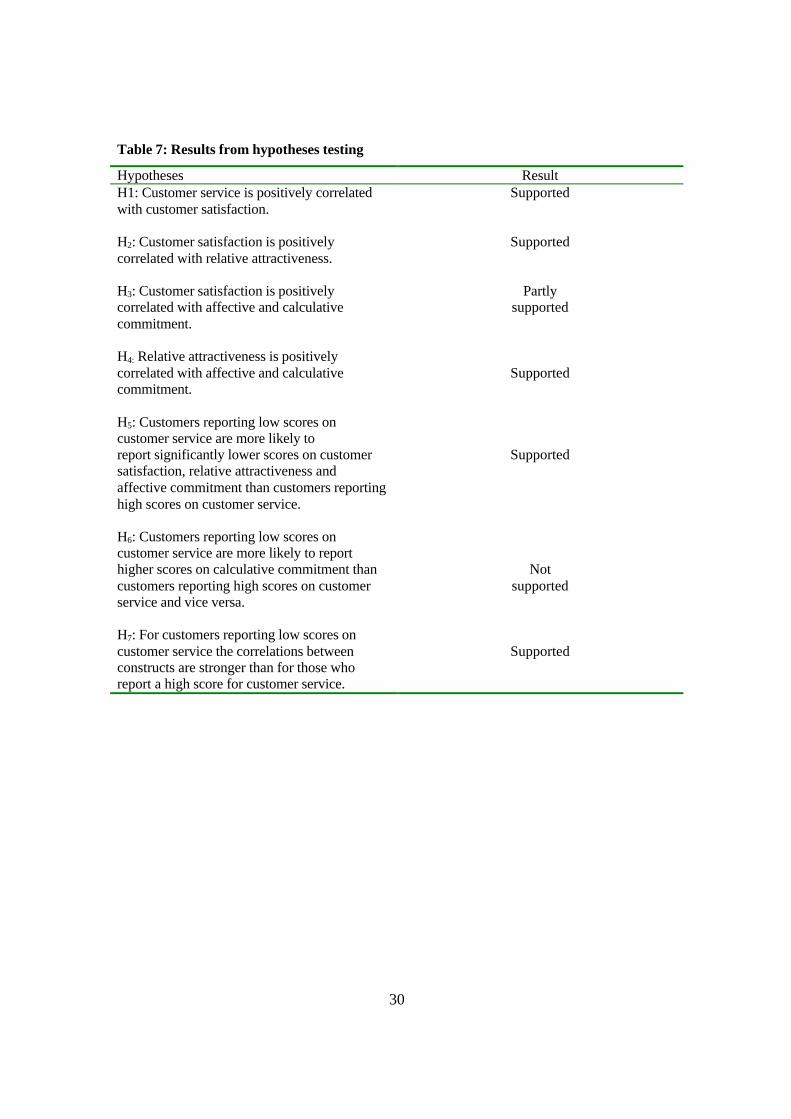
Then the 6 hypotheses were tested. The results from the tests are reported in Table 7 below.
20
Place Table 7 about here
From Table 7 we see that all hypotheses but number 6 are supported. Hypothesis 3 is only
partially supported. In summary we find a significant positive correlation between
customer service and customer satisfaction, customer satisfaction and relative attractiveness in
both samples. We do find that customer satisfaction is positively correlated with affective
commitment in both samples, while only positively correlated with calculative commitment in the
sample scoring low on customer service. Another finding is that customers scoring low on
customer service tend to score lower than the other group on all other constructs as well, i.e.
customer satisfaction, relative attractiveness and affective commitment. They do also tend to
score lower than the other group on calculative commitment, which is contradicting our
hypothesis. Also, the LISREL analyses support this finding. Here we find the path between
customer satisfaction and calculative commitment to be insignificant as well.
Customers who report a high score on customer service have weaker correlations among the
constructs plus higher construct scores. The fact that hypothesis 6 is supported reflects our
anticipation that customer service is important.
21
Discussion:
The purpose of this study was to investigate the impact of customer service on customer
satisfaction, relative attractiveness and commitment (affective and calculative). A conceptual
model treating customer service, customer satisfaction, relative attractiveness and commitment as
latent variables with multiple attributes is proposed and hypotheses developed. We find support
for all hypotheses, but number 5. However, hypothesis 2 is only partially supported. In summary
we find a significant positive correlation between customer satisfaction and relative attractiveness
in both samples. We do find that customer satisfaction is positively correlated with affective
commitment in both samples, while only positively correlated with calculative commitment in the
sample scoring low on customer service. Another finding is that customers scoring low on
customer service tend to score lower than the other group on all other constructs as well, i.e.
customer satisfaction, relative attractiveness and affective commitment. They do also tend to
score lower than the other group on calculative commitment, which is contradicting our
hypothesis. Also, the LISREL analysis support this finding and we can draw that we have a set of
findings that are robust and thus have external validity. Hypothesis 6, was testing the importance
of customer service. As anticipated we find that for customers who report low scores on customer
service reflect the importance of this function to them through higher correlation coefficients than
the other group. This finding implies that customer service is important to customers and a
organizational function service companies should proceed with causing when cutting costs.
22
Managerial implications
There are several managerial implications from this study. Clearly customer service is a key
driver of customer satisfaction, which in turn drives relative attractiveness and customers’
affective and calculative loyalty to the service provider. Relative attractiveness does also have an
important role in this model, driving both calculative and affective customer loyalty.
A service company is competitive when it can (more than) cover its costs through obtained prices
in the market. Companies who can maintain profitability in the long run are often characterized as
having obtained a sustainable competitive advantage. According to Porter (1980, 1985) a
company can pursue one of two strategies; cost leader or differentiator. Whereas cost leaders
obtain market price with lower operating costs, differentiators are described as obtaining a higher
than market price with higher operating costs than cost leaders. Executed successfully both
strategies will generate a return on investment higher than average. By nature making service
available to the public for purchase or consumption will generate a need for interaction between
the supplier and the customers. Customer service, in one form or another is something most
companies will offer in order to provide existing or potential customers information related to
their purchase or use of the service. In this study we have investigated the impact customer
service may have on perceived relative attractiveness and commitment. For managers of service
organizations pursuing a cost leader or differentiator strategy this study will be useful en several
ways. First of all, satisfied customers tend to be loyal. Customer service is a strong driver of
customer satisfaction, perceived relative attractiveness and commitment (i.e. calculative and
affective). As such customer service is a revenue generating activity of interest to both forms of
strategy. Improved customer service may stimulate existing customers to maintain their retention
rate or to increase current consumption pattern. Second, an improvement in customer services
may create a positive surprise and a stronger emotional tie due to customer delight. Third, due to
customer satisfaction’s direct and indirect link to relative calculative and affective commitment,
improving customer service may bring the customer higher up in Oliver’s loyalty hierarchy
23
(1999) thus create a stronger bond between the customer and the supplier. Finally, perceived
improvements in customer service by existing customers may create positive word of mouth thus
attracting new customers to the supplier. In summary we will claim that improving customer
service may help the company to increase existing customers’ lifetime value by creating stronger
bonds with the supplier, and create more positive word of mouth. All true elements of a revenue
creating activity. The prove of this claim may be found in companies known to the market as very
good on customer service, e.g. eBay.com, Barnes & Noble, Amazon.com, Charles Schwab.
According to ACSI they all were rewarded with very high customer satisfaction in 2000 (80, 77,
84, and 76 respectively; scale 0 – 100) and shares which during the last three years traded at
(Amazon, Charles Schwab) or above (eBay.com, Barnes & Noble) the market. Reversing the
argument, the airline industry has over the years tried to improve bottom line by becoming more
efficient. Both upstream and down stream activities have taken major cuts. Not surprisingly do
this industry perform significantly below the ACSI average since 4Q 1994 (ACSI May 21, 2001).
Shareholders should be concerned to know that the difference in airline industry satisfaction is
accelerating in negative direction compared to ACSI satisfaction. Finally, eToys.com was a short-
lived company who, to a large extent, went bankrupt due to mediocre customer service and
dissatisfied customers. Service managers’ current practice appears to be in stark contrast to these
findings as we see a tendency to focus cost cutting activities by reducing people in the service
experience equation.
24
Avenues for Future Research
There are several avenues for future research that crystallize from this study. We have identified
the importance of customer service to customer satisfaction, perceived relative attractiveness and
commitment. Relevant follow up questions could then be “what is driving customer service?”
and “what are the organizational support systems necessary in order for the front personnel to
provide excellent customer service for “brick & mortar” companies and “click & mortar
companies?” Finally a question in dire need of investigation is “what are the characteristics of
excellent front personnel?” After all it is not a matter of whether or not to focus customer service
when the going gets though, it is all about how a service provider can build the most effective
support system for the customer service to get going.
25
Figure 1: The Conceptual Model
CustomerService
Relativeattractiveness
Calculativecommitment
Affectivecommitment
CustomerSatisfaction
++
+
+
+
+CustomerService
Relativeattractiveness
Calculativecommitment
Affectivecommitment
CustomerSatisfaction
++
+
+
+
+
26
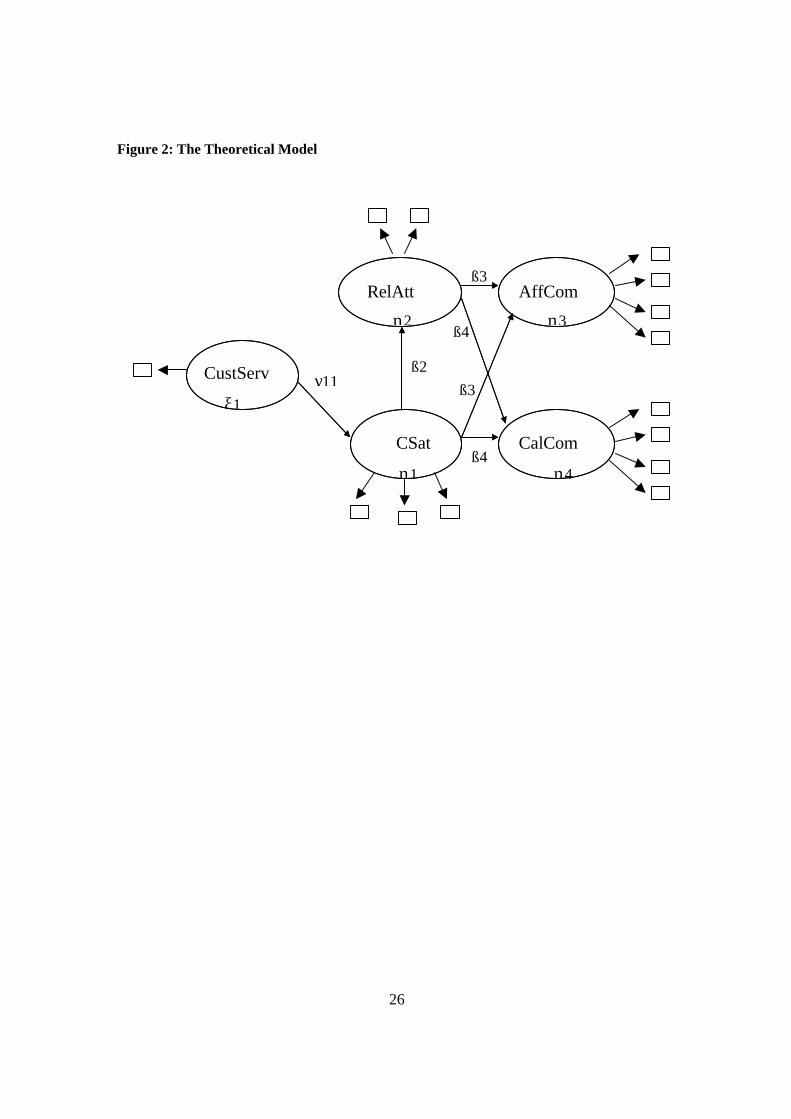
Figure 2: The Theoretical Model
RelAtt
CSat
CustServ
CalCom
AffCom
ß3
ß4
ß4
ß3
ß2γ11
η2
η1
η3
η4
ξ1
27
Table 1: Cronbach Alpha for the Different Constructs
Construct Cronbach’s alpha
Customer service 0.93a
Customer satisfaction 0.76
Relative attractiveness 0.75
Affective commitment 0.87
Calculative commitment 0.50
Table 2: Average Communality for Each Latent Variable in both Subsamples
Average Communality Low in Customer Service High in Customer Service
Customer Service 1.0 1.0
Customer Satisfaction 0.68 0.65
Relative Attractiveness 0.59 0.58
Affective Commitment 0.73 0.68
Calculative Commitment 0.46 0.44
a Principal component
28
Table 3: Paths Coefficients in the Causal Model Path Coefficient Low in Customer Service High in Customer Service
CustServ → CSat 0.50 0.37
CSat → RELatt 0.53 0.49
CSat → AFFcom 0.41 0.38
CSat → CALcom 0.31 0.09*
RELatt → AFFcom 0.31 0.23
RELatt → CALcom 0.36 0.45
* not significant
Table 4: The Explained Variance in the Key Latent Variables
Variance Explained R2 Low in Customer Service High in Customer Service
CSat 0.25 0.13
RELatt 0.28 0.24
AFFcom 0.41 0.28
CALcom 0.37 0.25
Table 5: Fit Statistics for the Causal Model
Chi-square RMSEA SRMR GFI AGFI NNFI 211.52 (df=60) p=0.00
0.055 0.037 0.96 0.94 0.95

29
Table 6: T-test Results
Mean Low Mean High Mean Difference Customer satisfaction 6.26 8.00 1.74
p=0.0 Relative attractiveness 5.88 7.17 1.29
p=0.0 Affective commitment 5.14 7.31 2.17
p=0.0 Calculative commitment
4.64 5.58 0.94 p=0.0
30
Table 7: Results from hypotheses testing
Hypotheses Result H1: Customer service is positively correlated with customer satisfaction.
Supported
H2: Customer satisfaction is positively correlated with relative attractiveness.
Supported
H3: Customer satisfaction is positively correlated with affective and calculative commitment.
Partly
supported
H4: Relative attractiveness is positively correlated with affective and calculative commitment.
Supported
H5: Customers reporting low scores on customer service are more likely to report significantly lower scores on customer satisfaction, relative attractiveness and affective commitment than customers reporting high scores on customer service.
Supported
H6: Customers reporting low scores on customer service are more likely to report higher scores on calculative commitment than customers reporting high scores on customer service and vice versa.
Not supported
H7: For customers reporting low scores on customer service the correlations between constructs are stronger than for those who report a high score for customer service.
Supported
31
Appendix A – Measurement and Latent Variables
Measurement variable Latent variable
Overall satisfaction Customer satisfaction
Performance versus the customer’s ideal
service provider in the category
Customer satisfaction
Expectancy disconfirmation (performance that
falls short of or exceeds expectations)
Customer satisfaction
Attractiveness compared to other companies Relative attractiveness
Price compared to other companies Relative attractiveness
Reputation compared to other companies Relative attractiveness
The pleasure taken in being a customer of the
company
Affective commitment
Identification with what the company stands
for
Affective commitment
Feeling of belongingness to the company Affective commitment
The most profitable alternative Calculative commitment
Location advantages versus other companies Calculative commitment
Alternative service providers Calculative commitment
32
Appendix B – Correlations between Latent Variables
Latent Variable HI Cust Serv
LO Cust Serv
HI CSat
LO CSat
HI AFF com
LO AFF com
HI CAL com
LO CAL com
HI REL att
LO REL att
Customer Service
1
Customer Satisfaction
.37 .50 1
Affective Commitment
.42 .40 .49 .58 1
Calculative Commitment
.22 .30 .31 .50 .48 .62 1
Relative Attractiveness
.20 .34 .49 .53 .42 .53 .49 .52 1 1
Appendix C – Factor Loadings (PLS)
Measurement variable HI CSat
LO CSat
HI REL att
LO REL att
HI AFF com
LO AFF com
HI CAL com
L0 CAL com
Overall satisfaction 0.85 0.86 Performance versus the customer’s ideal service provider in the category
0.81 0.83
Expectancy disconfirmation (performance that falls short of or exceeds expectations)
0.76 0.77
Attractiveness compared to other companies
0.77 0.79
Price compared to other companies
0.78 0.74
Reputation compared to other companies
0.73 0.78
The pleasure taken in being a customer of the company
0.84 0.86
Identification with what the company stands for
0.81 0.84
Feeling of belongingness to the company
0.82 0.88
The economics (benefits versus costs) of the alternative
0.92 0.91
Location advantages versus other companies
0.58 0.70
Alternative service providers 0.39 0.19
33
Appendix D – Factor Loadings and Error Terms (LISREL)
Measurement variable CSat REL att
AFF com
CAL com
Overall satisfaction .79 (.37)
Performance versus the customer’s ideal service provider in the category
.71 (.49)
Expectancy disconfirmation (performance that falls short of or exceeds expectations)
.68 (.54)
Attractiveness compared to other companies .65 (.57)
Price compared to other companies .60 (.64)
Reputation compared to other companies .65 (.57)
The pleasure taken in being a customer of the company
.76 (.42)
Identification with what the company stands for .61 (.63)
Feeling of belongingness to the company .70 (.50)
The economics (benefits versus costs) of the alternative
.76 (.43)
Location advantages versus other companies .41 (.83)
Alternative service providers .25 (.94)
34
References
Anderson, J. C. and D. W. Gerbing. 1988. Structural Equation Modeling in Practice: A Review
and Recommende Two-Step Approach. Psychological Bulletin, 103, 411-423.
Andreassen, T. W. and L. Lervik. 1999. Perceived Relative Attractiveness Today and Tomorrow
as Predictors of Future Repurchase Intention. Journal of Service Research, 2(2), 164-172.
Bearden, W. O., J. E. Teel, 1983. Selected Determinants of Consumer Satisfaction
and Complaint Reports. Advances in Consumer Research. ed. T. C. Kinnear. Provo, UT:
Association for Consumer Research.
Bell, D. E. 1982. Regret in Decision Making under Uncertainty. Operational Research, 30, 961-
980.
Bentler, P.M. 1983. Some Contributions to Efficient Statistics for Structural Models.
Psychological Bulletin, 107, 238-246.
Bentler, P. M. 1995. EQS: Structural Equations Program Manual. Encino, Multivariate Software.
Bentler, P. M. and D. G. Bonett .1980. Significance Tests and Goodness of Fit in the Analysis of
Covariance Structures. Psychological Bulletin, 88, 588-606.
Bollen, K. A. 1989. A New Incremental Fit Index for General Structural Equation Models.
Sociological Research and Methods, 17, 256-259.
35
Browne, M. W. and R. Cudeck. 1992. Alternative Ways of Assessing Model Fit. Sociological
Methods and Research 21(2), 230-258.
Crosby, L. A. and S. L. Johnoson. 2001. Branding and Your CRM Strategy. Marketing
Management, July/August, 6-7.
Fornell, C. 1992. A National Customer Satisfaction Barometer: The Swedish Experience. Journal
of Marketing, 56, 6-21.
Fornell, C. and J. Cha. 1994. Partial Least Squares. Advanced Methods of Marketing Research.
R. Bagozzi, P. Cambridge, Blackwell, 52-78.
Fornell, C., M. D. Johnson, E.W. Anderson, J. Cha and B. E. Bryan. 1996. The American
Customer Satisfaction Index: Nature, Purpose and Findings. Journal of Marketing, 60(October),
7-18.
Gerbing, D. W. and J. C. Anderson. 1992. Monte Carlo Evaluations of Goodness-of-Fit Indexes
for Structural Equation Models. Sociological Methods and Research, 25, 186-192.
Gluck, M. and G. H. Bower. 1988. From Conditioning to Category Learning: An Adaptive
Network Model. Journal of Experimental Psychology: General, 117, 227-47.
Heide, J. B. and A. S. Miner. 1992. The Shadow of the Future: Effects of Anticipated
Interaction and Frequency of Contact on Buyer-Seller Cooperation. Academy of
Management Journal 35, 265-291.
36
Hirschman, A. O. 1970. Exit, Voice, and Loyalty: Responses to Decline in Firms,
Organizations, and States Cambridge: Harvard University Press.
Hu, L. and P. M. Bentler. 1999. Cutoff Criteria for Fit Indexes in Covariance Structure Analysis:
Conventional Criteria Versus New Alternatives. Structural Equation Modeling, 6(1), 1-55.
Hunt, H. K. 1977. CS/D-Overview and Future Research Direction. In Conceptualization and
Measurement of Customer Satisfaction and Dissatisfaction, ed. H. K. Hunt, L. Hu and P. M.
Bentler. 1998. Fit Indecxs in Covariance Structure Modeling: Sensitivity to Underpatametrized
Model Misspecification. Psychological Methods, 3(4), 424-453.
Inman, J. J., J.S. Dyer and J. Jia. 1997. A Generalized Utility Model of Disappointment and
Regret Effects on Post-Choice Valuation. Marketing Science, 16, 2, 97-112.
Jacobs, R. S., Hyman, M. R. and McQuitty, S. 2000. Exchange-Specific Self-Disclosure,
Social Self-Disclosure and Personal Selling. Journal of Marketing Theory and
Practice, (Winter), 48-62.
Janiszewski,C. and S.M.J. Osselaer. 2000. A Connectionist Model of Brand-Quality
Associations. Journal of Marketing Research, XXXVII, 331-350.
Johnson, M. D., A. Gustafson, T. W. Andreassen, L. Lervik and J. Cha. .2001. The evolution and
future of national customer satisfaction index models. Journal of Economic Psychology, 22(2),
217-245.
37
Jöreskog, K. and D. Sörbom. 1999. LISREL. Chicago, Scientific Software Interntaional, Inc.
Jöreskog, K. G. and D. Sörbom. 1989. LISREL 7: A Guide to the Program and Applications.
Chicago, Scientific Software.
Kelley, S. W. and M. A. Davis .1994. Antecedents to customer expectation for service recovery.
Journal of the Academy of Marketing Science, 22(1), 52-61.
Kelley, S. W., K. D. Hoffman and M. A. Davis. 1993. A typology of retail failures and
recoveries. Journal of Retailing, 69(4), 429-452.
Kujala, J., T. and M. D. Johnson. 1993. Price knowledge and serach behavior for habitual, low
involvement food purchases. Journal of Economic Psychology, 14(2), 249-266.
Kumar, N. J., J. D. Hibbard and L. W. Stern. 1994. An empirical assessment of the nature and
consequences of marketing channel intermediary commitment. Cambridge, Marketing Science
Institute.
Landman, J. 1987. Regret: A Theoretical and Conceptual Analysis. Journal of Theory of
Social Behavior, 17, 135-160.
Loomes, G., Sugden, R. 1982. Regret Theory: An Alternative Theory of Rational Choice
under certainty. The Economic Journal, 92, 805-824.
38
Marsh, M. W., J. R. Balla and K. T. Hau. 1988. An Evaluation of Incremental Fit Indices: A
Clarification of Mathematical and Empirical Properties. Advanced Structural Equation Modeling:
Issues and Techniques. G. A. & R. E. Schumacker. Mahwah, Earlbaum, 315-353.
Meyer, J. P. and N. J. Allen .1984. Testing the "side-bet theory" of organizational commitment:
some methodological considerations. Journal of Applied Psychology, 69, 372-378.
Morgan, R., M. and S. D. Hunt, D. 1994. The Commitment--Trust Theory of Relationship
Marketing. Journal of Marketing, 58(July), 20-38.
Nunnally, J. C. 1978. Psychometric Theory. 2 ed. New York: McGraw-Hill.
Oliver, R. L. 1981. Measurement and Evaluation of Satisfaction Process in Retailer
Selling. Journal of Retailing, 57,25-48.
Oliver, R. L. 1993. A Conceptual Model of Service Quality and Service Satisfaction:
Compatible Goals, Different Concepts. In Advances in Services Marketing and
Management: Research and Practice, ed. T. A. Swartz, D. E. Bowen, S. W. Brown, vol.
2, pp. 65-85. Greenwich, CT: JAI Press.
Oliver, R. L. 1997. Satisfaction: A Behavioral Perspective on the Consumer. New York:
McGraw-Hill Companies, Inc.
Oliver, R. L. 1999. Whence Consumer Loyalty? Journal of Marketing, 63, 33-44.
Parasuraman, A., V. A. Zeithaml and L. L. Berry. 1994. Reassessment of Expectations as a
39
Comparison Standard in Measuring Service Quality. Journal of Marketing, 58, 111-124.
Porter, M. E. 1980. Competitive Strategy. The Free Press.
Porter, M. E. 1985. Competitive Advantage. New York: The Free Press.
Rust, R. T., R. L. Oliver. 1994. Service Quality: Insights and Managerial Implications
from the Frontier. In New Directions in Theory and Practice, ed. R. T. Rust, R. R. L.
Oliver, pp. 1-19. Thousand Oaks, CA: SAGE Publications , Inc.
Rust, R. T., V. A. Zeithaml and K. N. Lemon. 2000. Driving Customer Equity: How Customer
Liftime Value is Reshaping Corporate Strategy. New York, The Free Press.
Samuelsen, B. M. 1997. Customer loyalty: Causes and Effects (Kundelojalitet, Årsaker og
effekter). Hønefoss, Buskerud College.
Samuelsen, B. M. and K. Sandvik. 1997. The concept of customer loyalty. The 25th EMAC
Conference, University of Warwick, UK.
SPSS .2001. , SPSS, Inc.
Steenkamp, J.-B. E. M. and H. C. M. v. Trijp .1996. Quality guidance: A consumer-based
approach to food quality improvement using partial least squares. European Review of
Agricultural Economics, 23, 195-215.
40
Steiger, J. H. 1989. EzPATH: A Supplementary Module for SYSTAT and SYGRAPH. Evanston,
SYSTAT.
Westbrook, R. A. 1980. A Rating Scale for Measuring Product\Service Satisfaction. Journal of
Marketing, 44, 68-72.
Wold, H. 1989. Theoretical Empiricism: A General Rationale for Scientific Model Building. New
York.