
Locked out of a Just Transition: Fossil fuel financing in Africa
Upload
independentCategory
view
3download
0
When is Equity More than Just Financing? Evidence fromStrategic Alliances
Sudha KrishnaswamiDepartment of Finance
College of Business AdministrationUniversity of New OrleansNew Orleans, LA 70148
(504) [email protected]
Eduardo PabloIESA
Caracas 1010, Venezuela(58212) 555-4533
Venkat Subramaniam*
A.B. Freeman School of BusinessTulane University
New Orleans, LA 70118(504) 865-5493
_______________________________* Corresponding author. We thank John Hund, Carlos Maquieira, Tom Noe, Russ Robins, Paul Spindt, and theseminar participants at the Latin American Finance Conference, and Tulane University for their comments andsuggestions.
When is Equity More than Just Financing? Evidence fromStrategic Alliances
Abstract
A strategic alliance is a hybrid organizational form that is between an arms lengthcontract and a full-fledged merger between firms. In some alliances firms take a minority equitystake in the partner firm. We refer to these as equity alliances. Using data on 759 alliances, weexamine the motivation for the use of equity in alliances. We study whether equity is intended tostrengthen the contractual performance of the alliance or whether it is primarily a means offinancing for the capital constrained partner in the alliance. Consistent with the incompletecontracts theory, we find that equity is more likely to be used in alliances where the exact natureand the sharing of the output is ambiguous. We also find that equity is more likely to be usedwhen the difference in bargaining powers between the partners is higher, such as when thepartners differ significantly in size, market power, and growth opportunities. Finally, we findthat equity alliances are especially likely when the smaller partner (which is almost always thepartner selling equity) is high growth but is capital constrained. Thus, equity from alliancepartners is a viable alternative source of capital for such firms. Consistent with the view thatequity usage mitigates contracting costs and capital constraints, the market reaction to equityalliances is significantly higher compared to other alliances. Overall, the evidence suggests thatthe market views equity investments in alliances as more valuable than toeholds taken bypotential acquirers without a product market relationship.
1
Recently, there has been an increased interest in studying strategic alliances as a business
organizational form (e.g., Baker, Gibbons, and Murphy, 2002; Noe, Rebello, and Shrikande,
2002; Gulati and Singh, 1998; Chan, Kensinger, Keown, and Martin, 1997; Bleeke and Ernst,
1995; Pisano, 1989). An alliance is a hybrid organizational structure that lies between an arms
length contract and a merger. In a strategic alliance two or more firms pool their resources, both
technological and financial, to pursue a common business objective without going through a full-
fledged merger. Most of the research on alliances has focused on developing or testing
hypotheses that explain the creation, management, and survival of alliances among independent
companies (Gulati, 1995; Parkhe, 1993; Mody, 1993). There has been little research on the
relative advantages of the different types of alliances and on how the operations of an alliance
are financed. In this paper, we examine the determinants of the use of equity investments by a
firm in its partner-firm in strategic alliances.
An equity alliance is a strategic alliance where one of the partners in the alliance
purchases equity in the other partner firm. These equity investments are typically made through
a direct purchase of the shares in the firm via a private placement. Although non-equity
arrangements account for a majority of all alliances across industries, equity linkages are not
uncommon when forming alliances (Pisano, 1989; Zagnoli, 1987). Previous studies (Pisano,
1989; Harrigan, 1987) have examined the effect of industry and competitive conditions on the
choice between equity and non-equity alliances.
In this paper, using data on 759 alliances initiated over the period 1989-1997, we
examine the relative importance of several motives for the use of equity in strategic alliances.
We extend the work of Harrigan (1987) and Pisano (1989) by empirically analyzing the firm-
specific and alliance–specific determinants that explain the incidence of equity alliances. We
2
examine whether the use of equity in an alliance is intended to strengthen the contractual
performance of the alliance and also whether it is a means of financing for the capital constrained
partner. In particular, we study the role of incomplete contracts, bargaining power differences
between partners, and capital constraints in explaining the incidence of equity alliances.
Our paper is closely related to and complements the recent work of Allen and Phillips
(2000) on corporate block ownership. They examine the changes in investment and operating
performance of firms after other corporations purchase large equity positions, and ask whether
the changes in performance differ based on the existence of product market relationships. While
they analyze firms that have conducted block purchases and then distinguish between those with
product market relations and those without such relations, our aim is to analyze firms that come
together with a product market motive and examine the differences between those that have an
equity relation and those that do not. By comparing alliances that have an equity link with those
that do not, we are able to examine the incremental impact of equity linkages on product market
relations. We therefore are able to provide insights into the role of equity is mitigating
contracting problems in product market relations.
Our results show that equity is more likely to be used when an alliance is in a high
growth area or when the uncertainty about the output from the alliance is high (as in R&D and
technology alliances). We also find evidence that equity is used when an alliance pairs firms of
very different sizes, firms with different market powers, and firms with large differences in
growth options. In general, equity usage in alliances mitigates the post-formation bargaining
costs that arise when the difference in bargaining powers between the partners is high.
Finally, we find strong evidence that equity stakes are also taken to provide financing to
the capital constrained partner in the alliance. We find that the selling partners in equity

3
alliances have higher growth opportunities than their industry counterparts. These firms are also
severely capital constrained with little debt capacity. The buying firms, on the other hand, have
significantly more cash and are less liquidity constrained than the selling firms. Thus, equity
alliances are especially likely when one of the partners in the alliance is high growth but capital
constrained.
Our findings that capital constrained firms rely on financing from their alliance partners
complements the recent evidence in Baker and Wurgler (2002), Baker, Stein, and Wurgler
(2002), and Lerner, Shane, and Tsai (2002). Baker and Wurgler (2002) demonstrate that firms
attempt to time the market in their capital raising efforts and raise external equity primarily when
they believe they are overvalued. Baker, Stein, and Wurgler (2002) further demonstrate that
stock prices have a significant impact on the investment of firms that need external equity to
finance their marginal investments (equity dependent firms). In particular, they find that equity-
dependent firms, such as younger firms, with low cash balances and cash flow, high leverage and
low debt capacity are less likely to proceed with financing an investment if they have to issue
undervalued shares. In a similar vein, Lerner, Shane, and Tsai (2002) find that in the biotech
industry firms are more likely to finance research through pharmaceutical firms when public
markets are poor. Our findings add to the results in these papers, and indicate that equity
financing from alliance partners is a viable alternative for capital constrained firms.
Furthermore, our results reveal that equity financing by the alliance partner is useful in
mitigating contracting problems in an alliance besides solving capital constraint problems.
The stock price reaction to alliances is also consistent with the evidence described above.
We find that the reaction to alliances is positive, and technology alliances account for a
significant part of the reaction in the sample. Consistent with the view that equity usage
4
mitigates contracting costs and capital constraints, the market reaction to equity alliances is
significantly large. For the firm selling the equity, the announcement period abnormal return is
14.76%, while it is statistically insignificant for the buying firms. This stands in contrast to the
evidence documented in Mikkelson and Ruback (1985) and Choi (1991) regarding price reaction
to ordinary toehold announcements. They report that when a firm announces an acquisition of
shares in an another firm, the market reaction in the selling firm’s stock is positive, but only
around 2.2%. Thus, our evidence suggests that the market views equity investments associated
with strategic alliances as different from ordinary toeholds taken by potential acquirers, perhaps
because of the gains to both the buying and the selling firm from the improved contractual
performance of the alliance, and not because alliances are viewed as a prelude to an acquisition.
In fact, this evidence is consistent with the evidence in Allen and Phillips (2000) that block
purchases accompanied by product market relationships are associated with higher abnormal
returns than block purchases without product market relationships.
The rest of the paper is organized as follows. Section 1 sets out the hypotheses that
explain the use of equity in strategic alliances. Section 2 presents the data and the definitions of
the variables used in the study. Section 3 discusses the univariate and regression results. Section
4 presents evidence on the wealth gains in the different types of alliances. Section 5 provides
concluding comments.
1. The Choice between Equity and Non-equity Alliances
Several theories in the literature on alliances may be adapted to explain the use of equity
in strategic alliances. We classify these theories into three categories: (i) incomplete contracts,
(ii) differential bargaining power, and (iii) capital constraints. In what follows, we provide a
brief description of these theories and set out the hypotheses extracted from them.

5
1.1. Incomplete contracts
When two firms enter into a strategic alliance, they typically pool their technological and
financial resources to achieve a common business objective. For instance, two firms may have
some knowledge of two different aspects of a particular technology, and may decide to share
their know-how through an alliance, with a view to designing and developing a new marketable
product. As Pisano (1989) argues, in such alliances it is difficult to quantify the relative share of
knowledge and technology that each partner contributes to an alliance. It is also difficult to ex
ante identify the specific nature of the end-product and which of the two partners may stand to
benefit more from the output (Grossman and Hart, 1986). In this scenario, it may be especially
difficult to write a contract that not only specifies the exact contribution of each partner to the
alliance but also allocates the final output and profits from the alliance. Further, most alliances
evolve over time depending on the innovation process, which may warrant altering the terms of
the contract. Therefore, in such alliances contracting problems are likely since a contract written
at the conception of the alliance would have to be complete as well as flexible to accommodate
the innovations in the alliance.
Incomplete contracts have significant consequences. Klein, Crawford, and Alchian
(1978) argue that incomplete contracts between firms may lead to potential hold-up costs. In the
context of alliances, when contracts are incomplete, each partner involved in an alliance has ex-
ante less incentive to invest because of the fear of ex-post opportunistic behavior by the other
partner over the latent profits of the alliance. Equity alliances mitigate these problems of
incomplete contracting. As Aghion and Tirole (1994) suggest, through equity ownership, the
costs and benefits of innovating, designing, manufacturing, and marketing the product from an
alliance are proportionally shared. Even if the objective of an alliance evolves unpredictably

6
over time, equity ownership mitigates any potential for unilateral opportunism by the partners.
Choi (1993) and Kamien, Muller, and Zang (1992) present similar arguments to motivate the
incidence of co-operative research joint ventures between firms in an industry.
Although a full-fledged merger may solve the incomplete contracting problems
mentioned above it is not without significant costs of its own. For instance, if only a portion of
each partner’s assets are required for the alliance, a complete integration through a merger will
result in additional costs of administering and controlling unrelated businesses (Berger and Ofek,
1999 and 1995). This is supported by the findings in Maksimovic and Phillips (2001). Through
a detailed analysis of asset sales, they find that the comparative advantage of multi-division firms
is mainly in their primary industries. Also, Meyer, Milgrom, and Roberts (1992), Rajan,
Servaes, and Zingales (2000), and Scharfstein and Stein (2000) argue divisional managers of
integrated firms have incentives to engage in value-eroding bargaining and divisional rent-
seeking behavior that could lead to overinvestment in divisions with poor investment
opportunities. From a managerial incentives perspective, there is an additional cost to
expansions. Since the stock value of an integrated firm is only a weak signal of the performance
of any one divisional manager, stock based compensation is less efficient in integrated firms
(Aron, 1991). Finally, if the partners’ assets are specialized, valuing these assets for acquisition
may be a risky venture for the firm. This is further complicated if the partner has liabilities that
are hidden during the valuation process.1 An equity alliance mimics the key advantages of a
merger without incurring any associated disadvantages. Therefore, alliances where contracting
problems are higher are likely to be equity alliances.
1 Ravenscraft and Scherer (1987) provide several examples of mergers where the latent problems with the targetelude the buyer’s pre-merger inspections. For example, Wickes Inc. discovered that its recent acquisition, Collins &

7
1.2. Differential bargaining power
A variation of the incomplete contracting problem arises when there is significant
disparity in the bargaining powers of the partners in the alliance (Fagre and Wells, 1982). The
problems from differential bargaining power arise even in alliances where the contribution of
technological know-how and financial resources are quantifiable. When one partner in an
alliance has a bargaining advantage over the other, perhaps because it is larger in size, has less
unrecoverable investment in the alliance, or is a dominant firm with high market power, it may
be able to force renegotiation of terms after the initiation of the alliance. The dominant firm may
be able to extract concessions in the form of lower own-investment, a smaller contribution in
technical know-how, or a greater share of the final surplus from the alliance. This problem
would adversely affect both the formation and operation of efficiency enhancing strategic
alliances. In the extreme, the disadvantaged partner may forego entering into an alliance if they
perceive that their investment or knowledge could be subject to hold-up.
The contracting problems that arise due to disparity in bargaining powers may be
mitigated if the partner with the bargaining advantage can pre-commit to abstaining from
opportunism. Demski and Sappington (1991) and Noe, Rebello, and Shrikande (2002) among
others show that cross-ownership of equity or a minority equity investment by the dominant firm
in the partner firm are mechanisms that enable the firm to credibly pre-commit to abstaining
from opportunism. The costs and benefits of opportunism are internalized when there are equity
linkages across the partners. Thus, we expect equity alliances to be more likely when there is a
bigger disparity in bargaining power across the partners in an alliance.
Aikman, had potential product liabilities arising from violations of federal flammability standards for carpets. Theestimated costs associated with this oversight exceeded 20% of the purchase price of Collins & Aikman.

8
1.3. Capital constraints
A strategic alliance may be an indirect mechanism to forge a financial partnership
between a capital constrained firm and a cash-rich firm. Weingartner (1977) and Stiglitz and
Weiss (1981) analyze the causes of capital constraints in efficient capital markets. They argue
respectively that bankruptcy costs and adverse selection costs impose a limit on the amount of
credit extended by lenders. These costs are especially high for small, high growth firms with less
tangible assets. Such firms are therefore forced to seek other sources of capital. Equity
financing, however, is not a viable alternative either. As Myers and Majluf (1984) argue, when a
firm is subject to a high level of information asymmetry between the firm’s insiders and the
capital market, their equity is likely to be undervalued in the market. In fact, Baker, Stein, and
Wurgler (2002) demonstrate that stock prices have a significant impact on the investment of
firms that need external equity to finance their marginal investments. They find that equity-
dependent firms, such as younger firms with low cash balances and cash flow, high leverage and
low debt capacity are less likely to proceed with financing an investment if they have to issue
undervalued shares. These firms may have to rely on alternative financing sources such as funds
from well-informed private investors or from product market partners.
Hard capital rationing may also occur when a company experiences financial distress or
raising capital violates preexisting contractual agreements. Relying on new capital from an
informed alliance partner may mitigate the adverse selection costs of external equity for these
distressed firms. Partners in a strategic alliance may be better suited to take minority equity
positions in small capital constrained firms for two related reasons. First, purchasing a minority
equity stake in a capital constrained firm may be a way of financing innovations that require the
technological expertise of the capital constrained partner. Second, through an alliance, a firm
9
may be able to learn more about the cash flows and future prospects of the capital constrained
partner, and may be able to correctly value the equity stake in the firm. In fact, the latter reason
is further supported by Bhattacharya and Chiesa (1995) and Yosha (1995) who argue that in
some cases, a capital constrained firm may be willing to reveal proprietary, firm-specific
information more readily to an alliance partner than to a diffuse group of investors. Thus, an
alliance where one of the partners is capital constrained is more likely to be an equity alliance.
2. Data and Variable Definitions
2.1. Data
We identify our sample of strategic alliances formed in the U.S. during the period 1989 to
1997 from announcements in the Lexis-Nexis and the Dow Jones News Wires. For each
alliance, we obtain information on the partners involved in the alliance, the date on which the
alliance was established, the aim and a description of the alliance, and the capital invested (if
any) by each of the partners. This last item specifies either the dollar amount or the proportion
of one partner’s equity bought by the other partner. To be included in our empirical analysis, we
require that all the partners in the alliance be publicly traded in the U.S. with at least some
financial and stock price information available on CRSP and Compustat. This results in a
sample of 759 alliances which we use in our analysis.
Panel A of Table 1 presents descriptive statistics for the firms in the sample. In our
sample, about 13% of all alliances are equity alliances. In individual years, the proportion of
equity alliances ranges from 11% to 18.2% of all alliances in that year. The table also indicates
that significantly more alliances were formed in the more recent years -- with about 60% of the
alliances in the sample being formed over the 1995-1997 period.

10
We also classify alliances based on the type of agreement or contract between the
partners. Following Chan, Kensinger, Keown, and Martin (1997), in Panel B of Table 1 we
classify alliances into seven different types of business agreements – R&D alliances, technology
agreements, development and manufacturing agreements, marketing agreements, supply
agreements, licensing agreements, and alliances that involve more than one of the above
objectives. In panel B, alliances with multiple objectives are classified under “multiple” and are
also included once under each of their stated objectives. Thus, the total number of alliances add
up to more than 759 since alliances with multiple objectives are included multiple times. In 45
alliances we do not have sufficient data to identify the alliance type. In fact, in this last group,
often the partners involved in the alliance are themselves uncertain about the nature of the
alliance, and the alliance announcement typically involves a vague statement that refers to
cooperation for mutual benefit. In the last column of panel B we report the proportion of equity
alliances under each category.
Consistent with the incomplete contracts hypothesis, R&D alliances and alliances with
multiple objectives have the highest incidence of equity usage. More than half the R&D
alliances, and over one-quarter of the multiple alliances are equity alliances. In contrast, among
marketing alliances, where there is typically little or no uncertainty about the final output of the
alliance, only 10.4% of the alliances use equity. The evidence for the incomplete contracts
hypothesis is especially highlighted when we classify alliances into two broad categories –
technology and non- technology alliances. We classify all alliances that have R&D, technology,
development and manufacturing, or multiple objectives as technology alliances, and others such
as marketing, supply, and licensing agreements, as non-technology alliances. It may be seen that

11
nearly a fifth of all technology alliances are equity alliances while less than 5% of the non-
technology alliances are equity alliances.
2.2. Variable definitions
2.2.1. Incomplete contracts
To test the incomplete contracts hypothesis, we first identify alliances where writing
complete contracts is especially likely to be difficult. We expect contracting problems to be
higher when an alliance brings together partners who operate in different lines of business. This
is because each partner may not have the expertise to evaluate the contribution and monitor the
input of the other partner who operates in a different industry. Further, since the end-product is
the result of synergies between different industries, the firms in the alliance may not be able to
ex-ante accurately estimate the payoffs from the alliance. Therefore, we use an indicator
variable, cross-industry alliance, which is 1 if the partners in the alliance do not belong to the
same 3-digit SIC code and zero otherwise as one proxy for alliances likely to have more
problems of incomplete contracting. We also use another variable, Distance, to capture alliances
where writing complete contracts are more difficult. Distance is a categorical variable which is
1, 2, 3, or 4 depending on whether the partners in the alliance differ in their 4-digit, 3-digit, 2-
digit, or 1-digit SIC codes, respectively. A high value for distance would indicate very
dissimilar firms. This variable is 0 if the partners have the same 4-digit SIC code.
We also use another measure of distance in our analyses. This is a continuous measure of
distance and is used only as a specification check for the two measures used above. Following
Mohanram and Nanda (1998), if the partner firms have the same 4-digit SIC code, the distance is
0. If they have the same 3-digit code but different 4-digit code, distance is equal to the absolute
value of the difference in the 4th digit. If they have the same 2-digit code but different 3-digit
12
code, distance is equal to the absolute value of the difference in the 3rd digit multiplied by 10. If
they have the same 1-digit code but different 2-digit code, then distance is the difference in the
2nd digit multiplied by 100. Finally, if the firms differ in their 1-digit code, then we assign a
distance of 1000, since a smaller difference in the 1st digit does not imply any similarity in the
products of the two industries. Greater is the distance in an alliance, larger are the contracting
problems. We expect cross-industry alliances and alliances with greater distance to have a
higher likelihood of using equity linkages.
A diametrically opposite view of the incomplete contracting problem is in Harrigan
(1987). She argues that when alliances pair firms that operate in the same industry, the
contracting problems are particularly severe. Her conclusion is based on the view that firms
operating in the same industry are direct competitors and the loss of revenues, market share, and
future profitability of one firm is a more distinct advantage to the other. This results in more
opportunistic behavior that undermines the contractual performance of alliances. Based on this
view, we would expect alliances that pair firms from the same industry to be more likely to use
equity to mitigate hold up and other incomplete contracting problems.
Equity is also likely to be used when there is high uncertainty about the latent profits
from the alliance. The higher the uncertainty involved, the more difficult it is to write a
complete contract. As a consequence, the probability of opportunistic behavior increases.
Pisano (1989) shows that in the biotechnology industry, partners forming alliances in which the
main objective is R&D are more likely to have equity ties. In supply agreements, for example, it
is possible to write a contract that contains the technical specifications of the item supplied. In
this case, there is less room for opportunistic behavior, and therefore, less need for equity
linkages. Pisano also argues that alliances with multiple objectives are subject to more

13
contracting problems, and are therefore likely to be equity alliances. We define a variable,
technology dummy, which is 1 if the alliance is an R&D alliance, technology sharing agreement,
or has multiple objectives, and is 0 otherwise We expect this variable to be positively related to
the likelihood of equity usage in the alliance. Along the same lines, we also define an R&D
dummy variable which is 1 if the alliance is an R&D alliance and 0 otherwise, and a development
dummy which is 1 if the alliance involves product development and 0 otherwise. Again, we
expect each of these variables to be positively related to the incidence of equity alliances.
It may be more difficult to estimate the value of the final surplus in an alliance that
operates in a high growth industry. Further, depending on market conditions and on how the
growth options are utilized, the objective of these alliances are also more likely to evolve over
their lives. Hence, we would expect alliances in high growth industries to rely more on equity
linkages to mitigate contracting problems. Following Smith and Watts (1992) and Barclay and
Smith (1995), we use market to book ratio of assets to measure growth options in a firm’s
investment opportunity set. Market to book ratio is defined as the ratio of book value of total
assets minus book value of equity plus market value of equity to the book value of total assets.
We use two other proxies of growth opportunity, ratio of R&D expenditure to total assets and
ratio of intangible assets to total assets, as a robustness check. We expect alliances with higher
growth options to have a higher likelihood of using equity to mitigate contracting problems.2
2.2.2. Differential bargaining power
We use several measures to capture contracting problems that arise due to the disparity in
bargaining powers between the partners in an alliance. Relative bargaining power depends on
2 In the univariate analysis, we also use growth in sales from the year prior to the alliance formation to the year ofthe alliance formation as a measure of growth opportunities. This is a measure of short-term growth, while themarket to book ratio is an indicator of long-term growth.

14
three factors -- the initial strengths and weaknesses of the partners, how these strengths and
weaknesses change over time, and the potential for competitive conflict (Bleeke and Ernst,
1995). We measure relative bargaining power at the initiation of the alliance, since the decision
to use equity is made at that point.
Although the bargaining power of each partner depends on their intrinsic characteristics
and the purpose of the alliance itself, there are several other observable and measurable
indicators of bargaining power such as firm size, market power, and the prospects for future
growth. Larger firms are typically the dominant firms in an industry, have more resources under
their control, and hence wield more clout in an alliance. The larger the difference in size
between the partners, the weaker is the position of the smaller partner in negotiating its stake of
the surplus in the event of a hold-up. Relative size is measured as the ratio of larger partner’s
total assets to the smaller partner’s total assets. We expect relative size to be positively related to
the likelihood of the use of equity in an alliance.
While relative size is one measure of bargaining power, it is possible that the smaller
partner is a leading firm in its industry while the bigger partner is only a second-tier firm in its
industry. It is also possible that the smaller partner’s technological know-how is crucial to the
success of the alliance. Relative size does not fully capture these effects. To control for the
bargaining power of the smaller firm that may not be reflected in firm size, we use the ratio of
the market shares of the two partners in the alliance to capture the magnitude of the difference in
bargaining powers. Ratio of market shares is measured as high market share over low market
share, where the market share of each partner is computed as the ratio of the firm’s sales to the
total sales of all the firms in its industry. We expect the ratio of market shares to be positively
related to the incidence of equity alliances. In a similar vein, we also use ratio of market-to-

15
book, which is the ratio of the median market-to-book ratios of the industries of the two partners
in an alliance. Since the partner operating in the industry with greater growth options would be
especially crucial in the evolution and the efficient harvesting of the rewards from the alliance,
we expect that partner to have a greater bargaining power in the alliance. This suggests that
greater is the disparity in the growth options of the two industries, higher would be the incidence
of equity usage to mitigate the contracting costs that arise due to bargaining power disparities.
Relative market power between partners may also be a function of the concentrations of
the respective industries. We measure concentration of an industry using the Herfindahl Index.
Herfindahl Index = i2
i=1
N∑ , where αi represents the market share of firm i within an industry with
a total of N firms. This index is close to one for concentrated industries, while it is close to zero
for competitive environments. Since smaller firms that operate in concentrated industries have a
certain element of market power and hence relative importance that would offset size based
bargaining disadvantages, we expect a negative relation between the Herfindahl index of the
smaller partner’s industry and the likelihood of the use of equity in alliances. In all our analyses,
as in Graham, Lemmon, and Wolf (2002), we define industry according to 4-digit SIC code with
the requirement that there be a minimum of 5 companies in the industry. If we find fewer than 5
companies using the 4-digit SIC code, we define industry using the 3-digit SIC code, again
imposing the 5 company minimum requirement. We continue to apply this criterion until we
find more than 5 companies in an industry or until we reach the 1-digit SIC code.3
3 As an alternative but coarser measure of bargaining power differences between partners, we analyze the number ofother firms in each partners’ industry. We expect that when there are fewer firms in any partner’s industry then thatpartner’s bargaining power is likely to be higher. Therefore, we would expect increased incidence of equity usage insuch alliances to mitigate the ex post bargaining costs.

16
2.2.3. Capital constraints
To examine whether equity is used primarily as a source of capital for the capital
constrained partner in an alliance, we use several corporate liquidity measures in our empirical
analyses. Our first measure of capital constraints is Cash/Total assets, which is defined as the
ratio of free cash flow to total assets of each partner in the year prior to the alliance formation.
As in Lehn and Poulsen (1989), we define free cash flow as operating income before
depreciation minus total taxes, interest expense, dividends on preferred and common stock. We
expect to see higher incidences of equity usage in alliances where one of the partners has low
levels of cash flow relative to the other partner. Additionally, the capital constraints hypothesis
suggests that in equity alliances, cash flow will be higher for the selling firm compared to it’s
industry counterparts.
As a second measure of potential capital constraints we use debt ratio of the partners.
Debt ratio is defined as the ratio of the debt to total assets, where debt is defined as long-term
debt minus capital leases. In the presence of bankruptcy and debt related agency costs, highly
levered firms are forced to rely on external equity to finance their operations. Reliance on
external equity by highly levered firms is also consistent with Myers’ (1984) pecking order
theory of financing choices. To minimize the costs of external equity, especially the adverse
selection costs, highly levered firms entering into alliances will prefer to place their equity
privately with their partners. Thus, the capital constraints hypothesis suggests that in equity
alliances, debt ratio will be higher for the selling firm compared to it’s industry counterparts and
compared to the buying firm.
Since firms with low earnings and/or cash flows may be capital constrained even if their
debt ratios were low because their ability to raise additional debt capital is poor, debt ratio alone
17
may not be a complete indicator of capital constraints. To control for this problem, we also
compute other measures of financial health and ability to raise capital. We use interest coverage
ratio, capital expenditure coverage ratio, profit margin, and return on assets (ROA) as
additional measures. Interest coverage ratio is defined as the ratio of EBIT to interest expense,
and capital expenditure ratio is equal to income before extraordinary items plus depreciation
minus dividends on common stocks over capital expenditures. Profit margin is the ratio of
operating income before depreciation to sales, and return on assets is the ratio of operating
income before depreciation to total assets. When one of the partners is significantly capital
constrained, we would expect a higher likelihood of equity alliances. Also, the capital
constraints hypothesis suggests that in equity alliances, all four measures will be lower for the
selling firm compared to it’s industry counterparts and compared to the buying firm.
3. Determinants of Equity Linkages in Alliances
In this section we examine the firm-specific and alliance-specific characteristics that
explain the use of equity in alliances. We first analyze differences in the variables between the
equity and non-equity alliances, and then attempt to explain the incidence of equity alliances
using logistic regressions. Table 2 focuses on equity alliances, and presents the differences in
financial and industry characteristics of the selling and buying partners in equity alliances. We
find some evidence consistent with the implications of the differential bargaining power
hypothesis that equity is more likely to be used when alliances pair firms that differ greatly in
their size and market power. Panel A of Table 2 shows that in equity alliances, buying firms are
significantly larger (mean of about $26 billion) than selling firms (mean of $784 million). Also,
the buying firms command a greater market share in their respective industries. For a typical
18
buying firm, it’s market share is about 11.3% while a typical selling firm has a market share of
only around 1.4%. These differences are significant at the 1% level of significance.
Consistent with the implications of the incomplete contracting hypothesis that equity is
used when an alliance pairs high growth firms, we observe that in Table 2 both the buying and
selling firms have higher growth options than their industry counterparts. From Panel B of Table
2, it may be noted that all proxies for growth opportunities, market-to-book ratio, sales growth,
R&D/total assets, intangible assets/total assets, and capital expenditures/total assets are greater
for the buying firms compared to their industry means. A similar observation may also be made
for the selling firms. When we compare the buying firms with the selling firms, we do not find a
consistent difference in the growth options of the two groups. Thus, the evidence suggests that
equity alliances pair high growth firms. That is, unlike in mergers, there is not much evidence to
suggest that low growth buyers are seeking high growth “targets” via equity alliances.
Perhaps the most significant difference between buying and selling firms is in the degree
of capital constraints faced by the two partners. The evidence strongly supports the capital
constraints hypothesis that the infusion of capital in equity alliances is, in part, driven by the
capital constraints faced by the selling firm. From Panel A of Table 2, it may be seen that the
buying firms are not only larger but are also older with an average age of 19.4 years, compared
to the selling firms that average only 3.9 years. From Panel B of Table 2, we may see that the
buying firms have substantially more cash flow and debt capacity, are more profitable with fewer
capital constraints than the selling firms. The cash flow, profit margin, and ROA of the buying
firms are not only significantly higher than that of the selling firms, they are also higher when
compared to their own industry counterparts. These differences are all significant at the 1%
level. Further, the interest coverage ratio and capital expenditure coverage ratio of the buying

19
firms are also greater than the corresponding figures for the selling firms. These results indicate
that in equity alliances, the larger, more profitable and cash-rich firms infuse equity capital into
the smaller, capital constrained partners. Thus, consistent with the implications of the capital
constraints hypothesis, equity alliances are not just product market partnerships but are also
efficient financing partnerships.
Tables 3 and 4 compare the partners in equity alliances with the corresponding partners in
non-equity alliances. We first focus on the selling firm in equity alliances. Since there is no sale
of equity in non-equity alliances, it is not possible to identify the “corresponding” partner in a
non-equity alliance. However, our results in Table 2 reveal that in equity alliances, the selling
firm is on average smaller than the buying firm. Also, from further direct analysis of our data we
find that in 92% of the equity alliances, the smaller partner is the partner selling the equity.
Therefore, for our subsequent analyses we use firm size to match partners across alliances. So,
in Table 3, we compare the set of all smaller partners in equity alliances with the set of all
smaller partners in non-equity alliances.
The results in Table 3 highlight several fundamental differences between partners in
equity versus non-equity alliances. The results are unambiguously consistent with the
implications of the differential bargaining power and capital constraints hypotheses. We find
that the smaller partners in equity alliances are significantly smaller with an average size of $707
million compared to the smaller partners in non-equity alliances who average about $2.4 billion
in firm size, a difference that is significant at the 1% level. They are also younger and have
lower market share than their counterparts in non-equity alliances. This suggests that equity
linkages are more frequent when the smaller partner has lower market power, i.e., when the
smaller firm is at a disadvantaged bargaining position in the alliance.

20
More interestingly, from panel B of Table 3, it may be seen that the smaller partners in
equity alliances have growth opportunities that are indistinguishable from those involved in non-
equity alliances, but these firms are significantly more cash and capital constrained relative to
their non-equity counterparts and industry peers. In particular, the different measures of growth
prospects, market-to-book ratio, sales growth, R&D, and capital expenditures of the smaller
partners in equity alliances are at least as high as the corresponding measures of their industry
counterparts. However, the cash flow and interest coverage ratio of the smaller partners in
equity alliances are significantly weaker than those of their peers. On the other hand, the smaller
partners in non-equity alliances have higher growth, higher cash flow, stronger interest coverage,
more debt capacity, and are overall more profitable than their industry peers.
Furthermore, a direct comparison of the smaller partners in equity and non-equity
alliances reveal some important differences. The partners in equity alliances have similar growth
prospects, higher R&D, and higher capital expenditures than their non-equity alliance
counterparts. The smaller partners in equity alliances, however, are also more capital
constrained. Unlike the smaller partners in non-equity alliances, the smaller partners in equity
alliances have negative cash flow, very low interest coverage (despite low debt), very low capital
expenditure coverage, and low profit margin and ROA. Thus, our results indicate that smaller
partners that are capital constrained rely more on equity alliances than smaller partners that are
more profitable and those that are not capital constrained.
In Table 4 we perform the equivalent analysis for the bigger partners in equity and non-
equity alliances. As mentioned earlier, the bigger firms in equity alliances are most often (92%
of the times) the buyers of equity in the alliance. Consistent with this fact, we find that bigger
firms in equity alliances are bigger and older than corresponding firms in non-equity alliances.
21
Panel A of Table 4 shows that the median firm in equity alliances is about $16.6 billion in firm
size compared to a statistically significantly smaller $7.8 billion for the median firm in non-
equity alliances. For the larger partners, the median age in equity alliances is also about 50%
higher than the median age in non-equity alliances.
From Panel B of Table 4, it may be seen that the typical larger firm in equity alliances
has a higher profit margin than the corresponding partner in non-equity alliances. Further, the
larger partners in equity alliances have more cash flow, a lower debt ratio, a stronger interest
coverage ratio, and higher profit margin and ROA than their industry counterparts. Similar
characteristics are true of the larger partners in non-equity alliances as well. However, unlike the
larger partners in equity alliances, the corresponding partners in non-equity alliances have more
growth opportunities. Coupled with the evidence in Table 3 that smaller partners in equity
alliances are more capital constrained, these results suggest that cash rich, larger partners with
larger debt capacity seek out high growth but capital constrained partners for equity alliances.
Thus, equity alliances are at least partly driven by the need for capital and typically pair capital
constrained firms with cash-rich firms.
In Table 5 we further examine the impact of the differential bargaining power hypothesis,
and the capital constraints hypothesis on equity usage in strategic alliances. Here, we classify all
alliances into two groups based on several financial, industry, and other characteristics of the
smaller partner in the sample of strategic alliances. We then report the proportion of equity
alliances in each category. If equity usage in alliances mitigates contracting and bargaining costs
due to bargaining power differences between the partners, we would expect more equity
alliances in the subset of alliances where the smaller partner is ex-ante at a bargaining
disadvantage. Consistent with the implications of the differential bargaining power hypothesis,

22
we find that 15.2% of alliances use equity when the smaller partner's market power (proxied by
market share) is low, while only 7.5% of alliances use equity when the smaller partner's market
power is high. Similar results are also true when we classify alliances based on the smaller
partner's age and firm size. 16.1% of alliances use equity when the smaller partner's age is below
the median age of all smaller partners, while only 6.1% of alliances use equity in the complement
subsample. Also, when the smaller partner's size is below median, 15.7% of alliances use equity,
compared to 7% when the smaller partner's size is above median.
We would also expect that when an alliance is formed with a smaller partner that operates
in a competitive industry, the alliance is more likely to involve equity usage since the smaller
partner would be at a bargaining disadvantage vis-à-vis the larger partner. The results in Table 5
however, do not support this view. We do not find a difference in the proportion of alliances that
use equity between the two subsamples formed based on the concentration level of the smaller
partners’ industry (measured by Herfindahl index).
In Table 5, we also examine the implications of the capital constraints hypothesis by
classifying alliances into two groups based on five different measures of capital constraints and
analyzing the proportion of equity alliances in each group. Consistent with the capital
constraints hypothesis, we find that when the cash flow of the smaller partner is low, there is a
significantly greater proportion of equity alliances than when the cash flow is high (17.2% versus
5.4%). Also, in the group where the smaller partner’s interest coverage ratio is low, the
proportion of equity alliances is 17.5% compared to just 3.1% in the group where the interest
coverage ratio is high. Similar results are also true when we classify based on capital
expenditure coverage ratio, another index of capital constraint. Additionally, when debt capacity
is low, i.e., when the debt ratio is high and the interest coverage ratio is low, the proportion of

23
equity alliances is over three times larger than when the debt capacity is high (18.3% versus
5.4%). Thus, the evidence indicates that differential bargaining power and capital constraints are
important determinants of equity usage in alliances.
In addition to the evidence from analysis based on partner-specific information described
above, we also use alliance-specific information to examine the incomplete contracts hypothesis
and the differential bargaining power hypothesis. In Table 6 we compare alliance-specific
characteristics across equity and non-equity alliances. If contracting problems are higher when
alliances bring together partners who operate in different lines of business (cross-industry
alliances), then we would expect such alliances to use more equity. On the other hand, as
Harrigan (1987) argues, partners operating in the same industry are direct competitors and any
loss of revenues, market share, and future profitability of one firm is a more distinct advantage to
the other. This may result in more opportunistic behavior that undermines the contractual
performance of alliances. In this case we would expect same-industry alliances to use more
equity. We analyze these competing claims in Table 6. Consistent with Harrigan (1987), the
results indicate that among equity alliances 53.6% are cross-industry alliances while this
percentage is 69.2% among non-equity alliances. This difference is significant at the 1% level.
As a specification check, we also examine the relation between the incidence of equity
alliances and the two other measures of dissimilarity in the industry classification of the partners.
The results in Table 6 indicate that among equity alliances, both the categorical and continuous
distance measures are significantly smaller than among the non-equity alliances. The differences
are more pronounced in the medians. All differences are significant at the 1% level. This
indicates that partners that operate in similar industries rely more on equity alliances than
partners that operate in different industries. This is consistent with the view that incomplete
24
contracting problems are more severe in same-industry alliances, perhaps because of the direct
competition between the partners and the potential opportunism that it may foster. Alternatively,
this result suggests that when firms take an equity stake, they do so in focus-increasing
transactions (same-industry alliances) than in focus-decreasing transactions.
We examine the incomplete contracting hypothesis by analyzing whether alliances where
there is significant technology sharing such as R&D ventures, use equity more frequently to
mitigate the contracting problems that arise due to the uncertainty in input and output sharing in
such alliances. The results indicate that over 82% of equity alliances are technology related
alliances compared to only 47% of non-equity alliances. This difference is statistically
significant at the 1% level and is consistent with the implications of the incomplete contracting
hypothesis.
We also examine whether alliances where the bargaining power differential is greater use
more equity to mitigate contracting and hold-up problems. We measure bargaining power
differences using the differences in firm size, and growth options of the partners. Specifically,
we use the ratio of market-to-book, ratio of R&D intensities, and ratio of firm size of the two
partners as an index of the difference in bargaining powers between the two partners in the
alliances. We find that these variables are significantly higher for equity alliances than for non-
equity alliances. In particular, for equity alliances, the mean ratio of market-to-book is 3.90
while for non-equity alliances it is a significantly lower 2.43. Similarly, relative size, which is
the ratio of the size of larger partner to the size of the smaller partner, is significantly higher for
the sample of equity alliances than for the sample of non-equity alliances. These results indicate
that when the disparity in size and growth options between partners in an alliance is larger,
potentially increasing the risk of hold-up for the weaker partner in the alliance, firms tend to use

25
more equity linkages to mitigate the adverse effects of differential bargaining powers. Overall,
our results are consistent with the incomplete contracts hypothesis and the differential bargaining
power hypothesis.
Table 7 presents logistic regressions that explain the incidence of equity usage in
strategic alliances. In these regressions, the dependent variable is an indicator variable which is
1 if the alliance is an equity alliance and is 0 otherwise. The regressions across Panels A and B
of Table 7 use different specifications for the capital constraints hypothesis. Within each panel,
the different regressions use alternative proxies for the bargaining power differences. The
regressions in Table 7 offer evidence to support the incomplete contracting, the differential
bargaining power, and the capital constraints hypotheses. Consistent with the incomplete
contracts hypothesis, the R&D dummy, technology dummy, and development dummy, which
identify alliances that are most likely to have contracting problems have positive and significant
coefficients in the regressions in panels A and B. Thus, even after controlling for other factors,
equity usage is more likely in technology and R&D alliances.
We also find that the cross-industry dummy has a negative and significant coefficient in
the regressions. Consistent with the univariate results, this suggests that partners that operate in
the same industry are more likely to use equity to mitigate contracting costs that arise due to
potential opportunism problems when firms competing in the same industry decide to cooperate
through alliances. We also find some evidence to support the differential bargaining power
hypothesis. The coefficients of log of relative size, market share ratio, and R&D intensity are all
positive and significant in panels A and B of Table 7. Additionally, the variable measuring the
number of firms in each partner’s industry is negative and significant in all the regressions,
suggesting that as the number of firms in a partners’ industry decreases, there is more equity

26
usage to mitigate the increased bargaining costs.4 These results are consistent with the view that
equity linkages are more likely to be used to mitigate hold-up costs in alliances where the
bargaining power differences between the partners are high. The coefficient of the ratio of
market-to-book is not significant in any of the regressions. This suggests that once we control
for factors that measure incomplete contracting problems and capital constraints, the difference
in growth opportunities between the two partners does not dictate the use of equity in alliances.
Finally, we also find evidence to support the capital constraints hypothesis. In panel A of
Table 7 we find that the coefficient of the smaller partners’ cash flow to total assets is negative
and statistically significant in three of the four regressions. Similarly, from panel B, the
coefficient of the capital expenditure coverage ratio of the smaller partners is negative and
significant in three of the four regressions.5 These results suggest that firms with low cash flow,
low income relative to their capital expenditures, and firms with poor borrowing capacity rely
more on equity alliances. Consistent with the results of our univariate analysis, these results
suggest that capital constrained firms rely on equity infusions from alliance partners to finance
their growth opportunities. This is also consistent with the view that the adverse selection costs
of equity may be lower when equity is sourced from presumably well-informed alliance partners.
4. Wealth Effects of Equity and Non-equity Alliances
Chan, Kensinger, Keown, and Martin (1997) find positive abnormal returns around the
announcement of strategic alliances. We confirm these returns by employing the event-study
methodology used by Dodd and Warner (1983). We estimate a market model over a 155-day
4 Panels A and B in Table 7 report the results using the variable number of firms in the smaller partner’s industry.Virtually identical results are obtained when we replace this variable with the variable number of firms in the largerpartner’s industry.

27
period ending 45 days before the announcement of the alliance. The CRSP value-weighted
index is used as a proxy for the market portfolio. Table 8 summarizes the abnormal returns over
different time intervals around the announcement date for the sample of firms that engaged in
alliances. We obtain a significant two-day cumulative abnormal return of 1.75% in the window
(-1,0), which is consistent with the findings of earlier studies on alliances.
We also examine the announcement period abnormal returns for the different types of
alliances. We find that most of the positive abnormal returns are confined to equity alliances.
The average abnormal returns for equity alliances is 6.57% while for non-equity alliances it is
1.15%. This is consistent with the argument that equity usage in alliances mitigates the
contracting costs associated with incomplete contracting and differences in bargaining powers,
and further benefits the capital constrained partners by reducing their adverse selection costs of
equity. When we focus on equity alliances and analyze the wealth gains to the buying and
selling partners, we find that the buying partners have no significant abnormal reaction, while the
selling partners have 14.76% abnormal stock price reaction. This suggests that the market
perceives that benefits of using equity in alliances accrue primarily to the selling partners. The
result is also in contrast to the results regarding the announcement gains around toehold
acquisitions prior to takeovers. Mikkelson and Ruback (1985), and Choi (1991) report that target
firms experience a positive reaction of only about 2.1% around toehold announcements. Thus,
the market views equity positions taken as part of a strategic alliance to be more beneficial than
the gains to a potential takeover target. This evidence is consistent with the evidence in Allen
and Phillips (2000) that block purchases accompanied by product market relationships are
5 We also used debt capacity of the smaller partners as an alternate specification for capital constraints in the logisticregressions. Since we obtained qualitatively similar results to those reported in panels A and B of Table 7, we donot present those results here. The results are available from the authors upon request.
28
associated with higher abnormal returns (9.1%) than block purchases without product market
relationships. Additionally, as in our sample, the excess returns in Allen and Phillips (2000)
were confined to the selling firms, with the buyers experiencing no significant abnormal returns.
The evidence also indicates that the positive announcement period reaction in equity
alliances is mainly confined to technology alliances. This suggests that the wealth gains accrue
mainly in technology alliances where the benefits of mitigating the incomplete contracting costs
are high. Additionally, the gains are confined mostly to the selling partners, where they
experience a 15% abnormal reaction to the announcement of equity alliances. Even among non-
equity alliances, only the smaller partners experience a positive stock price reaction. This
reaction averages 2.17%. Here, both technology and non-technology alliances experience small
but significant price reactions of 1.25% and 1.06% respectively. Among non-equity alliances,
the largest gains accrue to the small partners engaging in technology alliances. Overall our
results indicate that though the product market agreements in alliances create value, the financing
arrangements and the enhanced efficiency of contracting achieved through equity alliances
actually create higher value.
5. Conclusion
In this paper, we analyze the incidence of equity linkages in strategic alliances using a
large sample of alliances formed during the period 1989 through 1997. A strategic alliance is a
business form in which two or more firms agree to pool their resources to pursue a common
objective. It is a hybrid organizational form that is between an arms length contract and a full-
fledged merger. In some alliances firms take a minority equity stake in the partner firm. We
refer to these as equity alliances. Using data on 759 alliances, we examine the motivation for the
use of equity in strategic alliances. We examine whether the use of equity in alliances is

29
intended to strengthen the contractual performance of the alliance and whether it is a means of
financing for the capital constrained partner in the alliance. In particular, we study the role of
incomplete contracts, bargaining power differences between partners, and capital constraints in
explaining the incidence of equity alliances. Consistent with the incomplete contracts theory,
equity is more likely to be used when an alliance pairs high growth partners or when the alliance
is a technology or R&D alliance. Typically, these are alliances where the exact nature and the
sharing of the output is ambiguous. The evidence is not consistent with the view that partners in
dissimilar industries use equity to mitigate any contracting problems. In fact, the evidence shows
that when firms take an equity stake, they are more likely to do so in focus increasing alliances
(i.e., same industry alliances).
We also find that equity is used when the difference in bargaining powers between the
partners is higher, such as when the partners differ significantly in size, market power, or growth
opportunities. Finally, we find that equity alliances are especially likely when the smaller
partner (which is almost always the selling partner) is high growth but is liquidity constrained.
Thus, equity is used as a means of providing financing to the capital constrained partner in the
alliance. We further find that the selling partners in equity alliances are typically high growth
but capital constrained firms that have poor borrowing capacity. By engaging in an equity
alliance, these firms forge a finance partnership along with their product market agreements with
their alliance partners. Sourcing equity from a well-informed product market partner reduces the
adverse selection costs of raising equity capital for these firms.
The stock price reaction to alliances is positive, and technology alliances account for a
significant part of the positive reaction in the sample. Consistent with the view that equity usage
mitigates contracting costs or capital constraints, the market reaction to equity alliances is

30
significantly large. For the firm selling the equity, the announcement period abnormal returns
are 14.76%, while it is insignificant for the buying firms. Thus, our evidence suggests that the
market views equity investments in strategic alliances as more valuable than toeholds taken by
potential acquirers where the abnormal reaction in the target firm stock is only around 2.2%.
Overall our results also indicate that though the product market agreements in alliances create
value, the financing arrangements and the efficient contracting in equity alliances may actually
create even higher value.

References
Aghion, P., and Tirole, J., 1994, The Management of Innovation, Quarterly Journal of
Economics, 109, 1185-1209.
Allen, J., and Phillips, G., 2000, Corporate Equity Ownership, Strategic Alliances and Product
Market Relationships, Journal of Finance, 55, 2791-2815.
Aron D., 1991, Using the Capital Market as a Monitor: Corporate Spinoff in an Agency
Framework, RAND Journal of Economics, 22, 505-518.
Baker, G., Gibbons, R., and Murphy, K., 2002, Relational Contracts and the Theory of the Firm,
Quarterly Journal of Economics, forthcoming.
Baker, M., Stein, J, and Wurgler, J., 2002, When Does the Market Matter? Stock Prices and the
Investment of Equity-Dependent Firms, working paper, New York University, NY.
Baker, M., and Wurgler, J., 2002, Market Timing and Capital Structure, Journal of Finance,
forthcoming.
Barclay M., and Smith C., 1995, The Priority Structure of Corporate Liabilities, The Journal of
Finance, 50, 899-917.
Berger, P. and Ofek E., 1995, Diversification Effect on Firm Value, Journal of Financial
Economics, 37, 39-65.
Berger, P. and Ofek E., 1999, Causes and Effects of Corporate Refocusing Programs, Review of
Financial Studies, 12, 311-345.
Bhattacharya S. and Chiesa G., 1995, Proprietary Information, Financial Intermediation, and
Research Incentives, Journal of Financial Intermediation, 4, 328-357.
Bleeke J. and Ernst D., 1995, Is your Strategic Alliance Really a Sale?, Harvard Business Review
January-February, 97-105.

Chan S., Kensinger J., Keown A., Martin J., 1997, Do Strategic Alliances Create Value?, Journal
of Financial Economics, 46, 199-221.
Choi D., 1991, Toehold Acquisitions, Shareholder Wealth, And the Market for Corporate
Control, Journal of Financial and Quantitative Analysis, 26, 391-408.
Choi J., 1993, Cooperative R&D with Product Market Competition, International Journal of
Industrial Organization, 11, 553-571.
Demski J., and Sappington D., 1991, Resolving Double Moral Hazard Problems with Buyout
Agreements, RAND Journal of Economics, 22, 232-240.
Dodd P. and Warner J., 1983, On Corporate Governance, Journal of Financial Economics, 11,
401-438.
Fagre N. L. and Wells L., 1982, Bargaining Power of Multinationals and the Host Government,
Journal of Economic Business Studies, 9-23.
Graham J., Lemmon M., and Wolf J., 2002, Does Corporate Diversification Destroy Value?
Journal of Finance, forthcoming.
Grossman, S., and Hart, O., 1986, The Costs and Benefits of Ownership: A Theory of Vertical
and Horizontal Integration, Journal of Political Economy, 94, 691-719.
Gulati, R., 1995, Social Structure and Alliance Formation Patterns: A Longitudinal Analysis,
Administrative Science Quarterly, 40, 619-52.
Gulati, R., and Singh, H., 1998, The Architecture of Cooperation: Managing Coordination Costs
and Appropriation Concerns in Strategic Alliances, Administrative Science Quarterly, 43,
781-814.
Harrigan, 1987, Strategic Alliances: Form, Autonomy, and Performance, working paper,
Columbia University, NY.

Kamien, M., Muller, E., and Zang, I., 19992, Research Joint Ventures and R&D Cartels,
American Economic Review, 82, 1293-1306.
Klein, B., Crawford, R., Alchian, A., 1978, Vertical Integration, Appropriable Rents, and the
Competitive Contracting Process, Journal of Law and Economics, 21, 297-326.
Lehn K. and Poulsen A., 1989, Free Cash Flow and Stockholder Gains in Going Private
Transactions, Journal of Finance, 44, 771-787.
Lerner, J., Shane, H., and Tsai, A., 2002, Do Equity Financing Cycles Matter? Evidence from
Biotechnology Alliances, Journal of Financial Economics, forthcoming.
Maksimovic, V., and Phillips, G., 2001, The Market for Corporate Assets: Who Engages in
Mergers and Asset Sales and Are there Efficiency Gains? Journal of Finance, 56, 2019-65.
Meyer, M., Milgrom, P., Roberts, J., 1992, Organizational Prospects, Influence Costs, and
Ownership Changes, Journal of Economics and Management Strategy, 1, 9-35.
Mikkelson W. and Ruback R., 1985, An empirical analysis of the interfirm equity investment
process, Journal of Financial Economics, 14, 523-553.
Mody A., 1993, Learning through alliances, Journal of Economic Behavior and Organization,
20, 151-170.
Mohanram P. and Nanda A., 1998, When do Joint Ventures Create Value? working paper,
Harvard Business School, MA.
Myers S., 1984, The Capital Structure Puzzle, Journal of Finance, 39, 575-592.
Myers S. and Majluf N., 1984, Corporate Financing and Investment Decisions when Firms have
Information that Investors do not have, Journal of Financial Economics, 13, 187-221.
Noe T. H., Rebello M. J., and Shrikhande M. M., 2002, Structuring International Cooperative
Ventures, Review of Financial Studies, forthcoming.
Parkhe A., 1993, Strategic alliance structuring: A game theoretic and transaction cost
examination of interfirm cooperation, Academy of Management Journal, 36, 794-829.
Pisano G. P., 1989, Using Equity Participation to Support Exchange: Evidence from the
Biotechnology Industry, Journal of Law, Economics, and Organization, 1, 109-125.
Rajan, R., H. Servaes, and L. Zingales, 2000, The Cost of Diversity: The Diversification
Discount and Inefficient Investment, Journal of Finance, 55, 35-80.
Ravenscraft, D.J., and F.M. Scherer, 1987, Mergers, Sell-offs, and Economic Efficiency,
Brookings Institution, Washington, D.C.
Scharfstein, D. and J. Stein, 2000, The Dark Side of Internal Capital Markets: Divisional Rent
Seeking and Inefficient Investment, Journal of Finance, 55, 2537-2564.
Smith C., and R. Watts, 1992, The investment opportunity set and corporate financing, dividend,
and compensation policies, Journal of Financial Economics, 32, 263-292
Stiglitz J. and Weiss A., 1981, Credit Rationing in Markets with Imperfect Competition. The
American Economic Review, 71, 393-410.
Weingartner, H. M., 1977, Capital Rationing: N Authors in Search of a Plot, Journal of Finance,
32, 1403-1432.
Yosha O., 1995, Information Disclosure Costs and the Choice of Financing Source, Journal of
Financial Intermediation, 4, 3-20.
Zagnoli, P., 1987, Inter-Firm Agreements as Bilateral Transactions. Paper delivered at the
conference on “New Technology and New Intermediaries: Competition, Intervention and
Cooperation in Europe, America and Asia.” Center for European Studies, Stanford
University, June 4-6.

Table 1
Distribution of Strategic Alliances by Formation Year and Alliance-Type
Panel A presents the distribution of 759 alliances formed during the period 1989 to 1997. The tableclassifies alliances into equity and non-equity alliances and specifies the number and proportion of eachtype of alliance in each year. Panel B classifies the alliances based on the type of agreement or contractbetween the partners. In panel B the total number of alliances add up to more than 759 since alliances withmore than one objective are included multiple times. This panel also classifies the alliances as technologyor non-technology alliances, where technology alliances are those that involve any R&D, technology,development and manufacturing, or multiple types of agreements.
Panel A
Year Number ofAlliances
Number of Non-Equity Alliances
Proportion Number ofEquity Alliances
Proportion
1989 19 16 84.20% 3 15.8%
1990 22 18 81.80% 4 18.2%
1991 33 27 81.80% 6 18.2%
1992 48 40 83.30% 8 16.7%
1993 72 63 87.50% 9 12.5%
1994 81 70 86.40% 11 13.6%
1995 116 102 87.90% 14 12.1%
1996 173 154 89.00% 19 11.0%
1997 195 172 88.20% 23 11.8%
Total 759 662 87.20% 97 12.8%
Panel B
Type of contract Number ofalliances
Proportion ofequity alliances
R&D 38 55.30%
Multiple 259 25.50%
Technology 119 16.80%
Dev. & Manuf. 215 15.80%
Marketing 460 10.40%
Supply 93 17.20%
Licensing 62 27.42%
Not identified 45 17.80%
1291 17.82%
Technology 367 19.9%
Non-technology 347 4.6%
Not identified 45 17.8%
Total 759 12.8%

Table 2
Descriptive Statistics of the Buying and Selling Partners in Equity Alliances
Panel A presents descriptive statistics comparison between the buyer and seller of equity in equity alliancesduring the period 1989 to 1997. The mean and median (below) are presented for selected variables. Thelast column reports the p-values for the Wilcoxon test of difference in means, and the test of difference inmedians. Panel B presents descriptive statistics comparison for the buyer firm and the seller firm with theirrespective industry counterparts. Columns 3 and 6 show the p-values for the Wilcoxon test of difference inmeans, and the test of difference in medians. The last column provides the p-values for these same tests butfor the differences between the buyer and seller firm involved in an equity alliance.Firm value is equal to book value of assets minus book value of equity plus market value of equity. It isgiven in millions of dollars. Market share is equal to firm net sales divided by the summation of net salesin the firm's industry where industry is based on the 4-digit SIC code with the requirement that there be aminimum of 5 companies in the industry. If we find fewer than 5 companies using the 4-digit SIC code, wedefine industry using the 3-digit SIC code, again imposing the 5 companies minimum requirement. Wecontinue to apply this criterion until we find more than 5 companies in an industry or until we reach the 1-digit SIC code. The same industry definition is also used for the Herfindahl index calculation. For eachcompany, age is defined as the difference between the year of the alliance formation minus the year whencompany information began appearing on CRSP. Market to book is the ratio of firm value over book valueof assets. Sales growth is the one-year percentage change in net sales just before the alliance formation.R&D, Intangible assets, and cash flow are obtained from Compustat in the year before the allianceformation. Cash is defined as operating income before depreciation minus total income taxes, interestexpense, dividends on preferred and common stock. Debt ratio is defined as debt over book value of assetswhere debt is long-term debt minus capital leases. Interest coverage is EBIT over interest expenses.Capital expenditure coverage is equal to income before extraordinary items plus depreciation minusdividends on common stocks over capital expenditures. Profit margin is operating income beforedepreciation over net sales. Asset turnover is sales over book value of assets. ROA is defined as operatingincome before depreciation over total assets. *, **, and *** represent significance at the 10%, 5%, and 1%levels, respectively.
Panel A Buyer Seller p-value
Firm value 26039.37
12906.71
784.3758
131.97
0.0001***
0.0001***
Market share 0.1131
0.0568
0.0141
0.0006
0.0001***
0.0001***
Herfindahl index 0.1703
0.1025
0.1682
0.1095
0.9053
0.5814
Age 19.3625
24.0000
3.875
1.000
0.0001***
0.0001***

Panel B Buyer Seller Difference
Firm Industry p-value Firm Industry p-value p-value
Market to book 2.9262
2.1547
2.5868
1.8194
0.0518*
0.0920*
3.4924
2.7329
2.6824
1.9376
0.0707*
0.1181
0.5010
0.2541
Sales growth 0.2499
0.1286
0.1568
0.0842
0.0445**
0.1702
0.8638
0.2151
0.1656
0.0903
0.0825*
0.0663*
0.5563
0.2571
R&D / Total assets 0.0946
0.0977
0.0831
0.0367
0.0019***
0.0001***
0.2821
0.2126
0.2237
0.1286
0.0075***
0.0055***
0.0001***
0.0001***
Intangibles /
Total assets
0.1463
0.1167
0.0775
0.0327
0.0005***
0.0112**
0.1181
0.0290
0.0591
0.0189
0.1106
0.7595
0.0329**
0.0133**
Capital expenditure /
Total assets
0.0827
0.0712
0.0744
0.0586
0.0608*
0.1809
0.0907
0.0658
0.0603
0.0445
0.0851*
0.1057
0.2276
0.6583
Cash / Total assets 0.1189
0.1116
0.0134
0.0594
0.0001***
0.0001***
-0.2736
-0.2649
-0.0586
0.0510
0.0005***
0.0002***
0.0001***
0.0001***
Debt ratio 0.1480
0.0893
0.2312
0.1989
0.0029***
0.0870*
0.0914
0.0089
0.2661
0.109
0.0001***
0.0002***
0.0001***
0.0004***
Interest coverage 18.9611
7.2578
36.9349
6.2308
0.4494
0.1960
-88.4935
-27.4186
62.9553
9.3113
0.0001***
0.0001***
0.0001***
0.0001***
Capital expenditure
coverage
1.4917
1.3161
-3.4019
0.4485
0.0001***
0.0005***
-12.3287
-3.0989
-15.8438
-0.9279
0.0001***
0.0001***
0.0001***
0.0001***
Profit margin 0.2198
0.2191
-0.9819
0.0695
0.0001***
0.0001***
-6.170
-0.2522
-1.0112
0.0157
0.0121**
0.0118**
0.0001***
0.0001***
ROA 0.1922
0.1834
0.0105
0.1012
0.0001***
0.0008***
-0.2585
-0.2355
-0.1114
0.0542
0.0097***
0.0015***
0.0001***
0.0001***

Table 3
Differences in Characteristics of the Smaller Partner betweenEquity and Non-Equity Alliances
Panel A presents descriptive statistics comparison for the small partners that are involved in an equity andnon-equity alliance during the period 1989 to 1997. The mean and median (below) are presented forselected variables. The last column reports the p-values for the Wilcoxon test of difference in means, andthe test of difference in medians. Panel B presents descriptive statistics comparison for the buyer firm andthe seller firm with their respective industry counterparts. Columns 3 and 6 show the p-values for theWilcoxon test of difference in means, and the test of difference in medians. The last column provides thep-values for these same tests but for the differences between the buyer and seller firm involved in an equityalliance.Firm value is equal to book value of assets minus book value of equity plus market value of equity. It isgiven in millions of dollars. Market share is equal to firm net sales divided by the summation of net salesin the firm's industry where industry is based on the 4-digit SIC code with the requirement that there be aminimum of 5 companies in the industry. If we find fewer than 5 companies using the 4-digit SIC code, wedefine industry using the 3-digit SIC code, again imposing the 5 companies minimum requirement. Wecontinue to apply this criterion until we find more than 5 companies in an industry or until we reach the 1-digit SIC code. The same industry definition is also used for the Herfindahl index calculation. For eachcompany, age is defined as the difference between the year of the alliance formation minus the year whencompany information began appearing on CRSP. Market to book is the ratio of firm value over book valueof assets. Sales growth is the one-year percentage change in net sales just before the alliance formation.R&D, Intangible assets, and cash flow are obtained from Compustat in the year before the allianceformation. Cash is defined as operating income before depreciation minus total income taxes, interestexpense, dividends on preferred and common stock. Debt ratio is defined as debt over book value of assetswhere debt is long-term debt minus capital leases. Interest coverage is EBIT over interest expenses.Capital expenditure coverage is equal to income before extraordinary items plus depreciation minusdividends on common stocks over capital expenditures. Profit margin is operating income beforedepreciation over net sales. Asset turnover is sales over book value of assets. ROA is defined as operatingincome before depreciation over total assets. *, **, and *** represent significance at the 10%, 5%, and 1%levels, respectively.
Panel A Equity Non-equity p-value
Firm value 707.1535
129.5645
2398.1860
365.8563
0.0036***
0.0032***
Market share 0.02303
0.0025
0.0456
0.0070
0.0013***
0.0173**
Herfindahl index 0.1669
0.1213
0.1865
0.1149
0.7142
1.0000
Age 6.0961
3.5000
9.2797
6.0000
0.0033***
0.0003***
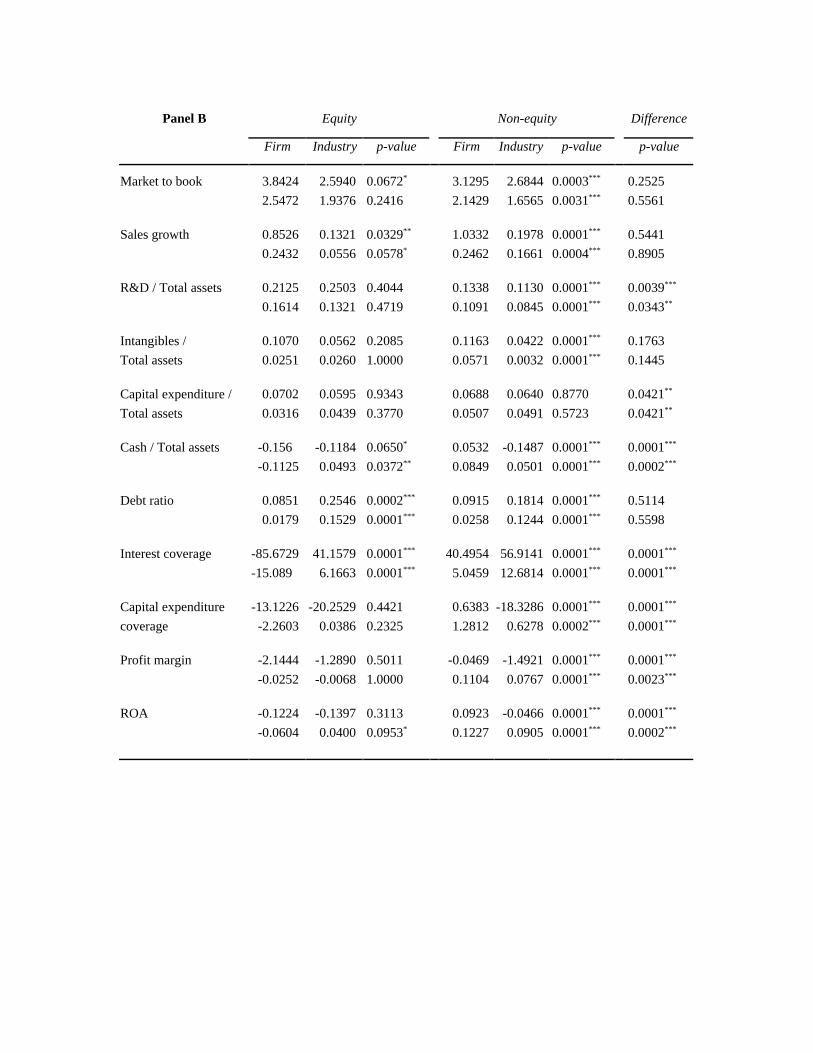
Panel B Equity Non-equity Difference
Firm Industry p-value Firm Industry p-value p-value
Market to book 3.8424
2.5472
2.5940
1.9376
0.0672*
0.2416
3.1295
2.1429
2.6844
1.6565
0.0003***
0.0031***
0.2525
0.5561
Sales growth 0.8526
0.2432
0.1321
0.0556
0.0329**
0.0578*
1.0332
0.2462
0.1978
0.1661
0.0001***
0.0004***
0.5441
0.8905
R&D / Total assets 0.2125
0.1614
0.2503
0.1321
0.4044
0.4719
0.1338
0.1091
0.1130
0.0845
0.0001***
0.0001***
0.0039***
0.0343**
Intangibles /
Total assets
0.1070
0.0251
0.0562
0.0260
0.2085
1.0000
0.1163
0.0571
0.0422
0.0032
0.0001***
0.0001***
0.1763
0.1445
Capital expenditure /
Total assets
0.0702
0.0316
0.0595
0.0439
0.9343
0.3770
0.0688
0.0507
0.0640
0.0491
0.8770
0.5723
0.0421**
0.0421**
Cash / Total assets -0.156
-0.1125
-0.1184
0.0493
0.0650*
0.0372**
0.0532
0.0849
-0.1487
0.0501
0.0001***
0.0001***
0.0001***
0.0002***
Debt ratio 0.0851
0.0179
0.2546
0.1529
0.0002***
0.0001***
0.0915
0.0258
0.1814
0.1244
0.0001***
0.0001***
0.5114
0.5598
Interest coverage -85.6729
-15.089
41.1579
6.1663
0.0001***
0.0001***
40.4954
5.0459
56.9141
12.6814
0.0001***
0.0001***
0.0001***
0.0001***
Capital expenditure
coverage
-13.1226
-2.2603
-20.2529
0.0386
0.4421
0.2325
0.6383
1.2812
-18.3286
0.6278
0.0001***
0.0002***
0.0001***
0.0001***
Profit margin -2.1444
-0.0252
-1.2890
-0.0068
0.5011
1.0000
-0.0469
0.1104
-1.4921
0.0767
0.0001***
0.0001***
0.0001***
0.0023***
ROA -0.1224
-0.0604
-0.1397
0.0400
0.3113
0.0953*
0.0923
0.1227
-0.0466
0.0905
0.0001***
0.0001***
0.0001***
0.0002***

Table 4
Differences in Characteristics of the Larger Partner betweenEquity and Non-Equity Alliances
Panel A presents descriptive statistics comparison for the large partners that are involved in an equity andnon-equity alliance during the period 1989 to 1997. The mean and median (below) are presented forselected variables. The last column reports the p-values for the Wilcoxon test of difference in means, andthe test of difference in medians. Panel B presents descriptive statistics comparison for the buyer firm andthe seller firm with their respective industry counterparts. Columns 3 and 6 show the p-values for theWilcoxon test of difference in means, and the test of difference in medians. The last column provides thep-values for these same tests but for the differences between the buyer and seller firm involved in an equityalliance.Firm value is equal to book value of assets minus book value of equity plus market value of equity. It isgiven in millions of dollars. Market share is equal to firm net sales divided by the summation of net salesin the firm's industry where industry is based on the 4-digit SIC code with the requirement that there be aminimum of 5 companies in the industry. If we find fewer than 5 companies using the 4-digit SIC code, wedefine industry using the 3-digit SIC code, again imposing the 5 companies minimum requirement. Wecontinue to apply this criterion until we find more than 5 companies in an industry or until we reach the 1-digit SIC code. The same industry definition is also used for the Herfindahl index calculation. For eachcompany, age is defined as the difference between the year of the alliance formation minus the year whencompany information began appearing on CRSP. Market to book is the ratio of firm value over book valueof assets. Sales growth is the one-year percentage change in net sales just before the alliance formation.R&D, Intangible assets, and cash flow are obtained from Compustat in the year before the allianceformation. Cash is defined as operating income before depreciation minus total income taxes, interestexpense, dividends on preferred and common stock. Debt ratio is defined as debt over book value of assetswhere debt is long-term debt minus capital leases. Interest coverage is EBIT over interest expenses.Capital expenditure coverage is equal to income before extraordinary items plus depreciation minusdividends on common stocks over capital expenditures. Profit margin is operating income beforedepreciation over net sales. Asset turnover is sales over book value of assets. ROA is defined as operatingincome before depreciation over total assets. *, **, and *** represent significance at the 10%, 5%, and 1%levels, respectively.
Panel A Equity Non-equity p-value
Firm value 33722.32
16556.17
26844.56
7797.731
0.0290**
0.0081***
Market share 0.1766
0.0971
0.1540
0.0784
0.2338
0.5448
Herfindahl index 0.1876
0.0980
0.1993
0.1273
0.9768
0.2380
Age 24.1730
27.5000
19.0618
19.0000
0.0121**
0.0026***
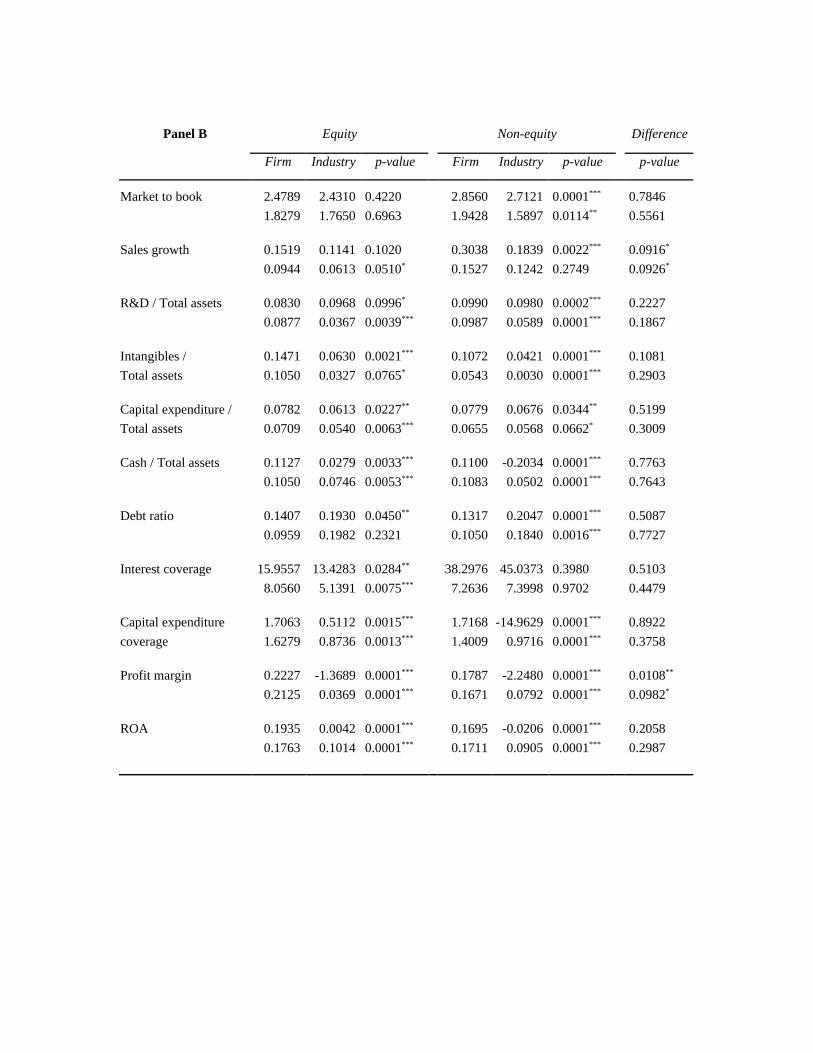
Panel B Equity Non-equity Difference
Firm Industry p-value Firm Industry p-value p-value
Market to book 2.4789
1.8279
2.4310
1.7650
0.4220
0.6963
2.8560
1.9428
2.7121
1.5897
0.0001***
0.0114**
0.7846
0.5561
Sales growth 0.1519
0.0944
0.1141
0.0613
0.1020
0.0510*
0.3038
0.1527
0.1839
0.1242
0.0022***
0.2749
0.0916*
0.0926*
R&D / Total assets 0.0830
0.0877
0.0968
0.0367
0.0996*
0.0039***
0.0990
0.0987
0.0980
0.0589
0.0002***
0.0001***
0.2227
0.1867
Intangibles /
Total assets
0.1471
0.1050
0.0630
0.0327
0.0021***
0.0765*
0.1072
0.0543
0.0421
0.0030
0.0001***
0.0001***
0.1081
0.2903
Capital expenditure /
Total assets
0.0782
0.0709
0.0613
0.0540
0.0227**
0.0063***
0.0779
0.0655
0.0676
0.0568
0.0344**
0.0662*
0.5199
0.3009
Cash / Total assets 0.1127
0.1050
0.0279
0.0746
0.0033***
0.0053***
0.1100
0.1083
-0.2034
0.0502
0.0001***
0.0001***
0.7763
0.7643
Debt ratio 0.1407
0.0959
0.1930
0.1982
0.0450**
0.2321
0.1317
0.1050
0.2047
0.1840
0.0001***
0.0016***
0.5087
0.7727
Interest coverage 15.9557
8.0560
13.4283
5.1391
0.0284**
0.0075***
38.2976
7.2636
45.0373
7.3998
0.3980
0.9702
0.5103
0.4479
Capital expenditure
coverage
1.7063
1.6279
0.5112
0.8736
0.0015***
0.0013***
1.7168
1.4009
-14.9629
0.9716
0.0001***
0.0001***
0.8922
0.3758
Profit margin 0.2227
0.2125
-1.3689
0.0369
0.0001***
0.0001***
0.1787
0.1671
-2.2480
0.0792
0.0001***
0.0001***
0.0108**
0.0982*
ROA 0.1935
0.1763
0.0042
0.1014
0.0001***
0.0001***
0.1695
0.1711
-0.0206
0.0905
0.0001***
0.0001***
0.2058
0.2987

Table 5
Impact of Bargaining Power Differences and Liquidity Constraints on Equity Usagein Strategic Alliances
Each cell in each column presents the percentage of equity alliances relative to the total number of alliancesin that cell. For each alliance, the small partner is classified as either low or high based on the variablesspecified in the panels. The small partner is said to have low levels of a variable if the value of the variableis lower than the median value of the variable of all firms in the sample of alliances, and is said to havehigh levels of the variable otherwise.Cash is defined as operating income before depreciation minus total income taxes, interest expense,dividends on preferred and common stock. Debt ratio is defined as debt over book value of assets wheredebt is long-term debt minus capital leases. Debt capacity is a dummy that takes the value of 1 if theinterest coverage is above and the debt ratio is below the median value in the sample of small firmsengaged in alliances and 0 otherwise. Interest coverage is EBIT over interest expenses. Capitalexpenditure coverage is equal to income before extraordinary items plus depreciation minus dividends oncommon stocks over capital expenditures. Market share is equal to firm net sales divided by thesummation of net sales in the firm's industry where industry is based on the 4-digit SIC code with therequirement that there be a minimum of 5 companies in the industry. If we find fewer than 5 companiesusing the 4-digit SIC code, we define industry using the 3-digit SIC code, again imposing the 5 companiesminimum requirement. We continue to apply this criterion until we find more than 5 companies in anindustry or until we reach the 1-digit SIC code. The same industry definition is also used for theHerfindahl index calculation. For each company, age is defined as the difference between the year of thealliance formation minus the year when company information began appearing in CRSP. Firm value isequal to book value of assets minus book value of equity plus market value of equity. *, **, and ***
represent significance at the 10%, 5%, and 1% levels, respectively.
Category Low High
Cash / Total assets 17.2 5.4
Debt ratio 12.3 10.5
Debt capacity 18.3 5.4
Interest coverage 17.5 3.1
Capital expenditure coverage 17.3 5.3
Market share 15.2 7.5
Herfindahl index 11.4 11.4
Age 16.1 6.1
Firm value 15.7 7

Table 6
Differences in Characteristics between Equity and Non-Equity Alliances
The second and third columns present the mean, median of different financial and industry characteristicsfor the sample 759 strategic alliances formed during the period 1989 to 1997. The last column reports thep-values for the Wilcoxon test of difference in means, and the test of difference in medians. Cross-industryalliance is a dummy variable that is 1 if the partners are in different industries based on the 3-digit SICcode, and is 0 otherwise. There are two measures of distance – Distance (categorical) is 1, 2, 3, or 4depending on whether the partners in the alliance differ in their 4-digit, 3 digit, 2-digit, or 1-digit SICcodes, respectively. This variable is 0 otherwise. Distance (continuous) is defined as follows. If the partnerfirms have the same 4-digit SIC code, the distance is 0. If they have the same 3-digit code but different 4-digit code, distance is equal to the absolute value of the difference in the 4th digit. If they have the same 2-digit code but different 3-digit code, distance is equal to the absolute value of the difference in the 3rd digitmultiplied by 10. If they have the same 1-digit code but different 2-digit code, then distance is thedifference in the 2nd digit multiplied by 100. Finally, if the firms differ in their 1-digit code, then we assigna distance of 1000, since a smaller difference in the 1 st digit does not imply any similarity in the products ofthe two industries. The Technology dummy takes the value of 1 if the contract involves R&D,development, technology or multiple type of agreements. The Ratio of market to book divides the largermarket-to-book ratio in the two partners over the smaller market-to-book ratio. Ratio of R&D intensities(R&D/Assets), the ratio of market value of assets, and the ratio of market shares are defined similarly. Forthe last two ratios we present the log value due to the dispersion of the data. Similar results obtain evenwithout taking logs. *, **, and *** represent significance at the 10%, 5%, and 1% levels, respectively.
Equity Alliances Non-Equity Alliances p-value
Cross-industry alliance 0.5360
1.0000
0.6918
1.0000
0.0023***
0.0023***
Distance (Categorical) 2.1134
2.0000
2.7054
4.0000
0.0008***
0.0019***
Distance (Continuous) 410.0417
20.0000
572.5204
1000.0000
0.0010***
0.0024***
Technology Dummy 0.8202
1.0000
0.4704
0.0000
0.0001***
0.0001***
Ratio of market to books 3.8979
1.2301
2.4322
1.5605
0.0064***
0.0103**
Ratio of R&D intensities 10.8419
2.9514
4.2628
2.0647
0.0436**
0.0213**
Relative Size 238.0535
59.2758
131.1221
11.8548
0.0001***
0.0001***
Log of ratio of market value of assets 4.1112
4.0809
2.8047
2.4727
0.0001***
0.0001***
Log of ratio of market shares 4.2162
4.2548
2.7826
2.3739
0.0001***
0.0001***

Table 7
Logistic Regressions to Explain the Incidence of Equity Alliances
The dependent variable is 1 for equity alliances and 0 otherwise. Cross-industry dummy takes de value of1 if the two partners are in different industries at the 3-digit SIC code and zero otherwise. The R&D,Technology, and Development dummies take the value of 1 if the contract specifies any R&D, technologyor technology transfer, and product development, respectively. Ratio of Market to Book divides the largerindustry median market-to-book from the two partners over the smaller industry median market-to-book.Ratio of R&D intensities (R&D/Total Assets), the ratio of market value of assets, and the ratio of marketshares are defined similarly. For the last two ratios we present logs values. Three proxies for capitalconstraint are presented. The small partner's cash flow over total assets, the small partner's capitalexpenditure coverage, and the debt capacity variable. Debt capacity equals 1 if the interest coverage andthe debt ratio of the smaller partner in an alliance are below and above the median in its industry,respectively and 0 otherwise. Panels A, B, and C present a series of logistic regressions by changing thecapital constraint variables in the models across the panels. P-values are presented in parentheses. *, **,and *** represent significance at the 10%, 5%, and 1% levels, respectively.
Panel A
Regressions (1) (2) (3) (4)
Constant -2.8941(0.0001)
-2.5275(0.0001)
-2.0518(0.0001)
-2.4115(0.0001)
Cross-Industry Dummy -0.4258(0.2556)
-0.7468**
(0.0333)-0.7373**
(0.0315)-0.4907(0.2347)
R&D Dummy 2.4298***
(0.0001)2.3738***
(0.0001)2.6383***
(0.0001)3.1910***
(0.0001)
Technology dummy 1.0436**
(0.0173)1.0998***
(0.0082)1.1132***
(0.0072)1.1693**
(0.0195)
Development Dummy 0.9352**
(0.0152)0.8843**
(0.0172)0.7844**
(0.0338)1.0912**
(0.0155)
Log of relative size 0.1929**
(0.0428)
Log of ratio of market shares 0.2072***
(0.0096)
Ratio of market-to-books 0.0117(0.4296)
Ratio of R&D intensity 0.0194*
(0.0911)
Number of firms in small partner's industry -0.0042**
(0.0317)-0.0055***
(0.0070)-0.0041**
(0.0197)-0.00487**
(0.0255)
Small Partner's Cash Flow / Total Assets -2.1909***
(0.0079)-0.6531(0.1648)
-1.3131**
(0.0115)-1.4599**
(0.0283)
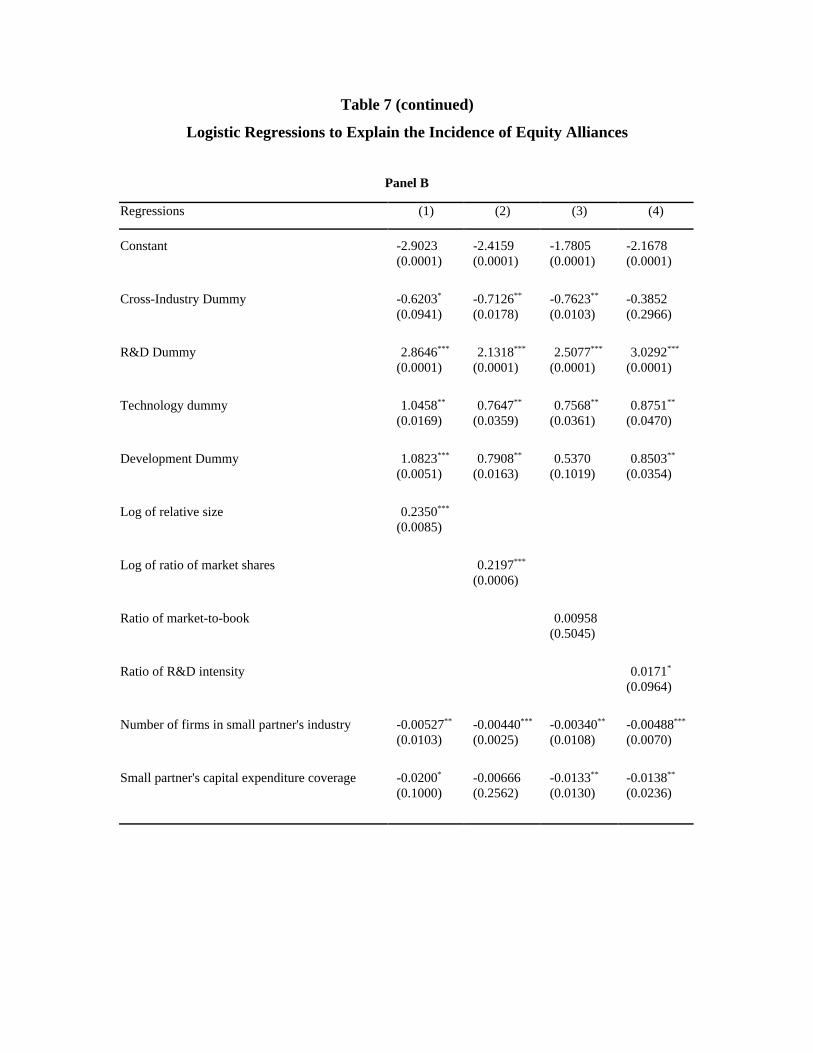
Table 7 (continued)
Logistic Regressions to Explain the Incidence of Equity Alliances
Panel B
Regressions (1) (2) (3) (4)
Constant -2.9023(0.0001)
-2.4159(0.0001)
-1.7805(0.0001)
-2.1678(0.0001)
Cross-Industry Dummy -0.6203*
(0.0941)-0.7126**
(0.0178)-0.7623**
(0.0103)-0.3852(0.2966)
R&D Dummy 2.8646***
(0.0001)2.1318***
(0.0001)2.5077***
(0.0001)3.0292***
(0.0001)
Technology dummy 1.0458**
(0.0169)0.7647**
(0.0359)0.7568**
(0.0361)0.8751**
(0.0470)
Development Dummy 1.0823***
(0.0051)0.7908**
(0.0163)0.5370
(0.1019)0.8503**
(0.0354)
Log of relative size 0.2350***
(0.0085)
Log of ratio of market shares 0.2197***
(0.0006)
Ratio of market-to-book 0.00958(0.5045)
Ratio of R&D intensity 0.0171*
(0.0964)
Number of firms in small partner's industry -0.00527**
(0.0103)-0.00440***
(0.0025)-0.00340**
(0.0108)-0.00488***
(0.0070)
Small partner's capital expenditure coverage -0.0200*
(0.1000)-0.00666(0.2562)
-0.0133**
(0.0130)-0.0138**
(0.0236)

Table 8Announcement Period Abnormal Returns for Strategic Alliances
sorted by Alliance-Type
The tables presents the abnormal returns over the (-1,0) and (0,0) intervals around the announcement datefor the sample of firms that engaged in alliances. We report the announcement period abnormal returns forthe different types of alliances. We employ the event-study methodology used by Dodd and Warner (1983)in computing the abnormal returns. The market model is estimated over a 155-day period ending 45 daysbefore the announcement of the alliance. The CRSP value-weighted index is used as a proxy for the marketportfolio. *, **, and *** represent significance at the 10%, 5%, and 1% levels, respectively.
(-1,0) (0,0)
Mean Median Mean Median
All alliances 0.0175*** 0.0047*** 0.0155*** 0.0042***
Equity 0.0657*** 0.0130*** 0.0606*** 0.0122***
Non-equity 0.0115*** 0.0033*** 0.0098*** 0.0035***
Equity
Buying 0.0017 -0.0014 0.0028 -0.0036
Selling 0.1476*** 0.1472*** 0.1319*** 0.0919***
Technology 0.0638*** 0.0127*** 0.0583*** 0.0122***
Non-technology 0.0883 0.0252 0.0862 0.0042
Buying and Technology -0.0060 -0.0027 -0.0043* -0.0037*
Buying and Non-Technology 0.0995 0.0200 0.0939 0.0162
Selling and Technology 0.1500*** 0.1556*** 0.1327 0.1037
Selling and Non-Technology 0.1199 0.0305 0.1225 -0.0077
Non-equity
Big Partner 0.0011 -0.0008 0.0027** 0.0016**
Small Partner 0.0217*** 0.0099*** 0.0168*** 0.0064***
Technology 0.0125*** 0.0044*** 0.0102*** 0.0045***
Non-Technology 0.0106*** 0.0030*** 0.0095*** 0.0029***
Big Partner and Technology 0.0019 0.0002 0.0037* 0.0011*
Big Partner and Non-Technology 0.0004 -0.0012 0.0019 0.0022
Small Partner and Technology 0.0230*** 0.0100*** 0.0167*** 0.0077***
Small Partner and Non-Technology 0.0206*** 0.0099*** 0.0169*** 0.0047***
Copyright © 2022 FDOKUMEN