What we can learn from the Dutch: Rebuilding Kerala post ...
160
What we can learn from the Dutch: Rebuilding Kerala post 2018 floods
-
Upload
khangminh22 -
Category
Documents
-
view
3 -
download
0
Transcript of What we can learn from the Dutch: Rebuilding Kerala post ...
What we can learn from the Dutch: Rebuilding Kerala post 2018 floods
Venu Rajamony
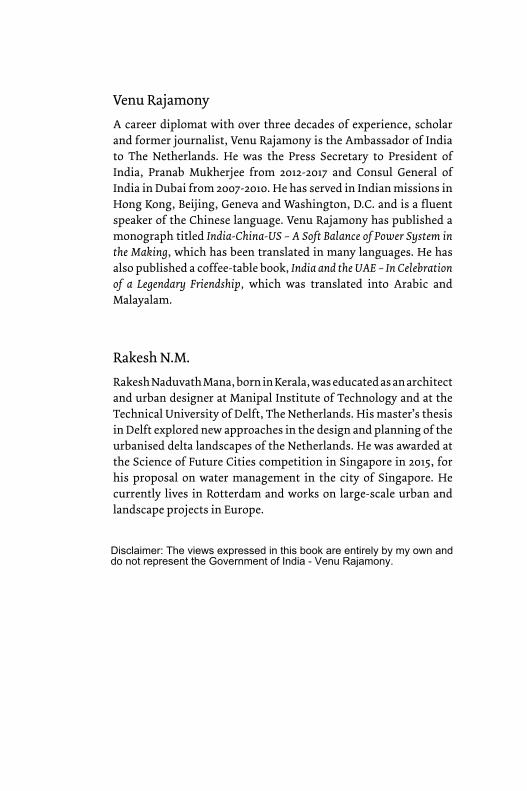
A career diplomat with over three decades of experience, scholar and former journalist, Venu Rajamony is the Ambassador of India to The Netherlands. He was the Press Secretary to President of India, Pranab Mukherjee from 2012-2017 and Consul General of India in Dubai from 2007-2010. He has served in Indian missions in Hong Kong, Beijing, Geneva and Washington, D.C. and is a fluent speaker of the Chinese language. Venu Rajamony has published a monograph titled India-China-US – A Soft Balance of Power System in the Making, which has been translated in many languages. He has also published a coffee-table book, India and the UAE – In Celebration of a Legendary Friendship, which was translated into Arabic and Malayalam.
Rakesh N.M.
Rakesh Naduvath Mana, born in Kerala, was educated as an architect and urban designer at Manipal Institute of Technology and at the Technical University of Delft, The Netherlands. His master’s thesis in Delft explored new approaches in the design and planning of the urbanised delta landscapes of the Netherlands. He was awarded at the Science of Future Cities competition in Singapore in 2015, for his proposal on water management in the city of Singapore. He currently lives in Rotterdam and works on large-scale urban and landscape projects in Europe.
Disclaimer: The views expressed in this book are entirely by my own anddo not represent the Government of India - Venu Rajamony.
What we can learn from the Dutch: Rebuilding Kerala post 2018 floods
Venu Rajamony and Rakesh N.M.
D C Books
English LanguageWhat we can learn from the Dutch: Rebuilding Kerala post 2018 floods
Referenceby Venu Rajamony and Rakesh N.M.
Rights ReservedFirst Published December 2018
Publishers D C Books, Kottayam 686 001 Kerala State, IndiaLiterature News Portal: www.dcbooks.comOnline Bookstore: www.onlinestore.dcbooks.come-bookstore: ebooks.dcbooks.comCustomercare: [email protected], 9846133336
Distributors D C Books-Current BooksINDIAD C Books Library Cataloguing in Publication DataVenu Rajamony, Rakesh N.M.What we can learn from the dutch: Rebuilding kerala post 2018 floods /Venu Rajamony, Rakesh N.M.160., 21 cm.ISBN 978-93-5282-592-91. Engineering 2. Flood control I. Rakesh N.M.627.4—dc22.
No part of this publication may be reproduced, or transmitted in any form or by any means, without prior written permission of the publisher.
isbn 978-93-5282-592-9
Printed in India at Rathna Offset Printers, Chennai, INDIA.
D C Books: The First Indian Book Publishing House to get ISO Certification
930/18-19-Sl.No. 18641-dcb 7068-100-40.00-12-18 -p tg-d np
5
Contents
Contents
Introduction 7
Chapter 1. Dutch Response to Floods over History 9
Chapter 2. Dutch Innovations in Water Management 34
Chapter 3. The Kerala Flood Disaster of 2018 60
Chapter 4. Adapting the Dutch Experience to Kerala 72
Conclusion 89
Annexure 1. PDNA Report - Executive Summary 90
Annexure 2. CWC Report 108
References 154

6
What we can learn from the Dutch: Rebuilding Kerala post 2018 floods
7
Contents
Introduction
The Netherlands is a tiny, low-lying country, similar to the size of Kerala, in the north-western sea coast of the European mainland. About 26% of the country is below the sea level and 60% of the land is prone to floods. This vulnerability to floods and the experience of past disasters have prompted them to develop one of the most advanced and sophisticated flood risk and water management systems in the world, which countries across the globe see as a model to learn from and emulate.
The floods in Kerala of 2018 have been a rude wake-up call to the people and Government of the State on how vulnerable the state is to climate change and water-related disasters. This book is therefore an attempt to highlight and draw attention to what Kerala can learn from the Dutch experience in combating floods and water management.

8
What we can learn from the Dutch: Rebuilding Kerala post 2018 floods
9
Dutch Response to Floods over History
Chapter 1
Dutch Response to Floods over History
The Flood-Prone Landscape of the Netherlands
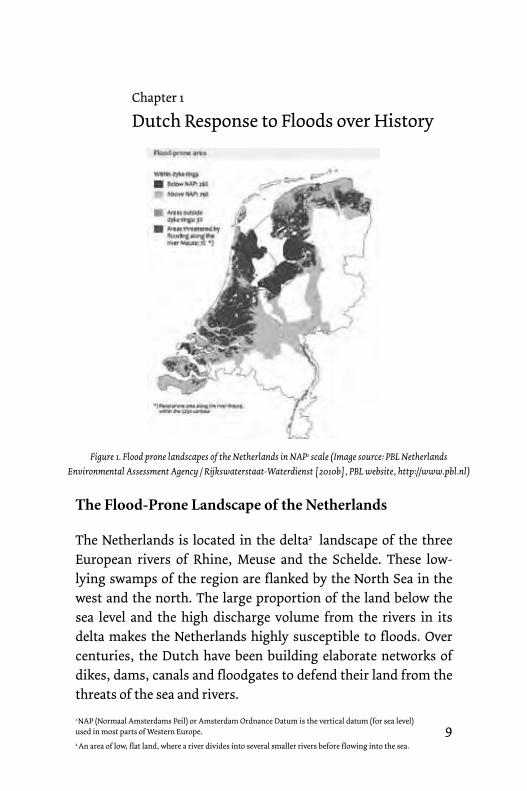
The Netherlands is located in the delta2 landscape of the three European rivers of Rhine, Meuse and the Schelde. These low-lying swamps of the region are flanked by the North Sea in the west and the north. The large proportion of the land below the sea level and the high discharge volume from the rivers in its delta makes the Netherlands highly susceptible to floods. Over centuries, the Dutch have been building elaborate networks of dikes, dams, canals and floodgates to defend their land from the threats of the sea and rivers.
1 NAP (Normaal Amsterdams Peil) or Amsterdam Ordnance Datum is the vertical datum (for sea level) used in most parts of Western Europe.2 An area of low, flat land, where a river divides into several smaller rivers before flowing into the sea.
Figure 1. Flood prone landscapes of the Netherlands in NAP1 scale (Image source: PBL Netherlands Environmental Assessment Agency / Rijkswaterstaat-Waterdienst [2010b], PBL website, http://www.pbl.nl)

10
What we can learn from the Dutch: Rebuilding Kerala post 2018 floods
Historically, the interaction between the sea and the high sediment-carrying rivers resulted in the formation of sandbanks on the river delta. Most of the towns of the Netherlands until the 12th century were built over these high sandbanks. With further
needs to expand the settlement as well as gain more fertile lands for agriculture, the Dutch drained water out of the peat3 swamps in the delta to make them dry for cultivation.
Rectilinear drains were drenched through the swamps and water was channeled back into the rivers and sea through a well-connected system of canals and reservoirs. The continuous infiltration of water into these peat swamps meant that continual draining of this water became necessary. This resulted in land subsidence. Gradually, these peatlands subsided below the level of the river (and in certain cases below the level of the sea), making them more vulnerable to flooding.
With the land subsiding below the river and sea levels, by the 15th century, windmills were introduced to pump water
Figure2. Traditional Dutch windmills in the village of Kinderdijk (Image source: https://beeldbank.rws.nl, Rijkswaterstaat)
3 Peat is a highly organic material found in marshy or damp regions, composed of partially decayed vegetable matter.
11
Dutch Response to Floods over History
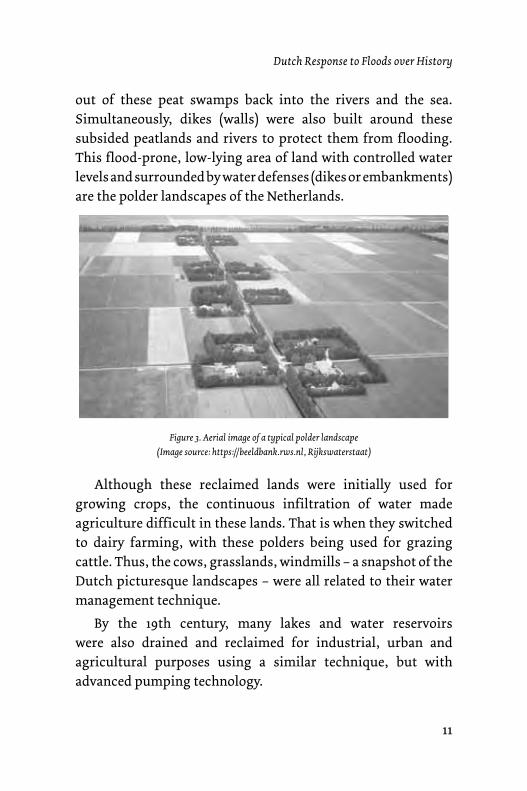
out of these peat swamps back into the rivers and the sea. Simultaneously, dikes (walls) were also built around these subsided peatlands and rivers to protect them from flooding. This flood-prone, low-lying area of land with controlled water levels and surrounded by water defenses (dikes or embankments) are the polder landscapes of the Netherlands.
Although these reclaimed lands were initially used for growing crops, the continuous infiltration of water made agriculture difficult in these lands. That is when they switched to dairy farming, with these polders being used for grazing cattle. Thus, the cows, grasslands, windmills – a snapshot of the Dutch picturesque landscapes – were all related to their water management technique.
By the 19th century, many lakes and water reservoirs were also drained and reclaimed for industrial, urban and agricultural purposes using a similar technique, but with advanced pumping technology.
Figure 3. Aerial image of a typical polder landscape (Image source: https://beeldbank.rws.nl, Rijkswaterstaat)
12
What we can learn from the Dutch: Rebuilding Kerala post 2018 floods
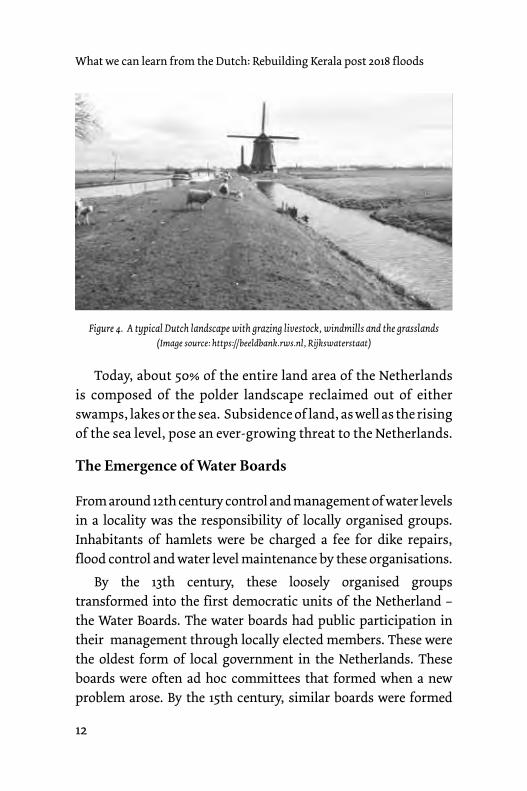
Today, about 50% of the entire land area of the Netherlands is composed of the polder landscape reclaimed out of either swamps, lakes or the sea. Subsidence of land, as well as the rising of the sea level, pose an ever-growing threat to the Netherlands.
The Emergence of Water Boards
From around 12th century control and management of water levels in a locality was the responsibility of locally organised groups. Inhabitants of hamlets were be charged a fee for dike repairs, flood control and water level maintenance by these organisations.
By the 13th century, these loosely organised groups transformed into the first democratic units of the Netherland – the Water Boards. The water boards had public participation in their management through locally elected members. These were the oldest form of local government in the Netherlands. These boards were often ad hoc committees that formed when a new problem arose. By the 15th century, similar boards were formed
Figure 4. A typical Dutch landscape with grazing livestock, windmills and the grasslands(Image source: https://beeldbank.rws.nl, Rijkswaterstaat)
13
Dutch Response to Floods over History
by local landowners to finance a windmill or later, a mechanical pump to drain their lands.
By the 19th century, there were many thousands of water boards in the Netherlands. The reorganisation of these water boards reduced their number to 3,500 in 1850, and to 2,500 water boards in 1950. Their numbers were further reduced to 25 water boards in 2011. As of 2018, there are 21 water boards in the Netherlands. Although reduced in number, these water boards together employ about 10,000 people in the country.
Today, these water boards are one of the most powerful institutions of the Netherlands. They are decentralised public entities with legal tasks and a self-supporting financial system. They form the fourth tier of government institutions along with the central government, provinces and the municipalities. Members of the water boards are elected democratically every four years.
Their scope of works has expanded from flood control in the past, to integrated land-use planning and environmental protection now. Their responsibilities include protection against sea and river water through the provision of dikes, dunes and dams, as well as maintaining optimum water level through management of the network of canals, streams and ditches. Their work ensures the quality of water by protecting it from industrial pollutants and waste water. They also manage inland waterways through depth-control measures and maintain rural roads.
Although the scope of their work is wide, they still operate on a local scale. They set rules for the local waterbodies and flood defences and decide on the tax for services provided to beneficiaries in their region. But, in order to cope with the fluvial floods and water management on a larger scale, a National Water Authority – Rijkswaterstaat (RWS) was established in 1798. RWS is responsible
14
What we can learn from the Dutch: Rebuilding Kerala post 2018 floods
for management of rivers and seas. It maintains dams, river dikes, navigation channels and storm surge barriers. It is also responsible for the communication of high water or storm warnings to local water boards and municipalities. Moreover, RWS, is the executive agency of the State Ministry of Public Works, Transport and Water Management and ensures that transport and developmental work are well-integrated into the water system which it operates. Water boards along with Rijskwaterstaat are thus jointly responsible for flood protection and maintenance of safe water levels within the country now.
Flood Disasters and Response of the Netherlands
There have been many devastating floods in the Netherlands recorded over the past 2,000 years. Most of these floods have been caused by storm surges of the surrounding North Sea which broke dikes and dams. Flooding also occurred when high water levels – caused by extreme rainfall or melting ice and snow caps of the Alps – overflowed the riverbanks.
The northern coast of the Netherlands has for centuries been shaped by the Zuiderzee (southern sea) – a shallow inland bay of the North Sea. This U-shaped coastline, 300 kms in length was dotted by prominent trading towns during the Dutch Golden Age4. The long coastline also meant that low-lying towns on these coasts suffered centuries of North Sea storm surges and floods destroying many lives and resources. For instance, the St. Lucia’s flood of 1287, took the lives of 50,000 to 80,000 people and is one of the largest floods in recorded history. The St. Elizabeth’s flood of 1421 claimed the lives of about 2,000 people and St. Felix’s flood of 1530 caused a similar amount of damage. But the worst disaster in the history of the country took place during the All Saints’ flood5
4 The Dutch Golden Age was a period in the history of the Netherlands, roughly spanning the 17th century, in which trade, science and art flourished.
5 These floods were usually named after the saint, on whose feast day the flood broke.
15
Dutch Response to Floods over History
of 1570, which was a consequence of storm surge from the North Sea. The entire coast of the Netherlands was flooded breaching its defense lines of dikes and dams. The death toll in that disaster was estimated to be 20,000 lives, leaving tens of thousands of people and livestock homeless.
Three main floods that occurred in the 20th century are the 1916 floods of the Zuiderzee, the flood of 1953 and the Meuse valley floods of 1993 and 1995. The Dutch response to these floods resulted in some engineering marvels, altering landscapes and the relationship of people and government with water.
1916 Zuiderzee Floods
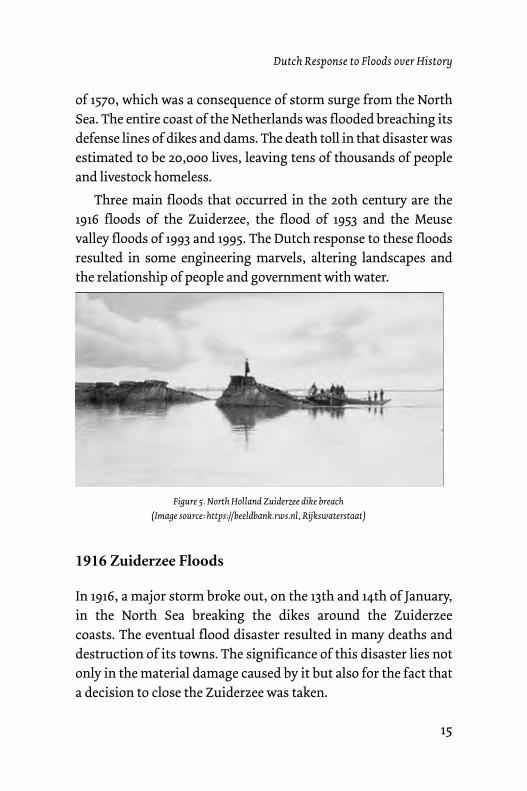
In 1916, a major storm broke out, on the 13th and 14th of January, in the North Sea breaking the dikes around the Zuiderzee coasts. The eventual flood disaster resulted in many deaths and destruction of its towns. The significance of this disaster lies not only in the material damage caused by it but also for the fact that a decision to close the Zuiderzee was taken.
Figure 5. North Holland Zuiderzee dike breach(Image source: https://beeldbank.rws.nl, Rijkswaterstaat)

16
What we can learn from the Dutch: Rebuilding Kerala post 2018 floods
Figure 6. Flooded town of Meppel during the 1916 floods (Image source: https://beeldbank.rws.nl, Rijkswaterstaat)
Afsluitdijk and the Closure of the Zuiderzee
In 1927, construction of a 32 km long (90 m wide) barrier dam to close off the Zuiderzee was begun. Within five years’ time, the dam closed off the sea, transforming the area of the former inland bay into the freshwater lake of Ijsselmeer. Four new polders of 40,000 hectares were reclaimed from the lake and developed for agriculture and housing – Wieringermeer (1930), Noordoostpolder (1942), Eastern Flevoland (1957) and Southern Flevoland (1968). A total of 165,000 hectares of new land was created from the former Zuiderzee. However, protests from environmentalists and public regarding the ecological consequence of impoldering the former sea, resulted in abandoning the original plan to create a fifth polder of Markerward in 1986.

17
Dutch Response to Floods over History
The Afsluitdijk was built over a span of five years by an army of men. A large part of the project was handcrafted. The base of the dam was constructed with basalt rocks and fabric woven from willow branches. Clay boulders dredged from the bottom of the Zuiderzee were set one on top of the other to build the base of the dam. The surface of the dam was further planted with grass to guard it from erosion. A motorway was constructed over the dam and 25 sluices built into it to allow for water discharge and ship navigation.
Figure 7. The Afsluitdijk and the reclaimed polders (Image source: Author)
18
What we can learn from the Dutch: Rebuilding Kerala post 2018 floods
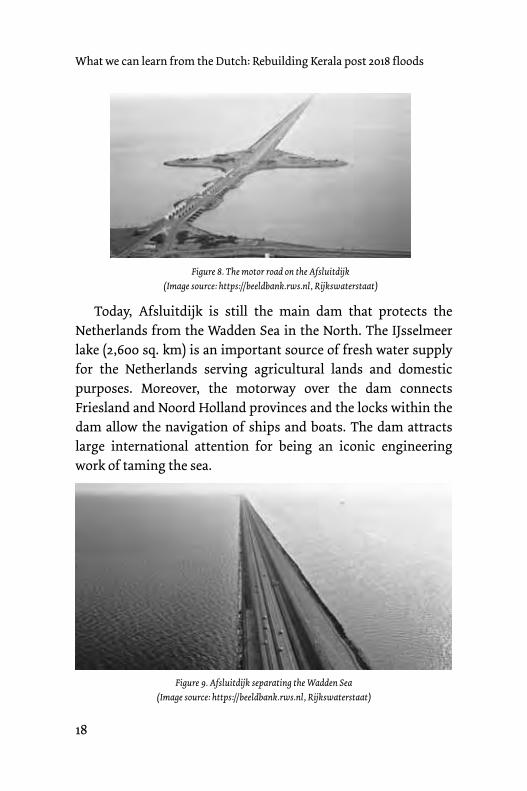
Figure 8. The motor road on the Afsluitdijk(Image source: https://beeldbank.rws.nl, Rijkswaterstaat)
Figure 9. Afsluitdijk separating the Wadden Sea (Image source: https://beeldbank.rws.nl, Rijkswaterstaat)
Today, Afsluitdijk is still the main dam that protects the Netherlands from the Wadden Sea in the North. The IJsselmeer lake (2,600 sq. km) is an important source of fresh water supply for the Netherlands serving agricultural lands and domestic purposes. Moreover, the motorway over the dam connects Friesland and Noord Holland provinces and the locks within the dam allow the navigation of ships and boats. The dam attracts large international attention for being an iconic engineering work of taming the sea.
19
Dutch Response to Floods over History
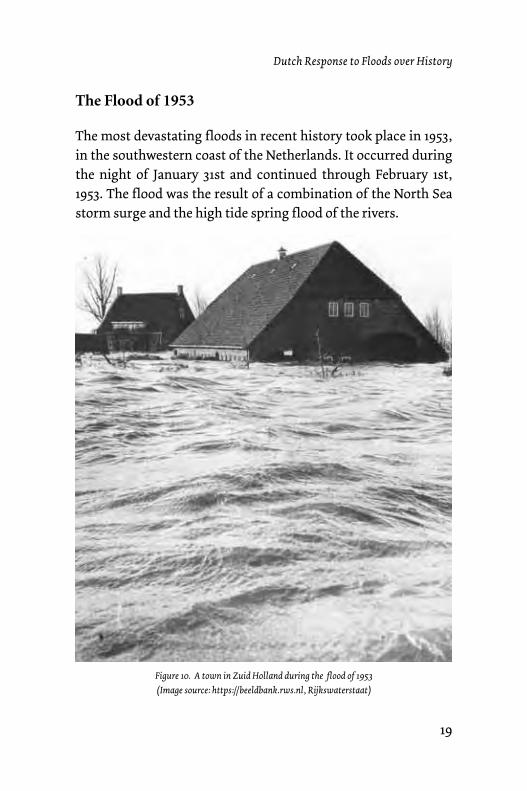
The Flood of 1953
The most devastating floods in recent history took place in 1953, in the southwestern coast of the Netherlands. It occurred during the night of January 31st and continued through February 1st, 1953. The flood was the result of a combination of the North Sea storm surge and the high tide spring flood of the rivers.
Figure 10. A town in Zuid Holland during the flood of 1953 (Image source: https://beeldbank.rws.nl, Rijkswaterstaat)
20
What we can learn from the Dutch: Rebuilding Kerala post 2018 floods
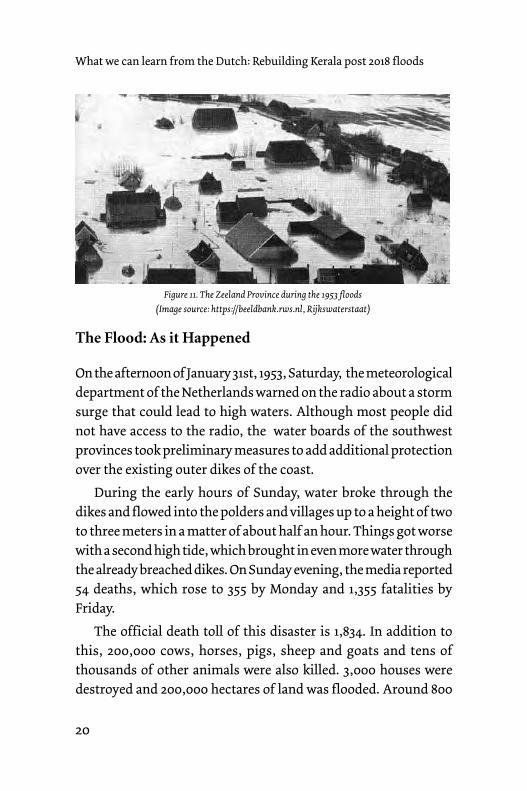
Figure 11. The Zeeland Province during the 1953 floods (Image source: https://beeldbank.rws.nl, Rijkswaterstaat)
The Flood: As it Happened
On the afternoon of January 31st, 1953, Saturday, the meteorological department of the Netherlands warned on the radio about a storm surge that could lead to high waters. Although most people did not have access to the radio, the water boards of the southwest provinces took preliminary measures to add additional protection over the existing outer dikes of the coast.
During the early hours of Sunday, water broke through the dikes and flowed into the polders and villages up to a height of two to three meters in a matter of about half an hour. Things got worse with a second high tide, which brought in even more water through the already breached dikes. On Sunday evening, the media reported 54 deaths, which rose to 355 by Monday and 1,355 fatalities by Friday.
The official death toll of this disaster is 1,834. In addition to this, 200,000 cows, horses, pigs, sheep and goats and tens of thousands of other animals were also killed. 3,000 houses were destroyed and 200,000 hectares of land was flooded. Around 800
21
Dutch Response to Floods over History
km of dikes were damaged and many agricultural lands ruined with saltwater intrusion.
As the region was unprepared for the disaster, it was the ad hoc rescue operations of everyday people that mitigated the disaster. For instance, sailing clubs and local boat owners organised themselves to search and rescue the survivors. Amateurs put up emergency radio stations for communication to the outside world as telephone and telegraph lines were damaged during the floods. Helicopters were also used to rescue people from rooftops.
After the 1953 floods, flood-risk policies and management drastically changed in the Netherlands. The government set new standards for dike construction as well as improved prediction and communication of flood warning. Scientific methods were introduced for flood risk management and a Delta Committee was formed. The committee comprised a team of experts who were to advise the government on measures to alleviate future floods.
Delta Works
The advice from the Delta Committee resulted in formulation of ‘Delta Works’– a series of spatial and infrastructural interventions in the south-west delta (Rhine-Meuse-Scheldt delta) region of the Netherlands aimed at creating a defence system against high water from the sea.
The recommendations of the Delta Committee included:
• ; Closure of the Hollandse IJssel (a branch of Rhine Delta) at the mouth of the river with storm surge barriers that permit movement of ships. This was implemented with the completion of the storm surge barrier Hollands IJsselkering in 1957.
22
What we can learn from the Dutch: Rebuilding Kerala post 2018 floods
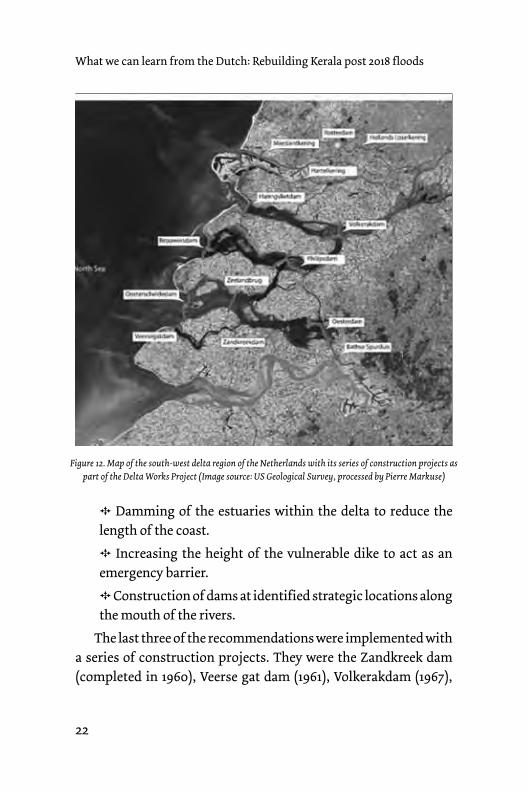
Figure 12. Map of the south-west delta region of the Netherlands with its series of construction projects as part of the Delta Works Project (Image source: US Geological Survey, processed by Pierre Markuse)
• ; Damming of the estuaries within the delta to reduce the length of the coast.
• ; Increasing the height of the vulnerable dike to act as an emergency barrier.
• ; Construction of dams at identified strategic locations along the mouth of the rivers.
The last three of the recommendations were implemented with a series of construction projects. They were the Zandkreek dam (completed in 1960), Veerse gat dam (1961), Volkerakdam (1967),
23
Dutch Response to Floods over History
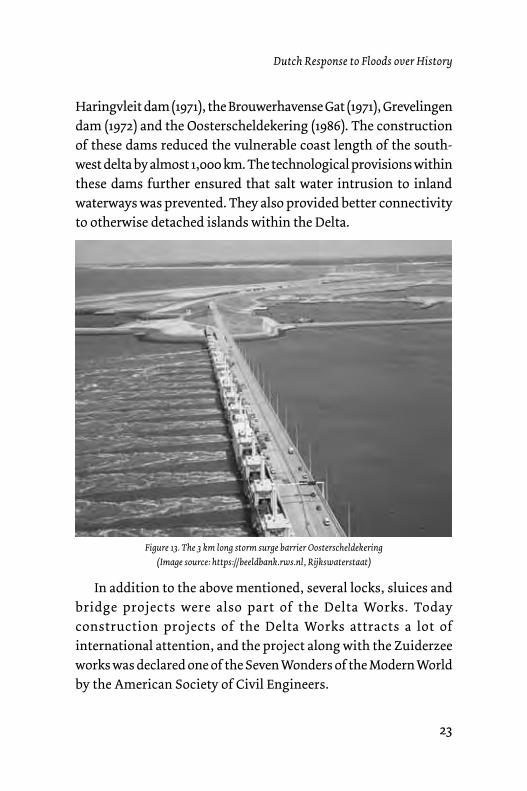
Haringvleit dam (1971), the Brouwerhavense Gat (1971), Grevelingen dam (1972) and the Oosterscheldekering (1986). The construction of these dams reduced the vulnerable coast length of the south-west delta by almost 1,000 km. The technological provisions within these dams further ensured that salt water intrusion to inland waterways was prevented. They also provided better connectivity to otherwise detached islands within the Delta.
Figure 13. The 3 km long storm surge barrier Oosterscheldekering(Image source: https://beeldbank.rws.nl, Rijkswaterstaat)
In addition to the above mentioned, several locks, sluices and bridge projects were also part of the Delta Works. Today construction projects of the Delta Works attracts a lot of international attention, and the project along with the Zuiderzee works was declared one of the Seven Wonders of the Modern World by the American Society of Civil Engineers.
24
What we can learn from the Dutch: Rebuilding Kerala post 2018 floods
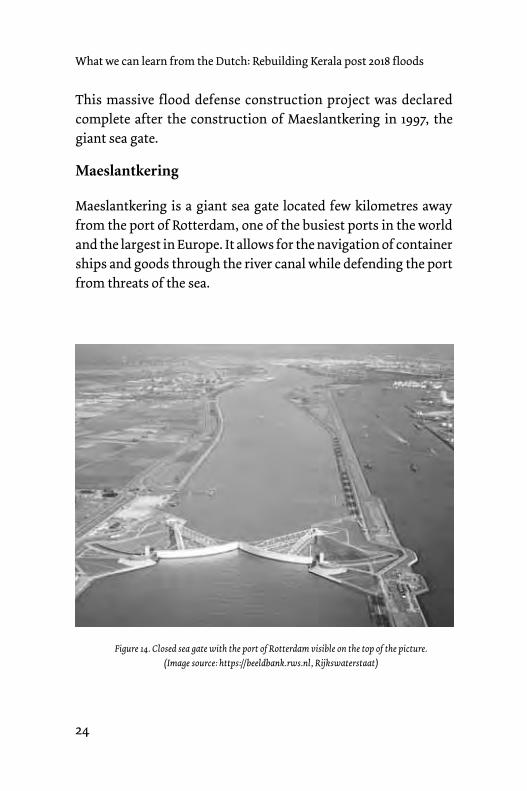
This massive flood defense construction project was declared complete after the construction of Maeslantkering in 1997, the giant sea gate.
Maeslantkering
Maeslantkering is a giant sea gate located few kilometres away from the port of Rotterdam, one of the busiest ports in the world and the largest in Europe. It allows for the navigation of container ships and goods through the river canal while defending the port from threats of the sea.
Figure 14. Closed sea gate with the port of Rotterdam visible on the top of the picture. (Image source: https://beeldbank.rws.nl, Rijkswaterstaat)
25
Dutch Response to Floods over History
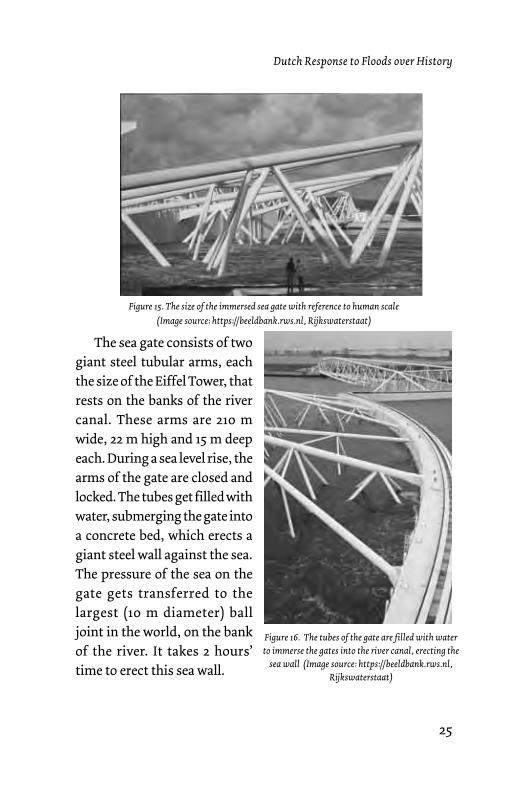
The sea gate consists of two giant steel tubular arms, each the size of the Eiffel Tower, that rests on the banks of the river canal. These arms are 210 m wide, 22 m high and 15 m deep each. During a sea level rise, the arms of the gate are closed and locked. The tubes get filled with water, submerging the gate into a concrete bed, which erects a giant steel wall against the sea. The pressure of the sea on the gate gets transferred to the largest (10 m diameter) ball joint in the world, on the bank of the river. It takes 2 hours’ time to erect this sea wall.
Figure 15. The size of the immersed sea gate with reference to human scale(Image source: https://beeldbank.rws.nl, Rijkswaterstaat)
Figure 16. The tubes of the gate are filled with water to immerse the gates into the river canal, erecting the
sea wall (Image source: https://beeldbank.rws.nl, Rijkswaterstaat)
26
What we can learn from the Dutch: Rebuilding Kerala post 2018 floods
The entire system is automated, as the computer monitors sea levels every hour. The computer system automatically decides when to open and close the gates. In order to reopen the gates, water in the tubes need to be emptied out. These gates are equipped with many motors to empty the water out. These motors are connected to the power grid of the country, with another backup grid and a generator. Failure to reopen the gate can pose even more threat, as blockage of water discharges from the rivers of Rhine and Meuse will flood the city of Rotterdam even faster than the North Sea. Maeslantkering is a monumental achievement of engineering. During its construction in 1997, it was an unprecedented way to safeguard the delta from the effects of sea storm surges or sea level rises, without compromising on transport and economic activities of the busy port and safety of its citizens.
River Floods of 1993, 1995 and Room for River Project
In 1993, the Meuse river flooded the Limburg region in the southern parts of the Netherlands. The flood was caused due to persistent rain resulting in heavy discharge of the river. About 12,000 people were evacuated from this region, while 170 sq. km of the flood plains were affected. Although no dikes were broken during the floods, the damages were estimated to be around Euro 100 million.
In 1995, high waters in the Rhine, Meuse and Waal rivers resulted in the flooding of the valley again. This led to the evacuation of 250,000 people from the flood-affected region, one of the largest evacuations in the country. After these two consecutive floods in the region, all flood defences were assessed against safety standards and it was discovered that higher discharges from rivers had resulted in higher water levels and waves.
Rather than increase the strength or raise the height of the dikes
27
Dutch Response to Floods over History
and dams along these rivers, an alternate approach was evolved. This approach comprised a set of measures to provide more space and room for the rivers to flow and came to be known as Room for the River project. Each of these measures aim to increase the disposal and storage capacity of the rivers, as well as to improve the spatial quality of the landscape along the river. The projects were executed with a high degree of public participation. All ideas and concerns of the public, provinces, nature conservationists and water boards were incorporated into the decision-making process.
Tailor-made solutions for different locations evolved as part of the project include:
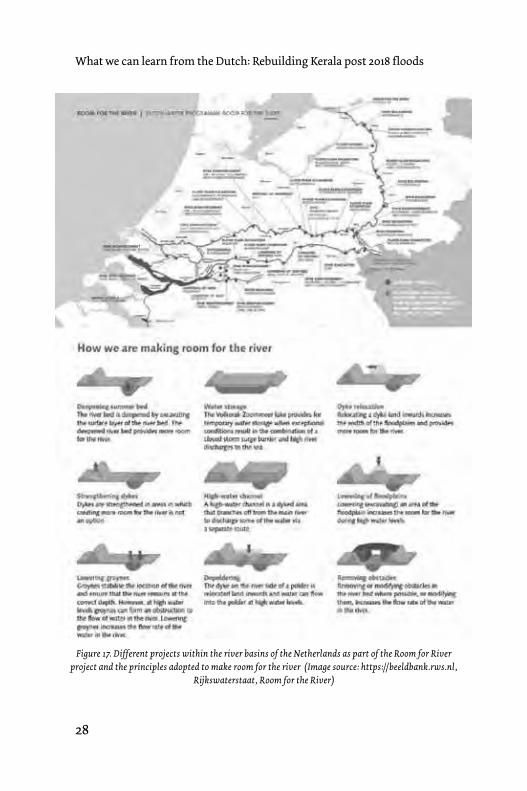
a. Lowering the flood plain: Sedimentation gradually raises the level of flood plains of many rivers. Lowering the flood plain by removing its top layers gives the river more space to flow when the water level rises.
b. Deepening the river bed: This involves dredging of the river bed to make it deeper thereby creating more room for the river.
c. Lowering perpendicular barriers (groynes) in river and
building parallel barriers: Lowering the barriers in the river and building parallel barriers enables easier drainage of excess water into the river. Barriers are constructed at right angles to the flow of the river which are then lowered or removed depending on the level of water. Barriers are also constructed parallel to the flow of the river.
d. Strengthening dykes: In several areas where widening of the river is not an option due to lack of space, the dykes will be strengthened instead.
e. Depoldering and Dyke relocation: Relocation of dykes inwards into the land increases the width of the flood plains and provides more room for the river. This is done by exposing
28
What we can learn from the Dutch: Rebuilding Kerala post 2018 floods
Figure 17. Different projects within the river basins of the Netherlands as part of the Room for River project and the principles adopted to make room for the river (Image source: https://beeldbank.rws.nl,
Rijkswaterstaat, Room for the River)
29
Dutch Response to Floods over History
land that had once been protected by the dyke to higher water levels so as to expand the river’s bed.
f. Temporary reservoirs: Under exceptional circumstances, such as when the storm surge barrier is closed and the river is discharging large volumes of water to the sea, lakes will serve as temporary water storage areas to retain excess river water.
g. High water channel: A high water channel is a branch of a river used to drain high water via a different route. The channel is not excavated below the water table, but is rather formed by building two dykes in the landscape.
h. Removing obstacles: Removing or modifying obstacles in the river wherever possible helps increase the flow rate for the river water. This includes lowering or eliminating ferry pier banks, widening bridge openings and removing or lowering quays and flood-free areas.
This integrated spatial design project provides more room for the rivers in 34 locations within its course to reduce the water levels during occasions of high discharge. Many of these projects are completed and the remaining ones scheduled to be completed by 2019. Work for the project started in 2006 with a total budget of Euro 2.9 billion, and the construction phase started in 2013.
Some examples of the 34 projects are below:
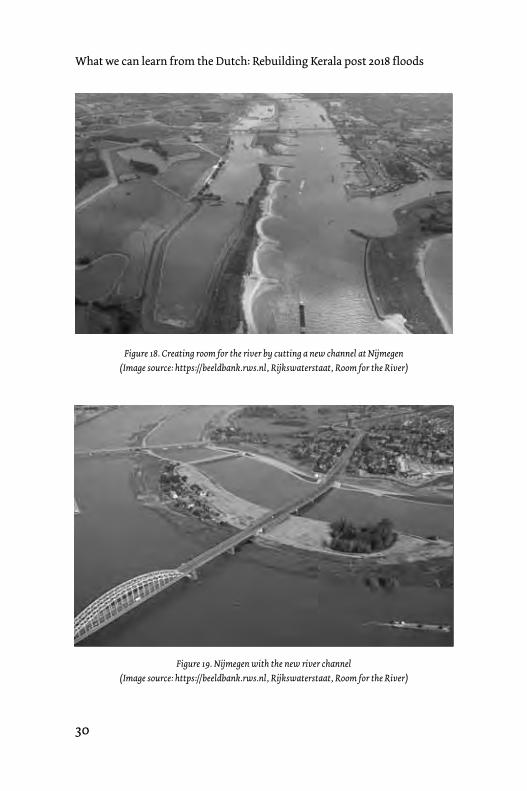
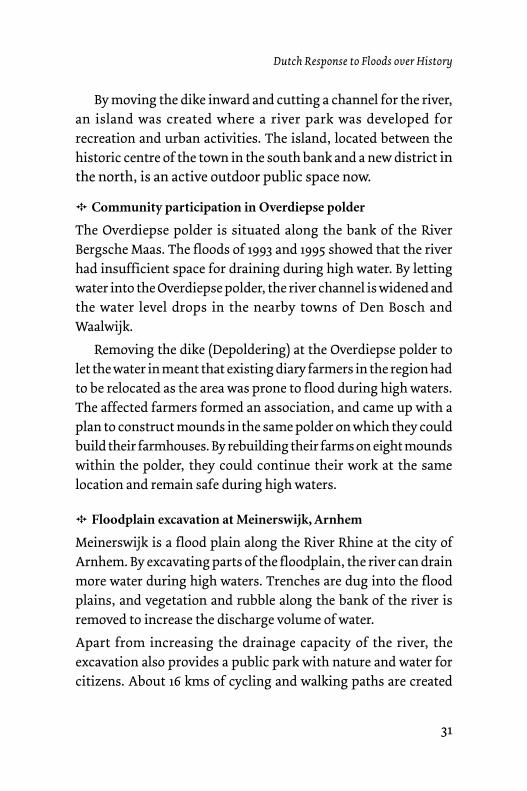
; Room for Waal in Nijmegen: Nijmegen is a town that is located on the banks of the River Waal. The river takes a sharp turn here and narrows itself to form a bottleneck. This bottleneck has caused floods in the town or put pressures on the dikes along the river during the high waters. After extensive public debate, it was decided to shift the dikes 350 m inland. Thus, there is enough room to construct a secondary channel for the river. This channel provides additional capacity for water drainage during high waters.
30
What we can learn from the Dutch: Rebuilding Kerala post 2018 floods
Figure 18. Creating room for the river by cutting a new channel at Nijmegen(Image source: https://beeldbank.rws.nl, Rijkswaterstaat, Room for the River)
Figure 19. Nijmegen with the new river channel(Image source: https://beeldbank.rws.nl, Rijkswaterstaat, Room for the River)
31
Dutch Response to Floods over History
By moving the dike inward and cutting a channel for the river, an island was created where a river park was developed for recreation and urban activities. The island, located between the historic centre of the town in the south bank and a new district in the north, is an active outdoor public space now.
; Community participation in Overdiepse polder
The Overdiepse polder is situated along the bank of the River Bergsche Maas. The floods of 1993 and 1995 showed that the river had insufficient space for draining during high water. By letting water into the Overdiepse polder, the river channel is widened and the water level drops in the nearby towns of Den Bosch and Waalwijk.
Removing the dike (Depoldering) at the Overdiepse polder to let the water in meant that existing diary farmers in the region had to be relocated as the area was prone to flood during high waters. The affected farmers formed an association, and came up with a plan to construct mounds in the same polder on which they could build their farmhouses. By rebuilding their farms on eight mounds within the polder, they could continue their work at the same location and remain safe during high waters.
; Floodplain excavation at Meinerswijk, Arnhem
Meinerswijk is a flood plain along the River Rhine at the city of Arnhem. By excavating parts of the floodplain, the river can drain more water during high waters. Trenches are dug into the flood plains, and vegetation and rubble along the bank of the river is removed to increase the discharge volume of water.
Apart from increasing the drainage capacity of the river, the excavation also provides a public park with nature and water for citizens. About 16 kms of cycling and walking paths are created
32
What we can learn from the Dutch: Rebuilding Kerala post 2018 floods
within the floodplain, and a number of viewpoints to the inner city and nature resulting in an enhanced spatial quality for the region.
From fighting against water to living with water
The Room for the River was a huge paradigm shift in the Dutch approach to water management. From around 1100 AD, the Dutch altered the course of their rivers and estuaries to enable habitation along their low-lying fertile delta. They created dikes and dams to embank their polders or reclaim their lakes to give way for agricultural and urban development. With the advancement in science and technology through the 19th and 20th century, the dikes were repeatedly reinforced using newer technologies. The Afsluitdijk project showed how to tame the sea and reclaim land, while the Delta Works revealed the engineering prowess of the country through its system of dams, sluices, locks, dikes, levees and storm surge barriers to shorten the coastline.
But, beginning from the 1970s, the approach to flood protection and spatial intervention evolved even further giving prominence to concern for the environment. The rapid urbanisation and population explosion post-war in Europe as well as awareness generated by nature conservationists and ecologists played an important role in the formulation of the Second National Policy Document on Spatial Planning (1966). The policy emphasised the need to take into account the concerns of the fragile delta landscape, ecology and environment in spatial planning. These changes at the policy level not only served as a basis for nature conservation in spatial planning, but also contributed to the growing awareness of the public about the effect of these large-scale interventions on the natural landscape. The political narrative
33
Dutch Response to Floods over History
of the country thus shifted from fighting against water for centuries, to living with water.
Room for the River project is based on this strategy of working with nature. Apart from providing enough space for the flow of the river, the project also makes optimal use of natural processes such as wind, water, sediment and vegetation to develop an integrated spatial plan. This model of building resilient and adaptable human settlements near water has caught the attention of the world, especially in the context of climate change and sea level rise.
H H H H
34
What we can learn from the Dutch: Rebuilding Kerala post 2018 floods
Chapter 2
Dutch Innovations in Water Management
As the Dutch approach to water management started changing from treating water as an enemy to living with water, there arose the realisation that raising of stronger walls or strengthening of existing dikes continually would not be a sustainable solution to deal with changing climate and its associated sea level rise.
At the same time, the remarkable engineering feats of Delta Works to make the region flood-proof also started to show adverse effects on the natural ecology of the delta region. The tidal activity of the estuarine landscape was reduced, turning salt water in the region to fresh water. This destroyed many of the flora and fauna of the area. Tidal flats in the region adjacent to the dams got eroded. Small creeks and gullies inland were silted. All these happened even as there was no remission to frequent flooding and droughts within river basins due to changing climate.
A turning point in the evolution of Dutch policies on water management was the summer drought of 2003, when a New Water Agreement was signed amongst national and local institutions for sustainable water management, especially policies that could tackle: a) the changing climate, b) fluctuating river drainage and c) rising sea levels. This agreement replaced the conventional approach of draining excess water as soon as possible to the sea,
35
Dutch Innovations in Water Management
with efforts to retain or store water for the drought period. Public campaigns were also launched with slogans like, ‘The Dutch live with water’ to inform people about the change in approach towards water.
A number of innovative projects which give effect to the principles of Building with nature, Living with water and Room for the River have been implemented or are under implementation in the Netherlands at present and some examples are described below:
A. Building with Nature
1. Sand Motor (Deltaduin)
Much of the 350 km long coast of the Netherlands is highly vulnerable to coastal erosion due to: a) limited deposition of sediments from inland rivers, b) ongoing subsidence of land and c) rising sea levels. Every four or five years, additional sand is supplemented on the coasts of Delfland in Zuid Holland. This frequent deposition of sand every four to five years is unfavourable to the marine ecosystem and leads to steepening of the coastal profile which increases the need for more sand nourishment.
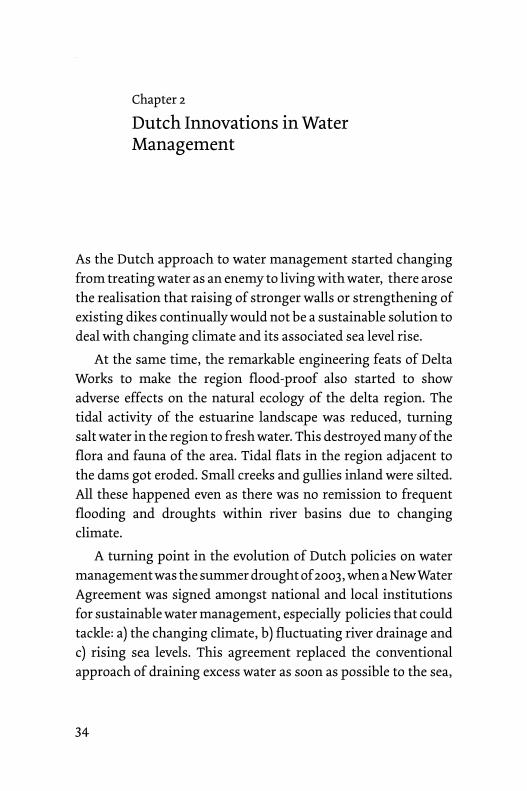
The concept behind the Sand Motor is to create a sandbank by depositing large quantities of sand at one location of the coast, and letting the wind, waves and currents distribute them evenly along.
In a pilot project to test the effect of a sandbank to protect the coast from the sea, a 128 hectare peninsula was created on the Delfland coast. The hook-shaped sand peninsula extends 1 km into the sea and is 2 km wide where it touches the shore. The sand
36
What we can learn from the Dutch: Rebuilding Kerala post 2018 floods
Figure 1. Bird's-eye view of the Sand Motor(Image source: https://beeldbank.rws.nl, Rijkswaterstaat)
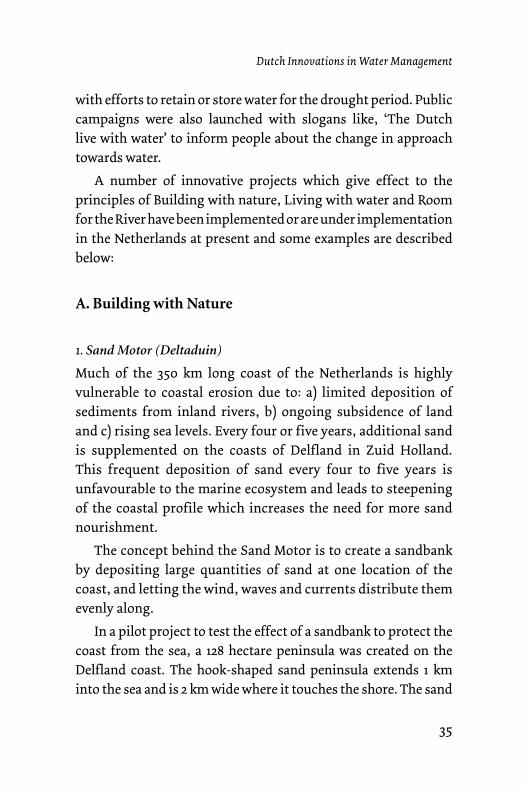
Figure 2. Recreational activities on the Sand Motor during the summer(Image source: https://beeldbank.rws.nl, Rijkswaterstaat)
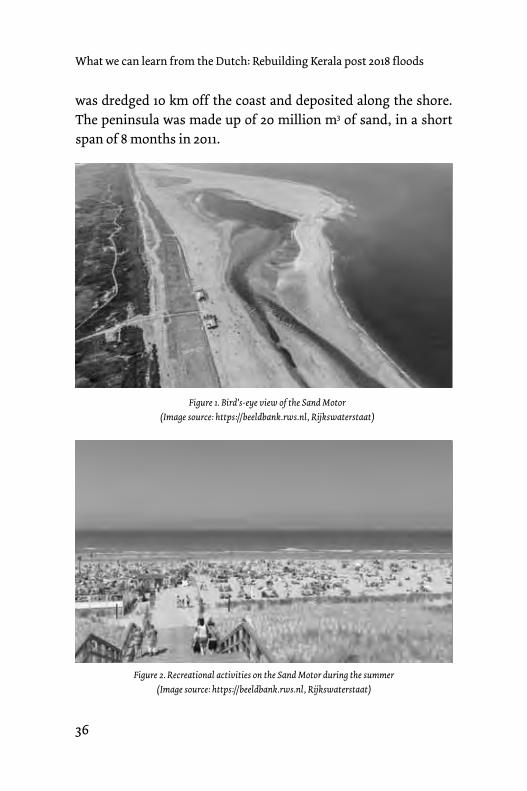
was dredged 10 km off the coast and deposited along the shore. The peninsula was made up of 20 million m3 of sand, in a short span of 8 months in 2011.
37
Dutch Innovations in Water Management
1 tidal flats, are coastal wetlands that form when mud is deposited by tides or rivers.
Figure 3. Sand dredging the Sand Motor (Image source: https://beeldbank.rws.nl, Rijkswaterstaat)
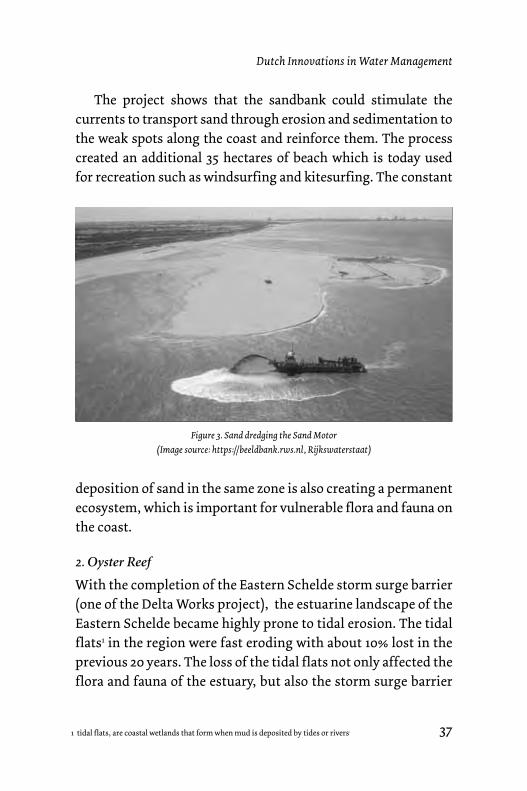
The project shows that the sandbank could stimulate the currents to transport sand through erosion and sedimentation to the weak spots along the coast and reinforce them. The process created an additional 35 hectares of beach which is today used for recreation such as windsurfing and kitesurfing. The constant
deposition of sand in the same zone is also creating a permanent ecosystem, which is important for vulnerable flora and fauna on the coast.
2. Oyster Reef
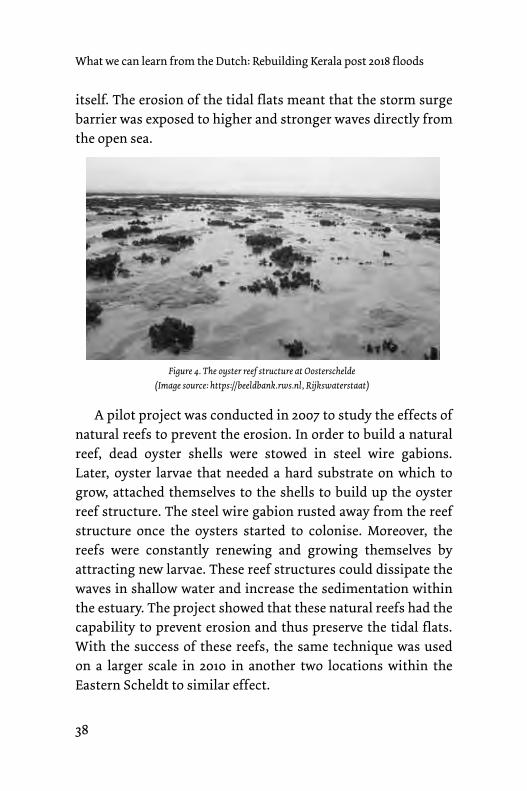
With the completion of the Eastern Schelde storm surge barrier (one of the Delta Works project), the estuarine landscape of the Eastern Schelde became highly prone to tidal erosion. The tidal flats1 in the region were fast eroding with about 10% lost in the previous 20 years. The loss of the tidal flats not only affected the flora and fauna of the estuary, but also the storm surge barrier
38
What we can learn from the Dutch: Rebuilding Kerala post 2018 floods
itself. The erosion of the tidal flats meant that the storm surge barrier was exposed to higher and stronger waves directly from the open sea.
A pilot project was conducted in 2007 to study the effects of natural reefs to prevent the erosion. In order to build a natural reef, dead oyster shells were stowed in steel wire gabions. Later, oyster larvae that needed a hard substrate on which to grow, attached themselves to the shells to build up the oyster reef structure. The steel wire gabion rusted away from the reef structure once the oysters started to colonise. Moreover, the reefs were constantly renewing and growing themselves by attracting new larvae. These reef structures could dissipate the waves in shallow water and increase the sedimentation within the estuary. The project showed that these natural reefs had the capability to prevent erosion and thus preserve the tidal flats. With the success of these reefs, the same technique was used on a larger scale in 2010 in another two locations within the Eastern Scheldt to similar effect.
Figure 4. The oyster reef structure at Oosterschelde(Image source: https://beeldbank.rws.nl, Rijkswaterstaat)
39
Dutch Innovations in Water Management
3. Willow dikes
As part of giving more space for the river in Noordwaard polders, a primary dike along the old river channel was removed which made the region inside the dike vulnerable to flooding. This meant that a new primary dike was required to protect the vulnerable area. One such location where the dike had to be raised and strengthened was along the historic Fort of Steugart.
The heightening of the dike in a traditional manner (with stones and concrete blocks) along the Fort was not well-received by the local public as it would affect the view lines and the general quality of space around the historic monument and the fort. Therefore, an alternate method was sought.
It was concluded that if the incoming wave of flood water was reduced through some means, the safety height required for the dike could be reduced. Therefore, locally available willow trees were planted on the foreground of the new dike to attenuate the incoming waves. This could reduce the required height of the dikes. In order to ensure that the vegetation could withstand the waves, several measures were considered in the design of the willow forest.
A 60 m wide willow field was planted along the length of the dike. The willow forest was raised on top of a small bank of less than a meter to ensure that the trees were not frequently flooded. The planting grid was staggered to ensure that there were hundreds of branches per sq. m, and the layout was optimised to defend the different wave impacts at different zones.
This continuous strip of willow plantation in front of the dike at Fort Steugart ensured an 80% reduction in the incoming wave height during the time of an extreme flood and made sure that the view lines to the fort and quality of space around the fort was preserved without compromising on safety.
40
What we can learn from the Dutch: Rebuilding Kerala post 2018 floods
B. Living with Water
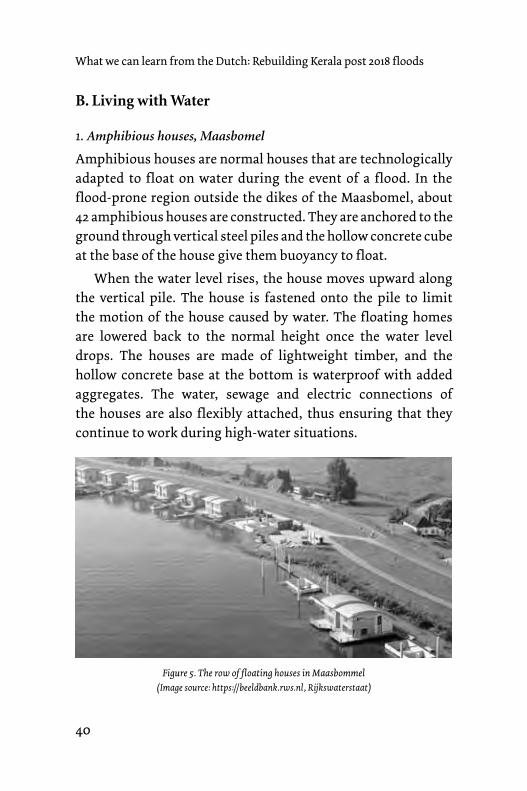
1. Amphibious houses, Maasbomel
Amphibious houses are normal houses that are technologically adapted to float on water during the event of a flood. In the flood-prone region outside the dikes of the Maasbomel, about 42 amphibious houses are constructed. They are anchored to the ground through vertical steel piles and the hollow concrete cube at the base of the house give them buoyancy to float.
When the water level rises, the house moves upward along the vertical pile. The house is fastened onto the pile to limit the motion of the house caused by water. The floating homes are lowered back to the normal height once the water level drops. The houses are made of lightweight timber, and the hollow concrete base at the bottom is waterproof with added aggregates. The water, sewage and electric connections of the houses are also flexibly attached, thus ensuring that they continue to work during high-water situations.
Figure 5. The row of floating houses in Maasbommel (Image source: https://beeldbank.rws.nl, Rijkswaterstaat)
41
Dutch Innovations in Water Management
2. Watersquare, Tiel
Watersquare in Tiel (Vogelburt) is an exemplary project of integrating urban design and flood water management to create an attractive and liveable neighbourhood. The municipality and water board have worked together with the inhabitants to create an urban square for recreation, sports and social activities during dry times which transforms into a temporary storage of rainwater during the rains.
The central square is a sports field, surrounded by four basins that catch rainwater from the surrounding neighbourhood through rainwater drains. The water gradually seeps into the ground. During heavy rains, the central square also stores the rainwater when the water overflows from the surrounding basins into it. The water plaza can store up to 550 m3 of rainwater.
The water square was part of a programme to manage the regular flooding that the low-lying neighbourhood had been experiencing for many years, owing to the high groundwater levels and water infiltration from the adjacent River Waal. This small-scale project contributes to flood adaptation of the region and improves spatial quality of the neighbourhood and the public space.
3. Flood Brigade of Kampen
Kampen is a historic town of the Netherlands located on the banks of the River Ijssel. Recently, the flood protection line of the Kampen town had to be raised 120 cm to correspond to the change in flood risk regulations. The challenge here was to raise the height of the dikes without compromising the historic view of the waterfront from the river.
The solution to this problem was to reactivate the old city
42
What we can learn from the Dutch: Rebuilding Kerala post 2018 floods
wall of the town whose remains are high and stable enough to act as the flood water defence of the town. The old city wall was incomplete along the water’s edge and cut by streets on the waterfront at many places. Therefore, there was need for additional barriers to be installed to complete the flood water defence line of the town. A flood brigade of 200 people from the town were trained to install these temporary barriers in case of a flood.
These temporary barriers are stored within the waterfront buildings of the town, so that they are easily accessible during the flood. These mobile barriers can be installed by the flood brigade in 3 hours’ time. An annual drill is conducted every year when the condition of the barriers is reviewed, and members can practise putting up the defence.
4. KEI Brigade of Kamperiland
Another example of people-led effort to deal with flood risks can be seen at the Mandjeswaard and Kamperiland during the high-water threat. When the water level increases in the Lake of Zwartemeer, the flood defence of the Mandjewaard and Kamperiland come under pressure. Then the KEI (Kamperiland) brigade of 170 people, consisting of men, women and children, are called upon to deposit sand bags on the dikes to increase its safety level. Such efforts which provide the common people an opportunity to actively involve themselves in the flood management of the region also contribute to raising water consciousness.
5. Examples from the city of Rotterdam
Integrating water management and urban development has been high on the agenda for the city of Rotterdam for more than
43
Dutch Innovations in Water Management
a decade. The city is located near the mouth of the River Maas and its port is one of the busiest in the world. The risk and frequency of flooding is high in Rotterdam. During extreme rainfalls, the drainage systems get disrupted causing flooding in streets and garages, with sewer water entering the canals and lakes of the city. In 2013, the city’s policies aligned towards holistic adaptation strategies through small-scale interventions within the city. As a result, several pilot studies and projects have been implemented in the city like water squares, underground water storage in parking garages, floating pavilion, rowing courses, multifunctional dikes, etc.
a. Benthemplien, Rotterdam
Benthemplein is the world’s first and largest water square, completed in 2013, with a capacity to store 1,800 m3 of rainwater. The square acts as a water storage during rainfall and as a recreational space during the dry climes. The square is delineated by a community college, church, youth theatre and gymnasium and stakeholders from each of these institutions work together to develop and discuss the potential usage and desired characteristics of the square, as well as the influence of stormwater on the area.
The square consists of three water basins that get filled with rainwater from the surrounding buildings and public spaces. Rainwater drains into it through the wide gutters at the edges of the square. The water is led into two of the shallow basins during normal rainfall. The entire sports field, the largest basin, is utilised as water storage during extreme rainfall. Once the weather is dry, the water seeps through the soil into the groundwater.
44
What we can learn from the Dutch: Rebuilding Kerala post 2018 floods
The storm water from the large basin is connected to the open water system of the city after a maximum of 36 hours. These squares become extremely useful during heavy rainfall to store water temporarily thus relieving the city drains.
b. Parking Garage as Storm water storage
Museumpark, a prominent public park in Rotterdam functions as a temporary storage for stormwater when the drains of the city cannot handle any more rainwater. This rainwater storage is located below the entrance of the parking garage. In about half an hour, about 10 million litres of water, equivalent to four Olympic swimming pools, can be stored within this space. As soon as the rain stops and the pressure on the sewer systems are relieved, the stored water is emptied back into the drains. Similarly, the public square in front of the Rotterdam central station, the Kruisplein, also acts as a storm water buffer for the locality. The square has an underground parking garage with 760 parking spaces and the roof of the garage serves as the storm water storage. The storage cavity is made from lightweight domed elements called water shells on which the concrete is poured and paved to complete the public square. This water storage space, with a capacity of 2.4 million litres, is connected to the nearby canal. During heavy rains, when the water level of the canal rises, a part of the water flows into the water storage. When the water level in the canal falls back to normal, the water from the storage flows back into the canal. These small-scale interventions have increased the retaining capacity of storm water within the city and reduced the risk of flooding in Rotterdam.
45
Dutch Innovations in Water Management
c. Eendragtspolder
Eendragtspolder is another example of a project built as a public amenity that can collect stormwater in emergencies. This polder is located close to the urban area of Rotterdam. The project area is 300 ha with functions of water storage, nature, recreation and an international rowing course (The World Rowing Championship 2016 was held here).
The area is divided into a 150 ha of lake area, containing the rowing course and another 150 ha of pond area consisting of natural swamp landscapes, canals, cycling, hiking trails and many recreational facilities. During heavy rains, water is let in from the adjacent River Rotte into the polder to reduce water levels in the river basin. The polder thus serves as reservoir for the Rotte river basin, storing upto 4 million m3 of water, and it also functions as a popular retreat for the people in Rotterdam with its water sports and nature.
d. Floating Diary Farm
In the winter of 2018, construction will start on the world’s first floating dairy farm at one of the harbours (Merwe haven) of the city of Rotterdam. This ambitious project is exploring possibilities of growing food for citizens within the city, without consuming the already scarce land.
The pilot project consists of a prototype of a floating farm which can accomodate up to 40 cows and produce half a million litres of milk a year for the city. With this, the project aims to shorten the logistics chain of milk by bringing milk production close to the city. The feed for the cows will be sourced from within the city’s breweries, golf courses and mills, and the manure returned to sports
46
What we can learn from the Dutch: Rebuilding Kerala post 2018 floods
fields, public parks and private gardens.
The founders claim that inspiration for the project came from the suffering of New York City, which during Hurricane Sandy had to go without fresh food for two days because everything had to be procured from outside the city. With Rotterdam being highly vulnerable to floods, this project of self reliance by growing its own food in water, received popular support. This project is also a good example of how the city is using the water and flood challenges as an opportunity to find new ways to use and live with the waters of the city.
C. Room for the River project
The most important large-scale intervention in flood management is the Room for the River project. Apart from the technical innovations in the field of flood management, this project is also an exemplary case of multi-level governance in executing a large-scale infrastructure project.
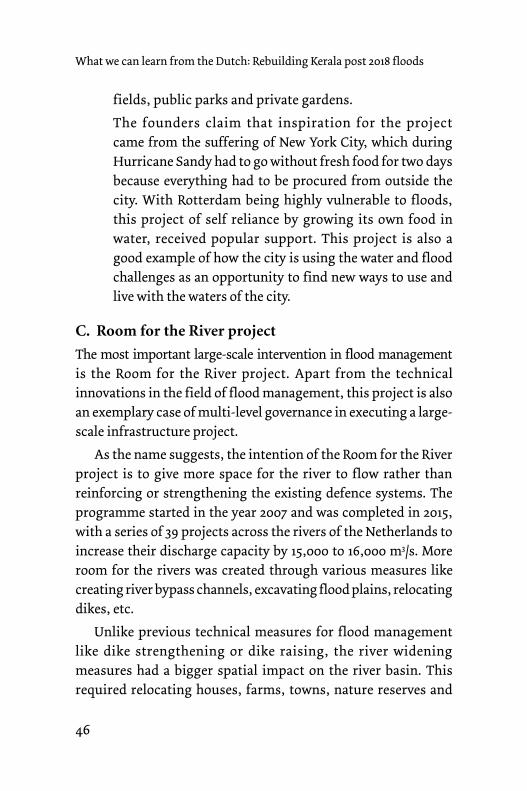
As the name suggests, the intention of the Room for the River project is to give more space for the river to flow rather than reinforcing or strengthening the existing defence systems. The programme started in the year 2007 and was completed in 2015, with a series of 39 projects across the rivers of the Netherlands to increase their discharge capacity by 15,000 to 16,000 m3/s. More room for the rivers was created through various measures like creating river bypass channels, excavating flood plains, relocating dikes, etc.
Unlike previous technical measures for flood management like dike strengthening or dike raising, the river widening measures had a bigger spatial impact on the river basin. This required relocating houses, farms, towns, nature reserves and
47
Dutch Innovations in Water Management
industries along the river. Therefore, involving the affected local communities, regional governments, and NGOs was an important feature of the strategy. The mode of operation was that, the national government (through Rijskwaterstaat) described the technical measures to achieve more space for the river in the selected locality taking into account the overall scale of the project. The regional actors had the opportunity to propose additional measures, alternatives or other new initiatives to protect their interests, without compromising on the flood safety measures. These new provisions would be possible, if additional funding for the same was procured by the initiated party. If that financing could be assured, then the central government would act as co-financiers for the execution of the same.
Consequently, national and regional governments, private and public stake holders, NGOs and business communities were all involved in the planning and execution of the projects. This collaborative approach of the Room for the River programme resulted in many creative solutions that contributed to the enhancement of economy, nature and quality of space along the rivers, while achieving flood safety within the region.
1. Room for River Ijssel in Deventer
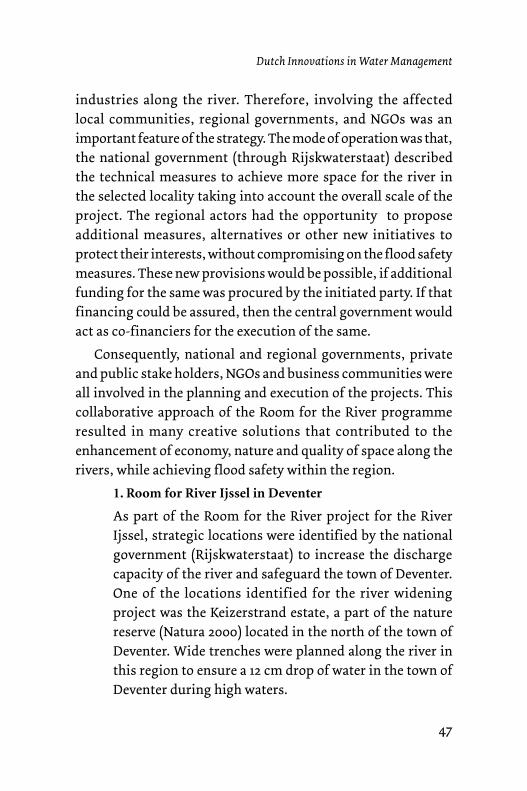
As part of the Room for the River project for the River Ijssel, strategic locations were identified by the national government (Rijskwaterstaat) to increase the discharge capacity of the river and safeguard the town of Deventer. One of the locations identified for the river widening project was the Keizerstrand estate, a part of the nature reserve (Natura 2000) located in the north of the town of Deventer. Wide trenches were planned along the river in this region to ensure a 12 cm drop of water in the town of Deventer during high waters.
48
What we can learn from the Dutch: Rebuilding Kerala post 2018 floods
The nature reserve was managed by a local independent organisation (IJssellandschap Foundation) and it was given the responsibility to maintain the area as per the regulations set by the project. The central government supported the foundation for the upkeep and maintenance of the area (which is expensive and labour-intensive). Trees and shrubs in the nature reserve had to be removed to ensure unobstructed passage of water. This brought nature development and flood water management at odds.
In order to ensure preservation of nature and at the same time, maintain the area in an economical manner, the IJssellandschap Foundation drew up a plan to introduce sustainable agriculture and livestock farming into the flood-prone area. An experienced farmer was hired and given access to 170 hectares of their land. The farmer
Figure 6. Infographics of the Room for River project at Deventer with Natuurdeij Farm (Image source: https://beeldbank.rws.nl, Rijkswaterstaat, Room for the River)
49
Dutch Innovations in Water Management
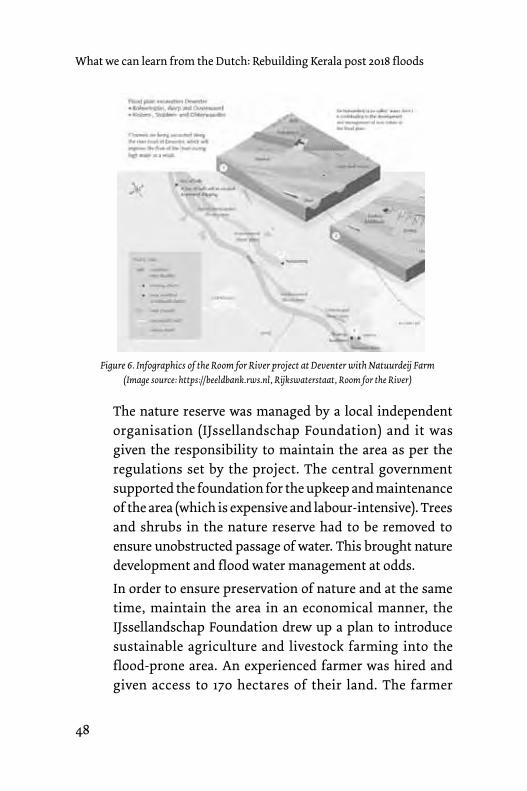
initiated commercial sustainable farming on the land and took over preservation of nature as well as flood water maintenance of the area. A farm was built on top of a concrete dam in the flood-prone area and meadows were introduced onto the foreland of the river. Grazing cattle kept grass low on the meadows for water drainage, while the foundation introduced more pathways and viewing points into the area connecting the nature reserve with the river.
The river widening project in the Keizerstrand estate became a reality through the involvement of a broad range of stakeholders. The central government formulated the plan for the region and the regional water board (Groot Salland) commissioned builders to execute the same. The IJssellandschap Foundation added value to the nature reserve by hiring the local farmer. The farmer sells milk and cows from the farm and also gets compensated by the foundation for keeping the area water-resilient. The decentralisation of the flood management project thus ensured that local interests were protected and intervention adapted to the specific situation of the region.
Figure 7. The farm built on the dam in the flood-prone area(Image source: https://beeldbank.rws.nl, Rijkswaterstaat, Room for the River)
50
What we can learn from the Dutch: Rebuilding Kerala post 2018 floods
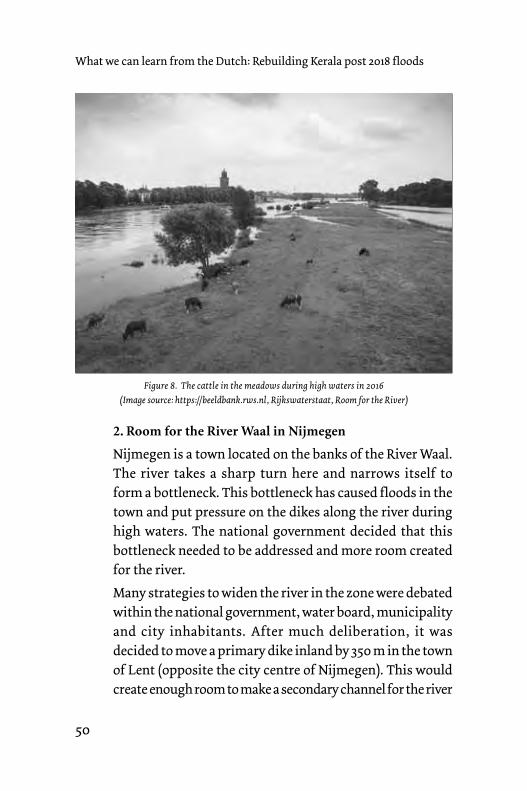
2. Room for the River Waal in Nijmegen
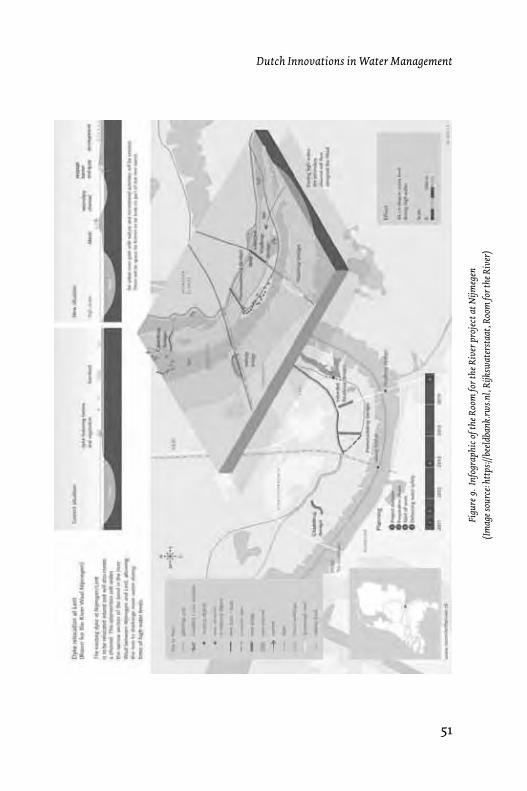
Nijmegen is a town located on the banks of the River Waal. The river takes a sharp turn here and narrows itself to form a bottleneck. This bottleneck has caused floods in the town and put pressure on the dikes along the river during high waters. The national government decided that this bottleneck needed to be addressed and more room created for the river.
Many strategies to widen the river in the zone were debated within the national government, water board, municipality and city inhabitants. After much deliberation, it was decided to move a primary dike inland by 350 m in the town of Lent (opposite the city centre of Nijmegen). This would create enough room to make a secondary channel for the river
Figure 8. The cattle in the meadows during high waters in 2016 (Image source: https://beeldbank.rws.nl, Rijkswaterstaat, Room for the River)
51
Dutch Innovations in Water Management
Figu
re 9
. In
fogr
aphi
c of t
he R
oom
for t
he R
iver
pro
ject
at N
ijmeg
en(Im
age s
ourc
e: ht
tps:/
/bee
ldba
nk.rw
s.nl,
Rijk
swat
erst
aat,
Roo
m fo
r the
Riv
er)

52
What we can learn from the Dutch: Rebuilding Kerala post 2018 floods
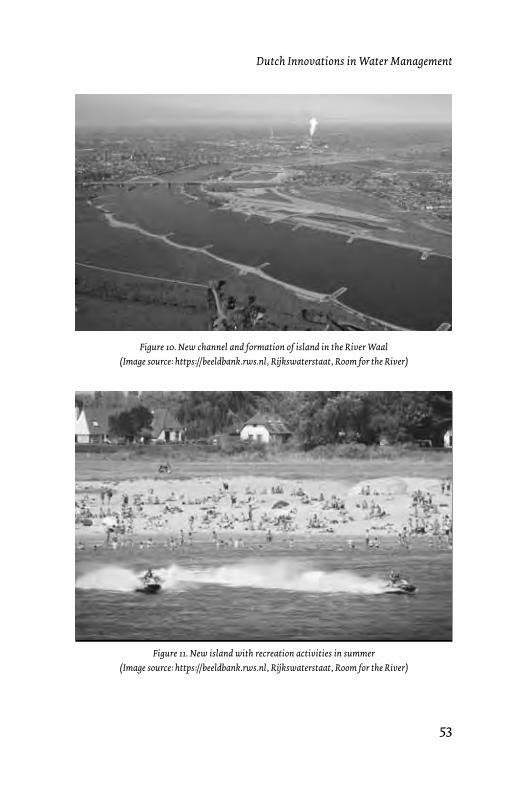
to drain during high waters, reducing the water levels by 35 cm along the river. Moving of the dike inward would result in the formation of a small island within the river which could be used for housing, recreation or nature reserves, adding more value to the town. But moving of the dike also meant that 150 houses had to be relocated inland. This resulted in opposition of the people most affected.
The doubts and opposition of the stakeholders were addressed through newsletters and involving them in the decision-making process by holding interactive workshops. Plans were presented in these workshops, in which people could give their inputs and discuss their concerns with experts in spatial design, engineers and policy makers. Through graphics and models, the effects of their inputs were visualised and considered, and through listening and addressing the concerns of the stakeholders, their doubts and opposition were overcome. The prospects of a flood-proof town becoming attractive for investments from companies and the benefits from new recreational facilities and spatial quality within the town outweighed the cons for most of the stakeholders.
The municipality, along with city inhabitants proposed waterfront buildings and recreational activities within the newly-formed island. It took the lead in developing the same and for the construction of bridges connecting the island with the towns. The regional province contributed to the project with a nature development area within the island. Thus, the island that formed as a result of the river widening project became a hotspot for outdoor recreational and leisure activities with its series of parks and beaches and waterfront buildings.
53
Dutch Innovations in Water Management
Figure 10. New channel and formation of island in the River Waal (Image source: https://beeldbank.rws.nl, Rijkswaterstaat, Room for the River)
Figure 11. New island with recreation activities in summer(Image source: https://beeldbank.rws.nl, Rijkswaterstaat, Room for the River)

54
What we can learn from the Dutch: Rebuilding Kerala post 2018 floods
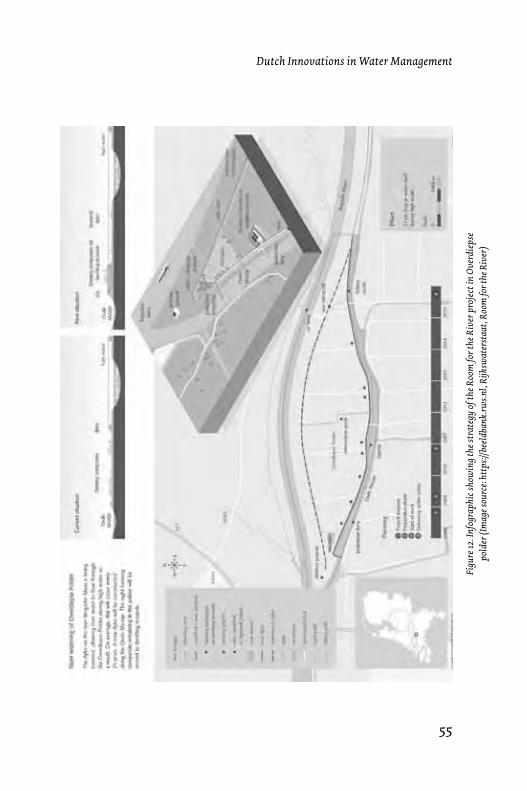
3. Room for the River Bergsche Maas in Overdiepse polder
Overdiepse polder was a marshland of the Meuse river basin until it was poldered in the 20th century. The small polder of 550 ha mostly consisted of diary farms and some arable crops of maize, beetroot, and potatoes. The polder has the River Bergsche Maas to its north, and the Oude Maasje in its south.
Overdiepse polder was selected as one of the locations in 2003 to make more room for the River Bergsche Maas by achieving a 27 cm drop in the waterlevels of the river during high waters. Consequently, the height of the dike was lowered resulting in flow of river water into the polder during floods.
There were 16 farms with about 94 inhabitants in the polder who were to be relocated to make room for the river. This was of course not well-recieved by the inhabitants of the polders. But rather than resisting the plan, the farmers (who also understood the public need for flood safety) worked with the provincial government and central government to develop alternate options.
A farmers association was formed, which along with provincial and local spatial designers drew up a plan to build new farms on mounds of soil. These mounds or terps were a traditional flood defense technique of the Dutch, with dwellings built over an artificial mound of soil and household waste to safeguard them from high tides or river flooding. The lands of the farmers who wanted to move away from the flood-prone polder were purchased by the municipality and used as public infrastructure. Implementation of these projects was
55
Dutch Innovations in Water Management
Figu
re 12
. Inf
ogra
phic
show
ing
the s
trat
egy
of th
e Roo
m fo
r the
Riv
er p
roje
ct in
Ove
rdie
pse
pold
er (I
mag
e sou
rce:
http
s://b
eeld
bank
.rws.n
l, Ri
jksw
ater
staa
t, R
oom
for t
he R
iver
)
56
What we can learn from the Dutch: Rebuilding Kerala post 2018 floods
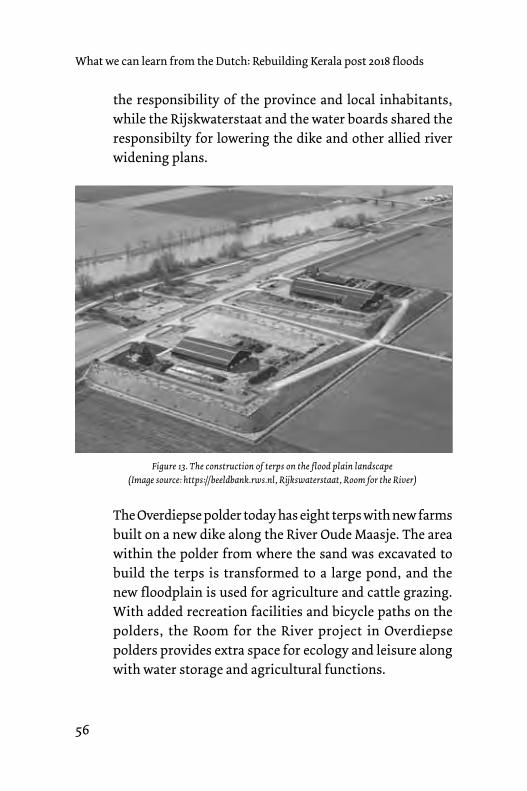
Figure 13. The construction of terps on the flood plain landscape(Image source: https://beeldbank.rws.nl, Rijkswaterstaat, Room for the River)
the responsibility of the province and local inhabitants, while the Rijskwaterstaat and the water boards shared the responsibilty for lowering the dike and other allied river widening plans.
The Overdiepse polder today has eight terps with new farms built on a new dike along the River Oude Maasje. The area within the polder from where the sand was excavated to build the terps is transformed to a large pond, and the new floodplain is used for agriculture and cattle grazing. With added recreation facilities and bicycle paths on the polders, the Room for the River project in Overdiepse polders provides extra space for ecology and leisure along with water storage and agricultural functions.
57
Dutch Innovations in Water Management
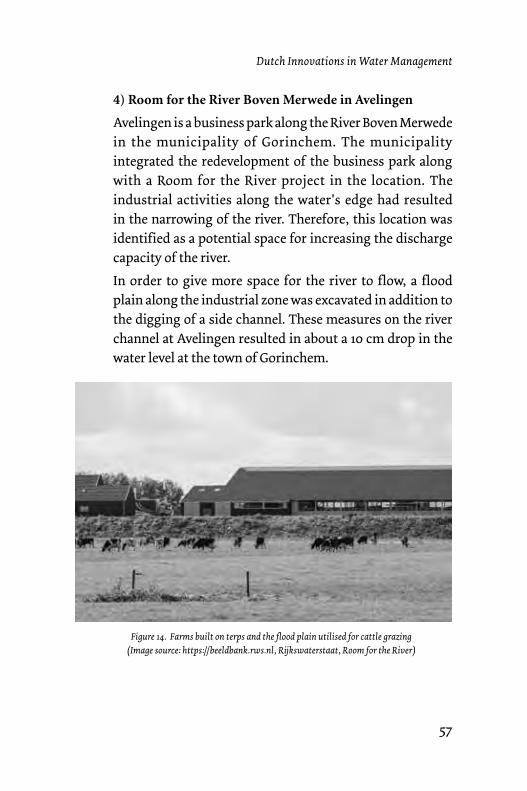
4) Room for the River Boven Merwede in Avelingen
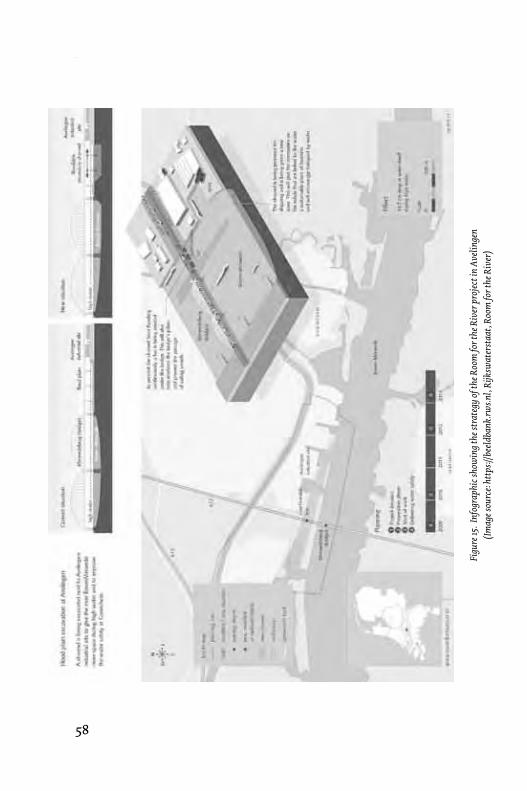
Avelingen is a business park along the River Boven Merwede in the municipality of Gorinchem. The municipality integrated the redevelopment of the business park along with a Room for the River project in the location. The industrial activities along the water's edge had resulted in the narrowing of the river. Therefore, this location was identified as a potential space for increasing the discharge capacity of the river.
In order to give more space for the river to flow, a flood plain along the industrial zone was excavated in addition to the digging of a side channel. These measures on the river channel at Avelingen resulted in about a 10 cm drop in the water level at the town of Gorinchem.
Figure 14. Farms built on terps and the flood plain utilised for cattle grazing(Image source: https://beeldbank.rws.nl, Rijkswaterstaat, Room for the River)
58
What we can learn from the Dutch: Rebuilding Kerala post 2018 floods
Figu
re 15
. Inf
ogra
phic
show
ing
the s
trat
egy
of th
e Roo
m fo
r the
Riv
er p
roje
ct in
Ave
linge
n (Im
age s
ourc
e: ht
tps:/
/bee
ldba
nk.rw
s.nl,
Rijk
swat
erst
aat,
Roo
m fo
r the
Riv
er)
59
Dutch Innovations in Water Management
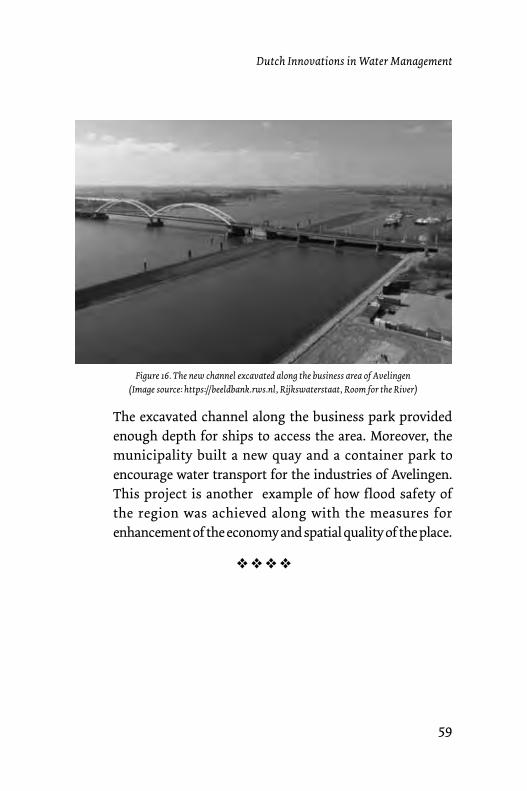
Figure 16. The new channel excavated along the business area of Avelingen(Image source: https://beeldbank.rws.nl, Rijkswaterstaat, Room for the River)
The excavated channel along the business park provided enough depth for ships to access the area. Moreover, the municipality built a new quay and a container park to encourage water transport for the industries of Avelingen. This project is another example of how flood safety of the region was achieved along with the measures for enhancement of the economy and spatial quality of the place.
H H H H
60
What we can learn from the Dutch: Rebuilding Kerala post 2018 floods
Chapter 3
The Kerala Flood Disaster of 2018
Kerala, the southernmost state of India is surrounded by the Arabian Sea in the west and the mountain range known as the Western Ghats in the east. This divides the region into three distinct terrains – the coastal plains, the midlands and the hill ranges. 44 rivers originate from the Western Ghats and 41 of them flow westward to the Arabian Sea. The remaining three rivers are tributaries of River Kaveri and flow eastward. The rivers are dammed in the highlands of the east and are devised to generate hydroelectricity and irrigate agricultural fields.
In addition to these rivers, a series of lagoons and backwaters are present behind the coastal edge of Kerala. These waterbodies are connected to the sea through azhis (permanent outlets) and pozhis (temporary outlets). The lakes, lagoons, and backwaters are interlinked through a canal system to form a well-connected navigable inland waterway. As of now, there is an uninterrupted stretch of 450 km of inland water across the length of the state.
Kerala and the Netherlands
Although located in very different climatic zones, there are some similarities between the physical features of Kerala and the Netherlands. The size of the country of the Netherlands (42,508 sq. km) is similar to the size of the state of Kerala (38,863 sq. km). With a straight north-south oriented coastline and the sea on the west, the coastal areas of both the places are similar.
61
The Kerala Flood Disaster of 2018
A chain of interconnected lakes and backwaters are present in the coastal lowlands of both the places. Most of the backwaters continue as backwaters in Kerala, while the Dutch backwaters have been predominantly reclaimed and turned to land. In Kerala, the Kuttanad backwaters is the only region where a similar reclaimed landscape exists. This was created in the 19th century by draining water out of the Vembanad lake. The traditional water management and polder making techniques used by the locals of Kuttanad are comparable to the polder making techniques of the Dutch delta region. While Dutch polders are used for urban, industrial and agricultural uses, the Kuttanad polders are devoted mostly to paddy cultivation.
Both the places are also dissimilar in many aspects. Population of the Netherlands (17 million) is only half the population of Kerala (35 million). The mountainous terrains with rolling hills and the fast-flowing rivers of Kerala highly contrasts with the low-lying flat lands and the slow-moving rivers in the Dutch delta. The tropical warm-humid climate of Kerala with two monsoon seasons contributes to an average annual rainfall of 3,107 mm. This is way higher than the 700 mm annual rainfall of the temperate maritime climate of the Netherlands. With strong westerly winds from the sea, the Netherlands remains windy and wet throughout the year.
Kerala receives most of its rainfall across the period of 6 months in two different monsoon seasons – the south-west and the north-east monsoon seasons. This heavy rainfall leads to high discharges in the rivers of Kerala. The rainwater finds its way through innumerable streams and channels into the rivers and ponds across the state. Extreme rainfall during these months can cause overflow of these streams, ponds, canals and rivers resulting in flood disasters.

62
What we can learn from the Dutch: Rebuilding Kerala post 2018 floods
Kerala Floods
There have occurred several floods in 20th century Kerala of which most well-known are the flood disasters of 1924 and 1961. Both of these are attributed to extreme rainfalls during the south-west monsoon season. The 1924 floods occurred between 16 and 18 of July destroying many lives, land and agriculture. Heavy rainfall was recorded throughout the state during this flood, resulting in high waters in most of the rivers.
The flood of 1961 also occurred as a result of heavy precipitation. The rainfall was predominantly in the southern region of Kerala with the Periyar river basin being the most affected. The floods took 115 lives, 50,000 homes and about 115,000 acres of paddy fields1.
The floods of 2018 is the worst natural disaster Kerala has experienced in recent history. The region received abnormally high rainfall from 1 June 2018 to 19 August 2018. As per the study report by the Central Water Commission (CWC)2, this rainfall was about 42% above normal. The rainfall recorded over Kerala during the
1,2 Kerala Floods of August 2018, Government of India, Central Water Commission, Hydrological Studies Organisation, Hydrology (S) Directorate, September 2018. (Accessed: http://cwc.gov.in/main/downloads/KeralaFloodReport/Rev-0.pdf )
Figure 1. The flooded town of Pala, Kerala, 2018(Image source: Vishnu Dinesh)
63
The Kerala Flood Disaster of 2018
periods of June, July and 1–19 August 2018 was 15%, 18% and 164% above normal, respectively.
In order to release the excess water, all the 35 major dams in the state had to be opened. Additionally, all the overflow gates of the Idukki dam had to be lifted – a first time incidence in 26 years. Several cases of landslides were also reported across the state due to the extreme rainfall, especially in the districts of Wayanad and Idukki.
There were several patches of heavy rains distributed throughout the monsoon season resulting in completely filled reservoirs across the state. Intense rains were received at the end of July and between the 8th and 9th of August. With another severe spell of rain between the 14th and 19th of August, the water system was unable to drain the rainwater into the sea anymore. The extreme rainfall (414 mm) between the 15th and 17th of August was unprecedented. These three days alone received more than half the rain between the 1st and 19th of August. This three-day storm caused flooding across Kerala, especially in the Periyar, Pamba, Chalakudy and Bharathapuzha basins.
The Government of Kerala declared 1,259 out of 1,644 villages and seven out of the fourteen districts of the state as flood affected. The disastrous floods and landslides between 22nd May and 29th August, affected 5.4 million people, displaced 1.4 million people, and took 433 lives.
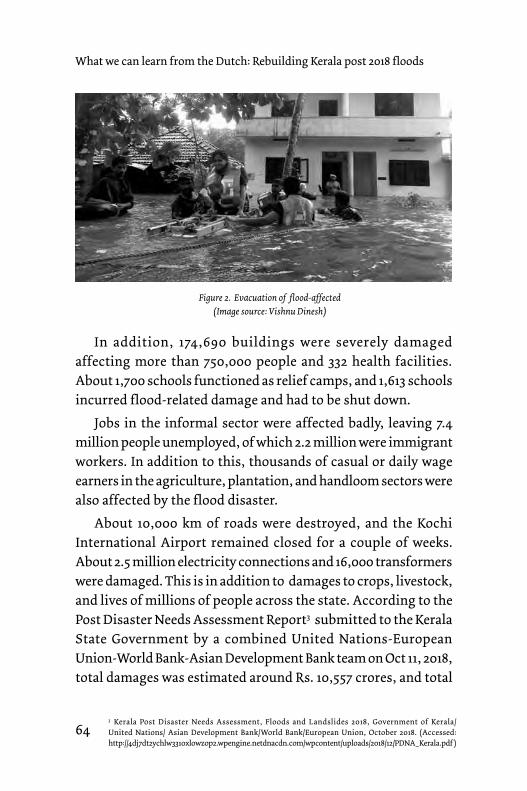
About 1.45 million people had to be evacuated to public relief camps, while thousands of people moved to the homes of friends and relatives in safer zones. A total of 3,879 camps were set up during the floods. About 20% of the state’s population lost access to piped waters and 317,000 shallow wells were damaged directly affecting 1.4 million people.
64
What we can learn from the Dutch: Rebuilding Kerala post 2018 floods
In addition, 174,690 buildings were severely damaged affecting more than 750,000 people and 332 health facilities. About 1,700 schools functioned as relief camps, and 1,613 schools incurred flood-related damage and had to be shut down.
Jobs in the informal sector were affected badly, leaving 7.4 million people unemployed, of which 2.2 million were immigrant workers. In addition to this, thousands of casual or daily wage earners in the agriculture, plantation, and handloom sectors were also affected by the flood disaster.
About 10,000 km of roads were destroyed, and the Kochi International Airport remained closed for a couple of weeks. About 2.5 million electricity connections and 16,000 transformers were damaged. This is in addition to damages to crops, livestock, and lives of millions of people across the state. According to the Post Disaster Needs Assessment Report3 submitted to the Kerala State Government by a combined United Nations-European Union-World Bank-Asian Development Bank team on Oct 11, 2018, total damages was estimated around Rs. 10,557 crores, and total
Figure 2. Evacuation of flood-affected(Image source: Vishnu Dinesh)
3 Kerala Post Disaster Needs Assessment, Floods and Landslides 2018, Government of Kerala/United Nations/ Asian Development Bank/World Bank/European Union, October 2018. (Accessed: http://4dj7dt2ychlw3310xlowzop2.wpengine.netdnacdn.com/wpcontent/uploads/2018/12/PDNA_Kerala.pdf )
65
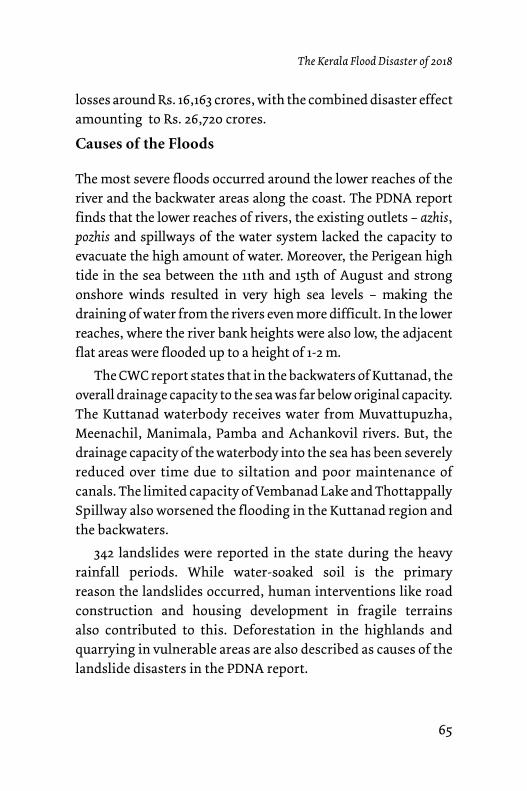
The Kerala Flood Disaster of 2018
losses around Rs. 16,163 crores, with the combined disaster effect amounting to Rs. 26,720 crores.
Causes of the Floods
The most severe floods occurred around the lower reaches of the river and the backwater areas along the coast. The PDNA report finds that the lower reaches of rivers, the existing outlets – azhis, pozhis and spillways of the water system lacked the capacity to evacuate the high amount of water. Moreover, the Perigean high tide in the sea between the 11th and 15th of August and strong onshore winds resulted in very high sea levels – making the draining of water from the rivers even more difficult. In the lower reaches, where the river bank heights were also low, the adjacent flat areas were flooded up to a height of 1-2 m.
The CWC report states that in the backwaters of Kuttanad, the overall drainage capacity to the sea was far below original capacity. The Kuttanad waterbody receives water from Muvattupuzha, Meenachil, Manimala, Pamba and Achankovil rivers. But, the drainage capacity of the waterbody into the sea has been severely reduced over time due to siltation and poor maintenance of canals. The limited capacity of Vembanad Lake and Thottappally Spillway also worsened the flooding in the Kuttanad region and the backwaters.
342 landslides were reported in the state during the heavy rainfall periods. While water-soaked soil is the primary reason the landslides occurred, human interventions like road construction and housing development in fragile terrains also contributed to this. Deforestation in the highlands and quarrying in vulnerable areas are also described as causes of the landslide disasters in the PDNA report.
66
What we can learn from the Dutch: Rebuilding Kerala post 2018 floods
The report concludes that the build-up of many simultaneous events resulted in the flood disaster. It states that ‘extremely high rainfall, immediate runoff, the low flood storage capacity in the reservoirs, poor drainage capacity of canals and sea outlets and high spring tides’ all came together to result in the very high-water levels4.
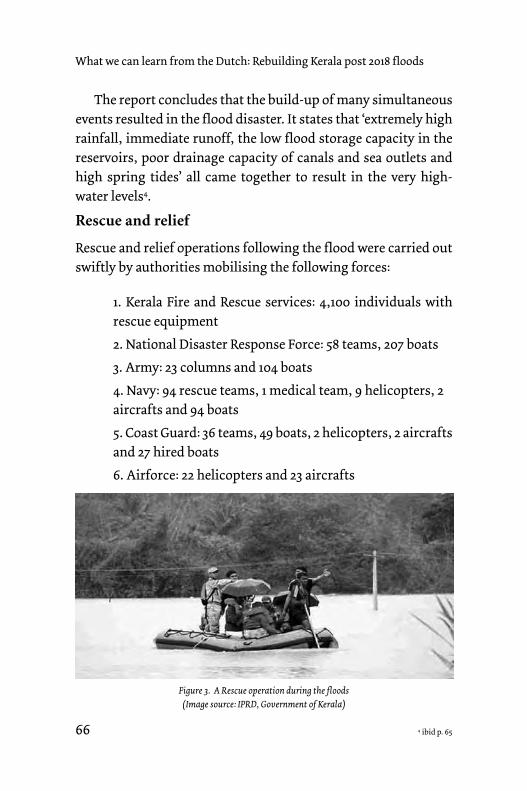
Rescue and relief
Rescue and relief operations following the flood were carried out swiftly by authorities mobilising the following forces:
1. Kerala Fire and Rescue services: 4,100 individuals with rescue equipment
2. National Disaster Response Force: 58 teams, 207 boats
3. Army: 23 columns and 104 boats
4. Navy: 94 rescue teams, 1 medical team, 9 helicopters, 2 aircrafts and 94 boats
5. Coast Guard: 36 teams, 49 boats, 2 helicopters, 2 aircrafts and 27 hired boats
6. Airforce: 22 helicopters and 23 aircrafts
Figure 3. A Rescue operation during the floods(Image source: IPRD, Government of Kerala)
4 ibid p. 65

67
The Kerala Flood Disaster of 2018
7. Border Security Force: 2 companies and 1 water vehicle team
8. Central Reserve Police Force: 10 teams
The heroes of the floods were however the local fishermen who provided voluntary assistance. About 669 boats with 4,357 fishermen are estimated to have saved at least 65,000 lives demonstrating in an exemplary manner spontaneous community involvement in flood relief activities.
State of the Kerala Water System
The PDNA report points out that the upper watersheds of the main rivers in Kerala are well-preserved as they are national parks and forest reserves. But, the increased urbanisation of the region has resulted in encroachment of these forests with buildings and plantation crops. This has led to increased runoff in these regions during heavy rainfall and inability of the soil to hold much water. It states that surface soil erosion of the watersheds has also caused increased sedimentation of the rivers.
In recent years, the pressure of urbanisation has resulted in the sand-filling of ponds, wetlands and other waterbodies for the construction of buildings and roads. This has adversely affected the natural flow of water and groundwater levels. Similarly, non-regulated sand mining in rivers has negatively affected river beds and the ecosystem. While most of the river channels of the region are stable and clearly delineated with steep and steady embankments, construction of bunds, small dams, and cross checks for local irrigation and water supply on
68
What we can learn from the Dutch: Rebuilding Kerala post 2018 floods
the river bed has resulted in blockage of water discharge and subsequent flooding of the upstream regions.
Regular flooding is experienced in the lower reaches of rivers and in the Kuttanad backwaters because of poor discharge capacities of the natural azhis, pozhis, and of the man-made barrages. The UN-EU PDNA report states that poor maintenance had silted the drainage canals of the Kuttanad water system. This reduced its drainage capacity into the sea, resulting in regular high waters in the region.
Challenge of coastal erosion
It needs to be noted in above regard that Kerala is also vulnerable to coastal erosion. The coast of Kerala is 592 km long, of which 340 km are protected by sea walls. The seaside is made up of sandy beaches that are prone to erosion. A recent report from the Ministry of Earth Sciences5 states that, in the past 25 years, Kerala has lost 45% of its coast to erosions. In addition, tidal activity, construction and dredging activities have also contributed to this erosion. Interestingly, 21% of the coast lost to erosion has been replenished by the sea itself. The natural process is thus adapting itself to respond to human interventions on the coasts. Moreover, different tidal fluctuations along the coast and the threat of tsunami surges have rendered the coastal region highly vulnerable to the floods.
Climate Change
The PDNA report states that the frequency of heavy rainfall events is on the rise and increase in precipitation extremes due to the monsoon is very likely. Consequently, this will increase the
5 National Assessment of Shoreline Changes Along Indian Coast 2018/Ministry of Earth Sciences National Centre of Coastal Research/ July 2018 (Accessed: https://www.indiaspend.com/wp-content/uploads/2018/11/National-Assessment-of-Shoreline-Changes-NCCR-report.pdf )

69
The Kerala Flood Disaster of 2018
6 Newspaper article about the rainfall pattern study conducted by the Indian Meteorological Department, attributing Kerala floods to climate change (Accessed: https://www.hindustantimes.com/india-news/climate-change-caused-deadly-kerala-rains-imd/story-YEg7ZHY2Mkaf3LhROY724O.html).
magnitude and frequency of river floods.
Similarly, studies6 conducted by the Indian Meteorological Department (IMD) has identified increased rainfall in the region between 1951 and 2016. Their study shows that the frequency of high rainfall (10-15 cm/day) is increasing while the days that have less than 5 cm/day of rainfall are decreasing. The IMD describes climate change as the cause of the extremely high rainfall that led to the floods in Kerala. Further, the PDNA report states that the projected sea level rise will be about 100 to 200 mm over the next 100 years. This will put enormous pressure on the coastal areas.
Water Resource Management
There are 80 dams in the state, of which 76 are operated and managed by the Government of Kerala. The KSEB (Kerala State Electricity Board) operates 58 dams with facilities for hydropower generation. The Water Resources department manages 16 dams for irrigation purposes of 5,670 sq. km of ayacut areas. The remaining 2 dams are operated by the Kerala Water Authority. Along with 18,000 ponds and the dams, the state has a combined water storage capacity of 5.8 BCM. The 7 large dams together hold 74% of the total live storage capacity.
The PDNA report concludes that there are many government entities that one way or another deal with water-related activities. The electricity department of the state is also actively involved in the water sector, with management of dams. But coordination between different departments is generally considered difficult.
In addition to these departments at the State level, the PDNA report also suggests that Kerala’s vibrant local self-government institutions can contribute to the management of waterways and flood mitigation. There are 1,200 such institutions in Kerala.
70
What we can learn from the Dutch: Rebuilding Kerala post 2018 floods
This includes 941 grama panchayats, 152 block panchayats, 14 district panchayats, 77 taluks, 87 municipalities, and 6 municipal corporations.
Main issues of Kerala’s river basin management
The PDNA report has identified the following as some of the key issues of the river basin system of Kerala:
1. Cross-sectoral coordination in policy development, planning, and building of infrastructure
2. Upper catchment soil and water conservation and erosion protection
3. River channel management in view of uncoordinated construction of dams and bunds for irrigation and domestic water supply
4. Poor state of canal embankments and silted-up, polluted drainage canals
5. Sub-optimal operational conditions and state of repair of weirs, barrages and spillways.
6. Sub-optimal protocols and adherence for dam operations without balanced consideration for downstream water demand, flood protection, environmental flow and power generation
7. Poor management of coastal river outlets
8. Sub-optimal polder management, e.g. the Kuttanad area
9. Lack of validated hydrological, topographical, land use and remote sensing data
71
The Kerala Flood Disaster of 2018
Recommendations
The PDNA report calls for the adoption and implementation of the concept of Integrated Water Resource Management (IWRM) which emphasises cross-disciplinary coordination of water, land and related resources in a river basin, watershed or catchment to attain long term sustainability. It states that the concept of IWRM has not yet been adopted by Kerala in its water resources management policies and if comprehensive IWRM had been applied according to international standards, the impact of the floods would definitely have been less.
The report recommends adoption of internationally accepted good practices, especially those pioneered by the Dutch such as:
1. Mitigation of flood risks – Room for River
2. Living with Water
3. Building with Nature
4. Measures for Flood Risk Management
5. Special measures for Kuttanad
H H H H
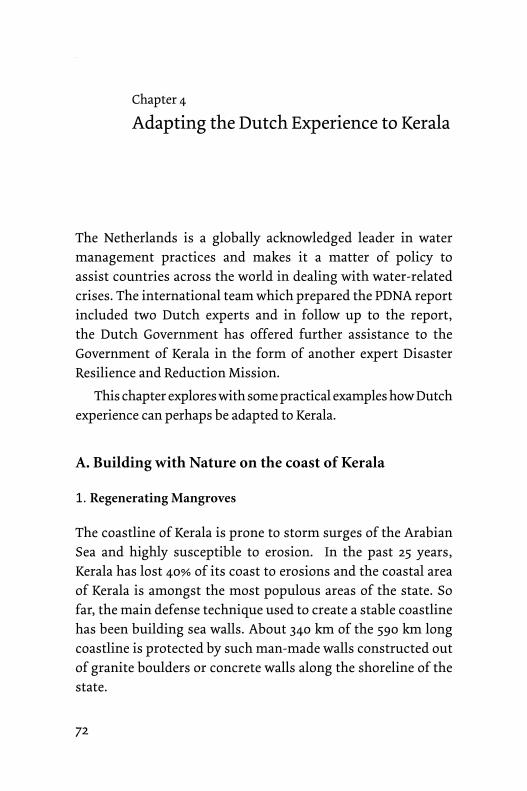
72
What we can learn from the Dutch: Rebuilding Kerala post 2018 floods
Chapter 4
Adapting the Dutch Experience to Kerala
The Netherlands is a globally acknowledged leader in water management practices and makes it a matter of policy to assist countries across the world in dealing with water-related crises. The international team which prepared the PDNA report included two Dutch experts and in follow up to the report, the Dutch Government has offered further assistance to the Government of Kerala in the form of another expert Disaster Resilience and Reduction Mission.
This chapter explores with some practical examples how Dutch experience can perhaps be adapted to Kerala.
A. Building with Nature on the coast of Kerala
1. Regenerating Mangroves
The coastline of Kerala is prone to storm surges of the Arabian Sea and highly susceptible to erosion. In the past 25 years, Kerala has lost 40% of its coast to erosions and the coastal area of Kerala is amongst the most populous areas of the state. So far, the main defense technique used to create a stable coastline has been building sea walls. About 340 km of the 590 km long coastline is protected by such man-made walls constructed out of granite boulders or concrete walls along the shoreline of the state.
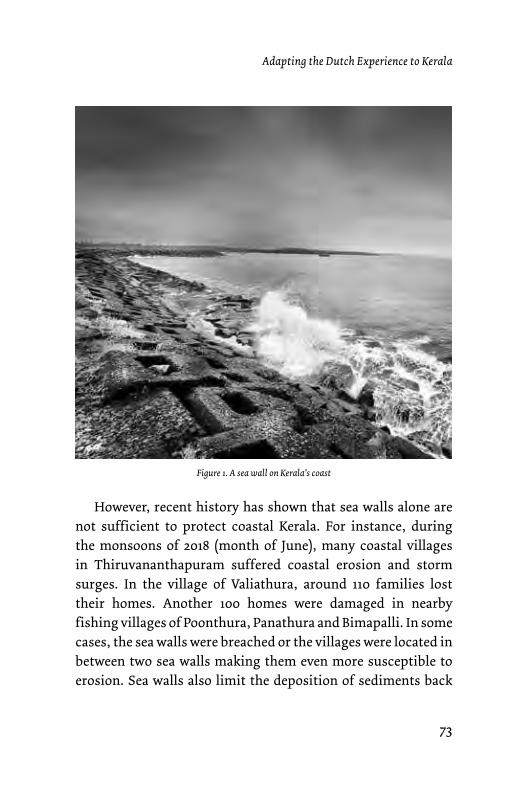
73
Adapting the Dutch Experience to Kerala
However, recent history has shown that sea walls alone are not sufficient to protect coastal Kerala. For instance, during the monsoons of 2018 (month of June), many coastal villages in Thiruvananthapuram suffered coastal erosion and storm surges. In the village of Valiathura, around 110 families lost their homes. Another 100 homes were damaged in nearby fishing villages of Poonthura, Panathura and Bimapalli. In some cases, the sea walls were breached or the villages were located in between two sea walls making them even more susceptible to erosion. Sea walls also limit the deposition of sediments back
Figure 1. A sea wall on Kerala's coast
74
What we can learn from the Dutch: Rebuilding Kerala post 2018 floods
to the coast after seasonal erosion, thus adversely affecting the stability of the coastline and its ecosystem.
Although the sea walls have proved to be less effective as a permanent solution to guard coastlines, in popular perception it is still seen as the best defence. For instance, after the coastal erosion (in May 2018) that affected many families in the district of Alappuzha, villagers (of Ambalapuzha) protested demanding construction of a new sea wall. Possibilities of using natural processes to protect the sea coast, have not been adequately explored in the state.
There are many Dutch studies and experiments in creating natural protective measures like sand dunes or mangroves that are of direct relevance to Kerala. One such experiment is a recent pilot project conducted in Demak, on the north coast of the Java island of Indonesia.
This project involved creating a mangrove forest to stabilise the eroding coastal edge. For decades, many kilometers of mangrove forests were destroyed in the northern part of the Java island for creating fish farming ponds and allied industries. This left the area highly vulnerable to coastal erosion and sea storms. The Dutch came up with a low tech-high impact solution to restore mangrove forests on the coast. They adapted an age-old Dutch tradition of reclaiming marshlands from the sea by placing permeable wooden barriers off the coast. This technique had been used for many years to reclaim marshlands from the Wadden Sea of the Netherlands.
Semi-permeable wooden barriers (dams) are created off the sea coast, in order to break the waves and retain sediments, increasing the bed height that allows conditions for mangroves to grow. These mangroves, apart from functioning as a fence
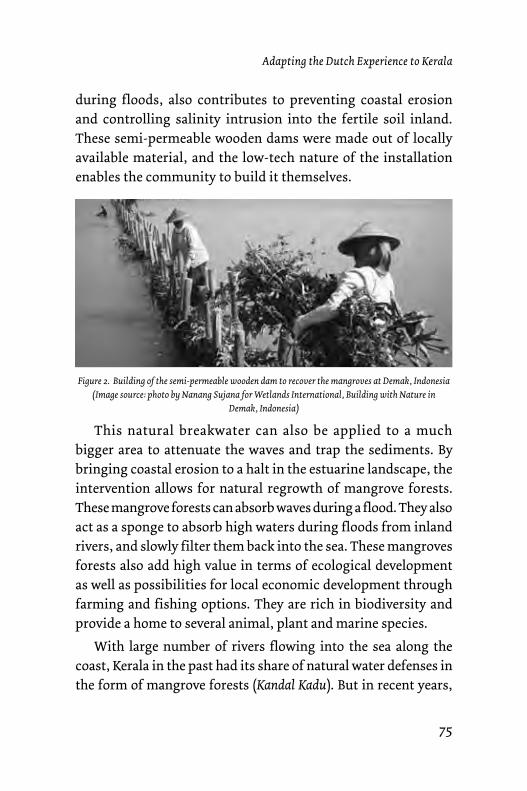
75
Adapting the Dutch Experience to Kerala
during floods, also contributes to preventing coastal erosion and controlling salinity intrusion into the fertile soil inland. These semi-permeable wooden dams were made out of locally available material, and the low-tech nature of the installation enables the community to build it themselves.
This natural breakwater can also be applied to a much bigger area to attenuate the waves and trap the sediments. By bringing coastal erosion to a halt in the estuarine landscape, the intervention allows for natural regrowth of mangrove forests.These mangrove forests can absorb waves during a flood. They also act as a sponge to absorb high waters during floods from inland rivers, and slowly filter them back into the sea. These mangroves forests also add high value in terms of ecological development as well as possibilities for local economic development through farming and fishing options. They are rich in biodiversity and provide a home to several animal, plant and marine species.
With large number of rivers flowing into the sea along the coast, Kerala in the past had its share of natural water defenses in the form of mangrove forests (Kandal Kadu). But in recent years,
Figure 2. Building of the semi-permeable wooden dam to recover the mangroves at Demak, Indonesia(Image source: photo by Nanang Sujana for Wetlands International, Building with Nature in
Demak, Indonesia)
76
What we can learn from the Dutch: Rebuilding Kerala post 2018 floods
most of these have been lost to construction, agricultural activities and shrimp farm industries. From 700 sq. kms of mangrove forests in 1957, today Kerala has only about 25 sq. km. Had there been more mangrove forests on the edges of the Kerala coast during the 2018 floods, they would have helped absorb some of the flood water that was unable to drain into the sea due to the high tides in August.
Reclaiming these mangrove forests could be a low tech, sustainable solution to fight coastal erosion, prevent salt intrusion to the inland rivers, engage the community and build with nature along the coast of Kerala. Environmentalists active in protecting mangrove forests in the state could be mobilised to lead initiatives to regenerate and grow new mangroves and wetlands back onto the coastal and backwaters landscape of Kerala as an alternative to sea walls.
2. Sand Motor
This Dutch innovation in eco-engineering has been discussed in detail in chapter two. The hook-shaped sand peninsula extending 1 km into the sea and 2 km wide where it touches the shore was made from sand dredged 10 km off the coast and deposited along the shore. This peninsula was made within a short span of 8 months after research and study of ecological conditions of the area.
The project shows that the sandbank can stimulate currents to transport sand through erosion and sedimentation to the weak spots along the coast and reinforce them. The process created an additional 35 hectares of the beach which is today used for recreation. The constant deposition of sand in the same zone is also creating a permanent ecosystem, which is important for the vulnerable flora and fauna of the coast. This could be of benefit to
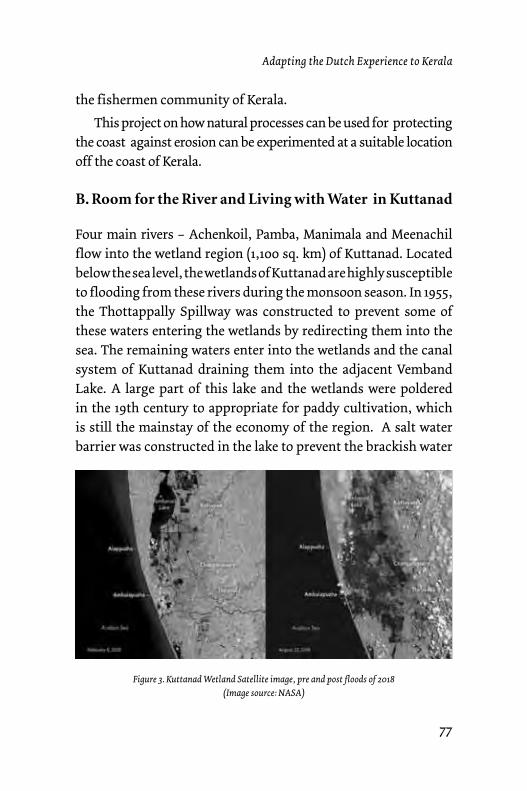
77
Adapting the Dutch Experience to Kerala
the fishermen community of Kerala.
This project on how natural processes can be used for protecting the coast against erosion can be experimented at a suitable location off the coast of Kerala.
B. Room for the River and Living with Water in Kuttanad
Four main rivers – Achenkoil, Pamba, Manimala and Meenachil flow into the wetland region (1,100 sq. km) of Kuttanad. Located below the sea level, the wetlands of Kuttanad are highly susceptible to flooding from these rivers during the monsoon season. In 1955, the Thottappally Spillway was constructed to prevent some of these waters entering the wetlands by redirecting them into the sea. The remaining waters enter into the wetlands and the canal system of Kuttanad draining them into the adjacent Vemband Lake. A large part of this lake and the wetlands were poldered in the 19th century to appropriate for paddy cultivation, which is still the mainstay of the economy of the region. A salt water barrier was constructed in the lake to prevent the brackish water
Figure 3. Kuttanad Wetland Satellite image, pre and post floods of 2018(Image source: NASA)
78
What we can learn from the Dutch: Rebuilding Kerala post 2018 floods
entering the agricultural area of Kuttanad.
This polder area of the Kuttanad region was worst hit during the floods of 2018. The heavy rainfall brought in excessive water through these rivers into Kuttanad, way beyond what the canal system could handle. This resulted in the worst flood disaster Kuttanad has experienced in recent history. About 270,000 people had to be evacuated from the region to relief camps, marking the largest emergency evacuation ever, from the region. This is apart from damage to homes and paddy fields caused by destruction of the bunds protecting them from water.
The PDNA report states that the poor drainage capacity of Kuttanad water system was due to inadequate maintenance of existing drainage infrastructure and siltation of canals and river channels. It has pointed out that land encroachment into the space for rivers and waterbodies of the wetland further contributed to the reduced drainage of water from the system. The reclamation of land from estuarine landscapes by construction of bunds and polders, and the building of salt water barrages have altered the natural drainage channels and ecology of the region. The report calls for the drawing up of a new Master Plan for the region.
Kuttanad is in need of measures that can lower flood water levels in the region by increasing the discharge capacities of the rivers and strategies to revive its natural ecology. The Dutch concept of creating more room for the river comprises of several measures that reduce flood water levels by giving more space for the river to drain its water. It also emphasises measures to improve the spatial quality and environmental conditions along the river basins.
In the context of Kuttanad, some of these measures could be:
1. Relocating or removing bunds at strategic locations to give
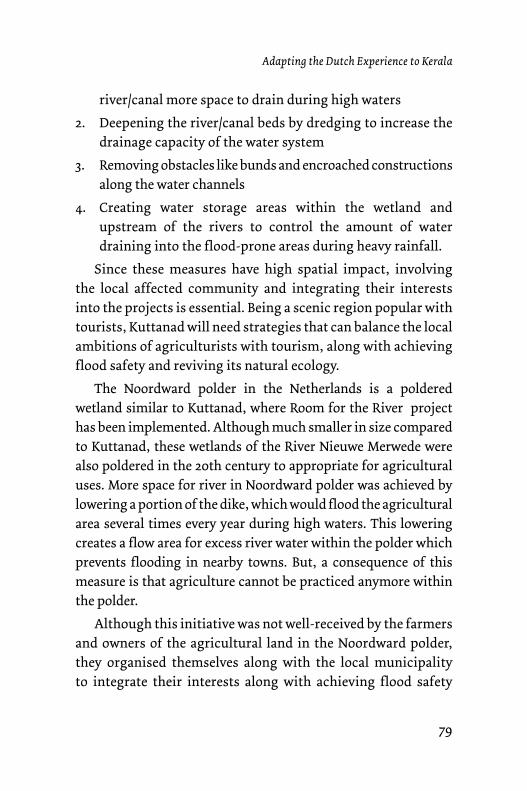
79
Adapting the Dutch Experience to Kerala
river/canal more space to drain during high waters
2. Deepening the river/canal beds by dredging to increase the drainage capacity of the water system
3. Removing obstacles like bunds and encroached constructions along the water channels
4. Creating water storage areas within the wetland and upstream of the rivers to control the amount of water draining into the flood-prone areas during heavy rainfall.
Since these measures have high spatial impact, involving the local affected community and integrating their interests into the projects is essential. Being a scenic region popular with tourists, Kuttanad will need strategies that can balance the local ambitions of agriculturists with tourism, along with achieving flood safety and reviving its natural ecology.
The Noordward polder in the Netherlands is a poldered wetland similar to Kuttanad, where Room for the River project has been implemented. Although much smaller in size compared to Kuttanad, these wetlands of the River Nieuwe Merwede were also poldered in the 20th century to appropriate for agricultural uses. More space for river in Noordward polder was achieved by lowering a portion of the dike, which would flood the agricultural area several times every year during high waters. This lowering creates a flow area for excess river water within the polder which prevents flooding in nearby towns. But, a consequence of this measure is that agriculture cannot be practiced anymore within the polder.
Although this initiative was not well-received by the farmers and owners of the agricultural land in the Noordward polder, they organised themselves along with the local municipality to integrate their interests along with achieving flood safety
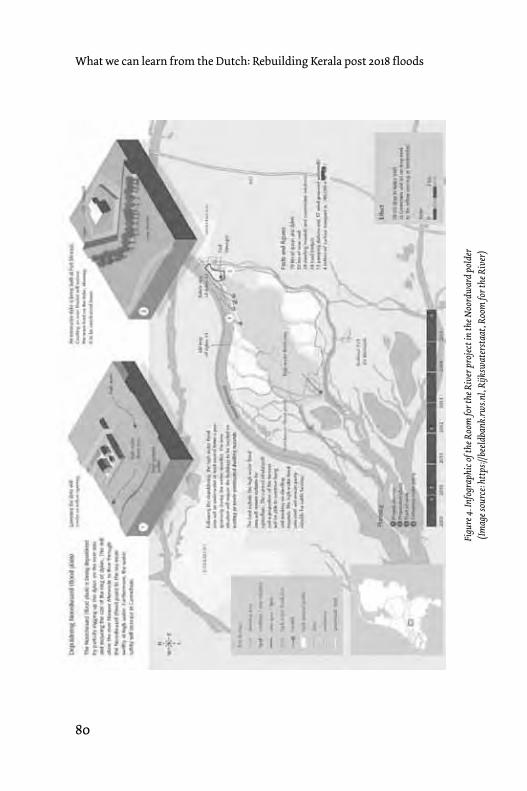
80
What we can learn from the Dutch: Rebuilding Kerala post 2018 floods
Figu
re 4
. Inf
ogra
phic
of t
he R
oom
for t
he R
iver
pro
ject
in th
e Noo
rdw
ard
pold
er(Im
age s
ourc
e: ht
tps:/
/bee
ldba
nk.rw
s.nl,
Rijk
swat
erst
aat,
Roo
m fo
r the
Riv
er)
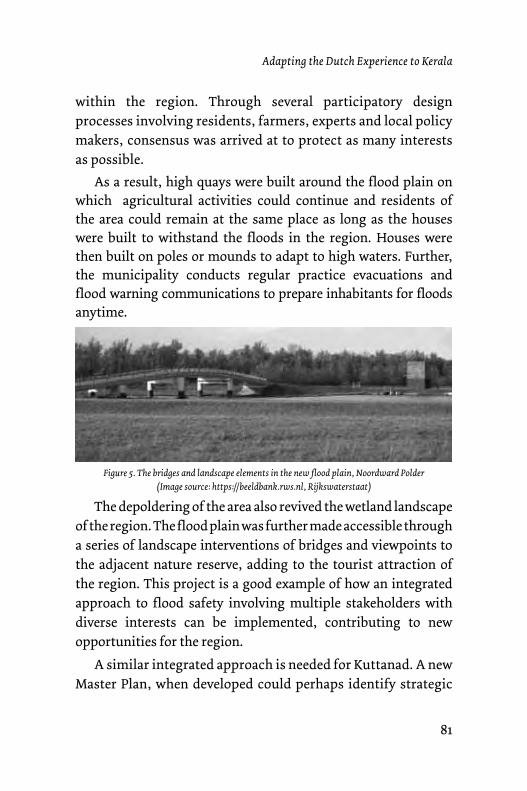
81
Adapting the Dutch Experience to Kerala
within the region. Through several participatory design processes involving residents, farmers, experts and local policy makers, consensus was arrived at to protect as many interests as possible.
As a result, high quays were built around the flood plain on which agricultural activities could continue and residents of the area could remain at the same place as long as the houses were built to withstand the floods in the region. Houses were then built on poles or mounds to adapt to high waters. Further, the municipality conducts regular practice evacuations and flood warning communications to prepare inhabitants for floods anytime.
The depoldering of the area also revived the wetland landscape of the region. The flood plain was further made accessible through a series of landscape interventions of bridges and viewpoints to the adjacent nature reserve, adding to the tourist attraction of the region. This project is a good example of how an integrated approach to flood safety involving multiple stakeholders with diverse interests can be implemented, contributing to new opportunities for the region.
A similar integrated approach is needed for Kuttanad. A new Master Plan, when developed could perhaps identify strategic
Figure 5. The bridges and landscape elements in the new flood plain, Noordward Polder (Image source: https://beeldbank.rws.nl, Rijkswaterstaat)
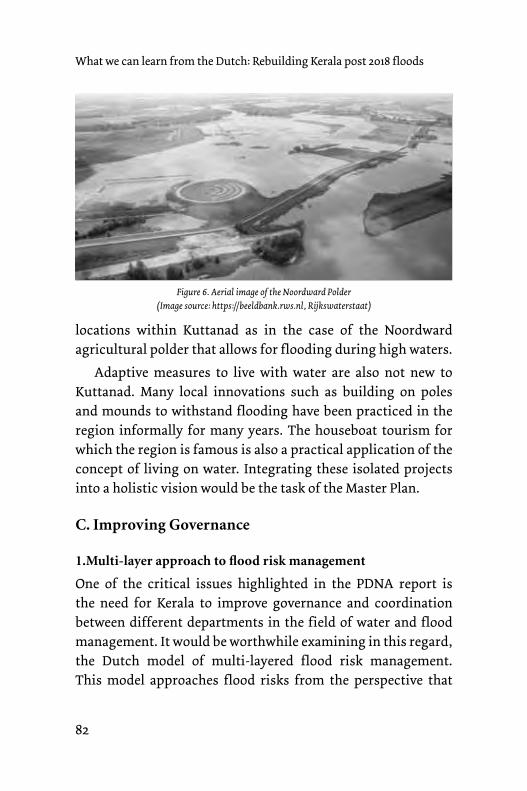
82
What we can learn from the Dutch: Rebuilding Kerala post 2018 floods
locations within Kuttanad as in the case of the Noordward agricultural polder that allows for flooding during high waters.
Adaptive measures to live with water are also not new to Kuttanad. Many local innovations such as building on poles and mounds to withstand flooding have been practiced in the region informally for many years. The houseboat tourism for which the region is famous is also a practical application of the concept of living on water. Integrating these isolated projects into a holistic vision would be the task of the Master Plan.
C. Improving Governance
1.Multi-layer approach to flood risk management
One of the critical issues highlighted in the PDNA report is the need for Kerala to improve governance and coordination between different departments in the field of water and flood management. It would be worthwhile examining in this regard, the Dutch model of multi-layered flood risk management. This model approaches flood risks from the perspective that
Figure 6. Aerial image of the Noordward Polder(Image source: https://beeldbank.rws.nl, Rijkswaterstaat)
83
Adapting the Dutch Experience to Kerala
investments in expensive preventive measures or measures to reduce the consequence of floods should be determined by factors such as economic activity, demographics and land use of the area concerned. The most vital areas require full protection while alternative measures should be found for the less vital periphery, where water could be permitted to flood to some extent.
According to this approach, flood risk is managed in three different layers:
I. Flood preventive measures
II. Sustainable spatial planning measures to manage floods
III. Crisis management during flood disaster
Layer I. Flood preventive measures
This layer consists of measures that try to prevent the possibility of flood. This includes installing flood defenses, strengthening and repairing dike/bunds, increasing river water discharge to the sea through widening/deepening river channels, digging secondary channels, depoldering, etc.
Layer II. Sustainable spatial planning measures
This layer consists of spatial planning and adaptive measures to reduce losses in the case of an extreme flood. This includes spatial solutions like compartmentalisation of space to control the flow of floodwater into the high-density settlements or agricultural lands, restrictions and building regulations that prevent buildings on unprotected vulnerable areas and adaptation measures on buildings (floating buildings, building on poles, amphibious housing, etc).
84
What we can learn from the Dutch: Rebuilding Kerala post 2018 floods
Layer III. Crisis management
This layer consists of organisational measures to improve disaster management and preparedness during a flood. The measures include flood-alert communication systems, contingency plans, providing evacuation training and improving risk awareness. It also includes development of evacuation routes and emergency refuges.
Recently, the island of Dordrecht in the Netherlands was made flood-proof through the application of this multi-layer approach. This 9,000 ha island with a population of 118,187 people was highly vulnerable to the high waters from the surrounding rivers, and storm surges from the adjacent sea. Physical evacuations in case of a flood was also difficult due to its limited connectivity (only three bridges) to the outside. Increasing the height and strength of the entire dike system around the island was not considered a cost-effective or sustainable solution. A multi-layer approach was therefore devised to make the island safe from flooding, while at the same time, ensuring that in the case of an extreme flood, citizens had a concrete strategy and action plan to be able to survive on the island.
The first layer (of preventive measures) consisted of protecting a selected zone through strengthening and raising the dikes around it. The zone in which 75% of the population lived was chosen to be protected, and would remain a safe place during the occurrence of an extreme flood.
The second layer of sustainable planning measures were applied to the flood-prone area outside the safe zone. This included building and planning regulations like adapting the buildings to flood by raising them on poles or mounds, and spatial planning measures to compartmentalise the island so
85
Adapting the Dutch Experience to Kerala
that flood water would not flow into the safe compartment. It also included the development of elevated access routes from the flood-prone compartments into the safe compartment during the event of high waters.
Layer three consisted of organisational measures like developing advanced flood threat communications and evacuation routes, so that people in flood-prone compartments have enough time to evacuate to the safe compartment. The strategy in this layer also included measures to protect vital infrastructure and ensure supply of goods and services to the safe zone during a disaster. In addition to these measures, annual evacuation drills are also conducted to ensure that people are well-prepared to face the floods.
Flood safety was thus provided for the island of Dordrecht in a cost-effective manner, decentralising flood risk management. While national water management boards are responsible for the first layer of preventive measures, the responsibilities for second and third layers are shared among local districts, municipalities, local communities, and private parties. The added layers also ensure that flood safety measures are adapted to specific local areas and implemented through active community participation rather than generic top-down measures.
It would be useful to examine how this approach can be adapted to the rebuilding of Kerala post 2018 floods. Investment in expensive flood preventive measures may be advisable only in areas of potentially high socio-economic damage. Less expensive measures of spatial/land use planning, and crisis management could be combined with preventive measures to achieve flood safety.

86
What we can learn from the Dutch: Rebuilding Kerala post 2018 floods
2. Flood Exercises
It would also be useful for the Government of Kerala to consider holding periodic flood exercises on the model of national exercises which are conducted in the Netherlands, in which all levels of government and the emergency services practice response to floods. This exercise focuses on collecting, processing and communicating flood/disaster threat information as well as associated decision making. The situation during a flood is simulated and evacuation response as well as rescue operations are undertaken. Exercises of this nature in the Netherlands are often week-long and involve upto 10,000 people. The locations are shifted to different regions of the country and planning and procedural deficiencies identified as well as roles and responsibilities of different personnel clarified with a view to improving coordination between the teams.
Instances of inability to understand the warning signals and lack of clarity on how to act after receiving the warning were reported during the 2018 Kerala floods. The PDNA report mentions that many district administrations did not comprehend the meaning of warnings like red alert or orange alert sent out by the IMD and this resulted in poor preparedness. In other cases, although the warnings were understood within the community, there was limited response due to lack of knowledge about the impact and extent of the floods.
3. Educating people to be aware and prepared
The famous story of the little Dutch boy (of Haarlem) who put his finger in a hole in the dike to prevent water from coming through the leak and stayed there throughout the night to save his village is well known in India. What this story symbolises is
87
Adapting the Dutch Experience to Kerala
the need for eternal vigilance against floods and all members of society, big or small to be willing to contribute their best for the protection of the community.
Every child in the Netherlands, including foreigners who live here, must not only learn how to swim, but also to swim with clothes and shoes on because a calamity can strike at any time. There are several mandatory flood and water-related educational programs for school children in the Netherlands. Apart from classroom education and information dissemination through the media, games and activities are also conducted for primary school children to raise water awareness. For instance, there is an annual water event called Battle of the Beach along the whole coast of the Netherlands, where kids learn to work together in building strong castles that can sustain the sea.
There are Dike Armies in the Netherlands, where citizens volunteer with regional water boards to protect the dikes. The dike armies can be summoned during times of high water or to monitor dikes when there is danger of a breach. Citizens are also educated about small measures which each of them can do, such as removing hard pavements from gardens so that the soil below absorbs as much water as possible. Active participation of local communities in flood risk management creates awareness of the risks and consequences as well as ownership for these interventions within the locality.
Newspaper reports of the 2018 Kerala floods revealed that let alone swim or use a boat on their own, many people were so unfit that even wading through waist deep water was difficult. This situation needs urgent remedial action. People of Kerala must recognise that swimming is an essential skill everyone must acquire for survival considering the state's long coastline,
88
What we can learn from the Dutch: Rebuilding Kerala post 2018 floods
large number of rivers and high rainfall. Similarly, those who live on the banks of rivers or close to the sea must know how to use a boat and ensure adequate availability of boats for rescue operations in any emergency.
H H H H
89
Conclusion
Conclusion
The State Government has set itself the goal of rebuilding a new, green Kerala. This goal can surely be achieved through collective and concerted efforts. The people of Kerala have demonstrated courage, resilience and capacity for united action during the 2018 floods. The state with its high level of literacy and education, vibrant civil society and media as well as strong network of local government institutions, can become a model for rest of India in community-led water management. The international community, especially the government and people of the Netherlands would be more than happy to partner the state in this endeavour.
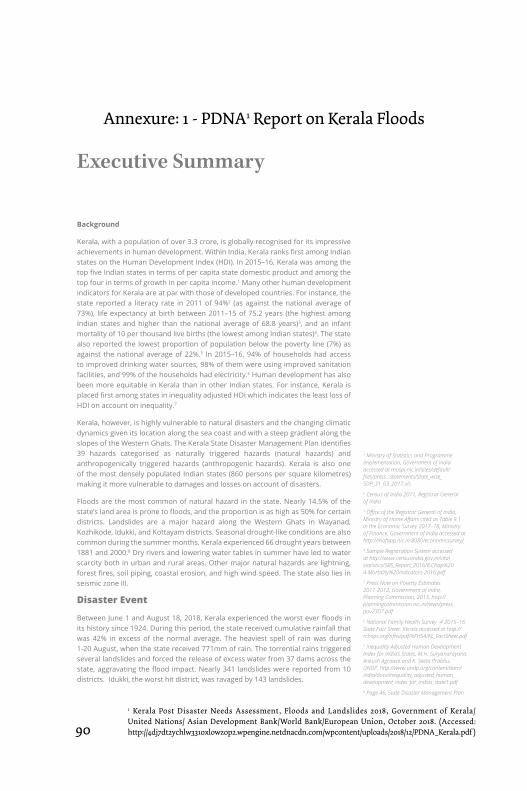
90
What we can learn from the Dutch: Rebuilding Kerala post 2018 floods
Executive Summary
6
Executive Summary
Background
Kerala, with a population of over 3.3 crore, is globally recognised for its impressive achievements in human development. Within India, Kerala ranks first among Indian states on the Human Development Index (HDI). In 2015–16, Kerala was among the top five Indian states in terms of per capita state domestic product and among the top four in terms of growth in per capita income.1 Many other human development indicators for Kerala are at par with those of developed countries. For instance, the state reported a literacy rate in 2011 of 94%2 (as against the national average of 73%), life expectancy at birth between 2011–15 of 75.2 years (the highest among Indian states and higher than the national average of 68.8 years)3, and an infant mortality of 10 per thousand live births (the lowest among Indian states)4. The state also reported the lowest proportion of population below the poverty line (7%) as against the national average of 22%.5 In 2015–16, 94% of households had access to improved drinking water sources, 98% of them were using improved sanitation facilities, and 99% of the households had electricity.6 Human development has also been more equitable in Kerala than in other Indian states. For instance, Kerala is placed first among states in inequality adjusted HDI which indicates the least loss of HDI on account on inequality.7
Kerala, however, is highly vulnerable to natural disasters and the changing climatic dynamics given its location along the sea coast and with a steep gradient along the slopes of the Western Ghats. The Kerala State Disaster Management Plan identifies 39 hazards categorised as naturally triggered hazards (natural hazards) and anthropogenically triggered hazards (anthropogenic hazards). Kerala is also one of the most densely populated Indian states (860 persons per square kilometres) making it more vulnerable to damages and losses on account of disasters.
Floods are the most common of natural hazard in the state. Nearly 14.5% of the state’s land area is prone to floods, and the proportion is as high as 50% for certain districts. Landslides are a major hazard along the Western Ghats in Wayanad, Kozhikode, Idukki, and Kottayam districts. Seasonal drought-like conditions are also common during the summer months. Kerala experienced 66 drought years between 1881 and 2000.8 Dry rivers and lowering water tables in summer have led to water scarcity both in urban and rural areas. Other major natural hazards are lightning, forest fires, soil piping, coastal erosion, and high wind speed. The state also lies in seismic zone III.
Disaster Event
Between June 1 and August 18, 2018, Kerala experienced the worst ever floods in its history since 1924. During this period, the state received cumulative rainfall that was 42% in excess of the normal average. The heaviest spell of rain was during 1-20 August, when the state received 771mm of rain. The torrential rains triggered several landslides and forced the release of excess water from 37 dams across the state, aggravating the flood impact. Nearly 341 landslides were reported from 10 districts. Idukki, the worst hit district, was ravaged by 143 landslides.
1 Ministry of Statistics and Programme Implementation, Government of India accessed at mospi.nic.in/sites/default/files/press...statements/State_wise_SDP_31_03_2017.xls2 Census of India 2011, Registrar General of India3 Office of the Registrar General of India, Ministry of Home Affairs cited as Table 9.1 in the Economic Survey 2017–18, Ministry of Finance, Government of India accessed at http://mofapp.nic.in:8080/economicsurvey/4 Sample Registration System accessed at http://www.censusindia.gov.in/vital_statistics/SRS_Report_2016/8.Chap%204-Mortality%20Indicators-2016.pdf5 Press Note on Poverty Estimates 2011-2012, Government of India, Planning Commission, 2013, http://planningcommission.nic.in/news/press_pov2307.pdf6 National Family Health Survey -4 2015–16 State Fact Sheet: Kerala accessed at http://rchiips.org/nfhs/pdf/NFHS4/KL_FactSheet.pdf7 Inequality Adjusted Human Development Index for India’s States, M.H. Suryanarayana, Ankush Agrawal and K. Seeta Prabhu, UNDP, http://www.undp.org/content/dam/india/docs/inequality_adjusted_human_development_index_for_indias_state1.pdf8 Page 46, State Disaster Management Plan
Annexure: 1 - PDNA1 Report on Kerala Floods
1 Kerala Post Disaster Needs Assessment, Floods and Landslides 2018, Government of Kerala/United Nations/ Asian Development Bank/World Bank/European Union, October 2018. (Accessed: http://4dj7dt2ychlw3310xlowzop2.wpengine.netdnacdn.com/wpcontent/uploads/2018/12/PDNA_Kerala.pdf )

91
ConclusionKerala Floods and Landslides
7According to latest reports of the state government, 1,259 out of 1,664 villages spread across its 14 districts were affected.9 The seven worst hit districts were Alappuzha, Ernakulam, Idukki, Kottayam, Pathanamthitha, Thrissur, and Wayanad, where the whole district was notified as flood affected. The devastating floods and landslides affected 5.4 million people, displaced 1.4 million people, and took 433 lives (22 May–29 August 2018) (Figure 1).
Immediate Response and Relief Operations
The state government responded swiftly with rescue and relief operations and saved many lives by rapidly mobilising the following national forces:
• Kerala Fire and Rescue Services: 4,100 individuals and the entire rescue equipment deployed
• National Disaster Response Force (NDRF): 58 teams, 207 boats
• Army: 23 columns, 104 boats
• Navy: 94 rescue teams, one medical team, nine helicopters, two fixed wing aircrafts and 94 boats
• Coast Guard: 36 teams, 49 boats, two helicopters, two fixed wing and 27 hired boats
• Air Force: 22 helicopters from Air Force and 23 fixed wing aircrafts
• Central Reserve Police Force: 10 teams
• Border Security Force: Two companies and one water vehicle team.
In addition, the fishing community of the state rendered phenomenal voluntary assistance towards search and rescue in the flood affected areas. Nearly 669 boats
Figure 1 Disaggregated Data on Casualties
9 Government order No. (P)No.05/2018/DMD dated Thiruvananthapuram, 29.09.2018
433
Source: Kerala State Disaster Management Authority
Annexures
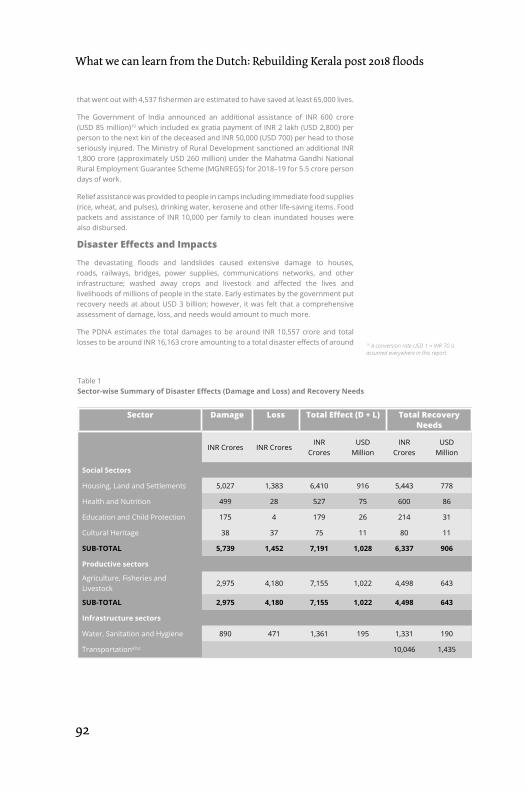
92
What we can learn from the Dutch: Rebuilding Kerala post 2018 floods
Executive Summary
8
that went out with 4,537 fishermen are estimated to have saved at least 65,000 lives.
The Government of India announced an additional assistance of INR 600 crore (USD 85 million)10 which included ex gratia payment of INR 2 lakh (USD 2,800) per person to the next kin of the deceased and INR 50,000 (USD 700) per head to those seriously injured. The Ministry of Rural Development sanctioned an additional INR 1,800 crore (approximately USD 260 million) under the Mahatma Gandhi National Rural Employment Guarantee Scheme (MGNREGS) for 2018–19 for 5.5 crore person days of work.
Relief assistance was provided to people in camps including immediate food supplies (rice, wheat, and pulses), drinking water, kerosene and other life-saving items. Food packets and assistance of INR 10,000 per family to clean inundated houses were also disbursed.
Disaster Effects and Impacts
The devastating floods and landslides caused extensive damage to houses, roads, railways, bridges, power supplies, communications networks, and other infrastructure; washed away crops and livestock and affected the lives and livelihoods of millions of people in the state. Early estimates by the government put recovery needs at about USD 3 billion; however, it was felt that a comprehensive assessment of damage, loss, and needs would amount to much more.
The PDNA estimates the total damages to be around INR 10,557 crore and total losses to be around INR 16,163 crore amounting to a total disaster effects of around
Table 1 Sector-wise Summary of Disaster Effects (Damage and Loss) and Recovery Needs
Sector Damage Loss Total Effect (D + L) Total Recovery Needs
INR Crores INR Crores
INR Crores
USD Million
INR Crores
USD Million
Social Sectors
Housing, Land and Settlements 5,027 1,383 6,410 916 5,443 778
Health and Nutrition 499 28 527 75 600 86
Education and Child Protection 175 4 179 26 214 31
Cultural Heritage 38 37 75 11 80 11
SUB-TOTAL 5,739 1,452 7,191 1,028 6,337 906
Productive sectors
Agriculture, Fisheries and Livestock
2,975 4,180 7,155 1,022 4,498 643
SUB-TOTAL 2,975 4,180 7,155 1,022 4,498 643
Infrastructure sectors
Water, Sanitation and Hygiene 890 471 1,361 195 1,331 190
Transportationa,b,c 10,046 1,435
10 A conversion rate USD 1 = INR 70 is assumed everywhere in this report.
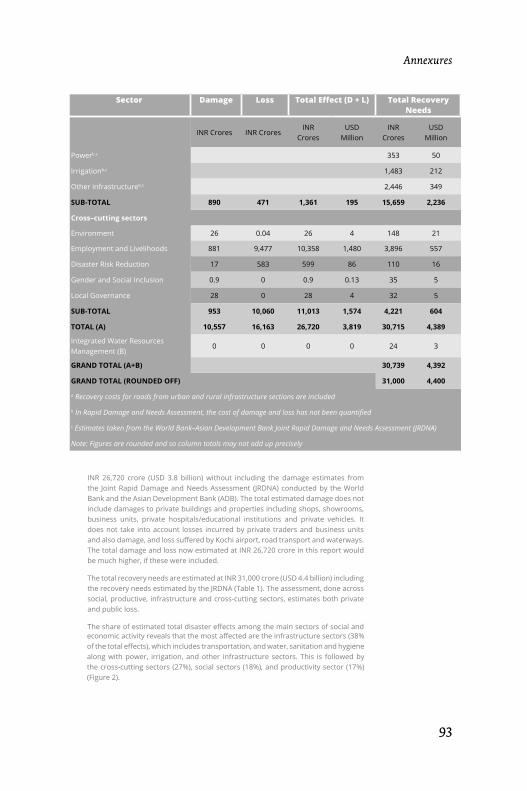
93
Conclusion
Kerala Floods and Landslides
9
Sector Damage Loss Total Effect (D + L) Total Recovery Needs
INR Crores INR Crores
INR Crores
USD Million
INR Crores
USD Million
Powerb.c 353 50
Irrigationb,c 1,483 212
Other infrastructureb,c 2,446 349
SUB-TOTAL 890 471 1,361 195 15,659 2,236
Cross–cutting sectors
Environment 26 0.04 26 4 148 21
Employment and Livelihoods 881 9,477 10,358 1,480 3,896 557
Disaster Risk Reduction 17 583 599 86 110 16
Gender and Social Inclusion 0.9 0 0.9 0.13 35 5
Local Governance 28 0 28 4 32 5
SUB-TOTAL 953 10,060 11,013 1,574 4,221 604
TOTAL (A) 10,557 16,163 26,720 3,819 30,715 4,389
Integrated Water Resources Management (B)
0 0 0 0 24 3
GRAND TOTAL (A+B) 30,739 4,392
GRAND TOTAL (ROUNDED OFF) 31,000 4,400
a Recovery costs for roads from urban and rural infrastructure sections are included
b In Rapid Damage and Needs Assessment, the cost of damage and loss has not been quantified
c Estimates taken from the World Bank–Asian Development Bank Joint Rapid Damage and Needs Assessment (JRDNA)
Note: Figures are rounded and so column totals may not add up precisely
INR 26,720 crore (USD 3.8 billion) without including the damage estimates from the Joint Rapid Damage and Needs Assessment (JRDNA) conducted by the World Bank and the Asian Development Bank (ADB). The total estimated damage does not include damages to private buildings and properties including shops, showrooms, business units, private hospitals/educational institutions and private vehicles. It does not take into account losses incurred by private traders and business units and also damage, and loss suffered by Kochi airport, road transport and waterways. The total damage and loss now estimated at INR 26,720 crore in this report would be much higher, if these were included.
The total recovery needs are estimated at INR 31,000 crore (USD 4.4 billion) including the recovery needs estimated by the JRDNA (Table 1). The assessment, done across social, productive, infrastructure and cross-cutting sectors, estimates both private and public loss.
The share of estimated total disaster effects among the main sectors of social and
Executive Summary
10
economic activity reveals that the most affected are the infrastructure sectors (38% of the total effects), which includes transportation, and water, sanitation and hygiene along with power, irrigation, and other infrastructure sectors. This is followed by the cross-cutting sectors (27%), social sectors (18%), and productivity sector (17%) (Figure 2).
The share of estimated recovery needs among the main sectors of social and economic activity reveals that infrastructure sectors have highest recovery needs (51% of the total recovery needs), followed by the social sectors (20%), productive sectors (15%) and cross-cutting sectors (14%) (Figure 3).
Figure 2 Share of Disaster Effects across Sectors
Figure 3 Share of Disaster Recovery Needs across Sectors
Source: Based on Table 1
Source: Based on Table 1
Annexures
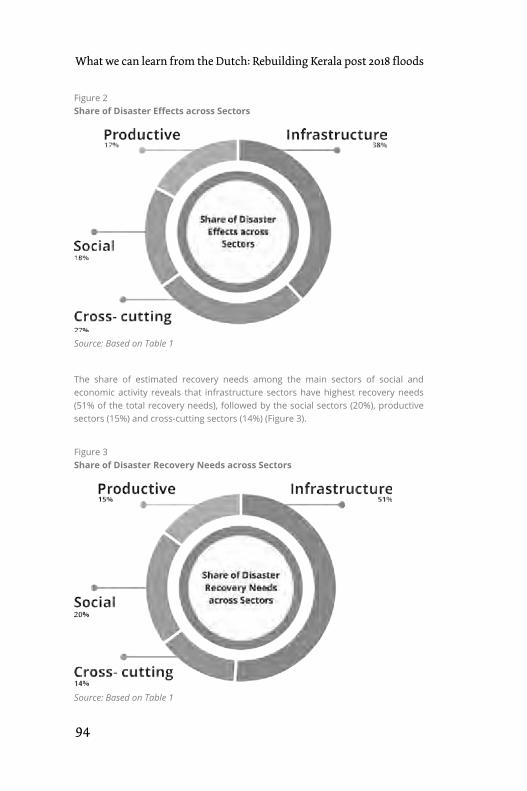
94
What we can learn from the Dutch: Rebuilding Kerala post 2018 floods
Executive Summary
10
economic activity reveals that the most affected are the infrastructure sectors (38% of the total effects), which includes transportation, and water, sanitation and hygiene along with power, irrigation, and other infrastructure sectors. This is followed by the cross-cutting sectors (27%), social sectors (18%), and productivity sector (17%) (Figure 2).
The share of estimated recovery needs among the main sectors of social and economic activity reveals that infrastructure sectors have highest recovery needs (51% of the total recovery needs), followed by the social sectors (20%), productive sectors (15%) and cross-cutting sectors (14%) (Figure 3).
Figure 2 Share of Disaster Effects across Sectors
Figure 3 Share of Disaster Recovery Needs across Sectors
Source: Based on Table 1
Source: Based on Table 1
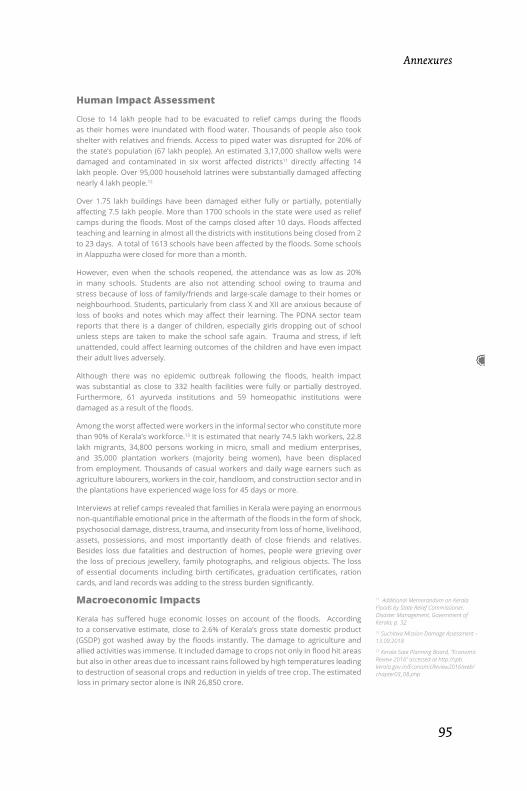
95
Conclusion
Kerala Floods and Landslides
11
Human Impact Assessment
Close to 14 lakh people had to be evacuated to relief camps during the floods as their homes were inundated with flood water. Thousands of people also took shelter with relatives and friends. Access to piped water was disrupted for 20% of the state’s population (67 lakh people). An estimated 3,17,000 shallow wells were damaged and contaminated in six worst affected districts11 directly affecting 14 lakh people. Over 95,000 household latrines were substantially damaged affecting nearly 4 lakh people.12
Over 1.75 lakh buildings have been damaged either fully or partially, potentially affecting 7.5 lakh people. More than 1700 schools in the state were used as relief camps during the floods. Most of the camps closed after 10 days. Floods affected teaching and learning in almost all the districts with institutions being closed from 2 to 23 days. A total of 1613 schools have been affected by the floods. Some schools in Alappuzha were closed for more than a month.
However, even when the schools reopened, the attendance was as low as 20% in many schools. Students are also not attending school owing to trauma and stress because of loss of family/friends and large-scale damage to their homes or neighbourhood. Students, particularly from class X and XII are anxious because of loss of books and notes which may affect their learning. The PDNA sector team reports that there is a danger of children, especially girls dropping out of school unless steps are taken to make the school safe again. Trauma and stress, if left unattended, could affect learning outcomes of the children and have even impact their adult lives adversely.
Although there was no epidemic outbreak following the floods, health impact was substantial as close to 332 health facilities were fully or partially destroyed. Furthermore, 61 ayurveda institutions and 59 homeopathic institutions were damaged as a result of the floods.
Among the worst affected were workers in the informal sector who constitute more than 90% of Kerala’s workforce.13 It is estimated that nearly 74.5 lakh workers, 22.8 lakh migrants, 34,800 persons working in micro, small and medium enterprises, and 35,000 plantation workers (majority being women), have been displaced from employment. Thousands of casual workers and daily wage earners such as agriculture labourers, workers in the coir, handloom, and construction sector and in the plantations have experienced wage loss for 45 days or more.
Interviews at relief camps revealed that families in Kerala were paying an enormous non-quantifiable emotional price in the aftermath of the floods in the form of shock, psychosocial damage, distress, trauma, and insecurity from loss of home, livelihood, assets, possessions, and most importantly death of close friends and relatives. Besides loss due fatalities and destruction of homes, people were grieving over the loss of precious jewellery, family photographs, and religious objects. The loss of essential documents including birth certificates, graduation certificates, ration cards, and land records was adding to the stress burden significantly.
Macroeconomic Impacts
Kerala has suffered huge economic losses on account of the floods. According to a conservative estimate, close to 2.6% of Kerala’s gross state domestic product (GSDP) got washed away by the floods instantly. The damage to agriculture and allied activities was immense. It included damage to crops not only in flood hit areas but also in other areas due to incessant rains followed by high temperatures leading to destruction of seasonal crops and reduction in yields of tree crop. The estimated
11 Additional Memorandum on Kerala Floods by State Relief Commissioner, Disaster Management, Government of Kerala, p. 3212 Suchitwa Mission Damage Assessment – 13.09.201813 Kerala Sate Planning Board, “Economic Review 2016” accessed at http://spb.kerala.gov.in/EconomicReview2016/web/chapter03_08.php
Executive Summary
12
loss in primary sector alone is INR 26,850 crore.
Many small traders suffered loss of stocks held in anticipation of Onam sales. While some of them are regular GST assessees, there are others who have opted for the composition scheme. The former category faces a serious problem. They had already paid input tax on their stock and had the right to claim credit for the same when the output was sold and return filed remitting the output tax collected. Since the stock for which they had paid input tax has been damaged in the floods, the input tax paid by them has become irrecoverable. The Government of Kerala could consider compensating the business community without changing the GST procedure and GSTIN platform by (i) starting with the valuation of individual loss and determination of compensation, (ii) developing a compensation package for the loss (both direct and consequential loss); and (iii) offering subsidised finances to business persons.
These losses and damages are likely to slow down Kerala’s economic growth. According to conservative estimates, Kerala’s growth rate could slip by around 1.2% in 2018–19. This loss could however be mitigated by the multiplier effects of an increase in (i) public expenditures and (ii) private consumption expenditures on account of remittances.
The loss of income and slowing down of economic growth are likely to reduce revenue collections. At the same time, public expenditures on disaster relief, reconstruction, and recovery are likely to rise substantially. It is estimated that, without factoring in additional resource mobilisation, the revenue deficit could rise to INR 31,332 crore, which would be nearly two-and-a-half times the budget estimate of INR 12,860 crore for 2018–19 before the disaster.
The state needs to have a medium-term expenditure restructuring plan (for the next five years) so as not to deviate from the fiscal consolidation path for a longer period. The state should target containing the revenue expenditure growth to close to 14% annually while maintaining growth of revenue receipts at 17% per annum after the liability for post-flood rehabilitation and reconstruction has been completed. A detailed plan would have to be envisaged to reach these targets.
Nava Keralam: Building a Green and Resilient Kerala
Nava Keralam is the government’s vision of converting the crisis into an opportunity by more explicitly embedding the idea of building a green and resilient Kerala into the Approach Paper to the Thirteenth Five-Year Plan, the Disaster Management Policy, the State Water Policy, and the Gender Equity and Women’s Empowerment Policies of Kerala.
The recovery policy framework for building a Green Kerala committed to: (i) the Chief Minister’s vision of a Nava Keralam (New Kerala), and (ii) the concept of ‘build back better and faster’ rests on four pillars:
• Pillar 1: Integrated water resources management (IWRM)
• Pillar 2: Eco-sensitive and risk-informed approaches to land use and settlements
• Pillar 3: Inclusive and people centred approach
• Pillar 4: Knowledge, innovation, and technology
Pillar 1: Integrated Water Resources Management
At its core, IWRM calls for internalising the themes of ‘room for the river’ and ‘living
Annexures Annexures
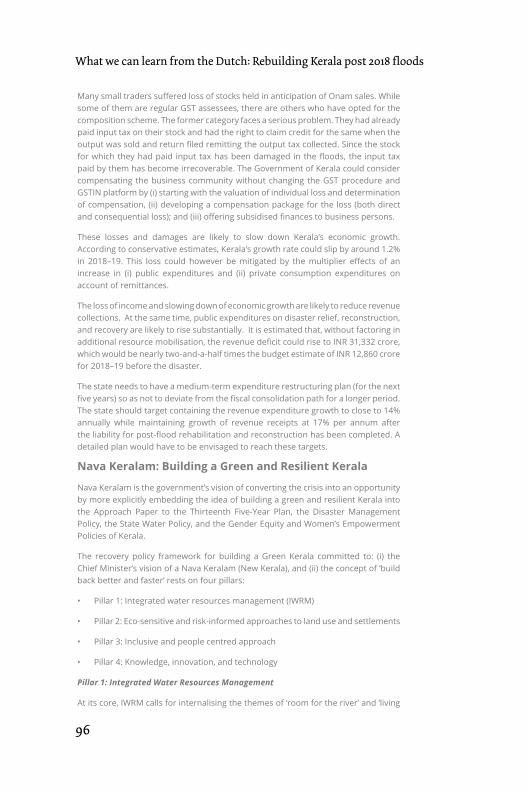
96
What we can learn from the Dutch: Rebuilding Kerala post 2018 floods
Executive Summary
12
loss in primary sector alone is INR 26,850 crore.
Many small traders suffered loss of stocks held in anticipation of Onam sales. While some of them are regular GST assessees, there are others who have opted for the composition scheme. The former category faces a serious problem. They had already paid input tax on their stock and had the right to claim credit for the same when the output was sold and return filed remitting the output tax collected. Since the stock for which they had paid input tax has been damaged in the floods, the input tax paid by them has become irrecoverable. The Government of Kerala could consider compensating the business community without changing the GST procedure and GSTIN platform by (i) starting with the valuation of individual loss and determination of compensation, (ii) developing a compensation package for the loss (both direct and consequential loss); and (iii) offering subsidised finances to business persons.
These losses and damages are likely to slow down Kerala’s economic growth. According to conservative estimates, Kerala’s growth rate could slip by around 1.2% in 2018–19. This loss could however be mitigated by the multiplier effects of an increase in (i) public expenditures and (ii) private consumption expenditures on account of remittances.
The loss of income and slowing down of economic growth are likely to reduce revenue collections. At the same time, public expenditures on disaster relief, reconstruction, and recovery are likely to rise substantially. It is estimated that, without factoring in additional resource mobilisation, the revenue deficit could rise to INR 31,332 crore, which would be nearly two-and-a-half times the budget estimate of INR 12,860 crore for 2018–19 before the disaster.
The state needs to have a medium-term expenditure restructuring plan (for the next five years) so as not to deviate from the fiscal consolidation path for a longer period. The state should target containing the revenue expenditure growth to close to 14% annually while maintaining growth of revenue receipts at 17% per annum after the liability for post-flood rehabilitation and reconstruction has been completed. A detailed plan would have to be envisaged to reach these targets.
Nava Keralam: Building a Green and Resilient Kerala
Nava Keralam is the government’s vision of converting the crisis into an opportunity by more explicitly embedding the idea of building a green and resilient Kerala into the Approach Paper to the Thirteenth Five-Year Plan, the Disaster Management Policy, the State Water Policy, and the Gender Equity and Women’s Empowerment Policies of Kerala.
The recovery policy framework for building a Green Kerala committed to: (i) the Chief Minister’s vision of a Nava Keralam (New Kerala), and (ii) the concept of ‘build back better and faster’ rests on four pillars:
• Pillar 1: Integrated water resources management (IWRM)
• Pillar 2: Eco-sensitive and risk-informed approaches to land use and settlements
• Pillar 3: Inclusive and people centred approach
• Pillar 4: Knowledge, innovation, and technology
Pillar 1: Integrated Water Resources Management
At its core, IWRM calls for internalising the themes of ‘room for the river’ and ‘living
97
ConclusionAnnexures
Kerala Floods and Landslides
13
with water’. It emphasises cross-disciplinary coordination of water, land, and related resources in a river basin, watershed or catchment to achieve long-term sustainability. With IWRM in place, it is possible to make proper plans for water safety and water security based on actual and planned land use resulting in multiple basin plans. Coordinated land and water use demands inter-sectorality at the level of policy, planning, and implementation. IWRM aims to break existing inter-sectoral barriers to establish a holistic framework for coordination. This is in line with the State Water Policy’s directive to ‘revamp the present piecemeal approach, which is mostly based on engineering solutions’.
River basin management with a ‘room for the river’ approach emphasises ecological conservation and restoration. This approach aims to lower flood levels in the rivers by increasing the wet areas of the rivers, giving them more room and space. Upstream river basin management with a focus on the conservation of forests assumes particular significance as all the short, fast-flowing, monsoon-fed rivers originate in the Western Ghats that have witnessed serious forest degradation. Equally important is the issue of coastal zone management.
An important prerequisite for IWRM is the availability of sufficient and reliable data and state of art hydrological models to support environmental and social impact assessments including mitigating measures to arrest environmental deterioration. This needs to be accompanied by a process of citizen education and democratic dialogue, such that the need for integrated water resource planning is communicated and appreciated at all levels.
Recommendations for recovery centre around protecting natural river flows and giving room to the river—concepts that inform the citizen education programmes. Preparation of basin-wide master plans linking upstream, and downstream zones should be prioritised.
Pillar 2: Eco-sensitive and Risk-Informed Approaches to Land Use and Settlements
An eco-sensitive and risk-informed approach needs to ensure that buildings are reconstructed using disaster resilient techniques, at the right location, away from flood plains and slopes. According to the Kerala State Disaster Management Policy, physical reconstruction must take into account the hazards of the particular location, resources and capacities people involved in the rebuilding, and the adoption of designs that offer resilience against floods, cyclones, earthquakes, and droughts.14
Additionally, for designing ‘green buildings’ to make Kerala a green state, it needs to capitalise on its experience and capacity to deploy alternative construction technologies with low carbon footprint including expertise drawn from Laurie Baker, Habitat Technology Group, Centre of Science and Technology for Rural Development (COSTFORD), People’s Movement for Sustainable Architecture, and government sponsored Nirmiti.15
The reconstruction of houses and public building using appropriate technologies offers a major opportunity for the skilling and green job creation in the sector. It is recommended that an Integrated Strategic Environmental Assessment be applied to mitigate the negative impact of the surge in construction activities. This approach developed by the UN Environment has been implemented during the post-conflict reconstruction of Sri Lanka and the post-disaster reconstruction of Nepal.
Pillar 3: Inclusive and People-Centred Approach
The recovery strategy for Nava Keralam will be premised on comprehensive vulnerability mapping (including inter-sectional vulnerabilities) to inform all stages
14 Government of Kerala, Kerala 2000 State Disaster Management Policy, Kerala State Disaster Management Authority15 There are about 40 such organisations working on alternative housing technologies in Kerala. If each of these organisations is entrusted with the task of constructing 500 houses, the required 18,000 houses can be constructed within the next six months, i.e. before the next south-west monsoon.
Executive Summary
14
of disaster recovery. During the recent rescue and relief operations, the extreme vulnerabilities of the elderly and persons with disabilities in the state became conspicuous. It was realised that the requirements of excluded groups need to be prioritised across all aspects of disaster mitigation and resilience building—early warning systems, relief operations, design and construction of buildings and community infrastructure, psycho-social interventions, livelihood enhancement measures and so on.
Mechanisms should be instituted for including the socially excluded in all aspects of the recovery strategy. Additional livelihood opportunities should be offered to women while simultaneously reducing their care burden by extending the working hours of anganwadi centres and setting up day care homes for the elderly. It is recommended that the MGNREGS be used to fill in the livelihood deficit in the aftermath of the floods. Furthermore, there should a focus on re-skilling of women and workers from scheduled castes and tribes, so as to engage them in climate-resilient agricultural work and natural resource protection under the Mahatma Gandhi National Rural Employment Guarantee Act (MGNREGA) 2005.
Men and women should be given joint title deeds for the newly constructed homes and proactive measures should be taken to include people who are conventionally excluded by the state’s social security programmes such as migrant workers and transgenders.
Strengthening the grama sabha, concurrent monitoring social audit and redress of grievances should be made an integral part of all programmes aimed at recovery.
Pillar 4: Knowledge, Innovation, and Technology
Knowledge, innovation, and the appropriate technology are vital in addressing the sustainable development and climate change challenges that Kerala faces. The Kerala floods illustrated the potential of information technology in both rescue and relief operations. The web-based application keralarescue.in as well as the use of social media including WhatsApp by voluntary groups and government officials helped to identify victims, camp locations, requirements in the camps, volunteer registration, and facilitate both rescue and relief operations. In many locations, these WhatsApp locations functioned as virtual ‘control rooms’. Social media was also used to mobilise thousands of volunteers for one-time cleaning operations. Web-based applications were also used to assess damages to houses and buildings (Rebuild Kerala app), forming the basis for compensation packages, as well as to mobilise financial resources for recovery through the Chief Minister’s Disaster Relief Fund portal. Information technology can also be used to re-coup lost documents, geo-tag beneficiaries, conduct social audits and help with redress of grievances.
The magnitude of the floods and landslides has underscored the need for research and knowledge generation activities. While downstream conditions hampered discharge of water, flooding was also a result of inappropriate human interventions in the middle and upper parts of river basins. There is a need therefore, for research on the role of deforestation, quarrying, unscientific road construction, slope modification, sand mining from river beds, construction on stream channels, narrowing and blocking of drainage channels and so on, in aggravating landslides and flooding. Such research outcomes can inform land-use maps for recovery and reconstruction projects, in particular road construction, location of hospitals and schools, and also for regular development planning.
The availability of state-of-the-art geographic information system (GIS) technologies facilitates the creation of such maps, as well as in their dissemination to local government agencies. Given Kerala’s decentralised governance architecture,
98
What we can learn from the Dutch: Rebuilding Kerala post 2018 floods
Executive Summary
14
of disaster recovery. During the recent rescue and relief operations, the extreme vulnerabilities of the elderly and persons with disabilities in the state became conspicuous. It was realised that the requirements of excluded groups need to be prioritised across all aspects of disaster mitigation and resilience building—early warning systems, relief operations, design and construction of buildings and community infrastructure, psycho-social interventions, livelihood enhancement measures and so on.
Mechanisms should be instituted for including the socially excluded in all aspects of the recovery strategy. Additional livelihood opportunities should be offered to women while simultaneously reducing their care burden by extending the working hours of anganwadi centres and setting up day care homes for the elderly. It is recommended that the MGNREGS be used to fill in the livelihood deficit in the aftermath of the floods. Furthermore, there should a focus on re-skilling of women and workers from scheduled castes and tribes, so as to engage them in climate-resilient agricultural work and natural resource protection under the Mahatma Gandhi National Rural Employment Guarantee Act (MGNREGA) 2005.
Men and women should be given joint title deeds for the newly constructed homes and proactive measures should be taken to include people who are conventionally excluded by the state’s social security programmes such as migrant workers and transgenders.
Strengthening the grama sabha, concurrent monitoring social audit and redress of grievances should be made an integral part of all programmes aimed at recovery.
Pillar 4: Knowledge, Innovation, and Technology
Knowledge, innovation, and the appropriate technology are vital in addressing the sustainable development and climate change challenges that Kerala faces. The Kerala floods illustrated the potential of information technology in both rescue and relief operations. The web-based application keralarescue.in as well as the use of social media including WhatsApp by voluntary groups and government officials helped to identify victims, camp locations, requirements in the camps, volunteer registration, and facilitate both rescue and relief operations. In many locations, these WhatsApp locations functioned as virtual ‘control rooms’. Social media was also used to mobilise thousands of volunteers for one-time cleaning operations. Web-based applications were also used to assess damages to houses and buildings (Rebuild Kerala app), forming the basis for compensation packages, as well as to mobilise financial resources for recovery through the Chief Minister’s Disaster Relief Fund portal. Information technology can also be used to re-coup lost documents, geo-tag beneficiaries, conduct social audits and help with redress of grievances.
The magnitude of the floods and landslides has underscored the need for research and knowledge generation activities. While downstream conditions hampered discharge of water, flooding was also a result of inappropriate human interventions in the middle and upper parts of river basins. There is a need therefore, for research on the role of deforestation, quarrying, unscientific road construction, slope modification, sand mining from river beds, construction on stream channels, narrowing and blocking of drainage channels and so on, in aggravating landslides and flooding. Such research outcomes can inform land-use maps for recovery and reconstruction projects, in particular road construction, location of hospitals and schools, and also for regular development planning.
The availability of state-of-the-art geographic information system (GIS) technologies facilitates the creation of such maps, as well as in their dissemination to local government agencies. Given Kerala’s decentralised governance architecture,
99
ConclusionAnnexures
Kerala Floods and Landslides
15
there is a need to enhance the knowledge base of local government with such maps, at appropriate scales, to improve understanding at the micro-level of the interconnectedness of risk factors and their cumulative impact. This understanding also needs to be imparted to citizens through grama sabhas and other forums. The student community and the youth, who proved their ability to respond to the crisis, need to be roped in as agents of knowledge generation and dissemination.
Knowledge generation and effective dissemination can help in early warning and risk information communication to the last mile. Knowledge generation and innovation also assume critical importance in the production of green technologies particularly in the context of housing and sanitation, as well as in expanding the scope of livelihood activities that carry a low carbon footprint.
Essential Building Blocks
Priority actions areas to build a green and resilient Kerala are:
Reviewing Land Use Patterns: Profitability of farming in Kerala has been adversely affected by the fragmentation of agricultural lands, dramatic reduction in land used for paddy cultivation, rising agricultural wages and globalisation of supply chains. The recovery period offers an opportunity to create a new land-use policy which enables the re-deployment of available land to maximise its natural ecosystem functions. Paddy lands could be conserved and managed as wetlands for ground water recharge, biodiversity conservation, and greenhouse gas emission reduction. It will also be possible to acquire and use land for ecosystem services such as biodiversity conservation and disaster risk reduction (DRR).
Changing Consumption Patterns: Fuelled by remittances and growing incomes, Kerala’s environmental footprint of consumption transcends state or even national boundaries. The government can and should systematically analyse its consumption pattern and see how its environmental footprint both locally and outside the state can be controlled and minimised. Kerala should aspire to become not only ‘locally’ green but should also begin to care about environmental destruction everywhere.
Sustainable Building Guidelines Kerala should reverse the trend of constructing ‘modern’ buildings that are not suitable for local weather conditions and encourage high energy consumption. Instead, it should adopt a locally ‘sustainable building guidelines’, similar to the one in the United Kingdom, whereby each building is systematically analysed for its carbon footprint based on its construction and operation. Use of material locally available is maximised and need for energy for cooling and lighting is minimised. This will also create thousands of new ‘green jobs’ in the state.
Maximise Use of Solar Energy: Given the potential for solar energy generation round the year, Kerala should aspire to be fully solar powered at least in housing, offices, and commercial establishments by 2030. As an interim measure, the government may stipulate that all new building construction, including buildings with aluminium roofs, have built in solar panels. Similar guidelines have been created in France which has much less potential for solar energy generation.
Green Technology Centres: Every household in Kerala has many opportunities to apply green technologies in household composting, domestic sewage management, solar energy, and resource recycling. Young people from villages can be trained in green technology installation and maintenance and hired at ‘green technology centres’ developed as cooperative societies in villages. In addition to improving environmental quality, these centres can create thousands of high skilled jobs in the community.
100
What we can learn from the Dutch: Rebuilding Kerala post 2018 floods
Executive Summary
16
Environment and Natural Resource Managers: Even though environmental guidelines exist for quarrying or sand mining, there is no local capacity to implement them. Kerala can be the first Indian state to employ an Environment and Natural Resources Manager in every local government body to map the valuable natural resources within the jurisdiction of the local body (rivers, ponds, streams, hills, sacred groves etc.) and advise the local administration on how they can be managed effectively.
Integrate Solid Waste Management Centres: Solid waste management in Kerala is not modern or well managed. Currently solid waste management is the responsibility of the local government bodies. However, they are unable to exercise this mandate correctly due to shortage of funds and expertise. It will be more appropriate to look it as a state-wide issue and see what waste streams would need centralised solutions (waste-to-energy plants, incinerators, or landfills), which waste streams could be locally managed (household level, ward level composting etc.), and which waste streams should be addressed by extended producer responsibility.
Greening the Tourism Sector: Revenues from tourism, if used creatively, can bring in funds and reasons for maintaining environmental resources in a better manner. Management of solid and liquid wastes, for instance, is a major issue in most places of tourist attraction. A comprehensive approach to greening the tourism sector, including an eco-tax for tourists could be a major step towards making Kerala’s tourism green. Similar measures could also apply to major pilgrim destinations.
Creating Green Jobs: Making Kerala a ‘green state’ could create new jobs locally, and also make the state a hub for green technology advisory services nationally and internationally. To give one example, the Cochin International Airport Limited is the first international airport in the world to go fully solar. Such expertise can be built in many other areas including waste management, ecotourism, and organic farming. Kerala should not just aspire to be a green state, but also a provider of such expertise to the rest of the world.
Climate Change Resilience: Improving climate literacy and promoting decentralised action for adaptation and mitigation are critical for building climate change resilience. Every local government should have a climate change adaptation plan and private individuals should be educated on the climate footprint of their personal actions from the food they eat to the mode of transport they use and the lifestyle choices they make. Kerala, with the highest forest cover of 52.3% among big states in India and increased focus of local self-governments on climate change adaptation, can emerge as a world leader in community-based climate resilience actions.16
Innovations for Greening Kerala
The PDNA has identified several innovative ideas across sectors for the greening of Kerala as it starts building back better and faster.
Integrated Water Resource Management: Learning from the international best practice of water resource management from the Netherlands, Kerala can promote best practices like ‘room for the river’, ‘living with water’, and ‘building with nature’. An analysis of the sector proposes that the state should launch a Hydrological Crash Programme for collecting available data using state-of-the-art hydrological software and build a hydrological model for a pilot basin. The government should also prepare a master plan for the Kuttanad area, start an awareness programme on living with water in flood prone areas, and set up a Kerala Water Partnership to organise dialogues and promote communication for behaviour change.
Housing, Land, and Settlements: In line with the state government’s vision of a ‘Nava Keralam’, the reconstruction processes envisage an eco-sensitive approach using
16 MOEFCC (2018), India State of Forest Report 2017, Ministry of Environment, Forest, and Climate Change, Government of India.

101
ConclusionAnnexures
Kerala Floods and Landslides
17
construction technologies based on local materials, fulfil the aspirations of the public, reduce the carbon footprint, and create more local green jobs. To achieve this, it is proposed be set up 70 housing facilitation centres to assist the house-owners choose designs appropriate to the location, procure materials and provide technical support to construct houses. Over 17,000 houses will be reconstructed and 2.17 lakh dwelling units repaired over a period of three years. Nearly 2,800 masons will be trained in disaster resilient construction technologies and 140 units of small scale building materials production centres will be established to rebuild and repair the 2.17 lakh houses that were affected by the floods and landslides. In the long term, it is proposed to review the existing building codes and bylaws for urban and rural areas. Kerala could emerge as the pioneer state to develop separate guidelines for construction on highlands and slopes for inclusion in the National Building Code.
The recovery strategy proposes to empower the Local Self Government Department (LSGD) offices to facilitate the adoption of risk resilient housing designs. The LSGD will also function as a regulatory body, guiding house-owners on appropriate structures for specific sites. It will work in close coordination with the Livelihood Inclusion and Financial Empowerment (LIFE) Mission.17
Health: Kerala is encouraged to transition to a ‘safe and green hospital’ concept through the allocation of adequate resources to health facilities that are most at ecological or hazard risk. Multiple gains are possible by integrating DRR with low carbon energy use, water conservation, sustainable consumption, and environmental protection. The green hospital approach could be extended beyond the 482 damaged allopathy hospitals to the reconstruction of the 1219 anganwadi centres. In the short-term, the recovery plan is to target life-saving interventions through curative and preventive approaches. The emphasis in the medium term is on improving health care access by restoring health facilities, improving capacities of the health workforce, and promoting DRR. The long-term plan is to promote ongoing health sector reforms, strengthen health facilities, and the health information system.
Education: The education sector proposes green schools that create a healthy environment conducive to learning and environmental protection. Efforts will be made to strengthen existing biodiversity parks in all schools and develop green-building infrastructural designs for schools and educational centres suitable to the topography, climate, and local conditions. About 1767 schools, education centres and child care institutions affected will be repaired and reconstructed. About 1990 school toilets will be repaired. The recovery and reconstruction strategy will focus on ensuring uninterrupted continuation of education service delivery. School buildings will be constructed or refurbished keeping in mind the notion of green and safe schools.
Medium term needs in the sector will be dominated by the reconstruction of damaged buildings and allied services. It is proposed that specially designated medical facilities for children with special needs be established in the community health centres. The Department of General and Higher Education will establish timelines for educational institutions to complete basic infrastructural reconstruction as per the Kerala Education Rules, 1958. It is suggested that steps be taken to strengthen existing disaster preparedness strategies and developed new ones. Children’s Committees and Home Committees should be established and local governments should receive support for drawing up timelines for building back safe and violence free schools with participation from the community and the children.
17 The LIFE Mission of the Govt of Kerala aims to provide safe housing to nearly 4.30 lakh of homeless persons and households living below the poverty line within a period of five years.
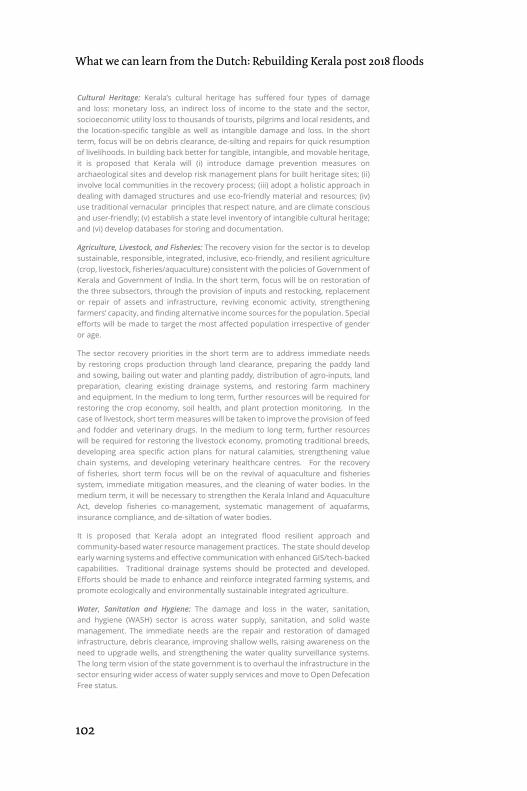
102
What we can learn from the Dutch: Rebuilding Kerala post 2018 floods
Executive Summary
18
Cultural Heritage: Kerala’s cultural heritage has suffered four types of damage and loss: monetary loss, an indirect loss of income to the state and the sector, socioeconomic utility loss to thousands of tourists, pilgrims and local residents, and the location-specific tangible as well as intangible damage and loss. In the short term, focus will be on debris clearance, de-silting and repairs for quick resumption of livelihoods. In building back better for tangible, intangible, and movable heritage, it is proposed that Kerala will (i) introduce damage prevention measures on archaeological sites and develop risk management plans for built heritage sites; (ii) involve local communities in the recovery process; (iii) adopt a holistic approach in dealing with damaged structures and use eco-friendly material and resources; (iv) use traditional vernacular principles that respect nature, and are climate conscious and user-friendly; (v) establish a state level inventory of intangible cultural heritage; and (vi) develop databases for storing and documentation.
Agriculture, Livestock, and Fisheries: The recovery vision for the sector is to develop sustainable, responsible, integrated, inclusive, eco-friendly, and resilient agriculture (crop, livestock, fisheries/aquaculture) consistent with the policies of Government of Kerala and Government of India. In the short term, focus will be on restoration of the three subsectors, through the provision of inputs and restocking, replacement or repair of assets and infrastructure, reviving economic activity, strengthening farmers’ capacity, and finding alternative income sources for the population. Special efforts will be made to target the most affected population irrespective of gender or age.
The sector recovery priorities in the short term are to address immediate needs by restoring crops production through land clearance, preparing the paddy land and sowing, bailing out water and planting paddy, distribution of agro-inputs, land preparation, clearing existing drainage systems, and restoring farm machinery and equipment. In the medium to long term, further resources will be required for restoring the crop economy, soil health, and plant protection monitoring. In the case of livestock, short term measures will be taken to improve the provision of feed and fodder and veterinary drugs. In the medium to long term, further resources will be required for restoring the livestock economy, promoting traditional breeds, developing area specific action plans for natural calamities, strengthening value chain systems, and developing veterinary healthcare centres. For the recovery of fisheries, short term focus will be on the revival of aquaculture and fisheries system, immediate mitigation measures, and the cleaning of water bodies. In the medium term, it will be necessary to strengthen the Kerala Inland and Aquaculture Act, develop fisheries co-management, systematic management of aquafarms, insurance compliance, and de-siltation of water bodies.
It is proposed that Kerala adopt an integrated flood resilient approach and community-based water resource management practices. The state should develop early warning systems and effective communication with enhanced GIS/tech-backed capabilities. Traditional drainage systems should be protected and developed. Efforts should be made to enhance and reinforce integrated farming systems, and promote ecologically and environmentally sustainable integrated agriculture.
Water, Sanitation and Hygiene: The damage and loss in the water, sanitation, and hygiene (WASH) sector is across water supply, sanitation, and solid waste management. The immediate needs are the repair and restoration of damaged infrastructure, debris clearance, improving shallow wells, raising awareness on the need to upgrade wells, and strengthening the water quality surveillance systems. The long term vision of the state government is to overhaul the infrastructure in the sector ensuring wider access of water supply services and move to Open Defecation Free status.
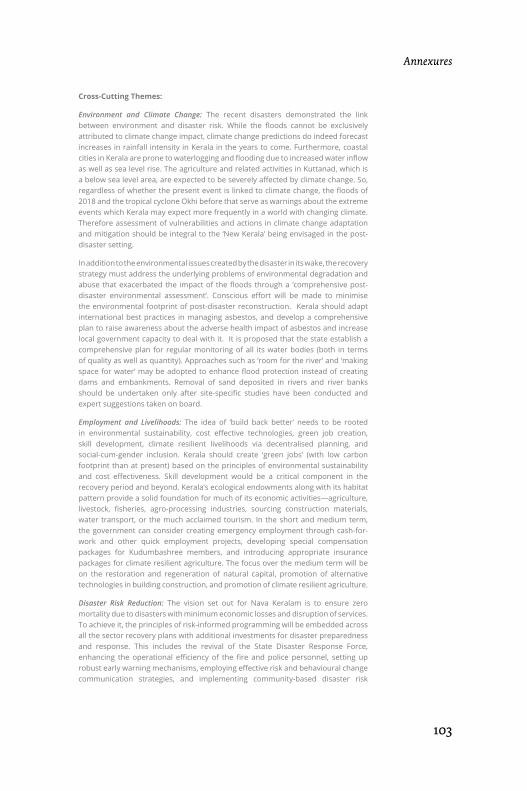
103
ConclusionAnnexures
Kerala Floods and Landslides
19
Cross-Cutting Themes:
Environment and Climate Change: The recent disasters demonstrated the link between environment and disaster risk. While the floods cannot be exclusively attributed to climate change impact, climate change predictions do indeed forecast increases in rainfall intensity in Kerala in the years to come. Furthermore, coastal cities in Kerala are prone to waterlogging and flooding due to increased water inflow as well as sea level rise. The agriculture and related activities in Kuttanad, which is a below sea level area, are expected to be severely affected by climate change. So, regardless of whether the present event is linked to climate change, the floods of 2018 and the tropical cyclone Okhi before that serve as warnings about the extreme events which Kerala may expect more frequently in a world with changing climate. Therefore assessment of vulnerabilities and actions in climate change adaptation and mitigation should be integral to the ‘New Kerala’ being envisaged in the post-disaster setting.
In addition to the environmental issues created by the disaster in its wake, the recovery strategy must address the underlying problems of environmental degradation and abuse that exacerbated the impact of the floods through a ‘comprehensive post-disaster environmental assessment’. Conscious effort will be made to minimise the environmental footprint of post-disaster reconstruction. Kerala should adapt international best practices in managing asbestos, and develop a comprehensive plan to raise awareness about the adverse health impact of asbestos and increase local government capacity to deal with it. It is proposed that the state establish a comprehensive plan for regular monitoring of all its water bodies (both in terms of quality as well as quantity). Approaches such as ‘room for the river’ and ‘making space for water’ may be adopted to enhance flood protection instead of creating dams and embankments. Removal of sand deposited in rivers and river banks should be undertaken only after site-specific studies have been conducted and expert suggestions taken on board.
Employment and Livelihoods: The idea of ‘build back better’ needs to be rooted in environmental sustainability, cost effective technologies, green job creation, skill development, climate resilient livelihoods via decentralised planning, and social-cum-gender inclusion. Kerala should create ‘green jobs’ (with low carbon footprint than at present) based on the principles of environmental sustainability and cost effectiveness. Skill development would be a critical component in the recovery period and beyond. Kerala’s ecological endowments along with its habitat pattern provide a solid foundation for much of its economic activities—agriculture, livestock, fisheries, agro-processing industries, sourcing construction materials, water transport, or the much acclaimed tourism. In the short and medium term, the government can consider creating emergency employment through cash-for-work and other quick employment projects, developing special compensation packages for Kudumbashree members, and introducing appropriate insurance packages for climate resilient agriculture. The focus over the medium term will be on the restoration and regeneration of natural capital, promotion of alternative technologies in building construction, and promotion of climate resilient agriculture.
Disaster Risk Reduction: The vision set out for Nava Keralam is to ensure zero mortality due to disasters with minimum economic losses and disruption of services. To achieve it, the principles of risk-informed programming will be embedded across all the sector recovery plans with additional investments for disaster preparedness and response. This includes the revival of the State Disaster Response Force, enhancing the operational efficiency of the fire and police personnel, setting up robust early warning mechanisms, employing effective risk and behavioural change communication strategies, and implementing community-based disaster risk
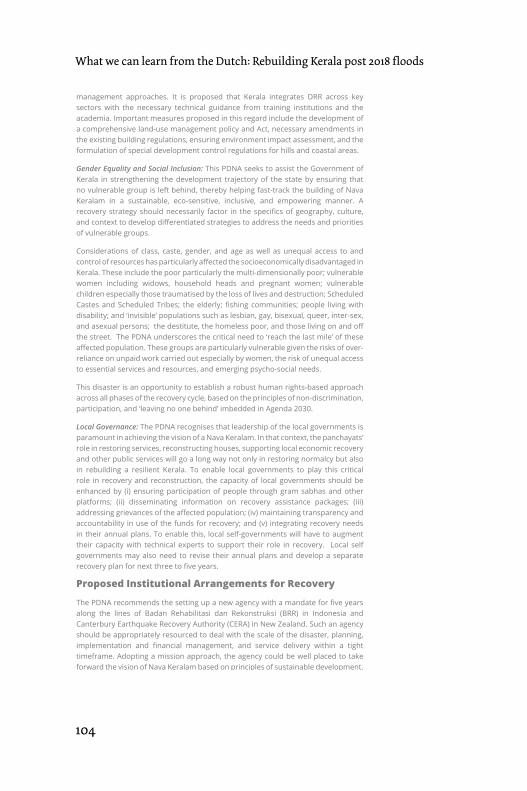
104
What we can learn from the Dutch: Rebuilding Kerala post 2018 floods
Executive Summary
20
management approaches. It is proposed that Kerala integrates DRR across key sectors with the necessary technical guidance from training institutions and the academia. Important measures proposed in this regard include the development of a comprehensive land-use management policy and Act, necessary amendments in the existing building regulations, ensuring environment impact assessment, and the formulation of special development control regulations for hills and coastal areas.
Gender Equality and Social Inclusion: This PDNA seeks to assist the Government of Kerala in strengthening the development trajectory of the state by ensuring that no vulnerable group is left behind, thereby helping fast-track the building of Nava Keralam in a sustainable, eco-sensitive, inclusive, and empowering manner. A recovery strategy should necessarily factor in the specifics of geography, culture, and context to develop differentiated strategies to address the needs and priorities of vulnerable groups.
Considerations of class, caste, gender, and age as well as unequal access to and control of resources has particularly affected the socioeconomically disadvantaged in Kerala. These include the poor particularly the multi-dimensionally poor; vulnerable women including widows, household heads and pregnant women; vulnerable children especially those traumatised by the loss of lives and destruction; Scheduled Castes and Scheduled Tribes; the elderly; fishing communities; people living with disability; and ‘invisible’ populations such as lesbian, gay, bisexual, queer, inter-sex, and asexual persons; the destitute, the homeless poor, and those living on and off the street. The PDNA underscores the critical need to ‘reach the last mile’ of these affected population. These groups are particularly vulnerable given the risks of over-reliance on unpaid work carried out especially by women, the risk of unequal access to essential services and resources, and emerging psycho-social needs.
This disaster is an opportunity to establish a robust human rights-based approach across all phases of the recovery cycle, based on the principles of non-discrimination, participation, and ‘leaving no one behind’ imbedded in Agenda 2030.
Local Governance: The PDNA recognises that leadership of the local governments is paramount in achieving the vision of a Nava Keralam. In that context, the panchayats’ role in restoring services, reconstructing houses, supporting local economic recovery and other public services will go a long way not only in restoring normalcy but also in rebuilding a resilient Kerala. To enable local governments to play this critical role in recovery and reconstruction, the capacity of local governments should be enhanced by (i) ensuring participation of people through gram sabhas and other platforms; (ii) disseminating information on recovery assistance packages; (iii) addressing grievances of the affected population; (iv) maintaining transparency and accountability in use of the funds for recovery; and (v) integrating recovery needs in their annual plans. To enable this, local self-governments will have to augment their capacity with technical experts to support their role in recovery. Local self governments may also need to revise their annual plans and develop a separate recovery plan for next three to five years.
Proposed Institutional Arrangements for Recovery
The PDNA recommends the setting up a new agency with a mandate for five years along the lines of Badan Rehabilitasi dan Rekonstruksi (BRR) in Indonesia and Canterbury Earthquake Recovery Authority (CERA) in New Zealand. Such an agency should be appropriately resourced to deal with the scale of the disaster, planning, implementation and financial management, and service delivery within a tight timeframe. Adopting a mission approach, the agency could be well placed to take forward the vision of Nava Keralam based on principles of sustainable development.

105
ConclusionAnnexures
Kerala Floods and Landslides
21
Financing for Recovery and Reconstruction
The state government requires INR 31,000 crore (USD 4.4 billion) for recovery and reconstruction. The following are some options for mobilising the required resources for recovery and reconstruction over a timeframe of five years:
Increase Borrowing: The state government can use the market instruments and borrow from national and international financial institutions. For instance, with the approval of the Government of India, the Government of Kerala may issue Reconstruction Bonds. The state could also borrow from the World Bank and ADB to support recovery and reconstruction by seeking permission from the central government to enhance its borrowing limit from the current 3% as stipulated by the Fiscal Responsibility and Budget Management (FBRM) Act in India to 4.5%. Overseas development assistance could be secured in terms of budget support or pooled basket funds or for specific projects for flood recovery.
Additional Funds from Centrally Sponsored Schemes (CSS): The state government may get additional funds from the central government under CSS like the MGNREGS for livelihoods, Pradhan Mantri Awas Yojana, (PMAY) for housing and other central schemes. While the National Disaster Response Fund (NDRF) does not typically support recovery and reconstruction, a part of the cost could be funded through the NDRF. The cost of the repairs, which is allowed through NDRF, could be utilised for supporting the reconstruction component.
Chief Ministers Disaster Relief Fund & Lottery: The Government of Kerala can consider raising additional resources, over and above INR 1,740 crore already mobilised through the Chief Minister’s Disaster Relief Fund. The new lottery scheme floated by the state government is expected to mobilise about INR 80 crore.
Augmenting Resources Through Taxes: The Government of Kerala can consider augmenting resources through taxes. The possibilities for additional resources through taxation can include (i) widening the tax base: to bring additional business units in the state under the commercial tax net of the state government; (ii) introducing new taxes such as a tax on vacant houses, or a tax on construction of large houses of more than 3,000 square feet area. The state government may consider introducing carbon tax on motor vehicles and building materials with high carbon footprint such as cement, steel, glass, aluminium, and so on.
Others: The state government may request additional statutory block revenue deficit grant under Article 275 of the Constitution. For this, Kerala may need to submit a revised revenue receipt and expenditure statement to the Commission. Among other possibilities are tapping Corporate Social Responsibility (CSR) Funds, crowd-funding through digital platforms, seeking grants from NGOs and international NGOs for recovery and reconstruction, and setting up Voluntary Reconstruction Funds attract contributions from the Malayali diaspora including alumni of educational institutions.
The people of Kerala have demonstrated extraordinary resilience in coping with the unprecedented disaster. The state has also demonstrated the power of public action in dealing with the aftermath of the floods. The potential exists for Kerala to tap the wealth of its traditional knowledge, the wealth of green ideas, the minds of its diaspora, and the spirit of volunteerism to demonstrate cost-effective ways of ensuring equitable and sustainable development. The disaster presents a new opportunity for Kerala to lead the world in establishing a green and resilient state.
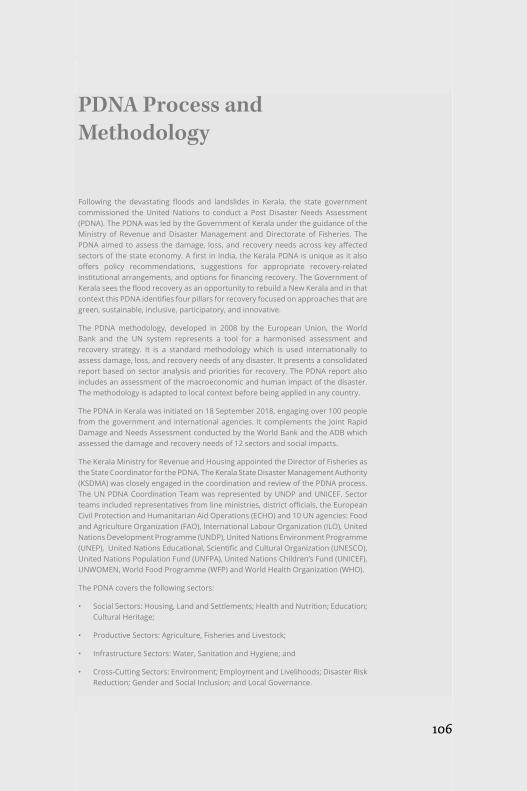
106
What we can learn from the Dutch: Rebuilding Kerala post 2018 floods
PDNA Process and Methodology
22
PDNA Process and Methodology
Following the devastating floods and landslides in Kerala, the state government commissioned the United Nations to conduct a Post Disaster Needs Assessment (PDNA). The PDNA was led by the Government of Kerala under the guidance of the Ministry of Revenue and Disaster Management and Directorate of Fisheries. The PDNA aimed to assess the damage, loss, and recovery needs across key affected sectors of the state economy. A first in India, the Kerala PDNA is unique as it also offers policy recommendations, suggestions for appropriate recovery-related institutional arrangements, and options for financing recovery. The Government of Kerala sees the flood recovery as an opportunity to rebuild a New Kerala and in that context this PDNA identifies four pillars for recovery focused on approaches that are green, sustainable, inclusive, participatory, and innovative.
The PDNA methodology, developed in 2008 by the European Union, the World Bank and the UN system represents a tool for a harmonised assessment and recovery strategy. It is a standard methodology which is used internationally to assess damage, loss, and recovery needs of any disaster. It presents a consolidated report based on sector analysis and priorities for recovery. The PDNA report also includes an assessment of the macroeconomic and human impact of the disaster.The methodology is adapted to local context before being applied in any country.
The PDNA in Kerala was initiated on 18 September 2018, engaging over 100 people from the government and international agencies. It complements the Joint Rapid Damage and Needs Assessment conducted by the World Bank and the ADB which assessed the damage and recovery needs of 12 sectors and social impacts.
The Kerala Ministry for Revenue and Housing appointed the Director of Fisheries as the State Coordinator for the PDNA. The Kerala State Disaster Management Authority (KSDMA) was closely engaged in the coordination and review of the PDNA process. The UN PDNA Coordination Team was represented by UNDP and UNICEF. Sector teams included representatives from line ministries, district officials, the European Civil Protection and Humanitarian Aid Operations (ECHO) and 10 UN agencies: Food and Agriculture Organization (FAO), International Labour Organization (ILO), United Nations Development Programme (UNDP), United Nations Environment Programme (UNEP), United Nations Educational, Scientific and Cultural Organization (UNESCO), United Nations Population Fund (UNFPA), United Nations Children’s Fund (UNICEF), UNWOMEN, World Food Programme (WFP) and World Health Organization (WHO).
The PDNA covers the following sectors:
• Social Sectors: Housing, Land and Settlements; Health and Nutrition; Education; Cultural Heritage;
• Productive Sectors: Agriculture, Fisheries and Livestock;
• Infrastructure Sectors: Water, Sanitation and Hygiene; and
• Cross-Cutting Sectors: Environment; Employment and Livelihoods; Disaster Risk Reduction; Gender and Social Inclusion; and Local Governance.
106
107
ConclusionKerala Floods and Landslides
23
The PDNA includes a special report on Integrated Water Resources Management and a diagnosis of the floods and landslides, given its significance in the state of Kerala.
The Kerala PDNA started with an orientation on the methodology and agreements on the scope of the assessment. Data was collected over a 10-day period with field visits by all sector teams to the 10 most affected districts. The field visits were held to gather first-hand information on the extent of damage as well as to validate data given by the various government departments. Meetings were held with district and panchayat officials, members of various local associations, women’s groups and affected people. These visits helped to assess the human impact of the disaster and develop recovery strategies focused on helping the most vulnerable people recover. A civil society expert group consultation was also held to gather views of diverse groups on rebuilding Kerala. The first draft of the PDNA report was presented to the Chief Secretary and Secretaries of the Line Ministries on 11 October 2018 and revised with inputs and feedback from relevant ministries and KSDMA. The final report was submitted to the Chief Minister of Kerala on 26 October 2018.
107
Annexures
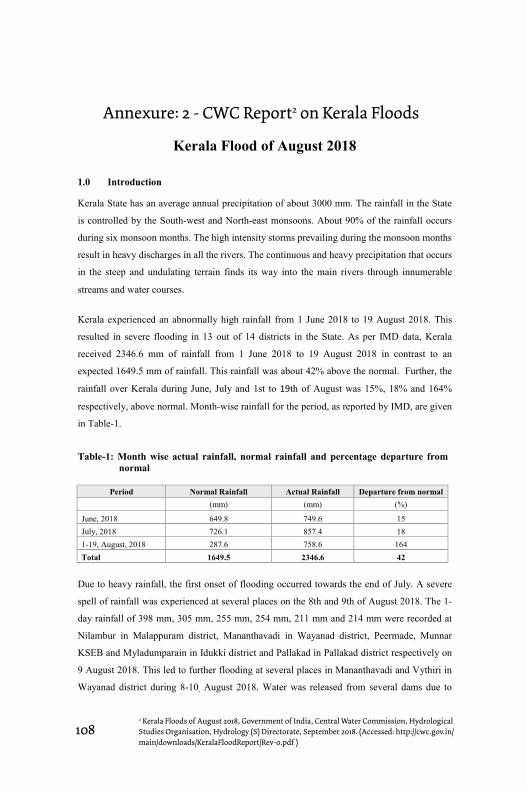
108
What we can learn from the Dutch: Rebuilding Kerala post 2018 floods
Central Water Commission Hydrology (S) Dte
Kerala Floods August 2018 Page 1
Kerala Flood of August 2018
1.0 Introduction
Kerala State has an average annual precipitation of about 3000 mm. The rainfall in the State
is controlled by the South-west and North-east monsoons. About 90% of the rainfall occurs
during six monsoon months. The high intensity storms prevailing during the monsoon months
result in heavy discharges in all the rivers. The continuous and heavy precipitation that occurs
in the steep and undulating terrain finds its way into the main rivers through innumerable
streams and water courses.
Kerala experienced an abnormally high rainfall from 1 June 2018 to 19 August 2018. This
resulted in severe flooding in 13 out of 14 districts in the State. As per IMD data, Kerala
received 2346.6 mm of rainfall from 1 June 2018 to 19 August 2018 in contrast to an
expected 1649.5 mm of rainfall. This rainfall was about 42% above the normal. Further, the
rainfall over Kerala during June, July and 1st to 19th of August was 15%, 18% and 164%
respectively, above normal. Month-wise rainfall for the period, as reported by IMD, are given
in Table-1.
Table-1: Month wise actual rainfall, normal rainfall and percentage departure from
normal
Period Normal Rainfall Actual Rainfall Departure from normal
(mm) (mm) (%)
June, 2018 649.8 749.6 15
July, 2018 726.1 857.4 18
1-19, August, 2018 287.6 758.6 164
Total 1649.5 2346.6 42
Due to heavy rainfall, the first onset of flooding occurred towards the end of July. A severe
spell of rainfall was experienced at several places on the 8th and 9th of August 2018. The 1-
day rainfall of 398 mm, 305 mm, 255 mm, 254 mm, 211 mm and 214 mm were recorded at
Nilambur in Malappuram district, Mananthavadi in Wayanad district, Peermade, Munnar
KSEB and Myladumparain in Idukki district and Pallakad in Pallakad district respectively on
9 August 2018. This led to further flooding at several places in Mananthavadi and Vythiri in
Wayanad district during 8-10, August 2018. Water was released from several dams due to
Annexure: 2 - CWC Report2 on Kerala Floods
2 Kerala Floods of August 2018, Government of India, Central Water Commission, Hydrological Studies Organisation, Hydrology (S) Directorate, September 2018. (Accessed: http://cwc.gov.in/main/downloads/KeralaFloodReport/Rev-0.pdf )
109
ConclusionCentral Water Commission Hydrology (S) Dte
Kerala Floods August 2018 Page 2
heavy rainfall in their catchments. The water levels in several reservoirs were almost near
their Full Reservoir Level (FRL) due to continuous rainfall from 1st of June. Another severe
spell of rainfall started from the 14th of August and continued till the 19th of August,
resulting in disastrous flooding in 13 out of 14 districts. The water level records at CWC
G&D sites for some of the rivers in Kerala are given at Annex-I. As per the rainfall records
of IMD, it has been found that the rainfall depths recorded during the 15-17, August 2018
were comparable to the severe storm that occurred in the year 1924.
1.1 Earlier floods in Kerala
The 1924 witnessed unprecedented and very heavy floods in almost all rivers of Kerala.
Heavy losses to life, property and crops etc. had been reported. The rainstorm of 16-18, July
1924 was caused by the South-west monsoon that extended to the south of peninsula on 15th
July and caused rainfall in Malabar. Under its influence, heavy rainfall occurred in almost
entire Kerala. The area under the storm recorded 1-day maximum rainfall on 17th of July, 2-
day maximum rainfall for 16-17, July 1924 and 3-day maximum rainfall for 16-18, July
1924. The centre of the 1-day and 2-day rainstorm was located at Devikulam in Kerala which
recorded 484 mm and 751 mm of rainfall respectively. The centre of 3-day rainstorm was
located at Munnar in Kerala which recorded a rainfall of 897 mm in 3 days.
The fury of 1924 flood levels in most of the rivers was still fresh in the memory of people of
Kerala, the year 1961 also witnessed heavy floods and rise in the water levels of reservoirs.
Usually in the State, heavy precipitation is concentrated over a period of 7 to 10 days during
the monsoon when the rivers rise above their established banks and inundate the low lying
areas. But in 1961, floods were unusually heavy not only in duration, but also in the intensity
of precipitation. During the year 1961, the monsoon started getting violent towards the last
week of June and in the early days of August, the precipitation was concentrated on most
parts of the southern region of Kerala. By the first week of July, the intensity gradually
spread over the other parts of the State and the entire State was reeling under severe flood by
the second week of July. The worst affected area was Periyar sub-basin and it also impacted
other sub-basins. Many of the important infrastructures like highways etc were submerged.
After a brief interval, by the middle of July, the monsoon became more violent, affecting the
northern parts of the State. The average rainfall was 56% above normal. The maximum daily
intensities recorded at four districts in 1961 are given in Table-2.
Annexures
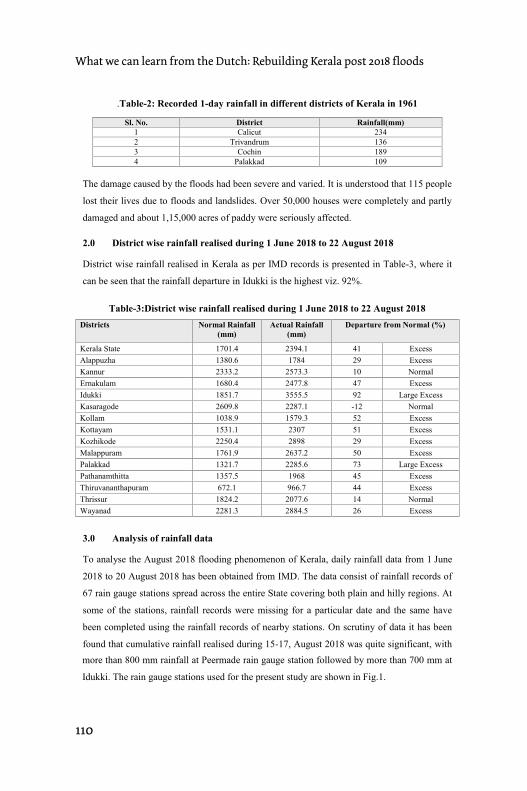
110
What we can learn from the Dutch: Rebuilding Kerala post 2018 floods Central Water Commission Hydrology (S) Dte
Kerala Floods August 2018 Page 3
.Table-2: Recorded 1-day rainfall in different districts of Kerala in 1961
Sl. No. District Rainfall(mm)
1 Calicut 234
2 Trivandrum 136
3 Cochin 189
4 Palakkad 109
The damage caused by the floods had been severe and varied. It is understood that 115 people
lost their lives due to floods and landslides. Over 50,000 houses were completely and partly
damaged and about 1,15,000 acres of paddy were seriously affected.
2.0 District wise rainfall realised during 1 June 2018 to 22 August 2018
District wise rainfall realised in Kerala as per IMD records is presented in Table-3, where it
can be seen that the rainfall departure in Idukki is the highest viz. 92%.
Table-3:District wise rainfall realised during 1 June 2018 to 22 August 2018
Districts Normal Rainfall
(mm)
Actual Rainfall
(mm)
Departure from Normal (%)
Kerala State 1701.4 2394.1 41 Excess
Alappuzha 1380.6 1784 29 Excess
Kannur 2333.2 2573.3 10 Normal
Ernakulam 1680.4 2477.8 47 Excess
Idukki 1851.7 3555.5 92 Large Excess
Kasaragode 2609.8 2287.1 -12 Normal
Kollam 1038.9 1579.3 52 Excess
Kottayam 1531.1 2307 51 Excess
Kozhikode 2250.4 2898 29 Excess
Malappuram 1761.9 2637.2 50 Excess
Palakkad 1321.7 2285.6 73 Large Excess
Pathanamthitta 1357.5 1968 45 Excess
Thiruvananthapuram 672.1 966.7 44 Excess
Thrissur 1824.2 2077.6 14 Normal
Wayanad 2281.3 2884.5 26 Excess
3.0 Analysis of rainfall data
To analyse the August 2018 flooding phenomenon of Kerala, daily rainfall data from 1 June
2018 to 20 August 2018 has been obtained from IMD. The data consist of rainfall records of
67 rain gauge stations spread across the entire State covering both plain and hilly regions. At
some of the stations, rainfall records were missing for a particular date and the same have
been completed using the rainfall records of nearby stations. On scrutiny of data it has been
found that cumulative rainfall realised during 15-17, August 2018 was quite significant, with
Central Water Commission Hydrology (S) Dte
Kerala Floods August 2018 Page 4
more than 800 mm rainfall at Peermade rain gauge station followed by more than 700 mm at
Idukki. The rain gauge stations used for the present study are shown in Fig.1.
Fig.1: Rain gauge stations of Kerala used for rainfall analysis

111
Conclusion
Central Water Commission Hydrology (S) Dte
Kerala Floods August 2018 Page 4
more than 800 mm rainfall at Peermade rain gauge station followed by more than 700 mm at
Idukki. The rain gauge stations used for the present study are shown in Fig.1.
Fig.1: Rain gauge stations of Kerala used for rainfall analysis
Annexures
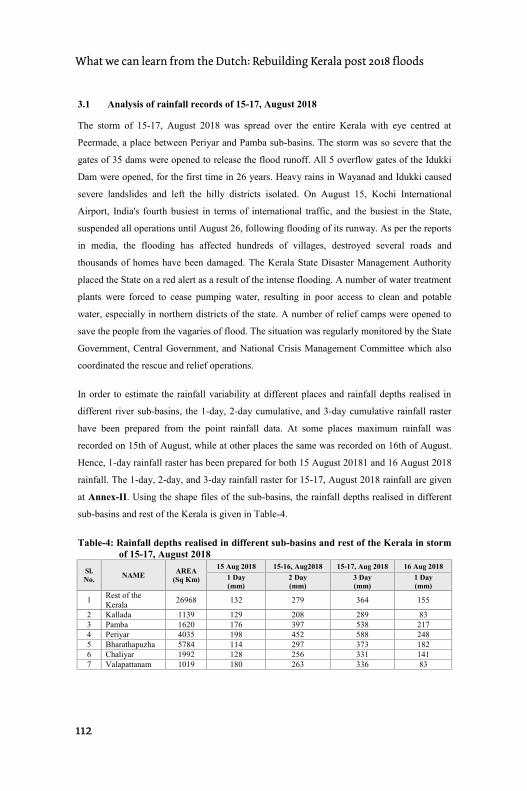
112
What we can learn from the Dutch: Rebuilding Kerala post 2018 floods Central Water Commission Hydrology (S) Dte
Kerala Floods August 2018 Page 5
3.1 Analysis of rainfall records of 15-17, August 2018
The storm of 15-17, August 2018 was spread over the entire Kerala with eye centred at
Peermade, a place between Periyar and Pamba sub-basins. The storm was so severe that the
gates of 35 dams were opened to release the flood runoff. All 5 overflow gates of the Idukki
Dam were opened, for the first time in 26 years. Heavy rains in Wayanad and Idukki caused
severe landslides and left the hilly districts isolated. On August 15, Kochi International
Airport, India's fourth busiest in terms of international traffic, and the busiest in the State,
suspended all operations until August 26, following flooding of its runway. As per the reports
in media, the flooding has affected hundreds of villages, destroyed several roads and
thousands of homes have been damaged. The Kerala State Disaster Management Authority
placed the State on a red alert as a result of the intense flooding. A number of water treatment
plants were forced to cease pumping water, resulting in poor access to clean and potable
water, especially in northern districts of the state. A number of relief camps were opened to
save the people from the vagaries of flood. The situation was regularly monitored by the State
Government, Central Government, and National Crisis Management Committee which also
coordinated the rescue and relief operations.
In order to estimate the rainfall variability at different places and rainfall depths realised in
different river sub-basins, the 1-day, 2-day cumulative, and 3-day cumulative rainfall raster
have been prepared from the point rainfall data. At some places maximum rainfall was
recorded on 15th of August, while at other places the same was recorded on 16th of August.
Hence, 1-day rainfall raster has been prepared for both 15 August 20181 and 16 August 2018
rainfall. The 1-day, 2-day, and 3-day rainfall raster for 15-17, August 2018 rainfall are given
at Annex-II. Using the shape files of the sub-basins, the rainfall depths realised in different
sub-basins and rest of the Kerala is given in Table-4.
Table-4: Rainfall depths realised in different sub-basins and rest of the Kerala in storm
of 15-17, August 2018
Sl.
No.NAME
AREA
(Sq Km)
15 Aug 2018 15-16, Aug2018 15-17, Aug 2018 16 Aug 2018
1 Day
(mm)
2 Day
(mm)
3 Day
(mm)
1 Day
(mm)
1Rest of the
Kerala26968 132 279 364 155
2 Kallada 1139 129 208 289 83
3 Pamba 1620 176 397 538 217
4 Periyar 4035 198 452 588 248
5 Bharathapuzha 5784 114 297 373 182
6 Chaliyar 1992 128 256 331 141
7 Valapattanam 1019 180 263 336 83
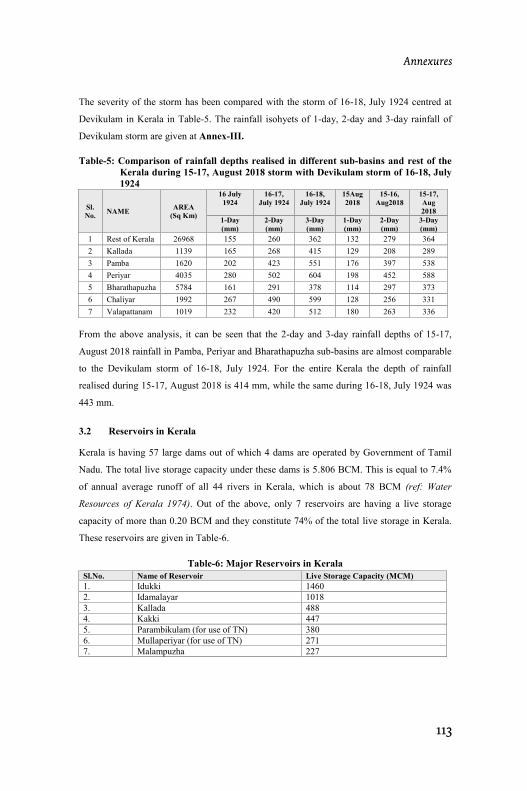
113
ConclusionCentral Water Commission Hydrology (S) Dte
Kerala Floods August 2018 Page 6
The severity of the storm has been compared with the storm of 16-18, July 1924 centred at
Devikulam in Kerala in Table-5. The rainfall isohyets of 1-day, 2-day and 3-day rainfall of
Devikulam storm are given at Annex-III.
Table-5: Comparison of rainfall depths realised in different sub-basins and rest of the
Kerala during 15-17, August 2018 storm with Devikulam storm of 16-18, July
1924
Sl.
No.NAME
AREA
(Sq Km)
16 July
1924
16-17,
July 1924
16-18,
July 1924
15Aug
2018
15-16,
Aug2018
15-17,
Aug
2018
1-Day
(mm)
2-Day
(mm)
3-Day
(mm)
1-Day
(mm)
2-Day
(mm)
3-Day
(mm)
1 Rest of Kerala 26968 155 260 362 132 279 364
2 Kallada 1139 165 268 415 129 208 289
3 Pamba 1620 202 423 551 176 397 538
4 Periyar 4035 280 502 604 198 452 588
5 Bharathapuzha 5784 161 291 378 114 297 373
6 Chaliyar 1992 267 490 599 128 256 331
7 Valapattanam 1019 232 420 512 180 263 336
From the above analysis, it can be seen that the 2-day and 3-day rainfall depths of 15-17,
August 2018 rainfall in Pamba, Periyar and Bharathapuzha sub-basins are almost comparable
to the Devikulam storm of 16-18, July 1924. For the entire Kerala the depth of rainfall
realised during 15-17, August 2018 is 414 mm, while the same during 16-18, July 1924 was
443 mm.
3.2 Reservoirs in Kerala
Kerala is having 57 large dams out of which 4 dams are operated by Government of Tamil
Nadu. The total live storage capacity under these dams is 5.806 BCM. This is equal to 7.4%
of annual average runoff of all 44 rivers in Kerala, which is about 78 BCM (ref: Water
Resources of Kerala 1974). Out of the above, only 7 reservoirs are having a live storage
capacity of more than 0.20 BCM and they constitute 74% of the total live storage in Kerala.
These reservoirs are given in Table-6.
Table-6: Major Reservoirs in Kerala
Sl.No. Name of Reservoir Live Storage Capacity (MCM)
1. Idukki 1460
2. Idamalayar 1018
3. Kallada 488
4. Kakki 447
5. Parambikulam (for use of TN) 380
6. Mullaperiyar (for use of TN) 271
7. Malampuzha 227
Annexures
114
What we can learn from the Dutch: Rebuilding Kerala post 2018 floods Central Water Commission Hydrology (S) Dte
Kerala Floods August 2018 Page 7
4.0 Volume of runoff generated during 15-17, August 2018 rainfall
In order to estimate the runoff volume generated in the rainfall event of 15-17, August 2018,
the sub-basins where severe flooding occurred have been analysed and estimated runoff
volume compared with the discharge records of CWC observation sites. For the analysis, the
drainage area of sub-basins, have been estimated up to terminal G&D site of CWC.
Volumetric analyses have been carried out for Periyar, Pamba, Chalakudi, Bharathapuzha and
Kabini sub-basins.
4.1 Runoff computations for Periyar sub-basin
The Periyar, 244 km in length, is the longest river of Kerala. The total drainage area of the
basin is 5389 sq.km out of which nearly 98 % lies in the Kerala State. The State wise
distribution of the drainage area is given in Table-7.
Table-7: State wise area distribution of Periyar sub-basin
The river originates at the forest land of Sivagiri peak 80 km South of Devikulam at an
elevation of 2438 m above MSL and traverses the steep mountainous terrain before it is
joined by the Mullayar, 16 km downstream. The river then turns westwards and continues to
flow in that direction for about 16 km on a sandy bed. After a winding course of about 13
km, the river reaches Vandiperiyar and passes through a second narrow gorge below which it
is joined by Perumthura. Further down, it is joined by six tributaries after which the important
tributary Edamala joins Periyar. Passing Malayattur and thereafter taking a meandering
course, the river reaches Alwaye where it divides itself into two branches. The upper branch
joins the Chalakudi river at Punthenvelikara and then expands into a broad sheet of water at
Munambham. The other branch taking a southerly course is broken up into a number of small
channels which fall into the Vembanad lake (as Varapuzha). There are two Hydrological
Observation Stations maintained by CWC on this river i.e at Neeleswaram & Vandiperiyar.
The Periyar river has a drainage area of 4,033 sq km upto CWC gauging station at
Neeleshwaram. The dams with significant storage in Periyar sub-basin are Mulla Periyar,
Name of State Drainage Area
(Sq.km)
Percentage of Total
Drainage Area
Tamil Nadu 114 2
Kerala 5284 98
Total 5398 100

115
ConclusionCentral Water Commission Hydrology (S) Dte
Kerala Floods August 2018 Page 8
Idukki and Idamalayar. The catchment area of river at Mulla Periyar dam is about 637 sq.km.
The free catchment between Mulla Periyar and Idukki dam is about 605 sq.km. The
catchment area intercepted by Idamalayar dam is about 472 sq.km. A catchment area map of
Periyar river upto CWC G&D site at Neeleshwaram is given in Fig.2.
Fig.2 Drainage area map of Periyar river up to Neeleshwaram G&D Site
During rainfall event of 15-17, August 2018 the rainfall depths realised in Mulla Periyar,
Idukki and Idamalayar catchments and remaining part of the sub-basin along with estimated
runoff during the same period are given in Table-8.
Annexures
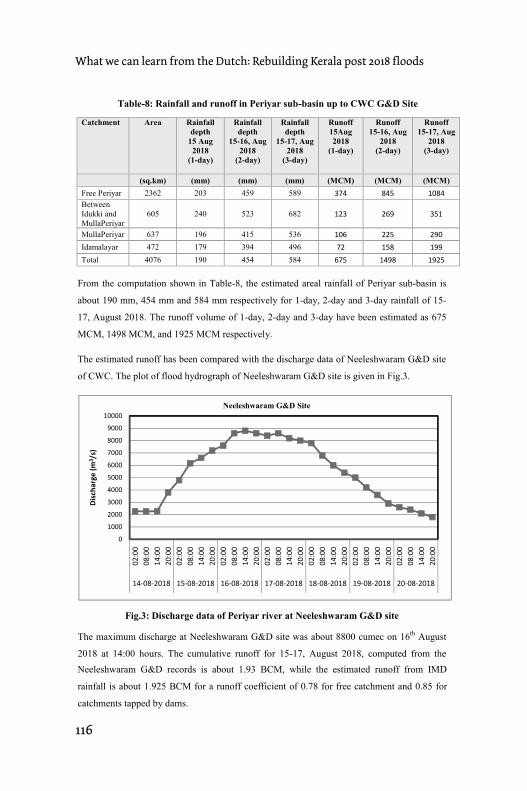
116
What we can learn from the Dutch: Rebuilding Kerala post 2018 floods Central Water Commission Hydrology (S) Dte
Kerala Floods August 2018 Page 9
Table-8: Rainfall and runoff in Periyar sub-basin up to CWC G&D Site
Catchment Area Rainfall
depth
15 Aug
2018
(1-day)
Rainfall
depth
15-16, Aug
2018
(2-day)
Rainfall
depth
15-17, Aug
2018
(3-day)
Runoff
15Aug
2018
(1-day)
Runoff
15-16, Aug
2018
(2-day)
Runoff
15-17, Aug
2018
(3-day)
(sq.km) (mm) (mm) (mm) (MCM) (MCM) (MCM)
Free Periyar 2362 203 459 589 374 845 1084
Between
Idukki and
MullaPeriyar
605 240 523 682 123 269 351
MullaPeriyar 637 196 415 536 106 225 290
Idamalayar 472 179 394 496 72 158 199
Total 4076 190 454 584 675 1498 1925
From the computation shown in Table-8, the estimated areal rainfall of Periyar sub-basin is
about 190 mm, 454 mm and 584 mm respectively for 1-day, 2-day and 3-day rainfall of 15-
17, August 2018. The runoff volume of 1-day, 2-day and 3-day have been estimated as 675
MCM, 1498 MCM, and 1925 MCM respectively.
The estimated runoff has been compared with the discharge data of Neeleshwaram G&D site
of CWC. The plot of flood hydrograph of Neeleshwaram G&D site is given in Fig.3.
Fig.3: Discharge data of Periyar river at Neeleshwaram G&D site
The maximum discharge at Neeleshwaram G&D site was about 8800 cumec on 16th
August
2018 at 14:00 hours. The cumulative runoff for 15-17, August 2018, computed from the
0
1000
2000
3000
4000
5000
6000
7000
8000
9000
10000
02:00
08:00
14:00
20:00
02:00
08:00
14:00
20:00
02:00
08:00
14:00
20:00
02:00
08:00
14:00
20:00
02:00
08:00
14:00
20:00
02:00
08:00
14:00
20:00
02:00
08:00
14:00
20:00
14-08-2018 15-08-2018 16-08-2018 17-08-2018 18-08-2018 19-08-2018 20-08-2018
Dis
cha
rge
(m
3/s
)
Neeleshwaram G&D Site
Central Water Commission Hydrology (S) Dte
Kerala Floods August 2018 Page 10
Neeleshwaram G&D records is about 1.93 BCM, while the estimated runoff from IMD
rainfall is about 1.925 BCM for a runoff coefficient of 0.78 for free catchment and 0.85 for
catchments tapped by dams.
Periyar sub-basin consists of about 50% of the total live storage of the State that is about 2.92
BCM. The reservoirs with substantial live storage capacity in Periyar sub-basin are Idukki,
Idamalyar and Mulla Periyar. During the rainfall event of 15-17, August 2018, the total
release during three days from Idukki reservoir was about 345 MCM (spill) and 30 MCM
(power house going to Muvattupuzha river) against the inflow volume of 435 MCM. Hence,
about 60 MCM of flood runoff was absorbed by Idukki reservoir during 15-17 August.
The average release from Idukki reservoir on 15 August 2018 was about 1100 cumec with
peak release of 1500 cumec against the average inflow of 1640 cumec. Idukki reservoir
received an average 533 cumec discharge from Mulla Periyar on 15 August 2018 with a peak
discharge of 760 cumec. The average release from Idukki reservoir on 16 August 2018 was
about 1400 cumec with peak release of 1500 cumec against the average inflow of about 2000
cumec. Idukki reservoir received an average 650 cumec discharge from Mulla Periyar on 16
August 2018 with a peak discharge of 760 cumec. The average release from Idukki reservoir
on 17 August 2018 was about 1460 cumec with peak release of 1500 cumec against the
average inflow of about 1440 cumec. Idukki reservoir received an average 390 cumec
discharge from Mulla Periyar on 17 August 2018 with a peak discharge of 590 cumec.
4.1.1 Reservoir operation of Idukki
Idukki reservoir lies in the State of Kerala on Periyar river. It has a gross storage of about
1997 MCM at FRL of 732.43 m. It has a gross storage of about 537 MCM at MDDL of
694.94 m. The live storage between FRL and MDDL is about 1460 MCM.
On 10 August 2018 at 00:00 hrs, the level in Idukki dam was 731.82 m i.e. 0.61 m below
FRL. The extra flood cushion available (below FRL) was about 40 MCM only. The inflow
into reservoir at that time was about 649 cumec and spill from dam was about 50 cumec (in
the river) and 115 cumec power house release (going to Muvattupuzha river). As a result, the
water level in the reservoir kept on rising. At 12:00 noon the level touched 732.16 m. To
contain the level within FRL, the spill from the reservoir was increased to 750 cumec (plus
118 cumec power house release) by 17:00 hrs on 10 August 2018 against similar inflows.
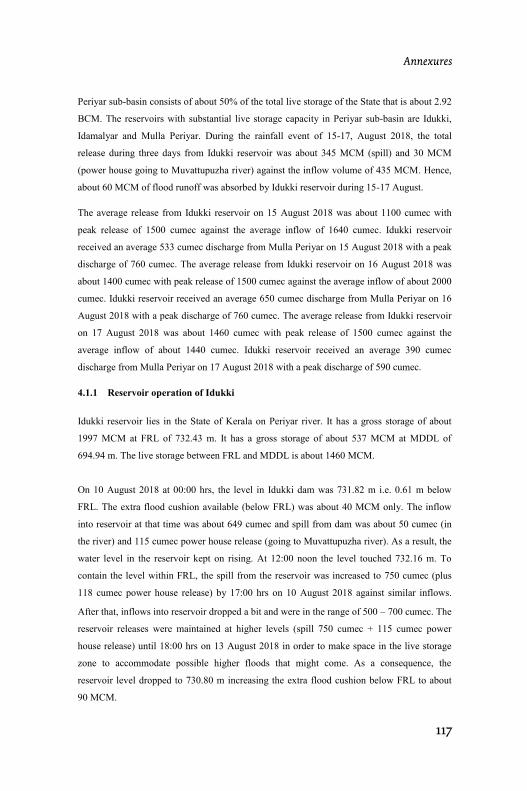
117
Conclusion
Central Water Commission Hydrology (S) Dte
Kerala Floods August 2018 Page 10
Neeleshwaram G&D records is about 1.93 BCM, while the estimated runoff from IMD
rainfall is about 1.925 BCM for a runoff coefficient of 0.78 for free catchment and 0.85 for
catchments tapped by dams.
Periyar sub-basin consists of about 50% of the total live storage of the State that is about 2.92
BCM. The reservoirs with substantial live storage capacity in Periyar sub-basin are Idukki,
Idamalyar and Mulla Periyar. During the rainfall event of 15-17, August 2018, the total
release during three days from Idukki reservoir was about 345 MCM (spill) and 30 MCM
(power house going to Muvattupuzha river) against the inflow volume of 435 MCM. Hence,
about 60 MCM of flood runoff was absorbed by Idukki reservoir during 15-17 August.
The average release from Idukki reservoir on 15 August 2018 was about 1100 cumec with
peak release of 1500 cumec against the average inflow of 1640 cumec. Idukki reservoir
received an average 533 cumec discharge from Mulla Periyar on 15 August 2018 with a peak
discharge of 760 cumec. The average release from Idukki reservoir on 16 August 2018 was
about 1400 cumec with peak release of 1500 cumec against the average inflow of about 2000
cumec. Idukki reservoir received an average 650 cumec discharge from Mulla Periyar on 16
August 2018 with a peak discharge of 760 cumec. The average release from Idukki reservoir
on 17 August 2018 was about 1460 cumec with peak release of 1500 cumec against the
average inflow of about 1440 cumec. Idukki reservoir received an average 390 cumec
discharge from Mulla Periyar on 17 August 2018 with a peak discharge of 590 cumec.
4.1.1 Reservoir operation of Idukki
Idukki reservoir lies in the State of Kerala on Periyar river. It has a gross storage of about
1997 MCM at FRL of 732.43 m. It has a gross storage of about 537 MCM at MDDL of
694.94 m. The live storage between FRL and MDDL is about 1460 MCM.
On 10 August 2018 at 00:00 hrs, the level in Idukki dam was 731.82 m i.e. 0.61 m below
FRL. The extra flood cushion available (below FRL) was about 40 MCM only. The inflow
into reservoir at that time was about 649 cumec and spill from dam was about 50 cumec (in
the river) and 115 cumec power house release (going to Muvattupuzha river). As a result, the
water level in the reservoir kept on rising. At 12:00 noon the level touched 732.16 m. To
contain the level within FRL, the spill from the reservoir was increased to 750 cumec (plus
118 cumec power house release) by 17:00 hrs on 10 August 2018 against similar inflows.
Central Water Commission Hydrology (S) Dte
Kerala Floods August 2018 Page 11
After that, inflows into reservoir dropped a bit and were in the range of 500 – 700 cumec. The
reservoir releases were maintained at higher levels (spill 750 cumec + 115 cumec power
house release) until 18:00 hrs on 13 August 2018 in order to make space in the live storage
zone to accommodate possible higher floods that might come. As a consequence, the
reservoir level dropped to 730.80 m increasing the extra flood cushion below FRL to about
90 MCM.
The inflows into the dam started rising from 18:00 hrs on 14 August 2018 when the level in
the reservoir was 730.88 m (i.e. an extra flood cushion of about 85 MCM. The outflows from
the dam were increased to about 1615 cumec (1500 cumec spill + 115 cumec power house
release) by 18:00 hrs on 15 August 2018 and continued until 03:00 hrs on 16 August 2018.
The peak inflow of about 2532 cumec into dam occurred at 22:00 hrs on 15 August 2018
when the corresponding release from the dam was of the order of 1614 cumec (1500 cumec
spill + 114 cumec power house release). Thus, the peak was attenuated from 2532 cumec to
1500 cumec (an attenuation of about 41% downstream of Idukki). The reservoir touched FRL
of 732.43 m at 01:00 hrs on 17 August 2018. The inflow, outflow and water level at Idukki
reservoir are given in Fig.4.
Fig.4: Inflow, outflow and water level at Idukki reservoir
729.50
730.00
730.50
731.00
731.50
732.00
732.50
733.00
0
500
1000
1500
2000
2500
3000
09
-08
-18
12
:00
09
-08
-18
19
:00
10
-08
-18
02
:00
10
-08
-18
09
:00
10
-08
-18
16
:00
10
-08
-18
23
:00
11
-08
-18
06
:00
11
-08
-18
13
:00
11
-08
-18
20
:00
12
-08
-18
03
:00
12
-08
-18
10
:00
12
-08
-18
17
:00
13
-08
-18
00
:00
13
-08
-18
07
:00
13
-08
-18
14
:00
13
-08
-18
21
:00
14
-08
-18
04
:00
14
-08
-18
11
:00
14
-08
-18
18
:00
15
-08
-18
01
:00
15
-08
-18
08
:00
15
-08
-18
15
:00
15
-08
-18
22
:00
16
-08
-18
05
:00
16
-08
-18
12
:00
16
-08
-18
19
:00
17
-08
-18
02
:00
17
-08
-18
09
:00
17
-08
-18
16
:00
17
-08
-18
23
:00
18
-08
-18
06
:00
Res
erv
oir
lev
el (
m)
Infl
ow
an
d O
utf
low
(C
um
ec)
Inflow, Outflow and Water Level: Idukki Reservoir
Inflow Outflow Water Level FRL
Annexures
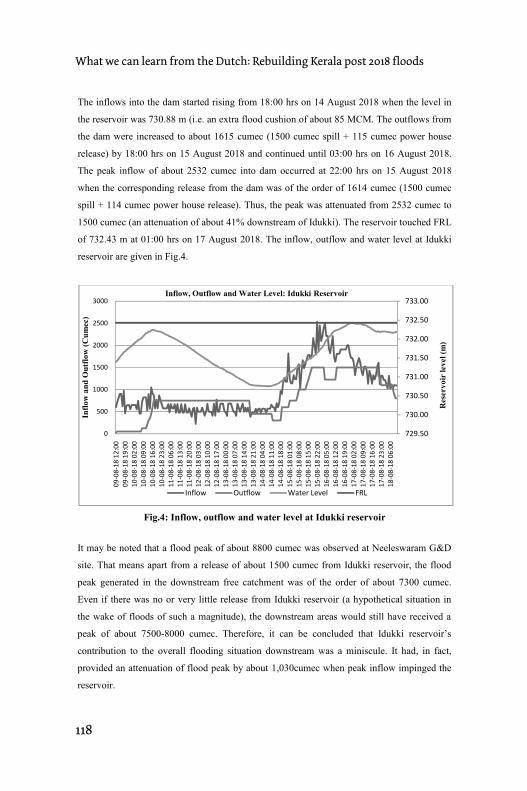
118
What we can learn from the Dutch: Rebuilding Kerala post 2018 floods
Central Water Commission Hydrology (S) Dte
Kerala Floods August 2018 Page 12
It may be noted that a flood peak of about 8800 cumec was observed at Neeleswaram G&D
site. That means apart from a release of about 1500 cumec from Idukki reservoir, the flood
peak generated in the downstream free catchment was of the order of about 7300 cumec.
Even if there was no or very little release from Idukki reservoir (a hypothetical situation in
the wake of floods of such a magnitude), the downstream areas would still have received a
peak of about 7500-8000 cumec. Therefore, it can be concluded that Idukki reservoir’s
contribution to the overall flooding situation downstream was a miniscule. It had, in fact,
provided an attenuation of flood peak by about 1,030cumec when peak inflow impinged the
reservoir.
4.1.2 Reservoir operation of Idamalayar
The Idamalayar Dam is located on the Idamalayar river, a tributary of the Periyar river in
Kerala. Its live storage is about 1018 MCM. The water level in Idamalayar reservoir on 8
August 2018 was 168.06 m i.e. just 1 m below FRL. The reservoir was nearly 97% full in
terms of live storage. The dedicated flood space between FRL (169 m) and MWL (170.3 m)
is about 60 MCM only. There were no spills till 8 August 2018. The inflow, outflow and
water level at Idamalayar reservoir (showing no attenuation after 9 August 2018) are given in
Fig.5.
Fig.5: Inflow, outflow and water level atIdamalyar reservoir
130.00
135.00
140.00
145.00
150.00
155.00
160.00
165.00
170.00
175.00
0
200
400
600
800
1000
1200
1400
01
-07
-20
18
08
-07
-20
18
15
-07
-20
18
22
-07
-20
18
29
-07
-20
18
05
-08
-20
18
12
-08
-20
18
19
-08
-20
18
Re
serv
oir
lev
el
(m)
Infl
ow
an
d O
utf
low
(C
um
ec)
Inflow, Outflow and Water Level in Idamalyar reservoir
Inflow Outflow Water Level FRL MWL
Central Water Commission Hydrology (S) Dte
Kerala Floods August 2018 Page 11
After that, inflows into reservoir dropped a bit and were in the range of 500 – 700 cumec. The
reservoir releases were maintained at higher levels (spill 750 cumec + 115 cumec power
house release) until 18:00 hrs on 13 August 2018 in order to make space in the live storage
zone to accommodate possible higher floods that might come. As a consequence, the
reservoir level dropped to 730.80 m increasing the extra flood cushion below FRL to about
90 MCM.
The inflows into the dam started rising from 18:00 hrs on 14 August 2018 when the level in
the reservoir was 730.88 m (i.e. an extra flood cushion of about 85 MCM. The outflows from
the dam were increased to about 1615 cumec (1500 cumec spill + 115 cumec power house
release) by 18:00 hrs on 15 August 2018 and continued until 03:00 hrs on 16 August 2018.
The peak inflow of about 2532 cumec into dam occurred at 22:00 hrs on 15 August 2018
when the corresponding release from the dam was of the order of 1614 cumec (1500 cumec
spill + 114 cumec power house release). Thus, the peak was attenuated from 2532 cumec to
1500 cumec (an attenuation of about 41% downstream of Idukki). The reservoir touched FRL
of 732.43 m at 01:00 hrs on 17 August 2018. The inflow, outflow and water level at Idukki
reservoir are given in Fig.4.
Fig.4: Inflow, outflow and water level at Idukki reservoir
729.50
730.00
730.50
731.00
731.50
732.00
732.50
733.00
0
500
1000
1500
2000
2500
3000
09
-08
-18
12
:00
09
-08
-18
19
:00
10
-08
-18
02
:00
10
-08
-18
09
:00
10
-08
-18
16
:00
10
-08
-18
23
:00
11
-08
-18
06
:00
11
-08
-18
13
:00
11
-08
-18
20
:00
12
-08
-18
03
:00
12
-08
-18
10
:00
12
-08
-18
17
:00
13
-08
-18
00
:00
13
-08
-18
07
:00
13
-08
-18
14
:00
13
-08
-18
21
:00
14
-08
-18
04
:00
14
-08
-18
11
:00
14
-08
-18
18
:00
15
-08
-18
01
:00
15
-08
-18
08
:00
15
-08
-18
15
:00
15
-08
-18
22
:00
16
-08
-18
05
:00
16
-08
-18
12
:00
16
-08
-18
19
:00
17
-08
-18
02
:00
17
-08
-18
09
:00
17
-08
-18
16
:00
17
-08
-18
23
:00
18
-08
-18
06
:00
Res
erv
oir
lev
el (
m)
Infl
ow
an
d O
utf
low
(C
um
ec)
Inflow, Outflow and Water Level: Idukki Reservoir
Inflow Outflow Water Level FRL
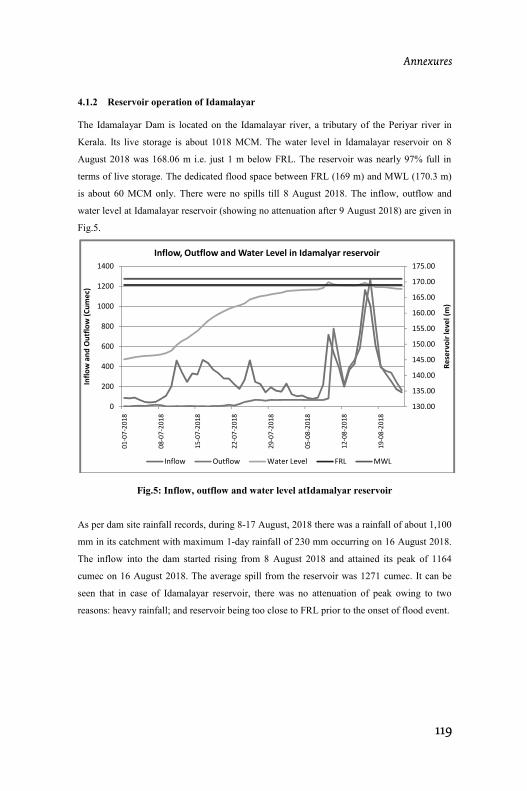
119
Conclusion
Central Water Commission Hydrology (S) Dte
Kerala Floods August 2018 Page 12
It may be noted that a flood peak of about 8800 cumec was observed at Neeleswaram G&D
site. That means apart from a release of about 1500 cumec from Idukki reservoir, the flood
peak generated in the downstream free catchment was of the order of about 7300 cumec.
Even if there was no or very little release from Idukki reservoir (a hypothetical situation in
the wake of floods of such a magnitude), the downstream areas would still have received a
peak of about 7500-8000 cumec. Therefore, it can be concluded that Idukki reservoir’s
contribution to the overall flooding situation downstream was a miniscule. It had, in fact,
provided an attenuation of flood peak by about 1,030cumec when peak inflow impinged the
reservoir.
4.1.2 Reservoir operation of Idamalayar
The Idamalayar Dam is located on the Idamalayar river, a tributary of the Periyar river in
Kerala. Its live storage is about 1018 MCM. The water level in Idamalayar reservoir on 8
August 2018 was 168.06 m i.e. just 1 m below FRL. The reservoir was nearly 97% full in
terms of live storage. The dedicated flood space between FRL (169 m) and MWL (170.3 m)
is about 60 MCM only. There were no spills till 8 August 2018. The inflow, outflow and
water level at Idamalayar reservoir (showing no attenuation after 9 August 2018) are given in
Fig.5.
Fig.5: Inflow, outflow and water level atIdamalyar reservoir
130.00
135.00
140.00
145.00
150.00
155.00
160.00
165.00
170.00
175.00
0
200
400
600
800
1000
1200
1400
01
-07
-20
18
08
-07
-20
18
15
-07
-20
18
22
-07
-20
18
29
-07
-20
18
05
-08
-20
18
12
-08
-20
18
19
-08
-20
18
Re
serv
oir
lev
el
(m)
Infl
ow
an
d O
utf
low
(C
um
ec)
Inflow, Outflow and Water Level in Idamalyar reservoir
Inflow Outflow Water Level FRL MWL
Central Water Commission Hydrology (S) Dte
Kerala Floods August 2018 Page 13
As per dam site rainfall records, during 8-17 August, 2018 there was a rainfall of about 1,100
mm in its catchment with maximum 1-day rainfall of 230 mm occurring on 16 August 2018.
The inflow into the dam started rising from 8 August 2018 and attained its peak of 1164
cumec on 16 August 2018. The average spill from the reservoir was 1271 cumec. It can be
seen that in case of Idamalayar reservoir, there was no attenuation of peak owing to two
reasons: heavy rainfall; and reservoir being too close to FRL prior to the onset of flood event.
4.2 Runoff computations for Pamba sub-basin
The Pamba, 176 km in length is the third longest river in Kerala. It is formed by the
confluence of the Pamba Aar, Kaki Aar, Arudhai Aar, Kakkad Aar and Kall Aar. The Pamba
Aar rises in the Peermedu Plateau at an elevation of 1670 m. A drainage area map of
river Pamba and Manimala is shown in Fig.6.
Fig.6: Drainage area map of Pamba and Manilmala rivers
The Kaki Aar, which forms the major tributary of the Pamba river, is a much larger stream at
the beginning than the main river. The Pamba river, after receiving the Kaki Aar flows in a
Annexures

120
What we can learn from the Dutch: Rebuilding Kerala post 2018 floods
Central Water Commission Hydrology (S) Dte
Kerala Floods August 2018 Page 13
As per dam site rainfall records, during 8-17 August, 2018 there was a rainfall of about 1,100
mm in its catchment with maximum 1-day rainfall of 230 mm occurring on 16 August 2018.
The inflow into the dam started rising from 8 August 2018 and attained its peak of 1164
cumec on 16 August 2018. The average spill from the reservoir was 1271 cumec. It can be
seen that in case of Idamalayar reservoir, there was no attenuation of peak owing to two
reasons: heavy rainfall; and reservoir being too close to FRL prior to the onset of flood event.
4.2 Runoff computations for Pamba sub-basin
The Pamba, 176 km in length is the third longest river in Kerala. It is formed by the
confluence of the Pamba Aar, Kaki Aar, Arudhai Aar, Kakkad Aar and Kall Aar. The Pamba
Aar rises in the Peermedu Plateau at an elevation of 1670 m. A drainage area map of
river Pamba and Manimala is shown in Fig.6.
Fig.6: Drainage area map of Pamba and Manilmala rivers
The Kaki Aar, which forms the major tributary of the Pamba river, is a much larger stream at
the beginning than the main river. The Pamba river, after receiving the Kaki Aar flows in a
Central Water Commission Hydrology (S) Dte
Kerala Floods August 2018 Page 14
Westerly direction till it is joined by the Arudhai Aar. At Narayanamuzhi, it turns and
follows a south-easterly direction until the Kakkad Aar joins it. Beyond the confluence, the
river flows in a Southerly direction up to Vadasserikkara where it is joined by the Kallar
which has its origin in the Valanjakkatti Malai.
There are two Hydrological Observation stations maintained by CWC on this river/Tributary
i.e at Kalloppara on river Manimala & Malakkara on river Pamba. The major reservoir
project in Pamba basin is Kakki dam. At Pandanad the river bifurcates, one branch taking a
westerly course. The Manimala joins the Pamba in its Neeretupuram branch. The river,
thereafter, flows northwards and falls into the Vembanad lake through several branches, the
important ones being the Pallathuruthy Aar and the Nedumudy Aar. The Pamba basin
experiences good rainfall, moderate temperature and humid atmosphere. The South West and
North East monsoon have great influence over the climatic condition of the basin. Even
though the coastal regions of the basin experience hot with high humidity, the hilly region is
generally cold. The average annual rainfall varies between 2276 mm to 4275 mm.
During rainfall event of 15-17, August 2018 the rainfall depths realised in Kakki dam, Pamba
dam and remaining part of the sub-basin along with estimated runoff during the same period
are given in Table-9.
Table-9: Rainfall and runoff in Pamba sub-basin up to CWC G&D Site
Catchment Area Rainfall
depth 15
Aug 2018
(1 day)
Rainfall
depth 15-
16, Aug
2018
(2day)
Rainfall
depth 15-
17, Aug
2018
(3 day)
Runoff
15Aug
2018
(1 day)
Runoff
15-16,
Aug
2018
(2 day)
Runoff
15-17,
Aug
2018
(3 day)
(sq.km) (mm) (mm) (mm) (MCM) (MCM) (MCM)
Manimala G&D
to confluence 700 175 388 526 92 204 276
Manimala G&D
site to confluence 93 175 388 526 12 27 37
Pamba dam 75 207 449 586 12 25 33
Kakki dam 177 196 394 522 26 52 69
Catchment up to
Malakkara G&D
site 1369 181 409 551 185 420 566
Catchment
between
Malakkara G&D
site and Manimala
confluence 63 110 197 280 5 9 13
Total 2477 179 397 537 297 663 894

121
Conclusion
Central Water Commission Hydrology (S) Dte
Kerala Floods August 2018 Page 14
Westerly direction till it is joined by the Arudhai Aar. At Narayanamuzhi, it turns and
follows a south-easterly direction until the Kakkad Aar joins it. Beyond the confluence, the
river flows in a Southerly direction up to Vadasserikkara where it is joined by the Kallar
which has its origin in the Valanjakkatti Malai.
There are two Hydrological Observation stations maintained by CWC on this river/Tributary
i.e at Kalloppara on river Manimala & Malakkara on river Pamba. The major reservoir
project in Pamba basin is Kakki dam. At Pandanad the river bifurcates, one branch taking a
westerly course. The Manimala joins the Pamba in its Neeretupuram branch. The river,
thereafter, flows northwards and falls into the Vembanad lake through several branches, the
important ones being the Pallathuruthy Aar and the Nedumudy Aar. The Pamba basin
experiences good rainfall, moderate temperature and humid atmosphere. The South West and
North East monsoon have great influence over the climatic condition of the basin. Even
though the coastal regions of the basin experience hot with high humidity, the hilly region is
generally cold. The average annual rainfall varies between 2276 mm to 4275 mm.
During rainfall event of 15-17, August 2018 the rainfall depths realised in Kakki dam, Pamba
dam and remaining part of the sub-basin along with estimated runoff during the same period
are given in Table-9.
Table-9: Rainfall and runoff in Pamba sub-basin up to CWC G&D Site
Catchment Area Rainfall
depth 15
Aug 2018
(1 day)
Rainfall
depth 15-
16, Aug
2018
(2day)
Rainfall
depth 15-
17, Aug
2018
(3 day)
Runoff
15Aug
2018
(1 day)
Runoff
15-16,
Aug
2018
(2 day)
Runoff
15-17,
Aug
2018
(3 day)
(sq.km) (mm) (mm) (mm) (MCM) (MCM) (MCM)
Manimala G&D
to confluence 700 175 388 526 92 204 276
Manimala G&D
site to confluence 93 175 388 526 12 27 37
Pamba dam 75 207 449 586 12 25 33
Kakki dam 177 196 394 522 26 52 69
Catchment up to
Malakkara G&D
site 1369 181 409 551 185 420 566
Catchment
between
Malakkara G&D
site and Manimala
confluence 63 110 197 280 5 9 13
Total 2477 179 397 537 297 663 894
Annexures
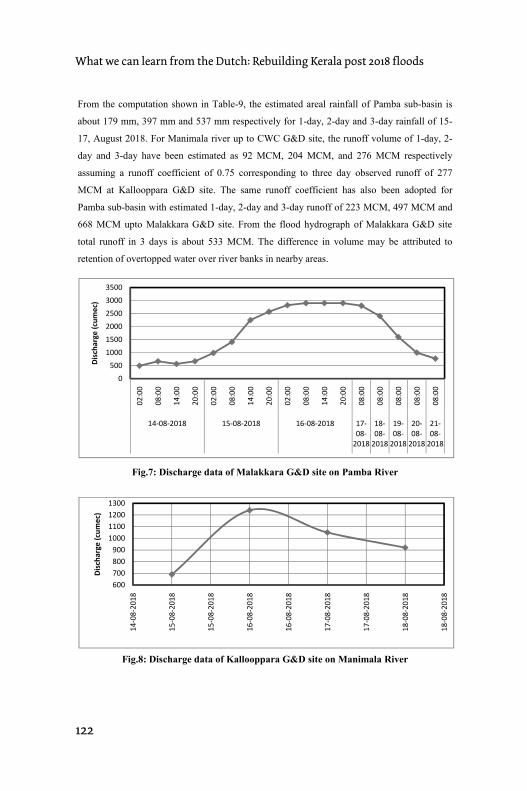
122
What we can learn from the Dutch: Rebuilding Kerala post 2018 floods Central Water Commission Hydrology (S) Dte
Kerala Floods August 2018 Page 15
From the computation shown in Table-9, the estimated areal rainfall of Pamba sub-basin is
about 179 mm, 397 mm and 537 mm respectively for 1-day, 2-day and 3-day rainfall of 15-
17, August 2018. For Manimala river up to CWC G&D site, the runoff volume of 1-day, 2-
day and 3-day have been estimated as 92 MCM, 204 MCM, and 276 MCM respectively
assuming a runoff coefficient of 0.75 corresponding to three day observed runoff of 277
MCM at Kallooppara G&D site. The same runoff coefficient has also been adopted for
Pamba sub-basin with estimated 1-day, 2-day and 3-day runoff of 223 MCM, 497 MCM and
668 MCM upto Malakkara G&D site. From the flood hydrograph of Malakkara G&D site
total runoff in 3 days is about 533 MCM. The difference in volume may be attributed to
retention of overtopped water over river banks in nearby areas.
Fig.7: Discharge data of Malakkara G&D site on Pamba River
Fig.8: Discharge data of Kallooppara G&D site on Manimala River
0
500
1000
1500
2000
2500
3000
3500
02:00
08:00
14:00
20:00
02:00
08:00
14:00
20:00
02:00
08:00
14:00
20:00
08:00
08:00
08:00
08:00
08:00
14-08-2018 15-08-2018 16-08-2018 17-
08-
2018
18-
08-
2018
19-
08-
2018
20-
08-
2018
21-
08-
2018
Dis
cha
rge
(cu
me
c)
600
700
800
900
1000
1100
1200
1300
14-08-2018
15-08-2018
15-08-2018
16-08-2018
16-08-2018
17-08-2018
17-08-2018
18-08-2018
18-08-2018
Dis
cha
rge
(cu
me
c)
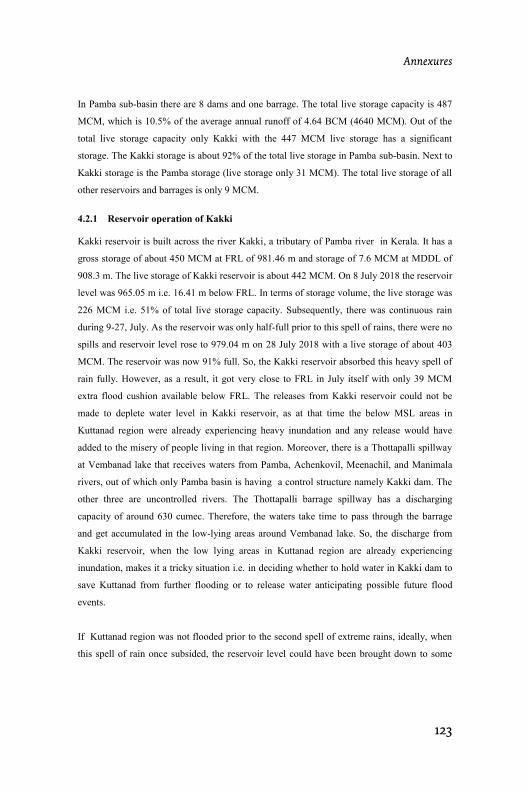
123
ConclusionCentral Water Commission Hydrology (S) Dte
Kerala Floods August 2018 Page 16
In Pamba sub-basin there are 8 dams and one barrage. The total live storage capacity is 487
MCM, which is 10.5% of the average annual runoff of 4.64 BCM (4640 MCM). Out of the
total live storage capacity only Kakki with the 447 MCM live storage has a significant
storage. The Kakki storage is about 92% of the total live storage in Pamba sub-basin. Next to
Kakki storage is the Pamba storage (live storage only 31 MCM). The total live storage of all
other reservoirs and barrages is only 9 MCM.
4.2.1 Reservoir operation of Kakki
Kakki reservoir is built across the river Kakki, a tributary of Pamba river in Kerala. It has a
gross storage of about 450 MCM at FRL of 981.46 m and storage of 7.6 MCM at MDDL of
908.3 m. The live storage of Kakki reservoir is about 442 MCM. On 8 July 2018 the reservoir
level was 965.05 m i.e. 16.41 m below FRL. In terms of storage volume, the live storage was
226 MCM i.e. 51% of total live storage capacity. Subsequently, there was continuous rain
during 9-27, July. As the reservoir was only half-full prior to this spell of rains, there were no
spills and reservoir level rose to 979.04 m on 28 July 2018 with a live storage of about 403
MCM. The reservoir was now 91% full. So, the Kakki reservoir absorbed this heavy spell of
rain fully. However, as a result, it got very close to FRL in July itself with only 39 MCM
extra flood cushion available below FRL. The releases from Kakki reservoir could not be
made to deplete water level in Kakki reservoir, as at that time the below MSL areas in
Kuttanad region were already experiencing heavy inundation and any release would have
added to the misery of people living in that region. Moreover, there is a Thottapalli spillway
at Vembanad lake that receives waters from Pamba, Achenkovil, Meenachil, and Manimala
rivers, out of which only Pamba basin is having a control structure namely Kakki dam. The
other three are uncontrolled rivers. The Thottapalli barrage spillway has a discharging
capacity of around 630 cumec. Therefore, the waters take time to pass through the barrage
and get accumulated in the low-lying areas around Vembanad lake. So, the discharge from
Kakki reservoir, when the low lying areas in Kuttanad region are already experiencing
inundation, makes it a tricky situation i.e. in deciding whether to hold water in Kakki dam to
save Kuttanad from further flooding or to release water anticipating possible future flood
events.
If Kuttanad region was not flooded prior to the second spell of extreme rains, ideally, when
this spell of rain once subsided, the reservoir level could have been brought down to some
Annexures
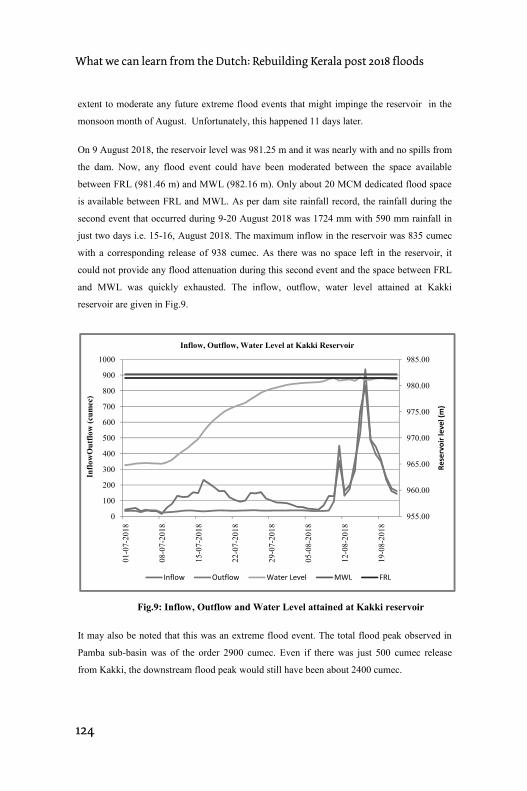
124
What we can learn from the Dutch: Rebuilding Kerala post 2018 floods Central Water Commission Hydrology (S) Dte
Kerala Floods August 2018 Page 17
extent to moderate any future extreme flood events that might impinge the reservoir in the
monsoon month of August. Unfortunately, this happened 11 days later.
On 9 August 2018, the reservoir level was 981.25 m and it was nearly with and no spills from
the dam. Now, any flood event could have been moderated between the space available
between FRL (981.46 m) and MWL (982.16 m). Only about 20 MCM dedicated flood space
is available between FRL and MWL. As per dam site rainfall record, the rainfall during the
second event that occurred during 9-20 August 2018 was 1724 mm with 590 mm rainfall in
just two days i.e. 15-16, August 2018. The maximum inflow in the reservoir was 835 cumec
with a corresponding release of 938 cumec. As there was no space left in the reservoir, it
could not provide any flood attenuation during this second event and the space between FRL
and MWL was quickly exhausted. The inflow, outflow, water level attained at Kakki
reservoir are given in Fig.9.
Fig.9: Inflow, Outflow and Water Level attained at Kakki reservoir
It may also be noted that this was an extreme flood event. The total flood peak observed in
Pamba sub-basin was of the order 2900 cumec. Even if there was just 500 cumec release
from Kakki, the downstream flood peak would still have been about 2400 cumec.
955.00
960.00
965.00
970.00
975.00
980.00
985.00
0
100
200
300
400
500
600
700
800
900
1000
01
-07
-20
18
08
-07
-20
18
15
-07
-20
18
22
-07
-20
18
29
-07
-20
18
05
-08
-20
18
12
-08
-20
18
19
-08
-20
18
Re
serv
oir
lev
el
(m)
Infl
ow
Ou
tflo
w (
cum
ec)
Inflow, Outflow, Water Level at Kakki Reservoir
Inflow Outflow Water Level MWL FRL
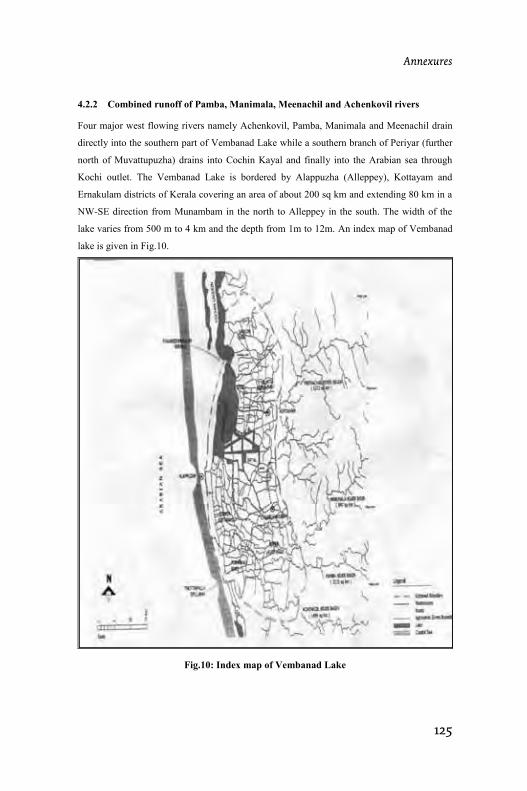
125
ConclusionCentral Water Commission Hydrology (S) Dte
Kerala Floods August 2018 Page 18
4.2.2 Combined runoff of Pamba, Manimala, Meenachil and Achenkovil rivers
Four major west flowing rivers namely Achenkovil, Pamba, Manimala and Meenachil drain
directly into the southern part of Vembanad Lake while a southern branch of Periyar (further
north of Muvattupuzha) drains into Cochin Kayal and finally into the Arabian sea through
Kochi outlet. The Vembanad Lake is bordered by Alappuzha (Alleppey), Kottayam and
Ernakulam districts of Kerala covering an area of about 200 sq km and extending 80 km in a
NW-SE direction from Munambam in the north to Alleppey in the south. The width of the
lake varies from 500 m to 4 km and the depth from 1m to 12m. An index map of Vembanad
lake is given in Fig.10.
Fig.10: Index map of Vembanad Lake
Annexures
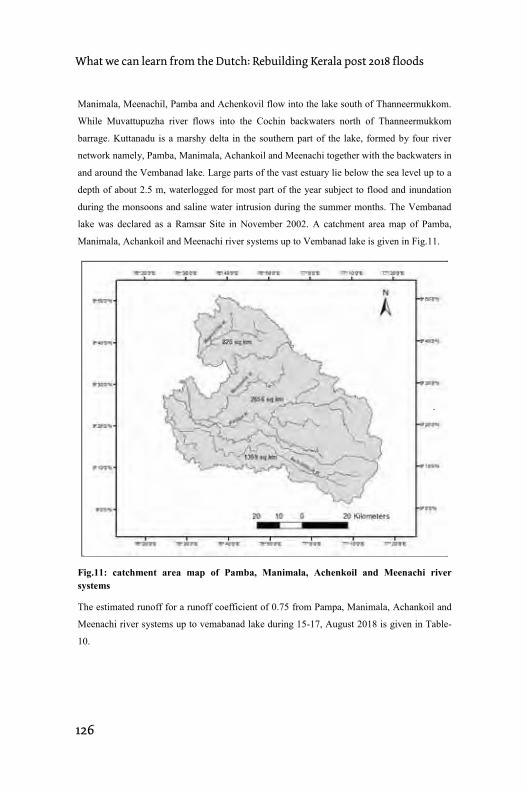
126
What we can learn from the Dutch: Rebuilding Kerala post 2018 floods Central Water Commission Hydrology (S) Dte
Kerala Floods August 2018 Page 19
Manimala, Meenachil, Pamba and Achenkovil flow into the lake south of Thanneermukkom.
While Muvattupuzha river flows into the Cochin backwaters north of Thanneermukkom
barrage. Kuttanadu is a marshy delta in the southern part of the lake, formed by four river
network namely, Pamba, Manimala, Achankoil and Meenachi together with the backwaters in
and around the Vembanad lake. Large parts of the vast estuary lie below the sea level up to a
depth of about 2.5 m, waterlogged for most part of the year subject to flood and inundation
during the monsoons and saline water intrusion during the summer months. The Vembanad
lake was declared as a Ramsar Site in November 2002. A catchment area map of Pamba,
Manimala, Achankoil and Meenachi river systems up to Vembanad lake is given in Fig.11.
Fig.11: catchment area map of Pamba, Manimala, Achenkoil and Meenachi river
systems
The estimated runoff for a runoff coefficient of 0.75 from Pampa, Manimala, Achankoil and
Meenachi river systems up to vemabanad lake during 15-17, August 2018 is given in Table-
10.
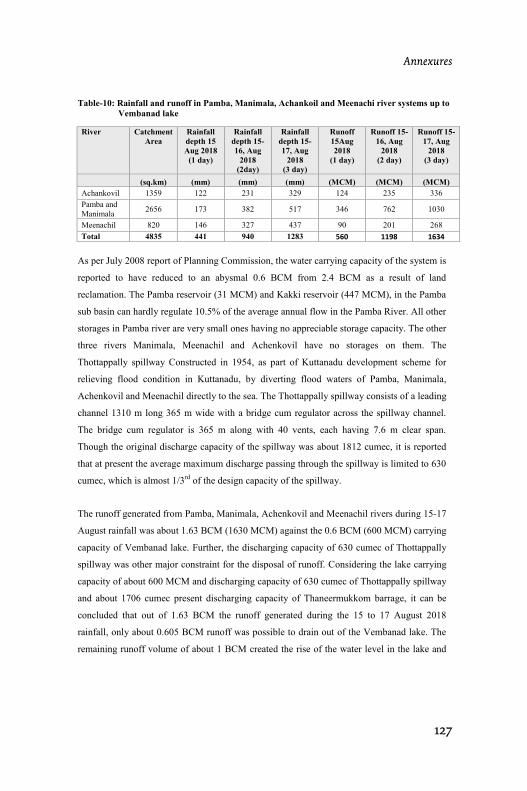
127
ConclusionCentral Water Commission Hydrology (S) Dte
Kerala Floods August 2018 Page 20
Table-10: Rainfall and runoff in Pamba, Manimala, Achankoil and Meenachi river systems up to
Vembanad lake
River Catchment
Area
Rainfall
depth 15
Aug 2018
(1 day)
Rainfall
depth 15-
16, Aug
2018
(2day)
Rainfall
depth 15-
17, Aug
2018
(3 day)
Runoff
15Aug
2018
(1 day)
Runoff 15-
16, Aug
2018
(2 day)
Runoff 15-
17, Aug
2018
(3 day)
(sq.km) (mm) (mm) (mm) (MCM) (MCM) (MCM)
Achankovil 1359 122 231 329 124 235 336
Pamba and
Manimala2656 173 382 517 346 762 1030
Meenachil 820 146 327 437 90 201 268
Total 4835 441 940 1283 560 1198 1634
As per July 2008 report of Planning Commission, the water carrying capacity of the system is
reported to have reduced to an abysmal 0.6 BCM from 2.4 BCM as a result of land
reclamation. The Pamba reservoir (31 MCM) and Kakki reservoir (447 MCM), in the Pamba
sub basin can hardly regulate 10.5% of the average annual flow in the Pamba River. All other
storages in Pamba river are very small ones having no appreciable storage capacity. The other
three rivers Manimala, Meenachil and Achenkovil have no storages on them. The
Thottappally spillway Constructed in 1954, as part of Kuttanadu development scheme for
relieving flood condition in Kuttanadu, by diverting flood waters of Pamba, Manimala,
Achenkovil and Meenachil directly to the sea. The Thottappally spillway consists of a leading
channel 1310 m long 365 m wide with a bridge cum regulator across the spillway channel.
The bridge cum regulator is 365 m along with 40 vents, each having 7.6 m clear span.
Though the original discharge capacity of the spillway was about 1812 cumec, it is reported
that at present the average maximum discharge passing through the spillway is limited to 630
cumec, which is almost 1/3rd
of the design capacity of the spillway.
The runoff generated from Pamba, Manimala, Achenkovil and Meenachil rivers during 15-17
August rainfall was about 1.63 BCM (1630 MCM) against the 0.6 BCM (600 MCM) carrying
capacity of Vembanad lake. Further, the discharging capacity of 630 cumec of Thottappally
spillway was other major constraint for the disposal of runoff. Considering the lake carrying
capacity of about 600 MCM and discharging capacity of 630 cumec of Thottappally spillway
and about 1706 cumec present discharging capacity of Thaneermukkom barrage, it can be
concluded that out of 1.63 BCM the runoff generated during the 15 to 17 August 2018
rainfall, only about 0.605 BCM runoff was possible to drain out of the Vembanad lake. The
remaining runoff volume of about 1 BCM created the rise of the water level in the lake and
Annexures
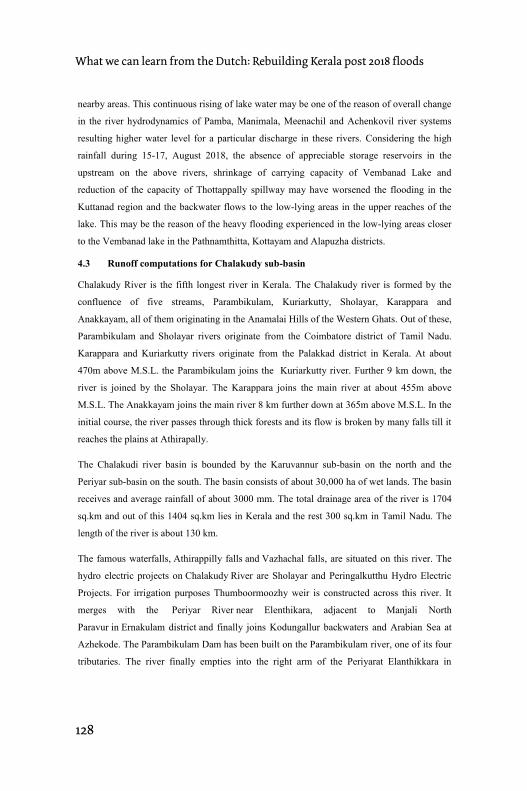
128
What we can learn from the Dutch: Rebuilding Kerala post 2018 floods Central Water Commission Hydrology (S) Dte
Kerala Floods August 2018 Page 21
nearby areas. This continuous rising of lake water may be one of the reason of overall change
in the river hydrodynamics of Pamba, Manimala, Meenachil and Achenkovil river systems
resulting higher water level for a particular discharge in these rivers. Considering the high
rainfall during 15-17, August 2018, the absence of appreciable storage reservoirs in the
upstream on the above rivers, shrinkage of carrying capacity of Vembanad Lake and
reduction of the capacity of Thottappally spillway may have worsened the flooding in the
Kuttanad region and the backwater flows to the low-lying areas in the upper reaches of the
lake. This may be the reason of the heavy flooding experienced in the low-lying areas closer
to the Vembanad lake in the Pathnamthitta, Kottayam and Alapuzha districts.
4.3 Runoff computations for Chalakudy sub-basin
Chalakudy River is the fifth longest river in Kerala. The Chalakudy river is formed by the
confluence of five streams, Parambikulam, Kuriarkutty, Sholayar, Karappara and
Anakkayam, all of them originating in the Anamalai Hills of the Western Ghats. Out of these,
Parambikulam and Sholayar rivers originate from the Coimbatore district of Tamil Nadu.
Karappara and Kuriarkutty rivers originate from the Palakkad district in Kerala. At about
470m above M.S.L. the Parambikulam joins the Kuriarkutty river. Further 9 km down, the
river is joined by the Sholayar. The Karappara joins the main river at about 455m above
M.S.L. The Anakkayam joins the main river 8 km further down at 365m above M.S.L. In the
initial course, the river passes through thick forests and its flow is broken by many falls till it
reaches the plains at Athirapally.
The Chalakudi river basin is bounded by the Karuvannur sub-basin on the north and the
Periyar sub-basin on the south. The basin consists of about 30,000 ha of wet lands. The basin
receives and average rainfall of about 3000 mm. The total drainage area of the river is 1704
sq.km and out of this 1404 sq.km lies in Kerala and the rest 300 sq.km in Tamil Nadu. The
length of the river is about 130 km.
The famous waterfalls, Athirappilly falls and Vazhachal falls, are situated on this river. The
hydro electric projects on Chalakudy River are Sholayar and Peringalkutthu Hydro Electric
Projects. For irrigation purposes Thumboormoozhy weir is constructed across this river. It
merges with the Periyar River near Elenthikara, adjacent to Manjali North
Paravur in Ernakulam district and finally joins Kodungallur backwaters and Arabian Sea at
Azhekode. The Parambikulam Dam has been built on the Parambikulam river, one of its four
tributaries. The river finally empties into the right arm of the Periyarat Elanthikkara in
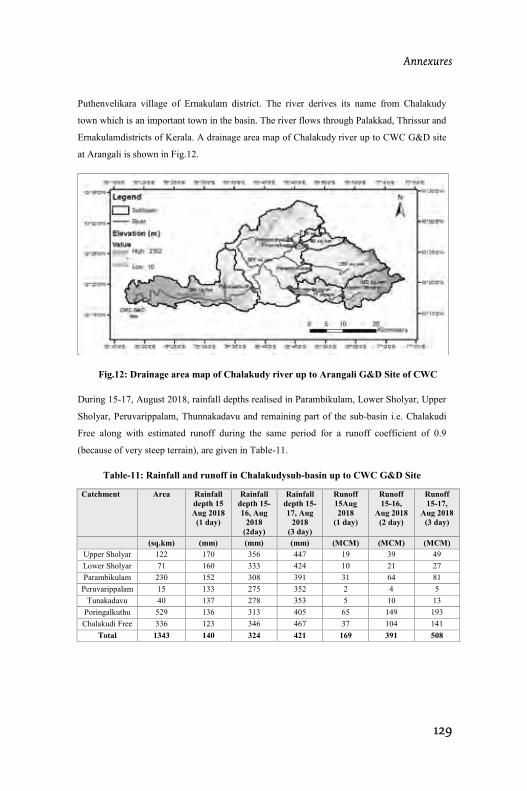
129
ConclusionCentral Water Commission Hydrology (S) Dte
Kerala Floods August 2018 Page 22
Puthenvelikara village of Ernakulam district. The river derives its name from Chalakudy
town which is an important town in the basin. The river flows through Palakkad, Thrissur and
Ernakulamdistricts of Kerala. A drainage area map of Chalakudy river up to CWC G&D site
at Arangali is shown in Fig.12.
Fig.12: Drainage area map of Chalakudy river up to Arangali G&D Site of CWC
During 15-17, August 2018, rainfall depths realised in Parambikulam, Lower Sholyar, Upper
Sholyar, Peruvarippalam, Thunnakadavu and remaining part of the sub-basin i.e. Chalakudi
Free along with estimated runoff during the same period for a runoff coefficient of 0.9
(because of very steep terrain), are given in Table-11.
Table-11: Rainfall and runoff in Chalakudysub-basin up to CWC G&D Site
Catchment Area Rainfall
depth 15
Aug 2018
(1 day)
Rainfall
depth 15-
16, Aug
2018
(2day)
Rainfall
depth 15-
17, Aug
2018
(3 day)
Runoff
15Aug
2018
(1 day)
Runoff
15-16,
Aug 2018
(2 day)
Runoff
15-17,
Aug 2018
(3 day)
(sq.km) (mm) (mm) (mm) (MCM) (MCM) (MCM)
Upper Sholyar 122 170 356 447 19 39 49
Lower Sholyar 71 160 333 424 10 21 27
Parambikulam 230 152 308 391 31 64 81
Peruvarippalam 15 133 275 352 2 4 5
Tunakadavu 40 137 278 353 5 10 13
Poringalkuthu 529 136 313 405 65 149 193
Chalakudi Free 336 123 346 467 37 104 141
Total 1343 140 324 421 169 391 508
Annexures
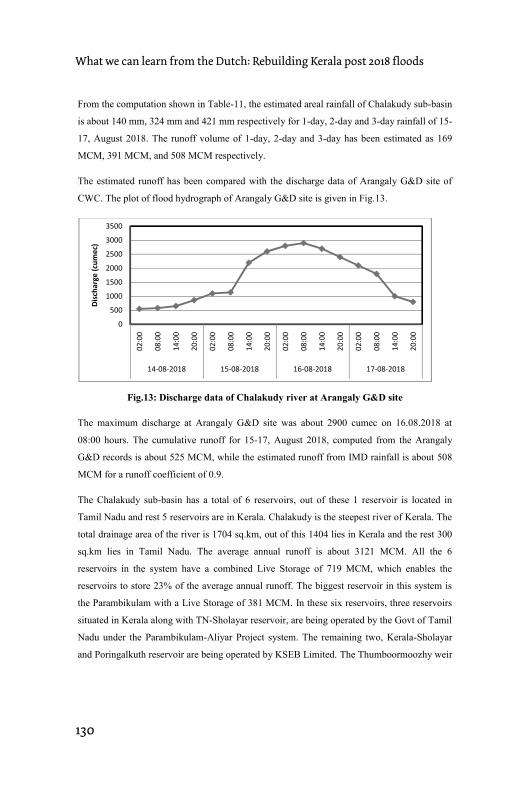
130
What we can learn from the Dutch: Rebuilding Kerala post 2018 floods Central Water Commission Hydrology (S) Dte
Kerala Floods August 2018 Page 23
From the computation shown in Table-11, the estimated areal rainfall of Chalakudy sub-basin
is about 140 mm, 324 mm and 421 mm respectively for 1-day, 2-day and 3-day rainfall of 15-
17, August 2018. The runoff volume of 1-day, 2-day and 3-day has been estimated as 169
MCM, 391 MCM, and 508 MCM respectively.
The estimated runoff has been compared with the discharge data of Arangaly G&D site of
CWC. The plot of flood hydrograph of Arangaly G&D site is given in Fig.13.
Fig.13: Discharge data of Chalakudy river at Arangaly G&D site
The maximum discharge at Arangaly G&D site was about 2900 cumec on 16.08.2018 at
08:00 hours. The cumulative runoff for 15-17, August 2018, computed from the Arangaly
G&D records is about 525 MCM, while the estimated runoff from IMD rainfall is about 508
MCM for a runoff coefficient of 0.9.
The Chalakudy sub-basin has a total of 6 reservoirs, out of these 1 reservoir is located in
Tamil Nadu and rest 5 reservoirs are in Kerala. Chalakudy is the steepest river of Kerala. The
total drainage area of the river is 1704 sq.km, out of this 1404 lies in Kerala and the rest 300
sq.km lies in Tamil Nadu. The average annual runoff is about 3121 MCM. All the 6
reservoirs in the system have a combined Live Storage of 719 MCM, which enables the
reservoirs to store 23% of the average annual runoff. The biggest reservoir in this system is
the Parambikulam with a Live Storage of 381 MCM. In these six reservoirs, three reservoirs
situated in Kerala along with TN-Sholayar reservoir, are being operated by the Govt of Tamil
Nadu under the Parambikulam-Aliyar Project system. The remaining two, Kerala-Sholayar
and Poringalkuth reservoir are being operated by KSEB Limited. The Thumboormoozhy weir
0
500
1000
1500
2000
2500
3000
3500
02:00
08:00
14:00
20:00
02:00
08:00
14:00
20:00
02:00
08:00
14:00
20:00
02:00
08:00
14:00
20:00
14-08-2018 15-08-2018 16-08-2018 17-08-2018
Dis
cha
rge
(cu
me
c)
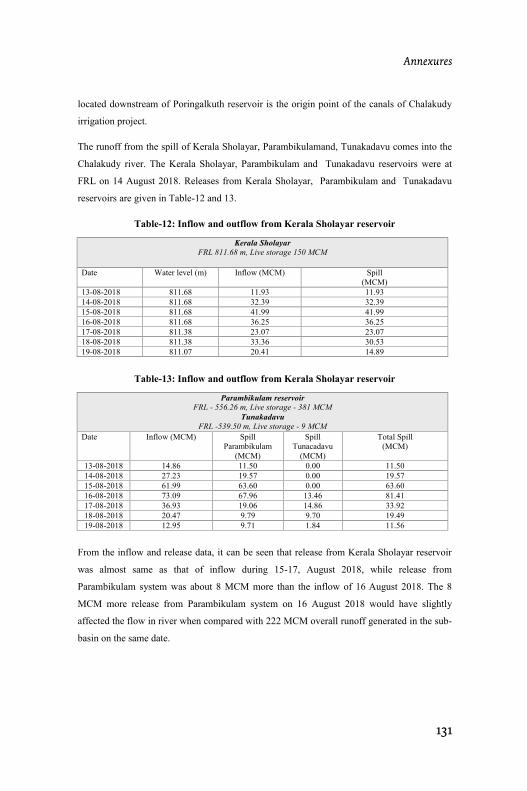
131
ConclusionCentral Water Commission Hydrology (S) Dte
Kerala Floods August 2018 Page 24
located downstream of Poringalkuth reservoir is the origin point of the canals of Chalakudy
irrigation project.
The runoff from the spill of Kerala Sholayar, Parambikulamand, Tunakadavu comes into the
Chalakudy river. The Kerala Sholayar, Parambikulam and Tunakadavu reservoirs were at
FRL on 14 August 2018. Releases from Kerala Sholayar, Parambikulam and Tunakadavu
reservoirs are given in Table-12 and 13.
Table-12: Inflow and outflow from Kerala Sholayar reservoir
Kerala Sholayar
FRL 811.68 m, Live storage 150 MCM
Date Water level (m) Inflow (MCM) Spill
(MCM)
13-08-2018 811.68 11.93 11.93
14-08-2018 811.68 32.39 32.39
15-08-2018 811.68 41.99 41.99
16-08-2018 811.68 36.25 36.25
17-08-2018 811.38 23.07 23.07
18-08-2018 811.38 33.36 30.53
19-08-2018 811.07 20.41 14.89
Table-13: Inflow and outflow from Kerala Sholayar reservoir
Parambikulam reservoir
FRL - 556.26 m, Live storage - 381 MCM
Tunakadavu
FRL -539.50 m, Live storage - 9 MCM
Date Inflow (MCM) Spill
Parambikulam
(MCM)
Spill
Tunacadavu
(MCM)
Total Spill
(MCM)
13-08-2018 14.86 11.50 0.00 11.50
14-08-2018 27.23 19.57 0.00 19.57
15-08-2018 61.99 63.60 0.00 63.60
16-08-2018 73.09 67.96 13.46 81.41
17-08-2018 36.93 19.06 14.86 33.92
18-08-2018 20.47 9.79 9.70 19.49
19-08-2018 12.95 9.71 1.84 11.56
From the inflow and release data, it can be seen that release from Kerala Sholayar reservoir
was almost same as that of inflow during 15-17, August 2018, while release from
Parambikulam system was about 8 MCM more than the inflow of 16 August 2018. The 8
MCM more release from Parambikulam system on 16 August 2018 would have slightly
affected the flow in river when compared with 222 MCM overall runoff generated in the sub-
basin on the same date.
Annexures
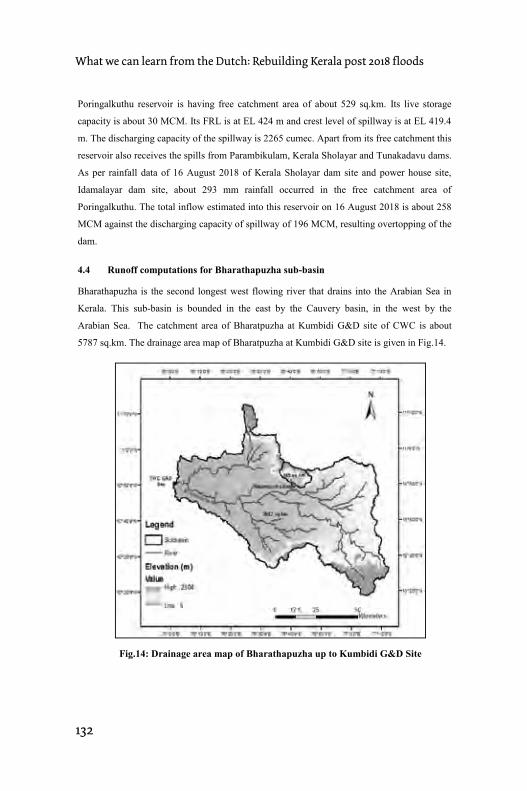
132
What we can learn from the Dutch: Rebuilding Kerala post 2018 floods Central Water Commission Hydrology (S) Dte
Kerala Floods August 2018 Page 25
Poringalkuthu reservoir is having free catchment area of about 529 sq.km. Its live storage
capacity is about 30 MCM. Its FRL is at EL 424 m and crest level of spillway is at EL 419.4
m. The discharging capacity of the spillway is 2265 cumec. Apart from its free catchment this
reservoir also receives the spills from Parambikulam, Kerala Sholayar and Tunakadavu dams.
As per rainfall data of 16 August 2018 of Kerala Sholayar dam site and power house site,
Idamalayar dam site, about 293 mm rainfall occurred in the free catchment area of
Poringalkuthu. The total inflow estimated into this reservoir on 16 August 2018 is about 258
MCM against the discharging capacity of spillway of 196 MCM, resulting overtopping of the
dam.
4.4 Runoff computations for Bharathapuzha sub-basin
Bharathapuzha is the second longest west flowing river that drains into the Arabian Sea in
Kerala. This sub-basin is bounded in the east by the Cauvery basin, in the west by the
Arabian Sea. The catchment area of Bharatpuzha at Kumbidi G&D site of CWC is about
5787 sq.km. The drainage area map of Bharatpuzha at Kumbidi G&D site is given in Fig.14.
Fig.14: Drainage area map of Bharathapuzha up to Kumbidi G&D Site
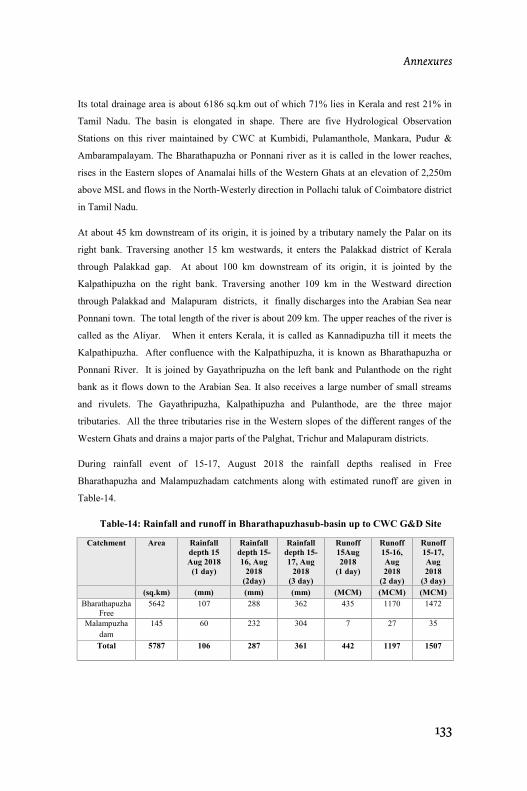
133
ConclusionCentral Water Commission Hydrology (S) Dte
Kerala Floods August 2018 Page 26
Its total drainage area is about 6186 sq.km out of which 71% lies in Kerala and rest 21% in
Tamil Nadu. The basin is elongated in shape. There are five Hydrological Observation
Stations on this river maintained by CWC at Kumbidi, Pulamanthole, Mankara, Pudur &
Ambarampalayam. The Bharathapuzha or Ponnani river as it is called in the lower reaches,
rises in the Eastern slopes of Anamalai hills of the Western Ghats at an elevation of 2,250m
above MSL and flows in the North-Westerly direction in Pollachi taluk of Coimbatore district
in Tamil Nadu.
At about 45 km downstream of its origin, it is joined by a tributary namely the Palar on its
right bank. Traversing another 15 km westwards, it enters the Palakkad district of Kerala
through Palakkad gap. At about 100 km downstream of its origin, it is jointed by the
Kalpathipuzha on the right bank. Traversing another 109 km in the Westward direction
through Palakkad and Malapuram districts, it finally discharges into the Arabian Sea near
Ponnani town. The total length of the river is about 209 km. The upper reaches of the river is
called as the Aliyar. When it enters Kerala, it is called as Kannadipuzha till it meets the
Kalpathipuzha. After confluence with the Kalpathipuzha, it is known as Bharathapuzha or
Ponnani River. It is joined by Gayathripuzha on the left bank and Pulanthode on the right
bank as it flows down to the Arabian Sea. It also receives a large number of small streams
and rivulets. The Gayathripuzha, Kalpathipuzha and Pulanthode, are the three major
tributaries. All the three tributaries rise in the Western slopes of the different ranges of the
Western Ghats and drains a major parts of the Palghat, Trichur and Malapuram districts.
During rainfall event of 15-17, August 2018 the rainfall depths realised in Free
Bharathapuzha and Malampuzhadam catchments along with estimated runoff are given in
Table-14.
Table-14: Rainfall and runoff in Bharathapuzhasub-basin up to CWC G&D Site
Catchment Area Rainfall
depth 15
Aug 2018
(1 day)
Rainfall
depth 15-
16, Aug
2018
(2day)
Rainfall
depth 15-
17, Aug
2018
(3 day)
Runoff
15Aug
2018
(1 day)
Runoff
15-16,
Aug
2018
(2 day)
Runoff
15-17,
Aug
2018
(3 day)
(sq.km) (mm) (mm) (mm) (MCM) (MCM) (MCM)
Bharathapuzha
Free
5642 107 288 362 435 1170 1472
Malampuzha
dam
145 60 232 304 7 27 35
Total 5787 106 287 361 442 1197 1507
Annexures
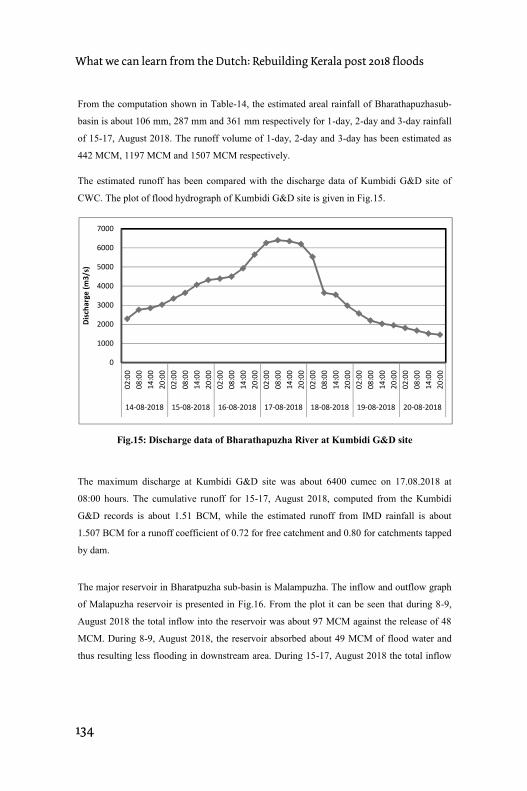
134
What we can learn from the Dutch: Rebuilding Kerala post 2018 floods Central Water Commission Hydrology (S) Dte
Kerala Floods August 2018 Page 27
From the computation shown in Table-14, the estimated areal rainfall of Bharathapuzhasub-
basin is about 106 mm, 287 mm and 361 mm respectively for 1-day, 2-day and 3-day rainfall
of 15-17, August 2018. The runoff volume of 1-day, 2-day and 3-day has been estimated as
442 MCM, 1197 MCM and 1507 MCM respectively.
The estimated runoff has been compared with the discharge data of Kumbidi G&D site of
CWC. The plot of flood hydrograph of Kumbidi G&D site is given in Fig.15.
Fig.15: Discharge data of Bharathapuzha River at Kumbidi G&D site
The maximum discharge at Kumbidi G&D site was about 6400 cumec on 17.08.2018 at
08:00 hours. The cumulative runoff for 15-17, August 2018, computed from the Kumbidi
G&D records is about 1.51 BCM, while the estimated runoff from IMD rainfall is about
1.507 BCM for a runoff coefficient of 0.72 for free catchment and 0.80 for catchments tapped
by dam.
The major reservoir in Bharatpuzha sub-basin is Malampuzha. The inflow and outflow graph
of Malapuzha reservoir is presented in Fig.16. From the plot it can be seen that during 8-9,
August 2018 the total inflow into the reservoir was about 97 MCM against the release of 48
MCM. During 8-9, August 2018, the reservoir absorbed about 49 MCM of flood water and
thus resulting less flooding in downstream area. During 15-17, August 2018 the total inflow
0
1000
2000
3000
4000
5000
6000
7000
02:00
08:00
14:00
20:00
02:00
08:00
14:00
20:00
02:00
08:00
14:00
20:00
02:00
08:00
14:00
20:00
02:00
08:00
14:00
20:00
02:00
08:00
14:00
20:00
02:00
08:00
14:00
20:00
14-08-2018 15-08-2018 16-08-2018 17-08-2018 18-08-2018 19-08-2018 20-08-2018
Dis
cha
rge
(m
3/s
)
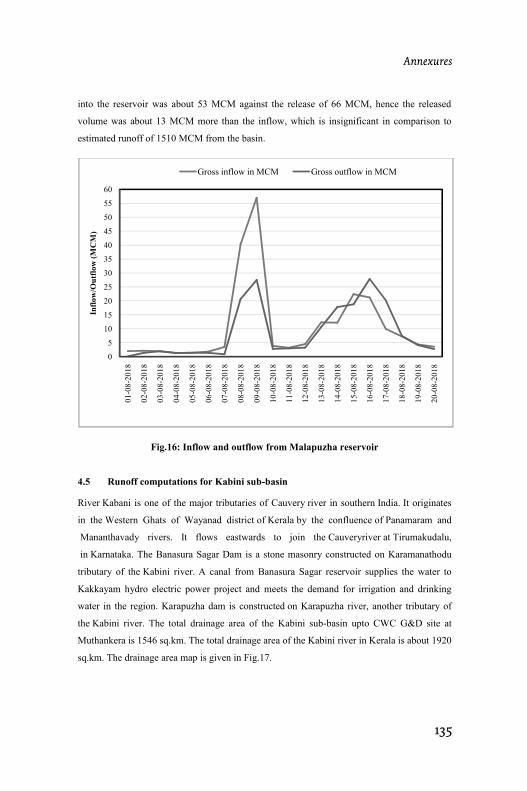
135
ConclusionCentral Water Commission Hydrology (S) Dte
Kerala Floods August 2018 Page 28
into the reservoir was about 53 MCM against the release of 66 MCM, hence the released
volume was about 13 MCM more than the inflow, which is insignificant in comparison to
estimated runoff of 1510 MCM from the basin.
Fig.16: Inflow and outflow from Malapuzha reservoir
4.5 Runoff computations for Kabini sub-basin
River Kabani is one of the major tributaries of Cauvery river in southern India. It originates
in the Western Ghats of Wayanad district of Kerala by the confluence of Panamaram and
Mananthavady rivers. It flows eastwards to join the Cauveryriver at Tirumakudalu,
in Karnataka. The Banasura Sagar Dam is a stone masonry constructed on Karamanathodu
tributary of the Kabini river. A canal from Banasura Sagar reservoir supplies the water to
Kakkayam hydro electric power project and meets the demand for irrigation and drinking
water in the region. Karapuzha dam is constructed on Karapuzha river, another tributary of
the Kabini river. The total drainage area of the Kabini sub-basin upto CWC G&D site at
Muthankera is 1546 sq.km. The total drainage area of the Kabini river in Kerala is about 1920
sq.km. The drainage area map is given in Fig.17.
0
5
10
15
20
25
30
35
40
45
50
55
60
01
-08
-20
18
02
-08
-20
18
03
-08
-20
18
04
-08
-20
18
05
-08
-20
18
06
-08
-20
18
07
-08
-20
18
08
-08
-20
18
09
-08
-20
18
10
-08
-20
18
11
-08
-20
18
12
-08
-20
18
13
-08
-20
18
14
-08
-20
18
15
-08
-20
18
16
-08
-20
18
17
-08
-20
18
18
-08
-20
18
19
-08
-20
18
20
-08
-20
18
Infl
ow
/Ou
tflo
w (
MC
M)
Gross inflow in MCM Gross outflow in MCM
Annexures
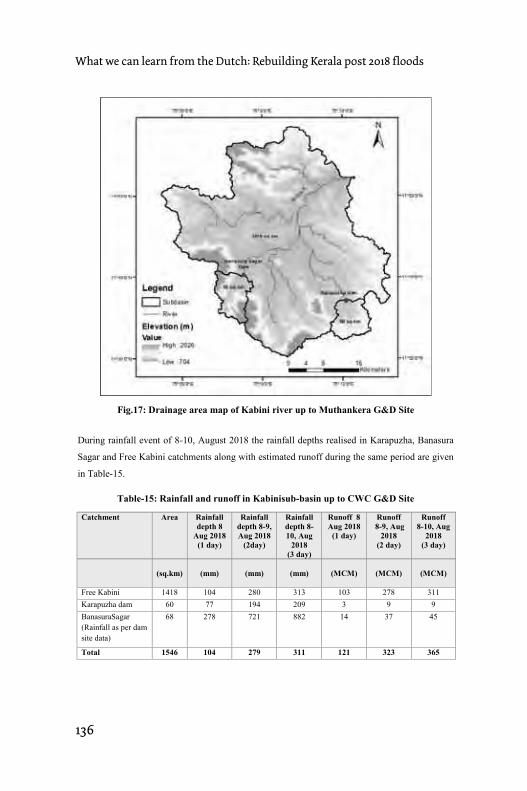
136
What we can learn from the Dutch: Rebuilding Kerala post 2018 floods Central Water Commission Hydrology (S) Dte
Kerala Floods August 2018 Page 29
Fig.17: Drainage area map of Kabini river up to Muthankera G&D Site
During rainfall event of 8-10, August 2018 the rainfall depths realised in Karapuzha, Banasura
Sagar and Free Kabini catchments along with estimated runoff during the same period are given
in Table-15.
Table-15: Rainfall and runoff in Kabinisub-basin up to CWC G&D Site
Catchment Area Rainfall
depth 8
Aug 2018
(1 day)
Rainfall
depth 8-9,
Aug 2018
(2day)
Rainfall
depth 8-
10, Aug
2018
(3 day)
Runoff 8
Aug 2018
(1 day)
Runoff
8-9, Aug
2018
(2 day)
Runoff
8-10, Aug
2018
(3 day)
(sq.km) (mm) (mm) (mm) (MCM) (MCM) (MCM)
Free Kabini 1418 104 280 313 103 278 311
Karapuzha dam 60 77 194 209 3 9 9
BanasuraSagar
(Rainfall as per dam
site data)
dam
68 278 721 882 14 37 45
Total 1546 104 279 311 121 323 365
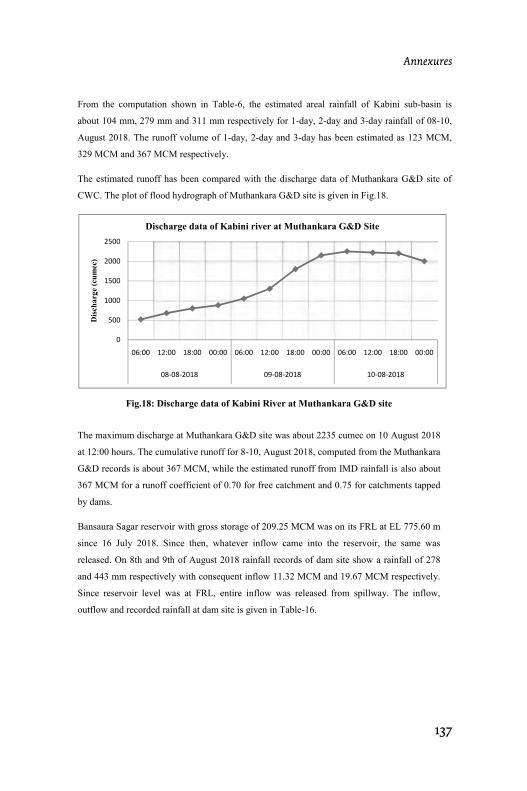
137
ConclusionCentral Water Commission Hydrology (S) Dte
Kerala Floods August 2018 Page 30
From the computation shown in Table-6, the estimated areal rainfall of Kabini sub-basin is
about 104 mm, 279 mm and 311 mm respectively for 1-day, 2-day and 3-day rainfall of 08-10,
August 2018. The runoff volume of 1-day, 2-day and 3-day has been estimated as 123 MCM,
329 MCM and 367 MCM respectively.
The estimated runoff has been compared with the discharge data of Muthankara G&D site of
CWC. The plot of flood hydrograph of Muthankara G&D site is given in Fig.18.
Fig.18: Discharge data of Kabini River at Muthankara G&D site
The maximum discharge at Muthankara G&D site was about 2235 cumec on 10 August 2018
at 12:00 hours. The cumulative runoff for 8-10, August 2018, computed from the Muthankara
G&D records is about 367 MCM, while the estimated runoff from IMD rainfall is also about
367 MCM for a runoff coefficient of 0.70 for free catchment and 0.75 for catchments tapped
by dams.
Bansaura Sagar reservoir with gross storage of 209.25 MCM was on its FRL at EL 775.60 m
since 16 July 2018. Since then, whatever inflow came into the reservoir, the same was
released. On 8th and 9th of August 2018 rainfall records of dam site show a rainfall of 278
and 443 mm respectively with consequent inflow 11.32 MCM and 19.67 MCM respectively.
Since reservoir level was at FRL, entire inflow was released from spillway. The inflow,
outflow and recorded rainfall at dam site is given in Table-16.
0
500
1000
1500
2000
2500
06:00 12:00 18:00 00:00 06:00 12:00 18:00 00:00 06:00 12:00 18:00 00:00
08-08-2018 09-08-2018 10-08-2018
Dis
cha
rge
(cu
mec
)
Discharge data of Kabini river at Muthankara G&D Site
Annexures

138
What we can learn from the Dutch: Rebuilding Kerala post 2018 floods Central Water Commission Hydrology (S) Dte
Kerala Floods August 2018 Page 31
The average release on 8th, 9th and 10th of August were 131 cumec, 228 cumec and 113
respectively, while the observed maximum discharge at CWC G&D site were about 880
cumec on 8 August 2018, 2150 cumec on 9 August 2018 and 2250 cumec on 9 August 2018.
Hence, major runoff was generated from untapped catchments of Kabini river.
Table-16: Inflow and Outflow and rainfall records of Bansura Sagar reservoir
DateReservoir level Rainfall Gross Inflow Spill
(m) mm MCM MCM
7-Aug-18 775.6 79.20 1.21 1.21
8-Aug-18 775.60 278.40 11.32 11.32
9-Aug-18 775.60 442.60 19.67 19.67
10-Aug-18 775.60 160.90 9.75 9.75
11-Aug-18 775.60 46.50 6.08 6.08
12-Aug-18 775.60 75.00 6.59 6.59
13-Aug-18 775.60 151.70 8.10 8.10
14-Aug-18 775.60 205.40 14.50 14.50
15-Aug-18 775.60 304.90 18.48 18.48
16-Aug-18 775.00 343.90 17.99 18.59
17-Aug-18 774.60 182.30 14.19 14.59
18-Aug-18 775.60 161.60 4.24 3.24
19-Aug-18 774.50 77.40 0.00 2.21
20-Aug-18 774.65 88.00 2.36 2.21
21-Aug-18 774.80 60.30 1.61 1.46
22-Aug-18 774.85 80.40 0.79 0.74
5.0 Rainfall depths realised for entire Kerala during 15-17, August 2018 and
estimated runoff
Using 1-day, 2-day and 3-day rainfall raster, estimated rainfall and runoff for entire Kerala
are presented in presented in Table-17. Considering the saturated ground condition and
estimated runoff coefficient in different sub-basins, a runoff coefficient of 0.75 has been
adopted for the entire Kerala.
Table-17: Estimated rainfall and runoff for entire Kerala during 15-17, August 2018
Area Estimated rainfall Estimated runoff
15 August
2018
15-16,
August 2018
15-17,
August 2018
15 August
2018
15-16,
August 2018
15-17,
August
2018
(sq.km) (mm) (mm) (mm) (MCM) (MCM) (MCM)
38863 140 316 414 4081 9211 12057
From the estimated quantity of runoff, it can be said that this huge runoff generated within a
short period of 3 days was beyond the carrying capacity of most of the rivers in Kerala,
resulting overbank flows from most of the rivers. Further, total catchment area tapped by
139
ConclusionAnnexures Central Water Commission Hydrology (S) Dte
Kerala Floods August 2018 Page 32
dams in Kerala excluding barrages is about 6610 sq.km. Taking a runoff coefficient of 0.8,
the runoff generated from the catchment tapped by the dams during the 3 days rainfall of 15-
17, August 2018 has been estimated about 2.19 BCM, out of total runoff of 12 BCM for
entire Kerala. The total live storage of Kerala is about 5.8 BCM. Even with 20% of the live
storage availability of 14 August 2018, the available flood moderation extent would have
been only 1.16 BCM against the estimated inflow of 2.19 BCM. It shows that in any case, it
was essential to make releases from reservoirs.
6.0 Findings of CWC Study
From analysis of rainfall data of IMD, discharge data of CWC G&D sites and inflow/outflow
data of reservoir received from Government of Kerala, the findings are as under:
i. Kerala terrain is a linear one with elevation varying from about -2 m to 1500 m in a
stretch of about 80 to 100 km across the State. The Western Ghats terrain has steep
slopes, while the rest of terrain is rolling/plains. The time of concentration (the time
required to travel the water from farthest point of project catchment to the project
catchment outlet) of most of the reservoirs in the region is about 2 to 3 hours only.
ii. During the August 2018 flood 13 out of 14 districts of the State were severely
affected from flood due to heavy rainfall. As per IMD, Kerala received about 2346.6
mm of rainfall during 1 June 2018 to 19 August 2018 against the normal rainfall of
1649.5 mm, which was 42% above the normal. During 1 August 2018 to 19 August
2018 total rainfall occurred in Kerala was about 758.6 mm against the normal of
287.6 mm, which was 164% above normal.
iii. A one day rainfall of 398 mm, 305 mm, 255 mm, 254 mm, 211 mm and 214mm
respectively was recorded at Nilambur in Mallapuram district, Mananthavady in
Wayanad district, Peermade, Munnar and Myladumpara in Idukki district and at
Pallakad district respectively on 9 August 2018. The severe rainfall in Wayanad
district resulted in heavy flooding at Mananthavadi and Vythiri during 8-10, August
2018.
iv. As per analysis carried out by CWC, the rainfall of 15-17, August 2018 having eye of
storm near Peermade between Pamba and Periyar sub-basins, was almost of the same
order as that of rainfall of Devikulam, Kerala which occurred during 16-18, July
140
What we can learn from the Dutch: Rebuilding Kerala post 2018 floods Central Water Commission Hydrology (S) Dte
Kerala Floods August 2018 Page 33
1924. As per the historical records severe most flooding had occurred in Kerala
during the year 1924. The average cumulative rainfall of 15-17, August 2018 is about
414 mm for entire Kerala. The consequent cumulative runoff of three days for the
entire Kerala (area about 38,800 sq.km) is about 12 BCM (12,000 MCM) for a runoff
coefficient of 0.75.
v. Further, total catchment area tapped by dams in Kerala excluding barrages is about
6610 sq.km. Taking a runoff coefficient of 0.8 the runoff generated from the
catchment tapped by the dams during the 3 days rainfall of 15-17, August 2018 has
been estimated about 2.19 BCM, out of total runoff of 12 BCM for entire Kerala. The
total live storage of Kerala is about 5.8 BCM. Even with 20% of the live storage
availability on 14 August 2018, the available flood moderation extent would have
been only 1.16 BCM against the estimated inflow of 2.19 BCM. It shows that in any
case, it was essential to make releases from reservoirs.
vi. Out of 758.6 mm rainfall from 1 August 2018 to 19 August 2018, about 414 mm
rainfall occurred in just three days viz 15-17, August 2018, which created severe
flooding in the State. Due to severe rainfall from 15-17, August 2018, the gates of
about 35 dams were also opened due to extremely large inflow of water in the
reservoirs. During August 2018, the reservoirs were either at FRL or only few feet
below the FRL.
vii. During 15-17, August 2018, the 3-day rainfall depths realised in Periyar, Pamba,
Chalakudi and Bharathapuzha sub-basins were 588 mm, 538 mm, 421 mm and 373
mm respectively and these depths are of the same order as that of 1924 rainfall.
viii. As per CWC’s Neeleswaram G&D site (Periyar sub-basin) records, the maximum
discharge passed in Periyar river was 8800 cumec on 16 August 2018 at 15:00 hrs and
maximum water level attained was at EL 12.4 m. The earlier HFL was recorded on 27
July 1974 at EL 11.105 m. The major storages in Periyar basin are Idukki (live
storage 1.4 BCM) and Idamalayar (LS 1.1 BCM). The peak release on 16 August
2018 from Idukki was 1500 cumec against a peak inflow of 2532 cumec achieving a
flood moderation of 1032 cumec. The release from Idamalayar on 16 August 2018
was 963 cumec against an inflow of 1164 cumec. The discharge in Periyar river at
Neeleswaram G&D site on 17 August 2018 was recorded as 8600 cumec and release

141
ConclusionAnnexures Central Water Commission Hydrology (S) Dte
Kerala Floods August 2018 Page 34
from Idukki and Idamalayar were 1500 cumec (inflow 1610 cumec) and 1272 cumec
(inflow 1007 cumec). On analysis of data it has been found that the releases from
these dams were the controlled releases, as the discharging capacity of these dams are
5013 cumec (Idukki) and 3012 cumec (Idamalyar).
ix. The maximum discharge in Pamba river at CWC, G&D site (Malakkara) was 2900
cumec on 16 August 2018 with corresponding water level at EL 9.58 m. The earlier
recorded HFL was 8.2 m. The major reservoir in Pamba sub-basin is Kakki and
release from this reservoir was 488 cumec (15th of August), 899 cumec (16th of
August), 443 cumec (17th of August), 356 cumec (18th of August), 309 cumec (19th
of August) against the spillway capacity of 1788 cumec. The reservoir was at EL
980.91 m on 14 August 2018, against the FRL at EL 981.46 m. The maximum
reservoir level attained on 19 August 2018 was 981.4 m.
x. From the analysis it has been found that the dams in Kerala neither added to the flood
nor helped in reduction of flood, as most of the dams were already at FRL or very
close to FRL on 14 August 2018, due to more than normal rainfall in the months of
June to July 2018. It may be noted that, had the reservoir been a few feet below FRL,
the flooding conditions would have not changed much, as the severe storm continued
for 3 days and even for 4 days at majority of the places, and in any case it would have
been necessary to release from the reservoirs after 1st day of the extreme rainfall.
xi. Nevertheless, it is essential to review the rule curves of all the reservoirs in Kerala.
The rule curves need to be meticulously drawn particularly for the reservoirs having
the live storage capacity, of more than 200 MCM in order to create some dynamic
flood cushion for moderating the floods of lower return periods particularly in the
early period of monsoon.
xii. The runoff generated from Pamba, Manimala Achenkovil and Meenachil rivers
during 15-17, August 2018 rainfall was about 1.63 BCM against the 0.6 BCM
carrying capacity of Vembanad lake. Further, the discharging capacity of 630 cumec
of Thottappally spillway was the other major constraint for the disposal of runoff.
Considering the lake carrying capacity of about 600 MCM and discharging capacity
of 630 cumec of Thottappally spillway and about 1706 cumec present discharging
capacity of Thaneermukkom barrage, it can be concluded that out of 1.63 BCM the
142
What we can learn from the Dutch: Rebuilding Kerala post 2018 floods Central Water Commission Hydrology (S) Dte
Kerala Floods August 2018 Page 35
runoff generated during the 15-17, August 2018 rainfall, only about 0.605 BCM
runoff was possible to drain out of the Vembanad lake. The remaining runoff volume
of about 1 BCM created the rise of the water level in the lake and nearby areas. This
continuous rising of lake water may be one of the reason of overall change in the river
hydrodynamics of Pamba, Manimala, Meenachil and Achenkovil river systems
resulting higher water level for a particular discharge in these rivers. Considering the
high rainfall during 15-17, August 2018, the absence of appreciable storage reservoirs
in the upstream in the above rivers along with the shrinkage of carrying capacity of
Vembanad Lake and reduction of the capacity of Thottappally spillway worsened the
flooding in the Kuttanad region and the backwaters flows to the low lying areas in the
upper reaches of the lake.
xiii. The worst affected districts noticed were Wayanad (Kabini sub-basin), Idukki
(Periyar sub-basin), Ernakulam (Periyar and Chalakudi) sub-basins, Alleppey and
Pathanamthitta (both in Pamba sub-basin).
xiv. In a nutshell, it can be concluded that August 2018 flood in Kerala was due to severe
storm occurrences during 8-9, August 2018 and 15-17, August 2018. The storm of 15-
17, August 2018 resulted in heavy flooding in Periyar, Pamba, Chalakudi and
Bharatpuzha sub-basins of Kerala. The rainfall during 15-17, August 2018 was almost
comparable to the historical 16-18, July 1924 rainfall of Kerala, particularly in
Periyar, Pamba, Chalakudi and Bharatpuzha sub-basins.
xv. The release from reservoirs had only minor role in flood augmentation as released
volume from the reservoirs were almost similar to inflow volumes. In fact Idukki
reservoir absorbed a flood volume of about 60 MCM during 15-17, August 2018.
Even, with the 75 percent-filled reservoir conditions, the current flood could have not
been mitigated as 1-day rainfall in majority of the area was more than 200 mm and
severe rainfall continued for 3 to 4 days.
7.0 Recommendations
i. It is essential to review the rule curves of all the reservoirs in Kerala. The rule curves
need to be formulated for both conservation as well operations during the flood,
143
ConclusionAnnexures Central Water Commission Hydrology (S) Dte
Kerala Floods August 2018 Page 36
particularly for the reservoirs having the live storage capacity of more than 200
MCM in order to create some dynamic flood cushion for moderating the floods of
lower return periods particularly in the early period of monsoon.
ii. For efficient discharge of flood runoff from Vembanad lake, the approach channels
to Thottappally spillway and the passage of the Thaneermukkom barrage should be
widened taking into consideration the lake hydrology, ecology, saline water
intrusion, etc based on scientific and engineering inputs.
iii. In basins like Periyar, Pamba and Achenkovil basins, Kerala should explore the
possibilities of creating suitable storage reservoirs, wherever feasible, for flood
moderation and other multipurpose uses.
iv. The Poringalkuthu dam should be inspected by DSRP panel and design flood,
spillway capacity of Poringalkuthu dam must be reviewed.
8.0 Limitations
i. The rainfall analysis carried out in the present study is based on the rainfall records of
67 rain gauge stations of IMD spread across the entire State covering both plain and
hilly regions. In hilly terrains of Chalakudy, Periyar, Pamba, Kabini and other sub-
basins, rainfall records of some more rain gauge stations may provide a further finer
estimate of rainfall and also the inflow volume into the reservoirs.
ii. The gauge records at some of the CWC G&D sites could not be observed on 16th and
17th of August 2018 because of inaccessibility of site due to severe flooding. Hence,
the estimated discharge may differ from the one that actually occurred.
iii. Some of the observations regarding the discharging capacity of Thottappally and
Thanneermukkom barrages, carrying capacity of Vembanad lake etc are based on the
reports of the other institutions.
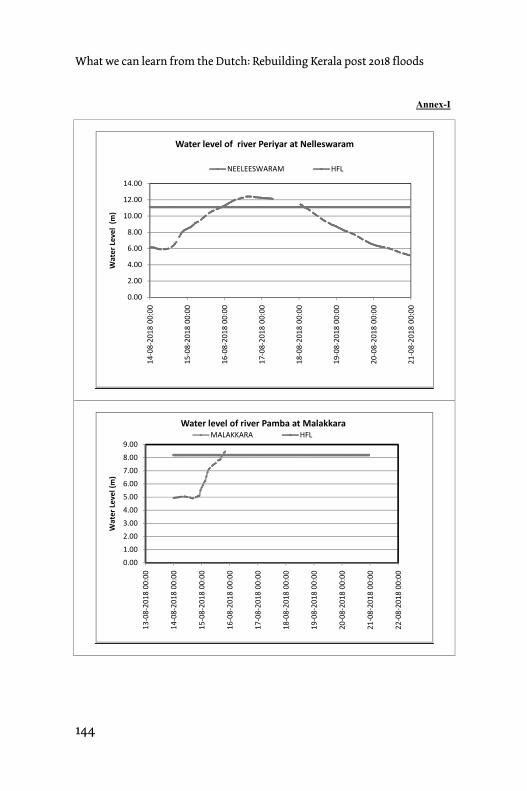
144
What we can learn from the Dutch: Rebuilding Kerala post 2018 floods Central Water Commission Hydrology (S) Dte
Kerala Floods August 2018 Page 37
Annex-I
0.00
2.00
4.00
6.00
8.00
10.00
12.00
14.00
14
-08
-20
18
00
:00
15
-08
-20
18
00
:00
16
-08
-20
18
00
:00
17
-08
-20
18
00
:00
18
-08
-20
18
00
:00
19
-08
-20
18
00
:00
20
-08
-20
18
00
:00
21
-08
-20
18
00
:00
Wa
ter
Lev
el
(m
)
Water level of river Periyar at Nelleswaram
NEELEESWARAM HFL
0.00
1.00
2.00
3.00
4.00
5.00
6.00
7.00
8.00
9.00
13
-08
-20
18
00
:00
14
-08
-20
18
00
:00
15
-08
-20
18
00
:00
16
-08
-20
18
00
:00
17
-08
-20
18
00
:00
18
-08
-20
18
00
:00
19
-08
-20
18
00
:00
20
-08
-20
18
00
:00
21
-08
-20
18
00
:00
22
-08
-20
18
00
:00
Wa
ter
Lev
el
(m)
Water level of river Pamba at MalakkaraMALAKKARA HFL
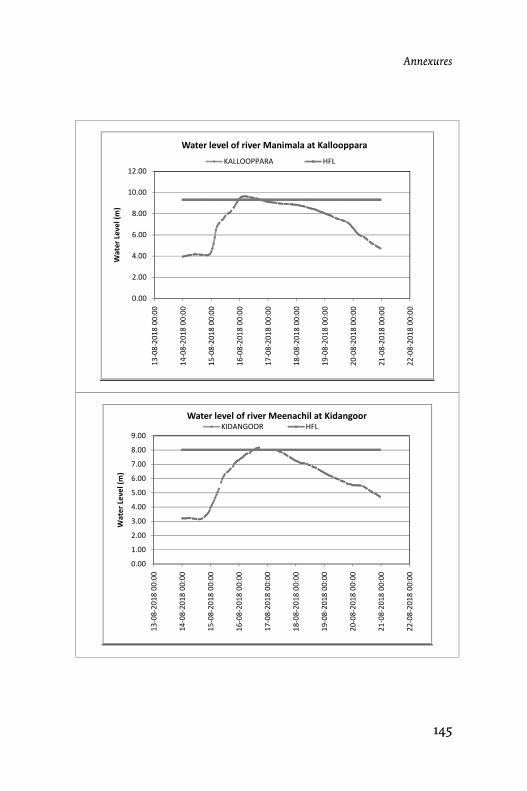
145
ConclusionAnnexures Central Water Commission Hydrology (S) Dte
Kerala Floods August 2018 Page 38
0.00
2.00
4.00
6.00
8.00
10.00
12.00
13
-08
-20
18
00
:00
14
-08
-20
18
00
:00
15
-08
-20
18
00
:00
16
-08
-20
18
00
:00
17
-08
-20
18
00
:00
18
-08
-20
18
00
:00
19
-08
-20
18
00
:00
20
-08
-20
18
00
:00
21
-08
-20
18
00
:00
22
-08
-20
18
00
:00
Wa
ter
Lev
el
(m)
Water level of river Manimala at Kallooppara
KALLOOPPARA HFL
0.00
1.00
2.00
3.00
4.00
5.00
6.00
7.00
8.00
9.00
13
-08
-20
18
00
:00
14
-08
-20
18
00
:00
15
-08
-20
18
00
:00
16
-08
-20
18
00
:00
17
-08
-20
18
00
:00
18
-08
-20
18
00
:00
19
-08
-20
18
00
:00
20
-08
-20
18
00
:00
21
-08
-20
18
00
:00
22
-08
-20
18
00
:00
Wa
ter
Lev
el
(m)
Water level of river Meenachil at KidangoorKIDANGOOR HFL
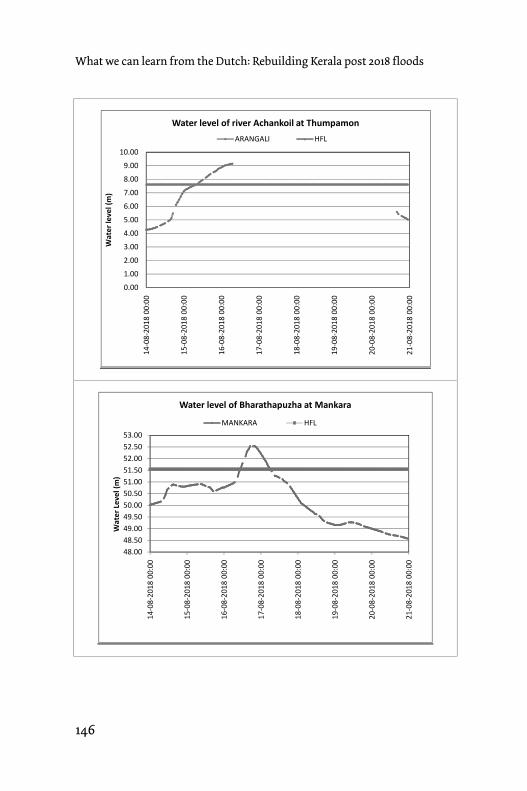
146
What we can learn from the Dutch: Rebuilding Kerala post 2018 floods Central Water Commission Hydrology (S) Dte
Kerala Floods August 2018 Page 39
0.00
1.00
2.00
3.00
4.00
5.00
6.00
7.00
8.00
9.00
10.001
4-0
8-2
01
8 0
0:0
0
15
-08
-20
18
00
:00
16
-08
-20
18
00
:00
17
-08
-20
18
00
:00
18
-08
-20
18
00
:00
19
-08
-20
18
00
:00
20
-08
-20
18
00
:00
21
-08
-20
18
00
:00
Wa
ter
lev
el
(m)
Water level of river Achankoil at Thumpamon
ARANGALI HFL
48.00
48.50
49.00
49.50
50.00
50.50
51.00
51.50
52.00
52.50
53.00
14
-08
-20
18
00
:00
15
-08
-20
18
00
:00
16
-08
-20
18
00
:00
17
-08
-20
18
00
:00
18
-08
-20
18
00
:00
19
-08
-20
18
00
:00
20
-08
-20
18
00
:00
21
-08
-20
18
00
:00
Wa
ter
Lev
el
(m)
Water level of Bharathapuzha at Mankara
MANKARA HFL
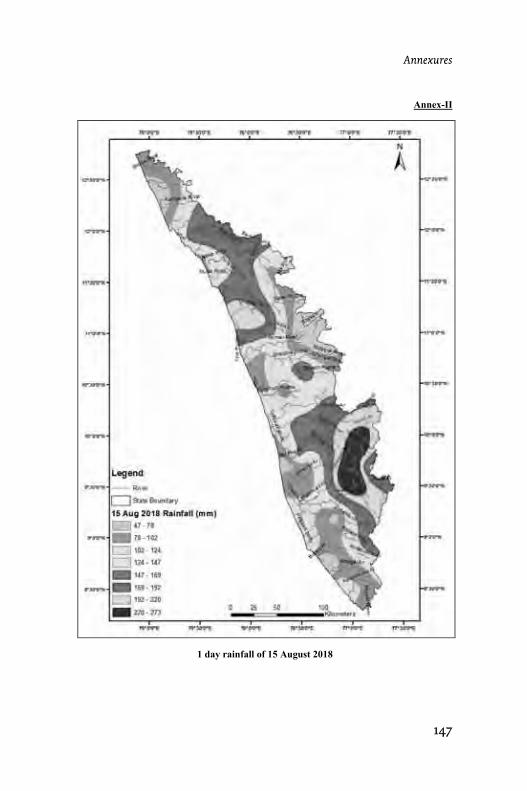
147
ConclusionAnnexures Central Water Commission Hydrology (S) Dte
Kerala Floods August 2018 Page 40
Annex-II
1 day rainfall of 15 August 2018
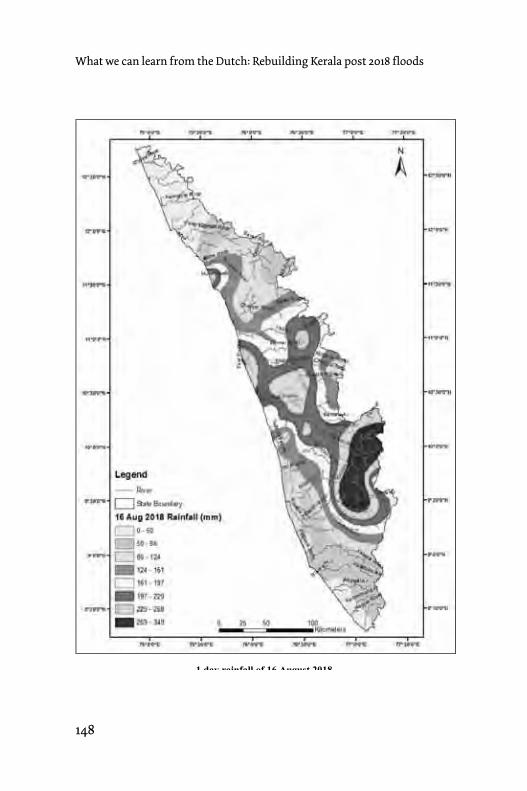
148
What we can learn from the Dutch: Rebuilding Kerala post 2018 floods Central Water Commission Hydrology (S) Dte
Kerala Floods August 2018 Page 41
1 day rainfall of 16 August 2018
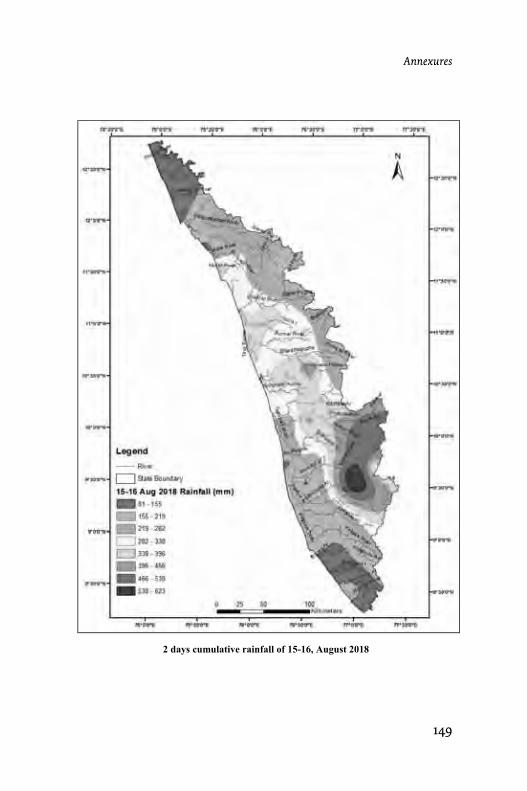
149
ConclusionAnnexures Central Water Commission Hydrology (S) Dte
Kerala Floods August 2018 Page 42
2 days cumulative rainfall of 15-16, August 2018
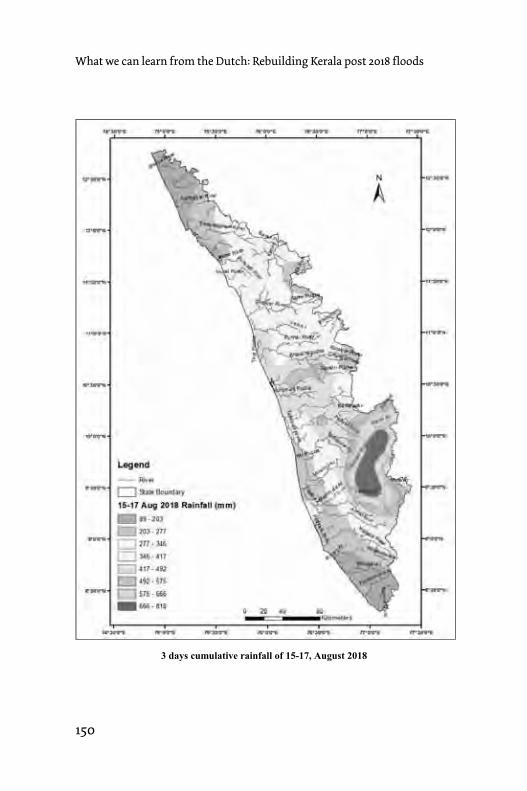
150
What we can learn from the Dutch: Rebuilding Kerala post 2018 floods Central Water Commission Hydrology (S) Dte
Kerala Floods August 2018 Page 43
3 days cumulative rainfall of 15-17, August 2018

151
ConclusionAnnexures Central Water Commission Hydrology (S) Dte
Kerala Floods August 2018 Page 44
Annex-III
Note: Storm isohyets are in cm
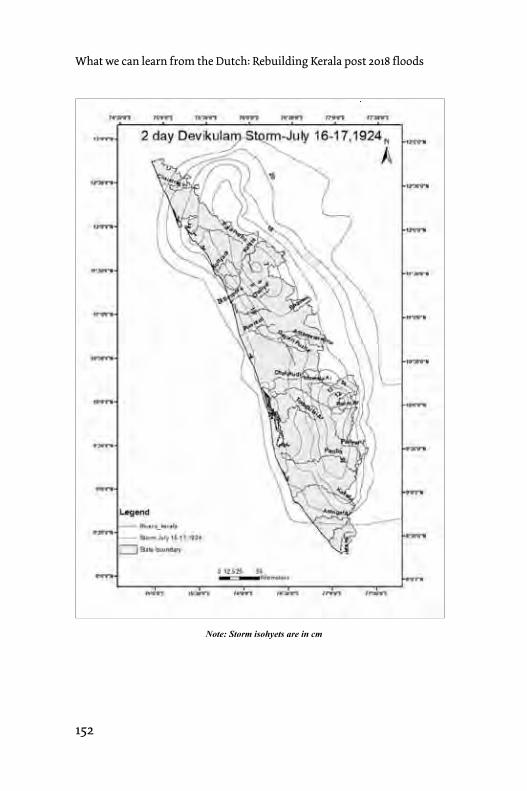
152
What we can learn from the Dutch: Rebuilding Kerala post 2018 floods Central Water Commission Hydrology (S) Dte
Kerala Floods August 2018 Page 45
Note: Storm isohyets are in cm
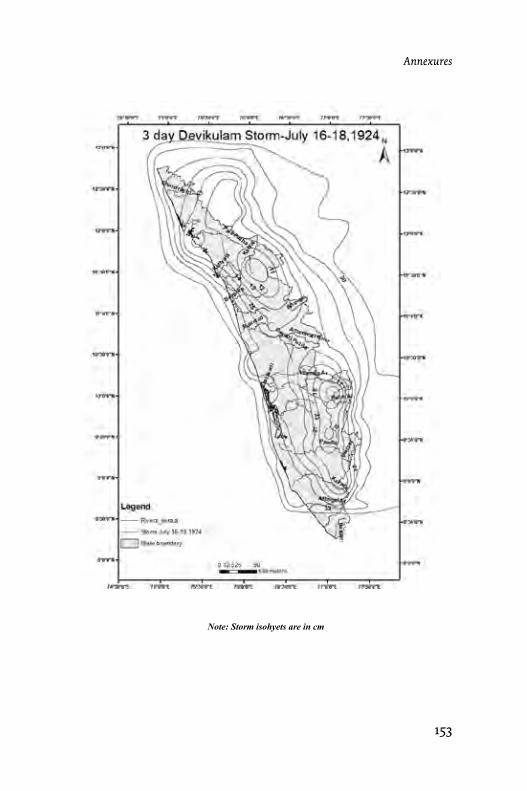
153
ConclusionAnnexures Central Water Commission Hydrology (S) Dte
Kerala Floods August 2018 Page 46
Note: Storm isohyets are in cm
154
What we can learn from the Dutch: Rebuilding Kerala post 2018 floods
Adiël Klompmaker. (2009). Nederland: zeespiegel, bodemdaling en watermanagement. Opgehaald van https://www.nemokennislink.nl/publicaties/nederland-zeespiegel-bodemdaling-en-watermanagement/Adiël Klompmaker. (2014). De watersnoodramp van 1916 . Opgehaald van https://www.nemokennislink.nl/publicaties/1916-de-watersnoodramp-die-nederland-veranderde/Deltawerken. (sd). Deltawerken - Deltaworks. Opgehaald van http://www.deltawerken.com/Deltaworks/23.htmlDeltawerken. (sd). Deltawerken - The Deltaplan. Opgehaald van http://www.deltawerken.com/The-Deltaplan-/92.htmlDeltawerken. (sd). Deltawerken - The first floods. Opgehaald van http://www.deltawerken.com/The-first-floods/302.htmlDeltawerken. (sd). Deltawerken - Zuider Zee flood (1916). Opgehaald van http://www.deltawerken.com/Zuider-Zee-flood-(1916)/306.htmlHistoriek. (sd). Watersnoodramp (1953) - Een rampzalige stormvloed. Opgehaald van https://historiek.net/watersnoodramp-1953/6913/Klijn, F., de Bruin, D., de Hoog, M., Jansen, S., & Sijmons, D. (2013, 9). Design quality of room-for-the-river measures in the Netherlands: role and assessment of the quality team (Q-team). International Journal of River Basin Management, 11(3), 287-299.Michael Kimmelman. (2017). The Dutch Have Solutions to Rising Seas. The World Is Watching. - The New York Times. Opgehaald van https://www.nytimes.com/interactive/2017/06/15/world/europe/climate-change-rotterdam.htmlRijke, J., van Herk, S., Zevenbergen, C., & Ashley, R. (2012, 12). Room for the River: delivering integrated river basin management in the Netherlands. International Journal of River Basin Management, 10(4), 369-382.Rijkswaterstaat Room for the River. (sd). River Widening Of Overdiepse Polder. Opgehaald van https://www.ruimtevoorderivier.nl/river-widening-overdiepse-polder/Rijkswaterstaat Room for the River, & UNESCO-IHE Delft. (2013). A Clever Combination Of Process And Content. UN-IHE Delft,Rijkswaterstaat Room for the River.Rijskwaterstaat Ruimte voor de rivier. (sd). Uiterwaardvergraving Meinerswijk. Opgehaald van https://www.ruimtevoorderivier.nl/project/uiterwaardvergraving-meinerswijk/River, R. R. (sd). Room For The Waal. Opgehaald van https://www.ruimtevoorderivier.nl/room-for-the-waal/Slomp, R. (2012). Flood risk and water management in the Netherlands. WD0712RB205.
Van de Ven, G. (1996). Man-made lowlands: history of water management and land reclmation in the Netherlands. Uitgeverij Matrijs.
Van Steen, P., & Pellenbarg, P. (2004). Water management challenges in the Netherlands. Tijdschrift voor economische en sociale geografie, 95(5), 590-599.
Cheryl Katz. (2013). To Control Floods, The Dutch Turn to Nature for Inspiration - Yale E360. Retrieved from Yale Environment 360: https://e360.yale.edu/features/to_control_floods_the_dutch_turn_to_nature_for_inspiration
ReferencesChapter 1
Chapter 2

155
Conclusion
Deltawerken. (n.d.). Deltawerken - Water management in the 21st century. Retrieved from http://www.deltawerken.com/Water-management-in-the-21st-century/1464.html
Enserink, B., Kamps, D., & Mostert, E. (2003). Public participation in river basin management in the Netherlands. The HarmoniCOP project—workpackage.
European Climate Adaptation Platform. (n.d.). Amphibious housing in Maasbommel, the Netherlands — Climate-ADAPT. Retrieved from https://climate-adapt.eea.europa.eu/metadata/case-studies/amphibious-housing-in-maasbommel-the-netherlands
Hoogheemraadschap van Schieland en de Krimpenerwaard. (n.d.). Eendragtspolder — Schieland en de Krimpenerwaard, naar home. Retrieved from https://www.schielandendekrimpenerwaard.nl/ons-werk/ruimtelijke-ordening/eendragtspolder
Hoogheemraadschap van Schieland en de Krimpenerwaard. (n.d.). Waterberging Museumparkgarage — Schieland en de Krimpenerwaard. Retrieved from https://www.schielandendekrimpenerwaard.nl/ons-werk/ruimtelijke-ordening/klimaatbestendige-stad/waterberging-museumparkgarage
Hoogheemraadschap van Schieland en de Krimpenerwaard. (n.d.). Waterplein Benthemplein — Schieland en de Krimpenerwaard, naar home. Retrieved from https://www.schielandendekrimpenerwaard.nl/ons-werk/ruimtelijke-ordening/klimaatbestendige-stad/waterplein-benthemplein
Ministry of Infrastructure and the Environment. (n.d.). Waterplein Tiel - Ruimtelijke adaptatie. Retrieved from https://ruimtelijkeadaptatie.nl/voorbeelden/@161147/waterplein-tiel/
Molenaar, A., & Gebraad, C. (n.d.). Rotterdam Resilient Delta City Connecting Water And Adaptation With Opportunities.
Projectinformatie - Ruimte voor de Waal. (n.d.). Retrieved from Ruimte voor de Waal Nijmegen: http://www.ruimtevoordewaal.nl/nl/het-project/projectinformatie
Prominski, M., Stokman, A., Stimberg, D., Voermanek, H., Zeller, S., & Bajc, K. (2017). River. Space. Design: Planning strategies, methods and projects for urban rivers(pp184-187). Birkhäuser.
Resilient Rotterdam. (n.d.). Resilient Rotterdam. Retrieved from https://www.resilientrotterdam.nl/en/initiatieven/rotterdam-getting-worlds-first-floating-urban-farm
Rijkswaterstaat Room for the River. (n.d.). River Widening Of Overdiepse Polder. Retrieved from https://www.ruimtevoorderivier.nl/river-widening-overdiepse-polder/
Rijkswaterstaat Room for the River. (n.d.). Room For The River Deventer. Retrieved from https://www.ruimtevoorderivier.nl/room-for-the-river-deventer/
Rijkswaterstaat, R. (n.d.). Room For The Waal. Retrieved from https://www.ruimtevoorderivier.nl/room-for-the-waal/
Rijskwaterstaat -Deltares -Ecoshape. (2013). Eco-engineering in the Netherlands Soft interventions with a solid impact. Rijskwaterstaat.
Rijskwaterstaat Ruimte voor de rivier. (n.d.). Uiterwaardvergraving Avelingen. Retrieved from https://www.ruimtevoorderivier.nl/project/uiterwaardvergraving-avelingen/
Rijskwaterstaat. (n.d.). Water innovations in the Netherlands | Leaflet | Government.nl. Retrieved from https://www.government.nl/documents/leaflets/2014/03/01/water-innovations-in-the-netherlands
Rijskwaterstaat. (n.d.). Water Management in the Netherlands. Rijskwaterstaat, Minitstry of Infrastructure and the Environment.
Rijskwaterstaat. (n.d.). Zandmotor | Rijkswaterstaat. Retrieved from https://www.rijkswaterstaat.nl/water/waterbeheer/bescherming-tegen-het-water/maatregelen-om-overstromingen-te-voorkomen/zandmotor/
Room for the River Waal – protecting the city of Nijmegen — Climate-ADAPT. (n.d.). Retrieved from European Climate Adaptation platform: https://climate-adapt.eea.europa.eu/metadata/case-studies/room-for-the-river-waal-2013-protecting-the-city-of-nijmegen
References

156
What we can learn from the Dutch: Rebuilding Kerala post 2018 floods
Tijs van den Boomen, Eric Frijters, Sandra van Assen, Marco Broekman, Guido van Eijck, Marieke Kums, Willemijn Lofvers, Saskia Naafs, Thijs van Spaandonk, Ady Steketee, F. (2017). Natuurderij- Deventer. In Urban challenges, resilient solutions : design thinking for the future of urban regions (pp. 216-223). Haarlem: TrancityxValiz.
Van Steen, P., & Pellenbarg, P. (n.d.). Water Management In The Netherlands: Introduction To The 2004 Maps Introduction: A Low Country.
Directorate Central Water Commission, H.-S. (2018). Central Water Commission Study Report Kerala Floods of August 2018 Hydrology (S) Dte.
Government of Kerala, United Nations, Asian Development Bank, World Bank, E. (2018). Kerala Post Disaster Needs Assessment Floods and Landslides-August 2018 European Union Civil Protection and Humanitarian Aid.
Hindustan Times. (n.d.). Climate change caused deadly Kerala rains: IMD | india news | Hindustan Times. Hindustan Times.
MS Swaminathan Research Foundation, India, the Government of Kerala, F. (2012). Kuttanad Below Sea Level Farming System.
Deltares. (2014). Dutch ‘Building with Nature’ approach used in coastal recovery for Java and Bali - Deltares. Retrieved from https://www.deltares.nl/en/news/dutch-building-nature-approach-used-coastal-recovery-java-bali/
Government of Kerala, United Nations, Asian Development Bank, World Bank, European Union. (2018). Kerala Post Disaster Needs Assessment Floods and Landslides-August 2018 European Union Civil Protection and Humanitarian Aid.
Government of Kerala, United Nations, Asian Development Bank,World Bank, European Union. (2018). October 2018 European Union Civil Proteccon and Humanitarian Aid Kerala Post Disaster Needs Assessment Floods and Landslides-August 2018 Executive Summary.
India Climate Dialogue. (n.d.). W(h)ither Kerala's mangroves - India Climate Dialogue. Retrieved from India Climate Dialogue: https://indiaclimatedialogue.net/2016/12/05/coastal-barriers-can-buffer-rising-seas/
Island of Dordrecht, the Netherlands | Urban green-blue grids. (n.d.). Retrieved from https://www.urbangreenbluegrids.com/projects/island-of-dordrecht-the-netherlands/
Kankara, R., Ramana Murthy, M., & Rajeevan, M. (2018). National Assessment of Shoreline changes along Indian Coast Status report for. Ministry of Earth Sciences National Centre for Coastal Research.
Kerala flood: Mass exodus in Alappuzha's Kuttanad region- The New Indian Express. (n.d.). Retrieved from http://www.newindianexpress.com/states/kerala/2018/aug/16/kerala-flood-mass-exodus-from-alappuzhas-kuttanad-region-1858642.html
Mongabay. (2018). Kerala's climate refugees increase as the sea eats into the coast. Retrieved from Mongabay: https://india.mongabay.com/2018/06/25/keralas-climate-refugees-increase-as-the-sea-eats-into-the-coast/
Rijkswaterstaat Room for the River. (n.d.). Depoldering Noordwaard. Retrieved from https://www.ruimtevoorderivier.nl/depoldering-noordwaard/
Chapter 3
Chapter 4
157
ConclusionReferences
Rijskwaterstaat -Deltares -Ecoshape. (2013). Eco-engineering in the Netherlands Soft interventions with a solid impact. Rijskwaterstaat.
Sea eats up parts of Alappuzha coast (2018). Retrieved from The Hindu: https://www.thehindu.com/todays-paper/tp-national/tp-kerala/sea-eats-up-parts-of-alappuzha-coast/article23652743.ece
Sea erosion: Coastal families conduct agitation in Alappuzha (2018). Retrieved from The Times of India: https://timesofindia.indiatimes.com/city/kozhikode/coastal-families-conducts-agitation-in-alappuzha/articleshow/64387693.cms
Stichting Toegepast Onderzoek Waterbeheer. (n.d.). Stowa - Thema's - Deltaproof - Publicaties - Meerlaagsveiligheid in de praktijk. Retrieved from http://deltaproof.stowa.nl/Publicaties/deltafact/Meerlaagsveiligheid_in_de_praktijk.aspx
The Newsminute. (n.d.). Kerala floods: With water not receding, Kuttanad is cut off from the rest of state | The News Minute. Retrieved from The Newsminute: https://www.thenewsminute.com/article/kerala-floods-water-not-receding-kuttanad-cut-rest-state-87439
Wageningen University and Research. (n.d.). Building with Nature along a tropical muddy coast in Indonesia: innovation in mangrove restoration - WUR. Retrieved from https://www.wur.nl/en/project/Building-with-Nature-along-a-tropical-muddy-coast-in-Indonesia-innovation-in-mangrove-restoration.htm

158
What we can learn from the Dutch: Rebuilding Kerala post 2018 floods

159
Conclusion

160
What we can learn from the Dutch: Rebuilding Kerala post 2018 floods