
What Makes a Good EUL? Analysis of Existing Estimates and ...
14
What Makes a Good EUL? Analysis of Existing Estimates and Implications for New Protocols for Estimated Useful Lifetimes (EULs) By Lisa A. Skumatz, Ph.D., Skumatz Economic Research Associates, Inc., Superior, CO ABSTRACT Determining a high efficiency measure’s lifetime is integral to reliably estimating energy savings. For more than 20 years, measure lifetime tables have been developed and used for program planning and evaluation by utilities across the United States (US). This paper investigates the following topics: Are the current protocols and values used around the US defensible? To what degree are the values transferable? What operational or other considerations affect (or should affect) the values used for a particular measure / sector / region (like business turnover, sector, climate, etc.)? What planning values should be used for “new” (measures without accepted lifetimes or a track record) and behavioral program measures How should remaining useful lifetime and technical degradation factors be treated? To examine these topics, the authors cross-compared the tables of measure lifetime values adopted by utilities across the US and tracked the underlying source(s) of the values. The authors assembled and performed a quality assessment analysis on more than 150 lifetime studies to identify measures for which high-quality, defensible estimated useful lifetimes EUL were (and were not) available. The authors also explored patterns of EUL values based on operating conditions, climate, and other factors. Dozens of studies addressing experimental design for evaluation of impacts and retention of behavioral programs in fields including and beyond the energy field were reviewed, as were measures for which changes in EULs would make an important difference in accepting or rejecting programs. The authors provide the results of these analyses and propose a methodology for calculating variations in EULs. This paper also suggests guidelines for 1) determining reliable EULs; 2) addressing behavioral programs; and 3) developing lifetimes for “new” measures and technologies without an in-field track record. INTRODUCTION 1 Sometimes called measure lifetime, persistence or retention, estimated useful lifetime (EUL) is one of the four important inputs into benefit-cost and other tests of an energy efficiency program’s performance. EULs are defined as the median number of years after installation in which 50% of the measures are in place and operable. EULs began to be examined in the late 1980s and early 1990s, as suspicions arose that laboratory lifetimes didn’t necessarily match marketplace retention for measures installed in large-scale programs. Business turnover, remodeling, climate, varying maintenance and many 1 Thanks to Juri Freeman, Dana D’Souza and Dawn BeMent of Skumatz Economic Research Associates for research contributing to this paper. 2012 International Energy Program Evaluation Conference, Rome, Italy 1
-
Upload
khangminh22 -
Category
Documents
-
view
0 -
download
0
Transcript of What Makes a Good EUL? Analysis of Existing Estimates and ...

What Makes a Good EUL? Analysis of Existing Estimates and Implications
for New Protocols for Estimated Useful Lifetimes (EULs)
By Lisa A. Skumatz, Ph.D., Skumatz Economic Research Associates, Inc., Superior, CO
ABSTRACT
Determining a high efficiency measure’s lifetime is integral to reliably estimating energy
savings. For more than 20 years, measure lifetime tables have been developed and used for
program planning and evaluation by utilities across the United States (US). This paper
investigates the following topics:
Are the current protocols and values used around the US defensible?
To what degree are the values transferable?
What operational or other considerations affect (or should affect) the values used for a
particular measure / sector / region (like business turnover, sector, climate, etc.)?
What planning values should be used for “new” (measures without accepted lifetimes or
a track record) and behavioral program measures
How should remaining useful lifetime and technical degradation factors be treated?
To examine these topics, the authors cross-compared the tables of measure lifetime values
adopted by utilities across the US and tracked the underlying source(s) of the values. The
authors assembled and performed a quality assessment analysis on more than 150 lifetime
studies to identify measures for which high-quality, defensible estimated useful lifetimes EUL
were (and were not) available. The authors also explored patterns of EUL values based on
operating conditions, climate, and other factors. Dozens of studies addressing experimental
design for evaluation of impacts and retention of behavioral programs in fields including and
beyond the energy field were reviewed, as were measures for which changes in EULs would
make an important difference in accepting or rejecting programs.
The authors provide the results of these analyses and propose a methodology for calculating
variations in EULs. This paper also suggests guidelines for 1) determining reliable EULs; 2)
addressing behavioral programs; and 3) developing lifetimes for “new” measures and
technologies without an in-field track record.
INTRODUCTION1
Sometimes called measure lifetime, persistence or retention, estimated useful lifetime
(EUL) is one of the four important inputs into benefit-cost and other tests of an energy efficiency
program’s performance. EULs are defined as the median number of years after installation in
which 50% of the measures are in place and operable.
EULs began to be examined in the late 1980s and early 1990s, as suspicions arose that
laboratory lifetimes didn’t necessarily match marketplace retention for measures installed in
large-scale programs. Business turnover, remodeling, climate, varying maintenance and many
1 Thanks to Juri Freeman, Dana D’Souza and Dawn BeMent of Skumatz Economic Research Associates for research
contributing to this paper.
2012 International Energy Program Evaluation Conference, Rome, Italy 1

other factors could potentially contribute to variations in lifetimes in the real world, and with
large-scale public contributions (in the form of ratepayer “public good charges” used to fund
efficiency programs), as well as shareholder and other dollars at risk, attention turned to
researching the question.
Protocols around the US are based on survival function approaches, which represent
defensible approaches for deriving values. In theory, standard practice and protocols for primary
EUL studies for a program measure generally involve:
A large-scale statistical survey or on-site visits2 to identify whether the measure is still in
place and operable, and if not, when it was removed,3
A statistical analysis using specialized lifetime / survival modeling approaches.4
Given the expense and complexity of the estimation work – and most especially the
necessary delay, relative to when the program is implemented5 – research on EUL has not
paralleled the frequency of implementation of new programs. Nor has it kept up with the
number and frequency of impact evaluations estimating program savings, which can be
conducted within a year or two of the program’s implementing. EUL values for programs and
benefit-cost and regulatory tests have tended to rely on EUL tables derived from secondary
sources and bootstrapped from existing tables.
Status of EUL Research
Bonneville Power Administration conducted a study of the effect of commercial turnover
on measure retention in 1991, and an official commercial EUL study in 1994 (Skumatz et. al.,
1994). Progress continued in several areas of the US (including the Northwest and Northeast),
but accelerated when California’s regulators developed protocols and required two phases of
EUL studies for identified measures funded by public goods funds. The goal of these EUL
studies was to determine whether the ex post EUL for the program measures was statistically
different from the program planning ex ante value. In 2004, the authors conducted a detailed
review (Skumatz, et. al. 2004) of more than 90 of these California studies (conducted between
January 1999 through March 2004), and the work was ultimately used to feed back into revised
EULs for California (Skumatz and Gardner 2005a).
Over the years, tables of EUL values to use in assessing program investments have been
adopted around the US. A 2009 review was conducted to assess the sources of EUL values, the
quality of the sources, and patterns in EUL values. The research found that very few of these
tables are documented. Interviews with staff from various agencies leads to the conclusion that
values were “bootstrapped” from tables adopted by other agencies across the country, adjusted
(either not at all or in fairly ad hoc ways) based on conference call discussions (Skumatz et.al.
2009). California’s EULs were updated in 2006 using feedback from the studies required under
2 The adequacy of phone vs. on-site depends on the measure type. A single new water heater in a household can
feasibly and reliably be asked by phone (Skumatz & Bordner 1997). Banks of fluorescent lighting in commercial
establishments may not be as well-suited to a phone interview approach. 3 and in some cases, whether it was moved elsewhere in the service territory and is still operating.
4 usually like SAS™ procedures Lifereg, lifetest, etc.
5 Confirmation / estimation of the lifetime needs to wait for multiple failures – which takes years. The program
implementers want reimbursement and/or incentives for the programs close to when the measures are installed.
2012 International Energy Program Evaluation Conference, Rome, Italy 2

the protocols6, and refined with conference call discussions; additional updates were
incorporated into the several-hundred-measure-long California DEER (Data Base for Energy
Efficient Resources) deemed values tables (which also include savings and costs).
The research finds most of the updates are based on existing tables used elsewhere (or
summary studies of EUL tables), not on original EUL research, although updates to EUL tables
in Canada, New England, and a few other locations are at least including the reports and citations
from which the adopted values derive. To put it simply, citations and sources for adopted EUL
tables are usually missing (and forgotten), and when present, they are surprisingly circular.
THE EUL PROBLEM: GAPS AND WEAKNESSES
In our review of existing EUL tables and values, we identified the following issues:
Lack of documentation of sources: Most tables of EULs lack source documents. Author
interviews and research indicate they were adopted some years ago, apparently based on research
on values used by other agencies around the nation. When ranges were identified, the value was
selected (usually via conference call or meeting) based on a comparison of most similar climate
or other factors that might influence usage and lifetime. There are other sources than survival
studies that can serve to estimate measure lifetimes. ASHRAE reports and journals (American
Society of Heating, Refrigerating, and Air-Conditioning Engineers) include published tables of
component lifetimes, but interviews indicate that the source for many of these values is expert
opinion, or values carried over from more than 30 years ago that were originally derived through
discussion.7
Few independent, quality studies: It is impossible to say exactly how many EUL studies have
been conducted, on how many measures, and where gaps remain. California’s CADMAC
searchable database lists 95 studies conducted between 1994 and 2006, about half of which
would be unique studies, and a fair number cover many of the same (common) measures, leaving
gaps in EUL research for less common measures.8 Of the 129 references that come up on CEE’s
database when searching “measure lifetime”, one was an EUL study; the remainder referred to
using values from tables. Other studies have certainly been completed other places, and we have
also found a few studies conducted in the UK, but the indications are these studies are not
widespread, and are not being conducted in bulk currently.
6 Note that these studies were not conducted to identify the appropriate EUL value; instead, they were designed to
test whether or not the ex post estimated EUL was significantly different from the ex ante value in the table. The
study notes whether the estimated value passed this test or not, and did not recommend new values. They did,
however, provide information indicating where ex ante values may or may not be supportable. 7 We discuss ASHRAE’s on-line database , which is a separate resource, later in this paper.
8 In the same database, there are 474 impact evaluation studies, and 245 process evaluations. California is clearly
the unusual case, with a significant number of EUL studies. Note, however, that the number of unique program
studies would be about half (there are repeats – 4th
and 9th
year, etc.). In addition, our review of these studies shows
that many conducted lifetime evaluations of the same measures because similar measures were included in multiple
programs. For the California studies, 22 addressed agricultural programs; 43 covered commercial and 26 industrial
(with some overlap), 38 were residential, and 21 covered new construction (again some overlap). There was also
significant repetition in the measures analyzed.
2012 International Energy Program Evaluation Conference, Rome, Italy 3

Misleading number of values: Many tables (including DEER) show values for hundreds of
measures. To the casual observer, this would tend to imply that there have been studies that
assign distinct measure lifetimes to each measure – including CFLs of different wattages, heating
equipment put in different business types, etc. The same values are repeated for whole
categories of equipment. This may be convenient, but it may lead some to think there is actual
data to support these different values, but this is not the case.
Lack of specificity for program variations: On the flip side of the previous issue is the
concern over one value used for a measure in all conditions. An illustrative example is that a
measure life of 10 years might be applied to a commercial lighting measure, when it may be left
in place for decades in the cash-strapped school sector, but changed out in three years in the
fashion-conscious restaurant sector. If savings are to be counted on, or “fair” incentives are to be
provided, there is a clear disconnect if one value is used. Where important variations can be
justified, they should be addressed to prevent “churning”, misuse, or mis-forecasting. We need
to recognize the variability, but not over-reach (as the previous bullet).
Lack of EULs for Behavioral Programs: Although virtually all programs involve some
behavioral element that has the potential to affect measure lifetime (O&M not conducted, on/off
switching outside of expectations, the selection as to setting on thermostats9, or myriad other
examples), one of the biggest gaps in lifetime studies is the virtual non-existence of studies
examining the retention of education, training, and behavior-focused “measures”. Behavioral
programs tend not to get energy savings credit, so EULs / retention / persistence has not been
much studied, even though the programs and their outcomes presumably do have lifetimes.
Reviewing more than 100 studies in education / training ((Skumatz and Green 2000, Skumatz
2009, Freeman and Skumatz 2012); we found only a couple that even mentioned the topic of the
retention of savings. Lacking other values, some utilities have “assigned” values of between one
and three years, but without research underpinning the selection.
The authors argue that there has not been enough attention to the topic of EULs. The
values being used bring a lack of reliability, and potential variation that undermines the accuracy
of computations of benefit cost ratios, regulatory tests, incentives, and other results. However,
impact evaluations measuring program savings are plentiful, and program-specific. The adage
that fits is “measuring <savings> with a micrometer, and cutting <EULs”> with a chainsaw”.
On the face of it, the resource allocation doesn’t seem to make sense; more budget to EULs
would likely improve computations more than more budget in impact evaluation work.
Is it a big problem?
Is this paucity of “real” data on EULs a big problem? Individual conditions affect the answer.
Not if we never have new equipment / innovations, or if the equipment uses the same
basic “mechanics” as other equipment that does have well-estimated EULs, or if the new
9 or the fact that some households never program them in the first place – a behavior potentially induced by lack of
knowledge
2012 International Energy Program Evaluation Conference, Rome, Italy 4

components or construction are similar in lifetimes to earlier equipment used for
estimating the EUL10
.
Not if the equipment is installed and maintained similar to the original equipment
measured for the EUL is well-performed – or the specific equipment type isn’t sensitive
to variations in these conditions.11
Not if we never vary the groups to whom we deliver programs or the climates in which
we deliver them, and use values computed for other situations.
Not if the EUL values that are estimated for the equipment show minimal variation.
Not if the measure isn’t an important part of the portfolio savings, benefit-cost, or
incentive.
However, we do have new equipment – and programmatic – innovations all the time.
Programs are introduced to new sectors and delivered in different ways. Derived EULs are
missing (or essentially ad hoc values are used) for measures that represent non-trivial portions of
the portfolio. And most importantly, the author’s research shows that the EULs that exist in
tables routinely vary by more than 25%. Regulators would be highly unlikely to accept savings
values that were off by 25%, but EULs that are off by that same amount have precisely the same
impact on a measure’s or program’s benefit cost ratio. The questions remain… If we agree with the assertion that evaluation is about helping to
avoid wrong decisions (Granger, 2006, Skumatz et.al. 2009), is the error introduced from
unsecured EUL values large enough to cause “wrong decisions about programs”? Are the ones
we’re using <badly> in error? Should we compute new measure lifetimes? At what cost? In
what timeframe? What are our options?
POSSIBLE SOLUTIONS? APPROACHES FOR PRACTICAL BEST
PRACTICES
Based on our review, there are several main sources that can be used to derive EUL
values, in the US or in some cases, internationally. Options, and their strengths and weaknesses,
are described in Table 1. The authors also summarize the relative quality of the option as a
source for EUL estimates, classified as high, medium, and lower quality, with the rationale
described within the Table (strong quantitative sources are generally higher quality; less
quantitative sources are generally assigned lower quality).
10
As an example, author interviews show contractors rail about the early failure of electronic components on boilers
and about construction of major equipment with flimsier materials that fail early. The contractors specifically
complain about electronic pieces that fail in five years and can’t be replaced because ‘we don’t support that
anymore’ or equipment that are completely dependent on frequent maintenance when earlier generations of the
equipment could be installed and ‘practically left on its own for years’. 11
If new, or energy efficient equipment is sensitive to these conditions, then EULs used in the past may be
vulnerable to error.
2012 International Energy Program Evaluation Conference, Rome, Italy 5

Table 1: Alternative Sources for Deriving EUL Estimates (Source: SERA) Source and Relative Quality Assessment
12 Key Advantages Key Disadvantages
1. Statistical EUL Studies and Adopted Values for
the specific defined measures: Studies of the
effective useful life of a measure that included
statistically valid samples of measure installation
conducted by independent third parties conducted
according to reliable protocols. Best practices
and protocols exist for these studies, including
protocols in various states, frameworks, and other
documents (Skumatz and Gardner 2005a,
Skumatz et.al. 2009). This represents a medium
to high quality source for EULs, depending on
methods and documentation. Cost: medium-high
Primary data,
quantitative
Statistical,
defensible, based
on real-world
installation
Somewhat costly
Can’t be conducted until
several years after
implementation, awaiting
failures.
Presumably, results would
vary based on program
design / conditions.
2. ASHRAE Tables: ASHRAE’s website includes
a database of reported data from 39,000 pieces of
equipment with service life data. The database
covers 8 end use measure types.13
The data can
be filtered as US-wide, or multiple geographic
sub-regions of the US. The tables report the
mean and median ages (and confidence intervals)
for equipment replaced, and equipment still in
service. This represents a medium quality source
for EULs as they include large sample sizes and
actual failures, but specificity to individual
measures / models is missing. Cost: low.
Primary data,
quantitative
Based on large
numbers of
equipment by
“type”
Data available by
region
Free, available at
any time
Not clear if it is random
reporting of information
Little information on
installation conditions,
situation, and refined
information on equipment
models, etc.
Gaps in data available.
3. Manufacturer warranty and lifetime
information: Manufacturers provide lifetime
information and lifetimes in association with
major equipment. These data provide a possible
source for EULs, or at least a source for the order
of magnitude for the range for the measure
lifetime. The confidence that can be placed in
EULs from this source is significantly improved
(to medium) if the estimation work is conducted
according to (and/or by) independent third party
measurement protocols. Otherwise, poorly
documented values represent lower quality / basic
sources for EUL values. Cost to use: low.
Presumably
primary data,
quantitative
Based on specific
equipment
Warranties may
provide a
“minimum” value
for EUL
Free, available at
any time
Unclear protocols, sample
sizes, etc. for study
Unclear is median or mean
lifetimes (medians are
standard for EULs)
Laboratory conditions
unlikely to mimic real-
world installations, field
operating conditions
Possible “commercial
agendas” embedded in the
numbers
May not be available for
all equipment
4. Stock / turnover and other studies: Several
statistical studies have been conducted using
stock, turnover, age cohorts, and other data from
surveys or shipments sources to estimate lifetimes
for measures. Some have been weak (basic), with
small sample sizes or “fairly” applicable
equipment types (rather than models); others have
Statistical, primary
data, based on real-
world operating
conditions
Doesn’t require
new data collection
Can be conducted
Complicated analysis
Shipments transfer
between states
Hard to assign lifetime to
specific program designs
and installation conditions.
12 Note that any of these options is ranked higher quality for a particular EUL application if they include strong
sample sizes, are well-documented, are adjusted to represent local conditions using defensible adjustment
mechanisms, or otherwise enhanced. 13
1) Air distribution, with 18 equipment options; 2) cooling, with 18 equipment options; 3) heat rejection, with 11
equipment options; 4) cooling pumps, with 6 equipment options; 5) heating, with 19 equipment options; 6) heating
pumps, with 6 equipment options; 7) controls, with 9 options; and 8) miscellaneous, with 22 options including
cogeneration, heat exchangers, humidifiers, refrigeration equipment and other types.
2012 International Energy Program Evaluation Conference, Rome, Italy 6

Source and Relative Quality Assessment12
Key Advantages Key Disadvantages
been fairly elaborate and higher quality (US
Department of Energy; medium quality source).
Cost: medium-high.
at any time Equipment “groups”, not
specific models
Not available for all
equipment
5. Review of adopted EUL tables from other
agencies: Researchers can assemble EUL tables
from other agencies, and attempt to identify their
underlying sources (and associated quality).
Values can be assigned based on various criteria:
documentation, consistency across sources, most
similar regionally, etc. This is a medium quality
source for EULs if well-documented, and a more
“basic” source if documentation of derivation is
missing or unclear, or the match of measure is
poor, etc. Cost: low.
Quasi-Quantitative
Inexpensive, quick
May be based on
values used for a
long period
(hopefully vetted
by experience)
Not reinventing the
wheel
Secondary data, unclear
lineage in many cases
Quality depends on source;
may / may not be based on
real-world operations
Not for the same program
design/ installation
conditions
Doesn’t encourage re-
analysis
6. Delphi with experts: Experts are provided data
on starting values for EULs of interest. Experts
are asked to respond with their value or reaction
to the values; new ranges / estimates are
computed and experts asked for another response,
and the revised values are used. These non-
statistical approaches to estimating EULs are
generally lower quality. Cost: low.
Inexpensive, quick
Leverages
expertise
Organized process
/ documentation
Not quantitative / not based
on primary data
May not well consider
specific operating
conditions, equipment
models
7. Stakeholder / expert discussion: Less formal
discussions, conference calls, stakeholder
feedback, surveys, or other mechanisms are used
to negotiate EUL values, usually with starting
values from secondary sources, as available.
These non-statistical approaches to estimating
EULs are generally lower quality. Cost: low.
Inexpensive, quick
Leverages
expertise
Not quantitative / not based
on primary data
May not well consider
specific operating
conditions, equipment
models
8. Other: TBD TBD
Identifying Measures that Need Higher-Reliability EUL Sources
Not all the options require primary data analysis, and not all the measures justify high cost
EUL derivations. Based on our analysis of the gaps and weaknesses (above), the authors suggest
the following criteria for assessing which measures may be in need of higher-reliability EUL
estimation work.
Level of Risk: The higher the risk of a poor (financial or other) decision from a bad EUL
value, the higher the priority of the measure in EUL terms. The most notable example would
be a measure for which the TRC (Total Resource Cost) Benefit/cost estimate is “near one”.
Risk may also arise from volatility of other elements of the computations (gas prices, etc.).
Importance / Priority: Measures responsible for high savings in an integrated plan (and for
which the EULs aren’t strong) would be higher priority for higher quality EULs. Similarly,
measures responsible for high payments or incentives might also be candidates for higher
quality EULs.
High Variability / Uncertainty and New Measures: Measures for which there is high
variability in the existing values, or for which there are no values – either because they are
2012 International Energy Program Evaluation Conference, Rome, Italy 7
new measures or have not been studied or incorporated into programs much in the past –
would hold higher priority for research than those with minimal variability.
Other criteria may also arise.
The authors suggest that EULs for high priority measures, and those with high risk, should, at
some point, be based on quantitative, and potentially primary, data work. Where those
characteristics intersect with highly variable EULs from the existing literature and EUL tables –
or new measures – estimation work is likely also warranted.
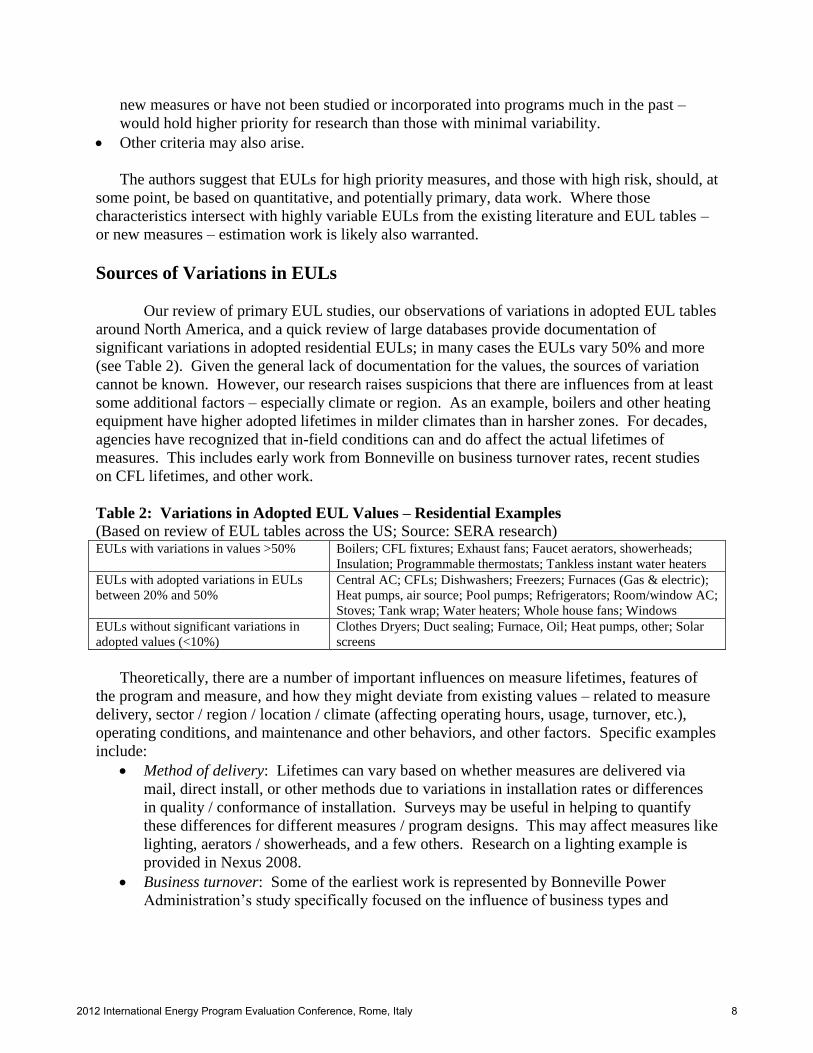
Sources of Variations in EULs
Our review of primary EUL studies, our observations of variations in adopted EUL tables
around North America, and a quick review of large databases provide documentation of
significant variations in adopted residential EULs; in many cases the EULs vary 50% and more
(see Table 2). Given the general lack of documentation for the values, the sources of variation
cannot be known. However, our research raises suspicions that there are influences from at least
some additional factors – especially climate or region. As an example, boilers and other heating
equipment have higher adopted lifetimes in milder climates than in harsher zones. For decades,
agencies have recognized that in-field conditions can and do affect the actual lifetimes of
measures. This includes early work from Bonneville on business turnover rates, recent studies
on CFL lifetimes, and other work.
Table 2: Variations in Adopted EUL Values – Residential Examples
(Based on review of EUL tables across the US; Source: SERA research) EULs with variations in values >50% Boilers; CFL fixtures; Exhaust fans; Faucet aerators, showerheads;
Insulation; Programmable thermostats; Tankless instant water heaters EULs with adopted variations in EULs
between 20% and 50% Central AC; CFLs; Dishwashers; Freezers; Furnaces (Gas & electric);
Heat pumps, air source; Pool pumps; Refrigerators; Room/window AC;
Stoves; Tank wrap; Water heaters; Whole house fans; Windows EULs without significant variations in
adopted values (<10%) Clothes Dryers; Duct sealing; Furnace, Oil; Heat pumps, other; Solar
screens
Theoretically, there are a number of important influences on measure lifetimes, features of
the program and measure, and how they might deviate from existing values – related to measure
delivery, sector / region / location / climate (affecting operating hours, usage, turnover, etc.),
operating conditions, and maintenance and other behaviors, and other factors. Specific examples
include:
Method of delivery: Lifetimes can vary based on whether measures are delivered via
mail, direct install, or other methods due to variations in installation rates or differences
in quality / conformance of installation. Surveys may be useful in helping to quantify
these differences for different measures / program designs. This may affect measures like
lighting, aerators / showerheads, and a few others. Research on a lighting example is
provided in Nexus 2008.
Business turnover: Some of the earliest work is represented by Bonneville Power
Administration’s study specifically focused on the influence of business types and
2012 International Energy Program Evaluation Conference, Rome, Italy 8

associated turnover, remodel, and renovation on four classes of measures – heating,
lighting, air-conditioning, and controls (Skumatz et.al. 1991).14
Operating hours: Recent examples of research into factors affecting lifetimes include the
exhaustive studies examining CFL lifetimes that recognize the influence of operating
hours on the years of EUL (business sectors, and for residential, the influence of the room
in which the CFL is installed) (KEMA 2008, Gaffney et. al. 2010).
Climate / region: Lifetimes for some measures can be affected by climate or region.
Many of the drivers relate to operating hours, but conditions may also matter. Our
review of lifetimes show shorter lifetimes appear to be adopted for heating systems in
colder climates, although without documentation, it could be this is based on agreement
rather than specific study. One source for adjustment factors may be the ASHRAE tables
(see ASHRAE reference), which allow sorting of age and lifetime data by region of the
country.
Sizing, installation and commissioning: Programs (and presumably the EULs) generally
assume installation according to manufacturer specifications; however, in real-world
retrofits, contractors commonly complain about insufficient clearance between high
efficiency system coils and walls, among many other considerations that could affect
equipment lifetimes. Quantifying these influences may be difficult, but a combination of
on-site inspections (associated with existing QA/QC) might help develop expert
adjustments when these types of factors exist. This could affect any measure, but might
be especially relevant in HVAC, water heating, and process measures.
Operations, maintenance, and behaviors: Systematic differences in operations,
maintenance or other behaviors might include failure to clean coils or filters, or other
practices. 15
Two programs with the same equipment might differ because one provided
education, or provided a maintenance contract, that affects O&M behaviors, and as a
consequence, lifetimes. Again, quantifying these influences on a broad scale may be
difficult; perhaps warranty information might provide clues. This could affect any
measure, including lighting (of course), the major end uses (HVAC, water heating) and
the variety of miscellaneous and process uses.16
An example of a study of the impact of
on-off switching of lighting (Jump, et.al, 2008).17
The degree to which cause-related variations can be formalized and turned into specific and
defensible “adjustment tables” to apply to “standard or default” EULs to provide more tailored
values in absence of specific statistical EUL studies conducted for a program or measure depends
on the region and measure. These types of efforts are currently underway by the author.
14
This study found some sectors experienced turnover, renovation, or remodeling rates that implied one half to one
third the equipment lifetime in some sectors compared to others; in some cases, even higher differences were implied. 15
Including factors mentioned earlier – climate or business types that affect operating hours, etc. 16
Recommendations for methods for behavioral program retention studies are included in Freeman and Skumatz
2012 and Skumatz 2012b. 17
Note: one commenter notes that the user should check whether the equipment covered by this study is still in use
in any programs to which its conclusions might be applied.
2012 International Energy Program Evaluation Conference, Rome, Italy 9
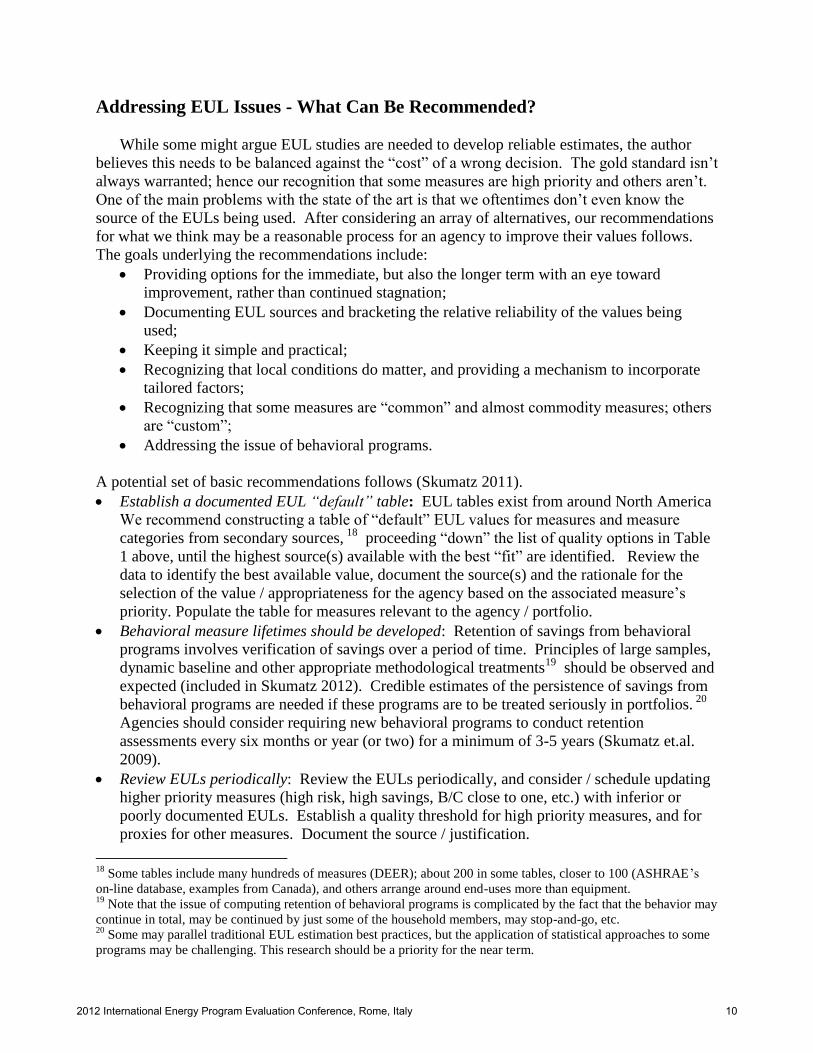
Addressing EUL Issues - What Can Be Recommended?
While some might argue EUL studies are needed to develop reliable estimates, the author
believes this needs to be balanced against the “cost” of a wrong decision. The gold standard isn’t
always warranted; hence our recognition that some measures are high priority and others aren’t.
One of the main problems with the state of the art is that we oftentimes don’t even know the
source of the EULs being used. After considering an array of alternatives, our recommendations
for what we think may be a reasonable process for an agency to improve their values follows.
The goals underlying the recommendations include:
Providing options for the immediate, but also the longer term with an eye toward
improvement, rather than continued stagnation;
Documenting EUL sources and bracketing the relative reliability of the values being
used;
Keeping it simple and practical;
Recognizing that local conditions do matter, and providing a mechanism to incorporate
tailored factors;
Recognizing that some measures are “common” and almost commodity measures; others
are “custom”;
Addressing the issue of behavioral programs.
A potential set of basic recommendations follows (Skumatz 2011).
Establish a documented EUL “default” table: EUL tables exist from around North America
We recommend constructing a table of “default” EUL values for measures and measure
categories from secondary sources, 18
proceeding “down” the list of quality options in Table
1 above, until the highest source(s) available with the best “fit” are identified. Review the
data to identify the best available value, document the source(s) and the rationale for the
selection of the value / appropriateness for the agency based on the associated measure’s
priority. Populate the table for measures relevant to the agency / portfolio.
Behavioral measure lifetimes should be developed: Retention of savings from behavioral
programs involves verification of savings over a period of time. Principles of large samples,
dynamic baseline and other appropriate methodological treatments19
should be observed and
expected (included in Skumatz 2012). Credible estimates of the persistence of savings from
behavioral programs are needed if these programs are to be treated seriously in portfolios. 20
Agencies should consider requiring new behavioral programs to conduct retention
assessments every six months or year (or two) for a minimum of 3-5 years (Skumatz et.al.
2009).
Review EULs periodically: Review the EULs periodically, and consider / schedule updating
higher priority measures (high risk, high savings, B/C close to one, etc.) with inferior or
poorly documented EULs. Establish a quality threshold for high priority measures, and for
proxies for other measures. Document the source / justification.
18
Some tables include many hundreds of measures (DEER); about 200 in some tables, closer to 100 (ASHRAE’s
on-line database, examples from Canada), and others arrange around end-uses more than equipment. 19
Note that the issue of computing retention of behavioral programs is complicated by the fact that the behavior may
continue in total, may be continued by just some of the household members, may stop-and-go, etc. 20
Some may parallel traditional EUL estimation best practices, but the application of statistical approaches to some
programs may be challenging. This research should be a priority for the near term.
2012 International Energy Program Evaluation Conference, Rome, Italy 10

Employ base EUL from default table or other sources: For program measures, use the most
suited EUL – measure or measure class – from the default table. If the measure is new, or is
missing from the default table, walk down the source options (Table 1), developing the best
value (which may be expert opinion, Delphi, warranty, etc. if no studies or adopted values
are available). If the quality of the available / developed value is not high enough to match
the measure’s priority, select a process / schedule for developing a quality value. Document
the source / justification.
If justified, tailor estimate with explicit adjustment factors: After identifying a starting EUL
value from the table or research, consider whether application of different adjustment factors
could improve the suitability of the EUL for the program / location / situation. Justify
inclusion / exclusion of each explicitly – delivery method, sector, turnover, operating hours,
climate, sizing, installation conditions, commissioning, operations, maintenance, and
behavioral influences, and any other deviations. Document the source / justification /
computations.
Consider other adjustments as needed: If the program meets the conditions for early
replacement or other elements related to conditions of RUL21
/ remaining useful lifetime
(imminent codes, other factors), adjust the lifetime accordingly (Skumatz 2011).22
If a
program is designed as early replacement, a credible case could be made for higher savings
for the period between the program’s replacement and end of life of the original equipment
(dependent on vintage), and traditional incremental savings until the expiration of the EUL.
If codes and standards can be foreseen, and the (adopted) estimated useful life exceeds the
number of years between installation of the measures and the implementation of codes, then
the measure life should be truncated and assigned the number of years to implementation of
the codes. Document the adjustment, computations, and source data. Adjustments are not
usually needed for Technical Degradation Factors (TDF).23
SUMMARY AND RECOMMENDATIONS: EULs – THE UNDER-RATED VALUE
The main conclusions of the paper follow:
Although defensible protocols exist, most adopted EULs are poorly documented: Despite
the existence of defensible protocols and adopted EUL tables for agencies across North America,
review of EUL values in use indicate weak documentation, “circular” derivations, and fairly
significant variations for some measures. The weaknesses and gaps in documentation make it
difficult to determine the defensibility of the values being used. But even though well-accepted
protocols exist (generally based on survival-based methods), the expense of the studies and the
21
Thanks are due to the NW Regional Technical Forum’s EUL Subcommittee and Mark Kendall, oversight contractor,
for suggesting RUL could be treated as an adjustment factor, and for many suggestions enhancing this paper. 22
Estimating RULs can be accomplished through additional survey questions at installation, existing data on
equipment vintage in the region, mortality computations / distributions on verified equipment age (or survey
information where model information is not available) to develop estimates of early removal periods, or adopting age
cohort information on equipment shipments / stocks (Welch and Rogers, 2011). 23
If technical degradation between an efficient measures and its standard counterpart is available at the time of the
program, and if an appropriate and defensible TDF scalar is available, then that scalar can be appropriately and
consistently applied to the adopted measure life as an adjusted measure life for the program measure. Most utilities
assume the influence of technical degradation is incorporated into measure lifetimes (Skumatz 2010).
2012 International Energy Program Evaluation Conference, Rome, Italy 11

time delays needed to await sufficient failures has led to relatively few primary, statistical EUL
studies being conducted.
Existing EULs vary for the same measure: EUL values currently in play across the country
vary significantly. Some variations may be due to climate and other explanatory factors. In
other cases, variations arise even for measures that might not be expected to vary with climate or
other basic explanatory factors (e.g. dishwashers, stoves, tankless water heaters).
Alternatives for deriving defensible EULs exist: Statistical survival-based EUL studies have
been the gold standard in EUL estimation, and generally the only alternative used. In this paper,
we present and rank a number of methods for developing EUL values (statistical studies,
ASHRAE tables, warranty data, shipments analyses, expert / Delphi, and other approaches), a list
that may provide defensible, practical, cost-effective alternatives – and documentable - proxies
for EULs. These proposed approaches address common measures, and provide possible options
to address new measures (which don’t have time for field failures, at least up front) and
behavioral programs.
Alternative EUL approaches may suffice for lower priority measures, saving budget for
defensible work on high priority EULs: The most expensive EUL derivation approaches may
not be justified or necessary for all measures. For measures that clearly pass benefit/cost tests, or
those with low cost or small savings in the integrated plans, simpler methods may suffice; for
high value / priority measures, EUL studies or more sophisticated analyses may, in fact, be
needed, and that is where research should be focused. Some of the analysis options may provide
defensible (and documented) near-term EUL proxies, as well as practical, reasonably cost-
effective, and better-documented improvements in EUL values for the longer term for some
measures. When allocating evaluation budgets, research on high priority EULs may have greater
payoff in reducing error and variance in B/C estimates than additional impact evaluations; the
tradeoffs should be considered.
Applying adjustment factors to basic EUL values may provide an option to improve “fit”
and allow transferability to new programs, regions, and conditions: For a few factors that
could be expected to affect measure lifetimes, adjustment factors could be developed (to address,
for example, climate, turnover, hours, etc.) and might, in fact, be fairly transferable and useful in
helping extend the use or improve the “fit” of EUL values. However, given that the
documentation on assumptions underlying current EUL values, it may be difficult to adopt
results as fully transferable until sources are better understood – or a new generation of better-
documented EULs is developed.
Next Steps:
The results of statistical EUL studies should be assembled into a database that can be
used as key sources for EUL values, and to allow exploration of the pattern in EULs
based on climate zones, program deviations, etc.
Agencies should revisit the issue of EULs, reviewing the values, better documenting
values, and enlisting adjustment methodologies as appropriate.
Research is needed in EULs for behavioral programs; frequent monitoring of retention
(of savings) should be required of program managers for these programs.
2012 International Energy Program Evaluation Conference, Rome, Italy 12
EULs are a significant part in the computation of TRC benefit cost, shareholder
incentives, and other important applications. Agencies conduct annual impact evaluation
for most programs, refining first year’s savings values by a few percent in many cases.
However, EULs are rarely re-examined, and our research indicates that values for EULs
for quite a few measures may vary by 50% and more, and even more vary by 20% or
more between different “accepted” (and usually undocumented) values. Research efforts
on EULs, at least for high priority measures, should be added to the research agenda.
This switch, for at least high priority measures, would provide more accurate B/C
computations than additional refinements in savings estimates. It appears to the author
that it is time to play a little “catch up” in the EUL arena.
REFERENCES
ASHRAE Equipment Service Life Values - online database referenced on web at
“http://xp20.ashrae.org/publicdatabase/service_life.asp”
California DEER Data Base for Energy Efficient Resources, at www.energy.ca.gov/DEER.
Database of EULs for hundreds of measures, with source citations. (checked 3/2012)
Freeman, Juri and Lisa A. Skumatz, 2012. “Widgets versus Actions: Measuring the Role of
Behavior Change in DSM Programs”, Proceedings of IEPEC Conference, Rome, June.
Gaffney, Kathleen, Miriam Goldberg, Paulo Tanimoto, and Alissa Johnson, 2010, “I Know what
you Lit Last Summer: Results from California’s Residential Lighting Metering Study”,
Proceedings from the ACEEE Summer Study on Energy Efficiency in Buildings,
Asilomar, CA, August.
Hickman, Curtis and Lisa A. Skumatz, 1994, “Effective ECM and Equipment Lifetimes in
Commercial Buildings: Calculation and Analysis”, Proceedings of the American Council
for an Energy Efficient Economy (ACEEE) Summer Study on Buildings, Asilomar, CA,
August.
Jump, Corina, James J. Hirch, Jane Peters, and Dulane Moran, 2008, “Welcome to the Dark
Side: The Effect of Switching on CFL Measure Life”, Proceedings from the ACEEE
Summer Study on Energy Efficiency in Buildings, Asilomar, CA, August.
KEMA, 2005. “CFL Metering Study”. Prepared for California’s Investor-Owned Utilities
(PG&E, SCE, SDG&E and SoCalGas), February.
KEMA, 2008, “Summary of EUL-RUL Analysis for the April 2008 Update to DEER”, from
New York State, 2011(?), “Appendix M – Guidelines for Early Replacement
Conditions”, available on web at
“www3.dps.ny.gov/.../$FILE/Appendix%20M%20final%205-05-2011.pdf” · PDF file.
Nexus Market Research, 2008, “Residential Lighting Measure Life Study”, submitted to New
England Residential Lighting Program Sponsors, Cambridge, MA, June. Available at
web, www.energy.ca.gov/DEER.
Skumatz, Lisa A., Ph.D. 2011. “Seminar on Status of Measure Lifetime Work”, Presentation to
Regional Technical Forum EUL Subcommittee, Portland, OR. August.
Skumatz, Lisa A., Ph.D. 2012b. “Measuring the Impacts of Behavior Change Programs – Filling
in the Blanks”, Proceedings of the ACEEE Summer Study on Buildings, Asilomar, CA,
August.
2012 International Energy Program Evaluation Conference, Rome, Italy 13

Skumatz, Lisa A., Ph.D. 1997. "Recognizing All Program Benefits: Estimating the Non-Energy
Benefits of PG&E's Venture Partner's Pilot Program (VPP)", Proceedings of the 1997
Energy Evaluation Conference, Chicago, Illinois.
Skumatz, Lisa A., 2011, “Remaining Useful Lifetimes and Persistence – Literature and
Methods”, Proceedings of the IEPEC Conference, Boston, MA, June.
Skumatz, Lisa A., Ph.D., and Rob Bordner. 1997. "Evaluation of PG&E’s Venture Partner's Pilot
Program (VPP)", Skumatz Economic Research Associates, Prepared for Pacific Gas and
Electric Company, San Francisco.
Skumatz, Lisa A. Ph.D;, and John Gardner. 2005a. "Revised / Updated EULs Based on
Retention and Persistence Studies Results", Prepared for Southern California Edison,
Rosemead, CA.
Skumatz, Ph.D., Lisa, and John Gardner. 2005b. "Best Practices in Measure Retention and
Lifetime Studies: Standards for Reliable Measure Retention Methodology Derived from
Extensive Review", Proceedings of the IEPEC Conference.
Skumatz, Lisa A., M. Sami Khawaja, Jane Colby. 2009. “Lessons Learned and Next Steps in
Energy Efficiency Measurement and Attribution: Energy Savings, Net to Gross, Non-
Energy Benefits, and Persistence on Energy Efficiency Behavior” Prepared for
California Institute for Energy and Environment (CIEE), Berkeley, CA, November.
Skumatz, Lisa, Karen Lorberau, Cabell Breckinridge. 1991. “Bonneville Power Administration
Measure Life Study I”, prepared for Bonneville Power Administration, Portland, OR.
Skumatz, Lisa A., Ph.D., Dave Whitson, Dan Thomas, Kevin Geraghty, Brenda Dunford, Karen
Lorberau, and Cabell Breckinridge. 1994. “Bonneville Power Administration Measure
Life Study II”, prepared for Bonneville Power Administration, Portland, OR.
Skumatz, Lisa A. Ph.D., Rose Woods, and Scott Dimetrosky. 2004. “Review of Retention and
Persistence Studies for the California Public Utilities Commission, (CPUC)”, Final
Report, October 20, 2004, California Public Utilities Commission, San Francisco, CA.
Welch, Cory, and Brad Rogers, 2010, “Estimating the Remaining Useful Life of Residential
Appliances”, Proceedings from the ACEEE Summer Study on Energy Efficiency in
Buildings, Asilomar, CA, August.
2012 International Energy Program Evaluation Conference, Rome, Italy 14