What Makes a "Bad" Ad? User Perceptions of Problematic ...
24
This paper appears at the 2021 CHI Virtual Conference on Human Factors in Computing Systems. What Makes a “Bad” Ad? User Perceptions of Problematic Online Advertising Eric Zeng Paul G. Allen School of Computer Science & Engineering University of Washington Seattle, WA, USA [email protected] Tadayoshi Kohno Paul G. Allen School of Computer Science & Engineering University of Washington Seattle, WA, USA [email protected] Franziska Roesner Paul G. Allen School of Computer Science & Engineering University of Washington Seattle, WA, USA [email protected] ABSTRACT Online display advertising on websites is widely disliked by users, with many turning to ad blockers to avoid “bad” ads. Recent ev- idence suggests that today’s ads contain potentially problematic content, in addition to well-studied concerns about the privacy and intrusiveness of ads. However, we lack knowledge of which types of ad content users consider problematic and detrimental to their browsing experience. Our work bridges this gap: first, we create a taxonomy of 15 positive and negative user reactions to online ad- vertising from a survey of 60 participants. Second, we characterize classes of online ad content that users dislike or find problematic, using a dataset of 500 ads crawled from popular websites, labeled by 1000 participants using our taxonomy. Among our findings, we report that users consider a substantial amount of ads on the web today to be clickbait, untrustworthy, or distasteful, including ads for software downloads, listicles, and health & supplements. CCS CONCEPTS • Information systems → Online advertising; Display adver- tising; • Social and professional topics → Commerce policy; • Human-centered computing → User studies. KEYWORDS online advertising, deceptive advertising, dark patterns 1 INTRODUCTION Online display advertising is a critical part of the modern web: ads sustain websites that provide free content and services to con- sumers, and many ads inform people about products and services that they are interested in. Still, many web users dislike online ads, finding them to be annoying, intrusive, and detrimental to their security or privacy. In an attempt to filter such “bad” ads, many users turn to ad blockers [5] — for instance, a 2016 study estimated that 18% of U.S. internet users and 37% of German internet users used an ad blocker [69], a large percentage considering that it takes some initiative and technical knowledge to seek out and install an ad blocker. There are many drivers of negative attitudes towards online ads. Some users find the mere presence of ads to be problematic, often associated with their (perceived) increasingly disruptive, in- trusive, and/or annoying qualities [5] or their impact on the load times of websites [92]. Users are also concerned about the privacy impacts of ads: research in computer security and privacy has re- vealed extensive ecosystems of tracking and targeted advertising (e.g., [9, 28, 30, 61, 62, 64, 76, 84, 97, 98]), which users often find to be creepy and privacy-invasive (e.g., [29, 96, 100, 101]). The specific content of ads can also cause direct or indirect harms to consumers, ranging from material harms in the extreme (e.g., scams [1, 34, 72], malware [65, 74, 104, 105], and discriminatory advertising [3, 57]) to simply annoying techniques that disrupt the user experience (e.g., animated banner ads [16, 38, 45]). In this work, we focus specifically on this last category of con- cerns, studying people’s perceptions of problematic or “bad” user- visible content in modern web-based ads. Driving this exploration is the observation that problematic content in modern web ads can be more subtle than flashing banner ads and outright scams. Recent anecdotes and studies suggest high volumes and a wide range of potentially problematic content, including “clickbait”, advertori- als or endorsements with poor disclosure practices, low-quality content farms, and deceptively formatted “native” ads designed to imitate the style of the hosting page [4, 7, 22, 39, 52, 63, 68, 71, 75, 90, 93, 103, 106]. While researchers and the popular press have drawn attention to these types of ad content, we lack a systematic understanding of how web users perceive these types of ads on the modern web in general. What makes an ad “bad”, in the eyes of today’s web users? What are people’s perceptions and mental mod- els of ads with arguably problematic content like “clickbait”, which falls in a grey area between scams and poorly designed annoying ads? What exactly is it that causes people to dislike (or like) an ad or class of ads? For future regulation and research attempting to classify, measure, and/or improve the quality of the ads ecosystem, where exactly should the line be drawn? We argue that such a systematic understanding of what makes an ad “bad” — grounded in the perceptions of a range of web users, not expert regulators, advertisers, or researchers — is crucial for two reasons. First, while some ads can clearly be considered “bad”, like outright scams, and others can be considered “benign”, like honest ads for legitimate products, there is a gray area where it is more nuanced and difficult to cleanly classify. For example, “clickbait” ads for tabloid-style celebrity news articles may not cross the line for causing material harms to consumers, but may annoy many users and use misleading techniques. While the U.S. Federal Trade Commission currently concerns itself with explicitly harmful ads like scams and deceptive disclosures [18, 33, 63], whether and how to address “clickbait” and other distasteful content is more nuanced. As part of our work, we seek to identify ads that do not violate current regulations and policies, but do harm user experiences, in order to inform improvements such as policy changes or the development of automated solutions. Second, research interested
-
Upload
khangminh22 -
Category
Documents
-
view
1 -
download
0
Transcript of What Makes a "Bad" Ad? User Perceptions of Problematic ...
This paper appears at the 2021 CHI Virtual Conference on Human Factors in Computing Systems.
What Makes a “Bad” Ad? User Perceptions of ProblematicOnline Advertising
Eric ZengPaul G. Allen School of Computer
Science & EngineeringUniversity of Washington
Seattle, WA, [email protected]
Tadayoshi KohnoPaul G. Allen School of Computer
Science & EngineeringUniversity of Washington
Seattle, WA, [email protected]
Franziska RoesnerPaul G. Allen School of Computer
Science & EngineeringUniversity of Washington
Seattle, WA, [email protected]
ABSTRACTOnline display advertising on websites is widely disliked by users,with many turning to ad blockers to avoid “bad” ads. Recent ev-idence suggests that today’s ads contain potentially problematiccontent, in addition to well-studied concerns about the privacy andintrusiveness of ads. However, we lack knowledge of which typesof ad content users consider problematic and detrimental to theirbrowsing experience. Our work bridges this gap: first, we create ataxonomy of 15 positive and negative user reactions to online ad-vertising from a survey of 60 participants. Second, we characterizeclasses of online ad content that users dislike or find problematic,using a dataset of 500 ads crawled from popular websites, labeledby 1000 participants using our taxonomy. Among our findings, wereport that users consider a substantial amount of ads on the webtoday to be clickbait, untrustworthy, or distasteful, including adsfor software downloads, listicles, and health & supplements.
CCS CONCEPTS• Information systems→ Online advertising; Display adver-tising; • Social and professional topics → Commerce policy;• Human-centered computing→ User studies.
KEYWORDSonline advertising, deceptive advertising, dark patterns
1 INTRODUCTIONOnline display advertising is a critical part of the modern web:ads sustain websites that provide free content and services to con-sumers, and many ads inform people about products and servicesthat they are interested in. Still, many web users dislike online ads,finding them to be annoying, intrusive, and detrimental to theirsecurity or privacy. In an attempt to filter such “bad” ads, manyusers turn to ad blockers [5]— for instance, a 2016 study estimatedthat 18% of U.S. internet users and 37% of German internet usersused an ad blocker [69], a large percentage considering that it takessome initiative and technical knowledge to seek out and install anad blocker.
There are many drivers of negative attitudes towards onlineads. Some users find the mere presence of ads to be problematic,often associated with their (perceived) increasingly disruptive, in-trusive, and/or annoying qualities [5] or their impact on the loadtimes of websites [92]. Users are also concerned about the privacyimpacts of ads: research in computer security and privacy has re-vealed extensive ecosystems of tracking and targeted advertising
(e.g., [9, 28, 30, 61, 62, 64, 76, 84, 97, 98]), which users often find tobe creepy and privacy-invasive (e.g., [29, 96, 100, 101]). The specificcontent of ads can also cause direct or indirect harms to consumers,ranging from material harms in the extreme (e.g., scams [1, 34, 72],malware [65, 74, 104, 105], and discriminatory advertising [3, 57])to simply annoying techniques that disrupt the user experience(e.g., animated banner ads [16, 38, 45]).
In this work, we focus specifically on this last category of con-cerns, studying people’s perceptions of problematic or “bad” user-visible content in modern web-based ads. Driving this explorationis the observation that problematic content in modern web ads canbe more subtle than flashing banner ads and outright scams. Recentanecdotes and studies suggest high volumes and a wide range ofpotentially problematic content, including “clickbait”, advertori-als or endorsements with poor disclosure practices, low-qualitycontent farms, and deceptively formatted “native” ads designedto imitate the style of the hosting page [4, 7, 22, 39, 52, 63, 68, 71,75, 90, 93, 103, 106]. While researchers and the popular press havedrawn attention to these types of ad content, we lack a systematicunderstanding of how web users perceive these types of ads on themodern web in general. What makes an ad “bad”, in the eyes oftoday’s web users? What are people’s perceptions and mental mod-els of ads with arguably problematic content like “clickbait”, whichfalls in a grey area between scams and poorly designed annoyingads? What exactly is it that causes people to dislike (or like) an ador class of ads? For future regulation and research attempting toclassify, measure, and/or improve the quality of the ads ecosystem,where exactly should the line be drawn?
We argue that such a systematic understanding of what makesan ad “bad”— grounded in the perceptions of a range of web users,not expert regulators, advertisers, or researchers— is crucial for tworeasons. First, while some ads can clearly be considered “bad”, likeoutright scams, and others can be considered “benign”, like honestads for legitimate products, there is a gray area where it is morenuanced and difficult to cleanly classify. For example, “clickbait”ads for tabloid-style celebrity news articles may not cross the linefor causing material harms to consumers, but may annoy manyusers and use misleading techniques. While the U.S. Federal TradeCommission currently concerns itself with explicitly harmful adslike scams and deceptive disclosures [18, 33, 63], whether and howto address “clickbait” and other distasteful content is more nuanced.As part of our work, we seek to identify ads that do not violatecurrent regulations and policies, but do harm user experiences,in order to inform improvements such as policy changes or thedevelopment of automated solutions. Second, research interested
Zeng et al.
Figure 1: An overview of our work and contributions.
in measuring, classifying, and experimenting on “bad” online adswill benefit from having detailed definitions and labeled examplesof “bad” ads, grounded in real users’ perceptions and opinions. Forexample, our prior work measuring the prevalence of “problematic”ads on the web used a researcher-created codebook of potentiallyproblematic ad content; that codebook was not directly groundedin broader user experiences and perceptions [106].
Research Questions. In this paper, our goal is thus to systemati-cally elicit and study what kinds of online ads people dislike, andthe reasons why they dislike them, focusing specifically on the user-visible content of those ads (rather than the underlying technicalmechanisms for ad targeting and delivery). We have two primaryresearch questions:
(1) RQ1—Defining “bad” in ads: What are the different typesof negative (and positive) reactions that people have to onlineads that they see? In other words, why do people dislike (orlike) online ads?
(2) RQ2— Identifying and characterizing “bad” ads: Whatspecific kinds of content and tactics in online ads cause peo-ple to have negative reactions? In other words, which ads dopeople dislike (or like)?
While ads appear in many places online— including in socialmedia feeds and mobile apps—we focus specifically on third partyprogrammatic advertising on the web [2], commonly found onnews, media, and other content websites. Unlike more verticallyintegrated social media platforms, the programmatic ad ecosystemis complex and diverse, with many different stakeholders and po-tential points of policy (non-)enforcement, including advertisers,supply-side and demand-side platforms, and the websites hostingthe ads themselves. A benefit of our focus on web ads is that thepublic nature of the web allows us to crawl and collect ads across awide range of websites, without needing to rely on explicit ad trans-parency platforms (which may be limited or incomplete [26, 87]) ormobile app data collection (which is more technically challenging).We expect that many of our findings will translate to ads in othercontexts (e.g., social media, mobile), though these different contextsalso raise additional research questions about the interactions be-tween the affordances of those platforms and the types of ads thatpeople like or dislike.
Contributions. Figure 1 shows an overview of the different com-ponents of our work and our resulting outputs and contributions.Specifically, our contributions include:
(1) Based on a qualitative survey characterizing 60 participants’attitudes towards the content and techniques found in mod-ern online web ads, we distill a taxonomy of 15 reasons whypeople dislike (and like) ads on the web, such as “untrustwor-thy”, “clickbait”, “ugly / bad style”, and “boring” (Section 3,answering RQ1).
(2) Using this taxonomy, we generate a dataset of 500 ads sam-pled randomly from a crawl of popular websites, labeled with12,972 opinion labels from 1025 people (Section 4, towardsanswering RQ2). This dataset is available in the paper’s sup-plemental materials1.
(3) Combining participant opinion labels with researcher con-tent labels of these 500 ads, and using unsupervised learningtechniques, we identify and characterize classes of ad contentand techniques that users react negatively to, such as click-bait native ads, distasteful content, deceptive and “scammy”content, and politicized ads (Section 4, answering RQ2).
Our findings serve as a foundation for policy and research onproblematic online advertising: for regulators, advertisers, and adplatforms, we provide evidence on which types of ads are mostdetrimental to user experience and consumer welfare, and for re-searchers, we provide a user-centric framework for defining prob-lematic ad content, enabling future research on the online advertis-ing ecosystem.
2 BACKGROUND, RELATEDWORK, ANDMOTIVATION
2.1 Background and Related WorkBroadly speaking, related work has studied (1) problematic contentand techniques in ads directly and/or (2) people’s perception of ads.Our work is inspired by (1) and expands on (2). In this section, webreak down prior work based on types of concerns with ads.
Computer Security Risks and Discrimination. Online ads have of-ten been leveraged formalicious and harmful purposes. For example,prior work in computer security has studied the use of ads to spreadmalware, clickfraud, and phishing attacks (e.g., [65, 74, 82, 104, 105]).Researchers have also surfaced concerns about how ads may be tar-geted at users in potentially discriminatory ways (e.g., [3, 57]), suchas by (intentionally or unintentionally) serving ads for certain em-ployment opportunities disproportionately to certain demographicgroups.
Deceptive Ads. Another class of problematic ads is those whichare explicitly deceptive— either in terms of the claims that theymake, or in their appearance as advertisements at all. Prior workstudying deceptive advertising predates web ads (i.e., print and TVads), showing, for instance, that false information in ads can beeffectively refuted later only under certain conditions (e.g. [14, 50,51]), that people infer false claims not directly stated in ads andmisattribute claims to incorrect sources (e.g., [44, 48, 79, 85]), andthat people’s awareness of specific deceptive ads can harm theirattitudes towards those brands [49] as well as towards advertisingin general [19, 23].
1Dataset also available at https://github.com/eric-zeng/chi-bad-ads-data

What Makes a “Bad” Ad? User Perceptions of Problematic Online Advertising
More recently on the web, there has been significant concernabout “native” advertisements which are designed to blend intothe primary content of the hosting website (e.g., sponsored searchresults or social media posts, or ads that look like articles on newswebsites). Significant prior work across disciplines suggests thatmost users do poorly at identifying such ads (e.g., [4, 9, 47, 53,53, 59, 89, 102, 103])— though people may do better after moreexperience [53], or with different disclosure designs (e.g., [47, 103]).Deceptive ads may affect user behavior even when identified [89].Prior work suggests that native ads can reduce user perceptionsof the credibility of the hosting site, even if the ads are rated ashigh quality in isolation [22]. Recent work has also raised concernsabout unclear affiliate marketing and/or endorsements on socialmedia [71, 93, 108]. Beyond outright scams, much of the U.S. FederalTrade Commission’s recent enforcement surrounding web ads hasfocused on ad disclosures for such native ads of various types [31–33, 63].
Annoying and Disruptive Ads. Even when ads are not explicitlymalicious or causing material harms, many users still dislike them.Traditionally, a common reason that people dislike web ads is thatthey are annoying and disruptive— either in general or due totheir specific designs— leading in part to the development andwidespread adoption of ad blockers [5, 69, 81]. Prior work hasstudied and summarized design features of ads that lead to perceivedor measured reductions in the user experience, including ads thatare animated, too large, or pop up [12, 27, 38, 86]. The impacts ofthese issues include increased cognitive load, feelings of irritationamong users, and reduced trust in the hosting websites and inadvertising or advertisers [12, 17, 107].
Clickbait and Other Low-Quality Content. The concerns aroundannoying and disruptive ads in the previous paragraph stem largelyfrom the design of ads. In addition, many modern web ads containlow-quality content that walks a fine line between “good” and “bad”ads. Recent anecdotal and scientific evidence suggests that there isa wide range of problematic, distasteful, and misleading content inonline ads (or on the websites to which they lead) — including low-quality “clickbait”, content farms, misleading or deceptive claims,mis/disinformation, and voter suppression [8, 9, 24, 36, 37, 52, 52, 54–56, 68, 75, 78, 90, 94, 95].
Our previous work measured the prevalence of these types ofads on news and misinformation sites, finding that large fractionsof ads on both types of sites contained content that was potentiallyproblematic (based on a researcher-created definition of “problem-atic”) [106]. Though anecdotes suggest that users recognize anddislike such ads (for example, a recent qualitative study of French-speaking Twitter discussions surfaced user criticisms of social me-dia ads using terms such as “Fail”, “Clickbait”, and “Cringe” [39]),user perceptions of these types of ads—which seem not to directlyviolate the policies of ad providers or regulators today—have notbeen systematically studied.
Further afield but related are broader discussions of “dark pat-terns” [15], e.g., on websites [70] and in mobile apps (e.g., [11, 43,77]), though none of these works considered web ads.
Ad Targeting and Privacy. Finally, a unique aspect of the onlineadvertising ecosystem is the ability to track and target specific
individuals. Significant prior work has revealed and measured theprivacy implications of these tracking and targeting capabilities(e.g. [28, 30, 61, 62, 64, 76, 84, 97, 98]), which end users may find“creepy”, insufficiently transparent, or otherwise distasteful [6, 29,96, 100, 101]. We note that such ad targeting may increase theimpacts of problematic ad content if such content is delivered toparticularly susceptible users (e.g., [83]).
2.2 MotivationWe identify several key gaps in prior work that we aim to address.First, studies of user perceptions of problematic ad content in theHCI community have focused largely on more traditional designissues (e.g., animated or explicitly deceptive ads), rather than thebroader and less well-defined range of “clickbait” and other tech-niques prevalent on the modern web. Second, research on the po-tential harms of online advertising in the computer security andprivacy community primarily focuses on ad targeting, distribution,and malware, rather than the user-facing content of the ads. Finally,many anecdotes or measurement studies of potentially problematiccontent in ads rely on researcher-created definitions of what isproblematic, rather than being grounded in user perceptions. Arethere types of problematic ad content that bother and harm users,but have not been addressed in prior measurement studies or in thepolicies of regulators and ad companies? And what exactly makesa “bad” ad bad? In this work, we aim to bridge these gaps througha user-centric analysis of ad content, eliciting user perceptions of awide range of ads collected from the modern web and characteriz-ing which attributes of an ad’s content contribute to negative userreactions.
3 SURVEY 1: WHY DO PEOPLE DISLIKE ADS?Towards answering our first research question, we conducted aqualitative survey to elicit a detailed set of reasons for what peoplelike or dislike about the content of modern online ads. The result-ing taxonomy enables future studies that classify, measure, andexperiment on “bad” online ads, including the second part of thispaper (Section 4).
Though our primary research questions are around reasons thatpeople dislike ads, we also collect data about reasons they maylike ads. This is for two reasons: first, we expect that there areads that users genuinely like, and that a user may both like anddislike parts of an ad, so we aim to surface the full spectrum ofusers’ opinions. Second, online ads are fundamental to supportingcontent and services on the modern web, and we aim for our workto ultimately improve the user experience of ads, not necessarily tobanish ads entirely.
3.1 Survey 1 Methodology3.1.1 Survey Protocol. We curated a set of 30 ads found on the web(described below in Section 3.1.2). We showed each participant 4randomly selected ads, and collected:
• Their overall opinion of the ad (5-point Likert scale).• What they liked and disliked about it (free response).• What they liked and disliked about similar ads if they re-member them (free response).

Zeng et al.
Figure 2: A sample of ads shown to participants in Survey 1, selected from the dataset of our prior work [106]. In that study,ads a-c were categorized as “benign”, and were each coded as “Product”. Ads d-f were categorized as “problematic”, using thefollowing codes: d) Supplement, e) Content Farm, f) Political Poll, g) Potentially Unwanted Software.
• Alternate keywords and phrases they would use to describethe ad.
For each participant, we also asked (a) what they like and dislikeabout online ads in general (free response), both at the beginningand end of the survey in case doing the survey jogged their memory,and (b) whether they use an ad blocker, and why. See Appendix Afor the full survey protocol.
3.1.2 Ads Dataset. To seed a diverse set of both positive and nega-tive reactions from participants, we asked participants to providetheir opinions on both “good” and “bad” ads. We selected a set of30 “problematic” and “benign” ads from a large, manually-labeleddataset2 of ads that we created in our prior work [106].
We created our previous dataset using a web crawler to scrapeads from the top 100 most popular news and misinformation web-sites. The ads collected were primarily third-party programmaticads, such as banner ads, sponsored content ads, and native ads. Thedataset did not include social media ads, video ads, search resultads, and retargeted ads. The ads were collected in January 2020.We manually labeled 5414 ads, using a researcher-generated code-book of problematic practices. Ads were considered “problematic” ifthey employed a known misleading practice, and were labeled withcodes such as “Content Farm”, “Potentially Unwanted Software”,and “Suppplements”; otherwise ads were considered “benign”, andlabeled with codes like “Product”.
2Prior dataset available at https://github.com/eric-zeng/conpro-bad-ads-data.
For this survey we picked 8 “benign” ads, and 22 “problematic”ads from our previous dataset. We show a sample of these ads inFigure 2.
We selected ads from this dataset with the goal of representing awide breadth of qualitative characteristics in a manageable numberof ads for the purposes of our survey. However, since ads differon many different features, and we did not know which featureswould be salient for participants ahead of time, we used the follow-ing set of heuristics to guide the selection of ads: First, we choseat least one ad labeled with each problematic code in our previousdataset. We selected additional ads for a specific problematic codeif there was diversity in the code in one of the following character-istics: product type, prominence of advertising disclosure, native vs.display formats, and the use of inappropriate content (distasteful,disgusting, or unpleasant images, sexually suggestive images, po-litical content in non-campaign ads, sensationalist claims, hatefulor violent content, and deceptive visual elements). We generatedthis list of characteristics based on our own preliminary qualitativeanalysis of the ads in the dataset, and based on the content policiesof advertising companies like Google [41].
3.1.3 Analysis. We analyzed the data from our survey using agrounded theory approach. We started with an initial round ofopen coding, creating codes to describe reasons why participantsdisliked or liked the ads, using words directly taken from the re-sponses, or words that closely summarized them, such as “clickbait”,“fearmongering”, and “virus”. Then, we iteratively generated a setof hierarchical codes that grouped low level codes, such as “Un-trustworthy”, and “Politicized”. Two coders performed both the
What Makes a “Bad” Ad? User Perceptions of Problematic Online Advertising
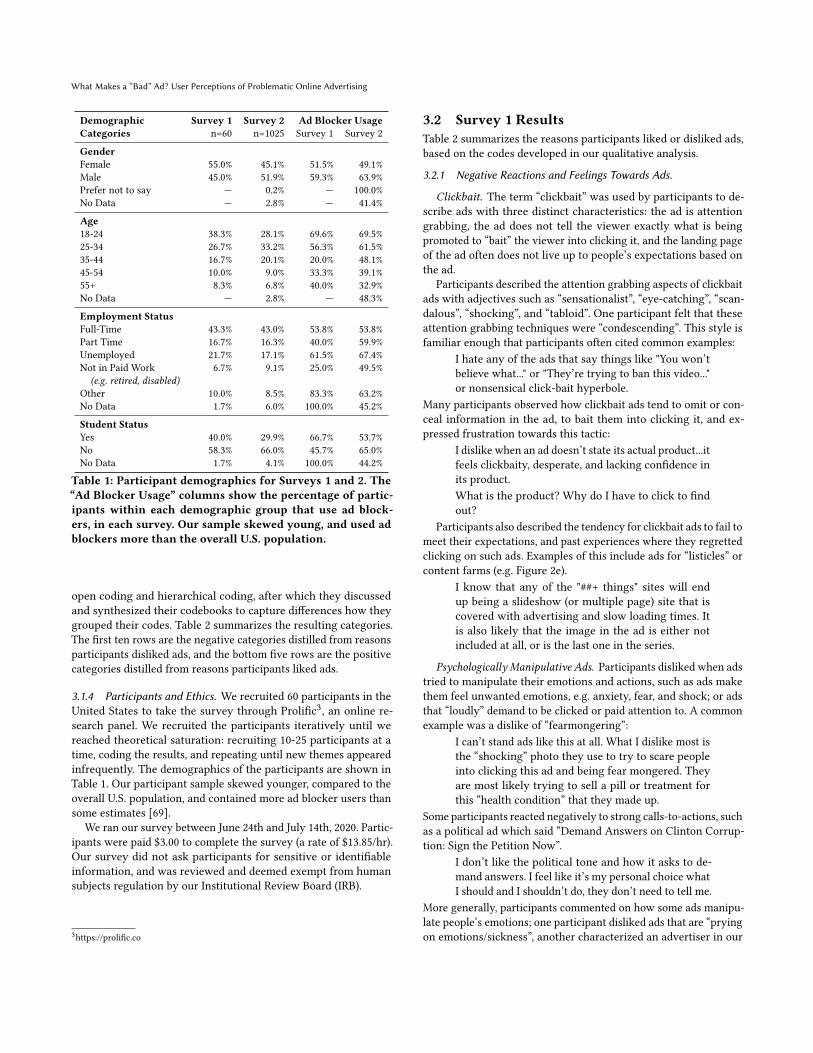
Demographic Survey 1 Survey 2 Ad Blocker UsageCategories n=60 n=1025 Survey 1 Survey 2
GenderFemale 55.0% 45.1% 51.5% 49.1%Male 45.0% 51.9% 59.3% 63.9%Prefer not to say — 0.2% — 100.0%No Data — 2.8% — 41.4%
Age18-24 38.3% 28.1% 69.6% 69.5%25-34 26.7% 33.2% 56.3% 61.5%35-44 16.7% 20.1% 20.0% 48.1%45-54 10.0% 9.0% 33.3% 39.1%55+ 8.3% 6.8% 40.0% 32.9%No Data — 2.8% — 48.3%
Employment StatusFull-Time 43.3% 43.0% 53.8% 53.8%Part Time 16.7% 16.3% 40.0% 59.9%Unemployed 21.7% 17.1% 61.5% 67.4%Not in Paid Work 6.7% 9.1% 25.0% 49.5%
(e.g. retired, disabled)Other 10.0% 8.5% 83.3% 63.2%No Data 1.7% 6.0% 100.0% 45.2%
Student StatusYes 40.0% 29.9% 66.7% 53.7%No 58.3% 66.0% 45.7% 65.0%No Data 1.7% 4.1% 100.0% 44.2%
Table 1: Participant demographics for Surveys 1 and 2. The“Ad Blocker Usage” columns show the percentage of partic-ipants within each demographic group that use ad block-ers, in each survey. Our sample skewed young, and used adblockers more than the overall U.S. population.
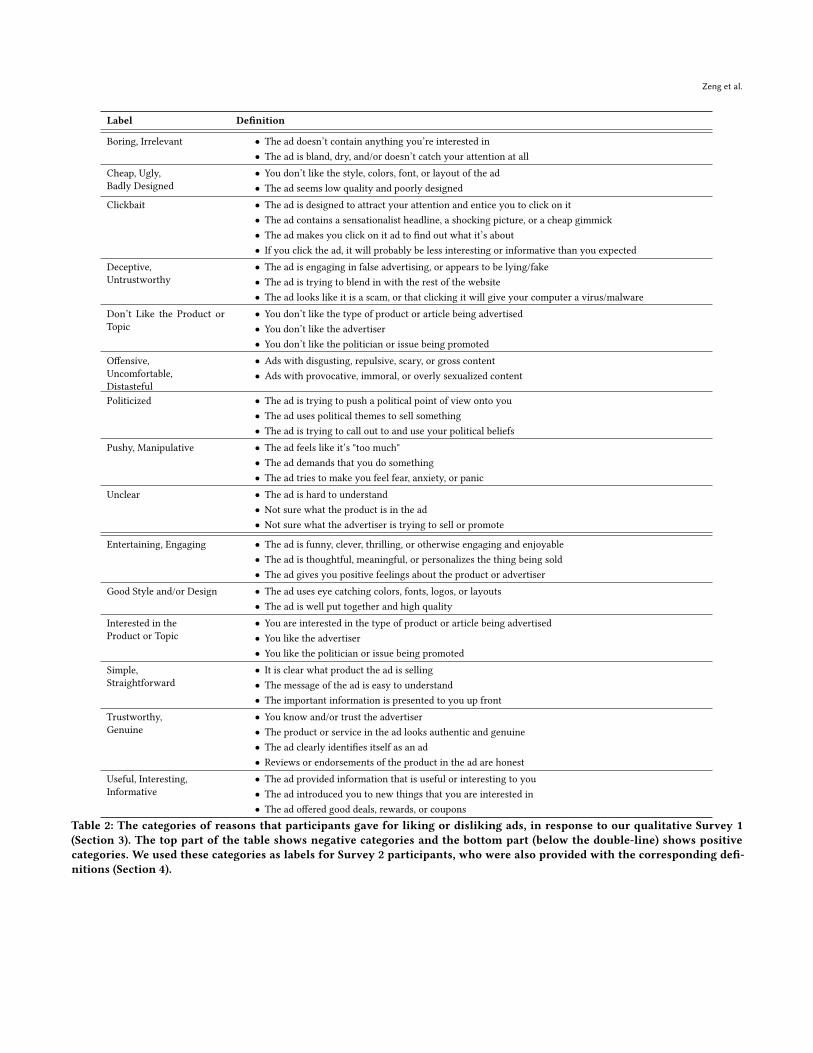
open coding and hierarchical coding, after which they discussedand synthesized their codebooks to capture differences how theygrouped their codes. Table 2 summarizes the resulting categories.The first ten rows are the negative categories distilled from reasonsparticipants disliked ads, and the bottom five rows are the positivecategories distilled from reasons participants liked ads.
3.1.4 Participants and Ethics. We recruited 60 participants in theUnited States to take the survey through Prolific3, an online re-search panel. We recruited the participants iteratively until wereached theoretical saturation: recruiting 10-25 participants at atime, coding the results, and repeating until new themes appearedinfrequently. The demographics of the participants are shown inTable 1. Our participant sample skewed younger, compared to theoverall U.S. population, and contained more ad blocker users thansome estimates [69].
We ran our survey between June 24th and July 14th, 2020. Partic-ipants were paid $3.00 to complete the survey (a rate of $13.85/hr).Our survey did not ask participants for sensitive or identifiableinformation, and was reviewed and deemed exempt from humansubjects regulation by our Institutional Review Board (IRB).
3https://prolific.co
3.2 Survey 1 ResultsTable 2 summarizes the reasons participants liked or disliked ads,based on the codes developed in our qualitative analysis.
3.2.1 Negative Reactions and Feelings Towards Ads.
Clickbait. The term “clickbait” was used by participants to de-scribe ads with three distinct characteristics: the ad is attentiongrabbing, the ad does not tell the viewer exactly what is beingpromoted to “bait” the viewer into clicking it, and the landing pageof the ad often does not live up to people’s expectations based onthe ad.
Participants described the attention grabbing aspects of clickbaitads with adjectives such as “sensationalist”, “eye-catching”, “scan-dalous”, “shocking”, and “tabloid”. One participant felt that theseattention grabbing techniques were “condescending”. This style isfamiliar enough that participants often cited common examples:
I hate any of the ads that say things like "You won’tbelieve what..." or "They’re trying to ban this video..."or nonsensical click-bait hyperbole.
Many participants observed how clickbait ads tend to omit or con-ceal information in the ad, to bait them into clicking it, and ex-pressed frustration towards this tactic:
I dislike when an ad doesn’t state its actual product...itfeels clickbaity, desperate, and lacking confidence inits product.What is the product? Why do I have to click to findout?
Participants also described the tendency for clickbait ads to fail tomeet their expectations, and past experiences where they regrettedclicking on such ads. Examples of this include ads for “listicles” orcontent farms (e.g. Figure 2e).
I know that any of the "##+ things" sites will endup being a slideshow (or multiple page) site that iscovered with advertising and slow loading times. Itis also likely that the image in the ad is either notincluded at all, or is the last one in the series.
Psychologically Manipulative Ads. Participants disliked when adstried to manipulate their emotions and actions, such as ads makethem feel unwanted emotions, e.g. anxiety, fear, and shock; or adsthat “loudly” demand to be clicked or paid attention to. A commonexample was a dislike of “fearmongering”:
I can’t stand ads like this at all. What I dislike most isthe “shocking” photo they use to try to scare peopleinto clicking this ad and being fear mongered. Theyare most likely trying to sell a pill or treatment forthis “health condition” that they made up.
Some participants reacted negatively to strong calls-to-actions, suchas a political ad which said “Demand Answers on Clinton Corrup-tion: Sign the Petition Now”.
I don’t like the political tone and how it asks to de-mand answers. I feel like it’s my personal choice whatI should and I shouldn’t do, they don’t need to tell me.
More generally, participants commented on how some ads manipu-late people’s emotions; one participant disliked ads that are “pryingon emotions/sickness”, another characterized an advertiser in our
Zeng et al.
Label Definition
Boring, Irrelevant • The ad doesn’t contain anything you’re interested in• The ad is bland, dry, and/or doesn’t catch your attention at all
Cheap, Ugly,Badly Designed
• You don’t like the style, colors, font, or layout of the ad• The ad seems low quality and poorly designed
Clickbait • The ad is designed to attract your attention and entice you to click on it• The ad contains a sensationalist headline, a shocking picture, or a cheap gimmick• The ad makes you click on it ad to find out what it’s about• If you click the ad, it will probably be less interesting or informative than you expected
Deceptive,Untrustworthy
• The ad is engaging in false advertising, or appears to be lying/fake• The ad is trying to blend in with the rest of the website• The ad looks like it is a scam, or that clicking it will give your computer a virus/malware
Don’t Like the Product orTopic
• You don’t like the type of product or article being advertised• You don’t like the advertiser• You don’t like the politician or issue being promoted
Offensive,Uncomfortable,Distasteful
• Ads with disgusting, repulsive, scary, or gross content• Ads with provocative, immoral, or overly sexualized content
Politicized • The ad is trying to push a political point of view onto you• The ad uses political themes to sell something• The ad is trying to call out to and use your political beliefs
Pushy, Manipulative • The ad feels like it’s "too much"• The ad demands that you do something• The ad tries to make you feel fear, anxiety, or panic
Unclear • The ad is hard to understand• Not sure what the product is in the ad• Not sure what the advertiser is trying to sell or promote
Entertaining, Engaging • The ad is funny, clever, thrilling, or otherwise engaging and enjoyable• The ad is thoughtful, meaningful, or personalizes the thing being sold• The ad gives you positive feelings about the product or advertiser
Good Style and/or Design • The ad uses eye catching colors, fonts, logos, or layouts• The ad is well put together and high quality
Interested in theProduct or Topic
• You are interested in the type of product or article being advertised• You like the advertiser• You like the politician or issue being promoted
Simple,Straightforward
• It is clear what product the ad is selling• The message of the ad is easy to understand• The important information is presented to you up front
Trustworthy,Genuine
• You know and/or trust the advertiser• The product or service in the ad looks authentic and genuine• The ad clearly identifies itself as an ad• Reviews or endorsements of the product in the ad are honest
Useful, Interesting,Informative
• The ad provided information that is useful or interesting to you• The ad introduced you to new things that you are interested in• The ad offered good deals, rewards, or coupons
Table 2: The categories of reasons that participants gave for liking or disliking ads, in response to our qualitative Survey 1(Section 3). The top part of the table shows negative categories and the bottom part (below the double-line) shows positivecategories. We used these categories as labels for Survey 2 participants, who were also provided with the corresponding defi-nitions (Section 4).
What Makes a “Bad” Ad? User Perceptions of Problematic Online Advertising
study as “impulse pushers” that “use too much psychology in anegative way”.
Distasteful, Offensive, and Uncomfortable Content. Participantsreacted to some ads in our survey with disgust, such as the ad show-ing a dirty laundry machine, and an ad with a poorly lit pictureof sprouting chickpeas in front of a banana (Figure 2d). Partici-pants reacted to these ads with words like “gross”, “disgusting”, and“repulsed”.
Some participants had similar reactions to content that theyfound offensive or immoral. For example, in an ad for the AshleyMadison online dating service, premised on enabling infidelity, oneparticipant said:
I dislike that this ad for many reasons, one of thembeing the idea that a person should leave their partnerfor a hotter one. Gross.
Others reacted negatively to ads that they perceived as unnecessar-ily sexually suggestive, or was “using sex to sell”.
Cheap, Ugly, and Low Quality Ads. Participants disliked the aes-thetics of some ads, describing them as “cheap”, “trashy”, “unpro-fessional”, and “low quality”. Some features they cited include poorquality images, the use of clip art images, “bad fonts”, or a feelingthat the ad is “rough” or “unpolished”. Some participants felt thatthe poor quality of the ad reflected poorly on the product, sayingthat it makes the company look “desperate”, or that it made themthink the ad looked like a scam. Participants also disliked specificstylistic choices, like small fonts or “garish”, too-bright colors.
Dislikes of Political Content in Ads. Participants disliked politicsin their ads, for different reasons. Most obviously, some participantsdisliked ads when they disagreed with the politician or politicalissue in the ad. Others disliked political ads because they dislikeseeing any kind of political message or tones in an advertisement:
[I dislike] everything. At least there’s no stupid Pres-ident in my face, but come on, get your politics andagenda away from me. I even agree with this ad butit’s still managing to annoy me! Go away!
Some participants observed that ad that looked like a political poll(Figure 2f) was intended to activate their political beliefs and lurethem into clicking to support their preferred candidate.
The ad makes me feel fear that the opposite politicalparty will win, and it makes me feel pride towardsmy own political party. I feel like I need to answerthe question on this ad to help promote my preferredcandidate.It calls to the political side of people in order to lureinto their ad. It is probably just a scam.
Untrustworthy and Deceptive Ads. Participants disliked ads thatfelt untrustworthy to them, describing such ads using words like“deceptive”, “fake”, “misleading”, “spam”, and “untrustworthy”.
Related to “clickbait”, participants mentioned disliking “bait andswitch” tactics, where something teased or promised in an ad turnsout not to exist on the landing page.
I don’t like ads that mislead what the application/product actually does. For example, there are some-times ads that show a very different style of gameplayfor an app than is actually represented.
Participants were also sensitive to perceived lies, false advertising,and fake endorsements. For the ad headlined “US Cardiologist: It’sLike a Pressure Wash for your Insides” (Figure 2d), a participantsaid:
“U.S. Expert”—who is it? It sounds like a lie.Participants also disliked visually deceptive ads. Several participantscalled out an ad that appeared to be a phishing attempt (Figure 2g):
I don’t like ads that try to deceive the user, or use but-tons like “continue” to try to get them to be confusedwith what is an ad and what is part of the site.
Some participants disliked ads labeled as “sponsored content”, see-ing through the attempts to disguise the ad as content they wouldbe interested in.
I dislike everything about this ad, because from myexperience, this ad leads to an article that pretends tobe an informed article, but is actually paid by one ofthe phone companies to advertise their brand.What I dislike is the paid product placement, disguisedas a genuine article.
Scams and Malware. Many participants suspected that the adsthat they did not trust were scams, or would somehow infect theircomputer with viruses or malware.
It just looks like a very generic ad which would giveyou a virus. It doesn’t even state the company, etc.I disliked all of this ad. Just by glancing at the headline,it seems like a scam and does not seem like it is from areputable source. The image doesn’t really add mucheither. I don’t like how the company/brand is in a tinybox either. It’s like they’re trying to hide it somehow?
Some participants suspected ads of spreading scams and malwarewhether or not the ad had to do with computer software. For exam-ple, for a suspicious ad about mortgages, one participant said:
It seems like a scam. The graphics are badly done andit seems like it would sell my information to someoneelse or download a virus.
Boring, Irrelevant, and Repetitive Ads. Participants generally re-ported disliking ads which bored them, were not relevant to theirinterests, or ads that they saw repeatedly (on the web in general,not in our survey).
Unclear Ads. Many participants found some of the ads shownto them in the survey to be confusing and unclear. A commoncomplaint was that it was unclear from looking at the ad whatexactly the product was; participants said this about ads from boththe problematic and benign categories (e.g. Figure 2b and c).
Targeted Advertising. While perceptions of privacy and targetedadvertising were not the main focus of this study, some participantsmentioned these as concerns when asked about ads they disliked ingeneral. Three participants mentioned disliking retargeted adver-tisements, i.e., ads for products which they had looked at previously,as they found these ads repetitive.
Zeng et al.
Other Disliked Topics and Genres of Ads. When asked about whatads they disliked in general, participants called out other specificexamples and genres of ads, unprompted by the ads we showed inthe survey. 10 participants independently said they disliked ads forvideo games, particularly mobile game ads that use dishonest bait-and-switch tactics. Some participants mentioned disliking certainkinds of ads on social media, like ads for “drop-shipping” schemes,ads with endorsements perceived to be inauthentic, and ads that“blend in” to the feed. Participants also mentioned disliking specifictopics such as dating ads, celebrity gossip ads, beauty ads, anddiet/supplement ads.
3.2.2 Positive Reactions to Ads. We now turn to participants’ pos-itive reactions to ads. While our primary research questions arearound negative reactions, we also wish to characterize the full spec-trum of people’s reactions to ads, especially when people mighthave different opinions about the same ads (e.g., one person mightfind annoying an ad that another finds entertaining), and to helpidentify types of ads that do not detract from user experience.
Trustworthy and Genuine Ads. Participants responded positivelyto ads that they described as “honest”, “trustworthy”, “legitimate”,and “authentic”. Some signals people cited for these traits includeads that look “refined” and high quality, images that accuratelydepict the product, and ads that include brands they recognized.
Good Design and Style. Participants liked aesthetically pleasingads, including ads with appealing visuals like pleasing color choices,images that are “eye-catching”, interesting, beautiful, or amusing,and a “modern” design style.
Entertaining and Engaging Ads. Participants liked ads that theyfound entertaining, engaging, or otherwise gave them positivefeelings. They variously described some of the ads as “humorous”,“clever”, “fun”, “upbeat”, “calming”, “unique”, and “diverse”.
Relevant, Interested in the Product. Many participants, when askedabout what kinds of ads they liked in general, said that they en-joyed ads which were targeted at their specific interests. Variousparticipants mentioned liking ads for their specific hobbies, food,pets, and for products they are currently shopping for, etc.
Simple and Straightforward. Participants appreciated ads thatwere easy to understand, and straightforward about what they wereselling.
Some participants mentioned that it was important that ads wereclearly identifiable as ads, present information up front, and clearlymention the brand:
When I am browsing, I enjoy ads that are unique andadvertise the brand name clearly, without disruptingthe content I am viewing. Specifically, side bannersand top banners are fine
And others appreciated direct approaches, as opposed to “clever”tactics or other appeals:
Simple–not too pushy. If I’m looking for insuranceit’s there. Not trying to be too clever or emotional.Nice palette–few and easy-to-focus-on visuals
Useful, Interesting, and Informative. Participants liked ads thatprovided them with useful information. Some participants gen-uinely liked seeing ads to discover new products:
I like seeing ads of events happening nearby me andproducts concerning sports and electronics because ifeel they are in a way an outlet for me to know whatsout there.
Others appreciated when the ads were informative about the prod-uct being sold:
[Explaining why they like a clothing ad] The pictureof the guy. It gives me a good idea of what it wouldlook like on me.
Stepping back, we organize and summarize the taxonomy ofboth positive and negative reactions that participants had ad con-tent in Table 2. We note that participants did not always agree ontheir assessment of specific ads— some of the positive and negativereactions we reported above referred to the same ads, suggestingthat a range of user perceptions and attitudes complicates any as-sessment of a given ad as strictly “good” or “bad”. We explore thisphenomena quantitatively, and in greater detail, in the next section,and we return to a general discussion combining the findings fromboth of our surveys in Section 5.
4 SURVEY 2: WHICH ADS DO PEOPLEDISLIKE?
Equippedwith our taxonomy of reasons that people dislike ads fromSurvey 1, we now turn to our second research question: specificallywhich ads do people dislike, and for which reasons? What are thespecific characteristics of ads that evoke these reactions? Can wecharacterize ad content on a spectrum, ranging from ads that peoplenearly universally agree are “bad” or “good” to the gray area inbetween where subjective opinions are mixed?
To answer these questions, we collected a large (new) dataset ofads from the web and surveyed a large number of participants. Ata high level, we (1) collected a dataset of 500 ads that we randomlysampled from ads appearing on the top 3000 U.S.-registered web-sites, (2) asked 1000 participants to rate and annotate 5 ads eachwith one or more opinion labels, derived from our taxonomy fromSurvey 1, (3) manually labeled each ad ourselves with on contentlabels to describe objective properties of the ads (e.g., topic, format),and (4) analyzed the resulting labeled ad dataset.
4.1 Survey 2 Methodology4.1.1 Ads Dataset. We wanted to collect participant ratings on alarge, diverse dataset of actual ads from the web. Thus we created anew dataset by crawling the top 3000 most popular U.S.-registeredwebsites, based on the Tranco top ranked sites list [60], matchingthe crawling methodology used to collect the ads in Survey 1 [106].
We crawled these sites using a custom-built web crawler basedon Puppeteer, a browser automation library for the Chromiumbrowser [42]. When the crawler visits a site, it identifies ads usingthe Easylist [25], a popular list of definitions used by ad blockers,and takes screenshots of each ad on the page. Our crawler visitedthe home page of each domain in the top 3000 list, scraped anyads found on the page, and then attempted to find a subpage onthe domain that contained ads (to account for cases where the
What Makes a “Bad” Ad? User Perceptions of Problematic Online Advertising
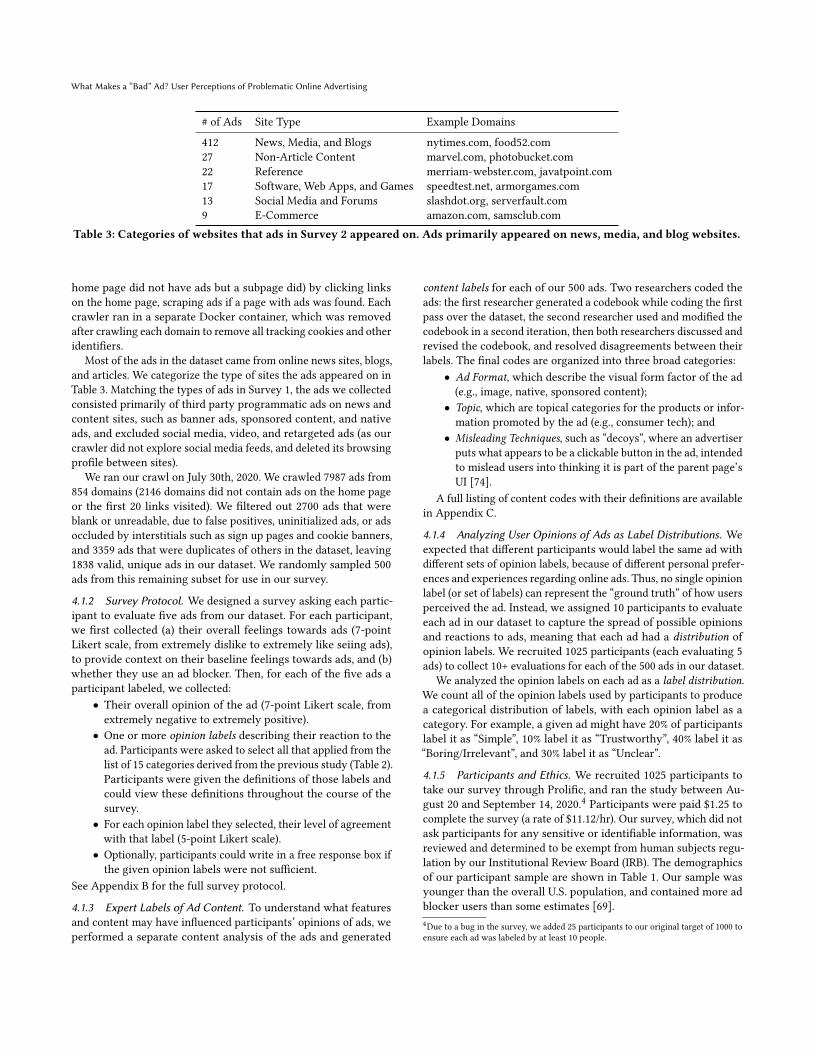
# of Ads Site Type Example Domains
412 News, Media, and Blogs nytimes.com, food52.com27 Non-Article Content marvel.com, photobucket.com22 Reference merriam-webster.com, javatpoint.com17 Software, Web Apps, and Games speedtest.net, armorgames.com13 Social Media and Forums slashdot.org, serverfault.com9 E-Commerce amazon.com, samsclub.com
Table 3: Categories of websites that ads in Survey 2 appeared on. Ads primarily appeared on news, media, and blog websites.
home page did not have ads but a subpage did) by clicking linkson the home page, scraping ads if a page with ads was found. Eachcrawler ran in a separate Docker container, which was removedafter crawling each domain to remove all tracking cookies and otheridentifiers.
Most of the ads in the dataset came from online news sites, blogs,and articles. We categorize the type of sites the ads appeared on inTable 3. Matching the types of ads in Survey 1, the ads we collectedconsisted primarily of third party programmatic ads on news andcontent sites, such as banner ads, sponsored content, and nativeads, and excluded social media, video, and retargeted ads (as ourcrawler did not explore social media feeds, and deleted its browsingprofile between sites).
We ran our crawl on July 30th, 2020. We crawled 7987 ads from854 domains (2146 domains did not contain ads on the home pageor the first 20 links visited). We filtered out 2700 ads that wereblank or unreadable, due to false positives, uninitialized ads, or adsoccluded by interstitials such as sign up pages and cookie banners,and 3359 ads that were duplicates of others in the dataset, leaving1838 valid, unique ads in our dataset. We randomly sampled 500ads from this remaining subset for use in our survey.
4.1.2 Survey Protocol. We designed a survey asking each partic-ipant to evaluate five ads from our dataset. For each participant,we first collected (a) their overall feelings towards ads (7-pointLikert scale, from extremely dislike to extremely like seiing ads),to provide context on their baseline feelings towards ads, and (b)whether they use an ad blocker. Then, for each of the five ads aparticipant labeled, we collected:
• Their overall opinion of the ad (7-point Likert scale, fromextremely negative to extremely positive).
• One or more opinion labels describing their reaction to thead. Participants were asked to select all that applied from thelist of 15 categories derived from the previous study (Table 2).Participants were given the definitions of those labels andcould view these definitions throughout the course of thesurvey.
• For each opinion label they selected, their level of agreementwith that label (5-point Likert scale).
• Optionally, participants could write in a free response box ifthe given opinion labels were not sufficient.
See Appendix B for the full survey protocol.
4.1.3 Expert Labels of Ad Content. To understand what featuresand content may have influenced participants’ opinions of ads, weperformed a separate content analysis of the ads and generated
content labels for each of our 500 ads. Two researchers coded theads: the first researcher generated a codebook while coding the firstpass over the dataset, the second researcher used and modified thecodebook in a second iteration, then both researchers discussed andrevised the codebook, and resolved disagreements between theirlabels. The final codes are organized into three broad categories:
• Ad Format, which describe the visual form factor of the ad(e.g., image, native, sponsored content);
• Topic, which are topical categories for the products or infor-mation promoted by the ad (e.g., consumer tech); and
• Misleading Techniques, such as “decoys”, where an advertiserputs what appears to be a clickable button in the ad, intendedto mislead users into thinking it is part of the parent page’sUI [74].
A full listing of content codes with their definitions are availablein Appendix C.
4.1.4 Analyzing User Opinions of Ads as Label Distributions. Weexpected that different participants would label the same ad withdifferent sets of opinion labels, because of different personal prefer-ences and experiences regarding online ads. Thus, no single opinionlabel (or set of labels) can represent the “ground truth” of how usersperceived the ad. Instead, we assigned 10 participants to evaluateeach ad in our dataset to capture the spread of possible opinionsand reactions to ads, meaning that each ad had a distribution ofopinion labels. We recruited 1025 participants (each evaluating 5ads) to collect 10+ evaluations for each of the 500 ads in our dataset.
We analyzed the opinion labels on each ad as a label distribution.We count all of the opinion labels used by participants to producea categorical distribution of labels, with each opinion label as acategory. For example, a given ad might have 20% of participantslabel it as “Simple”, 10% label it as “Trustworthy”, 40% label it as“Boring/Irrelevant”, and 30% label it as “Unclear”.
4.1.5 Participants and Ethics. We recruited 1025 participants totake our survey through Prolific, and ran the study between Au-gust 20 and September 14, 2020.4 Participants were paid $1.25 tocomplete the survey (a rate of $11.12/hr). Our survey, which did notask participants for any sensitive or identifiable information, wasreviewed and determined to be exempt from human subjects regu-lation by our Institutional Review Board (IRB). The demographicsof our participant sample are shown in Table 1. Our sample wasyounger than the overall U.S. population, and contained more adblocker users than some estimates [69].4Due to a bug in the survey, we added 25 participants to our original target of 1000 toensure each ad was labeled by at least 10 people.

Zeng et al.
Figure 3: Histogram of how much participants reported lik-ing/disliking seeing online ads in general. Overall, most par-ticipants disliked seeing ads; ad blocker users disliked adsmore.
Figure 4:Histogramof average overall opinion rating for adsin our dataset, where the values 1-7 map to a Likert scaleranging from extremely negative to extremely positive. Rat-ings for ads skewed negative, with a median score of 3.8.
4.2 Survey 2 Results4.2.1 General Attitudes Towards Ads. Our participants generallyskewed towards disliking ads to begin with. Figure 3 shows par-ticipants’ general attitude towards online ads; most participantsdisliked seeing ads in general, and the majority of those who dislikeseeing ads use an ad blocker. 57% reported using an ad blocker, 38%did not use an ad blocker, and 5% were not sure if they used one.
4.2.2 Prevalence of “Bad” Ads. How prevalent were “bad” ads inour sample of 500 unique ads crawled from the most popular 3000U.S.-registered websites? In this section, we analyze the quantityof ads that participants rated negatively in our dataset. While wecannot directly generalize from our sample to the web at large (dueto the fact that our dataset only captures a small slice of all adcampaigns running at one point in time, and that ads may havebeen targeted at our crawler and/or geographic location), our resultsprovide an approximation of how many “bad” ads web users seewhen visiting popular websites.
Number (%) of ads with >n% agreement
Opinion Label >25% >50% >75%
Simple 327 (65.4%) 156 (31.2%) 12 (2.4%)Clickbait 189 (37.8%) 103 (20.6%) 23 (4.6%)Good Design 231 (46.2%) 93 (18.6%) 10 (2.0%)Ugly/Bad Design 212 (42.4%) 68 (13.6%) 6 (1.2%)Boring/Irrelevant 243 (48.6%) 62 (12.4%) 4 (0.8%)Deceptive 140 (28.0%) 56 (11.2%) 9 (1.8%)Unclear 137 (27.4%) 38 (7.6%) 6 (1.2%)Interested in Product 142 (28.4%) 24 (4.8%) 0 (0.0%)Useful/Informative 103 (20.6%) 21 (4.2%) 0 (0.0%)Dislike Product 111 (22.2%) 20 (4.0%) 1 (0.2%)Politicized 22 (4.4%) 13 (2.6%) 3 (0.6%)Distasteful 27 (5.4%) 8 (1.6%) 0 (0.0%)Entertaining 56 (11.2%) 8 (1.6%) 0 (0.0%)Pushy/Manipulative 55 (11.0%) 7 (1.4%) 0 (0.0%)Trustworthy 62 (12.4%) 7 (1.4%) 0 (0.0%)
Any Negative Label 414 (82.8%) 226 (45.2%) 51 (10.2%)Any Positive Label 380 (76%) 207 (41%) 21 (4.2%)
Table 4: The number and proportion of ads in the datasetwhere >25%, >50%, or >75% of participants annotated the adwith the same label. Negative labels are italicized. Note thateach ad can have multiple labels with higher agreementthan the threshold, so the number of adswhere 50% of partic-ipants agreed on any negative or positive label is not simplythe sum of the relevant counts.
Overall Opinion of Ads in the Dataset. Most ads in the datasethad negative overall opinion ratings participants. Figure 4 showsa histogram of the average opinion rating for each ad (on a 7-point Likert scale from extremely negative (1) to extremely positive(7)). The median of the average opinion ratings across all ads was3.8, less than the value for the “Neutral” response (4). The Fisher-Pearson coefficient of skewness of the distribution was -0.281 (anormal distribution would have a coefficient of 0), and a test ofskewness indicates the skew is different from a normal distribution(z=-2.558, p=0.011), indicating that participants’ perceptions of adsskew negative. Additionally, no ads had an average rating over 6,while some had ratings under 2, indicating that there were no adsthat most people were extremely positive about.
Opinion Label Frequencies. Next, we analyzed the number of adslabeled by participants with each opinion label, for example, thenumber of ads labeled “clickbait”. Since opinion labels do not have aground truth value, but are instead a distribution of 10 participants’opinions, we cannot simply count the number of ads labeled witheach opinion label. Instead we calculated agreement: the percentageof participants who annotated the ad with a specific opinion label,out of all participants who rated the ad. Because agreement is acontinuous value (rather than binary), we analyze the distributionof agreement values when counting the number of ads labeled aspecific opinion label.
Table 4 shows the quantity and percentage of ads in the datasetwhere more than 25%, 50%, or 75% of participants agreed on an
What Makes a “Bad” Ad? User Perceptions of Problematic Online Advertising
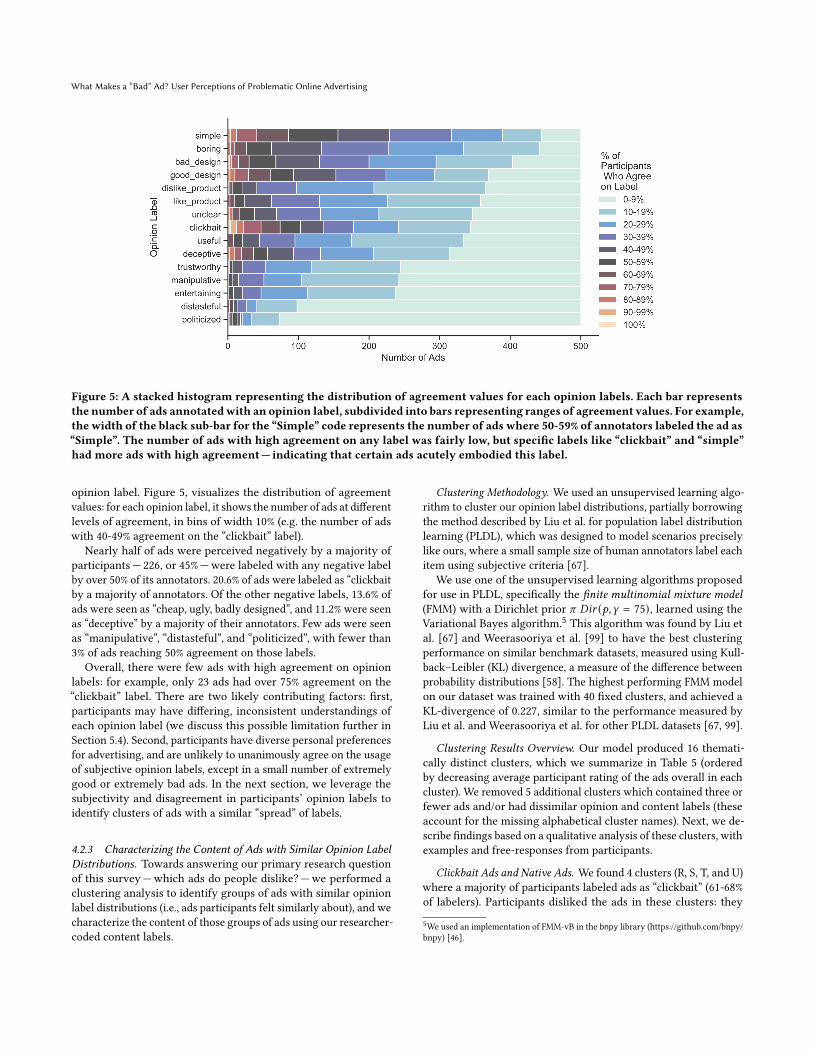
Figure 5: A stacked histogram representing the distribution of agreement values for each opinion labels. Each bar representsthe number of ads annotatedwith an opinion label, subdivided into bars representing ranges of agreement values. For example,the width of the black sub-bar for the “Simple” code represents the number of ads where 50-59% of annotators labeled the ad as“Simple”. The number of ads with high agreement on any label was fairly low, but specific labels like “clickbait” and “simple”had more ads with high agreement— indicating that certain ads acutely embodied this label.
opinion label. Figure 5, visualizes the distribution of agreementvalues: for each opinion label, it shows the number of ads at differentlevels of agreement, in bins of width 10% (e.g. the number of adswith 40-49% agreement on the “clickbait” label).
Nearly half of ads were perceived negatively by a majority ofparticipants— 226, or 45%—were labeled with any negative labelby over 50% of its annotators. 20.6% of ads were labeled as “clickbaitby a majority of annotators. Of the other negative labels, 13.6% ofads were seen as “cheap, ugly, badly designed”, and 11.2% were seenas “deceptive” by a majority of their annotators. Few ads were seenas “manipulative”, “distasteful”, and “politicized”, with fewer than3% of ads reaching 50% agreement on those labels.
Overall, there were few ads with high agreement on opinionlabels: for example, only 23 ads had over 75% agreement on the“clickbait” label. There are two likely contributing factors: first,participants may have differing, inconsistent understandings ofeach opinion label (we discuss this possible limitation further inSection 5.4). Second, participants have diverse personal preferencesfor advertising, and are unlikely to unanimously agree on the usageof subjective opinion labels, except in a small number of extremelygood or extremely bad ads. In the next section, we leverage thesubjectivity and disagreement in participants’ opinion labels toidentify clusters of ads with a similar “spread” of labels.
4.2.3 Characterizing the Content of Ads with Similar Opinion LabelDistributions. Towards answering our primary research questionof this survey—which ads do people dislike?—we performed aclustering analysis to identify groups of ads with similar opinionlabel distributions (i.e., ads participants felt similarly about), and wecharacterize the content of those groups of ads using our researcher-coded content labels.
Clustering Methodology. We used an unsupervised learning algo-rithm to cluster our opinion label distributions, partially borrowingthe method described by Liu et al. for population label distributionlearning (PLDL), which was designed to model scenarios preciselylike ours, where a small sample size of human annotators label eachitem using subjective criteria [67].
We use one of the unsupervised learning algorithms proposedfor use in PLDL, specifically the finite multinomial mixture model(FMM) with a Dirichlet prior 𝜋 𝐷𝑖𝑟 (𝑝,𝛾 = 75), learned using theVariational Bayes algorithm.5 This algorithm was found by Liu etal. [67] and Weerasooriya et al. [99] to have the best clusteringperformance on similar benchmark datasets, measured using Kull-back–Leibler (KL) divergence, a measure of the difference betweenprobability distributions [58]. The highest performing FMM modelon our dataset was trained with 40 fixed clusters, and achieved aKL-divergence of 0.227, similar to the performance measured byLiu et al. and Weerasooriya et al. for other PLDL datasets [67, 99].
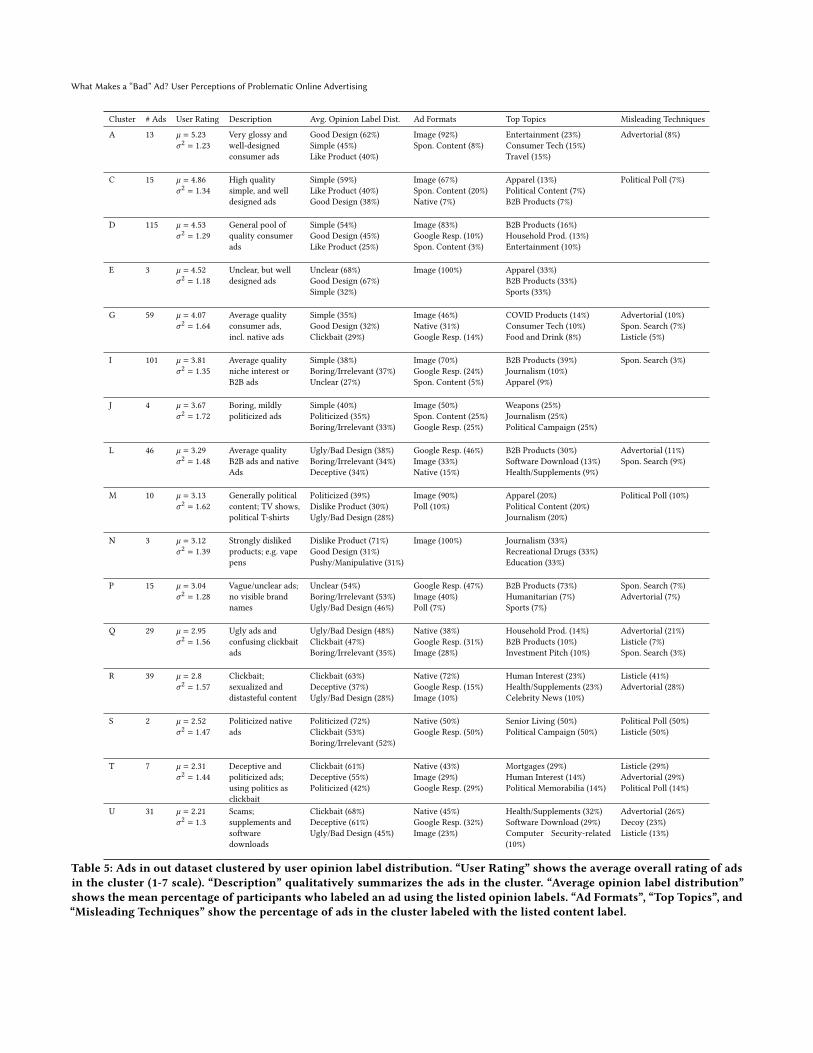
Clustering Results Overview. Our model produced 16 themati-cally distinct clusters, which we summarize in Table 5 (orderedby decreasing average participant rating of the ads overall in eachcluster). We removed 5 additional clusters which contained three orfewer ads and/or had dissimilar opinion and content labels (theseaccount for the missing alphabetical cluster names). Next, we de-scribe findings based on a qualitative analysis of these clusters, withexamples and free-responses from participants.
Clickbait Ads and Native Ads. We found 4 clusters (R, S, T, and U)where a majority of participants labeled ads as “clickbait” (61-68%of labelers). Participants disliked the ads in these clusters: they
5We used an implementation of FMM-vB in the bnpy library (https://github.com/bnpy/bnpy) [46].

Zeng et al.
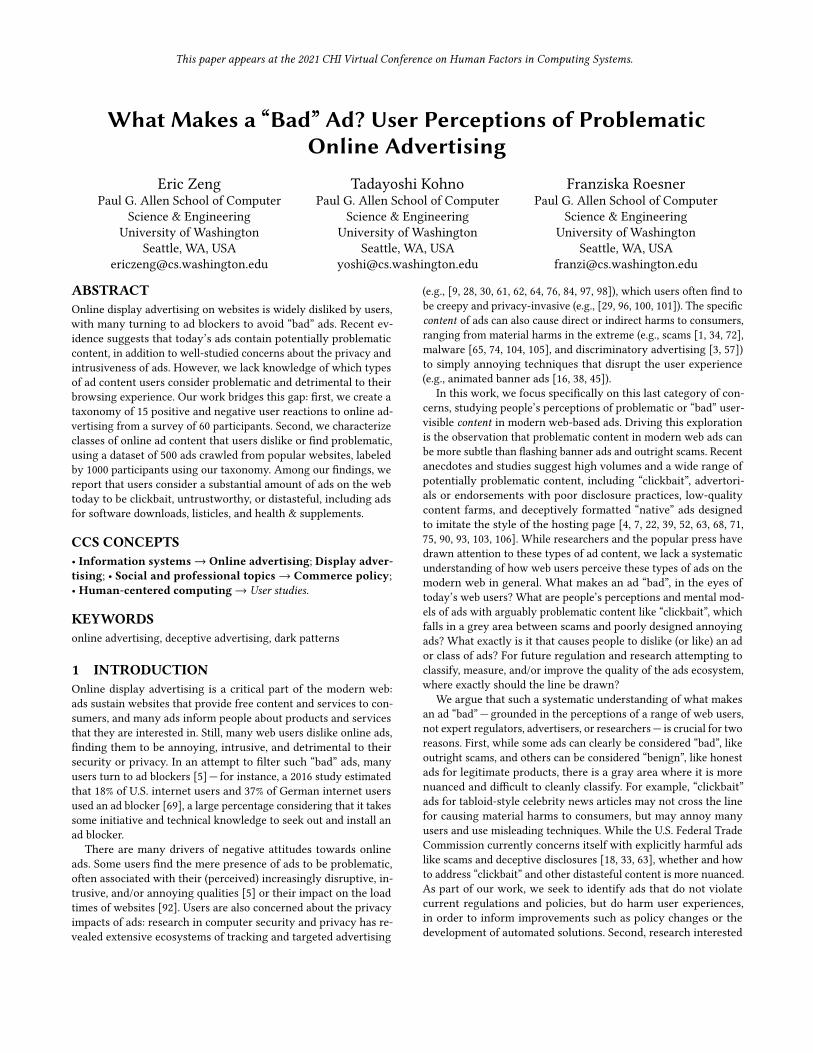
Figure 6: Examples of “bad” ads from our dataset, which appeared in clusters where participants frequently used labels suchas “clickbait”, “deceptive/untrustworthy” “distasteful”, and “politicized”. (a) is a native ad, for a celebrity news “listicle”, some-times called a “content farm”, an article designed to maximize ad revenue per viewer. (b) is a Google responsive display ad, fora dietary supplement, viewed by some participants as disgusting. (c) is a “decoy” software download ad, designed to look UI onthe parent page, seen by participants as deceptive. (d) is a native ad for a listicle featuring sexualized imagery (blurred by us),which participants found sexist and distasteful. (e) is a political campaign ad, designed to look like a poll, seen by participantsas politicized. (f) is an ad for reverse mortgages which uses political imagery to attract attention, also seen as politicized.
represent the four lowest-ranked clusters in terms of participants’overall opinion, with average ratings ranging from 2.21 to 2.8 (on a1-7 scale).
These clusters contain a diverse set of ad content includinglisticles, potentially fraudulent supplements, sexualized images,and tabloid news. The common thread among them is that manyare native ads (43%-72% of ads in these clusters), also known ascontent recommendation ads, or colloquially as “chumboxes” [68].These ads imitate the design of links to news articles on the site,and have been considered borderline deceptive by the FTC andresearchers [31, 47, 59, 102].
Numerous participants suspected that “clickbait” native ads, suchas the ad in Figure 6a, are content farms:
It seems like this ad would lead to an actual articlebut I think the website would be loaded with otheradvertisements.
They also commented on the tendency for listicle-style native adsto do a bait-and-switch.
(Figure 6a) It tries to fool into clicking something thatmay or may not have anything to do with the add bygiving me misleading or tangential information in theheadline.
Participants also found the lack of clear disclosure of the advertiseror brand in native ads confusing:
It’s difficult to tell that this is an ad rather than alegitimate recommended article.
Clickbait and Distasteful Content. Cluster R contains a high num-ber of “clickbait” ads containing sexualized or gross images, mostlyin the native ad format. We counted 12 ads featuring sexually sug-gestive pictures of women and 2 of men, mainly for human inter-est “listicles”. We also counted 5 pictures participants described as“gross” and disgusting, like dogs eating an unknown purple sub-stance, and a dirty toilet. On average, 27% of participants labeledads in this cluster as “distasteful”, the highest percentage for thatlabel in any cluster. Participants reacted negatively to these ads
What Makes a “Bad” Ad? User Perceptions of Problematic Online Advertising
Cluster # Ads User Rating Description Avg. Opinion Label Dist. Ad Formats Top Topics Misleading Techniques
A 13 ` = 5.23𝜎2 = 1.23
Very glossy andwell-designedconsumer ads
Good Design (62%)Simple (45%)Like Product (40%)
Image (92%)Spon. Content (8%)
Entertainment (23%)Consumer Tech (15%)Travel (15%)
Advertorial (8%)
C 15 ` = 4.86𝜎2 = 1.34
High qualitysimple, and welldesigned ads
Simple (59%)Like Product (40%)Good Design (38%)
Image (67%)Spon. Content (20%)Native (7%)
Apparel (13%)Political Content (7%)B2B Products (7%)
Political Poll (7%)
D 115 ` = 4.53𝜎2 = 1.29
General pool ofquality consumerads
Simple (54%)Good Design (45%)Like Product (25%)
Image (83%)Google Resp. (10%)Spon. Content (3%)
B2B Products (16%)Household Prod. (13%)Entertainment (10%)
E 3 ` = 4.52𝜎2 = 1.18
Unclear, but welldesigned ads
Unclear (68%)Good Design (67%)Simple (32%)
Image (100%) Apparel (33%)B2B Products (33%)Sports (33%)
G 59 ` = 4.07𝜎2 = 1.64
Average qualityconsumer ads,incl. native ads
Simple (35%)Good Design (32%)Clickbait (29%)
Image (46%)Native (31%)Google Resp. (14%)
COVID Products (14%)Consumer Tech (10%)Food and Drink (8%)
Advertorial (10%)Spon. Search (7%)Listicle (5%)
I 101 ` = 3.81𝜎2 = 1.35
Average qualityniche interest orB2B ads
Simple (38%)Boring/Irrelevant (37%)Unclear (27%)
Image (70%)Google Resp. (24%)Spon. Content (5%)
B2B Products (39%)Journalism (10%)Apparel (9%)
Spon. Search (3%)
J 4 ` = 3.67𝜎2 = 1.72
Boring, mildlypoliticized ads
Simple (40%)Politicized (35%)Boring/Irrelevant (33%)
Image (50%)Spon. Content (25%)Google Resp. (25%)
Weapons (25%)Journalism (25%)Political Campaign (25%)
L 46 ` = 3.29𝜎2 = 1.48
Average qualityB2B ads and nativeAds
Ugly/Bad Design (38%)Boring/Irrelevant (34%)Deceptive (34%)
Google Resp. (46%)Image (33%)Native (15%)
B2B Products (30%)Software Download (13%)Health/Supplements (9%)
Advertorial (11%)Spon. Search (9%)
M 10 ` = 3.13𝜎2 = 1.62
Generally politicalcontent; TV shows,political T-shirts
Politicized (39%)Dislike Product (30%)Ugly/Bad Design (28%)
Image (90%)Poll (10%)
Apparel (20%)Political Content (20%)Journalism (20%)
Political Poll (10%)
N 3 ` = 3.12𝜎2 = 1.39
Strongly dislikedproducts; e.g. vapepens
Dislike Product (71%)Good Design (31%)Pushy/Manipulative (31%)
Image (100%) Journalism (33%)Recreational Drugs (33%)Education (33%)
P 15 ` = 3.04𝜎2 = 1.28
Vague/unclear ads;no visible brandnames
Unclear (54%)Boring/Irrelevant (53%)Ugly/Bad Design (46%)
Google Resp. (47%)Image (40%)Poll (7%)
B2B Products (73%)Humanitarian (7%)Sports (7%)
Spon. Search (7%)Advertorial (7%)
Q 29 ` = 2.95𝜎2 = 1.56
Ugly ads andconfusing clickbaitads
Ugly/Bad Design (48%)Clickbait (47%)Boring/Irrelevant (35%)
Native (38%)Google Resp. (31%)Image (28%)
Household Prod. (14%)B2B Products (10%)Investment Pitch (10%)
Advertorial (21%)Listicle (7%)Spon. Search (3%)
R 39 ` = 2.8𝜎2 = 1.57
Clickbait;sexualized anddistasteful content
Clickbait (63%)Deceptive (37%)Ugly/Bad Design (28%)
Native (72%)Google Resp. (15%)Image (10%)
Human Interest (23%)Health/Supplements (23%)Celebrity News (10%)
Listicle (41%)Advertorial (28%)
S 2 ` = 2.52𝜎2 = 1.47
Politicized nativeads
Politicized (72%)Clickbait (53%)Boring/Irrelevant (52%)
Native (50%)Google Resp. (50%)
Senior Living (50%)Political Campaign (50%)
Political Poll (50%)Listicle (50%)
T 7 ` = 2.31𝜎2 = 1.44
Deceptive andpoliticized ads;using politics asclickbait
Clickbait (61%)Deceptive (55%)Politicized (42%)
Native (43%)Image (29%)Google Resp. (29%)
Mortgages (29%)Human Interest (14%)Political Memorabilia (14%)
Listicle (29%)Advertorial (29%)Political Poll (14%)
U 31 ` = 2.21𝜎2 = 1.3
Scams;supplements andsoftwaredownloads
Clickbait (68%)Deceptive (61%)Ugly/Bad Design (45%)
Native (45%)Google Resp. (32%)Image (23%)
Health/Supplements (32%)Software Download (29%)Computer Security-related(10%)
Advertorial (26%)Decoy (23%)Listicle (13%)
Table 5: Ads in out dataset clustered by user opinion label distribution. “User Rating” shows the average overall rating of adsin the cluster (1-7 scale). “Description” qualitatively summarizes the ads in the cluster. “Average opinion label distribution”shows the mean percentage of participants who labeled an ad using the listed opinion labels. “Ad Formats”, “Top Topics”, and“Misleading Techniques” show the percentage of ads in the cluster labeled with the listed content label.
Zeng et al.
(the average opinion rating was 2.8) and described their visceraldislike of the ads in the free response:
(Figure 6b) The picture of the egg yolk oozing outlooks disgusting. The ad also uses threatening lan-guage such as “before it’s too late”.
In response to a particularly sexually suggestive ad:Blatant soft-porn sexism. Completely disgusting.
Clickbait and Deceptive Content. Cluster U contains “scammy”clickbait ads— on average 61% of participants labeled ads from thiscluster as deceptive. This cluster also has the lowest average ratingfrom participants of all of the clusters (` = 2.21), indicating a widedislike for deception in advertising. Software download ads thatused decoys and phishing techniques were common (29% of adsin the cluster), such as ads for driver downloads, PDF readers, andbrowser extensions (Figure 6c).
Looks like an advertisement a scammer would use toget you to download bad software on to your com-puter.
We also observed numerous ads for supplements (32% of ads inthe cluster) which claimed to help with conditions such as weightloss, liver health (Figure 6b), and toenail fungus, but we did notfind ads for legitimate prescription drugs or medical services here,suggesting that people consider supplements to be particularly“scammy” or deceptive.
Clickbait and Politicized Ads. Clusters S and T encompass ads thatparticipants frequently rated as both “politicized” and “clickbait”.Of the 9 ads in these two clusters, two were ads from a politicalcampaign, both from U.S. President Donald Trump’s re-electioncampaign. Both of these ads present themselves as a political poll,asking “Approve of Trump? Yes or no?” (Figure 6e), and “Yes or No?Is the Media Fair?”, likely a tactic to bait users to click, exploiting adesire to make their political opinions heard.
The remainder of the politicized ads were not for political cam-paigns, but used political themes to attract attention. For exam-ple, we found ads that prominently used symbols associated withDonald Trump: an ad for mortgage refinancing that uses imageryreminiscent of the “MAGA” hat (Figure 6f), and a native ad for acommemorative coin, with the headline “Weird Gift from TrumpAngers Democrats!”.
Participants broadly disliked these politicized ads; the averageopinion rating was 2.31 and 2.52 for clusters T and S respectively.The low ratings may in part be due to the political beliefs of ourparticipants: 5 of 9 ads support or use pro-Trump imagery, and ourparticipant pool skewed Democratic: 51% identified as Democrats,16% as Republicans, and 26% as Independent.
Other Negatively Perceived Ad Clusters.• Cheap, Ugly, and Badly Designed Ads: Participants appearto dislike visually unattractive ads in general. Cluster Qcontains ads that do not have much in common in termsof content, but on average, 48% of participants labeled adsin this cluster as poorly designed, with an average opinionrating of 2.95.
• Unclear or Irrelevant Business-to-Business (B2B) Product Ads:Participants rated ads in cluster P as unclear and boring/
irrelevant, on average 54% and 53% of participants per adrespectively, and the overall rating was 3.04. 73% of these adswere aimed at businesses and commercial customers, indi-cating that these ads were likely confusing and not relevantto participants. Many ads also used Google’s ResponsiveDisplay ad format (47%), which sometimes lacked images,potentially adding to participants’ confusion.
• Strongly Disliked Products: Cluster N contained only threeads, but 71% of participants on average said they disliked theproduct (overall rating was 3.12). These ads contain sociallyundesirable products: vape pens, a medical school adver-tising that it does not require an MCAT exam score, andsubscriptions to a tabloid magazine.
• Non-Clickbait Politicized Ads: Cluster M contains ads thaton average 39% of participants labeled as politicized, 30% asdisliking the product, and 28% as boring or irrelevant. Com-pared to the political ads in clusters S and T, most of these adsdo not employ clickbait or deceptive tactics. They includeads like for political TV programming (e.g., Fox News) andpolitical T-shirts. In general, participants appear to dislikethese ads (the overall average rating was 3.13) more becausethey disagree with the politics than concerns about the ad’sdesign or tactics.
“Good” or Neutral Ads. The remainder of the clusters contain adsparticipants rated only slightly below average, or above average(with average overall opinions 3.29-5.23). Factors characterizingthese clusters included:
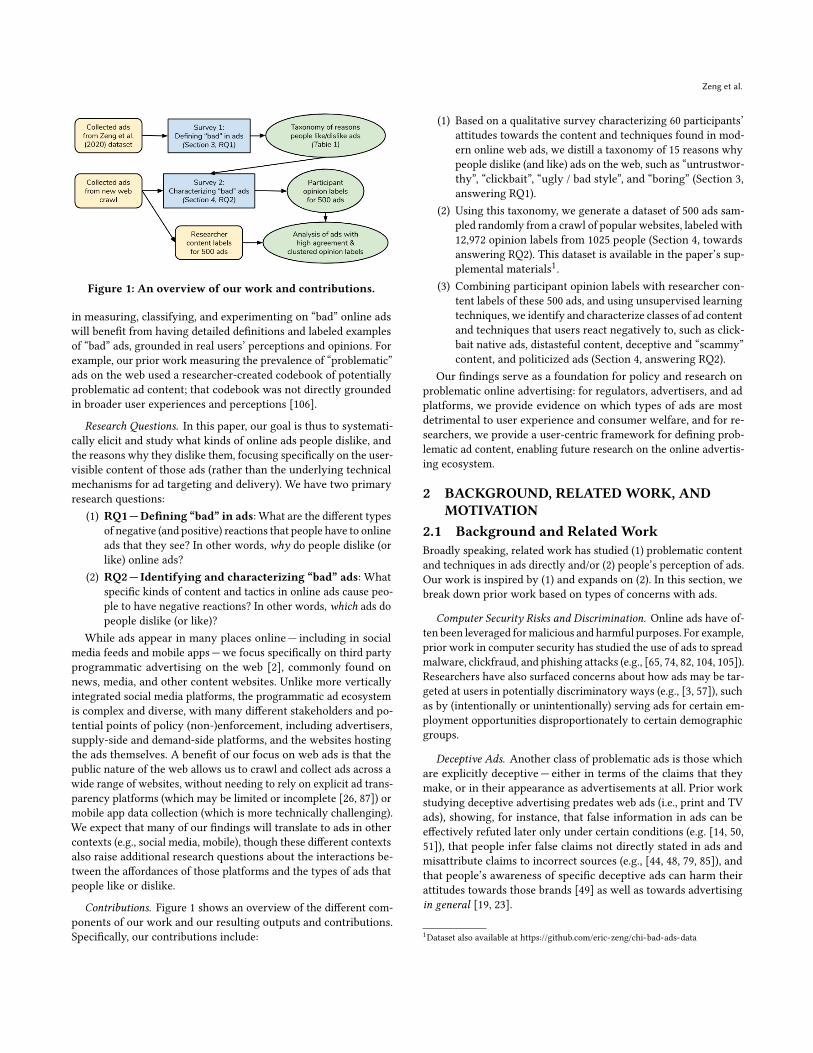
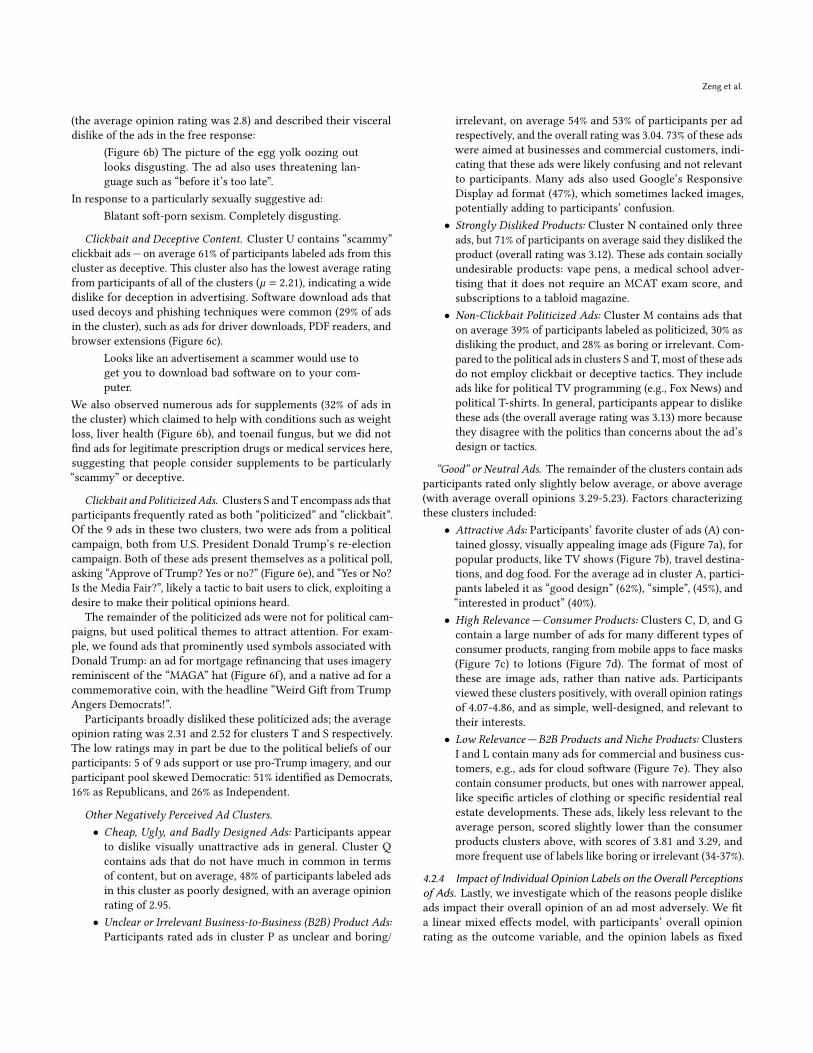
• Attractive Ads: Participants’ favorite cluster of ads (A) con-tained glossy, visually appealing image ads (Figure 7a), forpopular products, like TV shows (Figure 7b), travel destina-tions, and dog food. For the average ad in cluster A, partici-pants labeled it as “good design” (62%), “simple”, (45%), and“interested in product” (40%).
• High Relevance—Consumer Products: Clusters C, D, and Gcontain a large number of ads for many different types ofconsumer products, ranging from mobile apps to face masks(Figure 7c) to lotions (Figure 7d). The format of most ofthese are image ads, rather than native ads. Participantsviewed these clusters positively, with overall opinion ratingsof 4.07-4.86, and as simple, well-designed, and relevant totheir interests.
• Low Relevance—B2B Products and Niche Products: ClustersI and L contain many ads for commercial and business cus-tomers, e.g., ads for cloud software (Figure 7e). They alsocontain consumer products, but ones with narrower appeal,like specific articles of clothing or specific residential realestate developments. These ads, likely less relevant to theaverage person, scored slightly lower than the consumerproducts clusters above, with scores of 3.81 and 3.29, andmore frequent use of labels like boring or irrelevant (34-37%).
4.2.4 Impact of Individual Opinion Labels on the Overall Perceptionsof Ads. Lastly, we investigate which of the reasons people dislikeads impact their overall opinion of an ad most adversely. We fita linear mixed effects model, with participants’ overall opinionrating as the outcome variable, and the opinion labels as fixed

What Makes a “Bad” Ad? User Perceptions of Problematic Online Advertising
Figure 7: A sample of “good” ads from our dataset, that participants labeled positively, with labels like “good design”, “simple”,and “interested in product”. (a) and (b) are ads for consumer services, andwere in the highest rated cluster because of attractivevisuals and appealing products. (c) and (d) are also consumer products from clusters with above average ratings. (e) is anexample of an ad for B2B or enterprise products, which participants didn’t find problematic, but rated as boring or not relevant.
effects. We also modeled other context participants provided in thesurvey as fixed effects: their general feelings towards online ads(1-7 Likert scale), and whether they used an ad blocker. We modeledthe participant and the ads as random effects.
Opinion of Ad = Σ(Opinion Labels) + Use AdBlocker? + General Opinion of Ads + (1|Participant)+ (1|Ad)
We report the results of the maximal random effects structurein Table 6, in order of coefficient estimates (the effect size for eachvariable). We found that, as expected, positive opinion labels arecorrelated with higher ratings, and negative opinion labels arecorrelated with lower ratings. The negative opinion labels that hadthe largest effect on opinion ratings were “Distasteful, Offensive,Uncomfortable”, “Deceptive”, and “Clickbait”, which had nearlytwice the effect of labels like “Boring, Irrelevant”, suggesting thatthese opinion categories qualitatively describe “worse” traits in ads.
Participants opinion ratings were also affected by their overall at-titudes towards ads; participants who self-reported liking ads morein general rated specific ads more positively, and participants whoused ad blockers tended to rate ads more negatively, though thesefactors had less effect than the opinion labels (i.e. their substantiveperception of the ad).
5 DISCUSSIONFinally, we discuss the implications of our findings for policy andfuture research on online advertising.
5.1 Broader Lessons on the Online AdvertisingEcosystem
5.1.1 Ad Content Policy Is Lagging Behind User Perceptions. Ourresults show that users are unhappy with a significant proportionof ads. On average, participants gave 57.4% of ads in our samplea lower user rating than “neutral”, and 20% of ads had a loweraverage rating than “somewhat negative”. In the clusters of adswith the lowest ratings, users labeled the content of these ads asdeceptive, clickbait, ugly, and politicized. These ads often containedsupplements and software downloads, ads with sexually suggestiveand distasteful pictures, and product ads leveraging political themes.Clusters with low user ratings also had a much higher proportionof native ads than clusters with high user ratings.
Though most advertising platforms have policies against inap-propriate ad content (e.g. Google Ads prohibits malware, harass-ment, hacked political materials, and misrepresentation [41]), itappears that these policies are insufficient. Though we did not ob-serve acutely malicious ads in our study, it appears that a significantproportion of ads do not meet users’ expectations for acceptability.
5.1.2 Misaligned Incentives and Distributed Responsibility for Con-tent Moderation. Our results indicate that bad ad content is a prob-lem specifically in (but not limited to) the programmatic ads ecosys-tem. Our sample of ads came mostly from news and content web-sites, who generally use third parties to supply programmatic ads(unlike social media platforms like Facebook, which deliver adsend-to-end).
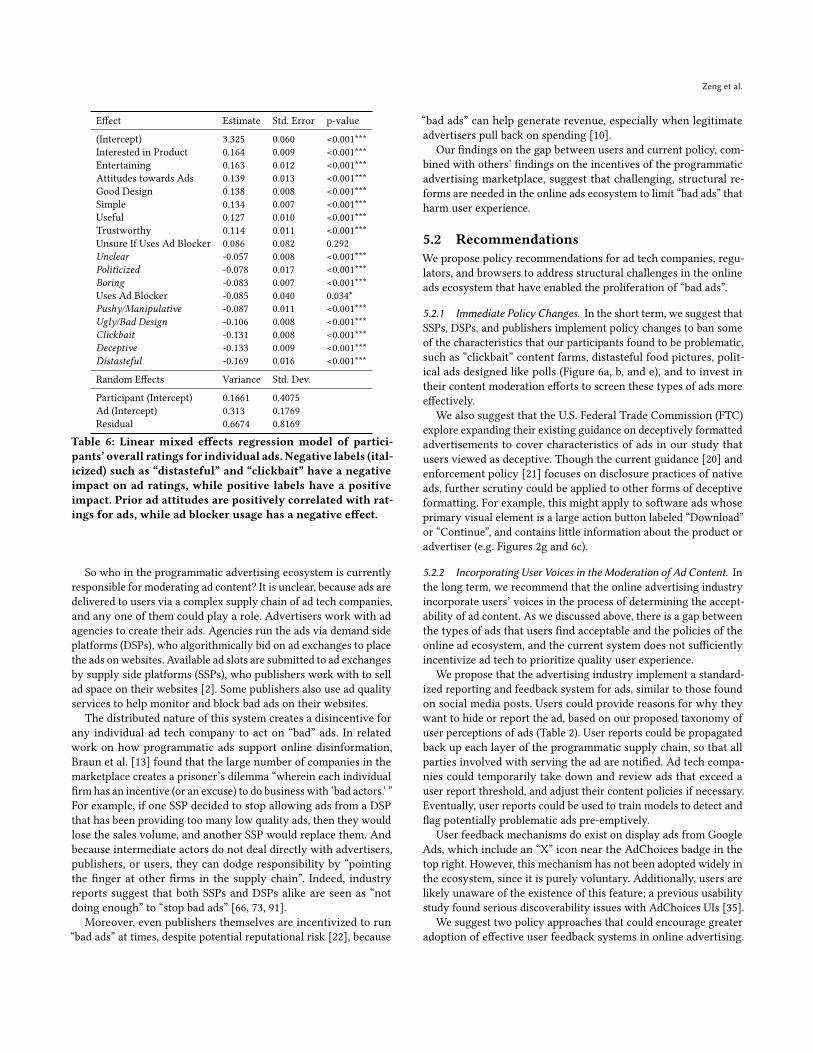
Zeng et al.
Effect Estimate Std. Error p-value
(Intercept) 3.325 0.060 <0.001***Interested in Product 0.164 0.009 <0.001***Entertaining 0.163 0.012 <0.001***Attitudes towards Ads 0.139 0.013 <0.001***Good Design 0.138 0.008 <0.001***Simple 0.134 0.007 <0.001***Useful 0.127 0.010 <0.001***Trustworthy 0.114 0.011 <0.001***Unsure If Uses Ad Blocker 0.086 0.082 0.292Unclear -0.057 0.008 <0.001***Politicized -0.078 0.017 <0.001***Boring -0.083 0.007 <0.001***Uses Ad Blocker -0.085 0.040 0.034*Pushy/Manipulative -0.087 0.011 <0.001***Ugly/Bad Design -0.106 0.008 <0.001***Clickbait -0.131 0.008 <0.001***Deceptive -0.133 0.009 <0.001***Distasteful -0.169 0.016 <0.001***
Random Effects Variance Std. Dev.
Participant (Intercept) 0.1661 0.4075Ad (Intercept) 0.313 0.1769Residual 0.6674 0.8169
Table 6: Linear mixed effects regression model of partici-pants’ overall ratings for individual ads. Negative labels (ital-icized) such as “distasteful” and “clickbait” have a negativeimpact on ad ratings, while positive labels have a positiveimpact. Prior ad attitudes are positively correlated with rat-ings for ads, while ad blocker usage has a negative effect.
So who in the programmatic advertising ecosystem is currentlyresponsible for moderating ad content? It is unclear, because ads aredelivered to users via a complex supply chain of ad tech companies,and any one of them could play a role. Advertisers work with adagencies to create their ads. Agencies run the ads via demand sideplatforms (DSPs), who algorithmically bid on ad exchanges to placethe ads onwebsites. Available ad slots are submitted to ad exchangesby supply side platforms (SSPs), who publishers work with to sellad space on their websites [2]. Some publishers also use ad qualityservices to help monitor and block bad ads on their websites.
The distributed nature of this system creates a disincentive forany individual ad tech company to act on “bad” ads. In relatedwork on how programmatic ads support online disinformation,Braun et al. [13] found that the large number of companies in themarketplace creates a prisoner’s dilemma “wherein each individualfirm has an incentive (or an excuse) to do business with ‘bad actors.’ ”For example, if one SSP decided to stop allowing ads from a DSPthat has been providing too many low quality ads, then they wouldlose the sales volume, and another SSP would replace them. Andbecause intermediate actors do not deal directly with advertisers,publishers, or users, they can dodge responsibility by “pointingthe finger at other firms in the supply chain”. Indeed, industryreports suggest that both SSPs and DSPs alike are seen as “notdoing enough” to “stop bad ads” [66, 73, 91].
Moreover, even publishers themselves are incentivized to run“bad ads” at times, despite potential reputational risk [22], because
“bad ads” can help generate revenue, especially when legitimateadvertisers pull back on spending [10].
Our findings on the gap between users and current policy, com-bined with others’ findings on the incentives of the programmaticadvertising marketplace, suggest that challenging, structural re-forms are needed in the online ads ecosystem to limit “bad ads” thatharm user experience.
5.2 RecommendationsWe propose policy recommendations for ad tech companies, regu-lators, and browsers to address structural challenges in the onlineads ecosystem that have enabled the proliferation of “bad ads”.
5.2.1 Immediate Policy Changes. In the short term, we suggest thatSSPs, DSPs, and publishers implement policy changes to ban someof the characteristics that our participants found to be problematic,such as “clickbait” content farms, distasteful food pictures, polit-ical ads designed like polls (Figure 6a, b, and e), and to invest intheir content moderation efforts to screen these types of ads moreeffectively.
We also suggest that the U.S. Federal Trade Commission (FTC)explore expanding their existing guidance on deceptively formattedadvertisements to cover characteristics of ads in our study thatusers viewed as deceptive. Though the current guidance [20] andenforcement policy [21] focuses on disclosure practices of nativeads, further scrutiny could be applied to other forms of deceptiveformatting. For example, this might apply to software ads whoseprimary visual element is a large action button labeled “Download”or “Continue”, and contains little information about the product oradvertiser (e.g. Figures 2g and 6c).
5.2.2 Incorporating User Voices in the Moderation of Ad Content. Inthe long term, we recommend that the online advertising industryincorporate users’ voices in the process of determining the accept-ability of ad content. As we discussed above, there is a gap betweenthe types of ads that users find acceptable and the policies of theonline ad ecosystem, and the current system does not sufficientlyincentivize ad tech to prioritize quality user experience.
We propose that the advertising industry implement a standard-ized reporting and feedback system for ads, similar to those foundon social media posts. Users could provide reasons for why theywant to hide or report the ad, based on our proposed taxonomy ofuser perceptions of ads (Table 2). User reports could be propagatedback up each layer of the programmatic supply chain, so that allparties involved with serving the ad are notified. Ad tech compa-nies could temporarily take down and review ads that exceed auser report threshold, and adjust their content policies if necessary.Eventually, user reports could be used to train models to detect andflag potentially problematic ads pre-emptively.
User feedback mechanisms do exist on display ads from GoogleAds, which include an “X” icon near the AdChoices badge in thetop right. However, this mechanism has not been adopted widely inthe ecosystem, since it is purely voluntary. Additionally, users arelikely unaware of the existence of this feature; a previous usabilitystudy found serious discoverability issues with AdChoices UIs [35].
We suggest two policy approaches that could encourage greateradoption of effective user feedback systems in online advertising.
What Makes a “Bad” Ad? User Perceptions of Problematic Online Advertising
First, browser vendors could require that third-party ad framesimplement feedback mechanisms, or else block the ad from ren-dering, similar to Google Chrome’s policy of blocking poor adexperiences [88]. Second, through regulation or legislation, onlineads could be required to include a mechanism for user feedback,and ad tech companies could be required to provide transparencyabout the number of reports they receive.
5.3 Future Research Directions5.3.1 Measuring “Regret”: Time and Attention Wasting Ads. Whichkinds of ads do people “regret” clicking on, and how often do peopledo so? Participants in our study anecdotally reported that they “re-gretted” clicking on ads for clickbait content farms and slideshows,because the quality of the content was than lower than expected,or the page did not contain the content promised. Measuring feel-ings of regret and of being misled could be used as a metric foridentifying ads that waste people’s time and attention, which couldprovide a basis for new legislation on online advertising, or couldprovide evidence for violations of existing FTC regulations against“misleading door openers” [21].
5.3.2 Targeting of “Bad Ads”. What is the role of ad targeting anddelivery in the distribution of “bad” ads? For example, do certaindemographic groups receive disproportionately many misleadinghealth and supplement ads? Understanding whether the ad target-ing and delivery infrastructure is being used to target vulnerablepopulations could contribute to ongoing discussions of regulationsand algorithmic fairness and privacy in the advertising ecosys-tem [3, 61, 62, 80].
5.3.3 Automated Classification of “Bad Ads”. Ourmethods and dataprovide a basis for potential automated approaches to detecting “badads”. Using the population label distribution learning approach [67],our dataset6 from Survey 2 could be used to train a classifier thatpredicts user opinion distributions based on the image and/or textcontent of the ad. Such a classifier could be used for future webmeasurement studies, or user-facing tools, like extensions to blockonly bad ads, or browser features to visually flag bad ads.
5.4 LimitationsOur study only examines third-party, programmatic advertisingcommon on news and content websites, and may not generalize toother types of online ads. Due to our crawling methodology, we didnot cover ads on social media, video ads, and ads targeted at spe-cific behaviors or locations. Additionally, our study is U.S. centric:we obtained ads using a U.S.-based crawler, from U.S. registeredsites, we surveyed U.S.-based people, and make U.S.-based policyrecommendations.
We did not show participants the full web page that the adsappeared on, which could affect their perception of the ads. Forexample, certain ads might be “acceptable” on an adult websitebut not on a news website. (Regarding that specific example, weexcluded adult sites from our dataset.) The screenshots we showedincluded a margin of 150 pixels of surrounding context on each sideof the ad (see Figure 8 in Appendix B).
6Dataset is available in the Supplemental Materials of this paper, or at https://github.com/eric-zeng/chi-bad-ads-data
Our participant samples skewed towards younger people and ad-blocker users. This reflects the overall userbase of Prolific7 and thetendency for younger people to use ad blockers [69]. As a result, ourdata may somewhat overestimate the level of negativity towardsads. However, our regression analysis (Section 4.2.4) indicates thatthough ad blocker users are likely to rate ads more negatively, howusers perceived the specifics of the ad were generally more impor-tant. Despite this bias, our results still are useful for understandingthe phenomenon of "bad" ads, by systematizing qualitative reasonsfor disliking ads, and surfacing the concerns of users who activelychoose to block ads.
Though we chose the sample of 30 ads in Survey 1 to cover abroad range of ad characteristics, it is nevertheless a small sam-ple and our resulting taxonomy describing user perceptions of adsis unlikely to be comprehensive. We note that no methodologycan cover all possible ads, since any crawl-based approach of ob-taining display ads is inherently a snapshot of a subset of the adcampaigns running at that time. Though different ads could resultin different user reactions, we believe that our approach of select-ing a qualitatively diverse set of ads from our previous study’slabeled dataset [106] surfaced many common reactions to ads fromparticipants, and provides a useful basis for future work.
In Survey 2, it is possible that participants interpreted the tax-onomy inconsistently, and assigned different meanings to the cat-egories than us (or other participants). Therefore it is possiblethat differences in participants’ understanding of the taxonomydecreased agreement in the opinion labels for some ads. We tried tomitigate potential confusion by making definitions of the categorieseasily accessible throughout the survey. Despite this limitation, ourresults still provide useful insight into clusters of ads that partici-pants had unambiguously negative or positive views of.
6 CONCLUSIONThough online advertisements are crucial to the modern web’s eco-nomic model, they often elicit negative reactions from web users.Beyond disliking the presence of ads or their potential privacy im-plications in general, web users may be negatively impacted (finan-cially, psychologically, or in terms of time and attention resources)by the content of specific ads. In this work, we studied people’sreactions to a range of ads crawled from the web, investigating whypeople dislike different types of ads and characterizing specificallywhich properties of an ad’s content contribute to these negativereactions. Based on both a qualitative and a large-scale quantitativesurvey, we find that large fractions of ads in our random sampleelicit concrete negative reactions from participants, and that thesenegative reactions can be used to generate and characterize mean-ingful clusters of “bad” ads. Our findings, taxonomy, and labeledad dataset provide a user-centric foundation for future policy andresearch aiming to curb problematic content in online ads and im-prove the overall quality of content that people encounter on theweb.
7 ACKNOWLEDGMENTSWe thank all of our study participants for making this work possible.We also thank Cyril Weerasooriya, Chris Homan, and Tong Liu for7Prolific panel demographics: https://prolific.co/demographics/
Zeng et al.
sharing their codebase, and insights on population label distributionlearning. We thank Kentrell Owens, Lucy Simko, Miranda Wei, andSam Wolfson for testing our surveys and providing feedback onour paper. We thank all of the anonymous reviewers for their feed-back and insight. This work was supported in part by the NationalScience Foundation under awards CNS-1565252 and CNS-1651230,and by the UW Tech Policy Lab, which receives support from: theWilliam and Flora Hewlett Foundation, the John D. and Catherine T.MacArthur Foundation, Microsoft, the Pierre and Pamela OmidyarFund at the Silicon Valley Community Foundation.
REFERENCES[1] AARP. 2019. Dietary Supplement Scams. https://www.aarp.org/money/scams-
fraud/info-2019/supplements.html.[2] AlgoAware. 2019. An overview of the Programmatic Advertising Ecosys-
tem: Opportunities and Challenges. https://platformobservatory.eu/app/uploads/2019/10/An-overview-of-the-Programmatic-Advertising-Ecosystem-Opportunities-and-Challenges.pdf. Observatory on the Online PlatformEconomy.
[3] Muhammad Ali, Piotr Sapiezynski, Miranda Bogen, Aleksandra Korolova, AlanMislove, and Aaron Rieke. 2019. Discrimination through Optimization: HowFacebook’s Ad Delivery Can Lead to Biased Outcomes. Proceedings of the ACMon Human-Computer Interaction 3, CSCW, Article 199 (Nov. 2019), 30 pages.https://doi.org/10.1145/3359301
[4] Michelle A. Amazeen and Bartosz W. Wojdynski. 2019. Reducing Native Adver-tising Deception: Revisiting the Antecedents and Consequences of PersuasionKnowledge in Digital News Contexts. Mass Communication and Society 22, 2(2019), 222–247.
[5] Mimi An. 2016. Why People Block Ads (And What It Means for Marketers andAdvertisers. https://web.archive.org/web/20200831221906/https://www.upa.it/static/upload/why/why-people-block-ads/why-people-block-ads.pdf. HubSpotResearch.
[6] Athanasios Andreou, Giridhari Venkatadri, Oana Goga, Krishna P. Gummadi,Patrick Loiseau, and Alan Mislove. 2018. Investigating Ad Transparency Mech-anisms in Social Media: A Case Study of Facebooks Explanations. In 25thAnnual Network and Distributed System Security Symposium, NDSS 2018, SanDiego, California, USA, February 18-21, 2018. The Internet Society, Reston, VA,15. http://wp.internetsociety.org/ndss/wp-content/uploads/sites/25/2018/02/ndss2018_10-1_Andreou_paper.pdf
[7] Anocha Aribarg and Eric M. Schwartz. 2020. Native Advertising in Online News:Trade-Offs Among Clicks, Brand Recognition, and Website Trustworthiness.Journal of Marketing Research 57, 1 (2020), 20–34. https://doi.org/10.1177/0022243719879711
[8] Samantha Baker. 2019. How GOP-linked PR firms use Google’s ad platform toharvest email addresses. Engadget. https://www.engadget.com/2019-11-11-google-political-ads-polls-email-collection.html.
[9] Muhammad Ahmad Bashir, Sajjad Arshad, William Robertson, and ChristoWilson. 2016. Tracing Information Flows Between Ad Exchanges UsingRetargeted Ads. In 25th USENIX Security Symposium (USENIX Security 16).USENIX Association, Austin, TX, 481–496. https://www.usenix.org/conference/usenixsecurity16/technical-sessions/presentation/bashir
[10] Andrew Blustein. 2020. Publishers May Lower Their Standards on Ad Quality inSearch of Revenue. https://www.adweek.com/programmatic/publishers-may-lower-their-standards-on-ad-quality-in-search-of-revenue/. Adweek.
[11] Christoph Bösch, Benjamin Erb, Frank Kargl, Henning Kopp, and Stefan Pfatthe-icher. 2016. Tales from the Dark Side: Privacy Dark Strategies and Privacy DarkPatterns. Proceedings on Privacy Enhancing Technologies 2016, 4 (July 2016),237–254.
[12] Giorgio Brajnik and Silvia Gabrielli. 2010. A Review of Online AdvertisingEffects on the User Experience. International Journal of Human–ComputerInteraction 26, 10 (2010), 971–997.
[13] Joshua A. Braun and Jessica L. Eklund. 2019. Fake News, Real Money: AdTech Platforms, Profit-Driven Hoaxes, and the Business of Journalism. DigitalJournalism 7, 1 (2019), 1–21. https://doi.org/10.1080/21670811.2018.1556314arXiv:https://doi.org/10.1080/21670811.2018.1556314
[14] Kathryn A. Braun and Elizabeth F. Loftus. 1998. Advertising’s misinformationeffect. Applied Cognitive Psychology 12, 6 (1998), 569–591.
[15] Harry Brignull. 2019. Dark Patterns. https://www.darkpatterns.org/.[16] Moira Burke, Anthony Hornof, Erik Nilsen, and Nicholas Gorman. 2005. High-
Cost Banner Blindness: Ads Increase Perceived Workload, Hinder Visual Search,and Are Forgotten. ACMTrans. Comput.-Hum. Interact. 12, 4 (Dec. 2005), 423–445.https://doi.org/10.1145/1121112.1121116
[17] Moira Burke, Anthony Hornof, Erik Nilsen, and Nicholas Gorman. 2005. High-Cost Banner Blindness: Ads Increase Perceived Workload, Hinder Visual Search,
and Are Forgotten. ACM Transactions on Compututer-Human Interaction 12, 4(Dec. 2005), 423–445.
[18] Colin Campbell and Pamela E. Grimm. 2019. The Challenges Native AdvertisingPoses: Exploring Potential Federal Trade Commission Responses and IdentifyingResearch Needs. Journal of Public Policy & Marketing 38, 1 (2019), 110–123.
[19] Margaret C. Campbell. 1995. When Attention-Getting Advertising Tactics ElicitConsumer Inferences of Manipulative Intent: The Importance of BalancingBenefits and Investments. Journal of Consumer Psychology 4, 3 (1995), 225–254.
[20] Federal Trade Comission. 2015. Native Advertising: A Guide for Busi-nesses. https://www.ftc.gov/tips-advice/business-center/guidance/native-advertising-guide-businesses.
[21] Federal Trade Commission. 2015. Commission Enforcement Policy Statement onDeceptively Formatted Advertisements. https://www.ftc.gov/public-statements/2015/12/commission-enforcement-policy-statement-deceptively-formatted.
[22] Henriette Cramer. 2015. Effects of Ad Quality & Content-Relevance on PerceivedContent Quality. In Proceedings of the 33rd Annual ACM Conference on HumanFactors in Computing Systems (Seoul, Republic of Korea) (CHI ’15). Associationfor Computing Machinery, New York, NY, USA, 2231–2234. https://doi.org/10.1145/2702123.2702360
[23] Peter R. Darke and Robin J. B. Ritchie. 2007. The Defensive Consumer: Ad-vertising Deception, Defensive Processing, and Distrust. Journal of MarketingResearch 44, 1 (2007), 114–127.
[24] Paresh Dave and Christopher Bing. 2019. Russian disinformation on YouTubedraws ads, lacks warning labels: researchers. https://www.reuters.com/article/us-alphabet-google-youtube-russia/russian-disinformation-on-youtube-draws-ads-lacks-warning-labels-researchers-idUSKCN1T80JP.
[25] Easylist Filter List Project. 2020. Easylist. https://easylist.to.[26] L. Edelson, T. Lauinger, and D.McCoy. 2020. A Security Analysis of the Facebook
Ad Library. In 2020 IEEE Symposium on Security and Privacy (SP). IEEE, NewYork, NY, 661–678. https://doi.org/10.1109/SP40000.2020.00084
[27] Steven M. Edwards, Hairong Li, and Joo-Hyun Lee. 2002. Forced Exposureand Psychological Reactance: Antecedents and Consequences of the PerceivedIntrusiveness of Pop-Up Ads. Journal of Advertising 31, 3 (2002), 83–95.
[28] Steven Englehardt and Arvind Narayanan. 2016. Online Tracking: A 1-Million-Site Measurement and Analysis. In Proceedings of the 2016 ACM SIGSAC Con-ference on Computer and Communications Security (Vienna, Austria) (CCS’16). Association for Computing Machinery, New York, NY, USA, 1388–1401.https://doi.org/10.1145/2976749.2978313
[29] Motahhare Eslami, Sneha R. Krishna Kumaran, Christian Sandvig, and KarrieKarahalios. 2018. Communicating Algorithmic Process in Online BehavioralAdvertising. In Proceedings of the 2018 CHI Conference on Human Factors inComputing Systems (Montreal QC, Canada) (CHI ’18). Association for ComputingMachinery, New York, NY, USA, 1–13. https://doi.org/10.1145/3173574.3174006
[30] Irfan Faizullabhoy and Aleksandra Korolova. 2018. Facebook’s AdvertisingPlatform: New Attack Vectors and the Need for Interventions. InWorkshop onConsumer Protection (ConPro). IEEE, New York, NY, 6.
[31] Federal Trade Commission. 2013. Blurred Lines: Advertising or Content? AnFTC Workshop on Native Advertising. https://www.ftc.gov/system/files/documents/public_events/171321/final_transcript_1.pdf.
[32] Federal Trade Commission. 2013. .com Disclosures: How to Make EffectiveDisclosures in Digital Advertising. https://www.ftc.gov/system/files/documents/plain-language/bus41-dot-com-disclosures-information-about-online-advertising.pdf.
[33] Federal Trade Commission. 2017. An Exploration of Consumers’ Adver-tising Recognition in the Contexts of Search Engines and Native Adver-tising. https://www.ftc.gov/reports/blurred-lines-exploration-consumers-advertising-recognition-contexts-search-engines-native.
[34] Federal Trade Commission. 2019. The Truth Behind Weight Loss Ads. https://www.consumer.ftc.gov/articles/truth-behind-weight-loss-ads.
[35] Stacia Garlach and Daniel Suthers. 2018. ’I’m supposed to see that?’AdChoicesUsability in the Mobile Environment. In Proceedings of the 51st Hawaii Interna-tional Conference on System Sciences. University of Hawaii at Manoa, Honolulu,HI, 10. https://doi.org/10.24251/HICSS.2018.476
[36] Global Disinformation Index. 2019. Cutting the Funding of Disinformation: TheAd-Tech Solution. https://disinformationindex.org/wp-content/uploads/2019/05/GDI_Report_Screen_AW2.pdf.
[37] Global Disinformation Index. 2019. The Quarter Billion Dollar Question: Howis Disinformation Gaming Ad Tech? https://disinformationindex.org/wp-content/uploads/2019/09/GDI_Ad-tech_Report_Screen_AW16.pdf.
[38] Daniel G. Goldstein, R. Preston McAfee, and Siddharth Suri. 2013. The Cost ofAnnoying Ads. In Proceedings of the 22nd International Conference onWorld WideWeb (Rio de Janeiro, Brazil) (WWW ’13). Association for Computing Machinery,New York, NY, USA, 459–470. https://doi.org/10.1145/2488388.2488429
[39] Gustavo Gomez-Mejia. 2020. “Fail, Clickbait, Cringe, Cancel, Woke”: VernacularCriticisms of Digital Advertising in Social Media Platforms. In HCII 2020: SocialComputing and Social Media. Participation, User Experience, Consumer Experience,and Applications of Social Computing. Springer International Publishing, Cham,CH, 309–324.
What Makes a “Bad” Ad? User Perceptions of Problematic Online Advertising
[40] Google. 2020. About responsive display ads. https://support.google.com/google-ads/answer/6363750?hl=en.
[41] Google. 2020. Google Ads policies. https://support.google.com/adspolicy/answer/6008942.
[42] Google. 2020. Puppeteer. https://developers.google.com/web/tools/puppeteer/.[43] Colin M. Gray, Yubo Kou, Bryan Battles, Joseph Hoggatt, and Austin L. Toombs.
2018. The Dark (Patterns) Side of UX Design. In Proceedings of the 2018 CHIConference on Human Factors in Computing Systems (Montreal QC, Canada)(CHI ’18). Association for Computing Machinery, New York, NY, USA, 1–14.https://doi.org/10.1145/3173574.3174108
[44] Lynn Hasher, David Goldstein, and Thomas Toppino. 1977. Frequency and theconference of referential validity. Journal of Verbal Learning and Verbal Behavior16, 1 (1977), 107–112.
[45] Weiyin Hong, James Y.L. Thong, and Kar Yan Tam. 2007. How do Web usersrespond to non-banner-ads animation? The effects of task type and user experi-ence. Journal of the American Society for Information Science and Technology 58,10 (2007), 1467–1482. https://doi.org/10.1002/asi.20624
[46] Michael C Hughes and Erik B Sudderth. 2014. bnpy: Reliable and scalablevariational inference for bayesian nonparametric models. In Proceedings of theNIPS Probabilistic Programming Workshop, Montreal, QC, Canada. MIT Press,Cambridge, MA, 8–13.
[47] David A. Hyman, David J. Franklyn, Calla Yee, and Mohammad Rahmati. 2017.Going Native: Can Consumers Recognize Native Advertising? Does it Matter?19 Yale J.L. & Tech. 77.
[48] Gita Venkataramani Johar. 1995. Consumer Involvement and Deception fromImplied Advertising Claims. Journal of Marketing Research 32, 3 (1995), 267–279.
[49] Gita Venkataramani Johar. 1996. Intended and Unintended Effects of CorrectiveAdvertising on Beliefs and Evaluations: An Exploratory Analysis. Journal ofConsumer Psychology 5, 3 (1996), 209–230.
[50] Gita Venkataramani Johar. 2016. Mistaken Inferences from Advertising Con-versations: A Modest Research Agenda. Journal of Advertising 45, 3 (2016),318–325.
[51] Gita Venkataramani Johar and Anne L. Roggeveen. 2007. Changing False Beliefsfrom Repeated Advertising: The Role of Claim-Refutation Alignment. Journalof Consumer Psychology 17, 2 (2007), 118–127.
[52] Joshua Gillin. 2017. The more outrageous, the better: How clickbait ads makemoney for fake news sites. https://www.politifact.com/punditfact/article/2017/oct/04/more-outrageous-better-how-clickbait-ads-make-mone/.
[53] A-Reum Jung and Jun Heo. 2019. Ad Disclosure vs. Ad Recognition: HowPersuasion Knowledge Influences Native Advertising Evaluation. Journal ofInteractive Advertising 19, 1 (2019), 1–14.
[54] Dan Keating, Kevin Schaul, and Leslie Shapiro. 2017. The Face-book ads Russians targeted at different groups. The WashingtonPost. https://www.washingtonpost.com/graphics/2017/business/russian-ads-facebook-targeting/.
[55] Young Mie Kim. 2018. Voter Suppression Has Gone Digital. Brennan Centerfor Justice. https://www.brennancenter.org/our-work/analysis-opinion/voter-suppression-has-gone-digital.
[56] Young Mie Kim, Jordan Hsu, David Neiman, Colin Kou, Levi Bankston, Soo YunKim, Richard Heinrich, Robyn Baragwanath, and Garvesh Raskutti. 2018. TheStealth Media? Groups and Targets behind Divisive Issue Campaigns on Face-book. Political Communication 35, 4 (2018), 515–541.
[57] Sara Kingsley, Clara Wang, Alex Mikhalenko, Proteeti Sinha, and ChinmayKulkarni. 2020. Auditing Digital Platforms for Discrimination in EconomicOpportunity Advertising. arXiv:2008.09656 [cs.CY]
[58] S. Kullback and R. A. Leibler. 1951. On Information and Sufficiency. Ann. Math.Statist. 22, 1 (03 1951), 79–86. https://doi.org/10.1214/aoms/1177729694
[59] Joe Lazauskas. 2016. Fixing Native Ads: What Consumers WantFrom Publishers, Brands, Facebook, and the FTC. Contently.https://the-content-strategist-13.docs.contently.com/v/fixing-sponsored-content-what-consumers-want-from-brands-publishers-and-the-ftc.
[60] Victor Le Pochat, Tom Van Goethem, Samaneh Tajalizadehkhoob, Maciej Ko-rczyński, and Wouter Joosen. 2019. Tranco: A Research-Oriented Top SitesRanking Hardened Against Manipulation. In 26th Network and Distributed Sys-tem Security Symposium (NDSS). The Internet Society, Reston, VA, 15.
[61] Mathias Lécuyer, Guillaume Ducoffe, Francis Lan, Andrei Papancea, Theofi-los Petsios, Riley Spahn, Augustin Chaintreau, and Roxana Geambasu. 2014.XRay: Enhancing the Web’s Transparency with Differential Correlation. In23rd USENIX Security Symposium (USENIX Security 14). USENIX Association,San Diego, CA, 49–64. https://www.usenix.org/conference/usenixsecurity14/technical-sessions/presentation/lecuyer
[62] Mathias Lecuyer, Riley Spahn, Yannis Spiliopolous, Augustin Chaintreau, Rox-ana Geambasu, and Daniel Hsu. 2015. Sunlight: Fine-Grained Targeting Detec-tion at Scale with Statistical Confidence. In Proceedings of the 22nd ACM SIGSACConference on Computer and Communications Security (Denver, Colorado, USA)(CCS ’15). Association for Computing Machinery, New York, NY, USA, 554–566.https://doi.org/10.1145/2810103.2813614
[63] Dami Lee. 2020. The FTC is cracking down on influencer marketing on YouTube,Instagram, and TikTok. https://www.theverge.com/2020/2/12/21135183/ftc-influencer-ad-sponsored-tiktok-youtube-instagram-review. The Verge.
[64] Adam Lerner, Anna Kornfeld Simpson, Tadayoshi Kohno, and Franziska Roes-ner. 2016. Internet Jones and the Raiders of the Lost Trackers: An Archae-ological Study of Web Tracking from 1996 to 2016. In 25th USENIX Secu-rity Symposium (USENIX Security 16). USENIX Association, Austin, TX, 997–1013. https://www.usenix.org/conference/usenixsecurity16/technical-sessions/presentation/lerner
[65] Zhou Li, Kehuan Zhang, Yinglian Xie, Fang Yu, and XiaoFeng Wang. 2012.Knowing Your Enemy: Understanding and DetectingMaliciousWeb Advertising.In Proceedings of the 2012 ACM Conference on Computer and CommunicationsSecurity (Raleigh, North Carolina, USA) (CCS ’12). Association for ComputingMachinery, New York, NY, USA, 674–686. https://doi.org/10.1145/2382196.2382267
[66] Ad Lightning. 2020. The 2020 State of Ad Quality Report. Obtained at https://blog.adlightning.com/the-2020-state-of-ad-quality-report.
[67] Tong Liu, Akash Venkatachalam, Pratik Sanjay Bongale, and ChristopherHoman. 2019. Learning to Predict Population-Level Label Distributions. InCompanion Proceedings of The 2019 World Wide Web Conference (San Francisco,USA) (WWW ’19). Association for Computing Machinery, New York, NY, USA,1111–1120. https://doi.org/10.1145/3308560.3317082
[68] John Mahoney. 2015. A Complete Taxonomy of Internet Chum. The Awl.https://www.theawl.com/2015/06/a-complete-taxonomy-of-internet-chum/.
[69] Matthew Malloy, Mark McNamara, Aaron Cahn, and Paul Barford. 2016. AdBlockers: Global Prevalence and Impact. In Proceedings of the 2016 InternetMeasurement Conference (Santa Monica, California, USA) (IMC ’16). Associationfor Computing Machinery, New York, NY, USA, 119–125. https://doi.org/10.1145/2987443.2987460
[70] Arunesh Mathur, Gunes Acar, Michael J. Friedman, Elena Lucherini, JonathanMayer, Marshini Chetty, and Arvind Narayanan. 2019. Dark Patterns at Scale:Findings from a Crawl of 11K Shopping Websites. Proc. ACM Hum.-Comput.Interact. 3, CSCW, Article 81 (Nov. 2019), 32 pages. https://doi.org/10.1145/3359183
[71] Arunesh Mathur, Arvind Narayanan, and Marshini Chetty. 2018. Endorsementson Social Media: An Empirical Study of Affiliate Marketing Disclosures onYouTube and Pinterest. Proc. ACM Hum.-Comput. Interact. 2, CSCW, Article 119(Nov. 2018), 26 pages. https://doi.org/10.1145/3274388
[72] Cristina Miranda. 2017. Can you trust that ad for a dietary supplement? FederalTrade Commission. https://www.consumer.ftc.gov/blog/2017/11/can-you-trust-ad-dietary-supplement.
[73] John Murphy. 2020. SSPs aren’t created equally: Insights into which SSPsdrove the most problematic impressions in Q2, 2020. https://www.confiant.com/resources/blog/ssp-performance-q4-2019. Confiant.
[74] Terry Nelms, Roberto Perdisci, Manos Antonakakis, and Mustaque Ahamad.2016. Towards Measuring and Mitigating Social Engineering Software Down-load Attacks. In 25th USENIX Security Symposium (USENIX Security 16).USENIX Association, Austin, TX, 773–789. https://www.usenix.org/conference/usenixsecurity16/technical-sessions/presentation/nelms
[75] Casey Newton. 2014. You might also like this story about weaponized clickbait.The Verge. https://www.theverge.com/2014/4/22/5639892/how-weaponized-clickbait-took-over-the-web.
[76] N. Nikiforakis, A. Kapravelos, W. Joosen, C. Kruegel, F. Piessens, and G. Vigna.2013. Cookieless Monster: Exploring the Ecosystem of Web-Based DeviceFingerprinting. In 2013 IEEE Symposium on Security and Privacy. IEEE, NewYork, NY, 541–555. https://doi.org/10.1109/SP.2013.43
[77] Midas Nouwens, Ilaria Liccardi, Michael Veale, David Karger, and Lalana Kagal.2020. Dark Patterns after the GDPR: Scraping Consent Pop-Ups and Demonstrat-ing Their Influence. In Proceedings of the 2020 CHI Conference on Human Factorsin Computing Systems (Honolulu, HI, USA) (CHI ’20). Association for ComputingMachinery, New York, NY, USA, 1–13. https://doi.org/10.1145/3313831.3376321
[78] Abby Ohlheiser. 2016. This is how Facebook’s fake-news writers make money.Washington Post. https://www.washingtonpost.com/news/the-intersect/wp/2016/11/18/this-is-how-the-internets-fake-news-writers-make-money/.
[79] Michel Tuan Pham and Gita Venkataramani Johar. 1997. Contingent Processesof Source Identification. Journal of Consumer Research 24, 3 (1997), 249–265.
[80] Angelisa C. Plane, Elissa M. Redmiles, Michelle L. Mazurek, and Michael CarlTschantz. 2017. Exploring User Perceptions of Discrimination in Online TargetedAdvertising. In 26th USENIX Security Symposium (USENIX Security 17). USENIXAssociation, Vancouver, BC, 935–951. https://www.usenix.org/conference/usenixsecurity17/technical-sessions/presentation/plane
[81] Enric Pujol, Oliver Hohlfeld, and Anja Feldmann. 2015. Annoyed Users: Adsand Ad-Block Usage in the Wild. In Proceedings of the 2015 Internet MeasurementConference (Tokyo, Japan) (IMC ’15). Association for Computing Machinery,New York, NY, USA, 93–106. https://doi.org/10.1145/2815675.2815705
[82] Vaibhav Rastogi, Rui Shao, Yan Chen, Xiang Pan, Shihong Zou, and Ryan Riley.2016. Are these Ads Safe: Detecting Hidden Attacks through the Mobile App-Web Interfaces. In NDSS. The Internet Society, Reston, VA, 15.

Zeng et al.
[83] Filipe N. Ribeiro, Koustuv Saha, Mahmoudreza Babaei, Lucas Henrique, John-natan Messias, Fabricio Benevenuto, Oana Goga, Krishna P. Gummadi, andElissa M. Redmiles. 2019. On Microtargeting Socially Divisive Ads: A CaseStudy of Russia-Linked Ad Campaigns on Facebook. In Proceedings of theConference on Fairness, Accountability, and Transparency (Atlanta, GA, USA)(FAT* ’19). Association for Computing Machinery, New York, NY, USA, 140–149.https://doi.org/10.1145/3287560.3287580
[84] Franziska Roesner, Tadayoshi Kohno, and David Wetherall. 2012. Detecting andDefending against Third-Party Tracking on the Web. In Proceedings of the 9thUSENIX Conference on Networked Systems Design and Implementation (San Jose,CA) (NSDI’12). USENIX Association, USA, 12.
[85] Anne L. Roggeveen and Gita Venkataramani Johar. 2002. Perceived SourceVariability Versus Familiarity: Testing Competing Explanations for the TruthEffect. Journal of Consumer Psychology 12, 2 (2002), 81–91.
[86] Christian Rohrer and John Boyd. 2004. The Rise of Intrusive Online Advertisingand the Response of User Experience Research at Yahoo!. In CHI ’04 ExtendedAbstracts on Human Factors in Computing Systems (Vienna, Austria) (CHI EA’04). Association for Computing Machinery, New York, NY, USA, 1085–1086.https://doi.org/10.1145/985921.985992
[87] Matthew Rosenberg. 2019. Ad Tool Facebook Built to Fight DisinformationDoesn’t Work as Advertised. https://www.nytimes.com/2019/07/25/technology/facebook-ad-library.html.
[88] Rahul Roy-Chowdhury. 2017. Improving advertising on the web. https://blog.chromium.org/2017/06/improving-advertising-on-web.html. Chromium Blog.
[89] Navdeep S. Sahni and Harikesh Nair. 2018. Sponsorship Disclosure and Con-sumer Deception: Experimental Evidence from Native Advertising in MobileSearch. https://ssrn.com/abstract=2737035.
[90] Sapna Maheshwari and John Herrman. 2016. Publishers Are Rethinking Those‘Around the Web’ Ads. https://www.nytimes.com/2016/10/31/business/media/publishers-rethink-outbrain-taboola-ads.html.
[91] Sergio Serra. 2019. Ad Quality: The Other Side Of The Fence. https://www.inmobi.com/blog/2019/05/10/ad-quality-the-other-side-of-the-fence. Inmobi.
[92] Alex Shellhammer. 2016. The need for mobile speed. https://web.archive.org/web/20200723132931/https://www.blog.google/products/admanager/the-need-for-mobile-speed/. Google Official Blog.
[93] Michael Swart, Ylana Lopez, Arunesh Mathur, and Marshini Chetty. 2020. IsThis An Ad?: Automatically Disclosing Online Endorsements On YouTube WithAdIntuition. In Proceedings of the 2020 CHI Conference on Human Factors inComputing Systems (Honolulu, HI, USA) (CHI ’20). Association for ComputingMachinery, New York, NY, USA, 1–12. https://doi.org/10.1145/3313831.3376178
[94] James Temperton. 2017. We need to talk about the internet’s fake ads problem.Wired. https://www.wired.co.uk/article/fake-news-outbrain-taboola-hillary-clinton.
[95] Kaitlyn Tiffany. 2019. A mysterious gut doctor is begging Americans to throwout “this vegetable” now. But, like, which? Vox. https://www.vox.com/the-goods/2019/5/8/18537279/chum-box-weird-sponsored-links-gut-doctor.
[96] Blase Ur, Pedro Giovanni Leon, Lorrie Faith Cranor, Richard Shay, and YangWang. 2012. Smart, Useful, Scary, Creepy: Perceptions of Online BehavioralAdvertising. In Proceedings of the Eighth Symposium on Usable Privacy andSecurity (Washington, D.C.) (SOUPS ’12). Association for Computing Machinery,NewYork, NY, USA, Article 4, 15 pages. https://doi.org/10.1145/2335356.2335362
[97] G. Venkatadri, A. Andreou, Y. Liu, A. Mislove, K. P. Gummadi, P. Loiseau, and O.Goga. 2018. Privacy Risks with Facebook’s PII-Based Targeting: Auditing a DataBroker’s Advertising Interface. In 2018 IEEE Symposium on Security and Privacy(SP). IEEE, New York, NY, 89–107. https://doi.org/10.1109/SP.2018.00014
[98] Paul Vines, Franziska Roesner, and Tadayoshi Kohno. 2017. Exploring ADINT:Using Ad Targeting for Surveillance on a Budget - or - How Alice Can Buy Adsto Track Bob. In Proceedings of the 2017 on Workshop on Privacy in the ElectronicSociety (Dallas, Texas, USA) (WPES ’17). Association for Computing Machinery,New York, NY, USA, 153–164. https://doi.org/10.1145/3139550.3139567
[99] Tharindu Cyril Weerasooriya, Tong Liu, and Christopher M. Homan. 2020.Neighborhood-based Pooling for Population-level Label Distribution Learning.arXiv:2003.07406 [cs.LG]
[100] Miranda Wei, Madison Stamos, Sophie Veys, Nathan Reitinger, Justin Goodman,Margot Herman, Dorota Filipczuk, Ben Weinshel, Michelle L. Mazurek, andBlase Ur. 2020. What Twitter Knows: Characterizing Ad Targeting Practices,User Perceptions, and Ad Explanations Through Users’ Own Twitter Data. In29th USENIX Security Symposium (USENIX Security 20). USENIX Association,Austin, TX, 145–162. https://www.usenix.org/conference/usenixsecurity20/presentation/wei
[101] Ben Weinshel, Miranda Wei, Mainack Mondal, Euirim Choi, Shawn Shan, ClaireDolin, Michelle L. Mazurek, and Blase Ur. 2019. Oh, the Places You’ve Been!User Reactions to Longitudinal Transparency About Third-Party Web Trackingand Inferencing. In Proceedings of the 2019 ACM SIGSAC Conference on Computerand Communications Security (London, United Kingdom) (CCS ’19). Associationfor Computing Machinery, New York, NY, USA, 149–166. https://doi.org/10.1145/3319535.3363200
[102] Bartosz W. Wojdynski. 2016. The Deceptiveness of Sponsored News Articles:How Readers Recognize and Perceive Native Advertising. American Behavioral
Scientist 60, 12 (2016), 1475–1491.[103] Bartosz W. Wojdynski and Nathaniel J. Evans. 2016. Going Native: Effects of
Disclosure Position and Language on the Recognition and Evaluation of OnlineNative Advertising. Journal of Advertising 45, 2 (2016), 157–168.
[104] Xinyu Xing, Wei Meng, Byoungyoung Lee, Udi Weinsberg, Anmol Sheth,Roberto Perdisci, and Wenke Lee. 2015. Understanding Malvertising ThroughAd-Injecting Browser Extensions. In Proceedings of the 24th International Con-ference on World Wide Web (Florence, Italy) (WWW ’15). International WorldWide Web Conferences Steering Committee, Republic and Canton of Geneva,CHE, 1286–1295. https://doi.org/10.1145/2736277.2741630
[105] Apostolis Zarras, Alexandros Kapravelos, Gianluca Stringhini, Thorsten Holz,Christopher Kruegel, and Giovanni Vigna. 2014. The Dark Alleys of MadisonAvenue: Understanding Malicious Advertisements. In Proceedings of the 2014Conference on Internet Measurement Conference (Vancouver, BC, Canada) (IMC’14). Association for Computing Machinery, New York, NY, USA, 373–380. https://doi.org/10.1145/2663716.2663719
[106] Eric Zeng, Tadayoshi Kohno, and Franziska Roesner. 2020. Bad News: Clickbaitand Deceptive Ads on News and Misinformation Websites. In Workshop onTechnology and Consumer Protection (ConPro). IEEE, New York, NY, 11.
[107] Wei Zha and H. Denis Wu. 2014. The Impact of Online Disruptive Ads on Users’Comprehension, Evaluation of Site Credibility, and Sentiment of Intrusiveness.American Communication Journal 16 (2014), 15–28. Issue 2.
[108] Paolo Zialcita. 2019. FTC Issues Rules for Disclosure of Ads by Social MediaInfluencers. https://www.npr.org/2019/11/05/776488326/ftc-issues-rules-for-disclosure-of-ads-by-social-media-influencers. NPR.
A SURVEY 1 PROTOCOLIn this survey, we are trying to learn about how you think aboutonline advertisements. In particular, we want to know what kindsof online ads you like and dislike, and why. First, we have a fewquestions about your attitudes towards ads in general. After thesequestions, we will show you some examples of ads, and have youtell us what you think about them.
(1) Think about the ads you see when browsing social media ornews, on your computer or your phone. What kinds of adsdo you like seeing, if any? (Free response)
(2) What kinds of ads do you dislike themost, andwhy?Here aresome optional prompts to guide your answer: Are there spe-cific ads that you remember disliking? Is there a type/genreof ad that you dislike in general? Do you see more ads thatyou dislike on certain apps or websites? (Free response)
(3) Do you use an ad blocker? (AdBlock, AdBlock Plus, uBlockOrigin, etc.) (Yes/No/Not Sure)
The following questions will ask about the advertisement shownbelow. (Repeated 4 times)
(4) What is your overall opinion of this ad? (7 point Likert Scale,Extremely Positive—Extremely Negative)
(5) What parts of this ad, if any, did you like? And why? (FreeResponse)
(6) What parts of this ad, if any, did you dislike? And why? (FreeResponse)
(7) What words or phrases would you use to describe the styleof this ad, and your emotions/reactions when you see thisad?
(8) Have you seen this ad before, or ads similar to this one? (FreeResponse)
(9) What do you like and/or dislike about ads similar to thisone? (Free Response)
Now that you’ve seen some examples of ads, we’d like you to thinkone more time about the questions we asked at the beginning ofthe survey.
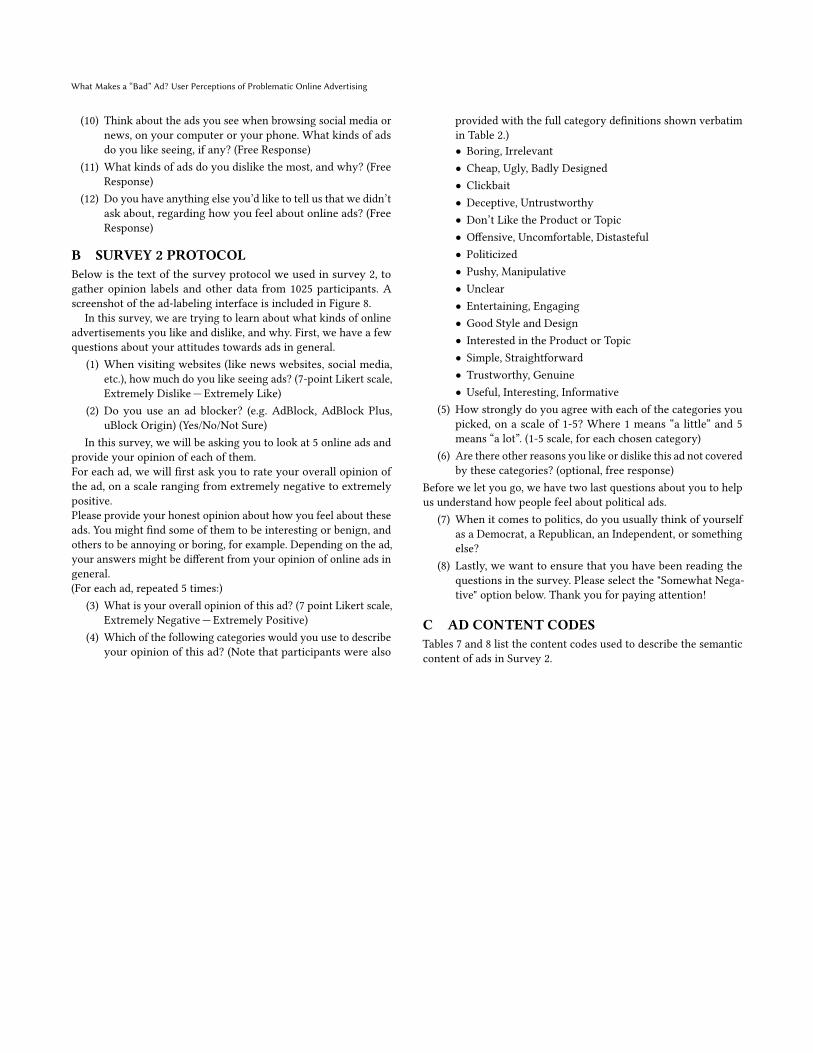
What Makes a “Bad” Ad? User Perceptions of Problematic Online Advertising
(10) Think about the ads you see when browsing social media ornews, on your computer or your phone. What kinds of adsdo you like seeing, if any? (Free Response)
(11) What kinds of ads do you dislike the most, and why? (FreeResponse)
(12) Do you have anything else you’d like to tell us that we didn’task about, regarding how you feel about online ads? (FreeResponse)
B SURVEY 2 PROTOCOLBelow is the text of the survey protocol we used in survey 2, togather opinion labels and other data from 1025 participants. Ascreenshot of the ad-labeling interface is included in Figure 8.
In this survey, we are trying to learn about what kinds of onlineadvertisements you like and dislike, and why. First, we have a fewquestions about your attitudes towards ads in general.
(1) When visiting websites (like news websites, social media,etc.), how much do you like seeing ads? (7-point Likert scale,Extremely Dislike—Extremely Like)
(2) Do you use an ad blocker? (e.g. AdBlock, AdBlock Plus,uBlock Origin) (Yes/No/Not Sure)
In this survey, we will be asking you to look at 5 online ads andprovide your opinion of each of them.For each ad, we will first ask you to rate your overall opinion ofthe ad, on a scale ranging from extremely negative to extremelypositive.Please provide your honest opinion about how you feel about theseads. You might find some of them to be interesting or benign, andothers to be annoying or boring, for example. Depending on the ad,your answers might be different from your opinion of online ads ingeneral.(For each ad, repeated 5 times:)
(3) What is your overall opinion of this ad? (7 point Likert scale,Extremely Negative—Extremely Positive)
(4) Which of the following categories would you use to describeyour opinion of this ad? (Note that participants were also
provided with the full category definitions shown verbatimin Table 2.)• Boring, Irrelevant• Cheap, Ugly, Badly Designed• Clickbait• Deceptive, Untrustworthy• Don’t Like the Product or Topic• Offensive, Uncomfortable, Distasteful• Politicized• Pushy, Manipulative• Unclear• Entertaining, Engaging• Good Style and Design• Interested in the Product or Topic• Simple, Straightforward• Trustworthy, Genuine• Useful, Interesting, Informative
(5) How strongly do you agree with each of the categories youpicked, on a scale of 1-5? Where 1 means “a little” and 5means “a lot”. (1-5 scale, for each chosen category)
(6) Are there other reasons you like or dislike this ad not coveredby these categories? (optional, free response)
Before we let you go, we have two last questions about you to helpus understand how people feel about political ads.
(7) When it comes to politics, do you usually think of yourselfas a Democrat, a Republican, an Independent, or somethingelse?
(8) Lastly, we want to ensure that you have been reading thequestions in the survey. Please select the "Somewhat Nega-tive" option below. Thank you for paying attention!
C AD CONTENT CODESTables 7 and 8 list the content codes used to describe the semanticcontent of ads in Survey 2.

Zeng et al.
Figure 8: A screenshot of the survey interface in survey 2. For each ad, participants were able to pick multiple reasons for whythey liked/disliked an ad. These responses were used as opinion labels in our analysis.
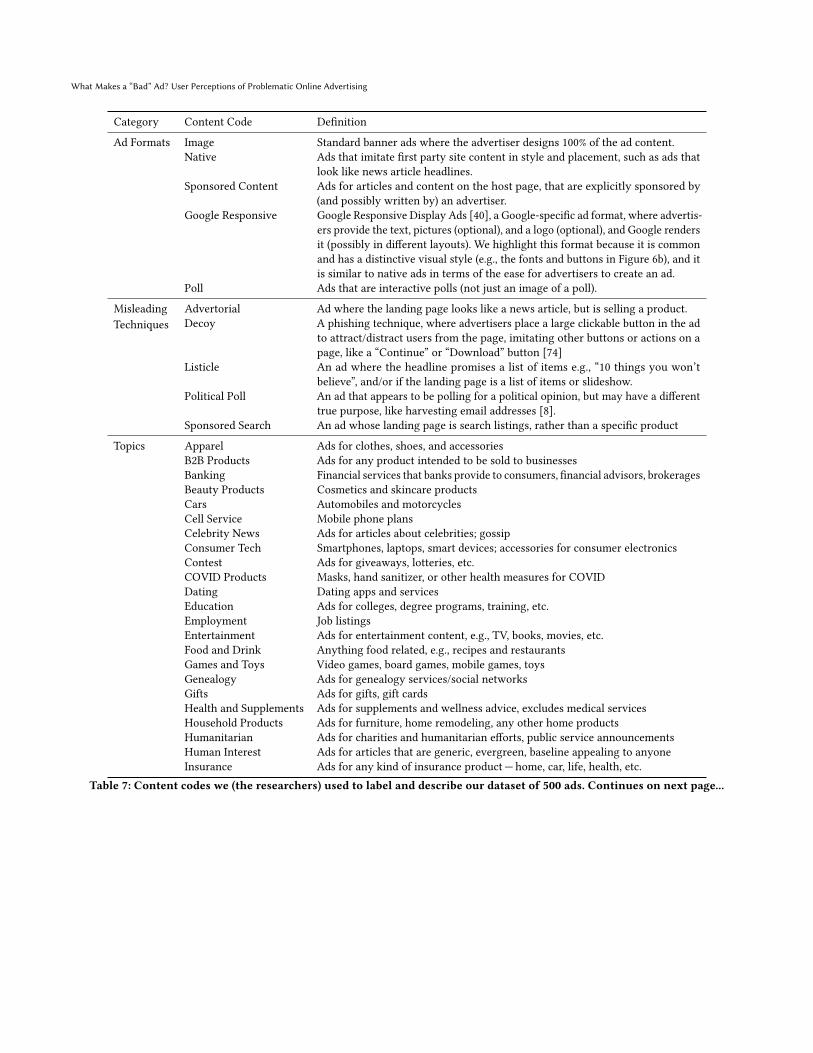
What Makes a “Bad” Ad? User Perceptions of Problematic Online Advertising
Category Content Code Definition
Ad Formats Image Standard banner ads where the advertiser designs 100% of the ad content.Native Ads that imitate first party site content in style and placement, such as ads that
look like news article headlines.Sponsored Content Ads for articles and content on the host page, that are explicitly sponsored by
(and possibly written by) an advertiser.Google Responsive Google Responsive Display Ads [40], a Google-specific ad format, where advertis-
ers provide the text, pictures (optional), and a logo (optional), and Google rendersit (possibly in different layouts). We highlight this format because it is commonand has a distinctive visual style (e.g., the fonts and buttons in Figure 6b), and itis similar to native ads in terms of the ease for advertisers to create an ad.
Poll Ads that are interactive polls (not just an image of a poll).
MisleadingTechniques
Advertorial Ad where the landing page looks like a news article, but is selling a product.Decoy A phishing technique, where advertisers place a large clickable button in the ad
to attract/distract users from the page, imitating other buttons or actions on apage, like a “Continue” or “Download” button [74]
Listicle An ad where the headline promises a list of items e.g., “10 things you won’tbelieve”, and/or if the landing page is a list of items or slideshow.
Political Poll An ad that appears to be polling for a political opinion, but may have a differenttrue purpose, like harvesting email addresses [8].
Sponsored Search An ad whose landing page is search listings, rather than a specific product
Topics Apparel Ads for clothes, shoes, and accessoriesB2B Products Ads for any product intended to be sold to businessesBanking Financial services that banks provide to consumers, financial advisors, brokeragesBeauty Products Cosmetics and skincare productsCars Automobiles and motorcyclesCell Service Mobile phone plansCelebrity News Ads for articles about celebrities; gossipConsumer Tech Smartphones, laptops, smart devices; accessories for consumer electronicsContest Ads for giveaways, lotteries, etc.COVID Products Masks, hand sanitizer, or other health measures for COVIDDating Dating apps and servicesEducation Ads for colleges, degree programs, training, etc.Employment Job listingsEntertainment Ads for entertainment content, e.g., TV, books, movies, etc.Food and Drink Anything food related, e.g., recipes and restaurantsGames and Toys Video games, board games, mobile games, toysGenealogy Ads for genealogy services/social networksGifts Ads for gifts, gift cardsHealth and Supplements Ads for supplements and wellness advice, excludes medical servicesHousehold Products Ads for furniture, home remodeling, any other home productsHumanitarian Ads for charities and humanitarian efforts, public service announcementsHuman Interest Ads for articles that are generic, evergreen, baseline appealing to anyoneInsurance Ads for any kind of insurance product— home, car, life, health, etc.
Table 7: Content codes we (the researchers) used to label and describe our dataset of 500 ads. Continues on next page...
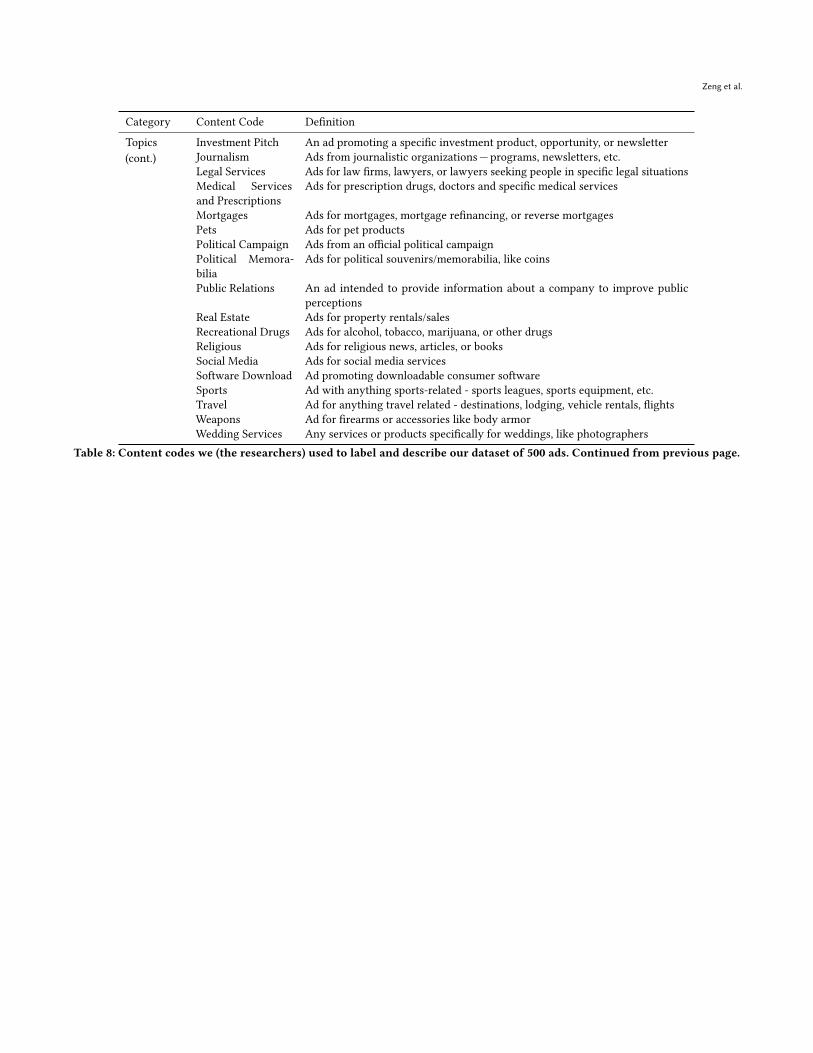
Zeng et al.
Category Content Code Definition
Topics(cont.)
Investment Pitch An ad promoting a specific investment product, opportunity, or newsletterJournalism Ads from journalistic organizations—programs, newsletters, etc.Legal Services Ads for law firms, lawyers, or lawyers seeking people in specific legal situationsMedical Servicesand Prescriptions
Ads for prescription drugs, doctors and specific medical services
Mortgages Ads for mortgages, mortgage refinancing, or reverse mortgagesPets Ads for pet productsPolitical Campaign Ads from an official political campaignPolitical Memora-bilia
Ads for political souvenirs/memorabilia, like coins
Public Relations An ad intended to provide information about a company to improve publicperceptions
Real Estate Ads for property rentals/salesRecreational Drugs Ads for alcohol, tobacco, marijuana, or other drugsReligious Ads for religious news, articles, or booksSocial Media Ads for social media servicesSoftware Download Ad promoting downloadable consumer softwareSports Ad with anything sports-related - sports leagues, sports equipment, etc.Travel Ad for anything travel related - destinations, lodging, vehicle rentals, flightsWeapons Ad for firearms or accessories like body armorWedding Services Any services or products specifically for weddings, like photographers
Table 8: Content codes we (the researchers) used to label and describe our dataset of 500 ads. Continued from previous page.