What is to be done? - PAHO/WHO
57
Health Impacts of Household Air Pollution in the PAHO Region What is to be done? Kirk R. Smith Professor of Global Environmental Health University of California, Berkeley
-
Upload
khangminh22 -
Category
Documents
-
view
3 -
download
0
Transcript of What is to be done? - PAHO/WHO

Health Impacts of Household Air
Pollution in the PAHO Region
What is to be done?
Kirk R. Smith
Professor of Global Environmental Health
University of California, Berkeley

Problems due to household
burning of solid fuels
-Poor use of natural resources
-Threat to natural environment
-Inefficient use of women’s time
-Climate impacts
But, here, I only focus on health

What has been done-#1
• Wait for development to work.
• Bottom line
– Percent using solid fuel slowly declines with
development alone (no special policies)
– But not always number of people exposed
– But can decline much faster with targeted clean
fuel policies

Increasing Prosperity and Development
De
cre
asin
g H
ou
seh
old
Air
Po
lluti
on
Very Low Income
200 million
Low Income 400 million
Middle Income 400 million
High Income 200 million
Ag res- 15%
PNG < 1%
Elec < 1%
Non-solid fuels
Solid Fuels
LPG – 30%
Wood – 49%
--1.0
~~4
~~400
Household Energy Ladder

Low- and Middle-Income Countries

Low- and Middle-Income Countries
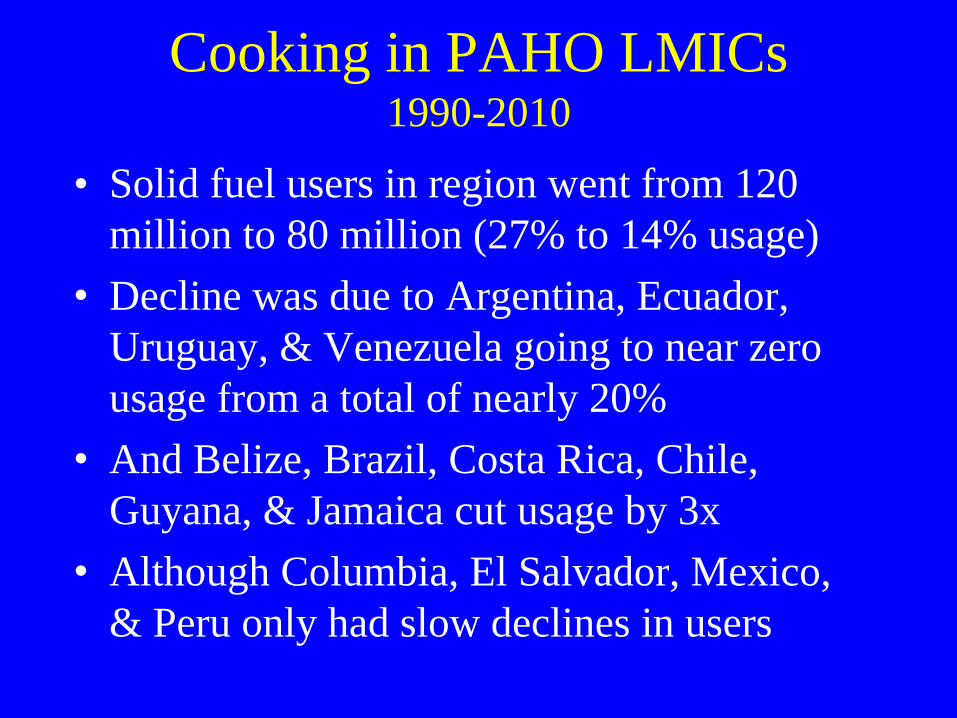
Cooking in PAHO LMICs 1990-2010
• Solid fuel users in region went from 120
million to 80 million (27% to 14% usage)
• Decline was due to Argentina, Ecuador,
Uruguay, & Venezuela going to near zero
usage from a total of nearly 20%
• And Belize, Brazil, Costa Rica, Chile,
Guyana, & Jamaica cut usage by 3x
• Although Columbia, El Salvador, Mexico,
& Peru only had slow declines in users

History, cont.
• Countries with about the same number
using solid fuels after 30 years
– Honduras
– Nicaragua
– Panama
• Countries with more users after 30 years
– Cuba
– Guatemala
– Haiti
– Paraguay

What has been done-#2
• Many hundreds of “improved” biomass stove
programs over ~40 years.
• Earliest in Guatemala – Lorena in 1970s
• Major national programs in China and India in the
1980s covering ~200 million households in all
• Peru, Mexico, Nepal and other countries today
• Hundreds of NGOs, big and small, promoting
stoves around the world over the decades
• Hundreds of stove models


0 2 4 6 8 10 12 14 16 18
Oorja stove, Oorja pellet fuel (Dry)
Philips fan HD4012, wood fuel (Dry)
Belonio, rice hull fuel (Dry)
Berkeley Darfur, wood fuel (Dry)
Envirofit G-3300, slow feed rate, wood fuel (Dry)
Philips fan HD4012, wood fuel (Wet)
StoveTec GreenFire, slow feed rate, wood fuel (Dry)
StoveTec Charcoal, charcoal fuel (Wet)
KCJ Standard, charcoal fuel (Dry)
Jiko Metal, charcoal fuel (Dry)
Jiko Ceramic, charcoal fuel (Dry)
Mayon Turbo, rice hull fuel (Wet)
Sampada, wood fuel (Wet)
Gyapa, charcoal fuel (Dry)
KCJ Standard, charcoal fuel (Wet)
Geres, charcoal fuel(Dry)
Envirofit G-3300, wood fuel (Dry)
3 Stone carefully tended, wood fuel (Dry)
Sampada, wood fuel (Dry)
Upesi Portable, wood fuel (Dry)
Jinqilin CKQ-80I, corn cob fuel (Dry)
Upesi Portable, wood fuel (Wet)
PM emission rate (g/hour)
Figure S29. PM2.5 Emission Rate (per Time)
Simmer
Hot Start
Cold Start
Best lab performance with dry wood - ~8x IAQG
Jetter et al., EST, 2012

RESPIRE Impact on pneumonia up to 18 months of age
Traditional open 3-stone fire:
kitchen 48-hour PM2.5 levels of
600 - 1000 μg/m3
WHO AQG = 10-35 ug/m3
Chimney woodstove, locally made
and popular with households

CO monitor
CO monitor

Kitch
en
CO
co
nce
ntr
atio
n (
pp
m)
0 5 10 15 20
0.5
12
48
12 (c)
Effect of
Chimney
Stove
On
Kitchen CO
Levels
Factor
of ~10 less
Control – open fire
Intervention –
Chimney Stove
Months
Guatemala RCT: Kitchen Concentrations
285 48-h
measurements
Smith, et al,
2010

Time relative to intervention (months)
Child C
O e
xpo
sure
(pp
m)
0 5 10 15 20
0.5
12
34
ControlIntervention
(a)
Effect of
Chimney
Stove
On
Infant
Exposures
- 2x less
1888 48-h
measurements
Smith, et al,
2010
Infant Exposures

-2 -1 0 1 2 3
0.0
0.5
1.0
1.5
(a)
Log of 48-hour CO (ppm)
Den
sity
Intervention group
Control group
-2 -1 0 1 2 3
0.0
0.5
1.0
1.5
(b)
Child Average of Log of CO (ppm)
-2 -1 0 1 2 3
0.0
0.5
1.0
1.5
(c)
Predicted Long-term Log of CO (ppm)
~50% reduction
in exposure of babies
With
open fire With
chimney
100 120 240
(ug/m3 PM2.5)
Chimney
stove did
not protect
all
babies

LONG-LASTING
LOW EMISSIONS
COMBUSTION UNIT

Proposed by Ambuj Sagar and Kirk R. Smith, Nature, May 2013
Multi-million Dollar Global Innovation
Prize for a Truly Clean
Biomass Combustion “Engine”
for Household Stoves
Corazón
de la casa (hogar)

Bottom Line - #2
• The cleanest stove models have been
disseminated to only a few thousand
households in the region
• And, as yet, no biomass stove in the world
comes close to the boundary – is clean
enough to be truly health protective in
household use
• Perhaps they can be clean enough, but much
more work is needed

Increasing Prosperity and Development
De
cre
asin
g H
ou
seh
old
Air
Po
lluti
on
Very Low Income
200 million
Low Income 400 million
Middle Income 400 million
High Income 200 million
Crop Waste Dung
Natural Gas
Electricity
Non-solid fuels
Solid Fuels
Liquefied Petroleum Gas
Wood
Household Energy Ladder
?
Continue to try to
Make the
Available Clean

Paradigm #1
Making the clean
available
New Paradigms

From ~4% of DALYs in 1990 How?
~1.5% of DALYs today

Ecuador
Not in the top 15 risks

Costa Rica
Not in the top 15 risks

Brazil

The Brazil Story

The Brazil Story

Up to 25% more efficient

Increasing Prosperity and Development
De
cre
asin
g H
ou
seh
old
Air
Po
lluti
on
Very Low Income
200 million
Low Income 400 million
Middle Income 400 million
High Income 200 million
Crop Waste Dung
Natural Gas
Electricity
Non-solid fuels
Solid Fuels
Liquefied Petroleum Gas
Wood
Household Energy Ladder
?
Try harder to
Make the
Clean Available

Paradigm #2
Stepping out of the box

If you don’t need your father’s land
line for a phone,
why your mother’s stove?
• Electrification is an essential human need –
brings many social and economic benefits
• Electrification also allows a wide range of
highly efficient cooking devices
• Every time a switch is flicked, instead of a
match, it is good for health


What is an induction cookstove? • Electric, yes, but entirely different technology
from traditional electric stoves
• High frequency magnetic field induces heat in pot
alone
• More efficient ~90% instead of ~60%
• Faster cooking ~1.5x
• Safer and cooler– surface is warm but does not
burn or cause fires
• Long-lived, easy to clean
• Large economies of scale in manufacture like
other electrical devices

Cooking with Induction


Safer – the stove does not get hot

- - Bajaj Electrical Ltd.
- Compton Greaves Ltd.
- Eurolux
- Glen Appliances Pvt. Ltd.
- Inalsa
- Jaipan Industries Ltd.
- Kenwood Ltd.
- Khaitan Electrical Ltd
- Morphy Richards
- Panasonic Corp.
- Phillips
- Preethi Kitchen Appliances, Ltd.
-Sunflame
-TTK Prestige Ltd.
-Usha International Ltd.
-Westinghouse
Induction Cooktop
Market in India
2012-2016
Published: March 2013
Infiniti Research Limited
35.4% per year growth
predicted: 2012-2016
Factor of nearly
five increase!

Flying off the shelves in China

Costs coming down dramatically
US $7.80 each (with warranty):
The cost of two coffee lattes
Ecuador has $250 million loan from
Chinese Export Bank to begin to
change out every stove
in the country to induction

Increasing Prosperity and Development
De
cre
asin
g H
ou
seh
old
Air
Po
lluti
on
Very Low Income
200 million
Low Income 400 million
Middle Income 400 million
High Income 200 million
Crop Waste Dung
Natural Gas
Electricity
Non-solid fuels
Solid Fuels
Liquefied Petroleum Gas
Wood
Household Energy Ladder
?

Paradigm #3: It takes a village
Gujarat, Feb Evening

Changing out one hearth at a time
is not as effective as changing out
whole villages
• Learned in sanitation programs years ago:
• Benefits:
– Herd effect: both household and community
benefits to clean fuels/stoves and latrines.
– With community interventions, a new set of
incentives and social pressures are possible.
– More efficient provision of service

• Government of India has been promoting
sanitation coverage to ensure better health
and quality of life for people in rural India.
• In 2005, it launched an award-based
Incentive Scheme for open-defecation-free
villages,
• Same kind of “herd” effect operates for dirty
combustion – need to not have offending
material in places where people live
Smokeless Villages?

Paradigm #4: It is a health issue
• Not primarily an energy, climate, or
employment issue
• Health sector finds the most effective
solutions possible and makes them available
• Treats all the same: we do not have rural
vaccines and urban vaccines
• Not stopped by taste, custom, poverty,
special interests, or political correctness
• Not afraid of advanced tech that works

The health community expects
proposed health Interventions
• To have systematic and phased evaluations of
their laboratory and field efficacy and
effectiveness – as with vaccines, drugs, , bednets,
latrines, etc.
• This must include rigorous monitoring: “You
don’t get what you expect, but what you inspect”
(No lográs lo que esperás, sino lo que
inspeccionás)
• With cookstove/fuels, the best analogy is not a
vaccine, but DOTS: directly observed therapy


● ● ● ● ● ● ● ●
●
●
●
● ●
●
●
●
●
●
●
●
●
●
●
●
●
●
●
●
●
●
●
●
●
●
● ●
●
●
0
25
50
75
−5 0 5 10 15 20 25 30
Week Since Intervention
Du
ratio
n o
f P
hili
ps U
se (
Ho
urs
)
●
● ● ● ● ●
● ●
●
● ●
●
●
●
● ●
●
● ●
●
●
●
●
●
●
●
● ● ● ● ● ● ●
● ●
● ●
●
● ● ● ● ● ● ● ●
●
●
●
●
●
●
●
●
●
●
●
●
●
●
●
● ●
●
●
●
●
●
●
● ●
●
● ●
●
●
0
5
10
15
−5 0 5 10 15 20 25 30
Week Since Intervention
Num
ber
of S
tove U
ses
● ●Traditional Philips

● ● ● ● ● ● ● ● ● ● ● ● ●●
●
●
● ●
●
●
●
●
●
●
●
●
●
●
●
●
●
●●
●
●
●
●
●●
●
●
●
●
0
25
50
75
−10 −5 0 5 10 15 20 25 30
Week Since Intervention
Du
ratio
n o
f P
hili
ps U
se (
Ho
urs
)
●
●
●
● ●
●
●
●
●
●
●
●
●
●
●
●
●
●
●
●
●
●
●
●
●
●
● ●
●
●
●
●
● ●
●
●
●
●
●
● ● ●
●
● ● ● ● ● ● ● ● ● ● ● ● ● ●
●
●
●
●
●
●
●
● ●
●
●
●
●
●
●
●
●
● ●
●
●
●
●
●
●
●
●
●
●
0
5
10
15
−10 −5 0 5 10 15 20 25 30
Week Since Intervention
Num
ber
of S
tove U
ses
● ●Traditional Philips

● ● ● ● ● ● ● ● ● ● ● ● ●
●
●
●●
●
●
● ●
●
●
●●
●
● ●
●
●
●
●
● ●
●
●
●●
●
●
●
●
●
0
20
40
60
−10 −5 0 5 10 15 20 25 30
Week Since Intervention
Du
ratio
n o
f P
hili
ps U
se (
Ho
urs
)
●
●
●
●
●
●
● ●
●
●
●
●
●
●
●
● ●
●
● ●
●
● ●
●
●
●
●
●
●
● ●
●
● ●
●
●
●
●
●
● ● ● ●● ● ● ● ● ● ● ● ● ● ● ● ●
●
●
●
●
●
●
●
●
●
●
●
●
●
●
● ●
●
●
●
●
●
●
●
● ●
●
●
●
● ●
0
5
10
15
20
−10 −5 0 5 10 15 20 25 30
Week Since Intervention
Num
ber
of S
tove U
ses
● ●Traditional Philips

● ● ● ● ● ● ● ● ● ● ● ●
●
●
●●
●
●
●
●
●
●
●
●
●
●
●
●
●●
●
● ●
●
●
●
● ●
●
●
●
●
0
25
50
75
−10 −5 0 5 10 15 20 25 30
Week Since Intervention
Du
ratio
n o
f P
hili
ps U
se (
Ho
urs
)
●
●
● ●
● ●
●
● ● ● ●
●
●
● ● ●
●
●
●
●
●
●
●
●
●
●
●
●
●
●
●
●
●
●
●
●
●
●
●
●
● ●
● ● ● ● ● ● ● ● ● ● ● ●
●
●
●
●
●
●
●
●
●
●
●
● ● ● ● ● ●
●
●
●
●
● ●
● ●
●
●
● ● ●0
5
10
15
20
−10 −5 0 5 10 15 20 25 30
Week Since Intervention
Num
ber
of S
tove U
ses
● ●Traditional Philips

Indian Ministry of Health
Air Pollution Task Force
• First Ministry of Health in world to treat AP
as one of its major priorities and consider
along with other risk factors in its mission
• First government agency in the world not to
address AP by location, but by total
exposure – a true health focus
• Thus, not indoor/household, not outdoor,
but by what will give the most health
benefit

Proposal for PAHO Region
• Workshop followed by publication
• Household Fuel Transitions for Health in
Latin America
• Share histories, lessons learned, etc from
nations have made transition
– Brazil, Ecuador, Costa Rica, etc.
• And those wishing to do so

Paradigm Shifts
• Make the clean available, as well as make
the available clean
• Embrace/enhance transformational leap-frog
technologies
• Look for community solutions
• Enhance displacement of clean fuels from
richer to poorer households
• Act recognizing that it is primarily a health
issue and thus optimize on exposure reduction
not renewability, local content, or climate

Increasing Prosperity and Development
De
cre
asin
g H
ou
seh
old
Air
Po
lluti
on
Very Low Income
200 million
Low Income 400 million
Middle Income 400 million
High Income 200 million
Crop Waste Dung
Natural Gas
Electricity
Non-solid fuels
Solid Fuels
Liquefied Petroleum Gas
Wood
Household Energy Ladder
How do we help
people move into
this realm?
Smith/Pillarisetti, 2014

56
GAMM Interaction Model:
Child Exposure
Many Thanks