How well can the theory of planned behavior account for occupational intentions
Upload
khangminh22Category
view
0download
0
What Factors Can InfluenceConsumers’ Intentions to UseShared Bikes ?
Master’s Thesis 30 creditsDepartment of Business StudiesUppsala UniversitySpring Semester of 2020
Date of Submission: 2020-06-03
Yuyang Lu
Shaza Sallam
Supervisor: Jukka Hohenthal
AbstractThe rapid development of sharing economy in the past decade has spawned a number ofexcellent products such as Airbnb and Uber. As one of the representative products of thesharing economy, the emergence and development of shared bikes are of great significance tothe country, the government and citizens. In this context, this study aims to use DecomposedTheory of Planned Behavior (DTPB) to investigate the factors influencing consumers’intentions to use shared bikes. We collected primary data from 268 respondents from differentdistricts as input, finally using SPSS 25.0 to conduct a regression analysis to test 9 antecedentvariables and 3 intermediate variables to verify 12 hypotheses. The empirical results indicatethat perceived usefulness, perceived joviality and perceived environmental protection have apositive influence on users' attitude towards using while perceived risk has a negativeinfluence; peer influence and superior influence have a positive influence on subjective norm;self-efficacy and resource facilitating condition have a positive influence on perceivedbehavior control; attitude, subjective norm and perceived behavior control are positivelyrelated to the intentions to use shared bikes. This study provides important and new insightsinto shared bikes adoption and intentions about consumer behavior.
Keywords: Sharing Economy, Shared Bikes, Intentions to Use, Decomposed Theory ofPlanned Behavior
Table of Contents1. Introduction.................................................................................................................................................1
1.1 Sharing Economy: Concept and Characteristics................................................................................ 11.2 The Development of Shared Bikes in the Sharing Economy.............................................................11.3 Research Purpose................................................................................................................................21.4 Structure of the Thesis........................................................................................................................ 3
2. Theoretical Research and Literature Review...........................................................................................42.1 Literature Review................................................................................................................................4
2.1.1 Concept of Shared Bikes..........................................................................................................42.1.2 Review of Shared Bike Research............................................................................................ 4
2.2 Theoretical Framework.......................................................................................................................52.2.1 Theory of Planned Behavior (TPB).........................................................................................52.2.2 Decomposed Theory of Planned Behavior (DTPB)................................................................6
3. Research Model and Hypotheses Development....................................................................................... 83.1 Attitude................................................................................................................................................83.2 Subjective Norm............................................................................................................................... 113.3 Perceived Behavior Control..............................................................................................................113.4 Proposed Research Model................................................................................................................ 12
4. Methodology.............................................................................................................................................. 134.1 Research Design................................................................................................................................134.2 Questionnaire Design........................................................................................................................144.3 Sample and Data Collection............................................................................................................. 154.4 Variables and Measurements............................................................................................................16
5. Data Analysis.............................................................................................................................................175.1 Sample Profile...................................................................................................................................175.2 Variables Profile............................................................................................................................... 185.3 Test of Reliability of the Measurement Model.................................................................................195.4 Test of Validity of the Measurement Model.................................................................................... 215.5 Correlation Analysis..........................................................................................................................225.6 Regression Analysis..........................................................................................................................245.7 Hypotheses Results...........................................................................................................................26
6. Discussions................................................................................................................................................. 276.1 Factors Influencing Users’Attitude to Use Shared Bikes................................................................ 276.2 Factors Influencing Users’ Subjective Norm to Use Shared Bikes..................................................306.3 Factors Influencing Users’ Perceived Behavior Control to Use Shared Bikes................................ 316.4 Factors Influencing Users’ intentions to Use Shared Bikes............................................................. 31
7. Conclusions................................................................................................................................................327.1 Summary of the Study...................................................................................................................... 327.2 Implications for Management...........................................................................................................32
8. Limitations and Future Research............................................................................................................32Reference........................................................................................................................................................34Appendix 1 Questionnaire (English)...........................................................................................................48Appendix 2 Questionnaire (Chinese).......................................................................................................... 51
1
1. Introduction1.1 Sharing Economy: Concept and CharacteristicsThe concept of "sharing" is not a new concept and it has been in our lives from the verybeginning. Benkler (2004) was the representative figure among these researchers whosummed up "sharing" in one phrase "nonreciprocal pro-social behavior". The concept ofsharing economy boomed after the economic crisis in 2008. All the market actors recognizedthe need to reorganize the economy, created new way to minimize the costs with the help ofthe continuous prosperity of technology, and also pushed both corporations and customers towork together to innovate new ways on how to pool and share resources that were totallyignored before (Habibi, Davidson & Laroche, 2017). The term "sharing economy" hasincreased into a comprehensive term for a wider zone of collaborative consumption activitiessuch as bartering, trading, leasing, sharing and exchange activities (Habibi, Davidson &Laroche, 2017). This might be the reason why many researchers called the sharing economyas "collaborative consumption" or "collaborative economy", and few of them called it"peer-to-peer platform" (Codagnone & Martens, 2016). Finally, the widespread use of sharingeconomy made the Oxford dictionary add it to its 2015 dictionary and defined it as " sharingeconomy is an economic system in which private individuals can share activities or services.In most cases, these shared activities or services are either free or pay via the Internet"(Oxford English Dictionary, 2018).
There are two main characteristics of promoting the rapid development of sharing economy:one is technological innovation, the other is supply-side flexibility (Zervas, Proserpio &Byers, 2017). Technological innovation organizes the penetration of the market for newsuppliers, facilitates and simplifies listings for consumers that they could search easily, andmaintain low overheads on transactions. Flexibility on the supply-side is anotherdistinguishing characteristic where by using technology, all factors from suppliers, consumersand all participants with the transaction process can insert or remove themselves in thelistings easily, and through the use of the Internet and modern smart devices, they can alsoadd or remove their products or services in the same way (Zervas, Proserpio & Byers, 2017).
1.2 The Development of Shared Bikes in the Sharing EconomyUnder the tide of sharing economy, the shared bike is one of the most representative products.It is a new way of travel formed by the combination of mobile Internet and traditional bikesand also it increases the times of bike use (Guo, Zhou, Wu & Li, 2017). Statistics show that itis growing rapidly for a number of reasons, such as its convenience, environmental usability,cost-saving efficiency and the ability to connect with other public transport (Yao, Liu, Guo,Liu & Zhou, 2019).
Bike sharing is a system that includes self-service bike rental, most of which is located inmajor urban centers around the world (Burden & Barth, 2009). Through the company'ssmartphone application, the system provides users with the service of renting bikes within aspecified period of time (Fishman & Von Wyss, 2017). Its core depends on the functions
2
provided by the rental system, rather than going to the company to contact them or dealingwith people face to face. Shared bikes can be freely used by consumers within 24 hours a dayand the most common payment method is to top up money to the account by debit card orcredit card (Chen et al., 2018).
In 1965, a group of activists launched a bike-sharing project in Amsterdam, the Netherlands.They called it "Witte Fietsen", which means "white bike", but the project was not successfulbut failed (DeMaio, 2009). Since then, the concept of bike sharing has spread widely fromEurope to China and it has experienced five generations of development (Midgley, 2011;Shaheen, Guzman & Zhang, 2010; Mátrai & Tóth, 2016). Currently, the latest generation isthe fifth generation called the "Dockless Bikes" generation which is combined with great datamanagement capabilities.
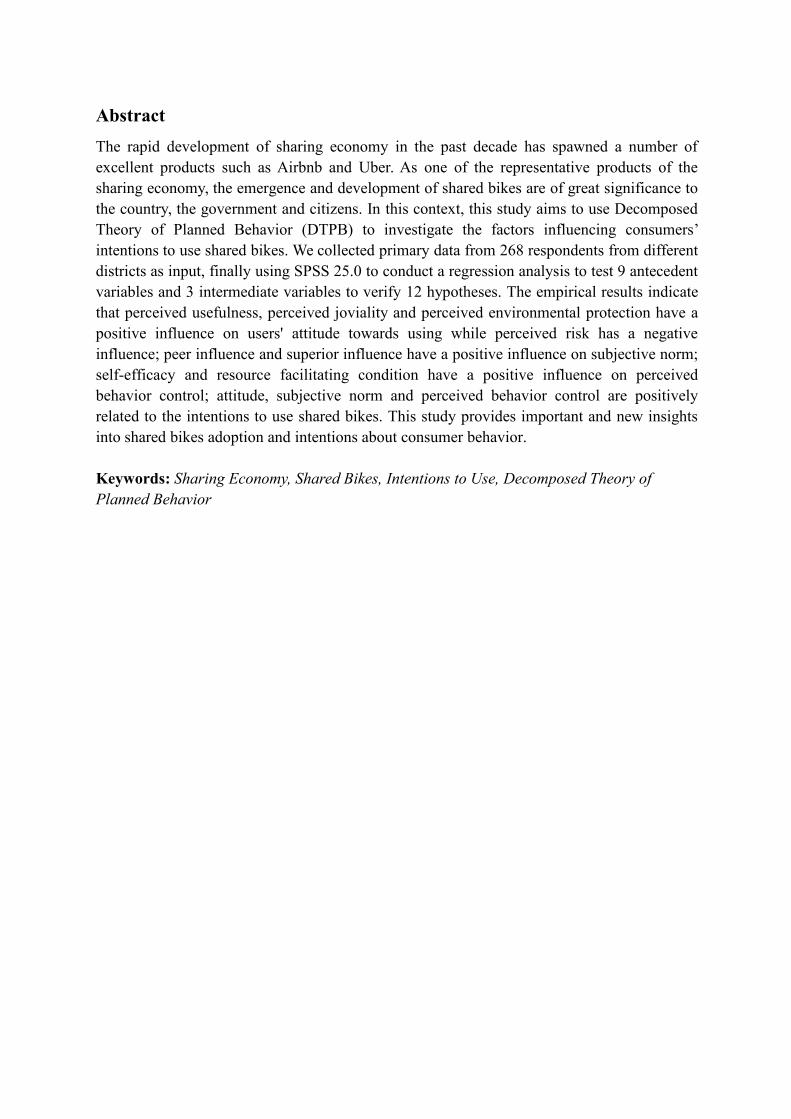
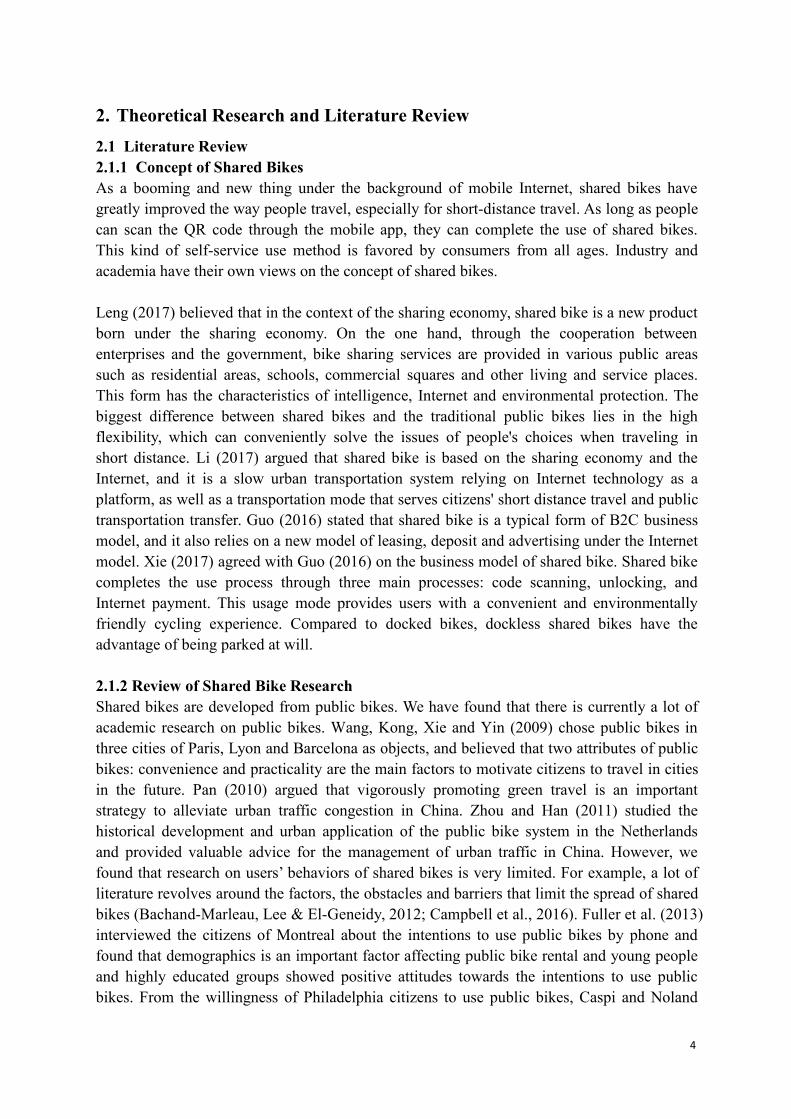
The number of shared bikes has increased to more than 1 million in 2015, and China hasbecome a leader in the bike sharing market (Goodyear, 2018). By 2018, the market size ofChina's bike-sharing market was about 10.8 billion yuan, which was mainly due to thegrowth of new users. In general, from 2015 to 2017, the bike-sharing market in China showedan explosive trend, and the market scale also expanded accordingly. In 2018, mobike1 andOfo2 accounted for more than 90% of the Chinese shared bike market (Hellobike, 2018) andin 2017, the number of Chinese bike-sharing users increased to 61.7 million (Reportlinker,2017). Fishman (2016) stated that there are approximately 946,000 bikes bike-sharing fleetglobally and 750,500 are in China. What's more, shared bikes also boomed in both Europeand the United States. According to Nacto (2016), by 2014, there were 414 bike-sharingprojects in Europe, eight times the figure in the United States. Fig.1 illustrates the number ofshared bike in U.S. bike sharing programs from 2010 to 2017 (Wagner, 2019).
Fig. 1. Number of bikes in bike-sharing programs in the United States from 2010 to 2017
1.3 Research PurposeAs we have previously mentioned about the rapid growth of the shared bikes worldwide,many studies studied the concept of shared bikes as the main object and they pointed out theimpact about the emergence and existence of the shared bikes on different industries,
1 Mobike is a fully station-less bike-sharing platform headquartered in Beijing that is solving the short distance connectivity problem incities.2 Ofo is a Beijing-based “non-docking” bike-sharing platform founded in 2014 and announced to do bankruptcy liquidation in 2018.

3
business model analysis of shared bikes or problems in the development and operation ofshared bikes (Bachand-Marleau, Lee & El-Geneidy, 2012; Cole et al., 2008, Midgley, 2011;Heesch & Sahlqvist, 2013; Campbell, Cherry, Ryerson, & Yang, 2016; Zhang, Thomas,Brussel & Van Maarseveen, 2017; Zhang & Mi, 2018; Winters, Hosford & Javaheri, 2019;Yao et al., 2019; Fishman, Washington & Haworth, 2013).
Due to the short development time of shared bikes, previous researchers rarely studied theexperience of consumers using shared bikes and the factors of continued intentions to useshared bikes from a human-oriented perspective. From a practical perspective, the usage rateof shared bikes in many cities was still lower than expected because usage rates of sharedbikes were influenced by the pricing scheme change (Wu, Kang, Hsu & Wang, 2019), whichhas caused municipal authorities to maintain great doubts about the long-term sustainabilityand supportability of shared bikes (Zhang, Zhang, Duan & Bryde, 2015). Thus, we also hopethis study can provide useful comments on solving the low usage rate of shared bikes.
As we recognize this gap between the earlier literature and status quo, this study usesDecomposed Theory of Planned Behavior (Taylor & Todd, 1995) as the theoretical sourcewhich guides us to investigate the factors for individuals from three aspects - attitude,subjective norm and perceived behavior control on intentions to use shared bikes. The studyalso divides attitude, subjective norm and perceived behavior control into several factors -perceived usefulness, perceived risk, perceived cost of use, perceived joviality, perceivedenvironmental protection, peer influence and superior influence, self-efficacy and resourcefacilitating condition. According to those nine factors, the aim of the thesis is to explore whatfactors can positively or negatively influence consumers’ intentions to use shared bikes.
In order to reach the research purpose, the research question of this study is to be addressedas follows:
What Factors Can Influence Consumers’ Intentions to Use Shared Bikes?
1.4 Structure of the ThesisChapter 1 mainly introduces the basic concept and characteristics of sharing economy, thedevelopment of shared bikes and the purpose of the research. Chapter 2 reviews the academicconcept of bike-sharing and the domestic and foreign literature on shared bikes. DecomposedTheory of Planned Behavior (DTPB), as the theoretical basis, is introduced into thetheoretical framework of the thesis. Then, we continue to explain its constituent elements indetail. Chapter 3 is to cover the proposed research model and put forward the hypotheses.Chapter 4 concentrates on the research method and research design, including the sampleprofile, sample selection and overall data collection method. Chapter 5 is the main part of thisthesis, focusing on the in-depth quantitative research. Based on this, data collection method,structure, questions of the survey and measurement descriptions are described. Chapter 6makes discussions based on the results from previous chapter. In Chapter 7, we make thesummary of this study and some implications for the management. Chapter 8, also the lastchapter, proposes limitations and possible future study opportunities.
4
2. Theoretical Research and Literature Review2.1 Literature Review2.1.1 Concept of Shared BikesAs a booming and new thing under the background of mobile Internet, shared bikes havegreatly improved the way people travel, especially for short-distance travel. As long as peoplecan scan the QR code through the mobile app, they can complete the use of shared bikes.This kind of self-service use method is favored by consumers from all ages. Industry andacademia have their own views on the concept of shared bikes.
Leng (2017) believed that in the context of the sharing economy, shared bike is a new productborn under the sharing economy. On the one hand, through the cooperation betweenenterprises and the government, bike sharing services are provided in various public areassuch as residential areas, schools, commercial squares and other living and service places.This form has the characteristics of intelligence, Internet and environmental protection. Thebiggest difference between shared bikes and the traditional public bikes lies in the highflexibility, which can conveniently solve the issues of people's choices when traveling inshort distance. Li (2017) argued that shared bike is based on the sharing economy and theInternet, and it is a slow urban transportation system relying on Internet technology as aplatform, as well as a transportation mode that serves citizens' short distance travel and publictransportation transfer. Guo (2016) stated that shared bike is a typical form of B2C businessmodel, and it also relies on a new model of leasing, deposit and advertising under the Internetmodel. Xie (2017) agreed with Guo (2016) on the business model of shared bike. Shared bikecompletes the use process through three main processes: code scanning, unlocking, andInternet payment. This usage mode provides users with a convenient and environmentallyfriendly cycling experience. Compared to docked bikes, dockless shared bikes have theadvantage of being parked at will.
2.1.2 Review of Shared Bike ResearchShared bikes are developed from public bikes. We have found that there is currently a lot ofacademic research on public bikes. Wang, Kong, Xie and Yin (2009) chose public bikes inthree cities of Paris, Lyon and Barcelona as objects, and believed that two attributes of publicbikes: convenience and practicality are the main factors to motivate citizens to travel in citiesin the future. Pan (2010) argued that vigorously promoting green travel is an importantstrategy to alleviate urban traffic congestion in China. Zhou and Han (2011) studied thehistorical development and urban application of the public bike system in the Netherlandsand provided valuable advice for the management of urban traffic in China. However, wefound that research on users’ behaviors of shared bikes is very limited. For example, a lot ofliterature revolves around the factors, the obstacles and barriers that limit the spread of sharedbikes (Bachand-Marleau, Lee & El-Geneidy, 2012; Campbell et al., 2016). Fuller et al. (2013)interviewed the citizens of Montreal about the intentions to use public bikes by phone andfound that demographics is an important factor affecting public bike rental and young peopleand highly educated groups showed positive attitudes towards the intentions to use publicbikes. From the willingness of Philadelphia citizens to use public bikes, Caspi and Noland
5
(2019) found that user age, perceived safety and the availability of public bikes are importantfactors affecting people’s intention to use public bikes. Kaplan, Manca, Nielsen and Prato(2015) analyzed the influencing factors of potential visitors' willingness to use Copenhagenpublic bikes on vacation under the model of TPB, and concluded that their behaviors areaffected by their attitudes towards bikes, their interest in public bikes, and the difficulty ofcycling. At the same time, they also concluded that tourists from countries with higher bikepenetration tend to show lower riding enthusiasm than tourists from countries with lower bikepenetration. Some Chinese scholars such as Cui (2011), Qian, Wang and Niu (2014), Guo andHan (2013) have studied the satisfaction of people with public bikes mainly in the cities ofWuhan and Taiyuan in China.
2.2 Theoretical FrameworkIn order to understand what factors can influence consumers’ intentions to use shared bikes,we choose Decomposed Theory of Planned Behavior (DTPB) as the theoretical framework(Taylor & Todd, 1995). According to the previous research, it concluded that DecomposedTheory of Planned Behavior is based on or developed from another four related theories,which are Theory of Reasoned Action (TRA) by Fishbein and Ajzen (1975), Theory ofPlanned Behavior (TPB) by Ajzen (1991), Technology Acceptance Model (TAM) by Davis(1989) and Innovation Diffusion Theory (IDT) by Rogers (1983).
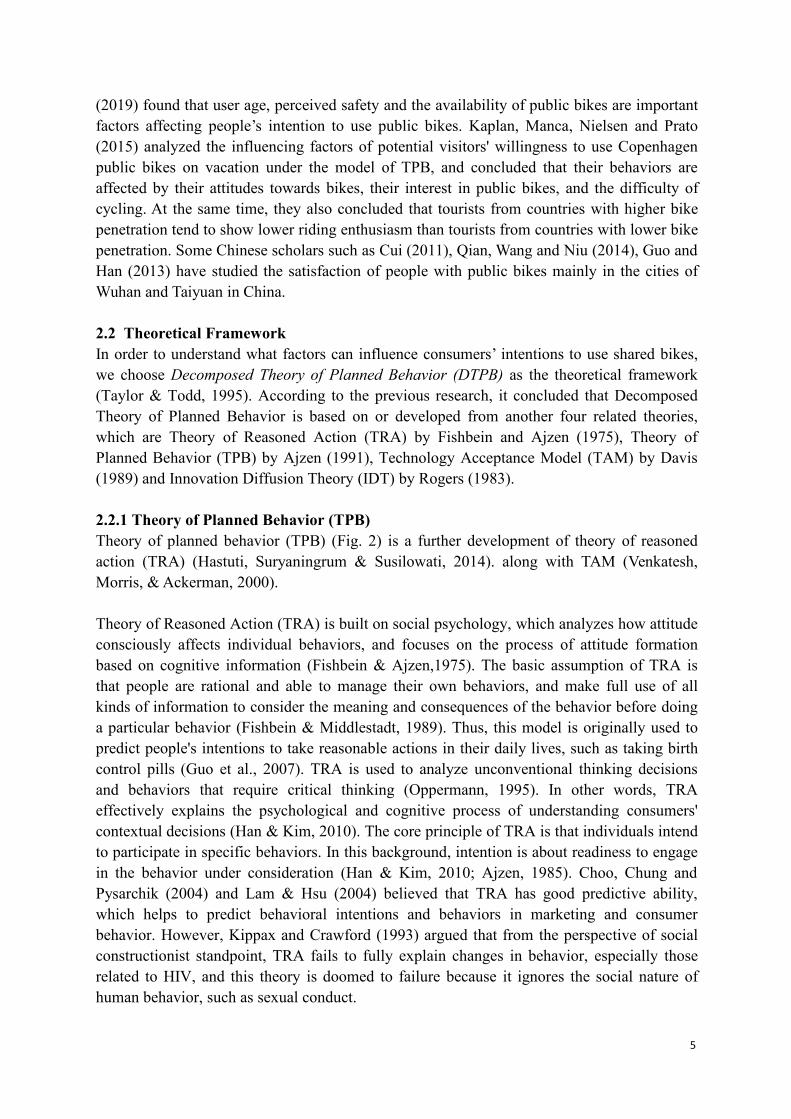
2.2.1 Theory of Planned Behavior (TPB)Theory of planned behavior (TPB) (Fig. 2) is a further development of theory of reasonedaction (TRA) (Hastuti, Suryaningrum & Susilowati, 2014). along with TAM (Venkatesh,Morris, & Ackerman, 2000).
Theory of Reasoned Action (TRA) is built on social psychology, which analyzes how attitudeconsciously affects individual behaviors, and focuses on the process of attitude formationbased on cognitive information (Fishbein & Ajzen,1975). The basic assumption of TRA isthat people are rational and able to manage their own behaviors, and make full use of allkinds of information to consider the meaning and consequences of the behavior before doinga particular behavior (Fishbein & Middlestadt, 1989). Thus, this model is originally used topredict people's intentions to take reasonable actions in their daily lives, such as taking birthcontrol pills (Guo et al., 2007). TRA is used to analyze unconventional thinking decisionsand behaviors that require critical thinking (Oppermann, 1995). In other words, TRAeffectively explains the psychological and cognitive process of understanding consumers'contextual decisions (Han & Kim, 2010). The core principle of TRA is that individuals intendto participate in specific behaviors. In this background, intention is about readiness to engagein the behavior under consideration (Han & Kim, 2010; Ajzen, 1985). Choo, Chung andPysarchik (2004) and Lam & Hsu (2004) believed that TRA has good predictive ability,which helps to predict behavioral intentions and behaviors in marketing and consumerbehavior. However, Kippax and Crawford (1993) argued that from the perspective of socialconstructionist standpoint, TRA fails to fully explain changes in behavior, especially thoserelated to HIV, and this theory is doomed to failure because it ignores the social nature ofhuman behavior, such as sexual conduct.
6
The biggest difference between TRA and TPB is that Ajzen (1991) introduced one newconstruct: perceived behavioral control to TRA. The new construct is attached an endeavor toperceived limitations achieved by individuals to complete a specific behavior. Put differently,the introduction of the PBC makes the theory explain and predict human behavior moreobjective and practical; at the same time, perceived behavior control can not only be perfectlyintegrated with attitude towards behavior and subjective norm, but also affect the occurrenceof actual behaviors under certain circumstances (Yan, 2014). Staats (2003) also presentedsome findings about the advantages for TPB. First, it makes clear distinctions betweencognition, affect and behavioral tendencies. Second, it gives the elaborate measurementmodel. Lastly, it has the capacity to create information on which interventions are based. Ingeneral, according to the requirements of different research purposes, different variables areintroduced into the theory of planed behavior would improve the theoretical predictivecredibility and explanatory power. Past research results showed that past behaviour is thevariable with the most times of intake of this theory (Han & Kim, 2010). TPB establishes thepredictability of the purchase intention model for shared bikes (Jebarajakirthy & Lobo, 2014),and also optimizes the potential relationship between intentions and its determinants bymeasuring each configuration at the same level of specificity (Paul, Modi & Patel, 2016).
After more than 20 years of development, Theory of Planned Behavior has been testified tobe an effective method to study human behavior. It has been successfully applied to a widerange of behaviors (Sommer, 2011). Han and Kim (2010) and Han, Hsu and Sheu (2010)used TPB model to show the decision-making process of consumers visiting green hotels,while Chen and Tung (2010) developed the TPB model, which combines moral norms andconsequences of recycling, to explain the intention of consumers’ recycling. Klöckner andBlöbaum (2010) discussed the impact of people's travel behavior patterns on the ecologicalenvironment through TPB. In the side of environmental protection, Oreg and Katz-Gerro(2006) verified the TPB model by studying recycling behaviors.
Fig. 2. Theory of Planned Behavior(Source: Ajzen, 1991)
2.2.2 Decomposed Theory of Planned Behavior (DTPB)
7
Decomposed Theory of Planned Behavior (DTBP) is an extension of TPB raised by Taylorand Todd (1995) in 1995, the purpose of which is to overcome some of the restrictions ofTPB (Ajzen, 1991). They indicated that decomposing attitudinal beliefs is the key to bettergrasp the relationships between the belief structures and antecedents of intention.
According to the diffusion of innovation theory (IDT), Taylor and Todd (1995) also arguedthat relative advantage, complexity and compatibility are the three salient characteristics ofan innovation that influences adoption (Rogers, 1983). When consumers come into contactwith new things for the first time, they will judge new things according to their existingknowledge, and produce attitudes tendency that they like or dislike, which ultimately affectwhether they can finally accept new things. IDT shows that when an individual adopts a newthing, the whole mental and behavioral process can be divided into five stages: Knowledge,Persuasion, Decision, Implementation and Confirmation (Rogers, 2003)
Taylor and Todd (1995) stated that compared with pure TPB and TRA models, thedecomposed model of the TPB has better explanatory power (Shih & Fang, 2004). Taylor andTodd (1995), from the perspective of information technology innovation, divided attitude intoperceived usefulness, perceived ease of use and compatibility. Taylor and Todd (1995)argued that perceived usefulness from Technology Acceptance Model (TAM) (Davis, 1989)could be regarded as relative advantage from Innovation Diffusion Theory (IDT), specificallybecause the use of a particular tool or technology leads to an improvement in productivity orperformance. Perceived ease of use from Technology Acceptance Model is equivalent tocomplexity from Innovation Diffusion Theory (IDT), which is manifested by the difficulty ofadoption or acceptance of a new technology or innovation (Taylor & Todd, 1995). Thecompatibility can refer to the explanation in the Innovation Diffusion Theory above.
Taylor and Todd (1995) split subjective norms into peer influence and superior influence.Peer influence is about the personal opinions of friends, colleagues or relatives, and superiorinfluence refers to the views of an individual's superiors on his or her behaviors (Taylor &Todd, 1995). Each referent group may share very different opinions on new shared bikes. Forexample, one's superiors may be optimistic about the use of shared bikes, because it willincrease people's travel choices. On the other hand, one person’s peers may be reluctant toadopt shared bikes because the daily travel pattern has been stable. Self-efficacy, resourcefacilitating condition and technology facilitating condition make up the perceived behaviorcontrol. Self-efficacy is mainly reflected in the individual's judgment of self-behavior ability.Taylor and Todd (1995) indicated that these three factors affect an individual's behaviorcontrol.
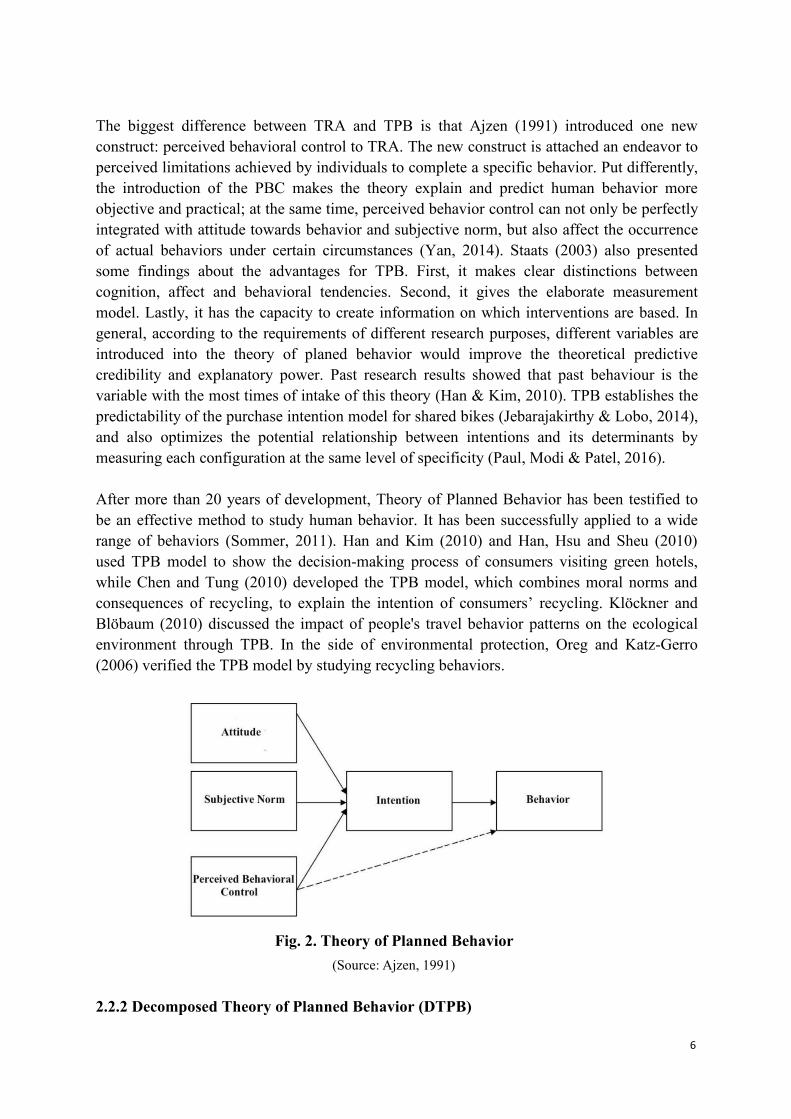
To sum up, DTBP (Fig. 3) has been widely used and validated as a model by many scholarsfor predicting behaviors intentions from attitude, subjective norms and perceived behaviorcontrol in the field of education (Atsoglou & Jimoyiannis, 2012; Cheon, Lee, Crooks andSong, 2012), consumer behavior (Tsai et al., 2015; Moons & De Pelsmacker, 2015), tourism(Garay, Font & Corrons, 2019) and information technology (Chwelos, Benbasat & Dexter,2001 and Shiue, 2007). Taylor and Todd (1995) suggested that we should take DTBP into
8
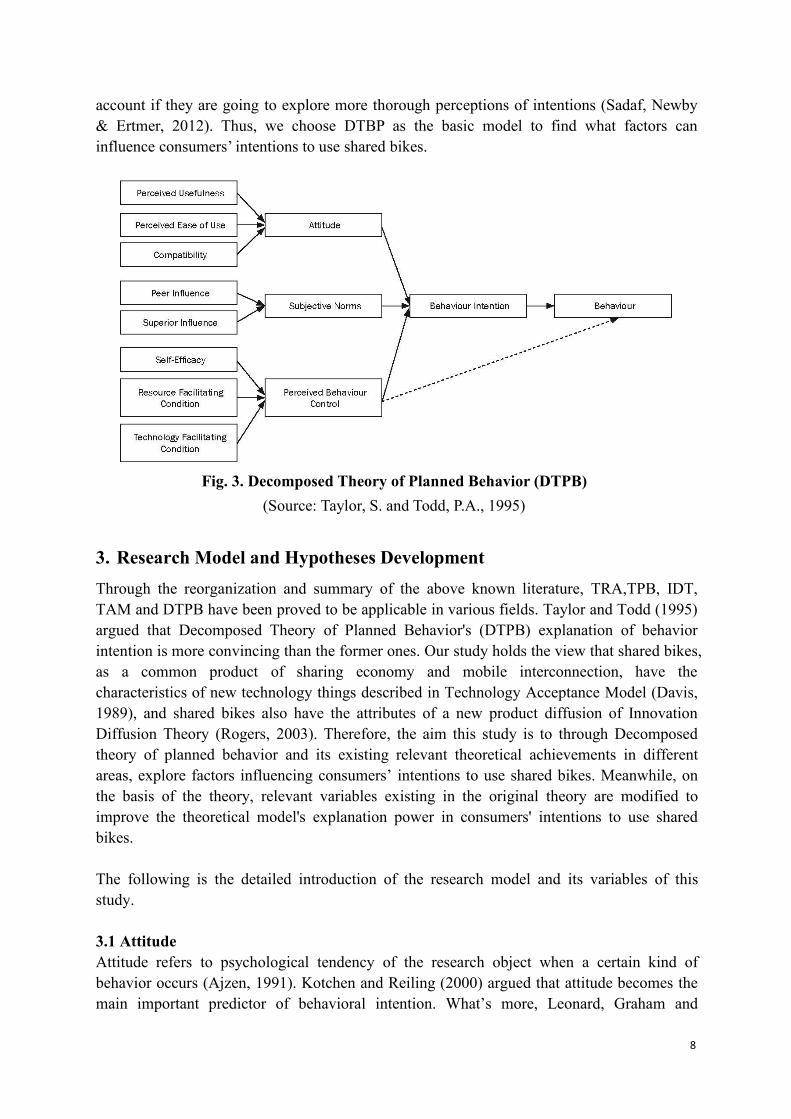
account if they are going to explore more thorough perceptions of intentions (Sadaf, Newby& Ertmer, 2012). Thus, we choose DTBP as the basic model to find what factors caninfluence consumers’ intentions to use shared bikes.
Fig. 3. Decomposed Theory of Planned Behavior (DTPB)(Source: Taylor, S. and Todd, P.A., 1995)
3. Research Model and Hypotheses DevelopmentThrough the reorganization and summary of the above known literature, TRA,TPB, IDT,TAM and DTPB have been proved to be applicable in various fields. Taylor and Todd (1995)argued that Decomposed Theory of Planned Behavior's (DTPB) explanation of behaviorintention is more convincing than the former ones. Our study holds the view that shared bikes,as a common product of sharing economy and mobile interconnection, have thecharacteristics of new technology things described in Technology Acceptance Model (Davis,1989), and shared bikes also have the attributes of a new product diffusion of InnovationDiffusion Theory (Rogers, 2003). Therefore, the aim this study is to through Decomposedtheory of planned behavior and its existing relevant theoretical achievements in differentareas, explore factors influencing consumers’ intentions to use shared bikes. Meanwhile, onthe basis of the theory, relevant variables existing in the original theory are modified toimprove the theoretical model's explanation power in consumers' intentions to use sharedbikes.
The following is the detailed introduction of the research model and its variables of thisstudy.
3.1 AttitudeAttitude refers to psychological tendency of the research object when a certain kind ofbehavior occurs (Ajzen, 1991). Kotchen and Reiling (2000) argued that attitude becomes themain important predictor of behavioral intention. What’s more, Leonard, Graham and
9
Bonacum (2004) stated that attitude determines whether the individual will have behavior andwhether the behavior under consideration is good or bad. Attitude is also the main significantpredictor of behavioral intention (Kotchen & Reiling, 2000). Attitudes are psychologicalemotions conveyed by consumers' evaluations. If they are positive, behavioral intentions willhave more positive tendency (Chen & Tung, 2014). To be more specific, in the context ofshared bikes, there is a positive relationship between attitude towards greenness of sharedbikes and behavioral intention (Wang, Douglas, Hazen & Dresner, 2018). Thus, we proposethat:
• H1.Attitude towards shared bikes using is positively related to intention to use shared bikes.
Perceived usefulness means that when users use a particular system, they subjectively thinkthat the improvement of work performance brought about by Davis (1989). The effects thatperceived usefulness have on intention to use technology such as mobile applications areassociated with instrumental behavior (Davis, 1989). Usefulness shows an extrinsicmotivation which is based on goal achievement such as rewards as the main motive forbehavioral intention (Venkatesh, 1999). Bike-sharing services are most likely used primarilyto satisfy inner and hedonic satisfactions, such as chatting, relaxing and exercising,eventually affecting consumer’s attitude to use. Liu and Yang (2018), based on the results ofadoption of the sharing economy, concluded that herd behavior, perceived usefulness, andperceived ease of use can affect consumers to adopt sharing applications, such as sharedbikes. Thus, we propose that:
• H1a. Perceived usefulness of shared bikes has a positive influence on users' attitudetowards using.
Perceived risk refers to the financial risk, privacy risk and psychological risk that users willfeel when they are about to use a shared bike. Introducing perceived risk into our proposedframework is based on following details. Regarding the classification of perceived risk,scholars in different periods such as Scott (1967), Jacoby and Kaplan (1972) and Peter andTarpey (1975) maintain different views. Featherman and Pavlou (2003) argued that in thee-service context, the main concern is about performance, financial, privacy and time risk.Risk plays a vital role in the field of consumer behavior, and it has made an importantcontribution to elucidating consumers’ information search behavior and the final consumer’spurchase decision (Arora & Rahul, 2018). Financial risk of using shared bikes means the riskof losing money (Lee, Park & Ahn, 2001; Fram & Grady, 1997). Privacy risk of using sharedbikes means the sharing bike companies may inappropriately use the users’ information(Nyshadham, 2000) and security concerning about payment and transmission of transaction(Kolsaker and Payne, 2002). In the research on traffic safety of e-bikes in China, Yao and Wu(2012) pointed out risk perception is proved to be negatively correlated with risk-takingbehaviors, which means the higher the perceived risk of a particular behavior is, the lower thelikelihood of participating in that behavior is (Iversen, 2004). Also, Bauer (1960) andFeatherman and Pavlou (2003) through examples proved that perceived risk has a negativeimpact on users’ behaviors. Thus, we propose that:
10
• H1b. Perceived risk of shared bikes has a negative influence on users' attitude towardsusing.
Perceived cost of use refers to the sum of all kinds of costs that consumers have to pay whenusing shared bikes, including money, time, energy and so on. Introducing perceived cost ofuse into our proposed framework is based on following details. Wu et al. (2019) argued thatthe pricing scheme change influences the usage rates of shared bikes, which can explain theusage rate of shared bikes in many cities is still lower than expected. Campbell et al. (2016)found that consumers tend to consider time and economic costs when choosing public bikes.Therefore, we think that consumers' perception of the cost of shared bikes has a negativerelationship with their attitudes. Thus, we propose that:
• H1c. Perceived cost of shared bikes has a negative influence on users' attitude towardsusing.
Perceived joviality is about using shared bikes can bring psychological and spiritualhappiness to consumers. Introducing perceived joviality into our proposed framework isbased on following details. Davis, Bagozzi and Warshaw (1992) argued that perceivedjoviality could be regarded as one of the most important concept of the hedonic motives,which can influence consumers to use new product technology and they introduced it into theTAM model to explain consumers’ attitudes towards new technology. Jan and Contreras(2011) in the study of shared knowledge, concluded that the purpose of sharing knowledgewith others is not only to transfer knowledge to others, but also to enjoy the pleasure ofsharing knowledge. Thus, we propose that:
H1d. Perceived Joviality of shared bikes has a positive influence on users' attitude towardsusing.
Perceived environmental protection refers to through the perception of shared bikes,consumers realize that using shared bikes could decrease the use of private cars and theimportance of environmental protection. Introducing perceived environmental protection intoour proposed framework is based on following details. Earlier studies have examined thatthere is a positive correlation between environmental concern and people’s environmentallyfriendly attitude and behaviors (Minton & Rose, 1997). Some studies have proved that thereis a close relationship between environmental concern and attitude and purchase intentiontowards green products, such as new energy vehicles (Ozaki & Sevastyanova, 2011; Wang etal., 2017). De Medeiros, Ribeiro and Cortimiglia (2016) concluded that green productspotentially affect consumers' shopping behavior. People who feel sensitive aboutenvironmental issues show greater willingness to pay higher prices for green products. WhenDelang and Cheng (2012) researched the attitudes of people in Hong Kong towards theelectric vehicles, the outcomes showed that the environmental advantages of electric vehiclescan promote consumers to form a good attitude towards electric vehicles and strengthenconsumers' willingness to buy at the same time. Thus, we propose that:
11
• H1e. Perceived environmental protection of shared bikes has a positive influence on users'attitude toward using.
3.2 Subjective NormSubjective norm refers to the social pressure perceived by the subject because of theoccurrence of a certain behavior (Fishbein & Ajzen, 1975). For our study, it means theindividuals receive the influence of interpersonal relationships and social organizations whenusing shared bikes. Park (2000) emphasized the influence of people who are crucial to theindividual or actor, such as close friends, relatives, colleagues or business partners.Subjective norms capture the feelings of social pressure sensed by individuals to a particularbehavior. We also find that in marketing and consumer behavior fields, previous studies haveexamined subjective norm as an important indicator of intention. For example, female hadintentions to receive hormone replacement therapy (Quine & Rubin, 1997), organic foodpurchase intention (Dean et al., 2012; Ha & Janda, 2012), consumers’ behavioral intentions toread menu labels in the restaurant industry (Kim et al., 2013) and environmental consciousconsumption (Khare, 2015; Moser, 2015; Tsarenko et al., 2013). Therefore, we propose that:
H2. Subjective norm is positively related to the intention to use shared bikes.
Taylor and Todd (1995) divided subjective norm into two constructs, namely, peer influenceand superior influence. Kaplan et al. (2015), for the promotion of urban public bikes, pointedout that people who come together have a positive impact on tourists' use of urban publicbikes. Ma et al. (2015) also pointed out that in the context of Innovation Diffusion Theory,the pressure of public opinion of the news media and competitors can promote thedevelopment of public bikes in a city to a certain extent. Thus, we propose that:
H2a. Peer influence has a positive influence on subjective norm.
H2b. Superior influence has a positive influence on subjective norm.
3.3 Perceived Behavior ControlIn Theory of Planned Behavior (TPB), Perceived behavior control is the most importantantecedent among three when concerning behaviors are partially under volitional control(Paul, Modi & Patel, 2016). Perceived behavior control refers to the degree of difficulty ofperceived behavior (Ajzen, 1991), which reflects past experience and expected obstacles.Zhou et al. (2013) stated that behavioral control (i.e. ability) and motive determine behavior.Also, many literature showed PBC has positive relationship with intention in various researchcontexts, such as consumer use intention of e-coupons (Kang et al., 2006). we argued thatlower the chance that consumers will encounter various problems in the process of usingshared bikes, the greater the possibility that they will continue to use or use the shared bikesindependently. Thus, we propose that:
H3. Perceived behavior control is positively related to intention to use shared bikes.
12
Self-efficacy judgment is believed to have a substantial effect on an individual’s emotionalresponse. Individuals tend to be satisfied with behaviors that they think are capable ofperformance, and tend to dislike behaviors that they think they cannot successfully master(Bandura, 1986). Self-efficacy refers to consumers' judgment of the ability to use shared bikes.Resource facilitating condition refers to beliefs about the availability of resources thatpromote expected behavior (Taylor & Todd, 1995). For example, resources such as money,skills, or opportunities are regarded as influencing factors on perceived behavioral control(Ajzen, 1991). In the context of shared bikes, resource facilitating condition represents theuse of resources needed in shared bikes such as mobile phones and mobile apps. Therefore, ifa person has sufficient resources or information on the behavior, he or she will have a higherintention to do this behavior (Madden et al., 1992). Hence, we propose that:
H3a. Self-efficacy has a positive influence on perceived behavior control.
H3b. Resource facilitating condition has a positive influence on perceived behavior control.
3.4 Proposed Research ModelWe use the Decomposed Theory of Planned Behavior (DTPB) to predict and explainconsumers' intentions to use shared bikes, and believe that consumers' intentions to useshared bikes is influenced by attitude, subjective norm and perceived behavioral control.Among the original variables that affect attitude, we think that perceived joviality is moreintuitive and concrete than perceived ease of use in terms of experience, so the perceived easeof use is deleted. What’s more, we have considered more internal and external practicalfactors such as environmental protection, price and risks that affect the intentions to useshared bikes, so the more abstract factor-compatibility is removed.
Among the variables that affect subjective norm, we keep the two variables of the originalmodel: peer influence and superior influence. Finally, among the variables that affectperceived behavioral control, we retain the self-efficacy and resource facilitating conditionand delete the technology facilitating condition because with the popularity of smartphonesand 4G, it has been regarded as an essential skill for people to learn how to use mobilephones. With the development of shared bike and its mobile apps, the technology facilitatingcondition basically meets all the needs of shared bikes including map positioning, mobilepayment, etc.
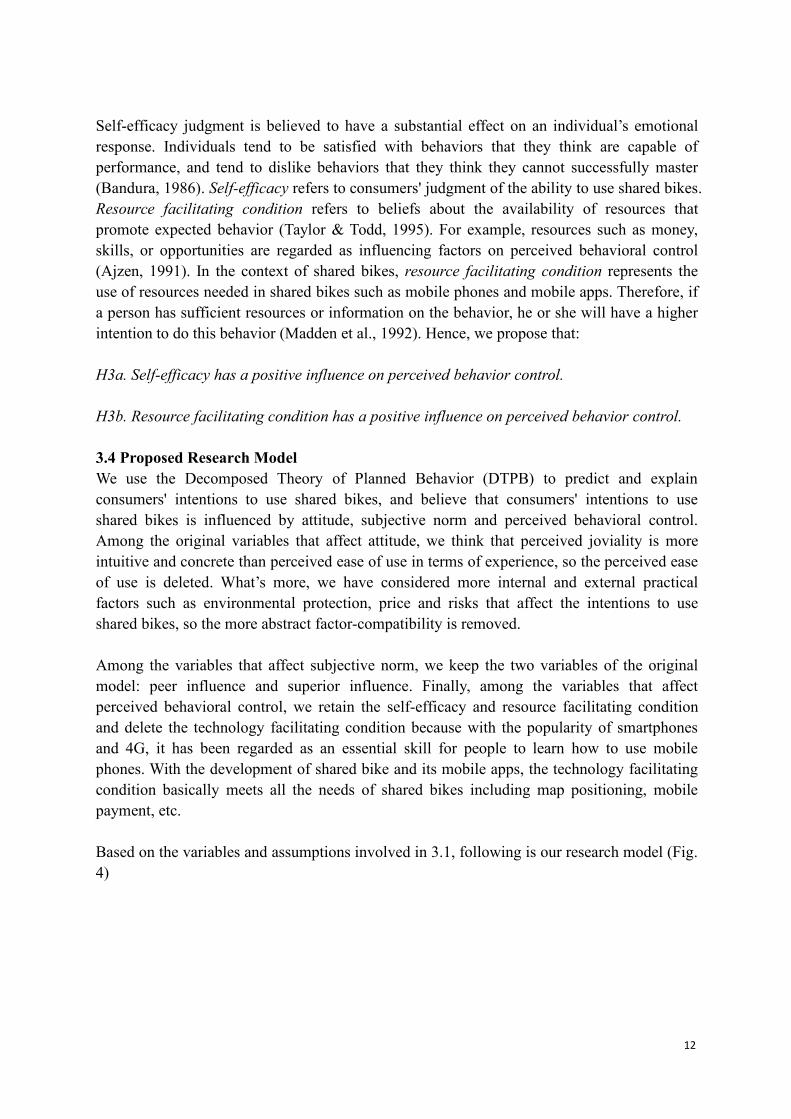
Based on the variables and assumptions involved in 3.1, following is our research model (Fig.4)
13
Fig.4. Proposed Framework of Consumers’ Intention to Use Shared Bikes
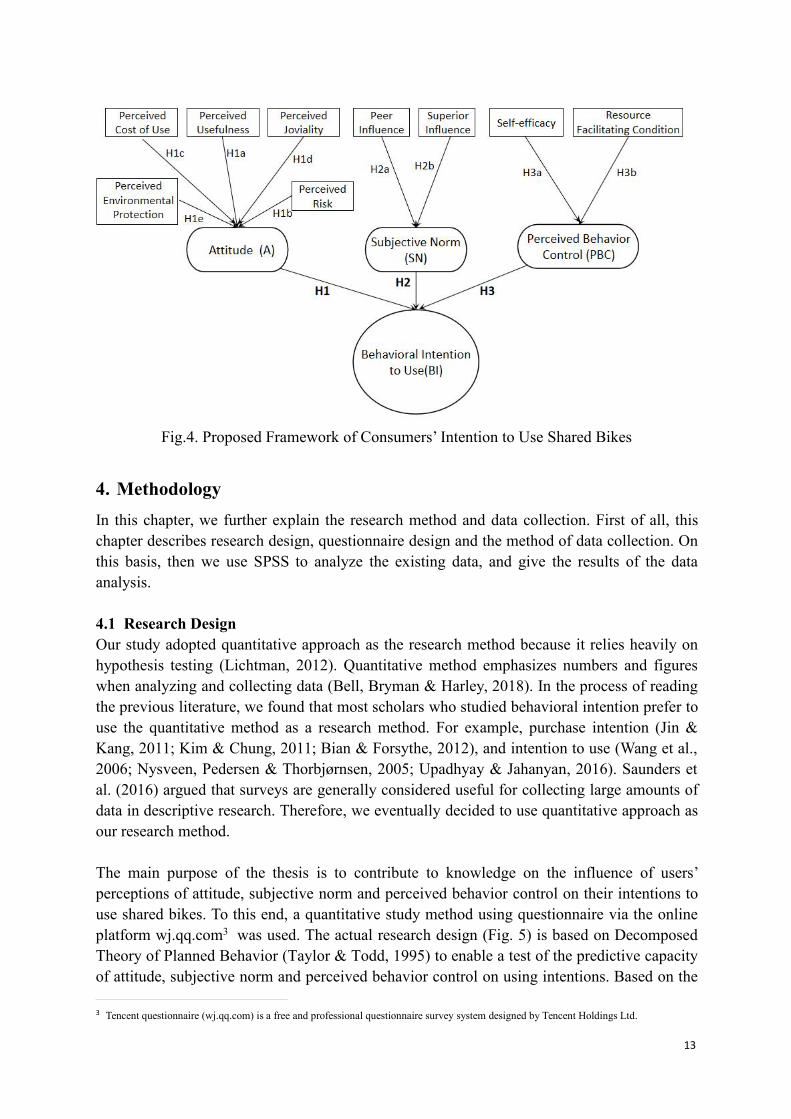
4. MethodologyIn this chapter, we further explain the research method and data collection. First of all, thischapter describes research design, questionnaire design and the method of data collection. Onthis basis, then we use SPSS to analyze the existing data, and give the results of the dataanalysis.
4.1 Research DesignOur study adopted quantitative approach as the research method because it relies heavily onhypothesis testing (Lichtman, 2012). Quantitative method emphasizes numbers and figureswhen analyzing and collecting data (Bell, Bryman & Harley, 2018). In the process of readingthe previous literature, we found that most scholars who studied behavioral intention prefer touse the quantitative method as a research method. For example, purchase intention (Jin &Kang, 2011; Kim & Chung, 2011; Bian & Forsythe, 2012), and intention to use (Wang et al.,2006; Nysveen, Pedersen & Thorbjørnsen, 2005; Upadhyay & Jahanyan, 2016). Saunders etal. (2016) argued that surveys are generally considered useful for collecting large amounts ofdata in descriptive research. Therefore, we eventually decided to use quantitative approach asour research method.
The main purpose of the thesis is to contribute to knowledge on the influence of users’perceptions of attitude, subjective norm and perceived behavior control on their intentions touse shared bikes. To this end, a quantitative study method using questionnaire via the onlineplatform wj.qq.com3 was used. The actual research design (Fig. 5) is based on DecomposedTheory of Planned Behavior (Taylor & Todd, 1995) to enable a test of the predictive capacityof attitude, subjective norm and perceived behavior control on using intentions. Based on the
3 Tencent questionnaire (wj.qq.com) is a free and professional questionnaire survey system designed by Tencent Holdings Ltd.
14
previous literature on the use of public bikes, electric bikes and shared bikes by consumers,the vast majority of researchers chose to use quantitative study as the research method(Campbell et al., 2016; Jäppinen, Toivonen & Salonen, 2013; Wang, Akar & Chen, 2018;Zhang et al., 2017; Haustein & Møller, 2016).
Last but not least, the research question of the study is tested by deductively forming ahypothesis derived from theory (Decomposed Theory of Planned Behavior). No matter forobjective testing or experimentation, it eventually supports or rejects the hypotheses. For eachstep, it controls the bias when collecting and analyzing data (Salkind, 2010).
4.2 Questionnaire DesignThis questionnaire is in the form of a closed questionnaire and does not involve any personalprivacy issues. After determining the relevant hypotheses and research models, the initialquestionnaire of this study is formed. This questionnaire is mainly composed of two parts.The first part is about the basic information about the respondents, including gender, location,age and educational background, etc., while the second part is about the motivation of users'intentions to use shared bikes.
The questionnaire was initially designed in English and then translated into Chinese by anindividual fluent in both English and Chinese. To ensure the equivalence of the translation,the questionnaire was back-translated into English by another bilingual person who was notfamiliar with the survey tool. Saunders et al. (2016) believed that the process of back-to-backtranslation is important for the study which is designed in English, so in order to follow thetraditional and widely accepted back-translation process (Brislin, 1986), we specificallyasked an undergraduate majoring in English literature at Nanjing University in China to helpreduce the cultural bias in the questionnaire and ensure its final validity and reliability. Wedesigned a total of Chinese and English versions of the questionnaire; the Chinesequestionnaire is mainly aimed at Chinese users, while the English questionnaire is mainlyused for Swedish and users in other districts.
Considering huge wastage may happen if the questions themselves have any problems due tothe questionnaire distributed in large numbers (Bell, Bryman & Harley, 2018), we did thepre-survey and looked for 25 students at Uppsala University. By taking this step, we requiredrespondents to fill in the questionnaire and collected the questionnaire on the spot to ensurethe reliability and authenticity of the questionnaire. After the pre-survey, we analyzed thereliability of the survey data to ensure each item has no bias.
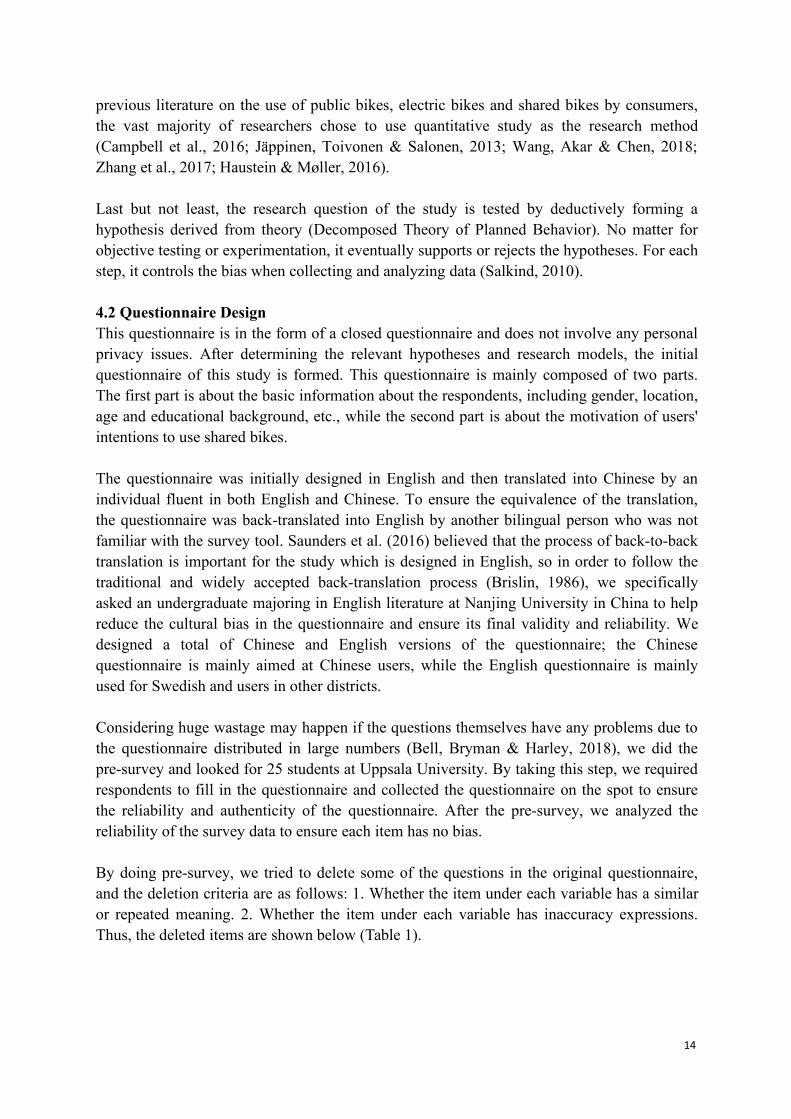
By doing pre-survey, we tried to delete some of the questions in the original questionnaire,and the deletion criteria are as follows: 1. Whether the item under each variable has a similaror repeated meaning. 2. Whether the item under each variable has inaccuracy expressions.Thus, the deleted items are shown below (Table 1).
15
Table 1 The DELETED Measurement ItemsVariable Item Deleted Measuring Item
Behavioral Intention to Use BI I am willing to continue to use shared bikesAttitude A I like sharing bikes very muchSubjective Norm SN1 People who influenced me think I should use shared
bikesPeople who influenced me use shared bikes
Perceived Behavior Control PBC N/APerceived Usefulness PU Using shared bikes provides an opportunity to exercise
In general, Shared bikes are useful to mePerceived Risk PR N/APerceived Cost of Use PCU N/APerceived Joviality PJ N/APerceived Environmental Protection PEP Shared bikes can reduce my use of motor vehiclesPeer Influence PI My good friends are using shared bikes.Superior Influence SI N/ASelf-efficacy SE N/AResource Facilitating Condition RFC N/A
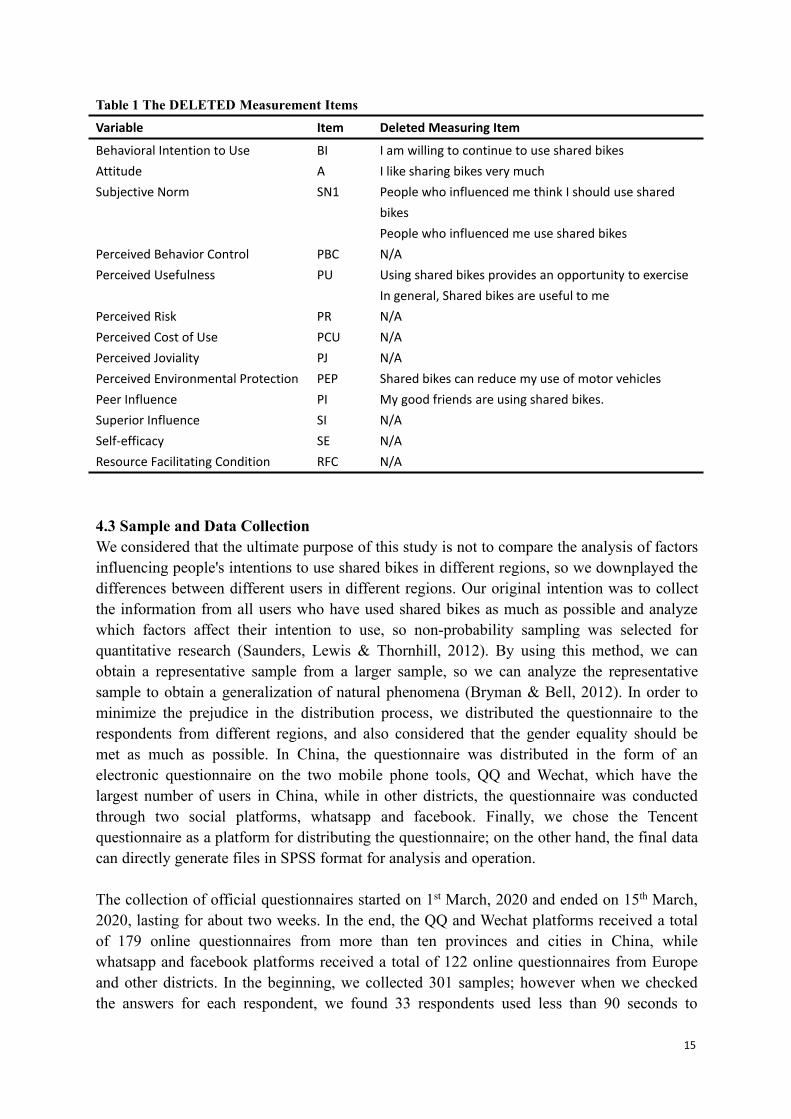
4.3 Sample and Data CollectionWe considered that the ultimate purpose of this study is not to compare the analysis of factorsinfluencing people's intentions to use shared bikes in different regions, so we downplayed thedifferences between different users in different regions. Our original intention was to collectthe information from all users who have used shared bikes as much as possible and analyzewhich factors affect their intention to use, so non-probability sampling was selected forquantitative research (Saunders, Lewis & Thornhill, 2012). By using this method, we canobtain a representative sample from a larger sample, so we can analyze the representativesample to obtain a generalization of natural phenomena (Bryman & Bell, 2012). In order tominimize the prejudice in the distribution process, we distributed the questionnaire to therespondents from different regions, and also considered that the gender equality should bemet as much as possible. In China, the questionnaire was distributed in the form of anelectronic questionnaire on the two mobile phone tools, QQ and Wechat, which have thelargest number of users in China, while in other districts, the questionnaire was conductedthrough two social platforms, whatsapp and facebook. Finally, we chose the Tencentquestionnaire as a platform for distributing the questionnaire; on the other hand, the final datacan directly generate files in SPSS format for analysis and operation.
The collection of official questionnaires started on 1st March, 2020 and ended on 15th March,2020, lasting for about two weeks. In the end, the QQ and Wechat platforms received a totalof 179 online questionnaires from more than ten provinces and cities in China, whilewhatsapp and facebook platforms received a total of 122 online questionnaires from Europeand other districts. In the beginning, we collected 301 samples; however when we checkedthe answers for each respondent, we found 33 respondents used less than 90 seconds to
16
complete the survey which should be removed from the data set. In order to ensure theaccuracy of the data, we screened the data and total sample size for this study is 268, with aneffective response rate of 89% (268/301).
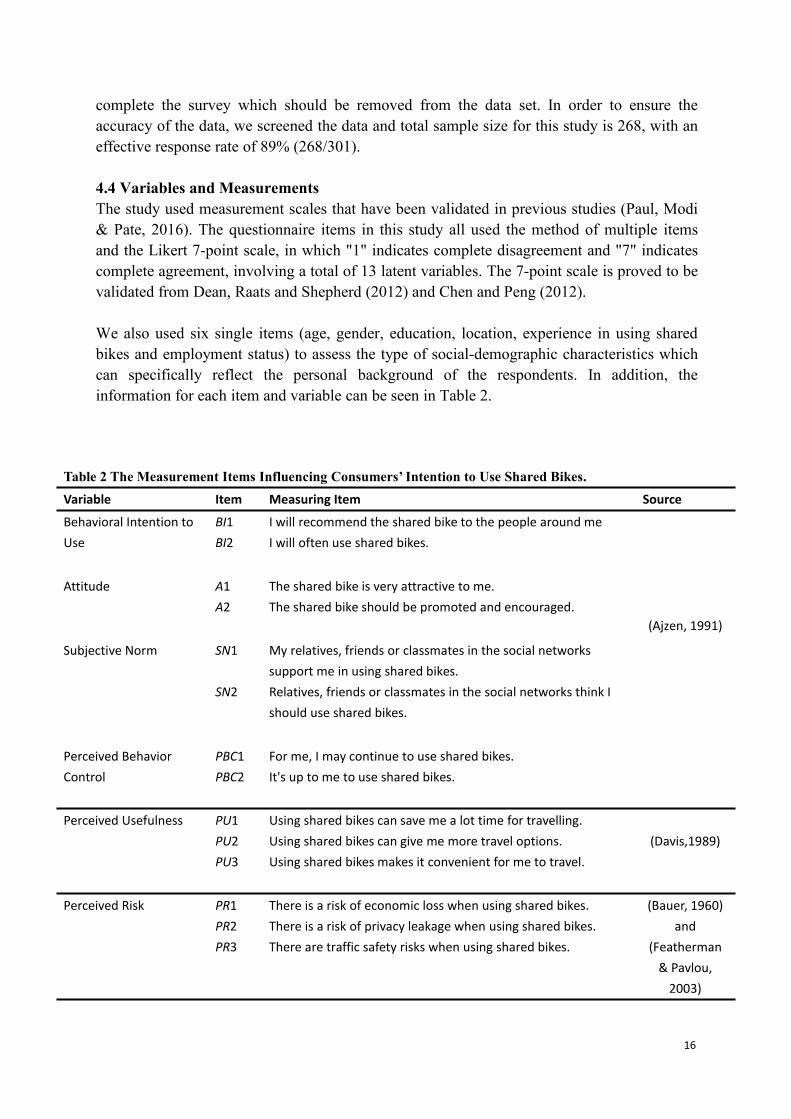
4.4 Variables and MeasurementsThe study used measurement scales that have been validated in previous studies (Paul, Modi& Pate, 2016). The questionnaire items in this study all used the method of multiple itemsand the Likert 7-point scale, in which "1" indicates complete disagreement and "7" indicatescomplete agreement, involving a total of 13 latent variables. The 7-point scale is proved to bevalidated from Dean, Raats and Shepherd (2012) and Chen and Peng (2012).
We also used six single items (age, gender, education, location, experience in using sharedbikes and employment status) to assess the type of social-demographic characteristics whichcan specifically reflect the personal background of the respondents. In addition, theinformation for each item and variable can be seen in Table 2.
Table 2 The Measurement Items Influencing Consumers’ Intention to Use Shared Bikes.Variable Item Measuring Item Source
Behavioral Intention toUse
BI1BI2
I will recommend the shared bike to the people around meI will often use shared bikes.
(Ajzen, 1991)
Attitude A1A2
The shared bike is very attractive to me.The shared bike should be promoted and encouraged.
Subjective Norm SN1
SN2
My relatives, friends or classmates in the social networkssupport me in using shared bikes.Relatives, friends or classmates in the social networks think Ishould use shared bikes.
Perceived BehaviorControl
PBC1PBC2
For me, I may continue to use shared bikes.It's up to me to use shared bikes.
Perceived Usefulness PU1PU2PU3
Using shared bikes can save me a lot time for travelling.Using shared bikes can give me more travel options.Using shared bikes makes it convenient for me to travel.
(Davis,1989)
Perceived Risk PR1PR2PR3
There is a risk of economic loss when using shared bikes.There is a risk of privacy leakage when using shared bikes.There are traffic safety risks when using shared bikes.
(Bauer, 1960)and
(Featherman& Pavlou,2003)
17
5. Data Analysis5.1 Sample ProfileParticipant demographics can be found in Table 3. For gender, the ratio of male to female isbasically equal (48.1% vs 51.9%), with slightly more female users than male users (129 vs139). Geographically, more than 50% of users (156) are from China, accounting for 58.2%,while users from Europe and other regions (112) account for 41.8%. According to the agedata of the sample, users are mostly from 18-35 age group (138), accounting for 51.5%,which indicates that users born in the 1980s and 1990s have a strong ability to accept newthings. It is also worth mentioning that the number of users in the 45+ age group (57) is up to21.3% and most of the Chinese users are from large and medium-sized cities. For the
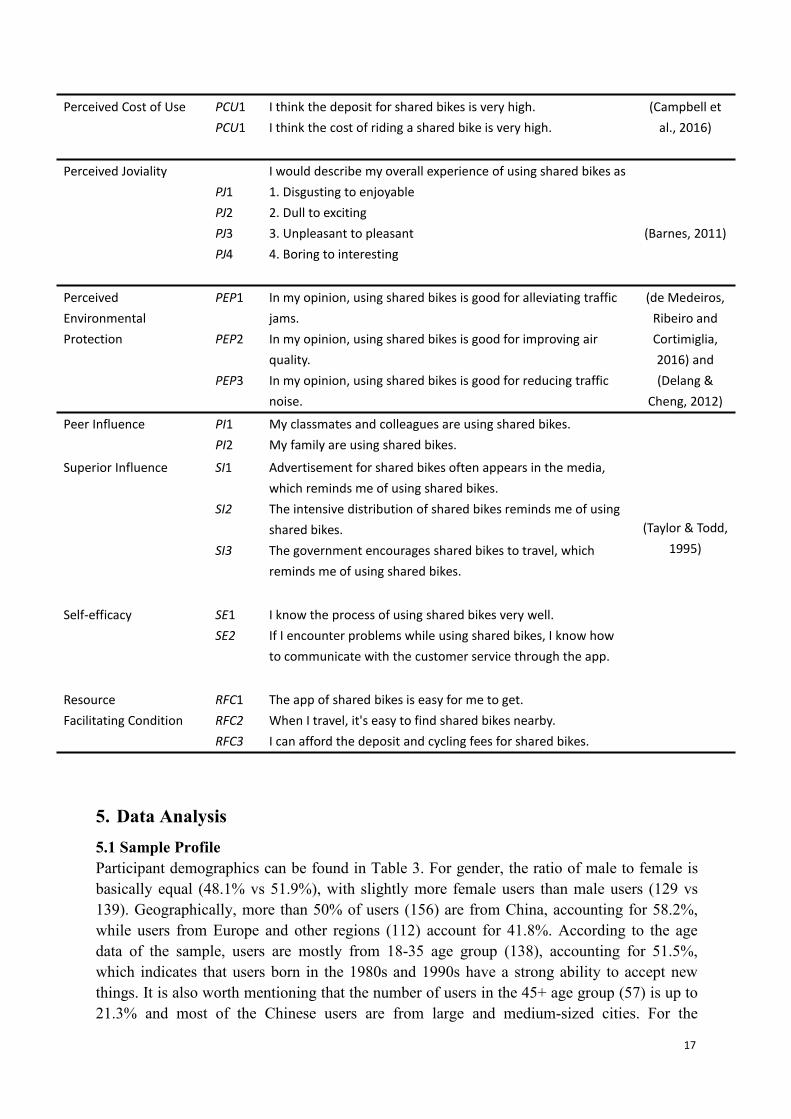
Perceived Cost of Use PCU1PCU1
I think the deposit for shared bikes is very high.I think the cost of riding a shared bike is very high.
(Campbell etal., 2016)
Perceived JovialityPJ1PJ2PJ3PJ4
I would describe my overall experience of using shared bikes as1. Disgusting to enjoyable2. Dull to exciting3. Unpleasant to pleasant4. Boring to interesting
(Barnes, 2011)
PerceivedEnvironmentalProtection
PEP1
PEP2
PEP3
In my opinion, using shared bikes is good for alleviating trafficjams.In my opinion, using shared bikes is good for improving airquality.In my opinion, using shared bikes is good for reducing trafficnoise.
(de Medeiros,Ribeiro andCortimiglia,2016) and(Delang &
Cheng, 2012)
Peer Influence PI1PI2
My classmates and colleagues are using shared bikes.My family are using shared bikes.
(Taylor & Todd,1995)
Superior Influence SI1
SI2
SI3
Advertisement for shared bikes often appears in the media,which reminds me of using shared bikes.The intensive distribution of shared bikes reminds me of usingshared bikes.The government encourages shared bikes to travel, whichreminds me of using shared bikes.
Self-efficacy SE1SE2
I know the process of using shared bikes very well.If I encounter problems while using shared bikes, I know howto communicate with the customer service through the app.
ResourceFacilitating Condition
RFC1RFC2RFC3
The app of shared bikes is easy for me to get.When I travel, it's easy to find shared bikes nearby.I can afford the deposit and cycling fees for shared bikes.

18
educational background, the proportion of those who have diploma/bachelor degree/masterdegree or above is 71.6%, indicating that the general educational degree of the respondents isrelatively high. From the point of career, the respondents are mostly students (102) and officeworkers (99). Nearly 70% of the respondents (183) have more than one year's experience ofusing shared bikes, among which 118 have more than two years' experience.
Table 3 Sample Characteristics.Variable Demographic Characteristics Frequency Percentage* (%)Gender Male
Female129139
48.151.9
Location ChinaEuropeOther
1561084
58.240.31.5
Age Less than 1818-2526-3536-45More than 45
1344946057
4.816.435.122.421.3
Education Middle school or belowHigh schoolDiplomaBachelorMaster or above
1561527763
5.622.819.428.723.5
Experience in using sharedbikes
Less than 6 months6-12 months13-24 monthsMore than 24 months
325365118
11.919.824.344.0
Employment Status StudentCivil servantGeneral office clerkProfessional staffSelf-employed individualRetireeOther
1021399912312
38.14.836.93.44.511.60.7
Note:*All the figures in Table 3 are calculated based on total valid sample of 268.
5.2 Variables ProfileThis study involves a total of 13 variables and a total of 33 items. Based on the descriptivestatistics of the mean, mode, variance and standard deviation of each item, it provides acertain reference for subsequent correlation analysis and linear regression. Variables profilecan be found in Table 4.
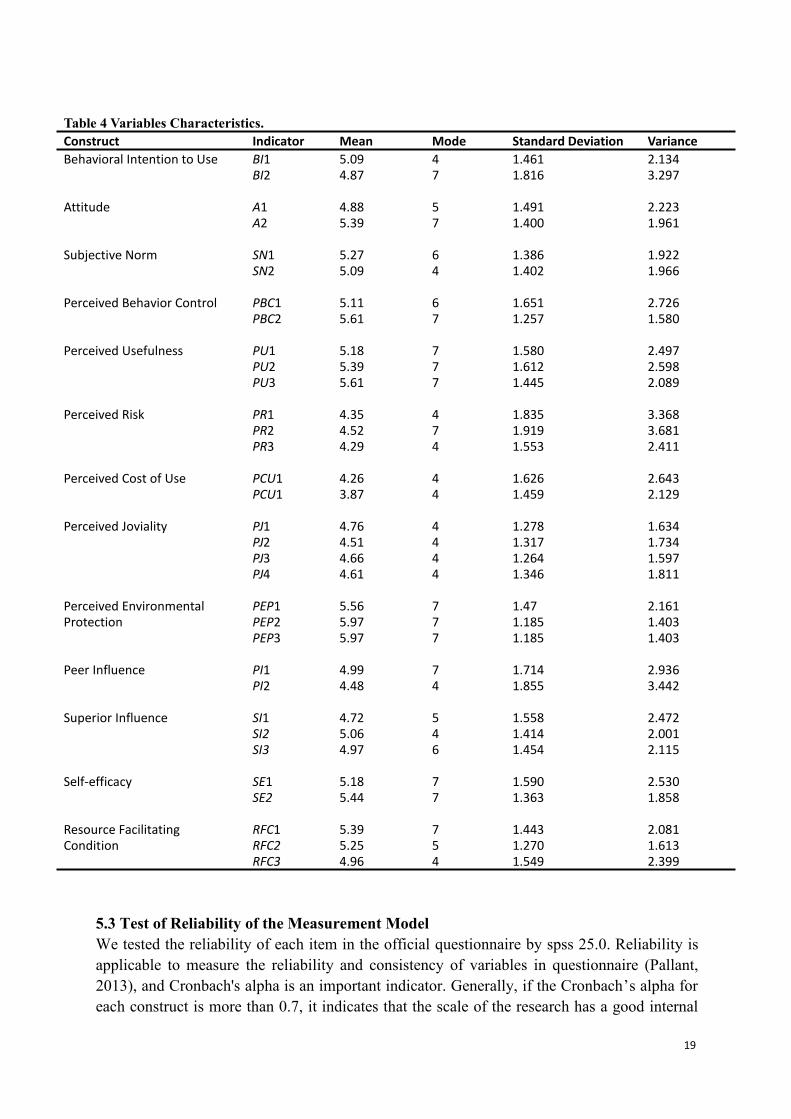
19
Table 4 Variables Characteristics.Construct Indicator Mean Mode Standard Deviation VarianceBehavioral Intention to Use BI1
BI25.094.87
47
1.4611.816
2.1343.297
Attitude A1A2
4.885.39
57
1.4911.400
2.2231.961
Subjective Norm SN1SN2
5.275.09
64
1.3861.402
1.9221.966
Perceived Behavior Control PBC1PBC2
5.115.61
67
1.6511.257
2.7261.580
Perceived Usefulness PU1PU2PU3
5.185.395.61
777
1.5801.6121.445
2.4972.5982.089
Perceived Risk PR1PR2PR3
4.354.524.29
474
1.8351.9191.553
3.3683.6812.411
Perceived Cost of Use PCU1PCU1
4.263.87
44
1.6261.459
2.6432.129
Perceived Joviality PJ1PJ2PJ3PJ4
4.764.514.664.61
4444
1.2781.3171.2641.346
1.6341.7341.5971.811
Perceived EnvironmentalProtection
PEP1PEP2PEP3
5.565.975.97
777
1.471.1851.185
2.1611.4031.403
Peer Influence PI1PI2
4.994.48
74
1.7141.855
2.9363.442
Superior Influence SI1SI2SI3
4.725.064.97
546
1.5581.4141.454
2.4722.0012.115
Self-efficacy SE1SE2
5.185.44
77
1.5901.363
2.5301.858
Resource FacilitatingCondition
RFC1RFC2RFC3
5.395.254.96
754
1.4431.2701.549
2.0811.6132.399
5.3 Test of Reliability of the Measurement ModelWe tested the reliability of each item in the official questionnaire by spss 25.0. Reliability isapplicable to measure the reliability and consistency of variables in questionnaire (Pallant,2013), and Cronbach's alpha is an important indicator. Generally, if the Cronbach’s alpha foreach construct is more than 0.7, it indicates that the scale of the research has a good internal
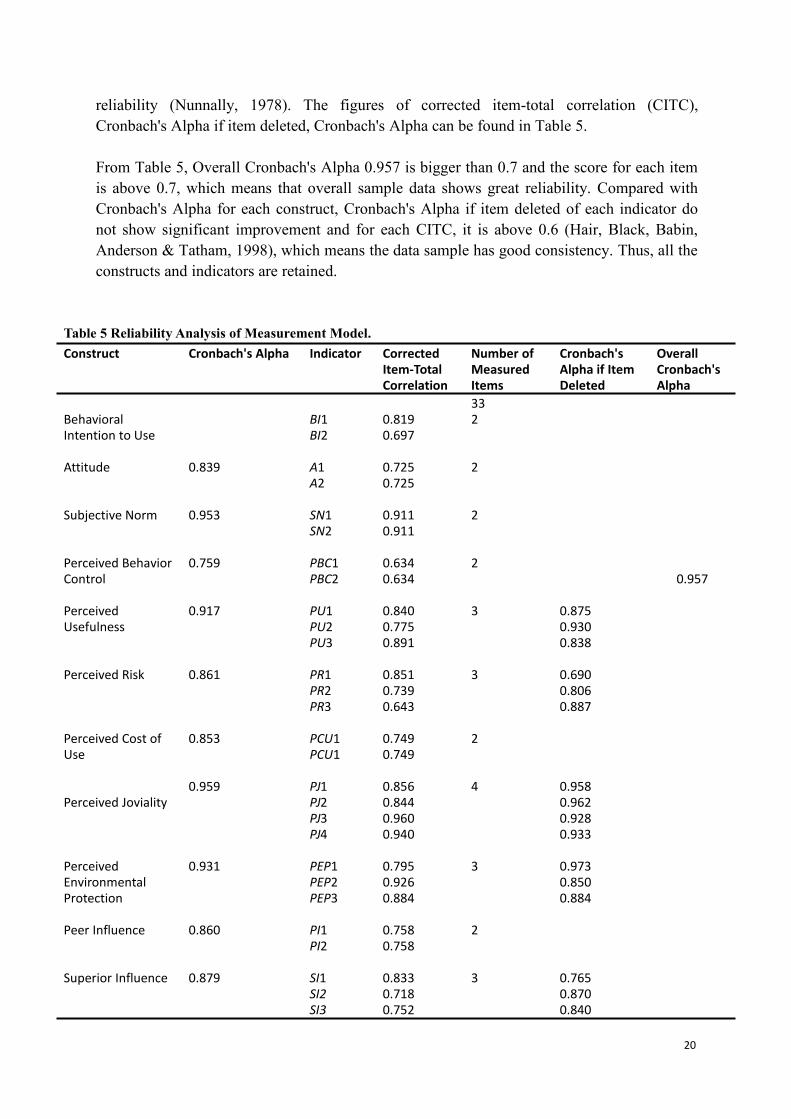
20
reliability (Nunnally, 1978). The figures of corrected item-total correlation (CITC),Cronbach's Alpha if item deleted, Cronbach's Alpha can be found in Table 5.
From Table 5, Overall Cronbach's Alpha 0.957 is bigger than 0.7 and the score for each itemis above 0.7, which means that overall sample data shows great reliability. Compared withCronbach's Alpha for each construct, Cronbach's Alpha if item deleted of each indicator donot show significant improvement and for each CITC, it is above 0.6 (Hair, Black, Babin,Anderson & Tatham, 1998), which means the data sample has good consistency. Thus, all theconstructs and indicators are retained.
Table 5 Reliability Analysis of Measurement Model.Construct Cronbach's Alpha Indicator Corrected
Item-TotalCorrelation
Number ofMeasuredItems
Cronbach'sAlpha if ItemDeleted
OverallCronbach'sAlpha
33BehavioralIntention to Use
BI1BI2
0.8190.697
2
0.957
Attitude 0.839 A1A2
0.7250.725
2
Subjective Norm 0.953 SN1SN2
0.9110.911
2
Perceived BehaviorControl
0.759 PBC1PBC2
0.6340.634
2
PerceivedUsefulness
0.917 PU1PU2PU3
0.8400.7750.891
3 0.8750.9300.838
Perceived Risk 0.861 PR1PR2PR3
0.8510.7390.643
3 0.6900.8060.887
Perceived Cost ofUse
0.853 PCU1PCU1
0.7490.749
2
Perceived Joviality0.959 PJ1
PJ2PJ3PJ4
0.8560.8440.9600.940
4 0.9580.9620.9280.933
PerceivedEnvironmentalProtection
0.931 PEP1PEP2PEP3
0.7950.9260.884
3 0.9730.8500.884
Peer Influence 0.860 PI1PI2
0.7580.758
2
Superior Influence 0.879 SI1SI2SI3
0.8330.7180.752
3 0.7650.8700.840

21
Self-efficacy 0.870 SE1SE2
0.7790.779
2
ResourceFacilitatingCondition
0.807 RFC1RFC2RFC3
0.6480.7220.613
3 0.7430.6820.789
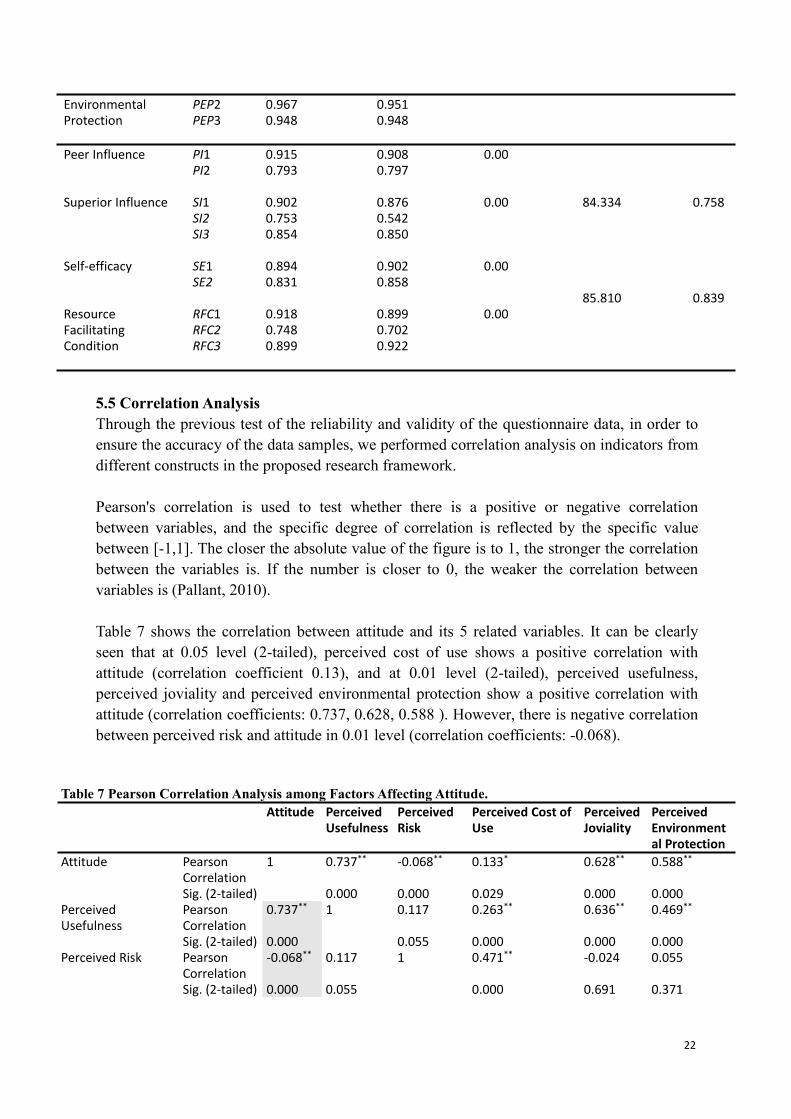
5.4 Test of Validity of the Measurement ModelValidity is applicable to measure the degree to which constructs are theoretically related(Campbell & Fiske, 1959), and Kaiser-Meyer-Olkin Measure (KMO), Factor loadings andCommonalities are important indicators. Generally, KMO value should be more than 0.6(Kaiser, 1974) and the Barlett ’ s Test of Sphericity value should be less than 0.05. Also,commonalities should be above 0.5 (Pallant, 2013).
Based on the proposed theoretical model, we performed factor analysis on five variables inattitude, two variables in subjective norm, two variables in perceived behavior control, andthree variables in behavioral Intention to use. More details can be found in Table 6.
Table 6 Validity Analysis of the Measurement Model.Construct Indicator Commonalities Factor Loading Sig. Variance Explained (%) KMOBehavioralIntention to Use
BI1BI2
0.9270.961
0.7820.876
0.00
92.773 0.798
Attitude A1A2
0.9650.944
0.8750.591
0.00
Subjective Norm SN1SN2
0.9510.950
0.8440.910
0.00
Perceived BehaviorControl
PBC1PBC2
0.7880.935
0.7910.785
0.00
PerceivedUsefulness
PU1PU2PU3
0.8790.8970.942
0.7840.8730.846
0.00
82.873 0.750
Perceived Risk PR1PR2PR3
0.8910.7910.696
0.8990.8770.815
0.00
Perceived Cost ofUse
PCU1PCU1
0.9180.860
0.8880.849
0.00
Perceived Joviality PJ1PJ2PJ3PJ4
0.8690.8760.9550.940
0.8350.8690.8960.906
0.00
Perceived PEP1 0.873 0.777 0.00
22
EnvironmentalProtection
PEP2PEP3
0.9670.948
0.9510.948
Peer Influence PI1PI2
0.9150.793
0.9080.797
0.00
84.334 0.758Superior Influence SI1SI2SI3
0.9020.7530.854
0.8760.5420.850
0.00
Self-efficacy SE1SE2
0.8940.831
0.9020.858
0.00
85.810 0.839ResourceFacilitatingCondition
RFC1RFC2RFC3
0.9180.7480.899
0.8990.7020.922
0.00
5.5 Correlation AnalysisThrough the previous test of the reliability and validity of the questionnaire data, in order toensure the accuracy of the data samples, we performed correlation analysis on indicators fromdifferent constructs in the proposed research framework.
Pearson's correlation is used to test whether there is a positive or negative correlationbetween variables, and the specific degree of correlation is reflected by the specific valuebetween [-1,1]. The closer the absolute value of the figure is to 1, the stronger the correlationbetween the variables is. If the number is closer to 0, the weaker the correlation betweenvariables is (Pallant, 2010).
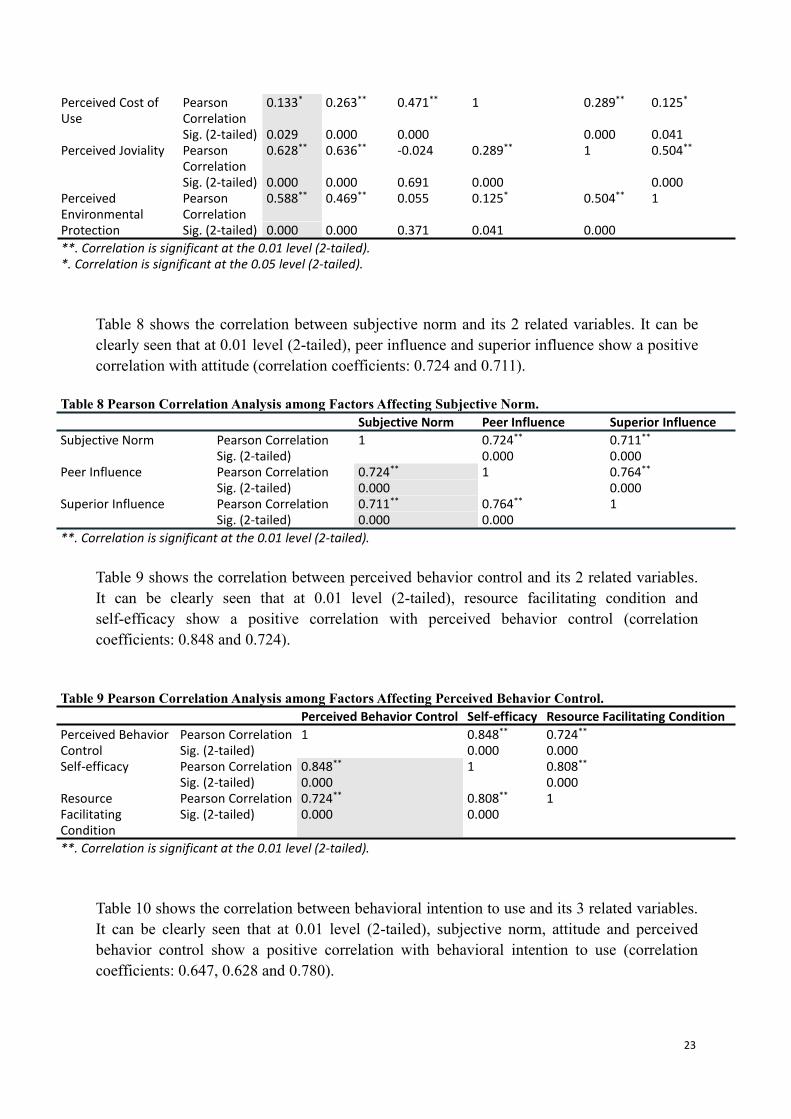
Table 7 shows the correlation between attitude and its 5 related variables. It can be clearlyseen that at 0.05 level (2-tailed), perceived cost of use shows a positive correlation withattitude (correlation coefficient 0.13), and at 0.01 level (2-tailed), perceived usefulness,perceived joviality and perceived environmental protection show a positive correlation withattitude (correlation coefficients: 0.737, 0.628, 0.588 ). However, there is negative correlationbetween perceived risk and attitude in 0.01 level (correlation coefficients: -0.068).
Table 7 Pearson Correlation Analysis among Factors Affecting Attitude.Attitude Perceived
UsefulnessPerceivedRisk
Perceived Cost ofUse
PerceivedJoviality
PerceivedEnvironmental Protection
Attitude PearsonCorrelation
1 0.737** -0.068** 0.133* 0.628** 0.588**
Sig. (2-tailed) 0.000 0.000 0.029 0.000 0.000PerceivedUsefulness
PearsonCorrelation
0.737** 1 0.117 0.263** 0.636** 0.469**
Sig. (2-tailed) 0.000 0.055 0.000 0.000 0.000Perceived Risk Pearson
Correlation-0.068** 0.117 1 0.471** -0.024 0.055
Sig. (2-tailed) 0.000 0.055 0.000 0.691 0.371
23
Table 8 shows the correlation between subjective norm and its 2 related variables. It can beclearly seen that at 0.01 level (2-tailed), peer influence and superior influence show a positivecorrelation with attitude (correlation coefficients: 0.724 and 0.711).
Table 9 shows the correlation between perceived behavior control and its 2 related variables.It can be clearly seen that at 0.01 level (2-tailed), resource facilitating condition andself-efficacy show a positive correlation with perceived behavior control (correlationcoefficients: 0.848 and 0.724).
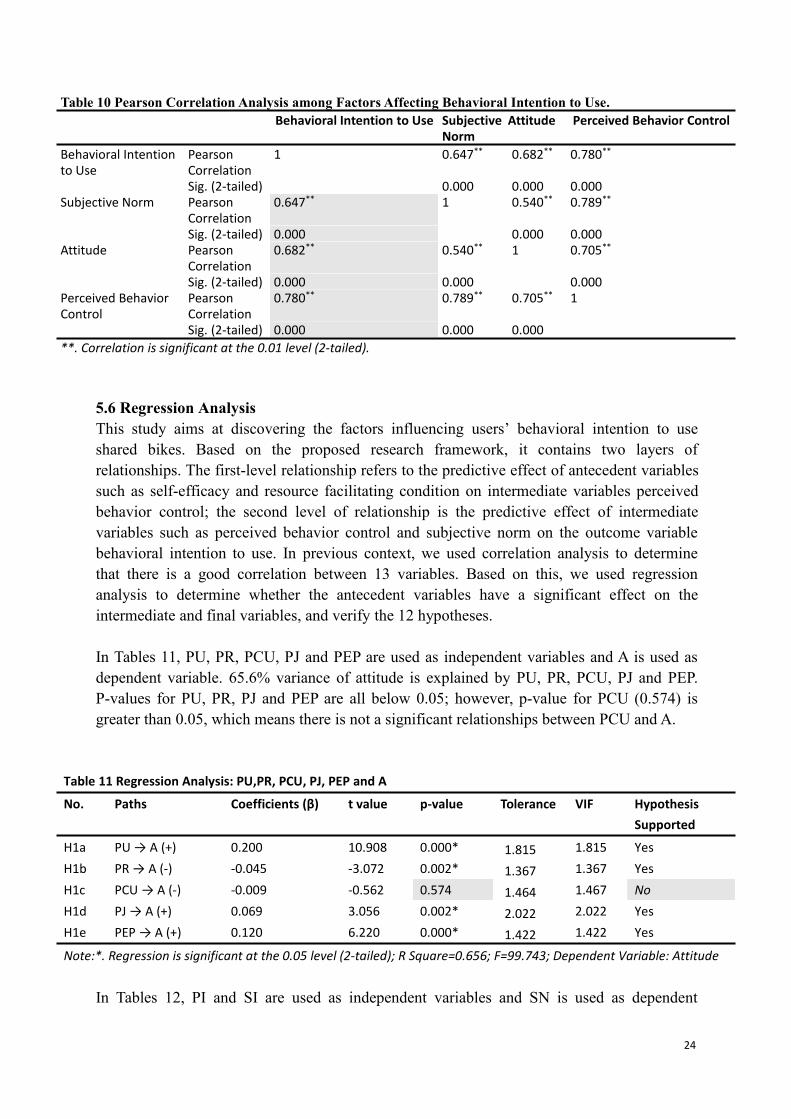
Table 10 shows the correlation between behavioral intention to use and its 3 related variables.It can be clearly seen that at 0.01 level (2-tailed), subjective norm, attitude and perceivedbehavior control show a positive correlation with behavioral intention to use (correlationcoefficients: 0.647, 0.628 and 0.780).
Perceived Cost ofUse
PearsonCorrelation
0.133* 0.263** 0.471** 1 0.289** 0.125*
Sig. (2-tailed) 0.029 0.000 0.000 0.000 0.041Perceived Joviality Pearson
Correlation0.628** 0.636** -0.024 0.289** 1 0.504**
Sig. (2-tailed) 0.000 0.000 0.691 0.000 0.000PerceivedEnvironmentalProtection
PearsonCorrelation
0.588** 0.469** 0.055 0.125* 0.504** 1
Sig. (2-tailed) 0.000 0.000 0.371 0.041 0.000**. Correlation is significant at the 0.01 level (2-tailed).*. Correlation is significant at the 0.05 level (2-tailed).
Table 8 Pearson Correlation Analysis among Factors Affecting Subjective Norm.Subjective Norm Peer Influence Superior Influence
Subjective Norm Pearson Correlation 1 0.724** 0.711**Sig. (2-tailed) 0.000 0.000
Peer Influence Pearson Correlation 0.724** 1 0.764**Sig. (2-tailed) 0.000 0.000
Superior Influence Pearson Correlation 0.711** 0.764** 1Sig. (2-tailed) 0.000 0.000
**. Correlation is significant at the 0.01 level (2-tailed).
Table 9 Pearson Correlation Analysis among Factors Affecting Perceived Behavior Control.Perceived Behavior Control Self-efficacy Resource Facilitating Condition
Perceived BehaviorControl
Pearson Correlation 1 0.848** 0.724**Sig. (2-tailed) 0.000 0.000
Self-efficacy Pearson Correlation 0.848** 1 0.808**Sig. (2-tailed) 0.000 0.000
ResourceFacilitatingCondition
Pearson Correlation 0.724** 0.808** 1Sig. (2-tailed) 0.000 0.000
**. Correlation is significant at the 0.01 level (2-tailed).
24
Table 10 Pearson Correlation Analysis among Factors Affecting Behavioral Intention to Use.Behavioral Intention to Use Subjective
NormAttitude Perceived Behavior Control
Behavioral Intentionto Use
PearsonCorrelation
1 0.647** 0.682** 0.780**
Sig. (2-tailed) 0.000 0.000 0.000Subjective Norm Pearson
Correlation0.647** 1 0.540** 0.789**
Sig. (2-tailed) 0.000 0.000 0.000Attitude Pearson
Correlation0.682** 0.540** 1 0.705**
Sig. (2-tailed) 0.000 0.000 0.000Perceived BehaviorControl
PearsonCorrelation
0.780** 0.789** 0.705** 1
Sig. (2-tailed) 0.000 0.000 0.000**. Correlation is significant at the 0.01 level (2-tailed).
5.6 Regression AnalysisThis study aims at discovering the factors influencing users’ behavioral intention to useshared bikes. Based on the proposed research framework, it contains two layers ofrelationships. The first-level relationship refers to the predictive effect of antecedent variablessuch as self-efficacy and resource facilitating condition on intermediate variables perceivedbehavior control; the second level of relationship is the predictive effect of intermediatevariables such as perceived behavior control and subjective norm on the outcome variablebehavioral intention to use. In previous context, we used correlation analysis to determinethat there is a good correlation between 13 variables. Based on this, we used regressionanalysis to determine whether the antecedent variables have a significant effect on theintermediate and final variables, and verify the 12 hypotheses.
In Tables 11, PU, PR, PCU, PJ and PEP are used as independent variables and A is used asdependent variable. 65.6% variance of attitude is explained by PU, PR, PCU, PJ and PEP.P-values for PU, PR, PJ and PEP are all below 0.05; however, p-value for PCU (0.574) isgreater than 0.05, which means there is not a significant relationships between PCU and A.
Table 11 Regression Analysis: PU,PR, PCU, PJ, PEP and A
No. Paths Coefficients (β) t value p-value Tolerance VIF HypothesisSupported
H1a PU → A (+) 0.200 10.908 0.000* 1.815 1.815 YesH1b PR → A (-) -0.045 -3.072 0.002* 1.367 1.367 YesH1c PCU → A (-) -0.009 -0.562 0.574 1.464 1.467 NoH1d PJ → A (+) 0.069 3.056 0.002* 2.022 2.022 YesH1e PEP → A (+) 0.120 6.220 0.000* 1.422 1.422 Yes
Note:*. Regression is significant at the 0.05 level (2-tailed); R Square=0.656; F=99.743; Dependent Variable: Attitude
In Tables 12, PI and SI are used as independent variables and SN is used as dependent

25
variable. 58.4 % variance of SN is explained by PI and SI. P-values for PI and SI (0.000) arebelow 0.05. Also VIF is 2.398 below 10 which shows no multicollinearity so there is asignificant relationships between PI, SI and SN.
Thus, Subjective Norm = 0.353*Peer Influence + 0.392*Superior Influence + Constant
Table 12 Regression Analysis: PI, SI and SN
No. Paths Coefficients (β) t value p-value Tolerance VIF HypothesisSupported
H2a PI → SN (+) 0.353 7.064 0.000* 0.417 2.398 YesH2b SI → SN (+) 0.392 6.208 0.000* 0.417 2.398 Yes
Note:*. Regression is significant at the 0.05 level (2-tailed); R Square=0.584; F=186.328; Dependent Variable:Subjective Norm
In Tables 13, SE and RFC are used as independent variables and PBC is used as dependentvariable. 72.4 % variance of PBC is explained by SE and RFC. P-values for SE and RFC(0.000 and 0.044) are all below 0.05. Also VIF is 2.883 below 10 which shows nomulticollinearity so there is a significant relationships between SE, RFC and PBC.
Thus, Perceived Behavior Control = 0.717*Self-efficacy + 0.121*Resource FacilitatingCondition + Constant
Table 13 Regression Analysis: SE, RFC and PBC
No. Paths Coefficients (β) t value p-value Tolerance VIF HypothesisSupported
H3a SE → PBC (+) 0.717 13.841 0.000* 0.347 2.883 YesH3b RFC → PBC (+) 0.121 2.028 0.044* 0.347 2.883 Yes
Note:*. Regression is significant at the 0.05 level (2-tailed); R Square=0.724; F=347.449; Dependent Variable:Perceived Behavioral Control
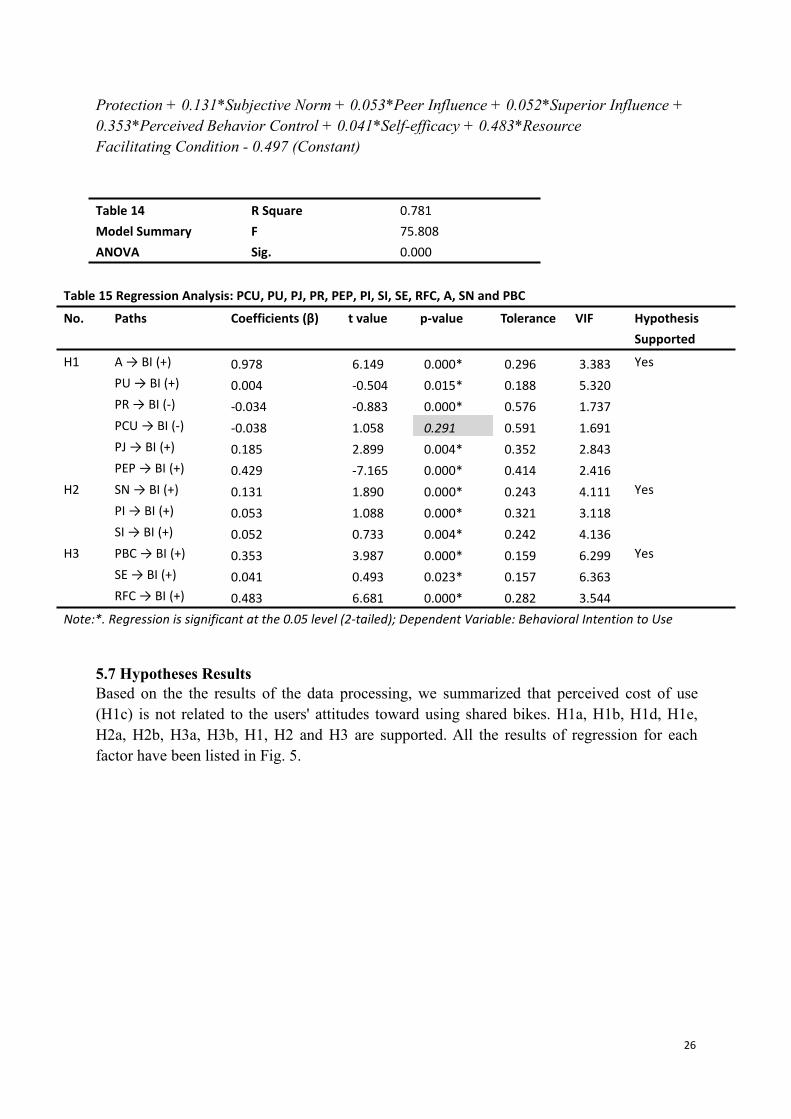
In Table 14 and 15, PCU, PU, PJ, PR, PEP, PI, SI, SE, RFC, A, SN and PBC are used asindependent variables and BI is used as dependent variable. 78.1% variance of BI isexplained by PCU, PU, PJ, PR, PEP, PI, SI, SE, RFC, A, SN and PBC. P-values for allindependent variables except PCU are all below 0.05; however, p-value for PCU (0.291) isgreater than 0.05, which means there is not a significant relationships between perceived costof use and behavioral intention to use. Also, the VIF of all the validated variables are below10.
Thus, Behavioral intention to Use = 0.978*Attitude + 0.004*Perceived Usefulness -0.038*Perceived risk + 0.185*Perceived Joviality + 0.429*Perceived Environmental
26
Protection + 0.131*Subjective Norm + 0.053*Peer Influence + 0.052*Superior Influence +0.353*Perceived Behavior Control + 0.041*Self-efficacy + 0.483*ResourceFacilitating Condition - 0.497 (Constant)
Table 14Model SummaryANOVA
R Square 0.781F 75.808Sig. 0.000
Table 15 Regression Analysis: PCU, PU, PJ, PR, PEP, PI, SI, SE, RFC, A, SN and PBC
No. Paths Coefficients (β) t value p-value Tolerance VIF HypothesisSupported
H1 A → BI (+) 0.978 6.149 0.000* 0.296 3.383 YesPU → BI (+) 0.004 -0.504 0.015* 0.188 5.320PR → BI (-) -0.034 -0.883 0.000* 0.576 1.737PCU → BI (-) -0.038 1.058 0.291 0.591 1.691PJ → BI (+) 0.185 2.899 0.004* 0.352 2.843PEP → BI (+) 0.429 -7.165 0.000* 0.414 2.416
H2 SN → BI (+) 0.131 1.890 0.000* 0.243 4.111 YesPI → BI (+) 0.053 1.088 0.000* 0.321 3.118SI → BI (+) 0.052 0.733 0.004* 0.242 4.136
H3 PBC → BI (+) 0.353 3.987 0.000* 0.159 6.299 YesSE → BI (+) 0.041 0.493 0.023* 0.157 6.363RFC → BI (+) 0.483 6.681 0.000* 0.282 3.544
Note:*. Regression is significant at the 0.05 level (2-tailed); Dependent Variable: Behavioral Intention to Use
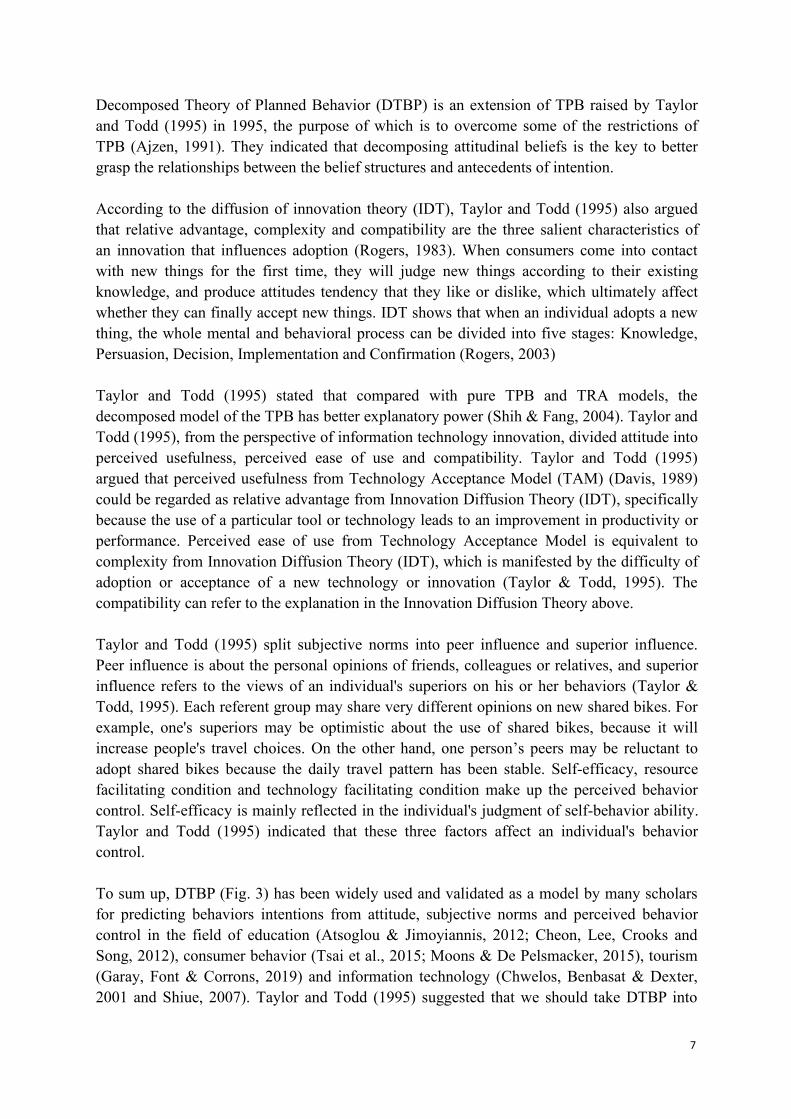
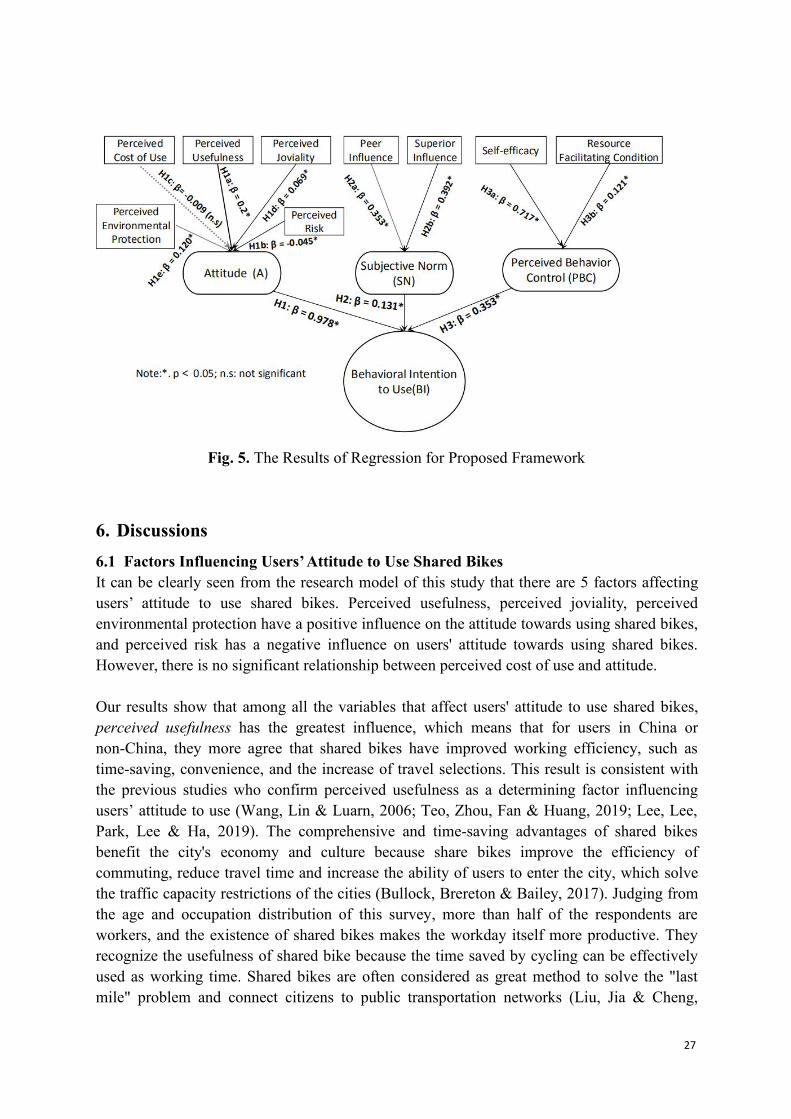
5.7 Hypotheses ResultsBased on the the results of the data processing, we summarized that perceived cost of use(H1c) is not related to the users' attitudes toward using shared bikes. H1a, H1b, H1d, H1e,H2a, H2b, H3a, H3b, H1, H2 and H3 are supported. All the results of regression for eachfactor have been listed in Fig. 5.
27
Fig. 5. The Results of Regression for Proposed Framework
6. Discussions6.1 Factors Influencing Users’Attitude to Use Shared BikesIt can be clearly seen from the research model of this study that there are 5 factors affectingusers’ attitude to use shared bikes. Perceived usefulness, perceived joviality, perceivedenvironmental protection have a positive influence on the attitude towards using shared bikes,and perceived risk has a negative influence on users' attitude towards using shared bikes.However, there is no significant relationship between perceived cost of use and attitude.
Our results show that among all the variables that affect users' attitude to use shared bikes,perceived usefulness has the greatest influence, which means that for users in China ornon-China, they more agree that shared bikes have improved working efficiency, such astime-saving, convenience, and the increase of travel selections. This result is consistent withthe previous studies who confirm perceived usefulness as a determining factor influencingusers’ attitude to use (Wang, Lin & Luarn, 2006; Teo, Zhou, Fan & Huang, 2019; Lee, Lee,Park, Lee & Ha, 2019). The comprehensive and time-saving advantages of shared bikesbenefit the city's economy and culture because share bikes improve the efficiency ofcommuting, reduce travel time and increase the ability of users to enter the city, which solvethe traffic capacity restrictions of the cities (Bullock, Brereton & Bailey, 2017). Judging fromthe age and occupation distribution of this survey, more than half of the respondents areworkers, and the existence of shared bikes makes the workday itself more productive. Theyrecognize the usefulness of shared bike because the time saved by cycling can be effectivelyused as working time. Shared bikes are often considered as great method to solve the "lastmile" problem and connect citizens to public transportation networks (Liu, Jia & Cheng,
28
2012). Therefore, bike sharing systems have frequently been cited as a way to using sharedbikes to go to the subway entrance with dense population and vehicles can also greatly reducethe chance of facing traffic jams. For this occasion, shared bikes are easily favored bycommuters (Bullock, Brereton & Bailey, 2017). Gray (2019) argued that among many otherproblems, too long commuting time may increase individual stress and one possible way toincrease mobility in low-income areas and transfer station deserts is dockless shared bikes.
Perceived environmental protection, as the second most important factor influencing users'attitude to use, has a regression coefficient of 0.12 (p = 0.000 <0.05). Shared bikes as atypical green vehicle, their absolute advantage of environmental protection is also one of theimportant reasons that affects the user's attitude to use. When consumers’ attitudes arepositive and they pay more attention to the environment, they are more likely to try to reducetheir negative impact on the environment (Singh & Gupta, 2013). Lowe, Pinhey and Grimes(1980) argued that higher environmental scores are related to being politically freedom,gender, skin colour, and with higher educational levels. Judging from the educationalbackground of this survey, more than 70% of the respondents have received higher educationdegree. This can explain why these respondents show a very high average scores in terms ofwhether sharing bikes can reduce traffic congestion, improve air quality, and reduce trafficnoise (Mean: 5.56, 5.97 and 5.97). Based on the previous research from Steg and Vlek (2009),Bodur and Sarigöllü (2005), and Poortinga, Spence, Demski and Pidgeon (2012), the resultsshowed that increased sensitivity to environmental issues significantly increases thepossibilities that individuals will implement environmental behaviors. Steg and Vlek (1997)also argued that the stronger the individual's environmental awareness, the easier they are torealize the environmental pollution caused by motor vehicles, thereby reducing the use ofmotor vehicles. To sum up, shared bikes greatly reduce traffic flow, energy consumption andharmful gas emissions, improves public health, and facilitates economic growth (Qiu & He,2018) so if individual has stronger environmental awareness, their good attitudes to useshared bikes are more obvious.
Although the regression coefficient of perceived joviality is only 0.069 (p = 0.002 <0.05), theresults presented by the respondents show the positive attitude towards using shared bikes.The overall experience of using shared bikes is enjoyable, exciting, pleasant and interesting.According to the survey report of current development of bike-sharing in China (iiMediaResearch, 2018), people like to use shared bikes to exercise in urban leisure squares, soperceived joviality has also become a positive factor influencing users' attitudes towardsusing shared bikes. Based on survey of 220 shared bike users, Zhang, Ma and Wang (2017)testified the influence of value and risks perception on shared bikes users’ subjectivewell-being and found that hedonic value has the biggest influence on users’ subjectivewell-being. One possible explanation for this is that when consumers perceived joviality, theytend to have a positive mood such as exciting emotions and this positive mood can create apositive attitude towards using shared bikes. Another very interesting and classic example isthat when Ofo entered the Sheffield market, Douglas Johnson, a Green councillor decided totry to use share bikes. He stated that he missed bikes in his childhood memory, so theappearance of shared bikes today can make up for his regrets. Douglas also believed that
29
using Ofo shared bike is an exciting thing because bike sharing is simple to use and does notcost taxpayers at all (Mcintyre & Kollewe, 2019).
Perceived risk is the only factor among all five variables that negatively affects the attitudetowards using shared bikes (β = -0.045 (0.002 <0.05)). Our results are consistent with somerelated research results on perceived risk and attitude in the past such as perceived risktowards online shopping attitude (Arora & Rahul, 2018). People perceive the risks of usingshared bikes mainly from three aspects: economy, privacy and security. This implies thatwhen users perceive high risk, they will not have a positive attitude towards using sharedbikes. In the Chinese market, when consumers are about to use shared bikes, they arerequired real-name registration, and the correspondence between data and people is inevitable.To restrict personal data from being abused or leaked, relying on corporate consciousness andindustry self-discipline are practical. In addition to privacy risks, many people have alsoexpressed concerns about the financial risks of using shared bikes. The user's doubts aboutthe use of shared bikes are mainly reflected in the deposit. Before renting a bike, the depositis required, and most users won't demand an immediate refund, since the amount paid inadvance allows them to ride unlimited for a small, paltry fee. As a result, large amounts ofmoney have been injected into large amounts of capital, raising a series of questions: howwill these deposits be used? Can these funds be diverted? How to monitor bike-sharingcompanies? (Yan, 2014). Consumers’ concerns about financial risks arising from the use ofshared bikes are particularly reflected in the bankruptcy of Ofo. In China, more than 15million people are waiting for Ofo shared bike company to refund its cash deposits. After thisevent, many consumers will consider the risk of deposits more carefully when using sharedbikes next time. Therefore, consumers' perceived risks have a negative influence on theattitude towards using shared bikes.
Many studies have investigated that price of products or services has always been asignificant influencer of consumers’ attitudes and intentions (Chang & Tseng, 2013; Kim &Kim, 2004; Moon, Chadee & Tikoo, 2008; Yoon, 2002). For example, shared bike projectadjusted the charges because the citizens were dissatisfied with its prices. US officials saidstarting from this week, the bike-sharing plan in New Orleans permanently lowered pricesbecause of complaints that the plan initially charged too high. The blue bike reduced the costof riding from $ 8 per hour or 13 cents per minute to $ 6 per hour or 10 cents per minute(Williams, 2018).
However, some previous findings (Kasilingam, 2020; Luarn & Lin, 2005) are challenged byour results as our results show that Perceived cost of use does not have a significantrelationship with attitude and intention to use shared bikes. This suggests that perceived costof use is not an obstacle for consumers to use shared bikes. Based on our sample profile, wethink that there is one possibility to be explained in that perceived cost of use does not affectconsumers’ attitude and intention to use. Choi, Kim., Kim and Kim (2006) through empiricalresearch on 159 customers who have experienced online shopping, identified the three qualityfactors from three perspective that have large impact on consumers’ loyal and disloyalbehaviors. Loyal behaviors can mediate the relationship between those Internet retail store

30
quality factors and price sensitivity. Based on this fact, we can predict that vast majority ofour surveyed respondents are stubborn and loyal users of shared bikes, so their attitudes andintentions towards shared bike are not affected by the cost per time for cycling or the cost ofmonthly card or the price increase.
6.2 Factors Influencing Users’ Subjective Norm to Use Shared BikesIn the research model, the factors that influence the users’ subjective norms towards usingshared bikes are peer influence and superior influence. Peer influence and superior influencehave similar regression coefficients (0.353 vs 0.392, p = 0.000 < 0.05). Previous studies haveshown that peer influence has an impact on individual’s subjective norm, which ultimatelyaffects the behavior of individuals (Wouters, Larsen, Kremers, Dagnelie & Geenen, 2010;Jaccard, Blanton & Dodge, 2005; Gifford-Smith, 2005; Meyer & Gast, 2008). Our resultsshow that both two variables have a positive influence on users’ subjective norm to useshared bikes.
Chan (2006) conducted a survey focusing on Hong Kong adolescents and the result showsthat if they are not unfamiliar with products, 67% of them would seek advice from their peers.What’s more, Kaplan et al. (2015) argued that in the process of travelling, tourists' use ofpublic bikes in cities is not only influenced by personal factors, but also more influenced bypeers. Thus, the above two points also directly prove our research results that classmates,colleagues and families do have positive influence on uses’ subjective norm to use sharedbikes.
Another factor influencing the subjective norm is superior influence. Our results show thatadvertising and government policies have a significant impact on users’ subjective norm,which lead to influence their intentions to use shared bikes. From the perspective ofgovernment, Detroit Department of Transportation had an initiative allowing Detroit buspassengers to use free shared bikes as part of a pilot program, which can make it easier forthe riders to move around the city and save time. The initiative provided customers whopurchased a period bus ticket from the Detroit Department of Transportation with a 30-daypermit to use the orange MoGo Detroit bikes. The Detroit Department of Transportationspokeswoman stated that they received favorable comments from the public and thedepartment hoped that the shared bikes system could reach people who did not hear about itbefore (Ryan, 2019). From consumer attitudes towards advertising, Tsang, Ho and Liang(2004) concluded that mobile advertising influences consumer subjective norm, whichultimately influences consumer behavior. From this perspective, the results (Tsang, Ho &Liang, 2004) are consistent with the results of our study. Another thing is on the eve of therelease of "Despicable Me 3", bike-sharing company Ofo teamed up with Universal Studiosto launch the customized Ofo bigeye bike. In the areas covered by "Ofo big eye bike", Ofoalso updated the effect of the little yellow man version of the app. The eyes of the littleyellow man on the interface will move up, down, left, and right along with the shaking toattract uses’ attention, which shows that advertising could remind people of using sharedbikes (Russell, 2017).
31
6.3 Factors Influencing Users’ Perceived Behavior Control to Use Shared BikesIn this study, factors influencing users’ perceived behavior control to use shared bikes areself-efficacy and resource facilitating condition and they both have positive influence onusers’ perceived behavior control. The regression coefficients of self-efficacy is 0.717 (p =0.000 <0.05).
In general, self-efficacy is mainly reflected in the basic understanding of mobile applicationsof mobile phones when users use shared bikes. Users need to enter the mobile applicationstore, download the shared bike mobile app, register, scan code to unlock, and pay the money.With the popularity of smart phones (Zonouz, Houmansadr, Berthier, Borisov & Sanders,2013), based on the questions such as "I know the process of using shared bikes very well"and “If I encounter problems while using shared bikes, I know how to communicate with thecustomer service through the app", the surveyed users showed the score of 5.18 and 5.44,which means that the shared bike users show a higher self-efficacy and even without externalassists, users can instinctively apply their knowledge to solve the problems such as charge forthe wrong amount.
The regression coefficient of resource facilitating condition is 0.121 (p = 0.044 <0.05).Compared with self-efficacy, it has less influence on the received behavior control. Resourcefacilitating condition is mainly reflected in the availability of apps and the availability ofshared bikes. In particular, the availability of bikes is generally higher in large cities than insmaller cities, making it more likely that people living in large cities can find a nearby sharedbike when they need a ride.
6.4 Factors Influencing Users’ intentions to Use Shared BikesIn the Decomposed Theory of Planned Behavior (DTPB), Taylor and Todd (1995)demonstrated that attitude, subjective norm and perceived behavior control have a directimpact on behavioral intentions. This study introduces DTPB to users’ intentions to useshared bikes, proposes and verifies relevant assumptions, further illustrating the effectivenessand accuracy of Decomposed Theory of Planned Behavior in explaining and predictingindividual behavior. From the final results of data analysis, attitude has the greatest impact onthe intentions to use, with a regression coefficient of 0.978 (p = 0.000 <0.05), followed byreceived behavior control (β = 0.353 (p = 0.000 <0.05)). Ajzen (1991) also pointed out thatsubjective norm is the weakest factor in intention models by earlier we. From our study,subjective norm has the least influence on intentions to use shared bikes, which is the same asAjzen (1991) (β = 0.131 (p = 0.000 <0.05)).
Judging from the variables of intentions to use, the two measuring items showed 5.09 and4.87, respectively, indicating that the respondents show a higher intention to use shared bikes,and to a certain extent, it also shows the high status of shared bikes in users’ minds. What’smore, previous studies have proved that intentions are positively influenced by perceivedbehavioral control (Chen & Peng, 2012; Chen & Tung, 2014). The two measuring items are5.11 and 5.61, which shows that with the rapid development of mobile phone applications,
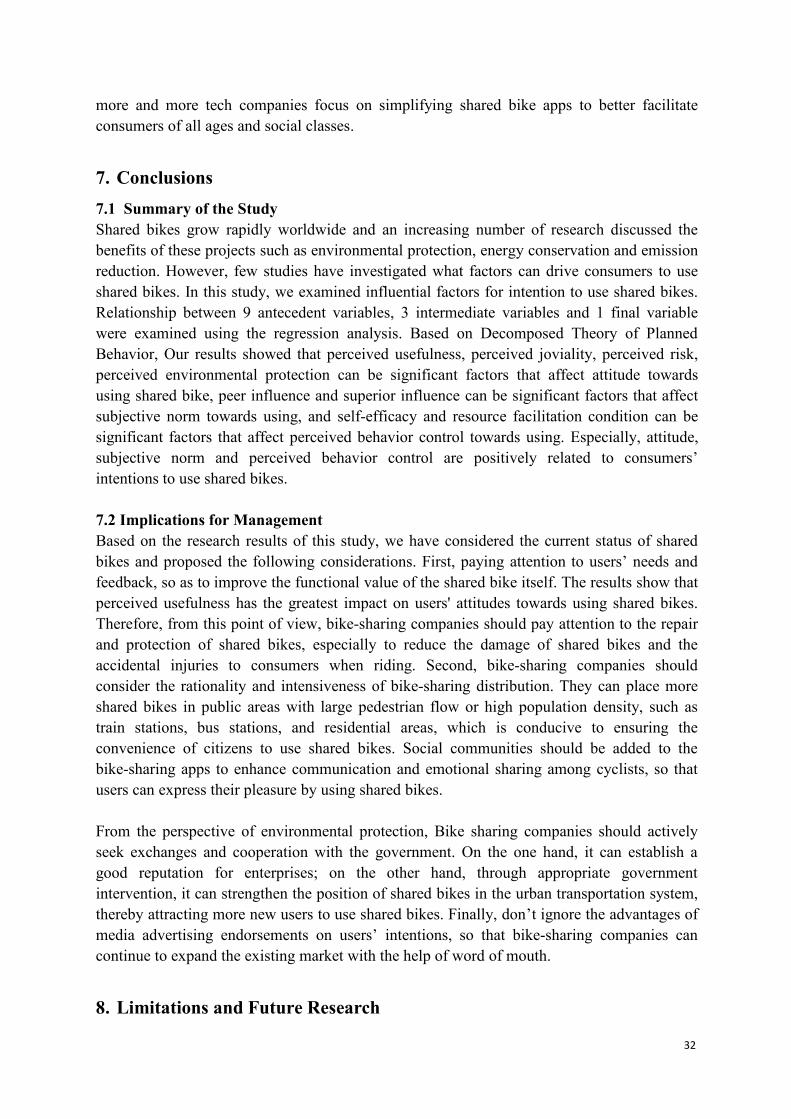
32
more and more tech companies focus on simplifying shared bike apps to better facilitateconsumers of all ages and social classes.
7. Conclusions7.1 Summary of the StudyShared bikes grow rapidly worldwide and an increasing number of research discussed thebenefits of these projects such as environmental protection, energy conservation and emissionreduction. However, few studies have investigated what factors can drive consumers to useshared bikes. In this study, we examined influential factors for intention to use shared bikes.Relationship between 9 antecedent variables, 3 intermediate variables and 1 final variablewere examined using the regression analysis. Based on Decomposed Theory of PlannedBehavior, Our results showed that perceived usefulness, perceived joviality, perceived risk,perceived environmental protection can be significant factors that affect attitude towardsusing shared bike, peer influence and superior influence can be significant factors that affectsubjective norm towards using, and self-efficacy and resource facilitation condition can besignificant factors that affect perceived behavior control towards using. Especially, attitude,subjective norm and perceived behavior control are positively related to consumers’intentions to use shared bikes.
7.2 Implications for ManagementBased on the research results of this study, we have considered the current status of sharedbikes and proposed the following considerations. First, paying attention to users’ needs andfeedback, so as to improve the functional value of the shared bike itself. The results show thatperceived usefulness has the greatest impact on users' attitudes towards using shared bikes.Therefore, from this point of view, bike-sharing companies should pay attention to the repairand protection of shared bikes, especially to reduce the damage of shared bikes and theaccidental injuries to consumers when riding. Second, bike-sharing companies shouldconsider the rationality and intensiveness of bike-sharing distribution. They can place moreshared bikes in public areas with large pedestrian flow or high population density, such astrain stations, bus stations, and residential areas, which is conducive to ensuring theconvenience of citizens to use shared bikes. Social communities should be added to thebike-sharing apps to enhance communication and emotional sharing among cyclists, so thatusers can express their pleasure by using shared bikes.
From the perspective of environmental protection, Bike sharing companies should activelyseek exchanges and cooperation with the government. On the one hand, it can establish agood reputation for enterprises; on the other hand, through appropriate governmentintervention, it can strengthen the position of shared bikes in the urban transportation system,thereby attracting more new users to use shared bikes. Finally, don’t ignore the advantages ofmedia advertising endorsements on users’ intentions, so that bike-sharing companies cancontinue to expand the existing market with the help of word of mouth.
8. Limitations and Future Research
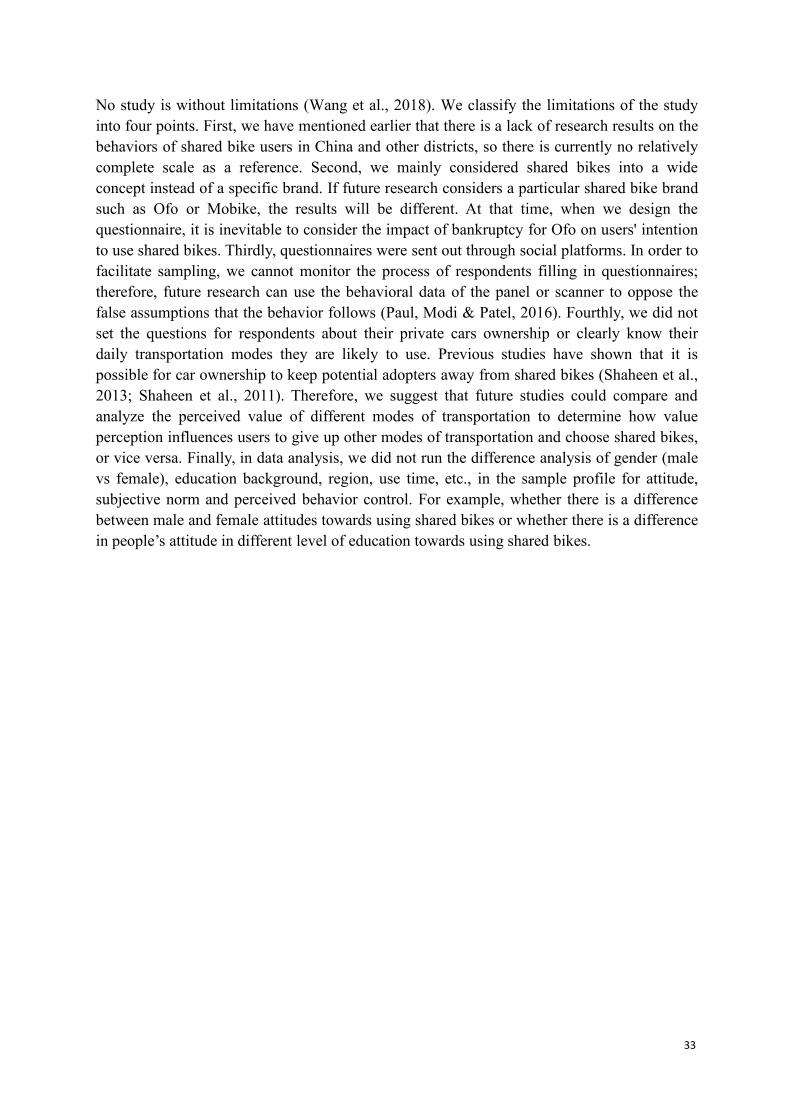
33
No study is without limitations (Wang et al., 2018). We classify the limitations of the studyinto four points. First, we have mentioned earlier that there is a lack of research results on thebehaviors of shared bike users in China and other districts, so there is currently no relativelycomplete scale as a reference. Second, we mainly considered shared bikes into a wideconcept instead of a specific brand. If future research considers a particular shared bike brandsuch as Ofo or Mobike, the results will be different. At that time, when we design thequestionnaire, it is inevitable to consider the impact of bankruptcy for Ofo on users' intentionto use shared bikes. Thirdly, questionnaires were sent out through social platforms. In order tofacilitate sampling, we cannot monitor the process of respondents filling in questionnaires;therefore, future research can use the behavioral data of the panel or scanner to oppose thefalse assumptions that the behavior follows (Paul, Modi & Patel, 2016). Fourthly, we did notset the questions for respondents about their private cars ownership or clearly know theirdaily transportation modes they are likely to use. Previous studies have shown that it ispossible for car ownership to keep potential adopters away from shared bikes (Shaheen et al.,2013; Shaheen et al., 2011). Therefore, we suggest that future studies could compare andanalyze the perceived value of different modes of transportation to determine how valueperception influences users to give up other modes of transportation and choose shared bikes,or vice versa. Finally, in data analysis, we did not run the difference analysis of gender (malevs female), education background, region, use time, etc., in the sample profile for attitude,subjective norm and perceived behavior control. For example, whether there is a differencebetween male and female attitudes towards using shared bikes or whether there is a differencein people’s attitude in different level of education towards using shared bikes.
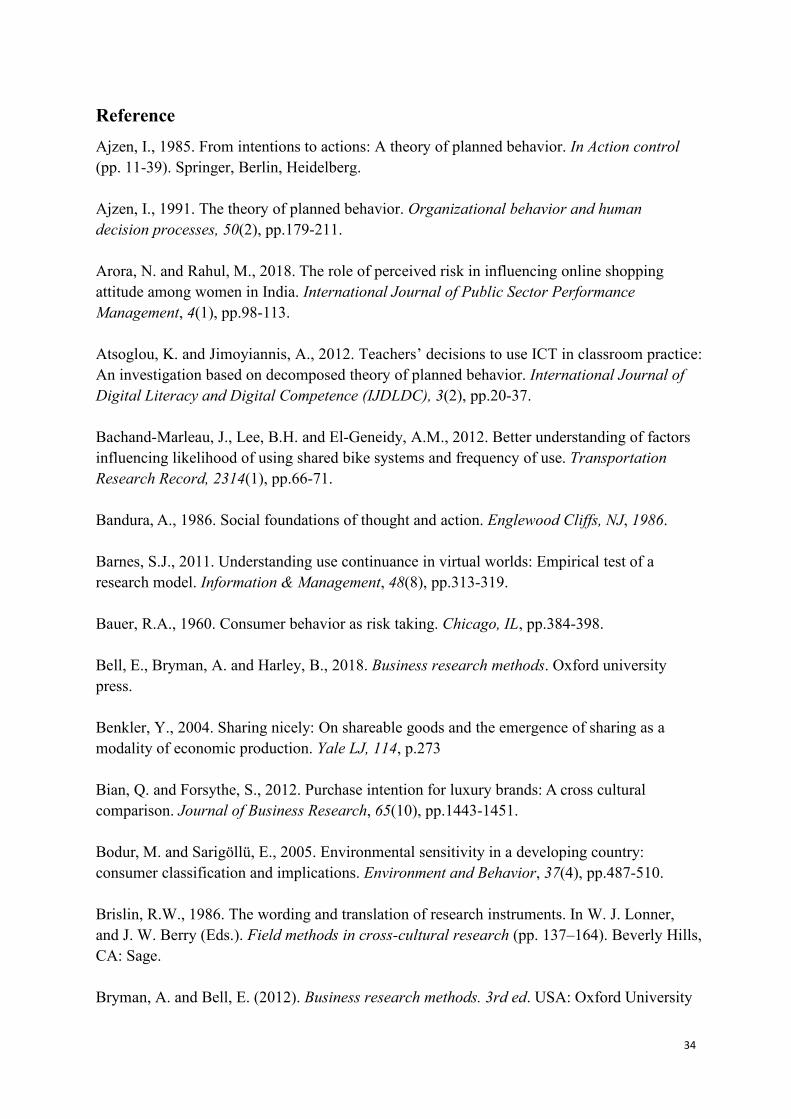
34
ReferenceAjzen, I., 1985. From intentions to actions: A theory of planned behavior. In Action control(pp. 11-39). Springer, Berlin, Heidelberg.
Ajzen, I., 1991. The theory of planned behavior. Organizational behavior and humandecision processes, 50(2), pp.179-211.
Arora, N. and Rahul, M., 2018. The role of perceived risk in influencing online shoppingattitude among women in India. International Journal of Public Sector PerformanceManagement, 4(1), pp.98-113.
Atsoglou, K. and Jimoyiannis, A., 2012. Teachers’ decisions to use ICT in classroom practice:An investigation based on decomposed theory of planned behavior. International Journal ofDigital Literacy and Digital Competence (IJDLDC), 3(2), pp.20-37.
Bachand-Marleau, J., Lee, B.H. and El-Geneidy, A.M., 2012. Better understanding of factorsinfluencing likelihood of using shared bike systems and frequency of use. TransportationResearch Record, 2314(1), pp.66-71.
Bandura, A., 1986. Social foundations of thought and action. Englewood Cliffs, NJ, 1986.
Barnes, S.J., 2011. Understanding use continuance in virtual worlds: Empirical test of aresearch model. Information & Management, 48(8), pp.313-319.
Bauer, R.A., 1960. Consumer behavior as risk taking. Chicago, IL, pp.384-398.
Bell, E., Bryman, A. and Harley, B., 2018. Business research methods. Oxford universitypress.
Benkler, Y., 2004. Sharing nicely: On shareable goods and the emergence of sharing as amodality of economic production. Yale LJ, 114, p.273
Bian, Q. and Forsythe, S., 2012. Purchase intention for luxury brands: A cross culturalcomparison. Journal of Business Research, 65(10), pp.1443-1451.
Bodur, M. and Sarigöllü, E., 2005. Environmental sensitivity in a developing country:consumer classification and implications. Environment and Behavior, 37(4), pp.487-510.
Brislin, R.W., 1986. The wording and translation of research instruments. In W. J. Lonner,and J. W. Berry (Eds.). Field methods in cross-cultural research (pp. 137–164). Beverly Hills,CA: Sage.
Bryman, A. and Bell, E. (2012). Business research methods. 3rd ed. USA: Oxford University
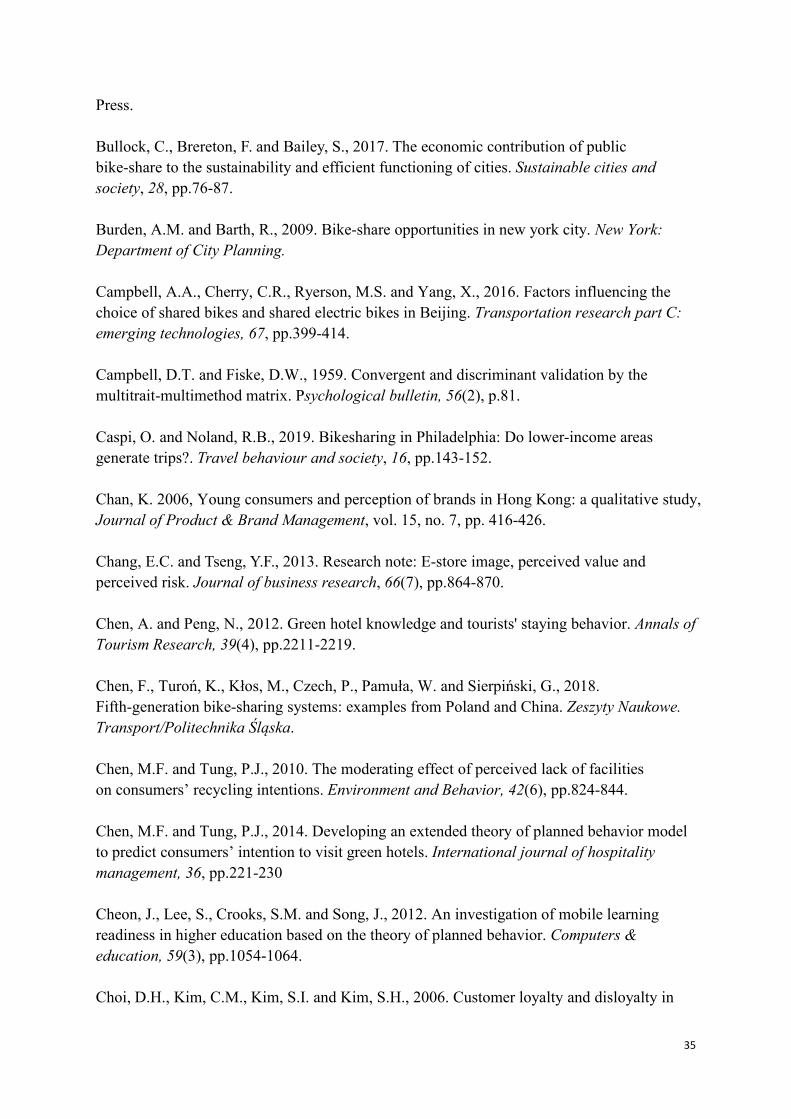
35
Press.
Bullock, C., Brereton, F. and Bailey, S., 2017. The economic contribution of publicbike-share to the sustainability and efficient functioning of cities. Sustainable cities andsociety, 28, pp.76-87.
Burden, A.M. and Barth, R., 2009. Bike-share opportunities in new york city. New York:Department of City Planning.
Campbell, A.A., Cherry, C.R., Ryerson, M.S. and Yang, X., 2016. Factors influencing thechoice of shared bikes and shared electric bikes in Beijing. Transportation research part C:emerging technologies, 67, pp.399-414.
Campbell, D.T. and Fiske, D.W., 1959. Convergent and discriminant validation by themultitrait-multimethod matrix. Psychological bulletin, 56(2), p.81.
Caspi, O. and Noland, R.B., 2019. Bikesharing in Philadelphia: Do lower-income areasgenerate trips?. Travel behaviour and society, 16, pp.143-152.
Chan, K. 2006, Young consumers and perception of brands in Hong Kong: a qualitative study,Journal of Product & Brand Management, vol. 15, no. 7, pp. 416-426.
Chang, E.C. and Tseng, Y.F., 2013. Research note: E-store image, perceived value andperceived risk. Journal of business research, 66(7), pp.864-870.
Chen, A. and Peng, N., 2012. Green hotel knowledge and tourists' staying behavior. Annals ofTourism Research, 39(4), pp.2211-2219.
Chen, F., Turoń, K., Kłos, M., Czech, P., Pamuła, W. and Sierpiński, G., 2018.Fifth-generation bike-sharing systems: examples from Poland and China. Zeszyty Naukowe.Transport/Politechnika Śląska.
Chen, M.F. and Tung, P.J., 2010. The moderating effect of perceived lack of facilitieson consumers’ recycling intentions. Environment and Behavior, 42(6), pp.824-844.
Chen, M.F. and Tung, P.J., 2014. Developing an extended theory of planned behavior modelto predict consumers’ intention to visit green hotels. International journal of hospitalitymanagement, 36, pp.221-230
Cheon, J., Lee, S., Crooks, S.M. and Song, J., 2012. An investigation of mobile learningreadiness in higher education based on the theory of planned behavior. Computers &education, 59(3), pp.1054-1064.
Choi, D.H., Kim, C.M., Kim, S.I. and Kim, S.H., 2006. Customer loyalty and disloyalty in
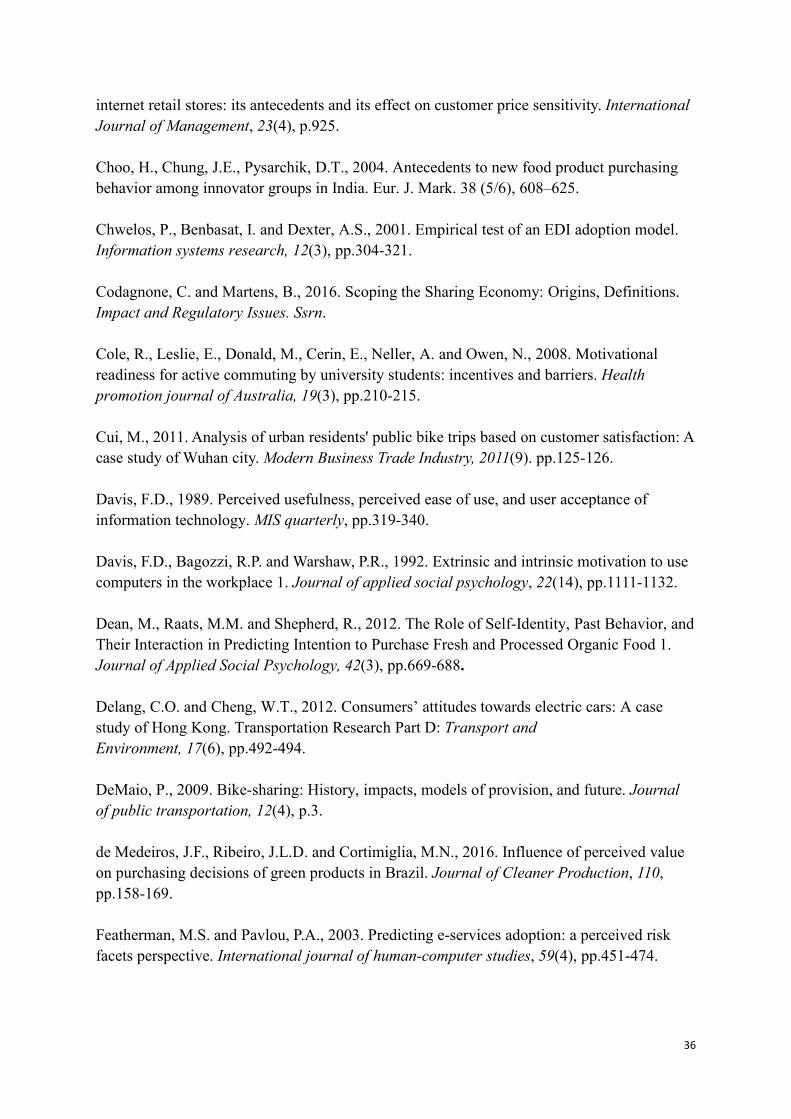
36
internet retail stores: its antecedents and its effect on customer price sensitivity. InternationalJournal of Management, 23(4), p.925.
Choo, H., Chung, J.E., Pysarchik, D.T., 2004. Antecedents to new food product purchasingbehavior among innovator groups in India. Eur. J. Mark. 38 (5/6), 608–625.
Chwelos, P., Benbasat, I. and Dexter, A.S., 2001. Empirical test of an EDI adoption model.Information systems research, 12(3), pp.304-321.
Codagnone, C. and Martens, B., 2016. Scoping the Sharing Economy: Origins, Definitions.Impact and Regulatory Issues. Ssrn.
Cole, R., Leslie, E., Donald, M., Cerin, E., Neller, A. and Owen, N., 2008. Motivationalreadiness for active commuting by university students: incentives and barriers. Healthpromotion journal of Australia, 19(3), pp.210-215.
Cui, M., 2011. Analysis of urban residents' public bike trips based on customer satisfaction: Acase study of Wuhan city.Modern Business Trade Industry, 2011(9). pp.125-126.
Davis, F.D., 1989. Perceived usefulness, perceived ease of use, and user acceptance ofinformation technology. MIS quarterly, pp.319-340.
Davis, F.D., Bagozzi, R.P. and Warshaw, P.R., 1992. Extrinsic and intrinsic motivation to usecomputers in the workplace 1. Journal of applied social psychology, 22(14), pp.1111-1132.
Dean, M., Raats, M.M. and Shepherd, R., 2012. The Role of Self‐Identity, Past Behavior, andTheir Interaction in Predicting Intention to Purchase Fresh and Processed Organic Food 1.Journal of Applied Social Psychology, 42(3), pp.669-688.
Delang, C.O. and Cheng, W.T., 2012. Consumers’ attitudes towards electric cars: A casestudy of Hong Kong. Transportation Research Part D: Transport andEnvironment, 17(6), pp.492-494.
DeMaio, P., 2009. Bike-sharing: History, impacts, models of provision, and future. Journalof public transportation, 12(4), p.3.
de Medeiros, J.F., Ribeiro, J.L.D. and Cortimiglia, M.N., 2016. Influence of perceived valueon purchasing decisions of green products in Brazil. Journal of Cleaner Production, 110,pp.158-169.
Featherman, M.S. and Pavlou, P.A., 2003. Predicting e-services adoption: a perceived riskfacets perspective. International journal of human-computer studies, 59(4), pp.451-474.
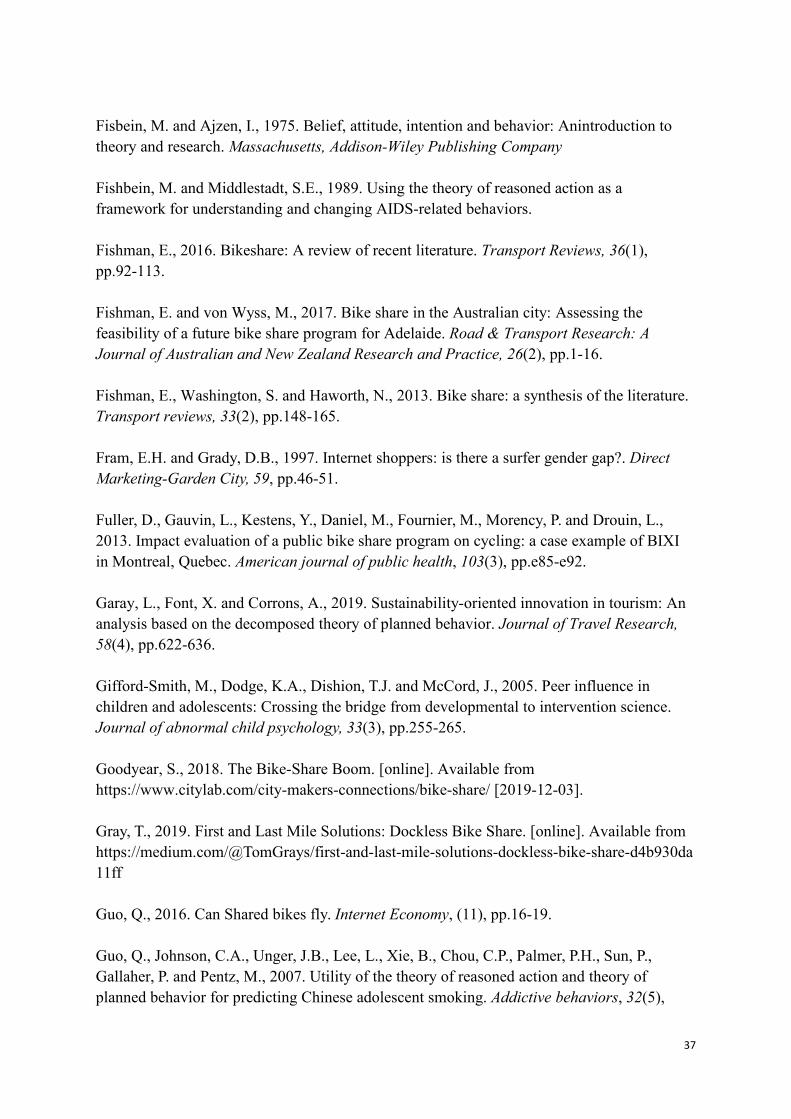
37
Fisbein, M. and Ajzen, I., 1975. Belief, attitude, intention and behavior: Anintroduction totheory and research. Massachusetts, Addison-Wiley Publishing Company
Fishbein, M. and Middlestadt, S.E., 1989. Using the theory of reasoned action as aframework for understanding and changing AIDS-related behaviors.
Fishman, E., 2016. Bikeshare: A review of recent literature. Transport Reviews, 36(1),pp.92-113.
Fishman, E. and von Wyss, M., 2017. Bike share in the Australian city: Assessing thefeasibility of a future bike share program for Adelaide. Road & Transport Research: AJournal of Australian and New Zealand Research and Practice, 26(2), pp.1-16.
Fishman, E., Washington, S. and Haworth, N., 2013. Bike share: a synthesis of the literature.Transport reviews, 33(2), pp.148-165.
Fram, E.H. and Grady, D.B., 1997. Internet shoppers: is there a surfer gender gap?. DirectMarketing-Garden City, 59, pp.46-51.
Fuller, D., Gauvin, L., Kestens, Y., Daniel, M., Fournier, M., Morency, P. and Drouin, L.,2013. Impact evaluation of a public bike share program on cycling: a case example of BIXIin Montreal, Quebec. American journal of public health, 103(3), pp.e85-e92.
Garay, L., Font, X. and Corrons, A., 2019. Sustainability-oriented innovation in tourism: Ananalysis based on the decomposed theory of planned behavior. Journal of Travel Research,58(4), pp.622-636.
Gifford-Smith, M., Dodge, K.A., Dishion, T.J. and McCord, J., 2005. Peer influence inchildren and adolescents: Crossing the bridge from developmental to intervention science.Journal of abnormal child psychology, 33(3), pp.255-265.
Goodyear, S., 2018. The Bike-Share Boom. [online]. Available fromhttps://www.citylab.com/city-makers-connections/bike-share/ [2019-12-03].
Gray, T., 2019. First and Last Mile Solutions: Dockless Bike Share. [online]. Available fromhttps://medium.com/@TomGrays/first-and-last-mile-solutions-dockless-bike-share-d4b930da11ff
Guo, Q., 2016. Can Shared bikes fly. Internet Economy, (11), pp.16-19.
Guo, Q., Johnson, C.A., Unger, J.B., Lee, L., Xie, B., Chou, C.P., Palmer, P.H., Sun, P.,Gallaher, P. and Pentz, M., 2007. Utility of the theory of reasoned action and theory ofplanned behavior for predicting Chinese adolescent smoking. Addictive behaviors, 32(5),
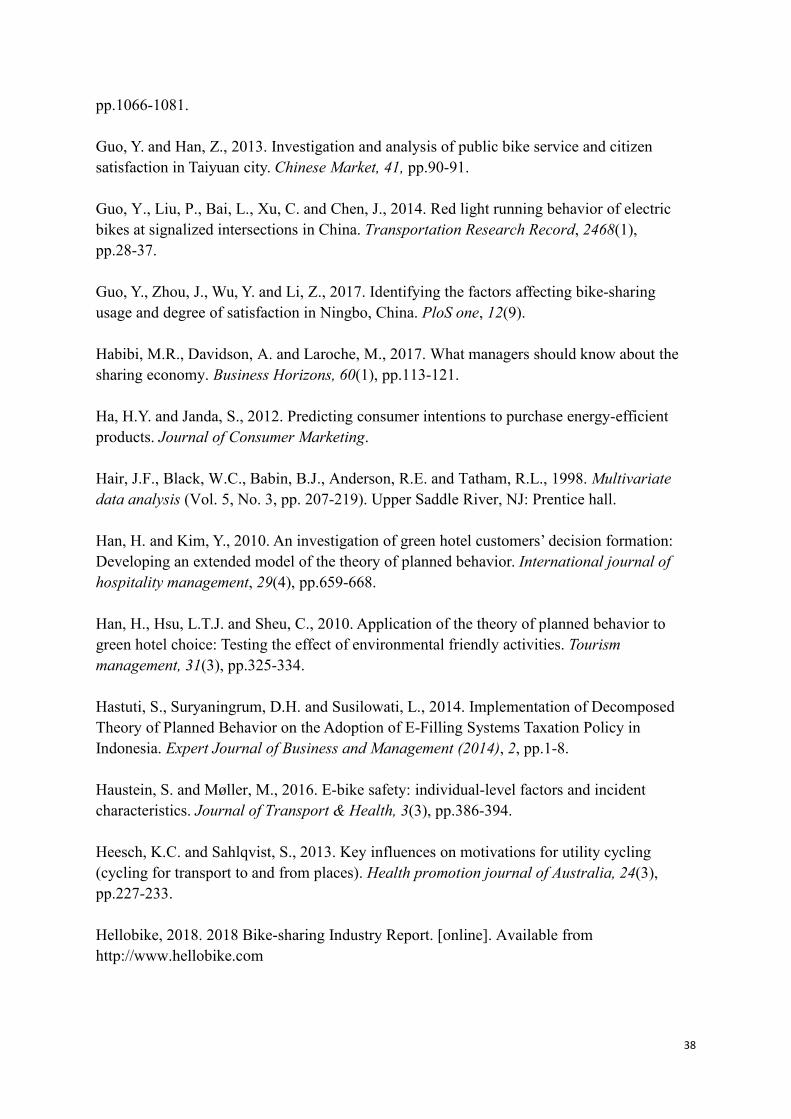
38
pp.1066-1081.
Guo, Y. and Han, Z., 2013. Investigation and analysis of public bike service and citizensatisfaction in Taiyuan city. Chinese Market, 41, pp.90-91.
Guo, Y., Liu, P., Bai, L., Xu, C. and Chen, J., 2014. Red light running behavior of electricbikes at signalized intersections in China. Transportation Research Record, 2468(1),pp.28-37.
Guo, Y., Zhou, J., Wu, Y. and Li, Z., 2017. Identifying the factors affecting bike-sharingusage and degree of satisfaction in Ningbo, China. PloS one, 12(9).
Habibi, M.R., Davidson, A. and Laroche, M., 2017. What managers should know about thesharing economy. Business Horizons, 60(1), pp.113-121.
Ha, H.Y. and Janda, S., 2012. Predicting consumer intentions to purchase energy‐efficientproducts. Journal of Consumer Marketing.
Hair, J.F., Black, W.C., Babin, B.J., Anderson, R.E. and Tatham, R.L., 1998. Multivariatedata analysis (Vol. 5, No. 3, pp. 207-219). Upper Saddle River, NJ: Prentice hall.
Han, H. and Kim, Y., 2010. An investigation of green hotel customers’ decision formation:Developing an extended model of the theory of planned behavior. International journal ofhospitality management, 29(4), pp.659-668.
Han, H., Hsu, L.T.J. and Sheu, C., 2010. Application of the theory of planned behavior togreen hotel choice: Testing the effect of environmental friendly activities. Tourismmanagement, 31(3), pp.325-334.
Hastuti, S., Suryaningrum, D.H. and Susilowati, L., 2014. Implementation of DecomposedTheory of Planned Behavior on the Adoption of E-Filling Systems Taxation Policy inIndonesia. Expert Journal of Business and Management (2014), 2, pp.1-8.
Haustein, S. and Møller, M., 2016. E-bike safety: individual-level factors and incidentcharacteristics. Journal of Transport & Health, 3(3), pp.386-394.
Heesch, K.C. and Sahlqvist, S., 2013. Key influences on motivations for utility cycling(cycling for transport to and from places). Health promotion journal of Australia, 24(3),pp.227-233.
Hellobike, 2018. 2018 Bike-sharing Industry Report. [online]. Available fromhttp://www.hellobike.com
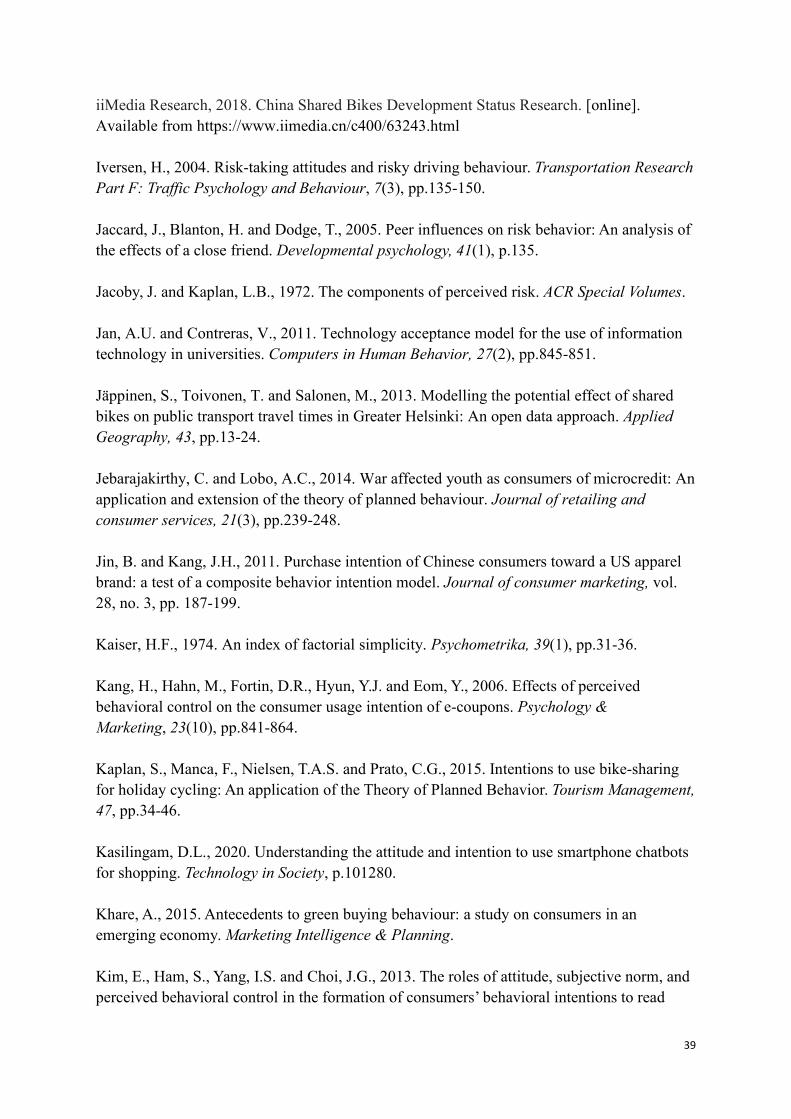
39
iiMedia Research, 2018. China Shared Bikes Development Status Research. [online].Available from https://www.iimedia.cn/c400/63243.html
Iversen, H., 2004. Risk-taking attitudes and risky driving behaviour. Transportation ResearchPart F: Traffic Psychology and Behaviour, 7(3), pp.135-150.
Jaccard, J., Blanton, H. and Dodge, T., 2005. Peer influences on risk behavior: An analysis ofthe effects of a close friend. Developmental psychology, 41(1), p.135.
Jacoby, J. and Kaplan, L.B., 1972. The components of perceived risk. ACR Special Volumes.
Jan, A.U. and Contreras, V., 2011. Technology acceptance model for the use of informationtechnology in universities. Computers in Human Behavior, 27(2), pp.845-851.
Jäppinen, S., Toivonen, T. and Salonen, M., 2013. Modelling the potential effect of sharedbikes on public transport travel times in Greater Helsinki: An open data approach. AppliedGeography, 43, pp.13-24.
Jebarajakirthy, C. and Lobo, A.C., 2014. War affected youth as consumers of microcredit: Anapplication and extension of the theory of planned behaviour. Journal of retailing andconsumer services, 21(3), pp.239-248.
Jin, B. and Kang, J.H., 2011. Purchase intention of Chinese consumers toward a US apparelbrand: a test of a composite behavior intention model. Journal of consumer marketing, vol.28, no. 3, pp. 187-199.
Kaiser, H.F., 1974. An index of factorial simplicity. Psychometrika, 39(1), pp.31-36.
Kang, H., Hahn, M., Fortin, D.R., Hyun, Y.J. and Eom, Y., 2006. Effects of perceivedbehavioral control on the consumer usage intention of e‐coupons. Psychology &Marketing, 23(10), pp.841-864.
Kaplan, S., Manca, F., Nielsen, T.A.S. and Prato, C.G., 2015. Intentions to use bike-sharingfor holiday cycling: An application of the Theory of Planned Behavior. Tourism Management,47, pp.34-46.
Kasilingam, D.L., 2020. Understanding the attitude and intention to use smartphone chatbotsfor shopping. Technology in Society, p.101280.
Khare, A., 2015. Antecedents to green buying behaviour: a study on consumers in anemerging economy.Marketing Intelligence & Planning.
Kim, E., Ham, S., Yang, I.S. and Choi, J.G., 2013. The roles of attitude, subjective norm, andperceived behavioral control in the formation of consumers’ behavioral intentions to read
40
menu labels in the restaurant industry. International Journal of Hospitality Management, 35,pp.203-213.
Kim, H.Y. and Chung, J.E., 2011. Consumer purchase intention for organic personal careproducts. Journal of consumer Marketing, vol. 28, no. 1, pp. 40-47.
Kim, E.Y. and Kim, Y.K., 2004. Predicting online purchase intentions for clothingproducts. European journal of Marketing.
Kippax, S. and Crawford, J., 1993. Flaws in the theory of reasoned action. The theoryof reasoned action: Its application to AIDS-preventive behavior, pp.253-269.
Klöckner, C.A. and Blöbaum, A., 2010. A comprehensive action determination model:Toward a broader understanding of ecological behaviour using the example of travel modechoice. Journal of Environmental Psychology, 30(4), pp.574-586.
Kolsaker, A. and Payne, C., 2002. Engendering trust in e‐commerce: a study of gender‐basedconcerns. Marketing intelligence & planning.
Kotchen, M.J. and Reiling, S.D., 2000. Environmental attitudes, motivations, and contingentvaluation of nonuse values: a case study involving endangered species. Ecological Economics,32(1),
Lam, T., Hsu, C.H.C., 2004. Theory of planned behavior: potential travelers from China. J.Hosp. Tour. Res. 28 (4), 463–482.
Lee, D., Park, J. and Ahn, J.H., 2001. On the explanation of factors affecting e-commerceadoption. ICIS 2001 Proceedings, p.14.
Lee, J., Lee, D., Park, Y., Lee, S. and Ha, T., 2019. Autonomous vehicles can be shared, but afeeling of ownership is important: Examination of the influential factors for intention to useautonomous vehicles. Transportation Research Part C: Emerging Technologies, 107,pp.411-422.
Leng, B., 2017. PEST model analysis of the bike-sharing industry.Modern Marketing, (4),p.120.
Leonard, M., Graham, S. and Bonacum, D., 2004. The human factor: the critical importanceof effective teamwork and communication in providing safe care. BMJ Quality &Safety, 13(suppl 1), pp.i85-i90.
Lichtman, M., 2012. Qualitative research in education: A user's guide. Sage publications.
41
Li, K., 2017. Study on the development countermeasures of urban shared bikes from theperspective of sharing economy. City, 3, pp.66-69.
Liu, Y. and Yang, Y., 2018. Empirical examination of users’ adoption of the sharingeconomy in china using an expanded technology acceptance model. Sustainability,10(4), p.1262.
Liu, Z., Jia, X. and Cheng, W., 2012. Solving the last mile problem: Ensure the success ofpublic bicycle system in Beijing. Procedia-Social and Behavioral Sciences, 43, pp.73-78.
Lowe, G.D., Pinhey, T.K. and Grimes, M.D., 1980. Public support for environmentalprotection: New evidence from national surveys. Pacific Sociological Review, 23(4),pp.423-445.
Luarn, P. and Lin, H.H., 2005. Toward an understanding of the behavioral intention to usemobile banking. Computers in human behavior, 21(6), pp.873-891.
Madden, T.J., Ellen, P.S. and Ajzen, I., 1992. A comparison of the theory of planned behaviorand the theory of reasoned action. Personality and social psychology Bulletin, 18(1), pp.3-9.
Ma, T., Liu, C. and Erdoğan, S., 2015. bike sharing and public transit: does Capital Bikeshareaffect Metrorail ridership in Washington, DC?. Transportation research record, 2534(1),pp.1-9.
Mátrai, T. and Tóth, J., 2016. Comparative assessment of public bike sharing systems.Transportation research procedia, 14, pp.2344-2351.
McIntyre, N. and Kollewe, J., 2019. Life cycle: Is it the end for Britain’s dockless bikeschemes. The Guardian. [online]. Available fromhttps://www.theguardian.com/cities/2019/feb/22/life-cycle-is-it-the-end-for-britains-dockless-bike-schemes
Meyer, T.A. and Gast, J., 2008. The effects of peer influence on disordered eatingbehavior. The Journal of School Nursing, 24(1), pp.36-42.
Midgley, P., 2011. bike-sharing schemes: enhancing sustainable mobility in urban areas.United Nations, Department of Economic and Social Affairs, 8, pp.1-12.
Minton, A.P. and Rose, R.L., 1997. The effects of environmental concern on environmentallyfriendly consumer behavior: An exploratory study. Journal of Business research, 40(1),pp.37-48.
Moon, J., Chadee, D. and Tikoo, S., 2008. Culture, product type, and price influences onconsumer purchase intention to buy personalized products online. Journal of business
42
research, 61(1), pp.31-39.
Moons, I. and De Pelsmacker, P., 2015. An extended decomposed theory of plannedbehaviour to predict the usage intention of the electric car: A multi-group comparison.Sustainability, 7(5), pp.6212-6245.
Moser, A.K., 2015. Thinking green, buying green? Drivers of pro-environmental purchasingbehavior. Journal of Consumer Marketing.
Nacto, 2016. Bike Share in the US: 2010-2016. Available fromhttps://nacto.org/bike-share-statistics-2016/
Nunnally, J. C., 1978. Psychometric theory (2nd ed.). New York: McGraw-Hill.
Nyshadham, E.A., 2000. Privacy policies of air travel web sites: a survey andanalysis. Journal of Air Transport Management, 6(3), pp.143-152.
Nysveen, H., Pedersen, P.E. and Thorbjørnsen, H., 2005. Explaining intention to use mobilechat services: moderating effects of gender. Journal of consumer Marketing, vol. 22, no. 5, pp.247-256.
Oreg, S. and Katz-Gerro, T., 2006. Predicting proenvironmental behaviorcross-nationally: Values, the theory of planned behavior, and value-belief-normtheory. Environment and behavior, 38(4), pp.462-483.
Oppermann, M., 1995. Travel life cycle. Annals of tourism research, 22(3), pp.535-552.
Oxford English Dictionary. In McArthur, T., Lam-McArthur, J., & Fontaine, L. (Eds.), 2018.The Oxford Companion to the English Language. : Oxford University Press.
Pallant, J., 2010. SPSS survival manual: a step by step guide to data analysis using SPSS.
Pallant, J., 2013. SPSS survival manual. McGraw-Hill Education (UK)
Pan, H., 2010. China green transport strategy solution the fundamental measures againsturban congestion. Modern Urban Research, pp.6-10.
Park, H.S., 2000. Relationships among attitudes and subjective norms: Testing the theory ofreasoned action across cultures. Communication Studies, 51(2), pp.162-175.
Paul, J., Modi, A. and Patel, J., 2016. Predicting green product consumption using theory ofplanned behavior and reasoned action. Journal of retailing and consumer services, 29,pp.123-134.
43
Peter, J.P. and Tarpey Sr, L.X., 1975. A comparative analysis of three consumer decisionstrategies. Journal of consumer research, 2(1), pp.29-37.
Poortinga, W., Spence, A., Demski, C. and Pidgeon, N.F., 2012. Individual-motivationalfactors in the acceptability of demand-side and supply-side measures to reduce carbonemissions. Energy Policy, 48, pp.812-819.
Qian, J., Wang, D. and Niu, Y., 2014. Analysis of the influencing factors of urban residents touse urban public bikes: A case study of Suzhou. Journal of Geophysical Research, 33(2),pp.358-371.
Qiu, L.Y. and He, L.Y., 2018. Bike sharing and the economy, the environment, andhealth-related externalities. Sustainability, 10(4), p.1145.
Quine, L. and Rubin, R., 1997. Attitude, subjective norm and perceived behavioural controlas predictors of women's intentions to take hormone replacement therapy. British Journal ofHealth Psychology, 2(3), pp.199-216.
Ozaki, R. and Sevastyanova, K., 2011. Going hybrid: An analysis of consumer purchasemotivations. Energy policy, 39(5), pp.2217-2227.
Reportlinker, 2017. China bike Sharing Industry Report, 2017-2021. [online]. Available fromhttps://www.reportlinker.com/p04838481/China-bike-Sharing-Industry-Report.html
Rogers, E.M. 1983, Diffusion of innovations, 3.th edn, Free Press, New York.
Rogers, E.M. 2003, Diffusion of innovations, 5.th edn, Free press, New York.
Russell, J., 2017. China’s on-demand bikes have now become advertising space. [online].Available fromhttps://techcrunch.com/2017/06/30/chinas-on-demand-bikes-have-now-become-advertising-space/
Ryan, N., 2019. DDOT pass buyers can use shared bikes for free The Detroit News. [online].Available fromhttps://eu.detroitnews.com/story/news/local/detroit-city/2018/07/02/ddot-pass-buyers-can-used-shared-bikes-free/752685002/
Sadaf, A., Newby, T.J. and Ertmer, P.A., 2012. Exploring pre-service teachers' beliefs aboutusing Web 2.0 technologies in K-12 classroom. Computers & Education, 59(3), pp.937-945.
Salkind, N.J. ed., 2010. Encyclopedia of research design (Vol. 1). Sage.
44
Saunders, M., Lewis, P. and Thornhill, A., 2012. Research Methods for Business Students.6th ed. Pearson Education Limited.
Saunders, M., Lewis, P. and Thornhill, A., 2016. Research Methods for Business Students 7thedition. Pearson Education Limited.
Scott, M., 1967. The Major dimensions of perceived Risk, Risk taking and informationhandling in Consumer Behavior, DF Coxed, Boston. Harvard. University press, pp.82-108.
Shaheen, S.A., Cohen, A.P. and Martin, E.W., 2013. Public bikesharing in North America:early operator understanding and emerging trends. Transportation research record, 2387(1),pp.83-92.
Shaheen, S.A., Guzman, S. and Zhang, H., 2010. Bikesharing in Europe, the Americas, andAsia: past, present, and future. Transportation Research Record, 2143(1), pp.159-167.
Shaheen, S.A., Zhang, H., Martin, E. and Guzman, S., 2011. China's Hangzhou public bike:understanding early adoption and behavioral response to bikesharing. TransportationResearch Record, 2247(1), pp.33-41.
Shih, Y.Y. and Fang, K., 2004. The use of a decomposed theory of planned behavior to studyInternet banking in Taiwan. Internet research. vol. 14, no. 3, pp. 213-223.
Shiue, Y.M., 2007. Investigating the sources of teachers' instructional technology use throughthe decomposed theory of planned behavior. Journal of Educational ComputingResearch, 36(4), pp.425-453.
Singh, N. and Gupta, K., 2013. Environmental attitude and ecological behaviour of Indianconsumers. Social Responsibility Journal.
Sommer, L., 2011. The theory of planned behaviour and the impact of past behaviour:International Business & Economics Research Journal (IBER), 10(1).
Staats, H., 2003. Understanding proenvironmental attitudes and behavior: An analysis andreview of research based on the theory of planned behavior. na.
Steg, L. and Vlek, C., 1997. The role of problem awareness in willingness-to-change car useand in evaluating relevant policy measures. Traffic and transport psychology. Theory andapplication.
Steg, L. and Vlek, C., 2009. Encouraging pro-environmental behaviour: An integrativereview and research agenda. Journal of environmental psychology, 29(3), pp.309-317.

45
Taylor, S. and Todd, P.A., 1995. Understanding information technology usage: A test ofcompeting models. Information systems research, 6(2), pp.144-176.
Teo, T., Zhou, M., Fan, A.C.W. and Huang, F., 2019. Factors that influence universitystudents’ intention to use Moodle: A study in Macau. Educational Technology Research andDevelopment, 67(3), pp.749-766.
Tsai, H.H., Cheng, M.J., Hung, S.W., He, D.S. and Wang, W.S., 2015, August. A study oforganic food consumption behavior using the decomposed theory of planned behavior. In2015 Portland International Conference on Management of Engineeringand Technology (PICMET) (pp. 2509-2515). IEEE.
Tsang, M.M., Ho, S.C. and Liang, T.P., 2004. Consumer attitudes toward mobile advertising:An empirical study. International journal of electronic commerce, 8(3), pp.65-78.
Tsarenko, Y., Ferraro, C., Sands, S. and McLeod, C., 2013. Environmentally consciousconsumption: The role of retailers and peers as external influences. Journal of Retailing andConsumer Services, 20(3), pp.302-310.
Venkatesh, V., 1999. Creating favorable user perceptions: exploring the role of intrinsicmotivation, and emotion into the technology acceptance model. Information SystemsResearch, 11(4), pp.342-365.
Venkatesh, V., Morris, M.G. and Ackerman, P.L., 2000. A longitudinal field investigation ofgender differences in individual technology adoption decision-makingprocesses. Organizational behavior and human decision processes, 83(1), pp.33-60.
Upadhyay, P. and Jahanyan, S., 2016. Analyzing user perspective on the factors affecting useintention of mobile based transfer payment. Internet Research, vol. 26, no. 1, pp. 38-56.
Wagner, I., 2019. Number of bikes in bikesharing programs in the United States from 2010 to2017. [online]. Available fromhttps://www.statista.com/statistics/912746/number-of-bike-sharing-programs-in-the-united-states/
Wang, K., Akar, G. and Chen, Y.J., 2018. Bike sharing differences among millennials, GenXers, and baby boomers: Lessons learnt from New York City’s bike share. Transportationresearch part A: policy and practice, 116, pp.1-14.
Wang, Y., Douglas, M.A., Hazen, B.T. and Dresner, M., 2018. Be green and clearly be seen:How consumer values and attitudes affect adoption of bike sharing. Transportation researchpart F: traffic psychology and behaviour, 58, pp.730-742.
Wang, Y.S., Lin, H.H. and Luarn, P., 2006. Predicting consumer intention to use mobile
46
service. Information systems journal, 16(2), pp.157-179.
Wang, Z.G., Kong, Z., Xie, J.H. and Yin, L.E., 2009. The 3rd generation of bike sharingsystems in Europe: Programs and implications. Urban Transport of China, 7(4), pp.7-12.
Wang, Z., Zhao, C., Yin, J. and Zhang, B., 2017. Purchasing intentions of Chinese citizens onnew energy vehicles: How should one respond to current preferential policy?. Journal ofCleaner Production, 161, pp.1000-1010.
Williams, J., 2018. New Orleans' bike-share program drops prices amid complaints abouthigher fees. [online]. Available fromhttps://www.nola.com/news/article_7481339a-31a4-5862-9807-cc9b1e227598.html
Winters, M., Hosford, K. and Javaheri, S., 2019. Who are the ‘super-users’ of public bikeshare? An analysis of public bike share members in Vancouver, BC. Preventive medicinereports, 15, p.100946.
Wouters, E.J., Larsen, J.K., Kremers, S.P., Dagnelie, P.C. and Geenen, R., 2010. Peerinfluence on snacking behavior in adolescence. Appetite, 55(1), pp.11-17.
Wu, Y.H., Kang, L., Hsu, Y.T. and Wang, P.C., 2019. Exploring trip characteristics ofbike-sharing system uses: Effects of land-use patterns and pricing schemechange. International journal of transportation science and technology, 8(3), pp.318-331.
Xie, H, 2017. Battle of the bike-sharing Kings: the bike-sharing melee. Managers, (2),pp.22-29.
Yao, L. and Wu, C., 2012. Traffic safety for electric bike riders in China: attitudes, riskperception, and aberrant riding behaviors. Transportation research record, 2314(1), pp.49-56.
Yan, Y., 2014. The emergence, development and review of the theory of plannedbehavior. Journal of International Communication, 36(7), pp.113-129.
Yao, Y., Liu, L., Guo, Z., Liu, Z. and Zhou, H., 2019. Experimental study on shared bike usebehavior under bounded rational theory and credit supervision mechanism. Sustainability,11(1), p.127.
Yoon, S.J., 2002. The antecedents and consequences of trust in online-purchasedecisions. Journal of interactive marketing, 16(2), pp.47-63.
Zervas, G., Proserpio, D. and Byers, J.W., 2017. The rise of the sharing economy: Estimatingthe impact of Airbnb on the hotel industry. Journal of marketing research, 54(5), pp.687-705.
47
Zhang, L., Zhang, J., Duan, Z.Y. and Bryde, D., 2015. Sustainable bike-sharing systems:characteristics and commonalities across cases in urban China. Journal of CleanerProduction, 97, pp.124-133.
Zhang, X., Ma, L. and Wang, G.S., 2017. Factors influencing users’ subjective well-being: anempirical study based on shared bicycles in China. Information Discovery and Delivery.
Zhang, Y. and Mi, Z., 2018. Environmental benefits of bike sharing: A big data-basedanalysis. Applied Energy, 220, pp.296-301.
Zhang, Y., Thomas, T., Brussel, M. and Van Maarseveen, M., 2017. Exploring the impact ofbuilt environment factors on the use of public bikes at bike stations: case study in Zhongshan,China. Journal of transport geography, 58, pp.59-70.
Zhou, H. and Han, L., 2011. Urban transportation: taking the road of green development-theexperience and enlightenment of Dutch urban bike transportation construction.Inquiry into Economics Issues, 2011(9), pp.176-180
Zhou, Y., Thøgersen, J., Ruan, Y. and Huang, G., 2013. The moderating role of human valuesin planned behavior: the case of Chinese consumers' intention to buy organic food. Journal ofConsumer Marketing.
Zonouz, S., Houmansadr, A., Berthier, R., Borisov, N. and Sanders, W., 2013. Secloud: Acloud-based comprehensive and lightweight security solution for smartphones. Computers &Security, 37, pp.215-227.
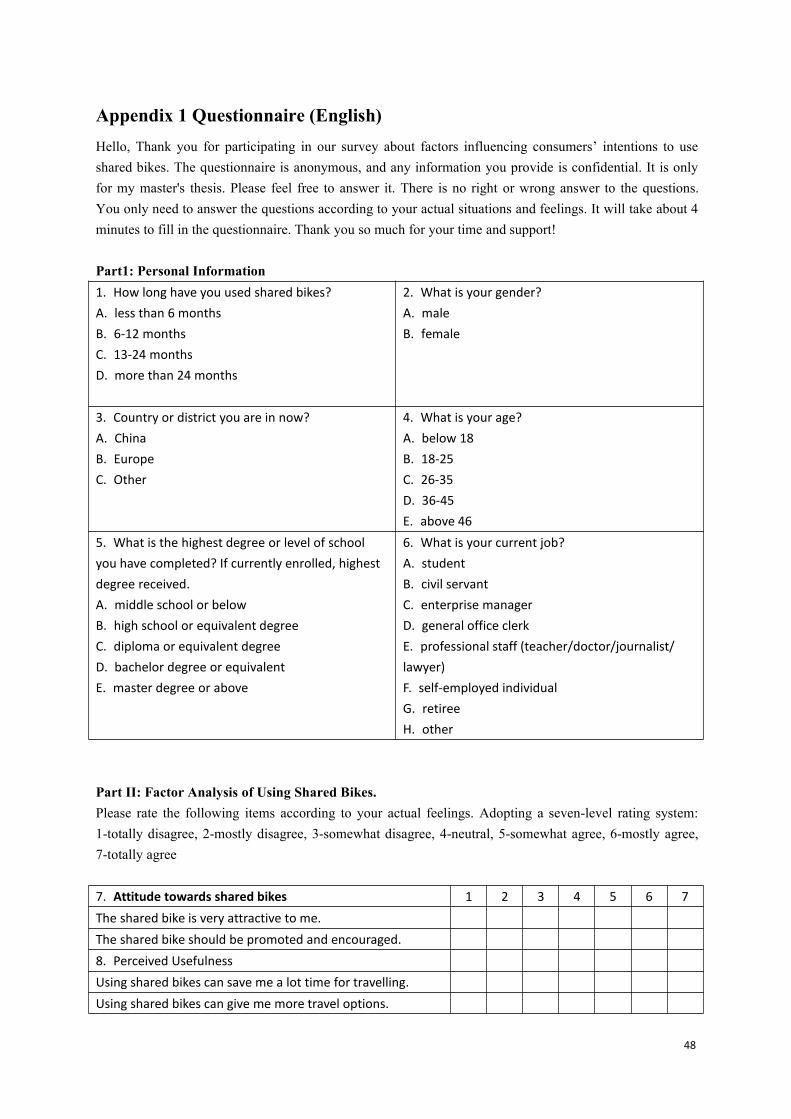
48
Appendix 1 Questionnaire (English)Hello, Thank you for participating in our survey about factors influencing consumers’ intentions to useshared bikes. The questionnaire is anonymous, and any information you provide is confidential. It is onlyfor my master's thesis. Please feel free to answer it. There is no right or wrong answer to the questions.You only need to answer the questions according to your actual situations and feelings. It will take about 4minutes to fill in the questionnaire. Thank you so much for your time and support!
Part1: Personal Information1. How long have you used shared bikes?A. less than 6 monthsB. 6-12 monthsC. 13-24 monthsD. more than 24 months
2. What is your gender?A. maleB. female
3. Country or district you are in now?A. ChinaB. EuropeC. Other
4. What is your age?A. below 18B. 18-25C. 26-35D. 36-45E. above 46
5. What is the highest degree or level of schoolyou have completed? If currently enrolled, highestdegree received.A. middle school or belowB. high school or equivalent degreeC. diploma or equivalent degreeD. bachelor degree or equivalentE. master degree or above
6. What is your current job?A. studentB. civil servantC. enterprise managerD. general office clerkE. professional staff (teacher/doctor/journalist/lawyer)F. self-employed individualG. retireeH. other
Part II: Factor Analysis of Using Shared Bikes.Please rate the following items according to your actual feelings. Adopting a seven-level rating system:1-totally disagree, 2-mostly disagree, 3-somewhat disagree, 4-neutral, 5-somewhat agree, 6-mostly agree,7-totally agree
7. Attitude towards shared bikes 1 2 3 4 5 6 7The shared bike is very attractive to me.The shared bike should be promoted and encouraged.8. Perceived UsefulnessUsing shared bikes can save me a lot time for travelling.Using shared bikes can give me more travel options.
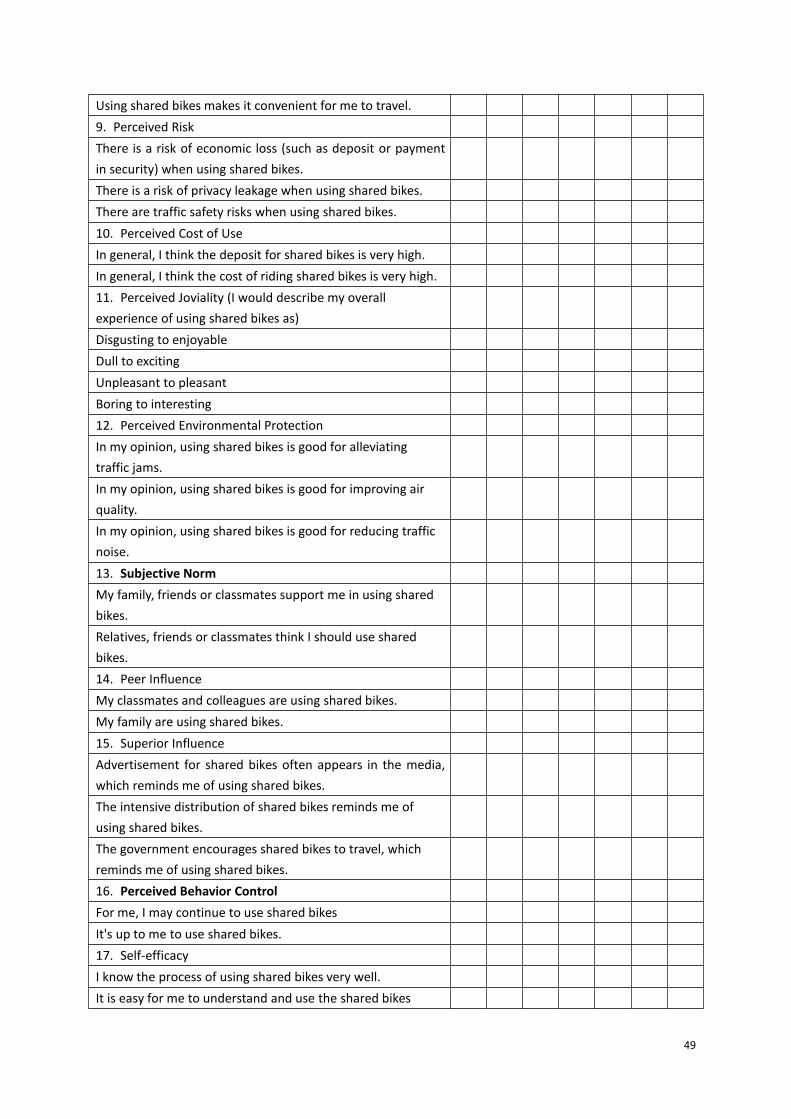
49
Using shared bikes makes it convenient for me to travel.9. Perceived RiskThere is a risk of economic loss (such as deposit or paymentin security) when using shared bikes.There is a risk of privacy leakage when using shared bikes.There are traffic safety risks when using shared bikes.10. Perceived Cost of UseIn general, I think the deposit for shared bikes is very high.In general, I think the cost of riding shared bikes is very high.11. Perceived Joviality (I would describe my overallexperience of using shared bikes as)Disgusting to enjoyableDull to excitingUnpleasant to pleasantBoring to interesting12. Perceived Environmental ProtectionIn my opinion, using shared bikes is good for alleviatingtraffic jams.In my opinion, using shared bikes is good for improving airquality.In my opinion, using shared bikes is good for reducing trafficnoise.13. Subjective NormMy family, friends or classmates support me in using sharedbikes.Relatives, friends or classmates think I should use sharedbikes.14. Peer InfluenceMy classmates and colleagues are using shared bikes.My family are using shared bikes.15. Superior InfluenceAdvertisement for shared bikes often appears in the media,which reminds me of using shared bikes.The intensive distribution of shared bikes reminds me ofusing shared bikes.The government encourages shared bikes to travel, whichreminds me of using shared bikes.16. Perceived Behavior ControlFor me, I may continue to use shared bikesIt's up to me to use shared bikes.17. Self-efficacyI know the process of using shared bikes very well.It is easy for me to understand and use the shared bikes
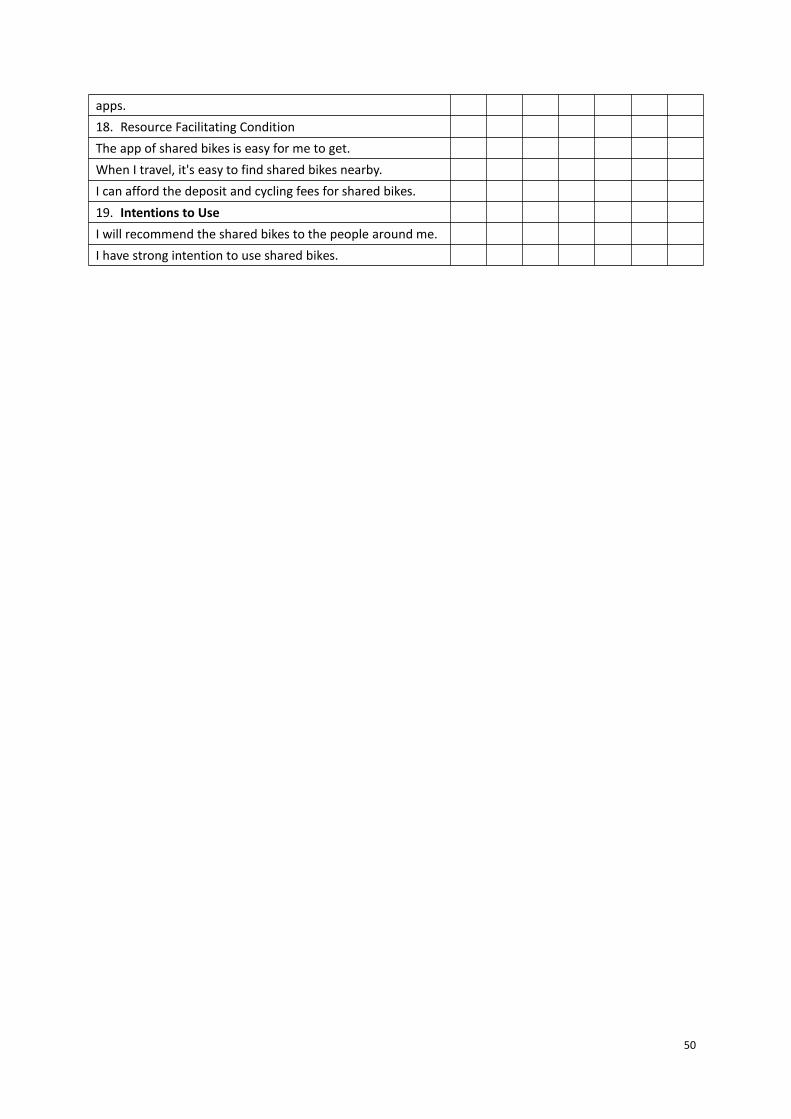
50
apps.18. Resource Facilitating ConditionThe app of shared bikes is easy for me to get.When I travel, it's easy to find shared bikes nearby.I can afford the deposit and cycling fees for shared bikes.19. Intentions to UseI will recommend the shared bikes to the people around me.I have strong intention to use shared bikes.
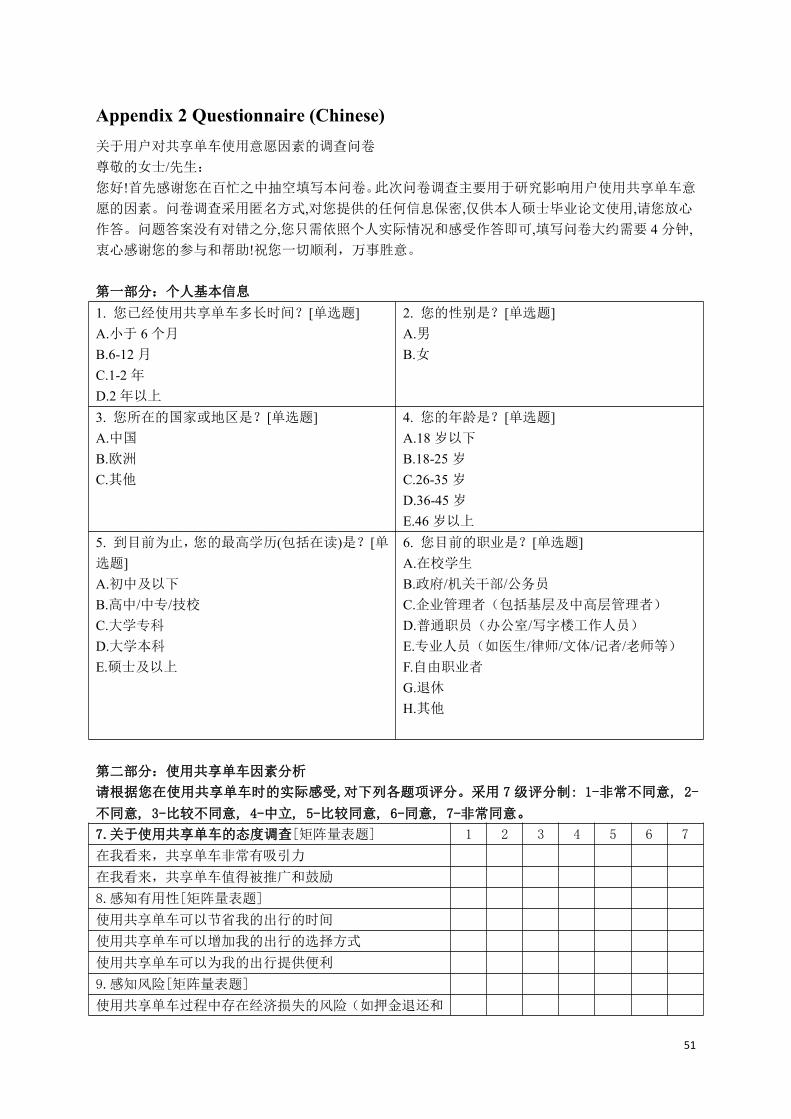
51
Appendix 2 Questionnaire (Chinese)关于用户对共享单车使用意愿因素的调查问卷
尊敬的女士/先生:
您好!首先感谢您在百忙之中抽空填写本问卷。此次问卷调查主要用于研究影响用户使用共享单车意
愿的因素。问卷调查采用匿名方式,对您提供的任何信息保密,仅供本人硕士毕业论文使用,请您放心
作答。问题答案没有对错之分,您只需依照个人实际情况和感受作答即可,填写问卷大约需要 4分钟,衷心感谢您的参与和帮助!祝您一切顺利,万事胜意。
第一部分:个人基本信息
1. 您已经使用共享单车多长时间?[单选题]A.小于 6个月
B.6-12月C.1-2 年
D.2年以上
2. 您的性别是?[单选题]A.男B.女
3. 您所在的国家或地区是?[单选题]A.中国
B.欧洲
C.其他
4. 您的年龄是?[单选题]A.18岁以下
B.18-25 岁
C.26-35 岁
D.36-45岁E.46岁以上
5. 到目前为止,您的最高学历(包括在读)是?[单选题]A.初中及以下
B.高中/中专/技校
C.大学专科
D.大学本科
E.硕士及以上
6. 您目前的职业是?[单选题]A.在校学生
B.政府/机关干部/公务员
C.企业管理者(包括基层及中高层管理者)
D.普通职员(办公室/写字楼工作人员)
E.专业人员(如医生/律师/文体/记者/老师等)
F.自由职业者
G.退休
H.其他
第二部分:使用共享单车因素分析
请根据您在使用共享单车时的实际感受,对下列各题项评分。采用 7 级评分制: 1-非常不同意, 2-
不同意, 3-比较不同意, 4-中立, 5-比较同意, 6-同意, 7-非常同意。
7.关于使用共享单车的态度调查[矩阵量表题] 1 2 3 4 5 6 7
在我看来,共享单车非常有吸引力
在我看来,共享单车值得被推广和鼓励
8.感知有用性[矩阵量表题]
使用共享单车可以节省我的出行的时间
使用共享单车可以增加我的出行的选择方式
使用共享单车可以为我的出行提供便利
9.感知风险[矩阵量表题]
使用共享单车过程中存在经济损失的风险(如押金退还和
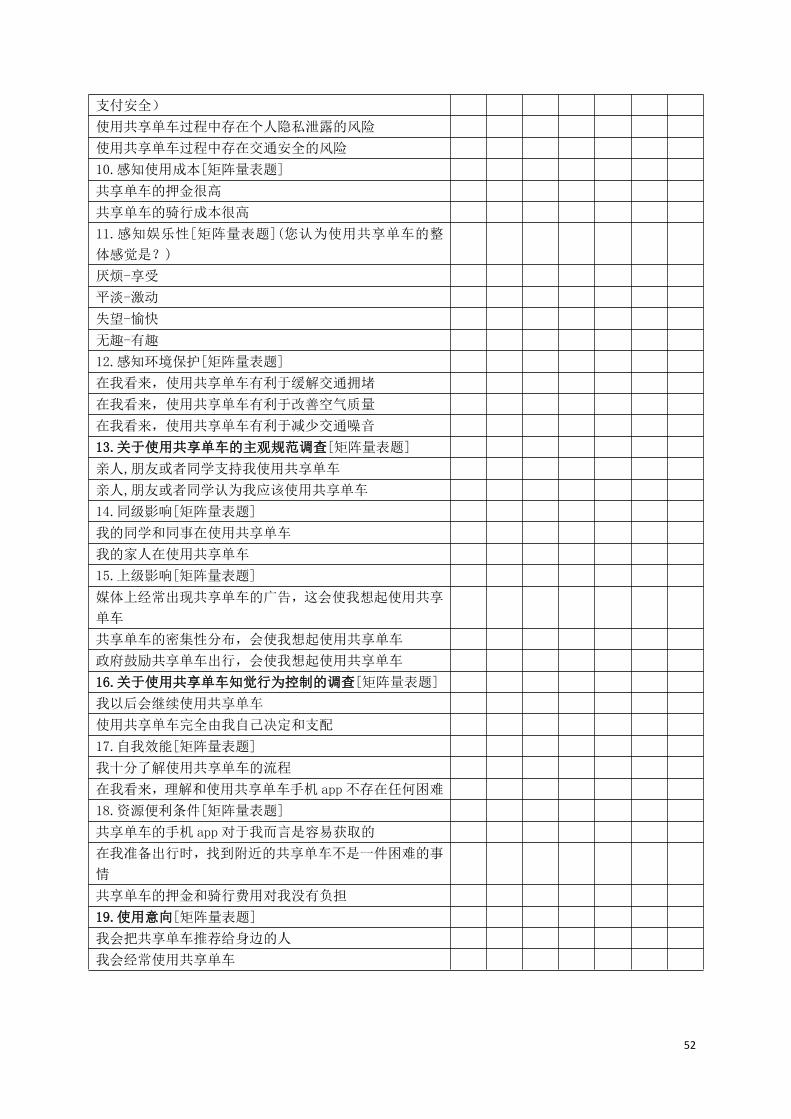
52
支付安全)
使用共享单车过程中存在个人隐私泄露的风险
使用共享单车过程中存在交通安全的风险
10.感知使用成本[矩阵量表题]
共享单车的押金很高
共享单车的骑行成本很高
11.感知娱乐性[矩阵量表题](您认为使用共享单车的整
体感觉是?)
厌烦-享受
平淡-激动
失望-愉快
无趣-有趣
12.感知环境保护[矩阵量表题]
在我看来,使用共享单车有利于缓解交通拥堵
在我看来,使用共享单车有利于改善空气质量
在我看来,使用共享单车有利于减少交通噪音
13.关于使用共享单车的主观规范调查[矩阵量表题]
亲人,朋友或者同学支持我使用共享单车
亲人,朋友或者同学认为我应该使用共享单车
14.同级影响[矩阵量表题]
我的同学和同事在使用共享单车
我的家人在使用共享单车
15.上级影响[矩阵量表题]
媒体上经常出现共享单车的广告,这会使我想起使用共享
单车
共享单车的密集性分布,会使我想起使用共享单车
政府鼓励共享单车出行,会使我想起使用共享单车
16.关于使用共享单车知觉行为控制的调查[矩阵量表题]
我以后会继续使用共享单车
使用共享单车完全由我自己决定和支配
17.自我效能[矩阵量表题]
我十分了解使用共享单车的流程
在我看来,理解和使用共享单车手机 app 不存在任何困难
18.资源便利条件[矩阵量表题]
共享单车的手机 app 对于我而言是容易获取的
在我准备出行时,找到附近的共享单车不是一件困难的事
情
共享单车的押金和骑行费用对我没有负担
19.使用意向[矩阵量表题]
我会把共享单车推荐给身边的人
我会经常使用共享单车
Copyright © 2022 FDOKUMEN