CLEF 15th Birthday: What Can We Learn From Ad Hoc Retrieval?
Upload
independentCategory
view
1download
0
What can we learn from the CIS IIdata on innovation in services?
The case of Italy
Giulio Cainelli*# – Nicola De Liso** – Giulio Perani***
AbstractThis paper, after recalling the debate on innovation in services, examines the structureof the (pilot) questionnaires circulated in Italy within the second round of the‘Community Innovation Survey’, specifically concerned with innovation in the servicesector. The quality of the Italian survey is also assessed through the analysis of theresponse rates to the different questions asked. Such an analysis gives rise to two mainresults: on the one hand one can understand some of the difficulties encountered byrespondent firms, while on the other hand some hints on possible questionnaireimprovements can be obtained. The conclusions also stress more general lessons thatcan be drawn from these early experiences.
Keywords: service sector, innovation, statistical surveys
JEL classification: L80, O30, C42
*Idse-Cnr, Milan and University of Bologna**Idse-Cnr, Milan and University of Lecce
***Istat, Rome
7th July 2000
# Corresponding author at Idse-Cnr, Via A.M. Ampère 56, 20131 Milan, Italy. Tel.: ++39-02-70643507;fax: ++39-02-70602807; e-mail: [email protected]
2
1. Introduction
The dynamics of innovation has put economists’ analytical tools under pressure
basically since the birth of modern economics. After all, Adam Smith’s opening
chapters of the Wealth of Nations, dealing with the the division of labour and its
economic implications, constitute an analysis of how work processes could be
innovated in order to get higher productivity. Since then economists have tackled
innovation in both positive and normative ways.
Positive analysis has experienced quite a few shifts of emphasis, from David
Ricardo’s chapter ‘On machinery’ added to the 1821 edition of his Principles to Marx’s
vision of technological progress as a tool to extract more suplus value from workers, to
the Solowian production function and the debate on the residual, up to the most recent
endogenous growth theories.
Since a long time governments also have tried to promote domestic production
and innovation, often by relying on economic and statistical work — and here we come
to normative analysis. Recent theorising on ‘national systems of innovation’ is a step in
this direction: what is it that makes certain nations better equipped to survive to fierce
competition?
If the analysis of technology and its change can be sometimes tricky — let us
just remind the Leontief paradox, Baumol’s cost desease and the productivity paradox1
— policy prescriptions based on these analyses (and thus paradoxes) are necessarily
trickier. Things are made more difficult when our theories and statistical analyses have
to be applied to the highly heterogeneous service sector.
A point must be stressed at the outset: while the service sector has become the
most important in terms of employment and value added since long — in 1960 the
former amounted to 46% of civilian employment and the latter to 53.2% of GDP for the
Major Seven2 (Oecd, 1999, p. 43 and p. 67) — economists and policy makers have
devoted proper attention to this sector much later, namely by the mid-1980s. Also, when
they began to do it, services were considered for long as non-innovative, passive users
and late adopters of technologies generated by other sectors (Coombs and Miles, 2000).
1 The latteer is tackled by Baily and Chakrabarti (1988).2 United States, Japan, Germany, France, Italy, UK, Canada.
3
The trend towards tertiarisation started long ago, and many nations which are
today mostly tertiarised have been at earlier stages industrial powers (the United
Kingdom, Germany, the USA). Nowadays, employment in services of civilian
employment amounts to 70.7% in the UK, 59.9% in Germany, 73.4% in the USA,
71.3% in Sweden, 69.9% in France, 74% in Canada, while for the overall Oecd area
employment in services amounts to 64.1% (Oecd, 1999, p. 43 – data refer to 1997). The
figures just mentioned explain why there is an increasing attention devoted to services
and innovation behaviour in services themselves.
Thus, so as economists attention has been rather slow to converge on the most
important sector of advanced economies, so has been data gathering. In fact, the first
‘Community Innovation Survey’ was conceived of in the early 1990s in order to
investigate the dynamics of innovation and innovative performance of the European
economy. The first round was carried out in 1992, and was exclusively concerned with
innovative performance in manufacturing industries. Five years later, in
acknowledgement of the importance of the tertiary sector, the survey ‘CIS-II’ was
extended to the services. The survey was carried out by means of questionnaires, and
the main focus was on technological innovation.
The fact that the aim was to investigate technological innovation in the service
sector deserves an explicit comment. The stress on the term ‘technological’ is
important, for it excludes explicitly “organisational and managerial changes such as the
implementation of advanced management techniques, the introduction of significantly
changed organisational structures … ” as well as “the implementation of a quality
standard such as ISO 9000” (Eurostat Questionnaire). On the other hand, are considered
as technological innovations the introduction of the use of “cellular phones to reroute
drivers throughout the day” or “the introduction of smart cards and multipurpose plastic
cards” (Eurostat Questionnaire).
In this paper we analyse, first of all, the Italian questionnaire and the way in
which the Italian firms responded to the questionnaire itself. Italy carried out a pilot
survey which considers the three-year period 1993-1995, instead of the 1994-1996
period as in the majority of the other European countries. As the Italian and the later
questionnaires differ slightly, we also provide some comparisons between the two
questionnaires’ structures. Secondly, we make explicit some of the theoretical ideas
4
which constitute a sort of hidden agenda behind the questionnaires themselves. Put it
another way, any questionnaire’s structure is characterised by a theoretical background
which underlies the empirical investigation. Thirdly, we address the likely economic
and policy implications coming from the analysis undertaken.
The analysis that we propose ought to be able to allow for some considerations
on the appropriateness of such an approach; in particular the ‘manufacturing bias’ which
affects the service questionnaire needs some attention. The paper is organised as
follows. In section two we briefly consider the main characteristics of the survey, that is
we refer to the relevant statistical population, the sample structure as well as to the
questionnaire both in terms of the questions asked and the rates of response; section
three tries to address the overall quality of the survey, while the fourth and concluding
section considers the question of what can be learnt from these surveys.
2. The Italian survey
In this section we briefly describe the characteristics of the sample selected by Istat, the
features of the questionnaire circulated, and, finally, we will compare the Istat and
Eurostat questionnaires.
2.1 The sample
The Italian survey was carried out by Istat, the Italian National Statistical Institute, in
the period November 1996-September 1997. It thus anticipated by a few months the
eurowide survey, and this also explains small differences which can be found in the
definitions used in the questionnaire.
The survey addressed a set of 6,005 firms, 1,245 of which having more than 200
employees; the firms employing more than 200 employees were contacted on a censual
basis, while the remaining 4,760 firms were selected through a stratified random
sample. The overall sample is thus representative of a population of 19,301 firms
employing 20 or more employees.
Of all the firms contacted by means of a postal questionnaire 3,331 firms replied
– a response rate which amounts to 55.5% of the original overall sample. The sample
was stratified according to the following variables: nineteen sub-sectors3, six classes of
3 The service sectors which have been covered are the following: (1) trade, maintenance and repair ofmotor vehicles; (2) wholesale trade (excluding motor vehicles); (3) retail trade; (4) hotels and restaurants;(5) land transport; (6) sea and coastal water transport; (7) travel and transport services; (8) postal and
5
employees4 and four geographical areas, that is North-East, North-West, Central Italy
and South (Perani and Del Santo, 1999)5.
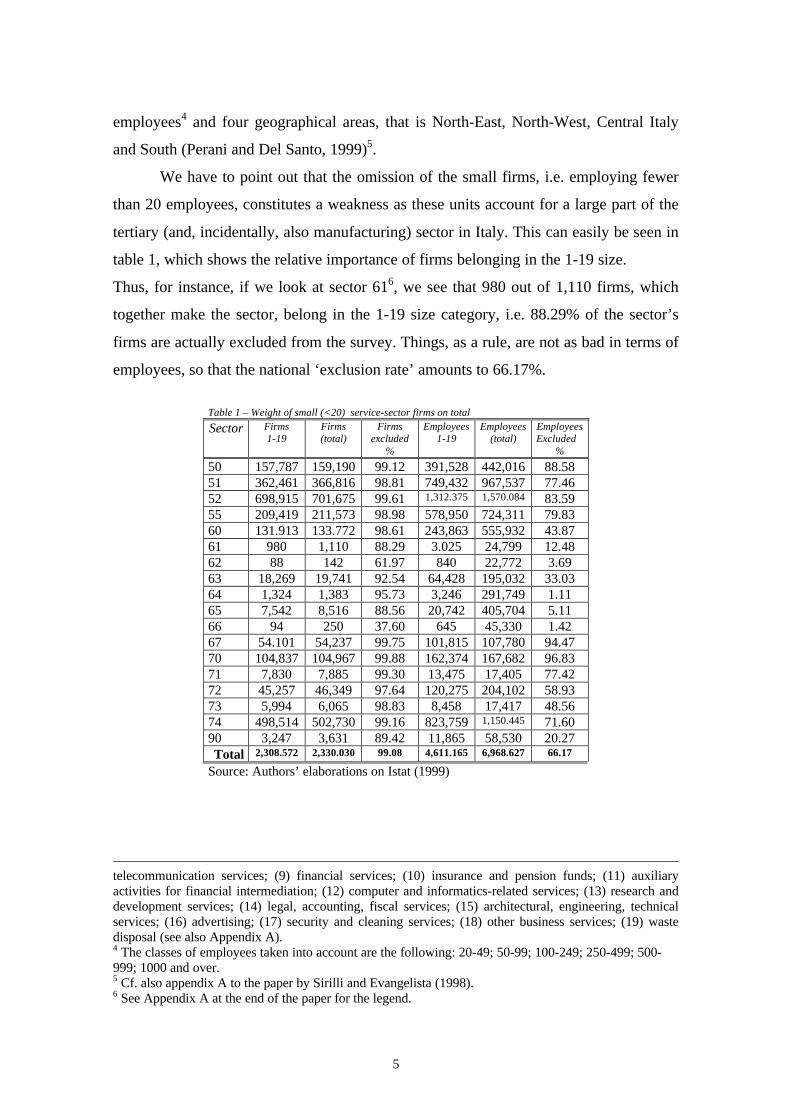
We have to point out that the omission of the small firms, i.e. employing fewer
than 20 employees, constitutes a weakness as these units account for a large part of the
tertiary (and, incidentally, also manufacturing) sector in Italy. This can easily be seen in
table 1, which shows the relative importance of firms belonging in the 1-19 size.
Thus, for instance, if we look at sector 616, we see that 980 out of 1,110 firms, which
together make the sector, belong in the 1-19 size category, i.e. 88.29% of the sector’s
firms are actually excluded from the survey. Things, as a rule, are not as bad in terms of
employees, so that the national ‘exclusion rate’ amounts to 66.17%.
Table 1 – Weight of small (<20) service-sector firms on total
Sector Firms1-19
Firms(total)
Firmsexcluded
%
Employees1-19
Employees(total)
EmployeesExcluded
%
50 157,787 159,190 99.12 391,528 442,016 88.5851 362,461 366,816 98.81 749,432 967,537 77.4652 698,915 701,675 99.61 1,312.375 1,570.084 83.5955 209,419 211,573 98.98 578,950 724,311 79.8360 131.913 133.772 98.61 243,863 555,932 43.8761 980 1,110 88.29 3.025 24,799 12.4862 88 142 61.97 840 22,772 3.6963 18,269 19,741 92.54 64,428 195,032 33.0364 1,324 1,383 95.73 3,246 291,749 1.1165 7,542 8,516 88.56 20,742 405,704 5.1166 94 250 37.60 645 45,330 1.4267 54.101 54,237 99.75 101,815 107,780 94.4770 104,837 104,967 99.88 162,374 167,682 96.8371 7,830 7,885 99.30 13,475 17,405 77.4272 45,257 46,349 97.64 120,275 204,102 58.9373 5,994 6,065 98.83 8,458 17,417 48.5674 498,514 502,730 99.16 823,759 1,150.445 71.6090 3,247 3,631 89.42 11,865 58,530 20.27Total 2,308.572 2,330.030 99.08 4,611.165 6,968.627 66.17
Source: Authors’ elaborations on Istat (1999)
telecommunication services; (9) financial services; (10) insurance and pension funds; (11) auxiliaryactivities for financial intermediation; (12) computer and informatics-related services; (13) research anddevelopment services; (14) legal, accounting, fiscal services; (15) architectural, engineering, technicalservices; (16) advertising; (17) security and cleaning services; (18) other business services; (19) wastedisposal (see also Appendix A).4 The classes of employees taken into account are the following: 20-49; 50-99; 100-249; 250-499; 500-999; 1000 and over.5 Cf. also appendix A to the paper by Sirilli and Evangelista (1998).6 See Appendix A at the end of the paper for the legend.
6
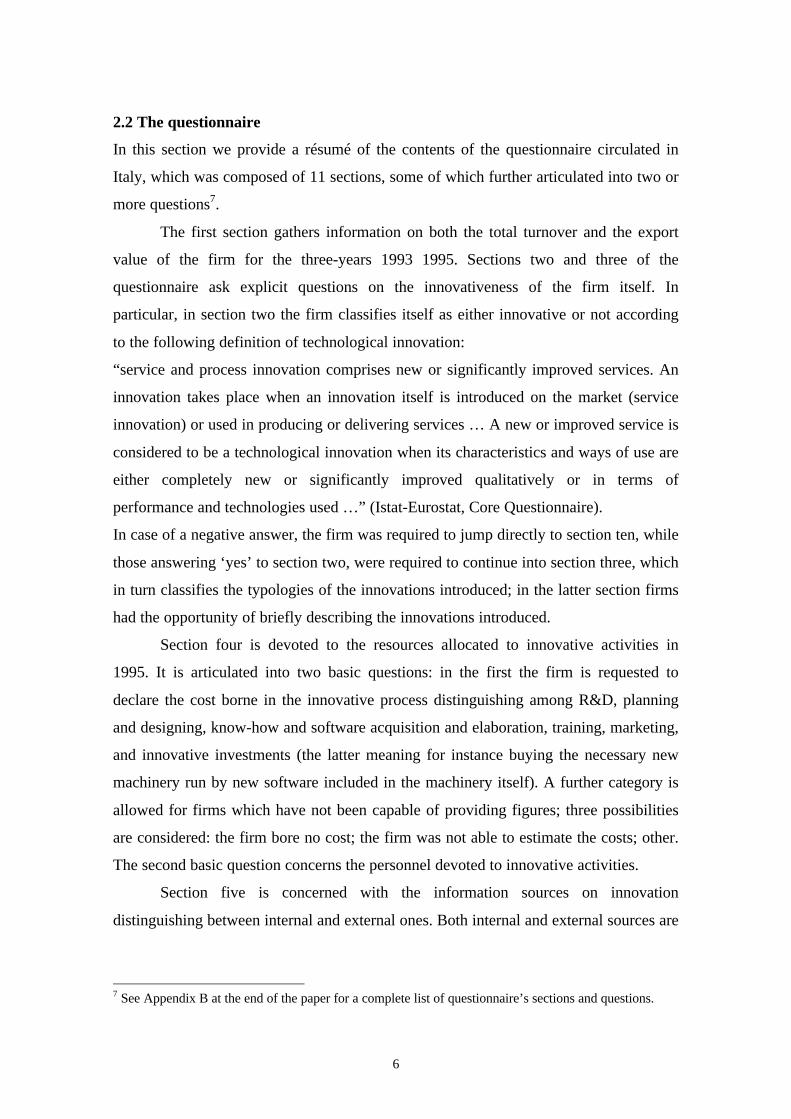
2.2 The questionnaire
In this section we provide a résumé of the contents of the questionnaire circulated in
Italy, which was composed of 11 sections, some of which further articulated into two or
more questions7.
The first section gathers information on both the total turnover and the export
value of the firm for the three-years 1993 1995. Sections two and three of the
questionnaire ask explicit questions on the innovativeness of the firm itself. In
particular, in section two the firm classifies itself as either innovative or not according
to the following definition of technological innovation:
“service and process innovation comprises new or significantly improved services. An
innovation takes place when an innovation itself is introduced on the market (service
innovation) or used in producing or delivering services … A new or improved service is
considered to be a technological innovation when its characteristics and ways of use are
either completely new or significantly improved qualitatively or in terms of
performance and technologies used …” (Istat-Eurostat, Core Questionnaire).
In case of a negative answer, the firm was required to jump directly to section ten, while
those answering ‘yes’ to section two, were required to continue into section three, which
in turn classifies the typologies of the innovations introduced; in the latter section firms
had the opportunity of briefly describing the innovations introduced.
Section four is devoted to the resources allocated to innovative activities in
1995. It is articulated into two basic questions: in the first the firm is requested to
declare the cost borne in the innovative process distinguishing among R&D, planning
and designing, know-how and software acquisition and elaboration, training, marketing,
and innovative investments (the latter meaning for instance buying the necessary new
machinery run by new software included in the machinery itself). A further category is
allowed for firms which have not been capable of providing figures; three possibilities
are considered: the firm bore no cost; the firm was not able to estimate the costs; other.
The second basic question concerns the personnel devoted to innovative activities.
Section five is concerned with the information sources on innovation
distinguishing between internal and external ones. Both internal and external sources are
7 See Appendix B at the end of the paper for a complete list of questionnaire’s sections and questions.
7
further articulated: in fact, firms are required to rank the importance of the source
according to a scale which ranges from 0 (‘not relevant at all’) to 5 (‘crucial’).
Section six deals with the objectives of the innovation distinguishing among the
different aims such as improving and enlarging the range of services provided or reduce
production costs. In this case also firms were required to rank the answers according to
the scale indicated previously.
Sections seven, eight and nine provide questions which lead to an assessment of
the impact of innovation on the firm’s performance; in particular, section seven requires
explicitly an evaluation of the likely impact of innovation on total turnover in 1995 (this
question will deserve particular attention and we will concentrate on it in the next
section); section eight concentrates on the impact of the innovation on total employment
distinguishing by low-, medium-, and highly-skilled workers during the three years
1993-1995; section nine investigates the likely impact of innovation on the whole
economic performance of the firm both in the period 1993-1995 and in the following
three year period 1996-1998 (the immediate future three-year period when the
questionnaire was circulated) .
Section ten focuses on the factors hampering or making unnecessary the
innovation. A list of possible factors is indicated in the questionnaire, ranging from lack
of financing to lack of sufficiently qualified workers. Each item has to be ranked
between 0 and 5.
Finally, section eleven poses two questions concerning the future of innovative
plans of the firm; in case of positive answer the firm is required to indicate the type of
innovation foreseen.
2.3 The Eurostat and the Istat questionnaire: a comparison
Let us begin with pointing out that both the Eurostat and the Istat questionnaires are
based on the Oecd-Eurostat 1997 edition of the Proposed Guidelines for Collecting and
Interpreting Technological Innovation Data generally referred to as the Oslo Manual.
However, some differences can be highlighted as the Italian questionnaire was prepared
and circulated before the final version of the Oslo Manual was made available (Perani
and Del Santo, 1999). Furthermore, some other differences are actually due to an Istat
choice.
8
First of all, the number of the different sections may differ because of small
differences in the structure of the questionnaire: for instance, what constitutes section 1
of the Istat questionnaire is part of the ‘general information about the enterprise’ of the
Eurostat one.
About the ‘definitions’ on whose basis the questionnaire has largely to be filled,
the basic ones are exactly the same, even though Istat supplies more examples of what
can be considered as a technological innovation; an example is the web pages. On the
other hand, Istat did not point out explicitly — as Eurostat did — what is not to be
considered as a technological innovation in services (organisational and managerial
changes, etc., as pointed out above).
Sections 2 and 3 of Istat’s questionnaire overlap with section 1 of Eurostat’s;
however in the Eurostat questionnaire, section 1 contains the ‘yes’ or ‘no’ answer to the
question of whether the firm has introduced any service innovation, while asking
immediately afterwards who developed the innovation (distinguishing among ‘mainly
other enterprises or institutes’, ‘the enterprise together with other enterprises or
institutes’ ‘mainly the enterprise’). On the other hand, the Istat questionnaire in its
section 3 asks to classify the types of innovation (‘service’, ‘process’, and
‘indistinguishable’).
A missing question in Istat’s questionnaire is Eurostat’s section 2, which
concerns the unsuccessful or not yet completed innovative processes. We believe that
the inclusion of this question would have been quite important in order to understand
the innovative process of which the timing has to be taken into account as well as the
fact there also exists a probability of failure. An example that fits both points can be the
one referring to the pharmaceutical R&D activity in which often long periods are
required before getting the desired results and, at the same time, the likelihood of failure
is fairly high.
Section four of Istat questionnaire is nearly the same as the Eurostat’s section 3;
however, Istat does not ask the question: ‘did your enterprise engage in R&D between
1994 and 1996’, but concentrates only on one year, namely 1995. Another important
difference concerns the total expenditure in terms of personnel devoted to innovative
activities. In fact, while Eurostat asks information only on personnel devoted to R&D,
Istat asks for an estimate of the personnel involved in the whole body of innovative
9
activities carried out by the firm. Thus, Istat’s questionnaire leads to consider the
personnel involved not only in R&D, but also in planning and designing, writing
innovating software, and so on (see Appendix B). Thus when making comparisons
among countries it is important to take into account this difference: should we ‘forget’
about it, Italy would see a great amount of human resources devoted to R&D in services
which would rather depend on the different data requested.
Istat questionnaire is missing section 4 and 5 of the Eurostat questionnaire which
include, respectively, a question on government support (subsidies, grants, loans) and a
question on whether the firm had applied for at least one patent between 1994 and 1996
in any country. While the lack of the second question may be, in a sense, justified
because patenting is not the typical form of innovative service protection, the lack of a
specific question on government support must be stressed. In fact, some measures to
facilitate the acquisition of innovative technologies in various forms exist at both the
national and regional levels.
Sections 5 and 6 of Istat’s questionnaire are fairly similar to Eurostat’s sections 7
and 6. One difference consists of the different ladder according to which a particular
topic is classified (from ‘not relevant at all’ to ‘crucial’); in fact Istat offers six different
options, while Eurostat only four. Moreover, the categories employed in section 6 do
not match perfectly.
Istat’s sections 7, 8 and 9 do not have an equivalent in Eurostat’s questionnaire.
The questions proposed by Istat are quite important; in fact the first asks to indicate the
percentage of total 1995 turnover connected to the innovative services as defined in
section 3, while the second and third ask, respectively, an evaluation of the impact of
innovation on employment and on the overall economic performance. However, to
provide an answer to the three questions is quite a difficult task because — leaving apart
extreme cases — it is difficult to identify and quantify the contribution of innovative
activity to the either turnover, or employment, or economic performance. It is not a
simple coincidence that the response rate to these questions was very low (cf. the next
section).
In Istat’s questionnaire we cannot find the equivalent of the Eurostat’s section 8
which concerns innovation co-operation in the three-year period considered. The actual
question is: ‘did your enterprise have any co-operation arrangements on innovation
10
activities with other enterprises or institutions in 1994-1996?’. This question is focused
on the role of the co-operative relations in the process of innovation creation (and
adoption). In particular, these relations may be quite important in those sectors in which
the weight of the formal innovative activity is not particularly high. An example can be
the co-operation between the suppliers of equipment, materials, components, or
software which have to be adapted to specific requirements set by the final users. We
have also to point out that a partial justification of this shortcoming may be due to
Italian traditional weakness of the links between firms and institutions such as
universities and research institutes.
Section 10 of Istat questionnaire is once more similar to Eurostat section 9, even
though the two sections differ slightly — the questions being on the factors hampering
innovation. Istat supplies more options (seventeen) than Eurostat (nine) in order to
understand why innovation may have been slackened off.
Finally, Istat questionnaire considers the foreseen firm’s future programmes on
innovation during the following three-year period, a question not found in Eurostat’s
questionnaire.
By way of conclusions of this section, we have to stress that despite being fairly
similar the two questionnaires are characterised by a few differences the most important
of which are the lack in Istat’s questionnaire of questions concerning government
support and innovation co-operation.
3. The quality of the Italian survey
In this section we assess the quality of the Italian survey in two different ways. First of
all, we analyse the rate of response to all of the questions included in the questionnaire;
thus what is assessed is the rate of response, and not the absolute figures: for instance,
in table 2a figure 18.93 at the cross between the column headed ‘Answer 13’ and row
‘sector 52’ means that 18.93% of the firms of belonging in sector 52 responded to
question 13, so that we know that nearly 19% of firms exported part of their services.
Secondly, we try to address this evidence in terms of the links existing between the way
in which the question is asked, its economic content, and the difficulties that might have
been encountered by the firms.
11
In order to evaluate the quality of the survey we go once more through the Istat
questionnaire section by section and we consider in detail the answers supplied to each
question (one can refer to appendices A and B at the end of the paper for the list of
sectors and questions, respectively).
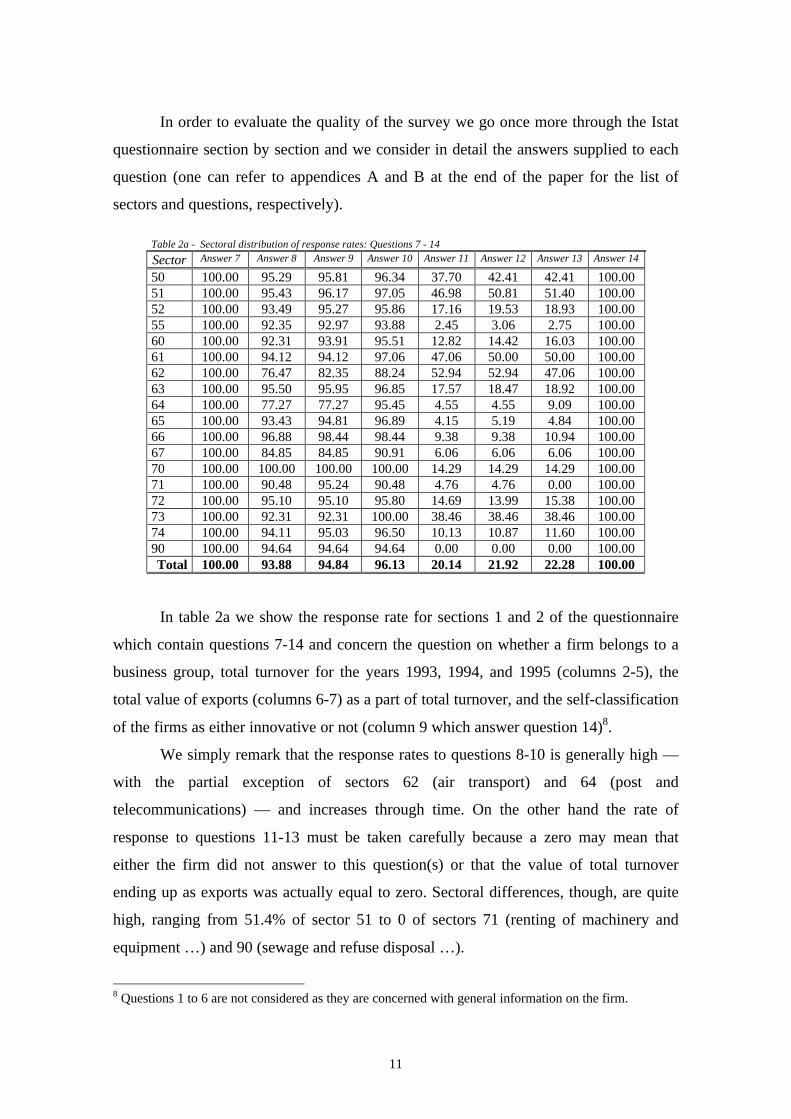
Table 2a - Sectoral distribution of response rates: Questions 7 - 14
Sector Answer 7 Answer 8 Answer 9 Answer 10 Answer 11 Answer 12 Answer 13 Answer 14
50 100.00 95.29 95.81 96.34 37.70 42.41 42.41 100.0051 100.00 95.43 96.17 97.05 46.98 50.81 51.40 100.0052 100.00 93.49 95.27 95.86 17.16 19.53 18.93 100.0055 100.00 92.35 92.97 93.88 2.45 3.06 2.75 100.0060 100.00 92.31 93.91 95.51 12.82 14.42 16.03 100.0061 100.00 94.12 94.12 97.06 47.06 50.00 50.00 100.0062 100.00 76.47 82.35 88.24 52.94 52.94 47.06 100.0063 100.00 95.50 95.95 96.85 17.57 18.47 18.92 100.0064 100.00 77.27 77.27 95.45 4.55 4.55 9.09 100.0065 100.00 93.43 94.81 96.89 4.15 5.19 4.84 100.0066 100.00 96.88 98.44 98.44 9.38 9.38 10.94 100.0067 100.00 84.85 84.85 90.91 6.06 6.06 6.06 100.0070 100.00 100.00 100.00 100.00 14.29 14.29 14.29 100.0071 100.00 90.48 95.24 90.48 4.76 4.76 0.00 100.0072 100.00 95.10 95.10 95.80 14.69 13.99 15.38 100.0073 100.00 92.31 92.31 100.00 38.46 38.46 38.46 100.0074 100.00 94.11 95.03 96.50 10.13 10.87 11.60 100.0090 100.00 94.64 94.64 94.64 0.00 0.00 0.00 100.00Total 100.00 93.88 94.84 96.13 20.14 21.92 22.28 100.00
In table 2a we show the response rate for sections 1 and 2 of the questionnaire
which contain questions 7-14 and concern the question on whether a firm belongs to a
business group, total turnover for the years 1993, 1994, and 1995 (columns 2-5), the
total value of exports (columns 6-7) as a part of total turnover, and the self-classification
of the firms as either innovative or not (column 9 which answer question 14)8.
We simply remark that the response rates to questions 8-10 is generally high —
with the partial exception of sectors 62 (air transport) and 64 (post and
telecommunications) — and increases through time. On the other hand the rate of
response to questions 11-13 must be taken carefully because a zero may mean that
either the firm did not answer to this question(s) or that the value of total turnover
ending up as exports was actually equal to zero. Sectoral differences, though, are quite
high, ranging from 51.4% of sector 51 to 0 of sectors 71 (renting of machinery and
equipment …) and 90 (sewage and refuse disposal …).
8 Questions 1 to 6 are not considered as they are concerned with general information on the firm.
12
Also, all of the firms have been capable of classifying themselves as either
innovative or not (Answer 14). The self-classification question marks a divide between
the two fundamental categories of firms, i.e. innovative or not. Thus, comments of
tables 2 to 13 are meant only for innovative firms, which amount to 1249 firms (or
37.49% of the total sample).
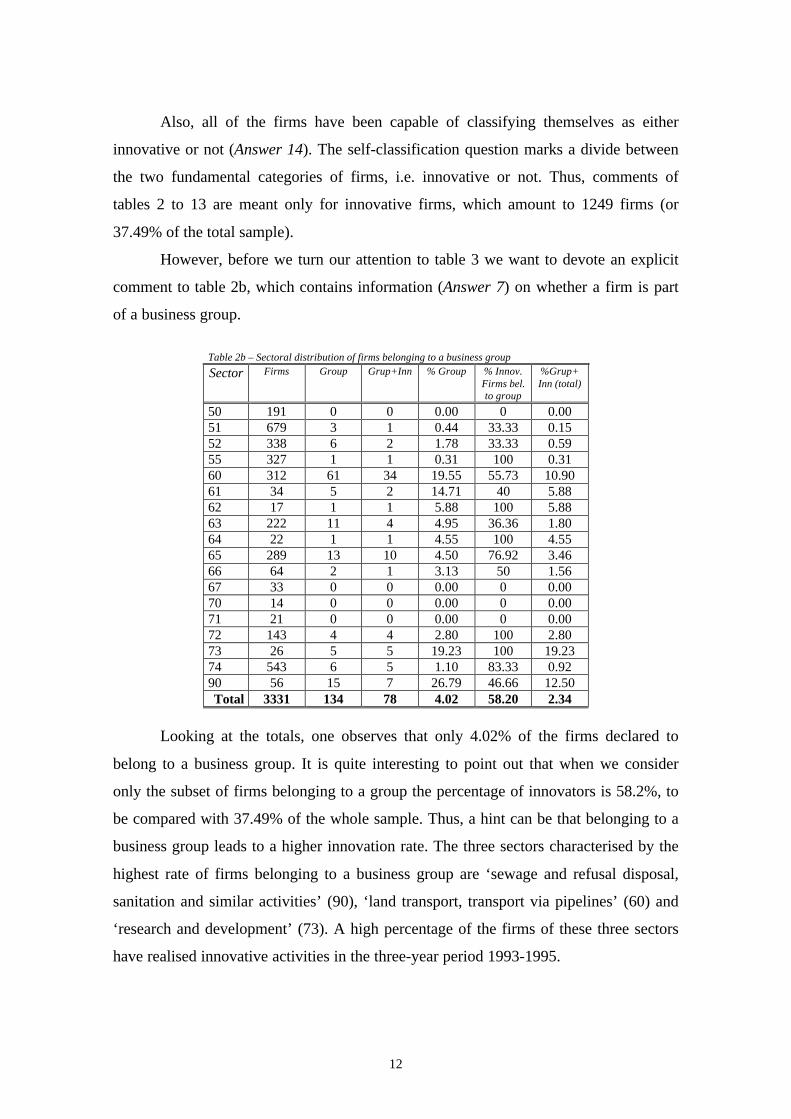
However, before we turn our attention to table 3 we want to devote an explicit
comment to table 2b, which contains information (Answer 7) on whether a firm is part
of a business group.
Table 2b – Sectoral distribution of firms belonging to a business group
Sector Firms Group Grup+Inn % Group % Innov.Firms bel.to group
%Grup+Inn (total)
50 191 0 0 0.00 0 0.0051 679 3 1 0.44 33.33 0.1552 338 6 2 1.78 33.33 0.5955 327 1 1 0.31 100 0.3160 312 61 34 19.55 55.73 10.9061 34 5 2 14.71 40 5.8862 17 1 1 5.88 100 5.8863 222 11 4 4.95 36.36 1.8064 22 1 1 4.55 100 4.5565 289 13 10 4.50 76.92 3.4666 64 2 1 3.13 50 1.5667 33 0 0 0.00 0 0.0070 14 0 0 0.00 0 0.0071 21 0 0 0.00 0 0.0072 143 4 4 2.80 100 2.8073 26 5 5 19.23 100 19.2374 543 6 5 1.10 83.33 0.9290 56 15 7 26.79 46.66 12.50Total 3331 134 78 4.02 58.20 2.34
Looking at the totals, one observes that only 4.02% of the firms declared to
belong to a business group. It is quite interesting to point out that when we consider
only the subset of firms belonging to a group the percentage of innovators is 58.2%, to
be compared with 37.49% of the whole sample. Thus, a hint can be that belonging to a
business group leads to a higher innovation rate. The three sectors characterised by the
highest rate of firms belonging to a business group are ‘sewage and refusal disposal,
sanitation and similar activities’ (90), ‘land transport, transport via pipelines’ (60) and
‘research and development’ (73). A high percentage of the firms of these three sectors
have realised innovative activities in the three-year period 1993-1995.
13
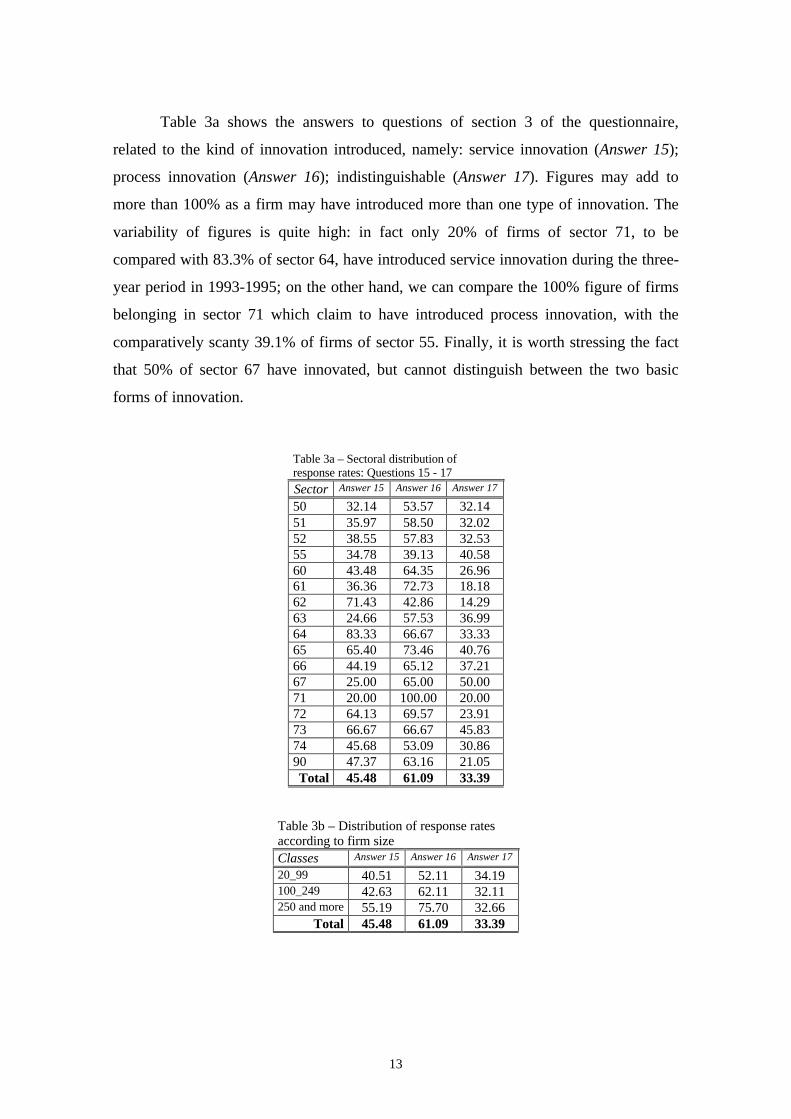
Table 3a shows the answers to questions of section 3 of the questionnaire,
related to the kind of innovation introduced, namely: service innovation (Answer 15);
process innovation (Answer 16); indistinguishable (Answer 17). Figures may add to
more than 100% as a firm may have introduced more than one type of innovation. The
variability of figures is quite high: in fact only 20% of firms of sector 71, to be
compared with 83.3% of sector 64, have introduced service innovation during the three-
year period in 1993-1995; on the other hand, we can compare the 100% figure of firms
belonging in sector 71 which claim to have introduced process innovation, with the
comparatively scanty 39.1% of firms of sector 55. Finally, it is worth stressing the fact
that 50% of sector 67 have innovated, but cannot distinguish between the two basic
forms of innovation.
Table 3a – Sectoral distribution ofresponse rates: Questions 15 - 17Sector Answer 15 Answer 16 Answer 17
50 32.14 53.57 32.1451 35.97 58.50 32.0252 38.55 57.83 32.5355 34.78 39.13 40.5860 43.48 64.35 26.9661 36.36 72.73 18.1862 71.43 42.86 14.2963 24.66 57.53 36.9964 83.33 66.67 33.3365 65.40 73.46 40.7666 44.19 65.12 37.2167 25.00 65.00 50.0071 20.00 100.00 20.0072 64.13 69.57 23.9173 66.67 66.67 45.8374 45.68 53.09 30.8690 47.37 63.16 21.05Total 45.48 61.09 33.39
Table 3b – Distribution of response ratesaccording to firm sizeClasses Answer 15 Answer 16 Answer 17
20_99 40.51 52.11 34.19100_249 42.63 62.11 32.11250 and more 55.19 75.70 32.66
Total 45.48 61.09 33.39
14
In table 3b we observe that bigger firms have innovated more both in terms of service
and process innovation, while smaller firms seem to be less capable of distinguishing
between the two types of innovation — even though the differences in the latter case are
not particularly high.
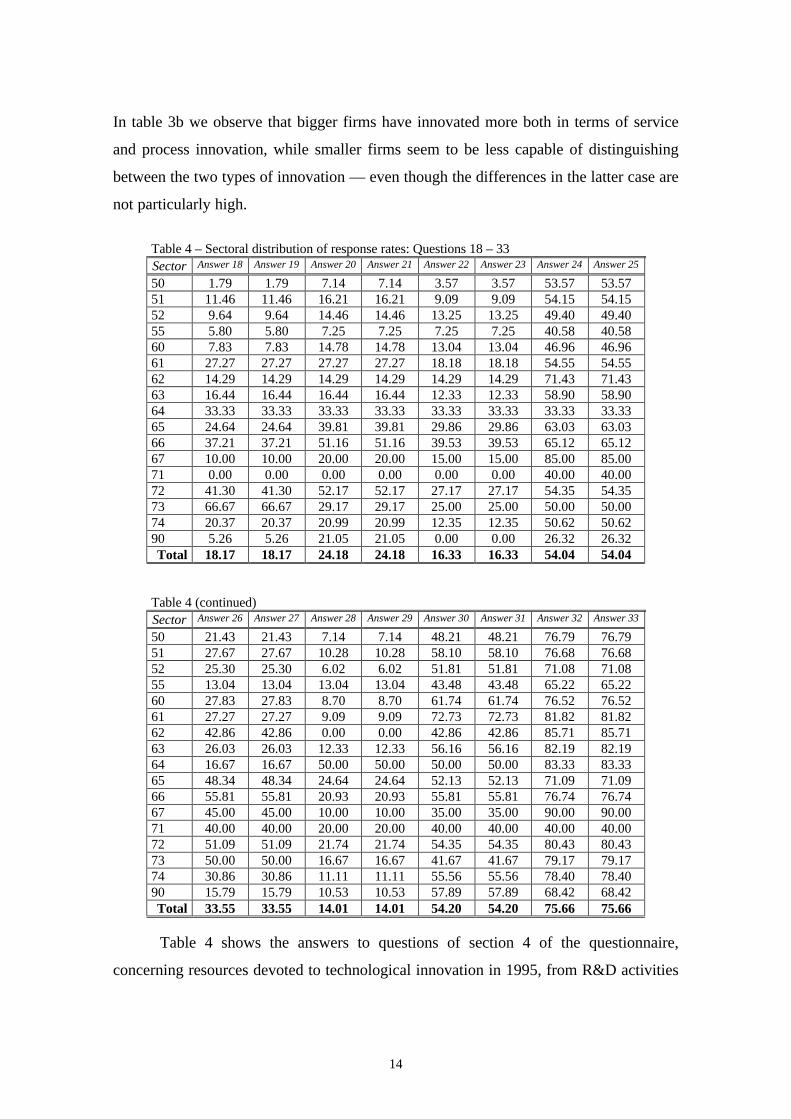
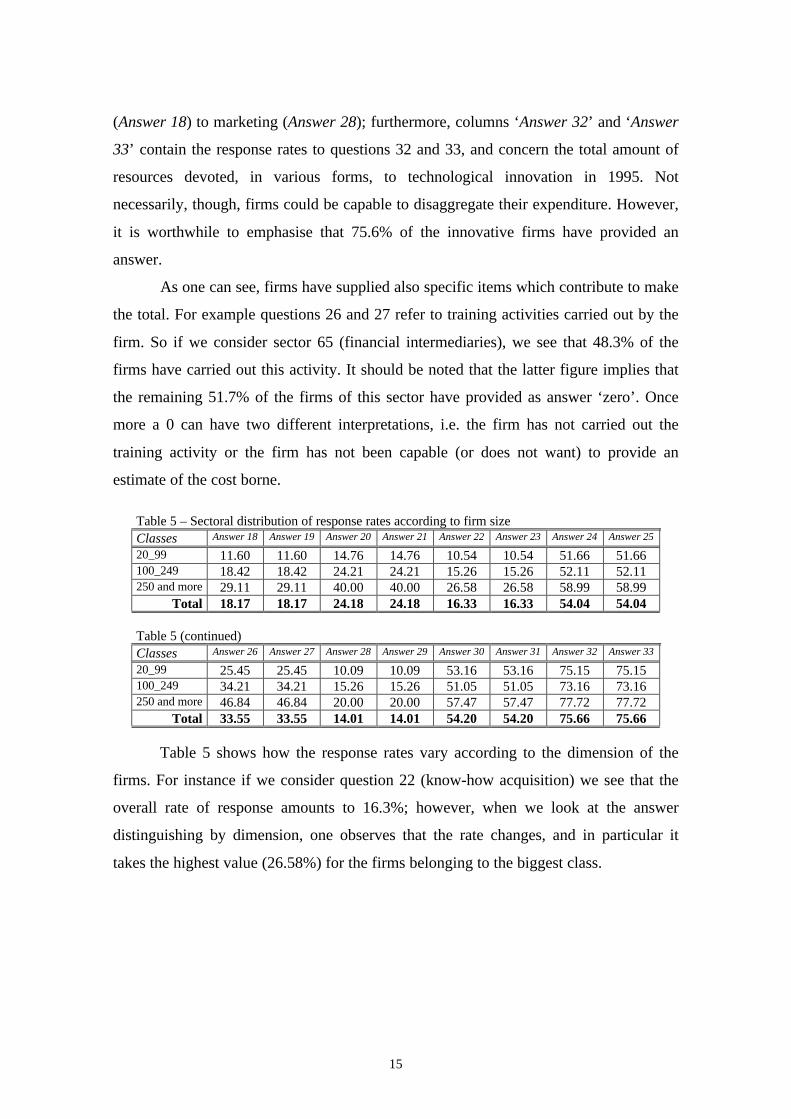
Table 4 – Sectoral distribution of response rates: Questions 18 – 33Sector Answer 18 Answer 19 Answer 20 Answer 21 Answer 22 Answer 23 Answer 24 Answer 25
50 1.79 1.79 7.14 7.14 3.57 3.57 53.57 53.5751 11.46 11.46 16.21 16.21 9.09 9.09 54.15 54.1552 9.64 9.64 14.46 14.46 13.25 13.25 49.40 49.4055 5.80 5.80 7.25 7.25 7.25 7.25 40.58 40.5860 7.83 7.83 14.78 14.78 13.04 13.04 46.96 46.9661 27.27 27.27 27.27 27.27 18.18 18.18 54.55 54.5562 14.29 14.29 14.29 14.29 14.29 14.29 71.43 71.4363 16.44 16.44 16.44 16.44 12.33 12.33 58.90 58.9064 33.33 33.33 33.33 33.33 33.33 33.33 33.33 33.3365 24.64 24.64 39.81 39.81 29.86 29.86 63.03 63.0366 37.21 37.21 51.16 51.16 39.53 39.53 65.12 65.1267 10.00 10.00 20.00 20.00 15.00 15.00 85.00 85.0071 0.00 0.00 0.00 0.00 0.00 0.00 40.00 40.0072 41.30 41.30 52.17 52.17 27.17 27.17 54.35 54.3573 66.67 66.67 29.17 29.17 25.00 25.00 50.00 50.0074 20.37 20.37 20.99 20.99 12.35 12.35 50.62 50.6290 5.26 5.26 21.05 21.05 0.00 0.00 26.32 26.32Total 18.17 18.17 24.18 24.18 16.33 16.33 54.04 54.04
Table 4 (continued)Sector Answer 26 Answer 27 Answer 28 Answer 29 Answer 30 Answer 31 Answer 32 Answer 33
50 21.43 21.43 7.14 7.14 48.21 48.21 76.79 76.7951 27.67 27.67 10.28 10.28 58.10 58.10 76.68 76.6852 25.30 25.30 6.02 6.02 51.81 51.81 71.08 71.0855 13.04 13.04 13.04 13.04 43.48 43.48 65.22 65.2260 27.83 27.83 8.70 8.70 61.74 61.74 76.52 76.5261 27.27 27.27 9.09 9.09 72.73 72.73 81.82 81.8262 42.86 42.86 0.00 0.00 42.86 42.86 85.71 85.7163 26.03 26.03 12.33 12.33 56.16 56.16 82.19 82.1964 16.67 16.67 50.00 50.00 50.00 50.00 83.33 83.3365 48.34 48.34 24.64 24.64 52.13 52.13 71.09 71.0966 55.81 55.81 20.93 20.93 55.81 55.81 76.74 76.7467 45.00 45.00 10.00 10.00 35.00 35.00 90.00 90.0071 40.00 40.00 20.00 20.00 40.00 40.00 40.00 40.0072 51.09 51.09 21.74 21.74 54.35 54.35 80.43 80.4373 50.00 50.00 16.67 16.67 41.67 41.67 79.17 79.1774 30.86 30.86 11.11 11.11 55.56 55.56 78.40 78.4090 15.79 15.79 10.53 10.53 57.89 57.89 68.42 68.42Total 33.55 33.55 14.01 14.01 54.20 54.20 75.66 75.66
Table 4 shows the answers to questions of section 4 of the questionnaire,
concerning resources devoted to technological innovation in 1995, from R&D activities
15
(Answer 18) to marketing (Answer 28); furthermore, columns ‘Answer 32’ and ‘Answer
33’ contain the response rates to questions 32 and 33, and concern the total amount of
resources devoted, in various forms, to technological innovation in 1995. Not
necessarily, though, firms could be capable to disaggregate their expenditure. However,
it is worthwhile to emphasise that 75.6% of the innovative firms have provided an
answer.
As one can see, firms have supplied also specific items which contribute to make
the total. For example questions 26 and 27 refer to training activities carried out by the
firm. So if we consider sector 65 (financial intermediaries), we see that 48.3% of the
firms have carried out this activity. It should be noted that the latter figure implies that
the remaining 51.7% of the firms of this sector have provided as answer ‘zero’. Once
more a 0 can have two different interpretations, i.e. the firm has not carried out the
training activity or the firm has not been capable (or does not want) to provide an
estimate of the cost borne.
Table 5 – Sectoral distribution of response rates according to firm sizeClasses Answer 18 Answer 19 Answer 20 Answer 21 Answer 22 Answer 23 Answer 24 Answer 25
20_99 11.60 11.60 14.76 14.76 10.54 10.54 51.66 51.66100_249 18.42 18.42 24.21 24.21 15.26 15.26 52.11 52.11250 and more 29.11 29.11 40.00 40.00 26.58 26.58 58.99 58.99
Total 18.17 18.17 24.18 24.18 16.33 16.33 54.04 54.04
Table 5 (continued)Classes Answer 26 Answer 27 Answer 28 Answer 29 Answer 30 Answer 31 Answer 32 Answer 33
20_99 25.45 25.45 10.09 10.09 53.16 53.16 75.15 75.15100_249 34.21 34.21 15.26 15.26 51.05 51.05 73.16 73.16250 and more 46.84 46.84 20.00 20.00 57.47 57.47 77.72 77.72
Total 33.55 33.55 14.01 14.01 54.20 54.20 75.66 75.66
Table 5 shows how the response rates vary according to the dimension of the
firms. For instance if we consider question 22 (know-how acquisition) we see that the
overall rate of response amounts to 16.3%; however, when we look at the answer
distinguishing by dimension, one observes that the rate changes, and in particular it
takes the highest value (26.58%) for the firms belonging to the biggest class.
16
Table 6a – Sectoral distribution of response rates: Question 34Sector Firms Answer 34
N.Answer 34
%Answer
34.1Answer
34.2Answer
34.3
50 56 13 23.21 30.77 69.23 0.0051 253 59 23.32 30.51 64.41 5.0852 83 24 28.92 20.83 62.50 16.6755 69 24 34.78 45.83 54.17 0.0060 115 27 23.48 37.04 62.96 0.0061 11 2 18.18 50.00 50.00 0.0062 7 1 14.29 0.00 100.00 0.0063 73 13 17.81 15.38 76.92 7.6964 6 1 16.67 100.00 0.00 0.0065 211 61 28.91 11.48 78.69 9.8466 43 10 23.26 0.00 100.00 0.0067 20 2 10.00 50.00 50.00 0.0071 5 3 60.00 33.33 66.67 0.0072 92 18 19.57 0.00 88.89 11.1173 24 5 20.83 20.00 60.00 20.0074 162 35 21.60 14.29 77.14 8.5790 19 6 31.58 0.00 100.00 0.00Total 1249 304 24.34 22.04 71.38 5.26
Table 6b – Distribution of response rates according to firm sizeClasses Firms Answer 34
N.Answer 34
%Answer
34.1Answer
34.2Answer
34.3
20_99 664 165 24.85 27.27 66.06 6.67100_249 190 51 26.84 13.73 78.43 7.84250 and more 395 88 22.28 17.05 77.27 5.68
Total 1249 304 24.34 22.04 71.38 6.58
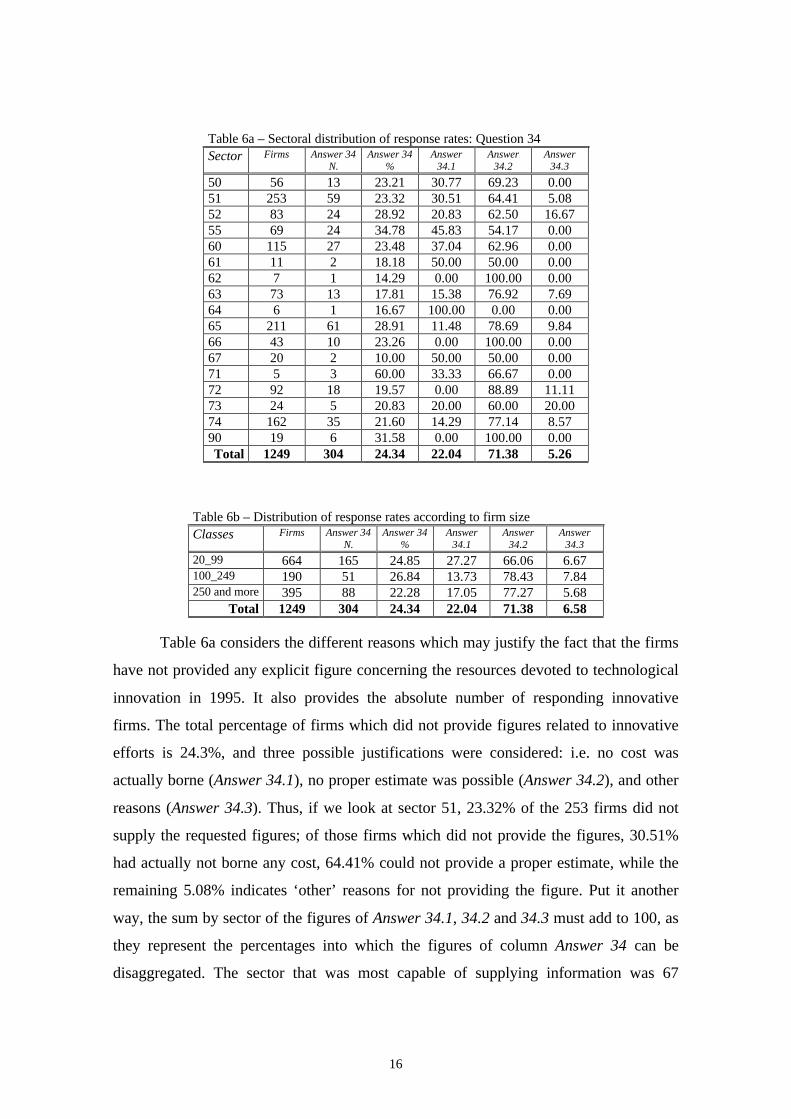
Table 6a considers the different reasons which may justify the fact that the firms
have not provided any explicit figure concerning the resources devoted to technological
innovation in 1995. It also provides the absolute number of responding innovative
firms. The total percentage of firms which did not provide figures related to innovative
efforts is 24.3%, and three possible justifications were considered: i.e. no cost was
actually borne (Answer 34.1), no proper estimate was possible (Answer 34.2), and other
reasons (Answer 34.3). Thus, if we look at sector 51, 23.32% of the 253 firms did not
supply the requested figures; of those firms which did not provide the figures, 30.51%
had actually not borne any cost, 64.41% could not provide a proper estimate, while the
remaining 5.08% indicates ‘other’ reasons for not providing the figure. Put it another
way, the sum by sector of the figures of Answer 34.1, 34.2 and 34.3 must add to 100, as
they represent the percentages into which the figures of column Answer 34 can be
disaggregated. The sector that was most capable of supplying information was 67
17
(‘activities auxiliary to financial intermediation’), with only 10% of firms filling Q. 34,
while the worst was sector 71 (‘renting of machinery and equipment without operator’),
with 60%.
Table 6b shows the analysis of responses by size. As one can see smaller firms
have the highest rate of the category 34.1, i.e. did not bear any cost related to innovation
in 1995. Medium-sized firms, instead, have the highest response rate of category 34.2,
that is they could not estimate the costs borne. Finally, option 34.3 was little used (in
eleven sectors out of eighteen we find a blank space).
Table 7 – Sectoral distribution of responserates: Question 35Sector Firms Answer 35
N.Answer 35
%
50 56 45 80.3651 253 198 78.2652 83 66 79.5255 69 43 62.3260 115 81 70.4361 11 9 81.8262 7 6 85.7163 73 61 83.5664 6 4 66.6765 211 179 84.8366 43 38 88.3767 20 16 80.0071 5 4 80.0072 92 84 91.3073 24 22 91.6774 162 132 81.4890 20 17 85.00Total 1249 1004 80.38
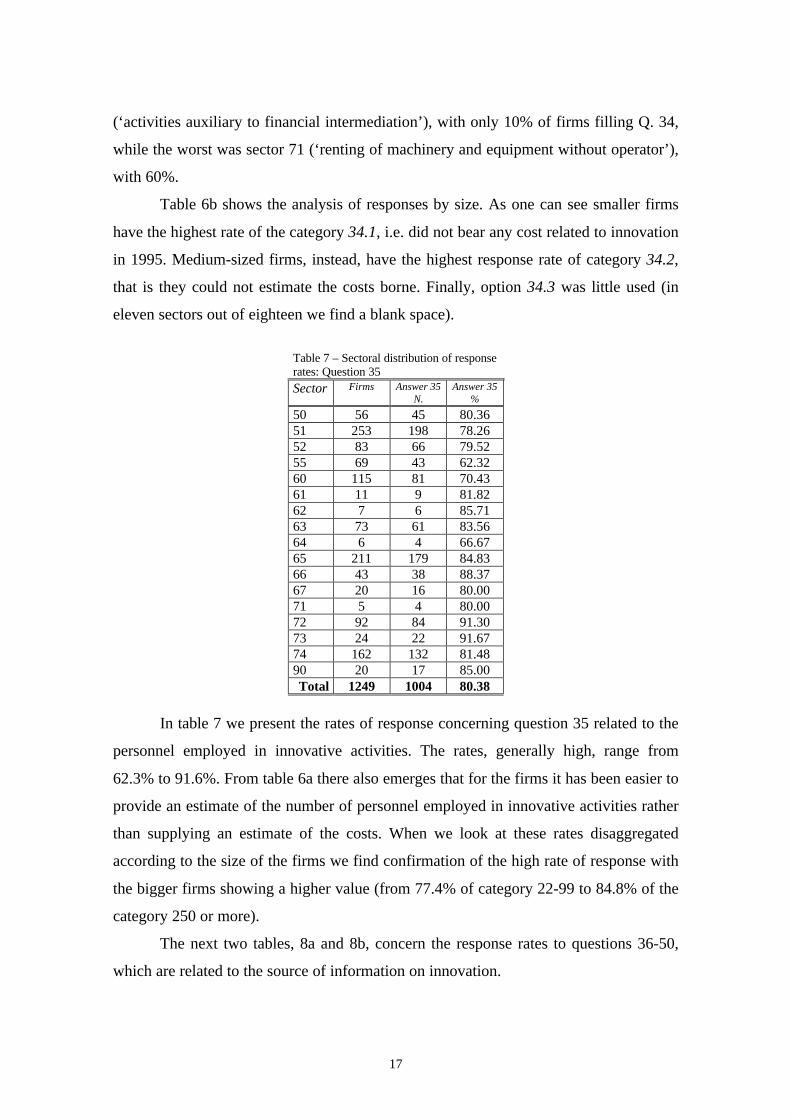
In table 7 we present the rates of response concerning question 35 related to the
personnel employed in innovative activities. The rates, generally high, range from
62.3% to 91.6%. From table 6a there also emerges that for the firms it has been easier to
provide an estimate of the number of personnel employed in innovative activities rather
than supplying an estimate of the costs. When we look at these rates disaggregated
according to the size of the firms we find confirmation of the high rate of response with
the bigger firms showing a higher value (from 77.4% of category 22-99 to 84.8% of the
category 250 or more).
The next two tables, 8a and 8b, concern the response rates to questions 36-50,
which are related to the source of information on innovation.
18
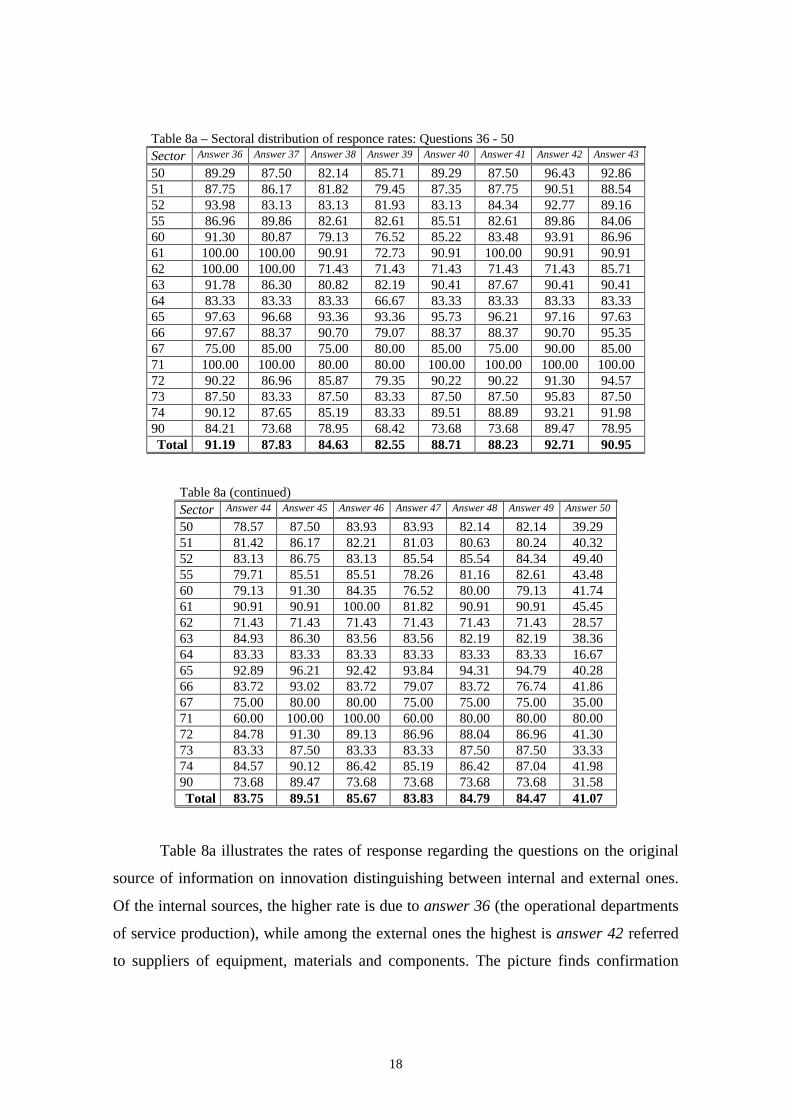
Table 8a – Sectoral distribution of responce rates: Questions 36 - 50Sector Answer 36 Answer 37 Answer 38 Answer 39 Answer 40 Answer 41 Answer 42 Answer 43
50 89.29 87.50 82.14 85.71 89.29 87.50 96.43 92.8651 87.75 86.17 81.82 79.45 87.35 87.75 90.51 88.5452 93.98 83.13 83.13 81.93 83.13 84.34 92.77 89.1655 86.96 89.86 82.61 82.61 85.51 82.61 89.86 84.0660 91.30 80.87 79.13 76.52 85.22 83.48 93.91 86.9661 100.00 100.00 90.91 72.73 90.91 100.00 90.91 90.9162 100.00 100.00 71.43 71.43 71.43 71.43 71.43 85.7163 91.78 86.30 80.82 82.19 90.41 87.67 90.41 90.4164 83.33 83.33 83.33 66.67 83.33 83.33 83.33 83.3365 97.63 96.68 93.36 93.36 95.73 96.21 97.16 97.6366 97.67 88.37 90.70 79.07 88.37 88.37 90.70 95.3567 75.00 85.00 75.00 80.00 85.00 75.00 90.00 85.0071 100.00 100.00 80.00 80.00 100.00 100.00 100.00 100.0072 90.22 86.96 85.87 79.35 90.22 90.22 91.30 94.5773 87.50 83.33 87.50 83.33 87.50 87.50 95.83 87.5074 90.12 87.65 85.19 83.33 89.51 88.89 93.21 91.9890 84.21 73.68 78.95 68.42 73.68 73.68 89.47 78.95Total 91.19 87.83 84.63 82.55 88.71 88.23 92.71 90.95
Table 8a (continued)Sector Answer 44 Answer 45 Answer 46 Answer 47 Answer 48 Answer 49 Answer 50
50 78.57 87.50 83.93 83.93 82.14 82.14 39.2951 81.42 86.17 82.21 81.03 80.63 80.24 40.3252 83.13 86.75 83.13 85.54 85.54 84.34 49.4055 79.71 85.51 85.51 78.26 81.16 82.61 43.4860 79.13 91.30 84.35 76.52 80.00 79.13 41.7461 90.91 90.91 100.00 81.82 90.91 90.91 45.4562 71.43 71.43 71.43 71.43 71.43 71.43 28.5763 84.93 86.30 83.56 83.56 82.19 82.19 38.3664 83.33 83.33 83.33 83.33 83.33 83.33 16.6765 92.89 96.21 92.42 93.84 94.31 94.79 40.2866 83.72 93.02 83.72 79.07 83.72 76.74 41.8667 75.00 80.00 80.00 75.00 75.00 75.00 35.0071 60.00 100.00 100.00 60.00 80.00 80.00 80.0072 84.78 91.30 89.13 86.96 88.04 86.96 41.3073 83.33 87.50 83.33 83.33 87.50 87.50 33.3374 84.57 90.12 86.42 85.19 86.42 87.04 41.9890 73.68 89.47 73.68 73.68 73.68 73.68 31.58Total 83.75 89.51 85.67 83.83 84.79 84.47 41.07
Table 8a illustrates the rates of response regarding the questions on the original
source of information on innovation distinguishing between internal and external ones.
Of the internal sources, the higher rate is due to answer 36 (the operational departments
of service production), while among the external ones the highest is answer 42 referred
to suppliers of equipment, materials and components. The picture finds confirmation
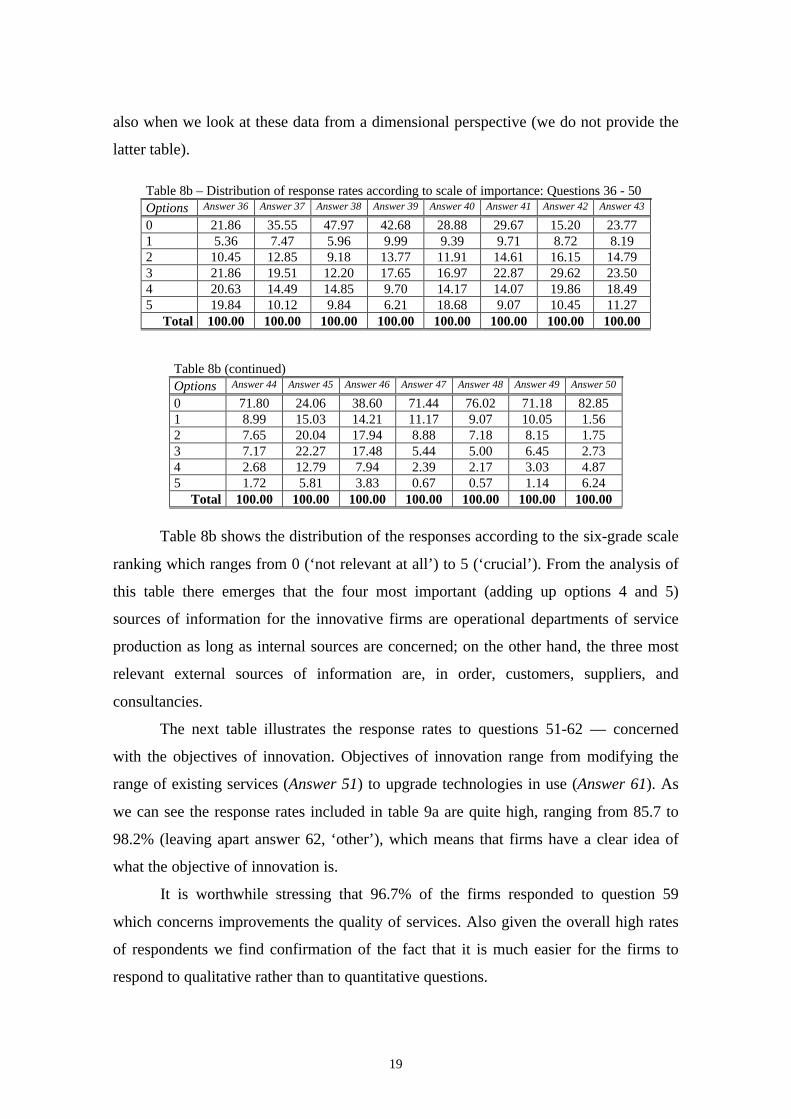
19
also when we look at these data from a dimensional perspective (we do not provide the
latter table).
Table 8b – Distribution of response rates according to scale of importance: Questions 36 - 50Options Answer 36 Answer 37 Answer 38 Answer 39 Answer 40 Answer 41 Answer 42 Answer 43
0 21.86 35.55 47.97 42.68 28.88 29.67 15.20 23.771 5.36 7.47 5.96 9.99 9.39 9.71 8.72 8.192 10.45 12.85 9.18 13.77 11.91 14.61 16.15 14.793 21.86 19.51 12.20 17.65 16.97 22.87 29.62 23.504 20.63 14.49 14.85 9.70 14.17 14.07 19.86 18.495 19.84 10.12 9.84 6.21 18.68 9.07 10.45 11.27
Total 100.00 100.00 100.00 100.00 100.00 100.00 100.00 100.00
Table 8b (continued)Options Answer 44 Answer 45 Answer 46 Answer 47 Answer 48 Answer 49 Answer 50
0 71.80 24.06 38.60 71.44 76.02 71.18 82.851 8.99 15.03 14.21 11.17 9.07 10.05 1.562 7.65 20.04 17.94 8.88 7.18 8.15 1.753 7.17 22.27 17.48 5.44 5.00 6.45 2.734 2.68 12.79 7.94 2.39 2.17 3.03 4.875 1.72 5.81 3.83 0.67 0.57 1.14 6.24
Total 100.00 100.00 100.00 100.00 100.00 100.00 100.00
Table 8b shows the distribution of the responses according to the six-grade scale
ranking which ranges from 0 (‘not relevant at all’) to 5 (‘crucial’). From the analysis of
this table there emerges that the four most important (adding up options 4 and 5)
sources of information for the innovative firms are operational departments of service
production as long as internal sources are concerned; on the other hand, the three most
relevant external sources of information are, in order, customers, suppliers, and
consultancies.
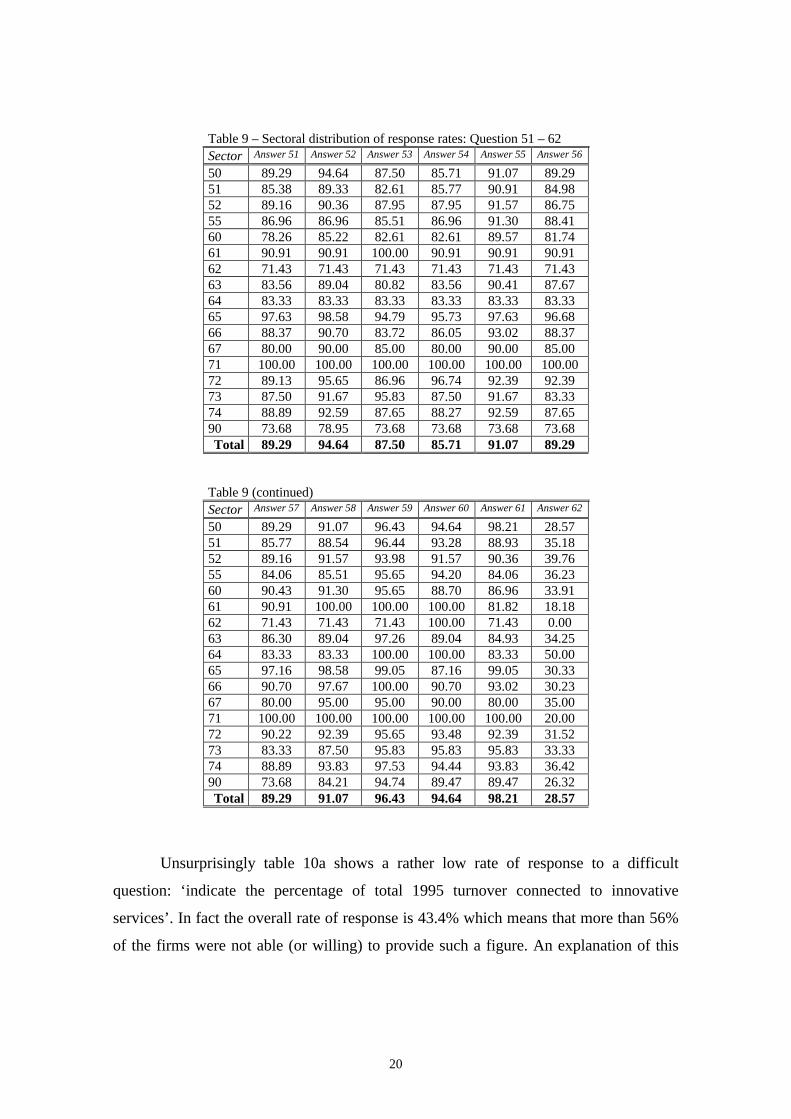
The next table illustrates the response rates to questions 51-62 — concerned
with the objectives of innovation. Objectives of innovation range from modifying the
range of existing services (Answer 51) to upgrade technologies in use (Answer 61). As
we can see the response rates included in table 9a are quite high, ranging from 85.7 to
98.2% (leaving apart answer 62, ‘other’), which means that firms have a clear idea of
what the objective of innovation is.
It is worthwhile stressing that 96.7% of the firms responded to question 59
which concerns improvements the quality of services. Also given the overall high rates
of respondents we find confirmation of the fact that it is much easier for the firms to
respond to qualitative rather than to quantitative questions.
20
Table 9 – Sectoral distribution of response rates: Question 51 – 62Sector Answer 51 Answer 52 Answer 53 Answer 54 Answer 55 Answer 56
50 89.29 94.64 87.50 85.71 91.07 89.2951 85.38 89.33 82.61 85.77 90.91 84.9852 89.16 90.36 87.95 87.95 91.57 86.7555 86.96 86.96 85.51 86.96 91.30 88.4160 78.26 85.22 82.61 82.61 89.57 81.7461 90.91 90.91 100.00 90.91 90.91 90.9162 71.43 71.43 71.43 71.43 71.43 71.4363 83.56 89.04 80.82 83.56 90.41 87.6764 83.33 83.33 83.33 83.33 83.33 83.3365 97.63 98.58 94.79 95.73 97.63 96.6866 88.37 90.70 83.72 86.05 93.02 88.3767 80.00 90.00 85.00 80.00 90.00 85.0071 100.00 100.00 100.00 100.00 100.00 100.0072 89.13 95.65 86.96 96.74 92.39 92.3973 87.50 91.67 95.83 87.50 91.67 83.3374 88.89 92.59 87.65 88.27 92.59 87.6590 73.68 78.95 73.68 73.68 73.68 73.68Total 89.29 94.64 87.50 85.71 91.07 89.29
Table 9 (continued)Sector Answer 57 Answer 58 Answer 59 Answer 60 Answer 61 Answer 62
50 89.29 91.07 96.43 94.64 98.21 28.5751 85.77 88.54 96.44 93.28 88.93 35.1852 89.16 91.57 93.98 91.57 90.36 39.7655 84.06 85.51 95.65 94.20 84.06 36.2360 90.43 91.30 95.65 88.70 86.96 33.9161 90.91 100.00 100.00 100.00 81.82 18.1862 71.43 71.43 71.43 100.00 71.43 0.0063 86.30 89.04 97.26 89.04 84.93 34.2564 83.33 83.33 100.00 100.00 83.33 50.0065 97.16 98.58 99.05 87.16 99.05 30.3366 90.70 97.67 100.00 90.70 93.02 30.2367 80.00 95.00 95.00 90.00 80.00 35.0071 100.00 100.00 100.00 100.00 100.00 20.0072 90.22 92.39 95.65 93.48 92.39 31.5273 83.33 87.50 95.83 95.83 95.83 33.3374 88.89 93.83 97.53 94.44 93.83 36.4290 73.68 84.21 94.74 89.47 89.47 26.32Total 89.29 91.07 96.43 94.64 98.21 28.57
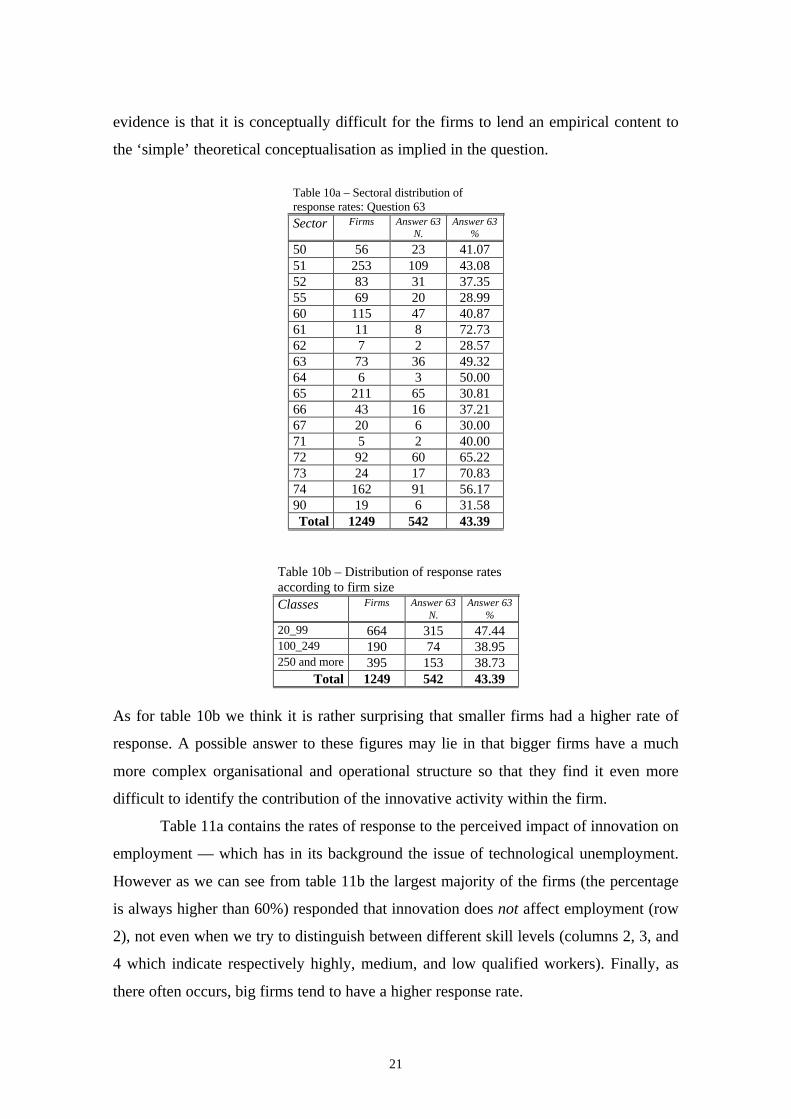
Unsurprisingly table 10a shows a rather low rate of response to a difficult
question: ‘indicate the percentage of total 1995 turnover connected to innovative
services’. In fact the overall rate of response is 43.4% which means that more than 56%
of the firms were not able (or willing) to provide such a figure. An explanation of this
21
evidence is that it is conceptually difficult for the firms to lend an empirical content to
the ‘simple’ theoretical conceptualisation as implied in the question.
Table 10a – Sectoral distribution ofresponse rates: Question 63Sector Firms Answer 63
N.Answer 63
%
50 56 23 41.0751 253 109 43.0852 83 31 37.3555 69 20 28.9960 115 47 40.8761 11 8 72.7362 7 2 28.5763 73 36 49.3264 6 3 50.0065 211 65 30.8166 43 16 37.2167 20 6 30.0071 5 2 40.0072 92 60 65.2273 24 17 70.8374 162 91 56.1790 19 6 31.58Total 1249 542 43.39
Table 10b – Distribution of response ratesaccording to firm sizeClasses Firms Answer 63
N.Answer 63
%
20_99 664 315 47.44100_249 190 74 38.95250 and more 395 153 38.73
Total 1249 542 43.39
As for table 10b we think it is rather surprising that smaller firms had a higher rate of
response. A possible answer to these figures may lie in that bigger firms have a much
more complex organisational and operational structure so that they find it even more
difficult to identify the contribution of the innovative activity within the firm.
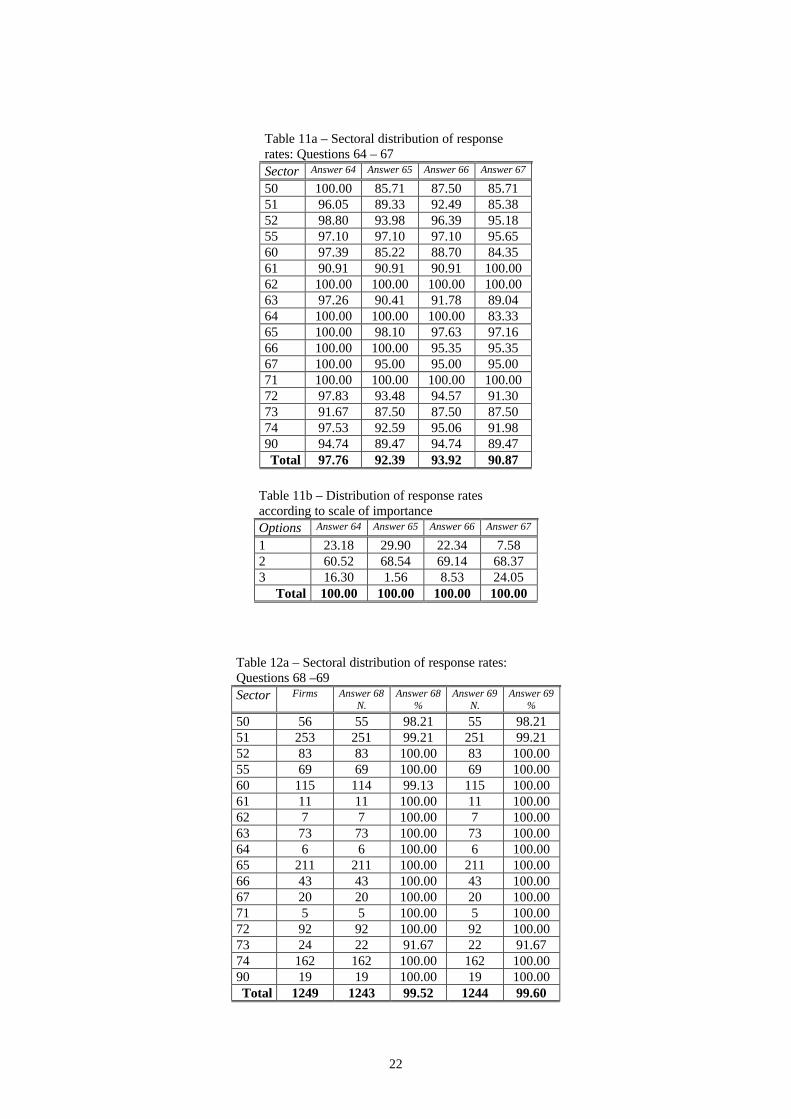
Table 11a contains the rates of response to the perceived impact of innovation on
employment — which has in its background the issue of technological unemployment.
However as we can see from table 11b the largest majority of the firms (the percentage
is always higher than 60%) responded that innovation does not affect employment (row
2), not even when we try to distinguish between different skill levels (columns 2, 3, and
4 which indicate respectively highly, medium, and low qualified workers). Finally, as
there often occurs, big firms tend to have a higher response rate.
22
Table 11a – Sectoral distribution of responserates: Questions 64 – 67Sector Answer 64 Answer 65 Answer 66 Answer 67
50 100.00 85.71 87.50 85.7151 96.05 89.33 92.49 85.3852 98.80 93.98 96.39 95.1855 97.10 97.10 97.10 95.6560 97.39 85.22 88.70 84.3561 90.91 90.91 90.91 100.0062 100.00 100.00 100.00 100.0063 97.26 90.41 91.78 89.0464 100.00 100.00 100.00 83.3365 100.00 98.10 97.63 97.1666 100.00 100.00 95.35 95.3567 100.00 95.00 95.00 95.0071 100.00 100.00 100.00 100.0072 97.83 93.48 94.57 91.3073 91.67 87.50 87.50 87.5074 97.53 92.59 95.06 91.9890 94.74 89.47 94.74 89.47Total 97.76 92.39 93.92 90.87
Table 11b – Distribution of response ratesaccording to scale of importanceOptions Answer 64 Answer 65 Answer 66 Answer 67
1 23.18 29.90 22.34 7.582 60.52 68.54 69.14 68.373 16.30 1.56 8.53 24.05
Total 100.00 100.00 100.00 100.00
Table 12a – Sectoral distribution of response rates:Questions 68 –69Sector Firms Answer 68
N.Answer 68
%Answer 69
N.Answer 69
%
50 56 55 98.21 55 98.2151 253 251 99.21 251 99.2152 83 83 100.00 83 100.0055 69 69 100.00 69 100.0060 115 114 99.13 115 100.0061 11 11 100.00 11 100.0062 7 7 100.00 7 100.0063 73 73 100.00 73 100.0064 6 6 100.00 6 100.0065 211 211 100.00 211 100.0066 43 43 100.00 43 100.0067 20 20 100.00 20 100.0071 5 5 100.00 5 100.0072 92 92 100.00 92 100.0073 24 22 91.67 22 91.6774 162 162 100.00 162 100.0090 19 19 100.00 19 100.00Total 1249 1243 99.52 1244 99.60
23
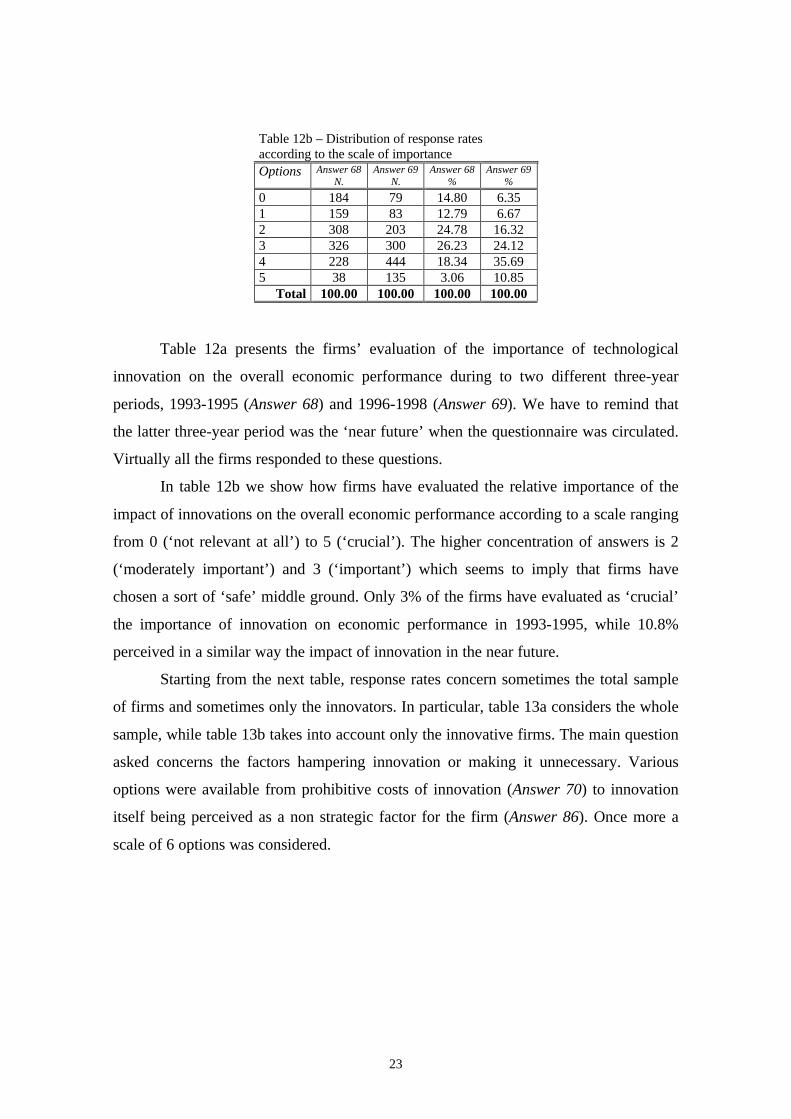
Table 12b – Distribution of response ratesaccording to the scale of importanceOptions Answer 68
N.Answer 69
N.Answer 68
%Answer 69
%
0 184 79 14.80 6.351 159 83 12.79 6.672 308 203 24.78 16.323 326 300 26.23 24.124 228 444 18.34 35.695 38 135 3.06 10.85
Total 100.00 100.00 100.00 100.00
Table 12a presents the firms’ evaluation of the importance of technological
innovation on the overall economic performance during to two different three-year
periods, 1993-1995 (Answer 68) and 1996-1998 (Answer 69). We have to remind that
the latter three-year period was the ‘near future’ when the questionnaire was circulated.
Virtually all the firms responded to these questions.
In table 12b we show how firms have evaluated the relative importance of the
impact of innovations on the overall economic performance according to a scale ranging
from 0 (‘not relevant at all’) to 5 (‘crucial’). The higher concentration of answers is 2
(‘moderately important’) and 3 (‘important’) which seems to imply that firms have
chosen a sort of ‘safe’ middle ground. Only 3% of the firms have evaluated as ‘crucial’
the importance of innovation on economic performance in 1993-1995, while 10.8%
perceived in a similar way the impact of innovation in the near future.
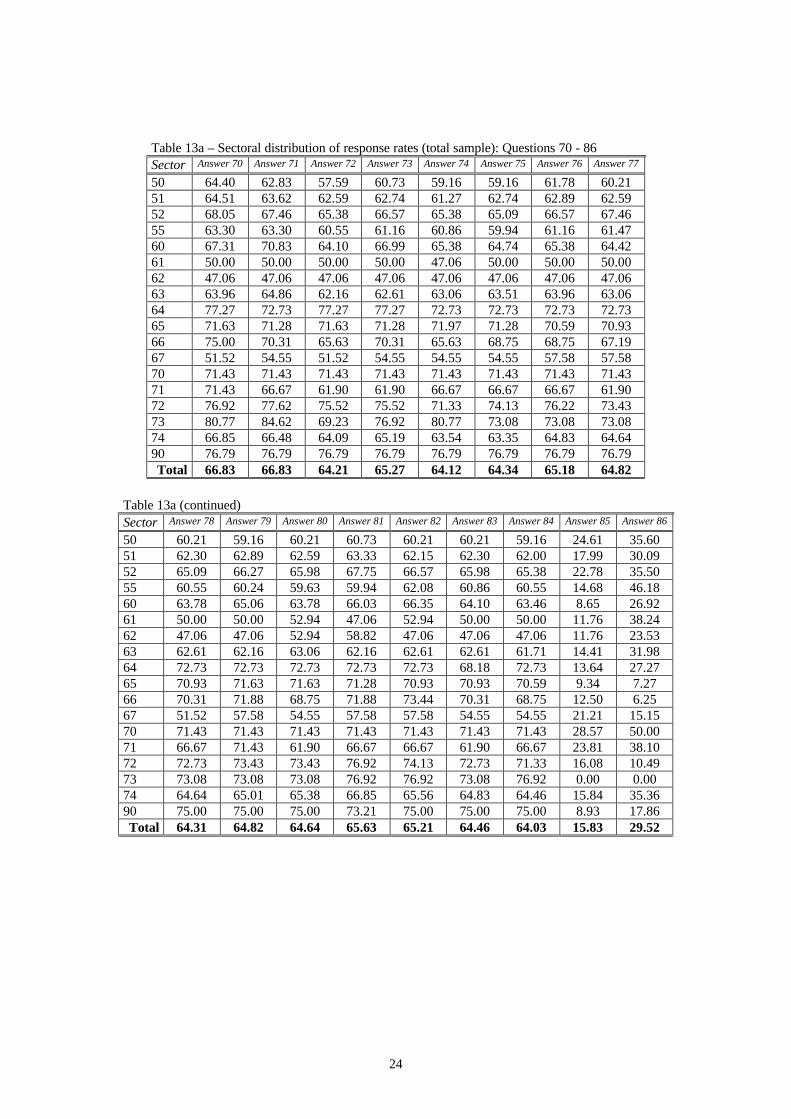
Starting from the next table, response rates concern sometimes the total sample
of firms and sometimes only the innovators. In particular, table 13a considers the whole
sample, while table 13b takes into account only the innovative firms. The main question
asked concerns the factors hampering innovation or making it unnecessary. Various
options were available from prohibitive costs of innovation (Answer 70) to innovation
itself being perceived as a non strategic factor for the firm (Answer 86). Once more a
scale of 6 options was considered.
24
Table 13a – Sectoral distribution of response rates (total sample): Questions 70 - 86Sector Answer 70 Answer 71 Answer 72 Answer 73 Answer 74 Answer 75 Answer 76 Answer 77
50 64.40 62.83 57.59 60.73 59.16 59.16 61.78 60.2151 64.51 63.62 62.59 62.74 61.27 62.74 62.89 62.5952 68.05 67.46 65.38 66.57 65.38 65.09 66.57 67.4655 63.30 63.30 60.55 61.16 60.86 59.94 61.16 61.4760 67.31 70.83 64.10 66.99 65.38 64.74 65.38 64.4261 50.00 50.00 50.00 50.00 47.06 50.00 50.00 50.0062 47.06 47.06 47.06 47.06 47.06 47.06 47.06 47.0663 63.96 64.86 62.16 62.61 63.06 63.51 63.96 63.0664 77.27 72.73 77.27 77.27 72.73 72.73 72.73 72.7365 71.63 71.28 71.63 71.28 71.97 71.28 70.59 70.9366 75.00 70.31 65.63 70.31 65.63 68.75 68.75 67.1967 51.52 54.55 51.52 54.55 54.55 54.55 57.58 57.5870 71.43 71.43 71.43 71.43 71.43 71.43 71.43 71.4371 71.43 66.67 61.90 61.90 66.67 66.67 66.67 61.9072 76.92 77.62 75.52 75.52 71.33 74.13 76.22 73.4373 80.77 84.62 69.23 76.92 80.77 73.08 73.08 73.0874 66.85 66.48 64.09 65.19 63.54 63.35 64.83 64.6490 76.79 76.79 76.79 76.79 76.79 76.79 76.79 76.79Total 66.83 66.83 64.21 65.27 64.12 64.34 65.18 64.82
Table 13a (continued)Sector Answer 78 Answer 79 Answer 80 Answer 81 Answer 82 Answer 83 Answer 84 Answer 85 Answer 86
50 60.21 59.16 60.21 60.73 60.21 60.21 59.16 24.61 35.6051 62.30 62.89 62.59 63.33 62.15 62.30 62.00 17.99 30.0952 65.09 66.27 65.98 67.75 66.57 65.98 65.38 22.78 35.5055 60.55 60.24 59.63 59.94 62.08 60.86 60.55 14.68 46.1860 63.78 65.06 63.78 66.03 66.35 64.10 63.46 8.65 26.9261 50.00 50.00 52.94 47.06 52.94 50.00 50.00 11.76 38.2462 47.06 47.06 52.94 58.82 47.06 47.06 47.06 11.76 23.5363 62.61 62.16 63.06 62.16 62.61 62.61 61.71 14.41 31.9864 72.73 72.73 72.73 72.73 72.73 68.18 72.73 13.64 27.2765 70.93 71.63 71.63 71.28 70.93 70.93 70.59 9.34 7.2766 70.31 71.88 68.75 71.88 73.44 70.31 68.75 12.50 6.2567 51.52 57.58 54.55 57.58 57.58 54.55 54.55 21.21 15.1570 71.43 71.43 71.43 71.43 71.43 71.43 71.43 28.57 50.0071 66.67 71.43 61.90 66.67 66.67 61.90 66.67 23.81 38.1072 72.73 73.43 73.43 76.92 74.13 72.73 71.33 16.08 10.4973 73.08 73.08 73.08 76.92 76.92 73.08 76.92 0.00 0.0074 64.64 65.01 65.38 66.85 65.56 64.83 64.46 15.84 35.3690 75.00 75.00 75.00 73.21 75.00 75.00 75.00 8.93 17.86Total 64.31 64.82 64.64 65.63 65.21 64.46 64.03 15.83 29.52
25
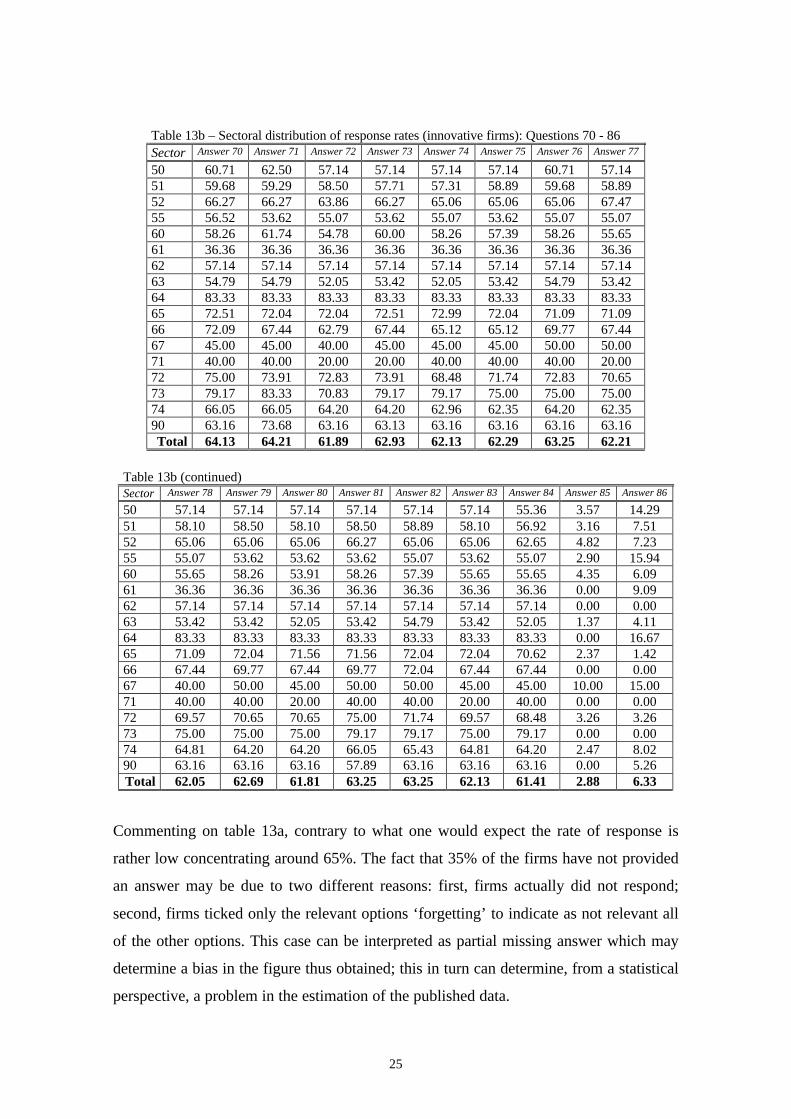
Table 13b – Sectoral distribution of response rates (innovative firms): Questions 70 - 86Sector Answer 70 Answer 71 Answer 72 Answer 73 Answer 74 Answer 75 Answer 76 Answer 77
50 60.71 62.50 57.14 57.14 57.14 57.14 60.71 57.1451 59.68 59.29 58.50 57.71 57.31 58.89 59.68 58.8952 66.27 66.27 63.86 66.27 65.06 65.06 65.06 67.4755 56.52 53.62 55.07 53.62 55.07 53.62 55.07 55.0760 58.26 61.74 54.78 60.00 58.26 57.39 58.26 55.6561 36.36 36.36 36.36 36.36 36.36 36.36 36.36 36.3662 57.14 57.14 57.14 57.14 57.14 57.14 57.14 57.1463 54.79 54.79 52.05 53.42 52.05 53.42 54.79 53.4264 83.33 83.33 83.33 83.33 83.33 83.33 83.33 83.3365 72.51 72.04 72.04 72.51 72.99 72.04 71.09 71.0966 72.09 67.44 62.79 67.44 65.12 65.12 69.77 67.4467 45.00 45.00 40.00 45.00 45.00 45.00 50.00 50.0071 40.00 40.00 20.00 20.00 40.00 40.00 40.00 20.0072 75.00 73.91 72.83 73.91 68.48 71.74 72.83 70.6573 79.17 83.33 70.83 79.17 79.17 75.00 75.00 75.0074 66.05 66.05 64.20 64.20 62.96 62.35 64.20 62.3590 63.16 73.68 63.16 63.13 63.16 63.16 63.16 63.16Total 64.13 64.21 61.89 62.93 62.13 62.29 63.25 62.21
Table 13b (continued)Sector Answer 78 Answer 79 Answer 80 Answer 81 Answer 82 Answer 83 Answer 84 Answer 85 Answer 86
50 57.14 57.14 57.14 57.14 57.14 57.14 55.36 3.57 14.2951 58.10 58.50 58.10 58.50 58.89 58.10 56.92 3.16 7.5152 65.06 65.06 65.06 66.27 65.06 65.06 62.65 4.82 7.2355 55.07 53.62 53.62 53.62 55.07 53.62 55.07 2.90 15.9460 55.65 58.26 53.91 58.26 57.39 55.65 55.65 4.35 6.0961 36.36 36.36 36.36 36.36 36.36 36.36 36.36 0.00 9.0962 57.14 57.14 57.14 57.14 57.14 57.14 57.14 0.00 0.0063 53.42 53.42 52.05 53.42 54.79 53.42 52.05 1.37 4.1164 83.33 83.33 83.33 83.33 83.33 83.33 83.33 0.00 16.6765 71.09 72.04 71.56 71.56 72.04 72.04 70.62 2.37 1.4266 67.44 69.77 67.44 69.77 72.04 67.44 67.44 0.00 0.0067 40.00 50.00 45.00 50.00 50.00 45.00 45.00 10.00 15.0071 40.00 40.00 20.00 40.00 40.00 20.00 40.00 0.00 0.0072 69.57 70.65 70.65 75.00 71.74 69.57 68.48 3.26 3.2673 75.00 75.00 75.00 79.17 79.17 75.00 79.17 0.00 0.0074 64.81 64.20 64.20 66.05 65.43 64.81 64.20 2.47 8.0290 63.16 63.16 63.16 57.89 63.16 63.16 63.16 0.00 5.26Total 62.05 62.69 61.81 63.25 63.25 62.13 61.41 2.88 6.33
Commenting on table 13a, contrary to what one would expect the rate of response is
rather low concentrating around 65%. The fact that 35% of the firms have not provided
an answer may be due to two different reasons: first, firms actually did not respond;
second, firms ticked only the relevant options ‘forgetting’ to indicate as not relevant all
of the other options. This case can be interpreted as partial missing answer which may
determine a bias in the figure thus obtained; this in turn can determine, from a statistical
perspective, a problem in the estimation of the published data.
26
Bearing the above in mind, figures show a fairly broad range of values. For
instance, ‘only’ 47.06% of firms belonging in sector 62 deemed the cost of innovation
to be too high, while 80.77% of sector 73 considered it too high (Answer 70). Also,
when we look at the columns containing answer 85 and 86 of table 12a, it is worth
emphasising that 15.83% of firms of the total sample did not innovate in the three-year
period 1993-1995 because they had already innovated (Answer 85), while 29.5% of
firms of the same sample did not think innovation as a strategic factor (Answer 86).
About table 13b we have to point out that even when we consider only innovative firms
similar structural problems emerge.
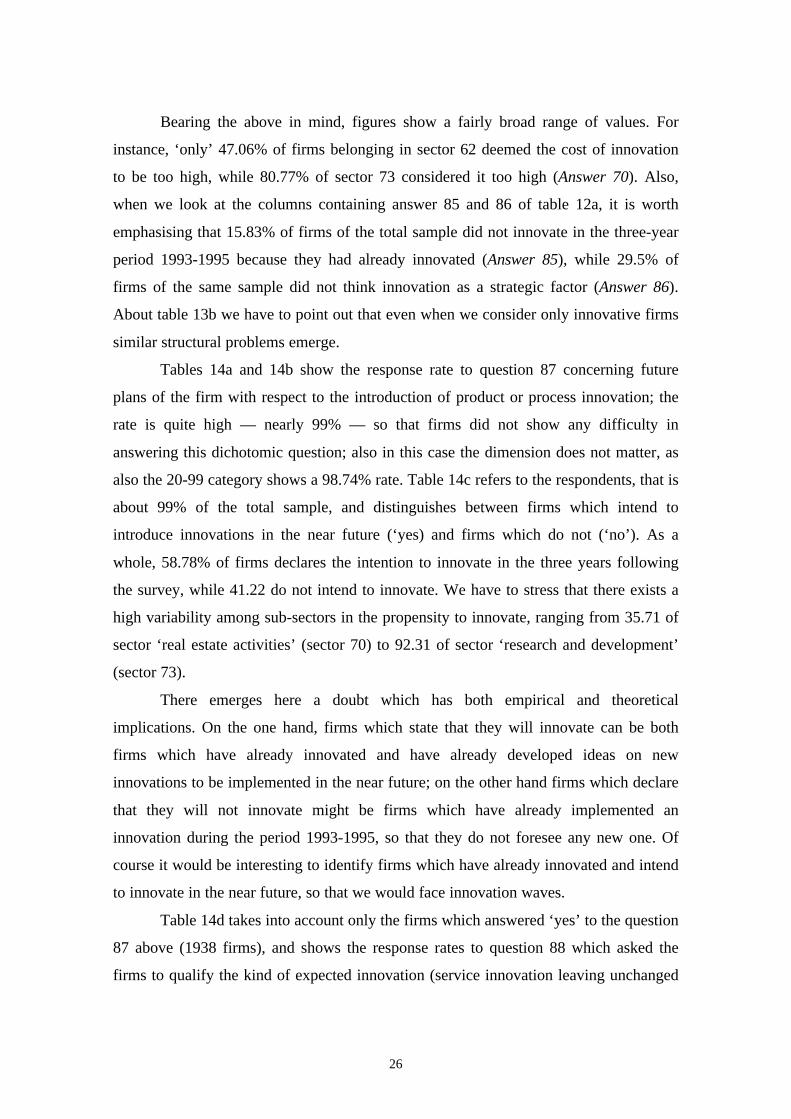
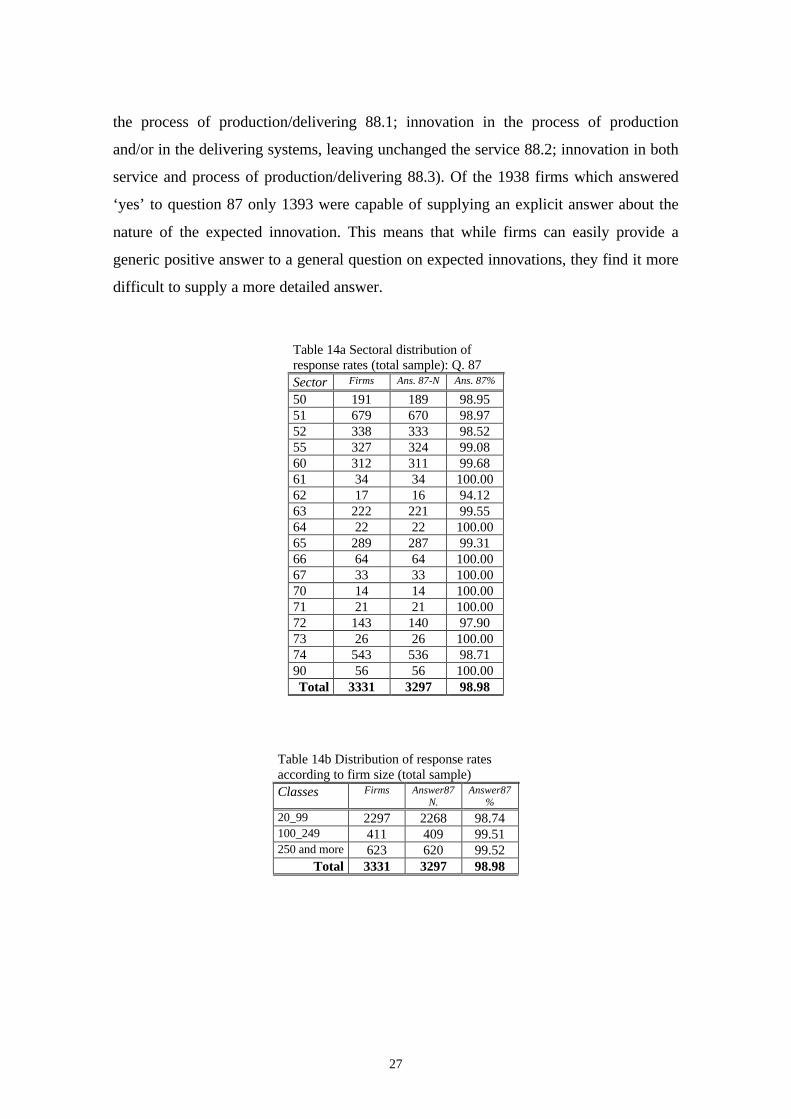
Tables 14a and 14b show the response rate to question 87 concerning future
plans of the firm with respect to the introduction of product or process innovation; the
rate is quite high — nearly 99% — so that firms did not show any difficulty in
answering this dichotomic question; also in this case the dimension does not matter, as
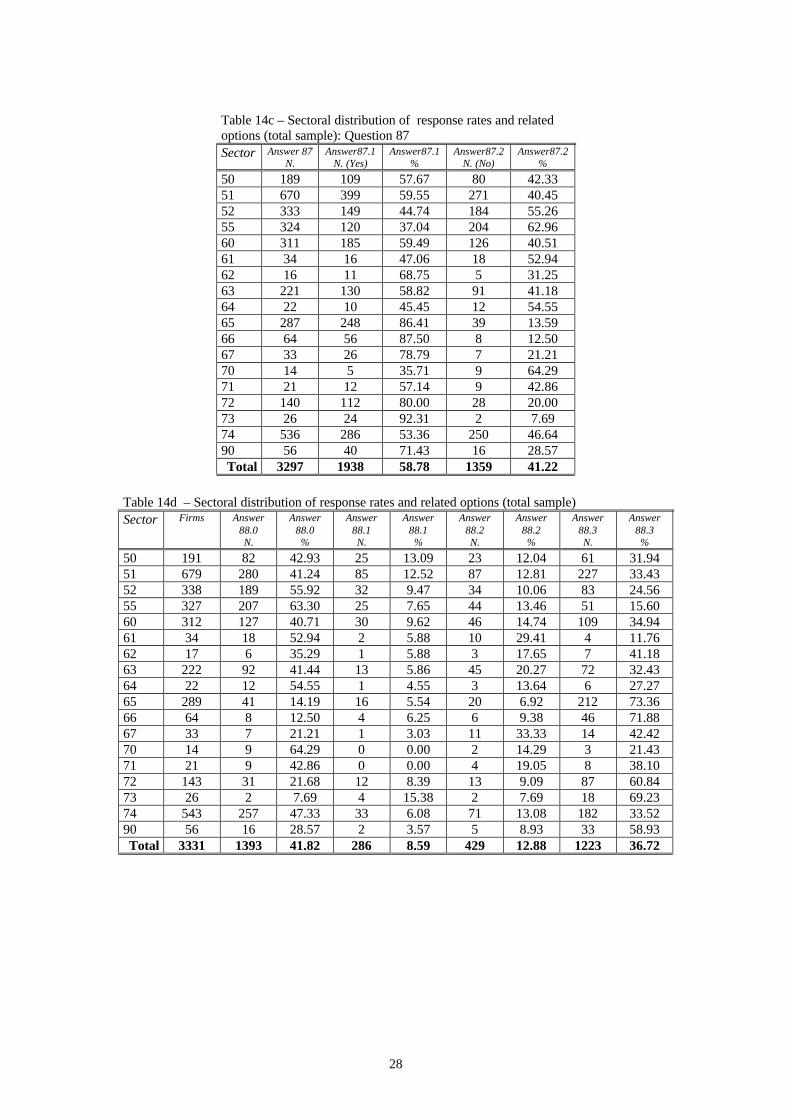
also the 20-99 category shows a 98.74% rate. Table 14c refers to the respondents, that is
about 99% of the total sample, and distinguishes between firms which intend to
introduce innovations in the near future (‘yes) and firms which do not (‘no’). As a
whole, 58.78% of firms declares the intention to innovate in the three years following
the survey, while 41.22 do not intend to innovate. We have to stress that there exists a
high variability among sub-sectors in the propensity to innovate, ranging from 35.71 of
sector ‘real estate activities’ (sector 70) to 92.31 of sector ‘research and development’
(sector 73).
There emerges here a doubt which has both empirical and theoretical
implications. On the one hand, firms which state that they will innovate can be both
firms which have already innovated and have already developed ideas on new
innovations to be implemented in the near future; on the other hand firms which declare
that they will not innovate might be firms which have already implemented an
innovation during the period 1993-1995, so that they do not foresee any new one. Of
course it would be interesting to identify firms which have already innovated and intend
to innovate in the near future, so that we would face innovation waves.
Table 14d takes into account only the firms which answered ‘yes’ to the question
87 above (1938 firms), and shows the response rates to question 88 which asked the
firms to qualify the kind of expected innovation (service innovation leaving unchanged
27
the process of production/delivering 88.1; innovation in the process of production
and/or in the delivering systems, leaving unchanged the service 88.2; innovation in both
service and process of production/delivering 88.3). Of the 1938 firms which answered
‘yes’ to question 87 only 1393 were capable of supplying an explicit answer about the
nature of the expected innovation. This means that while firms can easily provide a
generic positive answer to a general question on expected innovations, they find it more
difficult to supply a more detailed answer.
Table 14a Sectoral distribution ofresponse rates (total sample): Q. 87Sector Firms Ans. 87-N Ans. 87%
50 191 189 98.9551 679 670 98.9752 338 333 98.5255 327 324 99.0860 312 311 99.6861 34 34 100.0062 17 16 94.1263 222 221 99.5564 22 22 100.0065 289 287 99.3166 64 64 100.0067 33 33 100.0070 14 14 100.0071 21 21 100.0072 143 140 97.9073 26 26 100.0074 543 536 98.7190 56 56 100.00Total 3331 3297 98.98
Table 14b Distribution of response ratesaccording to firm size (total sample)Classes Firms Answer87
N.Answer87
%
20_99 2297 2268 98.74100_249 411 409 99.51250 and more 623 620 99.52
Total 3331 3297 98.98
28
Table 14c – Sectoral distribution of response rates and relatedoptions (total sample): Question 87Sector Answer 87
N.Answer87.1
N. (Yes)Answer87.1
%Answer87.2
N. (No)Answer87.2
%
50 189 109 57.67 80 42.3351 670 399 59.55 271 40.4552 333 149 44.74 184 55.2655 324 120 37.04 204 62.9660 311 185 59.49 126 40.5161 34 16 47.06 18 52.9462 16 11 68.75 5 31.2563 221 130 58.82 91 41.1864 22 10 45.45 12 54.5565 287 248 86.41 39 13.5966 64 56 87.50 8 12.5067 33 26 78.79 7 21.2170 14 5 35.71 9 64.2971 21 12 57.14 9 42.8672 140 112 80.00 28 20.0073 26 24 92.31 2 7.6974 536 286 53.36 250 46.6490 56 40 71.43 16 28.57Total 3297 1938 58.78 1359 41.22
Table 14d – Sectoral distribution of response rates and related options (total sample)Sector Firms Answer
88.0N.
Answer88.0%
Answer88.1N.
Answer88.1%
Answer88.2N.
Answer88.2%
Answer88.3N.
Answer88.3%
50 191 82 42.93 25 13.09 23 12.04 61 31.9451 679 280 41.24 85 12.52 87 12.81 227 33.4352 338 189 55.92 32 9.47 34 10.06 83 24.5655 327 207 63.30 25 7.65 44 13.46 51 15.6060 312 127 40.71 30 9.62 46 14.74 109 34.9461 34 18 52.94 2 5.88 10 29.41 4 11.7662 17 6 35.29 1 5.88 3 17.65 7 41.1863 222 92 41.44 13 5.86 45 20.27 72 32.4364 22 12 54.55 1 4.55 3 13.64 6 27.2765 289 41 14.19 16 5.54 20 6.92 212 73.3666 64 8 12.50 4 6.25 6 9.38 46 71.8867 33 7 21.21 1 3.03 11 33.33 14 42.4270 14 9 64.29 0 0.00 2 14.29 3 21.4371 21 9 42.86 0 0.00 4 19.05 8 38.1072 143 31 21.68 12 8.39 13 9.09 87 60.8473 26 2 7.69 4 15.38 2 7.69 18 69.2374 543 257 47.33 33 6.08 71 13.08 182 33.5290 56 16 28.57 2 3.57 5 8.93 33 58.93Total 3331 1393 41.82 286 8.59 429 12.88 1223 36.72
29
4. Conclusion: What can we learn from these surveys?
The Community innovation surveys aim at gathering statistical information so that one
can infer the nature and main features of the innovative behaviour and performance of
(European) firms. One of the ‘obvious’ consequences consists of the use of such
information for policy prescriptions.
What we have seen are the characteristics of the questionnaire used to this end,
and up to now we have basically refrained from doing any consideration about the
theoretical background of the questions asked. In other words, we have assumed, as
usual in this sort of analyses, that published data are characterised by a sort of
theoretical neutrality. However, the latter point, together with the possible statistical
problems which can arise in the process of data estimation, has been recently tackled by
quite a few contribution both in economic statistics and applied economics. Examples
are the work on the possible consequences deriving from the presence of sampling
errors in surveys such as the U.S. retail sales index (Bell and Wilcox, 1993), from the
use of seasonal adjustment methods (Ghysels and Perron, 1993; Maravall, 1997), and
from the adoption in National Accounting of untested hypotheses such as specific
aggregation schemes (Cainelli and Lupi, 1999).
A first point we want to stress consists of the theoretical background which
underlies the survey: in fact the basic assumption implied in the questionnaires used is
that the main characteristics of innovative behaviour in service sector are basically the
same as the ones that we find in manufacturing. Actually, most of the questions are
directly derived from the questionnaire adopted for the manufacturing survey, and it is
not a simple coincidence that the service survey has been centered on ‘technological’
innovation. However, the explicit exclusion of organisational and managerial changes as
well as the exclusion of the implementation of quality standards from the definition of
innovation constitute a structural weakness of the questionnaire.
Coombs and Miles (2000) refer to this way of transferring methods and concepts
developed for studying manufacturing innovation to service innovation as an
“assimilation approach”. This assimilation process does not necessarily capture core
aspects of the innovative activities typical of the service sector. Put it another way,
questions and methods which may perfectly fit with manufacturing innovativeness can
30
introduce theoretical biases in the empirical investigation of service innovation, while
leaving aside important features.
Ideally, it would have been much better to have a specific approach for dealing with
innovation in services, which would thus sign a ‘demarcation’ (Coombs and Miles,
2000):
“This approach … argues that services innovation is highly distinctive, followingdynamics and displaying features that require novel theories and instruments. Thisapproach, although not fully developed, has been the underpinning of specialisedstudies of innovation in services, and is now being tacitly applied by the use of ‘dualapproach’ surveys which adopt different questioning styles for manufacturing andservice firms.” (Coombs and Miles, 2000, pp. 85-86).
We have to point out that the development of analytical tools to investigate
innovative behaviour of the service sector is fairly recent. In fact, leaving aside a few
early contributions (e.g. Barras 1986; Soete and Miozzo, 1989), a broader debate has
taken place only in the mid-1990s (Miles, 1996; Hauknes, 1996; Gallouj and Weinstein,
1997). This is because a specific approach to innovation in services is quite difficult to
realize, while on the other hand there already existed a fully developed theory
concerned with manufacturing. It was thus easier to borrow concepts from the latter.
The reason which justifies these difficulties in developing a specific innovation theory
lies in the marked heterogeneity typical of the service sector, which comprises as
diverse subsectors as information technology and domestic service.
Three points need be emphasised. First of all, when the CIS-II took place the
debate had not yet reached a sufficient degree of maturity, and it is worth stressing that
when the questionnaires were being circulated some relevant works were being
published, i.e. the questionnaires’ structure could not have benefited from those
contributions. Secondly, even today a fully developed — let alone accepted — theory
does not exist. However, thirdly, the CIS-II experience together with the theoretical
debate of the last few years has made it possible to lay the foundations of a demarcation
approach — in this sense one can see Metcalfe and Miles (2000).
If what we have just said refers to the problems, characteristics and links
between theoretical considerations and the structure of the questionnaire, now let us
take into account the way in which firms answered the questions and what we can infer
from these answers. First of all, firms seem to show a lower capability to respond to
quantitative questions than to qualitative ones. This does not mean that qualitative
31
questions are intrinsically ‘better’ than quantitative ones, but rather, firms may have
difficulties in quantifying some aspects of their innovative process. In fact, innovations
in services often are pervasive and affect the whole organisation of the work process
and the competencies, making thus difficult the clear identification of specific
components of costs. A clear example is given by the response rate to question 63
(where firms were required to provide a percentage estimate of total 1995 turnover
connected with the new services ). Also, one has to keep into account that firms may be
reluctant to provide quantitative data on their innovative efforts despite all of the
assurances on confidentiality granted to them — but this is an insurmountable obstacle.
Secondly, the introduction of indirect indicators might be useful: an example,
concerning innovative capabilities, could be asking a question on the percentage of
employees capable of using specific software packages. Thirdly, from the analysis of
the previous sections there emerges that the response rates show a greater variability at
the sectoral level rather than at the dimensional level; put it another way, the response
rate does not depend on the dimension of the firms, but rather on the sector in which the
firm itself operates. This result indicates that it would be advisable to perform surveys
which take into account a more limited number of subsectors, characterised by greater
homogeneity.
A clarification is needed to remember that the Italian survey considered a fairly
‘high’ minimum size, i.e. 20 employees — and we have emphasised that such a
minimum size excludes 99% of firms and 66% of employees of the tertiary sector;
should we consider smaller firms, we suspect that the response rates would we more
variable, i.e. the small dimension would affect response rates. More important, such a
high rate of exclusion raises serious doubts on the heuristic capabilities of the Italian
survey.
Two final remarks emerge, one dealing with data construction, and the other
with data utilization. The first point concerns the role played by economic theory in
guiding the construction of statistical information – and in this sense, theory was not yet
developed enough when the survey took place. The second remark concerns policy
implications; in fact policy prescriptions addressing the service sector based on
manufacturing-biased concepts and methods may lead to ‘biased’ policy interventions.

32
Appendix A
In appendix A we provide the list of sectors included in the survey:
50 Sale, maintenance and repair of motor vehicles and motorcycles; retail trade ofautomotive fuel.
51 Wholesale trade and commission trade, except of motor vehicles and motorcycles.52 Retail trade, except of motor vehicles and motorcycles, repair of personal and
household goods.55 Hotels and restaurants.60 Land transport; transport via pipelines.61 Water transport.62 Air transport.63 Supporting and auxiliary transport activities; activities of travel agencies.64 Post and telecommunications.65 Financial intermediation66 Insurance and pension funding, except compulsory social security.67 Activities auxiliary to financial intermediation.70 Real estate activities.71 Renting of machinery and equipment without operator and personal and household
goods.72 Computer and related activities.73 Research and development (R&D).74 Other business activities90 Sewage and refuse disposal, sanitation and similar activities.
33
Appendix B
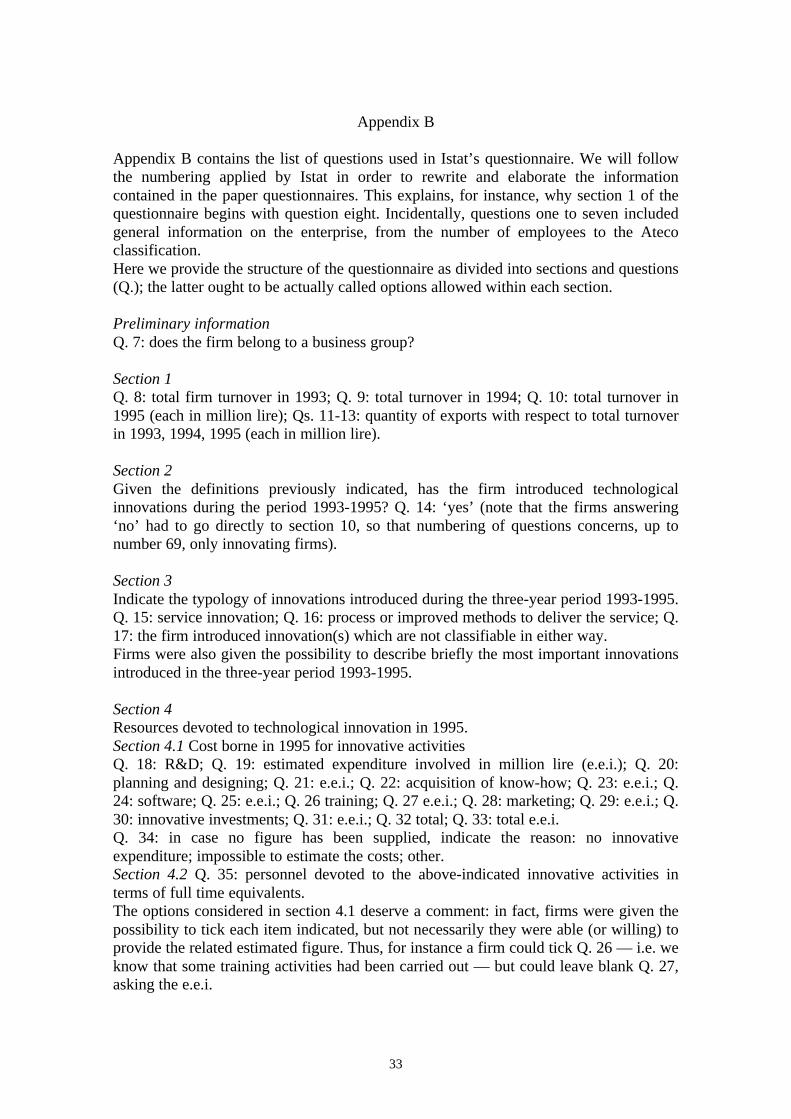
Appendix B contains the list of questions used in Istat’s questionnaire. We will followthe numbering applied by Istat in order to rewrite and elaborate the informationcontained in the paper questionnaires. This explains, for instance, why section 1 of thequestionnaire begins with question eight. Incidentally, questions one to seven includedgeneral information on the enterprise, from the number of employees to the Atecoclassification.Here we provide the structure of the questionnaire as divided into sections and questions(Q.); the latter ought to be actually called options allowed within each section.
Preliminary informationQ. 7: does the firm belong to a business group?
Section 1Q. 8: total firm turnover in 1993; Q. 9: total turnover in 1994; Q. 10: total turnover in1995 (each in million lire); Qs. 11-13: quantity of exports with respect to total turnoverin 1993, 1994, 1995 (each in million lire).
Section 2Given the definitions previously indicated, has the firm introduced technologicalinnovations during the period 1993-1995? Q. 14: ‘yes’ (note that the firms answering‘no’ had to go directly to section 10, so that numbering of questions concerns, up tonumber 69, only innovating firms).
Section 3Indicate the typology of innovations introduced during the three-year period 1993-1995.Q. 15: service innovation; Q. 16: process or improved methods to deliver the service; Q.17: the firm introduced innovation(s) which are not classifiable in either way.Firms were also given the possibility to describe briefly the most important innovationsintroduced in the three-year period 1993-1995.
Section 4Resources devoted to technological innovation in 1995.Section 4.1 Cost borne in 1995 for innovative activitiesQ. 18: R&D; Q. 19: estimated expenditure involved in million lire (e.e.i.); Q. 20:planning and designing; Q. 21: e.e.i.; Q. 22: acquisition of know-how; Q. 23: e.e.i.; Q.24: software; Q. 25: e.e.i.; Q. 26 training; Q. 27 e.e.i.; Q. 28: marketing; Q. 29: e.e.i.; Q.30: innovative investments; Q. 31: e.e.i.; Q. 32 total; Q. 33: total e.e.i.Q. 34: in case no figure has been supplied, indicate the reason: no innovativeexpenditure; impossible to estimate the costs; other.Section 4.2 Q. 35: personnel devoted to the above-indicated innovative activities interms of full time equivalents.The options considered in section 4.1 deserve a comment: in fact, firms were given thepossibility to tick each item indicated, but not necessarily they were able (or willing) toprovide the related estimated figure. Thus, for instance a firm could tick Q. 26 — i.e. weknow that some training activities had been carried out — but could leave blank Q. 27,asking the e.e.i.
34
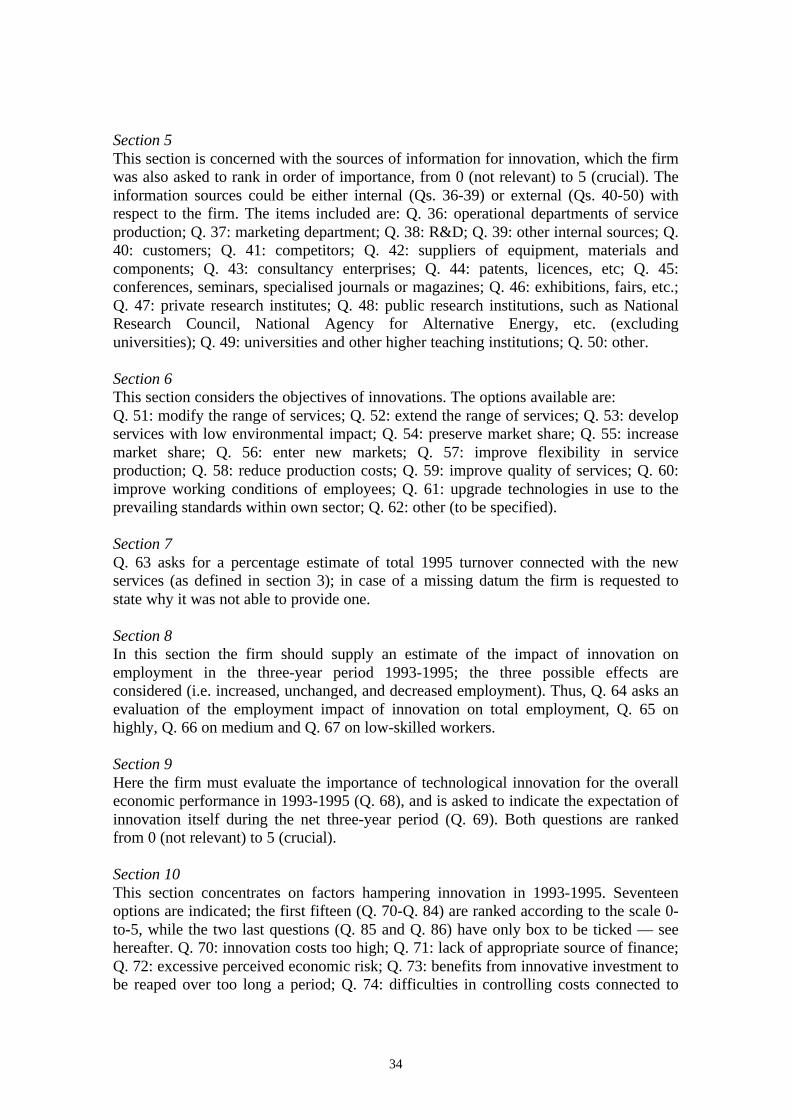
Section 5This section is concerned with the sources of information for innovation, which the firmwas also asked to rank in order of importance, from 0 (not relevant) to 5 (crucial). Theinformation sources could be either internal (Qs. 36-39) or external (Qs. 40-50) withrespect to the firm. The items included are: Q. 36: operational departments of serviceproduction; Q. 37: marketing department; Q. 38: R&D; Q. 39: other internal sources; Q.40: customers; Q. 41: competitors; Q. 42: suppliers of equipment, materials andcomponents; Q. 43: consultancy enterprises; Q. 44: patents, licences, etc; Q. 45:conferences, seminars, specialised journals or magazines; Q. 46: exhibitions, fairs, etc.;Q. 47: private research institutes; Q. 48: public research institutions, such as NationalResearch Council, National Agency for Alternative Energy, etc. (excludinguniversities); Q. 49: universities and other higher teaching institutions; Q. 50: other.
Section 6This section considers the objectives of innovations. The options available are:Q. 51: modify the range of services; Q. 52: extend the range of services; Q. 53: developservices with low environmental impact; Q. 54: preserve market share; Q. 55: increasemarket share; Q. 56: enter new markets; Q. 57: improve flexibility in serviceproduction; Q. 58: reduce production costs; Q. 59: improve quality of services; Q. 60:improve working conditions of employees; Q. 61: upgrade technologies in use to theprevailing standards within own sector; Q. 62: other (to be specified).
Section 7Q. 63 asks for a percentage estimate of total 1995 turnover connected with the newservices (as defined in section 3); in case of a missing datum the firm is requested tostate why it was not able to provide one.
Section 8In this section the firm should supply an estimate of the impact of innovation onemployment in the three-year period 1993-1995; the three possible effects areconsidered (i.e. increased, unchanged, and decreased employment). Thus, Q. 64 asks anevaluation of the employment impact of innovation on total employment, Q. 65 onhighly, Q. 66 on medium and Q. 67 on low-skilled workers.
Section 9Here the firm must evaluate the importance of technological innovation for the overalleconomic performance in 1993-1995 (Q. 68), and is asked to indicate the expectation ofinnovation itself during the net three-year period (Q. 69). Both questions are rankedfrom 0 (not relevant) to 5 (crucial).
Section 10This section concentrates on factors hampering innovation in 1993-1995. Seventeenoptions are indicated; the first fifteen (Q. 70-Q. 84) are ranked according to the scale 0-to-5, while the two last questions (Q. 85 and Q. 86) have only box to be ticked — seehereafter. Q. 70: innovation costs too high; Q. 71: lack of appropriate source of finance;Q. 72: excessive perceived economic risk; Q. 73: benefits from innovative investment tobe reaped over too long a period; Q. 74: difficulties in controlling costs connected to
35
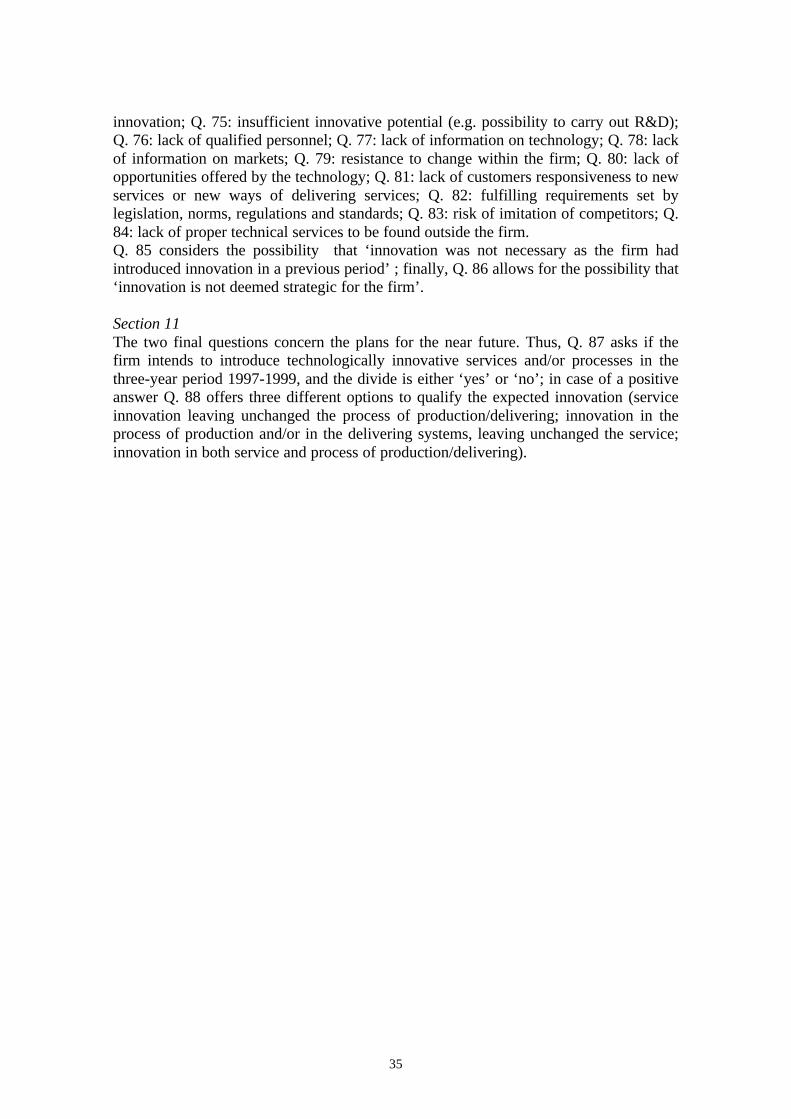
innovation; Q. 75: insufficient innovative potential (e.g. possibility to carry out R&D);Q. 76: lack of qualified personnel; Q. 77: lack of information on technology; Q. 78: lackof information on markets; Q. 79: resistance to change within the firm; Q. 80: lack ofopportunities offered by the technology; Q. 81: lack of customers responsiveness to newservices or new ways of delivering services; Q. 82: fulfilling requirements set bylegislation, norms, regulations and standards; Q. 83: risk of imitation of competitors; Q.84: lack of proper technical services to be found outside the firm.Q. 85 considers the possibility that ‘innovation was not necessary as the firm hadintroduced innovation in a previous period’ ; finally, Q. 86 allows for the possibility that‘innovation is not deemed strategic for the firm’.
Section 11The two final questions concern the plans for the near future. Thus, Q. 87 asks if thefirm intends to introduce technologically innovative services and/or processes in thethree-year period 1997-1999, and the divide is either ‘yes’ or ‘no’; in case of a positiveanswer Q. 88 offers three different options to qualify the expected innovation (serviceinnovation leaving unchanged the process of production/delivering; innovation in theprocess of production and/or in the delivering systems, leaving unchanged the service;innovation in both service and process of production/delivering).
36
ReferencesBarras R. (1986), Towards a Theory of Innovation in Services, Research Policy, vol. 15.Baily M.N. and Chakrabarti A.K. (1988), Innovation and the Productivity Crisis,
Washington, Brookings Institution.Bell W.R. and Wilcox D.W. (1993), The effects of sampling error on the time series
behaviour of consumption data, Journal of Econometrics, vol. 55, pp. 235-265.Cainelli G. and Lupi C. (1999), The choice of the aggregation level in the estimation of
quarterly national accounts, Review of Income and Wealth, series 45, number 4, pp.483-492.
Coombs R. and Miles I. (2000), Innovation, Measurement and Services: The NewProblematique, in Metcalfe and Miles, chapter 5, pp. 85-103.
Eurostat (1997), Community Innovation Survey II – Core Questionnaire. Service sector,Eurostat.
Gallouj F. and Weinstein O. (1997), Innovation in Services, Research Policy, vol. 26,pp. 537-556.
Ghysel E. and Perron P. (1993), The effect of seasonal adjustment filters on tests for aunit root, Journal of Econometrics, vol. 55, pp.57-98.
Hauknes J. (1996), Innovation in the Service Economy, Step Report, n. 7/96, Oslo.Hauknes J. (1999), A service based approach to innovation. A need for new concepts?
Challenges for the CIS approach to innovation, WP/STEP Group, November, Oslo.Holub H.W. and Tappeiner G. (1994), Modelling on the basis of models, Review of
Income and Wealth, series 43, pp. 505-510.Istat (1996), Questionnaire: Indagine sull’inovazione tecnologica nelle imprese dei
servizi. Anni 1993-95. Rilevazione pilota, Rome, Istat.Istat (1999), Censimento Intermedio dell’Industria e dei Servizi, 31 Dicembre 1996 -
Italia, Rome, Istat.Maravall A. (1997), Abuse of time series techniques in economic analysis, paper
presented at the 5th CEMAPRE Conference, Lisboa, 1997.Metcalfe J.S. and Miles I. (eds) (2000), Innovation systems in the service economy,
London, Kluwer Academic Publishers.Miles I. (1996), Innovation in Services: Services in Innovation, WP of the Manchester
Statistical Society.Oecd-Eurostat (1997), Proposed guidelines for collecting and interpreting technological
innovation data. Oslo manual, Paris, Oecd.Oecd (1999), Oecd Historical Statistics 1960-1997, Paris, Oecd.Perani G. and Del Santo A. (1999), “La rilevazione statistica dell’innovazione
tecnologica nei servizi”, in: Economia e Politica Industriale, n.103, pp. 147-172.Richter J. (1994), Use and misuse of national accounts from a modelling perspective,
Review of Income and Wealth, series 40, pp. 99-110.Sirilli G. and Evangelista R. (1998), “Technological innovation in services and
manufacturing: results from Italian surveys”, in: Research Policy, vol. 27, pp.881-899.
Soete L. and Miozzo M. (1989), Trade and Development in Services: A TechnologicalPerspective, WP 89-031, Merit, Maastricht.
Tether B.S. (1999), Innovation in services: A comparison with manufacturing usingevidence from the United Kingdom’s Community Innovation Survey, WP/CRIC,Manchester.
Copyright © 2022 FDOKUMEN