What are the links between morbidity and economic level ...
9
What are the links between morbidity and economic level? How should these terms be defined? These and other questions are raised in this paper. The author discusses the difficulties involved, and illustrates his discussion with examples selected from a survey carried out on Taiwan. PROBLEMS IN MEASURING THE INFLUENCE OF ECONOMIC LEVELS ON MORBIDITY Timothy D. Baker, M.D., M.P.H., F.A.P.H.A. Introduction OF what importance is the relation of morbidity to economic levels? Why should we address attention to this problem? If we hope to convert the cycle of poverty, ignorance, malnutri- tion, and sickness to one of education, improved nutrition, improved health, and economic development, we must gain understanding of the interactions of these variables. Leona Baumgartner, in a recent editorial in this Journal, quoted from Kimball's book "Tropical Africa": "It is bad enough that a man should be ignorant, for this cuts him off from the commerce of other men's minds; it is perhaps worse that a man should be poor, for this condemns him to a life of stint and scheming, in which there is no time for dreams and no respite from weariness. But what surely is worse, is that a man should be un- well, for this prevents him from doing anything much about either his poverty or his ignorance."17 The problems of ignorance, sickness, and poverty are not restricted to tropical Africa. One finds these problems even in the cities of the United States. Some economists tell us that eco- nomic development per se will lead to better health. Educators claim that edu- cation will lead to both better health and economic development, while we as health workers often claim that without health, neither education nor economic development can succeed. To plan log- ically for improvement in all of these areas one must be able to evaluate effects of each, in order to establish priorities. This paper does not attempt to assess and evaluate the priorities of these fac- tors. The difficulties and shortcomings of use of interview data in lieu of com- plete, standardized history and physical are not discussed.28 29'34 Discussion is limited to problems and pitfalls in the study of the interrelationships of eco- nomic level and morbidity as measured by household interview. Examples are drawn mainly from a year-long, nation- wide study in Taiwan. Background Although interest in the relationship between morbidity and economic level goes back at least as far as Edwin Chad- wick's Report on the Sanitary Condition of the Labouring Population of Great MARCH. 19966 499
-
Upload
khangminh22 -
Category
Documents
-
view
1 -
download
0
Transcript of What are the links between morbidity and economic level ...

What are the links between morbidity and economic level? How shouldthese terms be defined? These and other questions are raised in thispaper. The author discusses the difficulties involved, and illustrateshis discussion with examples selected from a survey carriedout on Taiwan.
PROBLEMS IN MEASURING THE INFLUENCE OF
ECONOMIC LEVELS ON MORBIDITY
Timothy D. Baker, M.D., M.P.H., F.A.P.H.A.
Introduction
OF what importance is the relationof morbidity to economic levels?
Why should we address attention to thisproblem? If we hope to convert thecycle of poverty, ignorance, malnutri-tion, and sickness to one of education,improved nutrition, improved health,and economic development, we mustgain understanding of the interactions ofthese variables. Leona Baumgartner, ina recent editorial in this Journal,quoted from Kimball's book "TropicalAfrica": "It is bad enough that a manshould be ignorant, for this cuts himoff from the commerce of other men'sminds; it is perhaps worse that a manshould be poor, for this condemns himto a life of stint and scheming, in whichthere is no time for dreams and norespite from weariness. But what surelyis worse, is that a man should be un-well, for this prevents him from doinganything much about either his povertyor his ignorance."17 The problems ofignorance, sickness, and poverty are notrestricted to tropical Africa. One findsthese problems even in the cities of theUnited States.Some economists tell us that eco-
nomic development per se will lead tobetter health. Educators claim that edu-cation will lead to both better healthand economic development, while we ashealth workers often claim that withouthealth, neither education nor economicdevelopment can succeed. To plan log-ically for improvement in all of theseareas one must be able to evaluateeffects of each, in order to establishpriorities.
This paper does not attempt to assessand evaluate the priorities of these fac-tors. The difficulties and shortcomingsof use of interview data in lieu of com-plete, standardized history and physicalare not discussed.28 29'34 Discussion islimited to problems and pitfalls in thestudy of the interrelationships of eco-nomic level and morbidity as measuredby household interview. Examples aredrawn mainly from a year-long, nation-wide study in Taiwan.
BackgroundAlthough interest in the relationship
between morbidity and economic levelgoes back at least as far as Edwin Chad-wick's Report on the Sanitary Conditionof the Labouring Population of Great
MARCH. 19966 499
Britain in 1842,2 Chadwick's work andother early studies are based more onimpressions than on statistics, and werefar more concerned with mortality thanmorbidity. However, in the late 1920'sand early 1930's a number of seriousattempts were made to evaluate morbid-ity patterns in the United States. Thesestudies included publication No. 26 ofthe Committee on Costs of MedicalCare,11 which reviewed the incidence ofillness and the cost of medical careamong representative families; thestudies in Essex County and in Hagers-town; and the studies on causes of ill-ness in 9,000 families from the PHSnation-wide periodic canvasses from1928 to 1931.4 The Public Health Serv-ice undertook a national health surveyin 1935-193625 which studied the rela-tion of sickness to its social and eco-nomic settings. Today, there are far toomany morbidity surveys to list them all,but the U. S. National Health Surveydeserves special mention. This survey,in continuous operation since 1957, hasin many ways set the standards for othernational health services. It provides awealth of useful data for health plan-ners in the United States.24
Major PointsThe four major points of this paper
are:First, economic level may be meas-
ured in at least three ways-income,expenditure, or wealth. Each of thesemeasures varies in ease of collection andin suitability for analysis.
Second, one may use family orweighted per capita measures. Use offamily expenditure shifts the largerfamilies with larger expenditures andmore opportunity for multiple wageearners into the higher economic levels.Per capita income or per capita ex-penditure is probably an improvementover the use of family data. Perhaps thebest measure is a scale which takes
cognizance of the fact that each addi-tional unit in a family will not cause asmuch increase in expenditure as theinitial unit.
Third, if one uses expenditure as ameasure of economic level in morbiditystudies, it may be essential to correcttotal expenditures by subtracting themedical expenditures, as these are ob-viously highly correlated with morbidity.Whether this correlation affects the re-sults significantly is another, and inreality the important, question.
Fourth, the definition of morbidityvaries. Whether this definition is beddays, days of reduced activity, days of"sickness" or persons sick will influencethe relationship of morbidity and eco-nomic level.
In considering all of these points wehope to show that morbidity-economicpatterns may show quite large, apparentshifts depending upon the method ofmeasuring economic level and themethod of measuring morbidity. Theexplanation of these shifts may lie inthe fact that economic level per se hasno direct causal relationship with mor-bidity, but acts through a series of moreor less closely correlated variables suchas age, sex, health practices, nutrition,housing, availability of medical care,and so forth. The complex interrela-tionships of the independent variablessuggest the use of multivariate analysisand we have used this method on ourTaiwan data. Presentation of resultswould probably not clarify, but confusethis presentation.Most of the remainder of this article
presents examples to illustrate these ma-jor points. A few of these examplescome from National Health Surveydata.22'23 The majority are drawn fromour study in Taiwan.
The Taiwan SurveyThe major purpose of our research
in Taiwan was to collect and analyzedata for a health manpower plan for
VOL. 56. NO. 3, A.J.P.H.
INFLUENCE OF ECONOMIC LEVELS ON MORBIDITY
Taiwan.* To measure the demand formedical services we undertook a ran-dom, cluster sample of households, strati-fied by urban-rural location. Thestrata were weighted according to totalsize of the strata components in thewhole population. Within each stratum,sampling areas were randomly selected,as were specific households. (Eachselected household was the index forthree other households; this is similar tothe method used by the National HealthSurvey.) The random selection of house-holds was made by reference to thehousehold register, a most useful heri-tage of the Japanese occupation. Eachmonth, a district public health nurse,who had been trained in our specialcourse in interviewing, contacted a setnumber of families. During the inter-view, the nurse sought to establish thefamily's expenditure pattern by esti-mating the value of staple foods con-sumed, inquiringr about expenditures forrent or equivalent rental value forowned housing, education, householdstaples, and so on, on a monthly basis,and about major expenditures on ayearly basis. In addition to the basicquestions about use of health services,the nurse asked about sickness in thefamily and about days lost from usualactivity during the previous month.When the interview was complete,
the nurse forwarded the questionnairesto the central office. The questionnaireswere checked, coded, transferred topunch cards and tabulated in the IBMoffice in Taipei. Questionnaires thatwere unclear or questionable were re-turned to the interviewer for rechecking.Two supervising nurse interviewers wereused for quality control. The check teststhat were run to determine the extent ofvariation were on the whole reassuring.The quality of our interview data is due
* The health manpower research project wascarried out in collaboration with Dr. MarkPerlman, professor of economics, Universityof Pittsburgh, who deserves thanks for hiscareful review of this article.
in large part to the dedication of thepublic health nurse interviewers andthe confidence that the public placed inthem.A one-month pilot survey was run, fol-
lowing which 12 monthly surveys, eachrepresentative of the island, were car-ried out. In all, data were secured on66,000 persons.
Expenditure, Income, or Wealth?The controversy over the use of in-
come, expenditure, or wealth as thebest measurement of economic well-being, is not new. In the United States,income has been used far more exten-sively than expenditure as a measure ofeconomic well-being.20'21'36 Efforts todiverge from income as a measureusually meet with criticism from thetraditionalists.
However, those of us who are in-terested in the relationship between eco-nomic levels and morbidity, and alsouse of medical services, might find theconcept of expenditure more useful incertain circumstances. In Taiwan, it isunlikely that we could have obtainedany information on income through di-rect questions. The instinctive repug-nance of a rural population to incomequestionnaires is well exemplified by theSinghalese rebellion which was trig-gered by a country-wide income survey.Second, if information had been col-lected on income, its validity would havebeen highly questionable. We did, inthe special case of physicians, collect in-formation directly on income. A com-parison with our estimates of physicianincome made from our island-widestudy of medical expenditures showedthat reported physician income figureswere less than one-third of what wethought to be a very conservative esti-mate! Economists familiar with incomesin Taiwan agreed that physician in-comes were probably understated tothis extent.
Economists point out that an im-
MARCH. 1966 501

Figure 1-Morbidity in relation to per capita expenditure and to familyexpenditure
200 400 Per capita expenditure/month 10001500 3000 Family expenditure per monthNEW TAIWAN DOLLARS (40NT$= l$U.S.)
portant drawback to the use of incomeas a measure of economic level is thatincome may vary considerably from yearto year.35 The same criticism surely ap-plies to the use of expenditure data. Tocompensate for such deficiencies incomecould be measured for more than oneyear to equalize any unusual divergen-cies in pattern, or expenditures couldbe measured, deleting all "unusual" out-lays for large purchases of durablegoods. However, both of these methodshave drawbacks.
Expenditure and income are certainlynot the only forms of measuring eco-
nomic level. The third broad category iswealth: accumulated savings, real estate,or durable goods. A study in the early1930's in rural Wisconsin'8 used a "cow
index" as a measure of economic well-being. A "cow index" or similar meas-
ure of holdings of property is probablythe only appropriate measure for de-termining economic level in those partsof developing nations which do not yetoperate on a monetary economy.
However, one of the major blocks inusing net worth or ownership of capitalgoods for assessing economic level isa lack of suitable gauges that would beapplicable in all parts of the country.
There are many problems in compar-ing data with economic levels set byexpenditure, economic levels set by in-come, and economic levels set by wealth.Expenditure and savings patterns bothdeserve more attention in correlationwith health habits. We did not collectinformation on income or wealth in ourTaiwanese study; we know of no studieswhich have collected information on
both income and total expenditure inrelation to health.
Per capita Expenditure, FamilyExpenditure, or a Combination?The information on morbidity in the
Taiwan study was collected primarily asancillary information. Our main pur-pose was to study the pattem of useof health services. However, this mor-bidity information furnished us with aclue to the great discrepancies that maybe introduced by using different meas-ures of economic level. We used percapita expenditure. However, in mosteconomic studies and, indeed, in theNational Health Survey, economic levelis set on a family basis rather than on
an individual basis. Possibly there issome justification for this, just as thereis some truth to the old adage that two
VOL. 56. NO. 3. A.J.P.H.
26
i 24
R
Z 22
H
E 20
0
Na
502

INFLUENCE OF ECONOMIC LEVELS ON MORBIDITY
can live as cheaply as one. However, theuse of family expenditure (as comparedto per capita measures) tends to con-centrate the higher morbidity familiesin the lower economic groups. Thesehigher morbidity families are probablyolder, one- and two-person families.The apparent marked differences be-
tween the patterns of morbidity in rela-tion to per capita expenditure and in re-lation to family expenditure are shownin Figure 1. With the change fromfamily income to per capita income thepicture may be similar. Data from theBureau of Labor Statistics show thaturban families increase in size with in-crease in family income.13 This increasein family size with increased income re-flects either increased eaming power ofthe older heads of households or second-ary wage earners witlhin the family.Obviously, converting from family in-come to per capita income would resultin marked changes of distribution offamilies by income level. We do not havedata available from the National HealthSurvey to see what effect changing fromfamily income to per capita incomewould have on morbidity rates. How-ever, changing from non age-adjustedrates to age-adjusted rates (which prob-ably parallels the effect of changingfrom family income to per capita in-come) lessens the difference in morbid-ity rates between the richest and thepoorest groups, as shown in Table 1.23
In the past, attempts have been madeto allow for the size of family, recog-nizing that children, in general, do notconsume as much as adults, and thatthere are certain economies of scale inlarger families. One of these methods isto give an arbitrary rating factor foradditional members in a family. Thisrating has been termed "adult mainte-nance unit" or "ammain."33 (It is in-teresting that this economic conceptalso was developed as a part of a healthresearch project, a study of pellagra insouthern United States.)
A far more useful concept than eitherfamily expenditure or per capita ex-penditure or even an arbitrarily appliedscale of "adult maintenance unit" hasbeen proposed.* In brief, this methoddivides families into economic deciles,quintiles, thirds (or any other convenientgrouping) by use of the distribution offamilies by income and by size of fam-ily. One finds the average income foreach family size and sets appropriateboundaries above and below this aver-age to take in the desired percentagesof families, using a standard curve-fitting technic. Once one has determinedeconomic levels by this method, the totalpersons in each economic class can beadded and then compared with othervariables such as morbidity levels, visitsto physicians, educational levels, andothers.
"Net" or "Gross" Expendifures?The peculiar association of higher
morbidity with hihlier economic levelled me to an initial explaination that wehad unduly concentrated sick people inthe upper economic levels by includingtheir health expenditures 1"5 with allother household expenditures. This "asso-ciation expenditure artifact," as Figure 2shows, had a substantial influence inoverloading the lhigher economic groupswith sick people. (Surprisingly, this
* Dr. William Reinke, assistant professor,Johns Hopkins University (paper in prepara-tion).
Table 1-Restricted activity days perperson per year (United States NationalHealth Survey)
AnnualFamilyIncome Unadjusted Age-Adjusted
<$2,000 29.1 22.82,000-3,999 17.7 17.14,000-6,999 13.7 14.87,000+ 13.1 13.7
MARCH, 1966 503

Figure 2-Effect of medical expenses on morbidity x expenditure curves
ros s
expenditure
Expenditure less, S 5J#-medical expenses
M Nu 4TUU bUUMONTHLY PER CAPITA EXPENDITURE (NT$ )
change did not have as great an effecton the economic level morbidity rela-tions as the change from family to percapita expenditure.) This shows thatone should usually delete an "asso-ciated expenditure" when using expendi-ture as a measure of economic level. Forexample, medical expenses should prob-ably be subtracted when studying mor-bidity or medical care; the same appliesto educational expenses when determin-ing the number of persons in collegefrom various economic levels. Inclusionof these unusual expenses would tend toconcentrate the very phenomenon one islooking for in higher economic groupsthan is justified.
Problems in Definition of MorbidityThere is a differential morbidity-
pattern by economic level in acute andin chronic diseases. Data from the Na-tional Health Survey show that occur-
rences of acute disease seem to have a
positive correlation with rising economiclevels.23 Such a relationship would notbe suggested by the doctrine that "pov-erty breeds disease." A certain amountof this correlation of high acute diseaserate with high economic level may beascribed to differing definitions of mor-
bidity for different social classes.19However, in Japan, where there is
probably more acute disease than inthe United States, there is a curious pat-tern of generally increasing disease in-
cidence with increasing economic level.7Dr. Sanders30 and before him Drs. Sart-well and Merrills1 have raised the ques-tion-If the sick die earlier in a givenpopulation group, will this lower theirmorbidity rate?
Certainly the definition of "morbid-ity" is of major importance in determin-ing the rates from different educationalgroups, and probably different economicgroups. The National Health Surveyuses four measures of morbidity-re-stricted activity days, bed disabilitydays, work loss days, and school lossdays.22 In our study in Taiwan we usedthe concepts of "sick" and "day lostfrom usual activity." All these defini-tions may be subject to a variety ofinterpretations. Despite the problems indefinition, the concepts of a bed day ora day lost from usual activity serve as
very useful measures of morbidity. Ifthe woman with premenstrual crampsis indeed "confined to bed" or "loses a
day from her usual activity" because itis the "custom" of her social groupand educational level, the effect on so-ciety is just the same as if she had beenreally sick.Another problem in the definition of
morbidity is choosing between "epi-sodes of illness per person" or "days lostper person."5'6 9'12 Use of the first meas-ure tends to overemphasize illnesses ofshort duration, while the second meas-ure can result in distortions of the
VOL. 56, NO. 3, A.J.P.H.
1.
t 1.21REs
O1.
§
0.4
504

INFLUENCE OF ECONOMIC LEVELS ON MORBIDITY
normal pattern, particularly when thesample size is small. Probably the onlyway to overcome this problem is to useboth measures of morbidity, or even toadd a third combination, "days lost perepisode of illness." The NORC-HIFstudy showed very clearly that with de-creasing income in the United Statesthere was decreasing awareness of theimportance of medical care and moreof a sense of resignation about physicalillness. This might lead to lower report-ing of illness in the lower economicgroups. Perhaps this concept of illness isalso characteristic of the Taiwanese.However, we are not convinced of this,because in Taiwan the illiterate reporthigher morbidity than the well-educated.We believe that health attitudes aremore closely correlated with educationthan with economie level but have nodirect evidence to prove this.
Economic Levels and Factors DirectlyInfluencing MorbiditySome of the problems in measuring
the relationship between morbidity andeconomic level may be better understoodby concurrently studying the associatedvariables of age, sex, education, and so011.
Perhaps the best established and mostwidely studied relationship is that ofmorbidity and age.9 Studies in many dif-ferent countries and at different pointsin time show that the older persons,particularly those over 65, have sub-stantially higher morbidity rates thanany other age group.3 The under-fiveage group in the developing countriesalso has higher risks of morbidity thanthe large population from age fivethrough forty-five. Although highermorbidity seems to be uniformly asso-ciated with the highest age group, thecorrelation of age group with economiclevel is by no means so universallyconsistent. In the Taiwan study, wefound that the high-risk age group (overage 50) made up 14 per cent of the
total population in our highest economicgroup, while it made up only 8 percent of the population in the lowest eco-nomic group. In the United States, onthe other hand, this pattern is reversed.Persons 45 or over make up 47 percent of the lowest income group and only24 per cent of the highest income group.This is due in part to basic demographicdifferences between the two countries,and in part to the artifact of measure-ment discussed earlier, under family orper capita expenditure.
Morbidity rates in Taiwan are fourtimes greater in the high-risk, over 50,age group than in the large, low-risk,age five to fifty group. This same ratioexists between the high-risk ages andthe low-risk ages shown in the NationalHealth Survey data. In Taiwan, the0-5 age group had an intermediate rateof morbidity. The National Health Sur-vey data showed 0-5 to be an extremelylow morbidity group.
Within certain limits, education hasbeen used as a measure of quality of in-dividual health practices. We found inour Taiwan study that the illiterate suf-fered twice as much illness as the highschool educated group. Only 30 percent of the population in the highesteconomic group was illiterate; the low-est economic group had over twice thispercentage of illiteracy. Thus, in Tai-wan, the correlation of education andeconomic level has an effect on morbid-ity-economic relationships which is oppo-site to the effect of correlation of ageand economic level. The National HealthSurvey does not go into the relation-ship of education to family income andmorbidity.The correlation of rural-urban loca-
tion with economic level is also of in-terest. In Taiwan, people living in therural areas have 50 per cent more ill-ness than those living in urban areas.The reasons may be lack of availabilityof medical attention for preventive orearly curative treatment, lack of munic-
MARCH, 1966 505
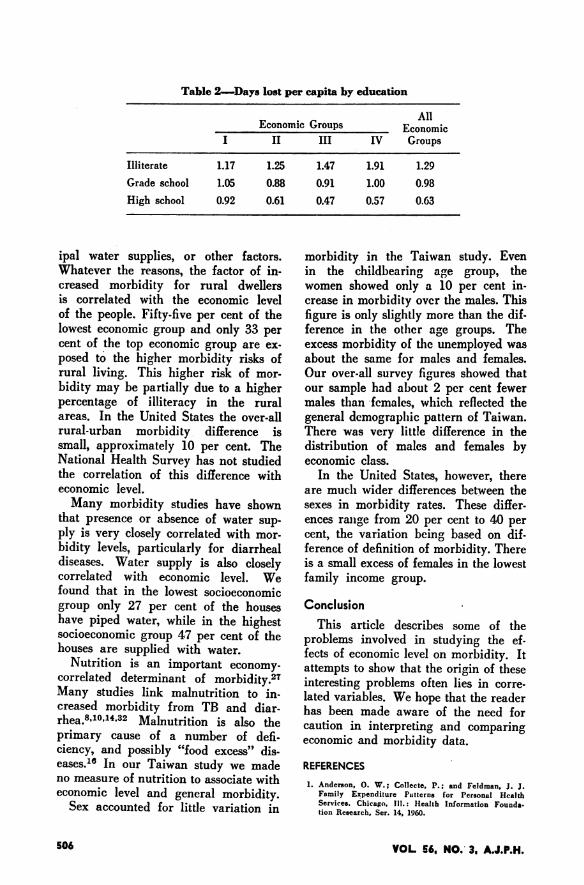
Table 2-Days lost per capita by education
AllEconomic Groups Economic
I II III IV Groups
Illiterate 1.17 1.25 1.47 1.91 1.29Grade school 1.05 0.88 0.91 1.00 0.98High school 0.92 0.61 0.47 0.57 0.63
ipal water supplies, or other factors.Whatever the reasons, the factor of in-creased morbidity for rural dwellersis correlated with the economic levelof the people. Fifty-five per cent of thelowest economic group and only 33 percent of the top economic group are ex-posed to the higher morbidity risks ofrural livingr. This higher risk of mor-bidity may be partially due to a higherpercentage of illiteracy in the ruralareas. In the United States the over-allrural-urban morbidity difference issmall, approximately 10 per cent. TheNational Health Survey has not studiedthe correlation of this difference witheconomic level.Many morbidity studies have shown
that presence or absence of water sup-ply is very closely correlated with mor-bidity levels, particularly for diarrhealdiseases. Water supply is also closelycorrelated with economic level. Wefound that in the lowest socioeconomicgroup only 27 per cent of the houseshave piped water, while in the highestsocioeconomic group 47 per cent of thehouses are supplied with water.
Nutrition is an important economy-correlated determinant of morbidity.27Many studies link malnutrition to in-creased morbidity from TB and diar-rhea.8'10'14.32 Malnutrition is also theprimary cause of a number of defi-ciency, and possibly "food excess" dis-eases."' In our Taiwan study we madeno measure of nutrition to associate witheconomic level and general morbidity.
Sex accounted for little variation in
morbidity in the Taiwan study. Evenin the childbearing age group, thewomen showed only a 10 per cent in-crease in morbidity over the males. Thisfigure is only slightly more than the dif-ference in the otlher age groups. Theexcess morbidity of the unemployed wasabout the same for males and females.Our over-all survey figures showed thatour sample had about 2 per cent fewermales than females, which reflected thegeneral demographic pattern of Taiwan.There was very little difference in thedistribution of males and females byeconomic class.
In the United States, however, thereare mucli wider differences between thesexes in morbidity rates. These differ-ences range from 20 per cent to 40 percent, the variation being based on dif-ference of definition of morbidity. Thereis a small excess of females in the lowestfamily income group.
ConclusionThis article describes some of the
problems involved in studying the ef-fects of economic level on morbidity. Itattempts to show that the origin of theseinteresting problems often lies in corre-lated variables. We hope that the readerhas been made aware of the need forcaution in interpretino and comparingeconomic and morbidity data.
REFERENCES1. Anderson, 0. W.; Collecte, P.; and Feldman, J. J.
Family Expenditure Puttterns for Personal HealthServices. Chicago, Ill.: Ilealth Information Founda-tion Research, Ser. 14, 1960.
VOL 56. NO.' 3, A.J.P.H.506

INFLUENCE OF ECONOMIC LEVELS ON MORBIDITY
2. Chadwick, E. Report to Her Majesty's PrincipleSecretary of State for the Home Department, fromthe Poor Law Commissioners on an Inquiry intothe Sanitary Condition of the Labouring Populationof Great Britain. London, England: W. Clowes andSons, 1842.
3. Collins, S. D.; Trantham, K. S.; and Lehmann, J.L. Sickness Experience in Selected Areas of theUnited States. USPHS Monogr. No. 25, Washington,D. C. (Jan.), 1955, PHS publ. No. 390.
4. Collins, S. D. Causes of Illnes in 9,000 FamiliesBased on a Nationwide Periodic Canvass, 1928-1931.Pub. Health Rep. 48:12 (Mar. 24), 1933.
5. . Duration of Illness from Specific Dis.eases. Ibid. (May 17). 1940, pp. 861-893 (Reprint2161) .
6. Cases and Days of Illness Among Malesand Females, Special Reference to Confinement toBed. Ibid. (Jan. 12), 1940, pp. 47-93 (Reprint 2129).
7. Currel, D.; Griffith, G. W.; Linder, F. E.; et al.Trends in the Study of Morbidity and Mortality.Geneva, Switzerland: PH Papers, WHO, 1965.
8. Dammin, G. J. The Pathogenesis of Acute DiarrhealDisease in Early Life. Bull. World Health Organ.31:1, 1964.
9. Downes, J.; Collins, S. D.; and others. MorbiditySurvey in Baltimore, 1938-1943. New York: MilbankMemorial Fund, 1957.
10. Downes, J. An Experiment in Control of Tuber-culosis Among Negroes. Milbank Mem. Fund Quart.1950, p. 28.
11. Falk, I. S.; Klem, M. C.; and Sinai, N. TheIncidence of Illness and the Receipt and Costs ofMedical Care Among Representative Families. Publ.No. 26. Committee on Costs of Medical Care.Chicago, Ill.: University of Chicago Press, 1933.
12. Gafaffer, W. M.; Frasier, E. S.; and Sitgreaves, R.Studies on the Duration of Disabling Sickness. Re-prints from Pub. Health Rep. Nos. 2201, 2404,2487, 2572, 2873. Washington, D. C.: Public HealthService (original printings 1940-1948).
13. Glick, P. G. American Families (Census Monogr.Ser.), New York: John Wylie, 1957.
14. Gordon, J. E.; Behar, M.; and Scrimshaw, N. S.Acute Diarrheal Disease in Less Developed Coun-tries. Bull. World Health Organ. 31:1, 1964.
15. Health Economics Branch. Notes on MethodologyUsed in Compiling Medical Expenditure Data. U. S.Department of Commerce, Labor and Health, Educa-tion, and Welfare (USPHS working document).
16. Interdepartmental Committee on Nutrition for Na-tional Defense, Nutritional Surveys of Jordan,Ecuador, Philippines, Peru, Thailand, etc. Wash-ington, D. C.: National Institute of Allergic andMetabolic Diseases, 1957-1963.
17. Kimball, G. H. T. Tropical Africa. New York:Twentieth Century Fund, 1960. Baumgartner, Leona.Health and Ethnic Minorities in the Sixties (Edi.torial). A.J.P.H. 55,4:495 (Apr.). 1965.
18. Kirkpatrick, E. L.; McNeal, P. E.: and Cowles,
M. L. Farm Family Living in Wisconsin. WisconsinAgricultural Experiment Station, Research Bull. 114,1933.
19. Learner, M., and Anderson, 0. W. Health Progressin the United States 1900-1960. Chicago: Universityof Chicago Press, 1963.
20. Miller, H. P. Income of the American People(Census Monogr. Ser.) New York: John Wylie, 1955.
21. Morgan, J. N.; David, M. H.; Cohen, W. J.; andBrazer, H. E. Income and Welfare in the UnitedStates. New York: McGraw Hill, 1962.
22. National Center for Health Statistics. Disability Days,United States. Washington, D. C.: Public HealthService. Publ. No. 1,000, Ser. 10, No. 9.
23. . Medical Care, Health Status andFamily Income, United States, May, 1964. Wash-ington, D. C.: Public Health Service. Publ. No.1,000, Ser. 10, No. 24.
24. . Origin and Program of the UnitedStates National Health Survey. Washington, D. C.:Public Health Service. Publ. 584-A1, Ser. Al(May), 1958.
25. Perrott, G. St. J.; Tibbitts, C.; and Britten, R. H.The National Health Survey: Scope and Method ofthe Nationwide Canvass of Sickness ina Relation toits Social and Economic Setting. Pub. Health Rep.(Sept. 15), 1939, pp. 1663-1687 (Reprint 2098).
26. Reid, M. Effect of Income Concept on ExpenditureCurves of Farm Families. Conference on Research inIncome and Wealth (Vol. 15). New York: NationalBureau of Economic Research, 1952.
27. Sanders, B. S. Environment and Growth. Baltimore,Md.: Warwick and York, 1934.
28. . How Good Are Hospital Data from aHousehold Survey. A.J.P.H. 49,12:1596-1606 (Dec.),1959.
29. Have Morbidity Surveys Been Over-sold? Ibid. 52,10:1648-1659 (Oct.). 1962.
30. . Measuring Community Health Levels.Ibid. 54,7:1063-1070 (July), 1964.
31. Sartwell, P. E., and Merrill, M. Influence of theDynamic Character of Chronic Disease on the In-terpretation of Morbidity Rates. Ibid. 42,5:579-584(May), 1952.
32. Scrimshaw, N. S.; Taylor, E. F.; and Gordon, J.E. Interactions of Nutrition and Infection (un-published monograph).
33. Sydenstricker, E.; King. W. I.; and Miehl, D. TheIncome Cycle in the Life of a Wage Earner. Wash-ington, D. C.: Gov. Ptg. Office, 1924.
34. U. S. Public Health Service. A Health Study inKit Carson County, Colorado. Washington, D. C.:Public Health Service, Publ. 844, 1962.
35. Vickrey, W. Resource Distribution Patterns and theClassification of Families, Studies in Income andWealth (Vol. 10). New York: National Bureau ofEconomic Research, 1947.
36. Woytinsky, W. S. Earnings and Social Security inthe United States. Committee on Social Security,Social Research Council, 1943.
Dr. Baker is associate director, Division of International Health, JohnsHopkins University School of Hygiene and Public Health, Baltimore, Md.21205.This paper was presented before the Epidemiology Section of the American
Public Health Association at the Ninety-Third Annual Meeting in Chicago,Ill., October 18, 1965.
This study was supported by a grant from The Agency for InternationalDevelopment.
MARCH, 1966 507