
WG III contribution to the Sixth Assessment Report CHAPTER 9
170
WG III contribution to the Sixth Assessment Report List of corrigenda to be implemented The corrigenda listed below will be implemented in the Chapter during copy-editing. CHAPTER 9 Document (Chapter, Annex, Supp. Material) Page (Based on the final pdf FGD version) Line Detailed information on correction to make Chapter 9 Include the reference cited in text but missing from bibliography - Issock, P. B., M. Mpinganjira, and M. Roberts-Lombard, 2018: Drivers of consumer attention to mandatory energy-efficiency labels affixed to home appliances: An emerging market perspective. J. Clean. Prod., 204, doi:10.1016/j.jclepro.2018.08.299. Chapter 9 Include the reference cited in text but missing from bibliography - Lee, D., 2020: PACE Financing Emerges as a Valuable Resource for Property Owners Rushing to Comply with NYC’s New Climate Mobilization Act. Cornell Real Estate Rev., 18. Chapter 9 Include the reference cited in text but missing from bibliography - Ramage, M. H., et al., 2017: The wood from the trees: The use of timber in construction. Renew. Sustain. Energy Rev., 68, doi:10.1016/j.rser.2016.09.107. Chapter 9 Include the reference cited in text but missing from bibliography - Goldman, C. A., et al., 2020: What does the future hold for utility electricity efficiency programs? Electr. J., 33, doi:10.1016/j.tej.2020.106728. Chapter 9 Include the reference cited in text but missing from bibliography - IEA, and UNDP, 2013: Modernising Building Energy Codes to Secure our Global Energy Future. IEA and UNDP, 74 pp.
-
Upload
khangminh22 -
Category
Documents
-
view
3 -
download
0
Transcript of WG III contribution to the Sixth Assessment Report CHAPTER 9

WG III contribution to the Sixth Assessment Report List of corrigenda to be implemented
The corrigenda listed below will be implemented in the Chapter during copy-editing.
CHAPTER 9
Document (Chapter,
Annex, Supp.
Material)
Page (Based on the final pdf FGD version)
Line Detailed information on correction to make
Chapter 9 Include the reference cited in text but missing from bibliography - Issock, P. B., M. Mpinganjira, and M. Roberts-Lombard, 2018: Drivers of consumer attention to mandatory energy-efficiency labels affixed to home appliances: An emerging market perspective. J. Clean. Prod., 204, doi:10.1016/j.jclepro.2018.08.299.
Chapter 9 Include the reference cited in text but missing from bibliography - Lee, D., 2020: PACE Financing Emerges as a Valuable Resource for Property Owners Rushing to Comply with NYC’s New Climate Mobilization Act. Cornell Real Estate Rev., 18.
Chapter 9 Include the reference cited in text but missing from bibliography - Ramage, M. H., et al., 2017: The wood from the trees: The use of timber in construction. Renew. Sustain. Energy Rev., 68, doi:10.1016/j.rser.2016.09.107.
Chapter 9 Include the reference cited in text but missing from bibliography - Goldman, C. A., et al., 2020: What does the future hold for utility electricity efficiency programs? Electr. J., 33, doi:10.1016/j.tej.2020.106728.
Chapter 9 Include the reference cited in text but missing from bibliography - IEA, and UNDP, 2013: Modernising Building Energy Codes to Secure our Global Energy Future. IEA and UNDP, 74 pp.

Chapter 9 Include the reference cited in text but missing from bibliography - Henriquez, R., G. Wenzel, D. E. Olivares, and M. Negrete-Pincetic, 2018: Participation of Demand Response Aggregators in Electricity Markets: Optimal Portfolio Management. IEEE Trans. Smart Grid, 9, doi:10.1109/TSG.2017.2673783.
Chapter 9 Front page Review Editor
Jessie Keenan now has two affiliations (the United States of America/Austria)
Chapter 9 75 16-17 Replace Only in China, the premature mortalities attributed to PM2.5 and O3 emissions exceeded 1.1 million in 2010 (Gu et al. 2018). With: According to the results of the quantitative model(Gu et al. 2018), the premature mortalities attributed to PM2.5 and O3 emissions may reach 168000-1796000 (95% Cl) in 2010.
Chapter 9 82 27-32 Several studies examined in the context of this assessment (see Table SM9.7) showed that direct rebound effects for residential energy consumption, which includes heating, are significant and range between -9% and 91%, with a median at 35% in Europe, 0-30% with a median at 20% in the US, and 72-127%, with a median at 89% in China. Replace: Several studies examined in the context of this assessment (see Table SM9.7) showed that direct rebound effects for residential energy consumption, which includes heating, are significant and range between -9% and 127%
Chapter 9 86 22-23 Replace: OECD countries, China and many developing countries (for example Ghana, Kenya, India, South Africa, etc.) (Chunekar, 2014) (Diawuo et al., 2018; Issock Issock et al., 2018) have adopted mandatory energy labelling. With: OECD countries, and many developing countries (for example China, Ghana, Kenya, India, South Africa, etc.) (Chunekar, 2014) (Diawuo et al., 2018; Issock Issock et al., 2018) have adopted mandatory energy labelling.

Do Not Cite, Quote or Distribute 9-1 Total pages: 168
Chapter 9: Buildings 1
2
Coordinating Lead Authors: Luisa F. Cabeza (Spain), Quan Bai (China) 3
Lead Authors: Paolo Bertoldi (Italy), Jacob Kihila (the United Republic of Tanzania), André F.P. 4
Lucena (Brazil), Érika Mata (Spain/Sweden), Sebastian Mirasgedis (Greece), Aleksandra Novikova 5
(Germany), Yamina Saheb (France/Algeria) 6
Contributing Authors: Peter Berrill (Germany/Ireland), Lucas R. Caldas (Brazil), Marta Chàfer 7
(Spain), Shan Hu (China), Radhika Khosla (United Kingdom/India), William Lamb (Germany/ United 8
Kingdom), David Vérez (Cuba/Spain), Joel Wanemark (Sweden) 9
Review Editors: Jesse Keenan (the United States of America), Maria Serrano Dina (the Dominican 10
Republic) 11
Chapter Scientist: Shan Hu (China) 12
Date of Draft: 28/11/2021 13
ACCEPTED VERSION
SUBJECT TO FIN
AL EDITS

Final Government Distribution Chapter 9 IPCC AR6 WGIII
Do Not Cite, Quote or Distribute 9-2 Total pages: 168
1
Table of Contents 2
Chapter 9: Buildings ...................................................................................................................... 9-1 3
Executive summary .......................................................................................................................... 9-4 4
9.1 Introduction .......................................................................................................................... 9-7 5
9.2 Services and components ................................................................................................... 9-10 6
9.2.1 Building types ............................................................................................................ 9-11 7
9.2.2 Building components and construction methods ....................................................... 9-11 8
9.2.3 Building services ........................................................................................................ 9-13 9
9.3 New developments in emission trends and drivers ............................................................ 9-15 10
9.3.1 Past and future emission trends .................................................................................. 9-15 11
9.3.2 Drivers of CO2 emissions and their climate impact ................................................... 9-19 12
9.3.3 Energy demand trends ................................................................................................ 9-25 13
9.4 Mitigation technological options and strategies towards zero carbon buildings................ 9-32 14
9.4.1 Key points from AR5 and special reports .................................................................. 9-32 15
9.4.2 Embodied energy and embodied carbon .................................................................... 9-32 16
9.4.3 Technological developments since AR5 .................................................................... 9-39 17
9.4.4 Case studies ................................................................................................................ 9-43 18
9.4.5 Low- and net zero energy buildings – exemplary buildings ...................................... 9-44 19
9.5 Non-technological and behavioural mitigation options and strategies .............................. 9-47 20
9.5.1 Non-technological determinants of energy demand and carbon emissions ............... 9-47 21
9.5.2 Insights from non-technological and behavioural interventions ................................ 9-48 22
9.5.3 Adoption of climate mitigation solutions– reasons and willingness .......................... 9-50 23
9.6 Global and regional mitigation potentials and costs .......................................................... 9-54 24
9.6.1 Review of literature calculating potentials for different world countries .................. 9-54 25
9.6.2 Assessment of the potentials at regional and global level .......................................... 9-57 26
9.6.3 Assessment of the potential costs ............................................................................... 9-59 27
9.6.4 Determinants of the potentials and costs .................................................................... 9-62 28
9.7 Links to adaptation ............................................................................................................. 9-65 29
9.7.1 Climate change impacts and adaptation in buildings ................................................. 9-65 30
9.7.2 Links between mitigation and adaptation in buildings .............................................. 9-67 31
9.8 Links to sustainable development ...................................................................................... 9-68 32
9.8.1 Overview of contribution of mitigation options to sustainable development ............ 9-68 33
9.8.2 Climate mitigation actions in buildings and health impacts ...................................... 9-71 34
9.8.3 Other environmental benefits of mitigation actions ................................................... 9-75 35
9.8.4 Social well-being........................................................................................................ 9-76 36
ACCEPTED VERSION
SUBJECT TO FIN
AL EDITS

Final Government Distribution Chapter 9 IPCC AR6 WGIII
Do Not Cite, Quote or Distribute 9-3 Total pages: 168
9.8.5 Economic implications of mitigation actions ............................................................. 9-77 1
9.9 Sectoral barriers and policies ............................................................................................. 9-79 2
9.9.1 Barriers, feasibility, and acceptance........................................................................... 9-79 3
9.9.2 Rebound effects.......................................................................................................... 9-82 4
9.9.3 Policy packages for the decarbonisation of buildings ................................................ 9-82 5
9.9.4 Financing mechanisms and business models for reducing energy demand ............... 9-89 6
9.9.5 Policies mechanisms for financing for on-site renewable energy generation ............ 9-90 7
9.9.6 Investment in building decarbonisation ..................................................................... 9-93 8
9.9.7 Governance and Institutional Capacity ...................................................................... 9-93 9
9.10 Knowledge Gaps ................................................................................................................ 9-96 10
Frequently Asked Questions .......................................................................................................... 9-97 11
References ...................................................................................................................................... 9-99 12
13
14
ACCEPTED VERSION
SUBJECT TO FIN
AL EDITS

Final Government Distribution Chapter 9 IPCC AR6 WGIII
Do Not Cite, Quote or Distribute 9-4 Total pages: 168
Executive summary 1
Global Greenhouse Gas (GHG) emissions from buildings were in 2019 at 12 GtCO2eq., equivalent 2
to 21% of global GHG emissions that year, out of which 57% were indirect emissions from offsite 3
generation of electricity and heat, 24% direct emissions produced onsite and 18% were embodied 4
emissions from the use of cement and steel (high evidence, high agreement). More than 95% of 5
emissions from buildings were CO2 emissions, CH4 and N2O represented 0.08%, and emissions from 6
halocarbon contributed by 3% to global GHG emissions from buildings. If only CO2 emissions would 7
be considered, the share of CO2 emissions from buildings out of global CO2 emissions increases to 31%. 8
Global final energy demand from buildings reached 128.8 EJ in 2019, and global electricity demand 9
was slightly above 43 EJ. The former accounted for 31% of global final energy demand and the latter 10
for 18% of global electricity demand. Residential buildings consumed 70% of global final energy 11
demand from buildings. Over the period 1990-2019, global CO2 emissions from buildings increased by 12
50%, global final energy demand grew by 38 and global final electricity demand increased by 161% 13
(high evidence, high agreement) {9.3}. 14
Drivers of GHG emissions in the building sector were assessed using the SER (Sufficiency, 15
Efficiency, Renewable) framework. Sufficiency measures tackle the causes of GHG emissions by 16
avoiding the demand for energy and materials over the lifecycle of buildings and appliances. 17
Sufficiency differs from efficiency in that the latter is about the continuous short-term marginal 18
technological improvements, which allows doing less with more in relative terms without considering 19
the planetary boundaries, while the former is about long-term actions driven by non-technological 20
solutions (i.e., land use management and planning), which consume less in absolute term and are 21
determined by biophysical processes. Sufficiency addresses the issue of a fair consumption of space 22
and resources. The remaining carbon budget, and its normative target for distributional equity, is the 23
upper limit of sufficiency, while requirements for a decent living standard define the minimum level of 24
sufficiency. The SER framework introduces a hierarchical layering which reduces the cost of 25
constructing and using buildings without reducing the level of comfort of the occupant. Sufficiency 26
interventions in buildings include the optimisation of the use of building, repurposing unused existing 27
buildings, prioritising multi-family homes over single-family buildings, and adjusting the size of 28
buildings to the evolving needs of households by downsizing dwellings. Sufficiency measures do not 29
consume energy during the use phase of buildings. 30
In most regions, historical improvements in efficiency have been approximately matched by 31
growth in floor area per capita. Implementing sufficiency measures that limit growth in floor area 32
per capita, particularly in developed regions, reduces the dependence of climate mitigation on 33
technological solutions (medium evidence, medium agreement). At a global level, up to 17% of the 34
mitigation potential could be captured by 2050 through sufficiency interventions (medium evidence, 35
medium agreement). Sufficiency is an opportunity to avoid locking buildings in carbon-intensive 36
solutions. Density, compacity, building typologies, bioclimatic design, multi-functionality of space, 37
circular use of materials, use of the thermal mass of buildings (to store heat for the cold season and to 38
protect occupants from high temperatures (i.e. heatwaves), when designing energy services, moving 39
from ownership to usership of appliances and towards more shared space, are among the sufficiency 40
measures already implemented in the leading municipalities. At the global level, the main drivers of 41
emissions include (i) population growth, especially in developing countries, (ii) increase in floor area 42
per capita, driven by the increase of the size of dwellings while the size of households kept decreasing, 43
especially in developed countries, (iii) the inefficiency of the newly constructed buildings, especially 44
in developing countries, and the low renovation rates and ambition level in developed countries when 45
existing buildings are renovated, iv) the increase in use, number and size of appliances and equipment, 46
especially ICT and cooling, driven by the growing welfare (income), and (v) the continued reliance on 47
fossil fuel based electricity and heat slow decarbonisation of energy supply. These factors taken together 48
ACCEPTED VERSION
SUBJECT TO FIN
AL EDITS

Final Government Distribution Chapter 9 IPCC AR6 WGIII
Do Not Cite, Quote or Distribute 9-5 Total pages: 168
are projected to continue driving GHG emissions in the building sector in the future (high evidence, 1
high agreement) {9.2, 9.3, 9.4, 9.5, 9.6, and 9.9}. 2
Bottom-up studies show a mitigation potential up to 85% in Europe and North America and up 3
to 45% in Asia Pacific Developed compared to the baselines by 2050, even though they sometimes 4
decline (robust evidence, high agreement). In developing countries, bottom-up studies estimate the 5
potential of up to 40-80% in 2050, as compared to their sharply growing baselines (medium 6
evidence, high agreement). The aggregation of results from all these bottom-up studies translates 7
into a global mitigation potential by 2050 of at least 8.2 GtCO2, which is equivalent to 61% of 8
their baseline scenario. The largest mitigation potential (5.4 GtCO2) is available in developing 9
countries while developed countries will be able to mitigate 2.7 GtCO2. These potentials represent the 10
low estimates, and the real potential is likely to be higher. These estimated potentials would be higher 11
if embodied emissions in buildings and those from halocarbons would be included (low evidence, high 12
agreement) {9.3, 9.6,}. 13
The development, since Assessment Report 5 (AR5), of integrated approaches to construction and 14
retrofit of buildings has led to the widespread of zero energy/carbon buildings in all climate zones. 15
The complementarity and the interdependency of measures lead to cost reduction while optimising the 16
mitigation potential grasped and avoiding the lock-in-effect. The growing consideration of integrated 17
approach to construction of new buildings as well as to the renovation of existing buildings results in a 18
lower relevance of the step-by-step approach to renovate buildings and to breaking down the potential 19
into cost categories, as to deliver deep mitigation and cost savings technologies and approaches shall 20
be applied together in an integrated and interdependent manner (medium evidence, high agreement). 21
The potential associated with the sufficiency measures as well as the exchange of appliances, 22
equipment, and lights with efficient ones is at cost below USD0 tCO2-1
(high evidence, high agreement). 23
The construction of high-performance buildings will become by 2050 a business-as-usual technology 24
with costs below USD20 tCO2-1
in developed countries and below USD100 tCO2-1
in developing 25
countries (medium evidence, high agreement). For existing buildings, there have been many examples 26
of deep retrofits where additional costs per CO2 abated are not significantly higher than those of shallow 27
retrofits. However, for the whole stock they tend to be in cost intervals of 0-200USD tCO2-1
and 28
>200USD tCO2-1
(medium evidence, medium agreement) . Literature emphasizes the critical role of the 29
decade between in 2020 and 2030 in accelerating the learning of know-how and skills to reduce the 30
costs and remove feasibility constrains for achieving high efficiency buildings at scale and set the sector 31
at the pathway to realize its full potential (high evidence, high agreement) {9.6, 9.9}. 32
The decarbonisation of buildings is constrained by multiple barriers and obstacles as well as 33
limited flow of finance (robust evidence, high agreement). The lack of institutional capacity, 34
especially in developing countries, and appropriate governance structures slow down the 35
decarbonisation of the global building stock (medium evidence, high agreement). The building 36
sector stands out for its high heterogeneity, with many different building types, sizes, and operational 37
uses. Its segment representing rented property faces principal/agent problems where the tenant benefits 38
from the decarbonisation investment made by the landlord. The organisational context and the 39
governance structure could trigger or hinder the decarbonisation of buildings (high evidence, high 40
agreement). Global investment in the decarbonisation of buildings was estimated at USD164 billion in 41
2020, not enough to close the investment gap (robust evidence, high agreement) {9.9}. 42
Policy packages based on the SER (Sufficiency, Efficiency, Renewables) framework could grasp 43
the full mitigation potential of the global building stock (medium evidence, high agreement). Low 44
ambitious policies will lock buildings in carbon for decades as buildings last for decades if not 45
centuries (high evidence, high agreement). Building energy codes is the main regulatory 46
instrument to reduce emissions from both new and existing buildings (high evidence, high 47
agreement). Most advanced building energy codes include bioclimatic design requirements to capture 48
ACCEPTED VERSION
SUBJECT TO FIN
AL EDITS

Final Government Distribution Chapter 9 IPCC AR6 WGIII
Do Not Cite, Quote or Distribute 9-6 Total pages: 168
the sufficiency potential of buildings, efficiency requirements by using the most efficient technologies 1
and requirements to increase the integration of renewable energy solutions to the building shape. Some 2
announced building energy codes extend these requirements from the use phase to the whole building 3
lifecycle. Building energy codes are proven to be especially effective if compulsory and combined with 4
other regulatory instruments such as minimum energy performance standard for appliances and 5
equipment, especially if the performance level is set at the level of the best available technologies in 6
the market (robust evidence, high agreement). Market-based instruments such as carbon taxes with 7
recycling of the revenues and personal or building carbon allowances also contribute to foster the 8
decarbonisation of the building sector (robust evidence, high agreement) . Requirements to limit the 9
use of land and property taxes are also considered effective policies to limit urban sprawl and to 10
prioritise multi-family buildings over single-family homes (medium evidence, high agreement) {9.9}. 11
Actions are needed to adapt buildings to future climate while ensuring wellbeing for all. The 12
expected heatwaves will inevitably increase cooling needs to limit the health impacts of climate 13
change (medium evidence, high agreement). Global warming will impact cooling and heating needs 14
but also the performance, durability and safety of buildings, especially historical and coastal ones, 15
through changes in temperature, humidity, concentrations of CO2 and chloride, and sea level rise. 16
Adaptation measures to cope with climate change may increase the demand for energy and materials 17
leading to an increase in GHG emissions if not mitigated. Sufficiency measures such as bioclimatic 18
design of buildings, which consider the expected future climate, and includes natural ventilation, white 19
walls and nature-based solutions (i.e., green roofs) will decrease the demand for cooling. Shared cooled 20
spaces with highly efficient cooling solutions are among the mitigation strategies which can limit the 21
effect of the expected heatwaves on people health. Sufficiency, efficiency, and renewable energy can 22
be designed to reduce buildings’ vulnerability to climate change impacts (medium evidence, high 23
agreement) {9.7, 9.8}. 24
Well-designed and effectively implemented mitigation actions in the buildings sector have 25
significant potential for achieving the United Nations Sustainable Development Goals. The 26
impacts of mitigation actions in the building sector go far beyond the goal of climate action (SDG13) 27
and contribute to further meeting fifteen other SDGs. Mitigation actions in the building sector bring 28
health gains through improved indoor air quality and thermal comfort as well as reduced financial 29
stresses in all world regions. Overall decarbonised building stock contribute to wellbeing and has 30
significant macro- and micro-economic effects, such as increased productivity of labour, job creation, 31
reduced poverty, especially energy poverty, and improved energy security that ultimately reduces net 32
costs of mitigation measures in buildings (high evidence, high agreement) {9.8}. 33
COVID-19 emphasised the importance of buildings for human wellbeing. However, the lockdown 34
measures implemented to avoid the spread of the virus have also stressed the inequalities in the 35
access for all to suitable and healthy buildings, which provide natural daylight and clean air to 36
their occupants (low evidence, high agreement). Meeting the new WHO health requirements, has also 37
put an emphasis on indoor air quality, preventive maintenance of centralised mechanical heating, 38
ventilation, and cooling systems. Moreover, the lockdown measures have led to spreading the South 39
Korean concept of officetel (office-hotel) to many countries and to extending it to officetelschool. The 40
projected growth, prior to the COVID-19, of 58% of the global residential floor area by 2050 compared 41
to the 290 billion m²yr-1 in 2019 might well be insufficient. Addressing the new needs for more 42
residential buildings may not, necessarily mean constructing new buildings, especially in the global 43
North. Repurposing existing non-residential buildings, no longer in use due to the expected spread of 44
teleworking triggered by the health crisis and enabled by digitalization, could be the way to overcome 45
the new needs for officetelschool buildings triggered by the health crisis (low evidence, high confidence) 46
{9.1, 9.2}. 47
48
ACCEPTED VERSION
SUBJECT TO FIN
AL EDITS

Final Government Distribution Chapter 9 IPCC AR6 WGIII
Do Not Cite, Quote or Distribute 9-7 Total pages: 168
9.1 Introduction 1
Total GHG emissions in the building sector reached 12 GtCO2eq. in 2019, equivalent to 21% of global 2
GHG emissions that year, of which 57% were indirect CO2 emissions from offsite generation of 3
electricity and heat, followed by 24% of direct CO2 emissions produced on-site and 18% from the 4
production of cement and steel used for construction and/or refurbishment of buildings. If only CO2 5
emissions would be considered, the share of buildings CO2 emissions increases to 31% out of global 6
CO2 emissions. Energy use in residential and non-residential buildings contributed 50% and 32% 7
respectfully, while embodied emissions contributed 18% to global building CO2 emissions. Global final 8
energy demand from buildings reached 128.8 EJ in 2019, equivalent to 31% of global final energy 9
demand. Residential buildings consumed 70% out of global final energy demand from buildings. 10
Electricity demand from buildings was slightly above 43 EJ in 2019, equivalent to more than 18% of 11
global electricity demand. Over the period 1990-2019, global CO2 emissions from buildings increased 12
by 50%, global final energy demand grew by 38%, with 54% increase in non-residential buildings and 13
32% increase in residential ones. Among energy carriers, the growth in global final energy demand was 14
strongest for electricity, which increased by 161%. 15
There is growing scientific evidence about the mitigation potential of the building sector and its 16
contribution to the decarbonisation of global and regional energy systems, and to meeting Paris 17
Agreement goals and Sustainable Development Goals (SDGs) (IPCC, 2018; IEA, 2019b; IEA 2019c). 18
Mitigation interventions in buildings are heterogeneous in many different aspects, from building 19
components (envelope, structure, materials, etc.) to services (shelter, heating, etc.), to building types 20
(residential and non-residential, sometimes also called commercial and public), to building size, 21
function, and climate zone. There are also variations between developed and developing countries in 22
mitigation interventions to implement, as the former is challenged by the renovation of existing 23
buildings while the latter is challenged by the need to accelerate the construction of new buildings. 24
This chapter aims at updating the knowledge on the building sector since the Intergovernmental Panel 25
on Climate Change (IPCC) Fifth Assessment Report (AR5) (Ürge-Vorsatz et al. 2014). Changes since 26
AR5 are reviewed, including: the latest development of building service and components (Section 9.2), 27
findings of new building related GHG emission trends (Section 9.3), latest technological (Section 9.4) 28
and non-technological (Section 9.5) options to mitigate building GHG emissions, potential emission 29
reduction from these measures at global and regional level (Section 9.6), links to adaptation (Section 30
9.7) and sustainable development (Section 9.8), and sectoral barriers and policies (Section 9.9). 31
The chapter introduces the concept of sufficiency, identified in the literature as a mitigation strategy 32
with high potential, and is organised around the Sufficiency-Efficiency-Renewables (SER) framework 33
(Box 9.1). 34
35
START BOX 9.1 HERE 36
Box 9.1 SER (sufficiency-efficiency-renewables) framework 37
The SER framework was introduced, late nineties, by a French NGO (Negawatt) (Negawatt 2017) 38
advocating for a decarbonised energy transition. In 2015, the SER framework was considered in the 39
design of the French energy transition law and the French energy transition agency (ADEME) is 40
developing its 2050 scenario based on the SER framework. 41
The three pillars of the SER framework include (i) sufficiency, which tackles the causes of the 42
environmental impacts of human activities by avoiding the demand for energy and materials over the 43
lifecycle of buildings and goods, (ii) efficiency, which tackles the symptoms of the environmental 44
impacts of human activities by improving energy and material intensities, and (iii) the renewables pillar, 45
ACCEPTED VERSION
SUBJECT TO FIN
AL EDITS

Final Government Distribution Chapter 9 IPCC AR6 WGIII
Do Not Cite, Quote or Distribute 9-8 Total pages: 168
which tackles the consequences of the environmental impacts of human activities by reducing the 1
carbon intensity of energy supply (Box 9.1 Figure 1). The SER framework introduces a hierarchical 2
layering, sufficiency first followed by efficiency and renewable, which reduces the cost of constructing 3
and using buildings without reducing the level of comfort of the occupant. 4
5
Box 9.1 Figure 1 SER framework applied to the building sector 6
Source: Saheb 2021 7
Sufficiency is not a new concept, its root goes back to the Greek word “sôphrosunè”, which was 8
translated in Latin to “sobrietas”, in a sense of “enough” (Cézard and Mourad 2019). The sufficiency 9
concept was introduced to the sustainability policy debate by (Sachs 1993) and to academia by (Princen 10
2003a). Since 1997, Thailand considers sufficiency, which was framed already in 1974 as Sufficiency 11
Economy Philosophy, as a new paradigm for development with the aim of improving human wellbeing 12
for all by shifting development pathways towards sustainability (Mongsawad 2012). The Thai approach 13
is based on three principles (i) moderation, (ii) reasonableness, and (iii) self-immunity. Sufficiency goes 14
beyond the dominant framing of energy demand under efficiency and behaviour. Sufficiency is defined 15
as avoiding the demand for materials, energy, land, water and other natural resources while delivering 16
a decent living standard for all within the planetary boundaries (Saheb 2021b, Princen 2005). Decent 17
living standards are a set of essential material preconditions for human wellbeing which includes 18
shelter, nutrition, basic amenities, health care, transportation, information, education, and public space 19
(Rao and Baer 2012; Rao and Min 2018; Rao et al. 2019). Sufficiency addresses the issue of a fair 20
consumption of space and resources. The remaining carbon budget, and its normative target for 21
distributional equity, is the upper limit of sufficiency, while requirements for a decent living standard 22
define the minimum level of sufficiency. Sufficiency differs from efficiency in that the latter is about 23
the continuous short-term marginal technological improvements which allow doing more with less in 24
relative terms without considering the planetary boundaries, while the former is about long-term actions 25
driven by non-technological solutions (i.e. land use management and planning), which consume less in 26
absolute-term and are determined by the biophysical processes (Princen 2003b). 27
Applying sufficiency principles to buildings requires (i) optimising the use of buildings, (ii) repurposing 28
unused existing ones, (iii) prioritising multi-family homes over single-family buildings, and (iv) 29
adjusting the size of buildings to the evolving needs of households by downsizing dwellings (Box 9.1 30
ACCEPTED VERSION
SUBJECT TO FIN
AL EDITS

Final Government Distribution Chapter 9 IPCC AR6 WGIII
Do Not Cite, Quote or Distribute 9-9 Total pages: 168
Figure 2) (Sandberg 2018) (Stephan et al. 2013)(Duffy 2009)(Fuller and Crawford 2011)(Wilson and 1
Boehland 2005)(McKinlay et al. 2019)(Sandberg 2018)(Huebner and Shipworth 2017)(Ellsworth-2
Krebs 2020) (Berrill et al. 2021). 3
4
Box 9.1 Figure 2 Sufficiency interventions and policies in the building sector 5
Source: Saheb 2021 6
Downsizing dwellings through cohousing strategies by repurposing existing buildings and clustering 7
apartments when buildings are renovated and by prioritising multi-family buildings over single-family 8
homes in new developments (Sandberg 2018) (Stephan et al. 2013)(Duffy 2009)(Fuller and Crawford 9
2011)(Wilson and Boehland 2005)(McKinlay et al. 2019)(Sandberg 2018)(Huebner and Shipworth 10
2017)(Ellsworth-Krebs 2020) (Ivanova and Büchs 2020) (Berrill and Hertwich 2021) are among the 11
sufficiency measures that avoid the demand for materials in the construction phase and energy demand 12
for heating, cooling and lighting in the use phase, especially if the conditioned volume and window 13
areas are reduced (Duffy 2009) (Heinonen and Junnila 2014). Less space also means less appliances 14
and equipment and changing preferences towards smaller ones (Aro 2020). Cohousing strategies 15
provide users, in both new and existing buildings, a shared space (i.e, for laundry, offices, guest rooms 16
and dining rooms) to complement their private space. Thus, reducing per capita consumption of 17
resources including energy, water and electricity (Klocker et al. 2012)(Natascha Klocker 2017), while 18
offering social benefits such as limiting loneliness of elderly people and single parents (Riedy et al. 19
2019)(Wankiewicz 2015). Senior cooperative housing communities and eco-villages are considered 20
among the cohousing examples to scale-up (Kuhnhenn et al. 2020). Local authorities have an important 21
role to play in the metamorphosis of housing by proposing communal spaces to be shared (J. Williams 22
2008)(Marckmann et al. 2012) through urban planning and land use policies (Duffy 2009)(Newton et 23
al. 2017). Thus, encouraging inter-generational cohousing as well as interactions between people with 24
different social backgrounds (Lietaert 2010)(J. Williams 2008). Progressive tax properties based on a 25
cap in the per-capita floor area are also needed to adapt the size of dwellings to households’ needs 26
(Murphy 2015) (Akenji 2021). 27
Efficiency, and especially energy efficiency and more recently resource efficiency, and the integration 28
of renewable to buildings are widespread concepts since the oil crisis of the seventies, while only most 29
ACCEPTED VERSION
SUBJECT TO FIN
AL EDITS

Final Government Distribution Chapter 9 IPCC AR6 WGIII
Do Not Cite, Quote or Distribute 9-10 Total pages: 168
advanced building energy codes consider sufficiency measures (IEA 2013). Efficiency and renewable 1
technologies and interventions are described in 9.4 and 9.9. 2
A systematic categorisation of policy interventions in the building sector through the SER framework 3
(Box 9.1 Figure 1) enables identification of the policy areas and instruments to consider for the 4
decarbonisation of the building stock, their overlaps as well as their complementarities. It also shows 5
that sufficiency policies go beyond energy and climate policies to include land use and urban planning 6
policies as well as consumer policies suggesting a need for a different governance including local 7
authorities and a bottom-up approach driven by citizen engagement. 8
END BOX 9.1 HERE 9
Compared to AR5, this assessment introduces four novelties (i) the scope of CO2 emissions has been 10
extended from direct and indirect emissions considered in AR5 to include embodied emissions, (ii) 11
beyond technological efficiency measures to mitigate GHG emissions in buildings, the contribution of 12
non-technological, in particular of sufficiency measures to climate mitigation is also considered, (iii) 13
compared to SR1.5, the link to sustainable development, well-being and decent living standard for all 14
has been further developed and strengthened, and finally (iv) the active role of buildings in the energy 15
system by making passive consumers prosumers is also assessed. 16
COVID-19 emphasised the importance of buildings for human wellbeing, however, the lockdown 17
measures implemented to avoid the spread of the virus has also stressed the inequalities in the access 18
for all to suitable and healthy buildings, which provide natural daylight and clean air to their occupants 19
(see also Cross-Chapter Box 1 in Chapter 1). COVID-19 and the new health recommendations (World 20
Health Organization 2021) emphasised the importance of ventilation and the importance of indoor air 21
quality (Wei et al. 2020)(J. et al. 2011)(Guyot et al. 2018)(William 2013)(Fisk 2015). The health crisis 22
has also put an emphasis on preventive maintenance of centralised mechanical heating, ventilation, and 23
cooling systems. Moreover, the lockdown measures have led to spreading the South Korean concept of 24
officetel (office-hotel) (Gohaud and Baek 2017) to many countries and to extending it to officetelschool. 25
Therefore, the projected growth, prior to the COVID-19, of 58% of the global residential floor area by 26
2050 compared to the 290 billion m² yr-1 in 2019 might well be insufficient. However, addressing the 27
new needs for more residential buildings may not, necessarily mean constructing new buildings. In fact, 28
repurposing existing non-residential buildings, no longer in use due to the expected spread of 29
teleworking triggered by the health crisis and enabled by digitalisation, could be the way to overcome 30
the new needs for officetelschool triggered by the health crisis. 31
The four novelties introduced in this assessment link the building sector to other sectors and call for 32
more sectoral coupling when designing mitigation solutions. Guidelines and methodologies developed 33
in Chapters 1, 2, 3, 4 and 5 are adopted in this chapter. Detailed analysis in building GHG emissions is 34
discussed based on Chapter 2 and scenarios to assess future emissions and mitigation potentials were 35
selected based on Chapters, 3 and 4. There are tight linkages between this chapter and Chapter 6, 7, 8, 36
10 and 11, which are sectoral sectors. This chapter focusses more on individual buildings and building 37
clusters, while Chapter 8 discusses macro topics in urban areas. Findings of this chapter provides 38
contribution to cross-sectoral prospection (Chapter 12), policies (Chapter 13), international cooperation 39
(Chapter 14), investment and finance (Chapter 15), innovation (Chapter 16), and sustainable 40
development (Chapter 17). 41
42
9.2 Services and components 43
This section mainly details the boundaries of the building sector; mitigation potentials are evaluated in 44
the following sections. 45
ACCEPTED VERSION
SUBJECT TO FIN
AL EDITS

Final Government Distribution Chapter 9 IPCC AR6 WGIII
Do Not Cite, Quote or Distribute 9-11 Total pages: 168
9.2.1 Building types 1
Building types and their composition affect the energy consumption for building operation as well as 2
the GHG emissions (Hachem-Vermette and Singh 2019). They also influence the energy cost 3
(MacNaughton et al. 2015) therefore, an identification of building type is required to understand the 4
heterogeneity of this sector. Buildings are classified as residential and non-residential buildings. 5
Residential buildings can be classified as slums, single-family house and multi-family house or 6
apartment/flats building. Single-family house can be divided between single-family detached (including 7
cottages, house barns, etc.) and single-family attached (or terrace house, small multi-family, etc.). 8
Another classification is per ownership: owner-occupiers, landlords, and owners’ 9
association/condominiums. 10
Non-residential buildings have a much broader use. They include cultural buildings (which include 11
theatres and performance, museums and exhibits, libraries, and cultural centres), educational buildings 12
(kindergarten, schools, higher education, research centre, and laboratories), sports (recreation and 13
training, and stadiums), healthcare buildings (health, wellbeing, and veterinary), hospitality (hotel, 14
casino, lodging, nightlife buildings, and restaurants and bars), commercial buildings and offices 15
(institutional buildings, markets, office buildings, retail, and shopping centres), public buildings 16
(government buildings, security, and military buildings), religious buildings (including worship and 17
burial buildings), and industrial buildings (factories, energy plants, warehouses, data centres, 18
transportation buildings, and agricultural buildings). 19
20
9.2.2 Building components and construction methods 21
An understanding of the methods for assembling various materials, elements, and components is 22
necessary during both the design and the construction phase of a building. A building can be broadly 23
divided into parts: the substructure which is the underlying structure forming the foundation of a 24
building, and the superstructure, which is the vertical extension of a building above the foundation. 25
There is not a global classification for the building components. Nevertheless, Figure 9.1 tries to 26
summarise the building components found in literature (Asbjørn 2009; Ching 2014; Mañá Reixach 27
2000). The buildings are divided in the substructure and the superstructure. The substructure is the 28
foundation of the building, where the footing, basement, and plinth are found. The superstructure 29
integrates the primary elements (heavyweight walls, columns, floors and ceilings, roofs, sills and lintels, 30
and stairs), the supplementary components (lightweight walls and curtain walls), the completion 31
components (doors and windows), the finishing work (plastering and painting), and the buildings 32
services (detailed in Section 9.3). 33
ACCEPTED VERSION
SUBJECT TO FIN
AL EDITS

Final Government Distribution Chapter 9 IPCC AR6 WGIII
Do Not Cite, Quote or Distribute 9-12 Total pages: 168
1
Figure 9.1 The main building components 2
3
ACCEPTED VERSION
SUBJECT TO FIN
AL EDITS

Final Government Distribution Chapter 9 IPCC AR6 WGIII
Do Not Cite, Quote or Distribute 9-13 Total pages: 168
At a global level, from historical perspective (from the Neolithic to the present), building techniques 1
have evolved to be able to solve increasingly complex problems. Vernacular architecture has evolved 2
over many years to address problems inherent in housing. Through a process of trial and error, 3
populations have found ways to cope with the extremes of the weather. The industrial revolution was 4
the single most important development in human history over the past three centuries. Previously, 5
building materials were restricted to a few manmade materials (lime mortar and concrete) along with 6
those available in nature as timber and stone. Metals were not available in sufficient quantity or 7
consistent quality to be used as anything more than ornamentation. The structure was limited by the 8
capabilities of natural materials; this construction method is called on-site construction which all the 9
work is done sequentially at the buildings site. The Industrial Revolution changed this situation 10
dramatically, new building materials emerged (cast-iron, glass structures, steel-reinforced concrete, 11
steel). Iron, steel and concrete were the most important materials of the nineteenth century (De 12
Villanueva Domínguez 2005; Wright 2000). In that context, prefabricated buildings (prefabrication also 13
known as pre-assembly or modularization) appeared within the so-called off-site construction. 14
Prefabrication has come to mean a method of construction whereby building elements and materials, 15
ranging in size from a single component to a complete building, are manufactured at a distance from 16
the final building location. Prefabricated buildings have been developed rapidly since World War II and 17
are widely used all over the world (Pons 2014; Moradibistouni et al. 2018) 18
Recently, advances in technology have produced new expectations in terms of design possibilities. In 19
that context, 3D printing seems to have arrived. 3D printing may allow in the future to build faster, 20
cheaper and more sustainable (Agustí-Juan et al. 2017; García de Soto et al. 2018). At the same time, it 21
might introduce new aesthetics, new materials, and complex shapes that will be printed at the click of 22
a mouse on our computers. Although 3D printing will not replace architectural construction, it would 23
allow optimization of various production and assembly processes by introducing new sustainable 24
construction processes and tools (De Schutter et al. 2018). Nevertheless, what is clear is that 3D printing 25
is a technology still in development, with a lot of potentials and that it is advancing quite quickly (Hager 26
et al. 2016; Stute et al. 2018; Wang et al. 2020). 27
9.2.3 Building services 28
Building services make buildings more comfortable, functional, efficient, and safe. In a generic point 29
of view, building services include shelter, nutrition, sanitation, thermal, visual, and acoustic comfort, 30
entertainment, communications, elevators, and illumination. In a more holistic view building services 31
are classified as shown in Figure 9.2. 32
ACCEPTED VERSION
SUBJECT TO FIN
AL EDITS

Final Government Distribution Chapter 9 IPCC AR6 WGIII
Do Not Cite, Quote or Distribute 9-14 Total pages: 168
1
Figure 9.2 Classification of building services. 2
The coloured small rectangles to the left of each building service denote to which other classifications that building service may relate to a lesser extent. 3
Source: adapted from Vérez and Cabeza 2021a4 ACCEPTED VERSION
SUBJECT TO FIN
AL EDITS

Final Government Distribution Chapter 9 IPCC AR6 WGIII
Do Not Cite, Quote or Distribute 9-15 Total pages: 168
A building management system is a system of devices configured to control, monitor, and manage 1
equipment in or around a building or building area and is meant to optimize building operations and 2
reduce cost (Kelsey Carle Schuster, Youngchoon Park 2019). Recent developments include the 3
integration of the system with the renewable energy systems (D.Arnone, V.Croce, G.Paterno 2016), 4
most improved and effective user interface (Rabe et al. 2018), control systems based on artificial 5
intelligence and IoT (Farzaneh et al. 2021). 6
The use of air conditioning systems in buildings will increase with the experienced rise in temperature 7
(Davis and Gertler 2015; De Falco et al. 2016) (Figure 9.8). This can ultimately lead to high energy 8
consumption rates. Therefore, adoption of energy efficient air conditioning is pertinent to balance the 9
provision of comfortable indoor conditions and energy consumption. Some of the new developments 10
that have been done include ice refrigeration (Xu et al. 2017), the use of solar photovoltaic power in the 11
air conditioning process (Burnett et al. 2014), and use of common thermal storage technologies (De 12
Falco et al. 2016) all of which are geared towards minimizing energy consumption and greenhouse gas 13
emissions. 14
Building designs have to consider provision of adequate ventilation. Natural ventilation reduces energy 15
consumption in buildings in warm climates compared to air conditioning systems (Azmi et al. 2017; 16
Taleb 2015). Enhanced ventilation has higher benefits to the public health than the economic costs 17
involved (MacNaughton et al. 2015). 18
On the refrigeration systems, the recent developments include the use of solar thermoelectric cooling 19
technologies as an energy efficient measure (Liu et al. 2015b); use of nanoparticles for energy saving 20
(Azmi et al. 2017) to mention some. 21
(Lambertz et al. 2019) stated that when evaluating the environmental impact of buildings, building 22
services are only considered in a very simplified way. Moreover, it also highlights that the increasing 23
use of new technologies such as Building Information Modelling (BIM) allows for a much more 24
efficient and easier calculation process for building services, thus enabling the use of more robust and 25
complete models. Furthermore, recent studies on building services related to climate change (Vérez and 26
Cabeza 2021a) highlight the importance of embodied energy (Parkin et al. 2019) (see Section 9.4). 27
28
9.3 New developments in emission trends and drivers 29
9.3.1 Past and future emission trends 30
Total GHG emissions in the building sector reached 12 GtCO2eq. in 2019, equivalent to 21% of global 31
GHG emissions that year. 57% of GHG emissions from buildings were indirect CO2 emissions from 32
generation of electricity and heat off-site, 24% were direct CO2 emissions produced on-site, and 18% 33
were from the production of cement and steel used for construction and refurbishment of buildings 34
(Figure 9.3a) (see Cross-Chapter Box 3 and Cross-Working Group Box 1 in Chapter 3). Halocarbon 35
emissions were equivalent to 3% of global building GHG emissions in 2019. In the absence of the 36
breakdown of halocarbon emissions per end-use sectors, they have been calculated for the purpose of 37
this chapter, by considering that 60% of global halocarbon emissions occur in buildings (Hu et al. 2020). 38
CH4 and N2O emissions were negligible, representing 0.08% each out of the 2019 global building GHG 39
emissions. Therefore, this chapter considers only CO2 emissions from buildings. By limiting the scope 40
of the assessment to CO2 emissions, the share of emissions from buildings increases to 31% of global 41
2019 CO2 emissions. Energy use in residential and non-residential buildings contributed 50% and 32% 42
respectfully, while embodied emissions contributed 18% to global building CO2 emissions. 43
44
45
46
47
ACCEPTED VERSION
SUBJECT TO FIN
AL EDITS

Final Government Distribution Chapter 9 IPCC AR6 WGIII
Do Not Cite, Quote or Distribute 9-16 Total pages: 168
(a) Global 1
2 3
(b) Regional 4
5 Figure 9.3 Building GHG emissions: historical based on IEA data and future emissions based on two IEA 6
scenarios (sustainable development, and net zero emissions), IMAGE Lifestyle-Renewable scenario and 7
Resource Efficiency and Climate Change-Low Energy Demand scenario (RECC-LED). RECC-LED data 8
include only space heating and cooling and water heating in residential buildings. The IEA current 9
policies scenario is included as a baseline scenario (IEA current policies scenario) 10
Over the period 1990-2019, global CO2 emissions from buildings increased by 50%. Global indirect 11
CO2 emissions increased by 92%, driven by the increase of fossil fuels-based electrification, while 12
global direct emissions decreased by 1%. At regional level, emissions in residential buildings decreased 13
in developed countries, except in Asia-Pacific developed, while they increased in developing countries. 14
ACCEPTED VERSION
SUBJECT TO FIN
AL EDITS

Final Government Distribution Chapter 9 IPCC AR6 WGIII
Do Not Cite, Quote or Distribute 9-17 Total pages: 168
The highest decrease was observed in Europe and Eurasia, with 13.6% decrease of direct emissions and 1
33% decrease of indirect emissions, while the highest increase of direct emissions occurred in Middle 2
East, 198%, and the highest increase of indirect emissions occurred in Eastern Asia, 2258%. Indirect 3
emissions from non-residential buildings increased in all regions. The highest increase occurred in 4
Eastern Asia, 1202%, and the lowest increase occurred in Europe and Central Asia, 4%, where direct 5
emissions from non-residential buildings decreased by 51%. Embodied emissions have also increased 6
in all regions. The highest increase occurred in Southern Asia, 334%, while the lowest increase occurred 7
in North America, 4%. (Figure 9.3b). 8
Future emissions were assessed using four global scenarios and their respective baselines (Box 9.2). 9
The selection of the scenarios was based on the features of each scenario, the geographic scope, and the 10
data availability to analyse future building emissions based on the SER framework (Box 9.1). 11
12
START BOX 9.2 HERE 13
Box 9.2 Scenarios used for the purpose of this chapter 14
Three out of the four scenarios selected, and their related baselines, are based on top-down modelling 15
and were submitted to AR6 scenario database, which includes in total 931 scenarios with a building 16
module (Annex III; see also Cross-Chapter Box 3, Box 3.1, and Box 3.2 in Chapter 3). A fourth 17
scenario, not included in AR6 scenario database, and based on a bottom-up modelling approach was 18
added. 19
The main features of these scenarios are shortly described below while the underlying modelling 20
approaches are described in Annex III. Each scenario is assessed compared to its baseline scenario: 21
International Energy Agency (IEA) scenarios: 22
2021 Net Zero Emissions by 2050 Scenario (NZE) is a normative scenario, which sets out a narrow 23
but achievable pathway for the global energy sector to achieve net zero CO2 emissions by 2050 (IEA 24
2021a) 25
2020 Sustainable Development Scenario (SDS), which integrates the impact of COVID-19 on health 26
outcomes and economies. It is also a normative scenario, working backwards from climate, clean air, 27
and energy access goals. SDS examines what actions would be necessary to achieve these goals. The 28
near-term detail is drawn from the IEA Sustainable Recovery Plan, which boosts economies and 29
employment while building cleaner and more resilient energy systems (IEA 2020a). 30
Analysis of the IEA scenarios above was conducted compared to the 2019 Current Policies Scenario, 31
which shows what happens if the world continues along its present path (IEA 2020a), and considered 32
as a baseline scenario. 33
IMAGE-Lifestyle-Renewable (LiRE) scenario is based on an updated version of the SSP2 baseline, 34
while also meeting the RCP2.6 radiative forcing target using carbon prices, together with the increased 35
adoption of additional lifestyle changes, by limiting the growth in the floor area per capita in developed 36
countries as well as the use of appliances. Regarding energy supply, IMAGE-LiRE assumes increased 37
electrification and increased share of renewable in the energy mix (Detlef Van Vuuren et.al 2021). 38
Resource Efficiency and Climate Change-Low Energy Demand (RECC-LED) scenario is produced 39
by a global bottom-up model, which assesses contributions of resource efficiency to climate change 40
mitigation. RECC-LED estimates the energy and material flows associated with housing stock growth, 41
driven by population and the floor area per capita (Pauliuk et al. 2021). This scenario is informed by 42
the Low Energy Demand Scenario (LED), which seeks convergence between developed and developing 43
countries in the access to decent living standard (Grubler et al. 2018). 44
ACCEPTED VERSION
SUBJECT TO FIN
AL EDITS

Final Government Distribution Chapter 9 IPCC AR6 WGIII
Do Not Cite, Quote or Distribute 9-18 Total pages: 168
For consistency between the four scenarios, aggregation of regions in this chapter differs from the one 1
of the IPCC. Europe and Eurasia have been grouped into one single region. 2
END BOX 9.2 HERE 3
4
The IEA-NZE scenario projects emissions from the global building stock to be lowered to 29 MtCO2 5
by 2050 against 1.7 GtCO2 in the IEA-SDS and 3.7 GtCO2 in IMAGE-LiRE Scenario. These projections 6
can be compared to IEA-CPS in which global emissions from buildings were projected to be at 13.5 7
GtCO2 in 2050, which is equivalent to the 2018 emissions level (Figure 9.3a). By 2050, direct emissions 8
from residential buildings are projected to be lowered to 108 MtCO2 in the IEA-NZE, this is four times 9
less than the projected direct emissions in RECC-LED scenario, six times less than those under the IEA-10
SDS and eleven times less than those in the IMAGE-LiRE scenario. 11
In the IEA-NZE scenario, indirect emissions are projected to be below zero by 2050 for both residential 12
and non-residential buildings, while residual indirect emissions from residential buildings are projected 13
to be 125 MtCO2 in RECC-LED, 634 MtCO2 in IEA-SDS, and 842GtCO2 in IMAGE-LiRE. Residual 14
indirect emissions from non-residential buildings are projected to be at 1.7 GtCO2 in IEA SDS and 15
double of this in IMAGE-LiRE scenario (Figure 9.3a). Compared to IEA-SDS, the highest decrease of 16
emissions in IEA-NZE is expected to occur after 2030. Direct emissions from residential buildings in 17
IEA-NZE are projected to be, by 2030, at 1.37 GtCO2, against 1.7 GtCO2 in the three other scenarios. 18
The highest cut in emissions in IEA-NZE and in IMAGE-LiRE occur through the decarbonisation of 19
energy supply. 20
At regional level, by 2050, the lowest emissions are projected to occur in developed Asia and Pacific, 21
with 6.73 MtCO2 under RECC-LED scenario and 12.4 MtCO2 under the IEA-SDS, and the highest 22
emissions are projected to occur in Europe and Eurasia in all three scenarios, with 152 MtCO2 in IEA-23
SDS, 199 MtCO2 in RECC-LED scenario and 381 MtCO2 in IMAGE-LiRE scenario. Emissions in 24
Africa are projected to decrease to 10 MtCO2 in RECC-LED, this is nine time less than those of 2019, 25
while they are projected to increase by 25% in IEA-SDS compared to those of 2019. Compared to IEA-26
SDS and IMAGE-LiRE, RECC-LED projects the highest decreases, over the period 2020-2030, of 27
direct emissions in residential buildings in all regions, up to 45% in Asia-Pacific developed and Eastern 28
Asia and the highest decreases of indirect emissions, ranging from 52% in Eastern Asia to 86% in Latin 29
America and Caribbean. Over the same period, the IEA-SDS projects the highest decreases of indirect 30
emissions to occur in Asia Pacific developed and North America. IMAGE-LiRE projects the lowest 31
decreases of emissions over the same decade in almost all regions (Figure 9.3b). 32
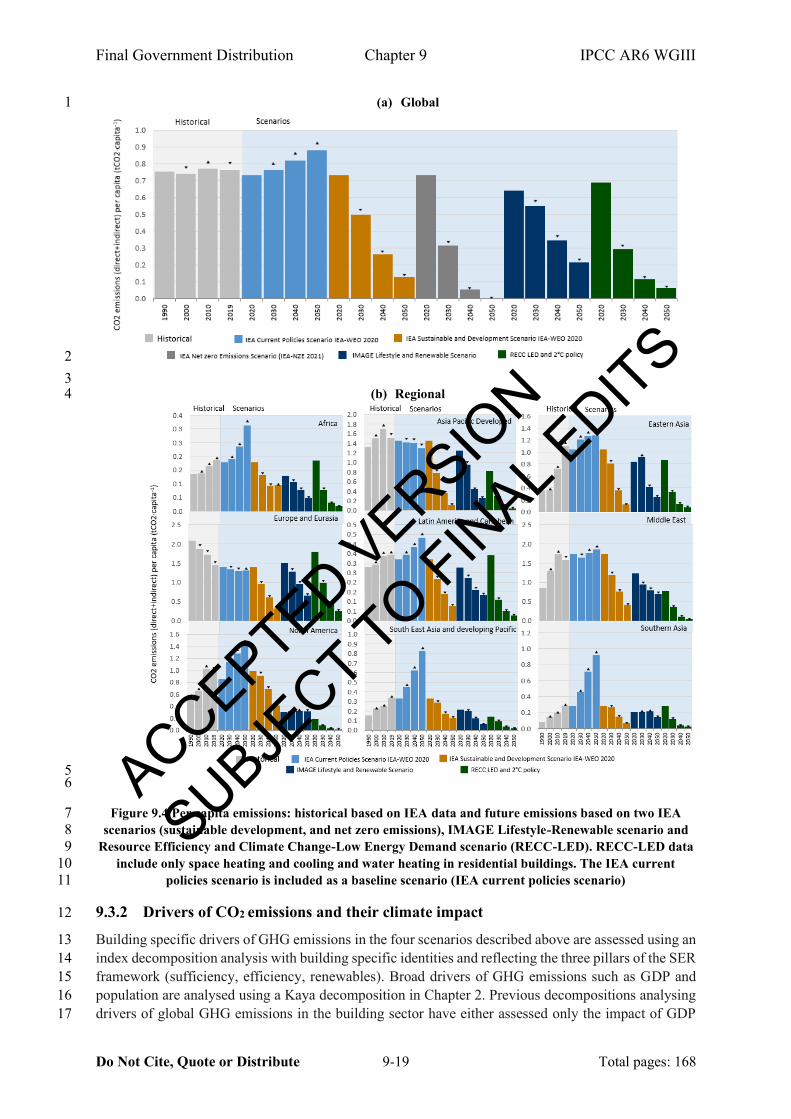
Emissions per capita from residential buildings at a global level reached 0.85 tCO2 per person in 2019. 33
The four scenarios assessed projects a decrease of the global per capita emissions by 2050, ranging 34
from 0 tCO2 in IEA NZE 0.21 tCO2 per person in IMAGE-LiRE, a 75% lower than those of 2019 35
(Figure 9.4a). There are great differences in the projected per capita emissions under each scenario 36
different scenarios across the regions (Figure 9.4b). Compared to IEA SDS and IMAGE-LiRE 37
scenarios, RECC-LED projects the lowest emissions per capita in all regions by 2050. Emissions per 38
capita in Europe and Eurasia are projected to be the highest in all scenarios by 2050, ranging from 0.26 39
tCO2 in RECC-LED and 0.31tCO2 in IEA SDS to 0.65 tCO2 in IMAGE-LiRE. 40
41
42
43
44
45
ACCEPTED VERSION
SUBJECT TO FIN
AL EDITS
Final Government Distribution Chapter 9 IPCC AR6 WGIII
Do Not Cite, Quote or Distribute 9-19 Total pages: 168
(a) Global 1
2
3 (b) Regional 4
5 6
Figure 9.4 Per capita emissions: historical based on IEA data and future emissions based on two IEA 7
scenarios (sustainable development, and net zero emissions), IMAGE Lifestyle-Renewable scenario and 8
Resource Efficiency and Climate Change-Low Energy Demand scenario (RECC-LED). RECC-LED data 9
include only space heating and cooling and water heating in residential buildings. The IEA current 10
policies scenario is included as a baseline scenario (IEA current policies scenario) 11
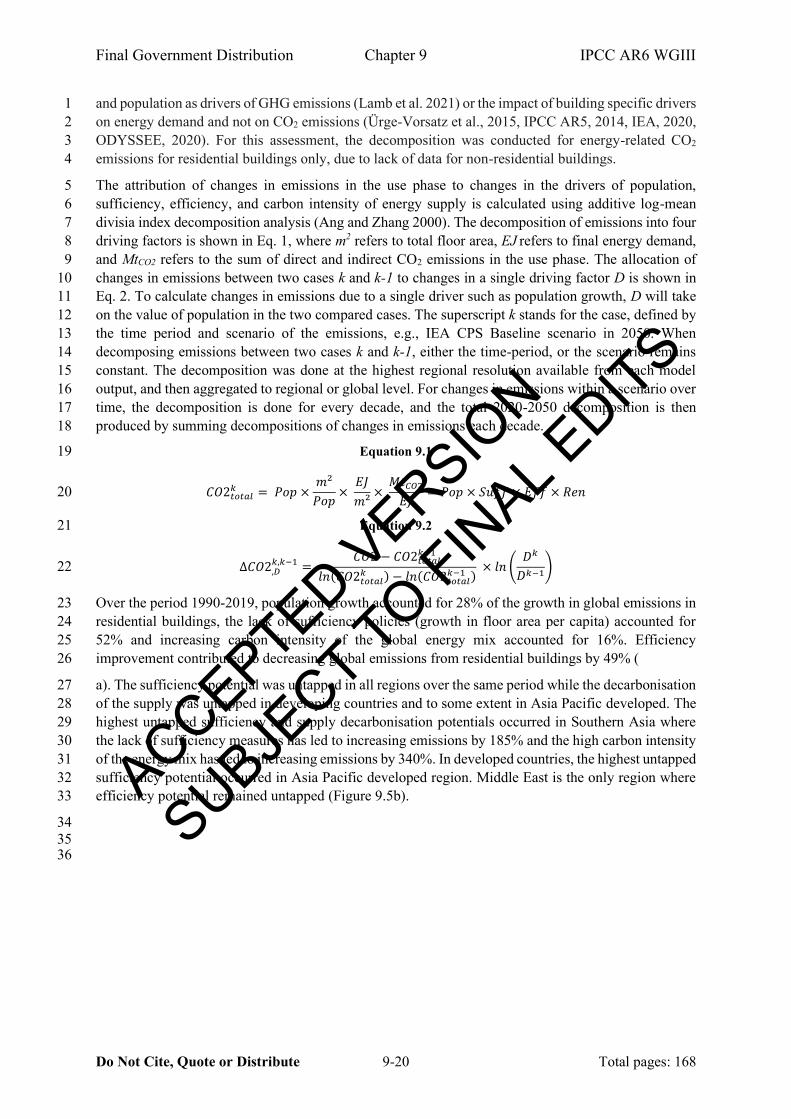
9.3.2 Drivers of CO2 emissions and their climate impact 12
Building specific drivers of GHG emissions in the four scenarios described above are assessed using an 13
index decomposition analysis with building specific identities and reflecting the three pillars of the SER 14
framework (sufficiency, efficiency, renewables). Broad drivers of GHG emissions such as GDP and 15
population are analysed using a Kaya decomposition in Chapter 2. Previous decompositions analysing 16
drivers of global GHG emissions in the building sector have either assessed only the impact of GDP 17
ACCEPTED VERSION
SUBJECT TO FIN
AL EDITS
Final Government Distribution Chapter 9 IPCC AR6 WGIII
Do Not Cite, Quote or Distribute 9-20 Total pages: 168
and population as drivers of GHG emissions (Lamb et al. 2021) or the impact of building specific drivers 1
on energy demand and not on CO2 emissions (Ürge-Vorsatz et al., 2015, IPCC AR5, 2014, IEA, 2020, 2
ODYSSEE, 2020). For this assessment, the decomposition was conducted for energy-related CO2 3
emissions for residential buildings only, due to lack of data for non-residential buildings. 4
The attribution of changes in emissions in the use phase to changes in the drivers of population, 5
sufficiency, efficiency, and carbon intensity of energy supply is calculated using additive log-mean 6
divisia index decomposition analysis (Ang and Zhang 2000). The decomposition of emissions into four 7
driving factors is shown in Eq. 1, where m2 refers to total floor area, EJ refers to final energy demand, 8
and MtCO2 refers to the sum of direct and indirect CO2 emissions in the use phase. The allocation of 9
changes in emissions between two cases k and k-1 to changes in a single driving factor D is shown in 10
Eq. 2. To calculate changes in emissions due to a single driver such as population growth, D will take 11
on the value of population in the two compared cases. The superscript k stands for the case, defined by 12
the time period and scenario of the emissions, e.g., IEA CPS Baseline scenario in 2050. When 13
decomposing emissions between two cases k and k-1, either the time-period, or the scenario remains 14
constant. The decomposition was done at the highest regional resolution available from each model 15
output, and then aggregated to regional or global level. For changes in emissions within a scenario over 16
time, the decomposition is done for every decade, and the total 2020-2050 decomposition is then 17
produced by summing decompositions of changes in emissions each decade. 18
Equation 9.1 19
𝐶𝑂2𝑡𝑜𝑡𝑎𝑙𝑘 = 𝑃𝑜𝑝 ×
𝑚²
𝑃𝑜𝑝×
𝐸𝐽
𝑚²×
𝑀𝑡𝐶𝑂2
𝐸𝐽= 𝑃𝑜𝑝 × 𝑆𝑢𝑓𝑓 × 𝐸𝑓𝑓 × 𝑅𝑒𝑛 20
Equation 9.2 21
∆𝐶𝑂2,𝐷𝑘,𝑘−1 =
𝐶𝑂2 − 𝐶𝑂2𝑡𝑜𝑡𝑎𝑙𝑘−1
𝑙𝑛(𝐶𝑂2𝑡𝑜𝑡𝑎𝑙𝑘 ) − 𝑙𝑛(𝐶𝑂2𝑡𝑜𝑡𝑎𝑙
𝑘−1 ) × 𝑙𝑛 (
𝐷𝑘
𝐷𝑘−1) 22
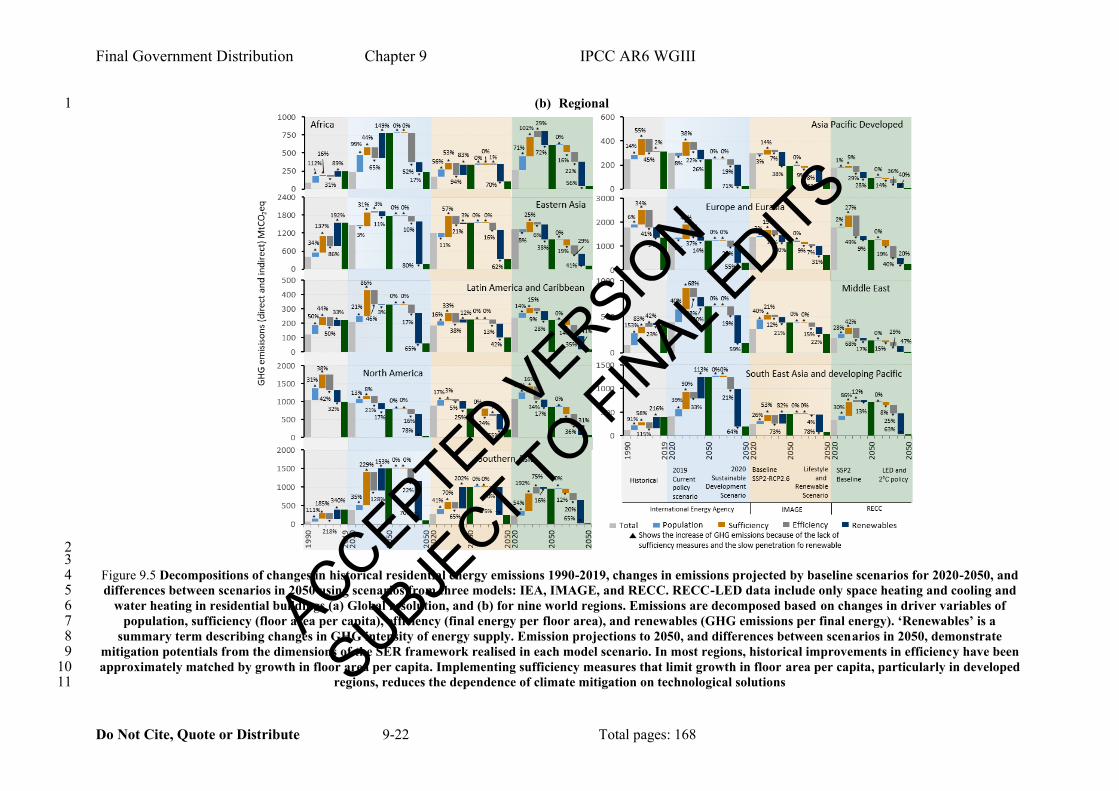
Over the period 1990-2019, population growth accounted for 28% of the growth in global emissions in 23
residential buildings, the lack of sufficiency policies (growth in floor area per capita) accounted for 24
52% and increasing carbon intensity of the global energy mix accounted for 16%. Efficiency 25
improvement contributed to decreasing global emissions from residential buildings by 49% ( 26
a). The sufficiency potential was untapped in all regions over the same period while the decarbonisation 27
of the supply was untapped in developing countries and to some extent in Asia Pacific developed. The 28
highest untapped sufficiency and supply decarbonisation potentials occurred in Southern Asia where 29
the lack of sufficiency measures has led to increasing emissions by 185% and the high carbon intensity 30
of the energy mix has led to increasing emissions by 340%. In developed countries, the highest untapped 31
sufficiency potential occurred in Asia Pacific developed region. Middle East is the only region where 32
efficiency potential remained untapped (Figure 9.5b). 33
34
35 36
ACCEPTED VERSION
SUBJECT TO FIN
AL EDITS

Final Government Distribution Chapter 9 IPCC AR6 WGIII
Do Not Cite, Quote or Distribute 9-21 Total pages: 168
(a) Global 1
2 3
4 5 6 7 8
9
ACCEPTED VERSION
SUBJECT TO FIN
AL EDITS
Final Government Distribution Chapter 9 IPCC AR6 WGIII
Do Not Cite, Quote or Distribute 9-22 Total pages: 168
(b) Regional 1
2 3
Figure 9.5 Decompositions of changes in historical residential energy emissions 1990-2019, changes in emissions projected by baseline scenarios for 2020-2050, and 4 differences between scenarios in 2050 using scenarios from three models: IEA, IMAGE, and RECC. RECC-LED data include only space heating and cooling and 5
water heating in residential buildings (a) Global resolution, and (b) for nine world regions. Emissions are decomposed based on changes in driver variables of 6 population, sufficiency (floor area per capita), efficiency (final energy per floor area), and renewables (GHG emissions per final energy). ‘Renewables’ is a 7
summary term describing changes in GHG intensity of energy supply. Emission projections to 2050, and differences between scenarios in 2050, demonstrate 8 mitigation potentials from the dimensions of the SER framework realised in each model scenario. In most regions, historical improvements in efficiency have been 9 approximately matched by growth in floor area per capita. Implementing sufficiency measures that limit growth in floor area per capita, particularly in developed 10
regions, reduces the dependence of climate mitigation on technological solutions 11
ACCEPTED VERSION
SUBJECT TO FIN
AL EDITS

Final Government Distribution Chapter 9 IPCC AR6 WGIII
Do Not Cite, Quote or Distribute 9-23 Total pages: 168
Scenarios assessed show an increase of the untapped sufficiency potential at the global level over the 1
period 2020-2050. The highest untapped sufficiency potential occurs in IEA scenarios as there are no 2
changes in the floor area per capita across different scenarios. The lack of sufficiency measures in 3
current policies will contribute to increasing emissions by 54%, offsetting the efficiency improvement 4
effect. By setting a cap in the growth of the floor area per capita in developed countries, 5% of emission 5
reductions in IMAGE-LiRE scenario derives from sufficiency. However, compared to 2020, the lack 6
of sufficiency measures in the baseline scenario will contribute to increasing emissions by 31%. RECC-7
LED scenario shows the highest global sufficiency potential captured compared to its baseline scenario 8
in 2050 as this scenario assumes a reduction in the floor area per capita in developed countries and 9
slower floor area growth in emerging economies. The four scenarios show a higher contribution of the 10
decarbonisation of energy supply to reducing emissions than the reduction of energy demand through 11
sufficiency and efficiency measures (Figure 9.6a). At regional level, the emissions reduction potential 12
from sufficiency is estimated at 25% in North America under both IMAGE-LiRE and RECC-LED 13
scenarios and at 19% in both Eastern Asia and Europe/Eurasia regions (Figure 9.6b). The highest 14
decarbonisation potential due to growth of renewable energy is 75% in Southern Asia under IMAGE-15
LiRE scenario. 16
There is a growing literature on the decarbonisation of end-use sectors while providing decent living 17
standard for all (Rao and Min 2018)(Rao et al. 2019)(Rao and Pachauri 2017) (Grubler et al. 2018), 18
(Millward-Hopkins et al. 2020). The floor area per capita is among the gaps identified in the 19
convergence between developed and developing countries in the access to decent living (Kikstra et al. 20
2021) while meeting energy needs. In the Low Energy Demand (LED) scenario, 30 m² per capita is the 21
converging figure assumed by 2050 (Grubler et al. 2018) while in the Decent Living with minimum 22
Energy (DLE) scenario, (Millward-Hopkins et al. 2020) assumes 15 m² per capita. 23
24
ACCEPTED VERSION
SUBJECT TO FIN
AL EDITS
Final Government Distribution Chapter 9 IPCC AR6 WGIII
Do Not Cite, Quote or Distribute 9-24 Total pages: 168
1
(a) Global 2
3
(b) Regional 4
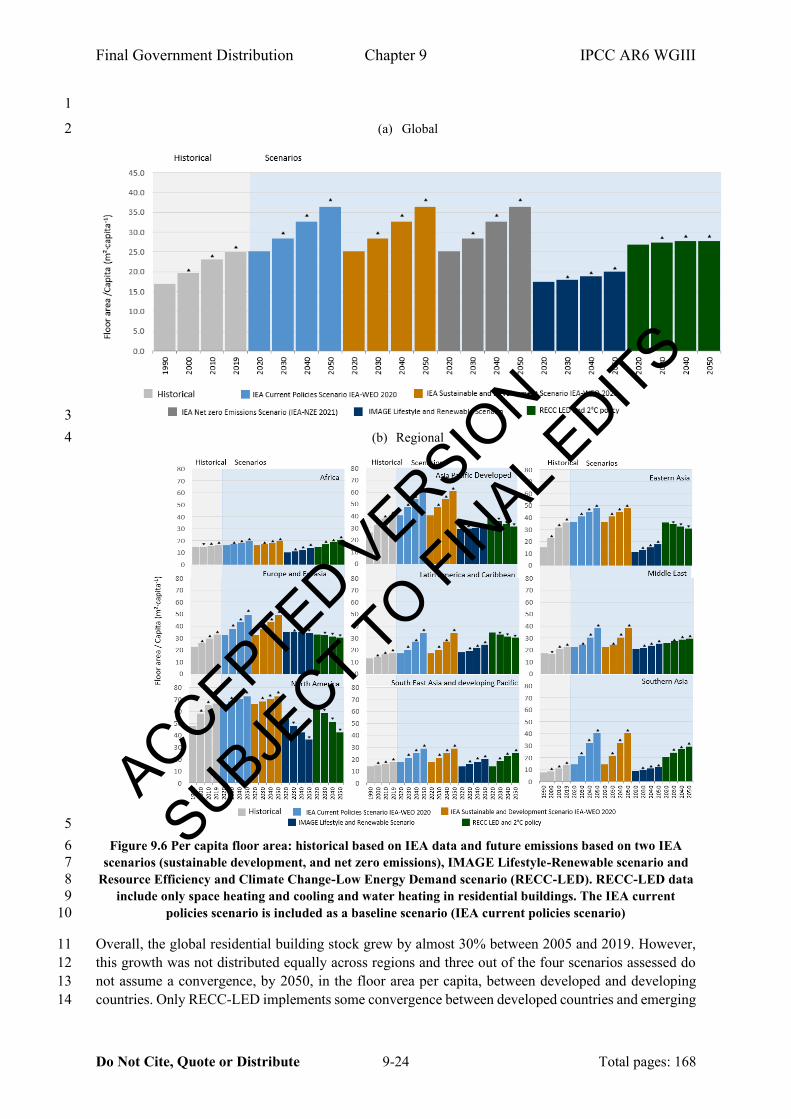
5
Figure 9.6 Per capita floor area: historical based on IEA data and future emissions based on two IEA 6
scenarios (sustainable development, and net zero emissions), IMAGE Lifestyle-Renewable scenario and 7
Resource Efficiency and Climate Change-Low Energy Demand scenario (RECC-LED). RECC-LED data 8
include only space heating and cooling and water heating in residential buildings. The IEA current 9
policies scenario is included as a baseline scenario (IEA current policies scenario) 10
Overall, the global residential building stock grew by almost 30% between 2005 and 2019. However, 11
this growth was not distributed equally across regions and three out of the four scenarios assessed do 12
not assume a convergence, by 2050, in the floor area per capita, between developed and developing 13
countries. Only RECC-LED implements some convergence between developed countries and emerging 14
ACCEPTED VERSION
SUBJECT TO FIN
AL EDITS

Final Government Distribution Chapter 9 IPCC AR6 WGIII
Do Not Cite, Quote or Distribute 9-25 Total pages: 168
economies to a range of 20-40 m² per capita. IEA scenarios assume a growth in the floor area per capita 1
in all regions with the highest growth in developed countries, up to 72 m² per capita in North America 2
from 66 m² per capita in 2019. IMAGE-LiRE projects a floor area per capita in Africa at 14 m² per 3
person. This is lower than the one of 2019, which was at 16 m² per capita (Figure 9.6). Beyond capturing 4
the sufficiency potential by limiting the growth in the floor area per capita in developed countries while 5
ensuring decent living standard, the acceptability of the global scenarios by developing countries is 6
getting attraction in academia (Hickel et al. 2021). 7
9.3.3 Energy demand trends 8
Global final energy demand from buildings reached 128.8 EJ in 2019, equivalent to 31% of global final 9
energy demand. The same year, residential buildings consumed 70% out of global final energy demand 10
from buildings. Over the period 1990-2019, global final energy demand from buildings grew by 38%, 11
with 54% increase in non-residential buildings and 32% increase in residential ones. At regional level, 12
the highest increase of final energy demand occurred in Middle East and Africa in residential buildings 13
and in all developing Asia in non-residential ones. By 2050, global final energy demand from buildings 14
is projected to be at 86 EJ in IEA NZE, 111 EJ in IEA SDS and 138 EJ in IMAGE-LiRE. RECC-LED 15
projects the lowest global final energy demand, at 15.7 EJ by 2050, but this refers to water heating, 16
space heating and cooling in residential buildings only (Figure 9.7a). 17
18 (a) Global 19
20 21
ACCEPTED VERSION
SUBJECT TO FIN
AL EDITS

Final Government Distribution Chapter 9 IPCC AR6 WGIII
Do Not Cite, Quote or Distribute 9-26 Total pages: 168
1 (b) Regional 2
3
Figure 9.7 Final energy demand per fuel: historical based on IEA data and future emissions based on two 4
IEA scenarios (sustainable development, and net zero emissions), IMAGE Lifestyle-Renewable scenario 5
and Resource Efficiency and Climate Change-Low Energy Demand scenario (RECC-LED). RECC-LED 6
data include only space heating and cooling and water heating in residential buildings. The IEA current 7
policies scenario is included as a baseline scenario (IEA current policies scenario) 8
Over the period 1990-2019, the use of coal decreased at a global level by 59% in residential buildings 9
and 52% in non-residential ones. Solar thermal experienced the highest increase, followed by 10
geothermal and electricity. However, by 2019, solar thermal and geothermal contributed by only 1% 11
each to global final energy demand, while electricity contributed by 51% in non-residential buildings 12
and 26% in residential ones. The same year, gas contributed by 26% to non-residential final energy 13
demand and 22% to residential final energy demand, which makes gas the second energy carrier used 14
in buildings after electricity. Over the period 1990-2019, the use of gas grew by 75% in residential 15
buildings and by 46% in non-residential ones. By 2050, RECC-LED projects electricity to contribute 16
by 71% to final energy demand in residential buildings, against 62% in IEA-NZE and 59% in IMAGE-17
LiRE. IEA-NZE is the only scenario to project less than 1% of gas use by 2050 in residential buildings 18
while the contribution of electricity to energy demand of non-residential buildings is above 60% in all 19
scenarios. At regional level, the use of coal in buildings is projected to disappear while the use of 20
electricity is projected to be above 50% in all regions by 2050 (Figure 9.7b). 21
Hydrogen emerged in the policy debate as an important energy carrier for the decarbonisation of the 22
energy system. In the case of the building sector, depending on how hydrogen is sourced (see Box 12.3 23
in Chapter 12), converting gas grids to hydrogen might be an appealing option to decarbonise heat 24
without putting additional stress on the electricity grids. However, according to (Elements energy Ltd 25
2018; Broad et al. 2020; Frazer-Nash Consultancy 2018; Gerhardt et al. 2020) (Strbac et al. 2018) the 26
delivered cost of heat from hydrogen would be much higher than the cost of delivering heat from heat 27
ACCEPTED VERSION
SUBJECT TO FIN
AL EDITS

Final Government Distribution Chapter 9 IPCC AR6 WGIII
Do Not Cite, Quote or Distribute 9-27 Total pages: 168
pumps, which could also be used for cooling. Repurposing gas grids for pure hydrogen networks will 1
also require system modifications such as replacement of piping and replacement of gas boilers and 2
cooking appliances, a factor cost to be considered when developing hydrogen roadmaps for buildings. 3
There are also safety and performance concerns with domestic hydrogen appliances (Frazer-Nash 4
Consultancy 2018). Over the period 1990-2019, hydrogen was not used in the building sector and 5
scenarios assessed show a very modest role for hydrogen in buildings by 2050 (Figure 9.7). 6
In developed countries, biomass is used for generating heat and power leading to reduction of indirect 7
emissions from buildings (Ortwein 2016)(IEA et al. 2020a). However, according to (IEA 2019b) despite 8
the mitigation potential of biomass, if the wood is available locally, its use remains low in developed 9
countries. Biomass is also used for efficient cook stoves and for heating using modern appliances such 10
as pellet-fed central heating boilers. In developing countries, traditional use of biomass is characterised 11
by low efficiency of combustion (due to low temperatures) leading to high levels of pollutants and CO 12
output, as well as low efficiency of heat transfer. The traditional use of biomass is associated with public 13
health risks such as pre mature deaths related to inhaling fumes from cooking (Dixon et al. 2015; Van 14
de Ven et al. 2019; Taylor et al. 2020; IEA 2019b). According to (Hanna et al. 2016) policies failed in 15
improving the use of biomass. Over the period 1990-2019, the traditional use of biomass decreased by 16
1% and all scenarios assessed do not project any traditional use of biomass by 2050. Biomass is also 17
used for the construction of buildings, leading to low embodied emissions compared to concrete 18
(Pauliuk et al. 2021; Hart and Pomponi 2020; Heeren et al. 2015a) 19
Over the period 1990-2019, space heating was the dominant end-use in residential buildings at a global 20
level, followed by water heating, cooking, and connected and small appliances (Figure 9.8a). However, 21
energy demand from connected and small appliances experienced the highest increase, 280%, followed 22
by cooking, 89%, cooling, 75%, water heating, 73% and space heating, around 10%. Space heating 23
energy demand is projected to decline over the period 2020-2050 in all scenarios assessed. RECC-LED 24
projects the highest decrease, 77%, of space heating energy demand, against 68% decrease in the IEA 25
NZE. IMAGE-LiRE projects the lowest decrease of heating energy demand, 21%. To the contrary, all 26
scenarios confirm cooling as a strong emerging trend (Box 9.3) and project an increase of cooling 27
energy demand. IMAGE-LiRE projects the highest increase, 143% against 45% in the IEA-NZE while 28
RECC-LED projects the lowest increase of cooling energy demand, 32%. 29
30
ACCEPTED VERSION
SUBJECT TO FIN
AL EDITS

Final Government Distribution Chapter 9 IPCC AR6 WGIII
Do Not Cite, Quote or Distribute 9-28 Total pages: 168
1 (a) Global 2
3
ACCEPTED VERSION
SUBJECT TO FIN
AL EDITS

Final Government Distribution Chapter 9 IPCC AR6 WGIII
Do Not Cite, Quote or Distribute 9-29 Total pages: 168
(b) Regional 1
2 Figure 9.8 Energy per end use: historical based on IEA data and future emissions based on two IEA scenarios (sustainable development, and net zero emissions), 3
IMAGE Lifestyle-Renewable scenario and Resource Efficiency and Climate Change-Low Energy Demand scenario (RECC-LED). RECC-LED data include only 4
space heating and cooling and water heating. The IEA current policies scenario is included as a baseline scenario (IEA current policies scenario) 5 ACCEPTED VERSION
SUBJECT TO FIN
AL EDITS
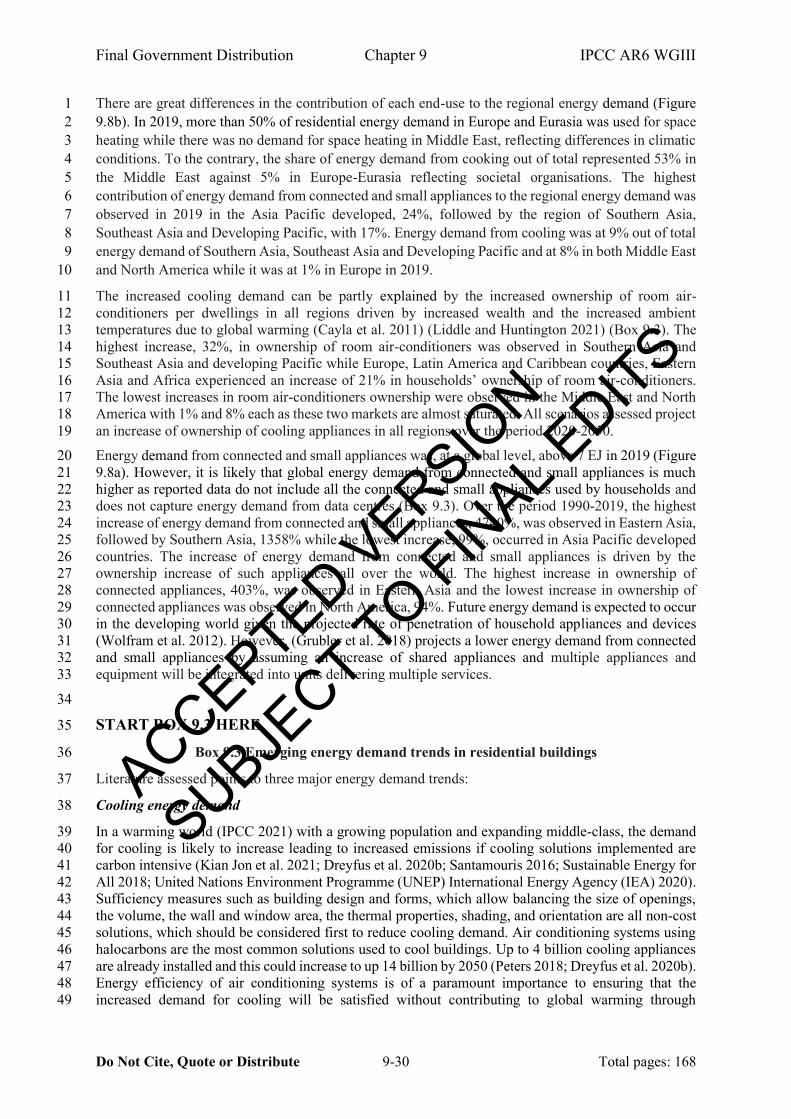
Final Government Distribution Chapter 9 IPCC AR6 WGIII
Do Not Cite, Quote or Distribute 9-30 Total pages: 168
There are great differences in the contribution of each end-use to the regional energy demand (Figure 1
9.8b). In 2019, more than 50% of residential energy demand in Europe and Eurasia was used for space 2
heating while there was no demand for space heating in Middle East, reflecting differences in climatic 3
conditions. To the contrary, the share of energy demand from cooking out of total represented 53% in 4
the Middle East against 5% in Europe-Eurasia reflecting societal organisations. The highest 5
contribution of energy demand from connected and small appliances to the regional energy demand was 6
observed in 2019 in the Asia Pacific developed, 24%, followed by the region of Southern Asia, 7
Southeast Asia and Developing Pacific, with 17%. Energy demand from cooling was at 9% out of total 8
energy demand of Southern Asia, Southeast Asia and Developing Pacific and at 8% in both Middle East 9
and North America while it was at 1% in Europe in 2019. 10
The increased cooling demand can be partly explained by the increased ownership of room air-11
conditioners per dwellings in all regions driven by increased wealth and the increased ambient 12
temperatures due to global warming (Cayla et al. 2011) (Liddle and Huntington 2021) (Box 9.3). The 13
highest increase, 32%, in ownership of room air-conditioners was observed in Southern Asia and 14
Southeast Asia and developing Pacific while Europe, Latin America and Caribbean countries, Eastern 15
Asia and Africa experienced an increase of 21% in households’ ownership of room air-conditioners. 16
The lowest increases in room air-conditioners ownership were observed in the Middle East and North 17
America with 1% and 8% each as these two markets are almost saturated. All scenarios assessed project 18
an increase of ownership of cooling appliances in all regions over the period 2020-2050. 19
Energy demand from connected and small appliances was, at a global level, above 7 EJ in 2019 (Figure 20
9.8a). However, it is likely that global energy demand from connected and small appliances is much 21
higher as reported data do not include all the connected and small appliances used by households and 22
does not capture energy demand from data centres (Box 9.3). Over the period 1990-2019, the highest 23
increase of energy demand from connected and small appliances, 4740%, was observed in Eastern Asia, 24
followed by Southern Asia, 1358% while the lowest increase, 99%, occurred in Asia Pacific developed 25
countries. The increase of energy demand from connected and small appliances is driven by the 26
ownership increase of such appliances all over the world. The highest increase in ownership of 27
connected appliances, 403%, was observed in Eastern Asia and the lowest increase in ownership of 28
connected appliances was observed in North America, 94%. Future energy demand is expected to occur 29
in the developing world given the projected rate of penetration of household appliances and devices 30
(Wolfram et al. 2012). However, (Grubler et al. 2018) projects a lower energy demand from connected 31
and small appliances by assuming an increase of shared appliances and multiple appliances and 32
equipment will be integrated into units delivering multiple services. 33
34
START BOX 9.3 HERE 35
Box 9.3 Emerging energy demand trends in residential buildings 36
Literature assessed points to three major energy demand trends: 37
Cooling energy demand 38
In a warming world (IPCC 2021) with a growing population and expanding middle-class, the demand 39
for cooling is likely to increase leading to increased emissions if cooling solutions implemented are 40
carbon intensive (Kian Jon et al. 2021; Dreyfus et al. 2020b; Santamouris 2016; Sustainable Energy for 41
All 2018; United Nations Environment Programme (UNEP) International Energy Agency (IEA) 2020). 42
Sufficiency measures such as building design and forms, which allow balancing the size of openings, 43
the volume, the wall and window area, the thermal properties, shading, and orientation are all non-cost 44
solutions, which should be considered first to reduce cooling demand. Air conditioning systems using 45
halocarbons are the most common solutions used to cool buildings. Up to 4 billion cooling appliances 46
are already installed and this could increase to up 14 billion by 2050 (Peters 2018; Dreyfus et al. 2020b). 47
Energy efficiency of air conditioning systems is of a paramount importance to ensuring that the 48
increased demand for cooling will be satisfied without contributing to global warming through 49
ACCEPTED VERSION
SUBJECT TO FIN
AL EDITS

Final Government Distribution Chapter 9 IPCC AR6 WGIII
Do Not Cite, Quote or Distribute 9-31 Total pages: 168
halocarbon emissions (Shah et al. 2019, 2015; Campbell 2018; United Nations Environment 1
Programme (UNEP) International Energy Agency (IEA) 2020). The installation of highly efficient 2
technological solutions with low Global Warming Potential (GWP), as part of the implementation of 3
the Kigali amendment to the Montreal Protocol, is the second step towards reducing GHG emissions 4
from cooling. Developing renewable energy solutions integrated to buildings is another track to follow 5
to reduce GHG emissions from cooling. 6
Electricity energy demand 7
Building electricity demand was slightly above 43 EJ in 2019, which is equivalent to more than 18% of 8
global electricity demand. Over the period 1990-2019, electricity demand increased by 161%. The 9
increase of global electricity demand is driven by the combination of rising incomes, income 10
distribution and the S-curve of ownership rates (Wolfram et al. 2012; Gertler et al. 2016). Electricity is 11
used in buildings for plug-in appliances i.e., refrigerators, cleaning appliances, connected and small 12
appliances, and lighting. An important emerging trend in electricity demand is the use of electricity for 13
thermal energy services (cooking, water, and space heating). The increased penetration of heat pumps 14
is the main driver of the use of electricity for heating. Heat pumps used either individually or in 15
conjunction with heat networks can provide heating in cold days and cooling in hot ones. (Lowes et al. 16
2020) suggests electricity is expected to become an important energy vector to decarbonise heating. 17
However, the use of heat pumps will increase halocarbon emissions (United Nations Environment 18
Programme (UNEP) International Energy Agency (IEA) 2020). (Bloess et al. 2018; Barnes and 19
Bhagavathy 2020; Connolly 2017) argue for electrification of heat as a cost-effective decarbonisation 20
measure, if electricity is supplied by renewable energy sources (Ruhnau et al. 2020). The electrification 21
of the heat supplied to buildings is likely to lead to an additional electricity demand and consequently 22
additional investment in new power plants. (Thomaßen et al. 2021) identifies flexibility as a key enabler 23
of larger heat electrification shares. Importantly, heat pumps work at their highest efficiency level in 24
highly efficient buildings and their market uptake is likely to require incentives due to their high up-25
front cost (Hannon 2015; Heinen et al. 2017). 26
Digitalisation energy demand 27
Energy demand from digitalisation occurs in datacentres, which are dedicated buildings or part of 28
buildings for accommodating large amount of information technologies equipment such as servers, data 29
storage and communication devices, and network devices. Data-centres are responsible for about 2% of 30
global electricity consumption (Diguet and Lopez 2019; Avgerinou et al. 2017). Energy demand from 31
datacentres arises from the densely packed configuration of information technologies, which is up to 32
100 times higher than a standard office accommodation (Chu and Wang 2019). Chillers combined with 33
air handling units are usually used to provide cooling in datacentres. Given the high cooling demand of 34
datacentres, some additional cooling strategies, such as free cooling, liquid cooling, low-grade waste 35
heat recovery, absorption cooling, etc., have been adopted. In addition, heat recovery can provide useful 36
heat for industrial and building applications. More recently, datacentres are being investigated as a 37
potential resource for demand response and load balancing (Zheng et al. 2020; Koronen et al. 2020). 38
Supplying datacentres with renewable energy sources is increasing (Cook et al. 2014) and is expected 39
to continue to increase (Koomey et al. 2011). Estimates of energy demand from digitalisation 40
(connected and small appliances, data centres, and data networks) combined vary from 5% to 12% of 41
global electricity use (Ferreboeuf 2019; Gelenbe and Caseau 2015; Malmodin and Lundén 2018; Diguet 42
and Lopez 2019). According to (Ferreboeuf 2019) the annual increase of energy demand from 43
digitalisation could be limited to 1.5% against the current 4% if sufficiency measures are adopted along 44
the value chain. 45
Digitalisation occurs also at the construction stage. (European Union 2019; Witthoeft and Kosta 2017) 46
identified seven digital technologies already in use in the building sector. These technologies include 47
(i) Building Information Modelling/Management (BIM), (ii) additive manufacturing, also known as 3D 48
printing, (iii) robots, (iv) drones, (v) 3D scanning, (vi) sensors, and (vii) Internet of Things (IoT). BIM 49
supports decision making in the early design stage and allows assessing a variety of design options and 50
their embodied emissions (Röck et al. 2018; Basbagill et al. 2013). 3D printing reduces material waste 51
and the duration of the construction phase as well as labour accidents (Dixit 2019). Coupling 3D printing 52
ACCEPTED VERSION
SUBJECT TO FIN
AL EDITS

Final Government Distribution Chapter 9 IPCC AR6 WGIII
Do Not Cite, Quote or Distribute 9-32 Total pages: 168
and robots allows for increasing productivity through fully automated prefabricated buildings. Drones 1
allow for a better monitoring and inspection of construction projects through real-time comparison 2
between planned and implemented solutions. Coupling drones with 3D scanning allows predicting 3
building heights and energy consumption (Streltsov et al. 2020). Sensors offer a continuous data 4
collection and monitoring of end-use services (i.e., heating, cooling, and lighting), thus allowing for 5
preventive maintenance while providing more comfort to end-users. Coupling sensors with IoT, which 6
connects to the internet household appliances and devices such as thermostats, enable demand-response, 7
and flexibility to reduce peak loads (IEA 2017; Lyons 2019). Overall, connected appliances offer a 8
variety of opportunities for end-users to optimise their energy demand by improving the responsiveness 9
of energy services (Nakicenovic et al. 2019; [IEA] - International Energy Agency 2017) through the 10
use of digital goods and services (Wilson et al., 2020) including peer-to-peer electricity trading 11
(Morstyn et al. 2018). 12
END BOX 9.3 HERE 13
14
9.4 Mitigation technological options and strategies towards zero carbon 15
buildings 16
Literature in this topic is extensive, but unfortunately, most studies and reviews do not relate themselves 17
to climate change mitigation, therefore there is a clear gap in reporting the mitigation potential of the 18
different technologies (Cabeza et al. 2020). It should be highlighted that when assessing the literature, 19
it is clear that a lot of new research is focussed on the improvement of control systems, including the 20
use of artificial intelligence or internet of things (IoT). 21
This section is organised as follow. First, the key points from AR5 and special reports are summarized, 22
following with a summary of the technological developments since AR5, specially focussing on 23
residential buildings. 24
9.4.1 Key points from AR5 and special reports 25
AR5 Chapter 9 on Buildings (Ürge-Vorsatz et al. 2014) presents mitigation technology options and 26
practices to achieve large reductions in building energy use as well as a synthesis of documented 27
examples of large reductions in energy use achieved in real, new, and retrofitted buildings in a variety 28
of different climates and examples of costs at building level. A key point highlighted is the fact that the 29
conventional process of designing and constructing buildings and its systems is largely linear, losing 30
opportunities for the optimization of whole buildings. Several technologies are listed as being able to 31
achieve significant performance improvements and cost potentials (daylighting and electric lighting, 32
household appliances, insulation materials, heat pumps, indirect evaporative cooling, advances in 33
digital building automation and control systems, and smart meters and grids to implement renewable 34
electricity sources). 35
9.4.2 Embodied energy and embodied carbon 36
9.4.2.1 Embodied energy and embodied carbon in building materials 37
As building energy demand is decreased the importance of embodied energy and embodied carbon in 38
building materials increases (Ürge-Vorsatz et al. 2020). Buildings are recognised as built following five 39
building frames: concrete, wood, masonry, steel, and composite frames (International Energy Agency 40
2019a); but other building frames should be considered to include worldwide building construction 41
practice, such as rammed earth and bamboo in vernacular design (Cabeza et al. 2021). 42
The most prominent materials used following these frames classifications are the following. Concrete, 43
a man-made material, is the most widely used building material. Wood has been used for many centuries 44
for the construction of buildings and other structures in the built environment; and it remains as an 45
important construction material today. Steel is the strongest building material; it is mainly used in 46
industrial facilities and in buildings with big glass envelopes. Masonry is a heterogeneous material using 47
bricks, blocks, and others, including the traditional stone. Composite structures are those involving 48
ACCEPTED VERSION
SUBJECT TO FIN
AL EDITS
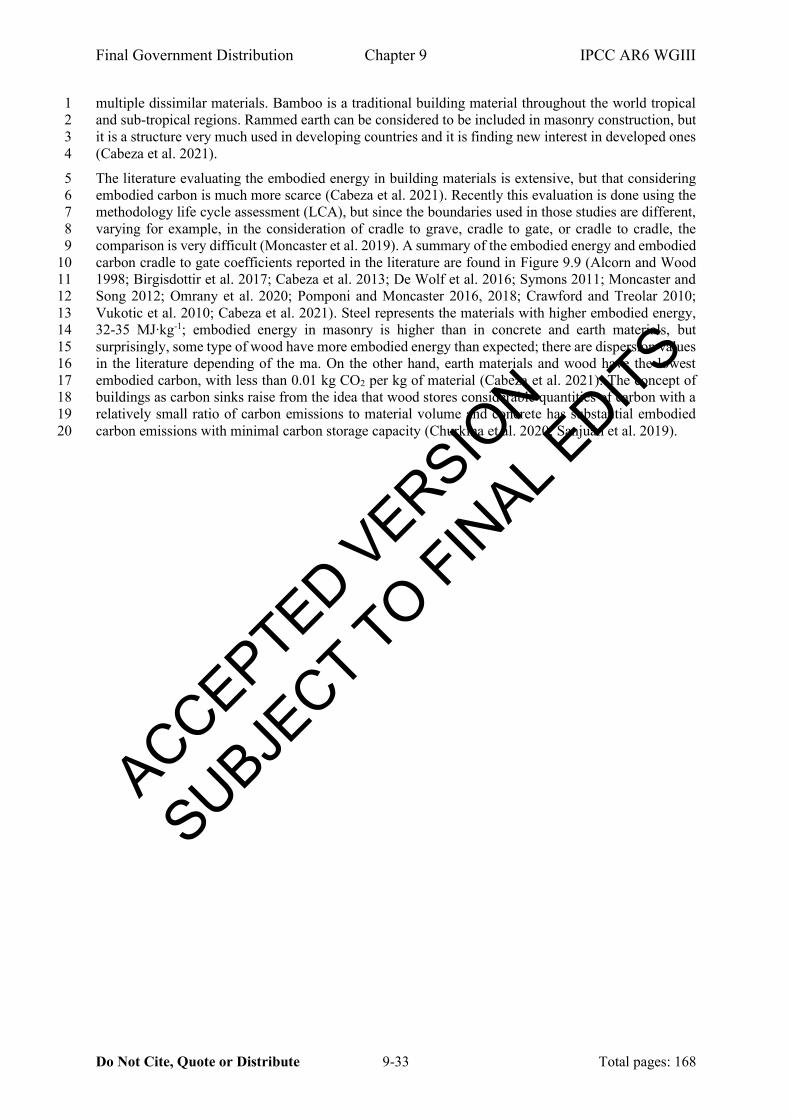
Final Government Distribution Chapter 9 IPCC AR6 WGIII
Do Not Cite, Quote or Distribute 9-33 Total pages: 168
multiple dissimilar materials. Bamboo is a traditional building material throughout the world tropical 1
and sub-tropical regions. Rammed earth can be considered to be included in masonry construction, but 2
it is a structure very much used in developing countries and it is finding new interest in developed ones 3
(Cabeza et al. 2021). 4
The literature evaluating the embodied energy in building materials is extensive, but that considering 5
embodied carbon is much more scarce (Cabeza et al. 2021). Recently this evaluation is done using the 6
methodology life cycle assessment (LCA), but since the boundaries used in those studies are different, 7
varying for example, in the consideration of cradle to grave, cradle to gate, or cradle to cradle, the 8
comparison is very difficult (Moncaster et al. 2019). A summary of the embodied energy and embodied 9
carbon cradle to gate coefficients reported in the literature are found in Figure 9.9 (Alcorn and Wood 10
1998; Birgisdottir et al. 2017; Cabeza et al. 2013; De Wolf et al. 2016; Symons 2011; Moncaster and 11
Song 2012; Omrany et al. 2020; Pomponi and Moncaster 2016, 2018; Crawford and Treolar 2010; 12
Vukotic et al. 2010; Cabeza et al. 2021). Steel represents the materials with higher embodied energy, 13
32-35 MJ∙kg-1; embodied energy in masonry is higher than in concrete and earth materials, but 14
surprisingly, some type of wood have more embodied energy than expected; there are dispersion values 15
in the literature depending of the ma. On the other hand, earth materials and wood have the lowest 16
embodied carbon, with less than 0.01 kg CO2 per kg of material (Cabeza et al. 2021). The concept of 17
buildings as carbon sinks raise from the idea that wood stores considerable quantities of carbon with a 18
relatively small ratio of carbon emissions to material volume and concrete has substantial embodied 19
carbon emissions with minimal carbon storage capacity (Churkina et al. 2020; Sanjuán et al. 2019). 20
ACCEPTED VERSION
SUBJECT TO FIN
AL EDITS

Final Government Distribution Chapter 9 IPCC AR6 WGIII
Do Not Cite, Quote or Distribute 9-34 Total pages: 168
1 ACCEPTED VERSIO
N
SUBJECT TO FIN
AL EDITS

Final Government Distribution Chapter 9 IPCC AR6 WGIII
Do Not Cite, Quote or Distribute 9-35 Total pages: 168
1
Figure 9.9 Building materials (a) embodied energy and (b) embodied carbon (Cabeza et al. 2021). 2 ACCEPTED VERSIO
N
SUBJECT TO FIN
AL EDITS

Final Government Distribution Chapter 9 IPCC AR6 WGIII
Do Not Cite, Quote or Distribute 9-36 Total pages: 168
9.4.2.2 Embodied emissions 1
Embodied emissions from production of materials are an important component of building sector 2
emissions, and their share is likely to increase as emissions from building energy demand decrease 3
(Röck et al. 2020). Embodied emissions trajectories can be lowered by limiting the amount of new floor 4
area required (Berrill and Hertwich 2021; Fishman et al. 2021), and reducing the quantity and GHG 5
intensity of materials through material efficiency measures such as lightweighting and improved 6
building design, material substitution to lower-carbon alternatives, higher fabrication yields and scrap 7
recovery during material production, and re-use or lifetime extension of building components (Allwood 8
et al. 2011; Pamenter and Myers 2021; Churkina et al. 2020; Heeren et al. 2015b; Pauliuk et al. 2021; 9
Hertwich et al. 2019). Reducing the GHG intensity of energy supply to material production activities 10
also has a large influence on reducing overall embodied emissions. Figure 9.10 shows projections of 11
embodied emissions to 2050 from residential buildings in a baseline scenario (SSP2 Baseline) and a 12
scenario incorporating multiple material efficiency measures and a much faster decarbonization of 13
energy supply (LED and 2°C policy) (Pauliuk et al. 2021). Embodied emissions are projected to be 32% 14
lower in 2050 than 2020 in a baseline scenario, primarily due to a lower growth rate of building floor 15
area per population. This is because the global population growth rate slows over the coming decades, 16
leading to less demand for new floor area relative to total population. Further baseline reductions in 17
embodied emissions between 2020 and 2050 derive from improvements in material production and a 18
gradual decline in GHG intensity of energy supply. In a LED + 2°C policy scenario, 2050 embodied 19
emissions are 86% lower than the Baseline. This reduction of 2050 emissions comes from contributions 20
of comparable magnitude from three sources; slower floor area growth leading to less floor area of new 21
construction per capita (sufficiency), reductions in the mass of materials required for each unit of newly 22
built floor area (material efficiency), and reduction in the GHG intensity of material production, from 23
material substitution to lower carbon materials, and faster transition of energy supply. 24
The attribution of changes in embodied emissions to changes in the drivers of population, sufficiency, 25
material efficiency, and GHG intensity of material production is calculated using additive log-mean 26
divisia index decomposition analysis (Ang and Zhang 2000). The decomposition of emissions into four 27
driving factors is shown in Eq. 9.3, where m2NC refers to floor area of new construction, kgMat refers to 28
mass of materials used for new construction, and kgCO2e refers to embodied GHG emissions in CO2e. 29
The allocation of changes in emissions between two cases k and k-1 to changes in a single driving factor 30
D is shown in Eq. 9.4. For instance, to calculate changes in emissions due to population growth, D will 31
take on the value of population in the two cases being compared. The superscript k stands for the time 32
period and scenario of the emissions, e.g., SSP2 Baseline scenario in 2050. When decomposing 33
emissions between two cases k and k-1, either the time period or the scenario stays constant. The 34
decomposition is done for every region at the highest regional resolution available, and aggregation 35
(e.g., to global level) is then done by summing over regions. For changes in emissions within a scenario 36
over time (e.g., SSP Baseline emissions in 2020 and 2050), the decomposition is made for every decade, 37
and the total 2020-2050 decomposition is then produced by summing decompositions of changes in 38
emissions each decade. 39
Equation 9.3 40
𝐺𝐻𝐺𝑒𝑚𝑏𝑘 = 𝑃𝑜𝑝 ×
𝑚𝑁𝐶2
𝑃𝑜𝑝×
𝑘𝑔𝑀𝑎𝑡
𝑚𝑁𝐶2 ×
𝑘𝑔𝐶𝑂2𝑒
𝑘𝑔𝑀𝑎𝑡
= 𝑃𝑜𝑝 × 𝑆𝑢𝑓𝑓 × 𝐸𝑓𝑓 × 𝑅𝑒𝑛 41
Equation 9.4 42
∆𝐺𝐻𝐺𝑒𝑚𝑏,𝐷𝑘,𝑘−1 =
𝐺𝐻𝐺𝑒𝑚𝑏𝑘 − 𝐺𝐻𝐺𝑒𝑚𝑏
𝑘−1
𝑙𝑛(𝐺𝐻𝐺𝑒𝑚𝑏𝑘 ) − 𝑙𝑛(𝐺𝐻𝐺𝑒𝑚𝑏
𝑘−1) × 𝑙𝑛 (
𝐷𝑘
𝐷𝑘−1) 43
44
ACCEPTED VERSION
SUBJECT TO FIN
AL EDITS

Final Government Distribution Chapter 9 IPCC AR6 WGIII
Do Not Cite, Quote or Distribute 9-37 Total pages: 168
1
(a) Global 2
3
4
5
6
7
8
(b) Regional 9
ACCEPTED VERSION
SUBJECT TO FIN
AL EDITS

Final Government Distribution Chapter 9 IPCC AR6 WGIII
Do Not Cite, Quote or Distribute 9-38 Total pages: 168
1
Figure 9.10 Decompositions of changes in residential embodied emissions projected by baseline scenarios for 2020-2050, and differences between scenarios in 2050 2
using two scenarios from the RECC model. (a) Global resolution, and (b) for nine world regions. Emissions are decomposed based on changes in driver variables of 3
population, sufficiency (floor area of new construction per capita), material efficiency (material production per floor area), and renewables (GHG emissions per 4
unit material production). ‘Renewables’ is a summary term describing changes in GHG intensity of energy supply. Emission projections to 2050, and differences 5
between scenarios in 2050, demonstrate mitigation potentials from the dimensions of the SER framework realised in each model scenario. 6
ACCEPTED VERSION
SUBJECT TO FIN
AL EDITS

Final Government Distribution Chapter 9 IPCC AR6 WGIII
Do Not Cite, Quote or Distribute 9-39 Total pages: 168
9.4.3 Technological developments since AR5 1
9.4.3.1 Overview of technological developments 2
There are many technologies that can reduce energy use in buildings (Finnegan et al. 2018; Kockat et 3
al. 2018a), and those have been extensively investigated. Other technologies that can contribute to 4
achieving carbon zero buildings are less present in the literature. Common technologies available to 5
achieve zero energy buildings were summarized in (Cabeza and Chàfer 2020) and are presented in 6
Tables SM9.1 to SM9.3 in detail, where Figure 9.11 shows a summary. 7
8
Figure 9.11 Energy savings potential of technology strategies for climate change mitigation in buildings. 9
Source: Adapted from (Bojić et al. 2014; Bevilacqua et al. 2019; Coma et al. 2017; Djedjig et al. 2015; Chen et 10 al. 2013; Haggag et al. 2014; Khoshbakht et al. 2017; Saffari et al. 2017; Seong and Lim 2013; Radhi 2011; 11
Pomponi et al. 2016; Andjelković et al. 2016; Rosado and Levinson 2019; Costanzo et al. 2016; Spanaki et al. 12 2014; Coma et al. 2016; Yang et al. 2015; Cabeza et al. 2010; Kameni Nematchoua et al. 2020; Annibaldi et al. 13 2020; Varela Luján et al. 2019; Jedidi and Benjeddou 2018; Capozzoli et al. 2013; Asdrubali et al. 2012; Irshad 14 et al. 2019; Luo et al. 2017; Prívara et al. 2011; Sourbron et al. 2013; Ling et al. 2020; Peng et al. 2020; Zhang 15
et al. 2020c; Dong et al. 2020; Harby et al. 2016; Liu et al. 2019; Vakiloroaya et al. 2014; Mahmoud et al. 2020; 16 Romdhane and Louahlia-Gualous 2018; Gong et al. 2019; de Gracia et al. 2013; Navarro et al. 2016; Fallahi et 17 al. 2010; Mujahid Rafique et al. 2015; Soltani et al. 2019; Imanari et al. 1999; Yu et al. 2020; Lee et al. 2018; 18 Sarbu and Sebarchievici 2014; Hohne et al. 2019; Zhang et al. 2019; Omara and Abuelnour 2019; Alam et al. 19
2019; Langevin et al. 2019; Cabeza and Chàfer 2020) 20
ACCEPTED VERSION
SUBJECT TO FIN
AL EDITS
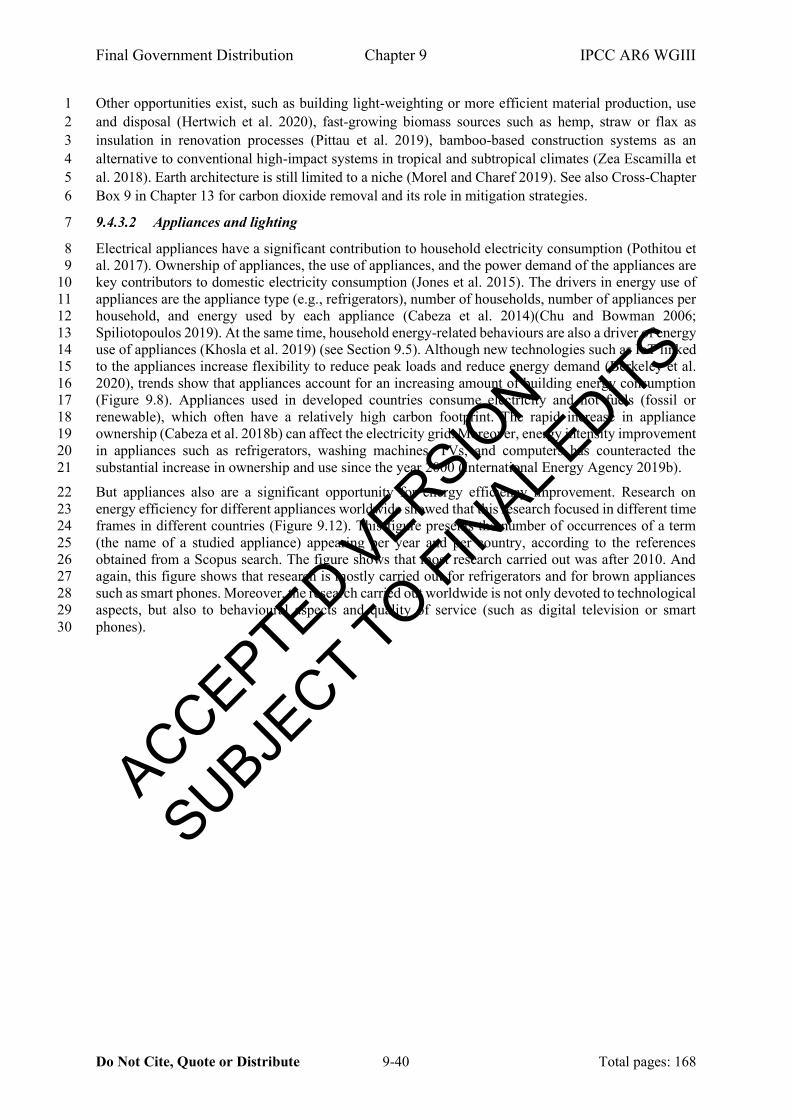
Final Government Distribution Chapter 9 IPCC AR6 WGIII
Do Not Cite, Quote or Distribute 9-40 Total pages: 168
Other opportunities exist, such as building light-weighting or more efficient material production, use 1
and disposal (Hertwich et al. 2020), fast-growing biomass sources such as hemp, straw or flax as 2
insulation in renovation processes (Pittau et al. 2019), bamboo-based construction systems as an 3
alternative to conventional high-impact systems in tropical and subtropical climates (Zea Escamilla et 4
al. 2018). Earth architecture is still limited to a niche (Morel and Charef 2019). See also Cross-Chapter 5
Box 9 in Chapter 13 for carbon dioxide removal and its role in mitigation strategies. 6
9.4.3.2 Appliances and lighting 7
Electrical appliances have a significant contribution to household electricity consumption (Pothitou et 8
al. 2017). Ownership of appliances, the use of appliances, and the power demand of the appliances are 9
key contributors to domestic electricity consumption (Jones et al. 2015). The drivers in energy use of 10
appliances are the appliance type (e.g., refrigerators), number of households, number of appliances per 11
household, and energy used by each appliance (Cabeza et al. 2014)(Chu and Bowman 2006; 12
Spiliotopoulos 2019). At the same time, household energy-related behaviours are also a driver of energy 13
use of appliances (Khosla et al. 2019) (see Section 9.5). Although new technologies such as IoT linked 14
to the appliances increase flexibility to reduce peak loads and reduce energy demand (Berkeley et al. 15
2020), trends show that appliances account for an increasing amount of building energy consumption 16
(Figure 9.8). Appliances used in developed countries consume electricity and not fuels (fossil or 17
renewable), which often have a relatively high carbon footprint. The rapid increase in appliance 18
ownership (Cabeza et al. 2018b) can affect the electricity grid. Moreover, energy intensity improvement 19
in appliances such as refrigerators, washing machines, TVs, and computers has counteracted the 20
substantial increase in ownership and use since the year 2000 (International Energy Agency 2019b). 21
But appliances also are a significant opportunity for energy efficiency improvement. Research on 22
energy efficiency for different appliances worldwide showed that this research focused in different time 23
frames in different countries (Figure 9.12). This figure presents the number of occurrences of a term 24
(the name of a studied appliance) appearing per year and per country, according to the references 25
obtained from a Scopus search. The figure shows that most research carried out was after 2010. And 26
again, this figure shows that research is mostly carried out for refrigerators and for brown appliances 27
such as smart phones. Moreover, the research carried out worldwide is not only devoted to technological 28
aspects, but also to behavioural aspects and quality of service (such as digital television or smart 29
phones). 30
ACCEPTED VERSION
SUBJECT TO FIN
AL EDITS

Final Government Distribution Chapter 9 IPCC AR6 WGIII
Do Not Cite, Quote or Distribute 9-41 Total pages: 168
1
Figure 9.12 Energy efficiency in appliances research. Year and number of occurrences of different appliances in each studied country/territory. 2
ACCEPTED VERSION
SUBJECT TO FIN
AL EDITS
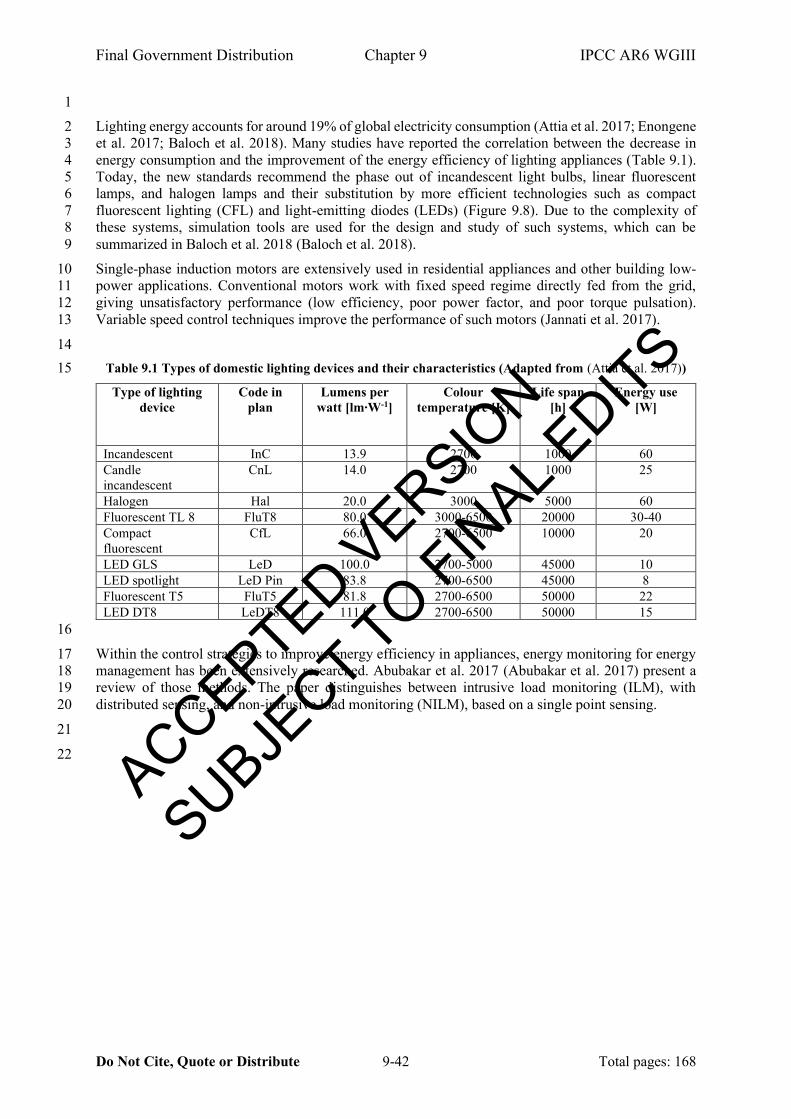
Final Government Distribution Chapter 9 IPCC AR6 WGIII
Do Not Cite, Quote or Distribute 9-42 Total pages: 168
1
Lighting energy accounts for around 19% of global electricity consumption (Attia et al. 2017; Enongene 2
et al. 2017; Baloch et al. 2018). Many studies have reported the correlation between the decrease in 3
energy consumption and the improvement of the energy efficiency of lighting appliances (Table 9.1). 4
Today, the new standards recommend the phase out of incandescent light bulbs, linear fluorescent 5
lamps, and halogen lamps and their substitution by more efficient technologies such as compact 6
fluorescent lighting (CFL) and light-emitting diodes (LEDs) (Figure 9.8). Due to the complexity of 7
these systems, simulation tools are used for the design and study of such systems, which can be 8
summarized in Baloch et al. 2018 (Baloch et al. 2018). 9
Single-phase induction motors are extensively used in residential appliances and other building low-10
power applications. Conventional motors work with fixed speed regime directly fed from the grid, 11
giving unsatisfactory performance (low efficiency, poor power factor, and poor torque pulsation). 12
Variable speed control techniques improve the performance of such motors (Jannati et al. 2017). 13
14
Table 9.1 Types of domestic lighting devices and their characteristics (Adapted from (Attia et al. 2017)) 15
Type of lighting
device
Code in
plan
Lumens per
watt [lm∙W-1]
Colour
temperature [K]
Life span
[h]
Energy use
[W]
Incandescent InC 13.9 2700 1000 60
Candle
incandescent
CnL 14.0 2700 1000 25
Halogen Hal 20.0 3000 5000 60
Fluorescent TL 8 FluT8 80.0 3000-6500 20000 30-40
Compact
fluorescent
CfL 66.0 2700-6500 10000 20
LED GLS LeD 100.0 2700-5000 45000 10
LED spotlight LeD Pin 83.8 2700-6500 45000 8
Fluorescent T5 FluT5 81.8 2700-6500 50000 22
LED DT8 LeDT8 111.0 2700-6500 50000 15
16
Within the control strategies to improve energy efficiency in appliances, energy monitoring for energy 17
management has been extensively researched. Abubakar et al. 2017 (Abubakar et al. 2017) present a 18
review of those methods. The paper distinguishes between intrusive load monitoring (ILM), with 19
distributed sensing, and non-intrusive load monitoring (NILM), based on a single point sensing. 20
21
22
ACCEPTED VERSION
SUBJECT TO FIN
AL EDITS

Final Government Distribution Chapter 9 IPCC AR6 WGIII
Do Not Cite, Quote or Distribute 9-43 Total pages: 168
1
9.4.4 Case studies 2
9.4.4.1 Warehouses 3
Warehouses are major contributors to the rise of greenhouse gas emissions in supply chains (Bartolini 4
et al. 2019). The expanding e-commerce sector and the growing demand for mass customization have 5
even led to an increasing need for warehouse space and buildings, particularly for serving the 6
uninterrupted customer demand in the business-to-consumer market. Although warehouses are not 7
specifically designed to provide their inhabitants with comfort because they are mainly unoccupied, the 8
impact of their activities in the global GHG emissions is remarkable. Warehousing activities contribute 9
roughly 11% of the total GHG emissions generated by the logistics sector across the world. Following 10
this global trend, increasing attention to green and sustainable warehousing processes has led to many 11
new research results regarding management concepts, technologies, and equipment to reduce 12
warehouses carbon footprint, i.e., the total emissions of GHG in carbon equivalents directly caused by 13
warehouses activities. 14
9.4.4.2 Historical and heritage buildings 15
Historical buildings, defined as those built before 1945, are usually low-performance buildings by 16
definition from the space heating point of view and represent almost 30–40% of the whole building 17
stock in European countries (Cabeza et al. 2018a). Historical buildings often contribute to townscape 18
character, they create the urban spaces that are enjoyed by residents and attract tourist visitors. They 19
may be protected by law from alteration not only limited to their visual appearance preservation, but 20
also concerning materials and construction techniques to be integrated into original architectures. On 21
the other hand, a heritage building is a historical building which, for their immense value, is subject to 22
legal preservation. The integration of renewable energy systems in such buildings is more challenging 23
than in other buildings. The review carried out by (Cabeza et al. 2018a) different case studies are 24
presented and discussed, where heat pumps, solar energy and geothermal energy systems are integrated 25
in such buildings, after energy efficiency is considered. 26
9.4.4.3 Positive energy or energy plus buildings 27
The integration of energy generation on-site means further contribution of buildings towards 28
decarbonisation (Ürge-Vorsatz et al. 2020). Integration of renewables in buildings should always come 29
after maximising the reduction in the demand for energy services through sufficiency measures and 30
maximising efficiency improvement to reduce energy consumption, but the inclusion of energy 31
generation would mean a step forward to distributed energy systems with high contribution from 32
buildings, becoming prosumers (Sánchez Ramos et al. 2019). Decrease price of technologies such as 33
PV and the integration of energy storage (de Gracia and Cabeza 2015) are essential to achieve this 34
objective. Other technologies that could be used are photovoltaic/thermal (Sultan and Ervina Efzan 35
2018), solar/biomass hybrid systems (Zhang et al. 2020b), solar thermoelectric (Sarbu and Dorca 2018), 36
solar powered sorption systems for cooling (Shirazi et al. 2018), and on-site renewables with battery 37
storage (Liu et al. 2021). 38
9.4.4.4 District energy networks 39
District heating networks have evolved from systems where heat was produced by coal or waste and 40
storage was in the form of steam, to much higher energy efficiency networks with water or glycol as 41
the energy carrier and fuelled by a wide range of renewable and low carbon fuels. Common low carbon 42
fuels for district energy systems include biomass, other renewables (i.e., geothermal, PV, and large solar 43
thermal), industry surplus heat or power-to-heat concepts, and heat storage including seasonal heat 44
storage (Lund et al. 2018). District energy infrastructure opens opportunities for integration of several 45
heat and power sources and is 'future proof' in the sense that the energy source can easily be converted 46
or upgraded in the future, with heat distributed through the existing district energy network. Latest 47
developments include the inclusion of smart control and AI (Revesz et al. 2020), and low temperature 48
ACCEPTED VERSION
SUBJECT TO FIN
AL EDITS

Final Government Distribution Chapter 9 IPCC AR6 WGIII
Do Not Cite, Quote or Distribute 9-44 Total pages: 168
thermal energy districts. Authors show carbon emissions reduction up to 80% compared to the use of 1
gas boilers. 2
3
9.4.5 Low- and net zero energy buildings – exemplary buildings 4
Nearly zero energy (NZE) buildings or low-energy buildings are possible in all world relevant climate 5
zones (Mata et al. 2020b; Ürge-Vorsatz et al. 2020) (Figure 9.13). Moreover, they are possible both for 6
new and retrofitted buildings. Different envelope design and technologies are needed, depending on the 7
climate and the building shape and orientation. For example, using the Passive House standard an annual 8
heating and cooling energy demand decrease between 75% and 95% compared to conventional values 9
can be achieved. Table 9.2 lists several exemplary low- and NZE-buildings with some of their feature. 10
11
12
13
Figure 9.13 Regional distribution of documented low-energy buildings. 14
Source: New Building Institute 2019; Ürge-Vorsatz et al. 2020 15
16
Table 9.2 Selected exemplary low- and net zero- energy buildings worldwide (Adapted from (Mørck 2017; 17 Schnieders et al. 2020; Ürge-Vorsatz et al. 2020)) 18
Building name
and organization
Location Building type Energy efficiency and renewable energy features Measured energy
performance
SDB-10 at the
software
development
company, Infosys
India Software
development
block
• Hydronic cooling and a district cooling system with a
chilled beam installation
• Energy-efficient air conditioning and leveraged load
diversity across categorized spaces: comfort air
conditioning (workstations, rooms), critical load
conditioning (server, hub, UPS, battery rooms),
ventilated areas (restrooms, electrical, transformer
rooms), and pressurized areas (staircases, lift wells,
lobbies)
EPI of 74 kWh·m-2, with
an HVAC peak load of
5.2 W·m-2 for a total
office area of 47,340 m2
and total conditioned area
of 29,115 m2
ACCEPTED VERSION
SUBJECT TO FIN
AL EDITS

Final Government Distribution Chapter 9 IPCC AR6 WGIII
Do Not Cite, Quote or Distribute 9-45 Total pages: 168
• BMS to control and monitor the HVAC system,
reduced face velocity across DOAS filters, and coils
that allow for low pressure drop
Y.S. Sun Green
Building by an
electronics
manufacturing
company Delta
Electronics Inc.,
Taiwan,
China
University
research
green
building
• Low cost and high efficiency are achieved via passive
designs, such as large roofs and protruded eaves which
are typical shading designs in hot-humid climates and
could block around 68% of incoming solar radiation
annually
• Porous and wind-channelling designs, such as multiple
balconies, windowsills, railings, corridors, and make
use of stack effect natural ventilation to remove warm
indoor air
• Passive cooling techniques that help reduce the annual
air-conditioning load by 30%
EUI of the whole building
is 29.53 kWh·m-2 (82%
more energy-saving
compared to the similar
type of buildings)
BCA Academy
Building
Singapore Academy
Building • Passive design features such a green roof, green walls,
daylighting, and stack effect ventilation
• Active designs such as energy-efficient lighting, air-
conditioning systems, building management system
with sensors and solar panels
• Well-insulated, thermal bridge free building envelope
First net zero energy
retrofitted building in
Southeast Asia
Energy-Plus
Primary School
Germany School • Highly insulated Passive House standard
• Hybrid (combination of natural and controlled
ventilation) ventilation for thermal comfort, air
quality, user acceptance and energy efficiency
• Integrated photovoltaic plant and wood pellet driven
combined heat and power generation
• Classrooms are oriented to the south to enable
efficient solar shading, natural lighting and passive
solar heating
• New and innovative building components including
different types of innovative glazing, electro chromic
glazing, LED lights, filters and control for the
ventilation system
Off grid building with an
EPI of 23 kWh m-2 yr-1
NREL Research
Support Facility
USA Office and
Research
Facility
• The design maximizes passive architectural strategies
such as building orientation, north and south glazing,
daylighting which penetrates deep into the building,
natural ventilation, and a structure which stores
thermal energy
• Radiant heating and cooling with radiant piping
through all floors, using water as the cooling and
heating medium in the majority of workspaces instead
of forced air
• Roof-mounted photovoltaic system and adjacent
parking structures covered with PV panels
EPI of 110 kWh m-2 yr-1
with a project area of
20624.5 m2 to become the
then largest the largest
commercial net zero
energy building in the
country
Mohammed Bin
Rashid Space
Centre (Schnieders
et al. 2020)
United
Arab
Emirates,
Dubai
Non-
residential,
offices
• Exterior walls U-value = 0.08 W m-2 K-1
• Roof U-value = 0.08 W m-2 K-1
• Floor slab U-value = 0.108 W m-2 K-1
• Windows UW = 0.89 W m-2 K-1
• PVC and aluminium frames, triple solar protective
glazing with krypton filling
• Ventilation = MVHR, 89% efficiency
• Heat pump for cooling with recovery of the rejected
heat for DHW and reheating coil
Cooling and
dehumidification demand
= 40 kWh m-2 yr-1
sensible cooling +10 kWh
m-2 yr-1 latent cooling
Primary energy demand =
143 kWh m-2 yr-1
ACCEPTED VERSION
SUBJECT TO FIN
AL EDITS

Final Government Distribution Chapter 9 IPCC AR6 WGIII
Do Not Cite, Quote or Distribute 9-46 Total pages: 168
Sems Have (Mørck
2017)
Roskilde,
Denmark
Multi-family
residential
(Retrofit)
• Pre-fabricated, light weight walls
• Low-energy glazed windows, basement insulated with
expanded clay clinkers under concrete
• Balanced mechanical ventilation with heat recovery
• PV
Final Energy Use: 24.54
kWh·m-2
Primary energy use: 16.17
kWh·m-2
1
2
ACCEPTED VERSION
SUBJECT TO FIN
AL EDITS

Final Government Distribution Chapter 9 IPCC AR6 WGIII
Do Not Cite, Quote or Distribute 9-47 Total pages: 168
9.5 Non-technological and behavioural mitigation options and strategies 2
Non-technological (NT) measures are key for low-carbon buildings, but still attract less attention than 3
technological measures (Ruparathna et al. 2016; Vence and Pereira 2019; Cabeza et al, 2020; Creutzig 4
et al. 2016; Mundaca et al. 2019; Mata et al. 2021b)(Creutzig et al. 2018). The section is set out to 5
understand, over the buildings lifecycle, NT determinants of buildings’ energy demand and emissions 6
(Section 9.5.1); to present NT climate mitigation actions (Section 9.5.2); then, to understand how to get 7
these actions implemented (Section 9.5.3). The latter is a starting point in the design of policies (Section 8
9.9). 9
9.5.1 Non-technological determinants of energy demand and carbon emissions 10
Buildings climate impact includes CO2 emissions from operational energy use, carbon footprint, PM2.5 11
concentrations and embodied carbon, and is unequivocally driven by GDP, income, population, 12
buildings floor area, energy price, climate, behaviour, and social and physical environment (Wolske et 13
al. 2020; Mata et al. 2021d). 14
9.5.1.1 Climate and physical environment 15
Outdoor temperature, Heating and Cooling Degree Days, sunshine hours, rainfall, humidity and wind 16
are highly determinant of energy demand ( Harold et al. 2015; Rosenberg 2014; Lindberg et al. 2019; 17
Risch and Salmon 2017)(Tol et al. 2012). Density, compacity, and spatial effects define the surrounding 18
environment and urban microclimate. Urban residents usually have a relatively affluent lifestyle, but 19
use less energy for heating (Huang 2015; Niu et al. 2012; Rafiee et al. 2019; Ayoub 2019; Oh and Kim 20
2019). Urbanization is discussed in Chapter 8. 21
Climate variability and extreme events may drastically increase peak and annual energy consumption 22
(Mashhoodi et al. 2019; Cui et al. 2017; Hong et al. 2013). Climate change effects on future demand 23
and emissions, are discussed in Section 9.7, and effects of temperature on health and productivity, in 24
Section 9.8. 25
9.5.1.2 Characteristics of the building 26
Building typology and floor area (or e.g. number of bedrooms or lot size) are correlated to energy 27
demand (Fosas et al. 2018; Morganti et al. 2019; Manzano-Agugliaro et al. 2015; Moura et al. 2015; 28
Berrill et al. 2021). Affluence is embedded in these variables as higher-income households have larger 29
homes and lots. Residential consumption increases with the number of occupants but consumption per 30
capita decreases proportionally to it (Serrano et al. 2017). Construction or renovation year has a negative 31
correlation as recently built buildings must comply with increasingly strict standards (Brounen et al. 32
2012; Kavousian et al. 2015; Österbring et al. 2016). Only for electricity consumption no significant 33
correlation is observed to building age (Kavousian et al. 2013). Material choices, bioclimatic and 34
circular design discussed in Section 9.4.2. 35
9.5.1.3 Socio-demographic factors 36
Income is positively correlated to energy demand (Singh et al. 2017; Bissiri et al. 2019; Sreekanth et al. 37
2011; Couture et al. 2012;Yu 2017; Moura et al. 2015; Mata et al. 2021b; Cayla et al. 2011). High-38
income households tend to use more efficient appliances and are likely to be more educated and 39
environmentally sensitive, but their higher living standards require more energy (Hidalgo et al. 2018; 40
Harold et al. 2015). Low-income households are in higher risk of fuel poverty (Section 9.8). 41
Mixed effects are found for household size, age, gender, ethnicity, education levels and tenancy status 42
(Engvall et al. 2014; Arawomo 2019; Lévy and Belaïd 2018; Hansen 2016; Rafiee et al. 2019). Single-43
parent and elderly households consume more gas and electricity, and gender has no significant effect 44
(Harold et al. 2015; Brounen et al. 2012; Huang 2015). Similarly, larger families use less electricity per 45
capita (Bedir et al. 2013; Kavousian et al. 2013). Heating expenditure tends to be higher for owners 46
than for renters, despite the formers tendency to have more efficient appliances (Gillingham et al. 2012; 47
Davis, 2012; Kavousian et al. 2015). 48
ACCEPTED VERSION
SUBJECT TO FIN
AL EDITS

Final Government Distribution Chapter 9 IPCC AR6 WGIII
Do Not Cite, Quote or Distribute 9-48 Total pages: 168
9.5.1.4 Behaviour 1
Occupants presence and movement, interactions with the building, comfort-driven adaptations and 2
cultural practices determine energy consumption (Li et al. 2019; Khosla et al. 2019; D’Oca et al. 2018; 3
Hong et al. 2017; O’Brien et al. 2020; Yan et al. 2017). Households consume more on weekends and 4
public holidays, and households with employed occupants consume less than self-employed occupants, 5
probably because some of the latter jobs are in-house (Harold et al. 2015; Hidalgo et al. 2018). 6
Understanding and accurate modelling of occupant behaviour is crucial to reduce the gap between 7
design and energy performance (Gunay et al. 2013; Yan et al. 2017), especially for more efficient 8
buildings, which rely on passive design features, human-centred technologies, and occupant 9
engagement (Grove-Smith et al. 2018; Pitts 2017). 10
9.5.2 Insights from non-technological and behavioural interventions 11
A range of NT actions can substantially reduce buildings energy demand and emissions (Figure 9.14; 12
see Supplementary Material SM9.2 for details). The subsections below present insights on the variations 13
depending on the solution, subsector, and region. 14
15
Figure 9.14 Energy saving and GHG mitigation potentials for categories of NT interventions for 16 Residential (R) and Non-Residential (NR) buildings, from studies with worldwide coverage. 17
Sources: (Ruparathna et al. 2016b; Khosrowpour et al. 2016; Kaminska 2019; Creutzig et al. 2016; Wilson et al. 18 2020b; Derungs et al. 2019; Levesque et al. 2019a; Bierwirth and Thomas 2019b; Roussac and Bright 2012; 19 Ohueri et al. 2018; Bavaresco et al. 2020; Ahl et al. 2019; Van Den Wymelenberg 2012; Cantzler et al. 2020; 20
Ivanova and Büchs 2020b; Harris et al. 2021a; van Sluisveld et al. 2016;Rupp et al. 2015; Grover 2019). 21
9.5.2.1 Passive and active design, management, and operation 22
Bioclimatic design and passive strategies for natural heating, cooling and lighting, can greatly reduce 23
buildings’ climate impact, and avoid cooling in developing countries (Bienvenido-Huertas et al. 2021, 24
2020; Amirifard et al. 2019). Design can provide additional small savings, e.g., by placing refrigerator 25
away from the oven, radiators or windows (Christidou et al. 2014). Passive management refers to 26
adjustments in human behaviour such as adapted clothing, allocation of activities in the rooms of the 27
building to minimize the energy use (Rafsanjani et al. 2015; Klein et al. 2012) or manual operation of 28
the building envelope (Rijal et al. 2012; Volochovic et al. 2012). Quantitative modelling of such 29
ACCEPTED VERSION
SUBJECT TO FIN
AL EDITS
Final Government Distribution Chapter 9 IPCC AR6 WGIII
Do Not Cite, Quote or Distribute 9-49 Total pages: 168
measures is most common for non-residential buildings, in which adaptive behaviours are affected by 1
the office space distribution and interior design, amount of occupants, visual comfort, outdoor view, 2
and ease to use control mechanisms (Talele et al. 2018; O’Brien and Gunay 2014). Socio demographic 3
factors, personal characteristics and contextual factors also influence occupant behaviour and their 4
interactions with buildings (D’Oca et al. 2018b; Hong et al. 2020). 5
Active management refers to human control of building energy systems. Efficient lighting practices can 6
effectively reduce summer peak demand (Dixon et al. 2015; Taniguchi et al. 2016). On the contrary, 7
the application of the Daylight-Saving Time in the US increases up to 7% lighting consumption (Rakha 8
et al. 2018). Efficient cooking practices for cooking, appliance use (e.g. avoid stand-by regime, select 9
eco-mode), or for hot water can save up to 25% (Teng et al. 2012; Berezan et al. 2013; Hsiao et al. 10
2014; Abrahamse and Steg 2013; Peschiera and Taylor 2012; Dixon et al. 2015; Reichert et al. 2016). 11
High behavioural control is so far proven difficult to achieve (Ayoub et al. 2014) (Sköld et al. 2018). 12
Automated controls and technical measures to trigger occupant operations are addressed in Section 9.4. 13
9.5.2.2 Limited demands for services 14
Adjustment in the set-point temperature in winter and summer results in savings between 5% and 25% 15
(Ayoub et al. 2014)(Christidou et al. 2014; Sun and Hong 2017; Taniguchi et al. 2016). As introduced 16
in 9.3, a series of recent works study a cap on the living area (Mata et al. 2021a) or an increase in 17
household size (Berrill et al. 2021). These studies are promising but of limited complexity in terms of 18
rebounds, interactions with other measures, and business models, thus require further investigation. 19
Professional assistance and training on these issues is limited (Maxwell et al. 2018). 20
Willingness to adopt is found for certain measures (full load to laundry appliances, lid on while cooking, 21
turning lights off, defer electricity usage and HVAC systems, adjust set-point temperature by 1°C) but 22
not for others (appliances on standby, using more clothes, avoid leaving the TV on while doing other 23
things, defer ovens, ironing or heating systems, adjust set-point temperature by 3°C, move to a low 24
energy house or smaller apartment) (Brown et al. 2013; Sköld et al. 2018; Yohanis 2012; Li et al. 2017). 25
A positive synergy with digitalization and smart home appliances is identified, driven by a combination 26
of comfort requirements and economic interest, confirmed by a willingness to defer electricity usage in 27
exchange for cost savings (Ferreira et al. 2018; Mata et al. 2020c). 28
9.5.2.3 Flexibility of demand and comfort requirements 29
In a flexible behaviour, the desired level of service is the same, but it can be shifted over time, typically 30
allowing automated control, for the benefit of the electricity or district heating networks. There are 31
substantial economic, technical, and behavioural benefits from implementing flexibility measures 32
(Mata et al. 2020c), with unknown social impacts. 33
With demand side measures (DSM), such as shifting demand a few hours, peak net demand can be 34
reduced up to 10-20% (Stötzer et al. 2015), a similar potential is available for short-term load shifting 35
during evening hours (Aryandoust and Lilliestam 2017). Although different household types show 36
different consumption patterns and thus an individual availability of DSM capacity during the day ( 37
Fischer et al. 2017), there is limited (Shivakumar et al. 2018) or inexistent (Nilsson et al. 2017; Drysdale 38
et al. 2015) information of consumers response to Time of Use pricing, specifically among those living 39
in apartments (Bartusch and Alvehag 2014). Behavioural benefits are identified in terms of increased 40
level of energy awareness of the users (Rehm et al. 2018), measured deliberate attempts of the 41
consumers to reduce and/or shift their electricity usage (Bradley et al. 2016). Real-time control and 42
behavioural change influence 40% of the electricity use during operational life of non-residential 43
buildings (Kamilaris et al. 2014). 44
9.5.2.4 Circular and sharing economy (CSE) 45
Non technological CSE solutions, based on the Regenerate, Share, Optimize, Loop, Virtualize, 46
Exchange (ReSOLVE) framework (CE100 2016; ARUP 2018) include sharing, virtualizing and 47
ACCEPTED VERSION
SUBJECT TO FIN
AL EDITS

Final Government Distribution Chapter 9 IPCC AR6 WGIII
Do Not Cite, Quote or Distribute 9-50 Total pages: 168
exchanging. These are less studied than circular materials, with notably less investigation of existing 1
buildings and sharing solutions (Pomponi and Moncaster 2017; Høibye and Sand 2018; Kyrö 2020; 2
European Commission 2020). 3
The sharing economy generates an increased utilization rate of products or systems by enabling or 4
offering shared use, access or ownership of products and assets that have a low ownership or use rate. 5
Measures include conditioned spaces (accommodation, facility rooms, offices) as well as tools and 6
transfer of ownership (i.e., second-hand or donation) (Rademaekers et al. 2017; Harris et al. 2021; 7
Mercado 2018; Hertwich et al. 2020; Cantzler et al. 2020; Mata et al. 2021c). The evidence on the link 8
between user behaviour and net environmental impacts of sharing options is still limited (Laurenti et al. 9
2019; Mata et al. 2020a; Harris et al. 2021b) and even begins to be questioned, due to rebounds that 10
partially or fully offset the benefits (Agrawal and Bellos 2017; Zink and Geyer 2017). E.g., the costs 11
savings from reduced ownership can be allocated to activities with a higher carbon intensity, or result 12
in increased mobility. Both reduced ownership and other circular consumption habits show no influence 13
on material footprint, other than mildly positive influence in low-income households (Junnila et al. 14
2018; Ottelin et al. 2020). 15
9.5.2.5 Value-chain, social and institutional innovations 16
Cooperative efforts are necessary to improve buildings energy efficiency (Masuda and Claridge 2014; 17
Kamilaris et al. 2014; Ruparathna et al. 2016). For instance, inter-disciplinary understanding of 18
organizational culture, occupant behaviour, and technology adoption is required to set up 19
occupancy/operation best practises (Janda 2014). Similarly, close collaboration of all actors along the 20
value chain can reduce by 50% emissions from concrete use (Habert et al. 2020); such collaboration 21
can be enhanced in a construction project by transforming the project organisation and delivery contract 22
to reduce costs and environmental impact (Hall and Bonanomi 2021). Building commissioning helps to 23
reduce energy consumption by streamlining the systems, but benefits may not persistent. Energy 24
communities are discussed later in the chapter. 25
NT challenges include training and software costs (tailored learning programs, learning-by-doing, 26
human capital mobilization), client and market demand (service specification, design and provision; 27
market and financial analysis) and legal issues (volatile energy prices, meeting regulation); and 28
partnership, governance and commercialization. These challenges are identified for Building 29
Information Modelling (Rahman and Ayer 2019; Oduyemi et al. 2017), PV industry (Triana et al. 2018), 30
Smart Living (Solaimani et al. 2015) or circular economy (Vence and Pereira 2019). 31
9.5.3 Adoption of climate mitigation solutions– reasons and willingness 32
Mixed effects are found for technical issues, attitudes, and values (Table 9.3). In spite of proven positive 33
environmental attitudes and willingness to adopt mitigation solutions, these are outweighed by financial 34
aspects all over the world (Mata et al. 2021b). Adopters in developed countries are more sensitive 35
towards financial issues and comfort disruptions; whereas in other world regions techno-economic 36
concerns prevail. Private consumers seem ready to support stronger governmental action, whereas non-37
private interventions are hindered by constraints in budgets and profits, institutional barriers and 38
complexities (Curtis et al. 2017; Zuhaib et al. 2017; Tsoka et al. 2018; Kim et al. 2019). 39
A variety of interventions targeted to heterogeneous consumer groups and decision makers is needed to 40
fulfil their diverse needs (Zhang et al. 2012; Liang et al. 2017; Soland et al. 2018; Marshall et al. 2015; 41
Haines and Mitchell 2014; Gram-Hanssen 2014; Friege et al. 2016; Hache et al. 2017; Ketchman et al. 42
2018). Policy reviews for specific market segments and empirical studies investigating investment 43
decisions would benefit from a multidisciplinary approach to energy consumption patterns and market 44
maturity (Boyd 2016; Marzano et al. 2018; Heiskanen and Matschoss 2017; Baumhof et al. 2018; 45
Wilson et al. 2018). 46
ACCEPTED VERSION
SUBJECT TO FIN
AL EDITS

Final Government Distribution Chapter 9 IPCC AR6 WGIII
Do Not Cite, Quote or Distribute 9-51 Total pages: 168
Table 9.3 Reasons for adoption of climate mitigation solutions. The sign represents if the effect is positive 1 (+) or negative (-), and the number of signs represents confidence level (++, many references; +, few 2
references) (Mata et al. 2021a) 3
Climate mitigation solutions for buildings
Bu
ild
ing e
nv
elo
pe
Eff
icie
nt
tech
nic
al
syst
em
s
On
-sit
e
ren
ew
ab
le
en
erg
y
Beh
avio
ur
Perfo
rm
an
ce
sta
nd
ard
s
Lo
w-c
arb
on
ma
teria
ls
Dig
ita
liza
tio
n
an
d
flexib
ilit
y
Cir
cu
lar
an
d
sha
rin
g e
con
.
Economic:
Subsidies/microloans* + ++ ++ + ++ +
Low/high investment costs - +/-- ++/-- +/- +/-- +/- - -
Short payback period + + + + + + +
High potential savings ++ ++ ++ + ++ ++ +
Market-driven demand + + + + +
Higher resale value + + + + +
Operating/maintenance costs + ++/- ++/- + + + +/-
Split incentives - - - - - -
Constrained budgets and profits - -- - -- - -- --
Price competitive (overall) + + + + + +
Information and support:
Governmental support and capacity/lack of +/- +/- ++/- ++/- + +/- -
Institutional barriers and complexities - - - - -- - - -
Information and labeling/lack of +/- ++/- ++/- + ++/- +/- -
Smart metering + + + +
Participative ownership + + + + +
Peer effects + + ++ + +
Professional advice/lack of +/- ++/- ++/- - +/-- - +/- +/-
Social norm + + + + + + +
Previous experience with solution/lack of +/- +/- +/- - - - +/- +/-
Technical:
Condition of existing elements + + + + + +
Natural resource availability + + ++ + + +
Performance and maintenance concerns* - - -- -- - - -
Low level of control over appliances - - - - -
Limited alternatives available - - - -
Not compatible with existing equipment - - - - - -
Attitudes and values:
Appealing novel technology + + ++ + + + ++ +
Social and egalitarian world views + + + + +
Willingness to pay + ++ + +
Heritage or aesthetic values +/- ++/- +/- +/- +/-
Environmental values + + ++ + ++ + ++ +
Status and comfort / Lack of ++ ++ ++ + ++ +
Discomfort during the retrofitting period - - - - -
Control, privacy, and security / Lack of* +/- +/- - - - +/--
Risk aversion - - - - - -
Social:
Size factors (household, building) +/- ++/- + + +
Status (education, income) +/- ++/- +/- +/- +/- + +/-
Sociodemographic (age, gender, and ethnicity) +/- ++/- +/- +/- +/- +/-
ACCEPTED VERSION
SUBJECT TO FIN
AL EDITS

Final Government Distribution Chapter 9 IPCC AR6 WGIII
Do Not Cite, Quote or Distribute 9-52 Total pages: 168
1
9.5.3.1 Building envelope 2
In North America and Europe, personal attitudes, values, and existing information and support are the 3
most and equally important reasons for improving the building envelope. Consumers have some 4
economic concerns and little technical concerns, the later related to the performance and maintenance 5
of the installed solutions (Mata el al, 2021c). In other world regions or per climate zone the literature is 6
limited. 7
Motivations are often triggered by urgent comfort or replacement needs. Maintaining the aesthetic value 8
may as well hinder the installation of insulation if no technical solutions are easily available (Haines 9
and Mitchell 2014; Bright et al. 2019). Local professionals and practitioners can both encourage 10
(Ozarisoy and Altan 2017; Friege 2016) and discourage the installation of insulation, according to their 11
knowledge and training (Maxwell et al. 2018; Curtis et al. 2017; Zuhaib et al. 2017; Tsoka et al. 2018). 12
If energy renovations of the buildings envelopes are not normative, cooperative ownership may be a 13
barrier in apartment buildings (Miezis et al. 2016). Similarly, product information and labelling may be 14
helpful or overwhelming (Ozarisoy and Altan 2017; Lilley et al. 2017; Bright et al. 2019). Decisions 15
are correlated to governmental support (Tam et al. 2016; Swantje et al. 2015) and peer information 16
(Friege et al. 2016; Friege 2016). 17
The intervention is required to be cost efficient, although value could be placed in the amount of energy 18
saved (Mortensen et al. 2016; Howarth and Roberts 2018; Kim et al. 2019; Lilley et al. 2017) or the 19
short payback period (Miezis et al. 2016). Subsidies have a positive effect (Swan et al. 2017). 20
9.5.3.2 Adoption of efficient HVAC systems and appliances 21
Mixed willingness is found to adopt efficient technologies. While developed countries are positive 22
towards building envelope technologies, appliances such as A-rated equipment or condensing boilers 23
are negatively perceived (Yohanis 2012). In contrast, adopters in Asia are positive towards energy 24
saving appliances (Liao et al. 2020; Spandagos et al. 2020). 25
Comfort, economic and ecological aspects, as well as information influence the purchase of a heating 26
system (Decker and Menrad 2015; Claudy et al. 2011). Information and support from different 27
stakeholders are the most relevant aspects in different geographical contexts (Tumbaz and Moğulkoç 28
2018; Hernandez-Roman et al. 2017; Curtis et al. 2018; Bright et al. 2019; Chu and Wang 2019). 29
Among high-income countries, economy aspects have positive effects, specially reductions in energy 30
bills and financial incentives or subsidies (Mortensen et al. 2016; Clancy et al. 2017; Christidou et al. 31
2014; Chun and Jiang 2013; Ketchman et al. 2018). Having complementary technologies already in 32
place also has positively affects adoption (Zografakis et al. 2012; Clancy et al. 2017), but performance 33
and maintenance concerns appear as barriers (Qiu et al. 2014). The solutions are positively perceived 34
as high-technology innovative, to enhance status, and are supported by peers and own-environmental 35
values (Ketchman et al. 2018; Mortensen et al. 2016; Heiskanen and Matschoss 2017). 36
9.5.3.3 Installation of renewable energy sources (RES) 37
Although consumers are willing to install distributed RES worldwide, and information has successfully 38
supported their roll out, economic and governmental support is still necessary for their full deployment. 39
Technical issues remain for either very novel technologies or for the integration of RES in the energy 40
system (Mata et al. 2021c; Ürge-Vorsatz et al. 2020). Capacities are to be built by coordinated actions 41
by all stakeholders (Musonye et al. 2020). To this aim, energy communities and demonstrative 42
interventions at local scale are key to address technical, financial, regulatory and structural barriers and 43
document long-term benefits (von Wirth et al. 2018; Shafique M Luo J 2020, Fouladvand et al. 2020). 44
ACCEPTED VERSION
SUBJECT TO FIN
AL EDITS

Final Government Distribution Chapter 9 IPCC AR6 WGIII
Do Not Cite, Quote or Distribute 9-53 Total pages: 168
Regarding solar technologies, heterogeneous decisions are formed by sociodemographic, economic and 1
technical predictors interwoven with a variety of behavioural traits (Alipour M Salim RA Sahin, O 2
2020; Khan 2020). Studies on PV adoption confirm place-specific (various spatial and peer effects), 3
multi-scalar cultural dynamics (Schaffer and Brun 2015; Bollinger and Gillingham 2012; Graziano and 4
Gillingham 2015). Environmental concern and technophilia drive the earliest PV adopters , while later 5
adopters value economic gains (Hampton and Eckermann 2013; Jager-Waldau et al. 2018; Abreu et al. 6
2019; Palm 2020). Previous experience with similar solutions increases adoption (Bach et al. 2020; K 7
2018; QURAISHI and AHMED 2019; Reindl and Palm 2020). 8
9.5.3.4 Low-carbon materials 9
Studies on low-carbon materials tend to focus on wood-based building systems and prefabricated 10
housing construction, mostly in high-income countries, as many sustainable managed forestries and 11
factories for prefabricated housing concentrated in such regions (Mata el al, 2021c). This uneven 12
promotion of wood can lead to its overconsumption (Pomponi et al. 2020). 13
Although the solutions are not yet implemented at scale, examples include , the adoption of low carbon 14
cement in Cuba motivated by the possibility of supplying the raising demand with low initial investment 15
costs (Cancio Díaz et al. 2017) or adoption of bamboo based social houses in Philippines motivated by 16
local job creation and Typhoon resistance (Zea Escamilla et al. 2016). More generally, low investment 17
costs and high level decision-making, e.g. political will and environmental values of society, increase 18
the adoption rate of low-carbon materials (Steinhardt and Manley 2016; Lien and Lolli 2019; Hertwich 19
et al. 2020). In contrast, observed barriers include lobbying by traditional materials industries, short-20
term political decision making (Tozer 2019) and concerns over technical performance, risk of damage, 21
and limited alternatives available (Thomas et al. 2014). 22
9.5.3.5 Digitalization and demand-supply flexibility 23
Demand-supply flexibility measures are experimentally being adopted in North America, Europe, and 24
Asia-Pacific Developed regions. Changes in the current regulatory framework would facilitate 25
participation based on trust and transparent communication (Wolsink 2012; Nyborg and Røpke 2013; 26
Mata et al. 2020b). However, consumers expect governments and energy utilities to steer the transition 27
(Seidl et al. 2019). 28
Economic challenges are observed, as unclear business models, disadvantageous market models and 29
high costs of advanced smart metering. Technical challenges include constraints for HPs and seasonality 30
of space heating demands. Social challenges relate to lack of awareness of real-time price information 31
and inadequate technical understanding. Consumers lack acceptance towards comfort changes (noise, 32
overnight heating) and increased automation (Sweetnam et al. 2019; Bradley et al. 2016; Drysdale et 33
al. 2015). Risks identified include higher peaks and congestions in low price-hours, difficulties in 34
designing electricity tariffs because of conflicts with CO2 intensity, and potential instability in the entire 35
electricity system caused by tariffs coupling to wholesale electricity pricing. 36
Emerging market players are changing customer utility relationships, as the grid is challenged with 37
intermittent loads and integration needs for ICTs, interfering with consumers requirements of autonomy 38
and privacy (Parag and Sovacool 2016; Wolsink 2012). Although most private PV owners would make 39
their storage system available as balancing load for the grid operator, the acquisition of new batteries 40
by a majority of consumers requires incentives (Gährs et al. 2015). For distributed energy hubs, social 41
acceptance depends on the amount of local benefits in economic, environmental or social terms 42
(Kalkbrenner and Roosen 2015), and increases around demonstration projects (von Wirth et al. 2018). 43
9.5.3.6 Circular and sharing economy 44
The circular and sharing economy begins to be perceived as organizational and technologically 45
innovative, with the potential to provide superior customer value, response to societal trends and 46
ACCEPTED VERSION
SUBJECT TO FIN
AL EDITS

Final Government Distribution Chapter 9 IPCC AR6 WGIII
Do Not Cite, Quote or Distribute 9-54 Total pages: 168
positive marketing (Mercado 2018; Cantzler et al. 2020; L.K et al. 2020). Although technical and 1
regulatory challenges remain, there are key difficulties around the demonstration of a business case for 2
both consumers and the supply chain (Pomponi and Moncaster 2017; Hart et al. 2019). 3
Government support is needed an initiator but also to reinforce building retrofit targets, promote more 4
stringent energy and material standards for new constructions, and protect consumer interests 5
(Hongping 2017; Fischer and Pascucci 2017; Patwa et al. 2020). Taxes clearly incentivize waste 6
reduction and recycling (Ajayi et al. 2015; Rachel and Travis 2011; Volk et al. 2019). In developing 7
countries, broader, international, market boundaries can allow for a more attractive business model 8
(Mohit et al. 2020). Participative and new ownership models can favour the adoption of prefabricated 9
buildings (Steinhardt and Manley 2016). Needs for improvements are observed, in terms of design for 10
flexibility and deconstruction, procurement and prefabrication and off-site construction, standardization 11
and dimensional coordination, with differences among solutions (Ajayi et al. 2017)(Schiller et al, 12
2015,2017; Osmani, 2012; Lu and Yuan, 2013; Cossu and Williams, 2015; Bakshan et al 2017; Coehlo 13
et al 2013). 14
Although training is a basic requirement, attitude, past experience, and social pressure can also be highly 15
relevant, as illustrated for waste management in a survey to construction site workers (Amal et al. 2017). 16
Traditional community practices of reuse of building elements are observed to be replaced by a culture 17
of waste (Hongping 2017; Ajayi et al. 2015). 18
19
9.6 Global and regional mitigation potentials and costs 20
9.6.1 Review of literature calculating potentials for different world countries 21
Section 9.4 provides an update on technological options and practices, which allow constructing and 22
retrofitting individual buildings to produce very low emissions during their operation phase. Since AR5, 23
the world has seen a growing number of such buildings in all populated continents, and a growing 24
amount of literature calculates the mitigation potential for different countries if such technologies and 25
practices penetrate at scale. Figure 9.15 synthesizes the results of sixty-seven bottom-up studies, which 26
rely on the bottom-up technology-reach approach and assess the potential of such technologies and 27
practices, aggregated to stock of corresponding products and/or buildings at national level. 28
The studies presented in Figure 9.15 rely on all, the combination, or either of the following mitigation 29
strategies: the construction of new high energy-performance buildings taking the advantage of building 30
design, forms, and passive construction methods; the thermal efficiency improvement of building 31
envelopes of the existing stock; the installation of advanced HVAC systems, equipment and appliances; 32
the exchange of lights, appliances, and office equipment, including ICT, water heating, and cooking 33
with their efficient options; demand side management, most often controlling comfort requirements and 34
demand-side flexibility and digitalization; as well as onsite production and use of renewable energy. 35
Nearly all studies, which assess the technological potential assume such usage of space heating, cooling, 36
water heating, and lighting that does not exceed health, living, and working standards, thus realizing at 37
least a part of the non-technological potential, as presented in Figure 9.14. The results presented in 38
Figure 9.15 relate to measures applied within the boundaries of the building sector, including the 39
reduction in direct and indirect emissions. The results exclude the impact of decarbonisation measures 40
applied within the boundaries of the energy supply sector, i.e., the decarbonisation of grid electricity 41
and district heat. 42
The analysis of Figure 9.15 illustrates that there is a large body of literature attesting to mitigation 43
potential in the countries of Europe and North America of up to 55-85% and in Asia-Pacific Developed 44
of up to 45% in 2050, as compared to their sector baseline emissions, even though they sometimes 45
decline. For developing countries, the literature estimates the potential of up to 40-80% in 2050, as 46
ACCEPTED VERSION
SUBJECT TO FIN
AL EDITS

Final Government Distribution Chapter 9 IPCC AR6 WGIII
Do Not Cite, Quote or Distribute 9-55 Total pages: 168
compared to their sharply growing baselines. The interpretation of these estimates should be cautious 1
because the studies rely on assumptions with uncertainties and feasibility constrains (see Sections 9.6.4, 2
Figure 9.20 and Table SM9.6). 3
4
Figure 9.15 Potential GHG emission reduction in buildings of different world countries grouped by 5
region, as reported by sixty-seven bottom-up studies 6
Sources: North America: Canada (Radpour et al. 2017; Subramanyam et al. 2017a,b; Trottier 2016; Zhang et al. 7
2020a), the Unites States of America (Gagnon, Peter, Margolis, Robert, Melius, Jennifer, Phillips, Saleb, Elmore 8
2016; Nadel 2016; Yeh et al. 2016; Zhang et al. 2020a; Wilson et al. 2017); Europe: Albania (Novikova et al. 9
2020, 2018c), Austria (Ploss et al. 2017), Bulgaria, the Czech Republic, Hungary (Csoknyai et al. 2016), France 10
(Ostermeyer, Y.; Camarasa, C.; Saraf, S.; Naegeli, C.; Jakob, M.; Palacios, A, Catenazzi 2018), the European 11
Union (Roscini et al. 2020; Brugger et al. 2021; Duscha et al. 2019), Germany (Markewitz et al. 2015; Bürger et 12
al. 2019; Ostermeyer et al. 2019b), Greece (Mirasgedis et al. 2017), Italy (Calise et al. 2021; Filippi Oberegger 13
et al. 2020), Lithuania (Toleikyte et al. 2018), Montenegro (Novikova et al. 2018c), Netherlands (Ostermeyer et 14
al. 2018a), Norway (Sandberg et al. 2021), Serbia (Novikova et al. 2018a), Switzerland (Iten et al. 2017; 15
Streicher et al. 2017), Poland (Ostermeyer et al. 2019a), the United Kingdom (Ostermeyer, Y.; Camarasa, C.; 16
Naegeli, C.; Saraf, S.; Jakob, M.; Hamilton, I; Catenazzi 2018a); Eurasia: Armenia, Georgia (Timilsina et al. 17
2016); the Russian Federation (Bashmakov 2017; Zhang et al. 2020a); Asia-Pacific Developed: Australia 18
(Butler et al. 2020; Energetics 2016; Zhang et al. 2020a), Japan (Zhang et al. 2020a; Momonoki et al. 2017; 19
Wakiyama and Kuramochi 2017; Sugyiama et al. 2020; Minami et al. 2019); Africa: Egypt (Pedzi Makumbe, 20
Manuela Mot, Marwa Moustafa Khalil 2017; Calise et al. 2021), Morocco (Merini et al. 2020), Nigeria (Dioha 21
et al. 2019; Kwag et al. 2019; Onyenokporo and Ochedi 2019), Rwanda (Colenbrander et al. 2019), South 22
Africa (Department of Environmental Affairs 2014), Uganda (de la Rue du Can et al. 2018), Algeria, Egypt, 23
Libya, Morocco, Sudan, Tunisia (Krarti 2019); Middle East - Qatar (Krarti et al. 2017; Kamal et al. 2019), 24
Saudi Arabia (Khan et al. 2017; Alaidroos and Krarti 2015), Bahrain, Iraq, Jordan, Kuwait, Lebanon, Oman, 25
Qatar, Saudi Arabia, State of Palestine, Syrian Arab Republic, United Arab Emirates, Yemen (Krarti 2019); 26
Eastern Asia - China (Tan et al. 2018; Xing et al. 2021; Zhou et al. 2018; Zhang et al. 2020); Southern Asia: 27
India (de la Rue du Can et al. 2019; Yu et al. 2018; Zhang et al. 2020); South-East Asia and Developing Pacific: 28
Indonesia (Kusumadewi and Limmeechokchai 2015, 2017), Thailand (Kusumadewi and Limmeechokchai 2015, 29
2017; Chaichaloempreecha et al. 2017), Viet Nam (ADB 2017), respective countries from the Asia-Pacific 30
Economic Cooperation (APEC) (Zhang et al. 2020a); Latin America and Caribbean: Brazil (de Melo and de 31
Martino Jannuzzi 2015; González-Mahecha et al. 2019), Colombia (Prada-hernández et al. 2015), Mexico 32
(Grande-acosta and Islas-samperio 2020; Rosas-Flores and Rosas-Flores 2020). 33
The novelty since AR5 is emerging bottom-up literature, which attempts to account for potential at 34
national and global level from applying the sufficiency approach (see Box 9.1 in Section 9.1and 35
decomposition analysis in Section 9.3.2). In spite of the reducing energy use per unit of floor area at 36
ACCEPTED VERSION
SUBJECT TO FIN
AL EDITS

Final Government Distribution Chapter 9 IPCC AR6 WGIII
Do Not Cite, Quote or Distribute 9-56 Total pages: 168
an average rate of 1.3% per year, the growth of floor area at an average rate of 3% per year causes rising 1
energy demand and GHG emissions because each new square meter must be served with thermal 2
comfort and/or other amenities (International Energy Agency 2017; Ellsworth-Krebs 2020). Nearly all 3
studies reviewed in Figure 9.15 assume the further growth of floor area per capita until 2050, with many 4
studies of developing countries targeting today per capita floor area as in Europe. 5
Table 9.4 reviews the bottom-up literature, which quantifies the potential from reorganization of human 6
activities, efficient design, planning, and use of building space, higher density of building and settlement 7
inhabitancy, redefining and downsizing goods and equipment, limiting their use to health, living, and 8
working standards, and their sharing, recognizing the number of square meters and devices as a 9
determinant of GHG emissions that could be impacted via policies and measures. Nearly all national or 10
regional studies originate from Europe and North America recognizing challenges, developed countries 11
face toward decarbonisation. Thus, (Goldstein et al. 2020) suggested prioritizing the reduction in floor 12
space of wealthier population and more efficient space planning because grid decarbonisation is not 13
enough to meet the U.S. target by 2050 whereas affluent suburbs may have 15 times higher emission 14
footprints than nearby neighbourhoods. (Cabrera Serrenho et al. 2019) argue that reducing the UK floor 15
area is a low cost mitigation option given a low building replacement rate and unreasonably high retrofit 16
costs of existing buildings. (Lorek and Spangenberg 2019) discusses the opportunity of reducing 17
building emissions in Germany fitting better the structure of the dwelling stock to the declined average 18
household size, as most dwellings have 3–4 rooms while most households have only one person. 19
Whereas these studies suggest sufficiency as an important option for developed countries, global studies 20
argue that it is also important for the developing world. This is because it provides the means to address 21
inequality, poverty reduction and social inclusion, ensuring the provision of acceptable living standards 22
for the entire global population given the planetary boundaries. As Figure 9.6 illustrates, the largest 23
share of current construction occurs in developing countries, while these countries follow a similar 24
demographic track of declining household sizes versus increasing dwelling areas. This trajectory 25
translates into the importance of their awareness of the likely similar forthcoming challenges, and the 26
need in early efficient planning of infrastructure and buildings with a focus on space usage and density. 27
28
Table 9.4 Potential GHG emission reduction in the building sector offered by the introduction of 29
sufficiency as a main or additional measure, as reported by bottom-up (or hybrid) literature 30
Region Reference Scenario and its result Sufficiency for floor space
Globe (Grubler et al.
2018)
The Low Energy Demand Scenario halves the final energy demand
of buildings by 2050, as compared the WEO Current Policy
(International Energy Agency 2019c) by modelling the changes in
quantity, types, and energy intensity of services.
The scenario assumed a reduction in
the residential and non-residential
building floor area to 29 and 11
m2·cap-1 respectively.
Globe (Millward-
Hopkins et al.
2020)
With the changes in structural and technological intensity, the
Decent Living Energy scenario achieved the decent living standard
for all whilst reducing the final energy consumption of buildings by
factor three, as compared to the WEO Current Policy Scenario
(International Energy Agency 2019c).
The scenario assumed a reduction in
floor area to 15 m2·cap-1 across the
world.
Globe (Levesque et
al. 2019)
Realizing both the technological and sufficiency potential, the Low
Demand Scenario and the Very Low Demand Scenario calculated a
reduction in global building energy demand by 32% and 45% in
2050, as compared to the business-as-usual baseline.
The Low Scenario limited the
residential and non-residential floor
area to 70 and 23 m2·cap-1; the Very
Low Scenario - to 45 and 15 m2·cap-
1.
EU (Bierwirth
and Thomas
2019b)
For the EU residential sector, the authors calculated potential
energy savings of 17% and 29% from setting the per capita floor
area limits.
A reduction of the residential floor
area to 30 m2·cap-1 and 35 m2·cap-1.,
respectively.
EU (Roscini et al.
2020)
With help of technological and non-technological measures, the
Responsible Policy Scenario for the EU buildings allows achieving
the emission reduction by 60% in 2030, as compared to 2015.
The scenario assumed 6% decrease
in the residential per capita floor
area (to max. 44.8 m2·cap-1).
Canada,
UK,
(Hertwich et
al. 2020)
The potential reduction in GHG emissions from the production of
building materials is 56%-58% in 2050, as compared to these
Via the efficient use of living space,
the scenario assumed its 20%
ACCEPTED VERSION
SUBJECT TO FIN
AL EDITS

Final Government Distribution Chapter 9 IPCC AR6 WGIII
Do Not Cite, Quote or Distribute 9-57 Total pages: 168
France,
Italy,
Japan,
USA,
Germany
baseline emissions. The reduction in heating and cooling energy
demand is 9%-10% in 2050, as compared to its baseline.
reduction, as compared to its
baseline development
UK (Cabrera
Serrenho et al.
2019)
The scenario found that the sufficiency measures allowed
mitigating 30% of baseline emissions of the English building sector
in 2050, without other additional measures.
The scenario assumed a 10%
reduction in the current floor area
per capita by 2050.
USA (Goldstein et
al. 2020)
The scenario calculated 16% GHG mitigation potential in 2050, as
compared to the baseline, on the top of two other scenarios
assuming building retrofits and grid decarbonization already
delivering a 42% emission reduction.
The scenario assumed a 10%
reduction in per capita floor area and
higher penetration of onsite
renewable energy.
Switzerland (Roca-
Puigròs et al.
2020)
The Green Lifestyle scenario allows achieving 48% energy savings
by 2050, as compared to the baseline, due to sufficiency in the floor
area among other measures.
The scenario assumed a reduction in
residential floor area. from 47 to 41
m2·cap-1.
France (Negawatt
2017)
The Negawatt scenario assumes that sufficiency behaviour becomes
a mainstream across all sectors. In 2050, the final energy savings
are 21% and 28% for the residential and tertiary sectors
respectively, as compared to their baselines.
The scenario assumes a limit of the
residential floor at 42 m2·cap-1 due
to apartment sharing and compact
urban planning.
France (Virage-
Energie Nord-
Pas-de-
Calais. 2016)
The authors assessed sufficiency opportunities across all sectors for
the Nord-Pas-de-Calais Region of France. Depending on the level
of implementation, sufficiency could reduce the energy
consumption of residential and tertiary buildings by 13-30% in
2050, as compared to the baseline.
The scenario assumed sharing
spaces, downsizing spaces and
sharing equipment from a ‘soft’ to
‘radical’ degree.
1
9.6.2 Assessment of the potentials at regional and global level 2
This section presents an aggregation of bottom-up potential estimates for different countries into 3
regional and then global figures for 2050, based on literature presented in Section 9.6.1. First, national 4
potential estimates reported as a share of baseline emissions in 2050 were aggregated into regional 5
potential estimates. Second, the latter were multiplied with regional baseline emissions to calculate the 6
regional potential in absolute numbers. Third, the global potential in absolute numbers was calculated 7
as a sum of regional absolute potentials. When several bottom-studies were identified for a region, either 8
a rounded average or a rounded median figure was taken, giving the preference to the one that was 9
closest to the potential estimates of countries with very large contribution to regional baseline emissions 10
in 2050 (i.e., to China in Eastern Asia). Furthermore, we preferred studies, which assessed the whole or 11
a large share of sector emissions and considered a comprehensive set of measures. The regional baseline 12
emissions, refer the WEO Current Policy Scenario (International Energy Agency 2019c). The sector 13
mitigation potential reported in Chapter 12 for the year 2030 was estimated in the same manner. 14
Figure 9.16 presents the mitigation potential in the building sector for the world and each region in 15
2050, estimated as a result of this aggregation exercise. The potentials presented in the figure are 16
different from those reported in Section 9.3.3, where they are estimated by IEA and IMAGE hybrid 17
model. The figure provides two breakdowns of the potential, into the reduction of direct and indirect 18
emissions as well as into the reduction of emissions from introducing sufficiency, energy efficiency, 19
and renewable energy measures. The potential estimates rely on the incremental stepwise approach, 20
assembling the measures according to the SER framework (see Box 9.1) and correcting the amount of 21
the potential at each step for the interaction of measures. The sequence of energy efficiency and 22
renewable energy measures follow the conclusion of the IPCC Global warming of 1.5°C Report (Rogelj 23
et al. 2018) that lower energy demand allows more choice of low-carbon energy supply options, and 24
therefore such sequencing is more beneficial and cost-effective. 25
Figure 9.16 argues that it is possible to mitigate 8.2 GtCO2 or 61% of global building emissions in 2050, 26
as compared to their baseline. At least 1.4 GtCO2 or 10% of baseline emissions could be avoided 27
introducing the sufficiency approaches. Further 5.6 GtCO2 or 42% of baseline emissions could be 28
mitigated with the help of energy efficiency technologies and practices. Finally, at least 1.1 GtCO2 or 29
9% of baseline emissions could be reduced through the production and use of onsite renewable energy. 30
ACCEPTED VERSION
SUBJECT TO FIN
AL EDITS
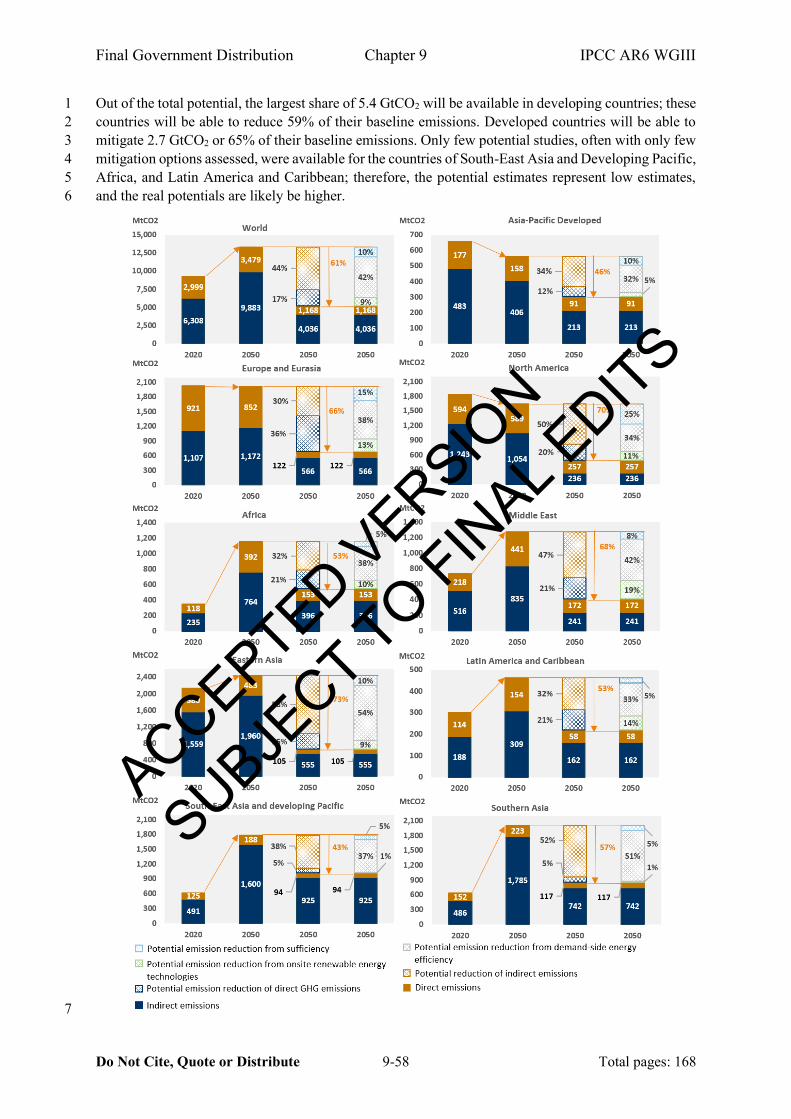
Final Government Distribution Chapter 9 IPCC AR6 WGIII
Do Not Cite, Quote or Distribute 9-58 Total pages: 168
Out of the total potential, the largest share of 5.4 GtCO2 will be available in developing countries; these 1
countries will be able to reduce 59% of their baseline emissions. Developed countries will be able to 2
mitigate 2.7 GtCO2 or 65% of their baseline emissions. Only few potential studies, often with only few 3
mitigation options assessed, were available for the countries of South-East Asia and Developing Pacific, 4
Africa, and Latin America and Caribbean; therefore, the potential estimates represent low estimates, 5
and the real potentials are likely be higher. 6
7
ACCEPTED VERSION
SUBJECT TO FIN
AL EDITS

Final Government Distribution Chapter 9 IPCC AR6 WGIII
Do Not Cite, Quote or Distribute 9-59 Total pages: 168
Note: the baseline refers to the WEO Current Policy Scenario (International Energy Agency 2019c). It may differ from other chapters. 1
Figure 9.16 Global and regional estimates of GHG emissions in the building sector in 2020 and 2050, and 2
their potential reduction in 2050 broken down by measure (sufficiency / energy efficiency / renewable 3
energy) and by emission source (direct / indirect) 4
9.6.3 Assessment of the potential costs 5
The novelty since AR5 is that a growing number of bottom-up studies considers the measures as an 6
integrated package recognising their technological complementarity and interdependence, rather than 7
the linear process of designing and constructing buildings and their systems, or incremental 8
improvements of individual building components and energy-using devices during building retrofits, 9
losing opportunities for the optimisation of whole buildings. Therefore, integrated measures rather than 10
the individual measures are considered for the estimates of costs and potentials. Figure 9.17 presents 11
the indicative breakdown of the potential reported in Figure 9.16 by measure and cost, to the extent that 12
it was possible to disaggregate and align to common characteristics. Whereas the breakdown per 13
measure was solely based on the literature reviewed in Section 9.6.1, the cost estimates additionally 14
relied on the literature presented in this section, Figure 9.20, and Table SM9.6. The literature reviewed 15
reports fragmented and sometimes contradicting cost-effectiveness information. Despite a large number 16
of exemplary buildings achieving very high performance in all parts of the world, there is a lack of 17
mainstream literature or official studies assessing the costs of these buildings at scale (Lovins 2018; 18
Ürge-Vorsatz et al. 2020). 19
Figure 9.17 indicates that a very large share of the potential in developed countries could be realized 20
through the introduction of sufficiency measures (at least 18% of their baseline emissions). Literature 21
identifies many opportunities, which may help operationalize it. These are reorganization of human 22
activities, teleworking, coworking, more efficient space design, planning and use, higher density of 23
building and settlement inhabitancy, flexible space, housing swaps, shared homes and facilities, space 24
and room renting, and others (Bierwirth and Thomas 2019a; Ivanova and Büchs 2020; Ellsworth-Krebs 25
2020). Whereas literature does not provide a robust cost assessment of the sufficiency potential, it 26
indicates that these measures are likely to be at no or very little cost (Cabrera Serrenho et al. 2019). 27
ACCEPTED VERSION
SUBJECT TO FIN
AL EDITS

Final Government Distribution Chapter 9 IPCC AR6 WGIII
Do Not Cite, Quote or Distribute 9-60 Total pages: 168
1
Notes: 1. The baseline refers to the WEO Current Policy Scenario (International Energy Agency 2019c). It may differ from other chapters. 2. The figure merged the results of Eurasia into those of developed countries. 2
Figure 9.17 Indicative breakdown of GHG emission reduction potential of the buildings sector in developed and developing countries into measure and costs in 3
2050, in absolute figures with uncertainty ranges and as a share of their baseline emissions 4
ACCEPTED VERSION
SUBJECT TO FIN
AL EDITS
Final Government Distribution Chapter 9 IPCC AR6 WGIII
Do Not Cite, Quote or Distribute 9-61 Total pages: 168
The exchange of lights, appliances, and office equipment, including ICT, water heating, and cooking 1
technologies could reduce more than 8% and 13% of the total sector baseline emissions in developed 2
and developing countries respectively, typically at negative cost (González-Mahecha et al. 2019; 3
Grande-Acosta and Islas-Samperio 2020; de Melo and de Martino Jannuzzi 2015; Prada-hernández et 4
al. 2015; Subramanyam et al. 2017a,b; Department of Environmental Affairs 2014). This cost-5
effectiveness is however often reduced by a larger size of appliances and advanced features, which 6
offset a share of positive economic effects (Molenbroek et al. 2015). 7
Advanced HVAC technologies backed-up with demand side management, and onsite integrated 8
renewables backed-up with demand-side flexibility and digitalization measures are typically a part of 9
the retrofit or construction strategy. Among HVAC technologies, heat pumps are very often modelled 10
to become a central heating and cooling technology supplied with renewable electricity. The estimates 11
of HVAC cost-effectiveness, including heat pumps, varies in modelling results from very cost-effective 12
to medium (Hirvonen et al. 2020; Akander et al. 2017; Prada-hernández et al. 2015; Department of 13
Environmental Affairs 2014). Among demand side management, demand-side flexibility and 14
digitalization options, various sensors, controls, and energy consumption feedback devices have 15
typically negative costs, whereas advanced smart management systems as well as thermal and electric 16
storages linked to fluctuating renewables are not yet cost-effective (Uchman 2021; Duman et al. 2021; 17
Nguyen et al. 2015; Huang et al. 2019; Sharda et al. 2021; Rashid et al. 2021; Prada-hernández et al. 18
2015). Several developed countries achieved to make onsite renewable energy production and use 19
profitable for at least a part of the building stock (Fina et al. 2020; Vimpari and Junnila 2019; Akander 20
et al. 2017; Horváth et al. 2016), but this is not yet the case for developing countries (Cruz et al. 2020; 21
Grande-acosta and Islas-samperio 2020; Kwag et al. 2019). Due to characteristics and parameters of 22
different building types, accommodating the cost-optimal renewables at large scale is especially 23
difficult in non-residential buildings and in urban areas, as compared to residential buildings and rural 24
areas (Fina et al. 2020; Horváth et al. 2016). 25
Literature agrees that new advanced buildings, using design, form, and passive building construction 26
equipped with demand side measures, and advanced HVAC technologies can reduce the sector total 27
baseline emissions in developed and developing countries by at least 10% and 25% in 2050, 28
respectively, and renewable energy technologies backed-up with demand-side flexibility and 29
digitalization measures typically installed in new buildings could further reduce these emissions by at 30
least 11% and 7% (see also Cross-Chapter Box 12 in Chapter 16). The literature however provides 31
different and sometimes conflicting information of their cost-effectiveness. (Esser et al. 2019) reported 32
that by 2016, the perceived share of buildings similar or close to nZEB in the new construction was just 33
above 20% across the EU. In this region, additional investment costs were no higher than 15%, as 34
reported for Germany, Italy, Denmark, and Slovenia (Erhorn-Kluttig et al. 2019). Still the European 35
market experiences challenges which relate to capacity and readiness, as revealed by (Architects’ 36
Council of Europe (ACE) 2019) recording a decline in the share of architects who are designing 37
buildings to nZEB standards to more than 50% of their time, from 14% in 2016 to 11% in 2018. In 38
contrast, the APEC countries reported additional investment costs of 67% on average (Xu and Zhang 39
2017) that makes them a key barrier to the nZEB penetration in developing countries as of today (Feng 40
et al. 2019). This calls for additional R&D policies and financial incentives to reduce the nZEB costs 41
(Xu and Zhang 2017; Kwag et al. 2019). 42
Thermal efficiency retrofits of existing envelopes followed up by the exchange of HVAC backed up 43
with demand side measures could reduce the sector total baseline emissions in developed and 44
developing countries by at least 18% and 7% respectively in 2050. There have been many individual 45
examples of deep building retrofits, which incremental costs are not significantly higher than those of 46
shallow retrofits. However, literature tends to agree that cost-effective or low cost deep retrofits are not 47
universally applicable for all cases, especially in historic urban areas, indicating a large share of the 48
ACCEPTED VERSION
SUBJECT TO FIN
AL EDITS

Final Government Distribution Chapter 9 IPCC AR6 WGIII
Do Not Cite, Quote or Distribute 9-62 Total pages: 168
potential in the high-cost category (Mata et al. 2019; Semprini et al. 2017; Paduos and Corrado 2017; 1
Subramanyam et al. 2017b; Department of Environmental Affairs 2014; Streicher et al. 2017; Akander 2
et al. 2017). Achieving deep retrofits assumes additional measures on the top of business-as-usual 3
retrofits, therefore high rate of deep retrofits at acceptable costs are not possible in case of low business-4
as-usual rates (Streicher et al. 2020). 5
For a few studies, which conducted an assessment of the sector transformation aiming at emission 6
reduction of 50–80% in 2050 versus their baseline, the incremental investment need over the modelling 7
period is estimated at 0.4–3.3% of the country annual GDP of the scenario first year (Kotzur et al. 2020; 8
Novikova et al. 2018c; Bashmakov 2017; Markewitz et al. 2015). These estimates represent strictly the 9
incremental share of capital expenditure and sometimes installation costs. Therefore, these figures are 10
not comparable with investment tracked against the regional or national sustainable finance taxonomies, 11
as recently developed in the EU (European Parliament and the Council 2020), Russia (Government of 12
Russian Federation 2021), South Africa (National Treasury of Republic of South Africa 2021), and 13
others, or the growing literature on calculating the recent finance flows (Macquarie et al. 2020; Hainaut 14
et al. 2021; Novikova et al. 2019; Valentova et al. 2019; Kamenders et al. 2019), because they are 15
measured against other methodologies, which are not comparable with the methodologies used to derive 16
the incremental costs by integrated assessment models and bottom-up studies. Therefore, the gap 17
between the investment need and recent investment flows is likely to be higher, than often reported. 18
9.6.4 Determinants of the potentials and costs 19
That fact that the largest share of the global flow area is still to be built offers a large potential for 20
emission reduction that is however only feasible if ambitious building energy codes will be applied to 21
this new stock (see Section 9.9.3 on building codes). The highest demand for additional floor area will 22
occur in developing countries; the building replacement is also the highest in developing countries 23
because their building lifetime could be as short as 30 years (Lixuan et al. 2016; Alaidroos and Krarti 24
2015). Whereas as of 2018, 73 countries had already had building codes or were developing them, only 25
41 had mandatory residential codes and 51 had mandatory non-residential codes (Global Alliance for 26
Buildings and Construction 2019). Therefore, the feasibility of capturing this potential is a subject to 27
greater coverage, adoption, and strength of building codes. 28
Low rates of building retrofits are the major feasibility constrain of building decarbonization in 29
developed countries. Long building lifetime and their slow replacement caused a lock-in of low energy 30
performance in old buildings of developed countries, especially in urban areas. A few studies of 31
developing countries, mostly medium and high-income, also considered building retrofits (Yu et al. 32
2018b; Zhou et al. 2018; Krarti 2019; Kamal et al. 2019; Prada-hernández et al. 2015). The studies in 33
developed countries tend to rely on either of the strategies: very “deep” envelope retrofits followed by 34
the exchange of HVAC with various advanced alternatives (Novikova et al. 2018c,b; Csoknyai et al. 35
2016; Filippi Oberegger et al. 2020; Duscha et al. 2019) or more shallow retrofits followed by switching 36
to low-carbon district heating or by the exchange of current HVAC with heat pumps linked to onsite 37
renewables backed up energy storages (Kotzur et al. 2020; Hirvonen et al. 2020; Yeh et al. 2016). The 38
factors, which impact the feasibility of these strategies therefore are the building retrofit rates and 39
replacement rates of building systems. To achieve the building stock decarbonization by 2050, most 40
studies reviewed in Figure 9.16 assume “deep” retrofit rates between 2.5% and 5%, and even 10% per 41
annum. (Esser et al. 2019) reported that the annual renovation rate in EU28 is around 0.2%, with 42
relatively small variation across individual EU member states. (Sandberg et al. 2016) simulated retrofit 43
rates in eleven European countries and concluded that only minor future increases in the renovation 44
rates of 0.6–1.6% could be expected. Therefore, without strong policies supporting these renovations, 45
the feasibility to achieve such high “deep” retrofit rates is low. 46
Among key factors affecting the costs-effectiveness of achieving high-performance buildings remain 47
low energy prices in many countries worldwide (Alaidroos and Krarti 2015; Akander et al. 2017) and 48
ACCEPTED VERSION
SUBJECT TO FIN
AL EDITS

Final Government Distribution Chapter 9 IPCC AR6 WGIII
Do Not Cite, Quote or Distribute 9-63 Total pages: 168
high discount rates reflecting low access to capital and high barriers. (Copiello et al. 2017) found that 1
the discount rate affects the economic results of retrofits four times higher than the energy price, and 2
therefore the reduction in upfront costs and working out barriers are the feasibility enablers. 3
The good news is that literature expects a significant cost reduction for many technologies, which are 4
relevant for the construction of high energy-performance buildings and deep retrofits. Applying a 5
technology learning curve to the data available for Europe and reviewing dozens of studies available, 6
(Köhler et al. 2018) estimated the cost reduction potential of biomass boilers, heat pumps, ventilation, 7
air-conditioning, thermal storages, electricity storages, solar PVs and solar thermal systems of 14%, 8
20%, 46–52%, 29%, 29%, 65%, 57%, and 43% respectively in 2050; no significant cost reduction 9
potential was found however for established and wide-spread insulation technologies. More investment 10
into RDD to reduce the technology costs and more financial incentives to encourage uptake of the 11
technologies would allow moving along this learning curve. 12
Furthermore, some literature argues that the key to cost-effectiveness is not necessarily a reduction in 13
costs of technologies, but a know-how and skills of their choosing, combining, sequencing, and timing 14
to take the most benefits of their interdependence, complementarity, and synergy as illustrated by many 15
examples (Lovins 2018; Ürge-Vorsatz et al. 2020). However, the scenarios reviewed lack such 16
approaches in their cost assessments. Few indicative examples of cost reduction at scale were provided 17
though not by the scenario literature, but case studies of the application of One-Stop Shop (OSS) 18
approach at scale (see Section 9.9.4). In 2013, the Dutch Energiesprong network brokered a deal 19
between Dutch building contractors and housing associations to reduce the average retrofit costs from 20
EUR 130,000 down to 65,000 for 111,000 homes with building prefabrication systems and project 21
delivery models while targeting energy savings of 45–80% (Ürge-Vorsatz et al. 2020); out of which 22
10,000 retrofits have been realized by 2020. The French Observatory of Low Energy Buildings reported 23
to achieve the cost-effective deep renovations of 818 dwellings and 27 detached houses in France setting 24
a cap for absolute primary energy consumption to achieve after renovation and a cap for the budget to 25
deliver it; the cost-effectiveness was however calculated with grants and public subsidies (Saheb 2018). 26
Literature emphasizes the critical role of the time between in 2020 and 2030 for the building sector 27
decarbonisation (IEA 2020a; Roscini et al. 2020). To set the sector at the pathway to realize its whole 28
mitigation potential, it is critical to exponentially accelerate the learning of this know-how and skills to 29
reduce the costs and remove feasibility constrains to enable the penetration of advanced technologies 30
at speed that the world has not seen before. The World Energy Outlook (IEA 2020a) portraited in the 31
Net Zero Emissions by 2050 Scenario (see Box 9.2) the challenges and commitments the sector will 32
have to address by 2030. These include bringing new buildings and existing buildings to near zero, with 33
a half of existing buildings in developed countries and a third of existing buildings in developing 34
countries being retrofitted by 2030. These also mean banning the sale of new fossil fuel-fired boilers, 35
as well as making heat pumps and very efficient appliances standard technologies. The Net Zero 36
Emissions by 2050 Scenario achieves almost fully to decarbonize the sector by 2050, with such 37
commitments reflected neither in the planning and modelling efforts (Section 9.9) nor in policies and 38
commitments (Section 9.9) of most world countries, with the countries of South-East Asia and 39
Developing Pacific, Southern Asia, Africa, and Latin America and Caribbean having the least research. 40
As discussed in Section 9.6.1, the alternative and low-cost opportunity to reduce the sector emissions 41
in the countries with high floor area per capita and the low stock turnover is offered by the introduction 42
of the sufficiency approach. Section 9.9.3.1 discusses a range of policy instruments, which could 43
support the realization of the sufficiency potential. As the approach is new, the literature does not yet 44
report experiences of these measures. In the framework of project OptiWohn, the German cities of 45
Göttingen, Köln und Tübingen just started testing the sufficiency approach and policy measures for 46
sufficiency (Stadt Göttingen 2020). Therefore, the feasibility of realizing the sufficiency potential 47
depends on its recognition by the energy and climate policy and the introduction of supporting measures 48
ACCEPTED VERSION
SUBJECT TO FIN
AL EDITS

Final Government Distribution Chapter 9 IPCC AR6 WGIII
Do Not Cite, Quote or Distribute 9-64 Total pages: 168
(Samadi et al. 2017; Ellsworth-Krebs 2020; Goldstein et al. 2020). More research is needed to 1
understand which measures will work and which will not. 2
Similar to buildings, the energy consumption and associated emissions of appliances and equipment is 3
driven by the replacement of old appliances and the additional stock due to the increase in penetration 4
and saturation of appliances. The feasibility of appliance stock replacement with efficient options is 5
higher than the feasibility of building stock replacement or retrofit due to their smaller size, shorter 6
lifetime, and cheaper costs (Chu and Bowman 2006; Spiliotopoulos 2019). Some literature argues that 7
once appliances achieve a particular level of efficiency their exchange does not bring benefits from the 8
resource efficiency point of view (Hertwich et al. 2019). Even through the data records a permanent 9
energy efficiency improvement of individual devices (Figure 9.12), their growing offsets energy savings 10
delivered by this improvement. The emerging literature suggests addressing the growing number of 11
energy services and devices as a part of climate and energy policy (Bierwirth and Thomas 2019b). 12
Sections 9.5.2.2 describes measures for limiting demand for these services and Section 9.5.3.6 addresses 13
reducing the number of technologies through their ownership and use patterns. (Grubler et al. 2018) 14
also suggested redefining energy services and aggregating appliances, illustrating the reduction of 15
energy demand by factor 30 to substitute over 15 different end-use devices with one integrated digital 16
platform. More research is needed to understand opportunities to realize this sufficiency potential for 17
appliances, and more research is needed to understand policies which may support these opportunities 18
(Bierwirth and Thomas 2019a). 19
The difference between baselines is among the main reason for difference between the potential 20
estimates in 2030 reported by Chapter 6 on buildings of AR4 (Levine et al. 2017) and the current section 21
of AR6. For developed countries, the sector direct and indirect baseline emissions in AR6 are 43% and 22
28% lower than those in AR4 respectively. For developing countries, the sector direct baseline 23
emissions in AR6 are 47% lower than those in AR4, and the sector indirect baseline emissions are 3% 24
higher than those in AR4. As AR6 is closer to 2030 than AR4 and thus more precise, the likely reason 25
for the difference (besides the fact that some potential was realized) is that AR4 overall overestimated 26
the future baseline emissions, and it underestimated how quickly the fuel switch to electricity from other 27
energy carriers has been happening, especially in developing countries. As illustrated, the baseline is 28
one of determinant of the potential size and hence, all reported estimates shall only be interpreted 29
together with the baseline developments. 30
The potential is a dynamic value, increasing with the technological progress. Most potential studies 31
reviewed in Section 9.6.1 consider today mature commercialised or near to commercialisation 32
technologies with demonstrated characteristics “freezing them” in the potential estimates until the study 33
target year. Until 2050, many of these technologies will further improve, and furthermore new advanced 34
technologies may emerge. Therefore, the potential estimates are likely to be low estimates of the real 35
potential volumes. Furthermore, models apply many other assumptions and they cannot always capture 36
right emerging societal or innovation trends; these trends may also significantly impact the potential 37
size into both directions (Brugger et al. 2021). 38
With the declining amount of emissions during the building operation stage, the share of building 39
embodied emissions in their lifetime emissions will grow, also due to additional building material 40
(Peñaloza et al. 2018; Cabeza et al. 2021). Reviewing 650 life cycle assessment case studies, (Röck et 41
al. 2020) estimated the contribution of embodied emissions to building lifetime emissions up to 45–42
50% for highly efficient buildings, surpassing 90% in extreme cases. 43
Recently, a significant body of research has been dedicated to studying the impacts of using bio-based 44
solutions (especially timber) for building construction instead of conventional materials, such as 45
concrete and steel, because more carbon is stored in bio-based construction materials than released 46
during their manufacturing. Assuming the aggressive use of timber in mid-rise urban buildings, 47
Churkina et al. (2020) estimated the associated mitigation potential between 0.04-3.7 GtCO2 per year 48
ACCEPTED VERSION
SUBJECT TO FIN
AL EDITS

Final Government Distribution Chapter 9 IPCC AR6 WGIII
Do Not Cite, Quote or Distribute 9-65 Total pages: 168
depending on how fast countries adopt new building practices and floor area per capita. Based on a 1
simplified timber supply-demand model for timber-based new floor area globally by 2050, Pomponi et 2
al. (2020) showed that the global supply of timber can only be 36% of the global demand for it between 3
2020 and 2050; especially much more forest areas will be required in Asian countries, such as China 4
and India and American countries, such as the USA, Mexico, and Argentina. Goswein et al. (2021) 5
conducted a similar detailed analysis for Europe and concluded that current European forest areas and 6
wheat plantations are sufficient to provide timber and straw for the domestic construction sector. 7
The increased use of timber and other bio-based materials in buildings brings not only benefits, but also 8
risks. The increased use of timber can accelerate degradation through poor management and the pressure 9
for deforestation, as already recorded in the Amazon and Siberia forests, and the competition for land 10
and resources (Brancalion et al. 2018; Carrasco et al. 2017; Hart and Pomponi 2020; Pomponi et al. 11
2020). Churkina et al. (2020) emphasized that promoting the use of more timber in buildings requires 12
the parallel strengthening of legislation for sustainable forest management, forest certification 13
instruments, and care for the people and social organizations that live in forests. In tropical and 14
subtropical countries, the use of bamboo and other fibres brings more benefits and less risks than the 15
use of timber (ibid). One of the main barriers associated with the use of bio-based materials in buildings 16
is fire safety, although there is extensive research on this topic (Audebert et al. 2019; Östman et al. 17
2017). This is a particularly important criterion for the design of medium and high-rise buildings, which 18
tend to be the most adequate typologies for denser and more compact cities. Overall, more robust 19
models are needed to assess the interlinkages between the enhanced use of bio-based materials in the 20
building stock and economic and social implications of their larger supply, as well as the associated 21
competition between forest and land-use activities (for food), and ecological aspects. Furthermore, more 22
research is required on how to change forest and building legislation and design a combination of policy 23
instruments for the specific political, economic and cultural county characteristics (Hildebrandt et al. 24
2017). Benefits and risks of enhanced use of wood products in buildings are also discussed in Chapter 25
7, Section 7.4.5.3. 26
27
9.7 Links to adaptation 28
Buildings are capital-intensive and long-lasting assets designed to perform under a wide range of 29
climate conditions (Hallegatte 2009; Pyke et al. 2012). Their long life span means that the building 30
stock will be exposed to future climate (de Wilde and Coley 2012; Wan et al. 2012; Hallegatte 2009) 31
and, as such, adaptation measures will be necessary. 32
The impacts of climate change on buildings can affect building structures, building construction, 33
building material properties, indoor climate and building energy use (Andrić et al. 2019). Many of those 34
impacts and their respective adaptation strategies interact with GHG mitigation in different ways. 35
9.7.1 Climate change impacts and adaptation in buildings 36
A large body of literature on climate impacts on buildings focuses on the impacts of climate change on 37
heating and cooling needs (de Wilde and Coley 2012; Wan et al. 2012; Andrić et al. 2019). The 38
associated impacts on energy consumption are expected to be higher in hot summer and warm winter 39
climates, where cooling needs are more relevant (Li et al. 2012; Wan et al. 2012; Andrić et al. 2019). If 40
not met, this higher demand for thermal comfort can impact health, sleep quality and work productivity, 41
having disproportionate effects on vulnerable populations and exacerbating energy poverty (Falchetta 42
and Mistry 2021; Biardeau et al. 2020; Sun et al. 2020) (see Section 9.8). 43
Increasing temperatures can lead to higher cooling needs and, therefore, energy consumption (Schaeffer 44
et al. 2012; Clarke et al. 2018; International Energy Agency 2018; Wan et al. 2012; Li et al. 2012; 45
Andrić et al. 2019). Higher temperatures increase the number of days/hours in which cooling is required 46
and as outdoor temperatures increase, the cooling load to maintain the same indoor temperature will be 47
ACCEPTED VERSION
SUBJECT TO FIN
AL EDITS

Final Government Distribution Chapter 9 IPCC AR6 WGIII
Do Not Cite, Quote or Distribute 9-66 Total pages: 168
higher (Andrić et al. 2019). These two effects are often measured by cooling degree-days1 (CDD) and 1
there is a vast literature on studies at the global (Atalla et al. 2018; Mistry 2019; Isaac and van Vuuren 2
2009; Biardeau et al. 2020; Clarke et al. 2018) and regional level (Bezerra et al. 2021; Zhou et al. 2014; 3
Falchetta and Mistry 2021). Other studies use statistical econometric analyses to capture the empirical 4
relationship between climate variables and energy consumption (Auffhammer and Mansur 2014; van 5
Ruijven et al. 2019). A third effect is that higher summer temperatures can incentivize the purchase of 6
space cooling equipment (Auffhammer 2014; De Cian et al. 2019; Biardeau et al. 2020), especially in 7
developing countries (Pavanello et al. 2021). 8
The impacts of increased energy demand for cooling can have systemic repercussions (Ralston Fonseca 9
et al. 2019; Ciscar and Dowling 2014), which in turn can affect the provision of other energy services. 10
Space cooling can be an important determinant of peak demand, especially in periods of extreme heat 11
(International Energy Agency 2018). Warmer climates and higher frequency and intensity of heat waves 12
can lead to higher loads (Dirks et al. 2015; Auffhammer et al. 2017), increasing the risk of grid failure 13
and supply interruptions. 14
Although heating demand in cold climate regions can be expected to decrease with climate change and, 15
to a certain extent, outweigh the increase in cooling demand, the effects on total primary energy 16
requirements are uncertain (Wan et al. 2012; Li et al. 2012). Studies have found that increases in 17
buildings energy expenditures for cooling more than compensate the savings from lower heating 18
demands in most regions (Clarke et al. 2018). In addition, climate change may affect the economic 19
feasibility of district heating systems (Andrić et al. 2019). 20
In cold climates, a warming climate can potentially increase the risk of overheating in high-performance 21
buildings with increased insulation and airtightness to reduce heat losses (Gupta and Gregg 2012). In 22
such situations, the need for active cooling technologies may arise, along with higher energy 23
consumption and GHG emissions (Gupta et al. 2015). 24
Changes in cloud formation can affect global solar irradiation and, therefore, the output of solar 25
photovoltaic panels, possibly affecting on-site renewable energy production (Burnett et al. 2014). The 26
efficiency of solar photovoltaic panels and their electrical components decreases with higher 27
temperatures (Simioni and Schaeffer 2019) (Bahaidarah et al. 2013). However, studies have found that 28
such effect can be relatively small (Totschnig et al. 2017), making solar PV a robust option to adapt to 29
climate change (Shen and Lior 2016; Santos and Lucena 2021) (see Section 9.4). 30
Climate change can also affect the performance, durability and safety of buildings and their elements 31
(facades, structure, etc.) through changes in temperature, humidity, wind, and chloride and CO2 32
concentrations (Bastidas-Arteaga et al. 2010; Bauer et al. 2018; Rodríguez-Rosales et al. 2021; Chen et 33
al. 2021). Historical buildings and coastal areas tend to be more vulnerable to these changes (Huijbregts 34
et al. 2012; Mosoarca et al. 2019; Cavalagli et al. 2019; Rodríguez-Rosales et al. 2021). 35
Temperature variations affect the building envelope, e.g. with cracks and detachment of coatings (Bauer 36
et al. 2016, 2018). Higher humidity (caused by wind-driven rain, snow or floods) hastens deterioration 37
of bio-based materials such as wood and bamboo (Brambilla and Gasparri 2020), also deteriorating 38
indoor air quality and users health (Grynning et al. 2017; Lee et al. 2020; Huijbregts et al. 2012). 39
Climate change can accelerate the degradation of reinforced concrete structures due to the increase of 40
chloride ingress (Bastidas-Arteaga et al. 2010) and the concentration of CO2, which increase the 41
corrosion of the embedded steel (Stewart et al. 2012; Peng and Stewart 2016; Chen et al. 2021). 42
FOOTNOTE1 CDD can be generally defined as the monthly or annual sum of the difference between an indoor
set point temperature and outdoor air temperature whenever the latter is higher than a given threshold temperature
(Mistry 2019).
ACCEPTED VERSION
SUBJECT TO FIN
AL EDITS

Final Government Distribution Chapter 9 IPCC AR6 WGIII
Do Not Cite, Quote or Distribute 9-67 Total pages: 168
Corrosion rates are higher in places with higher humidity and humidity fluctuations (Guo et al. 2019), 1
and degradation could be faster with combined effects of higher temperatures and more frequent and 2
intense precipitations (Bastidas-Arteaga et al. 2010; Chen et al. 2021). 3
Higher frequency and intensity of hurricanes, storm surges and coastal and non-coastal flooding can 4
escalate economic losses to civil infrastructure, especially when associated with population growth and 5
urbanization in hazardous areas (Bjarnadottir et al. 2011; Lee and Ellingwood 2017; Li et al. 2016). 6
Climate change should increase the risk and exposure to damage from flood (de Ruig et al. 2019), sea 7
level rise (Bove et al. 2020; Zanetti et al. 2016; Bosello and De Cian 2014) and more frequent wildfires 8
(Craig et al. 2020; Barkhordarian et al. 2018). 9
10
9.7.2 Links between mitigation and adaptation in buildings 11
Adaptation options interacts with mitigation efforts because measures to cope with climate change 12
impacts can increase energy and material consumption, which may lead to higher GHG emissions 13
(Kalvelage et al. 2014; Davide et al. 2019; Sharifi 2020). Energy consumption is required to adapt to 14
climate change. Mitigation measures, in turn, influence the degree of vulnerability of buildings to future 15
climate and, thus, the adaptation required. 16
Studies have assessed the increases in energy demand to meet indoor thermal comfort under future 17
climate (de Wilde and Coley 2012; Li et al. 2012; Andrić et al. 2019; Clarke et al. 2018). Higher cooling 18
needs may induce increases in energy demand (Wan et al. 2012; Li et al. 2012), which could lead to 19
higher emissions, when electricity is fossil-based (International Energy Agency 2018; Biardeau et al. 20
2020), and generate higher loads and stress on power systems (Auffhammer et al. 2017; Dirks et al. 21
2015). In this regard, increasing energy efficiency of space cooling appliances and adopting dynamic 22
cooling setpoint temperatures, can reduce the energy needs for cooling and limit additional emissions 23
and pressures on power systems (Davide et al. 2019; Bezerra et al. 2021) (Bienvenido-Huertas et al. 24
2020) (see Section 9.4, Figure 9.11 and Tables SM9.1 to SM9.3). This can also be achieved with on-25
site renewable energy production, especially solar PV for which there can be a timely correlation 26
between power supply and cooling demand, improving load matching (Salom et al. 2014; Grove-Smith 27
et al. 2018). 28
Mitigation alternatives through passive approaches may increase resilience to climate change impacts 29
on thermal comfort and reduce active cooling needs (González Mahecha et al. 2020; Rosse Caldas et 30
al. 2020; van Hooff et al. 2016; Wan et al. 2012; Andrić et al. 2019). Combining passive measures can 31
help counteracting climate change driven increases in energy consumption for achieving thermal 32
comfort (Huang and Hwang 2016). 33
Studies raise the concern that measures aimed at building envelope may increase the risk of overheating 34
in a warming climate (Dodoo and Gustavsson 2016; Fosas et al. 2018) (see Section 9.4). If this is the 35
case, there may be a conflict between mitigation through energy efficiency building regulations and 36
climate change adaptation (Fosas et al. 2018). However, while overheating may occur as a result of 37
poor insulation design, better insulation may actually reduce overheating when properly projected and 38
the overheating risk can be overcome by clever designs (Fosas et al. 2018). 39
Strengthening building structures to increase resilience and reduce exposure to the risk of extreme 40
events, such as draughts, torrential floods, hurricanes and storms, can be partially achieved by 41
improving building standards and retrofitting existing buildings (Bjarnadottir et al. 2011). However, 42
future climate is not yet considered in parameters of existing building energy codes (Steenbergen et al. 43
2012). While enhancing structural resilience would lead to GHG emissions (Liu and Cui 2018), so 44
would disaster recovery and re-building. This adaptation-mitigation trade-off needs to be further 45
assessed. 46
ACCEPTED VERSION
SUBJECT TO FIN
AL EDITS

Final Government Distribution Chapter 9 IPCC AR6 WGIII
Do Not Cite, Quote or Distribute 9-68 Total pages: 168
Since adaptation of the existing building stock may be more expensive and require building retrofit, 1
climate change must be considered in the design of new buildings to ensure performance robustness in 2
both current and future climates, which can have implications for construction costs (de Rubeis et al. 3
2020; Picard et al. 2020; Hallegatte 2009; Pyke et al. 2012; de Wilde and Coley 2012) and emissions 4
(Liu and Cui 2018). Building energy codes and regulations are usually based on cost-effectiveness and 5
historical climate data, which can lead to the poor design of thermal comfort in future climate 6
(Hallegatte 2009; Pyke et al. 2012; de Wilde and Coley 2012) and non-efficient active adaptive 7
measures based on mechanical air conditioning (De Cian et al. 2019) (see Section 9.4, Figure 9.11 and 8
Tables SM9.1 to SM9.3). However, uncertainty about future climate change creates difficulties for 9
projecting parameters for the design of new buildings (Hallegatte 2009; de Wilde and Coley 2012). This 10
can be especially relevant for social housing programs (Rubio-Bellido et al. 2017; González Mahecha 11
et al. 2020; Triana et al. 2018) in developing countries. 12
The impacts on buildings can lead to higher maintenance needs and the consequent embodied 13
environmental impacts related to materials production, transportation and end-of-life, which account 14
for a relevant share of GHG emissions in buildings life cycle (Rasmussen et al. 2018). Climate change 15
induced biodegradation is especially important for bio-based materials such as wood and bamboo 16
(Brambilla and Gasparri 2020) which are important options for reducing emissions imbued in buildings’ 17
construction materials (Peñaloza et al. 2016; Churkina et al. 2020; Rosse Caldas et al. 2020). 18
Although there can potentially be conflicts between climate change mitigation and adaptation, these can 19
be dealt with proper planning, actions, and policies. The challenge is to develop multifunctional 20
solutions, technologies and materials that can mitigate GHG emissions while improving buildings 21
adaptive capacity. Solutions and technologies should reduce not only buildings’ operational emissions, 22
but also embodied emissions from manufacturing and processing of building materials (Röck et al. 23
2020). For instance, some building materials, such as bio-concrete, can reduce life cycle emissions of 24
buildings and bring benefits in terms of building thermal comfort in tropical and subtropical climates. 25
Also, energy efficiency, sufficiency and on-site renewable energy production can help to increase 26
building resilience to climate change impacts and reduce pressure on the energy system. 27
28
9.8 Links to sustainable development 29
9.8.1 Overview of contribution of mitigation options to sustainable development 30
A growing body of research acknowledges that mitigation actions in buildings may have substantial 31
social and economic value beyond their direct impact of reducing energy consumption and/or GHG 32
emissions (Ürge-Vorsatz et al. 2016; Deng et al. 2017; Reuter et al. 2017; IEA 2014; US EPA 2018; 33
Kamal et al. 2019; Bleyl et al. 2019) (see also Cross-Chapter Box 6 in Chapter 7). In other words, the 34
implementation of these actions in the residential and non-residential sector holds numerous multiple 35
impacts (co-benefits, adverse side-effects, trade-offs, risks, etc.) for the economy, society and end-users, 36
in both developed and developing economies, which can be categorized into the following types (Nikas 37
et al. 2020; Thema et al. 2017; Ferreira et al. 2017; Reuter et al. 2017; IEA 2014; US EPA 2018; Ürge-38
Vorsatz et al. 2016): (i) health impacts due to better indoor conditions, energy/fuel poverty alleviation, 39
better ambient air quality and reduction of the heat island effect; (ii) environmental benefits such as 40
reduced local air pollution and the associated impact on ecosystems (acidification, eutrophication, etc.) 41
and infrastructures, reduced sewage production, etc.; (iii) improved resource management including 42
water and energy; (iv) impact on social well-being, including changes in disposable income due to 43
decreased energy expenditures and/or distributional costs of new policies, fuel poverty alleviation and 44
improved access to energy sources, rebound effects, increased productive time for women and children, 45
etc.; (v) microeconomic effects (e.g., productivity gains in non-residential buildings, enhanced asset 46
values of green buildings, fostering innovation); (vi) macroeconomic effects, including impact on GDP 47
driven by energy savings and energy availability, creation of new jobs, decreased employment in the 48
fossil energy sector, long-term reductions in energy prices and possible increases in electricity prices in 49
ACCEPTED VERSION
SUBJECT TO FIN
AL EDITS

Final Government Distribution Chapter 9 IPCC AR6 WGIII
Do Not Cite, Quote or Distribute 9-69 Total pages: 168
the medium run, possible impacts on public budgets, etc.; and (vii) energy security implications (e.g., 1
access to modern energy resources, reduced import dependency, increase of supplier diversity, smaller 2
reserve requirements, increased sovereignty and resilience). 3
Well-designed and effectively implemented mitigation actions in the sector of buildings have significant 4
potential for achieving the United Nations (UN) Sustainable Development Goals (SDGs). Specifically, 5
the multiple impacts of mitigation policies and measures go far beyond the goal of climate action 6
(SDG13) and contribute to further activating a great variety of other SDGs (Figure 9.18 presents some 7
indicative examples). Table 9.4 reviews and updates the analysis carried out in the context of the Special 8
Report on Global Warming of 1.5°C (Roy et al. 2018) demonstrating that the main categories of GHG 9
emission reduction interventions in buildings, namely the implementation of energy sufficiency and 10
efficiency improvements as well as improved access and fuel switch to modern low carbon energy, 11
contribute to achieving 16 out of a total of 17 SDGs. 12
13
Figure 9.18 Contribution of mitigation policies of the building sector to meeting sustainable development 14
goals. 15
Source: Based on information from (IEA et al. 2020b; IEA 2020b; Mills 2016; European Commission 2016; 16
Rafaj et al. 2018; Mzavanadze 2018a; World Health Organization 2016) and literature review presented in 17
Section 9.8.5.2. 18 ACCEPTED VERSION
SUBJECT TO FIN
AL EDITS

Final Government Distribution Chapter 9 IPCC AR6 WGIII
Do Not Cite, Quote or Distribute 9-70 Total pages: 168
Table 9.4 Aspects of mitigation actions in buildings and their contributions to the 2030 Sustainable 1 Development Goals. S: enhancement of energy sufficiency; E: energy efficiency improvements; R: improved 2
access and fuel switch to lower carbon and renewable energy. 3
Level of impact S E R S E R S E R S E R S E R S E R S E R S E R S E R S E R S E R S E R S E R S E R S E R S E R S E R
+3
+2
+1
-1
-2
-3
Health impact
Environmental impact
Resource efficienvy
Impact on social well-being
Microeconomic effects
Macroeconomic effects
Energy security
X X X
X X
X X X XX
X XX X X X XX X X X X
X X X XX X X
XX X XX
X X X X
SDG13
SDG14
SDG15
SDG16
SDG17
Dimensions of mitigation actions that impact SDGs
SDG7
SDG8
SDG9
SDG10
SDG11
SDG12
SDG1
SDG2
SDG3
SDG4
SDG5
SDG6
4
Notes: The strength of interaction between mitigation actions and SDGs is described with a seven-point scale 5 (Nilsson et al., 2016) Also, the symbol X shows the interactions between co-benefits/risk associated with 6 mitigation actions and the SDGs. SDG1: Sufficiency and efficiency measures result in reduced energy 7 expenditures and other financial savings that further lead to poverty reduction. Access to modern energy forms 8 will largely help alleviate poverty in developing countries as the productive time of women and children will 9 increase, new activities can be developed, etc. The distributional costs of some mitigation policies promoting 10 energy efficiency and lower carbon energy may reduce the disposable income of the poor. SDG2: Energy 11 sufficiency and efficiency measures result in lower energy bills and avoiding the “heat or eat” dilemma. Improved 12 cook-stoves provide better food security and reduces the danger of fuel shortages in developing countries; under 13 real-world conditions these impacts may be limited as the households use these stoves irregularly and 14 inappropriately. Green roofs can support food production. Improving energy access enhances agricultural 15 productivity and improves food security; on the other hand, increased bioenergy production may restrict the 16 available land for food production. SDG3: All categories of mitigation action result in health benefits through 17 better indoor air quality, energy/fuel poverty alleviation, better ambient air quality, and reduction of the heat island 18 effect. Efficiency measures with inadequate ventilation may lead to the sick building syndrome symptoms. SDG4: 19 Energy efficiency measures result in reduced school absenteeism due to better indoor environmental conditions. 20 Also, fuel poverty alleviation increases the available space at home for reading. Improved access to electricity and 21 clean fuels enables people living in poor developing countries to read, while it is also associated with greater 22 school attendance by children. SDG5: Efficient cook-stoves and improved access to electricity and clean fuels in 23 developing countries will result in substantial time savings for women and children, thus increasing the time for 24 rest, communication, education and productive activities. SDG6: Reduced energy demand due to sufficiency and 25 efficiency measures as well as an upscaling of RES can lead to reduced water demand for thermal cooling at 26 energy production facilities. Also, water savings result through improved conditions and lower space of dwellings. 27 Improved access to electricity is necessary to treat water at homes. In some situations, the switch to bioenergy 28 could increase water use compared to existing conditions. SDG7: All categories of mitigation action result in 29 energy/fuel poverty alleviation in both developed and developing countries as well as in improving the security 30 of energy supply. SDG8: Positive and negative direct and indirect macroeconomic effects (GDP, employment, 31 public budgets) associated with lower energy prices due to the reduced energy demand, energy efficiency and 32 RES investments, improved energy access and fostering innovation. Also, energy efficient buildings with 33 adequate ventilation, result in productivity gains and improve the competitiveness of the economy. SDG9: 34 Adoption of distributed generation and smart grids helps in infrastructure improvement and expansion. Also, the 35 development of “green buildings” can foster innovation. Reduced energy demand due to sufficiency and 36 efficiency measures as well as an upscaling of RES can lead to early retirement of fossil energy infrastructure. 37 SDG10: Efficient cook-stoves as well as improved access to electricity and clean fuels in developing countries 38 will result in substantial time savings for women and children, thus enhancing education and the development of 39 productive activities. Sufficiency and efficiency measures lead to lower energy expenditures, thus reducing 40 income inequalities. The distributional costs of some mitigation policies promoting energy efficiency and lower 41 carbon energy as well as the need for purchasing more expensive equipment and appliances may reduce the 42 disposable income of the poor and increase inequalities. SDG11: Sufficiency and efficiency measures as well as 43 fuel switching to RES and improvements in energy access would eliminate major sources (both direct and indirect) 44 of poor air quality (indoor and outdoor). Helpful if in-situ production of RES combined with charging electric 45 two, three and four wheelers at home. Buildings with high energy efficiency and/or green features are sold/rented 46
ACCEPTED VERSION
SUBJECT TO FIN
AL EDITS

Final Government Distribution Chapter 9 IPCC AR6 WGIII
Do Not Cite, Quote or Distribute 9-71 Total pages: 168
at higher prices than conventional, low energy efficient houses. SDG12: Energy sufficiency and efficiency 1 measures as well as deployment of RES result in reduced consumption of natural resources, namely fossil fuels, 2 metal ores, minerals, water, etc. Negative impacts on natural resources could be arisen from increased penetration 3 of new efficient appliances and equipment. SDG13: See sections 9.4-9.6. SDG15: Efficient cookstoves and 4 improved access to electricity and clean fuels in developing countries will result in halting deforestation. SDG16: 5 Building retrofits are associated with lower crime. Improved access to electric lighting can improve safety 6 (particularly for women and children). Institutions that are effective, accountable and transparent are needed at all 7 levels of government for providing energy access and promoting modern renewables as well as boosting 8 sufficiency and efficiency. SDG17: The development of zero energy buildings requires among others capacity 9 building, citizen participation as well as monitoring of the achievements. 10
Sources: (Balaban and Puppim de Oliveira 2017; Marmolejo-Duarte and Chen 2019; Barnes and Samad 2018; 11 Bailis et al. 2015; Baimel et al. 2016; Berrueta et al. 2017; Bleyl et al. 2019; Boermans et al. 2015; Brounen and 12 Kok 2011; Burney et al. 2017; Cajias et al. 2019; Camarinha-Matos 2016; Cameron et al. 2016; Cedeño-Laurent 13 et al. 2018; De Ayala et al. 2016; Deng et al. 2012; Fuerst et al. 2015, 2016; Fricko et al. 2016; Galán-Marín et al. 14 2015; Goldemberg et al. 2018; Hanna et al. 2016; Hasegawa et al. 2015; Hejazi et al. 2015; Högberg 2013; Holland 15 et al. 2015; Hyland et al. 2013; Jensen et al. 2016; Jeuland et al. 2018; Kahn and Kok 2014; Koirala et al. 2014; 16 Levy et al. 2016; Liddell and Guiney 2015; Maidment et al. 2014; Markovska et al. 2016; Alawneh et al. 2019; 17 Mastrucci et al. 2019; Mattioli and Moulinos 2015; McCollum et al. 2018; Mehetre et al. 2017; Mirasgedis et al. 18 2014; Mofidi and Akbari 2017; Mzavanadze 2018a; Niemelä et al. 2017; Ortiz et al. 2017; Payne et al. 2015; Rao 19 et al. 2016; Rao and Pachauri 2017; Rosenthal et al. 2018; Saheb et al. 2018b,a; Scott et al. 2014; Smith et al. 20 2016; Steenland et al. 2018; Tajani et al. 2018; Teubler et al. 2020; Thomson et al. 2017a; Tonn et al. 2018; Torero 21 2015; Van de Ven et al. 2020; Venugopal et al. 2018; Wierzbicka et al. 2018; Willand et al. 2015a; Winter et al. 22 2015; Zheng et al. 2012; Liu et al. 2015a; Sola et al. 2016; Song et al. 2016; Zhao et al. 2017; Grubler et al. 2018; 23 Thema et al. 2017; Ürge-Vorsatz et al. 2016; Nikas et al. 2020) (Blair et al. 2021; Batchelor et al. 2019; ESMAP 24 et al. 2020; Walters and Midden 2018) (European Commission 2016) (MacNaughton et al. 2018) 25
A review of a relatively limited number of studies made by (Ürge-Vorsatz et al. 2016) and (Payne et al. 26
2015) showed that the size of multiple benefits of mitigation actions in the sector of buildings may 27
range from 22% up to 7,400% of the corresponding energy cost savings. In 7 out of 11 case studies 28
reviewed, the value of the multiple impacts of mitigation actions was equal or greater than the value of 29
energy savings. Even in these studies, several effects have not been measured and consequently the size 30
of multiple benefits of mitigation actions may be even higher. Quantifying and if possible, monetizing, 31
these wider impacts of climate action would facilitate their inclusion in cost-benefit analysis, strengthen 32
the adoption of ambitious emissions reduction targets, and improve coordination across policy areas 33
reducing costs (Thema et al. 2017) (Smith et al. 2016). 34
35
9.8.2 Climate mitigation actions in buildings and health impacts 36
9.8.2.1 Lack of access to clean energy 37
In 2018, approximately 2.8 billion people worldwide, most of whom live in Asia and Africa, still use 38
polluting fuels, such as fuelwood, charcoal, dried crops, cow dung, etc., in low-efficiency stoves for 39
cooking and heating, generating household air pollution (HAP), which adversely affects the health of 40
the occupants of the dwellings, especially children and women (World Health Organization 2016; 41
Quinn et al. 2018; Rahut et al. 2017; Mehetre et al. 2017; Rosenthal et al. 2018; Das et al. 2018; Xin et 42
al. 2018; Liu et al. 2018) (IEA et al. 2020b). Exposure to HAP from burning these fuels is estimated to 43
have caused 3.8 million deaths from heart diseases, strokes, cancers, acute lower respiratory infections 44
in 2016 (World Health Organization 2018). It is acknowledged that integrated policies are needed to 45
address simultaneously universal energy access, limiting climate change and reducing air pollution 46
(World Health Organization 2016). (Rafaj et al. 2018) showed that a scenario achieving these SDGs in 47
2030 will imply in 2040 two million fewer premature deaths from HAP compared to current levels, and 48
1.5 million fewer premature deaths in relation to a reference scenario, which assumes the continuation 49
of existing and planned policies. The level of incremental investment needed in developing countries 50
to achieve universal access to modern energy was estimated at around USD0.8 trillion cumulatively to 51
2040 in the scenarios examined (Rafaj et al. 2018). 52
ACCEPTED VERSION
SUBJECT TO FIN
AL EDITS

Final Government Distribution Chapter 9 IPCC AR6 WGIII
Do Not Cite, Quote or Distribute 9-72 Total pages: 168
At the core of these policies is the promotion of improved cook-stoves and other modern energy-1
efficient appliances to cook (for the health benefits of improved cook-stoves see for example (García-2
Frapolli et al. 2010; Aunan et al. 2013) (Jeuland et al. 2018; Malla et al. 2011)), as well as the use of 3
non-solid fuels by poor households in developing countries (Figure 9.19). Most studies agree that the 4
use of non-solid energy options such as LPG, ethanol, biogas, piped natural gas, and electricity is more 5
effective in reducing the health impacts of HAP compared to improved biomass stoves (see for example 6
(Larsen 2016; Rosenthal et al. 2018; Steenland et al. 2018; Goldemberg et al. 2018). On the other hand, 7
climate change mitigation policies (e.g., carbon pricing) may increase the costs of some of these clean 8
fuels (e.g., LPG, electricity), slowing down their penetration in the poor segment of the population and 9
restricting the associated health benefits (Cameron et al. 2016). In this case, appropriate access policies 10
should be designed to efficiently shield poor households from the burden of carbon taxation (Cameron 11
et al. 2016). The evaluation of the improved biomass burning cook-stoves under real-world conditions 12
has shown that they have lower than expected, and in many cases limited, long-run health and 13
environmental impacts, as the households use these stoves irregularly and inappropriately, fail to 14
maintain them, and their usage decline over time (Wathore et al. 2017; Patange et al. 2015; Aung et al. 15
2016; Hanna et al. 2016). In this context, the various improved cook-stoves programs should consider 16
the mid- and long-term needs of maintenance, repair, or replacement to support their sustained use 17
(Schilmann et al. 2019; Shankar et al. 2014). 18
ACCEPTED VERSION
SUBJECT TO FIN
AL EDITS

Final Government Distribution Chapter 9 IPCC AR6 WGIII
Do Not Cite, Quote or Distribute 9-73 Total pages: 168
1
Figure 9.19 Trends on energy access: historical based on IEA statistics data and scenarios based on IEA WEO data. 2
ACCEPTED VERSION
SUBJECT TO FIN
AL EDITS

Final Government Distribution Chapter 9 IPCC AR6 WGIII
Do Not Cite, Quote or Distribute 9-74 Total pages: 168
Electrification of households in rural or remote areas results also to significant health benefits. For 1
example, in El Salvador, rural electrification of households leads to reduced overnight air pollutants 2
concentration by 63% due to the substitution of kerosene as a lighting source, and 34-44% less acute 3
respiratory infections among children under six (Torero 2015). In addition, the connection of the health 4
centres to the grid leads to improvements in the quality of health care provided (Lenz et al. 2017). 5
9.8.2.2 Energy/fuel poverty, indoor environmental quality and health 6
Living in fuel poverty, and particularly in cold and damp housing is related to excess winter mortality 7
and increased morbidity rates due to respiratory and cardiovascular diseases, arthritic and rheumatic 8
illnesses, asthma, etc. (Camprubí et al. 2016; Wilson et al. 2016; Lacroix and Chaton 2015; Ormandy 9
and Ezratty 2016; Payne et al. 2015; Thema et al. 2017). In addition, lack of affordable warmth can 10
generate stress related to chronic discomfort and high bills, fear of falling into debt, and a sense of 11
lacking control, which are potential drivers of further negative mental health outcomes, such as 12
depression (Howden-Chapman et al. 2012; Payne et al. 2015; Wilson et al. 2016; Liddell and Guiney 13
2015). Health risks from exposure to cold and inadequate indoor environmental quality may be higher 14
for low-income, energy-poor households, and in particular for those with elderly, young children, and 15
members with existing respiratory illness (Payne et al. 2015; Thomson et al. 2017b; Nunes 2019). High 16
temperatures during summer can also be dangerous for people living in buildings with inadequate 17
thermal insulation and inappropriate ventilation (Sanchez-Guevara et al. 2019; Thomson et al. 2019; 18
Ormandy and Ezratty 2016). Summer fuel poverty (or summer overheating risk) may increase 19
significantly in the coming decades under a warming climate (see also Section 9.7), with the poorest, 20
who cannot afford to install air conditioning, and the elderly (Nunes 2020) being the most vulnerable. 21
Improved energy efficiency in buildings contributes in fuel poverty alleviation and brings health gains 22
through improved indoor temperatures and comfort as well as reduced fuel consumption and associated 23
financial stress (Thomson and Thomas 2015; Curl et al. 2015; Poortinga et al. 2018; Lacroix and Chaton 24
2015; Liddell and Guiney 2015) (Willand et al. 2015). On the other hand, households suffering most 25
from fuel poverty experience more barriers for undertaking building retrofits (Camprubí et al. 2016) 26
(Charlier et al. 2018; Braubach and Ferrand 2013), moderating the potential health gains associated 27
with implemented energy efficiency programs. This can be avoided if implemented policies to tackle 28
fuel poverty target the most socially vulnerable households (Lacroix and Chaton 2015; Camprubí et al. 29
2016). (Mzavanadze 2018a) estimated that in EU-28 accelerated energy efficiency policies, reducing 30
the energy demand in residential sector by 333 TWh in 2030 compared to a reference scenario, coupled 31
with strong social policies targeting the most vulnerable households, could deliver additional co-32
benefits in the year of 2030 of around 24,500 avoided premature deaths due to indoor cold and around 33
22,300 DALYs of avoided asthma due to indoor dampness. The health benefits of these policies amount 34
to €4.8 billion in 2030. The impacts on inhabitants in developing countries would be much greater than 35
those in EU-28 owing to the much higher prevalence of impoverished household. 36
Apart from thermal comfort, the internal environment of buildings impacts public health through a 37
variety of pathways including inadequate ventilation, poor indoor air quality, chemical contaminants 38
from indoor or outdoor sources, outdoor noise, or poor lighting. The implementation of interventions 39
aiming to improve thermal insulation of buildings combined with inadequate ventilation may increase 40
the risk of mould and moisture problems due to reduced air flow rates, leading to indoor environments 41
that are unhealthy, with the occupants suffering from the sick building syndrome symptoms 42
(Wierzbicka et al. 2018; Cedeño-Laurent et al. 2018) (Willand et al. 2015). On the other hand, if the 43
implementation of energy efficiency interventions or the construction of green buildings is accompanied 44
by adequate ventilation, the indoor environmental conditions are improved through less moisture, 45
mould, pollutant concentrations, and allergens, which result in fewer asthma symptoms, respiratory 46
risks, chronic obstructive pulmonary diseases, heart disease risks, headaches, cancer risks, etc. (Cowell 47
2016; Allen et al. 2015; Doll et al. 2016; Wilson et al. 2016; Thomson and Thomas 2015) (Hamilton et 48
al. 2015; Militello-Hourigan and Miller 2018; Underhill et al. 2018; Cedeño-Laurent et al. 2018). (Fisk 49
2018) showed that increased ventilation rates in residential buildings results in health benefits ranging 50
from 20% to several-fold improvements; however, these benefits do not occur consistently, and 51
ventilation should be combined with other exposure control measures. As adequate ventilation imposes 52
ACCEPTED VERSION
SUBJECT TO FIN
AL EDITS
Final Government Distribution Chapter 9 IPCC AR6 WGIII
Do Not Cite, Quote or Distribute 9-75 Total pages: 168
additional costs, the sick building syndrome symptoms are more likely to be seen in low income 1
households (Shrubsole et al. 2016). 2
The health benefits of residents due to mitigation actions in buildings are significant (for a review see 3
(Maidment et al. 2014; Fisk et al. 2020; Thomson and Thomas 2015)), and are higher among low 4
income households and/or vulnerable groups, including children, the elderly and those with pre-existing 5
illnesses (Maidment et al. 2014; IEA 2014; Ortiz et al. 2019). (Tonn et al. 2018) estimated that the 6
health-related benefits attributed to the two weatherization programs implemented in the US in 2008 7
and 2010 exceeds by a factor of 3 the corresponding energy cost savings yield. (IEA 2014) also found 8
that the health benefits attributed to energy efficiency retrofit programs may outweigh their costs by up 9
to a factor of 3. (Ortiz et al. 2019) estimated that the energy retrofit of vulnerable households in Spain 10
requires an investment of around EUR 10.9-12.3 thousands per dwelling and would generate an average 11
saving to the healthcare system of EUR 372 per year and dwelling (due to only better thermal comfort 12
conditions in winter). 13
9.8.2.3 Outdoor air pollution 14
According to (World Health Organization 2018) around 4.2 million premature deaths worldwide (in 15
both cities and rural areas) are attributed to outdoor air pollution. Only in China, the premature 16
mortalities attributed to PM2.5 and O3 emissions exceeded 1.1 million in 2010 (Gu et al. 2018). 17
Mitigation actions in residential and non-residential sectors decrease the amount of fossil fuels burnt 18
either directly in buildings (for heating, cooking, etc.) or indirectly for electricity generation and thereby 19
reduce air pollution (e.g., PM, O3, SO2, NOx), improve ambient air quality and generate significant 20
health benefits through avoiding premature deaths, lung cancers, ischemic heart diseases, hospital 21
admissions, asthma exacerbations, respiratory symptoms, etc. (Karlsson et al. 2020; Balaban and 22
Puppim de Oliveira 2017; MacNaughton et al. 2018; Levy et al. 2016). Several studies have monetized 23
the health benefits attributed to reduced outdoor air pollution due to the implementation of mitigation 24
actions in buildings, and their magnitude expressed as a ratio to the value of energy savings resulting 25
from the implemented interventions in each case, are in the range of 0.08 in EU, 0.18 in Germany, 0.26-26
0.40 in US, 0.34 in Brazil, 0.47 in Mexico, 0.74 in Turkey, 8.28 in China and 11.67 in India (Diaz-27
Mendez et al. 2018; Joyce et al. 2013; MacNaughton et al. 2018; Levy et al. 2016). In developed 28
economies, the estimated co-benefits are relatively low due to the fact that the planned interventions 29
influence a quite clean energy source mix (Tuomisto et al. 2015; MacNaughton et al. 2018). On the 30
other hand, the health co-benefits in question are substantially higher in countries and regions with 31
greater dependency on coal for electricity generation and higher baseline morbidity and mortality rates 32
(Kheirbek et al. 2014; MacNaughton et al. 2018). 33
9.8.3 Other environmental benefits of mitigation actions 34
Apart from the health benefits mentioned above, mitigation actions in the buildings sector are also 35
associated with environmental benefits to ecosystems and crops, by avoiding acidification and 36
eutrophication, biodiversity through green roofs and walls, building environment through reduced 37
corrosion of materials, etc. (Mzavanadze 2018b; Thema et al. 2017) (Knapp et al. 2019; Mayrand and 38
Clergeau 2018), while some negative effects cannot be excluded (Dylewski and Adamczyk 2016). 39
Also, very important are the effects of mitigation actions in buildings on the reduction of consumption 40
of natural resources, namely fossil fuels, metal ores, minerals, etc. These comprise savings from the 41
resulting reduced consumption of fuels, electricity and heat and the lifecycle-wide resource demand for 42
their utilities, as well as potential net savings from the substitution of energy technologies used in 43
buildings (production phase extraction) (Thema et al. 2017) (European Commission 2016). (Teubler et 44
al. 2020) found that the implementation of an energy efficiency scenario in European buildings will 45
result in resource savings (considering only those associated with the generation of final energy 46
products) of 406 kg per MWh lower final energy demand in the residential sector, while the 47
corresponding figure for non-residential buildings was estimated at 706 kg per MWh of reduced energy 48
demand. On the other hand, (Smith et al. 2016) claim that a switch to more efficient appliances could 49
result in negative impacts from increased resource use, which can be mitigated by avoiding premature 50
replacement and maximizing recycling of old appliances. 51
ACCEPTED VERSION
SUBJECT TO FIN
AL EDITS

Final Government Distribution Chapter 9 IPCC AR6 WGIII
Do Not Cite, Quote or Distribute 9-76 Total pages: 168
Mitigation actions aiming to reduce the embodied energy of buildings through using local and 1
sustainable building materials can be used to leverage new supply chains (e.g., for forestry products), 2
which in turn bring further environmental and social benefits to local communities (Hashemi et al. 2015; 3
Cheong C and Storey D 2019). Furthermore, improved insulation and the installation of double- or 4
triple-glazed windows result in reduced noise levels. It is worth mentioning that for every 1 dB decrease 5
in excess noise, academic performance in schools and productivity of employees in office buildings 6
increases by 0.7% and 0.3% respectively (Kockat et al. 2018b). (Smith et al. 2016) estimated that in the 7
UK the annual noise benefits associated with energy renovations in residential buildings may reach 8
£400 million in 2030 outweighing the benefits of reduced air pollution. 9
9.8.4 Social well-being 10
9.8.4.1 Energy/fuel poverty alleviation 11
In 2018 almost 0.79 billion people in developing countries did not have access to electricity, while 12
approximately 2.8 billion people relied on polluting fuels and technologies for cooking (IEA et al. 13
2020b). Only in sub-Saharan Africa, about 548 million people (i.e., more than 50% of the population) 14
live without electricity. In developed economies, the EU Energy Poverty Observatory estimated that in 15
EU-28 44.5 million people were unable to keep their homes warm in 2016, 41.5 million had arrears on 16
their utility bills the same year, 16.3% of households faced disproportionately high energy expenditure 17
in 2010, and 19.2% of households reported being uncomfortably hot during summer in 2012 (Thomson 18
and Bouzarovski 2018). (Okushima 2016) using the “expenditure approach” estimated that fuel poverty 19
rates in Japan reached 8.4% in 2013. In the US, in 2015, 17 million households (14.4% of the total) 20
received an energy disconnect/delivery stop notice and 25 million households (21.2% of the total) had 21
to forgo food and medicine to pay energy bills (Bednar and Reames 2020). 22
The implementation of well-designed climate mitigation measures in buildings can help to reduce 23
energy/fuel poverty and improve living conditions with significant benefits for health (see Section 24
9.8.2) and well-being (Smith et al. 2016; Payne et al. 2015; Tonn et al. 2018). The social implications 25
of energy poverty alleviation for the people in low- and middle-income developing countries with no 26
access to clean energy fuels are further discussed in Section 9.8.4.2. In other developing countries and 27
in developed economies as well, the implementation of mitigation measures can improve the ability of 28
households to affordably heat/cool a larger area of the home, thus increasing the space available to a 29
family and providing more private and comfortable spaces for several activities like homework (Payne 30
et al. 2015). By reducing energy expenditures and making energy bills more affordable for households, 31
a “heat or eat” dilemma can be avoided resulting in better nutrition and reductions in the number of low 32
birthweight babies (Payne et al. 2015; Tonn et al. 2018). Also, renovated buildings and the resulting 33
better indoor conditions, can enable residents to avoid social isolation, improve social cohesion, lower 34
crime, etc. (Payne et al. 2015). (European Commission 2016) found that under an ambitious recast of 35
Energy Performance Buildings Directive (EPBD), the number of households that may be lifted from 36
fuel poverty across the EU lies between 5.17 and 8.26 million. To capture these benefits, mitigation 37
policies and particularly energy renovation programmes should target the most vulnerable among the 38
energy-poor households, which very often are ignored by the policy makers. In this context, it is 39
recognized that fuel poverty should be analysed as a multidimensional social problem (Mashhoodi et 40
al. 2019; Thomson et al. 2017b) (Charlier and Legendre 2019; Baker et al. 2018), as it is related to 41
energy efficiency, household composition, age and health status of its members, social conditions 42
(single parent families, existence of unemployed and retired people, etc.), energy prices, disposable 43
income, etc. In addition, the geographical dimension can have a significant impact on the levels of fuel 44
poverty and should be taken into account when formulating response policies (Besagni and Borgarello 45
2019; Mashhoodi et al. 2019). 46
9.8.4.2 Improved access to energy sources, gender equality and time savings 47
In most low- and middle-income developing countries women and children (particularly girls) spend a 48
significant amount of their time for gathering fuels for cooking and heating (World Health Organization 49
2016; Rosenthal et al. 2018). For example, in Africa more than 70% of the children living in households 50
that primarily cook with polluting fuels spend at least 15 hours and, in some countries, more than 30 51
hours per week in collecting wood or water, facing significant safety risks and constraints on their 52
ACCEPTED VERSION
SUBJECT TO FIN
AL EDITS

Final Government Distribution Chapter 9 IPCC AR6 WGIII
Do Not Cite, Quote or Distribute 9-77 Total pages: 168
available time for education and rest (World Health Organization 2016; Mehetre et al. 2017). Also, in 1
several developing countries (e.g., in most African countries but also in India, in rural areas in Latin 2
America and elsewhere) women spend several hours to collect fuel wood and cook, thus limiting their 3
potential for productive activities for income generation or rest ( García-Frapolli et al. 2010; Mehetre 4
et al. 2017; World Health Organization 2016). Expanding access to clean household energy for cooking, 5
heating and lighting will largely help alleviate these burdens (Lewis et al. 2017; World Health 6
Organization 2016; Rosenthal et al. 2018) (Malla et al. 2011). (Jeuland et al. 2018) found that the time 7
savings associated with the adoption of cleaner and more fuel-efficient stoves by low-income 8
households in developing countries are amount to USD 1.3-1.9 per household per month, constituting 9
the 23-43% of the total social benefits attributed to the promotion of clean stoves. 10
Electrification of remote rural areas and other regions that do not have access to electricity enables 11
people living in poor developing countries to read, socialize, and be more productive during the evening, 12
while it is also associated with greater school attendance by children (Torero 2015; Rao et al. 2016; 13
Barnes and Samad 2018). (Chakravorty et al. 2014) found that a grid connection can increase non-14
agricultural incomes of rural households in India from 9% up to 28.6% (assuming a higher quality of 15
electricity). On the other hand, some studies clearly show that electricity consumption for connected 16
households is extremely low, with limited penetration of electrical appliances (e.g., (Lee et al. 2017; 17
Cameron et al. 2016) and low quality of electricity (Chakravorty et al. 2014). The implementation of 18
appropriate policies to overcome bureaucratic red tape, low reliability, and credit constraints, is 19
necessary for maximizing the social benefits of electrification. 20
9.8.5 Economic implications of mitigation actions 21
9.8.5.1 Buildings-related labour productivity 22
Low-carbon buildings, and particularly well-designed, operated and maintained high-performance 23
buildings with adequate ventilation, may result in productivity gains and improve the competitiveness 24
of the economy through three different pathways (Bleyl et al. 2019; Thema et al. 2017; Niemelä et al. 25
2017; Mofidi and Akbari 2017; MacNaughton et al. 2015) (European Commission 2016): (i) increasing 26
the amount of active time available for productive work by reducing the absenteeism from work due to 27
illness, the presenteeism (i.e., working with illness or working despite being ill), and the inability to 28
work due to chronic diseases caused by the poor indoor environment; (ii) improving the indoor air 29
quality and thermal comfort of non-residential buildings, which can result in better mental well-being 30
of the employees and increased workforce performance; and (iii) reducing the school absenteeism due 31
to better indoor environmental conditions, which may enhance the future earnings ability of the students 32
and restrict the parents absenteeism due to care-taking of sick children. 33
Productivity gains due to increased amount of active time for work is directly related to acute and 34
chronic health benefits attributed to climate mitigation actions in buildings (see Section 9.8.2.2). The 35
bulk of studies quantifying the impact of energy efficiency on productivity focus on acute health effects. 36
Proper ventilation in buildings is of particular importance and can reduce absenteeism due to sick days 37
by 0.6–1.9 days per person per year (MacNaughton et al. 2015)(Ben-David et al. 2017; Thema et al. 38
2017). In a pan-European study, (Chatterjee and Ürge-Vorsatz 2018) showed that deep energy retrofits 39
in residential buildings may increase the number of active days by 1.78-5.27 (with an average of 3.09) 40
per year and person who has actually shifted to a deep retrofitted building. Similarly, the interventions 41
in the non-residential buildings result in increased active days between 0.79 and 2.43 (with an average 42
of 1.4) per year and person shifted to deeply retrofitted non-residential buildings. 43
As regards improvements in workforce performance due to improved indoor conditions (i.e., air quality, 44
thermal comfort, etc.), (Kozusznik et al. 2019) conducted a systematic review on whether the 45
implementation of energy efficient interventions in office buildings influence well-being and job 46
performance of employees. Among the 34 studies included in this review, 31 found neutral to positive 47
effects of green buildings on productivity and only 3 studies indicated detrimental outcomes for office 48
occupants in terms of job performance. Particularly longitudinal studies, which observe and compare 49
the office users’ reactions over time in conventional and green buildings, show that green buildings 50
have neutral to positive effects on occupants well-being and work performance (Thatcher and Milner 51
2016; Candido et al. 2019; Kozusznik et al. 2019). (Bleyl et al. 2019) estimated that deep energy retrofits 52
ACCEPTED VERSION
SUBJECT TO FIN
AL EDITS

Final Government Distribution Chapter 9 IPCC AR6 WGIII
Do Not Cite, Quote or Distribute 9-78 Total pages: 168
in office buildings in Belgium would generate a workforce performance increase of 10.4 to 20.8 1
EUR·m-2 renovated. In Europe every 1°C reduction in overheating during the summer period increases 2
students learning performance by 2.3% and workers performance in office buildings by 3.6% (Kockat 3
et al. 2018b). Considering the latter indicator, it was estimated that by reducing overheating across 4
Europe, the overall performance of the workers in office buildings can increase by 7-12% (Kockat et 5
al. 2018b). 6
9.8.5.2 Enhanced asset values of energy efficient buildings 7
A significant number of studies confirm that homes with high energy efficiency and/or green features 8
are sold at higher prices than conventional, low energy efficient houses. A review of 15 studies from 12 9
different countries showed that energy efficient dwellings have a price premium ranging between 1.5% 10
and 28%, with a median estimated at 7.8%, for the highest energy efficient category examined in each 11
case study compared to reference houses with the same characteristics but lower energy efficiency (the 12
detailed results of this review are presented in Table SM9.55 included in the Supplementary Material). 13
In a given real estate market, the higher the energy efficiency of dwellings compared to conventional 14
housing, the higher their selling prices. However, a number of studies show that this premium is largely 15
realized during resale transactions and is smaller or even negative in some cases immediately after the 16
completion of the construction (Deng and Wu 2014; Yoshida and Sugiura 2015). A relatively lower 17
number of studies (also included in Table SM9.5 of Supplementary Material) show that energy 18
efficiency and green features have also a positive effect on rental prices of dwellings (Cajias et al. 2019; 19
Hyland et al. 2013), but this is weaker compared to sales prices, and in a developing country even 20
negative as green buildings, which incorporate new technologies such as central air conditioning, are 21
associated with higher electricity consumption (Zheng et al. 2012). 22
Regarding non-residential buildings, (European Commission 2016) reviewed a number of studies 23
showing that buildings with high energy efficiency or certified with green certificates present higher 24
sales prices by 5.2-35%, and higher rents by 2.5-11.8%. More recent studies in relation to those included 25
in the review confirm these results (e.g., (Mangialardo et al. 2018; Ott and Hahn 2018)) or project even 26
higher premiums (e.g., (Chegut et al. 2014)) found that green certification in the London office market 27
results in a premium of 19.7% for rents). On the other hand, in Australia, a review study showed mixed 28
evidence regarding price differentials emerged as a function of energy performance of office buildings 29
(Acil Allen Consulting 2015). Other studies have shown that energy efficiency and green certifications 30
have been associated with lower default rates for commercial mortgages (An and Pivo 2020; Wallace 31
et al. 2018; Mathew et al. 2021). 32
More generally, (Giraudet 2020) based on a meta-analysis of several studies, showed that the 33
capitalization of energy efficiency is observed in building sales and rental (even in the absence of energy 34
performance certificates), but the resulting market equilibrium can be considered inefficient as rented 35
dwellings are less energy efficient than owner-occupied ones. 36
9.8.5.3 Macroeconomic effects 37
Investments required for the implementation of mitigation actions, create, mainly in the short-run, 38
increase in the economic output and employment in sectors delivering energy efficiency services and 39
products, which are partially counterbalanced by less investments and lower production in other parts 40
of the economy (Thema et al. 2017; US EPA 2018; Yushchenko and Patel 2016) (European 41
Commission 2016) (see also Cross-Working Group Box 1 in Chapter 3). The magnitude of these 42
impacts depends on the structure of the economy, the extent to which energy saving technologies are 43
produced domestically or imported from abroad, but also from the growth cycle of the economy with 44
the benefits being maximized when the related investments are realized in periods of economic 45
recession ( Mirasgedis et al. 2014; Thema et al. 2017; Yushchenko and Patel 2016). Particularly in 46
developing countries if the mitigation measures and other interventions to improve energy access 47
(Figure 9.19) are carried out by locals, the impact on economy, employment and social well-being will 48
be substantial (Mills 2016; Lehr et al. 2016). As many of these programs are carried out with foreign 49
assistance funds, it is essential that the funds be spent in-country to the full extent possible, while some 50
portion of these funds would need to be devoted to institution building and especially training. (Mills 51
2016) estimated that a market transformation from inefficient and polluting fuel-based lighting to solar-52
ACCEPTED VERSION
SUBJECT TO FIN
AL EDITS
Final Government Distribution Chapter 9 IPCC AR6 WGIII
Do Not Cite, Quote or Distribute 9-79 Total pages: 168
LED systems to fully serve the 112 million households that currently lack electricity access will create 1
directly 2 million new jobs in these developing countries, while the indirect effects could be even 2
greater. (IEA 2020b) estimated that 9-30 jobs would be generated for every million dollars invested in 3
building retrofits or in construction of new energy efficient buildings (gross direct and indirect 4
employment), with the highest employment intensity rates occurring in developing countries. 5
Correspondingly, 7-16 jobs would be created for every million dollars spent in purchasing highly 6
efficient and connected appliances, while expanding clean cooking through LPG could create 16-75 7
direct local jobs per million dollars invested. Increases in product and employment attributed to energy 8
efficiency investments also affect public budgets by increasing income and business taxation, reducing 9
unemployment benefits, etc. (Thema et al. 2017), thus mitigating the impact on public deficit of 10
subsidizing energy saving measures (Mikulić et al. 2016). 11
Furthermore, energy savings due to the implementation of mitigation actions will result, mainly in the 12
long-run, in increased disposable income for households, which in turn may be spent to buy other goods 13
and services, resulting in economic development, creation of new permanent employment and positive 14
public budget implications (IEA 2014; US EPA 2018; Thema et al. 2017). According to (Anderson et 15
al. 2014), the production of these other goods and services is usually more labour-intensive compared 16
to energy production, resulting in net employment benefits of about 8 jobs per million dollars of 17
consumer bill savings in the US. These effects may again have a positive impact on public budgets. 18
Furthermore, reduced energy consumption on a large scale is likely to have an impact on lower energy 19
prices and hence on reducing the cost of production of various products, improving the productivity of 20
the economy and enhancing security of energy supply (IEA 2014; Thema et al. 2017). 21
9.8.5.4 Energy security 22
GHG emission reduction actions in the sector of buildings affect energy systems by: (i) reducing the 23
overall consumption of energy resources, especially fossil fuels; (ii) promoting the electrification of 24
thermal energy uses; and (iii) enhancing distributed generation through the incorporation of RES and 25
other clean and smart technologies in buildings. Increasing sufficiency, energy efficiency and 26
penetration of RES result in improving the primary energy intensity of the economy and reducing 27
dependence on fossil fuels, which for many countries are imported energy resources (Markovska et al. 28
2016; Thema et al. 2017; Boermans et al. 2015). The electrification of thermal energy uses is expected 29
to increase the demand for electricity in buildings, which in most cases can be reversed (at national or 30
regional level) by promoting nearly zero energy new buildings and a deep renovation of the existing 31
building stock (Couder and Verbruggen 2017; Boermans et al. 2015). In addition, highly efficient 32
buildings can keep the desired room temperature stable over a longer period and consequently they have 33
the capability to shift heating and cooling operation in time (Boermans et al. 2015). These result in 34
reduced peak demand, lower system losses and avoided generation and grid infrastructure investments. 35
As a significant proportion of the global population, particularly in rural and remote locations, still lack 36
access to modern energy sources, renewables can be used to power distributed generation or micro-grid 37
systems that enable peer-to-peer energy exchange, constituting a crucial component to improve energy 38
security for rural populations (Leibrand et al. 2019; Kirchhoff and Strunz 2019). For successful 39
development of peer-to-peer micro-grids, financial incentives to asset owners are critical for ensuring 40
their willingness to share their energy resources, while support measures should be adopted to ensure 41
that also non-asset holders can contribute to investments in energy generation and storage equipment 42
and have the ability to sell electricity to others (Kirchhoff and Strunz 2019). 43
44
9.9 Sectoral barriers and policies 45
9.9.1 Barriers, feasibility, and acceptance 46
Understanding the reasons why cost-effective investment in building energy efficiency are not taking 47
place as expected by rational economic behaviour is critical to design effective policies for decarbonize 48
the buildings (Cattaneo 2019; Cattano et al. 2013). Barriers depend from the actors (owner, tenant, 49
utility, regulators, manufacturers, etc.), their role in energy efficiency project and the market, 50
ACCEPTED VERSION
SUBJECT TO FIN
AL EDITS

Final Government Distribution Chapter 9 IPCC AR6 WGIII
Do Not Cite, Quote or Distribute 9-80 Total pages: 168
technology, financial economic, social, legal, institutional, regulatory and policy structures (Reddy 1
1991; Weber 1997; Sorrell et al. 2000; Reddy 2002; Sorrell et al. 2011: Cagno et al. 2012; Bardhan et 2
al., 2014; Bagaini et al. 2020; Vogel et al. 2015; Khosla et al. 2017; Gupta et al. 2017). Barriers 3
identified for the refurbishment of exiting building or construction of new efficient buildings includes: 4
lack of high-performance products, construction methods, monitoring capacity, investment risks, 5
policies intermittency, information gaps, principal agent problems (both tenant and landlord face 6
disincentives to invest in energy efficiency), skills of the installers, lack of a trained and ready 7
workforce, governance arrangements in collectively owned properties and behavioural anomalies. (Do 8
et al. 2020; Dutt 2020; Gillingham and Palmer 2014;Yang et al., 2019; Song et al. 2020; Buessler et al. 9
2017)). A better understanding of behavioural barriers (Frederiks et al. 2015) is essential to design 10
effective policies to decarbonise the building sector. Energy efficiency in buildings faces one additional 11
problem: the sector is highly heterogeneous, with many different building types, sizes and operational 12
uses. Energy efficiency investments do not take place in isolation but in competition with other priorities 13
and as part of a complex, protracted investment process (Cooremans 2011). Therefore, a focus on 14
overcoming barriers is not enough for effective policy. Organisational context is important because the 15
same barrier might have very different organisational effects and require very different policy responses 16
(Mallaburn 2018). Cross-Chapter Box 2 in Chapter 2 presents a summary of methodologies for 17
estimating the macro-level impact of policies on indices of GHG mitigation. 18
Reaching deep decarbonisation levels throughout the life cycle of buildings depend on 19
multidimensional criteria for assessing the feasibility of mitigation measures, including criteria related 20
to geophysical, environmental-ecological, technological, economic, socio-cultural and institutional 21
dimensions. An assessment of 16 feasibility criteria for mitigation measures in the buildings sector 22
indicates whether a specific factor, within broader dimensions, acts as a barrier or helps enabling such 23
mitigation measures (Figure 9.20, Supplementary material Table SM9.6, Annex II.11). Although 24
mitigation measures are aggregated in the assessment of Figure 9.20 and feasibility results can differ 25
for more specific measures, generally speaking, the barriers to mitigation measures in buildings are few, 26
sometimes including technological and socio-cultural challenges. However, many co-benefits could 27
help enable mitigation in the buildings sector. For instance, many measures can have positive effects 28
on the environment, health and well-being, and distributional potential, all of which can boost their 29
feasibility. The feasibility of mitigation measures varies significantly according to socio-economic 30
differences across and within countries. 31
ACCEPTED VERSION
SUBJECT TO FIN
AL EDITS

Final Government Distribution Chapter 9 IPCC AR6 WGIII
Do Not Cite, Quote or Distribute 9-81 Total pages: 168
1
Figure 9.20 Summary of the extent to which different factors would enable or inhibit the deployment of mitigation options in buildings. 2
Blue bars indicate the extent to which the indicator enables the implementation of the option (E) and orange bars indicate the extent to which an indicator is a 3
barrier (B) to the deployment of the option, relative to the maximum possible barriers and enablers assessed. A X signifies the indicator is not applicable or does 4
not affect the feasibility of the option, while a forward slash / indicates that there is no or limited evidence whether the indicator affects the feasibility of the option. 5
The shading indicates the level of confidence, with darker shading signifying higher levels of confidence. Table SM9.6 provides an overview of the extent to which 6
the feasibility of options may differ across context (e.g., region), time (e.g., 2030 versus 2050), and scale (e.g., small versus large), and includes a line of sight on 7
which the assessment is based. The assessment method is explained in Annex II.11. 8 ACCEPTED VERSIO
N
SUBJECT TO FIN
AL EDITS

Final Government Distribution Chapter 9 IPCC AR6 WGIII
Do Not Cite, Quote or Distribute 9-82 Total pages: 168
9.9.2 Rebound effects 1
In the buildings sector energy efficiency improvements and promotion of cleaner fuels can lead to all 2
types of rebound effects, while sufficiency measures lead only to indirect and secondary effects (Chitnis 3
et al. 2013). The consideration of the rebound effects as a behavioural economic response of the 4
consumers to cheaper energy services can only partially explain the gap between the expected and actual 5
energy savings (Galvin and Sunikka-Blank 2017). The prebound effect, a term used to describe the 6
situation where there is a significant difference between expected and observed energy consumption of 7
non-refurbished buildings, is usually implicated in high rebound effects upon retrofitting (Teli et al. 8
2016; Calì et al. 2016; Galvin and Sunikka-Blank 2017). The access for all to modern energy services 9
such as heating and cooling is one of the wellbeing objectives governments aim for. However, ensuring 10
this access leads to an increase of energy demand which is considered as a rebound effect by (Berger 11
and Höltl 2019; Poon 2015; Seebauer 2018; Sorrell et al. 2018; Orea et al. 2015; Teli et al. 2016; Chitnis 12
et al. 2013). (Aydin et al. 2017) found that in the Netherlands the rebound effect for the lowest wealth 13
quantile is double compared to the highest wealth quantile. Similar, energy access in developing 14
countries leads to an increase consumption compared to very low baselines which is considered by some 15
authors as rebound (Copiello 2017). On the other hand, in households whose members have a higher 16
level of education and/or strong environmental values, the rebound is lower (Seebauer 2018). 17
Rebound effects in the building sector could be a co-benefit, in cases where the mechanisms involved 18
provide faster access to affordable energy and/or contribute to improved social well-being, or a trade-19
off, to the extent that the external costs of the increased energy consumption exceed the welfare benefits 20
of the increased energy service consumption (Galvin and Sunikka-Blank 2017; Sorrell et al. 2018) 21
(Chan and Gillingham 2015; Borenstein 2015). In cases where rebound effects are undesirable, 22
appropriate policies could be implemented for their mitigation. 23
There is great variation in estimates of the direct and indirect rebound effects, which stems from the 24
end-uses included in the analysis, differences in definitions and methods used to estimate the rebound 25
effects, the quality of the data utilized, the period of analysis and the geographical area in consideration 26
(Gillingham et al. 2016; International Risk Governance Council 2013; Galvin 2014). Several studies 27
examined in the context of this assessment (see Table SM9.7) showed that direct rebound effects for 28
residential energy consumption, which includes heating, are significant and range between -9% and 29
91%, with a median at 35% in Europe, 0-30% with a median at 20% in the US, and 72-127%, with a 30
median at 89% in China. The direct rebound effects for energy services other than heating may be 31
lower (Chen et al. 2018; Sorrell et al. 2018). The rebound effects may be reduced with the time as the 32
occupants learn how to optimally use the systems installed in energy renovated buildings (Calì et al. 33
2016) and seem to be lower in the case of major renovations leading to nZEB (Corrado et al. 2016). 34
The combined direct and indirect or the indirect only rebound effects were found to range between -2% 35
and 80%, with a median at 12% (see Table SM9.7). In non-residential buildings the rebound effects 36
may be smaller, as the commercial sector is characterized by lower price elasticities of energy demand, 37
while the comfort level in commercial buildings before renovation is likely to be better compared to 38
residential buildings (Qiu 2014). 39
9.9.3 Policy packages for the decarbonisation of buildings 40
There is no single energy efficiency policy (Wiese et al. 2018) able to decarbonise the building sector, 41
but a range of polices are needed, often included in a policy package (Kern et al., 2017; Rosenow et al. 42
2017) to enhance robustness against risks and uncertainties in both short and long-term and addressing 43
the different stakeholder perspectives (Forouli et al. 2019; Nikas et al. 2020; Doukas and Nikas 2020). 44
This is due to: the many barriers; the different types of buildings (residential, non-residential, etc.); the 45
different socio-economic groups of the population (social housing, informal settlement, etc.); the 46
country development status; the local climate (cooling and/or heating), ownership structure (tenant or 47
ACCEPTED VERSION
SUBJECT TO FIN
AL EDITS

Final Government Distribution Chapter 9 IPCC AR6 WGIII
Do Not Cite, Quote or Distribute 9-83 Total pages: 168
owner), the age of buildings. Effective policy packages include mandatory standards, codes, the 1
provision of information, carbon pricing, financing, and technical assistance for end-users. Important 2
element related to policy packages is whether the policies reinforce each other or diminish the impact 3
of individual policies, due to policy “overcrowding”. Examples are the EU policy package for efficiency 4
in buildings (Rosenow and Bayer 2017; Economidou et al, 2020; BPIE, 2020) and China goal of 10 5
million m2 NZEB during the 13th Five-Year Plan, presented in the Supplementary Material (Section 6
SM9.4). See also Cross-Chapter Box 10 in Chapter 14 for integrated policymaking for sector transitions. 7
Revisions in tenant and condominium law are necessary for reducing disincentives between landlord 8
and tenant or between multiple owners, these acts alone cannot incentivise them to uptake an energy 9
efficiency upgrade in a property (Economidou and Serrenho, 2019). A package addressing split 10
incentives include regulatory measures, information measures, labels, individual metering rules and 11
financial models designed to distribute costs and benefits to tenants and owners in a transparent and fair 12
way (Bird and Hernández 2012; Economidou and Bertoldi 2015; Castellazi et al. 2017). A more active 13
engagement of building occupants in energy saving practices, the development of agreements 14
benefitting all involved actors, acknowledgement of real energy consumption and establishment of cost 15
recovery models attached to the property instead of the owner are useful measures to address 16
misalignments between actors. 17
In developed countries policy packages are targeted to increase the number and depth of renovations of 18
existing building, while for developing countries policies focus on new construction, including 19
regulatory measures and incentives, while carbon pricing would be more problematic unless there is a 20
strong recycling of the revenues. Building energy codes and labels could be based on LCA emissions, 21
rather than energy consumption during the use phase of buildings, as it is the case in Switzerland and 22
Finland (Kuittinen and Häkkinen 2020). 23
Policy packages should also combine sufficiency, efficiency, and renewable energy instruments for 24
buildings, for example some national building energy codes already include minimum requirements for 25
the use of renewable energy in buildings. 26
9.9.3.1 Sufficiency and efficiency policies 27
Recently the concept of sufficiency complementary to energy efficiency has been introduced in policy 28
making (Saheb 2021; Bertoldi 2020; Hewitt 2018; Brischke et al. 2015; Thomas et al. 2019), see Box 29
9.1. Lorek and Spangenberg (2019b) investigated the limitations of the theories of planned behaviour 30
and social practice and proposed an approach combining both theories resulting in a heuristic 31
sufficiency policy tool. Lorek and Spangenberg (2019b) showed that increased living area per person 32
counteracts efficiency gains in buildings and called for sufficiency policy instruments to efficiency by 33
limit building size. This could be achieved via mandatory and prescriptive measures, e.g., progressive 34
building energy codes (IEA, 2013), or financial penalties in the form of property taxation (e.g., non-35
linear and progressive taxation), or with mandatory limits on building size per capita. Heindl and 36
Kanschik (2016) suggested that voluntary policies promoting sufficiency and proposed that sufficiency 37
should be "integrated in a more comprehensive normative framework related to welfare and social 38
justice". Alcott highlighted that in sufficiency there is a loss of utility or welfare (Alcott, 2008), Thomas 39
et al. (2019) described some of the possible policies, some based on the sharing economy principles, 40
for examples co-sharing space, public authorities facilitating the exchange house between young and 41
expanding families with elderly people, with reduce need for space. Policies for sufficiency include 42
land-use and urban planning policies. Berril et al, (2021) proposed removing policies, which support 43
supply of larger home typologies, e.g., single-family home or local land-use regulations restricting 44
construction of multifamily buildings. In non-residential building, sufficiency could be implemented 45
through the sharing economy, for example with flexible offices space with hot-desking. 46
ACCEPTED VERSION
SUBJECT TO FIN
AL EDITS
Final Government Distribution Chapter 9 IPCC AR6 WGIII
Do Not Cite, Quote or Distribute 9-84 Total pages: 168
Scholars have identified the "energy efficiency gap" (Hirst and Brown 1990; Jaffe and Stavins 1994; 1
Stadelmann 2017; Gillingham and Palmer 2014; Alcott and Greenstone 2012) and policies to overcome 2
it. (Markandya et al. 2015) and Shen et al. (2016) have classified energy efficiency policies in three 3
broad categories: the command and control (e.g. mandatory building energy codes; mandatory 4
appliances standards, etc.); price instruments (e.g. taxes, subsides, tax deductions, credits, permits and 5
tradable obligations, etc.); and information instruments (e.g. labels, energy audits, smart meters and 6
feed-back, etc.). Based on the EU Energy Efficiency Directive, the MURE and the IEA energy 7
efficiency policy databases (Bertoldi and Mosconi 2020), Bertoldi (2020) proposed six policy 8
categories: regulatory, financial and fiscal; information and awareness; qualification, training and 9
quality assurance; market-based instruments: voluntary action. The categorization of energy efficiency 10
policies used in this chapter is aligned with the taxonomy used in Chapter 13, sub-section 13.5.1 11
(economic or market-based instruments, regulatory instruments, and other policies). However, the 12
classification used here is more granular in order to capture the complexity of end-use energy efficiency 13
and buildings. 14
1. Regulatory instruments 15
Building energy codes 16
Several scholars highlighted the key role of mandatory building energy codes and minimum energy 17
performance requirements for buildings (Enker and Morrison 2017). Wang et al. (2019) finds that 18
"Building energy efficiency standards (BEES) are one of the most effective policies to reduce building 19
energy consumption, especially in the case of the rapid urbanization content in China". Ex-post policy 20
evaluation shows that stringent buildings codes reduce energy consumption in buildings and CO2 21
emissions and are cost-effective (Scott et al. 2015; Aydin and Brounen 2019; (Yu et al. 2017; Yu et al. 22
2018)(Aroonruengsawat 2012; Levinson 2016; Kotchen 2017; Jacobsen and Kotchen 2013). 23
Progressive building energy codes include requirements on efficiency improvement but also on 24
sufficiency and share of renewables (Rosenberg at al., 2017; Clune at al. 2012) and on embodied 25
emissions (Schwarz et al. 2020), for example the 2022 ASHRAE Standard 90.1 includes prescriptive 26
on-site renewable energy requirements for non-residential building. Evans et al. (2017; 2018) calls for 27
strengthen the compliance checks with efficiency requirements or codes when buildings are in operation 28
and highlighted the need for enforcement of building energy codes to achieve the estimate energy and 29
carbon savings recommending actions to improve enforcements, including institutional capacity and 30
adequate resources. 31
Evans et al. (2017; 2018) identified strengthening the compliance checks with codes when buildings 32
are in operation and the need for enforcement of building energy codes in order to achieve the estimate 33
energy and carbon savings, recommending actions to improve enforcements, including institutional 34
capacity and adequate resources. Another important issue to be addressed by policies is the 'Energy 35
Performance Gap' (EPG), i.e., the gap between design and policy intent and actual outcomes. 36
Regulatory and market support regimes are based on predictive models (Cohen and Bordass 2015) with 37
general assumptions about building types, the way they are used and are not covering all energy 38
consumption. In the perspective of moving towards net zero carbon, it is important that policy capture 39
and address the actual in-use performance of buildings (Gupta and Kotopouleas 2018; Gupta et al. 40
2015). Outcome-based codes are increasingly important because overcome some limitations of 41
prescriptive building energy codes, which typically do not regulate all building energy uses or do not 42
regulate measured operational energy use in buildings. Regulating all loads, especially plug and process 43
loads, is important because they account for an increasingly large percentage of total energy use as 44
building envelope and space-conditioning equipment are becoming more efficient (Denniston et al., 45
2011; Colker, 2012; Enker and Morrison, 2020). 46
Building codes could also foster the usage of wood and timber as a construction in particular for multi-47
storey buildings and in the long term penalise carbon intensive building materials (Ludwig 2019) with 48
ACCEPTED VERSION
SUBJECT TO FIN
AL EDITS

Final Government Distribution Chapter 9 IPCC AR6 WGIII
Do Not Cite, Quote or Distribute 9-85 Total pages: 168
policies based on environmental performance assessment of buildings and the “wood first” 1
principle (Ludwig, 2019; Ramage et al., 2017). 2
Retro-commissioning is a cost-effective process to periodically check the energy performance of 3
existing building and assure energy savings are maintained overtime (Ssembatya et al., 2021)(Kong et 4
al. 2019). 5
In countries with low rate of new construction, it is important to consider mandatory building energy 6
codes for existing buildings, but this may also be relevant for countries with high new construction, as 7
they will have soon a large existing building stock. The EU has requirements already in place when 8
building undergo a major renovation (Economidou et. al, 2020). Countries considering mandatory 9
regulations for existing buildings include Canada, the U.S. (specific cities), China, Singapore. Policies 10
include mandating energy retrofits for low performances existing buildings, when sold or rented. In 11
countries with increasing building stock, in particular in developing countries, policies are more 12
effective when targeting new buildings (Kamal et al. 2019). 13
NZEBs definitions are proposed by (Marszal et al. 2011; Deng and Wu 2014; Zhang and Zhou 2015; 14
Wells et al. 2018; Williams et al. 2016); ), covering different geographical areas, developing and 15
developed countries, and both existing buildings and new buildings. In 2019, China issued the national 16
standard Technical Standard for Nearly Zero Energy Building (MoHURD, 2019). California has also 17
adopted a building energy code mandating for NZEBs for new residential buildings in 2020 and 2030 18
for commercial buildings (Feng et al. 2019). Several countries have adopted targets, roadmaps or 19
mandatory building energy codes requiring net zero energy buildings (NZEBs) for some classes of new 20
buildings (Feng et al. 2019). 21
Building Labels and Energy Performance Certificates (EPCs) 22
Buildings labels are an important instrument , with some limitations. Li et al. (2019b) reviewed the EU 23
mandatory Energy Performance Certificates for buildings and proposed several measures to make the 24
EPC more effective in driving the markets towards low consumption buildings. Some authors have 25
indicated that the EPC based on the physical properties of the buildings (asset rating) may be misleading 26
due to occupancy behaviour (Cohen and Bordass 2015) and calculation errors (Crawley et al. 2019). 27
Control authorities can have a large impact on the quality of the label (Mallaburn 2018). Labels can 28
also include information on the GHG embedded in building material or be based on LCA. 29
US EPA Energy Star and NABERS (Gui and Gou, 2020) are building performance labels based on 30
performance, not on modelled energy use. Singapore has mandatory building energy labels, as do many 31
cities in the U.S., while India and Brazil have mandatory labels for public buildings. 32
Mandatory energy performance disclosure and benchmarking of building energy consumption is a 33
powerful policy instrument in particular for non-residential buildings (Trencher et al. 2016) and could 34
be more accurate than energy audits. Gabe (2016) showed that mandatory disclosure is more effective 35
than voluntary disclosure. Some US cities (e.g., New York) have adopted Emissions Performance 36
Standards for buildings, capping CO2 emissions. Accurate statistics related to energy use are very 37
important for reducing GHG in building sector. In 2015, the Republic of Korean stablished the National 38
Building Energy Integrated Management System, where building data and energy consumption 39
information are collected for policy development and public information. 40
Energy audits 41
Energy audits, help to overcome the information barriers to efficiency investments, in particular 42
buildings owned or occupied by small companies (Kalantzis and Revoltella, 2019). In the EU energy 43
audits are mandatory for large companies under the Energy Efficiency Directive (Nabitz and Hirzel 44
2019), with some EU Member States having a long experience with energy audits, as part of national 45
voluntary agreements with the private sector (Cornelis 2019; Rezessy and Bertoldi 2011). Singapore 46
ACCEPTED VERSION
SUBJECT TO FIN
AL EDITS
Final Government Distribution Chapter 9 IPCC AR6 WGIII
Do Not Cite, Quote or Distribute 9-86 Total pages: 168
has adopted mandatory audit for buildings (Shen et al, 2016). In the United States, several cities have 1
adopted energy informational policies in recent years, including mandatory buildings audits (Trencher 2
et al. 2016; Kontokosta et al., 2020). The State of New York has in place a subsidized energy audit for 3
residential building since 2010 (Boucher et al. 2018). It is important to assure the training of auditors 4
and the quality of the audit. 5
Minimum Energy Performance Standards (MEPSs) 6
Mandatory minimum efficiency standards for building technical equipment and appliances (e.g., 7
HVAC, appliances, ICT, lighting, etc.) is a very common, tested and successful policy in most of the 8
OECD countries (e.g. EU, US, Canada, Australia, etc.) for improving energy efficiency (Wu et al. 9
2019; Scott et al. 2015; Sonnenschein et al. 2019). Brucal and Roberts (2019) showed that efficiency 10
standards reduce product price. McNeil et al. (2019) highlighted how efficiency standards will help 11
developing countries in reducing the power peak demand by a factor of two, thus reducing large 12
investment costs in new generation, transmission, and distribution networks. Mandatory standards have 13
been implemented also other large economies, e.g., Russia, Brazil, India, South Africa, China, Ghana, 14
Kenya, Malaysia (Salleh et al., 2019), with an increase in the uptake also in developing countries, e.g. 15
Ghana, Kenya, Tunisia, etc. In Japan, there is a successful voluntary programme the Top Runner, with 16
similar results of mandatory efficiency standards (Inoue and Matsumoto 2019). 17
Appliance energy labelling 18
Mandatory energy labelling schemes for building technical equipment and appliances are very often 19
implemented together with minimum efficiency standards, with the mandatory standard pushing the 20
market towards higher efficiency and the label pulling the market (Bertoldi, 2019). OECD countries, 21
China and many developing countries (for example Ghana, Kenya, India, South Africa, etc.) (Chunekar 22
2014) (Diawuo et al., 2018; Issock Issock et al., 2018) have adopted mandatory energy labelling. Other 23
labelling schemes are of voluntary nature, e.g. the Energy Star programme in the US (Ohler et al., 2020), 24
which covers many different appliances. 25
Information campaign 26
Provision of information (e.g. public campaigns, targeted technical information, etc.) is a common 27
policy instrument to change end-user behaviour. Many authors agree that the effect of both targeted and 28
general advertisement and campaigns have a short lifetime and the effects tend to decrease over time 29
(Simcock et al. 2014; Diffney et al. 2013; Reiss and White 2008). The meta-analysis carried out by 30
(Delmas et al. 2013) showed that energy audits and personal information were the most effective 31
followed by providing individuals with comparisons with their peers’ energy use including "non-32
monetary, information-based" (Delmas et al. 2013). An effective approach integrates the social norm 33
as the basis for information and awareness measures on energy behaviour (Gifford 2011; Schultz et al. 34
2007). Information is more successful when it inspires and engages people: how people feel about a 35
given situation often has a potent influence on their decisions (Slovic and Peters 2006). The message 36
needs to be carefully selected and kept as simple as possible focusing on the following: entertain, 37
engage, embed and educate (Dewick and Owen 2015). 38
Energy consumption feedback with smart meters, smart billing and dedicated devices and apps is 39
another instrument recently exploited to reduce energy consumption (Zangheri et al. 2019; Karlin et al. 40
2015; Buchanan et al. 2018) very often coupled with contest-based interventions or norm-based 41
interventions (Bergquist et al. 2019). (Hargreaves et al. 2018) proposes five core types of action to 42
reduce energy use: turn it off, use it less, use it more carefully, improve its performance, and replace 43
it/use an alternative. According to (Aydin et al. 2018), technology alone will not be enough to achieve 44
the desired energy savings due to the rebound effect. The lack of interest from household occupants, 45
confusing feedback message and difficulty to relate it to practical intervention, overemphasis on 46
financial savings and the risks of “fallback effects” where energy use returns to previous levels after a 47
ACCEPTED VERSION
SUBJECT TO FIN
AL EDITS

Final Government Distribution Chapter 9 IPCC AR6 WGIII
Do Not Cite, Quote or Distribute 9-87 Total pages: 168
short time or rebound effects has been pointed out (Buchanan et al. 2015) as the main reasons for the 1
failing of traditional feedback. (Labanca and Bertoldi 2018) highlight the current limitations of policies 2
for energy conservation and suggests complementary policy approach based on social practices 3
theories. 4
2. Market-based instruments 5
Carbon allowances 6
A number of authors (Wadud and Chintakayala 2019; Fan et al. 2016; Raux et al. 2015; Marek et al. 7
2018; Li et al. 2015, 2018; Fawcett and Parag 2017) have investigated personal carbon allowances 8
introduced previously (Fleming 1997; Bristow et al. 2010; Fawcett 2010; Starkey 2012; Raux and 9
Marlot 2005; Ayres 1995). Although there is not yet any practical implementation of this policy, it 10
offers an alternative to carbon taxes, although there are some practical issues to be solved before it could 11
be rolled out. Recently the city of Lahti in Finland has introduced a personal carbon allowance in the 12
transport sector (Kuokkanen et al. 2020). Under this policy instrument governments sets allocates (free 13
allocation, but allowances could also be auctioned) allowances to cover the carbon emission for one 14
year, associated with energy consumption. Trade of allowances between people can be organised. 15
Personal carbon allowances can also foster renewable energies (energy consumption without carbon 16
emissions) both in the grid and in buildings (e.g., solar thermal). Personal carbon allowances can make 17
the carbon price more explicit to consumers, allowing them to know from the market value of each 18
allowance (e.g., 1 kg of CO2). This policy instrument will shift the responsibility to the individual. Some 19
categories may have limited ability to change their carbon budget or to be engaged by this policy 20
instruments. In addition, in common with many other environmental policies the distributional effects 21
have to be assessed carefully as this policy instrument may favour well off people able to purchase 22
additional carbon allowances or install technologies that reduce their carbon emissions (Burgess 2016; 23
Wang et al. 2017). 24
The concept of carbon allowances or carbon budget can also be applied to buildings, by assigning a 25
yearly CO2 emissions budget to each building. This policy would be a less complex than personal 26
allowances as buildings have metered or billed energy sources (e.g., gas, electricity, delivered heat, 27
heating oil, etc.). The scheme stimulates investments in energy efficiency and on-site renewable 28
energies and energy savings resulting from behaviour by buildings occupant. For commercial buildings, 29
similar schemes were implemented in the UK CRC Energy Efficiency Scheme (closed in 2019) or the 30
Tokyo Metropolitan Carbon and Trade Scheme (Nishida and Hua 2011)(Bertoldi et al. 2013a). The 31
Republic of Korea implemented since 2015 an Emission Trading Scheme, covering buildings (Park and 32
Hong 2014; Narassimhan et al. 2018; Lee and Yu 2017). More recently under the New York Climate 33
Mobilization Act enacted in 2019 New York City Local Law 97 established "Carbon Allowances" for 34
large buildings (Spiegel-Feld, 2019; Lee, 2020). 35
Public money can be used to reward and give incentives to energy saved, as a result of technology 36
implementation, and/or as a result of energy conservation and sufficiency (Eyre 2013; Bertoldi et al. 37
2013b; Prasanna et al. 2018). This can be seen as a core feature of the Energy Savings Feed-in Tariff 38
(ES-FiT). The ES-FiT is a performance-based subsidy, whereby actions undertaken by end-users – e.g., 39
investments in energy efficiency technology measures – are awarded based on the real energy savings 40
achieved. 41
Utilities Programmes, Energy Efficiency Resource Standard and Energy Efficiency Obligations 42
Ratepayers funded efficiency programmes, energy efficiency obligations, energy efficiency resource 43
standards and white certificates have been introduced in some EU Member States, in several US States, 44
Australia, South Korea and Brazil (Bertoldi et al. 2013a; Aldrich and Koerner 2018; Wirl 2015; Choi 45
et al. 2018a; Palmer et al. 2013; Brennan and Palmer 2013; Rosenow and Bayer 2017; Fawcett and 46
Darby 2018; Fawcett et al. 2019; Giraudet and Finon, 2015; Goldman et al, 2020; Nadel, 2019; Sliger 47
ACCEPTED VERSION
SUBJECT TO FIN
AL EDITS

Final Government Distribution Chapter 9 IPCC AR6 WGIII
Do Not Cite, Quote or Distribute 9-88 Total pages: 168
and Colburn, 2019). This policy instrument helps in improving energy efficiency in buildings, but there 1
is no evidence that it can foster deep renovations of existing buildings. Recently this policy instrument 2
has been investigated is some non-OECD countries such as Turkey, where white certificates could 3
deliver energy savings with some limitations (Duzgun and Komurgoz 2014) and UAE, as a useful 4
instrument to foster energy efficiency in buildings (Friedrich and Afshari 2015). Another similar market 5
based instrument is the energy saving auction mechanism implemented in some US States, Switzerland, 6
and in Germany (Thomas and Rosenow 2020; Langreder et al. 2019; Rosenow et al. 2019). Energy 7
efficiency projects participate in auctions for energy savings based on the cost of the energy saved and 8
receive a financial incentive, if successful. 9
Energy or carbon taxes 10
Energy and/or carbon taxes are a climate policy, which can help in reducing energy consumption (Sen 11
and Vollebergh 2018) and manage the rebound effect (Peng et al. 2019; Font Vivanco et al. 2016; 12
Freire-González 2020; Bertoldi 2020). The carbon tax has been adopted mainly in OECD countries and 13
in particular in EU Member States (Hájek et al. 2019; Bertoldi 2020; Sen and Vollebergh 2018) . There 14
is high agreement that carbon taxes can effective in reducing CO2 emissions (Andersson 2017; IPCC 15
2018; Hájek et al. 2019). It is hard to define the optimum level of taxation in order to achieve the desired 16
level of energy consumption or CO2 emission reduction (Weisbach et al. 2009). As for other energy 17
efficiency policy distributional effect and equity considerations have to be carefully considered and 18
mitigated (Borozan 2019). High energy prices tend to reduce the energy consumption particularly in 19
less affluent households, and thus attention is needed in order to avoid unintended effects such as energy 20
poverty. Bourgeois et al. (2021) showed that using carbon tax revenue to finance energy efficiency 21
investment reduces fuel poverty and increases cost-effectiveness. (Giraudet et al. 2021)assessed the 22
cost-effectiveness of various energy efficiency policies in France, concluding that a carbon tax is the 23
most effective. In particular, revenues could be invested in frontline services that can provide a range 24
of support - including advising householders on how to improve their homes. Hence, the introduction 25
of a carbon tax can be neutral or even positive to the economy, as investments in clean technologies 26
generate additional revenues. In addition, in the long term, a carbon/energy tax could gradually replace 27
the tax on labour reducing labour cost (e.g., the example of the German Eco-tax), thus helping to create 28
additional jobs in the economy. In literature, this is known as double dividend (Murtagh et al. 2013) 29
(Freire-González and Ho 2019). Urban economic researches (Rafaj et al. 2018; Creutzig 2014; Borck 30
and Brueckner 2018) have highlighted that higher carbon price would translate in incentives for citizens 31
to live closer to the city centre, which often means less floor space, less commuting distance and thus 32
reduced emissions. Xiang and Lawley (2019) indicated that the carbon tax in British Columbia 33
substantially reduced residential natural gas consumption. Saelim (2019) showed that simulated carbon 34
tax on residential consumption in Thailand will have a low impact on welfare and it will be slightly 35
progressive. Lin and Li (2011) indicate that a carbon tax could reduce the energy consumption and 36
boost the uptake of energy efficiency and renewable energies, while at the same time may impact social 37
welfare and the competitiveness of industry. Solaymani (2017) showed that in Malaysia a tax with 38
revenue recycling increases in the welfare of rural and urban households. Van Heerden et al. (2016) 39
explored economic and environmental effects of the CO2 tax in South Africa highlighting the negative 40
impact on GDP. This negative impact of the carbon tax on GDP is however greatly reduced by the 41
manner in which the tax revenue is recycled. National circumstances shall be taken into consideration 42
in introducing energy taxes, considering the local taxation and energy prices context with regard to 43
sustainable development, justice and equity. 44
A policy, which can have similar impact to a carbon tax and is the energy price/subsidy reform, which 45
also involves raising energy prices. Energy price/subsidy reform reduces energy consumption and 46
greenhouse gas emissions and encourages investment in energy efficiency (Aldubyan and Gasim, 2021; 47
Coady et al., 2018). In a similar manner, government revenues from subsidies reforms can be used to 48
ACCEPTED VERSION
SUBJECT TO FIN
AL EDITS

Final Government Distribution Chapter 9 IPCC AR6 WGIII
Do Not Cite, Quote or Distribute 9-89 Total pages: 168
mitigate the distributional impact on vulnerable population groups, including direct cash transfer 1
programmes (Schaffitzel, et al. 2020; Rentschler and Brazilian, 2017). 2
Taxes could also be used to penalise inefficient behaviour and favour the adoption of efficient behaviour 3
and technologies. Taxes are used in some jurisdictions to promote energy efficient appliances with 4
lower VAT. Similarly, the annual building/property tax (and also the purchase tax) could be based on 5
the CO2 emissions of the buildings, rather than on the value of the building. Tax credits are also an 6
important subsidy for the renovation of buildings in France (Giraudet, 2020), Italy (Alberini and 7
Bigano, 2015) and other countries. 8
9.9.4 Financing mechanisms and business models for reducing energy demand 9
Grants and subsidies are traditional financing instruments used by governments when optimal levels of 10
investments cannot be fully supported by the market alone. They can partly help overcoming the upfront 11
cost barrier as they directly fill an immediate financial gap and thus enable a temporary shift in the 12
market (Newell et al. 2019). These forms of support are usually part of policy mixes including further 13
fiscal and financial instruments such as feed-in tariffs and tax breaks (Polzin et al. 2019). Potential 14
issues with subsidies are the limited availability of public financing, the stop and go due to annual 15
budget and the competition with commercial financing. 16
Loans provide liquidity and direct access to capital important in deep renovation projects (Rosenow et 17
al. 2014). There is empirical evidence (Giraudet et al. 2021), that banks make large profits on personal 18
loans for renovation purposes. International financing institutions (IFIs) and national governments 19
provided subsidies in public-private partnerships so that financial institutions can offer customers loans 20
with attractive terms (Olmos et al. 2012). Loan guarantees are effective in reducing intervention 21
borrowing costs (Soumaré and Lai 2016). Combination of grants and subsidised loans financed by IFIs 22
could be an effective instrument together with guarantees. An important role in financing energy 23
efficiency can be played by green banks, which are publicly capitalized entities set up to facilitate 24
private investment in low-carbon, including energy efficiency (Linh and Anh, 2017; Tu and Yen, 2015; 25
Khan, 2018; Bahl, 2012) . Green banks have been established at the national level (e.g., UK, Poland) 26
and in the US at state and city level. 27
Wholesaling of EE of loans and utilities programmes, are other important financing instruments. 28
Another financing mechanism for building efficiency upgrades, mainly implemented so far in the US, 29
is efficiency-as-a-service under an energy services agreement (ESA), where the building owners or 30
tenant pay to the efficiency service provider a charge based on realized energy savings without any 31
upfront cost (Kim et al., 2012; Bertoldi, 2020). ESA providers give performance guarantees assuming 32
the risk that expected savings would occur (Bertoldi, 2020). 33
Energy Performance Contracting (EPC) is an agreement between a building owner and Energy Services 34
Company (ESCO) for energy efficiency improvements. EPC is a common financing vehicle for large 35
buildings and it is well developed in several markets (Nurcahyanto et al, 2020; Stuart et. al, 2018; 36
Carvallo et al, 2015; Ruan et al., 2018; Zheng et al., 2021; Bertoldi and Boza Kiss, 2017). Quality 37
standards are a part of the EPC (Augustins et al. 2018) . Guarantees can facilitate the provision of 38
affordable and sufficient financing for ESCOs (Bullier and Milin 2013). The ESCO guarantees a certain 39
level of energy savings and it shields the client from performance risk. The loan goes on the client's 40
balance sheet and the ESCO assumes full project performance risk (Deng et al. 2015). One of the 41
limitations is on the depth of the energy renovation in existing buildings. According to (Giraudet et al. 42
2018), EPC is effective at reducing information problems between contractors and investors. 43
Energy efficient mortgages are mortgages that credits a home energy efficiency by offering preferential 44
mortgage terms to extend existing mortgages to finance efficiency improvements. There are two types 45
of energy mortgages: (i) the Energy Efficient Mortgages (EEMs), and (ii) the Energy Improvement 46
ACCEPTED VERSION
SUBJECT TO FIN
AL EDITS

Final Government Distribution Chapter 9 IPCC AR6 WGIII
Do Not Cite, Quote or Distribute 9-90 Total pages: 168
Mortgages (EIMs), both can help in overcoming the main barriers to retrofit policies (Miu et al. 2018). 1
The success depends on the improved energy efficiency with a positive impact on property value and 2
on the reduction of energy bills and the income increase in the household. In the EU, the EeMAP 3
Initiative aims to create a standardised energy efficient mortgage template (Bertoldi et al. 2021). 4
On-bill financing is a mechanism that reduces first-cost barriers by linking repayment of energy 5
efficiency investments to the utility bill and thereby allowing customers to pay back part or all costs of 6
energy efficiency investments over time (Brown 2009). On-bill finance programmes can be categorised 7
into: (i) on-bill loans (assignment of the obligation to the property) and (ii) on-bill tariffs (payment off 8
in case of ownership transfer) (Eadson et al. 2013). On-bill finance programmes can be more effective 9
when set up as a service rather than a loan. (Mundaca and Klocke, 2018). 10
Property Assessed Clean Energy (PACE) is a means of financing energy renovations and renewable 11
energy through the use of specific bonds offered by municipal governments to investors (Mills 2016). 12
Municipalities use the funds raised to loan money towards energy renovations in buildings. The loans 13
are repaid over the assigned long term (15-20 years) via an annual assessment on their property tax bill 14
(Kirkpatrick and Bennear 2014). This model has been subject to consumer protection concerns. 15
Residential PACE programmes in California have been shown to increase PV deployment in 16
jurisdictions that adopt these programs (Ameli et al., 2017; Kirkpatrick and Bennear 2014). In US 17
commercial buildings, PACE volumes and programs, however, continue to grow (Lee, 2020). 18
Revolving funds allow reducing investment requirements and enhancing energy efficiency investment 19
impacts by recovering and reinvesting the savings generated (Setyawan 2014). Revolving fund could 20
make retrofit cost-neutral in the long term and could also dramatically increase low carbon investments, 21
including in developing countries (Gouldson et al. 2015). 22
Carbon finance, started under the Kyoto Protocol with the flexible mechanisms and further enhanced 23
under the Paris Agreement (Michaelowa et al. 2019), is an activity based on “carbon emission rights” 24
and its derivatives (Liu et al. 2015a). Carbon finance can promote low-cost emission reductions (Zhou 25
and Li 2019). Under Emission Trading Schemes or other carbon pricing mechanisms, auctioning carbon 26
allowances creates a new revenue stream. Revenues from auctioning could be used to finance energy 27
efficiency projects in buildings with grants, zero interest loans or guarantees (Wiese et al., 2020). 28
Crowdfunding is a new and rapidly growing form of financial intermediation that channels funds from 29
investors to borrowers (individuals or companies) or users of equity capital (companies) without 30
involving traditional financial organizations such as banks (Miller and Carriveau 2018). Typically, it 31
involves internet-based platforms that link savers directly with borrowers (European Union 2015). It 32
can play a significant role at the start of a renewable and sustainable energy projects (Dilger et al. 2017). 33
The One-Stop Shop (OSS) service providers for buildings energy renovations are organizations, 34
consortia, projects, independent experts or advisors that usually cover the whole or large part of the 35
customer renovation journey from information, technical assistance, structuring and provision of 36
financial support, to the monitoring of savings (Mahapatra et al. 2019; Bertoldi 2021b). OSSs are 37
transparent and accessible advisory tools from the client perspective and new, innovative business 38
models from the supplier perspective (Boza-Kiss and Bertoldi 2018). 39
9.9.5 Policies mechanisms for financing for on-site renewable energy generation 40
On-site renewable energy generation is a key component for the building sector decarbonisation, 41
complementing sufficiency and efficiency. Renewable energies (RES) technologies still face barriers 42
due to the upfront investment costs, despite the declining price of some technologies, long pay-back 43
period, unpredictable energy production, policy incertitude, architectural (in particular for built-in PV) 44
and landscape considerations, technical regulations for access to the grid, and future electricity costs 45
(Mah et al. 2018; Agathokleous and Kalogirou 2020). 46
ACCEPTED VERSION
SUBJECT TO FIN
AL EDITS

Final Government Distribution Chapter 9 IPCC AR6 WGIII
Do Not Cite, Quote or Distribute 9-91 Total pages: 168
Several policy instruments for RES have been identified by scholars (Azhgaliyeva et al. 2018; Pitelis 1
et al. 2020; Fouquet 2013): direct investments; feed-in tariffs; grants and subsidies; loans, taxes; 2
(tradable) green certificates or renewable/clean energy portfolio standards; information and education; 3
strategic planning; codes and standards; building codes; priority grid access; research, development and 4
deployment; and voluntary approaches. There are specific policies for renewable heating and cooling. 5
(Connor et al. 2013). In 2011, the UK introduced the Renewable Heat Incentive (RHI) support scheme 6
(Balta-Ozkan et al. 2015; Connor et al. 2015). The RHI guarantee a fixed payment per unit of heat 7
generated by a renewable heat technology for a specific contract duration (Yılmaz Balaman et al. 2019). 8
The most common implemented policy instruments are the feed-in tariffs (FiTs) and the Renewable/ 9
Energy Portfolio Standards (RPSs) (Alizada 2018; Xin-gang et al. 2017a; Bergquist et al., 2020), with 10
FiTs more suited for small scale generation. More than 60 countries and regions worldwide have 11
implemented one of the two policies (Sun and Nie 2015). FiT is a price policy guaranteeing the purchase 12
of energy generation at a specific fixed price for a fixed period (Xin-gang et al. 2020; Barbosa et al. 13
2018). RPS is a quantitative policy, which impose mandatory quota of RES generation to power 14
generators (Xin-gang et al. 2020) . 15
A flat rate feed-in tariff (FiT) is a well-tested incentive adopted in many jurisdictions to encourage end-16
users to generate electricity from RES using rooftop and on-site PV systems (Pacudan 2018). More 17
recently, there has been an increasing interest for dynamic FiTs taking into account electricity costs, 18
hosting capacity, ambient temperature, and time of day (Hayat et al. 2019). Since 2014, EU Member 19
States have been obligated to move from FiT to feed-in premium (FiTP) (Hortay and Rozner 2019); 20
where a FiTP consist in a premium of top of the electricity market price. Lecuyer and Quirion (2019) 21
argued that under uncertainty over electricity prices and renewable production costs a flat FiT results 22
in higher welfare than a FiTP. One of the main concerns with FiT systems is the increasing cost of 23
policies maintenance (Pereira da Silva et al. 2019; Roberts et al. 2019a; Zhang et al. 2018). In Germany, 24
the financial costs, passed on to consumers in the form a levy on the electricity price have increased 25
substantially in recent years (Winter and Schlesewsky 2019) resulting in opposition to the FiT in 26
particular by non-solar customers. A particular set up of the FiT encourage self-consumption through 27
net metering and net billing, which has a lower financial impact on electricity ratepayers compared with 28
traditional FiTs (Roberts et al. 2019b; Vence and Pereira 2019; Pacudan 2018). 29
In some countries, e.g. Australia (Duong et al. 2019), South Korea (Choi et al. 2018a), China (Yi et al. 30
2019), there was a transition from subsidies under the FiT to market-based mechanisms, such as RPSs 31
and tendering. Compared with FiT, RPS (or Renewable Obligations) reduce the subsidy costs (Zhang 32
et al. 2018). A number of scholars (Xin-gang et al. 2017; Li et al. 2019a; Liu et al. 2018a) have 33
highlighted the RPSs effectiveness in promoting the development of renewable energy. Other authors 34
(Requate 2015; An et al. 2015) have presented possible negative impacts of RPSs. 35
Both FiT and RPS can support the development of RES. Scholars compared the effectiveness of RPSs 36
and FiTs with mix results and different opinions, with some scholars indicating the advantages of RPS 37
(Ciarreta et al. 2017, 2014; Xin-gang et al. 2017), while Nicolini and Tavoni (2017) showed that in Italy 38
FiTs are outperforming RPSs and Tradable Green Certificates (TGCs). García-Álvarez et al. (2018) 39
carried out an empirical assessment of FiTs and RPSs for PV systems energy in EU over the period 40
2000–2014 concluding that that FiTs have a significant positive impact on installed PV capacity. This 41
is due to the small size of many rooftop installations and the difficulties in participating in trading 42
schemes for residential end users. Similar conclusions were reached by (Dijkgraaf et al. 2018) assessing 43
30 OECD countries and concluding that there is a “positive effect of the presence of a FiT on the 44
development of a country's added yearly capacity of PV”. Other scholars (Couture and Gagnon 2010; 45
Lewis and Wiser 2007; Lipp 2007; Cory et al. 2009) concluded that FiT can create a stable investment 46
framework and long-term policy certainty and it is better than RPS for industrial development and job 47
creation. Ouyang and Lin (2014) highlighted that RPS has a better implementation effect than FiT in 48
ACCEPTED VERSION
SUBJECT TO FIN
AL EDITS

Final Government Distribution Chapter 9 IPCC AR6 WGIII
Do Not Cite, Quote or Distribute 9-92 Total pages: 168
China, where FiT required very large subsidy. Ford et al. (2007) showed that TGC is a market-based 1
mechanism without the need for government subsidies. Marchenko (2008) and Wȩdzik et al. (2017) 2
indicate that the TGCs provide a source of income for investors. Choi et al. (2018a) analysed the 3
economic efficiency of FiT and RPS in the South Korean, where FiT was implemented from 2002 to 4
2011 followed by an RPS since 2012 (Park and Kim 2018; Choi et al. 2018b). Choi concluded that RPS 5
was more efficient for PV from the government's perspective while from an energy producers’ 6
perspective the FiT was more efficient. Some scholars proposed a policy combining FiT and RPS (Cory 7
et al. 2009). Kwon (2015) and del Río et al. (2017) concluded that both FiT and RPS are effective, but 8
policy costs are higher in RPSs than FiTs. RPS, REC trading and FiT subsidy could also be implemented 9
as complementary policies (Zhang et al. 2018). 10
Tenders are a fast spreading and effective instrument to attract and procure new generation capacity 11
from renewable energy sources (Bayer et al. 2018; Bento et al. 2020; Ghazali et al. 2020; Haelg 2020; 12
Batz T. and Musgens 2019). A support scheme based on tenders allows a more precise steering of 13
expansion and lower risk of excessive support (Gephart et al. 2017). Bento et al. (2020) indicated that 14
tendering is more effective in promoting additional renewable capacity comparing to other mechanisms 15
such as FiTs. It is also important to take into account the rebound effect in energy consumption by on-16
site PV users, which might reduce up to one fifth of the carbon benefit of renewable energy (Deng and 17
Newton 2017). 18
Financing mechanisms for RES are particularly needed in developing countries. Most of the common 19
supporting mechanisms (FiT, RPSs, PPA, auctions, net metering, etc.) have been implemented in some 20
developing countries (Donastorg et al. 2017). Stable policies and an investment-friendly environment 21
are essential to overcome financing barriers and attract investors (Donastorg et al. 2017). Kimura et al. 22
(2016) identified the following elements as essential for fostering RES in developing countries: 23
innovative business models and financial mechanisms/structures; market creation through the 24
implementation of market-based mechanisms; stability of policies and renewable energy legislation; 25
technical assistance to reduce the uncertainty of renewable energy production; electricity market design, 26
which reflects the impact on the grid capacity and grid balancing; improved availability of financial 27
resources, in particular public, and innovative financial instruments, such as carbon financing (Park et 28
al. 2018; Kim and Park 2018; Lim et al. 2013); green bonds; public foreign exchange hedging facility 29
for renewable energy financing, credit lines; grants and guarantees.. 30
• The end-user will be at the centre as a key participant in the future electricity system (Zepter et al. 2019; 31
Lavrijssen and Carrillo Parra, 2017) providing flexibility, storage, energy productions, peer to peer 32
trading, electric vehicle charging. Zepter indicates that “the current market designs and business models 33
lack incentives and opportunities for electricity consumers to become prosumers and actively participate 34
in the market”. Klein et al. (2019) explore the policy options for aligning prosumers with the electricity 35
wholesale market, through price and scarcity signals. Policies should allow for active markets 36
participation of small prosumers (Brown et al. 2019; Zepter et al. 2019), local energy communities and 37
new energy market actors such as aggregators (Iria and Soares 2019; Brown et al. 2019). Energy 38
Communities are new important players in the energy transition (Sokołowski, 2020; Gjorgievski, et al., 39
2021). Citizens and local communities can establish local energy communities, providing local RES 40
production to serve the community, alleviate energy poverty and export energy into the grid (DellaValle 41
and Sareen, 2020; Hahnel et al. 2020). Energy Communities have as primary purpose to provide 42
environmental, economic, or social community benefits by engaging in generation, aggregation, energy 43
storage, energy efficiency services and charging services for electric vehicles. Energy communities help 44
in increasing public acceptance and mobilise private funding. Demand response aggregators 45
(Mahmoudi et al., 2017; Henriquez at al., 2018) can aggregate load reductions by a group of consumers, 46
and sell the resulting flexibility to the electricity market (Zancanella P. et al. 2017). Regulatory 47
frameworks for electricity markets should allow demand response to compete on equal footing in energy 48
ACCEPTED VERSION
SUBJECT TO FIN
AL EDITS

Final Government Distribution Chapter 9 IPCC AR6 WGIII
Do Not Cite, Quote or Distribute 9-93 Total pages: 168
markets and encourage new business models for the provision of flexibility to the electricity grid (Shen 1
et al., 2014). Renewable energy and sufficiency requirements could be included in building energy 2
codes and implemented in coordination with each other and with climate policies, e.g. carbon pricing 3
(Oikonomou et al. 2014). 4
9.9.6 Investment in building decarbonisation 5
As Section 9.6.3 points out, the incremental investment cost to decarbonise buildings at national level 6
is up to 3.5% GDP per annum during the next thirty years (the global GDP in 2019 was USD 88 trillion). 7
As the following figures illustrate, only a very small share of it is currently being invested, leaving a 8
very large investment gap still to address. The incremental capital expenditure on energy efficiency in 9
buildings has grown since AR5 to reach the estimated USD 193 billion in 2021; Europe was the largest 10
investing region, followed by the USA and China (Figure 9.21). The incremental capital expenditure 11
on renewable energy heat vice versa declined to reach USD 24 billion in this year; the leading investor 12
was China, followed by Europe (ibid). The total capital expenditure on distributed small-scale (less than 13
1MW) solar systems in 2019 was USD 52.1 billion, down from the peak of USD 71 billion in 2011; 14
most of this capacity is installed in buildings (Frankfurt School - UNEP Centre/BNEF 2020). The US 15
was the largest country market with USD 9.6 billion investment; notably USD 5 billion was deployed 16
in the Middle East and Africa (ibid). (IEA 2021b) provided an estimate of annual average incremental 17
investment needs in building sector decarbonation between 2026 and 2030 of USD 711 billion, 18
including USD 509 billion in building energy efficiency and USD 202 billion in renewable heat for 19
end-use and electrification in buildings. Such investment would allow being on track towards meeting 20
the goals of the WEO Net Zero Emissions Scenario, as presented in Box 9.2. To reach these levels, the 21
respective investment must grow from their average volumes in 2016-2020 factor 3.6 and 4.5 22
respectively. As the investment needs estimated by (IEA 2021b) are significantly lower the investment 23
intervals reported by bottom-up literature (Section 9.6.3), the actual investment gap is likely to be 24
higher. 25
26
Notes: (i) An energy efficiency investment is defined as the incremental spending on new energy-efficient equipment or the full cost of 27 refurbishments that reduce energy use. (ii) Renewable heat for end-use include solar thermal applications (for district, space, and water 28 heating), bioenergy and geothermal energy, as well as heat pumps. (iii) The investment in 2021 is an estimate. 29
Figure 9.21 Incremental capital expenditure on energy efficiency investment (left) and renewable heat in 30
buildings, 2015-2021 31
Source: IEA 2021b 32
9.9.7 Governance and Institutional Capacity 33
9.9.7.1 Governance 34
Multilevel and polycentric governance is essential for implementing sufficiency, energy efficiency and 35
renewable energies policies (IPCC, 2018). Policies can be implemented at different levels of 36
ACCEPTED VERSION
SUBJECT TO FIN
AL EDITS

Final Government Distribution Chapter 9 IPCC AR6 WGIII
Do Not Cite, Quote or Distribute 9-94 Total pages: 168
government and decision making, international, national, regional, and local. Policies for building have 1
be adopted at national level (Enker and Morrison 2017), at state or regional level (Fournier et al. 2019), 2
or at city level (Trencher and van der Heijden 2019). Zhao et al. (2019) find that national policies are 3
instrumental in driving low carbon developments in buildings. 4
International agreements (Kyoto, Montreal/Kigali, Paris, etc.) play an important role in establishing 5
national energy-efficiency and renewable energy policies in several countries (Dhar et al. 2018; Bertoldi 6
2018). Under the Paris Agreement, some NDCs contain emission reduction targets for subsectors, e.g., 7
buildings, policies for subsectors and energy efficiency and/or renewable targets (see also Cross-8
Chapter Box 5 in Chapter 4). In the EU since 2007 climate and energy policies are part of a co-ordinated 9
policy package. EU Member States have prepared energy efficiency plans every three years and long 10
term renovation strategies for buildings (Economidou et al. 2020). Under the new Energy and Climate 11
Governance Regulation EU Member States have submitted at the end of 2020 integrated National 12
Energy and Climate Plans, including energy efficiency and renewable plans. (Oberthur, 2019; Schlacke 13
and Knodt, 2019). The integration of energy and climate change policies and their governance has been 14
analysed (von Lüpke and Well, 2020), highlighting the need of reinforcing the institutions, 15
anticipatory governance, the inconsistency of energy policies and the emerging multi-16
level governance. 17
Some policies are best implemented at international level. Efficiency requirements for traded goods and 18
the associated test methods could be set at global level in order to enlarge the market, avoid technical 19
barriers to trade; reduce the manufacturers design and compliance costs. International standards could 20
be applied to developing countries when specific enabling conditions exist, particularly in regard to 21
technology transfer, assistance for capacity buildings and financial support. This would also reduce the 22
dumping of inefficient equipment in countries with no or lower efficiency requirements. An example is 23
the dumping of new or used inefficient cooling equipment in developing countries, undermining 24
national and local efforts to manage energy, environment, health, and climate goals. Specific regulations 25
can be put in place to avoid such environmental dumping, beginning with the “prior informed consent” 26
as in the Rotterdam Convention and a later stage with the adoption of minimum efficiency requirements 27
for appliances (Andersen et al. 2018; United Nations Environment Programme (UNEP) 2017). Dreyfus 28
et al. (2020a) indicates that global policies to promote best technologies currently available have the 29
potential to reduce climate emissions from air conditionings and refrigeration equipment by 210–460 30
GtCO2-eq by 2060, resulting from the phasing down of HFC and from improved energy efficiency. 31
Another example is the commitment by governments in promoting improvements in energy efficiency 32
of cooling equipment in parallel with the phasedown of HFC refrigerants enshrined in the Biarritz 33
Pledge for Fast Action on Efficient Cooling signed in 2019. The policy development and 34
implementation costs will be reduced as the technical analysis leading to the standard could be shared 35
among governments. However, it is important that local small manufacturing companies in developing 36
countries have the capacity to invest in updating production lines for meeting new stringent international 37
efficiency requirements. 38
Building energy consumption is dependent on local climate and building construction traditions, 39
regional and local government share an important role in promoting energy efficiency in buildings and 40
on-site RES, through local building energy codes, constructions permits and urban planning. In South 41
Korea, there is a green building certification system operated by the government, based on this, Seoul 42
has enacted Seoul's building standard, which includes more stringent requirements. Where it is difficult 43
to retrofit existing buildings, e.g., historical buildings, cities may impose target at district level, where 44
RES could be shared among buildings with energy positive buildings compensating for energy 45
consuming buildings. Local climate and urban plans could also contribute to the integration of the 46
building sector with the local transport, water, and energy sectors, requiring, for example, new 47
constructions in areas served by public transport, close to offices or buildings to be ready for e-mobility. 48
ACCEPTED VERSION
SUBJECT TO FIN
AL EDITS
Final Government Distribution Chapter 9 IPCC AR6 WGIII
Do Not Cite, Quote or Distribute 9-95 Total pages: 168
Buildings GHG emission reduction shall also be considered in greenfield and brownfield developments 1
and urban expansion (Loo et al, 2017; Salviati and Ricciardo Lamonica., 2020), including co-benefis 2
(Zapata-Diomedi et al., 2019). 3
Energy efficiency, sufficiency, and renewable policies and measures will have a large impact on 4
different stakeholders (citizens, construction companies; equipment manufacturers; utilities, etc.), 5
several studies highlighted the importance of stakeholder consultation and active participation in policy 6
making and policy implementation (Vasileiadou and Tuinstra 2013; Ingold et al. 2020), including 7
voluntary commitments and citizen assemblies. In particular, energy users role will be transformed from 8
passive role to an active role, as outlined in the concept of energy citizenship (Campos and Marín-9
González, 2020). The energy citizens needs and voice should therefore be included in policy processes 10
among traditional business players, such as incumbent centralised power generation companies and 11
utilities (Van Veelen, 2018). Architects and engineers play an important role in the decarbonisation of 12
buildings. The professional bodies can mandate their members support energy efficiency and 13
sufficiency. For example, the US AIA states in their code of ethics that architects must inform clients 14
of climate risks and opportunities for sustainability. The capacity and quality of workforce and building 15
construction, retrofit, and service firms are essential to execute the fast transition in building systems 16
(see also Cross-Chapter Box 12 in Chapter 16). 17
9.9.7.2 Institutional capacity 18
The concept of institutional capacity is increasingly connected with the issue of public governance, 19
emphasising the broad institutional context within which individual policies are adopted. Institutions 20
are durable and are sources of authority (formal or informal) structuring repeated interactions of 21
individuals, companies, civil society groups, governments, and other entities. Thus, institutional 22
capacity also represents a broader “enabling environment” which forms the basis upon which 23
individuals and organisations interact. In general terms, capacity is “the ability to perform functions, 24
solve problems and set and achieve objectives” (Fukuda-Parr et al. 2002). Institutional capacity is an 25
important element for regional sustainable development (Farajirad et al. 2015). The role and importance 26
of institutional capacity is fundamental in implementing the building decarbonisation. Central and local 27
governments, regulatory organisations, financial institutions, standardisation bodies, test laboratories, 28
building construction and design companies, qualified workforce and stakeholders are key players in 29
supporting the implementation of building decarbonisation. 30
Governments (from national to local) planning to introduce efficiency, RES, and sufficiency policies 31
needs technical capacity to set sectoral targets and design policies and introduce effective and 32
enforcement with adequate structure and resources for their implementation. Policies discussed and 33
agreed with stakeholders and based on impartial data and impact assessments, have a higher possibility 34
of success. Public authorities need technical and economics competences to understand complex 35
technical issues and eliminate the knowledge gap in comparison to private sector experts, human and 36
financial resources to design, implement, revise, and evaluate policies. The role of energy efficiency 37
policy evaluation needs to be expanded, including the assessment of the rebound effect (Vine et al. 38
2013). For developing countries international support for institutional capacity for policy development, 39
implementation and evaluation is of key importance for testing laboratory, standards institute, 40
enforcement and compliances technicians and evaluation experts. Thus, in development support, 41
addition to technology transfer, also capacity buildings for national and local authorities should be 42
provides. The Paris Agreement Article 11 aims at enhancing the capacity of decision-making 43
institutions in developing countries to support effective implementation. 44
Enforcement of policies is of key importance. Policies on appliance energy standards needs to establish 45
criteria for random checks and tests of compliance, establish penalties and sanctions for non-46
compliance. For building code compliance there is the need to verify compliance after construction to 47
verify the consistence with building design (Vine et al. 2017). Often local authorities lack resources and 48
ACCEPTED VERSION
SUBJECT TO FIN
AL EDITS

Final Government Distribution Chapter 9 IPCC AR6 WGIII
Do Not Cite, Quote or Distribute 9-96 Total pages: 168
technical capacity to carry out inspections to check code compliance. This issue is even more pressing 1
in countries and cities with large informal settlements, where buildings may not be respecting building 2
energy codes for safety and health. 3
4
9.10 Knowledge Gaps 5
Insights from regions, sectors, and communities 6
• Due to the dominating amount of literature from developed countries and rapidly developing 7
Asia (China), the evidence and therefore conclusions are limited for the developing world. In 8
particular, there is limited evidence on the potential and costs the countries of South-East Asia 9
and Developing Pacific, Africa, and Latin America and Caribbean. 10
• The contribution of indigenous knowledge in the evolvement of buildings is not well 11
appreciated. There is a need to understand this contribution and provide methodological 12
approaches for incorporation of indigenous knowledge. 13
• Analysis of emissions and energy demand trends in non-residential buildings is limited due to 14
the number of building types included in this category and the scarcity of data for each building 15
type. The use of new data gathering techniques such as machine learning, GIS combined with 16
digital technologies to fill in this data gap was not identified in the literature. Consideration of 17
embodied emissions from building stock growth has only recently entered the global scenario 18
literature, and more development is expected in this area. 19
Measures, potentials, and costs 20
• There is a lack of scientific reporting of case studies of exemplary buildings, specially from 21
developing countries. Also, there is a lack of identification of researchers on technologies with 22
the mitigation potential of such technologies, bringing a lack in quantification of that potential. 23
• There is limited evidence on sufficiency measures including those from behavioural energy 24
saving practices: updated categorisations, current adoption rates and willingness to adopt. 25
• There is limited evidence on circular and shared economy in buildings, including taxonomies, 26
potentials, current adoption rates and willingness to adopt 27
• Most of the literature on climate change impacts on buildings is focused on thermal comfort. 28
There is need for further research on climate change impacts on buildings structure, materials 29
and construction and the energy and emissions associated with those impacts. Also, more 30
studies that assess the role of passive energy efficiency measures as adaptation options are 31
needed. Finally, regional studies leave out in depth analyses of specific regions. 32
Feasibility and policies 33
• Applications of human centred profiles for targeted policy making and considering stages of 34
diffusion of innovation, that is: what works (motivation) for whom (different stakeholders, not 35
only households) and when (stages of market maturity) 36
• The multiple co-benefits of mitigation actions are rarely integrated into decision-making 37
processes. So, there is a need to further develop methodologies to quantify and monetise these 38
externalities as well as indicators to facilitate their incorporation in energy planning. 39
ACCEPTED VERSION
SUBJECT TO FIN
AL EDITS

Final Government Distribution Chapter 9 IPCC AR6 WGIII
Do Not Cite, Quote or Distribute 9-97 Total pages: 168
• Policies for sufficiency have to be further analysed and tested in real situation, including ex 1
ante simulation and ex-post evaluation. The same is also valid for Personable (tradable) Carbon 2
Allowances. 3
Methods and models 4
• There is limited literature on the integration of behavioural measures and lifestyle changes in 5
modelling exercises 6
• Mitigation potential resulting from the implementation of sufficiency measures is not identified 7
in global energy/climate and building scenarios despite the growing literature on sufficiency. 8
At the best, mitigation potential from behaviour change is quantified in energy scenarios; 9
savings from structural changes and resource efficiency are not identified in the literature on 10
global and building energy models. 11
• The actual costs of the potential could be higher to rather optimistic assumptions of the 12
modelling literature, e.g., assuming a 2-3% retrofit rate, and even higher, versus the current 1%. 13
The uncertainty ranges of potential costs are not well understood. 14
• Despite a large number of exemplary buildings achieving very high performance in all parts of 15
the world and a growing amount of modelling literature on the potential, if these will penetrate 16
at scale, there is a lack of modelling literature assessing the costs of respective actions at 17
national, regional, and global level based on comprehensive cost assessments. 18
• There is a lack of peer-reviewed literature on investment gaps, which compares the investment 19
need in the building sector decarbonisation and recent investment flows into it estimated with 20
the same costing methodologies. 21
22
Frequently Asked Questions 23
FAQ 9.1 To which GHG emissions do buildings contribute? 24
There are three categories of GHG emissions from buildings: 25
i. direct emissions which are defined as all on-site fossil fuel or biomass-based combustion 26
activities (i.e., use of biomass for cooking, or gas for heating and hot water) and F-gas emissions 27
(i.e., use of heating and cooling systems, aerosols, fire extinguishers, soundproof) 28
ii. indirect emissions which occur off-site and are related to heat and electricity production 29
iii. embodied emissions which are related to extracting, producing, transforming, transporting, and 30
installing the construction material and goods used in buildings 31
In 2019, global GHG emissions from buildings were at 12 GtCO2-eq out of which 24% were direct 32
emissions, 57% were indirect emissions, and 18% were embodied emissions. More than 95% of 33
emissions from buildings were CO2 emissions, CH4 and N2O represented 0.08% each and emissions 34
from halocarbon contributed by 3% to global GHG emissions from buildings. 35
36
FAQ 9.2 What are the co-benefits and trade-offs of mitigation actions in buildings? 37
Mitigation actions in buildings generate multiple co-benefits (e.g., health benefits due to the improved 38
indoor and outdoor conditions, productivity gains in non-residential buildings, creation of new jobs 39
particularly at local level, improvements in social wellbeing etc.) beyond their direct impact on reducing 40
energy consumption and GHG emissions. Most studies agree that the value of these multiple benefits 41
is greater than the value of energy savings and their inclusion in economic evaluation of mitigation 42
ACCEPTED VERSION
SUBJECT TO FIN
AL EDITS

Final Government Distribution Chapter 9 IPCC AR6 WGIII
Do Not Cite, Quote or Distribute 9-98 Total pages: 168
actions may improve substantially their cost-effectiveness. It is also worth mentioning that in several 1
cases the buildings sector is characterized by strong rebound effects, which could be considered as a 2
co-benefit in cases where the mechanisms involved provide faster access to affordable energy but also 3
a trade-off in cases where the external costs of increased energy consumption exceed the welfare 4
benefits of the increased energy service consumption, thus lowering the economic performance of 5
mitigation actions. The magnitude of these co-benefits and trade-offs are characterized by several 6
uncertainties, which may be even higher in the future as mitigation actions will be implemented in a 7
changing climate, with changing building operation style and occupant behaviour. Mitigation measures 8
influence the degree of vulnerability of buildings to future climate change. For instance, temperature 9
rise can increase energy consumption, which may lead to higher GHG emissions. Also, sea level rise, 10
increased storms and rainfall under future climate may impact building structure, materials and 11
components, resulting in increased energy consumption and household expenditure from producing and 12
installing new components and making renovations. Well-planned energy efficiency, sufficiency and 13
on-site renewable energy production can help to increase building resilience to climate change impacts 14
and reduce adaptation needs. 15
16
FAQ 9.3 Which are the most effective policies and measures to decarbonize the building sector? 17
Several barriers (information, financing, markets, behavioural, etc.) still prevents the decarbonisation 18
of buildings stock, despite the several co-benefits, including large energy savings. Solutions include 19
investments in technological solutions (e.g., insulation, efficient equipment, and low-carbon energies 20
and renewable energies) and lifestyle changes. In addition, the concept of sufficiency is suggested to be 21
promoted and implemented through policies and information, as technological solutions will be not 22
enough to decarbonise the building sector. Due to the different types of buildings, occupants, and 23
development stage there is not a single policy, which alone will reach the building decarbonisation 24
target. A range of policy instruments ranging from regulatory measures such as building energy code 25
for NZEBs and appliance standards, to market-based instruments (carbon tax, personal carbon 26
allowance, renewable portfolio standards, etc.), and information. Financing (grants, loans, performance 27
base incentives, pays as you save, etc.) is another key enabler for energy efficiency technologies and 28
on-site renewables. Finally, effective governance and strong institutional capacity are key to have an 29
effective and successful implementation of policies and financing. 30
31
ACCEPTED VERSION
SUBJECT TO FIN
AL EDITS

Final Government Distribution Chapter 9 IPCC AR6 WGIII
Do Not Cite, Quote or Distribute 9-99 Total pages: 168
References 1
[IEA] - International Energy Agency, 2017: Digitalization & Energy. 188 pp. 2
Abrahamse, W., and L. Steg, 2013: Social influence approaches to encourage resource conservation: A 3
meta-analysis. Glob. Environ. Chang., 23, 1773–1785, 4
https://doi.org/10.1016/j.gloenvcha.2013.07.029. 5
Abubakar, I., S. N. Khalid, M. W. Mustafa, H. Shareef, and M. Mustapha, 2017: Application of load 6
monitoring in appliances’ energy management – A review. Renew. Sustain. Energy Rev., 67, 235–7
245, https://doi.org/10.1016/j.rser.2016.09.064. 8
Acil Allen Consulting, 2015: Commercial building disclosure - Program Review Final Report. 130 p. 9
pp. 10
ADB, 2017: Pathways to Low-Carbon Development for Viet Nam. 11
Agathokleous, R. A., and S. A. Kalogirou, 2020: Status, barriers and perspectives of building integrated 12
photovoltaic systems. Energy, 191, https://doi.org/10.1016/j.energy.2019.116471. 13
Agrawal, V. V., and I. Bellos, 2017: The Potential of Servicizing as a Green Business Model. Manage. 14
Sci., 63, 1545–1562, https://doi.org/10.1287/mnsc.2015.2399. 15
Agustí-Juan, I., F. Müller, N. Hack, T. Wangler, and G. Habert, 2017: Potential benefits of digital 16
fabrication for complex structures: Environmental assessment of a robotically fabricated concrete 17
wall. J. Clean. Prod., 154, 330–340, https://doi.org/10.1016/j.jclepro.2017.04.002. 18
Ahl, A., G. Accawi, B. Hudey, M. Lapsa, and T. Nichols, 2019: Occupant Behavior for Energy 19
Conservation in Commercial Buildings: Lessons Learned from Competition at the Oak Ridge 20
National Laboratory. Sustainability, 11, 3297, https://doi.org/10.3390/su11123297. 21
Ajayi, S. O., L. O. Oyedele, M. Bilal, O. O. Akinade, H. A. Alaka, H. A. Owolabi, and K. O. Kadiri, 22
2015: Waste effectiveness of the construction industry: Understanding the impediments and 23
requisites for improvements. Resour. Conserv. Recycl., 102, 101–112, 24
https://doi.org/10.1016/j.resconrec.2015.06.001. 25
——, ——, O. O. Akinade, M. Bilal, H. A. Alaka, H. A. Owolabi, and K. O. Kadiri, 2017: Attributes 26
of design for construction waste minimization: A case study of waste-to-energy project. Renew. 27
Sustain. Energy Rev., 73, 1333–1341, https://doi.org/10.1016/j.rser.2017.01.084. 28
Akander, J., M. Cehlin, and B. Moshfegh, 2017: Assessing the Myths on Energy Efficiency When 29
Retrofitting Multifamily Buildings in a Northern Region. Sustainable High Rise Buildings in 30
Urban Zones: Advantages, Challenges, and Global Case Studies, A. Sayigh, Ed., Springer 31
International Publishing, 139–161. 32
Akenji, L. et al, 2021: 1.5°C lifestyles report -Policy Approaches For a Fair Consumption Space. 33
Alaidroos, A., and M. Krarti, 2015: Optimal design of residential building envelope systems in the 34
Kingdom of Saudi Arabia. Energy Build., 86, 104–117, 35
https://doi.org/10.1016/j.enbuild.2014.09.083. 36
Alam, M., P. X. W. Zou, J. Sanjayan, and S. Ramakrishnan, 2019: Energy saving performance 37
assessment and lessons learned from the operation of an active phase change materials system in 38
a multi-storey building in Melbourne. Appl. Energy, 238, 1582–1595, 39
https://doi.org/10.1016/j.apenergy.2019.01.116. 40
Alawneh, R., F. Ghazali, H. Ali, and M. Asif, 2019: A new index for assessing the contribution of 41
energy efficiency in LEED 2009 certified green buildings to achieving UN sustainable 42
development goals in Jordan. Int. J. Green Energy, 16, 490–499, 43
https://doi.org/10.1080/15435075.2019.1584104. 44
ACCEPTED VERSION
SUBJECT TO FIN
AL EDITS
Final Government Distribution Chapter 9 IPCC AR6 WGIII
Do Not Cite, Quote or Distribute 9-100 Total pages: 168
Alcorn, A., and P. Wood, 1998: Recent work in embodied enrgy analysis of New Zealand building 1
materials. 1–23 pp. 2
Aldrich, E. L., and C. L. Koerner, 2018: White certificate trading: A dying concept or just making its 3
debut? Part II: Challenges to trading white certificates. Electr. J., 31, 41–47, 4
https://doi.org/10.1016/j.tej.2018.05.006. 5
Alexandri, E., and Coauthors, 2016: The Macroeconomic and Other Benefits of Energy Efficiency. 138 6
pp. https://ec.europa.eu/energy/sites/ener/files/documents/final_report_v4_final.pdf. 7
Alipour M Salim RA Sahin, O, H. S., 2020: Predictors, taxonomy of predictors, and correlations of 8
predictors with the decision behaviour of residential solar photovoltaics adoption: A review. 9
Renew. Sustain. ENERGY Rev., 123, https://doi.org/10.1016/j.rser.2020.109749. 10
Alizada, K., 2018: Rethinking the diffusion of renewable energy policies: A global assessment of feed-11
in tariffs and renewable portfolio standards. Energy Res. Soc. Sci., 44, 346–361, 12
https://doi.org/10.1016/j.erss.2018.05.033. 13
Allen, J. G., P. MacNaughton, J. G. C. Laurent, S. S. Flanigan, E. S. Eitland, and J. D. Spengler, 2015: 14
Green Buildings and Health. Curr. Environ. Heal. Reports, 2, 250–258, 15
https://doi.org/10.1007/s40572-015-0063-y. 16
Allwood, J. M., M. F. Ashby, T. G. Gutowski, and E. Worrell, 2011: Material efficiency: A white paper. 17
Resour. Conserv. Recycl., 55, 362–381, https://doi.org/10.1016/j.resconrec.2010.11.002. 18
Amal, B., S. Issam, C. Ghassan, E.-F. Mutasem, and K. Jalal, 2017: Behavioral determinants towards 19
enhancing construction waste management: A Bayesian Network analysis. Resour. Conserv. 20
Recycl., 117, 274–284, https://doi.org/10.1016/j.resconrec.2016.10.006. 21
Amirifard, F., S. A. Sharif, and F. Nasiri, 2019: Application of passive measures for energy conservation 22
in buildings – a review. Adv. Build. Energy Res., 13, 282–315, 23
https://doi.org/10.1080/17512549.2018.1488617. 24
An, X., and G. Pivo, 2020: Green Buildings in Commercial Mortgage-Backed Securities: The Effects 25
of LEED and Energy Star Certification on Default Risk and Loan Terms. Real Estate Econ., 48, 26
7–42, https://doi.org/10.1111/1540-6229.12228. 27
An, X., C. Zhao, S. Zhang, and X. Li, 2015: Joint equilibrium analysis of electricity market with tradable 28
green certificates. 2015 5th International Conference on Electric Utility Deregulation and 29
Restructuring and Power Technologies (DRPT), IEEE, 29–34. 30
ANDERSEN, S. O., R. FERRIS, R. PICOLOTTI, D. D. ZAELKE, R. S. CARVALHO, and M. 31
GONZALEZ, 2018: Defining the Legal and Policy Framework to Stop the Dumping of 32
Environmentally Harmful Products. Duke Environ. Law Policy Forum , 1–48. 33
Anderson, D. M., D. B. Belzer, O. V. Livingston, and M. J. Scott, 2014: Assessing National Employment 34
Impacts of Investment in Residential and Commercial Sector Energy Efficiency: Review and 35
Example Analysis. 100 p. pp. 36
https://www.pnnl.gov/main/publications/external/technical_reports/PNNL-23402.pdf. 37
Andersson, J., 2017: Cars, carbon taxes and CO 2 emissions. www.lse.ac.uk/grantham. 38
Andjelković, A. S., J. R. Petrović, and M. V. Kljajić, 2016: Double or single skin façade in a moderate 39
climate an energyplus assessment. Therm. Sci., 20, S1501–S1510, 40
https://doi.org/10.2298/TSCI16S5501A. 41
Andrić, I., M. Koc, and S. G. Al-Ghamdi, 2019: A review of climate change implications for built 42
environment: Impacts, mitigation measures and associated challenges in developed and 43
developing countries. J. Clean. Prod., 211, 83–102, https://doi.org/10.1016/j.jclepro.2018.11.128. 44
Ang, B. W., and F. Q. Zhang, 2000: A survey of index decomposition analysis in energy and 45
ACCEPTED VERSION
SUBJECT TO FIN
AL EDITS
Final Government Distribution Chapter 9 IPCC AR6 WGIII
Do Not Cite, Quote or Distribute 9-101 Total pages: 168
environmental studies. Energy, 25, 1149–1176, https://doi.org/10.1016/S0360-5442(00)00039-6. 1
Annibaldi, V., F. Cucchiella, P. De Berardinis, M. Gastaldi, and M. Rotilio, 2020: An integrated 2
sustainable and profitable approach of energy efficiency in heritage buildings. J. Clean. Prod., 3
251, 119516, https://doi.org/10.1016/j.jclepro.2019.119516. 4
Arawomo, D. F., 2019: Is Giffen behaviour compatible with residential demand for cooking gas and 5
kerosene?: Evidence from a state in Nigeria. Int. J. Energy Sect. Manag., 13, 45–59, 6
https://doi.org/10.1108/IJESM-04-2016-0007. 7
Architects’ Council of Europe (ACE), 2019: The Architectural Professsion in Europe 2018 - A Sector 8
Study. 106 pp. 9
Aro, R., 2020: ‘A bigger living room required a bigger TV’: Doing and negotiating necessity in well-10
to-do households. J. Consum. Cult., 20, 498–520, https://doi.org/10.1177/1469540517745706. 11
Aroonruengsawat, A., 2012: The Impact of State Level Building Codes on Residential Electricity 12
Consumption. Energy J., 33, https://doi.org/10.5547/ISSN0195-6574-EJ-Vol33-No1-2. 13
ARUP, 2018: From principles to practices. First steps towards a circular built environment. 14 p. pp. 14
Aryandoust, A., and J. Lilliestam, 2017: The potential and usefulness of demand response to provide 15
electricity system services. Appl. Energy, 204, 749–766, 16
https://doi.org/10.1016/j.apenergy.2017.07.034. 17
Asbjørn, K., 2009: Classification of Building Element Functions. Manag. IT Constr., 1–8. 18
Asdrubali, F., G. Baldinelli, and F. Bianchi, 2012: A quantitative methodology to evaluate thermal 19
bridges in buildings. Appl. Energy, 97, 365–373, https://doi.org/10.1016/j.apenergy.2011.12.054. 20
Atalla, T., S. Bigerna, C. A. Bollino, and P. Polinori, 2018: An alternative assessment of global climate 21
policies. J. Policy Model., 40, 1272–1289, https://doi.org/10.1016/j.jpolmod.2018.02.003. 22
Attia, S., M. Hamdy, and S. Ezzeldin, 2017: Twenty-year tracking of lighting savings and power density 23
in the residential sector. Energy Build., 154, 113–126, 24
https://doi.org/10.1016/j.enbuild.2017.08.041. 25
Audebert, M., D. Dhima, A. Bouchaïr, and A. Frangi, 2019: Review of experimental data for timber 26
connections with dowel-type fasteners under standard fire exposure. Fire Saf. J., 107, 217–234, 27
https://doi.org/10.1016/j.firesaf.2019.102905. 28
Auffhammer, M., 2014: Cooling China: The weather dependence of air conditioner adoption. Front. 29
Econ. China, 9, 70–84, https://doi.org/10.3868/s060-003-014-0005-5. 30
——, and E. T. Mansur, 2014: Measuring climatic impacts on energy consumption: A review of the 31
empirical literature. Energy Econ., 46, 522–530, https://doi.org/10.1016/j.eneco.2014.04.017. 32
——, P. Baylis, and C. H. Hausman, 2017: Climate change is projected to have severe impacts on the 33
frequency and intensity of peak electricity demand across the United States. Proc. Natl. Acad. Sci. 34
U. S. A., 114, 1886–1891, https://doi.org/10.1073/pnas.1613193114. 35
Augustins, E., D. Jaunzems, C. Rochas, and A. Kamenders, 2018: Managing energy efficiency of 36
buildings: analysis of ESCO experience in Latvia. Energy Procedia, 147, 614–623, 37
https://doi.org/10.1016/j.egypro.2018.07.079. 38
Aunan, K., and Coauthors, 2013: Upgrading to cleaner household stoves and reducing chronic 39
obstructive pulmonary disease among women in rural china - a cost-benefit analysis. Energy 40
Sustain. Dev., 17, 489–496, https://doi.org/10.1016/j.esd.2013.06.002. 41
Aung, T. W., G. Jain, K. Sethuraman, J. Baumgartner, C. Reynolds, A. P. Grieshop, J. D. Marshall, and 42
M. Brauer, 2016: Health and Climate-Relevant Pollutant Concentrations from a Carbon-Finance 43
ACCEPTED VERSION
SUBJECT TO FIN
AL EDITS

Final Government Distribution Chapter 9 IPCC AR6 WGIII
Do Not Cite, Quote or Distribute 9-102 Total pages: 168
Approved Cookstove Intervention in Rural India. Environ. Sci. Technol., 50, 7228–7238, 1
https://doi.org/10.1021/acs.est.5b06208. 2
Avgerinou, M., P. Bertoldi, and L. Castellazzi, 2017: Trends in Data Centre Energy Consumption under 3
the European Code of Conduct for Data Centre Energy Efficiency. Energies, 10, 1–18, 4
https://doi.org/10.3390/en10101470. 5
De Ayala, A., I. Galarraga, and J. V. Spadaro, 2016: The price of energy efficiency in the Spanish 6
housing market. Energy Policy, 94, 16–24, https://doi.org/10.1016/j.enpol.2016.03.032. 7
Aydin, E., N. Kok, and D. Brounen, 2017: Energy efficiency and household behavior: the rebound 8
effect in the residential sector. RAND J. Econ., 48, 749–782, https://doi.org/10.1111/1756-9
2171.12190. 10
——, D. Brounen, and N. Kok, 2018: Information provision and energy consumption: Evidence from 11
a field experiment. Energy Econ., 71, 403–410, https://doi.org/10.1016/j.eneco.2018.03.008. 12
Ayoub, M., 2019: A multivariate regression to predict daylighting and energy consumption of 13
residential buildings within hybrid settlements in hot-desert climates. Indoor Built Environ., 28, 14
848–866, https://doi.org/10.1177/1420326X18798164. 15
Ayoub, N., F. Musharavati, S. Pokharel, and H. A. Gabbar, 2014a: Energy consumption and 16
conservation practices in Qatar - A case study of a hotel building. Energy Build., 84, 55–69, 17
https://doi.org/10.1016/j.enbuild.2014.07.050. 18
Ayoub, N., F. Musharavati, S. Pokharel, and H. A. Gabbar, 2014b: Energy consumption and 19
conservation practices in Qatar - A case study of a hotel building. Energy Build., 84, 55–69, 20
https://doi.org/10.1016/j.enbuild.2014.07.050. 21
Ayres, R. U., 1995: Environmental Market Failures: Are There Any Local Market-Based Corrective 22
Mechanisms for Global Problems? Mitig. Adapt. Strateg. Glob. Chang., 1, 289–309, 23
https://doi.org/10.1023/B:MITI.0000018138.12428.65. 24
Azhgaliyeva, D., M. Belitski, Y. Kalyuzhnova, and M. Romanov, 2018: Policy instruments for 25
renewable energy: An empirical evaluation of effectiveness. Int. J. Technol. Intell. Plan., 12, 24–26
48. 27
Azmi, W. H., M. Z. Sharif, T. M. Yusof, R. Mamat, and A. A. M. Redhwan, 2017: Potential of 28
nanorefrigerant and nanolubricant on energy saving in refrigeration system – A review. Renew. 29
Sustain. Energy Rev., 69, 415–428, https://doi.org/10.1016/j.rser.2016.11.207. 30
Bach, L., D. Hopkins, and J. Stephenson, 2020: Solar electricity cultures: Household adoption dynamics 31
and energy policy in Switzerland. Energy Res. Soc. Sci., 63, 32
https://doi.org/10.1016/j.erss.2019.101395. 33
Bahaidarah, H., A. Subhan, P. Gandhidasan, and S. Rehman, 2013: Performance evaluation of a PV 34
(photovoltaic) module by back surface water cooling for hot climatic conditions. Energy, 59, 445–35
453, https://doi.org/10.1016/j.energy.2013.07.050. 36
Bailis, R., R. Drigo, A. Ghilardi, and O. Masera, 2015: The carbon footprint of traditional woodfuels. 37
Nat. Clim. Chang., 5, 266–272, https://doi.org/10.1038/nclimate2491. 38
Baimel, D., S. Tapuchi, and N. Baimel, 2016: Smart Grid Communication Technologies. J. Power 39
Energy Eng., 04, 1–8, https://doi.org/10.4236/jpee.2016.48001. 40
Baker, K. J., R. Mould, and S. Restrick, 2018: Rethink fuel poverty as a complex problem. Nat. Energy, 41
3, 610–612, https://doi.org/10.1038/s41560-018-0204-2. 42
Balaban, O., and J. A. Puppim de Oliveira, 2017: Sustainable buildings for healthier cities: assessing 43
the co-benefits of green buildings in Japan. J. Clean. Prod., 163, S68–S78, 44
https://doi.org/10.1016/j.jclepro.2016.01.086. 45
ACCEPTED VERSION
SUBJECT TO FIN
AL EDITS
Final Government Distribution Chapter 9 IPCC AR6 WGIII
Do Not Cite, Quote or Distribute 9-103 Total pages: 168
Baloch, A. A., P. H. Shaikh, F. Shaikh, Z. H. Leghari, N. H. Mirjat, and M. A. Uqaili, 2018: Simulation 1
tools application for artificial lighting in buildings. Renew. Sustain. Energy Rev., 82, 3007–3026, 2
https://doi.org/10.1016/j.rser.2017.10.035. 3
Balta-Ozkan, N., J. Yildirim, and P. M. Connor, 2015: Regional distribution of photovoltaic deployment 4
in the UK and its determinants: A spatial econometric approach. Energy Econ., 51, 417–429, 5
https://doi.org/10.1016/j.eneco.2015.08.003. 6
Barbosa, L., P. Ferrão, A. Rodrigues, and A. Sardinha, 2018: Feed-in tariffs with minimum price 7
guarantees and regulatory uncertainty. Energy Econ., 72, 8
https://doi.org/10.1016/j.eneco.2018.04.028. 9
Barkhordarian, A., H. von Storch, E. Zorita, P. C. Loikith, and C. R. Mechoso, 2018: Observed warming 10
over northern South America has an anthropogenic origin. Clim. Dyn., 51, 1901–1914, 11
https://doi.org/10.1007/s00382-017-3988-z. 12
Barnes, D. F., and H. Samad, 2018: Measuring the Benefits of Energy Access: A Handbook for 13
Development Practitioners. Inter-American Development Bank,. 14
Barnes, J., and S. M. Bhagavathy, 2020: The economics of heat pumps and the (un)intended 15
consequences of government policy. Energy Policy, 138, 111198, 16
https://doi.org/10.1016/j.enpol.2019.111198. 17
Bartolini, M., E. Bottani, and E. H. Grosse, 2019: Green warehousing: Systematic literature review and 18
bibliometric analysis. J. Clean. Prod., 226, 242–258, 19
https://doi.org/10.1016/j.jclepro.2019.04.055. 20
Bartusch, C., and K. Alvehag, 2014: Further exploring the potential of residential demand response 21
programs in electricity distribution. Appl. Energy, 125, 39–59, 22
https://doi.org/10.1016/j.apenergy.2014.03.054. 23
Basbagill, J., F. Flager, M. Lepech, and M. Fischer, 2013: Application of life-cycle assessment to early 24
stage building design for reduced embodied environmental impacts. Build. Environ., 60, 81–92, 25
https://doi.org/10.1016/j.buildenv.2012.11.009. 26
Bashmakov, I., 2017: Improving the Energy Efficiency of Russian Buildings. Probl. Econ. Transit., 58, 27
1096–1128, https://doi.org/10.1080/10611991.2016.1316099. 28
Bastidas-Arteaga, E., A. Chateauneuf, M. Sánchez-Silva, P. Bressolette, and F. Schoefs, 2010: 29
Influence of weather and global warming in chloride ingress into concrete: A stochastic approach. 30
Struct. Saf., 32, 238–249, https://doi.org/10.1016/j.strusafe.2010.03.002. 31
Batchelor, S., E. Brown, N. Scott, and J. Leary, 2019: Two birds, one stone-reframing cooking energy 32
policies in Africa and Asia. Energies, 12, 1–18, https://doi.org/10.3390/en12091591. 33
Batz T., and F. Musgens, 2019: A first analysis of the photovoltaic auction program in Germany. 34
IEEE,2019 16th International Conference on the European Energy Market (EEM), 18-20, 2019, 35
Ljubljana, SLOVENIA,. 36
Bauer, E., E. Pavón, E. Barreira, and E. Kraus De Castro, 2016: Analysis of building facade defects 37
using infrared thermography: Laboratory studies. J. Build. Eng., 6, 93–104, 38
https://doi.org/10.1016/j.jobe.2016.02.012. 39
——, P. M. Milhomem, and L. A. G. Aidar, 2018: Evaluating the damage degree of cracking in facades 40
using infrared thermography. J. Civ. Struct. Heal. Monit., 8, 517–528, 41
https://doi.org/10.1007/s13349-018-0289-0. 42
Baumhof, R., T. Decker, H. Röder, and K. Menrad, 2018: Which factors determine the extent of house 43
owners’ energy-related refurbishment projects? A Motivation-Opportunity-Ability Approach. 44
Sustain. Cities Soc., 36, 33–41, https://doi.org/10.1016/j.scs.2017.09.025. 45
ACCEPTED VERSION
SUBJECT TO FIN
AL EDITS

Final Government Distribution Chapter 9 IPCC AR6 WGIII
Do Not Cite, Quote or Distribute 9-104 Total pages: 168
Bavaresco, M. V., S. D’Oca, E. Ghisi, and R. Lamberts, 2020: Methods used in social sciences that suit 1
energy research: A literature review on qualitative methods to assess the human dimension of 2
energy use in buildings. Energy Build., 209, 109702, 3
https://doi.org/10.1016/j.enbuild.2019.109702. 4
Bayer, B., D. Schäuble, and M. Ferrari, 2018: International experiences with tender procedures for 5
renewable energy – A comparison of current developments in Brazil, France, Italy and South 6
Africa. Renew. Sustain. Energy Rev., 95, 305–327, https://doi.org/10.1016/j.rser.2018.06.066. 7
Bedir, M., E. Hasselaar, and L. Itard, 2013: Determinants of electricity consumption in Dutch dwellings. 8
Energy Build., 58, 194–207, https://doi.org/10.1016/j.enbuild.2012.10.016. 9
Bednar, D. J., and T. G. Reames, 2020: Recognition of and response to energy poverty in the United 10
States. Nat. Energy, 5, 432–439, https://doi.org/10.1038/s41560-020-0582-0. 11
Ben-David, T., A. Rackes, and M. S. Waring, 2017: Alternative ventilation strategies in U.S. offices: 12
Saving energy while enhancing work performance, reducing absenteeism, and considering 13
outdoor pollutant exposure tradeoffs. Build. Environ., 116, 140–157, 14
https://doi.org/10.1016/j.buildenv.2017.02.004. 15
Bento, N., M. Borello, and G. Gianfrate, 2020: Market-pull policies to promote renewable energy: A 16
quantitative assessment of tendering implementation. J. Clean. Prod., 248, 17
https://doi.org/10.1016/j.jclepro.2019.119209. 18
Berezan, O., C. Raab, M. Yoo, and C. Love, 2013: Sustainable hotel practices and nationality: The 19
impact on guest satisfaction and guest intention to return. Int. J. Hosp. Manag., 34, 227–233, 20
https://doi.org/10.1016/j.ijhm.2013.03.010. 21
Berger, T., and A. Höltl, 2019: Thermal insulation of rental residential housing: Do energy poor 22
households benefit? A case study in Krems, Austria. Energy Policy, 127, 341–349, 23
https://doi.org/10.1016/j.enpol.2018.12.018. 24
Bergquist, M., A. Nilsson, and E. Ejelöv, 2019: Contest-Based and Norm-Based Interventions: (How) 25
Do They Differ in Attitudes, Norms, and Behaviors? Sustainability, 11, 425, 26
https://doi.org/10.3390/su11020425. 27
Berkeley, L., H. Kramer, G. Lin, C. Curtin, E. Crowe, J. Granderson, A. Jiron, and C. Blazek, 2020: 28
Proving the Business Case for Building Analytics. https://doi.org/10.20357/B7G022. 29
Berrill, P., and E. G. Hertwich, 2021: Material flows and GHG emissions from housing stock evolution 30
in US counties, 2020–60. Build. Cities, 2, 599–617, https://doi.org/10.5334/bc.126. 31
——, K. T. Gillingham, and E. G. Hertwich, 2021: Linking Housing Policy, Housing Typology, and 32
Residential Energy Demand in the United States. Environ. Sci. Technol., 55, 33
https://doi.org/10.1021/acs.est.0c05696. 34
Berrueta, V. M., M. Serrano-Medrano, C. García-Bustamante, M. Astier, and O. R. Masera, 2017: 35
Promoting sustainable local development of rural communities and mitigating climate change: the 36
case of Mexico’s Patsari improved cookstove project. Clim. Change, 140, 63–77, 37
https://doi.org/10.1007/s10584-015-1523-y. 38
Bertoldi, P., 2018: The Paris Agreement 1.5°C goal: what it does mean for energy efficiency? roceeding 39
of 2018 ACEEE Summer Study on Energy Efficiency in Buildings, Washington DC, American 40
Council for an Energy-Efficient Economy, 268. 41
Bertoldi P., 2019: Policies, Recommendations and Standards (International Technical Standards, Main 42
Laws and Regulations; EU Directives; Energy Labeling). Handbook of Energy Efficiency in 43
Buildings, Elsevier, 5–73. 44
Bertoldi, P., 2020: Overview of the European Union policies to promote more sustainable behaviours 45
ACCEPTED VERSION
SUBJECT TO FIN
AL EDITS

Final Government Distribution Chapter 9 IPCC AR6 WGIII
Do Not Cite, Quote or Distribute 9-105 Total pages: 168
in energy end-users. Elsevier Inc., 451–477 pp. 1
——, and R. Mosconi, 2020: Do energy efficiency policies save energy? A new approach based on 2
energy policy indicators (in the EU Member States). Energy Policy, 139, 111320, 3
https://doi.org/10.1016/j.enpol.2020.111320. 4
——, N. Labanca, S. Rezessy, S. Steuwer, and V. Oikonomou, 2013a: Where to place the saving 5
obligation: Energy end-users or suppliers? Energy Policy, 63, 328–337, 6
https://doi.org/10.1016/j.enpol.2013.07.134. 7
——, S. Rezessy, and V. Oikonomou, 2013b: Rewarding energy savings rather than energy efficiency: 8
Exploring the concept of a feed-in tariff for energy savings. Energy Policy, 56, 526–535, 9
https://doi.org/10.1016/j.enpol.2013.01.019. 10
——, M. Economidou, V. Palermo, B. Boza‐Kiss, and V. Todeschi, 2021: How to finance energy 11
renovation of residential buildings: Review of current and emerging financing instruments in the 12
EU. WIREs Energy Environ., 10, https://doi.org/10.1002/wene.384. 13
Besagni, G., and M. Borgarello, 2019: The socio-demographic and geographical dimensions of fuel 14
poverty in Italy. Energy Res. Soc. Sci., 49, 192–203, https://doi.org/10.1016/j.erss.2018.11.007. 15
Bevilacqua, P., F. Benevento, R. Bruno, and N. Arcuri, 2019: Are Trombe walls suitable passive 16
systems for the reduction of the yearly building energy requirements? Energy, 185, 554–566, 17
https://doi.org/10.1016/j.energy.2019.07.003. 18
Bezerra, P., and Coauthors, 2021: Impacts of a warmer world on space cooling demand in Brazilian 19
households. Energy Build.,. 20
Biardeau, L. T., L. W. Davis, P. Gertler, and C. Wolfram, 2020: Heat exposure and global air 21
conditioning. Nat. Sustain., 3, 25–28, https://doi.org/10.1038/s41893-019-0441-9. 22
Bienvenido-Huertas, D., C. Rubio-Bellido, A. Pérez-Fargallo, and J. A. Pulido-Arcas, 2020: Energy 23
saving potential in current and future world built environments based on the adaptive comfort 24
approach. J. Clean. Prod., 249, 119306, https://doi.org/10.1016/j.jclepro.2019.119306. 25
——, ——, D. Marín-García, and J. Canivell, 2021: Influence of the Representative Concentration 26
Pathways (RCP) scenarios on the bioclimatic design strategies of the built environment. Sustain. 27
Cities Soc., 72, 103042, https://doi.org/10.1016/j.scs.2021.103042. 28
Bierwirth, A., and S. Thomas, 2019a: Energy sufficiency in buildings Concept paper. 29
——, and ——, 2019b: Estimating the sufficiency potential in buildings: The space between under-30
dimensioned and oversized. Eceee Summer Study Proc., 2019-June, 1143–1153. 31
Bird, S., and D. Hernández, 2012: Policy options for the split incentive: Increasing energy efficiency 32
for low-income renters. Energy Policy, 48, 506–514, https://doi.org/10.1016/j.enpol.2012.05.053. 33
Birgisdottir, H., and Coauthors, 2017: IEA EBC annex 57 ‘evaluation of embodied energy and CO2eq 34
for building construction.’ Energy Build., 154, 72–80, 35
https://doi.org/10.1016/j.enbuild.2017.08.030. 36
Bissiri, M., I. F. G. Reis, N. C. Figueiredo, and P. Pereira da Silva, 2019: An econometric analysis of 37
the drivers for residential heating consumption in the UK and Germany. J. Clean. Prod., 228, 557–38
569, https://doi.org/10.1016/j.jclepro.2019.04.178. 39
Bjarnadottir, S., Y. Li, and M. G. Stewart, 2011: A probabilistic-based framework for impact and 40
adaptation assessment of climate change on hurricane damage risks and costs. Struct. Saf., 33, 41
173–185, https://doi.org/10.1016/j.strusafe.2011.02.003. 42
Blair, M. J., B. Gagnon, A. Klain, and B. Kulišić, 2021: Contribution of biomass supply chains for 43
bioenergy to sustainable development goals. Land, 10, 1–28, 44
ACCEPTED VERSION
SUBJECT TO FIN
AL EDITS

Final Government Distribution Chapter 9 IPCC AR6 WGIII
Do Not Cite, Quote or Distribute 9-106 Total pages: 168
https://doi.org/10.3390/land10020181. 1
Bleyl, J. W., and Coauthors, 2019: Office building deep energy retrofit: life cycle cost benefit analyses 2
using cash flow analysis and multiple benefits on project level. Energy Effic., 12, 261–279, 3
https://doi.org/10.1007/s12053-018-9707-8. 4
Bloess, A., W. P. Schill, and A. Zerrahn, 2018: Power-to-heat for renewable energy integration: A 5
review of technologies, modeling approaches, and flexibility potentials. Appl. Energy, 212, 1611–6
1626, https://doi.org/10.1016/j.apenergy.2017.12.073. 7
Boermans, T., G. Papaefthymiou, M. Offermann, A. John, and F. Comaty, 2015: The role of energy 8
efficient buildings in the EUs future power system. www.ecofys.com. 9
Bojić, M., K. Johannes, and F. Kuznik, 2014: Optimizing energy and environmental performance of 10
passive Trombe wall. Energy Build., 70, 279–286, https://doi.org/10.1016/j.enbuild.2013.11.062. 11
Bollinger, B., and K. Gillingham, 2012: Peer Effects in the Diffusion of Solar Photovoltaic Panels. 12
Mark. Sci., 31, 900–912, https://doi.org/10.1287/mksc.1120.0727. 13
Borck, R., and J. K. Brueckner, 2018: Optimal energy taxation in cities. J. Assoc. Environ. Resour. 14
Econ., 5, 481–516, https://doi.org/10.1086/695614. 15
Borenstein, S., 2015: A microeconomic framework for evaluating energy efficiency rebound and some 16
implications. Energy J., 36, 1–21, https://doi.org/10.5547/01956574.36.1.1. 17
Borozan, D., 2019: Unveiling the heterogeneous effect of energy taxes and income on residential energy 18
consumption. Energy Policy, 129, 13–22, https://doi.org/10.1016/j.enpol.2019.01.069. 19
Bosello, F., and E. De Cian, 2014: Climate change, sea level rise, and coastal disasters. A review of 20
modeling practices. Energy Econ., 46, 593–605, https://doi.org/10.1016/j.eneco.2013.09.002. 21
Boucher, J. L., K. Araújo, and E. Hewitt, 2018: Do education and income drive energy audits? A socio-22
spatial analysis of New York State. Resour. Conserv. Recycl., 136, 355–366, 23
https://doi.org/10.1016/j.resconrec.2018.05.009. 24
Bourgeois, C., L. G. Giraudet, and P. Quirion, 2019: Social-environmental-economic trade-offs 25
associated with carbon-tax revenue recycling. ECEEE 2019 Summer Study Proceedings, Vol. 26
2019-June of, 1365–1372. 27
Bove, G., A. Becker, B. Sweeney, M. Vousdoukas, and S. Kulp, 2020: A method for regional estimation 28
of climate change exposure of coastal infrastructure: Case of USVI and the influence of digital 29
elevation models on assessments. Sci. Total Environ., 710, 136162, 30
https://doi.org/10.1016/j.scitotenv.2019.136162. 31
Boyd, K., 2016: Policies to reduce urban GHG emissions: Accounting for heterogeneity of 32
demographics, values, and urban form. Simon Fraser Univeresity, 95 p. pp. 33
Boza-Kiss, B., and P. Bertoldi, 2018: One-stop-shops for energy renovations of buildings. 34
Bradley, P., A. Coke, and M. Leach, 2016: Financial incentive approaches for reducing peak electricity 35
demand, experience from pilot trials with a UK energy provider. Energy Policy, 98, 108–120, 36
https://doi.org/10.1016/j.enpol.2016.07.022. 37
Brambilla, A., and E. Gasparri, 2020: Hygrothermal behaviour of emerging timber-based envelope 38
technologies in Australia: A preliminary investigation on condensation and mould growth risk. J. 39
Clean. Prod., 276, 124129, https://doi.org/10.1016/j.jclepro.2020.124129. 40
Brancalion, P. H. S., D. R. A. De Almeida, E. Vidal, P. G. Molin, V. E. Sontag, S. E. X. F. Souza, and 41
M. D. Schulze, 2018: Fake legal logging in the Brazilian Amazon. 1–8. 42
Braubach, M., and A. Ferrand, 2013: Energy efficiency, housing, equity and health. Int. J. Public 43
ACCEPTED VERSION
SUBJECT TO FIN
AL EDITS
Final Government Distribution Chapter 9 IPCC AR6 WGIII
Do Not Cite, Quote or Distribute 9-107 Total pages: 168
Health, 58, 331–332, https://doi.org/10.1007/s00038-012-0441-2. 1
Brennan, T. J., and K. L. Palmer, 2013: Energy efficiency resource standards: Economics and policy. 2
Util. Policy, 25, 58–68, https://doi.org/10.1016/j.jup.2013.02.001. 3
Bright, S., D. Weatherall, and R. Willis, 2019: Exploring the complexities of energy retrofit in mixed 4
tenure social housing: a case study from England, UK. Energy Effic., 12, 157–174, 5
https://doi.org/10.1007/s12053-018-9676-y. 6
Bristow, A. L., M. Wardman, A. M. Zanni, and P. K. Chintakayala, 2010: Public acceptability of 7
personal carbon trading and carbon tax. Ecol. Econ., 69, 8
https://doi.org/10.1016/j.ecolecon.2010.04.021. 9
Broad, O., G. Hawker, and P. E. Dodds, 2020: Decarbonising the UK residential sector: The dependence 10
of national abatement on flexible and local views of the future. Energy Policy, 140, 11
https://doi.org/10.1016/j.enpol.2020.111321. 12
Brounen, D., and N. Kok, 2011: On the economics of energy labels in the housing market. J. Environ. 13
Econ. Manage., 62, 166–179, https://doi.org/10.1016/j.jeem.2010.11.006. 14
——, ——, and J. M. Quigley, 2012: Residential energy use and conservation: Economics and 15
demographics. Eur. Econ. Rev., 56, 931–945, https://doi.org/10.1016/j.euroecorev.2012.02.007. 16
Brown, D., S. Hall, and M. E. Davis, 2019: Prosumers in the post subsidy era: an exploration of new 17
prosumer business models in the UK. Energy Policy, 135, 18
https://doi.org/10.1016/j.enpol.2019.110984. 19
Brown, M. H., 2009: Helping Small Business Reduce Emissions and Energy Use While Improving 20
Profitability On-Bill Financing. www.conoverbrown.com. 21
Brown, Z., N. Johnstone, I. Haščič, L. Vong, and F. Barascud, 2013a: Testing the effect of defaults on 22
the thermostat settings of OECD employees. Energy Econ., 39, 128–134, 23
https://doi.org/10.1016/j.eneco.2013.04.011. 24
Brown, Z., N. Johnstone, I. Haščič, L. Vong, and F. Barascud, 2013b: Testing the effect of defaults on 25
the thermostat settings of OECD employees. Energy Econ., 39, 128–134, 26
https://doi.org/10.1016/j.eneco.2013.04.011. 27
Brucal, A., and M. J. Roberts, 2019: Do energy efficiency standards hurt consumers? Evidence from 28
household appliance sales. J. Environ. Econ. Manage., 96, 88–107, 29
https://doi.org/10.1016/j.jeem.2019.04.005. 30
Brugger, H., W. Eichhammer, N. Mikova, and E. Dönitz, 2021: Energy Efficiency Vision 2050: How 31
will new societal trends influence future energy demand in the European countries? Energy Policy, 32
152, https://doi.org/10.1016/j.enpol.2021.112216. 33
Buchanan, K., R. Russo, and B. Anderson, 2015: The question of energy reduction: The problem(s) 34
with feedback. Energy Policy, 77, 89–96, https://doi.org/10.1016/j.enpol.2014.12.008. 35
——, S. Staddon, and D. van der Horst, 2018: Feedback in energy-demand reduction. Build. Res. Inf., 36
46, 231–237, https://doi.org/10.1080/09613218.2018.1412981. 37
Bullier, A., and C. Milin, 2013: Alternative financing schemes for energy efficiency in buildings. ECEE 38
2013 Summer Study - Rethink, Renew, Restart, 795–805 39
http://ww.w.managenergy.net/lib/documents/868/original_3-221-13_Bullier_-40
_Alternative_financing.pdf. 41
Bürger, V., T. Hesse, B. Köhler, A. Palzer, and P. Engelmann, 2019: German Energiewende—different 42
visions for a (nearly) climate neutral building sector in 2050. Energy Effic., 12, 73–87, 43
https://doi.org/10.1007/s12053-018-9660-6. 44
ACCEPTED VERSION
SUBJECT TO FIN
AL EDITS

Final Government Distribution Chapter 9 IPCC AR6 WGIII
Do Not Cite, Quote or Distribute 9-108 Total pages: 168
Burgess, M., 2016: Personal carbon allowances: A revised model to alleviate distributional issues. Ecol. 1
Econ., 130, 316–327, https://doi.org/10.1016/j.ecolecon.2016.08.002. 2
Burnett, D., E. Barbour, and G. P. Harrison, 2014: The UK solar energy resource and the impact of 3
climate change. Renew. Energy, 71, 333–343, https://doi.org/10.1016/j.renene.2014.05.034. 4
Burney, J., H. Alaofè, R. Naylor, and D. Taren, 2017: Impact of a rural solar electrification project on 5
the level and structure of women’s empowerment. Environ. Res. Lett., 12, 6
https://doi.org/10.1088/1748-9326/aa7f38. 7
Butler, C., A. Denis-Ryan, P. Graham, R. Kelly, L. Reedman, I. Stewart, and T. Yankos, 2020: 8
Decarbonisation futures: Solutions , actions and benchmarks for a net zero emissions Australia. 9
Cabeza, L. F., and M. Chàfer, 2020: Technological options and strategies towards zero energy buildings 10
contributing to climate change mitigation: a systematic review. Energy Build., 219, 110009 (1-11
46), https://doi.org/10.1016/j.enbuild.2020.110009. 12
Cabeza, L. F., A. Castell, M. Medrano, I. Martorell, G. Pérez, and I. Fernández, 2010: Experimental 13
study on the performance of insulation materials in Mediterranean construction. Energy Build., 14
42, 630–636, https://doi.org/10.1016/j.enbuild.2009.10.033. 15
Cabeza, L. F., C. Barreneche, L. Miró, J. M. Morera, E. Bartolí, and A. Inés Fernández, 2013: Low 16
carbon and low embodied energy materials in buildings: A review. Renew. Sustain. Energy Rev., 17
23, 536–542, https://doi.org/10.1016/j.rser.2013.03.017. 18
——, D. Urge-Vorsatz, M. A. McNeil, C. Barreneche, and S. Serrano, 2014: Investigating greenhouse 19
challenge from growing trends of electricity consumption through home appliances in buildings. 20
Renew. Sustain. Energy Rev., 36, 188–193, https://doi.org/10.1016/j.rser.2014.04.053. 21
——, A. de Gracia, and A. L. Pisello, 2018a: Integration of renewable technologies in historical and 22
heritage buildings: A review. Energy Build., 177, 96–111, 23
https://doi.org/10.1016/j.enbuild.2018.07.058. 24
——, D. Ürge-Vorsatz, D. Ürge, A. Palacios, and C. Barreneche, 2018b: Household appliances 25
penetration and ownership trends in residential buildings. Renew. Sustain. Energy Rev., 98, 1–8, 26
https://doi.org/10.1016/j.rser.2018.09.006. 27
——, M. Chàfer, and É. Mata, 2020: Comparative Analysis of Web of Science and Scopus on the 28
Energy Efficiency and Climate Impact of Buildings. Energies, 13, 409, 29
https://doi.org/10.3390/en13020409. 30
——, L. Boquera, M. Chàfer, and D. Vérez, 2021: Embodied energy and embodied carbon of structural 31
building materials: Worldwide progress and barriers through literature map analysis. Energy 32
Build., 231, 110612, https://doi.org/10.1016/j.enbuild.2020.110612. 33
Cabrera Serrenho, A., M. Drewniok, C. Dunant, and J. M. Allwood, 2019: Testing the greenhouse gas 34
emissions reduction potential of alternative strategies for the english housing stock. Resour. 35
Conserv. Recycl., 144, 267–275, https://doi.org/10.1016/j.resconrec.2019.02.001. 36
Cajias, M., F. Fuerst, and S. Bienert, 2019: Tearing down the information barrier: the price impacts of 37
energy efficiency ratings for buildings in the German rental market. Energy Res. Soc. Sci., 47, 38
177–191, https://doi.org/10.1016/j.erss.2018.08.014. 39
Calì, D., T. Osterhage, R. Streblow, and D. Müller, 2016: Energy performance gap in refurbished 40
German dwellings: Lesson learned from a field test. Energy Build., 127, 1146–1158, 41
https://doi.org/10.1016/j.enbuild.2016.05.020. 42
Calise, F., F. L. Cappiello, M. Vicidomini, J. Song, A. M. Pantaleo, S. Abdelhady, A. Shaban, and C. 43
N. Markides, 2021: Energy and economic assessment of energy efficiency options for energy 44
districts: Case studies in Italy and Egypt. Energies, 14, 1–24, https://doi.org/10.3390/en14041012. 45
ACCEPTED VERSION
SUBJECT TO FIN
AL EDITS

Final Government Distribution Chapter 9 IPCC AR6 WGIII
Do Not Cite, Quote or Distribute 9-109 Total pages: 168
Camarinha-Matos, L. M., 2016: Collaborative smart grids – A survey on trends. Renew. Sustain. Energy 1
Rev., 65, 283–294, https://doi.org/10.1016/j.rser.2016.06.093. 2
Cameron, C., S. Pachauri, N. D. Rao, D. McCollum, J. Rogelj, and K. Riahi, 2016: Policy trade-offs 3
between climate mitigation and clean cook-stove access in South Asia. Nat. Energy, 1, 1–5, 4
https://doi.org/10.1038/nenergy.2015.10. 5
Campbell, A., 2018: Price and income elasticities of electricity demand: Evidence from Jamaica. 6
Energy Econ., 69, 19–32, https://doi.org/10.1016/j.eneco.2017.10.040. 7
Camprubí, L., D. Malmusi, R. Mehdipanah, L. Palència, A. Molnar, C. Muntaner, and C. Borrell, 2016: 8
Façade insulation retrofitting policy implementation process and its effects on health equity 9
determinants: A realist review. Energy Policy, 91, 304–314, 10
https://doi.org/10.1016/j.enpol.2016.01.016. 11
Cancio Díaz, Y., S. Sánchez Berriel, U. Heierli, A. R. Favier, I. R. Sánchez Machado, K. L. Scrivener, 12
J. F. Martirena Hernández, and G. Habert, 2017: Limestone calcined clay cement as a low-carbon 13
solution to meet expanding cement demand in emerging economies. Dev. Eng., 2, 82–91, 14
https://doi.org/10.1016/j.deveng.2017.06.001. 15
Candido, C., L. Thomas, S. Haddad, F. Zhang, M. Mackey, and W. Ye, 2019: Designing activity-based 16
workspaces: satisfaction, productivity and physical activity. Build. Res. Inf., 47, 275–289, 17
https://doi.org/10.1080/09613218.2018.1476372. 18
Cantzler, J., F. Creutzig, E. Ayargarnchanakul, A. Javaid, L. Wong, and W. Haas, 2020: Saving 19
resources and the climate? A systematic review of the circular economy and its mitigation 20
potential. Environ. Res. Lett., 15, 123001, https://doi.org/10.1088/1748-9326/abbeb7. 21
Capozzoli, A., A. Gorrino, and V. Corrado, 2013: A building thermal bridges sensitivity analysis. Appl. 22
Energy, 107, 229–243, https://doi.org/10.1016/j.apenergy.2013.02.045. 23
Carrasco, L. R., T. Phuong, L. Nghiem, Z. Chen, and E. B. Barbier, 2017: Unsustainable development 24
pathways caused by tropical deforestation. 1–10. 25
Castellazi, L., P. Bertoldi, and M. Economidou, 2017: Overcoming the split incentive barrier in the 26
building sector - Unlocking the energy efficiency potential in the rental & multifamily sectors. 27
Publications Office of the European Union, 4 p. pp. 28
Cattaneo, C., 2019: Internal and external barriers to energy efficiency: which role for policy 29
interventions? Energy Effic., 12, 1293–1311, https://doi.org/10.1007/s12053-019-09775-1. 30
Cattano, C., R. Valdes-Vasquez, J. M. Plumblee, and L. Klotz, 2013: Potential solutions to common 31
barriers experienced during the delivery of building renovations for improved energy 32
performance: Literature review and case study. J. Archit. Eng., 19, 164–167, 33
https://doi.org/10.1061/(ASCE)AE.1943-5568.0000126. 34
Cavalagli, N., A. Kita, V. L. Castaldo, A. L. Pisello, and F. Ubertini, 2019: Hierarchical environmental 35
risk mapping of material degradation in historic masonry buildings: An integrated approach 36
considering climate change and structural damage. Constr. Build. Mater., 215, 998–1014, 37
https://doi.org/10.1016/j.conbuildmat.2019.04.204. 38
Cayla, J.-M., N. Maizi, and C. Marchand, 2011: The role of income in energy consumption behaviour: 39
Evidence from French households data. Energy Policy, 39, 7874–7883, 40
https://doi.org/10.1016/j.enpol.2011.09.036. 41
CE100, 2016: Capturing the value of Circular Economy through Reverse Logistics. 1–20 pp. 42
Cedeño-Laurent, J. G., A. Williams, P. MacNaughton, X. Cao, E. Eitland, J. Spengler, and J. Allen, 43
2018: Building Evidence for Health: Green Buildings, Current Science, and Future Challenges. 44
Annu. Rev. Public Health, 39, 291–308, https://doi.org/10.1146/annurev-publhealth-031816-45
ACCEPTED VERSION
SUBJECT TO FIN
AL EDITS

Final Government Distribution Chapter 9 IPCC AR6 WGIII
Do Not Cite, Quote or Distribute 9-110 Total pages: 168
044420. 1
Cézard, F., and M. Mourad, 2019: Panorama sur la notion de Sobriété – définitions, mises en œuvre, 2
enjeux (rapport final). 52 pp. www.ademe.fr/mediatheque. 3
Chaichaloempreecha, A., P. Winyuchakrit, and B. Limmeechokchai, 2017: Long-term energy savings 4
and GHG mitigations in Thailand’s building sector: Impacts of energy efficiency plan. Energy 5
Procedia, 138, 847–852, https://doi.org/10.1016/j.egypro.2017.10.110. 6
Chakravorty, U., M. Pelli, and B. Ural Marchand, 2014: Does the quality of electricity matter? Evidence 7
from rural India. J. Econ. Behav. Organ., 107, 228–247, 8
https://doi.org/10.1016/j.jebo.2014.04.011. 9
Chan, N. W., and K. Gillingham, 2015: The microeconomic theory of the rebound effect and its welfare 10
implications. J. Assoc. Environ. Resour. Econ., 2, 133–159, https://doi.org/10.1086/680256. 11
Charlier, D., and B. Legendre, 2019: A Multidimensional Approach to Measuring Fuel Poverty. Energy 12
J., 40. 13
——, A. Risch, and C. Salmon, 2018: Energy Burden Alleviation and Greenhouse Gas Emissions 14
Reduction: Can We Reach Two Objectives With One Policy? Ecol. Econ., 143, 294–313, 15
https://doi.org/10.1016/j.ecolecon.2017.07.002. 16
Chatterjee, S., and D. Ürge-Vorsatz, 2018: WP5 Social welfare: Quantification of productivity impacts. 17
D5.4a Final report. 76 p. pp. 18
Chegut, A., P. Eichholtz, and N. Kok, 2014: Supply, Demand and the Value of Green Buildings. Urban 19
Stud., 51, 22–43, https://doi.org/10.1177/0042098013484526. 20
Chen, G., Y. Lv, Y. Zhang, and M. Yang, 2021: Carbonation depth predictions in concrete structures 21
under changing climate condition in China. Eng. Fail. Anal., 119, 104990, 22
https://doi.org/10.1016/j.engfailanal.2020.104990. 23
Chen, K., Z. Li, T.-P. Lu, P.-L. P. Rau, and D. Huang, 2018: Cross-Cultural Design. Applications in 24
Cultural Heritage, Creativity and Social Development. P.-L.P. Rau, Ed. Springer International 25
Publishing, 266–274 pp. 26
Chen, Q., B. Li, and X. Liu, 2013: An experimental evaluation of the living wall system in hot and 27
humid climate. Energy Build., 61, 298–307, https://doi.org/10.1016/j.enbuild.2013.02.030. 28
Cheong C, and Storey D, 2019: Meeting Global Housing Needs with Low-Carbon Materials. 29
https://gggi.org/site/assets/uploads/2019/05/Report-Green-building-materials-for-low-cost-30
housing_circulated.pdf. 31
Ching, F. D. K., 2014: Building Construction Illustrated. 5th ed. Wiley, Ed. John Wiley & Sons, Inc., 32
Hoboken, 480 pp. 33
Chitnis, M., S. Sorrell, A. Druckman, S. K. Firth, and T. Jackson, 2013: Turning lights into flights: 34
Estimating direct and indirect rebound effects for UK households. Energy Policy, 55, 234–250, 35
https://doi.org/10.1016/j.enpol.2012.12.008. 36
Choi, B.-E., J.-H. Shin, J.-H. Lee, H.-J. Kim, S.-S. Kim, and Y.-H. Cho, 2018a: Energy Performance 37
Evaluation and Economic Analysis of Insulation Materials of Office Building in Korea. Adv. Civ. 38
Eng., 2018, 1–8, https://doi.org/10.1155/2018/9102391. 39
Choi, G., S.-Y. Huh, E. Heo, and C.-Y. Lee, 2018b: Prices versus quantities: Comparing economic 40
efficiency of feed-in tariff and renewable portfolio standard in promoting renewable electricity 41
generation. Energy Policy, 113, https://doi.org/10.1016/j.enpol.2017.11.008. 42
Christidou, C., K. P. Tsagarakis, and C. Athanasiou, 2014a: Resource management in organized 43
housing settlements, a case study at Kastoria Region, Greece. Energy Build., 74, 17–29, 44
ACCEPTED VERSION
SUBJECT TO FIN
AL EDITS

Final Government Distribution Chapter 9 IPCC AR6 WGIII
Do Not Cite, Quote or Distribute 9-111 Total pages: 168
https://doi.org/10.1016/j.enbuild.2014.01.012. 1
——, ——, and ——, 2014b: Resource management in organized housing settlements, a case study at 2
Kastoria Region, Greece. Energy Build., 74, 17–29, 3
https://doi.org/10.1016/j.enbuild.2014.01.012. 4
Chu, J., and E. Bowman, 2006: Long-live the machine. How ecodesign & energy labelling can prevent 5
premature obsolescence of laptops. 1–3 pp. 6
Chu, W. X., and C. C. Wang, 2019: A review on airflow management in data centers. Appl. Energy, 7
240, 84–119, https://doi.org/10.1016/j.apenergy.2019.02.041. 8
Chun, N., and Y. Jiang, 2013: How households in Pakistan take on energy efficient lighting technology. 9
Energy Econ., 40, 277–284, https://doi.org/10.1016/j.eneco.2013.07.006. 10
Chunekar, A., 2014: Standards and Labeling program for refrigerators: Comparing India with others. 11
Energy Policy, 65, https://doi.org/10.1016/j.enpol.2013.09.069. 12
Churkina, G., and Coauthors, 2020: Buildings as a global carbon sink. Nat. Sustain., 3, 269–276, 13
https://doi.org/10.1038/s41893-019-0462-4. 14
15
De Cian, E., F. Pavanello, T. Randazzo, M. N. Mistry, and M. Davide, 2019: Households’ adaptation 16
in a warming climate. Air conditioning and thermal insulation choices. Environ. Sci. Policy, 100, 17
136–157, https://doi.org/10.1016/j.envsci.2019.06.015. 18
Ciarreta, A., M. P. Espinosa, and C. Pizarro-Irizar, 2014: Switching from Feed-in Tariffs to a Tradable 19
Green Certificate Market. 20
——, ——, and ——, 2017: Optimal regulation of renewable energy: A comparison of Feed-in Tariffs 21
and Tradable Green Certificates in the Spanish electricity system. Energy Econ., 67, 387–399, 22
https://doi.org/10.1016/j.eneco.2017.08.028. 23
Ciscar, J. C., and P. Dowling, 2014: Integrated assessment of climate impacts and adaptation in the 24
energy sector. Energy Econ., 46, 531–538, https://doi.org/10.1016/j.eneco.2014.07.003. 25
Clancy, J. M., J. Curtis, and B. P. O’Gallachóir, 2017: What are the factors that discourage companies 26
in the Irish commercial sector from investigating energy saving options? Energy Build., 146, 243–27
256, https://doi.org/10.1016/j.enbuild.2017.04.077. 28
Clarke, L., and Coauthors, 2018: Effects of long-term climate change on global building energy 29
expenditures. Energy Econ., 72, 667–677, https://doi.org/10.1016/j.eneco.2018.01.003. 30
Claudy, M. C., C. Michelsen, and A. O’Driscoll, 2011: The diffusion of microgeneration technologies 31
– assessing the influence of perceived product characteristics on home owners’ willingness to pay. 32
Energy Policy, 39, 1459–1469, https://doi.org/10.1016/j.enpol.2010.12.018. 33
Cohen, R., and B. Bordass, 2015: Mandating transparency about building energy performance in use. 34
Build. Res. Inf., 43, 534–552, https://doi.org/10.1080/09613218.2015.1017416. 35
Colenbrander, S., A. Sudmant, N. Chilundika, and A. Gouldson, 2019: The scope for low-carbon 36
development in Kigali, Rwanda: An economic appraisal. Sustain. Dev., 27, 349–365, 37
https://doi.org/10.1002/sd.1906. 38
Coma, J., G. Pérez, C. Solé, A. Castell, and L. F. Cabeza, 2016: Thermal assessment of extensive green 39
roofs as passive tool for energy savings in buildings. Renew. Energy, 85, 1106–1115, 40
https://doi.org/10.1016/j.renene.2015.07.074. 41
——, ——, A. de Gracia, S. Burés, M. Urrestarazu, and L. F. Cabeza, 2017: Vertical greenery systems 42
for energy savings in buildings: A comparative study between green walls and green facades. 43
ACCEPTED VERSION
SUBJECT TO FIN
AL EDITS

Final Government Distribution Chapter 9 IPCC AR6 WGIII
Do Not Cite, Quote or Distribute 9-112 Total pages: 168
Build. Environ., 111, 228–237, https://doi.org/https://doi.org/10.1016/j.buildenv.2016.11.014. 1
Connolly, D., 2017: Heat Roadmap Europe: Quantitative comparison between the electricity, heating, 2
and cooling sectors for different European countries. Energy, 139, 580–593, 3
https://doi.org/10.1016/j.energy.2017.07.037. 4
Connor, P., V. Bürger, L. Beurskens, K. Ericsson, and C. Egger, 2013: Devising renewable heat policy: 5
Overview of support options. Energy Policy, 59, 3–16, 6
https://doi.org/10.1016/j.enpol.2012.09.052. 7
Connor, P. M., L. Xie, R. Lowes, J. Britton, and T. Richardson, 2015: The development of renewable 8
heating policy in the United Kingdom. Renew. Energy, 75, 9
https://doi.org/10.1016/j.renene.2014.10.056. 10
Cook, G., T. Dowdall, D. Pomerantz, and Y. Wang, 2014: Clicking Clean : How Companies are 11
Creating the Green Internet. 12
Cooremans, C., 2011: Make it strategic! Financial investment logic is not enough. Energy Effic., 4, 13
473–492, https://doi.org/10.1007/s12053-011-9125-7. 14
Copiello, S., 2017: Building energy efficiency: A research branch made of paradoxes. Renew. Sustain. 15
Energy Rev., 69, 1064–1076, https://doi.org/10.1016/j.rser.2016.09.094. 16
——, L. Gabrielli, and P. Bonifaci, 2017: Evaluation of energy retrofit in buildings under conditions of 17
uncertainty: The prominence of the discount rate. Energy, 137, 104–117, 18
https://doi.org/10.1016/j.energy.2017.06.159. 19
Cornelis, E., 2019: History and prospect of voluntary agreements on industrial energy efficiency in 20
Europe. Energy Policy, 132, 567–582, https://doi.org/10.1016/j.enpol.2019.06.003. 21
Corrado, V., I. Ballarini, S. Paduos, E. Primo, and P. Torino, 2016: The Rebound Effect after the Energy 22
Refurbishment of Residential Buildings towards High Performances. 4th International High 23
Performance Buildings Conference, 1–10. 24
Cory, K., T. Couture, and C. Kreycik, 2009: Feed-in Tariff Policy : Design, Implementation, and RPS 25
Policy Interactions. 1–17 pp. http://www.osti.gov/servlets/purl/951016-9NogXN/. 26
Costanzo, V., G. Evola, and L. Marletta, 2016: Energy savings in buildings or UHI mitigation? 27
Comparison between green roofs and cool roofs. Energy Build., 114, 247–255, 28
https://doi.org/10.1016/j.enbuild.2015.04.053. 29
Couder, J., and A. Verbruggen, 2017: Quantification and monetization of selected energy system and 30
security impacts. 47 p. pp. https://combi-project.eu/wp-31
content/uploads/D7.4_20180406_final.pdf. 32
Couture, S., S. Garcia, and A. Reynaud, 2012: Household energy choices and fuelwood consumption: 33
An econometric approach using French data. Energy Econ., 34, 1972–1981, 34
https://doi.org/10.1016/j.eneco.2012.08.022. 35
Couture, T., and Y. Gagnon, 2010: An analysis of feed-in tariff remuneration models: Implications for 36
renewable energy investment. Energy Policy, 38, 955–965, 37
https://doi.org/10.1016/j.enpol.2009.10.047. 38
Cowell, S., 2016: Occupant Health Benefits of Residential Energy Efficiency. 35 pp. 39
https://e4thefuture.org/wp-content/uploads/2016/11/Occupant-Health-Benefits-Residential-40
EE.pdf. 41
Craig, C. A., M. W. Allen, S. Feng, and M. L. Spialek, 2020: Exploring the impact of resident proximity 42
to wildfires in the northern Rocky Mountains: Perceptions of climate change risks, drought, and 43
policy. Int. J. Disaster Risk Reduct., 44, 101420, https://doi.org/10.1016/j.ijdrr.2019.101420. 44
ACCEPTED VERSION
SUBJECT TO FIN
AL EDITS

Final Government Distribution Chapter 9 IPCC AR6 WGIII
Do Not Cite, Quote or Distribute 9-113 Total pages: 168
Crawford, R. H., and G. J. Treolar, 2010: Database of embodied energy and water values for materials. 1
Crawley, J., P. Biddulph, P. J. Northrop, J. Wingfield, T. Oreszczyn, and C. Elwell, 2019: Quantifying 2
the Measurement Error on England and Wales EPC Ratings. Energies, 12, 3523, 3
https://doi.org/10.3390/en12183523. 4
Creutzig, F., 2014: How fuel prices determine public transport infrastructure, modal shares and urban 5
form. Urban Clim., 10, 63–76, https://doi.org/10.1016/j.uclim.2014.09.003. 6
——, B. Fernandez, H. Haberl, R. Khosla, Y. Mulugetta, and K. C. Seto, 2016: Beyond technology: 7
demand-side solutions for climate change mitigation. Annu. Rev. Environ. Resour., 41, 173–198, 8
https://doi.org/10.1146/annurev-environ-110615-085428. 9
——, and Coauthors, 2018: Towards demand-side solutions for mitigating climate change. Nat. Clim. 10
Chang., 8, 260–263, https://doi.org/10.1038/s41558-018-0121-1. 11
Cruz, T., R. Schaeffer, A. F. P. Lucena, S. Melo, and R. Dutra, 2020: Solar water heating technical-12
economic potential in the household sector in Brazil. Renew. Energy, 146, 1618–1639, 13
https://doi.org/10.1016/j.renene.2019.06.085. 14
Csoknyai, T., S. Hrabovszky-Horváth, Z. Georgiev, M. Jovanovic-Popovic, B. Stankovic, O. Villatoro, 15
and G. Szendrő, 2016: Building stock characteristics and energy performance of residential 16
buildings in Eastern-European countries. Energy Build., 132, 39–52, 17
https://doi.org/10.1016/j.enbuild.2016.06.062. 18
Cui, Y., D. Yan, T. Hong, C. Xiao, X. Luo, and Q. Zhang, 2017: Comparison of typical year and 19
multiyear building simulations using a 55-year actual weather data set from China. Appl. Energy, 20
195, 890–904, https://doi.org/10.1016/j.apenergy.2017.03.113. 21
Curl, A., A. Kearns, P. Mason, M. Egan, C. Tannahill, and A. Ellaway, 2015: Physical and mental 22
health outcomes following housing improvements: Evidence from the GoWell study. J. 23
Epidemiol. Community Health, 69, 12–19, https://doi.org/10.1136/jech-2014-204064. 24
Curtis, J., A. Walton, and M. Dodd, 2017: Understanding the potential of facilities managers to be 25
advocates for energy efficiency retrofits in mid-tier commercial office buildings. Energy Policy, 26
103, 98–104, https://doi.org/10.1016/j.enpol.2017.01.016. 27
Curtis, J., D. McCoy, and C. Aravena, 2018: Heating system upgrades: The role of knowledge, socio-28
demographics, building attributes and energy infrastructure. Energy Policy, 120, 183–196, 29
https://doi.org/10.1016/j.enpol.2018.05.036. 30
D.Arnone, V.Croce, G.Paterno, A. R., 2016: Energy management of multi-carrier smart buildings for 31
integrating local renewable energy system. 5th International Conference on Renewable Energy 32
Research and Applications, Birmingham,UK, 845–850. 33
D’Oca, S., T. Hong, and J. Langevin, 2018a: The human dimensions of energy use in buildings: A 34
review. Renew. Sustain. Energy Rev., 81, 731–742, https://doi.org/10.1016/j.rser.2017.08.019. 35
D’Oca, S., A. L. Pisello, M. De Simone, V. M. Barthelmes, T. Hong, and S. P. Corgnati, 2018b: Human-36
building interaction at work: Findings from an interdisciplinary cross-country survey in Italy. 37
Build. Environ., 132, 147–159, https://doi.org/10.1016/j.buildenv.2018.01.039. 38
Das, I., J. Pedit, S. Handa, and P. Jagger, 2018: Household air pollution (HAP), microenvironment and 39
child health: Strategies for mitigating HAP exposure in urban Rwanda. Environ. Res. Lett., 13, 40
https://doi.org/10.1088/1748-9326/aab047. 41
Davide, M., E. De Cian, and A. Bernigaud, 2019: Building a framework to understand the energy needs 42
of adaptation. Sustain., 11, 4085, https://doi.org/10.3390/su11154085. 43
Davis, L. W., and P. J. Gertler, 2015: Contribution of air conditioning adoption to future energy use 44
under global warming. Proc. Natl. Acad. Sci. U. S. A., 112, 5962–5967, 45
ACCEPTED VERSION
SUBJECT TO FIN
AL EDITS

Final Government Distribution Chapter 9 IPCC AR6 WGIII
Do Not Cite, Quote or Distribute 9-114 Total pages: 168
https://doi.org/10.1073/pnas.1423558112. 1
Decker, T., and K. Menrad, 2015: House owners’ perceptions and factors influencing their choice of 2
specific heating systems in Germany. Energy Policy, 85, 150–161, 3
https://doi.org/10.1016/j.enpol.2015.06.004. 4
Delmas, M. A., M. Fischlein, and O. I. Asensio, 2013: Information strategies and energy conservation 5
behavior: A meta-analysis of experimental studies from 1975 to 2012. Energy Policy, 61, 729–6
739, https://doi.org/10.1016/j.enpol.2013.05.109. 7
Deng, G., and P. Newton, 2017: Assessing the impact of solar PV on domestic electricity consumption: 8
Exploring the prospect of rebound effects. Energy Policy, 110, 9
https://doi.org/10.1016/j.enpol.2017.08.035. 10
Deng, H. M., Q. M. Liang, L. J. Liu, and L. D. Anadon, 2017: Co-benefits of greenhouse gas mitigation: 11
A review and classification by type, mitigation sector, and geography. Environ. Res. Lett., 12, 12
123001, https://doi.org/10.1088/1748-9326/aa98d2. 13
Deng, Q., X. Jiang, Q. Cui, and L. Zhang, 2015: Strategic design of cost savings guarantee in energy 14
performance contracting under uncertainty. Appl. Energy, 139, 68–80, 15
https://doi.org/10.1016/j.apenergy.2014.11.027. 16
Deng, Y., and J. Wu, 2014: Economic returns to residential green building investment: The developers’ 17
perspective. Reg. Sci. Urban Econ., 47, 35–44, 18
https://doi.org/10.1016/j.regsciurbeco.2013.09.015. 19
——, Z. Li, and J. M. Quigley, 2012: Economic returns to energy-efficient investments in the housing 20
market: Evidence from Singapore. Reg. Sci. Urban Econ., 42, 506–515, 21
https://doi.org/10.1016/j.regsciurbeco.2011.04.004. 22
Department of Environmental Affairs, 2014: South Africa’s Greenhouse Gas (GHG) Mitigation 23
Potential Analysis. 152 p. pp. 24
Derungs, C., E. Lobsiger-Kägi, U. Tomic, R. Marek, and B. Sütterlin, 2019: Occupant-centred 25
temperature reduction in an energy efficient site. J. Phys. Conf. Ser., 1343, 012146, 26
https://doi.org/10.1088/1742-6596/1343/1/012146. 27
Detlef Van Vuuren et.al, 2021: The 2021 SSP scenarios of the IMAGE 3.2 model. 28
Dewick, P., and P. Owen, 2015: How effective is a games-centric approach in changing student eco 29
behaviours? https://www.research.manchester.ac.uk/portal/en/publications/how-effective-is-a-30
gamescentric-approach-in-changing-student-eco-behaviours-research-evaluation-report-31
2015(42b3e263-a5b7-4397-90a4-4cec13e882c4).html (Accessed December 22, 2020). 32
Dhar, S., M. Pathak, and P. R. Shukla, 2018: Role of energy efficiency for low carbon transformation 33
of India. Chem. Eng. Trans., 63, 307–312, https://doi.org/10.3303/CET1863052. 34
Diaz-Mendez, S. E., A. A. Torres-Rodríguez, M. Abatal, M. A. E. Soberanis, A. Bassam, and G. K. 35
Pedraza-Basulto, 2018: Economic, environmental and health co-benefits of the use of advanced 36
control strategies for lighting in buildings of Mexico. Energy Policy, 113, 401–409, 37
https://doi.org/10.1016/j.enpol.2017.11.028. 38
Diffney, S., S. Lyons, and L. Malaguzzi Valeri, 2013: Evaluation of the effect of the Power of One 39
campaign on natural gas consumption. Energy Policy, 62, 978–988, 40
https://doi.org/10.1016/j.enpol.2013.07.099. 41
Diguet, C., and F. Lopez, 2019: L’Impact Spatial Et Energetique Des Data. 10 pp. 42
Dijkgraaf, E., T. P. van Dorp, and E. Maasland, 2018: On the effectiveness of feed-in tariffs in the 43
development of solar photovoltaics. Energy J., 39, https://doi.org/10.5547/01956574.39.1.edij. 44
ACCEPTED VERSION
SUBJECT TO FIN
AL EDITS

Final Government Distribution Chapter 9 IPCC AR6 WGIII
Do Not Cite, Quote or Distribute 9-115 Total pages: 168
Dilger, M. G., T. Jovanović, and K. I. Voigt, 2017: Upcrowding energy co-operatives – Evaluating the 1
potential of crowdfunding for business model innovation of energy co-operatives. J. Environ. 2
Manage., 198, 50–62, https://doi.org/10.1016/j.jenvman.2017.04.025. 3
Dioha, M. O., N. V. Emodi, and E. C. Dioha, 2019: Pathways for low carbon Nigeria in 2050 by using 4
NECAL2050. Renew. Energy Focus, 29, 63–77, https://doi.org/10.1016/j.ref.2019.02.004. 5
Dirks, J. A., and Coauthors, 2015: Impacts of climate change on energy consumption and peak demand 6
in buildings: A detailed regional approach. Energy, 79, 20–32, 7
https://doi.org/10.1016/j.energy.2014.08.081. 8
Dixit, M. K., 2019: 3-D Printing in Building Construction: A Literature Review of Opportunities and 9
Challenges of Reducing Life Cycle Energy and Carbon of Buildings. IOP Conf. Ser. Earth 10
Environ. Sci., 290, https://doi.org/10.1088/1755-1315/290/1/012012. 11
Dixon, G. N., M. B. Deline, K. McComas, L. Chambliss, and M. Hoffmann, 2015: Using Comparative 12
Feedback to Influence Workplace Energy Conservation: A Case Study of a University Campaign. 13
Environ. Behav., 47, 667–693, https://doi.org/10.1177/0013916513520417. 14
Djedjig, R., E. Bozonnet, and R. Belarbi, 2015: Analysis of thermal effects of vegetated envelopes: 15
Integration of a validated model in a building energy simulation program. Energy Build., 86, 93–16
103, https://doi.org/10.1016/j.enbuild.2014.09.057. 17
Do, T. N., P. J. Burke, K. G. H. Baldwin, and C. T. Nguyen, 2020: Underlying drivers and barriers for 18
solar photovoltaics diffusion: The case of Vietnam. Energy Policy, 144, 111561, 19
https://doi.org/10.1016/j.enpol.2020.111561. 20
Dodoo, A., and L. Gustavsson, 2016: Energy use and overheating risk of Swedish multi-storey 21
residential buildings under different climate scenarios. Energy, 97, 534–548, 22
https://doi.org/10.1016/j.energy.2015.12.086. 23
Doll, S. C., E. L. Davison, and B. R. Painting, 2016: Weatherization impacts and baseline indoor 24
environmental quality in low income single-family homes. Build. Environ., 107, 181–190, 25
https://doi.org/10.1016/j.buildenv.2016.06.021. 26
Donastorg, A., S. Renukappa, and S. Suresh, 2017: Financing Renewable Energy Projects in 27
Developing Countries: A Critical Review. IOP Conf. Ser. Earth Environ. Sci., 83, 28
https://doi.org/10.1088/1755-1315/83/1/012012. 29
Dong, H.-W., B.-J. Kim, S.-Y. Yoon, and J.-W. Jeong, 2020: Energy benefit of organic Rankine cycle 30
in high-rise apartment building served by centralized liquid desiccant and evaporative cooling-31
assisted ventilation system. Sustain. Cities Soc., 60, 102280, 32
https://doi.org/10.1016/j.scs.2020.102280. 33
Doukas, H., and A. Nikas, 2020: Decision support models in climate policy. Eur. J. Oper. Res., 280, 1–34
24, https://doi.org/10.1016/j.ejor.2019.01.017. 35
Dreyfus, G., and Coauthors, 2020a: Assessment of Climate and Development Benefits of Efficient and 36
Climate-Friendly Cooling. 37
Dreyfus, G., Borgford-Parnell, J. Fahey, B. Peters, and Xu, 2020b: Assessment of Climate and 38
Development Benefits of Efficient and Climate-Friendly Cooling. 39
https://ccacoalition.org/en/resources/assessment-. 40
Drysdale, B., J. Wu, and N. Jenkins, 2015: Flexible demand in the GB domestic electricity sector in 41
2030. Appl. Energy, 139, 281–290, https://doi.org/10.1016/j.apenergy.2014.11.013. 42
Duffy, A., 2009: Land use planning in Ireland-a life cycle energy analysis of recent residential 43
development in the Greater Dublin Area. Int. J. Life Cycle Assess., 14, 268–277, 44
https://doi.org/10.1007/s11367-009-0059-7. 45
ACCEPTED VERSION
SUBJECT TO FIN
AL EDITS

Final Government Distribution Chapter 9 IPCC AR6 WGIII
Do Not Cite, Quote or Distribute 9-116 Total pages: 168
Duman, A. C., H. S. Erden, Ö. Gönül, and Ö. Güler, 2021: A home energy management system with 1
an integrated smart thermostat for demand response in smart grids. Sustain. Cities Soc., 65, 2
https://doi.org/10.1016/j.scs.2020.102639. 3
Duong, T. T., T. D. Brewer, J. Luck, and K. K. Zander, 2019: Farmers’ assessment of plant biosecurity 4
risk management strategies and influencing factors: A study of smallholder farmers in Australia. 5
Outlook Agric., 48, 48–57, https://doi.org/10.1177/0030727019829754. 6
Duscha, V., J. Wachsmuth, J. Eckstein, and B. Pfluger, 2019: GHG-neutral EU2050 – a scenario of an 7
EU with net-zero greenhouse gas emissions and its implications. 8
Dutt, D., 2020: Understanding the barriers to the diffusion of rooftop solar: A case study of Delhi 9
(India). Energy Policy, 144, 111674, https://doi.org/10.1016/j.enpol.2020.111674. 10
Duzgun, B., and G. Komurgoz, 2014: Turkey’s energy efficiency assessment: White certificates 11
systems and their applicability in Turkey. Energy Policy, 65, 465–474, 12
https://doi.org/10.1016/j.enpol.2013.10.036. 13
Dylewski, R., and J. Adamczyk, 2016: The environmental impacts of thermal insulation of buildings 14
including the categories of damage: A Polish case study. J. Clean. Prod., 137, 878–887, 15
https://doi.org/10.1016/j.jclepro.2016.07.172. 16
Eadson, W., J. Gilbertson, and A. Walshaw, 2013: Attitudes and Perceptions of the Green Deal amongst 17
private sector landlords in Rotherham Summary Report. 18
https://www4.shu.ac.uk/research/cresr/sites/shu.ac.uk/files/green-deal-landlords-rotherham-19
summary.pdf (Accessed December 22, 2020). 20
Economidou, M., and P. Bertoldi, 2015: Practices to overcome split incentives in the EU building stock. 21
ECEEE 2015 Summer Study, 12. 22
——, and T. Serrenho, 2019: Assessment of progress made by Member States in relation to Article 23
19(1) of the Directive 2012/27/EU. Publications Office of the European Union, 62 p. pp. 24
Economidou, M., V. Todeschi, P. Bertoldi, D. D’Agostino, P. Zangheri, and L. Castellazzi, 2020: 25
Review of 50 years of EU energy efficiency policies for buildings. Energy Build., 225, 26
https://doi.org/10.1016/j.enbuild.2020.110322. 27
Elements energy Ltd, 2018: Cost analysis of future heat infrastructure options. 105 pp. 28
Ellsworth-Krebs, K., 2020: Implications of declining household sizes and expectations of home comfort 29
for domestic energy demand. Nat. Energy, 5, 20–25, https://doi.org/10.1038/s41560-019-0512-1. 30
Energetics, 2016: Modelling and analysis of Australia’s abatement opportunities. 60 p. pp. 31
Engvall, K., E. Lampa, P. Levin, P. Wickman, and E. Ofverholm, 2014: Interaction between building 32
design, management, household and individual factors in relation to energy use for space heating 33
in apartment buildings. Energy Build., 81, 457–465, 34
https://doi.org/10.1016/j.enbuild.2014.06.051. 35
Enker, R. A., and G. M. Morrison, 2017: Analysis of the transition effects of building codes and 36
regulations on the emergence of a low carbon residential building sector. Energy Build., 156, 40–37
50, https://doi.org/10.1016/j.enbuild.2017.09.059. 38
Enongene, K. E., P. Murray, J. Holland, and F. H. Abanda, 2017: Energy savings and economic benefits 39
of transition towards efficient lighting in residential buildings in Cameroon. Renew. Sustain. 40
Energy Rev., 78, 731–742, https://doi.org/10.1016/j.rser.2017.04.068. 41
Erhorn-Kluttig, H., and Coauthors, 2019: Cost-efficient Nearly Zero-Energy Buildings (NZEBs). IOP 42
Conf. Ser. Mater. Sci. Eng., 609, 062002, https://doi.org/10.1088/1757-899X/609/6/062002. 43
ESMAP, MECS, and World Bank Group, 2020: Cooking with electricity - A cost perspective. 44
ACCEPTED VERSION
SUBJECT TO FIN
AL EDITS

Final Government Distribution Chapter 9 IPCC AR6 WGIII
Do Not Cite, Quote or Distribute 9-117 Total pages: 168
Esser, A., A. Dunne, T. Meeusen, S. Quaschning, and W. Denis, 2019: Comprehensive study of building 1
energy renovation activities and the uptake of nearly zero-energy buildings in the EU. Final 2
report. 87 pp. 3
European Commission, 2016: The Macroeconomic and Other Benefits of Energy Efficiency Final 4
report. http://europa.eu. 5
——, 2020: Circular economy action plan. Eur. Comm., 28, https://doi.org/10.2775/855540. 6
European Parliament and the Council, 2020: Regulation (EU) 2020/852 of 18 June 2020 on the 7
establishment of a framework to facilitate sustainable investment, and amending Regulation (EU) 8
2019/2088. Off. J. Eur. Union, 13–43. 9
European Union, 2015: Crowdfunding from an investor perspective. 93 p. pp. 10
——, 2019: Supporting digitalisation of the construction sector and SMEs. 92 pp. 11
Evans, M., V. Roshchanka, and P. Graham, 2017: An international survey of building energy codes and 12
their implementation. J. Clean. Prod., 158, 382–389, 13
https://doi.org/10.1016/j.jclepro.2017.01.007. 14
Eyre, N., 2013: Energy saving in energy market reform—The feed-in tariffs option. Energy Policy, 52, 15
https://doi.org/10.1016/j.enpol.2012.07.042. 16
Falchetta, G., and M. N. Mistry, 2021: The role of residential air circulation and cooling demand for 17
electrification planning: implications of climate change over sub-Saharan Africa. Energy Econ.,. 18
De Falco, M., M. Capocelli, and A. Giannattasio, 2016: Performance analysis of an innovative PCM-19
based device for cold storage in the civil air conditioning. Energy Build., 122, 1–10, 20
https://doi.org/10.1016/j.enbuild.2016.04.016. 21
Fallahi, A., F. Haghighat, and H. Elsadi, 2010: Energy performance assessment of double-skin façade 22
with thermal mass. Energy Build., 42, 1499–1509, https://doi.org/10.1016/j.enbuild.2010.03.020. 23
Fan, J., Y. Li, Y. Wu, S. Wang, and D. Zhao, 2016: Allowance trading and energy consumption under 24
a personal carbon trading scheme: A dynamic programming approach. J. Clean. Prod., 112, 3875–25
3883, https://doi.org/10.1016/j.jclepro.2015.07.030. 26
Farajirad, K., G. Kazemian, and Roknoddin Eftekhari A., 2015: Explanatory Model of the Relationship 27
between Regional Governance, Institutional Capacity and Sustainable Development in Iran,. 28
Public Policy Adm. Res., 5. 29
Farzaneh, H., L. Malehmirchegini, A. Bejan, T. Afolabi, A. Mulumba, and P. P. Daka, 2021: Artificial 30
intelligence evolution in smart buildings for energy efficiency. Appl. Sci., 11, 1–26, 31
https://doi.org/10.3390/app11020763. 32
Fawcett, T., 2010: Personal carbon trading: A policy ahead of its time? Energy Policy, 38, 33
https://doi.org/10.1016/j.enpol.2010.07.001. 34
——, and Y. Parag, 2017: Personal Carbon Trading. Y. Parag and T. Fawcett, Eds. Routledge,. 35
——, and S. Darby, 2018: Energy sufficiency: an introduction. Concept paper. 36
——, J. Rosenow, and P. Bertoldi, 2019: Energy efficiency obligation schemes: their future in the EU. 37
Energy Effic., 12, 57–71, https://doi.org/10.1007/s12053-018-9657-1. 38
Feng, W., and Coauthors, 2019: A review of net zero energy buildings in hot and humid climates: 39
Experience learned from 34 case study buildings. Renew. Sustain. Energy Rev., 114, 109303, 40
https://doi.org/10.1016/j.rser.2019.109303. 41
Ferreboeuf, H., 2019: Lean ICT - towards digital sobriety. 90 pp. 42
ACCEPTED VERSION
SUBJECT TO FIN
AL EDITS
Final Government Distribution Chapter 9 IPCC AR6 WGIII
Do Not Cite, Quote or Distribute 9-118 Total pages: 168
Ferreira, M., M. Almeida, and A. Rodrigues, 2017: Impact of co-benefits on the assessment of energy 1
related building renovation with a nearly-zero energy target. Energy Build., 152, 587–601, 2
https://doi.org/10.1016/j.enbuild.2017.07.066. 3
Ferreira, P., A. Rocha, and M. Araujo, 2018: Awareness and attitudes towards demand response 4
programs – a pilot study. 2018 International Conference on Smart Energy Systems and 5
Technologies (SEST), IEEE, 1–6. 6
Filippi Oberegger, U., R. Pernetti, and R. Lollini, 2020: Bottom-up building stock retrofit based on 7
levelized cost of saved energy. Energy Build., 210, 109757, 8
https://doi.org/10.1016/j.enbuild.2020.109757. 9
Fina, B., H. Auer, and W. Friedl, 2020: Cost-optimal economic potential of shared rooftop PV in energy 10
communities: Evidence from Austria. Renew. Energy, 152, 217–228, 11
https://doi.org/10.1016/j.renene.2020.01.031. 12
Finnegan, S., C. Jones, and S. Sharples, 2018: The embodied CO 2 e of sustainable energy technologies 13
used in buildings: A review article. Energy Build., 181, 50–61, 14
https://doi.org/10.1016/j.enbuild.2018.09.037. 15
Fischer, A., and S. Pascucci, 2017: Institutional incentives in circular economy transition: The case of 16
material use in the Dutch textile industry. J. Clean. Prod., 155, 17–32, 17
https://doi.org/10.1016/J.JCLEPRO.2016.12.038. 18
Fishman, T., N. Heeren, S. Pauliuk, P. Berrill, Q. Tu, P. Wolfram, and E. G. Hertwich, 2021: A 19
comprehensive set of global scenarios of housing, mobility, and material efficiency for material 20
cycles and energy systems modeling. J. Ind. Ecol., 25, 305–320, 21
https://doi.org/10.1111/jiec.13122. 22
Fisk, W. J., 2015: Review of some effects of climate change on indoor environmental quality and health 23
and associated no-regrets mitigation measures. Build. Environ., 86, 70–80, 24
https://doi.org/10.1016/j.buildenv.2014.12.024. 25
Fisk, W. J., 2018: How home ventilation rates affect health: A literature review. Indoor Air, 28, 473–26
487, https://doi.org/10.1111/ina.12469. 27
Fisk, W. J., B. C. Singer, and W. R. Chan, 2020: Association of residential energy efficiency retrofits 28
with indoor environmental quality, comfort, and health: A review of empirical data. Build. 29
Environ., 180, 107067, https://doi.org/10.1016/j.buildenv.2020.107067. 30
Fleming, D., 1997: Tradable quotas: using information technology to cap national carbon emissions. 31
Eur. Environ., 7, https://doi.org/10.1002/(SICI)1099-0976(199709)7:5<139::AID-32
EET129>3.0.CO;2-C. 33
Font Vivanco, D., R. Kemp, and E. van der Voet, 2016: How to deal with the rebound effect? A policy-34
oriented approach. Energy Policy, 94, 114–125, https://doi.org/10.1016/j.enpol.2016.03.054. 35
Ford, A., K. Vogstad, and H. Flynn, 2007: Simulating price patterns for tradable green certificates to 36
promote electricity generation from wind. Energy Policy, 35, 37
https://doi.org/10.1016/j.enpol.2005.10.014. 38
Forouli, A., N. Gkonis, A. Nikas, E. Siskos, H. Doukas, and C. Tourkolias, 2019: Energy efficiency 39
promotion in Greece in light of risk: Evaluating policies as portfolio assets. Energy, 170, 818–40
831, https://doi.org/10.1016/j.energy.2018.12.180. 41
Fosas, D., D. A. Coley, S. Natarajan, M. Herrera, M. Fosas de Pando, and A. Ramallo-Gonzalez, 2018: 42
Mitigation versus adaptation: Does insulating dwellings increase overheating risk? Build. 43
Environ., 143, 740–759, https://doi.org/10.1016/j.buildenv.2018.07.033. 44
Fouladvand, J., N. Mouter, A. Ghorbani, and P. Herder, 2020: Formation and Continuation of Thermal 45
ACCEPTED VERSION
SUBJECT TO FIN
AL EDITS

Final Government Distribution Chapter 9 IPCC AR6 WGIII
Do Not Cite, Quote or Distribute 9-119 Total pages: 168
Energy Community Systems: An Explorative Agent-Based Model for the Netherlands. Energies, 1
13, 2829, https://doi.org/10.3390/en13112829. 2
Fouquet, D., 2013: Policy instruments for renewable energy – From a European perspective. Renew. 3
Energy, 49, https://doi.org/10.1016/j.renene.2012.01.075. 4
Fournier, E. D., F. Federico, E. Porse, and S. Pincetl, 2019: Effects of building size growth on residential 5
energy efficiency and conservation in California. Appl. Energy, 240, 446–452, 6
https://doi.org/10.1016/j.apenergy.2019.02.072. 7
Frankfurt School - UNEP Centre/BNEF, 2020: Global Trends Renewable Energy 2020. 8
Frazer-Nash Consultancy, 2018: Logistics of Domestic Hydrogen Conversion. 58 pp. 9
Frederiks, E. R., K. Stenner, and E. V. Hobman, 2015: Household energy use: Applying behavioural 10
economics to understand consumer decision-making and behaviour. Renew. Sustain. Energy Rev., 11
41, 1385–1394, https://doi.org/10.1016/j.rser.2014.09.026. 12
Freire-González, J., 2020: Energy taxation policies can counteract the rebound effect: analysis within a 13
general equilibrium framework. Energy Effic., 13, 69–78, https://doi.org/10.1007/s12053-019-14
09830-x. 15
——, and M. S. Ho, 2019: Carbon taxes and the double dividend hypothesis in a recursive-dynamic 16
CGE model for Spain. Econ. Syst. Res., 31, 267–284, 17
https://doi.org/10.1080/09535314.2019.1568969. 18
Fricko, O., S. C. Parkinson, N. Johnson, M. Strubegger, M. T. Van Vliet, and K. Riahi, 2016: Energy 19
sector water use implications of a 2 °C climate policy. Environ. Res. Lett., 11, 034011, 20
https://doi.org/10.1088/1748-9326/11/3/034011. 21
Friedrich, L., and A. Afshari, 2015: Framework for Energy Efficiency White Certificates in the Emirate 22
of Abu Dhabi. Energy Procedia, 75, 2589–2595, https://doi.org/10.1016/j.egypro.2015.07.316. 23
Friege, J., 2016: Increasing homeowners’ insulation activity in Germany: An empirically grounded 24
agent-based model analysis. Energy Build., 128, 756–771, 25
https://doi.org/10.1016/j.enbuild.2016.07.042. 26
——, G. Holtz, and É. J. L. Chappin, 2016: Exploring homeowners’ insulation activity. Jasss, 19, 1–27
19, https://doi.org/10.18564/jasss.2941. 28
Fuerst, F., P. McAllister, A. Nanda, and P. Wyatt, 2015: Does energy efficiency matter to home-buyers? 29
An investigation of EPC ratings and transaction prices in England. Energy Econ., 48, 145–156, 30
https://doi.org/10.1016/j.eneco.2014.12.012. 31
——, E. Oikarinen, and O. Harjunen, 2016: Green signalling effects in the market for energy-efficient 32
residential buildings. Appl. Energy, 180, 560–571, 33
https://doi.org/10.1016/j.apenergy.2016.07.076. 34
Fukuda-Parr, S., C. Lopes, and K. Malik, 2002: Overview: Institutional innovations for capacity 35
development. Capacity for Development, New Solutions to Old Problems, Edited by: Fukuda-36
Parr, S., Lopes, C. and Malik, K. London and Sterling, VA: U. 284 , UNDP-Earthscan, Ed. 37
Fuller, R. J., and R. H. Crawford, 2011: Impact of past and future residential housing development 38
patterns on energy demand and related emissions. J. Hous. Built Environ., 26, 165–183, 39
https://doi.org/10.1007/s10901-011-9212-2. 40
Gabe, J., 2016: An empirical comparison of voluntary and mandatory building energy performance 41
disclosure outcomes. Energy Policy, 96, 680–687, https://doi.org/10.1016/j.enpol.2016.06.044. 42
Gagnon, Peter, Margolis, Robert, Melius, Jennifer, Phillips, Saleb, Elmore, R., 2016: Photovoltaic 43
Technical Potential in the United States: A Detailed Assessment. 82 pp. 44
ACCEPTED VERSION
SUBJECT TO FIN
AL EDITS
Final Government Distribution Chapter 9 IPCC AR6 WGIII
Do Not Cite, Quote or Distribute 9-120 Total pages: 168
http://www.nrel.gov/docs/fy16osti/65298.pdf. 1
Gährs, S., K. Mehler, M. Bost, and B. Hirschl, 2015: Acceptance of ancillary services and willingness 2
to invest in PV-storage-systems. Energy Procedia, 73, 29–36, 3
https://doi.org/10.1016/j.egypro.2015.07.554. 4
Galán-Marín, C., C. Rivera-Gómez, and A. García-Martínez, 2015: Embodied energy of conventional 5
load-bearing walls versus natural stabilized earth blocks. Energy Build., 97, 146–154, 6
https://doi.org/10.1016/j.enbuild.2015.03.054. 7
Galvin, R., 2014: Making the “rebound effect” more useful for performance evaluation of thermal 8
retrofits of existing homes: Defining the “energy savings deficit” and the “energy performance 9
gap.” Energy Build., 69, 515–524, https://doi.org/10.1016/j.enbuild.2013.11.004. 10
——, and M. Sunikka-Blank, 2017: Ten questions concerning sustainable domestic thermal retrofit 11
policy research. Build. Environ., 118, 377–388, https://doi.org/10.1016/j.buildenv.2017.03.007. 12
García-Álvarez, M. T., L. Cabeza-García, and I. Soares, 2018: Assessment of energy policies to 13
promote photovoltaic generation in the European Union. Energy, 151, 14
https://doi.org/10.1016/j.energy.2018.03.066. 15
García-Frapolli, E., and Coauthors, 2010: Beyond fuelwood savings: Valuing the economic benefits of 16
introducing improved biomass cookstoves in the Purépecha region of Mexico. Ecol. Econ., 69, 17
2598–2605, https://doi.org/10.1016/j.ecolecon.2010.08.004. 18
García de Soto, B., I. Agustí-Juan, J. Hunhevicz, S. Joss, K. Graser, G. Habert, and B. T. Adey, 2018: 19
Productivity of digital fabrication in construction: Cost and time analysis of a robotically built 20
wall. Autom. Constr., 92, 297–311, https://doi.org/10.1016/j.autcon.2018.04.004. 21
Gelenbe, E., and Y. Caseau, 2015: The impact of information technology on energy consumption and 22
carbon emissions. Ubiquity, 1530–2180, 1–15, https://doi.org/10.1145/2755977. 23
Gephart, M., C. Klessmann, and F. Wigand, 2017: Renewable energy auctions – When are they (cost-24
)effective? Energy Environ., 28, https://doi.org/10.1177/0958305X16688811. 25
Gerhardt, N., J. Bard, R. Schmitz, M. Beil, M. Pfennig, and T. Kneiske, 2020: Hydrogen in the energy 26
system of the future: focus on heat in buildings. 46 pp. 27
Gertler, P. J., O. Shelef, C. D. Wolfram, and A. Fuchs, 2016: The demand for energy-using assets among 28
the world’s rising middle classes. Am. Econ. Rev., 106, 1366–1401, 29
https://doi.org/10.1257/aer.20131455. 30
Ghazali, F., A. H. Ansari, M. Mustafa, and W. M. Z. Wan Zahari, 2020: FEED-IN TARIFF, 31
AUCTIONS AND RENEWABLE ENERGY SCHEMES IN MALAYSIA: LESSONS FROM 32
OTHER JURISDICTIONS. IIUM Law J., 28, https://doi.org/10.31436/iiumlj.v28i1.482. 33
Gifford, R., 2011: The Dragons of Inaction: Psychological Barriers That Limit Climate Change 34
Mitigation and Adaptation. Am. Psychol., 66, 290–302, https://doi.org/10.1037/a0023566. 35
Gillingham, K., M. Harding, and D. Rapson, 2012: Split Incentives in Residential Energy Consumption. 36
Energy J., 33, 37–62, https://doi.org/10.5547/01956574.33.2.3. 37
——, D. Rapson, and G. Wagner, 2016: The Rebound Effect and Energy Efficiency Policy. Rev. 38
Environ. Econ. Policy, 10, 68–88, https://doi.org/10.1093/reep/rev017. 39
Giraudet, L.-G., 2020: Energy efficiency as a credence good: A review of informational barriers to 40
energy savings in the building sector. Energy Econ., 87, 104698, 41
https://doi.org/10.1016/j.eneco.2020.104698. 42
——, C. Bourgeois, and P. Quirion, 2018: Long-term efficiency and distributional impacts of energy 43
saving policies in the French residential sector. 27 p. 44
ACCEPTED VERSION
SUBJECT TO FIN
AL EDITS

Final Government Distribution Chapter 9 IPCC AR6 WGIII
Do Not Cite, Quote or Distribute 9-121 Total pages: 168
——, A. Petronevich, and L. Faucheux, 2019: How Do Lenders Price Energy Efficiency? Evidence 1
From Personal Consumption Loans. SSRN Electron. J., 31 p., 2
https://doi.org/10.2139/ssrn.3364243. 3
——, C. Bourgeois, and P. Quirion, 2021: Policies for low-carbon and affordable home heating: A 4
French outlook. Energy Policy, 151, https://doi.org/10.1016/j.enpol.2021.112140. 5
Global Alliance for Buildings and Construction, 2019: 2019 Global Status Report for Buildings and 6
Construction Sector. 7
Gohaud, E., and S. Baek, 2017: What is a Korean officetel? Case study on Bundang New Town. Front. 8
Archit. Res., 6, 261–271, https://doi.org/10.1016/j.foar.2017.04.001. 9
Goldemberg, J., J. Martinez-Gomez, A. Sagar, and K. R. Smith, 2018: Household air pollution, health, 10
and climate change: cleaning the air. Environ. Res. Lett., 13, 030201, 11
https://doi.org/10.1088/1748-9326/aaa49d. 12
Goldstein, B., D. Gounaridis, and J. P. Newell, 2020: The carbon footprint of household energy use in 13
the United States. Proc. Natl. Acad. Sci., 117, 19122–19130, 14
https://doi.org/10.1073/pnas.1922205117. 15
Gong, X., N. Wu, C. Li, M. Liang, and Y. Akashi, 2019: Energy performance and CO 2 emissions of 16
fuel cells for residential application in Chinese hot summer and cold winter areas. IOP Conf. Ser. 17
Earth Environ. Sci., 310, 022057, https://doi.org/10.1088/1755-1315/310/2/022057. 18
González-Mahecha, R. E., A. F. P. Lucena, R. Garaffa, R. F. C. Miranda, M. Chávez-Rodriguez, T. 19
Cruz, P. Bezerra, and R. Rathmann, 2019: Greenhouse gas mitigation potential and abatement 20
costs in the Brazilian residential sector. Energy Build., 184, 21
https://doi.org/10.1016/j.enbuild.2018.11.039. 22
González Mahecha, R. E., L. Rosse Caldas, R. Garaffa, A. F. P. Lucena, A. Szklo, and R. D. Toledo 23
Filho, 2020: Constructive systems for social housing deployment in developing countries: A case 24
study using dynamic life cycle carbon assessment and cost analysis in Brazil. Energy Build., 227, 25
110395, https://doi.org/10.1016/j.enbuild.2020.110395. 26
Gouldson, A., N. Kerr, J. Millward-Hopkins, M. C. Freeman, C. Topi, and R. Sullivan, 2015: Innovative 27
financing models for low carbon transitions: Exploring the case for revolving funds for domestic 28
energy efficiency programmes. Energy Policy, 86, 739–748, 29
https://doi.org/10.1016/j.enpol.2015.08.012. 30
Government of Russian Federation, 2021: Decree of the Government of the Russian Federation from 31
21.09.2021 № 1587 "On approval of the criteria for sustainable (including green) development 32
projects in the Russian Federation and requirements for the verification system of sustainable 33
(including. 34
de Gracia, A., and L. F. Cabeza, 2015: Phase change materials and thermal energy storage for buildings. 35
Energy Build., 103, 414–419, https://doi.org/10.1016/j.enbuild.2015.06.007. 36
——, L. Navarro, A. Castell, Á. Ruiz-Pardo, S. Alvárez, and L. F. Cabeza, 2013: Experimental study 37
of a ventilated facade with PCM during winter period. Energy Build., 58, 324–332, 38
https://doi.org/10.1016/j.enbuild.2012.10.026. 39
Gram-Hanssen, K., 2014: Existing buildings - Users, renovations and energy policy. Renew. Energy, 40
61, 136–140, https://doi.org/10.1016/j.renene.2013.05.004. 41
Grande-acosta, G. K., and J. M. Islas-samperio, 2020: Boosting Energy Effciency and Solar Energy 42
inside the Residential, Commercial, and Public Services Sectors in Mexico. 43
Grande-Acosta, G. K., and J. M. Islas-Samperio, 2020: Boosting energy efficiency and solar energy 44
inside the residential, commercial, and public services sectors in Mexico. Energies, 13, 45
ACCEPTED VERSION
SUBJECT TO FIN
AL EDITS
Final Government Distribution Chapter 9 IPCC AR6 WGIII
Do Not Cite, Quote or Distribute 9-122 Total pages: 168
https://doi.org/10.3390/en13215601. 1
Graziano, M., and K. Gillingham, 2015: Spatial patterns of solar photovoltaic system adoption: The 2
influence of neighbors and the built environment. J. Econ. Geogr., 15, 815–839, 3
https://doi.org/10.1093/jeg/lbu036. 4
Grove-Smith, J., V. Aydin, W. Feist, J. Schnieders, and S. Thomas, 2018: Standards and policies for 5
very high energy efficiency in the urban building sector towards reaching the 1.5°C target. Curr. 6
Opin. Environ. Sustain., 30, 103–114, https://doi.org/10.1016/J.COSUST.2018.04.006. 7
Grover, A. ., 2019: Understanding the role of Occupants in green building energy performance, in: 53rd 8
International Conference of the Architectural Science Association, ANZAScA 2019. Architectural 9
Science Association, A. Agrawal and R. Gupta, Eds., 547–556. 10
Grubler, A., and Coauthors, 2018: A low energy demand scenario for meeting the 1.5 °c target and 11
sustainable development goals without negative emission technologies. Nat. Energy, 3, 515–527, 12
https://doi.org/10.1038/s41560-018-0172-6. 13
Grynning, S., J. E. Gaarder, and J. Lohne, 2017: Climate Adaptation of School Buildings through MOM 14
- A Case Study. Procedia Eng., 196, 864–871, https://doi.org/10.1016/j.proeng.2017.08.018. 15
Gu, Y., T. W. Wong, C. K. Law, G. H. Dong, K. F. Ho, Y. Yang, and S. H. L. Yim, 2018: Impacts of 16
sectoral emissions in China and the implications: air quality, public health, crop production, and 17
economic costs. Environ. Res. Lett., 13, 084008, https://doi.org/10.1088/1748-9326/aad138. 18
Gunay, H. B., W. O’Brien, and I. Beausoleil-Morrison, 2013: A critical review of observation studies, 19
modeling, and simulation of adaptive occupant behaviors in offices. Build. Environ., 70, 31–47, 20
https://doi.org/10.1016/j.buildenv.2013.07.020. 21
Guo, L., and Coauthors, 2019: The effect of relative humidity change on atmospheric pitting corrosion 22
of stainless steel 304L. Corros. Sci., 150, 110–120, https://doi.org/10.1016/j.corsci.2019.01.033. 23
Gupta, R., and M. Gregg, 2012: Using UK climate change projections to adapt existing English homes 24
for a warming climate. Build. Environ., 55, 20–42, 25
https://doi.org/10.1016/j.buildenv.2012.01.014. 26
——, and A. Kotopouleas, 2018: Magnitude and extent of building fabric thermal performance gap in 27
UK low energy housing. Appl. Energy, 222, 673–686, 28
https://doi.org/10.1016/j.apenergy.2018.03.096. 29
——, M. Gregg, and K. Williams, 2015: Cooling the UK housing stock post-2050s. Build. Serv. Eng. 30
Res. Technol., 36, 196–220, https://doi.org/10.1177/0143624414566242. 31
Guyot, G., M. H. Sherman, and I. S. Walker, 2018: Smart ventilation energy and indoor air quality 32
performance in residential buildings: A review. Energy Build., 165, 416–430, 33
https://doi.org/10.1016/j.enbuild.2017.12.051. 34
Habert, G., S. A. Miller, V. M. John, J. L. Provis, A. Favier, A. Horvath, and K. L. Scrivener, 2020: 35
Environmental impacts and decarbonization strategies in the cement and concrete industries. Nat. 36
Rev. Earth Environ., 1, 559–573, https://doi.org/10.1038/s43017-020-0093-3. 37
Hache, E., D. Leboullenger, and V. Mignon, 2017: Beyond average energy consumption in the French 38
residential housing market: A household classification approach. Energy Policy, 107, 82–95, 39
https://doi.org/10.1016/j.enpol.2017.04.038. 40
Hachem-Vermette, C., and K. Singh, 2019: Optimization of the mixture of building types in a 41
neighborhood and their energy and environmental performance. Energy Build., 204, 109499, 42
https://doi.org/10.1016/j.enbuild.2019.109499. 43
Haelg, L., 2020: Promoting technological diversity: How renewable energy auction designs influence 44
policy outcomes. Energy Res. Soc. Sci., 69, https://doi.org/10.1016/j.erss.2020.101636. 45
ACCEPTED VERSION
SUBJECT TO FIN
AL EDITS

Final Government Distribution Chapter 9 IPCC AR6 WGIII
Do Not Cite, Quote or Distribute 9-123 Total pages: 168
Hager, I., A. Golonka, and R. Putanowicz, 2016: 3D Printing of Buildings and Building Components 1
as the Future of Sustainable Construction? Procedia Eng., 151, 292–299, 2
https://doi.org/10.1016/j.proeng.2016.07.357. 3
Haggag, M., A. Hassan, and S. Elmasry, 2014: Experimental study on reduced heat gain through green 4
façades in a high heat load climate. Energy Build., 82, 668–674, 5
https://doi.org/10.1016/j.enbuild.2014.07.087. 6
Hainaut, H., L. Gouiffes, I. Cochran, and M. Ledez, 2021: Panorama des financements climat. Edition 7
2020. 8
Haines, V., and V. Mitchell, 2014: A persona-based approach to domestic energy retrofit. Build. Res. 9
Inf., 42, 462–476, https://doi.org/10.1080/09613218.2014.893161. 10
Hájek, M., J. Zimmermannová, K. Helman, and L. Rozenský, 2019: Analysis of carbon tax efficiency 11
in energy industries of selected EU countries. Energy Policy, 134, 110955, 12
https://doi.org/10.1016/j.enpol.2019.110955. 13
Hall, D. M., and M. M. Bonanomi, 2021: Governing Collaborative Project Delivery as a Common-Pool 14
Resource Scenario. Proj. Manag. J., 52, 250–263, https://doi.org/10.1177/8756972820982442. 15
Hallegatte, S., 2009: Strategies to adapt to an uncertain climate change. Glob. Environ. Chang., 19, 16
240–247, https://doi.org/10.1016/j.gloenvcha.2008.12.003. 17
Hamilton, I., J. Milner, Z. Chalabi, P. Das, B. Jones, C. Shrubsole, M. Davies, and P. Wilkinson, 2015: 18
Health effects of home energy efficiency interventions in England: A modelling study. BMJ Open, 19
5, 1–11, https://doi.org/10.1136/bmjopen-2014-007298. 20
Hanna, R., E. Duflo, and M. Greenstone, 2016: Up in smoke: The influence of household behavior on 21
the long-run impact of improved cooking stoves. Am. Econ. J. Econ. Policy, 8, 80–114, 22
https://doi.org/10.1257/pol.20140008. 23
Hannon, M. J., 2015: Raising the temperature of the UK heat pump market: Learning lessons from 24
Finland. Energy Policy, 85, 369–375, https://doi.org/10.1016/j.enpol.2015.06.016. 25
Hansen, A. R., 2016: The social structure of heat consumption in Denmark: New interpretations from 26
quantitative analysis. Energy Res. Soc. Sci., 11, 109–118, 27
https://doi.org/10.1016/j.erss.2015.09.002. 28
Harby, K., D. R. Gebaly, N. S. Koura, and M. S. Hassan, 2016: Performance improvement of vapor 29
compression cooling systems using evaporative condenser: An overview. Renew. Sustain. Energy 30
Rev., 58, 347–360, https://doi.org/10.1016/j.rser.2015.12.313. 31
Hargreaves, T., C. Wilson, and R. Hauxwell-Baldwin, 2018: Learning to live in a smart home. Build. 32
Res. Inf., 46, 127–139, https://doi.org/10.1080/09613218.2017.1286882. 33
Harold, J., S. Lyons, and J. Cullinan, 2015: The determinants of residential gas demand in Ireland. 34
Energy Econ., 51, 475–483, https://doi.org/10.1016/j.eneco.2015.08.015. 35
Harris, S., É. Mata, A. Plepys, and C. Katzeff, 2021a: Sharing is daring, but is it sustainable? An 36
assessment of sharing cars, electric tools and offices in Sweden. Resour. Conserv. Recycl., 170, 37
105583, https://doi.org/10.1016/j.resconrec.2021.105583. 38
——, ——, ——, and ——, 2021b: Sharing is daring, but is it sustainable? Upscaling assessments of 39
sharing cars, tools and offices in Sweden. Resour. Conserv. Recycl.,. 40
Hart, J., and F. Pomponi, 2020: More timber in construction: Unanswered questions and future 41
challenges. Sustain., 12, https://doi.org/10.3390/SU12083473. 42
——, K. Adams, J. Giesekam, D. D. Tingley, and F. Pomponi, 2019: Barriers and drivers in a circular 43
economy: The case of the built environment. Procedia CIRP, 80, 619–624, 44
ACCEPTED VERSION
SUBJECT TO FIN
AL EDITS
Final Government Distribution Chapter 9 IPCC AR6 WGIII
Do Not Cite, Quote or Distribute 9-124 Total pages: 168
https://doi.org/10.1016/j.procir.2018.12.015. 1
Hasegawa, T., S. Fujimori, Y. Shin, A. Tanaka, K. Takahashi, and T. Masui, 2015: Consequence of 2
Climate Mitigation on the Risk of Hunger. Environ. Sci. Technol., 49, 7245–7253, 3
https://doi.org/10.1021/es5051748. 4
Hashemi, A., H. Cruickshank, and A. Cheshmehzangi, 2015: Environmental Impacts and Embodied 5
Energy of Construction Methods and Materials in Low-Income Tropical Housing. Sustainability, 6
7, 7866–7883, https://doi.org/10.3390/su7067866. 7
Hayat, M. A., F. Shahnia, and G. Shafiullah, 2019: Replacing Flat Rate Feed-In Tariffs for Rooftop 8
Photovoltaic Systems With a Dynamic One to Consider Technical, Environmental, Social, and 9
Geographical Factors. IEEE Trans. Ind. Informatics, 15, 10
https://doi.org/10.1109/TII.2018.2887281. 11
van Heerden, J., J. Blignaut, H. Bohlmann, A. Cartwright, N. Diederichs, and M. Mander, 2016: The 12
economic and environmental effects of a carbon tax in South Africa: A dynamic CGE modelling 13
approach. South African J. Econ. Manag. Sci., 19, 714–732, https://doi.org/10.17159/2222-14
3436/2016/v19n5a3. 15
Heeren, N., C. L. Mutel, B. Steubing, Y. Ostermeyer, H. Wallbaum, and S. Hellweg, 2015a: 16
Environmental Impact of Buildings—What Matters? Environ. Sci. Technol., 49, 9832–9841, 17
https://doi.org/10.1021/acs.est.5b01735. 18
——, ——, ——, ——, ——, and ——, 2015b: Environmental Impact of Buildings - What Matters? 19
Environ. Sci. Technol., 49, 9832–9841, https://doi.org/10.1021/acs.est.5b01735. 20
Heindl, P., and P. Kanschik, 2016: Ecological sufficiency, individual liberties, and distributive justice: 21
Implications for policy making. Ecol. Econ., 126, 42–50, 22
https://doi.org/10.1016/J.ECOLECON.2016.03.019. 23
Heinen, S., W. Turner, L. Cradden, F. McDermott, and M. O’Malley, 2017: Electrification of residential 24
space heating considering coincidental weather events and building thermal inertia: A system-25
wide planning analysis. Energy, 127, 136–154, https://doi.org/10.1016/j.energy.2017.03.102. 26
Heinonen, J., and S. Junnila, 2014: Residential energy consumption patterns and the overall housing 27
energy requirements of urban and rural households in Finland. Energy Build., 76, 295–303, 28
https://doi.org/10.1016/j.enbuild.2014.02.079. 29
Heiskanen, E., and K. Matschoss, 2017: Understanding the uneven diffusion of building-scale 30
renewable energy systems: A review of household, local and country level factors in diverse 31
European countries. Renew. Sustain. Energy Rev., 75, 580–591, 32
https://doi.org/10.1016/j.rser.2016.11.027. 33
34
Hejazi, M. I., and Coauthors, 2015: 21st century United States emissions mitigation could increase 35
water stress more than the climate change it is mitigating. Proc. Natl. Acad. Sci., 112, 10635–36
10640, https://doi.org/10.1073/pnas.1421675112. 37
Hernandez-Roman, F., C. Sheinbaum-Pardo, and A. Calderon-Irazoque, 2017: “Socially neglected 38
effect” in the implementation of energy technologies to mitigate climate change: Sustainable 39
building program in social housing. Energy Sustain. Dev., 41, 149–156, 40
https://doi.org/10.1016/j.esd.2017.09.005. 41
Hertwich, E., and Coauthors, 2020: Resource Efficiency and Climate Change: Material Efficiency 42
Strategies for a Low-Carbon Future. 43
Hertwich, E. G., and Coauthors, 2019: Material efficiency strategies to reducing greenhouse gas 44
emissions associated with buildings, vehicles, and electronics—a review. Environ. Res. Lett., 14, 45
ACCEPTED VERSION
SUBJECT TO FIN
AL EDITS
Final Government Distribution Chapter 9 IPCC AR6 WGIII
Do Not Cite, Quote or Distribute 9-125 Total pages: 168
043004, https://doi.org/10.1088/1748-9326/ab0fe3. 1
Hewitt, E., 2018: Organizational Characteristics in Residential Rental Buildings: Exploring the Role of 2
Centralization in Energy Outcomes. World Sustainability Series, Springer, 181–196. 3
Hickel, J., P. Brockway, G. Kallis, L. Keyßer, M. Lenzen, A. Slameršak, J. Steinberger, and D. Ürge-4
Vorsatz, 2021: Urgent need for post-growth climate mitigation scenarios. Nat. Energy, 6, 766–5
768, https://doi.org/10.1038/s41560-021-00884-9. 6
Hidalgo, J., S. Coello, and Y. González, 2018: The Determinants of Household Electricity Demand in 7
Marginal Ecuador: A Case Study at Monte Sinai. Proceedings of the 16th LACCEI International 8
Multi-Conference for Engineering, Education, and Technology: “Innovation in Education and 9
Inclusion,” Vol. 2018-July of, Latin American and Caribbean Consortium of Engineering 10
Institutions. 11
Hildebrandt, J., N. Hagemann, and D. Thrän, 2017: The contribution of wood-based construction 12
materials for leveraging a low carbon building sector in europe. Sustain. Cities Soc., 34, 405–418, 13
https://doi.org/10.1016/j.scs.2017.06.013. 14
Hirst, E., and M. Brown, 1990: Closing the efficiency gap: barriers to the efficient use of energy. 15
Resour. Conserv. Recycl., 3, 267–281, https://doi.org/10.1016/0921-3449(90)90023-W. 16
Hirvonen, J., J. Jokisalo, P. Sankelo, T. Niemelä, and R. Kosonen, 2020: Emission reduction potential 17
of different types of finnish buildings through energy retrofits. Buildings, 10, 18
https://doi.org/10.3390/buildings10120234. 19
Högberg, L., 2013: The impact of energy performance on single-family home selling prices in Sweden. 20
J. Eur. Real Estate Res., 6, 242–261, https://doi.org/10.1108/JERER-09-2012-0024. 21
Hohne, P. A., K. Kusakana, and B. P. Numbi, 2019: Optimal energy management and economic 22
analysis of a grid-connected hybrid solar water heating system: A case of Bloemfontein, South 23
Africa. Sustain. Energy Technol. Assessments, 31, 273–291, 24
https://doi.org/10.1016/j.seta.2018.12.027. 25
Holland, R. A., and Coauthors, 2015: Global impacts of energy demand on the freshwater resources of 26
nations. Proc. Natl. Acad. Sci., 112, E6707–E6716, https://doi.org/10.1073/pnas.1507701112. 27
Hong, T., W.-K. Chang, and H.-W. Lin, 2013: A fresh look at weather impact on peak electricity 28
demand and energy use of buildings using 30-year actual weather data. Appl. Energy, 111, 333–29
350, https://doi.org/10.1016/j.apenergy.2013.05.019. 30
——, D. Yan, S. D’Oca, and C. Chen, 2017: Ten questions concerning occupant behavior in buildings: 31
The big picture. Build. Environ., 114, 518–530, https://doi.org/10.1016/j.buildenv.2016.12.006. 32
——, C. Chen, Z. Wang, and X. Xu, 2020: Linking human-building interactions in shared offices with 33
personality traits. Build. Environ., 170, 106602, https://doi.org/10.1016/j.buildenv.2019.106602. 34
Hongping, Y., 2017: Barriers and countermeasures for managing construction and demolition waste: A 35
case of Shenzhen in China. J. Clean. Prod., 157, 84–93, 36
https://doi.org/10.1016/j.jclepro.2017.04.137. 37
van Hooff, T., B. Blocken, H. J. P. Timmermans, and J. L. M. Hensen, 2016: Analysis of the predicted 38
effect of passive climate adaptation measures on energy demand for cooling and heating in a 39
residential building. Energy, 94, 811–820, https://doi.org/10.1016/j.energy.2015.11.036. 40
Hortay, O., and B. P. Rozner, 2019: Allocating renewable subsidies. Econ. Anal. Policy, 64, 41
https://doi.org/10.1016/j.eap.2019.09.003. 42
Horváth, M., D. Kassai-Szoó, and T. Csoknyai, 2016: Solar energy potential of roofs on urban level 43
based on building typology. Energy Build., 111, 278–289, 44
https://doi.org/10.1016/j.enbuild.2015.11.031. 45
ACCEPTED VERSION
SUBJECT TO FIN
AL EDITS

Final Government Distribution Chapter 9 IPCC AR6 WGIII
Do Not Cite, Quote or Distribute 9-126 Total pages: 168
Howarth, C., and B. M. Roberts, 2018: The Role of the UK Green Deal in Shaping Pro-Environmental 1
Behaviours: Insights from Two Case Studies. Sustainability, 10, 2107, 2
https://doi.org/10.3390/su10062107. 3
Howden-Chapman, P., H. Viggers, R. Chapman, K. O’Sullivan, L. Telfar Barnard, and B. Lloyd, 2012: 4
Tackling cold housing and fuel poverty in New Zealand: A review of policies, research, and health 5
impacts. Energy Policy, 49, 134–142, https://doi.org/10.1016/j.enpol.2011.09.044. 6
Hsiao, T. Y., C. M. Chuang, N. W. Kuo, and S. M. F. Yu, 2014: Establishing attributes of an 7
environmental management system for green hotel evaluation. Int. J. Hosp. Manag., 36, 197–208, 8
https://doi.org/10.1016/j.ijhm.2013.09.005. 9
Hu, S., L. F. Cabeza, and D. Yan, 2020: Review and estimation of global halocarbon emissions in the 10
buildings sector. Energy Build., 225, 110311, https://doi.org/10.1016/j.enbuild.2020.110311. 11
Huang, K. T., and R. L. Hwang, 2016: Future trends of residential building cooling energy and passive 12
adaptation measures to counteract climate change: The case of Taiwan. Appl. Energy, 184, 1230–13
1240, https://doi.org/10.1016/j.apenergy.2015.11.008. 14
Huang, P., and Coauthors, 2019: Transforming a residential building cluster into electricity prosumers 15
in Sweden: Optimal design of a coupled PV-heat pump-thermal storage-electric vehicle system. 16
Appl. Energy, 255, https://doi.org/10.1016/j.apenergy.2019.113864. 17
Huang, W., 2015: The determinants of household electricity consumption in Taiwan: Evidence from 18
quantile regression. Energy, 87, 120–133, https://doi.org/10.1016/j.energy.2015.04.101. 19
Huang, Y.-K., J. McDowell, and P. Vargas, 2015: How Old I Feel Matters: Examining Age-Related 20
Differences in Motives and Organizational Citizenship Behavior. J. Park Recreat. Admi., 33, 20–21
39. 22
Huebner, G. M., and D. Shipworth, 2017: All about size? – The potential of downsizing in reducing 23
energy demand. Appl. Energy, 186, 226–233, https://doi.org/10.1016/j.apenergy.2016.02.066. 24
Huijbregts, Z., R. P. Kramer, M. H. J. Martens, A. W. M. van Schijndel, and H. L. Schellen, 2012: A 25
proposed method to assess the damage risk of future climate change to museum objects in historic 26
buildings. Build. Environ., 55, 43–56, https://doi.org/10.1016/j.buildenv.2012.01.008. 27
Hyland, M., R. C. Lyons, and S. Lyons, 2013: The value of domestic building energy efficiency - 28
evidence from Ireland. Energy Econ., 40, 943–952, https://doi.org/10.1016/j.eneco.2013.07.020. 29
IEA,IRENA,UNSD,World Bank, W., 2018: Tracking SDG7: The Energy Progress Report 2018. 29 pp. 30
IEA, 2014: Capturing the Multiple Benefits of Energy Efficiency. OECD/IEA, 224 pp. 31
——, 2019a: Perspectives for the Clean Energy Transition — The Critical Role of Buildings. Perspect. 32
Clean Energy Transit. — Crit. Role Build., 53, 1689–1699, 33
https://doi.org/10.1017/CBO9781107415324.004. 34
——, 2019b: Africa Energy Outlook 2019 World Energy Outlook Special Report. 288 p. pp. 35
www.iea.org/t&c/. 36
——, 2020a: World Energy Outlook. 37
——, 2020b: SWorld Energy Outlook Special Report in collaboration with the International Monetary 38
Fund. 39
——, 2021a: Net Zero by 2050 – A Roadmap for the Global Energy Sector. 40
——, 2021b: World Energy Investment 2021. 41
——, IRENA, UNSD, WB, and WHO, 2019: Tracking SDG7: The Energy Progress Report 2019. 176 42
p. pp. www.worldbank.org. 43
ACCEPTED VERSION
SUBJECT TO FIN
AL EDITS

Final Government Distribution Chapter 9 IPCC AR6 WGIII
Do Not Cite, Quote or Distribute 9-127 Total pages: 168
——, ——, ——, World Bank, and WHO, 2020a: Tracking SDG 7: The Energy Progress Report. 1
Track. SDG 7 Energy Prog. Rep., 176. 2
——, ——, ——, ——, and ——, 2020b: Tracking SDG 7 - The Energy Progress Report 2020. 3
https://trackingsdg7.esmap.org/data/files/download-documents/tracking_sdg_7_2020-4
full_report_-_web_0.pdf. 5
Imanari, T., T. Omori, and K. Bogaki, 1999: Thermal comfort and energy consumption of the radiant 6
ceiling panel system. Energy Build., 30, 167–175, https://doi.org/10.1016/S0378-7788(98)00084-7
X. 8
Ingold, K., F. Varone, M. Kammerer, F. Metz, L. Kammermann, and C. Strotz, 2020: Are responses to 9
official consultations and stakeholder surveys reliable guides to policy actors’ positions? Policy 10
Polit., 48, https://doi.org/10.1332/030557319X15613699478503. 11
Inoue, N., and S. Matsumoto, 2019: An examination of losses in energy savings after the Japanese Top 12
Runner Program? Energy Policy, 124, 312–319, https://doi.org/10.1016/j.enpol.2018.09.040. 13
International Energy Agency, 2017: Energy Technology Perspectives 2017 - Tracking Clean Energy 14
Progress. 15
——, 2018: The Future of Cooling. 16
——, 2019a: Material efficiency in clean energy. 17
——, 2019b: No Title. www.iea.org. 18
——, 2019c: World Energy Outlook. 19
International Risk Governance Council, 2013: The rebound effect: Implications of consumer behaviour 20
for robust energy policies. A review of the literature on the rebound effect in energy efficiency and 21
report from expert workshops. International Risk Governance Council, 37 p. pp. 22
IPCC, 2018: Global Warming of 1.5 °C an IPCC special report on the impacts of global warming of 23
1.5 °C above pre-industrial levels and related global greenhouse gas emission pathways, in the 24
context of strengthening the global response to the threat of climate change. V. Masson-Delmotte 25
et al., Eds. 26
——, 2021: IPCC: Climate Change 2021: The Physical Science Basis (Summary for Policymakers). 27
Cambridge Univ. Press. Press., Sixth Asse, 42. 28
Iria, J., and F. Soares, 2019: Real-time provision of multiple electricity market products by an 29
aggregator of prosumers. Appl. Energy, 255, https://doi.org/10.1016/j.apenergy.2019.113792. 30
Irshad, K., K. Habib, R. Saidur, M. W. Kareem, and B. B. Saha, 2019: Study of thermoelectric and 31
photovoltaic facade system for energy efficient building development: A review. J. Clean. Prod., 32
209, 1376–1395, https://doi.org/10.1016/j.jclepro.2018.09.245. 33
Isaac, M., and D. P. van Vuuren, 2009: Modeling global residential sector energy demand for heating 34
and air conditioning in the context of climate change. Energy Policy, 37, 507–521, 35
https://doi.org/10.1016/j.enpol.2008.09.051. 36
Iten R., Jakob M., Catenazzi G, Reiter U., Wunderlich A., S. D., 2017: Auswirkungen eines subsidiären 37
Verbots fossiler Heizungen. 38
Iten, R., A. Wunderlich, D. Sigrist, M. Jakob, G. Catenazzi, and U. Reiter, 2017: Auswirkungen eines 39
subsidiären Verbots fossiler Heizungen - Grundlagenbericht für die Klimapolitik nach 2020 40
[Effects of a subsidiary ban on fossil heating - Background report on climate policy after 2020]. 41
104 p. pp. 42
Ivanova, D., and M. Büchs, 2020: Household Sharing for Carbon and Energy Reductions: The Case of 43
ACCEPTED VERSION
SUBJECT TO FIN
AL EDITS

Final Government Distribution Chapter 9 IPCC AR6 WGIII
Do Not Cite, Quote or Distribute 9-128 Total pages: 168
EU Countries. Energies, 13, 1909, https://doi.org/10.3390/en13081909. 1
J. ", " Williams, 2008: " {Predicting} an {American} future for cohousing ". " Futur. ",. 2
J., S., and Coauthors, 2011: Ventilation rates and health: Multidisciplinary review of the scientific 3
literature. Indoor Air, 21, 191–204. 4
Jacobsen, G. D., and M. J. Kotchen, 2013: Are Building Codes Effective at Saving Energy? Evidence 5
from Residential Billing Data in Florida. Rev. Econ. Stat., 95, 6
https://doi.org/10.1162/REST_a_00243. 7
Jaffe, A. B., and R. N. Stavins, 1994: The energy-efficiency gap What does it mean? Energy Policy, 22, 8
804–810, https://doi.org/10.1016/0301-4215(94)90138-4. 9
Janda, K. B., 2014: Building communities and social potential: Between and beyond organizations and 10
individuals in commercial properties. Energy Policy, 67, 48–55, 11
https://doi.org/10.1016/j.enpol.2013.08.058. 12
Jannati, M., S. A. Anbaran, S. H. Asgari, W. Y. Goh, A. Monadi, M. J. A. Aziz, and N. R. N. Idris, 13
2017: A review on Variable Speed Control techniques for efficient control of Single-Phase 14
Induction Motors: Evolution, classification, comparison. Renew. Sustain. Energy Rev., 75, 1306–15
1319, https://doi.org/10.1016/j.rser.2016.11.115. 16
Jedidi, M., and O. Benjeddou, 2018: Effect of Thermal Bridges on the Heat Balance of Buildings. Int. 17
J. Sci. Res. Civ. Eng., 2, 2456–6667. 18
Jensen, O. M., A. R. Hansen, and J. Kragh, 2016: Market response to the public display of energy 19
performance rating at property sales. Energy Policy, 93, 229–235, 20
https://doi.org/10.1016/j.enpol.2016.02.029. 21
Jeuland, M., J. S. Tan Soo, and D. Shindell, 2018: The need for policies to reduce the costs of cleaner 22
cooking in low income settings: Implications from systematic analysis of costs and benefits. 23
Energy Policy, 121, 275–285, https://doi.org/10.1016/j.enpol.2018.06.031. 24
Jones, R. V., A. Fuertes, and K. J. Lomas, 2015: The socio-economic, dwelling and appliance related 25
factors affecting electricity consumption in domestic buildings. Renew. Sustain. Energy Rev., 43, 26
901–917, https://doi.org/10.1016/j.rser.2014.11.084. 27
Joyce, A., M. B. Hansen, and S. Nass-Schmidt, 2013: Monetising the multiple benefits of energy 28
efficient renovations of the buildings of the EU, ECEEE Summer Study Proceedings. ECEEE 29
2013 Summer Study Proceedings, 1497–1507. 30
Junnila, S., J. Ottelin, and L. Leinikka, 2018: Influence of reduced ownership on the environmental 31
benefits of the circular economy. Sustain., 10, https://doi.org/10.3390/su10114077. 32
K, T. R. B. R. D. H. M., 2018: Which factors determine the extent of house owners’ energy-related 33
refurbishment projects? A Motivation-Opportunity-Ability Approach. Sustain. Cities Soc., 36, 34
33–41, https://doi.org/10.1016/j.scs.2017.09.025. 35
Kahn, M. E., and N. Kok, 2014: The capitalization of green labels in the California housing market. 36
Reg. Sci. Urban Econ., https://doi.org/10.1016/j.regsciurbeco.2013.07.001. 37
Kalantzis, F., and D. Revoltella, 2019: Do energy audits help SMEs to realize energy-efficiency 38
opportunities? Energy Econ., 83, 229–239, https://doi.org/10.1016/j.eneco.2019.07.005. 39
Kalkbrenner, B. J., and J. Roosen, 2015: The role of community and trust in Germany. Energy Res. Soc. 40
Sci., 13, 60–70. 41
Kalvelage, K., U. Passe, S. Rabideau, and E. S. Takle, 2014: Changing climate: The effects on energy 42
demand and human comfort. Energy Build., 76, 373–380, 43
https://doi.org/10.1016/j.enbuild.2014.03.009. 44
ACCEPTED VERSION
SUBJECT TO FIN
AL EDITS

Final Government Distribution Chapter 9 IPCC AR6 WGIII
Do Not Cite, Quote or Distribute 9-129 Total pages: 168
Kamal, A., S. G. Al-Ghamdi, and M. Koç, 2019: Role of energy efficiency policies on energy 1
consumption and CO2 emissions for building stock in Qatar. J. Clean. Prod., 235, 1409–1424, 2
https://doi.org/10.1016/j.jclepro.2019.06.296. 3
Kamenders, A., C. Rochas, and A. Novikova, 2019: Investments in Energy Efficiency and Renewable 4
Energy Projects in Latvia in 2018. 1–37 pp. 5
Kameni Nematchoua, M., J. C. Vanona, and J. A. Orosa, 2020: Energy Efficiency and Thermal 6
Performance of Office Buildings Integrated with Passive Strategies in Coastal Regions of Humid 7
and Hot Tropical Climates in Madagascar. Appl. Sci., 10, 2438, 8
https://doi.org/10.3390/app10072438. 9
Kamilaris, A., B. Kalluri, S. Kondepudi, and T. Kwok Wai, 2014: A literature survey on measuring 10
energy usage for miscellaneous electric loads in offices and commercial buildings. Renew. 11
Sustain. Energy Rev., 34, 536–550, https://doi.org/10.1016/j.rser.2014.03.037. 12
Kaminska, A., 2019: Impact of Heating Control Strategy and Occupant Behavior on the Energy 13
Consumption in a Building with Natural Ventilation in Poland. Energies, 12, 4304, 14
https://doi.org/10.3390/en12224304. 15
Karlin, B., J. F. Zinger, and R. Ford, 2015: The effects of feedback on energy conservation: A meta-16
analysis. Psychol. Bull., 141, 1205–1227, https://doi.org/10.1037/a0039650. 17
Karlsson, M., E. Alfredsson, and N. Westling, 2020: Climate policy co-benefits: a review. Clim. Policy, 18
20, 292–316, https://doi.org/10.1080/14693062.2020.1724070. 19
Kavousian, A., R. Rajagopal, and M. Fischer, 2013a: Determinants of residential electricity 20
consumption: Using smart meter data to examine the effect of climate, building characteristics, 21
appliance stock, and occupants’ behavior. Energy, 55, 184–194, 22
https://doi.org/10.1016/j.energy.2013.03.086. 23
Kavousian, A., R. Rajagopal, and M. Fischer, 2013b: Determinants of residential electricity 24
consumption: Using smart meter data to examine the effect of climate, building characteristics, 25
appliance stock, and occupants’ behavior. Energy, 55, 184–194, 26
https://doi.org/10.1016/j.energy.2013.03.086 Correspondence Address - [email protected]. 27
Kavousian, A., R. Rajagopal, and M. Fischer, 2015: Ranking appliance energy efficiency in households: 28
Utilizing smart meter data and energy efficiency frontiers to estimate and identify the determinants 29
of appliance energy efficiency in residential buildings. Energy Build., 99, 220–230, 30
https://doi.org/10.1016/j.enbuild.2015.03.052. 31
Kelsey Carle Schuster, Youngchoon Park, S. R. S., 2019: Building management system with automated 32
vibration data analysis. 33
Ketchman, K. J., D. R. Riley, V. Khanna, and M. M. Bilec, 2018: Survey of Homeowners’ Motivations 34
for the Adoption of Energy Efficiency Measures: Evaluating a Holistic Energy Assessment 35
Program. J. Archit. Eng., 24, 04018024, https://doi.org/10.1061/(ASCE)AE.1943-5568.0000310. 36
Khan, I., 2020: Impacts of energy decentralization viewed through the lens of the energy cultures 37
framework: Solar home systems in the developing economies. Renew. Sustain. Energy Rev., 119, 38
https://doi.org/10.1016/j.rser.2019.109576. 39
Khan, M. M. A., M. Asif, and E. Stach, 2017: Rooftop PV potential in the residential sector of the 40
kingdom of Saudi Arabia. Buildings, 7, https://doi.org/10.3390/buildings7020046. 41
Kheirbek, I., J. Haney, S. Douglas, K. Ito, S. Caputo, and T. Matte, 2014: The public health benefits of 42
reducing fine particulate matter through conversion to cleaner heating fuels in New York city. 43
Environ. Sci. Technol., 48, 13573–13582, https://doi.org/10.1021/es503587p. 44
Khoshbakht, M., Z. Gou, K. Dupre, and H. Altan, 2017: Thermal Environments of an Office building 45
ACCEPTED VERSION
SUBJECT TO FIN
AL EDITS
Final Government Distribution Chapter 9 IPCC AR6 WGIII
Do Not Cite, Quote or Distribute 9-130 Total pages: 168
with double skin facade. J. Green Build., 12, https://doi.org/10.3992/1943-4618.12.3.3. 1
Khosla, R., N. Sircar, and A. Bhardwaj, 2019: Energy demand transitions and climate mitigation in 2
low-income urban households in India Energy demand transitions and climate mitigation in low-3
income urban households in India. Environ. Res. Lett., 14, 095008. 4
Khosrowpour, A., T. Duzener, and J. E. Taylor, 2016: Meta-Analysis of Eco-Feedback-Induced 5
Occupant Energy Efficiency Benchmarked with Standard Building Energy Rating Systems. 6
Construction Research Congress 2016, Reston, VA, American Society of Civil Engineers, 1192–7
1201. 8
Kian Jon, C., M. R. Islam, N. Kim Choon, and M. W. Shahzad, 2021: Future of Air Conditioning. 7 pp. 9
Kikstra, J. S., A. Mastrucci, J. Min, K. Riahi, and N. D. Rao, 2021: Decent living gaps and energy needs 10
around the world. Environ. Res. Lett., 16, https://doi.org/10.1088/1748-9326/ac1c27. 11
Kim, A. A., Y. Sunitiyoso, and L. A. Medal, 2019: Understanding facility management decision making 12
for energy efficiency efforts for buildings at a higher education institution. Energy Build., 199, 13
197–215, https://doi.org/10.1016/j.enbuild.2019.06.044. 14
Kim, J., and K. Park, 2018: Effect of the Clean Development Mechanism on the deployment of 15
renewable energy: Less developed vs. well-developed financial markets. Energy Econ., 75, 16
https://doi.org/10.1016/j.eneco.2018.07.034. 17
Kimura, F., S. Kimura, Y. Chang, and Y. Li, 2016: Financing renewable energy in the developing 18
countries of the East Asia Summit region: Introduction. Energy Policy, 95, 19
https://doi.org/10.1016/j.enpol.2016.04.005. 20
Kirchhoff, H., and K. Strunz, 2019: Key drivers for successful development of peer-to-peer microgrids 21
for swarm electrification. Appl. Energy, 244, 46–62, 22
https://doi.org/10.1016/j.apenergy.2019.03.016. 23
Kirkpatrick, A. J., and L. S. Bennear, 2014: Promoting clean energy investment: An empirical analysis 24
of property assessed clean energy. J. Environ. Econ. Manage., 68, 357–375, 25
https://doi.org/10.1016/j.jeem.2014.05.001. 26
Klein, L., J. Y. Kwak, G. Kavulya, F. Jazizadeh, B. Becerik-Gerber, P. Varakantham, and M. Tambe, 27
2012: Coordinating occupant behavior for building energy and comfort management using multi-28
agent systems. Autom. Constr., 22, 525–536, https://doi.org/10.1016/j.autcon.2011.11.012. 29
Klein, M., A. Ziade, and L. de Vries, 2019: Aligning prosumers with the electricity wholesale market 30
– The impact of time-varying price signals and fixed network charges on solar self-consumption. 31
Energy Policy, 134, https://doi.org/10.1016/j.enpol.2019.110901. 32
Klocker, N., C. Gibson, and E. Borger, 2012: Living together but apart: Material geographies of 33
everyday sustainability in extended family households. Environ. Plan. A, 44, 2240–2259, 34
https://doi.org/10.1068/a44594. 35
Knapp, S., S. Schmauck, and A. Zehnsdorf, 2019: Biodiversity impact of green roofs and constructed 36
wetlands as progressive eco-technologies in urban areas. Sustain., 11, 37
https://doi.org/10.3390/su11205846. 38
Kockat, J., P. V. Dorizas, J. Volt, and D. Staniaszek, 2018a: Building 4 People : Quantifying the benefits 39
of energy renovation investments in schools , offices and hospitals. 20 pp. 40
——, ——, ——, and ——, 2018b: Building 4 People : Quantifying the benefits of energy renovation 41
investments in schools , offices and hospitals. 42
Köhler, B., M. Stobbe, C. Moser, and F. Garzia, 2018: Guideline II : nZEB Technolo- gies 43
ACCELERATION FOR VIABLE NEARLY ZERO- Guideline II : nZEB Technolo- gies : Report on 44
cost reduction potentials. 45
ACCEPTED VERSION
SUBJECT TO FIN
AL EDITS
Final Government Distribution Chapter 9 IPCC AR6 WGIII
Do Not Cite, Quote or Distribute 9-131 Total pages: 168
Koirala, B. S., A. K. Bohara, and R. P. Berrens, 2014: Estimating the net implicit price of energy 1
efficient building codes on U.S. households. Energy Policy, 73, 667–675, 2
https://doi.org/10.1016/j.enpol.2014.06.022. 3
Kong, K. W., K. W. Lam, C. Chan, and P. Sat, 2019: Retro-Commissioning – Effective Energy 4
Conservation Initiatives in Existing Buildings. IOP Conf. Ser. Earth Environ. Sci., 290, 5
https://doi.org/10.1088/1755-1315/290/1/012099. 6
Koomey, J. G., S. Berard, M. Sanchez, and H. Wong, 2011: Implications of historical trends in the 7
electrical efficiency of computing. IEEE Ann. Hist. Comput., 8
https://doi.org/10.1109/MAHC.2010.28. 9
Koronen, C., M. Åhman, and L. J. Nilsson, 2020: Data centres in future European energy systems—10
energy efficiency, integration and policy. Energy Effic., 13, 129–144, 11
https://doi.org/10.1007/s12053-019-09833-8. 12
Kotchen, M. J., 2017: Longer-Run Evidence on Whether Building Energy Codes Reduce Residential 13
Energy Consumption. J. Assoc. Environ. Resour. Econ., 4, https://doi.org/10.1086/689703. 14
Kotzur, L., P. Markewitz, M. Robinius, G. Cardoso, P. Stenzel, M. Heleno, and D. Stolten, 2020: 15
Bottom-up energy supply optimization of a national building stock. Energy Build., 209, 16
https://doi.org/10.1016/j.enbuild.2019.109667. 17
Kozusznik, M. W., L. P. Maricutoiu, J. M. Peiró, D. M. Vîrgă, A. Soriano, and C. Mateo-Cecilia, 2019: 18
Decoupling office energy efficiency from employees’ well-being and performance: A systematic 19
review. Front. Psychol., 10, https://doi.org/10.3389/fpsyg.2019.00293. 20
Krarti, M., 2019: Evaluation of Energy Efficiency Potential for the Building Sector in the Arab Region. 21
Energies, 12, 4279, https://doi.org/10.3390/en12224279. 22
——, F. Ali, A. Alaidroos, and M. Houchati, 2017: Macro-economic benefit analysis of large scale 23
building energy efficiency programs in Qatar. Int. J. Sustain. Built Environ., 6, 597–609, 24
https://doi.org/10.1016/j.ijsbe.2017.12.006. 25
Kuhnhenn, K., L. Costa, E. Mahnke, L. Schneider, and S. Lange, 2020: A Societal Transformation 26
Scenario for Staying Below 1.5°C. Publ. Ser. Econ. Soc. Issues, 23, 100. 27
Kuittinen, M., and T. Häkkinen, 2020: Reduced carbon footprints of buildings: new Finnish standards 28
and assessments. Build. Cities, 1, https://doi.org/10.5334/bc.30. 29
Kuokkanen, A., M. Sihvonen, V. Uusitalo, A. Huttunen, T. Ronkainen, and H. Kahiluoto, 2020: A 30
proposal for a novel urban mobility policy: Personal carbon trade experiment in Lahti city. Util. 31
Policy, 62, https://doi.org/10.1016/j.jup.2019.100997. 32
Kusumadewi, T. V., and B. Limmeechokchai, 2015: Energy Efficiency Improvement and CO2 33
Mitigation in Residential Sector: Comparison between Indonesia and Thailand. Energy Procedia, 34
79, 994–1000, https://doi.org/10.1016/j.egypro.2015.11.599. 35
——, and ——, 2017: CO2 Mitigation in Residential Sector in Indonesia and Thailand: Potential of 36
Renewable Energy and Energy Efficiency. Energy Procedia, 138, 955–960, 37
https://doi.org/10.1016/j.egypro.2017.10.086. 38
Kwag, B. C., B. M. Adamu, and M. Krarti, 2019: Analysis of high-energy performance residences in 39
Nigeria. Energy Effic., 12, 681–695, https://doi.org/10.1007/s12053-018-9675-z. 40
Kyrö, R. K., 2020: Share, Preserve, Adapt, Rethink – a focused framework for circular economy. IOP 41
Conf. Ser. Earth Environ. Sci., 588, 042034, https://doi.org/10.1088/1755-1315/588/4/042034. 42
de la Rue du Can, S., D. Pudleiner, and K. Pielli, 2018: Energy efficiency as a means to expand energy 43
access: A Uganda roadmap. Energy Policy, 120, 354–364, 44
https://doi.org/10.1016/j.enpol.2018.05.045. 45
ACCEPTED VERSION
SUBJECT TO FIN
AL EDITS

Final Government Distribution Chapter 9 IPCC AR6 WGIII
Do Not Cite, Quote or Distribute 9-132 Total pages: 168
——, A. Khandekar, N. Abhyankar, A. Phadke, N. Z. Khanna, D. Fridley, and N. Zhou, 2019: Modeling 1
India’s energy future using a bottom-up approach. Appl. Energy, 238, 1108–1125, 2
https://doi.org/10.1016/j.apenergy.2019.01.065. 3
Labanca, N., and P. Bertoldi, 2018: Beyond energy efficiency and individual behaviours: policy insights 4
from social practice theories. Energy Policy, 115, 494–502, 5
https://doi.org/10.1016/j.enpol.2018.01.027. 6
Lacroix, E., and C. Chaton, 2015: Fuel poverty as a major determinant of perceived health: The case of 7
France. Public Health, 129, 517–524, https://doi.org/10.1016/j.puhe.2015.02.007. 8
Lamb, W. F., and Coauthors, 2021: A review of trends and drivers of greenhouse gas emissions by 9
sector from 1990 to 2018. Nat. Clim. Chang.,. 10
Lambertz, M., S. Theißen, J. Höper, and R. Wimmer, 2019: Importance of building services in 11
ecological building assessments. E3S Web Conf., 111, 03061, 12
https://doi.org/10.1051/e3sconf/201911103061. 13
Langevin, J., C. B. Harris, and J. L. Reyna, 2019: Assessing the Potential to Reduce U.S. Building CO2 14
Emissions 80% by 2050. Joule, 3, 2403–2424, https://doi.org/10.1016/j.joule.2019.07.013. 15
Langreder, N., F. Seefeldt, L.-A. Brischke, and T. Chmella, 2019: STEP up! The competitive efficiency 16
tender in Germany – step by step towards an effective new instrument for energy efficiency. 17
ECEEE 2019 Summer Study, 561–568. 18
Larsen, B., 2016: Benefits and costs of household cooking options for air pollution control. Benefits 19
and costs of addressing indoor air pollution challenges in Bangladesh. 38 p. pp. 20
http://www.copenhagenconsensus.com/sites/default/files/larsen_indoorairpollution.pdf. 21
Laurenti, R., J. Singh, J. M. Cotrim, M. Toni, and R. Sinha, 2019: Characterizing the Sharing Economy 22
State of the Research: A Systematic Map. Sustainability, 11, 5729, 23
https://doi.org/10.3390/su11205729. 24
Lecuyer, O., and P. Quirion, 2019: Interaction between CO2 emissions trading and renewable energy 25
subsidies under uncertainty: feed-in tariffs as a safety net against over-allocation. Clim. Policy, 26
19, https://doi.org/10.1080/14693062.2019.1625743. 27
Lee, J., and J. Yu, 2017: Market Analysis during the First Year of Korea Emission Trading Scheme. 28
Energies, 10, 1974, https://doi.org/10.3390/en10121974. 29
Lee, J., S. Wi, S. J. Chang, J. Choi, and S. Kim, 2020: Prediction evaluating of moisture problems in 30
light-weight wood structure: Perspectives on regional climates and building materials. Build. 31
Environ., 168, 106521, https://doi.org/10.1016/j.buildenv.2019.106521. 32
Lee, J. H., P. Im, and Y. Song, 2018: Field test and simulation evaluation of variable refrigerant flow 33
systems performance. Energy Build., 158, 1161–1169, 34
https://doi.org/10.1016/j.enbuild.2017.10.077. 35
Lee, J. Y., and B. R. Ellingwood, 2017: A decision model for intergenerational life-cycle risk 36
assessment of civil infrastructure exposed to hurricanes under climate change. Reliab. Eng. Syst. 37
Saf., 159, 100–107, https://doi.org/10.1016/j.ress.2016.10.022. 38
Lee, K., E. Miguel, and C. D. Wolfram, 2017: The Economics of Rural Electrification: Evidence from 39
Kenya. 1–4 pp. http://web.archive.org/web/20180217114447/https://www.theigc.org/wp-40
content/uploads/2018/01/Lee-et-al-2017-policy-brief.pdf%0Ahttps://www.theigc.org/wp-41
content/uploads/2018/01/Lee-et-al-2017-policy-brief.pdf. 42
Lehr, U., A. Mönnig, R. Missaoui, S. Marrouki, and G. Ben Salem, 2016: Employment from Renewable 43
Energy and Energy Efficiency in Tunisia – New Insights, New Results. Energy Procedia, 93, 223–44
228, https://doi.org/10.1016/j.egypro.2016.07.174. 45
ACCEPTED VERSION
SUBJECT TO FIN
AL EDITS
Final Government Distribution Chapter 9 IPCC AR6 WGIII
Do Not Cite, Quote or Distribute 9-133 Total pages: 168
Leibrand, A., N. Sadoff, T. Maslak, and A. Thomas, 2019: Using Earth Observations to Help 1
Developing Countries Improve Access to Reliable, Sustainable, and Modern Energy. Front. 2
Environ. Sci., 7, 1–14, https://doi.org/10.3389/fenvs.2019.00123. 3
Lenz, L., A. Munyehirwe, J. Peters, and M. Sievert, 2017: Does Large-Scale Infrastructure Investment 4
Alleviate Poverty? Impacts of Rwanda’s Electricity Access Roll-Out Program. World Dev., 89, 5
88–110, https://doi.org/10.1016/j.worlddev.2016.08.003. 6
Levesque, A., R. C. Pietzcker, and G. Luderer, 2019: Halving energy demand from buildings: The 7
impact of low consumption practices. Technol. Forecast. Soc. Change, 146, 253–266, 8
https://doi.org/10.1016/j.techfore.2019.04.025. 9
Levine, M., and Coauthors, 2017: Residential and commercial buildings. In Climate Change 2007: 10
Mitigation. Contribution of Working Group III to the Fourth Assessment Report of the 11
Intergovernmental Panel on Climate Change [B. Metz, O.R. Davidson, P.R. Bosch, R. Dave, L.A. 12
Meyer (eds)], C. 387–446 pp. 13
Levinson, A., 2016: How Much Energy Do Building Energy Codes Save? Evidence from California 14
Houses. Am. Econ. Rev., 106, https://doi.org/10.1257/aer.20150102. 15
Levy, J. I., M. K. Woo, S. L. Penn, M. Omary, Y. Tambouret, C. S. Kim, and S. Arunachalam, 2016: 16
Carbon reductions and health co-benefits from US residential energy efficiency measures. 17
Environ. Res. Lett., 11, 34017, https://doi.org/10.1088/1748-9326/11/3/034017. 18
Lévy, J. P., and F. Belaïd, 2018: The determinants of domestic energy consumption in France: Energy 19
modes, habitat, households and life cycles. Renew. Sustain. Energy Rev., 81, 2104–2114, 20
https://doi.org/10.1016/j.rser.2017.06.022. 21
Lewis, J. I., and R. H. Wiser, 2007: Fostering a renewable energy technology industry: An international 22
comparison of wind industry policy support mechanisms. Energy Policy, 35, 1844–1857, 23
https://doi.org/10.1016/j.enpol.2006.06.005. 24
Lewis, J. J., and Coauthors, 2017: Biogas Stoves Reduce Firewood Use, Household Air Pollution, and 25
Hospital Visits in Odisha, India. Environ. Sci. Technol., 51, 560–569, 26
https://doi.org/10.1021/acs.est.6b02466. 27
Li, D. H. W., L. Yang, and J. C. Lam, 2012: Impact of climate change on energy use in the built 28
environment in different climate zones - A review. Energy, 42, 103–112, 29
https://doi.org/10.1016/j.energy.2012.03.044. 30
Li, J., J. Fan, D. Zhao, and S. Wang, 2015: Allowance price and distributional effects under a personal 31
carbon trading scheme. J. Clean. Prod., 103, https://doi.org/10.1016/j.jclepro.2014.08.081. 32
——, S. Wang, J. Fan, and L. Liang, 2018: An equilibrium model of consumer energy choice using a 33
personal carbon trading scheme based on allowance price. J. Clean. Prod., 204, 1087–1096, 34
https://doi.org/10.1016/j.jclepro.2018.09.040. 35
Li, Q., C. Wang, and H. Zhang, 2016: A probabilistic framework for hurricane damage assessment 36
considering non-stationarity and correlation in hurricane actions. Struct. Saf., 59, 108–117, 37
https://doi.org/10.1016/j.strusafe.2016.01.001. 38
Li, R., G. Dane, C. Finck, and W. Zeiler, 2017: Are building users prepared for energy flexible 39
buildings?—A large-scale survey in the Netherlands. Appl. Energy, 203, 623–634, 40
https://doi.org/10.1016/j.apenergy.2017.06.067. 41
Li, W., C. Lu, and Y. W. Zhang, 2019a: Prospective exploration of future renewable portfolio standard 42
schemes in China via a multi-sector CGE model. Energy Policy, 128, 45–56, 43
https://doi.org/10.1016/j.enpol.2018.12.054. 44
Li, Y., S. Kubicki, A. Guerriero, and Y. Rezgui, 2019b: Review of building energy performance 45
ACCEPTED VERSION
SUBJECT TO FIN
AL EDITS

Final Government Distribution Chapter 9 IPCC AR6 WGIII
Do Not Cite, Quote or Distribute 9-134 Total pages: 168
certification schemes towards future improvement. Renew. Sustain. Energy Rev., 113, 109244, 1
https://doi.org/10.1016/j.rser.2019.109244. 2
Liang, J., Y. Qiu, and P. Padmanabhan, 2017: Consumers’ Attitudes towards Surcharges on Distributed 3
Renewable Energy Generation and Energy Efficiency Programs. Sustainability, 9, 1475, 4
https://doi.org/10.3390/su9081475. 5
Liao, X., S. V. Shen, and X. Shi, 2020: The effects of behavioral intention on the choice to purchase 6
energy-saving appliances in China: the role of environmental attitude, concern, and perceived 7
psychological benefits in shaping intention. Energy Effic., 13, 33–49, 8
https://doi.org/10.1007/s12053-019-09828-5. 9
Liddell, C., and C. Guiney, 2015: Living in a cold and damp home: Frameworks for understanding 10
impacts on mental well-being. Public Health, 129, 191–199, 11
https://doi.org/10.1016/j.puhe.2014.11.007. 12
Liddle, B., and H. Huntington, 2021: How prices, income, and weather shape household electricity 13
demand in high-income and middle-income countries. Energy Econ., 95, 14
https://doi.org/10.1016/j.eneco.2020.104995. 15
Lien, A. G., and N. Lolli, 2019: Costs and procurement for cross-laminated timber in mid-rise buildings. 16
J. Sustain. Archit. Civ. Eng., 25, 43–52, https://doi.org/10.5755/j01.sace.25.2.22099. 17
Lietaert, M., 2010: Cohousing’s relevance to degrowth theories. J. Clean. Prod., 18, 576–580, 18
https://doi.org/10.1016/j.jclepro.2009.11.016. 19
Lilley, S., G. Davidson, and Z. Alwan, 2017: ExternalWall Insulation (EWI): Engaging social tenants 20
in energy efficiency retrofitting in the North East of England. Buildings, 7, 21
https://doi.org/10.3390/buildings7040102. 22
Lim, X., W. H. Lam, and A. H. Shamsuddin, 2013: Carbon credit of renewable energy projects in 23
Malaysia. IOP Conf. Ser. Earth Environ. Sci., 16, https://doi.org/10.1088/1755-24
1315/16/1/012058. 25
Lin, B., and X. Li, 2011: The effect of carbon tax on per capita CO2 emissions. Energy Policy, 26
https://doi.org/10.1016/j.enpol.2011.05.050. 27
Lindberg, K. B., S. J. Bakker, and I. Sartori, 2019: Modelling electric and heat load profiles of non-28
residential buildings for use in long-term aggregate load forecasts. Util. Policy, 58, 63–88, 29
https://doi.org/10.1016/j.jup.2019.03.004. 30
Ling, J., H. Tong, J. Xing, and Y. Zhao, 2020: Simulation and optimization of the operation strategy of 31
ASHP heating system: A case study in Tianjin. Energy Build., 226, 110349, 32
https://doi.org/10.1016/j.enbuild.2020.110349. 33
Lipp, J., 2007: Lessons for effective renewable electricity policy from Denmark, Germany and the 34
United Kingdom. Energy Policy, 35, 5481–5495, https://doi.org/10.1016/j.enpol.2007.05.015. 35
Liu, D., M. Liu, E. Xu, B. Pang, X. Guo, B. Xiao, and D. Niu, 2018a: Comprehensive effectiveness 36
assessment of renewable energy generation policy: A partial equilibrium analysis in China. Energy 37
Policy, 115, 330–341, https://doi.org/10.1016/j.enpol.2018.01.018. 38
Liu, J., B. Hou, X. W. Ma, and H. Liao, 2018b: Solid fuel use for cooking and its health effects on the 39
elderly in rural China. Environ. Sci. Pollut. Res., 25, 3669–3680, https://doi.org/10.1007/s11356-40
017-0720-9. 41
Liu, J., X. Chen, H. Yang, and K. Shan, 2021: Hybrid renewable energy applications in zero-energy 42
buildings and communities integrating battery and hydrogen vehicle storage. Appl. Energy, 290, 43
116733, https://doi.org/10.1016/J.APENERGY.2021.116733. 44
Liu, L., F. Kong, X. Liu, Y. Peng, and Q. Wang, 2015a: A review on electric vehicles interacting with 45
ACCEPTED VERSION
SUBJECT TO FIN
AL EDITS

Final Government Distribution Chapter 9 IPCC AR6 WGIII
Do Not Cite, Quote or Distribute 9-135 Total pages: 168
renewable energy in smart grid. Renew. Sustain. Energy Rev., 51, 648–661, 1
https://doi.org/10.1016/j.rser.2015.06.036. 2
Liu, X., and Q. Cui, 2018: Combining carbon mitigation and climate adaptation goals for buildings 3
exposed to hurricane risks. Energy Build., 177, 257–267, 4
https://doi.org/10.1016/j.enbuild.2018.08.001. 5
Liu, Z., L. Zhang, G. Gong, H. Li, and G. Tang, 2015b: Review of solar thermoelectric cooling 6
technologies for use in zero energy buildings. Energy Build., 102, 207–216, 7
https://doi.org/10.1016/j.enbuild.2015.05.029. 8
——, W. Li, Y. Chen, Y. Luo, and L. Zhang, 2019: Review of energy conservation technologies for 9
fresh air supply in zero energy buildings. Appl. Therm. Eng., 148, 544–556, 10
https://doi.org/10.1016/j.applthermaleng.2018.11.085. 11
Lixuan, H., Z. Nan, F. Wei, K. Nina, F. David, Z. Yongqiang, and S. Kaare, 2016: Building stock 12
dynamics and its impacts on materials and energy demand in China. Energy Policy, 94, 47–55, 13
https://doi.org/10.1016/j.enpol.2016.03.024. 14
Lorek, S., and J. H. Spangenberg, 2019: Energy sufficiency through social innovation in housing. 15
Energy Policy, 126, 287–294, https://doi.org/10.1016/j.enpol.2018.11.026. 16
Lovins, A. B., 2018: How big is the energy efficiency resource? Environ. Res. Lett., 13, 090401, 17
https://doi.org/10.1088/1748-9326/aad965. 18
Lowes, R., J. Rosenow, M. Qadrdan, and J. Wu, 2020: Hot stuff: Research and policy principles for 19
heat decarbonisation through smart electrification. Energy Res. Soc. Sci., 70, 101735, 20
https://doi.org/10.1016/j.erss.2020.101735. 21
Luo, Y., L. Zhang, X. Wang, L. Xie, Z. Liu, J. Wu, Y. Zhang, and X. He, 2017: A comparative study 22
on thermal performance evaluation of a new double skin façade system integrated with 23
photovoltaic blinds. Appl. Energy, 199, 281–293, https://doi.org/10.1016/j.apenergy.2017.05.026. 24
Lyons, L., 2019: Digitalisation: Opportunities for heating and cooling. 58 pp. 25
M. Economidou, and P. Bertoldi, 2015: Practices to overcome split incentives in the EU building stock. 26
ECEEE 2015 Summer Study, 12. 27
MacNaughton, P., J. Pegues, U. Satish, S. Santanam, J. Spengler, and J. Allen, 2015: Economic, 28
environmental and health implications of enhanced ventilation in office buildings. Int. J. Environ. 29
Res. Public Health, 12, 14709–14722, https://doi.org/10.3390/ijerph121114709. 30
MacNaughton, P., X. Cao, J. Buonocore, J. Cedeno-Laurent, J. Spengler, A. Bernstein, and J. Allen, 31
2018: Energy savings, emission reductions, and health co-benefits of the green building movement 32
review-article. J. Expo. Sci. Environ. Epidemiol., 28, 307–318, https://doi.org/10.1038/s41370-33
017-0014-9. 34
Macquarie, R., and Coauthors, 2020: Updated View on the Global Landscape of Climate Finance 2019. 35
www.climatepolicyinitiative.org. 36
Mahapatra, K., B. Mainali, and G. Pardalis, 2019: Homeowners’ attitude towards one-stop-shop 37
business concept for energy renovation of detached houses in Kronoberg, Sweden. Energy 38
Procedia, 158, https://doi.org/10.1016/j.egypro.2019.01.888. 39
Mahmoud, M., M. Ramadan, S. Naher, K. Pullen, A. Baroutaji, and A.-G. Olabi, 2020: Recent advances 40
in district energy systems: A review. Therm. Sci. Eng. Prog., 20, 100678, 41
https://doi.org/10.1016/j.tsep.2020.100678. 42
Maidment, C. D., C. R. Jones, T. L. Webb, E. A. Hathway, and J. M. Gilbertson, 2014: The impact of 43
household energy efficiency measures on health: A meta-analysis. Energy Policy, 65, 583–593, 44
https://doi.org/10.1016/j.enpol.2013.10.054. 45
ACCEPTED VERSION
SUBJECT TO FIN
AL EDITS

Final Government Distribution Chapter 9 IPCC AR6 WGIII
Do Not Cite, Quote or Distribute 9-136 Total pages: 168
Malla, M. B., N. Bruce, E. Bates, and E. Rehfuess, 2011: Applying global cost-benefit analysis methods 1
to indoor air pollution mitigation interventions in Nepal, Kenya and Sudan: Insights and 2
challenges. Energy Policy, 39, 7518–7529, https://doi.org/10.1016/j.enpol.2011.06.031. 3
Mallaburn, P., 2018: Principles of successful non-residential energy efficiency policy. ECEEE 2018 4
Industrial Summer Study Proceedings, Vol. 2018-June of, 15–22. 5
Malmodin, J., and D. Lundén, 2018: The energy and carbon footprint of the global ICT and E & M 6
sectors 2010-2015. Sustain., https://doi.org/10.3390/su10093027. 7
Mañá Reixach, F., 2000: El Gros de l’obra: uns apunts de construcció. Edicions UPC,. 8
Mangialardo, A., E. Micelli, and F. Saccani, 2018: Does Sustainability Affect Real Estate Market 9
Values? Empirical Evidence from the Office Buildings Market in Milan (Italy). Sustainability, 11, 10
12, https://doi.org/10.3390/su11010012. 11
Mangold, M., M. Österbring, H. Wallbaum, L. Thuvander, and P. Femenias, 2016: Socio-economic 12
impact of renovation and energy retrofitting of the Gothenburg building stock. Energy Build., 123, 13
41–49, https://doi.org/10.1016/j.enbuild.2016.04.033. 14
Manzano-Agugliaro, F., F. G. Montoya, A. Sabio-Ortega, and A. García-Cruz, 2015: Review of 15
bioclimatic architecture strategies for achieving thermal comfort. Renew. Sustain. Energy Rev., 16
49, 736–755, https://doi.org/10.1016/j.rser.2015.04.095. 17
Marchenko, O. V., 2008: Modeling of a green certificate market. Renew. Energy, 33, 18
https://doi.org/10.1016/j.renene.2007.09.026. 19
Marckmann, B., K. Gram-Hanssen, and T. H. Christensen, 2012: Sustainable living and co-housing: 20
Evidence from a case study of eco-villages. Built Environ., 38, 413–429, 21
https://doi.org/10.2148/benv.38.3.413. 22
Marek, E., C. Raux, and D. Engelmann, 2018: Personal carbon allowances: Can a budget label do the 23
trick? Transp. Policy, 69, 170–178, https://doi.org/10.1016/j.tranpol.2018.06.007. 24
Markandya, A., X. Labandeira, and A. Ramos, 2015: Policy Instruments to Foster Energy Efficiency. 25
Green Energy and Technology, Vol. 164 of, 93–110. 26
Markewitz, P., P. Hansen, W. Kuckshinrichs, and J. F. Hake, 2015: Strategies for a low carbon building 27
stock in Germany. 8th International Scientific Conference on Energy and Climate Change. 28
Markovska, N., N. Duić, B. V. Mathiesen, Z. Guzović, A. Piacentino, H. Schlör, and H. Lund, 2016: 29
Addressing the main challenges of energy security in the twenty-first century – Contributions of 30
the conferences on Sustainable Development of Energy, Water and Environment Systems. 31
Energy, 115, 1504–1512, https://doi.org/10.1016/j.energy.2016.10.086. 32
Marmolejo-Duarte, C., and A. Chen, 2019: The Uneven Price Impact of Energy Efficiency Ratings on 33
Housing Segments and Implications for Public Policy and Private Markets. Sustainability, 11, 372, 34
https://doi.org/10.3390/su11020372. 35
Marshall, R., and Coauthors, 2015: Design and evaluation: End users, user datasets and personas. Appl. 36
Ergon., 46, 311–317, https://doi.org/10.1016/j.apergo.2013.03.008. 37
Marszal, A. J., P. Heiselberg, J. S. Bourrelle, E. Musall, K. Voss, I. Sartori, and A. Napolitano, 2011: 38
Zero Energy Building - A review of definitions and calculation methodologies. Energy Build., 43, 39
971–979, https://doi.org/10.1016/j.enbuild.2010.12.022. 40
Marzano, R., C. Rougé, P. Garrone, L. Grilli, J. J. Harou, and M. Pulido-Velazquez, 2018: Determinants 41
of the price response to residential water tariffs: Meta-analysis and beyond. Environ. Model. 42
Softw., 101, 236–248, https://doi.org/10.1016/j.envsoft.2017.12.017. 43
Mashhoodi, B., D. Stead, and A. van Timmeren, 2019: Spatial homogeneity and heterogeneity of energy 44
ACCEPTED VERSION
SUBJECT TO FIN
AL EDITS
Final Government Distribution Chapter 9 IPCC AR6 WGIII
Do Not Cite, Quote or Distribute 9-137 Total pages: 168
poverty: a neglected dimension. Ann. GIS, 25, 19–31, 1
https://doi.org/10.1080/19475683.2018.1557253. 2
Mastrucci, A., E. Byers, S. Pachauri, and N. D. Rao, 2019: Improving the SDG energy poverty targets: 3
Residential cooling needs in the Global South. Energy Build., 186, 405–415, 4
https://doi.org/10.1016/j.enbuild.2019.01.015. 5
Masuda, H., and D. E. Claridge, 2014: Statistical modeling of the building energy balance variable for 6
screening of metered energy use in large commercial buildings. Energy Build., 77, 292–303, 7
https://doi.org/10.1016/j.enbuild.2014.03.070. 8
Mata, É., J. Wanemark, V. M. Nik, and A. Sasic Kalagasidis, 2019: Economic feasibility of building 9
retrofitting mitigation potentials: Climate change uncertainties for Swedish cities. Appl. Energy, 10
242, 1022–1035, https://doi.org/10.1016/j.apenergy.2019.03.042. 11
——, S. Harris, A. Novikova, A. F. P. Lucena, and P. Bertoldi, 2020a: Climate Mitigation from Circular 12
and Sharing Economy in the Buildings Sector. Resour. Conserv. Recycl., 158, 104817, 13
https://doi.org/10.1016/j.resconrec.2020.104817. 14
——, A. K. Korpal, S. H. Cheng, J. P. Jiménez Navarro, F. Filippidou, J. Reyna, and R. Wang, 2020b: 15
A map of roadmaps for zero and low energy and carbon buildings worldwide. Environ. Res. Lett., 16
15, 113003, https://doi.org/10.1088/1748-9326/abb69f. 17
——, J. Ottosson, and J. Nilsson, 2020c: A review of flexibility of residential electricity demand as 18
climate solution in four EU countries. Environ. Res. Lett., 15, 073001, 19
https://doi.org/10.1088/1748-9326/ab7950. 20
Mata, É., J. M. Kihila, J. Wanemark, S. H. Cheng, S. Harris, F. Sandkvist, T. Nyberg, and K. 21
Yaramenka, 2021a: Non-technological and behavioral options for decarbonizing buildings – a 22
review of global topics, trends, gaps, and potentials. Sustain. Prod. Consum., 23
https://doi.org/10.1016/j.spc.2021.10.013. 24
Mata, É., D. Peñaloza, F. Sandkvist, and T. Nyberg, 2021b: What is stopping low-carbon buildings? A 25
global review of enablers and barriers. Energy Res. Soc. Sci., 82, 102261, 26
https://doi.org/10.1016/j.erss.2021.102261. 27
——, ——, J. Wanemark, and F. Sandkvist, 2021c: A review of reasons for (non) adoption of low 28
carbon building solutions. Environ. Innov. Soc. Transitions,. 29
——, J. Wanemark, S. H. Cheng, E. Ó Broin, M. Hennlock, and A. Sandvall, 2021d: Systematic map 30
of determinants of buildings’ energy demand and CO 2 emissions shows need for decoupling. 31
Environ. Res. Lett., 16, 055011, https://doi.org/10.1088/1748-9326/abe5d7. 32
——, ——, M. Hennlock, S. H. Cheng, E. Ó Broin, and A. Sandvall, 2021e: A systematic map of 33
determinants for buildings’ energy demand and climate impact. Environ. Res. Lett. Lett,. 34
Mathew, P., P. Issler, and N. Wallace, 2021: Should commercial mortgage lenders care about energy 35
efficiency? Lessons from a pilot study. Energy Policy, 150, 112137, 36
https://doi.org/10.1016/j.enpol.2021.112137. 37
Mattioli, R., and K. Moulinos, 2015: Communication network dependencies in smart grids. 38
Maxwell, K. B., S. H. Julius, A. E. Grambsch, A. R. Kosmal, E. Larson, and N. Sonti, 2018: Chapter 39
11 : Built Environment, Urban Systems, and Cities. Impacts, Risks, and Adaptation in the United 40
States: The Fourth National Climate Assessment, Volume II. Impacts, Risks, Adapt. United States 41
Fourth Natl. Clim. Assessment, Vol. II, II, 438–478, https://doi.org/10.7930/NCA4.2018.CH11. 42
Mayrand, F., and P. Clergeau, 2018: Green Roofs and Green Walls for Biodiversity Conservation: A 43
Contribution to Urban Connectivity? Sustainability, 10, 985, https://doi.org/10.3390/su10040985. 44
McCollum, D. L., and Coauthors, 2018: Connecting the sustainable development goals by their energy 45
ACCEPTED VERSION
SUBJECT TO FIN
AL EDITS

Final Government Distribution Chapter 9 IPCC AR6 WGIII
Do Not Cite, Quote or Distribute 9-138 Total pages: 168
inter-linkages. Environ. Res. Lett., 13, https://doi.org/10.1088/1748-9326/aaafe3. 1
McKinlay, A., C. Baldwin, and N. J. Stevens, 2019: Size Matters: Dwelling Size as a Critical Factor 2
for Sustainable Urban Development. Urban Policy Res., 37, 135–150, 3
https://doi.org/10.1080/08111146.2017.1374944. 4
McNeil, M. A., N. Karali, and V. Letschert, 2019: Forecasting Indonesia’s electricity load through 2030 5
and peak demand reductions from appliance and lighting efficiency. Energy Sustain. Dev., 49, 65–6
77, https://doi.org/10.1016/j.esd.2019.01.001. 7
Mehetre, S. A., N. L. Panwar, D. Sharma, and H. Kumar, 2017: Improved biomass cookstoves for 8
sustainable development: A review. Renew. Sustain. Energy Rev., 73, 672–687, 9
https://doi.org/10.1016/j.rser.2017.01.150. 10
Meier, H., and K. Rehdanz, 2010: Determinants of residential space heating expenditures in Great 11
Britain. Energy Econ., https://doi.org/10.1016/j.eneco.2009.11.008. 12
de Melo, C. A., and G. de Martino Jannuzzi, 2015: Cost-effectiveness of CO2 emissions reduction 13
through energy efficiency in Brazilian building sector. Energy Effic., 8, 815–826, 14
https://doi.org/10.1007/s12053-014-9322-2. 15
Mercado, J., 2018: Towards a Circular Building Industry in Berlin-Emerging Concepts from the 16
Circular Economy Kopernikus Projects Enavi Working Package 4 | Task 7 “Technical-systemic 17
analysis with a focus on energy efficiency in buildings.” 18
Merini, I., A. Molina-García, M. Socorro García-Cascales, M. Mahdaoui, and M. Ahachad, 2020: 19
Analysis and comparison of energy efficiency code requirements for buildings: A Morocco-Spain 20
case study. Energies, 13, https://doi.org/10.3390/en13225979. 21
Michaelowa, A., I. Shishlov, and D. Brescia, 2019: Evolution of international carbon markets: lessons 22
for the Paris Agreement. Wiley Interdiscip. Rev. Clim. Chang., 10, 23
https://doi.org/10.1002/wcc.613. 24
Miezis, M., K. Zvaigznitis, N. Stancioff, and L. Soeftestad, 2016: Climate change and buildings energy 25
efficiency - The key role of residents. Environ. Clim. Technol., 17, 30–43, 26
https://doi.org/10.1515/rtuect-2016-0004. 27
Mikulić, D., I. R. Bakarić, and S. Slijepčević, 2016: The economic impact of energy saving retrofits of 28
residential and public buildings in Croatia. Energy Policy, 96, 630–644, 29
https://doi.org/10.1016/j.enpol.2016.06.040. 30
Militello-Hourigan, R. E., and S. L. Miller, 2018: The impacts of cooking and an assessment of indoor 31
air quality in Colorado passive and tightly constructed homes. Build. Environ., 144, 573–582, 32
https://doi.org/10.1016/j.buildenv.2018.08.044. 33
Miller, L., and R. Carriveau, 2018: A review of energy storage financing—Learning from and 34
partnering with the renewable energy industry. J. Energy Storage, 19, 311–319, 35
https://doi.org/10.1016/j.est.2018.08.007. 36
Mills, E., 2016: Job creation and energy savings through a transition to modern off-grid lighting. Energy 37
Sustain. Dev., 33, 155–166, https://doi.org/10.1016/j.esd.2016.06.001. 38
Millward-Hopkins, J., J. K. Steinberger, N. D. Rao, and Y. Oswald, 2020: Providing decent living with 39
minimum energy: A global scenario. Glob. Environ. Chang., 65, 102168, 40
https://doi.org/10.1016/j.gloenvcha.2020.102168. 41
Minami, S., T. M. Ayako, Y. Yohei, and S. Yoshiyuki, 2019: Required specification of residential end-42
use energy demand model for application to national GHG mitigation policy making - Case study 43
for the Japanese plan for global warming countermeasures. Build. Simul. Conf. Proc., 6, 3706–44
3713, https://doi.org/10.26868/25222708.2019.211100. 45
ACCEPTED VERSION
SUBJECT TO FIN
AL EDITS
Final Government Distribution Chapter 9 IPCC AR6 WGIII
Do Not Cite, Quote or Distribute 9-139 Total pages: 168
Mirasgedis, S., C. Tourkolias, E. Pavlakis, and D. Diakoulaki, 2014: A methodological framework for 1
assessing the employment effects associated with energy efficiency interventions in buildings. 2
Energy Build., 82, 275–286, https://doi.org/10.1016/j.enbuild.2014.07.027. 3
Mirasgedis, S., Y. Sarafidis, and E. Georgopoulou, 2017: Long-term planning for the energy system of 4
Greece. 5
Mistry, M. N., 2019: Historical global gridded degree-days: A high-spatial resolution database of CDD 6
and HDD. Geosci. Data J., 1–8, https://doi.org/10.1002/gdj3.83. 7
Miu, L., N. Wisniewska, C. Mazur, J. Hardy, and A. Hawkes, 2018: A Simple Assessment of Housing 8
Retrofit Policies for the UK: What Should Succeed the Energy Company Obligation? Energies, 9
11, 2070, https://doi.org/10.3390/en11082070. 10
Mofidi, F., and H. Akbari, 2017: Personalized energy costs and productivity optimization in offices. 11
Energy Build., 143, 173–190, https://doi.org/10.1016/j.enbuild.2017.03.018. 12
Mohit, A., R. Felix, C. Lynette, and S. Arlindo, 2020: Buildings and the circular economy: Estimating 13
urban mining, recovery and reuse potential of building components. Resour. Conserv. Recycl., 14
154, 104581, https://doi.org/10.1016/j.resconrec.2019.104581. 15
Molenbroek, E., M. Smith, N. Surmeli, and S. Schimschar, 2015: Savings and benefits of global 16
regulations for energy efficient products. 106 p. pp. 17
https://ec.europa.eu/energy/sites/ener/files/documents/Cost of Non-World - Final Report.pdf. 18
Momonoki, T., A. Taniguchi-Matsuoka, Y. Yamaguchi, and Y. Shimoda, 2017: Evaluation of the 19
greenhouse gas reduction effect in the japanese residential sector considering the characteristics 20
of regions and households. Build. Simul. Conf. Proc., 1, 494–501, 21
https://doi.org/10.26868/25222708.2017.718. 22
Moncaster, A. M., and J. Y. Song, 2012: A comparative review of existing data and methodologies for 23
calculating embodied energy and carbon of buildings. Int. J. Sustain. Build. Technol. Urban Dev., 24
3, 26–36, https://doi.org/10.1080/2093761X.2012.673915. 25
Moncaster, A. M., F. N. Rasmussen, T. Malmqvist, A. Houlihan Wiberg, and H. Birgisdottir, 2019: 26
Widening understanding of low embodied impact buildings: Results and recommendations from 27
80 multi-national quantitative and qualitative case studies. J. Clean. Prod., 235, 378–393, 28
https://doi.org/10.1016/j.jclepro.2019.06.233. 29
Mongsawad, P., 2012: The philosophy of the sufficiency economy: a contribution to the theory of 30
development. Asia-Pacific Dev. J., 17, 123–143, https://doi.org/10.18356/02bd5fb3-en. 31
Moradibistouni, M., N. Isaacs, and B. Vale, 2018: Learning from the past to build tomorrow : an 32
overview of previous prefabrication schemes. 52nd International Conference of the Architectural 33
Science Association, 145–152. 34
Mørck, O. C., 2017: Energy saving concept development for the MORE-CONNECT pilot energy 35
renovation of apartment blocks in Denmark. Energy Procedia, 140, 240–251, 36
https://doi.org/10.1016/j.egypro.2017.11.139. 37
Morel, J., and R. Charef, 2019: What are the barriers affecting the use of earth as a modern construction 38
material in the context of circular economy? IOP Conf. Ser. Earth Environ. Sci., 225, 012053, 39
https://doi.org/10.1088/1755-1315/225/1/012053. 40
Morganti, M., A. Pages-Ramon, H. Coch, and A. Isalgue, 2019: Buildingmass and Energy Demand in 41
Conventional Housing Typologies of the Mediterranean City. Sustainability, 11, 3540, 42
https://doi.org/10.3390/su11133540. 43
Morstyn, T., N. Farrell, S. J. Darby, and M. D. McCulloch, 2018: Using peer-to-peer energy-trading 44
platforms to incentivize prosumers to form federated power plants. Nat. Energy, 3, 94–101, 45
ACCEPTED VERSION
SUBJECT TO FIN
AL EDITS

Final Government Distribution Chapter 9 IPCC AR6 WGIII
Do Not Cite, Quote or Distribute 9-140 Total pages: 168
https://doi.org/10.1038/s41560-017-0075-y. 1
Mortensen, A., P. Heiselberg, and M. Knudstrup, 2016: Identification of key parameters determining 2
Danish homeowners’ willingness and motivation for energy renovations. Int. J. Sustain. Built 3
Environ., 5, 246–268, https://doi.org/10.1016/j.ijsbe.2016.09.002. 4
Mosoarca, M., A. I. Keller, and C. Bocan, 2019: Failure analysis of church towers and roof structures 5
due to high wind velocities. Eng. Fail. Anal., 100, 76–87, 6
https://doi.org/10.1016/j.engfailanal.2019.02.046. 7
Moura, M. C. P., S. J. Smith, and D. B. Belzer, 2015: 120 Years of U.S. Residential Housing Stock and 8
Floor Space. PLoS One, 10, e0134135, https://doi.org/10.1371/journal.pone.0134135. 9
Mujahid Rafique, M., P. Gandhidasan, S. Rehman, and L. M. Al-Hadhrami, 2015: A review on 10
desiccant based evaporative cooling systems. Renew. Sustain. Energy Rev., 45, 145–159, 11
https://doi.org/10.1016/j.rser.2015.01.051. 12
Mundaca, L., D. Ürge-Vorsatz, and C. Wilson, 2019: Demand-side approaches for limiting global 13
warming to 1.5 °C. Energy Effic., 12, 343–362, https://doi.org/10.1007/s12053-018-9722-9. 14
Murphy, R., 2015: The Joy of Tax. How a fair tax system can create a better society. 1–250 pp. 15
Murtagh, N., M. Nati, W. R. Headley, B. Gatersleben, A. Gluhak, M. A. Imran, and D. Uzzell, 2013: 16
Individual energy use and feedback in an office setting: A field trial. Energy Policy, 62, 717–728, 17
https://doi.org/10.1016/j.enpol.2013.07.090. 18
Musonye, X. S., B. Davíðsdóttir, R. Kristjánsson, E. I. Ásgeirsson, and H. Stefánsson, 2020: Integrated 19
energy systems’ modeling studies for sub-Saharan Africa: A scoping review. Renew. Sustain. 20
Energy Rev., 128, https://doi.org/10.1016/j.rser.2020.109915. 21
Mzavanadze, N., 2018a: Quantifying energy poverty-related health impacts of energy efficiency. 66 p. 22
pp. https://combi-project.eu/wp-content/uploads/D5.4_20180514.pdf. 23
——, 2018b: Quantifying air pollution impacts of energy efficiency. 32 p. pp. https://combi-24
project.eu/wp-content/uploads/D3.4_20180514.pdf. 25
Nabitz, L., and S. Hirzel, 2019: Transposing The Requirements of the Energy Efficiency Directive on 26
Mandatory Energy Audits for Large Companies: A Policy‐Cycle‐based review of the National 27
Implementation in the EU-28 Member States. Energy Policy, 125, 548–561, 28
https://doi.org/10.1016/j.enpol.2017.12.016. 29
Nadel, S., 2016: Pathway to Cutting Energy Use and Carbon Emissions in Half. 43 p. pp. 30
https://www.aceee.org/sites/default/files/pathways-cutting-energy-use.pdf. 31
Nakicenovic, N., and Coauthors, 2019: The Digital Revoluion and Sustainable Development: 32
Opportunities and Challenges Report. 100 pp. 33
Narassimhan, E., K. S. Gallagher, S. Koester, and J. R. Alejo, 2018: Carbon pricing in practice: a review 34
of existing emissions trading systems. Clim. Policy, 18, 967–991, 35
https://doi.org/10.1080/14693062.2018.1467827. 36
Natascha Klocker, 2017: The environmental implications of multigenerational living: are larger 37
households also greener households? Multigenerational Fam. Living, 174–191, 38
https://doi.org/10.4324/9781315596266-17. 39
National Treasury of Republic of South Africa, 2021: Working Draft. Draft Green Finance Taxonomy 40
of South Africa. 41
Navarro, L., A. de Gracia, S. Colclough, M. Browne, S. J. McCormack, P. Griffiths, and L. F. Cabeza, 42
2016: Thermal energy storage in building integrated thermal systems: A review. Part 1. active 43
storage systems. Renew. Energy, 88, 526–547, https://doi.org/10.1016/j.renene.2015.11.040. 44
ACCEPTED VERSION
SUBJECT TO FIN
AL EDITS

Final Government Distribution Chapter 9 IPCC AR6 WGIII
Do Not Cite, Quote or Distribute 9-141 Total pages: 168
Negawatt, 2017: Scénario négaWatt : Un scénario de transition énergétique. 1
https://www.negawatt.org/. 2
New Building Institute, 2019: Getting to zero buildings database. 3
https://newbuildings.org/resource/getting-to-zero-database/. 4
Newell, R. G., W. A. Pizer, and D. Raimi, 2019: U.S. federal government subsidies for clean energy: 5
Design choices and implications. Energy Econ., 80, 831–841, 6
https://doi.org/10.1016/j.eneco.2019.02.018. 7
Newton, P., D. Meyer, and S. Glackin, 2017: Becoming urban: Exploring the transformative capacity 8
for a suburban-to-urban transition in Australia’s low-density cities. Sustain., 9, 9
https://doi.org/10.3390/su9101718. 10
Nguyen, H. T., D. T. Nguyen, and L. B. Le, 2015: Energy management for households with solar 11
assisted thermal load considering renewable energy and price uncertainty. IEEE Trans. Smart 12
Grid, 6, 301–314, https://doi.org/10.1109/TSG.2014.2350831. 13
Nicolini, M., and M. Tavoni, 2017: Are renewable energy subsidies effective? Evidence from Europe. 14
Renew. Sustain. Energy Rev., 74, 412–423, https://doi.org/10.1016/j.rser.2016.12.032. 15
Niemelä, T., K. Levy, R. Kosonen, and J. Jokisalo, 2017: Cost-optimal renovation solutions to 16
maximize environmental performance, indoor thermal conditions and productivity of office 17
buildings in cold climate. Sustain. Cities Soc., 32, 417–434, 18
https://doi.org/10.1016/j.scs.2017.04.009. 19
Nikas, A., V. Stavrakas, A. Arsenopoulos, H. Doukas, M. Antosiewicz, J. Witajewski-Baltvilks, and A. 20
Flamos, 2020: Barriers to and consequences of a solar-based energy transition in Greece. Environ. 21
Innov. Soc. Transitions, 35, 383–399, https://doi.org/10.1016/j.eist.2018.12.004. 22
Nilsson, A., P. Stoll, and N. Brandt, 2017: Assessing the impact of real-time price visualization on 23
residential electricity consumption, costs, and carbon emissions. Resour. Conserv. Recycl., 124, 24
152–161, https://doi.org/10.1016/j.resconrec.2015.10.007. 25
Nishida, Y., and Y. Hua, 2011: Motivating stakeholders to deliver change: Tokyo’s Cap-and-Trade 26
Program. Build. Res. Inf., 39, https://doi.org/10.1080/09613218.2011.596419. 27
Niu, S., X. Zhang, C. Zhao, and Y. Niu, 2012: Variations in energy consumption and survival status 28
between rural and urban households: A case study of the Western Loess Plateau, China. Energy 29
Policy, 49, 515–527, https://doi.org/10.1016/j.enpol.2012.06.046. 30
Novikova, A., T. Csoknyai, M. Jovanovic-Popovic, B. Stankovic, and Z. Szalay, 2018a: Assessment of 31
decarbonisation scenarios for the residential buildings of Serbia. Therm. Sci., 22, 1231–1247, 32
https://doi.org/10.2298/TSCI171221229N. 33
——, T. Csoknyai, M. J. Popović, B. Stanković, and Z. Szalay, 2018b: Assessment of decarbonisation 34
scenarios for the residential buildings of Serbia. Therm. Sci., 2018, 35
https://doi.org/10.2298/TSCI171221229N. 36
——, ——, and Z. Szalay, 2018c: Low carbon scenarios for higher thermal comfort in the residential 37
building sector of South Eastern Europe. Energy Effic., 11, 845–875, 38
https://doi.org/10.1007/s12053-017-9604-6. 39
——, K. Stelmakh, A. Klinge, and I. Stamo, 2019: Climate and energy investment map of Germany. 40
Status report 2016. 1–109 pp. 41
——, Z. Szalay, M. Horváth, J. Becker, G. Simaku, and T. Csoknyai, 2020: Assessment of energy-42
saving potential, associated costs and co-benefits of public buildings in Albania. Energy Effic., 43
13, 1387–1407, https://doi.org/10.1007/s12053-020-09883-3. 44
Nunes, A. R., 2020: General and specified vulnerability to extreme temperatures among older adults. 45
ACCEPTED VERSION
SUBJECT TO FIN
AL EDITS

Final Government Distribution Chapter 9 IPCC AR6 WGIII
Do Not Cite, Quote or Distribute 9-142 Total pages: 168
Int. J. Environ. Health Res., 30, 515–532, https://doi.org/10.1080/09603123.2019.1609655. 1
Nußholz, J. L. K., F. N. Rasmussen, K. Whalen, and A. Plepys, 2020: Material reuse in buildings: 2
Implications of a circular business model for sustainable value creation. J. Clean. Prod., 245, 3
118546, https://doi.org/10.1016/j.jclepro.2019.118546. 4
Nyborg, S., and I. Røpke, 2013: Constructing users in the smart grid-insights from the Danish eFlex 5
project. Energy Effic., 6, 655–670, https://doi.org/10.1007/s12053-013-9210-1. 6
O’Brien, W., and H. B. Gunay, 2014: The contextual factors contributing to occupants’ adaptive 7
comfort behaviors in offices – A review and proposed modeling framework. Build. Environ., 77, 8
77–87, https://doi.org/10.1016/j.buildenv.2014.03.024. 9
——, and Coauthors, 2020: Introducing IEA EBC annex 79: Key challenges and opportunities in the 10
field of occupant-centric building design and operation. Build. Environ., 178, 106738, 11
https://doi.org/10.1016/j.buildenv.2020.106738. 12
Oduyemi, O., M. I. Okoroh, and O. S. Fajana, 2017: The application and barriers of BIM in sustainable 13
building design. J. Facil. Manag., 15, 15–34, https://doi.org/10.1108/JFM-03-2016-0008. 14
Oh, M., and Y. Kim, 2019: Identifying urban geometric types as energy performance patterns. Energy 15
Sustain. Dev., 48, 115–129, https://doi.org/10.1016/j.esd.2018.12.002. 16
Ohueri, C. C., W. I. Enegbuma, and R. Kenley, 2018: Energy efficiency practices for Malaysian green 17
office building occupants. Built Environ. Proj. Asset Manag., 8, 134–146, 18
https://doi.org/10.1108/BEPAM-10-2017-0091. 19
Oikonomou, V., A. Flamos, and S. Grafakos, 2014: Combination of Energy Policy Instruments: 20
Creation of Added Value or Overlapping? Energy Sources, Part B Econ. Planning, Policy, 9, 21
https://doi.org/10.1080/15567241003716696. 22
Okushima, S., 2016: Measuring energy poverty in Japan, 2004–2013. Energy Policy, 98, 557–564, 23
https://doi.org/10.1016/j.enpol.2016.09.005. 24
Olmos, L., S. Ruester, and S. J. Liong, 2012: On the selection of financing instruments to push the 25
development of new technologies: Application to clean energy technologies. Energy Policy, 43, 26
252–266, https://doi.org/10.1016/j.enpol.2012.01.001. 27
Oluleye, G., and R. Smith, 2016: A mixed integer linear programming model for integrating 28
thermodynamic cycles for waste heat exploitation in process sites. Appl. Energy, 178, 434–453, 29
https://doi.org/10.1016/j.apenergy.2016.06.096. 30
——, L. Vasquez, R. Smith, and M. Jobson, 2016: A multi-period Mixed Integer Linear Program for 31
design of residential distributed energy centres with thermal demand data discretisation. Sustain. 32
Prod. Consum., 5, 16–28, https://doi.org/10.1016/j.spc.2015.11.003. 33
——, J. Allison, N. Kelly, and A. D. Hawkes, 2018: An optimisation study on integrating and 34
incentivising Thermal Energy Storage (TES) in a dwelling energy system. Energies, 11, 1–17, 35
https://doi.org/10.3390/en11051095. 36
Omara, A. A. M., and A. A. A. Abuelnour, 2019: Improving the performance of air conditioning 37
systems by using phase change materials: A review. Int. J. Energy Res., 43, 5175–5198, 38
https://doi.org/10.1002/er.4507. 39
Omrany, H., V. Soebarto, E. Sharifi, and A. Soltani, 2020: Application of Life Cycle Energy 40
Assessment in Residential Buildings: A Critical Review of Recent Trends. Sustainability, 12, 351, 41
https://doi.org/10.3390/su12010351. 42
Onyenokporo, N. C., and E. T. Ochedi, 2019: Low-cost retrofit packages for residential buildings in 43
hot-humid Lagos, Nigeria. Int. J. Build. Pathol. Adapt., 37, 250–272, 44
https://doi.org/10.1108/IJBPA-01-2018-0010. 45
ACCEPTED VERSION
SUBJECT TO FIN
AL EDITS

Final Government Distribution Chapter 9 IPCC AR6 WGIII
Do Not Cite, Quote or Distribute 9-143 Total pages: 168
Orea, L., M. Llorca, and M. Filippini, 2015: A new approach to measuring the rebound effect associated 1
to energy efficiency improvements: An application to the US residential energy demand. Energy 2
Econ., 49, 599–609, https://doi.org/10.1016/j.eneco.2015.03.016. 3
Ormandy, D., and V. Ezratty, 2016: Thermal discomfort and health: protecting the susceptible from 4
excess cold and excess heat in housing. Adv. Build. Energy Res., 10, 84–98, 5
https://doi.org/10.1080/17512549.2015.1014845. 6
Ortiz, J., N. Casquero-Modrego, and J. Salom, 2019: Health and related economic effects of residential 7
energy retrofitting in Spain. Energy Policy, 130, 375–388, 8
https://doi.org/10.1016/j.enpol.2019.04.013. 9
Ortiz, M. A., S. R. Kurvers, and P. M. Bluyssen, 2017: A review of comfort, health, and energy use: 10
Understanding daily energy use and wellbeing for the development of a new approach to study 11
comfort. Energy Build., 152, 323–335, https://doi.org/10.1016/j.enbuild.2017.07.060. 12
Ortwein, A., 2016: Combined Heat and Power Systems for the Provision of Sustainable Energy from 13
Biomass in Buildings. E3S Web Conf., 10, 00134, https://doi.org/10.1051/e3sconf/20161000134. 14
Österbring, M., É. Mata, L. Thuvander, M. Mangold, F. Johnsson, and H. Wallbaum, 2016: A 15
differentiated description of building-stocks for a georeferenced urban bottom-up building-stock 16
model. Energy Build., 120, https://doi.org/10.1016/j.enbuild.2016.03.060. 17
Ostermeyer, Y.; Camarasa, C.; Naegeli, C.; Saraf, S.; Jakob, M.; Hamilton, I; Catenazzi, G., 2018a: 18
Building Market Brief. United Kingdom. 70 p. pp. 19
——, 2018b: Building Market Brief. United Kingdom. 70 p. pp. 20
Ostermeyer, Y.; Camarasa, C.; Saraf, S.; Naegeli, C.; Jakob, M.; Palacios, A, Catenazzi, G. L. D., 2018: 21
Building Market Brief. France. 70 p. pp. 22
Ostermeyer, Y., C. Camarasa, S. Saraf, C. Naegli, M. Jakob, H. Visscher, and A. Meijer, 2018a: 23
Building Market Brief. The Netherlands. 70 p. pp. 24
——, ——, ——, ——, ——, ——, and ——, 2018b: Building Market Brief. The Netherlands. 70 p. 25
pp. http://cuesanalytics.eu/wp-content/uploads/2018/10/181023-CK-BMB-26
BMB_NETHERLANDS-DEF-CIE-Edition.pdf. 27
——, and Coauthors, 2019a: Building Market Brief. Poland. 64–75 pp. 28
——, C. Camarasa, S. Saraf, C. Naegli, M. Jakob, J. Von Geibler, K. Bienge, and L. Hennes, 2019b: 29
Building Market Brief. Germany. 70 p. pp. 30
Östman, B., D. Brandon, and H. Frantzich, 2017: Fire safety engineering in timber buildings. Fire Saf. 31
J., 91, 11–20, https://doi.org/10.1016/j.firesaf.2017.05.002. 32
Ott, C., and J. Hahn, 2018: Green pay off in commercial real estate in Germany: assessing the role of 33
Super Trophy status. J. Prop. Invest. Financ., 36, 104–124, https://doi.org/10.1108/JPIF-03-2017-34
0019. 35
Ottelin, J., H. Cetinay, and P. Behrens, 2020: Rebound effects may jeopardize the resource savings of 36
circular consumption: evidence from household material footprints. Environ. Res. Lett., 15, 37
104044, https://doi.org/10.1088/1748-9326/abaa78. 38
Ouyang, X., and B. Lin, 2014: Levelized cost of electricity (LCOE) of renewable energies and required 39
subsidies in China. Energy Policy, 70, https://doi.org/10.1016/j.enpol.2014.03.030. 40
Ozarisoy, B., and H. Altan, 2017: Adoption of Energy Design Strategies for Retrofitting Mass Housing 41
Estates in Northern Cyprus. Sustainability, 9, 1477, https://doi.org/10.3390/su9081477. 42
Pacudan, R., 2018: Feed-in tariff vs incentivized self-consumption: Options for residential solar PV 43
ACCEPTED VERSION
SUBJECT TO FIN
AL EDITS
Final Government Distribution Chapter 9 IPCC AR6 WGIII
Do Not Cite, Quote or Distribute 9-144 Total pages: 168
policy in Brunei Darussalam. Renew. Energy, 122, https://doi.org/10.1016/j.renene.2018.01.102. 1
Paduos, S., and V. Corrado, 2017: Cost-optimal approach to transform the public buildings into nZEBs: 2
An European cross-country comparison. Energy Procedia, Vol. 140 of, Elsevier Ltd, 314–324. 3
Palm, A., 2020: Early adopters and their motives: Differences between earlier and later adopters of 4
residential solar photovoltaics. Renew. Sustain. Energy Rev., 133, 110142, 5
https://doi.org/10.1016/j.rser.2020.110142. 6
Palmer, K. L., S. Grausz, B. Beasley, and T. J. Brennan, 2013: Putting a floor on energy savings: 7
Comparing state energy efficiency resource standards. Util. Policy, 25, 43–57, 8
https://doi.org/10.1016/j.jup.2013.02.002. 9
Pamenter, S., and R. J. Myers, 2021: Decarbonizing the cementitious materials cycle: A whole-systems 10
review of measures to decarbonize the cement supply chain in the UK and European contexts. J. 11
Ind. Ecol., 25, 359–376, https://doi.org/10.1111/jiec.13105. 12
Parag, Y., and B. K. Sovacool, 2016: Electricity market design for the prosumer era. Nat. Energy, 1, 13
nenergy201632, https://doi.org/10.1038/nenergy.2016.32. 14
Park, E., S. Kim, Y. S. Kim, and S. J. Kwon, 2018: Smart home services as the next mainstream of the 15
ICT industry: determinants of the adoption of smart home services. Univers. Access Inf. Soc., 17, 16
175–190, https://doi.org/10.1007/s10209-017-0533-0. 17
Park, H., and W. K. Hong, 2014: Korea’s emission trading scheme and policy design issues to achieve 18
market-efficiency and abatement targets. Energy Policy, 75, 73–83, 19
https://doi.org/10.1016/j.enpol.2014.05.001. 20
Park, H., and C. Kim, 2018: Do Shifts in Renewable Energy Operation Policy Affect Efficiency: 21
Korea’s Shift from FIT to RPS and Its Results. Sustainability, 10, 22
https://doi.org/10.3390/su10061723. 23
Parkin, A., M. Herrera, and D. A. Coley, 2019: Energy or carbon? Exploring the relative size of 24
universal zero carbon and zero energy design spaces. Build. Serv. Eng. Res. Technol., 40, 319–25
339, https://doi.org/10.1177/0143624418815780. 26
Patange, O. S., and Coauthors, 2015: Reductions in Indoor Black Carbon Concentrations from 27
Improved Biomass Stoves in Rural India. Environ. Sci. Technol., 49, 4749–4756, 28
https://doi.org/10.1021/es506208x. 29
Patwa, N., U. Sivarajah, A. Seetharaman, S. Sarkar, K. Maiti, and K. Hingorani, 2021: Towards a 30
circular economy: An emerging economies context. J. Bus. Res., 122, 725–735, 31
https://doi.org/10.1016/j.jbusres.2020.05.015. 32
Pauliuk, S., N. Heeren, P. Berrill, T. Fishman, A. Nistad, Q. Tu, P. Wolfram, and E. G. Hertwich, 2021: 33
Global scenarios of resource and emission savings from material efficiency in residential buildings 34
and cars. Nat. Commun., 12, https://doi.org/10.1038/s41467-021-25300-4. 35
Pavanello, F., and Coauthors, 2021: Air-Conditioning and the Adaptation Cooling Deficit in Emerging 36
Economies. Proc. Natl. Acad. Sci.,. 37
Payne, J., D. Weatherall, and F. Downy, 2015: Capturing the multiple benefits of energy efficiency in 38
practice: the UK example. ECEE 2015 Summer Study Proceedings, 229–238. 39
Pedzi Makumbe, Manuela Mot, Marwa Moustafa Khalil, and M. H., 2017: Energy Efficiency and 40
Rooftop Solar PV Opportunities in Cairo and Alexandria. 38 pp. 41
Peñaloza, D., M. Erlandsson, and A. Falk, 2016: Exploring the climate impact effects of increased use 42
of bio-based materials in buildings. Constr. Build. Mater., 125, 219–226, 43
https://doi.org/10.1016/j.conbuildmat.2016.08.041. 44
ACCEPTED VERSION
SUBJECT TO FIN
AL EDITS

Final Government Distribution Chapter 9 IPCC AR6 WGIII
Do Not Cite, Quote or Distribute 9-145 Total pages: 168
——, ——, J. Berlin, M. Wålinder, and A. Falk, 2018: Future scenarios for climate mitigation of new 1
construction in Sweden: Effects of different technological pathways. J. Clean. Prod., 2
https://doi.org/10.1016/j.jclepro.2018.03.285. 3
Peng, J.-T., Y. Wang, X. Zhang, Y. He, M. Taketani, R. Shi, and X.-D. Zhu, 2019: Economic and 4
welfare influences of an energy excise tax in Jiangsu province of China: A computable general 5
equilibrium approach. J. Clean. Prod., 211, 1403–1411, 6
https://doi.org/10.1016/j.jclepro.2018.11.267. 7
Peng, L., and M. G. Stewart, 2016: Climate change and corrosion damage risks for reinforced concrete 8
infrastructure in China. Struct. Infrastruct. Eng., 12, 499–516, 9
https://doi.org/10.1080/15732479.2013.858270. 10
Peng, P., G. Gong, X. Deng, C. Liang, and W. Li, 2020: Field study and numerical investigation on 11
heating performance of air carrying energy radiant air-conditioning system in an office. Energy 12
Build., 209, 109712, https://doi.org/10.1016/j.enbuild.2019.109712. 13
Pereira da Silva, P., G. Dantas, G. I. Pereira, L. Câmara, and N. J. De Castro, 2019: Photovoltaic 14
distributed generation – An international review on diffusion, support policies, and electricity 15
sector regulatory adaptation. Renew. Sustain. Energy Rev., 103, 16
https://doi.org/10.1016/j.rser.2018.12.028. 17
Peschiera, G., and J. E. Taylor, 2012: The impact of peer network position on electricity consumption 18
in building occupant networks utilizing energy feedback systems. Energy Build., 49, 584–590, 19
https://doi.org/10.1016/j.enbuild.2012.03.011. 20
Peters, T., 2018: a Cool World Defining the Energy Conundrum of Cooling for All Contributors. 19 pp. 21
Picard, T., T. Hong, N. Luo, S. Hoon, and K. Sun, 2020: Energy & Buildings Robustness of energy 22
performance of Zero-Net-Energy ( ZNE ) homes. Energy Build., 224, 110251, 23
https://doi.org/10.1016/j.enbuild.2020.110251. 24
Pitelis, A., N. Vasilakos, and K. Chalvatzis, 2020: Fostering innovation in renewable energy 25
technologies: Choice of policy instruments and effectiveness. Renew. Energy, 151, 26
https://doi.org/10.1016/j.renene.2019.11.100. 27
Pittau, F., G. Lumia, N. Heeren, G. Iannaccone, and G. Habert, 2019: Retrofit as a carbon sink: The 28
carbon storage potentials of the EU housing stock. J. Clean. Prod., 214, 365–376, 29
https://doi.org/10.1016/j.jclepro.2018.12.304. 30
Pitts, A., 2017: Passive House and Low Energy Buildings: Barriers and Opportunities for Future 31
Development within UK Practice. Sustainability, 9, 272, https://doi.org/10.3390/su9020272. 32
Ploss, M., T. Hatt, C. Schneider, T. Rosskopf, and M. Braun, 2017: Modellvorhaben „KliNaWo“. 33
Klimagerechter Nachhaltiger Wohnbau. 34
Polzin, F., F. Egli, B. Steffen, and T. S. Schmidt, 2019: How do policies mobilize private finance for 35
renewable energy?—A systematic review with an investor perspective. Appl. Energy, 236, 1249–36
1268, https://doi.org/10.1016/j.apenergy.2018.11.098. 37
Pomponi, F., and A. Moncaster, 2016: Embodied carbon mitigation and reduction in the built 38
environment – What does the evidence say? J. Environ. Manage., 181, 687–700, 39
https://doi.org/10.1016/j.jenvman.2016.08.036. 40
——, and ——, 2017: Circular economy for the built environment: a research framework. J. Clean. 41
Prod., 143, 710–718. 42
——, and ——, 2018: Scrutinising embodied carbon in buildings: The next performance gap made 43
manifest. Renew. Sustain. Energy Rev., 81, 2431–2442, 44
https://doi.org/10.1016/j.rser.2017.06.049. 45
ACCEPTED VERSION
SUBJECT TO FIN
AL EDITS

Final Government Distribution Chapter 9 IPCC AR6 WGIII
Do Not Cite, Quote or Distribute 9-146 Total pages: 168
——, P. A. E. Piroozfar, R. Southall, P. Ashton, and E. R. P. Farr, 2016: Energy performance of Double-1
Skin Façades in temperate climates: A systematic review and meta-analysis. Renew. Sustain. 2
Energy Rev., 54, 1525–1536, https://doi.org/10.1016/j.rser.2015.10.075. 3
——, J. Hart, J. H. Arehart, and B. D’Amico, 2020: Buildings as a Global Carbon Sink? A Reality 4
Check on Feasibility Limits. One Earth, 3, 157–161, 5
https://doi.org/10.1016/j.oneear.2020.07.018. 6
Pons, O., 2014: Assessing the sustainability of prefabricated buildings. Eco-efficient Construction and 7
Building Materials, Elsevier, 434–456. 8
Poon, I., 2015: Incorporation of rebound effect into energy efficient measures cost-benefit analysis 9
model. 2015 IEEE International Conference on Building Efficiency and Sustainable 10
Technologies, IEEE, 90–94. 11
Poortinga, W., S. Jiang, C. Grey, and C. Tweed, 2018: Impacts of energy-efficiency investments on 12
internal conditions in low-income households. Build. Res. Inf., 46, 653–667, 13
https://doi.org/10.1080/09613218.2017.1314641. 14
Pothitou, M., R. F. Hanna, and K. J. Chalvatzis, 2017: ICT entertainment appliances’ impact on 15
domestic electricity consumption. Renew. Sustain. Energy Rev., 69, 843–853, 16
https://doi.org/10.1016/j.rser.2016.11.100. 17
Prada-hernández, A., H. Vargas, A. Ozuna, and J. L. Ponz-tienda, 2015: Marginal Abatement Costs 18
Curve ( MACC ) for Carbon Emissions Reduction from Buildings : An Implementation for Office 19
Buildings in Colombia of Carbon Emissions from. Int. J. Civ. Struct. Eng. IJCSE, 2, 175–183. 20
Prasanna, A., J. Mahmoodi, T. Brosch, and M. K. Patel, 2018: Recent experiences with tariffs for saving 21
electricity in households. Energy Policy, 115, 514–522, 22
https://doi.org/10.1016/j.enpol.2018.01.044. 23
Princen, T., 2003a: Principles for {Sustainability}: {From} {Cooperation} and {Efficiency} to 24
{Sufficiency}. Glob. Environ. Polit., 3, 33–50, https://doi.org/10.1162/152638003763336374. 25
——, 2003b: Principles for Sustainability: From Cooperation and Efficiency to Sufficiency. Glob. 26
Environ. Polit., 3, 33–50, https://doi.org/10.1162/152638003763336374. 27
Prívara, S., J. Široký, L. Ferkl, and J. Cigler, 2011: Model predictive control of a building heating 28
system: The first experience. Energy Build., 43, 564–572, 29
https://doi.org/10.1016/j.enbuild.2010.10.022. 30
Pyke, C. R., S. McMahon, L. Larsen, N. B. Rajkovich, and A. Rohloff, 2012: Development and analysis 31
of Climate Sensitivity and Climate Adaptation opportunities indices for buildings. Build. Environ., 32
55, 141–149, https://doi.org/10.1016/j.buildenv.2012.02.020. 33
Qiu, Y., 2014: Energy Efficiency and Rebound Effects: An Econometric Analysis of Energy Demand 34
in the Commercial Building Sector. Environ. Resour. Econ., 59, 295–335, 35
https://doi.org/10.1007/s10640-013-9729-9. 36
——, G. Colson, and C. Grebitus, 2014: Risk preferences and purchase of energy-efficient technologies 37
in the residential sector. Ecol. Econ., 107, 216–229, 38
https://doi.org/10.1016/j.ecolecon.2014.09.002. 39
Quinn, A. K., and Coauthors, 2018: An analysis of efforts to scale up clean household energy for 40
cooking around the world. Energy Sustain. Dev., 46, 1–10, 41
https://doi.org/10.1016/j.esd.2018.06.011. 42
QURAISHI, K. S., and S. AHMED, 2019: ANALYSIS OF PURCHASE BEHAVIOR OF 43
RESIDENTIAL SOLAR ROOFTOP PV ADOPTERS. Int. J. Manag., 10, 28–37, 44
https://doi.org/10.34218/IJM.10.5.2019.003. 45
ACCEPTED VERSION
SUBJECT TO FIN
AL EDITS

Final Government Distribution Chapter 9 IPCC AR6 WGIII
Do Not Cite, Quote or Distribute 9-147 Total pages: 168
Rabe, M., A. Kühn, R. Dumitrescu, T. Mittag, M. Schneider, and J. Gausemeier, 2018: Impact of smart 1
services to current value networks. J. Mech. Eng., 5, 1–11. 2
Rachel, B., and W. Travis, 2011: The influence of collection facility attributes on household collection 3
rates of electronic waste: The case of televisions and computer monitors. Resour. Conserv. 4
Recycl., 55, 1051–1059, https://doi.org/10.1016/j.resconrec.2011.05.019. 5
Rademaekers, K., K. Svatikova, J. Vermeulen, T. Smit, and L. Baroni, 2017: Environmental potential 6
of the collaborative economy. 7
Radhi, H., 2011: Viability of autoclaved aerated concrete walls for the residential sector in the United 8
Arab Emirates. Energy Build., 43, 2086–2092, https://doi.org/10.1016/j.enbuild.2011.04.018. 9
Radpour, S., M. A. Hossain Mondal, and A. Kumar, 2017: Market penetration modeling of high energy 10
efficiency appliances in the residential sector. Energy, 134, 951–961, 11
https://doi.org/10.1016/j.energy.2017.06.039. 12
Rafaj, P., and Coauthors, 2018: Outlook for clean air in the context of sustainable development goals. 13
Glob. Environ. Chang., 53, 1–11, https://doi.org/10.1016/j.gloenvcha.2018.08.008. 14
Rafiee, A., E. Dias, and E. Koomen, 2019: Analysing the impact of spatial context on the heat 15
consumption of individual households. Renew. Sustain. Energy Rev., 112, 461–470, 16
https://doi.org/10.1016/j.rser.2019.05.033. 17
Rafsanjani, H., C. Ahn, and M. Alahmad, 2015: A Review of Approaches for Sensing, Understanding, 18
and Improving Occupancy-Related Energy-Use Behaviors in Commercial Buildings. Energies, 8, 19
10996–11029. 20
Rahman, R. A., and S. K. Ayer, 2019: Enhancing the non-technological skills required for effective 21
building information modeling through problem-based learning. J. Inf. Technol. Constr., 24, 154–22
166. 23
Rahut, D. B., A. Ali, and B. Behera, 2017: Domestic use of dirty energy and its effects on human health: 24
empirical evidence from Bhutan. Int. J. Sustain. Energy, 36, 983–993, 25
https://doi.org/10.1080/14786451.2016.1154855. 26
Rakha, T., Y. Chen, and C. Reinhart, 2018: Do Office Buildings `Save’ Energy in the United States 27
Due To Daylight Saving Time (Dst)? a 50-State Simulation-Based Study. 2018 Building 28
Performance Analysis Conference and Simbuild, 21–28. 29
Ralston Fonseca, F., P. Jaramillo, M. Bergés, and E. Severnini, 2019: Seasonal effects of climate change 30
on intra-day electricity demand patterns. Clim. Change, 154, 435–451, 31
https://doi.org/10.1007/s10584-019-02413-w. 32
Rao, N. D., and P. Baer, 2012: “Decent Living” emissions: A conceptual framework. Sustainability, 4, 33
656–681, https://doi.org/10.3390/su4040656. 34
——, and S. Pachauri, 2017: Energy access and living standards: Some observations on recent trends. 35
Environ. Res. Lett., 12, https://doi.org/10.1088/1748-9326/aa5b0d. 36
——, and J. Min, 2018: Decent Living Standards: Material Prerequisites for Human Wellbeing. Soc. 37
Indic. Res., 138, 225–244, https://doi.org/10.1007/s11205-017-1650-0. 38
Rao, N. D., A. Agarwal, and D. Wood, 2016: Impact of small-scale electricity system. 66 p. pp. 39
www.iiasa.ac.at. 40
Rao, N. D., J. Min, and A. Mastrucci, 2019: Energy requirements for decent living in India, Brazil and 41
South Africa. Nat. Energy, 4, 1025–1032, https://doi.org/10.1038/s41560-019-0497-9. 42
Rashid, M. M. U., M. A. Alotaibi, A. H. Chowdhury, M. Rahman, M. S. Alam, M. A. Hossain, and M. 43
A. Abido, 2021: Home energy management for community microgrids using optimal power 44
ACCEPTED VERSION
SUBJECT TO FIN
AL EDITS

Final Government Distribution Chapter 9 IPCC AR6 WGIII
Do Not Cite, Quote or Distribute 9-148 Total pages: 168
sharing algorithm. Energies, 14, https://doi.org/10.3390/en14041060. 1
Rasmussen, F. N., T. Malmqvist, A. Moncaster, A. H. Wiberg, and H. Birgisdóttir, 2018: Analysing 2
methodological choices in calculations of embodied energy and GHG emissions from buildings. 3
Energy Build., 158, 1487–1498, https://doi.org/10.1016/j.enbuild.2017.11.013. 4
Raux, C., and G. Marlot, 2005: A system of tradable CO2 permits applied to fuel consumption by 5
motorists. Transp. Policy, 12, https://doi.org/10.1016/j.tranpol.2005.02.006. 6
——, Y. Croissant, and D. Pons, 2015: Would personal carbon trading reduce travel emissions more 7
effectively than a carbon tax? Transp. Res. Part D Transp. Environ., 35, 72–83, 8
https://doi.org/10.1016/j.trd.2014.11.008. 9
Reddy, A. K. N., 1991: Barriers to improvements in energy efficiency. Energy Policy, 19, 10
https://doi.org/10.1016/0301-4215(91)90115-5. 11
Reddy, S. B., 2002: Barriers to the Diffusion of Renewable Energy Technologies. 12
Rehm, T. W., T. Schneiders, C. Strohm, and M. Deimel, 2018: Smart Home Field Test – Investigation 13
of Heating Energy Savings in Residential Buildings. 2018 7th International Energy and 14
Sustainability Conference (IESC), IEEE, 1–8. 15
Reichert, G., C. Schmidl, W. Haslinger, M. Schwabl, W. Moser, S. Aigenbauer, M. Wöhler, and C. 16
Hochenauer, 2016: Investigation of user behavior and assessment of typical operation mode for 17
different types of firewood room heating appliances in Austria. Renew. Energy, 93, 245–254, 18
https://doi.org/10.1016/j.renene.2016.01.092. 19
Reichmann, J., G. Habert, and F. Pittau, 2021: Land availability in Europe for a radical shift toward 20
bio-based construction Land availability in Europe for a radical shift toward bio-based 21
construction. Sustain. Cities Soc., 70, 102929, https://doi.org/10.1016/j.scs.2021.102929. 22
Reindl, K., and J. Palm, 2020: Energy efficiency in the building sector: A combined middle-out and 23
practice theory approach. Int. J. Sustain. Energy Plan. Manag., 28, 3–16, 24
https://doi.org/10.5278/ijsepm.3426. 25
Reiss, P. C., and M. W. White, 2008: What changes energy consumption? Prices and public pressures. 26
636–663 pp. 27
Requate, T., 2015: Green tradable certificates versus feed-in tariffs in the promotion of renewable 28
energy shares. Environ. Econ. Policy Stud., 17, 211–239, https://doi.org/10.1007/s10018-014-29
0096-8. 30
Reuter, M., B. Schlomann, C. Müller, and W. Eichhammer, 2017: A comprehensive indicator set for 31
measuring multiple benefits of energy efficiency. ECEEE 2017 Summer Study - Consumption, 32
Efficiency & Limits, 1891–1900. 33
Revesz, A., P. Jones, C. Dunham, G. Davies, C. Marques, R. Matabuena, J. Scott, and G. Maidment, 34
2020: Developing novel 5th generation district energy networks. Energy, 201, 117389, 35
https://doi.org/10.1016/j.energy.2020.117389. 36
Rezessy, S., and P. Bertoldi, 2011: Voluntary agreements in the field of energy efficiency and emission 37
reduction: Review and analysis of experiences in the European Union. Energy Policy, 39, 7121–38
7129, https://doi.org/10.1016/j.enpol.2011.08.030. 39
Riedy, C., L. Wynne, K. McKenna, and M. Daly, 2019: “It’s a Great Idea for Other People”: Cohousing 40
as a Housing Option for Older Australians. Urban Policy Res., 37, 227–242, 41
https://doi.org/10.1080/08111146.2018.1531750. 42
Rijal, H. B., P. Tuohy, M. A. Humphreys, J. F. Nicol, and A. Samuel, 2012: Considering the impact of 43
situation-specific motivations and constraints in the design of naturally ventilated and hybrid 44
buildings. Archit. Sci. Rev., 55, 35–48, https://doi.org/10.1080/00038628.2011.641734. 45
ACCEPTED VERSION
SUBJECT TO FIN
AL EDITS
Final Government Distribution Chapter 9 IPCC AR6 WGIII
Do Not Cite, Quote or Distribute 9-149 Total pages: 168
Risch, A., and C. Salmon, 2017: What matters in residential energy consumption: evidence from France. 1
Int. J. Glob. Energy Issues, 40, 79, https://doi.org/10.1504/IJGEI.2017.080767. 2
Roberts, M. B., A. Bruce, and I. MacGill, 2019a: A comparison of arrangements for increasing self-3
consumption and maximising the value of distributed photovoltaics on apartment buildings. Sol. 4
Energy, 193, https://doi.org/10.1016/j.solener.2019.09.067. 5
Roberts, M. B., A. Bruce, and I. MacGill, 2019b: Opportunities and barriers for photovoltaics on multi-6
unit residential buildings: Reviewing the Australian experience. Renew. Sustain. Energy Rev., 104, 7
95–110, https://doi.org/10.1016/j.rser.2018.12.013. 8
Roca-Puigròs, M., R. G. Billy, A. Gerber, P. Wäger, and D. B. Müller, 2020: Pathways toward a carbon-9
neutral Swiss residential building stock. Build. Cities, 1, 579–593, https://doi.org/10.5334/bc.61. 10
Röck, M., A. Hollberg, G. Habert, and A. Passer, 2018: LCA and BIM: Visualization of environmental 11
potentials in building construction at early design stages. Build. Environ., 140, 153–161, 12
https://doi.org/10.1016/j.buildenv.2018.05.006. 13
——, and Coauthors, 2020: Embodied GHG emissions of buildings – The hidden challenge for effective 14
climate change mitigation. Appl. Energy, 258, 114107, 15
https://doi.org/10.1016/j.apenergy.2019.114107. 16
Rodríguez-Rosales, B., D. Abreu, R. Ortiz, J. Becerra, A. E. Cepero-Acán, M. A. Vázquez, and P. Ortiz, 17
2021: Risk and vulnerability assessment in coastal environments applied to heritage buildings in 18
Havana (Cuba) and Cadiz (Spain). Sci. Total Environ., 750, 141617, 19
https://doi.org/10.1016/j.scitotenv.2020.141617. 20
Rogelj, J., and Coauthors, 2018: Mitigation pathways compatible with 1.5°C in the context of 21
sustainable development. Global Warming of 1.5 °C an IPCC special report on the impacts of 22
global warming of 1.5 °C above pre-industrial levels and related global greenhouse gas emission 23
pathways, in the context of strengthening the global response to the threat of climate change, V. 24
Masson-Delmotte et al., Eds., p. 82pp. 25
Romdhane, J., and H. Louahlia-Gualous, 2018: Energy assessment of PEMFC based MCCHP with 26
absorption chiller for small scale French residential application. Int. J. Hydrogen Energy, 43, 27
19661–19680, https://doi.org/10.1016/j.ijhydene.2018.08.132. 28
Rosado, P. J., and R. Levinson, 2019: Potential benefits of cool walls on residential and commercial 29
buildings across California and the United States: Conserving energy, saving money, and reducing 30
emission of greenhouse gases and air pollutants. Energy Build., 199, 588–607, 31
https://doi.org/10.1016/j.enbuild.2019.02.028. 32
Rosas-Flores, J. A., and D. Rosas-Flores, 2020: Potential energy savings and mitigation of emissions 33
by insulation for residential buildings in Mexico. Energy Build., 209, 34
https://doi.org/10.1016/j.enbuild.2019.109698. 35
Roscini, A. V., O. Rapf, and J. Kockat, 2020: On the way to a climate-neutral Europe. Contribution 36
from the building sector to a strengthened 2030 climate target. 37
Rosenberg, E., 2014: Calculation method for electricity end-use for residential lighting. Energy, 66, 38
295–304, https://doi.org/10.1016/j.energy.2013.12.049. 39
Rosenow, J., and E. Bayer, 2017: Costs and benefits of Energy Efficiency Obligations: A review of 40
European programmes. Energy Policy, 107, 53–62, https://doi.org/10.1016/j.enpol.2017.04.014. 41
——, R. Platt, and A. Demurtas, 2014: Fiscal impacts of energy efficiency programmes-The example 42
of solid wall insulation investment in the UK. Energy Policy, 74, 610–620, 43
https://doi.org/10.1016/j.enpol.2014.08.007. 44
——, R. Cowart, and S. Thomas, 2019: Market-based instruments for energy efficiency: a global 45
ACCEPTED VERSION
SUBJECT TO FIN
AL EDITS

Final Government Distribution Chapter 9 IPCC AR6 WGIII
Do Not Cite, Quote or Distribute 9-150 Total pages: 168
review. Energy Effic., 12, 1379–1398, https://doi.org/10.1007/s12053-018-9766-x. 1
Rosenthal, J., A. Quinn, A. P. Grieshop, A. Pillarisetti, and R. I. Glass, 2018: Clean cooking and the 2
SDGs: Integrated analytical approaches to guide energy interventions for health and environment 3
goals. Energy Sustain. Dev., 42, 152–159, https://doi.org/10.1016/j.esd.2017.11.003. 4
Rosse Caldas, L., A. Bernstad Saraiva, V. M. Andreola, and R. Dias Toledo Filho, 2020: Bamboo bio-5
concrete as an alternative for buildings’ climate change mitigation and adaptation. Constr. Build. 6
Mater., 263, 120652, https://doi.org/10.1016/j.conbuildmat.2020.120652. 7
Roussac, A. C., and S. Bright, 2012: Improving environmental performance through innovative 8
commercial leasing: An Australian case study. Int. J. Law Built Environ., 4, 6–22, 9
https://doi.org/10.1108/17561451211211714. 10
Roy, J., and Coauthors, 2018: Sustainable Development , Poverty Eradication and Reducing 11
Inequalities. Global Warming of 1.5 °C an IPCC special report on the impacts of global warming 12
of 1.5 °C above pre-industrial levels and related global greenhouse gas emission pathways, in the 13
context of strengthening the global response to the threat of climate change. 14
de Rubeis, T., S. Falasca, G. Curci, D. Paoletti, and D. Ambrosini, 2020: Sensitivity of heating 15
performance of an energy self-sufficient building to climate zone, climate change and HVAC 16
system solutions. Sustain. Cities Soc., 61, 102300, https://doi.org/10.1016/j.scs.2020.102300. 17
Rubio-Bellido, C., A. Pérez-Fargallo, J. A. Pulido-Arcas, and M. Trebilcock, 2017: Application of 18
adaptive comfort behaviors in Chilean social housing standards under the influence of climate 19
change. Build. Simul., 10, 933–947, https://doi.org/10.1007/s12273-017-0385-9. 20
Ruhnau, O., L. Hirth, and A. Praktiknjo, 2020: Heating with wind: Economics of heat pumps and 21
variable renewables. Energy Econ., 92, https://doi.org/10.1016/j.eneco.2020.104967. 22
de Ruig, L. T., T. Haer, H. de Moel, W. J. W. Botzen, and J. C. J. H. Aerts, 2019: A micro-scale cost-23
benefit analysis of building-level flood risk adaptation measures in Los Angeles. Water Resour. 24
Econ., 100147, https://doi.org/10.1016/j.wre.2019.100147. 25
van Ruijven, B. J., E. De Cian, and I. Sue Wing, 2019: Amplification of future energy demand growth 26
due to climate change. Nat. Commun., 10, 2762, https://doi.org/10.1038/s41467-019-10399-3. 27
Ruparathna, R., K. Hewage, and R. Sadiq, 2016: Improving the energy efficiency of the existing 28
building stock: A critical review of commercial and institutional buildings. Renew. Sustain. 29
Energy Rev., 53, 1032–1045, https://doi.org/10.1016/j.rser.2015.09.084. 30
Rupp, R. F., N. G. Vásquez, and R. Lamberts, 2015: A review of human thermal comfort in the built 31
environment. Energy Build., 105, 178–205, https://doi.org/10.1016/j.enbuild.2015.07.047. 32
Sachs, W., 1993: Die vier E ’ s. Polit. Ökologie, 33, 69–72. 33
Saelim, S., 2019: Carbon tax incidence on household consumption: Heterogeneity across socio-34
economic factors in Thailand. Econ. Anal. Policy, 62, 159–174, 35
https://doi.org/10.1016/j.eap.2019.02.003. 36
Saffari, M., A. de Gracia, C. Fernández, and L. F. Cabeza, 2017: Simulation-based optimization of 37
PCM melting temperature to improve the energy performance in buildings. Appl. Energy, 202, 38
420–434, https://doi.org/10.1016/j.apenergy.2017.05.107. 39
Saheb, Y., 2018: Deep Energy Renovation. 40
——, 2021: COP26: Sufficiency should be first. Build. Cities,. 41
——, H. Ossenbrink, S. Szabo, K. Bódis, and S. Panev, 2018a: Energy transition of Europe’s building 42
stock Implications for EU 2030 Sustainable Development Goals. Responsab. Environ., 90, 62–67. 43
ACCEPTED VERSION
SUBJECT TO FIN
AL EDITS

Final Government Distribution Chapter 9 IPCC AR6 WGIII
Do Not Cite, Quote or Distribute 9-151 Total pages: 168
Saheb, Y., S. Shnapp, and C. Johnson, 2018b: The Zero Energy concept: making the whole greater than 1
the sum of the parts to meet the Paris Climate Agreement’s objectives. Curr. Opin. Environ. 2
Sustain., 30, 138–150, https://doi.org/10.1016/j.cosust.2018.04.014. 3
Salom, J., A. J. Marszal, J. Widén, J. Candanedo, and K. B. Lindberg, 2014: Analysis of load match 4
and grid interaction indicators in net zero energy buildings with simulated and monitored data. 5
Appl. Energy, 136, 119–131, https://doi.org/10.1016/j.apenergy.2014.09.018. 6
Samadi, S., M. C. Gröne, U. Schneidewind, H. J. Luhmann, J. Venjakob, and B. Best, 2017: Sufficiency 7
in energy scenario studies: Taking the potential benefits of lifestyle changes into account. Technol. 8
Forecast. Soc. Change, 124, 126–134, https://doi.org/10.1016/j.techfore.2016.09.013. 9
Sanchez-Guevara, C., M. Núñez Peiró, J. Taylor, A. Mavrogianni, and J. Neila González, 2019: 10
Assessing population vulnerability towards summer energy poverty: Case studies of Madrid and 11
London. Energy Build., 190, 132–143, https://doi.org/10.1016/j.enbuild.2019.02.024. 12
Sánchez Ramos, J., Mc. C. Pavón Moreno, L. Romero Rodríguez, Mc. C. Guerrero Delgado, and S. 13
Álvarez Domínguez, 2019: Potential for exploiting the synergies between buildings through DSM 14
approaches. Case study: La Graciosa Island. Energy Convers. Manag., 194, 199–216, 15
https://doi.org/10.1016/j.enconman.2019.04.084. 16
Sandberg, M., 2018: Downsizing of Housing: Negotiating Sufficiency and Spatial Norms. J. 17
Macromarketing, 38, 154–167, https://doi.org/10.1177/0276146717748355. 18
Sandberg, N. H., and Coauthors, 2016: Dynamic building stock modelling: Application to 11 European 19
countries to support the energy efficiency and retrofit ambitions of the EU. Energy Build., 132, 20
26–38, https://doi.org/10.1016/j.enbuild.2016.05.100. 21
——, J. S. Næss, H. Brattebø, I. Andresen, and A. Gustavsen, 2021: Large potentials for energy saving 22
and greenhouse gas emission reductions from large-scale deployment of zero emission building 23
technologies in a national building stock. Energy Policy, 152, 24
https://doi.org/10.1016/j.enpol.2020.112114. 25
Sanjuán, M. Á., E. Estévez, and C. Argiz, 2019: Carbon dioxide absorption by blast-furnace slag 26
mortars in function of the curing intensity. Energies, 12, 1–9, https://doi.org/10.3390/en12122346. 27
Santamouris, M., 2016: Cooling the buildings – past, present and future. Energy Build., 128, 617–638, 28
https://doi.org/10.1016/j.enbuild.2016.07.034. 29
Santos, A. J. L., and A. F. P. Lucena, 2021: Climate change impact on the technical-economic potential 30
for solar photovoltaic energy in the residential sector: a case study for Brazil. Energy Clim. 31
Chang.,. 32
Sarbu, I., and C. Sebarchievici, 2014: General review of ground-source heat pump systems for heating 33
and cooling of buildings. Energy Build., 70, 441–454, 34
https://doi.org/10.1016/j.enbuild.2013.11.068. 35
——, and A. Dorca, 2018: A comprehensive review of solar thermoelectric cooling systems. Int. J. 36
Energy Res., 42, 395–415, https://doi.org/10.1002/er.3795. 37
Schaeffer, R., and Coauthors, 2012: Energy sector vulnerability to climate change: A review. Energy, 38
38, 1–12, https://doi.org/10.1016/j.energy.2011.11.056. 39
Schaffer, A. J., and S. Brun, 2015: Beyond the sun - Socioeconomic drivers of the adoption of small-40
scale photovoltaic installations in Germany. Energy Res. Soc. Sci., 10, 220–227, 41
https://doi.org/10.1016/j.erss.2015.06.010. 42
Schilmann, A., and Coauthors, 2019: A follow-up study after an improved cookstove intervention in 43
rural Mexico: Estimation of household energy use and chronic PM2.5 exposure. Environ. Int., 44
131, 105013, https://doi.org/10.1016/j.envint.2019.105013. 45
ACCEPTED VERSION
SUBJECT TO FIN
AL EDITS

Final Government Distribution Chapter 9 IPCC AR6 WGIII
Do Not Cite, Quote or Distribute 9-152 Total pages: 168
Schnieders, J., and Coauthors, 2020: Design and realisation of the Passive House concept in different 1
climate zones. Energy Effic., 13, 1561–1604, https://doi.org/10.1007/s12053-019-09819-6. 2
Schultz, P. W., J. M. Nolan, R. B. Cialdini, N. J. Goldstein, and V. Griskevicius, 2007: The 3
Constructive, Destructive, and Reconstructive Power of Social Norms. Psychol. Sci., 18, 429–434, 4
https://doi.org/10.1111/j.1467-9280.2007.01917.x. 5
De Schutter, G., K. Lesage, V. Mechtcherine, V. N. Nerella, G. Habert, and I. Agusti-Juan, 2018: Vision 6
of 3D printing with concrete — Technical, economic and environmental potentials. Cem. Concr. 7
Res., 112, 25–36, https://doi.org/10.1016/j.cemconres.2018.06.001. 8
Schwarz, M., C. Nakhle, and C. Knoeri, 2020: Innovative designs of building energy codes for building 9
decarbonization and their implementation challenges. J. Clean. Prod., 248, 119260, 10
https://doi.org/10.1016/j.jclepro.2019.119260. 11
Scott, F. L., C. R. Jones, and T. L. Webb, 2014: What do people living in deprived communities in the 12
UK think about household energy efficiency interventionsα. Energy Policy, 66, 335–349, 13
https://doi.org/10.1016/j.enpol.2013.10.084. 14
Scott, M. J., and Coauthors, 2015: Calculating impacts of energy standards on energy demand in U.S. 15
buildings with uncertainty in an integrated assessment model. Energy, 90, 1682–1694, 16
https://doi.org/10.1016/j.energy.2015.06.127. 17
Seebauer, S., 2018: The psychology of rebound effects: Explaining energy efficiency rebound 18
behaviours with electric vehicles and building insulation in Austria. Energy Res. Soc. Sci., 46, 19
311–320, https://doi.org/10.1016/j.erss.2018.08.006. 20
Seidl, R., T. von Wirth, and P. Krütli, 2019: Social acceptance of distributed energy systems in Swiss, 21
German, and Austrian energy transitions. Energy Res. Soc. Sci., 54, 117–128, 22
https://doi.org/10.1016/j.erss.2019.04.006. 23
Semprini, G., R. Gulli, and A. Ferrante, 2017: Deep regeneration vs shallow renovation to achieve 24
nearly Zero Energy in existing buildings: Energy saving and economic impact of design solutions 25
in the housing stock of Bologna. Energy Build., 156, 327–342, 26
https://doi.org/10.1016/j.enbuild.2017.09.044. 27
Sen, S., and H. Vollebergh, 2018: The effectiveness of taxing the carbon content of energy consumption. 28
J. Environ. Econ. Manage., 92, 74–99, https://doi.org/10.1016/j.jeem.2018.08.017. 29
Seong, Y.-B., and J.-H. Lim, 2013: Energy Saving Potentials of Phase Change Materials Applied to 30
Lightweight Building Envelopes. Energies, 6, 5219–5230, https://doi.org/10.3390/en6105219. 31
Serrano, S., D. Ürge-Vorsatz, C. Barreneche, A. Palacios, and L. F. Cabeza, 2017: Heating and cooling 32
energy trends and drivers in Europe. Energy, 119, 425–434, 33
https://doi.org/10.1016/j.energy.2016.12.080. 34
Setyawan, D., 2014: Formulating revolving fund scheme to support energy efficiency projects in 35
Indonesia. Energy Procedia, 47, 37–46, https://doi.org/10.1016/j.egypro.2014.01.194. 36
Shafique M Luo J, X. W. Z., 2020: Photovoltaic-green roofs: A review of benefits, limitations, and 37
trends. Sol. ENERGY, 202, 485–497, https://doi.org/10.1016/j.solener.2020.02.101. 38
Shah, N., M. Wei, V. Letschert, and A. Phadke, 2015: Benefits of Leapfrogging to Superefficiency and 39
Low Global Warming Potential Refrigerants in Room Air Conditioning. 40
——, ——, V. E. Letschert, and A. A. Phadke, 2019: Benefits of Energy Efficient and Low-Global 41
Warming Potential Refrigerant Cooling Equipment. 59 pp. 42
Shankar, A., and Coauthors, 2014: Maximizing the benefits of improved cookstoves: moving from 43
acquisition to correct and consistent use. Glob. Heal. Sci. Pract., 2, 268–274, 44
https://doi.org/10.9745/GHSP-D-14-00060. 45
ACCEPTED VERSION
SUBJECT TO FIN
AL EDITS

Final Government Distribution Chapter 9 IPCC AR6 WGIII
Do Not Cite, Quote or Distribute 9-153 Total pages: 168
Sharda, S., K. Sharma, and M. Singh, 2021: A real-time automated scheduling algorithm with PV 1
integration for smart home prosumers. J. Build. Eng., 44, 2
https://doi.org/10.1016/j.jobe.2021.102828. 3
Sharifi, A., 2020: Trade-offs and conflicts between urban climate change mitigation and adaptation 4
measures: A literature review. J. Clean. Prod., 276, 122813, 5
https://doi.org/10.1016/j.jclepro.2020.122813. 6
Shen, L., B. He, L. Jiao, X. Song, and X. Zhang, 2016: Research on the development of main policy 7
instruments for improving building energy-efficiency. J. Clean. Prod., 112, 1789–1803, 8
https://doi.org/10.1016/j.jclepro.2015.06.108. 9
Shen, P., and N. Lior, 2016: Vulnerability to climate change impacts of present renewable energy 10
systems designed for achieving net-zero energy buildings. Energy, 114, 1288–1305, 11
https://doi.org/10.1016/j.energy.2016.07.078. 12
Shirazi, A., R. A. Taylor, G. L. Morrison, and S. D. White, 2018: Solar-powered absorption chillers: A 13
comprehensive and critical review. Energy Convers. Manag., 171, 59–81, 14
https://doi.org/10.1016/j.enconman.2018.05.091. 15
Shivakumar, A., S. Pye, J. Anjo, M. Miller, P. B. Rouelle, M. Densing, and T. Kober, 2018: Smart 16
energy solutions in the EU: State of play and measuring progress. Energy Strateg. Rev., 20, 133–17
149, https://doi.org/10.1016/j.esr.2018.02.005. 18
Shrubsole, C., J. Taylor, P. Das, I. G. Hamilton, E. Oikonomou, and M. Davies, 2016: Impacts of energy 19
efficiency retrofitting measures on indoor PM2.5 concentrations across different income groups 20
in England: a modelling study. Adv. Build. Energy Res., 10, 69–83, 21
https://doi.org/10.1080/17512549.2015.1014844. 22
Simcock, N., and Coauthors, 2014: Factors influencing perceptions of domestic energy information: 23
Content, source and process. Energy Policy, 65, 455–464, 24
https://doi.org/10.1016/j.enpol.2013.10.038. 25
Simioni, T., and R. Schaeffer, 2019: Georeferenced operating-efficiency solar potential maps with local 26
weather conditions – An application to Brazil. Sol. Energy, 184, 345–355, 27
https://doi.org/10.1016/j.solener.2019.04.006. 28
Singh, G., A. Goel, and M. Choudhary, 2017: Analysis of domestic water demand variables of a 29
residential colony in Ajmer, Rajasthan (India). J. Water Sanit. Hyg. Dev., 7, 568–575, 30
https://doi.org/10.2166/washdev.2017.020. 31
Sköld, B., and Coauthors, 2018: Household preferences to reduce their greenhouse gas footprint: A 32
comparative study from four European cities. Sustain., 10, https://doi.org/10.3390/su10114044. 33
Slovic, P., and E. Peters, 2006: Risk Perception and Affect. Curr. Dir. Psychol. Sci., 15, 34
https://doi.org/10.1111/j.1467-8721.2006.00461.x. 35
van Sluisveld, M. A. E., S. H. Martínez, V. Daioglou, and D. P. van Vuuren, 2016: Exploring the 36
implications of lifestyle change in 2°C mitigation scenarios using the IMAGE integrated 37
assessment model. Technol. Forecast. Soc. Change, 102, 309–319, 38
https://doi.org/10.1016/j.techfore.2015.08.013. 39
Smith, A. C., and Coauthors, 2016: Health and environmental co-benefits and conflicts of actions to 40
meet UK carbon targets. Clim. Policy, 16, 253–283, 41
https://doi.org/10.1080/14693062.2014.980212. 42
Sola, P., C. Ochieng, J. Yila, and M. Iiyama, 2016: Links between energy access and food security in 43
sub Saharan Africa: an exploratory review. Food Secur., 8, 635–642, 44
https://doi.org/10.1007/s12571-016-0570-1. 45
ACCEPTED VERSION
SUBJECT TO FIN
AL EDITS

Final Government Distribution Chapter 9 IPCC AR6 WGIII
Do Not Cite, Quote or Distribute 9-154 Total pages: 168
Solaimani, S., W. Keijzer-Broers, and H. Bouwman, 2015: What we do - And don’t - Know about the 1
Smart Home: An analysis of the Smart Home literature. Indoor Built Environ., 24, 370–383, 2
https://doi.org/10.1177/1420326X13516350. 3
Soland, M., S. Loosli, J. Koch, and O. Christ, 2018: Acceptance among residential electricity consumers 4
regarding scenarios of a transformed energy system in Switzerland—a focus group study. Energy 5
Effic., 11, 1673–1688, https://doi.org/10.1007/s12053-017-9548-x. 6
Solaymani, S., 2017: Carbon and energy taxes in a small and open country. Glob. J. Environ. Sci. 7
Manag., 3, 51–62, https://doi.org/10.22034/gjesm.2017.03.01.006. 8
Soltani, M., and Coauthors, 2019: A comprehensive study of geothermal heating and cooling systems. 9
Sustain. Cities Soc., 44, 793–818, https://doi.org/10.1016/j.scs.2018.09.036. 10
Song, L., J. Lieu, A. Nikas, A. Arsenopoulos, G. Vasileiou, and H. Doukas, 2020: Contested energy 11
futures, conflicted rewards? Examining low-carbon transition risks and governance dynamics in 12
China’s built environment. Energy Res. Soc. Sci., 59, 101306, 13
https://doi.org/10.1016/j.erss.2019.101306. 14
Song, Y., M. Cervarich, A. K. Jain, H. S. Kheshgi, W. Landuyt, and X. Cai, 2016: The interplay between 15
bioenergy grass production and water resources in the United States of America. Environ. Sci. 16
Technol., 50, 3010–3019, https://doi.org/10.1021/acs.est.5b05239. 17
Sonnenschein, J., R. Van Buskirk, J. L. Richter, and C. Dalhammar, 2019: Minimum energy 18
performance standards for the 1.5 °C target: an effective complement to carbon pricing. Energy 19
Effic., 12, 387–402, https://doi.org/10.1007/s12053-018-9669-x. 20
Sorrell, S., J. Scleich, S. Scott, E. O’Malley, F. Trace, U. Boede, K. Ostertag, and P. Radgen, 2000: 21
Reducing barriers to energy efficiency in private and public organisations,. 22
https://www.esri.ie/system/files?file=media/file-uploads/2015-07/PRS47.pdf) (Accessed 23
December 22, 2020). 24
——, A. Mallett, and S. Nye, 2011: Barriers to industrial energy efficiency: A literature review. 25
Sorrell, S., B. Gatersleben, and A. Druckman, 2018: Energy sufficiency and rebound effects. Concept 26
paper. 63 p. pp. 27
Soumaré, I., and V. S. Lai, 2016: An analysis of government loan guarantees and direct investment 28
through public-private partnerships. Econ. Model., 59, 508–519, 29
https://doi.org/10.1016/j.econmod.2016.08.012. 30
Sourbron, M., C. Verhelst, and L. Helsen, 2013: Building models for model predictive control of office 31
buildings with concrete core activation. J. Build. Perform. Simul., 6, 175–198, 32
https://doi.org/10.1080/19401493.2012.680497. 33
Spanaki, A., D. Kolokotsa, T. Tsoutsos, and I. Zacharopoulos, 2014: Assessing the passive cooling 34
effect of the ventilated pond protected with a reflecting layer. Appl. Energy, 123, 273–280, 35
https://doi.org/10.1016/j.apenergy.2014.02.040. 36
Spandagos, C., M. Yarime, E. Baark, and T. L. Ng, 2020: “Triple Target” policy framework to influence 37
household energy behavior: Satisfy, strengthen, include. Appl. Energy, 269, 115117, 38
https://doi.org/10.1016/j.apenergy.2020.115117. 39
Spiliotopoulos, D., 2019: The future of the MEErP - Reinforcement of circular economy aspects in the 40
methdology. 6 p. pp. 41
Sreekanth, K. J., S. Jayaraj, and N. Sudarsan, 2011: A meta model for domestic energy consumption. 42
Int. J. Energy Econ. Policy, 1, 69–77. 43
Stadt Göttingen, 2020: Quartiersanalyse zur Identifizierung von Flächenoptimierungspotenzialen in 44
Göttingen. 45
ACCEPTED VERSION
SUBJECT TO FIN
AL EDITS

Final Government Distribution Chapter 9 IPCC AR6 WGIII
Do Not Cite, Quote or Distribute 9-155 Total pages: 168
Starkey, R., 2012: Personal carbon trading: A critical survey Part 2: Efficiency and effectiveness. Ecol. 1
Econ., 73, https://doi.org/10.1016/j.ecolecon.2011.09.018. 2
Steenbergen, R. D. J. M., T. Koster, and C. P. W. Geurts, 2012: The effect of climate change and natural 3
variability on wind loading values for buildings. Build. Environ., 55, 178–186, 4
https://doi.org/10.1016/j.buildenv.2012.03.010. 5
Steenland, K., A. Pillarisetti, M. Kirby, J. Peel, M. Clark, W. Checkley, H. H. Chang, and T. Clasen, 6
2018: Modeling the potential health benefits of lower household air pollution after a hypothetical 7
liquified petroleum gas (LPG) cookstove intervention. Environ. Int., 111, 71–79, 8
https://doi.org/10.1016/j.envint.2017.11.018. 9
Steinhardt, D. A., and K. Manley, 2016: Adoption of prefabricated housing-the role of country context. 10
Sustain. Cities Soc., 22, 126–135, https://doi.org/10.1016/j.scs.2016.02.008. 11
Stephan, A., R. H. Crawford, and K. de Myttenaere, 2013: Multi-scale life cycle energy analysis of a 12
low-density suburban neighbourhood in Melbourne, Australia. Build. Environ., 68, 35–49, 13
https://doi.org/10.1016/j.buildenv.2013.06.003. 14
Stewart, M. G., X. Wang, and M. N. Nguyen, 2012: Climate change adaptation for corrosion control of 15
concrete infrastructure. Struct. Saf., 35, 29–39, https://doi.org/10.1016/j.strusafe.2011.10.002. 16
Stötzer, M., I. Hauer, M. Richter, and Z. A. Styczynski, 2015: Potential of demand side integration to 17
maximize use of renewable energy sources in Germany. Appl. Energy, 146, 344–352, 18
https://doi.org/10.1016/j.apenergy.2015.02.015. 19
Strbac, G., D. Pudjianto, R. Sansom, P. Djapic, H. Ameli, N. Shah, N. Brandon, and A. Hawkes, 2018: 20
Analysis of Alternative UK Heat Decarbonisation Pathways. 159. 21
Streicher, K. N., D. Parra, M. C. Buerer, and M. K. Patel, 2017: Techno-economic potential of large-22
scale energy retrofit in the Swiss residential building stock. Energy Procedia, 122, 121–126, 23
https://doi.org/10.1016/j.egypro.2017.07.314. 24
——, S. Mennel, J. Chambers, D. Parra, and M. K. Patel, 2020: Cost-effectiveness of large-scale deep 25
energy retrofit packages for residential buildings under different economic assessment 26
approaches. Energy Build., 215, https://doi.org/10.1016/j.enbuild.2020.109870. 27
Streltsov, A., J. M. Malof, B. Huang, and K. Bradbury, 2020: Estimating residential building energy 28
consumption using overhead imagery. Appl. Energy, 280, 29
https://doi.org/10.1016/j.apenergy.2020.116018. 30
Stute, F., J. Mici, L. Chamberlain, and H. Lipson, 2018: Digital Wood: 3D Internal Color Texture 31
Mapping. 3D Print. Addit. Manuf., 5, 285–291, https://doi.org/10.1089/3dp.2018.0078. 32
Subramanyam, V., M. Ahiduzzaman, and A. Kumar, 2017a: Greenhouse gas emissions mitigation 33
potential in the commercial and institutional sector. Energy Build., 140, 295–304, 34
https://doi.org/10.1016/j.enbuild.2017.02.007. 35
——, A. Kumar, A. Talaei, and M. A. H. Mondal, 2017b: Energy efficiency improvement opportunities 36
and associated greenhouse gas abatement costs for the residential sector. Energy, 118, 795–807, 37
https://doi.org/10.1016/j.energy.2016.10.115. 38
Sugyiama, M., A. Taniguchi-Matsuoka, Y. Yamagushi, and Y. Shimoda, 2020: Required Specification 39
of Residential End-use Energy Demand Model for Application to National GHG Mitigation Policy 40
Making - Case Study for the Japanese Plan for Global Warming Countermeasures. Proceedings 41
of Building Simulation 2019: 16th Conference of IBPSA, Vol. 16 of, 3706–3713. 42
Sultan, S. M., and M. N. Ervina Efzan, 2018: Review on recent Photovoltaic/Thermal (PV/T) 43
technology advances and applications. Sol. Energy, 173, 939–954, 44
https://doi.org/10.1016/j.solener.2018.08.032. 45
ACCEPTED VERSION
SUBJECT TO FIN
AL EDITS

Final Government Distribution Chapter 9 IPCC AR6 WGIII
Do Not Cite, Quote or Distribute 9-156 Total pages: 168
Sun, K., and T. Hong, 2017: A framework for quantifying the impact of occupant behavior on energy 1
savings of energy conservation measures. Energy Build., 146, 383–396, 2
https://doi.org/10.1016/j.enbuild.2017.04.065. 3
——, M. Specian, and T. Hong, 2020: Nexus of Thermal Resilience and Energy Efficiency in 4
Buildings : A case study of a nursing home. https://doi.org/10.1016/j.buildenv.2020.106842. 5
Sun, P., and P. yan Nie, 2015: A comparative study of feed-in tariff and renewable portfolio standard 6
policy in renewable energy industry. Renew. Energy, 74, 255–262, 7
https://doi.org/10.1016/j.renene.2014.08.027. 8
Sustainable Energy for All, 2018: Chilling prospects: Providing sustainable cooling for all. 71 pp. 9
https://www.seforall.org/sites/default/files/SEforALL_CoolingForAll-Report_0.pdf. 10
Swan, W., R. Fitton, L. Smith, C. Abbott, and L. Smith, 2017: Adoption of sustainable retrofit in UK 11
social housing 2010-2015. Int. J. Build. Pathol. Adapt., 35, 456–469, 12
https://doi.org/10.1108/IJBPA-04-2017-0019. 13
Sweetnam, T., M. Fell, E. Oikonomou, and T. Oreszczyn, 2019: Domestic demand-side response with 14
heat pumps: controls and tariffs. Build. Res. Inf., 47, 344–361, 15
https://doi.org/10.1080/09613218.2018.1442775. 16
Symons, K., 2011: Book review: Embodied Carbon: The Inventory of Carbon and Energy (ICE). A 17
BSRIA Guide Embodied Carbon: The Inventory of Carbon and Energy (ICE). A BSRIA Guide 18
Hammond Professor GeoffJones CraigLowrie FionaTse Peter. University of Bath with BSRIA, 19
Bracknel. Proc. Inst. Civ. Eng. - Energy, 164, 206–206, 20
https://doi.org/10.1680/ener.2011.164.4.206. 21
Tajani, F., P. Morano, F. Di Liddo, K. Ntalianis, C. Guarnaccia, and N. Mastorakis, 2018: Energy 22
retrofit assessment through automated valuation models: An Italian case study. AIP Conference 23
Proceedings, Vol. 1982 of, 020045. 24
Taleb, H. M., 2015: Natural ventilation as energy efficient solution for achieving low-energy houses in 25
Dubai. Energy Build., 99, 284–291, https://doi.org/10.1016/j.enbuild.2015.04.019. 26
Talele, S., and Coauthors, 2018: Energy modeling and data structure framework for Sustainable 27
Human-Building Ecosystems (SHBE) — a review. Front. Energy, 12, 314–332, 28
https://doi.org/10.1007/s11708-017-0530-2. 29
Tam, V. W. Y., J. Wang, and K. N. Le, 2016: Thermal insulation and cost effectiveness of green-roof 30
systems: An empirical study in Hong Kong. Build. Environ., 110, 46–54, 31
https://doi.org/10.1016/j.buildenv.2016.09.032. 32
Tan, X., H. Lai, B. Gu, Y. Zeng, and H. Li, 2018: Carbon emission and abatement potential outlook in 33
China’s building sector through 2050. Energy Policy, 118, 429–439, 34
https://doi.org/10.1016/j.enpol.2018.03.072. 35
Taniguchi, A., T. Inoue, M. Otsuki, Y. Yamaguchi, Y. Shimoda, A. Takami, and K. Hanaoka, 2016: 36
Estimation of the contribution of the residential sector to summer peak demand reduction in Japan 37
using an energy end-use simulation model. Energy Build., 112, 80–92, 38
https://doi.org/10.1016/j.enbuild.2015.11.064. 39
Taylor, R., H. Wanjiru, O. W. Johnson, and F. X. Johnson, 2020: Modelling stakeholder agency to 40
investigate sustainable charcoal markets in Kenya. Environ. Innov. Soc. Transitions, 35, 493–508, 41
https://doi.org/10.1016/j.eist.2019.10.001. 42
Teli, D., T. Dimitriou, P. A. B. James, A. S. Bahaj, L. Ellison, and A. Waggott, 2016: Fuel poverty-43
induced “prebound effect” in achieving the anticipated carbon savings from social housing retrofit. 44
Build. Serv. Eng. Res. Technol., 37, 176–193, https://doi.org/10.1177/0143624415621028. 45
ACCEPTED VERSION
SUBJECT TO FIN
AL EDITS
Final Government Distribution Chapter 9 IPCC AR6 WGIII
Do Not Cite, Quote or Distribute 9-157 Total pages: 168
Teng, C. C., J. S. Horng, M. L. M. Hu, L. H. Chien, and Y. C. Shen, 2012: Developing energy 1
conservation and carbon reduction indicators for the hotel industry in Taiwan. Int. J. Hosp. 2
Manag., 31, 199–208, https://doi.org/10.1016/j.ijhm.2011.06.006. 3
Teubler, J., S. Kiefer, and K. Bienge, 2020: WP4 Resources: Methodology and quantification of 4
resource impacts from energy efficiency in Europe - project COMBI. 5
Thatcher, A., and K. Milner, 2016: Is a green building really better for building occupants? A 6
longitudinal evaluation. Build. Environ., 108, 194–206, 7
https://doi.org/10.1016/j.buildenv.2016.08.036. 8
Thema, J., and Coauthors, 2017: More than energy savings: quantifying the multiple impacts of energy 9
efficiency in Europe. ECEEE 2017 Summer Study, 1727–1736. 10
Thomas, D., G. Ding, and K. Crews, 2014: Sustainable timber use in residential construction: 11
Perception versus reality. WIT Trans. Ecol. Environ., 186, 399–410, 12
https://doi.org/10.2495/ESUS140341. 13
Thomas, S., and J. Rosenow, 2020: Drivers of increasing energy consumption in Europe and policy 14
implications. Energy Policy, 137, 111108, 15
https://doi.org/https://doi.org/10.1016/j.enpol.2019.111108. 16
Thomas, S., J. Thema, L. A. Brischke, L. Leuser, M. Kopatz, and M. Spitzner, 2019: Energy sufficiency 17
policy for residential electricity use and per-capita dwelling size. Energy Effic., 12, 1123–1149, 18
https://doi.org/10.1007/s12053-018-9727-4. 19
Thomaßen, G., K. Kavvadias, and J. P. Jiménez Navarro, 2021: The decarbonisation of the EU heating 20
sector through electrification: A parametric analysis. Energy Policy, 148, 111929, 21
https://doi.org/10.1016/j.enpol.2020.111929. 22
Thomson, H., and S. Thomas, 2015: Developing empirically supported theories of change for housing 23
investment and health. Soc. Sci. Med., 124, 205–214, 24
https://doi.org/10.1016/j.socscimed.2014.11.043. 25
Thomson, H., and S. Bouzarovski, 2018: Addressing Energy Poverty in the European Union: State of 26
Play and Action. 54 p. pp. 27
——, ——, and C. Snell, 2017a: Rethinking the measurement of energy poverty in Europe: A critical 28
analysis of indicators and data. Indoor Built Environ., 26, 879–901, 29
https://doi.org/10.1177/1420326X17699260. 30
——, C. Snell, and S. Bouzarovski, 2017b: Health, well-being and energy poverty in Europe: A 31
comparative study of 32 European countries. Int. J. Environ. Res. Public Health, 14, 32
https://doi.org/10.3390/ijerph14060584. 33
——, N. Simcock, S. Bouzarovski, and S. Petrova, 2019: Energy poverty and indoor cooling: An 34
overlooked issue in Europe. Energy Build., 196, 21–29, 35
https://doi.org/10.1016/j.enbuild.2019.05.014. 36
Timilsina, G., A. Sikharulidze, E. Karapoghosya, and S. Shatvoryan, 2016: How Do We Prioritize the 37
GHG Mitigation Options ? Development of a Marginal Abatement Cost Curve for the Building 38
Sector in Armenia and Georgia. 37 p. pp. 39
Tol, R. S. J., S. Petrick, and K. Rehdanz, 2012: Economics Department Working Paper Series The 40
Impact of Temperature Changes on Residential Energy Use. 41
Toleikyte, A., L. Kranzl, and A. Müller, 2018: Cost curves of energy efficiency investments in buildings 42
– Methodologies and a case study of Lithuania. Energy Policy, 115, 148–157, 43
https://doi.org/10.1016/j.enpol.2017.12.043. 44
Tonn, B., E. Rose, and B. Hawkins, 2018: Evaluation of the U.S. department of energy’s weatherization 45
ACCEPTED VERSION
SUBJECT TO FIN
AL EDITS

Final Government Distribution Chapter 9 IPCC AR6 WGIII
Do Not Cite, Quote or Distribute 9-158 Total pages: 168
assistance program: Impact results. Energy Policy, 118, 279–290, 1
https://doi.org/10.1016/j.enpol.2018.03.051. 2
Torero De Boeck Supérieur, M., 2015: THE IMPACT OF RURAL ELECTRIFICATION: 3
CHALLENGES AND WAYS FORWARD. Vol. 23 of, 49–75. 4
Torero, M., 2015: The impact of rural electrification: Challenges and ways forward. Rev. Econ. Dev., 5
23, 49–75, https://doi.org/10.3917/edd.hs03.0049. 6
Totschnig, G., and Coauthors, 2017: Climate change impact and resilience in the electricity sector: The 7
example of Austria and Germany. Energy Policy, 103, 238–248, 8
https://doi.org/10.1016/j.enpol.2017.01.019. 9
Tozer, L., 2019: The urban material politics of decarbonization in Stockholm, London and San 10
Francisco. Geoforum, 102, 106–115, https://doi.org/10.1016/j.geoforum.2019.03.020. 11
Trencher, G., and J. van der Heijden, 2019: Instrument interactions and relationships in policy mixes: 12
Achieving complementarity in building energy efficiency policies in New York, Sydney and 13
Tokyo. Energy Res. Soc. Sci., 54, 34–45, https://doi.org/10.1016/j.erss.2019.02.023. 14
——, V. Castán Broto, T. Takagi, Z. Sprigings, Y. Nishida, and M. Yarime, 2016: Innovative policy 15
practices to advance building energy efficiency and retrofitting: Approaches, impacts and 16
challenges in ten C40 cities. Environ. Sci. Policy, 66, 353–365, 17
https://doi.org/10.1016/j.envsci.2016.06.021. 18
Triana, M. A., R. Lamberts, and P. Sassi, 2018: Should we consider climate change for Brazilian social 19
housing? Assessment of energy efficiency adaptation measures. Energy Build., 158, 1379–1392, 20
https://doi.org/10.1016/j.enbuild.2017.11.003. 21
Trottier, 2016: Canada’s challenge & opportunity. Transformations for major reductions in GHG 22
emissions. 321 p. pp. 23
Tsoka, S., K. Tsikaloudaki, T. Theodosiou, and A. Dugue, 2018: Rethinking user based innovation: 24
Assessing public and professional perceptions of energy efficient building facades in Greece, Italy 25
and Spain. Energy Res. Soc. Sci., 38, 165–177, https://doi.org/10.1016/j.erss.2018.02.009. 26
Tumbaz, M. N. M., and H. T. Moğulkoç, 2018: Profiling energy efficiency tendency: A case for Turkish 27
households. Energy Policy, 119, 441–448, https://doi.org/10.1016/j.enpol.2018.04.064. 28
Tuomisto, J. T., and Coauthors, 2015: Building-related health impacts in European and Chinese cities: 29
a scalable assessment method. Environ. Heal., 14, 93, https://doi.org/10.1186/s12940-015-0082-30
z. 31
Uchman, W., 2021: The cost of increasing prosumer self-sufficiency. Appl. Therm. Eng., 186, 32
https://doi.org/10.1016/j.applthermaleng.2020.116361. 33
Underhill, L. J., M. P. Fabian, K. Vermeer, M. Sandel, G. Adamkiewicz, J. H. Leibler, and J. I. Levy, 34
2018: Modeling the resiliency of energy-efficient retrofits in low-income multifamily housing. 35
Indoor Air, 28, 459–468, https://doi.org/10.1111/ina.12446. 36
United Nations Environment Programme (UNEP), 2017: Accelerating the Global Adoption of Climate-37
Friendly and Energy-Efficient Refrigerators. 80 pp. http://united4efficiency.org/wp-38
content/uploads/2017/06/U4E-RefrigerationGuide-201705-Final-R1.pdf (Accessed December 39
22, 2020). 40
United Nations Environment Programme (UNEP) International Energy Agency (IEA), 2020: Cooling 41
Emissions and Policy Synthesis Report: Benefits of cooling efficiency and the Kigali Amendment. 42
50 pp. www.unep.org. 43
Ürge-Vorsatz, D., and Coauthors, 2014: Buildings. In: Mitigation. Working Group III contribution to 44
the Fifth Assessment Report of the Intergovernmental Panel of Climate Change. 671–738 pp. 45
ACCEPTED VERSION
SUBJECT TO FIN
AL EDITS
Final Government Distribution Chapter 9 IPCC AR6 WGIII
Do Not Cite, Quote or Distribute 9-159 Total pages: 168
Ürge-Vorsatz, D., L. F. Cabeza, S. Serrano, C. Barreneche, and K. Petrichenko, 2015: Heating and 1
cooling energy trends and drivers in buildings. Renew. Sustain. Energy Rev., 41, 85–98, 2
https://doi.org/10.1016/j.rser.2014.08.039. 3
——, and Coauthors, 2016: Measuring multiple impacts of low-carbon energy options in a green 4
economy context. Appl. Energy, 179, 1409–1426, 5
https://doi.org/10.1016/j.apenergy.2016.07.027. 6
——, R. Khosla, R. Bernhardt, Y. C. Chan, D. Vérez, S. Hu, and L. F. Cabeza, 2020: Advances Toward 7
a Net-Zero Global Building Sector. Annu. Rev. Environ. Resour., 45, 227–269, 8
https://doi.org/10.1146/annurev-environ-012420-045843. 9
US EPA, 2018: Quantifying the Multiple Benefits of Energy Efficiency and Renewable Energy: A Guide 10
for State and Local Governments. https://www.epa.gov/statelocalenergy/part-one-multiple-11
benefits-energy-efficiency-and-renewable-energy. 12
Vakiloroaya, V., B. Samali, A. Fakhar, and K. Pishghadam, 2014: A review of different strategies for 13
HVAC energy saving. Energy Convers. Manag., 77, 738–754, 14
https://doi.org/10.1016/j.enconman.2013.10.023. 15
Valentova, M., J. Knapek, and A. Novikova, 2019: Climate and energy investment map – Czechia. 16
Varela Luján, S., C. Viñas Arrebola, A. Rodríguez Sánchez, P. Aguilera Benito, and M. González 17
Cortina, 2019: Experimental comparative study of the thermal performance of the façade of a 18
building refurbished using ETICS, and quantification of improvements. Sustain. Cities Soc., 51, 19
101713, https://doi.org/10.1016/j.scs.2019.101713. 20
Vasileiadou, E., and W. Tuinstra, 2013: Stakeholder consultations: mainstreaming climate policy in the 21
Energy Directorate? Env. Polit., 22, https://doi.org/10.1080/09644016.2012.717376. 22
Van de Ven, D.-J., and Coauthors, 2019: Integrated policy assessment and optimisation over multiple 23
sustainable development goals in Eastern Africa. Environ. Res. Lett., 14, 094001, 24
https://doi.org/10.1088/1748-9326/ab375d. 25
——, and Coauthors, 2020: Erratum: Integrated policy assessment and optimisation over multiple 26
sustainable development goals in Eastern Africa (2019 Environ. Res. Lett. 14 094001). Environ. 27
Res. Lett., 15, 39602, https://doi.org/10.1088/1748-9326/ab49ad. 28
Vence, X., and Á. Pereira, 2019: Eco-innovation and Circular Business Models as drivers for a circular 29
economy. Contaduría y Adm., 64, 64, https://doi.org/10.22201/fca.24488410e.2019.1806. 30
Venugopal, P., A. Shekhar, E. Visser, N. Scheele, G. R. Chandra Mouli, P. Bauer, and S. Silvester, 31
2018: Roadway to self-healing highways with integrated wireless electric vehicle charging and 32
sustainable energy harvesting technologies. Appl. Energy, 212, 1226–1239, 33
https://doi.org/10.1016/j.apenergy.2017.12.108. 34
Vérez, D., and L. F. Cabeza, 2021a: Which building services are considered to have impact in climate 35
change? Build. Serv. Eng. Res. Technol., https://doi.org/https://doi.org/10.3390/en14133917. 36
——, and ——, 2021b: Bibliometric analysis on building services. Energy Build.,. 37
De Villanueva Domínguez, L., 2005: The three ages of construction. Inf. la Construcción, 57, 41–45, 38
https://doi.org/10.3989/ic.2005.v57.i498.476. 39
Vimpari, J., and S. Junnila, 2019: Estimating the diffusion of rooftop PVs: A real estate economics 40
perspective. Energy, 172, 1087–1097, https://doi.org/10.1016/j.energy.2019.02.049. 41
Vine, E., N. Hall, K. M. Keating, M. Kushler, and R. Prahl, 2013: Emerging evaluation issues: 42
persistence, behavior, rebound, and policy. Energy Effic., 6, https://doi.org/10.1007/s12053-012-43
9174-6. 44
ACCEPTED VERSION
SUBJECT TO FIN
AL EDITS
Final Government Distribution Chapter 9 IPCC AR6 WGIII
Do Not Cite, Quote or Distribute 9-160 Total pages: 168
——, A. Williams, and S. Price, 2017: The cost of enforcing building energy codes: an examination of 1
traditional and alternative enforcement processes. Energy Effic., 10, 2
https://doi.org/10.1007/s12053-016-9483-2. 3
Virage-Energie Nord-Pas-de-Calais., 2016: Mieux Vivre en Région Nord-Pas-de-Calais – Pour un 4
virage énergétique et des transformations sociétales. 28 p. pp. 5
Volk, R., R. Müller, J. Reinhardt, and F. Schultmann, 2019: An Integrated Material Flows, Stakeholders 6
and Policies Approach to Identify and Exploit Regional Resource Potentials. Ecol. Econ., 161, 7
292–320, https://doi.org/10.1016/j.ecolecon.2019.03.020. 8
Volochovic, A., Z. Simanaviciene, and D. Streimikiene, 2012: Šiltnamio Efektą Sukeliančių Dujų 9
Emisijų Mažinimas Dėl Elgsenos Pokyčių Lietuvos Namų Ūkiuose. Eng. Econ., 23, 242–249, 10
https://doi.org/10.5755/j01.ee.23.3.1936. 11
Vukotic, L., R. A. Fenner, and K. Symons, 2010: Assessing embodied energy of building structural 12
elements. Proc. Inst. Civ. Eng. Eng. Sustain., 163, 147–158, 13
https://doi.org/10.1680/ensu.2010.163.3.147. 14
Wadud, Z., and P. K. Chintakayala, 2019: Personal Carbon Trading: Trade-off and Complementarity 15
Between In-home and Transport Related Emissions Reduction. Ecol. Econ., 156, 397–408, 16
https://doi.org/10.1016/j.ecolecon.2018.10.016. 17
Wakiyama, T., and T. Kuramochi, 2017: Scenario analysis of energy saving and CO2 emissions 18
reduction potentials to ratchet up Japanese mitigation target in 2030 in the residential sector. 19
Energy Policy, 103, 1–15, https://doi.org/10.1016/j.enpol.2016.12.059. 20
Wallace, N., P. Issler, P. Mathew, and K. Sun, 2018: Impact of Energy Factors on Default Risk in 21
Commercial Mortgages. 22
Walters, S. A., and K. S. Midden, 2018: Sustainability of urban agriculture: Vegetable production on 23
green roofs. Agric., 8, 1–16, https://doi.org/10.3390/agriculture8110168. 24
Wan, K. K. W., D. H. W. Li, W. Pan, and J. C. Lam, 2012: Impact of climate change on building energy 25
use in different climate zones and mitigation and adaptation implications. Appl. Energy, 97, 274–26
282, https://doi.org/10.1016/j.apenergy.2011.11.048. 27
Wang, M., C. C. Wang, S. Sepasgozar, and S. Zlatanova, 2020: A Systematic Review of Digital 28
Technology Adoption. Buildings, 2020, 1–29. 29
Wang, S., J. Fan, D. .Zhao, and Y. Li, 2017: Study on consumers’ energy consumption and welfare 30
changes under the personal carbon trading scheme. Syst. Eng. Theory Pract., 37, 1512–1524. 31
Wang, Z., Q. Sun, B. Wang, and B. Zhang, 2019: Purchasing intentions of Chinese consumers on 32
energy-efficient appliances: Is the energy efficiency label effective? J. Clean. Prod., 238, 117896, 33
https://doi.org/10.1016/j.jclepro.2019.117896. 34
Wankiewicz, H., 2015: The potential of cohousing for rural Austria. Urban Res. Pract., 8, 46–63, 35
https://doi.org/10.1080/17535069.2015.1011426. 36
Wathore, R., K. Mortimer, and A. P. Grieshop, 2017: In-Use Emissions and Estimated Impacts of 37
Traditional, Natural- and Forced-Draft Cookstoves in Rural Malawi. Environ. Sci. Technol., 51, 38
1929–1938, https://doi.org/10.1021/acs.est.6b05557. 39
Weber, L., 1997: Some reflections on barriers to the efficient use of energy. Energy Policy, 25, 833–40
835, https://doi.org/10.1016/S0301-4215(97)00084-0. 41
Wȩdzik, A., T. Siewierski, and M. Szypowski, 2017: Green certificates market in Poland – The sources 42
of crisis. Renew. Sustain. Energy Rev., 75, https://doi.org/10.1016/j.rser.2016.11.014. 43
Wei, W., P. Wargocki, J. Zirngibl, J. Bendžalová, and C. Mandin, 2020: Review of parameters used to 44
ACCEPTED VERSION
SUBJECT TO FIN
AL EDITS

Final Government Distribution Chapter 9 IPCC AR6 WGIII
Do Not Cite, Quote or Distribute 9-161 Total pages: 168
assess the quality of the indoor environment in Green Building certification schemes for offices 1
and hotels. Energy Build., 209, https://doi.org/10.1016/j.enbuild.2019.109683. 2
Weisbach, D. A., G. E. Metcalf, and D. Weisbach, 2009: The Design of a Carbon Tax. 68 p. pp. 3
http://chicagounbound.uchicago.edu/journal_articles. 4
Wells, L., B. Rismanchi, and L. Aye, 2018: A review of Net Zero Energy Buildings with reflections on 5
the Australian context. Energy Build., 158, 616–628, 6
https://doi.org/10.1016/j.enbuild.2017.10.055. 7
Wierzbicka, A., and Coauthors, 2018: Healthy Indoor Environments: The Need for a Holistic Approach. 8
Int. J. Environ. Res. Public Health, 15, 1874, https://doi.org/10.3390/ijerph15091874. 9
Wiese, C., A. Larsen, and L.-L. Pade, 2018: Interaction effects of energy efficiency policies: a review. 10
Energy Effic., 11, 2137–2156, https://doi.org/10.1007/s12053-018-9659-z. 11
de Wilde, P., and D. Coley, 2012: The implications of a changing climate for buildings. Build. Environ., 12
55, 1–7, https://doi.org/10.1016/j.buildenv.2012.03.014. 13
Willand, N., I. Ridley, and C. Maller, 2015: Towards explaining the health impacts of residential energy 14
efficiency interventions - A realist review. Part 1: Pathways. Soc. Sci. Med., 133, 191–201, 15
https://doi.org/10.1016/j.socscimed.2015.02.005. 16
William, W. N., 2013: Exploring the consequences of climate change for indoor air quality. Environ. 17
Res. Lett., 8, 15022. 18
Williams, J., and Coauthors, 2016: Less is more: A review of low energy standards and the urgent need 19
for an international universal zero energy standard. J. Build. Eng., 6, 65–74, 20
https://doi.org/10.1016/j.jobe.2016.02.007. 21
Wilson, A., and J. Boehland, 2005: Small is beautiful: U.S. house size, resource use, and the 22
environment. J. Ind. Ecol., 9, 277–287, https://doi.org/10.1162/1088198054084680. 23
Wilson, C., H. Pettifor, and G. Chryssochoidis, 2018: Quantitative modelling of why and how 24
homeowners decide to renovate energy efficiently. Appl. Energy, 212, 1333–1344, 25
https://doi.org/10.1016/j.apenergy.2017.11.099. 26
Wilson, C., L. Kerr, F. Sprei, E. Vrain, and M. Wilson, 2020: Potential Climate Benefits of Digital 27
Consumer Innovations. Annu. Rev. Environ. Resour., 45, https://doi.org/10.1146/annurev-28
environ-012320-082424. 29
Wilson, E., and Coauthors, 2017: Energy Efficiency Potential in the U. S. Single-Family Housing Stock. 30
157 p. pp. www.nrel.gov/publications. 31
Wilson, J., D. Jacobs, A. Reddy, E. Tohn, J. Cohen, and E. Jacobsohn, 2016: Home Rx: The Health 32
Benefits of Home Performance. 33
Winter, E., A. Faße, and K. Frohberg, 2015: Food security, energy equity, and the global commons: a 34
computable village model applied to sub-Saharan Africa. Reg. Environ. Chang., 15, 1215–1227, 35
https://doi.org/10.1007/s10113-014-0674-0. 36
Winter, S., and L. Schlesewsky, 2019: The German feed-in tariff revisited - an empirical investigation 37
on its distributional effects. Energy Policy, 132, https://doi.org/10.1016/j.enpol.2019.05.043. 38
Wirl, F., 2015: White certificates - Energy efficiency programs under private information of consumers. 39
Energy Econ., 49, 507–515, https://doi.org/10.1016/j.eneco.2015.03.026. 40
von Wirth, T., L. Gislason, and R. Seidl, 2018: Distributed energy systems on a neighborhood scale: 41
Reviewing drivers of and barriers to social acceptance. Renew. Sustain. Energy Rev., 82, 2618–42
2628, https://doi.org/10.1016/j.rser.2017.09.086. 43
ACCEPTED VERSION
SUBJECT TO FIN
AL EDITS

Final Government Distribution Chapter 9 IPCC AR6 WGIII
Do Not Cite, Quote or Distribute 9-162 Total pages: 168
Witthoeft, S., and I. Kosta, 2017: Shaping the Future of Construction. Inspiring innovators redefine the 1
industry. 96 pp. 2
http://www3.weforum.org/docs/WEF_Shaping_the_Future_of_Construction_Inspiring_Innovato3
rs_redefine_the_industry_2017.pdf. 4
De Wolf, C., F. Yang, D. Cox, A. Charlson, A. S. Hattan, and J. Ochsendorf, 2016: Material quantities 5
and embodied carbon dioxide in structures. Proc. Inst. Civ. Eng. Eng. Sustain., 169, 150–161, 6
https://doi.org/10.1680/ensu.15.00033. 7
Wolfram, C., O. Shelef, and P. Gertler, 2012: How will energy demand develop in the developing 8
world? J. Econ. Perspect., 26, 119–138, https://doi.org/10.1257/jep.26.1.119. 9
Wolsink, M., 2012: The research agenda on social acceptance of distributed generation in smart grids: 10
Renewable as common pool resources. Renew. Sustain. Energy Rev., 16, 822–835, 11
https://doi.org/10.1016/j.rser.2011.09.006. 12
Wolske, K. S., K. T. Gillingham, and P. W. Schultz, 2020: Peer influence on household energy 13
behaviours. Nat. Energy, 5, 202–212, https://doi.org/10.1038/s41560-019-0541-9. 14
World Health Organization, 2016: Burning Opportunity: Clean Household Energy for Health, 15
Sustainable Development, and Wellbeing of Women and Children. WHO Press, 130 p. pp. 16
https://www.afro.who.int/sites/default/files/2017-06/9789241565233_eng.pdf. 17
——, 2018: World Health Statistics 2018: monitoring health for the SDGs: sustainable development 18
goals. World Health Organization, Ed. 86 pp. 19
——, 2021: Roadmap to improve and ensure good indoor ventilation in the context of COVID-19. Who, 20
38. 21
Wright, G. R. ., 2000: Ancient building technology. Volume 3. Construction. Illustrate. BRILL, 279 pp. 22
Wu, J., Z. Xu, and F. Jiang, 2019: Analysis and development trends of Chinese energy efficiency 23
standards for room air conditioners. Energy Policy, 125, 368–383, 24
https://doi.org/10.1016/j.enpol.2018.10.038. 25
Van Den Wymelenberg, K., 2012: Patterns of occupant interaction with window blinds: A literature 26
review. Energy Build., 51, 165–176, https://doi.org/10.1016/j.enbuild.2012.05.008. 27
Xiang, D., and C. Lawley, 2019: The impact of British Columbia’s carbon tax on residential natural gas 28
consumption. Energy Econ., 80, 206–218, https://doi.org/10.1016/j.eneco.2018.12.004. 29
Xin-gang, Z., Z. Yu-zhuo, R. Ling-zhi, Z. Yi, and W. Zhi-gong, 2017: The policy effects of feed-in 30
tariff and renewable portfolio standard: A case study of China’s waste incineration power industry. 31
Waste Manag., 68, 711–723, https://doi.org/10.1016/j.wasman.2017.06.009. 32
——, L. Pei-ling, and Z. Ying, 2020: Which policy can promote renewable energy to achieve grid 33
parity? Feed-in tariff vs. renewable portfolio standards. Renew. Energy, 162, 322–333, 34
https://doi.org/10.1016/j.renene.2020.08.058. 35
Xin, L., W. Chenchen, L. Chuanzhi, F. Guohui, Y. Zekai, and L. Zonghan, 2018: Effect of the energy-36
saving retrofit on the existing residential buildings in the typical city in northern China. Energy 37
Build., 177, 154–172, https://doi.org/10.1016/j.enbuild.2018.07.004. 38
Xing, R., T. Hanaoka, and T. Masui, 2021: Deep decarbonization pathways in the building sector: 39
China’s NDC and the Paris agreement. Environ. Res. Lett., 16, https://doi.org/10.1088/1748-40
9326/abe008. 41
Xu, W., and S. Zhang, 2017: APEC 100 Best Practice Analysis of Nearly / Net Zero Energy Building. 42
240 pp. 43
Xu, Y., X. Ma, R. H. E. Hassanien, X. Luo, G. Li, and M. Li, 2017: Performance analysis of static ice 44
ACCEPTED VERSION
SUBJECT TO FIN
AL EDITS

Final Government Distribution Chapter 9 IPCC AR6 WGIII
Do Not Cite, Quote or Distribute 9-163 Total pages: 168
refrigeration air conditioning system driven by household distributed photovoltaic energy system. 1
Sol. Energy, 158, 147–160, https://doi.org/10.1016/j.solener.2017.09.002. 2
Yan, D., T. Hong, B. Dong, A. Mahdavi, S. D’Oca, I. Gaetani, and X. Feng, 2017: IEA EBC Annex 66: 3
Definition and simulation of occupant behavior in buildings. Energy Build., 156, 258–270, 4
https://doi.org/10.1016/j.enbuild.2017.09.084. 5
Yang, W., Z. Wang, J. Cui, Z. Zhu, and X. Zhao, 2015: Comparative study of the thermal performance 6
of the novel green(planting) roofs against other existing roofs. Sustain. Cities Soc., 16, 1–12, 7
https://doi.org/10.1016/j.scs.2015.01.002. 8
Yeh, S., and Coauthors, 2016: A modeling comparison of deep greenhouse gas emissions reduction 9
scenarios by 2030 in California. Energy Strateg. Rev., 13–14, 169–180, 10
https://doi.org/10.1016/j.esr.2016.10.001. 11
Yi, Z., Z. Xin-gang, Z. Yu-zhuo, and Z. Ying, 2019: From feed-in tariff to renewable portfolio 12
standards: An evolutionary game theory perspective. J. Clean. Prod., 213, 1274–1289, 13
https://doi.org/10.1016/j.jclepro.2018.12.170. 14
yin Mah, D. N., G. Wang, K. Lo, M. K. H. Leung, P. Hills, and A. Y. Lo, 2018: Barriers and policy 15
enablers for solar photovoltaics (PV) in cities: Perspectives of potential adopters in Hong Kong. 16
Renew. Sustain. Energy Rev., 92, 921–936, https://doi.org/10.1016/j.rser.2018.04.041. 17
Yılmaz Balaman, Ş., J. Scott, A. Matopoulos, and D. G. Wright, 2019: Incentivising bioenergy 18
production: Economic and environmental insights from a regional optimization methodology. 19
Renew. Energy, 130, 867–880, https://doi.org/10.1016/j.renene.2018.06.083. 20
Yohanis, Y. G., 2012: Domestic energy use and householders’ energy behaviour. Energy Policy, 41, 21
654–665, https://doi.org/10.1016/j.enpol.2011.11.028. 22
Yoshida, J., and A. Sugiura, 2015: The Effects of Multiple Green Factors on Condominium Prices. J. 23
Real Estate Financ. Econ., 50, 412–437, https://doi.org/10.1007/s11146-014-9462-3. 24
Yu, S., 2017: Transition pathways of China and implications for climate change mitigation: evolution 25
of the buildings sector. . 26
——, M. Evans, P. Kyle, L. Vu, Q. Tan, A. Gupta, and P. Patel, 2018a: Implementing nationally 27
determined contributions: building energy policies in India’s mitigation strategy. Environ. Res. 28
Lett., 13, 034034, https://doi.org/10.1088/1748-9326/aaad84. 29
——, ——, ——, ——, ——, ——, and ——, 2018b: Implementing nationally determined 30
contributions: Building energy policies in India’s mitigation strategy. Environ. Res. Lett., 13, 31
034034, https://doi.org/10.1088/1748-9326/aaad84. 32
Yu, W., Y. Xu, H. Wang, Z. Ge, J. Wang, D. Zhu, and Y. Xia, 2020: Thermodynamic and 33
thermoeconomic performance analyses and optimization of a novel power and cooling 34
cogeneration system fueled by low-grade waste heat. Appl. Therm. Eng., 179, 115667, 35
https://doi.org/10.1016/j.applthermaleng.2020.115667. 36
Yushchenko, A., and M. K. Patel, 2016: Contributing to a green energy economy? A macroeconomic 37
analysis of an energy efficiency program operated by a Swiss utility. Appl. Energy, 179, 1304–38
1320, https://doi.org/10.1016/j.apenergy.2015.12.028. 39
Zancanella P., P. Bertoldi, and B. Boza- Kiss, 2017: Why is demand response not implemented in the 40
EU? Status of demand response and recommendations to allow demand response to be fully 41
integrated in energy markets. Proceeding ECEEE Summer Study in Energy Efficiency 2017, 42
ECEEE, Ed., Stockholm, ECEEE, 457–466 43
https://www.eceee.org/library/conference_proceedings/eceee_Summer_Studies/2017/2-policy-44
governance-design-implementation-and-evaluation-challenges/why-is-demand-response-not-45
implemented-in-the-eu-status-of-demand-response-and-recommendations-to-allow-dema. 46
ACCEPTED VERSION
SUBJECT TO FIN
AL EDITS
Final Government Distribution Chapter 9 IPCC AR6 WGIII
Do Not Cite, Quote or Distribute 9-164 Total pages: 168
Zanetti, V., W. de Sousa Junior, and D. De Freitas, 2016: A Climate Change Vulnerability Index and 1
Case Study in a Brazilian Coastal City. Sustainability, 8, 811, https://doi.org/10.3390/su8080811. 2
Zangheri, Serrenho, and Bertoldi, 2019: Energy Savings from Feedback Systems: A Meta-Studies’ 3
Review. Energies, 12, 3788, https://doi.org/10.3390/en12193788. 4
Zea Escamilla, E., G. Habert, and E. Wohlmuth, 2016: When CO2 counts: Sustainability assessment of 5
industrialized bamboo as an alternative for social housing programs in the Philippines. Build. 6
Environ., 103, 44–53, https://doi.org/10.1016/j.buildenv.2016.04.003. 7
Zea Escamilla, E., G. Habert, J. Correal Daza, H. Archilla, J. Echeverry Fernández, and D. Trujillo, 8
2018: Industrial or Traditional Bamboo Construction? Comparative Life Cycle Assessment (LCA) 9
of Bamboo-Based Buildings. Sustainability, 10, 3096, https://doi.org/10.3390/su10093096. 10
Zepter, J. M., A. Lüth, P. Crespo del Granado, and R. Egging, 2019: Prosumer integration in wholesale 11
electricity markets: Synergies of peer-to-peer trade and residential storage. Energy Build., 184, 12
https://doi.org/10.1016/j.enbuild.2018.12.003. 13
Zhang, C., J. Sun, M. Lubell, L. Qiu, and K. Kang, 2019: Design and simulation of a novel hybrid solar-14
biomass energy supply system in northwest China. J. Clean. Prod., 233, 1221–1239, 15
https://doi.org/10.1016/j.jclepro.2019.06.128. 16
Zhang, J., and N. Zhou, 2015: Zero-energy buildings – an overview of terminology and policies in 17
leading world regions. ECEEE 2015 Summer Study, 1299–1311. 18
Zhang, Q., G. Wang, Y. Li, H. Li, B. McLellan, and S. Chen, 2018: Substitution effect of renewable 19
portfolio standards and renewable energy certificate trading for feed-in tariff. Appl. Energy, 227, 20
https://doi.org/10.1016/j.apenergy.2017.07.118. 21
Zhang, S., and Coauthors, 2020a: Scenarios of energy reduction potential of zero energy building 22
promotion in the Asia-Pacific region to year 2050. Energy, 213, 23
https://doi.org/10.1016/j.energy.2020.118792. 24
Zhang, T., P. O. Siebers, and U. Aickelin, 2012: A three-dimensional model of residential energy 25
consumer archetypes for local energy policy design in the UK. Energy Policy, 47, 102–110, 26
https://doi.org/10.1016/j.enpol.2012.04.027. 27
Zhang, X., J. Yang, Y. Fan, X. Zhao, R. Yan, J. Zhao, and S. Myers, 2020b: Experimental and analytic 28
study of a hybrid solar/biomass rural heating system. Energy, 190, 116392, 29
https://doi.org/10.1016/j.energy.2019.116392. 30
Zhang, Y., N. Akkurt, J. Yuan, Z. Xiao, Q. Wang, and W. Gang, 2020c: Study on model uncertainty of 31
water source heat pump and impact on decision making. Energy Build., 216, 109950, 32
https://doi.org/10.1016/j.enbuild.2020.109950. 33
Zhao, D., A. P. McCoy, J. Du, P. Agee, and Y. Lu, 2017: Interaction effects of building technology and 34
resident behavior on energy consumption in residential buildings. Energy Build., 134, 223–233, 35
https://doi.org/10.1016/j.enbuild.2016.10.049. 36
Zhao, Z.-Y., L. Gao, and J. Zuo, 2019: How national policies facilitate low carbon city development: 37
A China study. J. Clean. Prod., 234, 743–754, https://doi.org/10.1016/j.jclepro.2019.06.116. 38
Zheng, J., A. A. Chien, and S. Suh, 2020: Mitigating Curtailment and Carbon Emissions through Load 39
Migration between Data Centers. Joule, 4, https://doi.org/10.1016/j.joule.2020.08.001. 40
Zheng, S., J. Wu, M. E. Kahn, and Y. Deng, 2012: The nascent market for “green” real estate in Beijing. 41
Eur. Econ. Rev., 56, 974–984, https://doi.org/10.1016/j.euroecorev.2012.02.012. 42
Zhou, K., and Y. Li, 2019: Carbon finance and carbon market in China: Progress and challenges. J. 43
Clean. Prod., 214, 536–549, https://doi.org/10.1016/j.jclepro.2018.12.298. 44
ACCEPTED VERSION
SUBJECT TO FIN
AL EDITS

Final Government Distribution Chapter 9 IPCC AR6 WGIII
Do Not Cite, Quote or Distribute 9-165 Total pages: 168
Zhou, N., N. Khanna, W. Feng, J. Ke, and M. Levine, 2018: Scenarios of energy efficiency and CO2 1
emissions reduction potential in the buildings sector in China to year 2050. Nat. Energy, 3, 978–2
984, https://doi.org/10.1038/s41560-018-0253-6. 3
Zhou, Y., and Coauthors, 2014: Modeling the effect of climate change on U.S. state-level buildings 4
energy demands in an integrated assessment framework. Appl. Energy, 113, 1077–1088, 5
https://doi.org/10.1016/j.apenergy.2013.08.034. 6
Zink, T., and R. Geyer, 2017: Circular Economy Rebound. J. Ind. Ecol., 21, 593–602, 7
https://doi.org/10.1111/jiec.12545. 8
Zografakis, N., K. Karyotakis, and K. P. Tsagarakis, 2012: Implementation conditions for energy saving 9
technologies and practices in office buildings: Part 1. Lighting. Renew. Sustain. Energy Rev., 16, 10
4165–4174, https://doi.org/10.1016/j.rser.2012.03.005. 11
Zuhaib, S., R. Manton, M. Hajdukiewicz, M. M. Keane, and J. Goggins, 2017: Attitudes and approaches 12
of Irish retrofit industry professionals towards achieving nearly zero-energy buildings. Int. J. 13
Build. Pathol. Adapt., 35, 16–40, https://doi.org/10.1108/IJBPA-07-2016-0015. 14
Abreu, J., N. Wingartz, and N. Hardy, 2019: New trends in solar: A comparative study assessing the 15
attitudes towards the adoption of rooftop PV. Energy Policy, 128, 347–363, 16
https://doi.org/10.1016/j.enpol.2018.12.038. 17
Alberini, A., and A. Bigano, 2015: How effective are energy-efficiency incentive programs? Evidence 18
from Italian homeowners. Energy Econ., 52, S76–S85, 19
https://doi.org/10.1016/j.eneco.2015.08.021. 20
Alcott, B., 2008: The sufficiency strategy: Would rich-world frugality lower environmental impact? 21
Ecol. Econ., 64, https://doi.org/10.1016/j.ecolecon.2007.04.015. 22
Aldubyan, M., and A. Gasim, 2021: Energy price reform in Saudi Arabia: Modeling the economic and 23
environmental impacts and understanding the demand response. Energy Policy, 148, 24
https://doi.org/10.1016/j.enpol.2020.111941. 25
Ameli, N., M. Pisu, and D. M. Kammen, 2017: Can the US keep the PACE? A natural experiment in 26
accelerating the growth of solar electricity. Appl. Energy, 191, 27
https://doi.org/10.1016/j.apenergy.2017.01.037. 28
Bertoldi, P., and B. Boza-Kiss, 2017: Analysis of barriers and drivers for the development of the 29
ESCO markets in Europe. Energy Policy, 107, https://doi.org/10.1016/j.enpol.2017.04.023. 30
Bienge, K., and Coauthors, 2019: Building Market Brief. Germany. 70 p. pp. 31
Camarasa, C., and Coauthors, 2019: Building Market Brief. Poland. 64–75 pp. 32
Campos, I., and E. Marín-González, 2020: People in transitions: Energy citizenship, prosumerism and 33
social movements in Europe. Energy Res. Soc. Sci., 69, 34
https://doi.org/10.1016/j.erss.2020.101718. 35
Coady, D., I. W. H. Parry, and B. Shang, 2018: Energy Price Reform: Lessons for Policymakers. Rev. 36
Environ. Econ. Policy, 12, https://doi.org/10.1093/reep/rey004. 37
Colker, R. M., 2012: Outcome Based Codes: Answering The Preliminary Questions. Strateg. Plan. 38
Energy Environ., 31, https://doi.org/10.1080/10485236.2012.10491662. 39
Cossu, R., and I. D. Williams, 2015: Urban mining: Concepts, terminology, challenges. Waste 40
Manag., 45, 1–3, https://doi.org/10.1016/j.wasman.2015.09.040. 41
DellaValle, N., and S. Sareen, 2020: Nudging and boosting for equity? Towards a behavioural 42
economics of energy justice. Energy Res. Soc. Sci., 68, 43
https://doi.org/10.1016/j.erss.2020.101589. 44
ACCEPTED VERSION
SUBJECT TO FIN
AL EDITS

Final Government Distribution Chapter 9 IPCC AR6 WGIII
Do Not Cite, Quote or Distribute 9-166 Total pages: 168
Denniston, S., M. Frankel, and D. Hewitt, 2011: Outcome-based Energy Codes On the Way to Net 1
Zero. Strateg. Plan. Energy Environ., 31, https://doi.org/10.1080/10485236.2011.10412181. 2
Diawuo, F. A., A. Pina, P. C. Baptista, and C. A. Silva, 2018: Energy efficiency deployment: A 3
pathway to sustainable electrification in Ghana. J. Clean. Prod., 186, 4
https://doi.org/10.1016/j.jclepro.2018.03.088. 5
Enker, R. A. and G. M. Morrison, 2020: The potential contribution of building codes to climate 6
change response policies for the built environment. Energy Effic., 13, 7
https://doi.org/10.1007/s12053-020-09871-7. 8
Giraudet, L.-G., and D. Finon, 2015: European experiences with white certifirecate obligations: A 9
critical review of existing evaluations. Econ. Energy Environ. Policy, 4, 10
https://doi.org/10.5547/2160-5890.4.1.lgir. 11
Gjorgievski, V. Z., S. Cundeva, and G. E. Georghiou, 2021: Social arrangements, technical designs 12
and impacts of energy communities: A review. Renew. Energy, 169, 13
https://doi.org/10.1016/j.renene.2021.01.078. 14
Gui, X., and Z. Gou, 2020: Association between green building certification level and post-occupancy 15
performance: Database analysis of the National Australian Built Environment Rating System. 16
Build. Environ., 179, https://doi.org/10.1016/j.buildenv.2020.106971. 17
Hahnel, U. J. J., M. Herberz, A. Pena-Bello, D. Parra, and T. Brosch, 2020: Becoming prosumer: 18
Revealing trading preferences and decision-making strategies in peer-to-peer energy 19
communities. Energy Policy, 137, https://doi.org/10.1016/j.enpol.2019.111098. 20
Inetrnational Energy Agency, 2017: Digitalization & Energy. 21
Jager-Waldau, A., and Coauthors, 2018: Self-consumption of electricity produced from PV systems in 22
apartment buildings - Comparison of the situation in Australia, Austria, Denmark, Germany, 23
Greece, Italy, Spain, Switzerland and the USA. 2018 IEEE 7th World Conf. Photovolt. Energy 24
Conversion, WCPEC 2018 - A Jt. Conf. 45th IEEE PVSC, 28th PVSEC 34th EU PVSEC, 1424–25
1430, https://doi.org/10.1109/PVSC.2018.8547583. 26
Kern, F., P. Kivimaa, and M. Martiskainen, 2017: Policy packaging or policy patching? The 27
development of complex energy efficiency policy mixes. Energy Res. Soc. Sci., 23, 11–25, 28
https://doi.org/10.1016/j.erss.2016.11.002. 29
Kontokosta, C. E., D. Spiegel-Feld, and S. Papadopoulos, 2020: The impact of mandatory energy 30
audits on building energy use. Nat. Energy, 5, https://doi.org/10.1038/s41560-020-0589-6. 31
Kwon, T., 2015: Is the renewable portfolio standard an effective energy policy?: Early evidence from 32
South Korea. Util. Policy, 36, https://doi.org/10.1016/j.jup.2015.09.002. 33
Linh, D. H., and T. Van Anh, 2017: Impact of stakeholders on the performance of green banking 34
products and services: The case of Vietnamese banks. Econ. Ann., 165, 35
https://doi.org/10.21003/ea.V165-29. 36
Loo, B. P. Y., A. H. T. Cheng, and S. L. Nichols, 2017: Transit-oriented development on greenfield 37
versus infill sites: Some lessons from Hong Kong. Landsc. Urban Plan., 167, 38
https://doi.org/10.1016/j.landurbplan.2017.05.013. 39
Lu, W., and H. Yuan, 2013: Investigating waste reduction potential in the upstream processes of 40
offshore prefabrication construction. Renew. Sustain. Energy Rev., 28, 804–811, 41
https://doi.org/10.1016/j.rser.2013.08.048. 42
Ludwig, G., 2019: The Role of Law in Transformative Environmental Policies—A Case Study of 43
“Timber in Buildings Construction in Germany.” Sustainability, 11, 44
https://doi.org/10.3390/su11030842. 45
ACCEPTED VERSION
SUBJECT TO FIN
AL EDITS

Final Government Distribution Chapter 9 IPCC AR6 WGIII
Do Not Cite, Quote or Distribute 9-167 Total pages: 168
Lund, H., and Coauthors, 2018: The status of 4th generation district heating: Research and results. 1
Energy, 164, 147–159, https://doi.org/10.1016/j.energy.2018.08.206. 2
von Lüpke, H., and M. Well, 2020: Analyzing climate and energy policy integration: the case of the 3
Mexican energy transition. Clim. Policy, 20, https://doi.org/10.1080/14693062.2019.1648236. 4
Mahmoudi, N., E. Heydarian-Forushani, M. Shafie-khah, T. K. Saha, M. E. H. Golshan, and P. Siano, 5
2017: A bottom-up approach for demand response aggregators’ participation in electricity 6
markets. Electr. Power Syst. Res., 143, https://doi.org/10.1016/j.epsr.2016.08.038. 7
MoHURD, 2019: Technical Standard for Nearly Zero Energy Building GB 51350-2019. China 8
Architecture & Building Press, 135 pp. 9
Mundaca, L., and S. Kloke, 2018: On-Bill Financing Programs to Support Low-Carbon Energy 10
Technologies: An Agent-Oriented Assessment. Rev. Policy Res., 35, 11
https://doi.org/10.1111/ropr.12302. 12
Nadel, 2019: Focusing and improving traditional energy efficiency strategies. Electr. J., 32, 13
https://doi.org/10.1016/j.tej.2019.106620. 14
Nurcahyanto, Y. Simsek, and T. Urmee, 2020: Opportunities and challenges of energy service 15
companies to promote energy efficiency programs in Indonesia. Energy, 205, 16
https://doi.org/10.1016/j.energy.2020.117603. 17
Ohler, A. M., D. G. Loomis, and K. Ilves, 2020: A study of electricity savings from energy star 18
appliances using household survey data. Energy Policy, 144, 19
https://doi.org/10.1016/j.enpol.2020.111607. 20
Osmani, M., 2012: Construction Waste Minimization in the UK: Current Pressures for Change and 21
Approaches. Procedia - Soc. Behav. Sci., 40, 37–40, 22
https://doi.org/10.1016/j.sbspro.2012.03.158. 23
Rentschler, J., and M. Bazilian, 2017: Policy Monitor—Principles for Designing Effective Fossil Fuel 24
Subsidy Reforms. Rev. Environ. Econ. Policy, 11, https://doi.org/10.1093/reep/rew016. 25
del Río, P., G. Resch, A. Ortner, L. Liebmann, S. Busch, and C. Panzer, 2017: A techno-economic 26
analysis of EU renewable electricity policy pathways in 2030. Energy Policy, 104, 27
https://doi.org/10.1016/j.enpol.2017.01.028. 28
Rosenow, F. Kern, and K. Rogge, 2017: The need for comprehensive and well targeted instrument 29
mixes to stimulate energy transitions: The case of energy efficiency policy. Energy Res. Soc. 30
Sci., 33, 95–104, https://doi.org/10.1016/j.erss.2017.09.013. 31
Ruan, H., X. Gao, and C. Mao, 2018: Empirical Study on Annual Energy-Saving Performance of 32
Energy Performance Contracting in China. Sustainability, 10, 33
https://doi.org/10.3390/su10051666. 34
Salleh, S. F., M. E. B. M. Roslan, and A. M. Isa, 2019: Evaluating the impact of implementing 35
Minimum Energy Performance Standards appliance regulation in Malaysia. Int. J. Environ. 36
Technol. Manag., 22, https://doi.org/10.1504/IJETM.2019.104752. 37
Salviati, L., and G. Ricciardo Lamonica, 2020: Containing urban expansion: Densification vs 38
greenfield development, socio-demographic transformations and the economic crisis in a 39
Southern European City, 2006–2015. Ecol. Indic., 110, 40
https://doi.org/10.1016/j.ecolind.2019.105923. 41
SARITA BAHL, 2012: THE ROLE OF GREEN BANKING IN SUSTAINABLE GROWTH. Int. J. 42
Mark. Financ. Serv. Manag. Res., 1, 27–35. 43
ACCEPTED VERSION
SUBJECT TO FIN
AL EDITS

Final Government Distribution Chapter 9 IPCC AR6 WGIII
Do Not Cite, Quote or Distribute 9-168 Total pages: 168
Schaffitzel, F., M. Jakob, R. Soria, A. Vogt-Schilb, and H. Ward, 2020: Can government transfers 1
make energy subsidy reform socially acceptable? A case study on Ecuador. Energy Policy, 137, 2
https://doi.org/10.1016/j.enpol.2019.111120. 3
Schlacke, S., and M. Knodt, 2019: The Governance System of the European Energy Union and 4
Climate Action. J. Eur. Environ. Plan. Law, 16, https://doi.org/10.1163/18760104-01604002. 5
Khan, S. A., 2018: GREEN BANKING: THE ROLE OF BANK FOR SAVING THE 6
ENVIRONMENT. Int. J. Entrep. Dev. Stud., 6, 63–80. 7
Sliger, J., and K. Colburn, 2019: Redefining energy efficiency: EE 2.0. Electr. J., 32, 8
https://doi.org/10.1016/j.tej.2019.106619. 9
Sokołowski, M. M., 2020: Renewable and citizen energy communities in the European Union: how 10
(not) to regulate community energy in national laws and policies. J. Energy Nat. Resour. Law, 11
38, https://doi.org/10.1080/02646811.2020.1759247. 12
Spiegel-Feld, D., 2019: LOCAL LAW 97: EMISSIONS TRADING FOR BUILDINGS. NEW YORK 13
Univ. LAW Rev. ONLINE, 94, 327–347. 14
Ssembatya, M., H. Fu, and D. E. Claridge, 2021: Long-term savings persistence from existing 15
building commissioning and retrofits. Sci. Technol. Built Environ., 27, 16
https://doi.org/10.1080/23744731.2021.1898820. 17
Thi Thanh Tu, T., and T. Thi Hoang Yen, 2015: Green Bank: International Experiences and Vietnam 18
Perspectives. Asian Soc. Sci., https://doi.org/10.5539/ass.v11n28p188. 19
Veelen, B. Van, 2018: Negotiating energy democracy in practice: governance processes in community 20
energy projects. Env. Polit., 27, 644–665, https://doi.org/10.1080/09644016.2018.1427824. 21
Wiese, R. Cowart, and J. Rosenow, 2020: The strategic use of auctioning revenues to foster energy 22
efficiency: status quo and potential within the European Union Emissions Trading System. 23
Energy Effic., 13, https://doi.org/10.1007/s12053-020-09894-0. 24
Zapata-Diomedi, B., C. Boulangé, B. Giles-Corti, K. Phelan, S. Washington, J. L. Veerman, and L. D. 25
Gunn, 2019: Physical activity-related health and economic benefits of building walkable 26
neighbourhoods: a modelled comparison between brownfield and greenfield developments. Int. 27
J. Behav. Nutr. Phys. Act., 16, https://doi.org/10.1186/s12966-019-0775-8. 28
Zheng, S., R. Wang, T. M. W. Mak, S.-C. Hsu, and D. C. W. Tsang, 2021: How energy service 29
companies moderate the impact of industrialization and urbanization on carbon emissions in 30
China? Sci. Total Environ., 751, https://doi.org/10.1016/j.scitotenv.2020.141610. 31
32
33
34 ACCEPTED VERSIO
N
SUBJECT TO FIN
AL EDITS