Participatory urban agriculture governance plan for fighting ...
Upload
khangminh22Category
view
0download
0
2020 Urban Water Management Plan
Westlake District June 2021
Quality. Service. Value

California Water Service 2020 Urban Water Management Plan
Westlake District
June 2021 Printed 6/25/2021
Page 1
EKI Environment & Water, Inc. M.Cubed
Gary Fiske and Associates
Table of Contents
Table of Contents ............................................................................................................................ 1
List of Tables ................................................................................................................................... 5
List of Figures .................................................................................................................................. 7
List of Acronyms .............................................................................................................................. 8
Chapter 1 Introduction and Overview .......................................................................................... 10
1.1 Background and Purpose ............................................................................................... 10
1.2 Urban Water Management Planning and the California Water Code ........................... 11
1.3 Relationship to Other Planning Efforts .......................................................................... 12
1.4 Plan Organization ........................................................................................................... 12
1.5 Demonstration of Consistency with the Delta Plan for Participants in Covered Actions .. ........................................................................................................................................ 13
1.6 Lay Description ............................................................................................................... 14
Chapter 2 Plan Preparation ........................................................................................................... 18
2.1 Public Water Systems ..................................................................................................... 18
2.2 Regional Planning ........................................................................................................... 19
2.3 Individual or Regional Planning and Compliance (Regional Alliance) ............................ 19
2.4 Plan Preparation, Standard Units, and Basis for Reporting ........................................... 20
2.5 Coordination and Outreach ........................................................................................... 21
2.5.1 Wholesale and Retail Coordination ........................................................................ 22
2.5.2 Coordination with and Notice to Other Agencies and the Community ................. 23
2.5.3 Coordination with Land Use Authorities ................................................................ 23
Chapter 3 System Description ...................................................................................................... 24
3.1 General Description........................................................................................................ 24
3.2 Service Area Boundary Map ........................................................................................... 25
3.3 Service Area Climate ...................................................................................................... 26
3.4 Service Area Population and Demographics .................................................................. 27
3.5 Land Uses within Service Area ....................................................................................... 29
Chapter 4 Water Use Characterization ......................................................................................... 32
4.1 Non-Potable Versus Potable Water Use ........................................................................ 32

California Water Service 2020 Urban Water Management Plan
Westlake District
June 2021 Printed 6/25/2021
Page 2
EKI Environment & Water, Inc. M.Cubed
Gary Fiske and Associates
4.2 Past, Current, and Projected Water Uses by Sector ...................................................... 33
4.2.1 Past and Current Water Use ................................................................................... 33
4.2.2 Projected Water Use ............................................................................................... 34
4.2.3 Distribution System Water Loss .............................................................................. 36
4.2.4 Future Water Savings in Projected Water Use ....................................................... 37
4.2.5 Water Use by Lower Income Households in Water Use Projections ..................... 40
4.2.6 Characteristic Five-Year Water Use ........................................................................ 41
4.3 Climate Change Considerations ..................................................................................... 41
Chapter 5 SB X7-7 Baseline and Targets ....................................................................................... 43
5.1 Wholesale Suppliers ....................................................................................................... 44
5.2 Updates to the 2015 UWMP Calculations...................................................................... 44
5.3 Service Area Population ................................................................................................. 44
5.4 Baseline Periods, Baseline GPCD, and Confirmed SB X7-7 2020 Target ........................ 44
5.5 Demonstration of Compliance with SB X7-7 2020 Target ............................................. 45
5.6 Demonstration of Compliance with Regional Alliance SB X7-7 2020 Target ................. 45
Chapter 6 Water Supply Characterization .................................................................................... 47
6.1 Purchased Water ............................................................................................................ 48
6.2 Groundwater .................................................................................................................. 48
6.3 Surface Water ................................................................................................................. 49
6.4 Stormwater .................................................................................................................... 49
6.5 Wastewater and Recycled Water ................................................................................... 50
6.5.1 Recycled Water Coordination ................................................................................. 50
6.5.2 Wastewater Collection, Treatment, and Disposal .................................................. 50
6.5.3 Recycled Water System and Recycled Water Beneficial Uses ................................ 54
6.5.4 Actions to Encourage and Optimize Future Recycled Water Use .......................... 56
6.6 Desalinated Water Opportunities .................................................................................. 57
6.7 Water Exchanges and Transfers ..................................................................................... 57
6.7.1 Exchanges ................................................................................................................ 57
6.7.2 Transfers ................................................................................................................. 57
6.7.3 Emergency Interties ................................................................................................ 57
6.8 Future Water Projects .................................................................................................... 58
California Water Service 2020 Urban Water Management Plan
Westlake District
June 2021 Printed 6/25/2021
Page 3
EKI Environment & Water, Inc. M.Cubed
Gary Fiske and Associates
6.9 Summary of Existing and Planned Sources of Water ..................................................... 59
6.10 Special Conditions....................................................................................................... 61
6.10.1 Climate Change Effects ........................................................................................... 61
6.10.2 Regulatory Conditions and Project Development .................................................. 61
6.10.3 Other Locally Applicable Criteria ............................................................................ 62
6.11 Energy Intensity .......................................................................................................... 62
Chapter 7 Water Supply Reliability Assessment ........................................................................... 64
7.1 Constraints on Water Sources........................................................................................ 64
7.1.1 Supply Availability ................................................................................................... 65
7.1.2 Water Quality .......................................................................................................... 66
7.1.3 Climate Change ....................................................................................................... 67
7.2 Reliability by Type of Year .............................................................................................. 68
7.3 Supply and Demand Assessment ................................................................................... 69
7.4 Water Supply Management Tools and Options ............................................................. 71
7.5 Drought Risk Assessment ............................................................................................... 72
7.5.1 Data, Methods, and Basis for Water Shortage Condition ...................................... 72
7.5.2 Drought Risk Assessment Water Source Reliability ................................................ 72
Chapter 8 Water Shortage Contingency Planning ........................................................................ 75
Chapter 9 Demand Management Measures ................................................................................ 81
9.1 Demand Management Measures for Wholesale Agencies............................................ 82
9.2 Demand Management Measures for Retail Suppliers ................................................... 82
9.2.1 Water Waste Prevention Ordinances ..................................................................... 82
9.2.2 Metering ................................................................................................................. 84
9.2.3 Conservation Pricing ............................................................................................... 84
9.2.4 Public Education and Outreach .............................................................................. 84
9.2.5 Programs to Assess and Manage Distribution System Real Loss ........................... 85
9.2.6 Water Conservation Program Coordination and Staffing Support ......................... 86
9.2.7 Other Demand Management Measures ................................................................. 86
9.3 Implementation over the Past Five Years ...................................................................... 88
9.4 Implementation to Achieve Water Use Targets ............................................................ 89
9.5 Water Use Objectives (Future Requirements) ............................................................... 89
California Water Service 2020 Urban Water Management Plan
Westlake District
June 2021 Printed 6/25/2021
Page 4
EKI Environment & Water, Inc. M.Cubed
Gary Fiske and Associates
Chapter 10 Plan Adoption, Submittal, and Implementation ........................................................ 92
10.1 Inclusion of All 2020 Data ........................................................................................... 92
10.2 Notice of Public Hearing ............................................................................................. 93
10.2.1 Notice to Cities and Counties .................................................................................. 93
10.2.2 Notice to the Public ................................................................................................ 94
10.3 Public Hearing and Adoption ...................................................................................... 95
10.4 Plan Submittal ............................................................................................................. 96
10.5 Public Availability ........................................................................................................ 96
10.6 Notification of Public Utilities Commission ................................................................ 97
10.7 Amending an Adopted UWMP or Water Shortage Contingency Plan ....................... 97
Appendix A: UWMP Act Checklist ................................................................................................ A-1
Appendix B: Correspondence ...................................................................................................... B-1
Appendix C: Public Meeting Notice ............................................................................................. C-1
Appendix D: City of Thousand Oaks General Plan Map ............................................................... D-1
Appendix E: Summary of Demand Projection Methodology and Assumptions .......................... E-1
Appendix F: DWR SB X7-7 Verification Forms ............................................................................. F-1
Appendix G: Climate Change Studies – Executive Summaries .................................................... G-1
Appendix H: Water Shortage Contingency Plan .......................................................................... H-1
Appendix I: Conservation Master Plan ......................................................................................... I-1
Appendix J: Resolution to Adopt UWMP ...................................................................................... J-1
California Water Service 2020 Urban Water Management Plan
Westlake District
June 2021 Printed 6/25/2021
Page 5
EKI Environment & Water, Inc. M.Cubed
Gary Fiske and Associates
List of Tables
Table 2-1. Public Water Systems (DWR Table 2-1) ....................................................................... 18
Table 2-2. Plan Identification (DWR Table 2-2) ............................................................................ 19
Table 2-3. Supplier Identification (DWR Table 2-3) ...................................................................... 21
Table 2-4. Water Supplier Information Exchange (DWR Table 2-4) ............................................. 22
Table 3-1. Population – Current and Projected (DWR Table 3-1)................................................. 28
Table 3-2. Demographic and Housing Characteristics .................................................................. 29
Table 4-1. Demands for Potable and Non-Potable Water - Actual (DWR Table 4-1) ................... 34
Table 4-2. Use for Potable and Non-Potable Water – Projected (DWR Table 4-2) ...................... 35
Table 4-3. Total Gross Water Use (Potable and Non-Potable) (DWR Table 4-3) ......................... 35
Table 4-4. 12 Month Water Loss Audit Reporting (DWR Table 4-4)............................................. 36
Table 4-5. Inclusion in Water Use Projections (DWR Table 4-5) .................................................. 37
Table 4-6. Future Water Savings from Plumbing Codes, Conservation Programs, and Water Rates (AF) ...................................................................................................................................... 39
Table 4-7. Lower Income Household Projected Water Use (AF) .................................................. 40
Table 4-8. Characteristic Five-Year Water Use (AF) ...................................................................... 41
Table 4-9. Climate Change Effect on Demand .............................................................................. 42
Table 5-1. SB X7-7 Baselines and Targets Summary (DWR Table 5-1) ......................................... 45
Table 5-2. SB X7-7 2020 Compliance (DWR Table 5-2) ................................................................. 45
Table 5-3. SB X7-7 Regional Alliance – 2020 GPCD (DWR RA 2020 GPCD Table) ......................... 46
Table 5-4. SB X7-7 Regional Alliance – 2020 Compliance (DWR RA 2020 Compliance Table) ..... 46
Table 6-1. Groundwater Volume Pumped (DWR Table 6-1) ........................................................ 49
Table 6-2. Wastewater Collected Within Service Area in 2020 (DWR Table 6-2) ........................ 52

California Water Service 2020 Urban Water Management Plan
Westlake District
June 2021 Printed 6/25/2021
Page 6
EKI Environment & Water, Inc. M.Cubed
Gary Fiske and Associates
Table 6-3. Wastewater Treatment and Discharge Within Service Area in 2020 (DWR Table 6-3)....................................................................................................................................................... 53
Table 6-4. Recycled Water Direct Beneficial Uses Within Service Area (DWR Table 6-4) ............ 55
Table 6-5. 2015 UWMP Recycled Water Use Projection Compared to 2020 Actual (DWR Table 6-5) ................................................................................................................................................... 56
Table 6-6. Methods to Expand Future Recycled Water Use (DWR Table 6-6) ............................. 56
Table 6-7. Expected Future Water Supply Projects or Programs (DWR Table 6-7) ...................... 58
Table 6-8. Water Supplies - Actual (DWR Table 6-8) .................................................................... 59
Table 6-9. Water Supplies – Projected (DWR Table 6-9) .............................................................. 60
Table 6-10. Recommended Energy Intensity – Total Utility Approach (DWR Table O-1B) .......... 63
Table 7-1. Basis of Water Year Data (Reliability Assessment) (DWR Table 7-1) ........................... 69
Table 7-2. Normal Year Supply and Demand Comparison (DWR Table 7-2) ................................ 70
Table 7-3. Single Dry Year Supply and Demand Comparison (DWR Table 7-3) ............................ 70
Table 7-4. Multiple Dry Years Supply and Demand Comparison (DWR Table 7-4) ...................... 71
Table 7-5. Five-Year Drought Risk Assessment Tables (DWR Table 7-5) ...................................... 73
Table 8-1. Water Shortage Contingency Plan Levels (DWR Table 8-1)......................................... 76
Table 8-2. Demand Reduction Actions (DWR Table 8-2) .............................................................. 77
Table 8-3. Supply Augmentation and Other Actions (DWR Table 8-3) ......................................... 80
Table 9-1. Cal Water DMMs Available to District Customers ....................................................... 88
Table 9-2. Implementation of Customer DMMs: 2016-2020 ....................................................... 89
Table 10-1. Notification to Cities and Counties (DWR Table 10-1) ............................................... 94
California Water Service 2020 Urban Water Management Plan
Westlake District
June 2021 Printed 6/25/2021
Page 7
EKI Environment & Water, Inc. M.Cubed
Gary Fiske and Associates
List of Figures
Figure 3-1. District Location and Service Boundaries ................................................................... 26
Figure 3-2. 30-Year Normals, Precipitation and Maximum Daily Air Temperature ..................... 27
Figure 3-3. SCAG Integrated Modeling and Forecasting Framework ........................................... 30

California Water Service 2020 Urban Water Management Plan
Westlake District
June 2021 Printed 6/25/2021
Page 8
EKI Environment & Water, Inc. M.Cubed
Gary Fiske and Associates
List of Acronyms
AB Assembly Bill AF Acre-Feet AFY Acre-Feet Per Year AMI Advanced Metering Infrastructure ASR Aquifer Storage and Recovery AWWA American Water Works Association CAP Customer Assistance Program CCR California Code of Regulations CFS Cubic Feet Per Second CII Commercial, Industrial, Institutional CMWD Calleguas Municipal Water District CPUC California Public Utilities Commission CUWCC California Urban Water Conservation Council CWC California Water Code DDW Division of Drinking Water DMM Demand Management Measure DWR Department of Water Resources EO Executive Order FT Feet GPCD Gallons Per Capita Per Day ILI Infrastructure Leakage Index kWh Kilowatt Hours kWh/AF Kilowatt Hours Per Acre-Foot MCLs Maximum Contaminant Levels MGD Million Gallons Per Day MWD Metropolitan Water District PWS Public Water System RA Regional Alliance RUWMP Regional Urban Water Management Plan SB Senate Bill SCAG Southern California Association of Governments SGMA Sustainable Groundwater Management Act SPM Scenario Planning Model SWP California State Water Project SWRCB State Water Resources Control Board TAP Technical Assistance Program TAZ Transportation Analysis Zones USEPA United States Environmental Protection Agency UWMP Urban Water Management Plan
California Water Service 2020 Urban Water Management Plan
Westlake District
June 2021 Printed 6/25/2021
Page 9
EKI Environment & Water, Inc. M.Cubed
Gary Fiske and Associates
WSCP Water Shortage Contingency Plan WTP Water Treatment Plant WWTP Wastewater Treatment Plant

California Water Service 2020 Urban Water Management Plan
Westlake District
June 2021 Printed 6/25/2021
Page 10
EKI Environment & Water, Inc. M.Cubed
Gary Fiske and Associates
Chapter 1 Introduction and Overview
This chapter discusses the importance and uses of this Urban Water Management Plan (UWMP or Plan), the relationship of this Plan to the California Water Code (CWC), the relationship of this Plan to other local and regional planning efforts, and how this Plan is organized and developed in general accordance with the UWMP Guidebook 2020. 1 Specifically, this chapter contains the following sections:
1.1 Background and Purpose
1.2 Urban Water Management Planning and the California Water Code
1.3 Relationship to Other Planning Efforts
1.4 Plan Organization
1.5 Demonstration of Consistency with the Delta Plan for Participants in Covered Actions
1.6 Lay Description
1.1 Background and Purpose
California Water Service Company (Cal Water) is an investor-owned public utility supplying water service to approximately 1.8 million Californians through over 481,000 connections. Its 25 districts serve 63 communities spanning from the Chico-Hamilton City District in the northern portion of the state to the Palos Verdes District in southern California. California Water Service Group, Cal Water’s parent company, also provides water service to communities in Washington, New Mexico, and Hawaii. While water rates are set separately for each of Cal Water’s 25 districts, oversight of the water rate setting process and district operations is provided by the California Public Utilities Commission (CPUC). Cal Water incorporated in 1926 and has provided water service to communities served by the Westlake District (also referred to herein as District”) since 1983, when it purchased the Westlake Water Company.
This UWMP is a foundational document and source of information about Westlake District’s historical and projected water demands, water supplies, supply reliability and potential vulnerabilities, water shortage contingency planning, and demand management programs. Among other things, it is used as:
1 The UWMP Guidebook 2020 is available at: https://water.ca.gov/Programs/Water-Use-And-Efficiency/Urban-Water-Use-Efficiency/Urban-Water-Management-Plans

California Water Service 2020 Urban Water Management Plan
Westlake District
June 2021 Printed 6/25/2021
Page 11
EKI Environment & Water, Inc. M.Cubed
Gary Fiske and Associates
• A long-range planning document by Cal Water for water supply and system planning; and
• A source for data on population, housing, water demands, water supplies, and capital improvement projects used in:
o Regional water resource management plans prepared by wholesale water suppliers and other regional planning authorities (as applicable),
o General Plans prepared by cities and counties, and
o Statewide and broad regional water resource plans prepared by the California Department of Water Resources (DWR), the State Water Resources Control Board (SWRCB), or other state agencies.
The District’s last UWMP was completed in 2016, referred to herein as the “2015 UWMP.” This Plan is an update to the 2015 UWMP and carries forward information from that plan that remains current and relevant, and provides additional information as required by subsequent amendments to the UWMP Act (CWC §10610 – 10657). Although this Plan is an update to the 2015 UWMP, it was developed to be a self-contained, stand-alone document and does not require readers to reference information contained in previous UWMP updates.
1.2 Urban Water Management Planning and the California Water Code
The UWMP Act requires urban water suppliers to prepare an UWMP every five years and to submit this plan to the DWR, the California State Library, and any city or county within which the supplier provides water supplies. All urban water suppliers, either publicly or privately owned, providing water for municipal purposes either directly or indirectly to more than 3,000 customers or supplying more than 3,000 acre-feet annually are required to prepare an UWMP (CWC §10617).
The UWMP Act was enacted in 1983. Over the years it has been amended in response to water resource challenges and planning imperatives confronting California. A significant amendment was made in 2009 as a result of the governor’s call for a statewide 20 percent reduction in urban water use by 2020, referred to as “20x2020,” the Water Conservation Act of 2009, and “SB X7-7.” This amendment required urban retail water suppliers to establish water use targets for 2015 and 2020 that would result in statewide water savings of 20 percent by 2020. Beginning in 2016, urban retail water suppliers were required to comply with the water conservation requirements in SB X7-7 in order to be eligible for state water grants or loans. Chapter 5 of this plan contains the data and calculations used to determine compliance with these requirements.
A subsequent substantial revision to the UWMP Act was made in 2018 through a pair of bills (i.e., Assembly Bill 1668 and Senate Bill 606), referred to as “Making Water Conservation a

California Water Service 2020 Urban Water Management Plan
Westlake District
June 2021 Printed 6/25/2021
Page 12
EKI Environment & Water, Inc. M.Cubed
Gary Fiske and Associates
California Way of Life” or the “2018 Water Conservation Legislation.” These changes include, among other things, additional requirements for Water Shortage Contingency Plans (WSCPs), expansion of dry year supply reliability assessments to a five-year drought period, establishment of annual drought risk assessment procedures and reporting, and new conservation targets referred to as “annual water use objectives,” which will require retailers to continue to reduce water use beyond the 2020 SB X7-7 targets. The UWMP Act contains numerous other requirements that an UWMP must satisfy. Appendix A to this Plan lists each of these requirements and where in the Plan they are addressed.
1.3 Relationship to Other Planning Efforts
This Plan provides information specific to water management and planning by the Westlake District. However, water management does not happen in isolation; there are other planning processes that integrate with the UWMP to accomplish urban planning. Some of these relevant planning documents include relevant city and county General Plans, Water Master Plans, Recycled Water Master Plans, integrated resource plans, Integrated Regional Water Management Plans, Groundwater Management Plans, Groundwater Sustainability Plans, and others.
This Plan is informed by and helps to inform these other planning efforts. In particular, this Plan utilizes information contained in city and county General Plans and local and regional water resource plans to the extent data from these plans are applicable and available.
1.4 Plan Organization
The organization of this Plan follows the same sequence as outlined in the UWMP Guidebook 2020. 2
Chapter 1 - Introduction and Overview
Chapter 2- Plan Preparation
Chapter 3 - System Description
Chapter 4 - Water Use Characterization
Chapter 5 - SB X7-7 Baseline and Targets
Chapter 6 - Water Supply Characterization
2 The UWMP Guidebook 2020 is available at: https://water.ca.gov/Programs/Water-Use-And-Efficiency/Urban-Water-Use-Efficiency/Urban-Water-Management-Plans
California Water Service 2020 Urban Water Management Plan
Westlake District
June 2021 Printed 6/25/2021
Page 13
EKI Environment & Water, Inc. M.Cubed
Gary Fiske and Associates
Chapter 7 - Water Supply Reliability Assessment
Chapter 8 - Water Shortage Contingency Planning
Chapter 9 - Demand Management Measures
Chapter 10 - Plan Adoption, Submittal, and Implementation
In addition to these ten chapters, this Plan includes a number of appendices providing supporting documentation and supplemental information. Pursuant to CWC §10644(a)(2), this Plan utilizes the standardized forms, tables, and displays developed by DWR for the reporting of water use and supply information required by the UWMP Act. This Plan also includes additional tables, figures, and maps to augment the set developed by DWR, as appropriate. The table headers indicate if the table is part of DWR’s standardized set of submittal tables.
1.5 Demonstration of Consistency with the Delta Plan for Participants in Covered Actions
Although not required by the UWMP Act, in the UWMP Guidebook 2020, 3 DWR recommends that all suppliers that are participating in, or may participate in, receiving water from a proposed project that is considered a “covered action” under the Delta Plan—such as a (1) multiyear water transfer; (2) conveyance facility; or (3) new diversion that involves transferring water through, exporting water from, or using water in the Sacramento-San Joaquin Delta (Delta)—provide information in their UWMP to demonstrate consistency with the Delta Plan policy WR P1, Reduce Reliance on the Delta Through Improved Regional Water Self-Reliance (California Code of Regulations, Title 23, Section 5003).
The Westlake District purchases water from the Calleguas Municipal Water District (CMWD). CMWD is one of the 27 member agencies of the Metropolitan Water District of Southern California (MWD), which imports water through the Colorado River Aqueduct, which is owned by MWD, and the California Aqueduct, a facility of the California State Water Project (SWP), which is owned and operated by the DWR. Discussion of regional self-reliance and reduced reliance on water supplies from the Delta Watershed is available in Appendix 11 of MWD’s Draft 2020 UWMP.
3 The UWMP Guidebook 2020 is available at: https://water.ca.gov/Programs/Water-Use-And-Efficiency/Urban-Water-Use-Efficiency/Urban-Water-Management-Plans
California Water Service 2020 Urban Water Management Plan
Westlake District
June 2021 Printed 6/25/2021
Page 14
EKI Environment & Water, Inc. M.Cubed
Gary Fiske and Associates
1.6 Lay Description
This Urban Water Management Plan (UWMP or Plan) is prepared for the Cal Water Westlake District (also referred to herein as “District”), which serves drinking water to a population of approximately 19,500 in the city of Thousand Oaks. This UWMP serves as a foundational planning document and includes descriptions of historical and projected water demands, and water supplies, and the resulting reliability during a set of defined water supply conditions over a 20-year planning horizon. This document also describes the actions the District is taking to promote water conservation, both by the District itself and by its customers (referred to as “demand management measures”), and includes a plan to address potential water supply shortages such as drought or other impacts to supply availability (the “Water Shortage Contingency Plan”). This UWMP is updated every five years in accordance with state requirements under the Urban Water Management Planning Act and amendments (Division 6 Part 2.6 of the California Water Code [CWC] §10610 – 10656). Past plans developed for the District are available on the California Department of Water Resources (DWR) Water Use Efficiency Data Portal website: https://wuedata.water.ca.gov/. This document includes 10 chapters, which are summarized below.
Chapter 1- Introduction and Overview
This chapter presents the background and purpose of the UWMP, identifies the Plan organization, and provides this lay description overview of the document. For districts that rely on water from the Sacramento-San Joaquin Delta, this section also discusses and demonstrates consistency with the Delta Plan. The Westlake District, however, does not receive water from a “covered action” under the Delta Plan, as discussed further in Appendix 11 of the Metropolitan Water District of Southern California’s (MWD) Draft 2020 UWMP.
Chapter 2 - Plan Preparation
This chapter discusses key structural aspects related to the preparation of the UWMP, and describes the coordination and outreach conducted as part of the preparation of the Plan, including coordination with local agencies (i.e., City of Thousand Oaks), and the public.
CWC § 10630.5
Each plan shall include a simple lay description of how much water the agency has on a reliable basis, how much it needs for the foreseeable future, what the agency’s strategy is for meeting its water needs, the challenges facing the agency, and any other information necessary to provide a general understanding of the agency’s plan.
California Water Service 2020 Urban Water Management Plan
Westlake District
June 2021 Printed 6/25/2021
Page 15
EKI Environment & Water, Inc. M.Cubed
Gary Fiske and Associates
Chapter 3 - System Description
This chapter provides a description of the Westlake District’s water system and the service area, including information related to the climate, population, and demographics. The Westlake District is located in Ventura County. The Westlake District has a population of approximately 19,500 and has a climate characterized by warm dry summers and mild wet winters. The majority of the 19 inches of average annual precipitation falls between October and May. The service area includes land uses including: a mixture of low, medium, and high density residential, mixed use, commercial, public facilities, and parks/open space. All water customers are considered urban (i.e., non-agricultural water users).
Chapter 4 - Water Use Characterization
This chapter provides a description and quantifies the Westlake District’s current and projected demands through the year 2045. The District provides drinking water (also referred to as “potable water”) to customers. Water demands refer not only to the water used by customers, but also includes the water used as part of the system’s maintenance and operation, as well as unavoidable losses inherent in the operation of a water distribution system. Water demand within the District was 6,706 acre-feet per year (AFY) on average between 2016 and 2020. Taking into account historical water use, expected population increase and other growth, climatic variability, and other assumptions, potable water demand within the District is projected to increase to 6,943 AFY by 2025, a change of 4 percent compared to the 2016-2020 average. The projected potable water demand decreases to 6,836 AFY by 2045. In dry year periods, potable water demands are expected to be somewhat higher, potentially up to 7,226 AFY by 2025 during an extended five-year drought.
Chapter 5 - SB X7-7 Baseline and Targets
In this chapter, the Westlake District demonstrates compliance with its per capita water use target for the year 2020. The Water Conservation Act of 2009 (Senate Bill X7-7) was enacted in November 2009 and requires the state of California to achieve a 20 percent reduction in urban per capita water use by December 31, 2020. In order to achieve this, each urban retail water supplier was required to establish water use targets for 2015 and 2020 using methodologies established by DWR. The Westlake District is in compliance with its 2020 water use target of 373 gallons per capita per day (GPCD), having reduced its water use in 2020 to 324 GPCD. The Westlake District is also a member of a “Regional Alliance” for purposes of SB X7-7 compliance. The Regional Alliance’s 2020 water use is 139 GPCD, which is in compliance with and below its 2020 target of 161 GPCD.
California Water Service 2020 Urban Water Management Plan
Westlake District
June 2021 Printed 6/25/2021
Page 16
EKI Environment & Water, Inc. M.Cubed
Gary Fiske and Associates
Chapter 6 - Water Supply Characterization
This chapter presents an analysis of the Westlake District’s water supplies, as well as an estimate of water-related energy-consumption. The intent of this chapter is to present a comprehensive overview of the District’s water supplies, estimate the volume of available supplies over the UWMP planning horizon, and assess the sufficiency of the District’s supplies to meet projected demands under “normal” hydrologic conditions.
The water supply for the Westlake District is a combination of purchased imported water and recycled water, and there are no new sources of supply currently planned. Imported water, which makes up the majority of District supply, is purchased from the Calleguas Municipal Water District (CMWD) which is a member agency of the MWD. The water is imported to the District via the California State Water Project (also referred to herein as “State Water Project” or “SWP”). According to the Draft 2020 CMWD UWMP, there will be sufficient supplies to meet all future projected demands through 2045. The Tapia Water Reclamation Facility, owned and operated by Las Virgenes Municipal Water District, provides the wastewater service and recycled water for the Westlake District service area. Treated effluent from the Tapia Water Reclamation Facility is recycled for irrigation of commercial property, parks golf courses, and school grounds.
Calculating and reporting of water system energy intensity is a new requirement for the 2020 UWMPs. Energy intensity is defined as the net energy used for water treatment, pumping, conveyance, and distribution for all water entering the distribution system, and does not include the energy used to treat wastewater. The energy intensity for the Westlake District is estimated to be 258 kilowatt hours per acre-foot of water (kWh/AF).
Chapter 7 - Water Supply Reliability Assessment
This chapter assesses the reliability of the Westlake District’s water supplies, with a specific focus on potential constraints such as supply availability, water quality, and climate change. The intent of this chapter is to identify any potential constraints that could affect the reliability of the District’s supply (such as drought conditions) to support the District’s planning efforts to ensure that its customers are well served. Water supply reliability is assessed during normal, single dry-year, and multiple dry-year hydrologic conditions. Based on this analysis, the Westlake District expects the available supplies to be sufficient to meet projected demands in all hydrologic conditions, including a five-year drought period. Potential water quality issues are not expected to constrain the water provided to the District’s customers, as water quality is routinely monitored and the District is able to make all appropriate adjustments to its treatment and distribution system to ensure only high quality drinking water is provided.

California Water Service 2020 Urban Water Management Plan
Westlake District
June 2021 Printed 6/25/2021
Page 17
EKI Environment & Water, Inc. M.Cubed
Gary Fiske and Associates
Chapter 8 - Water Shortage Contingency Planning
This chapter describes the Water Shortage Contingency Plan (WSCP) for the Westlake District. The WSCP serves as a standalone document to be engaged in the case of a water shortage event, such as a drought or supply interruption, and defines specific policies and actions that will be implemented at various shortage level scenarios. For example, implementing customer water budgets and surcharges, or restricting landscape irrigation to specific days and/or times. Consistent with DWR requirements, the WSCP includes six levels to address shortage conditions ranging from up to 10 percent to greater than 50 percent shortage. Chapter 9 - Demand Management Measures
This chapter includes descriptions of past and planned conservation programs that Cal Water operates within each demand management measure (DMM) category outlined in the UWMP Act, specifically: (1) water waste prevention ordinances, (2) metering, (3) conservation pricing, (4) public education and outreach, (5) distribution system water loss management, (6) water conservation program coordination and staffing support, and (7) “other” DMMs. Cal Water has developed a suite of conservation programs and policies, which address each DMM category. Chapter 10 - Plan Adoption, Submittal, and Implementation
This chapter provides information on a public hearing, the adoption process for the UWMP and WSCP, the adopted UWMP and WSCP submittal process, plan implementation, and the process for amending the adopted UWMP and WSCP. Prior to adopting the Plan, Cal Water held a formal public hearing to present information on its Westlake District UWMP and WSCP on May 27, 2021, 5:00 PM. This UWMP and the corresponding WSCP were submitted to DWR within 30 days of adoption and by the July 1, 2021 deadline.
California Water Service 2020 Urban Water Management Plan
Westlake District
June 2021 Printed 6/25/2021
Page 18
EKI Environment & Water, Inc. M.Cubed
Gary Fiske and Associates
Chapter 2 Plan Preparation
This chapter discusses the type of Urban Water Management Plan (UWMP or Plan) the Westlake District (also referred to herein as District”) has prepared and includes information that will apply throughout the Plan. Coordination and outreach during the development of the Plan is also discussed. Specifically, this chapter includes the following sections:
2.1 Public Water Systems
2.2 Regional Planning
2.3 Individual or Regional Planning and Compliance
2.4 Plan Preparation, Standard Units, and Basis for Reporting
2.5 Coordination and Outreach
2.1 Public Water Systems
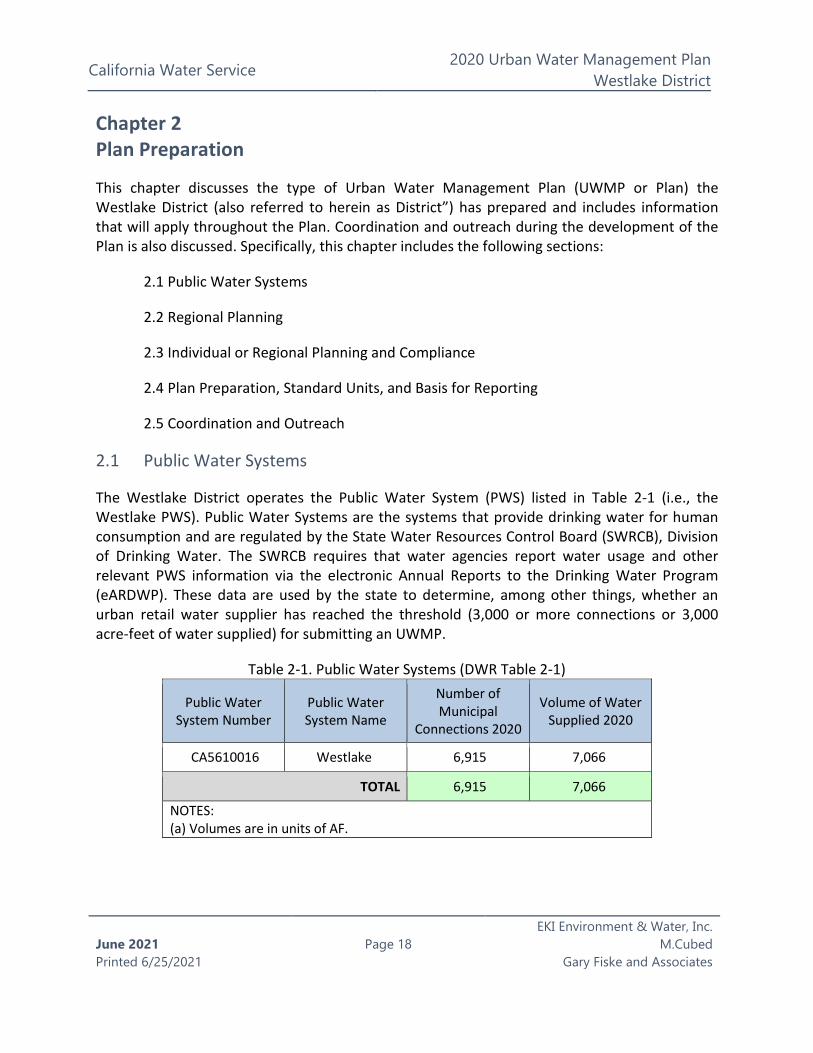
The Westlake District operates the Public Water System (PWS) listed in Table 2-1 (i.e., the Westlake PWS). Public Water Systems are the systems that provide drinking water for human consumption and are regulated by the State Water Resources Control Board (SWRCB), Division of Drinking Water. The SWRCB requires that water agencies report water usage and other relevant PWS information via the electronic Annual Reports to the Drinking Water Program (eARDWP). These data are used by the state to determine, among other things, whether an urban retail water supplier has reached the threshold (3,000 or more connections or 3,000 acre-feet of water supplied) for submitting an UWMP.
Table 2-1. Public Water Systems (DWR Table 2-1)
Public Water System Number
Public Water System Name
Number of Municipal
Connections 2020
Volume of Water Supplied 2020
CA5610016 Westlake 6,915 7,066
TOTAL 6,915 7,066
NOTES: (a) Volumes are in units of AF.
California Water Service 2020 Urban Water Management Plan
Westlake District
June 2021 Printed 6/25/2021
Page 19
EKI Environment & Water, Inc. M.Cubed
Gary Fiske and Associates
2.2 Regional Planning
Regional planning can deliver mutually beneficial solutions to all agencies involved by reducing costs for the individual agency, assessing water resources at the appropriate geographic scale, and allowing for solutions that cross jurisdictional boundaries. California Water Service Company (Cal Water) participates in regional water resources planning initiatives throughout California in the regions in which its 25 water districts are located. In the region in which the Westlake District is located, regional water resources planning is done in cooperation with the Calleguas Municipal Water District, which provides wholesale water to the District. More broadly, Cal Water supports the 2019 Integrated Regional Water Management Plan prepared by the Watersheds Coalition of Ventura County.
2.3 Individual or Regional Planning and Compliance (Regional Alliance)
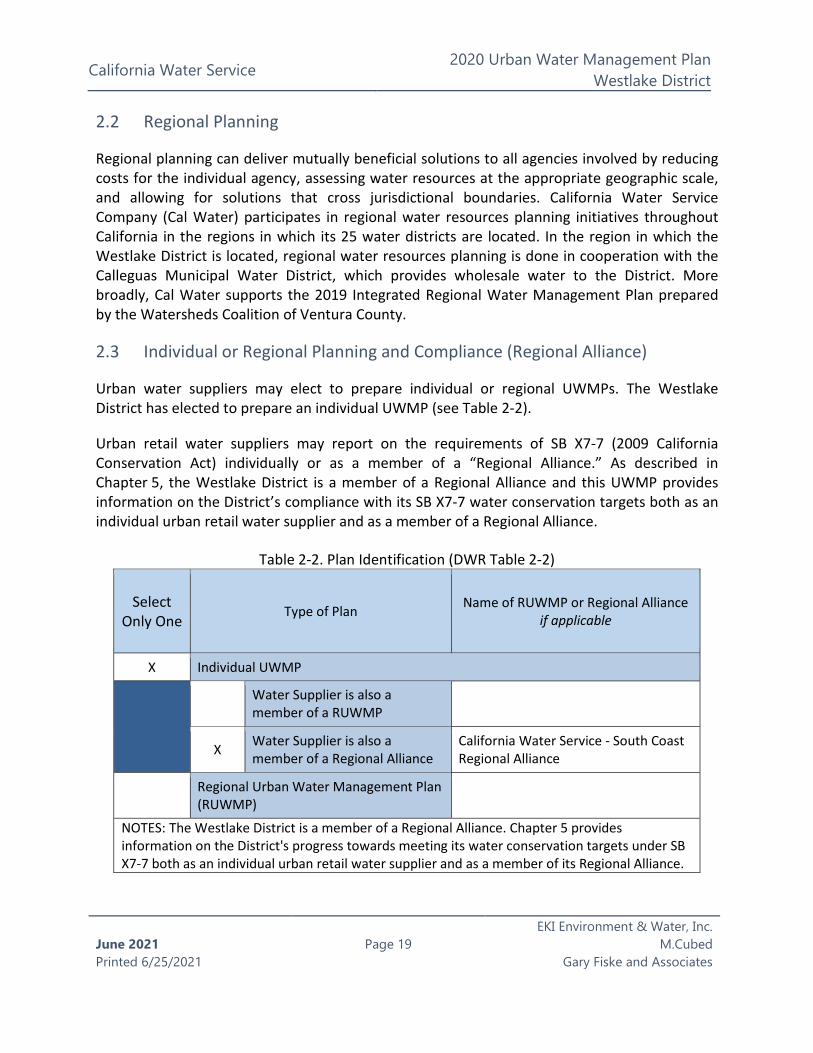
Urban water suppliers may elect to prepare individual or regional UWMPs. The Westlake District has elected to prepare an individual UWMP (see Table 2-2).
Urban retail water suppliers may report on the requirements of SB X7-7 (2009 California Conservation Act) individually or as a member of a “Regional Alliance.” As described in Chapter 5, the Westlake District is a member of a Regional Alliance and this UWMP provides information on the District’s compliance with its SB X7-7 water conservation targets both as an individual urban retail water supplier and as a member of a Regional Alliance.
Table 2-2. Plan Identification (DWR Table 2-2)
Select Only One
Type of Plan Name of RUWMP or Regional Alliance if applicable
X Individual UWMP
Water Supplier is also a member of a RUWMP
X Water Supplier is also a member of a Regional Alliance
California Water Service - South Coast Regional Alliance
Regional Urban Water Management Plan (RUWMP)
NOTES: The Westlake District is a member of a Regional Alliance. Chapter 5 provides information on the District's progress towards meeting its water conservation targets under SB X7-7 both as an individual urban retail water supplier and as a member of its Regional Alliance.

California Water Service 2020 Urban Water Management Plan
Westlake District
June 2021 Printed 6/25/2021
Page 20
EKI Environment & Water, Inc. M.Cubed
Gary Fiske and Associates
2.4 Plan Preparation, Standard Units, and Basis for Reporting
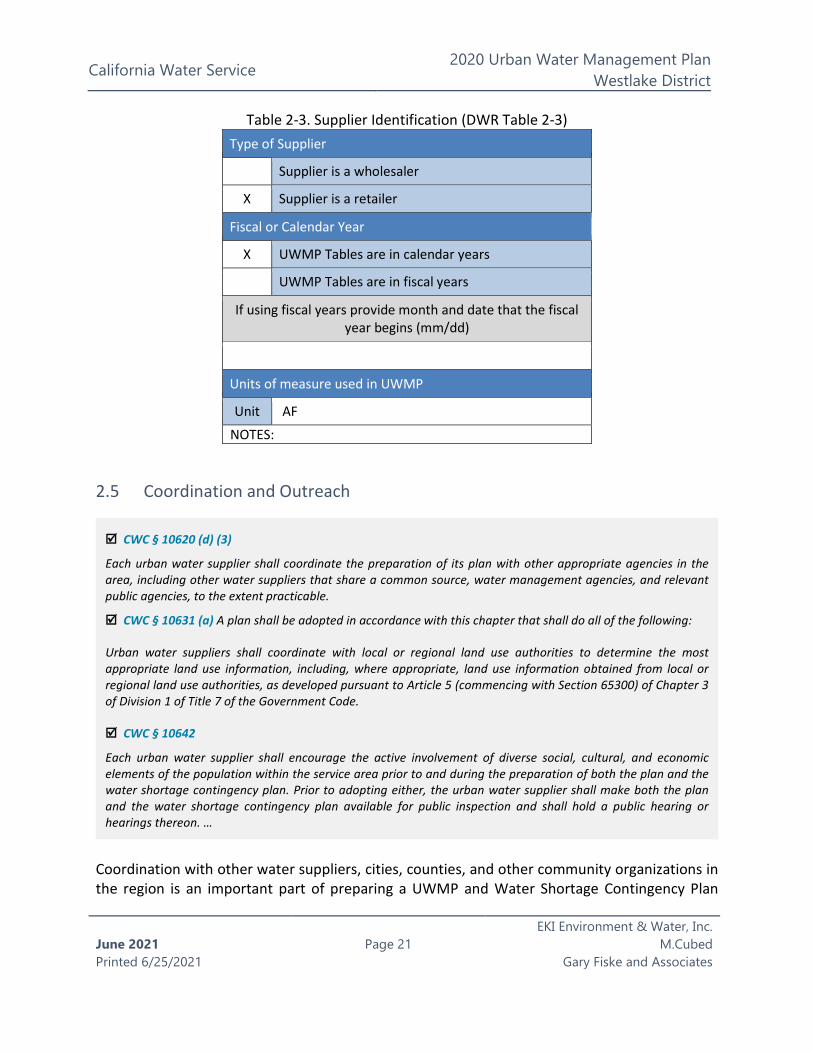
Per California Water Code (CWC) §10617, the Westlake District is an urban water supplier providing water for municipal purposes to more than 3,000 customers or supplying more than 3,000 acre-feet of water annually. It is therefore obligated under CWC §10621(f) to develop and submit an UWMP to the California Department of Water Resources (DWR) by July 1, 2021. The Westlake District is an urban retail water supplier, as defined by CWC §10608.12 (t) and §10617, and as identified in Table 2-3. The Westlake District is not a wholesale water supplier.
Annual volumes of water reported in this UWMP are measured in acre-feet (AF) and are reported on a calendar year basis (Table 2-3). Water use and planning data reported in this UWMP for calendar year 2020 cover the full twelve months of the year, as required by the UWMP Guidelines.
CWC § 10608.12 (t)
“Urban retail water supplier” means a water supplier, either publicly or privately owned, that directly provides potable municipal water to more than 3,000 end users or that supplies more than 3,000 acre-feet of potable water annually at retail for municipal purposes.
CWC § 10617
“Urban water supplier” means a supplier, either publicly or privately owned, providing water for municipal purposes either directly or indirectly to more than 3,000 customers or supplying more than 3,000 acre-feet of water annually. An urban water supplier includes a supplier or contractor for water, regardless of the basis of right, which distributes or sells for ultimate resale to customers. This part applies only to water supplied from public water systems subject to Chapter 4 (commencing with Section 116275) of Part 12 of Division 104 of the Health and Safety Code.
CWC § 10621 (a)
Each urban water supplier shall update its plan at least once every five years on or before July 1, in years ending in six and one, incorporating updated and new information from the five years preceding each update.
CWC § 10621 (f)
Each urban water supplier shall update and submit its 2020 plan to the department by July 1, 2021.
California Water Service 2020 Urban Water Management Plan
Westlake District
June 2021 Printed 6/25/2021
Page 21
EKI Environment & Water, Inc. M.Cubed
Gary Fiske and Associates
Table 2-3. Supplier Identification (DWR Table 2-3) Type of Supplier
Supplier is a wholesaler
X Supplier is a retailer
Fiscal or Calendar Year
X UWMP Tables are in calendar years
UWMP Tables are in fiscal years
If using fiscal years provide month and date that the fiscal year begins (mm/dd)
Units of measure used in UWMP
Unit AF
NOTES:
2.5 Coordination and Outreach
Coordination with other water suppliers, cities, counties, and other community organizations in the region is an important part of preparing a UWMP and Water Shortage Contingency Plan
CWC § 10620 (d) (3)
Each urban water supplier shall coordinate the preparation of its plan with other appropriate agencies in the area, including other water suppliers that share a common source, water management agencies, and relevant public agencies, to the extent practicable.
CWC § 10631 (a) A plan shall be adopted in accordance with this chapter that shall do all of the following:
Urban water suppliers shall coordinate with local or regional land use authorities to determine the most appropriate land use information, including, where appropriate, land use information obtained from local or regional land use authorities, as developed pursuant to Article 5 (commencing with Section 65300) of Chapter 3 of Division 1 of Title 7 of the Government Code.
CWC § 10642
Each urban water supplier shall encourage the active involvement of diverse social, cultural, and economic elements of the population within the service area prior to and during the preparation of both the plan and the water shortage contingency plan. Prior to adopting either, the urban water supplier shall make both the plan and the water shortage contingency plan available for public inspection and shall hold a public hearing or hearings thereon. …

California Water Service 2020 Urban Water Management Plan
Westlake District
June 2021 Printed 6/25/2021
Page 22
EKI Environment & Water, Inc. M.Cubed
Gary Fiske and Associates
(WSCP). This section identifies the agencies and organizations Westlake District sought to coordinate with during preparation of this Plan.
2.5.1 Wholesale and Retail Coordination
Urban retail water suppliers relying on one or more wholesalers for water supply are required to provide these wholesalers with information regarding projected water supply and demand. Westlake District provided information regarding projected water supply and demand to the wholesale water supplier listed in Table 2-4.
Table 2-4. Water Supplier Information Exchange (DWR Table 2-4) The retail Supplier has informed the following wholesale supplier(s) of projected water use in accordance with Water Code Section 10631.
Wholesale Water Supplier Name
Calleguas Municipal Water District
NOTES:
CWC § 10631 (h)
An urban water supplier that relies upon a wholesale agency for a source of water shall provide the wholesale agency with water use projections from that agency for that source of water in five-year increments to 20 years or as far as data is available. The wholesale agency shall provide information to the urban water supplier for inclusion in the urban water supplier’s plan that identifies and quantifies, to the extent practicable, the existing and planned sources of water as required by subdivision (b), available from the wholesale agency to the urban water supplier over the same five-year increments, and during various water-year types in accordance with subdivision (f). An urban water supplier may rely upon water supply information provided by the wholesale agency in fulfilling the plan informational requirements of subdivisions (b) and (f).

California Water Service 2020 Urban Water Management Plan
Westlake District
June 2021 Printed 6/25/2021
Page 23
EKI Environment & Water, Inc. M.Cubed
Gary Fiske and Associates
2.5.2 Coordination with and Notice to Other Agencies and the Community
The Westlake District coordinated with cities, counties, and other community organizations during preparation of this UWMP. Cal Water provided notice to these entities and the communities it serves 60 days prior to the public hearing it held on May 27, 2021, to present the draft of the UWMP, address questions, and receive comments. Cities and counties receiving the public hearing notification from Westlake District as required per CWC §10621 (b) are listed in Table 10-1 in Chapter 10 of this Plan.
Copies of correspondence with other agencies and public notices are provided in Appendix B and Appendix C, respectively.
2.5.3 Coordination with Land Use Authorities
Cal Water coordinated with the City of Thousand Oaks staff to review and confirm that appropriate land use assumptions were used to develop the UWMP demand projections. Correspondence with land use authorities is included in Appendix B.
CWC § 10620 (d) (3)
Each urban water supplier shall coordinate the preparation of its plan with other appropriate agencies in the area, including other water suppliers that share a common source, water management agencies, and relevant public agencies, to the extent practicable.
CWC § 10642
Each urban water supplier shall encourage the active involvement of diverse social, cultural, and economic elements of the population within the service area prior to and during the preparation of both the plan and the water shortage contingency plan. Prior to adopting either, the urban water supplier shall make both the plan and the water shortage contingency plan available for public inspection and shall hold a public hearing or hearings thereon. Prior to any of these hearings, notice of the time and place of the hearing shall be published within the jurisdiction of the publicly owned water supplier pursuant to Section 6066 of the Government Code. The urban water supplier shall provide notice of the time and place of a hearing to any city or county within which the supplier provides water supplies. Notices by a local public agency pursuant to this section shall be provided pursuant to Chapter 17.5 (commencing with Section 7290) of Division 7 of Title 1 of the Government Code. A privately owned water supplier shall provide an equivalent notice within its service area. After the hearing or hearings, the plan or water shortage contingency plan shall be adopted as prepared or as modified
CWC § 10631 (a) A plan shall be adopted in accordance with this chapter that shall do all of the following:
Urban water suppliers shall coordinate with local or regional land use authorities to determine the most appropriate land use information, including, where appropriate, land use information obtained from local or regional land use authorities, as developed pursuant to Article 5 (commencing with Section 65300) of Chapter 3 of Division 1 of Title 7 of the Government Code.

California Water Service 2020 Urban Water Management Plan
Westlake District
June 2021 Printed 6/25/2021
Page 24
EKI Environment & Water, Inc. M.Cubed
Gary Fiske and Associates
Chapter 3 System Description
This chapter describes the Westlake District (also referred to as the “District”) water system and service area, including climate, population, demographics, and land uses to help in understanding various elements of water supply and demand. This chapter includes the following sections:
3.1 General Description
3.2 Service Area Boundary Map
3.3 Service Area Climate
3.4 Service Area Population and Demographics
3.5 Land Uses within Service Area
3.1 General Description
The District is owned and operated by California Water Service Company (Cal Water), an investor-owned water utility regulated by the California Public Utilities Commission (CPUC). The District operates 105 miles of pipeline, six storage tanks, and 23 booster pumps to deliver roughly six million gallons of water daily to approximately 6,900 service connections. The District delivers water to residential, commercial, and governmental customers. Residential customers account for most of the District’s service connections and 68 percent of its water uses. Non-residential water uses account for 25 percent of total demand, while distribution system losses account for 7 percent. Water served by the District comes from imported surface
CWC § 10631 (a)
A plan shall be adopted in accordance with this chapter that shall do all of the following:
Describe the service area of the supplier, including current and projected population, climate, and other social, economic, and demographic factors affecting the supplier’s water management planning. The projected population estimates shall be based upon data from the state, regional, or local service agency population projections within the service area of the urban water supplier and shall be in five-year increments to 20 years or as far as data is available. The description shall include the current and projected land uses within the existing or anticipated service area affecting the supplier’s water management planning. Urban water suppliers shall coordinate with local or regional land use authorities to determine the most appropriate land use information, including, where appropriate, land use information obtained from local or regional land use authorities, as developed pursuant to Article 5 (commencing with Section 65300) of Chapter 3 of Division 1 of Title 7 of the Government Code.
California Water Service 2020 Urban Water Management Plan
Westlake District
June 2021 Printed 6/25/2021
Page 25
EKI Environment & Water, Inc. M.Cubed
Gary Fiske and Associates
water from the Metropolitan Water District of Southern California through Calleguas Municipal Water District.
3.2 Service Area Boundary Map
Figure 3-1 shows the location of the District and its current service area boundaries. The District is in the eastern part of Ventura County within the City of Thousand Oaks, about 40 miles northwest of Los Angeles. The service area encompasses 8,200 acres which was part of the historic Russell Valley Ranch. The City of Thousand Oaks Water Department and California American Water Company run water systems in the remaining parts of Thousand Oaks.
The District’s service area is hilly, with elevations ranging from 900 feet to 1,675 feet above sea level. The San Andreas Fault Zone is situated to the northeast of the District. The Bailey, Malibu Coast, and Chatsworth Faults surround the District. These faults, along with others, cause the uplift of base rock that forms the Santa Monica and San Gabriel Mountains bordering the District. A major earthquake on these faults has the potential to disrupt water service in the District.

California Water Service 2020 Urban Water Management Plan
Westlake District
June 2021 Printed 6/25/2021
Page 26
EKI Environment & Water, Inc. M.Cubed
Gary Fiske and Associates
Figure 3-1. District Location and Service Boundaries
3.3 Service Area Climate
The District’s climate is characterized by warm dry summers and mild wet winters (see Figure 3-2). 4 Most rainfall occurs between October and May. Precipitation totals in the summer months are negligible. On average, the District receives 19 inches of rainfall annually. Maximum daily air temperature averages 85 degrees Fahrenheit during the summer months. In the winter, it averages 65 degrees Fahrenheit.
4 Precipitation and temperature data downloaded from: https://prism.oregonstate.edu/explorer/. These data represent a 30-year period from 1980 through 2010. The x-axis reflects the end of the 30-year time series.

California Water Service 2020 Urban Water Management Plan
Westlake District
June 2021 Printed 6/25/2021
Page 27
EKI Environment & Water, Inc. M.Cubed
Gary Fiske and Associates
Figure 3-2. 30-Year Normals, Precipitation and Maximum Daily Air Temperature
Based on a review of data downloaded from the Oregon State PRISM dataset for 1895 to 2019, rainfall varies significantly from year-to-year, as it does in most of California. 5 The standard deviation in annual rainfall is 8 inches, or 42 percent of average annual rainfall. 6 Consecutive years of below average rainfall are common. Since 1895, runs of below average rainfall lasting three or more years have occurred ten times and runs lasting five or more years have occurred three times. The longest run in the time-series lasted ten years, from 1895 through 1904. While rainfall in the region is highly variable, there has been no statistically significant trend in the mean or variance of annual rainfall since 1895.
The District’s climate has been warming. Since 1895, average daily temperature has increased at an average rate of 0.027 degrees Fahrenheit per year. This trend has been accelerating. Since 1950, average daily temperature has increased at an average rates of 0.032 degrees Fahrenheit per year, and since 1980 at a rate of 0.04 degrees Fahrenheit per year. Mean annual temperature for the period 2010-2019 was 3.1 degrees Fahrenheit higher than for the period 1900-1909.
3.4 Service Area Population and Demographics
The District’s service area population was 19,477 in 2020. The District estimates its service area population using census block population counts from decadal census data. The census estimates are converted to average population per single- and multi-family service, which are applied to service counts for years between the decadal censuses. This method is similar to the way in which the California Department of Water Resources (DWR) Population Tool estimates
5 Downloaded from: https://prism.oregonstate.edu/explorer/. The x-axis reflects the end of the 30-year time series. 6 The standard deviation measures the typical, or average, year-to-year variation in annual rainfall.
California Water Service 2020 Urban Water Management Plan
Westlake District
June 2021 Printed 6/25/2021
Page 28
EKI Environment & Water, Inc. M.Cubed
Gary Fiske and Associates
service area population. The two methods generate nearly identical population estimates in most cases. 7
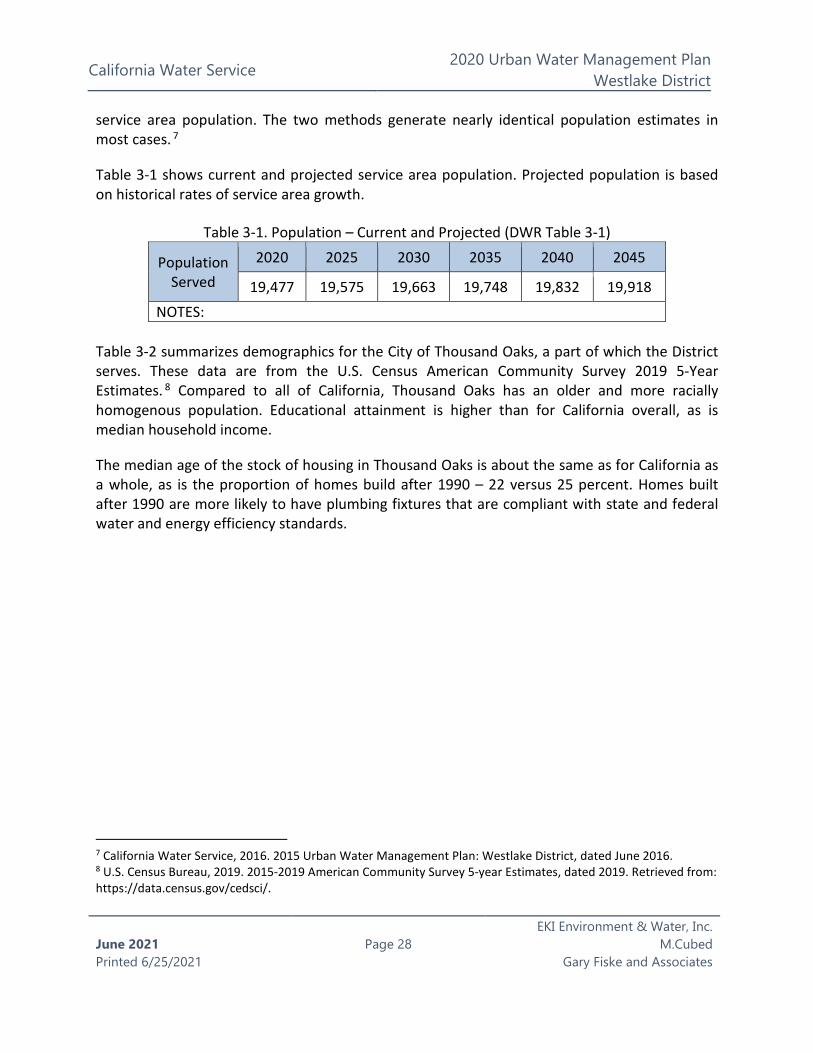
Table 3-1 shows current and projected service area population. Projected population is based on historical rates of service area growth.
Table 3-1. Population – Current and Projected (DWR Table 3-1)
Population Served
2020 2025 2030 2035 2040 2045
19,477 19,575 19,663 19,748 19,832 19,918 NOTES:
Table 3-2 summarizes demographics for the City of Thousand Oaks, a part of which the District serves. These data are from the U.S. Census American Community Survey 2019 5-Year Estimates. 8 Compared to all of California, Thousand Oaks has an older and more racially homogenous population. Educational attainment is higher than for California overall, as is median household income.
The median age of the stock of housing in Thousand Oaks is about the same as for California as a whole, as is the proportion of homes build after 1990 – 22 versus 25 percent. Homes built after 1990 are more likely to have plumbing fixtures that are compliant with state and federal water and energy efficiency standards.
7 California Water Service, 2016. 2015 Urban Water Management Plan: Westlake District, dated June 2016. 8 U.S. Census Bureau, 2019. 2015-2019 American Community Survey 5-year Estimates, dated 2019. Retrieved from: https://data.census.gov/cedsci/.

California Water Service 2020 Urban Water Management Plan
Westlake District
June 2021 Printed 6/25/2021
Page 29
EKI Environment & Water, Inc. M.Cubed
Gary Fiske and Associates
Table 3-2. Demographic and Housing Characteristics Demographics Thousand Oaks California Median Age (years) 44.2 36.5 Racial Makeup (%)
White 85.9 63.8 Black or African American 2.0 7.0 American Indian and Alaska Native 1.4 1.9 Asian 11.9 16.7 Native Hawaiian 0.3 0.8 Some other race 2.9 15.1
Hispanic or Latino (of any race) (%) 19.4 39.0 Educational Attainment (%)
Bachelor’s Degree or Higher 50.8 33.9 Primary Language Spoken at Home (%)
English Only or Speak English “very well” 91.9 82.2 Limited English-Speaking Households 4.3 8.9
Median Household Income ($) 109,378 75,235 Population below Federal Poverty Level (%) 5.2 13.4 Housing Thousand Oaks California Median Year Built 1977 1975 Year Housing Built (%)
2010 or Later 1.3 3.5 2000 to 2009 10.1 11.2 1990 to 1999 11.2 10.9 Before 1990 77.5 74.5
3.5 Land Uses within Service Area
Current land uses within the District is a mixture of low, medium, and high density residential, mixed use, commercial, public facilities, and parks/open space. A map showing General Plan land use designations for communities served by the District is provided in Appendix D.

California Water Service 2020 Urban Water Management Plan
Westlake District
June 2021 Printed 6/25/2021
Page 30
EKI Environment & Water, Inc. M.Cubed
Gary Fiske and Associates
The District’s population and service growth projections are tied to Southern California Association of Governments (SCAG) census tract level projections of population, housing, and employment. 9 These projections, in turn, are developed by SCAG through detailed land use, demographic, and transportation modeling. This modeling covers the entirety of the SCAG region which spans six counties (Imperial, Los Angeles, Riverside, San Bernardino, and Ventura) and 191 cities. The SCAG modeling framework is depicted in Figure 3-3.
Figure 3-3. SCAG Integrated Modeling and Forecasting Framework
Within this integrated modeling and forecasting system, SCAG’s Scenario Planning Model (SPM) serves as a conduit between local land use planning information and the SCAG modeling framework by delivering locally vetted data and plans for use in the key SCAG models. This helps to ensure that regional plans are consistent with local data and policy inputs. SCAG works collaboratively with the region’s local jurisdictions to develop the land use inputs that feed into its regional, subarea, and local forecasts.
SCAG develops socioeconomic estimates and growth projections including population, households, and employment for over 11,000 small areas called Transportation Analysis Zones (TAZ). Further, SCAG apportions the TAZ projections to the census tracts that span the region. The population, household, and employment projections used by the District to forecast service
9 https://scag.ca.gov/data-tools-forecasting
California Water Service 2020 Urban Water Management Plan
Westlake District
June 2021 Printed 6/25/2021
Page 31
EKI Environment & Water, Inc. M.Cubed
Gary Fiske and Associates
area population and service connections tie back to these SCAG census tract land use and growth projections.

California Water Service 2020 Urban Water Management Plan
Westlake District
June 2021 Printed 6/25/2021
Page 32
EKI Environment & Water, Inc. M.Cubed
Gary Fiske and Associates
Chapter 4 Water Use Characterization
This chapter describes and quantifies the Westlake District’s (also referred to as the “District”) past, current, and projected water uses through 2045. For the purposes of the Urban Water Management Plan (UWMP or Plan), the terms “water use” and “water demand” are used interchangeably. This chapter has the following subsections:
4.1 Non-Potable Versus Potable Water Use
4.2 Past, Current, and Projected Water Uses by Sector
4.3 Climate Change Considerations
Appendix E provides additional information and data related to the development of the water demand projections presented in this chapter.
4.1 Non-Potable Versus Potable Water Use
This Plan distinguishes between recycled, potable, and raw water uses and supplies. Recycled water is addressed comprehensively in Chapter 6, but a summary of recycled water demand is
CWC § 10631 (d) (1) A plan shall be adopted in accordance with this chapter that shall do all of the following:
For an urban retail water supplier, quantify, to the extent records are available, past and current water use, over the same five-year increments described in subdivision (a), and projected water use, based upon information developed pursuant to subdivision (a), identifying the uses among water use sectors, including, but not necessarily limited to, all of the following:
(A) Single-family residential.
(B) Multifamily.
(C) Commercial.
(D) Industrial.
(E) Institutional and governmental.
(F) Landscape.
(G) Sales to other agencies.
(H) Saline water intrusion barriers, groundwater recharge, or conjunctive use, or any combination thereof.
(I) Agricultural.
(J) Distribution system water loss.
California Water Service 2020 Urban Water Management Plan
Westlake District
June 2021 Printed 6/25/2021
Page 33
EKI Environment & Water, Inc. M.Cubed
Gary Fiske and Associates
included in Table 4-3 of this chapter. The primary focus of this chapter is the historical and projected potable water uses in the District.
4.2 Past, Current, and Projected Water Uses by Sector
4.2.1 Past and Current Water Use
Table 4-1 shows water use in 2016-2020 by use type (referred to as “sector” in CWC §10631). Per capita water use has been decreasing in the District since the mid-2000s. Several factors have contributed to this reduction. California Water Service Company (Cal Water) implemented conservation pricing starting in 2009, supplying stronger financial incentives to use water efficiently, and starting around 2012 Cal Water tripled the level of expenditure on conservation programs aimed at helping customers use less water. Additionally, appliance efficiency standards and plumbing codes have contributed to significant improvement over time in the average water use efficiency of the installed base of appliances and plumbing fixtures. For example, a new toilet uses roughly one-third the amount of water as a toilet manufactured in the 1980s, while a new clothes washer uses about half the amount of water as an older
CWC § 10631 (d)
For an urban retail water supplier, quantify, to the extent records are available, past and current water use, over the same five-year increments described in subdivision (a), and projected water use, based upon information developed pursuant to subdivision (a), identifying the uses among water use sectors, including, but not necessarily limited to, all of the following:
(A) Single-family residential.
(B) Multifamily.
(C) Commercial.
(D) Industrial.
(E) Institutional and governmental.
(F) Landscape.
(G) Sales to other agencies.
(H) Saline water intrusion barriers, groundwater recharge, or conjunctive use, or any combination thereof.
(I) Agricultural.
(J) Distribution system water loss.
California Water Service 2020 Urban Water Management Plan
Westlake District
June 2021 Printed 6/25/2021
Page 34
EKI Environment & Water, Inc. M.Cubed
Gary Fiske and Associates
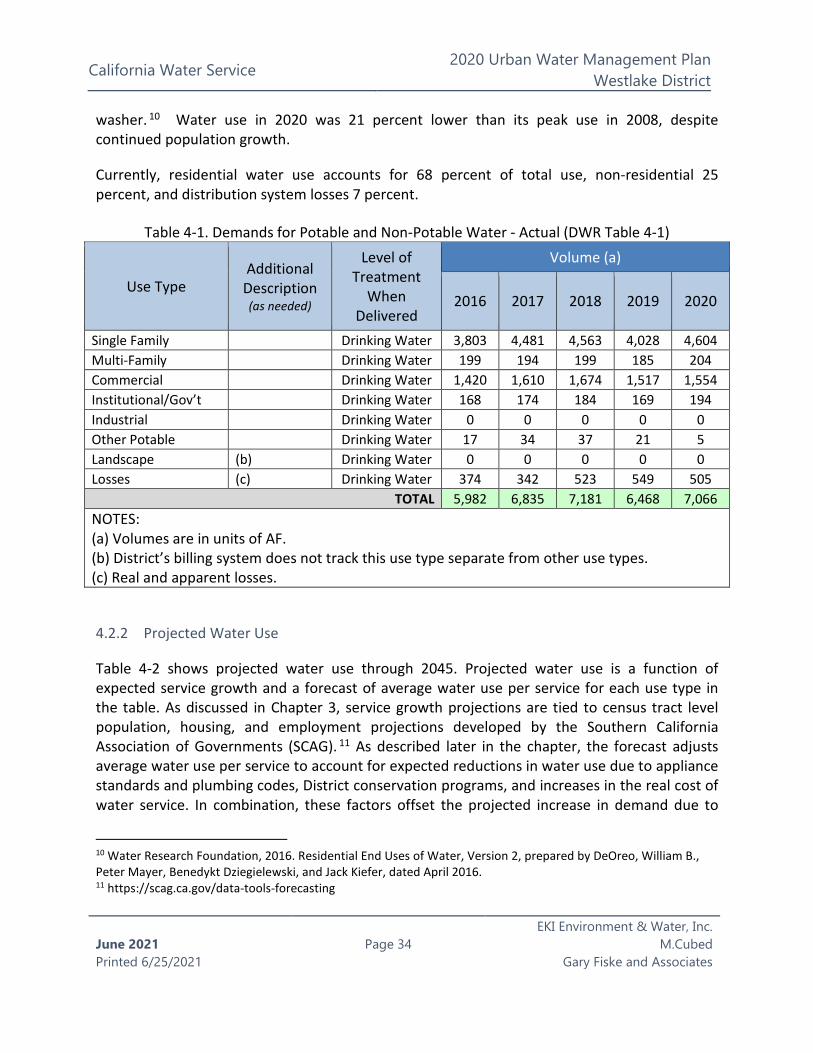
washer. 10 Water use in 2020 was 21 percent lower than its peak use in 2008, despite continued population growth.
Currently, residential water use accounts for 68 percent of total use, non-residential 25 percent, and distribution system losses 7 percent.
Table 4-1. Demands for Potable and Non-Potable Water - Actual (DWR Table 4-1)
Use Type Additional
Description (as needed)
Level of Treatment
When Delivered
Volume (a)
2016 2017 2018 2019 2020
Single Family Drinking Water 3,803 4,481 4,563 4,028 4,604 Multi-Family Drinking Water 199 194 199 185 204 Commercial Drinking Water 1,420 1,610 1,674 1,517 1,554 Institutional/Gov’t Drinking Water 168 174 184 169 194 Industrial Drinking Water 0 0 0 0 0 Other Potable Drinking Water 17 34 37 21 5 Landscape (b) Drinking Water 0 0 0 0 0 Losses (c) Drinking Water 374 342 523 549 505
TOTAL 5,982 6,835 7,181 6,468 7,066 NOTES: (a) Volumes are in units of AF. (b) District’s billing system does not track this use type separate from other use types. (c) Real and apparent losses.
4.2.2 Projected Water Use
Table 4-2 shows projected water use through 2045. Projected water use is a function of expected service growth and a forecast of average water use per service for each use type in the table. As discussed in Chapter 3, service growth projections are tied to census tract level population, housing, and employment projections developed by the Southern California Association of Governments (SCAG). 11 As described later in the chapter, the forecast adjusts average water use per service to account for expected reductions in water use due to appliance standards and plumbing codes, District conservation programs, and increases in the real cost of water service. In combination, these factors offset the projected increase in demand due to
10 Water Research Foundation, 2016. Residential End Uses of Water, Version 2, prepared by DeOreo, William B., Peter Mayer, Benedykt Dziegielewski, and Jack Kiefer, dated April 2016. 11 https://scag.ca.gov/data-tools-forecasting
California Water Service 2020 Urban Water Management Plan
Westlake District
June 2021 Printed 6/25/2021
Page 35
EKI Environment & Water, Inc. M.Cubed
Gary Fiske and Associates
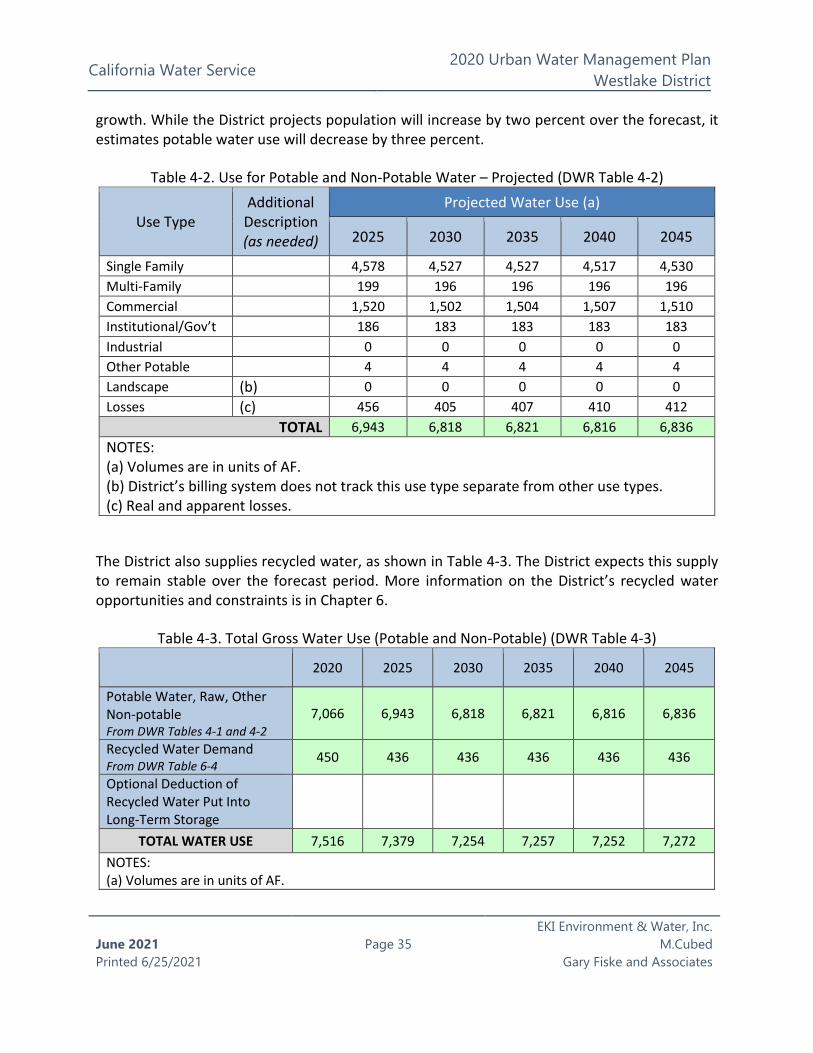
growth. While the District projects population will increase by two percent over the forecast, it estimates potable water use will decrease by three percent.
Table 4-2. Use for Potable and Non-Potable Water – Projected (DWR Table 4-2)
Use Type Additional
Description (as needed)
Projected Water Use (a)
2025 2030 2035 2040 2045
Single Family 4,578 4,527 4,527 4,517 4,530 Multi-Family 199 196 196 196 196 Commercial 1,520 1,502 1,504 1,507 1,510 Institutional/Gov’t 186 183 183 183 183 Industrial 0 0 0 0 0 Other Potable 4 4 4 4 4 Landscape (b) 0 0 0 0 0 Losses (c) 456 405 407 410 412
TOTAL 6,943 6,818 6,821 6,816 6,836 NOTES: (a) Volumes are in units of AF. (b) District’s billing system does not track this use type separate from other use types. (c) Real and apparent losses.
The District also supplies recycled water, as shown in Table 4-3. The District expects this supply to remain stable over the forecast period. More information on the District’s recycled water opportunities and constraints is in Chapter 6.
Table 4-3. Total Gross Water Use (Potable and Non-Potable) (DWR Table 4-3) 2020 2025 2030 2035 2040 2045
Potable Water, Raw, Other Non-potable From DWR Tables 4-1 and 4-2
7,066 6,943 6,818 6,821 6,816 6,836
Recycled Water Demand From DWR Table 6-4 450 436 436 436 436 436
Optional Deduction of Recycled Water Put Into Long-Term Storage
TOTAL WATER USE 7,516 7,379 7,254 7,257 7,252 7,272 NOTES: (a) Volumes are in units of AF.
California Water Service 2020 Urban Water Management Plan
Westlake District
June 2021 Printed 6/25/2021
Page 36
EKI Environment & Water, Inc. M.Cubed
Gary Fiske and Associates
4.2.3 Distribution System Water Loss
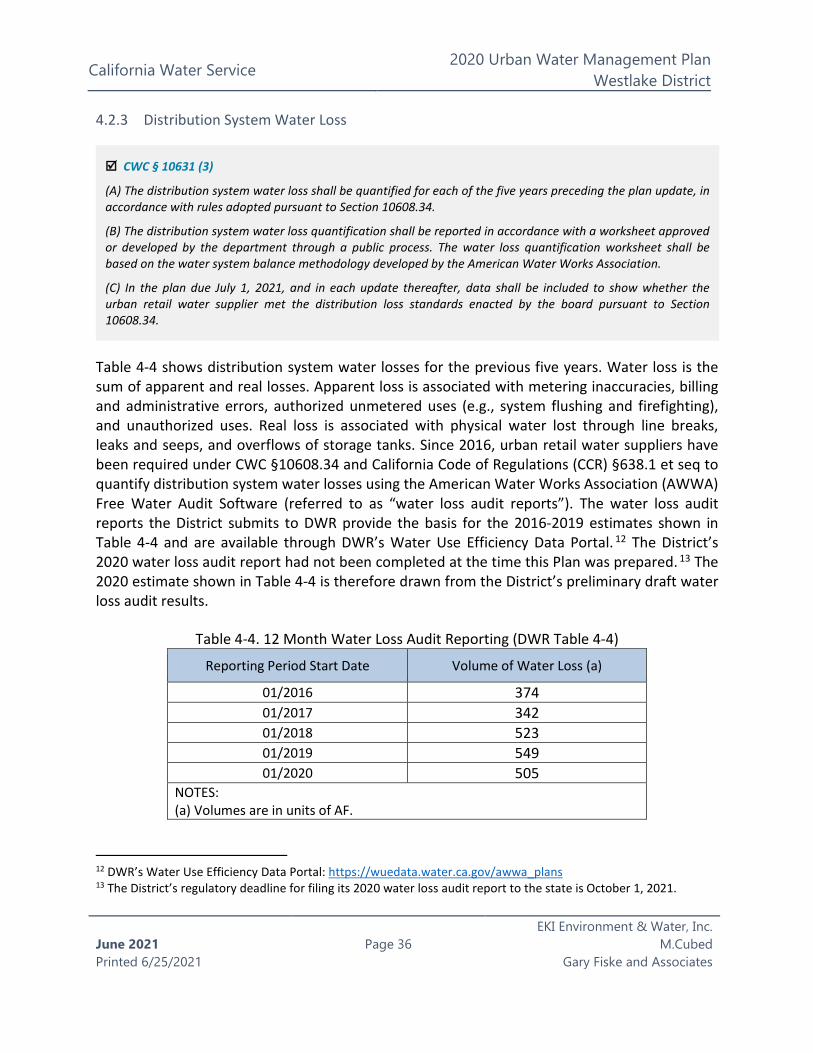
Table 4-4 shows distribution system water losses for the previous five years. Water loss is the sum of apparent and real losses. Apparent loss is associated with metering inaccuracies, billing and administrative errors, authorized unmetered uses (e.g., system flushing and firefighting), and unauthorized uses. Real loss is associated with physical water lost through line breaks, leaks and seeps, and overflows of storage tanks. Since 2016, urban retail water suppliers have been required under CWC §10608.34 and California Code of Regulations (CCR) §638.1 et seq to quantify distribution system water losses using the American Water Works Association (AWWA) Free Water Audit Software (referred to as “water loss audit reports”). The water loss audit reports the District submits to DWR provide the basis for the 2016-2019 estimates shown in Table 4-4 and are available through DWR’s Water Use Efficiency Data Portal. 12 The District’s 2020 water loss audit report had not been completed at the time this Plan was prepared. 13 The 2020 estimate shown in Table 4-4 is therefore drawn from the District’s preliminary draft water loss audit results.
Table 4-4. 12 Month Water Loss Audit Reporting (DWR Table 4-4)
Reporting Period Start Date Volume of Water Loss (a)
01/2016 374 01/2017 342 01/2018 523 01/2019 549 01/2020 505
NOTES: (a) Volumes are in units of AF.
12 DWR’s Water Use Efficiency Data Portal: https://wuedata.water.ca.gov/awwa_plans 13 The District’s regulatory deadline for filing its 2020 water loss audit report to the state is October 1, 2021.
CWC § 10631 (3)
(A) The distribution system water loss shall be quantified for each of the five years preceding the plan update, in accordance with rules adopted pursuant to Section 10608.34.
(B) The distribution system water loss quantification shall be reported in accordance with a worksheet approved or developed by the department through a public process. The water loss quantification worksheet shall be based on the water system balance methodology developed by the American Water Works Association.
(C) In the plan due July 1, 2021, and in each update thereafter, data shall be included to show whether the urban retail water supplier met the distribution loss standards enacted by the board pursuant to Section 10608.34.
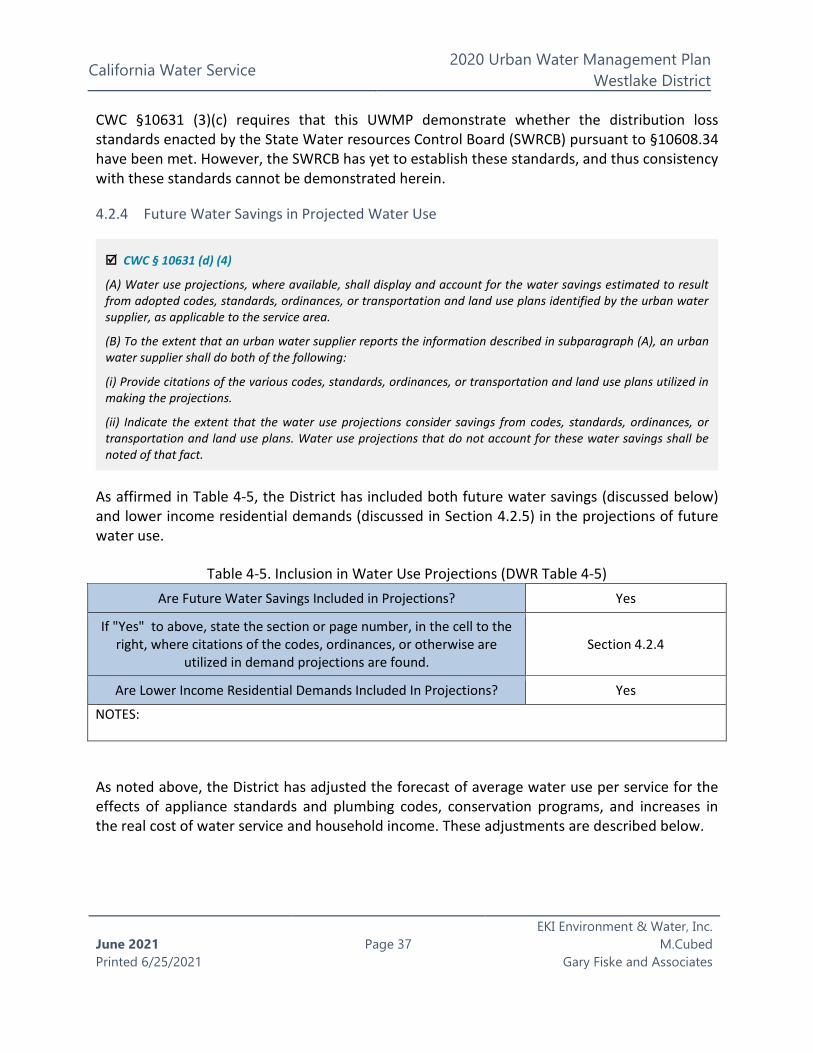
California Water Service 2020 Urban Water Management Plan
Westlake District
June 2021 Printed 6/25/2021
Page 37
EKI Environment & Water, Inc. M.Cubed
Gary Fiske and Associates
CWC §10631 (3)(c) requires that this UWMP demonstrate whether the distribution loss standards enacted by the State Water resources Control Board (SWRCB) pursuant to §10608.34 have been met. However, the SWRCB has yet to establish these standards, and thus consistency with these standards cannot be demonstrated herein.
4.2.4 Future Water Savings in Projected Water Use
As affirmed in Table 4-5, the District has included both future water savings (discussed below) and lower income residential demands (discussed in Section 4.2.5) in the projections of future water use.
Table 4-5. Inclusion in Water Use Projections (DWR Table 4-5) Are Future Water Savings Included in Projections? Yes
If "Yes" to above, state the section or page number, in the cell to the right, where citations of the codes, ordinances, or otherwise are
utilized in demand projections are found. Section 4.2.4
Are Lower Income Residential Demands Included In Projections? Yes
NOTES:
As noted above, the District has adjusted the forecast of average water use per service for the effects of appliance standards and plumbing codes, conservation programs, and increases in the real cost of water service and household income. These adjustments are described below.
CWC § 10631 (d) (4)
(A) Water use projections, where available, shall display and account for the water savings estimated to result from adopted codes, standards, ordinances, or transportation and land use plans identified by the urban water supplier, as applicable to the service area.
(B) To the extent that an urban water supplier reports the information described in subparagraph (A), an urban water supplier shall do both of the following:
(i) Provide citations of the various codes, standards, ordinances, or transportation and land use plans utilized in making the projections.
(ii) Indicate the extent that the water use projections consider savings from codes, standards, ordinances, or transportation and land use plans. Water use projections that do not account for these water savings shall be noted of that fact.

California Water Service 2020 Urban Water Management Plan
Westlake District
June 2021 Printed 6/25/2021
Page 38
EKI Environment & Water, Inc. M.Cubed
Gary Fiske and Associates
The District uses forecasts of per capita water savings from appliance standards and plumbing codes prepared for DWR to adjust its projections of average water use per service. 14 These forecasts incorporate the effects of the following codes and regulations:
• Assembly Bill (AB) 715, enacted in 2007, requires that any toilet or urinal sold or installed in California on or after January 1, 2014 cannot have a flush rating exceeding 1.28 and 0.5 gallons per flush, respectively. AB 715 superseded the state’s previous standards for toilet and urinal water use set in 1991 of 1.6 and 1.0 gallons per flush, respectively. On April 8, 2015, in response to the Governor’s Emergency Drought Response Executive Order (EO B-29-15), the California Energy Commission approved new standards for urinals requiring that they not consume more than 0.125 gallons per flush, 75 percent less than the standard set by AB 715.
• Water use standards for residential and commercial clothes washers and dishwashers are established by the U.S. Department of Energy through its authority under the federal Energy Policy and Conservation Act. Water use efficiency is summarized by the water factor for the appliance which measures the gallons of water used per cycle per cubic foot of capacity. A typical top-loading residential clothes washer manufactured in the 1990s had a water factor of around 12. In 2015, the allowable water factor for top- and front-loading residential clothes was reduced to 8.4 and 4.7, respectively. In 2018, water factor standard for top-loading residential clothes washers will be reduced to 6.5. In 2010 the allowable water factor for top- and front-loading commercial clothes washers was reduced to 8.5 and 5.5, respectively. The maximum water factor for Energy Star compliant top- and front-loading washers is 3.7 and 4.3, respectively. The U.S. Environmental Protection Agency estimates that Energy Star washers made up at least 60 percent of the residential market and 30 percent of the commercial market in 2011. 15 An Energy Star compliant washer uses about two-thirds less water per cycle than washers manufactured in the 1990s. Federal dishwasher water use efficiency standards were last updated in 2013. The maximum water use for standard and compact sized dishwashers is 5.0 and 3.5 gallons per cycle, respectively.
• New construction and renovations in California are now subject to CalGreen Code requirements. CalGreen includes prescriptive indoor provisions for maximum water consumption of plumbing fixtures and fittings in new and renovated properties. CalGreen also allows for an optional performance path to compliance, which requires an overall aggregate 20 percent reduction in indoor water use from a calculated baseline using a set of worksheets provided with the CalGreen guidelines.
14 M.Cubed, 2016. Projected Statewide and County-Level Effects of Plumbing Codes and Appliance Standards on Indoor GPCD, technical memorandum prepared for the California Department of Water Resources, dated August 2016. 15 EPA Energy Star Unit Shipment and Market Penetration Report Calendar Year 2011 Summary.

California Water Service 2020 Urban Water Management Plan
Westlake District
June 2021 Printed 6/25/2021
Page 39
EKI Environment & Water, Inc. M.Cubed
Gary Fiske and Associates
• Senate Bill (SB) 407, enacted in 2009, mandates that all buildings in California come up to current State plumbing fixture standards within this decade. This law establishes requirements that residential and commercial property built and available for use on or before January 1, 1994 replace plumbing fixtures that are not water conserving, defined as “noncompliant plumbing fixtures.” This law also requires effective January 1, 2017 that a seller or transferor of single-family residential property show to the purchaser or transferee, in writing, the specified requirements for replacing plumbing fixtures and whether the real property includes noncompliant plumbing. Similar disclosure requirements went into effect for multi-family and commercial transactions January 1, 2019. SB 837, passed in 2011, reinforces the disclosure requirement by amending the statutorily required transfer disclosure statement to include disclosure about whether the property follows SB 407 requirements.
The District’s 2015 Conservation Master Plan forms the basis for the forecast of water savings from conservation programs. Cal Water used the Alliance for Water Efficiency’s Water Conservation Tracking Tool to estimate expected water savings from planned program implementation. 16
Projected increases in water service costs and household income form the basis for the adjustments to average water use due to changes in the real cost of water service. The forecast uses the historical rate of increase in District water rates to project future water service costs. It uses Caltrans income projections for Ventura County to estimate changes in household income. It uses empirically derived estimates of price and income demand elasticity to adjust future water demand for changes in these variables. 17
Table 4-6 shows total water savings from plumbing codes and appliance standards, conservation programs, and increases in the real cost of water service.
Table 4-6. Future Water Savings from Plumbing Codes, Conservation Programs, and Water Rates (AF)
2025 2030 2035 2040 2045 204 376 431 496 535
16 Alliance for Water Efficiency Water Conservation Tracking Tool: https://www.allianceforwaterefficiency.org/resources/topic/water-conservation-tracking-tool 17 M.Cubed, 2018. California Water Service 2020 Test Year Sales Forecast: 2018 General Rate Case, prepared for California Water Service by M.Cubed, dated January 2018.
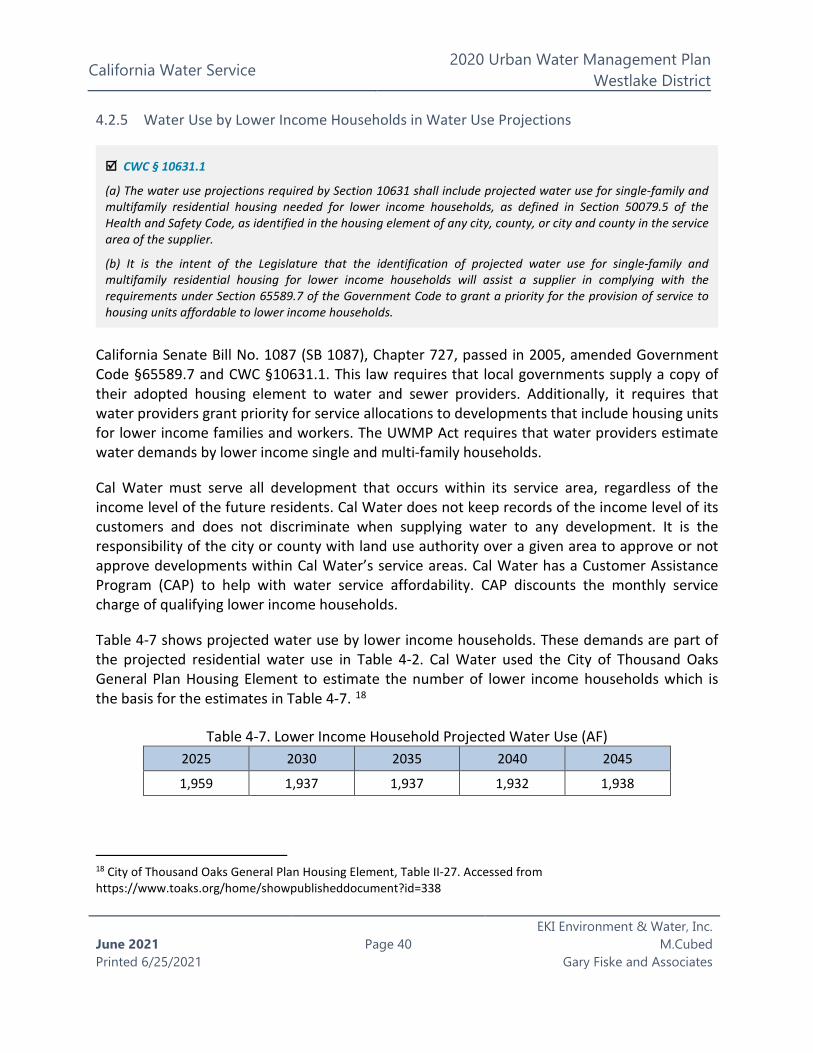
California Water Service 2020 Urban Water Management Plan
Westlake District
June 2021 Printed 6/25/2021
Page 40
EKI Environment & Water, Inc. M.Cubed
Gary Fiske and Associates
4.2.5 Water Use by Lower Income Households in Water Use Projections
California Senate Bill No. 1087 (SB 1087), Chapter 727, passed in 2005, amended Government Code §65589.7 and CWC §10631.1. This law requires that local governments supply a copy of their adopted housing element to water and sewer providers. Additionally, it requires that water providers grant priority for service allocations to developments that include housing units for lower income families and workers. The UWMP Act requires that water providers estimate water demands by lower income single and multi-family households.
Cal Water must serve all development that occurs within its service area, regardless of the income level of the future residents. Cal Water does not keep records of the income level of its customers and does not discriminate when supplying water to any development. It is the responsibility of the city or county with land use authority over a given area to approve or not approve developments within Cal Water’s service areas. Cal Water has a Customer Assistance Program (CAP) to help with water service affordability. CAP discounts the monthly service charge of qualifying lower income households.
Table 4-7 shows projected water use by lower income households. These demands are part of the projected residential water use in Table 4-2. Cal Water used the City of Thousand Oaks General Plan Housing Element to estimate the number of lower income households which is the basis for the estimates in Table 4-7. 18
Table 4-7. Lower Income Household Projected Water Use (AF) 2025 2030 2035 2040 2045
1,959 1,937 1,937 1,932 1,938
18 City of Thousand Oaks General Plan Housing Element, Table II-27. Accessed from https://www.toaks.org/home/showpublisheddocument?id=338
CWC § 10631.1
(a) The water use projections required by Section 10631 shall include projected water use for single-family and multifamily residential housing needed for lower income households, as defined in Section 50079.5 of the Health and Safety Code, as identified in the housing element of any city, county, or city and county in the service area of the supplier.
(b) It is the intent of the Legislature that the identification of projected water use for single-family and multifamily residential housing for lower income households will assist a supplier in complying with the requirements under Section 65589.7 of the Government Code to grant a priority for the provision of service to housing units affordable to lower income households.
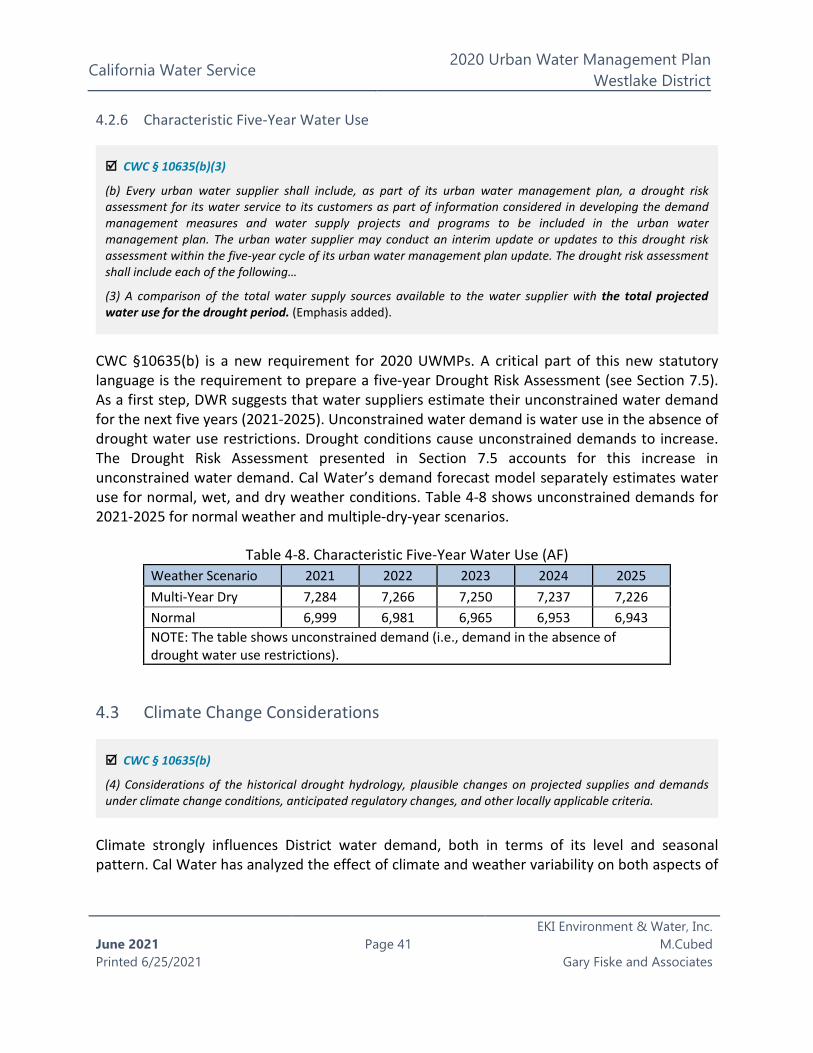
California Water Service 2020 Urban Water Management Plan
Westlake District
June 2021 Printed 6/25/2021
Page 41
EKI Environment & Water, Inc. M.Cubed
Gary Fiske and Associates
4.2.6 Characteristic Five-Year Water Use
CWC §10635(b) is a new requirement for 2020 UWMPs. A critical part of this new statutory language is the requirement to prepare a five-year Drought Risk Assessment (see Section 7.5). As a first step, DWR suggests that water suppliers estimate their unconstrained water demand for the next five years (2021-2025). Unconstrained water demand is water use in the absence of drought water use restrictions. Drought conditions cause unconstrained demands to increase. The Drought Risk Assessment presented in Section 7.5 accounts for this increase in unconstrained water demand. Cal Water’s demand forecast model separately estimates water use for normal, wet, and dry weather conditions. Table 4-8 shows unconstrained demands for 2021-2025 for normal weather and multiple-dry-year scenarios.
Table 4-8. Characteristic Five-Year Water Use (AF) Weather Scenario 2021 2022 2023 2024 2025 Multi-Year Dry 7,284 7,266 7,250 7,237 7,226 Normal 6,999 6,981 6,965 6,953 6,943 NOTE: The table shows unconstrained demand (i.e., demand in the absence of drought water use restrictions).
4.3 Climate Change Considerations
Climate strongly influences District water demand, both in terms of its level and seasonal pattern. Cal Water has analyzed the effect of climate and weather variability on both aspects of
CWC § 10635(b)(3)
(b) Every urban water supplier shall include, as part of its urban water management plan, a drought risk assessment for its water service to its customers as part of information considered in developing the demand management measures and water supply projects and programs to be included in the urban water management plan. The urban water supplier may conduct an interim update or updates to this drought risk assessment within the five-year cycle of its urban water management plan update. The drought risk assessment shall include each of the following…
(3) A comparison of the total water supply sources available to the water supplier with the total projected water use for the drought period. (Emphasis added).
CWC § 10635(b)
(4) Considerations of the historical drought hydrology, plausible changes on projected supplies and demands under climate change conditions, anticipated regulatory changes, and other locally applicable criteria.
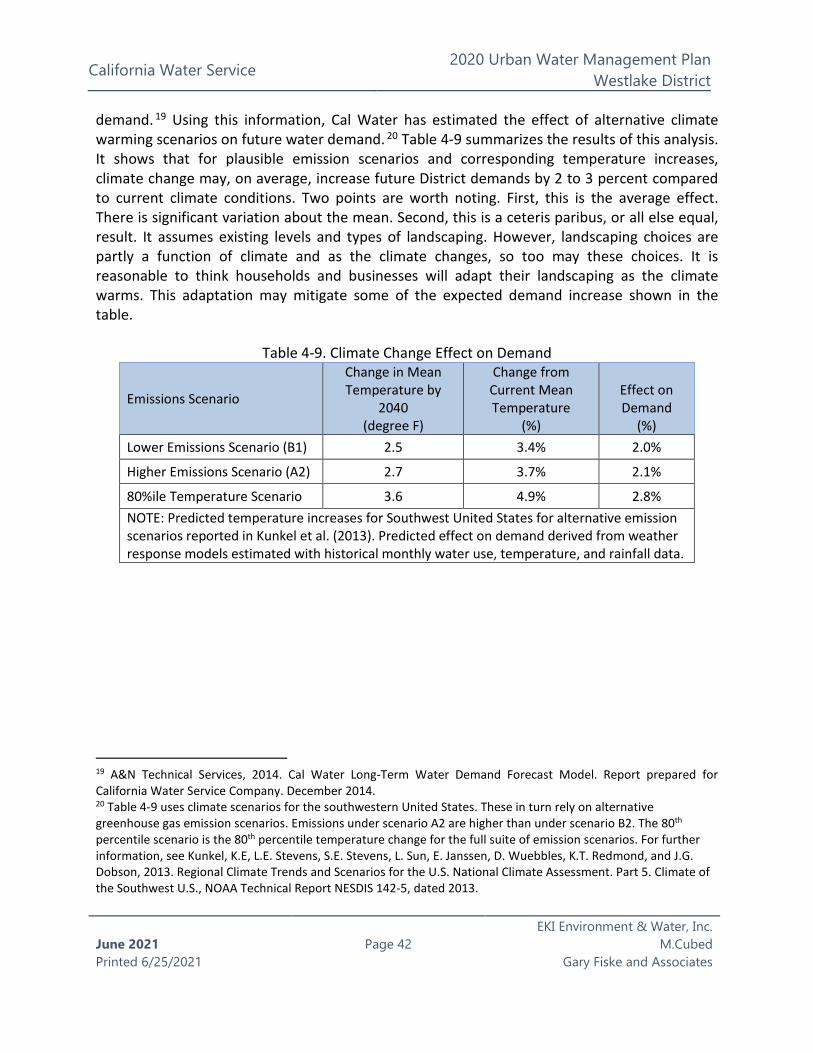
California Water Service 2020 Urban Water Management Plan
Westlake District
June 2021 Printed 6/25/2021
Page 42
EKI Environment & Water, Inc. M.Cubed
Gary Fiske and Associates
demand. 19 Using this information, Cal Water has estimated the effect of alternative climate warming scenarios on future water demand. 20 Table 4-9 summarizes the results of this analysis. It shows that for plausible emission scenarios and corresponding temperature increases, climate change may, on average, increase future District demands by 2 to 3 percent compared to current climate conditions. Two points are worth noting. First, this is the average effect. There is significant variation about the mean. Second, this is a ceteris paribus, or all else equal, result. It assumes existing levels and types of landscaping. However, landscaping choices are partly a function of climate and as the climate changes, so too may these choices. It is reasonable to think households and businesses will adapt their landscaping as the climate warms. This adaptation may mitigate some of the expected demand increase shown in the table.
Table 4-9. Climate Change Effect on Demand
Emissions Scenario
Change in Mean Temperature by
2040 (degree F)
Change from Current Mean Temperature
(%)
Effect on Demand
(%) Lower Emissions Scenario (B1) 2.5 3.4% 2.0%
Higher Emissions Scenario (A2) 2.7 3.7% 2.1%
80%ile Temperature Scenario 3.6 4.9% 2.8% NOTE: Predicted temperature increases for Southwest United States for alternative emission scenarios reported in Kunkel et al. (2013). Predicted effect on demand derived from weather response models estimated with historical monthly water use, temperature, and rainfall data.
19 A&N Technical Services, 2014. Cal Water Long-Term Water Demand Forecast Model. Report prepared for California Water Service Company. December 2014. 20 Table 4-9 uses climate scenarios for the southwestern United States. These in turn rely on alternative greenhouse gas emission scenarios. Emissions under scenario A2 are higher than under scenario B2. The 80th percentile scenario is the 80th percentile temperature change for the full suite of emission scenarios. For further information, see Kunkel, K.E, L.E. Stevens, S.E. Stevens, L. Sun, E. Janssen, D. Wuebbles, K.T. Redmond, and J.G. Dobson, 2013. Regional Climate Trends and Scenarios for the U.S. National Climate Assessment. Part 5. Climate of the Southwest U.S., NOAA Technical Report NESDIS 142-5, dated 2013.
California Water Service 2020 Urban Water Management Plan
Westlake District
June 2021 Printed 6/25/2021
Page 43
EKI Environment & Water, Inc. M.Cubed
Gary Fiske and Associates
Chapter 5 SB X7-7 Baseline and Targets
The Water Conservation Act of 2009, also known as Senate Bill (SB) X7-7, requires that urban retail water suppliers reduce their per capita water use by 20 percent by 2020. SB X7-7 defines an urban retail water supplier as “a water supplier, either publicly or privately owned, that directly provides potable municipal water to more than 3,000 end users or that supplies more than 3,000 acre-feet of potable water annually at retail for municipal purposes” (CWC §10608.12). The Westlake District meets both criteria. The state will assess each urban retail water supplier’s 2020 per capita water use against the target it established in its 2015 urban water management plan (UWMP).
This chapter demonstrates the District’s compliance with its SB X7-7 per capita water use target and includes the following sections:
5.1 Wholesale Suppliers
5.2 Updates to the 2015 UWMP Calculations
5.3 Service Area Population
CWC § 10608.24 (b)
Each urban retail water supplier shall meet its urban water use target by December 31, 2020.
CWC § 10608.28
(a) An urban retail water supplier may meet its urban water use target within its retail service area, or through mutual agreement, by any of the following:
(1) Through an urban wholesale water supplier.
(2) Through a regional agency authorized to plan and implement water conservation, including, but not limited to, an agency established under the Bay Area Water Supply and Conservation Agency Act (Division 31 (commencing with Section 81300)).
(3) Through a regional water management group as defined in Section 10537.
(4) By an integrated regional water management funding area.
(5) By hydrologic region.
(6) Through other appropriate geographic scales for which computation methods have been developed by the department.
(b) A regional water management group, with the written consent of its member agencies, may undertake any or all planning, reporting, and implementation functions under this chapter for the member agencies that consent to those activities. Any data or reports shall provide information both for the regional water management group and separately for each consenting urban retail water supplier and urban wholesale water supplier
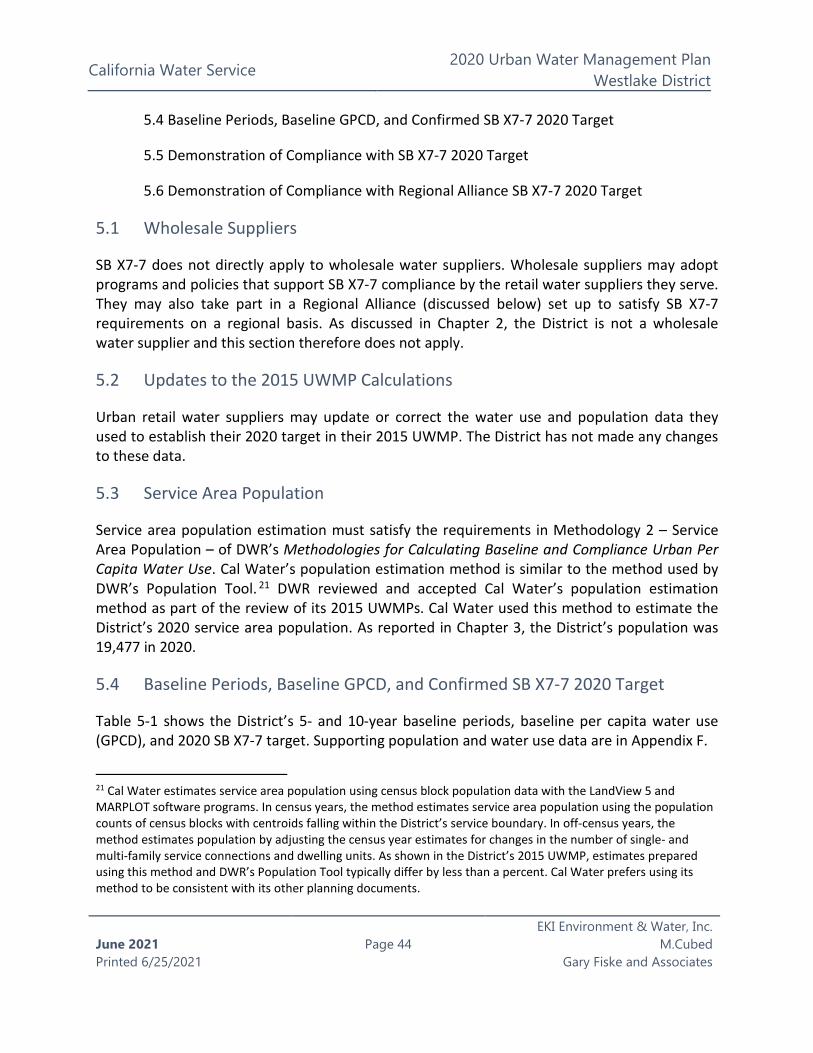
California Water Service 2020 Urban Water Management Plan
Westlake District
June 2021 Printed 6/25/2021
Page 44
EKI Environment & Water, Inc. M.Cubed
Gary Fiske and Associates
5.4 Baseline Periods, Baseline GPCD, and Confirmed SB X7-7 2020 Target
5.5 Demonstration of Compliance with SB X7-7 2020 Target
5.6 Demonstration of Compliance with Regional Alliance SB X7-7 2020 Target
5.1 Wholesale Suppliers
SB X7-7 does not directly apply to wholesale water suppliers. Wholesale suppliers may adopt programs and policies that support SB X7-7 compliance by the retail water suppliers they serve. They may also take part in a Regional Alliance (discussed below) set up to satisfy SB X7-7 requirements on a regional basis. As discussed in Chapter 2, the District is not a wholesale water supplier and this section therefore does not apply.
5.2 Updates to the 2015 UWMP Calculations
Urban retail water suppliers may update or correct the water use and population data they used to establish their 2020 target in their 2015 UWMP. The District has not made any changes to these data.
5.3 Service Area Population
Service area population estimation must satisfy the requirements in Methodology 2 – Service Area Population – of DWR’s Methodologies for Calculating Baseline and Compliance Urban Per Capita Water Use. Cal Water’s population estimation method is similar to the method used by DWR’s Population Tool. 21 DWR reviewed and accepted Cal Water’s population estimation method as part of the review of its 2015 UWMPs. Cal Water used this method to estimate the District’s 2020 service area population. As reported in Chapter 3, the District’s population was 19,477 in 2020.
5.4 Baseline Periods, Baseline GPCD, and Confirmed SB X7-7 2020 Target
Table 5-1 shows the District’s 5- and 10-year baseline periods, baseline per capita water use (GPCD), and 2020 SB X7-7 target. Supporting population and water use data are in Appendix F.
21 Cal Water estimates service area population using census block population data with the LandView 5 and MARPLOT software programs. In census years, the method estimates service area population using the population counts of census blocks with centroids falling within the District’s service boundary. In off-census years, the method estimates population by adjusting the census year estimates for changes in the number of single- and multi-family service connections and dwelling units. As shown in the District’s 2015 UWMP, estimates prepared using this method and DWR’s Population Tool typically differ by less than a percent. Cal Water prefers using its method to be consistent with its other planning documents.
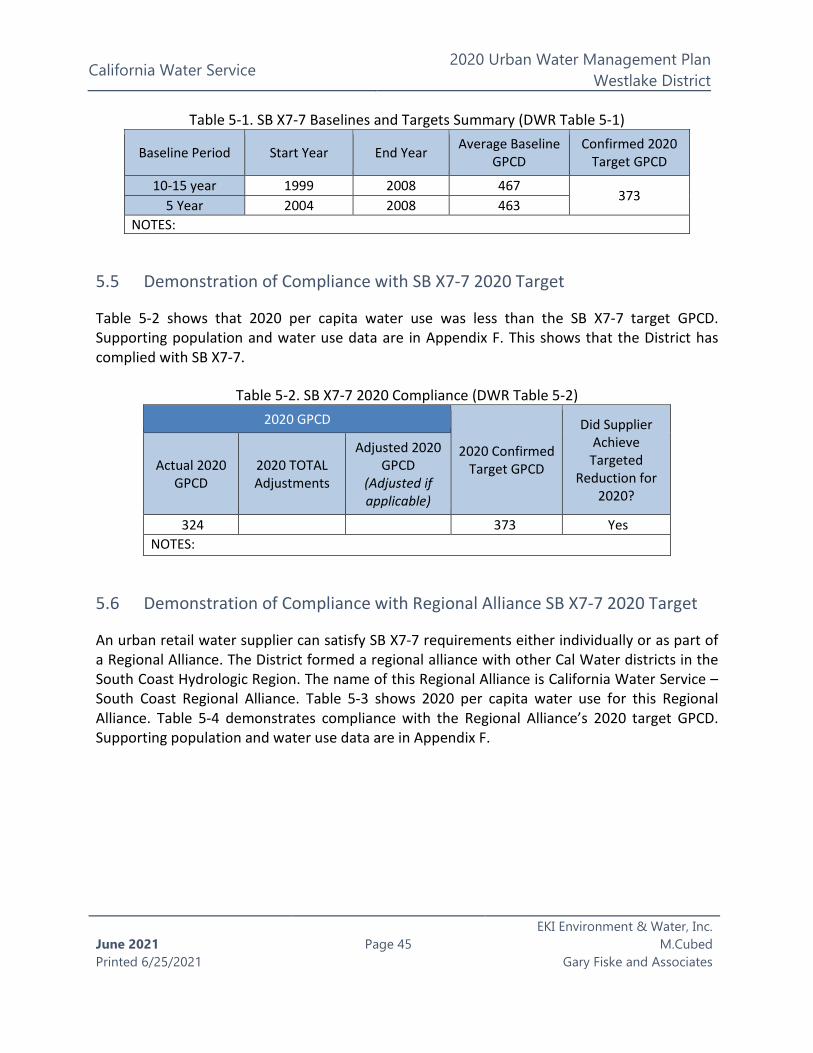
California Water Service 2020 Urban Water Management Plan
Westlake District
June 2021 Printed 6/25/2021
Page 45
EKI Environment & Water, Inc. M.Cubed
Gary Fiske and Associates
Table 5-1. SB X7-7 Baselines and Targets Summary (DWR Table 5-1)
Baseline Period Start Year End Year Average Baseline GPCD
Confirmed 2020 Target GPCD
10-15 year 1999 2008 467 373
5 Year 2004 2008 463 NOTES:
5.5 Demonstration of Compliance with SB X7-7 2020 Target
Table 5-2 shows that 2020 per capita water use was less than the SB X7-7 target GPCD. Supporting population and water use data are in Appendix F. This shows that the District has complied with SB X7-7.
Table 5-2. SB X7-7 2020 Compliance (DWR Table 5-2) 2020 GPCD
2020 Confirmed Target GPCD
Did Supplier Achieve Targeted
Reduction for 2020?
Actual 2020 GPCD
2020 TOTAL Adjustments
Adjusted 2020 GPCD
(Adjusted if applicable)
324 373 Yes NOTES:
5.6 Demonstration of Compliance with Regional Alliance SB X7-7 2020 Target
An urban retail water supplier can satisfy SB X7-7 requirements either individually or as part of a Regional Alliance. The District formed a regional alliance with other Cal Water districts in the South Coast Hydrologic Region. The name of this Regional Alliance is California Water Service – South Coast Regional Alliance. Table 5-3 shows 2020 per capita water use for this Regional Alliance. Table 5-4 demonstrates compliance with the Regional Alliance’s 2020 target GPCD. Supporting population and water use data are in Appendix F.
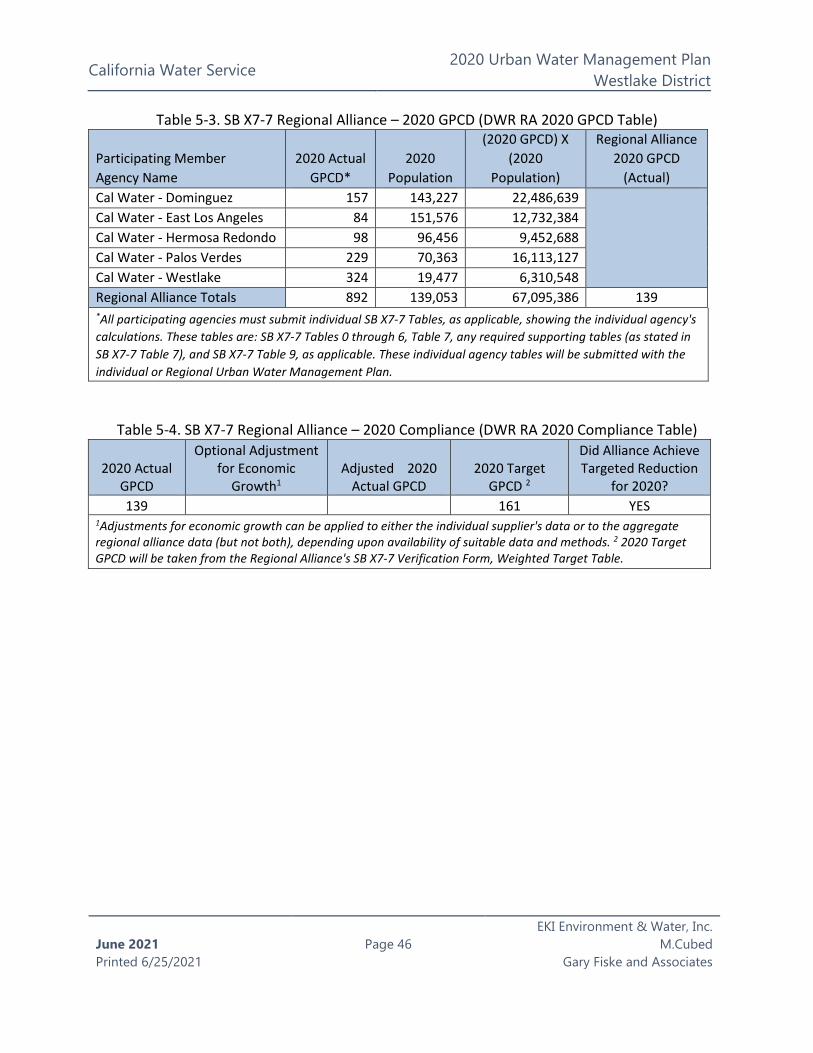
California Water Service 2020 Urban Water Management Plan
Westlake District
June 2021 Printed 6/25/2021
Page 46
EKI Environment & Water, Inc. M.Cubed
Gary Fiske and Associates
Table 5-3. SB X7-7 Regional Alliance – 2020 GPCD (DWR RA 2020 GPCD Table)
Participating Member Agency Name
2020 Actual GPCD*
2020 Population
(2020 GPCD) X (2020
Population)
Regional Alliance 2020 GPCD
(Actual) Cal Water - Dominguez 157 143,227 22,486,639
Cal Water - East Los Angeles 84 151,576 12,732,384 Cal Water - Hermosa Redondo 98 96,456 9,452,688 Cal Water - Palos Verdes 229 70,363 16,113,127 Cal Water - Westlake 324 19,477 6,310,548 Regional Alliance Totals 892 139,053 67,095,386 139 *All participating agencies must submit individual SB X7-7 Tables, as applicable, showing the individual agency's calculations. These tables are: SB X7-7 Tables 0 through 6, Table 7, any required supporting tables (as stated in SB X7-7 Table 7), and SB X7-7 Table 9, as applicable. These individual agency tables will be submitted with the individual or Regional Urban Water Management Plan.
Table 5-4. SB X7-7 Regional Alliance – 2020 Compliance (DWR RA 2020 Compliance Table)
2020 Actual GPCD
Optional Adjustment for Economic
Growth1 Adjusted 2020
Actual GPCD 2020 Target
GPCD 2
Did Alliance Achieve Targeted Reduction
for 2020? 139 161 YES
1Adjustments for economic growth can be applied to either the individual supplier's data or to the aggregate regional alliance data (but not both), depending upon availability of suitable data and methods. 2 2020 Target GPCD will be taken from the Regional Alliance's SB X7-7 Verification Form, Weighted Target Table.
California Water Service 2020 Urban Water Management Plan
Westlake District
June 2021 Printed 6/25/2021
Page 47
EKI Environment & Water, Inc. M.Cubed
Gary Fiske and Associates
Chapter 6 Water Supply Characterization
This chapter provides a description of the Westlake District’s (also referred to herein as the “District”) current water supplies, including a discussion of potential supply sources, as well as assessment of the energy intensity used to operate the Westlake District treatment and distribution system. The water supply for the customers of the Westlake District is a combination of purchased imported water and recycled water. Purchased water provides the majority of the total supply while recycled water makes up the remaining portion.
This chapter includes the following sections:
6.1 Purchased Water
6.2 Groundwater
6.3 Surface Water
6.4 Stormwater
6.5 Wastewater and Recycled Water
6.6 Desalinated Water Opportunities
6.7 Water Exchanges and Transfers
6.8 Future Water Projects
6.9 Summary of Existing and Planned Sources of Water
6.10 Special Conditions
6.11 Energy Intensity
CWC § 10631 (b) A plan shall be adopted in accordance with this chapter that shall do all of the following:
Identify and quantify, to the extent practicable, the existing and planned sources of water available to the supplier over the same five-year increments described in subdivision (a).
California Water Service 2020 Urban Water Management Plan
Westlake District
June 2021 Printed 6/25/2021
Page 48
EKI Environment & Water, Inc. M.Cubed
Gary Fiske and Associates
6.1 Purchased Water
The Westlake District purchases imported water from the Calleguas Municipal Water District (CMWD), which is a member agency of the Metropolitan Water District of Southern California (MWD). CMWD acts as a secondary wholesale water agency, purchasing the water from MWD and reselling it the District.
6.2 Groundwater
CWC § 10631 (h) A plan shall be adopted in accordance with this chapter and shall do all of the following:
An urban water supplier that relies upon a wholesale agency for a source of water shall provide the wholesale agency with water use projections from that agency for that source of water in five-year increments to 20 years or as far as data is available. The wholesale agency shall provide information to the urban water supplier for inclusion in the urban water supplier’s plan that identifies and quantifies, to the extent practicable, the existing and planned sources of water as required by subdivision (b), available from the wholesale agency to the urban water supplier over the same five-year increments, and during various water-year types in accordance with subdivision (f). An urban water supplier may rely upon water supply information provided by the wholesale agency in fulfilling the plan informational requirements of subdivisions (b) and (f).
CWC § 10631
(b) Identify and quantify, to the extent practicable, the existing and planned sources of water available to the supplier over the same five-year increments described in subdivision (a), providing supporting and related information, including all of the following:
(4) If groundwater is identified as an existing or planned source of water available to the supplier, all of the following information:
(A) The current version of any groundwater sustainability plan or alternative adopted pursuant to Part 2.74 (commencing with Section 10720), any groundwater management plan adopted by the urban water supplier, including plans adopted pursuant to Part 2.75 (commencing with Section 10750), or any other specific authorization for groundwater management for basins underlying the urban water supplier’s service area.
(B) A description of any groundwater basin or basins from which the urban water supplier pumps groundwater. For basins that a court or the board has adjudicated the rights to pump groundwater, a copy of the order or decree adopted by the court or the board and a description of the amount of groundwater the urban water supplier has the legal right to pump under the order or decree. For a basin that has not been adjudicated, information as to whether the department has identified the basin as a high- or medium-priority basin in the most current official departmental bulletin that characterizes the condition of the groundwater basin, and a detailed description of the efforts being undertaken by the urban water supplier to coordinate with groundwater sustainability agencies or groundwater management agencies listed in subdivision (c) of Section 10723 to maintain or achieve sustainable groundwater conditions in accordance with a groundwater sustainability plan or alternative adopted pursuant to Part 2.74 (commencing with Section 10720).
(C) A detailed description and analysis of the location, amount, and sufficiency of groundwater pumped by the urban water supplier for the past five years. The description and analysis shall be based on information that is reasonably available, including, but not limited to, historic use records.

California Water Service 2020 Urban Water Management Plan
Westlake District
June 2021 Printed 6/25/2021
Page 49
EKI Environment & Water, Inc. M.Cubed
Gary Fiske and Associates
As shown in Table 6-1, groundwater is not being used as a source for the District. Groundwater is not thought to be a viable supply due to the low productivity of much of the underlying basin and because of water quality concerns. Local groundwater has been found to contain high levels of total dissolved solids, iron, manganese, and other naturally occurring minerals.
Table 6-1. Groundwater Volume Pumped (DWR Table 6-1)
X Supplier does not pump groundwater. The supplier will not complete the table below.
All or part of the groundwater described below is desalinated.
Groundwater Type
Location or Basin Name 2016 2017 2018 2019 2020
TOTAL
NOTES:
6.3 Surface Water
Potrero Valley Creek runs through the District service area and may be a potential source of water to the District. Lake Sherwood is a reservoir with capacity of 2,600 acre-feet (AF) with a dam that was constructed in 1904 and is owned by the Sherwood Country Club. Water flows from Lake Sherwood into Potrero Valley Creek and subsequently into Westlake Reservoir. The reservoir is owned by the Westlake Lake Management Association, which has rights to up to 1,500 acre-feet per year (AFY) for purposes of filling and maintaining the water level in the reservoir. Las Virgenes Municipal Water District has rights to 1,030 AFY in Triunfo Canyon Creek below Westlake.
While it is not believed that there are any available water rights to the local surface water sources, it may be possible for California Water Service Company (Cal Water) to obtain some water rights via trade or exchange of groundwater, increasing the yield of local potable or non-potable water for the District. However, further studies are needed to evaluate the feasibility of the use of local surface water supplies and no local surface water is included in the supply sources listed herein.
6.4 Stormwater
There are no plans to divert stormwater for beneficial uses in the Westlake District.
California Water Service 2020 Urban Water Management Plan
Westlake District
June 2021 Printed 6/25/2021
Page 50
EKI Environment & Water, Inc. M.Cubed
Gary Fiske and Associates
6.5 Wastewater and Recycled Water
The recycling of wastewater offers several potential benefits to Cal Water and its customers. Perhaps the greatest of these benefits is to help maintain a sustainable supply by utilizing recycled water for appropriate uses (e.g., landscape, irrigation) now being served by potable water in order to reduce potable supply needs. The potential volume of recycled water that can be produced is proportional to the volume of wastewater that is generated by the District, and is discussed in the following sections.
6.5.1 Recycled Water Coordination
Cal Water relies on two wastewater agencies for wastewater treatment:
• Las Virgenes Municipal Water District; and • Triunfo Sanitation District
6.5.2 Wastewater Collection, Treatment, and Disposal
A summary of the 2020 wastewater collection, treatment, and disposal for the District is shown in Table 6-2. The estimate is calculated by annualizing 90 percent of January water use in the service area. As indicated in Table 6-3, no wastewater is treated or disposed of within the District service area.
The Tapia Water Reclamation Facility, owned and operated by Las Virgenes Municipal Water District, provides the wastewater service and recycled water for the Westlake District service area. The wastewater at the Tapia Water Reclamation Facility undergoes tertiary treatment
CWC § 10633
The plan shall provide, to the extent available, information on recycled water and its potential for use as a water source in the service area of the urban water supplier. The preparation of the plan shall be coordinated with local water, wastewater, groundwater, and planning agencies that operate within the supplier’s service area.
CWC § 10633 (a)
A description of the wastewater collection and treatment systems in the supplier’s service area, including a quantification of the amount of wastewater collected and treated and the methods of wastewater disposal.
CWC § 10633 (b)
A description of the quantity of treated wastewater that meets recycled water standards, is being discharged, and is otherwise available for use in a recycled water project.

California Water Service 2020 Urban Water Management Plan
Westlake District
June 2021 Printed 6/25/2021
Page 51
EKI Environment & Water, Inc. M.Cubed
Gary Fiske and Associates
with sand filtration and chlorination. The Tapia Water Reclamation Facility currently treats 9.5 million gallons per day (MGD) of wastewater.
Las Virgenes Municipal Water District also has a joint venture with Triunfo Sanitation District. Triunfo owns the recycled water in Ventura County. The CMWD then purchases the recycled water from Triunfo Sanitation District. During the summer months, 100 percent of the treated effluent from the Tapia Water Reclamation Facility is recycled for irrigation of commercial property, parks, golf courses, and school grounds. During winter months, a smaller amount of wastewater is recycled due to lower recycled water needs by the District. The remainder is discharged to Malibu Creek.

California Water Service 2020 Urban Water Management Plan
Westlake District
June 2021 Printed 6/25/2021
Page 52
EKI Environment & Water, Inc. M.Cubed
Gary Fiske and Associates
Table 6-2. Wastewater Collected Within Service Area in 2020 (DWR Table 6-2) There is no wastewater collection system. The supplier will not complete the table below.
Percentage of 2020 service area covered by wastewater collection system (optional)
Percentage of 2020 service area population covered by wastewater collection system (optional)
Wastewater Collection Recipient of Collected Wastewater
Name of Wastewater Collection Agency
Wastewater Volume
Metered or Estimated?
Volume of Wastewater
Collected from UWMP Service
Area 2020
Name of Wastewater Treatment Agency Receiving Collected
Wastewater
Treatment Plant Name
Is WWTP Located Within
UWMP Area?
Is WWTP Operation
Contracted to a Third Party?
(optional)
Triunfo Sanitation District Estimated 3,046
Las Virgenes Municipal Water District and Triunfo Sanitation District
Tapia Water Reclamation Facility
No
Total Wastewater Collected from Service Area in 2020: 3,046
NOTES: (a) Volumes are in AF. (b) The volume of wastewater collected from the District service area in 2020 is estimated by annualizing 90 percent of January water
use in the District.

California Water Service 2020 Urban Water Management Plan
Westlake District
June 2021 Printed 6/25/2021
Page 53
EKI Environment & Water, Inc. M.Cubed
Gary Fiske and Associates
Table 6-3. Wastewater Treatment and Discharge Within Service Area in 2020 (DWR Table 6-3) X No wastewater is treated or disposed of within the UWMP service area. The supplier will not complete the table below.
Wastewater Treatment
Plant Name
Discharge Location Name or Identifier
Discharge Location
Description
Wastewater Discharge ID
Number (optional)
Method of
Disposal
Does This Plant Treat
Wastewater Generated Outside the
Service Area?
Treatment Level
2020 volumes
Wastewater Treated
Discharged Treated
Wastewater
Recycled Within Service
Area
Recycled Outside
of Service
Area
Instream Flow Permit
Requirement
Total
NOTES:

California Water Service 2020 Urban Water Management Plan
Westlake District
June 2021 Printed 6/25/2021
Page 54
EKI Environment & Water, Inc. M.Cubed
Gary Fiske and Associates
6.5.3 Recycled Water System and Recycled Water Beneficial Uses
The Triunfo Sanitation District constructed a recycled water distribution system in the southern portion of the Westlake District, and CMWD constructed a recycled water distribution system in the North Ranch portion of the District. In an effort to consolidate the management and operation of these two systems, CMWD has purchased the South Ranch distribution pipeline and will be the sole wholesaler for all recycled water supplies in the region. MWD assisted in the development of these recycled water projects through its Local Projects Program.
Cal Water has signed an agreement for the purchase of recycled water from these systems as the supplies become available. Deliveries in the South Ranch and North Ranch began upon completion of the distribution system in 1995. As the price of MWD's potable supply increases, it will likely become economical to add additional services to the recycled water system. As a result, the sales of recycled should slowly increase, reducing the volume of imported potable water that must be purchased from MWD.
During the summer months, 100 percent of the treated effluent from the Tapia Water Reclamation Facility is recycled for irrigation of commercial property, parks, golf courses, and school grounds. Wastewater is not recycled during the winter months, but is discharged to Malibu Creek.
As shown in Table 6-4, recycled water use in the Westlake District is projected to be used at a constant rate between 2020 and 2045. Table 6-5 compares the 2015 estimate for 2020 to the 2020 actual recycled water use. The difference is due to a cancelled project at Rockfield Park.
CWC § 10633 (c-g)
(c) A description of the recycled water currently being used in the supplier’s service area, including, but not limited to, the type, place, and quantity of use.
(d) A description and quantification of the potential uses of recycled water, including, but not limited to, agricultural irrigation, landscape irrigation, wildlife habitat enhancement, wetlands, industrial reuse, groundwater recharge, indirect potable reuse, and other appropriate uses, and a determination with regard to the technical and economic feasibility of serving those uses.
(e) The projected use of recycled water within the supplier’s service area at the end of 5, 10, 15, and 20 years and a description of the actual use of recycled water in comparison to uses previously projected pursuant to this subdivision.
(f) A description of actions, including financial incentives, which may be taken to encourage the use of recycled water, and the projected results of these actions in terms of acre-feet of recycled water used per year.
(g) A plan for optimizing the use of recycled water in the supplier’s service area, including actions to facilitate the installation of dual distribution systems, to promote recirculating uses, to facilitate the increased use of treated wastewater that meets recycled water standards, and to overcome any obstacles to achieving that
d

California Water Service 2020 Urban Water Management Plan
Westlake District
June 2021 Printed 6/25/2021
Page 55 EKI Environment & Water, Inc.
M.CubedGary Fiske and Associates
Table 6-4. Recycled Water Direct Beneficial Uses Within Service Area (DWR Table 6-4) Recycled water is not used and is not planned for use within the service area of the supplier. The supplier will not complete the table below.
Name of Supplier Producing (Treating) the Recycled Water:
Las Virgenes Municipal Water District and Triunfo Sanitation District
Name of Supplier Operating the Recycled Water Distribution System:
Calleguas Municipal Water District
Supplemental Water Added in 2020 (volume)
Source of 2020 Supplemental Water
Beneficial Use Type Potential Beneficial
Uses of Recycled Water (Describe)
Amount of Potential Uses of Recycled Water
(Quantity)
General Description
of 2020 Uses
Level of Treatment 2020 2025 2030 2035 2040 2045
Landscape irrigation (excludes golf courses)
Irrigation of commercial property, parks, and school grounds
Tertiary 450 436 436 436 436 436
Total: 450 436 436 436 436 436 2020 Internal Reuse
NOTES: (a) Volumes are in units of AF.
436 Irrigation
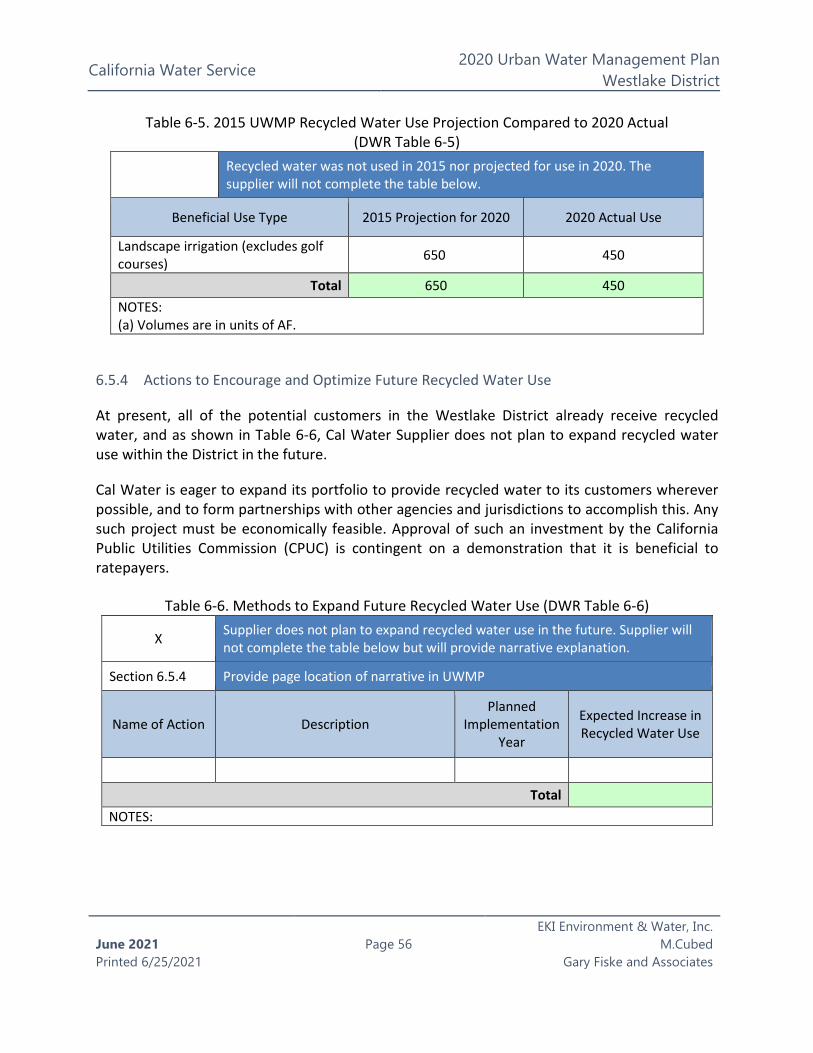
California Water Service 2020 Urban Water Management Plan
Westlake District
June 2021 Printed 6/25/2021
Page 56
EKI Environment & Water, Inc. M.Cubed
Gary Fiske and Associates
Table 6-5. 2015 UWMP Recycled Water Use Projection Compared to 2020 Actual (DWR Table 6-5)
Recycled water was not used in 2015 nor projected for use in 2020. The supplier will not complete the table below.
Beneficial Use Type 2015 Projection for 2020 2020 Actual Use
Landscape irrigation (excludes golf courses) 650 450
Total 650 450 NOTES: (a) Volumes are in units of AF.
6.5.4 Actions to Encourage and Optimize Future Recycled Water Use
At present, all of the potential customers in the Westlake District already receive recycled water, and as shown in Table 6-6, Cal Water Supplier does not plan to expand recycled water use within the District in the future.
Cal Water is eager to expand its portfolio to provide recycled water to its customers wherever possible, and to form partnerships with other agencies and jurisdictions to accomplish this. Any such project must be economically feasible. Approval of such an investment by the California Public Utilities Commission (CPUC) is contingent on a demonstration that it is beneficial to ratepayers.
Table 6-6. Methods to Expand Future Recycled Water Use (DWR Table 6-6)
X Supplier does not plan to expand recycled water use in the future. Supplier will not complete the table below but will provide narrative explanation.
Section 6.5.4 Provide page location of narrative in UWMP
Name of Action Description Planned
Implementation Year
Expected Increase in Recycled Water Use
Total
NOTES:

California Water Service 2020 Urban Water Management Plan
Westlake District
June 2021 Printed 6/25/2021
Page 57
EKI Environment & Water, Inc. M.Cubed
Gary Fiske and Associates
6.6 Desalinated Water Opportunities
The Pacific Ocean is located a few miles away from the District, so the potential for seawater desalination exists. There are no known seawater desalination projects currently planned in the nearby region (Malibu, Port Hueneme, Oxnard, or Ventura), but these coastal cities would be the most likely opportunity for desalination. Due to the high cost of desalination supplies, it would not be feasible for the District to lead the pursuit of such a project. Even if such a project were constructed, it would be expensive to construct transmission and pump the water to the District. However, if such a project were constructed, it may free imported water demands from these coastal cities for use by the District. Therefore, if such a project were to be pursued by another entity, the District would support and consider joining such a project to benefit the reliability of its water supplies.
6.7 Water Exchanges and Transfers
6.7.1 Exchanges
Cal Water is not pursuing any exchange opportunities at this time.
6.7.2 Transfers
Cal Water has not identified any water transfer opportunities to date that it is actively pursuing with sufficient certainty to be reflected in this Urban Water Management Plan.
6.7.3 Emergency Interties
During an emergency, the District can transfer water through interconnections to or from the neighboring water system owned by the Las Virgenes Water District. These interconnections can be used to help offset the impact of interrupted service to District customers or, being two-way connections, these facilities can be used to supply water to Las Virgenes Water District.
CWC § 10631 (g) A plan shall be adopted in accordance with this chapter and shall do all of the following:
Describe the opportunities for development of desalinated water, including, but not limited to, ocean water, brackish water, and groundwater, as a long-term supply.
CWC § 10631 (c) A plan shall be adopted in accordance with this chapter and shall do all of the following:
Describe the opportunities for exchanges or transfers of water on a short-term or long-term basis.
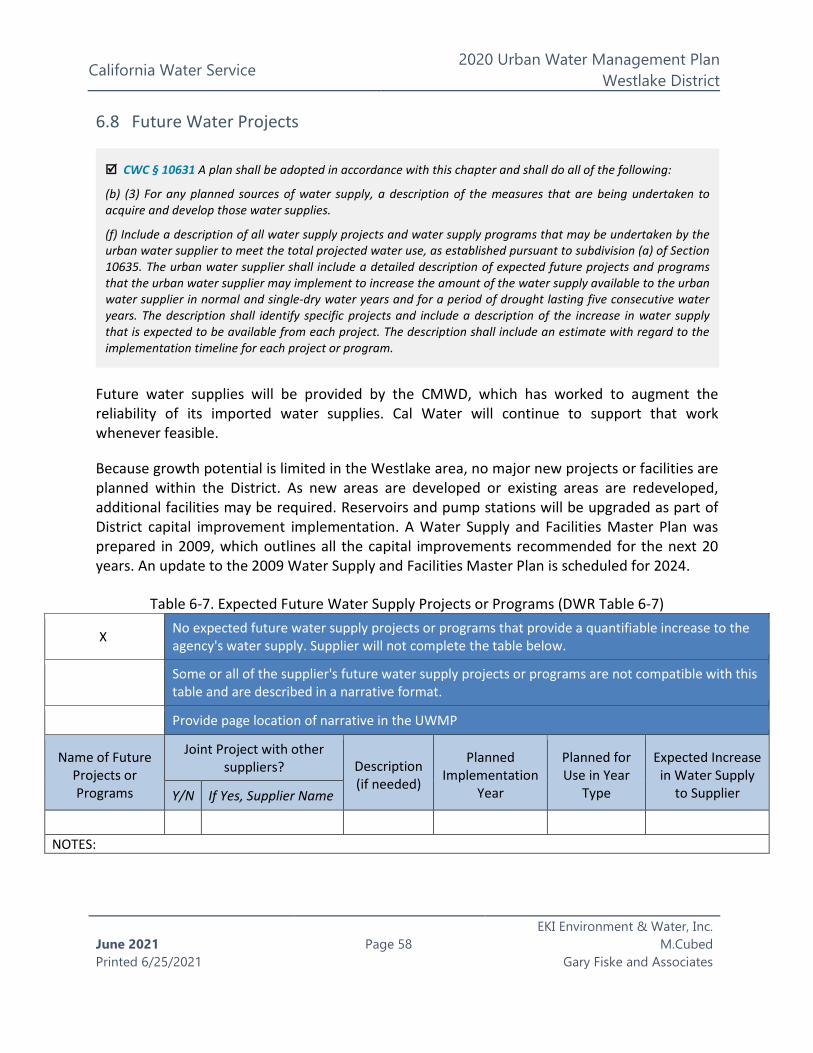
California Water Service 2020 Urban Water Management Plan
Westlake District
June 2021 Printed 6/25/2021
Page 58
EKI Environment & Water, Inc. M.Cubed
Gary Fiske and Associates
6.8 Future Water Projects
Future water supplies will be provided by the CMWD, which has worked to augment the reliability of its imported water supplies. Cal Water will continue to support that work whenever feasible.
Because growth potential is limited in the Westlake area, no major new projects or facilities are planned within the District. As new areas are developed or existing areas are redeveloped, additional facilities may be required. Reservoirs and pump stations will be upgraded as part of District capital improvement implementation. A Water Supply and Facilities Master Plan was prepared in 2009, which outlines all the capital improvements recommended for the next 20 years. An update to the 2009 Water Supply and Facilities Master Plan is scheduled for 2024.
Table 6-7. Expected Future Water Supply Projects or Programs (DWR Table 6-7)
X No expected future water supply projects or programs that provide a quantifiable increase to the agency's water supply. Supplier will not complete the table below.
Some or all of the supplier's future water supply projects or programs are not compatible with this table and are described in a narrative format.
Provide page location of narrative in the UWMP
Name of Future Projects or Programs
Joint Project with other suppliers? Description
(if needed)
Planned Implementation
Year
Planned for Use in Year
Type
Expected Increase in Water Supply
to Supplier Y/N If Yes, Supplier Name
NOTES:
CWC § 10631 A plan shall be adopted in accordance with this chapter and shall do all of the following:
(b) (3) For any planned sources of water supply, a description of the measures that are being undertaken to acquire and develop those water supplies.
(f) Include a description of all water supply projects and water supply programs that may be undertaken by the urban water supplier to meet the total projected water use, as established pursuant to subdivision (a) of Section 10635. The urban water supplier shall include a detailed description of expected future projects and programs that the urban water supplier may implement to increase the amount of the water supply available to the urban water supplier in normal and single-dry water years and for a period of drought lasting five consecutive water years. The description shall identify specific projects and include a description of the increase in water supply that is expected to be available from each project. The description shall include an estimate with regard to the implementation timeline for each project or program.
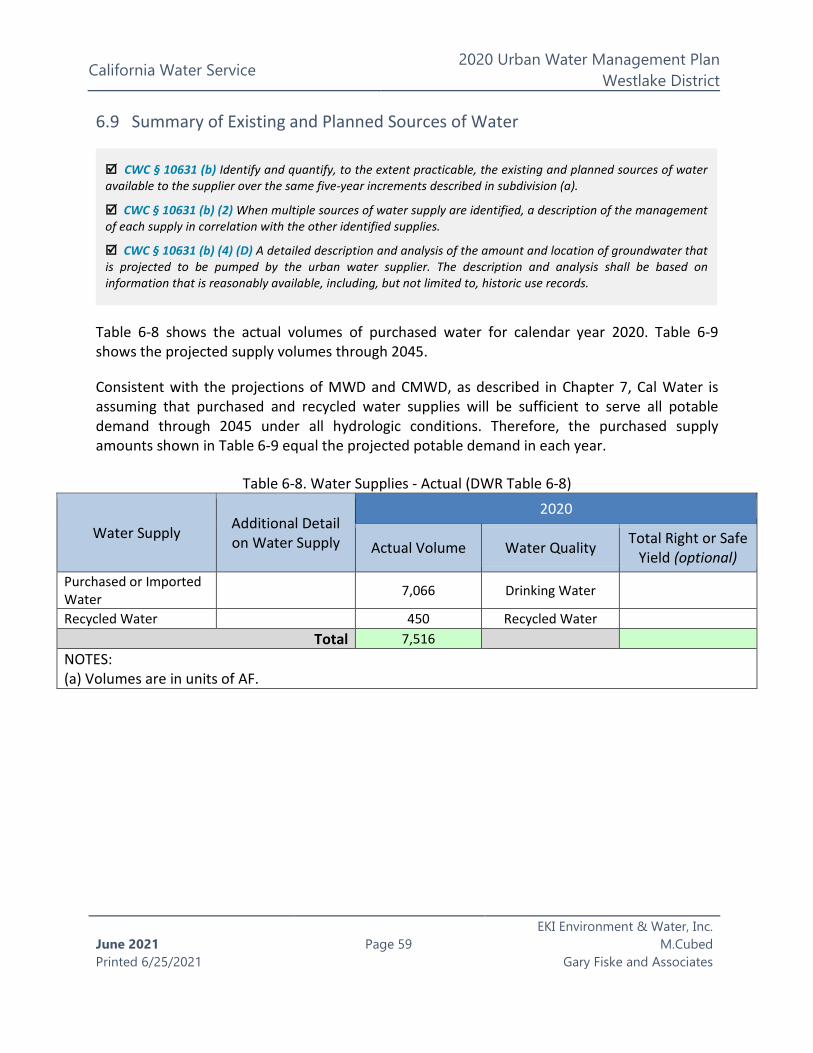
California Water Service 2020 Urban Water Management Plan
Westlake District
June 2021 Printed 6/25/2021
Page 59
EKI Environment & Water, Inc. M.Cubed
Gary Fiske and Associates
6.9 Summary of Existing and Planned Sources of Water
Table 6-8 shows the actual volumes of purchased water for calendar year 2020. Table 6-9 shows the projected supply volumes through 2045.
Consistent with the projections of MWD and CMWD, as described in Chapter 7, Cal Water is assuming that purchased and recycled water supplies will be sufficient to serve all potable demand through 2045 under all hydrologic conditions. Therefore, the purchased supply amounts shown in Table 6-9 equal the projected potable demand in each year.
Table 6-8. Water Supplies - Actual (DWR Table 6-8)
Water Supply Additional Detail on Water Supply
2020
Actual Volume Water Quality Total Right or Safe Yield (optional)
Purchased or Imported Water 7,066 Drinking Water
Recycled Water 450 Recycled Water Total 7,516
NOTES: (a) Volumes are in units of AF.
CWC § 10631 (b) Identify and quantify, to the extent practicable, the existing and planned sources of water available to the supplier over the same five-year increments described in subdivision (a).
CWC § 10631 (b) (2) When multiple sources of water supply are identified, a description of the management of each supply in correlation with the other identified supplies.
CWC § 10631 (b) (4) (D) A detailed description and analysis of the amount and location of groundwater that is projected to be pumped by the urban water supplier. The description and analysis shall be based on information that is reasonably available, including, but not limited to, historic use records.
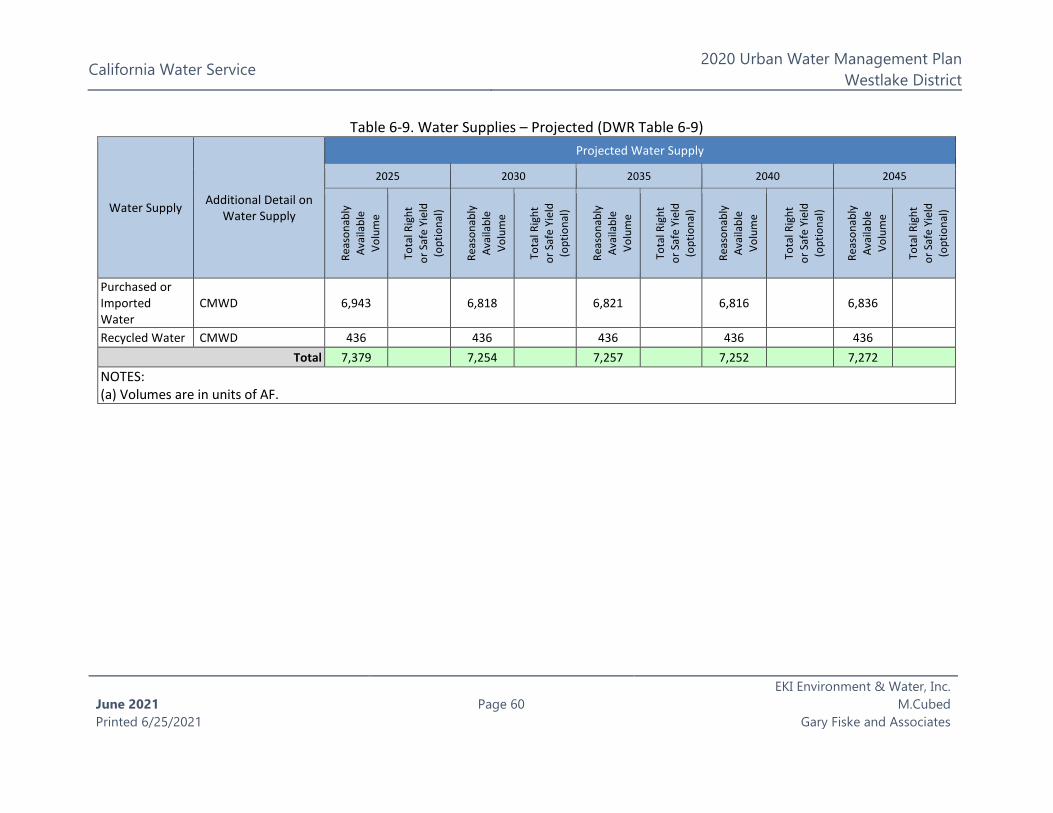
California Water Service 2020 Urban Water Management Plan
Westlake District
June 2021 Printed 6/25/2021
Page 60
EKI Environment & Water, Inc. M.Cubed
Gary Fiske and Associates
Table 6-9. Water Supplies – Projected (DWR Table 6-9)
Water Supply Additional Detail on Water Supply
Projected Water Supply
2025 2030 2035 2040 2045
Reas
onab
ly
Avai
labl
e Vo
lum
e
Tota
l Rig
ht
or S
afe
Yiel
d (o
ptio
nal)
Reas
onab
ly
Avai
labl
e Vo
lum
e
Tota
l Rig
ht
or S
afe
Yiel
d (o
ptio
nal)
Reas
onab
ly
Avai
labl
e Vo
lum
e
Tota
l Rig
ht
or S
afe
Yiel
d (o
ptio
nal)
Reas
onab
ly
Avai
labl
e Vo
lum
e
Tota
l Rig
ht
or S
afe
Yiel
d (o
ptio
nal)
Reas
onab
ly
Avai
labl
e Vo
lum
e
Tota
l Rig
ht
or S
afe
Yiel
d (o
ptio
nal)
Purchased or Imported Water
CMWD 6,943 6,818 6,821 6,816 6,836
Recycled Water CMWD 436 436 436 436 436 Total 7,379 7,254 7,257 7,252 7,272
NOTES: (a) Volumes are in units of AF.
California Water Service 2020 Urban Water Management Plan
Westlake District
June 2021 Printed 4/15/2021
Page 61
EKI Environment & Water, Inc. M.Cubed
Gary Fiske and Associates
6.10 Special Conditions
6.10.1 Climate Change Effects
Cal Water is committed to incorporating climate change into its ongoing water supply planning. Section 4.3 of this Urban Water Management Plan includes a description of plausible changes to projected demands under climate change conditions, and Cal Water is currently working to consider the effects of climate change in future demand modeling. The impact of climate change on District supplies is addressed in detail in the key resources described below, which are incorporated into this Plan by reference:
• Cal Water is currently in the process of developing a multi-phase climate change study. Phase 1, which primarily consisted of a literature and tools review of previous and complementary studies, was completed in December 2020. 22 Phase 2 will include District-level vulnerability assessments of Cal Water’s facilities and operations, including developing an assessment approach that evaluates climate impacts to Cal Water, identifies asset vulnerabilities, and prioritizes climate risks. Phase 3 will focus on an assessment of climate-driven impacts to water supply resources and demand. Phase 2 is expected to be completed by December 2021. The executive summary of Phase 1 of this study is included in this Plan in Appendix G.
• In 2016, Cal Water completed a study of climate change impacts on a representative subset of its districts, including the Westlake District, to gain a better understanding of the potential impacts of climate change on the availability of its diverse supplies. 23 The 2016 study relied on the best available projections of changes in climate (temperature and precipitation) through the end of the century to examine how surface water flows and groundwater recharge rates may change. The executive summary of this study is included in this Plan in Appendix G.
6.10.2 Regulatory Conditions and Project Development
Emerging regulatory conditions (e.g., issues surrounding the Water Quality Control Plan for the San Francisco/Sacramento-San Joaquin Delta Estuary [Bay-Delta Plan]) may affect planned future projects and the characterization of future water supply availability and analysis. The District does not have any current plans to develop additional supply sources. If the District does move forward with any plans to develop supply projects, emerging regulatory conditions
22 ICF, 2020. California Water Service Climate Change – Water Resource Monitoring and Adaptation Plan – Phase 1, prepared by ICF, dated December, 17, 2020. 23 California Water Service Company, 2016. Potential Climate Change Impacts on the Water Supplies of California Water Service, prepared by Gary Fiske and Associates, Inc. and Balance Hydrologics, Inc., dated January 2016.
California Water Service 2020 Urban Water Management Plan
Westlake District
June 2021 Printed 4/15/2021
Page 62
EKI Environment & Water, Inc. M.Cubed
Gary Fiske and Associates
will be considered, and the associated water supply reliability impacts will be assessed in future UWMP updates.
6.10.3 Other Locally Applicable Criteria
Other locally applicable criteria may affect characterization and availability of an identified water supply (e.g., changes in regional water transfer rules may alter the availability of a water supply that had historically been readily available). The District does not have any current plans to develop additional supply sources. If the District does move forward ahead with any plans to develop supply projects, locally applicable criteria will be considered, and the associated water supply reliability impacts will be assessed in future UWMP updates.
6.11 Energy Intensity
The “Total Utility Approach” as defined by DWR in the UWMP 2020 Guidebook is used to report water-related energy-consumption data for the Westlake District. Calendar year 2019 is selected as the one-year reporting period, and utility bills for the associated time period are used as the source for energy consumption data. Utility bills reported the following energy consumption data for the Westlake District during calendar year 2019:
𝑇𝑇𝑇𝑇𝑇𝑇𝑇𝑇𝑇𝑇 𝐸𝐸𝐸𝐸𝐸𝐸𝐸𝐸𝐸𝐸𝐸𝐸 𝐶𝐶𝑇𝑇𝐸𝐸𝐶𝐶𝐶𝐶𝐶𝐶𝐸𝐸𝐶𝐶 𝑏𝑏𝐸𝐸 𝑇𝑇ℎ𝐸𝐸 𝑊𝑊𝐸𝐸𝐶𝐶𝑇𝑇𝑇𝑇𝑇𝑇𝑊𝑊𝐸𝐸 𝐷𝐷𝐷𝐷𝐶𝐶𝑇𝑇𝐸𝐸𝐷𝐷𝑠𝑠𝑇𝑇 = 1,667,400 𝑊𝑊𝑊𝑊ℎ
Table 6-10 shows the energy consumed for each acre-foot (AF) of water entering the distribution system in the Westlake District, including energy associated with the pumping, treatment, conveyance, and distribution of drinking water, but not including energy associated
CWC § 10631.2
(a) In addition to the requirements of Section 10631, an urban water management plan shall include any of the following information that the urban water supplier can readily obtain:
(1) An estimate of the amount of energy used to extract or divert water supplies. (2) An estimate of the amount of energy used to convey water supplies to the water treatment plants or
distribution systems. (3) An estimate of the amount of energy used to treat water supplies. (4) An estimate of the amount of energy used to distribute water supplies through its distribution systems. (5) An estimate of the amount of energy used for treated water supplies in comparison to the amount used for
nontreated water supplies. (6) An estimate of the amount of energy used to place water into or withdraw from storage. (7) Any other energy-related information the urban water supplier deems appropriate. (b) The department shall include in its guidance for the preparation of urban water management plans a
methodology for the voluntary calculation or estimation of the energy intensity of urban water systems. The department may consider studies and calculations conducted by the Public Utilities Commission in developing the methodology.
(c) The Legislature finds and declares that energy use is only one factor in water supply planning and shall not be considered independently of other factors.
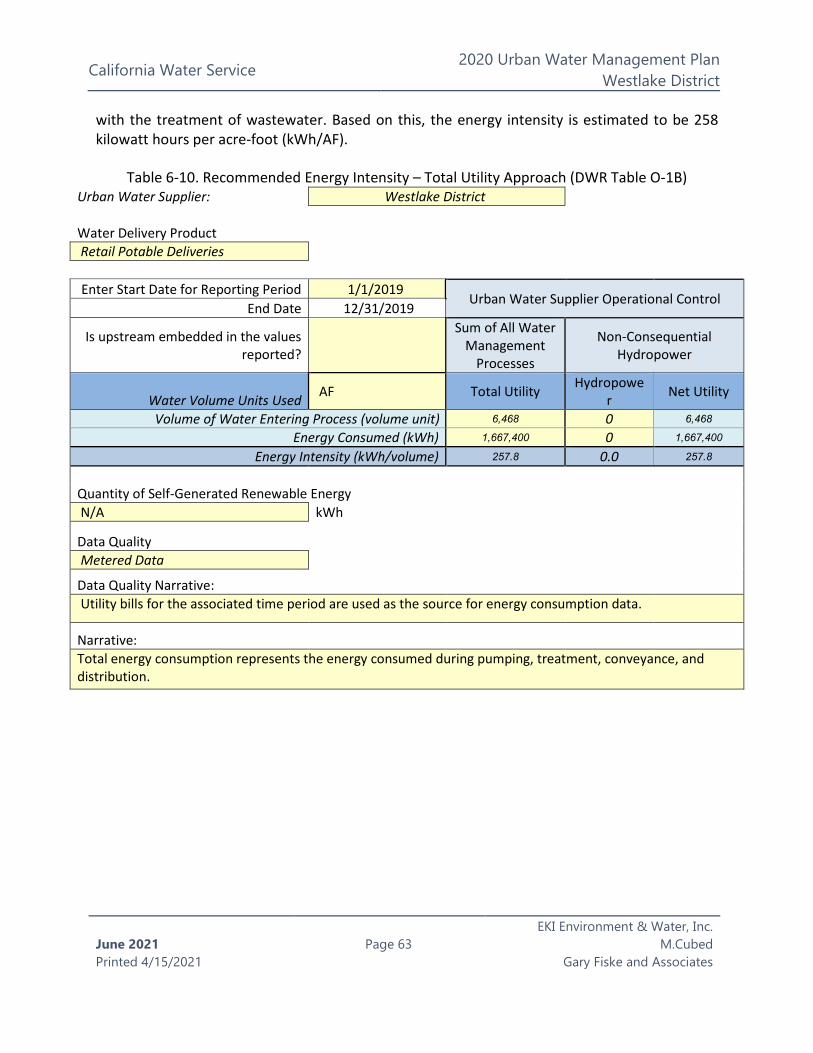
California Water Service 2020 Urban Water Management Plan
Westlake District
June 2021 Printed 4/15/2021
Page 63
EKI Environment & Water, Inc. M.Cubed
Gary Fiske and Associates
with the treatment of wastewater. Based on this, the energy intensity is estimated to be 258 kilowatt hours per acre-foot (kWh/AF).
Table 6-10. Recommended Energy Intensity – Total Utility Approach (DWR Table O-1B) Urban Water Supplier: Westlake District Water Delivery Product Retail Potable Deliveries Enter Start Date for Reporting Period 1/1/2019
Urban Water Supplier Operational Control End Date 12/31/2019
Is upstream embedded in the values reported?
Sum of All Water Management
Processes
Non-Consequential Hydropower
Water Volume Units Used AF Total Utility Hydropower Net Utility
Volume of Water Entering Process (volume unit) 6,468 0 6,468 Energy Consumed (kWh) 1,667,400 0 1,667,400
Energy Intensity (kWh/volume) 257.8 0.0 257.8 Quantity of Self-Generated Renewable Energy N/A kWh
Data Quality Metered Data
Data Quality Narrative: Utility bills for the associated time period are used as the source for energy consumption data.
Narrative:
Total energy consumption represents the energy consumed during pumping, treatment, conveyance, and distribution.
California Water Service 2020 Urban Water Management Plan
Westlake District
June 2021 Printed 4/15/2021
Page 64
EKI Environment & Water, Inc. M.Cubed
Gary Fiske and Associates
Chapter 7 Water Supply Reliability Assessment
This chapter describes the reliability of the Westlake District’s (also referred to herein as the “Westlake District” or “District”) water supplies. Assessment of water supply reliability is complex and dependent upon a number of factors, such as the number of water sources, regulatory and legal constraints, hydrological and environmental conditions, climate change, and expected growth, among others. Based on available historical information and projections of future water uses, regulatory and legal constraints, and hydrological and environmental conditions, including climate change, California Water Service Company (Cal Water) has made its best determination of future water supply reliability of for the Westlake District. This chapter includes the following sections:
7.1 Constraints on Water Sources
7.2 Reliability by Type of Year
7.3 Supply and Demand Assessment
7.4 Water Supply Management Tools and Options
7.5 Drought Risk Assessment
7.1 Constraints on Water Sources
The Westlake District relies on purchases of imported water from Calleguas Municipal Water District (CMWD) for 100 percent of its potable supply. In addition, as described in Chapter 6, a portion of irrigation demand within the District is served with recycled water. The CMWD’s Draft 2020 Urban Water Management Plan (UWMP) states:
Calleguas’ water supplies are sufficient to meet projected demands under [normal, single-dry-year and multiple-dry year] hydrologic conditions.… Calleguas is well positioned to
CWC § 10620 (f)
An urban water supplier shall describe in the plan water management tools and options used by that entity that will maximize resources and minimize the need to import water from other regions.
CWC § 10630.5
Each plan shall include a simple lay description of how much water the agency has on a reliable basis, how much it needs for the foreseeable future, what the agency’s strategy is for meeting its water needs, the challenges facing the agency, and any other information necessary to provide a general understanding of the agency’s plan.

California Water Service 2020 Urban Water Management Plan
Westlake District
June 2021 Printed 4/15/2021
Page 65
EKI Environment & Water, Inc. M.Cubed
Gary Fiske and Associates
mitigate the challenges posed by hydrologic variability, potential climate change, and regulatory risk through the supply capabilities and investments in storage made on the Metropolitan Regional-level and through Calleguas’ own reasonable available outage supply stored in Lake Bard (7,500 AF) and the Las Posas ASR 24 (20,000 AF).
Based on this, Cal Water assumes that CMWD will be able to meet all of the District’s forecasted demands. The CMWD operates several facilities that increase the reliability of the CMWD’s supply to its retailers. Further, CMWD and Metropolitan Water District of Southern California (MWD) have banked a significant amount of water in the Las Posas Subbasin. This water can be extracted during times when imported supplies are curtailed. In addition, Lake Bard is located in the center of the CMWD service area and can store approximately 8,000 acre-feet (AF) of water. The CMWD operates the Lake Bard Water Treatment Plant (WTP), which is adjacent to the lake and has a treatment capacity of 100 cubic feet per second (cfs). Supplies stored in Lake Bard can be used during times when imported supplies are curtailed.
Additional future supplies for CMWD are expected to come from treatment of local groundwater that is currently too saline for potable use. These desalters will improve overall regional supply reliability. Also, water transfer agreements between agricultural and municipal water users are another method for increasing CMWD’s supply reliability. While Cal Water is not directly involved in the afore-mentioned projects, Cal Water may benefit indirectly as a retail customer of CMWD.
The District’s recycled water supplies are anticipated to be 100 percent reliable.
Although a supply shortfall is not projected, Cal Water has identified several potential constraints on future water supplies, including water quality and climate change. These constraints, along with associated management strategies are summarized in the following sections.
7.1.1 Supply Availability
As discussed above, the Draft CMWD 2020 UWMP projects that CMWD will have sufficient supply to meet the demands of all of its customers, including that of the Westlake District, through 2045.
24 Las Posas Aquifer Storage and Recovery Project

California Water Service 2020 Urban Water Management Plan
Westlake District
June 2021 Printed 4/15/2021
Page 66
EKI Environment & Water, Inc. M.Cubed
Gary Fiske and Associates
7.1.2 Water Quality
Impaired water quality also has the potential to affect water supply reliability. Cal Water has and will continue to meet all state and federal water quality regulations. All drinking water standards are set by the U.S. Environmental Protection Agency (USEPA) under the authorization of the Federal Safe Drinking Water Act of 1974. In California, the State Water Resources Control Board (SWRCB), Division of Drinking Water (DDW) can either adopt the USEPA standards or set more stringent standards, which are then codified in Title 22 of the California Code of Regulations. There are two general types of drinking water standards:
• Primary Maximum Contaminant Levels (MCLs) are health protective standards and are established using a very conservative risk-based approach for each constituent that takes into potential health effects, detectability and treatability, and costs of treatment. Public water systems may not serve water that exceeds Primary MCLs for any constituent.
• Secondary MCLs are based on the aesthetic qualities of the water such as taste, odor, color, and certain mineral content, and are considered limits for constituents that may affect consumer acceptance of the water. The drinking water delivered in the Westlake District meets all federal and state regulations. All drinking water standards are set by the U.S. Environmental Protection Agency under the authorization of the Federal Safe Drinking Water Act of 1974. In California, the state’s Division of Drinking Water can either adopt the USEPA standard or set state standards that are more stringent than those set by the federal government.
All the potable water for this district is treated surface water purchased from CMWD. There are generally no water quality issues except for seasonal nitrification in the reservoirs. Cal Water takes measures to mitigate this problem by turning over the water in the tanks. Occasionally, flushing may have to be performed and/or additional chlorine must be manually added to one or more of the storage tanks. There have been mixing systems installed in a few reservoirs for this purpose. Additional tank circulation systems may be necessary in the future. Since this water system is disinfected with chloramines, nitrification is a possibility that is constantly monitored in the distribution system and in storage tanks. No additional treatment is provided by Cal Water.
CWC § 10634
The plan shall include information, to the extent practicable, relating to the quality of existing sources of water available to the supplier over the same five-year increments as described in subdivision (a) of Section 10631, and the manner in which water quality affects water management strategies and supply reliability.

California Water Service 2020 Urban Water Management Plan
Westlake District
June 2021 Printed 4/15/2021
Page 67
EKI Environment & Water, Inc. M.Cubed
Gary Fiske and Associates
Cal Water routinely monitors the water that is treated and served to customers to ensure that water delivered to customers meets these drinking water standards. The results of this testing are reported to the SWRCB DDW following each test and are summarized annually in Water Quality Reports (also known as “Consumer Confidence Reports”), which are provided to customers by mail and made available on Cal Water’s website: https://www.calwater.com/waterquality/water-quality-reports/.
Given Cal Water’s proactive monitoring and management of water quality in its source water supplies, water quality is not expected to impact the reliability of the District’s available supplies within the planning horizon (i.e., through 2045).
7.1.3 Climate Change
As described in Chapter 6, the District’s sole supply source is water imported by CMWD, which is a member agency of MWD. In Section 2.6 of its Draft 2020 Urban Water Management Plan, MWD discusses in detail its multi-pronged approach to considering climate change and states that “Metropolitan continues to integrate current climate change science into its planning efforts.” MWD’s extensive efforts to future impacts of climate change on its supplies ensure that the Westlake District’s supply projections also reflect those impacts. Cal Water is actively working to further quantify and consider future climate change impacts as part of its ongoing supply and operations planning. Section 6.10.1 provides a summary of the climate change supply impact assessments that Cal Water has previously performed and those planned for the near term.
CWC § 10631 (b) (1)
…For each source of water supply, consider any information pertinent to the reliability analysis conducted pursuant to Section 10635, including changes in supply due to climate change.
California Water Service 2020 Urban Water Management Plan
Westlake District
June 2021 Printed 4/15/2021
Page 68
EKI Environment & Water, Inc. M.Cubed
Gary Fiske and Associates
7.2 Reliability by Type of Year
Per the UWMP Guidebook 2020, the water service reliability assessment includes three unique year types.
• A normal hydrologic year represents the water supplies available under normal conditions; this could be an averaged range of years or a single representative year;
• A single dry year represents the lowest available water supply; and
• A five-consecutive year drought represents the driest five-year period in the historical record.
For the Westlake District, the identification of year types follows that of CMWD, which in turn is based on the years identified by MWD. Thus, the single dry year in Table 7-1 is 1977 and the five-year dry period is 1988-1992. The average year is based on historical Southern California Association of Governments (SCAG) census tract projections.
As indicated in Section 7.1.1, the District’s water supplies are highly reliable regardless of water year type. Therefore, total purchased water and recycled water supplies are expected to be sufficient to meet projected water demands of the District under all hydrologic conditions, including in normal, single dry, and multiple dry years.
As such, the projected “volume available” estimates presented in Table 7-1 are equal to the maximum demands across projected years and year types shown in Table 7-2, Table 7-3, and
CWC § 10631 (b)
Identify and quantify, to the extent practicable, the existing and planned sources of water available to the supplier over the same five-year increments described in subdivision (a), providing supporting and related information, including all of the following:
CWC § 10631 (b)(1)
A detailed discussion of anticipated supply availability under a normal water year, single dry year, and droughts lasting at least five years, as well as more frequent and severe periods of drought, as described in the drought risk assessment. For each source of water supply, consider any information pertinent to the reliability analysis conducted pursuant to Section 10635, including changes in supply due to climate change.
CWC § 10635 (a)
Every urban water supplier shall include, as part of its urban water management plan, an assessment of the reliability of its water service to its customers during normal, dry, and multiple dry water years. This water supply and demand assessment shall compare the total water supply sources available to the water supplier with the long-term total projected water use over the next 20 years, in five-year increments, for a normal water year, a single dry water year, and a drought lasting five consecutive water years. The water service reliability assessment shall be based upon the information compiled pursuant to Section 10631, including available data from state, regional, or local agency population projections within the service area of the urban water supplier.
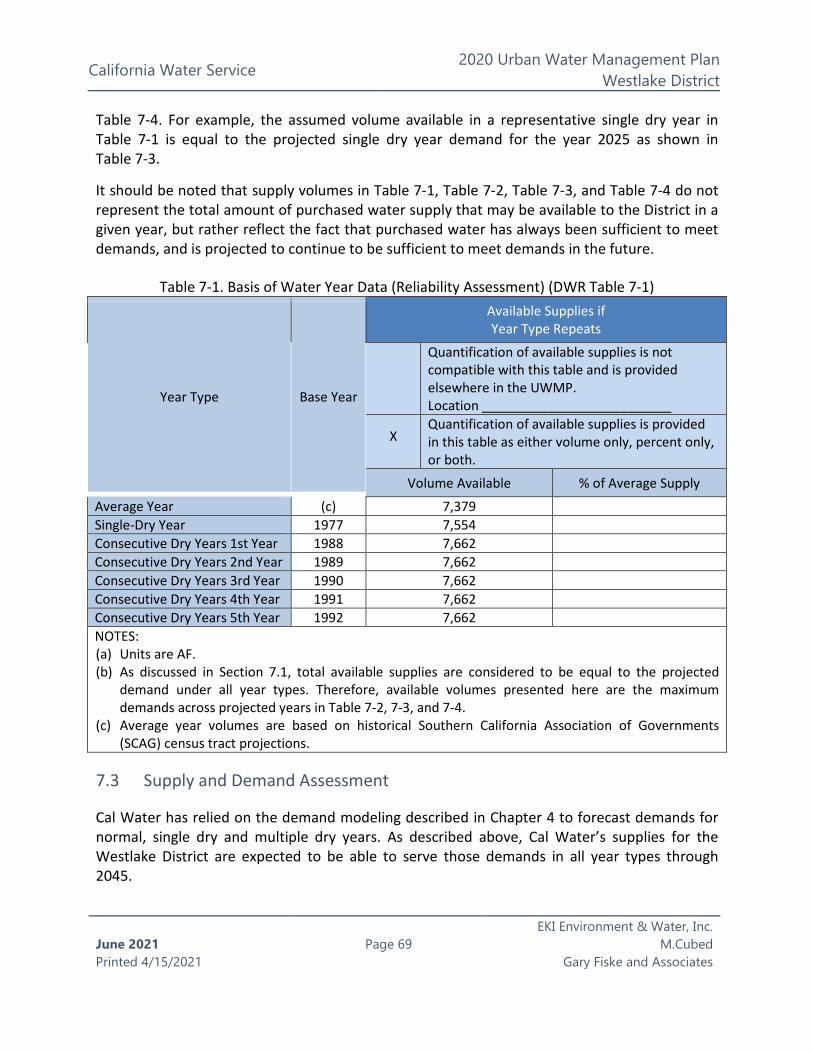
California Water Service 2020 Urban Water Management Plan
Westlake District
June 2021 Printed 4/15/2021
Page 69
EKI Environment & Water, Inc. M.Cubed
Gary Fiske and Associates
Table 7-4. For example, the assumed volume available in a representative single dry year in Table 7-1 is equal to the projected single dry year demand for the year 2025 as shown in Table 7-3.
It should be noted that supply volumes in Table 7-1, Table 7-2, Table 7-3, and Table 7-4 do not represent the total amount of purchased water supply that may be available to the District in a given year, but rather reflect the fact that purchased water has always been sufficient to meet demands, and is projected to continue to be sufficient to meet demands in the future.
Table 7-1. Basis of Water Year Data (Reliability Assessment) (DWR Table 7-1)
Year Type Base Year
Available Supplies if Year Type Repeats
Quantification of available supplies is not compatible with this table and is provided elsewhere in the UWMP. Location __________________________
X Quantification of available supplies is provided in this table as either volume only, percent only, or both.
Volume Available % of Average Supply
Average Year (c) 7,379 Single-Dry Year 1977 7,554 Consecutive Dry Years 1st Year 1988 7,662 Consecutive Dry Years 2nd Year 1989 7,662 Consecutive Dry Years 3rd Year 1990 7,662 Consecutive Dry Years 4th Year 1991 7,662 Consecutive Dry Years 5th Year 1992 7,662 NOTES: (a) Units are AF. (b) As discussed in Section 7.1, total available supplies are considered to be equal to the projected
demand under all year types. Therefore, available volumes presented here are the maximum demands across projected years in Table 7-2, 7-3, and 7-4.
(c) Average year volumes are based on historical Southern California Association of Governments (SCAG) census tract projections.
7.3 Supply and Demand Assessment
Cal Water has relied on the demand modeling described in Chapter 4 to forecast demands for normal, single dry and multiple dry years. As described above, Cal Water’s supplies for the Westlake District are expected to be able to serve those demands in all year types through 2045.

California Water Service 2020 Urban Water Management Plan
Westlake District
June 2021 Printed 4/15/2021
Page 70
EKI Environment & Water, Inc. M.Cubed
Gary Fiske and Associates
Table 7-2 shows the projected supply and demand totals for a normal year. The supply and demand totals are consistent with those in Table 6-9 and Table 4-3, respectively. Table 7-3 shows the projected supply and demand totals for a single dry year, and Table 7-4 shows the projected supply and demand totals for multiple dry year periods extending five years.
Table 7-2. Normal Year Supply and Demand Comparison (DWR Table 7-2) 2025 2030 2035 2040 2045
Supply totals From DWR Table 6-9 7,379 7,254 7,257 7,252 7,272 Demand totals From DWR Table 4-3 7,379 7,254 7,257 7,252 7,272 Difference 0 0 0 0 0 NOTES: (a) Volumes are in units of AF.
Table 7-3. Single Dry Year Supply and Demand Comparison (DWR Table 7-3) 2025 2030 2035 2040 2045
Supply totals 7,554 7,426 7,429 7,424 7,445 Demand totals 7,554 7,426 7,429 7,424 7,445 Difference 0 0 0 0 0 NOTES: (a) Volumes are in units of AF.
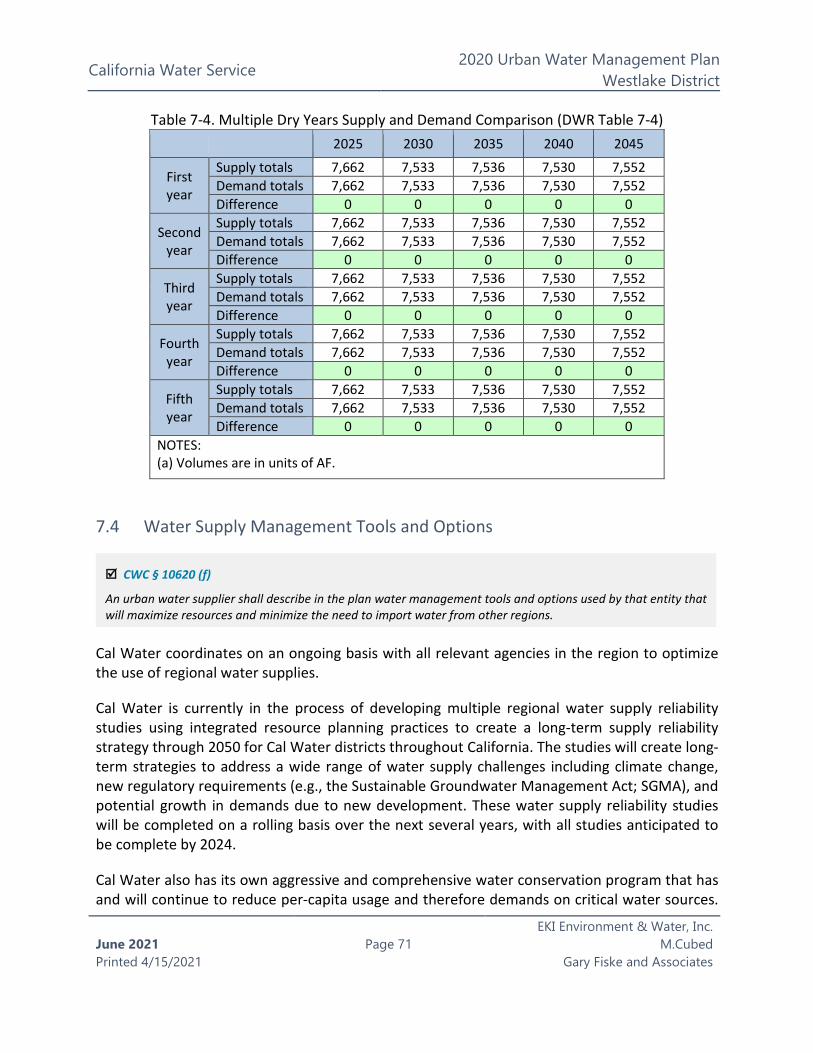
California Water Service 2020 Urban Water Management Plan
Westlake District
June 2021 Printed 4/15/2021
Page 71
EKI Environment & Water, Inc. M.Cubed
Gary Fiske and Associates
Table 7-4. Multiple Dry Years Supply and Demand Comparison (DWR Table 7-4) 2025 2030 2035 2040 2045
First year
Supply totals 7,662 7,533 7,536 7,530 7,552 Demand totals 7,662 7,533 7,536 7,530 7,552 Difference 0 0 0 0 0
Second year
Supply totals 7,662 7,533 7,536 7,530 7,552 Demand totals 7,662 7,533 7,536 7,530 7,552 Difference 0 0 0 0 0
Third year
Supply totals 7,662 7,533 7,536 7,530 7,552 Demand totals 7,662 7,533 7,536 7,530 7,552 Difference 0 0 0 0 0
Fourth year
Supply totals 7,662 7,533 7,536 7,530 7,552 Demand totals 7,662 7,533 7,536 7,530 7,552 Difference 0 0 0 0 0
Fifth year
Supply totals 7,662 7,533 7,536 7,530 7,552 Demand totals 7,662 7,533 7,536 7,530 7,552 Difference 0 0 0 0 0
NOTES: (a) Volumes are in units of AF.
7.4 Water Supply Management Tools and Options
Cal Water coordinates on an ongoing basis with all relevant agencies in the region to optimize the use of regional water supplies.
Cal Water is currently in the process of developing multiple regional water supply reliability studies using integrated resource planning practices to create a long-term supply reliability strategy through 2050 for Cal Water districts throughout California. The studies will create long-term strategies to address a wide range of water supply challenges including climate change, new regulatory requirements (e.g., the Sustainable Groundwater Management Act; SGMA), and potential growth in demands due to new development. These water supply reliability studies will be completed on a rolling basis over the next several years, with all studies anticipated to be complete by 2024.
Cal Water also has its own aggressive and comprehensive water conservation program that has and will continue to reduce per-capita usage and therefore demands on critical water sources.
CWC § 10620 (f)
An urban water supplier shall describe in the plan water management tools and options used by that entity that will maximize resources and minimize the need to import water from other regions.
California Water Service 2020 Urban Water Management Plan
Westlake District
June 2021 Printed 4/15/2021
Page 72
EKI Environment & Water, Inc. M.Cubed
Gary Fiske and Associates
Cal Water is committed to helping its customers use water efficiently and has developed a range of water conservation programs to support this goal. To ensure that it is providing the right mix of programs in the most cost-effective manner possible, Cal Water routinely conducts comprehensive conservation program analysis and planning. This is done on a five-year cycle in tandem with the UWMP. Cal Water’s Conservation Master Plan provides the basis for the information on the implementation of and expected water savings from Demand Management Measures (DMMs) presented in Chapter 9.
7.5 Drought Risk Assessment
7.5.1 Data, Methods, and Basis for Water Shortage Condition
The Drought Risk Assessment uses the projected 2021-2025 demands assuming an extended five-year drought over that period. This evaluation considers historical drought hydrology and plausible changes on projected supplies and demands under climate change conditions, anticipated regulatory changes, and other locally applicable criteria. As described above, the available supply for each of those years is assumed to equal the demand.
7.5.2 Drought Risk Assessment Water Source Reliability
As described in Chapter 6, imported water purchased from CMWD is the sole source of potable supply for the Westlake District. In addition the District uses recycled water to meet some irrigation demands. Table 7-5 provides a comparison of the total (potable and non-potable)
CWC § 10635(b)
Every urban water supplier shall include, as part of its urban water management plan, a drought risk assessment for its water service to its customers as part of information considered in developing the demand management measures and water supply projects and programs to be included in the urban water management plan. The urban water supplier may conduct an interim update or updates to this drought risk assessment within the five-year cycle of its urban water management plan update. The drought risk assessment shall include each of the following:
(1) A description of the data, methodology, and basis for one or more supply shortage conditions that are necessary to conduct a drought risk assessment for a drought period that lasts five consecutive water years, starting from the year following when the assessment is conducted.
(2) A determination of the reliability of each source of supply under a variety of water shortage conditions. This may include a determination that a particular source of water supply is fully reliable under most, if not all, conditions.
(3) A comparison of the total water supply sources available to the water supplier with the total projected water use for the drought period.
(4) Considerations of the historical drought hydrology, plausible changes on projected supplies and demands under climate change conditions, anticipated regulatory changes, and other locally applicable criteria.
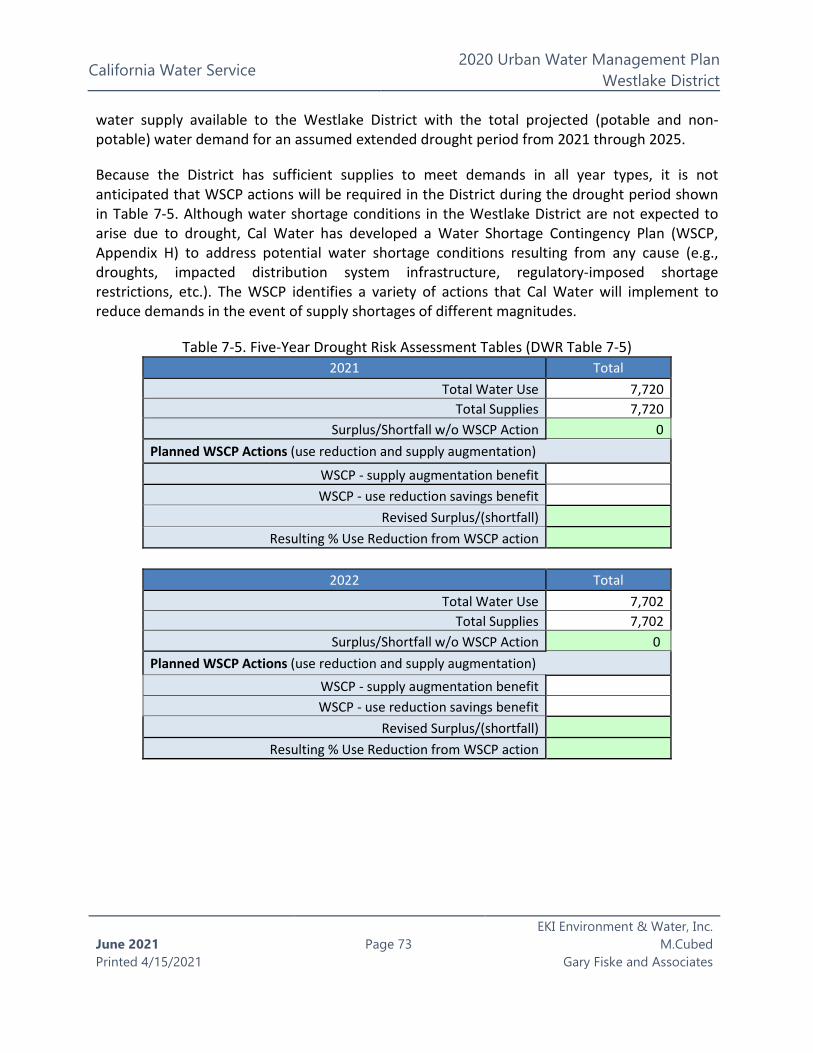
California Water Service 2020 Urban Water Management Plan
Westlake District
June 2021 Printed 4/15/2021
Page 73
EKI Environment & Water, Inc. M.Cubed
Gary Fiske and Associates
water supply available to the Westlake District with the total projected (potable and non-potable) water demand for an assumed extended drought period from 2021 through 2025.
Because the District has sufficient supplies to meet demands in all year types, it is not anticipated that WSCP actions will be required in the District during the drought period shown in Table 7-5. Although water shortage conditions in the Westlake District are not expected to arise due to drought, Cal Water has developed a Water Shortage Contingency Plan (WSCP, Appendix H) to address potential water shortage conditions resulting from any cause (e.g., droughts, impacted distribution system infrastructure, regulatory-imposed shortage restrictions, etc.). The WSCP identifies a variety of actions that Cal Water will implement to reduce demands in the event of supply shortages of different magnitudes.
Table 7-5. Five-Year Drought Risk Assessment Tables (DWR Table 7-5) 2021 Total
Total Water Use 7,720 Total Supplies 7,720
Surplus/Shortfall w/o WSCP Action 0 Planned WSCP Actions (use reduction and supply augmentation)
WSCP - supply augmentation benefit WSCP - use reduction savings benefit
Revised Surplus/(shortfall) Resulting % Use Reduction from WSCP action
2022 Total
Total Water Use 7,702 Total Supplies 7,702
Surplus/Shortfall w/o WSCP Action 0 Planned WSCP Actions (use reduction and supply augmentation)
WSCP - supply augmentation benefit WSCP - use reduction savings benefit
Revised Surplus/(shortfall) Resulting % Use Reduction from WSCP action

California Water Service 2020 Urban Water Management Plan
Westlake District
June 2021 Printed 4/15/2021
Page 74
EKI Environment & Water, Inc. M.Cubed
Gary Fiske and Associates
Table 7-5. Five-Year Drought Risk Assessment Tables (DWR Table 7-5) 2023 Total
Total Water Use 7,686 Total Supplies 7,686
Surplus/Shortfall w/o WSCP Action 0 Planned WSCP Actions (use reduction and supply augmentation)
WSCP - supply augmentation benefit WSCP - use reduction savings benefit
Revised Surplus/(shortfall) Resulting % Use Reduction from WSCP action
2024 Total Total Water Use 7,673
Total Supplies 7,673 Surplus/Shortfall w/o WSCP Action 0
Planned WSCP Actions (use reduction and supply augmentation) WSCP - supply augmentation benefit WSCP - use reduction savings benefit
Revised Surplus/(shortfall) Resulting % Use Reduction from WSCP action
2025 Total
Total Water Use 7,662 Total Supplies 7,662
Surplus/Shortfall w/o WSCP Action 0 Planned WSCP Actions (use reduction and supply augmentation)
WSCP - supply augmentation benefit WSCP - use reduction savings benefit
Revised Surplus/(shortfall) Resulting % Use Reduction from WSCP action
NOTES: (a) Volumes are in units of AF.
California Water Service 2020 Urban Water Management Plan
Westlake District
June 2021 Printed 4/15/2021
Page 75
EKI Environment & Water, Inc. M.Cubed
Gary Fiske and Associates
Chapter 8 Water Shortage Contingency Planning
The Water Shortage Contingency Plan (WSCP) for the Westlake District (also referred to herein as “District”) is included in this Urban Water Management Plan (UWMP) as Appendix H. The WSCP serves as a standalone document to be engaged in the case of a water shortage event, such as a drought or supply interruption, and defines specific policies and actions that will be implemented at various shortage level scenarios. The primary objective of the WSCP is to ensure that the District has in place the necessary resources and management responses needed to protect health and human safety, minimize economic disruption, and preserve environmental and community assets during water supply shortages and interruptions. Consistent with California Water Code (CWC) §10632, the WSCP includes six levels to address shortage conditions ranging from up to 10 percent to greater than 50 percent shortage, identifies a suite of demand mitigation measures for the District to implement at each level, and identifies procedures for the District to annually assess whether or not a water shortage is likely to occur in the coming year, among other things.
A summary of the key elements of the WSCP including water shortage levels, demand-reduction actions, and supply augmentation and other actions is shown in Table 8-1, Table 8-2, and Table 8-3.
CWC § 10640
(a) Every urban water supplier required to prepare a plan pursuant to this part shall prepare its plan pursuant to Article 2 (commencing with Section 10630). The supplier shall likewise periodically review the plan as required by Section 10621, and any amendments or changes required as a result of that review shall be adopted pursuant to this article.
(b) Every urban water supplier required to prepare a water shortage contingency plan shall prepare a water shortage contingency plan pursuant to Section 10632. The supplier shall likewise periodically review the water shortage contingency plan as required by paragraph (10) of subdivision (a) of Section 10632 and any amendments or changes required as a result of that review shall be adopted pursuant to this article.
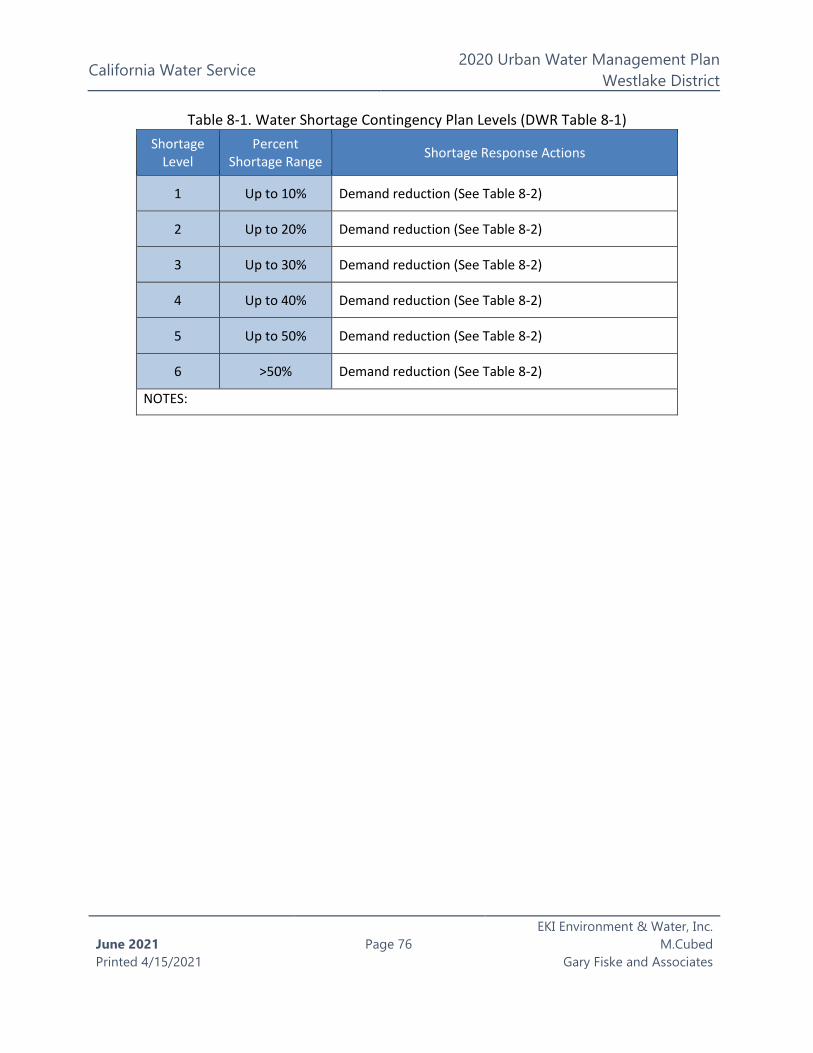
California Water Service 2020 Urban Water Management Plan
Westlake District
June 2021 Printed 4/15/2021
Page 76
EKI Environment & Water, Inc. M.Cubed
Gary Fiske and Associates
Table 8-1. Water Shortage Contingency Plan Levels (DWR Table 8-1) Shortage
Level Percent
Shortage Range Shortage Response Actions
1 Up to 10% Demand reduction (See Table 8-2)
2 Up to 20% Demand reduction (See Table 8-2)
3 Up to 30% Demand reduction (See Table 8-2)
4 Up to 40% Demand reduction (See Table 8-2)
5 Up to 50% Demand reduction (See Table 8-2)
6 >50% Demand reduction (See Table 8-2)
NOTES:

California Water Service 2020 Urban Water Management Plan
Westlake District
June 2021 Printed 6/25/2021
Page 77
EKI Environment & Water, Inc. M.Cubed
Gary Fiske and Associates
Table 8-2. Demand Reduction Actions (DWR Table 8-2)
Shortage Level
Demand Reduction Actions Drop down list
How much is this going to reduce the
shortage gap?
Additional Explanation or Reference (optional)
Penalty, Charge, or
Other Enforcement?
Add additional rows as needed
1 Other 9%
1. Limit landscape irrigation to specific times 2. Customers must repair leaks, breaks, and malfunctions in a timely manner 3. Restrict or prohibit runoff from landscape irrigation 4. Prohibit application of potable water to outdoor landscapes within 48 hours of measurable rainfall 5. Prohibit use of potable water for washing hard surfaces 6. Lodging establishments must offer opt out of linen service 7. Require shut-off nozzles on hoses for vehicle washing with potable water 8. Restaurants may only serve water upon request 9. No watering of landscape of newly constructed homes and buildings in a manner inconsistent with regulations or other requirements established by the California Building Standards Commission, and the Department of Housing and Community Development, or other state agency 10. Prohibit Potable Water Use for Decorative Water Features that do not Recirculate Water
Yes
1 Other --
1. Expand Public Information/Media Campaign 2. Water Bill Inserts 3. Promote online water waste reporting 4. Expand Rebates or Giveaways of Plumbing Fixtures and Devices 5. Expand Rebates for Landscape Irrigation Efficiency 6. Expand CII Water Use Surveys
No
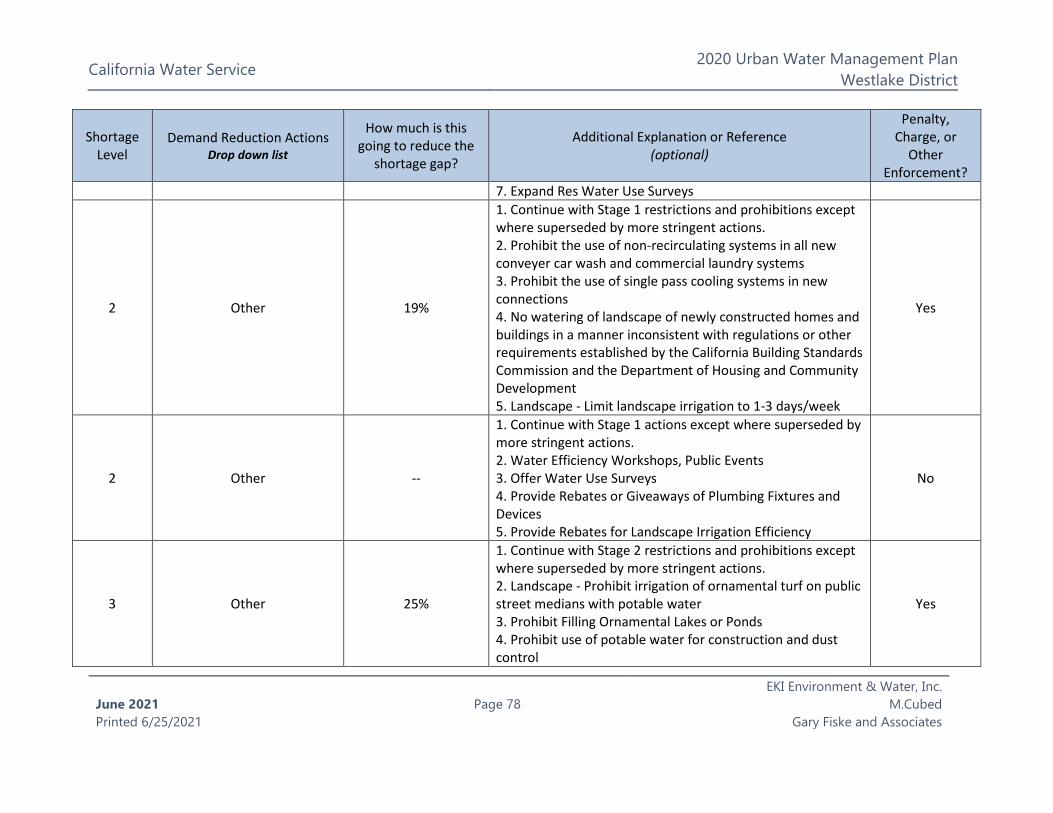
California Water Service 2020 Urban Water Management Plan
Westlake District
June 2021 Printed 6/25/2021
Page 78
EKI Environment & Water, Inc. M.Cubed
Gary Fiske and Associates
Shortage Level
Demand Reduction Actions Drop down list
How much is this going to reduce the
shortage gap?
Additional Explanation or Reference (optional)
Penalty, Charge, or
Other Enforcement?
7. Expand Res Water Use Surveys
2 Other 19%
1. Continue with Stage 1 restrictions and prohibitions except where superseded by more stringent actions. 2. Prohibit the use of non-recirculating systems in all new conveyer car wash and commercial laundry systems 3. Prohibit the use of single pass cooling systems in new connections 4. No watering of landscape of newly constructed homes and buildings in a manner inconsistent with regulations or other requirements established by the California Building Standards Commission and the Department of Housing and Community Development 5. Landscape - Limit landscape irrigation to 1-3 days/week
Yes
2 Other --
1. Continue with Stage 1 actions except where superseded by more stringent actions. 2. Water Efficiency Workshops, Public Events 3. Offer Water Use Surveys 4. Provide Rebates or Giveaways of Plumbing Fixtures and Devices 5. Provide Rebates for Landscape Irrigation Efficiency
No
3 Other 25%
1. Continue with Stage 2 restrictions and prohibitions except where superseded by more stringent actions. 2. Landscape - Prohibit irrigation of ornamental turf on public street medians with potable water 3. Prohibit Filling Ornamental Lakes or Ponds 4. Prohibit use of potable water for construction and dust control
Yes

California Water Service 2020 Urban Water Management Plan
Westlake District
June 2021 Printed 6/25/2021
Page 79
EKI Environment & Water, Inc. M.Cubed
Gary Fiske and Associates
Shortage Level
Demand Reduction Actions Drop down list
How much is this going to reduce the
shortage gap?
Additional Explanation or Reference (optional)
Penalty, Charge, or
Other Enforcement?
5. Prohibit use of potable water for street washing
3 Other --
1. Continue with Stage 2 actions except where superseded by more stringent actions. 2. Home or Mobile Water Use Reports 3. Decrease Frequency and Length of Line Flushing 4. Reduce System Water Loss 5. Increase Water Waste Patrols/Enforcement 6. Implement Drought Rate Structure and Customer Water Budgets (Res) 7. Implement Drought Rate Structure and Customer Water Budgets (CII)
No
4 Other 37%
1. Continue with Stage 3 restrictions and prohibitions except where superseded by more stringent actions. 2. Prohibit vehicle washing except with recirculatedecycled water or low-volume systems 3. Prohibit use of water for recreational purposes such as water parks and the filling of pools
Yes
4 Other -- 1. Continue with Stage 3 actions except where superseded by more stringent actions. 2. Promote / Expand Use of Recycled Water
No
5 Other 48%
1. Continue with Stage 4 restrictions and prohibitions except where superseded by more stringent actions. 2. Require net zero demand Increase on new water service connections 3. Prohibit single-pass cooling systems
Yes
5 Other -- 1. Continue with Stage 4 actions except where superseded by more stringent actions. No

California Water Service 2020 Urban Water Management Plan
Westlake District
June 2021 Printed 6/25/2021
Page 80
EKI Environment & Water, Inc. M.Cubed
Gary Fiske and Associates
Shortage Level
Demand Reduction Actions Drop down list
How much is this going to reduce the
shortage gap?
Additional Explanation or Reference (optional)
Penalty, Charge, or
Other Enforcement?
2. Require Pool Covers
6 Other 60%
1. Continue with Stage 5 restrictions and prohibitions except where superseded by more stringent actions. 2. Moratorium on new water service connections 3. Prohibit all landscape irrigation
Yes
NOTES:
Table 8-3. Supply Augmentation and Other Actions (DWR Table 8-3)
Shortage Level
Supply Augmentation Methods and Other
Actions by Water Supplier
How much is this going to reduce the
shortage gap?
Additional Explanation or Reference
(optional)
NOTES:
California Water Service 2020 Urban Water Management Plan
Westlake District
June 2021 Printed 6/25/2021
Page 81
EKI Environment & Water, Inc. M.Cubed
Gary Fiske and Associates
Chapter 9 Demand Management Measures
This chapter presents a summary of past and planned demand management measure (DMM) implementation in the Westlake District (also referred to as the “District”), as well as an overview of the expected water savings.
This chapter has the following sections:
9.1 Demand Management Measures for Wholesale Agencies
9.2 Demand Management Measures for Retail Suppliers
9.3 Implementation over the Past Five Years
9.4 Implementation to Achieve Water Use Targets
9.5 Water Use Objectives
CWC § 10631 (e)
Provide a description of the supplier’s water demand management measures. This description shall include all of the following:
(1) (A) For an urban retail water supplier, as defined in Section 10608.12, a narrative description that addresses the nature and extent of each water demand management measure implemented over the past five years. The narrative shall describe the water demand management measures that the supplier plans to implement to achieve its water use targets pursuant to Section 10608.20.
(B) The narrative pursuant to this paragraph shall include descriptions of the following water demand management measures:
(i) Water waste prevention ordinances.
(ii) Metering.
(iii) Conservation pricing.
(iv) Public education and outreach.
(v) Programs to assess and manage distribution system real loss.
(vi) Water conservation program coordination and staffing support.
(vii) Other demand management measures that have a significant impact on water use as measured in gallons per capita per day, including innovative measures, if implemented.
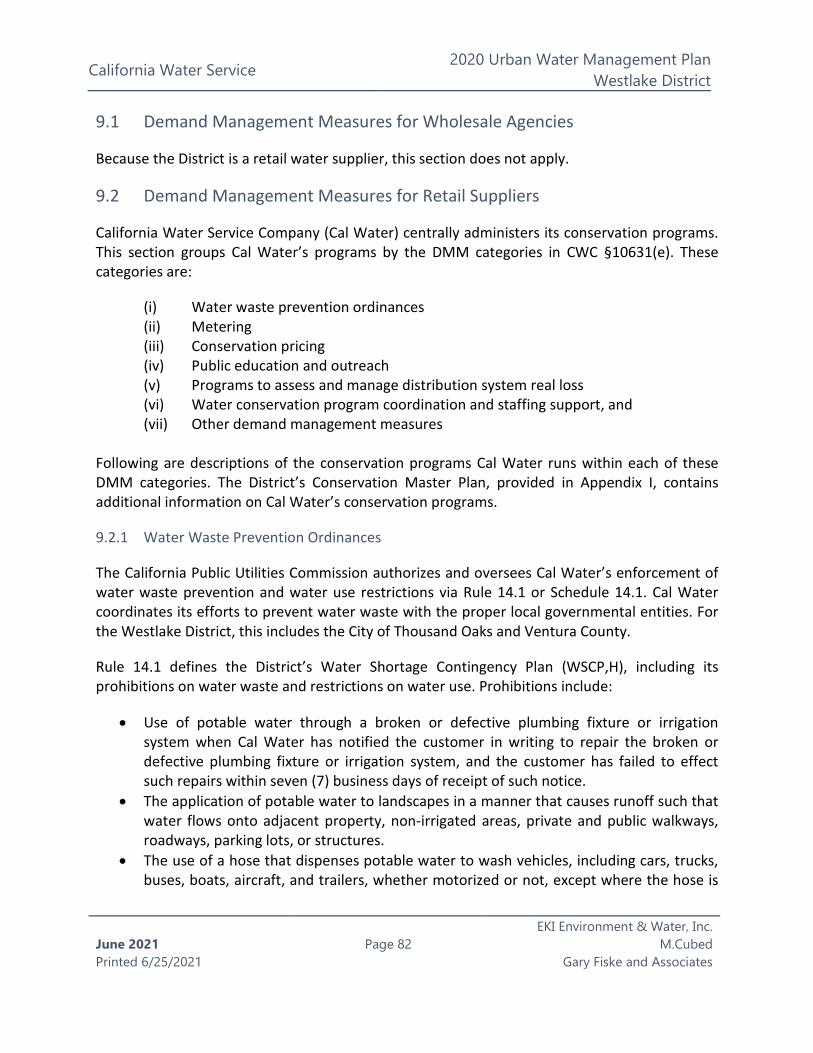
California Water Service 2020 Urban Water Management Plan
Westlake District
June 2021 Printed 6/25/2021
Page 82
EKI Environment & Water, Inc. M.Cubed
Gary Fiske and Associates
9.1 Demand Management Measures for Wholesale Agencies
Because the District is a retail water supplier, this section does not apply.
9.2 Demand Management Measures for Retail Suppliers
California Water Service Company (Cal Water) centrally administers its conservation programs. This section groups Cal Water’s programs by the DMM categories in CWC §10631(e). These categories are:
(i) Water waste prevention ordinances (ii) Metering (iii) Conservation pricing (iv) Public education and outreach (v) Programs to assess and manage distribution system real loss (vi) Water conservation program coordination and staffing support, and (vii) Other demand management measures
Following are descriptions of the conservation programs Cal Water runs within each of these DMM categories. The District’s Conservation Master Plan, provided in Appendix I, contains additional information on Cal Water’s conservation programs.
9.2.1 Water Waste Prevention Ordinances
The California Public Utilities Commission authorizes and oversees Cal Water’s enforcement of water waste prevention and water use restrictions via Rule 14.1 or Schedule 14.1. Cal Water coordinates its efforts to prevent water waste with the proper local governmental entities. For the Westlake District, this includes the City of Thousand Oaks and Ventura County.
Rule 14.1 defines the District’s Water Shortage Contingency Plan (WSCP,H), including its prohibitions on water waste and restrictions on water use. Prohibitions include:
• Use of potable water through a broken or defective plumbing fixture or irrigation system when Cal Water has notified the customer in writing to repair the broken or defective plumbing fixture or irrigation system, and the customer has failed to effect such repairs within seven (7) business days of receipt of such notice.
• The application of potable water to landscapes in a manner that causes runoff such that water flows onto adjacent property, non-irrigated areas, private and public walkways, roadways, parking lots, or structures.
• The use of a hose that dispenses potable water to wash vehicles, including cars, trucks, buses, boats, aircraft, and trailers, whether motorized or not, except where the hose is
California Water Service 2020 Urban Water Management Plan
Westlake District
June 2021 Printed 6/25/2021
Page 83
EKI Environment & Water, Inc. M.Cubed
Gary Fiske and Associates
fitted with a shut-off nozzle or device attached to it that causes it to cease dispensing water immediately when not in use.
Restrictions on water use during shortages include, but are not necessarily limited to:
• Outdoor irrigation restrictions in terms of time of day and weekly frequency. • Obligations to fix leaks, breaks, or malfunctions within five (5) business days of written
notification by Cal Water. • Application of potable water to driveways and sidewalks. • The use of potable water in a water feature, except where the water is part of a
recirculating system. • The application of potable water to outdoor landscapes during and within 48 hours after
measurable rainfall. • The serving of drinking water other than upon request in eating or drinking
establishments. • Irrigation of ornamental landscape on public street medians. • Irrigation outside of newly constructed homes and buildings with potable water in a
manner inconsistent with regulations or other requirements established by the California Building Standards Commission and the Department of Housing and Community Development.
• Operators of hotels and motels shall provide guests with the option of choosing not to have towels and linens laundered daily. The hotel or motel shall prominently display notice of this option in each guest room using clear and easily understood language.
• Limits on filling ornamental lakes or ponds. • Use of potable water for street cleaning with trucks, except for initial wash-down for
construction purposes. • Use of potable water for construction purposes, such as consolidation of backfill, dust
control, or other uses unless no other source of water or other method can be used.

California Water Service 2020 Urban Water Management Plan
Westlake District
June 2021 Printed 6/25/2021
Page 84
EKI Environment & Water, Inc. M.Cubed
Gary Fiske and Associates
9.2.2 Metering
The District meters all service connections and bills customers for water use monthly. Cal Water may install advanced metering infrastructure (AMI) in the future to improve metering accuracy and supply prompt feedback to customers about water use and leaks. Cal Water is currently piloting (AMI) in several districts. AMI may be used by Cal Water in the future to detect and alert households of leaks and other possible problems as well as to provide customers with tailored water use information to help them use water more efficiently.
9.2.3 Conservation Pricing
The CPUC reviews and authorizes District water rates in a General Rate Case every three years. Currently, the District uses a three-tier increasing block rate design for residential water use and a single-tier uniform rate design for non-residential use. The District provides rate assistance to lower income households through its Customer Assistance Program (CAP).
9.2.4 Public Education and Outreach
The District’s public outreach program is divided into four components, as follows:
Public Information Program – Cal Water operates an extensive public information program to provide information to customers on ways to use water efficiently and to market its conservation programs through multiple media outlets, including the Cal Water website, direct mail and bills, digital media, social media, and email.
CWC § 526 (a)
Notwithstanding any other provision of law, an urban water supplier that, on or after January 1, 2004, receives water from the federal Central Valley Project under a water service contract or subcontract … shall do both of the following:
(1) On or before January 1, 2013, install water meters on all service connections to residential and nonagricultural commercial buildings constructed prior to January 1, 1992, located within its service area.
(2) On and after March 1, 2013, or according to the terms of the Central Valley Project water contract in operation, charge customers for water based on the actual volume of deliveries, as measured by a water meter.
CWC § 527 (a)
(a) An urban water supplier that is not subject to Section 526 shall do both of the following:
(1) Install water meters on all municipal and industrial service connections located within its service area on or before January 1, 2025.

California Water Service 2020 Urban Water Management Plan
Westlake District
June 2021 Printed 6/25/2021
Page 85
EKI Environment & Water, Inc. M.Cubed
Gary Fiske and Associates
School Education Program - Cal Water’s school education program includes the Cal Water H2O Challenge, a project-based learning competition for grades 4-6, individual student competitions for grades K-12 and general information and learning materials for students and teachers. Cal Water deploys its school education program in all its districts. Cal Water H2O Challenge is a project-based competition for classrooms, grades 4-6. The program is offered in partnership with DoGoodery, the California Association of Science Educators (CASE), and the WestEd K-12 Alliance. The program aligns with the Common Core State Standards and the Next Generation Science Standards. The Cal Water H2O Challenge offers a unique opportunity for upper elementary teachers to facilitate their students’ learning of standards-based content, while developing the core understanding of environmental principles necessary to becoming science-literate citizens.
Smart Landscape Tune-Up Program – This program provides customers with an irrigation system evaluation and installation of approved efficient irrigation system equipment, such as a smart irrigation controller and high-efficiency sprinkler nozzles. The program also includes irrigation system adjustments and detection and repair of irrigation system leaks. This program is available to all Cal Water customers at no charge.
Residential Customer Portal – Through its residential customer portal, Cal Water provides tailored assistance to each residential customer via customized water-efficiency targets, water savings calculators, and customer-specific recommendations for programs and water-saving tips.
Non-Residential Customer Assistance – Cal Water provides tailored assistance to commercial customers through customized incentives, commercial water surveys, and large landscape water use surveys. The non-residential assistance program helps commercial customers efficiently use water for sanitation/cleaning, heating/cooling, process, and landscape purposes.
9.2.5 Programs to Assess and Manage Distribution System Real Loss
As discussed above, reducing distribution system losses is one of the main focuses of the new Making Water Conservation a California Way of Life regulations. In preparation for these new requirements, Cal Water took part in the California Water Loss Technical Assistance Program (TAP) in both 2016 and 2017. Cal Water annually conducts distribution system audits using the American Water Works Association (AWWA) Free Water Audit Software. It has also developed a Water Loss Control Plan and Water Loss Control Policy to guide future water loss management with respect to:
• Meeting CPUC and state water loss standards and regulations • Improving audit data and validity scores • Implementing cost-effective water loss control actions
California Water Service 2020 Urban Water Management Plan
Westlake District
June 2021 Printed 6/25/2021
Page 86
EKI Environment & Water, Inc. M.Cubed
Gary Fiske and Associates
To coordinate and oversee water loss management actions across its multiple districts, Cal Water has added a Water Loss Program Analyst position to its conservation staff.
9.2.6 Water Conservation Program Coordination and Staffing Support
The CPUC reviews and authorizes Cal Water conservation program and staffing level in a general rate case every three years. Currently, Cal Water has nine full-time conservation positions: as follows:
• Director of Water Resource Sustainability, • Conservation Program Manager, • Research, Analytics and Reporting Manager, • Water Resource Sustainability Analyst, • Water Loss Program Analyst, • Three Conservation Program Coordinators, and • Conservation Assistant.
These staff manage all aspects of Cal Water’s conservation programs that are run in 24 districts serving a combined population of 1.8 million people.
9.2.7 Other Demand Management Measures
In addition to the DMM programs described above, Cal Water operates rebate, give-away, and direct installation programs aimed at plumbing fixture replacement and irrigation equipment and landscape efficiency improvements. Following are brief descriptions of each of these DMMs.
High-Efficiency Toilet Replacement – This program replaces old toilets with MaP certified high-efficiency toilets via financial rebates, direct installation, or direct distribution.25 Current rebate amounts are up to $50/toilet for residential toilet replacement and up to $100/toilet for commercial toilet replacement.
High-Efficiency Urinal Replacement – This program replaces old urinals with high-efficiency urinals meeting the state’s 0.125 gallon per flush water use standard via financial rebates and direct installation. While available to all non-residential customers, the program targets sites with higher-than-average bathroom utilization, such as restaurants and office buildings. The current rebate amount is up to $150/urinal.
25 For information on MaP certified toilets, see: https://www.map-testing.com/.

California Water Service 2020 Urban Water Management Plan
Westlake District
June 2021 Printed 6/25/2021
Page 87
EKI Environment & Water, Inc. M.Cubed
Gary Fiske and Associates
Clothes Washer Replacement – This program provides a financial rebate to replace an old inefficient clothes washer with a new high-efficiency washer. The program is available to all residential and multi-family customers. The current rebate amount is up to $150/washer.
Residential Conservation Kit Distribution – This program offers residential customers conservation kits featuring a range of water-saving plumbing retrofit devices. The kits are available at no charge and include two high-efficiency showerheads (1.5 gpm), two bathroom faucet aerators (1.0 gpm), one kitchen faucet aerator (1.5 gpd), toilet leak tablets, and an outside multi-function, full-stop hose nozzle.
Smart Irrigation Controller Installation – This program provides a financial rebate for the installation of a smart irrigation controller that automatically adjusts watering schedule in response to changing weather conditions. The current rebate amount is $125/controller for residential customers and $25/station for commercial customers.
High-Efficiency Sprinkler Nozzle Rebate – This program provides a financial rebate for the installation of high-efficiency sprinkler nozzles. This program is available to all Cal Water customers. The current rebate amount is $5/nozzle.
Large Rotary Nozzle Rebate – This program provides a financial rebate for the installation of high-efficiency large rotary nozzles. This program is available to all Cal Water customers. The current rebate amount is up to $30/nozzle toward the nozzle purchase cost and up to $8/spray body toward installation cost, if installed by a C-27 licensed landscape contractor.
Spray Body with Integrated Pressure Regulation and Check Valve Rebate – This program provides a financial rebate for the installation of high-efficiency spray bodies with integrated pressure regulation. This program is available to all Cal Water customers. The current rebate amount is up to $10/body toward the spray body purchase cost and up to $8/spray body toward installation cost, if installed by a C-27 licensed landscape contractor.
Turf Replacement Rebate – This program provides a financial rebate for replacement of turf with approved drought-tolerant landscaping. Cal Water operated this program in 2015/16 as a drought response measure. The program will be re-started as part of Cal Water’s irrigation equipment/landscape upgrade program offerings.
Table 9-1 summarizes the DMMs available to District customers at the time this Plan was prepared.
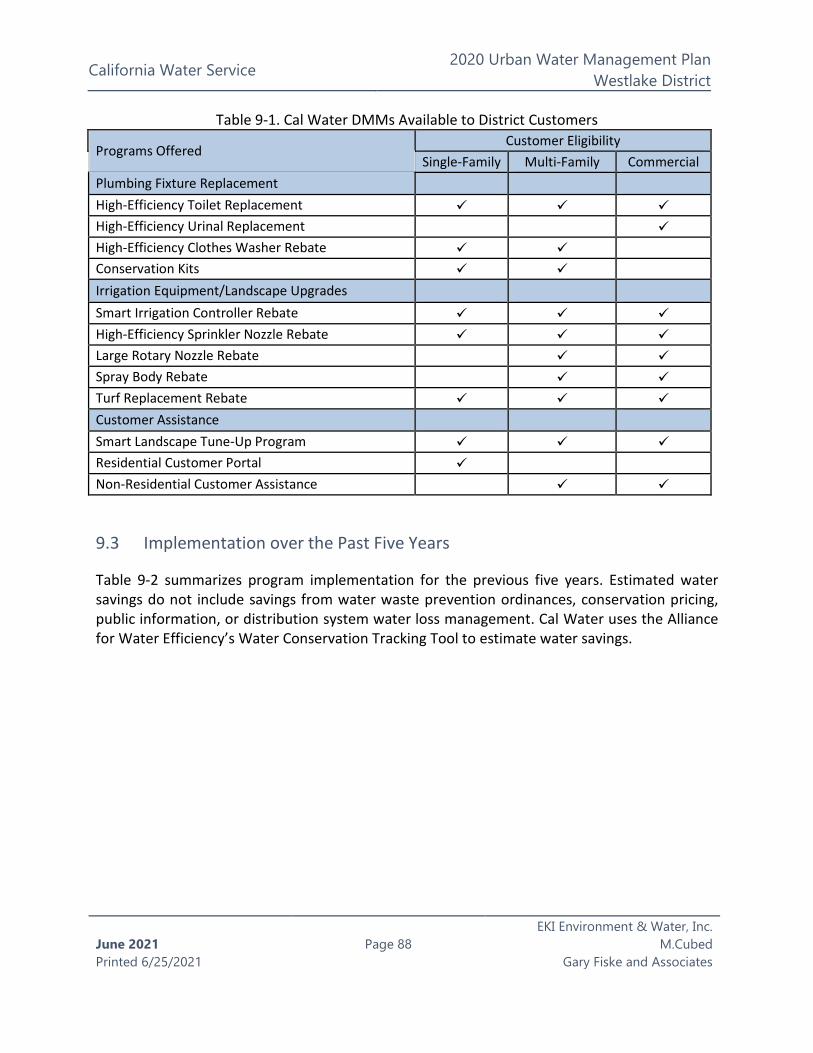
California Water Service 2020 Urban Water Management Plan
Westlake District
June 2021 Printed 6/25/2021
Page 88
EKI Environment & Water, Inc. M.Cubed
Gary Fiske and Associates
Table 9-1. Cal Water DMMs Available to District Customers
Programs Offered Customer Eligibility
Single-Family Multi-Family Commercial Plumbing Fixture Replacement High-Efficiency Toilet Replacement High-Efficiency Urinal Replacement High-Efficiency Clothes Washer Rebate Conservation Kits Irrigation Equipment/Landscape Upgrades Smart Irrigation Controller Rebate High-Efficiency Sprinkler Nozzle Rebate Large Rotary Nozzle Rebate Spray Body Rebate Turf Replacement Rebate Customer Assistance Smart Landscape Tune-Up Program Residential Customer Portal Non-Residential Customer Assistance
9.3 Implementation over the Past Five Years
Table 9-2 summarizes program implementation for the previous five years. Estimated water savings do not include savings from water waste prevention ordinances, conservation pricing, public information, or distribution system water loss management. Cal Water uses the Alliance for Water Efficiency’s Water Conservation Tracking Tool to estimate water savings.

California Water Service 2020 Urban Water Management Plan
Westlake District
June 2021 Printed 6/25/2021
Page 89
EKI Environment & Water, Inc. M.Cubed
Gary Fiske and Associates
Table 9-2. Implementation of Customer DMMs: 2016-2020 Indoor Programs 2016 – 2020 Total Average Annual
Toilets & Urinals (number distributed) 467 93 Clothes Washers (number distributed) 106 21 Conservation Kits (number distributed) 65 13 Outdoor Programs Smart Controllers (number distributed) 94 19 Nozzles & Spray Bodies (number distributed) 699 140 Turf Buy-Back (sq ft removed) 430,513 86,103 Residential Assistance Programs Surveys/Audits (homes receiving) 30 6 Non-Residential Assistance Programs Surveys/Audits (sites receiving) 1 0 Large Landscape Reports (sites receiving) 86 17
Estimated Water Savings (AF) 258 52 Note: Estimated water savings for 2016-2020. DMMs will continue to generate savings after 2020 for their useful life.
9.4 Implementation to Achieve Water Use Targets
All the DMMs described above contributed to the District’s compliance with its SB X7-7 2020 target GPCD.
9.5 Water Use Objectives (Future Requirements)
CWC §10609 requires that urban retail water suppliers develop new water use objectives that are based on specific standards for certain water use sectors. These water use objectives will not be developed until 2023. Suppliers are encouraged in this UWMP cycle to consider how they will align their conservation management actions to meet these future obligations.
As noted above, Cal Water’s conservation programs are subject to review and approval by the CPUC every three years as part of a general rate case. In making conservation program recommendations to the CPUC, Cal Water carefully considers how they will advance multiple goals, including compliance with the pending state water use objectives. Specific goals identified in Cal Water’s most recent general rate case included:
• Maintaining continuity with and furthering implementation of conservation programs authorized by the previous general rate case.
California Water Service 2020 Urban Water Management Plan
Westlake District
June 2021 Printed 6/25/2021
Page 90
EKI Environment & Water, Inc. M.Cubed
Gary Fiske and Associates
• Preserving gains in water conservation achieved during the 2013-2017 drought. • Ensuring Cal Water districts follow state regulations and policies for water conservation,
water loss management, and groundwater management, including Executive Order B-37-16, SB 555, and the Sustainable Groundwater Management Act (SGMA).
• Advancing cost-effective water use efficiency alternatives in districts with high water supply costs.
Cal Water developed a scoring method to adjust conservation programs and budgets to further these goals. The method specifically considers five important policy drivers:
1. State Conservation Standards and Water Use Objectives 2. SGMA Compliance 3. SB 555 Water Loss Management Requirements 4. Commercial, Institutional, and Industrial (CII) Water Management 5. Avoided Water Cost and Affordability
The method assigns greater weight to the State Conservation Standards and Water Use Objectives and SGMA Compliance policy drivers, reflecting their importance to overall water resources management.
A district’s SGMA score depends on its groundwater basin priority, basin adjudication status, and groundwater dependence. The method assigns the highest scores to districts in unadjudicated basins that are critically overdrafted or high priority and where groundwater makes up more than 45 percent of the district’s water supply. The Westlake District ranked in the bottom third of Cal Water districts for this policy driver.
A district’s State Conservation Standards and Water Use Objectives score depends on:
• Total landscape area • Total turf area • Number of large residential landscapes • Difference between current indoor residential water use and indoor water use standard • Difference in current total water use and simulated total water use objective
The Westlake District ranked in the top third of Cal Water’s districts for this policy driver.
A district’s SB 555 Water Loss Management score depends on the district’s infrastructure leakage index (ILI) from its most recent validated water loss audit. The ILI is a performance indicator of real (physical) water loss from the water distribution system. A high ILI indicates possible distribution system inefficiencies and may also indicate significant water system
California Water Service 2020 Urban Water Management Plan
Westlake District
June 2021 Printed 6/25/2021
Page 91
EKI Environment & Water, Inc. M.Cubed
Gary Fiske and Associates
leakage. The Westlake District ranked in the middle third of Cal Water’s districts for this policy driver.
A district’s CII Water Management score is a function of the amount of CII water use in the district. The Westlake District ranked in the middle of Cal Water’s districts for this policy driver.
A district’s Avoided Water Cost and Affordability score is a function of its avoided cost of water supply, as estimated by the California Urban Water Conservation Council (CUWCC)/Water Research Foundation Avoided Cost Model. The Westlake District ranks in the top third of Cal Water’s districts for this policy driver.
Cal Water used the resulting scores as the basis for proposed changes in district conservation budgets in its most recent general rate case. These proposed budget adjustments ranged from 5 to 25 percent. The recommended adjustment for the Westlake District was 20 percent.

California Water Service 2020 Urban Water Management Plan
Westlake District
June 2021 Printed 6/25/2021
Page 92
EKI Environment & Water, Inc. M.Cubed
Gary Fiske and Associates
Chapter 10 Plan Adoption, Submittal, and Implementation
This chapter provides information on a public hearing, the adoption process for the Urban Water Management Plan (UWMP) and Water Shortage Contingency Plan (WSCP), the adopted UWMP and WSCP submittal process, plan implementation, and the process for amending the adopted UWMP or WSCP. This chapter includes the following sections:
10.1 Inclusion of All 2020 Data
10.2 Notice of Public Hearing
10.3 Public Hearing and Adoption
10.4 Plan Submittal
10.5 Public Availability
10.6 Notification of Public Utilities Commission
10.7 Amending an Adopted UWMP or Water Shortage Contingency Plan
10.1 Inclusion of All 2020 Data
This UWMP includes the water use and planning data for the entire calendar year of 2020, per the UWMP Guidebook 2020.
CWC § 10621 (b)
Every urban water supplier required to prepare a plan pursuant to this part shall, at least 60 days before the public hearing on the plan required by Section 10642, notify any city or county within which the supplier provides water supplies that the urban water supplier will be reviewing the plan and considering amendments or changes to the plan. The urban water supplier may consult with, and obtain comments from, any city or county that receives notice pursuant to this subdivision.
California Water Service 2020 Urban Water Management Plan
Westlake District
June 2021 Printed 6/25/2021
Page 93
EKI Environment & Water, Inc. M.Cubed
Gary Fiske and Associates
10.2 Notice of Public Hearing
Prior to adopting the Plan, California Water Service Company (Cal Water) held a virtual public hearing to present information on its Westlake District (also referred to herein as “District”) 2020 UWMP and WSCP on May 27, 5:00 PM. 26
Relevant entities were notified of the UWMP and WSCP review at least 60 days prior to the public hearing, including: (1) cities, counties, and (2) the public. These same entities were noticed again with the specific date, time and location of the hearing at least two weeks prior to the public hearing. The notice to the public, as specified in Government Code 6066, and letters to relevant agencies can be found in Appendix C and Appendix B, respectively.
10.2.1 Notice to Cities and Counties
Table 10-1 lists the cities and counties that were notified. Copies of these letters are provided in Appendix B.
26 Restrictions related to the COVID-19 pandemic prevented the District from holding an in-person public hearing as previously planned.
CWC § 10642
Each urban water supplier shall encourage the active involvement of diverse social, cultural, and economic elements of the population within the service area prior to and during the preparation of both the plan and the water shortage contingency plan. Prior to adopting either, the urban water supplier shall make both the plan and the water shortage contingency plan available for public inspection and shall hold a public hearing or hearings thereon. Prior to any of these hearings, notice of the time and place of the hearing shall be published within the jurisdiction of the publicly owned water supplier pursuant to Section 6066 of the Government Code. The urban water supplier shall provide notice of the time and place of a hearing to any city or county within which the supplier provides water supplies. Notices by a local public agency pursuant to this section shall be provided pursuant to Chapter 17.5 (commencing with Section 7290) of Division 7 of Title 1 of the Government Code. A privately owned water supplier shall provide an equivalent notice within its service area. After the hearing or hearings, the plan or water shortage contingency plan shall be adopted as prepared or as modified after the hearing or hearings.
CWC § 10631 (a) A plan shall be adopted in accordance with this chapter that shall do all of the following:
Urban water suppliers shall coordinate with local or regional land use authorities to determine the most appropriate land use information, including, where appropriate, land use information obtained from local or regional land use authorities, as developed pursuant to Article 5 (commencing with Section 65300) of Chapter 3 of Division 1 of Title 7 of the Government Code.
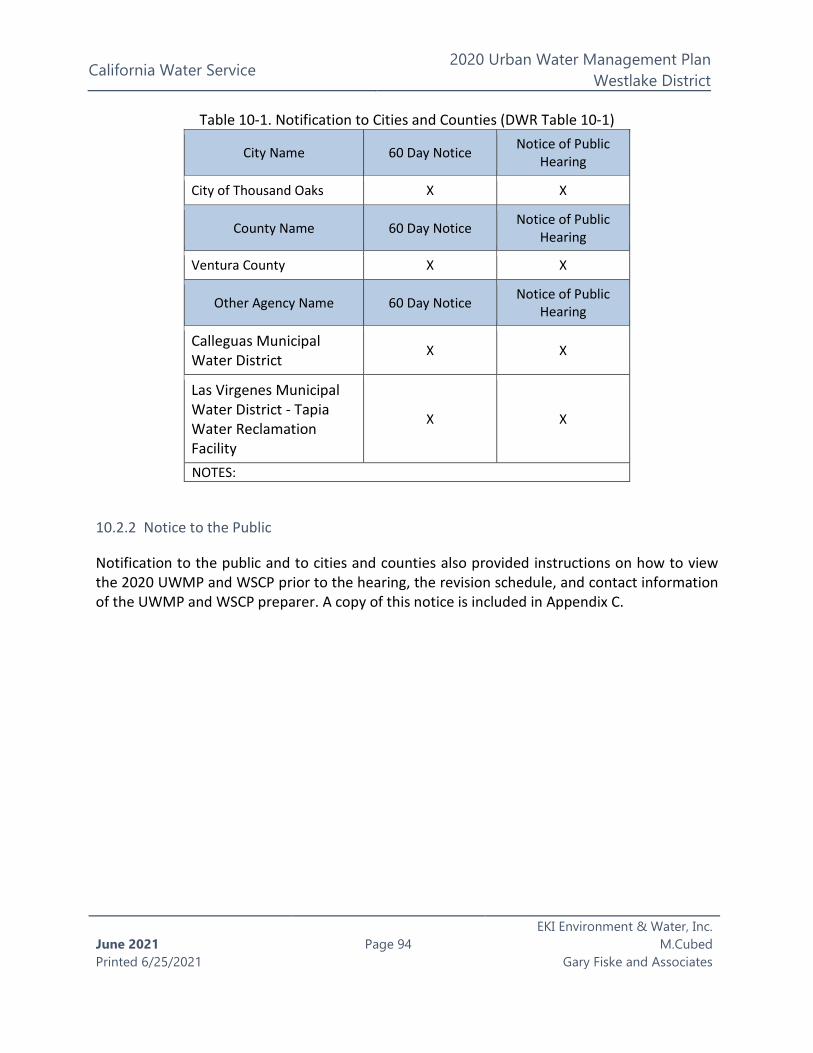
California Water Service 2020 Urban Water Management Plan
Westlake District
June 2021 Printed 6/25/2021
Page 94
EKI Environment & Water, Inc. M.Cubed
Gary Fiske and Associates
Table 10-1. Notification to Cities and Counties (DWR Table 10-1)
City Name 60 Day Notice Notice of Public Hearing
City of Thousand Oaks X X
County Name 60 Day Notice Notice of Public Hearing
Ventura County X X
Other Agency Name 60 Day Notice Notice of Public Hearing
Calleguas Municipal Water District
X X
Las Virgenes Municipal Water District - Tapia Water Reclamation Facility
X X
NOTES:
10.2.2 Notice to the Public
Notification to the public and to cities and counties also provided instructions on how to view the 2020 UWMP and WSCP prior to the hearing, the revision schedule, and contact information of the UWMP and WSCP preparer. A copy of this notice is included in Appendix C.

California Water Service 2020 Urban Water Management Plan
Westlake District
June 2021 Printed 6/25/2021
Page 95
EKI Environment & Water, Inc. M.Cubed
Gary Fiske and Associates
10.3 Public Hearing and Adoption
The deadline for public comments on the UWMP and WSCP was June 2, 2021, one week after the public hearing. The final Plan was formally adopted by Cal Water’s Vice President of Engineering June 20, 2021, and was submitted to California Department of Water Resources (DWR) within 30 days of approval. Appendix I presents a copy of the signed Resolution of Plan Adoption. Appendix B contains the following:
• Letters sent to and received from various agencies regarding this plan, and
• Correspondence between Cal Water and participating agencies.
CWC § 10608.26
(a) In complying with this part, an urban retail water supplier shall conduct at least one public hearing to accomplish all of the following:
(1) Allow community input regarding the urban retail water supplier’s implementation plan for complying with this part.
(2) Consider the economic impacts of the urban retail water supplier’s implementation plan for complying with this part.
(3) Adopt a method, pursuant to subdivision (b) of Section 10608.20, for determining its urban water use target.
CWC § 10621 (b)
Every urban water supplier required to prepare a plan pursuant to this part shall, at least 60 days before the public hearing on the plan required by Section 10642, notify any city or county within which the supplier provides water supplies that the urban water supplier will be reviewing the plan and considering amendments or changes to the plan. The urban water supplier may consult with, and obtain comments from, any city or county that receives notice pursuant to this subdivision.

California Water Service 2020 Urban Water Management Plan
Westlake District
June 2021 Printed 6/25/2021
Page 96
EKI Environment & Water, Inc. M.Cubed
Gary Fiske and Associates
10.4 Plan Submittal
This 2020 UWMP and WSCP were submitted to DWR within 30 days of adoption and by the July 1, 2021 deadline. The submittal was done electronically through Water Use Efficiency Data Portal, an online submittal tool. The adopted UWMP and WSCP were also sent to the California State Library and to the cities and counties listed in Table 10-1 no later than 30 days after adoption.
10.5 Public Availability
On or about May 3, 2021, an electronic version of the draft 2020 UWMP and WSCP were made available for review by visiting Cal Water’s website: https://www.calwater.com/conservation/uwmp-review/. 27
27 Restrictions related to the COVID-19 pandemic prevented the District from making a printed hard-copy available for public review as previously planned.
CWC § 10621 (f)
(1) Each urban water supplier shall update and submit its 2020 plan to the department by July 1, 2021.
CWC § 10635 (c)
The urban water supplier shall provide that portion of its urban water management plan prepared pursuant to this article to any city or county within which it provides water supplies no later than 60 days after the submission of its urban water management plan.
CWC § 10644 (a)
(1) An urban water supplier shall submit to the department, the California State Library, and any city or county within which the supplier provides water supplies a copy of its plan no later than 30 days after adoption. Copies of amendments or changes to the plans shall be submitted to the department, the California State Library, and any city or county within which the supplier provides water supplies within 30 days after adoption.
(2) The plan, or amendments to the plan, submitted to the department pursuant to paragraph (1) shall be submitted electronically and shall include any standardized forms, tables, or displays specified by the
CWC § 10645
(a) Not later than 30 days after filing a copy of its plan with the department, the urban water supplier and the department shall make the plan available for public review during normal business hours.
(b) Not later than 30 days after filing a copy of its water shortage contingency plan with the department, the urban water supplier and the department shall make the plan available for public review during normal business hours.
California Water Service 2020 Urban Water Management Plan
Westlake District
June 2021 Printed 6/25/2021
Page 97
EKI Environment & Water, Inc. M.Cubed
Gary Fiske and Associates
10.6 Notification of Public Utilities Commission
Cal Water is an urban water supplier regulated by the California Public Utilities Commission. Cal Water included the District’s 2020 UWMP and WSCP as part of its general rate case filings.
10.7 Amending an Adopted UWMP or Water Shortage Contingency Plan
If the 2020 UWMP or WSCP is amended, each of the steps for notification, public hearing, adoption and submittal will also be followed for the amended document.
CWC § 10621 (c)
An urban water supplier regulated by the Public Utilities Commission shall include its most recent plan and water shortage contingency plan as part of the supplier’s general rate case filings.
CWC § 10644 (b)
If an urban water supplier revises its water shortage contingency plan, the supplier shall submit to the department a copy of its water shortage contingency plan prepared pursuant to subdivision (a) of Section 10632 no later than 30 days after adoption, in accordance with protocols for submission and using electronic reporting tools developed by the department.
California Water Service 2020 Urban Water Management Plan
Westlake District
June 2021 Printed 6/25/2021
Page A-1
EKI Environment & Water, Inc. M.Cubed
Gary Fiske and Associates
Appendix A: UWMP Act Checklist
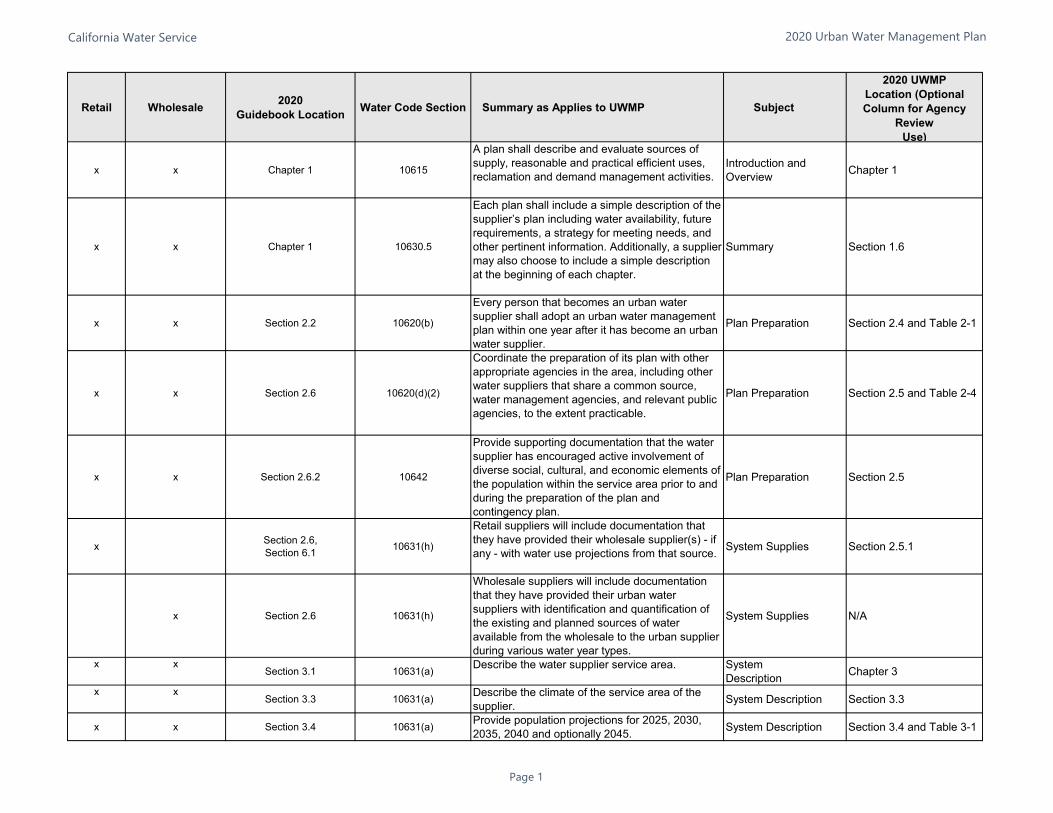
California Water Service 2020 Urban Water Management Plan
Retail Wholesale 2020Guidebook Location Water Code Section Summary as Applies to UWMP Subject
2020 UWMPLocation (Optional Column for Agency
ReviewUse)
x x Chapter 1 10615
A plan shall describe and evaluate sources of supply, reasonable and practical efficient uses, reclamation and demand management activities.
Introduction and Overview Chapter 1
x x Chapter 1 10630.5
Each plan shall include a simple description of the supplier’s plan including water availability, future requirements, a strategy for meeting needs, and other pertinent information. Additionally, a supplier may also choose to include a simple description at the beginning of each chapter.
Summary Section 1.6
x x Section 2.2 10620(b)
Every person that becomes an urban water supplier shall adopt an urban water management plan within one year after it has become an urban water supplier.
Plan Preparation Section 2.4 and Table 2-1
x x Section 2.6 10620(d)(2)
Coordinate the preparation of its plan with other appropriate agencies in the area, including other water suppliers that share a common source, water management agencies, and relevant public agencies, to the extent practicable.
Plan Preparation Section 2.5 and Table 2-4
x x Section 2.6.2 10642
Provide supporting documentation that the water supplier has encouraged active involvement of diverse social, cultural, and economic elements of the population within the service area prior to and during the preparation of the plan and contingency plan.
Plan Preparation Section 2.5
x Section 2.6,Section 6.1 10631(h)
Retail suppliers will include documentation that they have provided their wholesale supplier(s) - if any - with water use projections from that source. System Supplies Section 2.5.1
x Section 2.6 10631(h)
Wholesale suppliers will include documentation that they have provided their urban water suppliers with identification and quantification of the existing and planned sources of water available from the wholesale to the urban supplier during various water year types.
System Supplies N/A
x xSection 3.1 10631(a) Describe the water supplier service area. System
Description Chapter 3
x xSection 3.3 10631(a) Describe the climate of the service area of the
supplier. System Description Section 3.3
x x Section 3.4 10631(a) Provide population projections for 2025, 2030, 2035, 2040 and optionally 2045. System Description Section 3.4 and Table 3-1
Page 1

California Water Service 2020 Urban Water Management Plan
Retail Wholesale 2020Guidebook Location Water Code Section Summary as Applies to UWMP Subject
2020 UWMPLocation (Optional Column for Agency
ReviewUse)
x xSection 3.4.2 10631(a)
Describe other social, economic, and demographic factors affecting the supplier’s water management planning.
System Description Section 3.4 and Table 3-2
x xSections 3.4 and
5.4 10631(a) Indicate the current population of the service area.
System Description and Baselinesand Targets
Setion 3.4 and Table 3-1
x xSection 3.5 10631(a) Describe the land uses within the service area. System
Description Section 3.5
x xSection 4.2 10631(d)(1)
Quantify past, current, and projected water use, identifying the uses among water use sectors. System Water Use Section 4.2 and Tables 4-
1 to 4-3
x x Section 4.2.4 10631(d)(3)(C) Retail suppliers shall provide data to show the distribution loss standards were met. System Water Use Section 4.2.3
x xSection 4.2.6 10631(d)(4)(A)
In projected water use, include estimates of water savings from adopted codes, plans, and other policies or laws.
System Water Use Section 4.2.4 and Tables 4-5 and 4-6
x xSection 4.2.6 10631(d)(4)(B)
Provide citations of codes, standards, ordinances, or plans used to make water use projections. System Water Use Section 4.2.4
x optional Section 4.3.2.4 10631(d)(3)(A) Report the distribution system water loss for each of the 5 years preceding the plan update. System Water Use Section 4.2.3 and Table 4-
4x
optional Section 4.4 10631.1(a)Include projected water use needed for lower income housing projected in the service area of the supplier.
System Water Use Section 4.2.5 and Table 4-7
x xSection 4.5 10635(b)
Demands under climate change considerations must be included as part of the drought risk assessment.
System Water Use Section 7.5.1
x Chapter 5 10608.20(e)
Retail suppliers shall provide baseline daily per capita water use, urban water use target, interim urban water use target, and compliance daily per capita water use, along with the bases for determining those estimates, including references to supporting data.
Baselines and Targets Chapter 5
x Chapter 5 10608.24(a) Retail suppliers shall meet their water use target by December 31, 2020. Baselines and Targets Section 5.5 and Table 5-2
x Section 5.1 10608.36
Wholesale suppliers shall include an assessment of present and proposed future measures, programs, and policies to help their retail water suppliers achieve targeted water use reductions.
Baselines and Targets N/A
Page 2
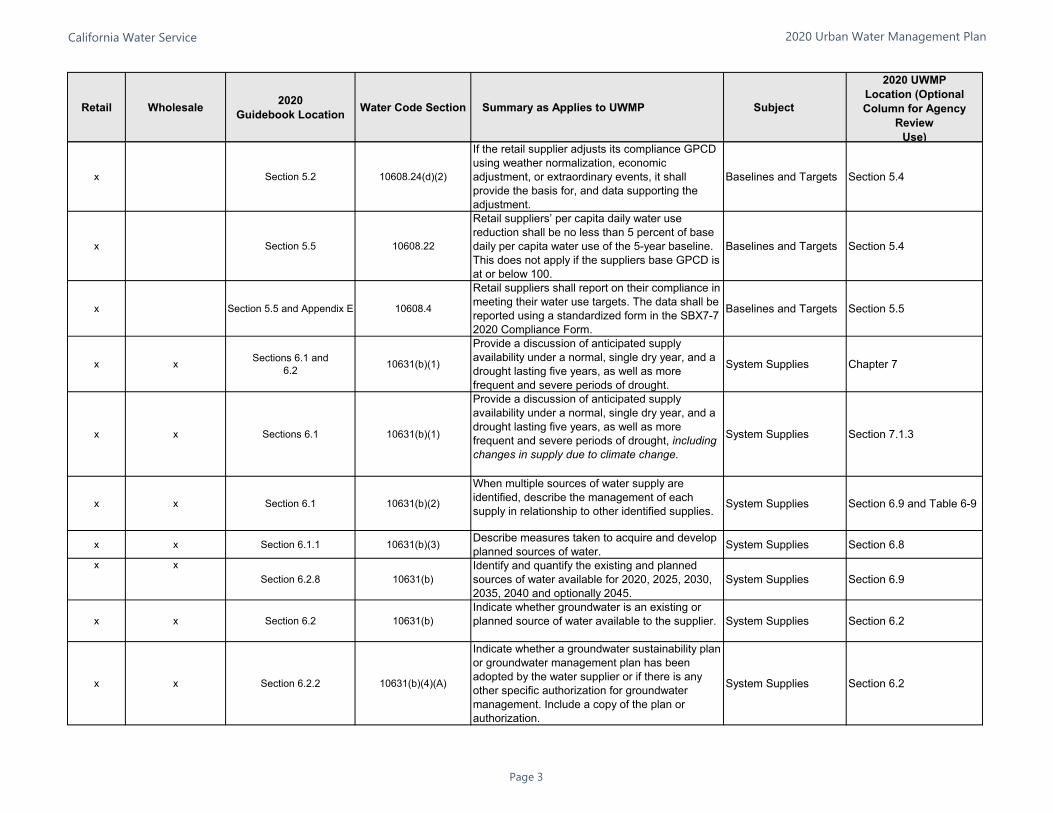
California Water Service 2020 Urban Water Management Plan
Retail Wholesale 2020Guidebook Location Water Code Section Summary as Applies to UWMP Subject
2020 UWMPLocation (Optional Column for Agency
ReviewUse)
x Section 5.2 10608.24(d)(2)
If the retail supplier adjusts its compliance GPCD using weather normalization, economic adjustment, or extraordinary events, it shall provide the basis for, and data supporting the adjustment.
Baselines and Targets Section 5.4
x Section 5.5 10608.22
Retail suppliers’ per capita daily water use reduction shall be no less than 5 percent of base daily per capita water use of the 5-year baseline. This does not apply if the suppliers base GPCD is at or below 100.
Baselines and Targets Section 5.4
x Section 5.5 and Appendix E 10608.4
Retail suppliers shall report on their compliance in meeting their water use targets. The data shall be reported using a standardized form in the SBX7-7 2020 Compliance Form.
Baselines and Targets Section 5.5
x x Sections 6.1 and6.2 10631(b)(1)
Provide a discussion of anticipated supply availability under a normal, single dry year, and a drought lasting five years, as well as more frequent and severe periods of drought.
System Supplies Chapter 7
x x Sections 6.1 10631(b)(1)
Provide a discussion of anticipated supply availability under a normal, single dry year, and a drought lasting five years, as well as more frequent and severe periods of drought, including changes in supply due to climate change.
System Supplies Section 7.1.3
x x Section 6.1 10631(b)(2)
When multiple sources of water supply are identified, describe the management of each supply in relationship to other identified supplies. System Supplies Section 6.9 and Table 6-9
x x Section 6.1.1 10631(b)(3) Describe measures taken to acquire and develop planned sources of water. System Supplies Section 6.8
x xSection 6.2.8 10631(b)
Identify and quantify the existing and planned sources of water available for 2020, 2025, 2030, 2035, 2040 and optionally 2045.
System Supplies Section 6.9
x x Section 6.2 10631(b)Indicate whether groundwater is an existing or planned source of water available to the supplier. System Supplies Section 6.2
x x Section 6.2.2 10631(b)(4)(A)
Indicate whether a groundwater sustainability plan or groundwater management plan has been adopted by the water supplier or if there is any other specific authorization for groundwater management. Include a copy of the plan or authorization.
System Supplies Section 6.2
Page 3
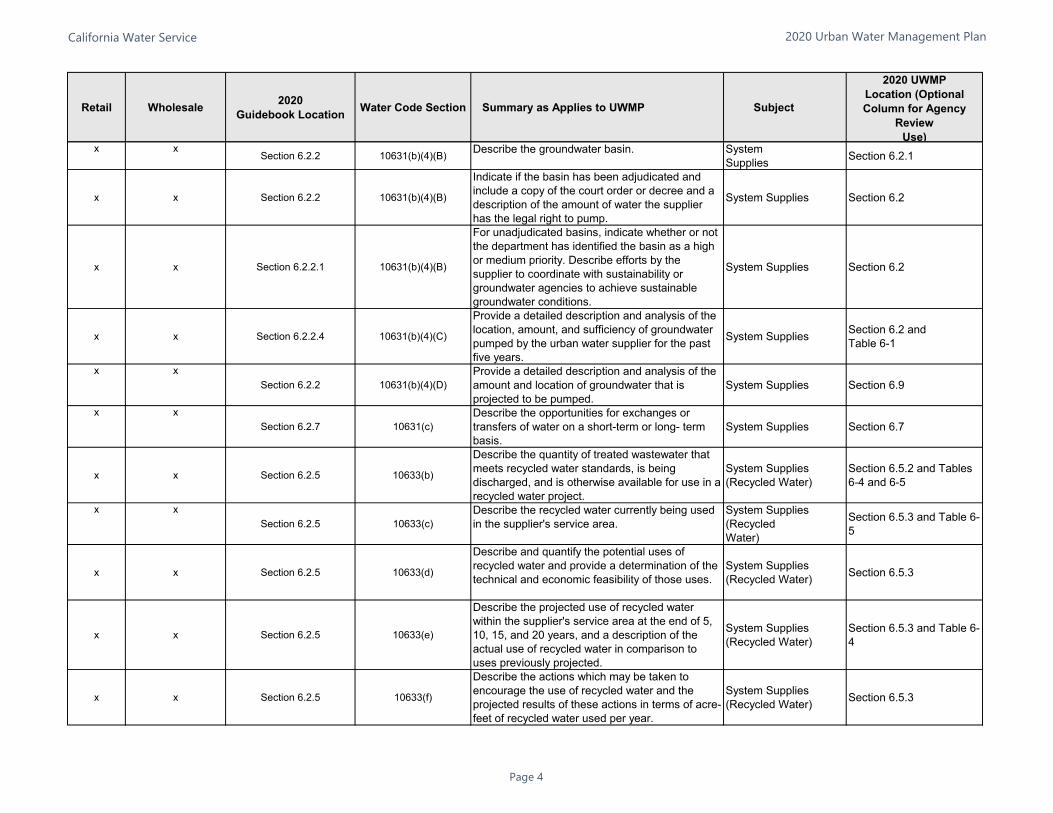
California Water Service 2020 Urban Water Management Plan
Retail Wholesale 2020Guidebook Location Water Code Section Summary as Applies to UWMP Subject
2020 UWMPLocation (Optional Column for Agency
ReviewUse)
x xSection 6.2.2 10631(b)(4)(B) Describe the groundwater basin. System
Supplies Section 6.2.1
x x Section 6.2.2 10631(b)(4)(B)
Indicate if the basin has been adjudicated and include a copy of the court order or decree and a description of the amount of water the supplier has the legal right to pump.
System Supplies Section 6.2
x x Section 6.2.2.1 10631(b)(4)(B)
For unadjudicated basins, indicate whether or not the department has identified the basin as a high or medium priority. Describe efforts by the supplier to coordinate with sustainability or groundwater agencies to achieve sustainable groundwater conditions.
System Supplies Section 6.2
x x Section 6.2.2.4 10631(b)(4)(C)
Provide a detailed description and analysis of the location, amount, and sufficiency of groundwater pumped by the urban water supplier for the past five years.
System Supplies Section 6.2 and Table 6-1
x xSection 6.2.2 10631(b)(4)(D)
Provide a detailed description and analysis of the amount and location of groundwater that is projected to be pumped.
System Supplies Section 6.9
x xSection 6.2.7 10631(c)
Describe the opportunities for exchanges or transfers of water on a short-term or long- term basis.
System Supplies Section 6.7
x x Section 6.2.5 10633(b)
Describe the quantity of treated wastewater that meets recycled water standards, is being discharged, and is otherwise available for use in a recycled water project.
System Supplies (Recycled Water)
Section 6.5.2 and Tables 6-4 and 6-5
x xSection 6.2.5 10633(c)
Describe the recycled water currently being used in the supplier's service area.
System Supplies (RecycledWater)
Section 6.5.3 and Table 6-5
x x Section 6.2.5 10633(d)
Describe and quantify the potential uses of recycled water and provide a determination of the technical and economic feasibility of those uses.
System Supplies (Recycled Water) Section 6.5.3
x x Section 6.2.5 10633(e)
Describe the projected use of recycled water within the supplier's service area at the end of 5, 10, 15, and 20 years, and a description of the actual use of recycled water in comparison to uses previously projected.
System Supplies (Recycled Water)
Section 6.5.3 and Table 6-4
x x Section 6.2.5 10633(f)
Describe the actions which may be taken to encourage the use of recycled water and the projected results of these actions in terms of acre-feet of recycled water used per year.
System Supplies (Recycled Water) Section 6.5.3
Page 4
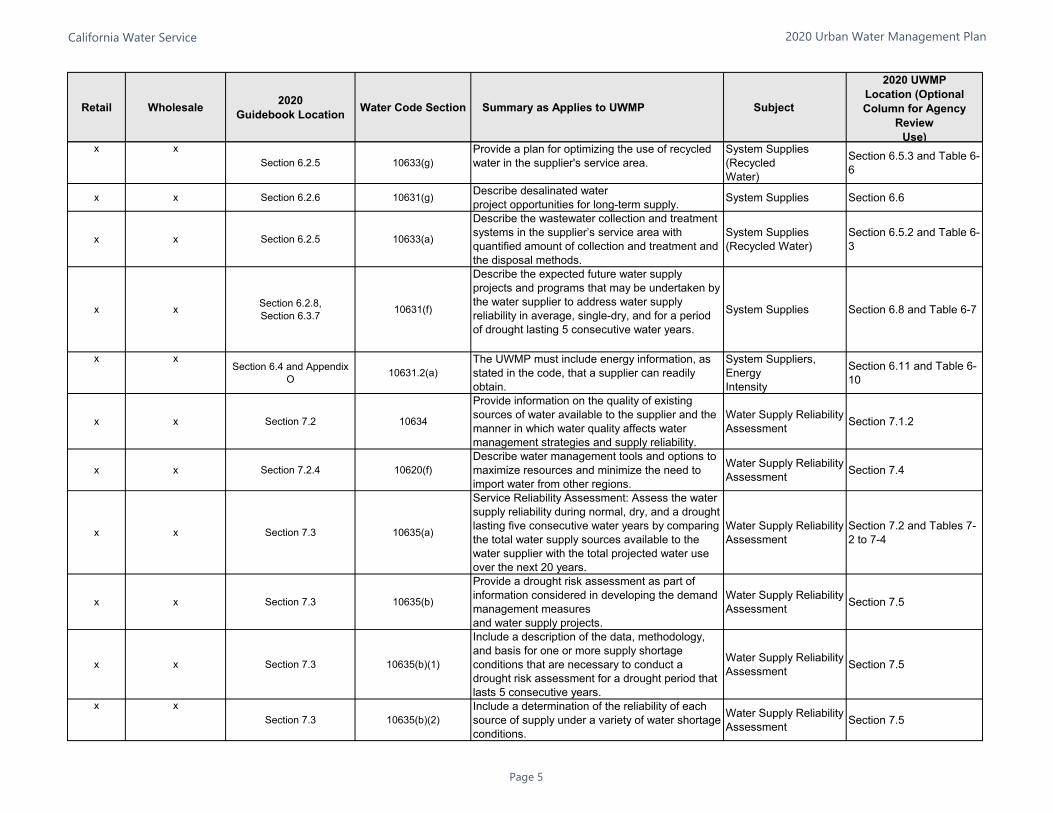
California Water Service 2020 Urban Water Management Plan
Retail Wholesale 2020Guidebook Location Water Code Section Summary as Applies to UWMP Subject
2020 UWMPLocation (Optional Column for Agency
ReviewUse)
x xSection 6.2.5 10633(g)
Provide a plan for optimizing the use of recycled water in the supplier's service area.
System Supplies (RecycledWater)
Section 6.5.3 and Table 6-6
x x Section 6.2.6 10631(g) Describe desalinated waterproject opportunities for long-term supply. System Supplies Section 6.6
x x Section 6.2.5 10633(a)
Describe the wastewater collection and treatment systems in the supplier’s service area with quantified amount of collection and treatment and the disposal methods.
System Supplies (Recycled Water)
Section 6.5.2 and Table 6-3
x x Section 6.2.8,Section 6.3.7 10631(f)
Describe the expected future water supply projects and programs that may be undertaken by the water supplier to address water supply reliability in average, single-dry, and for a period of drought lasting 5 consecutive water years.
System Supplies Section 6.8 and Table 6-7
x xSection 6.4 and Appendix
O 10631.2(a)The UWMP must include energy information, as stated in the code, that a supplier can readily obtain.
System Suppliers, EnergyIntensity
Section 6.11 and Table 6-10
x x Section 7.2 10634
Provide information on the quality of existing sources of water available to the supplier and the manner in which water quality affects water management strategies and supply reliability.
Water Supply Reliability Assessment Section 7.1.2
x x Section 7.2.4 10620(f)Describe water management tools and options to maximize resources and minimize the need to import water from other regions.
Water Supply Reliability Assessment Section 7.4
x x Section 7.3 10635(a)
Service Reliability Assessment: Assess the water supply reliability during normal, dry, and a drought lasting five consecutive water years by comparing the total water supply sources available to the water supplier with the total projected water use over the next 20 years.
Water Supply Reliability Assessment
Section 7.2 and Tables 7-2 to 7-4
x x Section 7.3 10635(b)
Provide a drought risk assessment as part of information considered in developing the demand management measuresand water supply projects.
Water Supply Reliability Assessment Section 7.5
x x Section 7.3 10635(b)(1)
Include a description of the data, methodology, and basis for one or more supply shortage conditions that are necessary to conduct a drought risk assessment for a drought period that lasts 5 consecutive years.
Water Supply Reliability Assessment Section 7.5
x xSection 7.3 10635(b)(2)
Include a determination of the reliability of each source of supply under a variety of water shortage conditions.
Water Supply Reliability Assessment Section 7.5
Page 5

California Water Service 2020 Urban Water Management Plan
Retail Wholesale 2020Guidebook Location Water Code Section Summary as Applies to UWMP Subject
2020 UWMPLocation (Optional Column for Agency
ReviewUse)
x x Section 7.3 10635(b)(3)Include a comparison of the total water supply sources available to the water supplier with the total projected water use for the drought period.
Water Supply Reliability Assessment Section 7.5 and Table 7-5
x x Section 7.3 10635(b)(4)
Include considerations of the historical drought hydrology, plausible changes on projected supplies and demands under climate change conditions, anticipated regulatory changes, and other locally applicable criteria.
Water Supply Reliability Assessment Section 7.5
x xChapter 8 10632(a)
Provide a water shortage contingency plan (WSCP) with specified elements below.
Water Shortage ContingencyPlanning
Appendix H
x xChapter 8 10632(a)(1)
Provide the analysis of water supply reliability (from Chapter 7 of Guidebook) in the WSCP.
Water Shortage ContingencyPlanning
Appendix H
x x Section 8.10 10632(a)(10)
Describe reevaluation and improvement procedures for monitoring and evaluation the water shortage contingency plan to ensure risk tolerance is adequate and appropriate water shortage mitigation strategies are implemented.
Water Shortage Contingency Planning Appendix H
x x Section 8.2 10632(a)(2)(A)Provide the written decision- making process and other methods that the supplier will use each year to determine its water reliability.
Water Shortage Contingency Planning Appendix H
x x Section 8.2 10632(a)(2)(B)
Provide data and methodology to evaluate the supplier’s water reliability for the current year and one dry year pursuant to factors in the code.
Water Shortage Contingency Planning Appendix H
x x Section 8.3 10632(a)(3)(A)
Define six standard water shortage levels of 10, 20, 30, 40, 50 percent shortage and greater than 50 percent shortage. These levels shall be based on supply conditions, including percent reductions in supply, changes in groundwater levels, changes in surface elevation, or other conditions. The shortage levels shall also apply to a catastrophic interruption of supply.
Water Shortage Contingency Planning Appendix H
x x Section 8.3 10632(a)(3)(B)
Suppliers with an existing water shortage contingency plan that uses different water shortage levels must cross reference their categories with the six standard categories.
Water Shortage Contingency Planning Appendix H
x x Section 8.4 10632(a)(4)(A)
Suppliers with water shortage contingency plans that align with the defined shortage levels must specify locally appropriate supply augmentation actions.
Water Shortage Contingency Planning Appendix H
Page 6
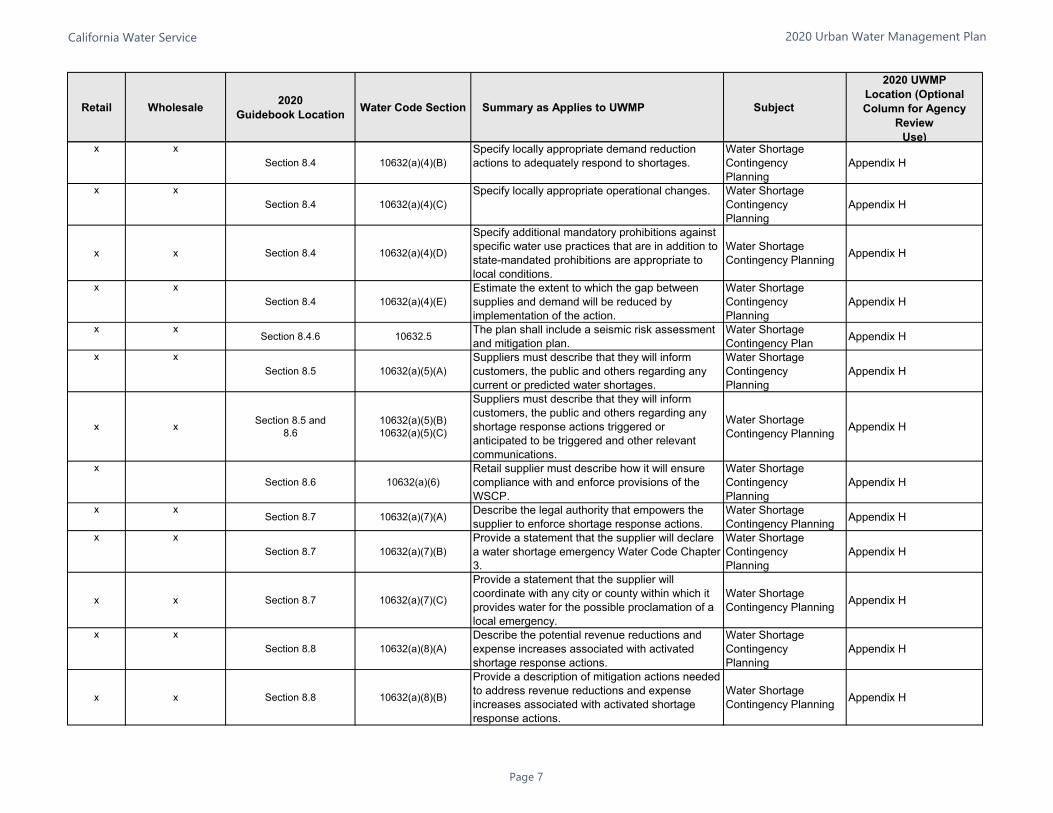
California Water Service 2020 Urban Water Management Plan
Retail Wholesale 2020Guidebook Location Water Code Section Summary as Applies to UWMP Subject
2020 UWMPLocation (Optional Column for Agency
ReviewUse)
x xSection 8.4 10632(a)(4)(B)
Specify locally appropriate demand reduction actions to adequately respond to shortages.
Water Shortage ContingencyPlanning
Appendix H
x xSection 8.4 10632(a)(4)(C)
Specify locally appropriate operational changes. Water Shortage ContingencyPlanning
Appendix H
x x Section 8.4 10632(a)(4)(D)
Specify additional mandatory prohibitions against specific water use practices that are in addition to state-mandated prohibitions are appropriate to local conditions.
Water Shortage Contingency Planning Appendix H
x xSection 8.4 10632(a)(4)(E)
Estimate the extent to which the gap between supplies and demand will be reduced by implementation of the action.
Water Shortage ContingencyPlanning
Appendix H
x xSection 8.4.6 10632.5 The plan shall include a seismic risk assessment
and mitigation plan.Water ShortageContingency Plan Appendix H
x xSection 8.5 10632(a)(5)(A)
Suppliers must describe that they will inform customers, the public and others regarding any current or predicted water shortages.
Water Shortage ContingencyPlanning
Appendix H
x x Section 8.5 and8.6
10632(a)(5)(B)10632(a)(5)(C)
Suppliers must describe that they will inform customers, the public and others regarding any shortage response actions triggered or anticipated to be triggered and other relevant communications.
Water Shortage Contingency Planning Appendix H
xSection 8.6 10632(a)(6)
Retail supplier must describe how it will ensure compliance with and enforce provisions of the WSCP.
Water Shortage ContingencyPlanning
Appendix H
x xSection 8.7 10632(a)(7)(A) Describe the legal authority that empowers the
supplier to enforce shortage response actions.Water ShortageContingency Planning Appendix H
x xSection 8.7 10632(a)(7)(B)
Provide a statement that the supplier will declare a water shortage emergency Water Code Chapter 3.
Water Shortage ContingencyPlanning
Appendix H
x x Section 8.7 10632(a)(7)(C)
Provide a statement that the supplier will coordinate with any city or county within which it provides water for the possible proclamation of a local emergency.
Water Shortage Contingency Planning Appendix H
x xSection 8.8 10632(a)(8)(A)
Describe the potential revenue reductions and expense increases associated with activated shortage response actions.
Water Shortage ContingencyPlanning
Appendix H
x x Section 8.8 10632(a)(8)(B)
Provide a description of mitigation actions needed to address revenue reductions and expense increases associated with activated shortage response actions.
Water Shortage Contingency Planning Appendix H
Page 7

California Water Service 2020 Urban Water Management Plan
Retail Wholesale 2020Guidebook Location Water Code Section Summary as Applies to UWMP Subject
2020 UWMPLocation (Optional Column for Agency
ReviewUse)
x Section 8.8 10632(a)(8)(C)
Retail suppliers must describe the cost of compliance with Water Code Chapter 3.3: Excessive Residential Water Use During Drought.
Water Shortage Contingency Planning Appendix H
x Section 8.9 10632(a)(9)
Retail suppliers must describe the monitoring and reporting requirements and procedures that ensure appropriate data is collected, tracked, and analyzed for purposes of monitoring customer compliance.
Water Shortage Contingency Planning Appendix H
x Section 8.11 10632(b)
Analyze and define water features that are artificially supplied with water, including ponds, lakes, waterfalls, and fountains, separately from swimming pools and spas.
Water Shortage Contingency Planning Appendix H
x x Sections 8.12 and10.4 10635(c)
Provide supporting documentation that Water Shortage Contingency Plan has been, or will be, provided to any city or county within which it provides water, no later than 30 days after the submission of the plan to DWR.
Plan Adoption, Submittal, and Implementation
Section 10.3
x x Section 8.14 10632(c)
Make available the Water Shortage Contingency Plan to customers and any city or county where it provides water within 30 after adopted the plan.
Water Shortage Contingency Planning Section 10.4
x Sections 9.1 and9.3 10631(e)(2)
Wholesale suppliers shall describe specific demand management measures listed in code, their distribution system asset management program, and supplier assistance program.
Demand Management Measures N/A
x Sections 9.2 and9.3 10631(e)(1)
Retail suppliers shall provide a description of the nature and extent of each demand management measure implemented over the past five years. The description will address specific measures listed in code.
Demand Management Measures Chapter 9
x Chapter 10 10608.26(a)
Retail suppliers shall conduct a public hearing to discuss adoption, implementation, and economic impact of water use targets (recommended to discuss compliance).
Plan Adoption, Submittal, and Implementation
Section 10.3
x x Section 10.2.1 10621(b)
Notify, at least 60 days prior to the public hearing, any city or county within which the supplier provides water that the urban water supplier will be reviewing the plan and considering amendments or changes to the plan. Reported in Table 10-1.
Plan Adoption, Submittal, and Implementation
Section 10.2
Page 8

California Water Service 2020 Urban Water Management Plan
Retail Wholesale 2020Guidebook Location Water Code Section Summary as Applies to UWMP Subject
2020 UWMPLocation (Optional Column for Agency
ReviewUse)
x x Section 10.4 10621(f)Each urban water supplier shall update and submit its 2020 plan to the department by July 1, 2021.
Plan Adoption, Submittal, andImplementation
Section 10.4
x x Sections 10.2.2,10.3, and 10.5 10642
Provide supporting documentation that the urban water supplier made the plan and contingency plan available for public inspection, published notice of the public hearing, and held a public hearing about the plan and contingency plan.
Plan Adoption, Submittal, and Implementation
Chapter 10
x xSection 10.2.2 10642
The water supplier is to provide the time and place of the hearing to any city or county within which the supplier provides water.
Plan Adoption, Submittal, and Implementation
Section 10.2.1
x xSection 10.3.2 10642
Provide supporting documentation that the plan and contingency plan has been adopted as prepared or modified.
Plan Adoption, Submittal, and Implementation
Section 10.3
x xSection 10.4 10644(a)
Provide supporting documentation that the urban water supplier has submitted this UWMP to the California State Library.
Plan Adoption, Submittal, and Implementation
Section 10.4
x x Section 10.4 10644(a)(1)
Provide supporting documentation that the urban water supplier has submitted this UWMP to any city or county within which the supplierprovides water no later than 30 days after adoption.
Plan Adoption, Submittal, and Implementation
Section 10.4
x x Sections 10.4.1and 10.4.2 10644(a)(2)
The plan, or amendments to the plan, submitted to the department shall be submitted electronically.
Plan Adoption, Submittal, andImplementation
Section 10.4
x x Section 10.5 10645(a)
Provide supporting documentation that, not later than 30 days after filing a copy of its plan with the department, the supplier has or will make the plan available for public review during normal business hours.
Plan Adoption, Submittal, and Implementation
Section 10.5
x x Section 10.5 10645(b)
Provide supporting documentation that, not later than 30 days after filing a copy of its water shortage contingency plan with the department, the supplier has or will make the plan available for public review during normal business hours.
Plan Adoption, Submittal, and Implementation
Section 10.5
x x Section 10.6 10621(c)If supplier is regulated by the Public Utilities Commission, include its plan and contingencyplan as part of its general rate case filings.
Plan Adoption, Submittal, and Implementation
Section 10.6
x xSection 10.7.2 10644(b)
If revised, submit a copy of the water shortage contingency plan to DWR within 30 days ofadoption.
Plan Adoption, Submittal, and Implementation
Section 10.7
Page 9

California Water Service 2020 Urban Water Management Plan
Westlake District
June 2021 Printed 6/25/2021
Page B-1
EKI Environment & Water, Inc. M.Cubed
Gary Fiske and Associates
Appendix B: Correspondence
• UWMP Notice of Preparation • District Mailing List • Growth Projection and Land Use Letter • UWMP and WSCP Public Draft Comments
Note: There were no public comments received on the UWMP or WSCP Public Draft.

Notice of Preparation of Urban Water Management Plan and Water Shortage Contingency Plan - 2020 Update
The Urban Water Management Planning Act (California Water Code §10608–10656) requires that California Water Service (Cal Water) update its Urban Water Management Plan (UWMP) and associated Water Shortage Contingency Plan (WSCP) every 5 years. Cal Water is currently reviewing its existing UWMP and associated WSCP, which were updated in 2016, and considering revisions for each plan. Coordination with other water suppliers, cities, counties, and community organizations in the region is an important part of the preparation of Cal Water’s UWMP and WSCP. We are available to discuss the assumptions used in the development of the plans including available water supply, water demands, land use, as well as other aspects of the plans. A draft of the 2020 UWMP and WSCP will be made available for public review and a public hearing will be scheduled in Spring 2021. We will notify you when the draft is available for review, how to access it, and details regarding the public hearing. The updated UWMP and WSCP are due by July 1, 2021. If you would like more information regarding our 2015 UWMP and WSCP and the schedule for updating these documents, or if you would like to participate in the preparation of the 2020 UWMP and WSCP, please contact:
Michael Bolzowski Senior Engineer
California Water Service Phone: (408) 367-8338
Email: [email protected]

Dan Drugan Manager of Water Resources Calleguas Municipal Water District [email protected]
Andrew Powers City Manager City of Thousand Oaks [email protected]
Cliff Finley Public Works Director City of Thousand Oaks [email protected]
Cynthia Rodriguez City Clerk City of Thousand Oaks [email protected]
Dave Ward Planning Director County of Ventura, Planning Division [email protected]
Mark Lunn County Clerk Ventura County [email protected]
David Peterson General Manager Las Virgenes Municipal Water District ‐ Tapia Water Reclamation Facility [email protected]
Michael Powers County Executive Officer Ventura County [email protected]
Al Adam Council Member City of Thousand Oaks [email protected]
Bob Huber Supervisor Ventura County Board of Supervisors [email protected]
Claudia Bill‐de la Pena Mayor City of Thousand Oaks [email protected]
Matt LaVere Supervisor Ventura County Board of Supervisors [email protected]
Bob Engler Mayor Pro Tem City of Thousand Oaks [email protected]
Kelly Long Supervisor Ventura County Board of Supervisors [email protected]
Ed Jones Council Member City of Thousand Oaks [email protected]
Linda Parks Board Chair Ventura County Board of Supervisors [email protected]
Kevin McNamee Council Member City of Thousand Oaks [email protected]
Brad Coffey Group Manager, Water Resources Group Metropolitan Water District of Southern California [email protected]

1
Bolzowski, Michael R.
From: Hurley, Michael
Sent: Tuesday, May 18, 2021 1:56 PM
Cc: Varney, Douglas; Lundy, Rocky; Bolzowski, Michael R.
Subject: Cal Water's 2020 Draft UWMP for its Westlake District
Attachments: Westlake (TO CM) - Cal Water UWMP_Land Use Coordination.pdf
Dear Mr. Powers,
California Water Service (Cal Water) is currently updating its Urban Water Management Plan (UWMP) and Water Shortage Contingency Plan (WSCP) to reflect water service conditions in its Westlake District. The Westlake District serves portions of the City of Thousand Oaks in Ventura County.
The State requires all urban water suppliers that provide water for municipal purposes either directly or indirectly to more than 3,000 customers or supply more than 3,000 acre-feet of water annually to prepare an UWMP and WSCP at least once every five years. These documents support Cal Water’s long-term resource planning to ensure that adequate water supplies are available to meet existing and future water demands under defined conditions.
Cal Water's estimates of future water demands are based on demographic projections and current and projected land use forecasts for each of its service area. For the Westlake service area, Cal Water's water demand forecast is tied to Southern California Association of Governments (SCAG) census tract level projections of population, housing, and employment. These projections, in turn, are developed by SCAG through detailed land use, demographic, and transportation modeling.
The UWMP also incorporates water supply assessments (WSA) for projects in or near the Westlake District into the demand forecast. As additional large-scale projects and/or specified land use planning processes arise (e.g., general plans, specific plans), additional WSAs will be developed to consider their impacts on available supplies.
We have attached the current public review draft of the UWMP, and incorporated WSCP for your review. Please share this with others in your organization that may be interested in the information.
Cal Water is available to discuss the assumptions used in the development of the UWMP for the Westlake District, including available supply, water demands, land use, as well as any other aspects of the plan.
Should you have any questions or comments, please contact Michael Bolzowski at [email protected].
Sincerely,
Michael B. Hurley Water Resources Manager

California Water Service 2020 Urban Water Management Plan
Westlake District
June 2021 Printed 6/25/2021
Page C-1
EKI Environment & Water, Inc. M.Cubed
Gary Fiske and Associates
Appendix C: Public Meeting Notice
• Public Meeting Notice of Intent • Proof of Publication • Public Meeting Presentation
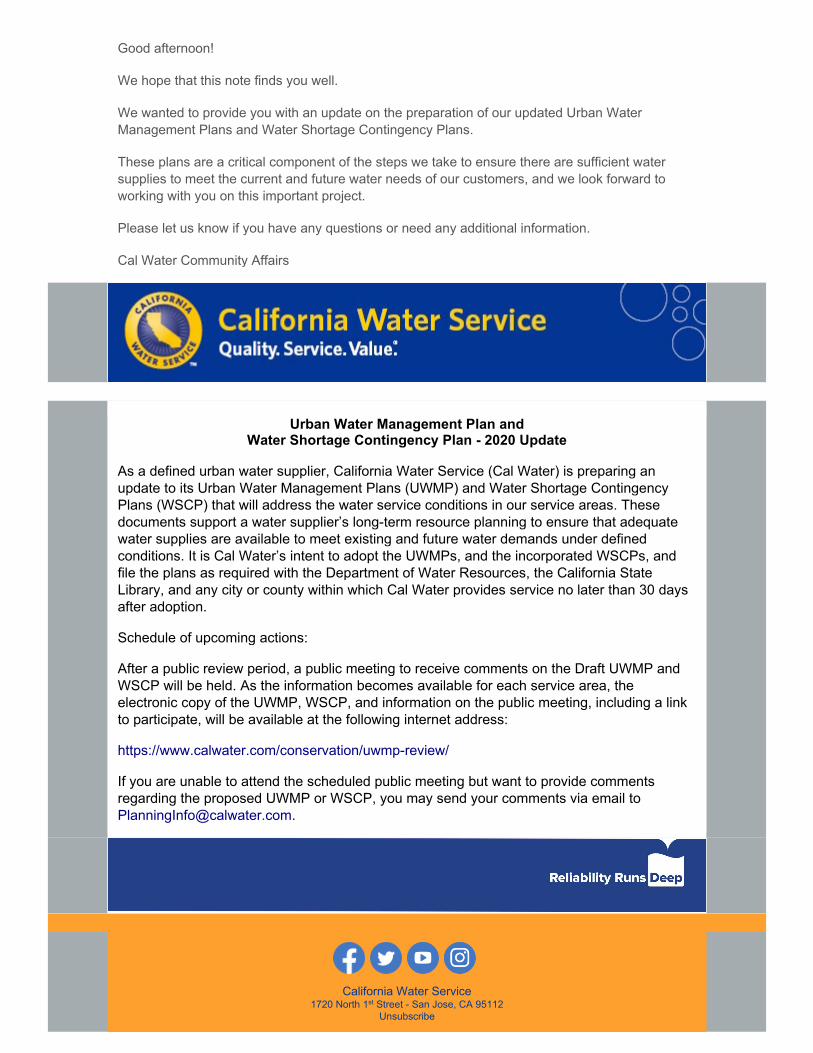
Good afternoon! We hope that this note finds you well. We wanted to provide you with an update on the preparation of our updated Urban Water Management Plans and Water Shortage Contingency Plans. These plans are a critical component of the steps we take to ensure there are sufficient water supplies to meet the current and future water needs of our customers, and we look forward to working with you on this important project. Please let us know if you have any questions or need any additional information. Cal Water Community Affairs
Urban Water Management Plan and Water Shortage Contingency Plan - 2020 Update
As a defined urban water supplier, California Water Service (Cal Water) is preparing an update to its Urban Water Management Plans (UWMP) and Water Shortage Contingency Plans (WSCP) that will address the water service conditions in our service areas. These documents support a water supplier’s long-term resource planning to ensure that adequate water supplies are available to meet existing and future water demands under defined conditions. It is Cal Water’s intent to adopt the UWMPs, and the incorporated WSCPs, and file the plans as required with the Department of Water Resources, the California State Library, and any city or county within which Cal Water provides service no later than 30 days after adoption. Schedule of upcoming actions: After a public review period, a public meeting to receive comments on the Draft UWMP and WSCP will be held. As the information becomes available for each service area, the electronic copy of the UWMP, WSCP, and information on the public meeting, including a link to participate, will be available at the following internet address: https://www.calwater.com/conservation/uwmp-review/ If you are unable to attend the scheduled public meeting but want to provide comments regarding the proposed UWMP or WSCP, you may send your comments via email to [email protected].
California Water Service 1720 North 1st Street - San Jose, CA 95112
Unsubscribe

CALIFORNIA NEWSPAPER SERVICE BUREAU
CNS
D A I L Y J O U R N A L C O R P O R A T I O N
To the right is a copy of the notice you sent to us for publication in theVENTURA COUNTY STAR. Please read this notice carefully and call us withany corrections. The Proof of Publication will be filed with the County Clerk, ifrequired, and mailed to you after the last date below. Publication date(s) forthis notice is (are):
Daily Journal CorporationServing your legal advertising needs throughout California. Call your local
Mailing Address : 915 E FIRST ST, LOS ANGELES, CA 90012Telephone (213) 229-5300 / Fax (213) 229-5481
Visit us @ WWW.LEGALADSTORE.COM
EMILY HERNANDEZCALIFORNIA WATER SERVICE CO/PLANNING DEPT.1720 NORTH FIRST ST.SAN JOSE, CA 95112
GPN GOVT PUBLIC NOTICE
CALIFORNIA WATER SERVICE - WESTLAKE DISTRICT
05/12/2021 , 05/19/2021
BUSINESS JOURNAL, RIVERSIDE (951) 784-0111
DAILY COMMERCE, LOS ANGELES (213) 229-5300
LOS ANGELES DAILY JOURNAL, LOS ANGELES (213) 229-5300
ORANGE COUNTY REPORTER, SANTA ANA (714) 543-2027
SAN FRANCISCO DAILY JOURNAL, SAN FRANCISCO (800) 640-4829
SAN JOSE POST-RECORD, SAN JOSE (408) 287-4866
THE DAILY RECORDER, SACRAMENTO (916) 444-2355
THE DAILY TRANSCRIPT, SAN DIEGO (619) 232-3486
THE INTER-CITY EXPRESS, OAKLAND (510) 272-4747
Notice Type:
Ad Description
COPY OF NOTICE
3469019
!A000005713268!
The charge(s) for this order is as follows. An invoice will be sent after the lastdate of publication. If you prepaid this order in full, you will not receive aninvoice.
NOTICE OF INTENT TO ADOPTAN URBAN WATER
MANAGEMENT PLAN ANDWATER SHORTAGE
CONTINGENCY PLANAND HOLD A PUBLIC MEETING
TO RECEIVE COMMENTS ON THEPROPOSED PLANS
CALIFORNIA WATER SERVICE –WESTLAKE DISTRICT
California Water Code (CWC)sections 10610 through 10656,known as the "Urban WaterManagement Planning Act" (Act),require all urban water suppliers thatprovide water for municipalpurposes either directly or indirectlyto more than 3,000 customers orsupply more than 3,000 acre-feet ofwater annually to prepare an UrbanWater Management Plan (UWMP)at least once every five years.UWMPs support a water supplier'slong-term resource planning toensure that adequate water suppliesare available to meet existing andfuture water demands under definedconditions. The UWMP mustdescribe and evaluate sources ofsupply, reasonable and practicalefficient uses, reclamation, anddemand management activities. Thecomponents of the plan may varyaccording to an individualcommunity or area's characteristicsand its capabilities to efficiently useand conserve water. The UWMPmust also address measures forresidential, commercial,governmental, and industrial waterdemand management.Further, Section 10632 of the CWCrequires that every urban watersupplier shall prepare and adopt aWater Shortage Contingency Plan(WSCP) as part of its plan (UWMP).Section 10632.2 provides that,"An urban water supplier shallfollow, where feasible andappropriate, the prescribedprocedures and implementdetermined shortage responseactions in its water shortagecontingency plan...or reasonablealternative actions, provided thatdescriptions of the alternativeactions are submitted with theannual water shortage assessmentreport pursuant to Section 10632.1."The WSCP will be incorporated asan appendix of the UWMP.One of Cal Water's service areas isthe Westlake District, which islocated in Ventura County. TheWestlake District serves portions ofthe Cities of Westlake Village andThousand Oaks and portions ofunincorporated Ventura County. Asa defined urban water supplier, CalWater is preparing an update to itsUWMP that will address the waterservice conditions in the Westlake
District. It is Cal Water's intent toadopt that UWMP, and theincorporated WSCP, and file thatplan as required with theDepartment of Water Resources,the California State Library, and anycity or county within which CalWater provides service no later than30 days after adoption.Schedule of upcoming actions:On or about May 3, 2021, anelectronic copy of the Draft 2020UWMP and WSCP will be availablefor review. After a public reviewperiod, a public meeting to receivecomments on the Draft UWMP andWSCP Plan for the Westlake Districtwill be held online on May 27, 2021,at 5:00 p.m. The electronic copy ofthe UWMP, WSCP, and additionalinformation on the public meeting,including a link to participate, isavailable at the following internetaddress:https://www.calwater.com/conservation/uwmp-review/If you are unable to attend thescheduled public meeting but wantto provide comments regarding theproposed UWMP or WSCP, youmay send your comments via emailto [email protected]. CalWater will receive comments on theDraft 2021 UWMP and WSCP fromMay 3 through June 3, 2021.Please share this notice with othersthat may have interest in this matter.5/12, 5/19/21CNS-3469019#VENTURA COUNTY STAR

Quality. Service. Value. 1
Westlake District
2020 Urban Water Management Plan 2020 Water Shortage Contingency Plan
California Water ServiceMay 27, 2021
Quality. Service. Value.
Quality. Service. Value. 2
Meeting Agenda
• Purpose and objectives• Introduce California Water Service (CWS) staff and consultants• Presentation of the 2020 Urban Water Management Plan (UWMP)• Presentation of 2020 Water Shortage Contingency Plan (WSCP)• Drought update• Public comments and questions

Quality. Service. Value. 3
2020 UWMP Update: Public Outreach
• Preliminary information sent to relevant entities in February 2021• Second notice sent to relevant entities in May 2021• Two notices posted in local newspaper• Draft 2020 UWMP and WSCP available for review at
https://www.calwater.com/conservation/uwmp-review/• Public hearing

Quality. Service. Value. 4
Urban Water Management Planning Act
• Supports long-term water resource planning to ensure adequate supplies
• California Water Code - Sections 10610-10656• Threshold: Utilities with 3,000+ services or 3,000+ acre-feet per
year (AFY) water sales• At least a 20-year planning horizon; Cal Water’s plan covers 25 years• Must be updated every 5 years and submitted by July 1, 2021• Basis for SB-610 Water Supply Assessments

Quality. Service. Value. 5
UWMP Elements
• Service area description• Population forecast• Supply and demand projections through 2045 in normal, single dry
and multiple dry years• Water supply reliability• Conservation/Demand Management Measures• Climate change• WSCP
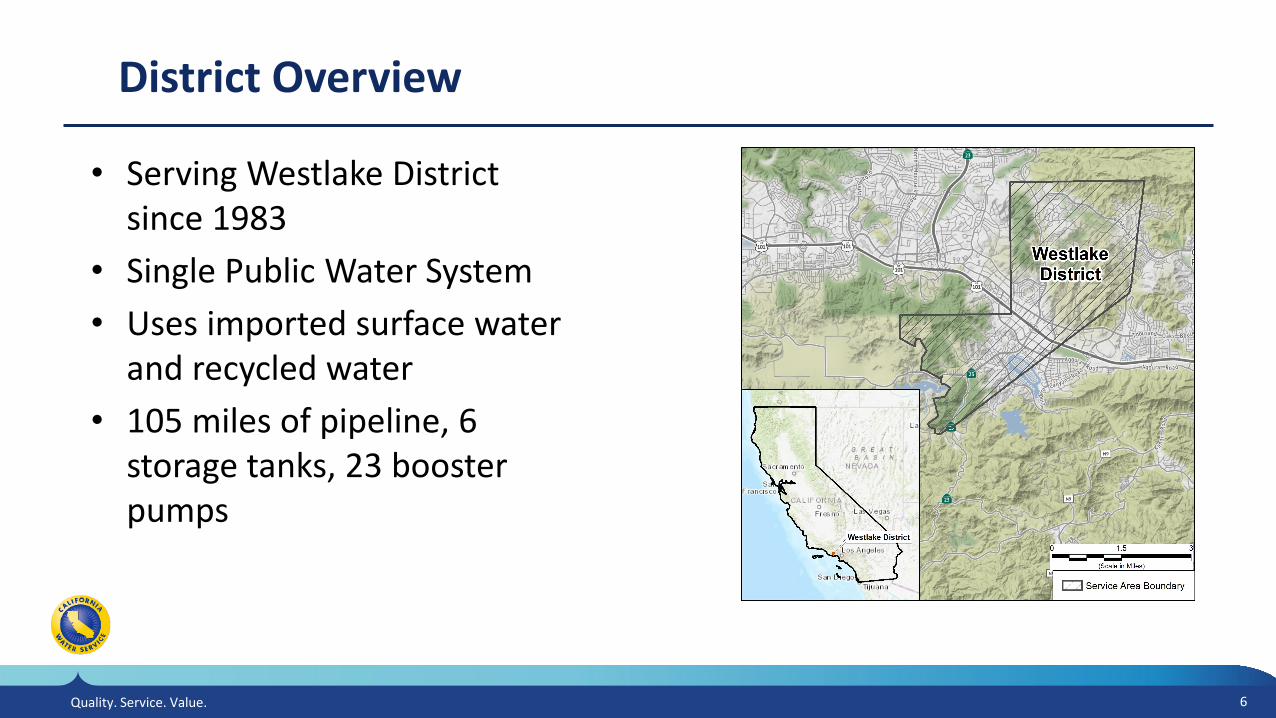
Quality. Service. Value. 6
District Overview
• Serving Westlake District since 1983
• Single Public Water System• Uses imported surface water
and recycled water• 105 miles of pipeline, 6
storage tanks, 23 booster pumps
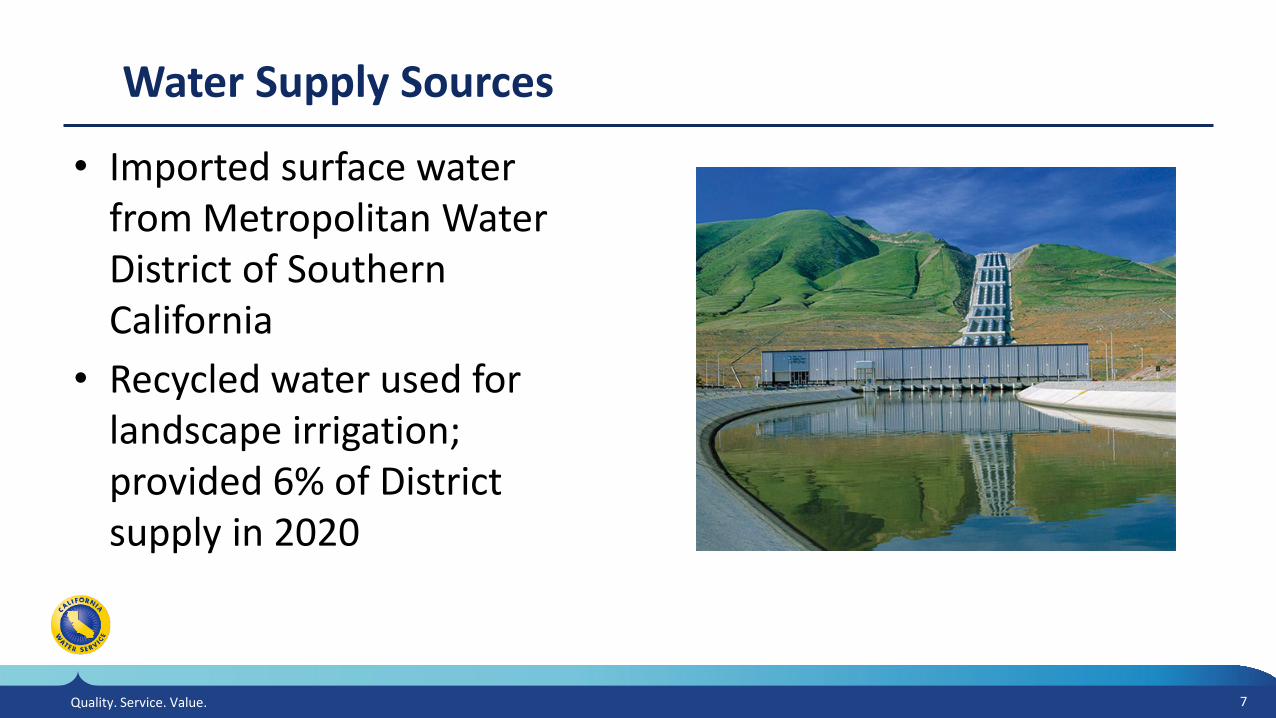
Quality. Service. Value. 7
• Imported surface water from Metropolitan Water District of Southern California
• Recycled water used for landscape irrigation; provided 6% of District supply in 2020
Water Supply Sources

Quality. Service. Value. 8
Distribution of Services/Demand
Types of Services Demand
Quality. Service. Value. 9
Demand Projection Methodology
• Forecast horizon is beyond 20 years required by UWMP• Generates normal-, wet-, and dry-year demand forecasts• Directly considers impacts of climate change• Demand model uses historical data on services, sales, production,
population, and proposed conservation measures• Regional Growth Forecast: housing and employment growth
forecasts based on census-tract-level forecasts prepared by Southern California Association of Governments (SCAG)
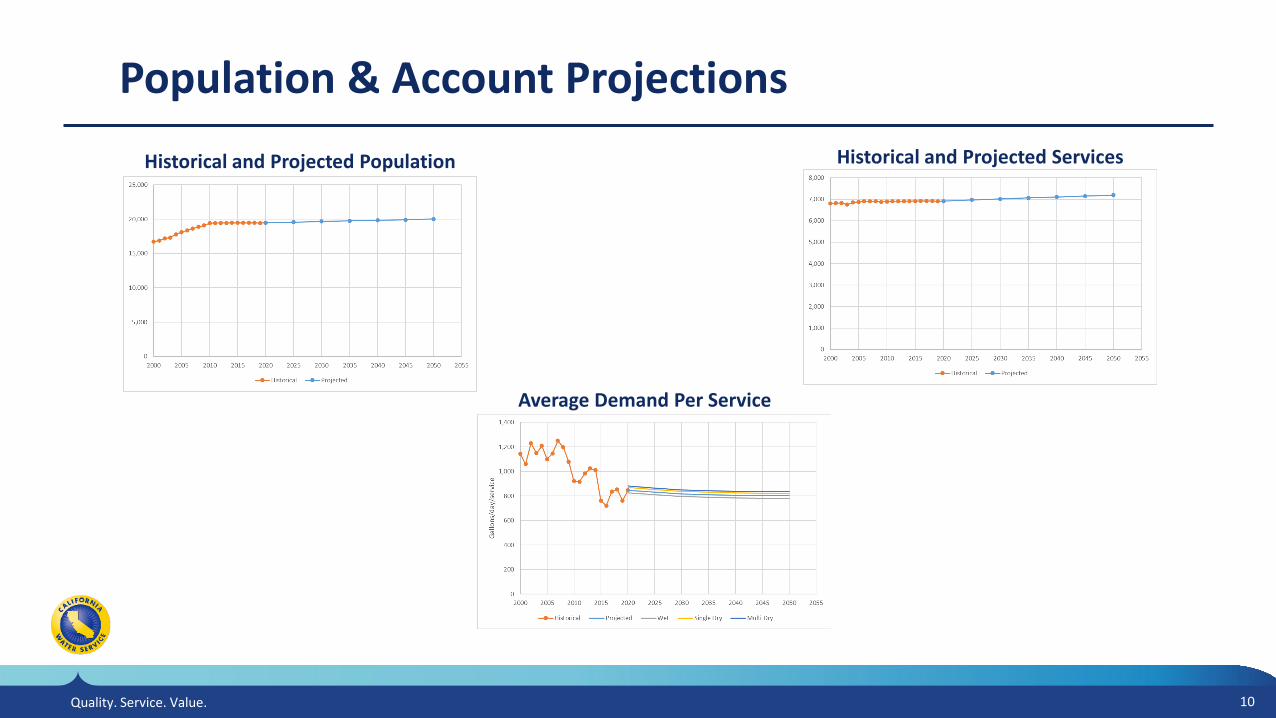
Quality. Service. Value. 10
Population & Account ProjectionsHistorical and Projected ServicesHistorical and Projected Population
Average Demand Per Service
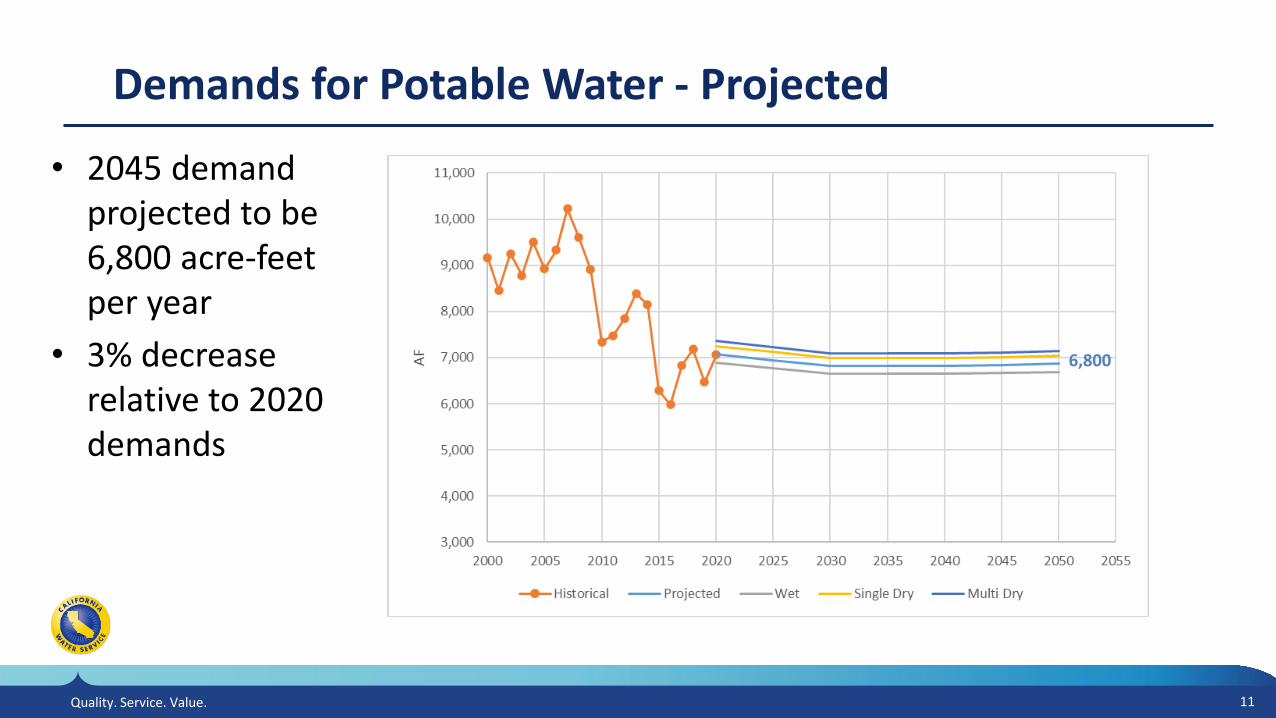
Quality. Service. Value. 11
Demands for Potable Water - Projected
• 2045 demand projected to be 6,800 acre-feet per year
• 3% decrease relative to 2020 demands
6,800
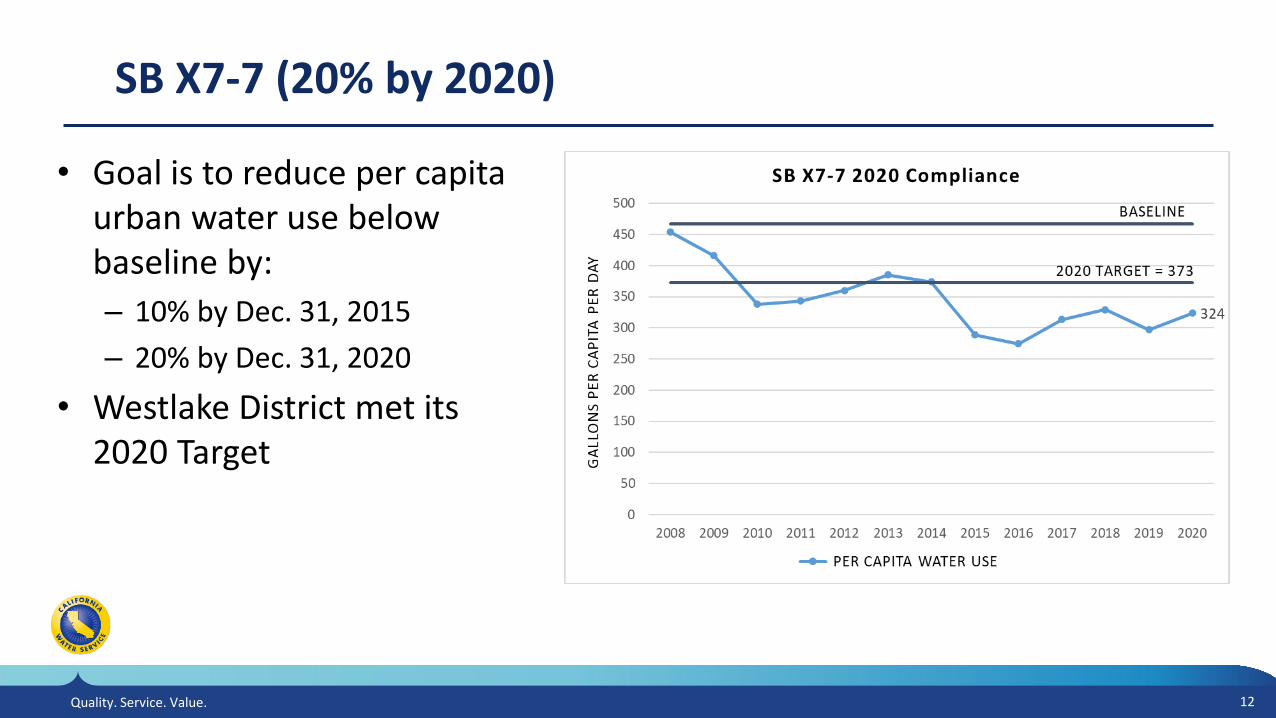
Quality. Service. Value. 12
SB X7-7 (20% by 2020)
• Goal is to reduce per capita urban water use below baseline by:– 10% by Dec. 31, 2015– 20% by Dec. 31, 2020
• Westlake District met its 2020 Target

Quality. Service. Value. 13
• Cal Water developing long-term supply reliability strategy for all districts
• Supply/Demand and Drought Risk Assessments completed for UWMP indicate District can meet projected demands in all year types through 2045
• Any shortages will be addressed by the WSCP
Supply Sufficiency

Quality. Service. Value. 14
Local Topics – Westlake District
• District per capita water use has decreased 34% since early 2000s but is still relatively high.
• New state regulations are expected to require further reductions in per capita water use, with focus on residential water use and non-residential landscape water use.
• Cal Water offers a range of programs and financial incentives for customers to improve water use efficiency.
• www.calwater.com/conservation/

Quality. Service. Value. 15
Water Shortage Contingency Plan Elements
• Comprehensive drought response plan– Annual assessment of water supply reliability– Six standard shortage stages
(10% to >50%)– Shortage response actions– Communication protocols– Monitoring, enforcement, and reporting
• Quantitatively assessed using Drought Response Tool
Quality. Service. Value. 16
Drought Update
• Governor has issued drought emergencies in 41 counties• Cal Water is monitoring drought conditions in all its service
territories– Established a Drought Response Committee– Proactively developing conservation messaging
• Cal Water is closely coordinating its drought response with other water agencies and regulatory bodies
• Cal Water will follow protocols outlined in the WSCP as needed– Based on local conditions or state mandates

Quality. Service. Value. 17Quality. Service. Value.
Questions or Comments• Draft 2020 UWMP and 2020 WSCP available at
https://www.calwater.com/conservation/uwmp-review/ • Comments on any parts of the UWMP will be accepted
through June 2, 2021• Send 2020 UWMP and WSCP comments to:

California Water Service 2020 Urban Water Management Plan
Westlake District
June 2021 Printed 6/25/2021
Page D-1
EKI Environment & Water, Inc. M.Cubed
Gary Fiske and Associates
Appendix D: City of Thousand Oaks General Plan Map
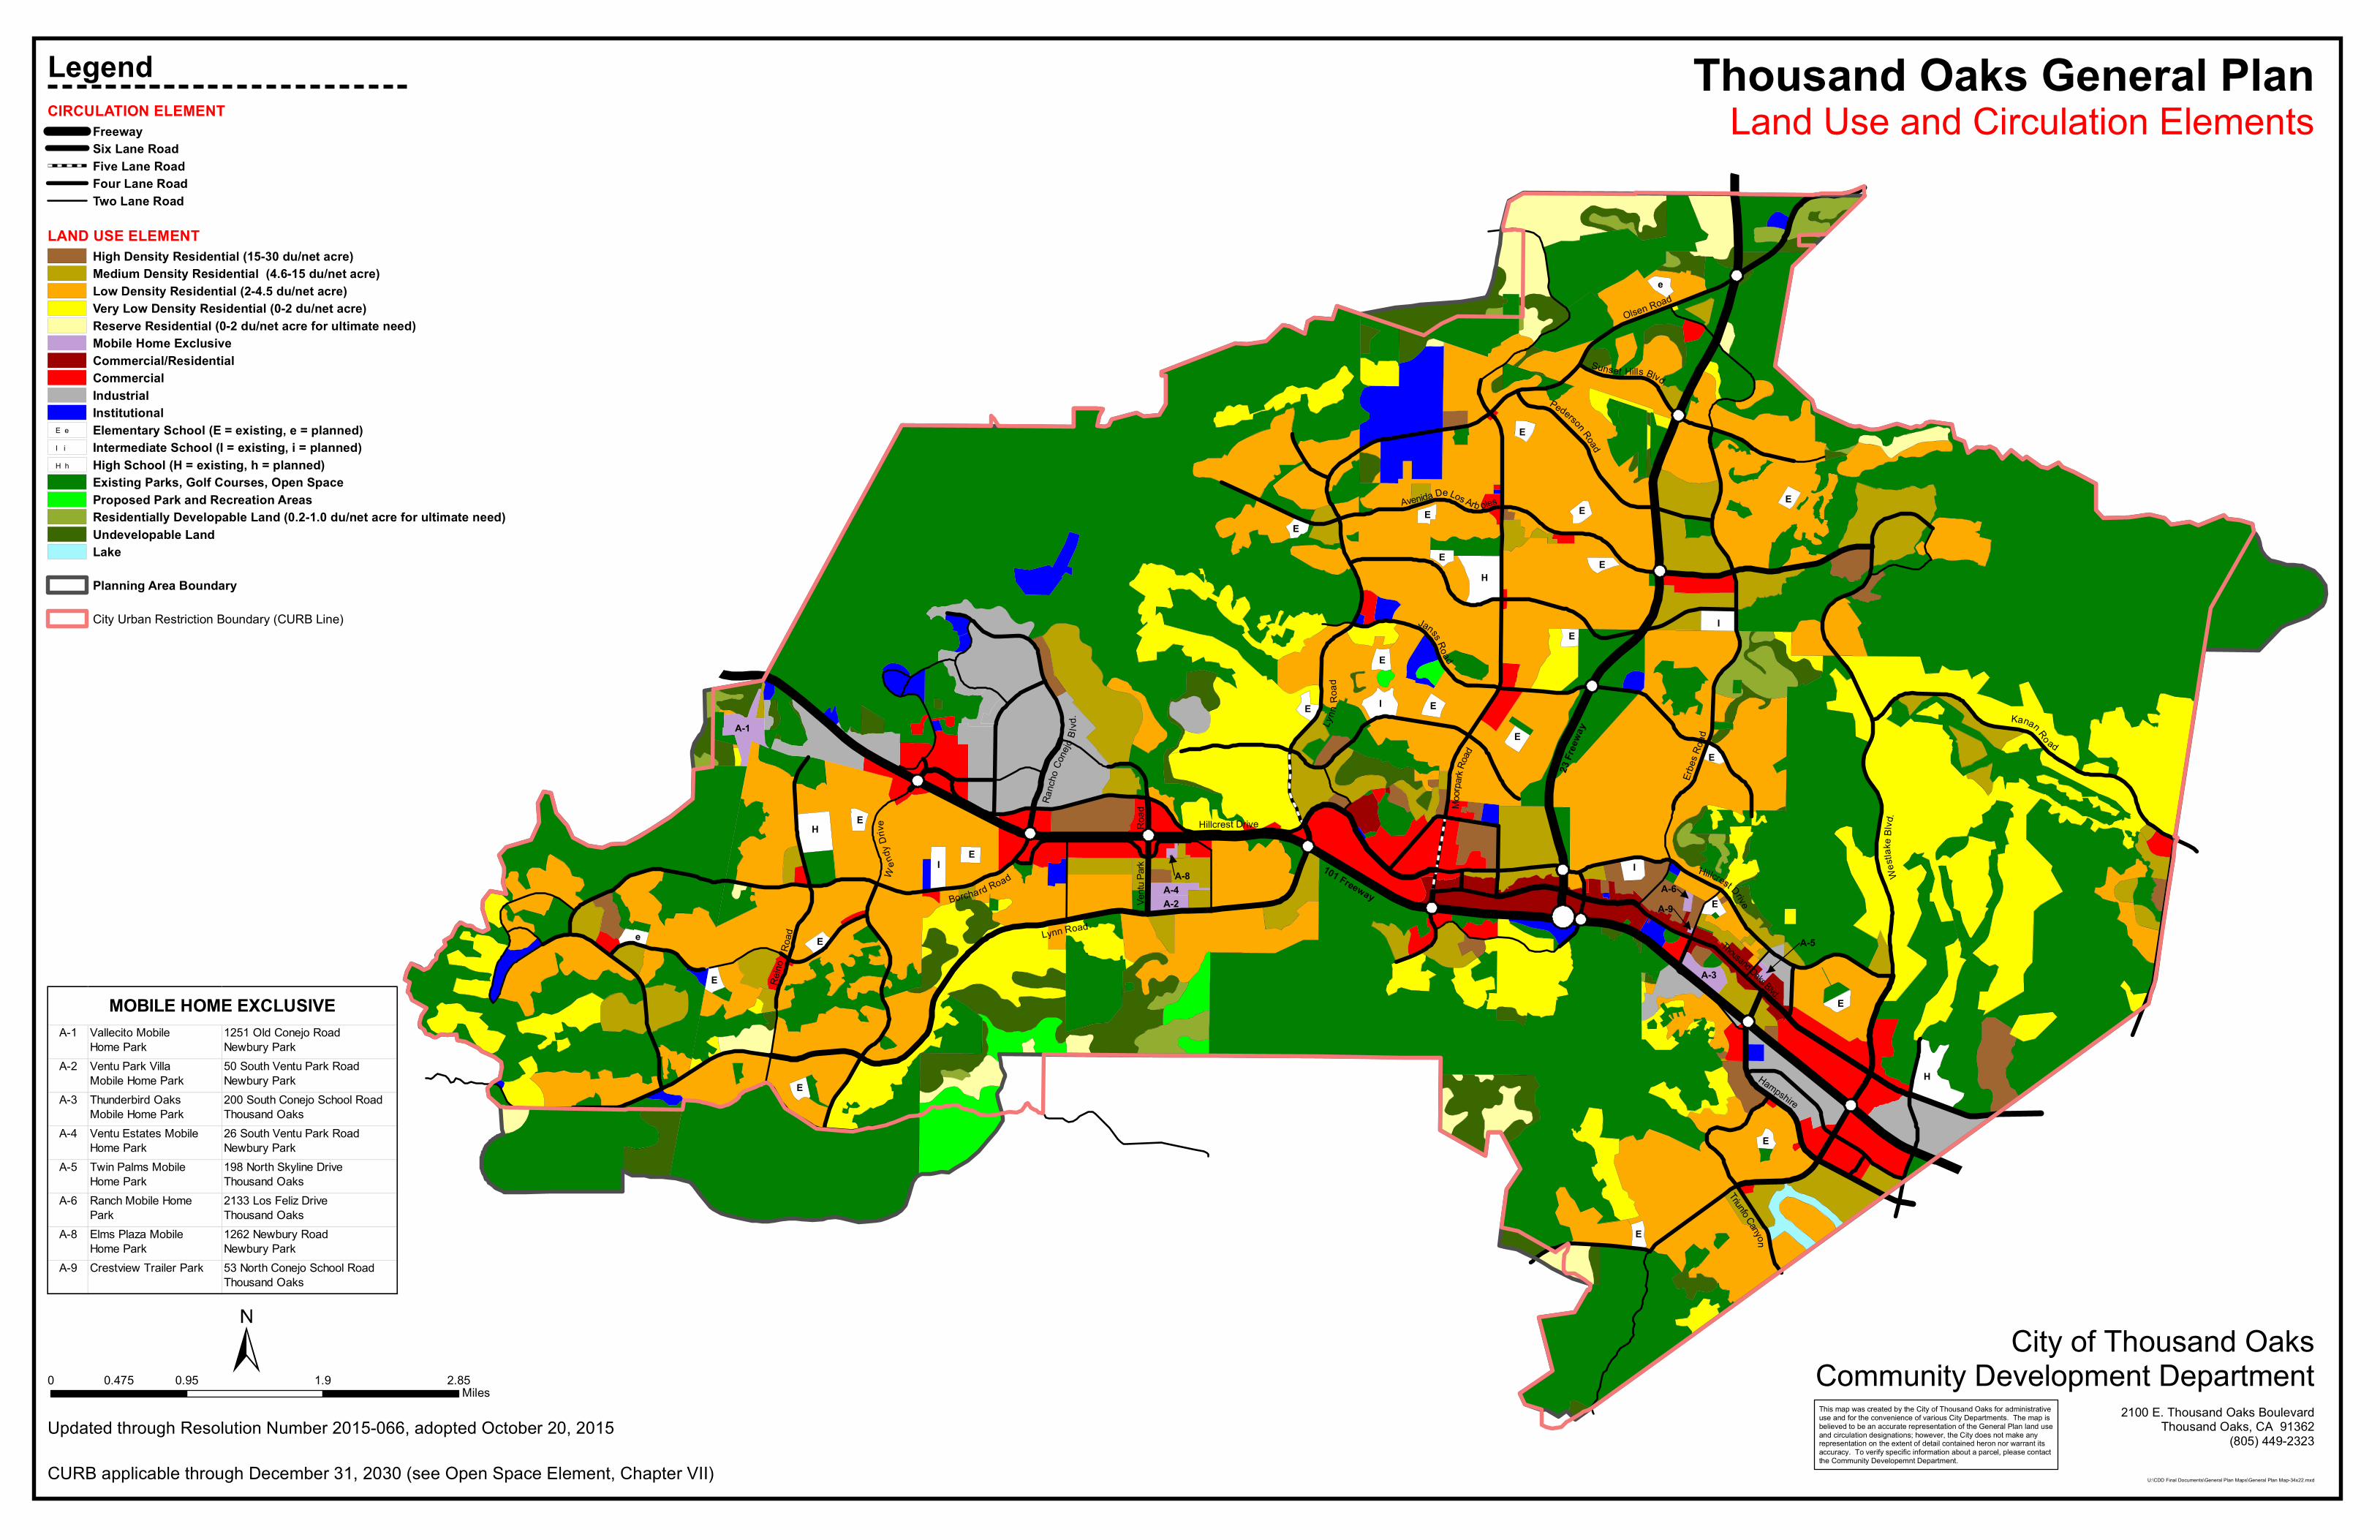
Lynn Road
Borchard Road
Ranc
hoCo
nejo
B lvd
.
Olsen Road
Lynn
Road
Moorp
arkRo
ad
23Fre
eway
Erbes
Road
Westl
ake B
l vd.
Kanan Ro ad
Avenida De Los Arb oles
Janss Road
Pederson Road
Sunset Hills Blvd.
Hillcrest Drive
101 Freeway
Hampshire
Hillcrest Drive
Ventu
Park
Reino
HE
A-1
IE
Ee
E
E
E I
E
E
E
E
HE
EE
E
E
e
E
E
I
E
I
E
E
H
E
E
A-2A-4
A-3
A-8
Road
Road
A-9
A-5
A-6W
endy
Drive
Triunfo Canyon
Thousand Oaks Blvd.
Thousand Oaks General Plan
0 0.95 1.9 2.850.475Miles
Land Use and Circulation ElementsLegendCIRCULATION ELEMENT
FreewaySix Lane RoadFive Lane RoadFour Lane RoadTwo Lane Road
LAND USE ELEMENTHigh Density Residential (15-30 du/net acre)Medium Density Residential (4.6-15 du/net acre)Low Density Residential (2-4.5 du/net acre)Very Low Density Residential (0-2 du/net acre)Reserve Residential (0-2 du/net acre for ultimate need)Mobile Home ExclusiveCommercial/ResidentialCommercialIndustrialInstitutionalElementary School (E = existing, e = planned)Intermediate School (I = existing, i = planned)High School (H = existing, h = planned)Existing Parks, Golf Courses, Open SpaceProposed Park and Recreation AreasResidentially Developable Land (0.2-1.0 du/net acre for ultimate need)Undevelopable LandLake
Planning Area Boundary
City Urban Restriction Boundary (CURB Line)
U:\CDD Final Documents\General Plan Maps\General Plan Map-34x22.mxdCURB applicable through December 31, 2030 (see Open Space Element, Chapter VII)
Updated through Resolution Number 2015-066, adopted October 20, 2015
E eI iH h
City of Thousand OaksCommunity Development Department
2100 E. Thousand Oaks BoulevardThousand Oaks, CA 91362
(805) 449-2323
This map was created by the City of Thousand Oaks for administrativeuse and for the convenience of various City Departments. The map isbelieved to be an accurate representation of the General Plan land useand circulation designations; however, the City does not make anyrepresentation on the extent of detail contained heron nor warrant itsaccuracy. To verify specific information about a parcel, please contactthe Community Developemnt Department.
A-1 Vallecito MobileHome Park
1251 Old Conejo RoadNewbury Park
A-2 Ventu Park VillaMobile Home Park
50 South Ventu Park RoadNewbury Park
A-3 Thunderbird OaksMobile Home Park
200 South Conejo School RoadThousand Oaks
A-4 Ventu Estates MobileHome Park
26 South Ventu Park RoadNewbury Park
A-5 Twin Palms Mobile Home Park
198 North Skyline DriveThousand Oaks
A-6 Ranch Mobile Home Park
2133 Los Feliz DriveThousand Oaks
A-8 Elms Plaza MobileHome Park
1262 Newbury RoadNewbury Park
A-9 Crestview Trailer Park 53 North Conejo School RoadThousand Oaks
MOBILE HOME EXCLUSIVE
California Water Service 2020 Urban Water Management Plan
Westlake District
June 2021 Printed 6/25/2021
Page E-1
EKI Environment & Water, Inc. M.Cubed
Gary Fiske and Associates
Appendix E: Summary of Demand Projection Methodology and Assumptions
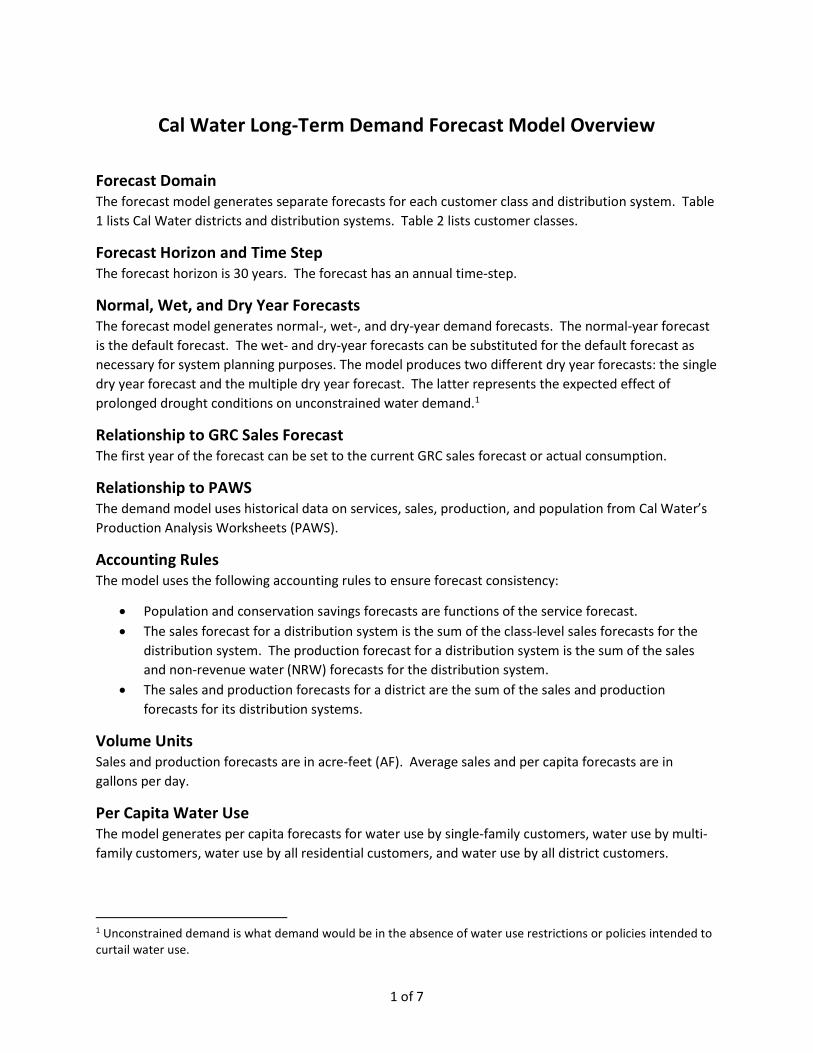
1 of 7
Cal Water Long-Term Demand Forecast Model Overview
Forecast Domain The forecast model generates separate forecasts for each customer class and distribution system. Table 1 lists Cal Water districts and distribution systems. Table 2 lists customer classes.
Forecast Horizon and Time Step The forecast horizon is 30 years. The forecast has an annual time-step.
Normal, Wet, and Dry Year Forecasts The forecast model generates normal-, wet-, and dry-year demand forecasts. The normal-year forecast is the default forecast. The wet- and dry-year forecasts can be substituted for the default forecast as necessary for system planning purposes. The model produces two different dry year forecasts: the single dry year forecast and the multiple dry year forecast. The latter represents the expected effect of prolonged drought conditions on unconstrained water demand.1
Relationship to GRC Sales Forecast The first year of the forecast can be set to the current GRC sales forecast or actual consumption.
Relationship to PAWS The demand model uses historical data on services, sales, production, and population from Cal Water’s Production Analysis Worksheets (PAWS).
Accounting Rules The model uses the following accounting rules to ensure forecast consistency:
x Population and conservation savings forecasts are functions of the service forecast. x The sales forecast for a distribution system is the sum of the class-level sales forecasts for the
distribution system. The production forecast for a distribution system is the sum of the sales and non-revenue water (NRW) forecasts for the distribution system.
x The sales and production forecasts for a district are the sum of the sales and production forecasts for its distribution systems.
Volume Units Sales and production forecasts are in acre-feet (AF). Average sales and per capita forecasts are in gallons per day.
Per Capita Water Use The model generates per capita forecasts for water use by single-family customers, water use by multi-family customers, water use by all residential customers, and water use by all district customers.
1 Unconstrained demand is what demand would be in the absence of water use restrictions or policies intended to curtail water use.

Cal Water Long-Term Demand Forecast Model Overview
2 of 7
Service Forecast The forecast model generates three alternative service forecasts:
x Average Y-Y Change in Services. The model bases the forecast on the historical year-to-year (y-y) change in the number of services. This forecast assumes additive growth.
x Average Y-Y % Change in Services. The model bases the forecast on the historical y-y percentage change in services. This forecast assumes exponential growth.
x Regional Growth Forecast. The model uses regional housing and employment growth forecasts to project future services. Districts in the Bay Area use census-tract level growth forecasts prepared by the Association of Bay Area Governments (ABAG). Districts in Southern California use census-tract-level growth forecasts prepared by the Southern California Association of Governments (SCAG). The remaining districts use county-level forecasts prepared by Caltrans.
Regional Forecasts Table 3 lists the regional forecasts in the model. Table 4 summarizes how the model uses the regional forecasts to project future services.
Service Floors and Ceilings The forecast can include floors and ceilings on the service growth. The floor (ceiling) is the minimum (maximum) number of services allowed in the forecast.
User-Specified Growth Rates The model allows user-specified growth rates.
Water Supply Assessments The user can add to the forecast projected services and water use from Water Supply Assessments prepared for proposed development projects. The user can specify how much of this projected growth in services and water use the model should treat as additive to the baseline forecast.
Population Forecasts The population projection is a function of the residential service projections to ensure internal consistency. Population in year t is:
𝑃𝑜𝑝𝑢𝑙𝑎𝑡𝑖𝑜𝑛 =𝑝𝑒𝑟𝑠𝑜𝑛𝑠𝑠𝑒𝑟𝑣𝑖𝑐𝑒
∙ 𝑆𝐹𝑅𝑠𝑒𝑟𝑣𝑖𝑐𝑒𝑠 +𝑝𝑒𝑟𝑠𝑜𝑛𝑠𝑠𝑒𝑟𝑣𝑖𝑐𝑒
∙ 𝑀𝐹𝑅𝑠𝑒𝑟𝑣𝑖𝑐𝑒𝑠
For multi-family services, the calculation of average persons per service uses the equation below. The model uses county assessor data linked to Cal Water customer data to estimate average dwelling units per parcel and average parcels per service. It uses census data to estimate average persons per dwelling unit.
𝑝𝑒𝑟𝑠𝑜𝑛𝑠𝑠𝑒𝑟𝑣𝑖𝑐𝑒
=𝐴𝑣𝑔 𝐷𝑤𝑒𝑙𝑙𝑖𝑛𝑔 𝑈𝑛𝑖𝑡𝑠
𝑃𝑎𝑟𝑐𝑒𝑙∙
𝐴𝑣𝑔 𝑃𝑎𝑟𝑐𝑒𝑙𝑠𝑆𝑒𝑟𝑣𝑖𝑐𝑒
∙𝐴𝑣𝑔 𝑃𝑒𝑟𝑠𝑜𝑛𝑠
𝐷𝑤𝑒𝑙𝑙𝑖𝑛𝑔 𝑈𝑛𝑖𝑡
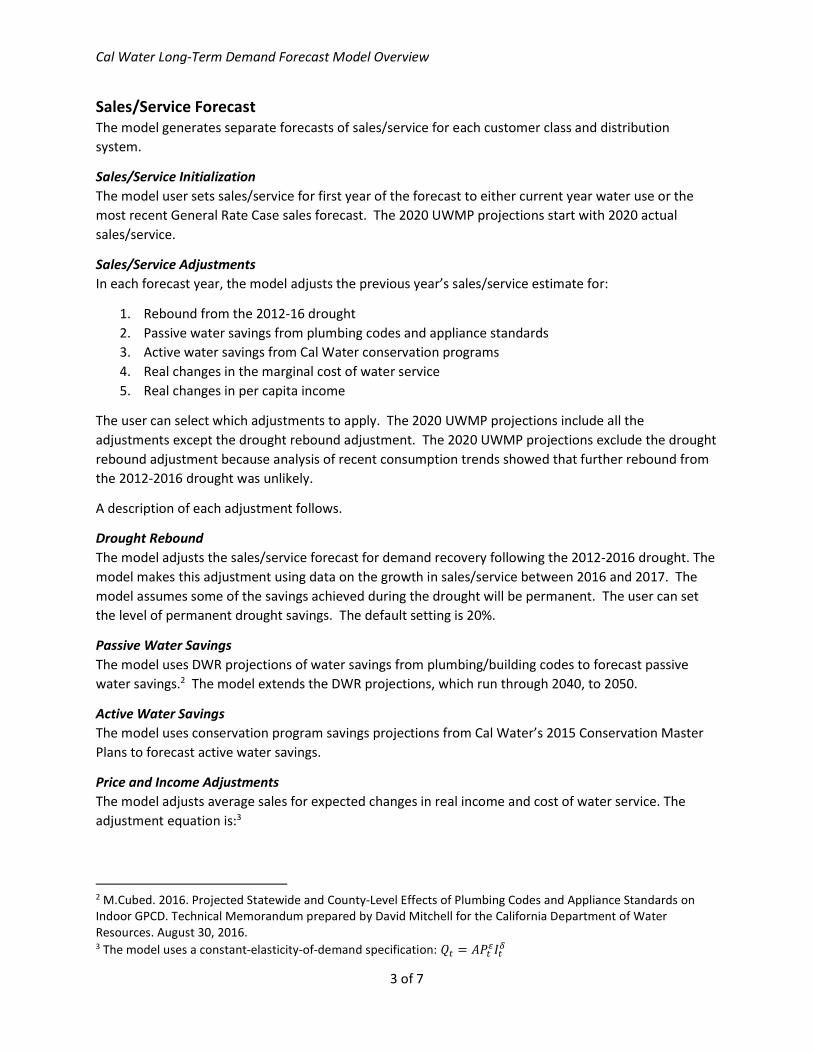
Cal Water Long-Term Demand Forecast Model Overview
3 of 7
Sales/Service Forecast The model generates separate forecasts of sales/service for each customer class and distribution system.
Sales/Service Initialization The model user sets sales/service for first year of the forecast to either current year water use or the most recent General Rate Case sales forecast. The 2020 UWMP projections start with 2020 actual sales/service.
Sales/Service Adjustments In each forecast year, the model adjusts the previous year’s sales/service estimate for:
1. Rebound from the 2012-16 drought 2. Passive water savings from plumbing codes and appliance standards 3. Active water savings from Cal Water conservation programs 4. Real changes in the marginal cost of water service 5. Real changes in per capita income
The user can select which adjustments to apply. The 2020 UWMP projections include all the adjustments except the drought rebound adjustment. The 2020 UWMP projections exclude the drought rebound adjustment because analysis of recent consumption trends showed that further rebound from the 2012-2016 drought was unlikely.
A description of each adjustment follows.
Drought Rebound The model adjusts the sales/service forecast for demand recovery following the 2012-2016 drought. The model makes this adjustment using data on the growth in sales/service between 2016 and 2017. The model assumes some of the savings achieved during the drought will be permanent. The user can set the level of permanent drought savings. The default setting is 20%.
Passive Water Savings The model uses DWR projections of water savings from plumbing/building codes to forecast passive water savings.2 The model extends the DWR projections, which run through 2040, to 2050.
Active Water Savings The model uses conservation program savings projections from Cal Water’s 2015 Conservation Master Plans to forecast active water savings.
Price and Income Adjustments The model adjusts average sales for expected changes in real income and cost of water service. The adjustment equation is:3
2 M.Cubed. 2016. Projected Statewide and County-Level Effects of Plumbing Codes and Appliance Standards on Indoor GPCD. Technical Memorandum prepared by David Mitchell for the California Department of Water Resources. August 30, 2016. 3 The model uses a constant-elasticity-of-demand specification: 𝑄 = 𝐴𝑃 𝐼

Cal Water Long-Term Demand Forecast Model Overview
4 of 7
∆𝑄 = 𝑄 1 −𝑃𝑃
𝐼𝐼
where 𝑄 is sales/service in the base year of the forecast, and are the price of water and
income relative to the base year of the forecast, and 𝜀 and 𝛿 are empirically derived estimates of price and income elasticity.
Sales Forecast The sales forecast is the product of the service and average use per service forecasts.
Non-Revenue Water Forecast The non-revenue water forecast is a function of the services forecast. The forecast starts with an initial estimate of non-revenue water, expressed in gallons/connection/day. The model decomposes this estimate into real and apparent loss. The model assumes future apparent loss is equal to the average apparent loss for the five year before the start of the forecast. In the case of real loss, the model assumes Cal Water’s loss management program will reduce real losses over time. The amount of reduction depends on the staring estimate of real loss. If this estimate is 10 gallons/connection/day or less, the model assumes no further reduction. Otherwise, the model assumes real losses (in gallons/connection/day) will decrease until they are equal to 75% of the average real loss for the five years before the start of the forecast or the State Water Board draft real water loss standard for the distribution system, whichever is greater.4 The model assumes the reduction in real loss will occur between 2020 and 2030.
Production Forecast The production forecast is the sum of the sales and NRW forecasts.
Normal, Wet, Single Dry, and Multiple Dry Year Projections The model generates normal, wet, single dry, and multiple dry year forecasts of sales and production. The model bases these forecasts on empirically derived relationships between monthly water sales, rainfall, and air temperature estimated for each Cal Water district.5
x Wet year – minus one standard deviation weather effect on sales and production x Single dry year – plus one standard deviation weather effect on sales and production x Multiple dry year – plus 1.6 standard deviations weather effect on sales and production
In the case of the dry year forecasts, the model is forecasting demand in the absence of drought water use restrictions or other policies that would limit water use in dry years.
4 The State Water Board did not develop a draft water loss standard for every Cal Water distribution system. For those without a draft standard, the model assumes real losses will decrease until they are equal to 75% of the average real loss for the five year before the start of the forecast. 5 A&N Technical Services, Cal Water Long Term Water Demand Forecast Model, December 2014.
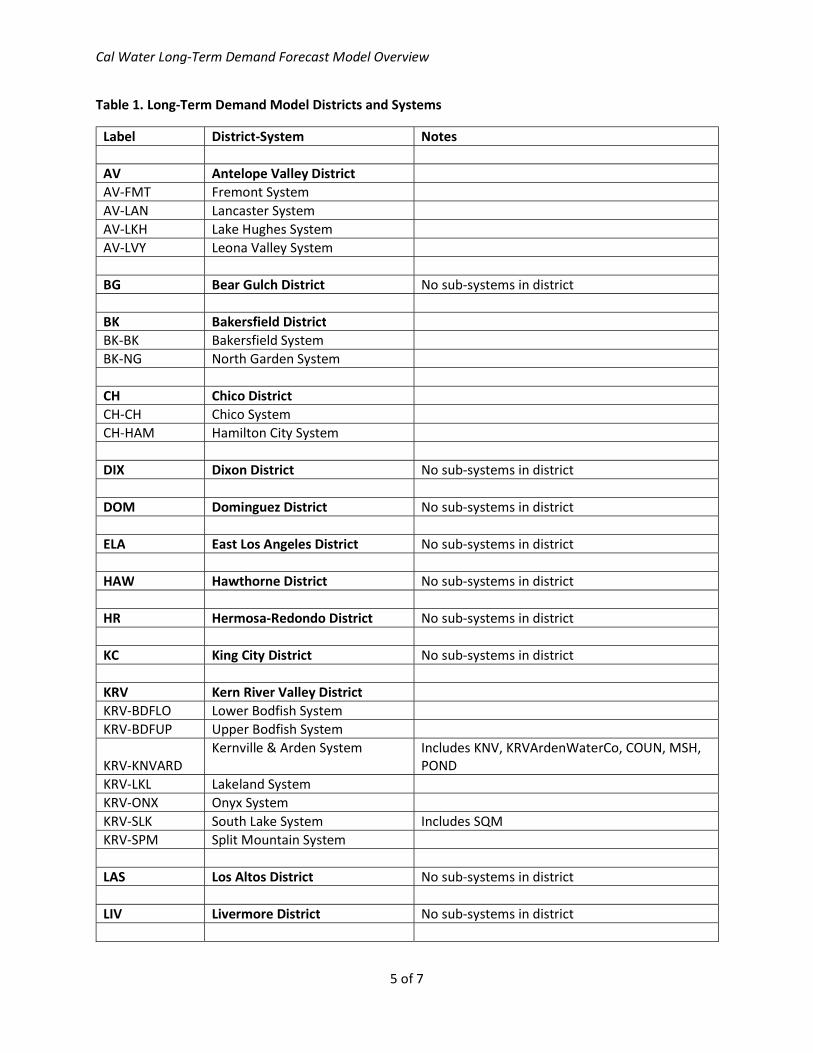
Cal Water Long-Term Demand Forecast Model Overview
5 of 7
Table 1. Long-Term Demand Model Districts and Systems
Label District-System Notes AV Antelope Valley District AV-FMT Fremont System AV-LAN Lancaster System AV-LKH Lake Hughes System AV-LVY Leona Valley System BG Bear Gulch District No sub-systems in district BK Bakersfield District BK-BK Bakersfield System BK-NG North Garden System CH Chico District CH-CH Chico System CH-HAM Hamilton City System DIX Dixon District No sub-systems in district DOM Dominguez District No sub-systems in district ELA East Los Angeles District No sub-systems in district HAW Hawthorne District No sub-systems in district HR Hermosa-Redondo District No sub-systems in district KC King City District No sub-systems in district KRV Kern River Valley District KRV-BDFLO Lower Bodfish System KRV-BDFUP Upper Bodfish System
KRV-KNVARD Kernville & Arden System Includes KNV, KRVArdenWaterCo, COUN, MSH,
POND KRV-LKL Lakeland System KRV-ONX Onyx System KRV-SLK South Lake System Includes SQM KRV-SPM Split Mountain System LAS Los Altos District No sub-systems in district LIV Livermore District No sub-systems in district
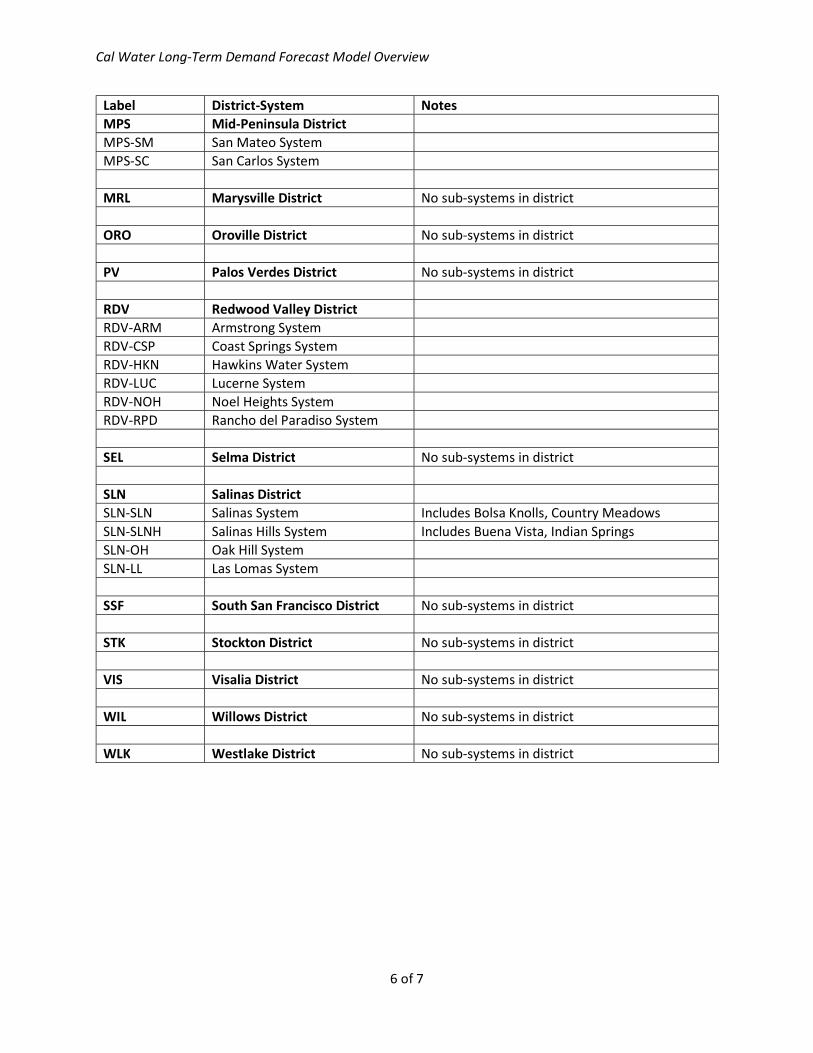
Cal Water Long-Term Demand Forecast Model Overview
6 of 7
Label District-System Notes MPS Mid-Peninsula District MPS-SM San Mateo System MPS-SC San Carlos System MRL Marysville District No sub-systems in district ORO Oroville District No sub-systems in district PV Palos Verdes District No sub-systems in district RDV Redwood Valley District RDV-ARM Armstrong System RDV-CSP Coast Springs System RDV-HKN Hawkins Water System RDV-LUC Lucerne System RDV-NOH Noel Heights System RDV-RPD Rancho del Paradiso System SEL Selma District No sub-systems in district SLN Salinas District SLN-SLN Salinas System Includes Bolsa Knolls, Country Meadows SLN-SLNH Salinas Hills System Includes Buena Vista, Indian Springs SLN-OH Oak Hill System SLN-LL Las Lomas System SSF South San Francisco District No sub-systems in district STK Stockton District No sub-systems in district VIS Visalia District No sub-systems in district WIL Willows District No sub-systems in district WLK Westlake District No sub-systems in district
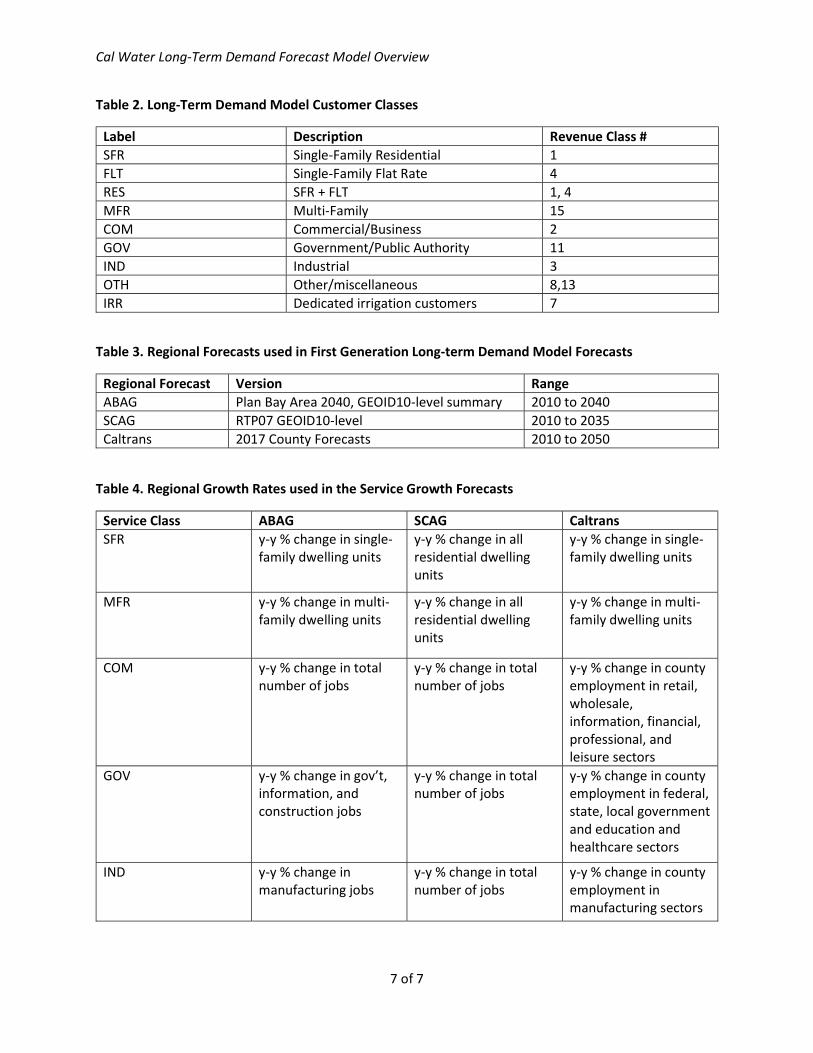
Cal Water Long-Term Demand Forecast Model Overview
7 of 7
Table 2. Long-Term Demand Model Customer Classes
Label Description Revenue Class # SFR Single-Family Residential 1 FLT Single-Family Flat Rate 4 RES SFR + FLT 1, 4 MFR Multi-Family 15 COM Commercial/Business 2 GOV Government/Public Authority 11 IND Industrial 3 OTH Other/miscellaneous 8,13 IRR Dedicated irrigation customers 7
Table 3. Regional Forecasts used in First Generation Long-term Demand Model Forecasts
Regional Forecast Version Range ABAG Plan Bay Area 2040, GEOID10-level summary 2010 to 2040 SCAG RTP07 GEOID10-level 2010 to 2035 Caltrans 2017 County Forecasts 2010 to 2050
Table 4. Regional Growth Rates used in the Service Growth Forecasts
Service Class ABAG SCAG Caltrans SFR y-y % change in single-
family dwelling units y-y % change in all residential dwelling units
y-y % change in single-family dwelling units
MFR y-y % change in multi-family dwelling units
y-y % change in all residential dwelling units
y-y % change in multi-family dwelling units
COM y-y % change in total number of jobs
y-y % change in total number of jobs
y-y % change in county employment in retail, wholesale, information, financial, professional, and leisure sectors
GOV y-y % change in gov’t, information, and construction jobs
y-y % change in total number of jobs
y-y % change in county employment in federal, state, local government and education and healthcare sectors
IND y-y % change in manufacturing jobs
y-y % change in total number of jobs
y-y % change in county employment in manufacturing sectors
Historical and Projected Services, Water Sales, and Total Production

District Demand Projection ReportWestlake
6/4/2021
General Rate Case Sales Baseline 2020
Historical Data Range First Year 2000Last Year 2020
Forecast Range First Year 2020Last Year 2050
Service Growth Basis SCAG Growth Forecasts
Service Growth RatesSCAG Historical %Y-Y1
Class Projected 5-Yr 10-Yr 15-Yr 20-YrRES2 0.1% 0.0% 0.1% 0.0% 0.0%MFR 0.1% 0.0% 0.0% 4.5% 3.3%COM 0.4% -0.3% -0.3% -0.7% 0.1%GOV 0.4% 0.0% 0.0% 0.2% 0.3%IND 0.4% -100.0% -100.0%TOT 0.0% 0.0% 0.0% 0.1%
Completion IncorporatedWater Supply Assessments WSA Name Date into Forecast (Y/N)
12345
Sales Forecast Adjustments Drought Rebound OFFPlumbing Code ONActive Conservation ONPrice Response ONIncome Response ON
Non-Revenue Water (NRW) Basis Real loss (gal/con/day):2016-2020 average if <= 10 gal/con/dayDraft Water Board standard or 75% of 2016-2020 average,whichever is greater, by 2030.Apparent loss (gal/con/day): 2016-2020 average.
1. Account reclassifications can impact historical %Y-Y growth rates for individual customer classes.2. RES = Metered and unmetered single-family residential customers.
Page 1 of 15

District Demand Projection ReportWestlake
6/4/2021
Historical Service Counts
YEAR RES MFR COM GOV IND OTH IRR TOT2000 6,116 65 510 84 14 9 0 6,7982001 6,079 65 565 88 14 8 0 6,8192002 6,090 65 561 87 14 10 0 6,8272003 6,031 64 548 86 15 8 0 6,7522004 6,117 65 566 87 15 7 0 6,8562005 6,134 65 576 87 15 6 0 6,8832006 6,147 65 580 87 15 8 0 6,9012007 6,149 100 549 88 10 10 0 6,9072008 6,142 120 542 90 1 9 0 6,9032009 6,121 125 535 89 0 7 0 6,8772010 6,139 125 536 89 0 5 0 6,8952011 6,156 125 530 89 0 6 0 6,9052012 6,158 125 530 89 0 5 0 6,9062013 6,155 125 532 89 0 4 0 6,9062014 6,163 125 532 89 0 8 0 6,9172015 6,166 125 528 89 0 7 0 6,9152016 6,165 125 531 89 0 7 0 6,9172017 6,168 125 533 89 0 6 0 6,9212018 6,172 125 528 89 0 7 0 6,9212019 6,160 125 523 89 0 9 0 6,9062020 6,174 125 519 89 0 8 0 6,9152021202220232024202520262027202820292030
CAGR RES MFR COM GOV IND OTH IRR TOT5-Year 0.0% 0.0% -0.3% 0.0% 2.2% 0.0%
10-Year 0.1% 0.0% -0.3% 0.0% 4.2% 0.0%15-Year 0.0% 4.5% -0.7% 0.2% -100.0% 2.4% 0.0%20-Year 0.0% 3.3% 0.1% 0.3% -100.0% -0.5% 0.1%
CAGR = Compound Annual Growth Rate
Page 2 of 15
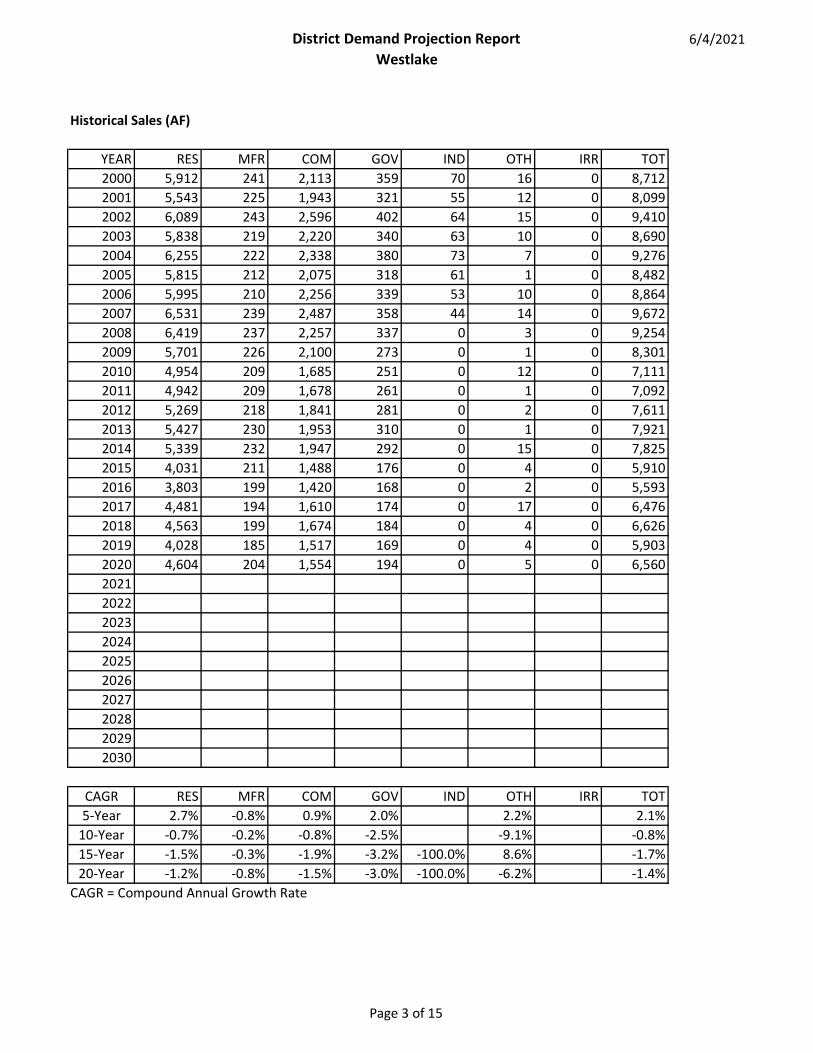
District Demand Projection ReportWestlake
6/4/2021
Historical Sales (AF)
YEAR RES MFR COM GOV IND OTH IRR TOT2000 5,912 241 2,113 359 70 16 0 8,7122001 5,543 225 1,943 321 55 12 0 8,0992002 6,089 243 2,596 402 64 15 0 9,4102003 5,838 219 2,220 340 63 10 0 8,6902004 6,255 222 2,338 380 73 7 0 9,2762005 5,815 212 2,075 318 61 1 0 8,4822006 5,995 210 2,256 339 53 10 0 8,8642007 6,531 239 2,487 358 44 14 0 9,6722008 6,419 237 2,257 337 0 3 0 9,2542009 5,701 226 2,100 273 0 1 0 8,3012010 4,954 209 1,685 251 0 12 0 7,1112011 4,942 209 1,678 261 0 1 0 7,0922012 5,269 218 1,841 281 0 2 0 7,6112013 5,427 230 1,953 310 0 1 0 7,9212014 5,339 232 1,947 292 0 15 0 7,8252015 4,031 211 1,488 176 0 4 0 5,9102016 3,803 199 1,420 168 0 2 0 5,5932017 4,481 194 1,610 174 0 17 0 6,4762018 4,563 199 1,674 184 0 4 0 6,6262019 4,028 185 1,517 169 0 4 0 5,9032020 4,604 204 1,554 194 0 5 0 6,5602021202220232024202520262027202820292030
CAGR RES MFR COM GOV IND OTH IRR TOT5-Year 2.7% -0.8% 0.9% 2.0% 2.2% 2.1%
10-Year -0.7% -0.2% -0.8% -2.5% -9.1% -0.8%15-Year -1.5% -0.3% -1.9% -3.2% -100.0% 8.6% -1.7%20-Year -1.2% -0.8% -1.5% -3.0% -100.0% -6.2% -1.4%
CAGR = Compound Annual Growth Rate
Page 3 of 15
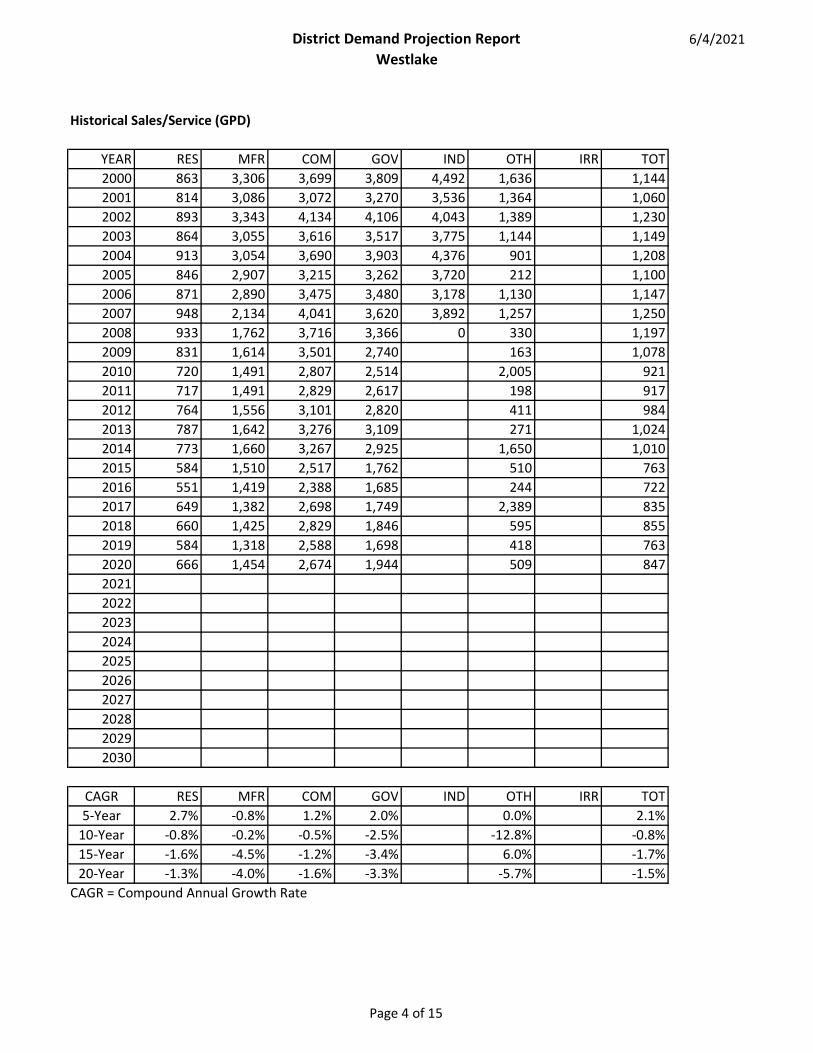
District Demand Projection ReportWestlake
6/4/2021
Historical Sales/Service (GPD)
YEAR RES MFR COM GOV IND OTH IRR TOT2000 863 3,306 3,699 3,809 4,492 1,636 1,1442001 814 3,086 3,072 3,270 3,536 1,364 1,0602002 893 3,343 4,134 4,106 4,043 1,389 1,2302003 864 3,055 3,616 3,517 3,775 1,144 1,1492004 913 3,054 3,690 3,903 4,376 901 1,2082005 846 2,907 3,215 3,262 3,720 212 1,1002006 871 2,890 3,475 3,480 3,178 1,130 1,1472007 948 2,134 4,041 3,620 3,892 1,257 1,2502008 933 1,762 3,716 3,366 0 330 1,1972009 831 1,614 3,501 2,740 163 1,0782010 720 1,491 2,807 2,514 2,005 9212011 717 1,491 2,829 2,617 198 9172012 764 1,556 3,101 2,820 411 9842013 787 1,642 3,276 3,109 271 1,0242014 773 1,660 3,267 2,925 1,650 1,0102015 584 1,510 2,517 1,762 510 7632016 551 1,419 2,388 1,685 244 7222017 649 1,382 2,698 1,749 2,389 8352018 660 1,425 2,829 1,846 595 8552019 584 1,318 2,588 1,698 418 7632020 666 1,454 2,674 1,944 509 8472021202220232024202520262027202820292030
CAGR RES MFR COM GOV IND OTH IRR TOT5-Year 2.7% -0.8% 1.2% 2.0% 0.0% 2.1%
10-Year -0.8% -0.2% -0.5% -2.5% -12.8% -0.8%15-Year -1.6% -4.5% -1.2% -3.4% 6.0% -1.7%20-Year -1.3% -4.0% -1.6% -3.3% -5.7% -1.5%
CAGR = Compound Annual Growth Rate
Page 4 of 15

District Demand Projection ReportWestlake
6/4/2021
Historical Production (AF)
YEAR SALES NRW PROD NRW %NRW
GPD/Svc2000 8,712 458 9,170 5.0% 602001 8,099 360 8,459 4.3% 472002 9,410 -161 9,248 -1.7% -212003 8,690 92 8,782 1.0% 122004 9,276 233 9,509 2.5% 302005 8,482 438 8,920 4.9% 572006 8,864 465 9,329 5.0% 602007 9,672 551 10,223 5.4% 712008 9,254 348 9,602 3.6% 452009 8,301 603 8,904 6.8% 782010 7,111 229 7,339 3.1% 302011 7,092 381 7,473 5.1% 492012 7,611 233 7,844 3.0% 302013 7,921 468 8,388 5.6% 602014 7,825 322 8,146 3.9% 422015 5,910 385 6,295 6.1% 502016 5,593 390 5,982 6.5% 502017 6,476 359 6,835 5.3% 462018 6,626 556 7,181 7.7% 722019 5,903 566 6,468 8.7% 732020 6,560 505 7,066 7.2% 652021202220232024202520262027202820292030
CAGR SALES NRW PRODNRW
GPD/Svc5-Year 2.1% 5.6% 2.3% 5.6%
10-Year -0.8% 8.2% -0.4% 8.2%15-Year -1.7% 1.0% -1.5% 0.9%20-Year -1.4% 0.5% -1.3% 0.4%
CAGR = Compound Annual Growth Rate
Page 5 of 15

District Demand Projection ReportWestlake
6/4/2021
Historical GPCD
GPCDYEAR POPULATION RESIDENTIAL TOTAL2000 16,717 329 4902001 16,899 305 4472002 17,195 329 4802003 17,322 312 4532004 17,790 325 4772005 18,096 297 4402006 18,387 301 4532007 18,651 324 4892008 18,892 315 4542009 19,100 277 4162010 19,397 238 3382011 19,435 237 3432012 19,440 252 3602013 19,434 260 3852014 19,451 256 3742015 19,458 195 2892016 19,456 184 2742017 19,464 214 3132018 19,472 218 3292019 19,445 193 2972020 19,477 220 3242021202220232024202520262027202820292030
CAGR POPULATION RESIDENTIAL GPCD TOTAL GPCD5-Year 0.0% 2.5% 2.3%
10-Year 0.0% -0.8% -0.4%15-Year 0.5% -2.0% -2.0%20-Year 0.8% -2.0% -2.0%
CAGR = Compound Annual Growth Rate
Page 6 of 15
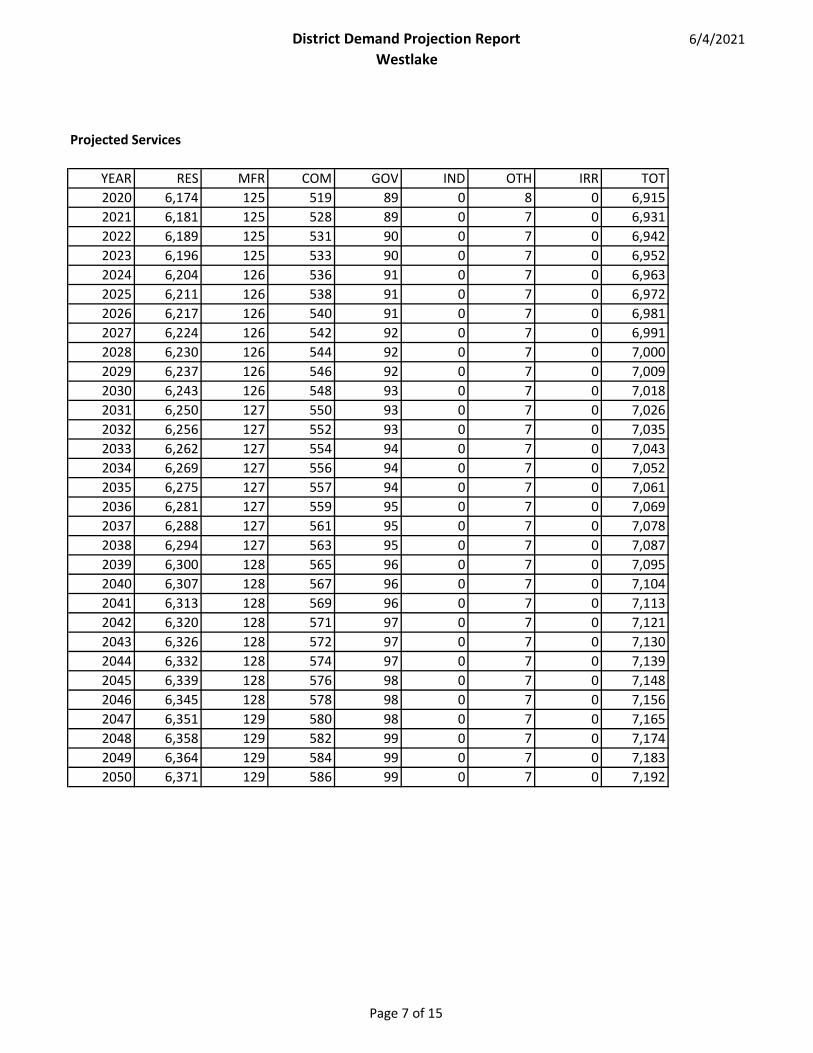
District Demand Projection ReportWestlake
6/4/2021
Projected Services
YEAR RES MFR COM GOV IND OTH IRR TOT2020 6,174 125 519 89 0 8 0 6,9152021 6,181 125 528 89 0 7 0 6,9312022 6,189 125 531 90 0 7 0 6,9422023 6,196 125 533 90 0 7 0 6,9522024 6,204 126 536 91 0 7 0 6,9632025 6,211 126 538 91 0 7 0 6,9722026 6,217 126 540 91 0 7 0 6,9812027 6,224 126 542 92 0 7 0 6,9912028 6,230 126 544 92 0 7 0 7,0002029 6,237 126 546 92 0 7 0 7,0092030 6,243 126 548 93 0 7 0 7,0182031 6,250 127 550 93 0 7 0 7,0262032 6,256 127 552 93 0 7 0 7,0352033 6,262 127 554 94 0 7 0 7,0432034 6,269 127 556 94 0 7 0 7,0522035 6,275 127 557 94 0 7 0 7,0612036 6,281 127 559 95 0 7 0 7,0692037 6,288 127 561 95 0 7 0 7,0782038 6,294 127 563 95 0 7 0 7,0872039 6,300 128 565 96 0 7 0 7,0952040 6,307 128 567 96 0 7 0 7,1042041 6,313 128 569 96 0 7 0 7,1132042 6,320 128 571 97 0 7 0 7,1212043 6,326 128 572 97 0 7 0 7,1302044 6,332 128 574 97 0 7 0 7,1392045 6,339 128 576 98 0 7 0 7,1482046 6,345 128 578 98 0 7 0 7,1562047 6,351 129 580 98 0 7 0 7,1652048 6,358 129 582 99 0 7 0 7,1742049 6,364 129 584 99 0 7 0 7,1832050 6,371 129 586 99 0 7 0 7,192
Page 7 of 15

District Demand Projection ReportWestlake
6/4/2021
Projected Sales (AF)
YEAR RES MFR COM GOV IND OTH IRR TOT2020 4,606 204 1,554 194 0 5 0 6,5622021 4,551 200 1,557 191 0 4 0 6,5032022 4,555 200 1,547 190 0 4 0 6,4952023 4,560 199 1,537 188 0 4 0 6,4892024 4,567 199 1,529 187 0 4 0 6,4862025 4,578 199 1,520 186 0 4 0 6,4872026 4,566 198 1,510 185 0 4 0 6,4622027 4,553 198 1,501 184 0 4 0 6,4392028 4,543 197 1,502 183 0 4 0 6,4292029 4,535 197 1,502 183 0 4 0 6,4212030 4,527 196 1,502 183 0 4 0 6,4132031 4,526 196 1,503 183 0 4 0 6,4122032 4,521 196 1,503 183 0 4 0 6,4062033 4,524 196 1,503 183 0 4 0 6,4102034 4,525 196 1,503 183 0 4 0 6,4122035 4,527 196 1,504 183 0 4 0 6,4142036 4,524 196 1,504 183 0 4 0 6,4112037 4,520 196 1,505 183 0 4 0 6,4072038 4,521 196 1,505 183 0 4 0 6,4082039 4,518 196 1,506 183 0 4 0 6,4072040 4,517 196 1,507 183 0 4 0 6,4062041 4,518 196 1,507 183 0 4 0 6,4082042 4,520 196 1,508 183 0 4 0 6,4112043 4,522 196 1,509 183 0 4 0 6,4142044 4,528 196 1,510 183 0 4 0 6,4212045 4,530 196 1,510 183 0 4 0 6,4242046 4,533 197 1,511 183 0 4 0 6,4282047 4,536 197 1,512 183 0 4 0 6,4322048 4,540 197 1,513 183 0 4 0 6,4372049 4,545 197 1,514 183 0 4 0 6,4432050 4,551 197 1,515 183 0 4 0 6,450
Page 8 of 15

District Demand Projection ReportWestlake
6/4/2021
Projected Sales/Service (GPD)
YEAR RES MFR COM GOV IND OTH IRR TOT2020 666 1,455 2,674 1,943 0 508 0 8472021 657 1,430 2,630 1,909 0 508 0 8382022 657 1,424 2,600 1,886 0 508 0 8352023 657 1,419 2,573 1,864 0 508 0 8332024 657 1,414 2,547 1,844 0 508 0 8322025 658 1,411 2,521 1,824 0 508 0 8312026 656 1,405 2,496 1,804 0 508 0 8262027 653 1,400 2,472 1,786 0 508 0 8222028 651 1,395 2,464 1,779 0 508 0 8202029 649 1,391 2,455 1,771 0 508 0 8182030 647 1,386 2,447 1,764 0 508 0 8162031 647 1,384 2,439 1,758 0 508 0 8152032 645 1,381 2,431 1,751 0 508 0 8132033 645 1,380 2,423 1,745 0 508 0 8122034 644 1,378 2,416 1,738 0 508 0 8122035 644 1,377 2,408 1,732 0 508 0 8112036 643 1,375 2,401 1,726 0 508 0 8102037 642 1,373 2,394 1,720 0 508 0 8082038 641 1,372 2,387 1,714 0 508 0 8072039 640 1,371 2,380 1,709 0 508 0 8062040 639 1,370 2,373 1,703 0 508 0 8052041 639 1,369 2,366 1,697 0 508 0 8042042 638 1,368 2,360 1,692 0 508 0 8042043 638 1,367 2,353 1,687 0 508 0 8032044 638 1,367 2,346 1,681 0 508 0 8032045 638 1,366 2,340 1,676 0 508 0 8022046 638 1,366 2,333 1,671 0 508 0 8022047 638 1,365 2,327 1,665 0 508 0 8012048 638 1,365 2,320 1,660 0 508 0 8012049 638 1,365 2,314 1,655 0 508 0 8012050 638 1,364 2,308 1,650 0 508 0 801
Page 9 of 15
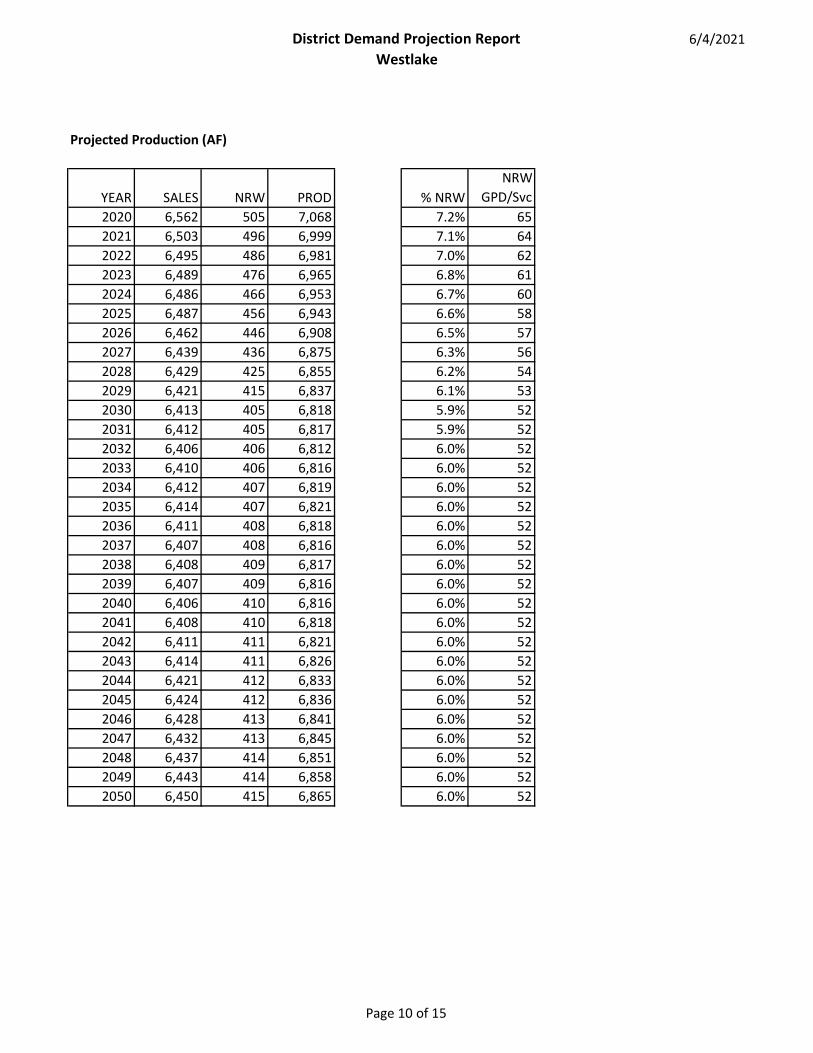
District Demand Projection ReportWestlake
6/4/2021
Projected Production (AF)
YEAR SALES NRW PROD % NRWNRW
GPD/Svc2020 6,562 505 7,068 7.2% 652021 6,503 496 6,999 7.1% 642022 6,495 486 6,981 7.0% 622023 6,489 476 6,965 6.8% 612024 6,486 466 6,953 6.7% 602025 6,487 456 6,943 6.6% 582026 6,462 446 6,908 6.5% 572027 6,439 436 6,875 6.3% 562028 6,429 425 6,855 6.2% 542029 6,421 415 6,837 6.1% 532030 6,413 405 6,818 5.9% 522031 6,412 405 6,817 5.9% 522032 6,406 406 6,812 6.0% 522033 6,410 406 6,816 6.0% 522034 6,412 407 6,819 6.0% 522035 6,414 407 6,821 6.0% 522036 6,411 408 6,818 6.0% 522037 6,407 408 6,816 6.0% 522038 6,408 409 6,817 6.0% 522039 6,407 409 6,816 6.0% 522040 6,406 410 6,816 6.0% 522041 6,408 410 6,818 6.0% 522042 6,411 411 6,821 6.0% 522043 6,414 411 6,826 6.0% 522044 6,421 412 6,833 6.0% 522045 6,424 412 6,836 6.0% 522046 6,428 413 6,841 6.0% 522047 6,432 413 6,845 6.0% 522048 6,437 414 6,851 6.0% 522049 6,443 414 6,858 6.0% 522050 6,450 415 6,865 6.0% 52
Page 10 of 15
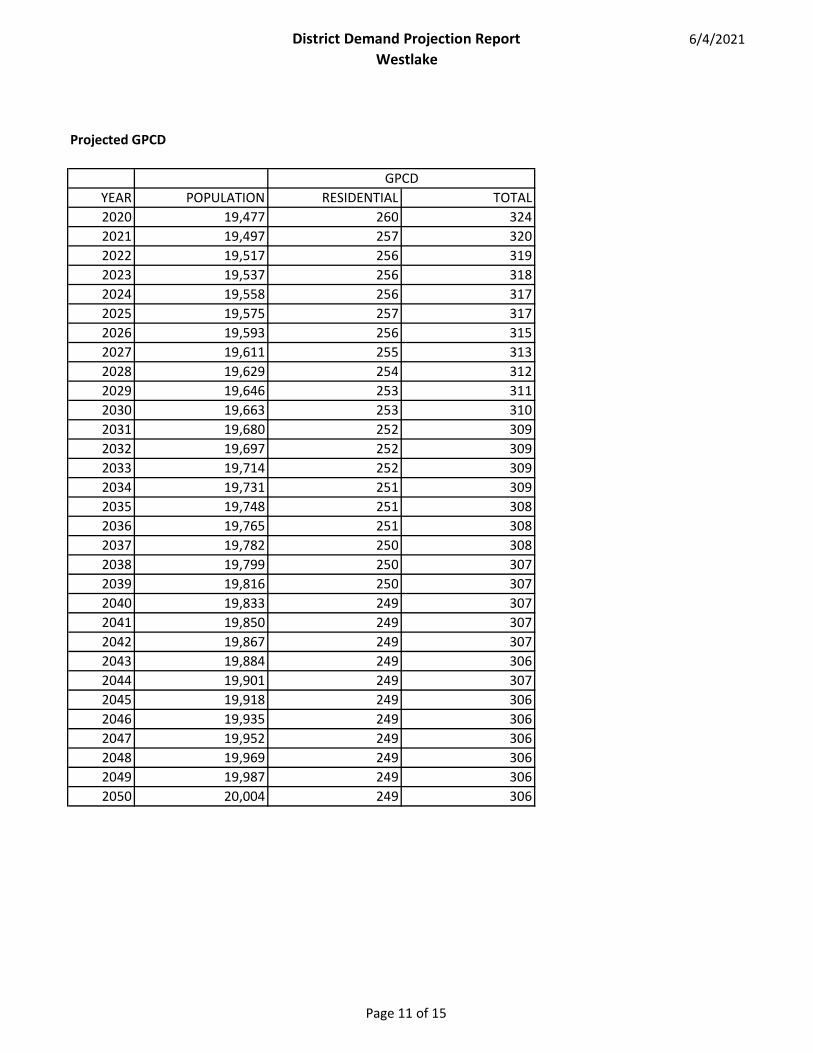
District Demand Projection ReportWestlake
6/4/2021
Projected GPCD
GPCDYEAR POPULATION RESIDENTIAL TOTAL2020 19,477 260 3242021 19,497 257 3202022 19,517 256 3192023 19,537 256 3182024 19,558 256 3172025 19,575 257 3172026 19,593 256 3152027 19,611 255 3132028 19,629 254 3122029 19,646 253 3112030 19,663 253 3102031 19,680 252 3092032 19,697 252 3092033 19,714 252 3092034 19,731 251 3092035 19,748 251 3082036 19,765 251 3082037 19,782 250 3082038 19,799 250 3072039 19,816 250 3072040 19,833 249 3072041 19,850 249 3072042 19,867 249 3072043 19,884 249 3062044 19,901 249 3072045 19,918 249 3062046 19,935 249 3062047 19,952 249 3062048 19,969 249 3062049 19,987 249 3062050 20,004 249 306
Page 11 of 15

District Demand Projection ReportWestlake
6/4/2021
Normal, Single-Year, and Multi-Year Dry Year Demand (AF)
YEAR NORMALSINGLE
DRY YEAR% OF
NORMALMULTI
DRY YEAR% OF
NORMAL2020 7,068 7,246 103% 7,356 104%2021 6,999 7,175 103% 7,284 104%2022 6,981 7,157 103% 7,266 104%2023 6,965 7,141 103% 7,250 104%2024 6,953 7,128 103% 7,237 104%2025 6,943 7,118 103% 7,226 104%2026 6,908 7,083 103% 7,191 104%2027 6,875 7,048 103% 7,156 104%2028 6,855 7,028 103% 7,135 104%2029 6,837 7,009 103% 7,116 104%2030 6,818 6,990 103% 7,097 104%2031 6,817 6,990 103% 7,096 104%2032 6,812 6,984 103% 7,091 104%2033 6,816 6,988 103% 7,095 104%2034 6,819 6,991 103% 7,097 104%2035 6,821 6,993 103% 7,100 104%2036 6,818 6,991 103% 7,097 104%2037 6,816 6,988 103% 7,094 104%2038 6,817 6,990 103% 7,096 104%2039 6,816 6,988 103% 7,095 104%2040 6,816 6,988 103% 7,094 104%2041 6,818 6,990 103% 7,097 104%2042 6,821 6,994 103% 7,100 104%2043 6,826 6,998 103% 7,105 104%2044 6,833 7,005 103% 7,112 104%2045 6,836 7,009 103% 7,116 104%2046 6,841 7,014 103% 7,121 104%2047 6,845 7,018 103% 7,125 104%2048 6,851 7,024 103% 7,131 104%2049 6,858 7,031 103% 7,138 104%2050 6,865 7,038 103% 7,145 104%
Page 12 of 15
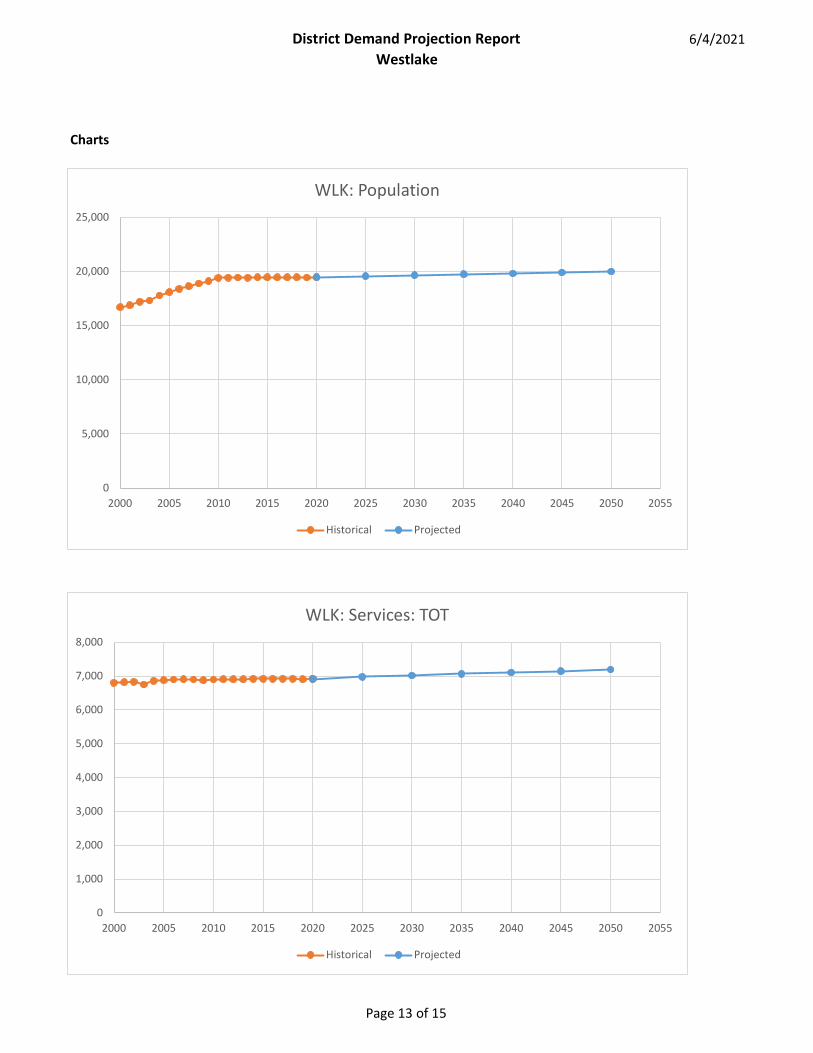
District Demand Projection ReportWestlake
6/4/2021
Charts
0
5,000
10,000
15,000
20,000
25,000
2000 2005 2010 2015 2020 2025 2030 2035 2040 2045 2050 2055
WLK: Population
Historical Projected
0
1,000
2,000
3,000
4,000
5,000
6,000
7,000
8,000
2000 2005 2010 2015 2020 2025 2030 2035 2040 2045 2050 2055
WLK: Services: TOT
Historical Projected
Page 13 of 15

District Demand Projection ReportWestlake
6/4/2021
3,000
4,000
5,000
6,000
7,000
8,000
9,000
10,000
11,000
2000 2005 2010 2015 2020 2025 2030 2035 2040 2045 2050 2055
AF
WLK: Production
Historical Projected Wet Single Dry Multi Dry
0
2,000
4,000
6,000
8,000
10,000
12,000
2000 2005 2010 2015 2020 2025 2030 2035 2040 2045 2050 2055
AF
WLK: Sales: TOT
Historical Projected Wet Single Dry Multi Dry
Page 14 of 15
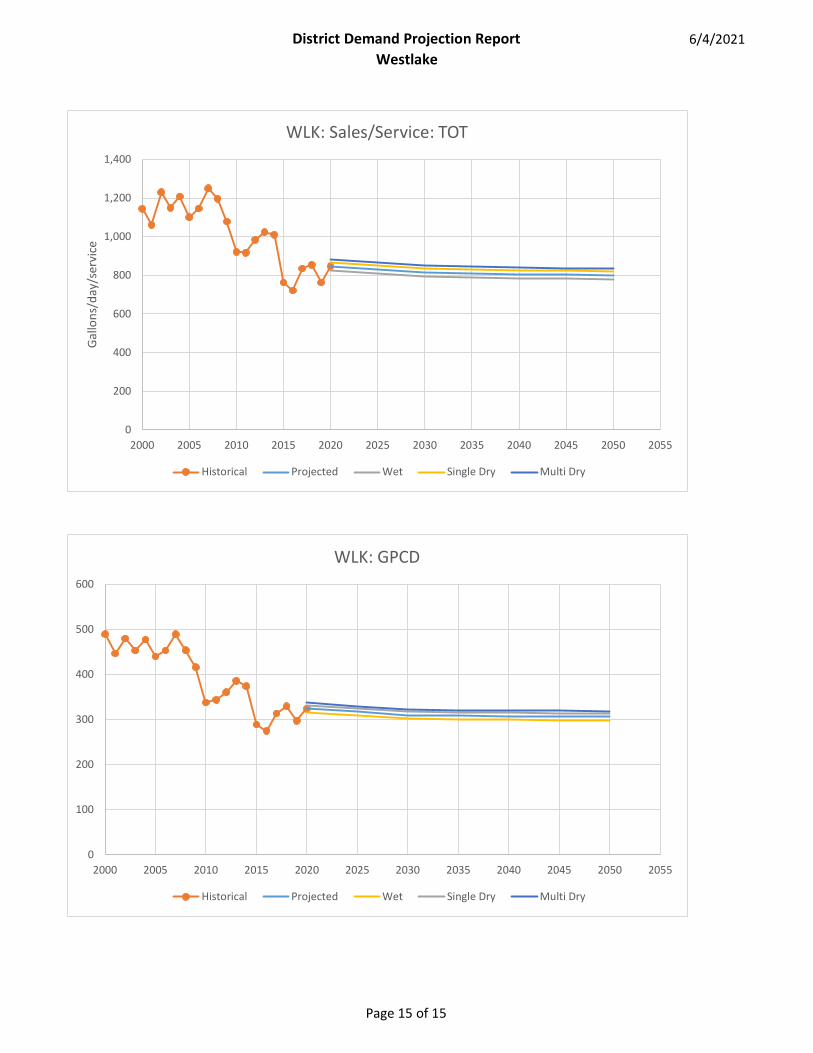
District Demand Projection ReportWestlake
6/4/2021
0
200
400
600
800
1,000
1,200
1,400
2000 2005 2010 2015 2020 2025 2030 2035 2040 2045 2050 2055
Gallo
ns/d
ay/s
ervi
ce
WLK: Sales/Service: TOT
Historical Projected Wet Single Dry Multi Dry
0
100
200
300
400
500
600
2000 2005 2010 2015 2020 2025 2030 2035 2040 2045 2050 2055
WLK: GPCD
Historical Projected Wet Single Dry Multi Dry
Page 15 of 15
California Water Service 2020 Urban Water Management Plan
Westlake District
June 2021 Printed 6/25/2021
Page F-1
EKI Environment & Water, Inc. M.Cubed
Gary Fiske and Associates
Appendix F: DWR SB X7-7 Verification Forms

Water Conservation Act of 2009SB X7-7
Verification Forms
Westlake District
2020 Urban Water Management PlanAppendix F
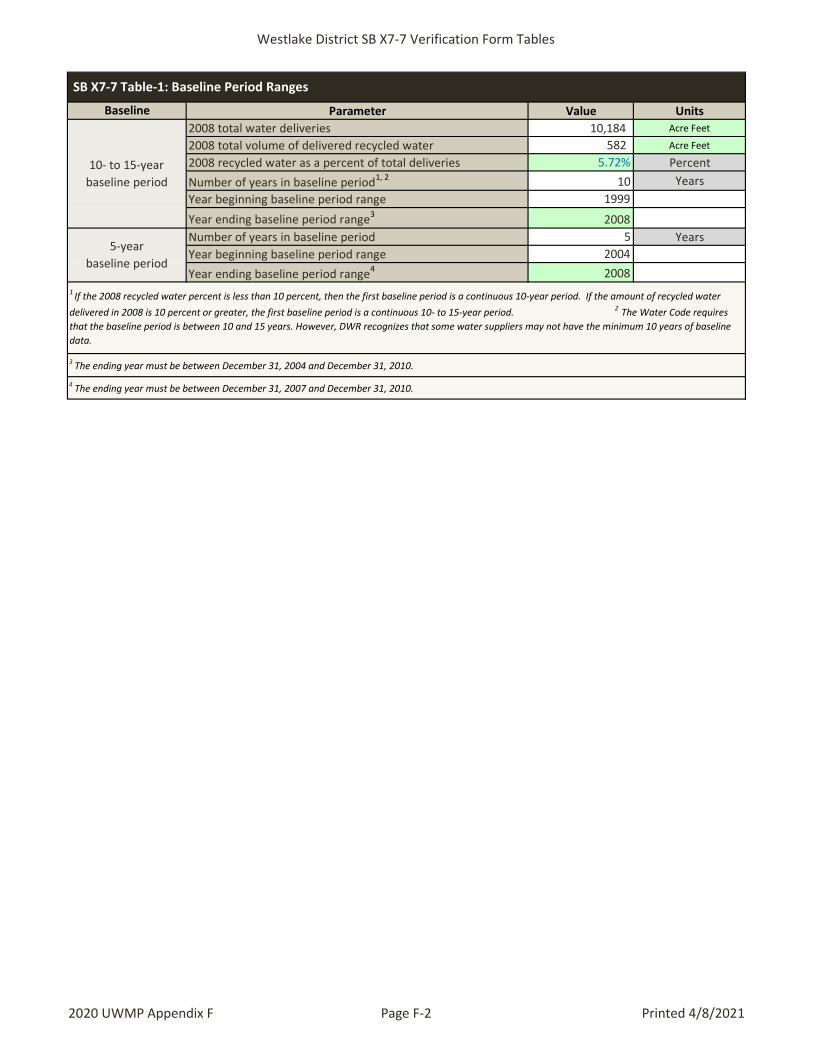
Westlake District SB X7-7 Verification Form Tables
Parameter Value Units2008 total water deliveries 10,184 Acre Feet
2008 total volume of delivered recycled water 582 Acre Feet
2008 recycled water as a percent of total deliveries 5.72% PercentNumber of years in baseline period1, 2 10 YearsYear beginning baseline period range 1999
Year ending baseline period range3 2008Number of years in baseline period 5 YearsYear beginning baseline period range 2004
Year ending baseline period range4 2008
SB X7-7 Table-1: Baseline Period Ranges
1 If the 2008 recycled water percent is less than 10 percent, then the first baseline period is a continuous 10-year period. If the amount of recycled water delivered in 2008 is 10 percent or greater, the first baseline period is a continuous 10- to 15-year period. 2 The Water Code requires that the baseline period is between 10 and 15 years. However, DWR recognizes that some water suppliers may not have the minimum 10 years of baseline data.
3 The ending year must be between December 31, 2004 and December 31, 2010.
4 The ending year must be between December 31, 2007 and December 31, 2010.
5-year baseline period
Baseline
10- to 15-year baseline period
2020 UWMP Appendix F Page F-2 Printed 4/8/2021
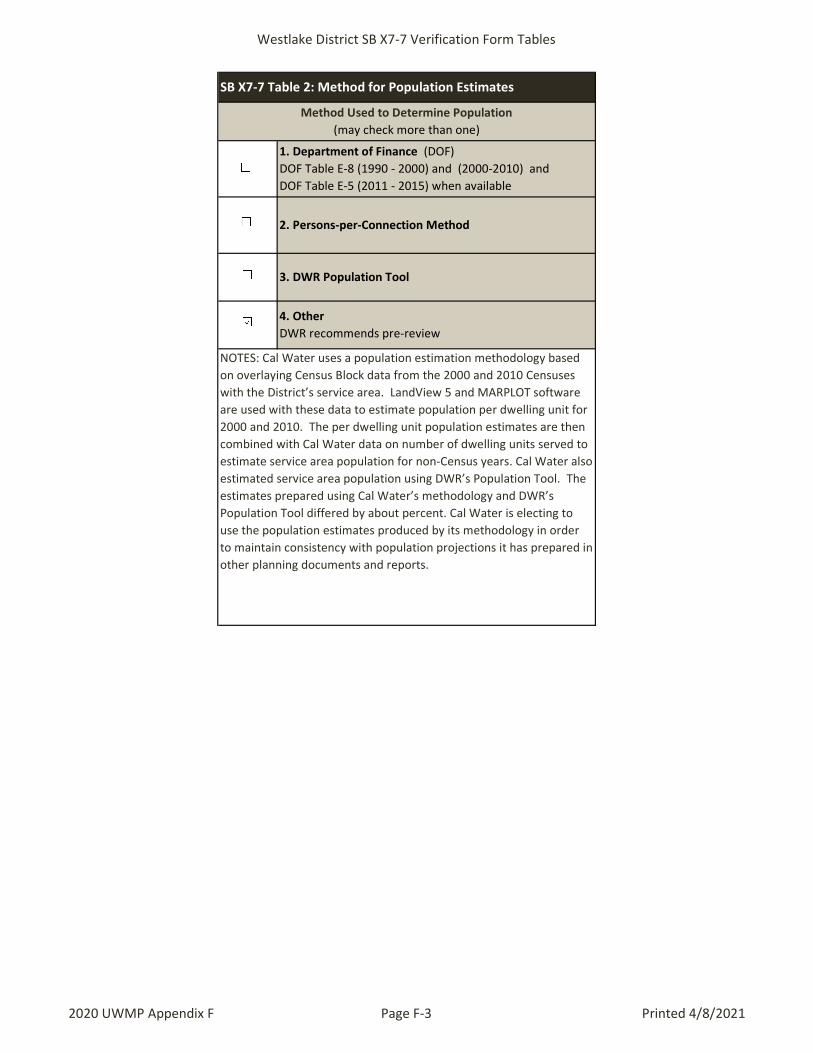
Westlake District SB X7-7 Verification Form Tables
NOTES: Cal Water uses a population estimation methodology based on overlaying Census Block data from the 2000 and 2010 Censuses with the District’s service area. LandView 5 and MARPLOT software are used with these data to estimate population per dwelling unit for 2000 and 2010. The per dwelling unit population estimates are then combined with Cal Water data on number of dwelling units served to estimate service area population for non-Census years. Cal Water also estimated service area population using DWR’s Population Tool. The estimates prepared using Cal Water’s methodology and DWR’s Population Tool differed by about percent. Cal Water is electing to use the population estimates produced by its methodology in order to maintain consistency with population projections it has prepared in other planning documents and reports.
SB X7-7 Table 2: Method for Population Estimates
Method Used to Determine Population(may check more than one)
1. Department of Finance (DOF)DOF Table E-8 (1990 - 2000) and (2000-2010) andDOF Table E-5 (2011 - 2015) when available
3. DWR Population Tool
4. OtherDWR recommends pre-review
2. Persons-per-Connection Method
2020 UWMP Appendix F Page F-3 Printed 4/8/2021

Westlake District SB X7-7 Verification Form Tables
Population
Year 1 1999 16,872 Year 2 2000 16,717 Year 3 2001 16,899 Year 4 2002 17,195 Year 5 2003 17,322 Year 6 2004 17,790 Year 7 2005 18,096 Year 8 2006 18,387 Year 9 2007 18,651 Year 10 2008 18,892 Year 11Year 12Year 13Year 14Year 15
Year 1 2004 17,790 Year 2 2005 18,096 Year 3 2006 18,387 Year 4 2007 18,651 Year 5 2008 18,892
19,458
SB X7-7 Table 3: Service Area Population
10 to 15 Year Baseline Population
5 Year Baseline Population
2015 Compliance Year Population
Year
2015
2020 UWMP Appendix F Page F-4 Printed 4/8/2021

Westlake District SB X7-7 Verification Form Tables
Exported Water
Change in Dist. System
Storage(+/-)
Indirect Recycled
WaterThis column will
remain blank until SB X7-7 Table 4-B is completed.
Water Delivered
for Agricultural
Use
Process WaterThis column will
remain blank until SB X7-7 Table 4-D is completed.
Year 1 1999 9,146 - - 9,146 Year 2 2000 9,170 - - 9,170 Year 3 2001 8,459 - - 8,459 Year 4 2002 9,248 - - 9,248 Year 5 2003 8,782 - - 8,782 Year 6 2004 9,509 - - 9,509 Year 7 2005 8,920 - - 8,920 Year 8 2006 9,329 - - 9,329 Year 9 2007 10,223 - - 10,223 Year 10 2008 9,602 - - 9,602 Year 11 0 - - - - Year 12 0 - - - - Year 13 0 - - - - Year 14 0 - - - - Year 15 0 - - - -
9,239
Year 1 2004 9,509 - - 9,509 Year 2 2005 8,920 - - 8,920 Year 3 2006 9,329 - - 9,329 Year 4 2007 10,223 - - 10,223 Year 5 2008 9,602 - - 9,602
9,517
6,295 - - - 6,295
Volume Into Distribution
SystemThis column will
remain blank until SB X7-7 Table 4-A is completed.
Annual Gross
Water Use
Deductions
* NOTE that the units of measure must remain consistent throughout the UWMP, as reported in Table 2-3
SB X7-7 Table 4: Annual Gross Water Use *
2015
10 to 15 Year Baseline - Gross Water Use
10 - 15 year baseline average gross water use 5 Year Baseline - Gross Water Use
5 year baseline average gross water use2015 Compliance Year - Gross Water Use
Baseline YearFm SB X7-7 Table 3
2020 UWMP Appendix F Page F-5 Printed 4/8/2021
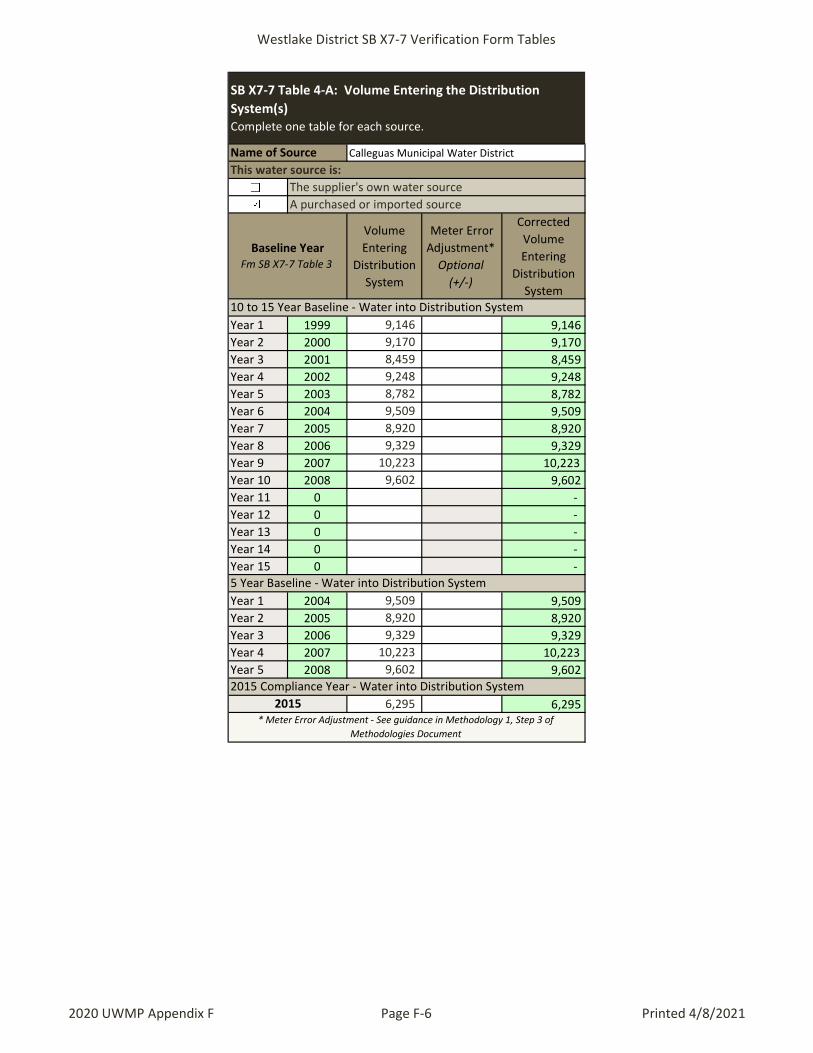
Westlake District SB X7-7 Verification Form Tables
Volume Entering
Distribution System
Meter Error Adjustment*
Optional(+/-)
Corrected Volume Entering
Distribution System
Year 1 1999 9,146 9,146 Year 2 2000 9,170 9,170 Year 3 2001 8,459 8,459 Year 4 2002 9,248 9,248 Year 5 2003 8,782 8,782 Year 6 2004 9,509 9,509 Year 7 2005 8,920 8,920 Year 8 2006 9,329 9,329 Year 9 2007 10,223 10,223 Year 10 2008 9,602 9,602 Year 11 0 - Year 12 0 - Year 13 0 - Year 14 0 - Year 15 0 -
Year 1 2004 9,509 9,509 Year 2 2005 8,920 8,920 Year 3 2006 9,329 9,329 Year 4 2007 10,223 10,223 Year 5 2008 9,602 9,602
6,295 6,295
SB X7-7 Table 4-A: Volume Entering the Distribution System(s)Complete one table for each source.
10 to 15 Year Baseline - Water into Distribution System
5 Year Baseline - Water into Distribution System
2015 Compliance Year - Water into Distribution System
Name of Source
Baseline YearFm SB X7-7 Table 3
* Meter Error Adjustment - See guidance in Methodology 1, Step 3 of Methodologies Document
This water source is:The supplier's own water sourceA purchased or imported source
2015
Calleguas Municipal Water District
2020 UWMP Appendix F Page F-6 Printed 4/8/2021

Westlake District SB X7-7 Verification Form Tables
Service Area PopulationFm SB X7-7
Table 3
Annual Gross Water UseFm SB X7-7
Table 4
Daily Per Capita Water Use (GPCD)
Year 1 1999 16,872 9,146 484 Year 2 2000 16,717 9,170 490 Year 3 2001 16,899 8,459 447 Year 4 2002 17,195 9,248 480 Year 5 2003 17,322 8,782 453 Year 6 2004 17,790 9,509 477 Year 7 2005 18,096 8,920 440 Year 8 2006 18,387 9,329 453 Year 9 2007 18,651 10,223 489 Year 10 2008 18,892 9,602 454 Year 11 0 - - Year 12 0 - - Year 13 0 - - Year 14 0 - - Year 15 0 - -
467
Service Area PopulationFm SB X7-7
Table 3
Gross Water UseFm SB X7-7
Table 4
Daily Per Capita Water
Use
Year 1 2004 17,790 9,509 477 Year 2 2005 18,096 8,920 440 Year 3 2006 18,387 9,329 453 Year 4 2007 18,651 10,223 489 Year 5 2008 18,892 9,602 454
463
19,458 6,295 289
SB X7-7 Table 5: Gallons Per Capita Per Day (GPCD)
Baseline YearFm SB X7-7 Table 3
10 to 15 Year Baseline GPCD
10-15 Year Average Baseline GPCD 5 Year Baseline GPCD
5 Year Average Baseline GPCD 2015 Compliance Year GPCD
2015
Baseline YearFm SB X7-7 Table 3
2020 UWMP Appendix F Page F-7 Printed 4/8/2021
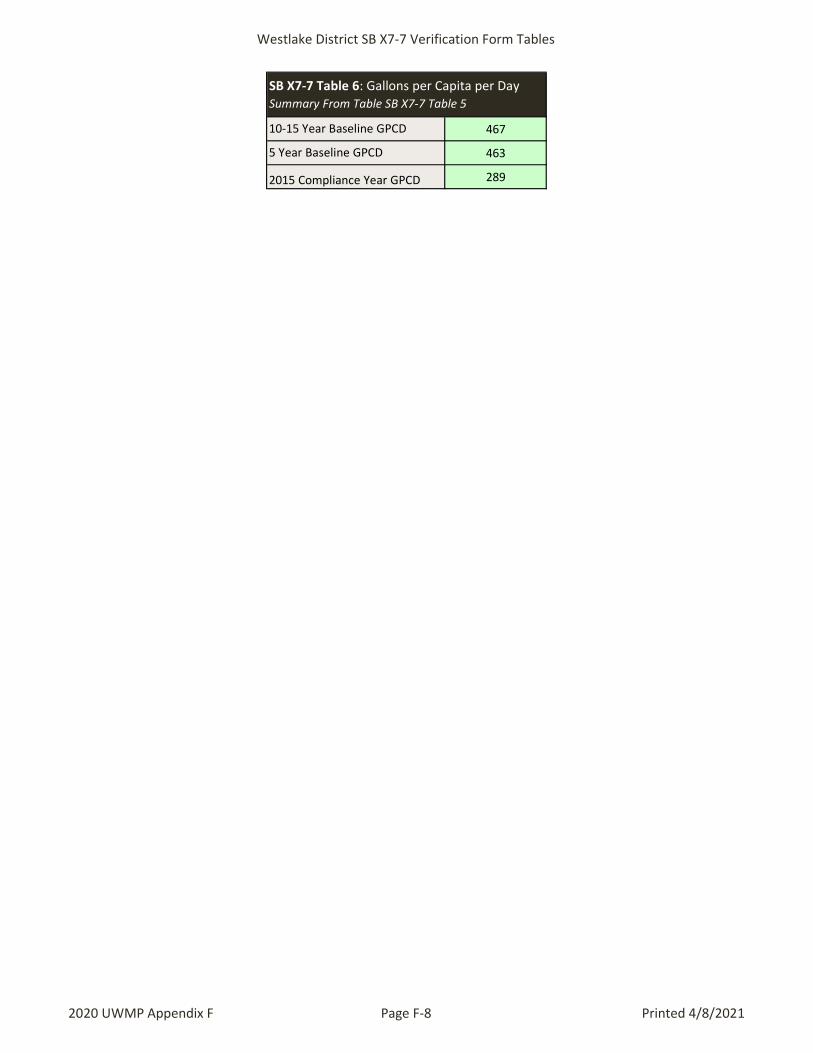
Westlake District SB X7-7 Verification Form Tables
467
463
2015 Compliance Year GPCD 289
SB X7-7 Table 6: Gallons per Capita per Day Summary From Table SB X7-7 Table 5
10-15 Year Baseline GPCD
5 Year Baseline GPCD
2020 UWMP Appendix F Page F-8 Printed 4/8/2021

Westlake District SB X7-7 Verification Form Tables
Supporting Documentation
Method 1 SB X7-7 Table 7A
Method 2 SB X7-7 Tables 7B, 7C, and 7D Contact DWR for these tables
Method 3 SB X7-7 Table 7-E
Method 4 Method 4 Calculator
SB X7-7 Table 7: 2020 Target MethodSelect Only One
Target Method
2020 UWMP Appendix F Page F-9 Printed 4/8/2021

Westlake District SB X7-7 Verification Form Tables
10-15 Year Baseline GPCD
2020 Target GPCD
467 373
SB X7-7 Table 7-A: Target Method 120% Reduction
2020 UWMP Appendix F Page F-10 Printed 4/8/2021
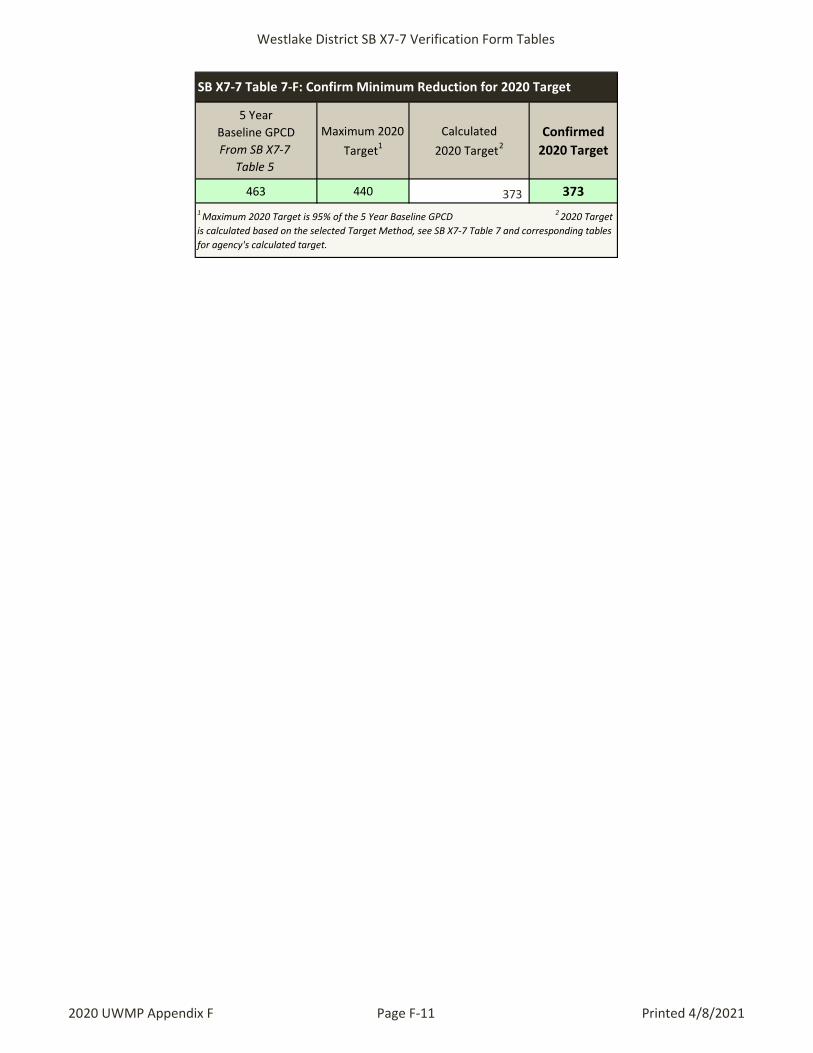
Westlake District SB X7-7 Verification Form Tables
5 YearBaseline GPCDFrom SB X7-7
Table 5
Maximum 2020 Target1
Calculated2020 Target2
Confirmed 2020 Target
463 440 373 373
SB X7-7 Table 7-F: Confirm Minimum Reduction for 2020 Target
1 Maximum 2020 Target is 95% of the 5 Year Baseline GPCD 2 2020 Target is calculated based on the selected Target Method, see SB X7-7 Table 7 and corresponding tables for agency's calculated target.
2020 UWMP Appendix F Page F-11 Printed 4/8/2021
California Water Service 2020 Urban Water Management Plan
Westlake District
June 2021 Printed 6/25/2021
Page G-1
EKI Environment & Water, Inc. M.Cubed
Gary Fiske and Associates
Appendix G: Climate Change Studies – Executive Summaries
• Climate Change – Water Resource Monitoring and Adaptation Plan – Phase 1 • Potential Climate Change Impacts on the Water Supplies of California Water Service

Submitted to: California Water Service1720 North First Street San Jose, CA 95112
Submitted by: ICF 555 W 5th St Suite 3100 Los Angeles, CA 90013
Climate Change- Water Resource Monitoring and Adaptation Plan – Phase 1
December 17, 2020
Cal Water Climate Change Water Resource Monitoring and Adaptation Plan
1
Executive Summary Shifts in the frequency and severity of natural hazards resulting from climate change, often referred to as climate hazards, increasingly threaten water resources in California. These relevant climate hazards include reductions to snowpack, greater concentrations of precipitation in both a shorter rain season and isolated atmospheric river events, and more volatility between wet and dry water years.
To identify and prepare for impacts from these hazards, California Water Service (Cal Water) is seeking to identify climate change vulnerabilities to water supplies, operations and facilities, and to develop adaptation strategies to address those vulnerabilities through a Climate Change Water Resources Monitoring and Adaptation Plan. This body of work is intended to provide Cal Water with information to inform decisions on water system/asset management and resource planning to better prepare for and respond to current and projected changes to climate. This work represents a forward-looking approach in addressing climate risks for California utilities, as the large majority of water wholesaler and utilities have not completed climate vulnerability and adaptation plans.
In the first phase of this effort, the ICF team collaborated with Cal Water to conduct a literature and tools review as the foundation for subsequent phases of work. In Phase 2 of this project, the ICF team and Cal Water will undertake a vulnerability assessment of Cal Water’s facilities and operations by developing an assessment approach that evaluates climate impacts to Cal Water, identifies asset vulnerabilities, and prioritizes climate risks. Phase 3 will focus on an assessment of climate-driven impacts to water supply resources and demand. This first phase of research and assessment will provide Cal Water with a clear “lay of the land” in understanding available methodologies and lessons learned in conducting vulnerability assessments and developing adaptation plans in the water sector. This work can provide key insights for Cal Water, industry practitioners, and Cal Water customers on best practices and needs in climate vulnerability and adaptation efforts.
This first phase will also act as a foundation for Cal Water to build on in subsequent phases of work. ICF and Cal Water will build on research and findings developed in Phase 1 to define the scope of Phases 2 and 3.
In Phase 1, the ICF team undertook three areas of review:
1) Literature and tools related to adaptation planning by water suppliers and other relevant organizations
2) Methods and data in Cal Water’s 2016 Vulnerability Study “Potential Climate Change Impacts on the Water Supplies of California Water Service”
3) Climate change impact assessments and adaptation plans beyond Cal Water (wholesalers, state agencies) that could affect Cal Water’s vulnerability or adaptive capacity
In the first part of our assessment, the studies we reviewed conclude that there is high certainty of climate-driven reductions to snowpack, wetter winter months, and more volatility between wet and dry water years. While California water systems are designed to operate under a wide
Cal Water Climate Change Water Resource Monitoring and Adaptation Plan
2
range of hydrologic conditions, they are not designed to absorb and adapt to the projected levels of change, which could have impacts on historical supplies from reservoir systems and groundwater systems. These studies also revealed a suite of potential approaches to vulnerability assessment and risk assessment that are applicable to Phases 2 and 3.
Key studies that the ICF team referenced include Brown and Caldwell’s “Impacts of Climate Change on Honolulu Water Supplies and Planning Strategies for Mitigation”, the Water Research Foundation’s (WRF)’s “Mapping Climate Exposure and Climate Information Needs to Water Utility Business Functions”, the Metropolitan Water District’s (MWD)’s “2015 Integrated Water Resources Plan” and “2015 Urban Water Management Plan”, and the U.S. Environmental Protection Agency’s (EPA’s) Climate Resilience Evaluation and Awareness Toolkit (CREAT).
In the second part of our review, we found that Cal Water’s 2016 Climate Change Vulnerability Study undertook a high-level investigation of impacts of climate change on water supply, including surface water, groundwater, and imported water throughout Cal Water service areas. However, the study did not use uniform metrics across water suppliers, was unable to apply the currently available downscaled climate projections, and did not consider the full suite of potential climate impacts to Cal Water’s systems, including impacts of compounding climate hazards and impacts on Cal Water facilities and operations.
In the third part of this work, the ICF team researched and assessed existing climate vulnerability assessments and adaptation efforts that have an impact on Cal Water’s ability to mitigate impacts from climate change. This included efforts by water supply wholesalers connected to Cal Water’s system, and state agencies that regulate Cal Water’s supplies, operations, and planning efforts. This will allow Cal Water to build on existing actions and avoid recreating adaptation efforts that are planned or have been implemented.
Cal Water has undertaken key steps toward adaptation planning since the 2016 Vulnerability Study, such as this work to provide additional vulnerability analysis, working locally to identify and prepare to meet Sustainable Groundwater Management Act (SGMA) requirements, and coordinating with wholesalers on their identified climate-driven vulnerabilities. Phases 2 and 3 of this work will further frame system vulnerabilities within an adaptation planning context for a flexible and anticipatory response.
The ICF team’s literature review focused on identifying approaches for assessing water utility vulnerabilities of assets and water resources, and adaptation planning needs (summarized in Table 1). To identify these priority approaches, the team reviewed a list of publications with input from Cal Water on key sources. We reviewed and analyzed the relevant literature for applicability to Cal Water, the advantages and fit within a robust plan for assessment, and the potential disadvantages. We highlighted those approaches in the sections on key takeaways and the applicability of approaches to Cal Water. Table 1 provides important considerations raised by the ICF team during this process.
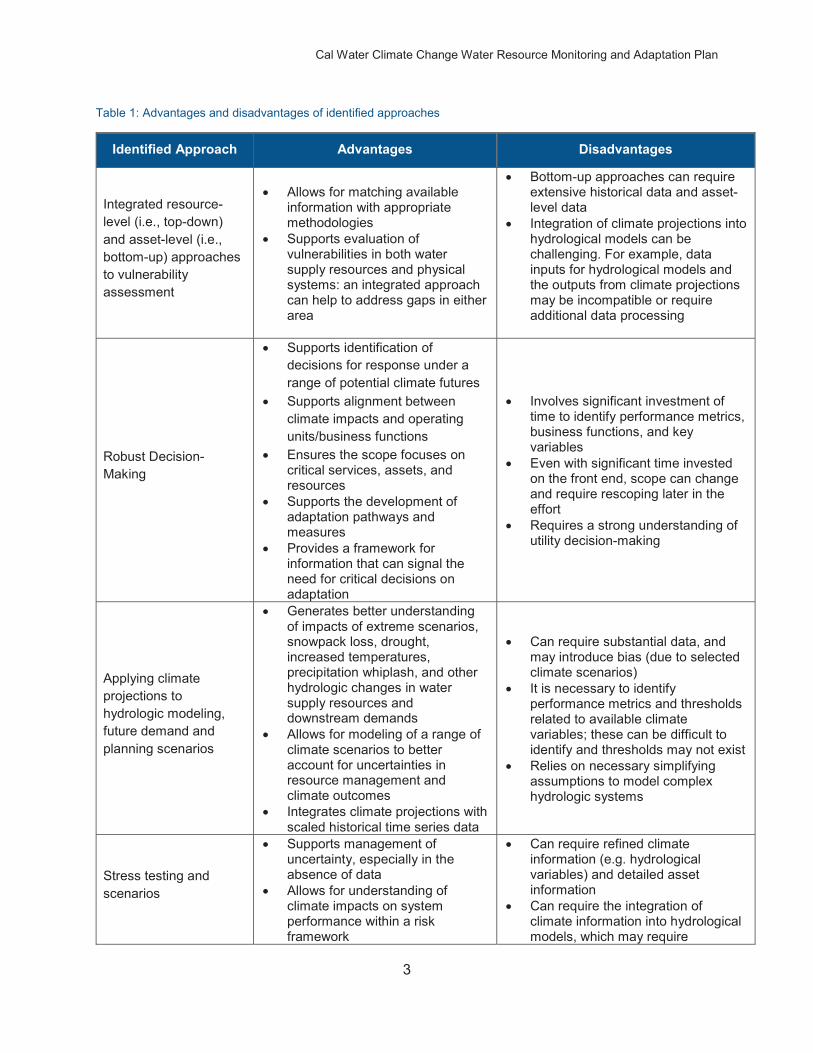
Cal Water Climate Change Water Resource Monitoring and Adaptation Plan
3
Table 1: Advantages and disadvantages of identified approaches
Identified Approach Advantages Disadvantages
Integrated resource-level (i.e., top-down) and asset-level (i.e., bottom-up) approaches to vulnerability assessment
Allows for matching available information with appropriate methodologies
Supports evaluation of vulnerabilities in both water supply resources and physical systems: an integrated approach can help to address gaps in either area
Bottom-up approaches can require extensive historical data and asset-level data
Integration of climate projections into hydrological models can be challenging. For example, data inputs for hydrological models and the outputs from climate projections may be incompatible or require additional data processing
Robust Decision-Making
Supports identification of decisions for response under a range of potential climate futures
Supports alignment between climate impacts and operating units/business functions
Ensures the scope focuses on critical services, assets, and resources
Supports the development of adaptation pathways and measures
Provides a framework for information that can signal the need for critical decisions on adaptation
Involves significant investment of time to identify performance metrics, business functions, and key variables
Even with significant time invested on the front end, scope can change and require rescoping later in the effort
Requires a strong understanding of utility decision-making
Applying climate projections to hydrologic modeling, future demand and planning scenarios
Generates better understanding of impacts of extreme scenarios, snowpack loss, drought, increased temperatures, precipitation whiplash, and other hydrologic changes in water supply resources and downstream demands
Allows for modeling of a range of climate scenarios to better account for uncertainties in resource management and climate outcomes
Integrates climate projections with scaled historical time series data
Can require substantial data, and may introduce bias (due to selected climate scenarios)
It is necessary to identify performance metrics and thresholds related to available climate variables; these can be difficult to identify and thresholds may not exist
Relies on necessary simplifying assumptions to model complex hydrologic systems
Stress testing and scenarios
Supports management of uncertainty, especially in the absence of data
Allows for understanding of climate impacts on system performance within a risk framework
Can require refined climate information (e.g. hydrological variables) and detailed asset information
Can require the integration of climate information into hydrological models, which may require

Cal Water Climate Change Water Resource Monitoring and Adaptation Plan
4
Identified Approach Advantages Disadvantages
Supports identification of major performance metrics and their potential for failure
Helps in understanding how the severity of impacts varies for facilities, operations, and water supplies under different climate change conditions.
significant data processing to be compatible with one another
Can result in qualitative or directional findings that don’t provide straightforward adaptation responses
Engaging staff in climate change vulnerability assessments and adaptation plans
Provides perspective for setting study parameters
Provides targeted input and data into assessment
Identifies existing data gaps and actions to address gaps
Supports development of institutional capacity for monitoring impacts, adaptation planning, and implementation
Can be time-consuming for team members attending workshops and interviews; requires a targeted approach to ensure efficiency and that the right data is captured
Requires cross-team coordination that may be outside of “normal” communication pathways, e.g. between engineers and policy specialists
Evaluating costs of inaction
Helps to prioritize adaptation planning needs
Creates a better understanding of the risks to Cal Water
Requires scaling information on past costs without clear data on future impacts, creating uncertainties in estimates
Use of Flexible Adaptation Pathways
Helps to select appropriate timing (including lead time from planning to implementation) and application of adaptation measures
Considers and compares multiple strategies in adaptation planning
Includes triggers that signal when decision-makers should decide on switching to another pathway
Allows for adaptive decisions under uncertainty by integrating points for re-assessing pathway and actions
Considers alternative external developments over time
Does not provide a fixed timeline for actions
This approach is relatively new and may require coordination with budget cycles and external policy updates, since actions evolve over time
May push decision burden onto future decision-makers who did not develop original pathway
Our team synthesized these identified methodologies, findings, and insights into an overarching approach for characterizing climate vulnerabilities and planning for adaptation at both an asset level and water supply planning level to suit Cal Water’s needs in addressing climate change impacts, shown in Figure 1.
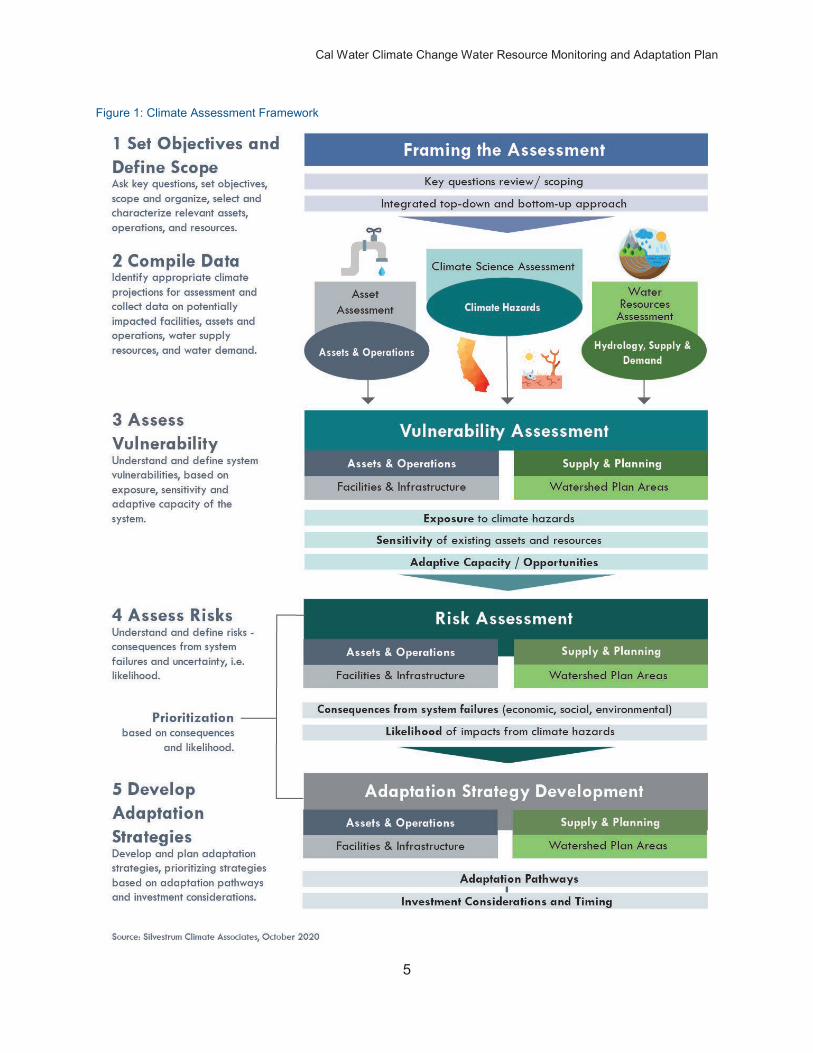
Cal Water Climate Change Water Resource Monitoring and Adaptation Plan
5
Figure 1: Climate Assessment Framework
Cal Water Climate Change Water Resource Monitoring and Adaptation Plan
6
Based on this review, the ICF team is making the following key recommendations for guiding Cal Water’s efforts in identifying climate vulnerabilities and planning for adaptation:
Apply a standard conceptual framework to vulnerability assessment which integrates both top-down analysis and bottom-up analysis (see Figure 1). The standard conceptual framework for assessing climate vulnerabilities and risks includes understanding exposure, sensitivity, and adaptive capacity, and potential impacts as components of vulnerability, and consequence and likelihood as components of risk. Top-down analysis would begin by applying downscaled Global Climate Model (GCM) projections to assess impacts on water supply resources and the bottom-up analysis would begin by identifying system sensitivities to climate hazards. These analyses are complementary.
Use a robust decision making (RDM) framework for vulnerability assessment and adaptation planning by seeking to identify decisions for response under a range of potential climate futures, mapping impacts on operating units/business functions, and ensuring that the scope focuses on critical services, assets, and resources. A robust decision-making framing will support the development of adaptation pathways and measures by monitoring information that signals the need for critical decisions on adaptation.
Engage staff and key stakeholders in the planning process to gain a holistic planning perspective for setting study parameters, providing targeted input into assessment and plan development, and supporting institutional capacity for adaptation.
Build off of the 2016 Cal Water Climate Change Impact study by applying updated climate models and projections for additional hydrologic variables to hydrologic modeling, future demand and planning scenarios, and scaled historical time series data to better understand impacts of extremes, precipitation whiplash, and other hydrologic changes in water supply resources. We recommend presentation of this with uniform metrics for more actionable findings.
Assess climate impact consequence by stress-testing key water system performance metrics. This includes developing a range of impact scenarios to understand how the severity of impacts varies for facilities, operations, and water supplies under different climate change conditions.
Evaluating the order of magnitude cost of inaction. We recommend communicating consequences in terms of direct costs to Cal Water and customers without adaptation actions to prioritize adaptation response.
Follow a step-by-step, iterative process to adaptive management which fully aligns with potential exposure to climate hazards and vulnerabilities, including:
o Utilizing Flexible Adaptation Pathways in planning for selecting appropriate timing and application of adaptation measures
o Planning for monitoring and evaluation o Evaluating adaptation investment decisions
Cal Water Climate Change Water Resource Monitoring and Adaptation Plan
7
During Phases 2 and 3 in which Cal Water and the ICF team will further assess vulnerability, we will frame the study outputs within a decision-making context for compatibility with adaptation planning concepts and eventual investment in adaptation measures.
Potential Climate Change Impacts on the Water Supplies of California Water Service Prepared by Gary Fiske and Associates, Inc. Balance Hydrologics, Inc. January 2016

ES-1
Executive Summary
Introduction
California Water Service Company (Cal Water) provides water service to roughly 478,000 customers – about 1.7 million people – located in 83 state-wide communities in 24 service districts. Cal Water’s districts rely on a variety of supply sources, including local groundwater, local surface water, and imported supplies. It is critical for Cal Water to gain a better understanding of the potential impacts of climate change on the availability of those supplies. Impacts are inherently uncertain, but Cal Water believes that the only responsible course is to carefully incorporate climate change into its ongoing water supply planning.
The present project and report represent a first step in that path. In order for Cal Water to determine how its long-term water supply planning should reflect climate change impacts, it must first have an understanding of what the impacts of climate change on its supply sources might be. That is the purpose of this study.
The work reported on here focuses on the sample of Cal Water districts highlighted in Figure ES-1. These districts account for 85% of Cal Water’s total 2014 production and reflect the diversity of all Cal Water districts, including geographic, hydrologic, and climatic conditions and primary and secondary supply sources.
Changes in climate can affect the availability of local groundwater and surface water supplies, as well as purchased imported supplies. This study separately addresses the impacts on each of these for each sample district. It relies on the best available projections of changes in climate (temperature and precipitation) through the end of the century. It then uses the climate projections to examine how surface water flows and groundwater recharge rates may change.
For imported supplies, this study relies on studies already completed by wholesale providers where possible. Where no such studies have been done or where the data from such studies was unavailable, other approaches were developed to estimate climate change impacts on these supplies.
The results reported here provide an integrated view of how projected climate changes may affect water supply availability for Cal Water’s service districts. The results also represent a first step in integrating potential future climate change impacts into Cal Water’s ongoing supply planning. Because of the inherent uncertainties, a nuanced risk assessment may be needed to guide the incorporation of these results into long-range planning. Beyond the Company’s supply/infrastructure planning, the results also can affect the Company’s triennial General Rate Cases; they may also have potential operational implications.

ES-2
Figure ES- 1. Cal Water Service Districts with Sample Districts Highlighted
ES-3
Estimating Changes in Climate
Climate change is primarily driven by increased concentrations of greenhouse gases (GHGs) in the atmosphere. The trajectory of future climate change is a function of the rate at which those concentrations are projected to increase and the manner in which the atmosphere and oceans respond to increased concentrations. Both are difficult to model. Thus, while the scientific community overwhelmingly agrees that climate change will occur (and indeed may already have begun), the trajectory of those changes is very uncertain.
The projections of temperature and precipitation that underlie this study are based on 40 of the latest Global Circulation Models (GCMs) run as part of the Coupled Model Intercomparison Project Phase 5 (CMIP5). Generally speaking, this type of approach is termed an ensemble analysis, for which the downscaled climate projections for any particular Cal Water Service District were based on the median of the 40 downscaled GCM datasets. The GCMs used by the analysis are driven by two GHG emission pathways that bound the possible trajectories of GHG concentrations.
Impacts of Climate Change on Water Supplies
The supplies for each district consist of a mix of local surface water, local groundwater, and/or purchased imports. Climate change impacts were estimated for each of these components. The approaches used for each are described below. Based on the breakdown of district production among the supply sources, Table ES-1 shows the ranges of projected overall climate change impacts on available supply, relative to the historic average.1 Table ES-2 groups this vulnerability into 4 categories of expected change, and Figure ES-2 maps the end-of-century vulnerability.
1 The historical averages used here, and elsewhere in this report, are based on the entire range of historical data available for the district-specific analyses. These ranges vary across districts, and are specified within the district-specific technical memoranda.
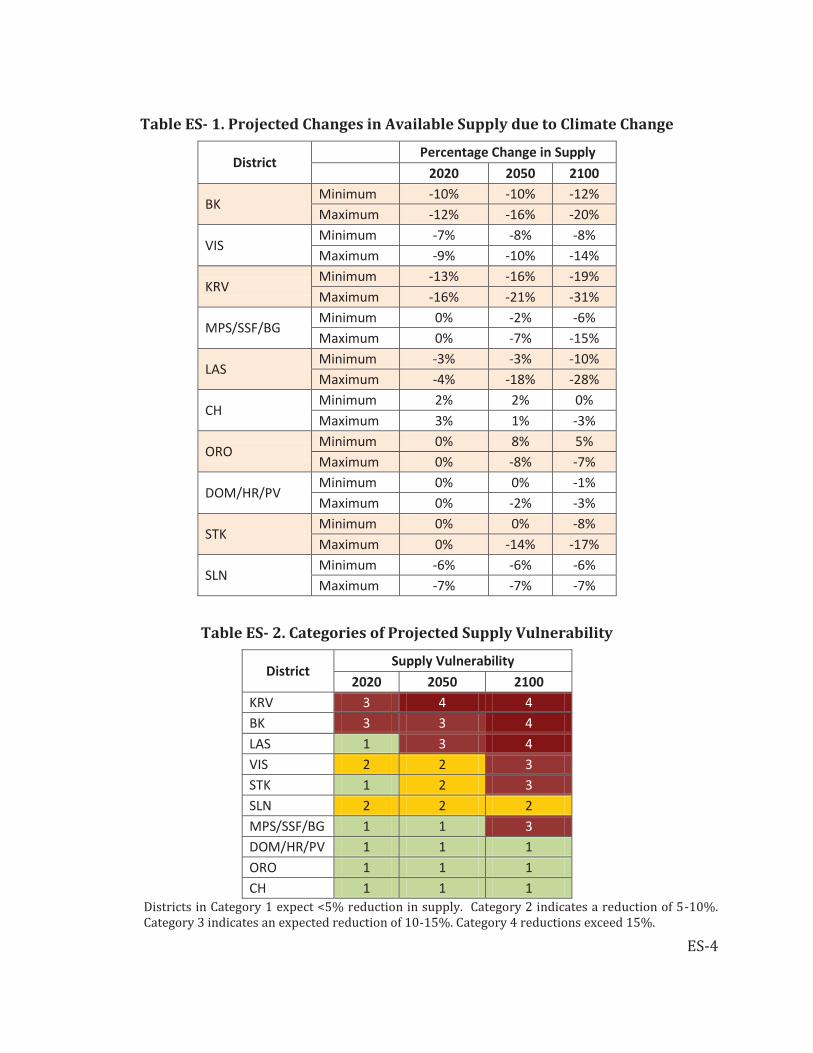
ES-4
Table ES- 1. Projected Changes in Available Supply due to Climate Change
District Percentage Change in Supply 2020 2050 2100
BK Minimum -10% -10% -12% Maximum -12% -16% -20%
VIS Minimum -7% -8% -8% Maximum -9% -10% -14%
KRV Minimum -13% -16% -19% Maximum -16% -21% -31%
MPS/SSF/BG Minimum 0% -2% -6% Maximum 0% -7% -15%
LAS Minimum -3% -3% -10% Maximum -4% -18% -28%
CH Minimum 2% 2% 0% Maximum 3% 1% -3%
ORO Minimum 0% 8% 5% Maximum 0% -8% -7%
DOM/HR/PV Minimum 0% 0% -1% Maximum 0% -2% -3%
STK Minimum 0% 0% -8% Maximum 0% -14% -17%
SLN Minimum -6% -6% -6% Maximum -7% -7% -7%
Table ES- 2. Categories of Projected Supply Vulnerability
District Supply Vulnerability
2020 2050 2100 KRV 3 4 4 BK 3 3 4 LAS 1 3 4 VIS 2 2 3 STK 1 2 3 SLN 2 2 2 MPS/SSF/BG 1 1 3 DOM/HR/PV 1 1 1 ORO 1 1 1 CH 1 1 1
Districts in Category 1 expect <5% reduction in supply. Category 2 indicates a reduction of 5-10%. Category 3 indicates an expected reduction of 10-15%. Category 4 reductions exceed 15%.
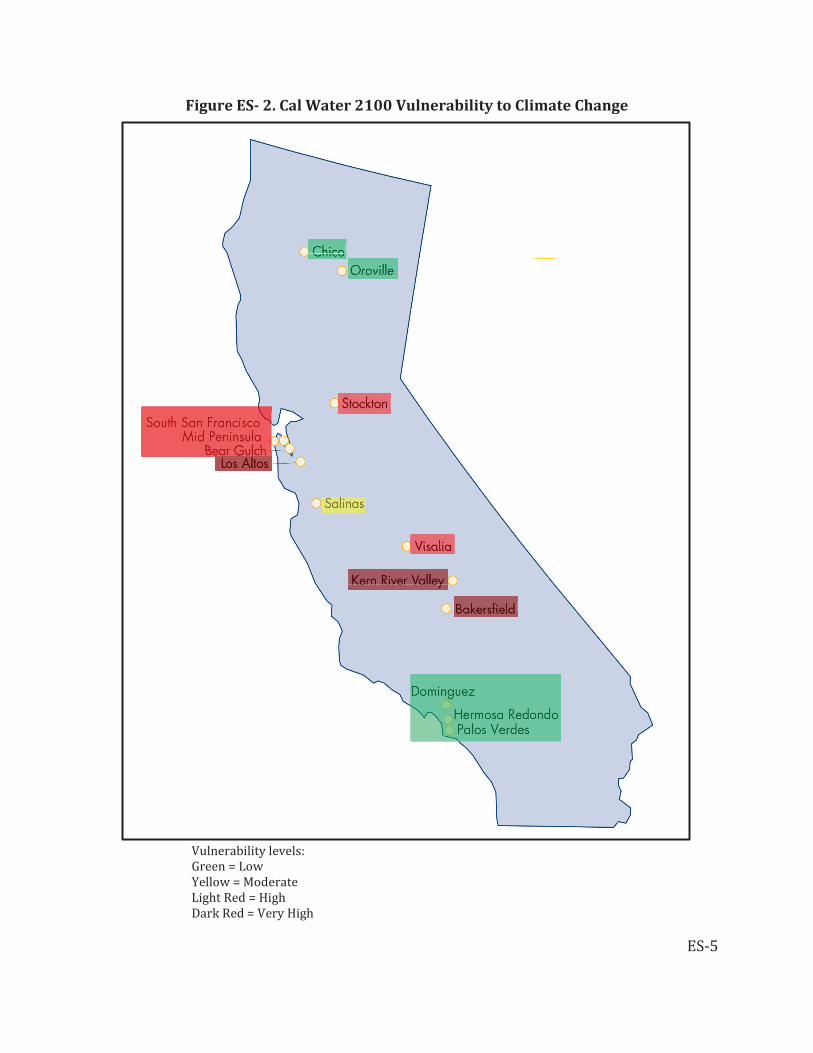
ES-5
Figure ES- 2. Cal Water 2100 Vulnerability to Climate Change
Vulnerability levels: Green = Low Yellow = Moderate Light Red = High Dark Red = Very High

ES-6
Estimating Climate Change Impacts on Local Surface Supplies
For those Cal Water districts that obtain a portion of their water supplies from local surface water, projected average annual precipitation in each of three forecast years (2020, 2050, 2100) were compared to historical precipitation to estimate the projected average annual discharge for that forecast year. Table ES-3 shows the estimated percent changes in surface water availability compared to historical averages.
Table ES- 3. Estimated Impacts on Local Surface Supply Availability
District Percent Change in Runoff 2020 2050 2100
BK Minimum Impact -17% -18% -19% Maximum Impact -18% -19% -23%
KRV Minimum Impact -17% -18% -19% Maximum Impact -18% -19% -23%
MPS/SSF/BG Minimum Impact +3% +6% +12% Maximum Impact +3% +5% +6%
Of the three districts, the two in the southern San Joaquin Valley are projected to experience significant reductions in their local surface supplies. In contrast, the Bear Gulch district surface supply is forecast to increase.
Estimating Climate Change Impacts on Local Groundwater Supplies
Climate change impacts on Cal Water’s local groundwater supplies result from changes in projected groundwater recharge. The three groundwater recharge components include:
Local river sources; Direct recharge from precipitation on the groundwater basin; and Recharge from agricultural and urban deep percolation.
The analysis first estimated the split of local recharge among these three components using geographic and geologic data, geochemical markers, and previously published reports and other supporting information. The climate change impacts on each component were then estimated, consolidated into overall projections of recharge impacts, and compared to estimated historical recharge rates.
Estimates of impacts on river recharge used the methodology for local surface supply described above. For the purposes of this phase of work, it was assumed that the change in recharge from the river is proportional to the change in total annual discharge. The estimated amount of water that will recharge directly into a groundwater basin from rain (or snow) is based on a balance of evapotranspiration (ET), precipitation rates, and soil

ES-7
water capacity. Recharge is estimated using both historical and projected precipitation and temperature data. Decadal averages in projected recharge are then used to calculate long-term trends. This is illustrated in Figure ES-3 for Kern River Valley.
Figure ES- 3. Historic and Projected Decadal Direct-Precipitation Recharge for Kern River Valley
A quantitative projection of recharge from deep percolation beneath irrigated fields and urban areas is beyond the scope of this phase. Instead, districts for which a significant proportion of recharge is from agricultural and urban water are identified and expected trends under climate change of this water source for those districts are estimated. At-risk service areas with decreasing agricultural and urban water sources can be explored further in future work.
The estimated percentage impacts on each of the recharge components are multiplied by the expected fractions that each component is of total recharge to calculate the range of expected recharge reductions. Table ES-4 shows those results for each district, excluding the impacts of urban/agricultural applied water percolation.
Actual impacts on Cal Water’s ability to pump groundwater may be less than these recharge reductions because the storage volumes in different basins have differing degrees of responsiveness to changes in recharge. The degree to which changes in recharge volumes translate into available groundwater supply is a function of the hydrogeologic attributes of the basin. A detailed understanding of those characteristics would require a level of modeling that is well beyond the scope of this phase of work. Instead, the estimates of basin responsiveness were based on the historical record of how the basin’s water level has varied with recent climate variability. For some districts, the basin appears to be highly responsive, while for others changes in climate do not have much impact.

ES-8
Table ES- 4. Projected Changes in Average Annual Groundwater Recharge
District Percentage Change in
Recharge 2020 2050 2100
BK Minimum -14% -15% -15% Maximum -14% -15% -18%
VIS Minimum -9% -10% -11% Maximum -9% -10% -14%
KRV Minimum -13.4% -19% -23% Maximum -15% -22% -35%
MPS/SSF/BG Minimum -2% -4% -6% Maximum -2% -6% -12%
LAS Minimum -7% -8% -13% Maximum -8% -18% -25%
CH Minimum 6% 4% 1% Maximum 6% 2% -4%
ORO Minimum 0% 0% 0% Maximum 0% 0% 0%
DOM/HR/PV Minimum 0% 0% 0% Maximum 0% 0% 0%
STK Minimum -2% -3% -6% Maximum -2% -4% -7%
SLN Minimum -7% -7% -7% Maximum -7% -7% -7%
The overall risk to Cal Water’s groundwater supplies for each district is based on the expected recharge reductions and the expected responsiveness of basin water level to those reductions. Table ES-5 rates each district’s groundwater supply risk on a 1-5 scale, with 1 indicating little or no risk and 5 indicating high risk. Figure ES-4 is a visual depiction of these ratings.
Generally speaking, the groundwater supply impacts are large for the districts in the southern San Joaquin Valley. The Los Altos District also shows a high impact, largely because a significant portion of its recharge is from imported supplies, which are forecast to decrease significantly. Further north in the Central Valley, groundwater supplies are less affected. The Bay Area and Los Angeles Basin districts also show relatively smaller impacts.

ES-9
Table ES- 5. District Groundwater Risk Ratings
District Rating BK 5 KRV 5 LAS 5 VIS 4 SLN 3 CH 2 MPS/SSF/BG 2 STK 2 ORO 1 DOM/HR/PV 1
Figure ES- 4. Groundwater Risk Ratings

ES-10
Impacts of Climate Change on Imported Water Supplies
About half of Cal Water’s supply is imported water that is purchased from wholesale suppliers. The supply and delivery systems of these suppliers are generally very complex and it is impossible within the confines of this project to independently model the impacts of climate change on those systems. The analysis therefore relied on available data, including the results of any climate change modeling that these suppliers themselves have done and other indicators of climate change impacts.
As a result, the climate change scenarios on which the estimates of impacts on different wholesale supplies are based will differ from one another and from the approach described above for the analysis of local supply impacts. The time frames of the results also differ. However, despite those limitations, important information about potential future climate change impacts on wholesale water supply availability was developed. Table ES-6 compares summary measures of central tendency for the potential district-specific climate change impacts on the availability of imported supplies.
Table ES- 6. Projected Climate Change Impacts on Imported Supplies
District Source Mid-Century
Late-Century
BK SWP -7% -17% LAS SWP, CVP -9% -21% ORO SWP -1% -3% MPS/SSF/BG SFPUC -10% -20% DOM/HR/PV MWD -1% to -2% -2% to -5% STK USBR -5% -10%
Conclusions and Next Steps
The study results indicate significant risks for some districts. This points to the need for Cal Water to account for these risks in its future water supply planning if it is to minimize the adverse effects on its customers. The sole focus of this effort was to assess the potential climate change impacts on Cal Water’s supplies. That is an important first step in integrating climate change into supply planning, but this study was not designed to:
Analyze the impacts of these future supply limitations on Cal Water’s ability to serve future customer demands. This is a function of such factors as water rights and contractual arrangements, how future demands are forecast to grow, how water conservation programming will affect those demands, and how Cal Water might modify the manner in which it operates its system.
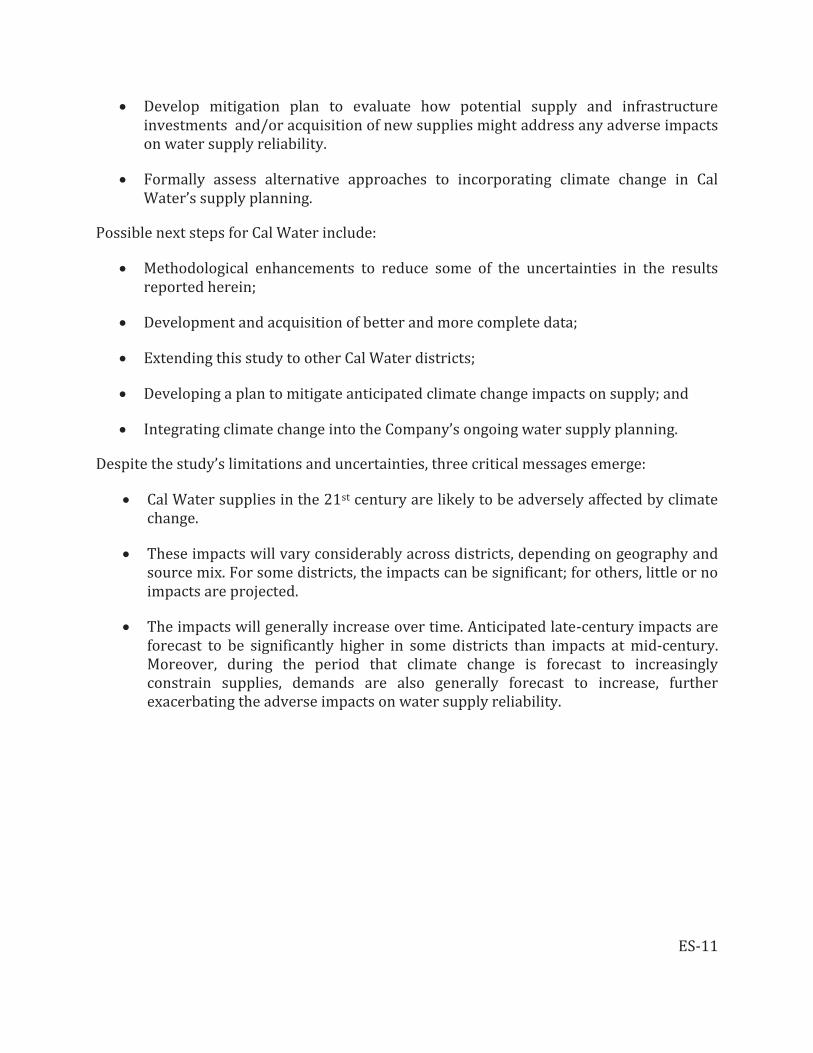
ES-11
Develop mitigation plan to evaluate how potential supply and infrastructure investments and/or acquisition of new supplies might address any adverse impacts on water supply reliability.
Formally assess alternative approaches to incorporating climate change in Cal Water’s supply planning.
Possible next steps for Cal Water include:
Methodological enhancements to reduce some of the uncertainties in the results reported herein;
Development and acquisition of better and more complete data;
Extending this study to other Cal Water districts;
Developing a plan to mitigate anticipated climate change impacts on supply; and
Integrating climate change into the Company’s ongoing water supply planning.
Despite the study’s limitations and uncertainties, three critical messages emerge:
Cal Water supplies in the 21st century are likely to be adversely affected by climate change.
These impacts will vary considerably across districts, depending on geography and source mix. For some districts, the impacts can be significant; for others, little or no impacts are projected.
The impacts will generally increase over time. Anticipated late-century impacts are forecast to be significantly higher in some districts than impacts at mid-century. Moreover, during the period that climate change is forecast to increasingly constrain supplies, demands are also generally forecast to increase, further exacerbating the adverse impacts on water supply reliability.
California Water Service 2020 Urban Water Management Plan
Westlake District
June 2021 Printed 6/25/2021
Page H-1
EKI Environment & Water, Inc. M.Cubed
Gary Fiske and Associates
Appendix H: Water Shortage Contingency Plan

Westlake District June 2021
Water Shortage Contingency Plan 2020 Update
Quality. Service. Value


California Water Service Water Shortage Contingency Plan 2020 Update
Westlake District
June 2021 Printed 6/18/2021
Page 1
EKI Environment & Water, Inc. M.Cubed
Gary Fiske and Associates
Chapter 1 Introduction
This document describes the water shortage contingency plan (WSCP) for the Westlake District (also referred to herein as the “District”). The WSCP includes the stages of response to a water shortage caused by drought or by supply interruptions caused by infrastructure failure, regulatory mandate, or catastrophic human-caused or natural events. The primary objective of the WSCP is to ensure that the District has in place the necessary resources and management responses needed to protect health and human safety, minimize economic disruption, and preserve environmental and community assets during water supply shortages and interruptions.
Specifically, this Plan includes the following chapters:
Chapter 1 - Introduction
Chapter 2 - Water Supply Reliability Analysis
Chapter 3 - Annual Water Supply and Demand Assessment Procedures
Chapter 4 - Water Shortage Levels
Chapter 5 - Shortage Response Actions
Chapter 6 - Communication Protocols
Chapter 7 - Compliance and Enforcement
CWC § 10640
(a) Every urban water supplier required to prepare a plan pursuant to this part shall prepare its plan pursuant to Article 2 (commencing with Section 10630). The supplier shall likewise periodically review the plan as required by Section 10621, and any amendments or changes required as a result of that review shall be adopted pursuant to this article.
(b) Every urban water supplier required to prepare a water shortage contingency plan shall prepare a water shortage contingency plan pursuant to Section 10632. The supplier shall likewise periodically review the water shortage contingency plan as required by paragraph (10) of subdivision (a) of Section 10632 and any amendments or changes required as a result of that review shall be adopted pursuant to this article.
CWC § 10632.3
It is the intent of the Legislature that, upon proclamation by the Governor of a state of emergency under the California Emergency Services Act (Chapter 7 (commencing with Section 8550) of Division 1 of Title 2 of the Government Code) based on drought conditions, the board defer to implementation of locally adopted water shortage contingency plans to the extent practicable.
California Water Service Water Shortage Contingency Plan 2020 Update
Westlake District
June 2021 Printed 6/18/2021
Page 2
EKI Environment & Water, Inc. M.Cubed
Gary Fiske and Associates
Chapter 8 - Legal Authorities
Chapter 9 - Financial Consequences of WSCP
Chapter 10 - Monitoring and Reporting
Chapter 11 - WSCP Refinement Procedures
Chapter 12 - Plan Adoption, Submittal, and Availability
California Water Service Water Shortage Contingency Plan 2020 Update
Westlake District
June 2021 Printed 6/18/2021
Page 3
EKI Environment & Water, Inc. M.Cubed
Gary Fiske and Associates
Chapter 2 Water Supply Reliability Analysis
As described in Chapter 6 of the District Urban Water Management Plan (UWMP), District water supply sources include purchases of imported water and recycled water.
Chapter 7 of the District UWMP demonstrates that the supplies available to the District are considered highly reliable in extended drought conditions, and are expected to continue to be sufficient to meet projected District demands in all hydrologic conditions evaluated, including an extended five-year drought period. Although water shortage conditions are not expected to arise due to drought, this WSCP addresses potential water shortage conditions resulting from any cause (e.g., droughts, impacted distribution system infrastructure, regulatory-imposed shortage restrictions, catastrophic events, etc.).
CWC § 10632 (a) (1) The analysis of water supply reliability conducted pursuant to Section 10635.

California Water Service Water Shortage Contingency Plan 2020 Update
Westlake District
June 2021 Printed 6/18/2021
Page 4
EKI Environment & Water, Inc. M.Cubed
Gary Fiske and Associates
Chapter 3 Annual Water Supply and Demand Assessment Procedures
On an annual basis, the District will conduct a Supply-Demand Assessment (SDA) to identify whether there is likely to be a water shortage condition in the coming year. This assessment will assume that the following year will experience a shortfall of 20%, corresponding to Water Shortage Level 3. Each element of the annual SDA is described below.
CWC § 10632 (a) (2)
The procedures used in conducting an annual water supply and demand assessment that include, at a minimum, both of the following:
(A) The written decision-making process that an urban water supplier will use each year to determine its water supply reliability.
(B) The key data inputs and assessment methodology used to evaluate the urban water supplier’s water supply reliability for the current year and one dry year, including all of the following:
(i) Current year unconstrained demand, considering weather, growth, and other influencing factors, such as policies to manage current supplies to meet demand objectives in future years, as applicable.
(ii) Current year available supply, considering hydrological and regulatory conditions in the current year and one dry year. The annual supply and demand assessment may consider more than one dry year solely at the discretion of the urban water supplier.
(iii) Existing infrastructure capabilities and plausible constraints.
(iv) A defined set of locally applicable evaluation criteria that are consistently relied upon for each annual water supply and demand assessment.
(v) A description and quantification of each source of water supply.
CWC § 10632.1
An urban water supplier shall conduct an annual water supply and demand assessment pursuant to subdivision (a) of Section 10632 and, on or before July 1 of each year, submit an annual water shortage assessment report to the department with information for anticipated shortage, triggered shortage response actions, compliance and enforcement actions, and communication actions consistent with the supplier’s water shortage contingency plan. An urban water supplier that relies on imported water from the State Water Project or the Bureau of Reclamation shall submit its annual water supply and demand assessment within 14 days of receiving its final allocations, or by July 1 of each year, whichever is later.
CWC § 10632.2
An urban water supplier shall follow, where feasible and appropriate, the prescribed procedures and implement determined shortage response actions in its water shortage contingency plan, as identified in subdivision (a) of Section 10632, or reasonable alternative actions, provided that descriptions of the alternative actions are submitted with the annual water shortage assessment report pursuant to Section 10632.1. Nothing in this section prohibits an urban water supplier from taking actions not specified in its water shortage contingency plan, if needed, without having to formally amend its urban water management plan or water shortage contingency plan.

California Water Service Water Shortage Contingency Plan 2020 Update
Westlake District
June 2021 Printed 6/18/2021
Page 5
EKI Environment & Water, Inc. M.Cubed
Gary Fiske and Associates
1. Evaluation Criteria
The evaluation criteria that will be used to identify whether the District is likely to experience a water shortage in the coming year include:
a. Treatment and Distribution System Constraints - An assessment of the probabilities of facility and infrastructure outages and the degree to which they could limit Cal Water’s ability to access, convey, or treat adequate supplies, including any planned maintenance or capital improvements over the next year that could affect its ability to provide sufficient supply to meet demands.
b. Local Regulatory Conditions - Evaluation of (1) any new GSA policies (e.g., pumping allocations) or sustainability criteria that could trigger a change in groundwater volume available for pumping, and (2) any new limitations on well permitting that could limit the ability to deepen existing supply wells or drill new supply wells.
c. State Regulatory Conditions - Evaluation of any state-mandated drought or water use restrictions.
These criteria will be assessed by Cal Water staff, including District staff with detailed knowledge of District operations. The data used to support these assessments may include, but is not limited to, supply capacity, supply and pump capacity, firm capacities, tank storage capacity, system demand, and zone demand.
2. Water Supply
The District obtains its supplies from Central Basin Municipal Water District (CBMWD). The only identified potential constraints on water supply are the operational limitations and potential local regulatory conditions identified as evaluation criteria above.
3. Unconstrained Customer Demand
The demand forecast described in Chapter 4 of the District UWMP yields the anticipated unconstrained water demand, i.e. the expected water use in the absence of shortage-caused reductions in water use. During a drought cycle, unconstrained demand typically increases due to higher than normal air temperatures and lower than normal precipitation. The supply reliability analysis and Drought Risk Assessment presented in Chapter 7 of the District UWMP accounts for this anticipated shift in unconstrained water demand, and as discussed above, even with these increases in demand the available supply is expected to be sufficient to meet these demands.

California Water Service Water Shortage Contingency Plan 2020 Update
Westlake District
June 2021 Printed 6/18/2021
Page 6
EKI Environment & Water, Inc. M.Cubed
Gary Fiske and Associates
The model underlying the demand forecast described in Chapter 4 of the District UWMP has an annual time step. Cal Water has begun developing a short-term demand model with a monthly time step that will be more appropriate for the annual supply-demand assessments.
4. Planned Water Use for Current Year Considering Dry Subsequent Year
Cal Water will evaluate the anticipated supplies for the current year, assuming that the following year will be dry, as defined above, using the Evaluation Criteria identified above. Barring changes in supply availability per the Evaluation Criteria, the assumed dry subsequent year is not expected to affect the manner in which Cal Water will draw water from the basin in the current year, and the planned water use for the current year will equal the unconstrained demand.
5. Infrastructure Considerations
As part of its triennial General Rate Case applications to the California Public Utilities Commission (CPUC), Cal Water prepares a Supply-Demand Analysis (CPUC SD Analysis) for each of its Districts. The CPUC SD Analysis is an inventory of water production and pump assets that provide direct and indirect sources of supply to meet customer demands in accordance with CPUC General Order 103-A and California Code of Regulations (CCR) Title 22 Waterworks Standards. This CPUC SD Analysis is based on a combination of regulatory requirements, professional consultant recommendations, and industry standard practices, including those from the American Water Works Association (AWWA) and American Society of Civil Engineers (ASCE). It identifies specific vulnerabilities in different pressure zones within the system and evaluates the system against performance criteria that meet regulatory requirements and ensure operationally adequate levels of service.
Cal Water plans to extend the District CPUC SD Analysis to perform this analysis on an annual basis. This analysis will guide Cal Water’s annual evaluation of operational treatment/distribution constraints that could potentially limit the availability of supplies. This evaluation of supply well operational constraints and treatment and distribution constraints will be completed by March 31 of each year and will assess potential impacts on supply availability. If such constraints are identified, Cal Water will develop a plan to address these constraints, mitigate potential effects, and implement the appropriate water shortage stage of action per Chapter 5 below.
6. Other Factors
As identified under the Evaluation Criteria above, local regulatory conditions could potentially limit the availability of supplies. Therefore, Cal Water will evaluate the

California Water Service Water Shortage Contingency Plan 2020 Update
Westlake District
June 2021 Printed 6/18/2021
Page 7
EKI Environment & Water, Inc. M.Cubed
Gary Fiske and Associates
development of new regulatory constraints by March 31 of each year and assess their potential impacts on supply availability. If such constraints are identified, Cal Water will develop a plan to address these constraints and mitigate potential effects and implement the appropriate water shortage stage of action per Chapter 5, below.
Consistent with California Water Code (CWC) § 10632.1, Cal Water will perform and submit an SDA to DWR by July 1st of each year beginning in 2022.

California Water Service Water Shortage Contingency Plan 2020 Update
Westlake District
June 2021 Printed 6/18/2021
Page 8
EKI Environment & Water, Inc. M.Cubed
Gary Fiske and Associates
Chapter 4 Water Shortage Levels
Consistent with the requirements of CWC § 10632(a)(3), this WSCP is based on the six water shortage levels (also referred to as “stages”) shown in Table 4-1. These shortage stages are intended to address shortage caused by any condition, including the catastrophic interruption of water supplies.
Table 4-1. Water Shortage Contingency Plan Levels (DWR Table 8-1) Shortage
Level Percent
Shortage Range Shortage Response Actions
1 Up to 10% Demand reduction (See Table 5-1)
2 Up to 20% Demand reduction (See Table 5-1)
3 Up to 30% Demand reduction (See Table 5-1)
4 Up to 40% Demand reduction (See Table 5-1)
5 Up to 50% Demand reduction (See Table 5-1)
6 >50% Demand reduction (See Table 5-1)
NOTES:
Shortage response actions for each of these stages are identified and discussed in Chapter 5.
CWC § 10632 (a) (3)
(A) Six standard water shortage levels corresponding to progressive ranges of up to 10, 20, 30, 40, and 50 percent shortages and greater than 50 percent shortage. Urban water suppliers shall define these shortage levels based on the suppliers’ water supply conditions, including percentage reductions in water supply, changes in groundwater levels, changes in surface elevation or level of subsidence, or other changes in hydrological or other local conditions indicative of the water supply available for use. Shortage levels shall also apply to catastrophic interruption of water supplies, including, but not limited to, a regional power outage, an earthquake, and other potential emergency events.
(B) An urban water supplier with an existing water shortage contingency plan that uses different water shortage levels may comply with the requirement in subparagraph (A) by developing and including a cross-reference relating its existing categories to the six standard water shortage levels.
California Water Service Water Shortage Contingency Plan 2020 Update
Westlake District
June 2021 Printed 6/18/2021
Page 9
EKI Environment & Water, Inc. M.Cubed
Gary Fiske and Associates
Chapter 5 Shortage Response Actions
This chapter describes the response actions Cal Water will take to deal with the shortages associated with each of the six stages enumerated in Chapter 4. As discussed above, the existing groundwater supply of the District is expected to be able to serve 100% of future demands under all conditions of precipitation and hydrology. However, inasmuch as Cal Water may have to implement shortage response actions to comply with state mandates or local regulatory changes, or respond to catastrophic events, it is important to carefully identify and describe the anticipated necessary actions.
5.1 Demand Reduction
The combinations of demand-reduction actions required to resolve the shortages associated with each of the six drought stages are based on Cal Water’s experiences in dealing with past drought-related shortages and also include other actions deemed appropriate to achieve the required demand reductions. In order to evaluate and ensure that the right actions would be implemented with the proper level of intensity, Cal Water employed the Drought Response Tool (DRT), an Excel spreadsheet model developed by EKI Environment and Water, Inc.
The DRT provides a quantitative framework that allows Cal Water to systematically estimate the monthly and cumulative annual demand reductions expected to result from particular combinations of drought response actions and associated implementation rates. Data inputs to
CWC § 10632 (a) (4)
Shortage response actions that align with the defined shortage levels and include, at a minimum, all of the following:
(A) Locally appropriate supply augmentation actions.
(B) Locally appropriate demand reduction actions to adequately respond to shortages.
(C) Locally appropriate operational changes.
(D) Additional, mandatory prohibitions against specific water use practices that are in addition to state-mandated prohibitions and appropriate to the local conditions.
(E) For each action, an estimate of the extent to which the gap between supplies and demand will be reduced by implementation of the action.
CWC § 10632 (b)
For purposes of developing the water shortage contingency plan pursuant to subdivision (a), an urban water supplier shall analyze and define water features that are artificially supplied with water, including ponds, lakes, waterfalls, and fountains, separately from swimming pools and spas, as defined in subdivision (a) of Section 115921 of the Health and Safety Code.

California Water Service Water Shortage Contingency Plan 2020 Update
Westlake District
June 2021 Printed 6/18/2021
Page 10
EKI Environment & Water, Inc. M.Cubed
Gary Fiske and Associates
the DRT include total production, class-specific water use, population, and assumptions regarding the split between indoor and outdoor water use for each customer class.
For each drought response action, the user specifies:
• The customer class(es) and end use(s) that are affected;
• The percent savings for those end use(s) for each account that implements the action. These are based on evaluations reported in the literature, or where such studies are not available, on best estimates based on Cal Water experience; and
• The percentage of accounts assumed to implement the action, which is presumed to be the result of the intensity level of Cal Water program implementation, including but not limited to marketing and enforcement activities.
Based on the foregoing inputs, the DRT model calculates the resulting monthly savings. Cal Water adjusted the combination of actions and implementation levels to achieve the targeted savings levels at each of the six shortage stages.
In order to evaluate the robustness of the DRT model, Cal Water modeled the actions implemented during the height of the last drought for a subset of its Districts, and found that the modeled water shortage reductions were generally consistent with the responses observed in its Districts. In short, the DRT is a robust, transparent tool to tie a particular set of shortage-response actions to an expected reduction in demand.
For each of the six water shortage stages, the modeling targeted the mid-range of the required demand reduction range, ergo:
• 5% for Stage 1, • 15% for Stage 2, • 25% for Stage 3,
• 35% for Stage 4, • 45% for Stage 5, and • 55% for Stage 6.
The key DRT inputs and outputs for each of the six water shortage stages are reproduced in Attachment A.
Table 5-1 shows the water shortage reduction actions, savings assumptions, and implementation rates that are required for the District to achieve the targeted annual demand reductions for each of the six shortage stages. At each stage, there are two types of demand-reduction actions identified:
• Restrictions on customer water usage; and • Consumption reduction actions by Cal Water to encourage decreased water usage.
The total demand reductions are governed by a set of user-specified constraints to ensure that usage levels do not endanger health and safety or result in unacceptable economic impacts. The DRT will not permit estimated usage reductions to violate these constraints, regardless of

California Water Service Water Shortage Contingency Plan 2020 Update
Westlake District
June 2021 Printed 6/18/2021
Page 11
EKI Environment & Water, Inc. M.Cubed
Gary Fiske and Associates
the demand reduction actions selected. For most Cal Water districts, including Westlake, the following default constraints are used:
• A minimum residential indoor per capita daily usage of 25 gallons, • A maximum residential outdoor usage reduction of 100%, • A maximum Commercial, industrial, and institutional (CII) indoor usage reduction of
30%, and • A maximum CII outdoor usage reduction of 100%.
Many actions are implemented across a number of stages, some at increasing implementation levels. Therefore the actions are listed as a row under the first stage at which they are implemented, and the implementation rate is shown under each stage column heading at the right. The unit savings represent a percentage savings of the end uses indicated in the table.
Because of the DRT logic described above, the format of Table 5-1 differs from that of the default DWR table.
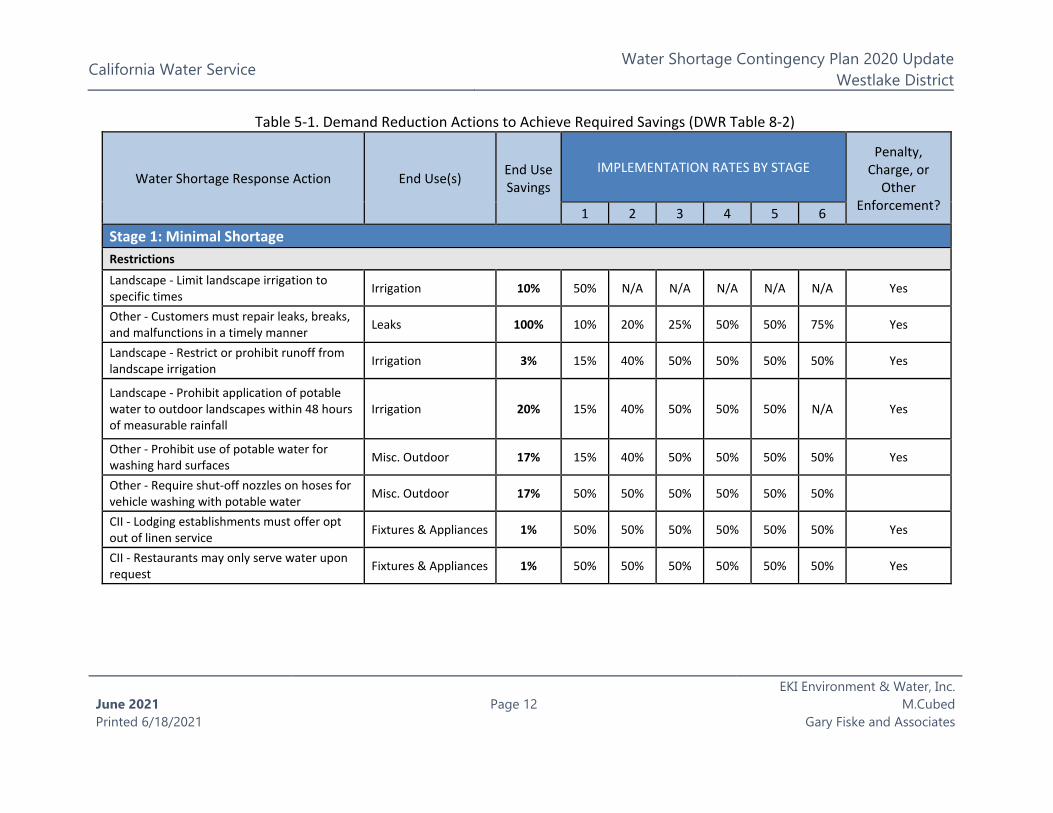
California Water Service Water Shortage Contingency Plan 2020 Update
Westlake District
June 2021 Printed 6/18/2021
Page 12 EKI Environment & Water, Inc.
M.CubedGary Fiske and Associates
Table 5-1. Demand Reduction Actions to Achieve Required Savings (DWR Table 8-2)
Water Shortage Response Action End Use(s) End Use Savings
IMPLEMENTATION RATES BY STAGE Penalty,
Charge, or Other
Enforcement? 1 2 3 4 5 6
Stage 1: Minimal Shortage Restrictions
Landscape - Limit landscape irrigation to specific times Irrigation 10% 50% N/A N/A N/A N/A N/A Yes
Other - Customers must repair leaks, breaks, and malfunctions in a timely manner Leaks 100% 10% 20% 25% 50% 50% 75% Yes
Landscape - Restrict or prohibit runoff from landscape irrigation Irrigation 3% 15% 40% 50% 50% 50% 50% Yes
Landscape - Prohibit application of potable water to outdoor landscapes within 48 hours of measurable rainfall
Irrigation 20% 15% 40% 50% 50% 50% N/A Yes
Other - Prohibit use of potable water for washing hard surfaces Misc. Outdoor 17% 15% 40% 50% 50% 50% 50% Yes
Other - Require shut-off nozzles on hoses for vehicle washing with potable water Misc. Outdoor 17% 50% 50% 50% 50% 50% 50%
CII - Lodging establishments must offer opt out of linen service Fixtures & Appliances 1% 50% 50% 50% 50% 50% 50% Yes
CII - Restaurants may only serve water upon request Fixtures & Appliances 1% 50% 50% 50% 50% 50% 50% Yes
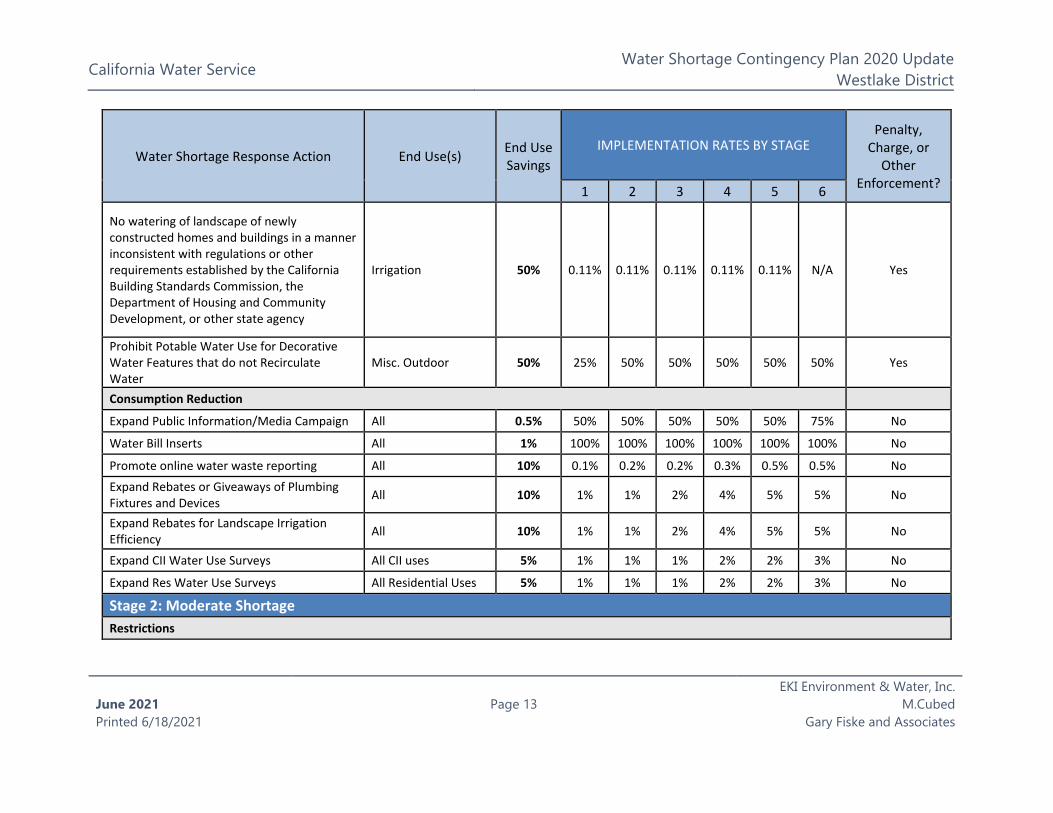
California Water Service Water Shortage Contingency Plan 2020 Update
Westlake District
June 2021 Printed 6/18/2021
Page 13
EKI Environment & Water, Inc. M.Cubed
Gary Fiske and Associates
Water Shortage Response Action End Use(s) End Use Savings
IMPLEMENTATION RATES BY STAGE Penalty,
Charge, or Other
Enforcement? 1 2 3 4 5 6
No watering of landscape of newly constructed homes and buildings in a manner inconsistent with regulations or other requirements established by the California Building Standards Commission, the Department of Housing and Community Development, or other state agency
Irrigation 50% 0.11% 0.11% 0.11% 0.11% 0.11% N/A Yes
Prohibit Potable Water Use for Decorative Water Features that do not Recirculate Water
Misc. Outdoor 50% 25% 50% 50% 50% 50% 50% Yes
Consumption Reduction
Expand Public Information/Media Campaign All 0.5% 50% 50% 50% 50% 50% 75% No
Water Bill Inserts All 1% 100% 100% 100% 100% 100% 100% No
Promote online water waste reporting All 10% 0.1% 0.2% 0.2% 0.3% 0.5% 0.5% No
Expand Rebates or Giveaways of Plumbing Fixtures and Devices All 10% 1% 1% 2% 4% 5% 5% No
Expand Rebates for Landscape Irrigation Efficiency All 10% 1% 1% 2% 4% 5% 5% No
Expand CII Water Use Surveys All CII uses 5% 1% 1% 1% 2% 2% 3% No
Expand Res Water Use Surveys All Residential Uses 5% 1% 1% 1% 2% 2% 3% No
Stage 2: Moderate Shortage Restrictions
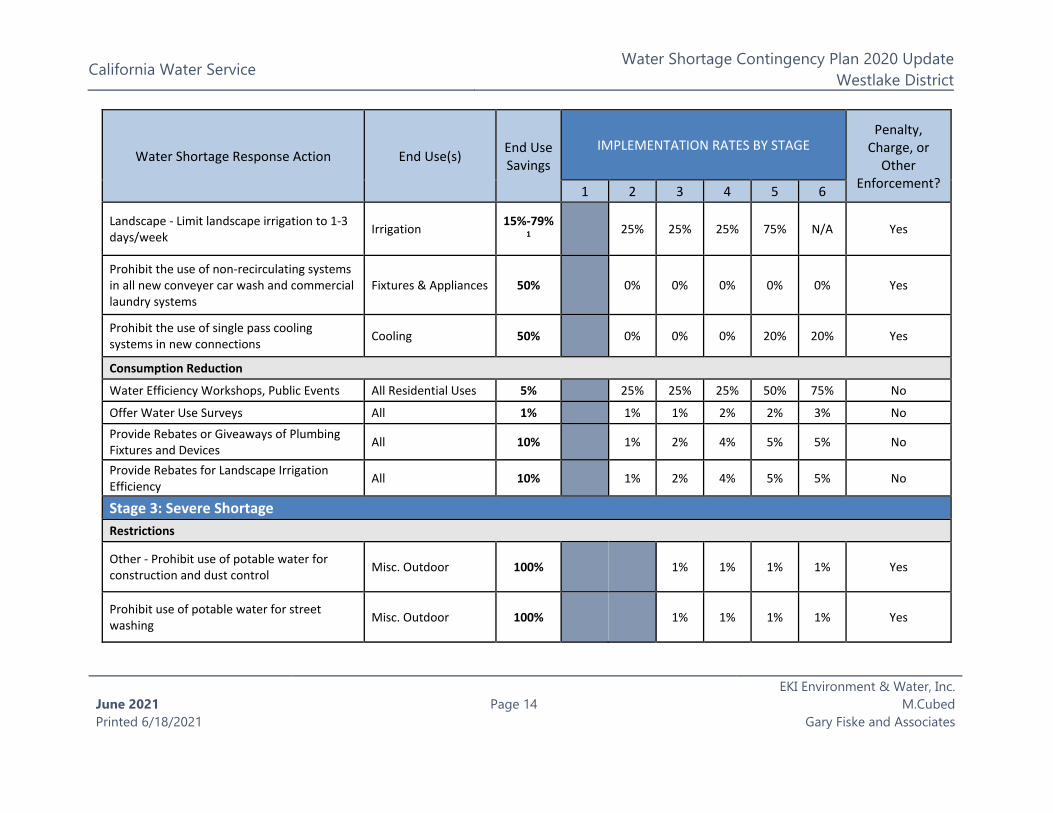
California Water Service Water Shortage Contingency Plan 2020 Update
Westlake District
June 2021 Printed 6/18/2021
Page 14
EKI Environment & Water, Inc. M.Cubed
Gary Fiske and Associates
Water Shortage Response Action End Use(s) End Use Savings
IMPLEMENTATION RATES BY STAGE Penalty,
Charge, or Other
Enforcement? 1 2 3 4 5 6
Landscape - Limit landscape irrigation to 1-3 days/week Irrigation 15%-79%
1 25% 25% 25% 75% N/A Yes
Prohibit the use of non-recirculating systems in all new conveyer car wash and commercial laundry systems
Fixtures & Appliances 50% 0% 0% 0% 0% 0% Yes
Prohibit the use of single pass cooling systems in new connections Cooling 50% 0% 0% 0% 20% 20% Yes
Consumption Reduction
Water Efficiency Workshops, Public Events All Residential Uses 5% 25% 25% 25% 50% 75% No
Offer Water Use Surveys All 1% 1% 1% 2% 2% 3% No
Provide Rebates or Giveaways of Plumbing Fixtures and Devices All 10% 1% 2% 4% 5% 5% No
Provide Rebates for Landscape Irrigation Efficiency All 10% 1% 2% 4% 5% 5% No
Stage 3: Severe Shortage Restrictions
Other - Prohibit use of potable water for construction and dust control Misc. Outdoor 100% 1% 1% 1% 1% Yes
Prohibit use of potable water for street washing Misc. Outdoor 100% 1% 1% 1% 1% Yes
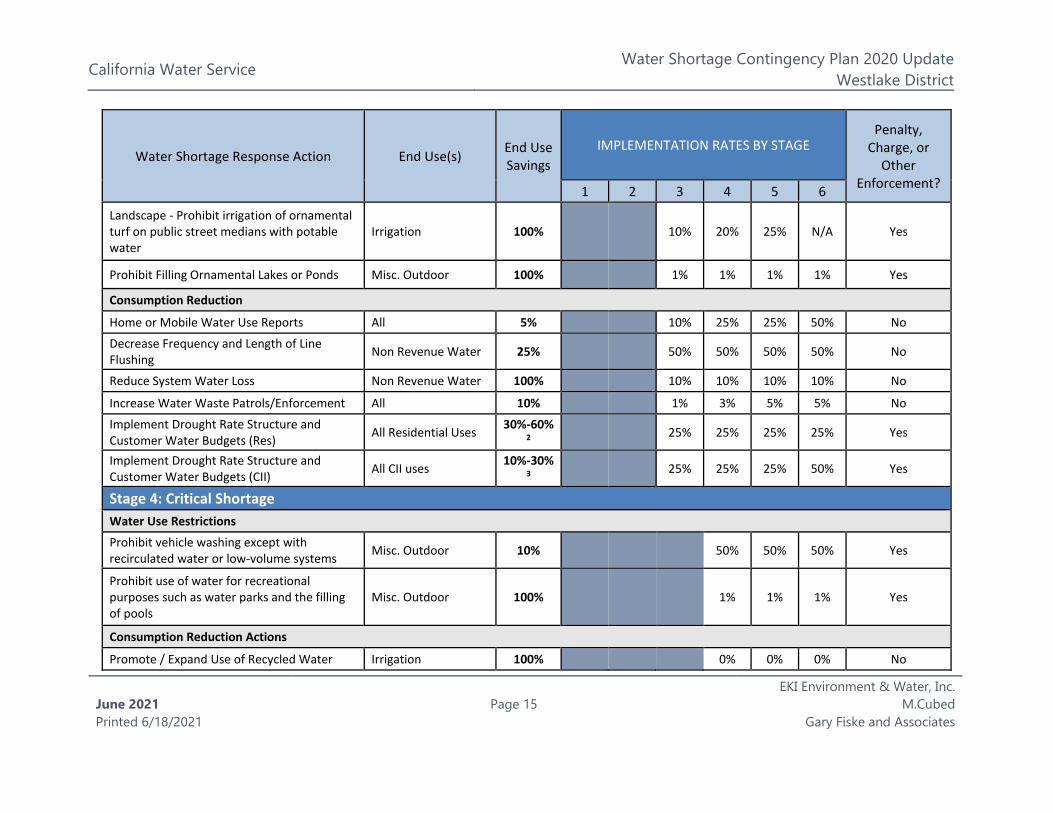
California Water Service Water Shortage Contingency Plan 2020 Update
Westlake District
June 2021 Printed 6/18/2021
Page 15
EKI Environment & Water, Inc. M.Cubed
Gary Fiske and Associates
Water Shortage Response Action End Use(s) End Use Savings
IMPLEMENTATION RATES BY STAGE Penalty,
Charge, or Other
Enforcement? 1 2 3 4 5 6
Landscape - Prohibit irrigation of ornamental turf on public street medians with potable water
Irrigation 100% 10% 20% 25% N/A Yes
Prohibit Filling Ornamental Lakes or Ponds Misc. Outdoor 100% 1% 1% 1% 1% Yes
Consumption Reduction
Home or Mobile Water Use Reports All 5% 10% 25% 25% 50% No
Decrease Frequency and Length of Line Flushing Non Revenue Water 25% 50% 50% 50% 50% No
Reduce System Water Loss Non Revenue Water 100% 10% 10% 10% 10% No
Increase Water Waste Patrols/Enforcement All 10% 1% 3% 5% 5% No
Implement Drought Rate Structure and Customer Water Budgets (Res) All Residential Uses 30%-60%
2 25% 25% 25% 25% Yes
Implement Drought Rate Structure and Customer Water Budgets (CII) All CII uses 10%-30%
3 25% 25% 25% 50% Yes
Stage 4: Critical Shortage Water Use Restrictions
Prohibit vehicle washing except with recirculated water or low-volume systems Misc. Outdoor 10% 50% 50% 50% Yes
Prohibit use of water for recreational purposes such as water parks and the filling of pools
Misc. Outdoor 100% 1% 1% 1% Yes
Consumption Reduction Actions
Promote / Expand Use of Recycled Water Irrigation 100% 0% 0% 0% No
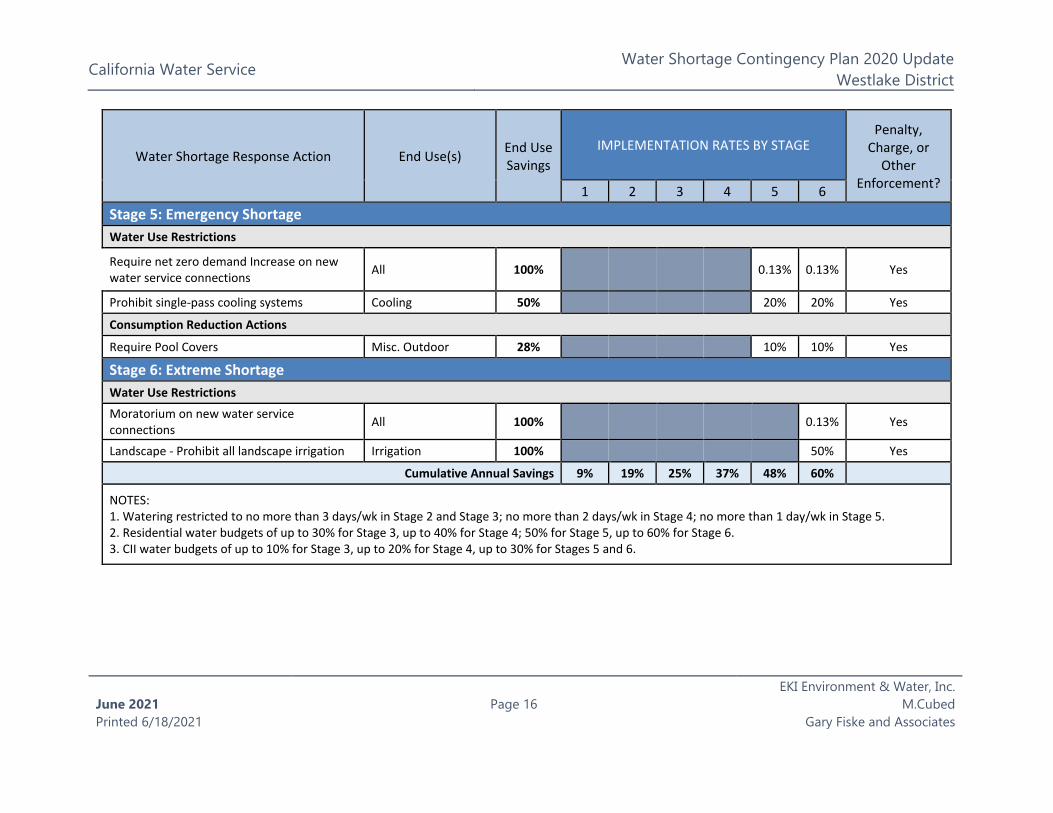
California Water Service Water Shortage Contingency Plan 2020 Update
Westlake District
June 2021 Printed 6/18/2021
Page 16
EKI Environment & Water, Inc. M.Cubed
Gary Fiske and Associates
Water Shortage Response Action End Use(s) End Use Savings
IMPLEMENTATION RATES BY STAGE Penalty,
Charge, or Other
Enforcement? 1 2 3 4 5 6
Stage 5: Emergency Shortage Water Use Restrictions
Require net zero demand Increase on new water service connections All 100% 0.13% 0.13% Yes
Prohibit single-pass cooling systems Cooling 50% 20% 20% Yes
Consumption Reduction Actions
Require Pool Covers Misc. Outdoor 28% 10% 10% Yes
Stage 6: Extreme Shortage Water Use Restrictions
Moratorium on new water service connections All 100% 0.13% Yes
Landscape - Prohibit all landscape irrigation Irrigation 100% 50% Yes
Cumulative Annual Savings 9% 19% 25% 37% 48% 60%
NOTES: 1. Watering restricted to no more than 3 days/wk in Stage 2 and Stage 3; no more than 2 days/wk in Stage 4; no more than 1 day/wk in Stage 5. 2. Residential water budgets of up to 30% for Stage 3, up to 40% for Stage 4; 50% for Stage 5, up to 60% for Stage 6. 3. CII water budgets of up to 10% for Stage 3, up to 20% for Stage 4, up to 30% for Stages 5 and 6.
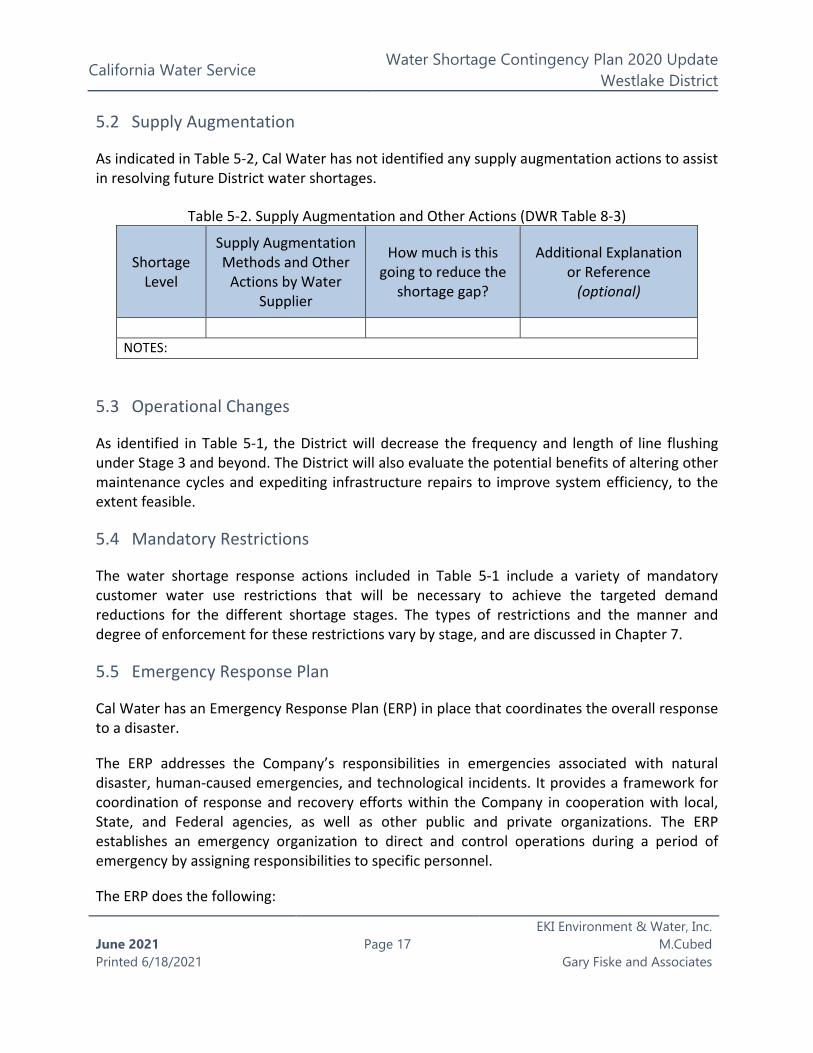
California Water Service Water Shortage Contingency Plan 2020 Update
Westlake District
June 2021 Printed 6/18/2021
Page 17
EKI Environment & Water, Inc. M.Cubed
Gary Fiske and Associates
5.2 Supply Augmentation
As indicated in Table 5-2, Cal Water has not identified any supply augmentation actions to assist in resolving future District water shortages.
Table 5-2. Supply Augmentation and Other Actions (DWR Table 8-3)
Shortage Level
Supply Augmentation Methods and Other
Actions by Water Supplier
How much is this going to reduce the
shortage gap?
Additional Explanation or Reference
(optional)
NOTES:
5.3 Operational Changes
As identified in Table 5-1, the District will decrease the frequency and length of line flushing under Stage 3 and beyond. The District will also evaluate the potential benefits of altering other maintenance cycles and expediting infrastructure repairs to improve system efficiency, to the extent feasible.
5.4 Mandatory Restrictions
The water shortage response actions included in Table 5-1 include a variety of mandatory customer water use restrictions that will be necessary to achieve the targeted demand reductions for the different shortage stages. The types of restrictions and the manner and degree of enforcement for these restrictions vary by stage, and are discussed in Chapter 7.
5.5 Emergency Response Plan
Cal Water has an Emergency Response Plan (ERP) in place that coordinates the overall response to a disaster.
The ERP addresses the Company’s responsibilities in emergencies associated with natural disaster, human-caused emergencies, and technological incidents. It provides a framework for coordination of response and recovery efforts within the Company in cooperation with local, State, and Federal agencies, as well as other public and private organizations. The ERP establishes an emergency organization to direct and control operations during a period of emergency by assigning responsibilities to specific personnel.
The ERP does the following:
California Water Service Water Shortage Contingency Plan 2020 Update
Westlake District
June 2021 Printed 6/18/2021
Page 18
EKI Environment & Water, Inc. M.Cubed
Gary Fiske and Associates
• It conforms to the State mandated Standardized Emergency Management System (SEMS) and the National Incident Management System (NIMS), and it effectively structures emergency response at all levels in compliance with the Incident Command System (ICS).
• It establishes response policies and procedures, while providing the Company clear guidance related to emergency planning.
• It describes and details procedural steps necessary to protect lives and property. • It outlines coordination requirements. • It provides a basis for unified training and response exercises to ensure compliance.
The District has installed backup power generators at some of its booster sites and pump storage sites that can be operated in the event of a system wide power outage. A complete loss of power has never been experienced, but the generators have been used in the past to overcome localized outages.
During an emergency, the District can transfer water through interconnections to or from the neighboring water system owned by the Las Virgenes Water District. These interconnections can be used to help offset the impact of interrupted service to District customers or, being two-way connections, these facilities can be used to supply water to Las Virgenes.
5.6 Seismic Risk Assessment and Mitigation Plan
Cal Water’s ERP includes information on various hazards and a related fault map overlying the District. The Los Angeles County Emergency/Disaster Plans and Annexes, which include additional discussion of area earthquake risk and mitigation, can be found at https://ceo.lacounty.gov/emergencydisaster-plans-and-annexes.
CWC § 10632.5
(a) In addition to the requirements of paragraph (3) of subdivision (a) of Section 10632, beginning January 1, 2020, the plan shall include a seismic risk assessment and mitigation plan to assess the vulnerability of each of the various facilities of a water system and mitigate those vulnerabilities.
(b) An urban water supplier shall update the seismic risk assessment and mitigation plan when updating its urban water management plan as required by Section 10621.
(c) An urban water supplier may comply with this section by submitting, pursuant to Section 10644, a copy of the most recent adopted local hazard mitigation plan or multihazard mitigation plan under the federal Disaster Mitigation Act of 2000 (Public Law 106-390) if the local hazard mitigation plan or multihazard mitigation plan addresses seismic risk.

California Water Service Water Shortage Contingency Plan 2020 Update
Westlake District
June 2021 Printed 6/18/2021
Page 19
EKI Environment & Water, Inc. M.Cubed
Gary Fiske and Associates
5.7 Shortage Response Action Effectiveness
Table 5-1 above shows the effectiveness of the specific demand-reduction actions and implementation levels necessary for the District to achieve the targeted savings for each water shortage stage. The bottom row indicates the total annual cumulative savings expected to be reached at each water shortage stage level. Additional details, including anticipated savings on a month-by-month basis are provided in the DRT model inputs and outputs included in Attachment B.

California Water Service Water Shortage Contingency Plan 2020 Update
Westlake District
June 2021 Printed 6/18/2021
Page 20
EKI Environment & Water, Inc. M.Cubed
Gary Fiske and Associates
Chapter 6 Communication Protocols
Cal Water intends to escalate communication to customers and stakeholders, as needed, throughout any water shortage situation to help ensure they are aware of current conditions, any water use restrictions that are in effect, and the many ways Cal Water can help them reduce their water use. Cal Water’s outreach efforts include multiple channels, including bill messages, bill inserts, direct mail, email, letters, social media, print, radio, music streaming services, TV, over-the-top media, movie theatre advertising, and group presentations.
These efforts will expand on current Cal Water outreach efforts and will be customized to the needs at the time of the shortage to ensure a proper channel mix so that the maximum audience is reached as efficiently as possible.
CWC § 10632 (a) (5)
Communication protocols and procedures to inform customers, the public, interested parties, and local, regional, and state governments, regarding, at a minimum, all of the following:
(A) Any current or predicted shortages as determined by the annual water supply and demand assessment described pursuant to Section 10632.1.
(B) Any shortage response actions triggered or anticipated to be triggered by the annual water supply and demand assessment described pursuant to Section 10632.1.
(C) Any other relevant communications.
California Water Service Water Shortage Contingency Plan 2020 Update
Westlake District
June 2021 Printed 6/18/2021
Page 21
EKI Environment & Water, Inc. M.Cubed
Gary Fiske and Associates
Chapter 7 Compliance and Enforcement
7.1 Water Use Restrictions
In accordance with Rule 14.1, Cal Water is currently authorized to take the following actions to enforce the water use restrictions:
First Violation: Cal Water shall provide the customer with a written notice of violation.
Second Violation: If Cal Water verifies that the customer has used potable water for non- essential, wasteful uses after having been notified of the first violation, Cal Water shall provide the customer with a second written notice of violation and is authorized to install a flow-restricting device on the customer’s service line.
Cal Water has submitted to the California Public Utilities Commission (CPUC) an update to Rule 14.1 and Schedule 14.1, for approval, to align with the restrictions identified in this WSCP. Rule 14.1 and Schedule 14.1 are discussed in more detail in Chapter 8. The current versions of Rule 14.1 and Schedule 14.1 can be found on the Cal Water website.
7.2 Non-Essential, Wasteful Uses
In the event that more stringent measures are needed, implementation of Schedule 14.1 would be requested from the CPUC. If implemented, Cal Water is currently authorized to take the following actions when its personnel verify a customer is using potable water for non-essential, wasteful uses.
First Violation: Cal Water shall provide the customer with a written notice of violation. In addition, Cal Water is authorized to take the following actions:
A. If the customer currently receives service through a metered connection, install a real- time water measurement device on the customer’s service line and provide the customer with access to information from the device. The cost of the device, including installation and ongoing operating costs, may be billed to the customer, and nonpayment may result in discontinuance of service.
B. If the customer does not currently receive service through a metered connection, install a water meter on the customer’s service line, charge the
CWC § 10632 (a) (6) For an urban retail water supplier, customer compliance, enforcement, appeal, and exemption procedures for triggered shortage response actions as determined pursuant to Section 10632.2.
California Water Service Water Shortage Contingency Plan 2020 Update
Westlake District
June 2021 Printed 6/18/2021
Page 22
EKI Environment & Water, Inc. M.Cubed
Gary Fiske and Associates
customer for water use pursuant to Cal Water’s metered service tariffs and rules, and install a real-time water measurement device on the customer’s service line and provide the customer with access to information from the device. The cost of the device, including installation and ongoing operating costs, may be billed to the customer, and nonpayment may result in discontinuance of service.
Second Violation: If Cal Water verifies that the customer has used potable water for non- essential, wasteful uses after having been notified of the first violation, Cal Water shall provide the customer with a second written notice of violation. In addition to the actions prescribed under the first violation above, Cal Water is authorized to take the following actions:
A. Apply the following waste of water penalties, which are in addition to any other charges authorized by this Schedule or other Cal Water tariffs.
i. If Stage 1 is in effect, $25
ii. If Stage 2 is in effect, $50
iii. If Stage 3 is in effect, $100
iv. If Stage 4 is in effect, $200
B. At its sole discretion, waive the waste of water penalty if the customer participates in a water use evaluation provided by Cal Water and/or provides documentation to Cal Water proving that a drip irrigation system, micro spray irrigation system, high-efficiency sprinkler system, or properly programmed smart irrigation controller has been installed, after a notice of violation was delivered, and is in use at the customer’s service address.
Third Violation: If Cal Water verifies that the customer has used potable water for non- essential, wasteful uses after having been notified of the second violation, Cal Water shall provide the first and second violations above, Cal Water is authorized to take the following actions:
A. Apply the following waste of water penalties, which are in addition to any other charges authorized by this Schedule or other Cal Water tariffs.
i. If Stage 1 is in effect, $50 ii. If Stage 2 is in effect, $100
iii. If Stage 3 is in effect, $200 iv. If Stage 4 is in effect, $400
B. At its sole discretion, waive the waste of water surcharge if the customer participates in a water use evaluation provided by Cal Water and/or provides documentation to Cal Water proving that a drip irrigation system, micro spray
California Water Service Water Shortage Contingency Plan 2020 Update
Westlake District
June 2021 Printed 6/18/2021
Page 23
EKI Environment & Water, Inc. M.Cubed
Gary Fiske and Associates
irrigation system, high- efficiency sprinkler system, or properly programmed smart irrigation controller has been installed, after notice of violations have been delivered, and is in use at the customer’s service address.
Fourth Violation: If Cal Water verifies that the customer has used potable water for non- essential, wasteful uses after having been notified of the third violation, Cal Water shall provide the customer with a fourth written notice of violation. In addition to actions set forth in previous violations prescribed above, Cal Water is authorized to install a flow- restricting device on the customer’s service line.
Egregious Violations: Notwithstanding the foregoing framework for penalties, customers who Cal Water has verified are egregiously using potable water for non-essential, wasteful uses are subject to having a flow- restricting device installed on their service line. After providing the customer with one notice of egregious violation, either by direct mail or door hanger, which documents the egregious use of potable water for non-essential, wasteful uses and explains that failure to correct the violation may result in the installation of a flow-restricting device on the customer’s service line, Cal Water is authorized to install a flow-restricting device on the customer’s service line.
Cal Water plans to submit to the CPUC an update to Schedule 14.1 to align with this WSCP including, but not limited to, consistency with the new six stage shortage level structure.
7.3 Drought Surcharges
Water budgets and associated drought surcharges are included as actions in Table 5-1. Cal Water will implement such actions through the implementation of Schedule 14.1.

California Water Service Water Shortage Contingency Plan 2020 Update
Westlake District
June 2021 Printed 6/18/2021
Page 24
EKI Environment & Water, Inc. M.Cubed
Gary Fiske and Associates
Chapter 8 Legal Authorities
Cal Water is an investor-owned water utility that is regulated by the CPUC. As such, it does not have the authority to adopt resolutions or ordinances. Rule 14.1, as filed with the CPUC, serves as Cal Water’s restrictions on non-essential, wasteful uses of potable water. In the event that more stringent measures are required, Cal Water may request the addition of Schedule 14.1 which serves as Cal Water’s WSCP and includes staged mandatory reductions and drought surcharges. Cal Water shall coordinate with any city or county within which it provides water supply services for the possible proclamation of a local emergency as defined in Section 8558 of the Government Code and to ensure consistency with local resolutions and ordinances.
On April 1, 2016, Cal Water filed its current Schedule 14.1 with the CPUC.1 The Schedule lays out the staged mandatory reductions and drought surcharges associated with Cal Water’s WSCP. This filing is consistent with Resolution W-5034, adopted by the Commission on April 9, 2015, ordering compliance with requirements of the State Water Resources Control Board (SWRCB).
Schedule 14.1 is an extension of Rule 14.1. The compliance and enforcement information presented in Chapter 7 is based on the current versions of both Rule 14.1 and Schedule 14.1, which are based, in part, on the specific SWRCB requirements associated with the Governor’s Executive Order B-29-15, which required statewide cutbacks to address the unprecedented 2011-2017 drought, as well as the additional information required pursuant to the CWC.
Cal Water has submitted an update to Rule 14.1 and Schedule 14.1 to the CPUC, for approval, to align with this WSCP.
1 For reference, the current version of Rule 14.1 and Schedule 14.1 are included as Attachment B.
CWC § 10632 (a) (7)
(A) A description of the legal authorities that empower the urban water supplier to implement and enforce its shortage response actions specified in paragraph (4) that may include, but are not limited to, statutory authorities, ordinances, resolutions, and contract provisions.
(B) A statement that an urban water supplier shall declare a water shortage emergency in accordance with Chapter 3 (commencing with Section 350) of Division 1.
(C) A statement that an urban water supplier shall coordinate with any city or county within which it provides water supply services for the possible proclamation of a local emergency, as defined in Section 8558 of the Government Code.
California Water Service Water Shortage Contingency Plan 2020 Update
Westlake District
June 2021 Printed 6/18/2021
Page 25
EKI Environment & Water, Inc. M.Cubed
Gary Fiske and Associates
In the event of a determination of a water shortage Cal Water shall declare a water shortage emergency in accordance with the Water Code Chapter 3 (commencing with Section 350) of Division 1 and implement the Water Shortage Contingency Plan at the appropriate Stage.

California Water Service Water Shortage Contingency Plan 2020 Update
Westlake District
June 2021 Printed 6/18/2021
Page 26
EKI Environment & Water, Inc. M.Cubed
Gary Fiske and Associates
Chapter 9 Financial Consequences of WSCP
In 2008, the CPUC approved the creation of a Water Revenue Adjustment Mechanism (WRAM) and Modified Cost Balancing Accounts (MCBA). The goals of the WRAM and MCBA are to sever the relationship between sales and revenue to remove the disincentive to reduce water use. The WRAM and MCBA are designed to be revenue neutral in order to ensure that both the utility and ratepayers are neither harmed nor benefitted.
In 2020, the CPUC ordered that regulated water utilities may not include the continuation of the WRAM and MCBA in their next general rate case filing but may propose the use of a Monterey-Style Revenue Adjustment Mechanism and Incremental Cost Balancing Account. As such, the WRAM and MCBA will no longer be in place for Cal Water beginning in 2023.
During a water shortage, Cal Water will file for a Drought Memorandum Account, or similar, to track incremental shortage-related expenses to be reviewed by the CPUC for future recovery in rates. Cal Water will also file for a Drought Lost Revenue Memorandum Account, or similar, to track reduced sales to be reviewed by the CPUC for future recovery in rates.
Both the Drought Memorandum Account and Drought Lost Revenue Memorandum Account are mechanisms that have been approved by the CPUC in previous droughts.
CWC § 10632 (a) (8)
A description of the financial consequences of, and responses for, drought conditions, including, but not limited to, all of the following:
(A) A description of potential revenue reductions and expense increases associated with activated shortage response actions described in paragraph (4).
(B) A description of mitigation actions needed to address revenue reductions and expense increases associated with activated shortage response actions described in paragraph (4).
(C) A description of the cost of compliance with Chapter 3.3 (commencing with Section 365) of Division 1.

California Water Service Water Shortage Contingency Plan 2020 Update
Westlake District
June 2021 Printed 6/18/2021
Page 27
EKI Environment & Water, Inc. M.Cubed
Gary Fiske and Associates
Chapter 10 Monitoring and Reporting
During the period 2014-16, in order to effectively respond to the drought, Cal Water realigned its organizational structure to ensure sufficient resources were available to implement its WSCP. The day-to-day implementation was overseen by the Director of Drought Management & Conservation, with the assistance of the Drought Response Project Manager. The Director of Drought Management & Conservation reported to a team of Cal Water’s Officers (Steering Committee), including the President & CEO, the Vice President of Corporate Communications & Community Affairs, the Vice President of Customer Service & Information Technology, the Vice President of Operations, and the Vice President of Continuous Improvement.
Reporting to the Director of Drought Management & Conservation was a team of functional leads, each responsible for managing individual portions of Cal Water’s Plan. This team included the Director of Customer Service, the Water Conservation Manager, the Manager of Corporate Communications, the Water Supply Manager, and the Government & Community Relations Manager.
Cal Water would implement a similar structure to effectively manage future water shortages.
This structure includes regular meetings with reporting on items such as:
• Aggregate customer demands, • Customer compliance with water use restrictions, • Current and projected water supply conditions, • Customer outreach activities, • Customer service inquiries, and • Operations activities (e.g., water flushing activities, leak repairs, etc.).
CWC § 10632 (a) (9) For an urban retail water supplier, monitoring and reporting requirements and procedures that ensure appropriate data is collected, tracked, and analyzed for purposes of monitoring customer compliance and to meet state reporting requirements.
California Water Service Water Shortage Contingency Plan 2020 Update
Westlake District
June 2021 Printed 6/18/2021
Page 28
EKI Environment & Water, Inc. M.Cubed
Gary Fiske and Associates
Chapter 11 WSCP Refinement Procedures
Cal Water’s Drought Steering Committee utilizes an adaptive management process to regularly assess and determine adjustments and changes to the implementation of the WSCP. These refinements are implemented by the Director of Drought Management & Conservation (or equivalent) through the team of functional leads.
CWC § 10632 (a) (10) Reevaluation and improvement procedures for systematically monitoring and evaluating the functionality of the water shortage contingency plan in order to ensure shortage risk tolerance is adequate and appropriate water shortage mitigation strategies are implemented as needed.
California Water Service Water Shortage Contingency Plan 2020 Update
Westlake District
June 2021 Printed 6/18/2021
Page 29 EKI Environment & Water, Inc.
M.CubedGary Fiske and Associates
Chapter 12 Plan Adoption, Submittal, and Availability
The deadline for public comments on the WSCP was June 2, 2021, one week after the public hearing. The final WSCP was formally adopted by Cal Water’s Vice President of Customer Service & Chief Citizenship Officer on June 20, 2021. The District UWMP includes a copy of the signed Resolution of Plan Adoption and contains the following:
• Letters sent to and received from various agencies regarding the UWMP and WSCP,and
• Correspondence between Cal Water and participating agencies.
This UWMP and WSCP were submitted to DWR within 30 days of adoption and by the July 1, 2021 deadline. The submittal was done electronically through Water Use Efficiency Data Portal, an online submittal tool. The adopted WSCP was also sent to the California State Library and to the cities and counties lisDted in Table 10-1 of the District UWMP.
On or about May 3, 2021, an electronic version of the draft 2020 WSCP was made available for review by visiting Cal Water’s website: https://www.calwater.com/conservation/uwmp-review/.2
2 Restrictions related to the COVID-19 pandemic prevented the District from making a printed hard-copy available for public review as previously planned.
CWC § 10632 (c) The urban water supplier shall make available the water shortage contingency planprepared pursuant to this article to its customers and any city or county within which it provides water suppliesno later than 30 days after adoption of the water shortage contingency plan.
Attachment A
Key Drought Response Tool Tables and Charts

Agency Name Westlake
Total Population Served 19,471
Conservation Goal (%) 5%
Drought Stage Stage 1
Number of Residential Accounts 6,296
Number of Commercial, Industrial, and
Institutional (CII) Accounts616
Number of Dedicated Irrigation Accounts 0
Baseline Year(s) 2020
Percentage of Residential Indoor Use
During Minimum Month (%)38%
Percentage of Comm-Gov Indoor Use
During Minimum Month (%)56%
Comments WLK
Enter Agency Information
Westlake
1 - Home
Drought Response Tool
HomeInput Baseline Year Water Use
Baseline Year Water Use
Profile
Drought Response
Actions
Estimated Water Savings
Drought Response Tracking
Worksheet 1 - Home
Page 1 of 1
Date Printed: 6/22/2021
Drought Response Tool
© 2015 Erler & Kalinowski, Inc.

Westlake
1 - Home
Drought Response Tool
HomeInput Baseline Year Water Use
Baseline Year Water Use
Profile
Drought Response
Actions
Estimated Water Savings
Drought Response Tracking
Enter agency information
Enter Baseline Year production and use
Review and confirm entered information
Select Drought Response Actions and input estimated water
savings and implementation rates.
Review estimated water production and compare estimated
savings to conservation target.
Track production and water savings against the conservation
target.
Navigation
Download and read the guide before using this Tool
1 - HOME
2 - INPUT BASELINEYEAR WATER USE
3 - BASELINE YEAR WATER USE PROFILE
4 - DROUGHTRESPONSE ACTIONS
5 - ESTIMATEDWATER SAVINGS
6 - DROUGHT RESPONSE TRACKING
USER'S GUIDE
Worksheet 1 - Home
Page 1 of 1
Date Printed: 6/22/2021
Drought Response Tool
© 2015 Erler & Kalinowski, Inc.
Westlake
1 - Home
Drought Response Tool
HomeInput Baseline Year Water Use
Baseline Year Water Use
Profile
Drought Response
Actions
Estimated Water Savings
Drought Response Tracking
For questions about this tool or for additional information, contact:
Anona Dutton, P.G., C.Hg.
(650) 292-9100
Disclaimer: This electronic file is being provided by EKI Environment & Water Inc. (EKI; fomerly Erler &
Kalinowski, Inc.) at the request of (CLIENT). The Drought Response Tool was transmitted to CLIENT in
electronic format, on a CD dated [DATE] (Original Document). Only the Original Document, provided to, and for
the sole benefit of, CLIENT constitutes EKI’s professional work product. An electronic copy of the Drought
Response Tool is provided to CLIENT’s Customer Agencies, for use only by CLIENT-designated Customer
Agencies. The Drought Response Tool is copyrighted by EKI. All rights are reserved by EKI, and content may
not be reproduced, downloaded, disseminated, published, or transferred in any form or by any means, except
with the prior written permission of EKI. Customer Agencies may use the Drought Response Tool for reviewing
potential drought response alternatives. The delivery to, or use by, Customer Agencies of the Drought Response
Tool does not provide rights of reliance by Client Agencies or other third parties without the express written
consent of EKI and subject to the execution of an agreement between such Customer Agency or other third party
and EKI. EKI makes no warranties, either express or implied, of the electronic media or regarding its
merchantability, applicability, compatibility with the recipients’ computer equipment or software; of the fitness for
any particular purpose; or that the electronic media contains no defect or is virus free. Use of EKI’s Drought
Response Tool, other electronic media, or other work product by Client Agency or others shall be at the party’s
sole risk. Further, by use of this electronic media, the user agrees, to the fullest extent permitted by law, to
defend, indemnify and hold harmless EKI, CLIENT, and their officers, directors, employees, and subconsultants
against all damages, liabilities or costs, including reasonable attorneys’ fees and defense costs, arising from any
use, modification or changes made to the electronic files by anyone other than EKI or from any unauthorized
distribution or reuse of the electronic files without the prior written consent of EKI.
© 2015 Erler & Kalinowski, Inc.
Worksheet 1 - Home
Page 1 of 1
Date Printed: 6/22/2021
Drought Response Tool
© 2015 Erler & Kalinowski, Inc.

Units: (mg)
Date
Total Production
(mg)
Residential
Water Use
(mg)
COM-GOV
Water Use
(mg)
Industrial Water
Use
(mg)
Non-Revenue
Water Use
(mg) Total R-GPCD Comments
October 243 150 68 0 26 248
November 164 137 57 0 -31 235
December 83 105 41 0 -63 174
January 128 70 22 0 36 117
February 151 100 34 0 17 183
March 109 99 36 0 -26 164
April 119 72 21 0 26 123
May 216 109 32 0 75 181
June 240 155 53 0 32 265
July 248 176 66 0 7 291
August 254 177 72 0 5 293
September 249 167 70 1 11 286
Select the units to input monthly production and use data. Enter the total monthly potable water production for the Baseline Year. Next, enter monthly water use data by sector for the Baseline Year. If you bill on a bi-monthly
basis, divide your billing data between the months that the billing cycle includes. If your single-family and multi-family accounts are tracked separately, enter the combined water use for both sectors in the Residential Water
Use column. If your commercial, industrial, and institutional (CII) accounts are tracked separately, enter the combined water use for each sector in the CII Water Use column. Your non-revenue water use is calculated by
subtracting your monthly residential, CII, and dedicated irrigation water uses from your monthly production. Your monthly residential gallons per capita per day (R-GPCD) is calculated by dividing your monthly residential
water use by your population entered in Worksheet 1 - Home.
2 - Input Baseline Year (2020) Water Use
Input Baseline Year (2020) Production and Water Use
Westlake
Drought Response Tool
HomeInput Baseline Year
Water UseBaseline Year Water
Use ProfileDrought Response
ActionsEstimated Water
SavingsDrought Response
Tracking
Worksheet 2 - Input Baseline Year Water Use
Page 1 of 1
Date Printed: 6/22/2021
Drought Response Tool
© 2015 Erler & Kalinowski, Inc.

Units: (mg)
Residential CII Dedicated Irrigation Non-Revenue
Total 2,205 1,517 572 0 116
Total Indoor 458 315 143 -- --
Total Outdoor 1,630 1,202 429 0 --
Total Non-Revenue 116 -- -- -- 116
Total Indoor % 21% 21% 25% 0% --
Total Outdoor % 74% 79% 75% 100% --
Total Non-Revenue % 5% -- -- -- 100%
3 - Baseline Year (2020) Water Use ProfileWestlake
Baseline Year (2020) Annual Water Use Summary
Water Use (mg)
Water Use Comments
A summary of your Baseline Year water use by sector and major end use category is shown below. Select the units in which your production and use data are displayed.
Total Production
(mg)
Residential69%
CII26%
Non-Revenue5%
Baseline Year (2020) Percent Annual Water Use by Sector
Residential CII Non-Revenue
21%25%
21%
79%
75%
100%
74%
100%
5%
0
500
1,000
1,500
2,000
2,500
Residential CII Dedicated Irrigation Non-Revenue Total
(mg
)
Baseline Year (2020) Annual Water Use by Sector and End Use
Indoor Outdoor Non-Revenue
AnnualW
ate
r
Drought Response Tool
HomeInput Baseline Year
Water Use
Baseline Year
Water Use Profile
Drought Response Actions
Estimated Water Savings
Drought Response Tracking
Worksheet 3 - Baseline Year Water Use Profile
Page 1 of 1
Date Printed: 6/22/2021
Drought Response Tool
© 2015 Erler & Kalinowski, Inc.
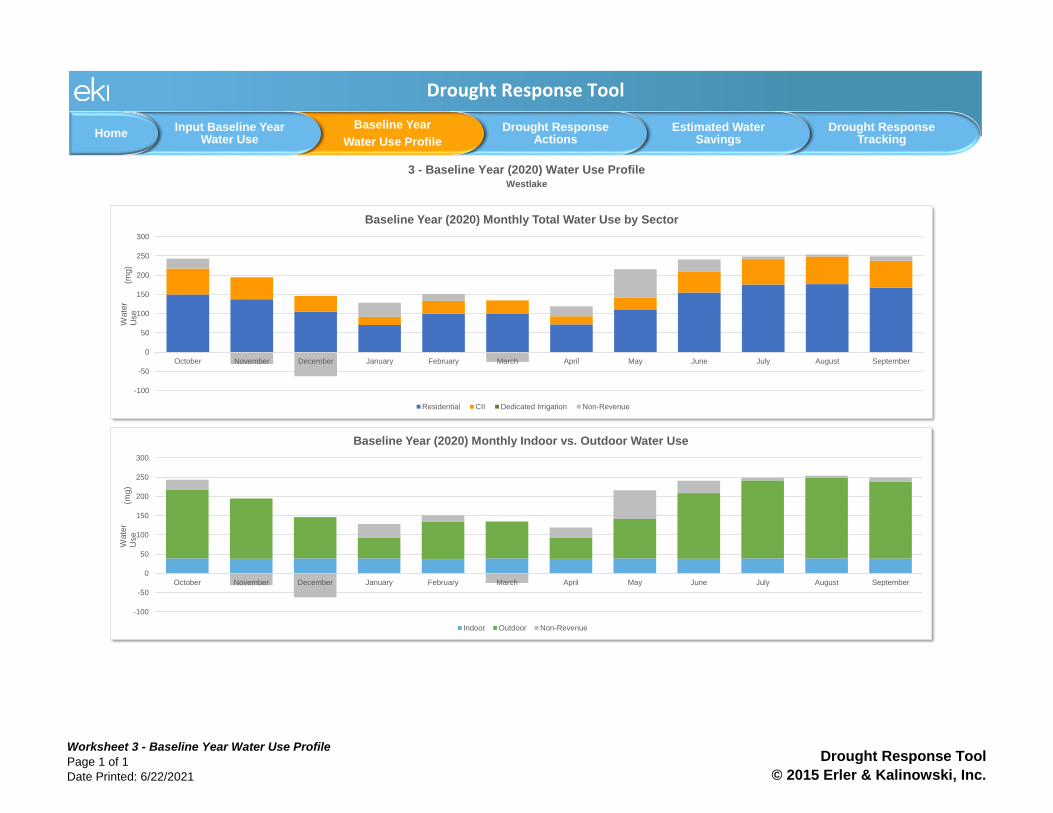
3 - Baseline Year (2020) Water Use ProfileWestlake
Drought Response Tool
HomeInput Baseline Year
Water Use
Baseline Year
Water Use Profile
Drought Response Actions
Estimated Water Savings
Drought Response Tracking
-100
-50
0
50
100
150
200
250
300
October November December January February March April May June July August September
(mg)
Baseline Year (2020) Monthly Total Water Use by Sector
Residential CII Dedicated Irrigation Non-Revenue
Wate
r U
se
-100
-50
0
50
100
150
200
250
300
October November December January February March April May June July August September
(mg
)
Baseline Year (2020) Monthly Indoor vs. Outdoor Water Use
Indoor Outdoor Non-Revenue
Wate
r U
se
Worksheet 3 - Baseline Year Water Use Profile
Page 1 of 1
Date Printed: 6/22/2021
Drought Response Tool
© 2015 Erler & Kalinowski, Inc.
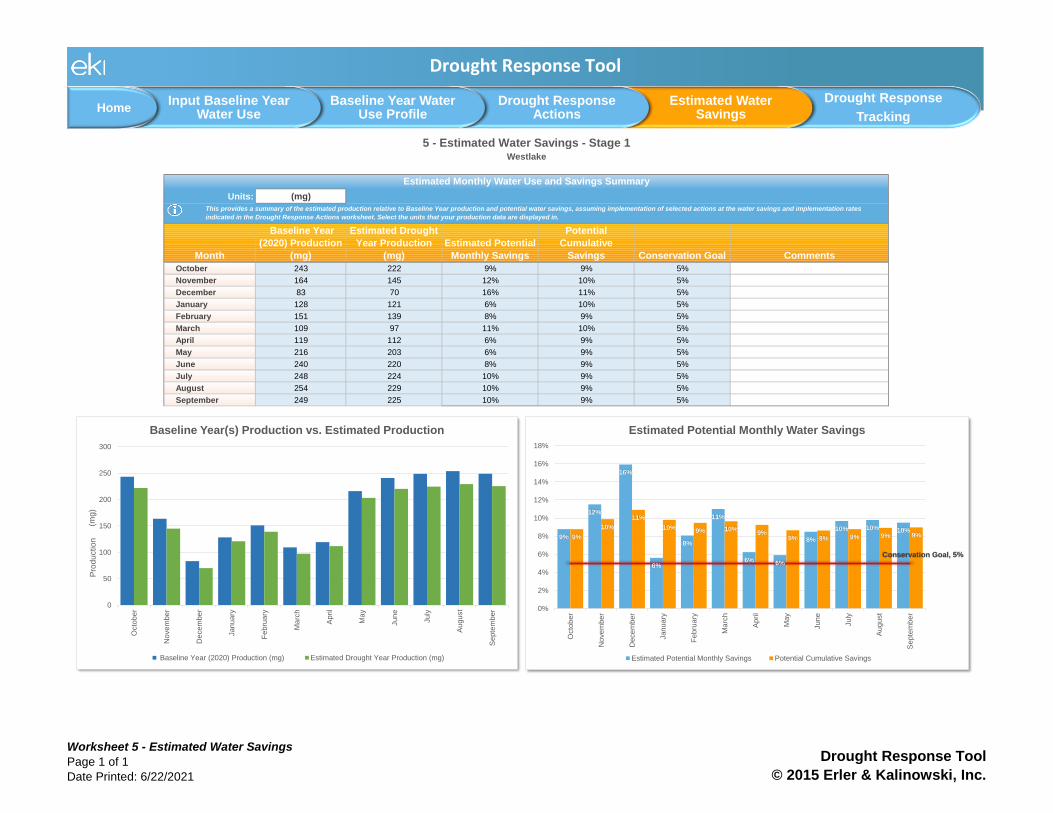
Units: (mg)
Month
Baseline Year
(2020) Production
(mg)
Estimated Drought
Year Production
(mg)
Estimated Potential
Monthly Savings
Potential
Cumulative
Savings Conservation Goal Comments
October 243 222 9% 9% 5%
November 164 145 12% 10% 5%
December 83 70 16% 11% 5%
January 128 121 6% 10% 5%
February 151 139 8% 9% 5%
March 109 97 11% 10% 5%
April 119 112 6% 9% 5%
May 216 203 6% 9% 5%
June 240 220 8% 9% 5%
July 248 224 10% 9% 5%
August 254 229 10% 9% 5%
September 249 225 10% 9% 5%
Westlake
Estimated Monthly Water Use and Savings Summary
5 - Estimated Water Savings - Stage 1
This provides a summary of the estimated production relative to Baseline Year production and potential water savings, assuming implementation of selected actions at the water savings and implementation rates
indicated in the Drought Response Actions worksheet. Select the units that your production data are displayed in.
9%
12%
16%
6%
8%
11%
6% 6%
8%
10% 10% 10%9%
10%
11%
10% 9% 10%9%
9% 9% 9% 9% 9%
Conservation Goal, 5%
0%
2%
4%
6%
8%
10%
12%
14%
16%
18%
Octo
be
r
No
ve
mbe
r
De
ce
mbe
r
Jan
uary
Fe
bru
ary
Ma
rch
Ap
ril
Ma
y
Jun
e
July
Au
gu
st
Se
pte
mb
er
Estimated Potential Monthly Water Savings
Estimated Potential Monthly Savings Potential Cumulative Savings
0
50
100
150
200
250
300
Octo
be
r
No
ve
mbe
r
De
ce
mbe
r
Jan
uary
Fe
bru
ary
Ma
rch
Ap
ril
Ma
y
Jun
e
July
Au
gu
st
Se
pte
mb
er
(mg
)
Baseline Year(s) Production vs. Estimated Production
Baseline Year (2020) Production (mg) Estimated Drought Year Production (mg)
Pro
du
ctio
n
Drought Response Tool
HomeInput Baseline Year
Water UseBaseline Year Water
Use ProfileDrought Response
ActionsEstimated Water
Savings
Drought Response
Tracking
Worksheet 5 - Estimated Water Savings
Page 1 of 1
Date Printed: 6/22/2021
Drought Response Tool
© 2015 Erler & Kalinowski, Inc.
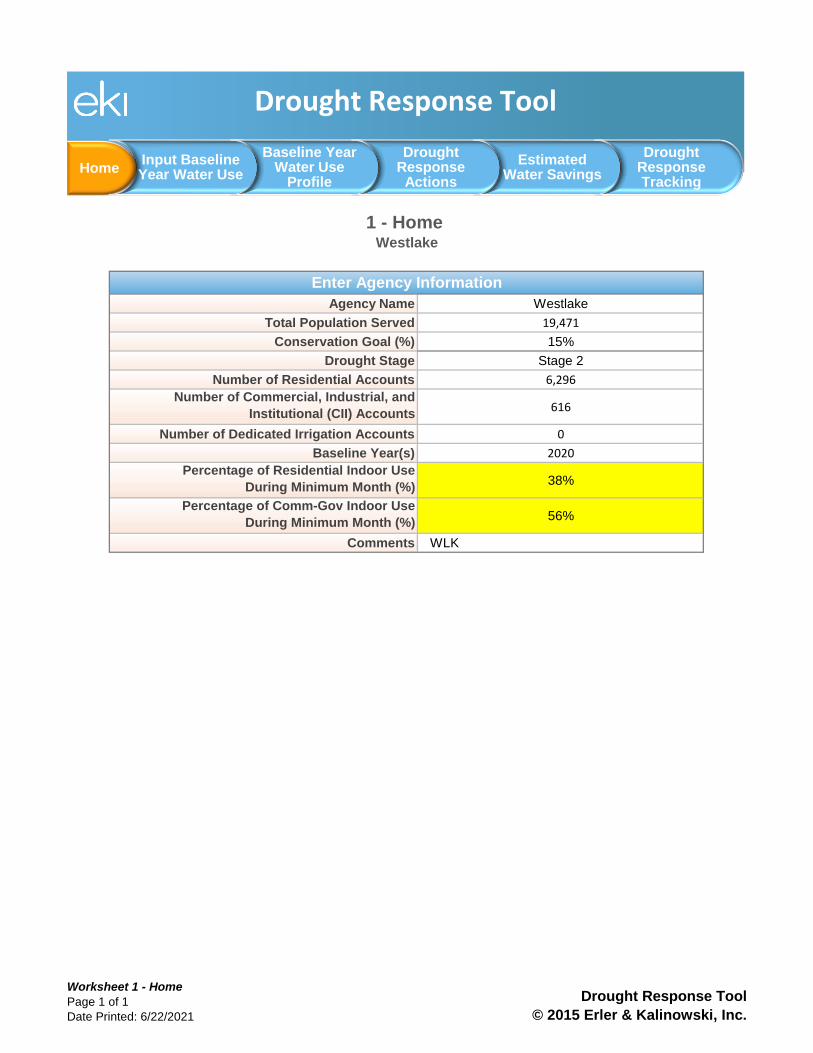
Agency Name Westlake
Total Population Served 19,471
Conservation Goal (%) 15%
Drought Stage Stage 2
Number of Residential Accounts 6,296
Number of Commercial, Industrial, and
Institutional (CII) Accounts616
Number of Dedicated Irrigation Accounts 0
Baseline Year(s) 2020
Percentage of Residential Indoor Use
During Minimum Month (%)38%
Percentage of Comm-Gov Indoor Use
During Minimum Month (%)56%
Comments WLK
Enter Agency Information
Westlake
1 - Home
Drought Response Tool
HomeInput Baseline Year Water Use
Baseline Year Water Use
Profile
Drought Response
Actions
Estimated Water Savings
Drought Response Tracking
Worksheet 1 - Home
Page 1 of 1
Date Printed: 6/22/2021
Drought Response Tool
© 2015 Erler & Kalinowski, Inc.

Units: (mg)
Month
Baseline Year
(2020) Production
(mg)
Estimated Drought
Year Production
(mg)
Estimated Potential
Monthly Savings
Potential
Cumulative
Savings Conservation Goal Comments
October 243 198 18% 18% 15%
November 164 124 24% 21% 15%
December 83 55 34% 23% 15%
January 128 113 12% 21% 15%
February 151 125 17% 20% 15%
March 109 84 23% 20% 15%
April 119 103 13% 19% 15%
May 216 189 13% 18% 15%
June 240 197 18% 18% 15%
July 248 198 20% 19% 15%
August 254 201 21% 19% 15%
September 249 199 20% 19% 15%
Westlake
Estimated Monthly Water Use and Savings Summary
5 - Estimated Water Savings - Stage 2
This provides a summary of the estimated production relative to Baseline Year production and potential water savings, assuming implementation of selected actions at the water savings and implementation rates
indicated in the Drought Response Actions worksheet. Select the units that your production data are displayed in.
18%
24%
34%
12%
17%
23%
13% 13%
18%
20% 21% 20%18%
21%
23%
21% 20% 20%19%
18% 18% 19% 19% 19%Conservation Goal,
15%
0%
5%
10%
15%
20%
25%
30%
35%
40%
Octo
be
r
No
ve
mbe
r
De
ce
mbe
r
Jan
uary
Fe
bru
ary
Ma
rch
Ap
ril
Ma
y
Jun
e
July
Au
gu
st
Se
pte
mb
er
Estimated Potential Monthly Water Savings
Estimated Potential Monthly Savings Potential Cumulative Savings
0
50
100
150
200
250
300
Octo
be
r
No
ve
mbe
r
De
ce
mbe
r
Jan
uary
Fe
bru
ary
Ma
rch
Ap
ril
Ma
y
Jun
e
July
Au
gu
st
Se
pte
mb
er
(mg
)
Baseline Year(s) Production vs. Estimated Production
Baseline Year (2020) Production (mg) Estimated Drought Year Production (mg)
Pro
du
ctio
n
Drought Response Tool
HomeInput Baseline Year
Water UseBaseline Year Water
Use ProfileDrought Response
ActionsEstimated Water
Savings
Drought Response
Tracking
Worksheet 5 - Estimated Water Savings
Page 1 of 1
Date Printed: 6/22/2021
Drought Response Tool
© 2015 Erler & Kalinowski, Inc.

Agency Name Westlake
Total Population Served 19,471
Conservation Goal (%) 25%
Drought Stage Stage 3
Number of Residential Accounts 6,296
Number of Commercial, Industrial, and
Institutional (CII) Accounts616
Number of Dedicated Irrigation Accounts 0
Baseline Year(s) 2020
Percentage of Residential Indoor Use
During Minimum Month (%)38%
Percentage of Comm-Gov Indoor Use
During Minimum Month (%)56%
Comments WLK
Enter Agency Information
Westlake
1 - Home
Drought Response Tool
HomeInput Baseline Year Water Use
Baseline Year Water Use
Profile
Drought Response
Actions
Estimated Water Savings
Drought Response Tracking
Worksheet 1 - Home
Page 1 of 1
Date Printed: 6/22/2021
Drought Response Tool
© 2015 Erler & Kalinowski, Inc.

Units: (mg)
Month
Baseline Year
(2020) Production
(mg)
Estimated Drought
Year Production
(mg)
Estimated Potential
Monthly Savings
Potential
Cumulative
Savings Conservation Goal Comments
October 243 180 26% 26% 25%
November 164 120 27% 26% 25%
December 83 61 26% 26% 25%
January 128 100 22% 25% 25%
February 151 114 24% 25% 25%
March 109 82 25% 25% 25%
April 119 92 22% 25% 25%
May 216 165 24% 25% 25%
June 240 179 26% 25% 25%
July 248 183 26% 25% 25%
August 254 187 26% 25% 25%
September 249 183 26% 25% 25%
Westlake
Estimated Monthly Water Use and Savings Summary
5 - Estimated Water Savings - Stage 3
This provides a summary of the estimated production relative to Baseline Year production and potential water savings, assuming implementation of selected actions at the water savings and implementation rates
indicated in the Drought Response Actions worksheet. Select the units that your production data are displayed in.
26%27% 26%
22%
24% 25%
22%24%
26%26% 26% 26%26% 26% 26%
25% 25% 25% 25% 25% 25% 25% 25% 25%
Conservation Goal, 25%
0%
5%
10%
15%
20%
25%
30%
Octo
be
r
No
ve
mbe
r
De
ce
mbe
r
Jan
uary
Fe
bru
ary
Ma
rch
Ap
ril
Ma
y
Jun
e
July
Au
gu
st
Se
pte
mb
er
Estimated Potential Monthly Water Savings
Estimated Potential Monthly Savings Potential Cumulative Savings
0
50
100
150
200
250
300
Octo
be
r
No
ve
mbe
r
De
ce
mbe
r
Jan
uary
Fe
bru
ary
Ma
rch
Ap
ril
Ma
y
Jun
e
July
Au
gu
st
Se
pte
mb
er
(mg
)
Baseline Year(s) Production vs. Estimated Production
Baseline Year (2020) Production (mg) Estimated Drought Year Production (mg)
Pro
du
ctio
n
Drought Response Tool
HomeInput Baseline Year
Water UseBaseline Year Water
Use ProfileDrought Response
ActionsEstimated Water
Savings
Drought Response
Tracking
Worksheet 5 - Estimated Water Savings
Page 1 of 1
Date Printed: 6/22/2021
Drought Response Tool
© 2015 Erler & Kalinowski, Inc.

Agency Name Westlake
Total Population Served 19,471
Conservation Goal (%) 35%
Drought Stage Stage 4
Number of Residential Accounts 6,296
Number of Commercial, Industrial, and
Institutional (CII) Accounts616
Number of Dedicated Irrigation Accounts 0
Baseline Year(s) 2020
Percentage of Residential Indoor Use
During Minimum Month (%)38%
Percentage of Comm-Gov Indoor Use
During Minimum Month (%)56%
Comments WLK
Enter Agency Information
Westlake
1 - Home
Drought Response Tool
HomeInput Baseline Year Water Use
Baseline Year Water Use
Profile
Drought Response
Actions
Estimated Water Savings
Drought Response Tracking
Worksheet 1 - Home
Page 1 of 1
Date Printed: 6/22/2021
Drought Response Tool
© 2015 Erler & Kalinowski, Inc.

Units: (mg)
Month
Baseline Year
(2020) Production
(mg)
Estimated Drought
Year Production
(mg)
Estimated Potential
Monthly Savings
Potential
Cumulative
Savings Conservation Goal Comments
October 243 152 38% 38% 35%
November 164 95 42% 39% 35%
December 83 43 48% 41% 35%
January 128 89 30% 39% 35%
February 151 97 35% 38% 35%
March 109 66 40% 38% 35%
April 119 82 31% 37% 35%
May 216 147 32% 36% 35%
June 240 152 37% 37% 35%
July 248 152 39% 37% 35%
August 254 154 39% 37% 35%
September 249 152 39% 37% 35%
Westlake
Estimated Monthly Water Use and Savings Summary
5 - Estimated Water Savings - Stage 4
This provides a summary of the estimated production relative to Baseline Year production and potential water savings, assuming implementation of selected actions at the water savings and implementation rates
indicated in the Drought Response Actions worksheet. Select the units that your production data are displayed in.
38%
42%
48%
30%
35%
40%
31% 32%
37%39% 39% 39%
38%39%
41%39% 38% 38% 37% 36% 37% 37% 37% 37%
Conservation Goal, 35%
0%
10%
20%
30%
40%
50%
60%
Octo
be
r
No
ve
mbe
r
De
ce
mbe
r
Jan
uary
Fe
bru
ary
Ma
rch
Ap
ril
Ma
y
Jun
e
July
Au
gu
st
Se
pte
mb
er
Estimated Potential Monthly Water Savings
Estimated Potential Monthly Savings Potential Cumulative Savings
0
50
100
150
200
250
300
Octo
be
r
No
ve
mbe
r
De
ce
mbe
r
Jan
uary
Fe
bru
ary
Ma
rch
Ap
ril
Ma
y
Jun
e
July
Au
gu
st
Se
pte
mb
er
(mg
)
Baseline Year(s) Production vs. Estimated Production
Baseline Year (2020) Production (mg) Estimated Drought Year Production (mg)
Pro
du
ctio
n
Drought Response Tool
HomeInput Baseline Year
Water UseBaseline Year Water
Use ProfileDrought Response
ActionsEstimated Water
Savings
Drought Response
Tracking
Worksheet 5 - Estimated Water Savings
Page 1 of 1
Date Printed: 6/22/2021
Drought Response Tool
© 2015 Erler & Kalinowski, Inc.

Agency Name Westlake
Total Population Served 19,471
Conservation Goal (%) 45%
Drought Stage Stage 5
Number of Residential Accounts 6,296
Number of Commercial, Industrial, and
Institutional (CII) Accounts616
Number of Dedicated Irrigation Accounts 0
Baseline Year(s) 2020
Percentage of Residential Indoor Use
During Minimum Month (%)38%
Percentage of Comm-Gov Indoor Use
During Minimum Month (%)56%
Comments WLK
Enter Agency Information
Westlake
1 - Home
Drought Response Tool
HomeInput Baseline Year Water Use
Baseline Year Water Use
Profile
Drought Response
Actions
Estimated Water Savings
Drought Response Tracking
Worksheet 1 - Home
Page 1 of 1
Date Printed: 6/22/2021
Drought Response Tool
© 2015 Erler & Kalinowski, Inc.
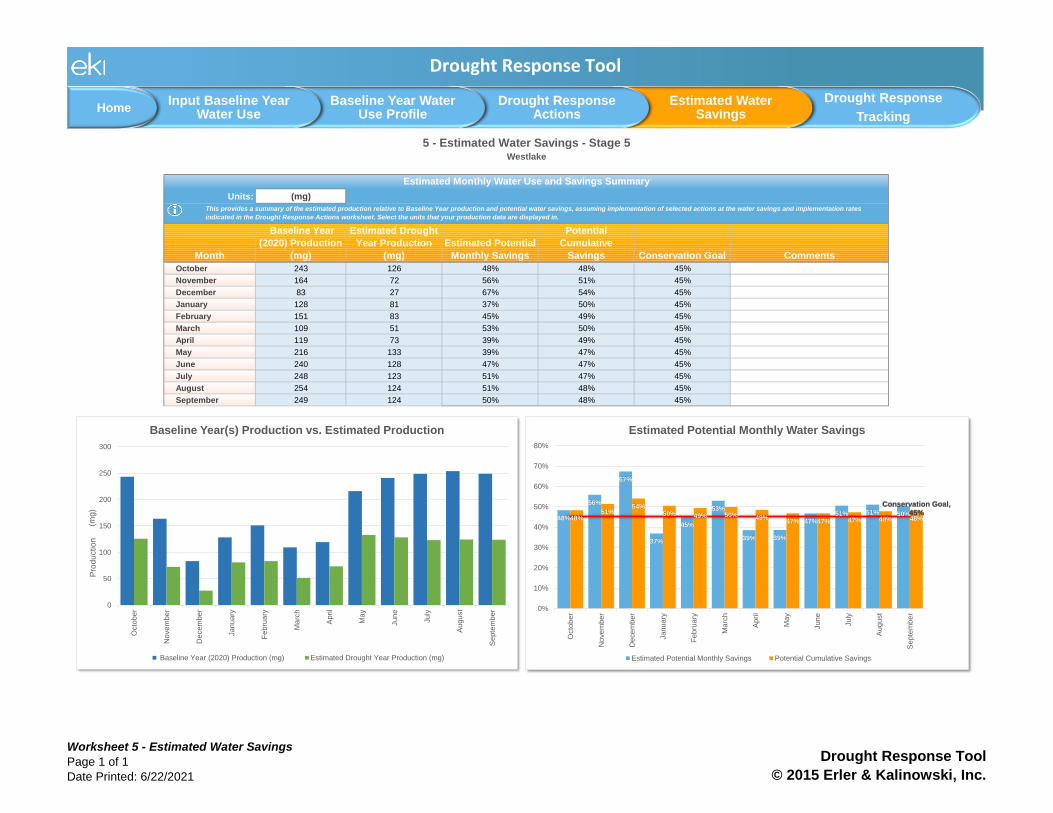
Units: (mg)
Month
Baseline Year
(2020) Production
(mg)
Estimated Drought
Year Production
(mg)
Estimated Potential
Monthly Savings
Potential
Cumulative
Savings Conservation Goal Comments
October 243 126 48% 48% 45%
November 164 72 56% 51% 45%
December 83 27 67% 54% 45%
January 128 81 37% 50% 45%
February 151 83 45% 49% 45%
March 109 51 53% 50% 45%
April 119 73 39% 49% 45%
May 216 133 39% 47% 45%
June 240 128 47% 47% 45%
July 248 123 51% 47% 45%
August 254 124 51% 48% 45%
September 249 124 50% 48% 45%
Westlake
Estimated Monthly Water Use and Savings Summary
5 - Estimated Water Savings - Stage 5
This provides a summary of the estimated production relative to Baseline Year production and potential water savings, assuming implementation of selected actions at the water savings and implementation rates
indicated in the Drought Response Actions worksheet. Select the units that your production data are displayed in.
48%
56%
67%
37%
45%
53%
39% 39%
47%51% 51% 50%
48%51%
54%50% 49% 50% 49%
47% 47% 47% 48% 48%
Conservation Goal, 45%
0%
10%
20%
30%
40%
50%
60%
70%
80%
Octo
be
r
No
ve
mbe
r
De
ce
mbe
r
Jan
uary
Fe
bru
ary
Ma
rch
Ap
ril
Ma
y
Jun
e
July
Au
gu
st
Se
pte
mb
er
Estimated Potential Monthly Water Savings
Estimated Potential Monthly Savings Potential Cumulative Savings
0
50
100
150
200
250
300
Octo
be
r
No
ve
mbe
r
De
ce
mbe
r
Jan
uary
Fe
bru
ary
Ma
rch
Ap
ril
Ma
y
Jun
e
July
Au
gu
st
Se
pte
mb
er
(mg
)
Baseline Year(s) Production vs. Estimated Production
Baseline Year (2020) Production (mg) Estimated Drought Year Production (mg)
Pro
du
ctio
n
Drought Response Tool
HomeInput Baseline Year
Water UseBaseline Year Water
Use ProfileDrought Response
ActionsEstimated Water
Savings
Drought Response
Tracking
Worksheet 5 - Estimated Water Savings
Page 1 of 1
Date Printed: 6/22/2021
Drought Response Tool
© 2015 Erler & Kalinowski, Inc.

Agency Name Westlake
Total Population Served 19,471
Conservation Goal (%) 55%
Drought Stage Stage 6
Number of Residential Accounts 6,296
Number of Commercial, Industrial, and
Institutional (CII) Accounts616
Number of Dedicated Irrigation Accounts 0
Baseline Year(s) 2020
Percentage of Residential Indoor Use
During Minimum Month (%)38%
Percentage of Comm-Gov Indoor Use
During Minimum Month (%)56%
Comments WLK
Enter Agency Information
Westlake
1 - Home
Drought Response Tool
HomeInput Baseline Year Water Use
Baseline Year Water Use
Profile
Drought Response
Actions
Estimated Water Savings
Drought Response Tracking
Worksheet 1 - Home
Page 1 of 1
Date Printed: 6/22/2021
Drought Response Tool
© 2015 Erler & Kalinowski, Inc.
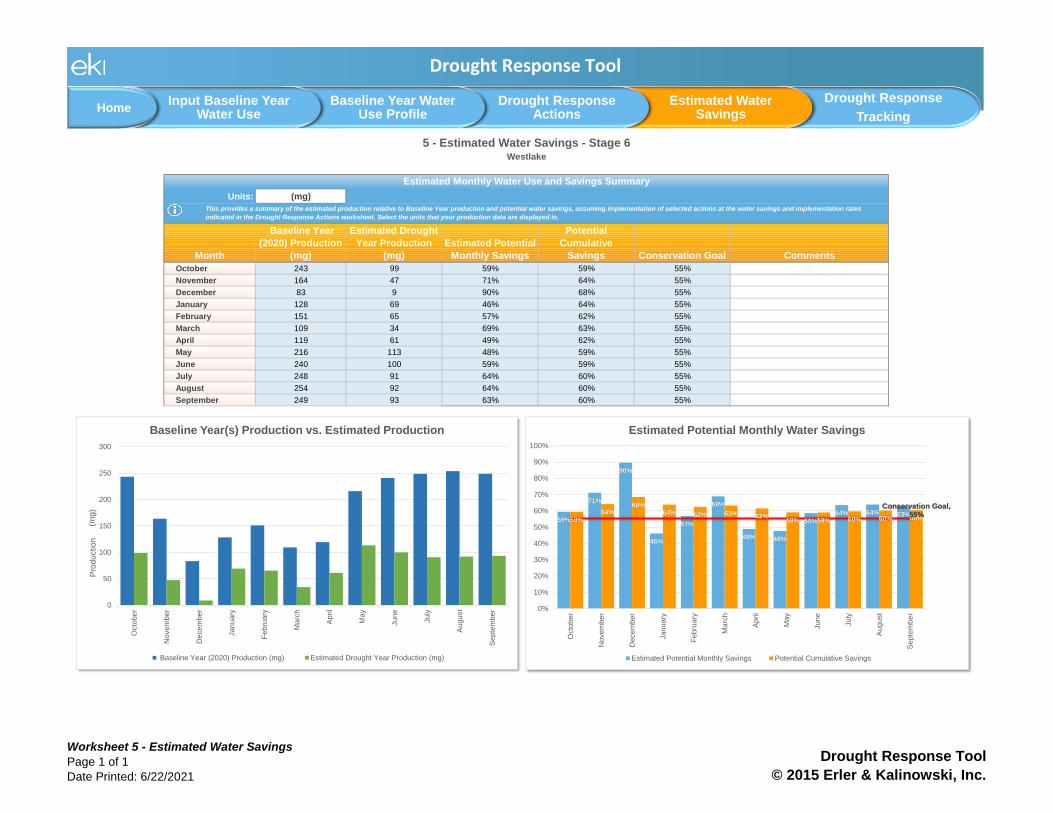
Units: (mg)
Month
Baseline Year
(2020) Production
(mg)
Estimated Drought
Year Production
(mg)
Estimated Potential
Monthly Savings
Potential
Cumulative
Savings Conservation Goal Comments
October 243 99 59% 59% 55%
November 164 47 71% 64% 55%
December 83 9 90% 68% 55%
January 128 69 46% 64% 55%
February 151 65 57% 62% 55%
March 109 34 69% 63% 55%
April 119 61 49% 62% 55%
May 216 113 48% 59% 55%
June 240 100 59% 59% 55%
July 248 91 64% 60% 55%
August 254 92 64% 60% 55%
September 249 93 63% 60% 55%
Westlake
Estimated Monthly Water Use and Savings Summary
5 - Estimated Water Savings - Stage 6
This provides a summary of the estimated production relative to Baseline Year production and potential water savings, assuming implementation of selected actions at the water savings and implementation rates
indicated in the Drought Response Actions worksheet. Select the units that your production data are displayed in.
59%
71%
90%
46%
57%
69%
49% 48%
59%
64% 64% 63%59%
64%68%
64% 62% 63% 62%59% 59% 60% 60% 60%
Conservation Goal, 55%
0%
10%
20%
30%
40%
50%
60%
70%
80%
90%
100%
Octo
be
r
No
ve
mbe
r
De
ce
mbe
r
Jan
uary
Fe
bru
ary
Ma
rch
Ap
ril
Ma
y
Jun
e
July
Au
gu
st
Se
pte
mb
er
Estimated Potential Monthly Water Savings
Estimated Potential Monthly Savings Potential Cumulative Savings
0
50
100
150
200
250
300
Octo
be
r
No
ve
mbe
r
De
ce
mbe
r
Jan
uary
Fe
bru
ary
Ma
rch
Ap
ril
Ma
y
Jun
e
July
Au
gu
st
Se
pte
mb
er
(mg
)
Baseline Year(s) Production vs. Estimated Production
Baseline Year (2020) Production (mg) Estimated Drought Year Production (mg)
Pro
du
ctio
n
Drought Response Tool
HomeInput Baseline Year
Water UseBaseline Year Water
Use ProfileDrought Response
ActionsEstimated Water
Savings
Drought Response
Tracking
Worksheet 5 - Estimated Water Savings
Page 1 of 1
Date Printed: 6/22/2021
Drought Response Tool
© 2015 Erler & Kalinowski, Inc.

Attachment B
CPUC Rule and Schedule 14.1

CALIFORNIA WATER SERVICE COMPANY Revised Cal. P.U.C. Sheet No. xxxxx -W1720 North First Street, San Jose, CA 95112(408) 367-8200 Canceling Cal. P.U.C. Sheet No. 10202 -W
Rule No. 14.1WATER SHORTAGE CONTINGENCY PLAN (continued)
(Page 1) ( T )
A. APPLICABILITY ( N )
1. This schedule applies to all of California Water Service’s regulated ratemaking areas in California, |as well as Grand Oaks Water. ||
B. GENERAL INFORMATION |1. All expenses incurred by utility to implement Rule 14.1, and Schedule 14.1, and requirements |
of the California State Water Resources Control Board (“Water Board”) that have not been |considered in a General Rate Case or other proceeding shall be accumulated by Cal Water in a |separate memorandum account, authorized in Resolution W-4976, for disposition as directed |or authorized from time to time by the Commission. |
2. To the extent that a Stage of Mandatory Water Use Restrictions in Schedule 14.1 has |been activated, and a provision in this Rule is inconsistent with the activated Stage in |Schedule 14.1, the provisions of Schedule 14.1 apply. |
C. DEFINITIONS |For the purposes of this Rule, the following terms have the meanings set forth in this section. |
1. “Commercial nursery” means the use of land, buildings or structures for the growing and/or storing |of flowers, fruit trees, ornamental trees, vegetable plants, shrubs, trees and similar vegetation for the |purpose of transplanting, for use as stock or grafting, and includes the retail sale or wholesale |distribution of such items directly from the premises/lot. |
2. “Drip irrigation system” means a non-spray, low-pressure, and low volume irrigation system utilizing |emission devices with a precipitation or flow rate measured in gallons per hour (GPH), designed |to slowly apply small volumes of water at or near the root zone of plants or other landscaping. |
3. “Flow rate” means the rate at which water flows through pipes, valves, and emission devices, measured in |gallons per minute (GPM), gallons per hour (GPH), inches per hour (IPH), hundred cubic feet (Ccf), |or cubic feet per second (CFS). |
4. “Flow-restricting device” means valves, orifices, or other devices that reduce the flow of potable water |through a service line, which are capable of passing a minimum of 3 Ccf per person, per month, based | upon the U.S. Census calculation of the average number of people in a household in the area. |
5. “High-efficiency sprinkler systems” means an irrigation system with emission devices, |such as sprinkler heads or nozzles, with a precipitation or flow rate no greater than one IPH. |
6. “Irrigation” means the application of potable water by artificial means to landscape. |
7. “Irrigation system” means the components of a system meant to apply water to an area for the purpose |of irrigation, including, but not limited to, piping, fittings, sprinkler heads or nozzles, drip tubing, |valves, and control wiring. |
8. “Landscape” means all of the outdoor planting areas, turf areas, and water features at a particular location. |
9. “Measureable rainfall” means any amount of precipitation of more than one-tenth of an inch (0.1”). |
10. “Micro spray irrigation system” means a low-pressure, low-volume irrigation system utilizing |emission devices that spray, mist, sprinkle, or drip with a precipitation or flow rate measured |in GPH, designed to slowly apply small volumes of water to a specific area. ( N )
(To be inserted by utility) (To be inserted by Cal. P.U.C.)Advice Letter No. Date Filed
Decision No. Effective
Resolution No.TITLE
-NAME
Vice President
PAUL G. TOWNSLEYIssued by
(continued)
2167-A
This tariff has been approved by the California Public Utilities Commission.
CALIFORNIA WATER SERVICE COMPANY Revised Cal. P.U.C. Sheet No. xxxxx -W1720 North First Street, San Jose, CA 95112(408) 367-8200 Canceling Cal. P.U.C. Sheet No. 10203 -W
Rule No. 14.1WATER SHORTAGE CONTINGENCY PLAN (continued)
(Page 2) ( T )C. DEFINITIONS (Continued) ( N )
11. “Ornamental landscape” means shrubs, bushes, flowers, ground cover, turf, lawns, and |grass planted for the purpose of improving the aesthetic appearance of property, but does not |include crops or other agricultural products or special landscape areas. |
12. "Ornamental turf" means a ground cover surface of grass that can be mowed and is planted for |the purpose of improving the aesthetic appearance of the property, but does not include crops |or other agricultural products or special landscape areas. |
13. “Plumbing fixture” means a receptacle or device that is connected to a water supply system, |including, but not limited to, pipes, toilets, urinals, showerheads, faucets, washing machines, |water heaters, tubs, and dishwashers. |
14. “Potable water” means water supplied by Cal Water which conforms to the federal and state |standards for human consumption. |
15. “Properly programmed” means a smart irrigation controller that has been programmed |according to the manufacturer’s instructions and site-specific conditions. |
16. “Real-time water measurement device” means a device or system that provides regularly |updated electronic information regarding the customer’s water use. |
17. “Runoff” means water which is not absorbed by the soil or landscape to which it is applied |and flows from the landscape onto other areas. |
18. “Smart irrigation controller” means an automatic device used to remotely control valves that |operate an irrigation system that has been tested by an American National Standards Institute |accredited third-party certifying body or laboratory in accordance with the Environmental |Protection Agency’s WaterSense program (or an analogous successor program), and certified by |such body or laboratory as meeting the performance and efficiency requirements of such program, |or the more stringent performance and efficiency requirements of another similar program. |
19. “Special landscape area” means an area of the landscape dedicated solely to edible plants and areas |dedicated to active play such as parks, sports fields, golf courses, and where turf provides a |playing surface. |
20. “Turf” means a ground cover surface of grass that can be mowed. |
21. “Water feature” means a design element where open, artificially supplied water performs an aesthetic |or recreation feature, including, but not limited to, ponds, lakes, waterfalls, fountains, and streams. |
22. “Water use evaluation” means an evaluation of the efficiency of indoor water-using devices, |including, but not limited to, measurement of flow rates for all existing showerheads, faucets, and |toilets, inspection for leaks, and providing written recommendations to improve the efficiency |of the indoor water-using fixtures and devices and/or an evaluation of the performance of an |irrigation system, including, but not limited to, inspection for leaks, reporting of overspray or runoff, |and providing written recommendations to improve the performance of the irrigation system. ( N )
(To be inserted by utility) (To be inserted by Cal. P.U.C.)
Advice Letter No. Date Filed
Decision No. Effective
Resolution No.
- Vice PresidentTITLE
NAME
(continued)
Issued by
2167-A PAUL G. TOWNSLEY
This tariff has been approved by the California Public Utilities Commission.
CALIFORNIA WATER SERVICE COMPANY Revised Cal. P.U.C. Sheet No. xxxxx -W1720 North First Street, San Jose, CA 95112(408) 367-8200 Canceling Cal. P.U.C. Sheet No. 10204 -W
Rule No. 14.1WATER SHORTAGE CONTINGENCY PLAN (continued)
(Page 3) ( T )
D. ENFORCEMENT ( N )
Each Stage of this Rule establishes certain restrictions on the use of potable water. Violating the restrictions |set forth in a particular Stage while it is in effect is declared a non-essential, wasteful use of potable water. |Subject to the schedule and conditions outlined below, Cal Water is authorized to install a flow-restricting |device on the service line of any customer when its personnel verify a customer is using potable water |for non-essential, wasteful uses. No person shall have any right or claim in law or in equity, against Cal Water |because of, or as a result of, any matter or thing done or threatened to be done pursuant to the restrictions on |using potable water for non-essential, wasteful uses. |
1. FIRST VIOLATION: Cal Water shall provide the customer with a written notice of |violation. |
2. SECOND VIOLATION: If Cal Water verifies that the customer has used potable water for |non-essential, wasteful uses after having been notified of the first violation, Cal Water |shall provide the customer with a second written notice of violation and is authorized to |install a flow-restricting device on the customer’s service line. Cal Water shall not be |held liable for any injuries, damages, and/or consequences arising from the installation |of a flow restricting device. |
|3. NOTICES OF VIOLATION: ||
A. Written notices of violation provided to customers pursuant to this Rule shall |document the verified violation and alert the customer to the fact that future |violations of the restricted uses of potable water may result in the installation of |a flow-restricting device on the customer’s service line or the discontinuation of |the customer’s service. |
B. If Cal Water elects to install a flow-restricting device on a customer’s service line, |the written notice of violation shall explain that a flow-restricting device has or |will be installed on the customer’s service line, document the steps the customer |must take in order for the flow-restricting device to be removed, and explain |that after the flow-restricting device is removed, it may be reinstalled, without |further notice, if the customer is again verified by Cal Water’s personnel to be |using potable water for non-essential, wasteful uses. |
4. FLOW RESTRICTING DEVICE CONDITIONS: The installation of a flow-restricting |devide on a customer’s service line is subject to the following conditions: |
a. The device shall be capable of providing the premise with a minimum of 3 Ccf per person, per month, | based upon the U.S. Census calculation of the average number of people in a household in the area. |
b. The device may only be removed by Cal Water, and only after a minimum three-day period has elapsed. ||c. Any tampering with the device may result in the discontinuation of the customer’s water service and the |
customer being charged for any damage to Cal Water’s equipment or facilities and any required service |visits. ( N )
(To be inserted by utility) (To be inserted by Cal. P.U.C.)
Advice Letter No. Date Filed
Decision No. Effective
Resolution No.
NAME
- Vice PresidentTITLE
(continued)
Issued by
2167-A PAUL G. TOWNSLEY
This tariff has been approved by the California Public Utilities Commission.

CALIFORNIA WATER SERVICE COMPANY New Cal. P.U.C. Sheet No. xxxxx -W1720 North First Street, San Jose, CA 95112(408) 367-8200 Canceling Cal. P.U.C. Sheet No. 10205 -W
Rule No. 14.1WATER SHORTAGE CONTINGENCY PLAN (continued)
(Page 4) ( T )
D. ENFORCEMENT (Continued) ( N )|d. After the removal of the device, if Cal Water verifies that the customer is using potable water |
for non-essential, wasteful uses, Cal Water may install another flow-restricting device |without prior notice. This device may remain in place until water supply conditions |warrant its removal. If, despite the installation of the device, Cal Water verifies that the |customer is using potable water for non-essential and, unauthorized wasteful uses, then |Cal Water may discontinue the customer’s water service, as provided in its Rule No. 11. |
5. FLOW-RESTRICTING DEVICE REMOVAL CHARGES: The charge to customers for removal |of a flow-restricting device installed pursuant to this Rule is $100 during normal business |hours, and $150 for the device to be removed outside of normal business hours. |
E. WASTEFUL USES OF WATER |
Except where necessary to address an immediate health or safety need or to comply with a term or |condition in a permit issued by a state or federal agency, customers are prohibited, at all times, from |using potable water for the following actions, as each is declared a non-essential, wasteful use of water: |
1. Use of potable water through a broken or defective plumbing fixture or irrigation |system when Cal Water has notified the customer in writing to repair the broken or |defective plumbing fixture or irrigation system, and the customer has failed to effect |such repairs within seven (7) business days of receipt of such notice; |
2. The application of potable water to landscapes in a manner that causes runoff such that |water flows onto adjacent property, non-irrigated areas, private and public walkways, |roadways, parking lots, or structures; |
3. The use of a hose that dispenses potable water to wash vehicles, including cars, trucks, |buses, boats, aircraft, and trailers, whether motorized or not, except where the hose is |fitted with a shut-off nozzle or device attached to it that causes it to cease dispensing |water immediately when not in use. |
|F. MANDATORY STAGED RESTRICTIONS OF WATER USE ||
1. ADOPTION OF STAGED MANDATORY RESTRICTIONS: Cal Water may implement the |following staged mandatory restrictions of water use, after notifying the Director of the |Commission’s Division of Water and Audits (DWA), by a Tier 1 advice letter in both |hard-copy and emailed formats, of Cal Water’s intent to implement a particular stage, if: |
a. Water supplies are projected to be insufficient to meet normal customer |demand by Cal Water; or |
b. A water supply shortage or threatened shortage exists; or |c. Water supplies are curtailed by a wholesale water supplier; or |d. Directed to do so under a duly adopted emergency regulation by the |
Commission or other authorized government agencies. ( N )
(To be inserted by utility) (To be inserted by Cal. P.U.C.)
Advice Letter No. Date Filed
Decision No. Effective
Resolution No.
NAME
- Vice PresidentTITLE
(continued)
Issued by
2167-A PAUL G. TOWNSLEY
This tariff has been approved by the California Public Utilities Commission.
CALIFORNIA WATER SERVICE COMPANY New Cal. P.U.C. Sheet No. 1720 North First Street, San Jose, CA 95112(408) 367-8200 Canceling Cal. P.U.C. Sheet No.
Rule No. 14.1 ( N )WATER SHORTAGE CONTINGENCY PLAN (continued) |
(Page 5) ||
F. MANDATORY STAGED RESTRICTIONS OF WATER USE (Continued) ||2. PUBLIC NOTICE: Thirty (30) days prior to implementing a mandatory staged reduction in water |
use in this Rule, Cal Water shall notify its customer of the requirements of the particular stage |implemented by Cal Water by bill insert, direct mailing, email, or bill message directing |the customer to additional information on Cal Water’s website. |
3. STAGE 1 WATER SHORTAGE: A Stage 1 Water Shortage occurs when Cal Water, the |Commission, a wholesale water supplier, or other authorized government agency |determines that measures are needed to reduce water consumption by customers |served by public water suppliers. In addition to the prohibitions outlined in Section E, |the following restrictions may be imposed by Cal Water, except where necessary to |address an immediate health or safety need or to comply with a term or condition in a |permit issued by a state or federal agency: |
a. Outdoor Irrigation Restrictions (Stage 1) |
i. Irrigating ornamental landscapes with potable water is limited to no |more than three (3) days per week, on a schedule established and posted |by Cal Water on its website or otherwise provided to customers by bill |message, bill insert, direct mail, or email, or as follows: |
1. Customers with even-numbered addresses may irrigate on Saturdays, Tuesdays, and |Thursdays. |
2. Customers with odd-numbered addresses may irrigate on Sundays, Wednesdays, and Fridays. |
3. Customers without a street address may irrigate on Saturdays, Tuesdays, and Thursdays. |
4. Notwithstanding the foregoing restrictions, irrigation of special landscape areas or |commercial nurseries may occur as needed, provided that the customer who wishes |to irrigate a special landscape area or commercial nursery presents Cal Water with a |plan to achieve water use reductions commensurate with those that would be achieved by |complying with foregoing restrictions. |
5. Notwithstanding the foregoing restrictions, when a city, county, or other local public agency |in one of Cal Water’s service areas duly adopts restrictions on the number of days or hours |of the day that customers may irrigate which are different than those adopted by Cal Water, |Cal Water may enforce the city, county, or other local public agency’s restrictions. |
ii. Irrigating ornamental landscape with potable water is prohibited during the hours between |8:00 a.m. and 6:00 p.m. |
iii. The foregoing restrictions do not apply to: |
1. Landscape irrigation zones that exclusively use drip irrigation systems and/or micro spray |irrigation system; ( N )
(To be inserted by utility) (To be inserted by Cal. P.U.C.)
Advice Letter No. Date Filed
Decision No. Effective
Resolution No.
NAME
- Vice PresidentTITLE
(continued)
Issued by
2167-A PAUL G. TOWNSLEY
This tariff has been approved by the California Public Utilities Commission.

CALIFORNIA WATER SERVICE COMPANY New Cal. P.U.C. Sheet No. 1720 North First Street, San Jose, CA 95112(408) 367-8200 Canceling Cal. P.U.C. Sheet No.
Rule No. 14.1 ( N )WATER SHORTAGE CONTINGENCY PLAN (continued) |
(Page 6) ||F. MANDATORY STAGED RESTRICTIONS OF WATER USE (Continued) |
[Stage 1 (cont.)] |
2. Irrigating ornamental landscapes with the use of a hand-held |bucket or similar container, with a continuously monitored hose |which is fitted with an automatic shut-off nozzle or device |attached to it that causes it to cease dispensing water |immediately when not in use or monitored, or for the express |purpose of adjusting or repairing an irrigation system. |
b. Obligation to Fix Leaks, Breaks or Malfunctions: All leaks, breaks, or other |malfunctions in the customer’s plumbing fixture(s) or irrigation system(s) must |be repaired within five (5) business days of written notification by Cal Water, |unless other arrangements are made with Cal Water. |
c. Prohibited Uses of Water: Customers are prohibited from using potable water |for the following actions: |
i. The application of potable water to driveways and sidewalks; |
ii. The use of potable water in a water feature, except where the water is |part of a recirculating system; |
iii. The application of potable water to outdoor landscapes during and within |forty-eight (48) hours after measurable rainfall. |
d. Other duly adopted restrictions on the use potable water as prescribed from |time to time by the Commission or other authorized government agencies are |incorporated herein by reference. |
4. STAGE 2 WATER SHORTAGE: A Stage 2 Water Shortage occurs when the Stage 1 Water |Shortage restrictions are deemed insufficient to achieve identified water use goals established by |Cal Water, the Commission, a wholesale water supplier, or other authorized government agency. |In addition to the prohibited wasteful water use practices listed in Section D, the following |restrictions may be imposed by Cal Water, except where necessary to address an immediate |health or safety need or to comply with a term or condition in a permit issued by a state or federal |agency. Differences from or additions to the previous Stage are underlined. |
a. Outdoor Irrigation Restrictions (Stage 2) |
i. Irrigating ornamental landscapes with potable water is limited to no more than three (3) days |per week, on a schedule established and posted by Cal Water on its website or otherwise |provided to customers by bill message, bill insert, direct mail, or email, or as follows: |
1. Customers with even-numbered addresses may irrigate on |Saturdays, Tuesdays, and Thursdays. |
2. Customers with odd-numbered addresses may irrigate on |Sundays, Wednesdays, and Fridays. ( N )
(To be inserted by utility) (To be inserted by Cal. P.U.C.)Advice Letter No. Date Filed
Decision No. Effective
Resolution No.
NAME
- Vice PresidentTITLE
(continued)
2167-A PAUL G. TOWNSLEYIssued by
This tariff has been approved by the California Public Utilities Commission.
CALIFORNIA WATER SERVICE COMPANY New Cal. P.U.C. Sheet No. 1720 North First Street, San Jose, CA 95112(408) 367-8200 Canceling Cal. P.U.C. Sheet No.
Rule No. 14.1 ( N )WATER SHORTAGE CONTINGENCY PLAN (continued) |
(Page 7) ||F. MANDATORY STAGED RESTRICTIONS OF WATER USE (Continued) |
[Stage 2 (cont.)] |
3. Customers without a street address may irrigate on Saturdays, Tuesdays, and Thursdays. |
4. Notwithstanding the foregoing restrictions, irrigation of special landscape areas or |commercial nurseries may occur as needed, provided that the customer who wishes |to irrigate a special landscape area or commercial nursery presents Cal Water with a |plan to achieve water use reductions commensurate with those that would be achieved |by complying with foregoing restrictions. |
5. Notwithstanding the foregoing restrictions, when a city, county, or other public agency in one |of Cal Water’s service areas duly adopts restrictions on the number of days or hours of |the day that customers may irrigate which are different than those adopted by Cal Water, |Cal Water may enforce the city, county, or other local public agency’s restrictions. |
ii. Irrigating ornamental landscape with potable water is prohibited during |the hours between 8:00 a.m. and 6:00 p.m. |
iii. The foregoing restrictions do not apply to: |
1. Landscape irrigation zones that exclusively use drip irrigation |systems and/or micro spray irrigation system; |
2. Irrigating ornamental landscapes with the use of a hand-held bucket or similar |container, a continuously monitored hose which is fitted with an automatic |shut-off nozzle or device attached to it that causes it to cease dispensing water |immediately when not in use or monitored, or for the express purpose of adjusting |or repairing an irrigation system. |
b. Obligation to Fix Leaks, Breaks or Malfunctions: All leaks, breaks, or other malfunctions in the |customer’s plumbing fixture(s) or irrigation system(s) must be repaired within three (3) business |days of written notification by Cal Water, unless other arrangements are made with Cal Water. |
c. Prohibited Uses of Water: Customers are prohibited from using potable water |for the following actions: |i. The application of potable water to driveways and sidewalks; |ii. The use of potable water in a water feature, except where the water is |
part of a recirculating system; |iii. The application of potable water to outdoor landscapes during and within |
forty-eight (48) hours after measurable rainfall; |iv. The serving of drinking water other than upon request in eating or |
drinking establishments, including but not limited to restaurants, hotels, |cafes, cafeterias, bars, or other public places where food or drink are |served and/or purchased; ( N )
(To be inserted by utility) (To be inserted by Cal. P.U.C.)Advice Letter No. Date Filed
Decision No. Effective
Resolution No.
NAME
- Vice PresidentTITLE
(continued)Issued by
2167-A PAUL G. TOWNSLEY
This tariff has been approved by the California Public Utilities Commission.

CALIFORNIA WATER SERVICE COMPANY New Cal. P.U.C. Sheet No. 1720 North First Street, San Jose, CA 95112(408) 367-8200 Canceling Cal. P.U.C. Sheet No.
Rule No. 14.1 ( N )WATER SHORTAGE CONTINGENCY PLAN (continued) |
(Page 8) ||
F. MANDATORY STAGED RESTRICTIONS OF WATER USE (Continued) |[Stage 2 (cont.)] |
v. Irrigation of ornamental landscape on public street medians; |
vi. Irrigation outside of newly constructed homes and buildings with potable water in a manner |inconsistent with regulations or other requirements established by the California Building |Standards Commission and the Department of Housing and Community Development. |
d. Operators of hotels and motels shall provide guests with the option of choosing |not to have towels and linens laundered daily. The hotel or motel shall |prominently display notice of this option in each guest room using clear and |easily understood language. |
e. Limits on Filling Ornamental Lakes or Ponds: Filling or re-filling ornamental lakes |or ponds with potable water is prohibited, except to the extent needed to |sustain aquatic life, provided that such animals are of significant value and have |been actively managed within the water feature prior to the implementation of |any staged mandatory restrictions of water use as described in this Rule. |
f. Other duly adopted restrictions on the use of potable water as prescribed from |time to time by the Commission or other authorized government agencies are |incorporated herein by reference. |
5. STAGE 3 WATER SHORTAGE: A Stage 3 Water Shortage occurs when the Stage 2 Water |Shortage restrictions are deemed insufficient to achieve identified water use goals |established by Cal Water, the Commission, a wholesale water supplier, or other |authorized government agency. In addition to the prohibited wasteful water use |practices listed in Section D, the following restrictions may be imposed by Cal Water, |except where necessary to address an immediate health or safety need or to comply |with a term or condition in a permit issued by a state or federal agency. Differences |from or additions to the previous Stages are underlined. |
a. Outdoor Irrigation Restrictions |
i. Irrigating ornamental landscapes with potable water is limited to no more than two (2) days |per week, on a schedule established and posted by Cal Water on its website or otherwise |provided to customers by bill message, bill insert, direct mail, or email, or as follows: |
1. Customers with even-numbered addresses may irrigate on Saturdays and Tuesdays |(previous Stages allowed Thursdays as well). |
2. Customers with odd-numbered addresses may irrigate on Sundays and Wednesdays |(previous Stages allowed Fridays as well). |
3. Customers without a street address may irrigate on Saturdays and Tuesdays |(previous Stages allowed Thursdays as well). ( N )
(To be inserted by utility) (To be inserted by Cal. P.U.C.)
Advice Letter No. Date Filed
Decision No. Effective
Resolution No.
NAME
- Vice PresidentTITLE
(continued)
Issued by
2167-A PAUL G. TOWNSLEY
This tariff has been approved by the California Public Utilities Commission.

CALIFORNIA WATER SERVICE COMPANY New Cal. P.U.C. Sheet No. 1720 North First Street, San Jose, CA 95112(408) 367-8200 Canceling Cal. P.U.C. Sheet No.
Rule No. 14.1 ( N )WATER SHORTAGE CONTINGENCY PLAN (continued) |
(Page 9) ||
F. MANDATORY STAGED RESTRICTIONS OF WATER USE (Continued) |[Stage 3 (cont.)] |
4. Notwithstanding the foregoing restrictions, irrigation of special landscape areas or |commercial nurseries may occur as needed, provided that the customer who wishes to |irrigate a special landscape area or commercial nursery presents Cal Water with a |plan to achieve water use reductions commensurate with those that would be achieved by |complying with foregoing restrictions. |
5. Notwithstanding the foregoing restrictions, when a city, county, or other local public agency |in one of Cal Water’s service areas duly adopts restrictions on the number of days or hours |of the day that customers may irrigate which are different than those adopted by Cal Water, |Cal Water may enforce the city, county, or other local public agency’s restrictions. |
ii. Irrigating ornamental landscape with potable water is prohibited during the hours between |8:00 a.m. and 6:00 p.m. |
iii. The foregoing restrictions do not apply to: |
1. Landscape irrigation zones that exclusively use drip irrigation systems and/or micro spray |irrigation system; |
2. Irrigating ornamental landscapes with the use of a hand-held bucket or similar container, |a continuously monitored hose which is fitted with an automatic shut-off nozzle or |device attached to it that causes it to cease dispensing water immediately when not in |use or monitored, or for the express purpose of adjusting or repairing an irrigation system. |
b. Obligation to Fix Leaks, Breaks or Malfunctions: All leaks, breaks, or other malfunctions in the |customer’s plumbing fixtures and/or irrigation system must be repaired within two (2) business days |of written notification by Cal Water, unless other arrangements are made with Cal Water. |
c. Prohibited Uses of Water: Customers are prohibited from using potable water for the following actions: |
i. The application of potable water to driveways and sidewalks; |
ii. The use of potable water in a water feature, except where the water is part of a recirculating system; |
iii. The application of potable water to outdoor landscapes during and within |forty-eight (48) hours after measurable rainfall; |
iv. The serving of drinking water other than upon request in eating or drinking establishments, including |but not limited to restaurants, hotels, cafes, cafeterias, bars, or other public places where food or |drink are served and/or purchased; |
v. Irrigation of ornamental turf on public street medians; |
vi. Irrigation outside of newly constructed homes and buildings with potable water in a manner |inconsistent with regulations or other requirements established by the California Building |Standards Commission and the Department of Housing and Community Development. |
vii. Use of potable water for street cleaning with trucks, except for initial |wash-down for construction purposes (if street sweeping is not feasible); ( N )
(To be inserted by utility) (To be inserted by Cal. P.U.C.)
Advice Letter No. Date Filed
Decision No. Effective
Resolution No.
NAME
- Vice PresidentTITLE
(continued)
Issued by
2167-A PAUL G. TOWNSLEY
This tariff has been approved by the California Public Utilities Commission.
CALIFORNIA WATER SERVICE COMPANY New Cal. P.U.C. Sheet No. 1720 North First Street, San Jose, CA 95112(408) 367-8200 Canceling Cal. P.U.C. Sheet No.
Rule No. 14.1 ( N )WATER SHORTAGE CONTINGENCY PLAN (continued) |
(Page 10) ||
F. MANDATORY STAGED RESTRICTIONS OF WATER USE (Continued) |[Stage 3 (cont.)] |
viii. Use of potable water for construction purposes, such as consolidation of |backfill, dust control, or other uses unless no other source of water or |other method can be used. |
d. Operators of hotels and motels shall provide guests with the option of choosing not to have towels |and linens laundered daily. The hotel or motel shall prominently display notice of this option in each |guest room using clear and easily understood language. |
e. Limits on Filling Ornamental Lakes or Ponds: Filling or re-filling ornamental lakes or ponds with |potable water is prohibited, except to the extent needed to sustain aquatic life, provided that such |animals are of significant value and have been actively managed within the water feature prior to the |implementation of any staged mandatory restrictions of water use as described in this Rule. |
f. Other duly adopted restrictions on the use of potable water as prescribed from time to time by the |Commission or other authorized government agencies are incorporated herein by reference. |
6. STAGE 4 WATER SHORTAGE: A Stage 4 Water Shortage occurs when the Stage 3 Water |Shortage restrictions are deemed insufficient to achieve identified water use goals established by Cal Water, the Commission, a wholesale water supplier, or other |authorized government agency. In addition to the prohibited wasteful water use practices listed in Section D, the following restrictions may be imposed by Cal Water, |except where necessary to address an immediate health or safety need or to comply |with a term or condition in a permit issued by a state or federal agency. Differences |from or additions to the previous Stage are underlined. |
a. Irrigating ornamental landscape with potable water is prohibited, except when a |hand-held bucket or a similar container, or a continuously monitored hose which |is fitted with an automatic shut-off nozzle or device attached to it that causes it |to cease dispensing water immediately when not in use or monitored is used to |maintain vegetation, including trees and shrubs. |
b. Obligation to Fix Leaks, Breaks or Malfunctions: All leaks, breaks, or other |malfunctions in the customer’s plumbing fixtures or irrigation system must be |repaired within one (1) business day of written notification by Cal Water, unless |other arrangements are made with Cal Water. |
Prohibited Uses of Water: Customers are prohibited from using potable water for the following actions: |
i. The application of potable water to driveways and sidewalks; |
ii. The use of potable water in a water feature, except where the water is part of a recirculating system; |
iii. The application of potable water to outdoor landscapes during and within forty-eight (48) hours after |measurable rainfall; (N)
(To be inserted by utility) (To be inserted by Cal. P.U.C.)
Advice Letter No. Date Filed
Decision No. Effective
Resolution No.
NAME
- Vice PresidentTITLE
(continued)
Issued by
2167-A PAUL G. TOWNSLEY
This tariff has been approved by the California Public Utilities Commission.

CALIFORNIA WATER SERVICE COMPANY New Cal. P.U.C. Sheet No. 1720 North First Street, San Jose, CA 95112(408) 367-8200 Canceling Cal. P.U.C. Sheet No.
Rule No. 14.1 ( N )WATER SHORTAGE CONTINGENCY PLAN (continued) |
(Page 11) ||
F. MANDATORY STAGED RESTRICTIONS OF WATER USE (Continued) |[Stage 4 (cont.)] |
iv. The serving of drinking water other than upon request in eating or |drinking establishments, including but not limited to restaurants, hotels, |cafes, cafeterias, bars, or other public places where food or drink are |served and/or purchased; |
[Note that items previously identified as (v) and (vi) in Stage 3 have been eliminated.] |
v. Use of potable water for street cleaning with trucks (the previous Stage |allowed certain exceptions); |
vi. Use of potable water for construction purposes, such as consolidation of |backfill, dust control, or other uses (the previous Stage allowed certain |exceptions). |
c. Operators of hotels and motels shall provide guests with the option of choosing |not to have towels and linens laundered daily. The hotel or motel shall |prominently display notice of this option in each guest room using clear and |easily understood language. |
d. Limits on Filling Ornamental Lakes or Ponds: Filling or re-filling ornamental lakes |or ponds with potable water is prohibited, except to the extent needed to |sustain aquatic life, provided that such animals are of significant value and have |been actively managed within the water feature prior to the implementation of |any staged mandatory restrictions of water use as described in this Rule. |
f. Other duly adopted restrictions on the use of utility-supplied potable water as |prescribed from time to time by the Commission or other authorized |government agencies, commissions, or officials are incorporated herein by reference. |
|G. ADOPTION OF STAGED MANDATORY WATER USE REDUCTIONS (for Schedule 14.1) |
1. ADDITION OF SCHEDULE 14.1: If, in the opinion of Cal Water, more stringent water |conservation measures are required due to supply conditions or government directive, |Cal Water may request the addition of a Schedule No. 14.1 – Staged Mandatory Water |Use Reductions, via a Tier 2 advice letter. |
A. Cal Water may not activate Schedule No. 14.1 until it has been authorized to do |so by the California Public Utilities Commission, as delegated to its Division of |Water and Audits. |
B. A Schedule No. 14.1 that has been authorized by the California Public Utilities |Commission shall remain dormant until triggered by specific conditions detailed |in the Schedule 14.1 tariff and Cal Water has requested and received |authorization for activating a stage by the California Public Utilities Commission. ( N )
(To be inserted by utility) (To be inserted by Cal. P.U.C.)Advice Letter No. Date Filed
Decision No. Effective
Resolution No.
NAME
- Vice PresidentTITLE
(continued)
2167-A PAUL G. TOWNSLEYIssued by
This tariff has been approved by the California Public Utilities Commission.

CALIFORNIA WATER SERVICE COMPANY New Cal. P.U.C. Sheet No. 1720 North First Street, San Jose, CA 95112(408) 367-8200 Canceling Cal. P.U.C. Sheet No.
Rule No. 14.1 ( N )WATER SHORTAGE CONTINGENCY PLAN (continued) |
(Page 12) |
G. ADOPTION OF STAGED MANDATORY WATER USE REDUCTIONS (for Schedule 14.1) (continued) |
c. Notice of the Tier 2 advice letter and associated public participation hearing, if |required, shall be provided to customers through a bill insert or a direct mailing, |as set forth in Subsection 5 (Public Notice) below. |
d. Cal Water shall comply with all requirements of Sections 350-358 of the |California Water Code. |
e. The Tier 2 advice letter requesting the addition of a Schedule No. 14.1 shall |include, but not be limited to: |
i. A proposed Schedule No. 14.1 tariff, which shall include but not be limited to: |
1. Applicability, |
2. Territory applicable to, |
3. A detailed description of each stage of water budgets (the |number of stages requested for a ratemaking area may vary |depending on the specifics of the water shortage event), |
4. A detailed description of the trigger(s) that activates each stage of |water budgets, |
5. A detailed description of each water use restriction for each stage |of water budgets, |
6. Water use violation levels, written warning levels, associated |fines, if applicable, and exception procedures, |
7. Conditions for installation of a flow restrictor, |
8. Charges for removal of flow restrictors, and |
9. Special conditions |
ii. Justification for, and documentation and calculations in support of the |water budgets. |
2. Conditions for Activating Schedule No. 14.1: Cal Water may file a Tier 1 advice letter to |request activation of a particular stage of its Schedule No. 14.1 tariff if: |
a. Cal Water, the California Public Utilities Commission, wholesale water supplier, |or other government agency declares an emergency requiring mandatory water |budgets, mandatory water rationing, or mandatory water allocations; or |
b. A government agency declares a state of emergency in response to severe |drought conditions, earthquake or other catastrophic event that severely |reduces Cal Water’s water supply; or |
c. Cal Water is unable to achieve water conservation targets set by itself; or |
d. Water conservation targets set by itself or a governing agency are insufficient; or |
e. Cal Water chooses to subsequently activate a different stage of its Schedule No. 14.1 tariff. |(continued)
(To be inserted by utility) (To be inserted by Cal. P.U.C.)Advice Letter No. Date Filed
Decision No. Effective
Resolution No.
Issued by2167-A PAUL G. TOWNSLEY
NAME
- Vice PresidentTITLE
This tariff has been approved by the California Public Utilities Commission.
CALIFORNIA WATER SERVICE COMPANY New Cal. P.U.C. Sheet No. 1720 North First Street, San Jose, CA 95112(408) 367-8200 Canceling Cal. P.U.C. Sheet No.
Rule No. 14.1 (N)WATER SHORTAGE CONTINGENCY PLAN (continued) |
(Page 13) |
G. ADOPTION OF STAGED MANDATORY WATER USE REDUCTIONS (for Schedule 14.1) (continued) |
a. Include, but not be limited to, a justification for activating the particular stage of |mandatory water use reductions, as well as the period during which the |particular stage will be in effect. |
b. Be accompanied by the customer notification measures detailed in sub-section 5 (Public Notice) below. |
4. De-Activating Schedule No. 14.1: When Schedule No. 14.1 is activated and Cal Water |determines that water supplies are again sufficient to meet normal demands, and |mandatory water use reductions are no longer necessary, Cal Water shall seek the |approval of the California Public Utilities Commission, via a Tier 1 advice letter, to de- |activate the particular stage of mandatory water use reductions that had been |authorized. |
5. Public Notice |
a. When Cal Water requests the addition of a Schedule 14.1 – Staged Mandatory |Water Use Reductions Tariff, via a Tier 2 advice letter, it shall provide notice of |the Tier 2 advice letter and associated public hearing provided to customers |through bill inserts or direct mailing, and it shall comply with all requirements of |Sections 350-358 of the California Water Code (CWC), including but not limited |to the following: |
i. In order to be in compliance with both the General Order 96-B and CWC, |notice shall be provided via both newspaper and bill insert/direct mailing. |
ii. One notice shall be provided for each advice letter filed, that includes |both notice of the filing of the Tier 2 advice letter as well as the details of |the public hearing (date, time, place, etc.). |
iii. The public meeting shall be held after the Tier 2 advice letter is filed, and |before the Commission authorizes the addition of Schedule 14.1 to the |tariff except in cases of emergency water shortages approved by DWA. |
iv. Cal Water shall consult with Division of Water and Audits staff prior to |filing advice letter, in order to determine details of public meeting. |
b. In the event that Schedule No. 14.1- Staged Mandatory Water Use Reductions |Tariff is triggered, and Cal Water requests activation through the filing of a Tier 1 |advice letter, Cal Water shall notify its customers and provide each customer |with a summary of Schedule No. 14.1 by means of bill insert or direct mailing. |Notification shall take place prior to imposing any penalties associated with this |plan. If activation of Schedule No. 14.1 occurs one year or more since the public |hearing associated with adding Schedule 14.1 to its tariffs, then Cal Water shall |conduct a public hearing pursuant to California Water Code Section 351 prior to |activating a stage of its Mandatory Water Use Reduction Tariff. |
c. During the period that a stage of Schedule No. 14.1 is activated, Cal Water shall |provide customers with updates in at least every other bill, regarding its water |supply status and the results of customers' conservation efforts. (N)
(To be inserted by utility) (To be inserted by Cal. P.U.C.)Advice Letter No. Date Filed
Decision No. Effective
Resolution No.
NAME2167-A PAUL G. TOWNSLEY
Issued by
[end]
- Vice PresidentTITLE
This tariff has been approved by the California Public Utilities Commission.
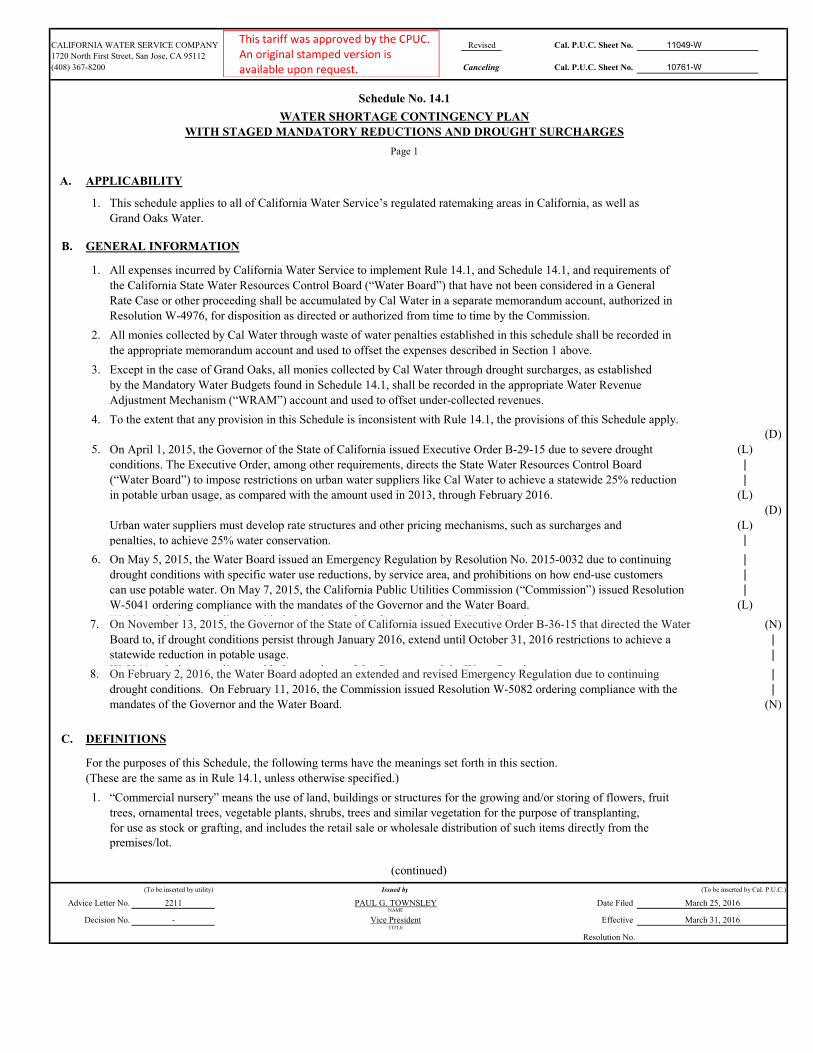
CALIFORNIA WATER SERVICE COMPANY Revised Cal. P.U.C. Sheet No. 11049-W
1720 North First Street, San Jose, CA 95112
(408) 367-8200 Canceling Cal. P.U.C. Sheet No. 10761-W
Schedule No. 14.1
WATER SHORTAGE CONTINGENCY PLANWITH STAGED MANDATORY REDUCTIONS AND DROUGHT SURCHARGES
Page 1
A. APPLICABILITY
1. This schedule applies to all of California Water Service’s regulated ratemaking areas in California, as well asGrand Oaks Water.
B. GENERAL INFORMATION
1. All expenses incurred by California Water Service to implement Rule 14.1, and Schedule 14.1, and requirements of
the California State Water Resources Control Board (“Water Board”) that have not been considered in a General
Rate Case or other proceeding shall be accumulated by Cal Water in a separate memorandum account, authorized in
Resolution W-4976, for disposition as directed or authorized from time to time by the Commission.
2. All monies collected by Cal Water through waste of water penalties established in this schedule shall be recorded in
the appropriate memorandum account and used to offset the expenses described in Section 1 above.
3. Except in the case of Grand Oaks, all monies collected by Cal Water through drought surcharges, as established
by the Mandatory Water Budgets found in Schedule 14.1, shall be recorded in the appropriate Water Revenue
Adjustment Mechanism (“WRAM”) account and used to offset under-collected revenues.
4. To the extent that any provision in this Schedule is inconsistent with Rule 14.1, the provisions of this Schedule apply.(D)
5. On April 1, 2015, the Governor of the State of California issued Executive Order B-29-15 due to severe drought (L)
conditions. The Executive Order, among other requirements, directs the State Water Resources Control Board |
(“Water Board”) to impose restrictions on urban water suppliers like Cal Water to achieve a statewide 25% reduction |
in potable urban usage, as compared with the amount used in 2013, through February 2016. (L)(D)
Urban water suppliers must develop rate structures and other pricing mechanisms, such as surcharges and (L)
penalties, to achieve 25% water conservation. |
6. On May 5, 2015, the Water Board issued an Emergency Regulation by Resolution No. 2015-0032 due to continuing |
drought conditions with specific water use reductions, by service area, and prohibitions on how end-use customers |
can use potable water. On May 7, 2015, the California Public Utilities Commission (“Commission”) issued Resolution |
W-5041 ordering compliance with the mandates of the Governor and the Water Board. (L)
W-5041 ordering compliance with the mandates of the Governor and the Water Board.7. On November 13, 2015, the Governor of the State of California issued Executive Order B-36-15 that directed the Water (N)
Board to, if drought conditions persist through January 2016, extend until October 31, 2016 restrictions to achieve a |statewide reduction in potable usage. |
W-5041 ordering compliance with the mandates of the Governor and the Water Board.8. On February 2, 2016, the Water Board adopted an extended and revised Emergency Regulation due to continuing |
drought conditions. On February 11, 2016, the Commission issued Resolution W-5082 ordering compliance with the |mandates of the Governor and the Water Board. (N)
W-5041 ordering compliance with the mandates of the Governor and the Water Board.
C. DEFINITIONS
For the purposes of this Schedule, the following terms have the meanings set forth in this section.
(These are the same as in Rule 14.1, unless otherwise specified.)
1. “Commercial nursery” means the use of land, buildings or structures for the growing and/or storing of flowers, fruittrees, ornamental trees, vegetable plants, shrubs, trees and similar vegetation for the purpose of transplanting, for use as stock or grafting, and includes the retail sale or wholesale distribution of such items directly from the premises/lot.
(To be inserted by utility) (To be inserted by Cal. P.U.C.)
Advice Letter No. Date Filed
Decision No. Effective
Resolution No.TITLE
-
NAME
March 31, 2016Vice President
PAUL G. TOWNSLEY
Issued by
(continued)
2211 March 25, 2016
This tariff was approved by the CPUC. An original stamped version is available upon request.
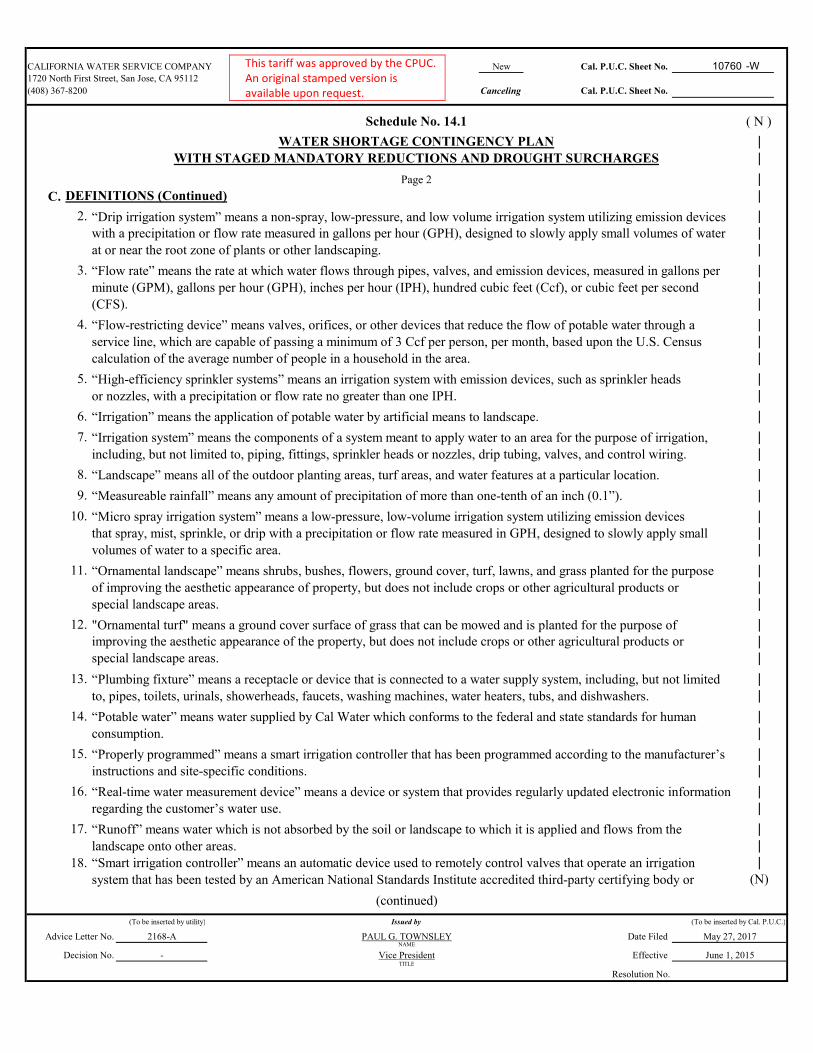
CALIFORNIA WATER SERVICE COMPANY New Cal. P.U.C. Sheet No. 10760 -W1720 North First Street, San Jose, CA 95112
(408) 367-8200 Canceling Cal. P.U.C. Sheet No.
Schedule No. 14.1 ( N )
WATER SHORTAGE CONTINGENCY PLAN |
WITH STAGED MANDATORY REDUCTIONS AND DROUGHT SURCHARGES |
Page 2 |
C. DEFINITIONS (Continued) |
2. “Drip irrigation system” means a non-spray, low-pressure, and low volume irrigation system utilizing emission devices |
with a precipitation or flow rate measured in gallons per hour (GPH), designed to slowly apply small volumes of water |
at or near the root zone of plants or other landscaping. |
3. “Flow rate” means the rate at which water flows through pipes, valves, and emission devices, measured in gallons per |
minute (GPM), gallons per hour (GPH), inches per hour (IPH), hundred cubic feet (Ccf), or cubic feet per second |
(CFS). |
4. “Flow-restricting device” means valves, orifices, or other devices that reduce the flow of potable water through a |
service line, which are capable of passing a minimum of 3 Ccf per person, per month, based upon the U.S. Census |
calculation of the average number of people in a household in the area. |
5. “High-efficiency sprinkler systems” means an irrigation system with emission devices, such as sprinkler heads |
or nozzles, with a precipitation or flow rate no greater than one IPH. |
6. “Irrigation” means the application of potable water by artificial means to landscape. |
7. “Irrigation system” means the components of a system meant to apply water to an area for the purpose of irrigation, |
including, but not limited to, piping, fittings, sprinkler heads or nozzles, drip tubing, valves, and control wiring. |
8. “Landscape” means all of the outdoor planting areas, turf areas, and water features at a particular location. |
9. “Measureable rainfall” means any amount of precipitation of more than one-tenth of an inch (0.1”). |
10. “Micro spray irrigation system” means a low-pressure, low-volume irrigation system utilizing emission devices |
that spray, mist, sprinkle, or drip with a precipitation or flow rate measured in GPH, designed to slowly apply small |
volumes of water to a specific area. |
11. “Ornamental landscape” means shrubs, bushes, flowers, ground cover, turf, lawns, and grass planted for the purpose |
of improving the aesthetic appearance of property, but does not include crops or other agricultural products or |
special landscape areas. |
12. "Ornamental turf" means a ground cover surface of grass that can be mowed and is planted for the purpose of |
improving the aesthetic appearance of the property, but does not include crops or other agricultural products or |
special landscape areas. |
13. “Plumbing fixture” means a receptacle or device that is connected to a water supply system, including, but not limited |
to, pipes, toilets, urinals, showerheads, faucets, washing machines, water heaters, tubs, and dishwashers. |
14. “Potable water” means water supplied by Cal Water which conforms to the federal and state standards for human |
consumption. |
15. “Properly programmed” means a smart irrigation controller that has been programmed according to the manufacturer’s |
instructions and site-specific conditions. |
16. “Real-time water measurement device” means a device or system that provides regularly updated electronic information |
regarding the customer’s water use. |
17. “Runoff” means water which is not absorbed by the soil or landscape to which it is applied and flows from the |
landscape onto other areas. |
18. “Smart irrigation controller” means an automatic device used to remotely control valves that operate an irrigation |
system that has been tested by an American National Standards Institute accredited third-party certifying body or (N)
(To be inserted by utility) (To be inserted by Cal. P.U.C.)
Advice Letter No. Date Filed
Decision No. Effective
Resolution No.
NAME
- Vice President June 1, 2015TITLE
(continued)
Issued by
2168-A PAUL G. TOWNSLEY May 27, 2017
This tariff was approved by the CPUC. An original stamped version is available upon request.

CALIFORNIA WATER SERVICE COMPANY Revised Cal. P.U.C. Sheet No. 11048-W
1720 North First Street, San Jose, CA 95112
(408) 367-8200 Canceling Cal. P.U.C. Sheet No. 10758-W -W
Schedule No. 14.1
WATER SHORTAGE CONTINGENCY PLAN
WITH STAGED MANDATORY REDUCTIONS AND DROUGHT SURCHARGES (continued)
Page 3
C. DEFINITIONS (Continued)
laboratory in accordance with the Environmental Protection Agency’s WaterSense program (or an analogous successor
program), and certified by such body or laboratory as meeting the performance and efficiency requirements of such
program, or the more stringent performance and efficiency requirements of another similar program.
19. “Special landscape area” means an area of the landscape dedicated solely to edible plants and areas dedicated to
active play such as parks, sports fields, golf courses, and where turf provides a playing surface.
20. “Turf” means a ground cover surface of grass that can be mowed.
21. “Water feature” means a design element where open, artificially supplied water performs an aesthetic or recreation
feature, including, but not limited to, ponds, lakes, waterfalls, fountains, and streams.
22. “Water use evaluation” means an evaluation of the efficiency of indoor water-using devices, including, but not
limited to, measurement of flow rates for all existing showerheads, faucets, and toilets, inspection for leaks, and
providing written recommendations to improve the efficiency of the indoor water-using fixtures and devices and/or
an evaluation of the performance of an irrigation system, including, but not limited to, inspection for leaks, reporting
of overspray or runoff, and providing written recommendations to improve the performance of the irrigation system.
D. WASTE OF WATER PENALTIES
Each Stage of this Schedule establishes certain restrictions on the use of potable water. Violating the restrictions set forth
in a particular Stage while it is in effect is declared a non-essential, wasteful use of potable water. Cal Water is
authorized to take the following actions when its personnel verify a customer is using potable water for non-essential,
wasteful uses. No person shall have any right or claim in law or in equity, against Cal Water because of, or as a result
of, any matter or thing done or threatened to be done pursuant to the restrictions on using potable water for
non-essential, wasteful uses.
Note: When a Stage in this Schedule has been activated, Section D in this Schedule supersedes Section D
(Enforcement) in Rule 14.1.
1. FIRST VIOLATION: Cal Water shall provide the customer with a written notice of violation. In addition, Cal Water
is authorized to take the following actions:
a. If the customer currently receives service through a metered connection, install a real-time water measurement
device on the customer’s service line and provide the customer with access to information from the device.
The cost of the device, including installation and ongoing operating costs, may be billed to the customer, and (C)
nonpayment may result in discontinuance of service.
b. If the customer does not currently receive service through a metered connection, install a water meter on the
customer’s service line, charge the customer for water use pursuant to Cal Water’s metered service tariffs and
rules, and install a real-time water measurement device on the customer’s service line and provide the customer
with access to information from the device. The cost of the device, including installation and ongoing operating
costs, may be billed to the customer, and nonpayment may result in discontinuance of service. (C)
2. SECOND VIOLATION: If Cal Water verifies that the customer has used potable water for non-essential, wasteful
uses after having been notified of the first violation, Cal Water shall provide the customer with a second written notice
of violation. In addition to the actions prescribed under the first violation above, Cal Water is authorized to take the
following actions:
a. Apply the following waste of water penalties, which are in addition to any other charges authorized by this
Schedule or other Cal Water tariffs.
i. If Stage 1 is in effect, $25 (Stage 1 is detailed below in Section E).
ii. If Stage 2 is in effect, $50 (Stage 2 is detailed below in Section F).
(continued)
(To be inserted by utility) (To be inserted by Cal. P.U.C.)
Advice Letter No. Date Filed
Decision No. Effective
Resolution No.
March 25, 20162211
- Vice President March 31, 2016
Issued by
NAME
PAUL G. TOWNSLEY
TITLE
This tariff was approved by the CPUC. An original stamped version is available upon request.
CALIFORNIA WATER SERVICE COMPANY New Cal. P.U.C. Sheet No. 10758 -W1720 North First Street, San Jose, CA 95112
(408) 367-8200 Canceling Cal. P.U.C. Sheet No.
Schedule No. 14.1 ( N )
WATER SHORTAGE CONTINGENCY PLAN |WITH STAGED MANDATORY REDUCTIONS AND DROUGHT SURCHARGES (continued) |
Page 4 |
D. WASTE OF WATER PENALTIES (Continued) |
iii. If Stage 3 is in effect, $100 (Stage 3 is detailed below in Section G). |
iv. If Stage 4 is in effect, $200 (Stage 4 is detailed below in Section H). |
b. At its sole discretion, waive the waste of water penalty if the customer participates in a water use evaluation |
provided by Cal Water and/or provides documentation to Cal Water proving that a drip irrigation system, |micro spray irrigation system, high-efficiency sprinkler system, or properly programmed smart irrigation |
controller has been installed, after a notice of violation was delivered, and is in use at the customer’s service |
address. |
3. THIRD VIOLATION: If Cal Water verifies that the customer has used potable water for non-essential, wasteful |
uses after having been notified of the second violation, Cal Water shall provide the customer with a third written |
notice of violation. In addition to the actions prescribed under the first and second violation above, Cal Water |
is authorized to take the following actions: |
a. Apply the following waste of water penalties, which are in addition to any other charges authorized by this |
Schedule or other Cal Water tariffs. |i. If Stage 1 is in effect, $50 (Stage 1 is detailed below in Section E). |
ii. If Stage 2 is in effect, $100 (Stage 2 is detailed below in Section F). |iii. If Stage 3 is in effect, $200 (Stage 3 is detailed below in Section G). |iv. If Stage 4 is in effect, $400 (Stage 4 is detailed below in Section H). |
b. At its sole discretion, waive the waste of water surcharge if the customer participates in a water use |
evaluation provided by Cal Water and/or provides documentation to Cal Water proving that a drip irrigation |
system, micro spray irrigation system, high-efficiency sprinkler system, or properly programmed smart |
irrigation controller has been installed, after notice of violations have been delivered, and is in use at the |
customer’s service address. |
4. FOURTH VIOLATION: If Cal Water verifies that the customer has used potable water for non-essential, |
wasteful uses after having been notified of the third violation, Cal Water shall provide the customer with a |
fourth written notice of violation. In addition to actions set forth in previous violations prescribed above, Cal Water |
is authorized to install a flow-restricting device on the customer’s service line. Cal Water shall not be held liable |
for any injuries, damages, and/or consequences arising from the installation of a flow restricting device. |
5. EGREGIOUS VIOLATIONS: Notwithstanding the foregoing framework for penalties, customers who Cal Water |
has verified are egregiously using potable water for non-essential, wasteful uses are subject to having a flow- |
restricting device installed on their service line. After providing the customer with one notice of egregious violation, |
either by direct mail or door hanger, which documents the egregious use of potable water for non-essential, |
wasteful uses and explains that failure to correct the violation may result in the installation of a flow-restricting |
device on the customer’s service line, Cal Water is authorized to install a flow-restricting device on the customer’s |
service line. Cal Water shall not be held liable for any injuries, damages, and/or consequences arising from the |
installation of a flow restricting device. ||
6. NOTICES OF VIOLATION: |
a. Unless otherwise specified, written notices of violation provided to customers pursuant to this Schedule |shall document the verified violation and alert the customer to the fact that future violations of the restricted |uses of potable water may result in a real-time water measurement device being installed on the customer’s |service line at the customers expense, waste of water surcharges being applied to the customer’s bill, the |installation of a flow-restricting device on the customer’s service line, or the discontinuation of the |
customer’s service. ( N )
(To be inserted by utility) (To be inserted by Cal. P.U.C.)
Advice Letter No. Date Filed
Decision No. Effective
Resolution No.
NAME
- Vice President June 1, 2015TITLE
(continued)
Issued by
2168-A PAUL G. TOWNSLEY May 27, 2017
This tariff was approved by the CPUC. An original stamped version is available upon request.
CALIFORNIA WATER SERVICE COMPANY New Cal. P.U.C. Sheet No. 10757 -W1720 North First Street, San Jose, CA 95112
(408) 367-8200 Canceling Cal. P.U.C. Sheet No.
Schedule No. 14.1 ( N )
WATER SHORTAGE CONTINGENCY PLAN |WITH STAGED MANDATORY REDUCTIONS AND DROUGHT SURCHARGES (continued) |
Page 5 |
D. WASTE OF WATER PENALTIES (Continued) |
b. If Cal Water elects to install a flow-restricting device on a customer’s service line, the written notice shall |
document the steps the customer must take in order for the flow-restricting device to be removed, and shall |
explain that after the flow-restricting device is removed, it may be reinstalled, without further notice, |
if the customer is again verified by Cal Water to be using potable water for non-essential, wasteful |
uses. ||
7. FLOW RESTRICTING DEVICE CONDITIONS: The installation of a flow-restricting device on a customer’s |
service line is subject to the following conditions: |
a. The device shall be capable of providing the premise with a minimum of 3 Ccf per person, per month, based |
upon the U.S. Census calculation of the average number of people in a household in the area. |
b. The device may only be removed by Cal Water, and only after a minimum three-day period has elapsed. |
c. Any tampering with the device may result in the discontinuation of the customer’s water service and the |
customer being charged for any damage to Cal Water’s equipment or facilities and any required service visits. |
d. After the removal of the device, if Cal Water’s personnel verify that the customer is using potable water for non- |
essential, wasteful uses, Cal Water may install another flow-restricting device without prior notice. This device |
shall remain in place until water supply conditions warrant its removal. If, despite the installation of the device, |
Cal Water’s personnel verifies that the customer is using potable water for non-essential, wasteful uses, |
then Cal Water may discontinue the customer’s water service, as provided in its Rule No. 11. |
8. FLOW-RESTRICTING DEVICE REMOVAL CHARGES: The charge to customers for removal of a flow- |
restricting device installed pursuant to this Schedule is $100 during normal business hours, and $150 for the |
device to be removed outside of normal business hours. |
E. STAGE ONE WATER USE RESTRICTIONS |
1. WASTEFUL USES OF WATER (STAGE 1) |
The following restrictions may be imposed by Cal Water, except where necessary to address an immediate health |or safety need, or to comply with a term or condition in a permit issued by a state or federal agency: |
a. Outdoor Irrigation Restrictions (Stage 1) |
i. Irrigating ornamental landscapes with potable water is limited to no more than three (3) days per week, |
on a schedule established and posted by Cal Water on its website or otherwise provided to customers by |
bill message, bill insert, direct mail, or email, or as follows: |
1. Customers with even-numbered addresses may irrigate on Saturdays, Tuesdays, and |
Thursdays. |
2. Customers with odd-numbered addresses may irrigate on Sundays, Wednesdays, and |Fridays. |
3. Customers without a street address may irrigate on Saturdays, Tuesdays, and Thursdays. (N)
(To be inserted by utility) (To be inserted by Cal. P.U.C.)
Advice Letter No. Date Filed
Decision No. Effective
Resolution No.
- Vice President June 1, 2015TITLE
(continued)
Issued by
2168-A PAUL G. TOWNSLEY May 27, 2017NAME
This tariff was approved by the CPUC. An original stamped version is available upon request.
CALIFORNIA WATER SERVICE COMPANY New Cal. P.U.C. Sheet No. 10756 -W1720 North First Street, San Jose, CA 95112
(408) 367-8200 Canceling Cal. P.U.C. Sheet No.
Schedule No. 14.1 ( N )
WATER SHORTAGE CONTINGENCY PLAN |WITH STAGED MANDATORY REDUCTIONS AND DROUGHT SURCHARGES (continued) |
Page 6 |
E. STAGE ONE WATER USE RESTRICTIONS (Continued) |
4. Notwithstanding the foregoing restrictions, irrigation of special landscape areas or commercial nurseries |
may occur as needed, provided that the customer who wishes to irrigate a special landscape area or |
commercial nursery presents Cal Water with a plan to achieve water use reductions commensurate with |
those that would be achieved by complying with foregoing restrictions. |
5. Notwithstanding the foregoing restrictions, when a city, county, or other local public agency in one of |
Cal Water’s service areas duly adopts restrictions on the number of days or hours of the day that |
customers may irrigate that are different than those adopted by Cal Water, Cal Water may enforce the |
city, county, or other local public agency’s restrictions. |
ii. Irrigating ornamental landscape with potable water is prohibited during the hours between 8:00 a.m. and |
6:00 p.m. |
iii. The foregoing restrictions do not apply to: |
1. Landscape irrigation zones that exclusively use drip irrigation systems and/or micro spray irrigation |
system; |
2. Irrigating ornamental landscapes with the use of a hand-held bucket or similar container, with a |continuously monitored hose which is fitted with an automatic shut-off nozzle or device attached to it |
that causes it to cease dispensing water immediately when not in use or monitored, or for the express |
purpose of adjusting or repairing an irrigation system. |
b. Obligation to Fix Leaks, Breaks or Malfunctions: All leaks, breaks, or other malfunctions in the customer’s |
plumbing fixtures and/or irrigation system must be repaired within five (5) business days of written |
notification by Cal Water, unless other arrangements are made with Cal Water. |
c. Prohibited Uses of Water: Customers are prohibited from using potable water for the following actions: |
i. The application of potable water to landscapes in a manner that causes runoff such that water flows onto |adjacent property, non-irrigated areas, private and public walkways, roadways, parking lots, or structures; |
ii. The use of a hose that dispenses potable water to wash vehicles, including cars, trucks, buses, boats, aircraft, |
and trailers, whether motorized or not, except where the hose is fitted with a shut-off nozzle or device |
attached to it that causes it to cease dispensing water immediately when not in use. |iii. The application of potable water to driveways and sidewalks; |iv. The use of potable water in a water feature, except where the water is part of a recirculating system; |v. The application of potable water to outdoor landscapes during and within forty-eight (48) hours after |
measurable rainfall (see Definitions); |vi. The serving of drinking water other than upon request in eating or drinking establishments, including but |
not limited to restaurants, hotels, cafes, cafeterias, bars, or other public places where food or drink are served |and/or purchased; |
vii. Irrigation of ornamental turf on public street medians with potable water; |viii. Irrigation outside of newly constructed homes and buildings with potable water in a manner inconsistent with |
regulations or other requirements established by the California Building Standards Commission and the |Department of Housing and Community Development. |
d. Operators of hotels and motels shall provide guests with the option of choosing not to have towels and linens |
laundered daily. The hotel or motel shall prominently display notice of this option in each guest room using clear |
and easily understood language. ( N )
(To be inserted by utility) (To be inserted by Cal. P.U.C.)
Advice Letter No. Date Filed
Decision No. Effective
Resolution No.
NAME
- Vice President June 1, 2015TITLE
(continued)
Issued by
2168-A PAUL G. TOWNSLEY May 27, 2017
This tariff was approved by the CPUC. An original stamped version is available upon request.

CALIFORNIA WATER SERVICE COMPANY Revised Cal. P.U.C. Sheet No. 11047-W1720 North First Street, San Jose, CA 95112
(408) 367-8200 Canceling Cal. P.U.C. Sheet No. 10754-W
Schedule No. 14.1
WATER SHORTAGE CONTINGENCY PLANWITH STAGED MANDATORY REDUCTIONS AND DROUGHT SURCHARGES (continued)
Page 7
E. STAGE ONE WATER USE RESTRICTIONS (Continued)
[Stage 1 (cont.)]
e. Limits on Filling Ornamental Lakes or Ponds: Filling or re-filling ornamental lakes or ponds with potable water is prohibited, except to the extent needed to sustain aquatic life, provided that such animals are of significant value and have been actively managed within the water feature prior to the implementation of any staged mandatory restrictions of water use as described in this Schedule.
f. Other duly adopted restrictions on the use of potable water as prescribed from time to time by the Commission or other authorized government agencies are incorporated herein by reference.
F. STAGE TWO WATER USE RESTRICTIONS
1. MANDATORY WATER BUDGETS AND BANKING (STAGE 2)
As described in greater detail below, the Water Board has mandated reductions in potable urban usage, as compared (T)
with the amount used in 2013, in each of Cal Water’s service areas. Water suppliers must develop rate structures and |other pricing mechanisms, such as surcharges and penalties, to achieve these mandated reductions |
a. Mandatory Reduction Percentages: The Water Board has established increasing levels of required water |reduction for each service areas based upon the residential per capita per day use (R-GPCD) in that service |
area for the three summer months of July through September 2014. The Water Board’s approach considers the |
relative per capita water usage in each service area and requires that those areas with high per-capita use achieve |
proportionally greater reductions than those with low use. The Water Board has also allowed for adjustments to |
these required water reductions based on specific criteria. |
Each month, the Water Board determines whether a service area has met its mandatory reduction percentage by |calculating cumulative savings in the service area since June 2015, and comparing those with the amount of water |used during the same months in 2013. (T)
b. Customer Water Budgets: Each customer with metered potable water service (residential and non-residential customers) will receive an individualized “Water Budget” for each billing period. (T)
i. The Water Budget will be based on the units of water (CCF) that customer used in the same billing period in |
2013, minus the Mandatory Reduction Percentage established by the Water Board for that customer’s service (T)
area. A customer’s Water Budget will vary according to their monthly water usage in 2013. Cal Water shall (C)
notify its customers of any changes to the Mandatory Reduction Percentage by the Water Board through bill |
inserts or direct mailings prior to applying the changed percentage in the requirements in this Schedule, |
consistent with the "Update" process described in Section F.1.d.(iv) of this Schedule. Cal Water shall also |include the current Mandatory Reduction Percentage in effect for each service area on its website. (C)
ii. If a customer was not in his or her current location in 2013, the average monthly consumption will be used as a starting budget. If customers have a unique situation and the average budget is not appropriate, they can file an appeal to have their Water Budget increased. Cal Water may also modify the starting budget to reflect (T)
suitable use.
iii. The Water Budget for the following billing period will appear on each customer’s water bill. Customers will (T)
also be able to find their Water Budgets, and their individual water use history dating back to 2013, by going (T)
to usage.calwater.com (do not include “www”), and entering their account number, street (or house) number, and ZIP code.
(D)
(To be inserted by utility) (To be inserted by Cal. P.U.C.)
Advice Letter No. Date Filed
Decision No. Effective
Resolution No.
Issued by
2211 PAUL G. TOWNSLEY
(continued)
March 25, 2016NAME
- Vice President March 31, 2016TITLE
This tariff was approved by the CPUC. An original stamped version is available upon request.
CALIFORNIA WATER SERVICE COMPANY Revised Cal. P.U.C. Sheet No. 11046-W
1720 North First Street, San Jose, CA 95112
(408) 367-8200 Canceling Cal. P.U.C. Sheet No. 10753-W
Schedule No. 14.1
WATER SHORTAGE CONTINGENCY PLANWITH STAGED MANDATORY REDUCTIONS AND DROUGHT SURCHARGES (continued)
Page 8
F. STAGE TWO WATER USE RESTRICTIONS (continued) (T)
1. MANDATORY WATER BUDGETS AND BANKING (STAGE 2) (continued) (T)
c. Minimum Water Budgets: A minimum monthly amount of water that protects the health and safety of customers will be established for each service area as a Minimum Water Budget for single-family residential customers.
i. No single-family residential customer will have a water budget that is below the threshold of the monthly Minimum Water Budget, even if applying the Mandatory Reduction Percentage to that customer’s 2013 usage would result in a lower amount.
ii. The Minimum Water Budget for each service area is identified in Appendix A. (For areas with bi-monthly billing and bi-monthly water budgets, the Minimum Water Budget in Appendix A should be doubled for the billing period.)
d. Drought Surcharges: If a customer uses more units of potable water (CCF) than their Water Budget in a (T)
billing period, that customer’s water bill may reflect an additional “Drought Surcharge” for each unit of (C)
water over the Water Budget, depending on the amount of excess usage (according to usage tiers described below). |
i. Tier A and Tier B Excess Water Usage: Excess water usage above a customer’s Water Budget may fall into |
one or both of two tiers – Tier A and Tier B. The amount of usage in Tiers A and B varies by service area, and |
depends upon whether an area has met its Mandatory Reduction Percentage on a cumulative basis. |
For the purposes of Drought Surcharges, each service area will fall into one of two categories – those in |compliance with the Mandatory Reduction Percentage, and those not in compliance. There are two sample tables |in the last section of this Schedule (Section I). The first sample table identifies the Tier A and B usage amounts for |those service areas that are in compliance with their Mandatory Reduction Percentage, as of the date specified in |Appendix A. The second sample table identifies the Tier A and B usage amounts for those service areas that |are not in compliance with their Mandatory Reduction Percentage, as of the date specified in Appendix A. (C)
ii. Current Surcharges and Tiers: Appendix A to this schedule provides the Drought Surcharge rate per unit of (T)
water and the excess water usage in Tiers A and B that are currently in effect for each service area. (C)
At this time, Drought Surcharges only apply to excess water usage that falls within “Tier B.” Excess |
water usage in Tier A constitutes a “courtesy” tier to which Drought Surcharges are not applied. As stated |
below under Water Banking, however, all excess water usage will be applied against a customer’s “banked” water |
amounts, regardless of whether the usage falls within Tier A or Tier B. (C)
Customers will continue to pay the normal tariffed rates for potable water, in addition to any applicable Drought (T)
Surcharges. Cal Water retains the right to increase the surcharges if there are changes to the rates in the future. (T)
iii. Current Compliance Status of Service Area: Appendix B to this schedule provides the Mandatory Reduction (C)
Percentage adopted by the Water Board for each area, and the actual cumulative savings for each area, as of the |
date specified in Appendix A. Drought Surcharges will be applied based on Tier A and B excess water usage |beginning with the first day of each billing period that starts on or after March 31, 2016. |
iv. Updates: An increase in the excess usage designated in Tier A, an increase in Customer Water Budgets, or a decrease |
in Drought Surcharge rates, are “less restrictive” tariff changes that may be implemented via a Tier 1 advice letter. |
A decrease in the excess usage designated in Tier A, a decrease in Customer Water Budgets, or an increase in Drought |Surcharge rates are “more restrictive” tariff changes that shall be implemented by filing a Tier 2 advice letter. Cal |
Water shall notify its customers, and provide each customer with a summary of the changes by means of a bill insert |
or direct mailing, prior to the effective date of a more restrictive tariff change. |
A service area's compliance status, which determines the amount of excess usage designated for Tiers A and B, shall |
be updated no more than once every 90 days, or to implement different requirements of the Water Board as needed. (C)
(continued)
(To be inserted by utility) (To be inserted by Cal. P.U.C.)
Advice Letter No. Date Filed
Decision No. Effective
Resolution No.
2211 March 25, 2016
Issued by
PAUL G. TOWNSLEYNAME
Vice PresidentTITLE
- March 31, 2016
This tariff was approved by the CPUC. An original stamped version is available upon request.
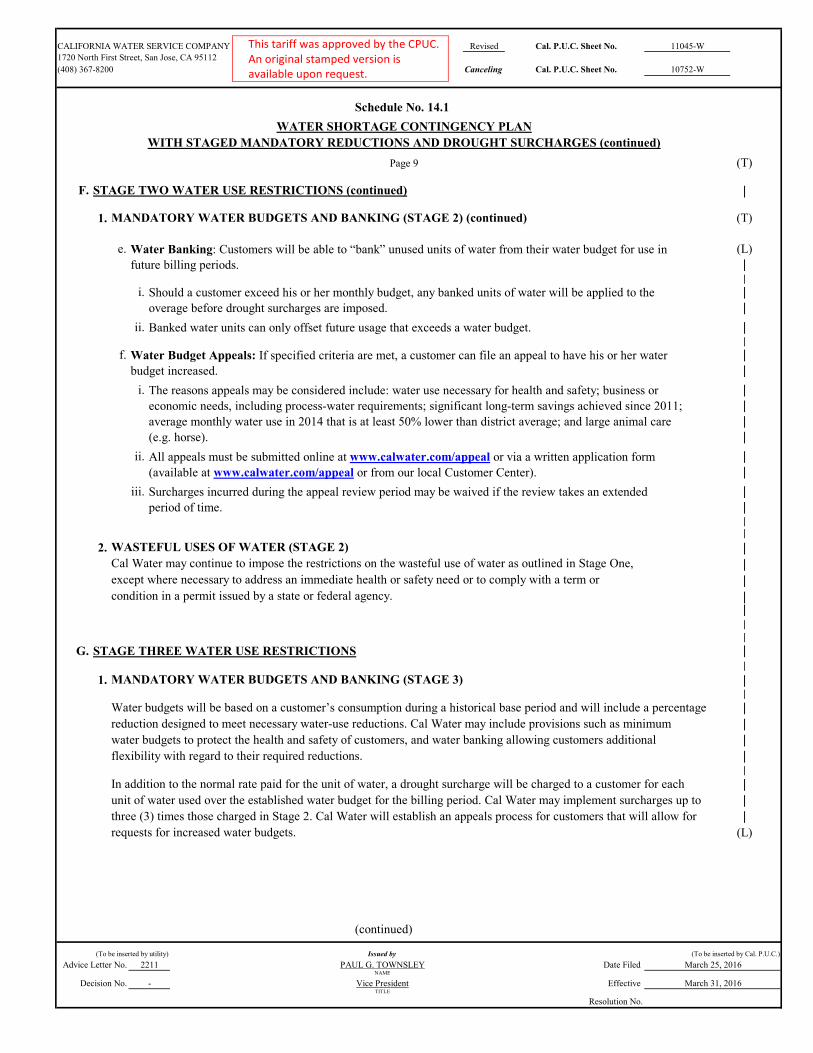
CALIFORNIA WATER SERVICE COMPANY Revised Cal. P.U.C. Sheet No. 11045-W
1720 North First Street, San Jose, CA 95112
(408) 367-8200 Canceling Cal. P.U.C. Sheet No. 10752-W
Schedule No. 14.1
WATER SHORTAGE CONTINGENCY PLAN
WITH STAGED MANDATORY REDUCTIONS AND DROUGHT SURCHARGES (continued)
Page 9 (T)
F. STAGE TWO WATER USE RESTRICTIONS (continued) |
1. MANDATORY WATER BUDGETS AND BANKING (STAGE 2) (continued) (T)
e. Water Banking: Customers will be able to “bank” unused units of water from their water budget for use in (L)
future billing periods. ||
i. Should a customer exceed his or her monthly budget, any banked units of water will be applied to the |
overage before drought surcharges are imposed. |
ii. Banked water units can only offset future usage that exceeds a water budget. ||
f. Water Budget Appeals: If specified criteria are met, a customer can file an appeal to have his or her water |
budget increased. |
i. The reasons appeals may be considered include: water use necessary for health and safety; business or |
economic needs, including process-water requirements; significant long-term savings achieved since 2011; |
average monthly water use in 2014 that is at least 50% lower than district average; and large animal care |
(e.g. horse). |
ii. All appeals must be submitted online at www.calwater.com/appeal or via a written application form |
(available at www.calwater.com/appeal or from our local Customer Center). |
iii. Surcharges incurred during the appeal review period may be waived if the review takes an extended |
period of time. |||
2. WASTEFUL USES OF WATER (STAGE 2) |Cal Water may continue to impose the restrictions on the wasteful use of water as outlined in Stage One, |except where necessary to address an immediate health or safety need or to comply with a term or |condition in a permit issued by a state or federal agency. |
||
|
G. STAGE THREE WATER USE RESTRICTIONS ||
1. MANDATORY WATER BUDGETS AND BANKING (STAGE 3) ||
Water budgets will be based on a customer’s consumption during a historical base period and will include a percentage |
reduction designed to meet necessary water-use reductions. Cal Water may include provisions such as minimum |
water budgets to protect the health and safety of customers, and water banking allowing customers additional |
flexibility with regard to their required reductions. ||
In addition to the normal rate paid for the unit of water, a drought surcharge will be charged to a customer for each |
unit of water used over the established water budget for the billing period. Cal Water may implement surcharges up to |
three (3) times those charged in Stage 2. Cal Water will establish an appeals process for customers that will allow for |
requests for increased water budgets. (L)
(continued)
(To be inserted by utility) (To be inserted by Cal. P.U.C.)
Advice Letter No. Date Filed
Decision No. Effective
Resolution No.
Issued by
2211 PAUL G. TOWNSLEY March 25, 2016NAME
- Vice President March 31, 2016TITLE
This tariff was approved by the CPUC. An original stamped version is available upon request.

CALIFORNIA WATER SERVICE COMPANY Revised Cal. P.U.C. Sheet No. 11044-W1720 North First Street, San Jose, CA 95112
(408) 367-8200 Canceling Cal. P.U.C. Sheet No. 10751-W
Schedule No. 14.1
WATER SHORTAGE CONTINGENCY PLANWITH STAGED MANDATORY REDUCTIONS AND DROUGHT SURCHARGES (continued)
Page 10 ( T )
G. STAGE THREE WATER USE RESTRICTIONS (Continued)
[Stage 3 (cont.)]
2. WASTEFUL USES OF WATER (STAGE 3)The following restrictions may be imposed by Cal Water, except where necessary to address an immediate health or safety need or to comply with a term or condition in a permit issued by a state or federal agency.Differences from or additions to previous Stages are underlined. (The following restrictions are the same as those provided in Stage 3 of Rule 14.1.)
a. Outdoor Irrigation Restrictions (Stage 3)
i. Irrigating ornamental landscapes with potable water is limited to no more than two (2) days per week, on a schedule established and posted by Cal Water on its website or otherwise provided to customers by bill message, bill insert, direct mail, or email, or as follows:
1. Customers with even-numbered addresses may irrigate on Saturdays and Tuesdays (previous Stages allowed Thursdays as well).
2. Customers with odd-numbered addresses may irrigate on Sundays and Wednesdays (previous Stages allowed Fridays as well).
3. Customers without a street address may irrigate on Saturdays and Tuesdays(previous Stages allowed Thursdays as well).
4. Notwithstanding the foregoing restrictions, irrigation of special landscape areas or commercial nurseries may occur as needed, provided that the customer who wishes to irrigate a special landscape area or commercial nursery presents Cal Water with a plan to achieve water use reductions commensurate with those that would be achieved by complying with foregoing restrictions.
5. Notwithstanding the foregoing restrictions, when a city, county, or other local public agency in one of Cal Water’s service areas duly adopts restrictions on the number of days or hours of the day that customers may irrigate which are different than those adopted by Cal Water, Cal Water may enforce the city, county, or other local public agency’s restrictions.
ii. Irrigating ornamental landscape with potable water is prohibited during the hours between 8:00 a.m. and 6:00 p.m.
iii. The foregoing restrictions do not apply to:
1. Landscape irrigation zones that exclusively use drip irrigation systems and/or micro spray irrigation system;
2. Irrigating ornamental landscapes with the use of a hand-held bucket or similar container, a continuously monitored hose which is fitted with an automatic shut-off nozzle or device attached to it that causes it tocease dispensing water immediately when not in use or monitored, or for the express purpose of adjusting or repairing an irrigation system.
b. Obligation to Fix Leaks, Breaks or Malfunctions: All leaks, breaks, or other malfunctions in the customer’s
plumbing fixtures and/or irrigation system must be repaired within two (2) business days of written notification by Cal Water, unless other arrangements are made with Cal Water.
c. Prohibited Uses of Water: Customers are prohibited from using potable water for the following actions:
i. The application of potable water to landscapes in a manner that causes runoff such that water flows onto adjacent property, non-irrigated areas, private and public walkways, roadways, parking lots, or structures(note: this provision appears under Section E in Rule 14.1);
(continued)
(To be inserted by utility) (To be inserted by Cal. P.U.C.)
Advice Letter No. Date Filed
Decision No. Effective
Resolution No.
NAME
- Vice President March 31, 2016TITLE
Issued by
2211 PAUL G. TOWNSLEY March 25, 2016
This tariff was approved by the CPUC. An original stamped version is available upon request.

CALIFORNIA WATER SERVICE COMPANY Revised Cal. P.U.C. Sheet No. 11043-W
1720 North First Street, San Jose, CA 95112
(408) 367-8200 Canceling Cal. P.U.C. Sheet No. 10750-W
Schedule No. 14.1
WATER SHORTAGE CONTINGENCY PLANWITH STAGED MANDATORY REDUCTIONS AND DROUGHT SURCHARGES (continued)
Page 11 ( T )
G. STAGE THREE WATER USE RESTRICTIONS (Continued)
[Stage 3 (cont.)]
ii. The use of a hose that dispenses potable water to wash vehicles, including cars, trucks, buses, boats, aircraft, and trailers, whether motorized or not, except where the hose is fitted with a shut-off nozzle or device attached to it that causes it to cease dispensing water immediately when not in use (note: this provision appears under Section E in Rule 14.1).
iii. The application of potable water to driveways and sidewalks;
iv. The use of potable water in a water feature, except where the water is part of a recirculating system;
v. The application of potable water to outdoor landscapes during and within forty-eight (48) hours after measurable rainfall;
vi. The serving of drinking water other than upon request in eating or drinking establishments, includingbut not limited to restaurants, hotels, cafes, cafeterias, bars, or other public places where food or drink are served and/or purchased;
vii. Irrigation of ornamental turf on public street medians with potable water;
viii. Irrigation outside of newly constructed homes and buildings with potable water in a manner inconsistent with regulations or other requirements established by the California Building Standards Commission and the Department of Housing and Community Development.
ix. Use of potable water for street cleaning with trucks, except for initial wash-down for constructionpurposes (if street sweeping is not feasible);
x. Use of potable water for construction purposes, such as consolidation of backfill, dust control, or other uses unless no other source of water or other method can be used.
d. Operators of hotels and motels shall provide guests with the option of choosing not to have towels and linens laundered daily. The hotel or motel shall prominently display notice of this option in each guest room using clear and easily understood language.
e. Limits on Filling Ornamental Lakes or Ponds: Filling or re-filling ornamental lakes or ponds with potable water is prohibited, except to the extent needed to sustain aquatic life, provided that such animals are of significant value and have been actively managed within the water feature prior to the implementation of any staged mandatory restrictions of water use as described in this Schedule.
f. Other duly adopted restrictions on the use of potable water as prescribed from time to time by the Commission
or other authorized government agencies are incorporated herein by reference.
H. STAGE FOUR WATER USE RESTRICTIONS
1. MANDATORY WATER BUDGETS AND BANKING (STAGE 4)
Water budgets will be based on a customer’s consumption during a historical base period and will include a percentage reduction designed to meet necessary water-use reductions. Cal Water may include provisions such as minimumwater budgets to protect the health and safety of customers, and water banking allowing customers additional flexibility with regard to their required reductions.
In addition to the normal rate paid for the unit of water, a drought surcharge will be charged to a customer for each unit of water used over the established water budget for the billing period. For Stage 4, Cal Water may implement surcharges up to three (3) times those charged in Stage 2. Cal Water may require customer consumption reductions of up to 50%.
Cal Water will establish an appeals process for customers that will allow for requests for increased water budgets.
(continued)
(To be inserted by utility) (To be inserted by Cal. P.U.C.)
Advice Letter No. Date Filed
Decision No. Effective
Resolution No.
NAME
- Vice President March 31, 2016TITLE
Issued by
2211 PAUL G. TOWNSLEY March 25, 2016
This tariff was approved by the CPUC. An original stamped version is available upon request.
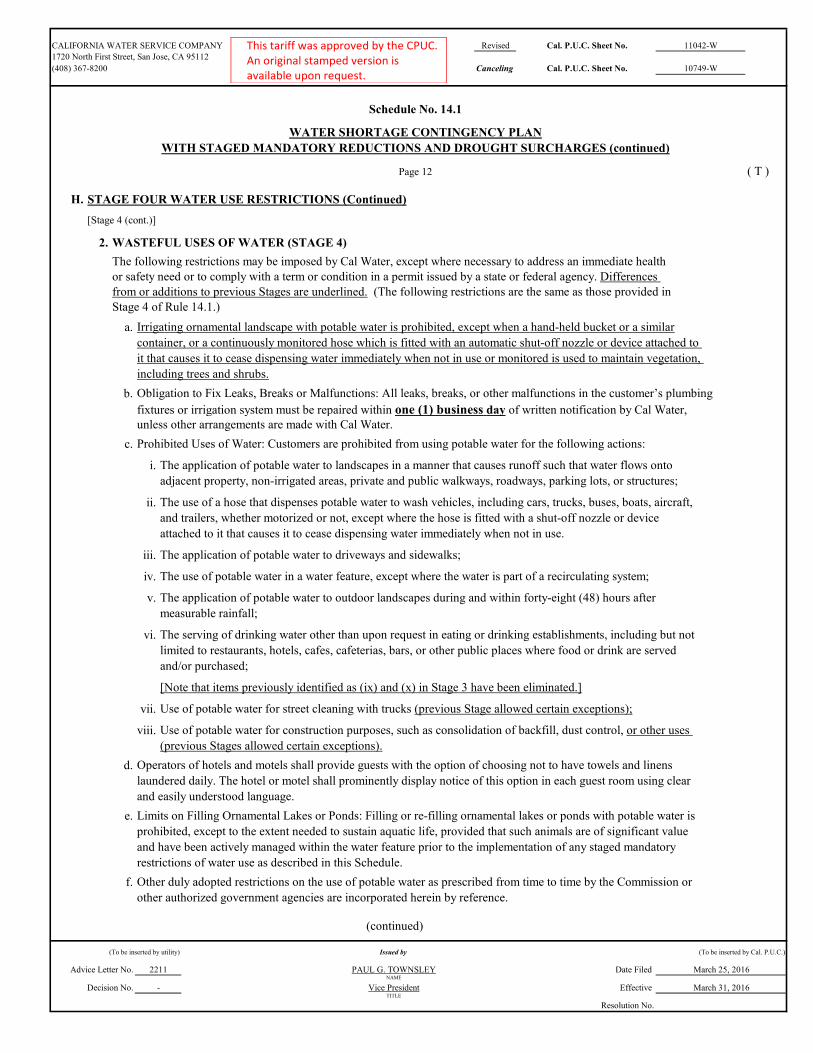
CALIFORNIA WATER SERVICE COMPANY Revised Cal. P.U.C. Sheet No. 11042-W
1720 North First Street, San Jose, CA 95112
(408) 367-8200 Canceling Cal. P.U.C. Sheet No. 10749-W
Schedule No. 14.1
WATER SHORTAGE CONTINGENCY PLAN
WITH STAGED MANDATORY REDUCTIONS AND DROUGHT SURCHARGES (continued)
Page 12 ( T )
H. STAGE FOUR WATER USE RESTRICTIONS (Continued)
[Stage 4 (cont.)]
2. WASTEFUL USES OF WATER (STAGE 4)
The following restrictions may be imposed by Cal Water, except where necessary to address an immediate health or safety need or to comply with a term or condition in a permit issued by a state or federal agency. Differences from or additions to previous Stages are underlined. (The following restrictions are the same as those provided in Stage 4 of Rule 14.1.)
a. Irrigating ornamental landscape with potable water is prohibited, except when a hand-held bucket or a similar
container, or a continuously monitored hose which is fitted with an automatic shut-off nozzle or device attached to
it that causes it to cease dispensing water immediately when not in use or monitored is used to maintain vegetation,
including trees and shrubs.
b. Obligation to Fix Leaks, Breaks or Malfunctions: All leaks, breaks, or other malfunctions in the customer’s plumbing
fixtures or irrigation system must be repaired within one (1) business day of written notification by Cal Water, unless other arrangements are made with Cal Water.
c. Prohibited Uses of Water: Customers are prohibited from using potable water for the following actions:
i. The application of potable water to landscapes in a manner that causes runoff such that water flows onto
adjacent property, non-irrigated areas, private and public walkways, roadways, parking lots, or structures;
ii. The use of a hose that dispenses potable water to wash vehicles, including cars, trucks, buses, boats, aircraft,
and trailers, whether motorized or not, except where the hose is fitted with a shut-off nozzle or device
attached to it that causes it to cease dispensing water immediately when not in use.
iii. The application of potable water to driveways and sidewalks;
iv. The use of potable water in a water feature, except where the water is part of a recirculating system;
v. The application of potable water to outdoor landscapes during and within forty-eight (48) hours after
measurable rainfall;
vi. The serving of drinking water other than upon request in eating or drinking establishments, including but not
limited to restaurants, hotels, cafes, cafeterias, bars, or other public places where food or drink are served
and/or purchased;
[Note that items previously identified as (ix) and (x) in Stage 3 have been eliminated.]
vii. Use of potable water for street cleaning with trucks (previous Stage allowed certain exceptions);
viii. Use of potable water for construction purposes, such as consolidation of backfill, dust control, or other uses
(previous Stages allowed certain exceptions).
d. Operators of hotels and motels shall provide guests with the option of choosing not to have towels and linens
laundered daily. The hotel or motel shall prominently display notice of this option in each guest room using clear
and easily understood language.
e. Limits on Filling Ornamental Lakes or Ponds: Filling or re-filling ornamental lakes or ponds with potable water is
prohibited, except to the extent needed to sustain aquatic life, provided that such animals are of significant value
and have been actively managed within the water feature prior to the implementation of any staged mandatory
restrictions of water use as described in this Schedule.
f. Other duly adopted restrictions on the use of potable water as prescribed from time to time by the Commission or
other authorized government agencies are incorporated herein by reference.
(continued)
(To be inserted by utility) (To be inserted by Cal. P.U.C.)
Advice Letter No. Date Filed
Decision No. Effective
Resolution No.
Issued by
2211 PAUL G. TOWNSLEY March 25, 2016NAME
- Vice President March 31, 2016TITLE
This tariff was approved by the CPUC. An original stamped version is available upon request.

CALIFORNIA WATER SERVICE COMPANY Revised Cal. P.U.C. Sheet No. 11041-W
1720 North First Street, San Jose, CA 95112
(408) 367-8200 Canceling Cal. P.U.C. Sheet No. 10748-W
Schedule No. 14.1
WATER SHORTAGE CONTINGENCY PLAN
WITH STAGED MANDATORY REDUCTIONS AND DROUGHT SURCHARGES (continued)
Page 13 ( T )
I. SAMPLE TABLES WITH TIER A AND TIER B EXCESS USAGE AMOUNTS ( N )
1. FOR DISTRICTS IN COMPLIANCE WITH MANDATORY REDUCTIONS |
For the purposes of applying Drought Surcharges, the sample table below identifies the number of units over a |
customer's Water Budget (the excess usage) that falls within Tiers A and B in a district whose cumulative savings |
meet the Water Board's Mandatory Reduction Percentage as of the date identified in Appendix A. |
|
|
|
|
|
|
|
|
|
|
|
|
|
|
|
Tier A -
No Surcharges
Units Over Water
Budget
Units Over
Water Budget
Surcharge per unit
(Non-LIRA
Customers)
Surcharge per unit
(LIRA
Customers)
Fremont Valley
& Lake Hughes1-6 7+ $4.5200 $2.2600 5 RSF Area
Lancaster 1-5 6+ $7.1180 $3.5590 5
Leona Valley 1-4 5+ $4.5200 $2.2600 5 RSF Area
Bakersfield 1-6 7+ $4.1868 $2.0934 7
Mid-Peninsula 1-3 4+ $10.0000 $5.0000 6
1-3 4+ $5.6492 $2.8246 6Bayshore
For Districts in Compliance with
Mandatory Water Reduction Targets
District Service Area
Tier B - Drought Surcharges Applied
Antelope Valley
Minimum
Water Budget
(Ccf per
month)
Rate Support
Fund Area
(RSF)
|
|
|
|
|
|
|
|
|
|
|
|
|
|
|
|
|
|
|
|
|
|
|
|
( N )
(continued)
(To be inserted by utility) (To be inserted by Cal. P.U.C.)
Advice Letter No. Date Filed
Decision No. Effective
Issued by
2211 PAUL G. TOWNSLEY March 25, 2016
- Vice President March 31, 2016
NAME
South San Francisco 1-3 4+ $5.6492 $2.8246 6
Bear Gulch 1-5 6+ $10.0000 $5.0000 6
Chico 1-6 7+ $3.1314 $1.5657 6
Dixon 1-3 4+ $7.9402 $3.9701 7
Dominguez 1-3 4+ $6.9934 $3.4967 7
East Los Angeles 1-4 5+ $3.7605 $1.8803 9
Grand Oaks 1-6 7+ $2.1236 $1.0618 5
Hermosa Redondo 1-3 4+ $9.1586 $4.5793 5
Kern River Valley 1-3 4+ $4.5200 $2.2600 4 RSF Area
King City 1-4 5+ $6.7536 $3.3768 9
Livermore 1-4 5+ $7.6194 $3.8097 6
Los Altos 1-5 6+ $8.1608 $4.0804 6
Marysville 1-4 5+ $5.1470 $2.5735 6
Oroville 1-5 6+ $6.1840 $3.0920 6
Palos Verdes 1-6 7+ $9.5358 $4.7679 6
Redwood Valley 1-4 5+ $4.5200 $2.2600 4 RSF Area
Salinas 1-3 4+ $5.7776 $2.8888 7
Selma 1-5 6+ $3.0122 $1.5061 8
Stockton 1-4 5+ $5.5506 $2.7753 7
Visalia 1-5 6+ $2.9796 $1.4898 7
Westlake 1-6 7+ $9.2378 $4.6189 6
Willows 1-5 6+ $4.1356 $2.0678 6
Bayshore
Decision No. Effective
Resolution No.
- Vice President March 31, 2016TITLE
This tariff was approved by the CPUC. An original stamped version is available upon request.

CALIFORNIA WATER SERVICE COMPANY New Cal. P.U.C. Sheet No. 11040-W
1720 North First Street, San Jose, CA 95112
(408) 367-8200 Canceling Cal. P.U.C. Sheet No.
Schedule No. 14.1
WATER SHORTAGE CONTINGENCY PLAN
WITH STAGED MANDATORY REDUCTIONS AND DROUGHT SURCHARGES (continued)
Page 14 ( T )
I. SAMPLE TABLES WITH TIER A AND TIER B EXCESS USAGE AMOUNTS ( N )
2. FOR DISTRICTS NOT IN COMPLIANCE WITH MANDATORY REDUCTIONS |
For the purposes of applying Drought Surcharges, the sample table below identifies the number of units over a |
customer's Water Budget (the excess usage) that falls within Tiers A and B in a district whose cumulative savings |
do NOT meet the Water Board's Mandatory Reduction Percentage as of the date identified in Appendix A. |
|
|
|
|
|
|
|
|
|
|
|
|
|
|
|
Tier A -
No Surcharges
Units Over Water
Budget
Units Over
Water Budget
Surcharge per unit
(Non-LIRA
Customers)
Surcharge per unit
(LIRA
Customers)
Fremont Valley
& Lake Hughes1 2+ $4.5200 $2.2600 5 RSF Area
Lancaster 1 2+ $7.1180 $3.5590 5
Leona Valley 1 2+ $4.5200 $2.2600 5 RSF Area
Bakersfield 1 2+ $4.1868 $2.0934 7
Mid-Peninsula 1 2+ $10.0000 $5.0000 6
Antelope Valley
Bayshore
For Districts not in Compliance with
Mandatory Water Reduction Targets
Tier B - Drought Surcharges Applied
District Service Area
Minimum
Water Budget
(Ccf per
month)
Rate Support
Fund Area
(RSF)(CCF per month)
|
|
|
|
|
|
|
|
|
|
|
|
|
|
|
|
|
|
|
|
|
|
|
|
|
( N )
(continued)
(To be inserted by utility) (To be inserted by Cal. P.U.C.)
Advice Letter No. Date Filed
Decision No. Effective
Issued by
2211 PAUL G. TOWNSLEY March 25, 2016
- Vice President March 31, 2016
NAME
South San Francisco 1 2+ $5.6492 $2.8246 6
Bear Gulch 1 2+ $10.0000 $5.0000 6
Chico 1 2+ $3.1314 $1.5657 6
Dixon 1 2+ $7.9402 $3.9701 7
Dominguez 1 2+ $6.9934 $3.4967 7
East Los Angeles 1 2+ $3.7605 $1.8803 9
Grand Oaks 1 2+ $2.1236 $1.0618 5
Hermosa Redondo 1 2+ $9.1586 $4.5793 5
Kern River Valley 1 2+ $4.5200 $2.2600 4 RSF Area
King City 1 2+ $6.7536 $3.3768 9
Livermore 1 2+ $7.6194 $3.8097 6
Los Altos 1 2+ $8.1608 $4.0804 6
Marysville 1 2+ $5.1470 $2.5735 6
Oroville 1 2+ $6.1840 $3.0920 6
Palos Verdes 1 2+ $9.5358 $4.7679 6
Redwood Valley 1 2+ $4.5200 $2.2600 4 RSF Area
Salinas 1 2+ $5.7776 $2.8888 7
Selma 1 2+ $3.0122 $1.5061 8
Stockton 1 2+ $5.5506 $2.7753 7
Visalia 1 2+ $2.9796 $1.4898 7
Westlake 1 2+ $9.2378 $4.6189 6
Willows 1 2+ $4.1356 $2.0678 6
Bayshore
Decision No. Effective
Resolution No.
- Vice President March 31, 2016TITLE
This tariff was approved by the CPUC. An original stamped version is available upon request.

CALIFORNIA WATER SERVICE COMPANY Revised Cal. P.U.C. Sheet No. 11119-W1720 North First Street, San Jose, CA 95112
(408) 367-8200 Canceling Cal. P.U.C. Sheet No. 11039-W
Schedule No. 14.1
WATER SHORTAGE CONTINGENCY PLANWITH STAGED MANDATORY REDUCTIONS AND DROUGHT SURCHARGES (continued)
Page 15
APPENDIX A to Schedule 14.1 - NOT IN EFFECT ( C )
Drought Surcharge Tiers (applies to all metered customers of potable water) ( C )
Tier A - No
Surcharges
As of 2/1/16
Antelope ValleyFremont Val.
/Lake Hughes1-6 7+ $4.5200 $2.2600 5 RSF Area
Lancaster 1-5 6+ $7.1180 $3.5590 5
Leona Valley 1-4 5+ $4.5200 $2.2600 5 RSF Area
Bakersfield 1-6 7+ $4.1868 $2.0934 7
Bayshore Mid-Peninsula 1-3 4+ $10.0000 $5.0000 6
South San Francisco 1-3 4+ $5.6492 $2.8246 6
Bear Gulch 1-5 6+ $10.0000 $5.0000 6
Chico 1-6 7+ $3.1314 $1.5657 6
Dixon 1-3 4+ $7.9402 $3.9701 7
Dominguez 1-3 4+ $6.9934 $3.4967 7
East Los Angeles 1-4 5+ $3.7605 $1.8803 9
Grand Oaks 1-6 7+ $2.1236 $1.0618 5
Hermosa Redondo No 1 2+ $9.1586 $4.5793 5
Kern River Valley No 1 2+ $4.5200 $2.2600 4 RSF Area
King City 1-4 5+ $6.7536 $3.3768 9
Tier B - Drought Surcharges Applied
District Service Area
In Compliance
with Mandatory
Reduction?
Minimum
Water
Budget
(Ccf per
month)
Rate
Support
Fund Area
(RSF)
Units Over
Water Budget
Units Over
Water Budget
Surcharge per unit
(Non-LIRA
Customers)
Surcharge per unit
(LIRA
Customers)
(CCF per month)
(a) The Drought Surcharge is equal to two (2) times the highest residential tier rate with a $10.00 maximum EXCEPT:
The Drought Surcharge in Rate Support Fund (RSF) areas is equal to $4.52.
The Drought Surcharge for districts with a 10% or less water reduction requirement is equal to the highest residential tier rate.
(b) The Drought Surcharge for LIRA customers is 50% of the Drought Surcharge for Non-LIRA customers.
(c) The Minimum Water Budget is set at 55 gpcd (gallons per capita per day) multiplied by the number of people per
household for the area according to the U.S. Census.
(d) A district is determined to be in compliance if it has met or is within one percent of its Mandatory Reduction requirement.
(continued)
(To be inserted by utility) (To be inserted by Cal. P.U.C.)
Advice Letter No. Date Filed 7/15/16
Decision No. Effective 7/29/16
Resolution No.
NAME
- Vice PresidentTITLE
Issued by
2225 PAUL G. TOWNSLEY
King City 1-4 5+ $6.7536 $3.3768 9
Livermore 1-4 5+ $7.6194 $3.8097 6
Los Altos 1-5 6+ $8.1608 $4.0804 6
Marysville 1-4 5+ $5.1470 $2.5735 6
Oroville 1-5 6+ $6.1840 $3.0920 6
Palos Verdes No 1 2+ $9.5358 $4.7679 6
Redwood Valley (all) 1-4 5+ $4.5200 $2.2600 4 RSF Area
Salinas 1-3 4+ $5.7776 $2.8888 7
Selma 1-5 6+ $3.0122 $1.5061 8
Stockton 1-4 5+ $5.5506 $2.7753 7
Visalia No 1 2+ $2.9796 $1.4898 7
Westlake No 1 2+ $9.2378 $4.6189 6
Willows 1-5 6+ $4.1356 $2.0678 6
This tariff was approved by the CPUC. An original stamped version is available upon request.

CALIFORNIA WATER SERVICE COMPANY New Cal. P.U.C. Sheet No. 11038-W1720 North First Street, San Jose, CA 95112
(408) 367-8200 Canceling Cal. P.U.C. Sheet No.
Schedule No. 14.1
WATER SHORTAGE CONTINGENCY PLANWITH STAGED MANDATORY REDUCTIONS AND DROUGHT SURCHARGES (continued)
Page 16 ( T )
APPENDIX B to Schedule 14.1 ( T )
CUMULATIVE WATER SAVED COMPARED TO MANDATORY REDUCTIONS ( C )
Cumulative Percentage
Saved
Water Board's
Target PercentageIn Compliance? |
Jun. 2015 to Jan. 2016 (as
compared to 2013) *
Mandatory
Reduction *As of
Feb. 1, 2016 **|
California Water Service Company Antelope Valley 47.8% 36% |
California Water Service Company Bakersfield 31.1% 32% |
California Water Service Company Bear Gulch 35.0% 36% |
California Water Service Company Chico District 38.3% 32% |
California Water Service Company Dixon, City of 30.2% 28% |
California Water Service Company Dominguez 16.8% 16% |
California Water Service Company East Los Angeles 15.5% 8% |
California Water Service Company Hermosa Redondo 18.3% 20% No |
California Water Service Company Kern River Valley 20.1% 28% No |
California Water Service Company King City 21.8% 12% |
California Water Service Company Livermore 39.9% 24% |
California Water Service Company Los Altos/Suburban 38.1% 32% |
California Water Service Company Marysville 26.2% 24% |
California Water Service Company Mid Penninsula 26.6% 16% |
California Water Service Company Oroville 28.5% 28% |
Urban Water Supplier
California Water Service Company Oroville 28.5% 28% |
California Water Service Company Palos Verdes 28.9% 36% No |
California Water Service Company Redwood Valley 31.7% 16% |
California Water Service Company Salinas District 24.9% 16% |
California Water Service Company Selma 39.0% 32% |
California Water Service Company South San Francisco 20.8% 8% |
California Water Service Company Stockton 22.6% 20% |
California Water Service Company Visalia 25.6% 32% No |
California Water Service Company Westlake 33.5% 36% No |
California Water Service Company Willows 30.1% 28% ( C )
* The figures in Appendix B are from the State Water Resources Control Board's website at:http://www.waterboards.ca.gov/water_issues/programs/conservation_portal/docs/2016feb/suppliercompliance_022516.pdf ( C )
( D )** A district is determined to be in compliance if it has met or is within one percent of its Mandatory Reduction requirement. ( N )
[end]
(To be inserted by utility) (To be inserted by Cal. P.U.C.)
Advice Letter No. 2211 Date Filed
Decision No. - Effective
Resolution No.TITLE
PAUL G. TOWNSLEY March 25, 2016NAME
Vice President March 31, 2016
Issued by
This tariff was approved by the CPUC. An original stamped version is available upon request.

California Water Service 2020 Urban Water Management Plan
Westlake District
June 2021 Printed 6/25/2021
Page I-1
EKI Environment & Water, Inc. M.Cubed
Gary Fiske and Associates
Appendix I: Conservation Master Plan

CONSERVATION
MASTER
PLAN
2021 – 2025
April 2021 Westlake District
California Water Service
Prepared by M.Cubed

Westlake District Conservation Master Plan: 2021-2025
April 2021 Page | i
Table of Contents
List of Acronyms .....................................................................................................................................iii
1 Introduction .................................................................................................................................... 1
1.1 Master Plan Scope and Objectives .................................................................................. 1
1.2 Relationship to GRC and UWMP ...................................................................................... 1
1.3 Relationship to Water Shortage Contingency Plan .................................................. 2
1.4 Report Organization ............................................................................................................. 2
2 District Overview ........................................................................................................................... 3
3 Conservation Goals and Progress ........................................................................................... 6
3.1 Conservation Program Activity and Water Savings ................................................. 6
3.2 Plumbing Codes and Water Use Efficiency Standards ............................................ 6
3.3 Compliance with State Urban Water Use Target ....................................................... 8
3.4 Compliance with CPUC Conservation Goals ................................................................ 9
3.5 Making Water Conservation a California Way of Life .......................................... 10
4 Water Conservation Program ................................................................................................ 13
4.1 Conservation Program Drivers ..................................................................................... 13
4.2 Customer Conservation Programs ............................................................................... 14
4.2.1 Plumbing Fixture Replacement ............................................................................ 14
4.2.2 Irrigation Equipment/Landscape Upgrades ................................................... 15
4.2.3 Customer Assistance ................................................................................................ 15
4.2.4 Summary of Customer Programs ........................................................................ 16
4.3 School Education and Public Information Programs ........................................... 16
4.4 Water System Efficiency .................................................................................................. 17

Westlake District Conservation Master Plan: 2021-2025
April 2021 Page | ii
4.4.1 System Water Loss Management......................................................................... 17
4.4.2 Metering and Pricing ................................................................................................ 17
4.5 Conservation Partnerships ............................................................................................. 18
5 Conservation Budget ................................................................................................................. 18
6 Performance Metrics ................................................................................................................. 22
7 Program Monitoring and Reporting.................................................................................... 22

Westlake District Conservation Master Plan: 2021-2025
April 2021 Page | iii
List of Acronyms AB Assembly Bill
AF Acre-feet (one AF equals 325,851 gallons)
AMI Advanced metering infrastructure
AMR Automatic meter reading
AWE Alliance for Water Efficiency
BCR Benefit Cost Ratio
BMP Best Management Practice
CalWEP California Water Efficiency Partnership
CII Commercial, industrial, and institutional
CPUC California Public Utilities Commission
CUWCC California Urban Water Conservation Council
EO Executive Order
GPCD Gallons per capita per day
GPF Gallons per flush
GPM Gallons per minute
GRC General Rate Case
HET High efficiency toilet
HEU High efficiency urinal
HEW High efficiency clothes washer
IOU Investor-owned utility
MaP Maximum performance toilet testing program
MGD Million gallons per day
MOU Memorandum of Understanding Regarding Urban Water Conservation in California
SB Senate Bill
SB X7-7 Senate Bill X7-7 Water Conservation Act of 2009
ULFT Ultra low flow toilet
UWMP Urban Water Management Plan
WF Water Factor
WSCP Water Shortage Contingency Plan
Westlake District Conservation Master Plan: 2021-2025
April 2021 Page | 1
1 Introduction
1.1 Master Plan Scope and Objectives
Cal Water is committed to helping its customers use water efficiently and has developed a range of water conservation programs to support this goal. To ensure that it is providing the right mix of programs in a cost-effective manner, Cal Water routinely conducts comprehensive conservation program analysis and planning. This is done on a five-year cycle in tandem with the Urban Water Management Plan (UWMP). The results of this planning for the Westlake District are summarized in this report, which covers the period 2021 to 2025.
The main purposes of this Conservation Master Plan are to:
• Serve as a broad guidance document that helps inform annual conservation activities, such as program levels, staffing, and budget needs both internally and for stakeholders.
• Summarize the mix of conservation measures that Cal Water plans to implement going forward, including the estimated water savings, costs, and effects on water demand.
• Explain the evaluation process and factors considered in selecting conservation measures.
• Provide an update to the 2016-20 Conservation Master Plan as part of a five-year review cycle to assess program performance and identify the need for any adjustments; and
• Ensure Cal Water districts are positioned to comply with the state’s Making Water Conservation a California Way of Life regulations.
1.2 Relationship to GRC and UWMP
Cal Water’s operations are regulated by the California Public Utilities Commission (CPUC), which approves the budgets and rates for each Cal Water district every three years in a General Rate Case (GRC) proceeding. The district’s conservation programs and expenditures are part of the GRC proceeding. The last GRC covered the three-year period 2020-22 and a new GRC covering the period 2023-25 is presently underway. The conservation programs and budgets for 2021 in this plan reflect those authorized in the last GRC while those recommended for 2023-25 reflect programs and budgets being proposed by Cal Water in the current GRC.

Westlake District Conservation Master Plan: 2021-2025
April 2021 Page | 2
This plan is an update to the Conservation Master Plan Cal Water completed in 2016 covering the period 2016-20. It constitutes the primary source of information on historical and proposed implementation of conservation programs reported in the Westlake District’s 2020 UWMP. A copy of this plan is provided as an appendix to the UWMP.
1.3 Relationship to Water Shortage Contingency Plan
The Water Conservation Master Plan is distinct from Cal Water’s Water Shortage Contingency Plan (WSCP), which is also part of each district’s UWMP. While the main purpose of the WSCP is to provide a blue-print for responding to water shortage emergencies caused by drought or other events resulting in temporary disruption to water supplies, the goal of the Water Conservation Master Plan is to provide a blue-print for providing education, assistance, and incentives to help customers use water efficiently all the time. Regardless of drought, water in California is an increasingly scarce resource. Investing in water use efficiency has repeatedly been shown to be a cost-effective way to ensure adequate supply of water for the future. While the conservation programs Cal Water implements are critically important during periods of water shortage, their primary purpose is to help make sure Cal Water can reliably serve customer water needs far into the future.
1.4 Report Organization
The remainder of this report is organized as follows:
• Section 2 provides a brief overview of the District, including the communities it serves, its sources of water supply, and its customer water demands.
• Section 3 discusses Cal Water’s conservation goals and accomplishments, in particular with respect to the Water Conservation Act of 2009, CPUC conservation requirements, and the state’s pending Making Water Conservation a California Way of Life regulations.
• Section 4 describes the conservation programs Cal Water currently offers to its customers and discusses new programs Cal Water intends to offer.
• Section 5 presents the water savings, costs, and benefits expected from the recommended conservation programs.
• Section 6 discusses metrics used to assess program performance.
• Section 7 addresses program monitoring and future updates to the Conservation Master Plan.
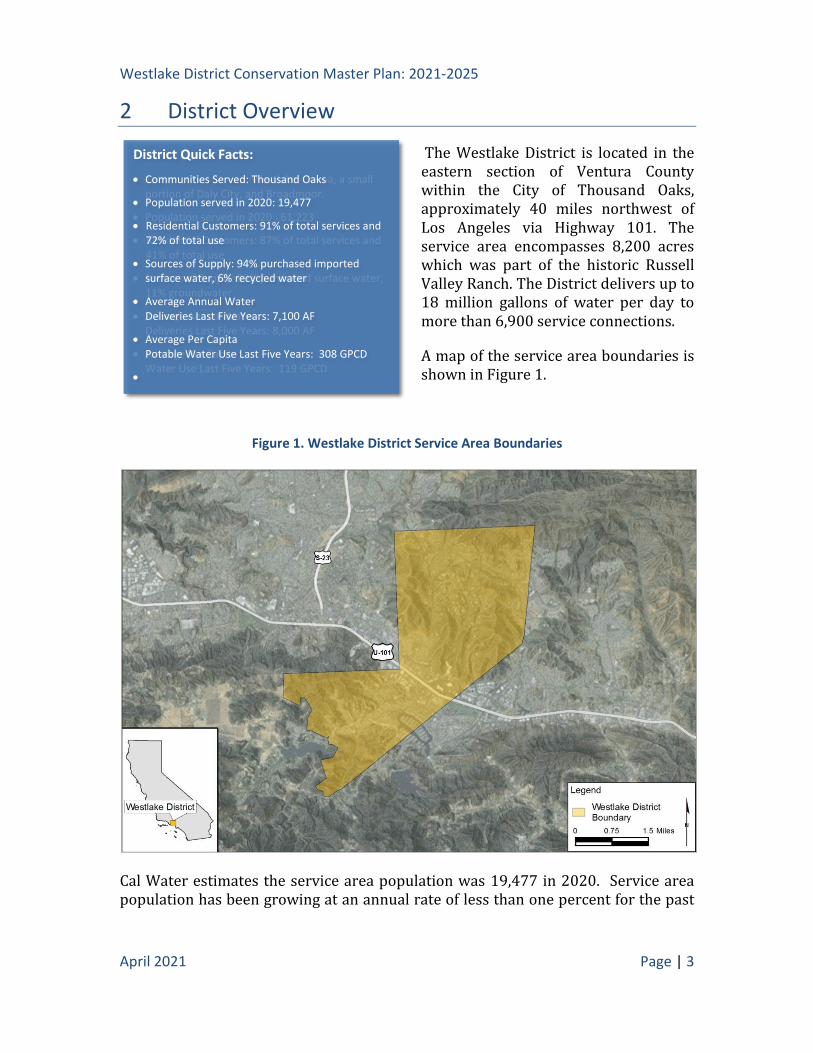
Westlake District Conservation Master Plan: 2021-2025
April 2021 Page | 3
2 District Overview
The Westlake District is located in the eastern section of Ventura County within the City of Thousand Oaks, approximately 40 miles northwest of Los Angeles via Highway 101. The service area encompasses 8,200 acres which was part of the historic Russell Valley Ranch. The District delivers up to 18 million gallons of water per day to more than 6,900 service connections.
A map of the service area boundaries is shown in Figure 1.
Figure 1. Westlake District Service Area Boundaries
Cal Water estimates the service area population was 19,477 in 2020. Service area population has been growing at an annual rate of less than one percent for the past
District Quick Facts:
• Communities Served: Westlake, Colma, a small portion of Daly City, and Broadmoor.
• Population served in 2020 : 61,223
• Residential Customers: 87% of total services and 41% of total use
• Sources of Supply: 89% purchased surface water, 11% groundwater
• Average Annual Water Deliveries Last Five Years: 8,000 AF
• Average Per Capita Water Use Last Five Years: 119 GPCD
•
District Quick Facts:
• Communities Served: Thousand Oaks
• Population served in 2020: 19,477
• Residential Customers: 91% of total services and 72% of total use
• Sources of Supply: 94% purchased imported surface water, 6% recycled water
• Average Annual Water Deliveries Last Five Years: 7,100 AF
• Average Per Capita Potable Water Use Last Five Years: 308 GPCD
•

Westlake District Conservation Master Plan: 2021-2025
April 2021 Page | 4
15 years. Between 2016 and 2020, the District’s population increased at an average rate of 0.1 percent per year.
The District delivers a combination of imported surface water and recycled water. Over the last five years, approximately 94 percent was imported surface water and 6 percent was recycled water.
The District delivers water to residential, commercial, industrial, and governmental customers. Residential customers account for 91 percent of water services in the District. The share of services in 2020 by customer category is shown in Figure 2. The share of total water sales by customer category over the period 2016-2020 is shown in Figure 3. Residential customers accounted for 77 percent of water use over this period.
Annual demand has averaged 7,100 acre-feet (AF) over the five-year period 2016-2020. Total annual demands since 1980 are shown in Figure 4.
Figure 2. Share of Services in 2020 by Customer Category
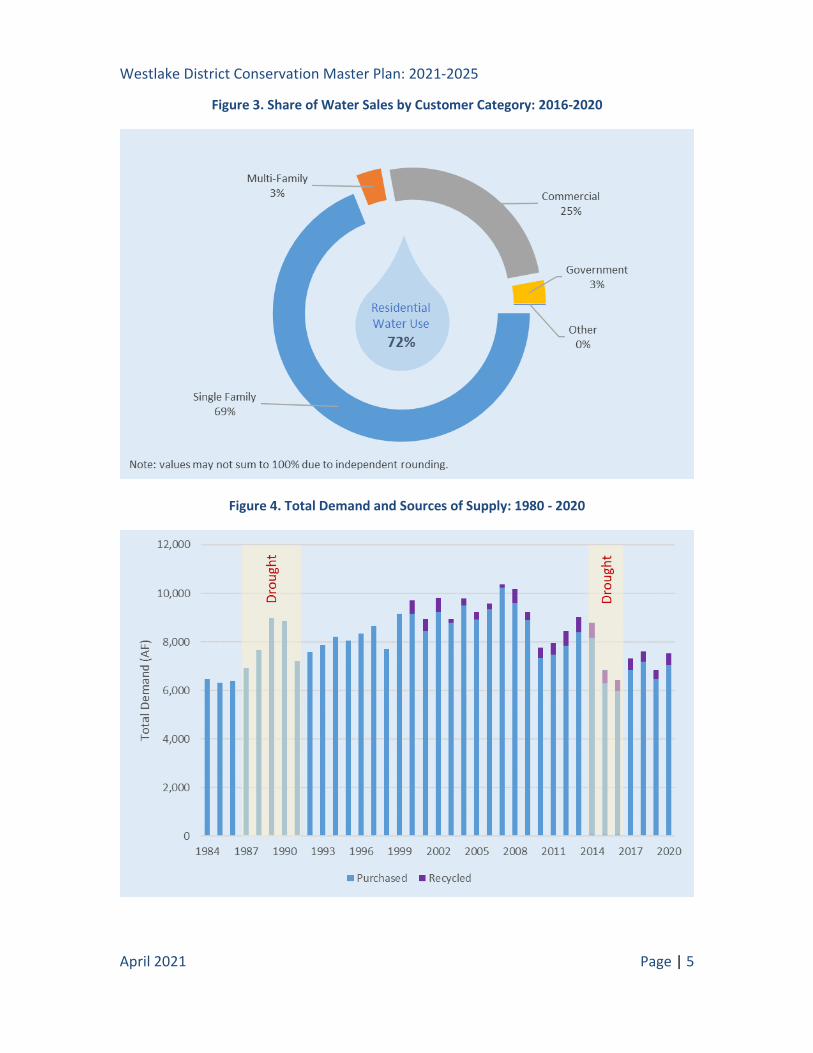
Westlake District Conservation Master Plan: 2021-2025
April 2021 Page | 5
Figure 3. Share of Water Sales by Customer Category: 2016-2020
Figure 4. Total Demand and Sources of Supply: 1980 - 2020
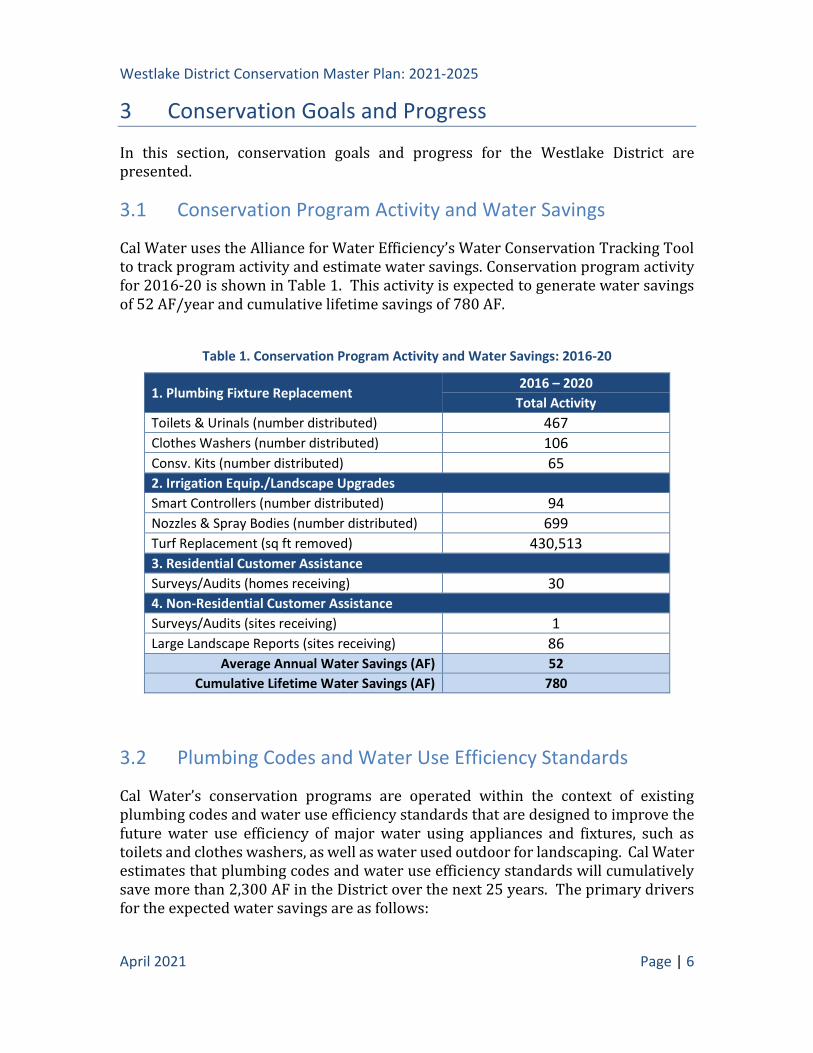
Westlake District Conservation Master Plan: 2021-2025
April 2021 Page | 6
3 Conservation Goals and Progress
In this section, conservation goals and progress for the Westlake District are presented.
3.1 Conservation Program Activity and Water Savings
Cal Water uses the Alliance for Water Efficiency’s Water Conservation Tracking Tool to track program activity and estimate water savings. Conservation program activity for 2016-20 is shown in Table 1. This activity is expected to generate water savings of 52 AF/year and cumulative lifetime savings of 780 AF.
Table 1. Conservation Program Activity and Water Savings: 2016-20
1. Plumbing Fixture Replacement 2016 – 2020
Total Activity
Toilets & Urinals (number distributed) 467
Clothes Washers (number distributed) 106
Consv. Kits (number distributed) 65
2. Irrigation Equip./Landscape Upgrades
Smart Controllers (number distributed) 94
Nozzles & Spray Bodies (number distributed) 699
Turf Replacement (sq ft removed) 430,513
3. Residential Customer Assistance
Surveys/Audits (homes receiving) 30
4. Non-Residential Customer Assistance
Surveys/Audits (sites receiving) 1
Large Landscape Reports (sites receiving) 86
Average Annual Water Savings (AF) 52
Cumulative Lifetime Water Savings (AF) 780
3.2 Plumbing Codes and Water Use Efficiency Standards
Cal Water’s conservation programs are operated within the context of existing plumbing codes and water use efficiency standards that are designed to improve the future water use efficiency of major water using appliances and fixtures, such as toilets and clothes washers, as well as water used outdoor for landscaping. Cal Water estimates that plumbing codes and water use efficiency standards will cumulatively save more than 2,300 AF in the District over the next 25 years. The primary drivers for the expected water savings are as follows:

Westlake District Conservation Master Plan: 2021-2025
April 2021 Page | 7
• AB 715, enacted in 2007, requires that any toilet or urinal sold or installed in California on or after January 1, 2014 cannot have a flush rating exceeding 1.28 and 0.5 gallons per flush, respectively. AB 715 superseded the state’s previous standards for toilet and urinal water use set in 1991 of 1.6 and 1.0 gallons per flush, respectively. On April 8, 2015, in response to the Governor’s Emergency Drought Response Executive Order (EO B-29-15), the California Energy Commission approved new standards for urinals requiring that they not use more than 0.125 gallons per flush, 75% less than the standard set by AB 715.
• Water use standards for residential and commercial clothes washers and dishwashers are established by the U.S. Department of Energy through its authority under the federal Energy Policy and Conservation Act. Water use efficiency is summarized by the water factor for the appliance which measures the gallons of water used per cycle per cubic foot of capacity. A typical top-loading residential clothes washer manufactured in the 1990s had a water factor of around 12. In 2015, the allowable water factor for top- and front-loading residential clothes was reduced to 8.4 and 4.7, respectively. In 2018, the water factor standard for top-loading residential clothes washers was reduced to 6.5. In 2010 the allowable water factor for top- and front-loading commercial clothes washers was reduced to 8.5 and 5.5, respectively. The maximum water factor for Energy Star compliant top- and front-loading washers is 3.7 and 4.3, respectively. An Energy Star compliant washer uses about two-thirds less water per cycle than washers manufactured in the 1990s. There also are federal dishwasher efficiency standards. The maximum water use for standard and compact sized dishwashers is 5.0 and 3.5 gallons per cycle, respectively.
• New construction and renovations in California are subject to CalGreen Code requirements. CalGreen includes prescriptive indoor provisions for maximum water consumption of plumbing fixtures and fittings in new and renovated properties. CalGreen also allows for an optional performance path to compliance, which requires an overall aggregate 20% reduction in indoor water use from a calculated baseline using a set of worksheets provided with the CalGreen guidelines.
• SB 407, enacted in 2009, mandates that existing buildings in California come up to current state plumbing fixture standards. This law establishes requirements that residential and commercial property built and available for use on or before January 1, 1994 replace plumbing fixtures that are not water conserving, defined as “noncompliant plumbing fixtures” as follows:
o any toilet manufactured to use more than 1.6 gallons of water per flush;
o any urinal manufactured to use more than one gallon of water per flush;
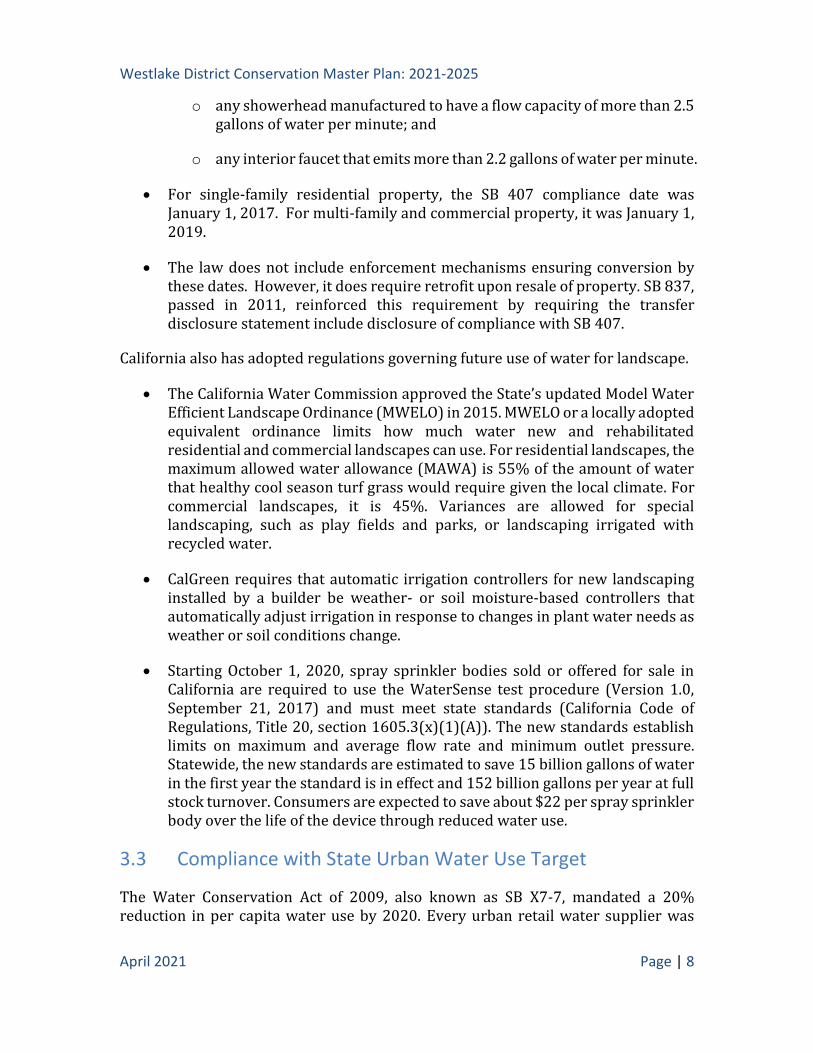
Westlake District Conservation Master Plan: 2021-2025
April 2021 Page | 8
o any showerhead manufactured to have a flow capacity of more than 2.5 gallons of water per minute; and
o any interior faucet that emits more than 2.2 gallons of water per minute.
• For single-family residential property, the SB 407 compliance date was January 1, 2017. For multi-family and commercial property, it was January 1, 2019.
• The law does not include enforcement mechanisms ensuring conversion by these dates. However, it does require retrofit upon resale of property. SB 837, passed in 2011, reinforced this requirement by requiring the transfer disclosure statement include disclosure of compliance with SB 407.
California also has adopted regulations governing future use of water for landscape.
• The California Water Commission approved the State’s updated Model Water Efficient Landscape Ordinance (MWELO) in 2015. MWELO or a locally adopted equivalent ordinance limits how much water new and rehabilitated residential and commercial landscapes can use. For residential landscapes, the maximum allowed water allowance (MAWA) is 55% of the amount of water that healthy cool season turf grass would require given the local climate. For commercial landscapes, it is 45%. Variances are allowed for special landscaping, such as play fields and parks, or landscaping irrigated with recycled water.
• CalGreen requires that automatic irrigation controllers for new landscaping installed by a builder be weather- or soil moisture-based controllers that automatically adjust irrigation in response to changes in plant water needs as weather or soil conditions change.
• Starting October 1, 2020, spray sprinkler bodies sold or offered for sale in California are required to use the WaterSense test procedure (Version 1.0, September 21, 2017) and must meet state standards (California Code of Regulations, Title 20, section 1605.3(x)(1)(A)). The new standards establish limits on maximum and average flow rate and minimum outlet pressure. Statewide, the new standards are estimated to save 15 billion gallons of water in the first year the standard is in effect and 152 billion gallons per year at full stock turnover. Consumers are expected to save about $22 per spray sprinkler body over the life of the device through reduced water use.
3.3 Compliance with State Urban Water Use Target
The Water Conservation Act of 2009, also known as SB X7-7, mandated a 20% reduction in per capita water use by 2020. Every urban retail water supplier was

Westlake District Conservation Master Plan: 2021-2025
April 2021 Page | 9
required to establish a 2020 per capita water use target based on their historical water use. Water suppliers could also form a Regional Alliance with other retail water suppliers and meet the requirement jointly. The District formed a Regional Alliance with other Cal Water districts in the South Coast Hydrologic Region. As long as either the District’s or the Regional Alliance’s 2020 per capita water use is below target, the District will have met the act’s requirements.
Figure 5 demonstrates the District’s compliance with the Water Conservation Act of 2009. Both the District’s and the Regional Alliance’s 2020 water use were below their respective targets. Through the concerted efforts of Cal Water and its customers, District per capita water use is now 34% below its peak reached in the early-2000s (see Figure 6).
Figure 5. 2020 Target and Actual Per Capita Water Use
3.4 Compliance with CPUC Conservation Goals
In 2008, the California Public Utilities Commission (CPUC) established water conservation goals of 1-2% per year for Class A utilities, which includes California Water Service Company.1 As shown in Figure 6, the District has consistently exceeded these goals since their adoption.
1 CPUC Decision 08-02-036, dated February 29, 2008.
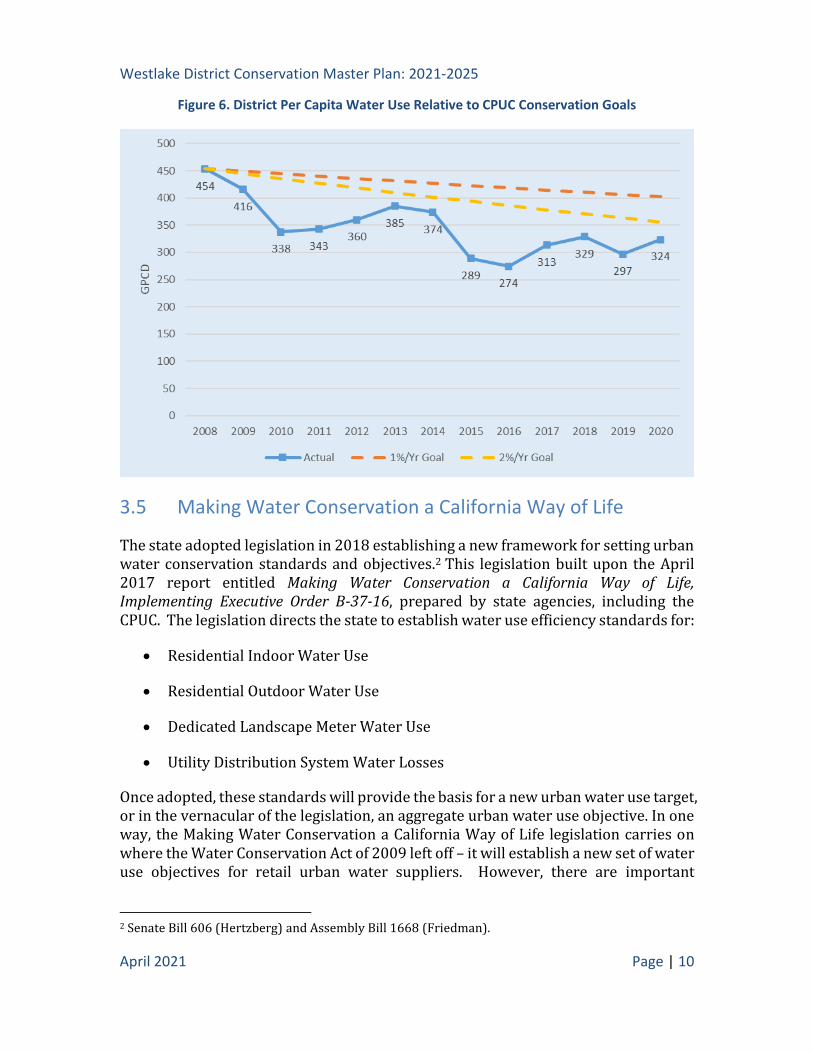
Westlake District Conservation Master Plan: 2021-2025
April 2021 Page | 10
Figure 6. District Per Capita Water Use Relative to CPUC Conservation Goals
3.5 Making Water Conservation a California Way of Life
The state adopted legislation in 2018 establishing a new framework for setting urban water conservation standards and objectives.2 This legislation built upon the April 2017 report entitled Making Water Conservation a California Way of Life, Implementing Executive Order B-37-16, prepared by state agencies, including the CPUC. The legislation directs the state to establish water use efficiency standards for:
• Residential Indoor Water Use
• Residential Outdoor Water Use
• Dedicated Landscape Meter Water Use
• Utility Distribution System Water Losses
Once adopted, these standards will provide the basis for a new urban water use target, or in the vernacular of the legislation, an aggregate urban water use objective. In one way, the Making Water Conservation a California Way of Life legislation carries on where the Water Conservation Act of 2009 left off – it will establish a new set of water use objectives for retail urban water suppliers. However, there are important
2 Senate Bill 606 (Hertzberg) and Assembly Bill 1668 (Friedman).

Westlake District Conservation Master Plan: 2021-2025
April 2021 Page | 11
differences. First, whereas the 2009 legislation established a long-term reduction target, under the new regulations, urban water suppliers will report water use relative to the new target annually starting in 2023 and will need to achieve the new target by January 1, 2027. Second, while the 2009 legislation applied to all urban water uses, the new legislation excludes non-residential uses other than water served by dedicated landscape meters from the target setting process. Instead, it requires DWR and the State Water Board to propose best management practices, including water audits and water management plans for non-residential customers above a certain size or volume of use, by October 1, 2021. Third, whereas the 2009 legislation set the same objective for all urban water suppliers (reduce water use by 20%), the new legislation varies the objective based on local conditions and existing levels of water use.3
Figure 7 shows the components of an urban water supplier’s water use objective. The first four components will be based on the efficiency standards the state sets for indoor and outdoor residential water use, dedicated landscape meter water use, and utility distribution system losses. The fifth component allows for special circumstances, such as a large seasonal population or significant water use for fire protection, while the sixth component provides credit for water recycling. Added together, the six components establish the water suppliers water use objective.
For water suppliers failing to meet their water use objective, the legislation specifies progressive enforcement, as follows:
• Starting November 1, 2023, the State Water Board may issue information orders to obtain information to determine technical assistance needs for compliance (CWC 10609.26(a))
• Starting November 1, 2024, the State Water Board may issue written notices to warn suppliers of violation and request corrective actions by the next annual reporting (CWC 10609.26(b))
• Starting November 1, 2025, the State Water Board may issue conservation orders that may include referral to DWR for technical assistance and other local enforcement actions, including imposition of civil liability (CWC 10609.26(c)
Cal Water conducted a risk assessment to determine which of its districts may require additional resources to meet the new conservation regulations. The risk assessment considered current and projected level of overall water use, level of indoor residential water use, extent of residential and non-residential landscape area and water use, and
3 For additional information, see Making Water Conservation a California Way of Life: Primer of 2018 Legislation on Water Conservation and Drought Planning Senate Bill 606 (Hertzberg) and Assembly Bill 1668 (Friedman).
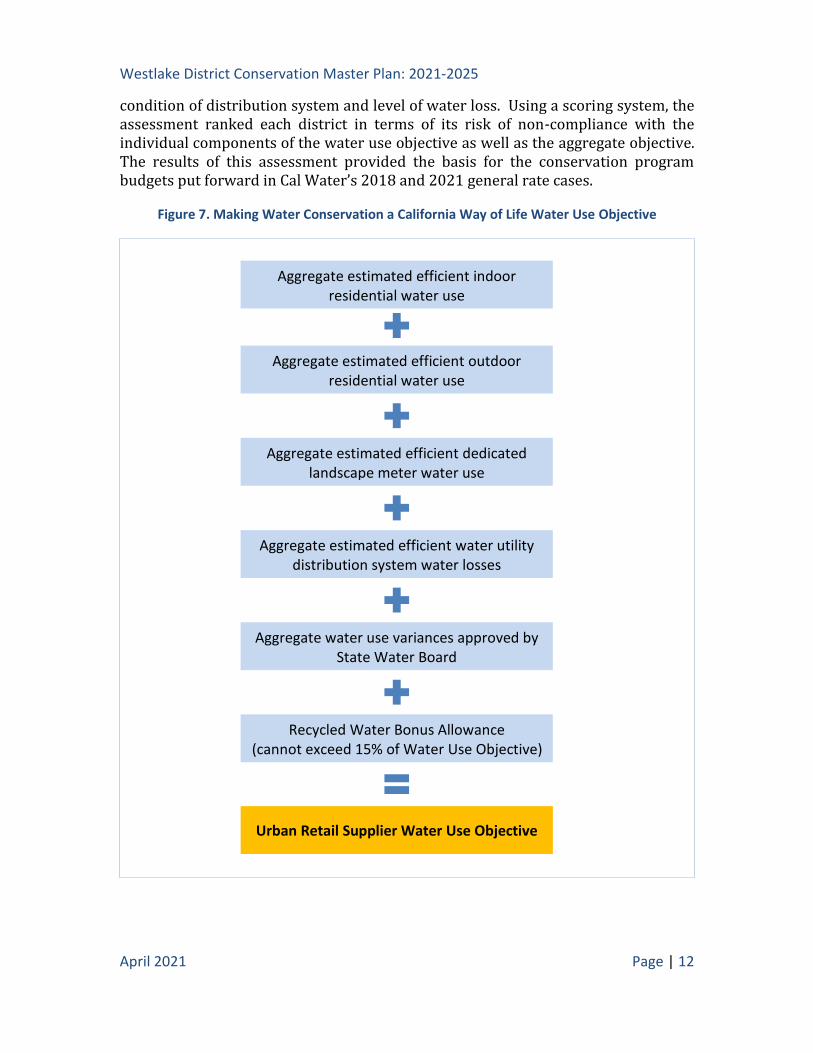
Westlake District Conservation Master Plan: 2021-2025
April 2021 Page | 12
condition of distribution system and level of water loss. Using a scoring system, the assessment ranked each district in terms of its risk of non-compliance with the individual components of the water use objective as well as the aggregate objective. The results of this assessment provided the basis for the conservation program budgets put forward in Cal Water’s 2018 and 2021 general rate cases.
Figure 7. Making Water Conservation a California Way of Life Water Use Objective
Aggregate estimated efficient dedicated landscape meter water use
Aggregate estimated efficient indoor residential water use
Aggregate estimated efficient outdoor residential water use
Aggregate estimated efficient water utility distribution system water losses
Aggregate water use variances approved by State Water Board
Recycled Water Bonus Allowance (cannot exceed 15% of Water Use Objective)
Urban Retail Supplier Water Use Objective
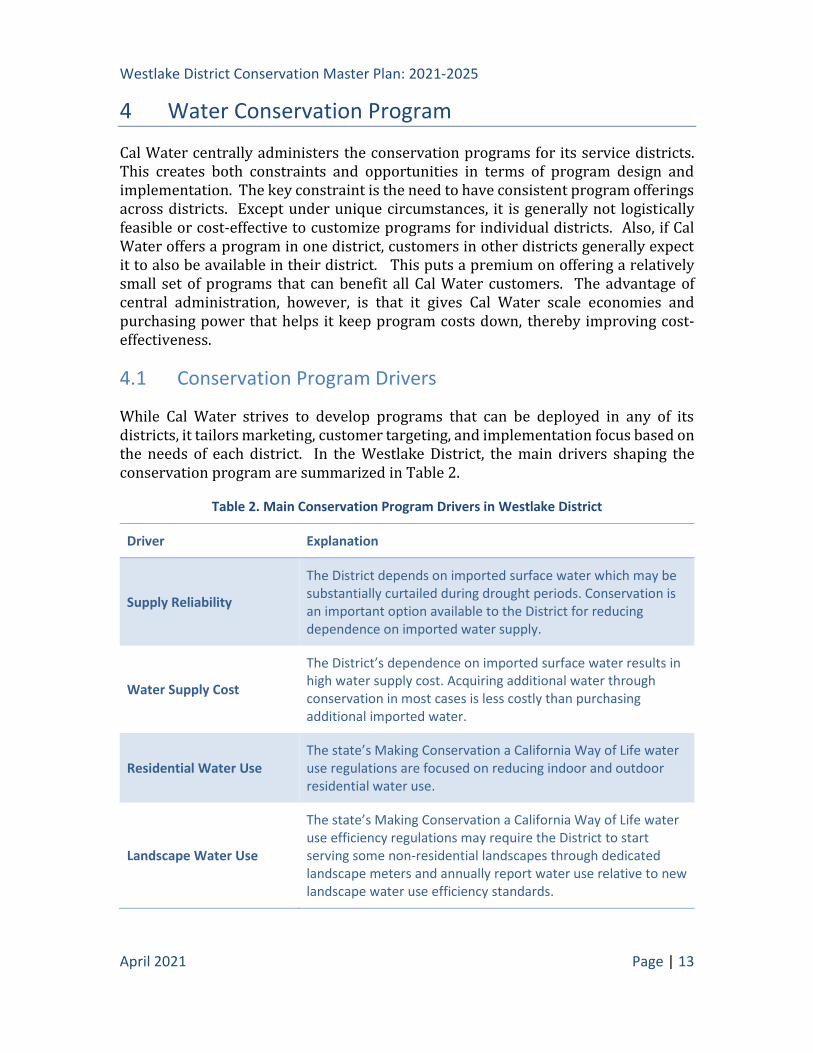
Westlake District Conservation Master Plan: 2021-2025
April 2021 Page | 13
4 Water Conservation Program
Cal Water centrally administers the conservation programs for its service districts. This creates both constraints and opportunities in terms of program design and implementation. The key constraint is the need to have consistent program offerings across districts. Except under unique circumstances, it is generally not logistically feasible or cost-effective to customize programs for individual districts. Also, if Cal Water offers a program in one district, customers in other districts generally expect it to also be available in their district. This puts a premium on offering a relatively small set of programs that can benefit all Cal Water customers. The advantage of central administration, however, is that it gives Cal Water scale economies and purchasing power that helps it keep program costs down, thereby improving cost-effectiveness.
4.1 Conservation Program Drivers
While Cal Water strives to develop programs that can be deployed in any of its districts, it tailors marketing, customer targeting, and implementation focus based on the needs of each district. In the Westlake District, the main drivers shaping the conservation program are summarized in Table 2.
Table 2. Main Conservation Program Drivers in Westlake District
Driver Explanation
Supply Reliability
The District depends on imported surface water which may be substantially curtailed during drought periods. Conservation is an important option available to the District for reducing dependence on imported water supply.
Water Supply Cost
The District’s dependence on imported surface water results in high water supply cost. Acquiring additional water through conservation in most cases is less costly than purchasing additional imported water.
Residential Water Use The state’s Making Conservation a California Way of Life water use regulations are focused on reducing indoor and outdoor residential water use.
Landscape Water Use
The state’s Making Conservation a California Way of Life water use efficiency regulations may require the District to start serving some non-residential landscapes through dedicated landscape meters and annually report water use relative to new landscape water use efficiency standards.

Westlake District Conservation Master Plan: 2021-2025
April 2021 Page | 14
4.2 Customer Conservation Programs
Cal Water’s conservation programs are grouped into four categories:
• Plumbing Fixture Replacement
• Irrigation Equipment/Landscape Upgrades
• Residential Customer Assistance
• Non-Residential Customer Assistance
A description of current programs in each of these categories follows. Where rebate amounts are listed, these are current rebate levels. Readers should note that rebate amounts may be adjusted in the future in response to CPUC requirements or changes to program design.
4.2.1 Plumbing Fixture Replacement
High-Efficiency Toilet Replacement – This program replaces old toilets with MaP certified high-efficiency toilets via financial rebates, direct installation, or direct distribution. 4 Current rebate amounts are up to $50/toilet for residential toilet replacement and up to $100/toilet for commercial toilet replacement.
High-Efficiency Urinal Replacement – This program replaces old urinals with high-efficiency urinals meeting the state’s 0.125 gallon per flush water use standard via financial rebates and direct installation. While available to all non-residential customers, the program targets sites with higher-than-average bathroom utilization, such as restaurants and office buildings. The current rebate amount is up to $150/urinal.
Clothes Washer Replacement – This program provides a financial rebate to replace an old inefficient clothes washer with a new high-efficiency washer. The program is available to all residential and multi-family customers. The current rebate amount is up to $150/washer.
Residential Conservation Kit Distribution – This program offers residential customers conservation kits featuring a range of water-saving plumbing retrofit devices. The kits are available at no charge and include two high-efficiency showerheads (1.5 gpm), two bathroom faucet aerators (1.0 gpm), one kitchen faucet aerator (1.5 gpd), toilet leak tablets, and an outside multi-function, full-stop hose nozzle.
4 For information on MaP certified toilets, see: https://www.map-testing.com/
Westlake District Conservation Master Plan: 2021-2025
April 2021 Page | 15
4.2.2 Irrigation Equipment/Landscape Upgrades
Smart Irrigation Controller Installation – This program provides a financial rebate for the installation of a smart irrigation controller that automatically adjusts watering schedule in response to changing weather conditions. The current rebate amount is $125/controller for residential customers and $25/station for commercial customers.
High-Efficiency Sprinkler Nozzle Rebate – This program provides a financial rebate for the installation of high-efficiency sprinkler nozzles. This program is available to all Cal Water customers. The current rebate amount is $5/nozzle.
Large Rotary Nozzle Rebate – This program provides a financial rebate for the installation of high-efficiency large rotary nozzles. This program is available to all Cal Water customers. The current rebate amount is up to $30/nozzle toward the nozzle purchase cost and up to $8/spray body toward installation cost, if installed by a C-27 licensed landscape contractor.
Spray Body with Integrated Pressure Regulation and Check Valve Rebate – This program provides a financial rebate for the installation of high-efficiency spray bodies with integrated pressure regulation. This program is available to all Cal Water customers. The current rebate amount is up to $10/body toward the spray body purchase cost and up to $8/spray body toward installation cost, if installed by a C-27 licensed landscape contractor.
Turf Replacement Rebate – This program provides a financial rebate for replacement of turf with approved drought-tolerant landscaping. Cal Water operated this program in 2015/16 as a drought response measure. The program will be re-started as part of Cal Water’s irrigation equipment/landscape upgrade program offerings.
4.2.3 Customer Assistance
Smart Landscape Tune-Up Program – This program provides customers with an irrigation system evaluation and installation of approved efficient irrigation system equipment, such as a smart irrigation controller and high-efficiency sprinkler nozzles. The program also includes irrigation system adjustments and detection and repair of irrigation system leaks. This program is available to all Cal Water customers at no charge.
Residential Customer Portal – Through its residential customer portal, Cal Water provides tailored assistance to each residential customer via customized water-efficiency targets, water savings calculators, and customer-specific recommendations for programs and water-saving tips.
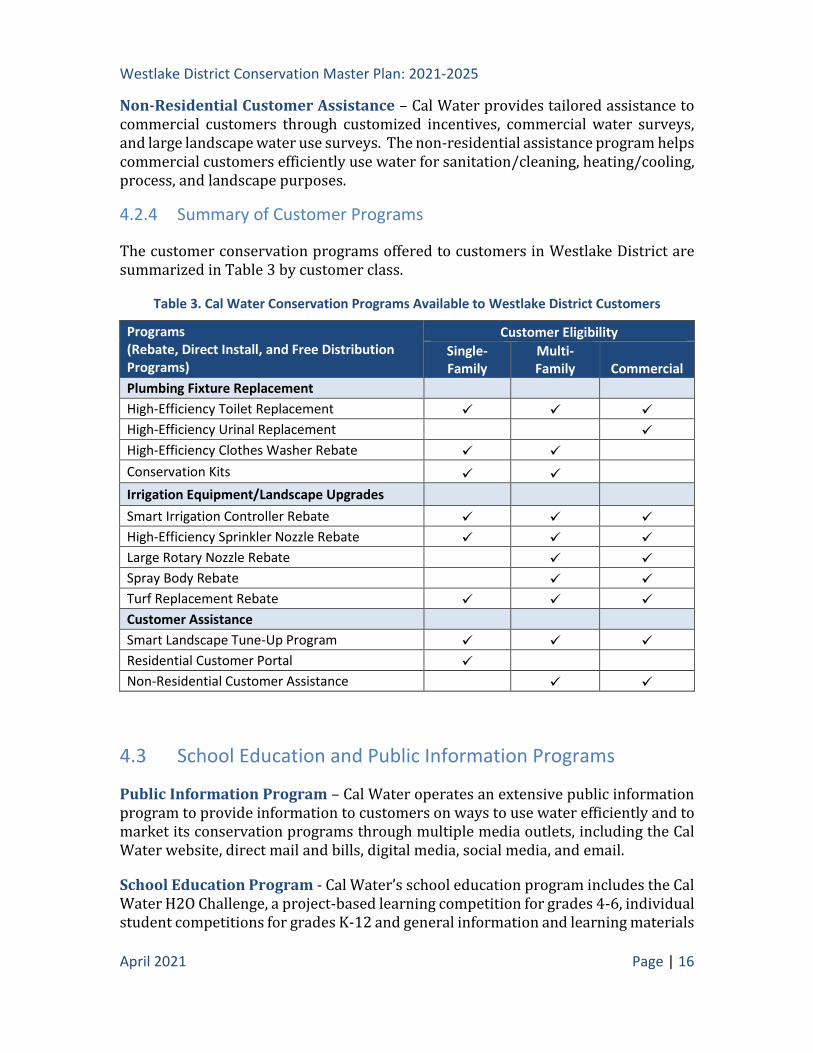
Westlake District Conservation Master Plan: 2021-2025
April 2021 Page | 16
Non-Residential Customer Assistance – Cal Water provides tailored assistance to commercial customers through customized incentives, commercial water surveys, and large landscape water use surveys. The non-residential assistance program helps commercial customers efficiently use water for sanitation/cleaning, heating/cooling, process, and landscape purposes.
4.2.4 Summary of Customer Programs
The customer conservation programs offered to customers in Westlake District are summarized in Table 3 by customer class.
Table 3. Cal Water Conservation Programs Available to Westlake District Customers
Programs (Rebate, Direct Install, and Free Distribution Programs)
Customer Eligibility
Single-Family
Multi- Family Commercial
Plumbing Fixture Replacement
High-Efficiency Toilet Replacement ✓ ✓ ✓
High-Efficiency Urinal Replacement ✓
High-Efficiency Clothes Washer Rebate ✓ ✓ Conservation Kits ✓ ✓ Irrigation Equipment/Landscape Upgrades
Smart Irrigation Controller Rebate ✓ ✓ ✓
High-Efficiency Sprinkler Nozzle Rebate ✓ ✓ ✓
Large Rotary Nozzle Rebate ✓ ✓
Spray Body Rebate ✓ ✓
Turf Replacement Rebate ✓ ✓ ✓
Customer Assistance
Smart Landscape Tune-Up Program ✓ ✓ ✓
Residential Customer Portal ✓ Non-Residential Customer Assistance ✓ ✓
4.3 School Education and Public Information Programs
Public Information Program – Cal Water operates an extensive public information program to provide information to customers on ways to use water efficiently and to market its conservation programs through multiple media outlets, including the Cal Water website, direct mail and bills, digital media, social media, and email.
School Education Program - Cal Water’s school education program includes the Cal Water H2O Challenge, a project-based learning competition for grades 4-6, individual student competitions for grades K-12 and general information and learning materials
Westlake District Conservation Master Plan: 2021-2025
April 2021 Page | 17
for students and teachers. Cal Water deploys its school education program in all its districts. Cal Water H2O Challenge is a project-based competition for classrooms, grades 4-6. The program is offered in partnership with DoGoodery, the California Association of Science Educators (CASE), and the WestEd K-12 Alliance. The program aligns with the Common Core State Standards and the Next Generation Science Standards. The Cal Water H2O Challenge offers a unique opportunity for upper elementary teachers to facilitate their students’ learning of standards-based content, while developing the core understanding of environmental principles necessary to becoming science-literate citizens.
4.4 Water System Efficiency
4.4.1 System Water Loss Management
As discussed above, reducing distribution system losses is one of the main focuses of the new Making Water Conservation a California Way of Life regulations. In preparation for these new requirements, Cal Water took part in the California Water Loss Technical Assistance Program (TAP) in both 2016 and 2017. Cal Water annually conducts distribution system audits using the American Water Works Association (AWWA) Free Water Audit Software. It has also developed a Water Loss Control Plan and Water Loss Control Policy to guide future water loss management with respect to:
• Meeting CPUC and state water loss standards and regulations
• Improving audit data and validity scores
• Implementing cost-effective water loss control actions
To coordinate and oversee water loss management actions across its multiple districts, Cal Water has added a Water Loss Program Analyst position to its conservation staff.
4.4.2 Metering and Pricing
Cal Water has deployed conservation-oriented rate designs in all its districts since 2008. The CPUC reviews these rate designs every three years as part of a general rate case. Cal Water is continuously seeking ways to improve the efficiency and equity of the rates and charges paid by customers. One example is Cal Water’s Customer Assistance Program (CAP), which provides bill discounts to qualifying lower income households.
All service connections in the District are metered. In addition to its use for billing, Cal Water uses meter data in the management of its conservation programs, including using it to analyze water use trends and identify customers that may benefit from Cal Water conservation programs. Cal Water is also piloting automatic meter reading
Westlake District Conservation Master Plan: 2021-2025
April 2021 Page | 18
(AMR) and advanced metering infrastructure (AMI) in several of its districts. Broad adoption of AMI would allow Cal Water in the future to detect and alert households of leaks and other possible problems as well as provide customers with tailored water use information to help them use water more efficiently.
4.5 Conservation Partnerships
Cal Water collaborates with organizations at the local, state, and national level to promote and advance water use efficiency, including as a member of the following organizations and initiatives.
California Water Efficiency Partnership (CalWEP) – CalWEP’s mission is to maximize urban water efficiency and conservation throughout California by supporting and integrating innovative technologies and practices; encouraging effective public policies; advancing research, training, and public education; and building collaborative approaches and partnerships. In addition to being a CalWEP member, Cal Water serves on the organization’s board of directors.
Alliance for Water Efficiency - The Alliance for Water Efficiency (AWE) is a national non-profit organization dedicated to efficient and sustainable use of water. In addition to being an AWE member, Cal Water uses the AWE Water Conservation Tracking Tool to evaluate conservation programs and track water savings.
EPA WaterSense - As an EPA WaterSense partner, Cal Water has committed to educating its customers about the value of water, water efficiency, and the WaterSense brand. Products and services earning the WaterSense label have been certified to be at least 20 percent more efficient without sacrificing performance.
5 Conservation Budget
The District’s recommended conservation budget for the period 2021-2025 is presented in Figure 8.5 Cal Water used the three-step process shown in Figure 9 to develop the conservation budget. In the first step, a wide range of possible conservation programs are qualitatively screened in terms of their potential savings, implementation feasibility, customer receptivity, and cost. The program screening filters used in this step are listed in Table 4. In the second step, the programs passing through the screen are quantitatively analyzed using the AWE’s Water Conservation Tracking Tool. In the third step, a portfolio of programs is developed based on the
5 This is a composite of the conservation budget the CPUC approved in Cal Water’s 2018 general rate case, which covers the period 2020-2022, and the budget Cal Water is proposing in its 2021 general rate case, which covers the period 2023-2025. Depending on the outcome of the general rate case, the adopted 2023-2025 budget may differ from Cal Water’s recommended budget.

Westlake District Conservation Master Plan: 2021-2025
April 2021 Page | 19
results of the second step. As discussed earlier, in its two most recent general rate cases Cal Water has further refined the conservation budget based on the results of a risk assessment used to determine which districts may require additional resources to meet the state’s new conservation regulations.
Figure 8. Recommend Conservation Budget and Allocation: 2021-2025

Westlake District Conservation Master Plan: 2021-2025
April 2021 Page | 20
Figure 9. Conservation Program Assessment Method
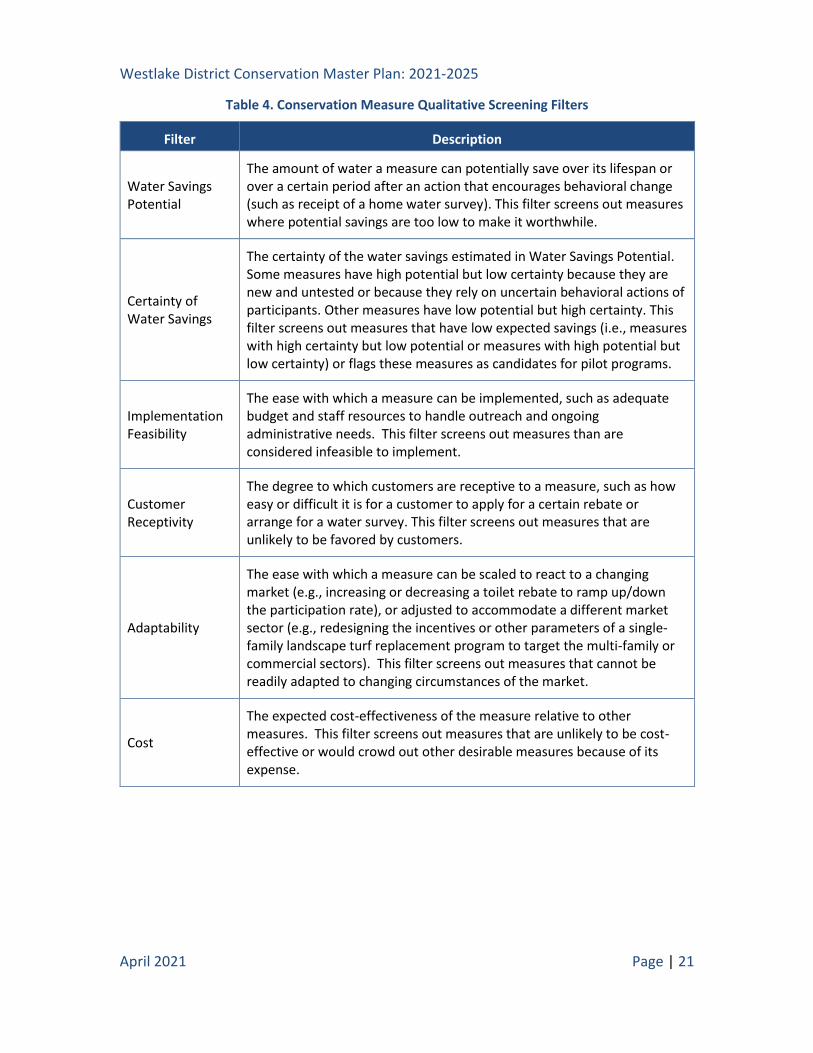
Westlake District Conservation Master Plan: 2021-2025
April 2021 Page | 21
Table 4. Conservation Measure Qualitative Screening Filters
Filter Description
Water Savings Potential
The amount of water a measure can potentially save over its lifespan or over a certain period after an action that encourages behavioral change (such as receipt of a home water survey). This filter screens out measures where potential savings are too low to make it worthwhile.
Certainty of Water Savings
The certainty of the water savings estimated in Water Savings Potential. Some measures have high potential but low certainty because they are new and untested or because they rely on uncertain behavioral actions of participants. Other measures have low potential but high certainty. This filter screens out measures that have low expected savings (i.e., measures with high certainty but low potential or measures with high potential but low certainty) or flags these measures as candidates for pilot programs.
Implementation Feasibility
The ease with which a measure can be implemented, such as adequate budget and staff resources to handle outreach and ongoing administrative needs. This filter screens out measures than are considered infeasible to implement.
Customer Receptivity
The degree to which customers are receptive to a measure, such as how easy or difficult it is for a customer to apply for a certain rebate or arrange for a water survey. This filter screens out measures that are unlikely to be favored by customers.
Adaptability
The ease with which a measure can be scaled to react to a changing market (e.g., increasing or decreasing a toilet rebate to ramp up/down the participation rate), or adjusted to accommodate a different market sector (e.g., redesigning the incentives or other parameters of a single-family landscape turf replacement program to target the multi-family or commercial sectors). This filter screens out measures that cannot be readily adapted to changing circumstances of the market.
Cost
The expected cost-effectiveness of the measure relative to other measures. This filter screens out measures that are unlikely to be cost-effective or would crowd out other desirable measures because of its expense.
Westlake District Conservation Master Plan: 2021-2025
April 2021 Page | 22
6 Performance Metrics
Cal Water periodically evaluates program savings potential and cost-effectiveness using the AWE Water Conservation Tracking Tool. Based on the most recent evaluation, the expected water savings and cost-effectiveness of Westlake’s conservation program are as follows:
• Water Savings – Up to 200 AF/year and cumulatively up to 3,100 AF over the useful life of the measures. Program water savings will help the District comply with new state water conservation regulations.
• Unit Cost – $700/AF (rounded to nearest $100), which is less than the District’s purchased water cost.
• Benefit-Cost Ratio -- 1.9. The District’s conservation program is expected to pay back $1.90 in avoided purchased water costs for every dollar of program expenditure.
7 Program Monitoring and Reporting
Cal Water regularly reviews its conservation programs to ensure they are performing as expected. This includes the following:
Program Tracking - Cal Water uses the AWE Water Conservation Tracking tool to track program participation, cost, and water savings. This data helps Cal Water monitor program performance, analyze water use trends, and forecast future water demand.
Research and Evaluation – Cal Water regularly evaluates program performance and undertakes pilot projects to assess the effectiveness of its programs. Examples include:
• Comprehensive statistical evaluations of bathroom retrofit programs operated between 2013 and 2018
• Statistical evaluations of water savings associated with high-efficiency irrigation nozzle replacement, smart irrigation controller installation, and turf replacement programs.
• Development of statistical models of customer program participation that help Cal Water target programs based on household and neighborhood attributes.
• AMR and AMI pilot projects.
Westlake District Conservation Master Plan: 2021-2025
April 2021 Page | 23
Annual Conservation Report – Cal Water annually reports on the conservation program’s progress and accomplishments, and posts public reports for each of its districts on its public website (https://www.calwater.com/conservation/water-conservation-reports/).
CPUC Reporting – Cal Water reports to the CPUC annually on the implementation, cost, and performance of its conservation programs.
State Reporting – Starting in 2023, Cal Water will annually report District water use relative to its water use objective as part of the new Making Water Conservation a California Way of Life regulations.
California Water Service 2020 Urban Water Management Plan
Westlake District
June 2021 Printed 6/25/2021
Page J-1
EKI Environment & Water, Inc. M.Cubed
Gary Fiske and Associates
Appendix J: Resolution to Adopt UWMP


Copyright © 2022 FDOKUMEN