western pacific region data bank on socioeconomic and ...
184
-
Upload
khangminh22 -
Category
Documents
-
view
0 -
download
0
Transcript of western pacific region data bank on socioeconomic and ...


WESTERN PACIFIC REGION
DATA BANK
ON
SOCIOECONOMIC AND HEALTH INDICATORS
Manila, Philippines
August 198~
Rev/June 1984
Rev! December 1984

PREFACl':
The Socioeconomic and Heal th Indicators Data Bank "a8 eetabl ished in 1979 by the Regional Office for the Western Pacific of the World Kealth Organization as a baeie for studying the health situation in the Region and ••• eBsing health trends. In 1981, the information provided by the data bank wae corrected and updated and data in respect of thirteen additional indicators were added. An attempt was also made to categorize these indicators.
The present compilation of the data hank includes additional indicators relevant to the global and regional monitoring of the implementation of strategies for health for ,,11 by the year 2000. The thirty-one indicators contained in the data hank as of Karch 1983 were u.od in the preparation of the report on regional monitoring to be .ubmitted to the Regional Committeee in September 1983. Responses received from M~mbPr States in relation to the Common Framework and Format For Monitoring Progre .. in Implementing the Strategies For ""81th For All by the Year 2000 have been used in updating the contents of the data hank.
It should be emphasized that, in .pit~. of the precautions taken Bnd the careful screening of data, some of the information may havp 8
relatively low degree of reliability and comparability. In addition thp extent of coverage varies among the indicators and from country to country.
In spite of these limitations, this document presents. an overview of the regional situation, although it does not provide any indepth description of individual countries or area8. To facilitate its usage, data on all indicators are presented by country/area while data for all cOtlntries/area. are presented by indicator.
the data contained in this document are stored on diskettes supported by the Word Proce8sing System 30 and can be provided, on request, to thoRr i ntere sted.
Any comnents you .. i.h to Make to improve this document will bp ~re8tly appreciated.
Hiroshi Nakajima, MD. ,Ph.D. Regional Director

WESTERN PACIFIC REGION DATA BANK
ON SOCIOECONOMIC AND HEALTH INDICATORS
PART II INDICATORS BY COUNTRY OR AREA
Table of Contents
Alneri can Samoa ...................................................................................................... .. Aus tralia ................................ "" ........................................................ " .......... .. Brunei Chins
............................................................................................................
....................................................................................................... ...................................................................................................... Cook Islands
Democratic Kampuchea ...................................................................................... Fiji ........................................................................................................................ French Polynesia .................. ,. .............................................. "" .... ........................ .. Gu.am ............ .............................................................................................................. .. Hong Kong ................................................ ................................................................ .. Japan ........................................................................................................................ .. Kiribati ...................... " .......................................................................................... .. Lao People's Democratic Republic .................................. . Ka.cao ............................................................................................. . Malays ia ......................................................................................................... . Nauru .................................................................................................................... .. New Caledonia ........................................................................................................ New Zealand ............................................................................................................. Hi ue ....................................................................................................................... .. Papua New Guinea ................................................................................................ ..
.......................................................................................................... Ph it i ppines Republic of Korea ............................................................................................... Samoa ....................................................................................................................... .. Singapore ................................... " .. .. .. .. .. .. .. .. .. .. . .. .. .. .. .. .. ................................ . Solomon Islands ..................................................... .. .................... .. Tokelau Tonga
.. .. .. .. .. .. .. .. .. .. .. .. .. .. .. .. .. .. .. .. .. .. .. .. .. . .. .. .. .. .. .. .. .. .. . . .. .. . .. ..
.. .. .. .. .. .. .. .. .. .. .. .. .. .. .. .. .. .. .. .. .. .. .. .. .. .. . .. .............. .........
Trust Territory of the Pacific Islands •••••••••••••••••••••• ~uvalu .................................................................................... , ............................... .. IV' anuatu .................................................................................................................. .. ~iet Nam ........... """ .............................................................................................. .. [wallis and Futuna ............................................................................................. ..
Doc 8684C Disk 1172A CAMS-GUM) Doc 9327C Disk 0727A (HOK-PNG) Doc 8745C Disk 0728C (PHL-WAF)
1 3 5 7 9
11 13 15 17 19 21 23 25 27 29 31 33 35 37 39 41 43 45 47 49 51 53 55 57 59 61 63

WORLD HEALTH ORGANIZATION Regional Office for the Western Pacific
WESTERN PACIFIC REGION DATA BANK
ON SOCIOECONOMIC AND HEALTH INDICATORS
PART 1 BY INDICATORS
Manila, Philippines August 1983
Rev/Jun. 1984 Rev/Dec. 1984

WESTERN PACIFIC REGION DATA BANK
ON SOCIOECONOMIC AND HEALTH INDICATORS
Part I BY INDICATORS
TABLE OF CONTENTS
Indicators Number Name Definition
1. Area(in 1000 sq kilometres)
z. Population
3.
4.
5.
6.
7.
8.
9.
10.
11.
Annual popUlation growth rate
Percentage of population (less than 15 years and 65+)
Urban popuLation
Rate of natural increase of population per annum (%)
Crude birth rate
Crude death rate
Life expectancy at birth, by sel{
Infant mortality rate
Total fertility rate
The area in square kilometres relates to total surface area of the specified geographical units
Estimated total population
Average annual growth rate of population for a given period computed by fitting a trend line to logarithmic value of population
Population aged less than 15 years or 65 years and above as a percentage of total population
Population in urban areas as per cent of total population
Net crude increase of population -the difference between crude birth rate and crude death rate
Number of live births to estimated mid-year total population
Number of deaths to estimated mid year total population
Average number of years a new born can be expected to live under the prevailing mortality conditions
Number of deaths under one year of age among a given population per 1000 ~ive births which occurred am~ng the popuLation
Number of live births - legitimate or illegitimate - in one year per 1000 women of ages 15-49 years
Page
1
1
1
1
2
3
3
3
4
4
l2. Socio-economic indicators for the year 2000
whether married or unmarried ) I 5-1
Forecast values for the year 200~~

Indicators
WESTERN PACIFIC REGION DATA BANK
ON SOCIOECONOMIC AND HEALTH INDICATORS
PART I BY INDICATORS
TABLE OF CONTENTS (cont'd)
Numb.er Name Definition Page
13. Per capita Gross National Product (GNP) at market prices
14. Rate of growth of
15.
16.
17.
18.
19.
per capita GNP, 1970-79
Percentage Gross Domestic Product (GOP) derived from manufacturing industries at constant factor cost
Economically active population in primary sector
Daily per capita calorie supply
Daily per capita protein supply
Adult literacy ratio
Value including compensation of 7 employees, operating surplus, provision for the consumption of fixed capital and indirect taxes less subsidies to producers, of gross output of goods and services by resident producers less the value of their intermediate consumption divided by mid-year population and converted to U.S. dollars
Average annual growth rates of GNP 7 per capita at constant market pric~s during 1970-79
Percentage of output from manufacturing industries to total Gross Domestic Product in producers values at constant factor cost
All persons engaged or seeking employment in an economic activity, whether as employers, own account workers, ~alaried employees or unpaid workers assisting in the operation of a family farm or business
The total calorie supply available for hUlllan consumption divided by the total number of actual population utilizing it
Th~ total protein supply available for human consumption divided by the total number of actual population utilizing it
The number of reported adult literates i.e. persons who nave tne ability to read and write, divided by the total number of the adult population, 15 years of age and over
7
8
B
8
9

Indicators Number Name
WESTERN PACIFIC REGION DATA BANK
ON SOCIOECONOMIC AND HEALTH INDICATORS
PART I BY INDICATORS
TABLE OF CONTENTS (cont'd)
Definition
20. Healtn budget/expenditure Government consumptiDn budget or expenditure at current prices for health sector
21. Heal th manpower Number of persons qualified from recognized medical or health institutions and actually working in the country whether in private or as employees of an official service or a private institution
Page
9
10
I i i
22. Ten leading causes of communicable diseases morbidity
Top ten causes under which the largest number of ,ases have been reported during a given year
11-18 I
23.
24.
25.
26.
27.
28.
Ten leading causes of mortality
Cases and deaths for six diseases under the WHO Expanded Programme on Immunization
Cases and deaths for six diseases under the WHO Annual Communicable Diseases llulletin
Cases for five diseases under the WHO Monthly Communicable Diseases Notes
Proportion of infants fully immunized against tuberculosis, diphtheria, poliomyelitis and measles
Percent of population served with safe water
Top ten causes under which the largest number of deaths have been reported during a given year
Number of cases and deaths due to Diphtheria, Pertussis, Tetanus, Poliomyelitis, Tuberculosis and Measles reported during the year
Number of cases and deaths due to causes that are of emerging public health significance reported durirrg the year
Number of cases and deaths due to causes considered as of epidemic sigrrificance reported during the year
Proportion of infants under 1 year of age who have been fully immunized against tuberculosis, diphtheria, poliomyelitis and measles
Percentage of popUlation with water laid in the living quarters by pipes from a community-wide system or an individual installation such as a
I
19-26 1
27-28
29-30
31-32
Jl~
pressure tank, pump, etc. inside O~ I outside the living quarters hut
I !
il within 100 metres ! ~ ____ ~ ____________________ ~ _____________________________ J-_~

Npmber
*29.
*30.
*31.
WESTERN PACIFIC REGION DATA BANK
ON SOCIOECONOMIC AND HEALTH INDICATORS
PART I BY INDICATORS
TABLE OF CONTENTS (cont'd)
Indicators Name
Percent of population with adequate sanitary facilities
Definition
Percentage of population with adequate sanitary facilities in the home or immediate vicinity
Percent of low birth weights infants (~2499 g)
Percentage of newborn infants with a birth weight of less than 2500 grams (up to and including 2499 grams)
Maternal mortality rate
Legend:
Number of deaths of women while pregnant or within 42 days of termination of pregnancy, irrespective of the duration and the site of the pregnancy. from any Cause relates to or aggravated by the pregnancy or its management but not from accidental or incidental cause
= Nil ... or blank =
NA = * =
Not available/not known Not applicable Additional indicators included starting
August 1983
Doc 5614C Disk 1110A Doc 0588Z Disk 1114A (Leading Causes of Morbidity/Mortality)
34
35
J5

No.
1
2 3
4
S
6
1
8
9 10
11
lZ
13
14
15
16
17
18 19
20
21 22
23
24
25
2b
27
28
29
30
31
32
*1981 **1983
WESTERN PACIFIC REGION !lATA BANl<
ON
Part I Page 1 30 December 1984
SOCIOECONOMl~ AND HEALTH INDICATORS
Annual CountTy/Are-a Area 1982 Estimated population
(in 1000 •• 1<0» IpoP"lotion ('OOO) o.owth rate (X)
Amecican Samoa 0.20 35 ... Australia 7 &82.3 15 379** 0982-83) 1.3 :&runei 5. )) 200 \ 1982) 2.7
China 9 59&.9& 1 026 504 \l9~2} I..
Cook Is land.'S 0.24 18 (982) L&
Democrat1C Kampuchea 181.04 6 780 \19.2) <.9
FijI. 10.27 057 (j 982) 1.8
French Polynesia 4.00 IS. ... Cu ... 0.55 113** 0970-80) 2.6 Hong Kong LV> 5 233 \ 1982) 1.5
Japan 372.31 lL~O" ,,,0., V,I
~lrlb.tl v.n 00 11982) 2.2
Lao People's Dem. Ilep. 236.80 J 80u 119.2) 2.>
Mae-eo 0.02 292 (982) 2.B
Malaysia 329.75 14 500 (19B2) 2.1
NauTu 0.02 7 (982) 0.0
Ne", Caledonia 19.0& 142.4 • ... Nev Zealand 269.06 3 175 (1982 ) 1.1 Ih.ue 0.26 3 l1982) -3.1
Papua New Guinea 462.84 3 329 ll970-19} 2.3
Philippines 300.00 52 055** (1983) 2.51 RepubLic of Korea ... 0< J, JJI ll981} 1.6
Samoa 2.84 157.02 l19.2} 2 ••
Sl.ngapore 0.62 2 472 (1982) 1.2
Solomon Islands 27.5 2'0 \1970-70) •••
Tokelau u.Ol 3 '"
Tonga 0.7u 99 ll'bO-lb) lob
T T of the Pac1f~c Islands 1. 78 142 (1982 ) 1.9
"Tuvalu .026 B (1982) 2.2
Vanuatu 12 .19 128** (1979) 3.2
Vii!t Nam 331.69 55 955 \1970-791 2.J
Wallis and Futuna 0.255 10 ...

Part I. Pa.ge 2 30 D •• ember 1984
No.
I
2
3
4
5
6
7
B
9
10
11
12
u
14 1)
16
17
18
19
20
21
22
23
24
25
26
27
28
29
30
II
32
WES'lERN PACIFIC UClON DATA BAliK
ON SOCIOECONOMIC AND HEALTH INDICATORS
Country/Area Percentage of population 'lear 15 vro 65+ vrs
Ame~ican Samoa ... ... AuatTalia. 1982 24.7 9.9
Brunei 1982 36.1 2.9
China 1982 32.7 5.6
Cook Is lands 1982 49.8 4.0
Democratic Xampuch~a 1962 33.1 2.3
Fiji 1982 36.3 3.3
French Polynesia ... ... Goa .. 1962 39.6 1.7
Hong Kong 1982 24.3 b.9
Japan 1962 23.1 9.5
Kiribati 1982 41.1 3.6
Lao People B LIe'" Rep. i>"" ».2 >.0
Macao 1980 34.0 4.0
Ka.lays18 1.~" '~.l '.7 Nauru ... ... New Caledo'nu ... ... Hew Zealand 1982 26.1 10.0
N1ue 1982 46.1 6.6
Papua New Guinea 1980 41.9 3.3
PhLhpP1nes 1983 41.34 3.42
Republic of 1(01'8a 1982 31.9 4.1
Samoa 1982 48.2 3.2
Sinaapol'l1 1982 25.6 4.9
Solomon hlaods 1976 48.0 l.l
tOlr.elau ... ... Tonga 1982 39.1 3.3
T T of the Pacific Islands 1982 44.3 4.1
Tuvalu 1979 33.4 4.7
Vanuatu 1979 45.4 2.9
Vl.et "Ham l .. U ~1.2 >.6
Wallis and Futuna ... ...
Urban PO ulation Year %
1960 45.7
1981 85.6
1981 59.4
1980 21.0
1980 29.9
1960 15.0
1980 37.0
1980 39.0
1980 27.3
1980 92.0
1980 18.0
1980 ,7.8
1980 15.0
1980 98.0
1980 39.9
'" ... 1981 83.6
1980 20 .. 7
1980 20.0
1960 39.0
1980 57.0
1982 29.1
1981 100.0
19B\) 10.0
'" 1980 31.8
1980 55.6
'" 1979 17.8
1981 19.0
...

No
1
2
)
4
5
• 7
• 9
10
11 12
13
14
15 Ib
17
)8
19
20
21
2.
23
24
25
26
17
28
29
30 31
32
Country I Area
American Samoa
Au,&tralia Brunei
China
Cook Iabnds Delllocrat1c K8JDpuchea
Fiji
rrenCh roly"."
G .....
lionS Koo,
Japan
lCl.r1batl
Lao People's Oem. Rep.
H.a:c:ao
Malaysia Nauru
Ne., Calf!donia
New Zealand
Niue
Papua New GUlnea
Phi lippines
RepuDuc ot Korea.
Samoa
Sl.ogapore
Solomon Islands
Tokelau
Tonga
T T of the Pacific
Tuvalu
Vanuatu Vi-et NBIllo
Wallis and Futuna
*Peninsular Malaysia **1982
Islands
'''198) ****1984
WESTERN PACIFIC REGI09 DATA BANK
ON SOCIOECONOMIC AND HEALTH INDICATORS
IRate of natural Year increase of Crude Crude
population birth death % per annum rate rate
1980-82 2.98 14.3 4.5
1983 0.85 15.8* 7.6** 1982 2.6 29.7 3.88
1982 1.35 71.4 7.9
1983 \.9~ 23.8 7.4 1.6Z 2.59 4~;' 5 19 ••
1.61 l.b >1.1 5.)
10112 l.J JO 7
1981 2.41 27.9 3.B
1902 1.2 16.5 4.8
1983 0.6S** 12.7 6.2 10'" Z.U. >4.9 14.0
1982 2.51 40.8 15.7
1982 1.80 26 8
1981 2.29 30.6' 5.2" 1982 1.5 19.8 4.5
1981 2.09 27 6.1
1980 0.76 )6.1 8.5
1980 2.J JO.3 7.3
1~];-8U 2.53 41.1 15.8
1983 2.49 H.60 8. )0
l>a< 1.00 23.3 6.5
19S2 2.2 29.4 7.1
,,", 1.2 1/.3 5.3
1982 3.3 44.6 11.7
1982 1.7 21.7 10.3
1981 2.4 28.6 4.9
1981 2.7 31.3 4.3
1961 1.83 33.2** II. 3**
1983 3.2**-· 44.0 12.0 1~81 2.11 28.6 6.9
, ... ... ...
Yesr
1978-82
1982 1982
1962
1982 1982
1.67
1977-79
1982
1981
1983 1978
1980-85
1982
1982
1982
1981
1963
1978-79
1982
HS2
IS]!'.!
1976
1982
1983 1982
PaTt I rage 3 30 December 19K4
Life ekpe:<::c.&ncy at birCh
Total Mille !rema l.e
10.1 I '" I ..•
• .• I 71 I 18
70.1 I '" 1 •••
.,. I 65 I 68
64.3 I ••• , ... .. , I 42 I 45
.,. f 10 I 14
61 / ... 1 •••
.,. 1 66.91 12.2
.., -7 l2 I lij
... I 74 I 80
... -7 50 I 54
... I 45 I 48
65 I •.. I '"
... , 68' I n' ... I '" I ...
'" I ... r ... ~ 60 I ... I ...
... I '" / ...
... 7U-61-; 62
... I R-53 f 54
... I bO •• / ••• 0
66 I 63 / 69
... I 63 f 65
... -, 69 I J4 -54 154/54
... / '" I .. ,
58 ,7 ... I ...
... I ... I .. .
.. , / 57 I 60
." I 55 I 41
." I 62 66
... f '" I ... -
U - urban R - rural

Part t Paae 4 30 Decembe.r 1984
No.
1
Z
3
4
5
6
7
8
9
10
11
12
13
14
15 . 16
17
18
19
20
21
22
23
24
25
2&
27
28
29
30
31
32
WESTElN PACIfIC R&GION DATA BA*
ON SOCIOBCONOHIC ANI) lIEALTH 1111lICATOllS
Infant Country/Area Year DIOTtality Year
rate
American SalROB 1980-82 16.7
Australia 1982 10.3 1975-82
Brunei 1982 12.1 1975-80
China 1982 42 1982
Cook Islands 1983 22.4 1982
Democratic Kampuchea 1982 160.0 1982
F1]1 1981 ·2a.8 19~2
freach Polynesia 1977-79 47
Guaat . N81 10.6
Hong Kong 1982 9.9 1982
Ja'Pan 1~83 6.2 1,.J
1C.iriba.ti 1978 87 1982
Lao People a -))e"Q .. Rep .. m2 12~ 19B2
Macao 1982 18.0
Malaysla 1982 19.26 1982
Nauru ... New Cs ledonia ... New Zealand 1980 13.0 19B2
Niue ... Papua New Guinea 1981 73 1975-80
Philippines 1982 61 1983
Republic of korea 1982 35.0 1982
SalllO;s 1962 35 1915-80
Singapore 1982 10.8 1982
So Lamon Ialands m2- --'b.ll 1982
Tokelau 1980 44.4
Tonga 1961 21.7
T T of the Pacific Islands 1982 23.2
Tuvalu N82 3&.8 1982
Vanuatu 19B3 75 198J
Vlet Noaa 1981 33.9 1975-80
Wallis_ and Futuna .. ,
'total fertility rate
(15-49 yearsJ
.. , 1.9
5.1
2.6
4.2
5.1
3.4+
... '" 1.9
1.8
4.7
5.8
. " 3.8
...
. .. 2.0
. .. 6.0 j 4.50 I
2.6
5.91
1.7
7.3
... '"
... 2.8.
b.b
5.8
...

No.
1
2
3
4
S
6
7
8
9
10
11
12
13
14
15
16
17
18
19
20
2!
22
23
24
25
26
27
28
29
30
31
32
WESTERN PACIFI~ REGION DATA BANK
ON
Part 1 Page 5 30 December 1984
SOCIOECONOMIC AND HEALTH INDICATORS
2000 Life expectancy Country/Area Estimated Year at birth
population Male Female (' 000)
American Sa.moa 39 · .. ... Australia 17 762 1995-2000 71.3 78.1
Brunei 306 '" ... China 1 189 572 1995-2000 67.9 72.6
Cook Islands 37 '" ... Deaoeratic Kampuchea 13 403 1995-2000 56.6 60.1
Fiji 764 1995-2000 71.4 76.4
Prancb Polyne,iA 247 ... ... Guam 213 · .. ... Hong Kong 6 262 1995-2000 70.6 77.1
Jap4n 128 901 1995-2000 73.5 78.3
Kiribati 95 '" ... Lao PeOplef~~: ne ... aep. 5 725 1995-2000 51.9 55.1
Macao 334 ... ... Malaysia 20 181 1995-2000 66.5 70.5
Nauru 10 · .. ." New Caledonia 282 · .. ... New Zealand 4 027 1995-2000 71.8 78.2
Niue 7 ... ... Papua New Guinea 4 986 1995-2000 60.0 59.5
Philippines 75 224 1995-2000 65.9 70.1
Republic of Korea 50 790 1995'·2000 67.0 71.3
Samoa 203 2000 71 73
SiP8apare J 095 1995-2000 70.6 75.7
Solomon Islands 462 ... ... Tokelau . . . ... ... Tonga 119 ... ... T T of the Pacific Islands 234 ... ... Tuvalu ... ... ... Vanuatu 166 ... ... Viet Nam 7.9 355 1995-2000 55.7 59.2
Wallis and Futuna 9 ... ... TOTAL WPR 1 602 810

Pa-rt I Page 6 30 D.c.~.r 1984
No.
1
2
3
4
5
6
7
8
9
10
11
12
13
14
15
16
17
18
19
20
21
22
23
24
25
26
27
28
29
30
31
32
WESTERN PACIPIC REGION DATA BANK
ON SOCIOECONOMIC AND HEALTH INDICATORS
1995-2000 Country/Area Annual popln Year
growth rate (%)
Ame1:'ican Samoa LOS
Australia 0.93 1995-2000
Brunei 2.00
China 0.97 1995-2000
Cook Is lands 1.10
Democratic Kampuchea 1.86 1995-2000
Fiji 0.64 1995-2000
French Polynesia 1. 31
Gu$ .. 2.58
Hong Kong 0.86 1995-2000
Japan 0.48 1995-2000
Kiribati 1.SS
tao People's Dem. Rep. 1.93 1995-2000
Macao 0.90
Malaysia 1.52 1995-2000
NaU1:U 1.03
New Caledonia 2.48
New Zealand 0.92 1995-2000
Niue 1.11
Papua New Cuinea 2.11 1995-2000
Philippines 1.91 1995-2000
Republic of Korea 1.18 1995-2000
SaJloa 0.9 2000
Singapore 0.81 1995-2000
Solomon Ial4nda 3.30
Tokelau . . . Tonga 1.04
T T of the Pacific Islands 2.05
Tuvalu 0.00
Va.nuatu 1.83
Viet Nam 1. 81 995-2000
Wallis and Fut:una 0.00
Crude Crude Natural birth death Inc Tease
rate rate (%) per annum
· .. · .. · .. IS.I 8.7 0.64
· ., · .. · .. 17.4 7.1 0.97
· .. · .. · .. 28.5 9.9 1.86
17.9 4.11 1.31
· .. ... .. . '" · .. · .. 14.9 7.5 0.74
14.1 9.4 0.47
· .. ... · .. 31.9 12.6 1.93
· .. ... · .. 21.1 5.9 1.52
· .. · ., · .. · .. · .. · .. 16.0 8.1 0.19
· .. · .. · .. 30.6 9.5 2.11
23.90 6.20 1.77
18.8 6.9 1.19
21 5 1.6
15.1 6 .• 4 0.87
· .. . .. ... · .. ... · .. · .. ... · .. · .. · .. · .. · .. · .. . .. · .. ... · .. 29.0 10.9 1.81
... · .. · ..

WESTERN PACIFIC REGION DATA BANK
ON SOCIOECONOMIC AND HEALTH INDICATORS
No. Country/Area·
1 American Samoa
2 Australia
3 Brunei
4 China
5 Cook Islands
6 Democratic Kampuchea
7 Fiji
8 French Polynesia
9 Guam
lO Hong Kong
11 Japan
12 Kiribati
13 Lao People s Dem. Rep.
14 Macao
15 Malay.ia
Ib nauru
17 New Caledonia
IS New Zealand
19 Niue
20 Papua New GUl.nea
21 Philippines
22 Republic of Korea
23 S~oa
24 Singapore
25 Solomon Islands 26 Tokelau
27 Tonga
28 T T of the Pacific Islands
29 Tuvalu
10 Vanuatu
3l Viet Ham ,,, walHS ana ~utuna
• Per cap1.ta GDP ** Data is for 1970-1977
+ Data is for 1972-1981
Per capita GNP Rate of at market growth of Erices in US$ per capita
Year Data GNP, (%) 1970-1979
... · .. 1982-83 11 957 1.3
1982 15 908* 4.6
1980 290 2.8
1982 1 008· · .. ... · ..
1980 1 850 3.0
1980 6 780 1.8**
1982 4 760 5.1**
1982 4 3;0* 6.5
1980 9 890 3.9
".2 JOO •• 0··
1978 83 · .. ""' 1 ,UU D.U
1983 1 868 5.4
... · ..
... · .. 1>"2 > 214 0.5
· .. · .. 1980 954 0.3
1983 658 3.9
1982 I 678 8.1
1982 302 ... 1981 4 200 6.7
1981 601 2.7+
· .. · .. 1982 499 ...
· .. ... 1981 421 ... 1>.0 020 1.8"
1982 <500 · .. · .. .. ,
Part I Page 7 30 December 1984
Percentage of Gross Domestic Product (GDP) from manufacturing at constant factor cost
Year Data
· .. ... '"
1980 34.0
1978 5.1
. .. 1980 11.6
...
... 1979 27.6
... 1978 47.2
· .. · ..
19S0 20.5
. .. · .. · .. · ..
1977 7.7
1983 25.1
1980 29.9
... 1980 22.5
...
. .. 1979 9.9
...
...
... · ..
, " . .

Part I Page 8 30 December 1984
WESTERN PACIFIC REGION DATA BAlIK
ON SOCIOEOONOHIC AND HEALTH INDICATORS
No. Count ry I Area Year ," ,<, active
I_:~"tor oulture lin. asri
1 American Samoa . . . ... 2 19B1 . 379 ~.O
3 Brunei ... ... • China
11980 2b' 8" ".8
5 Cook ...... u. ... 6 11980 2 >22 74.0
7 Fiji 11980 83 40.1
8 Funch ... ... 9 Gun ...
10 Hnng Kong 1980 57 2.5
II Japan 1980 b bIZ 11.0
12 ... ... 13 Lao People'. Dem. Rep~ 1980 1 300 73 ••
14 Macao ... ... 15 -, i19• O 2 21b 47 .•
lb Nauru ... ... 17 New ... .. 1. Mew ~9HO 118 9.3
19 Niue
20 Papua New Guinea ~980 I 259 82.3
21 Phil: ~983 10 250 52.1
22 of Korea 1980 5 601 38.6
23 Samoa 197. 2.02 12.0
2. 1980 21 2.2
25 ou.~u ~980 6 30.0
26 ... ... 27 Tonga f97. 9 43.4
Z8 T T of the ... ... 29 Tuvalu
30 f979 41.5 79.0
31 Viet Ham f980 16 847 70.6
J2 Wallis and Futuna ... ... Data for 1980
+ Data for 1915-77
Year IDaily pe: capita
supply "
.. . . .. > 2 500 99.0
.".-.. 2 959 73.7
2 '39 .3.4
.. .. .. 1 7.7 40.1
uu-, 2577 5~.8
. 2 738 .9.5
1982 1 905 80
1982 2 211 78.9
. 2 847 8b.5
.. . "" ." 1 .42 47.7
"" ." 2 181 57.9
UII ." 2 5b2 4 •• 5
. .. .. .
. .. .. ., .- 3 443 109.9
... ... ''',-, 2 241 4'.8
1981 2 599.3 66.6
1982 2 485 73.6*
1982 3 500 41.5
197 3 074 H4.2
2 128 41.9
... 19H2, 2 750 61.2'
... ...
... ... 1979 2 546 68.4
1982' 1 850 49
I ... ...

No. Coul).try/Area 'fear
I klIerlean £d/OOa
2 Aust'(nlia 1981
I-j- B1:unei 1982
4 Cbilla , Cook Islands
6 Uemo~ratic Kampuchea
7 Fiji
" Frencb Polynesia , Uuam
10 Hong Kong 1980
II Japan
12 Kiribati ".2
n Lao People' & Dem. ,"p. 19"O
14 Macao IlYO'
IS Mala)'liia 1980
lb Nauru
11 New Caledonia
1. New Zealand I"" 19 Niue
20 Papua New ~Ulaea , ... 21 Pnillppinu 1982
l2 Nepub1Lc or Korea 1"'0
23 S&IlIoa 1982
<4 :iing<lpor-e I"" 25 Solomon IdBl1ds
2& Tok~la.u
" Tou~a 1916
" r T of the Pacifi~ Islands
" Tuvalu 1982
,0 ValiUll.[U
" V11'I[ Nt(m "., 32 Walhs and futun4
" " t:Olurute by K 1. + l't!-r~en[ of GOP **OEficis1 Populati.ulI Ba.e nat .svailable.
WESTRRN PACIFIC lEGION OATA bA)Q(
ON SOCIOECONOMIC .uro llEALtti INDICATORS
ileal th bud et Adult Year
liu-racy -rate Tot.17Mare]F~ale Amount
... f . .. f . .. ... ••• f SS f S2 198'-S2 Atm 11 199
80 I 86 f 7J 198~ >$ 64 173 '" · •. I ..• I .•. ... ... f ... I ••• 1982 USO 2 .3. "5
· .. I •.. I .•• -...
.•• f ••• f ••• 1981 '$ 18 670 180
• •• / ••• f ••• 1971 ... ••• f ••. f ••• 1983 US$ 11 270 406
S7 I " I
78 1979/8D ,",$1 038 624 769
... f . .. f ... 1915 , ... '001 ••. ' •.•
,,., " , 600 000
41 f ••• f ... ... 90 , ••• ... 1919 PIIotaCIjI8
17 565 iZ4.70
72 f ••• f ••• 1984- "I 1 101 810 440 ••• f ••• I ••. ... ••• I ••• ( •.. 19l1:t F.Crl' 1 b2.2 990 000
,. , ... , ... 1 .. , lIZ .. I " •• 2
• •• f ••• f ••• 1977(18 "21 402 42a
" f ••• I ... 19S\(E) KINA 64 609 000
,. f ••• f .•• 1~82 • J 125 .38 000
8. I "" .. "" \r1onlll III I75 41'
.. I ... I •.. 1981 US$ 4 76$ D13 .. , ... , ... 198' S$ 3>0 •• 0 000
... , ... I ... 1981 Sll. 3.05
... f ... / . .. 1982-Sl WSo 170 2&4
· •• f 79 I ,. "81/S2 TS 1 &64 l2I
... f . .. f ... 1978 USI 1 760 100
90 f ••. I ... 19.0 A$ '43 '" ••• f ••• f ••• [98, flffl 280 Ol9 000
,. I •.. I ..• 1981 ... ... I ... I •.. ...
ex llii!nditure
Per capita
... AI 144
>\ 323
... US$' 164.18
... F$ 32.8
usl ,.s USI ,UO
Hkl 216.2
Y 51 811
AS 2b.1
... Pat_ca,
63.3
HO" 12
... F.Crl' 10 , ••
.Z> 427.b
HZ$ lOO.6
KINA 19.1)
p 61.6
WOI\& 4 523.6
wsl 30.21
5$ l32.99
sII 12.2
usl 56.S" TO 16.8{)
USS 58.3
A$ 33
FHH 2 295.2
...
...
l'aet I Pate 9 )0 Dece~be~ 1984
--~ t of tot..!!l ElI.chaJl~~ Hit!!
bl.ldt;et to 1 US$
. .. US, LOO
7.. AT 0.88
5.0 ., O. -151.';;7--. .. ...
13.9 .tl O.95~O
. .. ... F. 0.7':180
... . .. 7.2 uRS l.oo 7.48 ilKT---;;.Ui)~
---.-. .. , 24U
10.) A, L.Of,
... . .. -. .. l'at~c.J!<
'.4S
4.0 1<$ 2.22
... . .. 7.21 F.e .. 140.>5
12.1 .1T 1.02
... ... 1.02
'.J kINA 0.68
5.23 P 11.00
2., Won 6B5.VO
11.5 usl 0.97
).69 , . :l.U4
•. s 5If" 1.12 -
1.n usl 0.~7
11.3 T$ O.9J,o){)
. .. 051 1.00
7.8 A$ 0.86
... , .. 10.0
.. . .. . .. . ..

.
Part I Page 10 30 December 1984
WESTEBB PACIFIC REGION DATA 8AIIK
ON SOCIOBCONOMIC AND HEALTH INDICATORS
He"lth Manoower No. Country/Area Year Medical
Physicians assistants
Number Per Number Per 10 000 10 000 Doo'n DOD'n
1 Americian Samoa 1984 25 7.2 4 1.1
2 AU8trails. 1~81 27 128 1'.2 ... 3 th'unei 1982 107 '.J 94 4.7
4 Chl.na "'" OU' ou, 6.) 423 410 4.5
5 Cook Is lands 1983 1. 4
• uemocratLc Kampuchea ... ... 7 Fiji 1980 284 4.5 34 0.5
8 French Polynesl8 1980 143 9.7 ... 9 Guam 1983 83 7.4 '"
10 liong K.ong 1 •• 0 J .,6 8.0 326 0.7
11 Japan 1982 161 260 13.8 ... 12 Kuibatl 1980 15 .2.6 IS 2.6
13 I..QO ~8ople's Dem_ Rep_ 1979 127 0.4 707 2.0
14 Macao 1980 269 9.5 275 9.7
15 Malaysia: P$nl.n&uln U80 3 S14 3.1 1 749 1.5
S.bah 1977 110 1.4 ... Sarawak 1978 88 0.7 175 1.5
16 Mauru 1.,1 10 14.3 ... 17 Ne w Ca led ooie 1982 89 (; .0 ... 1. New Zealand 1982 5 21U 16.4 ... 19 Niue 1980 2 •• 1 ... 2U Pap .... a New GULnea 1982 2]2 0.7 197 0.6
2l Phi lippiJ'l.es 1982 .
7 378 1.7 ... 22 Republlc ot Korea 19~2 2> U91 •• 4 '" 23 Samoa 1982 47 3.0 1 u.l 24 Sl.ngapore 1982 2 ~Z2) 9 ... 25 Solomon blands 1980 38 1.7 -2. Tokelau 1980 4 20.0 ... 27 Tonga 1982 41 4.1 1. I.b
28 T T of the Pacific Islands 1980 46 3.4 46 3.4
29 Tuvalu 1980 4 5.0 8 10#0
30 Vanuatu 1.~1 22 1.9 19 1.6
31 Viet Ham 1981 44 400 8.0
32 Wallis and Futuna 1982 4 4.0 -*Ratio per 1 000 females
Professional nursing/midwifer~
i),ersonnet Number Per
JO 000 DODln
18 5.1
139 434 43.4
'53 27.6
477 201 S.1
9
. .. 1 284 20.5
17l 18.5
3D) 30.7
12 109 2S.2
323 739 21.6
154 26.6
98 0.3
622 21.9
9 095 8.0
535 6.8
449 3;8-
9 12.9
22. 15 ••
... 2J 76.7
2 459 7.4
19 114 1.3
46 651 U.S
J4, Zl.9
10 207 41.3
390 17.8
. .. 161 16.1
193 14.3
18 22.5
221 18.1
14 600{ 13.61 13 900 4.9'
4 4.0

WESTERN PAClfl C RECION DATA BANK ON SOCIOECONOMIC AAD HEALTH INDICATORS, 1982
Ten leading causes of communicable diseases morbidity in countries or aress of the WHO Western Pa~ific Regioo*
I Count.a/Area Estimated Scope of Ten leadlng: causes of morb1.d1ty I No. Name Year population Reference Data, 1st cause 2nd cause 3rd CAuse
(1) (2) (3) (4) , (S) (6) (1) (8) (9) 1. American Samoa 1982 3, 000 SPEHIS 1980 Notl.fieble a. Influenza Chicken pox Other food poisaniaa
diseases bacteualL b 12 428 136 101 c. 35 509 J8b 289 4. 487 052 005
2. Australia 1982 15 176 000 CHIP revised Infectious •• Gonorrhoea Total svobilis SalmQnella infection by Gov't, and 1984 parasitic b. 12 805 3 211 1 866
diseases c. 84 21 12 d. 098 090-097 003
3. Brunei 1982 200 000 CHIP revised Infectious .. Measles DiarThoeal diseases Tuberculo"is by Gov't, and 1984 parasitic b. S96 570 269
diseases <. 298 28, 134 d.
4. China 1979 970 920 000 Government e. nvsfltten' Influenza Malaria letter of 6 Jun 1980 b. 2 907 828 2 654 566 2 384 543
c. 299 273 246 d.
5. Cook Islands 1983 18 000 CHIP revised Notifiable a.. l~iuries and Diseases of the Diseases of the. by Gov't. diseases exte.rnal causes respiratorY s'Vstem digestive 9v.tem 1984 b. 220 206 106
c. 1 239 1 171 597 d.
6. Democratic Kampuchea 1973 7 &70 000 World Health •• Influenza Amoebiasis Typhoid fever Stgtiatice: b. 25 753 2 117 972 Annual 1976 <. 336 28 13
d. 7. Fi j i 1981 636 000 MOR Annual Notifiable •• Influenza Diarrhoea presumed {'.,onorrhoea
Report 1981 diseases infect (infantile) b 92 596 8 870 1 314 c. 14 142 1 355 201 d. 487 009.3 098
8. French Polynesia 1982 154 100 Gov't Res- Notifiable a. 1l1-defined lnfluenza Mumps pOnses to diseases intestinal infections WliSA Quest b. 8 741 7 422 1 726 1982 c. 5 676 4 819 1 121
d. 009 _48-' ___ 072
4th cause (0)
Gonococcal infectio~
b2 177 098
Tuberculosis .11 fot"ms
1 363 9
01O-01B Gonococcal infection
243 121
Measles
900 075 93
Disease~ of the skin L subcutaneous tiss
88 495
Measles'" 672 . 9
Measles (Morbilli)
1 003 153
Measles
1 187 171 055 -
t.egE!l,d: a. Name of clise.ase Note; + incomplete data b. Number of cases c. Rate per 100 000 population d. lCD code * Exeept for Mac~o
..., .... 0== 00 " "'~n
~ n ~ N ~ ~
ij. ~
" <D
'" po

WESTERN PACIFIC REGION nATA BANK ON SOCIOECONOMIC AND HEALTH INDICATORS, 1982
Ten leading causes of communicable diseases roo~bidity in co~ntries or areas of the WHO Western Pacific Region*
Coun~/Area Ten lesdLng causes of morb~d~ty No. Name Year 5th cause 6th cause 7th cause 8th ceuse IIJth C.ause
(1) (2) (3) (ll) (12) (13) (14) (15) 1. American Samoa 1982 •• Total of all Other salaonella l.el>rosv Sh~_,-elloBl.S MuMpS
h~atlti8 infection b 15 9 9 8 8 c. 43 26 26 23 2) d. 003 030 004 072
2. Australia 1982 •• Viral he.tl8tititlo He~atitis B 8eru~ Q fever Ci8'1,diasis* Malaria
b. 1 046 725 616 548 437 c. 7 S 4 4 3 d. 070 010.3 083.0 001.1 084
3. Brunei 1982 a. Infective h'fi>atitis Rubella
h. 172 10) c. 86 52 d.
4. China 1979 •• Viral he~~titis Whooping cough Scarlet fever Epid cerebrospinal 1'ypbo~id. and lIenin2itis ivsratVDboid fever
b. 471 580 401 312 148 080 109 304 61 200 c. 49 41 15 11 6 d.
5. Cook Tslands 1983 a. Di8eas~8 of the Diseases of the Infec tious and Dis of the muscular SYmPtoms and i11-circulator s stem i&.enito-ur1na • • rasitic disease& skeletal system defined conditions
b. 85 83 60 49 47 c. 478 467 338 276 265 d.
6. DemocratIc Kampuchea 1973 •• Gonococcal inf+ Syphi lis & 8~q'" Pertu8sia+ Poliomvelitis+ Cbolera+ b. 427 376 372 197 159 c. 6 5 5 3 2 d.
7. Fiji 1981 •• Syphilis Chicken Q.OX Infectious Trachoma Pulmonarv hepatitis tuberculosis
b. 401 359 162 156 151 c. 62 55 25 24 23 d. 090-097 010-012
8. French Polyne8~a 1980 •• Chicken POX Gonococcal Dengue Other and Tuberculosis infection un6pecified sv~hilis
h. 900 995 565 I 182 65 c. 584 646 367 I 118 42 d. 052 098 061 I Q97_ - ---- __ 010-<)18 ____
10th cause (16)
Pulmona_ry tuberculosis
4 11
011 Shigellosis
(Shiaella infect* 344
2 004
Leptospirosis
27 462 3
Diseases of the n~rvous svstern-~
46 --l 259 ..-J
Rae-ilIa" dvsent+ 131 --2 ,
Food poisonini-
124 19
Viral hC!~atitis
50 n
- -Q70 ___
Legend: a. Name of diaea8e Note: + incomplete data b. Number of cases c. Rate per 100 000 popUlation d. leD code - Except for Y~cao
-
~:;: .. ~ i-" " eo M
~" ~
~ ~

"'-,~
WESTERN pACIFIC REGION DATA BANK ON SOCIOECONOMIC AND HEALTH INDICATORS, 1982
Ten leading causes of comtnunicahle diseases morbidity in c.ountries or ar,eas of tbe WHO Weste.rn Pacific Region*
Country J Area Estimated Scope of Ten lea.din& c.auses of morbl.dlty No. Name Year population Reference Data Itt c.auae 2nd cause. 3rd cause
(1) (2) (3) (4) (5) (6) 0) (6) (9) .
9. Guam 1982 101 OOu CHIP, 198, NOhfl.able a. 11l~uenz. Connol:' oe4 Other .e mone a diseases infection
b. 2 038 412 166 c. 2 117 428 172 d. 487 098 003
10. ROil!< Kong 1981 4 906 000 CHIP, 1983 Infectious a. 1le:8~iratorY Viral hepatitis Chicken EPX and tuberculosis
parasitic b. 7 347 1 738 1 140 diseases c. 143 34 22
d. 010-012 070 052 11. Ja,an 1983 119 260 000 CHIP revised Infectious a. PulmonarY Other food poisonina Influenza
by Gov't, and tuberculosis 1984 parasitic b. 57 401 27 513 26 143
diseases e. d. 010-012 005 487
12. Uribati 1981 59 000 Country Infectious a. Qp~er resoiratorv Dl.arrhoe.a. Lower respiratory Review by and tract infection tract infection CLO/Tarawa, parasitic b. 26 588 6 333 4 328 1983 diseases c. 45 064 10 734 7 336
d. 13. Lao People s Oem. Rep. 1980 3 461 000 CHIP revised, a. Ill-defined Influenza Malaria
1983 intestinal infections b. 50 223 36 742 25 854 c. 1 337 978 688 d. 009 487 084
It.. Hecso 1980 284 000 Gov't Re&- a. Pulmonarv Viral heoatitis Influenza pOnSf!S to tuberculosis WRSA Quest b. 1 108 225 44 1981 c. 390 79 15
d. 011 070 487 15. Mala),sia 1983 14 863 000 CHlp revised a. Malaria Tuberculosis Measles
by Gov't, 1984 b. 19 019 9 361 9 313
c, 128.50 63.27 62.92 d, 084 018 055
16. "uro 1980 7 300 SPEHrs 1980 Notifiable •• Den ue Gonorrhoea Hel)atitis viral diseases type B
b. 538 51 42 c. 7 370 699 575 d. - O~l~ __ - 098 070.3
Legend: •• Name of disesse b. NutllbE:r of cases c. Rate per 100 000 population d. lCD code .. Except for tiacao .... PerSons affected (outbreaks, 175)
4th cause. (10)
Ch1.cken pox
144 150 052
Other food poisonini (bacterial)
666*" 13
005 Gonococcal infection
12 291
098 Sores/wounds
3 440 5 831
Other diseases of the lunst~
9 928 264 518
Pneumonia
30 11
Conococcal infection
4 762 32.17
098 Measles
10 137 055
"'"".., 0 •• 0> ~ '" . ~ • " --i~
• ~ '" '" ".

WESTERN PACIFIC lEGION DATA BANK OK SOCIOECONOMIC AND IlEALTH INDICATORS. 1982
Ten leading causes of c01D!:Dunicable diseases morbidity in countries OT areas of the WC Weste'rn Pacific. Region*
Country /Area Ko. Name Year
(1) (2) (3) 9. Guam 1982
10. Hong Kong 1981
11. Japan 1983
12. Kit'ibati 1981
13. Lao People s Dem. Rep. 1980
14. Macao
15. MalayS18
16. Nauru
1980
1983
1980
Name of disease Number of cases
5th c.ause (n)
a. Shigellosl.s
b. 49 c. 51 d. 004 s. ShiR.ellosis
b. 563 c. 11 d. _OQI< ... ltaasles
b. 7 281 c. d. 055 a. Coniunetivitis
b. 3 430 e. 5 814 d. a. StrePtococal sore
throat 6 scarlatina b. 7 211 e. 192 d. 034 •• Ioseill.
d"y8enteTY_ b. 15 e. 5 d. a. Hump"
b. 3 508 c. 23.70 d. 072 a. Svnbilis
b. 8 e. 110 d. 090-097
Legend: a. b. e. d.
Rate per 100 000 population ICD code
'It Except for Macao + Imported cases
6th cause (12)
Tuberculosis lomona
41 43
011 'r"rDhoid and
~ra~yphoid fe-vey 500
10 Qj!2
Otber tub«rculo81 •
6 388
013-018 Skin infeetiOllS
2 156 3 654
Amoebiasis
6 667 178 006
Tuberculosis of other organs
13 5
017 Viral bepatitie
3 346 22.61
070 Shiaellosis
6 82
004
TeD lea4l.ng causes of IIOrbidlty
7th ~)u$e 8th Cause 9tb Cause (13 (14) (15)
OtbeT f 1Son- Giar<ha8is Be~~h.8 viral ~hacterul
Z9 25 18 30 26 19
OOS 007.1 070 Tuberculotd. of Measles Malaria
other. ~ns 314 249 62
6 5 1 014 Glf!:\t18 137 055 084 Otber .. ~lla Whooping cou.th __ SnMlia
n eet101l 3 612 2 459 1 687
003 033 090-097 Otitined.ial c.-uuicab1e Anaemia
perforation 4i8.ases 1 156 817 466 1 959 1 385 790
~Intestinal infect. Shil.ellosis Pu11DOn~rr 4ue to other 0 anill" tuhe'Uulons
5 793 4 768 4 587 154 177 122 008 004 Gll
Heasles Acute Ot1\ ... Gastroenter1tis .....2....~n.ia
9 9 8 3 3 3
Qai_c~ Cholera id fever aud ~r.~id fever
3200 2 195 1 2:t3 21.62 14.83 13.19
053 001 002 Coajunc.tiviti8 Fish poisoning _~titi' viral
type A 5 5 4 ~ 68 59
372 8865.2 070.1·
lOth cause (16)
Measles
9 (6. 9
055 L!2.Fo!I...
55 1
030 Shigellosis
1 579
004 Fish ..£..oisoni!1L
443 751
Pneumonia or&..an-ism uns eC1fied
4 308 115 486
Tetanus
4 1
031 Oth food~8oni!Y
_....1bae-te:n.al 1 582
10.69 005
Salmonella infect oth thantyphoidJ
1 14
003
~;?~ .. ~ "'~~ ~ O~M
V ~
::g ...

WESTERN PACIFIC REGION DATA BANK ON SOCIOECONOMIC AND HEALTH INDICATORS. 1982
Ten leading causes of c01L'III1unieable diseases morbidity in countries or are.a of tbe Wt10 Weateirn Pacific lle:gion*
["No. 1(1) ~Ne"
118. Ne~
1 19. -Niue
'1 (Area N.me (2)
Estimated Yea'll population I Reference . (3) (4) (5)
119801 - 14lr-500 Go"..--Responses to WHSA Quest. 1981
11981
\1980
3 175 OOOICHIP by Gov't, 1983
3 226fGov't Res-to I WHSA Quest:
1981
I 20'-P;:pua New Cuinea 119ijzr 3 329
iby GoV't. 1984
I 21. 11982\ 51 276 ooOICHIP by Gov't J
1984
22 ~ Republic-ofKorea 119821 39 131 OOOlCRIP
23. Samoa 11932
24-: \1980
by Gov't. 1983
15} 420lliPR Dat. Bank updated by -April 1983
2 403 000 Gov't Res-to
IWBSA Que.t 1962
Legend: a. Neue of disease b. Numbe~ of C.Ses c. Rate per 100 000 popu l.1tion d. lCD code * Except for Macao ** Sec.-e notifi.ble {rom June 1980
~ope of nata 3.§l
I.
lst eause (?)
Ten- Issci. c..taae& o.f
2od(~).. r -~;~lJSe 4tb cauee (101
diseases I :± I b. 796 762 577. .534
and l.nfeetiooe acter1al ~infeetlol1** ~ paras.itic b. 1 145 845 532 442 diseases c. 36 2.1 11 14
-
,lll.t:I;L.J.UU5ia. ViJ'.l llep A Sal~11a - other -{ood-1)ohon1.Da c.mpvlobacter
d. I
~ ~ ~ ...... and
,otifiable~. 49 ill ==r 43 l 3 T l ..a.! ------ c. 1 493 1 3 ......
c! a
tract 1ufection and colit1& I D. 447 831 364 783 353 4&3 00 923 Ic. 882.2 _I 71a.6 I _~ 1- 59C8
.t.m:et:LLuus+;.pr~~a_tub~rC'!l108'L~ _____ ~ro_~ ___ L ____ Measl-.!!s ______ l Mump. and 'J!. i
parasitic ~ 154 340- _. - - - 2Tll6O 6 776 1 487 I diseases c. 392.4 68.8 17.2 3.8 ..J
C!. 010 0:><>. O~_ 072 ~. ItlJluen~a Qtber di8. of t:1Ie Diarmoea. lJre8umed Conjunctivitis
dise.ases • tea iDfect (cbild;
I ~ c. :f 175 2 002 1 168 J.. 1.6 1 __ 7.1.,7 7 419.
8 5 000.5
.Jl<I9 .... 3----.1 _ 372. "'II.I."''''',L~U;
Iii. ra: ----Gonococca.l Putman." Other 4
nd infection tuberculosis ••••• itic b. 3 409 2 562 --T---~ 330 - ., 1 07· diseases c. 142 107 91 I 4 ...
_d. _ _ _098. _ 011 J. 0991 ...u.n
~ >q: .= ~ "'~" ~ " ~~ ~ ~
lJ. ~ ~
'" '" ~

I No. (1)
17~ New
pe-. New
19. Niue
N_ <2l
WESTERN PACIFIC REGION DATA BARK ON SOCIOEOOMOHIC AND REALTH INDI~toRS. 1982
Ten leading causes of caamunicable diaeaaea morbidity in eountrie8 or areas of the WHO Weatetn Pacific Region.
5th cause
h*Efr-17--u: (11) ~
.ed
~ 573.1-573.3
11981 la. Viral he'Patiti9 B
lb. Icc
L-!! 11980 \!.
-317-
_11
6th c.au •• (12)
67 if
II
TeD 7th eau ••
(13) ~~.1!.--
147 105 ~.2
tubercul~i_
_~J! 8
Viral
of 10< ~e.u.e
_(14)
_~yc
_265 8
O.bet" foool
r'; 8 i Z c: g41 248 93 ~ <I. 52 098 0 005
!lith cause ~5'
)8is
173
----2-
10th c.ause (16)
...lE:.feet (infantile)
009.3
102 ~
D~ t 2D. Papua liew Guinea
!: __ if! _ _ __ i_4!~ _ _ ___ 1: ________ ~ 11982 r Sy'tllio Per.uuia I Pilbel' I or_ ~liti_.!.
~ 4
~ '1982 a. Pnewortia Tuberculosis· Malaria ~~Dtery. all fo_ aU fo_ I
,b. 134 928 127 720 40 915 ". 448 I 26 701 I 17 919 _1 c. _ ~ _ 251.6 -'!Q,~ _ _ __ _ --2!&.-__ ..L 52.6 35.3 I ~ I 22. RePUblic of Kon. r-1982 ~ Mosquito bo~~_l_ -~ig~~~u.h-- __ ~L~~i!i ~ JLI~@-_r~~~~_qcoe~@l~ore
_1~71- -,00 - 1 u31Seftr j~~~~ ___ L __ ~ ___ L ___ ~ .!'..!.. 1.0 - T - -----I.8 ~r=__=_---o.g--=r - ---O~2 1 0.1 1!.Q4_
113. Sa..,. - - -- - - - feetiOUtt .i ...... 1 _.qItcOllt.aae.oue: t:ua -rurv- of blood ves
f24.
498 492 372 3711 .- 511.5 I 3)0.9 )1~.3 312.5236.3 • I
34 I 46 I 01 42 009.3 50 I 1982 t,.. Viz-al bepat1tiB 1 Ch1Ckb~ __ :l-_O_~_her food CPuJiuu Late .VDhlli. latent Me_alea
Leatmd: a. .... of 4i ..... b. Number of ca.es
~'):-----1-00r-- 932 -569- - -- - 557 493 4'0
•• 42 39 24 23 21 20 d. 7_ O~. 5 H2 ___ 096___ 055
c.. late per 100 000 ~\ll.tiOtl d. Ic) code * Except for lVcao
~l~ "'"" • " ~ ... i'" .. " ~
-~---

WESTERN PACIFIC HEGIOII DATA BANK ON SOCIOECONOMIC AND HBALtv IKnICATORS. 1982
Ten leading causes of communicable disea8es morbidity in eountries or areas of the WHO Western Pacific Re&ion*
Country/Area Estimated Scope of Ten leadina causes of lIlorbidi~ No. Na ... Year population Reference Data 1st cause 2nd cause 3rd cause
(1) .(2) (3)' (4) • (S) (6) (7) (8) (9) 25. Solomon Islands 1980 22S 200 SPEHIS •. 1980 Notifiable e. lnflftllza Diarrhoea .presumed Coniunctivitis
disease.s infect child-adult b. ~ "l~ .'i..1I.~. c. 77 ... 2 726 2 122 d. .a7 9<19. 3 72
26. Tokelau 1981 3 000 Annua.l Report All causes a. IDfluenza Infections of skin & Gastroenteritis on Heal th 8ubcutaneous t~6sue Services, lb. ~ --""- ~ 1981 e. _ .... ~L». 282 3 1l~
I"· 27. Tonga 1981 98 000 Report of the Notifiable a. IltfloeaZ4l Con 'unctivities GaatToenter1t1s
Min of Health diseases . for 1980 c. 8.'24 616 2 379
28. T T of the Pac1fic Is 1982 142 000 SPENIS, 1980 Notifiable e. In---.!.loenza Amoeb1.8S18 Gonococcal diseases , 1n ect]"on
b. 9 '13 780 435 c. 0 ... 1 '49 ,06
Id. ...'!."'- 006 ~ 29. Tuvalu 1980 8 000 SPEHIS, 1980 Notifiable •• Infhteuza DiaYThoea, presumed Measles
diseases infect lchild-adult lb. IZ ~ C. 48.800 .~ .• 67 ...'!.~
Id. .... 7 00 •• 3 uS, 30 Vanuatu 1983 130 000 CHIP revised Infectious .. Iofloenu. tll-defined Halarl.s
by Gov't, and lntestlnal lnfectl.o'n 1984 parasitic b. 33 000 22 000 19.119
diseases e. l) "
11 ,.7 iO »7 d. 4l!1 009 084
:H. Vl.et Ham . 1980 53 122 000 WPR Data Infectious •• Influenza DIarrhoeal d~seases _~sente!'.Y Bank updated and by WRC, parasitic. lb. '11 7... ' .'.'" ~"- .~~3 Hanoi, 1983 diseases e. 691 b~1 2,.,>
I'" "7..-...4 ~ 32. Wallis and Futuns 1980 10 800 SPEHIS 1980 Notifiable •• Influenza Measles Conjunctiviti.
diseases b. 2 31)7 342 191 e. . L • . "'". ~ . d. 4111 055 ~2
Legend; s. Na'lM" of diae..sse b. Number of cases e. Rate per 100 000 population d. leD code
* Except for Macao
4th cause (0)
Infantile diarthoea
~ . 1 533 Q<J9~
8rom:tliti.
~ ~
In;.snt11e larr oes
1~
ChIcken LOX.
1~ 12.
lDiarrhQea presumed infect_~infantl.l~
Hl
2...=. Ou9.3
Measles all forms ~ ."2 05)
Malaria
~1 928 2.!.1 ~ • De~ue
21 -,,. UbI
w..,.., o ~ ~ .. " r ~ ~ " ~~ II ~ .,. B
" '" "" ~

WESTERN PACIFIC REGION DATA ~ ON SOCIOECONOKIC AND HEALTH INDICATORS, 1932
Ten leading causes of communicable disease. morbidity in countri~a or aTeas of the WHO Western Pacifie Region*
Country/Area No. N .... Year 5th C.&l.ls,e
(1) (2) (3) (ll) 25. Solomon Islands 1980 •• Measles
b. 340 e. 151 d. 055
26. Tokelau 1981 •• Other d~.ea.e of the di2estive ~!stem
b. no c. 3 667 d.
27 Tonga 1901 a. DepEue
b. 1 362 c. 1 3,,9 d.
2B. T T of the Pacific 18 1982 a. Strep sore throat and scarlet fever
b. 117 c. 82 d.
29. Tuvalu 1980 •• Whooping couk;h
b. 230 e. 3 067 d. 033
30. Vanua .1 1983 a. Viral benatitie (uncOtlfinaed) -
b. 340 c. 266 d. 070
31. Viet Ns.;- 1980 a. ArtbrQPod borne baemorrhaaic fever
b. 68 990 c. 128 d. 0.7
.2. Waills and Futuna 19tiO a. Hepatl.t.18 vl.'rel type A
b. 4 c. 37 d. 070.1
Legend. a. Naae of di8ease ~. Nuatber of casea C'a late per 100 000 population d.. ICD code
* • Except for Macao Bacteriologically confi~
6th ~au8e (12)
GonoT-rhoea
213 ~,
098 Observat1one and
investigations ~4
3 133
Broncho Pbeumon~.
1 120 1 139
Cholera
108+ 76
Conjun~tivitis
215 2 867
372 Tuberculosis, all forms
171 133
010-018 Whoopiua cough
67 318 125 033
Syphilis
3 28
90-097
Ten lea~iQl; eauBeF of aorbiditv 7th cause 8th: cause 9tb cause
(13) (14) (U) He .... ti tj.o PulloonaT1/ te'Ptosoi'Cosis
un8'OeC1fied tuberculosis 168 170 118
75 75 52 573.1-573.3 010-012 100
Oth dlS of akib • I luauatoTY Ana_l..& lub~ut4neOU6 tiSsue dzaeaae of tbe ~y~
78 70 ~9 2 600 2 333 1 %7
Adult Glll1:'rooe.. Ch:l.cken po¥ Measles ~morbilll
480 302 187 488 307 1)111
Fish -poilSODiq tUberculosis. all Repat1tis fOnls infectlou8
10J 99 43 73 70 30
E81>5.2 ShiKe 1108 is 'Fi_ ooi.oning . De""""
43 27 IS S73 360 200 004 £165.2 061
L~~os:r Whooping.cougb De9.&ue \.active c •• es)
100 - 200 30 -78 - 156 23 -
030 033 061 Measles APe K_a
57 991 )2443 23 3!16 108 98 44 055 072
Pu lmoD.ary Aaoebu.sis Gouon_ tuberculosu
3 1 .1 28 9 9
010-012 006 098
lOtb caUf;e (16)
l.epr'OlIY
40 18
030 Pn~~.
10 333
Lobar ,. 168 111
01
34 %4
030 Pu.~t'Y
tuberculosis 12
160 00-612
Other. and uuapeeifi.4 aypbili. --
097 Cbi
19 2 )7 2
" I 9
030
'" ...... 0 __ .. ~ :r~" n ......
i'" .. ~
i

WBS~RN PACIFIC REGION DATA BANK ON SOCIOECONOMIC ABO HEALTH INDICATORS, 1982
Ten leading causes of communicable diseases mortality in countries or areas of the WHO Western Pacific Region
Country/Area Estimate.d Scope of Ten le.adi.ng C.a08~S of morcahty No. N .... Year population Reference Data h:t cause 2nd cause 3rd cause (1) (2) (3) (4) m (6) (7) (8) (9) 1. American Samoa 1981- '81 34000 CHIP revised All a. Cardiovaseular A.t.cident8 cancer
1982 '82 35 000 by GoV't, Causes disease 1984 b 26 18 13
c. 82 55 46 d.
2. Australia 1082 15 176 000 CHIP revised All a. Acute mYocardial Cerebrovascular Other ischaemic hy Gov 1 t, causes infection diseases heart disease 1984 b. 23 161 13 977 9 184
c. 153 92 61 d. 410 430-438 411-414
3. Brunei 1982 200 000 CHIP revised All s. Svurotoms and ill- Cereb accid incl all Accidents - all by Gov't, causes defined conditions forms of h~art dis forens 1984 b. 279 159 80
- e. 139 79 40 d. 114 1127-1133 1150-1152
4. China 1979 970 920 000 Government CD only s. Dysentery Measles Epidemiological letter meningitis 6 June 1980 b. 6 330 5 931 4 903
c. 0.7 0.6 0.5 d.
5. CQok Is lands 1983 18 000 CHIP revised All .. Diseases of the Di8eases of the NeoplasltlS by Gav't, causes circu1.atory system respiratory syst&m 1984 b. 42 20 13
c. 237 . 113 73 d.
6. Democratic Kampuchea 1974 7 888 000 World Health CD only a. ChG-1era Statistics b. Annual 1976 c. 14
d. 0.2 7. Fiji 1978 607 382 Gov't Resp All a. Ischaemic heart Senility Other disorder of
to WHSA causes disease heart rhythm Quest 1980 b 613 303 231 on Causes c. 101 50 38 of Deaths d. 410-414 794 427.9
8. French Polynesia 1978 142 000 'Sul1etin CD only •• l1enin2itis Tubercul 0$ i s others R.espirat:ory Hensue 1 des tube.rculosis Maladies b. 3 2 1 1979 c. 2 1 0.7
d. 320 013-018 010-012
Legend: a. Name of disease b. Number of CAse. c. Rate per 100 000 population d. lCD code
4th cause (10)
Cerebrovascular dise.as.e
11 24
Mali~ant neo~lssm-trachea bra & 1un2
6 031 35
162 Hali20ant neo la.me
70 35
1113-1120 Ep idetlliologic<ll
encephalitis 2 031
0.2
Endocrine and metabolic diseases
10 56
Symptoms and i11-defined condit10ns
216 36
780-783'795'796 Diphtheri.
1 0.7
032
"' .... 0 •• GO ~ :r"n " ~~
~ '" ij. ~ N
'" '" ...

WESTERN PACIFIC REGION DATA BAKl,~ SOCIOECONOMIC AND HEALTH INDICATORS, 1982
Ten leading causes of communicable diseases mortality" in countries or area. of the WHO Western Pacific Region
UOunt.rY/Area - - - r--- - ,-----Ten ludina. causes of aortali~
No. Name Year 5th cause 6th cause 7th cau.e 8th cause 9t.h cause Ill) (2) (3) (ll) (12) (13) (4) OS)
-1. hnerl.can Samoa 1981- a. ChroPl.c pulmonary Pneumou18 and. Dl.seaaea ~t Boaic.l.Cle SU1C:ide 1982 diseases influenza newborn infants
b 7 5 5 " 4 c. 28 12 16 9 8 o.
2. Australia 1982 •• Other forms of Motor vehicle Malignant neQP1 .... Bronchitis Malignant neapl ... heart dl.sease traffic accidents of colon blDhveema 6. asthma of female breast
b. 5 337 3 364 2 708 2 35lL 2 117 c. 40 22 18 16 13 d. 415 416 420-429 810-819 153 490-493 174
3. Brunei 1982 e. Re.@'p.iratc)1;y Septicaemia Other o-erinatal Tuberculosis All other diseases conditions causes all foms
b. 45 22 21 20 16 c. 22 11 10 10 8 d. 1134-1136 118 847 B5 »6 849
4. COina 1979 a. Haemorrba~ic fever Diphtheria Viral heoatiti. LeotospirQsis WhOODiP2 coulth
h. 1 459 1 292 1 103 805 715 c. 0.2 0.1 0.1 0.08 0.07 d.
s. Cook Is lands 1983 a. Symptoms and il1- Cert eond orig in Infectious and Injur1e. and Diseases of the defined conditions perinatal oerlod araaitic diseases 1)Oisoninr. diaestive svstem
h. 10 5 4 4 3 c. 56 28 23 23 17 d.
6. DeftlOC ra t ic KaDtpuchea 1974 a. -h. c. d.
7. Fiji 1978 a. RYPl!rtenaive Otqer cause.s of Diabetes mellitus Othel" ~ewaonia --'!!ysent~ry
dl.seases perinatal mortalit unspecJ..fied b. 208 203 185 174 89 c. 34 33 30 29 15 d. 400-404 760-763' 769' 250 481-486 009
773· 777-779 8. French Polynesia 1978 •• Diarrhoea- Leprosy
infantile h. 1 1 c. 0.7 0.7 d. 009 030 -- --
Legend: a. Name of disease b. Humber of ca.es c. Rate per 100 000 popUlation d. lCD code
"'I"" o • " Ii' m .-
~ ........ ~o m ~ -10th cause
(16) '" '" .. CoNlenltal anOMalies
3 12
Pn:euaonia
1 995 14
480-486 Cogell~tal abnonaalities
1_'_ 6
849 InflUenza
364 0.04
Diseasea of the nervous Ivstem
2 II
Cerebravaseular d. •
8 13
430-438
.... ;"'"~i$tfffi W· Wbm

WESTERN PACIFIC REGION DATA BANK ON " SOCIOECONOMIC AND HEALTH INDICATORS, 1982
Ten leading causes of ~ommunicable disea$es mortality in countries or 8~eas of the WHO Western Paeific Region
Count rv I Area Estimated Scope of Ten ieadina causes of ~ortality No. Nam. Year popul«tiQt\ Refe.rence Data lac cause 2rtcl «ute 3'rd caust 0) (2) (3) (4) (5) (6) 0) (8) (9) 9. Guam 1981 100 000 CHIP l'eviaed All a. Dises.aes of !ta11 ueo 14 ..... Cerehra9a.cular
by Gavlt, causes the heatt .11 sites d18eaae 1983 b 96 58" '1
c. 103 62 33 d.
10. Hong Kong 1981 4 906 000 CHIP revised All 8. Mali.anant Heart diseases inc! Cereb~ova6cul&r by Govtt, causes neoo:latllls hyper heart d~se8se disease 1983 b. 6 586 3 829 1 252
c. 128 74 63 d. 140--208 390-429 430-438
11. Japan 1983 119 260 000 CHIP revised All a. Mali2.nant Cerebrovascular Heart di .. eases by Gov't, c.auses neop~asaas di.~a.e8 1984 b. 176 174 145 81>1 132 217
c. 148.3 122.8 111.3 d.
12_ Kiribati 1980 58 000 GHIP r~vised All 4. Dis of oth parts of Tuberculosis Intestinal by Gov't. c.8.uses the d igeative &.l'~tem infectious diseases 1981 b. 15 14 13
c. 26 24 22 d. 5'0--579 010-018 001-009
13. Lao People's nem_ Rep. 1971 3 033 000 CHIP revised All 4. Male:ria Uri -bronchi tis- ertendve 1983 causes RriltOe ~Jt\eu-.ot'1ia disea8e.
h. 208 56 48 c. 7 2 2 d.
14. MacaQ 1983 300 000 CRIP revised All a _ Seni litv wnhout CeTebTov8acuiaT Tuberculosis of by Gov't., causes mention of psychosis diseases re.pirat~ry ,yatea 1984 b. 213 168 94
c.
· 15_ Malaysia {Pen~nsular) 982 14 500 000 CHIP revised All s. Heart disesses Accidents D'1seaeea of by Gov't t causes earl y infancy 1984 ~ 2 912 2 373 2 129
c. 2.67 2.18 1.95 d.
16. Nauru 974 7 000 Hot'ta 1i ty. All a. Cardiov8scu111r Iniu~ Senility Morbidity b causes diseases Epid Stat., · 11 10 3 MOR, Nauru. · 157 143 43 1975 d. ABo-A88 AN138-AN150 A136 -"
Legend: B. Name of disease b. Number of eases c. Rate per 100 000 population d. len code
4th cau,e (to)
All othe~ accidentE
26 28
Pne'UlDOnia all fOt1ll8
2 133 41
48()-4116 Pne~ ... and b~b tu 46672
39.3
~h diseases of thE respiratory sy.tem
11 19
466 480-519 Tubet'c-ulosi. -
an fo .... 45
1
Mal neo of trachea broncbu8 snd lung
76
Neo .... 1 432
1.31
'DiHaH'" ().f the re."irato.rY system
2 29
A89-A9~
.." ... .., O&\!; 2"" 1'1 "' .. t~ • .. ~ .,.

•
WESTERN PACIFIC Rl!GIOli DATA lIANK ON SOCIOECONOMIC A\OI) HEALTH INIllCATORS, 1982
Ten leading causes of communicable diseases mort~lity in countries OT areas of the WHO We8~ern Patifie Region
Count" I Area No. N..,. YeaT
(l) (2) (3) 9. Guam 1981
10. Hong Kong 1981
.
11. Japan 19.3
12. Kir1bati 1980
13. Lao People s Dem. Rep. 1971
14. Hale-eo 1983
15. Kal.ysia (Peninsular) 1982
16. kuru 1974
1-----
Legend; a. Kade of disease b. ....ber- of cases
5th cause (11)
•• Motor veh1.cle accidents
b Zl c. 23 O. a. Iniurv & Doieoni
b. 1 943 Ie. 38 O. 800-999 a. Senilit wl.thout mention of ~syehosi$
b. 29 394 c. 24.7 d. a. Cerebrovascular
diseases h. 7
•• 12 d. 430-435
4. Diarrhoea
lb. 44 e • 1
· 8.. Ma1i5tllant neapl ... of other .ltes
· 69
· · · cardiovascular diaeae.-.
lb. 1 402
· 1.29 10· · Bacterial
infection
· 2
· 29
· A5-A21
c.. Rate per 100 000 population d.. lCD code
6th C808e
(12) Cirrbo81B of
h.ver 14 IS
Ne h:riti& ne Tot Ind & ~pJlro8i.
851 17
580-589 Accident.
29 458 24.8
Tr8.nsQDrt Becl.dents
7 12
E800-B848
Prematurity
38 1
Bronc:h chron IruDsJl e1Il~b: aeaa ,. aatha.
59
Pneumonia.
612 0.56
Diebete8 ~11itu.
2 29
1.64
Tep le8di~ cause. of 1Iol"t~i~ 7th cause 8th caulS!!! 9th cau.e Ivth cause
(13) (14) (15) (16) Baaic.l.de O~h d18.ases of the Dlabetea .el ltU3 Certaln causel oj
central nervous 8 8 mot'tal-ear!I.. lnfar 12 12 11 9 13 13 12 10
B:ronehitie ehron & bereulo.is iinel c.rtain ~ orl~_ ChrouL: liv~r Wl.I!'PI _~_ & ... tb late effel!'ta of T8 in_periut.l riod . diJea It cirrholi
610 489 441 ~ 13 10 9 1
490-493 OlO-ell8 137 760-779 571 Su1cide Ci Trlloa iL of the ~eueift L~p~r.ltJ.. ll.~ro
liv~r diseases !IPdrome~~hro.i. 24 97() 16 795 13 482 12 260
21.0 14.1 11.3 10.3
Diseases of the Di8 of nulm eire , Nutritional O~h l.tllUl'ie8 .ar!.l nenoU8~8tem oth form. heart die 4efieumc1e. ~~1 ~~ traUJ&l
6 6 5 5 10 10 9 9
320-359 4!2-429 260-269 910-929 958-959 99()-995
Avitwnoses/ Meni~o- l1.!iuriea Choli~./chol anae.ia encephalitis a'06 C1rr
31 29 20 1& 1 1 0.7 0.5
Acu.te lQ'oeardial R erten.i~e dilease Pne.ooooia E1D.bolilnll c:b'E'OII:I did infarction of art ~llar~e.
57 56 44 38
Tuberculosis Di8eases of liver ca8t~oetlteriti. Deficiency_ ~.e5
503 297 117 143 0.46 0.27 0.16 ~.14
.
_ L-------~-- --
,"" .~'-
....... 0" .. GO ~ ,,,. " • ~~~ ~ -i

WSSTEKN PACIFIC REGION DATA BANK ON SOCIOECOllOll1C AIID IlEALTH INDICATORS, 1982
Ten leading causes of communicable discases moytality in countries or areas of the WHO Western Pacific Region
Countr .Area Estimated Scope of Ten leadill& causes of 1DOrtalit~ No. Name 'Year population Reference Data !at cause 2nd cause 3rd cause (ll (2) (3) (4) (5) (6) OJ (8) (9) 17. New Caledonia 1978 142 000 Cl:ilP revised All a. __ ~fail1ance cire Tumeurs ma 1 ignes Traumatismes d~ver.
by Govtt, causes ou rea iratoire 1983 b 5~ 48 46
<. 39 34 32 d.
IS. New Zealand 198D 3 144 000 WHSA 1981 All a .. Otb forms of heart Other malignant Cerebrovascular Vital causes dis & ~rten8ion neQpJasms di •• ase Statistics h. 8 841 4 332 3 158 & Causes of e. 282 1~ 101 Deaths d.
19. Niue 1979 3 700 CHIP rev ised All •• Pneumonia Influenz!L Russian CeTebrovascular by Govlt, tauses disease&. 1983 b. 4 3 2
c. 108 81 54 d.
20. Papua New Guinea 1980 3 006 799 Gov't Res- AU o. Ot.h dis of the Disuses of the Rickettsiosis & oth ponsea to causes respiratory system ner'¥ous By_tem arthrQpO~-borne di. WHSA Quest h. 1 ~3 270 251 1981 c. ]4 9 -"-d. 32 22 05
21. Philippines 1982 51 276 DOO CHIP revised All •• Pneumonia Toberc.ulosis - Heart diseases by Gov't. causes .11 forms 1984 b. 40 965 ,0 559 18~
c. 80.7 40.5 37.1 d.
22. Republic of Korea 1982 39 331 000 CHIP revised CD only .. Diphtheria Typhoid fever by Gov't:, b. - -1984 c. - -
d. 23. S&lUoa. 1982 157 420 W'PR Data All a. Sign symptom and Poeuaonia Diaeases~l eire
Ra.nk updated. causes ill-defined o-tb fol'lU heart du by CLO/Apis) b 69 25 23 1983 c. 43.8 15.9 1'+ ___ 0
d. 46 321 28 24. Singapore 1982 2 472 000 Gov't Res- •• Cancel" I.chaeaic sud other CerebrQvascul.ar
ponses to heart diaea.es di.eases WHSA Quest b. 2 722 2 661 1 .. _6 1981 c. 11 11 6
-_._--- -- - - -- -- - 4. J4()-~S, 2l12-2~_ 410-414, 415-429 430-438 - ---
Legend: a. Name of disease b. Number of cases c. Rate peT 100 000 population d. ICD code
4th cauae (0)
Malad,es cerebro-v88culairea
33 23
Mal ne'?lL of bronchulS tu1!&.. and trachea
1 133 :
36
Accident - drowning
2 54
Dis - .....£...ulmona ~ eire & oth forme. hrt di.!
2100 8
28 Mal!£nant n.~.8111.s
9 290 18.3
Poisonin..s: sod toxic ef~ eet
2 ~
53 PneumonUI
1~ 6
480-486
........ ., ... f'-:~ " ..., .. ; .., .,. ~
" l!l .,.

WESTER. PACIFIC REGION DATA BANK OR SOCIOECOMOHIC AND HEALTH INDICATORS, 1982
Ten leading causes of communicable diseases mortality in countries or areas of the WHO Western Pacific Region
I flo.(1) 17. New
i 18. New
I -iI9 •• ~
"/Area Name (2)
20. PapulI. New Guinea I~--·-
1 21. Phi
[22. oX-KOrea
Year (l)
11978
Ie.
1
1980 ~. b. e.
11979 lao
[1980
~ ~
1 1982 •• , -
e" c. ;r:
f1982 a. h
5th cause (11)
1 105 35
1 27
,itia
-
bth cause .. JJ1L
Other via lent d'taths
1 052 34
!<eapi ....
1 27
in .... l ___ t- Certafn COM ori~ _1 in r1utal oer1.od
236 - -- -\. 220 7
4S H8-a~ Accidents
-8 680- 8 528 17.1 16&
Tel 7th cause
(13)
a~c1.4entl -
§22 20
Heart
1 27
Tuberculol!iis -
161 i -02
Bronchitis
4 670 9.2
8th eauae (4)
--r-- -459
.../. 15
-1
27
Other --
f 141
- .... -- -0:
A~tamino.e8 6 ot:h nutr'J:.tiQQl dllLf
3 141 6.2
-
23. SaUloa 1982 I~ lrt: .J.Acut.e but. ill-def T I1lteatillal
24.
Ib:-
- 1982 ~. Ac' _ i &
~.
~
-I fG. 18G0-94,
Legend; &. Name of disease b. Number of caseS c. Rate per 100 000 population d. lCD code
10.7 -r -, itu!l.
361 1
lli..
-Linfeetious di.eases
10.7 10.7 293 01
HVMrtensive Jle:Dhritis and eli.ease ne»b
283 _ U8 1
401-405 -I 580-58
9th cause <15)
-iHabetes Mellitus
446 14
Asthma
-1
Tf
10th cause D6l
~~~ self-
37
1 '"P
Jl>is of otb arts of Si 8
digestive system ill-defi!!id cond-1 -5- - T--4
34 ,ee of tbe
!ut. r.sp,rato: syat..,
G1lronic liver di: and eirrlioais of d.iae.tive_ sys.
IS 9.5
l' ...J. -8.2
Tube_t'Culosi_5 T -Bronchitis
, 205 -, -19
>g; ~ '" $ .. ~ n ..... ,~ .. " i

WESTERN PACIFIC REGION DATA ~ OR SOCIOECONOMIC AND HULTH IIll>ICATORS, 1982
Ten leading causes of communicable diseases mortality in countries or areas of the WHO Western Peeific legion
Countryl Area Estimated Scope of Ten leu' causes of aortali~ No. Nam. Year population Reference Data bt cause lDd c_e 3rd cause (0 (2) (3) (4) (S) (6) (7) (8) (9) 25. Solomon Ialands 1977 207 000 CHIP revised a. Certa1u cond arig TuberClJlo.a ia »eart diaoTders &
1980 perinatal oeriod ca~diovascular di. b 17 12 9 c. 8 6 4 d. Al31-A135 M.M '"0 A82-A85
26. Tokehu 1981 3 000 Annual Report: All .. Ce~~brovascular ~ia Otb d1eease. of the on Health causes di,eases diautive '.7Ii1tetD
/ Services, b. 2 2 2 1981 c. 67 1>7 67
d. 27. Tonga 1980 97 000 Report of a.Nepbritl.S nepht"otl(; Pa~l.a Dlabetes mell1tua
NOH for 1980* ~~drome & ne~h~osis b. 22 17 16 c. 22 17 16 d. 350 321 181
18. Trust Territory of 1961 138 000 1979 Country •• Diaease of heart a.it>l' _i""""t Dia'uboeal and, the Pa~ific Islands Heal th Report - ~nte.tLnal di.eaees
for 31st WHO b. 55 "1 39 ltC!!, 1980 c. 44 "2 31
d.390-398 402 410-429 }4I)-209 210-239 004> aD. 008-009 29. Tuvalu 1980 8 oaa Ministry of a. Stillblrth Corooary ~art Livet' failure
S.ocial Serv. J diae:u.e. liealth Div. b. 4 3 2 Ann Rep 19S0 c. sa 311 2S
d. 766.1 414.0 572.8 30. Vanuatu 1983 130 000 CHIP revised •• Cast roenterit is Tct'UlU8 Infectious h~p~titi8
by eov't, 1984 b. 19 2 1
c. 5 1.6 0.8 d.
31. Viet Nam 1980 53 257 000 WPR Data Bank All •• toteritis AY1ta.iDO.~S & otb Bacillary dYsentery updated by causes ... tr).tlOOlll de! aDd aoebiasis. WRC , Hanoi. b 2 003 14~ 1 347 1983 c. 4 3 3
d. A5 A6S A4 32. Wallis and Futuna 1972 10 OUO Fifth Report 8. Birth injury: etc. llea:r1: diseases Pneumonia
on World Health Situa- b. 18 10 6 tion 1967-72 c. 180 lOP 80
d.
Legend: a. Name of disease b. Number of c.tes c. Rate per 100 000 po?ulation d. lCD code ~ Medically certified
4th cauae (0)
Pn8'01IMmia
9 4
A91-A92 Menit1R.itis.
1 33
IschsE!1II.ie heart diseaAe
1> 13
027 Chron obtcr pul 6i. & allied eoadit1ODS
)5 28
490-~96 Amoebic dysentery
1 12
006.9 Who~Jt\g cough
--Tubereulo.18 of
rf:B...p.iratot:Y ~Y.~_ 1 093
2 A6
Avi tlllDiaoses: etc.
7 70
-
"' .. '" 0 •• .. ., "'.~ to " ... M
i'" .. .,
~

WESTERN PACIFIC REGION DATA BANK ON SOCIOECONOMIC AND !IJlAl.TH INDICATORS, 1982
Ten leading causes of communicable diseases mortality in countries or area Ii of the WHO We'stern Pacific ResiGn
Country Area Ten leadiU& causes of mortality No. N .... Year- 5th cause 6th c.ause 7th cause 8th cause 9th cause
0) (2) (3) Cll) (12) (13) (14) (15) 2S. Solomon Islands 1977 a. Enteritis Mall. nt Disorders of tbe M~~r1.t1& In!£..th LeLTO~
neoplasm8 digestive systeas b 8 7 1 1 6 e. 4 3 3 3 3 d. A5 A45-A60 AI01-AI04 AI05-AI06 A20
26. Tok.elau 1981 a. De ener4tive Oth caTd10vascular heart disease disease
h. 1 1 c. 33 33 d.
21. TOllia 1980 •• Acute myocardial Keningocoecal Cerebrovascular Septicaemia __ "~~tensive dis infection disease
b. 12 10 10 8 8 c. 12 10 10 8 8 d. 270 036 029 038 026
28. Trust Territory of 1981 •• Influenza and Cerebrovascular Prematuri ~y Ac.c.ident. - Diabetes mellitus the Pacific Islan.ds pneUIDonia dieeasE!s all t....n>_es
b. 32 25 26 22 16 c. 26 20 21 18 13 d. 480-487 4J0.-438 165 E80o-E949 250
29. 'Tuvalu 1980 •• Rep.tHis - Ken~~iti9 Enc~p~aliti8 Epi1~'!Y_ C.V.A • fulminatin2
b. 1 1 1 1 1 e. 12 12 12 12 12 d. 070.1 322.9 323.9 345.9 436
30. Vanuatu 1983 a. Eosiuaph meni itis b. -•• -d.
31. Viet Na .. 1980 •• Malaria Oth~r diseases of Cholera Viral enc~halitis Other disea'E!' of dilleati-.e .vstem respirato{}" _SYECt_
b. 826 715 774 694 515 c. 2 1 1 1 ~ d. A31 A104 Al A27 1.96
32. Wallis and -Futuna 1972 a. Hali2n&nt neo 188ms Sympt08l6 ete Congenital anomalies
S S 4 c. SO 50 40 d.
Legend: a. WaM of di.ease b. ~ber of c •• e. c. Rate per 100 000 population d. lCl> code
10th cause (16)
Keni~l.t18
5 2
A72
"'1~",,~ of....!. .. le breast
1 7
lU Suicide
16 13
E950-E9S9 Acute
icitl.8 1 12
540.9
Ott;u foTIU of heart 4ilea'.
496 ~
A84
a:l~ 'i" '" l~~
~ w ... ~

IiESTllBil PACIFle UGIOII DATA lIAR
ON SOCIOECONOMIC AND HEALTH INOICATORS
Part I Pap 27 30 December 1984
Six disea&es under the WHO Leaflet on Childhood Communicable Diseases CWMulative totals of csses and deaths from ~eports received for the year 1982
eumu •••••• DIPK rllERIA ltiV~!¥~r d' ~~~~~ation
c •••• (5) ;r~th. TE~S I<~' ~~). ('000) 1982 eas.. (L) Deaths C •••• (,,) ne.th.
(3)
1 American Samoa 35 - · .. 1 · .. · .. . .. 2 1> 176 1 - 19. ] II 5
3 Brunei 200 - - - - 1 · .. 4 . cn.no , ULO 'u~ · .. ... 5 Cook I. - - - -b o /.u .. , .. '" .. . ... 7 Fiji 657 - - 11 - I ... S • French -, I)~ · .. • · 9 w.., 10' · .. - · .. - · .. 10 Hong Kong 5233 1 1 1 - 22 1>
11 J.p.n 11. 499 H - "1) 14 Jo «
'" ou z 1/ - 3 I
13 Lao People'. Dem. lIep, 3 800 II 271B · .. 1015 ".
14 Moe.o n:< - - 4 - ]
15 -, 14 500 10' · 126 47 · .. 16 'suru I - - - - - -11 New 148 - - - - - -,. • e" .... '.00 j , •• i - - 5 -I." Niue 3 ... ... · .. · .. · .. · .. 2U '.pua N." Gulnes 3 J:l9 - ... 1422 ... 40 .. 21 Phi: 51 276 1275 190 B296 47 1427 545
a 0' ""re' "JJl . " ... · .. ... · .. · .. 23 S.moa 157 - - - - - -24 2 472 b .. · .. .. . ... ... 2) 2>U . . . · .. .. , · .. · .' · .. lb j - - - -27 Tonga 99 - - J '.'
Z. T T of 'he I.lands 142 - · .. - ". - · .. 29 Tuvalu • - -30 v.,,~_ •• _" 124 JO 5 2
31 Viet Nam 55 955 2065 48624 · .. 972 · .. J2 W.lli. and Futun. 10 . . . · .. '" · .. .., '"
TOTAL WPR 1 348 489 3401 , .. 04<0' •• 3591 590
*Data for 1983

li~}' I
2
3
4
5
• 7
6
• 10
11
12
13
l'
n 16
17
16
19
20
21
U
23
24
25
26
27
"" 29
30 31
32
-.-:: .. ~. 011
SOClOECONOKIC AND HJALTH INDICATORS
Six di8~a8e8 under tbe WHO Leaflet on Childhood Communicable Diseases Cumulative totals of cases and deaths from reports received for the year 1982
~ population ~ ~;). . ('OOOi3~982 C •••• (II)' Caee. (
Amed(:an Samoa 35 - · .. 4 · .. 2
15 176 - · .. 11'9 0] · .. Brunei 200 · 'b' 20 243
cn,na -r U'b 'U.
Cook 18 - -- 29 I 4
6 180 · .. '" · .. · .. · .. Fiji .
-657 11> · .. IU'
French -, ii. -154 -I .7 · .. 1187
Gua .. 101 - ... .. · .. • Hong Kong 5 ,jJ --;:- 7527 454 1863
Japan 118 499 I -;c- .6600 441] 6715
'U 62 I 11
toao Peop 1& '. D.... lap. 3 800 1166 ... IOJU · .. IJ80
Macao 292 --; .. · ;. 2>] · .. -Malaysia 14 500 5 · .. • U,. · .. • 2 ••
.auru I -;;c --;0 8 - 1
Hew Co 148 :; lUI ... 1448
New 3 166 - -- 434 6 -Niue 3 · .. .. , 2 · .. -Papua N ... , Guinea 3 329 18 · .. · .. · .. 12771
Phi 51 276 256 J3 '1~"' "UI .,," ",puDlic of \{on. 39 331 --... .- · · .. ... Saonoa 157 - - - - 27
2 472 1. 2179 1965
Islands 250 · .. 3 -~ -- - - -
Tonga 99 - . .-. •• · .. 187
T T of tn. PacU'e 142 ... In · .. I
Tuvalu 8 - -c;: 12 - -,,* 124 IH 15 400
Viet Ham 55 955 89-2 .;; · .. · .. 59300
WaU18 ana Futuna 10 , - 87
TOTAL WPR 1 348 489 2345 3J 1157 722 11 640 : 121250
-Data fol' 1983
6) Death.
· .. 5
1
-
· .. · .. · ..
5
2J
2
· .. -
· .. -
... --
· .. 1174
... -
· .. -
· .. --... -
1210

No. 0)
1
2
3
4
5
6
7
8
9
10
11
12
13
14
15
16
17
'0 19
20
21
22
23
24
25
26
<7
28
19
]0
31
l2
Part 1 Pate 29
~ESTERN PACIfIC REGION DAtA BANK
30 December 1984
ON SOCIOECOWOMIC AND HEAlTH INDIC4'l'ORS
Five diseases under the WHO Annual Communicable Diaeaaea Bulletin Cumulative totals of caSes from report. received for the year 1982
Countr'1J/irea £.c1.td.4ted HEPAflfIS VIRAl population GONORRHOEA TYPE A
Name ( '000) 1982 (2 ) (3) (4) (5)
American Samoa 35 62 10
Australia 15 176 12 805 788
Brunei 200 172 57
China 1 026 504 ... ... Coole. 18 lands. 18 91 -DemOCT4tic Kampuche4 6 780 .. , .. , Piji 657 1 314 162
French Polynesia 154 440 HO
Guam LOI 402 49
lion& Kong 5 233 ... ... Japan HS 499 10 391 ... Kinbati 60 15 1
Lao People 13 Oem. Rep. 3 800 . .. ... Macao 292 - ... Malaysia 14 500 5 073(-) ... Nal4ru 7 ,0 " New Caledonia 148 156 ... Ne ... Zealand , •• 6 ... 1 64.( lJ
Niue 3 5 1 Papua New Guinea 3 329 13 456 ... Philippines 51 216 6 823(l ) 7 522(543)
Republic. of Korea 39 331 . - .. ... Samoa lSI ... '"
Singapore 2472 15 184 ... Solorpon IBlandli 250 83 -Tokelau 3 I ... Tongs 99 ze -'f T of tbe Pacific Islands 142 524 ... Tuvalu 8 )(-) -Vanustu* 124 Z50( Inc) 9(-)
Viet Nam 55 9>5 1 665 ... Wallis and Futuna 10 1 2
'fOTAL WPR I 348 489 69594(139) 1u \)
~ote! The figures should he regarded as estimates. The num&er within the parentheses refer co the number of deaths.
*Data for 1983
'tYPE B
(6)
-2 010
-. ..
-... ...
5
5
."
... 3
...
. ..
... ..
. .. 393(4)
-... ... . .. .. . ... ... .. . -
... --. .. -
2 4>8(4)
UNSP
(7)
5
844
-474 bOl( 1153)
-."
... 56
80
1 554(l8)
... 15
'"
123(3)
j <40
." 224
5\-)
-.. '
...
... ". 42,
61
-13
n 2\-)
340 I) 6.7,7.)
-497 331( 1210)

Part' I Pase )U 30 December 1984 WESTERN PACIFIC REGION
DATA 1I1J11(
No. ( 1)
I
2
3
4
5
6
7 S·
9
10
11
12
13
14
" 16
11
18
I~
20
21
22
23
24
25
26
27
28
.9
30
I 31
32
ON SOCIOECONOMIC AND HEALTH INDICATORS
Five diseases under the WHO Annual Communicable niaea8as Bulletin Cumulative totals of ca~e8 from Teport. received for the year 1982
Count1:'y l Area Est1m4ted population SYPHILIS TRACHOMA
NalDe ( '(00) 1982 (2) (3) (8) (9)
ArIlerican Samoa 35 - -Australia 15 176 3 211 I
Ilt'une.i 200 - 4
China 1 026 504 ... .., Cook Islands 18 - -Democratic Kampuchea 6 780 ... ... rijl 657 407 156
French Polynesia 154 367 -Guam 101 45 -Hong Kong 5 233 ... ... Japan 118 499 1 659 17
Kiribati 60 I ... Lao Peo~Le s Oem. Rep. 3 800 5 43
Mae~o 2" - ... Muaysia 14 500 668 1
Nauru 7 8 ... New Csledonis. 148 507 -New Zealand 3 166 ... -Niue 3 - ... Papua New Guinea 3 329 4 161 ... Philippines 51 276 87\7 ) ... Republic of Korea 39 331 ... . .. Samoa 157 ... ... Singapore 2472 1 097 ... Solomon Islands 250 - ... Tokelau 3 - ... Tonga 99 ... 1
T T of the Pacific Islands 142 - '"
Tuvalu 8 - ... Vauu4tu* 124 - ... Viet Nam 55 955 616 1 069 808
Wallia. and Futuna 10 2 ... TOTAL WPR 1 348 489 12 841 1 070 031
Note~ The figures $hould be regarded 8S estimates. The uumber within the pal'e.ntheaea 'tefer to the number of death,.
*Data. for 1963
YAWS
(10)
-... ---
.., ---
..,
... -
...
.. , 22
-... ... -
...
. ..
.. ,
.. .
.. ,
...
...
. .. --
200
." -
2Z2

i /
No. ;l) 1 , J
4
5
0
7
S
Y
10
11
12
lJ
14
15
1"
17
lij
19
lU
n n
2)
'4
25
LO
27 2.
29
~30 31
J<
WESTERN PACIFIC REGION DATA BANK
ON SOClOECONOMlC AND HEALTH INDICATORS
Five diseases under the WHO Monthly CD Notes
Part 1 Page 31 30 Decealber 1984
Cumulative totals of cases and deaths from reports received for the year 1982
Name (2)
Amel'iean Sllmoa.
Brune'
Chin.
Cook 10 land.
Fiji
frenCh "' Gu ...
Hong Kong
Japan
ti
Lao Peop'e's Dem. Rep.
Matao
Malaysia
Nauru
New
New
Niue
Yapu. New Guinea
" "public of Ko«.
Samoa
81"0_.
lalands
'foke1.u
Tong .....
T 'f of the PaCific
Tuvalu**
. Vanuatu***
Viet Nam
Waills and Yutuna
'fOTAL WPR
**Data for 1960/t981 ***Oata for 1983
Estimated Cumul popu atl.on ('000) 1982 c •••• (,'0) ~eath.
(3)
35 - -1) 170 1 · ..
ZOO } -1 026 504 SS'
IS - -6 JaO
o}7 - · .. ". - · .. 101 - -
} 213 - -118 499 15 ...
00 - -j ijOU .. · ..
292 - -14 500 573 ...
! - -14. ...
j 'b" 1 -j - -
jjB ... '"
51 "'" on 61
JY jJl 14} 4
157 - -2 472 31
250 - -J
99 - ... 142 -
8
124
55 955 57 ... LU - -
1 348 489 "" 65
tiV.~Of ~ ,. ~a.e. (,;)oe.t.8 C.s •• _,,'>lD •• tb.
- - - -276 a1
- - - -'41., ""' - - - -
. . . ... . lij . " 4 ..
011 ,. 1 .. - - 1 -
... ...
... .. , 24 ... .Uij - - -
jJ .. , , 1
.. - -j WO ... 40 .. ,
)5ij ... - -
631 - -, - 2 1
618 4
... .. ... ... 968 47 41l lijU
- - 107 4
'U - ... 216 15
- - - -...
1362 ... 2 .. . - -
15 -3 2
31973 ... 1890 . 1 - - -
41206 51 '0". 1981

Part I !lage 32 30 December 1984 WEstERN PACIFIC REGION
nAtA BANK ON
SOCIOECONOMIC AND HEALTH INDICATORS
Five diseases under the WHO Monthly CD Notes Cumulative totals of cases and deaths from reports received for the year 1982
No. (I)
American Samoa
2 Australia
j Bru""l
I>
I HJ1
8. French _, 'La
9 Guam
10 Hong Kong
11 Japan
12
13 Lao '" '. D01lI. Rep. 14 Haca"
15 Malay.ia ,. nauru
17 II ... ,
,. -... 19 Niue
1.:1. Of I<Or ..
2l S.,.04
24
.25
z. . 27 Tong.*
2. T T of the PacifiC
29 T. " .. * : 30 , II Het .am
, 32 Wallis and Futuna
TOTAL WPR
**Data for 1983
poptJlation ('000) 1982
(3)
35
l> 116
zuu 1 02. 504
10
• /.0 . " 1)4
lUI
" 233
liB 499
00
3800
292
14 500 .
1
148
j lbb
J
51 276
157
Z '1>
250
}
99 ,., 8
124
55 955
10
1 34H,469
12428
1 bOI
-
... ,"".
b380
bb,
72187
36709
36742
...
... -
274
... 698
4.00)
168286
.. , 7872
... 8296
.)2
8778 ,,}UO
3719
33000 362208
1695
2
... J9
- -556 106774
-'" ...
U4
••• 115
- Zz
- 29 .. , ,. 3 Jl
III
... 5
- -- 2
... 26
- 1
... '"
1038 ...
... J
- 49
... .. . - 1
- -... 13
" 6
lOa ... 2403
- -n91 1'11926
... 4
4590
.. . ..
-
...
. ..
-3
.. 7
9
2
--2
1
...
... --
... --
... .. , -
10
-.b29
--
30
, .. . ..
--... -
... -
.. -
--
... -
'" ... -----
.. --
146
-176
--
20
. .. .' . ..
-.. -
. .. -
... -
... -...
... -----
.. ,
-
-20

•
WESTERN PACIFIC REGION DATA BANK
ON SOCIOECONOMIC AND HEALTH INDICATORS
Part I Page 33 30 December 1984
Proportion of infants under 1 year of age who have been fully immunized against tuberculosis, diphtheria, pOliomyelitis and measles, 1982
NO. Country/Area BCG DPT III POLIO III MEASLES
1 American Samoa 52.3 51.2
2 Australia
3 Brunei 96.0 87.0 96.5 80.7
4 China
5 Cook Is lands
6 Democratic Kampuchea
7 Fiji 98.3 62.& 58.6 1.5
8 French Polynesia
9 Guam 30.0 50.0
10 Hong Kong 100.0 80.0 90.0
11 Japan 84.6
12 Kiribati 67.S 28.9 21.2
13 Lao People s Dem~ Rep. 3.7
14 Macao
15 Malaysia 76.6 47.1 55.1
I 16 Nauru
17 New Caledonia
18 New Zealand
19 Niue 100.0 7.5 79.1
20 Papua New Guinea 50.5 25.4 25.1
21 Philippines 61.3 43.5
22 Republic of Korea 100 61.0 62.4 4.9
23 Samoa
24 Singapore 84.5 80.9 88.0 0.3
25 Solomon Islands 46.2 36.3 34.5
26 Tokelau 31.4
27 Tonga 88.8 &4.7 40.2 39.4
28 T T of the Pac ific Islands 24.7 12.7 1.0 , 29 Tuvalu 78.0 72.0 66.0
30 Vanuatu 72 22 17 20
11 Viet Nam O. I
32 Wallis and Futuna 100.0 72.1

Part I Page 34 30 December 19B4 WESTERN PACIFIC REGION
DATA BANK ON
SOCIOECONOMIC AND HEALTH INDICATORS
Per cent of No. Country/Area Year population
s e,rved wi th safe water
1 American Samoa 1980 60
2 Australia 1982 98.6
j Brunei 1982 85
4 China · .. 5 Cook Islands 19B1 10.7
.
6 Democratic Kampuchea ... 7 Fiji · ..
-
8 French Polynesia · .. 9 Guam 1982 100
10 Hong Kong 1982 99 11 Japan · .. 12 Kiribati 1982 10
13 Lao People' s Dem. Rep. ... 14 Macao 1982 100
15 Ma1ays1a ... 16 Nauru · .. 17 New Caledonia ... 18 New Zealand 1982 99.9
19 Niue · .. 20 Papua New Guinea 1982 75
Zl Phll i ppines 1982 64.5
22 Republic of Korea ... 23 Samoa 1982 0
24 Singapore 1982 100
25 Solomon Islands ... 26 Tokelau ... 27 Tonga 1982 91.3
28 T T of the Pacific Islands ... 29 Tuvalu 1982 13
30 Vanuatu 1979 25
31 Viet Nam · .. 32 Wallis and Futuna · ..
. * ?er cent of urban populat10n
Percent of ! Year population with adequate sanitary facilities
• · .. 1982 98.6
1982 60*
· .. 1982 85
...
... · ..
1982 95+
1982 99+
... 1982 10
.. . 1982 100
... · .. .. .
1982 99.9
· .. 1982 75
1982 56.5
... 1982 85.0
1982 100
.. . · ..
1982 36.6
· .. 1982 82
1979 25
.. .
..,

,
No.
1
2
3
4
5
6
7
8
9
10
11
12
13
14
15
16
17
18
19
20
21
22
l3
24
25
26
27
28
29
30
31
32
WESTERN PACIFIC REGION DATA BANK
ON SOCIOECONOMIC AND HEALTH INDICATORS
Percent of low birth weight Country/Area infants ( ~ 2499 grams)
Year Data
American Samoa 1982 2.9
Australia 1979 5.8
Brunei 1982 98.0
China 1979 6.0
Cook Islands 1982 3.2
Democratic Kampuchea ... Fiji 1979 13 .9
French Polynesia ... Guam 1981 8.7
Hong Kong 1975 8.1
Japan 1982 5.2
Kiribati ... Lao People's Dem. Rep. 1979 18.0
Macao ... M.alaysia 1979 9.0
Nauru · .. New Caledonia · .. New Zealand 1982 5.8
Niue · .. Papua New Guinea 1979 25.0
Philippines 1981 18.1
Republic of Korea 1981 9.2
Samoa 1982 1.5
Singapore 1982 8.0
Solomon Islands ... Tokelau · .. Tonga 1982 0.4
T T of the Pacific Islands · .. Tuvalu 1982 5
Vanuatu 1983 4.7
Viet Nam 1982 8
Wallis and Futuna · ..
Part I Page 35 30 December 1984
Maternal mortality rate
Year Data
1975 0.91
1982 0.10
1982 0.015
... 1982 0
· .. 1981 0.82
· .. 1981 0.0
1982 0.01
1980 0.204
1982 0.1
.. . 1982 0.4
1982 0.50
.. ' · ..
1980 0.1
· .. 1980 8.0
1982 0.90
1980 0.42
1982 0.2
1981 0.1
· .. .. . '" . ~ · ..
1982 0
1983 1.1
1980 1.0
.. ,
I I

WESTERN PACIFIC REGION DATA BANK ON SOCIoeCONOMIC AND HEALTH INDICATORS
Part II Pa.ge 1 )0 Dec.ember 1964
F~=aa.=~ •• ~~.m$ •••• ~ •• ==~==~~: •• =c==~======~====~=~======~-=~===~===~==-=======~=======-~=a •• ~g •• T~a.~= •• _ •• _ lodicator(s) for: AMERrC~ SAMOA Year Data Source of Data
~._ •• c~=====a.a •• = •• =~a.~.=.===~==A===~==============~==== =""""""=="""' ... "'='" ""====""",,,,,,,",,,=::==,," ==2==============~=== 1. Area (in 1000 8q~ km.) 1981 0.20 12/83
~. Estimated population ('OOOJ 1982 35 12/82.1
.1. Annual population growth rate (Xl · .. 4. Percentage of population - less than 15 years ...
- 65+ years · .. 5. Urban popul~tion 1%) 1980 45.) 03/79
6. Rate of natural incre ••• of popul.ation (% per annum} 1980-1982 2.98 06/82
) . Crude bl.rth rate tp.r luuO populatl0n) 1980-1.82 J4.3 VblH2
8. orod. d •• tn uto (por 1000 p.pulahOn) 1900-1952 ~., v.to,
9. L1fe expectancy at bl.rth - 'total ~ye.rs~ 70.1 06/84 - Mde (years) ... - FeUl&\e (years) ...
10. Infant ~ort.lity rate ~pt!t' LOGO li'Ve births) 1980-1982 16.) 13/83
11. Total fertility '(ate (women 15-49 years) ... 12. Socia-economic indicators for the year 2000
Estimated population, (' 000) 2000 )9 0)179.1
tite expectancy at birth - Kale (y •• rs) ... - FemaLe (years) ...
Annual population growth rate l (Xl 1995-2000 1.05 03179.1
Crude birth rate (per 1000 population) ... Crude death rate (per LOaD population) ... Rate of natural increase \l. per annum' · ..
11. Pet' Capita Cross Nationa.l Product (GNP) at market pric~s (US$) ...
14. Rate of growth of per capita GNP CO ."
15. Percentage G'[o8S Domestic Product (GDP) derived from manufacturing at constan~ factor cost (%) ...
16. Economi<:ally active pap in primary sector
- Number in agriculture ( 000) ... - Percent in agrlCulture 11') ...
I) . Daily per capita calorie supply (calories) ... IS. Daily per capita protein supply (grams) .. , 19. Adult literacy race .. Total .. ,
.... Male .. , - Female ...
'0. Health bud,~t {expenditure
- Mount ... - Per capita ... - A. , of total budget ...
Source 13/83: Government1s Report on Monitoring Progress in Implementing Strategy for HFA/2000, 1983
03/79.1
O)/)9 : 06/82: v6/64 :
12/82: 12/82.1: 12182.2: 12/8): 12184:
14/80:
World Population 'l'rends. and P-rospec.ta by Country 1950-2000: ~u~ry Report of the 1978 Assessment, UN. 1979 Urban, Rural and City Population, 1950-2000, As Assessed in 1978, UN. 1979 American Samoa Plan for He&lch, 1980-1984 and. t9B2-1986 Information furnished by American Samoa Health Planning and. Development Agency. 16 November 1984 Government Reports on the Number of Cases of CD Leaflet on Childhood CD, Report 3/62 Govet'runent's Reply to EPI Health Information System Qultstionnaire, 1982 COU1ltt)' klealth Information Profilt! (CHIP) revised by Governlllent, 1982 and 198) Gov~rnment Respohses to W()~ld HeaLth Statistj,'CB Annual Que&tionnail"e Oil Health Hanpuwer, 1964 South Pal!ific r;pidemioLo~ica1 lIud !{eaah Information S~rvice. Anlwal Report 1960

Part II Page 2 ~O December 1984
WESTERN PACIFIC REGION DATA BANK ON SOCIOECONOMIC AND HEALTH INDICATORS
~~;~:~=~======~;============a_=====g======a=~=.a=~=====3=~-~=;=====~-====.~~=3==========~a~=
Indicator(s) for: AMERICAN SAlIOA Year Data F=~===~=====~·====~=s===.===~======.==.=~=.==~~===.-"=._=. .... ""=:::="'= == ...... ....,==== • ......... """'a;:o."' ..
21. Health manpower Number Ratio per 10 OOU
Physic iana 1984 25 7.2 Medical assistants 1984 4 1.1 Professional Nursing/Midwifery PersonnEll 1984 18 5.1
22- Ten leading causes of morDidity leD c:ode No. of Rate per C.su 100 000
Influenza 487 1982 12 428 35 509 Chicken pox 052 1982 136 38b
I Other food poisoning (bacterial) 005 1982 101 289 Gonococcal infection 09& 1982 62 177 Total of all hepatitia 1982 1~ 43 OtheT salmonella infection 003 1982 9 ·2. Leprosy 030 1982 9 26 Shigellosis 004 1982 8 23 Mumps 012 1982 8 23 PulmOnary tube~culoais 011 1982 4 11
23. Ten leading causes of mort4iley rCD code No. of Rate per Deaths 100 000
Caxdicv8scula't' disease 1981-82 26 82 Accidents 1981-82 18 55 Cancer 1981-82 13 46 C@rebrOV&8Cular disease 1981-82 11 24 Chronic pulmonary disease 1981-82 7 28 Pneumonia and influenca 1981-82 5 12 Disease of newbo~n infanta 1981-82 5 Ib l~cmicide 1981-82 4 9 Suicide 1981-82 4 8 cooaeniul anomalies 1981-82 3 12
24. Cases and deaths for 81X d1sealles under the WHO-EPI COl_eg De.athg
Diphtheria 1982 - · .. Pertussis 1982 1 · .. Tetanus 1982 ... · .. Poliolllyeliti.s 1982 - ... 'Tuberculosis 1982 4 · .. Measles 1982 2 · ..
Z>. Cases for dueases under the WOO Annual CD Bulletin Case8
Gonorrhoea 1982 62 Hepatitis viral - Type A 1982 10
- Type B 1982 -- UNSP 1982 5
Sypnillis 1982 -Trachoma 1982, -Yave 1982 -
0
26. Case.s and deaths for six diseases under the WHO Monthly CD Notes Cas4!« Deat.hs
Cholera 1982 - -Dengue fever/DHF 1982 - -Encephalitis 1982 - -Influenza 1982 12 428 -Meningitis 1982 2 1 Plague 1982 - -
27. Proportion of infants unde.t o.ne. year ot age who have bee.n fully immunized against tuberculosis.) diphtheria. poliomyelitis and measles
BeG DPT III 1982 52.3 Polio III 1982 51.2 Measles
28. Per cent of population served with ,afe water 1980 bO
29. Per cent of population ~ith adequate sanitary -f --facilitieG ...
i3O • Per c.ent of low blrth we1ght i.fants (" 2499 gr .... ) 1982 2.9 31. Maternal Illoctality 'tate 1975 0.91 ,
==~=.=.Q=3a=c.~
Source of DatR ••• .a ..... ;:o"" .......
06/84
14/80
06/84
12/82.1'
12/82
12/82
12/82.2
13/83
13/83
12/83

Part II Pale 3 30 Docember \984
WESTERN PACIFIC REGION DATA BANK ON SOCIOECONOMIC AND HEALTH INDICATORS
-======~~~#c~=~c~========~=====~===~=====~~=~~============ ,",""""=====_00: =~=~¥~_== •••• a=.#.~ ••• Indicatods) for: AUSTRALIA Year Data
F=====:==~========c========~=========",=~====~==-==== •• ==== =""'==,..===== ~===_=_=a=_====~s=~=~= 1. Area (in WOO sq. km.) 1984 7 68Z.3
Z. Estimated population (' QOO) 1983 15 379
3. Annual population growth rate (X) 1982-1983 1.3
4. Percentage of population - less chan 15 years 1982 24.7
- 65+ years 1982 9.9
5. Urban population (%) 1981 85.8
6. Rate of nacut61 increase of population (% per annum) 1983 0.85
7. Crude birth rate (per 1000 population) 1982 !S.B
8. Crude death rate ~per 1000 popUlation) 1982 1:0
9. Life expecw.ncy at birth - Total (y •• rs) - Male (years) \982 11 - Female (years) 1982 18
10. lnf4~t mortality rate (per 1000 live births) 1982 10.3
L Tot4l fertility rate (women 15-49 years) 1915-1982 1.9
12. Socio-economic indicators for the year 2000
Estimated population, (,000) 2000 17 162
Life expectancy at birth - !tale ly •• rs) 1995-2000 71.3
- Female (years) 1995-2000 78.1
Annual population grDWth rate, (I) 1995-2000 0.93
Crude birth rate (per 1000 population) 1995-2000 15.1
Crude death rate (per 1000 population) 1995-2000 8.7
Rate of natural incre.asi (X per annum) 1995-2000 0.64
D. Per Capita Cl;'OBS National Product (GNPJ at DUlrket pt'ices (US,) 1982-1983 11 957 or
(A$) to 522
14. R~te of arovtn of per capita GNP (Xl 191.0-1983 1.3
15. P.rc.ent.a.e Gtos. Domestic Prod\l.ct {GDP) derived irOQ .anufacturins at con.tant factor cost (%) ...
6. E~on~1c811Y act1Y~ pop 1n primary sector
- Number in &&ricolture ( 000) 1981 379
- Percent in agriculture (X) 1981 6.0
17. Daily per capita calorie supply (calories) 1981-\982 exceed. 2 500
\8. Daily per capita proteln supply (grams) 1981-1982 99.0
9. Adult literacy rate - Total - Male 1981 88 - Female 1981 82
o. Health budget/expenditure
- Amount (AS,,) 1981-1982 II 199
- Per capita. (A$ ) 1981-1982 144
- As % of total budget 1981-1982 7.6
Ufficial Excha.nge Rate: I US$ ~ AS 0.88 ( 1982)
Source 13/83 ~
O}/79.1,
06[84
10[82 : 12/83:
Government's Report on Monitoring Progress in Implementing Strategy for MFA/lOOD, 1983 World Population Trends and Pro&pecte by Country 1950-2000; Summary Report of the 1918 Assessment I UN. 1979 Information furnished by the Commonvealth Department of Health, Australia. 21 July 1984 1982 ESCAP Population Data Sheet Country Health Information Profile (CHIP) revised by the Government, 1983
.== •• 2* •••• ~ ••••
Sout'ce of Data ==a:~=~~~.=~=.=.=
00/84
06[84
06/B4
10/62
06/84
06/84 Oo~/84
10(82
06/"4
06/S4 06/8_
06/84
06/84
03/19.1
03179.1
03179.1
03/79.1
03T19.1
03/79.1
03179.1
06/84
06/B4
06784
06/84
06/84
06/84
13{83 13/83
Ob/84
06/84
06,84

Part II Page 4 30 December 1984
WESTERN FACIFIC REGION DATA BANK ON SOCIOECONOMIC AND HEAlTH INDICATORS
=~;~=~~====;==;====~==========.~===~===~====-.~===========p ..,===='" .========~===========~==~~
Indicatod5) for: AUSTRALIA Year D.ta e$~===-==~=== __ z=.~"'==~="'._D.a •• ~ •• c=a~~«.===_.===.=== •• =~. ""=1 •• "= •. =.a.~. __ ~ •.•• =.= •• ,..~ ••• 21- Heal th manpower Number Ratio per
10 000 Physicians 1981 27 128 18.2 Medical assistaats 1981 ... Professional Nursing/Midwifery' Personnel 1981 139 434 43.4
22. Ten leading causes of morbidity ICD code No. of Rate p4Jr Cases 100 000
Gonorrhoea 098 1982 12 805 84 Total syphilis 090-091 1982 3 211 21 Salmonella infections 003 1982 1 866 12 'tuberculosis. all forms 010-018 1982 I 363 9 Viral hepatitis 070 1982 1 046 7 Hepatitis a (Serum)* 070.3 1982 72; 5 Q fever 083.0 1982 616 4 Giardiasis'" 001.1 1982 548 4 Malaria 084 1982 437 3 Shigellosis (Shigella infections*) 004 1982 344 2
23. Ten leading causes of mortal1ty leD code No. of Rate per Deaths 100 000
Acute myocardial infarction 410 1982 23 161 153 CeTebrovascular disease 430-438 1962 13 977 92 Other iachaemic heart disease 411-414 1982 9 184 61 Malignant neoplasm of tX4chea, bronchus 162 1962 6 031 35 and lung Other fo~~ of heart dis6aee 415, 416, 420-429 1962 5 337 40 Motor vehicl~ traffic acci.dent .. 810-819 1982 3 364 22 Malignant neoplssm of colon 153 1982 2 708 18 Bronchitis, emphytema and .'theaa 490-493 1982 2 359 16 Malignant neoplasm of female br8ut 174 1982 2 137 13 tneumonia 480-486 1982 1 995 14 Atherosc hro8 ie 440 1982 1 653 11
24. Cases and deaths tor s ~x d lose.sea unGer the W»O-EPl Cases Deaths
Diphtheria 1982 1 -PertuBIiI is 1982 196 1 Tetanus 1982 11 5 PolioIDyelitis 1982 - · .. Tuberculosis 1982 1 169 6, Measles 1982 '" 5
5. Cases for d1.Sea8eS under the WHO Annual CD Bulletin Cases
Gonorrhoea 1982 12 805 Hepatitis viral - Type A 1982 788
- Type 6 1982 2 010 - UNSP 1982 844
Syph illis 1982 3 211 Tl'achom~ 1982 1 Yaws H8l ... ,
6. Cases and deaths for six dieeasea under the WHO Monthly CD Notes Cases Deaths
Cholera 1982 1 · .. Dengue fe."e.r !mu' 1982 276 · .. Encephalitis 1982 221 .,. I:nfluenza 1982 1 601 · .. Heningitis 1982 39 ... Plague 1982 - -
7. Proportion of infants under one year of age ~o have beeD fully immunized againat tuberculosis, diphtherial poliomyelitis and measles
BeG DPT 111 Polio III I !-teas: tes
28. Per cent of pop~lation served witb aa£e water 1982 98.6
<9. Per cent of population with adequate sanitary facilities 1982 98.6
30. Per cent of low birth weight munt. lIS 2499 gr .... ) 1979 5.8
31- Maternal aaortality rate 1982 0.10
* Not nQtli1able In all of the Statea and TerrltoT1es of AuQtr8l~a
=~U'.Q._.== •• "'== Source of n..ta .... SI. ...............
06/84
06/84
06/84
06/84
06/64
06/84
13/83
13/83
13/B3
06[84

r WESTBRN PACIFIC RECION DATA &AK& ON SOCIOBCONOMIC AN)) REAL!H INDICATORS
Part 11 Page 5 10 December 1984
F==~~=a.===~~*~a:================~=~~======~=====~======= =~======c=_ =====~=============~=
a;:::::=:;'~:;:i lndicator(s) for: BRUNEI Year Data F=~~===~·~·····=·===~~~~=~===Q=x==a====~=~a======Q= =-="' ... === ..... .~._.a .. ===~.=.==.a •• _ . .... Q_-.... ~ ..
1. Area (in 1000 SQ. In.) 1982 5.77
2. Estimated populatiun (' 000) 1982 200
3. Annual populat.ian gr<Jwtb rate (I) 1982 2. I
4. Percentage of popu la t ion - less than 15 years 1982 38.1
- 65+ years 1981 2.9
5. Urban population (%) 1981 59.4
6. Rate of natural increase of population (% per annum) 1982 2.6
7. Crude birth rate l per 1000 population) 1982 29.7
8. Crude death race (per 1000 population) 1982 3.88
i9.
Life exrectancy at birth - Total (years) 1982 70.1 - Male (years) - Female (yeara)
o. Infant mortaLity rate (per 1000 live births) 1982 12.1
1. Total fertility rate {women 15-49 years} 1975-1980 5.1
2. Socia-economic indicators for tbe year 2000
Estimated population. ( 000) 2000 306
Life expectancy at birth - Male (years) ... - Female (years) ...
Annual population growth rate. (X) 1995-2000 2.00
Crude bi1::th r8.te lper 1000 population) ... Crude death rate (per 1000 popule.tLOnJ ... Rate of natural Inc.ease II per annum) ...
D. Per Capita Gross National Product (GNP) at market prices (US$) 1982 15 908* or
lB.) 44 852
4. Rate of growth of per capita GIIP (%1 1970-1919 4.6
5. Percentage Cro8s Domeatic Pro-duct (GOP) dedve4 from manufaeturing at ~onstant factor cost (%) ...
<6. Economic.ally active pop in pdmst')' sector
- Number in agt'iculture l' 000) ... - Percent in agric.ulture {l) ...
11. Daily per capita calorie supply (calories) 1915-1977 2 959
18. Daily per capita protein supply (gra1Jls) 1975-1977 13.7
9. Adult literat::y rate - Total 1982 80.3 - Hale 86 - Female 7J
O. Health budget !expenditure
- Amount \B$) 1982 64 773 315
- Per capita (8$J 1982 323
- As % of total budget 1982 5
* Per c apl.ta GDP Official Exchange Rate: US$ 1.00 • 8$ 0.35467 (1980
Sour~e 13/83: Gover~nt's Report on Monitoring Progress in Lnplementing Strategy for HFAIZOOO, 1983
03/79.1
03/79 06/84: 07/81: 12/81:
World Population Treods and Prospecte by Country 1950-2000: Summ~ry Report of the 1978 ~&BeS8ment~ UN, 1979 FAO Production Yearbook 1979 Country Health Information Profile (CHIP) revised by Government, 1984 1981 World Bank Atlas Government Responses to WHSA Questionnaire on Causes of InfectiQus and Parasitic. Diseases and on Number of Deaths by Cause Government'8 Reply to EFr Health Information System Questionnaire, 1982 Country Health Information Profile (CHIP) revised by Government. 1982 and 1983 WHO!WPRO Publication/Document
12/83 .
06/84
06/84
06/84
06/84
12/83
06/84
06/84
06181,
13/83
06/84
14f83
03/79.1
03179.1
06/84
07/8!
03/79
03/79
13/83 13183 13/83
06/84
06184
06/84
12/b2.2: 12/83: 12/83: 14/83: 1983 World Population Data Sheet, Pop~lation Reference Bu~e8u Inc., Washington, DC

Part tt Page 6 30 December 1984
WESTERN PACIFIC !\EGLON DATA BANK ON SOCIOECONOMIC AND HEALTH INDICATORS
~._._A.a_ •.• __ ~ •.. _.Z_.4 __ .a=_. __ *._~_=~a=z==.S$~~.=z_ .•• ... ... "' .... = •• =.c.aa._ ........ a-=._~. Indicator(s.) for. !!!!!m Year Data ••• = ••• _~~= ... __ .. =:cc.=~._ ••••• ==.==~~.=.= ... ~=#. ___ •• ~= ........ 0= :_Zl ....... __ ........ == .. = .. ==== ....
21. Ke-a1th manpower Number Ratio per 10 000
Physicians 1982 101 5.3 Medical ••• iatanta 1982 94 4.7 Professional Nuralng!Midwif8ry Pereonnal 1982 553 27.6
22. Leading caulee ot morbid~ty lCD codf! No. of R.ate per Caself 100 000
Mea.le. 1982 596 298 Di~rrhoeal dieeasea 1982 570 285 Tuberculosis 1982 269 134 Gonococcal inf£ction 1982 243 121 tnfective hepatiti& 1982 172 86 Rub_I.Ia 1982 103 52
23. Leading causes of ~ortality lCD code No. of R4te per De.uhs 100 000
Symptoms and ill-defined conditione B4 1982 219 139 Cet'ebrovascular accidents including El7-B33 1982 159 79
all forma of heart disea6e Accidents - all forms 850-B52 1982 80 40 Malignant neopla.ms Bll-B20 1982 70 35 Respi~atory conditions 834-B36 1982 45 22 Septicaemia »8 1982 22 11 Other perinatal causes 847 1982 21 10 TuberculQ8is, all forms 85,86 1982 20 10 All other diseases B49 1982 16 8 Congenital Abno~alicies B49 1982 13 6
24. Cases and deaths for six. diseases under the waO-EPI Case& Deaths
Diph.theria 1982 - -Pertussis 1982 - -Tetanus 1982 1 ... PQliomyelitis 1982 ... . .. Tuberculosis 1982 269 20 Measles 1982 243 1
25. Cases for disease. under the WHO Annual CD Bulletin Cases
Gonorrhoea 1982 172 Hepatitis viTal - Type A 1982 57
- Type B 1982 -- UNSP 1982 -
Syphillis 1981 -Trachoma 1982 4 Yaws 1982 -
26. Cases and d~ath8 for six diaeases under the WHO Monthly CD No~e& Cases Dea.ths
Cholera 1982 5 -Oengue fever !DMF 1982 - -Encephalitis 1982 - -Influenza 1982 - -Meningit is 1982 - 4 Plague 19B2 - -
27. Proportion of infants under one year of age who have been fully immonized sg4inst tuberculosis. diphtheria~ poliomyelitis and measles
BCG 1982 96 OPT II I 1982 B7 Polio tIl 1982 96.:; Measles 1982 80.1
28. Per cent of population served with safe water 1982 85
29. Per <;:ent of popUlation with adequate sanitary 1982 60· facilities
30. PeT cent of low hirth weight infants ( ~2499 grams) 1982 98.0
3!. Maternal mortality rate 1982 0.015
• Pt't" cent of urbl1n populatlon
..--...... ~-.... Source of Data ....... A ••• ~ •• ~
06/84
06/84
06/84
06/84
06/84
06/84
06/84
0./84
13/83
06/B4
06/84

WESTERN PACIFIC REGION DATA BANK ON SOCIOECONOMIC AND HEALTH INDICATORS
Part II Page -, 30 December 1984
",;;;;""""c:::,",====="",,,,=,,,=,::;====""=====:=~;;====~=""============"'''''=''' =====-=========-",================""=-,""""-====,,,=-.\O"""..,IRP""Q""'" ~
Indicatods) fon ~ Year Data -========~============~======s======================.====u= =."' ... ""===== ======.====~=====~===== l. Area (in WOO sq. km. ) 1981 9596.96
2. E"timated population ('000) 1982 1 026 S04
3. Annual population growth rate (Z) 1982 1.4
4. Percentage of population - less than 15 years 1982 32.7
- 65+ years 1982 5.6
S. Urban ?Lpulation (%) 1980 21.0
6. Rate of natural increase of population (% per annum) 1982 1. J5
7. Crude birth rate (per 1000 population) 1982 21.4
8. Crude death rate (per 1000 population) 1982 7.9
9. Life expectancy at birth - Total ~ye.rs? - Male (years) \982 65 - Female (years) 1982 68
10. Infant mot'tality rate (per 1000 live births) 1982 42.0
11. Total fertility rate (women 15-49 years) 1982 2.6
12. Socio-economic indicators- for the year 2000
Estimated population, ( 000) 2000 1 189 572
Life expectancy at birth - Male (years) 1995-2000 67.9
- Female (year~ ) 1995-2000 72.6 -- Annual population gt'owth rate. (%) 1995-2000 0.97 -- Crude birth rate (per 1000 popUlation) 1995-2000 17.4
Crude death rat.e (per 1000 population) 1995-2000 7.7
Rate of natural increase (% pH annum) 1995-2000 0.97
13_ Per Capita Gras$: National Product (CNP) at market prices (U5$) 1980 290
4. Rate of growth of per capita GNP \%1 1970-1979 2.8
15. Percentage Gross Domestic Product tGDP) derived from manufacturing at constant factor cost (X) 1980 34.0
16. EcoltOlOl.cally <tctLve pop '" prl.luary sector
- Number in agricul ture ( 000) 1980 265 879
- Percent in agriculture (X) 1980 59.8
17. Daily per capita calorie supply (calories) 1975-1977 2 439
18. Daily per capita protein supply (grams) 1975-1977 63.4
9. Melt literacy rate - Total ... - Male - Female
rlO. Health budget/expenditure
- Amount ... - Per capita ... - As % of total budget ...
SourC8 13/83: Government IS Report on Nonitoring Progress in Implementing Strategy for ij,A/2000, 1983 World Population Trends and Prospects by Country 1950-2000: Suww4ry Report of the 1978 Assessment, UN. 1979 FAD Production Yearbook 1979 FAO Production Yearbook 1980 Government letter of 6 Jun~ 1980 Official National Publication 1981 World Sank Atlas 19B2 ESCAP Population Data Sheet World Health Statisti.cs Quarterly. VoL 33, No.1, 1980 World Health Statistics Annual 1982) Vital StatisticlI and Causes of De.aths Key Indicators of Developing Member Countries of ADB, April 1982
Source of Data ========~.~ ...... ~
Il/B2
10/82
10/82
10/82
10/82
14/8J
10/B2
10lB2 --10lB2
lO/a2 10/82 ~ !OrSI
10/82
OJ/J'J .1
OJ/79.1
03179.1
03/79.1
03/79.1
03/79.1
OJ/79.1
07/81
07/81
14/82
OJ/80
03/80
03{79
03/79
03/79: 03/80: 06/80: 06/81: 07/81: !0/8Z: 11/80 : 11/82; 14/82 : 14/83: 1983 World Population Data Sheet. Population i(~fetence Bureau Inc: •• W.allhir.gton, DC

Pa'lt II Page b 30 December 1984
WESTERN PACIFIC REGION DATA BANK ON SOCIOECONOMIC AND HEALTH INDICATORS
F~==.=~====~_.~~~===:.a~==~=~=a.~~=~==~===z==~==~a.===a •• --_ ..... == ... :a===~ •••• _==~ .... ",# ••• = .... _ Indicatot'(s) for: .£!!!!'!! Year Data.
F=== ... =~·ft.=_=a==_== ... __ =.=~~_==:a~a.=_=== ......... ==_==a~D==== ... == ... === •••••..•..... : .. ...... =""._._. 1. Health manpower Number Ratio per
10 000 Physicians 1976 609 608 6.5 Medical assistants 1978 423 410 4.5 Profe8sional Nursing/Midwifery Per sonne 1 1978 477 201 5.1
122• Ten le.ading causes of morbidity leD code No. of Rate peC' Cases 100 00
Dysentery 1979 2 907 816 299 Influenza. 1979 2 654 566 273 Malaria 1979 2 384 543 246 Measles 1979 900 075 93 Viral hepatitis 1979 471 580 49 'Whoop ing cough 1979 401 372 41 Scarlet fever 1979 148 080 15 ~pid celeb~o-spinal mening~t~s 1979 109 304 11 ~yphoid and paratyphoid fever 1979 61 200 6 Lep'tospil'o6is 1979 27 462 )
D. Ten lead~n8 causes ot mortal~ty leO code No. of Rate per Deaths 100 000
Dysentery 1979 6 330 0.7 Measles 1979 5 931 0.6 Epid. meningitis 1979 4 903 0.5 Epid. encephalitis 1979 2 031 0.2 Maemorrhagic fever 1979 1 "59 0.2 Diphthe:t'ia 1979 1 292 0.1 Viral h.patich 1979 1 103 0.1 Leptospiroais 1979 805 0.08 Whooping ,cough 1979 715 0.0) Influenza 1979 364 0.04
4. Case~ and deaths for s~x. d18eases under the WSo-E?l Cases Deaths
Diphtheria 1982 · .. . .. Pertussis 1982 · .. · .. tetanus 1982 · .. · .. Po liOttlyelititl 1982 · .. · .. 'tuberculosis 1982 .. . · .. Measles 1982 · .. · ..
25. Cases for d~seaSleB under the WllO Annual CD Bulletin Cases
Gonorrhoea 1980 · .. Hepatitis viral - Type A 1980 · ..
- Type B 1980 · .. - UNSP 1980 474 601(1153)
Syphill-is 1980 · .. Trachoma 1960 ... YaW's 1980 -
26. Csses and deaths for six diseases under the WHO Monthly CD Notes Cases Deaths
Cholera 1980 88* ... OF/OHF 1980 · .. . .. Encephalitis 1980 14 192 1 193 Influenza 1980 2 937 931 556 Meningitis 1980 108 714 4 590 Plag';le 1980 30 20
27. Proportion of infants under one year Qf age who have been fully immuniz~d against tuberculosis, diphtheri a, poliomyelitis and measles
BeG .. , DPT III Polio III Measles
28. Per cent of populat1.0U served with safe vater ... 29. Per cent of population with adequate s8nita~y
faeilities . , . 30, Per cent of low birth we~ght wfant. , ~ 2409 grams) 1919 6.0
31. Matel"nal mortality rate ,.,
• Parachole~a The !lumber within the parentheses refer to the number of deaths.
._.-... _-----_.-Source of Data . .. _ ............ --
06/61
06/80
06/80
13/83
06/81
.06/61
U/80

for~
WESTERN ?ACI~IC REGION DA!A BANK ON SOCIOECONOMIC AND HEALTH INDICATORS
Year Data
Part II Pase 9 30 December I ~b4
1. Area (in 1000 sq. km.) 1981 0.24 12/83
Source 13/83.
03/79.1:
03/79: 06/84: 10/82: 12/80: 12/83: 14182:
(u8$) (NZ$)
198.
1978
1008" or 963
5.1
Government's Report on Monitoring Prog~e8s in Implementing Strategy for MFA/2000, 1983 World Population Trends and Prospects by Country 1950-2000: Summary Report of the 1978 A88e8s~nt) UN, 1979
12/83
14/82
Urban, Rural and City Population, 1950-2000, as Assessed in 1978, UN, 1979 Information furni6hed by the Ministry of Health, Cook Islands, 12 November 1984 1982 ESCAP Population Data Sheet Gove:rtunent Reports on the. Numbey of Cases of CD Country Health Information Profile (CHIP) revised by Government, 1982 and 1983 Xey lndicators of Developing Member Countries of ADB, April 1982

Part II Page to 30 December 1984
WESTtRN PACIFIC REGION DATA B~ ON SOCIOECONOMIC ,AND imALTH INDICATORS
lndicator(s) for~ COOIt ISL 'lear
121 • ,
Health manpower
Physicians 1983 Medic.l assistants 1983 Profesaional Nursin,/Hidwifery Per80nnel 1983
~2. Ten a_u.es of ·ICDcod.-
lnjuri~. rif)ti external c.~ •• 1983 Db ..... of tbe re'piratory 41tr •• 1983 ot •••••• of tbe di ••• tivi sy.te~ 1983 nil..... of tbe akin artd 8ubcut.neoua ti.,y .. 1983 nilea ••• of the circul.to~y .y.t •• 19B3 oi •••••• ~f the ,Inieo·urinary .y.t •• 1983 Infectioua and p.~ .. itie di ...... 1983 Dise •• es of the mUleular-akelecal .yat~ 1983 Symptom. and ill-defined conditions 1983 Diseases of the nervoue system 1983
23. Ten ~ause8 of ICD code
Diseases of circulatory system 1983 Diseases of the respiratory system 1983 NeoplaamB 1983 Endocrine and metabolic diseases 1983 SymptOlDs and i ll-def ined cond itions 1983 Certain conditions originating in perinatal period 1983 Infectious and parasitic diseases 1983 Inuries and poisoning 1983 Diseases of the digestive system 1983 Diseases of the nervous system 1983
124 eases and d .. th. _ for six under tbe WHO-EPI
Diphtheria 1983 Pertus.ia 1983 Tetanu8 1983 Poliomyelitis 1983 Tuberculosis 1983 Meu188 1983
125 c.... tor ,undar the WHO Annual CO BulLet1n
Gonorrhoea 1983 Hepatitis viral - Type A 1983
- Type B 1983 - UNSP 1983
Syphi His 1983 Trachoma 1983 Yaws 1983
26. c .... and death. for .i. undor the WHO Monthly CD Notes
Cholera 1983 Dengue fever/DBF 1983 Encephalitis 1983 Influenza 1983 Meningitis 1980 Plague 1983
27. nopo,:t10n ot 1ntant. un •• r one year of age Who have-been fully immunized against tuberculosis, diphtheria, poli~yeliti8 and measles
BeG OPT III Polio III Measles ,
128. Per cent of ."rved with .afe water rWBI
129 • ::~i~~nt of .~. with 11982
130. Per cent of low birth weight infant. ( " 2499 gr .... ) 11982
13l • rate 11982
Data Source of Data
NWllber Ratio per to 000
18 06/84 4
69
:;.:f ~t. per 100 000
220 1 239 06/84 208 1 171 106 597 88 4" 8S 478 83 467 60 338 49 276 47 26S 46 2S9
No, of ~~·o~~r Death. 42 237 06/84 20 113 13 73 10 S6 10 S6
S 28 4 23 4 23 3 17 2 11
Ca.es Deaths
" - 06/84 - -- -- -
29 1 4 -
Cases 91 06/84
...
... ... ...
... ... Cases Deaths
- - 06/84 - -- -
5 101 -- -... . ..
10.7 13{83
8) 13/83
3.2 13/83
U 13/83

I$S_ PACIFIC IIEGIOli DATA IWIK ON SOCIOECO~OHIC AND HEALTH INDICATORS
Part II Page 11 30 December 1984
f=_~~·=·~·_"·"··~G~_ ••••• " •••• *o ••• ~._ •• __ •• ________ A --_ .... _-.... -_ ...... -... _- -.-... ---~.-.-.. -.. Indicator(a) for: DElIOCRATIC KAMPUCHEA Year Data
F-.~ •• __ ............ aa .......... = .. ~ ........ =a_ ••• ~ ••• _ ~--""-.. -10---------1. At-ea (in 1000 sq. km.) 1961 161.04
2. Sot'IO&te4 populoti ... , \ 000) 1.82 6 780
>. Annua, populat1on growth rate, m 1982 -2-.g
1 4 • re<centas. of populohon ~ 1 ... than. 15 year. 1982 33.1
- 6'. yell1:8 "82 2.3
,. Urban popolatlon (;0) 1980 1'.0
b. late of natural l.ncrease 01: population (l per aURWIl) 1982 2.59
7. CruQ<o birth rate (per 1000 popu1atlon) 1982 liS-. S
S. Crude death rate {per 1000 populat10n) 1982 19.6
9. Life expectancy at birth - Total ~year6)
- Male (years) 1982 42 - Female (years) 1982 45
10. Infan~ cortality rate (per 1000 live births) 1982 160
U. Total fertility rate (women 15-49 years) 1982 5.1
2. Socio-econa.ie indicatora for tne year 2000
E.ti .. ted population, ( 'OOO) 2000 13 403
Life e~peetanc7 at bi~th - Mala ly .... } 1995-2000 '6.6 - female (year.) 1995-2000 60.1
Annual population growth rate 7 (X) 1995-2000 1.86
Crude birth rate lper 1000 popu1atl.on) 199)-2000 28.5
Crud. death rat. (per 1000 population) 1995-2000 9.9
late of natural increase \1 per annum) 1995-2000 1.86
ll. Per C.p.t. Gro ..... U .... l •• o",,"t \GlOP) at market prices (US.) · "
1 •• Rat. of growth of per cap.t. GNP lX) . .. 15. Percentage Gross Domestic Product lGDP) derived
from manufacturing at constant factor coat (X) · .. lb. Econoal.cally actl.ve pop ~n prlmary sector
- Number in agriculture ('000) 1980 2 522
- Percent in agriculture (%) 1980 74.0
17. Daily per capita calori~ supply. (calories) 1977-1979 1 767
18. Daily per capita protein supply {grams) 1977-1979 40.1
19. Adult literac.y rate - Total · .. - Male - Female
O. Health budget/expenditure
- Amount ... - Per capita · .. - As l of total budget · ..
.
Source 03/79.1: World Population Trends and Prospects by Country 1950-2000: Summary Report of the 1978 Aaeessment, UN) 1979 FAO Production Yearbook 1919 FAO Production Yearbook 1980 Official National Publication 1982 ESCAP Population Dats Sheet ~orld Health Statistics Annual, 1916
Source. of Data .. -........ -... ~.-. 06/75
10162
10/82
10/82
10182
14/83
10182
10782
10/82
10/82 10/82
10182
liil82
03179.1
03179.1
03/79.1
03/79.1
03/79.1
03/79.1
03/79.1
03/80
03/80
03179
0'5179
03/79 03/80 06/75 10/82 11/76 14/83 1983 World Population Data Sheet, Population Ref@Tenee Bureau Inc., Washington, DC

Part 11 Pale 12 30 December 1984
WESTIRN PACIFIC R!GION DATA BANK ON SOCIOECONOMIC AND HEALTH INDICATORS
~==.~a#=~=~_==~===-==~.=~.=~==~=8=~~=_._ ••• ".=~= •••• =_~ •• =_= .. ,."' ....... --=-..................... Illdicator(a} for; DEMOCIIATIC KNWUCHEA tear Data
f·=· .. ·_·= .. 3 •• =-...... 2 ..... = ... ==~p=---....... ~ ........ ~ ..... --.c -= __ 1&
-·-... ···=-·~r·1& .. ··· ... ~ ~1. Health MAIlpOWer Number Ratio per
10 000 Physieian& .. , Medieal assistants ... Protes.lonal Nur.ing/Mid~ife~y Personael ...
2. Ten le.dirt& eauaes of _rb,dity tCD code Ro. of Rate per c. ••• 100 000
Influenaa 1973 25 753 336 """'.bi .. lo 1973 2 117 28 7yplloid fever 1973 972 13 Heu1,.- 1973 672 9 COhocOGcel infection. 1973 427 6 8yphili. ~d .aqual ••• 1973 376 5 Pertua.ei.s* 1973 372 5 Polioayelitia* 1973 197 3 Cholera'" 1973 159 2 Bacillary dysentery. 1973 131 2
f23. Ten leadillfl CAuses of mortalIty ICD code No. of Rat. per Death. 100 000
Cholera 1974 14 0.2
4. C .... aDd deaths for S1X d18eue' under the WHO-EPI Caees Death.
Dipbtheril!l ... ... Pertussis Tetanue Poliomyelitis Tuberculosis Measles
[25. Cases for diseases under the WHO Annual cn Bulletin Ca •••
Gonorrhoea .. , Hepatitis viral - Type A
- Type II - UNSP
Syphilli. Trachoma Yaws
26. caseB and de-a ebs for six dise •• es uDder the WHO Monthly CD Notes Cas.es Deaths
Cholera Dengue fever/UHF
... . .. Encephalitis Influenza Keniqiti:s nague
27. Proportion of infanta under ODe year of ag~ ~o have been fully immunized against tuberculosis, diphtheria, polioayelitia and .ea.les
BCG ... DI'T 111 Polio III Measles
28. Per cent of population ,erved with safe water ... 29. Per cent of population ~ith adequate sanitary .
facilities ... 30. Pet: cent of low birth \feiaht nteau \ ~ 2499 grams) ... n. Maternal lDOt'tallty rate ... * Ineo1Q.plete data
.... _ .......... -SOUrce of Data .......... ~ ...
11/76
11/76
;

WEStERN PACIFIC REGION DATA RANK ON SOCIOECONOMIC AND HEALTH INDICATORS
Part II Page 13 30 December 196tl
F~.s~_~ •• ~_ •• "_ •• = •• ~ •• _._~~~.~Q.&_~=a& •• CC~=~=2.DC_~~A~ "' ......... "' ..... .. ..... _ ........ .=2~=a~= ...... :.a FIJI 'tear Data Sourc:e of Data Indicator(s) for: ra ................ _.=._.b .• ~ •.• -.-...... -=.==_c .. == .... &_=-~ .. ~-... -="' .... "" .... _ .......... ;: .. "" .. =~~ZC5===~==2==
1- Area (in 1000 sq. km.) 1981 18.27
2. Estimated population, ('000) 1982 657
3. Annual populat10a growth rate III 1982 1.8
4. Percentage of population - less than 15 years 1982 36.3
- 65+ years 1982 3.3
5. UrbolUl population (X) 1980 31.0
6. Rate of natural increase of population ~% per annUltlT 1981 2.6
1. Crude birch r.te (per 1000 population) 1981 31.7
B. Crude death rate (per 1000 population) 1981 5.5
9. Life expectancy at biTth - Total (years) - Hale (years) 1982 70 - Female (years) 1982 74
-O. lnfant mortality r.te lper 1000 live birth,) 1981 28.8
1. Total fertility rate (women 15-49 years) 1982 3.4+
2. Socio-ecODo.ic indic.tors for the year 2000
Estimated populatioo. ('000) 2000 764
Life .xpect.ncy ~t birth - Hale (years) 1995-2000 71.4
- Female (years) 1995-2000 76.4
Annual population ~rowth rate, (%J 1995-2000 0.64
CTude birth rate (per 1000 population) 1995-2000 17.9
Crude death rate (per 1000 population) 1995-2000 4.8
Rate of natural increase (X per annum) 1995-2000 1.31
3. Per Capita Gross National Product (GNP) at market prices (US$) 1980 1 850
14. Rate of growth of per cap1Ce GNP (%) 1970-1919 3.0
15. Percentage Gross Domestic Product (GOP) deri~ed from manufacturin& at conatant factor cost (X) 1980 I!..
16. Economically act1ve pop in pr1mary sector
- Numbor in .,riculture ('000) 1980 83
- P.reeQt :La. •• r1cultuu (ll 1980 40.1
7. Daily per c4pit:& calorie supply I (calories) 1975-1971 2 57)
18. Daily per capita protein supply (grams) 1915-1917 56.8
9. Adult literacy rate - Total ... - Kale - Feaale
O. Health budget/expe~diture
- AIlaunt 'F$) 1981 18 670 280
- Pel: capita (F$) 1981 32.8
- As 4 of total budaet ... Official Exchaaa.e 'tate: US, 1.00 • F, 0.1980 (1980)
03/19: 03/80: 06/80: 06/83: 07/81: 10/82. 11/80: 12/80:
World Population Trends and Prospects by Country 1950-2000: Summary Report of the 1918 Assessment, UN~ 1979 FAO Production YearbooK 1979 FAD Production Yearbook 1980 Ministry of Health, Annual Report 1979-1980 Ministry of Health. Annual Report for 1981 1981 World Bank Atlas 1982 ESCAP Populatioo Data Sheet World Health Statistics Quarterly, Vol. 33, No.3, 198Q Government Relponaes to World Health Statistics Anuual questionnaire on Certain Caqles of Infectious and Parasiti~ Di.aseel. and on Nu.bllr of Deaths by Cause. G~eraaent Reaponaee to World Health Statistics Questionnaite on He.lth ~power Gove~at'. leply to EPl Health Information Syste. Queationnaire, 1982 Country lIea1th InfO'l':ution Profile (OOP) rev,iaed by Govertlfleut, 1983 ley lndieatora of' Developing He.ber Countries of ADB, April 1982
1,/83
10/82
10{82
10182
10/82
14183
06183
06183
06/83
10/8, 10/82
06/83
10/82
03/79.1
03/19.1
03/19.1
03119.1
03/19.1
03119.1
03/19.1
01/81
07/81
14/82
03180
OJ/80
03/19
03/19
06/80
06780
12/82:
12/82.2: 12/83: 14/82 : 14/83: 1983 World PopulatioQ Data &beat, Population Reference Bureau Inc., Wa.hinston, DC

Put 11 I:lage 14 30 December 1984
WESTERN PACIFIC REGION DATA BANK ON SOCIOECONOMIC AND HEALTH INDICATORS
~===~.-*.c.a.~_==.===c=.a.~=.~ •• ~ __ .== __ ~ .................... ................................. Indicatods) fon FIJI Year D.ot. •••• ___ ••• a •• m.~.=._=.~~ •••• =.= ..... __ ==._~== •• _ •••• ~ ... _ --- •••• = ...... ~ •••••• --.....
1 . . Health manpOWer _r Ratio per
- 10 000 Physicians 1980 284 4.5 Medical assistants 1980 34 0.5 Professional Nursing/Midwifery Personnel 1980 I 284 20.5
2. Ten leading causes 0'£ morbidity ICD codie 110. of Rate per Ca.e. 100 000
Influenza 481 1981 92 596 14 142 Infantile diarrhoea 009.3 1981 8 870 1 355 Gonorrhoea 098 1981 1 314 201 Me .. }es (Morbilli) 19B1 I 003 153 SyphUio 090-091 1981 407 62 Chickenpox 1981 3511 55 Infectious hepatitis 1981 162 25 Trachoma 010-012 1981 156 24 Pul.an.ry tuberculo.i, 1981 lSI 23 Food poisoning 1981 124 19
23. 'ten leadl.ng causes of mor~.hty ICD code No. of Rate per De.the 100 000
lscnaeaic heart dieeAse 410-414 1978 613 101 Senility i9' 1978 303 SO other disorder of heart rhythm 427.9 1978 231 38 Symptoms and ill-def condition. 7&0-783, 795, 796 1918 216 36 HypertensiYe diaeaee18 400-404 1978 208 34 Other cauHS of perinatal mort.lity 760-763, 769, ) 1918 203 33
773. 777-779 )
Diabetes mellitus 250 1978 185 30 Otbllrr paeumonia 481-486 1978 174 29 o,.entery unspecified 009 1978 89 IS Cerebrov •• aular di ••••• 430-43B 1978 78 13
••• ea. ... and d:~ath •. tor alX Cluea,e. under the WHO-Ert CU •• Deatb.
Diphtheria 1982 - -Pertu .. i, 1912 11 -Tetmu, 1982 \ · .. 'oliontyelit1a 1982 - -Tubercula.La 1982 115 · .. Measle. 1982 70S · ..
25. eae., tor d~se •• e. under the WlfO AnnuaL CD DUlletin C ••••
Gonorrhoea 1981 1 314 Hepatitis viral - Type A 1981 162
- Type 8 1981 ... - URSP 1981 ...
SyphiUis 1981 407 Trachoma 19B1 1S6 Yaws 1981 -
~6. Cases and deaths for six db.a ••• under the WHO Monthly CD Notes . CU •• Deaths
Cholera 1981 - · .. Dengue fever/DHF 1981 18 · .. Encephalit,is 1981 4 ... tnfluenla 1981 92 596 ... Meningitis 1981 114 · .. 'laaue 1981 - · .. .
27. Proportion of infante under one year of ase wbo have been fully immunized against tuberculosis, diphthe~ia. poliOWfeliti' and measlea
BeG 1~82 98.l DPT III 198~ &2.6 Polio III 1982 58.6 Measles 1982 1.5
28. Per cent of population aerved with .afe water ... 29. Per cent of population with adequaee sanitary .
facilities ... 30. Per cent of low birth weilbt infonts ( , 2499 grall8' 1979 13.9
3l. Maternal mortality r.te 19'1 D.~2
1"11. numbe~ within tbe p .rentb .... Tefer to tbe 1L'UallbeT ot death ••
.......•......... Source of Data .. ...............
12/82
06/83
12/80
06/8)
06/83
Oi/83
12/82.2
11/80
06/83

WESTERN PACIFIC REGION DATA RANK ON SOCIOECONOMIC AND HEALTH INDICATORS
Part II Page 15 30 December 1~84
. ~._.Da ...... m.~_ .. g._ •• ~_ ••.. _ •• __ •. _ .. a. __ =_. __ ... ~ ... .. --. __ .... ~ .. ---... ~ ..... . ...... -....... --. Indieator(.) £or~ i'RliIiCU IOLYIiESIA 'fear Data Source of Data
.~_ •• _______ •• _ •• ~==a._~._"'.= •• " •• = __ .===.=.D._~~.= __ .... ~ ... ==.-. .. ,...= .... -.= ......... .~ .. D ........... sac
1. Are. (in 1000 sq. km.) 1981 4.00 12/83
2. Estiaated population, { OOO} 1982 154 12182.1
3. Annual population growth rate, ('J · .. 4. Percentage of population - less than 1:> years · ..
- 65+ years · .. 5. Urban populat10n (l) 1980 39.0 14183
, 6. Rate of natural increase or populatlon (X per annum) 1982 2.3 14/83
7. Crude birth rate !.peT' luuO population) 1982 30 14183
8. Crude death rate (per 1000 populat1on) 1982 7 1~,"3
9. Life e~pectancy at birth - Total \y .... } 1977-79 61 14/80.1 - Hale (years) - Faule (yean)
10. Infant .artality r.te (per 1000 bve births) 1977-79 47 14/80.1
1. 'fotal futility rate l_n 15-49 y.ar.) · .. 12. Socio-eeonoalc indicator. for the year 2000
B.timated population, ('000) 2000 247 03179.1
Life ~Kpectancy at blrth - Hale lye ... ) 1995-2000 · .. - 'emale \years) 1995-2000 · ..
Annual population growth r.te, (n 1995-2000 1.31 03/79.1
Crude birth rate (per 1000 population) ... Crude death rate (per 1000 p'opulatioo) · .. Rate of natural increase (% per annum) · ..
13. Per Capita Gross National Product ~GNP) at market prices (US$) 1980 6 7S0 071s1
14. Rate of growth of per capl.t.a GNP l%} 1910-1977 1.8 01/19
15. 'Percent.age Gross Domestic Produ.ct tGDP} den.ved feam ~nufa~turin8 at constant factor coat (%) · ..
1 •• Economically active pop in pri~T'Y .ector
- Nuu,er in agriculture (·000) · .. - Percent in agriculture lX) · ..
17. Daily per capita calorie supply (cBlories) 1975-1971 2 738 03/79
18. l>aily per capita protein supply (grams) 1975-1971 69.5 03179
19. Adult literacy rate - Total ... - Male - Female
20. Health budget/expenditure - Amount · .. - Per capita (USS) 1977 198 12/82.3
- As % of total budget · .. Source 03/79.1: World Population Trends and Prospects by Country 1950-2000:
03/79: 06/19 : 07/19: 01lSl: 12/80:
12IS0.1: 12/82:
12/S2.1: 12IS2.3: 12IS~: 14180 : 14/80.1 14/8):
Summary Report of the 1978 Assessment, UN, 1979 FAO Production Yearbook 1979 Bulletin Mensuel des Maladies 1979 World Bank Atlas 1981 World Bank Atlas Government Responses to World Health Statistics Annual Questionnaire on Health Manpower Government Reports on the Number o~ Cases of CD Government Responses to World Health Statistics Annual Questionnaire on Certain Causes of Infectious and Parasitic Diseases and on Number of Deaths by Cause Leaflet on Childhood CD, Report 3/82 WHO Seminar on Financing Health Development, June 1982
·Country ~ealtb Information Profile (CHIP) revised by Government, 1983 South Pacific Epidemiological Bnd Health Inforlilation Service, Annual Report 1980 South Pacific Economies 1980 1983 World Population Data Sheet, Population. Ref~rence BUTeau Inc., Was-bingcon. DC

Part II Paae 16 30 December 1984
1I!II'l!liIRII. PACIPIC REGION DATA BANk 011 SOCIOECONOMIC AHD HEALTH INDICATORS
r===~=~~·====·~e===-=====-.==g~~.-=--.==g.===_===~=K •• ==-~==~ F"-=;r="'. = ..... "= •••• # ••••••••••• - ••
Indicator(s) for: FRENCH POLYNESIA Year Data ~C& •• _=.~.~._3 •• ===g_a .. _ .. __ • __ .~.a==~ •• =.= •• _ ••• = •• =~.=._= ~= •••• --= .......... p ... -._= .......
1. Health lU'ftpower Mumbe't' ltatio p'er 10 000
Phydciall8 1980 143 9.7 Medical Assistants 1980 ... PrQfeseional NurBing~idwitery Pe'r80nne~ 1980 272 18.5
2. Ten leachna: causes of morbidity ICD code No. of Rate. per Cases 100 000
Ill-.lefined inte.tina1 infections 009 1982 8 741 5 676 Influenza 487 1982 7 422 4 819 _po 072 1982 1 726 1 121 Meade. 055 1982 1 187 771 lhi..ckenpox 052 1982 900 5114 Gonococcal infection 098 1982 995 646 DensU4!. 061· 1982 565 l67 Other and unspecified syphi lis 097 1982 182 U8 Tu.btTeuloa.is 010-018 1982 65 42 Vir.l hepatitis 070 1982 50 32
~3. Ten le.dina causes of .. ort.lity lCD code No. of Rate per Deaths 100000
Meningitis 320 1978 3 2 Tuberculosis - others 013-018 1978 2 1 Tuberculosis - 'respiratory 010-012 1978 1 0.7 Diphthe'l'ia 032 1918 1 0.7 Diarrhoea infantile 009 1978 1 0.7 Lep"tQ8Y 030 1978 1 0.7
4. Ca.e. and deaths for six cH ••• ses under the ~-IPI Cales Deaths
Dipbth.ria 198Z - · .. Pert" .. i. 1982 8 · .. Tataatu 1982 ... ... PoUO/IIYeUtl. 1982 1 · .. Tuberculod. 1962 61 · .. Me.ele. 1980 1187 · ..
2S. ease. for disaases under tbe Will Annual CD Bulletin Ca •• ,
Gon.orrhoea 1980 440 Hepatitis viral - Type A 1980 no
- Type B 1980 5 - UNSP 1980 56
Syphillis 1980 367 Trachoma 1980 -Yaws 1980 -
26. Cases and deatbs for six diseases under the WHO Monthly CD Notes Cases neath.
Cholera 1980 - · .. Dengue fever/DHF 1980 617 ... Encephalitis 1980 1 · .. Influenza 1980 6 386 · '. Meningitis 1980 115 ... Plague 1980 -
27. Proportion of infants under one year of age who have »een fully immunized .,.inlt tuberculosis. diphtheria, poliDmfelitis and measlel
BeG · .. DPT III Polio In Measles
8. Per cent of popUlation served with safe water · .. 29. Per cent of pop.ulation ~th adequate sanitary
facUi'tiea · .. O. Per cent of low birth weight infants { , 2499 ara.a} · ..
31 • Maternal mortality rate .. ~ , .... , , · .. j • - .. - -
ta ••••• _= .......... SOIJ.rc:.e of Data
• .... a_ ..........
12/80
12/82
06/79
12/82
12/80.1
12/80.1

WESTERN PACIFIC RECION DATA RANK OR SOCIOECONOMIC AND HEALTH INDICATORS
Part II Page 17 30 December 1984
:~~~=2=~===m~=======~=s~=~g=====~=~a============m====== ~=~===~===m-=mgSm==. __ ~~== =~=aD~===~a.~=~= lndicator(s) for~ ~ Year Data Source of Data
==~m=2~== __ a __ .====~=~=~=~========~========2_=.======== ======= .. === ==""==".== ..... ,,, .... =s=~_===",=",===m~ 1. Area (in 1000 sq. kill.) 1981 0.55 12/83
2. Estimated population, I 000) 1983 113 12/83
). Annual population growth rate (%) 1970-1980 2.6 13TS)
4. Ptreent",. of popul.tion - leee than 15 yeau 1982 39.6 10/82
- 65+ years 1982 1.7 10/62
5. Urban populatl0n (%) 1980 27.3 0)/79
6. R.ste of natural increa8e of population (X per annura) 1981 2.41 12/83
7- Crude blrth rate !,.pel' 1000 population) 1961 27.9 12/6)
8. Crllde death rate l per 1000 population) 1981 3.8 12183
9. Life expectancy at bi~th - Total (year,) - Hale (years) 1982 66.9 12(83 - Female (years) 1982 72.2 12/83
10. Infant ttlOrtality rate (per 1000 live births) 1981 10.6 12/83
1. Total fertility rate (women 15-49 years) ... 12. Socia-economic indicators for the year 2000
Estimated population) ( '000) 2000 213 03/79.1
Life expectancy at birth - Male (years) · .. - Female (years) ...
Annual population growth rate, (X) 1995-2000 2.58 03/79.1
Crude birth rate (per 1000 population) · .. Crud. death rate (per 1000 population) · .. Rata of natural incr •• ae (% per Bonum) · ..
13. Per CapJ.ta Gl'OS8 National Product (GNP) at market prices (usi) 1982 4 760 13/83
14. Rate of growth of per cap~ta GNP IX) 1970-1977 5.1 07/79
15. Percentage Gross Domestic Product (GDP) derived from manufacturing at constant factor cost m · ..
16. Economically active pop in primary sector
- Number in agriculture ('000) · .. - Percent in agriculture (X) · ..
17. Daily pel' capita calorie supply (calories) 1982 1 905 13783
18. Daily per capita protein supply (grams) 1962 60 13/63
19. Adult literacy rate ... Total · .. - Kale - Female
20. Health budget/expenditure
- Amount (US$) 1983 11 270 40& 12/63
- Per ('spita (US$) 1983 100 12/83
- As % of total budget 1983 7.2 12/83
Source 13/83: Government's Report on Monitoring Progress in Implementing Strategy for ~FA/2000, 1983
03/7~.1'
03/79: 07/79, 10/82 : 12/81: 12/82.1: 12/82.2: 12/83 : 14/80:
World Population Trends and Prospects by Country 1950-2000; Summary Report of the 1978 Assessment, UN, 1979 Urban, Rural and City Population, 1950-2000, as A8se8s~a in 1978, UN, 1979 1919 World Bank Atlas 1982 ESCAP Population Data Sheet Govern~ent Reports on the Number of Cases of CD Leaflet on Childhood CD, Report 3/82 Govern~nt's Reply to EPI Health Information System Questionnaire, 1982 Country Health Information Profile (CHIP) revised by Government, 1983 South Pacific Epidemiological and Health Information Service, Annual Report 1980

P.rt II Pas. 18 30 De~ember 1984
IIII1'B1U! Pillute UClOll DATA BAa 011 SOCIOSWNOMtC AIID HULTH INDlCAtou
r··· .. a ...... R ..... = ........................................... .. _ .... --..................... lndieato'l'<.) fol'~ 4llMl Y •• -r Dat.
~~ ... ~~ ........................ -................ ~ ....... ..._-- --.......... r-......... tn. Health .anpower _or Ratio per
10000 Physicians 1983 83 7.4 ~dica,l a8sistant's 1983 ... Professional Nursing/Midwifery PeJ'80nnel 1983 305 30.7
2. Ten leading cautes of morbidity JCD code }to. of 'late per eases 100 000
. Influenl:8 487 1982 2038 2117 Gonorrhoea 098 1982 412 428 Other oalmone11. infection. 003 1982 166 172 Chickenpox 052 1982 144 150 Shigello.is 004 1982 49 51 1\lbercU1.08i.&. -,ull1011An:y all 1982 41 43 Otber foocl poiaonina (bacterial) 005 1982 29 30 Ciardi.ai. 007.1 1982 25 26 Hepatiti., viral 070 1982 18 19 Measle. 055 1981 9(6*1 9
~3. Tan I.Adine cau.e. of martality teo code 110. of 118te per Death. 100000
Dieealee of he.rt 1981 96 103 Malignant neopla ... ; 811 aite. 1981 58 62 Cerebrovascular disease 1981 31 33 All otber accidents , 1981 26 28 Motor vehicle accidents 1981 21 23 Cirrhosis of liver 1981 14 15 Homicide 1981 12 1)
Otber diseases of central nervous SY8tem 1981 12 13 Diabete8 mellitus 1981 11 12 Certain causes of mortality - early infancy 1981 9 10
24. eases and deatbs for lix di •••• es under the WHO-IPI eae •• Death.
Diphtheria 1982 - '" Pertu •• ia 1982 - ... 'tetanua 1982 - ... PoliOllyeU t ia 1982 - ,,, Tuberculoda 1982 44 '" Mead •• 1982 9 ...
25. cales for dieeaaes uttd~r the W1!O Annual CD Bulletin ~ses
Gonorrhoea 1980 402 Ht!patitis viral - Type A 1980 49
- Type B 1980 5 - UNSP 1980 80
Syphillia 1980 45 Trachoma 1980 -Yaws 1980 -.
26. Cases aad deaths for six dia.a.es under the WHO Monthly CD Notes eaeeB Deaths
Cholera 1980 - -Dengue fever JDlfF 1980 - -Encepbalitis 1980 1 -Influenza 1980 669 -Meningitis 1980 22 -Plague 1980 ... '"
21. Proportion of infants under one year of age who have been fully i.-unized against tuberculosis. diphtheria. poliomyelitis and measles
BCG DPT 111 1981 30.0 Polio III 1982 50.0 Measles
28. Per cent of population setved with Hfe water 1982 100 29. Per cent of papulation with adequate 8auitary
h.cilities 1982 95+ 30. Per cent of low birth weight infants ( '" 2499 gram") 1981 8.7
31. Mate:VnAl mortality rate 1981 0.0
* Imported csses.
. ............... -8oul'ce of Dt.t.a .................
12/83
12/83
11/63
12/82.1
12/81
12181
12182.2 12/82.2
13183
13183
13/83
12/83

wt;S'fl':.RN PACIFIC REGION DATA BANK ON SOCIOECONOMIC AND HEALTH INOICATORS
Part II Page 19 30 /)ecembl't· 1'::184
f~==·a~=~#~ ••• ~~=~~=~aa •• " ••• ~~=$~==.=~~ •• ==~a===aa=c ... ~=~. ", ... =,.. .... =- ~a~Q_aag~a=~.~== ... """" .. == ... "' .. ""s .. "',. ... IndicatodB:) for; HONG KONG Year Data Source of Data
==c====~_=====_==~a_~~.w~ •• _=_._a==._.=~==== .. =.====a===.#~ •• "'=""""""" __ ~.=s=c="' ....... = == .... "''''''== ....... == 1. Area (in 1000 sq. \un.) 1981 1.05 12/83
2. Estimated population ( '000) 1982 5 233 10782
3. Annual population growtb rate 1%) 1982 1.5 13/83
4. Perc~ntage of population - less than 15 years 1982 24.3 10/82
- 65 ... yesrs 1982 6.9 10/82
5. Urban'population (%) 1980 92.0 14/83
6. Rate of natural inc~ea8e of popuhtion (% per annUD'l) 1982 1.2 14/83
7. Crude birth rate (per 1000 population) 1982 16.5 10/82
B. Crude death rate (per 1000 population) 1982 4.8 - 10/82
9. Life expectancy at birth - Total (y •• <o )
- lfale (years) 1961 n 13/83 - Female (years) 1981 18 !J/83
10. Infant mortality rate (per 1000 live births) 1982 9.9 13/83
u. rotal fertility rate \women 15-49 years} 1982 \.9 10/82
12. Socia-economic indielittors for the year 2000
"-- EHtimated population, 1'000) 2000 6 262 03/79.1 f--- Life expectancy at birth - Ha.le (years) 1995-2000 70.6 03779.1
- Female (years) 1995-2000 77 .. 1 03/79.1
Annual population growth rate, (%) 1995-2000 0.86 03(79.1
Crude birth rate (per 1000 population) 1995-2000 l4.9 03/19.1
Crude death rate (per 1000 population) 1995-2000 7.5 03/79.1
Rate of natural increaae {% per annum) 1995-2000 0.74 03/79.1
iJ. Per Capita Gross National Product (GNP) at ma~ket prices (US$) 1982 4 J.>O* or 13/83
(HK$) 30 060
~;. Rate of growth of per capita CNP, a) 1970-1979 6.5 07/81
15. Percentage Groas Domestic Product (GOP) derive<i from manufacturing at constant facto~ cost (t) 1979 27.6 14/62
lb. Economically act1ve pop 10 primary &ectoT
- Number in agriculture ('DOO) 1980 57 03-/80
- l'erc~nt i. agriculture. (X) 1.980 2.5 03/80
ll. Daily per capita <:a.lorie supply (calories) 19B2 2 211 .---- 137"8J
Iw-:- Daily per capita protein supply (gramB) 1982 78.9 13/83
19. Adult 1 iteracy rate: - Total 1980 8) !J/B3 - Male 1960 95 13/83 - Female 1980 18 13/83
20. Health budget/expenditure
- Amount (HJ($) 1979/80 I 038 624 )69 12/83
- Per capita (HK$) 1979/80 216.2 12/83
- As % of total budget 1979/80 7.48 12/83
• Per caplta GOP
o[[icial E.xchange Rate~ 08$1.00 ='- HK$ 5.00 (1960)
Smuce 13/83:
03/79.1:
03/80, 07/81 : 10/82, 12/81,
12/82: 12/82.2: 12/83 : 14/82: 14/83 :
Government's Report on Monitoring PrQgre8~ in Implementing Sttlltegy for HFA/2000, 1983 World Population Trends and Prospects by Country 19S0-2000. Summary Report of the 1978 A~se8ament, UN,1979 FAO Production Yearbook 1980 1981 World Bank Atlas 1982 ESCAP Population Data Sh~et Government Responses to World Health Stntiatic$ Annual Quet:ltionnait·c 0(\ He,deh M.;inpoW'er, 1981 Gover~ent Reports on the Number of Cases of CD Government's Reply to EPt K~alth Information Syate. QueBtionnaire~ 19ti2 Country Health Info~tiQn Profile (CRlP) revised by Government} 198) Key Indicators ot Developin& Member countries of ADB, Ap~il 1982 1983 WQ~ld PopulatiOn V.ata Sheet, llopulotion Reference 5urclIu lnc., W36hington. OC

l'art 11 Page 2.0 30 Decl:mber 1984
WESTERN PACIFIC REGION DA~A SANK ON SOCIOECOKOMIC AND HEALTH INDICATORS
_E __ .~ .... "_". ______ . ______ ". __ ._. ___ ._._._ .. _"._~ ... "... ....... . ... _ .... _._~ _____ .. IndlcU.orl.) tor; HONG I(OHG Yen !l&t.
• __ •••••• _ ........... __ •• _ ••••••• _ ..... ____ ••••••• __ • __ ~_ •• _.aa ~_a_._ ._ ........ .•........ 1- H.ealth IB&npower Number .Ratio pet'
10 000 Phyaicians 1980 3 836 8.0 Medical assistants 1980 326 0.1 PxofeasiooaL Nursing/Midwifery Pet'sonnel 1980 12 109 2S.2
'j. Ten leading. caueea of eorbidity lCD code No. ot Rate per Calles )00 000
~5pi£atoTY tubetculoaia 010-012 1981 7 347 143 Viral hepatitis; 070 19tH 1 738 34 Chick-enpox. 052 1981 1 140 22 Other food poiBOQing (bacterial) 005 1981 666* 13 Shigellosis 004 1981 563 11 Typhoid and paratyphoid fever 002 U81 500 10 Tuberculosis of other organa 014,.016-018, 137 1981 314 6 Meaale.e 055 1981 249 S Mal.ria 084 1981 62 1 L,eprosy 030 1981 55 1
73. Ten 1ead1tl& causes of mortallty ten code Ko. of !tate pe't' Deaths 100 000
Mal!spant neopla •• s 140-208 1981 6 586 128 H.eart di ....... , incL hype~t.n.i~e h •• l:t di" .... e 390-4l9 1981 3 629 74 C.$.b~ov •• cul.r di'.a •• 410-438 lf~1 J 252 63 PneullH)nia • aU lOdie 480-486 1981 2 133 41 Injury end poi.oni~& 600-999 198! 1 943 38 "~pht'ith. neph-rodc a'ynd~ome 580-S89 ~981 8'1 17
and nephI' os it Bronchitis. ehronie & unsp, e.phyaema 6t asthma 490-493 1981 610 H r"berculoais (inc late effects of tubereulosia)QlO-OlB, 137 1981 439 10
ceriajndconditiona otiginatiPB in the perinat8ll 760-779 1981 447 9 P n.o
Chronic liver diseases and ~irrho9is 571 1931 3;1 7
'4. Cases and deaths for six diseases under 'he WHo-EPl Ca~e~ D'~Hths
Diphth~ria 1982 1 )
P~rtuaai8 1982 I -'tetanus 1982 22 IS l'oliomyelitia 1982 - -Tubereulos is 1982 7 527 454 Measles 1982 1 863 5
25. Cases for di.eases under the WHO AnnUal CD Bl.llletin
Conorrt.oea 1980 ... Hep.-tith viral - Type A 1980 ...
- Type 6 1980 ... - UNSP 1980 1 554(38)
Syphillie 1980 ... Trachoma 1980 ... Yaws 1980 ...
26. Cases and deaths for six diaeases under th~ ~o Honthl~ cn Notes Cases Deaths
Cholera 1980 - -Dengue fever/DRF 1980 ... ... Enc.eph.lic:ia " 1980 . . . ... Influenza 1980 ... -Meninsitis 1980 29 ~ Plague 1980 - -
27. Proport1on of 1nfants under one year_of age who have been fully iamuni&e4 againar tuberculosis, diphtheria; poliQmye1itis and measles
BeG 1982 100.0 OPT III 1982 80.0 Polio III )982 90.0 Measles
28. Per cent of popu1.ation served-with safe water 1982 99
1~. Per cent of population with adequate 6anitary faci iities 1982 99+
30. Per cent of low birth weight infants ( ~2499 gra.s) 1915 8.1
31. Katernal mo'tt.ail.ty 'rate 1982 0.01
*l'et'~ons <tffected (outbrea.ks, 175) The number within the parentheses refer to the nuQlber of deaths.
. __ ............. Soul'ce of D.t. _ ...............
12/81
12/83
t2/83
13183
12181
12/81
12182.2
13763-
Il/S3
n/83
13/83

WESTERN PACIFIC REGION DATA BANK O~ SOCIOECONOMIC AND HEALTH INDICATORS
Part II Page: 21 30 [)ecelDber 1984
~~a=~~=~=3=~~:~=~=====.=:=~==.==== •• 2=.~=C=~======~==~=_= == .. .c::::==",,_=_= =C'3=~aa*== .... _a3=3=3_ •• 3_~ __ =~~ Indic.!ltor(s) for: ~ Year O.ta Source of Oats.
~=~C*=~=.~D=."'.=a.===D="'= •• C.== ••• _"3=.=C==== ... c==~~g=_ .. = ... =.=_.2"" ... ., .. -=-"" ..... =-= ... -,. D_."=_C"'~_C~~_=~. 1. Area (in 1000 sq. km. ) 19B1 312.31 01178
2. Eetimated population {'OOO) 1982 U8 499 10182
3. Annual population growth rata (X) 1982 0.7 10/82
4. Percentage of population - len than 15 yelll:'S 1982 23.1 10182
- 65+ years 1982 9.5 10/82
5. Urban p~pul.tion (X) 1980 78.0 14/83
6. Rate of natural increa.e of population (% per annum) 1952 0.68 10182
7. Crude birth rate lper 1000 population) 1983 12.7 Db/8/t
8. Crude death Tate (per 1000 population) 1983 6.2 06/84
9. Life expectancy at birth - Total (years) - Male (years) 1983 74.22 06/84 - Fezule (years) 1983 79.66 06/84
10. Infant mortality rate (per 1000 live births) 1983 6.2 06/84
1. Total fertility rate (women 15-49 years} 1983 1.8 00/84
2. SQcio-ecOflomic indicators for tbe year 2000
Eatimated population. (. OOOl ,000 128 901 03/79.1
Life e)tpectancy at birth - Kale lyears" 199\-2000 73.5 0>/79.1
- F .... l. lyeara) 199\-2000 7".3 0)179.1
Annual population growth raCe, (%) 1995-2000 0.48 03179.1
Crude birth rate (per 1000 population) 1995-2000 14.1 03/79.1
Crude death rate (per 1000 population) 1995-2000 9.4 03179.1
Rate of natural increase li per annum5 1995-2000 0.47 03179.1
3. Per Capita Gro88 National Product ~GNP'. at mer1c.et pricea _~~_$) 1980 ~ m%Eo 07/81
4. Rate of growth of per capita GNP t%) 1970-1979 3.9 07/81
5. Percentage Gross Domestic Product (GOP) derived from manufacturing at con.tant factor coat (%) ...
16. Economic.ally active pop in primary sec tot;"
- Nucaber in agriculture (1000) 1980 6 612 0]180
- Percent in agdculture l%) 1980 H.O 0,,80
17. Daily per capita calorie supply {calqries) 197>-1977 2 847 03179
18. Daily pe. capita protein supply (grams) 1915-1977 86.5 On)?
19. Adult literacy rate - Total ... - Male - Female
20. Health budget7expenditure
- Amount ... ---- Per capita (¥) 1975 57 871 07181
- As % ,af t.otd budge/;- --- -- r- ... ----Official exchange l"ate; USSl.OO • Y 240.00 (1980)
Source 01/78; 03/79.1:
03/79: 03/80: 06184:
07181: 10/82; 11/80: ll/BI: 12182,
12/82. I; 12182.2; 12182.4; 12/83: 12/84;
14/53;
UN Oemographic Yearbook 1978 World Population Trends and Prospects by Country 1950-2000: SUmtn8ry Report of the 1978 Assessment, UN 1979 FAD Production Yearbook 1979 FAO Production Yearbook 1980 Information furnished by the Kiniet(y at Health and Welfare, Japa~. 'l August 1984 1981 World Bank Atlas 1982 F.SCAP Population Data Sheet World Health Statistics Quarterly, Vol. 33, No.3, 1980 World Health Statistics Annual 1981, Vital Stati8tic~ and Causes of Deaths Government Respooses to World Health Stati8tics Annual. Questionnaire on Certain Causes of Infectious and Paraeitic Di8~ales and on Number of Deaths by Cause; and Government Reports on the Number of Cases of CD Leaflet 00 Childhood CD. Report 3/82 Government's Reply to EPr Health Infontladon Syatem Questionnaire. 1982 Report on the progrus of beal tb ac t i vir iea I 1982 Reyiaed Country Health tnformation Profile. 1983 Government Responses to World Health Statistics Annual Queationnaire on Heal.th Manpower 198) World Populat.ion Data Sheet, Population Refel'ence Bureau, Inc •• Waahincton, DC

P4rt 11 '-S.22 3ll Dee_r 1984
lIESTEIUI !ACU1C \lJiGI0N nATA JlAIIK ON SOCIOaoOIlOKIC t.I1I> I1lIALTH INDlCA'lOlIS
~.~_=.z=.~=.a=.~=-~u=~== •• aa.z. __ =.a~ ••• ~ __ .~._ ........ ~= •• _= .. -=_.- r-•• ~.-•••• = ••••• --...... Indieator(s) for: JAPAN Yea~ Data
~" •••• ~ •• ~" •• __ ."' •• ;;;:; ••• " ••• ~D .... a •• _ ••• == ............ .... D.=- .= .......... ~ ........ * 21. Health .......... r "-or 1tatio per
10 000 Phyaieiao.. 1982 161 260 13.8 Medical aa8iatantB 1982 · .. PrQfe •• ional Nursing/Midwifery Personnel 1982 323 739 27.6
~2. Tea. te:&ting, causes of morbidity lCD eode No. of bte par Cases 100 000
~~nary tuberculosis 010-012 1983 57 401 48.1 Other food poisoning 005 1983 27 513 23.1 Influenza 487 1983 26 143 21.9 Gonocoeeal infection 098 1983 12 291 10.3 Me.alea 055 1983 7 281 6.1 Other tuberculosis Oll-018 1983 6 388 5.4 Oolllor •• 1_11& inf .... tion 003 1983 J 612 3.0 Whoopi.", co",h 033 1983 2 4~9 2.1 SyphiH. 090-097 1983 1 687 1.4 SIllS.Uoah 004 1983 1 579 1.3
123• Ten I •• ,,! .. cau.es of mortCllty tCD code. No. of late per Deatb. 100 000
IIAU_t MOpl ..... 1983 176 174 148.3 Cerebl'Ov.lcuJ.a:t dia .. ae 1983 145 861 122.8 Heart dia •••• e 1983 131 217 111.3 Pne.uaonia aM bTOuchitie 1983 46 672 39.3 Senility without .entiora of p.yeboli. 1983 29 394 24.7 Accident.. 1983 29 458 24.8 Suici". 1983 24 970 21.0 Cirrhosis of tbe liver 1983 16 795 14.1 Hypertensive diseases 1983 13 482 1l.3 Nephritis, nephrotic syndrouae and nephrosis 1983 U 260 10.3
24. Cales and deaths for six elbe •• ea under the Iilb-EPl CU.e Oeatb.*
Diphtheria. 1982 Z9 -PertWiai. 1982 2 815 14 Tetanue 1982 36 22 Po1,-litis 1982 1 -TubeTC.uloli. 1982 66 600 4473 Mea81 •• 1982 6 715 23
25. Cas.. for di •••• es unde!' the WHO Annual CD BuU4!tia ea •••
GoB<YC'rhoea 1982 10 391 He'Patitia viral - Type A 1982 · ..
- Type B 1982 · .. - UNSP 1982 · ..
Sypbillio 1982 1 659 Trachoma 1982 17 YaW8 1982 · ..
6. Case, and de. tbs for six die..... under the WHO Monthly CD Note. Cues neAt.h..
Cholera 1982 15 ... Dengue fever/DHF 1982 · .. · .. Encephalitis 1982 24 · .. Influep •• 1982 7Z 187 · .. ~inaitis 1982 18 ... Plague 1982 · .. · ..
27. Proportion of infants under one year of &Ie vho have been fully· immunized agaiBst tubeR-ulo.-ia, diphtheria, poli<Jlll:felitia au lU-aalea
BCG 1982 84.6 Dl'T HI Polio III MeL-Bles
26. PeT cent of population served .ith safe water · .. 29. Per cent of population with adequate saditary
facilitiea · .. 30. Per cent af law birth weight infant. (~2499 gra ... l 1982 5.2
31. Haternal mort_lity rate 1980 0.204
*lIlcomplete
..iII!II .•.•. ~ ........ '" So~t'e. of Data ................
12/84
06/84
06/84
12/82.1
12/82
12IB2
12/82.2
06/84
12/83

.
WESTERN PACIFIC REGION DATA BANK ON SOCIOECONOMIC AND HEALTH INDICATORS
Part II Page 23 30 Decemb er 1984
r~a=.~.=.~.=~~=.~~=c_=m== __ ..... a.GA. ___ .~~ ••• _.""._._C. .............. ..a ........... ..... """' ...... ' .......... Indicator(s) for~ KIRIBATI Year D.ta Source of Data r"'·· .. • .. ·-Q..,"""''''· ... ''''· .. ·····-·· __ ....... "._ ... •• .. ·''"II-,_· .. · ........ ·u ... _= ..... ,.. .. c=-....... . .... _----- . ............. ~ .....
1. AreD (in 1000 8q. k •• ) 1981 0.72 12/83
2. Estimated populet1oo. ( '000) 19112 ~60 12/82.1
3. AAnue! population arowth rate l» 10&2 2.2 IllS)
4. Percentage of PQPulat10D - len than 1) )'ears 1982 41.1 10/82
- 65+ years 1982 3 .6~ 10/82
5. Urban population (X) .. 1980 37.8 03/79
6. Rate of natural increase of population \1 per annum) 1978 2.09 10182
7. Crude birth rate (per 1000 population) 1978 34.9 10/82
8. Crude death rate tper 1000 population) 1978 14.0 10/82
9. Life exp~ctancy at bLrth - Total (ye.,,)
- Male (years) 1978 50 10/82 - Female (ye.rs) 1978 54 10/82
10. Infant mortality rate (per 1000 live births) 1978 87 13/83
11. Total fertil ity rate (women 15-49 yeat'.J 1982 4.7 10/82
12. Socio-economic indicators fOT: ttl!!! year 2000
EstLmated population, ('000) 2000 95 03/79.1
Life expectancy at b1rth - Male lye.rs> .. , - Pemale '-year.) ...
Annual populatl0n Iro~t:h rate, \X) 1995-2000 1.58 03/79.1
Crude bitth rate lpel' 1000 population) ... Crude d~ath rate (per 1000 population) .. , Rate of uatural iucre •• e (t per annum) ...
13. P~r Capita Gross National Product tGNP) at market price8 (Ust) 1982 300 13/83
\4. It.atc of growth of pel" capita GNP IX) 1910-1977 &,0 01/19 ,-
15. Percentage Cross Uomedtlt:: Product tGDP} derived from manufacturing at constant factor coat <:0 1978 47.2 14/81
16. Econ()mica11y active pop in primary sector
- Number in agriculture (rOOO) · .. - Percent in agriculture (%) ...
17. Daily per capita calorie supply (caloriee) · .. 18. Dal.ly per capi ta protein supply (grams) · .. 19. Adult literacy rate - Total 1982 100 13/83
- Male - Female
20. l\eal th bud&~tlexrenditure
- Aa..ouClt .(,,$) 1982 1 600 000 12/82. J
- Per capit.a lAU 1982 26.7 12(82.3
- As % of total budget 1982 10.3 12/82.3
Official r;xchange 'Rate; US$ 1.00 • A$ 1.06 (1982)
Source
03/19 : 07/79; 10/B" J.2/dl~
12/8:1; 12/82. b 12/82.2: 12/82.3; 12/81; 12/83.1: !4/8! :
Governmentls Repoct on Monitoring Progress in Implementing Strategy for MFA/20aO, 1983 World Population 1're[\di;.-~uG.,Pr_08pects by Country 1950-2000, Summary ~p(,!'t of the 1978 Assessment, UN 1979 I1rban, Rural and City Population~ 1950-2000$ lis Ass-essed in 1978. UN. 1979 1979 World Bank Atlas 1982 ESCAP Population Data Sheet GJveroment responses to World Health Stati8ti~8 Annual Questionnaire on Health Manpower. 1981 Government's Reports on the Number of Cases of CD Leaflet on Childhood CD, Report 3/82 Governmentls Reply to EPt -Wealth Infor~tion System Questionnaire, J982 WHO Semina.r on Financing Health Development, June 1982 COllfltry Health Information Profile (CHIP) revllOcd by Goverument, 1981. 1982 Lmd 1963 Country Review by CLO/1'srawa, 1983 Key Indicators of Developing Member Countries of ADS. April 1981

Part II Page 24 30 December 1984
WESTERN PACIFIC REGION DATA BANK ON SOCIOECONOMIC AND HEALTH INDICATORS
~.$=:C==QS~.'= •• C=.=~~.= ••• _ •• A __ =~ __ • __ =EC$.=_= __ =_ •••• =_==~= •• -= ... == . ....................... Indie:ator(s) for; KIRIIlATI Yesr Dats
~ .............. __ ..................... __ ._._. __ .m_. __ .. ____ . __ = ___ ..... -. -_ .......... p •••••••••••
1. Healtb l18a.power llumber Ratio psr 10 000
Phy.ic:ia". 1980 l' 2.6 Medical assistants 1980 1~ 2.6 Professional Nursing/Mid~ifery Personnel 1980 1~4 26.6
1'2. Ten leading causes of morbidity ICD code No~ of Rate per Case8 100 000
Upper respiratory tract infection 1981 26 588 45064 Diarrhoea 1981 6 333 10 734 Lower respiratory tract infe.ction 1981 4 328 7 336 Sores/wounds 1981 3 440 ~ 831 Conjunctivitis 1981 3 430 5 814 Skin infections 1981 2 156 3 654 otitis media/perforation 1981 1 156 1 959 Communicable disea8es 1981 817 1 385 Anaemia 1981 466 790 Fish poisoning 1981 443 751
3. Ten leading: causes of mortality IeD code No. of Rate per Deaths 100 000
Diseases of other parts of digestive system 530-579 1980 15 26 Tuberculosis 010-018 1980 14 24 lntestinai infectious diseases 001-009 1980 13 22 Other diseases ·of respiratory system 466, 480-519 1980 11 19 Cerebrovascular disease 430-438 1980 7 12 Transport accidents E800-E848 1980 7 12 Diseases of the nervous system 320-359 1980 6 10 Dis of pulmonary circulation and
other fo~s of heart disease 415-429 1980 6 10 Nutritional deficiencies 260-269 1980 ~ 9 Otner inju~ie8, early complieationa of trauma
910-929, 958-959, 990-995 1980 5 9
24. Cases and deatbs for six dba.,es under the WHo-SPI Cues Deaths
Diphtheria 1982 2 -Pertussis 1982 17 -Tetanus 1982 3 1 Poliomyelitis 1982 - -Tuberculos is • 1982 62 1 Measles 1982 11 2
25. Cases fot diseases under the WHO Annual CD Bulletin Ca.ses
Gonorrhoea 1980 15 Hepatitis '1i'ral - Type A 1980 1
- Type B 1980 3 - UNSP 1980 15
Syphillis 1980 1 Trachoma 1980 ... , Yaws 1980 -
26. Cases and deaths for six diseases under 'he WHO Monthly CD Notes Cases Deaths
Cholera 1980 - -Dengue fever/OHF 1980 808 -Encephalitis 1980 - -Influenza 1980 38 709 J Meningitis 1980 31 7 Plague 1980 - -
27. Proportion of infants under one year of age who have been fully immunized against tuberculosis, cliphtheria t
poliomyelitis and measles BeG 1982 67.8 DPT III 1982 28.9 Polio III 1982 21.2 Measles 1982
28. Per cent of population served with safe water 1982 10
29. Per cent of population with adequate sanitary facilities 1982 10
30. Per cent of low birth weight infants ( ~2499 grams) ... 31- Maternal mortality rate 1982 0.1
••••••••• d ......
Source of Data. ....... _ ........
12/81
12/83.1
12/83
12/82.1
12/82
12/82
12/82.2
13/83
13/83
13/83

WESTERN PACIFIC REGION DATA BANK ON SOCIOECONOMIC AND HEALTH INDICATORS
Part 11 Page 2\ 30 December 1984
."~""_ •• _."""=I."~."'="".,,"""I:II"==.CI.".C ••• ".~"."."'''''''.''''''''.'' ....... = •• =="".=~="I' . .............. -.. .~.-=-....... -~. Indicator(s) fon LAO PEOPLE's DEMOCRATIC REPUBLIC Year Data Source of Data ••• == ...... aa ........... =~ •• =CI ......... __ ._ ..... _ .. _._== ........... = •• ... ............ -.. ...-........... .................
1. Ar ... (in 1000 sq. <m.) 1981 236.80 12/83
2. Eettmeted populatlon, ( 000) 1982 3 800 12(82
J. Annual population gTowt~ rate \X} 1982 2.5 10/82
4. Percentage of popul_tion - less than 15 years 1982 43.2 10/82
- 65+ years 1982 3.0 10/62
5. Urban populahon (1) 1980 15.0 14/83
6. iste of nat\lral lncre •• " or populat,on (1 per annum) 1982 2.51 10/82
7. Crude blrth rate (per 1000 popUlation) 1982 40.8 10(82
8. Crude death rate (per 1000 population) 1982 15.7 10(62
9. Life expectancy at birth - rotal (years) - Male (years) 1980-19B5 45.0 12/B2 - FelUle (years) 1960-1985 4B.0 12(82
O. Infant mortality rate 'per 1000 live birthsJ 1982 124.0 10182
1. total fertility rate (women 15-49 years) 19B2 5.8 10(82
2. Socio-economic indicators for the yen 2000
Estimated population, ('000) 2000 5 725 03/79.1
Life expeetancy at birth - MAle lyears) 1995-7000 H.9 03(79.1
- Fellah (y •• rs) 1995-2000 55.1 03/79.1
Annual population ,rowth rat. •• <X) 1995-2000 1.93 03(79.1
C'l'ude. bl.rth rate. t..per lUUU population) 1995-2000 31.9 03179.1
Crude death rate (per 1000 population) 1995-2000 12 .6 03(79.1
Rate of natural increase (% per annum) 1995-2000 1.93 03f79.1
13. Per Capita Gross National ?rodu~t (GNP) at market prices (UsS) 1978 83 12/82
14. Rate of growth of per cap1ta GNP (%) ... 15. Percentage Gross Domestic Product (G])P) derived
from manufacturing at constant factor cost (X) ... 16. Eeonomically active pop in primary sector
- Number in agriculture (' 000) 1980 1 300 03/80
- Plrcent in agriculture (%) 1980 73.8 03/80
17. Daily per capita calorie supply lcalories} 1977-1979 1 842 03/79
18. Daily per capita protein supply (grams) 1917-1979 47.7 off79
19. Adult literacy rate - Total 1980 41 12/82 - Male - Female
20. Health budget/expenditure
- Amount ... - Per c«pi ta .. , - As '% of total budget ...
Source 03/79.1: World Population Trends ana ProspeCts &y Country 19S0-2000~ Summary Report of the 1978 Assessment I UN 1979
03/79; 03(80, 10/82, 12(60 ; 12/81, 12/82, 12/82.2., 12/83, 14/83,
FAO Production Yearbook 1979 FAO Production Yearbook 1980 1982 ESCAP Population Uata Sheet WHO/WPRO publication/document Leaflet on Childhood CO. Report 31Sl Country Review by WRC, Vientiane, 1982 Government's Reply to EPI Health Information System Questionnaire. 1982 Country Health Infonaation Profile (CHIP) revised. 1983 1983 World Population Data Sheet, Pvpulation Reference Bureau Inc .• Washington, DC

Part-II 1'4ge 26 3011"" ... ber 1984
WESTERN PACIFIC RlGIOH DATA BANK ON SOCIOECONOMIC AND H!A~TN INDICATORS
Indicatorls) for:
Health manpower
Physicians ~dical assistants Professional Nursing/Midwifery Personnel
Ill~d.fined intestinal infections 009 Influe.z. 487 Malaria 084 Other disea.es of luna 518 Streptococcal sore throat and scarlatina 034 Amoebiasis 006 Intestinal infectiona due to other Ol'ganisUl8 008 Shigellosis 004 Pulmonary tuberculosis all Pneumonia, organism unspecified 486
Malaria Uri-bronchiti8-g~ippe, pneuaonia Hypertensive disease Tuberculosis - 611 forma Diarrhoea Preuaaturity Avitaminoses/Anaemia Meningo-eneephalitis Injuries Cholicystitis/Cholilithiasia/cirrnosis Del. complication
the \IIIo-BPI Diphtheria Pe~t\1s8i8 'tetaTillS Poliomyelitis 'tuberculosis Meaeles
Annual CD Bulletin Gonorrboea Hepatitis viral - Type A
- Type B
Syphilli. Trachoma Yaws
WHO Monthly CD Notes Cholera
- UNSP
Dengue fever/DHP Encephalitis Influenza Meningitis Plague
been fully i.munized against poliomyelitis and measles
BCG DPT III Polio III Measles
Yea-r
1980 1980 1980 1980 1980 1980 1980 1980 1980 1980
1971 1971 1971 1971 1911 1911 1971 1971 1971 1971 1971
Yesr 1980 1980 1980 1980 1980 1980
'Year 1980 1980 1980 1980 1980 1980 1980
Year 1980 1980 1980 1980 1980 1980
1982
of
_or Ratio peT 10.000
0.4 12/80
per C •••• 100 000 50 223 1 337 12/83 36 742 978 25 854 688 9 928 264 7 211 192 b 667 178 5 793 154 4 768 127 4 587 122 4 308 115
per Death. 100 000
208 7 12/83 56 2 48 2 45 1 44 1 38 1 31 1 29 1 20 0.7 16 0.5 16 0.5
c •••• Deathe II 12181
2 718 1 015 1 166 7 630 1 380 ...
Cases 12/83
5 43
Cases Deathe 12183
37 5 1
36 742 111 9
3.7 12/82.

WESTERN PACIFIC REGION DATA BANK ON SOCIOECONOMIC AND HEALTH INDICATORS
Part 11 Page 27 30 December 1984
~_.~.~ ••. ~.~_=._ •.. __ ~._ •••• __ . __ ~ __ . __ ~m3~.~: ____ •••• ___ .... _ .... "' ... •.... -.-m·----~r~-···a~.-.. --~-Indicator(s) £01': ~ Ye.ar Data Source af Datil
~.~" ••••• ~ •• = •••• _" •• _ •• " ••••• =3=._====_~~~=_~.~#.* ••• ... -.. _ .... ... ... ,. ........... ""' .... m .. _.~ ••• ~~ ... ~==~
1. Area (in 1000 ....... ) 1981 0.02
2. I.ti.-teo population ('000) 1982 292
3. Annual population growth rate (t) 1982 2.8
. Pel'cent.ge of pop~lation - less than 15 year. 1980 34
- 65+ years 1980 4
5. U~ban population "J 1980 98.0
6. &ste of natural increase of population {% per annum) 1982 l. 80
7. Crude birth rate (per 1000 population) 1962 26.0
8. Crude death rate {per 1000 population) 1982 8.0
9. Life expectancy st birth - Tot .. 1 (yean) 1982 65 - Male (years) - Female (years)
10. Infant mortality rate (per 1000 live births) \982 18.0
I. Total fertility rate (women 150-49 years) · .. 2. Socio-economic indicators for the year 2000
Estimated population, ( 'Qoo) 2000 334
Life expectancy at birth - Male (yearB) · .. - FeatBle (years) ...
Annual population aro.tb rate. (%) 1995-2000 0.90
Crude birth rate (p.r 1000 population) · .. Crude deatb rate (per lOGO population) · .. Rate of natural incre •• e ~. per annum) · ..
13. Par Capita Gro •• National P~oduet (GNP) at market prices (US$) 1982 I 500
4. Rate of growth of per capita GNP lX,) 1970-1979 15.0
5. Percentage Gross Domestic Product (GDP) derived from manufacturing at coustant factor cost (X) · ..
16. 'Ec.onomieally act ive pop in prillary' sector
- Number in agricultu~ ('000) · .. - Percent in agriculture CX) · ..
7. Daily per capita. calc>ri-e supply lcalories) 1977-197. 2 181
18. Daily per eapit4 protein supply (grams) 1977-1979 57.9
9. Adult literacy rate - 'Total 1982 90 - Kale - Pemale
pO. Health budget/expenditure
- Amount (Patae .. l 1979 17 565 174.70
- P(.r capita (Patacat> 1979 63.3
- As % of total buclg-ec. · .. Official Excbange Rate: US, 1.00 = Potae •• 5.45 (1982)
Source 13/83;
03/79.1 ;
03/79; 06/84: 07/Bl : 10/82: 12/80;
12/81:
12/82: 12/82.1; 12/83:
GovernmentJs Report on Monitoring Progress in Implementing Strategy for HFA/2000, 1983 World Papulation Trends and Prospects by Country 1950-2000: Summary Report of the 1978 Assesament , UN 1979 FAD Production le8~book 1919 Informstion furnisbed by the Government of Macao, S August 1984 1981 WOTld Banlt Atlas 1982 ESCAP Population Data Sheet Government Responses Co World Health Statistics Annual Questionoaire on » •• lth Manpower, 1980 Government Responses to World Health Statistics Annual Questionnaire on Certain Cau~e8 of Infectious and Parasitic Diaea.ses; and on Number of Deaths by enlJee Government's Reports on the Number of Cases of CD Leaflet on Childhood CD) Report 3/82 Country Health Information Profile (CHIP) revised by Goverument, 1983
12/83
12/S2.1
13/83
10/82
10/82
10/82
10182
10/82
10/82
13/83
IJ/80
-
03(79.1
03179.1
13/8)
07/81
03179
03/79
13183
12/83
12/83

Part 11 Page 28 )0 December 1984
WES~ERN PACIFIC REGION DATA BANK ON SOCIOECONOMIC AND HEALTH INDICATORS
;~~~=~======m:=;;=~====~~=~======#==~~=======~m==~========~===== ~m .. === _._=~~=a~~~~~~=:_.~_Z_dm
Indicator (8) ,fo",; ~ Year Data =~_ ... ~sm~.=_=~ms=a_====a~~=m=.====.==_a=m=~~~a=*.=~~.=_=_==. ==--- =-= .......... ..,- ._ •• """"="""" 21. Heal th manpower Number: Ratio per
10 000 Physicians 1980 269 9.5 Medical assistants 1980 275 9.7 Professional Nursing/Midwifery PeriSonne 1 1980 622 21.9
22. Ten leading causes of morbidity lCD code No. of Rate per Cases 100 000
Pulmonary tuberculosis 011 1980 1 108 390 Viral hepatitia 070 1980 225 79 Influenza 487 1980 44 15 Pneumonia 1980 ~O 11 Bacillary dysentery 1980 15 5 Tuberculosis of oth~r ot'g.ans 017 1980 13 5 Hea.lea 1980 9 3 Acute gastroenteritis 1980 9 J Qthet' pneumoni a 1980 8 3 'tetanu~ 037 1980 4 1
3. Ten leading causes of mortality leD code No. of Rate per Deaths 100 000
Senility without Mention of psychosis 1983 213 70.1 Cerebrovascular disease 1983 168 55.3 TubeTculosis of respiratory system 1983 94 30.9 Malignant neoplasm of trachea, b'tonchu8 and lung 1983 76 25.0 Kalignart neoplasm of other sites 1983 69 22.7 'Bronchitis, chronic and uneepecified, 1983 59 19.4 e~phy8ema and a&tnma
Acute myocardial infarction 1983 57 18.8 Hypertensive disease 1983 56 18.4 Pneumonia 1983 44 14.5 Jmbo 1 i 8m , thrombosis and other diseases of the 1983 38 12.5
arteries, arterioles, and capill.ries
24. Cases and deaths for six diseases under the WHO-Efl Cases Deaths
Diphtheria 1982 - -Pel"tuuh 1982 4 -Tet«nU8 1982 3 ... Poliomyelitis 1982 · .. ... Tuberculosis 1982 233 · .. Measles 1982 - -
5. Cases for diseases under the WHO Annual CD Bulletin Cases
Gonorrhoea. 1980 -Hepatitis 'viral - Type A 1980 · ..
- Type B 1980 · .. - UJISP 1980 123(3)
Syphillis 1980 -T'ra.choPl8 1980 · .. 'taws 1980 · ..
16. Cases and deaths for six diseases under the WHO Monthly CD Notes Cases Deaths.
Cholera 1980 - -Dengue fever/DHF 1980 · .. · .. Encephalitis. 1980 - -Influenza 1980 · .. ... Meningitis 1980 5 2 Plague 1980 - -
27. Proportion of infants under one year of age who have been fully immuaized against tuberculosis, diphtheria, poliomyelitis and mea91ee
BCG DPT III Polio III Measles
,28. P.~ cent of population served with safe water 1982 100
29. PeT cent of population with adequate sanitary he i lities 1982 100
lO. Per cent of 10(,1 hirth weight infants ( ",2499 gr...,.) , · .. 31. Maternal mortality rate 1982 0.4
The number w~th1n the parentheses refer to the number of deaths.
.J:==-.... ~ .... "' ..... Sou'tce of Data
1--....... _.,. .....
12/80
12/81
06/84
~ 13/83
12/82
12/82
13/83
D/sl
13/83

i
I , Part 11 Page 29 30 De~embe~ 1984
WESTERN PACIFIC lECION DATA BANK ON SOCIOECONOMIC Al\D lU!ALTK INDICATORS
_~=~~._c •• ==_.~=~= •••••••• _ ••••• =z •• ~=c=.=~c=~.=a== •••• Q.= ••• ~~.=%Q. Indicacor(s) for; MALAySIA
~ .... = ... _=Sd~_~ ................... wc= •••••• *._ ......... B ••• ~3~_~=. __ ••• 1. Area (in 1000 .q. ~.) Peninsular
Sabab Sarawak
2. Estimated population (. 000)
3. Annual population growth tate '<J 4. Percentale of population - leas than 15 years
- 65+ years
5. Urban population (%>
6. Rate of natural inere •• e of population (X 'Per annUID)
7. Crude birth 'l'8te lper 1000 population)
8. CNde deat.tI. rate \per 1000 populauon]
9. Lif •• ~p.ct.ncy at birth - Total ~Y·"'! ... Male (year.> - Pemale (year.>
, .. Intent a.ortaltty rate \peT 1000 bve births)
1. Total f«.tlhty rate \W .... n 15-4. Y'.U)
2. Soeio-$eOnONiC ~ndic.tor' for the year 2DOO
Sstu.ated popu1otion. ('000)
Life expectancy at bireb - Hale (y .... )
- Female (years)
AnnU41 popUlation g~th TBte. (Xl
Crude birth rate (pel' 1000 population)
Ct'Ude death rate (per 1000 populatlon)
Rate of natural increase {% per annum)
13. Per Capita Gro •• N.t~onal P~oduct (GNP). at .drket prices (UBi)
0<$)
14. Rate <?f growth 01: per cap.t.t. GNP (1)
15. Percentage Gro .. Dome.tic Product, (GDP) de'tived from manufacturing at conat.nt factor cart (X)
16. Economically Active pop in pri.ary sector
- Number in a&rlc:ulture \ 0001
- Perteut in .agriculture (XJ
17. Daily per capiea calorie supply (ealorLes>
18. Daily po< capit. protein supply (gram.)
19. Adult literacy rate - Total - Hale - Female
20. Health budget/expenditure
- Amount IMI)
- Per ca.pita IMS)*
- As 1 of total budget
Official Exchange Rate; US$ 1.00 • M$ 2.22 (1983) *Officia1 Population Base not availAble.
**Peninsular Malaysia
................. lear ............
1981 1981 1981
1982
1982
1982
1982
1980
1982
1982
1981
1982 1982
1982 1982
2000
1995-2000
1995-2000
1995-2000
1995-2000
1995-2wO
1995-2000
1983
1982
1980
1980
1900
1977-1919
1971-1979
1980
1984
1984
1984
. ................. Da.t", . •.••........•.
131.59 73.71
124.45
14 506.4
2.1
38.1
3.1
39.9
2.29
30.6"* . .... 67.1*'" 12.5"'·
19.26 1.8
20 181
66.5
70.5
1.51
21.1
5.9
1.52
1 868 or " 391
~.4
20.5
2 216
4>.8
2 562
46.S
12
1 101 810 440
72***
4
***Based on estimated population using the growth rate of the 1980 population census.
• ... === ..... ~~~ ••• SO\lrc~ of Data . ..... ~ .. ~_ .. c.~
12/83
06/84
06/K4
10/82
10/02
06/84
10/82
06/84 00/0.
06/84 06/84
06/8.
10/02
03179.1
01t79.1
03/79.1
03tl9.1
03/79.1
03f19.1
03179.1
13/83
06/84
14/81
03/80
OlloO
03/79
0311.
13/83
06/84
06184
06/84
Sour(:e 13/83: 03/79.1 :
Covernment's Report on MonitoFing Progress in Implementing Strategy for tWA/20aO I 1983 World Population Trends and Prospects by Country 1950-2000:
03119: 03/80: 06/84: 07/81: 10/82: 12/82.2: 12/83: 14/81: 14/83:
Summary Report of the 1978 Ass~ssment, UN 1919 FAn Production Yearbook 1919 I~AO Pt'oduJ!tion Yearbook 1980 Colml t'y l:Iealth Information Pt'nfi Ie (CHIP) reviud by Govflrnrnent. 1984 1981 World Bcnk Atl •• 1981 ESCAr Population Data Sheet Government ~ 8 Reply to EPt Health Information System. Quesciollna,ire, 1982 Country Health Info~ation P~ofile (CHIP) revised by Goveroment l 1983 Key Indicators of Developing Me~er Countries of ADS, April 1981\ 1983 World Population Data Sheet, Population Reference Bureau Inc., Wsshiolton, DC

Part 1) Pqe 30 JO·Dec .. ber 1984
WBST-I1lIt PACIFIC 116101 'DATA BIdIlt ON SOCtOEaMOMIC AlfD lUI:ALTH INDlCATQJlS
......... -.. --.......... --.............. -... -... -........ --..... -~ .... ..._-.. _-_ •.... _ .. -..... _-_.-. ..... lu~ie.tor(.) fO~1 IW4t.QU. Ye.as: btlt.. SOus:<:a of o.t .. _--------_ .. _-._.-_. __ . .--... - ~ ... -. _-- _ ....
21. ~lth lIlanpoves- ..... ber ..tio pet' lQ 000
1'bysidana Penilllular 1980 1 514 3.1 12/83 S.bah 1971 llO 1.4 Sar&wa" 1978 sa 0.7
Kt4iul .au.tant. P*n,n.ulat 1980 1 749 1.5 •• NII 1911 ... • uank 1918 \15 I..
.,. .... ,.., .. ........ ~~~.ry ......... , 'anil'Jaular 1980 9 095 8.0 ....... 1911 535 6.8 'u..,u 1l)76 449 3.8
.'" Tea l •• eli-na Clad .. of INrl>ld1t1 LCD eOcfe 110. Ot bee ,. .. ea. ••• 100 000
~lad. 084 1983 19 019 128.50 06/84 'luberculollh 018 198) 9 361 6'.2:7 Keulea 0" 1933 9 113 &2.92 Con~oec41 inf~c~iona 098 1983 -4 162 )2.17 "-- On 1983 3.)08 2.3.10 Vir41 hepuitia 0,. 1983 3 34tio 22.61 Chickenp()X 053 1983 1 200 .21.62 Cholera 001 1983 2 US 14.13 Typhoid fever an4 p.r.t,pb~id fever 002 U83 1 95) 13.19 Other food poiaODi~ ~act.~i&l) 005 19-83 1 SSl 10.69
3. ftn. le.«o.iq eMl ... \l-f lIOrul ity tCD eode No. of aat. per o. .. th. 100 000
Ite-.rt diae .... 1982: 1911 2.67 06/84 kddenta 1982 2 373 2.18 Dh ••••• of •• d,. inthCI)' 1981 2 129 1.95 "'opb ... 1942 I. 432 1.31 Ca~iov •• eul*f 6i •••••• 1982 1 4<)2 1.19 rn'UIIII)IIl..1i1 19&2 612 0.56-1'Ub.-rcull:lle~. uat SO, 0.46' Di ...... of l'~.r 1982 297 '1.27 Qltttolntollti.tb UU 111 0.16 o.fici.nay oi •••••• U1B2 1" O.H.
~ .. ""'! ••• !'" .... ~-............... \It:ldft tb41 WMO-IPI caa •• n..tb,
OLphthl'ia 198.2 10 '" 13/83 Pertu.d. 1.982 ". . .. Tet.nue 1982 ., ... Polioayelhia 1982 5 ... ruberc:u.lod. 1~82 9 OS. .. , Me.a.lea 1982 9 268 ...
f" e..... for ~i~ ••• e. uader tbl Will Annual CD Butl.ti~ C ....
GQporrboe. 1942 So 01) 11/83 flepaitth viral - l'ypo A 1982 '"
- Typ. B 1982 '" - IIIISP 198, 3 240
$yphillia 1982 6" TtacbOlfla 1982 1 YIiIW8 1982 " , .. ca... and deeth. for aiK 4{aea ... under the
~ Monthly CD Motes CU .. Death. Choleu 1982 513 ... 11/83 Dengue fever IDar nil 309. ... Encepbalitis 1982 •• ... Influenza 1982 ... Hellingitis 1982 ". ... PlAgue 1982 - ...
7. Propo~c,on of LnfaRc8 under one year of· 5g~ who have ~ f~lly i .. uniKed al8tn.t tUbcrculo.i.~ aiphth~rl., polia.yeliti' ~d msaal.,
B"" 19S1- 16.6 12/82.2 D"111 1981 41.1 Polic. III 1982- SS.l Measle.
'8. h. ceQt of popllhtioa. •• ~d with •• fe v4t~r . .. 29. r.~ e.nt of population ~itb ~equate sanitary
facilities ... 30. Per eent· of low birth wei.abt inhnts ( .a 24,.., gra-.) 1979 9.0 I"., I'" Maternal aortal~ty TAte \~82 0.50 06/14

lIESTElM pt..ClnC REGION J)ATA BAlIK ON SOClOE~IC AIQ) UALTII IMDle&TOIIS
'tart 11 Pale l~ 30 D.., ... ber 1984
r--. __ a.~ ••• _.~a.~~= •• ~=~~.~~ __ =-~aa~GU~~ •••• Q= •• a •• _.a~. _._ .. _-_ ... .._ ........... _ ...•.......•••. Indicator(s) for: NAURU Year Data Source of Dct41
~ ... __ ....... _ ••••••••• s;:;';; ........... ~ __ a •••••• __ ••••• ............ .. _ ..... _ .. • ••• Q •••••••••••
1. Area (in 1000 sq. km.) 1981 0.02
2. E.t.m&ted populat,on I'ODU} 19~2 7
3. Annual populatLon growth rate I» 1.82 0.0
4. P.rceDtaae at poputat1.on - less than 15 years · .. - t).l+ yeaI'I ...
5. Urban populat.on II} · .. i 6. bte af natural 1nc:real8. ot populat1.on u per annum) 198' 1.)
7. Crud. blrth rat. Iper 1000 population) 1982 19.8
B. Crud. d •• tb rat. Iper 1000 population) 1982 4.~
9. Life azpettaney at bIrth - Total Iyears) · .. - Kele (yearo) '" - Female (year.) · ..
10. Infant mortality rate \p&r 1000 live births} ... n. Total fertility ~ate (women 15-49 yeara) · .. 12. Socio-ecoao.ic indicators for the year 2000
E.ti~ted population, I 000) 2000 10 Lif. expectaney at birth - Kele lyears} · ..
- female_ (years) .. , Annual population growth rate, I%l 1995-2000 1.03
Crude birth rate (per 1000 population)
Crude death rat. Iper 1000 population}
late of natural lucre.Be \1 per annum)
I'" .. r "ap.ta Gr ... National ¥rodu<t (GNP) at market prices (us$) · ..
14. Rate of growth of per <apa. GNI' \:<i · .. 1,. Percentage Gro8' DoJUe.tl.c -Product tGDP) derlVed
from aanufacturing at constant factor coat (%) ... 16. Economically active pop in primary sector
- Number in agl'iculture (. aoo) ... - Percent in agriculture (X) · ..
I) • Daily per capita calorie supply lcalQries) · .. tB. D&lly per c.apita protein supply (grems) ... 19. Adult literacy rate - Total · ..
- Male - Vemale
20. Health budget/expenditure
- Amount · .. - Per capita · .. - As % of total budget · ..
Source 01/82; 03/79.1,.
UN Demographic Yearbook World Population Trends and l'roapectll by Country 19S0-2000~ Summary Report of the 1978 AS8eB9~ent, UN 1979 Morbidity, Hortality and Epidemiological Stati&tic$, MOH, Nauru, 1975 1982 ESCAP Population Data Sheet World Health Statistics Annual 19J1~ Vol. III Leaflet on Childhood CD, Report 3/82 Country Health Information Profile (CHIP) revieed by Government. 198)
12/83
10/82
10/82
Ull 82
u1l82
01/82
03/19.1
03179. t
06/75. 10/B2. 12/1 I, 12182.1. 12/B3: 14/80. South Pacific Epidemiological and Heslth rnformation S.rvice, Annual Repol't 1980

Part II Pale 32 30 December 1984
WESTERN PAOIFIC RRGION DATA BABK ON SOCIOECONOMIC AIID JlJ!ALTH INDICATORS
~a~ •••• ==~ .. =-.~~=a •• =_." •••••• ~.~ __ M. __ ~~_ •••• _." •• "'''. _ .... 1;1 .... ~ ... ~ .. ~ .. ~ ....... IndicatoT(s) for' liAUliU 'Year Data
•• =~ .... =-••••• ~ ••••• ;;;;; ..... ~ ••• .c.=~.c ............ _ ..... ~-.. ------- ---.. :-.-~ 1. Health aaDpower NU1Ibe-r Ratio per
10 000 Physicians 1971 10 14.3 Medical assistant. 1971 ... Professional Nursing/Midwifery Personnel 1971 9 12.9
2. Ten leading causes of 1IlOrbulity lCD code No. of Rate per Ca.el- 100 000
Dengue 061 1980 538 7 370 GonorThoea 098 1980 51 699 Hepatitis l viral type »- 070.3 1980 42 S75 Measles 055 1980 10 137 Syphilis 090-097 1980 8 no Sbiaellosis 004 1980 6 82 Conjunctivitis 372 1980 S 68 Fieb poiaouinl £865.2 1980 5 68 Hepatitia. viral type A 070.1 1980 4 59 Salmonella infection (other tlul. typhoid) 003 1980 1 14
Fl)· Ten lead1ng cau ••• of .art.lity ICD code No. ~; ~~. per Deaths 100 000
Cardiovaacular diaeaae A80-AS8 1974 11 I 157 Injury t.N138-A11150 1974 10 143 Senility A136 1974 3 43 Diseases of respiratory .yatea AS9-A96 1974 2 29 Ba~teri.l infection AS-AU 1974 2 29 Diabetes mellitus A64 1974 2 29
~4. Cases and deaths for six d1seases under the WHO-BPI C.Be. Death.
Diphtheria 1982 - -PertlJB8i& 1982 - -Tetanus 1982 - -PoliOlOy.liti. 1982 - -Tubereuloe ie 1982 8 -Measles 1982 1 -
~S. Ca.es_for dl.eases under t~e WHO Annual CD lulletin c.tae.
Gonorrhoea 1980 50 Hepatitis viral - TYpe A 1980 4
- type B 1980 42 - URSP 1980 · ..
SypbiUia 1980 8 Trachoma 1980 · .. Yawa 1980 -
6. Cases and deatbs for six disea.e8 under the WIIO Monthly CD Not •• Ca.es Deatb&
Cholera 1980 - -Dengue feverlDBJ! 1980 538 ... Encephalitia 1980 - -Influenza 1980 - -Meningitis 1980 - -Plague 1980 - -
27. ProportlDn of infants under one year of age Who have been fully iGmMnized against tuberculosis. diphtheria. poliomyelitis and measles
RCG DPT III '" Polio 111 Neasles
28. Per cent of population served with safe vater · .. 29. Per cent of population with adeqUAte sanitary
facilities · .. 130 • Per cent of law birth weight infants ( ,2499 gr .... i · .. 31. Maternal mortality rate · ..
..._ ............ Source of nata ._--...•...
12171
14180
06175
12182.1
14180
14180

WESTERN PACIFIC REGION DATA BANK ON SOCIOECONOMIC AND HEALTH INDICATORS
Part 11 Page 33 30 December 19a~
F==~=S=~=~========~~~:~=C._=D=====~==~D==.D~D====.~~C===- "' ....... c_= ... ""_= =.==2==="' ...... "' .. "".:;==."'.,.=~01 .. """'""'S ... Ind ieatod 8) for: IIl!Ii CALEDONIA Year Data Sourc,," of Dsts FSQ#c.c_ ••• ~.~~=a_-== __ .... caD_C=_==D=~_ •••• =_._._= ... a __ •••• = •• -= ..... _."" ..... "" .. _"" ... • ........ Q"" .. "'."" ... ""
1. Area (in 1000 sq. 1<111. ) 1981 19.06 12/83
2. Esti!Uted population ( 000) 1981 142.4 12/83.1
J. Annual population growth rste (%) · .. 4. Pe«.etlta&e of population - leu than 15 years · ..
- 65+ ye-are ... 5. Urban pOpu14tlon \:t) · .. 6. bte of natuT'al increase of population ~~ per annum) 1981 2.09 12/83.1
7. Crude blrth rate (per 1000 population) 1981 27 12/83.1
8. Crude deatb rate lper 1000 popuh,tion) 1981 6.1 12/83.1
9. Life expectancy at birth - Total ,y .. re! · .. - Malo (yea'tl) · .. - Female (yeal"a) · ..
10. lofant 1IIol'tal1ty rate (per 1000 live birt~.1 · .. U. Total rortlhty rote '" ... n 1)-4. yen.) · .. 1,2. Socio-ec:onollic: indicator. for the year 2000
Ettimated population. " OOO} 2000 2S2 03/79.1
Life expectancy at birth - Hale (ye • .,) · .. - Female (yean) ...
Annual population growth rate. 1%) 1995-2000 2.48 03/79.1
Cl"ude birth rate (per 1000 population) · .. Crude death rate (per 1000 population) · .. Rate of natural increase (% per annUlll) · ..
13. Per Capita Gross National Product (GNP) at mayket: prices (usi) · ..
14. Rate of growth of per capita GNP (%1 · .. IS. Percf!ntage GrOSB Do1Destic Product (OOP) derived
from. manufacturina at. constant factor coet (%) ... 16. Economically activd pop in primar,y tecto;,
- Number in aat'lculture \'000) ... - Percent in agriculture (%) · ..
17. Da~ly per capit. ealor1e supply \calories} · .. 18. Daily per capita protein supply (grams) · .. 19. Mult 1 i teraey rate - Total . ..
- Male ... ... Peaale · ..
20. Health budget/expenditure
- Amoupt (F. CFP) 1982 I 622 990 000 12/83.1
- Per capita (F. CPP) 1982 10 966 12/83.1
- As % of total budget 1982 7.27 \2/83.1
Offit i.l £Xc:bange: Rate: US$ 1.00 • F. CFP 146.55 11982)
Source Q3/79.1.
12/Sb
12/82.
12/8). 12183.1.
14/80.
World Population Trends and Prospects by Count~ 1950-2000; Summary Report of the 1978 AB.e.aDent, UN 1979 GoveTnment response6 to World Health Statistics Annual Questionnaire on Certain Causes of Infeetiou. aod Parasitic nise.us; .nd on NU"IIbel" of Deaths by cauae Government's Responses to World U..lth StatiQticB Annual Questionnaire on Health Manpower) 1982 Country Health Information Profile (CRIP) revised by Government, 1980 and 1983 Summary Report on Health Activities Carried Out in New Caledonia and Dependencies i.n 1982 (J4th Regional Colrlflittee Meeting, 1983) South Pacific Epidemiological and Health InfOrMation Service Annual Report, 1980

Pat"t II Page 34 3-0 December 1984
WESTERN PACIFIC REGION DATA BANK ON SOCIOECONOMIC AND HEALTH INDICATORS
~==_~=~==g~ •• _=~=~==~=~:~=_=.==$=_c==:=:==~c=====a.=_=a.:===~== =="'=== =~",a==~=~~=~.=.~Eo=a= ••••• Indicator(s) for~ NEll CALEDONIA Year Dsta
~=~. __ ===_"=~.2$=~=z=.s~.~._~.=~"".=~=====~===_._.== •• p=_~="'.~~ .......... .~c===.= ••• ~~~ •• a ••••••••• 21. Ned th manpower Numbe.r Ratio peT
10 000 Physiciane 1982 89 6.0 Medical Qssi$tants 1980 ... Professional Nursing/Midwifery Personnel 1980 228 15.9
22. ten leading causes of .orbidity lCD code No. of Rate per Cases 100 000
Dengue 051 1980 796 567 Gonol'rb()ea 098 1980 762 542 Influenza 487 1980 577 411 Syphilis 090-097 1980 ,34 380 Hepatitis, unspecified 573.1-513.3 1980 234 167 Measles 055 1980 167 119 Fish pois.oning ti865.2 1980 147 105 IIIDoebi8Sis 006 1980 130 93 1\Jberculosi&, pulmonary 010-012 1980 103 73 Diar1:'hoeoll, presumed -infectious, Unfanti Ie) 009.3 1980 89 63
23. Ten leacling causes of .sortality lCD code 110. of Rate per Deltba 100 000
otf.ill_nee eire ou re.piratoire 1978 55 39 ~UT. maliane. 1978 48 34 ~.U8dti..a! divers 1978 46 32 Halades cerebro-v .. sculaire8 1978 33 23
24. C.a~8 and deaths for aix dile.les und~r the WHO-BPI eale. Death.
Dipbtheria Pertussis Tetanus PoliOlllye1 i tis 1982 5 ... Tuberculosis 1982 107 ... Measles 1982 1448 ...
25. Cases for diseases under the WHO Annual CD Bulletin Cases
Gonorrhoea 1980 756 Hepatitis viral - Type A 1980 · ..
- Type B 1980 · .. - UNSP 1980 224
Syphillis 1980 501 TrachoQl.B 1980 -Yaws 1980 · ..
26. Cases and deaths for six diseases under the WHO Monthly CD Notes Cases Deaths
Cholera 1980 · .. ... Dengue feve'r tDHF 1980 6Jl -Ence.phalitis 1980 - -Influenza 1982 274 -Meningitis 1980 2 -Plague 1980 · .. ...
27. 'P'copo'l"tion of infants under one year of age who have been flJ,Uy immunized against tuberculollis. diphtheria, poliomyelitis and measlee
BOO · .. DPT III Polio III Meules
28. Per cent of population served with safe water · .. 29. Po< cent of population wi th adequate sanitary · .. 30. Per cent of low birth ..,-eight infants t ~ 2499 grams) ... 3!. Maternal mortality rate · ..
=-,., ........... "" ... =11 ...
Source of Dat" . .... "' ................
12/83.1 12[87 12/82
12/81
"-12/83
12183.11
14/80
--14/80

Part 11 Pase 35 30 December 1984
WBS'l'E1I1f PACIFIC !lEGION I>I\XA BAH ON SOCIOECONOMIC AHD HEALTH INDICATORS
~_.G.~_ ••• _._." •• A •• _._ •••• "._._._ •• ____ A2 •••••••••••• ...Q •••••••• Indicator(s) for~ NEW ZI!M.ARD Year
p==.~ ••• A~ •••• "" ••••• ~~ __ "-=._ ••••••• Q._~~ .. _A ••••• _. p ............ 1- Are. (iD 1000 sq. km.) 1981
2. Eotimatad population l 0(0) 1981
3. Annu&i population growth rate \X) 1982
4. Percentage of population - leis than 15 years 1982
- 65+ years 1982
5. Urb ... population l%) 1981
6. Rate of natural increa.e of population \% per annum') 1980
7. Crude birth rate ~per 1000 population) 1980
8. cru4e d ... h rate \per 100II populat,onl f930-
9. Life expeetaney at birth - Total \y •• rs) 1982 .. Kale ()teat") - i'emale (yeat's)
I'u, 'n .... t IIIMtauty rat. \p •• ".W l1V, b>rth.r 1980
U. Total fett.lity rate 1_ 15-49 yesrs} 1982
12. Socio-economit indieators for the year 2000
Eati .. ced ~opul.tion. { OOOl 2000
Lif. expectancy at birth - Male (years I 1995-2000
... Female {years) 1995-2000
Annual population growth rate. (%) 1995-2000
Crude birth rate {per 1000 population} 1995-2000
Crude death rate (per 1000 population) 1995-2000
Rate of natural increase (I per annum> 1995-2000
13. Per C.pita GroBs National ~roduct (CNP) at ms.rket prices (us$) 1981-1982
(NZ$)
14. Rate of grewth of per capitE! GNP \.1 1970-19)9
15. Percentage Groea Oomtestic Product (GDP) derived from ~Lufacturing at conetant factor cost (X)
16. Econoaically active pop in primary sector
- Number in agriculture ('000) 1980
- PeTcent in agriculture (%) 1980
17. Daily per capita: calorie supply (calories) 1915-1971
18. Daily per capita protein supply (grams) 1975-1971
19. Adult literacy rate - Total 1982 - Male - Female
O. Health budget/expenditure
- Amount (NZ') 1981
- Per capita (NU) 19S1
- Aa % of total budget 1981
Official ElCchange Rate: US$ 1.00 ~ NZ, 1.02 (l981l
. ............... nata ..... _ •.........
269.06
3 175
1.1
26.3
10.0
83.6
0.76
16.1
8.5
> 60
13.1)
2.0
4 027
71.8
78.2
0.92
16.0
8.1
0.79
9 114 or lD &22
0.5
...
US
9.3
3443
109.9
98
1 358.2m
427.6
12.1
Source 13/83; Government's Report on Monitoring Progress in Imple~nting Strategy for MFA/20DD, 1983 World Population Trends and Prospects by Country 1950-2000: Summary Report of the 1978 Assessment, UN, 1979 FAO Production Yearbook 1979 FAO ProQuction Yearbook 1980 1981 World Bank Atlas 1982 iSCAP Population Data Sheet Covernment Report* on the Number of Cases of CD Leaflet on Childhood CD, Report 3/82
........ - ..... Source of Date. . ..............
12/83
lil83
10/82
10/82
10/82
12/83
12/83
12/83
12{S3
13/S3
D{83
1018}
03/19.1
03779.1
03119.1
03/19.1
03179.1
03/79.1
03/79.1
13/83
07(81
03/80
OJTSO
03/79
03779
13/83
12/83
12/83
IUS)
03/79: 03/80: 0718h 10/82: 12/82, 12/82.1: 12/83: Country Health Information Profile (CHIP) revised by Government, 1983

Pa'l't 11 Pal~ 36 30 December 1984
WESTERN PACIFIC REGION DATA BANK 011 SOCIOECOMO~IC AND HEALTH l~lCATOBS
.~==$~~=.$=~ma __ •• = ••• =~=~==~C~~=~.~~====Z.D===_.=~=Z====_.~~ "" .. == .. ", c===mC"'D"'_===~_=D"'.= •••• m=~ lndicatods) for. NEW ZEAJ.A/lD Year Date.
~==~=~",=== __ .. == •• =._.= •• Q •• =.=._.~=.=== •• =.=",,==.===a=======.E= .... a ... = ="" .. ~ ... ==a .... == <a.,...:" ....... _."".
1. Health manpower Nurnoer Ratio per 10 000
Physicians 1982 5 210 16.4 Medical assistants Professional Nursing/Midwifery Personnel
2. Ten leading causes of morbidity leO code NOa of Rate pet Cases 100 000
Viral hepatitis - A 1981 1 145 36 Salmonella infections 1981 845 27 lood poisoniqg (bacterial) 1981 532 17 Campylobacter infection* 1981 442 14 Viral hepatitis -. B 1981 377 12 Leptospiral infection 1981 325 10 Pulmonary tuberculosis 1981 268 8 AncyclostOPlia.i6 1981 265 8 Dysentery 1981 171 5 Tuberculosis, occult 1981 102 3
pl. Ten lead1ng caU$es of JIlOrtahty leD code No. of Rate. per tleath. 100 000
Other fo~ of beart disease and hypert6nsion 1980 8 841 282 Other maliln.nt neopl •• ms 1980 4 3)2 138 C.rebroVaacular di ••••• 1980 3 1'8 101 Malianant neoplalm of ~ronchu., luna and trachea 1980 1 133 36 PnelJitOnia 1980 1 105 35 Other accidents an4 violent deaths 1980 1 052 34 Motor vehicle accidents 1980 622 20 Bronch itia 1980 459 15 Diabetes mellitus 1980 446 14 Suicide and self-inflicted injury 1980 337 11
f4. Cases and deaths for Sl.X dite:aaea under the WKO-EPI Cases Deaths
Diphtheria 1982 I -Pertussis 1982 - -Tetanus 1982 5 -Policmyelitis 1982 - -Tuberculosis 1982 434 6 Measle.s 1982 - -
fS, Cases fOT d~se8ses under the WO Annual CD &ulletin Cases
Gonorrhoea 198Q · .. Hepatitis viral - Type A 1980 1 649 0)
- Type R 1980 393 (4) - UNSP 1980 5 (-)
SyphiUis 1980 · .. Trachoma 1980 -Yaws 1980 · ..
6. Ca6es and deaths for six diseases UDder the WHO Monthly CD Notes Ca.Ges Deaths
Cholera 1980 1 -Dengue feve~/DRF 1980 5 -Encephalitis 1980 2 I Influenza 1980 .. . ... Meningitis 1980 26 2 Plague 1980 - -
7. Proportion of infanta under one year of age who have been fully immunized against tuberculosis, diphtheria. poliomyelitis and measles · ..
BCC DPT 111 Polio III Measles
8. Per (eat of population served with a.fe water 1982 99.9
? Per cent of population with .dequate .anitary facilities 1982 99.9
30. Per cent of low birth welght infants ( .. 2499 grams) 1982 5.8
31. Mate'tnal mortality tate 1980 0.1
• Became not~flable from June 1980 • The nWDbe-r within the pa;rentbeaea refer to the number of deaths.
•• E.a.= •• _ •••• a~ Soutc.e of Data
a=~= ... _~_ •• =."'~~
12/83
12/83
12/83
12/82.1
12/82
12182
13183
13/83
13183
U18)

WESTERN PACIFIC REGION DATABANK ON SOCIOECONOMIC AND HEALTH INDICATORS
Put II Page 31 30 December 1984
.. ~~~~._c __ = ••••• a ••• g ... __ ==a_. ___ 5a •• ~=_~_=.~ .. ~. ____ u=~. ......... "''''''' .... ... ...................... '" -................... Indicator(s) for; .!ill!! Year Data Source of Da.ta
•• _a ....... _ •• __ •• _ ••••• ~_ •• c~ •••••••••••••••••• _~~== ............. -... -.... ~ .... .................. 1. Are. (in 1000 .q. k ... ) 1981 0.26
2. Eltimatod population (OOO) 1982 3
i 3. Annual population Irowtn rate (X) 1962 -3.1
I 4. PercentAge of population - les. than B ye.rs 1982 46.1
- b)+ years 1982 6.6
5. Urban population II} 1980 20.7
6. Rate ot natuTal l.nCrea&e of populatl.on C~ per annum} 1980 2.3
7. Crude birth rate (per 1000 populatiouH980 1980 30.3
8. Crude death rate (per 1000 populstlonJ 1980 7.3
9. Lifo ."peetaney at b1~tI\ - Total (y .... >. ... - Male (ye.n) ... - Female (years) ."
O. Inl"4ot mort.ality rate ~p~r 1000 h.ve birth8) ... 11. Total ferti1,ty rat. (women 15-49 ye.ro) ... 12. SQC10-eeonom~e 1udic8tora for the Y'" 2000
Estiaated population, ( '000) 2000 1
Life expect.n.:y at; birth - Kal. (),ears) ... - r .... 1. (years) ...
Annual population arowth rat., (X) 1995-2000 1.11
Crude birch r.te (p •• 1000 population) ... Crude death rat. (per 1000 population) .. , Rate of nat\.1ral inc'te.le ~% per annum:> .. ,
13. Per ~apit. GrosB Nat10nal Product (GNP), at aerket prices (US$) ...
14. Rate of arowth of per •• pit. GKP (l) ... IS. Percentage Gyosa Domestlc Product (GDP) der1ved
from manufacturing at constant factor cost (1) ... 16. Economically active pop in primary sector
- Nu1lber in agriculture ('000) ... - Percent in agriculture (%) ...
17. Daily per capita calorie supply (calories) ... 18. 1>811y per capita protein supply (gram.> . .. 19. Adult literacy rate - Total ...
- Kale - Female
O. Health budget/expenditure
- Amount (NZ$) 1977-1978 402 428
- Per capita (HZ$) 1977-1978 100.6
- As % of total budget .. , Officid exchange rate: US$l.OO ~ N2$l.02 (979)
Source 03/79.1:
03/79: 06/79: 10/82 : 12/80:
12/80: 12181 :
12/82.1: 12182.2: 12/83:
~orld Population Trends and Prospects by Country 1950-2000. Summary Report of the 1978 Assessment, UN 1979 Urban, Rural snd City Population, 1950-2000 1 as Assessed in 1978, U~. 1979 Estimates of Expenditure and Revenue 1978/79, Niue 1982 ESCAP Population Data Sheet Govern.ent Responses to World Health Statistics Annual Questionnaire on Health Manpower, 19&0 Government Reports on the Nuuber of Cases of CO Government Respon8es to World Health Statistics Annual Questionnaire on Certain Causes of Infectious and Parasitic Diseases; and on Number of Deaths by Cause Leaflet on Childhood CD, Rep~rt 3/82 Government's Heply to EPI Health Information System Questionnaire, 1982 Country Health Information Profile (CHIP) revised by Government. 19B3
12/83
10/82
10/82
10182
10182
03/79
10/82
10/82
10/82
03/79.1
03/79.1
06/79
06/79
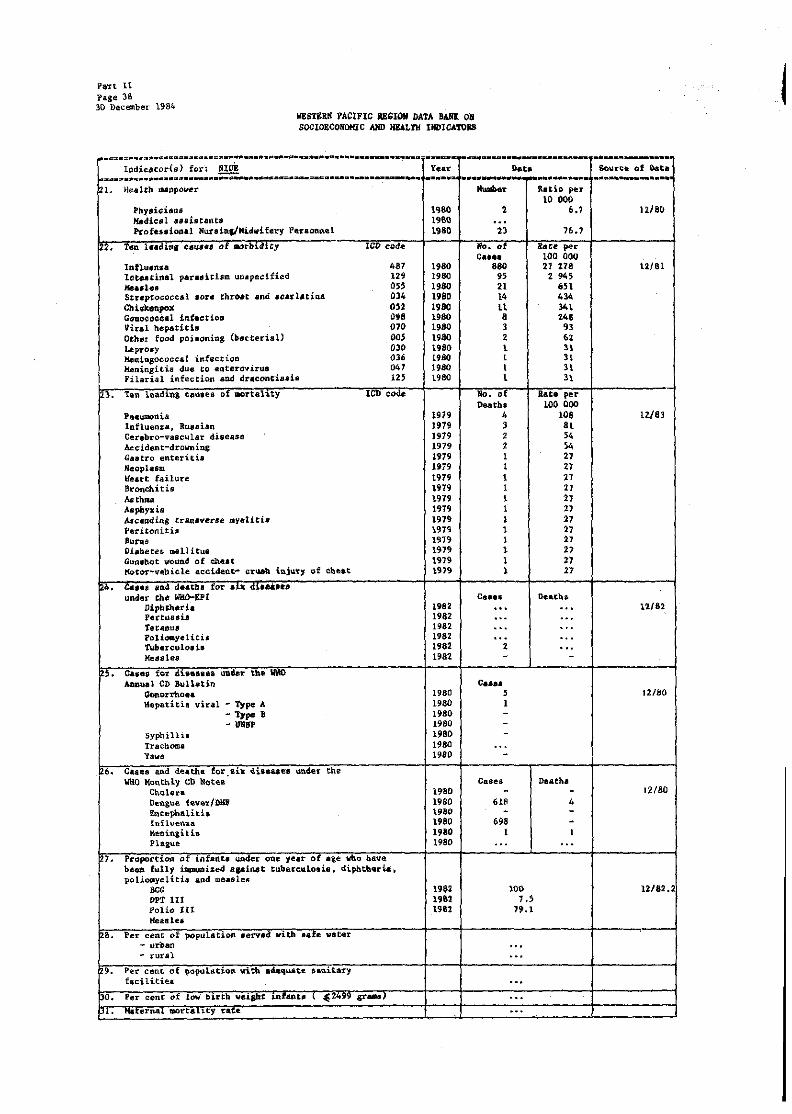
I.'~'tt 11 hge 36 30 December 1984
WES'it!RN PACIFIC UGION DATA BAH Oli SOCIOECONOHIC AND HULl'H INDlCATOltB
~~.=.~.~.~_s~~#_~~.~.c_~ .. _ .. ~~~ .. ~ .. _ .... ~~_._ ....... _._ ... -._.~ .. \'""-_._ ... _-_ ..... --- ,... ..... _---Indicator(s) for: NIuE Yea~ Dat. SOUT~. of o.ta
_ •• ~ .. _.~ __ ••• z ....... ~~ ... = •• -=.~~.~A. ___ . __ .. __ . __ • __ . ~ .• _._ ..... _-,.._._._- .,;."'--_ ... ., 1. Health tIllIl'lpow~r llulaber Ratio pn
10 000 PhYllici6ln. "SO 2 6.1 12/80 Medical a,si.tant8 19BO ... Ptofessional Nur.inalMidwifery Pe'l'.acmnel 1980 2l 76.1
'". TC.1l l .. ,U.tll Cau,.l8, of IIOrbldity ICD code Wo. of Rate pe~ c .... loa 000
lnfl.u.nll$ .87 1980 880 21 17tl ta/SI lnt.uind para.iti.m unlpecified ". 1980 95 2 94' He .. l •• 0» 1980 21 651 Streptococcal .ore throat and acarlatil14 034 1980 I' 43. Cb hkilllflPOl' 0" 1980 11 341 Gonococcal tnt.ctiou 0.8 1980 8 246 Viral he:patitia OlD 1980 , 93 Otber food poi soning (bacterial) 005 1980 2 .. Leprosy 03D 1980 t " KeRil18ococcal infection Ole; 1980 1 3t Meningitis due to enterovirus 041 1980 1 31 Filarial infection and dracontiasia 125 1980 1 31
~,. Tefl lead1.na tau,es of DCrtal~ty ICD co<l. No. of Rate per Deaths lOG 000
PneUlllOrtia 1919 4 108 1>/a, lnfluenza, Ru.sian 1979 3 81 Cerebro-vascular disease 1919 2 54 Aecident-drovning 1979 2 54 Gaatro enteritis 1919 I 27 Neoplasm 1919 I 27 Heart failure. 1979 I 21 Bronchitis 1979 1 2J Asthaa 1919 1 2J Asphyxia 1919 1 27 Aac8Qdin8 transverse myelitis 1979 I " Peritonitis 1979 1 " ....... 1'919 ) " Pi.beteL mellitus 1979 1 27 Guasbot ~und of chut 1919 I 27 Hotor-vebiele. accident- erueb. inil.l:ty of cbut 19'9 1 27
2./1., C. •• ,l srut d •• tba for elk db ....... under the WKD-EPI C.aell Oeat-h ..
Diphmsr:l.s 1982 .. . ... l.'1/62 l'ertl1ui, 1982 ... '" Tetartutll 1982 '" ... FoliCllllyeliti' 1982 ... '" Tub.rculos is 1982 2 ... Heules 19&2 - -
5. Ca.es for di •••• ea Il1lhr the WHO Annusl CD Bull.tin C ••••
Gcnol'"choe& 1980 5 IUbO lIepatith viral - 1> ... 1980 1
- 1)ope » 1980 --.... 1980 -syphillil 1980 -Tr.choma 1980 ... Yawa 1980 -
6. Caae. and de.the for aill: di •• ate. under ~he WHO Monthly CD Notes Cases Deatha
Cholera 1980 - - 12/80 Dengue. fever/DHr 1980 61' 4 E'l\eephalith 1980 - -Infl\).en~a 1980 698 -He1linlitis 1980 I I Platu~ 1980 ... ...
7. PToportied of infadta uader one year of &&~ who have baeD fully i~i~ed ... inat tube.rcu.loeu. dipbtberi.& I pOlioaye.litia and measles
llCG 19&2 100 12/82.2 OPT III 19B1 1.5 Polio III 1981 19.1 MeaBles
~ .. Per cent of population served with Bate water - urban '" - rural ...
•• Pet" cent of popul.tion ~th a'eqUAte sanitary facilities ...
pO. Per cent of low birtb weiaht mfuu ( ~1499 graaa' '"
, . .H. ",tarnal mort.nty tat:.e ...

Part II Psge 39 3D DecellIber 1984
WESTERN PACIFIC RiGION DATA BANK ON SOCI<ltCOIIQIIC AIID HEALTH INDlCA'I'ORS
=.~a.=_ ... ~._._.a_=_~.~ .......... a ... =~.~~._=._._ ..... ~ ............. .............. "'. ................... Indicator(,) for: PAPUA NEW GUINEA Yen Dati Soul'~e of Data
• ~ ............... D ...................... = ... =. __ ....•• u •• ••••••••••• • ••••••••••••• ............ _ ... 1- Area (in 1000 eq. km.) 1981 462.64
2. Eoti_tied _lotion (0011> 1982 3 329
3, Annual population growth rate (% ) 1970-1979 2.3
4. Percentage of population - le.ss than IS years 1960 41.9
- 65+ years: 1980 3.3
5. Urban P"I"'18tioo (X) 1980 20.0
6. late of natural increase of popu 1. t ion (1 per .nn .... ) 1975-1960 2.53
7. Crud. birth rat. (por 1000 p"pulatioo> 1975-1980 41.1
8. ~rud. d •• th rot. I,er 1000 p.,..lotion) 19"-'9"" 15.8
9. LUe expec.t:'nc:y at b,rth - Tbt.1 ~ye ••• ) - hi. (y .... ) 1981 u - 6i.o
R - '3.0 - '-I. (yea .. ) 1981 U - 62.0
R - 54.0
O. Inf'n.t lIQrta1:L.ty rate ~per loco live birtbsJ 1981 13
1. Total fertilit, rate (women 15-49 y.au) 1975-1980 6.0
2. Socio""'econOJllic indic.tOl"B for the year 2000
&,tim.ted .popolation, ( '000) 2000 4 986
Li f-e expee taney at birth - Male (years) 1995-2000 60.0
- Fe ... le (y.aro) 1995-2000 59.5
~uual papulation growth rat., (OJ;) 1995-2000 2.11
crud,. birth rate (per 1000 population) 1995-2000 30.6
ctuda death rate (per 1000 population) 1995-2000 9.5
ht .. of ftatural increase (% per annum) 1995-2000 2.ll
13. Par ca!'ita Gro •• National Product \CNPJ at market prices (US$) 1980 954
4. Rate ot g'rt;Jwth of per caplta CliP, (Z) 1970-1979 0.3
5. Percentage Gross Do.estic Product (CDP) derived from lR&ftufacturing at conltant factor cost (X) 1977 7.7
16. leonom.t:ally acth'e pop in Ptl'IBary a.ctor
- _ber 'n 8sr,cultoml VOOO) 1980 1 259
- Percent in agriculture eo 1980 82.3
17. Daily per capita calorie supply (calories) 1975-1977 2 247
18. nailjr per c.pita protein supply (gr .... ) 1975-1977 45.8
19. Adult lieeracy rate - Total 1982 45 - Male - Female
20. Health budget/expenditure
- labount (lUNA) 198)(£) 64 809 000
- :Per c:api ta (1I:11IA) 1981(£) 19.77
- As % of total budget 1981(£) 9.3
Official Exchange lUrt e : US$ 1.00· Kina 0.68 (1960)
Source 13/83.
03/79.1.
03/79. 03/80. 07/81. 10/82. 12/81.
12/82.2. 12/82.3. 12/83. 12/84. 14/82.
Government ' , Report on Monitoring Progress in lmplementins Strategy for HFA/2000, 1983 World Population Tr,end s and Prospects by Country 19S0-200(h S~ary Report of the 1978 Assessment, UN 1919 FAO Production Yearbook 1979 FAO p~oduetion Yearbook 1980 1981 World Bank Atlas 1982 ESCAP POfiuJation Data Sbeet Government les~n8e8 to World He~lth Statistics Annual Questionnaire on Certain Causes of Infectious and Parasitic Diseasesi and on Number of Deaths by Cause Gover~nt Reply to EPI ~altb Information System Questionn,iTe, 1982 WHO Seminar on Financing Health Development} 1982 WPR Data Bank updated by WaC/Port Horesby. 1983 Country Health Information Profile (CHIP) re¥iaed by Government, 1984 Key Indicators of Developinc Member Countries of ADB, April 1982
12/64
12/84
12/84
12184
12/84
12/83
12/83
12/83
12/83
13/83
13/83
13/83
10/82
03/79.1
03179.1
03/79.1
03/19.1
03179.\
03,79.1
03179.1
13/83
07/81
14/62 •
03100
03180
03/79
03/79
13/83
12182.3
12/82.3
12/82.3

Part II page 40 3C Decomber 1984
WESTERN PACIFIC REGION DA1A BA~ ON SOCIOECONOMIC AND HEALTH INDICATORS
::S==:==~.==.A=C-=~~=C====_~====~===~=_&====~=========~=.==~=§===-=.~=a~ ="=~===T==~~D===Z%_ •• ~C=D Indicator(s) for: PAPUA NEW GUINEA Year Data
====2=====_S====.=~~===_========D_ ••• ===================Q:_== ••• _ ~"" .. == .. D=·==-·--==~F~===-==*==-·· 21. Health manpower Number Ratio per
10 000 Physicians 1982 232 0.7 Medical assistants 1979 197 0.6 Profe&sional Nursing/Midwifery Personnel 1982 2 459 7.4
22. Ten leading causes of morbidity* leD code No. of Rate per Csses 100 000
Diarrhoea 1982 49 711 1 493 Influenza 1982 43 905 1 319 Gonorrhoea 1982 13 456 404 Measles 1982 12 771 384 SyphiUa 1982 ·4 161 125 Pertussis 1982 1 422 43 Pigbel 1982 804 24 Tetanu8 1982 40 I Poliomyelitis 1982 18 0.5
~3. Ten lead\og Causes of mortality reD code No .. of Rate pel' Oeath" 100 000
Other diaea.e8 of ~e,piratory system 32 1980 1 023 3. Di8e.8.e of the nervous sysce ... 22 1980 270 9 Rickettsiosis and otber arthropod-borne diseases 05 1980 251 8 Dis of pulmonary, Co il'culation , oth forms heart dia 28 1980 240 8 Incestin41 infectious diaeaees 01 1980 236 8 Certain conditions originating in
the perinatal period 45 1980 220 7 Tuberculosis 02 1980 161 5 Other bacterial diseases 03 1980 146 5 Diseases of other parts of digestive system 34 1980 146 5 Signs, BYlIIIptoms and ill-defined eond it ions 46 1979 1J6 4
24. Cases and de.aths for six di.eales under the WHO-EPI Cases DeAths
Diphtheria 1982 - · .. Pertussis 1982 1 422 '" tetanus 1982 40 · .. Pol~eliti-& 1982 18 '" Tuberculosis 1982 · .. '" Measles 1982 12 771 '"
25. Cases for diseases unde't the WHO Annual CD Bulletin Cases
Gonorrhoea 1982 13 456 Hepatitfs vit'al - Type A 1982 · ..
- Type B 1982 ... - UNSP 1982 · ..
Syphillis 1982 4 161 Trachoma 1982 ... Yaws 1982 · ..
26. Gases and deaths for six diseases under the WHO Monthly CD Notes Ca8es Deaths
Cholera 1982 · .. ., . Dengue feveT/DHF 1982 .. . · .. Encephalitie 1982 · .. '" Influenza 1982 43 905 · .. Keningitie 1982 · .. · .. Plague 1982 · .. · ..
27. Proportion of infants under one year of age who have been fully i1lltlunized against tuberculosis, dipbtheTia, poliomyelitis and measles
BCG 1982 50.5 VPT III 1982 25.4 Polio 111 1982 25.1 Measles
28. Per cent of popUlation served with Bafe water 1982 75
29. Per Cent of popUlation wi th adequate 68nita'rY faci lities 1982 75
l0c" Per cent of low birth weight infant.-( .:$ 2499 grams) 1979 25
31. Maternal mortality rate 1980 8.0
• Notlf18ble dlsease8.
_.~~~_ •• =m=sa ••
Source of Data & •• =~=a=_~=~~~~
12/84
12/84 , 12/81
12/84
12/84
12/84
12182.1
1f/83
13/83
12/83
12/84

WESTERN PACIFIC lEGION DATA BANK ON SOCIOECONOMIC AftD HEALTH INDICATORS
Part II Page 41 30 Decelllber 1984
~ ..... --......... -.-..... ~ •..•..... -.. ~.-.. -.. ----....... ........•. . •............. . ..... -....•.... tndicAtor{s) lor; PUlLlP'INES Year Dst_ Source of Oar&
~ ........... ~ ••• s~ •••• ~.~._ ....... _ •••• ~ •• _ ........... ~a. ••..•..... _.a .••..••.. ~A • .... -~ .. -... -... l. Area (in 1000 sq. kma) 1981 300.00 12/83
2. Estimated population (' 000) 19H3 52 055 06184
3. Annual population gt"ovth rate (% I 19S3 2.51 06184
4. Pe~centage of population - less than 15 years 1983 41.34 06/84
- 65- years 1983 3.42 06/84
5. U.ban population (%1 1980 39.0 14/83
6. Bate of natural increase of population U per aMUII) 1983 2.49 06/84
7. Crude birth rate lper 1000 population) 1983 33.60 06/84
•• Crude deatk rate "per 1000 populat:'Lon} 19B3 8.70 00184
9. Ll.fe. expec.tancy at b1.rth - Tota! ~yeal's~ 1983 06/64 - Male (years) 60.40
- Female (yearl) 1983 64.00 06/84
O. Inf.nt mortahty .ate (per 1000 live •• rths) 1982 61 12/83
U. 'lotol fortihty rat. ~_ U-49 y .... ' 10 .. 4.)0 06{1I4
2. Socio-economic iodlcator. for the year 2000
hUmeted populati.OD, l 000) 2000 75 224 061'4
Life expectancy at birch - Hale (y.oro) 1995-2000 6'.9 03179.1
- ' .... 1. (yeors) H95-2QUO 70.1 U]{79.1
Annual population arowth rat., 1995-2000 '" 1995-2000 1.91 06/84
Crude birch rate lper 1000 population) 1995-2000 23.90 06/84
Crude death rate (per 1000 population) 1995-2000 6.20 06/84
Bate of natural incre4.e (% per annum) 1995-2000 1.17 06184
13. Per Capita Gross National Product lGMP} , at market prices (USS) 1983 658 or 06184
(p ) 1 312
14. Rate of growth of per capita GNP (Xl 1970-1979 3.9 07/81
15. Percentage Gross Domestic Product (GDP) derived. from manufacturing at constant factor cost (%) 1983 25.1 06184
16. Econodll.cal1y actlve pop ~n prlaary sector
- Number in agriculture {'OOO) 1981 10 250 06/84
- Percent in agriculture. {%) 1983 52.1 06184
17. Daily per ca.pita. calorie supply (calories) 1981 2 599.3 06/84
18. Daily po. capita protein supply (grams) 1981 66.6 06/84
19. Adult literacy rate - fotal 1982 90 13/83 - Hale - Female
~O. Health budget/expenditure
- Amount (~ I 1982 1 125 638 000 12183
- Per capita (P) 1982 61.6 12183
- As % of total budget 1982 5.23 12183
Official Exchange Rate~ USS 1.00 = PIl.Il27 (1983)
Source 13/83:
03119.1:
06/84 :
Government's Report on Monitocing Pro,re8B in l.plemen%ing Strategy for HFAI2000, 1983 Wo~id Po~ul&tion Trends and Prospects by Country, 1950-20QO~
Su~ry Report of the 1978 Aase'Baent, UN. 1979 Information furniShed by the National Eccnomic and Development Authority, Philippines. 29 October 1984 1981 World Bank Atlas Leaflet on Childhood CD. Report 3/82 Government's Reply to EPI Nealtk Information System Questionnaire, 1982 Country Health Information Profile (CRIP) revised by Govern-ent, 1983
-
07/81: 12/82.1: 12182.2: 12/83: 14183: 1983 World Population Data Sheet, Population Reference Bureau Inc., Washington. DC

PB'l't II rage 42 30 Dece~ber 1984
WESTERN PACIFIC REGION DATA BANK ON SOCIOECONOMIC AND IIBALTH INDICATOR.S
Indicator(s) for: Year Data
121 • &81 th unpower llumbe< Ratio per 10 000
Pbyaicians 1982 7 378 1. 6878 Hedic.~ B&siatsntB 1982 '" Profes.ional Nuraing~i4wifery Personnel 1982 19 114 1.2655
122. Ten <:811&.8 of ICD code 110. of ~~·o~~r Cases Upper re8pirato~ tract infection 1982 447 831 882.2 Gastroenteritis and colitis 1982 364 783 718.6 Bronchitis 1982 353 463 696.3 Influepza 1982 300 923 592.8 Pn4uaaui •• 1982 134 928 265.8 Tuberculosie t 811 tOtlU 1982 127 720 251.6 Mal&~id 1982 40 915 80.6 Dy.entery I all toms 1982 36 448 71.B Ke •• lee 1982 26 701 52.6 Whooping cough 1982 17 919 35.3
~3. Ten causee of "",rt.Hty ICD code 110. of Rate per Death. 100 \)00
PneWllOTLi&. 1982 40 96S 80.7 Tuo.rculoeia, all fonts 1982 20 559 40.5 Reart dise •••• 1982 18 833 37.1 Malign-nt neoplu_ 1982 9 29\) 18.3 Galltl'oes,tet'itia and- colitis !t8l 8680 11.1 Accidents 1982 8 SZS 16.8 BroAozhi.t.ia 1982 4 670 9.2 Avitamioo ... and othe~ aut~itiOD.l deficiency aS2 3 147 6.2 Cardio~ •• eular acei4.nt. 1982 - -Dis ••••• of re'piratory .y.tea 1982 - -
24. C .... add 4_~~.~_ tor .. ,. under the WHO-EPI CISBee De.ath.
Diphtheria 1962 1 275 190 Pe¥tuaeh 1982 8 296 47 Tetanus , 1982 1 421 545 Poliomyelitis 1982 256 33 Tuberculo.ia 1982 61 829 6 607 Me.llles 1982 23 676 1 174
2S. ea ••• for dJ" uruler the WHO Annual CD Bulletin c.s ••
Gonorrhoea 1980 6 8230) Haparitill viral - "!ype A 1980 7 522( 543)
- "!ype 8 1980 ... - lfflSP 1980 ...
Sypbillia 1980 87(7) T.achoms: 1980 ... Yaws 1980 ...
26. ca ••• and_ d"~b~ tor .'x under the WHO Mopthly ~ Notes c..es Deatbe
Cbclera 1980 823 61 Dengue fevel'/DHF 1980 968 41 Encephalit.is 1980 411 180 lntluenza 1980 188 286 1 038 Me.nin,iti.s 1'180 ... ... Plague 1980 - -
27. of under GOO year of as. who bave been fully immunized aaainat tuberculosi., diphtheria, poliom,elitiB and measles
seG 1982 61.3 OPT III 1982 Polio III 1982 43.3 Mea,les
28. Per cent of oerved witb .afe woter 1982 64.S
?9. ~~~, ~~:~, of witb D' •• _, ........ ,
~982 56.5
?O. Per cent ot low birth ""iabt ( "2499 gr .... ) 1981 lB.l
:31. -J rate 1982 0.90
The nuebeT within tbe psreptbes •• refer to the nu.ber of deatbl~
Source of Data
06/84
06/84 I , 06/84
12/82.1
12/83
12/83
11/82.2
13/83
06/84
13/83
13/83

WESTERN PACIFIC REGION DATA BANK ON SOCIOECONOMIC AND HEALTH INDICATORS
Part II Page 43 30 Dete.ber 1964
~ •••••• a~ •• =.RK~a ••• _ ............ _ ••••••••••••••••••••••• ............ . ... _ ............ . ............... Indicator(s} for: lE~U8LIC OF KOREA Year DatA Source of Data
~ •••••• K .. a.:~~.& ..... =.:a ••• e= •••••• "_=.".= •• _~.3 ••• S ••• ~ ... g .......... ""-=- ....... _--_."".., .................. ~~B
1. Area (in 1000 sq. km.) 19a2 99.02
2. E!lLimate4 populatl.Oll (IOOO) 1982 39 331
3. Annual population growtb rate (%) 1981 1.6 ... Percentage of populat10n - 1.18 than IS- years 1982 31.9
- 65+ years 1982 4.1 ,. Urban populatlon (%) 1980 57.0
•• Rate of natural increase of population (% per annum) 1982 1.68
I. --crT"". b-"tn Tate (per 1000 populotlQ.) 1982 23.3
T. Crude death rate Tper 1000- populat.oii) 1982 •• 5
-'-. -Life expeetanc:y at b:l.rth - Total (yean! 1978-1979 66 - Hale (yeara) 1978-1979 63 - Feaa1e (ye.r8) 1978-1979 69
110. Infant mortallcy rate~per ICffiO ll.v~ butha) 1982 35.0
1I. Total fertillty rate (women 15-49 years) 1982 2.6
IlT. Soclo-economic indlcators for the year -20"0(J
E8ti~ted population,-{- 000, 2000 50 790
life expectancy at birth - Male (y .... ) 1995-2000 67.0
- Vemale 1year,) 1995-2000 71.3
AnnuiiT populsc1.on ,rowth r.ta. {l) 1995-2000 Ll.
Cru<le Mr'h rato <per 1000 populatToiiT 1995-%000 18.8
Crude death rate (per 1000 populatl.onJ 1995-2000 6.9
Rate of natural loncra"e U per annum) 1995-2000 1.19
IT. .orCopr .. Gro .. N.,.onol Produc' {GNPI at market pric.s (US.) 1982 1 678
14. RAte of srowtb of per cap1ta GNP (X) 1970-1979 B.l 15. Percentage G~oss Dome.tlc Product-rCDP} derived
from manufacturing at conetant factor coat (%l 1980 29.9
16. Economically active pop in primary sector
- Number in agriculture ('000) 1980 5 601
- Percent in agTiculture (1) 1980 38.6
17. I}aily p.r capita calorie supply (calories) 1982 2 485
18. Duly per capita protf!in .upply-Tgr .... ) 1980 73.6
19. Adult literacy rate - Total 1970 86 - Male 1970 82 - Female 1970 88
20. Kealth budget/expenditure
- Amount -(WooS) 1981 17, 419m
- Per capita (Woo. I 1981 4 523.6
- As % of total budget 1981 2.2
Official Exchan g e Rate; USI 1.00 m Won 685.00 (1981)
Soucce 13/83:
03/S0; 06181: 0"/84:
071Bl: 10182: 12/81 :
Government's Report on Monitoriag PI-ogress in Implementing Strategy for HFA/2000, 1983 World Population Trends and Prospects by Country. 1950-2000: Summary Report of the 1978 A85ess~ent, UN, L979 FAO Production Yearbook \980 Official National Publication Iniormation furnished by the Ministry of Foreign Affairs, Republic Df Korea. 2; September 1984 1981 World Bank Atlas 19B2 ESCAP Population Data Sheet Government responses to World Health Statistics Annual Questionnaire on Heal th Manpower Covernment I $ Reply to EPI Heal th Inforl'll8t ion System Ques tianoaire, 1982 Country Ilealtb Information Profile (CHl~) revised by GoverlUllent , 1983 Key Indicators of Oev~loping Member Countries of ADS. April 1982
12/8J
12/83
13183
10/82
10182
14/83
12/83
12/83
12783
13/83 13/83 13/83
Ut83
10182
03/79.1
03179.1
03179.1
03{7' .1
03/79.1
03/79.1
OJI79.!
06/84
07/81
14/82
OJ/~O
03/80
13783
13/83
13/83 13183 D/B)
06(81
06/81
06/81
12182.2: 12/83: 14182: 14/83: 198) World Population Data Sheet. Population Reference Bureau Ine., W~8hington. DC

Port 11 Psa_ 44 30 December 1984
WESTERN PACll'IC REGION DATA BAlIK 011 SOCIOECONOMIC AND HEALTH INDICATORS
r··--··· ...... •• ... ····~· .. ··-~ .. ···-·~··=·~=···· .. --·····-.. •· ..••• _ .... __ .a .................. lridic.tor(.) for' lUIPUBLIC OF KOlIM Year Data r···· .. • ........... ·-.. ···············*·~-·-~·=···Q····~··s ... ~ ........ .................. :. ...........
21. tied th llan,Qwer NWIIh.r Ratio per 10 000
Pbpicianl 1982 2S 097 6.4 Medic«l aBsistants 1982 ... Profe •• ional Nur,in./Ni4wifery Personnel 191!Z 466S1 U.8
2. ten lea·ch.ng cauae8 01 lDOrb1dl.ty ICD code No~ of Rate per Cases 100 000
Primary tuberculosis infection 010 1982 IS4 340 392.4 Leprosy 030 1982 27 060 68.8 H\lad •• 055 1982 6 77& 17 .2 .... IIJI. 012 1982 1 .. 87 l.8 Mo.quito bO('D. enoeepbalitb 062 1982 1 197 l.O WbooPUla co • .., 033 1982 700 1"*8 Typ~o'4 and paT.ty~0'4 f.v.~ 002 1982 l33 0.9 Streptococcal .o~. throat an4 aca-tlatina 034 1982 94 0.2 Shi,ellolil 004 1982 52 0.1
III.~ .............. Source of Pata ~ ..............
06/84
12/83
Diphthuia 032 1982 17 0.04
~l. ran 14&41"4 .au.". of "".tality ICI> .ode No. of Rate per Deaths 100 000
Diphtheria 1982 0 01>/84 Ty~oid feveT 1982 0
24. C.,es and death. fot six. diseases under the WKO-EPI C •• e, Deatns
D-iphtheTia 1982 ... . .. 13/83 Perttl8si. 1982 · .. · .. Tetanus 1982 · .. . .. Polimay8liti& 1982 · .. · .. Tuberculoa is 1982 · .. --.. * .. 10. 1982 ... · ..
~,. ~ ••• s . for dl' .... e. under the 1iR0 Annual CD Bulletin Caul
Gonorrbo4. 1980 · .. Hap.tide viral - Type " 1980 · ..
- TYPO B 1980 · .. - UIISP 1980 · ..
SyphUli. 1980 · .. 'lraehoma 1980 · .. Yawl 1980 · ..
~~. ea... 104 'oatil. for .111 ,,, ........ ulldet' tbe WHO Monthly CD Hote. C .... Death,
Cbolf:ra 1980 145 4 12/83 Dengue fever/DHF 1980 - -iaceph&liti. 1980 101 4 InUuenaa 1980 · .. · .. kninaitil 1980 3 -Pla,ue 1980 ~ -
~1. rTO)O"ttton ~f lQ~anto .~r OIl. ye.r of age who ....,. b .. Q fully i.-uaized _Iainat tuberculo.is J diphtberi.) poliomyelitis aQd ~ •• lea
DCG 1982 100 U/B2.t DPTIlI 1982 61.0 PoliQ III 1982 62.4 Me ... 1 •• 1911,2 4.9
~8. Per cent of populati ...... .-.ed ,fit!> safe water ... 29. Per ect of pop"lation 'Wloth aU4.uate sani tary
fðei .. · .. ~. P •• eeot of 1 .... bLrth ... 1"'~ infanta \ , 2499 gr_> 1981 9.2 U/83 31. Maternal lIortahty r.ate U81) 0.42 12/83
,

Part II Page 4S 30 December 1984
WEStERN PACIFIC BJlGlON DATA 1IAIIK OJ( SOCIOBCONOMIC AND lI8ALTI! INDICATORS
_ ••• _ ..................... _ •••••• ~ •• ~ ••• oa~pa •• ~ •••• ~.~ ................ Indicator(s) for~ ~ Year
~. ____ ......................... _ •••• * •• ~.=.~ ...... c._ ... = ..... .............. 1. Area (in 1000 sq. klll.) 1982
2. Esti ... ted population \ 000) 1982
3. Annual population gt'oweh rate (X) 1982
4. Percentlige of population - leu than 15 years 1982
- 6,+ years 1982
5. Urban population (%) 1982
6. Rat~ of natural inere •• e of populatl.on 0: per annum) 1982
7. Crude bnth rate (,per 1000 populatlon) 1982
8. Crude death rate Ipar luuu popula"a.) 1982
9. Lif. exp •• tA.CY at birth - Tatal (yo.rs) -)(ale (yon.) 1ge2 ~ '.male (yaAre) 1982
O. IDioM ..,rtaUCy rot. (por 1000 live blrthl) 1982
1. Total tertility rat. (women IH9 y .... ) 1975"1980
2. Socio-eeoao.ic indicators :or tbe year 2000
I.ti.ated populatiao, I 000) 2000
Life ezpectancy at bl~th - Hale (ye ... ) 2000
- F •• ale lyear8) 2000
Annual population growth rato, (%) 1995-2000
CTude birth rate (per 1000 population) 2000
Crude d~ath rate (per 1000 population) 2000
Rate of natural increase U per aMum) 2000
13. Per Capita Gross National Produ~t (GNP) at market prices (US;) 1982
(WS$)
4. Rate Gf growth of per capita G~ (I)
15. Percectaae Gross Domestic Product (GDP) derived from manufacturing at conatanC factor cost (X)
16. EconOll.lca 11 y active pop in primary .ectol;'
- Number in agriculture (fOOO) 1976
- Percent in agriculture (%/ 1970
17. Da11y per capita calorie supply ~calQrieaJ 1982
18. Daily ~r cepit a protein supply (grams} 1982
19. Adult literacy rate - Total 1982 - llale - FetUle
O. Health bud.et/expenditure
- AIIount (WS$) 1982
- Per capita (WSS) 1982
- As % of total budget 1982
Official ExChange rate: US$ 1.00 • WS$ 0.97 ( 1980)
. .............. . ..........•... Date Source of Data .. ......... ""' ......... .~ •• m .............. G
2.84 12/83
157.42 12183
2.8 12/83
48.2 10/82
:1.2 10182
29.1 12183
2.2 Ut83
29.4 12/83
7.1 \2/83
63 13/83 65 13183
35 Il/83
5.91 12/83
203 03/79.1
71 03179.1
73 03179.1
0.9 03119.1
21 03/79.1
5 03/79.1
1.6 03/79.1
302 ar 13/83 290
. ..
... 12/83
2.02 12/83
12 12/83
3 500 121S3
41.5 12t83
98 13/63
4 765 013 12/83
30.27 12/83
11.5 12183
Source Government's Reports on Monitoring Progrea8 in Implementing Strategy for BFA/2oo0, 1983
03/79.1:
10/82: 12/83:
World Popul4tion Trends and Prospects by Country, 1950-2000~ Summary Beport of the 1978 Aa8es8ment, UN. 1979 1982 ESCAP Population Data Sheet WPR Data Bank updated by CLO. Apia, 1983

Part 11 Page 46 30 Dec ... be, 1984
WSTEliII P4CIFIC IIIGIOR DATA B&Mll 011 SOCIOBCOIlOHlC AIIlI lIEALTli lllOlCA'!OI!.S
=D=a._m=~.=.===~ ___ ._=_ .. = ••• ~.= ...... =.= •• ~_a._= __ ••••••••• ~. . __ ..... . ......................... Indicat~r(s) for~ ~ Year Date
~ .......... -..................... = ..... = ........ -.--.......... r.-•• "' ..... jI--...... _._.,._._ ........ 1. Hedth ... _ ltuIBber .... tio p*r
10 000 Physicians 1982 47 3.0 Medical assistants 1982 I 0.1 Professional Nu~8ing/Mio~if.~1 ?erl'lonnel 1982 345 21.9
2. Ten leading causes of morbidity lCD COGe 60. of Ilate per C ••• a 100000
Influenza 487 1981 7 !l72 5 000.5 Other diaeasea of the respiratory sytem 32 1982 2 175 1 381.6 Diarrhoea, presumed infectious (Child-adult) 009.3 1982 2 002 1 271.7 Conjunctivitis 372.3 1982 1 1&8 7 419.5 Di,esses of other parts of digestive system 34 1982 821 521.5 Signs, symptoms and ill-defiued conditicn~ 46 1982 H1 330.9 Intestinal Infectious disea ••• 01 1982 498 316.3 Diseases of skin, subcutaneous tis8ues 42 1982 492 312 .5 Infantile Diarrhoea 009.3 1982 372 236.3 Open wounds and injury of blood vesaela 50 1982 ~70 235.0
p. Tep le4dlng causes of mortalIty lCD code: No~ of Rate pel' DeBtns 100000
Sign, sy.ptom And ill-defiued 46 1982 69 43.8 PD,8U11lonia 321 1982 25 15.9 Die.a.es pul$Ollary circul.tn other lonac h •• l't dit 28 1982 23 14.6 POieonin, and toxic effect 5~ 1982 22 13.9 Hypett.a,ive di •••• dJ 26 1982 18 11.4 IIch ... f.c: h.art cihe ..... 27 1982 17 10 .. 7 Acute but ill - defined cerebrovascular 193 1982 17 10.7 Intestinal infectious dise •• es 01 1982 17 10.7 Chronic liver disease and cirrhosis 15 1982 15 9.5 Diseases of otber parts of digestive syatem 34 1982 13 8.2
24. Ca8es and deaths for 8lX duea.e. under the WHo-EPI Casea lleatb.
Diphtheria 1982 0 0 Pertussis 1982 0 0 Tetanus 1982 0 0 Polioayelitis 1982 0 0 Tuberculosis 1982 I) a Measles 1982 27 0
,. Cases for diseases under the WHO Adnual CD Bulletin Cases
Gonorrhoea Hepatitia viral - Type A
- Type B - UNSP
Syphillis Trachoma Y<JW$
6. Cases and deaths for six. diaeaeea under the WHO Monthly CD Notes Cases Deaths
Choler4 1982 0 0 Dengue fever/DHF 1982 21 0 Encephalitis 1982 ... -Influenza 1982 7 872 0 Meningitis 1982 49 0 Plague 1982 0 0
7. Proportiot\ of l.nfants under one year ot age who have been fully iamunized against tuberculosis, diphtheria, poliomyeli~i8 and ~asle8
BeG DPT III Polio III Measles
8. Per cent of population se~ed with 8.fe water 1982 0
9. Per cent of population with adequate santtary l~Bl 8S.0 facilities
flO. Pe~ cent of low birth weight infa!'lts (~ 2499 gra .. oJ 1982 1.5
pI. Maternal mortality rate 1982 0.2
................. Source of Det. . ................
12/83
12/83 ,
12183
12/83
12/83
13/83
12/83
13/83
u/a3

r
Part II Page 47 30 Decemb~r 1984
WESTERN PACIFIC REGION DATA BANK ON SOCIOECONOMIC AND HEALTH INDICATORS
~ ........ ___ •• a ....... _._ ...... ___ ••••••••• ~* ••• c ........ . _-_ .... . ....•.•...... . ................. Indieator(,> for: SIIIGAl'OU Y.ar Data Sou'tce of nat_
~ .......... -....................... ---~.-.. ----....•..•. _ .... _-1'--•• - •••••••• .. ................ 1. Area (in 1000 .~. kll.) 1982 0.62
l. .. uuu. popuUh.n ,-"WI .... '~I<
). Annual population 8~owtll rate I') 1~~2 1.2
•• rcrcentage or popuutlOD - leas tnan D yea1'8 UOl "' .. - b'''' years l~U~ 4.9
). Urban populatIon 1'1 19.1 100
b. Rate ot natural 1n.creue or populat10n \7. per a.tlWllI 1>", L.l
7. Crude b1.rth rate {per J.UUU populatl.OQ} 19., 1/.J
". Crude death rate \per lOuO pOpulat1on) b.2 ).J
9. L1fe expectancy at tn:r,th - _ Total ~year&! - Me le (yea .. ) 1982 69 - Female (years) 1982 74
10. Infant 1llOrtality rate (per 1000 live births) 1982 10.8
11. Total fertility rate (women lS-49 ye.ra) 1982 1.7
12. Socio-economic indicators for the year 2000
!stimated population, ~ 1000) 2000 3 095
Life e¥pectancy at birth - Kale (years) 1995-2000 70.6
- F .... l. (yoan) 1995-2000 75.7 Annual populat10n &Towth .ate, 1995-l000IX) 1995-2000 0.87
Crude birth rate \por 100U populaUon) 1995-2000 15.1
Crude death rat. IP'" lOUO population) ".,-<UUU •• q
Rate of natural incr •• ,e {I per annuUl:} 1995-2000 0.81
3. Per Capita Gross National Product ~GNP) at market prices (US$) 1981 ~ 200
(5$)
4. a.te of growth of per capita GNP l%} 1970-1979 6.7
15. Percentage Gross Domestic Product (GDP) derived from manufacturing at constant factor cost (X) 1980 22.5
lb. Econolll.cally act~ve pop 1n pr1mary sector
- Humber in agriculture { OOO} 19uu 21
- Percent in agriculture ex) 1980 2.2
17. Daily per capita calorie supply \calories} 1.71 , 074
8. Daily per capita protein supply {grams) 1971 84.2
9. Adl.1lt literacy rate - Total 1982 84.0 - Male - Female:
O. Health budgetfexpenditure
- Amount 15$) 1982 330 890 000
- Pet capita (5$) 1982 132.99
- As % of total budaet 1982 3.69
Official Exchange Rate: US$ l~OO ~ S$ 2.04 (1981)
Source 13/63:
03/19.1:
01/80: 06/8~: 01/81: 10/82 : 12/82 :
Government's Report on HoaitoriQl Progres8 in Implementing Strategy for HFA/2000, 1983 World Population Trends and Prospects by Country, 1950-2000: Summary aepo~t of the 1978 A.seas~nt. UN, 1979 fAO Prod~tion YearbOOk 1980 Annual leport of Mioistry of Health, 1982 19B1 World Rank Atlas 1982 ESCAP Population Data Sheet Government responses to World Health Statistics Annual Questionnaire on Certain Causes of Infectious and Parasitic Diseases; and on Number of Deaths by Cau8e~ 1982 Government1s Reply to EPI Health Information System Questionnaire, 1982 Country Health Information Profile (CHIP) revised, 1983 Key Indicators of Developing M«mber Countries of ADB, April 1982
12/8)
'U{ ••
B/8)
lu/.2
10/82
14/83
lUI~2
lUlij2
!UIS2
D/83 13/83
13/83
10/82
OJ{79.1
03179.1
03{79.1
03/19.1
OJ/H.l
U'/I'" 03/19.1
13/83
07181
14/82
03/60
OllSO
Ul8J
13/8)
1318J
06/02
06/82
06/82
12/82.2: 12/83 : 14/82: 14/83: 1983 World Population Data Sheet, Population Reference Bureau, Inc., Washington. DC

Part Il Pa.ge 48 30 Decembe-t 1984
WESTERN PACIFIC REGION DATA BANK ON SOCIOECONOKIC AND HEALTH INDICATORS
r~=~=~-=.=~=====#===~~==.=.=~ ••• --•• ~ ••••• = •••• _.m •• z~ •••••••• ~ ••••• _ ........ c~.~ •• _ ..............
Indicator(s) for; SINGAl'ORl: leal' Data F·==····=···=a.·············· .. • .. • .. ···a ................... ---.w -_ ... .......... p •••••••••• --_.
1. Health IIISInpower Jkurmll!:r Ratio per 10 000
Physicians 1982 2 225 9 Hedical assistants 1982 ... Professional Nursing/Mi4wifery feT60nnel 1982 10 207 41.3
2. Ten leadiag causae of morbidity teo code 110. of bee per Ca.ti. 100 000
Gonococcal infection 098 1980 3409 142 Pulmonary tuberculoais 011 1980 2 562 107 Other venereal diseases 099 1980 2 330 91 Dermatopbytos i. no 1980 1 074 45 Viral hepatitis 070 1980 1 001 42 Chickenpox 052 1980 932 39 Other food poisoning (bacte'tial) 005 1980 569 24 CadidisAis 112 1980 557 23 Late syphilis) LAt.ent 096 1980 493 21 Me&81ea , 055 1980 490 20
3. Ten l.adtng cau ••• of mort.uty leD code 1110. of II&U per Death. 100 000
Cancer 140-208, 1982 2 722 11 210-239
Isc:haemic and other b.ea'tt di .... ae.. 410-414. 1982 2 661 11 415-429, 393-398
Cerebro~a.cular disease 430-438 1982 1 466 6 Pneumonia 4&0-486 1982 1 364 6 Accidenta, poi8onina and ~iol.nce &800-949 1982 573 2 Diabe'ea .. llitu& 258 1982 361 1 Hypertensive disease 401-405 1982 283 1 Nephritis and nephrosis 5So-S89 1982 238 1 Tuber~ulo. i.e 010-018 1982 20' 1 Bronchiti" empny6ePa and •• thma 490-493 1982 191 1
24. C •••• and death. for 'lK 4Ua ••• 11 under the WU~BPt C •••• o.achs
Diphtheria 19112 6 ... Pertus.is 1982 ... ... Tetanus 1982 ... ... Poliomyelitis 1982 1 ... TuberculolJ il9 1982 2 179 ... Heaales 19&0 1 965 ...
z, . Cases tor diseases under riU 1iII0 Annual CD Bulletin 0 ••••
Gonorrboea 1980 15 I.8It Hepatitis viral - Type ,.. 1980 ...
- Type B 19&0 ... - UNsP 19&2 426
Syphillis 1980 1097 Trachoma 1980 ... Yawa US\) ...
• 6. Cases and deaths for six die eases under the WHO Monthly CD Note8 CAees l>eatb&
Cbole~a 198~ 31 ... Dengue fevet/DRF 1982 216 ... Encephali.tis 1982 15 ... Influenza 1980 ... ... Meningitis 1980 ... ... Plague 1980 - -
7. Proport1.on of l.nfants under one year of age who have been fully immunized against tuberculosis, diphtheria, poli~yeLiti& an~ aeaeles
BeG 1982 84.5 OPT III 1982 80.9 Polio III 1982 88.0 Meas lee 1982 0.3
2H. Per cent of population served with safe water 1982 100
9. Per cent; of pop~lation with adequate sanitary 1982 100 facilities
pa. Per cent af low birth weight infants (C 2499 ir_J 1982 8.0
rn . Maternal mortality rate 1981 0.1
.-.~.~-........ ~ Source of Data . ....•..........
06/82
12(82
, 12(82
11/83
06/82
06/82
12/82.2
B/83
13/83
1l/33
ll/HJ

r
WESTERN PACIfIC REGION DATA BANK ON SOCIOECONOMIC AND HBAL1H INDlCA10RS
Year Data
P~rt II Page 49 30 December 1984
Source of Data
1. Ar.. (in 1000 oq. km.) 1982 27.5 12/83.1
Source 03/79.l.
03/79: 03/80: 12/80: 12/82:
12/82.2: 12/83: 12/83.1 12/84: 14/80:
1981 601
- Female
WorLd Population Trends and Prospects by Country, 1950-2000: Su~ry Report of the 1976 ~8eS8meat. UN, 1979 FAO Production learbooK, 1979 FAO Produccion Yeerbook. 1980 Country Kealth Information Profile (CHIP) revised, 1980 Government Reapooaea to World Health Statistics Annual Questionnaire on Health Maupower, 1982 Government's Reply to EPI Health Information System Questionnaire, 1982 Country Review by CLO, Honiara, 1983 Country Health Information Profile (CHIP) reviaed J 1983 WPR Oata Bank updated by CLO, Honiara. 1983 and 19&4
12/84 12/84
12/84
South Pacific Epidemiolo&ical and Health Infor.ation Service, Annual Report 1980

Part LI Page 50 30 December t984
WiSTEBM PACIFlC REGION DATA BANK ON SOCIOli\CONOKIC AND III!ALTH INDICATOIlS
,~ .. (.) for; raar
in. Health manpower
Physicians 1980 Medicsl assistants 1980 Professional Nursing/Midwifery Personnel 1980
In. Ten ".U"'6 causeS ot ICD co<ie
InflueQza 487 1980 Diarrhoea - child-adult 009.3 1980 Conjunctivitis 372 1980 Diarrhoeal infantile 009.3 1980 Heasles 055 1980 Gonorrhoea 098 1980 Hepatitis, unspecified 573.1-573.3 1980 tuberculosis, pulmonary 010-012 1980 Leptospirosis 100 1980 Lepro.y 030 1980
123. '£On <au'" of _ ••• ., l~D eode
Certain cond ori&iaAting - ,.rinAtal p.~i.od. A131-1113~ 1977 tulterc"lo.b A6. 119, 1110 1977 Heare disorder. and c&r4iova.cular diaease 1182-1185 1977 Pnel.ltlOtlia II91-A92 un Enteritis 1.5 1977 Malignant neoplasms 1145-A60 1977 Disorders of digestive system AI0I-AI04 1977 Nephritis ineph A105-A106 1977 Leprosy 1120 1971 Meningitis A72 1911 Bronchitis, emphysema and asthma 1193, 1.95 1971
124. c •••• and death. tor six under the ~-EPI
Diphtheria 1982 PertussiS! 1982 Tetanus 1982 Poliomyelitis 1982 Tuberculosis 1982 Measles 1982
I'" Caa.s tor d: . under the WHO Annual CD Bulletln
Gorwrrhoea 1980 Hepatitis viral - type A 1980
- Type J; 1980 - UNSP 1980
Sypnitl is 1980 Trachoma 1980 Yaws. 1980
20. Casea .... • eaths tor ux undn the WHO Monthly CD Notes
Cholera 1980 Dengue fever/DHf 1980 Encephalitis 1980 Influ.enza 1980 Meningitis 1980 Plague 1980
27. ~:~~;r~ion of .. nd .. one y.ar of age who have been immunized against tuberculosis, dip~theria,
poliomyelitis and measles BCG 1982 DP'I III 1982 Polio III 1982 Measles
128. Per cent ot served vith safe "'ater
129. P.r cent ot with facilities
1>0. Per cent at low birth weight (4i 2499 gr .... )
I'" ., rate
. Data Source of Data
lIulIIbe. Rat.io pet: 10 000
38 1.7 12/82 -
390 n.s No. of Rate pe. Cases 100 000 17 485 7 764 110/80 6 138 2 726 4 778 2 122 3 453 1 533
340 151
, 213 95 168 75 170 75 U8 52 40 18
110. of Rat·og~r De.the 100
17 8 12/80 12 6 9 4 9 4 8 4 7 3 7 3 1 3 6 J 5 2 ; 2
Cases Deaths ... ... ... ... ... ... ... ... ... ... ... ...
C.ses 83 14/60 -...
63 -... ...
Cases Death. - - 14/80 - -- -
8 296 -1 -- -
46.2 12182.2 36.3 34.5
...
... '" ...

WESTERN PACIFIC R~GION DATA BANK ON SOCIOECONOlIIC AND H!:ALTH INDICATORS
Part II Page 51 )0 Decetaber 1984
'-~.~=~._~-=~_C~~_ •• _R=.= •••• _ •• D. __ GS_=CD*_==== __ a_= __ ~= •• ..., .. a ___ ... . .. _---"". __ ...... _.-_.""._ ... -... lndic:ator<a) for; TOKELAU Year Data Source of Data
F~=·3 •• =aa. •• ~ ___ a._ .. ""a .. == •• _m~.==_~ .... =-=c ... _.=.=.==_ ... = -= .. 1:1 .......... = ............... ... c ... c .......... _ ... '" 1. Area (in 1000 sq. lou.) 1981 0.01
2. E.ti .. ted population, (' 000) 1982 3
3. Annual population growth rate, (%) · .. 4. Percentage of population - leas than 15 years · ..
- 65+ yeau · .. S. Urban population (XJ . .. 6. Rate of natural increase of population (% Pf!:r annUllli) 1982 1.7
7. Orude birth rate lper 1000 population) 1982 27.7
8. Crude death rate lper 1000 population) 1982 10.3
9. Life expectancy at birth - Total (years) · .. - Mal. (years) · .. - Female (years) ...
10. Infant mortality rate (per 1000 li~e births) 1980 44.4 11. lotal fertility rate ~women 1~-49 years) · " 12. Socia-economic indicators for tl'le year 2000
Eat1.-ted population, \' 000) · .. L~fe expectancy at birth - Male Iyears} · ..
- Pemale (ye.r8) · .. Anndal pop~lation 8~th rate. (XJ · .. Cruel. birth rate Iper 1000 population) ... Crud. death rat. (per 1000 population) ... Rate of n.tul'al incl'ea.. II pet:' annum} · ..
13. Per Capita Cross National Product (GNP) at lIIa-rket prices (U8$) · ..
14. Rate of growth of per capita GNP (» . .. 15. PercentalG: Cross Domestic. Product lGDP) derived
from manufacturing at con8tant factor cost (%) · .. 16. Economically active pop in primary Bector · ..
- Number in agriculture (1000) ... - Percent in agriculture (X) ...
17. Daily per capita calorie supply (calorie s) · .. 18. Daily per capita protein supply (gram.) · .. 19. Molt literacy rate - Total · ..
- Hale - Female
20. Health budget/expenditure
- Amount (WS$) 1982-1983 170 284
- Per capita IWS$) 1982-1983 56.8*
- As % of tot .. l budget 1982-1983 7.17
*Computed by UIN.
Source 13/83.
06/81; 06/82. 06/83. 12182.
12/82.1, 12/82.2. 12/83;
Government's Report on Monitoring Progress in Lmplementing Strategy for HFA/2000, 1983 Annual Report on Health Services, 1981 Annual Report On Health Services. 1982 Report of the Administrator of Tokelau fo'E' the Year Ended 31 March 1983. Government Responses to World ae,lth Statistics Annual Que8tionnire on Health Manpower, 1982 Leaflet on Childhood CD, Report 3/82 Government's Reply to [PI Health Information System Questionnaire, 1982 Country Health Information Profile (CHIP) revised by Government, 1983
12/83
12/82.1
06/82
06/82
06/82
12/83
06/83
06/83

Part 11 Pat:r;e 5-2 30 December 1984
WESTERN PA~IFIC REGION DATA B~NK ON SOCIOECONOMIC AND HEALTH INDICATORS
F:=====;=~===~~===~=~==s==$a=&:===~=c:==~=~S====DC==~===£======= """" .... == ==========-===~~====.=~~ lndicator(s) for; TOKELAU Year Data
f============-=,...···=-======--================================== ===:0== =========··~F·_·==E=~~~= 121. Health manpower NUJIl"ber Ratio per
10 000 Physicians 1930 4 20.0 loI.edical assistants 1980 · .. Professional Nursing/Midwifery Personnel 1930 · ..
,. Ten leadin& causes ot morbidity ICD coda No. of Rate per Cases 100 000
Influenza 1981 1 024 34 133 Infections of skin and subcutaneous tissue 1981 84) 28 233 Gaatro-enteritis 1961 335 11 166 Bronchitis 1981 24) 8 233 Otber diseases of the oigestive system 1981 110 3 66) Observati.ons a"" invest igations 1981 94 3 133 Other diseases of the skin and subcutaneous tissue 1981 )8 2 600 InflaBID8l:0ry diseases of the eye 1981 70 2 333 AnaetDia 19.1 59 1 9b) PneUPlonia 19~1 10 333
3. Ten leading causes of mortality lCU code No. of Rate per Deaths 100 000
Cerebro-vascular disease 19tH 2 07 Pnewnonia 1981 2 67 Other di3eae8s of the digestive system 1981 2 6) Meningitis 1981 1 33 Degenerative heart disease 1981 1 3] Other c4rdiovascular di8ea8e 1981 1 3:>
4. Cases and deaths for Sl.X diseases under the W"" Chi Idhooa Cotll11unicable Di&e"ses Casu Deathtl
Oiphtheria 1982 - -Pertusais 1982 - -Tet.nul 1982 - -iJo liotnyalitis 19!>2 - -'fubf:!t'culosis 1982 - -Measles 1982 - -
5. Cases for dl. •••••• under the WHO Annual CO Bulletin Cases
Gonorrhoea 1982 1 Hepatitis v1ral - Type A 1982 · ..
- Type 8 1982 · .. - UNSP 19~2. -
Syphillis 1982 -Tracnoma 1982 · .. Yaws 1982 · ..
6. Caties and deaths for six diseases under the WHO Monthly CD Notes Cs.5es Deaths
Cholera 1982 ... " . Dengue fever /DHF 1982 .. . " . Encephalitis 1982 · .. " . Influenza 198> b):L -lteol.ngitis 1982 - -Plague 198' · .. '"
2). Proportion of intants under one year of age who have been fuLly Lmmunized against tuberculosis , diphtheria, po liomye litis and measles
BeG 1982 31.4 DPT 111 Polio ill Measles
S. Per cent of population served with safe water ... 9. Per cent of popUlation with adequate sanitary
fac.ilit.ies ... 30. Per cent of low birth weight infants ( 'f 2'.99 grams) ... 31. Maternal mortality rate ...
,
.. c ........ "' ....... "":z"'=~
Source of Data ","'.=2"==="S=.,.,,,
12/~2
Ob/81
.
06/81
06182
tibl8l
Ubi!>,
12182.2

WESTERN PACIFIC REGION DATA BANK ON SOCIOECONOMIC AND HEALTH INDICATORS
~==~~_=s=~===-~ •• =~~=~==~==~===Q~~=.==.=a=.==.~.==.===== Indicato~(8) for: ~
r·=e==.=.== ...... a.=_=S.=d~ ......... *.--.. ===~=--=-== ••• 1. Area (in 1000 sq. km.)
1. Rltt".t •• popu,.t,on, ('(1(10)
j. Annual population growth rate, (X)
4. Percentage of populatton - less than 15 yeara
: 6, Rate or nltUnl inora". or popu,ahon " per Innum) /. C.UQ. 0'«0 rata \p.~ 1000 populOtlonl
8. C.u •• d.,th rate !par luuu P0J>llut'ORJ
••
10.
11.
Llre expectancy at bl.rth - To-tal ~yeara? - Female (years) - Male (years)
Infant mortahty rate (per 1000 live births)
·rot,1 ferul1ty rate (w"",en 15-49 years)
12. Socia-economic indicators for the year 2000
Eatuuated population, ('000)
Life expectancy at b~rth ~ Hale (years)
- Female (years)
Annual populatl.oa growth rate. (X)
Crude birth rate (per 1000 population)
Crude death rate (per 1000 population)
Rate of natural incresee (% per annum)
13. P_r Capita OrO.1 National Product (GNP). at urket: pricss (US,>
(Ti)
14. Rate of grOtllth of per capita GNP ~:l)
15. Pe:rcentage Gros, DoIIe.he P'roduct {GOP} derived from manuf8~turing at constant factor cost (X)
6~ Economically active pop in pr~ry .ector
- Number in agnculturo \ '000)
- Percent 10 agriculture UJ"
17. D1uly per capita calorie supply \c~lories)
18. Daily per capita protein supply t;.gralDs)
19. Adult literacy rate - Total - Male - Female
O. Health budget/expenditure
- Amount
- Per capita
- As % of total budget
(Ttl
Official Exchsnge Rate: 1 US$ • TS 0.9430 (1982)
.==.==_=:Z~=
Year .. ...... == ..... "' ...
1981
1982
1966-1976
1982
198~
1980
1981
1016
1981
2000
1995-2000
1982
1979
1976
1976
1982
1975-1977
1976 1976
1981(82
1981/82
1981/82
Part 11 Page 503 30 December 1984
Data Source of Data ......... "' ......... r-........... _.II ••
2
0.70 11/82
99 10{82
1.6 13{83
39.1 10/82
1.3 10182
J1.8 u/8.
2.4
28.6
4 ••
58
21. 7
119
1.04
499 or 504
9.9
9
43.4
750
61.2
79 78
0./81
06/81
00/81
13/~J
13/83
03179.1
03179.1
lJ/83
14182
03/80
03/80
13183
03179
!J183 13/83
1 664 121 . 06/81
16.80 Obl81
11.3 06181
Source 13/83: Government's Report on Monitoring ProgresB in Implementing Strategy for BfA12000. 1983
03179.1:
03179 : 03/80: 06180: 06/81: 10/82: 11182: 12/82.2: 12/83: 12(84:
14/82:
World Population Trends and Projects by Count~y 1950-Z000~ Summary Report of tbe 1978 AsseS8ment, UN FAa Production Yearbook 1979 FAO Production Yearbook 1980 Report of the Ministry of Health for 1980 Report of the Ministry of Health for 1981 1982 ESCAP Population Data Sheet World Health _Statistic8 Annual 1982l Vital StetisticB and Causes of Deaths Cove'rnment I s Reply ttl EfI Health Info~tion System Questionnaire. 1982 Couu,'try Health Infornsation Profile (CRIP) revised. by Gove.rnment. 1983 Government Responses to World Health Statistics An~ual Questionnai~e on Health Manpower, 1984 Key Indicators of Developing ~er Countries of ADB, April 1982

iart II Page 54 30 Deeember 1984
WESTERN PACIfIC RtGION DATA BAtIK ON SOCIOECONOMIC AND HEALTH INDlCATORS
~~===.=.=~~.=.ap==.=.====.==.=a=====D==D=====~=======~=a======== ... c:="'==_ ~D=._=_a.=~ •• ==~Q •• "'A"'_~ lndiclltor(tt) for: ~ Year Data
~=.~ ........................ _~.~=.~ .... ~ .. ===2~==~=.~O$_.D_ •••• ~=. .."' .... ............ ~ ........... n. Health I118npower Number Ratio per
to 000 Physic iane 1982 41 4.1 Medical aaaistants 1982 16 1.6 Professional Nursing/Midwifery Personnel 1982 161 16.1
122• Ten lea«il.ng causea ot fDorbuhty lCD code No. of Rate per Cases 100 000
Influenza 1961 8 778 8 924 Conjunctivitis 1961 5 524 5 &16 Castro-enteritis 1981 2 340 2 379 lnfantile diarrhoea 1981 1 451 1 475 Dengue 1981 1 362 1 .J89 6roncho pneumonia 1981 1 120 1 139 Mul t d iat'rnoe& 19BI 480 488 Chicken po¥. 1981 )02 )07 MeaBl~& (Mol'billi) 1981 187 190 Lobar pneuDll)nia 1981 168 171
23. Ten hadl.ng oauee. ot .. o«al1ty* ICD code NQ. of R.tte' pdt"
Death. 100 000 Nephric!" nephrotic .yndrome and nephI'o,iM )50 1980 22 22 Pn,uPlooia 321 1980 17 17 Di.bet~6 mellitua 181 1980 16 16 lschaemic heart disease 27 1980 13 13 Acute dlyo&al"dial 270 1980 lZ 12 Meningococcal infection 036 1980 10 10 Cerebrovascular disease 29 1980 10 10 Septicaemia 038 1980 8 S Hypertensive disease 2& 1980 8 8 Malignant neoplasm of temale breast 113 19BO 7 I Poisoning and toxic effects 53 19BO 7 7
4. Cases and deaths for six diseases under the WliO-EPI Cases De.ath..
Diphtheria 1981 - · .. l?~rtu6si8 1981 - · .. Tetanus 1981 3 · .. P()liomyelitis 19BI - · .. 'tuberculosis 19B1 48 · .. Measles 19B1 IBI ...
25. Cases for diseases under the WHO Annual CD Bulletin CasEIs
Gonorrhoea 19B1 28 Hepatitis viral - Type A 1981 -
- TYpe B 1981 -- UNSP 1981 13
Syphillis 1981 ... Trachoma 1981 1 )'aws 1981 ...
26. Cases and deaths for six diseases under the WIIO Monthly CD Notes Cases Deathl'J
Cholera 1980 - · .. Dengue fevEt'/DRF 1981 I 3&2 · .. Encephalitis 1980 2 · .. Influenza 19BI B 718 ... Meningitis 19BI 13 · .. Plague 1980 - · ..
7. Proportion of infanta under one year of age who have been fuLly immuni~ed against tuberculosis, diphtheTia, poliomyelitis and measles
BCG 1982 88.8 OPT III 1982 64.7 Polio III 1982 40.2 loieash!:& I
19~2 39.4 , , 28. Per cent of ~opulation ~erved with safe water 1982 91.3
9. Per cent of population with adequate sanitary facilities 19~2 36.6
30. Per cent of low birth weight infants (~ 249~ grams) 1982 0.4
31. Maternal mortality rate ... *Medically ce~tified
""0$"'0:0"" ............ = .....
SQurce of Da"~ ..•.............
12184
06180
06/60
06/81
06/B1
06/81
12182.2
13/83
13183
13183

WESTERN PACIFIC ({EGION DATA HANK ON SOCIOECONOI'lIC AND HEALTH INDICATORS
Part 11 Page 55 30 December 1984
r~~===~=~~===:~~=~=~=======~=====~=~====~=C===========~== .==c======cc.,=, ,=,==r:::==':::=======--======="""'="'===o.: .. Indieator(Q) for; T T of the PA-CH Ie ISLANDS Ye<ic Data Source of I)at",
F==========·=~=···=u=.=====~=~~==~===.E=_====-=========== ======:c:== ..... .. =; .. ::1:1:",=",,,,,,=== .. ,,, ==========a:===~_ .. ,", 12/ B) 1. Area (in 1000 sq. km. ) 1981 1. 78
2. Est iJuated population. ( 000) 19B2 142 12/62.1
3. Annual po\,ulatiou g:towth rate, m 1982 1.9 10/B2
4. Percentsge of papulation - leu than 15 years 198:1. 44.3 10/82
- 65+ years 1982 4.1 10/82
5. Urb4n populatlon (X) 1980 55.6 12/83
O. Ratt of natural increase of populatl.on (% per annum) 1981 2.7 06/82
7. CUHie birth rate ~per 1000 population) 1981 31. 3 06/82
8. Crude de.ath Tate "per LOOO popula.tion) 1981 4.3 06/82
9. Life expectancy at birth - Total ~years) ... - Male (years) ... - Female (years) ...
10. Infant. mortality rate (per lOOt> live oirths) 1982 23.2 11/83
11. Total fertility rate (women 1:'-49 years) ... 12. Socia-economic indioCators for the year 2000
.Estimated population, (' 000) 2000 234 03/79.1
Life expectancy at birth - Male (years) ... - Fewale (years) ...
Anoual population growth rate, (%) 1995-2000 2.0:' 03779.1
Crude birth rate (per 1000 population) ... Crude death rate (per 1000 popUlation) ... Rate: of natural inc rease ll. per annum) ...
13. PMr Cepit« Groas Nadonill Product (GNP) ac market prices (U8$) ...
14. !tate of growth of per capits GNP (~) ... 15. Perl:entage Gl"O 8S Domestic Pl"oduct (GDP) derived
from manufacturing at constant factor cost (%) ... 16. Economically active pop in prImary 61ector
- Number in agricult.ure ( 000) ... - Percent in a.griculture (4) ...
17. Daily per capita calorie supply (calories) ... 18. Daily per capita protein supply (grams) '"
\ 9. Aa.ult lit.eracy rate - 'Iatal '" - Male - }o'emale
20. Health budget/expenditure
- Amount (US$) 19)8 ) 760 100 06/78
- Per capita (US$) 1978 58.3 06/78
- As % of total budget '"
Source 03179.l. World l'opulation Trends and Prospf:cts by Country, 1950-2000:
06/18: 06/82: 10/82: 12/80: 12/81: 12/82:
12/82.1: 12/82.2: 12/83: 14/80:
SUPilIary Report of tbe 1976 Assessment. UN, 19)9 trust Territory of the Pacific Islands 1978 Annual Report Trust Territory of the Pacific Islands 19M1 Annual Report 1982 ESCAP Population Data Sheet 1979 Country Health_Report for 31st WHO Regional Committee, 19~O Goveraaent Reports an the Number of Cases of CU Government Responses to World Health Statistics AnnuaL questionnaire on Health Manpower, 1982 Leaflet on Childhood CD, Report 3/82 Government's Reply to EPI Health Information System Questionnaire, 19ij2 Country Health, Information Profile (CHIP) revised by Goverruuent J 1963 Soutb Pacific Epidemiological and Health Information service, Annual Report 19liO

Pall" ~r. 30 DecaDber 1984
WEST£lIl PACIFIC UGIOII Jl4T4 JWIII: Oil SOCIO!GOIlOMIC AJID IlBALTH IRDlllATORS
Indicator(s) for:
tlealth manpower
Phys.icians Medical •• sistlnts Profe.eional Nursina/Midvif*ry Personnel
Influea.&a Amoebi •• ia Oonoccocal iat.ccion Ch .elI.n po.
487 006 0'8
Streptoooce.l .ore throat and .carlet fever Cholera Fi.h poi.ooing Tuberculosis, all forms Hepatitis, infectious Leprosy
caUl,S
Disea.e of heart
1865.2
030
Benign and malignant neople ... Diarrhoeal and intestiR.l 'd •• eases Chronic obstructive pulm06arY diseases
390-398, 402, 410-429 140-209, 2l0~239
004, 006, 008-009 and allied
490-496 480-487 430-438
condition. Influenza and pneumonia Cereb~ovascular dises.es Prema tur i ty Accidents. all types Disbete •• ellitu& Suicide Cert.ia caU8e& of mortality of early infancy
under the WHO-ElI Diphtheria Pertuaai. fatanu8 PoliOlbyeliti. Tub.rculChl i. " ... ,1 ••
Annual CO Bulletin. Gonorrhoea Hepatitis virs.t - Type A
- Type 11
Syphillis T!8.cn..ma 'iaws
WHO Monthly CD Notes Cholera
- UIISP
Dengue fever/DHF Snceph&litis Influenza MeningitiS Plague
765 8800-8949
250 8950-£959
760-764 766-779
fully immunized a~iQ8t t~bereuto8is» diphtheria. polioayelitis and measles
»CG J)PT III Polio !II Mes.sles
Year
1980 1980 1980
1982 1982 1982 1982 1982 1982 1982 1982 1982 1982
1981 1981 1981
1981 1981 1981 1981 1981 1981 1981
1981
1982 1982 19,82 1982 1982 1982
1980 1980 1980 1980 1980 1980 1980
1980 1980 1980 1980 1980 1980
1982 1982 1982
_or
46 46
193
D.a, ••
n.ts
9 913 780 435 179 117 108* 103 99 43 34
Death. SS 52 39
35 32 25 26 22 16 16
14
122 1
Cales 524
73
CaBes
16 300 19
24.7 12.7 1.0
Ratio per lU 000
3.4 3.4
14.3
6 981 549 306 126
82 76 73 70 30 24
per 100 000
44 42 31
28 26 20 21 18 IJ 13
11
De.the ... ... '"
Deaths
a total of 84l cases, Qf whicb 108 were bacteriologically confiraed. had been reported with 4 s~.,act.c death,.
SOurce of Data
12/82
14(80
12/80
12(82.1
12/81
12(81
12/82.2

WESTERN PACIFIC REGION DATA BANK ON SOCIOECONOMIC AND HEALTH INDICATORS
Pa.rt II Page 57 30 December 1984
=c~ ........ c.a.== •• _.=~~.~~~a=~=====~==~~==_~=====*_=:==g ='"'=""'IS ........... "" ===~ ••• --= ••• ~~ ==mg._.=a=a~m~~~ Indicator(,) for: ~ Year DJita. Source of Data
=.=.=~.====.= •••••• "'=.====3==========================~~:= =""=",==",, .. :aCl ..... =;0 ... "'''''.''' ....... ''' .. ==m.~=m~= •• = •• ~ 1. Area (in 1000 sq. km. ) 1982 .026
2. Estimated populat'lon, \ 000) 1982 6
3. Annual ~opulation growth rate, (%) 1982 2.2
4. Percentage of population - les.$ than 15 years 1979 )3.4
- 65'" years 1979 4.7
5. urban populat~on (%) . .. o. Rate of natural increase of popu.latl.on {t pet: annum} 1981 1.83
7. Crude birth ra.te ~ per 1000 population) 1982 33.2
s. Crude death rate (per 1000 popul.ac.ion) 1982 11.3
9. Life expectancy a~ birth ... l'otal \y"oro! - Male (years) 1982 57 ... Female (years) 1982 60
10. Infant ""<tality rate {peT 1000 live birth., 1982 36.8
111. Tot.' fertll1ty ute <women 15-49 ye.rs) 1982 2.8+
12. Socio-econoDlic indl.cato'ts for the yea.1" lOOO
Estimated popu.lation, (' 000) ... Life expectancy at birth - Male (Y·.U) · ..
- Female {years) · .. Annual populat1.on growth rate, \jj,} 1995-2000 0.00
Crude bltth rate (per 1000 population) · .. Crude death rate (p"r 1000 population) · .. 8.ate of natural increase (% pe r annum} ...
13. Per Capies Gross National Product (GNP) at U18rket prices (USS) 1981 421
14. Rate of gtowth of per capita GNP (%) . .. 15. Percentage Gross Domestic Product (GOP) derived
from manufacturing at constant factor cost (%) ... 10. Eccnoulol.cally active pop in primary 8ectOt: f-- - Number- in agriculture ( 000) ...
- Pel'cent in agriculture ~%J · .. 17. Daily per ca.pita calorie supply (calories) ... IS. Dai~)' per capita protein supply \gra,ms} · .. 19. Adult literacy rate - Total 1982 90
- Male - Female
20. Health budget/expenditure
- Amount (AI) 1980 243 135
- Per capita (AI) 1980 33
- As 1 of totsl budget 1980 7.8
Official ~xchang~ rate: US, 1.00 ~ A$ 0.86 (19BO)
Source U/b3:
03/79.};
06/80 ; 06/82; 10/82: 12/82.2: 12/83 : 12/83:
Government's Report on Monitoring ~rQgres6 in l~pte~enting StTategy for HFAj2000 f 1983 World Population Trends and Prospects hy Country, 1950-2000. Summary Report of the 1978 A8sesament, UN, 191~
Ministry of Social Services, ijealth Division Annual Report, 1980 Ministry of Social Services, Health Division Annual Report. 1982 1982 ESCAP Pop~lation Data Sheet GO'lernroent 1 s Reply to EPI Health lnforma.tiou System Questionnaire, 19~2 Country Health Information Profile (CHIP) revised by Covernment, 1983 Government Responses to World Health Statistics Annual Questionnaire on Health Manpower~ 1983
12(S]
10lR2
13(S}
10182
10182
1>/83
06182
06/82
13/83 13(83
12183
10/82
03/19.1
12/83
))/S3
06/82
06/82
06/82
14(80: South Pacific Epidemiological and Health Information Service, Annual Report 19~O

rUL\.. ......
Page 58 30 December 1984
WESTERN PACIFIC REGION DATA BANK ON SOCIOECONOMIC AND HEALTH INDICATORS
~ ... =a •• =~2.== ••• ~~~_= ••• = •• = ••••• _ ••• -=a •• a._= •• ~ •• & ••• =_ ...... •• __ il:_ _ •••••••••••••••••• a ••••
In4icator(0) for, TUVALU Y.Ar Data ~ ........................... ~* ............... - .................. ...... - ............ ~ ........... 21. Health unpowel' NUMber kdo pet"
10 000 PhY$icians 1~81 4 5.0 Medical assistants 1981 8 10.0 PTofessional Nur8ing/Hidwife~y Pel'8oonel 1981 18 22.5
22. Ten 1 eacfing causes of morbIdity leo code No. of Race pel' Cases 100 000
Influenza 487 1980 3 660 48 800 Diarrhoea, presumed infectious (child-adultl 009.3 1980 725 9 667 Measles 055 1980 329 4 387 Diarrnoea, presumed infectiou.1& Hnfantih:) 009.3 1980 270 3 600 Whooping cough 033 1980 no J 067 Conjunctivitis 372 1980 215 2 867 Shigellosis 004 1980 43 573 Fish poisoning, 2865.2 1980 27 360 Dengue 061 1980 15 200 Tuberculosis, pulmonary 010-012 1980 12 160
123 • Tert le~1ng c4uses of mottallty leO code No. of tate per Deaths 100 000
Stillbirth 766.1 1980 4 SO Coronary heart disease 414.0 1980 3 38 Live.r failure 572.8 1980 2 2S Amoebic-dyaeneery 006.9 1980 1 12 Hepatitie- fulcinating 070.1 1980 1 12 Meningitis 322.9 1980 1 U I1nc:ephali t ia 323.9 198Q 1 12 Ipil.pay 345.9 1980 1 12 C.V.A 436 1980 1 12· Acut~ appendicitis 540.9 1980 1 12 Peritonitis 567.9 1980 1 12 Chronic nephrotic syndrome 581.9 1980 1 12 Blood disorder 289.9 1980 1 12 Sh~ck-st4bled wound 988.0 1980 1 12
124. Cases and deaths for six diseases under the WHO-EPt Csses Deaths
Diphtheria 1982 - -Pertussis 1982 - -Tetanus 1982 - -Poliomyelitis 1982 - -Tuberculosis 1982 12 -Measles 1982 - -
25. Cases for diseases under the WHO Annual CD Bulletin Cases
Gonorrhoea 1980 3(-) Repatitis viral - Type A 1980 -
- Type B 1980 -- UNSP 1980 2(-)
Syphill is 1980 -Trachoma 1980 ... Yawil 1980 -
6. Cases and deaths for six diseases under the WHO Monthly CD No~es Cases Deaths
Cholera 1980 - -Dengue fever /DHF 1980 IS -Encephalitis 1980 - -Influenza 1980 3 719 -}!t.eningitis 1980 & -Plague 1980 - -
27. Proportion of infants und.er one yelLr of age who have bee. I fully immunized againat tuberculosis, dipbtheria,
poliomyelitis and measles , , OPT III , 1982 72.0 , 8eG , 1982 78.0 , Polio III 1982 &6.0 Measles
2B. Per cent of population served with .afe water 1982 13
29. Per cent of population with ad~quate saultary facilities 1982 82
30. Per cent of low birth weight infants I. 2U9 8ra ... ) 1982 , 131 • Maternal mortalLty rate 1962 IJ
The number within the'parentheseB refer to the number of deathe.
. ... _. __ ..... ioutc.of:Dat.
• •••••••••••••••
12/83
14/80
..
06180
13/83
06/80
06/80
12/82.2
12183
13/83
\Jf8]
IJ/83

WESTERK P~CIFIC REGION DATA BANK ON SOCIOECONOMIC AND HBALTH INDICATORS
Part 11 ,_ 59 30 December 1984
S~==.A==a===_=~_.==A====D._D_.====c.a.==~.== •• a.a_.aa •• ~. - •••• -~"'= .. ... __ . __ ........ .-.-.... --.. ~ ... Indicator(s) for: VANUATD Year Data Source of Data
C==== •• ==_ •• =~~==="==.===== ••• =-== ••• 2= •• __ a====_ •••• =.= ........ "' ... "'- ....... __ ......... ......•••..•..•. 1- Area (in 1000 sq. .... ) 1981 12.19
2. Estimated population, l' OOO} 1983 128
3. AnnUal population growth rate. t%) 197.9 3.2
4. Pereel1tage of population - leas than 15 years 1979 45.4
- 6$+ yeara 1~79 2.9 ,. Urban pOpulation (%l 197' 17.8
6. Rate of natural incre •• e of population II per annUlI) 197~ 3.2
7. Crude birth rate (par 1000 population) 1983 44.0
8. Crude deatb rate (per 1000 population) 1983 12.0·
9. Life expectancy at birth - Total (years) - Male (years) 1983 55 - FetUlle (years) 1983 47
10. Infant mortality rate (per 1000 live births) 1983 75
1. Total fertility rate (women 15-49 years) 1983 6.6
12. soeio-economic indieators for the year 2000
Estimated population, \ I 000) 2000 166
Life expectancy at birth - Male \y.ars} ... - Female (yeara) ...
Annual population growth rate. (X) 1995-2000 1.83
Crude b1rth rate (per 1000 population) ... Crude de.th rate ~p.t' 1000 population) ... Rate of ~atural increaBe (X per annum) ...
13. Pe~ CapLta Gross National Product ~GDP)
at 1I8.rket prices (US$) 1980 620
14. Rate of growth of per capita GNP (%) 1970-1977 1.8
15. Percentage Gros. Domestic Product (COP) derived from manufacturing at constant f8£tor cost (X) ...
16. Economically active pop in primary lector
- Number in agriculture (' 000) 1979 41.5
- Percent in agriculture (X) 1979 79
17. Daily per caPita calorie supply (calories) 1979 2 546
IS. Daily per capita protein supply {grams' 1979 68.4
19. Adult literacy rate - Total ... - Male - Female
20. Health budget/expenditure
- Aaount IFHa} 1981 280 01~ 000
- Per capita IFNH} 1981 2 295.2
- As % of total budget ... Official Exchange Rate: US$ 1.00 = FNH 70.00 (1980)
Source 13/83; Government's Report on Monitoring Progress in Implementing Strategy for MFA/2000, 1983
03/79.1:
06/84: 06/84.1: 10/32: 12/81:
12/81: 12/82:
12/82.1 : 12/82.2: 12/83: 12/84: 14/76:
World Population Trend, and Project. by Country 19S0-.2000: SUlIIDary Report of the 1978 Assesament, UN, 1979 Information furnished by the National Health Office. Vanuatu, 1 August 1984 Report of Dr Trinidad Oateria. 1983 1982 ESCAP Population Data Sheet Government RespcnBes to World Health Statistics Annual Questionnaire on Certain Causes of Infectious and Parasitic Diseases and on HUmber of Deatns by Cauae Government Reports on the Number of Cases of CD Government Responses to World Health Statistics Annual Questionnaire on Health Manpower. 1982 Leaflet on Childbood CD. Report 3/82 Government's Reply to EPI Health Information System Questionnaire, 1982 Country Health Information Profile (CHIP) revised by Goverument, 1983 WPR Data Bank updated by CLO. ViI., 1983 and 1984 Rural Health Service by Dr Ratard, 1976
12/83
06/84
06/84
06/84
06/84
06/84
06/84
06/84.1
06/84.1
06/84.1 06/84.1
12/84
06/84
03179.1
03/79.1
13/83
12/84
121S4
12/84
!J/S3
13(83
12/84
12(84

Part II 1\,... 60 ,oieceaber 1984
WII$TEaN PA£IFIC HGIOll DATA BAlIK 011 SOClOECa-IC AlII) 1IEAL'1'H INDlCA'lORS
• ____ .-=.~~~e._a ... _~_a ....... &a ••••• ~ •• ~ ••••• s~ ••••• ~e ••• _a ............. - ~ ............... -... ~ .. -................ Indicator(s> for. VApYlTU Year n.ta 90\1;1:'0. of Da t I
~ ... a-=."""""~.".~.*"" •• "= ••••• o" ••••• ~,,,""'''. ~ .. '":"-j..~"-iI!' ..... , .......... .., .. __ . __ .... [21. lli!alth .... _r Ruuber Ratio per
10 000 Ph.ysicians 1981 22 1.9 12/82 Medical assistants 1981 19 1.6 Profe •• ioael Nursina/Midwifery Peraonnel 1981 221 18.1
2. Ten l •• ding callSes of """,bi4ity leo code 10. of 1I&t. per Oa_ laO 000
Inf1,*.8. 487 1981 II '000 25 181 06/84 Il1~ int •• ~in.l inf .. ~ieG 009 19113 22 ~ 17 187 Malad.. 084 1981 19 119 14 937 Hea&1.s 055 1983 400 312 Viral b.p.titia (unconfirmed) 070 1983 J40 266 Tuber~ulo.il. all form. 010-018 1981 171 IlJ LepN&Y ".th. c .... )· 030 19$3 100 - 200 78 - 156 l4beot>'''' ·ouah 033 1983 30 23 Dengue 061 1983 - -Other and un.pacified syphiLis 097 1983 - -Typhoid .ftd paratyphoid fever 002 1983 - -
23. Tefl lHdiq e*_. of .ortahty lCO code Ito. of lat. per D •• th. lOa 000
Gastroenbe'l'itia 1983 19 15 06/84 TateM 1983 2 1.6 Intec't1.ou8 he,atiti., 1983 1 0.8 Whooping coUSh 1983 - -Rosin.ph meningitis 1983 - -
24. Cases and deaths fot' six dieeases under the WHO-EPI Cases Deaths
Diphtheria 1983 - - 06/84 Pertue.i. 1983 )0 -Tetanua 1983 5 2 PoliDfll.litia 198) - -Tuberculosis I 1983 171 15 Messles 1983 400 -
25. Cases for d11eases under the WHO Annual CD Bulletin C •• es
Gonorrboaa (unconfirmed) 1983 250 (1)2.) 06/84 Hepatitis viral - Type A 1983 9(-)
- Type • 1983 -- um 1983 340
Syphillia 1983 -Trachoma 1983 ... Yaws (unconfirmed) 1983 zoo
26. Cases and deaths for six dis •• eel under tbe WHO Monthly CD Notes Ca.es Deaths
Chplers 1983 - - 06/84 Dengue fever/DRF 1983 - -Encephalitis 1983 3 2 Influenr.:a 1983 33 000 -Heqil'l8 i tis 1983 108 10 Plague 1983 - -
27. Proportl0n of lnfants unde~ one year of age wbo have been fully immuuized againlt tuberculosis, diphtheria, poliomyeliti. and measles
BeG 1983 72 06/64 OPT III 19&3 22 Polio III 1983 17 Measle. 1983 20
26. Per cent of population Be-ned lrtltb •• fe water 1979 25 131S3
29. Per cent of population with adequate seni"ry 1979 25 13/83 facilities
30. Per cent of low birth weilht infants lo( 2499 gTa,..) 1963 4.7 66184
31. Maternal lDo<rtality rate 19.J 1.1 06/84
The n~ber within the par.nthetes refer to the number of deaChs.

WEST&RN PACIFIC REGION DATA ~ ON SOCIOECONOMIC AND HlALTH INDICATORS
Part II Page 61 30 December 1984
F~=~=#-C#· .. ·=~~a==~--~==c=~==~=~=~-==~~==-===-~=~~== ",-====""==,,,= _=--c ......... _="" ....... ~_~=.u= ... == ... == lndi •• tor(s) for' §OCIALIST REPUBLIC OF VIET NAN 'leat" Data Source of Data
~==",,=~=~_~ •• _= .. === •• -== .. s.c ... w==.~= •• ~ ••••• =~ ... =ZOI= ... ",:::,::: __ ",,,,, ....... _-= .... _. .=-_ ..... ===== ..... 1. Area (in 1000 sq. km.) 1981 331.69 12/83
Z. Esti.sated populatl.on, ( 000) 1982 55 955 10/62
3. Annual population growth rate. (%) 1970-1979 2.3 12/83
4. rerc4nta,se of popUlation - leu than 15 years 1980 41.2 12T83
- 65+ years 1980 3.6 12183
i 5• Urbap popula~ioD l~} 1981 19.0 14/83
I. ~. Rate of n.tut'al Loera.,e of populauon (% per annum) 1961 2.17 12/83
1. Crude blrth rate <per rooo population) 1981 28.6 12/S3
B. Crude death rate (per 1000 populanan) 190' 6.9 12/83
••• L«o expectancy at birth - Total (y.ars) . - Male (years) 1982 62 13/83
- Female (years) 1982 66 13/83
O. Infant mortality rate (per 1000 live births) 19B1 33.9 121B3
11. Total fertility rate ~woraen 15-49 years) 1975-1960 5.8 12/83
2. Socia-economic indiCAtor. for the year 2000
Eati1bated population, \ 0(0) 2000 79 355 03/79.1
Life expectancy at birth - Male (years) 1995-2000 55.7 03/79.1 - Female (years) 1995-2000 59.2 03/79.1
Annual population growth rate, (%J 1995-2000 1.81 03/79.1
Crude bir~h rate (per 1000 population) 1995-2000 29.0 03/79.1
Crude death rate (per 1000 population) 1995-2000 10 .. 9 03179.1
Rate of natural incre ••• ~X 'Pe't annum) 1995-2000 1.81 0~ri9.1
3. PeT Capita droa. Nat.ional P!,pduct (ClW) at aul't'ket prices (US.) 1982 .(500 13(83
14. Rate of arowth ot per capito GNl' UI ... I'" h ... "taB_ ",e" a ..... tic Pr.duct (CCllP) derived
from manufacturirtg at conetaot factor coet (%) ... 116 • &coacmic.lty 44tive pop in p~imary •• ctor
- NUOIber in agriculture ('OOO) 1980 16 647 12rSY
- Percent in agn.cui ture t 1) 1980 70.6 12/83
17. Daily per capita calorie supply (calories) 1982 1 850 13/83
18. Paily per capita protein supply 19r ••• ) 1982 49 13/83
19. Adult literacy rate ... Total 1982 96 13/83 ... f1ale ... Female
20. Health rudget/expenditure
- AnIoUnt ... - PBr capita. ... - As % of total bucl.get 1981 6 12/83
Source D/83: Government I S Report on Monitoring Progress in Implementing Strategy for RFA/2000, 19B3
03(79.1 :
10/82 : 12/81, 12/82:
12/82.1: 12/82.2: 12/83, 12{83: 14/83, .
World Population TTends and PIospects by Country, 1950-2000! Su~ry Report of tQe 1978 Assessment, UN, 1979 1982 ESCAP Population Data Sheet Government Reports on the Number of Cases of CD Government'& Responses to World Healtn Statistics Annua\ Que6tionnaire on Health Manpower, 1982 Leaflet on Childhood CO, Report 3/82 Government's Reply to EFr Information System Questionnaire, 1982 Country Health Information Profile (CRIP) re¥ised by Government. 1981 and 1983 WPR nata Bank updated by WRC/Ha~oi, 1983 1983 World Population Data Sheet, Population Reference Bureau, Inc., WaShington. DC

Part It Page 62 30 _ .... b.r 1984
WESTERN PACIFIC REGION DATA BANK ON SOCIOECONOHlC AND HEALTH INDICATORS
~ ........ _ •••••••••••• _ ••• _._ •••••••• _._ •••••• s •• ~ ••••• _ ••• S~._ .-.-.... ._---..•.••.•..•.....••.. Indicator(e) for~ SOCIALIST RSPUBLIC OF VIET NAM Year Data
.......... _ ................... a ..... w __ ..... =a •• == •• ~ •• s •• ~ • ••• • •• s .... • ............ a •• ."'-.... : ........ I. Health manpower NUtIlber Ratio per
l() 000 Physicians 19B1 44 400 8.0 Medical assistants 19B1 ~rofeB6ional Nurses 1981 74 600 13.6 Hid",ivea 1981 13 900 4.9*
Fl. Ten leadl.ng, causel of morbidIty teD code No. of Rate per Cases 100 000
Influ«naa 470-474 1980 371 262 691 Diarrboeal dbeue 009 1980 349 914 651 Dysentery 1980 133 953 H3 M41a'tis 084 1980 91 928 171 Arthropod-borne haemorrba,ic fe.ver 067 1980 68 990 128 WhDOpl"ll coush 033 1980 67 318 125 Measle. 055 1980 57 991 108 APe 1980 52 443 98 Humps 072 1980 23 386 44 Chickenpox 052 1~80 19 752 37
3. 'fen leadl.ng causes 01 mO't'tah,ty ICD code No. ot Rate per Deaths 100 000
Enuritia A5 1980 1 003 4 Avitaminoses & other nutritional deficiency A65 1980 1 456 3 Bacillary dysentery and .-oe~i~.iB A4 1980 1 347 3 TuberCUlosis of respiratory system A6 1980 1 093 2 Malaria A31 1980 826 2 Other diseases of digestive system AI04 1980 775 1 Cholet'a Al 1980 774 I Viral encephalitis Al7 1980 694 1 Other diseases of respiratory system A96 1980 515 1 Other forms of heart diseaae AB4 1980 496 1
4. CaseS and deaths for S1X d1.8esse& under the Wo-EPI C •• es Deaths
Diphtheria 1982 2 065 '" Pertussis 1982 48 624 · .. Tetanus 1982 972 · .. Pol iOatye 1 i t is 1982 892 · .. 'l'uberculosi. 1982 ., . · .. Heasles 1982 59 300 '"
5. Caaes. for dUBases under the l1li0 Annual CD Bulletin Casee
Gonorrhoea 1980 1 665 Hepatitis viral - Typ. A 1980 ...
- Type B 1980 ... - UNSP 1980 15 667 (76) .
Syphillia 1980 616 trachoma 1980 1 069 808 Yaws 1980
6. Cases and deaths for six di&eases under the ~O Monthly CD Notes Cases Deaths
Cholera H82 57 · .. Dengue fever IDRF 1982 31 973 · .. Encephalitis 1982 1 890 · .. Influenza 1982 362 208 ... Meningitis 1982 2 403 · .. Plague 1982 146 · ..
27. Proportion of infants under one yea.r of age who have been fully imQunized against tuberculosis, diphtheria. poliomyelitis and meaales
BeG OPT III Polio III Mesales 1977 0.7
28. P.r cent ot population served wlth safe watet' ., . 29. Per cent;: of pOpuJstl.on ~l.ch adequate sanl.tary
facilities . " 30. Per cEtnt of low birth w~ight infant. (~2499 gr"",s) 1982 8
31. Maternal ~ortality rate 1980 1.0
*R~tio per 1 000 females
.............. ~. Source of Dat& * ............ ~~.~
12/82
12/83
12/83
12/82
12/81
12/81
12/82.2
13/83
13/83

WESTERN PACIFIC REGION DATA BANK ON SOCIOECONOMIC AND HEALTH INDICATORS
Part II Pose 63 30 Uec ... ber 1984
f=~~~==· .. ·=··~=-==a==.D~ •• == •••• =~==a=a •• =~ ••• == •• ~ ••••• • ••••••••• . .. __ ........ . ••....•....... Indicator(s) for: WALLIS AND FUTUNA Year Data Source of Data
~.-==.== ..... __ •••• == •• a= ••••••••• = ••• ========= •••• =a=. __ .. ". ........ ............... . .............. 1. Are. (in 1000 sq. \<Ill. ) 1981 0.255 12/82
2. Estimated population J ('000) 1982 10 12/82
J. Annual population growth rate, I%} · .. 4. Percentage of popUlation - less than 15 years · ..
- 6.)+ years · .. ,. Urban populat10n (OJ · ..
I b. Rate of natural increase of population l~ per annum) · .. 7. Crude b1rth rate \ per 1000 populatLon) ... 8. Crude death ra te \ per 1000 population) · .. 9. Life eapectancy at birth - Total (years)
- Male (years) · .. - Female (years) · ..
110 • Infant morta11ty rate (per 1000 hve births) · .. H. Total ferti1Lty rat. (women 15-49 yeara) · .. 112 • Soc10-econom1c 1nd1cators tor the year 20UU
Zltill8ted population, ( 000) 2uw • 03/79.1
Life expectancy at birth - Total (ye ... )
- Hale (years) · .. , - Female (years) · ..
Annual population growth rate, {X) 1995-2000 0.00 03179.1
Crude birth rate (per 1000 population) · . , Crude death rate (per 1000 population) · .. . late of natural increase (X per annum) · ..
3. Per Ca~ita Gross National P~oduct (GNP) at market prices (US$) · ..
4. Rate 0' srowth ot per caplta GNP, IOJ · .. 15. Percentage Gross uomeaC:1c Product (GDP) derLved
froa manufacturing at coo.tant factor coat (%) ... 16. Economically active pop in primary aector
- Nuaber Ln agriculture ('000) · .. - Percent in agriculture (%) · ..
7. Daily per capita calorie supply lcalories) · .. 18. Daily per capita protein supply (grams) · .. 9. Adult literacy rate - Total · ..
- Male - Female
O. Health budget/expenditure
- Amount · .. - Per capita · .. - As % of total budget · ..
Source 03/79.1:
11/75: 12/81: 12/82: 12/82.1: 12/82.2 : 12/83:
World Population Trends and PTospects by Country, 1950-2000:
14/80:
Summary Report of the 1918 Aasesament. UN, 1979 Fifth Report on the World Health SituatioD 1969-1972, WHO, 1975 Government Reports on the Number of Case8 of CD Country Health Information Profile (CHIP) revised, 1982 Leaflet on Childhood CD, Report 3/82 Gover~ntls Reply to EPI Health Information Sy&tem Questionnaire, 1982 Government Responses to World Health Statistics Annual Questionnaire on Health Manpower, 1983 South Pacific Epidemiologic41 and Health Information Service, Annual Jeport 1980

Part II Page 04 30 December 1984
WESTERN PACIFIC REGION DAtA B4HK ON SOClOECOIIOKlC AIID Il&ALTH 1I111ICATOU
Indicator(s) for~ Year
i. Health uapowar
PhYIJ·icia •• 1982 Medical as.letanta 1982 Protessional Nursing/Midwifery Personnel 1982
22. Ten eau.es of -, leD .od. Influenza 487 1980 Meaales OSS 1980 Conjunctivitis 372 1980 Dengue 061 1980 Hepatitis, viral type A 070.1 1980 Syphilis 090-097 .1980 Tube:rculosia. pulmonary 010-012 1980 Amoet:d~. is 006 1980 Gonorrhoea 098 1980 Leprosy 030 1980 Rheum.atic fever I atute 390-392 1980
~3. Ten ".un. of •• ., -ycj)COiIe
Birth iDjury, etc 1972 Reatt die ... e. 1972 PnellllOnia 1972 Avit_inOli •• , etc 1972 M81iSGant Deopl •• m 1972 Symptom., etc 1972 Con&enital anom.li&s 1972
~4. Ca ... and doath. for ab under .the WHO-Efl
Diphtheria Pertuasb Tetanus Poliomyelitis Tuberculosis 1982 Measles 1982
2~. Ca. e. _ for . an4er the WHO Annual CD Sullet1n
Gonorrhoea 1980 Hepatitis viral - Type A 1980
- Type B 1980 - lINSP 1980
Syphillis 1980 Trachoma 1980 Yaws 1980
26. Ca.e. and death. for ai" under the WHO Monthly CD Notes
Cholera 1980 Denaue fever/DHF 1980 Jr.ncephalit~e 1980 Influenza 1980 Meningitis 1980 PI"",. 1980
~1 • :~. :ion of und.roa •• y.~ .f,~~~. wlto bave beeil-fully i~ized aaain*t tuberculoais a .L
poliomyelitis and meaales BeC 1982 BPT III 1982 Po) io III He.asles
<8. Per .ent of "".u .... u •• erved with •• fe "atar
f~' ~::i~~~e~f , with -sanitary
r'u. .or .enc of low '>rtn We1gtlc ( , 2499giillla}
131. _"ULL> rate
». .. Boul'ce of Data
"""",u .. ti~ P"~ 10 000
4 4.0 12/83 -4 4.0
N •• at a!~e per Casu , 100 000
2 307 21 361 14/80 342 3 167 191 1 769
21 194 4 31 3 28 3 28 1 9 1 9 1 9 1 9 .
~t:: ~~·oE~r 18 180 11/15 10 100 8 80 7 70 S 50 5 50 4 40
Ca •• s Deat!1_
5 12/81.1 87
Cases 1 12/81 2 --2 ... -
Cases Deatbs~ - - 12/81 1 -- -
1 695 -- -- -
100 12/82.2 72.1
...
...
...
...

WESTERN PACIFIC REGION DATA BANK ON SOCIOECONOMIC AND HEALTH INDICATORS
PART III GLOBAL AND R~GIONAL INDICATORS
TO MONITOR STRATEGY FOR HEALTH FOR ALL BY THE YEAR 2000
(a) Heal th policy indicators
(b) socioeconomic indicators
TABLE OF CONTENTS
Indicators
Health for all has received endorsement as policy at the highest official level (Gil
Mechanisms for involving people in the implementation of strategies have been formed or strengthened, and are actually functioning (GZ)
At least 5% of the gross national product is spent on health (G3)
A reasonable percentage of national health expenditure is devoted to primary health care (G4)
Resources are equitably distributed (GS)
Defined strategies for health for all are accompanied by explicit resource allocations (G6)
Defined strategies for health for all need external resources (G6)
The needs for external resources of defined strategies for health for all are receiving the sustained support of more affluent countries (G6)
- At least 80% of local communities at all levels have well-establiBhed voluntary and formal
Page
1
1
1 I 1
,
1
1
community organizations t which are committed to continuous priml;lry health care action programmes [RI] I
The community contributes in cash and in kind to health or health related action [R2]
The percentage of population served with safe water in the home or within 15 minutes' walking distance is 100 (GLl.!)
The percentage of population with adequate sanitary facilities in the home or immediate vicinity is 100 (G7.1.2)
The adult literacy ratio for both men and women exceeds 70% (GIL)
The gross national product per head exceeds US$50() at 1980 market prices (Gl2)
The daily per capita calorie availability exceeds 2500 calories [R3]
The daily per capita protein availability exceeds 70 grams [R4]
I 1
2
2
t 2 I
I
i 2 i
I 2 I
I
! 2
I

WESTERN PACIFIC REGION DATA BANK ON SOCIOECONOMIC AND HEALTH INDICATORS
PART III GLOBAL AND REGIONAL INDICATORS
TO MONITOR STRATEGY FOR HEALTH FOR ALL BY THE YEAR 2000
(d Hea lth Status and quality of life TruiIcator s
(d) Indicators of the delivery of health ~
Doc 8750C Disk 1114A
TABLE OF CONTENTS
Indicators
At least 90% of newborn infants have a birth weight of at least 2500 grams (G8.1)
At least 90% of children have a weight for age that corresponds to reference values given in Annex 1 to Development of Indicators for Monitoring Progress Towards Health for All by the Year 2000 (G8.2)
The infant mortality rate for all ide,',ifiable sub-groups is below 50 per 1000 live b'rths (G9)
Life expectancy at birth is over 60 years (GlO)
Maternal mortality rate is below 3 per thousand live births [R5]
No cases of diphtheria, tetanus, whooping cough, measles, poliomyelitis and tuberculosis occur [R61
Primary health care is available to the whole population with at least the fOllowing:
The percentage of deliveries by trained health personnel is 95 (G7.4.l)
The percentage of children immunized against diphtheria, tetanus, whooping cough, measles, pOliomyelitis and tuberculosis is 95 (G7.2)
Local health care, including availability of at least 20 essential drugs, within one hourts walk or travel is 100% (G7.3)
The percentage of children up to at least one year of age given routine child care by trained health personnel 15 100 (G7.4.2)
The percentage of pregnant women with at least three visits for antenatal care is 100 (G7.4.1l
The population growth rate is reduced to less than 1% [R 7l
Page
3
1 3
3
3
3
3
4
4
4
4
4
4

Health PQlicy IndicatoT&
Heal th fOl: ~chanilllll,s
all h ... for invohiQ&: received people in the endor'&ement i.ple.entation
Count t'Y or area 88 policy of atut!'!sie. at the I b.~ """ bighut fO;r'lJled or official streng.thened, l.vel and a:J"e.
actually functioning
(Gl) (C2)
1. AJotERlCAN SAMOA (USA • • 2. AUSTRALIA • • J. BRUNEI • • 4. CRINA • • 5. COOK ISLANDS [NEZ) - -6. Democratic Kam u~bea ... ... 1. Fi-i • ." 8. French Po~y!!"ell'ia J_FR ... .,. 9. GUAM USA - +
LO. MNG KONG [UIO + • l1. Japan ... .,. l2. KIR,IBATI • + l3. Lap fep Ie a Delli.. tt. •• • ... 14. MACAO PO. + lS. MALAYSIA + • l6. Nauru ... ." 17. New Caledonia FR ... ... LS. NEW ZEALAND + + 19. Niue (NEZ ... ... !O. PAPUA NEW GUINEA + • n. PHILIPPINES + '" 22. REPUBLIC or KOREA • D. SAMOA + • l4. SINGAPORE + + ~5. Solo.on Islanda • ... 2 • TOKELAU NE2 • !7. 'I'OHGA • +
!8. T T of Pacific. r. USA '" ... t9. TUVAW + + W. VANUATU • • H. VIET HAM + + 12_ WAlliA And PutUDa I 'FR ... . ..
1
WESTERN PACIFIC REGION DA~A SAMK ON SDCIOEOlNOMlC AND HEALTH DmlCATOas
At lea"t: A re.a.aaaable fle_oul't'ea Defiaed Itrat4si •• 51 of the Jtu"eentage of an for bealth fOl' an
groa• tbe oatigpd equitably A", , .... natiDllal health npeo- i.- cc~- '811t.ernal product diture i. ributed panled by : re80urcea ill .pent devoted to ellPHcit (0)
DO health I'ri..ny .
"_ouree ,
health ca~ allocation' , ,
(G3) [1;4) (G5) (G6)
• (fiN) · (/".,.) ... ... ... [ )
• 7.5 8" JO-f>01 of • "" --(1980-81) state or
ter e:x .... (1m) 5_.0 .... (1982) 40
'" -- NA
'" ... • .., ... .... (1962) 6.1 ... (1982) 45 + -- -
'" ... ... . .. '" ." " . ... ... [ )
... ... '" ... ... ... • 1983 2. --- .,. ---4,4 • "'81) .2 • IIA ---
(1981-81) ... '" - ... -
+ 1982 • .... (1982 '" - .. , -- -'" ... ... ... .. ,
• 1982)10 ... • -- ... -- 1 8J 3.59 + 1983 22.2 + • -'" ... ... ... .. , [ )
. .. '" ... ... ... • 1982 7.J + 1974 34.4 + ---- NA --
'" ... ... ... ... - • 1982 50 • .- -... ... ... ... .. , - (191'U 3.4 ,.'. - - + ---• ,. 2 5 •• + 1982) 25 - - + -
1980) 2.1 "" + -- - - -'" '" ... '" .. .
• 1982 • • 1982 ., ... . .. ... 4.5 + [198" 25.3 - - +
( 1980-81) ... .. ... ... ...
+ (1981 7.B*' .. ... -- - • -... + 19 3 40-50 + .- ... '" + (1982 55 + ... ... [ ... .. ... . .. ••• \ J
iAt , ... , '"' • ofl ... l Th. con.DDitiea at .11 1.~1. cOMMn:lity have vell-.atabliabed coft'trib\ltea voluntary and fonul co...u- 10 c •• b and pity or&aDiz.ti~ ~ich in kind to aTe com.itted to coGti- health or nuoua priaary health care. health nla-action DrOllr.-e. ted action "t_ % of lout <:_1- "",. ,,-,.
ties at all le~l. nity ba.ve wrell ellt.abliabed contri '9QlunteI'}' , fcn:.a1 butiDl'l
(all ca-u.nitl' Gqa_ '«2)
.. . ... .. . • '" NA
... ... -.. . ... ... - ... . + . .. . .. '" .. . " . . ..
'" ... ... .. . ... • + ... +
... .. . (1982) 2 • ., '" ... '" '" .. . ... ...
+ ... + ... '" '" ... .. . ...
+ '" ... ... ... . .. ... '" - 19 77 • • ... + + ... + ... ... .. . ... ... ... .. . ... + ... +
'" ... .. . + ... • • ... .., + ... • ... ... ...
Notes; The Duahu in brackete ,hove t.he (\umb~1:' gi'IV4!n to the indicAtors in tbe global indicator liat (Clobd StTat.egy far llealtb Far All by tbe leu 2000, WHO, GenevII, 1981 ("Health for All" series. No.3), pageili 75-76).
Legend;
NA~S of countriea in c.pltAl letter. refer to those who ba~ sub.itted • report on Monito[ing f~ogre.a in Lmp1e.enting Str.t~gy for Meclth For An by t.bO!! 1"eat 2000.
r" No
No tnto~8tionJDot aVail.ble tv. ~t appl ic able
* (C6) !be needs fQr e~~er~l reSources of ve11-defined .t:J"ate,i •• for health for .!l are rEceiving .u~t.ined ~uppart f~om mare affluePL cOUfttrie ••
- 1 of I;NP .pent 011 t,ea:th th'lough ;>\.Iblic t1<!.111tt~ elI:penditul'~ Per cent of CPP.
t>oc_nt No. 8750C llilik.et:te No" llJ4A
~~~ ., " t:I II> <1
" o _ ~
t ... o , ~ 00 ~

SocioeconQ~ic indicators
Country or .I:C4a
1. AHER.lCAlt SAMOA (USA
2. AllSTRALlA
J. BRtn.lE!
4. CHINA
5. COOK ISLAJII)S , .... 6. Dcmoc1;'etic tte..puc.b.ea
1. Fiji
8. Prench Polruesia (FR)
9. GUAM ( .... 10. 00,," 'ONG IUK'
11. Japal1
12.KIRlIATl
13. Lao Pl!ople s \HIm. Rep.
14. HAeM (PO.
15. MALAYSIA
16. Nauru
17. New ca1edouiil IF., 18. HEW z.t.I.UJro
19. Niue llOlZ
20. PAPUA N£W GUlHEA
21. PHlLII'PlNES
22. REPUBLIC OF KOREA
23. SAMOA
,.. ''''''''''01IE 25. S01amou u lands
'6. ~LW , .. z 1. TO\IGA
8. r T of 'a~ifi~ 1_ \USA
~,. ',,"vAUl
rw. VANUAtu
1. vur MAN
~_lu and ~utu~ (PI)
Lelepd: • Per c~pit. GDP
The percentAge of opulation ,ervad vitb
safe vAte~ in tbe bome Or within 15 minutes' albng distance is 100
{C').lol} D .. t .. I ~ of popula~
lation served with safe water
- (980) 60
- I " •• " , •• 6
- 1(1982) 85
... ... - I ,,,81, 10.1
... ...
... ...
... . .. • I (198') 100
- 1"'8" .. ... . ..
- (lg.8.2} 10
... . .. • I (1982) 100
... . ..
... . ..
... . .. - I U'.2) ".0
... ... - I "9B" 75
I 1198" 64.5
... . ... .. (10'2) 0
+ 119.2} 100
... . ..
... . .. - U,82) 91.3
.. . ... • \I'B" 13
- \197., » ... . .. ... ...
1I&S1"SU P.M:llIC UGIOH DATA BAMX ON SOCJCICCOIiOtIlC AND HEALTH INDICATORS
l'IMt perceaUoge Tbe adult literacy The ,1'0" natiOQal of popvla~ioo witb rate for MJth .en product per bead .dequ.te sanitar, and vo.en exceeds 70 exceeda US$ 500 at facilitie. iQ ~ ~~BO ~rket prices bo.e ~ i~di.te vidnity is 100
(G).l.2) (Gll) (G12) .... %ofpopn Dot • Adult literacy nat. Per CAp1ta vit.h adequate rate (t 1M 'F ) GRP at HDicuy lIlP US$ fac:jlitiu
... . .. . .. . .. . .. ... ~ ,to.2, ••• 6 • .""" , .. ,., •
I" "'-~:~57 - : (1"')
..,.. • \1'82) 80/ •• 173 • \1982) 15908*'
. .. . .. . .. . .. - ,19 •• " ,..,
- I ,1'82, 8' ... . .. • "98" 1008*
... . .. ... . .. . .. . ..
. .. ... . .. .c· • "980, 18'0
. .. . .. . .. . .. + 11980, 67.0
- • ('082) .s. ... . .. • ,,962, 4760
- • \<'.', ... • I"'""' 0,,""0 • ,19." .,,.,. . .. · .. ... . .. • (1'80) ".0
- \1"» ,. + I (1,.,,100/ I - 0"2) 300
. .. . .. - 1(19.0) 411 I - (1'78) 83
• ' (I"') 100 • I d •• " 90, , • ,19.2, 1500
... . .. • i'I'.o, 72, , • n •• 3, 1 ...
... · .. . .. . .. . .. ...
. .. ... ... ... . .. ... - ,(I"" 09.' • 1(1'8" 9., , • . ~1982) 9214
. .. . .. . .. ... . .. ... - 1l982} 75 I II • .,} '5, I • (1980) 'S4 .. n'l1, ,..5 • I ,19." 9{), , • ,19, .. " .5.
. .. · ., • I,I'70} "' .• ,,8. • ,'08" 1678
- · ",." 85 • 11'8" ,8, / (1982J 302
• \I'"'''' 100 + 11982) "'" , • ,'''8'' 4200 . .. · .. . .. . .. , • ,\1.8" ""' . .. . .. . ' . . .. . .. . .. - U08l) 36.' • (1976) " /19/78 • : \1982) 49.
. .. ... . .. . ... .. . . .. - \l962J 82 + 1"82) 90/ / - : 0.81) 421
- • (1979) 25 ... . .. • : (1980) 620
. .. . .. • 1982) .6/ / - : 1"8" < SOO
. .. . .. . .. . .. ... ... , .... 1 of urban papulation a~ CUTTent pyice~
"
The daily 2!r caeita calorie availability e~c .. d. 2500 calories
(R3) Oat .. I Duly per
capit. calarie supply
. .. . .. • , <1961-82'
exc:.e~b 2500
• (197S-11, 2959
- 11l."-77J 24"
. .. ... - 1,1977-79> 1767
• 1'1975- 7, "77
• 1\1915-77 J 27.18
- 111982, , .. , - I 'U." "'l
• ,1'75-77) 2847
... ... - 1917-19) 1842
- ,1977-19, U81
• \l017-1'} 2'62
. .. . ..
. .. . .. • ,'1975-77) 3443
. .. . .. - :,1975-77) "'7
• I'U." 25-99.
• l,l'8'} 248.5
+ 1'8', 3,..
• lOn, 3<174
.. "7>-77, 2,2.
. .. ... + (1982) 27>0
. .. . ..
... . .. + 1979) 2".
- 11)81) 18!.D
... . ..
tb. deily l!r ~.tit~ protein availability sxceeda 70 gr~s
(R4) Data Da:dy per
capita protein supply
. .. ... • ,.8,...,1) ••
• (l915-n} 11.1 .. ,,,'-17> 63.4
. .. ... - 1977-79) 40.1
- 1975-77) .56.8
- 1975-17J 6CJ.5
• 19." 80
• 'U." ,.., + 1975-77) 86.5
. .. ... \1977-79}" 47.7
1977-79; 57.9
- ,'977-79} 46.'
. .. . ..
. .. . -+ ,,,75-7))10'.9
. .. . .. - '\1915-77) ·45.3
- 1981) 66.6
• ,.80) 1.3.6
- 1982) 41.5
• 19711 84.2
- ",5- 7, 41.'
. .. . .. - (1915-77) 61.2
. .. . ..
. .. ... 19'9) &8.4
- .1982 ) 4' . .. . ..
\
~~~ o •• ~ ,
l? III n
"~. ~ t ~
" ~
~

H~alth Status and Quality of Life Indicators
At least 90 % of newborn infants
Country or area ;nave a birth eigbt of at
least 2500 gra~s
(G8.11 Data Birth weight
at. lealt 2. 500 grams
I
1. AMEiUCAN SAMOA (USA + ( 1982) 97.1
2. AUSTJW,IA + (1979' 94.2
3. BRUNEI + 1(198)> 98.0
4. CHINA ... 1(19'9) 94.~O
>. COOK ISLAOll' ,NEt ... ! \1982) 90.8
6. DeaocratLc ~puchea ... ... 7. Fiji - 1(1919) 86.1
8. French PolyuelJia (n) ... ... 9. GUAM (USA . + 1(1981) 9[.3
10. nONe KONG (UIO + I «975) .1., 11. Japan + (1982) 94.8
12. K1RlBATl - ... 13. Lao People's Dem. Rep. • 1"919) 82.0
14. MACAO (POR + ... 15. MALAYSlA + I (1979) 91.0
16 .• liau["u ... ., . 17. New Caledonia (Fa) ... ... 18. NEW ZEALAND .,. I (982) 94.2
19., Niue (NEZ ... ... O. PAPUA HEW CUINeA I (J 979) 75.0
1. i'HlLIPPlHES • 1'198ll 81..
f!2. 'QEPUl!.LIC Oi KOaEA + i "'811 90.8
3. SAMOA + (1982) 98.5
f!4. SINGAPORE + Il 198Z) 92.0
~5, $olomao IsIsnds ... ... p6. to\(EUU ,NEZ ... ...
7. TONGA + Il1982J 99.6
8. T T of Pac.ifie ls \USA ... ... 9. TUVALU .f- Il19lJ2) 95.0
O. VANUATU + (l983 ) 95.3
1. VIET MAK · (1982 ) 92.0 ~. WaLL1$ and Futuna \fR ... .. '
P~Ol.nsu1ar Malaysi.a.
~~J~~ ¥~~~rl~ ~e~lU~ UA1~ bA"~ Vh SOCIOECONOMIC AND HEALTH INDICAtORS
At least 90% of ch11dren Tbe l.nfatl.t have a weight for age that IJIOt't.dity rate cQree_ponds t:o reference for: all idel1ti-values giveD in Annex 1 fiable subgroups to Dev of Indicatars is below 50 per for Monitorin& ProSres6 1OQO live birtbs towards HFAf2000
(G8.2l «9) Dat. I at children tirader Data Infant
5 11"8 vith a weight mortality for age that rllte CDrreSpondS to the r~ference values
... . .. + (1980-82.) 16.7
+ ... + I ,,'.V 10.3
(l,,') SO + I ,,982) 12.1
... . .. + (1.962) 42.0
... . .. + ,19." 22·4
. .. . .. - ( 198', 160
... ... + 09" } 28.8
. .. . .. + Om·H} 47.0
... . .. + \1981 } 10.6
... . .. + (1.82) •••
... . .. + (983) 6.2 . . .. · "978) 87
... . .. · (198') ,,4
+ . .. + {l982} 18
... . .. + ( "'82) 19.26
... . .. . .. . ..
.. . . .. . .. . .. + (1,82) .0 + • (l~O) 13.0
. .. . .. ... . ..
... . .. - I ([,8l) 73
. <I •• " 82.8 - I""" ., ... . .. + 1\1982) 35.0
+ (l982J 97 + I ".a2) )$
... ... + 1(,.8" 10.8
. .. . .. • I ("B2) •• . .. . .. + 1'1980' 44.4
... . .. • 1(198" 11.7
\ ... . .. + 1(198" 23.2 , • "'82) 96.7 • I""" 36.8 i .. ' ... (I 983) 75 i - (}982) .. , • (198l) 13.' .
L1fe e~pectancy at Maternal birth is over 60 years UIOrtaHty is
below 3 per tbousand 1 ive births
(G}O) CiI,S) ".,. Life eXpectancy Data Maternal T 1M IF mortality
rate
+ (1978-62)70.11 1 + (1975) 0.91
+ '982) /71/78 + 1982) 0.10
+ (982) '0' , + (198V 0.01S
+ {l982} /65, .. . .. ... + 1982, 64.31 , • 19." 0
- (198" ,4>,45 ... ' .. + 1982} 00"" + 1\1981) 0.82
+ 1977-79,61, , . .. ... + (198" /67172 + 19a1) 0.0
+ 1,19." ml18 + 1982} 0.01
+ 0'8" ,74/0ll + (1980) 0.204
- 1(1978) ,50,,. + 1982/0,1
- "80-85} /45/48 . .. ... + (1 •• 2) .51 I + 1982) 0.4
+ 1'1982 ) ,,,.-m- + (19B2) 0.50*
. .. . .. . .. . ..
... ... . .. . .. + 1.8') ,. .0/ / + ,'>"V} 0.1
. .. . .. . .. . .. - "81} U ;;;;~ - ,,1 •• 0, 8.0
B
+ I' "8" '60.4'''.0 + 1982] 0.90
+ ,.,8-7" •• ,." •• + 198-0) 0.42
+ (l'8" 16"" + 098" 0.'
• 198" ,6'/74 + "8" '.1
- (198" 5",,,,,54 . .. ... . .. . .. . .. ... - 097', 58/ / . .. ...
... . .. . .. . .. • 1982) t51/6O • ~ U 982) 0
- !09S3 ) /SSi47 - (1983) 1.1
· ~(l9BZ ) /62/66 + 1930) 1.0
j ••• . .. I··' ... : ... i'· r '" I'"
No clIses of diphtheria. tec4nus. wllOoping cough. tU:aales. poliomyelitiS tuberculosis occur
(R6)
-----
. .. · -
· -·
· -·
I
, ---
I ·
I . .. ! -, · i -I -I -! ·
-
i
i
i (
.-
<.oJ ~ "(J o ••
'" " c: .., ,..
" :-> ..., .... r. ~ e. ... r.
~
't

Indicators of the Ilelivet:r of health csre
ITh. percentaBe 10f dell.veTl.es by trained health
COuntry or area Iperaonnel IS 95
I I (G].4.1) Data % of WODIen
attended during ! childbirth I by trained ersonnel
l. AHElUCAN SAMOA (USA) + (J.a4> 9b.5
2 • AUSTRALIA , - (1982) 98.6
3. !-BlmEl - 1982) 85.3
4. CW .. .. , . ,. S. COOK: ISLANDS ,NEz, .. , .,. 6. Democratic Kampuchea .. . ... 7. Piji ... '"
8. French Polynes~4 lFRJ ... ... 9. GUA,M ,USA} + 1982) 99.9
W. HDNG KONG ,UK! + 1982) 99.5:
11. Japan " . '" 12. KIIUMtI .. , '" D. La.o People a Dem. Rep. ... ... 14. MACAO \POR) • ... 15. MALAYSIA ... '" Ilb. Nsu'tu ... ... 17. New Caledonia ,Fa, ... ... 18. NEW ZEAl.AJID ., . ... IS'. Niue (REt) .,. ... 20. PAPUA NEW ,GUINEA ... '" 21. PHILlPPlNES . ,. ... 11. REPUBLIC OF KOREA ... '" 23. SAMoA - ,.8') 52 24. SINGAP'ORE • .. 25. Sol~on lal.ods .. . .. , 26. l'OltELAU <1"'" . ,. ... 21. "lOlIGA - 19.'} 8).)
28. T T O[ Pacifi<: h \USAJ ... ., 9. TUVALU + ,,9", 100
30. YIJ(UATU , 1983} 61
31. VIEr NAM l + 1952) tOO
~H.. 101&1118 and P\ltu~ .. \flt) 1-'. '"
WESTERN PACIFIC R&CION DATA BANK O~ SOCIOECO~OMIC AND HEALTH tNDICATORS
.. bealth care is aYKilable tQ the ¥kole latian witb at leaat the following: :I'hc ~roeatag;e of ~c.l health ear~ the per&eotace 01 lb~ percental. of childree ~l~ed ineludial evailability children up to At least pregnant vo.en with against diphtheria, ~~ at leest one year of ase Ci Vetl at leaat three tetanus. ~ping cough, 20 easentiel d~I., rO'lolltine child care by vi, it. for aote-•• sle». pollOllJyelitia, twithin ODe hour'. w~}k t.Taioed hultb natal care is 100 snd t~rculo.is is 95 or tya'Ve1. ia 100% personnel is lOO
(G1.2) (G7 • 3) (G7.4.2) (G7.4.1) Dat..ao :.1 or children n«t« % of population Data I of chIldren Data ! ;;: . of wOoten
i.-mit.~d to whicb ll)cal cared fOT .p to atteltded health tare at leaat one year durioa i& available prepatley by
trained persorutf!J.
- 1I.s4l ,. - 09..t> 95 ... " . . .. ., . ... .., - 0'82) 98.6 - ( 1982) 98.6 - (1987) 98.6
• (1902, 95 - I <l982J 98 + U'82, 100 + ma" 100
... . .. . .. '" ... ... .., '"
'" .., + 1"'82' '00 + "'02, 100 + \1'''' 100 . . ~ .., ... ... . .. . .. ... '"
'" .. , ., . ... ... . .. ... '" . .. ... '" '" ... '" '" . ..
- ... - U"" .8 '" . .. - 1\19." 07
- In • .,} 8' + 100" '0+ '" ... ... .,. ... . .. ... '" '" ... ... ... ... ... - 1082) to '" ... ... ., . .., . .. . .. ... ". . .. . .. ...
+ '" + '" + ... • '" .. , ... ... '" '" . .. . .. . .. . .. ... . .. ... '" '" '" ... . .. ... . .. '" '" '" . .. . .. - .. . . .. ... . .. ., . '" . ..
. .. ... . .. '" ... '" '" ... '" ., . - ,,1 •• 2) " - 1(198)> '7.3 - t982J 32.7
- . - . .. .., '" ... ., . ... ... ... .,. . .. '" '" '" '" ...
- !(1981) 59-96 l'anse • ,<U.Z} •• - ,19.2) 72 - ,198') .,
• ., . + '" • '" + ...
.. , ... " . '" '" . .. '" ...
... . .. ... " . ". '" '" . .. - U9IJZI J9-89 nate - 1'1'." ... , - ,,1>0" ... .. '"' ...
.. , '" l ... ". '" '" . .. . .. - 19.-,.2J )0-18 Tal\&e. • I'''.'' 100 '" '" + 1'1"" 100
... . .. - 1'10'" 80 .,. . .. - 1\1983h.pp'Z'.90
... . .. ! - (952) 75 - '(I08" .0 '" ...
... ... ( ... . .. . .. " . .,. I'" -
The popu1.tt ion , gl"owtb rate is I
I reduced to less
I tbb 1%
(>1) Data Maus1
pop'u 8r Olo'tb rate
i - 119.", ."
- (1982 -83) 1.3!
- 1"·82) •• 7
- 1\ 1,82J ).4
- I' ,.." I .•
- 1'198L1 2.'
- 1'19·V l.8
'" . .. - 1""0-80, 2 .•
- I'''''' I.S
+ I' ,.." 0.7
- I""'} ,., -1"082J 2.5
- 1119• 2' 2.8
- 19." 2.7
• I' \982} 0.0
'" ... - 19.82) t.1
+ t981, -3.1
- 1910-79) 2.3
- "." 2.5
- , .. ,, 1.61
- 1981} 2.sl - U9 • ., "2
- 19]0-76) 3.4j
... , - 1,,.0.-7., l •• ! - 1982' 1 •• 1 , - 198" 2.71 - 1919) 3,'1
i - 1"0·]q, 2 •. I
I'" ... I
W~~
0d::: ~ !i'0' n ~ ~ . ~
~ ~
• n
~ ~ ~

WORLD HEALTH ORGANIZATION Regional Office for the Western Pacific
WESTERN PACIFIC REGION DATA BANK
ON SOCIOECONOMIC AND HEALTH INDICATORS
PART IV GLOBAL AND REGIONAL INDICATORS BY COUNTRY OR AREA
TO MONITOR STRATEGY FOR HEALTH FOR ALL BY THE YEAR 2000
Manila, Philippines August 1983
Rev I Jun. 1984 Rev IDee. 1984

WESTERN PACIFIC REGION DATA BANK
ON SOCIOECONOMIC AND HEALTH INDICA10RS
PART IV GLOBAL AND REGIONAL INDICA10RS BY COUNTRY OR AREA
TO MONI1OR STRATEGY FOR HEALTH FOR ALL BY THE YEAR 2000
TABLE OF CONTENTS
........................................................................................................ American Samoa Australia .................................................................................................................. Brunei China
........................................................................................................................ ..........................................................................................................................
Cook Is lands .............................. " .. " ...................................................................... .. Democratic Kampuchea ............................................................................................ ~iji ............................................................................ ,. ............................................ .. French Fblynesia .................................................... ,. ............................................ .. Guam ...................................................................... ,. .................................................. ..
.................................................................................................................. Hong Kong Japan Kiribati
.......................................................................................................................... .................................................................. , .............................................. ..
Lao People's Democratic Republic .................................................................. .. Ma.cao ........................................................................................................................ .. Malaysia ........................................ .. .. .. .. .. .. .. .. .. .. .. .. .. .. .. .. .. .. .. .. .. .. .. .. .. .. .. .. .. .. .. .. .. .. .. .. .. .. t-la.uru ........................................................................................................................ .. lNew Ca ledonia New Zealand
.......................................................................................................... ............................................................................................................
Niue ............................................................................................................................ .................................................................................................... Papua New G.tinea
Phi 11 ppines Republic of Korea
.............................................................................................................. ..................................................................................................
.......................................................................................................................... Samoa Singapore ................................................................................................................ So lomon Is land s ........ " .......................................................................................... .. Tokelau ................................................................................................................... ..
........................................................ " ............................................................ .. Tonga Trust Territory of the Pacific Islands .......... ~ .......................................... .. Tuvalu .............................................................. .. .. .. .. .. .. "" ........................................ .. Vanuatu ;let Nam
...................................................................................................................... ....................................................................................................................
Wallis and Futuna ..................................................................................................
Doc 868SC Disk 1171A Doc 9214C Disk 1171A
(AMS-PNG) (PHL-WAF)
1 3 5 7 9
11 13 15 17 19 21 23 25 27 29 31 33 3S 37 39 41 43 45 47 49 Sl 53 55 57 59 61 63

WESTERN PACIFIC RECIO~ DATA RANK ON SOCIOECONOMIC AND ijEALTH INDICATORS
Indicator(s) fOT~ AMERICAN SAMOA Year Da.ta
(A) Health policy indieatofs:
Health for all has received endorsement as policy at the highest official level (Gl)
Mechanisms for involving people in the implementation of strategies have been formed or strengthened, snd are actually functioning (G2)
At least 5% of the gross national product is 5pent on health (Gl)
A reasonable percentage of national h~alth expenditure is devoted to primary health care (G4)
Resources are equitably distributed (G5)
Defined strategies for health for all are decompaniad by explicit resourc~ 811ocations (C6)
U~fined atrategies for health for all need external rellources (G6)
The needs for e~ternal resourceg of well-detin~d strategies for health for all are ~eceivin& sustained support from more affluent countries (GG)
- At least 80% of local communiti~s at all levels have well-establishe4 voluntary and formal community organizations, which are committed to continuous primary health care action programmes [Rl)
- The cowmunicy contributeB in caah and in kind to health or health related action lR21
(b) Socioeconomic indicators:
'l'he percentagt! of populs.tion aerved with safe water in the home or within 15 minutes' walk.in!$, distance ,. 100 (G7.!.l)
The percentage of popUlation with adequate sanitary facilities in the hOme or immediate vicinity i. 100 (G7.1. 2)
The adult literacy rate for both men and women excee4. 70% (Gll) (Totall HI F)
1~e cross national product per head exceeds U5$500 at 1980 market prices (GI2)
The daily per capita calorie availability exceeds 2500 calori •• [R3]
The daily rer capita protein availability exceeds 70 gr .... [R4]
1982 +
1982 +
19811 +
198, +
...
...
...
...
1980
Part IV Page 1 30 DeccUlber 19.04
Actual Data
Yes
Yes
Yes
Yes
60
Source of data
13/83
13/S)
06184
Ob/8~
13/83
Notes: The number in brackets show the number given to the indicator in the global indicator list (~ Strategy for Health For All by the Year 2000, WHO, Geneva, 1981 ("Health For All" Series No.3), pages 75-76).
+ Yes No No info~ation/not available
NA Not dpplicable
Source 13/ B3 ~ Government I $ Report on Monitllring Progress in Implementing Strategy for HFA/1000, 1983
06184: Information furni$hed by the American Samoa Planning and Development Agency, 16 November 1984
12/83: Country Health Information Profile (CHIP) revised by Government

Pa1:t IV Page 2 30 December 1984
WESTERN PACIFIC REGION DATA BANK ON SOCIOECONOMIC AND HEALTH INDICATORS
Indicator(s) for: AMERICAN SAMOA
(c) Health status and quality of life indicators:
- At least 90% of newborn intants have a birth weight of at least 2500 grams (Ga.l)
- At least 90% of children have a weight for age that corresponds to reference values given in Annex 1 to Development of Indicators for Monitoring Progre.s Towards Health for All by the Yea, 2000 (Ga.2)
- The infant mortality rate- for all identifiable sllb-groups i. below 50 por 1000 live births (G9)
- Life expectaney at birth is over 60 years (GIO) (Total/ H/ F)
- Maternal mortality Tate is below l per tholl.and live births (as}
- No casea of diphtheria, tetanus, whooping cough, mea.ales-, poliomyelitis and tuberCulosis occur
(d) Indicators of the delivery of health care:
Primary health care is available to the whole population with .t least the following.
- lbe pareentase of deliveries by trained healtb per.onnel i. 95 (G7.4.1)
- Th. p.reentaS8 of childr.n immunized a&ainst diphth.~i •• tetanuI, ~oop1aa couah. mea,l." poliomyelitis and t~b.rculo.ia i. ~5 (G1.2)
- Loeal health care, includina availability of at least 20 e ••• ntial drusa, within one houri, walk or t~avel is 100% (G7.l)
- The percentage of children up to at least one year of age given routine child care by trained health personnel is 100 (G7.4.2)
[&6]
- The percentage of pregnant women with at leaat tnree vi.its for antenatal care is 100 (G7.4.1)
- 'l'he population growth rate is 1:educed to 1 ••• than 1% [R7]
Year Data
1982
1980-82
1978-82
1975
1982
19&4
1984
1981(.
+
+
+
+
-
+
Actual Dats.
97.1
16.7
70.1
0.91
Tuberculosis Messles Whooping Cough
96.5
4 2
I
76 (2 yr olds) 84 (6 yr olds)
95
No
SOUTce of Data
13/83
13163
06/84
12/83
13/83
06/84
UIB3
13/83
06/84

Part IV Page 3 30 December 1984
WESTERN PACIFIC REGION DATA RANK ON SOCIOECONOMIC AND HEALTH INDICATORS
Indicator(s) for: AUSTRALIA
(a) Health pot icy indicators:
Health for all has received endorsement as policy at the highest official level (Gl)
- Mechanisms for involving people in the implementation of strategies have been formed or strengthened, and are actually functioning (G2)
At least 5% of the gross national product is spent on health (G3)
A reasonable perc~nta8e of national health experAiture is devoted to primary health care (G4) (in the form of health centres, c~inic8, caaqalty dept.)
Resources are equitably distributed (GS)
Defioed strategies for health for all are accompanied by explicit re$ource allocations (G6)
Defined strategies for health for all need external resources (G6)
The needs fo~ external resources of well-defined strategies for health for all are receiving sustained support from more affluent countries (G6)
- At leaat 80% of local communities at all levels have well-established voluntary and formal community organizations, which are committed to continuous primary health care action programm~s [Rl)
The community contributes in cash and in kind to health or health related action [R21
(b) Socioeconomic indicators;
the percentage of population served with safe water in the home or within 15 minutes' walking distance i. 100 (G7.1.1)
The percentage of population with adequate sanitary facilities in the home or immediate vicinity i. 100 (G).1.2l
The adult literacy rate for both men and women exceeds 70% (GIL) (15 years of age) (Total! MJ F)
The gross national product per head exceeds US$SOO at 1980 market prices (C12)
The daily per capita calorie availability eKceeds 2500 calories [R3)
The daily par capita protein availability exceeds 70 grams [R4 J
Year
1980-81
1980-81
1980-81
1982
1982
1982
1982
1982
1982
1982
1982
1982
1981
1982-83
198Q-81
1981-82
Data
+
+
+
NA
NA
NA
NA
+ +
+
+
Yes
Yes
7.5%
Actual Data
30-60% of statel tet'ritory expenditures
Yes
The situation in AUS would meet this leve 1 of community participation
98.&
98.6
Total Male. Female
US$11 957 or Ai 10 522
exceeds 2500 calories
99 grams
88% 82%
Source of Data
13/83
13/83
0&/84
13/83
13/83
13/83
13/83
13183
13/83
13/83
13/83
06/84
13/83
06/84
Notes~ The number in brackets show the number given to the indicator in the global indicator list (Global Strategy for Health Por All by the Year 2000, WHO, Ceneva, 1981 (IlHealth For All" Series No.3), pages 75-76).
;. Yea
No No information/not available
NA Not applicable
Source 13/83: Government's Report on Monitoring Progress in Implementing Strategy fo~ HFA/2000, 1983
06/84: Information furnished by the Commonwealth Department of Health, Australia I 27 July 1984
12/82: Leaflet on Childhood Communicable Diseases, Report 3/82 •

Part IV Page 4 30 Decembe~ 1984
WESTERN PACIFIC REGION DATA BANK ON SOCIOECONOMIC AND IIl!ALTH INDICATORS
Indicator(s) for: AUSTRALIA
(c) Health status and quality of life indicators;
- At LeBet 90% of ~e~orn infanta have a biTth ~eight of at leaat 2500 gram. (G8.1)
- At least 90% of children have a weight for that corresponds to reference values given Annex 1 to Development of Indicators for Monitoring Progress Towards Health for all the Year 2000 (G8.l)
age in
by
- The infant .ortality rate for all identifiable sub-aroups is below 50 per 1000 live births (C9)
- Life expectancy at birth is over 60 years (CIO) (Tot~l/ HI F)
~ Maternal mortality raCe i. below 3 per thou •• nd live birth. [.'1
- No cases of diphtheria, tetanu8~ whooping cough, measles, poliomyelitis and tuberculosis occur [Rb}
(d) Indicators of the delivery of health care:
Pri~ry health care is available to the whole population with at least the following.
- Th~ percentage of deliveries by trained health personnel i. 95 (G7.4.1)
- The percentage of children immunized against diphtheria, tetanus. whooping cough, measles, poliomyelitis and tuberculosia is 95 (G7.2)
- Local health care, including availability of at least 20 essential drua., within one hour's walk or travel is 100% (G7.3)
- The percentage of children up to at least one year of age given routine child care by trained health personnel i6 tOo (G7.4.Z)
- the percentage of pregn8n~ women with at least three visits for antenatal care is 100 (G7.4.1)
- the population growth is reduced to 1 ... th." 1% [17)
Year
1979
1982
1982
1981
1981
1982
1982
1982
1982
1982
1982-83
Data
+
+
Actual D1't4
94.2
AveragE!. unit$. would lIeet the reference v.luea
+ 10.3
Total
• Male 71 year_ + Female 18 years
+ I· 0.10
- diphtheria 1 tetanus 11 whooping cough 1~6 tuberc.uloeie IIt9 poliomyeli.tis nil
- 98 .. 6
- 98.6
- 98.6
- 98.6
- 1.3%
&ou\'~e of Data
13/83
13/83
06/84
13/83
Ot/54
12/82
13/83
13/83
!J/83
11/83
06/84
,

Parf IV Page 5 30 December 1984
WESTERN PACIFIC REGION DATA BANK ON SOCIOEOONOKIC AND HEALTH INDICATORS
Indicacor(s) forl ~
(a) Health policy indicators:
lIealth for all nA8 received endorsement as policy at the highest official level (GI)
Mechanisms for involving people in the implementation of strategies have been formed or strel~tbened, and are actually functioning (G2)
At leaat 5% of tne gross national product is spent on health (Gl)
A reasonable percentage of national health expenditure is devoted to primary health care (G4)
- Resources are equitably distributed (GS)
O~fined 8trate,i~$ for health for all are accompanied by explicit resource allocations (G6)
Defined strategies for health for all need external resourcea (Cb)
The needs fo~ external ~e8ourceB of well-defined 8trategiea for health for all are receiving Buatain6d support from more affluent countries (G6)
- At lea.t 80% of local communiti6s at all levele have well-establiahed voluntary and formal eommunity organizations, which are committed to continuous prim.ry health eare action programmes (R1]
The community contributes in cash and in kind to health or health related action {R2}
(b) Socioeconomic indicators:
~ The percentage of population 8e~ved with safe water in the home or within 15 minutes' walking distance is 100 (C7.1.l)
The percentage ox population with adequate sanitary fa<:ilitieB in the home or immediate vicinity i. 100 (G1.1.2)
- The adult literacy rate for both men and women exceed. 70% (GIl) (Total/ HI F)
The gross national product per head exceeds USS500 at 1980 market prices (G12)
The daily per eapita calorie availability exceeds 2~OO calories rR3)
The daily per capita protein availability exceeds 70 gr.... [R4]
Year
1982
1982
1982
1982
1982
1982
1982
1982
1982
1982
1982
19B2
1975-77
1975-77
Dats
•
•
•
•
NA
NA
KA
+ •
Actual Data
Yes
Yes
5.0
40
No
85
60**
Total - 80.3 Male - 86
+ Female - 73
+
•
•
uBi 15 90B" .$ 44 852
2959
73.7
Source of Data
13/83
13183
061B4
13/83
13183
13/83
13/83
13/83
06184
13183
13/83
06/84
03/79
03/19
Note.: The number in braCkets show the number given to the indicator in the global indicator liat (Global Stt'alegy for Health For All by the Year 2000, WHO) Geneva, 19B1 ("Health For All" Series No~-rr:-page. 15-76).
+ Yes No No info~atiQn/not available
NA Not applicable * Per capita GnP ** Per cent of urban population
SOurce 13/63:
03179: 06184:
12/83:
Government's Report on Monitoring Progress in Dnplementing Strategy for HFAJ2000, 1983 FAD Production Yearbook 1979 Country Health Information Profile (CHIP) revieed by Government, 1984 WUO/WPRO publication/document

Part IV Pa&e 6 30 December 1984
WESTERN PACIFIC REGION DATA BANK ON SOCIOECONOMIC AND HEALTH INDICATORS
-------------------------------~--,_--_r--~~~----,.~~ Actual Sou~ce
Indicator(s) fo~: ~ Year
~-------------------------(e) Health status and quality of life
.
- At l~a.t 90% of newborn infants have a biyth weight of at least 2500 g~ams (Ga.l)
- At least 90% of children have a ~eight fOT age that correspo~d8 t~ refeyence values given in Anne~ 1 to Development of Indicators for Monitoring Progres8 Towards Health for All by the Ye.r 2000 (G8.Z)
1982
1982
- The infant mortality rate for all identifiable 1982 sub-groups is below 50 per 1000 live births (G9)
- Life expectancy at birth is over 60 years (G1D) 1982 (T~tal1 1'0/ F)
- Maternal ~ortality rate ia below 3 pe~ 1982 thousand live births [RS]
- No ca.e. of diphtheria" tetanus, whooping cough, 19e,2 ~a81e8. poliomyelitia and tuberculosis occur [R6]
(d) Indieatora of the delivery of health Care:
Pri •• ry health care is available to the whole population with at least tbe following:
- The percent.,e of deliveriea by trained health personnel i8 9' CG1.4.1)
- The percent_._ of ebild~en immuniz~d 8sain.t dip~tb.ria, tet.nUI, whooping cough. measles. ?oliomyelitis and tuberculosis is 95 (G7.2)
- Local health care. including availability of at le.at 20 es.eotial drugs, within one houri, walk or travel ia 100% (G7.3)
- the percentage of childTen up to at least one year of age given routine child care by trained bealth personnel is 100 (G7.4.2)
- The percentage of pregnant women with at least three visits for antenatal care is 100 (Gl.4.1)
- The population growth rate is reduced to 1 ••• than 1% [R7]
1982
1982
1982
1982
1982
1982
Data Data of Oat.
+ 98.0 0618.
80 13/83
+ 12.12 06184
+ 70.1 years 13183
+ .015 06/84
- Tuberculosis 269 06/84 Measles 243 Diphtheria nil Tetanus 1 Whooping cough nil
85.3 06/84
+ 95 06/84
98 06184
+ 100 13/83
+ 100 13/83
2.7 06/84

Part IV Page 7 30 December 1984
WESTERN PACIFIC REGION DATA BANK ON SOCIOECONOMIC AND HEALTH INDICATORS
Indicator(s) fo~~ CHINA
(4) Healtn policy indicators.
- Health for all has received endorsement as policy at tne highest official level (GI)
- Mechanisms for involving people in the implementation of strategies have been formed or strengthened, Qnd are actually functioning (G2)
- At least 5% of the &ross national product is spent on health (03)
- A reasonable percentaga of national h~alth expenditure i. devoted to primary health care (G4)
- Resources are equitably distributed (G5)
Defined strategies for health for all are accompanied by explicit resource allocations (G6)
Defined strategies for health for all need external resources (G6)
The needs for external resources of well-defined strategies for bealth for all are receiving sustained support from more affluent countries (G6)
At least 80% of local communities at all levels have well-established voluntary and formal community organizations, which are committed to continuous primery health care aetion programmes [Rl]
The community contributes in cash and in kind to health or health related action [R2]
(b) Socioeconomic indicator8~
- The percentage of population served with safe water in the home or within 15 minutes' walking distance is 100 (G7.1.1)
- The percentage of popUlation with adequate sanitary faciLities in the home or immediate vicinity i. 100 (G7.1.2)
- The adult literacy rate for both men and women <xcoeda 10% (GIl) (Totall M/ F)
The gross national product per head exceeds US$500 at 1980 market prices (G12)
The daily per capita calorie availability exceeds 2500 calorie. [al]
The daily per capita protein availability exceeds 70 gram. [R4)
Year Data
1982 +
1982 +
1982 +
1980
1915-11
1975-77
Actual Data
Yes
Yes
Yes
us$ 290
2439
63.4
Source of Data
13/83
13/83
13/83
07/81
03/79
03/19
Notes; The number in brackets show tne number given to the indicator in the global indicator list (Global Strategy for Health For All by the Year 2000, WHO. Geneva, 1981 ("Health For All'1 Series No. ~ page. 75-16).
.,. Yes No No information/not available
~A Not applicable
Source 13/83~
03/19; 07/81 ; 10/82; 11/BO:
Government 1 s RepQ~t on Monitoring Progress in Implementing Strategy for HFA/2000, 1983 FAO Production Yearbook 1979 1981 W~rld Bank Atlas 1982 ESCAP Population Data Sheet World Health Statistics Quarterly. Vol. 33, No.3, 1980

Part IV Page 8 30 Oecember 1984
WES'fE1lN PACIFIC R1!GION DATA BANK ON SOCIOBCONOMIC AND WEAlTH INDICATORS
Indicator(s) for~ ~
(c) Health status and Quality of life indicators~
- At least 90% of n~orn infants have a birth weight of at least 2500 grams (C8.1)
- At least 90% of children have a weight for age that corresponds to reference values given in Annex 1 to Development of Indicators for Monitoring Progress Towards Health for All by the V.a. lOOQ (08.2)
- The infant mortality rste fot all identifiable sub-groups is below 50 per 1000 live births (G9)
Life expectancy at birth is over 60 years (CIO) (Total/M/F)
- Maternal .artality rate i8 below 3 per thousand live births [as]
Year
1979
1982
1982
- No caael of diphtheria, tetanus, whooping cough, 1982 me4s1es, poliomyelitis and tuberculosis occur (R6}
(d) Indicators of the delivery of health care.
Primary health care is available to the whole population with at least the following~
- 'fhe percentage of deliveries by trained health perBonnel is 95 (G7.4.1)
- The percenta,e of children immunized against diphtheria, tetanus. whooping cough, measlea. polio.Yllitis and tubercula.is is 9~ (G7~2)
- Local bealth car., inc Iud ina availability ot at l ••• e 20 •••• nel.l drua_, wit~i~ one nourt, walk or trlvel is 100% (G1.3)
- The percentage of children up to at least one year of ale given routine child care by trained healtn personnel is loa (Gl.4.Z)
- The percentage of pregnant women with at least three visits for antenatal care is 100 (G7.4.1)
The population growth rate i$ reduced to 1.es8 than 1% [&1]
1982
Data
+
+
+ +
94.0
42.0
Aptual Date
Total Hale - 65 years Fe~le - 68 yeare
Numbe~ of cases not available
1.4
Source of Data
11/80
10/82
10/82
13/83
10/82
I
4
4

WESTERN PACIFIC REGION DATA BANK ON SOCIOECONOIIIC AND HEALTij INDICATORS
lndieator(s) for: COOK ISLANDS
(a) Health golicy indicators:
"ealth for all haa received endorsement a8 polic~ at th~ highe't official level (Gl)
- Mechanisms for involving people in the implementation of strategies have been formed or strengthened, and are actually functioning (e2)
At least 5% of the gross national product is spent on health (GJ)
A reasonable percentage of national health expenditure is devoted to primary healrh care (G4)
Resour~es are equitably distributed (G5)
Oefined strategies for health for all are accompanied by explicit resource allocations (Go)
Defined strategies for health for all need external resources (G6)
- The needs for external resources of well-defined strategies for health for all are receiving sustained support from more affluent countries (Go)
- At least 80% of local communities at: all levels have well-eatablished voluntary and formal community or~anizations, which are committed to continuous primary health care action programmes [Rl}
- Tbe ~ommunity eontributes in cash and in kind to health or health related action {R2}
(b) Socioeconomic indicators.
The ~ercenta&e of population served with safe water in the home or within 15" minutes' walking diatAnce is 100 (G7.l.lJ
'{'he pf!rcentage of population with adequatoe sanitary facilities in the home or immediate vicinity i. 100 (G7.1.2)
The adult literacy rate for both men and women •• < •• d. 10% (Gil) (Total! III F)
The gross national product per head exceeds US$500 at 1980 market prices (G12)
The daily per capita calorie availability exceeds 1>00 <olori •• {R)l
'fOe daily ~peT.e~r-=c:a~p;i=t~a protein availability exceeQS 70 gr", .. [B4]
Year
1982
1982
1962
1982
lY62
1982
1982
1982
1982
1981
1982
1982
Part IV Page 9 30 December 1984
Data
+
+
+
•
+
Actual Data
No
No
6.1
45
Yes
No
No
No
Yes
10.7
85
US$ 1008* or NZ$ 963
SaUl'<:e of Data
IJ/83
13183
l3/S}
I J/83
13/63
!J/B'
l3/8)
13/83
lJ/ll)
13/83
13/83
13/83
13/8]
12/83
!JIB)
13/8)
Notes. The nu~ber in bracketa spow the number given to the indicator in the global indicator list (Global Strategy for Health For All by the 'lear :lOOO. WHO, Geneva. 1981 {"Healtb For All" Sel'ii!8 No.~ pages 1.5-76).
+ Yea No No ir.formation/not available
NA Not applicable • Per capita GDP
Source 13/83l Government's Report on Monitoring Progress in Implementing Strategy for HFA/2000 J 1983
06/84: Information furnished by the Ministry of Health, 12 November 1984
12/83; CHIP revised by Government, 1983

Pa~c LV ~age 10 10 December 1984
WESTERN PACIFIC REGION DATA BANK ON SOCIOECONOMIC AND HEALTH INDICATORS
Indic8cor(s) for: COOK ISLANDS
(c) Health status And Quality of life indicato~e:
- At lea.t 90: of newborn infants have a birt~ weight of at leaat 2500 grams (GS.L)
- At least 90% of chilaren nave a weight for age that corresponds to ~efeTence values given in Annex 1 to Development of Indicators for Monitoring Progress Towards Heslth for All by the ~e.r 2000 (GB.l)
1982
- The infant mortality rate for all identifiable 1983 8ub-groups i8 below 50 per iOOO live birthu (G9)
- Life expectancy at birth is over 60 years (GlO) 1982 (Total 1M/F)
- Materoal mortality rat~ is below 3 per 1982 thousand live births [RS]
- No eases of diphtheria, tetanus, whooping cough. 1983 mea.lea, poliomyelitis apd tuberculo.is occur (R6]
(d) Indicators of the delivery of health care:
Primary health care is available to the whole population with at least the following:
- the percentage of deliye~i •• by tTained he.lth peraonnel i. 95 (07.4.1)
- The percantage of children immunized against diphtherial t*~.QU'1 whoopina cou,h, •••• 18., polioajelitis and tuberculosis is 95 (G1.2)
- Local health c.r~, i~l~ina availability of at 1 ••• t 20 •••• nti.1 drusa, ~ithin one bour'. walk or travel is 100% (G7.3)
- The percentage of children up to at least one year of age 'given ~autine child care by trained nealth pecsonnel is 100 (01.4.2)
The percentage of pregnant women with at least three visits for antenatal care is 100 (G7~4.1)
- The population growth rate is reduced ~Q le •• than 1% {R7]
1982
1982
1982
1982
Data
•
•
•
•
•
+
+
96.8
22.4
64.3
o
Actual Data
TUberculosis - 29 Me.8les - 4
100
100
100
1.6
.
Source of Data
13/83
13/83
06/84
06/84
13/83
06/84
13/83
l3/83
13/83
13/83

WESTERN PACIFIC REGION DATA BANK ON SOCIOECONOMIC AND HEALTH INDICATORS
Indicator(s) for~ DEMOCRATIC KAMPUCHEA
(a) H~alth policy indicators:
Healtn for all nas received endorsement as poLicy at the highest official level (Gl)
Mechanisms for involving people in the implementation of strategie8 have been formed or strengthened, and are actually functioning (GZ)
At least 5% of the gro8s national product is spent on health (G3)
A ce~8onable percentage of national health expenditure ilf devoted to pdtll6ry health care (G4)
Resources are equitably distributed (GS)
Defined strategies for health for all ace accompanied by explicit resource at locations (G6)
Defined strategies for health fo·r all need external resources (G6)
The needs for eKternal reSources of well-defined strategies for health for all are receiving sustained support fro~ mor~ affluent countries (G6)
At least 80% of local communities at all l~vels have well-establisned voluntary and formal community Qr,anizations l ~ich are committed to continuous primary bealth C4re action prosrammes [al)
The community contribute. in cash and in kind to health or health related action [R21
(b) Socioeconomic indicators.
- The percentage of population served with safe water in the ho~e or within 1S ~inutesl walking distance i. 100 (G1.Lll
- The percentage of population with adequate sanitary facilities in the home or immediate vicinity i. 100 (GI.I.2l
- The adult literacy rate f~r both men and women exceed. 70% (Gill (TotAl/M/F)
- The gross national product p~r head exceeds US$500 at 1980 market prices (G12)
The daily per capita calorie availability exceeds 2500 calorie. (a3]
The daily per capita protein availability exceeds 70 gram. (R4 J
'fear
1977-19
1971-79
Part LV Page l1 30 December 198.4
Data Actual
Data
[)6]
40.1
Source of Data
03/19
03/79
Notes~ The number in brackets show the nu~ber given to the indicator in the global indicator list (Global Strategy for Healtb For All by the 'lear 2000, WHO j Geneva. 1981 C'Health For All" Series No.~ pa, •• 75-16).
+ Yes No No information/not available
NA Not applicable
Source 03/79: 1O/S2;
FAD Production Yearbook 1979 1982 ESeA? population Data Sheet

Part IV page 12 30 December 1984
WESTERN PACIFIC REGION nATA BANK ON SOCIOEOONOMIC AND HEALTH lNDlCA'lDRS
Indicatoda) fat'. DEMOCRATIC KAMPUCHEA
(c) Health status and quality of life indicators.
At least 90% of newborn infants have a biTth weight of at least 2500 grams (G8.1)
At least 9at of chi ldren have a weight for age that co'tuapoudB to 1:e.fe-rence values gi",en in
.Annex 1 to Development of Indicators for Monitoring progntlll "l'o""ards Health for All by the Year 2000 (GE.2)
- ~e infant Mortality "t"ate for all identifiah1.e sub-groups is below 50 per 1000 live births (G9)
- Life expectancy at birth is over 60 years (CIO) (Tots1/H!F)
- Maternal OIortal ity rate is below 3 per thousand live births [R51
- No cases of diPhtberia, tetanus, Whooping cough, measles, pOliomyelitis and tuberculosis occur (RbI
(d) Indicators of the delivery of health eare:
Primary health care is available to the whole population with at least the following:
- The percentage of deliveries by trained health personnel h 95 (C7.4.1)
- The percentale of children iaaaunized aa_inn diphtheria, utanua, whooping cOLlabJ measles. poliomyelitis and tuberculaaill i_ 95 (C7.2)
- Local health c.~.) includinl availability of at leaat 20 e ... nc.ial drusa, within one bour'. walk or travel il 100% (C7.3)
- 'lbe percentage of children up to at least one year of age given routine child care by trained health personnel is 100 (G7.4.2)
- The percent_ae of pregnant women with at least three visits for antenatal care is 100 (C7.4.1)
- 1he population growtb rate is reduced to leas than U LR'1
Year Dot.
1982
1982
1982
Actual Dots
160.0
Total -Male - 42 years l'eNle - 45 years
2.9
SOU1:.ee of Data
10/82
10/82
10/82

WESTERN PACIFIC REGION DATA BANK ON SOCIOECONOMIC AND HEALTH INDICATORS
Part IV Page 13
30 December 1984
--·-----------------------------------------------------·-------.-----------,-------,----~~~c~t~u~.'l----.-~SO~u~r~c~.---'
Indicator(a) fot: ~ Year Dat. Data of Data
(8) ne.alth policy indicators;
- Health for all has received endon~ement as policy at the highest official level (Gl)
- Mechanisms for involving people in the implementation of strategies have been formed ~r strengthened, and are actually functioning (e2)
... At least 5% of the gross national product is spent on health (C3)
- A reasonable percentage of national health expenditure is devoted to primary health care (G4)
- Resources are equitably distributed (GS)
- Defined 8trategies for health for all a'[e accompanied by explicit resource dllocations (G6)
- Defined strategies for health for all need external re sout"c es (G6)
- 'l1'le needs for external re$ourcea of well-defined strategies for health for all are receiving sustained support from more affluent countries (G6)
- At least 80% of local communities at all levels have weU-eat'ablished voluntary and formal community organizations~ which are committed to continuous primary health care action programmes {Rl]
- The community contributes in cash and in kind to health or health related 8(:tion {R2l
(b) Socioeconomic indicators:
- The percentage of population aerved with safe water in the ho.e or within 15 minutes' walking distance is 100 (Gl.loll
- 'l1le pet'ce.ntage of population with adequate sanitary facilities in the home or immediate vicinity i. too (G7.1.2)
- The adult literacy rate for both men and women exceed. 70% (Gll) (Total/M/F)
The groBs nationsl product per head exceeds usSSOO at 1980 lNrket prices (G12)
1982 + Yes 12/83
1980 + US$ 1850 01/81
The daily per capita calorie availability exceeds 2500 calofu:s [R3]
1915-17 + 2,71 03/19
The daily per capita protein availability exceeds 70 gram. (w.)
1915-77 56.8 03/79
Notes: The number in brac~et& show the number given to the indicator in the global indicator list {Global Stratef~ for Health For All by the Year 2000, WHO. Geneva, 1981 ("Health For All" Series No.~ page. -16).
.. Yea No No information/not available
NA Not applicable
Source 03/79: 06/83: 0) /81: 10/82: 11/80:
12/83: 12/83:
FAO Production Yearbook 1979 Ministry of Health, Annual Report For 1981 1981 World Bank Atlas 1982 ESCAP Population Data Sheet World Health Statistics ~arteTly Vol. 33) No.3) 19BO CHIP revised by Government, 1983 WHO/WPllO publieation/docwaent

Pat"f. IV Page 14 )0 December 1984
Indicator(s) for: !!.:!!
WESTERN PACIPIC REGION DATA BAlIK ON SOClOEOONOMIC AND HEALTH INDICA'!1lRS
Year Data N-tu.al
Data ,Sourc:e of Data
~---------------------------------+----~---+--------------4---~ (c) Health statu. and quality of life indicat ....... ·
- At le.at 90% of newbor~ infants have a birth weight of at least 2500 gram. (G8.1)
- At least 90% of chi ldren have l:l we.ight for age that correspond8 to reference values given in Annex 1 to Developaent of Indicatore for Monitoring ProSress 'I'OWBl1l& Health for All by the yea. 2000 '(G8.2)
- The infant mortality ~ate for all identifi4ble eub-groups ia below 50 per 1000 live births (C9)
- Li fe elltpttctancy at birth is over 60 y'.:urB (GlO) (1I>ta1IMIF)
- »It.rna! mortaUty rate h below .1 per thousand live births (k5]
1979
1981
1982
1981
- No c.,e. of diphth.ria, tetanus, whooping cough, 1982 me«.lee, poliamyeliti6 and tube~ulo8is occur lR6}
(d) Indicato1"8 of the delivery of health care:
Primary health cere is available to the Whole population with at least the following.
- 'rt1e pereent6ge of deliveries by trained health personnel is 95 (07.4_1)
the percentage of children immunized against diphtheria, tetanus, wbQoping cough, measles, poliomyelitis end tuberculosis is 95 <C7.2)
- Local health ceTe. including availability of at lea.t: 20 e •• ential dl"U&8, within one hour's valk ~r travel is 1001 (G7.3)
- The percentage of cnildren up to at least one year of age given routine child care by trained health personnel is 100 (G7.4.2)
- The percentage of pregnant VOlDen with at least tbree "i. its: for antenaul car€; is: lOQ (C7.4.0
- '['be population growth rate is reduced to 1 ... tban 1% IRn
1982
+
+ +
+
86.1
28.8
Total -Male - 10. ),ec.ra Fe.ale - 74 years
0.82
Pertu .. ia 11 Tat~u. 1 Tuberculosis 115 Measles 105
1.8
11/80
06/83
10/82
06183
ll/83
10/82
~-------------------------.-----~----~--~--------------~--~ *tncom~lete data

Part IV Pag~ 15 30 December 1984
WESTERN PACIFIC REGION DATA BANK ON SOCIOEOONOMIC AND HEALTH INDICATORS
Indicat:or(a) for;. FRENCH POLYltESIA
(a) Health policy indicators~
- Health for all has received endorsement aa pOlicy at the highest official level (el)
- »echaniams for invQlving people in the implementation of .8tratlegies have been fonned or $trengthened. and are actually functioning (G2)
- At least 5% of the gros8 national product is spent on health (Gl)
- A reason.ble pereentage of national health e~penditure is dtvoted to primary health care (G4)
- Resources are equitably distributed (C5)
- Defined atr.tecie8 for health for all are accomp8nitd by explicit resource allocations (G6)
Defined .teatesie. for health for all need external resourcea (G6)
The need. for eKternal relourcea of well-defined strategies for health for all are receiving sustained support from more affluent countries (G6)
At least 80% af local communities at all levels have well-established voluntary and formal community organizations. which are committed to continuous primary health care action programmes (RIl
!be community contributeS in cash and in kind to health ot" health related action [R21
(b) Socioeconomic indicators:
- Ttle pe'tcentflge of population served with safe water in the ho.e or within 15 minutes ' walking distance i. 100 (C).I.I)
- the pe't'cencage of population with adequate sanitary facilities in the h~e or immediate vicinity i. 100 (CJ.I.2)
- The adult literacy rate for both men and women .xceed. 7 o:t (Cll) (Total 1M/F)
The gross national product per head exceeds US$500 at 1980 market prices (GI2)
The daily per capita calorie availability exceeds 2500 calodes (83\
the daily per capita protein availability excee4s )0 gram. 1R4]
Yeiilr
1980
1975-))
1975-)7
Dat.
~ ...
•
Actual Data
US$ 6780
2738
69. )
Source of nat.
07/81
03/)9
03/79
Note s: The number in braCkets sho~ tbe number given to the indicator in the" global indicato't' list (Global StrsteiY for Health For All by the Year 2000, WHO, Geneva, 1981 ("Health For All" Series NO.~ ~p.~g~e~.~T75-~7~6n)~.~~~~~~~~~~~~~~
+ yes No No in£o~ation/not available
NA Not applicable
Source 07181: 03/7 9: 12/B2: 14/80:
1981 World Bank Atlas FAO production Yearbook 1979 teeflet on Chi Idhood CD. Report 3)[1.2 South pacific Economies 1980

Part IV Page 16 30 Decemher 1984
WESTERN FIICIFIC REGION DATA BANK ON SDCIOEOONOMIC AND HEALTH INDlCA'lOl\S
Indicoilto'da) for: FRENCH POLYNESIA Year Data At,tua 1
Dat. SO\lrCe of !)ate
~-----------------------------~------~------~---r--------------~----~ (c) Health status and quality of life indicators;
At teal.t 90% of newborn infants hay. 8
birth veisht of at least 2500 grams (C8.!)
At least 9~ of children have 8 weight for age that corresponds to reference values given in Anne¥ 1 to Development of Iodicatera for Monitoring Progress 'it)wards ~alth for. All by 'he year 2000 (GIl.2)
- 'Ibe infant mortality rate fot' all idetltifiable 1977-79 sub-group.8 i. below 50 per 1000 live births (G9)
- Life expectancy at birth is over 60 years (GiO) 1977-79 (Wt.1/H!F)
- Maternal mortality rate is below 3 per thou~ulnd I ive births IRS J
- No cases of diphtheria, tetanus, whooping cough, _eaBles , poliomyelitis and tuberculosis occur (Rb)
(d) Indicato!'. of the delivery of h.alt:h care:
Primary health care is available (0 the whole population with at least the following:
- 'Jt1,e pettent.age of deliveries by trained hc:alth personnel is 95 (G7.4.1)
- the percentage of children immunized against diphtherial tetanus, whooping cough, measles, poliomyelitis and tuberculosis is 95 (G7.Z)
Local health care. including availal>ility of at least 20 essential drugs, witPin one hQur' 8 \.'alk or trave.l is 100% (G7. 3)
'lbe percentage. of children up to at least one year of age given routine chi Id care by traiDed health personnel is 100 (C7.4.2)
The percentage of pregnant women with at least three visit. for antenatal care is 100 (G7.4.1)
The population growth rate is reduced to less than 1% {an
1982
+
+
47
61
Pertussis Tetanus
8
Tubereuloais 67 Meaalea 1187 ~liomyeliti. I
14/80
14/80
12{82

Part IV Page 17 30 December 1984
WESTERN PACIFIC REGION DATA BANK ON SOCIOECONOMIC AND HEALTH INDICATORS
Indicator($) for: ~
(a) Health policy indieatore:
- Health for all has received end01'8ement ss policy at the highest official level (01)
- Mechanisms for involving people in the implementation of strategies have been f04med or strengthened. and are actually fUl'LCtioning (G2)
- At least S% of the gross national product is spent on healtb (G3)
- A reasonable percentage of national he.alth ekpenditure is devoted to primary health care (04)
- Resources aTe equitably distributed (G5)
- Defined strategieQ for heal th for all are accompanied by explicit resource allocations (C6)
- Defined strategies for healtb for all need external resources (Go)
- The needs for external resources of well-defined strategies for health for all are receiving sustained suppo~t from more affluent countries (G6)
At least 80% of local communities at all levels have well-established voluntary and formal community o~gani~ations. which are committed to continuous primary health care action programmes CRl)
'!'he cOIDllU.mity contribute. in c,t.h an.d in kind to health or health re lated action [aZl
(b) Soc.ioeconomic indicators:
- The percentage of population served with safe water in the home or within 15 minutes' walking distance i. 100 (C7.l.1)
- The pe~centage of population with adequate sanitary facilities in the home or immediate vicinity i. 100 (C7.l.2)
- the adult literacy rate for both men and women exceeds 70% (Gil) (TOts 1/ H/ p)
!be gross national product per head exceeds US$500 at 1980 market prices (Gl2)
The daily per capita calo~ie availability exceeds 2500 calorie. [R3]
The daily per capita protein availability exceeds 70 grams fAA}
Year
1983
1983
1983
1983
1983
1983
1982
1982
1982
1982
1982
Data
-
+
· .. +
-· ..
· .. · ..
+
+
+
+
No
Yes
not
28%
No
.v:tual Data
given
These are in existence in Guam of voluntary heal th arg. but no community organizations committed to continuous PRe action programmes
No direct contrib~tion only through p8yGlent of taxes. licensee, & atber revenues
100
95+
US$ 4760
1905
80 grams
SOUTce of DatA
13/83
13/83
13/83
13/83
13/83
13/83
1)/83
13/83
13/B3
13/83
13/83
Notes: the number in brackets show the number given to the indicator in the global indicator list (Global Strategy for Health For All by the Year 2000, WHO, Geneva. 1981 ("Health For All" Series No.~ages 75-76) •
+ yes No No infonmation/not available
NA Not applicable
Sourc e 13/83:
12/83: 12/82:
Government's Report.on Monitoring Progress in Implementing Strategy for HFA/2000, 1983 CHIP ~evi8ed by Govetnment, 1983 Leaflet on Childhood CD, Report 3/82

Pat't IV Page 18 30 necember 1984
WESTERM PACIFIC REGION DATA BANK ON SOClOECONOMIC AND HEALTH INDICAtoRS
-----------------------·------------------------------~------r------.--------~AO~t~u~a~I-------r~SO~u-rc~e~-,
Indicator(s) for: ~ year nata Data of Data
r-----------------------------------~----_r--_+--------------~--~ (c) Healtb status and quality of life indicators;
- At least 9{1t of newborn infaJltB hAve a birth weight of at lea8t 2500 gra1ll.8 (GS.l)
- At hast 90% of chi Idren have a weight for aSt> that corTesptmda to reference values given in Annex 1 to Develop~nt of Indicators for Monitoring PrOgftS8 'lbwarda Health for All by the Yea, 2000 (GS.2)
- The infant wp~talicy rate for all identifiable sub-groupe is below 50 per 1000 live births (Gg)
- Li fe expectancy at birth is over 60 years (GlO) (TOtBIIM/F)
- Hate['nal mortality rate is below 3 per thousand live births fR5}
No cases of diphtherial tetanus. whooping cough. meules. poliomyelitis snd tuberculosis OCCUl" , IR6 J
(d) IndicAton of the delivery of health care~
Pri.ary he.lth care i8 avail~ble to ,be whole ~opulation with at least the fol1owing~
- The percentage of deliveries by trained health per.onne} ia 9S (GJ.4.1)
1981
1981
1981
1982
1981
198.2
1982
- The percent:age of chi ldren immunized against diphtheria, taunu •• whooping: caught measles, po\iomyelitia and tuberculoBis is ~s (Gi.2)
July 1981 June 1982
- Local health carll!:) including avaqability of .. t le.at 20 esaenti.l drug8~ within one hOUT 1 , walK or travel i. lOUt (G7.3)
- the percentage of children up to at least one year of age given routine chi Id care by trained health per,onnel is 100 (Ci.4.2)
... The percentage of p'Cegn.tnt women with at least three visits for arltenatal care itl 100 (G7.4.1)
- fhe population gro~th rate is reduced to less I:han 1% {R71
* ():>ntTacted off-ial.no •• Inc luding Illilitary and permanent 1:'eaide.nt aliena
1982
1982
1910-80
I
+
+
+ +
+
-
+
91.3 13/83
Not available 13/83
10.& 12/83
Total - 12/83 11/1 Ie - 6&.9 yeara Female - 72.2 yesTs
0.0 12/83
TUberculosis 44 12/82 Measles 9 (6*) Others 0
99.9 13/83
No 11/83
98 13{83
97 H/B]
2.6** 13/83

WESTeRN PAcIFIC REGION DATA BANK ON SOCII)E:CONOtotIC AND HEAl.TH INDICATORS
r-------------.--Indicator(s) for~ HONG KONG
(a) Health policy indicators.
Ha.lth for all has received endorsement a8 policy at tne highest official level (GI)
Mechanisms for involving peopLe in the implementation of strategies have been formed or strengthened. and are actually functioning (02)
At least 5% of the gross national product is spent on health (GJ)
A reasonable percentage of national health e~penditure is devoted to primary health care (G4)
ResourceS are equitably distributed (CS)
Defined strategies for health for all are acco~panied Dy explicit reaourC~8 allocation6 (CD)
Defined strategies for health for all need external resources (G6)
The needs for external resources of well-defined ~tTategies for health for all are receiving sustained support from more affluent countries (G6)
- At leaat 80% of local c.ollWunities at all levels have well-established voluntary and formal community organizations. which are committed to continuous primary health care action progranun.es [Rl]
- The co~unity contributes in cash and in kind to health or health related action [Rll
(b) Socioeconomic indieatora~
- The percentage of population served with safe water in the ho.e or within IS minutes' walking distance is 100 (G7.1.!)
- The percentage of population with adequate sanitary facilities in the home or inmediate vicinity is 100 (G7.1.2)
- Th$ adult literacy rate for both men and women exceeds 701 (Gil) (Tota1/M/F) (14 ye.rs and above)
- The groBs national product per head exceeds US$SOO at 1980 market prices (GI2)
The daily fer capita calorie availability exceeds 2500 calor1es (R31
The daily per capita protein availability exceeds 70 8u ... [R4J
Year
1983
1983
1981/82
1981
1982
1982
1982
1982
1982
1982
1982
1982
1980
1982*
1982
1982
Data
+
+
+
+
NA
NA
NA
+
+
+
•
+
Part IV Page 19 30 Decembe~ 1984
Yes
Yes
A.ctual Datil
4.4%
62%
Yes
Yes
Yes
99%
99%+
Total - 87 Male - 95 Female - 78
US$ 4 350** or HK$ 30 060
2211
18.9 grams
Source of Oitta
13/83
D/s3
131B3
)3/83
13183
niB)
)3/83
13/83
13/83
13183
13/8)
13/8)
13/83
13/83
Notes~ The number in brackets show the nu~ber given to ~he indicato~ in the global indicator li8t (Cloba1 Strategy for Kealth For All by the Year 2000, WHO. Gene"a. 1981 (IlHealth For All" Series No. ~ pages 75-76).
... Yes No No information/not available
NA Not applicable * Pre I illlinary
** Per capita GDP
Source 1)/83~ Government's Report on Monitoring Progress in Implementing Strategy for HFA/2000, 1983

Part IV Page 20 30 l1ecember 1984
WESTERS PACIFIC REGION DATA BANK ON SOCIOECONOMIC AND HEALTH INDICATORS 1981
Indicator(s) for~ HONG KONG
(c) Uealth status and quality of life indic8.tor8~
- At least 90% of newborn infants have a birth weight of at least 2,00 grams (G8.1)
- At least 90% of children have a weight for age that correspond. to reference value$ given in Annex 1 to Develop~ent of Indicators for Monitorial Progress Towards Health for All by the Year 2000 (08.2)
.. 'The infant mortal.ity rate. for all identifiable sub-group. i. bel.ow SO per 1000 live births (G9)
- Life expectancy at birth is over 60 years (GIO) (Tot.l/M/F)
- Maternal mortality rate is below 3 per thousand live births [as)
- No ~aseB of diphtheria, tetanus, whooping cough, measles, poliomyelitis and tuberculosis occur [R6]
(d) Indicators of the delivery of health care;
Pri.ary health Care is available to the whole population with at lea.t the following;
- The percentage of deliveries by trained health personnel i. 95 (G7.4~1)
The percentage of children i~ni~ed against diphth-ari., tet.nuI, whooping;- cough, illeGal •• , poliomJelitil and tuberculosis is 9, (G7.2)
- Local health care, including availability of at least 20 essential drugs. within one hour's walk or travel is 100% {G7.3)
- The percentage Qf children up to at least oae year of age given routine child care by trained health personnel is 100 (G7.4.2)
- Tbe percentage of pregnant women with at least three visits fo~ antenatal care is 100 (C7.4.1)
- The population Qrowth rate is redu~ed to less than 1% [li1j
Year
1975
1982
1982
1981
1982
1982
.
1982
1982
1982
1982
Data
+ 91.9
Actual . Data
Not available
+ 9.9
+ +
Total Hale - 72 .. 4 years F •• ale - 78.1 years
+ 0.01
Diphtheria Pertu.is Tetanus Poliomyelitis Tuberculosia MeasLes
+ 99.5%
85%
+ 99+%
- 1.5
1 1
22
7527 1863
Source of Data
13/83
13/83
13/83
13/83
13/83
13/83
13/83
13/83
13/83
13/83

Part IV Page 21 30 DecetDber 1984
WESTERN PACIFIC REGION DATA BANK ON SOCIOECONOMIC AND K£ALTH INDICATORS
lndicator(s) for. ~
(a) Health policy indicators:
Health for all has received endorsement as policy at the highest official level (Gl)
Mechanisms for involving people in the implementation of strategies have been formed or strengthened, and are actually functioning (G2)
At least 5% of the gross national product is spent on health (G3)
A reasonable percentage of national health expenditure ia devoted to primary health care (G4)
aa.o~re ••• ~e .quit.bIy diQtributed (C5)
Defined strategies for health for all are .ccompaaied by explicit resource allocations (G6)
Defined strategiea for health for all need external reso .... rces (G6)
The needs for external resources of well-defined strategies for health for all are receiving sustained support from more affluent countries (G6)
At least 80% of local communities at all levels have well-establisbed voluntary and formal community organizations, which are c~mmitted to continuous pri~_ry health care action programmes LRII
The community contributes in cash and in kind to health or health related action [R21
(b) Socioeconomic indicators:
The percentage of population served with safe water in the home or within 15 minutes' walking distan~e i. 100 (G7.I.Il
The percentage of population with adequate sanitary facilities in the home or immediate vicinity is 100 (G7.1.2)
- The edult literacy rate for both men and women exceeds 70% (GIl) (Total/M/F)
The gross national product per head eKceeds US$SOO at 1980 market prices (G12)
The daily p~r capita calorie availability exceeds 2500 calories [R3)
The daily p~r capita protein availability exceeds 70 gr .... lR4J
Year Data
NA
NA
NA
1980 +
1975-77 +
1975-77 +
Actual Data
US$ 9 890
2 847
86.5
Source of Data
07/81
03/79
OJ/7~
Notes: The number in brackets show the number given to the indicator in the global indicator list {Global Strategy for Health For All by the 'tear 2000, WHO, Geneva, 1981 ("Health For All" Series No.-J-)-,p.ge. 75-76).
+ Yes No No information/oot available
NA Not applicable
Source 03/79 : 07/81: 10/82 : 11/80 :
12/82: 12/83:
FAO Production Yearbook 1979 1981 World Bank Atlas 1982 BSCAP PopUlation n~ta Sheet World Health Statistics Quarterly, Vol. 33, No.3, 1980 Leaflet on Childhood CD. Report J/~2
Revised CHIP, 1983

Part IV Page 22 30 December 1984
WESTERN PACIPIC RBGION DATA BANK ON SOCIOECONOMIC AND HE~TH INDICATORS
Indicator(s) for. ~
(c) Health status and quality of life indicatorB~
- At least 90% of ne~born infants have a bi~th weight of at least 2500 grass (CS.l)
- At l~ast 90% of children have a weight for age that corresponds to reference values given in Annex I to Developnlent of Indicators -for Monitoring Progress Towards Health for All by the Year 2000 (G8.Z)
Year
1982
- The infant mortality rate for all identifiable 1983 sub-groups is beloW' 50 per 1000 live births (09) .
- Life expectancy at birth is over 60 years (GI0) 1983 (Toul/K/F)
- Maternal mortality rate ia below 3 per 1980 thousand live births [&5}
No ea8~a of diphtheria, tetanus. whooping cough, 19S1 measles, poliomyelitis and tuberc~losis occur [R61
(d) Indicators of the delivery of health care:
Primary health care is available ~o the whole population with at least. the following;
- The percentage of deliveries by trained heal~h personnel is 95 (G7.4.1)
- The percentage of children immunized against diphtheria, tetanus, whooping cough. measles, poliomyelit is and tuberculosis is 95 (G7 .. 2)
- Local health care. including availability of at least 20 essential drugs, within one hour's walk or travel is 100% (07.3)
- The percentage of children up to at least one year of age given routine child care by trained health per80nnel is 100 (G7.4,Z)
- The percentage of pregnant women with at least three visits for antenatal care is 100 (G7.4.1)
- The population growth rate i8 reduced to Ie •• than II [R7[
1982
Data
+
+
+ +
+
+
94.8
6.2
Actual nata
Total -Male - 74.2 years Female - 19.7 years
0.204
Dipbtoria 29 P.rtus.i. 2815 Tetanus 36 Polioayelitia 1 Tuberculosis 66600 Hea.lel 6715
0.1
1-
Source of nata
06/84
06/84
06/84
12/83
12/82
10/82

Part IV Page ZJ
30 D~cembe[" 1984
WESTERN PACIFIC REGIO~ DATA BANK ON SOCIOECONOMIC ~D HEALTH INDICATORS
lndicator(s) for~ KIRIBATI
(.> Health policY indicators:
• Health for all haa re~eived endorsement as policy at the highest offi.cial level (Gl)
- Mechanisms for involving people in the implementation of strategies have been formed or strengthened, and are actualLy functioning (G2)
- At least 5% of the gross national product is spent on health (G31
- A reasoaable percentage of national health expenditure is devoted to pri~ry health care (04)
Resources are equitably distributed (G5)
Defined strategies for health for all are accompanied by explicit resource allocatioRs (G6)
Defined .trate,ies for health for all need external resources (G6)
fh. nl:!edt1l for axc.rcad rtl80UrCdS of w.U-defiQad strategies for haalth for all ac~ receiving sustained support from moce affluent countries (G6)
At least 80% of local communities at all levels have well-established voluntary and formal community or&anizacions. which are committed to continuous primary health care action programmes [R1]
- The community contributes in cash and in kind to health or health related action [&2}
Year
1982
1982
1982
1982
1982
1982
1982
1982
1982
1982
Data
• ~e.
• Yea
• 9
• 30
- Not
...
'"
'"
- 2%
• 3%
Actual Data
yet
Sout".:e of ilata.
13183
1318)
13183
UI83
1]/81
U18)
1318)
13/83
13183
~----------------------------------~----~r----+----------~------(b) Socioeconomic indicators~
- The percentage of population served with safe water in the home or ~ithin 15 minutes' walking distance is 100 (G7.1. j)
The percentage of ~opulation with adequate sanitary facilities in the home or immediate vicinity is 100 (G7.1. 2)
- The: adult literacy rate fat' both men and WOmen exceeds 70% (Gll) (Total/M/F)
- The gross national product per head exceeds US$500 at 198U market prices (Gl2)
The daily per capita calorie availability exceeds 2jOO calories [R31
The daily per capita protein availability exceeds 70 grams (a41
19B2
1982
1982
1982
•
10
10
Lotal - lOO Hale -Feiliale -
US$ 300
13/8)
illS)
[J18]
IJIB)
Notes: The number in brackets show the number given to the indicator in the global indicator list (Global Strategy for Health For All by the Year 2000, WHO. Geneva. 1981 (UHealth For All" Series Noe~ pages 75-76).
+ Yes No No inforaation/not available
MA Not applicable
Source 13/83. Government's Report on Monitorina ProgreB8 in Implementing Strategy for HFA/2000. 1981 1982 ESCAP Population Data Sheet Leaflet on Childhood CD. Report 3/82

Part IV Page 24 30 December 1984
WESTERN PACIFIC REGION DATA BAKK ON SOCIOECONOMIC AND HEALTH INDICATORS
Indicator(s) for~ KIRIBATI
(~) Health status and Quality of life indicator8~
- At least 90% of newborn infants have a birth weight of at least 2500 grams (Ga. I)
- At least 90% of children nave • weight for .,. that corresponds to reference value. given in ~nex 1 to Development of Indicators for Mon.itorin& P-rOj'l' ••• 'rwards Health for All by the Yea. 2000 (G8.2)
- The infant mortality rete for all identifiable sub~groups is below 50 per 1000 live birth. (G9)
- Life .a:xpectancy at birth is over 60 years (C10) (To.tal/N/P)
- Maternal mortality rate is beLOw 3 per thousand live births [RS]
- No cases of diphtheria, tetanus, whooping cough, measles. polio~yeliti. and t~bercul0.is occur (Ro)
(d) Indicators of the delivery of health care:
Primary health care is available to the whole population with at leaat tne £ollo~inat
- The percantas. of deliveri •• by trainad health personnel ie 95 (G7.4.1)
- The percenta,e of children immunized against diphtheria, tetanus. whooping cougn. measles, poliomyelitis and tube~culGsis is 95 (G1.2)
- Local health care, including availability of at least 20 essential drugs. within one· houris walk or travel is 100% (C7.)
- The percentage of children up to ae least one year of age given routine child care by . trained nealth personnel i& 100 (01.4.2)
- The percentage of pregnant women with at least three visits for antenatal care is 100 (G7.4.l)
- The population ,ro~th rate is reduced to 1 ••• than 1% (R71
Ye.ar Data
1982
1982
1978
1978
1982 •
1982
1982
1982
No
87
Total Hale F .... le
0.1
Actual Data
Diphtheria 2 Tetanus J Pertussis 17 Tuberculosia ~2 Mea.lee 11
10
2.2
Source of l)a.ta
13183
13/83
13/83
10/82
13/83
12182
13/8)
13/83

WESTERN PACIFIC REGION DATA BAHK ON SOCIOECONOMIC AND HEALTH INDICATORS
Indicator(s) for~ LAO PEOPLE'S DEMOCRATIC REPUBLIC
(a) Health policy indicators~
He~lth for all has received endorsement a8 poli~y at the highest official level (Gl)
Mechanisms for involving people in toe implementation of strategies have been formed Ot atrenAthened, and are setual1y functioning (02)
At least S% of the gro.e nation.t -produat is .epfmt on heal th (Q3)
A reasonable percentage of national health expenditure is devoted to primary health care (G4)
Ru·ources are equitably distributed (GS)
Defined 8trategies for health fpr all are accompanied by explicit resource allocations (G6)
Defined 6tcategies for health for all need exte~nal resources (G6)
The needs for external resources of well-defined strategies for health for all are receiving sustained support from more affluent countries (G6)
At least 80% of local communities at all levels have well-established voluntary and formal community organizations, which are committed to continuous primary health care action programmes [Rl]
The community contributes in cash and in kind to health O~ health related action [R2]
Tbe percentage of po~ulation served with aafe water in the home or within 15 minutes' walking distance is 100 (G7.1.ll
- The percentage of population with adequate sanitary facilities in th~ home or immediate vicinity i. 100 (G7.l.Z)
- The adult literacy rate for both men and women exceeds 70% (Gll) (Total/M/F)
The gross national product per head exceeds US.SOO at 1980 market prices (Gll)
The daily per CRJita calorie availability exceeds 2500 calories [ J
The daily per capita protein availability exceeds 70 gr"",. fR4)
Year
1982
1980
1978
1977-79
1977-79
Data
+
Part IV Page 25 30 December 1984
Actu41 Data
Yes
Total - 41 Mah -Female -
$83
1842
47.7
Source of Data
12/82
12/82
12/82
03179
03/79
NQte9~ The number in brackets show the number given to the indicator in the global indicator list (Global Stcat~gy for Hea.lth For All by the Yeat" 2000, WHO, Geneva, 1981 (UHealth Por All" Series No.--rr:-page. 75-76).
... Yes No No info~atiQn/not available
NA Not applicable
Source 03/79: 10/82, 12/82,
FAO Production Yearbook 1979 1982 ESCAP Population Data Sheet Country Review by WRC 1 Vientiane, 1982

Part IV PaSe 2& 30 December 1984
WESTERN PACIfIC REGION DATA BANK ON SOCIOECONOMIC AIIll HEALTH INDICATORS
Indicator(s) for~ LAO PEOPLE'S DEMOCRATIC REPUBLIC
(c) Health status and quality of life indicators.
- At least 90% of ne~born infants have a birth veignt of at lea~t 2500 gr8m$ (GS.l)
- At least 90% of children hAve a weight for age that corresponds to reference values given in Annex 1 to Development of Indicators for Monitoring Progress Towards Health for All by the Yea. 2000 (G8.2)
- The infant mortality rate for all identifiable sub-groups is below 50 per 1000 live births ~G9)
- Life expectancy at birth is OVdr 60 years (GIO> (Total/Hll)
- Maternal mortality rate is below 3 per thousand live births [RS]
- No cases of diphtheria, tetanus, whooping cough, ~a81es, poliomyelitis and tubereuioei8 occur [&6)
(d) Indicators of the delivery of health care;
Primary health care is available to the whole popolation ~ith at least the follo"ing:
- The percentage of ~eliverie8 by trained health personnel is 95 (G7.4.1)
- The percentale of children immunized againlt diphtheria, tetanus, whoop ins cough, me •• lls, polio_yeliti. and tub.~culo.l. i. 9S (G7.2)
- Local health care, inaluding availability of at least 20 e8sential drugs, within one hour's walk or travel is 100% (G7.3)
- The pe~centage of ehilQren ~p to at least one year of age given routine child cace by t~ained bealth personnel is 100 (G7.4.2)
- The percentage of pregnant women with at least three visits for antenatal care is 100 (G7.4.1)
- The population growth rate is reduced to le88 than 1% ! an
Year Data
1979
1982 -
1980-85 --
... 19BO -
1982
Actual Data
82.0
124.0
Total -Kale - 4S Feaale - 48
Diptheria putu •• ia Tetanu.
y •• ta Jean
11 1718 1015
Poliomyelitis 1166 Tubercu.losis 7630 Meaales 1380
2.5
Source of Data
12/82
10/82
12182
12/82
10/82

WESTER~ PACIFIC REGION DATA BANK ON SOCIOECONOMIC AND HEALTH INDICATORS
Indicator(s) for: MACAO
(a) Health policy indicators;
Health for all has received endorsement as policy at the hignest official level (GI)
Mechanisms for involving people in the implementation of strategies have been formed or strengthened) and are actually functioning (G2)
At least S% of the gross national product is spent on hoalth (G3)
A reasonable percentage of national health expenditure is devoted to primary health care (G4)
Re~ource8 are equitably distributed (05)
Defined strategies for health for all are accompanied by explicit resource allocations (G6)
Defined .t~ategie. for health for all need external resources (G6)
The needs for external re80urces of well-defined strategies for he41tb for all are receiving sU8tained .upport from mOTe affluent countries (G6)
At least 80% of local communities at all levels have well-established voluntary and fOr$al community organizationa, which are committed to continuous primary health care action programmes [RI)
The community contributes in cash and in kind to health or health related action [R21
(b) Socioeconomic indicators:
The percentage of population served with safe ~ater in the home or within 1S minutes· walking distance is 100 (G7.1.1)
The percentage of population with adequate sanitary facilities in the home or immediate vicinity is 100 (G7.1.2)
The adult literacy rate for both men and women exceeds 70% (GIl) (Total/M/F)
The gross national product per head exc~edB US$500 at 1980 market prices (GI2)
The daily per capita calorie availability exceeds 2500 calories [Rl)
The daily per capita protein availabili'ty exceeds 70 gums {R4]
Year
1982
1982
1982
1982
1982
1982
1982
1982
1982
1977-79
1977-79
Data
+
+
+
+
+
+
+
Part: IV Pale 27 )0 Oecember 1984
Actual Data
Yea
No
10
Yeo
100
100
Total Male
- 90
Female -
ust noo
2181
57.9
SauTee of Data
13/83
13/83
13/83
13/83
13/83
13/83
13/83
n/8)
13/83
03/79
03/79
Notes: The number in brackets show the number given to the indicator in the global indicator list (Global Strategy for Health For All by the Year 2000, WHO, Geneva, 1981 ("Health For AU u Series No.-3-)-,pages 75-76).
+ Yes No No information/not available
NA Not.applicable
Source 13/83: Government's Report on Monitoring Progress in Implementing Strategy for MFA/20aO) 1983
03/19: FAO Production Yearbook 1979

Part IV Page 28 30 De~ember 1984
WESTERN PACIFIC REGION DATA BANK ON SOCIOECONOKIC AHV IlEALTH III!)ICATORS
lndicator(s) for~ ~
(c) Health status and quality of life indie.tor.~
- At least 90% of newborn infants have 8
birth weight of at least 2500 grams (GS.l)
- At least 90% of children have a weight for age that correeponds to reference values given in Annex 1 to Development of Indicators for Monitoring Progress Towards Health for All by the Year 2000 (G8.2)
- The infant mortality rate for all identifiable sub-groups is below SO per 1000 live birth. (G9)
Year
1982
1982
1982
Data
+ Yes
+ Yea
+ 18.0
Actual Data
- Life expectancy at birth is over 60 years (CIa) (Total/M/F)
1982 + Total - 65 year.
- Maternal mortality rate is below 3 per thousand live births [151
1982
No caae. of diphtheria, tetanus. whooping eou,h l 1982 mea.lea. poliamyelitil .ad tubarculDlie occur (R6)
(d) Indicators of the delivery of health care:
Primary health care is available to the whole population with at least the following.
- The percentage of deliveries by trained health personnel is 95 (G7.4.1)
- The percentage of children immunized against diphtheria, tetanus. whooping cough, measles, poliomyelitis and tuberculosis is 95 (C7.2)
- Local health care. including availability of at least 20 essential drugs. within one hour's walk or travel is 100% (G7.3)
- The percentage of children up to at leaet one year of age given routine child care by trained health personnel is 100 (G7.4.2)
- The percentage of pregnant women with at least three visits for antenatal care is 100 (G7.4.1)
- The population growth rate is reduced to 1es. than 1% (Rn
1982
1982
1982
1982
1982
1982
Male ~
F ..... 1. -
~ 0.4
- D{ptberia 0 Tub.rculo.b 233 ..... 1 •• . .. Tetanus 3 Whooping cough 4 Poliomyelitie 0
+ Yu
+ Yes
+ Yes
+ Yes
+ Yes
- 2.8%
Source of Data
13/83
13/83
13/83
13/83
13/113
13/83
13/83
13/83
13/83
13/83
13/83
13/83

Part IV Page 29 30 December 1984
WESTERW PACI'IC IBGION OA7A ,ANK ON SOClOECONOMIC AMD KlALtH INDICATORS
Indicator(s) for: MALAYSIA
(.) Health policy indicators:
Health for all has received endorsement as policy at the highest official level (Gl)
Mechanisms for involving people in the i.plementation of strategies have been formed or strengthened, and are actually functioning (G2)
At least 5% of the grosB national product is spent on health (G3)
A reasonable percentage of national health expenditure is devoted to primary health care (G4)
Re80u~es are equitably distributed (G~)
Defined strategies for health for all are accompanied by explicit re.ou~ce allocations (G6)
Defined strategies for health for all need external reaour<:e8 (G6)
- The needs for external resources of well-defined .trategies for health for all are receiving sUltained support from more affluent countries (06)
- At least 80% of local communities at all levels have well-established voluntary and formal community organizationa, which are committed to continuOUB primary health care action programmes (Rl)
The community contributes in cash and in kind to health or health related action IR2J
(b) Socioeconomic indicators;
The percentage of popUlation served with safe water in the home or within IS minutes· walking dietan<:e i. 1<1<1 (G7.1.ll
The percentage of population with adequate sanitary facilitiea in the home or immediate vicinity i. 100 (G7.1.2)
The adult literacy rate for both men and women exceeds 70% (Gll) (Tota1/M/')
The gross national product per head exceeds US$SOO at 1980 mar~et prices (G12)
Year
1982
1982
1983
1983
1983
1983
1983
1983
1983
1980
1983
Data
+
+
+
+
+
+
+
+
+
+
Yes
Yes
3.59
22.2
Ye.
Yet
Yeo
Yes
YeB
Act,,", Data
Total - 12 Male -Female -
US$ 1868 or K$ 4391
~O\lTCe
of Oata
13/83
13183
13/83
13/83
131Sl
13/83
13/83
ll/S)
13/83
The daily per capita calorie availability exceeds 2500 calor~e8 {R31
1977-79 + 2562 03/79
The daily per capita protein availability exceeds 70 gr.... [R4)
1977-79 46.5 03179
Notes; The number in brackets show the number given to the indicator in the global indicator lil[ (Globsl Strategy for Health For All by the Year 2000) WHO, Geneva, 1981 (flHedth For Alltt Series No.~ pageL 75-76).
+ Yes No No information/not available
NA' Hot available
Source 13/83;
03/79, 06/S4.
Government's Report on Monitoring Progress in bnplementing Strategy for HFA/2000, 19R3 FAD Production Yearbook 1979 Country Health Information Profile (CHIP) revised by ~ernment, 1984

i
Fart IV Page 30 30 December 1984
WESTERN PACIFIC REGION DATA BANK ON SOCIOECONOMIC AND HEALTH INDICATORS
Indicator{.) for: MALAYSIA
(c) ae.lth .tatu. and quality of life in4tcators:
- At least 90% of newborn infants h~ve a birth weight of at least 2500 grams (G8.1)
- At least 90% of children have a weight for age that corresponds to teference values given in Annex 1 to Development of Indicators for Monitoring Progre&s Towards. Health for All by the Yea. 2000 (G8.2)
The infant mortality rate for all identifiable Bub-croups ia below jO per 1000 live births (G9)
Year
1979
\982
- Life expectancy at birth is over 60 years (ClO) 1982 (Tota1/M/F)
- Maternal mQrtality rate is below 3 per 1982 thousand live births [RS]
NO ca.e. of diphtheria. tet&nu' t whoopina cough. meaalea. poliomyelitia and tuberculosis Occur [R61
(d) Indicators af the delivery of bealth care.
Primary health care is available to the whole population with at least the following;
- The percentage of deliveries by trained health personnel is 95 (G7.4.1)
- The percentage of children immunized against diphtheria, tetanus, whooping cough, measles, poli~yeliti8 and tuberculosis is 95 (G1.2)
- Local health care, including availability of at least 20 essential drugs, ~ithin one hour's walk or travel is 100% (C7.3)
- The percentage of children up to at lea6t one year of age given routine child care by trained health personnel is 100 (G7.4.2)
The percentage of pregnant women with at least three visits for antenatal care is 100 (G7.4.l)
- The population growth rate is reduced to less than It fR7J
*Peninsular Malaysia
\982
1982
Data
+
+
+ +
+
-
91.0
19.26
total
Actmll Data
-Male - 67.7 years iff
Female - 72.5 year."
0.50
Diphtheria 10 Pertuuia 126 Po liamre 1i t is 5 Tetanus 47 Tuberculoai. 9056 Mealle. 9268
2.7
Source of Data
1)/83
06/84
06/84
06/84
13/83
06/84

Pact IV Page 31 30 December 1984
WESTERN PACIFIC REGION DATA BANK ON SOCIOECONOMIC AND HgA[.TH INllICATORS
.-------------------------------~----._----._~~~_r=_---Actual SaUTee Indicator(s) for~ ~
(a) Health policy indicators:
Health for all has received endorsement as policy at the highest official level (el)
Kechanis~B for involving people in the implementation of strategies have been formed or strengthened! and are actually functioning (G2)
- At least 5% of the grosa national product is spent on health (Gl)
- A reasonable percentage of national health expenditure is devoted to primary health care (G4)
- Resources are· equitably distributed (C5)
- Defined strategies for health for all are accompanied by explicit resource allocations (G6)
- Defined strategies for health for aLL need external resources (G6)
- The needa for external resources of well-defined strategies for health for all are receiving 8ustAinad support fr~ more affluent countries (~6)
- At l&Bst 80% of local communities at all levels have well-e.tabliabad voluntary -and forillal l!o.IIU'fWnity o~lafiiz.tion •• which are COMmitted to continuous pridary health care action programmes [Rl]
- The community contributes in cash and in kind to health or health related action {R2}
(b) Socioeconomic indicators~
- The percentage of population served with Bafe water in the hOlll.e or within 15 minutes' walking distance is 100 (G).l.l)
- The percentage of population with adequate sanitary racilities in the home or immediate vicinity is 100 (G) .1.2)
The adult litera~y rate for both men and women exceeds 70% (Gil) (Totall MJ F)
The gross national product pe~ head exceeds USI500 at 1980 market price. (G12)
The daily per capita calorie availability exceeds 2500 calories (R31
The daily per capita protein availability eKceeds 70 gram. (R4)
Year Dattt Data of Data
...
...
...
...
...
...
Note8~ The number in brackets show the number given to the indicator in the global indicator list (~ Strategy- fot' Health For All by the Year 2000. WH0 1 Geneva, 1981 ("Health For AlllI Series No~ 3), pages 75-76).
t- Yes No , No information/not available
NA Not appli~able
Source lO/8h 12/82:
1982 ESCAP Population Data Sheet Leaflet on Childhood CD, Report 3/82
I

Part IV Poge 32 3a lleeember 1984
WESTERN PACIFIC REGION DATA BANK OK SOCIOECONOlIIC ANtI 1IloIJ.T11 INDICATORS
Indicator(s) fOT~ ~
(c) Health status and quality of life indicator8~
- At lease 90% of newborn infanta have a birth weight of at least 2500 grams (G8~1)
- At least 90% of children have a weight fot' age that corresponds to reference values given in Annex 1 to Development of Indieators for Monitoring Progress Towards Health for All by the Year 2000 (Ga.2)
- The infant mortality rate for all identifiable sub-groups is belov 50 per 1000 live births (G9)
- Life e~pectancy at birch is over 60 years (GIO) (Total/ H/ F)
- Maternal mortality rate i. below 3 per thouaand live births [as1
Yelr
- No c •••• of 4ipbth.~i.t tet&ftva, Wboopina co~ah. 1982 mea,le., poli~.liti. a84 tubercula.i. OGcur 116]
(d) Indicators of the delivery of health car~~
Pri.ary health care i. available to the whole population with at least the following~
- The percentage of deliveries by trained health personnel is 95 (G7.4.1)
- The percenta,e of children immunized against diphtheria, tetanu.~ Whooping cough. meaeles , polio~eliti8 and tuberculosis is 9~ (C1.2)
Local health care, including availability of at lesst 20 eBsential drugs, within one hour's walk or travel is 100% (G7.3)
- The percentage of children up to dt least one year of age giv~n routine child Care by trained health personnel is 100 (G7~4~2)
- T~e percent8ge of pregnant women with at least three visits for antenatal care is 100 (G1~4.1)
The population gTowth rate is reduced to 1... than 1% ! Rn
1~82
nata
•
Actuol o.to
M. •• l.. 1 Tubarculoai.a .g
o
Boul;'ca of Oat.
12/82
10/82

WESTERN PACIFIC lIGION DAT~ BANK ON SOCIOECONOMIC AND HEALTH INDICATORS
.
Indicator(s) for! NEW CALEDONIA
(a) Health policy indicators:
- Health for all has received endorsement 8S policy at tbe highest official level (Gl)
- Mechanisms for involving people in the implementation of strategies have been formed or strengthened, and are actually functioning (G2)
- At least 5% of the gross national product is spent on heal ~h (G3)
- A rea80nable percentage of national health expenditure is devoted to primary health care (G4)
- Re.ourcee are equi~ably distributed (G5)
- Defined 8trat~8ie8 for health for all are accompanied by Qxplicit resource &11ocationa (C6)
- Defined strategies for nealth for all need external resources (G6)
- The needs for external resources of well-defined strategies for health for all are receiving sustained support from more affluent countries (G6)
- At least 80% of local communities at all levels have well-established voluntary and formal community organizations, which are committed to continuous pri~ry health care action programmes (Rl]
- The community contributes in ca~h and in kind to health or health related action (R2}
lh) Socioeconomic indicators~
- The percentage of population served with safe water I
in the home or within 15 minutes' walking distance i. 100 (G7.1.11
- The percentage of population with adequate sanitary facilities in the home or immediate vicinity i. 100 (G7.lo2)
The adult literacy rate for both men and women exceeds 10% (Gil) (Total/M!F)
the gross national product per head exceeds US$500 at 1980 market prices (GI2)
The daily per capita calorie availability exceeds 2500 calories [R31
The daily per capita protein availability exceeds 10 grams \R4]
Year Data
Part tv hge 33 30 December 1984
Actual Data
Source of Data
Notes: The number in bracke~s show the number given to the indicator in the global indicator lilt (Global Strategy for Health For All by the Year 2000, WHO, Geneva, 1981 ("Health For All" Series No.~ pago. 75-16).
+ Yes No No informa'tion/not available
NA Not applicable
Source 12/83. WHo/wpRO puhlication/document - Summary Report on Health Activities Carried Out in New Caledonia and Dependencies in 1982 (34th Re. 1981)

Part IV PS8e 34 30 December 1984
WESTBRN PACIFIC REGION DATA BANK ON SOCIOECONOMIC ANO HEALTH IHDICATORS
Indicator(s) for~ NEW CALEDONIA
c) Health I!Itat~& and q-ualitz of life indicator!~,
- At least 90% of newborn infanta havf! 11.
birth weight of at least 2500 grams (GS.I)
- At least 90% af children bsve a weight for sge that corresponds to reference values given in Annex 1 to Development of Indicators for Monitoring Progress Towards Health for All by the Year ZOOO (G8.Z)
- The infant mortality rate for all identifiable sub-groups is below 50 per 1000 live births (G9)
- Life expectancy at birth is OVer 60 years <GIO) (Total/M/F)
- Maternal mortality rate is below 3 per thousand live births [R5]
No cales Qf diphtheria, tetanua, whooping cough, ~e •• l ••• poliomyelitil aQ4 tuberculosis occur [&6)
(d) Indicatora of the delivery of health c.re~
Primary health care is available to the whole population with at least the following:
The percentage of deliveries by trained health personnel is 95 (G7.4.1)
The percentage of children immunized against diphtheria. tetanu9 J whooping cough, meaales, poliomyelitis and tuberculosis is 95 (G7.2)
Local health care, including availability of at leaat 20 essential drugs, within ane houris walk or travel is 100% (G7.3)
The percentage of children up to at leaat one year of age given-rDutine child care by trained health personnel is 100 (G7.4.2)
The percentage of pregnant women with at least three visits for antenat~l care is 100 (G7.4.1)
The population growth rate is reduced to les8 than 1% (R7)
Year Data
1982
...
I I ...
...
Actual Data
Poliomyelitis 'l'uberculoliia Measles
5 101
1448
Source of Data
12/83

WESTERN PACIFIC REGION D~TA BANK ON SOCIOECONOMIC AND HEAlTH INDICA'IORS
(a) Health policy indicators:
- Health for all has received endorseroent as policy at the highest official level (GI)
- Mechanisms_ for involving people in the iaplementation of strategies have been formed or a trenathened , and are actually functioning (G2)
- At le.at 5% of the grOBI national product is spent on heal th (G3)
- A reasonable percentaae of n4tional health expenditure is devoted to primary heal th care (G4)
- leaourcee are equitably distributed (GS)
Defined strategies for health for all are accompanied by explicit resource allocations (G6)
Defined strategies fot health for all need external resources (G6)
the needs for external resources of well-defined 6trategies for health for all are receiving 6ustained support from more affluent countries (G6)
- ~t least 80% of local communities at all levels have well-esubli.hed voluntary and formal community otganiutions. which aore committed to continuous primary health care action progranmes (Rl]
- The community contributes in cash and in kind to ltealth or health related action [R2]
(b) Socioeconomic indicators:
- 'the percentage of population served with safe water in the home or within 15 minutes' walking distance is 100 (G7.!.I)
- The percentage of population with adequate sanitary facilities in the ho.e or immediate vicinity is 100 (G7.1.2)
- The adult literacy rate for both men and women exceed. 701 (Gil) l Tote \ III/F)
the gross national product per head exceeds US~500 at 1980 market prices (Gil)
the daily fer capita calorie availability exceeds 2500 caloues [R3}
The daily per capita protein availability exceeds 70 grams [104]
year Data
1982 +
1982 +
1982 +
1974 +
1981-82 +
1982 NA
1982 NA
1982 NA
1982 +
1982
1982
1982 +
198H12 +
1975-77 +
1975-77 +
Part IV Page 35 30 December 1984
Actual oate
NEZ haB been a signatory to all the WHO resolutions relating to this programme and adopted the declaration of the 1978 Alma Ata conference on PHC
yea
7.3%
34.4%
Yes
Yes
99.9%
99.9%
Total - 98 Male -Female -
US$ 9 214 or NZ$ 10 622
109.9
Source of Data
13/83
13/83
I 13/83
13 183
13/83
13/83
13/83
13/83
13/83
13183
13/83
13/83
U/S3
03/79
03/79
Notes: The number in brackets show the number given to the indicator in the global indicator list (Global Strategy for Health For All by the Year 2000. WHO, :~neva, 1981 ("Health For All" Series No.3). pages 75-76).
+ yes No No infonaation/not available
NA No t appl ieable
SOurce 13/83:
03/79: 10/82: 12/82:
Government'. R.eport on Monitoring progress in Implementing Strategy for HFA/2000, 1983 FAO P~oduction Yearbook 1979 1982 ESCAP Population Data Sheet Leaflet on Childhood CD, Repott 3/82

Part IV Page 36 30 Dece.ber 1984
Indicator(s) for~ HEW ZEALAND
WESTERN PACIFIC REGION DATA BANK ON SOCIOECONOMIC AND MEALTH INDICATORS
Year Data
c) He.lt~ It.tUB and quality of life indicators~
Actual Data
- At 1 ••• t 90% of newborn infants n.ve a birth waight of at le.at 2500 Kr~8 (Ga.l)
1982 + I 94.2
- At leaat 90% of children have a weight for age that corre.pond. to reference valuea given in Annex 1 to Davelopa.nt of Indicators for Monitoring Progre8s toward. Health for All by the Year 2000 (G8.2)
- Tha infant mortality rate for all identifiable sub-groupe is below 50 per 1000 live births (G9)
- Life expectancy at birth i$ over 60 years (GlO) (Total/M/P)
- Maternal mortality rate is below 3 per thousand live births [as)
1982
1980
1982
1980
No cales of diphtheria, tetanus, whooping cough, 1982 mea81~sJ poliomyelitis and tuberculosis occur [R6J
(d) Indicators of the delivery of health care~
Primary health care is available to the whole population with at least the following~
the percentage of deliveries by trained health personnel is 95 (G7.4.1)
- The percent4ge of children immunized againat diphtberia, tetanus, whooping cough, measles, poliomyelitis and tuberculosis is 95 (C7.2)
Local health care. including availability of at least 20 es.ential drugs, within one hour'. walk or travel i. 100% (C1.3)
- The percentaae of children up to at least one y •• r of age given routine child care by trained health personnel i. 100 (G7.4.2)
- The percentage of pregnant women with at least three visits for antenatal care is 100 (G1.4.i)
- The popu-latioD. growth rate is reduced to 1 ••• than 1% [&1J
1982
1982
+
+
+
+
...
...
90
13.0
Total ->60 yeara Male -Female -
0.1
Diphtheria Tetanus Tuberculosis
No
1.1
1 S
434
Source of Data
U/83
U/83
13/83
13/83
13/83
12/82
13/83
10/82

Pa.rt IV Pa.ge 37 30 D~cember 1984
WESTERN PACIFIC REGION DATA BANK ON SOCIOECONOMIC AND HEALTH INDICATORS
Indicator(s) for. NIUE
(.) Health policy indicators;
Health for all has received endorsement sa policy at the highest official level (Gl)
He~haniBms for involving people in the implementation of strategies have been fanned or strengthened. and are actually functioning (G2)
At least 5% of the gross national product ia spent on health (G3)
A reasonable percentage of national healtn expenditure is devoted to primary health care (G4)
Resources are equitably distributed (GS)
Defined strategies for health for all are accompanied by explicit resource allocations (G6)
Defined strRtegiea for health for all need external reSDurces (G6)
The needs for external re.ources of well-defined strategies for health for all are receiving sustained suppo~t from more affluent countries (C6)
- At least 80% of local communities at all levels have well-established voluntary and formal community organizations~ which are committed to continuous primary health c.~e action programmes [Rll
- The community contrib~te. in caah and in kina to health or h.alth related a~eion lRl]
(b) Socioeconomie indicatora~
- The percentaie of population served with safe water in the h~e Or within 15 minutes' walking distance 10 100 (G7.1.1)
- The percentage of population with adequate sanitary facilities in the home or immediate vicinity i. 100 (G7.1.2)
The adult literacy rate for both men and women exceeds 70% (Gil) (Total/M/F)
The gross Rational prqduct per head exceeds US$500 at 1980 market prices ·(GI2)
The daily per capiea calorie availability exceeds 2500 calories [RlJ
The daily per capita protein availability exceeds 70 gr8lll8 [R4 J
Year Data Actual
Data Source of Data
Notes~ The number in brackets show the number given to the indicator in the global indicator list (Global Strategy for Kealth For All by the Year 2000, WHO, Geneva. 1981 ("Health For AlL u Setiee No.~ pages 7S-7&).
+ Yes Ho No information/not available
NA Not applicable
Source 10/82: 12/82:
19&2 ESCAP Population Data Sheet Leaflet on Childhood CD, Report 3/82

Pllrt IV Page 38 30 December 1984
Indicator(s) for~ ~IUE
WESTERN PACIFIC REGION DATA BANK ON SOCIOECONOMIC A$D HEALTH INDICATORS
Year Data Actual Data
Source of Data
·r----------------------------------r----t----r--------------+-----4 (c-) Health status and quality of life indicators ..
- At least 90% of newboTU infants have a birth weight of at lesst 2500 grams (G8.l)
- At least 90% of children bave a weight for age the.t <:'o1:'reapond$ to reference values given in Annex 1 to Development of Indicators for MonitoEing PrQgrea. Towards Health for All by the Y •• r 2000 (G8.2)
- The infant mortality rate for all identifiable aUD-lroupl is below 50 per 1000 live birtb. (G9)
- Life ._pactancy at birth il over 60 years (CIO) (Totall H/ F)
- Maternal mortality rate is below 3 per thousand live births IRS]
- No cases of diphtheria. tetanus, Whooping cough, 1982 measle" p~liomyelitis and tuberculosis occur IR6)
Cd) Indicator. of the delivery of healtb care~
Primary health care is available to the whole population with at leaat Cne following~
- The percentage of deli~erie8 by trained health per.onnel is 9S (G7.4.1)
~ The percentage of children i.munized against diphtheria. tetanus. Whooping cough, measles, pOlio.yelitis and tuberculosis is 95 (07.2)
- Local health care, includina .~ail.bility of at le.at 10 es.enti.l dtuaa, within ORe hour'. walk or travel ia 100% (C1.3)
- The percentage of children up to at least one year Df age given routine child care by trained health personnel is 100 (G7.4.2)
- The percentage of pregnant women with at least three visits for antenatal care is 100 (G7.4.l)
- The population growth rate is reduced to le.. than 1% ! R7]
* Incomplete
1982
Tuberculosis 2* 12/82
...
+ -3.1 10182

Part tv Page 39 30 Oecember 1984
w~srERN PACIFIC REGION DATA SANK ON SOCIO~COMOMle AND aEALTH INDICATORS
Indicato~(8) fo~~ PAPUA NEW GUINEA
(a) Kealtn policy indicators.
Health for all has received endorsement as policy at the high,st official level (GI)
Mech.n1.811l8 for involvin& people in the implement«tion of atrategie. haye bean formed or stren,Cbened, .ad are .ctually functionin& (G2)
At t ••• t 'X of the Iro.1 national product i. spent on health (G3)
- A reasonable percentaae of national health expenditure is devoted to primary health ca~e (G4)
Resources a~e equitably distributed (CS)
Defined strategies for health for all are accompanied by eKplicic resource allocations (a6)
Defined strategies for health for all need external rE:Sources (G6)
The needa for eKternal resources of well-defined strate,iea far health for all are receiving sustained support from more affluent countries (C6)
At lea.c 80% of local communities at all levels have well-established voluntary and form«l community org~ni£ations. which are committed to continuous pri~ry health care action programmes lil]
The community contriDutes in cash and in kind to heatth OT health related action lR2)
(b) Socioeconomic indicator$~
The percentage of population served with safe water in the hoae or within 15 minutes' walking distance i. 100 (G7.l.l)
The percentage of population with adequate sanitary facilities in the home or immediate vicinity is 100 (G7.l.2)
The adult literacy rate for both men and women exceeds 10% (Gil) (Total/M/F)
The groa. national product ver head exceeds USS500 at 1980 market prices (G12)
The daily per capita calorie availability exceeds 2500 calories [R31
The daily per capita protein availability exceeds 70 gr.~. (R4)
Year
1982
19S2
1982
1982
1982
1982
1982
1982
1980
197$-77
1975-77
Deta
+
+
+
+
+
Ye,
Yes
Actual Data
Health expenditure a8 a percentage of GPD ha~ inc~ea8ed steadily from 2.1% in t970 to an eatimated J.J in 1983
It is estimated that approxitnlitely 50% of nat ional health ~xpenditure is devoted to local health car~
Yes
75%
75%
45
US$ 954
2241
45.8
Source at Dlile.
13/83
!J/83
13183
UiS3
13/83
13/83
!J/B3
13/83
13/83
03179
03/19
Note5~ The number in brackets show the number given to the indicator in the global indicator list (Clobal Strategy for Kealth For All by the Year 20(,)0, WHO, Geneva. 1981 (I'Health For All" Series No.~ages 15-76) •
+- Yea
- /1o No information/not available
~A Not applicable
Source l3/83~
03/19: 12i63: 12184 :
Government's Report on Monitoring Progress in Implementing Strategy for HFA/2000, 198] FAO Production Yearbook 1979 WPR Data Bank updated by WRC, Port Moresby, 1983 CHIP revised by Government, 1984

Part IV Page ~O 30 December 1984
WESTIRN PACIIIC RKCION DATA IIAIIK 011 SOCIOECONOMIC AND HEALTH INDICATORS
IDdie.~oT(.) fOT' PAPUA lII\Ii (iUINIA
(0) HeAlth status and gualitl of life indicat~r ••
- At least 90% of newborn infants have a birth weight of at least 2S00 gr." (G8.1)
- At least 9Q% of ~nildren haye A weight for a •• that corresponda to reference values given in Annex 1 to DeY.1o~nt of Indicators for Monitoring Progtel. Toward. Healtb for All by the Year 2000 (G8.2)
- the infant ao~t&Lity rate for All identifiable 8ub-aroupa is below SO per 1000 live birth. (O9)
- Lif,. expectant:y at birth is over 60 years (GIO) (total/ll/P)
- Maternal mort.lity rite i. bllow 3 per thou. and live births [a51
- No cases of diphtheria, tetanus t whooping cough, mea.le" poliomyelitis and tuberculosis occur [161
(d) lndicators of the delivery of b.ealth care.:
Primary health care is svailable to the whole population with at least the following;
- the percentage of deliveries by trained heal~ pe~8onnel is 95 (G1.4*1)
- Tbe percentage of children immuni,ed against diphtheria) tetanu8, whooping cough, measles. poliomyelitis and tuberculosis is 95 (G7.2)
- Local health eare, including availability of at least 20 essential drugs. within one hour's walk or travel is 100% (C7.3)
- The percentage of children up to at least one year of age given routine child care by tTained health personnel is 100 (G7.4.2)
- The percentage of pregnant women ~ith at least tbree visits for antenatal care is 100 <C7.4.1)
- Tbe population growth rate is reduced to 1 ••• tban 1% [R1)
Yeas: Date
1919 -
1981 -1981 .
-
1980 -1982 -
'"
1982
1982
1982
1970-79
.Actual Source Data of Data
15.0 12/83
... 13/83
13 13/83
fotal - 13/83 Urban~ Male - 61 year.
'arMl. - 62 yalra llural: Mill. - 53 y.ara
r.ul. - Sit- yeara
8.0 12184
Fertuaaia 1422 12/84 Tetanus 40 PoliOlRyelitia 18 l'Jeasles 12711
15 13/83
91.3% 12/83
32.1 12/83
2.3 12/83

Part IV Page 41 30 December 1984
WESTERN PACIFIC REGION DATA BANK ON SOCIOECONO~IC AND HEALTH INDICATORS
Indie.tor(.) for: PHILIPPINES Year Data Actual
Data SOurce of Data
---------------------------------------+-----~------4_--------~----~ (a) Health policy indicator9~
Health for all has received endorsement as policy at the highest official level (Gl)
Mechanisms fot' involving people in the implementation o( strategies have been formed or strengthened, and are -actually functioning (G2)
At least 5% of the groas national product ia spEnt on health (G3)
A reasonable percentage of national health expenditure is devoted to primary health care (G4)
Re80urce~ are equitably distributed (GS)
Defined atrategies for health £o~ all are accompanied by explicit reSOU1"Ce allocations (G6)
Defined strategies for health for all need external ['t!8ources (G6)
The needs for external resources of v~ll-defined strategies for health for all are receiving sustained support from more affluent countries (G6)
- At least 80% of local communities at all levels have well-established voluntary and formal community organizations. which are committed to continuous primary health care action programmes [Rl]
- The community contributes in ca~h and in kind to health or health related action (R21
(b) Socioeconomic indicators;
The percent as- of popul&tion served with safe water in the home or within 15 minutea' walking distance i. 100 (07.1.ll
the percentage of population with adequate sanitary facilities in the home or immediate vicinity i. 100 (07-1.2)
- The adult literacy rate for both men and women exceed. 70% (GIl) (Total/M/F)
The. gross national product per head exceeds USS500 at 1980 market prices (GI2)
the daily per capita calorie availability exceeds 2500 calories (R3]
The daily per capita protein availability exceeds 70 grams (R41
1982
1983
1982
1982
1982
1982
1983
1981
1981
+
+
+
+
+
Yes
77
64.5
56.5
Total - 90 Male -Itemale -
U5$ 658 or P 7 312
2599.3
66.6
13/83
13/83
13/83
!J/83
06/84
13/83
06/84
06/84
06/84
Notes: The number in brackets show the number given to the indicator in the global indicator list {Global Strategy for Health lor All by the Year 2000. WHO. Geneva. 19B1 ("Health For All" Series No.-l-)-,pages 75-76).
.. Yes No No information/not available
NA Not applicable
Source 13/83.
06/84:
12/82: 12/83:
Government's Report on Monitoring Progress in Implementing Strategy for HFA/2000, 1983 Information furnished by the National Economic and Development Authority, Philippines, 29 October 1984 Leaflet on Childhood CD. Report 1/82 CHIP revised by Government, 1983

Pat;t IV Paga 42 30 ·Dec~er 1984
WESTERN PACIFIC REGION DATA BANK ON SOCIOECONOMIC AND HEALTH INDICATORS
Indicator(s) for: PHILIPPINES
(c) Health status and quality of life indicator8~
- At least 90% of newborn infants have a birth weight of at least 2S00 grams (G8.l)
- At least 90% of cbildren have a weight for age that corresponds to reference values given in Annex 1 to Development of Indicators for Monitoring Progress Towards Health for All by the Year 2000 (G8.l)
- The infant mortality rate for all identifiable lub-&roupa is below 50 per 1000 live births (G9)
- Lif. axpeccancy at birth is ovar 60 years (G10) (T~t.l/I1/P)
- Maternal mortality rate is below 3 per thousand live births (RS]
- No cases of dipntheria, tetanus, whooping cough, poliomyelitis and tuberculosis occur [&6]
(d) Indicators of the delivery of health care:
Primary health care is available to the whole population with at least the following~
- The percentage of deliveries by trained health personnel is 95 (G7 .4.1)
The percentage of children immunized against diphtheria, tetanus, whooping cough, messles, poliomyelitis and tuberculosis i8'95 (07.2)
- Local health care, including availability of at least 20 essential drugs, within one hourls walk or travel is 100% (G7.3)
- The percentage of children up to at least one year of age given routine child care by trained health personnel is 100 (07.4.2)
- The percentage of pregnant women with at least three visits for antenatal care is 100 (G'.4.1)
- The population growth rate is reduced to 1.88 than 1% [R7)
Year Data
1981
1982
1982
1983
1982 +
1982
1982
1983
81.9
82.8
61
ActuQI Data
total -Male - 60.4 Female - 64.0
0.90
Diphtheria Pertussis Tetanus Poliomyelitis Tuberculosis Measles
No
2.5
1275 8296 1427
256 61829 23676
Source of Data
13/83
13/83
12t83
Q6/84
13/83
12/82
13/83
06/84

WESTERN PACI~IC REGION DATA ~ ON SOCIOECONOMIC AND HEALTH INDICATORS
lndic.tor(s) for. BlPUBLlC OF KOREA
<.> Health policy indicators;
~.lth for all bas received endorlement a8 policy at tbe nigbeet official level (Gl)
- Mechanisms for involving people in the i.,lementation of strategies have been formed or strengthened, and are actually functioning (G2)
At least 5% of the gross national product ia spent all heal tn (G3)
A rea.onable percentage of national health expenditure is devoted to primary health care (G4)
Re.o~rce8 are equitably di$tributed (G5)
a.fioed str8ta,ie. for he.lth for all are accompanied by explicit resourCe allocations (Go)
Defined strategies for health for all need external resources (C6)
The needs for external resources of well-defined • trateaies for health for all Are receiving the 8u8tained support from more affluent countries (G6)
At lesat 80% of local communities at all levels nave well-established voluntary and formal c~nity organizations, which sre committed to continuous primary health car~ action programmes [Rll
The community contributes in c_sh and in kind to health or health related action [R2l
(b) Socioeconomic indicators.
The percentage of population 8e~ved with safe water 'io the home or within 15 minutes' .... alking distance i, 100 (G1.loll
The percentage of population with adequate sanitary facilities in the home or immediate vicinity is 100 (G1.lo2»
The adult literacy rate for both men and women exceeds 70% (GIl) (Toto 11M/F)
The gross national product per head exceeds US$500 at 1980 market prices (G12)
The daily per capita calorie availability exceeds 2500 c.lories (R3J
The daily per capita protein availability exceeds 70 gram. lR4l
Year
1982
1982
1917
1982
1982
1982
1982
1982
1982
1970
1982
1982
1982
Data
..
..
..
..
+
+
+ + .. +
..
+
Part IV Psge 43 30 December 1984
Actual Data
Yes
No
3.4
No
Ye •
Ye,
Ye •
Yeo
Ye,
Total - 86 Male - 82 Female - 88
us; 1678
2485
13.6
SourCe of Data
13/83
13183
13/83
13/83
13/J
13/83
nlB3
13/83
13183
13/83
06/B4
13/83
13/83
Notes: The number in brackets shDw the number given to the indicator in the global indicator list (Global Strategy for He:alth For All by the Year 2000, WHO. Ceneva. 1981 <"Health For All" Series N'o.~ psge. 15-16).
+ Yes No No information/not available
NA Not applicable
Source 13/83: Government's Report on Monitoring Progress in Implementing Strategy for HFA/2000, 1983
o6/84~ Information furnished by the Mini8try of Foreign Affairs, Republic of Korea. 25 September 1984
12/83; CHIP revi$ed by Government, 1983

Part IV 'aa.44 30 De_r 1984
WESTERN PACIFIC BEGlON DA~A SANK ON SOCIOtCOHOKIC AND HEALTH INDICATORS
Indicator(s) for~ BEPU!L!C OF KOalA
(0) HeAltb .tatus and guality of li~ indio.tora:
- At least 90% of newborn infanta have a birth weiabt of at l •• at 2500 g.ama (GR.l)
- At l~a.t 90% of children have a weight for age that corresponds to reference value, given in ARoe~ 1 td Development of Indicators for Monito~l .. PyogTe.8 10wards Health for All by the Y •• r 2000 (G8.2)
- The infant mortality rate for all identifiable sub-grOUps i. below 50 per 1000 live births (Gg)
.. Life. expeetanc.y at birtb i& over 60 years (ClO) (Tonal/H/Fl
Year .
1981
1982
1978-79
- MaterDal .ortality rate is below 3 per 1982 thousand live birth. {RS)
- Jo c •••• of diphtheria, tat_nus, ~oopin& cough, 1982 .... 1 ••• poliomyelitia and tuberculosis occur [161
Cd) 1Ddisttor. of the deLiverY of healtb care~
Primary health care is available to the whole popuution with at l.ut the following.
- The percentage of d~liverie. by trained health per.onnel i. 95 (G7.4.ll
- The percentage of children immunized againat diphtheria. tetanu8, wboopina cough, ~ea.lea. polioayeiitis and tuberculosis is 95 (G7.2)
- Local health care, including availability af at least 20 e •• entia1 drUC" within one bour's walk or travel i. 100% (G7.3)
- The percentage of children up to at least one year of age given routine cl\ ild. C8-,:e by trained health per.annel is 100 (G7.4.2)
- The percentage of pregnant woaen with at leaat three vi.it& fOT antenatal care i. 100 (Ci.4.1)
- the population growth rate is reduced to 1... than 1% eRn
.1981
Data
+
...
•
• +
•
3S.0
Actual Data
Tot~l • 66 y.ar. Hale - 63 year. 1..al. - 69 years
0.4
Source of Data
13/8]
12/83
13/83
11163
U/83
13/83

WESTERN PACIFIC BEGION DATA BANK ON SOCIOEOONOMIC AND HEALTH INDICAtORS
lruiieator(s) for. SAMOA
(_) HBalth policy indicators.
- Health for all bas received endprsement 88 policy at tbe biSbo.t official lavel (GIl
- Meeh.n1 ... fOr iavolv1D& ,.op1. in tbe jaip~....at.ti.OI\ o.f Itretlli •• have been fotIQd or att ... th.ned , and are .ctually funetionins (G2)
- At leaat 51 of the Bro •• national product is Ipent on healtb (G3)
- A reasonable percentace of national health eKpeaditure is devoted to primary health care (O4)
- "eouree. are equitably distributed (GS)
- Defined Itrategiea for health for all are a~comp8Died by explicit resource allocations (C6)
- Defined strategies for health for all need external resources (C6)
- 1.'be needs for external reSOurces of well-defilled atratesi •• for health for all are receiving sustained support from .ore affluent countries (G6)
- At leaat 80% of local communities at all levels have w.l1-e.t.bliahed voluntary and form.l com.unity oc&ani&ation •• which .~. co.&itted to continuou8 primary health care action prograftlDes [RI]
- The coaaunity contrib~t •• in ca.b and in kind to baalth OT health related ection (RZ)
(~) SociQeconomic indicatore;
- 'lbe percentage of population served wi th safe vater in the boII1e or within IS minutes' walking, distance is 100 (G7.1.1)
- The percentage of population with adequate sanitary facilities in the bome or immediate vicinity i. 100 (C7.1.2)
- the adult literacy ratio for both men and women .""eeda 10% (Cll) (Total/HIF)
- The gross national product per head exceeds US$500 at 1980 market pricea (GI2)
The daily per capita calorie availability exceeds 2500 calories [R3 j
The daily per capita protein availability exceeds 70 grams [R4]
'Year
1982
1982
1982
1982
1982
1982
1982
1982
1982
1982
1982
1982
1982
1982
1982
1982
Data
+
+
+
+
+
+
+
+
+
Part IV Poae 45 30 necomber 1984
Yea
Actual Data
Ye.
5.0%
25.0%
No
No
Yea
No
Ye.
Ye.
o
85
TOtal - 98 Male -Female -
US$ 302 or WS$ 290
3 500
41.5
Source of oata
13/83
13/83
13/83
13/RJ
12/83
13183
13/83
13183
12/83
12/83
13/83
12/83
13/8]
13{83
12/83
12/83
NOtes: the number in brackets show the number given to the indicator in the global indicator list (Global Str.t!~ for Health For All by the Year 2000, WHO, Geneva, 1981 ("Health Por All" Series NO.~ paces -76).
+ yes - No
Ho information/not available RA Not applicable
Source 13/83: Governmentls Report on Monitoring Progress in Implementing Strategy for HFA/2000. 1983
12/83: WPR Data Bank updated 'by CLD/Apia, 1983

Part IV ,..,.46 30 D •• _er 1984
WESTERN PACIFIC REGION DATA BANK ON SOCIOEOONOMIC AND HEALTH INDlCAroRS
Indicator(s) for: ~
(e) Health-at.lul aDd quality of life indicators:
- At l •• at 9at of newborn infants hQve a birth weight of at least 2500 grams (G8.1)
- At lust 9at- of children have a weight for age tba.t coruspond. to -refel'enc:e values given in __ 1 to Deve lopment of lad icatora for ... i.tod", PrOara .. towari. Haaltb for All by tho Year 2000 (G8.2)
- 'lItei:1lf.nt aortaUty rate for an identifiable .ub-stoups 10 bol"" SO per 1000 live births (G9)
- Life expectancy at birth i. over 60 years (GIO) ( 'rotall11{r)
- Ha-ternal mortality rate IS below 3 per thousand live births [ItS)
- 110 ea,e. of diphtheria, t.t.DU8~ vhoopil'll cough, .... 1 •• , poliomyeliti •• nd tubereuloais occur [R6]
I'el) Indicators of the delivery of health care;
PTi .. xy health care is available to the whole population with at least the following;
- The percent.se of deliv.~ie8 by trained health pan ....... 1 io 9~ (Q7.4.1)
- t'he peNenteae of cbi lanD imuni.ed asaiDlt diphtheria, tet.oul t wboepin& coulh, mea. 1 •• , pal'..,eliti. and tuberculooi. io 9~ (G7.2)
- LON! Mal'th car. , includina avanability of at l ... t 20 e •• ential drua_, within one bour's walk or tr .... l ia 100% (G1~3)
- The percentage of children up to at le.at one year of age eiven routine ~hild care by trained health per.onnel- ia 100 (G7 .4. 2)
- 1h. percentage of pregnant women with at least tbree visita for antenatal care ie too (G1 ~4.1)
- 'ltle PQ,pulation growth rate is reduced to 1... than 1% [R1 J
Year Data
1982 +
1982 +
1982 +
1982 +
1982 +
1982
1982
1982
1982 +
1982
1982
1982
Actual Data
98.5
91
Total Hal. Peule
0.2
- 63 year. 65 yeul
No eaee. for all die ..... except .aalea - 27
52 by trained health per.omel
BCG 96.0% DPT 80.11(3 do ••• ) Polio 80.1%(3 do ••• ) 1I000le. '9.2%
88
72
92
2.8
So\lX'Ce of Data
13/83
12/83
13/83
13/83
12/83
12/83
12/83
12/83
Ul83
12/83
12/83
12/83

WESTERN PACIFIC REGION DATA BANK ON SOCIOECONOMIC AND Hl!ALTH INDICATORS
Indicator(s) for. SINGAPORE
(a) Health policy indicators:
- Health for all has received endorsement 88 policy at the highest official level (el)
- Mechanisms for involving people in the i.plementation of strategies have been £o~ed or atrengthened, and are actually functioning (G2)
- At least 51 of the gross national product is spent on health (G3)
- A rea.onable percentaae of national health expenditure i. devoted to primary health care (G4)
- Re,ourees are equitably distributed (G5)
- Defined strategies for health for all are accompanied by explicit resource allocatioDs (G6)
- Defined strategies for health for all need external reSQurces (C6)
- The need. for e~terD41 resource. of well-defined strategies for health for all are receiving suetained support from more affluent countries (G6)
- At least 80% of local communities at all levels hav~ well-eatabli8hed voluntary and formal community o~.nization •• which are committed to continuous pri1D8ry health care action programmes [Rl]
- 1be community contributes in cash and in kind to bealth or health related action (R2 J
(b) Socioeconomic indicators:
1be percenta.e of population serv.d with safe water in the hace or within 1.5 minutes' walking distance i. 100 (G7.L.l)
'!'be percentage of population with adequate sanitary facilities in the home or i~diate vicinity i. 100 (C7.1.2l
- The adult literacy rate for both men and women e"ceeds 70% (Cll) (Total/MIF)
'Ibe gross national product per head exceeds U8$500 at 1980 market prices (GI2)
'!be daily per capita calorie availability exceeds 2500 calone. (RJ J
The daily per capita protein availability exceeds 70 grams (R4 J
Year
1982
1982
1980
1982
1982
1982
1982
1982
1982
1982
1982
1980
1981
1977
1977
])at.
+
+
NA
+
NA
+
+
+
+
+
Part IV Page 47 30 December 1984
Yes
Yes
2.7
Not
Actual Data
Appl icable
Yee
No
No
Not Appl icable
100
100
Total - 84.0 Male -Female -
us. 4200
3074
84.2
Source of nata
13r83
l3r8l
13/83
13/83
13/S3
13/8 ~
13183
13/83
13183
13/83
13/83
13/83
13/83
13/83
13/83
Notes; The number in brackets show the number given to the indicator in the global indicator list (Global Strategy for Health For All by the Year 2000. WHO, Geneva. 1981 ("Health For All" Series No.~ pales 75-76).
+ Yea No No info~ation/not available
NA Not applicable
Source 13/83: Government's Report on Monitoring Progress in Implementing Strategy for MFA/2000, 1983

Pllrt IV Page 48 30 Dec"",ber 1984
WESTtRN PACIFIC REGION DATA BANK ON SOCIOBOONOMIC AND HEALTH INDICA'lORS
:rn:dicator(s) for: SINGAPORE
(e) Health statu. and quality of life indicators:
- At least 90% of newborn infants have a birth weight of at least 2500 grams (G8.l)
- At least 9crL of children have a weight for age that corresponds to reference valUf;8 given in Annex 1 t~ Development of Indicators for Monitoring: Progreas 'lbwards Heal th for All by the Year 2000 (G8.2)
- The infant mortality rate for all identifiable 8ub-grol.lpa is below 50 per 1000 li'\T6 births (G9)
- Life expectancy at birth i. over 60 years (G1'O) (Tor.1IM")
- Maternal-mortality rate i. below 3 per thousand live birtbs [tl5)
- No cases of diphtheria, tetanus, whooping cough, meaalee. poliomy~liti6 and tuberculosis occur {R6}
Cd) Indicators of the delivery of health care:
Primary health can is available to the whole population with at least the £ol1o,",i08:
- the percentage of deliveries by trained health personnel is 95 (C7.4.1)
- The percentage of children immunized against diphtheria, tetsnl.lS, whooping cough, measles, poliomyelitis and tuberculosis is 95 (G7.2)
- Local health care, including availability of at least 20 essential drugs, within one hour's walk or travel is 100'% (G7.3)
- 'Itle percentage of children up to at least one year of age given routine child care by trained health personnel is 100 (G7.4.2)
- 'ltte percentage of pregnant women with at least three visits for antenatal care is 100 (G7.4.I)
- The population growth rate is redueed to Ie •• than 1% [R7]
year
1982
1982
1982
1981
1982
1982
1982
1982
1982
1982
1982
Data
+
+
• •
•
+
+
+
+
+
92.0
10.8
"'-tual Data
Total -Male - 69 y.are , ... le - 14 year.
0.1
Diphtheria poliomyelitis Tuberculosis Measles
Yes
Yea
yes
Yea
Yes
1.2
6 1
2179 1965
$oU'fCe of Data
13/83
13/83
Il/83
13/83
13/83
13/83
13/83
13/83
13/83
13/83
13/83

Part tv Page 49 30 December 1984
WESTERN PACIFIC NEGION DATA BANK ON SOCIOECONOMIC AND HEALTH INDICATORS
(.) Health policy indicator,_
Health fot all has received endO~8ement 88 policy at the highest of£i&ial level (Gl)
Mechanisms for involving people in the implementation of atracegies have been formed QT
stren&thened, and are actually functioning (GZ)
At least 5% of the gross national product is spent on health (G3)
A reasonable peTcentage of national health expenditure is devoted to primary health csre (G4)
Resources are equitably distributed (GS)
Defined strateSles for health for all are accompanied by explicit resource allocations (G6)
Defined strategies for health for all need exteTnal resourc.es (G6l
'the needs for external reS<lurces of well-defined .tr4elsie. for health for all are receiving sustained support from more affluent count~ie8 (G6)
At lea8~ 80% of local communities at all levels have well-establiShed voluntary and fonnal cODUIlunity organizations. which are committed to continuous primary health care action p~ogramme8 {RI]
the community contributes in cash and in kind to health or health related action [R2l
(b) Socioeconomic indicators~
The percentage of population served with safe water in the home or wituin 15 minutes' walking distance i. lOa (G7.1. t)
The percentage of population with adequate sanitary facilities in the home or immediate vicinity u lOa (G7.1.2)
The adult literacy rate for both men and women exceeds 70% (Gil) (Total/~/F)
The gross aatiQnal produc~ per head e~ceeds US$SOO at 1~80 market prices (G12)
- The ~aily per capita calorie availability exceeds 2500 calo~ies [i31
The daily peT capita protein availability exceed~ 70 gram. [M)
Year Data
1982 •
1981 +
1975-17
1975-71
\'e8
Actual Data
US$ 601
2128
41.9
Sourc. of Date
12/a3
12/84
03179
03/79
Notes; The nUiuber in braCkets show the numbec given to the indicator in the global indicator list (Gloual Strategy for Health For All by the Year 2000, WHO, Geneva, 1981 ("Health Fot" All" Series No.-3)-,pages 75-76).
--I- Yes No No information/not available
NA Not applicable
Sourc~ 03/79: 12/83: 12/84:
FAO Production Yearbook 1979 Country Review uy CLO/Honiara, 19B3 WPR Data Bank updated by CLO}Honiars J 1983 arid 1984

Part IV page 50 30 December 1984
WESTERN PACIFIC "'r.ION DATA BANK ON SOClOECONOll1C Al'" cEArtH lNDICATORS
Indicatods') for: SOLOMON IS1.A.MDS
(c) Health status and quality of life indicators;
- At least 90% of newborn infants have a birth weight of at l.ast 2500 grams (G8.1)
- At least 90% of children have a weight for age that corresponds to refe~ence values given in Annex 1 to Development of Indicators fo:r Monitoring Progress Towards Health for All by the Year 2000 (GB.2)
- The infent mortality rate for all identifiable Bub-groups is below 50 per tOOO live birtha (G9)
- Life expectancy at birth is over 60 years (CIO) (Total/M/F)
- Maternal mortality rate i$ below 3 per thousand live birtbs [R5}
- No cases of diphtheria, tetanus, whooping cough, measles. poliomyelitis "and tuberculosis occur {R6]
.
(d) Indicators of tbe delivery of health care;
primary health care ie available to the wnole popUlation with «t least the following:
- The percentage of deliveries by trained health personnel is 9$ (G7.4.1)
- The percentage of children i~unized against diphtheria, tetanus, whooping cough. ·1UeasleB, poliomyelitis and tuberculosis is 95 (C7.t)
Local health care, including availability of at least 20 essential drugs, within one hourIs walk or travel is 100% (G1.3)
The percentage of children up to at least one ye'ar of age given routine child care by trained health personnel is 100 (G7.4.2)
The percentage of pregnant women with at least three visits for arlteru&tal care is 100 (G1.4.1)
- The population growth rate is reduced to less tban 1% 1&7)
Year Data
1982 •
1982
.
40.0
Actual Data
Total - 54.0 years Male - 54.0 years Female - 54.0 years
3.4
Source of Data
12/84
12/84
12/84

WES'I'ERN PACIFIC REGION DATA BANK ON SOCtOECDNOKlC AND liEALTH INDICA'IORS
Indicator(a) for: 'IDltEUU ISLANDS
(a) keIth poli·cy indicators.
- Health for all has received endorsement as policy at the highest offieial level (el)
- Mechanisms for involving people in the implementation of strategies have been formed or strengthened, and are actually functioning (G2)
Year
1982
1982
- At least 5% of the groBs national product is spent on health (G3)
FY 1982/83
- A reaBonable percentage of national health expenditure is devoted to primary health care (G4)
Resources are equitably distributed (GS)
Defined &tr8t~8ie8 for health for all are Accompanied by explicit resource allocation (C6)
Defined strategies for health for all need external re&OU~~8 (G6)
The needs for external resources of well-defined strategies for health for all are receiving sustained support from more affluent countries (G6)
At least 80% of local communities at all levels have well-established voluntary and formal community organizations, which are committed to continuou8 priJD&ry health care action programmes [all
The community contribute a in caab and in kind to health or health related action (R2]
(b) Socioeconomic indicators:
'!tie percentage of population served with aafe water in the ha.e or within IS minutes ' walking distance i. 100 (C7.loI)
- The percentage of population with adequate sanitary facilities in the home or immediate viCinity is lOa (C7.lo2)
The adult literacy rate for both men and women exceeds 70% (GlI) (Total/H/F)
The gross national product per head exceeds US$500 at 1980 market prices (Gl2)
The daily per capita calorie availability exceeds 2500 calories {R31
The daily per capita protein availability exceeds 70 grlUllB lR4 J
1982
Data
+
+
+
No
PMrt IV page ;1 30 December 1984
Actual Data
Yes
8%
85% of the budget goes to services re lated PHe
Source of Data
13/83
13183
131.,
NOtes: the number in brackets show the number given to the indicator in the global indicator list (Global Strategy for Health For All by the Year 2000. WHO. Geneva, 1981 ("Health For All" Series No.~ paS" 75-76).
+ Yes No No information/not available
NA Not applicable
Source 13/83; Government1s Report on Monitoring Progreu in Implementing Strategy for HFA/2000. 1983
12/83: CHIP revised by Government, 1983

Part 1" Page 52 30 December 1984
WESTERN PACIFIC REGION DATA BANK ON SOCIOEOlNOIlIC AND HEALTH INDICAtoRS
:rndicator(s) for: TOKELAU ISLANDS
(c) Health statu. and 9uality of life indicators:
- At l~ast 90% of newborn infanta have a birth weight of at leaat 2S00 grams (cS.l)
- At le.st 90% of children have a wei.ght for age that corresponds to ref,ereMe valu •• given in An~ •• 1 to Dlv.lopment of Indicator. for II>llttorina pro, .... 'l'Owor". Hod th for All by tbe Yo" 2000 (08.2)
- ~. infant mortality rate for all identlfiabl« oub-atoupo io b_lov 50 ~~ 1000 live bi~th. (C9)
- Li fa I8spectaru:y at birth i. over 60 yean (G10) (Total /!lIP)
- Me ternal mort ality rate is below :3 per tbou.and live birth. (RS]
'tear
1980
- No ca.es of diphtheria, tetanus, Whooping cough. 1982 mea8les~ poliomyelitia and tuberculosi. OCcur lR6J
(d) Indicators of cbe delivery of health care:
Primary health care is available to the whole population with at least the following:
- The pereentage of deliveries by trained health personnel is 9S (c7.4.l)
- The percentage of children immunized against diphtheria. tetanus, wbooping cough, measles. polioeyelitis and tuberculosis i. 95 (07.2)
- Local health care. including availability of at lealt 20 e •• ential drug •• _ within one houl". walk or tr.vel i.. 100% (c:.7.3)
- The percentage of ehi ldren up to at leaat one year of age given routine child care by trained health personnel is 100 (G7.4.2)
- 'ltIe percentage of pregnant women with at least tbree ",iaits for antenatal care is 100 (C7.4.1)
- The population growth rate is reduced to Ie •• tMn 1); [R7\
,
Dot. ,
-
...
...
-
"
44.4
A/:.tua I Data
tlfmber of casea not available
Source of Data
12/83

)
Part IV Pa,e )3 30 D~c.embet" 19H~
WESTERN PACIFIC REGION DATA RANK ON SOCIOECONOMIC AND HEALTH INOICATORS
Indicator(s) for~ ~ Year Data
<a) Health policy indicators:
ne41th for all has received endorsement as policy at the bighest official level (Gl)
- Mechanisms for involving peopl~ in the implementation of strategies have been formed or strengthened, and are actually functioning (G2)
At leaat S% of the gross national product is spent on health (C3)
A reasonable perc~nt8ge of national health expenditure ia devoted to primary health care (G4)
Reaourc;.es are equitllbly distributed (G5)
Defined strategies for health for all are accompanied by explicit resource allocation (G6)
Defined strategies for health for all need external resources (G6)
The needs for ,external resources of well-defined st~ategie8 for health for all are receiving sustain~d support from more affluent countries (G6)
At least 80% of local communities at all levels have well-eseablished voluntary and formal community organizations, which are committed to continuous primary health care action p~ogrammes [RI}
- The community contributes in cash and in kind to health or health related action [Rll
(b) Socioeconomic iQd!cator8:
The percentage of population served with safe water in the home or within 15 minutes' walking distance i. 100 (G7.l.ll
The percentage of population with adequate sanitary facilities in the home or immediate vicinity is 100 (G7.1.2l
The adult literacy rate for both men and women exceed a 70t (Glll (15 years & overl (Tot.l/M/F)
The gross national product pet head exceeds US$500 at 1980 market prices (G12)
The 4aily per capita calorie availability exceeds 2500 calories [R3]
The daily per capita protein availability exceeds 7Q gr .... [Il4J
1982
1982
980/81
1982
1982
1982
1982
19B2
1982
1982
1982
1982
1976
1982
1982
+
+
+
+
+
+
+
+ +
+
Yes
Yes
4.5%
25.3%
Actusl Data
More wack is now being made on more equitable allocation and for more emph •• is on local health care
Yes
Tonga is receiving sustained support from mo't'e affluent countries taward6 this strategy for HFA
Yea
Yes
91.3
36.6
Total -Male - 79 Female - 18
US$ 499 or T$ 504
2750
6[,2
Source I)f D41tu
13/83
13/83
13/83
1]/83
!Jlb3
lJ/83
13/83
1 JIB)
13/83
13/83
13/83
13/83
13/83
03/79
Notes. The number in brackets show the number given to the indicator in the global indicator liBt (Clobal Strat~&y for ~~ealth For All by the Year 2000. WHO. Geneva, 1981 ("Health For Allu Se:des ~o. 3), pa&es 15-76).
+
NA
Yes No No information/not available Not applicab le
Source 13/83;
03/79: 12/83 :
Government's Report on Monitoring P~ogre81 in Implementing Strategy for HFA/2000~ 1983 fAD PrOduction Yearbook 1979 CH:IP revised by Government, 19&3

"~t IV Page 54 30 bee •• ber 1984
WESTERN PACIFIC RlGION DATA BANK ON SOCIOECONOMIC AND HEALTH INDICATORS 19S2
Indicator(.) for: ~
(c) Health status and quality of life indicators:
- At least 90% of newborn infanta have a birth weight of at least 2500 grams (C8.1)
- At least 90% of childreR have a weight for age that corresponds to teference values given in Annex 1 to Developaent of ludicatore for Monitorin& P'Cosre.s _Towards H.ealth for All by the 'lea< 2000 (GS.Z)
Year
1982
- The infant mor,ality t&te fo~ all identifiable 1981 8ub-,roup. i. ~elow 50 per 1000 live birth. (09)
~ Life .xpe~t.ncy at birtb i. over 60 years (GIO) 1976 (T"tal/K/P)
- Maternal ao~tality rate is below 3 per 1982 thousand live births [as}
- No ca.e~ of diphtheria. t.tanu8. whooping cough, 1982 ~.sle81 poliomyelitis and tubercula,i. occur [&6]
(d) ladie.tors of the delivery of health care;
Primary health care is available to the whole population ~ith at least the following.
- The percentage of deliveries by trained health personnel is 95 (G7.4.1)
- The percentage of enildten (infanta under one year of age) immunized against diphtheria, tetanus, whooping cough, .easies, poliomyelitis and tuberculosis is 95 (G7.2)
- LGcal nealth care, including availability of at least 20 essential druga, within one hour's walk or travel is 100% (G7.3)
- The percentage of children up to at least one year of age given routine child care by trained health persQnnel i. 100 (G1.4.2)
- The percentage of pregnant women with at least three visits for antenatal care is 100 (G7.4.1)
- The ropulation growtb rate is redu~ed to Ie •• than 1% [R7)
* Proportion of women attended during pregnancy - 65.5%
1~82
1982
1982
1982
1966-76
Data
+
+
-
...
-
99.6
21.7
Actual J>a.ta
Total - 58 Male -temale -
No data available
Diptllet'i.-, Pe'C'tuaaia Teeanus fol.io&yelitie Tuberculoai. Measles
85.5*
--3 -
48 187
Diptheria (3 doses) Tetanus (3 doses) Whooping cough (3 doses) Measles (3 doses) Poliomyelitis (3 doses) Tuberculosis (1 dose)
86.3%
40.0%
1.6
64.7% 46.7% 46.7% 39.4% 40.2% 8S.8%
..
Source of DAta
13/83
n/Sl
13/83
13163
12/83
13/S3
13/83
13/83
}lIB}
13/83

Part IV Page 55 30 DeceII1ber 1984
WESTERN PACIFIC Rf:GIOH DATA BrANK ON SOCIOEOOIIOMlC AND HEALTH INDICATORS
lDdieatorC.) fO~t T T of the PACIPIC ISLANDS Ye.' Data ""tun
Data
(8) lItelth policy inciieatora;
- Healtb for all has received endorsement as policy at the highest official level (Gl)
- "cbaniams for involvina people in the "~ .. ation 0'£ stratelie. have been formed or .tNllCthued, and are actually functioning (e2)
- .. 1 ••• t .5% of the gro •• national product is 'pent Oa h .. ltl! (C3) .
- A H.u.ODable pereentage of national bealth _pe~i:ture i. devoted to p'l'imary h~~lth care (G4)
- ... ..,urc: .. are equitably diatribute<i (G5)
- ..,' .. d ,trat •• i •• for healtb fo~ all are .C~' by explicit .. IOU ••• allocation. (06)
• ..~ •• crateli •• for baalth for all n.e' .~t.rftal H.O ...... (CI')
- 'lIN: ..... for external N!,ource. of weU- defined .Hat.,,"1 for health for all an nceivina elllt.i.e." .upport from more affluent countries (C6)
- AS. least 80% of local coauunitiel at all levels b.ve well-eatabli.bed voluntary and formal community o~ni •• tion., which are committed to continuous pri.a:ry health caN action progralllnes [Rt']
- lbe c~nity contributes in cash and in kind to bealth or bealth re lated a~tion IR2)
(b) SOcioeconomic indicators;
- 'tile percentaae of population served with aafe vater in the hoae or within 15 minutea' walking distance is 100 (G7.1.1)
- 'lb. ~rcentage of population with adequate sanitary facilitie. in the home or immediate vicinity is 100 (C1.1. 2)
- the adult literacy rate for both men and women _eed. 70% (Gil) ('l'otal/M/F)
• !be grol. national product per bead exceeds US'SOO at 1980 .. rket prices (Gi2)
- 1he daily per capita calorie availability exceeds 2500 calories (83 ]
- 1be daily per capita protein availability exceeds 70 gr .... [11>4)
"t..; lb_ number in brackets sbow the number siven to the indicator in the global indicator liat (Global WHO, Geneva, 1981 (nHealth For All" Seriea 'No.-n-:--
+ Yea - III>
Ro information/not available NA a;,t applicable
Source 10/82: 12/82: 12/83:
1982 ESCAP population Data Sheet Leaflet on Childhood CD. leport 3/82 CHIP reviled by Qovernment, 1983

Part IV PlIge 56 30 Deoember 1984
W]tSTERN PACIFIC REGION DATA BANK ON SOCIOEOONOMIC AND HEALTH INDICATORS
Indieator(s) for: T T OF THE PACIFIC ISLANDS Year Data Actual
Data Sou.rce of Data
r---~----------------------------r---r----r--'----------~------(e) Health status and quality of lite indicators:
- At least 90% of newborn iuianti have a birth weight of at least 2500 grams (CS.I)
- At least 90% of children have a weight for age that corresponds to reference vslues given in Annex 1 to Development of Indicators for Monitoring Progress 'nlwards Health for All by the Year ,2000 (C8.1l
- The infant mortality rate for all identifiable sub-groupa is below 50 per 1000 live births (G9)
- Li fe expectancy at birth is over 60 years (G1O) (Total/H/F)
- Maternal mortality rate is below 3 per thousand live births [RS]
1982
- No cases of diphtheria. tetanus, whooping cough. 19M measles, poliomyeliti. and tuberculosi. occur [R6)
(d) Indicators of the delivery of health care:
Primary health care i. available to the whole population with at le&.t the following;
The percent&&e of deliveries by trained health per.onnel is 9S (C7~4.1)
The percentage of children immunized against dipbtheria, tetanus, whooping cough. measles. pOliomyelitis and tuberculosis is 9S (G7.2)
Local health care. including availability of at lesst 20 essential drugs. within one houris walk or travel is 100% (G7.l)
The percentage of children up to at least one year of age given 'routine child care by trained health personnel is 100 (G7.4.2)
'l11e percentage of pregnant women with at least three visits for antenatal care is 100 (C7.4.l)
- The population growth rate is reduced to lese thall 1% [R7]
1982
+ 23.2
TUberc uIo.is 122 Measles 1
1.9
12/83 .
12/82
10/82

Part IV Page 57 30 December 1984
lJESTERN PACIFIC REGION DA'fA BANK ON SOCIOECONOMIC AND HEALTH INDICATORS
Indicator(s) for~ ~ Year Data
(.) Hfal\b policy indio.to~a1
- Ke.lth for all h •• received .ftd~~.ament a. policy at the hlaho,' official lovol (Gl)
- Machr.nislU for involving people in the implementacion of strategies have been formed or 8trenachened, and are actually functioning (G2)
- At least 5% of the gross national product is spent on health (G3)
- A reasonable percentage of national health expenditure is devoted to prima~y health care (G4)
- Resources are equitably distributed (CS)
Defined strategies for health for all are accompanied by explicit resource allocations (G6)
Defined strategies [or health for all need external resources (G6)
The needs fot external TaSOUTt,8S of \ofell-defit\ed strategies for health for all are receiving sustained support f~om more affluent countries (G6)
At least 80% of local communities at all levels have ~11-est8blished voluntary and formal co~unity organizations, which are committed to continuous p~imary health care action prograwmee lall
The community contributes in cash and in kind to health or health related action (R2)
(b) Socioeconomic ifldicatots;
The percentage of population served with safe water in the home or within 15 minutes I walking distance i. 100 (GI.1.ll
The percentage of population with adequate sanitary facilities in the home Qr immediate vicinity is 100 (GI.lo2)
The adult literacy tate for both men and women exceeds 70% (Gil) (Tot.1/M/F)
The gr08$ national product per head exceeds US$SOO at 1980 market prices (G12)
The daily per capita calorie availability exceeds 2500 calories [R3l
Tbe daily per capit~ protein availability exceeds 70 grams IR4l
1982 +
1982
1981
1982
1982
1982
1982
19B2 +
1982 +
1982 +
1982
1982 +
1981
Actual Data
Con.tituttQO contain •• statement on the right of citizens to li~e a healthy life
Yeo
7.8*
% not known
Yes
Financial sssiatance received from affluent countries and organizations for the dev~lQpmant of the naLional health services
% not available but one women's committee & one health committee exists on each island
Community provides free labour
13
82
Total Male
- 90
FenUlle -
US$ 421
SOUrce of Data
lll83
Il!B3
13/83
13103 I i
lJ!83
13!BJ
13/83 i
13/83
12/83
13/83
13/83
U/8)
Notes: The number in brackets 8ho~ the number given to the indicator in the global indicator list (Global Strategy for Health For All by the Yea.r 2000, WHO, Geneva, 1981 ("Health For Alll! Series No.3), pages 75-76).
+ Yes No
No info~tion/not Bvailable NA Not applicable * Percentage of GNP spent on health
through public expenditure
Source 13/83: Government's Report on Monitoring Progress in Implementing Strategy for "FA/20aO, 1983
12/83: CHIP revised by Government, 1983

Part IV Page 58 30 Dec,mbe. 198.
WESTERN PACIFIC REGION DATA BANK ON SOCIOECONOMIC AND HEALTH INDICATORS
Indicator(s) for. ~
(c) Health .tatu8 and quality of life iudicatots:
- At lea.t 90% of newbo~n infaats bave a birth wei,bt of at least 2SOD gram. (GB.I)
- At least 90% of children have a weight for age that cor.eaponds to reference values given in Annex 1 to Development of Indicatore for Monito~ia8 Progre8s Towards Health for All by the Year 2000 (Ga.2)
- The infant mortality ~ate for all identifiable Bub-groups i8 below 50 per 1000 live births (09)
- Life expectancy at bitth is over 60 years (GI0) (To tol/M/F)
- Maternal mortality rate is below 3 per thousand live births {&5]
- No cases of dipbtheria, tetanus. ~ooping cough, measles, poli~yeliti8 and tuberculosis occur (R6]
(d) Indicators of the delive~y of health eare;
Primary h.alth care ia avail.ble to the whole population with at ie.lt the following:
- The percentage of deliveries by trained health personnel is 95 (G1.4.1)
- The perceaUge of children i'llillll1.lnized against diphtheria~ tetaDus, whooping cough, measles, poliomyelitis and tuberculosis is 95 (G7.2)
- Local health Care, including availability of at least 20 essential drugs, within one hour's walk or travel is '100% (G7.J)
- The percentage of children up to at least one year of age given routine child care by trained heslth personnel is 100 (G7.4.2) ,
- The percentage of pregnant women with at least three visitB for antenatal care is 100 (G7 .. 4 .. 1)
- The population growth rate is ~educed to I ••• than 1% tR71
Year
1982
1982
1982
1982
1982
1982
1982
1982
1982
198~
1982
Data Actual
Data
+ 95.0
+ 96.7 (2-5 years of age)
+ 36.8
Total -- Male - 51 year. - :remale - 60 ye.ar.
+ 0
+ Diphtheria nil + Tetanu8 nil + Per tusa is nil + Measles nil
(children & adult) + Poliomyelitis nil - Tuberculosis 12
(child't'en and adult)
+ 100
- Diphtheria (3 doses) Tetanus (3 doses) Whooping cough (3 do.es) Measles (1 dose) Poliomyelitis (3 doses) TubercQlosis(o-l yr of age) Tuberculosis(6-l5 yr_ of age)
+ 100
.. 100
- 2.2
13/83
13/83
12/83
l3/83
13/83
13/8)
13/83
721 l3/83 72% 72% nil 66% 78% 5U%
13/83
13/83
13/83

Indicator(s) for: VANUATU
WESTERN PACIFIC REGION DATA BANK O~ SOCIOECONOMIC AND HEALTH INDICATORS
Year tlata Actual
Data
Part 1\1 Page JY 30 D~C~mbpl 1 'JHll
SourC.e of Datll
r-------------------------------~r_----r_--+--------------~---. (a) Realth policy indicators.
(b)
Health for a11 has received endorsement as policy at the highest official level (Gl)
Mechanisms for involving people in the implementation of strategies have been formed or strengthened, and are actually functioning (G2)
- At least S% of the gross national product is spent on health (G3)
A reasonable percentage of national health expenditure is devoted to primary health care (G4)
Resources are equitably distributed (GS)
Defined strateQies for health for all are accompanied by explicit resource allocations (G6)
Defined strategies for health for all need external resources (G6)
- The needs for external resources of well-defined strategies for health for all are receiving ~u~tail\ed support from more affluent countries (G6)
- At least 80~ at local communities at all levels have well-established voluntary and formal community organizations, which are committed to continuous priTQary health care action prQgr81lUlles [IU]
The community contributes in ~ash and in kinQ to health or health related action (R2}
~ocioeconomic indicatorll
The perc~nta&e tJf population served with sail;! water in tha home or ~ithin 15 ~inut$" walking distance i. 100 (G7.1.1)
The percentage of population with adequate sanitaJ:"Y facilities in the horue or immediate vicinity is 100 (G7.!.1)
The adul t 1 it~'['acy rate for both men and wom~n exceed. 10% (Gil) (TataI/M/F)
The gross national product per head exceeds US$500 at 1960 market prices (GI2)
The daily per capita calorie availability exceeds 2500 calories lR3}
Tbe daily per capita protein availability exceeds 70 gram. [R4]
1983 +
1983 +
1983 +
198) +
1983
198)
1983
198)
1979
197'1
1980 ,
1979 +
1979
Yea
Approximately 40-50% of the national health expenditure
Yes
External re8ource~ are received in various forms and from various organiz.ations
15
25
us$ 620
2546
68.4
d/8 J
1318)
ll183
l)/83
1)/83
n/8)
l3/83
13/83
13/83
Notes: The number in brackets show the number given to the indicator in the global indicator list (Global Strate&y for Health For All by the Year 2000, WHO, Geneva, 1981 ("Health For All" Series No.~age8 59-60).
... Yes No No information/not available
NA Not applicable
Source 13/83:
06/84:
12/84: 12/82:
Government's Report on Monitoring Progress in Implementing Strategy for HFA/:lOOO, 1983 Inforruation furnished by the National Health Otfice, Vanuatu, 7 August 1984 WPR Data Bank updated by CLO/Vila, 1983 and 1984 Leaflet on Chi Idbood CD, Report 3/82

Part LV Pago 60 30 Docember 1984
WESTERN PACIFIC REGION DATA BANK ON SOCIOECOHOKIC AND SKALTH INDICATORS
lndicator(s) fori VANUATU
(c) Health 8tatus and quality of life indicators;
- At least 901 of newborn infants have a birth weight of at least 2500 grams (G8.l)
- At. least 90% of children have' a weight for age that corresponds to reference valoes given in Annex 1 to DevelQ~nt of Indicators for Monitoring Progress T~ard6 Health for All by tno Ye.r 2000 (G8.2)
- The infant mortality rate for all idantifiable sub-groups ia below 50 per 1000 live births (09)
Life expectancy at birth is over 60 years (GlO) (fotal/K/F>
Maternal mortality rate is below 3 per thousand live births [a5)
No cases of diphtheria, tetanu8, whooping cough, measles, poliomyelitis and tuberculosis occur [R61
(d) Indicators of the delivery of health care:
Primary health care is available to the whole population with at least the following:
- The percentage of deliveries by trained health personnel is 95 (G7~4~l)
The percentage of children itllDlunized against diphtheria. ~etanus, whooping eQugh, measles, poliomyelitis and tuberculosis is 95 (G7.2)
- Local health care. including availability of at least 20 e.sential druss, within one hour's walk or travel is 1001 (G7.1)
The percentage of children up to at least one year of age given routine child care by trained health personnel is 100 (07.4.2)
The percentage of pregnant women ~ith at. least three visits for antenatal care is 100 (G7.4.1)
The population growth rate is reduced to less than 1% [R7)
Year Oats
1983 +
1983
1983
1983
1983
1983
1982
1983
1979
95.3
75
Total Kal. Female
1.1
ActUAl Data
- 5>50 yean - 41 years
Pertuuis 30 Tuberculosis 1 '11 Tetanus 5 Measles 400
61
approximately 80% of pop'n have acce •• to local health ca"te
around 90
3.2
Source of Data
06/84
12/84
06/84
06/84
06/84
06/84
13/83
06/84
06/84

Part IV Page 61 30 December 1984
WESTERN PACIFIC REGION DATA BANK ON SOCIOECONOMIC AND HEALTH INOICAtoftS
Indicatod.) for: SOCIALIST REPUBLIC OF VItT NAM
(a) neal~h policy indicato~8~
Health for all has received endorsement as policy at the highest official level (GI)
.. Me'chaniems for involving people in the implementation of strategies have been formed or &trength~ned, and are actually functioning (e2)
At leaet 51 of the gr088 national product ia spent in health (G3)
A reasonable percentage of national health expenditure i8 devoted to primary heal th care (G4)
Re.ourclI!J8 are equitably diltributed (GS)
Dafiaed atra,egiea fox healtn for all are .ccompanied by explicit re'ource allocations (G6)
Defined strategies for bealth for all need external resources (C6)
- ')'be need. for external resources of well-defined strategies for health for all are receiving su&tained support from more affluent countries (G6)
At least 80% of local communities at all leve19 have well-establisbed voluntary and formal community organizations, which are committed to continuous primary health care action programmes [R11
The community contributes in cash and in kind to health or health related action (R2l
Dat.
1982 +
1982 +
1982 +
1982 +
1982 +
1982 +
yes
Yea
55
Y ..
Ye,
Yes
Ac tUB 1
"" t.
Source of Dat a
D/B)
13/8]
11/11 )
13/8)
13/83
~------------------------------+-----+---~--------~-----(b) Socioeconomic indicators:
- The percentage of population served with s8fe ~ater in the home or within 15 minutes' walking distance i. 100 (C7.1.1)
- The percentage of population with adequate sanitary facilities in the home or immediate vicinity is 100 (C7.1.2)
- The adult literacy rate for both meo and women •• ceeds 70% (Gil) (Total/M/F)
'!be gross national product per head exceeds U5$500 at 1980 ma1."ket prices (G12)
'Itle daily per capita calorie availability exceeds 2500 calories [R31
The daily per capita protein availability exceeds 70 grams [M I
1982 +
1982
198~
1982
Total - 96 Male -Pemale -
less than US$ 500
1850
49
13/B3
13/8)
13/83
LJ /R:l
Notes: The number in brackets show the number given to the indicator in the global indicator li~t (GlobaJ Strategy for Health For /1.11 by the Year 2000. WHO. Geneva. 1981 (Ul1ea lth For All" S~ries No.-)-)-,pages 75-76).
+ Yes No No information/not available
NA Not applicable
Source 13/83:
12/82: 12/83:
Government'" Report on Monitoring Progre:sa in Implementing strategy for HFA/2000, 1983 Leaflet on Childhood CD, Report 3/82 WPR Data Bank llpdated by WRO/Hanoi, 1983

Part IV Page 62 30 December 1984
WESTERN PACIFIC REGION DATA BANK ON SOCIOEOONO>O:C AND HEALTH INDICATORS
Indicator{s) for;. SOCIAL 1ST REPUBLIC OF VIET NIIM
(c) Health statUB and qU41ity of life indicators:
- At least 90% of newborn infants have a birth weight of at least 2500 grams (GB.l)
- At least 904 of chi Idren have a weight for age that corresponds to reference values given in Annex 1 to Development of Indicators for Monitoring Progress TOwaroe Health for All by the Year 2000 (G8.2)
- The infant mortality rate for all identifiable sub-groups is below SO per 1000 live births (C9)
- Life expectancy at birth is over 60 years (GIO) (Total/KIF)
- Maternal mortality rate is below 3 per thousand live birth. ['15)
- No cases of diphtheria, tetanu., whooping cougn. .eaales, poliomydlitis and tuberculosis occur [R61
(d) Indicators of the delivery of health care:
Primary health care is avaih.ble to the whole population with at least the following:
- The pftrcentage of deliveries by trained health personnel is 95 (G7.4.l)
- The petcentage of children immunized against diphtheria, tetanus. whooping coug,h, measles, poliomyelitis and tuberculosis is 95 (G7.2)
- Local health care, including availability of at least 20 essential drugs. within one hour's walk or travel is 100% (G7.3)
- 'fhe percentage of chi ldren up to at 1 east one year of age given routine child care by trained health personnel is 100 (C7.4.2)
- The percentage of pregnant women with at least three visits for antenatal care is 100 (G7.4.1)
- The population growth rate is reduced to less than U IR7]
Year Data
1982 +
1982
1981 +
1982 + +
1980 +
1982 -
1982 +
1982
198Z
.Actual Data
92.0
86
33.9
Total -lIB Ie - 62 Female - 66
1.0
Di phtheria Pertu.eie Tatanul PoliOlDyelitie Measles
100
75
90
2.3
206~ 46624
972 892
59300
Source of Data
13/83
13/83
12183
13/83
13/83
12/82
13/83
13/83
12/83

WESTERN PACIFIC REGION DATA BANK ON SOCIOECDNOMIC AND HEALTH INDICATORS
Part IV Page b.l 30 December 1984
I I Actua 1 Source
i~ ____ In __ d_i_C_._t_o_r_(_._)_f_o __ r_: __ W_AL __ L __ 'S_'_A_N_D __ F_U_T_U_N_A __________________ -1~--y,-e-.-r __ -1 ___ Da __ t_.-1C-, ______ oa __ t_. ______ -1 ___ 0_f_~~~ ! 1(8) Healtb policy indicators:
- Health for all has received endorsement as policy at the highest official level (Gl) I Mechanisms fOT involving people in the implementation of strategies have been fonned or strengthened, and are actually functioning (C2)
At least 5% of the gross national product is spent on health (G3)
A re~8onable percentage of national health expenditure is devoted to primary heal th care (G4)
Resources are equitably distributed (GS)
Defined strategies for health for all a~e accompanied by explicit resource allocations (G6)
Defined strategies for health for all need external resources (G6)
The needs for external resources of well-defined strategies for health for all are receiving sustained support from more affluent countries (G6)
At lean 80% of local communities at all levels have well-established voluntary and formal community organizations, which are committed to continuous primary health care action programmes (Rl J
the community contributes in cash and in kind to health or health related action {R2 J
(b) Socioec.Jnomic indicators;
- The percentage of population served with safe water in the home or within IS minutesl walking distance i. 100 (G7.1.1)
The percentage of population with adequate sanitary facilities in the home or immediate vicinity is 100 (C7.1.2)
The adult literacy rate for both men and women exceeds 70% (GIl) (Iotal/M!F)
The gross national product per head exceeds US~500 at 1980 market prices (G12)
The daily per capita calorie availability exceeds 2500 calories (al]
The daily per capita protein availability exceeds 70 grams [R4 J
~,----------------------------____________ ~ ____ _L _____ L-________ , __ 4 ______ _
N:>tes: The oWllber in brackets show the number given to the indicator in the global indicator list (Global Strategy for Health For All by the Year 2000, WHO, Geneva, 19tH (IlHealth For All" Series No.-3~ pages 75-76).
+ yes No No information/not available
NA Nlt applicable
Source 12/82; Leaflet on Childhood CD, Report 3/82

Part IV Page 64 30 December 1984
WESTERN PACIFIC RF.GION DATA BANK ON SOCIOECONOMIC AND HEALTH INDICATORS
Indicator(s) for: WALLIS AND FUTUNA
(c) Health atatus and quality of life indic.ator5~
- At least 90% of newborn infants have a birth weight of at least 2500 grams (G8.1)
- At least 9ca of chi ldren have a weight for age that corresponds to reference values given in Annex 1 to Development of Indicators for Monitoring Progress 'lbwards Haalth for All by the Year 2000 (G8.2)
- The infant mortality rate for all identifiable 8ub-groups is below 50 per 1000 live births (G9)
- Life expectancy at birth is over 60 years (GIO) (TOtal/HIF)
- Maternal mortality rate is below 3 per thousand live births (R5]
- No cases of diphtheria) tetanus, whooping cou~. measles) poliomyelitis and tuberculosis occur [R6]
(d) Indic.ators of the delivery of health care;
Primary health care is available to the whole population with at least the following:
- The percentage of deliveries by trained health personnel is 95 (G7.4.1)
- The percentage of children immunized against diphtheria, tetanus, whooping cough, tDeaales, poliomyelitis and tuberculosis is 95 (07.2)
- Local health care, including availability of at least 20 essential drugs, within one hourIs walk or travel is 100% (C7.:3>
- Ihe percentage of children up to at least one year of age given routine child care by trained health personnel is 100 (G7.4.Z)
- The percentage of pregnant women with at least three viaits for antenatal care is 100 (G7.4.1)
- '!be population growth rate is reduced to less than 1% [R7]
Year Dat.
1982
Actu81 Data
'Tuberculosis 5 Measles 87
Source ... of oata
12/82

WORLD HEALTH ORGANIZATION Regional Office for the Western Pacific
WESTERN PACIFIC REGION DATA BANK
ON SOCIOECONOMIC· AND HEALTH INDICATORS
Sources of information
Manila, Philippines Augus t 1983
Rev/Jun. 1984 Rev /Dee. 1984

01/78 01/81 01/82
03/79 03/79
03/79.1
03/80
06/75
06/78 06/79
Ob/80 06/80
06/80 06/80 06/81 06/81 06/82 06/82 06/82
06/82 06/83 06/81
06/84
06/84
06/84
06/84
06/84 :
06/84 ;
06/84
06/84
WESTERN PACIFIC REGION DATA BANK
ON SOCIOECONOMIC AND HEALTH INDICATORS
Sources of Information
UN Demographic Yearbook, 1978 UN Demographic Yearbook, 1981 UN Demographic Yearbook, 1982
FAG Production Yearbook 1979
Page 1
Urban, Rural and City Population, 1950-2000, as Assessed in 1978, UN, 1979 World Population Trends and Prospects by Country 1950-2000 Summary Report of the 1978 Assessment, UN, 1979 FAa Production Yearbook 1980
Morbidity, Mortality and Epidemiological Statistics, MOH, Nauru, 1975 Trust Territory of the Pacific Islands, 1978 Annual Report Yearbook of Public Health and Social Statistics, Republic of Korea Ministry of Health, Annual Report 1979-1980, Fiji Ministry of Social Services. Health Division Annual Report 1980, Tuvalu Report of the Ministry of Health, 1980, Tonga Government letter of 6 June 1980, People's Republic of China Annual Report on Health Services, 1981, Tok~1au Official National Publication Annual Report on Health Services, 1982, Singapore Trust Territory of the Pacific Islands, 1982 Annual Report Ministry of Social Services, Health Division Annual Report 1982, Tuvalu American Samoa Plan for Health, 1980-1983 and 1982-1986 Ministry of Health, Annual Report 1981, Fiji Report of the Administrator of Tokelau for the Year-Ended 31 March 1983 Information furnished by the Government of Macao, 8 August 1984 Information furnished by the Commonwealth Department of Health, Australia, 27 July 1984 Information furnished by the Ministry of Health and Welfare, Japan, 2 August 1984 Information furnished by the National Health Office, Vanuatu, 7 August 1984 Information furnished by the Ministry of Foreign Affairs, Republic of Korea, 25 September 1984 Information furnished by the National Economic and Development Authority, Philippines, 29 October 1984 Information furnished by the Ministry of Health, Cook Islands, 12 November 1984 Information and Documentation System Unit, Planning and Development Division, Ministry of Health, Malaysia, 30 Oc tober 1984

06/84
06/84
06/84.1 06/84.1 06/84.2
07/79 07/81
10/81
11/75
11/80 11/82
12/80 12/80 12/80 12/82
12/82
12/82 12/82 12/82.1 12/82.2
12/82.3 12/82.4 12/83 12/83
12/83 12/83.1 12/83.1
12/84 12/84
WESTERN PACIFIC REGION DATA BANK
ON SOCIOECONOMIC AND HEALTH INDICATORS
Sources of Information
Page 2
Information furnished by the Ministry of Education and Health, Negara Brunei Darussalam, 28 November 1984 Vital Statistics 1980-1982, Department of Statistics, Malaysia Report of Dr Trinidad Osteria, 1983 Federal Expenditure, 1984, Ministry of Finance, Malaysia Information and Documentation System Unit, Planning and Development Division, Ministry of Health, Malaysia
1979 World Bank Atlas 1981 World Bank Atlas
1982 ESCAP Population Data Sheet
Fifth Report on the World Health Situation 1969-1972, WHO, 1975 World Health Statistics Quarterly, Vol. 33, No.3, 1980 World Health Statistics Annual 1982, Vital Statistics and Causes of Deaths
1979 Country Health Report for 31st WHO RCM, 1980 Government Reports on the Number of Cases of CD Country Health Information Profile (CHIP) revised, 1980 Government responses to WHSA Questionnaire on Health Manpower, 1982 Government responses to World Health Statistics Annual Questionnaire on Certain Causes of Infectious and Parasitic Diseases and on Number of Deaths by Cause Country Review by WRC/CLO, 1983 & 1984 Government Reports on the Number of Cases of CD Leaflet on Childhood Communicable Diseases, Report 3/82 Government's Reply to EPI Health Information System Questionnaire, 1982 WHO Seminar on Financing Health Development, 1982 Report on the progress of health activities, 1982 WHO/WPRO publication/document Country Health Information Profile (CHIP) revised by Government, 1983 WPR Databank updated by WRC/CLO, 1983 Country Review by CLO/Tarawa, 1983 Summary Report on Health Activities Carried Out in New Caledonia and Dependencies in 1982 (34th Regional Committee Meeting, 1983) WPR Dats Bank updated by CLO, Honiara, 1983 and 1984 Government responses to WHSA Questionnaire on Health Manpower, 1984

13/83 :
14/76 14/80
14/80.1 14/82
14/83
WESTERN PACIFIC REGION DATA BANK
ON SOCIOECONOMIC AND HEALTH INDICATORS
Sources of Information
Page 1
Government's Report on Monitoring Progress ~n Implementing Strategy for HFA/2000, 1983
Rural Health Service by Dr Ratard, 1976 South Pacific Epidemiological and Health Information Service, Annual Report 1980 South Pacific Economies 1980 Key Indicators of Developing Member Countries of ADB, April 1982 1983 World Population Data Sheet, Population Reference Bureau Inc., Washington, DC
Doc 9214C Disk 1171A