WELLS FARGO MASTER TRUST Form N-CSR Filed 2017-07 ...
311
Business Address 525 MARKET STREET 12TH FLOOR SAN FRANCISCO CA 94105 800-222-8222 Mailing Address 525 MARKET STREET 12TH FLOOR SAN FRANCISCO CA 94105 SECURITIES AND EXCHANGE COMMISSION FORM N-CSR Certified annual shareholder report of registered management investment companies filed on Form N-CSR Filing Date: 2017-07-27 | Period of Report: 2017-05-31 SEC Accession No. 0001193125-17-238203 (HTML Version on secdatabase.com) FILER WELLS FARGO MASTER TRUST CIK:1087961| IRS No.: 000000000 | State of Incorp.:DE | Fiscal Year End: 1231 Type: N-CSR | Act: 40 | File No.: 811-09689 | Film No.: 17985624 Copyright © 2017 www.secdatabase.com . All Rights Reserved. Please Consider the Environment Before Printing This Document
-
Upload
khangminh22 -
Category
Documents
-
view
1 -
download
0
Transcript of WELLS FARGO MASTER TRUST Form N-CSR Filed 2017-07 ...
Business Address525 MARKET STREET12TH FLOORSAN FRANCISCO CA 94105800-222-8222
Mailing Address525 MARKET STREET12TH FLOORSAN FRANCISCO CA 94105
SECURITIES AND EXCHANGE COMMISSION
FORM N-CSRCertified annual shareholder report of registered management investment companies filed on
Form N-CSR
Filing Date: 2017-07-27 | Period of Report: 2017-05-31SEC Accession No. 0001193125-17-238203
(HTML Version on secdatabase.com)
FILERWELLS FARGO MASTER TRUSTCIK:1087961| IRS No.: 000000000 | State of Incorp.:DE | Fiscal Year End: 1231Type: N-CSR | Act: 40 | File No.: 811-09689 | Film No.: 17985624
Copyright © 2017 www.secdatabase.com. All Rights Reserved.Please Consider the Environment Before Printing This Document
Table of Contents
UNITED STATESSECURITIES AND EXCHANGE COMMISSION
Washington, D.C. 20549
FORM N-CSR
CERTIFIED SHAREHOLDER REPORT OF REGISTEREDMANAGEMENT INVESTMENT COMPANIES
Investment Company Act file number: 811-09689
Wells Fargo Master Trust(Exact name of registrant as specified in charter)
525 Market St., San Francisco, CA 94105(Address of principal executive offices) (Zip code)
C. David MessmanWells Fargo Funds Management, LLC
525 Market St., San Francisco, CA 94105(Name and address of agent for service)
Registrant��s telephone number, including area code: 800-222-8222
Date of fiscal year end: May 31
Registrant is making a filing for 13 of its series:
Wells Fargo C&B Large Cap Value Portfolio, Wells Fargo Diversified Large Cap Growth Portfolio, Wells Fargo Emerging GrowthPortfolio, Wells Fargo Index Portfolio, Wells Fargo International Growth Portfolio, Wells Fargo International Value Portfolio, WellsFargo Large Company Value Portfolio, Wells Fargo Small Company Growth Portfolio, Wells Fargo Small Company Value Portfolio,Wells Fargo Core Bond Portfolio, Wells Fargo Real Return Portfolio, Wells Fargo Managed Fixed Income Portfolio, and Wells FargoStable Income Portfolio.
Copyright © 2017 www.secdatabase.com. All Rights Reserved.Please Consider the Environment Before Printing This Document

Date of reporting period: May 31, 2017
Copyright © 2017 www.secdatabase.com. All Rights Reserved.Please Consider the Environment Before Printing This Document

Table of ContentsITEM 1. REPORT TO STOCKHOLDERS
Copyright © 2017 www.secdatabase.com. All Rights Reserved.Please Consider the Environment Before Printing This Document
Table of ContentsAnnual ReportMay 31, 2017
Allocation Funds
∎ Wells Fargo Growth Balanced Fund
∎ Wells Fargo Moderate Balanced Fund
Copyright © 2017 www.secdatabase.com. All Rights Reserved.Please Consider the Environment Before Printing This Document
Table of ContentsReduce clutter. Save trees.
Sign up for electronic delivery of prospectuses and shareholder reports at wellsfargo.com/advantagedelivery
Conte nts
* A complete schedule of portfolio holdings as of the report date may be obtained, free of charge, by accessing the following website:https://www.wellsfargofunds.com/assets/edocs/regulatory/holdings/index-ann.pdf or by calling Wells Fargo Funds at 1-800-222-8222. This completeschedule, filed on Form N-CSR, is also available on the SEC�s website at sec.gov.
**A complete schedule of portfolio holdings as of the report date may be obtained, free of charge, by accessing the following website:https://www.wellsfargofunds.com/assets/edocs/regulatory/holdings/core-bond-ann.pdf or by calling Wells Fargo Funds at 1-800-222-8222. This completeschedule, filed on Form N-CSR, is also available on the SEC�s website at sec.gov.
The views expressed and any forward-looking statements are as of May 31, 2017, unless otherwise noted, and are those of the Fund managers and/or Wells Fargo FundsManagement, LLC. Discussions of individual securities, or the markets generally, or any Wells Fargo Fund are not intended as individual recommendations. Future eventsor results may vary significantly from those expressed in any forward-looking statements. The views expressed are subject to change at any time in response to changing
Letter to shareholders 2Performance highlights 4Fund expenses 15
Portfolio of investmentsWells Fargo Growth Balanced Fund 16Wells Fargo Moderate Balanced Fund 17
Financial statementsStatements of assets and liabilities 18Statements of operations 19Statements of changes in net assets 20Financial highlights 22Notes to financial statements 26Report of independent registered public accounting
firm 35
Master portfolios
Portfolio of investmentsWells Fargo C&B Large Cap Value Portfolio 36Wells Fargo Diversified Large Cap Growth Portfolio 40Wells Fargo Emerging Growth Portfolio 46Wells Fargo Index Portfolio (Summary portfolio of
investments)* 51
Wells Fargo International Growth Portfolio 58Wells Fargo International Value Portfolio 62Wells Fargo Large Company Value Portfolio 70Wells Fargo Small Company Growth Portfolio 75Wells Fargo Small Company Value Portfolio 81Wells Fargo Core Bond Portfolio (Summary portfolio of
investments)** 86Wells Fargo Managed Fixed Income Portfolio 93Wells Fargo Real Return Portfolio 104Wells Fargo Stable Income Portfolio 115
Financial statementsStatements of assets and liabilities 124Statements of operations 128Statements of changes in net assets 132Financial highlights 145Notes to financial statements 147Report of independent registered public accounting
firm 163Other information 164List of abbreviations 173
Copyright © 2017 www.secdatabase.com. All Rights Reserved.Please Consider the Environment Before Printing This Document

circumstances in the market. Wells Fargo Funds Management, LLC and the Fund disclaim any obligation to publicly update or revise any views expressed or forward-looking statements.
NOT FDIC INSURED ? NO BANK GUARANTEE ? MAY LOSE VALUE
Copyright © 2017 www.secdatabase.com. All Rights Reserved.Please Consider the Environment Before Printing This Document
Table of Contents
2 Wells Fargo Allocation Funds Letter to shareholders (unaudited)
1 The S&P 500 Index consists of 500 stocks chosen for market size, liquidity, and industry group representation. It is a market-value-weighted index witheach stock�s weight in the index proportionate to its market value. You cannot invest directly in an index.
2 The Morgan Stanley Capital International (MSCI) All Country World Index (ACWI) ex USA Index (Net) is a free-float-adjusted market-capitalization-weighted index that is designed to measure the equity market performance of developed markets, excluding the United States and Canada.Source: MSCI. MSCI makes no express or implied warranties or representations and shall have no liability whatsoever with respect to any MSCI datacontained herein. The MSCI data may not be further redistributed or used as a basis for other indexes or any securities or financial products. This reportis not approved, reviewed, or produced by MSCI. You cannot invest directly in an index.
Andrew OwenPresidentWells Fargo Funds
Despite heightened marketvolatility at times, in general,
global stocks delivereddouble-digit results and
bond markets had smaller,but positive, results as well.
Dear Shareholder:We are pleased to offer you this annual report for the Wells Fargo Allocation Fundsfor the 12-month period that ended May 31, 2017. Despite heightened marketvolatility at times, in general, global stocks delivered double-digit results and bondmarkets had smaller, but positive, results as well. U.S. and international stocksreturned 17.47% and 18.24% for the 12-month period, respectively, as measured bythe S&P 500 Index1 and the MSCI ACWI ex USA Index (Net)2; within fixed income,the Bloomberg Barclays U.S. Aggregate Bond Index3 returned 1.58%.
Worries over interest rates and the U.K.��s Brexit vote largely drovemarkets during the early part of the reporting period.The first three weeks of June 2016 brought heightened volatility, spurred largely bya disappointing jobs report and uncertainty over whether the U.K. would remain inthe European Union (E.U.). The U.K.�s Brexit vote on June 23 shocked countriesworldwide. Stock markets fell as investors worried that the U.K.�s departure fromthe E.U. would slow global growth and prolong the low-interest-rate environment.Following the initial rout, however, U.S. stocks rose as investors seemed to decidethat any negative effects would be more localized and not create a serious risk forglobal growth. Similarly, government bonds rallied immediately post-Brexit, and non-Treasury sectors rallied soon after as investors regained their appetite for risk. As aresult, most bond markets remained in a situation of ultralow yields and tight creditspreads. Interestingly, U.S. bonds continued to be supported by demand from bothdomestic and nontraditional foreign buyers looking for positive yield since U.S.interest rates were the highest among developed-country bonds.
Globally, stocks delivered positive results in the third quarter of 2016;bond yields remained low.Stocks� upward trend continued into August and then lost some steam. Ever sincethe Great Recession, markets worldwide have been supported to varying degreesby accommodative policies from leading central banks, including the FederalReserve (Fed), European Central Bank, Bank of England, and Bank of Japan. As aresult, investors have watched closely for any signs that global central banks mighttighten their measures. In the U.S., early-September comments by several Fedofficials appeared to suggest a September interest-rate increase, which sent stockand bond prices down. However, stocks surged following the Fed�s September 20meeting on news that the Fed had decided to delay a rate increase to later in 2016.In bond markets, interest rates rose during the quarter but remained at historicallylow levels as a result of easy monetary policies, subdued global growth, and modestinflation expectations. Yields did rise, however, after bottoming in early July,because market participants felt that yields had overshot the real risks of the U.K.�sBrexit vote and as economic activity strengthened.
During the fourth quarter of 2016, prospects for faster growth and higherinterest rates in the U.S. influenced markets.Early in the fourth quarter of 2016, U.S. stocks tended to trade lower amid concernssuch as a likely interest-rate increase and uncertainty over the approaching generalelection. However, following Donald Trump�s election as
Copyright © 2017 www.secdatabase.com. All Rights Reserved.Please Consider the Environment Before Printing This Document

3 The Bloomberg Barclays U.S. Aggregate Bond Index is a broad-based benchmark that measures the investment-grade, U.S. dollar�denominated, fixed-rate taxable bond market, including Treasuries, government-related and corporate securities, mortgage-backed securities (agency fixed-rate and hybridadjustable-rate mortgage pass-throughs), asset-backed securities, and commercial mortgage-backed securities. You cannot invest directly in an index.
Copyright © 2017 www.secdatabase.com. All Rights Reserved.Please Consider the Environment Before Printing This Document
Table of Contents
Letter to shareholders (unaudited) Wells Fargo Allocation Funds 3president in early November, U.S. stocks began to rally. Investors appearedoptimistic that the new administration would usher in a series of progrowth policies,and supportive economic news helped the rally carry through the quarter. Thebuoyant environment sent interest rates higher as well. At its mid-Decembermeeting, Fed officials raised their short-term target interest rate for the first time ina year by a quarter percentage point to between 0.50% and 0.75%. The fourthquarter also saw the implementation of the Securities and ExchangeCommission�s new rules for money market funds, which included floating netasset values (NAVs) for institutional prime and municipal money market funds aswell as the possibility of liquidity fees and redemption gates. In the year leading upto money market fund reform implementation, nearly $1 trillion in assets movedfrom these types of money market funds into government money market funds,which continued to transact at a stable $1 NAV. Outside of the U.S., the prospectsfor faster U.S. growth appeared to trigger some acceleration in Europe.
Stock markets rose again as economies grew in the first five months of2017.Stocks rallied globally, supported by global economic growth. In the U.S.,unemployment continued to decline, consumer sentiment improved, and inflationinched up. In March, Fed officials raised their short-term target interest rate by aquarter percentage point to between 0.75% and 1.00%. With the Fed�s target-rateincrease, short-term bond yields also rose modestly. Longer-term Treasury yieldswere little changed, however, leading to positive performance. Investment-gradecorporate bonds and high-yield bonds benefited from strong demand. Non-U.S.bond yields remained within a modest range as well and credit sectorsoutperformed. Outside the U.S., stocks in both developed and emerging marketsbenefited from global economic growth and a weaker U.S. dollar. In addition,European stocks advanced as political risk declined with the election of Frenchpresident Emmanuel Macron, a center-left candidate who supports the EuropeanUnion.
Don��t let short-term uncertainty derail long-term investment goals.Periods of uncertainty can present challenges, but experience has taught us thatmaintaining long-term investment goals can be an effective way to plan for thefuture. To help you create a sound strategy based on your personal goals and risktolerance, Wells Fargo Funds offers more than 100 mutual funds spanning a widerange of asset classes and investment styles. Although diversification cannotguarantee an investment profit or prevent losses, we believe it can be an effectiveway to manage investment risk and potentially smooth out overall portfolioperformance. We encourage investors to know their investments and tounderstand that appropriate levels of risk-taking may unlock opportunities.
Thank you for choosing to invest in Wells Fargo Funds. We appreciate yourconfidence in us and remain committed to helping you meet your financial needs.
Sincerely,
Andrew OwenPresidentWells Fargo Funds
Copyright © 2017 www.secdatabase.com. All Rights Reserved.Please Consider the Environment Before Printing This Document
Although diversificationcannot guarantee aninvestment profit or preventlosses, we believe it can bean effective way to manageinvestment risk andpotentially smooth out overallportfolio performance.
Copyright © 2017 www.secdatabase.com. All Rights Reserved.Please Consider the Environment Before Printing This Document

For further information about your Fund, contact your investment professional, visit our website at wellsfargofunds.com,or call us directly at 1-800-222-8222. We are available 24 hours a day, 7 days a week.
Copyright © 2017 www.secdatabase.com. All Rights Reserved.Please Consider the Environment Before Printing This Document
Table of Contents
4 Wells Fargo Allocation Funds Performance highlights (unaudited)
Wells Fargo Growth Balanced Fund1
Investment objectiveThe Fund seeks total return, consisting of capital appreciation and current income.
ManagerWells Fargo Funds Management, LLC
SubadviserWells Capital Management Incorporated
Subadvisers for the affiliated master portfolios
Portfolio managers
Average annual total returns (%) as of May 31, 2017
Including sales charge Excluding sales charge Expense ratios2 (%)Inception date 1 year 5 year 10 year 1 year 5 year 10 year Gross Net3
Class A (WFGBX) 10-14-1998 4.55 9.32 4.12 10.93 10.63 4.73 1.35 1.20Class C (WFGWX) 10-1-1998 9.10 9.80 3.95 10.10 9.80 3.95 2.10 1.95Administrator Class (NVGBX) 11-11-1994 � � � 11.19 10.90 5.00 1.27 0.95Growth Balanced Blended Index4 � � � � 11.88 10.22 5.84 � �
Bloomberg Barclays U.S. Aggregate BondIndex5 � � � � 1.58 2.24 4.46 � �
MSCI EAFE Index (Net)6 � � � � 16.44 10.21 1.06 � �
Russell 1000® Growth Index7 � � � � 20.27 15.98 8.77 � �
Russell 1000® Value Index8 � � � � 14.66 14.67 5.15 � �
Russell 2000® Index9 � � � � 20.36 14.04 6.40 � �
S&P 500 Index10 � � � � 17.47 15.42 6.94 � �
Figures quoted represent past performance, which is no guarantee of future results, and do not reflect taxes that a shareholder may pay on funddistributions or the redemption of fund shares. Investment return and principal value of an investment will fluctuate so that an investor�s shares, when redeemed, may beworth more or less than their original cost. Performance shown without sales charges would be lower if sales charges were reflected. Current performance may be loweror higher than the performance data quoted, which assumes the reinvestment of dividends and capital gains. Current month-end performance is available on the Fund�swebsite, wellsfargofunds.com.
Index returns do not include transaction costs associated with buying and selling securities, any mutual fund fees or expenses, or any taxes. It is not possible to investdirectly in an index.
Analytic Investors, LLCArtisan Partners Limited PartnershipCooke & Bieler, L.P.Galliard Capital Management, Inc.
Golden Capital Management, LLCLSV Asset ManagementPeregrine Capital Management, LLCWells Capital Management Incorporated
Kandarp Acharya, CFA®, FRMThomas C. Biwer, CFA®Petros Bocray, CFA®, FRM�
Aldo Ceccarelli, CFA®Christian Chan, CFA®Erik Sens, CFA®
Copyright © 2017 www.secdatabase.com. All Rights Reserved.Please Consider the Environment Before Printing This Document

For Class A shares, the maximum front-end sales charge is 5.75%. For Class C shares, the maximum contingent deferred sales charge is 1.00%. Performance including acontingent deferred sales charge assumes the sales charge for the corresponding time period. Administrator Class shares are sold without a front-end sales charge orcontingent deferred sales charge.
Please see footnotes on page 6.
Copyright © 2017 www.secdatabase.com. All Rights Reserved.Please Consider the Environment Before Printing This Document
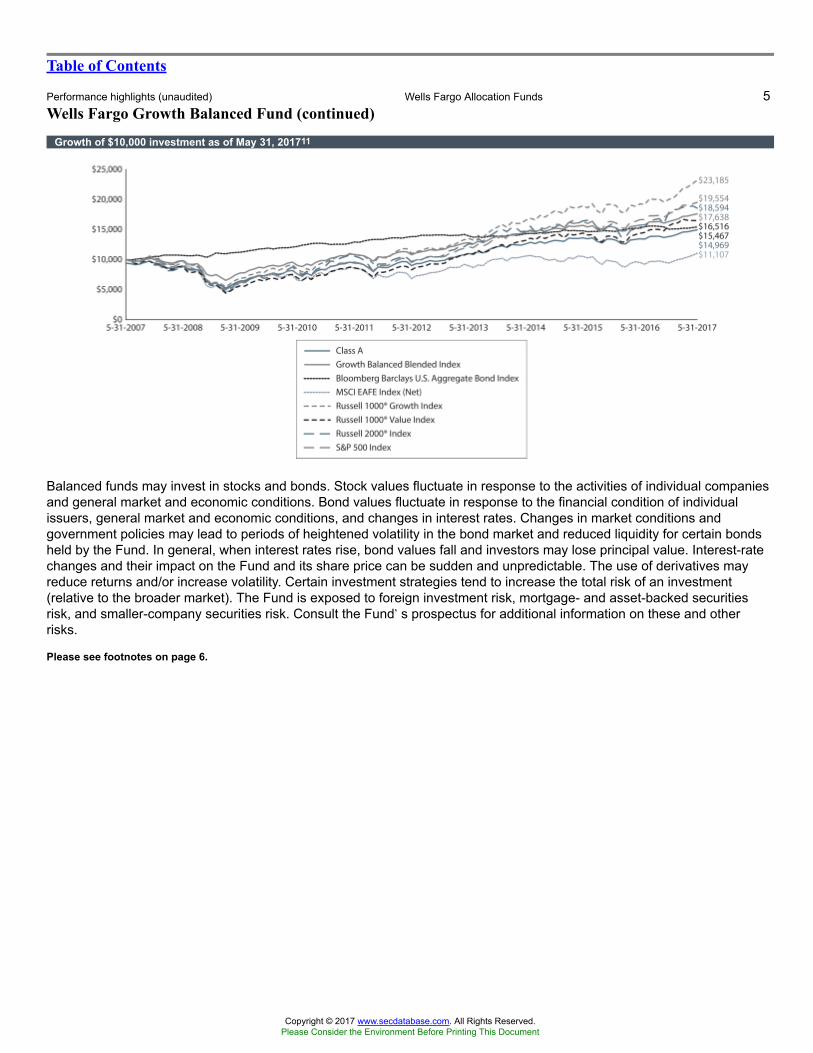
Table of Contents
Performance highlights (unaudited) Wells Fargo Allocation Funds 5Wells Fargo Growth Balanced Fund (continued)
Growth of $10,000 investment as of May 31, 201711
Balanced funds may invest in stocks and bonds. Stock values fluctuate in response to the activities of individual companiesand general market and economic conditions. Bond values fluctuate in response to the financial condition of individualissuers, general market and economic conditions, and changes in interest rates. Changes in market conditions andgovernment policies may lead to periods of heightened volatility in the bond market and reduced liquidity for certain bondsheld by the Fund. In general, when interest rates rise, bond values fall and investors may lose principal value. Interest-ratechanges and their impact on the Fund and its share price can be sudden and unpredictable. The use of derivatives mayreduce returns and/or increase volatility. Certain investment strategies tend to increase the total risk of an investment(relative to the broader market). The Fund is exposed to foreign investment risk, mortgage- and asset-backed securitiesrisk, and smaller-company securities risk. Consult the Fund�s prospectus for additional information on these and otherrisks.
Please see footnotes on page 6.
Copyright © 2017 www.secdatabase.com. All Rights Reserved.Please Consider the Environment Before Printing This Document
Table of Contents
6 Wells Fargo Allocation Funds Performance highlights (unaudited)
Wells Fargo Growth Balanced Fund (continued)
� Mr. Bocray became a portfolio manager of the Fund on October 1, 2016.1 The Fund is a gateway blended fund that invests in multiple affiliated master portfolios of Wells Fargo Master Trust in varying proportions. References
to the investment activities of the Fund are intended to refer to the investment activities of the affiliated master portfolios in which it invests.2 Reflects the expense ratios as stated in the most recent prospectuses, which include the impact of 0.51% in net expenses from affiliated master
portfolios. The expense ratios shown are subject to change and may differ from the annualized expense ratios shown in the financial highlights of thisreport.
3 The manager has contractually committed through September 30, 2017, to waive fees and/or reimburse expenses to the extent necessary to cap theFund�s Total Annual Fund Operating Expenses After Fee Waiver at the amounts shown. After this time, the cap may be increased or the commitmentto maintain the cap may be terminated only with the approval of the Board of Trustees. Brokerage commissions, stamp duty fees, interest, taxes,acquired money market fund fees and expenses (if any), and extraordinary expenses are excluded from the expense cap. All other acquired fund feesand expenses from the affiliated master portfolios are included in the expense cap. Without this cap, the Fund�s returns would have been lower. Theexpense ratio paid by an investor is the net expense ratio or the Fund�s Total Annual Fund Operating Expenses After Fee Waivers, as stated in theprospectuses.
4 Source: Wells Fargo Funds Management, LLC. The Growth Balanced Blended Index is weighted 35% in the Bloomberg Barclays U.S. AggregateBond Index, 16.25% in the Russell 1000® Growth Index, 16.25% in the Russell 1000® Value Index, 16.25% in the S&P 500 Index, 9.75% in the MSCIEAFE Index (Net), and 6.50% in the Russell 2000® Index. You cannot invest directly in an index.
5 The Bloomberg Barclays U.S. Aggregate Bond Index is a broad-based benchmark that measures the investment-grade, U.S. dollar�denominated,fixed-rate taxable bond market, including Treasuries, government-related and corporate securities, mortgage-backed securities (agency fixed-rate andhybrid adjustable-rate mortgage pass-throughs), asset-backed securities, and commercial mortgage-backed securities. You cannot invest directly inan index.
6 The Morgan Stanley Capital International (MSCI) Europe, Australasia, Far East (EAFE) Index (Net) is a free-float-adjusted market-capitalization-weighted index that is designed to measure the equity market performance of developed markets, excluding the United States and Canada. TheMSCI EAFE Index (Net) consists of the following 21 developed markets country indexes: Australia, Austria, Belgium, Denmark, Finland, France,Germany, Hong Kong, Ireland, Israel, Italy, Japan, the Netherlands, New Zealand, Norway, Portugal, Singapore, Spain, Sweden, Switzerland, and theUnited Kingdom. Source: MSCI. MSCI makes no express or implied warranties or representations and shall have no liability whatsoever with respectto any MSCI data contained herein. The MSCI data may not be further redistributed or used as a basis for other indexes or any securities or financialproducts. This report is not approved, reviewed, or produced by MSCI. You cannot invest directly in an index.
7 The Russell 1000® Growth Index measures the performance of those Russell 1000 companies with higher price-to-book ratios and higher forecastedgrowth values. You cannot invest directly in an index.
8 The Russell 1000® Value Index measures the performance of those Russell 1000 companies with lower price-to-book ratios and lower forecastedgrowth values. You cannot invest directly in an index.
9 The Russell 2000® Index measures the performance of the 2,000 smallest companies in the Russell 3000® Index, which represents approximately8% of the total market capitalization of the Russell 3000® Index. You cannot invest directly in an index.
10 The S&P 500 Index consists of 500 stocks chosen for market size, liquidity, and industry group representation. It is a market-value-weighted indexwith each stock�s weight in the index proportionate to its market value. You cannot invest directly in an index.
11 The chart compares the performance of Class A shares for the most recent ten years with the Growth Balanced Blended Index, the BloombergBarclays U.S. Aggregate Bond Index, the MSCI EAFE Index (Net), the Russell 1000® Growth Index, the Russell 1000® Value Index, the Russell2000® Index, and the S&P 500 Index. The chart assumes a hypothetical $10,000 investment in Class A and reflects all operating expenses andassumes the maximum initial sales charge of 5.75%.
12 The MSCI All Country World Index (ACWI) ex USA Index (Net) is a free-float-adjusted market-capitalization-weighted index that is designed tomeasure the equity market performance of developed markets, excluding the United States and Canada. You cannot invest directly in an index.
13 The Bloomberg Barclays U.S. Corporate High Yield Bond Index is an unmanaged, U.S. dollar�denominated, nonconvertible, non-investment-gradedebt index. The index consists of domestic corporate bonds rated Ba and below with a minimum outstanding amount of $150 million. You cannotinvest directly in an index.
14 The ten largest holdings, excluding cash and cash equivalents, are calculated based on the value of the securities of the affiliated master portfoliosallocable to the Fund divided by the total net assets of the Fund. Holdings are subject to change and may have changed since the date specified.
Copyright © 2017 www.secdatabase.com. All Rights Reserved.Please Consider the Environment Before Printing This Document

15 Current target allocation includes the effect of any tactical futures overlay that may be in place. Effective cash is comprised of the net impact of longand/or short futures contracts held as part of dynamic risk management strategy. These amounts are subject to change and may have changed sincethe date specified.
Copyright © 2017 www.secdatabase.com. All Rights Reserved.Please Consider the Environment Before Printing This Document
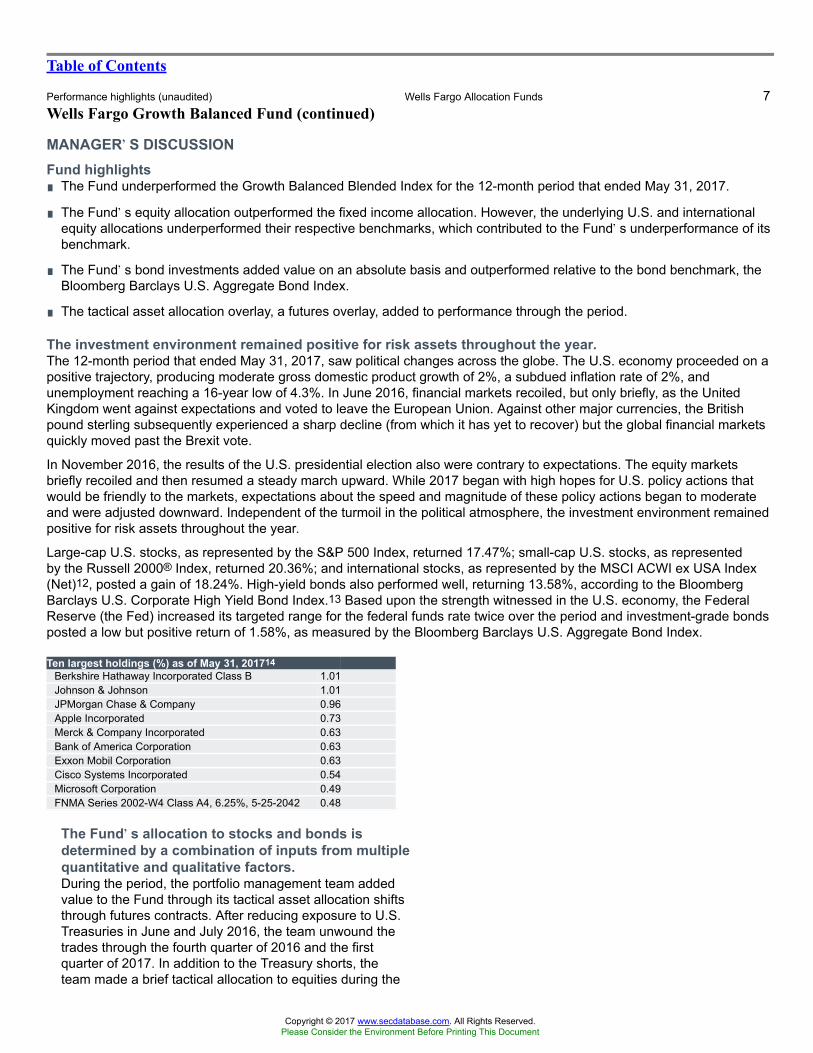
Table of Contents
Performance highlights (unaudited) Wells Fargo Allocation Funds 7Wells Fargo Growth Balanced Fund (continued)
MANAGER��S DISCUSSIONFund highlights∎ The Fund underperformed the Growth Balanced Blended Index for the 12-month period that ended May 31, 2017.
∎ The Fund�s equity allocation outperformed the fixed income allocation. However, the underlying U.S. and internationalequity allocations underperformed their respective benchmarks, which contributed to the Fund�s underperformance of itsbenchmark.
∎ The Fund�s bond investments added value on an absolute basis and outperformed relative to the bond benchmark, theBloomberg Barclays U.S. Aggregate Bond Index.
∎ The tactical asset allocation overlay, a futures overlay, added to performance through the period.
The investment environment remained positive for risk assets throughout the year.The 12-month period that ended May 31, 2017, saw political changes across the globe. The U.S. economy proceeded on apositive trajectory, producing moderate gross domestic product growth of 2%, a subdued inflation rate of 2%, andunemployment reaching a 16-year low of 4.3%. In June 2016, financial markets recoiled, but only briefly, as the UnitedKingdom went against expectations and voted to leave the European Union. Against other major currencies, the Britishpound sterling subsequently experienced a sharp decline (from which it has yet to recover) but the global financial marketsquickly moved past the Brexit vote.
In November 2016, the results of the U.S. presidential election also were contrary to expectations. The equity marketsbriefly recoiled and then resumed a steady march upward. While 2017 began with high hopes for U.S. policy actions thatwould be friendly to the markets, expectations about the speed and magnitude of these policy actions began to moderateand were adjusted downward. Independent of the turmoil in the political atmosphere, the investment environment remainedpositive for risk assets throughout the year.
Large-cap U.S. stocks, as represented by the S&P 500 Index, returned 17.47%; small-cap U.S. stocks, as representedby the Russell 2000® Index, returned 20.36%; and international stocks, as represented by the MSCI ACWI ex USA Index(Net)12, posted a gain of 18.24%. High-yield bonds also performed well, returning 13.58%, according to the BloombergBarclays U.S. Corporate High Yield Bond Index.13 Based upon the strength witnessed in the U.S. economy, the FederalReserve (the Fed) increased its targeted range for the federal funds rate twice over the period and investment-grade bondsposted a low but positive return of 1.58%, as measured by the Bloomberg Barclays U.S. Aggregate Bond Index.
Ten largest holdings (%) as of May 31, 201714Berkshire Hathaway Incorporated Class B 1.01Johnson & Johnson 1.01JPMorgan Chase & Company 0.96Apple Incorporated 0.73Merck & Company Incorporated 0.63Bank of America Corporation 0.63Exxon Mobil Corporation 0.63Cisco Systems Incorporated 0.54Microsoft Corporation 0.49FNMA Series 2002-W4 Class A4, 6.25%, 5-25-2042 0.48
The Fund��s allocation to stocks and bonds isdetermined by a combination of inputs from multiplequantitative and qualitative factors.During the period, the portfolio management team addedvalue to the Fund through its tactical asset allocation shiftsthrough futures contracts. After reducing exposure to U.S.Treasuries in June and July 2016, the team unwound thetrades through the fourth quarter of 2016 and the firstquarter of 2017. In addition to the Treasury shorts, theteam made a brief tactical allocation to equities during the
Copyright © 2017 www.secdatabase.com. All Rights Reserved.Please Consider the Environment Before Printing This Document

Hedge altered, small-cap overweight maintained.The team altered its hedged exposure to Japanese equities
by switching to unhedged exposure to the yen. The equity allocation added value to the Fund and underperformed thebenchmark for the period.
Please see footnotes on page 6.
presidential election as volatile conditions prevailed, whichalso added value.
Copyright © 2017 www.secdatabase.com. All Rights Reserved.Please Consider the Environment Before Printing This Document
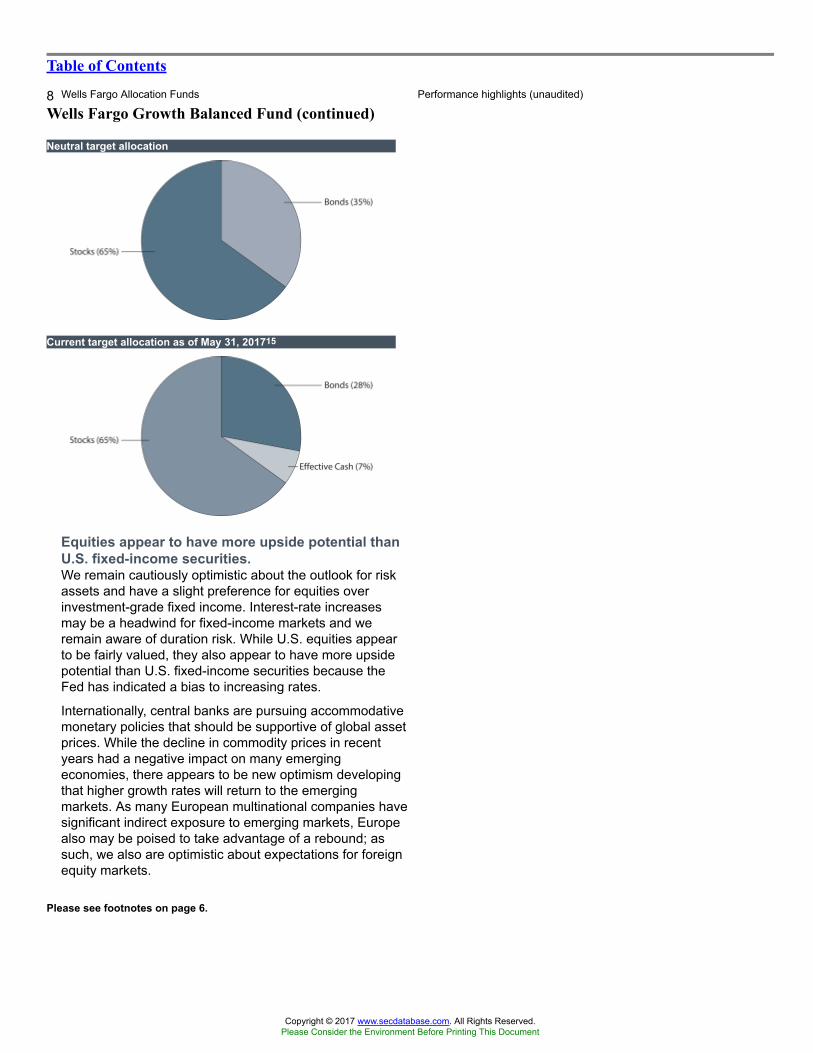
Table of Contents
8 Wells Fargo Allocation Funds Performance highlights (unaudited)
Wells Fargo Growth Balanced Fund (continued)
Please see footnotes on page 6.
Neutral target allocation
Current target allocation as of May 31, 201715
Equities appear to have more upside potential thanU.S. fixed-income securities.We remain cautiously optimistic about the outlook for riskassets and have a slight preference for equities overinvestment-grade fixed income. Interest-rate increasesmay be a headwind for fixed-income markets and weremain aware of duration risk. While U.S. equities appearto be fairly valued, they also appear to have more upsidepotential than U.S. fixed-income securities because theFed has indicated a bias to increasing rates.
Internationally, central banks are pursuing accommodativemonetary policies that should be supportive of global assetprices. While the decline in commodity prices in recentyears had a negative impact on many emergingeconomies, there appears to be new optimism developingthat higher growth rates will return to the emergingmarkets. As many European multinational companies havesignificant indirect exposure to emerging markets, Europealso may be poised to take advantage of a rebound; assuch, we also are optimistic about expectations for foreignequity markets.
Copyright © 2017 www.secdatabase.com. All Rights Reserved.Please Consider the Environment Before Printing This Document

Table of Contents
This page is intentionally left blank.
Copyright © 2017 www.secdatabase.com. All Rights Reserved.Please Consider the Environment Before Printing This Document
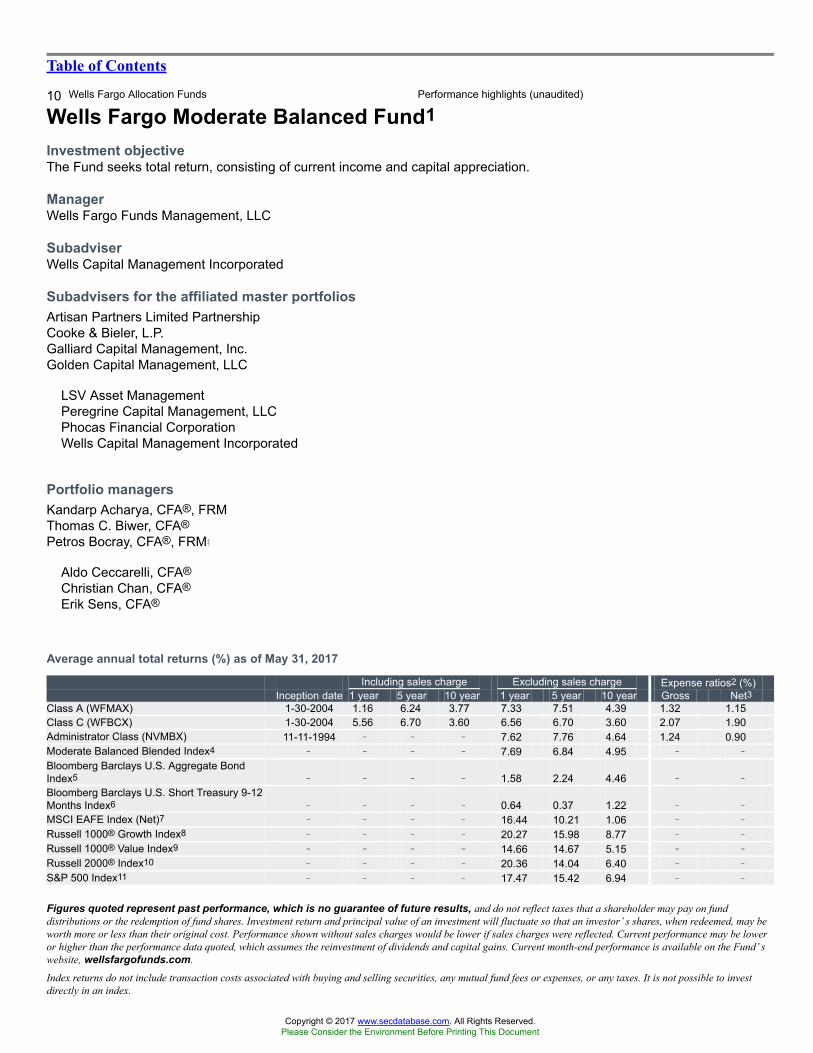
Table of Contents
10 Wells Fargo Allocation Funds Performance highlights (unaudited)
Wells Fargo Moderate Balanced Fund1
Investment objectiveThe Fund seeks total return, consisting of current income and capital appreciation.
ManagerWells Fargo Funds Management, LLC
SubadviserWells Capital Management Incorporated
Subadvisers for the affiliated master portfolios
Portfolio managers
Average annual total returns (%) as of May 31, 2017
Including sales charge Excluding sales charge Expense ratios2 (%)Inception date 1 year 5 year 10 year 1 year 5 year 10 year Gross Net3
Class A (WFMAX) 1-30-2004 1.16 6.24 3.77 7.33 7.51 4.39 1.32 1.15Class C (WFBCX) 1-30-2004 5.56 6.70 3.60 6.56 6.70 3.60 2.07 1.90Administrator Class (NVMBX) 11-11-1994 � � � 7.62 7.76 4.64 1.24 0.90Moderate Balanced Blended Index4 � � � � 7.69 6.84 4.95 � �
Bloomberg Barclays U.S. Aggregate BondIndex5 � � � � 1.58 2.24 4.46 � �
Bloomberg Barclays U.S. Short Treasury 9-12Months Index6 � � � � 0.64 0.37 1.22 � �
MSCI EAFE Index (Net)7 � � � � 16.44 10.21 1.06 � �
Russell 1000® Growth Index8 � � � � 20.27 15.98 8.77 � �
Russell 1000® Value Index9 � � � � 14.66 14.67 5.15 � �
Russell 2000® Index10 � � � � 20.36 14.04 6.40 � �
S&P 500 Index11 � � � � 17.47 15.42 6.94 � �
Figures quoted represent past performance, which is no guarantee of future results, and do not reflect taxes that a shareholder may pay on funddistributions or the redemption of fund shares. Investment return and principal value of an investment will fluctuate so that an investor�s shares, when redeemed, may beworth more or less than their original cost. Performance shown without sales charges would be lower if sales charges were reflected. Current performance may be loweror higher than the performance data quoted, which assumes the reinvestment of dividends and capital gains. Current month-end performance is available on the Fund�swebsite, wellsfargofunds.com.
Index returns do not include transaction costs associated with buying and selling securities, any mutual fund fees or expenses, or any taxes. It is not possible to investdirectly in an index.
Artisan Partners Limited PartnershipCooke & Bieler, L.P.Galliard Capital Management, Inc.Golden Capital Management, LLC
LSV Asset ManagementPeregrine Capital Management, LLCPhocas Financial CorporationWells Capital Management Incorporated
Kandarp Acharya, CFA®, FRMThomas C. Biwer, CFA®Petros Bocray, CFA®, FRM�
Aldo Ceccarelli, CFA®Christian Chan, CFA®Erik Sens, CFA®
Copyright © 2017 www.secdatabase.com. All Rights Reserved.Please Consider the Environment Before Printing This Document

For Class A shares, the maximum front-end sales charge is 5.75%. For Class C shares, the maximum contingent deferred sales charge is 1.00%. Performance including acontingent deferred sales charge assumes the sales charge for the corresponding time period. Administrator Class shares are sold without a front-end sales charge orcontingent deferred sales charge.
Please see footnotes on page 12.
Copyright © 2017 www.secdatabase.com. All Rights Reserved.Please Consider the Environment Before Printing This Document
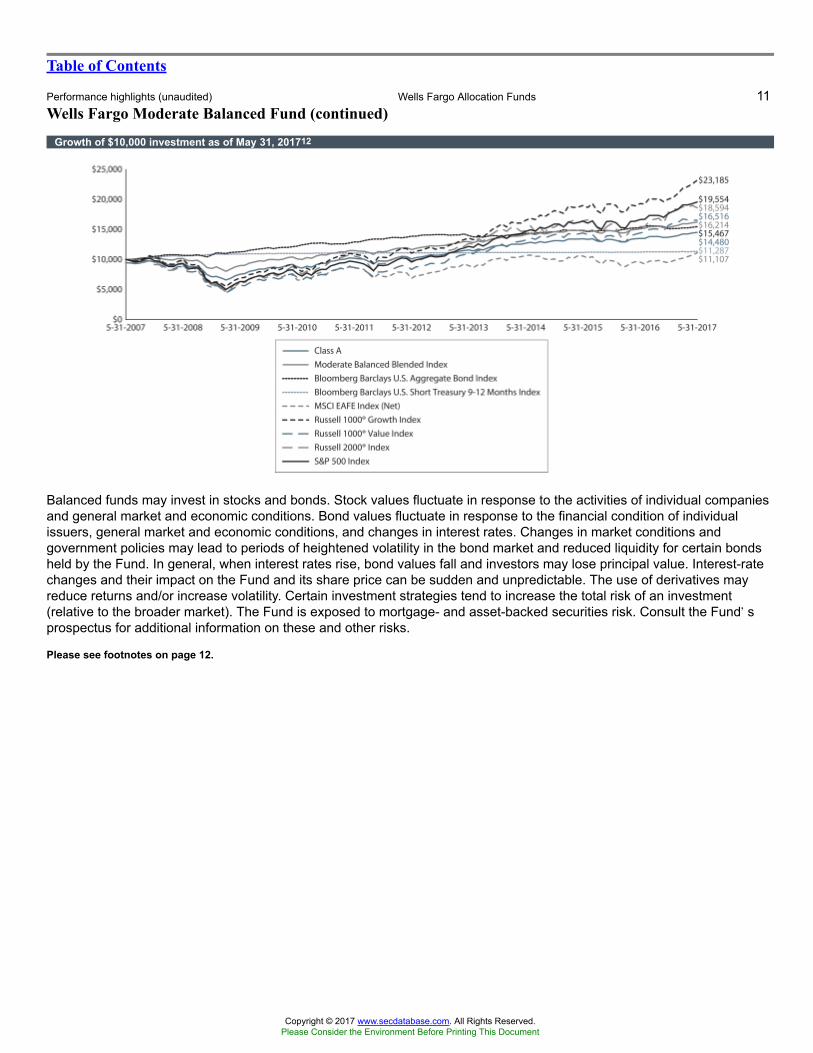
Table of Contents
Performance highlights (unaudited) Wells Fargo Allocation Funds 11Wells Fargo Moderate Balanced Fund (continued)
Growth of $10,000 investment as of May 31, 201712
Balanced funds may invest in stocks and bonds. Stock values fluctuate in response to the activities of individual companiesand general market and economic conditions. Bond values fluctuate in response to the financial condition of individualissuers, general market and economic conditions, and changes in interest rates. Changes in market conditions andgovernment policies may lead to periods of heightened volatility in the bond market and reduced liquidity for certain bondsheld by the Fund. In general, when interest rates rise, bond values fall and investors may lose principal value. Interest-ratechanges and their impact on the Fund and its share price can be sudden and unpredictable. The use of derivatives mayreduce returns and/or increase volatility. Certain investment strategies tend to increase the total risk of an investment(relative to the broader market). The Fund is exposed to mortgage- and asset-backed securities risk. Consult the Fund�sprospectus for additional information on these and other risks.
Please see footnotes on page 12.
Copyright © 2017 www.secdatabase.com. All Rights Reserved.Please Consider the Environment Before Printing This Document
Table of Contents
12 Wells Fargo Allocation Funds Performance highlights (unaudited)
Wells Fargo Moderate Balanced Fund (continued)
� Mr. Bocray became a portfolio manager of the Fund on October 1, 2016.1 The Fund is a gateway blended fund that invests in multiple affiliated master portfolios of Wells Fargo Master Trust in varying proportions. References
to the investment activities of the Fund are intended to refer to the investment activities of the affiliated master portfolios in which it invests.2 Reflects the expense ratios as stated in the most recent prospectuses, which include the impact of 0.47% in net expenses from affiliated master
portfolios. The expense ratios shown are subject to change and may differ from the annualized expense ratios shown in the financial highlights of thisreport.
3 The manager has contractually committed through September 30, 2017, to waive fees and/or reimburse expenses to the extent necessary to cap theFund�s Total Annual Fund Operating Expenses After Fee Waiver at the amounts shown. After this time, the cap may be increased or the commitmentto maintain the cap may be terminated only with the approval of the Board of Trustees. Brokerage commissions, stamp duty fees, interest, taxes,acquired money market fund fees and expenses (if any), and extraordinary expenses are excluded from the expense cap. All other acquired fund feesand expenses from the affiliated master portfolios are included in the expense cap. Without this cap, the Fund�s returns would have been lower. Theexpense ratio paid by an investor is the net expense ratio or the Fund�s Total Annual Fund Operating Expenses After Fee Waivers, as stated in theprospectuses.
4 Source: Wells Fargo Funds Management, LLC. The Moderate Balanced Blended Index is weighted 45% in the Bloomberg Barclays U.S. AggregateBond Index, 15% in the Bloomberg Barclays U.S. Short Treasury 9-12 Months Index, 10% in the Russell 1000® Growth Index, 10% in the Russell1000® Value Index, 10% in the S&P 500 Index, 6% in the MSCI EAFE Index (Net), and 4% in the Russell 2000® Index. You cannot invest directly inan index.
5 The Bloomberg Barclays U.S. Aggregate Bond Index is a broad-based benchmark that measures the investment-grade, U.S. dollar�denominated,fixed-rate taxable bond market, including Treasuries, government-related and corporate securities, mortgage-backed securities (agency fixed-rate andhybrid adjustable-rate mortgage pass-throughs), asset-backed securities, and commercial mortgage-backed securities. You cannot invest directly inan index.
6 The Bloomberg Barclays U.S. Short Treasury 9�12 Months Index is an unmanaged index that includes aged U.S. Treasury bills, notes, and bondswith a remaining maturity from 9 up to (but not including) 12 months. It excludes zero-coupon STRIPS. You cannot invest directly in an index.
7 The Morgan Stanley Capital International (MSCI) Europe, Australasia, Far East (EAFE) Index (Net) is a free-float-adjusted market-capitalization-weighted index that is designed to measure the equity market performance of developed markets, excluding the United States and Canada. TheMSCI EAFE Index (Net) consists of the following 21 developed markets country indexes: Australia, Austria, Belgium, Denmark, Finland, France,Germany, Hong Kong, Ireland, Israel, Italy, Japan, the Netherlands, New Zealand, Norway, Portugal, Singapore, Spain, Sweden, Switzerland, and theUnited Kingdom. Source: MSCI. MSCI makes no express or implied warranties or representations and shall have no liability whatsoever with respectto any MSCI data contained herein. The MSCI data may not be further redistributed or used as a basis for other indexes or any securities or financialproducts. This report is not approved, reviewed, or produced by MSCI. You cannot invest directly in an index.
8 The Russell 1000® Growth Index measures the performance of those Russell 1000 companies with higher price-to-book ratios and higher forecastedgrowth values. You cannot invest directly in an index.
9 The Russell 1000® Value Index measures the performance of those Russell 1000 companies with lower price-to-book ratios and lower forecastedgrowth values. You cannot invest directly in an index.
10 The Russell 2000® Index measures the performance of the 2,000 smallest companies in the Russell 3000® Index, which represents approximately8% of the total market capitalization of the Russell 3000® Index. You cannot invest directly in an index.
11 The S&P 500 Index consists of 500 stocks chosen for market size, liquidity, and industry group representation. It is a market-value-weighted indexwith each stock�s weight in the index proportionate to its market value. You cannot invest directly in an index.
12 The chart compares the performance of Class A shares for the most recent ten years with the Moderate Balanced Blended Index, the BloombergBarclays U.S. Aggregate Bond Index, the Bloomberg Barclays U.S. Short Treasury 9�12 Months Index, the MSCI EAFE Index (Net), the Russell1000® Growth Index, the Russell 1000® Value Index, the Russell 2000® Index, and the S&P 500 Index. The chart assumes a hypothetical $10,000investment in Class A and reflects all operating expenses and assumes the maximum initial sales charge of 5.75%.
13 The MSCI All Country World Index (ACWI) ex USA Index (Net) is a free-float-adjusted market-capitalization-weighted index that is designed tomeasure the equity market performance of developed markets, excluding the United States and Canada. You cannot invest directly in an index.
14 The Bloomberg Barclays U.S. Corporate High Yield Bond Index is an unmanaged, U.S. dollar�denominated, nonconvertible, non-investment-gradedebt index. The index consists of domestic corporate bonds rated Ba and below with a minimum outstanding amount of $150 million. You cannotinvest directly in an index.
15 The ten largest holdings, excluding cash and cash equivalents, are calculated based on the value of the securities of the affiliated master portfoliosallocable to the Fund divided by the total net assets of the Fund. Holdings are subject to change and may have changed since the date specified.
16 Current target allocation includes the effect of any tactical futures overlay that may be in place. Effective cash is comprised of the net impact of longand/or short futures contracts held as part of dynamic risk management strategy. These amounts are subject to change and may have changed sincethe date specified.
Copyright © 2017 www.secdatabase.com. All Rights Reserved.Please Consider the Environment Before Printing This Document
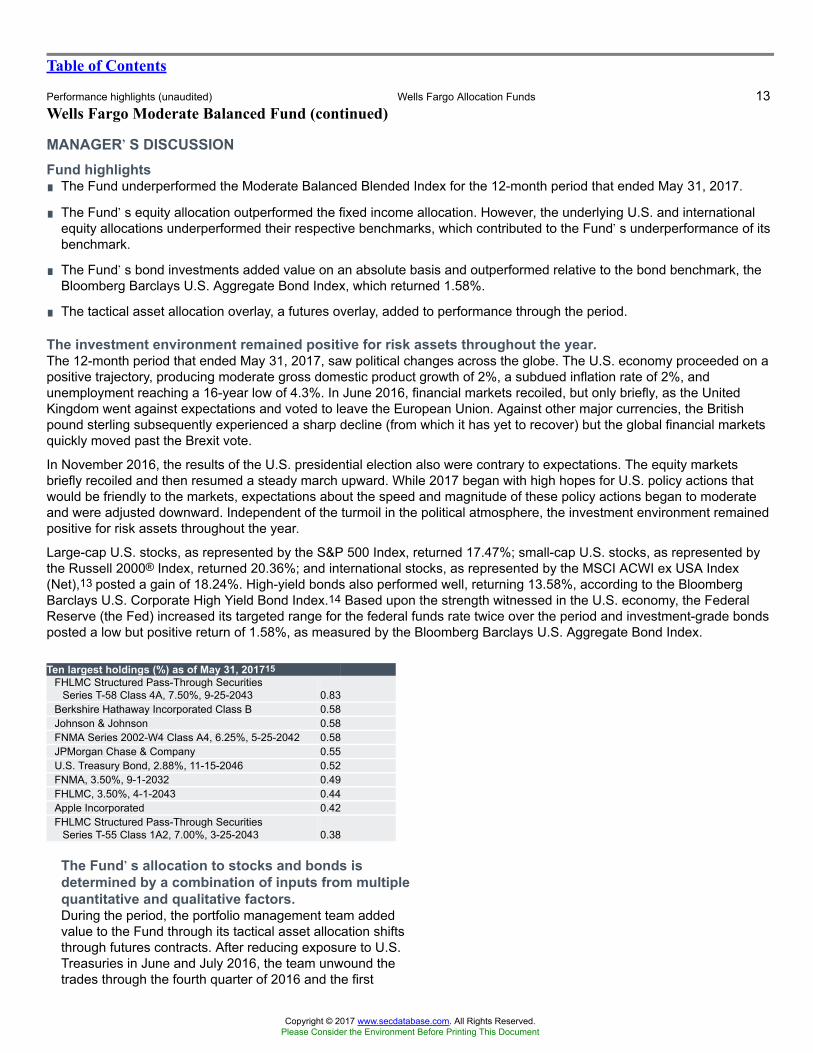
Table of Contents
Performance highlights (unaudited) Wells Fargo Allocation Funds 13Wells Fargo Moderate Balanced Fund (continued)
MANAGER��S DISCUSSIONFund highlights∎ The Fund underperformed the Moderate Balanced Blended Index for the 12-month period that ended May 31, 2017.
∎ The Fund�s equity allocation outperformed the fixed income allocation. However, the underlying U.S. and internationalequity allocations underperformed their respective benchmarks, which contributed to the Fund�s underperformance of itsbenchmark.
∎ The Fund�s bond investments added value on an absolute basis and outperformed relative to the bond benchmark, theBloomberg Barclays U.S. Aggregate Bond Index, which returned 1.58%.
∎ The tactical asset allocation overlay, a futures overlay, added to performance through the period.
The investment environment remained positive for risk assets throughout the year.The 12-month period that ended May 31, 2017, saw political changes across the globe. The U.S. economy proceeded on apositive trajectory, producing moderate gross domestic product growth of 2%, a subdued inflation rate of 2%, andunemployment reaching a 16-year low of 4.3%. In June 2016, financial markets recoiled, but only briefly, as the UnitedKingdom went against expectations and voted to leave the European Union. Against other major currencies, the Britishpound sterling subsequently experienced a sharp decline (from which it has yet to recover) but the global financial marketsquickly moved past the Brexit vote.
In November 2016, the results of the U.S. presidential election also were contrary to expectations. The equity marketsbriefly recoiled and then resumed a steady march upward. While 2017 began with high hopes for U.S. policy actions thatwould be friendly to the markets, expectations about the speed and magnitude of these policy actions began to moderateand were adjusted downward. Independent of the turmoil in the political atmosphere, the investment environment remainedpositive for risk assets throughout the year.
Large-cap U.S. stocks, as represented by the S&P 500 Index, returned 17.47%; small-cap U.S. stocks, as represented bythe Russell 2000® Index, returned 20.36%; and international stocks, as represented by the MSCI ACWI ex USA Index(Net),13 posted a gain of 18.24%. High-yield bonds also performed well, returning 13.58%, according to the BloombergBarclays U.S. Corporate High Yield Bond Index.14 Based upon the strength witnessed in the U.S. economy, the FederalReserve (the Fed) increased its targeted range for the federal funds rate twice over the period and investment-grade bondsposted a low but positive return of 1.58%, as measured by the Bloomberg Barclays U.S. Aggregate Bond Index.
Ten largest holdings (%) as of May 31, 201715FHLMC Structured Pass-Through Securities
Series T-58 Class 4A, 7.50%, 9-25-2043 0.83Berkshire Hathaway Incorporated Class B 0.58Johnson & Johnson 0.58FNMA Series 2002-W4 Class A4, 6.25%, 5-25-2042 0.58JPMorgan Chase & Company 0.55U.S. Treasury Bond, 2.88%, 11-15-2046 0.52FNMA, 3.50%, 9-1-2032 0.49FHLMC, 3.50%, 4-1-2043 0.44Apple Incorporated 0.42FHLMC Structured Pass-Through Securities
Series T-55 Class 1A2, 7.00%, 3-25-2043 0.38
The Fund��s allocation to stocks and bonds isdetermined by a combination of inputs from multiplequantitative and qualitative factors.During the period, the portfolio management team addedvalue to the Fund through its tactical asset allocation shiftsthrough futures contracts. After reducing exposure to U.S.Treasuries in June and July 2016, the team unwound thetrades through the fourth quarter of 2016 and the first
Copyright © 2017 www.secdatabase.com. All Rights Reserved.Please Consider the Environment Before Printing This Document

Please see footnotes on page 12.quarter of 2017. In addition to the Treasury shorts, theteam made a brief tactical allocation to equities during thepresidential election as volatile conditions prevailed, whichalso added value.
Hedge altered, small-cap overweight maintained.The team altered its hedged exposure to Japaneseequities by switching to unhedged exposure to the yen.The equity allocation added value to the Fund andunderperformed the benchmark for the period.
Copyright © 2017 www.secdatabase.com. All Rights Reserved.Please Consider the Environment Before Printing This Document
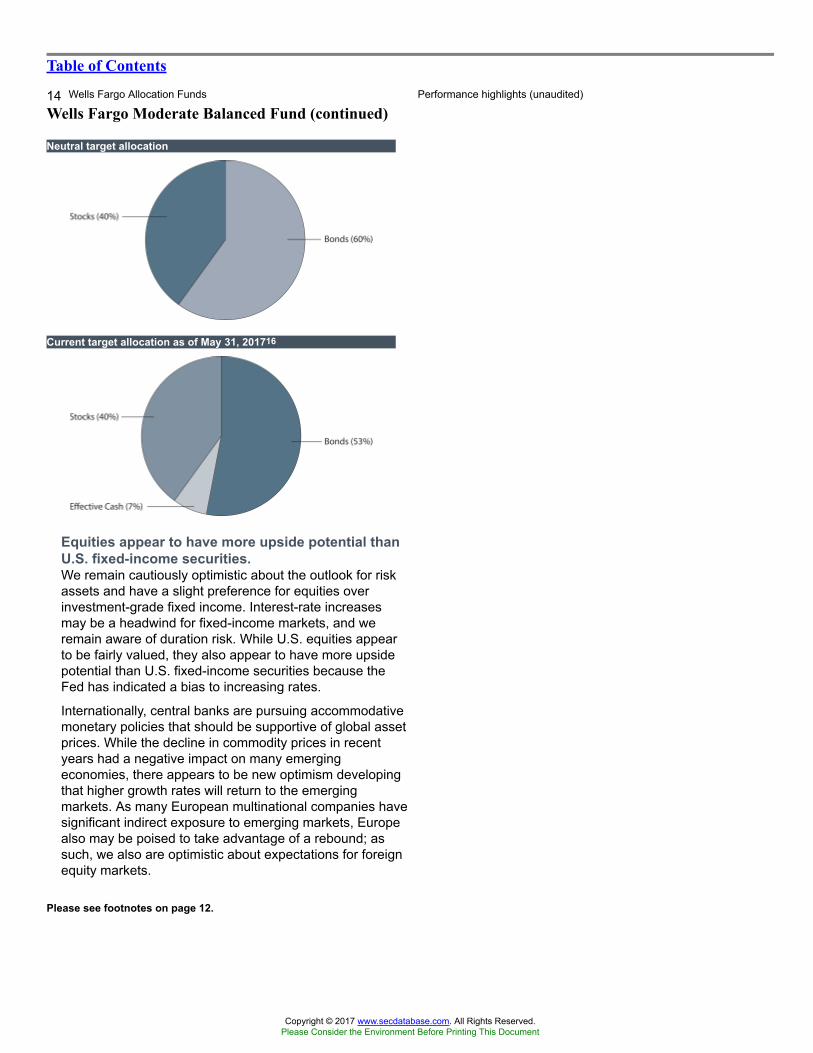
Table of Contents
14 Wells Fargo Allocation Funds Performance highlights (unaudited)
Wells Fargo Moderate Balanced Fund (continued)
Please see footnotes on page 12.
Neutral target allocation
Current target allocation as of May 31, 201716
Equities appear to have more upside potential thanU.S. fixed-income securities.We remain cautiously optimistic about the outlook for riskassets and have a slight preference for equities overinvestment-grade fixed income. Interest-rate increasesmay be a headwind for fixed-income markets, and weremain aware of duration risk. While U.S. equities appearto be fairly valued, they also appear to have more upsidepotential than U.S. fixed-income securities because theFed has indicated a bias to increasing rates.
Internationally, central banks are pursuing accommodativemonetary policies that should be supportive of global assetprices. While the decline in commodity prices in recentyears had a negative impact on many emergingeconomies, there appears to be new optimism developingthat higher growth rates will return to the emergingmarkets. As many European multinational companies havesignificant indirect exposure to emerging markets, Europealso may be poised to take advantage of a rebound; assuch, we also are optimistic about expectations for foreignequity markets.
Copyright © 2017 www.secdatabase.com. All Rights Reserved.Please Consider the Environment Before Printing This Document
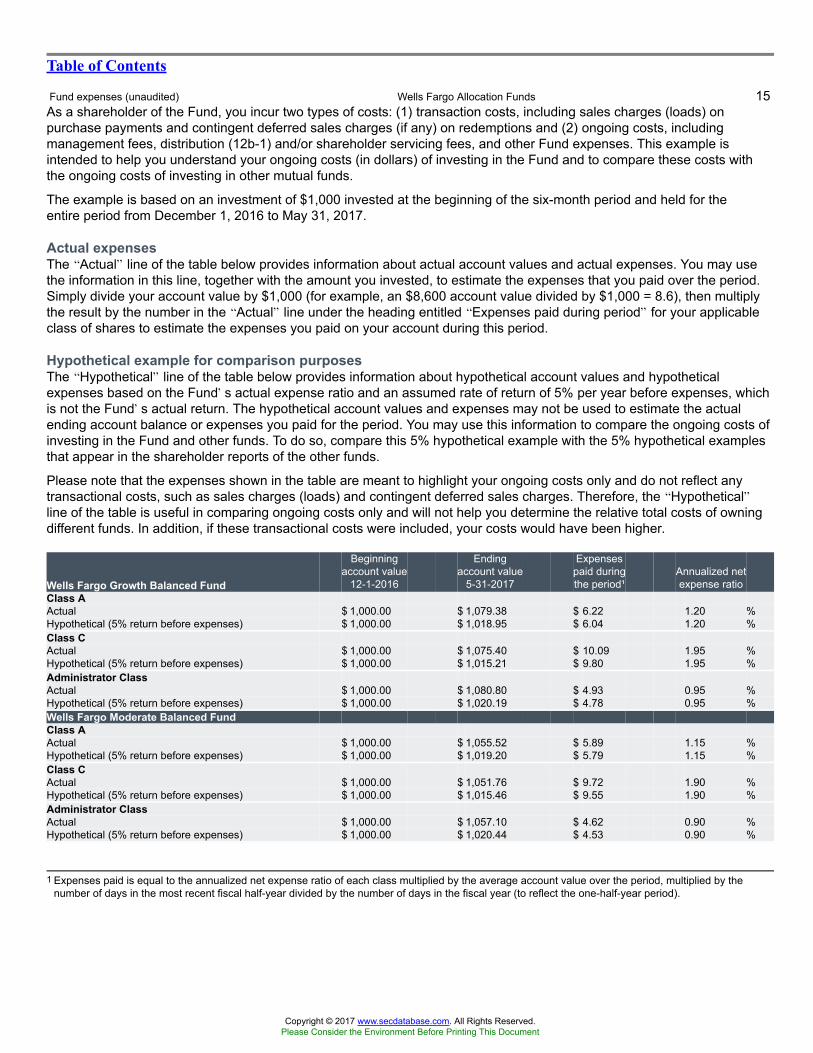
Table of Contents
Fund expenses (unaudited) Wells Fargo Allocation Funds 15As a shareholder of the Fund, you incur two types of costs: (1) transaction costs, including sales charges (loads) onpurchase payments and contingent deferred sales charges (if any) on redemptions and (2) ongoing costs, includingmanagement fees, distribution (12b-1) and/or shareholder servicing fees, and other Fund expenses. This example isintended to help you understand your ongoing costs (in dollars) of investing in the Fund and to compare these costs withthe ongoing costs of investing in other mutual funds.
The example is based on an investment of $1,000 invested at the beginning of the six-month period and held for theentire period from December 1, 2016 to May 31, 2017.
Actual expensesThe �Actual� line of the table below provides information about actual account values and actual expenses. You may usethe information in this line, together with the amount you invested, to estimate the expenses that you paid over the period.Simply divide your account value by $1,000 (for example, an $8,600 account value divided by $1,000 = 8.6), then multiplythe result by the number in the �Actual� line under the heading entitled �Expenses paid during period� for your applicableclass of shares to estimate the expenses you paid on your account during this period.
Hypothetical example for comparison purposesThe �Hypothetical� line of the table below provides information about hypothetical account values and hypotheticalexpenses based on the Fund�s actual expense ratio and an assumed rate of return of 5% per year before expenses, whichis not the Fund�s actual return. The hypothetical account values and expenses may not be used to estimate the actualending account balance or expenses you paid for the period. You may use this information to compare the ongoing costs ofinvesting in the Fund and other funds. To do so, compare this 5% hypothetical example with the 5% hypothetical examplesthat appear in the shareholder reports of the other funds.
Please note that the expenses shown in the table are meant to highlight your ongoing costs only and do not reflect anytransactional costs, such as sales charges (loads) and contingent deferred sales charges. Therefore, the �Hypothetical�line of the table is useful in comparing ongoing costs only and will not help you determine the relative total costs of owningdifferent funds. In addition, if these transactional costs were included, your costs would have been higher.
Wells Fargo Growth Balanced Fund
Beginningaccount value
12-1-2016
Endingaccount value
5-31-2017
Expensespaid duringthe period¹
Annualized netexpense ratio
Class AActual $ 1,000.00 $ 1,079.38 $ 6.22 1.20 %Hypothetical (5% return before expenses) $ 1,000.00 $ 1,018.95 $ 6.04 1.20 %Class CActual $ 1,000.00 $ 1,075.40 $ 10.09 1.95 %Hypothetical (5% return before expenses) $ 1,000.00 $ 1,015.21 $ 9.80 1.95 %Administrator ClassActual $ 1,000.00 $ 1,080.80 $ 4.93 0.95 %Hypothetical (5% return before expenses) $ 1,000.00 $ 1,020.19 $ 4.78 0.95 %Wells Fargo Moderate Balanced FundClass AActual $ 1,000.00 $ 1,055.52 $ 5.89 1.15 %Hypothetical (5% return before expenses) $ 1,000.00 $ 1,019.20 $ 5.79 1.15 %Class CActual $ 1,000.00 $ 1,051.76 $ 9.72 1.90 %Hypothetical (5% return before expenses) $ 1,000.00 $ 1,015.46 $ 9.55 1.90 %Administrator ClassActual $ 1,000.00 $ 1,057.10 $ 4.62 0.90 %Hypothetical (5% return before expenses) $ 1,000.00 $ 1,020.44 $ 4.53 0.90 %
1 Expenses paid is equal to the annualized net expense ratio of each class multiplied by the average account value over the period, multiplied by thenumber of days in the most recent fiscal half-year divided by the number of days in the fiscal year (to reflect the one-half-year period).
Copyright © 2017 www.secdatabase.com. All Rights Reserved.Please Consider the Environment Before Printing This Document
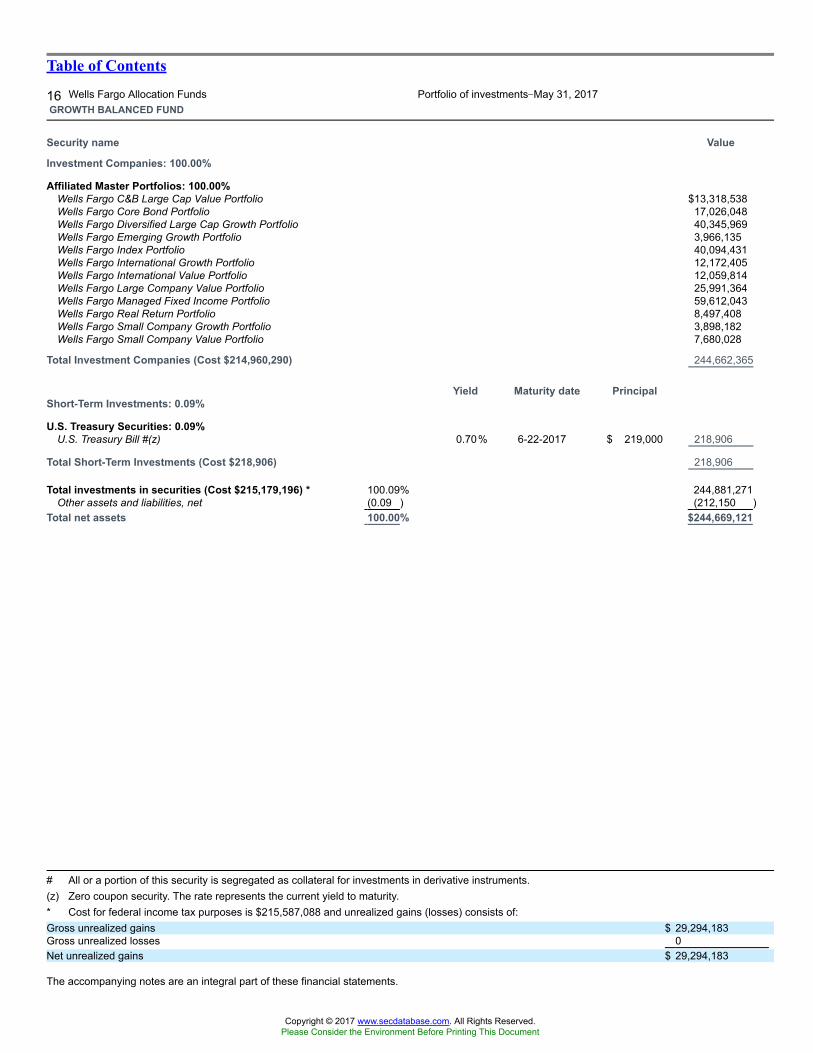
Table of Contents
16 Wells Fargo Allocation Funds Portfolio of investments�May 31, 2017GROWTH BALANCED FUND
Security name Value
Investment Companies: 100.00%
Affiliated Master Portfolios: 100.00%Wells Fargo C&B Large Cap Value Portfolio $13,318,538Wells Fargo Core Bond Portfolio 17,026,048Wells Fargo Diversified Large Cap Growth Portfolio 40,345,969Wells Fargo Emerging Growth Portfolio 3,966,135Wells Fargo Index Portfolio 40,094,431Wells Fargo International Growth Portfolio 12,172,405Wells Fargo International Value Portfolio 12,059,814Wells Fargo Large Company Value Portfolio 25,991,364Wells Fargo Managed Fixed Income Portfolio 59,612,043Wells Fargo Real Return Portfolio 8,497,408Wells Fargo Small Company Growth Portfolio 3,898,182Wells Fargo Small Company Value Portfolio 7,680,028
Total Investment Companies (Cost $214,960,290) 244,662,365
Yield Maturity date PrincipalShort-Term Investments: 0.09%
U.S. Treasury Securities: 0.09%U.S. Treasury Bill #(z) 0.70% 6-22-2017 $ 219,000 218,906
Total Short-Term Investments (Cost $218,906) 218,906
Total investments in securities (Cost $215,179,196) * 100.09% 244,881,271Other assets and liabilities, net (0.09 ) (212,150 )
Total net assets 100.00% $244,669,121
# All or a portion of this security is segregated as collateral for investments in derivative instruments.(z) Zero coupon security. The rate represents the current yield to maturity.* Cost for federal income tax purposes is $215,587,088 and unrealized gains (losses) consists of:Gross unrealized gains $ 29,294,183Gross unrealized losses 0Net unrealized gains $ 29,294,183
The accompanying notes are an integral part of these financial statements.
Copyright © 2017 www.secdatabase.com. All Rights Reserved.Please Consider the Environment Before Printing This Document
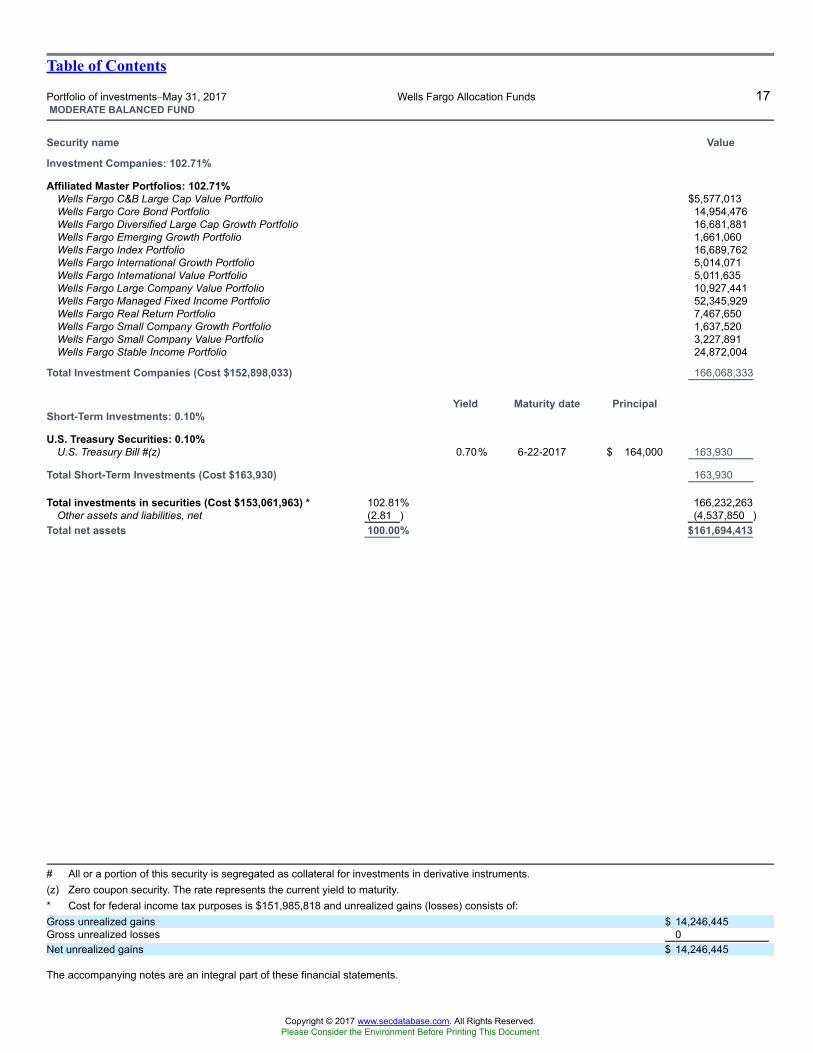
Table of Contents
Portfolio of investments�May 31, 2017 Wells Fargo Allocation Funds 17MODERATE BALANCED FUND
Security name Value
Investment Companies: 102.71%
Affiliated Master Portfolios: 102.71%Wells Fargo C&B Large Cap Value Portfolio $5,577,013Wells Fargo Core Bond Portfolio 14,954,476Wells Fargo Diversified Large Cap Growth Portfolio 16,681,881Wells Fargo Emerging Growth Portfolio 1,661,060Wells Fargo Index Portfolio 16,689,762Wells Fargo International Growth Portfolio 5,014,071Wells Fargo International Value Portfolio 5,011,635Wells Fargo Large Company Value Portfolio 10,927,441Wells Fargo Managed Fixed Income Portfolio 52,345,929Wells Fargo Real Return Portfolio 7,467,650Wells Fargo Small Company Growth Portfolio 1,637,520Wells Fargo Small Company Value Portfolio 3,227,891Wells Fargo Stable Income Portfolio 24,872,004
Total Investment Companies (Cost $152,898,033) 166,068,333
Yield Maturity date PrincipalShort-Term Investments: 0.10%
U.S. Treasury Securities: 0.10%U.S. Treasury Bill #(z) 0.70% 6-22-2017 $ 164,000 163,930
Total Short-Term Investments (Cost $163,930) 163,930
Total investments in securities (Cost $153,061,963) * 102.81% 166,232,263Other assets and liabilities, net (2.81 ) (4,537,850 )
Total net assets 100.00% $161,694,413
# All or a portion of this security is segregated as collateral for investments in derivative instruments.(z) Zero coupon security. The rate represents the current yield to maturity.* Cost for federal income tax purposes is $151,985,818 and unrealized gains (losses) consists of:Gross unrealized gains $ 14,246,445Gross unrealized losses 0Net unrealized gains $ 14,246,445
The accompanying notes are an integral part of these financial statements.
Copyright © 2017 www.secdatabase.com. All Rights Reserved.Please Consider the Environment Before Printing This Document
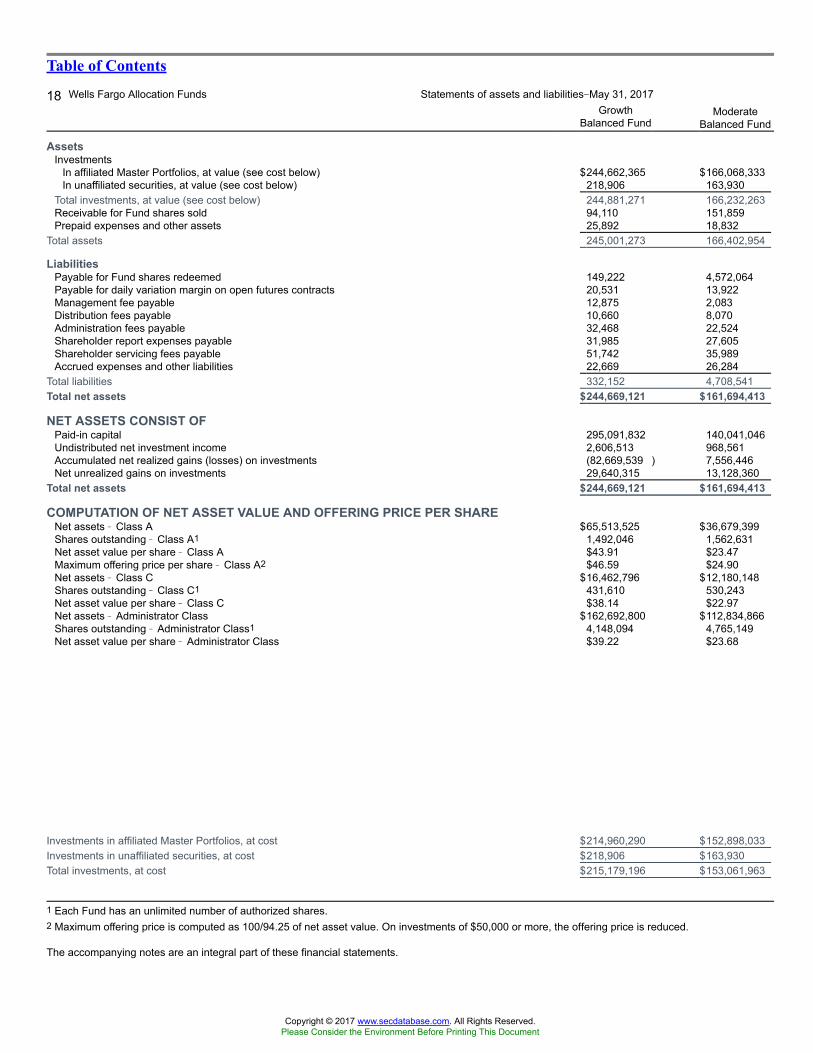
Table of Contents
18 Wells Fargo Allocation Funds Statements of assets and liabilities�May 31, 2017Growth
Balanced FundModerate
Balanced Fund
AssetsInvestments
In affiliated Master Portfolios, at value (see cost below) $244,662,365 $166,068,333In unaffiliated securities, at value (see cost below) 218,906 163,930
Total investments, at value (see cost below) 244,881,271 166,232,263Receivable for Fund shares sold 94,110 151,859Prepaid expenses and other assets 25,892 18,832
Total assets 245,001,273 166,402,954
LiabilitiesPayable for Fund shares redeemed 149,222 4,572,064Payable for daily variation margin on open futures contracts 20,531 13,922Management fee payable 12,875 2,083Distribution fees payable 10,660 8,070Administration fees payable 32,468 22,524Shareholder report expenses payable 31,985 27,605Shareholder servicing fees payable 51,742 35,989Accrued expenses and other liabilities 22,669 26,284
Total liabilities 332,152 4,708,541Total net assets $244,669,121 $161,694,413
NET ASSETS CONSIST OFPaid-in capital 295,091,832 140,041,046Undistributed net investment income 2,606,513 968,561Accumulated net realized gains (losses) on investments (82,669,539 ) 7,556,446Net unrealized gains on investments 29,640,315 13,128,360
Total net assets $244,669,121 $161,694,413
COMPUTATION OF NET ASSET VALUE AND OFFERING PRICE PER SHARENet assets � Class A $65,513,525 $36,679,399Shares outstanding � Class A1 1,492,046 1,562,631Net asset value per share � Class A $43.91 $23.47Maximum offering price per share � Class A2 $46.59 $24.90Net assets � Class C $16,462,796 $12,180,148Shares outstanding � Class C1 431,610 530,243Net asset value per share � Class C $38.14 $22.97Net assets � Administrator Class $162,692,800 $112,834,866Shares outstanding � Administrator Class1 4,148,094 4,765,149Net asset value per share � Administrator Class $39.22 $23.68
Investments in affiliated Master Portfolios, at cost $214,960,290 $152,898,033Investments in unaffiliated securities, at cost $218,906 $163,930Total investments, at cost $215,179,196 $153,061,963
1 Each Fund has an unlimited number of authorized shares.2 Maximum offering price is computed as 100/94.25 of net asset value. On investments of $50,000 or more, the offering price is reduced.
The accompanying notes are an integral part of these financial statements.
Copyright © 2017 www.secdatabase.com. All Rights Reserved.Please Consider the Environment Before Printing This Document

Table of Contents
Statements of operations�year ended May 31, 2017 Wells Fargo Allocation Funds 19Growth
Balanced FundModerate
Balanced Fund
Investment incomeDividends allocated from affiliated Master Portfolios* $2,983,144 $1,429,553Interest allocated from affiliated Master Portfolios** 2,615,433 3,117,003Securities lending income allocated from affiliated Master Portfolios 64,747 35,531Other income and other income allocated from affiliated Master Portfolios 3,258 1,807Interest 536 417Expenses allocated from affiliated Master Portfolios (1,376,876 ) (1,049,477 )Waivers allocated from affiliated Master Portfolios 133,832 167,393
Total investment income 4,424,074 3,702,227
ExpensesManagement fee 741,806 573,987Administration fees
Class A 135,955 76,804Class B 177 1 123 1Class C 34,201 27,678Administrator Class 216,004 183,972
Shareholder servicing feesClass A 161,851 91,433Class B 211 1 146 1Class C 40,716 32,950Administrator Class 415,040 352,636
Distribution feesClass B 633 1 439 1Class C 122,148 98,849
Custody and accounting fees 10,740 9,022Professional fees 27,057 31,277Registration fees 67,010 61,338Shareholder report expenses 68,565 65,718Trustees� fees and expenses 17,407 17,327Other fees and expenses 10,071 9,775
Total expenses 2,069,592 1,633,474Less: Fee waivers and/or expense reimbursements (638,023 ) (569,781 )
Net expenses 1,431,569 1,063,693Net investment income 2,992,505 2,638,534
REALIZED AND UNREALIZED GAINS (LOSSES) ON INVESTMENTSNet realized gains (losses) on:
Securities transactions allocated from affiliated Master Portfolios 18,441,846 8,954,995Unaffiliated securities (7 ) (5 )Futures transactions 337,186 262,104
Net realized gains on investments 18,779,025 9,217,094Net change in unrealized gains (losses) on:
Securities transactions allocated from affiliated Master Portfolios 3,633,528 1,944,976Futures transactions (31,485 ) (18,603 )
Net change in unrealized gains (losses) on investments 3,602,043 1,926,373Net realized and unrealized gains (losses) on investments 22,381,068 11,143,467Net increase in net assets resulting from operations $25,373,573 $13,782,001
* Net of foreign dividend withholding taxes allocated from affiliated Master Portfolios in the amount of $103,256 $48,535** Net of foreign interest withholding taxes allocated from affiliated Master Portfolios in the amount of $231 $236
1 For the period from June 1, 2016 to December 5, 2016. Effective at the close of business on December 5, 2016, Class B shares were converted toClass A shares and are no longer offered by the Fund.
The accompanying notes are an integral part of these financial statements.
Copyright © 2017 www.secdatabase.com. All Rights Reserved.Please Consider the Environment Before Printing This Document
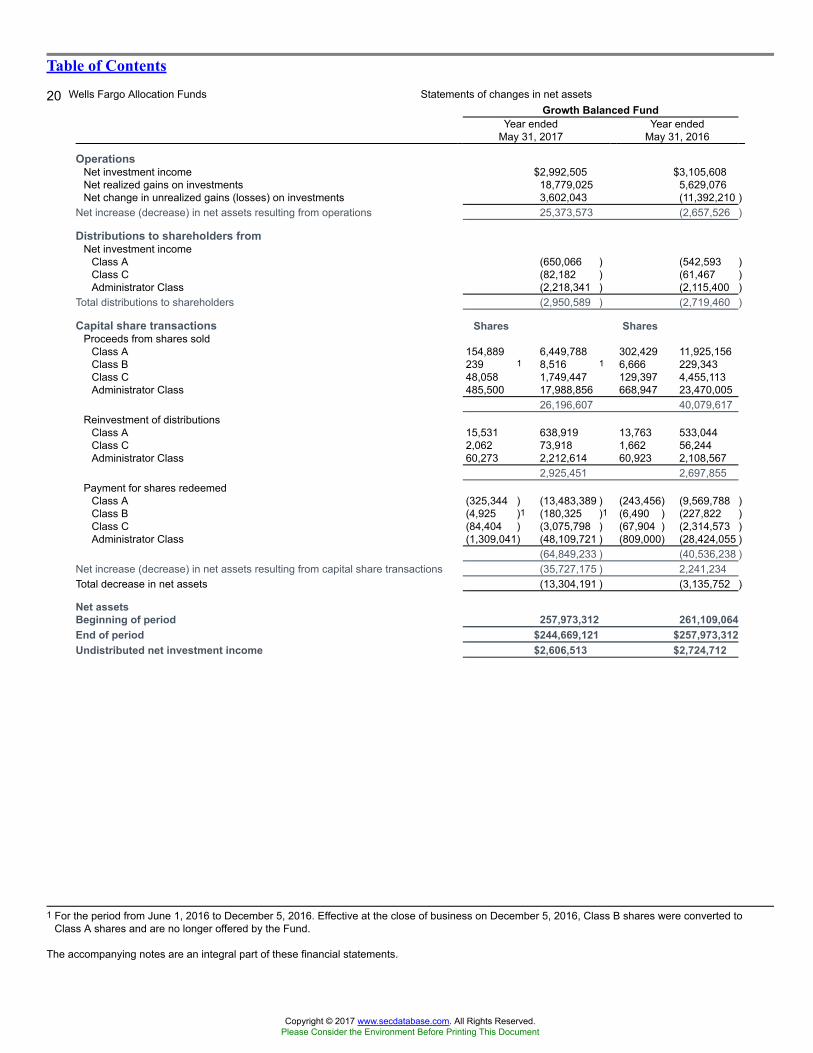
Table of Contents
20 Wells Fargo Allocation Funds Statements of changes in net assetsGrowth Balanced Fund
Year endedMay 31, 2017
Year endedMay 31, 2016
OperationsNet investment income $2,992,505 $3,105,608Net realized gains on investments 18,779,025 5,629,076Net change in unrealized gains (losses) on investments 3,602,043 (11,392,210 )
Net increase (decrease) in net assets resulting from operations 25,373,573 (2,657,526 )
Distributions to shareholders fromNet investment income
Class A (650,066 ) (542,593 )Class C (82,182 ) (61,467 )Administrator Class (2,218,341 ) (2,115,400 )
Total distributions to shareholders (2,950,589 ) (2,719,460 )
Capital share transactions Shares SharesProceeds from shares sold
Class A 154,889 6,449,788 302,429 11,925,156Class B 239 1 8,516 1 6,666 229,343Class C 48,058 1,749,447 129,397 4,455,113Administrator Class 485,500 17,988,856 668,947 23,470,005
26,196,607 40,079,617Reinvestment of distributions
Class A 15,531 638,919 13,763 533,044Class C 2,062 73,918 1,662 56,244Administrator Class 60,273 2,212,614 60,923 2,108,567
2,925,451 2,697,855Payment for shares redeemed
Class A (325,344 ) (13,483,389 ) (243,456) (9,569,788 )Class B (4,925 )1 (180,325 )1 (6,490 ) (227,822 )Class C (84,404 ) (3,075,798 ) (67,904 ) (2,314,573 )Administrator Class (1,309,041) (48,109,721 ) (809,000) (28,424,055 )
(64,849,233 ) (40,536,238 )Net increase (decrease) in net assets resulting from capital share transactions (35,727,175 ) 2,241,234Total decrease in net assets (13,304,191 ) (3,135,752 )
Net assetsBeginning of period 257,973,312 261,109,064End of period $244,669,121 $257,973,312Undistributed net investment income $2,606,513 $2,724,712
1 For the period from June 1, 2016 to December 5, 2016. Effective at the close of business on December 5, 2016, Class B shares were converted toClass A shares and are no longer offered by the Fund.
The accompanying notes are an integral part of these financial statements.
Copyright © 2017 www.secdatabase.com. All Rights Reserved.Please Consider the Environment Before Printing This Document
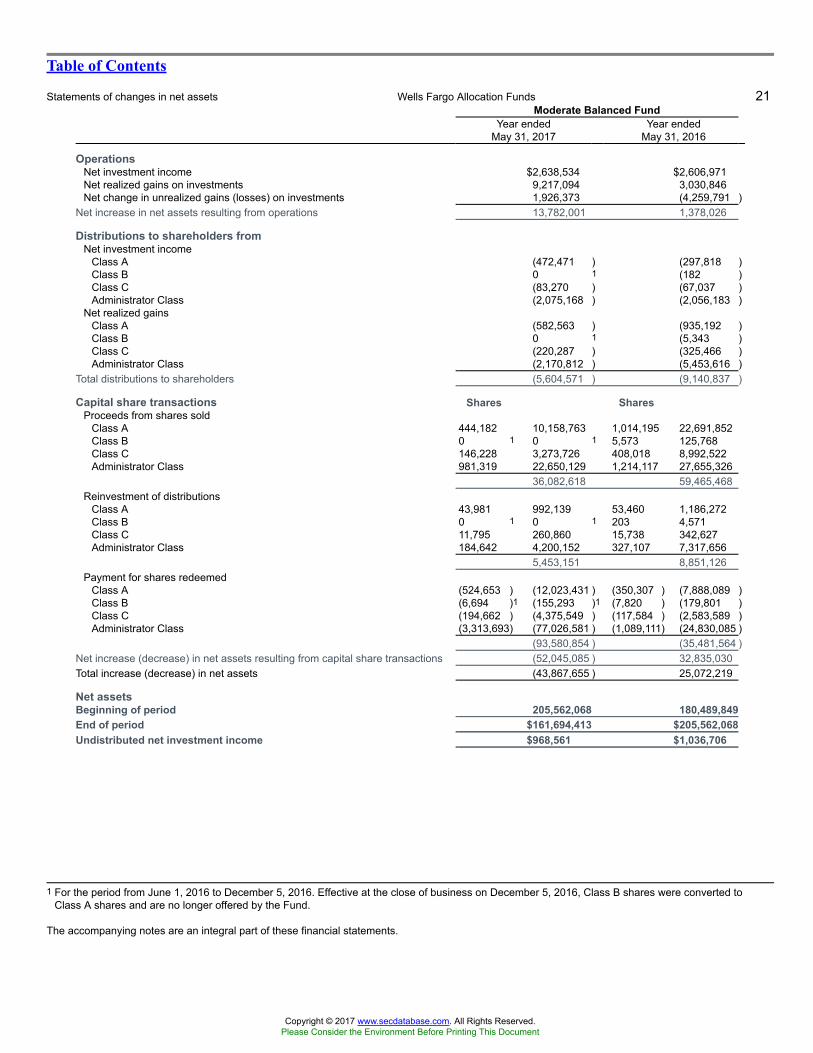
Table of Contents
Statements of changes in net assets Wells Fargo Allocation Funds 21Moderate Balanced Fund
Year endedMay 31, 2017
Year endedMay 31, 2016
OperationsNet investment income $2,638,534 $2,606,971Net realized gains on investments 9,217,094 3,030,846Net change in unrealized gains (losses) on investments 1,926,373 (4,259,791 )
Net increase in net assets resulting from operations 13,782,001 1,378,026
Distributions to shareholders fromNet investment income
Class A (472,471 ) (297,818 )Class B 0 1 (182 )Class C (83,270 ) (67,037 )Administrator Class (2,075,168 ) (2,056,183 )
Net realized gainsClass A (582,563 ) (935,192 )Class B 0 1 (5,343 )Class C (220,287 ) (325,466 )Administrator Class (2,170,812 ) (5,453,616 )
Total distributions to shareholders (5,604,571 ) (9,140,837 )
Capital share transactions Shares SharesProceeds from shares sold
Class A 444,182 10,158,763 1,014,195 22,691,852Class B 0 1 0 1 5,573 125,768Class C 146,228 3,273,726 408,018 8,992,522Administrator Class 981,319 22,650,129 1,214,117 27,655,326
36,082,618 59,465,468Reinvestment of distributions
Class A 43,981 992,139 53,460 1,186,272Class B 0 1 0 1 203 4,571Class C 11,795 260,860 15,738 342,627Administrator Class 184,642 4,200,152 327,107 7,317,656
5,453,151 8,851,126Payment for shares redeemed
Class A (524,653 ) (12,023,431 ) (350,307 ) (7,888,089 )Class B (6,694 )1 (155,293 )1 (7,820 ) (179,801 )Class C (194,662 ) (4,375,549 ) (117,584 ) (2,583,589 )Administrator Class (3,313,693) (77,026,581 ) (1,089,111) (24,830,085 )
(93,580,854 ) (35,481,564 )Net increase (decrease) in net assets resulting from capital share transactions (52,045,085 ) 32,835,030Total increase (decrease) in net assets (43,867,655 ) 25,072,219
Net assetsBeginning of period 205,562,068 180,489,849End of period $161,694,413 $205,562,068Undistributed net investment income $968,561 $1,036,706
1 For the period from June 1, 2016 to December 5, 2016. Effective at the close of business on December 5, 2016, Class B shares were converted toClass A shares and are no longer offered by the Fund.
The accompanying notes are an integral part of these financial statements.
Copyright © 2017 www.secdatabase.com. All Rights Reserved.Please Consider the Environment Before Printing This Document
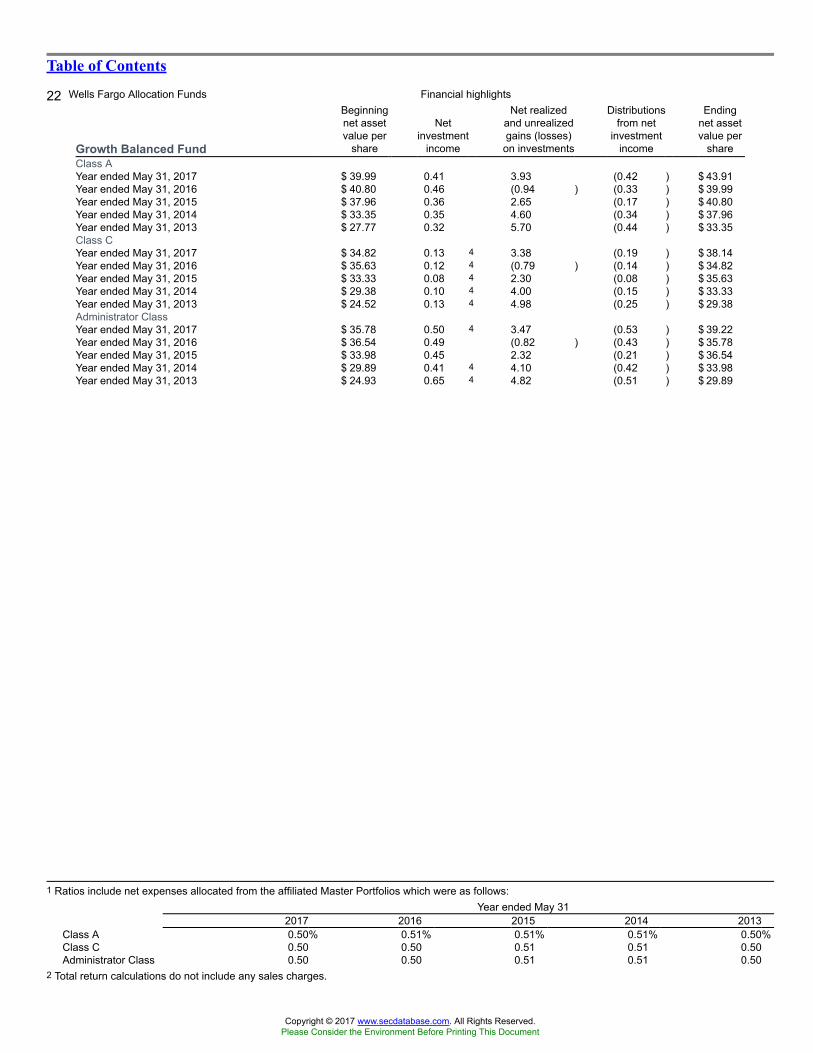
Table of Contents
22 Wells Fargo Allocation Funds Financial highlights
Growth Balanced Fund
Beginningnet assetvalue per
share
Netinvestment
income
Net realizedand unrealizedgains (losses)
on investments
Distributionsfrom net
investmentincome
Endingnet assetvalue per
shareClass AYear ended May 31, 2017 $ 39.99 0.41 3.93 (0.42 ) $ 43.91Year ended May 31, 2016 $ 40.80 0.46 (0.94 ) (0.33 ) $ 39.99Year ended May 31, 2015 $ 37.96 0.36 2.65 (0.17 ) $ 40.80Year ended May 31, 2014 $ 33.35 0.35 4.60 (0.34 ) $ 37.96Year ended May 31, 2013 $ 27.77 0.32 5.70 (0.44 ) $ 33.35Class CYear ended May 31, 2017 $ 34.82 0.13 4 3.38 (0.19 ) $ 38.14Year ended May 31, 2016 $ 35.63 0.12 4 (0.79 ) (0.14 ) $ 34.82Year ended May 31, 2015 $ 33.33 0.08 4 2.30 (0.08 ) $ 35.63Year ended May 31, 2014 $ 29.38 0.10 4 4.00 (0.15 ) $ 33.33Year ended May 31, 2013 $ 24.52 0.13 4 4.98 (0.25 ) $ 29.38Administrator ClassYear ended May 31, 2017 $ 35.78 0.50 4 3.47 (0.53 ) $ 39.22Year ended May 31, 2016 $ 36.54 0.49 (0.82 ) (0.43 ) $ 35.78Year ended May 31, 2015 $ 33.98 0.45 2.32 (0.21 ) $ 36.54Year ended May 31, 2014 $ 29.89 0.41 4 4.10 (0.42 ) $ 33.98Year ended May 31, 2013 $ 24.93 0.65 4 4.82 (0.51 ) $ 29.89
1 Ratios include net expenses allocated from the affiliated Master Portfolios which were as follows:Year ended May 31
2017 2016 2015 2014 2013Class A 0.50% 0.51% 0.51% 0.51% 0.50%Class C 0.50 0.50 0.51 0.51 0.50Administrator Class 0.50 0.50 0.51 0.51 0.50
2 Total return calculations do not include any sales charges.
Copyright © 2017 www.secdatabase.com. All Rights Reserved.Please Consider the Environment Before Printing This Document

3 Portfolio turnover rate is calculated by aggregating the results of multiplying the Fund�s investment percentage in the respective affiliated MasterPortfolio by the corresponding affiliated Master Portfolio�s portfolio turnover rate.
4 Calculated based upon average shares outstanding
The accompanying notes are an integral part of these financial statements.
Copyright © 2017 www.secdatabase.com. All Rights Reserved.Please Consider the Environment Before Printing This Document
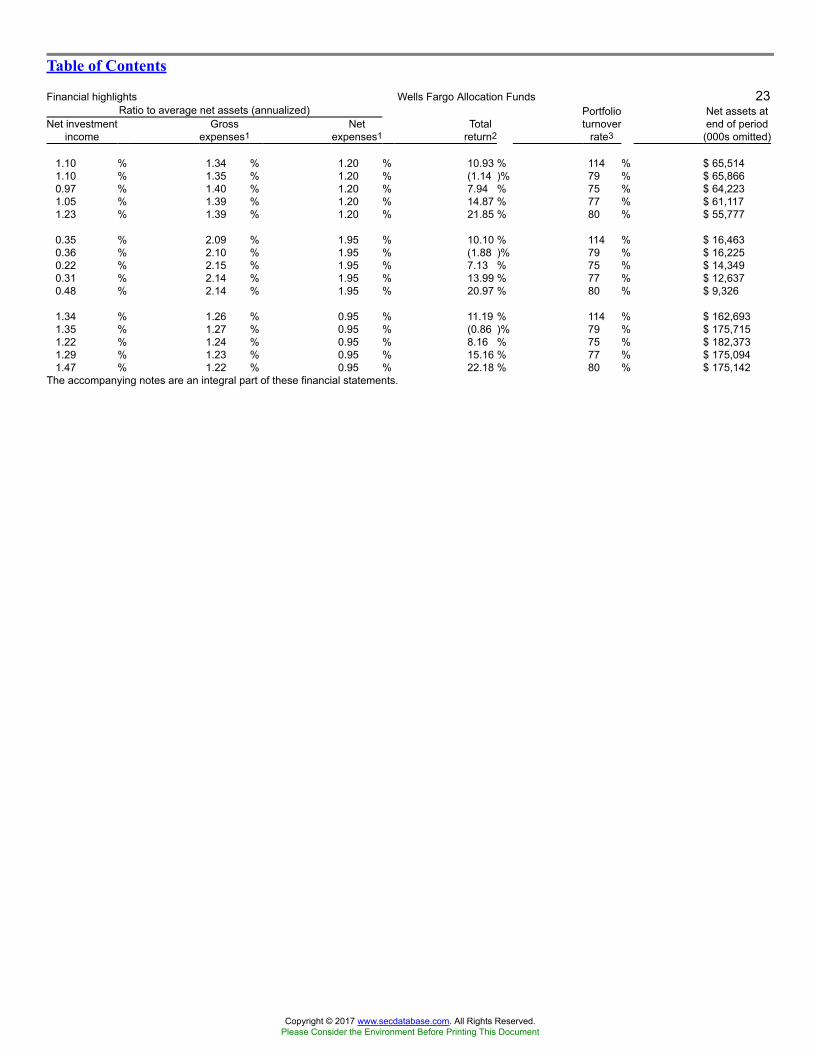
Table of Contents
Financial highlights Wells Fargo Allocation Funds 23Ratio to average net assets (annualized)
Net investmentincome
Grossexpenses1
Netexpenses1
Totalreturn2
Portfolioturnover
rate3
Net assets atend of period(000s omitted)
1.10 % 1.34 % 1.20 % 10.93 % 114 % $ 65,5141.10 % 1.35 % 1.20 % (1.14 )% 79 % $ 65,8660.97 % 1.40 % 1.20 % 7.94 % 75 % $ 64,2231.05 % 1.39 % 1.20 % 14.87 % 77 % $ 61,1171.23 % 1.39 % 1.20 % 21.85 % 80 % $ 55,777
0.35 % 2.09 % 1.95 % 10.10 % 114 % $ 16,4630.36 % 2.10 % 1.95 % (1.88 )% 79 % $ 16,2250.22 % 2.15 % 1.95 % 7.13 % 75 % $ 14,3490.31 % 2.14 % 1.95 % 13.99 % 77 % $ 12,6370.48 % 2.14 % 1.95 % 20.97 % 80 % $ 9,326
1.34 % 1.26 % 0.95 % 11.19 % 114 % $ 162,6931.35 % 1.27 % 0.95 % (0.86 )% 79 % $ 175,7151.22 % 1.24 % 0.95 % 8.16 % 75 % $ 182,3731.29 % 1.23 % 0.95 % 15.16 % 77 % $ 175,0941.47 % 1.22 % 0.95 % 22.18 % 80 % $ 175,142
The accompanying notes are an integral part of these financial statements.
Copyright © 2017 www.secdatabase.com. All Rights Reserved.Please Consider the Environment Before Printing This Document
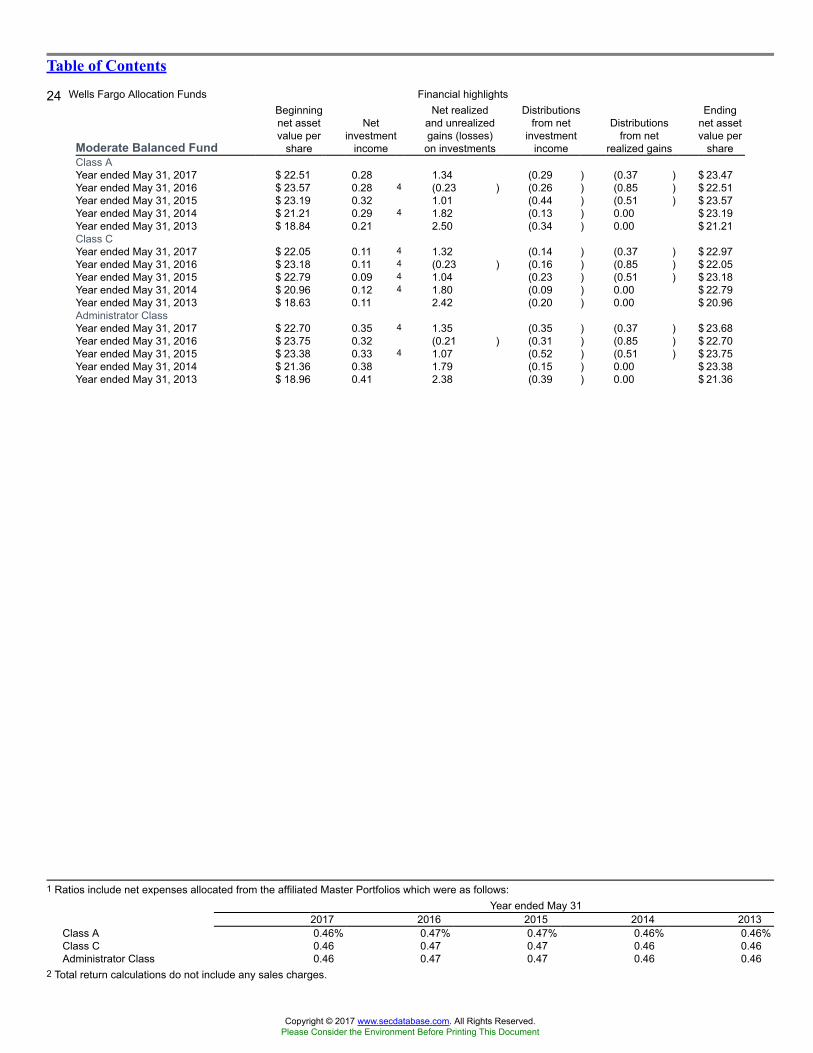
Table of Contents
24 Wells Fargo Allocation Funds Financial highlights
Moderate Balanced Fund
Beginningnet assetvalue per
share
Netinvestment
income
Net realizedand unrealizedgains (losses)
on investments
Distributionsfrom net
investmentincome
Distributionsfrom net
realized gains
Endingnet assetvalue per
shareClass AYear ended May 31, 2017 $ 22.51 0.28 1.34 (0.29 ) (0.37 ) $ 23.47Year ended May 31, 2016 $ 23.57 0.28 4 (0.23 ) (0.26 ) (0.85 ) $ 22.51Year ended May 31, 2015 $ 23.19 0.32 1.01 (0.44 ) (0.51 ) $ 23.57Year ended May 31, 2014 $ 21.21 0.29 4 1.82 (0.13 ) 0.00 $ 23.19Year ended May 31, 2013 $ 18.84 0.21 2.50 (0.34 ) 0.00 $ 21.21Class CYear ended May 31, 2017 $ 22.05 0.11 4 1.32 (0.14 ) (0.37 ) $ 22.97Year ended May 31, 2016 $ 23.18 0.11 4 (0.23 ) (0.16 ) (0.85 ) $ 22.05Year ended May 31, 2015 $ 22.79 0.09 4 1.04 (0.23 ) (0.51 ) $ 23.18Year ended May 31, 2014 $ 20.96 0.12 4 1.80 (0.09 ) 0.00 $ 22.79Year ended May 31, 2013 $ 18.63 0.11 2.42 (0.20 ) 0.00 $ 20.96Administrator ClassYear ended May 31, 2017 $ 22.70 0.35 4 1.35 (0.35 ) (0.37 ) $ 23.68Year ended May 31, 2016 $ 23.75 0.32 (0.21 ) (0.31 ) (0.85 ) $ 22.70Year ended May 31, 2015 $ 23.38 0.33 4 1.07 (0.52 ) (0.51 ) $ 23.75Year ended May 31, 2014 $ 21.36 0.38 1.79 (0.15 ) 0.00 $ 23.38Year ended May 31, 2013 $ 18.96 0.41 2.38 (0.39 ) 0.00 $ 21.36
1 Ratios include net expenses allocated from the affiliated Master Portfolios which were as follows:Year ended May 31
2017 2016 2015 2014 2013Class A 0.46% 0.47% 0.47% 0.46% 0.46%Class C 0.46 0.47 0.47 0.46 0.46Administrator Class 0.46 0.47 0.47 0.46 0.46
2 Total return calculations do not include any sales charges.
Copyright © 2017 www.secdatabase.com. All Rights Reserved.Please Consider the Environment Before Printing This Document

3 Portfolio turnover rate is calculated by aggregating the results of multiplying the Fund�s investment percentage in the respective affiliated MasterPortfolio by the corresponding affiliated Master Portfolio�s portfolio turnover rate.
4 Calculated based upon average shares outstanding
The accompanying notes are an integral part of these financial statements.
Copyright © 2017 www.secdatabase.com. All Rights Reserved.Please Consider the Environment Before Printing This Document
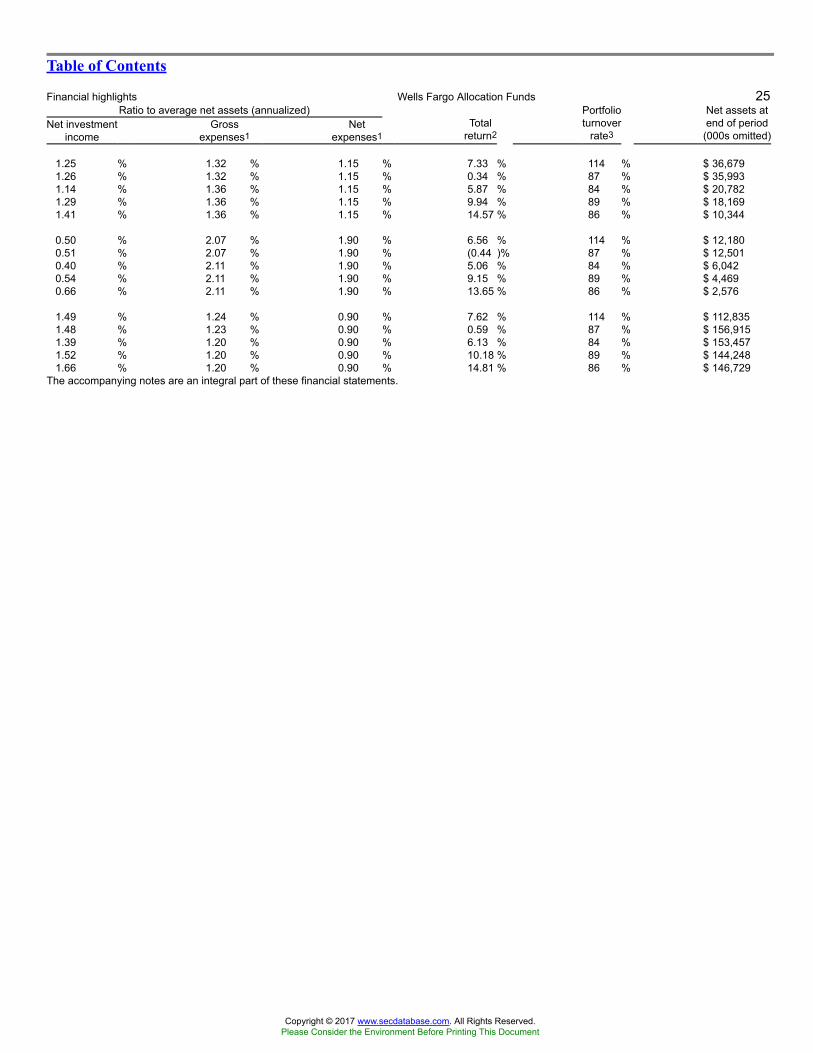
Table of Contents
Financial highlights Wells Fargo Allocation Funds 25Ratio to average net assets (annualized)
Net investmentincome
Grossexpenses1
Netexpenses1
Totalreturn2
Portfolioturnover
rate3
Net assets atend of period(000s omitted)
1.25 % 1.32 % 1.15 % 7.33 % 114 % $ 36,6791.26 % 1.32 % 1.15 % 0.34 % 87 % $ 35,9931.14 % 1.36 % 1.15 % 5.87 % 84 % $ 20,7821.29 % 1.36 % 1.15 % 9.94 % 89 % $ 18,1691.41 % 1.36 % 1.15 % 14.57 % 86 % $ 10,344
0.50 % 2.07 % 1.90 % 6.56 % 114 % $ 12,1800.51 % 2.07 % 1.90 % (0.44 )% 87 % $ 12,5010.40 % 2.11 % 1.90 % 5.06 % 84 % $ 6,0420.54 % 2.11 % 1.90 % 9.15 % 89 % $ 4,4690.66 % 2.11 % 1.90 % 13.65 % 86 % $ 2,576
1.49 % 1.24 % 0.90 % 7.62 % 114 % $ 112,8351.48 % 1.23 % 0.90 % 0.59 % 87 % $ 156,9151.39 % 1.20 % 0.90 % 6.13 % 84 % $ 153,4571.52 % 1.20 % 0.90 % 10.18 % 89 % $ 144,2481.66 % 1.20 % 0.90 % 14.81 % 86 % $ 146,729
The accompanying notes are an integral part of these financial statements.
Copyright © 2017 www.secdatabase.com. All Rights Reserved.Please Consider the Environment Before Printing This Document
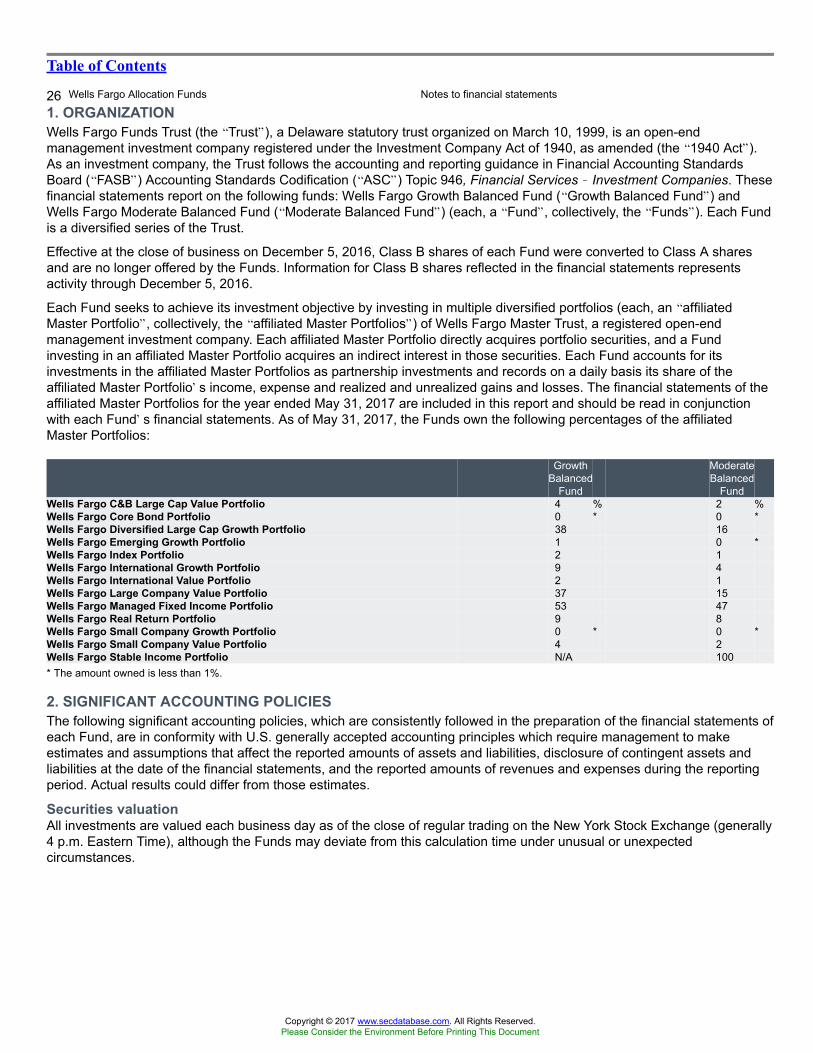
Table of Contents
26 Wells Fargo Allocation Funds Notes to financial statements
1. ORGANIZATIONWells Fargo Funds Trust (the �Trust�), a Delaware statutory trust organized on March 10, 1999, is an open-endmanagement investment company registered under the Investment Company Act of 1940, as amended (the �1940 Act�).As an investment company, the Trust follows the accounting and reporting guidance in Financial Accounting StandardsBoard (�FASB�) Accounting Standards Codification (�ASC�) Topic 946, Financial Services � Investment Companies. Thesefinancial statements report on the following funds: Wells Fargo Growth Balanced Fund (�Growth Balanced Fund�) andWells Fargo Moderate Balanced Fund (�Moderate Balanced Fund�) (each, a �Fund�, collectively, the �Funds�). Each Fundis a diversified series of the Trust.
Effective at the close of business on December 5, 2016, Class B shares of each Fund were converted to Class A sharesand are no longer offered by the Funds. Information for Class B shares reflected in the financial statements representsactivity through December 5, 2016.
Each Fund seeks to achieve its investment objective by investing in multiple diversified portfolios (each, an �affiliatedMaster Portfolio�, collectively, the �affiliated Master Portfolios�) of Wells Fargo Master Trust, a registered open-endmanagement investment company. Each affiliated Master Portfolio directly acquires portfolio securities, and a Fundinvesting in an affiliated Master Portfolio acquires an indirect interest in those securities. Each Fund accounts for itsinvestments in the affiliated Master Portfolios as partnership investments and records on a daily basis its share of theaffiliated Master Portfolio�s income, expense and realized and unrealized gains and losses. The financial statements of theaffiliated Master Portfolios for the year ended May 31, 2017 are included in this report and should be read in conjunctionwith each Fund�s financial statements. As of May 31, 2017, the Funds own the following percentages of the affiliatedMaster Portfolios:
GrowthBalanced
Fund
ModerateBalanced
FundWells Fargo C&B Large Cap Value Portfolio 4 % 2 %Wells Fargo Core Bond Portfolio 0 * 0 *Wells Fargo Diversified Large Cap Growth Portfolio 38 16Wells Fargo Emerging Growth Portfolio 1 0 *Wells Fargo Index Portfolio 2 1Wells Fargo International Growth Portfolio 9 4Wells Fargo International Value Portfolio 2 1Wells Fargo Large Company Value Portfolio 37 15Wells Fargo Managed Fixed Income Portfolio 53 47Wells Fargo Real Return Portfolio 9 8Wells Fargo Small Company Growth Portfolio 0 * 0 *Wells Fargo Small Company Value Portfolio 4 2Wells Fargo Stable Income Portfolio N/A 100* The amount owned is less than 1%.
2. SIGNIFICANT ACCOUNTING POLICIESThe following significant accounting policies, which are consistently followed in the preparation of the financial statements ofeach Fund, are in conformity with U.S. generally accepted accounting principles which require management to makeestimates and assumptions that affect the reported amounts of assets and liabilities, disclosure of contingent assets andliabilities at the date of the financial statements, and the reported amounts of revenues and expenses during the reportingperiod. Actual results could differ from those estimates.
Securities valuationAll investments are valued each business day as of the close of regular trading on the New York Stock Exchange (generally4 p.m. Eastern Time), although the Funds may deviate from this calculation time under unusual or unexpectedcircumstances.
Copyright © 2017 www.secdatabase.com. All Rights Reserved.Please Consider the Environment Before Printing This Document
Table of Contents
Notes to financial statements Wells Fargo Allocation Funds 27Investments in the affiliated Master Portfolios are valued daily based on each Fund�s proportionate share of each affiliatedMaster Portfolio�s net assets, which are also valued daily. Securities held in the affiliated Master Portfolios are valued asdiscussed in the Notes to Financial Statements of the affiliated Master Portfolios, which are included elsewhere in thisreport.
Futures that are listed on a foreign or domestic exchange or market are valued at the official closing price or, if none, thelast sales price.
Debt securities are valued at the evaluated bid price provided by an independent pricing service or, if a reliable price is notavailable, the quoted bid price from an independent broker-dealer.
Investments which are not valued using any of the methods discussed above are valued at their fair value, as determined ingood faith by the Board of Trustees of the Funds. The Board of Trustees has established a Valuation Committee comprisedof the Trustees and has delegated to it the authority to take any actions regarding the valuation of portfolio securities thatthe Valuation Committee deems necessary or appropriate, including determining the fair value of portfolio securities, unlessthe determination has been delegated to the Management Valuation Team of Wells Fargo Funds Management, LLC(�Funds Management�). The Board of Trustees retains the authority to make or ratify any valuation decisions or approveany changes to the Valuation Procedures as it deems appropriate. On a quarterly basis, the Board of Trustees receivesreports on any valuation actions taken by the Valuation Committee or the Management Valuation Team which may includeitems for ratification.
Valuations of fair valued securities are compared to the next actual sales price when available, or other appropriate marketvalues, to assess the continued appropriateness of the fair valuation methodologies used. These securities are fair valuedon a day-to-day basis, taking into consideration changes to appropriate market information and any significant changes tothe inputs considered in the valuation process until there is a readily available price provided on an exchange or by anindependent pricing service. Valuations received from an independent pricing service or independent broker-dealer quotesare periodically validated by comparisons to most recent trades and valuations provided by other independent pricingservices in addition to the review of prices by the manager and/or subadviser. Unobservable inputs used in determining fairvaluations are identified based on the type of security, taking into consideration factors utilized by market participants invaluing the investment, knowledge about the issuer and the current market environment.
Futures contractsEach Fund may enter into futures contracts and may be subject to interest rate risk and equity price risk in the normalcourse of pursuing its investment objectives. The Fund may buy and sell futures contracts in order to gain exposure to, orprotect against, changes in interest rates and security values. The primary risks associated with the use of futures contractsare the imperfect correlation between changes in market values of securities held by the Fund and the prices of futurescontracts, and the possibility of an illiquid market.
The aggregate principal amounts of the contracts are not recorded in the financial statements. Fluctuations in the value ofthe contracts are recorded in the Statements of Assets and Liabilities as an asset or liability and in the Statements ofOperations as unrealized gains or losses until the contracts are closed, at which point they are recorded as net realizedgains or losses on futures contracts. With futures contracts, there is minimal counterparty risk to the Fund since futures areexchange traded and the exchange�s clearinghouse, as counterparty to all exchange traded futures, guarantees the futuresagainst default.
Security transactions and income recognitionSecurities transactions are recorded on a trade date basis in each Fund and each affiliated Master Portfolio. Realized gainsor losses in each Fund and each affiliated Master Portfolio are recorded on the basis of identified cost.
Interest income is accrued daily and bond discounts are accreted and premiums are amortized daily based on the effectiveinterest method by each Fund and affiliated Master Portfolio. To the extent debt obligations are placed on non-accrualstatus, any related interest income may be reduced by writing off interest receivables when the collection of all or a portionof interest has been determined to be doubtful based on consistently applied procedures and the fair value has decreased.If the issuer subsequently resumes interest payments or when the collectability of interest is reasonably assured, the debtobligation is removed from non-accrual status.
Dividend income in each affiliated Master Portfolio is recognized on the ex-dividend date, except for certain dividends fromforeign securities which are recorded as soon as the custodian verifies the ex-dividend date.
Income from foreign securities is recorded net of foreign taxes withheld where recovery of such taxes is not assured.
Copyright © 2017 www.secdatabase.com. All Rights Reserved.Please Consider the Environment Before Printing This Document
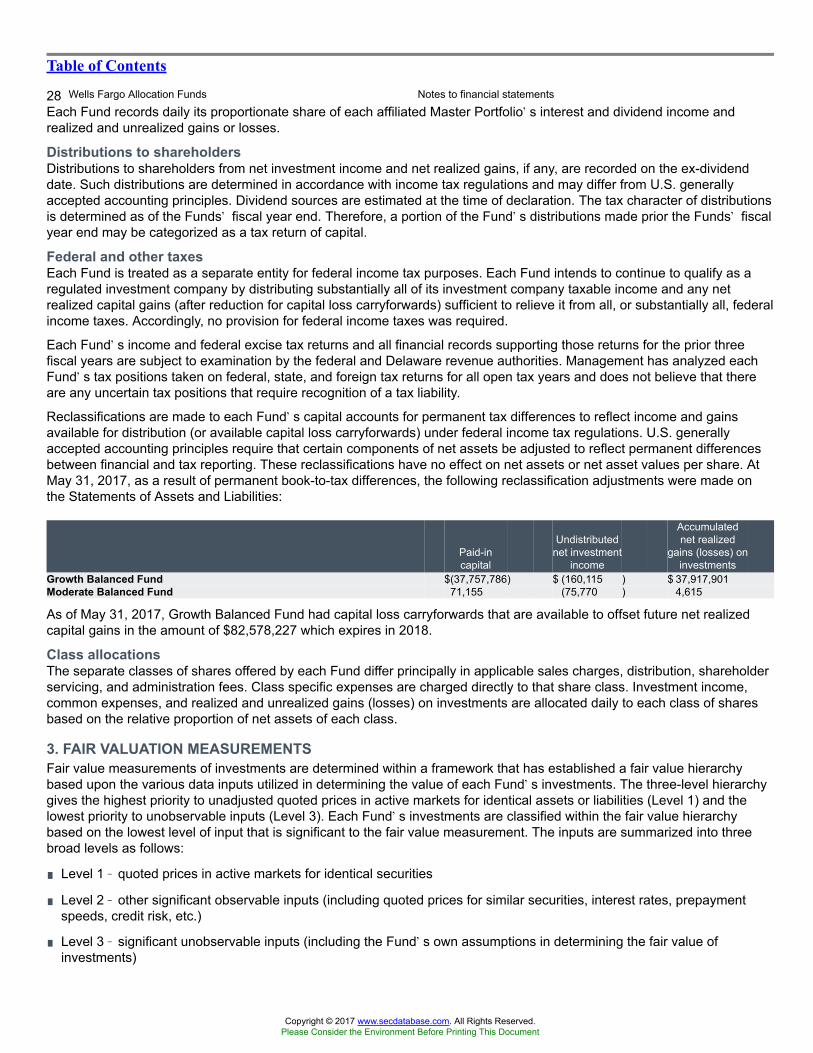
Table of Contents
28 Wells Fargo Allocation Funds Notes to financial statements
Each Fund records daily its proportionate share of each affiliated Master Portfolio�s interest and dividend income andrealized and unrealized gains or losses.
Distributions to shareholdersDistributions to shareholders from net investment income and net realized gains, if any, are recorded on the ex-dividenddate. Such distributions are determined in accordance with income tax regulations and may differ from U.S. generallyaccepted accounting principles. Dividend sources are estimated at the time of declaration. The tax character of distributionsis determined as of the Funds� fiscal year end. Therefore, a portion of the Fund�s distributions made prior the Funds� fiscalyear end may be categorized as a tax return of capital.
Federal and other taxesEach Fund is treated as a separate entity for federal income tax purposes. Each Fund intends to continue to qualify as aregulated investment company by distributing substantially all of its investment company taxable income and any netrealized capital gains (after reduction for capital loss carryforwards) sufficient to relieve it from all, or substantially all, federalincome taxes. Accordingly, no provision for federal income taxes was required.
Each Fund�s income and federal excise tax returns and all financial records supporting those returns for the prior threefiscal years are subject to examination by the federal and Delaware revenue authorities. Management has analyzed eachFund�s tax positions taken on federal, state, and foreign tax returns for all open tax years and does not believe that thereare any uncertain tax positions that require recognition of a tax liability.
Reclassifications are made to each Fund�s capital accounts for permanent tax differences to reflect income and gainsavailable for distribution (or available capital loss carryforwards) under federal income tax regulations. U.S. generallyaccepted accounting principles require that certain components of net assets be adjusted to reflect permanent differencesbetween financial and tax reporting. These reclassifications have no effect on net assets or net asset values per share. AtMay 31, 2017, as a result of permanent book-to-tax differences, the following reclassification adjustments were made onthe Statements of Assets and Liabilities:
Paid-incapital
Undistributednet investment
income
Accumulatednet realized
gains (losses) oninvestments
Growth Balanced Fund $(37,757,786) $ (160,115 ) $ 37,917,901Moderate Balanced Fund 71,155 (75,770 ) 4,615
As of May 31, 2017, Growth Balanced Fund had capital loss carryforwards that are available to offset future net realizedcapital gains in the amount of $82,578,227 which expires in 2018.
Class allocationsThe separate classes of shares offered by each Fund differ principally in applicable sales charges, distribution, shareholderservicing, and administration fees. Class specific expenses are charged directly to that share class. Investment income,common expenses, and realized and unrealized gains (losses) on investments are allocated daily to each class of sharesbased on the relative proportion of net assets of each class.
3. FAIR VALUATION MEASUREMENTSFair value measurements of investments are determined within a framework that has established a fair value hierarchybased upon the various data inputs utilized in determining the value of each Fund�s investments. The three-level hierarchygives the highest priority to unadjusted quoted prices in active markets for identical assets or liabilities (Level 1) and thelowest priority to unobservable inputs (Level 3). Each Fund�s investments are classified within the fair value hierarchybased on the lowest level of input that is significant to the fair value measurement. The inputs are summarized into threebroad levels as follows:
∎ Level 1 � quoted prices in active markets for identical securities
∎ Level 2 � other significant observable inputs (including quoted prices for similar securities, interest rates, prepaymentspeeds, credit risk, etc.)
∎ Level 3 � significant unobservable inputs (including the Fund�s own assumptions in determining the fair value ofinvestments)
Copyright © 2017 www.secdatabase.com. All Rights Reserved.Please Consider the Environment Before Printing This Document
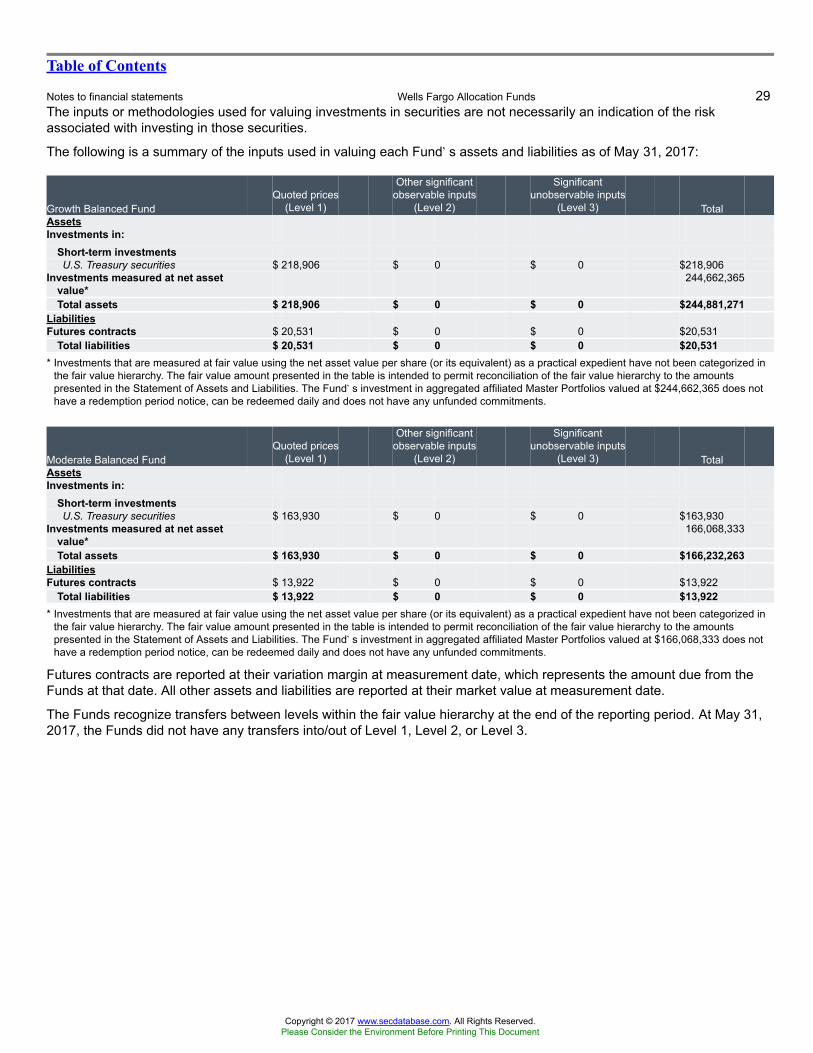
Table of Contents
Notes to financial statements Wells Fargo Allocation Funds 29The inputs or methodologies used for valuing investments in securities are not necessarily an indication of the riskassociated with investing in those securities.
The following is a summary of the inputs used in valuing each Fund�s assets and liabilities as of May 31, 2017:
Growth Balanced FundQuoted prices
(Level 1)
Other significantobservable inputs
(Level 2)
Significantunobservable inputs
(Level 3) TotalAssetsInvestments in:
Short-term investmentsU.S. Treasury securities $ 218,906 $ 0 $ 0 $218,906
Investments measured at net assetvalue*
244,662,365
Total assets $ 218,906 $ 0 $ 0 $244,881,271LiabilitiesFutures contracts $ 20,531 $ 0 $ 0 $20,531
Total liabilities $ 20,531 $ 0 $ 0 $20,531* Investments that are measured at fair value using the net asset value per share (or its equivalent) as a practical expedient have not been categorized in
the fair value hierarchy. The fair value amount presented in the table is intended to permit reconciliation of the fair value hierarchy to the amountspresented in the Statement of Assets and Liabilities. The Fund�s investment in aggregated affiliated Master Portfolios valued at $244,662,365 does nothave a redemption period notice, can be redeemed daily and does not have any unfunded commitments.
Moderate Balanced FundQuoted prices
(Level 1)
Other significantobservable inputs
(Level 2)
Significantunobservable inputs
(Level 3) TotalAssetsInvestments in:
Short-term investmentsU.S. Treasury securities $ 163,930 $ 0 $ 0 $163,930
Investments measured at net assetvalue*
166,068,333
Total assets $ 163,930 $ 0 $ 0 $166,232,263LiabilitiesFutures contracts $ 13,922 $ 0 $ 0 $13,922
Total liabilities $ 13,922 $ 0 $ 0 $13,922* Investments that are measured at fair value using the net asset value per share (or its equivalent) as a practical expedient have not been categorized in
the fair value hierarchy. The fair value amount presented in the table is intended to permit reconciliation of the fair value hierarchy to the amountspresented in the Statement of Assets and Liabilities. The Fund�s investment in aggregated affiliated Master Portfolios valued at $166,068,333 does nothave a redemption period notice, can be redeemed daily and does not have any unfunded commitments.
Futures contracts are reported at their variation margin at measurement date, which represents the amount due from theFunds at that date. All other assets and liabilities are reported at their market value at measurement date.
The Funds recognize transfers between levels within the fair value hierarchy at the end of the reporting period. At May 31,2017, the Funds did not have any transfers into/out of Level 1, Level 2, or Level 3.
Copyright © 2017 www.secdatabase.com. All Rights Reserved.Please Consider the Environment Before Printing This Document
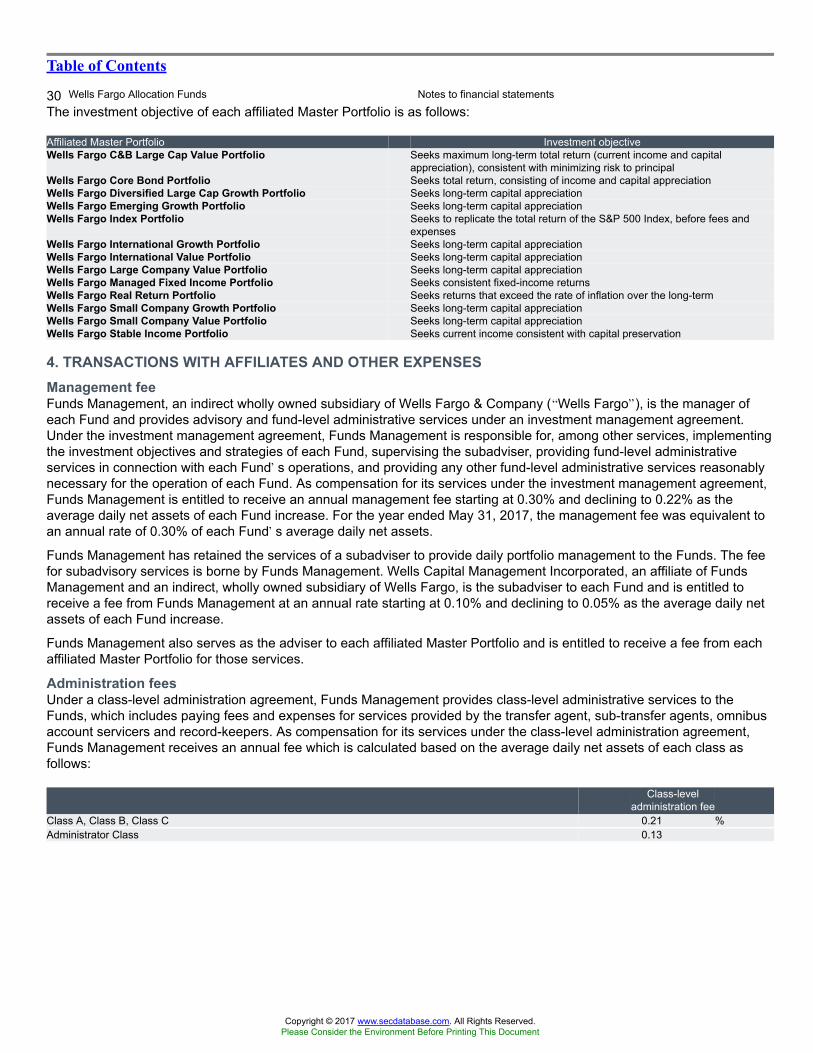
Table of Contents
30 Wells Fargo Allocation Funds Notes to financial statements
The investment objective of each affiliated Master Portfolio is as follows:
Affiliated Master Portfolio Investment objectiveWells Fargo C&B Large Cap Value Portfolio Seeks maximum long-term total return (current income and capital
appreciation), consistent with minimizing risk to principalWells Fargo Core Bond Portfolio Seeks total return, consisting of income and capital appreciationWells Fargo Diversified Large Cap Growth Portfolio Seeks long-term capital appreciationWells Fargo Emerging Growth Portfolio Seeks long-term capital appreciationWells Fargo Index Portfolio Seeks to replicate the total return of the S&P 500 Index, before fees and
expensesWells Fargo International Growth Portfolio Seeks long-term capital appreciationWells Fargo International Value Portfolio Seeks long-term capital appreciationWells Fargo Large Company Value Portfolio Seeks long-term capital appreciationWells Fargo Managed Fixed Income Portfolio Seeks consistent fixed-income returnsWells Fargo Real Return Portfolio Seeks returns that exceed the rate of inflation over the long-termWells Fargo Small Company Growth Portfolio Seeks long-term capital appreciationWells Fargo Small Company Value Portfolio Seeks long-term capital appreciationWells Fargo Stable Income Portfolio Seeks current income consistent with capital preservation
4. TRANSACTIONS WITH AFFILIATES AND OTHER EXPENSESManagement feeFunds Management, an indirect wholly owned subsidiary of Wells Fargo & Company (�Wells Fargo�), is the manager ofeach Fund and provides advisory and fund-level administrative services under an investment management agreement.Under the investment management agreement, Funds Management is responsible for, among other services, implementingthe investment objectives and strategies of each Fund, supervising the subadviser, providing fund-level administrativeservices in connection with each Fund�s operations, and providing any other fund-level administrative services reasonablynecessary for the operation of each Fund. As compensation for its services under the investment management agreement,Funds Management is entitled to receive an annual management fee starting at 0.30% and declining to 0.22% as theaverage daily net assets of each Fund increase. For the year ended May 31, 2017, the management fee was equivalent toan annual rate of 0.30% of each Fund�s average daily net assets.
Funds Management has retained the services of a subadviser to provide daily portfolio management to the Funds. The feefor subadvisory services is borne by Funds Management. Wells Capital Management Incorporated, an affiliate of FundsManagement and an indirect, wholly owned subsidiary of Wells Fargo, is the subadviser to each Fund and is entitled toreceive a fee from Funds Management at an annual rate starting at 0.10% and declining to 0.05% as the average daily netassets of each Fund increase.
Funds Management also serves as the adviser to each affiliated Master Portfolio and is entitled to receive a fee from eachaffiliated Master Portfolio for those services.
Administration feesUnder a class-level administration agreement, Funds Management provides class-level administrative services to theFunds, which includes paying fees and expenses for services provided by the transfer agent, sub-transfer agents, omnibusaccount servicers and record-keepers. As compensation for its services under the class-level administration agreement,Funds Management receives an annual fee which is calculated based on the average daily net assets of each class asfollows:
Class-leveladministration fee
Class A, Class B, Class C 0.21 %Administrator Class 0.13
Copyright © 2017 www.secdatabase.com. All Rights Reserved.Please Consider the Environment Before Printing This Document
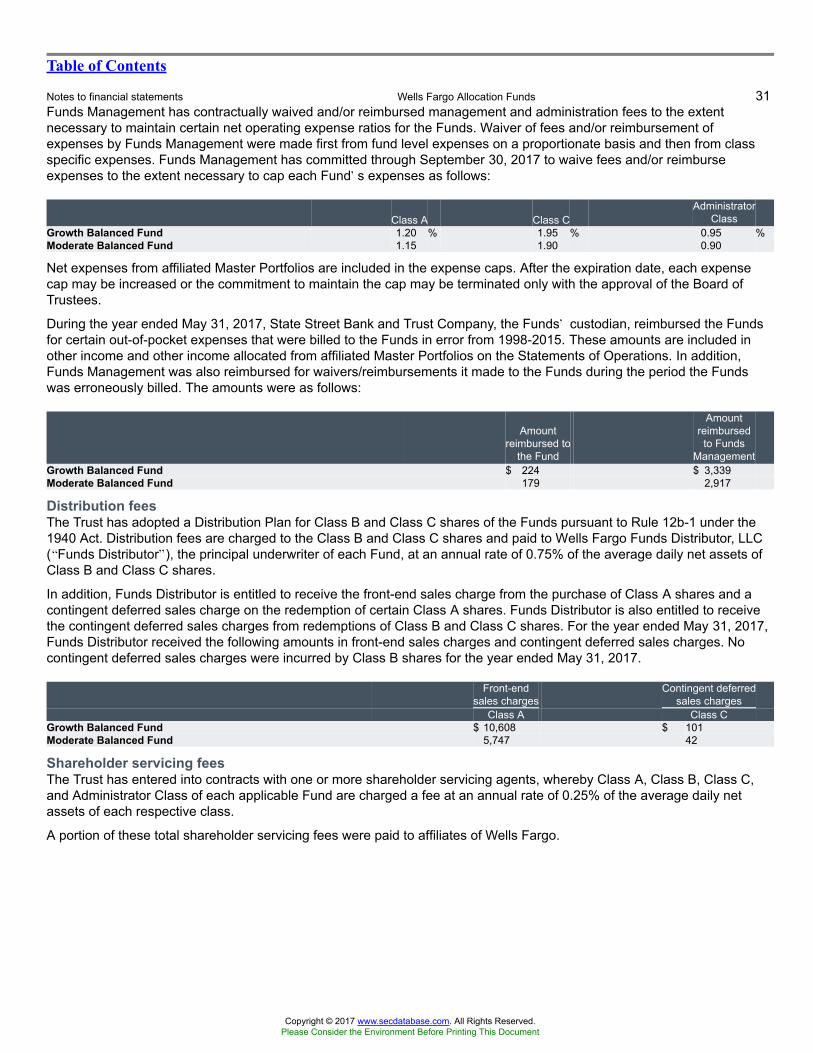
Table of Contents
Notes to financial statements Wells Fargo Allocation Funds 31Funds Management has contractually waived and/or reimbursed management and administration fees to the extentnecessary to maintain certain net operating expense ratios for the Funds. Waiver of fees and/or reimbursement ofexpenses by Funds Management were made first from fund level expenses on a proportionate basis and then from classspecific expenses. Funds Management has committed through September 30, 2017 to waive fees and/or reimburseexpenses to the extent necessary to cap each Fund�s expenses as follows:
Class A Class CAdministrator
ClassGrowth Balanced Fund 1.20 % 1.95 % 0.95 %Moderate Balanced Fund 1.15 1.90 0.90
Net expenses from affiliated Master Portfolios are included in the expense caps. After the expiration date, each expensecap may be increased or the commitment to maintain the cap may be terminated only with the approval of the Board ofTrustees.
During the year ended May 31, 2017, State Street Bank and Trust Company, the Funds� custodian, reimbursed the Fundsfor certain out-of-pocket expenses that were billed to the Funds in error from 1998-2015. These amounts are included inother income and other income allocated from affiliated Master Portfolios on the Statements of Operations. In addition,Funds Management was also reimbursed for waivers/reimbursements it made to the Funds during the period the Fundswas erroneously billed. The amounts were as follows:
Amountreimbursed to
the Fund
Amountreimbursed
to FundsManagement
Growth Balanced Fund $ 224 $ 3,339Moderate Balanced Fund 179 2,917
Distribution feesThe Trust has adopted a Distribution Plan for Class B and Class C shares of the Funds pursuant to Rule 12b-1 under the1940 Act. Distribution fees are charged to the Class B and Class C shares and paid to Wells Fargo Funds Distributor, LLC(�Funds Distributor�), the principal underwriter of each Fund, at an annual rate of 0.75% of the average daily net assets ofClass B and Class C shares.
In addition, Funds Distributor is entitled to receive the front-end sales charge from the purchase of Class A shares and acontingent deferred sales charge on the redemption of certain Class A shares. Funds Distributor is also entitled to receivethe contingent deferred sales charges from redemptions of Class B and Class C shares. For the year ended May 31, 2017,Funds Distributor received the following amounts in front-end sales charges and contingent deferred sales charges. Nocontingent deferred sales charges were incurred by Class B shares for the year ended May 31, 2017.
Front-endsales charges
Contingent deferredsales charges
Class A Class CGrowth Balanced Fund $ 10,608 $ 101Moderate Balanced Fund 5,747 42
Shareholder servicing feesThe Trust has entered into contracts with one or more shareholder servicing agents, whereby Class A, Class B, Class C,and Administrator Class of each applicable Fund are charged a fee at an annual rate of 0.25% of the average daily netassets of each respective class.
A portion of these total shareholder servicing fees were paid to affiliates of Wells Fargo.
Copyright © 2017 www.secdatabase.com. All Rights Reserved.Please Consider the Environment Before Printing This Document
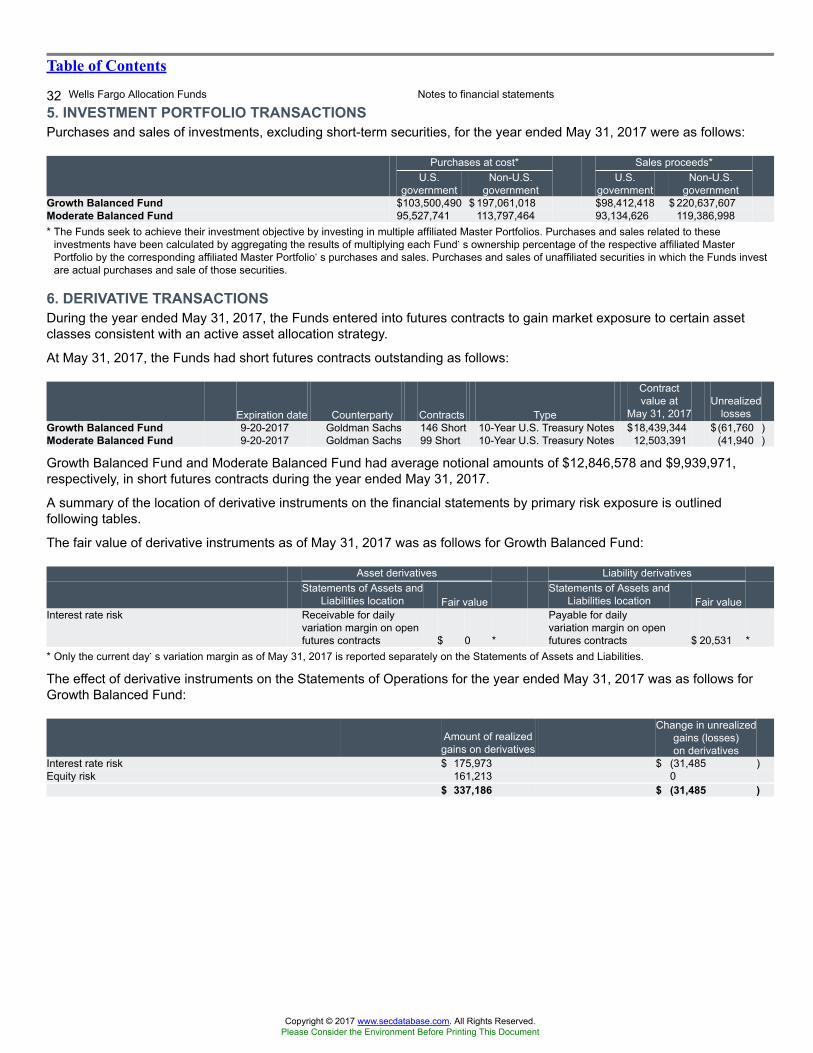
Table of Contents
32 Wells Fargo Allocation Funds Notes to financial statements
5. INVESTMENT PORTFOLIO TRANSACTIONSPurchases and sales of investments, excluding short-term securities, for the year ended May 31, 2017 were as follows:
Purchases at cost* Sales proceeds*U.S.
governmentNon-U.S.
governmentU.S.
governmentNon-U.S.
governmentGrowth Balanced Fund $103,500,490 $ 197,061,018 $98,412,418 $ 220,637,607Moderate Balanced Fund 95,527,741 113,797,464 93,134,626 119,386,998* The Funds seek to achieve their investment objective by investing in multiple affiliated Master Portfolios. Purchases and sales related to these
investments have been calculated by aggregating the results of multiplying each Fund�s ownership percentage of the respective affiliated MasterPortfolio by the corresponding affiliated Master Portfolio�s purchases and sales. Purchases and sales of unaffiliated securities in which the Funds investare actual purchases and sale of those securities.
6. DERIVATIVE TRANSACTIONSDuring the year ended May 31, 2017, the Funds entered into futures contracts to gain market exposure to certain assetclasses consistent with an active asset allocation strategy.
At May 31, 2017, the Funds had short futures contracts outstanding as follows:
Expiration date Counterparty Contracts Type
Contractvalue at
May 31, 2017Unrealized
lossesGrowth Balanced Fund 9-20-2017 Goldman Sachs 146 Short 10-Year U.S. Treasury Notes $18,439,344 $(61,760 )Moderate Balanced Fund 9-20-2017 Goldman Sachs 99 Short 10-Year U.S. Treasury Notes 12,503,391 (41,940 )
Growth Balanced Fund and Moderate Balanced Fund had average notional amounts of $12,846,578 and $9,939,971,respectively, in short futures contracts during the year ended May 31, 2017.
A summary of the location of derivative instruments on the financial statements by primary risk exposure is outlinedfollowing tables.
The fair value of derivative instruments as of May 31, 2017 was as follows for Growth Balanced Fund:
Asset derivatives Liability derivativesStatements of Assets and
Liabilities location Fair valueStatements of Assets and
Liabilities location Fair valueInterest rate risk Receivable for daily
variation margin on openfutures contracts $ 0 *
Payable for dailyvariation margin on openfutures contracts $ 20,531 *
* Only the current day�s variation margin as of May 31, 2017 is reported separately on the Statements of Assets and Liabilities.
The effect of derivative instruments on the Statements of Operations for the year ended May 31, 2017 was as follows forGrowth Balanced Fund:
Amount of realizedgains on derivatives
Change in unrealizedgains (losses)on derivatives
Interest rate risk $ 175,973 $ (31,485 )Equity risk 161,213 0
$ 337,186 $ (31,485 )
Copyright © 2017 www.secdatabase.com. All Rights Reserved.Please Consider the Environment Before Printing This Document
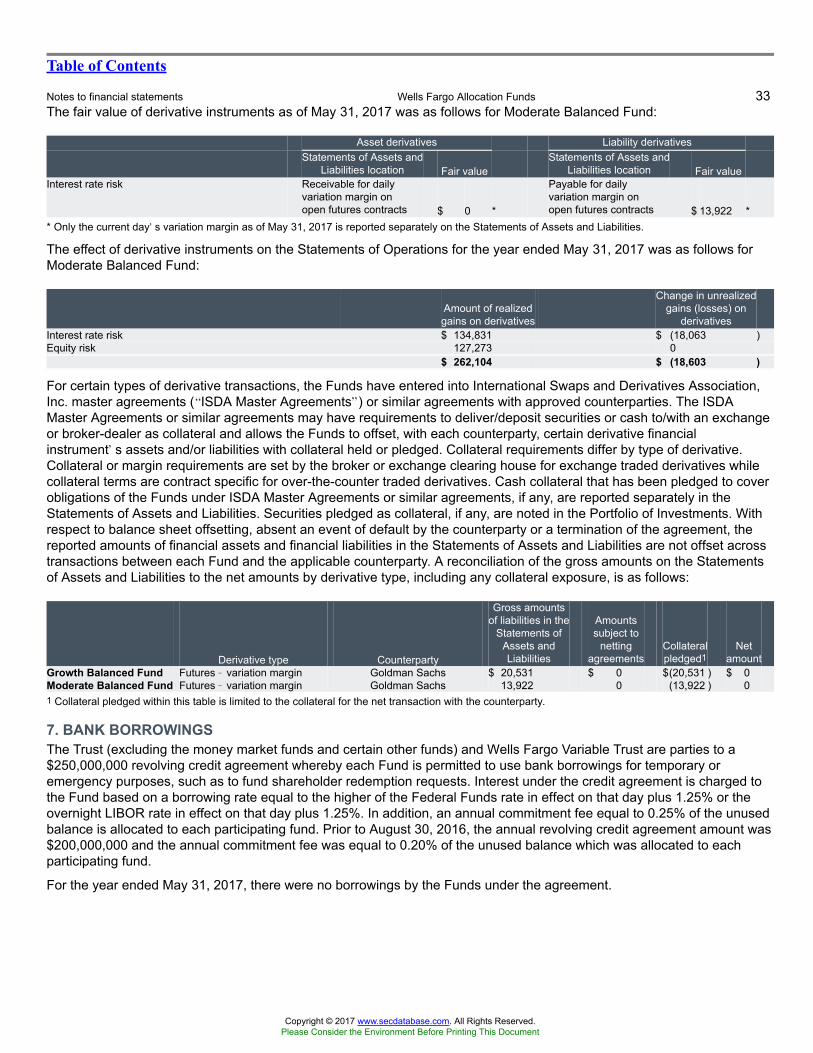
Table of Contents
Notes to financial statements Wells Fargo Allocation Funds 33The fair value of derivative instruments as of May 31, 2017 was as follows for Moderate Balanced Fund:
Asset derivatives Liability derivativesStatements of Assets and
Liabilities location Fair valueStatements of Assets and
Liabilities location Fair valueInterest rate risk Receivable for daily
variation margin onopen futures contracts $ 0 *
Payable for dailyvariation margin onopen futures contracts $ 13,922 *
* Only the current day�s variation margin as of May 31, 2017 is reported separately on the Statements of Assets and Liabilities.
The effect of derivative instruments on the Statements of Operations for the year ended May 31, 2017 was as follows forModerate Balanced Fund:
Amount of realizedgains on derivatives
Change in unrealizedgains (losses) on
derivativesInterest rate risk $ 134,831 $ (18,063 )Equity risk 127,273 0
$ 262,104 $ (18,603 )
For certain types of derivative transactions, the Funds have entered into International Swaps and Derivatives Association,Inc. master agreements (�ISDA Master Agreements�) or similar agreements with approved counterparties. The ISDAMaster Agreements or similar agreements may have requirements to deliver/deposit securities or cash to/with an exchangeor broker-dealer as collateral and allows the Funds to offset, with each counterparty, certain derivative financialinstrument�s assets and/or liabilities with collateral held or pledged. Collateral requirements differ by type of derivative.Collateral or margin requirements are set by the broker or exchange clearing house for exchange traded derivatives whilecollateral terms are contract specific for over-the-counter traded derivatives. Cash collateral that has been pledged to coverobligations of the Funds under ISDA Master Agreements or similar agreements, if any, are reported separately in theStatements of Assets and Liabilities. Securities pledged as collateral, if any, are noted in the Portfolio of Investments. Withrespect to balance sheet offsetting, absent an event of default by the counterparty or a termination of the agreement, thereported amounts of financial assets and financial liabilities in the Statements of Assets and Liabilities are not offset acrosstransactions between each Fund and the applicable counterparty. A reconciliation of the gross amounts on the Statementsof Assets and Liabilities to the net amounts by derivative type, including any collateral exposure, is as follows:
Derivative type Counterparty
Gross amountsof liabilities in the
Statements ofAssets andLiabilities
Amountssubject to
nettingagreements
Collateralpledged1
Netamount
Growth Balanced Fund Futures � variation margin Goldman Sachs $ 20,531 $ 0 $(20,531 ) $ 0Moderate Balanced Fund Futures � variation margin Goldman Sachs 13,922 0 (13,922 ) 01 Collateral pledged within this table is limited to the collateral for the net transaction with the counterparty.
7. BANK BORROWINGSThe Trust (excluding the money market funds and certain other funds) and Wells Fargo Variable Trust are parties to a$250,000,000 revolving credit agreement whereby each Fund is permitted to use bank borrowings for temporary oremergency purposes, such as to fund shareholder redemption requests. Interest under the credit agreement is charged tothe Fund based on a borrowing rate equal to the higher of the Federal Funds rate in effect on that day plus 1.25% or theovernight LIBOR rate in effect on that day plus 1.25%. In addition, an annual commitment fee equal to 0.25% of the unusedbalance is allocated to each participating fund. Prior to August 30, 2016, the annual revolving credit agreement amount was$200,000,000 and the annual commitment fee was equal to 0.20% of the unused balance which was allocated to eachparticipating fund.
For the year ended May 31, 2017, there were no borrowings by the Funds under the agreement.
Copyright © 2017 www.secdatabase.com. All Rights Reserved.Please Consider the Environment Before Printing This Document
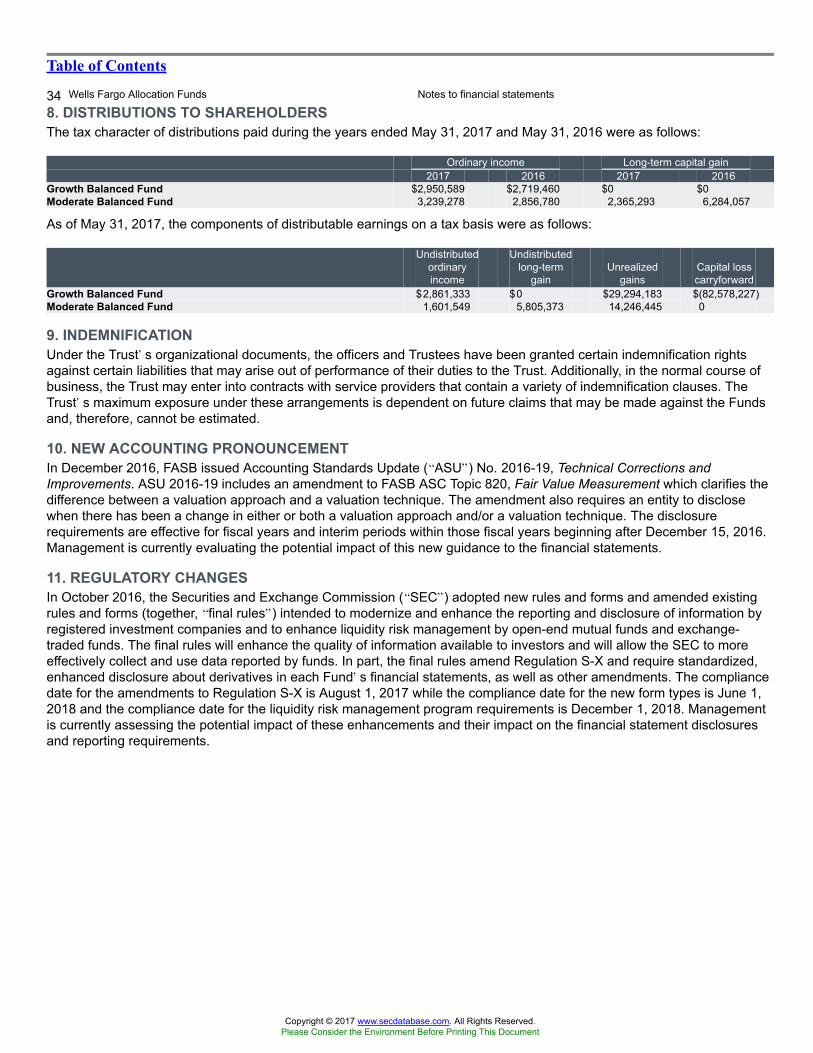
Table of Contents
34 Wells Fargo Allocation Funds Notes to financial statements
8. DISTRIBUTIONS TO SHAREHOLDERSThe tax character of distributions paid during the years ended May 31, 2017 and May 31, 2016 were as follows:
Ordinary income Long-term capital gain2017 2016 2017 2016
Growth Balanced Fund $2,950,589 $2,719,460 $0 $0Moderate Balanced Fund 3,239,278 2,856,780 2,365,293 6,284,057
As of May 31, 2017, the components of distributable earnings on a tax basis were as follows:
Undistributedordinaryincome
Undistributedlong-term
gainUnrealized
gainsCapital losscarryforward
Growth Balanced Fund $2,861,333 $0 $29,294,183 $(82,578,227)Moderate Balanced Fund 1,601,549 5,805,373 14,246,445 0
9. INDEMNIFICATIONUnder the Trust�s organizational documents, the officers and Trustees have been granted certain indemnification rightsagainst certain liabilities that may arise out of performance of their duties to the Trust. Additionally, in the normal course ofbusiness, the Trust may enter into contracts with service providers that contain a variety of indemnification clauses. TheTrust�s maximum exposure under these arrangements is dependent on future claims that may be made against the Fundsand, therefore, cannot be estimated.
10. NEW ACCOUNTING PRONOUNCEMENTIn December 2016, FASB issued Accounting Standards Update (�ASU�) No. 2016-19, Technical Corrections andImprovements. ASU 2016-19 includes an amendment to FASB ASC Topic 820, Fair Value Measurement which clarifies thedifference between a valuation approach and a valuation technique. The amendment also requires an entity to disclosewhen there has been a change in either or both a valuation approach and/or a valuation technique. The disclosurerequirements are effective for fiscal years and interim periods within those fiscal years beginning after December 15, 2016.Management is currently evaluating the potential impact of this new guidance to the financial statements.
11. REGULATORY CHANGESIn October 2016, the Securities and Exchange Commission (�SEC�) adopted new rules and forms and amended existingrules and forms (together, �final rules�) intended to modernize and enhance the reporting and disclosure of information byregistered investment companies and to enhance liquidity risk management by open-end mutual funds and exchange-traded funds. The final rules will enhance the quality of information available to investors and will allow the SEC to moreeffectively collect and use data reported by funds. In part, the final rules amend Regulation S-X and require standardized,enhanced disclosure about derivatives in each Fund�s financial statements, as well as other amendments. The compliancedate for the amendments to Regulation S-X is August 1, 2017 while the compliance date for the new form types is June 1,2018 and the compliance date for the liquidity risk management program requirements is December 1, 2018. Managementis currently assessing the potential impact of these enhancements and their impact on the financial statement disclosuresand reporting requirements.
Copyright © 2017 www.secdatabase.com. All Rights Reserved.Please Consider the Environment Before Printing This Document
Table of Contents
Report of independent registered public accounting firm Wells Fargo Allocation Funds 35BOARD OF TRUSTEES AND SHAREHOLDERS OF WELLS FARGO FUNDS TRUST:
We have audited the accompanying statements of assets and liabilities, including the portfolios of investments, of the WellsFargo Growth Balanced Fund and Wells Fargo Moderate Balanced Fund (collectively the �Funds�), two of the fundsconstituting the Wells Fargo Funds Trust, as of May 31, 2017, and the related statements of operations for the year thenended, the statements of changes in net assets for each of the years in the two-year period then ended, and the financialhighlights for each of the years in the five-year period then ended. These financial statements and financial highlights arethe responsibility of the Funds� management. Our responsibility is to express an opinion on these financial statements andfinancial highlights based on our audits.
We conducted our audits in accordance with the standards of the Public Company Accounting Oversight Board (UnitedStates). Those standards require that we plan and perform the audit to obtain reasonable assurance about whether thefinancial statements and financial highlights are free of material misstatement. An audit includes examining, on a test basis,evidence supporting the amounts and disclosures in the financial statements. Our procedures included confirmation ofinvestments owned as of May 31, 2017, by correspondence with the custodian and brokers, transfer agent, or by otherappropriate auditing procedures. An audit also includes assessing the accounting principles used and significant estimatesmade by management, as well as evaluating the overall financial statement presentation. We believe that our audits providea reasonable basis for our opinion.
In our opinion, the financial statements and financial highlights referred to above present fairly, in all material respects, thefinancial position of the Funds as of May 31, 2017, the results of their operations for the year then ended, changes in theirnet assets for each of the years in the two-year period then ended, and the financial highlights for each of the years in thefive-year period then ended, in conformity with U.S. generally accepted accounting principles.
Boston, MassachusettsJuly 26, 2017
Copyright © 2017 www.secdatabase.com. All Rights Reserved.Please Consider the Environment Before Printing This Document

Table of Contents
36 Wells Fargo Allocation Funds Portfolio of investments�May 31, 2017C&B LARGE CAP VALUE PORTFOLIO
Security name Shares Value
Common Stocks: 95.33%
Consumer Discretionary: 15.10%
Hotels, Restaurants & Leisure: 2.92%Brinker International Incorporated « 82,700 $3,244,321Carnival Corporation 115,400 7,393,678
10,637,999
Household Durables: 2.31%Whirlpool Corporation 45,200 8,386,408
Media: 4.84%Omnicom Group Incorporated 109,500 9,167,340Twenty-First Century Fox Incorporated Class A 311,000 8,434,320
17,601,660
Textiles, Apparel & Luxury Goods: 5.03%Gildan Activewear Incorporated 372,100 10,768,574HanesBrands Incorporated « 364,900 7,535,185
18,303,759
Consumer Staples: 5.77%
Beverages: 1.99%Diageo plc ADR 59,420 7,244,486
Personal Products: 2.04%Unilever NV ADR « 131,040 7,440,451
Tobacco: 1.74%Philip Morris International 52,700 6,313,460
Energy: 6.13%
Energy Equipment & Services: 1.46%Schlumberger Limited 76,300 5,309,717
Oil, Gas & Consumable Fuels: 4.67%Chevron Corporation 31,500 3,259,620Exxon Mobil Corporation 97,900 7,880,950World Fuel Services Corporation 165,000 5,831,100
16,971,670
Financials: 26.53%
Banks: 5.92%Bank of America Corporation 216,400 4,849,524JPMorgan Chase & Company 121,300 9,964,795PNC Financial Services Group Incorporated 56,600 6,718,420
21,532,739
The accompanying notes are an integral part of these financial statements.
Copyright © 2017 www.secdatabase.com. All Rights Reserved.Please Consider the Environment Before Printing This Document
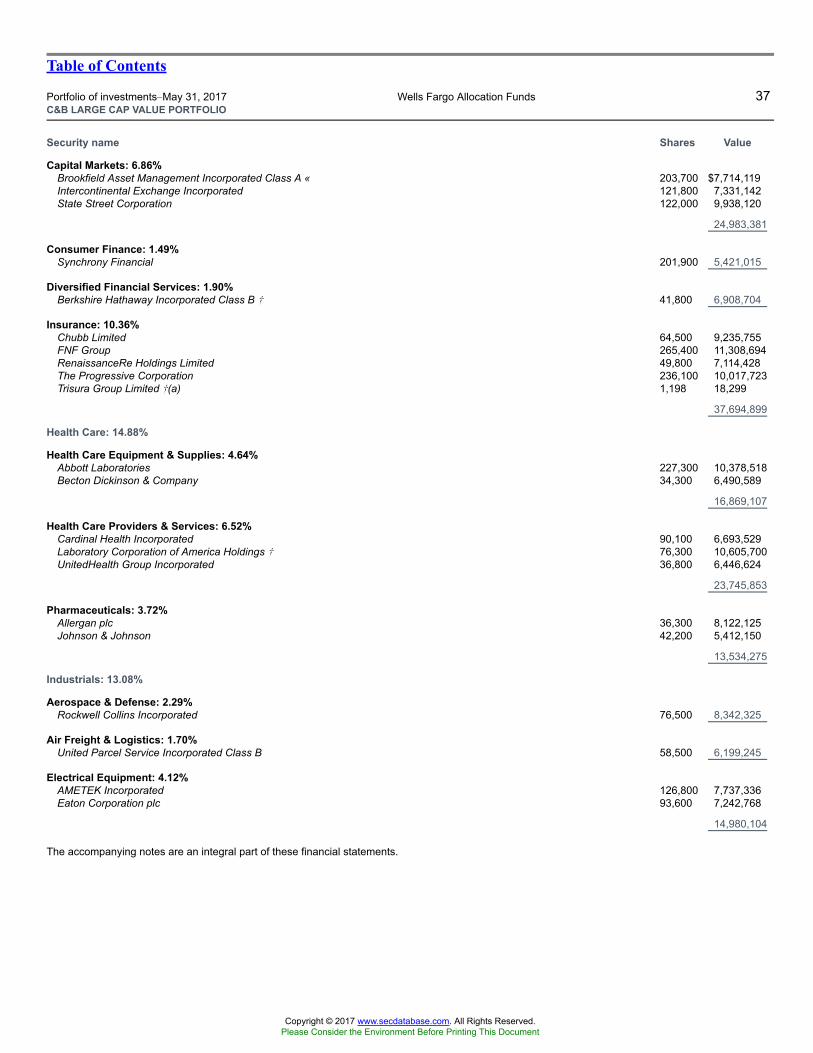
Table of Contents
Portfolio of investments�May 31, 2017 Wells Fargo Allocation Funds 37C&B LARGE CAP VALUE PORTFOLIO
Security name Shares Value
Capital Markets: 6.86%Brookfield Asset Management Incorporated Class A « 203,700 $7,714,119Intercontinental Exchange Incorporated 121,800 7,331,142State Street Corporation 122,000 9,938,120
24,983,381
Consumer Finance: 1.49%Synchrony Financial 201,900 5,421,015
Diversified Financial Services: 1.90%Berkshire Hathaway Incorporated Class B � 41,800 6,908,704
Insurance: 10.36%Chubb Limited 64,500 9,235,755FNF Group 265,400 11,308,694RenaissanceRe Holdings Limited 49,800 7,114,428The Progressive Corporation 236,100 10,017,723Trisura Group Limited �(a) 1,198 18,299
37,694,899
Health Care: 14.88%
Health Care Equipment & Supplies: 4.64%Abbott Laboratories 227,300 10,378,518Becton Dickinson & Company 34,300 6,490,589
16,869,107
Health Care Providers & Services: 6.52%Cardinal Health Incorporated 90,100 6,693,529Laboratory Corporation of America Holdings � 76,300 10,605,700UnitedHealth Group Incorporated 36,800 6,446,624
23,745,853
Pharmaceuticals: 3.72%Allergan plc 36,300 8,122,125Johnson & Johnson 42,200 5,412,150
13,534,275
Industrials: 13.08%
Aerospace & Defense: 2.29%Rockwell Collins Incorporated 76,500 8,342,325
Air Freight & Logistics: 1.70%United Parcel Service Incorporated Class B 58,500 6,199,245
Electrical Equipment: 4.12%AMETEK Incorporated 126,800 7,737,336Eaton Corporation plc 93,600 7,242,768
14,980,104
The accompanying notes are an integral part of these financial statements.
Copyright © 2017 www.secdatabase.com. All Rights Reserved.Please Consider the Environment Before Printing This Document
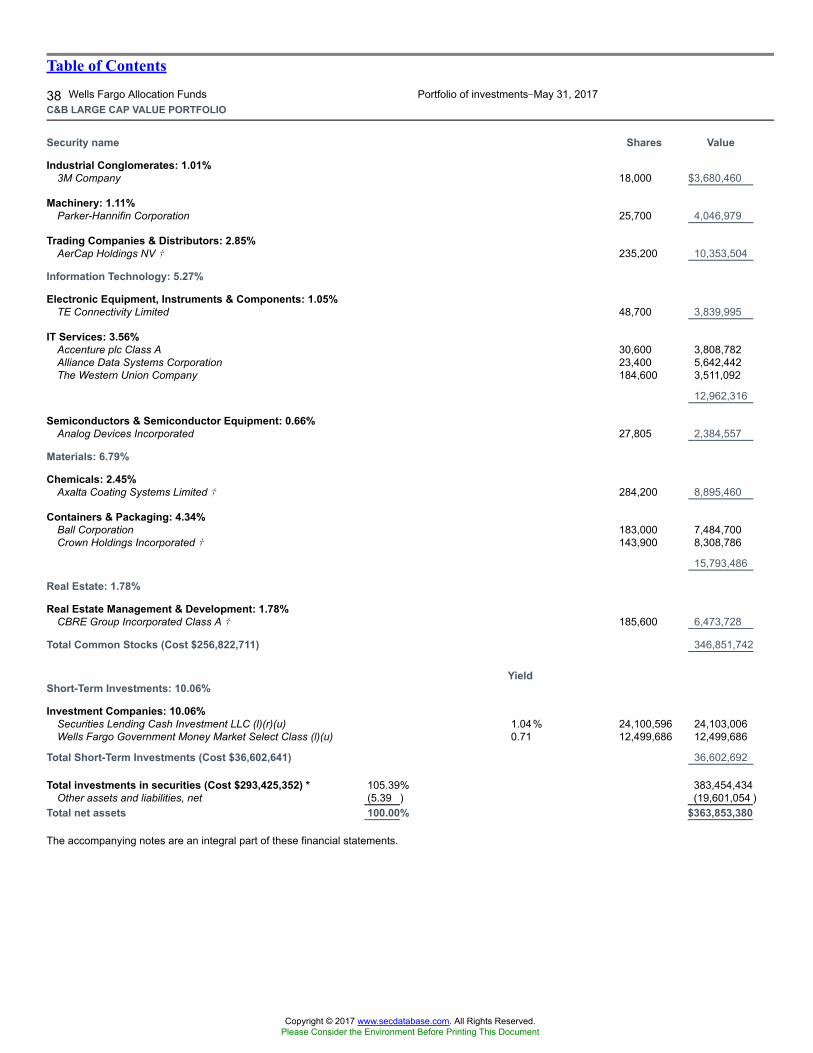
Table of Contents
38 Wells Fargo Allocation Funds Portfolio of investments�May 31, 2017C&B LARGE CAP VALUE PORTFOLIO
Security name Shares Value
Industrial Conglomerates: 1.01%3M Company 18,000 $3,680,460
Machinery: 1.11%Parker-Hannifin Corporation 25,700 4,046,979
Trading Companies & Distributors: 2.85%AerCap Holdings NV � 235,200 10,353,504
Information Technology: 5.27%
Electronic Equipment, Instruments & Components: 1.05%TE Connectivity Limited 48,700 3,839,995
IT Services: 3.56%Accenture plc Class A 30,600 3,808,782Alliance Data Systems Corporation 23,400 5,642,442The Western Union Company 184,600 3,511,092
12,962,316
Semiconductors & Semiconductor Equipment: 0.66%Analog Devices Incorporated 27,805 2,384,557
Materials: 6.79%
Chemicals: 2.45%Axalta Coating Systems Limited � 284,200 8,895,460
Containers & Packaging: 4.34%Ball Corporation 183,000 7,484,700Crown Holdings Incorporated � 143,900 8,308,786
15,793,486
Real Estate: 1.78%
Real Estate Management & Development: 1.78%CBRE Group Incorporated Class A � 185,600 6,473,728
Total Common Stocks (Cost $256,822,711) 346,851,742
YieldShort-Term Investments: 10.06%
Investment Companies: 10.06%Securities Lending Cash Investment LLC (l)(r)(u) 1.04% 24,100,596 24,103,006Wells Fargo Government Money Market Select Class (l)(u) 0.71 12,499,686 12,499,686
Total Short-Term Investments (Cost $36,602,641) 36,602,692
Total investments in securities (Cost $293,425,352) * 105.39% 383,454,434Other assets and liabilities, net (5.39 ) (19,601,054 )
Total net assets 100.00% $363,853,380
The accompanying notes are an integral part of these financial statements.
Copyright © 2017 www.secdatabase.com. All Rights Reserved.Please Consider the Environment Before Printing This Document
Table of Contents
Portfolio of investments�May 31, 2017 Wells Fargo Allocation Funds 39C&B LARGE CAP VALUE PORTFOLIO
« All or a portion of this security is on loan.� Non-income-earning security
Copyright © 2017 www.secdatabase.com. All Rights Reserved.Please Consider the Environment Before Printing This Document

(a) The security is fair valued in accordance with procedures approved by the Board of Trustees.(l) The issuer of the security is an affiliated person of the Portfolio as defined in the Investment Company Act of 1940.(r) The investment is a non-registered investment vehicle purchased with cash collateral received from securities on loan.(u) The rate represents the 7-day annualized yield at period end.* Cost for federal income tax purposes is $298,983,965 and unrealized gains (losses) consists of:Gross unrealized gains $ 93,470,378Gross unrealized losses (8,999,909 )Net unrealized gains $ 84,470,469
The accompanying notes are an integral part of these financial statements.
Copyright © 2017 www.secdatabase.com. All Rights Reserved.Please Consider the Environment Before Printing This Document
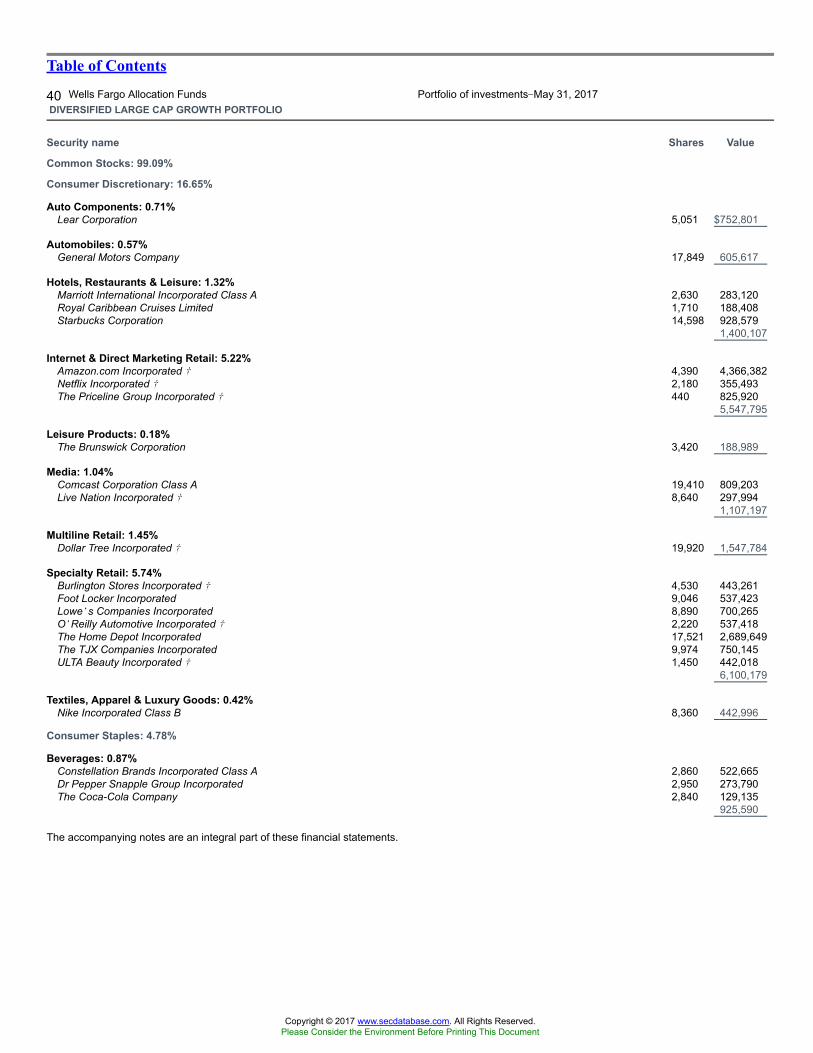
Table of Contents
40 Wells Fargo Allocation Funds Portfolio of investments�May 31, 2017DIVERSIFIED LARGE CAP GROWTH PORTFOLIO
Security name Shares Value
Common Stocks: 99.09%
Consumer Discretionary: 16.65%
Auto Components: 0.71%Lear Corporation 5,051 $752,801
Automobiles: 0.57%General Motors Company 17,849 605,617
Hotels, Restaurants & Leisure: 1.32%Marriott International Incorporated Class A 2,630 283,120Royal Caribbean Cruises Limited 1,710 188,408Starbucks Corporation 14,598 928,579
1,400,107
Internet & Direct Marketing Retail: 5.22%Amazon.com Incorporated � 4,390 4,366,382Netflix Incorporated � 2,180 355,493The Priceline Group Incorporated � 440 825,920
5,547,795
Leisure Products: 0.18%The Brunswick Corporation 3,420 188,989
Media: 1.04%Comcast Corporation Class A 19,410 809,203Live Nation Incorporated � 8,640 297,994
1,107,197
Multiline Retail: 1.45%Dollar Tree Incorporated � 19,920 1,547,784
Specialty Retail: 5.74%Burlington Stores Incorporated � 4,530 443,261Foot Locker Incorporated 9,046 537,423Lowe�s Companies Incorporated 8,890 700,265O�Reilly Automotive Incorporated � 2,220 537,418The Home Depot Incorporated 17,521 2,689,649The TJX Companies Incorporated 9,974 750,145ULTA Beauty Incorporated � 1,450 442,018
6,100,179
Textiles, Apparel & Luxury Goods: 0.42%Nike Incorporated Class B 8,360 442,996
Consumer Staples: 4.78%
Beverages: 0.87%Constellation Brands Incorporated Class A 2,860 522,665Dr Pepper Snapple Group Incorporated 2,950 273,790The Coca-Cola Company 2,840 129,135
925,590
The accompanying notes are an integral part of these financial statements.
Copyright © 2017 www.secdatabase.com. All Rights Reserved.Please Consider the Environment Before Printing This Document
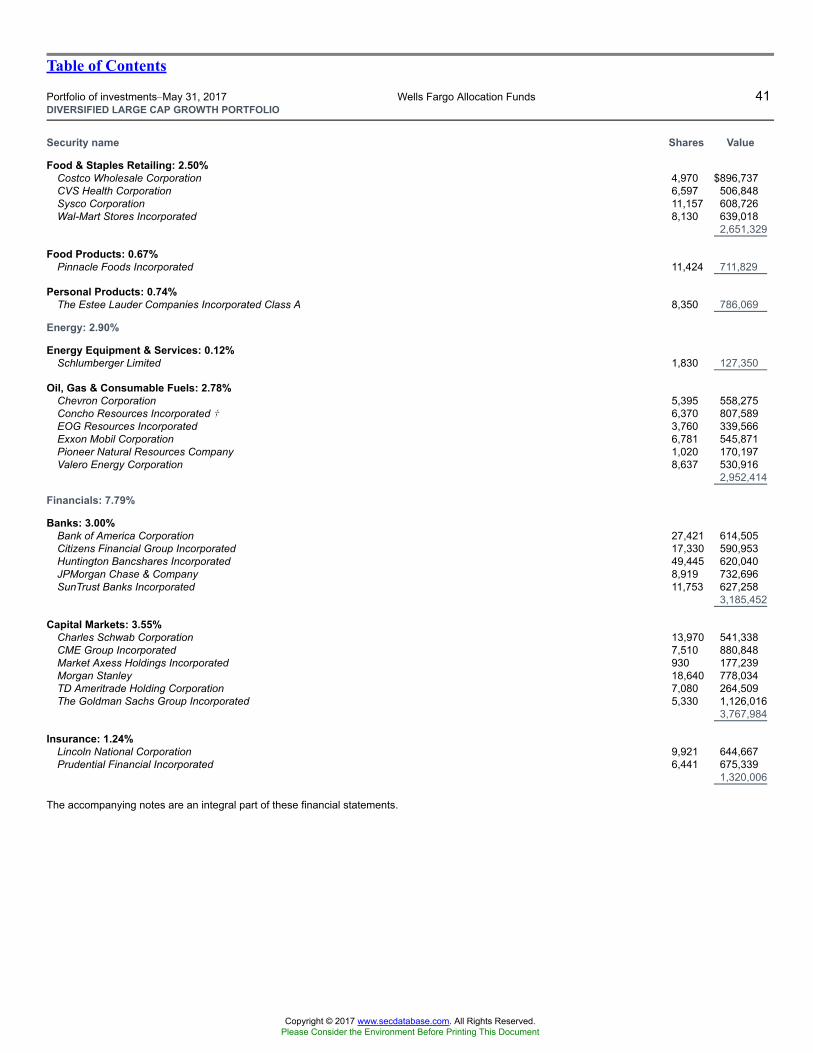
Table of Contents
Portfolio of investments�May 31, 2017 Wells Fargo Allocation Funds 41DIVERSIFIED LARGE CAP GROWTH PORTFOLIO
Security name Shares Value
Food & Staples Retailing: 2.50%Costco Wholesale Corporation 4,970 $896,737CVS Health Corporation 6,597 506,848Sysco Corporation 11,157 608,726Wal-Mart Stores Incorporated 8,130 639,018
2,651,329
Food Products: 0.67%Pinnacle Foods Incorporated 11,424 711,829
Personal Products: 0.74%The Estee Lauder Companies Incorporated Class A 8,350 786,069
Energy: 2.90%
Energy Equipment & Services: 0.12%Schlumberger Limited 1,830 127,350
Oil, Gas & Consumable Fuels: 2.78%Chevron Corporation 5,395 558,275Concho Resources Incorporated � 6,370 807,589EOG Resources Incorporated 3,760 339,566Exxon Mobil Corporation 6,781 545,871Pioneer Natural Resources Company 1,020 170,197Valero Energy Corporation 8,637 530,916
2,952,414
Financials: 7.79%
Banks: 3.00%Bank of America Corporation 27,421 614,505Citizens Financial Group Incorporated 17,330 590,953Huntington Bancshares Incorporated 49,445 620,040JPMorgan Chase & Company 8,919 732,696SunTrust Banks Incorporated 11,753 627,258
3,185,452
Capital Markets: 3.55%Charles Schwab Corporation 13,970 541,338CME Group Incorporated 7,510 880,848Market Axess Holdings Incorporated 930 177,239Morgan Stanley 18,640 778,034TD Ameritrade Holding Corporation 7,080 264,509The Goldman Sachs Group Incorporated 5,330 1,126,016
3,767,984
Insurance: 1.24%Lincoln National Corporation 9,921 644,667Prudential Financial Incorporated 6,441 675,339
1,320,006
The accompanying notes are an integral part of these financial statements.
Copyright © 2017 www.secdatabase.com. All Rights Reserved.Please Consider the Environment Before Printing This Document
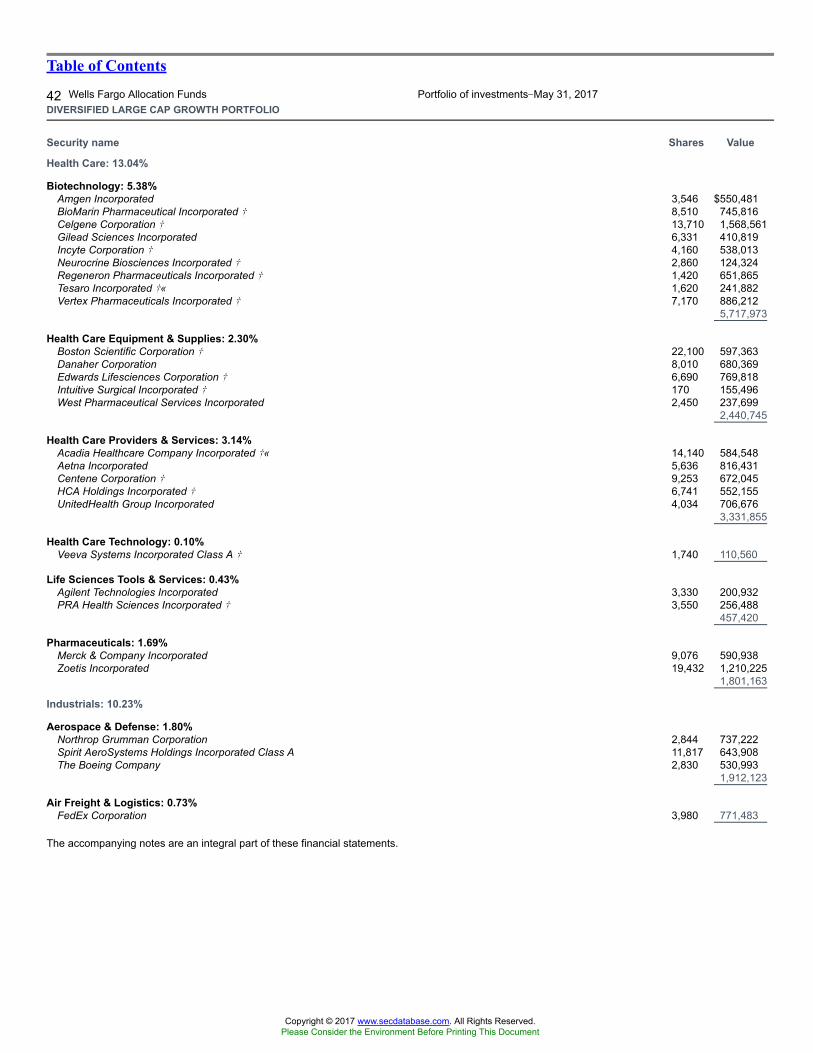
Table of Contents
42 Wells Fargo Allocation Funds Portfolio of investments�May 31, 2017DIVERSIFIED LARGE CAP GROWTH PORTFOLIO
Security name Shares Value
Health Care: 13.04%
Biotechnology: 5.38%Amgen Incorporated 3,546 $550,481BioMarin Pharmaceutical Incorporated � 8,510 745,816Celgene Corporation � 13,710 1,568,561Gilead Sciences Incorporated 6,331 410,819Incyte Corporation � 4,160 538,013Neurocrine Biosciences Incorporated � 2,860 124,324Regeneron Pharmaceuticals Incorporated � 1,420 651,865Tesaro Incorporated �« 1,620 241,882Vertex Pharmaceuticals Incorporated � 7,170 886,212
5,717,973
Health Care Equipment & Supplies: 2.30%Boston Scientific Corporation � 22,100 597,363Danaher Corporation 8,010 680,369Edwards Lifesciences Corporation � 6,690 769,818Intuitive Surgical Incorporated � 170 155,496West Pharmaceutical Services Incorporated 2,450 237,699
2,440,745
Health Care Providers & Services: 3.14%Acadia Healthcare Company Incorporated �« 14,140 584,548Aetna Incorporated 5,636 816,431Centene Corporation � 9,253 672,045HCA Holdings Incorporated � 6,741 552,155UnitedHealth Group Incorporated 4,034 706,676
3,331,855
Health Care Technology: 0.10%Veeva Systems Incorporated Class A � 1,740 110,560
Life Sciences Tools & Services: 0.43%Agilent Technologies Incorporated 3,330 200,932PRA Health Sciences Incorporated � 3,550 256,488
457,420
Pharmaceuticals: 1.69%Merck & Company Incorporated 9,076 590,938Zoetis Incorporated 19,432 1,210,225
1,801,163
Industrials: 10.23%
Aerospace & Defense: 1.80%Northrop Grumman Corporation 2,844 737,222Spirit AeroSystems Holdings Incorporated Class A 11,817 643,908The Boeing Company 2,830 530,993
1,912,123
Air Freight & Logistics: 0.73%FedEx Corporation 3,980 771,483
The accompanying notes are an integral part of these financial statements.
Copyright © 2017 www.secdatabase.com. All Rights Reserved.Please Consider the Environment Before Printing This Document
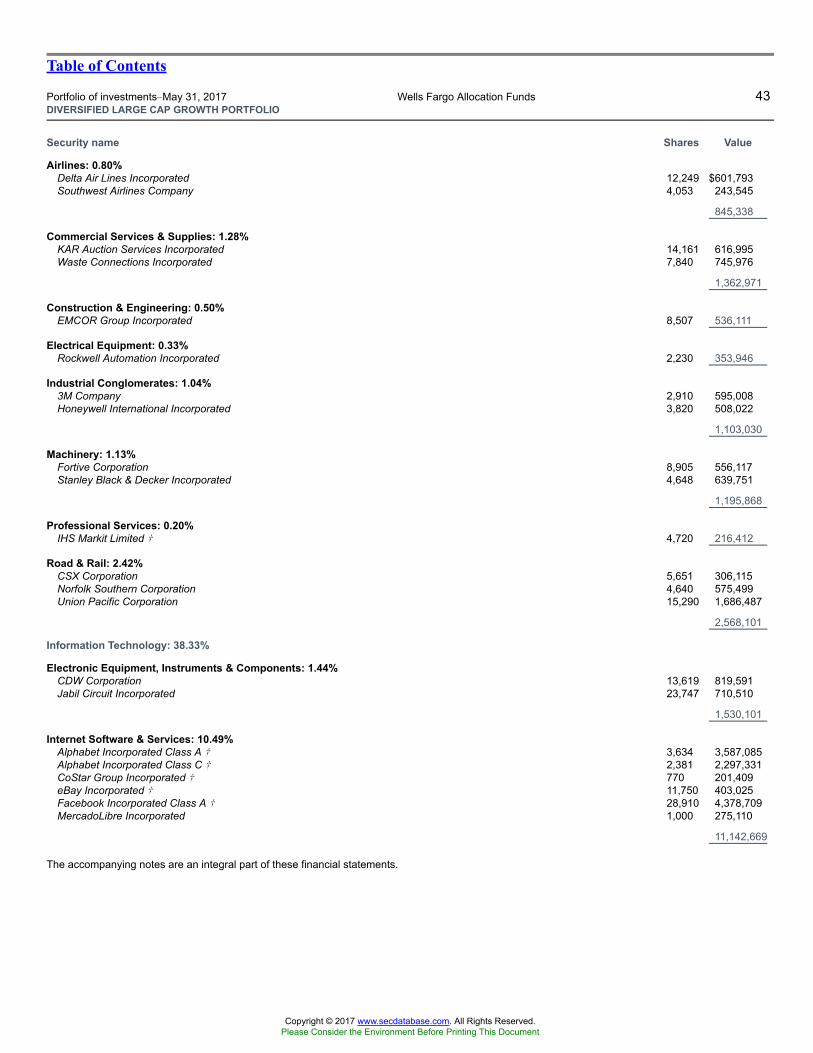
Table of Contents
Portfolio of investments�May 31, 2017 Wells Fargo Allocation Funds 43DIVERSIFIED LARGE CAP GROWTH PORTFOLIO
Security name Shares Value
Airlines: 0.80%Delta Air Lines Incorporated 12,249 $601,793Southwest Airlines Company 4,053 243,545
845,338
Commercial Services & Supplies: 1.28%KAR Auction Services Incorporated 14,161 616,995Waste Connections Incorporated 7,840 745,976
1,362,971
Construction & Engineering: 0.50%EMCOR Group Incorporated 8,507 536,111
Electrical Equipment: 0.33%Rockwell Automation Incorporated 2,230 353,946
Industrial Conglomerates: 1.04%3M Company 2,910 595,008Honeywell International Incorporated 3,820 508,022
1,103,030
Machinery: 1.13%Fortive Corporation 8,905 556,117Stanley Black & Decker Incorporated 4,648 639,751
1,195,868
Professional Services: 0.20%IHS Markit Limited � 4,720 216,412
Road & Rail: 2.42%CSX Corporation 5,651 306,115Norfolk Southern Corporation 4,640 575,499Union Pacific Corporation 15,290 1,686,487
2,568,101
Information Technology: 38.33%
Electronic Equipment, Instruments & Components: 1.44%CDW Corporation 13,619 819,591Jabil Circuit Incorporated 23,747 710,510
1,530,101
Internet Software & Services: 10.49%Alphabet Incorporated Class A � 3,634 3,587,085Alphabet Incorporated Class C � 2,381 2,297,331CoStar Group Incorporated � 770 201,409eBay Incorporated � 11,750 403,025Facebook Incorporated Class A � 28,910 4,378,709MercadoLibre Incorporated 1,000 275,110
11,142,669
The accompanying notes are an integral part of these financial statements.
Copyright © 2017 www.secdatabase.com. All Rights Reserved.Please Consider the Environment Before Printing This Document
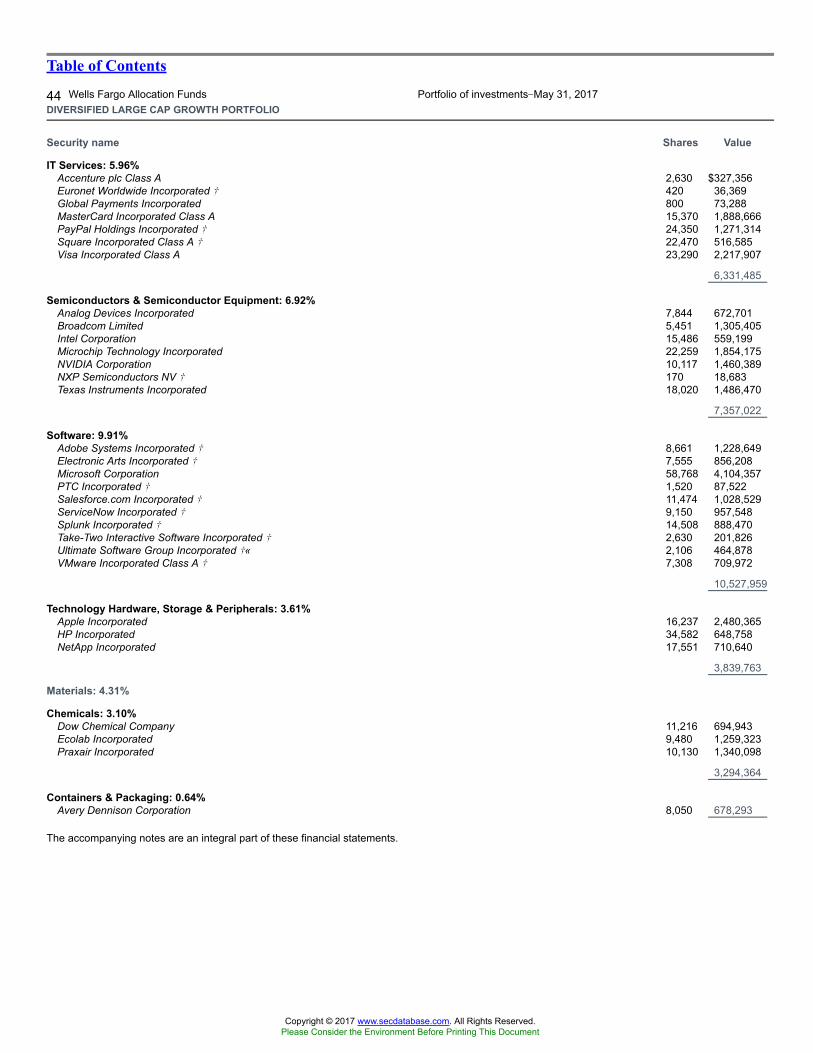
Table of Contents
44 Wells Fargo Allocation Funds Portfolio of investments�May 31, 2017DIVERSIFIED LARGE CAP GROWTH PORTFOLIO
Security name Shares Value
IT Services: 5.96%Accenture plc Class A 2,630 $327,356Euronet Worldwide Incorporated � 420 36,369Global Payments Incorporated 800 73,288MasterCard Incorporated Class A 15,370 1,888,666PayPal Holdings Incorporated � 24,350 1,271,314Square Incorporated Class A � 22,470 516,585Visa Incorporated Class A 23,290 2,217,907
6,331,485
Semiconductors & Semiconductor Equipment: 6.92%Analog Devices Incorporated 7,844 672,701Broadcom Limited 5,451 1,305,405Intel Corporation 15,486 559,199Microchip Technology Incorporated 22,259 1,854,175NVIDIA Corporation 10,117 1,460,389NXP Semiconductors NV � 170 18,683Texas Instruments Incorporated 18,020 1,486,470
7,357,022
Software: 9.91%Adobe Systems Incorporated � 8,661 1,228,649Electronic Arts Incorporated � 7,555 856,208Microsoft Corporation 58,768 4,104,357PTC Incorporated � 1,520 87,522Salesforce.com Incorporated � 11,474 1,028,529ServiceNow Incorporated � 9,150 957,548Splunk Incorporated � 14,508 888,470Take-Two Interactive Software Incorporated � 2,630 201,826Ultimate Software Group Incorporated �« 2,106 464,878VMware Incorporated Class A � 7,308 709,972
10,527,959
Technology Hardware, Storage & Peripherals: 3.61%Apple Incorporated 16,237 2,480,365HP Incorporated 34,582 648,758NetApp Incorporated 17,551 710,640
3,839,763
Materials: 4.31%
Chemicals: 3.10%Dow Chemical Company 11,216 694,943Ecolab Incorporated 9,480 1,259,323Praxair Incorporated 10,130 1,340,098
3,294,364
Containers & Packaging: 0.64%Avery Dennison Corporation 8,050 678,293
The accompanying notes are an integral part of these financial statements.
Copyright © 2017 www.secdatabase.com. All Rights Reserved.Please Consider the Environment Before Printing This Document

Table of Contents
Portfolio of investments�May 31, 2017 Wells Fargo Allocation Funds 45DIVERSIFIED LARGE CAP GROWTH PORTFOLIO
Security name Shares Value
Metals & Mining: 0.57%Nucor Corporation 10,464 $607,958
Real Estate: 0.86%
Equity REITs: 0.86%American Tower Corporation 2,400 314,856Prologis Incorporated 10,875 603,992
918,848
Telecommunication Services: 0.20%
Wireless Telecommunication Services: 0.20%T-Mobile US Incorporated � 3,120 210,350
Total Common Stocks (Cost $70,462,153) 105,285,399
YieldShort-Term Investments: 1.58%
Investment Companies: 1.58%Securities Lending Cash Investment LLC (l)(r)(u) 1.04% 1,105,508 1,105,618Wells Fargo Government Money Market Fund Select Class (l)(u) 0.71 568,057 568,057
Total Short-Term Investments (Cost $1,673,649) 1,673,675
Total investments in securities (Cost $72,135,802) * 100.67% 106,959,074Other assets and liabilities, net (0.67 ) (706,661 )
Total net assets 100.00% $106,252,413
� Non-income-earning security« All or a portion of this security is on loan.(l) The issuer of the security is an affiliated person of the Portfolio as defined in the Investment Company Act of 1940.(r) The investment is a non-registered investment company purchased with cash collateral received from securities on loan.(u) The rate represents the 7-day annualized yield at period end.* Cost for federal income tax purposes is $72,430,252 and unrealized gains (losses) consists of:Gross unrealized gains $ 35,755,646Gross unrealized losses (1,226,824 )Net unrealized gains $ 34,528,822
The accompanying notes are an integral part of these financial statements.
Copyright © 2017 www.secdatabase.com. All Rights Reserved.Please Consider the Environment Before Printing This Document
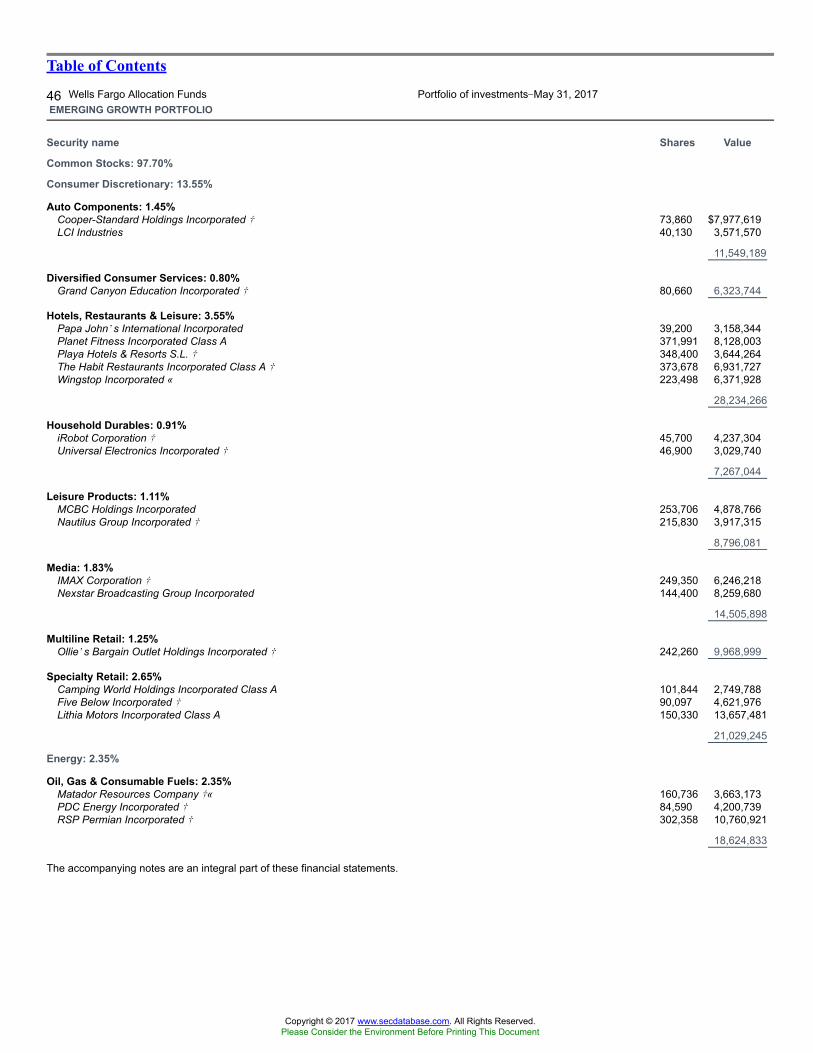
Table of Contents
46 Wells Fargo Allocation Funds Portfolio of investments�May 31, 2017EMERGING GROWTH PORTFOLIO
Security name Shares Value
Common Stocks: 97.70%
Consumer Discretionary: 13.55%
Auto Components: 1.45%Cooper-Standard Holdings Incorporated � 73,860 $7,977,619LCI Industries 40,130 3,571,570
11,549,189
Diversified Consumer Services: 0.80%Grand Canyon Education Incorporated � 80,660 6,323,744
Hotels, Restaurants & Leisure: 3.55%Papa John�s International Incorporated 39,200 3,158,344Planet Fitness Incorporated Class A 371,991 8,128,003Playa Hotels & Resorts S.L. � 348,400 3,644,264The Habit Restaurants Incorporated Class A � 373,678 6,931,727Wingstop Incorporated « 223,498 6,371,928
28,234,266
Household Durables: 0.91%iRobot Corporation � 45,700 4,237,304Universal Electronics Incorporated � 46,900 3,029,740
7,267,044
Leisure Products: 1.11%MCBC Holdings Incorporated 253,706 4,878,766Nautilus Group Incorporated � 215,830 3,917,315
8,796,081
Media: 1.83%IMAX Corporation � 249,350 6,246,218Nexstar Broadcasting Group Incorporated 144,400 8,259,680
14,505,898
Multiline Retail: 1.25%Ollie�s Bargain Outlet Holdings Incorporated � 242,260 9,968,999
Specialty Retail: 2.65%Camping World Holdings Incorporated Class A 101,844 2,749,788Five Below Incorporated � 90,097 4,621,976Lithia Motors Incorporated Class A 150,330 13,657,481
21,029,245
Energy: 2.35%
Oil, Gas & Consumable Fuels: 2.35%Matador Resources Company �« 160,736 3,663,173PDC Energy Incorporated � 84,590 4,200,739RSP Permian Incorporated � 302,358 10,760,921
18,624,833
The accompanying notes are an integral part of these financial statements.
Copyright © 2017 www.secdatabase.com. All Rights Reserved.Please Consider the Environment Before Printing This Document
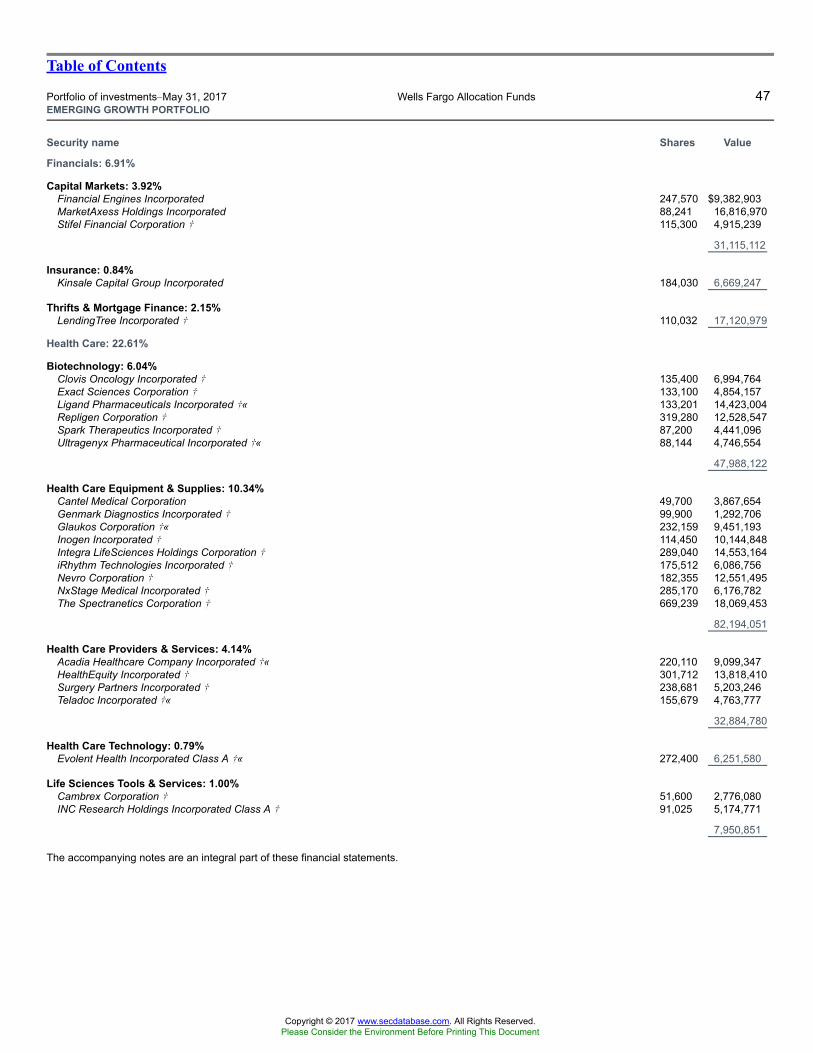
Table of Contents
Portfolio of investments�May 31, 2017 Wells Fargo Allocation Funds 47EMERGING GROWTH PORTFOLIO
Security name Shares Value
Financials: 6.91%
Capital Markets: 3.92%Financial Engines Incorporated 247,570 $9,382,903MarketAxess Holdings Incorporated 88,241 16,816,970Stifel Financial Corporation � 115,300 4,915,239
31,115,112
Insurance: 0.84%Kinsale Capital Group Incorporated 184,030 6,669,247
Thrifts & Mortgage Finance: 2.15%LendingTree Incorporated � 110,032 17,120,979
Health Care: 22.61%
Biotechnology: 6.04%Clovis Oncology Incorporated � 135,400 6,994,764Exact Sciences Corporation � 133,100 4,854,157Ligand Pharmaceuticals Incorporated �« 133,201 14,423,004Repligen Corporation � 319,280 12,528,547Spark Therapeutics Incorporated � 87,200 4,441,096Ultragenyx Pharmaceutical Incorporated �« 88,144 4,746,554
47,988,122
Health Care Equipment & Supplies: 10.34%Cantel Medical Corporation 49,700 3,867,654Genmark Diagnostics Incorporated � 99,900 1,292,706Glaukos Corporation �« 232,159 9,451,193Inogen Incorporated � 114,450 10,144,848Integra LifeSciences Holdings Corporation � 289,040 14,553,164iRhythm Technologies Incorporated � 175,512 6,086,756Nevro Corporation � 182,355 12,551,495NxStage Medical Incorporated � 285,170 6,176,782The Spectranetics Corporation � 669,239 18,069,453
82,194,051
Health Care Providers & Services: 4.14%Acadia Healthcare Company Incorporated �« 220,110 9,099,347HealthEquity Incorporated � 301,712 13,818,410Surgery Partners Incorporated � 238,681 5,203,246Teladoc Incorporated �« 155,679 4,763,777
32,884,780
Health Care Technology: 0.79%Evolent Health Incorporated Class A �« 272,400 6,251,580
Life Sciences Tools & Services: 1.00%Cambrex Corporation � 51,600 2,776,080INC Research Holdings Incorporated Class A � 91,025 5,174,771
7,950,851
The accompanying notes are an integral part of these financial statements.
Copyright © 2017 www.secdatabase.com. All Rights Reserved.Please Consider the Environment Before Printing This Document
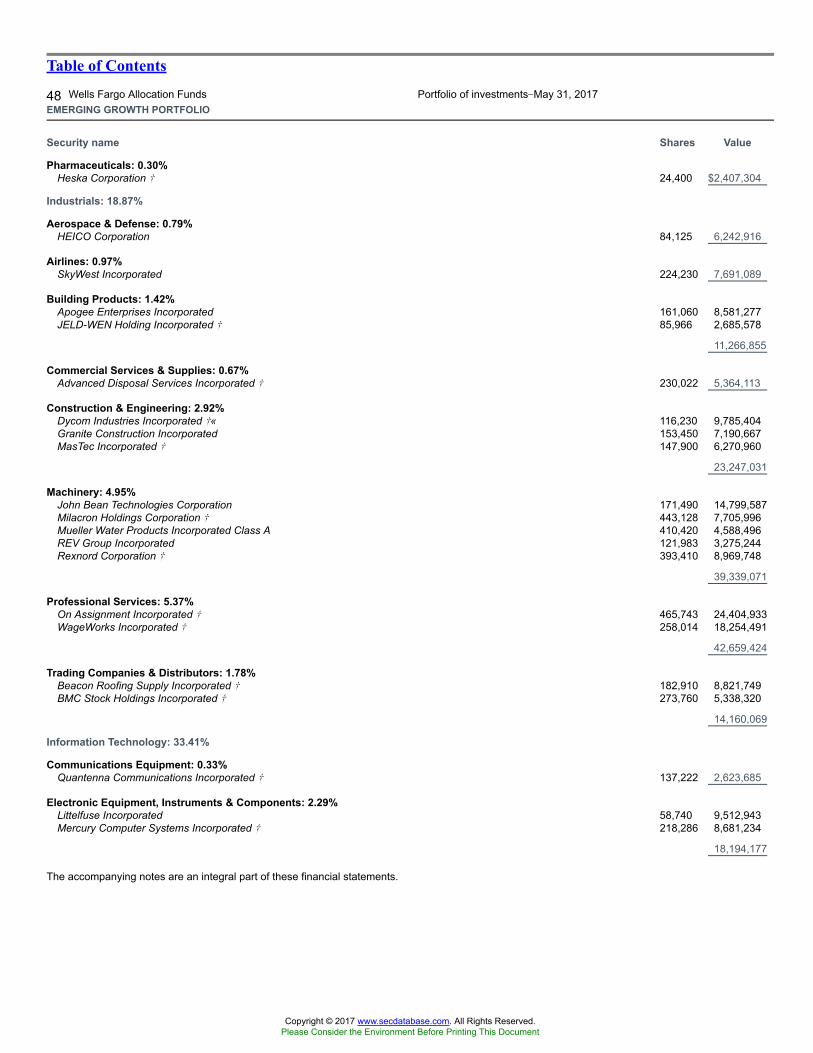
Table of Contents
48 Wells Fargo Allocation Funds Portfolio of investments�May 31, 2017EMERGING GROWTH PORTFOLIO
Security name Shares Value
Pharmaceuticals: 0.30%Heska Corporation � 24,400 $2,407,304
Industrials: 18.87%
Aerospace & Defense: 0.79%HEICO Corporation 84,125 6,242,916
Airlines: 0.97%SkyWest Incorporated 224,230 7,691,089
Building Products: 1.42%Apogee Enterprises Incorporated 161,060 8,581,277JELD-WEN Holding Incorporated � 85,966 2,685,578
11,266,855
Commercial Services & Supplies: 0.67%Advanced Disposal Services Incorporated � 230,022 5,364,113
Construction & Engineering: 2.92%Dycom Industries Incorporated �« 116,230 9,785,404Granite Construction Incorporated 153,450 7,190,667MasTec Incorporated � 147,900 6,270,960
23,247,031
Machinery: 4.95%John Bean Technologies Corporation 171,490 14,799,587Milacron Holdings Corporation � 443,128 7,705,996Mueller Water Products Incorporated Class A 410,420 4,588,496REV Group Incorporated 121,983 3,275,244Rexnord Corporation � 393,410 8,969,748
39,339,071
Professional Services: 5.37%On Assignment Incorporated � 465,743 24,404,933WageWorks Incorporated � 258,014 18,254,491
42,659,424
Trading Companies & Distributors: 1.78%Beacon Roofing Supply Incorporated � 182,910 8,821,749BMC Stock Holdings Incorporated � 273,760 5,338,320
14,160,069
Information Technology: 33.41%
Communications Equipment: 0.33%Quantenna Communications Incorporated � 137,222 2,623,685
Electronic Equipment, Instruments & Components: 2.29%Littelfuse Incorporated 58,740 9,512,943Mercury Computer Systems Incorporated � 218,286 8,681,234
18,194,177
The accompanying notes are an integral part of these financial statements.
Copyright © 2017 www.secdatabase.com. All Rights Reserved.Please Consider the Environment Before Printing This Document
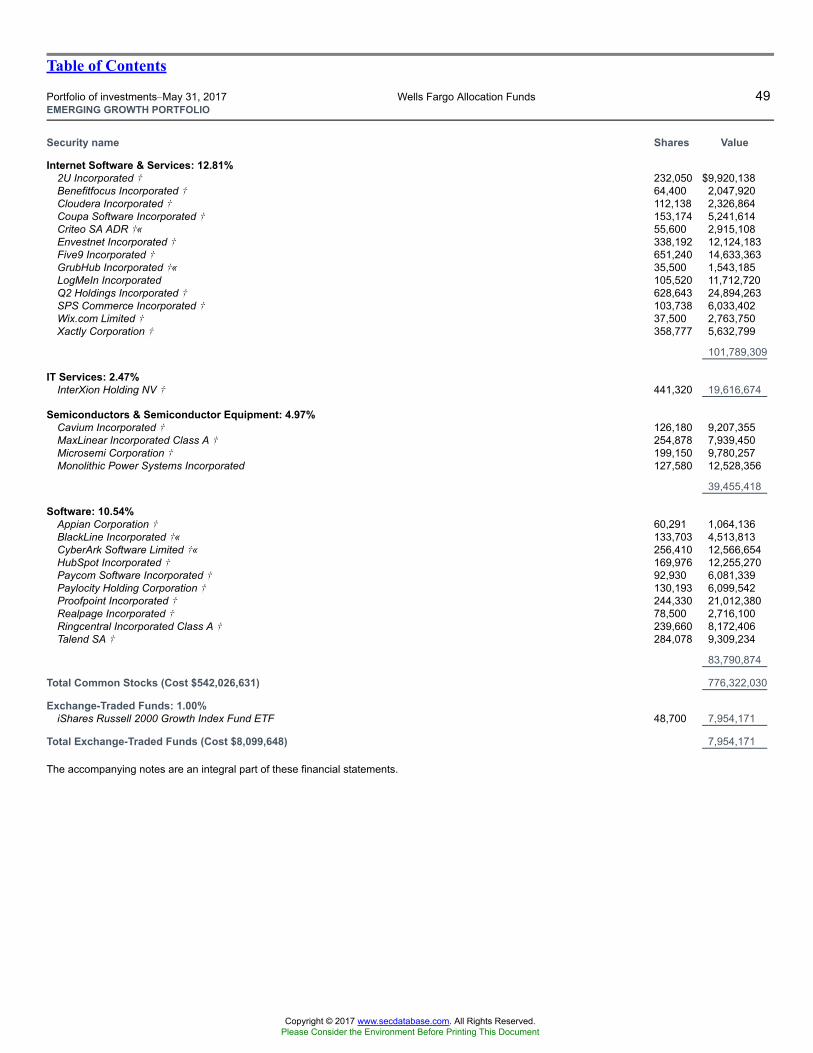
Table of Contents
Portfolio of investments�May 31, 2017 Wells Fargo Allocation Funds 49EMERGING GROWTH PORTFOLIO
Security name Shares Value
Internet Software & Services: 12.81%2U Incorporated � 232,050 $9,920,138Benefitfocus Incorporated � 64,400 2,047,920Cloudera Incorporated � 112,138 2,326,864Coupa Software Incorporated � 153,174 5,241,614Criteo SA ADR �« 55,600 2,915,108Envestnet Incorporated � 338,192 12,124,183Five9 Incorporated � 651,240 14,633,363GrubHub Incorporated �« 35,500 1,543,185LogMeIn Incorporated 105,520 11,712,720Q2 Holdings Incorporated � 628,643 24,894,263SPS Commerce Incorporated � 103,738 6,033,402Wix.com Limited � 37,500 2,763,750Xactly Corporation � 358,777 5,632,799
101,789,309
IT Services: 2.47%InterXion Holding NV � 441,320 19,616,674
Semiconductors & Semiconductor Equipment: 4.97%Cavium Incorporated � 126,180 9,207,355MaxLinear Incorporated Class A � 254,878 7,939,450Microsemi Corporation � 199,150 9,780,257Monolithic Power Systems Incorporated 127,580 12,528,356
39,455,418
Software: 10.54%Appian Corporation � 60,291 1,064,136BlackLine Incorporated �« 133,703 4,513,813CyberArk Software Limited �« 256,410 12,566,654HubSpot Incorporated � 169,976 12,255,270Paycom Software Incorporated � 92,930 6,081,339Paylocity Holding Corporation � 130,193 6,099,542Proofpoint Incorporated � 244,330 21,012,380Realpage Incorporated � 78,500 2,716,100Ringcentral Incorporated Class A � 239,660 8,172,406Talend SA � 284,078 9,309,234
83,790,874
Total Common Stocks (Cost $542,026,631) 776,322,030
Exchange-Traded Funds: 1.00%iShares Russell 2000 Growth Index Fund ETF 48,700 7,954,171
Total Exchange-Traded Funds (Cost $8,099,648) 7,954,171
The accompanying notes are an integral part of these financial statements.
Copyright © 2017 www.secdatabase.com. All Rights Reserved.Please Consider the Environment Before Printing This Document
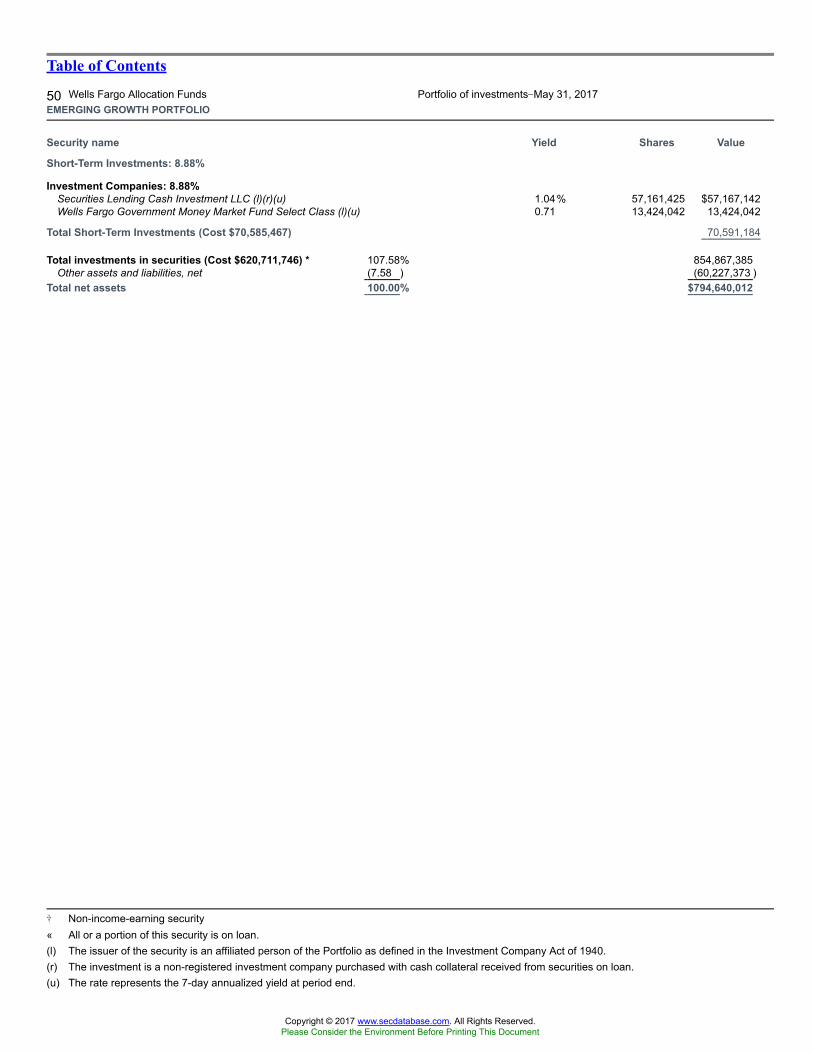
Table of Contents
50 Wells Fargo Allocation Funds Portfolio of investments�May 31, 2017EMERGING GROWTH PORTFOLIO
Security name Yield Shares Value
Short-Term Investments: 8.88%
Investment Companies: 8.88%Securities Lending Cash Investment LLC (l)(r)(u) 1.04% 57,161,425 $57,167,142Wells Fargo Government Money Market Fund Select Class (l)(u) 0.71 13,424,042 13,424,042
Total Short-Term Investments (Cost $70,585,467) 70,591,184
Total investments in securities (Cost $620,711,746) * 107.58% 854,867,385Other assets and liabilities, net (7.58 ) (60,227,373 )
Total net assets 100.00% $794,640,012
� Non-income-earning security« All or a portion of this security is on loan.(l) The issuer of the security is an affiliated person of the Portfolio as defined in the Investment Company Act of 1940.(r) The investment is a non-registered investment company purchased with cash collateral received from securities on loan.(u) The rate represents the 7-day annualized yield at period end.
Copyright © 2017 www.secdatabase.com. All Rights Reserved.Please Consider the Environment Before Printing This Document
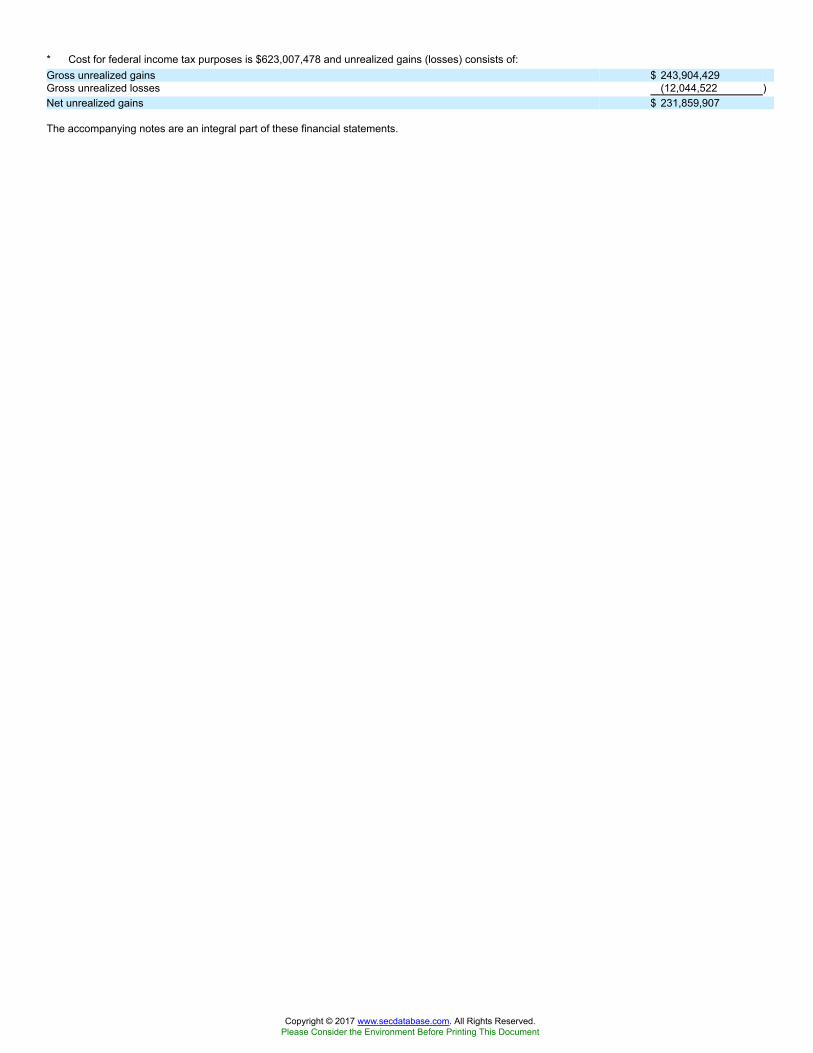
* Cost for federal income tax purposes is $623,007,478 and unrealized gains (losses) consists of:Gross unrealized gains $ 243,904,429Gross unrealized losses (12,044,522 )Net unrealized gains $ 231,859,907
The accompanying notes are an integral part of these financial statements.
Copyright © 2017 www.secdatabase.com. All Rights Reserved.Please Consider the Environment Before Printing This Document
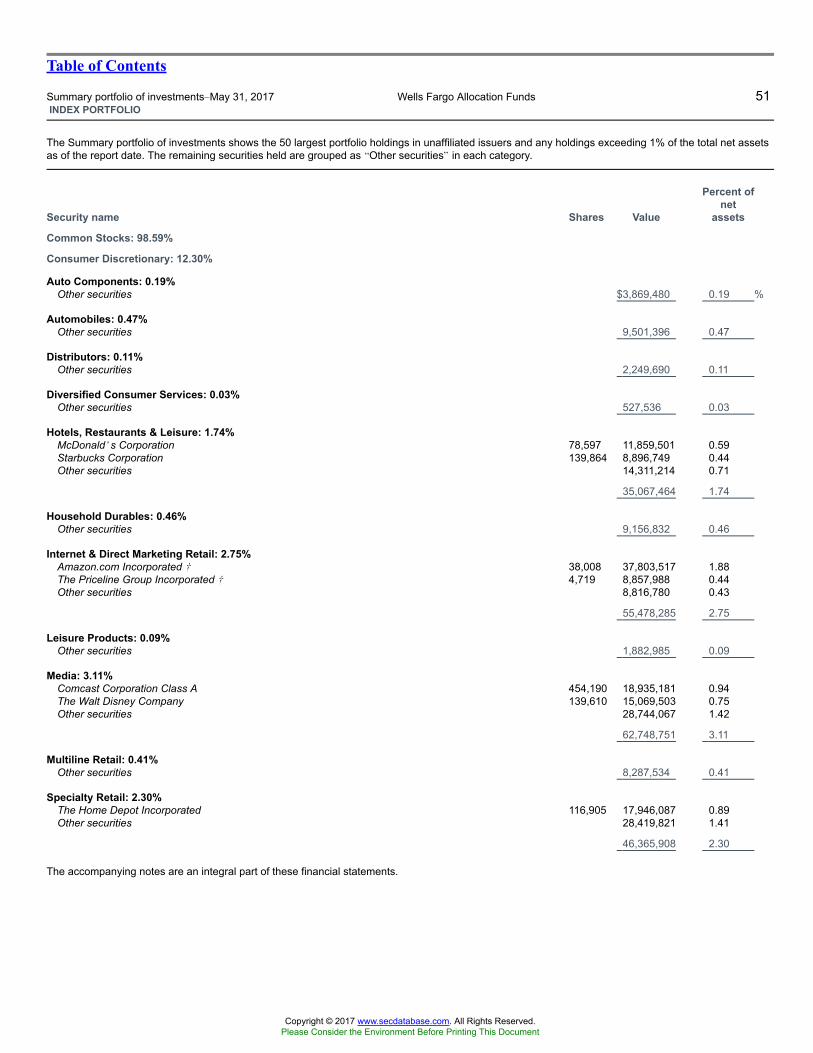
Table of Contents
Summary portfolio of investments�May 31, 2017 Wells Fargo Allocation Funds 51INDEX PORTFOLIO
The Summary portfolio of investments shows the 50 largest portfolio holdings in unaffiliated issuers and any holdings exceeding 1% of the total net assetsas of the report date. The remaining securities held are grouped as �Other securities� in each category.
Security name Shares Value
Percent ofnet
assets
Common Stocks: 98.59%
Consumer Discretionary: 12.30%
Auto Components: 0.19%Other securities $3,869,480 0.19 %
Automobiles: 0.47%Other securities 9,501,396 0.47
Distributors: 0.11%Other securities 2,249,690 0.11
Diversified Consumer Services: 0.03%Other securities 527,536 0.03
Hotels, Restaurants & Leisure: 1.74%McDonald�s Corporation 78,597 11,859,501 0.59Starbucks Corporation 139,864 8,896,749 0.44Other securities 14,311,214 0.71
35,067,464 1.74
Household Durables: 0.46%Other securities 9,156,832 0.46
Internet & Direct Marketing Retail: 2.75%Amazon.com Incorporated � 38,008 37,803,517 1.88The Priceline Group Incorporated � 4,719 8,857,988 0.44Other securities 8,816,780 0.43
55,478,285 2.75
Leisure Products: 0.09%Other securities 1,882,985 0.09
Media: 3.11%Comcast Corporation Class A 454,190 18,935,181 0.94The Walt Disney Company 139,610 15,069,503 0.75Other securities 28,744,067 1.42
62,748,751 3.11
Multiline Retail: 0.41%Other securities 8,287,534 0.41
Specialty Retail: 2.30%The Home Depot Incorporated 116,905 17,946,087 0.89Other securities 28,419,821 1.41
46,365,908 2.30
The accompanying notes are an integral part of these financial statements.
Copyright © 2017 www.secdatabase.com. All Rights Reserved.Please Consider the Environment Before Printing This Document
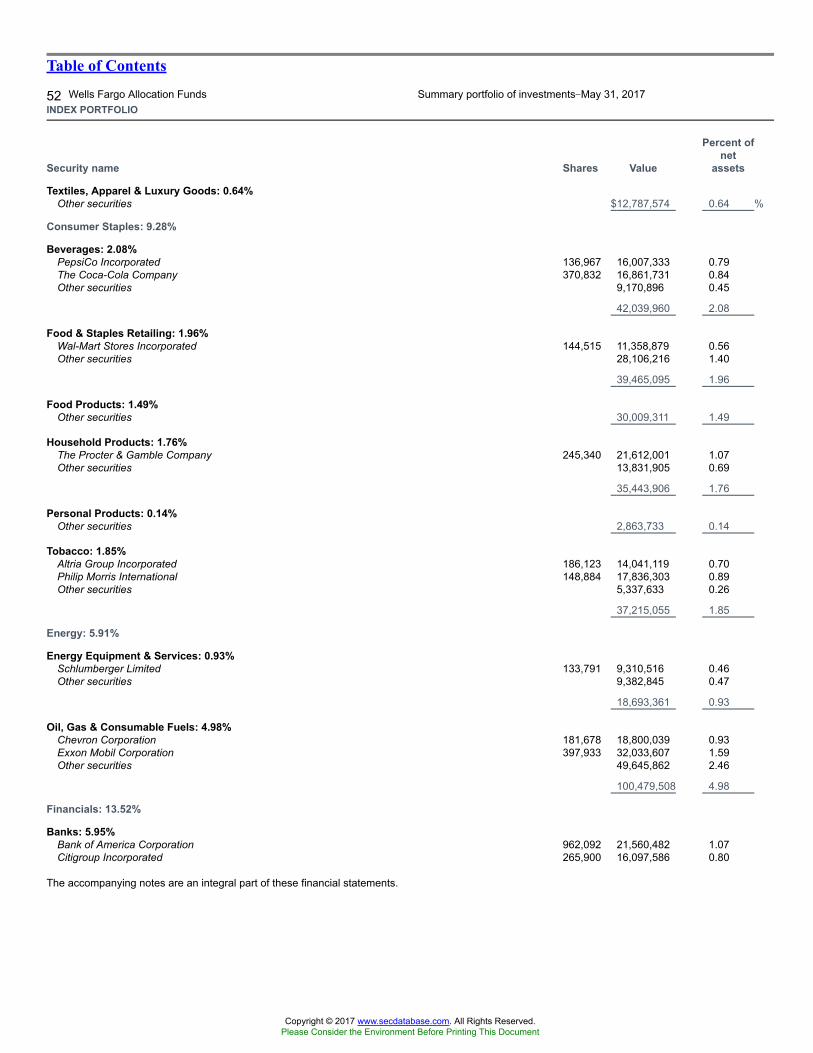
Table of Contents
52 Wells Fargo Allocation Funds Summary portfolio of investments�May 31, 2017INDEX PORTFOLIO
Security name Shares Value
Percent ofnet
assets
Textiles, Apparel & Luxury Goods: 0.64%Other securities $12,787,574 0.64 %
Consumer Staples: 9.28%
Beverages: 2.08%PepsiCo Incorporated 136,967 16,007,333 0.79The Coca-Cola Company 370,832 16,861,731 0.84Other securities 9,170,896 0.45
42,039,960 2.08
Food & Staples Retailing: 1.96%Wal-Mart Stores Incorporated 144,515 11,358,879 0.56Other securities 28,106,216 1.40
39,465,095 1.96
Food Products: 1.49%Other securities 30,009,311 1.49
Household Products: 1.76%The Procter & Gamble Company 245,340 21,612,001 1.07Other securities 13,831,905 0.69
35,443,906 1.76
Personal Products: 0.14%Other securities 2,863,733 0.14
Tobacco: 1.85%Altria Group Incorporated 186,123 14,041,119 0.70Philip Morris International 148,884 17,836,303 0.89Other securities 5,337,633 0.26
37,215,055 1.85
Energy: 5.91%
Energy Equipment & Services: 0.93%Schlumberger Limited 133,791 9,310,516 0.46Other securities 9,382,845 0.47
18,693,361 0.93
Oil, Gas & Consumable Fuels: 4.98%Chevron Corporation 181,678 18,800,039 0.93Exxon Mobil Corporation 397,933 32,033,607 1.59Other securities 49,645,862 2.46
100,479,508 4.98
Financials: 13.52%
Banks: 5.95%Bank of America Corporation 962,092 21,560,482 1.07Citigroup Incorporated 265,900 16,097,586 0.80
The accompanying notes are an integral part of these financial statements.
Copyright © 2017 www.secdatabase.com. All Rights Reserved.Please Consider the Environment Before Printing This Document
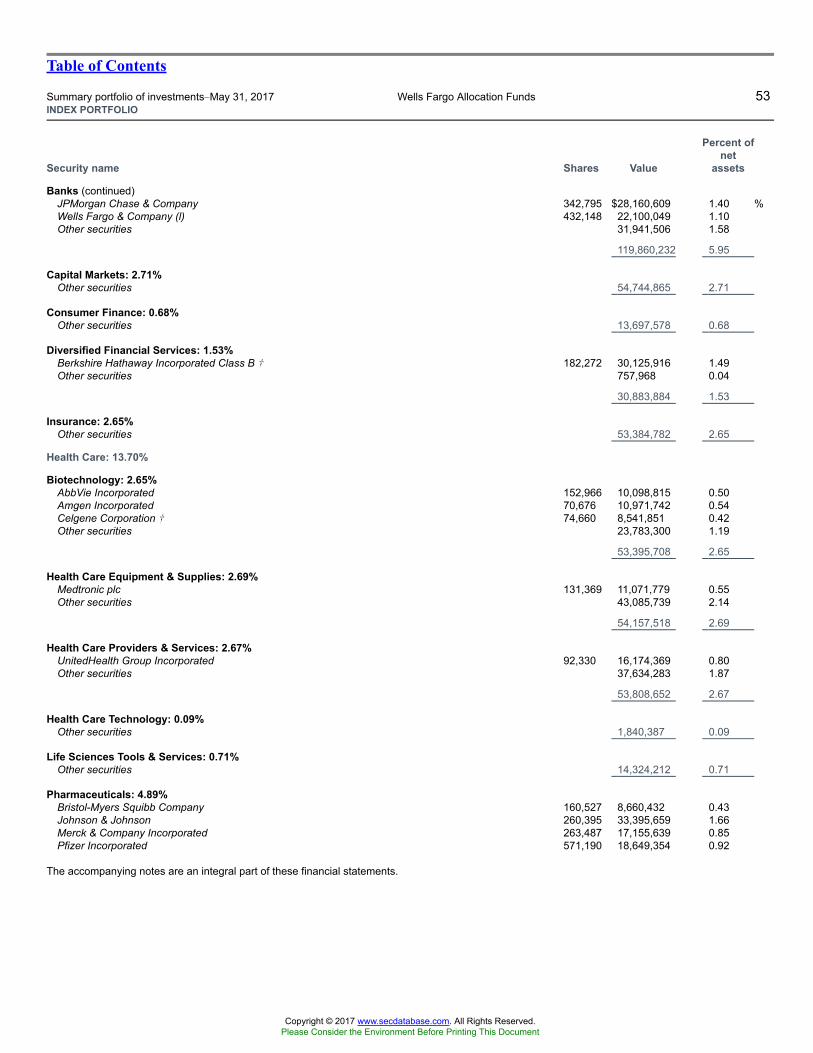
Table of Contents
Summary portfolio of investments�May 31, 2017 Wells Fargo Allocation Funds 53INDEX PORTFOLIO
Security name Shares Value
Percent ofnet
assets
Banks (continued)JPMorgan Chase & Company 342,795 $28,160,609 1.40 %Wells Fargo & Company (l) 432,148 22,100,049 1.10Other securities 31,941,506 1.58
119,860,232 5.95
Capital Markets: 2.71%Other securities 54,744,865 2.71
Consumer Finance: 0.68%Other securities 13,697,578 0.68
Diversified Financial Services: 1.53%Berkshire Hathaway Incorporated Class B � 182,272 30,125,916 1.49Other securities 757,968 0.04
30,883,884 1.53
Insurance: 2.65%Other securities 53,384,782 2.65
Health Care: 13.70%
Biotechnology: 2.65%AbbVie Incorporated 152,966 10,098,815 0.50Amgen Incorporated 70,676 10,971,742 0.54Celgene Corporation � 74,660 8,541,851 0.42Other securities 23,783,300 1.19
53,395,708 2.65
Health Care Equipment & Supplies: 2.69%Medtronic plc 131,369 11,071,779 0.55Other securities 43,085,739 2.14
54,157,518 2.69
Health Care Providers & Services: 2.67%UnitedHealth Group Incorporated 92,330 16,174,369 0.80Other securities 37,634,283 1.87
53,808,652 2.67
Health Care Technology: 0.09%Other securities 1,840,387 0.09
Life Sciences Tools & Services: 0.71%Other securities 14,324,212 0.71
Pharmaceuticals: 4.89%Bristol-Myers Squibb Company 160,527 8,660,432 0.43Johnson & Johnson 260,395 33,395,659 1.66Merck & Company Incorporated 263,487 17,155,639 0.85Pfizer Incorporated 571,190 18,649,354 0.92
The accompanying notes are an integral part of these financial statements.
Copyright © 2017 www.secdatabase.com. All Rights Reserved.Please Consider the Environment Before Printing This Document
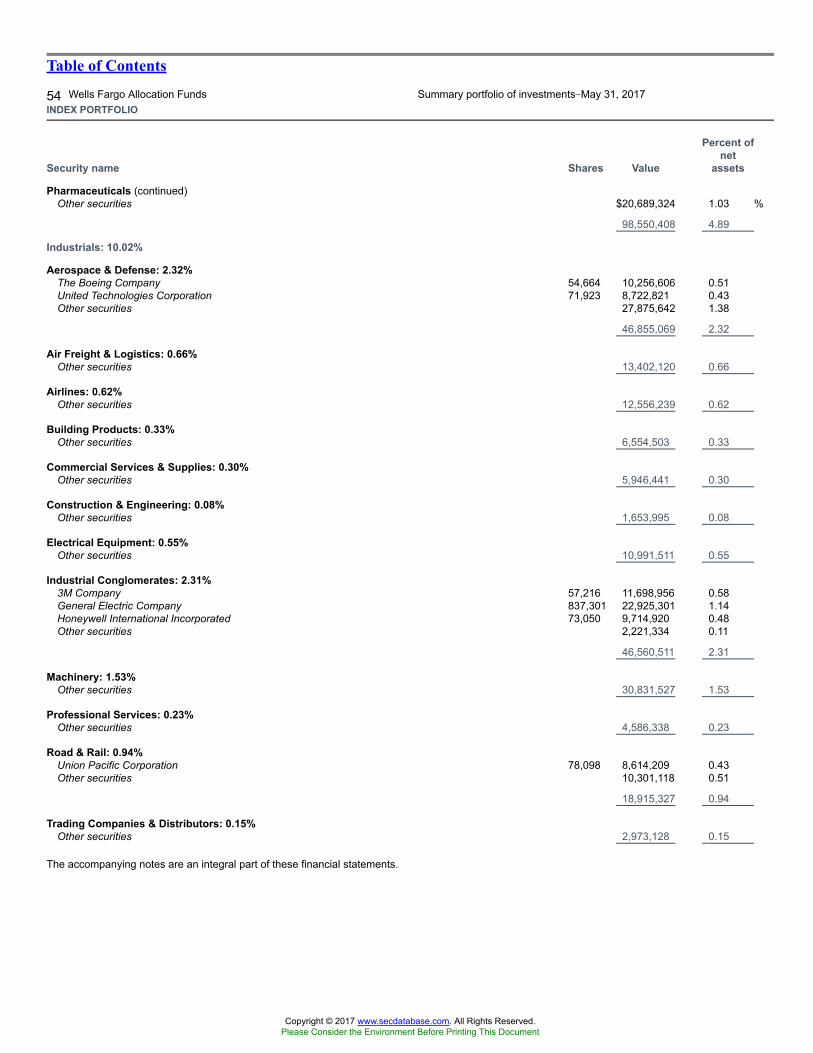
Table of Contents
54 Wells Fargo Allocation Funds Summary portfolio of investments�May 31, 2017INDEX PORTFOLIO
Security name Shares Value
Percent ofnet
assets
Pharmaceuticals (continued)Other securities $20,689,324 1.03 %
98,550,408 4.89
Industrials: 10.02%
Aerospace & Defense: 2.32%The Boeing Company 54,664 10,256,606 0.51United Technologies Corporation 71,923 8,722,821 0.43Other securities 27,875,642 1.38
46,855,069 2.32
Air Freight & Logistics: 0.66%Other securities 13,402,120 0.66
Airlines: 0.62%Other securities 12,556,239 0.62
Building Products: 0.33%Other securities 6,554,503 0.33
Commercial Services & Supplies: 0.30%Other securities 5,946,441 0.30
Construction & Engineering: 0.08%Other securities 1,653,995 0.08
Electrical Equipment: 0.55%Other securities 10,991,511 0.55
Industrial Conglomerates: 2.31%3M Company 57,216 11,698,956 0.58General Electric Company 837,301 22,925,301 1.14Honeywell International Incorporated 73,050 9,714,920 0.48Other securities 2,221,334 0.11
46,560,511 2.31
Machinery: 1.53%Other securities 30,831,527 1.53
Professional Services: 0.23%Other securities 4,586,338 0.23
Road & Rail: 0.94%Union Pacific Corporation 78,098 8,614,209 0.43Other securities 10,301,118 0.51
18,915,327 0.94
Trading Companies & Distributors: 0.15%Other securities 2,973,128 0.15
The accompanying notes are an integral part of these financial statements.
Copyright © 2017 www.secdatabase.com. All Rights Reserved.Please Consider the Environment Before Printing This Document
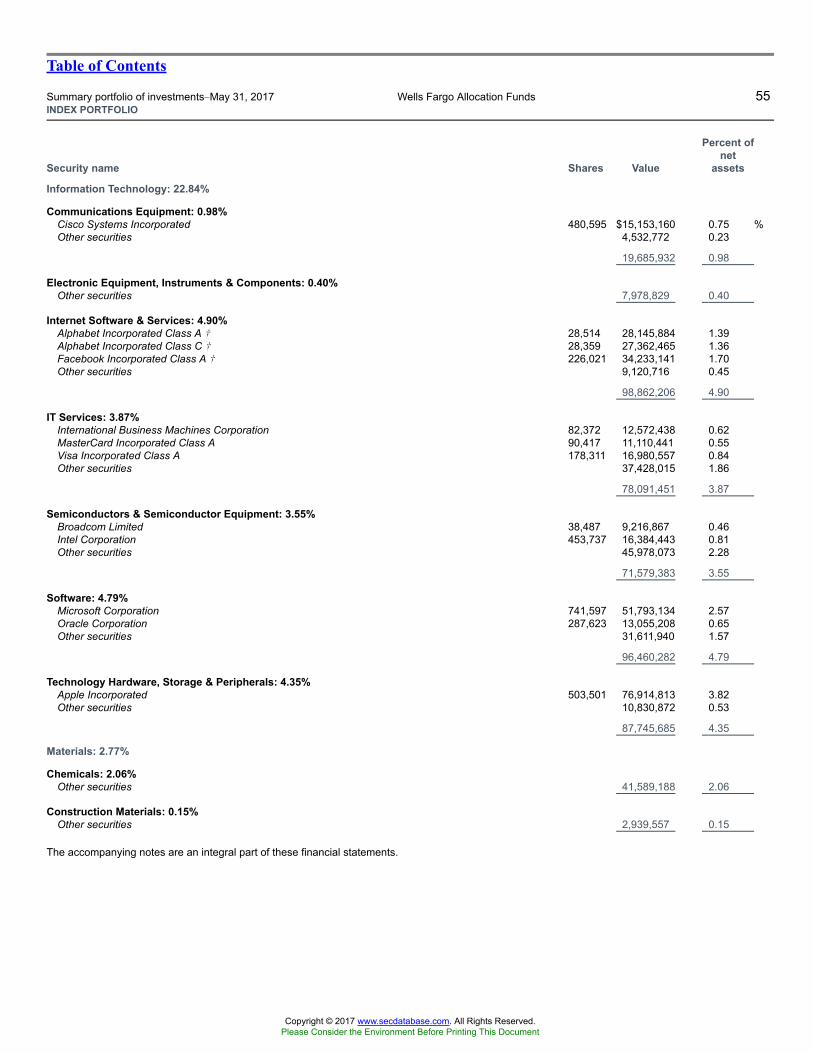
Table of Contents
Summary portfolio of investments�May 31, 2017 Wells Fargo Allocation Funds 55INDEX PORTFOLIO
Security name Shares Value
Percent ofnet
assets
Information Technology: 22.84%
Communications Equipment: 0.98%Cisco Systems Incorporated 480,595 $15,153,160 0.75 %Other securities 4,532,772 0.23
19,685,932 0.98
Electronic Equipment, Instruments & Components: 0.40%Other securities 7,978,829 0.40
Internet Software & Services: 4.90%Alphabet Incorporated Class A � 28,514 28,145,884 1.39Alphabet Incorporated Class C � 28,359 27,362,465 1.36Facebook Incorporated Class A � 226,021 34,233,141 1.70Other securities 9,120,716 0.45
98,862,206 4.90
IT Services: 3.87%International Business Machines Corporation 82,372 12,572,438 0.62MasterCard Incorporated Class A 90,417 11,110,441 0.55Visa Incorporated Class A 178,311 16,980,557 0.84Other securities 37,428,015 1.86
78,091,451 3.87
Semiconductors & Semiconductor Equipment: 3.55%Broadcom Limited 38,487 9,216,867 0.46Intel Corporation 453,737 16,384,443 0.81Other securities 45,978,073 2.28
71,579,383 3.55
Software: 4.79%Microsoft Corporation 741,597 51,793,134 2.57Oracle Corporation 287,623 13,055,208 0.65Other securities 31,611,940 1.57
96,460,282 4.79
Technology Hardware, Storage & Peripherals: 4.35%Apple Incorporated 503,501 76,914,813 3.82Other securities 10,830,872 0.53
87,745,685 4.35
Materials: 2.77%
Chemicals: 2.06%Other securities 41,589,188 2.06
Construction Materials: 0.15%Other securities 2,939,557 0.15
The accompanying notes are an integral part of these financial statements.
Copyright © 2017 www.secdatabase.com. All Rights Reserved.Please Consider the Environment Before Printing This Document
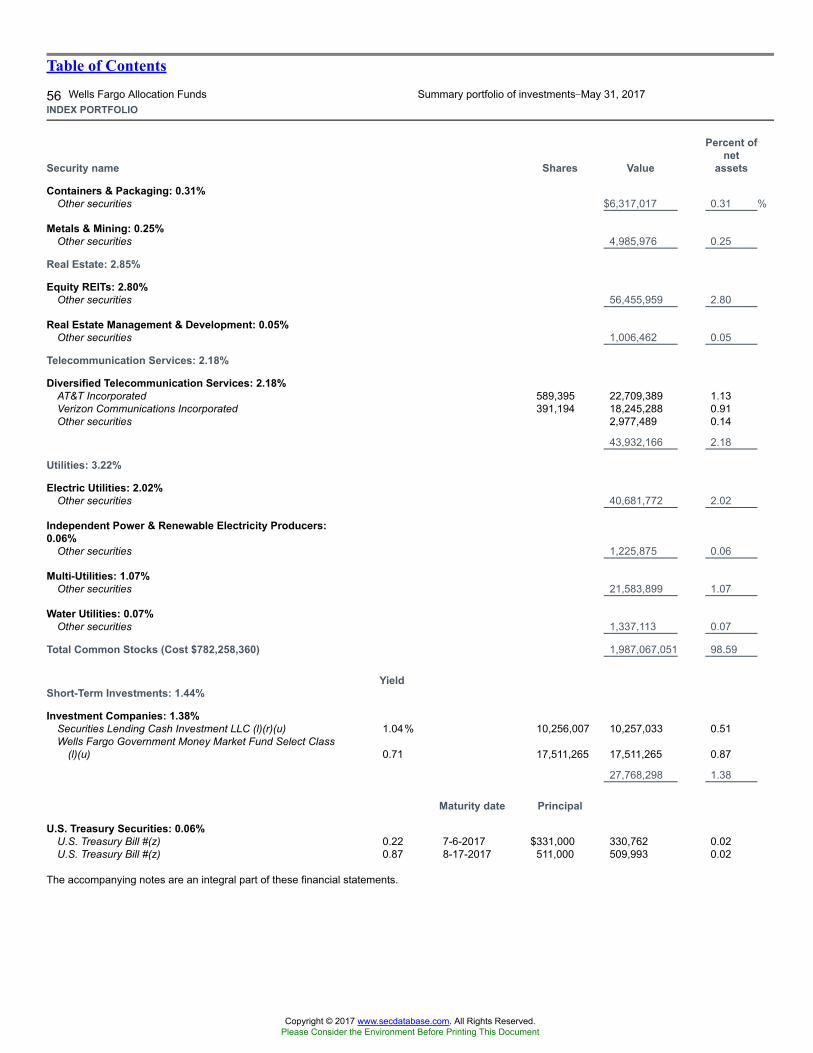
Table of Contents
56 Wells Fargo Allocation Funds Summary portfolio of investments�May 31, 2017INDEX PORTFOLIO
Security name Shares Value
Percent ofnet
assets
Containers & Packaging: 0.31%Other securities $6,317,017 0.31 %
Metals & Mining: 0.25%Other securities 4,985,976 0.25
Real Estate: 2.85%
Equity REITs: 2.80%Other securities 56,455,959 2.80
Real Estate Management & Development: 0.05%Other securities 1,006,462 0.05
Telecommunication Services: 2.18%
Diversified Telecommunication Services: 2.18%AT&T Incorporated 589,395 22,709,389 1.13Verizon Communications Incorporated 391,194 18,245,288 0.91Other securities 2,977,489 0.14
43,932,166 2.18
Utilities: 3.22%
Electric Utilities: 2.02%Other securities 40,681,772 2.02
Independent Power & Renewable Electricity Producers:0.06%
Other securities 1,225,875 0.06
Multi-Utilities: 1.07%Other securities 21,583,899 1.07
Water Utilities: 0.07%Other securities 1,337,113 0.07
Total Common Stocks (Cost $782,258,360) 1,987,067,051 98.59
YieldShort-Term Investments: 1.44%
Investment Companies: 1.38%Securities Lending Cash Investment LLC (l)(r)(u) 1.04% 10,256,007 10,257,033 0.51Wells Fargo Government Money Market Fund Select Class
(l)(u) 0.71 17,511,265 17,511,265 0.87
27,768,298 1.38
Maturity date Principal
U.S. Treasury Securities: 0.06%U.S. Treasury Bill #(z) 0.22 7-6-2017 $331,000 330,762 0.02U.S. Treasury Bill #(z) 0.87 8-17-2017 511,000 509,993 0.02
The accompanying notes are an integral part of these financial statements.
Copyright © 2017 www.secdatabase.com. All Rights Reserved.Please Consider the Environment Before Printing This Document
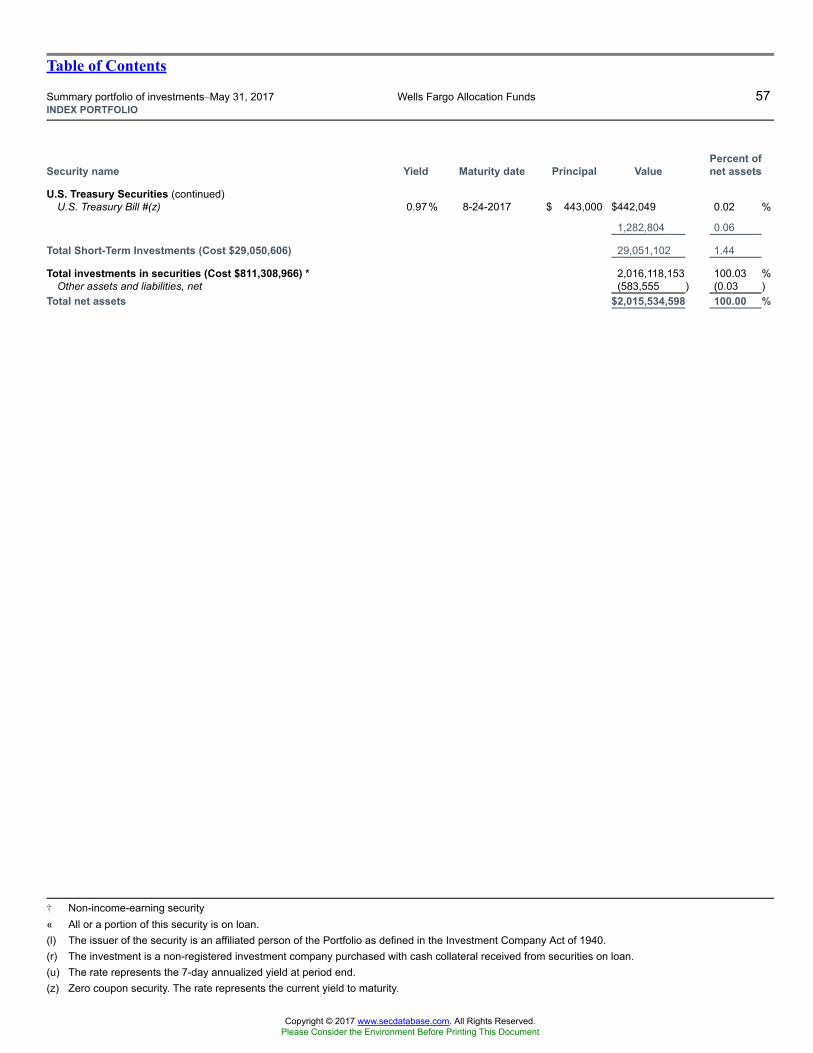
Table of Contents
Summary portfolio of investments�May 31, 2017 Wells Fargo Allocation Funds 57INDEX PORTFOLIO
Security name Yield Maturity date Principal ValuePercent ofnet assets
U.S. Treasury Securities (continued)U.S. Treasury Bill #(z) 0.97% 8-24-2017 $ 443,000 $442,049 0.02 %
1,282,804 0.06
Total Short-Term Investments (Cost $29,050,606) 29,051,102 1.44
Total investments in securities (Cost $811,308,966) * 2,016,118,153 100.03 %Other assets and liabilities, net (583,555 ) (0.03 )
Total net assets $2,015,534,598 100.00 %
� Non-income-earning security« All or a portion of this security is on loan.(l) The issuer of the security is an affiliated person of the Portfolio as defined in the Investment Company Act of 1940.(r) The investment is a non-registered investment company purchased with cash collateral received from securities on loan.(u) The rate represents the 7-day annualized yield at period end.(z) Zero coupon security. The rate represents the current yield to maturity.
Copyright © 2017 www.secdatabase.com. All Rights Reserved.Please Consider the Environment Before Printing This Document
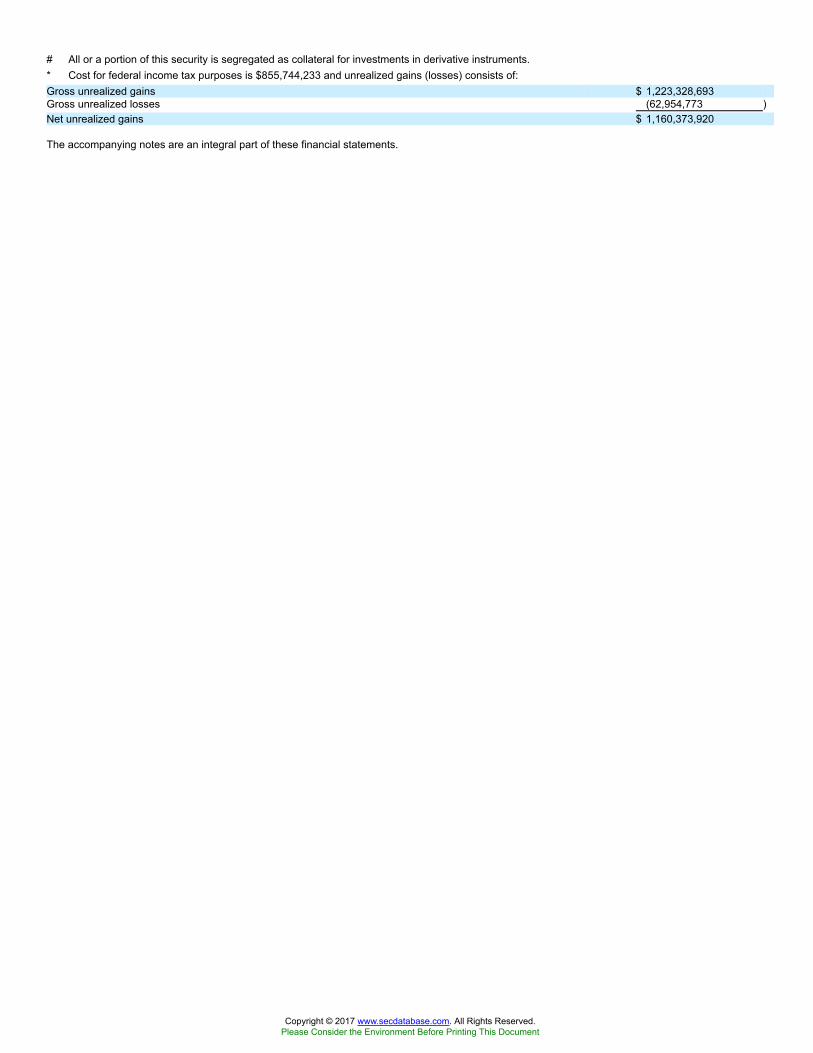
# All or a portion of this security is segregated as collateral for investments in derivative instruments.* Cost for federal income tax purposes is $855,744,233 and unrealized gains (losses) consists of:Gross unrealized gains $ 1,223,328,693Gross unrealized losses (62,954,773 )Net unrealized gains $ 1,160,373,920
The accompanying notes are an integral part of these financial statements.
Copyright © 2017 www.secdatabase.com. All Rights Reserved.Please Consider the Environment Before Printing This Document
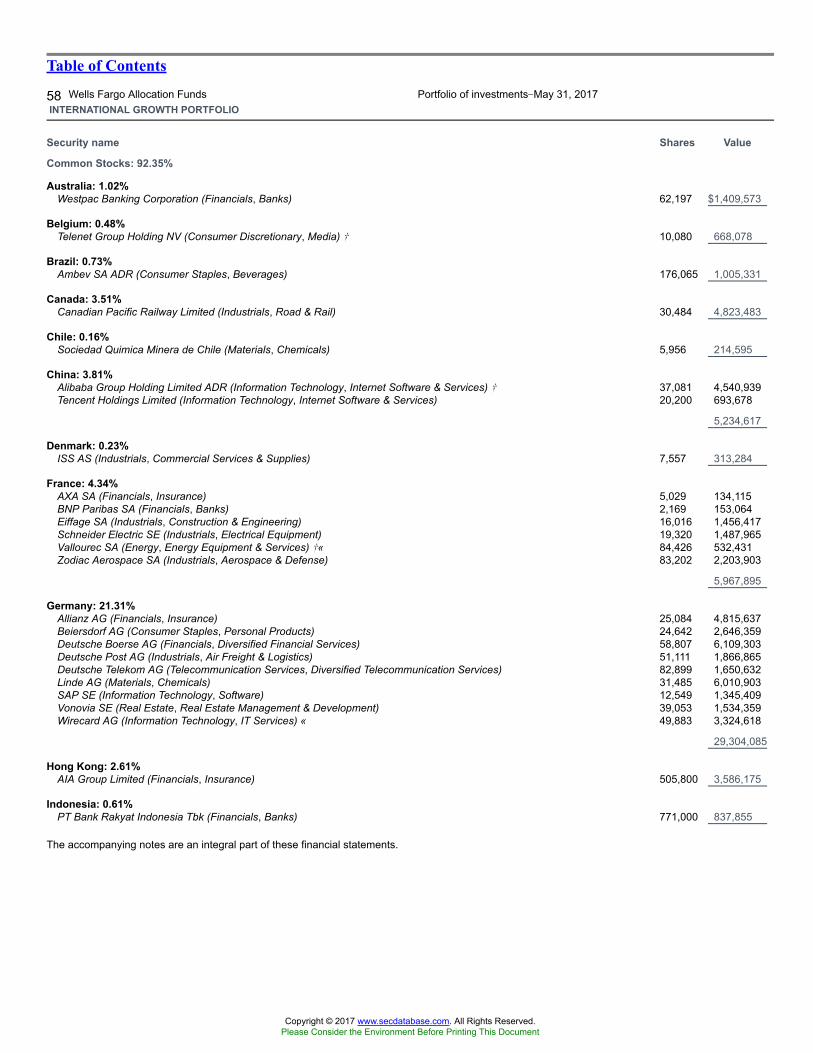
Table of Contents
58 Wells Fargo Allocation Funds Portfolio of investments�May 31, 2017INTERNATIONAL GROWTH PORTFOLIO
Security name Shares Value
Common Stocks: 92.35%
Australia: 1.02%Westpac Banking Corporation (Financials, Banks) 62,197 $1,409,573
Belgium: 0.48%Telenet Group Holding NV (Consumer Discretionary, Media) � 10,080 668,078
Brazil: 0.73%Ambev SA ADR (Consumer Staples, Beverages) 176,065 1,005,331
Canada: 3.51%Canadian Pacific Railway Limited (Industrials, Road & Rail) 30,484 4,823,483
Chile: 0.16%Sociedad Quimica Minera de Chile (Materials, Chemicals) 5,956 214,595
China: 3.81%Alibaba Group Holding Limited ADR (Information Technology, Internet Software & Services) � 37,081 4,540,939Tencent Holdings Limited (Information Technology, Internet Software & Services) 20,200 693,678
5,234,617
Denmark: 0.23%ISS AS (Industrials, Commercial Services & Supplies) 7,557 313,284
France: 4.34%AXA SA (Financials, Insurance) 5,029 134,115BNP Paribas SA (Financials, Banks) 2,169 153,064Eiffage SA (Industrials, Construction & Engineering) 16,016 1,456,417Schneider Electric SE (Industrials, Electrical Equipment) 19,320 1,487,965Vallourec SA (Energy, Energy Equipment & Services) �« 84,426 532,431Zodiac Aerospace SA (Industrials, Aerospace & Defense) 83,202 2,203,903
5,967,895
Germany: 21.31%Allianz AG (Financials, Insurance) 25,084 4,815,637Beiersdorf AG (Consumer Staples, Personal Products) 24,642 2,646,359Deutsche Boerse AG (Financials, Diversified Financial Services) 58,807 6,109,303Deutsche Post AG (Industrials, Air Freight & Logistics) 51,111 1,866,865Deutsche Telekom AG (Telecommunication Services, Diversified Telecommunication Services) 82,899 1,650,632Linde AG (Materials, Chemicals) 31,485 6,010,903SAP SE (Information Technology, Software) 12,549 1,345,409Vonovia SE (Real Estate, Real Estate Management & Development) 39,053 1,534,359Wirecard AG (Information Technology, IT Services) « 49,883 3,324,618
29,304,085
Hong Kong: 2.61%AIA Group Limited (Financials, Insurance) 505,800 3,586,175
Indonesia: 0.61%PT Bank Rakyat Indonesia Tbk (Financials, Banks) 771,000 837,855
The accompanying notes are an integral part of these financial statements.
Copyright © 2017 www.secdatabase.com. All Rights Reserved.Please Consider the Environment Before Printing This Document
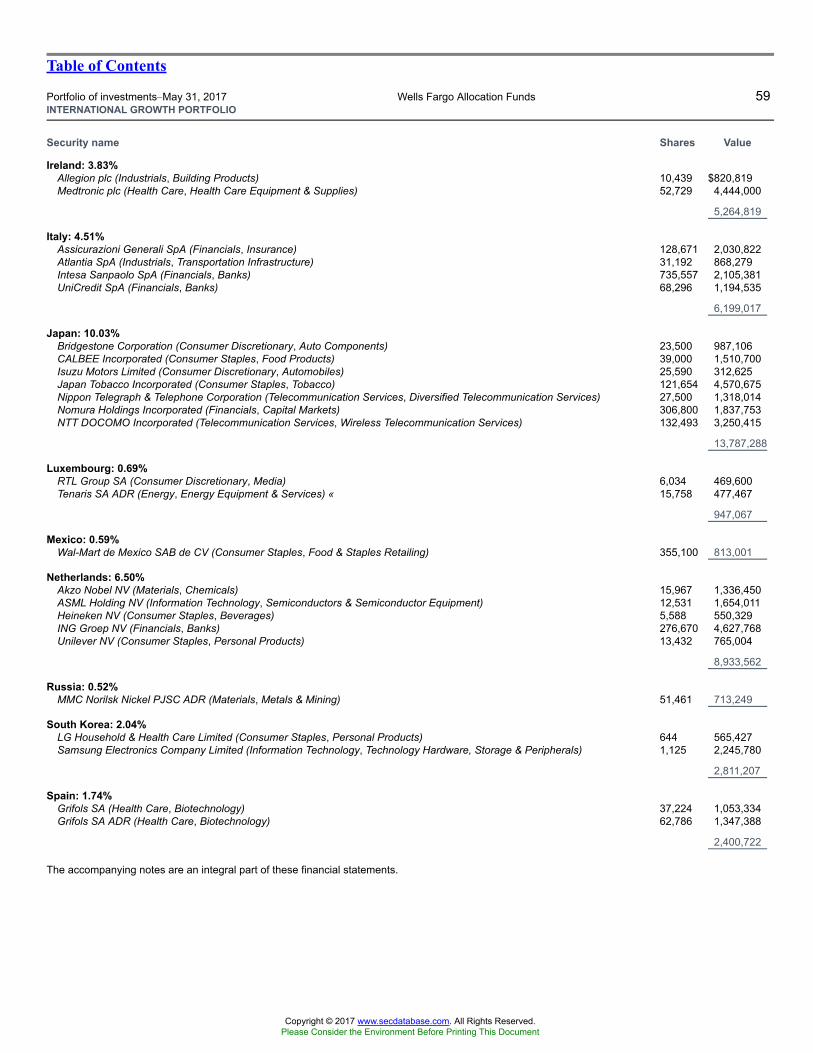
Table of Contents
Portfolio of investments�May 31, 2017 Wells Fargo Allocation Funds 59INTERNATIONAL GROWTH PORTFOLIO
Security name Shares Value
Ireland: 3.83%Allegion plc (Industrials, Building Products) 10,439 $820,819Medtronic plc (Health Care, Health Care Equipment & Supplies) 52,729 4,444,000
5,264,819
Italy: 4.51%Assicurazioni Generali SpA (Financials, Insurance) 128,671 2,030,822Atlantia SpA (Industrials, Transportation Infrastructure) 31,192 868,279Intesa Sanpaolo SpA (Financials, Banks) 735,557 2,105,381UniCredit SpA (Financials, Banks) 68,296 1,194,535
6,199,017
Japan: 10.03%Bridgestone Corporation (Consumer Discretionary, Auto Components) 23,500 987,106CALBEE Incorporated (Consumer Staples, Food Products) 39,000 1,510,700Isuzu Motors Limited (Consumer Discretionary, Automobiles) 25,590 312,625Japan Tobacco Incorporated (Consumer Staples, Tobacco) 121,654 4,570,675Nippon Telegraph & Telephone Corporation (Telecommunication Services, Diversified Telecommunication Services) 27,500 1,318,014Nomura Holdings Incorporated (Financials, Capital Markets) 306,800 1,837,753NTT DOCOMO Incorporated (Telecommunication Services, Wireless Telecommunication Services) 132,493 3,250,415
13,787,288
Luxembourg: 0.69%RTL Group SA (Consumer Discretionary, Media) 6,034 469,600Tenaris SA ADR (Energy, Energy Equipment & Services) « 15,758 477,467
947,067
Mexico: 0.59%Wal-Mart de Mexico SAB de CV (Consumer Staples, Food & Staples Retailing) 355,100 813,001
Netherlands: 6.50%Akzo Nobel NV (Materials, Chemicals) 15,967 1,336,450ASML Holding NV (Information Technology, Semiconductors & Semiconductor Equipment) 12,531 1,654,011Heineken NV (Consumer Staples, Beverages) 5,588 550,329ING Groep NV (Financials, Banks) 276,670 4,627,768Unilever NV (Consumer Staples, Personal Products) 13,432 765,004
8,933,562
Russia: 0.52%MMC Norilsk Nickel PJSC ADR (Materials, Metals & Mining) 51,461 713,249
South Korea: 2.04%LG Household & Health Care Limited (Consumer Staples, Personal Products) 644 565,427Samsung Electronics Company Limited (Information Technology, Technology Hardware, Storage & Peripherals) 1,125 2,245,780
2,811,207
Spain: 1.74%Grifols SA (Health Care, Biotechnology) 37,224 1,053,334Grifols SA ADR (Health Care, Biotechnology) 62,786 1,347,388
2,400,722
The accompanying notes are an integral part of these financial statements.
Copyright © 2017 www.secdatabase.com. All Rights Reserved.Please Consider the Environment Before Printing This Document
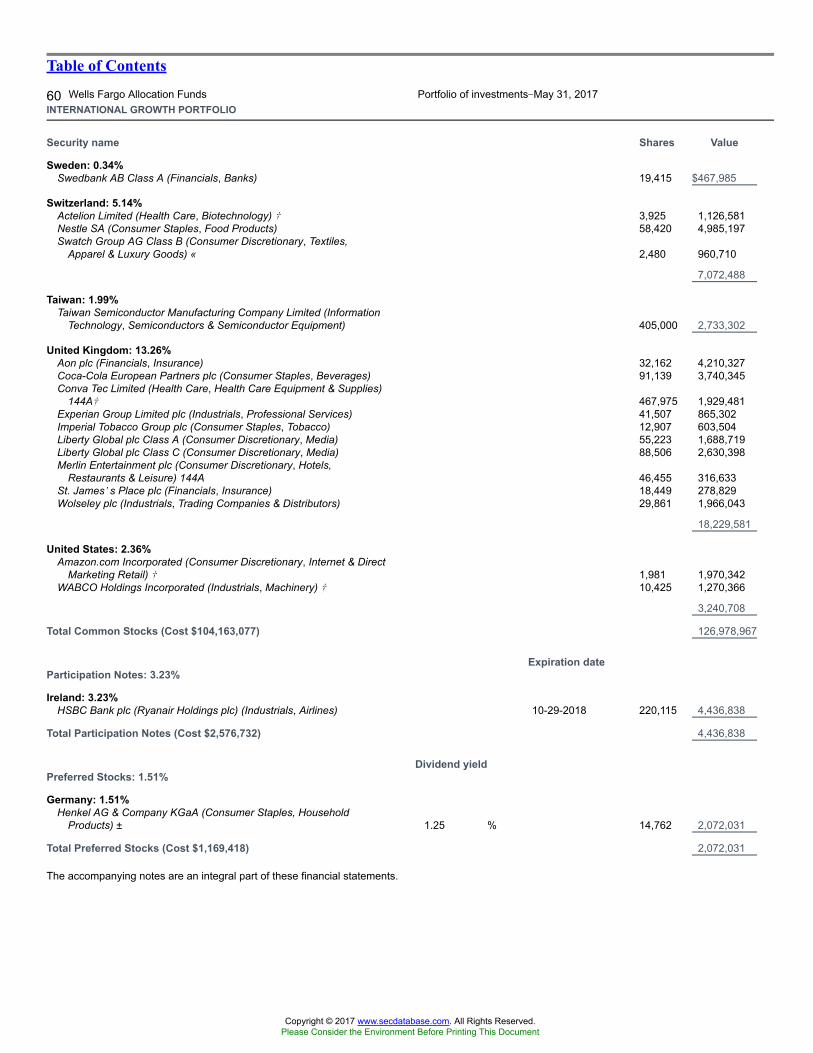
Table of Contents
60 Wells Fargo Allocation Funds Portfolio of investments�May 31, 2017INTERNATIONAL GROWTH PORTFOLIO
Security name Shares Value
Sweden: 0.34%Swedbank AB Class A (Financials, Banks) 19,415 $467,985
Switzerland: 5.14%Actelion Limited (Health Care, Biotechnology) � 3,925 1,126,581Nestle SA (Consumer Staples, Food Products) 58,420 4,985,197Swatch Group AG Class B (Consumer Discretionary, Textiles,
Apparel & Luxury Goods) « 2,480 960,710
7,072,488
Taiwan: 1.99%Taiwan Semiconductor Manufacturing Company Limited (Information
Technology, Semiconductors & Semiconductor Equipment) 405,000 2,733,302
United Kingdom: 13.26%Aon plc (Financials, Insurance) 32,162 4,210,327Coca-Cola European Partners plc (Consumer Staples, Beverages) 91,139 3,740,345Conva Tec Limited (Health Care, Health Care Equipment & Supplies)
144A� 467,975 1,929,481Experian Group Limited plc (Industrials, Professional Services) 41,507 865,302Imperial Tobacco Group plc (Consumer Staples, Tobacco) 12,907 603,504Liberty Global plc Class A (Consumer Discretionary, Media) 55,223 1,688,719Liberty Global plc Class C (Consumer Discretionary, Media) 88,506 2,630,398Merlin Entertainment plc (Consumer Discretionary, Hotels,
Restaurants & Leisure) 144A 46,455 316,633St. James�s Place plc (Financials, Insurance) 18,449 278,829Wolseley plc (Industrials, Trading Companies & Distributors) 29,861 1,966,043
18,229,581
United States: 2.36%Amazon.com Incorporated (Consumer Discretionary, Internet & Direct
Marketing Retail) � 1,981 1,970,342WABCO Holdings Incorporated (Industrials, Machinery) � 10,425 1,270,366
3,240,708
Total Common Stocks (Cost $104,163,077) 126,978,967
Expiration dateParticipation Notes: 3.23%
Ireland: 3.23%HSBC Bank plc (Ryanair Holdings plc) (Industrials, Airlines) 10-29-2018 220,115 4,436,838
Total Participation Notes (Cost $2,576,732) 4,436,838
Dividend yieldPreferred Stocks: 1.51%
Germany: 1.51%Henkel AG & Company KGaA (Consumer Staples, Household
Products) ± 1.25 % 14,762 2,072,031
Total Preferred Stocks (Cost $1,169,418) 2,072,031
The accompanying notes are an integral part of these financial statements.
Copyright © 2017 www.secdatabase.com. All Rights Reserved.Please Consider the Environment Before Printing This Document

Table of Contents
Portfolio of investments�May 31, 2017 Wells Fargo Allocation Funds 61INTERNATIONAL GROWTH PORTFOLIO
Security name Yield Shares Value
Short-Term Investments: 4.98%
Investment Companies: 4.98%Securities Lending Cash Investment LLC (l)(r)(u) 1.04 % 5,192,235 $ 5,192,363Wells Fargo Government Money Market Fund Select Class (l)(u) 0.71 1,660,070 1,660,070
Total Short-Term Investments (Cost $6,852,433) 6,852,433
Total investments in securities (Cost $114,761,660) * 102.07% 140,340,269Other assets and liabilities, net (2.07 ) (2,849,239 )
Total net assets 100.00% $137,491,030
� Non-income-earning security« All or a portion of this security is on loan.144A The security may be resold in transactions exempt from registration, normally to qualified institutional buyers, pursuant to Rule 144A under the
Securities Act of 1933.± Variable rate investment. The rate shown is the rate in effect at period end.(l) The issuer of the security is an affiliated person of the Portfolio as defined in the Investment Company Act of 1940.(r) The investment is a non-registered investment company purchased with cash collateral received from securities on loan.(u) The rate represents the 7-day annualized yield at period end.* Cost for federal income tax purposes is $114,881,370 and unrealized gains (losses) consists of:Gross unrealized gains $ 26,180,758Gross unrealized losses (721,859 )Net unrealized gains $ 25,458,899
The following table shows the percent of total long-term investments by sector as of May 31, 2017:Consumer Staples 25.33 %Financials 25.32Industrials 16.77Information Technology 12.39Health Care 7.42Materials 6.20Telecommunication Services 4.66Real Estate 1.15Energy 0.76
Copyright © 2017 www.secdatabase.com. All Rights Reserved.Please Consider the Environment Before Printing This Document

100.00 %
The accompanying notes are an integral part of these financial statements.
Copyright © 2017 www.secdatabase.com. All Rights Reserved.Please Consider the Environment Before Printing This Document
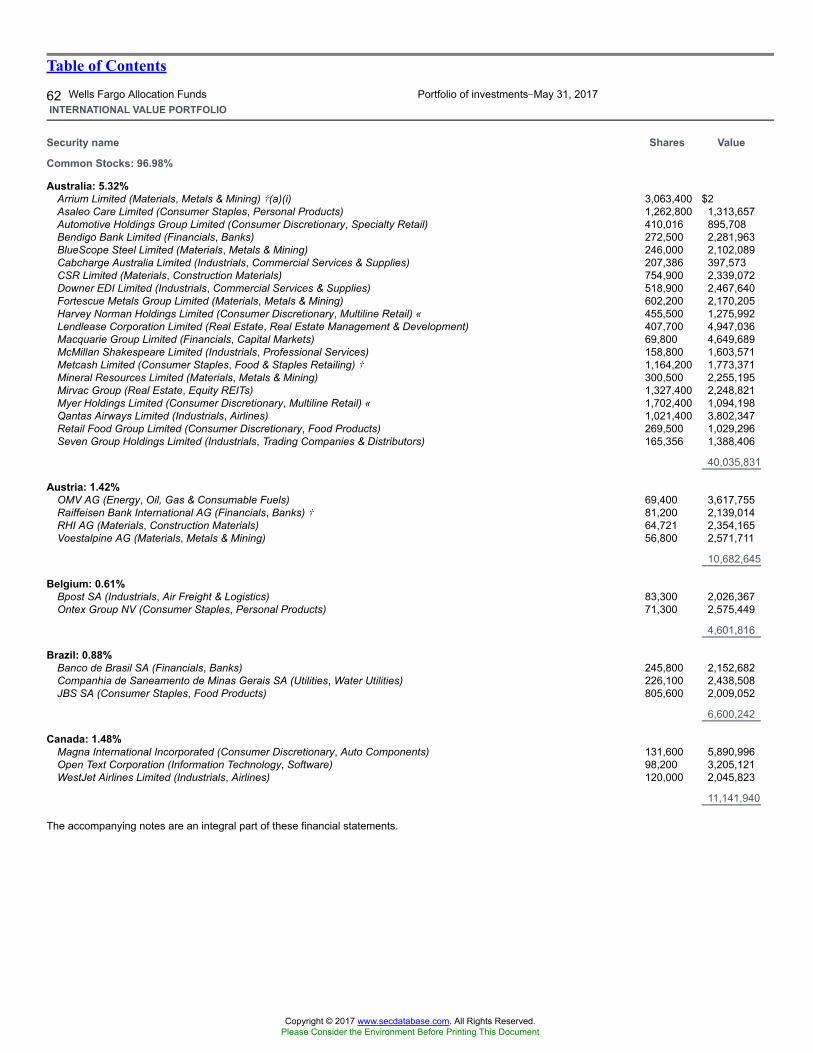
Table of Contents
62 Wells Fargo Allocation Funds Portfolio of investments�May 31, 2017INTERNATIONAL VALUE PORTFOLIO
Security name Shares Value
Common Stocks: 96.98%
Australia: 5.32%Arrium Limited (Materials, Metals & Mining) �(a)(i) 3,063,400 $2Asaleo Care Limited (Consumer Staples, Personal Products) 1,262,800 1,313,657Automotive Holdings Group Limited (Consumer Discretionary, Specialty Retail) 410,016 895,708Bendigo Bank Limited (Financials, Banks) 272,500 2,281,963BlueScope Steel Limited (Materials, Metals & Mining) 246,000 2,102,089Cabcharge Australia Limited (Industrials, Commercial Services & Supplies) 207,386 397,573CSR Limited (Materials, Construction Materials) 754,900 2,339,072Downer EDI Limited (Industrials, Commercial Services & Supplies) 518,900 2,467,640Fortescue Metals Group Limited (Materials, Metals & Mining) 602,200 2,170,205Harvey Norman Holdings Limited (Consumer Discretionary, Multiline Retail) « 455,500 1,275,992Lendlease Corporation Limited (Real Estate, Real Estate Management & Development) 407,700 4,947,036Macquarie Group Limited (Financials, Capital Markets) 69,800 4,649,689McMillan Shakespeare Limited (Industrials, Professional Services) 158,800 1,603,571Metcash Limited (Consumer Staples, Food & Staples Retailing) � 1,164,200 1,773,371Mineral Resources Limited (Materials, Metals & Mining) 300,500 2,255,195Mirvac Group (Real Estate, Equity REITs) 1,327,400 2,248,821Myer Holdings Limited (Consumer Discretionary, Multiline Retail) « 1,702,400 1,094,198Qantas Airways Limited (Industrials, Airlines) 1,021,400 3,802,347Retail Food Group Limited (Consumer Discretionary, Food Products) 269,500 1,029,296Seven Group Holdings Limited (Industrials, Trading Companies & Distributors) 165,356 1,388,406
40,035,831
Austria: 1.42%OMV AG (Energy, Oil, Gas & Consumable Fuels) 69,400 3,617,755Raiffeisen Bank International AG (Financials, Banks) � 81,200 2,139,014RHI AG (Materials, Construction Materials) 64,721 2,354,165Voestalpine AG (Materials, Metals & Mining) 56,800 2,571,711
10,682,645
Belgium: 0.61%Bpost SA (Industrials, Air Freight & Logistics) 83,300 2,026,367Ontex Group NV (Consumer Staples, Personal Products) 71,300 2,575,449
4,601,816
Brazil: 0.88%Banco de Brasil SA (Financials, Banks) 245,800 2,152,682Companhia de Saneamento de Minas Gerais SA (Utilities, Water Utilities) 226,100 2,438,508JBS SA (Consumer Staples, Food Products) 805,600 2,009,052
6,600,242
Canada: 1.48%Magna International Incorporated (Consumer Discretionary, Auto Components) 131,600 5,890,996Open Text Corporation (Information Technology, Software) 98,200 3,205,121WestJet Airlines Limited (Industrials, Airlines) 120,000 2,045,823
11,141,940
The accompanying notes are an integral part of these financial statements.
Copyright © 2017 www.secdatabase.com. All Rights Reserved.Please Consider the Environment Before Printing This Document
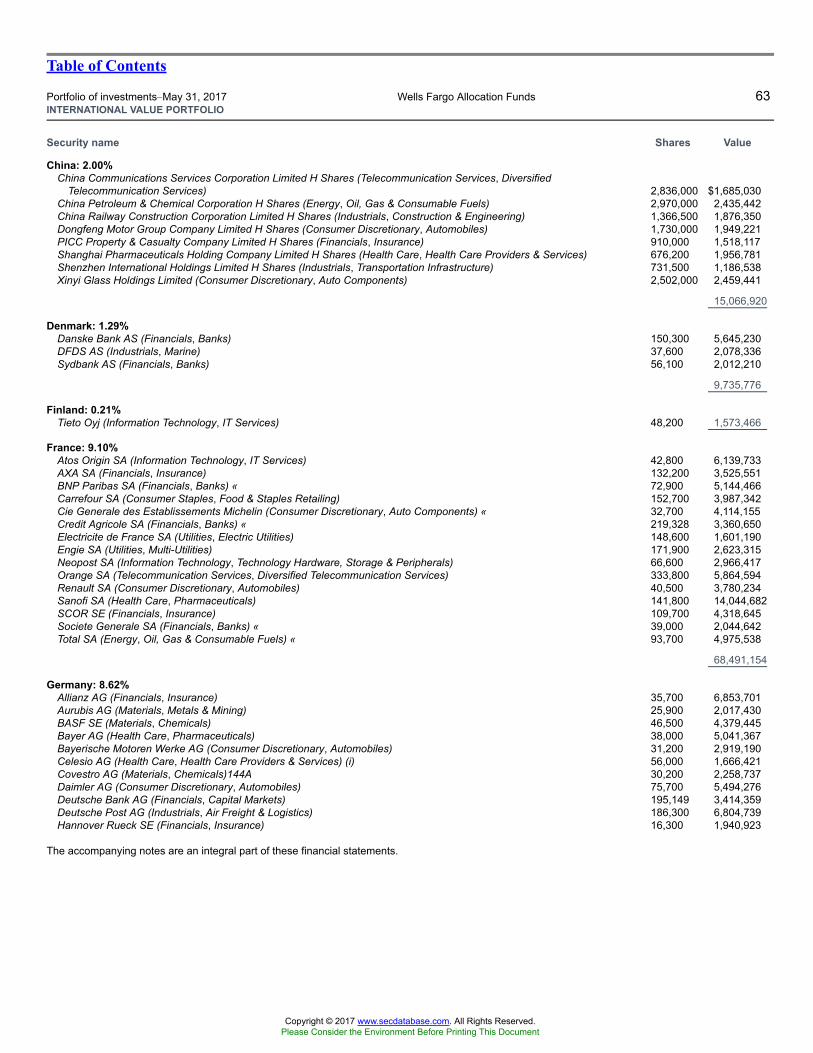
Table of Contents
Portfolio of investments�May 31, 2017 Wells Fargo Allocation Funds 63INTERNATIONAL VALUE PORTFOLIO
Security name Shares Value
China: 2.00%China Communications Services Corporation Limited H Shares (Telecommunication Services, Diversified
Telecommunication Services) 2,836,000 $1,685,030China Petroleum & Chemical Corporation H Shares (Energy, Oil, Gas & Consumable Fuels) 2,970,000 2,435,442China Railway Construction Corporation Limited H Shares (Industrials, Construction & Engineering) 1,366,500 1,876,350Dongfeng Motor Group Company Limited H Shares (Consumer Discretionary, Automobiles) 1,730,000 1,949,221PICC Property & Casualty Company Limited H Shares (Financials, Insurance) 910,000 1,518,117Shanghai Pharmaceuticals Holding Company Limited H Shares (Health Care, Health Care Providers & Services) 676,200 1,956,781Shenzhen International Holdings Limited H Shares (Industrials, Transportation Infrastructure) 731,500 1,186,538Xinyi Glass Holdings Limited (Consumer Discretionary, Auto Components) 2,502,000 2,459,441
15,066,920
Denmark: 1.29%Danske Bank AS (Financials, Banks) 150,300 5,645,230DFDS AS (Industrials, Marine) 37,600 2,078,336Sydbank AS (Financials, Banks) 56,100 2,012,210
9,735,776
Finland: 0.21%Tieto Oyj (Information Technology, IT Services) 48,200 1,573,466
France: 9.10%Atos Origin SA (Information Technology, IT Services) 42,800 6,139,733AXA SA (Financials, Insurance) 132,200 3,525,551BNP Paribas SA (Financials, Banks) « 72,900 5,144,466Carrefour SA (Consumer Staples, Food & Staples Retailing) 152,700 3,987,342Cie Generale des Establissements Michelin (Consumer Discretionary, Auto Components) « 32,700 4,114,155Credit Agricole SA (Financials, Banks) « 219,328 3,360,650Electricite de France SA (Utilities, Electric Utilities) 148,600 1,601,190Engie SA (Utilities, Multi-Utilities) 171,900 2,623,315Neopost SA (Information Technology, Technology Hardware, Storage & Peripherals) 66,600 2,966,417Orange SA (Telecommunication Services, Diversified Telecommunication Services) 333,800 5,864,594Renault SA (Consumer Discretionary, Automobiles) 40,500 3,780,234Sanofi SA (Health Care, Pharmaceuticals) 141,800 14,044,682SCOR SE (Financials, Insurance) 109,700 4,318,645Societe Generale SA (Financials, Banks) « 39,000 2,044,642Total SA (Energy, Oil, Gas & Consumable Fuels) « 93,700 4,975,538
68,491,154
Germany: 8.62%Allianz AG (Financials, Insurance) 35,700 6,853,701Aurubis AG (Materials, Metals & Mining) 25,900 2,017,430BASF SE (Materials, Chemicals) 46,500 4,379,445Bayer AG (Health Care, Pharmaceuticals) 38,000 5,041,367Bayerische Motoren Werke AG (Consumer Discretionary, Automobiles) 31,200 2,919,190Celesio AG (Health Care, Health Care Providers & Services) (i) 56,000 1,666,421Covestro AG (Materials, Chemicals)144A 30,200 2,258,737Daimler AG (Consumer Discretionary, Automobiles) 75,700 5,494,276Deutsche Bank AG (Financials, Capital Markets) 195,149 3,414,359Deutsche Post AG (Industrials, Air Freight & Logistics) 186,300 6,804,739Hannover Rueck SE (Financials, Insurance) 16,300 1,940,923
The accompanying notes are an integral part of these financial statements.
Copyright © 2017 www.secdatabase.com. All Rights Reserved.Please Consider the Environment Before Printing This Document
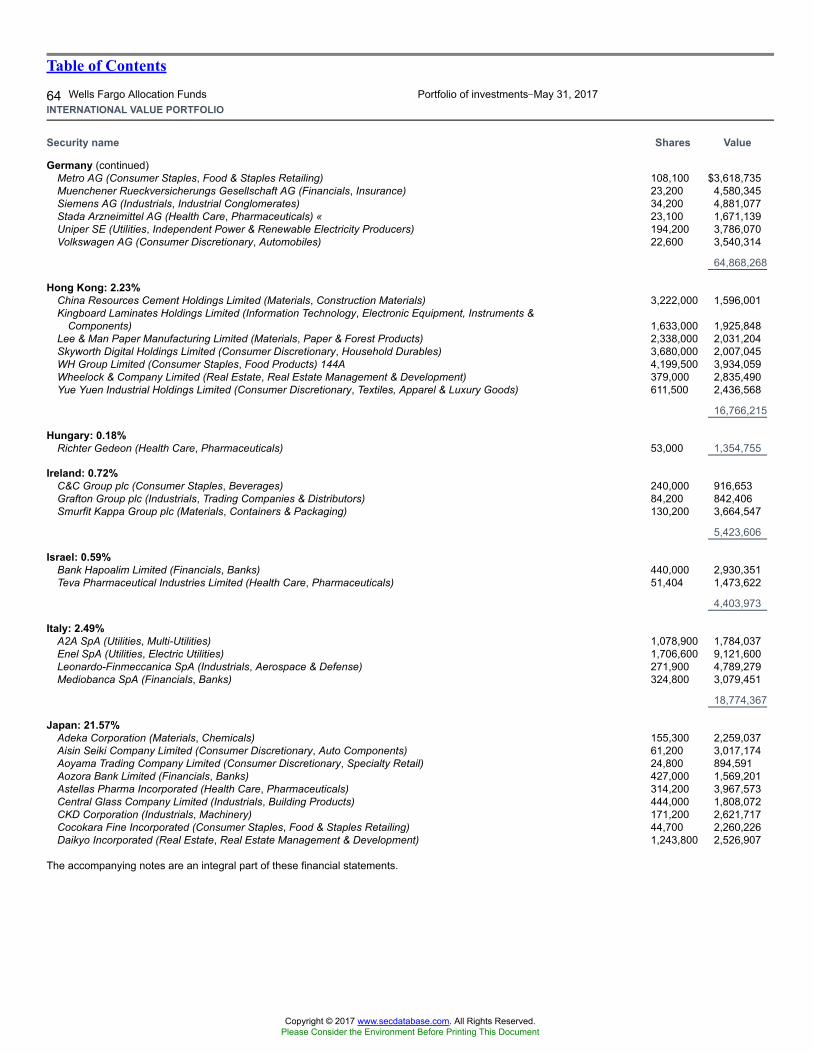
Table of Contents
64 Wells Fargo Allocation Funds Portfolio of investments�May 31, 2017INTERNATIONAL VALUE PORTFOLIO
Security name Shares Value
Germany (continued)Metro AG (Consumer Staples, Food & Staples Retailing) 108,100 $3,618,735Muenchener Rueckversicherungs Gesellschaft AG (Financials, Insurance) 23,200 4,580,345Siemens AG (Industrials, Industrial Conglomerates) 34,200 4,881,077Stada Arzneimittel AG (Health Care, Pharmaceuticals) « 23,100 1,671,139Uniper SE (Utilities, Independent Power & Renewable Electricity Producers) 194,200 3,786,070Volkswagen AG (Consumer Discretionary, Automobiles) 22,600 3,540,314
64,868,268
Hong Kong: 2.23%China Resources Cement Holdings Limited (Materials, Construction Materials) 3,222,000 1,596,001Kingboard Laminates Holdings Limited (Information Technology, Electronic Equipment, Instruments &
Components) 1,633,000 1,925,848Lee & Man Paper Manufacturing Limited (Materials, Paper & Forest Products) 2,338,000 2,031,204Skyworth Digital Holdings Limited (Consumer Discretionary, Household Durables) 3,680,000 2,007,045WH Group Limited (Consumer Staples, Food Products) 144A 4,199,500 3,934,059Wheelock & Company Limited (Real Estate, Real Estate Management & Development) 379,000 2,835,490Yue Yuen Industrial Holdings Limited (Consumer Discretionary, Textiles, Apparel & Luxury Goods) 611,500 2,436,568
16,766,215
Hungary: 0.18%Richter Gedeon (Health Care, Pharmaceuticals) 53,000 1,354,755
Ireland: 0.72%C&C Group plc (Consumer Staples, Beverages) 240,000 916,653Grafton Group plc (Industrials, Trading Companies & Distributors) 84,200 842,406Smurfit Kappa Group plc (Materials, Containers & Packaging) 130,200 3,664,547
5,423,606
Israel: 0.59%Bank Hapoalim Limited (Financials, Banks) 440,000 2,930,351Teva Pharmaceutical Industries Limited (Health Care, Pharmaceuticals) 51,404 1,473,622
4,403,973
Italy: 2.49%A2A SpA (Utilities, Multi-Utilities) 1,078,900 1,784,037Enel SpA (Utilities, Electric Utilities) 1,706,600 9,121,600Leonardo-Finmeccanica SpA (Industrials, Aerospace & Defense) 271,900 4,789,279Mediobanca SpA (Financials, Banks) 324,800 3,079,451
18,774,367
Japan: 21.57%Adeka Corporation (Materials, Chemicals) 155,300 2,259,037Aisin Seiki Company Limited (Consumer Discretionary, Auto Components) 61,200 3,017,174Aoyama Trading Company Limited (Consumer Discretionary, Specialty Retail) 24,800 894,591Aozora Bank Limited (Financials, Banks) 427,000 1,569,201Astellas Pharma Incorporated (Health Care, Pharmaceuticals) 314,200 3,967,573Central Glass Company Limited (Industrials, Building Products) 444,000 1,808,072CKD Corporation (Industrials, Machinery) 171,200 2,621,717Cocokara Fine Incorporated (Consumer Staples, Food & Staples Retailing) 44,700 2,260,226Daikyo Incorporated (Real Estate, Real Estate Management & Development) 1,243,800 2,526,907
The accompanying notes are an integral part of these financial statements.
Copyright © 2017 www.secdatabase.com. All Rights Reserved.Please Consider the Environment Before Printing This Document
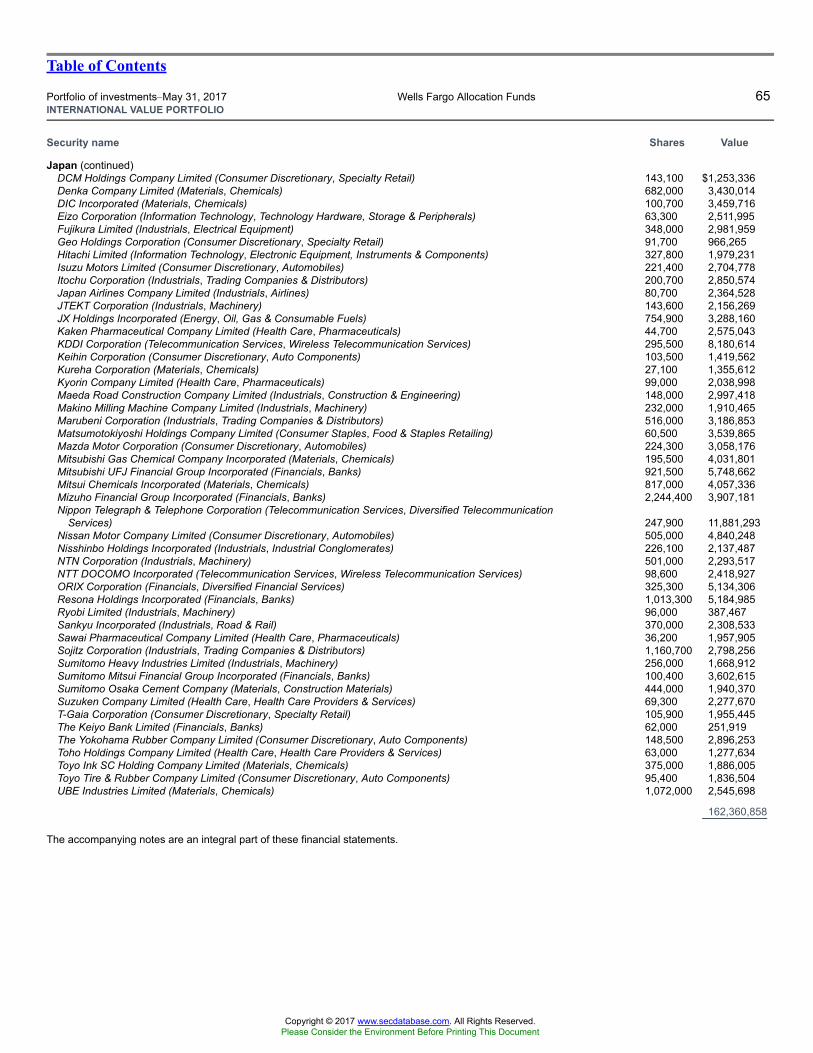
Table of Contents
Portfolio of investments�May 31, 2017 Wells Fargo Allocation Funds 65INTERNATIONAL VALUE PORTFOLIO
Security name Shares Value
Japan (continued)DCM Holdings Company Limited (Consumer Discretionary, Specialty Retail) 143,100 $1,253,336Denka Company Limited (Materials, Chemicals) 682,000 3,430,014DIC Incorporated (Materials, Chemicals) 100,700 3,459,716Eizo Corporation (Information Technology, Technology Hardware, Storage & Peripherals) 63,300 2,511,995Fujikura Limited (Industrials, Electrical Equipment) 348,000 2,981,959Geo Holdings Corporation (Consumer Discretionary, Specialty Retail) 91,700 966,265Hitachi Limited (Information Technology, Electronic Equipment, Instruments & Components) 327,800 1,979,231Isuzu Motors Limited (Consumer Discretionary, Automobiles) 221,400 2,704,778Itochu Corporation (Industrials, Trading Companies & Distributors) 200,700 2,850,574Japan Airlines Company Limited (Industrials, Airlines) 80,700 2,364,528JTEKT Corporation (Industrials, Machinery) 143,600 2,156,269JX Holdings Incorporated (Energy, Oil, Gas & Consumable Fuels) 754,900 3,288,160Kaken Pharmaceutical Company Limited (Health Care, Pharmaceuticals) 44,700 2,575,043KDDI Corporation (Telecommunication Services, Wireless Telecommunication Services) 295,500 8,180,614Keihin Corporation (Consumer Discretionary, Auto Components) 103,500 1,419,562Kureha Corporation (Materials, Chemicals) 27,100 1,355,612Kyorin Company Limited (Health Care, Pharmaceuticals) 99,000 2,038,998Maeda Road Construction Company Limited (Industrials, Construction & Engineering) 148,000 2,997,418Makino Milling Machine Company Limited (Industrials, Machinery) 232,000 1,910,465Marubeni Corporation (Industrials, Trading Companies & Distributors) 516,000 3,186,853Matsumotokiyoshi Holdings Company Limited (Consumer Staples, Food & Staples Retailing) 60,500 3,539,865Mazda Motor Corporation (Consumer Discretionary, Automobiles) 224,300 3,058,176Mitsubishi Gas Chemical Company Incorporated (Materials, Chemicals) 195,500 4,031,801Mitsubishi UFJ Financial Group Incorporated (Financials, Banks) 921,500 5,748,662Mitsui Chemicals Incorporated (Materials, Chemicals) 817,000 4,057,336Mizuho Financial Group Incorporated (Financials, Banks) 2,244,400 3,907,181Nippon Telegraph & Telephone Corporation (Telecommunication Services, Diversified Telecommunication
Services) 247,900 11,881,293Nissan Motor Company Limited (Consumer Discretionary, Automobiles) 505,000 4,840,248Nisshinbo Holdings Incorporated (Industrials, Industrial Conglomerates) 226,100 2,137,487NTN Corporation (Industrials, Machinery) 501,000 2,293,517NTT DOCOMO Incorporated (Telecommunication Services, Wireless Telecommunication Services) 98,600 2,418,927ORIX Corporation (Financials, Diversified Financial Services) 325,300 5,134,306Resona Holdings Incorporated (Financials, Banks) 1,013,300 5,184,985Ryobi Limited (Industrials, Machinery) 96,000 387,467Sankyu Incorporated (Industrials, Road & Rail) 370,000 2,308,533Sawai Pharmaceutical Company Limited (Health Care, Pharmaceuticals) 36,200 1,957,905Sojitz Corporation (Industrials, Trading Companies & Distributors) 1,160,700 2,798,256Sumitomo Heavy Industries Limited (Industrials, Machinery) 256,000 1,668,912Sumitomo Mitsui Financial Group Incorporated (Financials, Banks) 100,400 3,602,615Sumitomo Osaka Cement Company (Materials, Construction Materials) 444,000 1,940,370Suzuken Company Limited (Health Care, Health Care Providers & Services) 69,300 2,277,670T-Gaia Corporation (Consumer Discretionary, Specialty Retail) 105,900 1,955,445The Keiyo Bank Limited (Financials, Banks) 62,000 251,919The Yokohama Rubber Company Limited (Consumer Discretionary, Auto Components) 148,500 2,896,253Toho Holdings Company Limited (Health Care, Health Care Providers & Services) 63,000 1,277,634Toyo Ink SC Holding Company Limited (Materials, Chemicals) 375,000 1,886,005Toyo Tire & Rubber Company Limited (Consumer Discretionary, Auto Components) 95,400 1,836,504UBE Industries Limited (Materials, Chemicals) 1,072,000 2,545,698
162,360,858
The accompanying notes are an integral part of these financial statements.
Copyright © 2017 www.secdatabase.com. All Rights Reserved.Please Consider the Environment Before Printing This Document
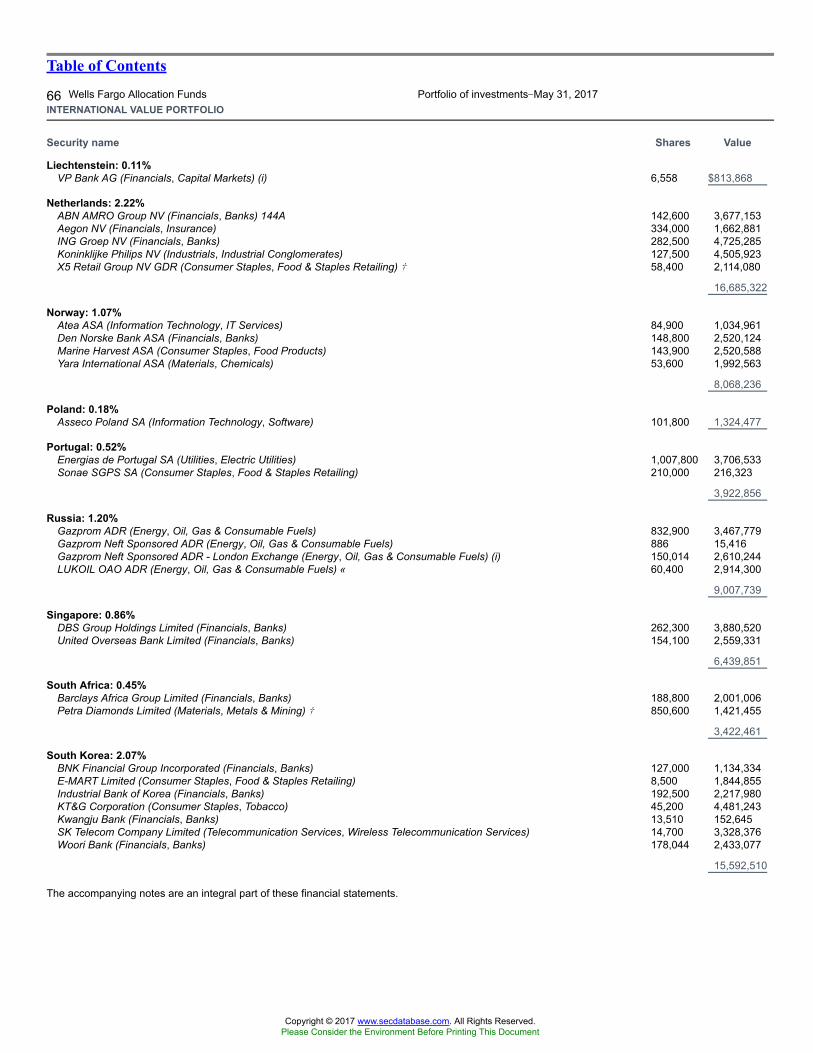
Table of Contents
66 Wells Fargo Allocation Funds Portfolio of investments�May 31, 2017INTERNATIONAL VALUE PORTFOLIO
Security name Shares Value
Liechtenstein: 0.11%VP Bank AG (Financials, Capital Markets) (i) 6,558 $813,868
Netherlands: 2.22%ABN AMRO Group NV (Financials, Banks) 144A 142,600 3,677,153Aegon NV (Financials, Insurance) 334,000 1,662,881ING Groep NV (Financials, Banks) 282,500 4,725,285Koninklijke Philips NV (Industrials, Industrial Conglomerates) 127,500 4,505,923X5 Retail Group NV GDR (Consumer Staples, Food & Staples Retailing) � 58,400 2,114,080
16,685,322
Norway: 1.07%Atea ASA (Information Technology, IT Services) 84,900 1,034,961Den Norske Bank ASA (Financials, Banks) 148,800 2,520,124Marine Harvest ASA (Consumer Staples, Food Products) 143,900 2,520,588Yara International ASA (Materials, Chemicals) 53,600 1,992,563
8,068,236
Poland: 0.18%Asseco Poland SA (Information Technology, Software) 101,800 1,324,477
Portugal: 0.52%Energias de Portugal SA (Utilities, Electric Utilities) 1,007,800 3,706,533Sonae SGPS SA (Consumer Staples, Food & Staples Retailing) 210,000 216,323
3,922,856
Russia: 1.20%Gazprom ADR (Energy, Oil, Gas & Consumable Fuels) 832,900 3,467,779Gazprom Neft Sponsored ADR (Energy, Oil, Gas & Consumable Fuels) 886 15,416Gazprom Neft Sponsored ADR - London Exchange (Energy, Oil, Gas & Consumable Fuels) (i) 150,014 2,610,244LUKOIL OAO ADR (Energy, Oil, Gas & Consumable Fuels) « 60,400 2,914,300
9,007,739
Singapore: 0.86%DBS Group Holdings Limited (Financials, Banks) 262,300 3,880,520United Overseas Bank Limited (Financials, Banks) 154,100 2,559,331
6,439,851
South Africa: 0.45%Barclays Africa Group Limited (Financials, Banks) 188,800 2,001,006Petra Diamonds Limited (Materials, Metals & Mining) � 850,600 1,421,455
3,422,461
South Korea: 2.07%BNK Financial Group Incorporated (Financials, Banks) 127,000 1,134,334E-MART Limited (Consumer Staples, Food & Staples Retailing) 8,500 1,844,855Industrial Bank of Korea (Financials, Banks) 192,500 2,217,980KT&G Corporation (Consumer Staples, Tobacco) 45,200 4,481,243Kwangju Bank (Financials, Banks) 13,510 152,645SK Telecom Company Limited (Telecommunication Services, Wireless Telecommunication Services) 14,700 3,328,376Woori Bank (Financials, Banks) 178,044 2,433,077
15,592,510
The accompanying notes are an integral part of these financial statements.
Copyright © 2017 www.secdatabase.com. All Rights Reserved.Please Consider the Environment Before Printing This Document

Table of Contents
Portfolio of investments�May 31, 2017 Wells Fargo Allocation Funds 67INTERNATIONAL VALUE PORTFOLIO
Security name Shares Value
Spain: 2.92%Banco Santander Central Hispano SA (Financials, Banks) 429,681 $2,790,384Distribuidora Internacional SA (Consumer Staples, Food & Staples Retailing) « 483,500 2,975,861Gas Natural SDG SA (Utilities, Gas Utilities) 209,300 5,271,324Iberdrola SA (Utilities, Electric Utilities) 433,600 3,457,324International Consolidated Airlines Group SA (Industrials, Airlines) 325,200 2,530,785Repsol YPF SA (Energy, Oil, Gas & Consumable Fuels) 294,900 4,940,978
21,966,656
Sweden: 1.60%Boliden AB (Materials, Metals & Mining) 102,400 2,802,881Electrolux AB Class B (Consumer Discretionary, Household Durables) 104,100 3,342,880Nordea Bank AB (Financials, Banks) 177,300 2,276,581Skandinaviska Enskilda Banken AB Class A (Financials, Banks) 144,900 1,747,189Telia Company AB (Telecommunication Services, Diversified Telecommunication Services) 417,000 1,908,583
12,078,114
Switzerland: 6.72%Aryzta AG (Consumer Staples, Food Products) 42,100 1,329,222Baloise Holding AG (Financials, Insurance) 28,800 4,406,752Credit Suisse Group AG (Financials, Capital Markets) 221,500 3,041,609Georg Fischer AG (Industrials, Machinery) 3,000 2,829,487Helvetia Holding AG (Financials, Insurance) 4,600 2,662,021Roche Holding AG (Health Care, Pharmaceuticals) 43,700 11,992,628Swiss Life Holding AG (Financials, Insurance) 22,100 7,372,371Swiss Reinsurance AG (Financials, Insurance) 75,700 6,901,358UBS Group AG (Financials, Capital Markets) 290,700 4,622,147Valiant Holding AG (Financials, Banks) (i) 22,700 2,641,361Zurich Insurance Group AG (Financials, Insurance) 9,500 2,792,473
50,591,429
Taiwan: 0.93%Hon Hai Precision Industry Company Limited (Information Technology, Electronic Equipment, Instruments &
Components) 1,112,000 3,807,839Pegatron Corporation (Information Technology, Technology Hardware, Storage & Peripherals) 1,035,000 3,193,191
7,001,030
Thailand: 1.19%Bangchak Corporation PCL (Energy, Oil, Gas & Consumable Fuels) 2,188,900 2,185,044Krung Thai Bank PCL ADR (Financials, Banks) 4,470,600 2,507,001Thai Oil PCL (Energy, Oil, Gas & Consumable Fuels) 1,003,900 2,269,533Thanachart Capital PCL (Financials, Banks) 1,481,500 2,033,474
8,995,052
Turkey: 0.24%TAV Havalimanlari Holding AS (Industrials, Transportation Infrastructure) 366,300 1,795,212
United Kingdom: 15.99%3i Group plc (Financials, Capital Markets) 409,100 4,717,591AMEC Foster Wheeler plc (Energy, Energy Equipment & Services) 83,300 546,299Aviva plc (Financials, Insurance) 398,600 2,696,276
The accompanying notes are an integral part of these financial statements.
Copyright © 2017 www.secdatabase.com. All Rights Reserved.Please Consider the Environment Before Printing This Document
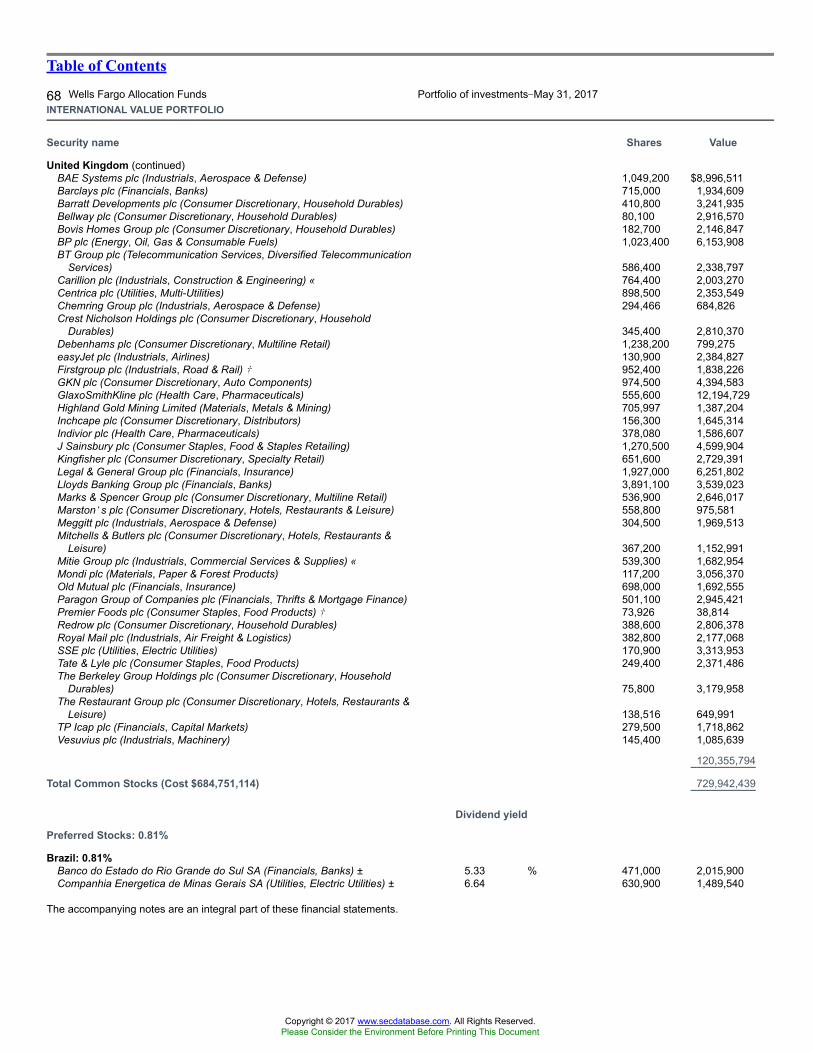
Table of Contents
68 Wells Fargo Allocation Funds Portfolio of investments�May 31, 2017INTERNATIONAL VALUE PORTFOLIO
Security name Shares Value
United Kingdom (continued)BAE Systems plc (Industrials, Aerospace & Defense) 1,049,200 $8,996,511Barclays plc (Financials, Banks) 715,000 1,934,609Barratt Developments plc (Consumer Discretionary, Household Durables) 410,800 3,241,935Bellway plc (Consumer Discretionary, Household Durables) 80,100 2,916,570Bovis Homes Group plc (Consumer Discretionary, Household Durables) 182,700 2,146,847BP plc (Energy, Oil, Gas & Consumable Fuels) 1,023,400 6,153,908BT Group plc (Telecommunication Services, Diversified Telecommunication
Services) 586,400 2,338,797Carillion plc (Industrials, Construction & Engineering) « 764,400 2,003,270Centrica plc (Utilities, Multi-Utilities) 898,500 2,353,549Chemring Group plc (Industrials, Aerospace & Defense) 294,466 684,826Crest Nicholson Holdings plc (Consumer Discretionary, Household
Durables) 345,400 2,810,370Debenhams plc (Consumer Discretionary, Multiline Retail) 1,238,200 799,275easyJet plc (Industrials, Airlines) 130,900 2,384,827Firstgroup plc (Industrials, Road & Rail) � 952,400 1,838,226GKN plc (Consumer Discretionary, Auto Components) 974,500 4,394,583GlaxoSmithKline plc (Health Care, Pharmaceuticals) 555,600 12,194,729Highland Gold Mining Limited (Materials, Metals & Mining) 705,997 1,387,204Inchcape plc (Consumer Discretionary, Distributors) 156,300 1,645,314Indivior plc (Health Care, Pharmaceuticals) 378,080 1,586,607J Sainsbury plc (Consumer Staples, Food & Staples Retailing) 1,270,500 4,599,904Kingfisher plc (Consumer Discretionary, Specialty Retail) 651,600 2,729,391Legal & General Group plc (Financials, Insurance) 1,927,000 6,251,802Lloyds Banking Group plc (Financials, Banks) 3,891,100 3,539,023Marks & Spencer Group plc (Consumer Discretionary, Multiline Retail) 536,900 2,646,017Marston�s plc (Consumer Discretionary, Hotels, Restaurants & Leisure) 558,800 975,581Meggitt plc (Industrials, Aerospace & Defense) 304,500 1,969,513Mitchells & Butlers plc (Consumer Discretionary, Hotels, Restaurants &
Leisure) 367,200 1,152,991Mitie Group plc (Industrials, Commercial Services & Supplies) « 539,300 1,682,954Mondi plc (Materials, Paper & Forest Products) 117,200 3,056,370Old Mutual plc (Financials, Insurance) 698,000 1,692,555Paragon Group of Companies plc (Financials, Thrifts & Mortgage Finance) 501,100 2,945,421Premier Foods plc (Consumer Staples, Food Products) � 73,926 38,814Redrow plc (Consumer Discretionary, Household Durables) 388,600 2,806,378Royal Mail plc (Industrials, Air Freight & Logistics) 382,800 2,177,068SSE plc (Utilities, Electric Utilities) 170,900 3,313,953Tate & Lyle plc (Consumer Staples, Food Products) 249,400 2,371,486The Berkeley Group Holdings plc (Consumer Discretionary, Household
Durables) 75,800 3,179,958The Restaurant Group plc (Consumer Discretionary, Hotels, Restaurants &
Leisure) 138,516 649,991TP Icap plc (Financials, Capital Markets) 279,500 1,718,862Vesuvius plc (Industrials, Machinery) 145,400 1,085,639
120,355,794
Total Common Stocks (Cost $684,751,114) 729,942,439
Dividend yield
Preferred Stocks: 0.81%
Brazil: 0.81%Banco do Estado do Rio Grande do Sul SA (Financials, Banks) ± 5.33 % 471,000 2,015,900Companhia Energetica de Minas Gerais SA (Utilities, Electric Utilities) ± 6.64 630,900 1,489,540
The accompanying notes are an integral part of these financial statements.
Copyright © 2017 www.secdatabase.com. All Rights Reserved.Please Consider the Environment Before Printing This Document
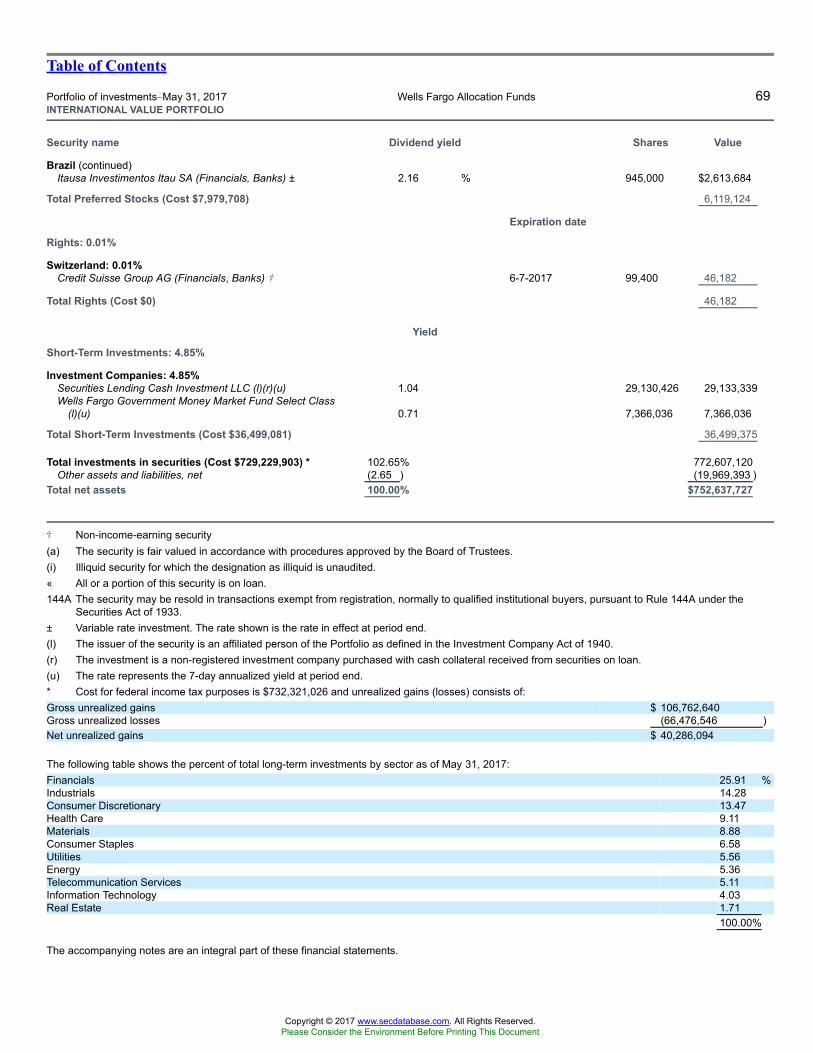
Table of Contents
Portfolio of investments�May 31, 2017 Wells Fargo Allocation Funds 69INTERNATIONAL VALUE PORTFOLIO
Security name Dividend yield Shares Value
Brazil (continued)Itausa Investimentos Itau SA (Financials, Banks) ± 2.16 % 945,000 $2,613,684
Total Preferred Stocks (Cost $7,979,708) 6,119,124
Expiration date
Rights: 0.01%
Switzerland: 0.01%Credit Suisse Group AG (Financials, Banks) � 6-7-2017 99,400 46,182
Total Rights (Cost $0) 46,182
Yield
Short-Term Investments: 4.85%
Investment Companies: 4.85%Securities Lending Cash Investment LLC (l)(r)(u) 1.04 29,130,426 29,133,339Wells Fargo Government Money Market Fund Select Class
(l)(u) 0.71 7,366,036 7,366,036
Total Short-Term Investments (Cost $36,499,081) 36,499,375
Total investments in securities (Cost $729,229,903) * 102.65% 772,607,120Other assets and liabilities, net (2.65 ) (19,969,393 )
Total net assets 100.00% $752,637,727
� Non-income-earning security(a) The security is fair valued in accordance with procedures approved by the Board of Trustees.(i) Illiquid security for which the designation as illiquid is unaudited.« All or a portion of this security is on loan.144A The security may be resold in transactions exempt from registration, normally to qualified institutional buyers, pursuant to Rule 144A under the
Securities Act of 1933.± Variable rate investment. The rate shown is the rate in effect at period end.(l) The issuer of the security is an affiliated person of the Portfolio as defined in the Investment Company Act of 1940.(r) The investment is a non-registered investment company purchased with cash collateral received from securities on loan.(u) The rate represents the 7-day annualized yield at period end.* Cost for federal income tax purposes is $732,321,026 and unrealized gains (losses) consists of:Gross unrealized gains $ 106,762,640Gross unrealized losses (66,476,546 )Net unrealized gains $ 40,286,094
The following table shows the percent of total long-term investments by sector as of May 31, 2017:Financials 25.91 %Industrials 14.28Consumer Discretionary 13.47Health Care 9.11Materials 8.88Consumer Staples 6.58Utilities 5.56Energy 5.36Telecommunication Services 5.11Information Technology 4.03Real Estate 1.71
100.00%
The accompanying notes are an integral part of these financial statements.
Copyright © 2017 www.secdatabase.com. All Rights Reserved.Please Consider the Environment Before Printing This Document
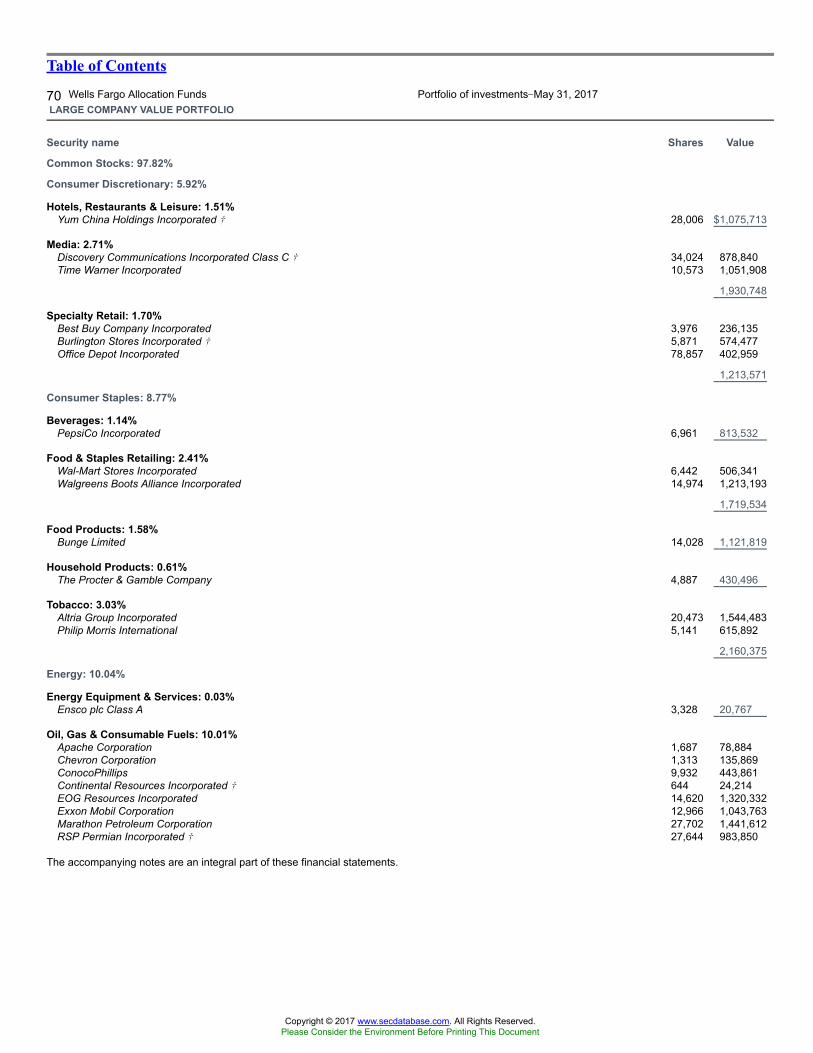
Table of Contents
70 Wells Fargo Allocation Funds Portfolio of investments�May 31, 2017LARGE COMPANY VALUE PORTFOLIO
Security name Shares Value
Common Stocks: 97.82%
Consumer Discretionary: 5.92%
Hotels, Restaurants & Leisure: 1.51%Yum China Holdings Incorporated � 28,006 $1,075,713
Media: 2.71%Discovery Communications Incorporated Class C � 34,024 878,840Time Warner Incorporated 10,573 1,051,908
1,930,748
Specialty Retail: 1.70%Best Buy Company Incorporated 3,976 236,135Burlington Stores Incorporated � 5,871 574,477Office Depot Incorporated 78,857 402,959
1,213,571
Consumer Staples: 8.77%
Beverages: 1.14%PepsiCo Incorporated 6,961 813,532
Food & Staples Retailing: 2.41%Wal-Mart Stores Incorporated 6,442 506,341Walgreens Boots Alliance Incorporated 14,974 1,213,193
1,719,534
Food Products: 1.58%Bunge Limited 14,028 1,121,819
Household Products: 0.61%The Procter & Gamble Company 4,887 430,496
Tobacco: 3.03%Altria Group Incorporated 20,473 1,544,483Philip Morris International 5,141 615,892
2,160,375
Energy: 10.04%
Energy Equipment & Services: 0.03%Ensco plc Class A 3,328 20,767
Oil, Gas & Consumable Fuels: 10.01%Apache Corporation 1,687 78,884Chevron Corporation 1,313 135,869ConocoPhillips 9,932 443,861Continental Resources Incorporated � 644 24,214EOG Resources Incorporated 14,620 1,320,332Exxon Mobil Corporation 12,966 1,043,763Marathon Petroleum Corporation 27,702 1,441,612RSP Permian Incorporated � 27,644 983,850
The accompanying notes are an integral part of these financial statements.
Copyright © 2017 www.secdatabase.com. All Rights Reserved.Please Consider the Environment Before Printing This Document
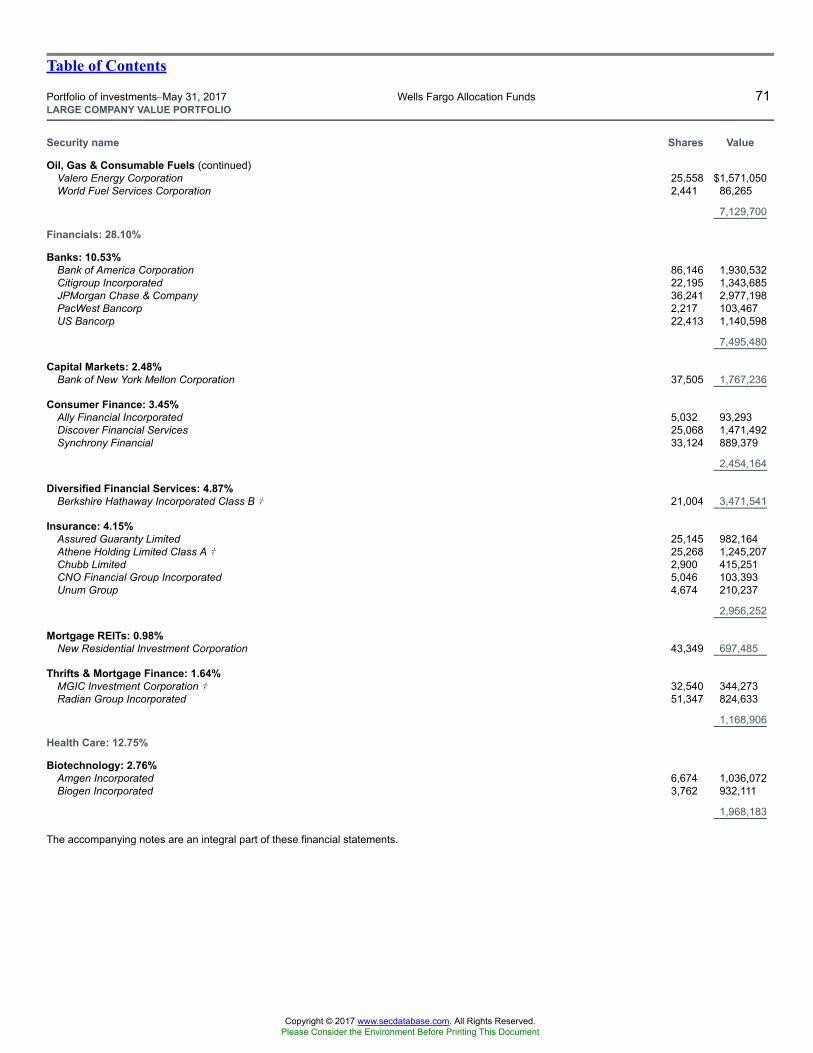
Table of Contents
Portfolio of investments�May 31, 2017 Wells Fargo Allocation Funds 71LARGE COMPANY VALUE PORTFOLIO
Security name Shares Value
Oil, Gas & Consumable Fuels (continued)Valero Energy Corporation 25,558 $1,571,050World Fuel Services Corporation 2,441 86,265
7,129,700
Financials: 28.10%
Banks: 10.53%Bank of America Corporation 86,146 1,930,532Citigroup Incorporated 22,195 1,343,685JPMorgan Chase & Company 36,241 2,977,198PacWest Bancorp 2,217 103,467US Bancorp 22,413 1,140,598
7,495,480
Capital Markets: 2.48%Bank of New York Mellon Corporation 37,505 1,767,236
Consumer Finance: 3.45%Ally Financial Incorporated 5,032 93,293Discover Financial Services 25,068 1,471,492Synchrony Financial 33,124 889,379
2,454,164
Diversified Financial Services: 4.87%Berkshire Hathaway Incorporated Class B � 21,004 3,471,541
Insurance: 4.15%Assured Guaranty Limited 25,145 982,164Athene Holding Limited Class A � 25,268 1,245,207Chubb Limited 2,900 415,251CNO Financial Group Incorporated 5,046 103,393Unum Group 4,674 210,237
2,956,252
Mortgage REITs: 0.98%New Residential Investment Corporation 43,349 697,485
Thrifts & Mortgage Finance: 1.64%MGIC Investment Corporation � 32,540 344,273Radian Group Incorporated 51,347 824,633
1,168,906
Health Care: 12.75%
Biotechnology: 2.76%Amgen Incorporated 6,674 1,036,072Biogen Incorporated 3,762 932,111
1,968,183
The accompanying notes are an integral part of these financial statements.
Copyright © 2017 www.secdatabase.com. All Rights Reserved.Please Consider the Environment Before Printing This Document
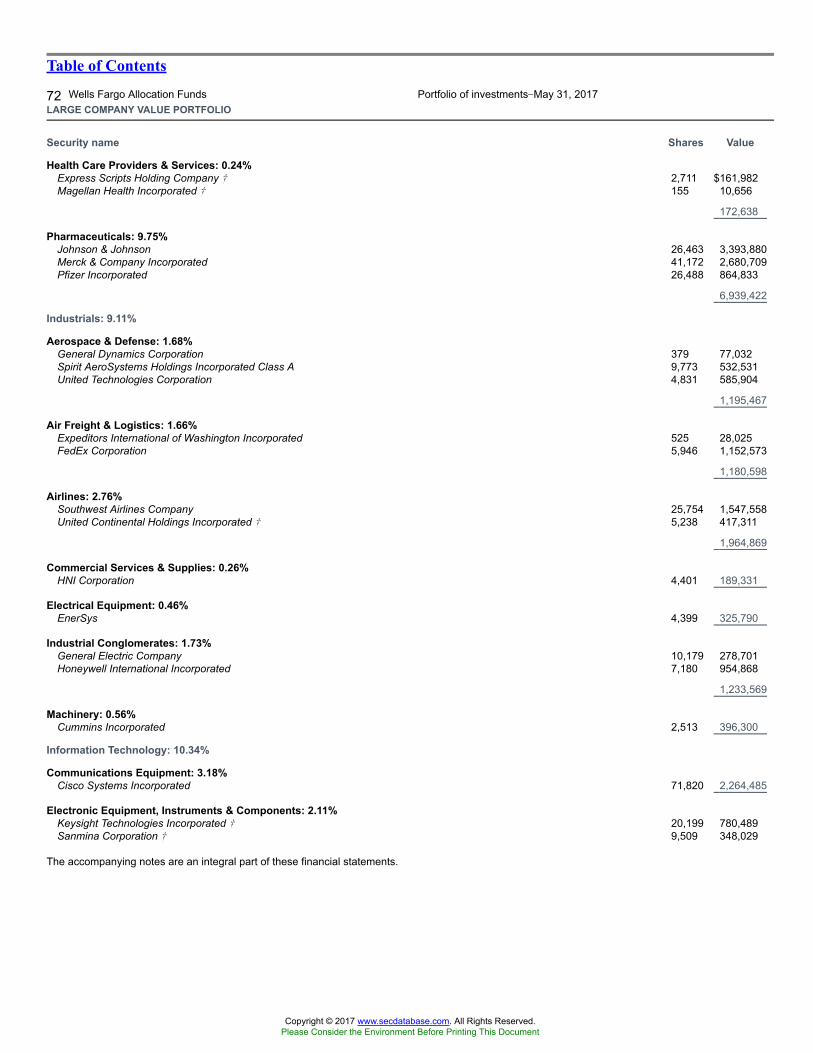
Table of Contents
72 Wells Fargo Allocation Funds Portfolio of investments�May 31, 2017LARGE COMPANY VALUE PORTFOLIO
Security name Shares Value
Health Care Providers & Services: 0.24%Express Scripts Holding Company � 2,711 $161,982Magellan Health Incorporated � 155 10,656
172,638
Pharmaceuticals: 9.75%Johnson & Johnson 26,463 3,393,880Merck & Company Incorporated 41,172 2,680,709Pfizer Incorporated 26,488 864,833
6,939,422
Industrials: 9.11%
Aerospace & Defense: 1.68%General Dynamics Corporation 379 77,032Spirit AeroSystems Holdings Incorporated Class A 9,773 532,531United Technologies Corporation 4,831 585,904
1,195,467
Air Freight & Logistics: 1.66%Expeditors International of Washington Incorporated 525 28,025FedEx Corporation 5,946 1,152,573
1,180,598
Airlines: 2.76%Southwest Airlines Company 25,754 1,547,558United Continental Holdings Incorporated � 5,238 417,311
1,964,869
Commercial Services & Supplies: 0.26%HNI Corporation 4,401 189,331
Electrical Equipment: 0.46%EnerSys 4,399 325,790
Industrial Conglomerates: 1.73%General Electric Company 10,179 278,701Honeywell International Incorporated 7,180 954,868
1,233,569
Machinery: 0.56%Cummins Incorporated 2,513 396,300
Information Technology: 10.34%
Communications Equipment: 3.18%Cisco Systems Incorporated 71,820 2,264,485
Electronic Equipment, Instruments & Components: 2.11%Keysight Technologies Incorporated � 20,199 780,489Sanmina Corporation � 9,509 348,029
The accompanying notes are an integral part of these financial statements.
Copyright © 2017 www.secdatabase.com. All Rights Reserved.Please Consider the Environment Before Printing This Document
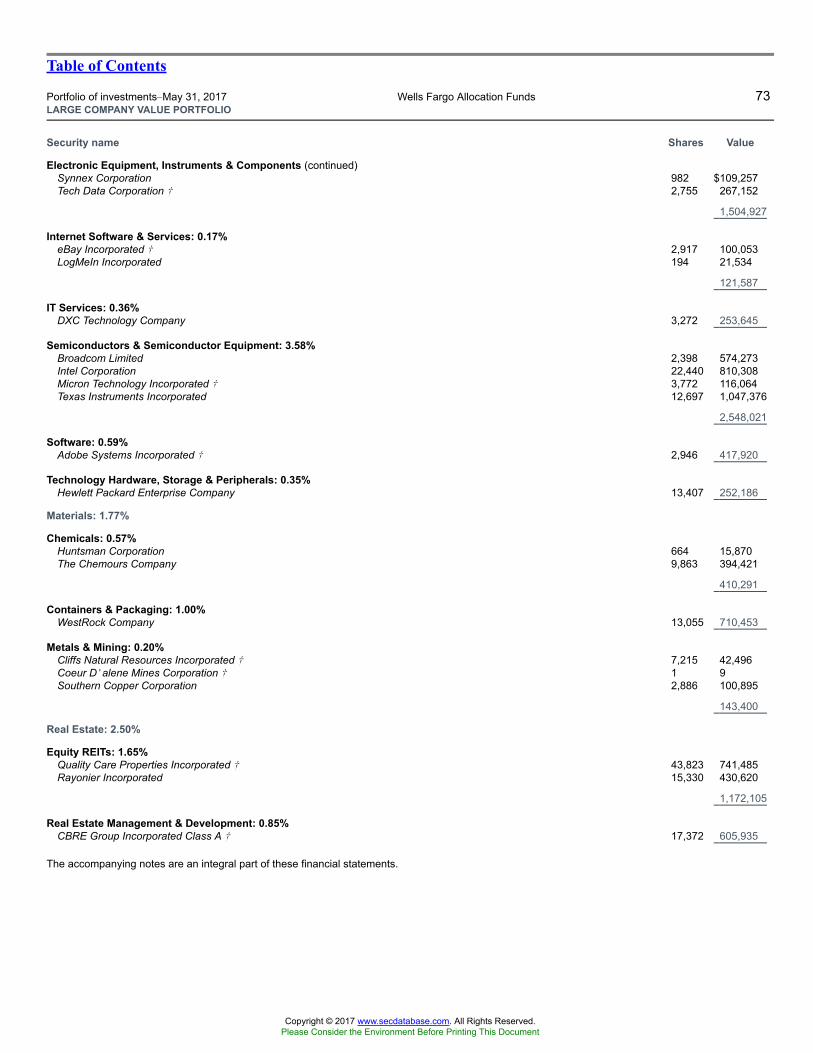
Table of Contents
Portfolio of investments�May 31, 2017 Wells Fargo Allocation Funds 73LARGE COMPANY VALUE PORTFOLIO
Security name Shares Value
Electronic Equipment, Instruments & Components (continued)Synnex Corporation 982 $109,257Tech Data Corporation � 2,755 267,152
1,504,927
Internet Software & Services: 0.17%eBay Incorporated � 2,917 100,053LogMeIn Incorporated 194 21,534
121,587
IT Services: 0.36%DXC Technology Company 3,272 253,645
Semiconductors & Semiconductor Equipment: 3.58%Broadcom Limited 2,398 574,273Intel Corporation 22,440 810,308Micron Technology Incorporated � 3,772 116,064Texas Instruments Incorporated 12,697 1,047,376
2,548,021
Software: 0.59%Adobe Systems Incorporated � 2,946 417,920
Technology Hardware, Storage & Peripherals: 0.35%Hewlett Packard Enterprise Company 13,407 252,186
Materials: 1.77%
Chemicals: 0.57%Huntsman Corporation 664 15,870The Chemours Company 9,863 394,421
410,291
Containers & Packaging: 1.00%WestRock Company 13,055 710,453
Metals & Mining: 0.20%Cliffs Natural Resources Incorporated � 7,215 42,496Coeur D�alene Mines Corporation � 1 9Southern Copper Corporation 2,886 100,895
143,400
Real Estate: 2.50%
Equity REITs: 1.65%Quality Care Properties Incorporated � 43,823 741,485Rayonier Incorporated 15,330 430,620
1,172,105
Real Estate Management & Development: 0.85%CBRE Group Incorporated Class A � 17,372 605,935
The accompanying notes are an integral part of these financial statements.
Copyright © 2017 www.secdatabase.com. All Rights Reserved.Please Consider the Environment Before Printing This Document
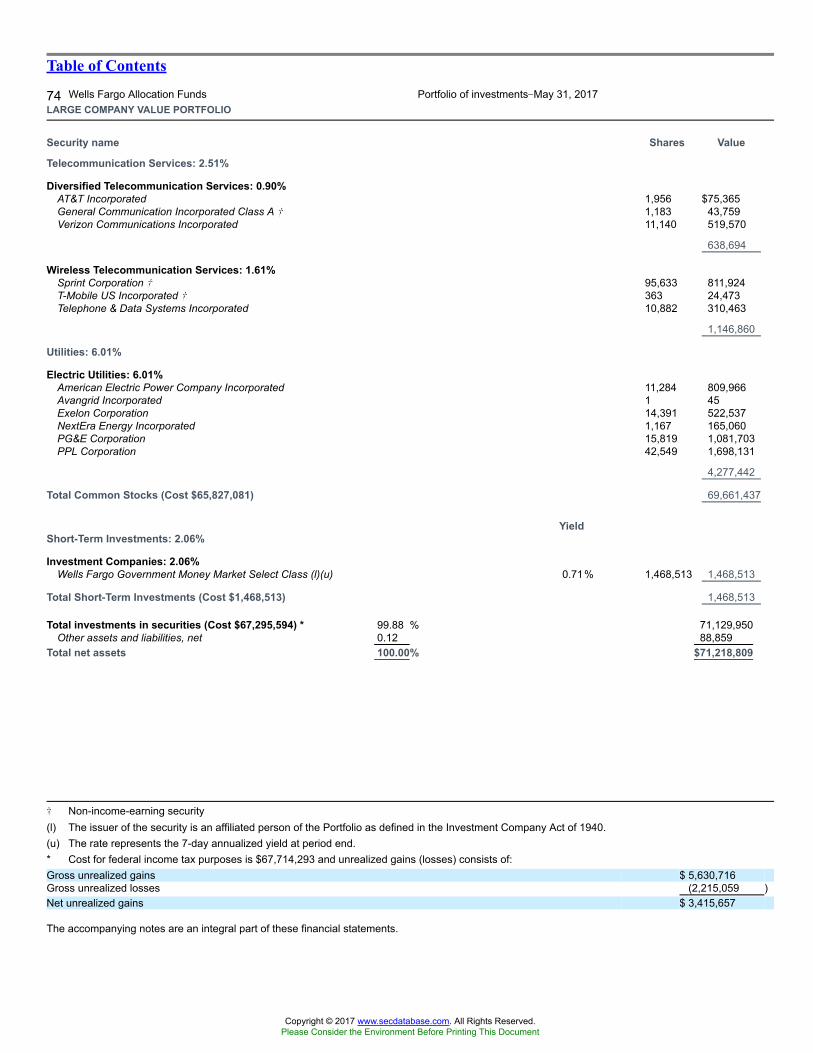
Table of Contents
74 Wells Fargo Allocation Funds Portfolio of investments�May 31, 2017LARGE COMPANY VALUE PORTFOLIO
Security name Shares Value
Telecommunication Services: 2.51%
Diversified Telecommunication Services: 0.90%AT&T Incorporated 1,956 $75,365General Communication Incorporated Class A � 1,183 43,759Verizon Communications Incorporated 11,140 519,570
638,694
Wireless Telecommunication Services: 1.61%Sprint Corporation � 95,633 811,924T-Mobile US Incorporated � 363 24,473Telephone & Data Systems Incorporated 10,882 310,463
1,146,860
Utilities: 6.01%
Electric Utilities: 6.01%American Electric Power Company Incorporated 11,284 809,966Avangrid Incorporated 1 45Exelon Corporation 14,391 522,537NextEra Energy Incorporated 1,167 165,060PG&E Corporation 15,819 1,081,703PPL Corporation 42,549 1,698,131
4,277,442
Total Common Stocks (Cost $65,827,081) 69,661,437
YieldShort-Term Investments: 2.06%
Investment Companies: 2.06%Wells Fargo Government Money Market Select Class (l)(u) 0.71% 1,468,513 1,468,513
Total Short-Term Investments (Cost $1,468,513) 1,468,513
Total investments in securities (Cost $67,295,594) * 99.88 % 71,129,950Other assets and liabilities, net 0.12 88,859
Total net assets 100.00% $71,218,809
� Non-income-earning security(l) The issuer of the security is an affiliated person of the Portfolio as defined in the Investment Company Act of 1940.(u) The rate represents the 7-day annualized yield at period end.* Cost for federal income tax purposes is $67,714,293 and unrealized gains (losses) consists of:Gross unrealized gains $ 5,630,716Gross unrealized losses (2,215,059 )Net unrealized gains $ 3,415,657
The accompanying notes are an integral part of these financial statements.
Copyright © 2017 www.secdatabase.com. All Rights Reserved.Please Consider the Environment Before Printing This Document

Table of Contents
Portfolio of investments�May 31, 2017 Wells Fargo Allocation Funds 75SMALL COMPANY GROWTH PORTFOLIO
Security name Shares Value
Common Stocks: 96.07%
Consumer Discretionary: 11.18%
Auto Components: 1.50%Fox Factory Holding Corporation � 336,360 $11,049,419Gentherm Incorporated � 371,453 14,003,778
25,053,197
Diversified Consumer Services: 0.54%Houghton Mifflin Harcourt Company � 734,787 9,074,619
Hotels, Restaurants & Leisure: 2.02%Del Taco Restaurants Incorporated � 736,285 9,446,537Extended Stay America Incorporated 946,194 17,220,731Zoe�s Kitchen Incorporated �« 509,494 7,087,062
33,754,330
Media: 2.54%IMAX Corporation �« 691,033 17,310,377Lions Gate Entertainment Class A « 245,681 6,657,955Lions Gate Entertainment Class B � 306,107 7,741,446Media General Incorporated �(a) 347,897 0Nexstar Broadcasting Group Incorporated 189,928 10,863,882
42,573,660
Specialty Retail: 4.19%At Home Group Incorporated �« 365,203 6,843,904Burlington Stores Incorporated � 179,504 17,564,466Carvana Corporation �« 89,428 898,751Chico�s FAS Incorporated 729,160 6,897,854Dick�s Sporting Goods Incorporated 378,142 15,552,980Monro Muffler Brake Incorporated 196,734 9,758,006Party City Holdco Incorporated �« 760,645 12,588,675
70,104,636
Textiles, Apparel & Luxury Goods: 0.39%G-III Apparel Group Limited � 335,789 6,571,391
Consumer Staples: 2.16%
Food & Staples Retailing: 1.18%Performance Food Group Company � 697,677 19,744,259
Household Products: 0.98%Central Garden & Pet Company Class A � 564,614 16,322,991
Energy: 2.42%
Energy Equipment & Services: 0.60%Keane Group Incorporated �« 645,863 9,933,373
The accompanying notes are an integral part of these financial statements.
Copyright © 2017 www.secdatabase.com. All Rights Reserved.Please Consider the Environment Before Printing This Document
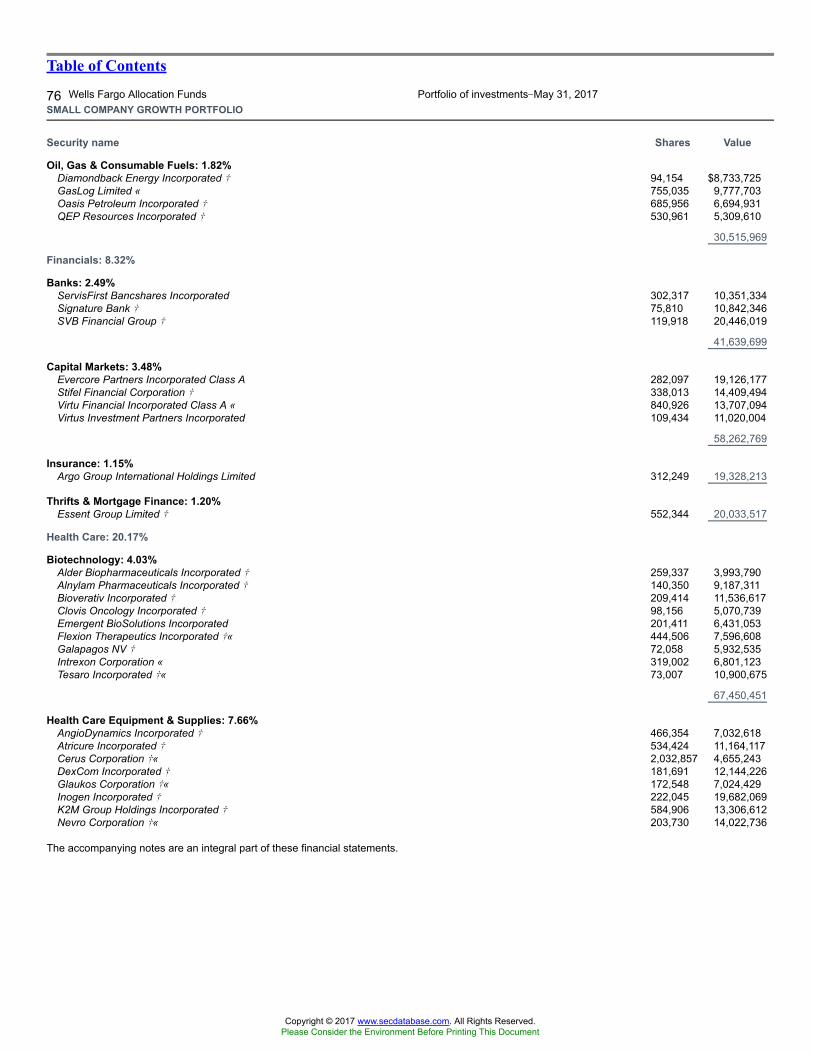
Table of Contents
76 Wells Fargo Allocation Funds Portfolio of investments�May 31, 2017SMALL COMPANY GROWTH PORTFOLIO
Security name Shares Value
Oil, Gas & Consumable Fuels: 1.82%Diamondback Energy Incorporated � 94,154 $8,733,725GasLog Limited « 755,035 9,777,703Oasis Petroleum Incorporated � 685,956 6,694,931QEP Resources Incorporated � 530,961 5,309,610
30,515,969
Financials: 8.32%
Banks: 2.49%ServisFirst Bancshares Incorporated 302,317 10,351,334Signature Bank � 75,810 10,842,346SVB Financial Group � 119,918 20,446,019
41,639,699
Capital Markets: 3.48%Evercore Partners Incorporated Class A 282,097 19,126,177Stifel Financial Corporation � 338,013 14,409,494Virtu Financial Incorporated Class A « 840,926 13,707,094Virtus Investment Partners Incorporated 109,434 11,020,004
58,262,769
Insurance: 1.15%Argo Group International Holdings Limited 312,249 19,328,213
Thrifts & Mortgage Finance: 1.20%Essent Group Limited � 552,344 20,033,517
Health Care: 20.17%
Biotechnology: 4.03%Alder Biopharmaceuticals Incorporated � 259,337 3,993,790Alnylam Pharmaceuticals Incorporated � 140,350 9,187,311Bioverativ Incorporated � 209,414 11,536,617Clovis Oncology Incorporated � 98,156 5,070,739Emergent BioSolutions Incorporated 201,411 6,431,053Flexion Therapeutics Incorporated �« 444,506 7,596,608Galapagos NV � 72,058 5,932,535Intrexon Corporation « 319,002 6,801,123Tesaro Incorporated �« 73,007 10,900,675
67,450,451
Health Care Equipment & Supplies: 7.66%AngioDynamics Incorporated � 466,354 7,032,618Atricure Incorporated � 534,424 11,164,117Cerus Corporation �« 2,032,857 4,655,243DexCom Incorporated � 181,691 12,144,226Glaukos Corporation �« 172,548 7,024,429Inogen Incorporated � 222,045 19,682,069K2M Group Holdings Incorporated � 584,906 13,306,612Nevro Corporation �« 203,730 14,022,736
The accompanying notes are an integral part of these financial statements.
Copyright © 2017 www.secdatabase.com. All Rights Reserved.Please Consider the Environment Before Printing This Document
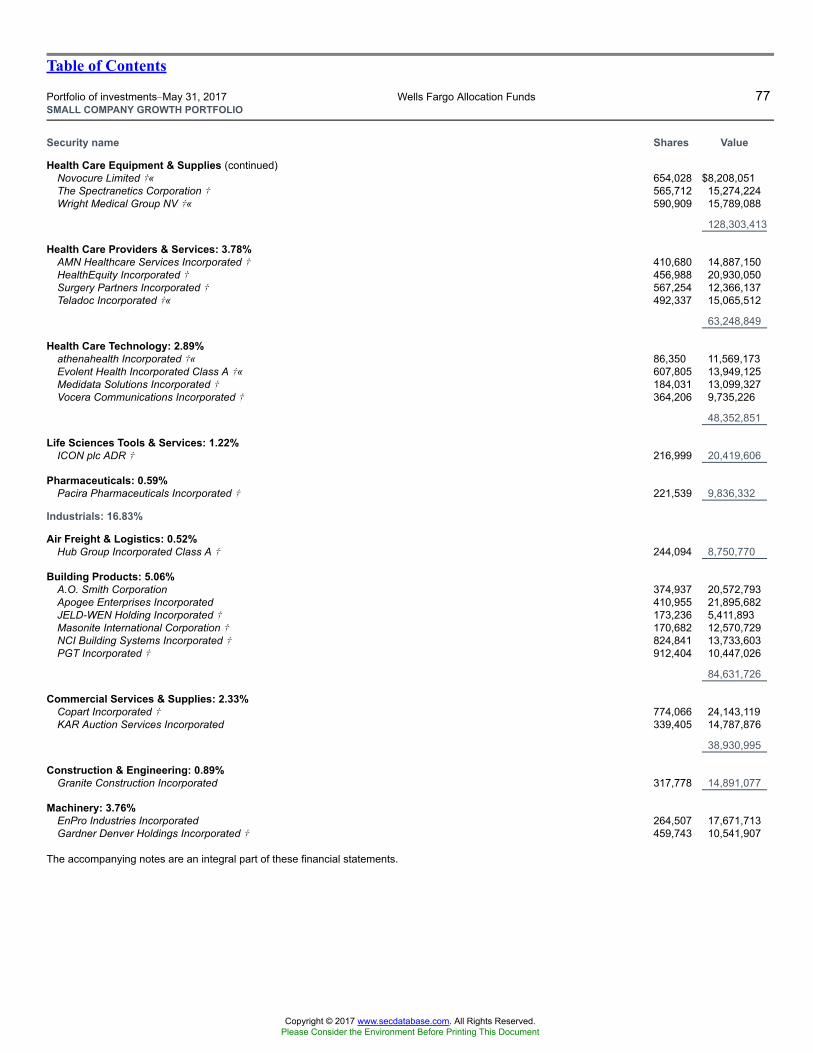
Table of Contents
Portfolio of investments�May 31, 2017 Wells Fargo Allocation Funds 77SMALL COMPANY GROWTH PORTFOLIO
Security name Shares Value
Health Care Equipment & Supplies (continued)Novocure Limited �« 654,028 $8,208,051The Spectranetics Corporation � 565,712 15,274,224Wright Medical Group NV �« 590,909 15,789,088
128,303,413
Health Care Providers & Services: 3.78%AMN Healthcare Services Incorporated � 410,680 14,887,150HealthEquity Incorporated � 456,988 20,930,050Surgery Partners Incorporated � 567,254 12,366,137Teladoc Incorporated �« 492,337 15,065,512
63,248,849
Health Care Technology: 2.89%athenahealth Incorporated �« 86,350 11,569,173Evolent Health Incorporated Class A �« 607,805 13,949,125Medidata Solutions Incorporated � 184,031 13,099,327Vocera Communications Incorporated � 364,206 9,735,226
48,352,851
Life Sciences Tools & Services: 1.22%ICON plc ADR � 216,999 20,419,606
Pharmaceuticals: 0.59%Pacira Pharmaceuticals Incorporated � 221,539 9,836,332
Industrials: 16.83%
Air Freight & Logistics: 0.52%Hub Group Incorporated Class A � 244,094 8,750,770
Building Products: 5.06%A.O. Smith Corporation 374,937 20,572,793Apogee Enterprises Incorporated 410,955 21,895,682JELD-WEN Holding Incorporated � 173,236 5,411,893Masonite International Corporation � 170,682 12,570,729NCI Building Systems Incorporated � 824,841 13,733,603PGT Incorporated � 912,404 10,447,026
84,631,726
Commercial Services & Supplies: 2.33%Copart Incorporated � 774,066 24,143,119KAR Auction Services Incorporated 339,405 14,787,876
38,930,995
Construction & Engineering: 0.89%Granite Construction Incorporated 317,778 14,891,077
Machinery: 3.76%EnPro Industries Incorporated 264,507 17,671,713Gardner Denver Holdings Incorporated � 459,743 10,541,907
The accompanying notes are an integral part of these financial statements.
Copyright © 2017 www.secdatabase.com. All Rights Reserved.Please Consider the Environment Before Printing This Document
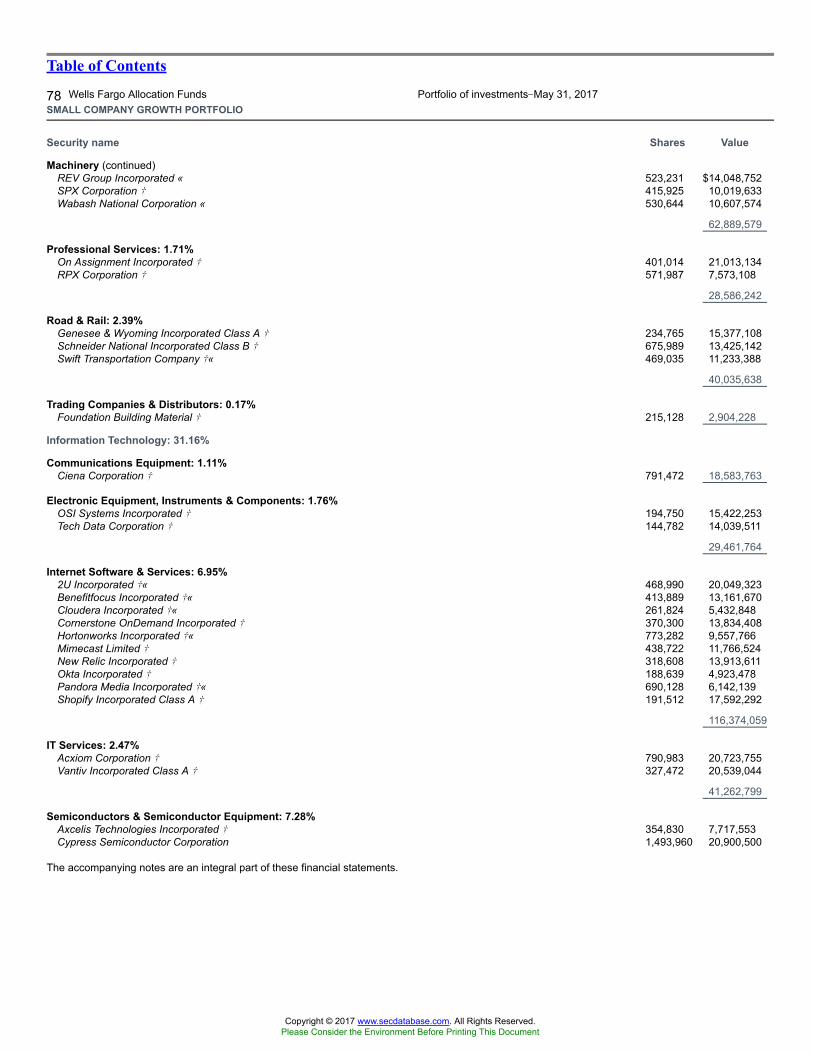
Table of Contents
78 Wells Fargo Allocation Funds Portfolio of investments�May 31, 2017SMALL COMPANY GROWTH PORTFOLIO
Security name Shares Value
Machinery (continued)REV Group Incorporated « 523,231 $14,048,752SPX Corporation � 415,925 10,019,633Wabash National Corporation « 530,644 10,607,574
62,889,579
Professional Services: 1.71%On Assignment Incorporated � 401,014 21,013,134RPX Corporation � 571,987 7,573,108
28,586,242
Road & Rail: 2.39%Genesee & Wyoming Incorporated Class A � 234,765 15,377,108Schneider National Incorporated Class B � 675,989 13,425,142Swift Transportation Company �« 469,035 11,233,388
40,035,638
Trading Companies & Distributors: 0.17%Foundation Building Material � 215,128 2,904,228
Information Technology: 31.16%
Communications Equipment: 1.11%Ciena Corporation � 791,472 18,583,763
Electronic Equipment, Instruments & Components: 1.76%OSI Systems Incorporated � 194,750 15,422,253Tech Data Corporation � 144,782 14,039,511
29,461,764
Internet Software & Services: 6.95%2U Incorporated �« 468,990 20,049,323Benefitfocus Incorporated �« 413,889 13,161,670Cloudera Incorporated �« 261,824 5,432,848Cornerstone OnDemand Incorporated � 370,300 13,834,408Hortonworks Incorporated �« 773,282 9,557,766Mimecast Limited � 438,722 11,766,524New Relic Incorporated � 318,608 13,913,611Okta Incorporated � 188,639 4,923,478Pandora Media Incorporated �« 690,128 6,142,139Shopify Incorporated Class A � 191,512 17,592,292
116,374,059
IT Services: 2.47%Acxiom Corporation � 790,983 20,723,755Vantiv Incorporated Class A � 327,472 20,539,044
41,262,799
Semiconductors & Semiconductor Equipment: 7.28%Axcelis Technologies Incorporated � 354,830 7,717,553Cypress Semiconductor Corporation 1,493,960 20,900,500
The accompanying notes are an integral part of these financial statements.
Copyright © 2017 www.secdatabase.com. All Rights Reserved.Please Consider the Environment Before Printing This Document
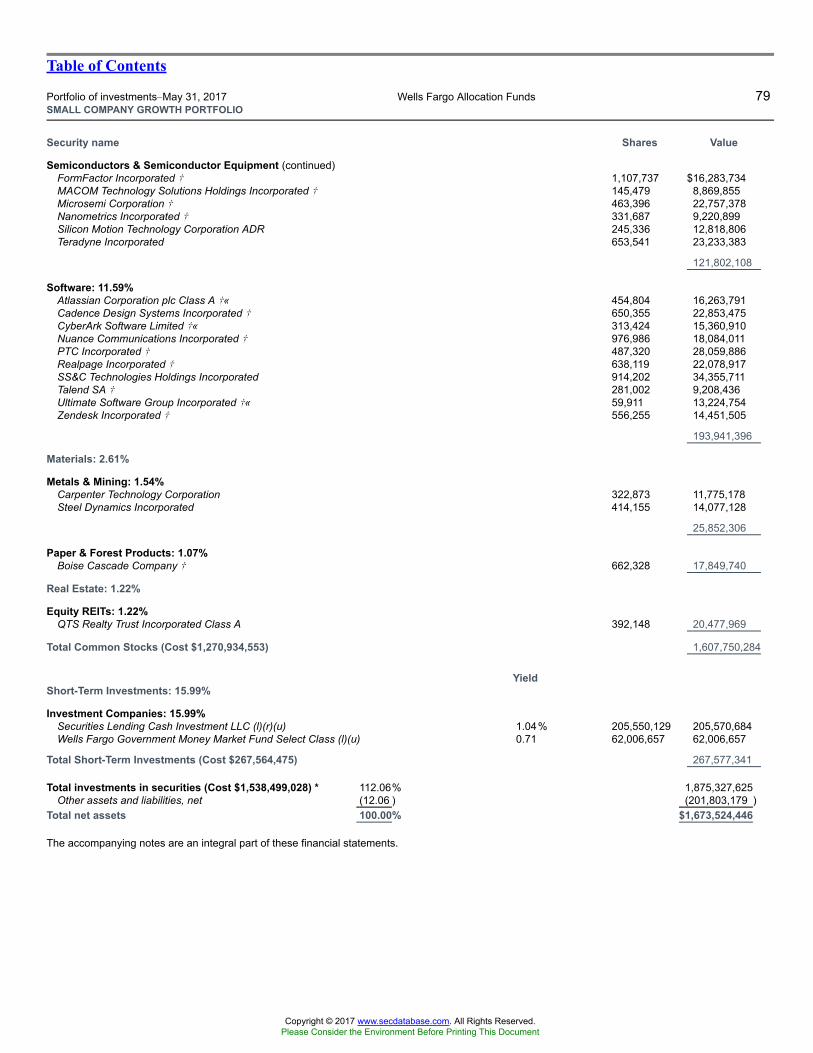
Table of Contents
Portfolio of investments�May 31, 2017 Wells Fargo Allocation Funds 79SMALL COMPANY GROWTH PORTFOLIO
Security name Shares Value
Semiconductors & Semiconductor Equipment (continued)FormFactor Incorporated � 1,107,737 $16,283,734MACOM Technology Solutions Holdings Incorporated � 145,479 8,869,855Microsemi Corporation � 463,396 22,757,378Nanometrics Incorporated � 331,687 9,220,899Silicon Motion Technology Corporation ADR 245,336 12,818,806Teradyne Incorporated 653,541 23,233,383
121,802,108
Software: 11.59%Atlassian Corporation plc Class A �« 454,804 16,263,791Cadence Design Systems Incorporated � 650,355 22,853,475CyberArk Software Limited �« 313,424 15,360,910Nuance Communications Incorporated � 976,986 18,084,011PTC Incorporated � 487,320 28,059,886Realpage Incorporated � 638,119 22,078,917SS&C Technologies Holdings Incorporated 914,202 34,355,711Talend SA � 281,002 9,208,436Ultimate Software Group Incorporated �« 59,911 13,224,754Zendesk Incorporated � 556,255 14,451,505
193,941,396
Materials: 2.61%
Metals & Mining: 1.54%Carpenter Technology Corporation 322,873 11,775,178Steel Dynamics Incorporated 414,155 14,077,128
25,852,306
Paper & Forest Products: 1.07%Boise Cascade Company � 662,328 17,849,740
Real Estate: 1.22%
Equity REITs: 1.22%QTS Realty Trust Incorporated Class A 392,148 20,477,969
Total Common Stocks (Cost $1,270,934,553) 1,607,750,284
YieldShort-Term Investments: 15.99%
Investment Companies: 15.99%Securities Lending Cash Investment LLC (l)(r)(u) 1.04% 205,550,129 205,570,684Wells Fargo Government Money Market Fund Select Class (l)(u) 0.71 62,006,657 62,006,657
Total Short-Term Investments (Cost $267,564,475) 267,577,341
Total investments in securities (Cost $1,538,499,028) * 112.06% 1,875,327,625Other assets and liabilities, net (12.06 ) (201,803,179 )
Total net assets 100.00% $1,673,524,446
The accompanying notes are an integral part of these financial statements.
Copyright © 2017 www.secdatabase.com. All Rights Reserved.Please Consider the Environment Before Printing This Document

Table of Contents
80 Wells Fargo Allocation Funds Portfolio of investments�May 31, 2017SMALL COMPANY GROWTH PORTFOLIO
Copyright © 2017 www.secdatabase.com. All Rights Reserved.Please Consider the Environment Before Printing This Document
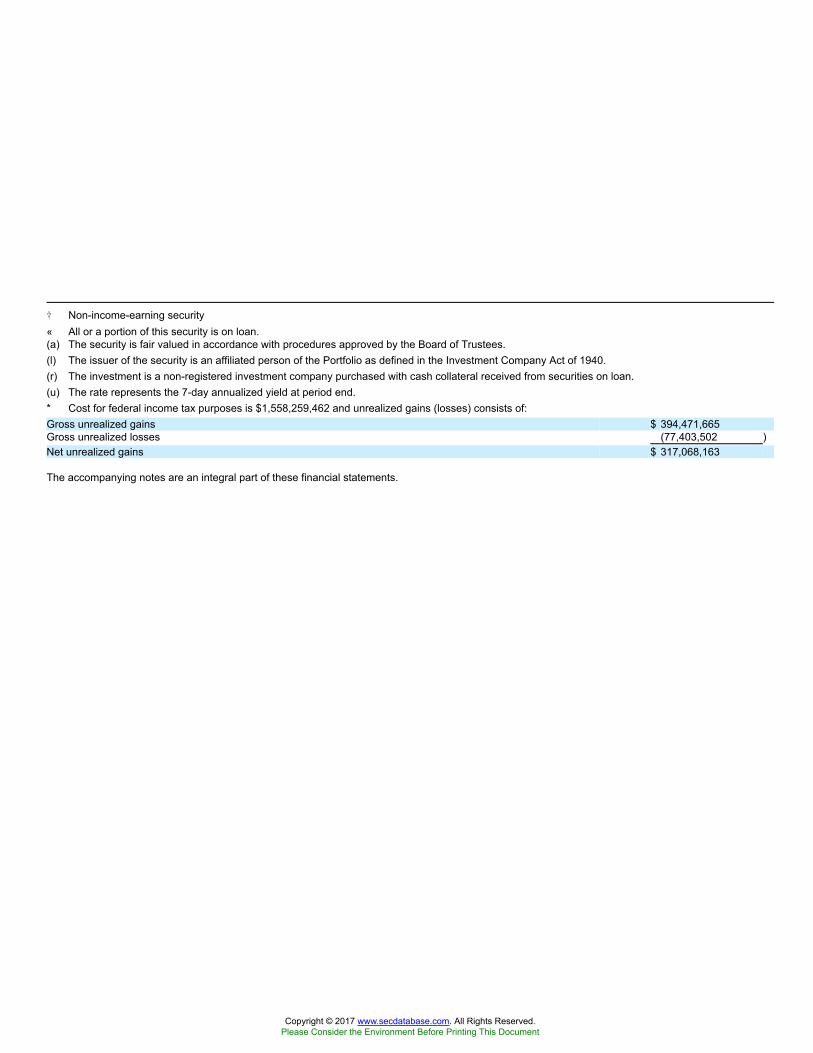
� Non-income-earning security« All or a portion of this security is on loan.(a) The security is fair valued in accordance with procedures approved by the Board of Trustees.(l) The issuer of the security is an affiliated person of the Portfolio as defined in the Investment Company Act of 1940.(r) The investment is a non-registered investment company purchased with cash collateral received from securities on loan.(u) The rate represents the 7-day annualized yield at period end.* Cost for federal income tax purposes is $1,558,259,462 and unrealized gains (losses) consists of:Gross unrealized gains $ 394,471,665Gross unrealized losses (77,403,502 )Net unrealized gains $ 317,068,163
The accompanying notes are an integral part of these financial statements.
Copyright © 2017 www.secdatabase.com. All Rights Reserved.Please Consider the Environment Before Printing This Document

Table of Contents
Portfolio of investments�May 31, 2017 Wells Fargo Allocation Funds 81SMALL COMPANY VALUE PORTFOLIO
Security name Shares Value
Common Stocks: 97.36%
Consumer Discretionary: 18.52%
Auto Components: 2.06%American Axle & Manufacturing Holdings Incorporated � 112,135 $1,694,354Visteon Corporation � 27,148 2,722,673
4,417,027
Diversified Consumer Services: 1.52%Adtalem Global Education Incorporated 87,003 3,253,912
Hotels, Restaurants & Leisure: 6.55%ClubCorp Holdings Incorporated 151,834 2,019,392Eldorado Resorts Incorporated � 161,960 3,360,670Extended Stay America Incorporated 116,154 2,114,003Penn National Gaming Incorporated � 185,641 3,588,441Red Robin Gourmet Burgers Incorporated � 41,001 2,955,147
14,037,653
Household Durables: 3.23%Century Communities Incorporated � 88,455 2,202,530Taylor Morrison Home Corporation Class A � 83,986 1,952,675TRI Pointe Homes Incorporated � 223,703 2,767,206
6,922,411
Internet & Direct Marketing Retail: 1.13%1-800-Flowers.com Incorporated Class A � 241,063 2,410,630
Leisure Products: 1.09%American Outdoor Brands Corporation �« 102,616 2,324,252
Media: 0.82%Regal Entertainment Group Class A « 84,075 1,748,760
Specialty Retail: 1.34%Asbury Automotive Group Incorporated � 28,926 1,618,410Urban Outfitters Incorporated � 66,868 1,261,799
2,880,209
Textiles, Apparel & Luxury Goods: 0.78%Oxford Industries Incorporated 31,262 1,680,020
Consumer Staples: 2.53%
Food & Staples Retailing: 1.36%The Andersons Incorporated 44,211 1,551,806United Natural Foods Incorporated � 34,309 1,370,301
2,922,107
Food Products: 1.17%Darling Ingredients Incorporated � 159,245 2,495,369
The accompanying notes are an integral part of these financial statements.
Copyright © 2017 www.secdatabase.com. All Rights Reserved.Please Consider the Environment Before Printing This Document
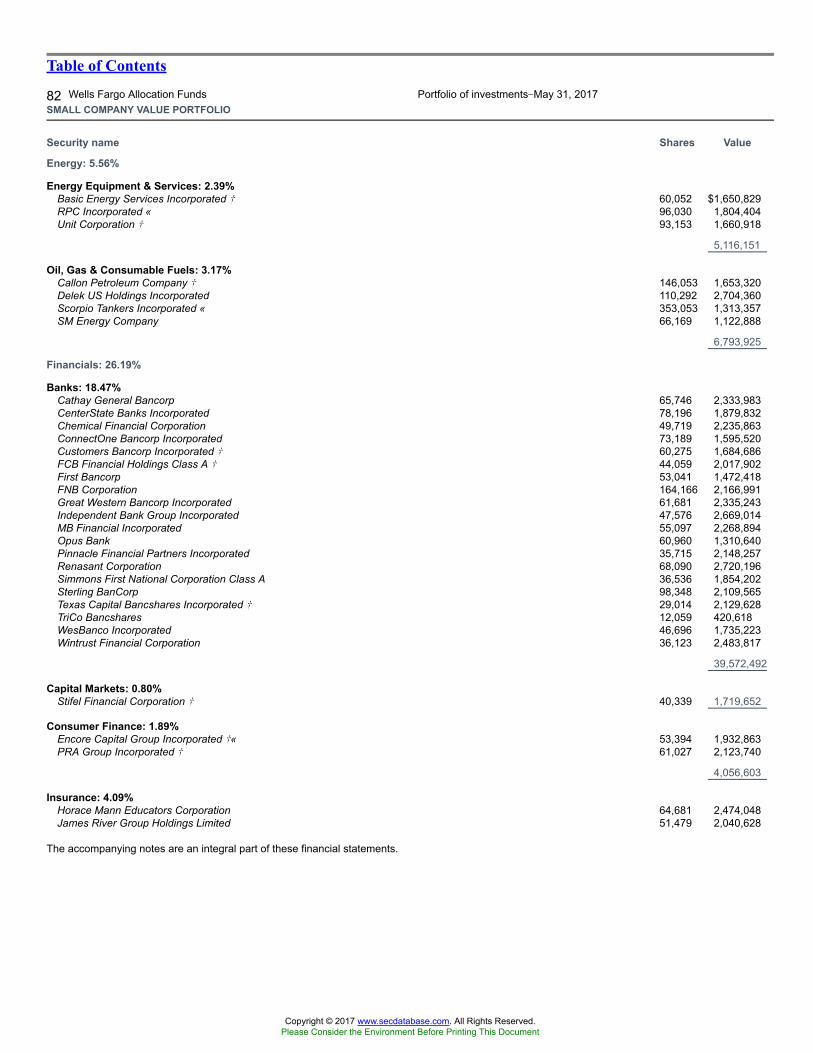
Table of Contents
82 Wells Fargo Allocation Funds Portfolio of investments�May 31, 2017SMALL COMPANY VALUE PORTFOLIO
Security name Shares Value
Energy: 5.56%
Energy Equipment & Services: 2.39%Basic Energy Services Incorporated � 60,052 $1,650,829RPC Incorporated « 96,030 1,804,404Unit Corporation � 93,153 1,660,918
5,116,151
Oil, Gas & Consumable Fuels: 3.17%Callon Petroleum Company � 146,053 1,653,320Delek US Holdings Incorporated 110,292 2,704,360Scorpio Tankers Incorporated « 353,053 1,313,357SM Energy Company 66,169 1,122,888
6,793,925
Financials: 26.19%
Banks: 18.47%Cathay General Bancorp 65,746 2,333,983CenterState Banks Incorporated 78,196 1,879,832Chemical Financial Corporation 49,719 2,235,863ConnectOne Bancorp Incorporated 73,189 1,595,520Customers Bancorp Incorporated � 60,275 1,684,686FCB Financial Holdings Class A � 44,059 2,017,902First Bancorp 53,041 1,472,418FNB Corporation 164,166 2,166,991Great Western Bancorp Incorporated 61,681 2,335,243Independent Bank Group Incorporated 47,576 2,669,014MB Financial Incorporated 55,097 2,268,894Opus Bank 60,960 1,310,640Pinnacle Financial Partners Incorporated 35,715 2,148,257Renasant Corporation 68,090 2,720,196Simmons First National Corporation Class A 36,536 1,854,202Sterling BanCorp 98,348 2,109,565Texas Capital Bancshares Incorporated � 29,014 2,129,628TriCo Bancshares 12,059 420,618WesBanco Incorporated 46,696 1,735,223Wintrust Financial Corporation 36,123 2,483,817
39,572,492
Capital Markets: 0.80%Stifel Financial Corporation � 40,339 1,719,652
Consumer Finance: 1.89%Encore Capital Group Incorporated �« 53,394 1,932,863PRA Group Incorporated � 61,027 2,123,740
4,056,603
Insurance: 4.09%Horace Mann Educators Corporation 64,681 2,474,048James River Group Holdings Limited 51,479 2,040,628
The accompanying notes are an integral part of these financial statements.
Copyright © 2017 www.secdatabase.com. All Rights Reserved.Please Consider the Environment Before Printing This Document
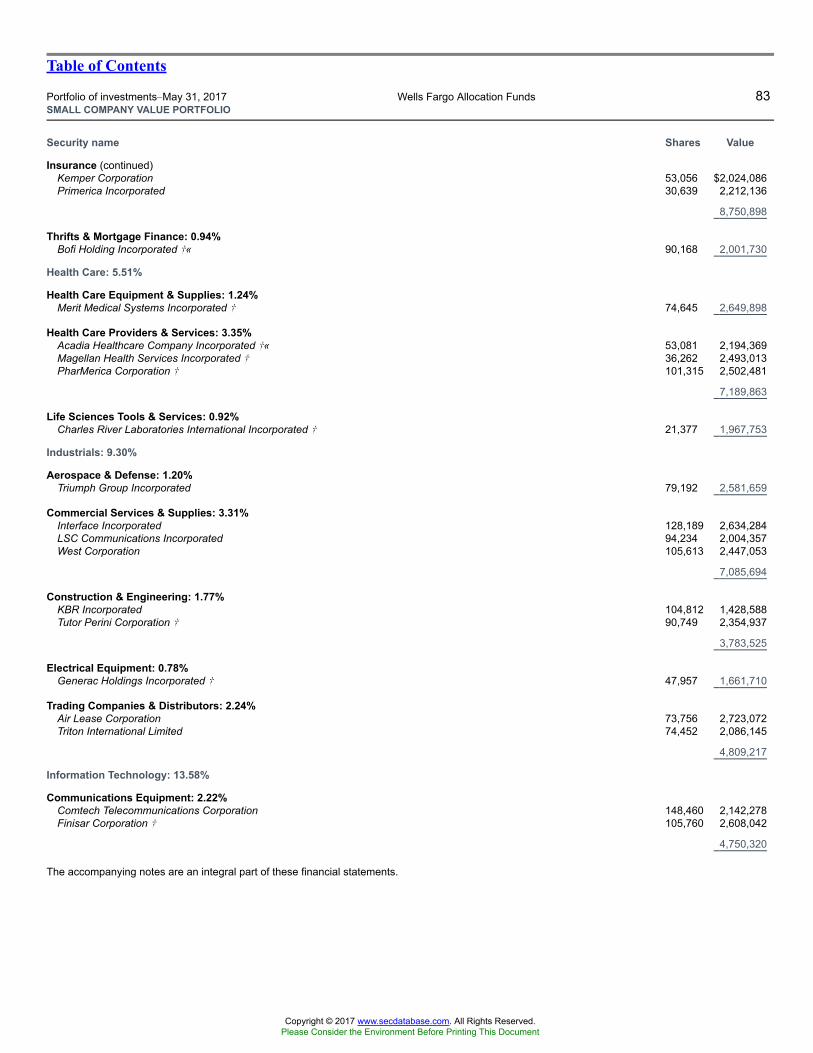
Table of Contents
Portfolio of investments�May 31, 2017 Wells Fargo Allocation Funds 83SMALL COMPANY VALUE PORTFOLIO
Security name Shares Value
Insurance (continued)Kemper Corporation 53,056 $2,024,086Primerica Incorporated 30,639 2,212,136
8,750,898
Thrifts & Mortgage Finance: 0.94%Bofi Holding Incorporated �« 90,168 2,001,730
Health Care: 5.51%
Health Care Equipment & Supplies: 1.24%Merit Medical Systems Incorporated � 74,645 2,649,898
Health Care Providers & Services: 3.35%Acadia Healthcare Company Incorporated �« 53,081 2,194,369Magellan Health Services Incorporated � 36,262 2,493,013PharMerica Corporation � 101,315 2,502,481
7,189,863
Life Sciences Tools & Services: 0.92%Charles River Laboratories International Incorporated � 21,377 1,967,753
Industrials: 9.30%
Aerospace & Defense: 1.20%Triumph Group Incorporated 79,192 2,581,659
Commercial Services & Supplies: 3.31%Interface Incorporated 128,189 2,634,284LSC Communications Incorporated 94,234 2,004,357West Corporation 105,613 2,447,053
7,085,694
Construction & Engineering: 1.77%KBR Incorporated 104,812 1,428,588Tutor Perini Corporation � 90,749 2,354,937
3,783,525
Electrical Equipment: 0.78%Generac Holdings Incorporated � 47,957 1,661,710
Trading Companies & Distributors: 2.24%Air Lease Corporation 73,756 2,723,072Triton International Limited 74,452 2,086,145
4,809,217
Information Technology: 13.58%
Communications Equipment: 2.22%Comtech Telecommunications Corporation 148,460 2,142,278Finisar Corporation � 105,760 2,608,042
4,750,320
The accompanying notes are an integral part of these financial statements.
Copyright © 2017 www.secdatabase.com. All Rights Reserved.Please Consider the Environment Before Printing This Document
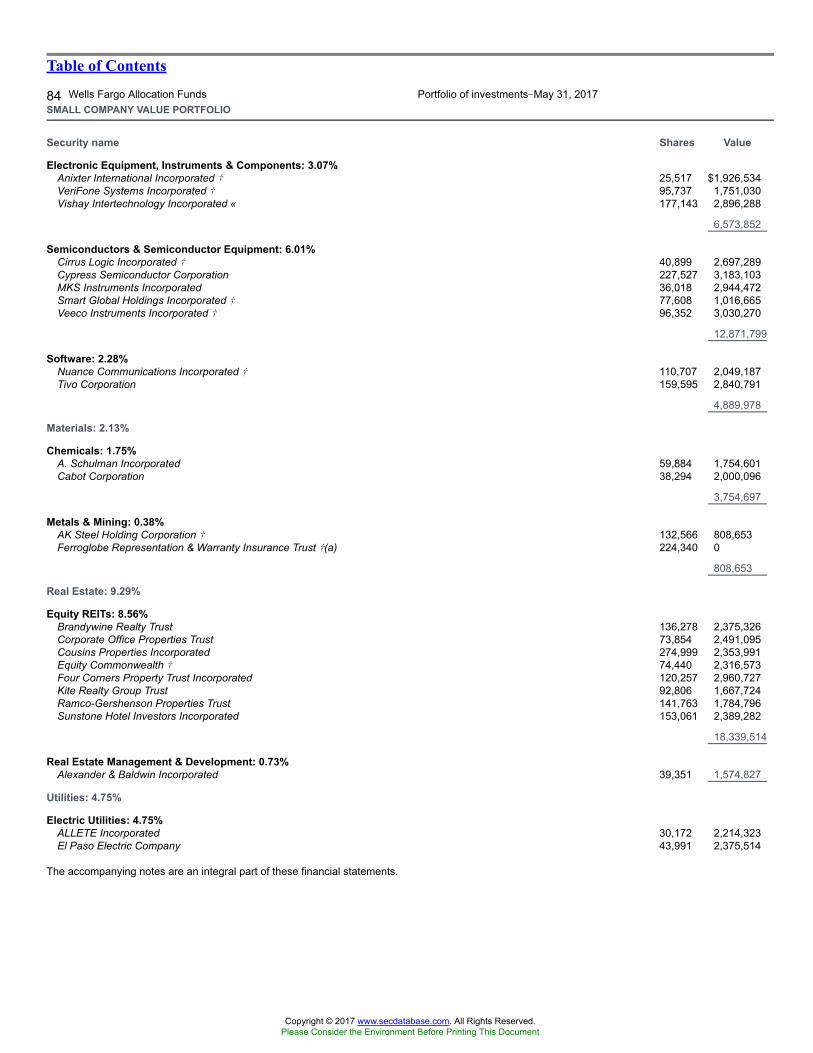
Table of Contents
84 Wells Fargo Allocation Funds Portfolio of investments�May 31, 2017SMALL COMPANY VALUE PORTFOLIO
Security name Shares Value
Electronic Equipment, Instruments & Components: 3.07%Anixter International Incorporated � 25,517 $1,926,534VeriFone Systems Incorporated � 95,737 1,751,030Vishay Intertechnology Incorporated « 177,143 2,896,288
6,573,852
Semiconductors & Semiconductor Equipment: 6.01%Cirrus Logic Incorporated � 40,899 2,697,289Cypress Semiconductor Corporation 227,527 3,183,103MKS Instruments Incorporated 36,018 2,944,472Smart Global Holdings Incorporated � 77,608 1,016,665Veeco Instruments Incorporated � 96,352 3,030,270
12,871,799
Software: 2.28%Nuance Communications Incorporated � 110,707 2,049,187Tivo Corporation 159,595 2,840,791
4,889,978
Materials: 2.13%
Chemicals: 1.75%A. Schulman Incorporated 59,884 1,754,601Cabot Corporation 38,294 2,000,096
3,754,697
Metals & Mining: 0.38%AK Steel Holding Corporation � 132,566 808,653Ferroglobe Representation & Warranty Insurance Trust �(a) 224,340 0
808,653
Real Estate: 9.29%
Equity REITs: 8.56%Brandywine Realty Trust 136,278 2,375,326Corporate Office Properties Trust 73,854 2,491,095Cousins Properties Incorporated 274,999 2,353,991Equity Commonwealth � 74,440 2,316,573Four Corners Property Trust Incorporated 120,257 2,960,727Kite Realty Group Trust 92,806 1,667,724Ramco-Gershenson Properties Trust 141,763 1,784,796Sunstone Hotel Investors Incorporated 153,061 2,389,282
18,339,514
Real Estate Management & Development: 0.73%Alexander & Baldwin Incorporated 39,351 1,574,827
Utilities: 4.75%
Electric Utilities: 4.75%ALLETE Incorporated 30,172 2,214,323El Paso Electric Company 43,991 2,375,514
The accompanying notes are an integral part of these financial statements.
Copyright © 2017 www.secdatabase.com. All Rights Reserved.Please Consider the Environment Before Printing This Document
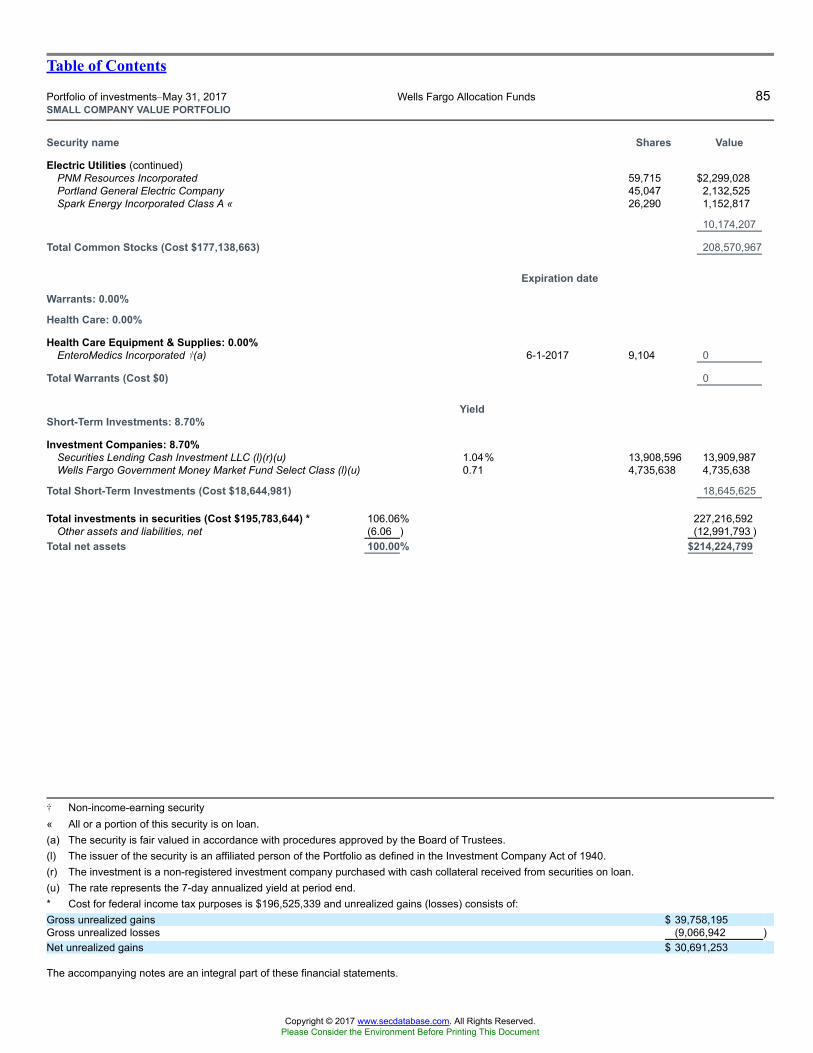
Table of Contents
Portfolio of investments�May 31, 2017 Wells Fargo Allocation Funds 85SMALL COMPANY VALUE PORTFOLIO
Security name Shares Value
Electric Utilities (continued)PNM Resources Incorporated 59,715 $2,299,028Portland General Electric Company 45,047 2,132,525Spark Energy Incorporated Class A « 26,290 1,152,817
10,174,207
Total Common Stocks (Cost $177,138,663) 208,570,967
Expiration date
Warrants: 0.00%
Health Care: 0.00%
Health Care Equipment & Supplies: 0.00%EnteroMedics Incorporated �(a) 6-1-2017 9,104 0
Total Warrants (Cost $0) 0
YieldShort-Term Investments: 8.70%
Investment Companies: 8.70%Securities Lending Cash Investment LLC (l)(r)(u) 1.04% 13,908,596 13,909,987Wells Fargo Government Money Market Fund Select Class (l)(u) 0.71 4,735,638 4,735,638
Total Short-Term Investments (Cost $18,644,981) 18,645,625
Total investments in securities (Cost $195,783,644) * 106.06% 227,216,592Other assets and liabilities, net (6.06 ) (12,991,793 )
Total net assets 100.00% $214,224,799
� Non-income-earning security« All or a portion of this security is on loan.(a) The security is fair valued in accordance with procedures approved by the Board of Trustees.(l) The issuer of the security is an affiliated person of the Portfolio as defined in the Investment Company Act of 1940.(r) The investment is a non-registered investment company purchased with cash collateral received from securities on loan.(u) The rate represents the 7-day annualized yield at period end.* Cost for federal income tax purposes is $196,525,339 and unrealized gains (losses) consists of:Gross unrealized gains $ 39,758,195Gross unrealized losses (9,066,942 )Net unrealized gains $ 30,691,253
The accompanying notes are an integral part of these financial statements.
Copyright © 2017 www.secdatabase.com. All Rights Reserved.Please Consider the Environment Before Printing This Document
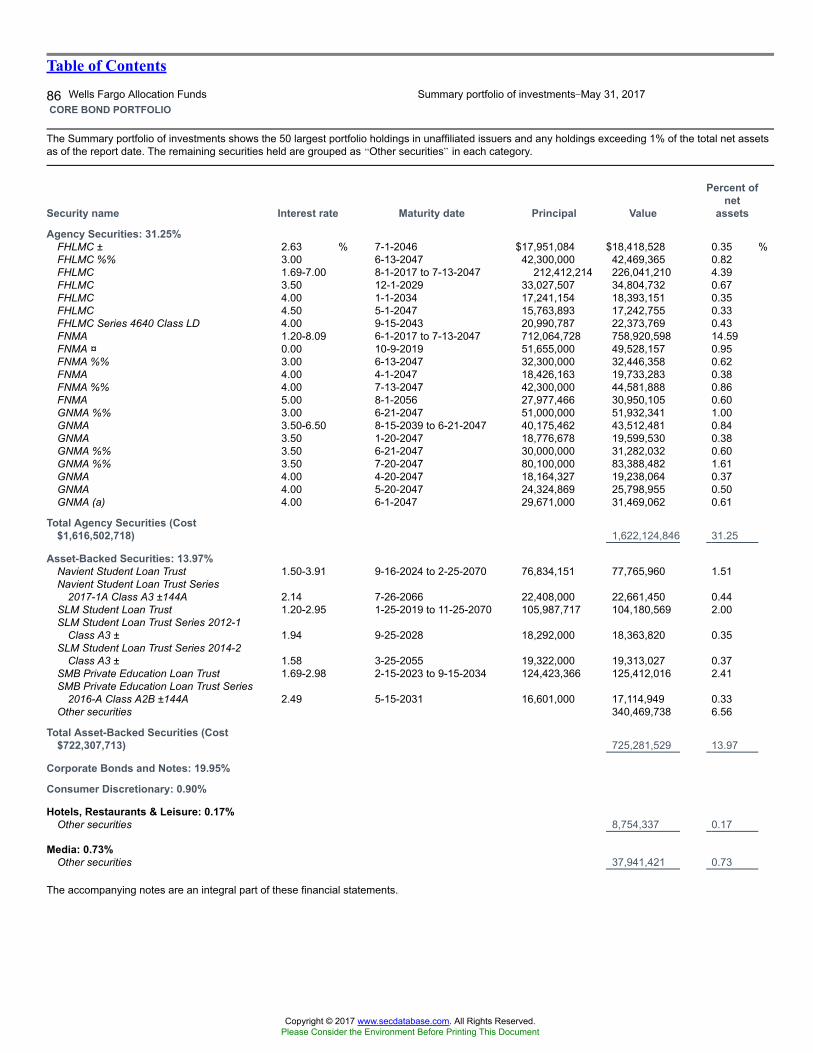
Table of Contents
86 Wells Fargo Allocation Funds Summary portfolio of investments�May 31, 2017CORE BOND PORTFOLIO
The Summary portfolio of investments shows the 50 largest portfolio holdings in unaffiliated issuers and any holdings exceeding 1% of the total net assetsas of the report date. The remaining securities held are grouped as �Other securities� in each category.
Security name Interest rate Maturity date Principal Value
Percent ofnet
assets
Agency Securities: 31.25%FHLMC ± 2.63 % 7-1-2046 $17,951,084 $18,418,528 0.35 %FHLMC %% 3.00 6-13-2047 42,300,000 42,469,365 0.82FHLMC 1.69-7.00 8-1-2017 to 7-13-2047 212,412,214 226,041,210 4.39FHLMC 3.50 12-1-2029 33,027,507 34,804,732 0.67FHLMC 4.00 1-1-2034 17,241,154 18,393,151 0.35FHLMC 4.50 5-1-2047 15,763,893 17,242,755 0.33FHLMC Series 4640 Class LD 4.00 9-15-2043 20,990,787 22,373,769 0.43FNMA 1.20-8.09 6-1-2017 to 7-13-2047 712,064,728 758,920,598 14.59FNMA ¤ 0.00 10-9-2019 51,655,000 49,528,157 0.95FNMA %% 3.00 6-13-2047 32,300,000 32,446,358 0.62FNMA 4.00 4-1-2047 18,426,163 19,733,283 0.38FNMA %% 4.00 7-13-2047 42,300,000 44,581,888 0.86FNMA 5.00 8-1-2056 27,977,466 30,950,105 0.60GNMA %% 3.00 6-21-2047 51,000,000 51,932,341 1.00GNMA 3.50-6.50 8-15-2039 to 6-21-2047 40,175,462 43,512,481 0.84GNMA 3.50 1-20-2047 18,776,678 19,599,530 0.38GNMA %% 3.50 6-21-2047 30,000,000 31,282,032 0.60GNMA %% 3.50 7-20-2047 80,100,000 83,388,482 1.61GNMA 4.00 4-20-2047 18,164,327 19,238,064 0.37GNMA 4.00 5-20-2047 24,324,869 25,798,955 0.50GNMA (a) 4.00 6-1-2047 29,671,000 31,469,062 0.61
Total Agency Securities (Cost$1,616,502,718) 1,622,124,846 31.25
Asset-Backed Securities: 13.97%Navient Student Loan Trust 1.50-3.91 9-16-2024 to 2-25-2070 76,834,151 77,765,960 1.51Navient Student Loan Trust Series
2017-1A Class A3 ±144A 2.14 7-26-2066 22,408,000 22,661,450 0.44SLM Student Loan Trust 1.20-2.95 1-25-2019 to 11-25-2070 105,987,717 104,180,569 2.00SLM Student Loan Trust Series 2012-1
Class A3 ± 1.94 9-25-2028 18,292,000 18,363,820 0.35SLM Student Loan Trust Series 2014-2
Class A3 ± 1.58 3-25-2055 19,322,000 19,313,027 0.37SMB Private Education Loan Trust 1.69-2.98 2-15-2023 to 9-15-2034 124,423,366 125,412,016 2.41SMB Private Education Loan Trust Series
2016-A Class A2B ±144A 2.49 5-15-2031 16,601,000 17,114,949 0.33Other securities 340,469,738 6.56
Total Asset-Backed Securities (Cost$722,307,713) 725,281,529 13.97
Corporate Bonds and Notes: 19.95%
Consumer Discretionary: 0.90%
Hotels, Restaurants & Leisure: 0.17%Other securities 8,754,337 0.17
Media: 0.73%Other securities 37,941,421 0.73
The accompanying notes are an integral part of these financial statements.
Copyright © 2017 www.secdatabase.com. All Rights Reserved.Please Consider the Environment Before Printing This Document
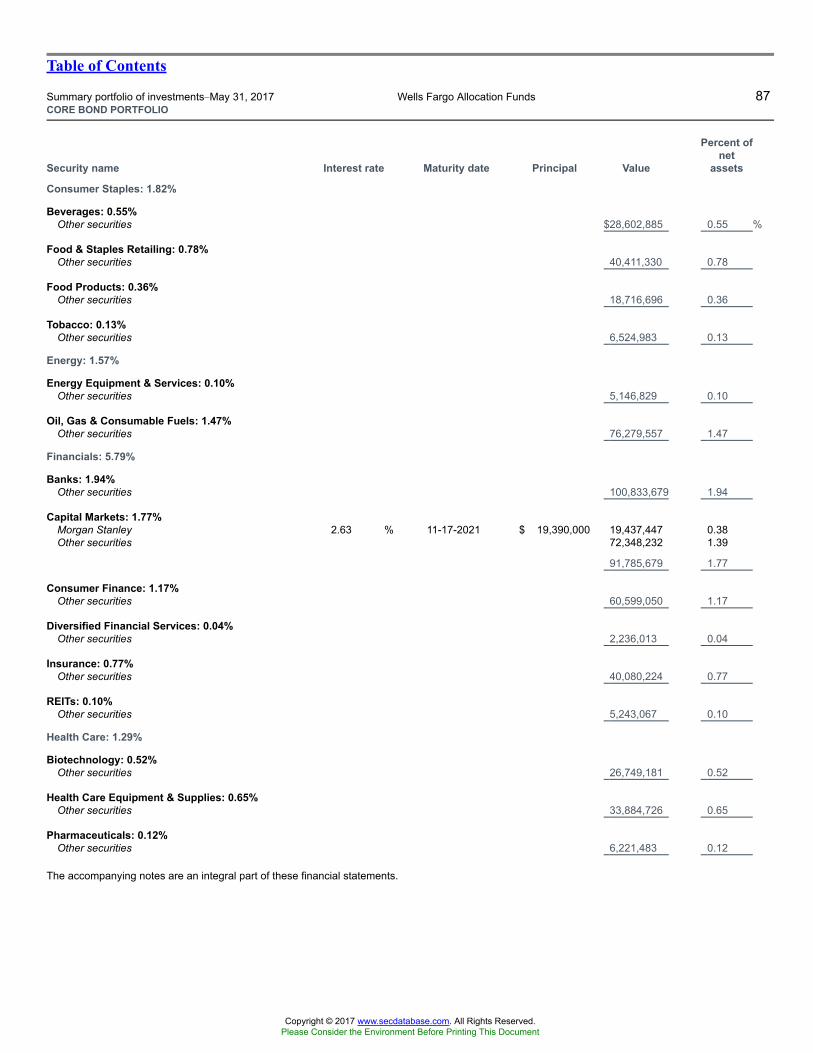
Table of Contents
Summary portfolio of investments�May 31, 2017 Wells Fargo Allocation Funds 87CORE BOND PORTFOLIO
Security name Interest rate Maturity date Principal Value
Percent ofnet
assets
Consumer Staples: 1.82%
Beverages: 0.55%Other securities $28,602,885 0.55 %
Food & Staples Retailing: 0.78%Other securities 40,411,330 0.78
Food Products: 0.36%Other securities 18,716,696 0.36
Tobacco: 0.13%Other securities 6,524,983 0.13
Energy: 1.57%
Energy Equipment & Services: 0.10%Other securities 5,146,829 0.10
Oil, Gas & Consumable Fuels: 1.47%Other securities 76,279,557 1.47
Financials: 5.79%
Banks: 1.94%Other securities 100,833,679 1.94
Capital Markets: 1.77%Morgan Stanley 2.63 % 11-17-2021 $ 19,390,000 19,437,447 0.38Other securities 72,348,232 1.39
91,785,679 1.77
Consumer Finance: 1.17%Other securities 60,599,050 1.17
Diversified Financial Services: 0.04%Other securities 2,236,013 0.04
Insurance: 0.77%Other securities 40,080,224 0.77
REITs: 0.10%Other securities 5,243,067 0.10
Health Care: 1.29%
Biotechnology: 0.52%Other securities 26,749,181 0.52
Health Care Equipment & Supplies: 0.65%Other securities 33,884,726 0.65
Pharmaceuticals: 0.12%Other securities 6,221,483 0.12
The accompanying notes are an integral part of these financial statements.
Copyright © 2017 www.secdatabase.com. All Rights Reserved.Please Consider the Environment Before Printing This Document
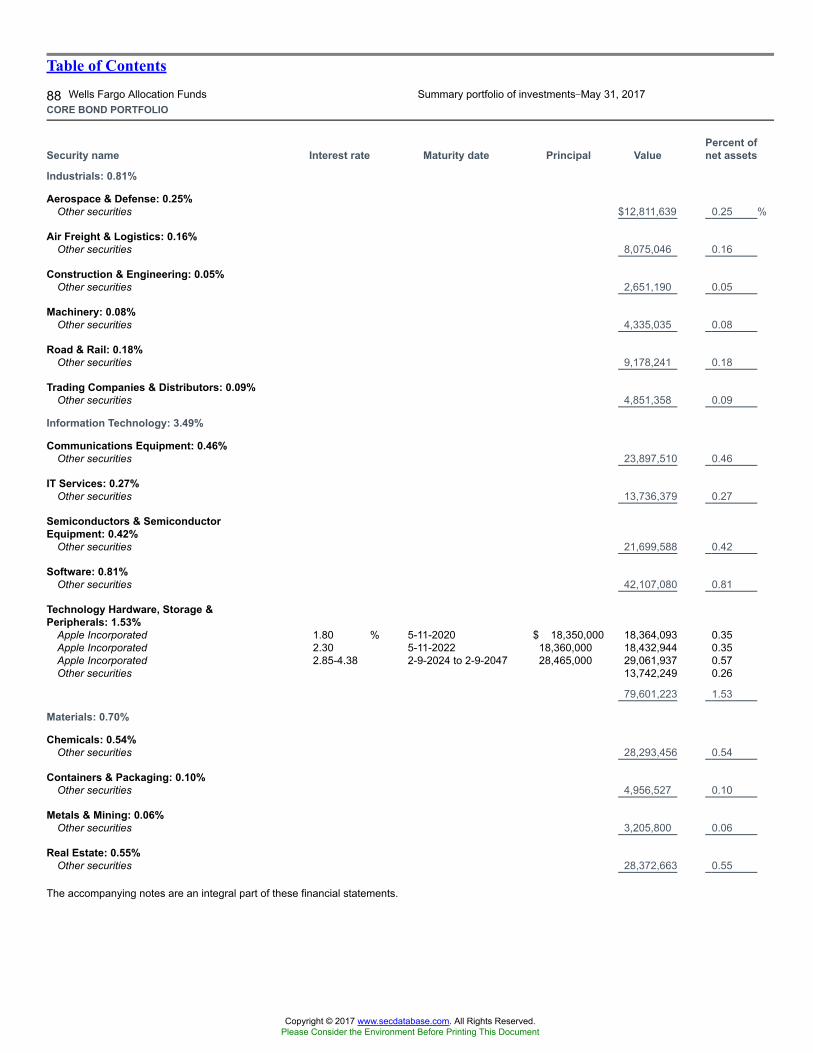
Table of Contents
88 Wells Fargo Allocation Funds Summary portfolio of investments�May 31, 2017CORE BOND PORTFOLIO
Security name Interest rate Maturity date Principal ValuePercent ofnet assets
Industrials: 0.81%
Aerospace & Defense: 0.25%Other securities $12,811,639 0.25 %
Air Freight & Logistics: 0.16%Other securities 8,075,046 0.16
Construction & Engineering: 0.05%Other securities 2,651,190 0.05
Machinery: 0.08%Other securities 4,335,035 0.08
Road & Rail: 0.18%Other securities 9,178,241 0.18
Trading Companies & Distributors: 0.09%Other securities 4,851,358 0.09
Information Technology: 3.49%
Communications Equipment: 0.46%Other securities 23,897,510 0.46
IT Services: 0.27%Other securities 13,736,379 0.27
Semiconductors & SemiconductorEquipment: 0.42%
Other securities 21,699,588 0.42
Software: 0.81%Other securities 42,107,080 0.81
Technology Hardware, Storage &Peripherals: 1.53%
Apple Incorporated 1.80 % 5-11-2020 $ 18,350,000 18,364,093 0.35Apple Incorporated 2.30 5-11-2022 18,360,000 18,432,944 0.35Apple Incorporated 2.85-4.38 2-9-2024 to 2-9-2047 28,465,000 29,061,937 0.57Other securities 13,742,249 0.26
79,601,223 1.53
Materials: 0.70%
Chemicals: 0.54%Other securities 28,293,456 0.54
Containers & Packaging: 0.10%Other securities 4,956,527 0.10
Metals & Mining: 0.06%Other securities 3,205,800 0.06
Real Estate: 0.55%Other securities 28,372,663 0.55
The accompanying notes are an integral part of these financial statements.
Copyright © 2017 www.secdatabase.com. All Rights Reserved.Please Consider the Environment Before Printing This Document
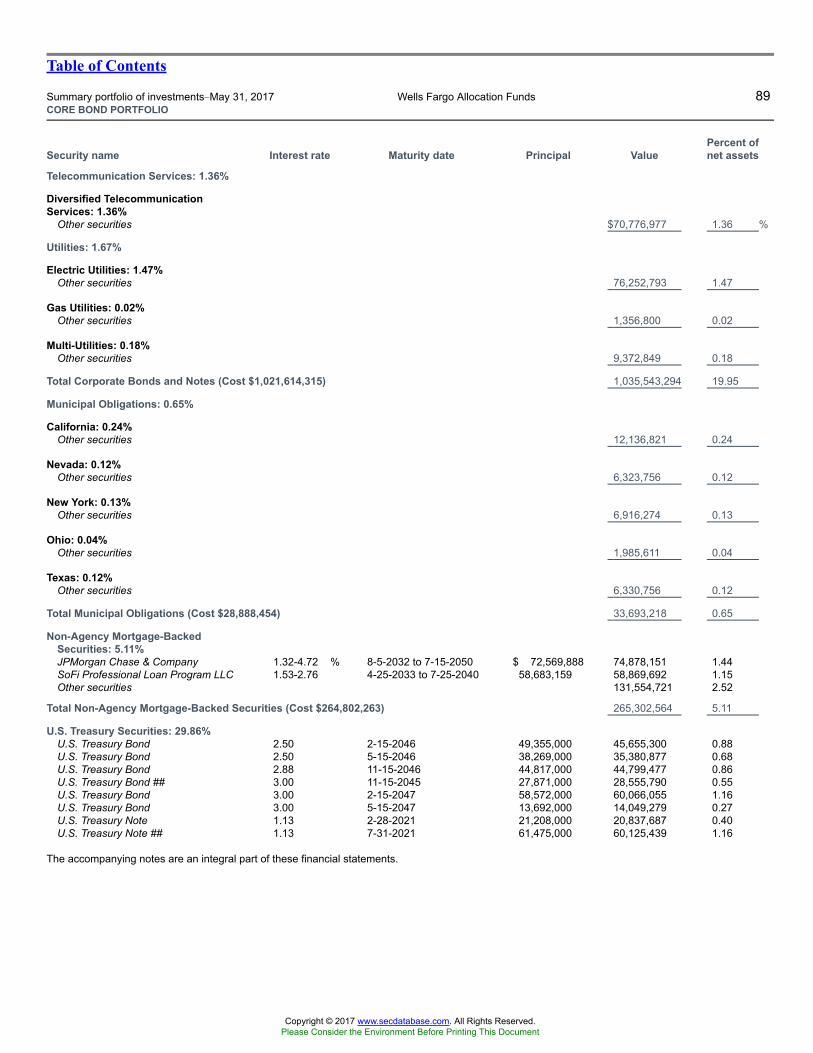
Table of Contents
Summary portfolio of investments�May 31, 2017 Wells Fargo Allocation Funds 89CORE BOND PORTFOLIO
Security name Interest rate Maturity date Principal ValuePercent ofnet assets
Telecommunication Services: 1.36%
Diversified TelecommunicationServices: 1.36%
Other securities $70,776,977 1.36 %
Utilities: 1.67%
Electric Utilities: 1.47%Other securities 76,252,793 1.47
Gas Utilities: 0.02%Other securities 1,356,800 0.02
Multi-Utilities: 0.18%Other securities 9,372,849 0.18
Total Corporate Bonds and Notes (Cost $1,021,614,315) 1,035,543,294 19.95
Municipal Obligations: 0.65%
California: 0.24%Other securities 12,136,821 0.24
Nevada: 0.12%Other securities 6,323,756 0.12
New York: 0.13%Other securities 6,916,274 0.13
Ohio: 0.04%Other securities 1,985,611 0.04
Texas: 0.12%Other securities 6,330,756 0.12
Total Municipal Obligations (Cost $28,888,454) 33,693,218 0.65
Non-Agency Mortgage-BackedSecurities: 5.11%JPMorgan Chase & Company 1.32-4.72 % 8-5-2032 to 7-15-2050 $ 72,569,888 74,878,151 1.44SoFi Professional Loan Program LLC 1.53-2.76 4-25-2033 to 7-25-2040 58,683,159 58,869,692 1.15Other securities 131,554,721 2.52
Total Non-Agency Mortgage-Backed Securities (Cost $264,802,263) 265,302,564 5.11
U.S. Treasury Securities: 29.86%U.S. Treasury Bond 2.50 2-15-2046 49,355,000 45,655,300 0.88U.S. Treasury Bond 2.50 5-15-2046 38,269,000 35,380,877 0.68U.S. Treasury Bond 2.88 11-15-2046 44,817,000 44,799,477 0.86U.S. Treasury Bond ## 3.00 11-15-2045 27,871,000 28,555,790 0.55U.S. Treasury Bond 3.00 2-15-2047 58,572,000 60,066,055 1.16U.S. Treasury Bond 3.00 5-15-2047 13,692,000 14,049,279 0.27U.S. Treasury Note 1.13 2-28-2021 21,208,000 20,837,687 0.40U.S. Treasury Note ## 1.13 7-31-2021 61,475,000 60,125,439 1.16
The accompanying notes are an integral part of these financial statements.
Copyright © 2017 www.secdatabase.com. All Rights Reserved.Please Consider the Environment Before Printing This Document
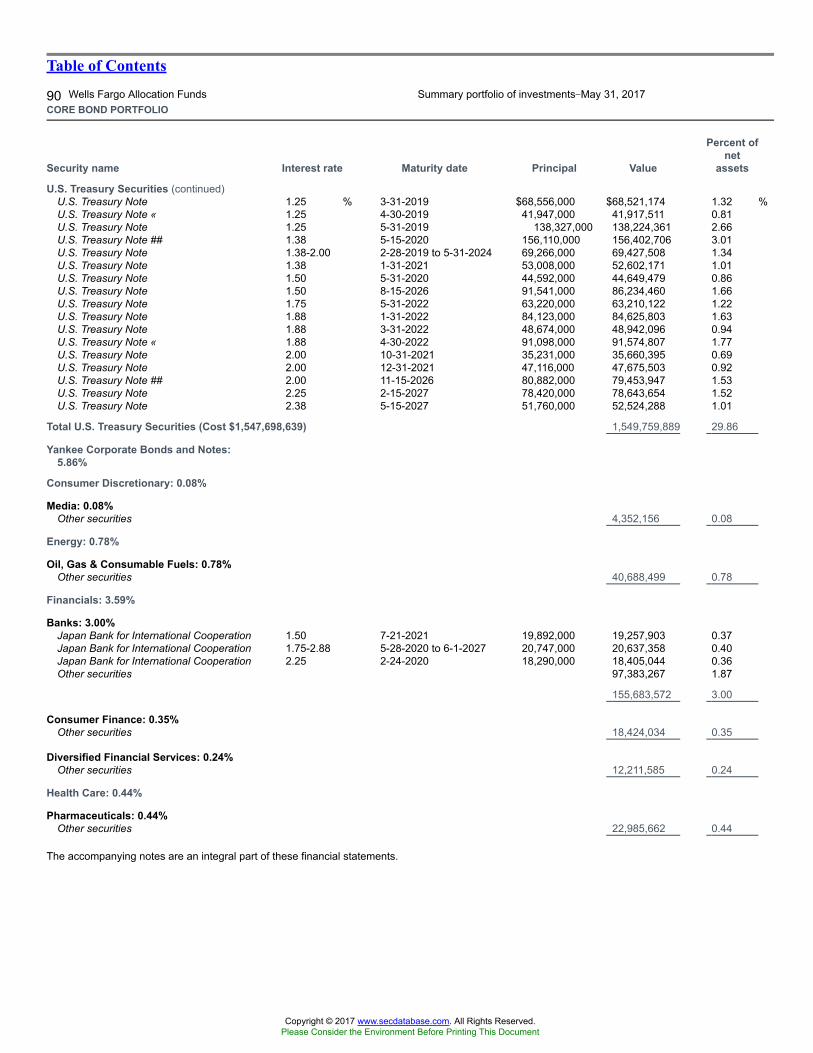
Table of Contents
90 Wells Fargo Allocation Funds Summary portfolio of investments�May 31, 2017CORE BOND PORTFOLIO
Security name Interest rate Maturity date Principal Value
Percent ofnet
assets
U.S. Treasury Securities (continued)U.S. Treasury Note 1.25 % 3-31-2019 $68,556,000 $68,521,174 1.32 %U.S. Treasury Note « 1.25 4-30-2019 41,947,000 41,917,511 0.81U.S. Treasury Note 1.25 5-31-2019 138,327,000 138,224,361 2.66U.S. Treasury Note ## 1.38 5-15-2020 156,110,000 156,402,706 3.01U.S. Treasury Note 1.38-2.00 2-28-2019 to 5-31-2024 69,266,000 69,427,508 1.34U.S. Treasury Note 1.38 1-31-2021 53,008,000 52,602,171 1.01U.S. Treasury Note 1.50 5-31-2020 44,592,000 44,649,479 0.86U.S. Treasury Note 1.50 8-15-2026 91,541,000 86,234,460 1.66U.S. Treasury Note 1.75 5-31-2022 63,220,000 63,210,122 1.22U.S. Treasury Note 1.88 1-31-2022 84,123,000 84,625,803 1.63U.S. Treasury Note 1.88 3-31-2022 48,674,000 48,942,096 0.94U.S. Treasury Note « 1.88 4-30-2022 91,098,000 91,574,807 1.77U.S. Treasury Note 2.00 10-31-2021 35,231,000 35,660,395 0.69U.S. Treasury Note 2.00 12-31-2021 47,116,000 47,675,503 0.92U.S. Treasury Note ## 2.00 11-15-2026 80,882,000 79,453,947 1.53U.S. Treasury Note 2.25 2-15-2027 78,420,000 78,643,654 1.52U.S. Treasury Note 2.38 5-15-2027 51,760,000 52,524,288 1.01
Total U.S. Treasury Securities (Cost $1,547,698,639) 1,549,759,889 29.86
Yankee Corporate Bonds and Notes:5.86%
Consumer Discretionary: 0.08%
Media: 0.08%Other securities 4,352,156 0.08
Energy: 0.78%
Oil, Gas & Consumable Fuels: 0.78%Other securities 40,688,499 0.78
Financials: 3.59%
Banks: 3.00%Japan Bank for International Cooperation 1.50 7-21-2021 19,892,000 19,257,903 0.37Japan Bank for International Cooperation 1.75-2.88 5-28-2020 to 6-1-2027 20,747,000 20,637,358 0.40Japan Bank for International Cooperation 2.25 2-24-2020 18,290,000 18,405,044 0.36Other securities 97,383,267 1.87
155,683,572 3.00
Consumer Finance: 0.35%Other securities 18,424,034 0.35
Diversified Financial Services: 0.24%Other securities 12,211,585 0.24
Health Care: 0.44%
Pharmaceuticals: 0.44%Other securities 22,985,662 0.44
The accompanying notes are an integral part of these financial statements.
Copyright © 2017 www.secdatabase.com. All Rights Reserved.Please Consider the Environment Before Printing This Document
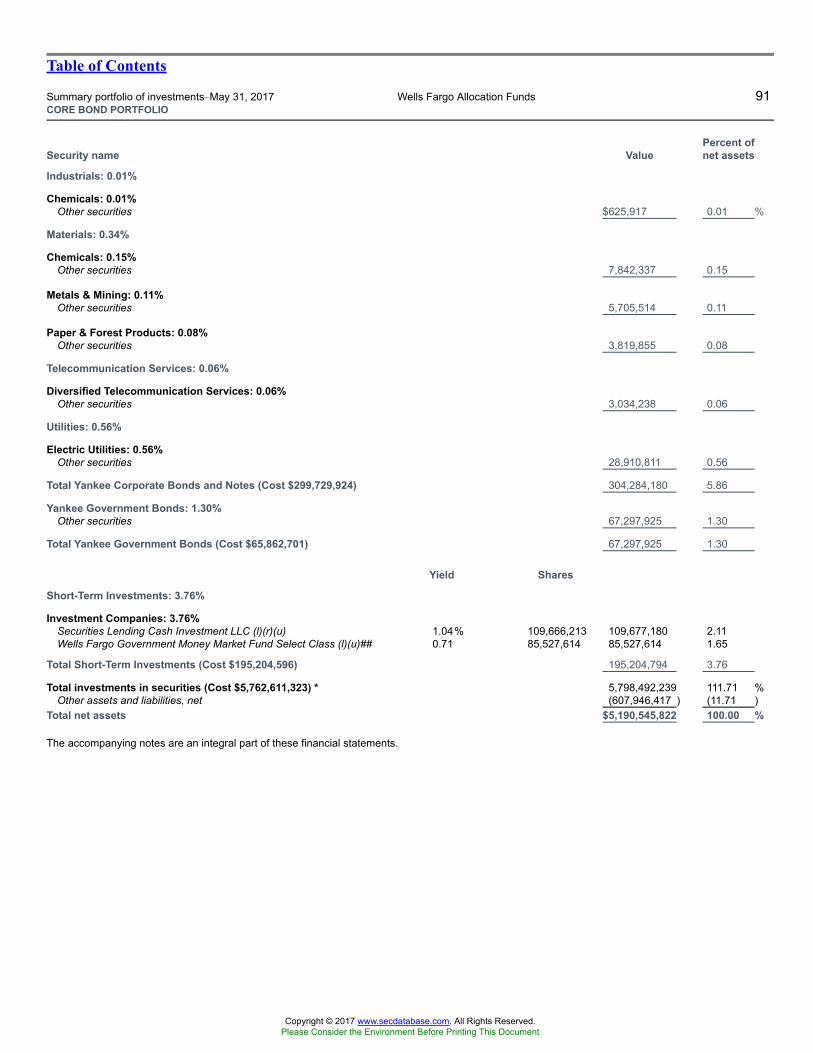
Table of Contents
Summary portfolio of investments�May 31, 2017 Wells Fargo Allocation Funds 91CORE BOND PORTFOLIO
Security name ValuePercent ofnet assets
Industrials: 0.01%
Chemicals: 0.01%Other securities $625,917 0.01 %
Materials: 0.34%
Chemicals: 0.15%Other securities 7,842,337 0.15
Metals & Mining: 0.11%Other securities 5,705,514 0.11
Paper & Forest Products: 0.08%Other securities 3,819,855 0.08
Telecommunication Services: 0.06%
Diversified Telecommunication Services: 0.06%Other securities 3,034,238 0.06
Utilities: 0.56%
Electric Utilities: 0.56%Other securities 28,910,811 0.56
Total Yankee Corporate Bonds and Notes (Cost $299,729,924) 304,284,180 5.86
Yankee Government Bonds: 1.30%Other securities 67,297,925 1.30
Total Yankee Government Bonds (Cost $65,862,701) 67,297,925 1.30
Yield Shares
Short-Term Investments: 3.76%
Investment Companies: 3.76%Securities Lending Cash Investment LLC (l)(r)(u) 1.04% 109,666,213 109,677,180 2.11Wells Fargo Government Money Market Fund Select Class (l)(u)## 0.71 85,527,614 85,527,614 1.65
Total Short-Term Investments (Cost $195,204,596) 195,204,794 3.76
Total investments in securities (Cost $5,762,611,323) * 5,798,492,239 111.71 %Other assets and liabilities, net (607,946,417 ) (11.71 )
Total net assets $5,190,545,822 100.00 %
The accompanying notes are an integral part of these financial statements.
Copyright © 2017 www.secdatabase.com. All Rights Reserved.Please Consider the Environment Before Printing This Document
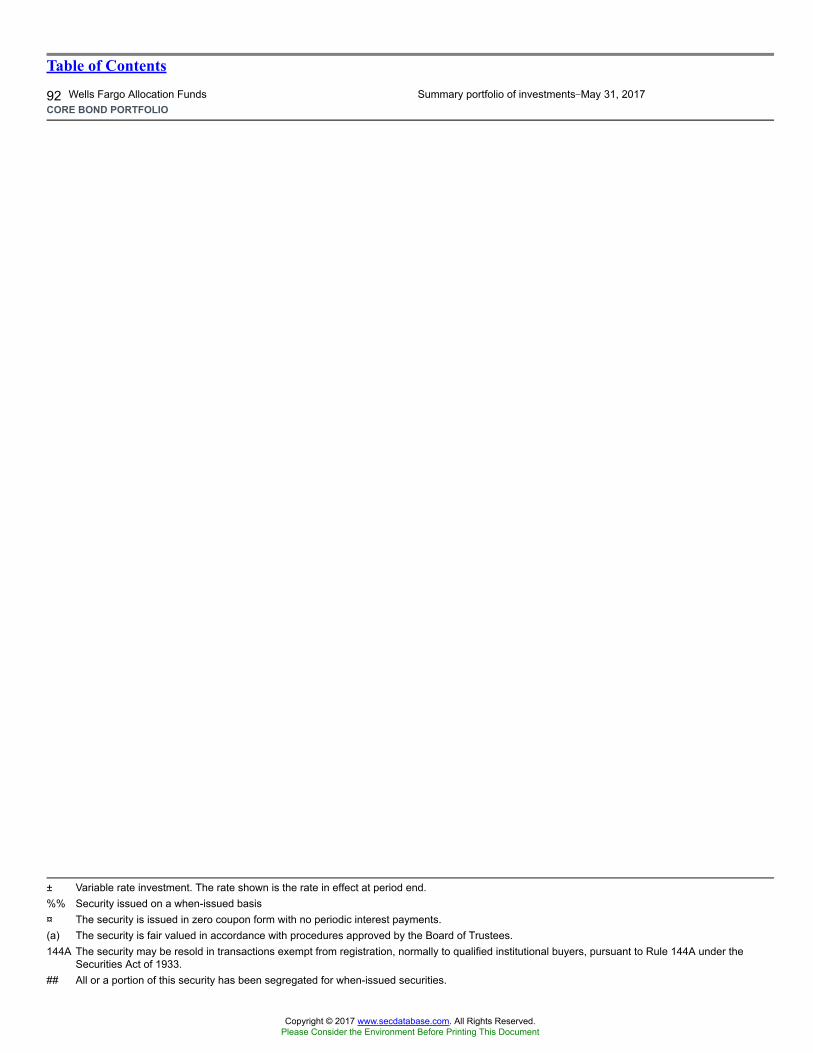
Table of Contents
92 Wells Fargo Allocation Funds Summary portfolio of investments�May 31, 2017CORE BOND PORTFOLIO
± Variable rate investment. The rate shown is the rate in effect at period end.%% Security issued on a when-issued basis¤ The security is issued in zero coupon form with no periodic interest payments.(a) The security is fair valued in accordance with procedures approved by the Board of Trustees.144A The security may be resold in transactions exempt from registration, normally to qualified institutional buyers, pursuant to Rule 144A under the
Securities Act of 1933.## All or a portion of this security has been segregated for when-issued securities.
Copyright © 2017 www.secdatabase.com. All Rights Reserved.Please Consider the Environment Before Printing This Document
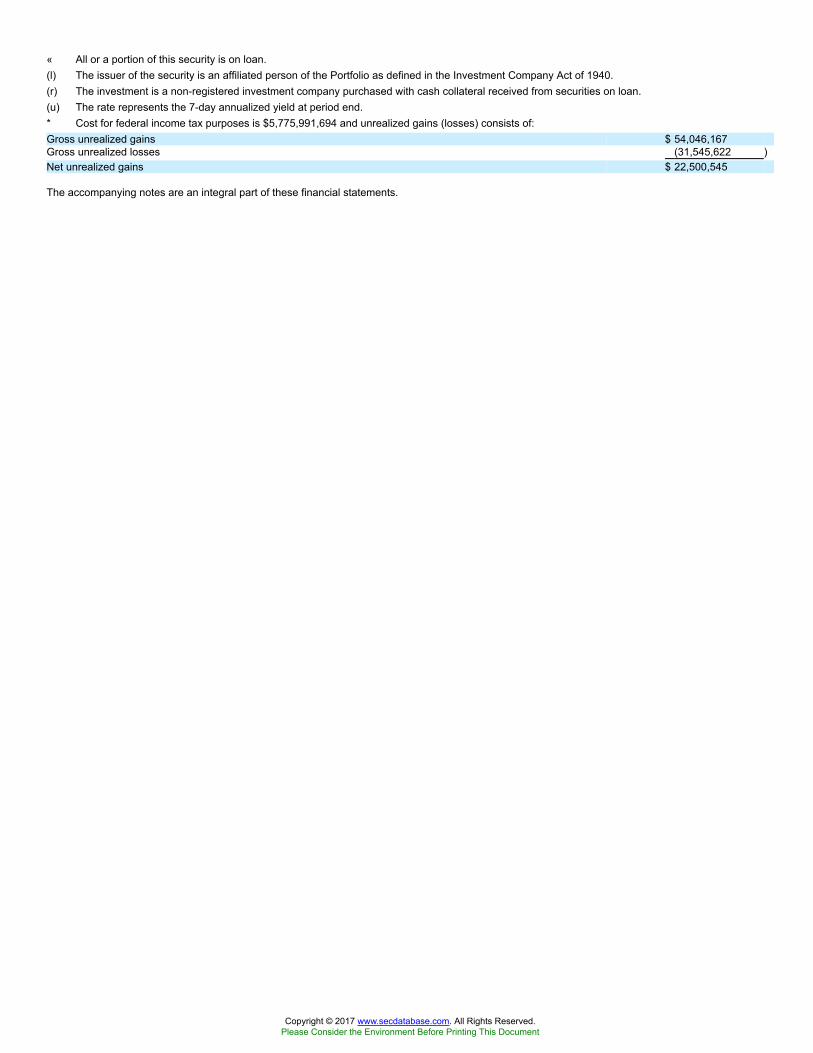
« All or a portion of this security is on loan.(l) The issuer of the security is an affiliated person of the Portfolio as defined in the Investment Company Act of 1940.(r) The investment is a non-registered investment company purchased with cash collateral received from securities on loan.(u) The rate represents the 7-day annualized yield at period end.* Cost for federal income tax purposes is $5,775,991,694 and unrealized gains (losses) consists of:Gross unrealized gains $ 54,046,167Gross unrealized losses (31,545,622 )Net unrealized gains $ 22,500,545
The accompanying notes are an integral part of these financial statements.
Copyright © 2017 www.secdatabase.com. All Rights Reserved.Please Consider the Environment Before Printing This Document
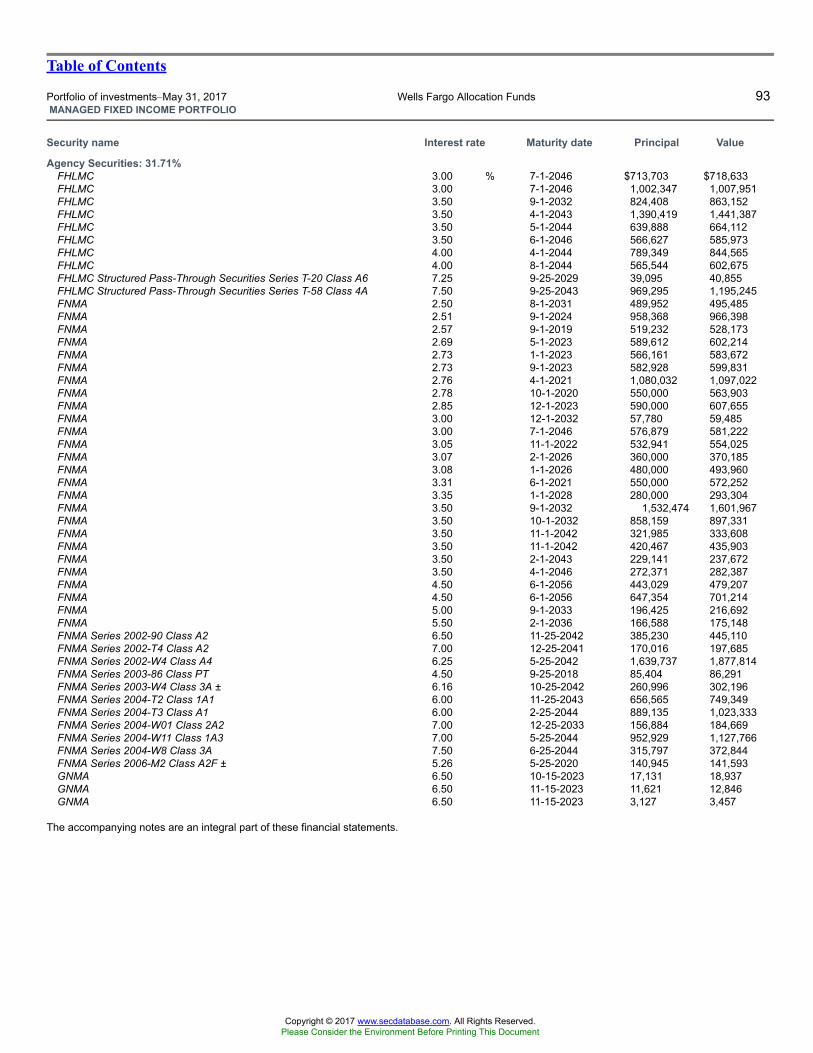
Table of Contents
Portfolio of investments�May 31, 2017 Wells Fargo Allocation Funds 93MANAGED FIXED INCOME PORTFOLIO
Security name Interest rate Maturity date Principal Value
Agency Securities: 31.71%FHLMC 3.00 % 7-1-2046 $713,703 $718,633FHLMC 3.00 7-1-2046 1,002,347 1,007,951FHLMC 3.50 9-1-2032 824,408 863,152FHLMC 3.50 4-1-2043 1,390,419 1,441,387FHLMC 3.50 5-1-2044 639,888 664,112FHLMC 3.50 6-1-2046 566,627 585,973FHLMC 4.00 4-1-2044 789,349 844,565FHLMC 4.00 8-1-2044 565,544 602,675FHLMC Structured Pass-Through Securities Series T-20 Class A6 7.25 9-25-2029 39,095 40,855FHLMC Structured Pass-Through Securities Series T-58 Class 4A 7.50 9-25-2043 969,295 1,195,245FNMA 2.50 8-1-2031 489,952 495,485FNMA 2.51 9-1-2024 958,368 966,398FNMA 2.57 9-1-2019 519,232 528,173FNMA 2.69 5-1-2023 589,612 602,214FNMA 2.73 1-1-2023 566,161 583,672FNMA 2.73 9-1-2023 582,928 599,831FNMA 2.76 4-1-2021 1,080,032 1,097,022FNMA 2.78 10-1-2020 550,000 563,903FNMA 2.85 12-1-2023 590,000 607,655FNMA 3.00 12-1-2032 57,780 59,485FNMA 3.00 7-1-2046 576,879 581,222FNMA 3.05 11-1-2022 532,941 554,025FNMA 3.07 2-1-2026 360,000 370,185FNMA 3.08 1-1-2026 480,000 493,960FNMA 3.31 6-1-2021 550,000 572,252FNMA 3.35 1-1-2028 280,000 293,304FNMA 3.50 9-1-2032 1,532,474 1,601,967FNMA 3.50 10-1-2032 858,159 897,331FNMA 3.50 11-1-2042 321,985 333,608FNMA 3.50 11-1-2042 420,467 435,903FNMA 3.50 2-1-2043 229,141 237,672FNMA 3.50 4-1-2046 272,371 282,387FNMA 4.50 6-1-2056 443,029 479,207FNMA 4.50 6-1-2056 647,354 701,214FNMA 5.00 9-1-2033 196,425 216,692FNMA 5.50 2-1-2036 166,588 175,148FNMA Series 2002-90 Class A2 6.50 11-25-2042 385,230 445,110FNMA Series 2002-T4 Class A2 7.00 12-25-2041 170,016 197,685FNMA Series 2002-W4 Class A4 6.25 5-25-2042 1,639,737 1,877,814FNMA Series 2003-86 Class PT 4.50 9-25-2018 85,404 86,291FNMA Series 2003-W4 Class 3A ± 6.16 10-25-2042 260,996 302,196FNMA Series 2004-T2 Class 1A1 6.00 11-25-2043 656,565 749,349FNMA Series 2004-T3 Class A1 6.00 2-25-2044 889,135 1,023,333FNMA Series 2004-W01 Class 2A2 7.00 12-25-2033 156,884 184,669FNMA Series 2004-W11 Class 1A3 7.00 5-25-2044 952,929 1,127,766FNMA Series 2004-W8 Class 3A 7.50 6-25-2044 315,797 372,844FNMA Series 2006-M2 Class A2F ± 5.26 5-25-2020 140,945 141,593GNMA 6.50 10-15-2023 17,131 18,937GNMA 6.50 11-15-2023 11,621 12,846GNMA 6.50 11-15-2023 3,127 3,457
The accompanying notes are an integral part of these financial statements.
Copyright © 2017 www.secdatabase.com. All Rights Reserved.Please Consider the Environment Before Printing This Document
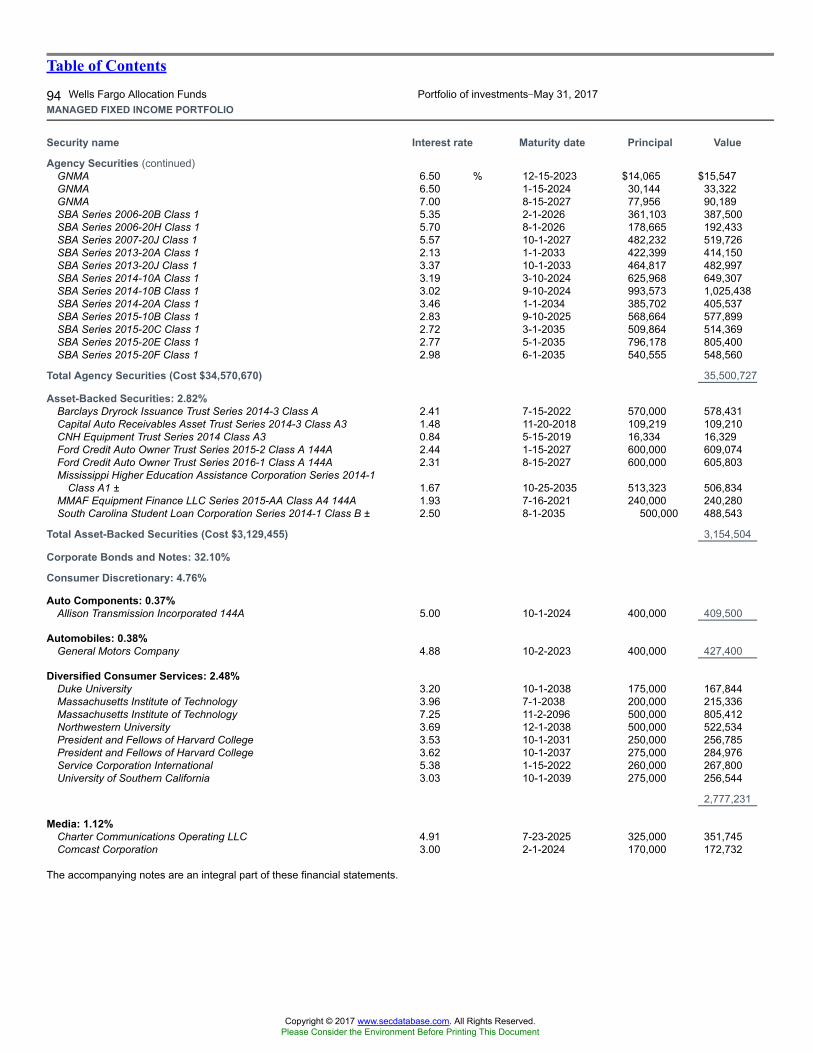
Table of Contents
94 Wells Fargo Allocation Funds Portfolio of investments�May 31, 2017MANAGED FIXED INCOME PORTFOLIO
Security name Interest rate Maturity date Principal Value
Agency Securities (continued)GNMA 6.50 % 12-15-2023 $14,065 $15,547GNMA 6.50 1-15-2024 30,144 33,322GNMA 7.00 8-15-2027 77,956 90,189SBA Series 2006-20B Class 1 5.35 2-1-2026 361,103 387,500SBA Series 2006-20H Class 1 5.70 8-1-2026 178,665 192,433SBA Series 2007-20J Class 1 5.57 10-1-2027 482,232 519,726SBA Series 2013-20A Class 1 2.13 1-1-2033 422,399 414,150SBA Series 2013-20J Class 1 3.37 10-1-2033 464,817 482,997SBA Series 2014-10A Class 1 3.19 3-10-2024 625,968 649,307SBA Series 2014-10B Class 1 3.02 9-10-2024 993,573 1,025,438SBA Series 2014-20A Class 1 3.46 1-1-2034 385,702 405,537SBA Series 2015-10B Class 1 2.83 9-10-2025 568,664 577,899SBA Series 2015-20C Class 1 2.72 3-1-2035 509,864 514,369SBA Series 2015-20E Class 1 2.77 5-1-2035 796,178 805,400SBA Series 2015-20F Class 1 2.98 6-1-2035 540,555 548,560
Total Agency Securities (Cost $34,570,670) 35,500,727
Asset-Backed Securities: 2.82%Barclays Dryrock Issuance Trust Series 2014-3 Class A 2.41 7-15-2022 570,000 578,431Capital Auto Receivables Asset Trust Series 2014-3 Class A3 1.48 11-20-2018 109,219 109,210CNH Equipment Trust Series 2014 Class A3 0.84 5-15-2019 16,334 16,329Ford Credit Auto Owner Trust Series 2015-2 Class A 144A 2.44 1-15-2027 600,000 609,074Ford Credit Auto Owner Trust Series 2016-1 Class A 144A 2.31 8-15-2027 600,000 605,803Mississippi Higher Education Assistance Corporation Series 2014-1
Class A1 ± 1.67 10-25-2035 513,323 506,834MMAF Equipment Finance LLC Series 2015-AA Class A4 144A 1.93 7-16-2021 240,000 240,280South Carolina Student Loan Corporation Series 2014-1 Class B ± 2.50 8-1-2035 500,000 488,543
Total Asset-Backed Securities (Cost $3,129,455) 3,154,504
Corporate Bonds and Notes: 32.10%
Consumer Discretionary: 4.76%
Auto Components: 0.37%Allison Transmission Incorporated 144A 5.00 10-1-2024 400,000 409,500
Automobiles: 0.38%General Motors Company 4.88 10-2-2023 400,000 427,400
Diversified Consumer Services: 2.48%Duke University 3.20 10-1-2038 175,000 167,844Massachusetts Institute of Technology 3.96 7-1-2038 200,000 215,336Massachusetts Institute of Technology 7.25 11-2-2096 500,000 805,412Northwestern University 3.69 12-1-2038 500,000 522,534President and Fellows of Harvard College 3.53 10-1-2031 250,000 256,785President and Fellows of Harvard College 3.62 10-1-2037 275,000 284,976Service Corporation International 5.38 1-15-2022 260,000 267,800University of Southern California 3.03 10-1-2039 275,000 256,544
2,777,231
Media: 1.12%Charter Communications Operating LLC 4.91 7-23-2025 325,000 351,745Comcast Corporation 3.00 2-1-2024 170,000 172,732
The accompanying notes are an integral part of these financial statements.
Copyright © 2017 www.secdatabase.com. All Rights Reserved.Please Consider the Environment Before Printing This Document
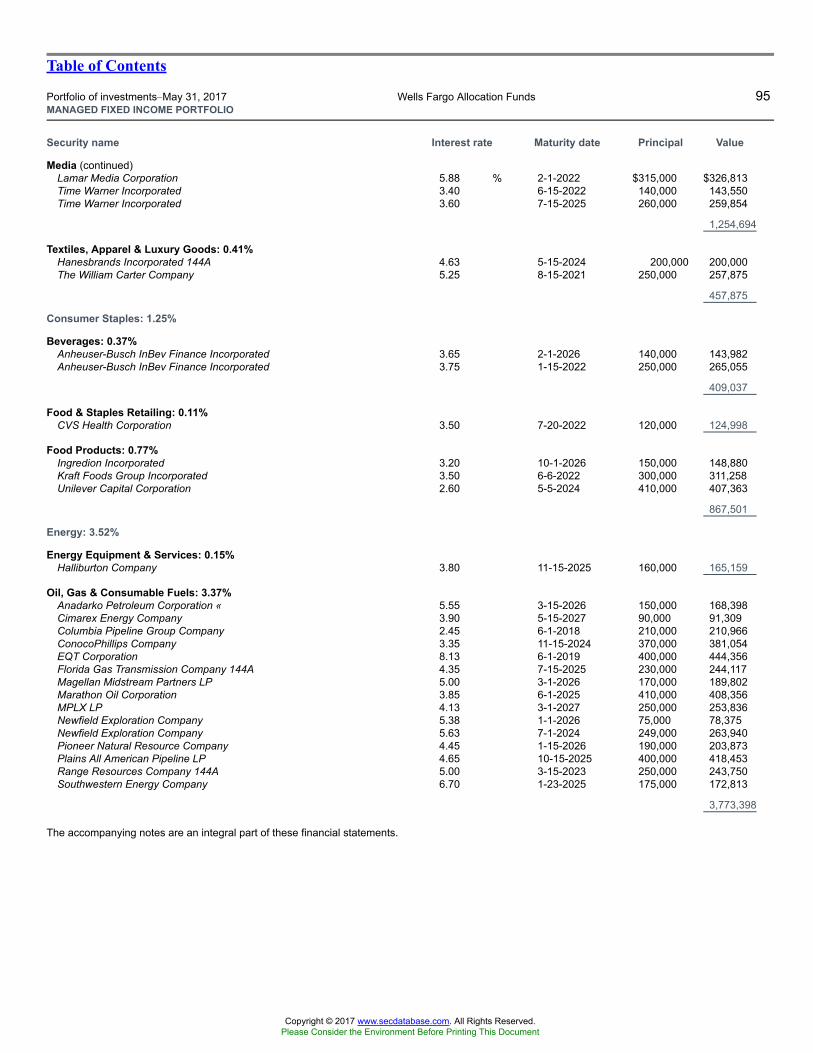
Table of Contents
Portfolio of investments�May 31, 2017 Wells Fargo Allocation Funds 95MANAGED FIXED INCOME PORTFOLIO
Security name Interest rate Maturity date Principal Value
Media (continued)Lamar Media Corporation 5.88 % 2-1-2022 $315,000 $326,813Time Warner Incorporated 3.40 6-15-2022 140,000 143,550Time Warner Incorporated 3.60 7-15-2025 260,000 259,854
1,254,694
Textiles, Apparel & Luxury Goods: 0.41%Hanesbrands Incorporated 144A 4.63 5-15-2024 200,000 200,000The William Carter Company 5.25 8-15-2021 250,000 257,875
457,875
Consumer Staples: 1.25%
Beverages: 0.37%Anheuser-Busch InBev Finance Incorporated 3.65 2-1-2026 140,000 143,982Anheuser-Busch InBev Finance Incorporated 3.75 1-15-2022 250,000 265,055
409,037
Food & Staples Retailing: 0.11%CVS Health Corporation 3.50 7-20-2022 120,000 124,998
Food Products: 0.77%Ingredion Incorporated 3.20 10-1-2026 150,000 148,880Kraft Foods Group Incorporated 3.50 6-6-2022 300,000 311,258Unilever Capital Corporation 2.60 5-5-2024 410,000 407,363
867,501
Energy: 3.52%
Energy Equipment & Services: 0.15%Halliburton Company 3.80 11-15-2025 160,000 165,159
Oil, Gas & Consumable Fuels: 3.37%Anadarko Petroleum Corporation « 5.55 3-15-2026 150,000 168,398Cimarex Energy Company 3.90 5-15-2027 90,000 91,309Columbia Pipeline Group Company 2.45 6-1-2018 210,000 210,966ConocoPhillips Company 3.35 11-15-2024 370,000 381,054EQT Corporation 8.13 6-1-2019 400,000 444,356Florida Gas Transmission Company 144A 4.35 7-15-2025 230,000 244,117Magellan Midstream Partners LP 5.00 3-1-2026 170,000 189,802Marathon Oil Corporation 3.85 6-1-2025 410,000 408,356MPLX LP 4.13 3-1-2027 250,000 253,836Newfield Exploration Company 5.38 1-1-2026 75,000 78,375Newfield Exploration Company 5.63 7-1-2024 249,000 263,940Pioneer Natural Resource Company 4.45 1-15-2026 190,000 203,873Plains All American Pipeline LP 4.65 10-15-2025 400,000 418,453Range Resources Company 144A 5.00 3-15-2023 250,000 243,750Southwestern Energy Company 6.70 1-23-2025 175,000 172,813
3,773,398
The accompanying notes are an integral part of these financial statements.
Copyright © 2017 www.secdatabase.com. All Rights Reserved.Please Consider the Environment Before Printing This Document
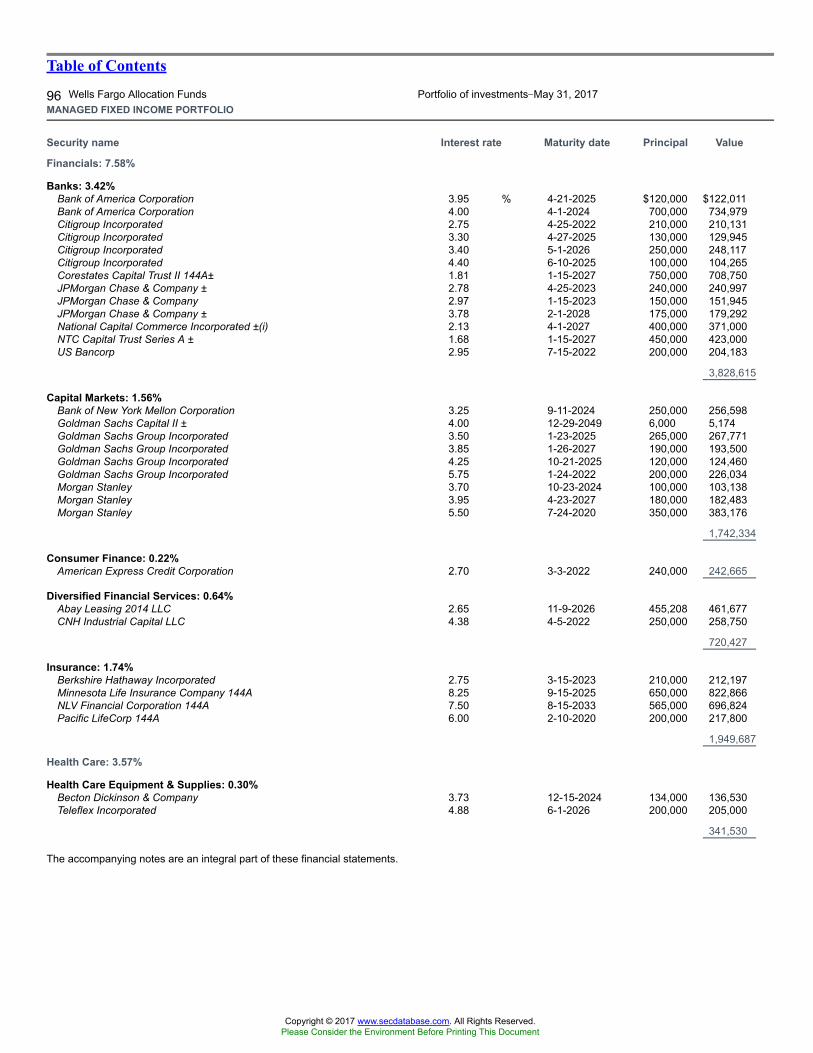
Table of Contents
96 Wells Fargo Allocation Funds Portfolio of investments�May 31, 2017MANAGED FIXED INCOME PORTFOLIO
Security name Interest rate Maturity date Principal Value
Financials: 7.58%
Banks: 3.42%Bank of America Corporation 3.95 % 4-21-2025 $120,000 $122,011Bank of America Corporation 4.00 4-1-2024 700,000 734,979Citigroup Incorporated 2.75 4-25-2022 210,000 210,131Citigroup Incorporated 3.30 4-27-2025 130,000 129,945Citigroup Incorporated 3.40 5-1-2026 250,000 248,117Citigroup Incorporated 4.40 6-10-2025 100,000 104,265Corestates Capital Trust II 144A± 1.81 1-15-2027 750,000 708,750JPMorgan Chase & Company ± 2.78 4-25-2023 240,000 240,997JPMorgan Chase & Company 2.97 1-15-2023 150,000 151,945JPMorgan Chase & Company ± 3.78 2-1-2028 175,000 179,292National Capital Commerce Incorporated ±(i) 2.13 4-1-2027 400,000 371,000NTC Capital Trust Series A ± 1.68 1-15-2027 450,000 423,000US Bancorp 2.95 7-15-2022 200,000 204,183
3,828,615
Capital Markets: 1.56%Bank of New York Mellon Corporation 3.25 9-11-2024 250,000 256,598Goldman Sachs Capital II ± 4.00 12-29-2049 6,000 5,174Goldman Sachs Group Incorporated 3.50 1-23-2025 265,000 267,771Goldman Sachs Group Incorporated 3.85 1-26-2027 190,000 193,500Goldman Sachs Group Incorporated 4.25 10-21-2025 120,000 124,460Goldman Sachs Group Incorporated 5.75 1-24-2022 200,000 226,034Morgan Stanley 3.70 10-23-2024 100,000 103,138Morgan Stanley 3.95 4-23-2027 180,000 182,483Morgan Stanley 5.50 7-24-2020 350,000 383,176
1,742,334
Consumer Finance: 0.22%American Express Credit Corporation 2.70 3-3-2022 240,000 242,665
Diversified Financial Services: 0.64%Abay Leasing 2014 LLC 2.65 11-9-2026 455,208 461,677CNH Industrial Capital LLC 4.38 4-5-2022 250,000 258,750
720,427
Insurance: 1.74%Berkshire Hathaway Incorporated 2.75 3-15-2023 210,000 212,197Minnesota Life Insurance Company 144A 8.25 9-15-2025 650,000 822,866NLV Financial Corporation 144A 7.50 8-15-2033 565,000 696,824Pacific LifeCorp 144A 6.00 2-10-2020 200,000 217,800
1,949,687
Health Care: 3.57%
Health Care Equipment & Supplies: 0.30%Becton Dickinson & Company 3.73 12-15-2024 134,000 136,530Teleflex Incorporated 4.88 6-1-2026 200,000 205,000
341,530
The accompanying notes are an integral part of these financial statements.
Copyright © 2017 www.secdatabase.com. All Rights Reserved.Please Consider the Environment Before Printing This Document
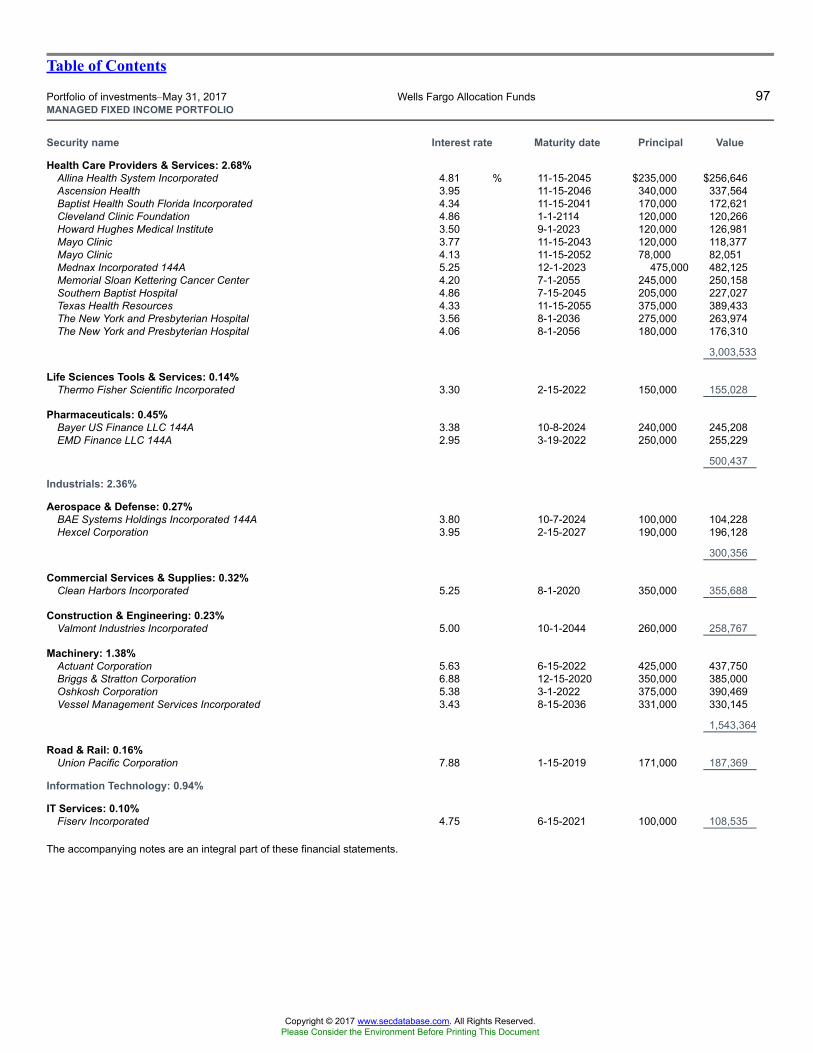
Table of Contents
Portfolio of investments�May 31, 2017 Wells Fargo Allocation Funds 97MANAGED FIXED INCOME PORTFOLIO
Security name Interest rate Maturity date Principal Value
Health Care Providers & Services: 2.68%Allina Health System Incorporated 4.81 % 11-15-2045 $235,000 $256,646Ascension Health 3.95 11-15-2046 340,000 337,564Baptist Health South Florida Incorporated 4.34 11-15-2041 170,000 172,621Cleveland Clinic Foundation 4.86 1-1-2114 120,000 120,266Howard Hughes Medical Institute 3.50 9-1-2023 120,000 126,981Mayo Clinic 3.77 11-15-2043 120,000 118,377Mayo Clinic 4.13 11-15-2052 78,000 82,051Mednax Incorporated 144A 5.25 12-1-2023 475,000 482,125Memorial Sloan Kettering Cancer Center 4.20 7-1-2055 245,000 250,158Southern Baptist Hospital 4.86 7-15-2045 205,000 227,027Texas Health Resources 4.33 11-15-2055 375,000 389,433The New York and Presbyterian Hospital 3.56 8-1-2036 275,000 263,974The New York and Presbyterian Hospital 4.06 8-1-2056 180,000 176,310
3,003,533
Life Sciences Tools & Services: 0.14%Thermo Fisher Scientific Incorporated 3.30 2-15-2022 150,000 155,028
Pharmaceuticals: 0.45%Bayer US Finance LLC 144A 3.38 10-8-2024 240,000 245,208EMD Finance LLC 144A 2.95 3-19-2022 250,000 255,229
500,437
Industrials: 2.36%
Aerospace & Defense: 0.27%BAE Systems Holdings Incorporated 144A 3.80 10-7-2024 100,000 104,228Hexcel Corporation 3.95 2-15-2027 190,000 196,128
300,356
Commercial Services & Supplies: 0.32%Clean Harbors Incorporated 5.25 8-1-2020 350,000 355,688
Construction & Engineering: 0.23%Valmont Industries Incorporated 5.00 10-1-2044 260,000 258,767
Machinery: 1.38%Actuant Corporation 5.63 6-15-2022 425,000 437,750Briggs & Stratton Corporation 6.88 12-15-2020 350,000 385,000Oshkosh Corporation 5.38 3-1-2022 375,000 390,469Vessel Management Services Incorporated 3.43 8-15-2036 331,000 330,145
1,543,364
Road & Rail: 0.16%Union Pacific Corporation 7.88 1-15-2019 171,000 187,369
Information Technology: 0.94%
IT Services: 0.10%Fiserv Incorporated 4.75 6-15-2021 100,000 108,535
The accompanying notes are an integral part of these financial statements.
Copyright © 2017 www.secdatabase.com. All Rights Reserved.Please Consider the Environment Before Printing This Document
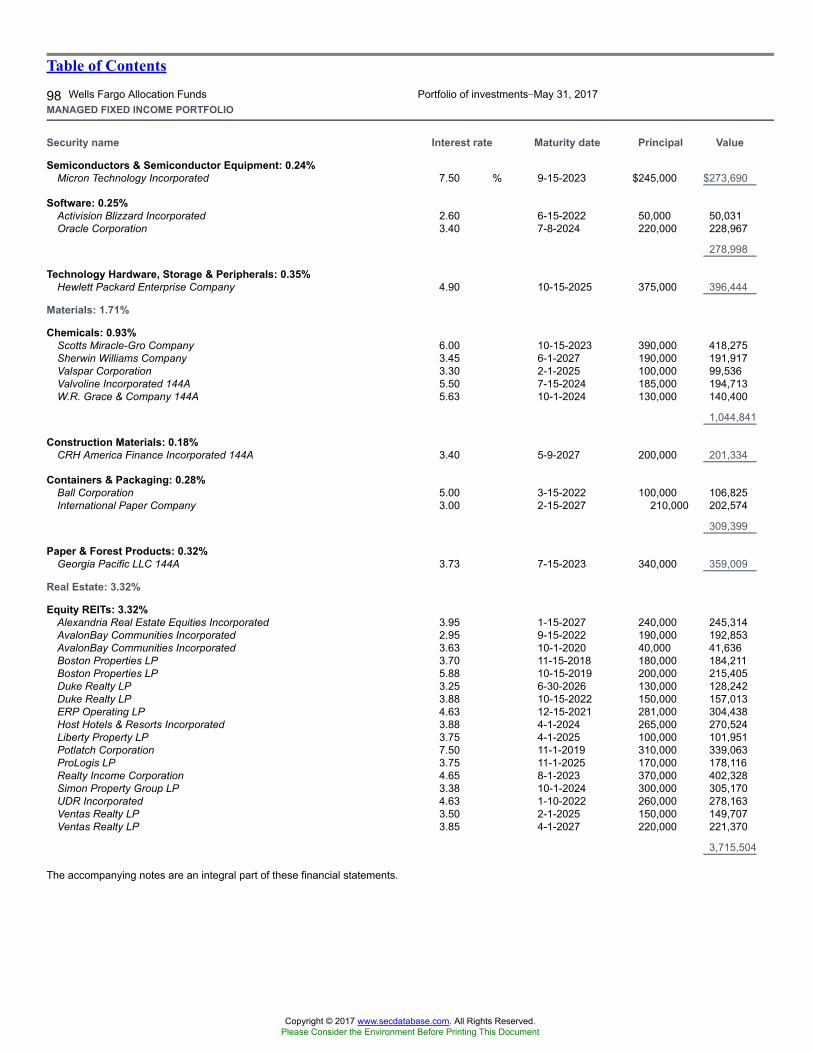
Table of Contents
98 Wells Fargo Allocation Funds Portfolio of investments�May 31, 2017MANAGED FIXED INCOME PORTFOLIO
Security name Interest rate Maturity date Principal Value
Semiconductors & Semiconductor Equipment: 0.24%Micron Technology Incorporated 7.50 % 9-15-2023 $245,000 $273,690
Software: 0.25%Activision Blizzard Incorporated 2.60 6-15-2022 50,000 50,031Oracle Corporation 3.40 7-8-2024 220,000 228,967
278,998
Technology Hardware, Storage & Peripherals: 0.35%Hewlett Packard Enterprise Company 4.90 10-15-2025 375,000 396,444
Materials: 1.71%
Chemicals: 0.93%Scotts Miracle-Gro Company 6.00 10-15-2023 390,000 418,275Sherwin Williams Company 3.45 6-1-2027 190,000 191,917Valspar Corporation 3.30 2-1-2025 100,000 99,536Valvoline Incorporated 144A 5.50 7-15-2024 185,000 194,713W.R. Grace & Company 144A 5.63 10-1-2024 130,000 140,400
1,044,841
Construction Materials: 0.18%CRH America Finance Incorporated 144A 3.40 5-9-2027 200,000 201,334
Containers & Packaging: 0.28%Ball Corporation 5.00 3-15-2022 100,000 106,825International Paper Company 3.00 2-15-2027 210,000 202,574
309,399
Paper & Forest Products: 0.32%Georgia Pacific LLC 144A 3.73 7-15-2023 340,000 359,009
Real Estate: 3.32%
Equity REITs: 3.32%Alexandria Real Estate Equities Incorporated 3.95 1-15-2027 240,000 245,314AvalonBay Communities Incorporated 2.95 9-15-2022 190,000 192,853AvalonBay Communities Incorporated 3.63 10-1-2020 40,000 41,636Boston Properties LP 3.70 11-15-2018 180,000 184,211Boston Properties LP 5.88 10-15-2019 200,000 215,405Duke Realty LP 3.25 6-30-2026 130,000 128,242Duke Realty LP 3.88 10-15-2022 150,000 157,013ERP Operating LP 4.63 12-15-2021 281,000 304,438Host Hotels & Resorts Incorporated 3.88 4-1-2024 265,000 270,524Liberty Property LP 3.75 4-1-2025 100,000 101,951Potlatch Corporation 7.50 11-1-2019 310,000 339,063ProLogis LP 3.75 11-1-2025 170,000 178,116Realty Income Corporation 4.65 8-1-2023 370,000 402,328Simon Property Group LP 3.38 10-1-2024 300,000 305,170UDR Incorporated 4.63 1-10-2022 260,000 278,163Ventas Realty LP 3.50 2-1-2025 150,000 149,707Ventas Realty LP 3.85 4-1-2027 220,000 221,370
3,715,504
The accompanying notes are an integral part of these financial statements.
Copyright © 2017 www.secdatabase.com. All Rights Reserved.Please Consider the Environment Before Printing This Document
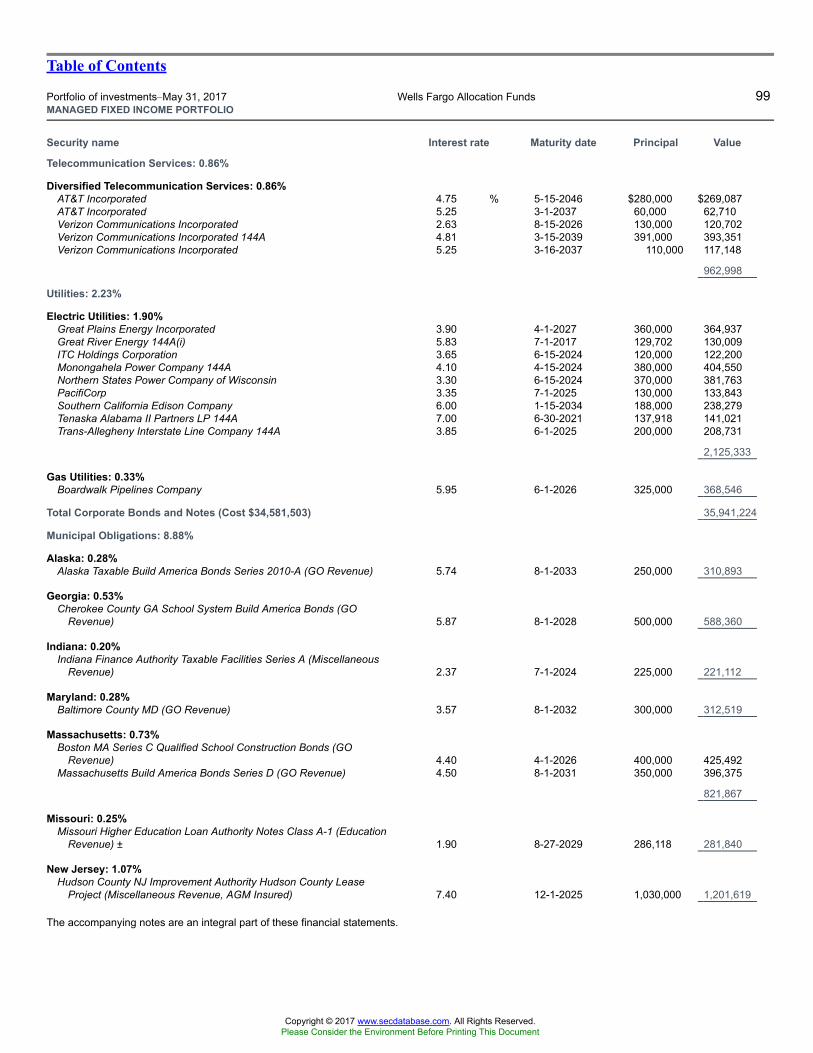
Table of Contents
Portfolio of investments�May 31, 2017 Wells Fargo Allocation Funds 99MANAGED FIXED INCOME PORTFOLIO
Security name Interest rate Maturity date Principal Value
Telecommunication Services: 0.86%
Diversified Telecommunication Services: 0.86%AT&T Incorporated 4.75 % 5-15-2046 $280,000 $269,087AT&T Incorporated 5.25 3-1-2037 60,000 62,710Verizon Communications Incorporated 2.63 8-15-2026 130,000 120,702Verizon Communications Incorporated 144A 4.81 3-15-2039 391,000 393,351Verizon Communications Incorporated 5.25 3-16-2037 110,000 117,148
962,998
Utilities: 2.23%
Electric Utilities: 1.90%Great Plains Energy Incorporated 3.90 4-1-2027 360,000 364,937Great River Energy 144A(i) 5.83 7-1-2017 129,702 130,009ITC Holdings Corporation 3.65 6-15-2024 120,000 122,200Monongahela Power Company 144A 4.10 4-15-2024 380,000 404,550Northern States Power Company of Wisconsin 3.30 6-15-2024 370,000 381,763PacifiCorp 3.35 7-1-2025 130,000 133,843Southern California Edison Company 6.00 1-15-2034 188,000 238,279Tenaska Alabama II Partners LP 144A 7.00 6-30-2021 137,918 141,021Trans-Allegheny Interstate Line Company 144A 3.85 6-1-2025 200,000 208,731
2,125,333
Gas Utilities: 0.33%Boardwalk Pipelines Company 5.95 6-1-2026 325,000 368,546
Total Corporate Bonds and Notes (Cost $34,581,503) 35,941,224
Municipal Obligations: 8.88%
Alaska: 0.28%Alaska Taxable Build America Bonds Series 2010-A (GO Revenue) 5.74 8-1-2033 250,000 310,893
Georgia: 0.53%Cherokee County GA School System Build America Bonds (GO
Revenue) 5.87 8-1-2028 500,000 588,360
Indiana: 0.20%Indiana Finance Authority Taxable Facilities Series A (Miscellaneous
Revenue) 2.37 7-1-2024 225,000 221,112
Maryland: 0.28%Baltimore County MD (GO Revenue) 3.57 8-1-2032 300,000 312,519
Massachusetts: 0.73%Boston MA Series C Qualified School Construction Bonds (GO
Revenue) 4.40 4-1-2026 400,000 425,492Massachusetts Build America Bonds Series D (GO Revenue) 4.50 8-1-2031 350,000 396,375
821,867
Missouri: 0.25%Missouri Higher Education Loan Authority Notes Class A-1 (Education
Revenue) ± 1.90 8-27-2029 286,118 281,840
New Jersey: 1.07%Hudson County NJ Improvement Authority Hudson County Lease
Project (Miscellaneous Revenue, AGM Insured) 7.40 12-1-2025 1,030,000 1,201,619
The accompanying notes are an integral part of these financial statements.
Copyright © 2017 www.secdatabase.com. All Rights Reserved.Please Consider the Environment Before Printing This Document
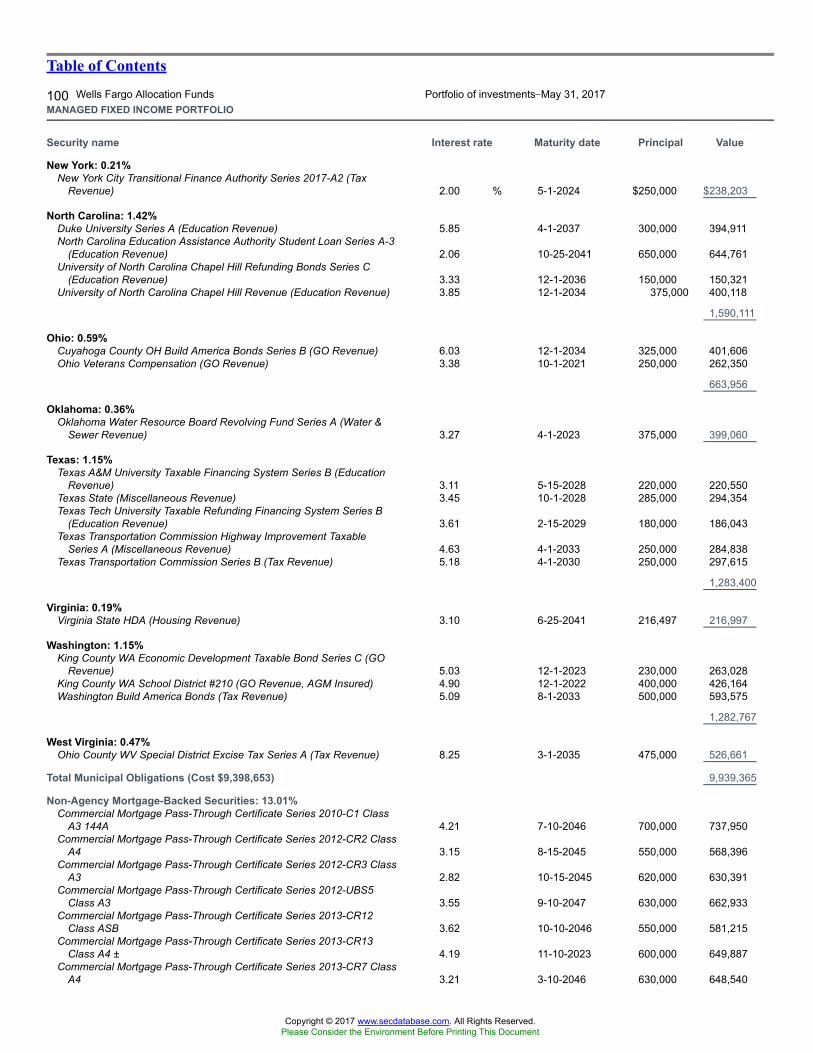
Table of Contents
100 Wells Fargo Allocation Funds Portfolio of investments�May 31, 2017MANAGED FIXED INCOME PORTFOLIO
Security name Interest rate Maturity date Principal Value
New York: 0.21%New York City Transitional Finance Authority Series 2017-A2 (Tax
Revenue) 2.00 % 5-1-2024 $250,000 $238,203
North Carolina: 1.42%Duke University Series A (Education Revenue) 5.85 4-1-2037 300,000 394,911North Carolina Education Assistance Authority Student Loan Series A-3
(Education Revenue) 2.06 10-25-2041 650,000 644,761University of North Carolina Chapel Hill Refunding Bonds Series C
(Education Revenue) 3.33 12-1-2036 150,000 150,321University of North Carolina Chapel Hill Revenue (Education Revenue) 3.85 12-1-2034 375,000 400,118
1,590,111
Ohio: 0.59%Cuyahoga County OH Build America Bonds Series B (GO Revenue) 6.03 12-1-2034 325,000 401,606Ohio Veterans Compensation (GO Revenue) 3.38 10-1-2021 250,000 262,350
663,956
Oklahoma: 0.36%Oklahoma Water Resource Board Revolving Fund Series A (Water &
Sewer Revenue) 3.27 4-1-2023 375,000 399,060
Texas: 1.15%Texas A&M University Taxable Financing System Series B (Education
Revenue) 3.11 5-15-2028 220,000 220,550Texas State (Miscellaneous Revenue) 3.45 10-1-2028 285,000 294,354Texas Tech University Taxable Refunding Financing System Series B
(Education Revenue) 3.61 2-15-2029 180,000 186,043Texas Transportation Commission Highway Improvement Taxable
Series A (Miscellaneous Revenue) 4.63 4-1-2033 250,000 284,838Texas Transportation Commission Series B (Tax Revenue) 5.18 4-1-2030 250,000 297,615
1,283,400
Virginia: 0.19%Virginia State HDA (Housing Revenue) 3.10 6-25-2041 216,497 216,997
Washington: 1.15%King County WA Economic Development Taxable Bond Series C (GO
Revenue) 5.03 12-1-2023 230,000 263,028King County WA School District #210 (GO Revenue, AGM Insured) 4.90 12-1-2022 400,000 426,164Washington Build America Bonds (Tax Revenue) 5.09 8-1-2033 500,000 593,575
1,282,767
West Virginia: 0.47%Ohio County WV Special District Excise Tax Series A (Tax Revenue) 8.25 3-1-2035 475,000 526,661
Total Municipal Obligations (Cost $9,398,653) 9,939,365
Non-Agency Mortgage-Backed Securities: 13.01%Commercial Mortgage Pass-Through Certificate Series 2010-C1 Class
A3 144A 4.21 7-10-2046 700,000 737,950Commercial Mortgage Pass-Through Certificate Series 2012-CR2 Class
A4 3.15 8-15-2045 550,000 568,396Commercial Mortgage Pass-Through Certificate Series 2012-CR3 Class
A3 2.82 10-15-2045 620,000 630,391Commercial Mortgage Pass-Through Certificate Series 2012-UBS5
Class A3 3.55 9-10-2047 630,000 662,933Commercial Mortgage Pass-Through Certificate Series 2013-CR12
Class ASB 3.62 10-10-2046 550,000 581,215Commercial Mortgage Pass-Through Certificate Series 2013-CR13
Class A4 ± 4.19 11-10-2023 600,000 649,887Commercial Mortgage Pass-Through Certificate Series 2013-CR7 Class
A4 3.21 3-10-2046 630,000 648,540
Copyright © 2017 www.secdatabase.com. All Rights Reserved.Please Consider the Environment Before Printing This Document

The accompanying notes are an integral part of these financial statements.
Copyright © 2017 www.secdatabase.com. All Rights Reserved.Please Consider the Environment Before Printing This Document
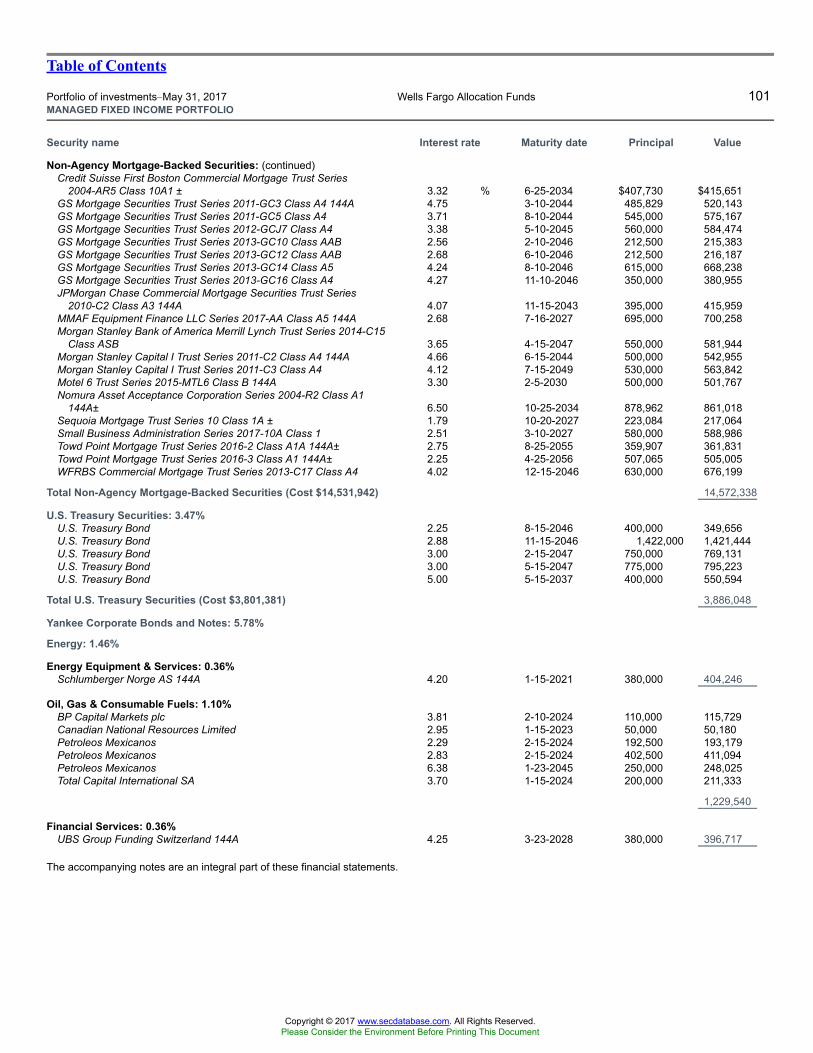
Table of Contents
Portfolio of investments�May 31, 2017 Wells Fargo Allocation Funds 101MANAGED FIXED INCOME PORTFOLIO
Security name Interest rate Maturity date Principal Value
Non-Agency Mortgage-Backed Securities: (continued)Credit Suisse First Boston Commercial Mortgage Trust Series
2004-AR5 Class 10A1 ± 3.32 % 6-25-2034 $407,730 $415,651GS Mortgage Securities Trust Series 2011-GC3 Class A4 144A 4.75 3-10-2044 485,829 520,143GS Mortgage Securities Trust Series 2011-GC5 Class A4 3.71 8-10-2044 545,000 575,167GS Mortgage Securities Trust Series 2012-GCJ7 Class A4 3.38 5-10-2045 560,000 584,474GS Mortgage Securities Trust Series 2013-GC10 Class AAB 2.56 2-10-2046 212,500 215,383GS Mortgage Securities Trust Series 2013-GC12 Class AAB 2.68 6-10-2046 212,500 216,187GS Mortgage Securities Trust Series 2013-GC14 Class A5 4.24 8-10-2046 615,000 668,238GS Mortgage Securities Trust Series 2013-GC16 Class A4 4.27 11-10-2046 350,000 380,955JPMorgan Chase Commercial Mortgage Securities Trust Series
2010-C2 Class A3 144A 4.07 11-15-2043 395,000 415,959MMAF Equipment Finance LLC Series 2017-AA Class A5 144A 2.68 7-16-2027 695,000 700,258Morgan Stanley Bank of America Merrill Lynch Trust Series 2014-C15
Class ASB 3.65 4-15-2047 550,000 581,944Morgan Stanley Capital I Trust Series 2011-C2 Class A4 144A 4.66 6-15-2044 500,000 542,955Morgan Stanley Capital I Trust Series 2011-C3 Class A4 4.12 7-15-2049 530,000 563,842Motel 6 Trust Series 2015-MTL6 Class B 144A 3.30 2-5-2030 500,000 501,767Nomura Asset Acceptance Corporation Series 2004-R2 Class A1
144A± 6.50 10-25-2034 878,962 861,018Sequoia Mortgage Trust Series 10 Class 1A ± 1.79 10-20-2027 223,084 217,064Small Business Administration Series 2017-10A Class 1 2.51 3-10-2027 580,000 588,986Towd Point Mortgage Trust Series 2016-2 Class A1A 144A± 2.75 8-25-2055 359,907 361,831Towd Point Mortgage Trust Series 2016-3 Class A1 144A± 2.25 4-25-2056 507,065 505,005WFRBS Commercial Mortgage Trust Series 2013-C17 Class A4 4.02 12-15-2046 630,000 676,199
Total Non-Agency Mortgage-Backed Securities (Cost $14,531,942) 14,572,338
U.S. Treasury Securities: 3.47%U.S. Treasury Bond 2.25 8-15-2046 400,000 349,656U.S. Treasury Bond 2.88 11-15-2046 1,422,000 1,421,444U.S. Treasury Bond 3.00 2-15-2047 750,000 769,131U.S. Treasury Bond 3.00 5-15-2047 775,000 795,223U.S. Treasury Bond 5.00 5-15-2037 400,000 550,594
Total U.S. Treasury Securities (Cost $3,801,381) 3,886,048
Yankee Corporate Bonds and Notes: 5.78%
Energy: 1.46%
Energy Equipment & Services: 0.36%Schlumberger Norge AS 144A 4.20 1-15-2021 380,000 404,246
Oil, Gas & Consumable Fuels: 1.10%BP Capital Markets plc 3.81 2-10-2024 110,000 115,729Canadian National Resources Limited 2.95 1-15-2023 50,000 50,180Petroleos Mexicanos 2.29 2-15-2024 192,500 193,179Petroleos Mexicanos 2.83 2-15-2024 402,500 411,094Petroleos Mexicanos 6.38 1-23-2045 250,000 248,025Total Capital International SA 3.70 1-15-2024 200,000 211,333
1,229,540
Financial Services: 0.36%UBS Group Funding Switzerland 144A 4.25 3-23-2028 380,000 396,717
The accompanying notes are an integral part of these financial statements.
Copyright © 2017 www.secdatabase.com. All Rights Reserved.Please Consider the Environment Before Printing This Document
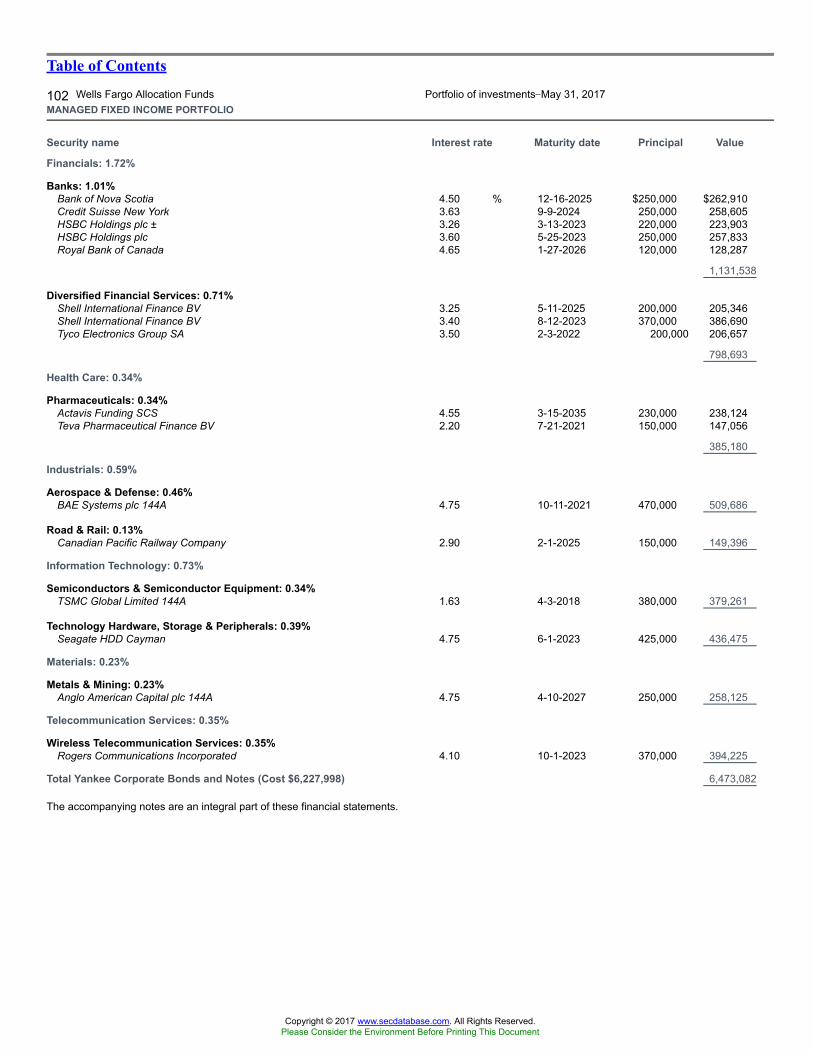
Table of Contents
102 Wells Fargo Allocation Funds Portfolio of investments�May 31, 2017MANAGED FIXED INCOME PORTFOLIO
Security name Interest rate Maturity date Principal Value
Financials: 1.72%
Banks: 1.01%Bank of Nova Scotia 4.50 % 12-16-2025 $250,000 $262,910Credit Suisse New York 3.63 9-9-2024 250,000 258,605HSBC Holdings plc ± 3.26 3-13-2023 220,000 223,903HSBC Holdings plc 3.60 5-25-2023 250,000 257,833Royal Bank of Canada 4.65 1-27-2026 120,000 128,287
1,131,538
Diversified Financial Services: 0.71%Shell International Finance BV 3.25 5-11-2025 200,000 205,346Shell International Finance BV 3.40 8-12-2023 370,000 386,690Tyco Electronics Group SA 3.50 2-3-2022 200,000 206,657
798,693
Health Care: 0.34%
Pharmaceuticals: 0.34%Actavis Funding SCS 4.55 3-15-2035 230,000 238,124Teva Pharmaceutical Finance BV 2.20 7-21-2021 150,000 147,056
385,180
Industrials: 0.59%
Aerospace & Defense: 0.46%BAE Systems plc 144A 4.75 10-11-2021 470,000 509,686
Road & Rail: 0.13%Canadian Pacific Railway Company 2.90 2-1-2025 150,000 149,396
Information Technology: 0.73%
Semiconductors & Semiconductor Equipment: 0.34%TSMC Global Limited 144A 1.63 4-3-2018 380,000 379,261
Technology Hardware, Storage & Peripherals: 0.39%Seagate HDD Cayman 4.75 6-1-2023 425,000 436,475
Materials: 0.23%
Metals & Mining: 0.23%Anglo American Capital plc 144A 4.75 4-10-2027 250,000 258,125
Telecommunication Services: 0.35%
Wireless Telecommunication Services: 0.35%Rogers Communications Incorporated 4.10 10-1-2023 370,000 394,225
Total Yankee Corporate Bonds and Notes (Cost $6,227,998) 6,473,082
The accompanying notes are an integral part of these financial statements.
Copyright © 2017 www.secdatabase.com. All Rights Reserved.Please Consider the Environment Before Printing This Document
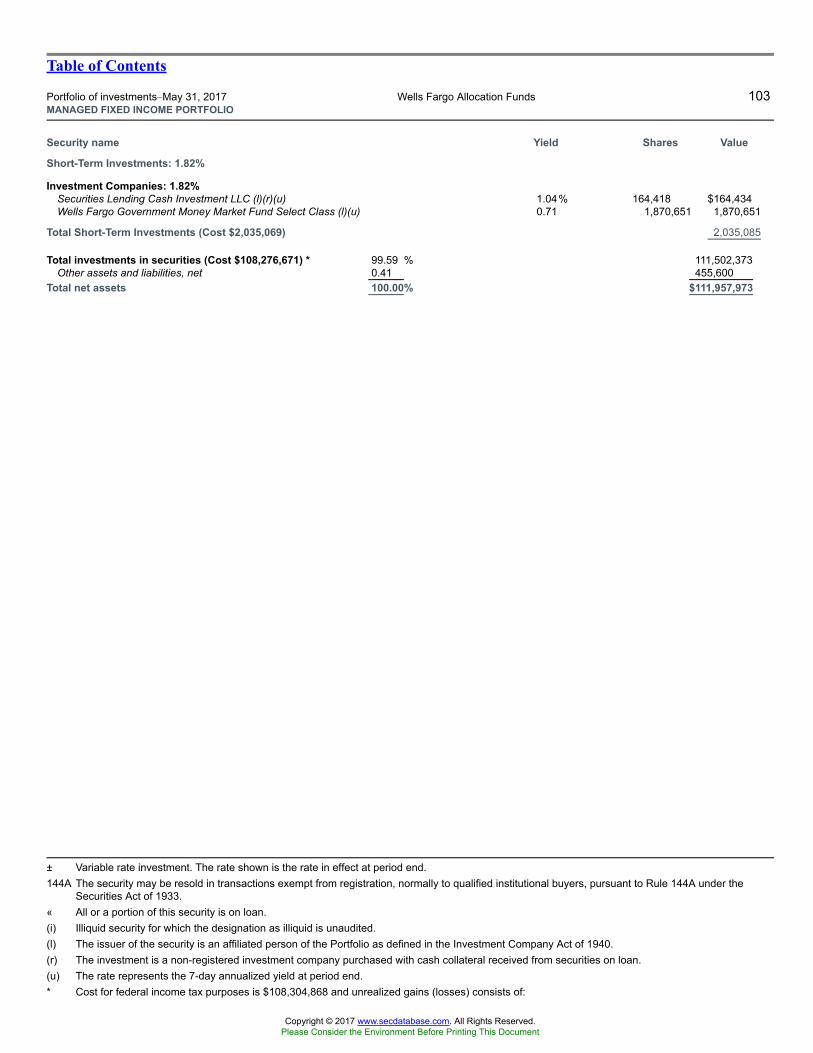
Table of Contents
Portfolio of investments�May 31, 2017 Wells Fargo Allocation Funds 103MANAGED FIXED INCOME PORTFOLIO
Security name Yield Shares Value
Short-Term Investments: 1.82%
Investment Companies: 1.82%Securities Lending Cash Investment LLC (l)(r)(u) 1.04% 164,418 $164,434Wells Fargo Government Money Market Fund Select Class (l)(u) 0.71 1,870,651 1,870,651
Total Short-Term Investments (Cost $2,035,069) 2,035,085
Total investments in securities (Cost $108,276,671) * 99.59 % 111,502,373Other assets and liabilities, net 0.41 455,600
Total net assets 100.00% $111,957,973
± Variable rate investment. The rate shown is the rate in effect at period end.144A The security may be resold in transactions exempt from registration, normally to qualified institutional buyers, pursuant to Rule 144A under the
Securities Act of 1933.« All or a portion of this security is on loan.(i) Illiquid security for which the designation as illiquid is unaudited.(l) The issuer of the security is an affiliated person of the Portfolio as defined in the Investment Company Act of 1940.(r) The investment is a non-registered investment company purchased with cash collateral received from securities on loan.(u) The rate represents the 7-day annualized yield at period end.* Cost for federal income tax purposes is $108,304,868 and unrealized gains (losses) consists of:
Copyright © 2017 www.secdatabase.com. All Rights Reserved.Please Consider the Environment Before Printing This Document
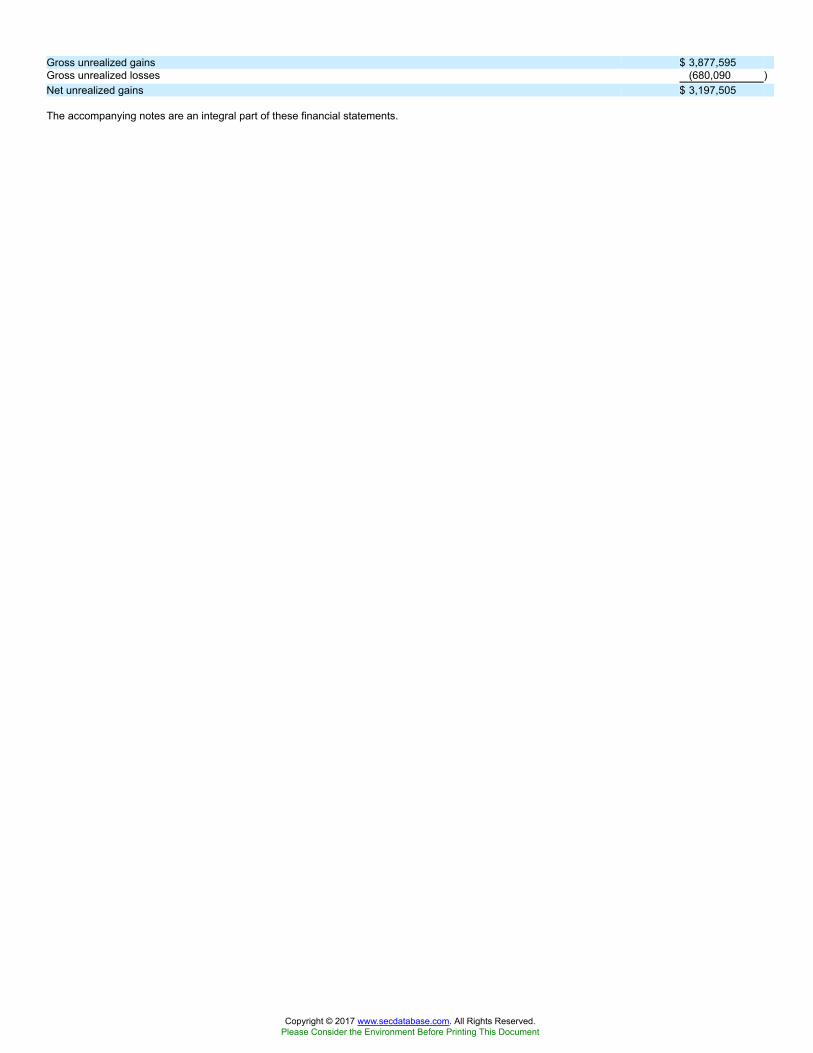
Gross unrealized gains $ 3,877,595Gross unrealized losses (680,090 )Net unrealized gains $ 3,197,505
The accompanying notes are an integral part of these financial statements.
Copyright © 2017 www.secdatabase.com. All Rights Reserved.Please Consider the Environment Before Printing This Document
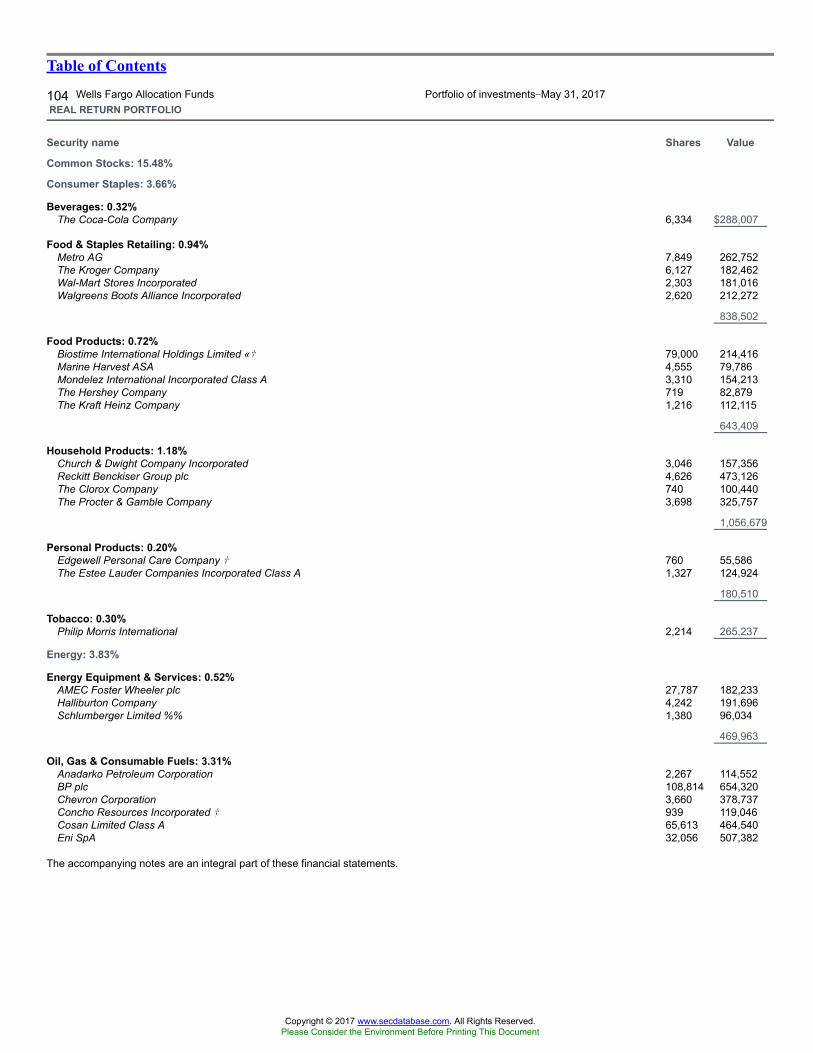
Table of Contents
104 Wells Fargo Allocation Funds Portfolio of investments�May 31, 2017REAL RETURN PORTFOLIO
Security name Shares Value
Common Stocks: 15.48%
Consumer Staples: 3.66%
Beverages: 0.32%The Coca-Cola Company 6,334 $288,007
Food & Staples Retailing: 0.94%Metro AG 7,849 262,752The Kroger Company 6,127 182,462Wal-Mart Stores Incorporated 2,303 181,016Walgreens Boots Alliance Incorporated 2,620 212,272
838,502
Food Products: 0.72%Biostime International Holdings Limited «� 79,000 214,416Marine Harvest ASA 4,555 79,786Mondelez International Incorporated Class A 3,310 154,213The Hershey Company 719 82,879The Kraft Heinz Company 1,216 112,115
643,409
Household Products: 1.18%Church & Dwight Company Incorporated 3,046 157,356Reckitt Benckiser Group plc 4,626 473,126The Clorox Company 740 100,440The Procter & Gamble Company 3,698 325,757
1,056,679
Personal Products: 0.20%Edgewell Personal Care Company � 760 55,586The Estee Lauder Companies Incorporated Class A 1,327 124,924
180,510
Tobacco: 0.30%Philip Morris International 2,214 265,237
Energy: 3.83%
Energy Equipment & Services: 0.52%AMEC Foster Wheeler plc 27,787 182,233Halliburton Company 4,242 191,696Schlumberger Limited %% 1,380 96,034
469,963
Oil, Gas & Consumable Fuels: 3.31%Anadarko Petroleum Corporation 2,267 114,552BP plc 108,814 654,320Chevron Corporation 3,660 378,737Concho Resources Incorporated � 939 119,046Cosan Limited Class A 65,613 464,540Eni SpA 32,056 507,382
The accompanying notes are an integral part of these financial statements.
Copyright © 2017 www.secdatabase.com. All Rights Reserved.Please Consider the Environment Before Printing This Document
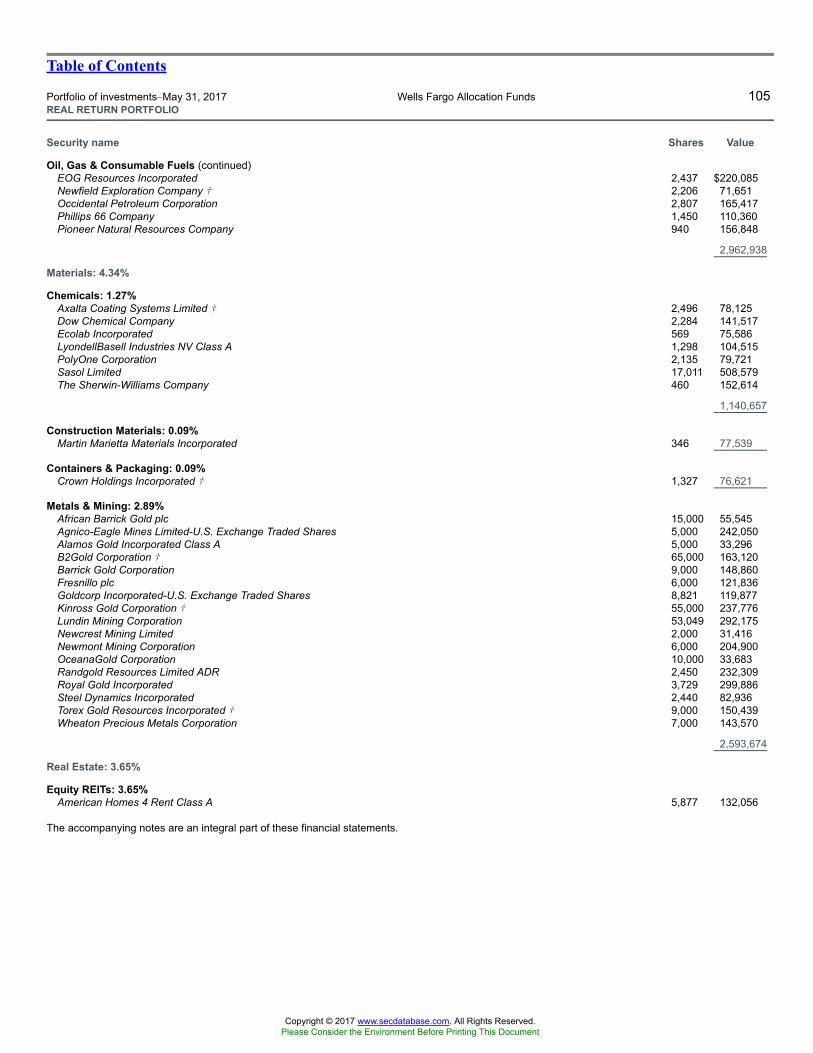
Table of Contents
Portfolio of investments�May 31, 2017 Wells Fargo Allocation Funds 105REAL RETURN PORTFOLIO
Security name Shares Value
Oil, Gas & Consumable Fuels (continued)EOG Resources Incorporated 2,437 $220,085Newfield Exploration Company � 2,206 71,651Occidental Petroleum Corporation 2,807 165,417Phillips 66 Company 1,450 110,360Pioneer Natural Resources Company 940 156,848
2,962,938
Materials: 4.34%
Chemicals: 1.27%Axalta Coating Systems Limited � 2,496 78,125Dow Chemical Company 2,284 141,517Ecolab Incorporated 569 75,586LyondellBasell Industries NV Class A 1,298 104,515PolyOne Corporation 2,135 79,721Sasol Limited 17,011 508,579The Sherwin-Williams Company 460 152,614
1,140,657
Construction Materials: 0.09%Martin Marietta Materials Incorporated 346 77,539
Containers & Packaging: 0.09%Crown Holdings Incorporated � 1,327 76,621
Metals & Mining: 2.89%African Barrick Gold plc 15,000 55,545Agnico-Eagle Mines Limited-U.S. Exchange Traded Shares 5,000 242,050Alamos Gold Incorporated Class A 5,000 33,296B2Gold Corporation � 65,000 163,120Barrick Gold Corporation 9,000 148,860Fresnillo plc 6,000 121,836Goldcorp Incorporated-U.S. Exchange Traded Shares 8,821 119,877Kinross Gold Corporation � 55,000 237,776Lundin Mining Corporation 53,049 292,175Newcrest Mining Limited 2,000 31,416Newmont Mining Corporation 6,000 204,900OceanaGold Corporation 10,000 33,683Randgold Resources Limited ADR 2,450 232,309Royal Gold Incorporated 3,729 299,886Steel Dynamics Incorporated 2,440 82,936Torex Gold Resources Incorporated � 9,000 150,439Wheaton Precious Metals Corporation 7,000 143,570
2,593,674
Real Estate: 3.65%
Equity REITs: 3.65%American Homes 4 Rent Class A 5,877 132,056
The accompanying notes are an integral part of these financial statements.
Copyright © 2017 www.secdatabase.com. All Rights Reserved.Please Consider the Environment Before Printing This Document
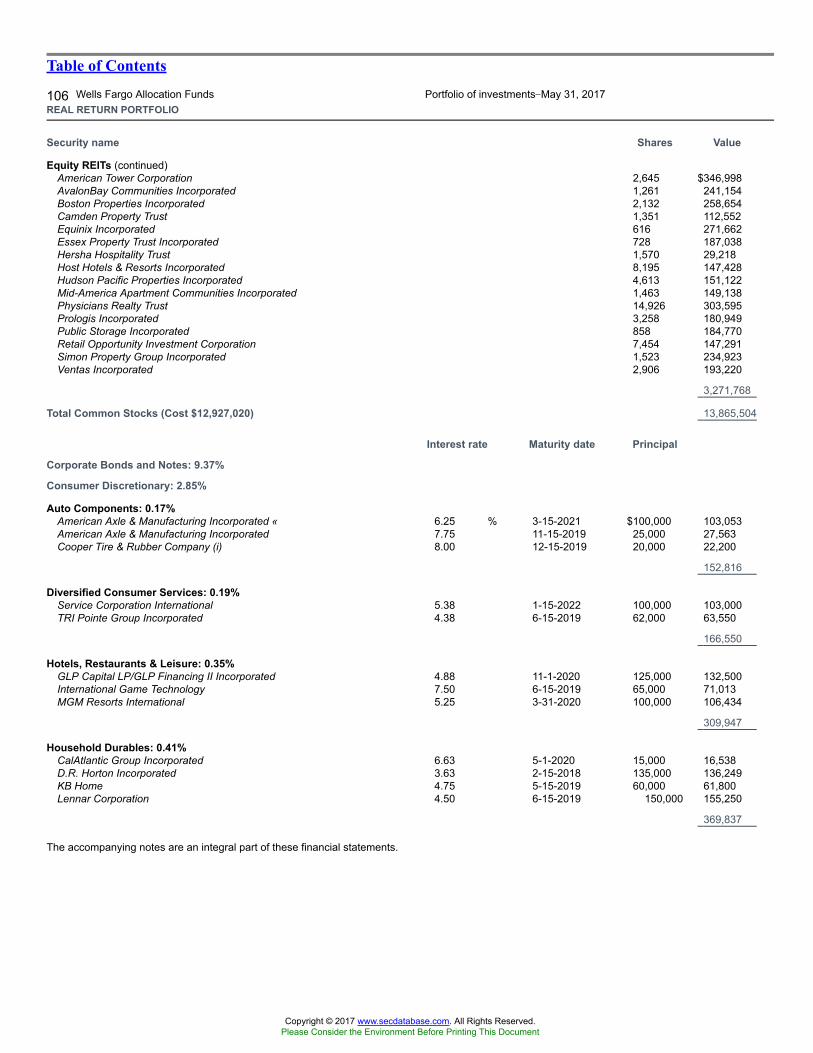
Table of Contents
106 Wells Fargo Allocation Funds Portfolio of investments�May 31, 2017REAL RETURN PORTFOLIO
Security name Shares Value
Equity REITs (continued)American Tower Corporation 2,645 $346,998AvalonBay Communities Incorporated 1,261 241,154Boston Properties Incorporated 2,132 258,654Camden Property Trust 1,351 112,552Equinix Incorporated 616 271,662Essex Property Trust Incorporated 728 187,038Hersha Hospitality Trust 1,570 29,218Host Hotels & Resorts Incorporated 8,195 147,428Hudson Pacific Properties Incorporated 4,613 151,122Mid-America Apartment Communities Incorporated 1,463 149,138Physicians Realty Trust 14,926 303,595Prologis Incorporated 3,258 180,949Public Storage Incorporated 858 184,770Retail Opportunity Investment Corporation 7,454 147,291Simon Property Group Incorporated 1,523 234,923Ventas Incorporated 2,906 193,220
3,271,768
Total Common Stocks (Cost $12,927,020) 13,865,504
Interest rate Maturity date Principal
Corporate Bonds and Notes: 9.37%
Consumer Discretionary: 2.85%
Auto Components: 0.17%American Axle & Manufacturing Incorporated « 6.25 % 3-15-2021 $100,000 103,053American Axle & Manufacturing Incorporated 7.75 11-15-2019 25,000 27,563Cooper Tire & Rubber Company (i) 8.00 12-15-2019 20,000 22,200
152,816
Diversified Consumer Services: 0.19%Service Corporation International 5.38 1-15-2022 100,000 103,000TRI Pointe Group Incorporated 4.38 6-15-2019 62,000 63,550
166,550
Hotels, Restaurants & Leisure: 0.35%GLP Capital LP/GLP Financing II Incorporated 4.88 11-1-2020 125,000 132,500International Game Technology 7.50 6-15-2019 65,000 71,013MGM Resorts International 5.25 3-31-2020 100,000 106,434
309,947
Household Durables: 0.41%CalAtlantic Group Incorporated 6.63 5-1-2020 15,000 16,538D.R. Horton Incorporated 3.63 2-15-2018 135,000 136,249KB Home 4.75 5-15-2019 60,000 61,800Lennar Corporation 4.50 6-15-2019 150,000 155,250
369,837
The accompanying notes are an integral part of these financial statements.
Copyright © 2017 www.secdatabase.com. All Rights Reserved.Please Consider the Environment Before Printing This Document
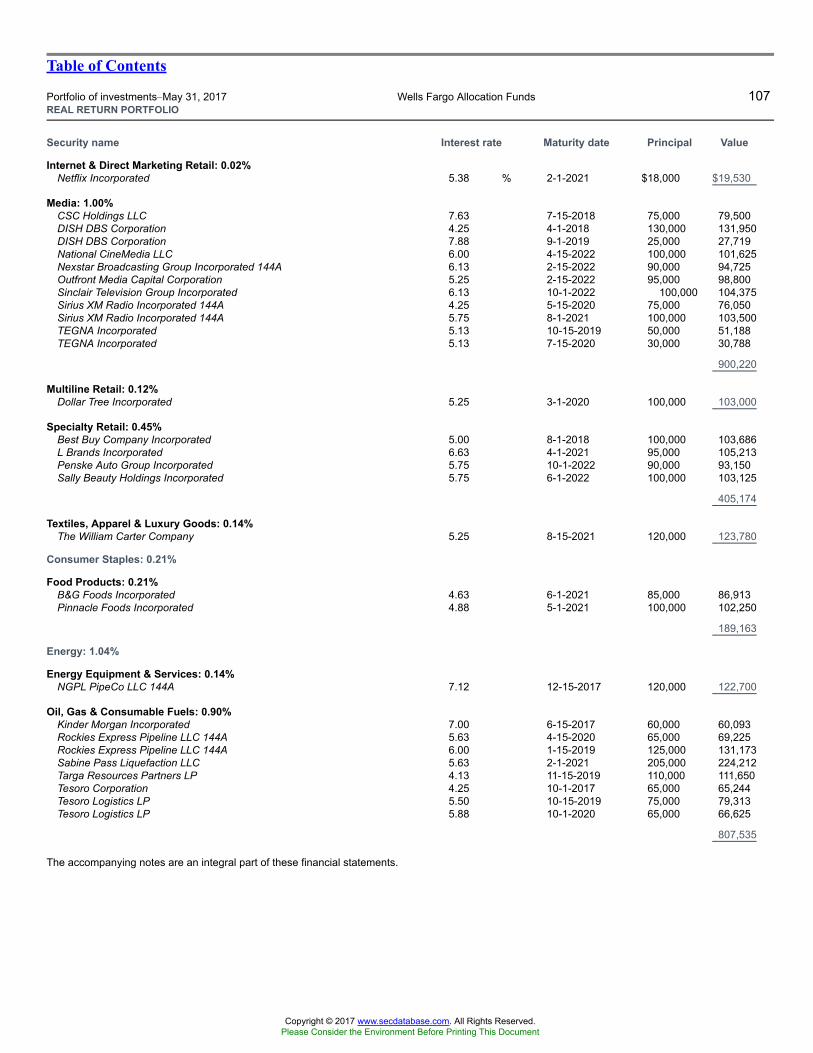
Table of Contents
Portfolio of investments�May 31, 2017 Wells Fargo Allocation Funds 107REAL RETURN PORTFOLIO
Security name Interest rate Maturity date Principal Value
Internet & Direct Marketing Retail: 0.02%Netflix Incorporated 5.38 % 2-1-2021 $18,000 $19,530
Media: 1.00%CSC Holdings LLC 7.63 7-15-2018 75,000 79,500DISH DBS Corporation 4.25 4-1-2018 130,000 131,950DISH DBS Corporation 7.88 9-1-2019 25,000 27,719National CineMedia LLC 6.00 4-15-2022 100,000 101,625Nexstar Broadcasting Group Incorporated 144A 6.13 2-15-2022 90,000 94,725Outfront Media Capital Corporation 5.25 2-15-2022 95,000 98,800Sinclair Television Group Incorporated 6.13 10-1-2022 100,000 104,375Sirius XM Radio Incorporated 144A 4.25 5-15-2020 75,000 76,050Sirius XM Radio Incorporated 144A 5.75 8-1-2021 100,000 103,500TEGNA Incorporated 5.13 10-15-2019 50,000 51,188TEGNA Incorporated 5.13 7-15-2020 30,000 30,788
900,220
Multiline Retail: 0.12%Dollar Tree Incorporated 5.25 3-1-2020 100,000 103,000
Specialty Retail: 0.45%Best Buy Company Incorporated 5.00 8-1-2018 100,000 103,686L Brands Incorporated 6.63 4-1-2021 95,000 105,213Penske Auto Group Incorporated 5.75 10-1-2022 90,000 93,150Sally Beauty Holdings Incorporated 5.75 6-1-2022 100,000 103,125
405,174
Textiles, Apparel & Luxury Goods: 0.14%The William Carter Company 5.25 8-15-2021 120,000 123,780
Consumer Staples: 0.21%
Food Products: 0.21%B&G Foods Incorporated 4.63 6-1-2021 85,000 86,913Pinnacle Foods Incorporated 4.88 5-1-2021 100,000 102,250
189,163
Energy: 1.04%
Energy Equipment & Services: 0.14%NGPL PipeCo LLC 144A 7.12 12-15-2017 120,000 122,700
Oil, Gas & Consumable Fuels: 0.90%Kinder Morgan Incorporated 7.00 6-15-2017 60,000 60,093Rockies Express Pipeline LLC 144A 5.63 4-15-2020 65,000 69,225Rockies Express Pipeline LLC 144A 6.00 1-15-2019 125,000 131,173Sabine Pass Liquefaction LLC 5.63 2-1-2021 205,000 224,212Targa Resources Partners LP 4.13 11-15-2019 110,000 111,650Tesoro Corporation 4.25 10-1-2017 65,000 65,244Tesoro Logistics LP 5.50 10-15-2019 75,000 79,313Tesoro Logistics LP 5.88 10-1-2020 65,000 66,625
807,535
The accompanying notes are an integral part of these financial statements.
Copyright © 2017 www.secdatabase.com. All Rights Reserved.Please Consider the Environment Before Printing This Document
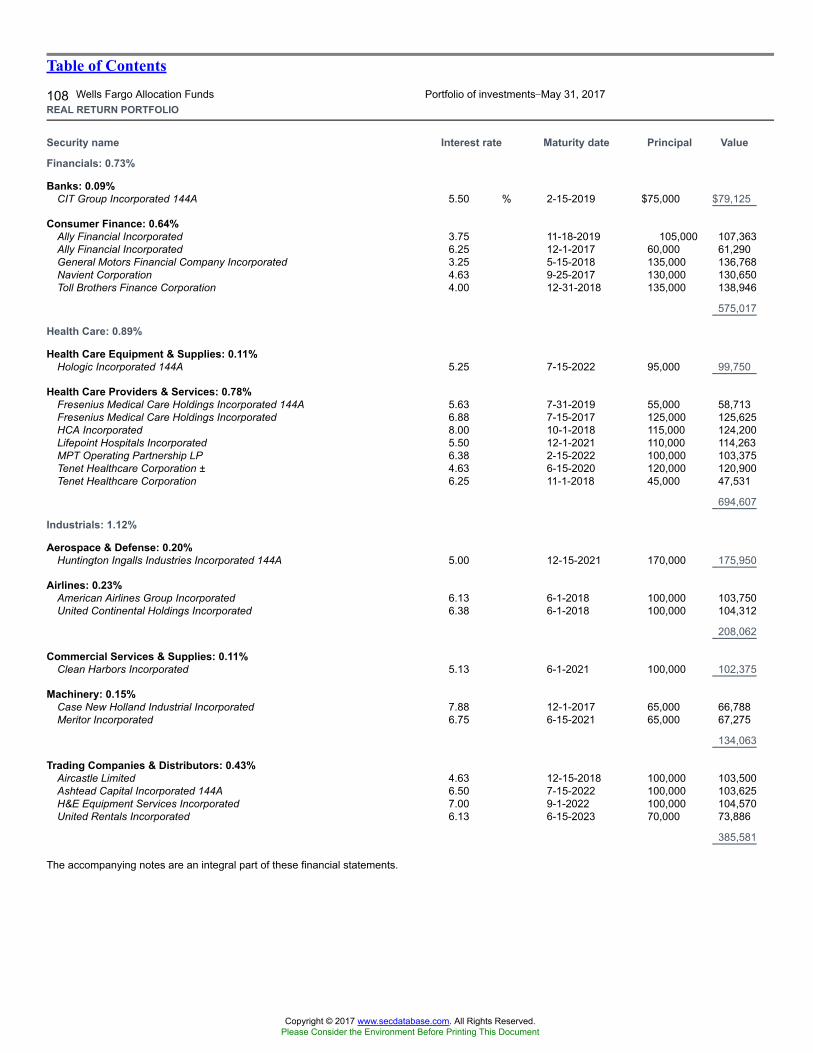
Table of Contents
108 Wells Fargo Allocation Funds Portfolio of investments�May 31, 2017REAL RETURN PORTFOLIO
Security name Interest rate Maturity date Principal Value
Financials: 0.73%
Banks: 0.09%CIT Group Incorporated 144A 5.50 % 2-15-2019 $75,000 $79,125
Consumer Finance: 0.64%Ally Financial Incorporated 3.75 11-18-2019 105,000 107,363Ally Financial Incorporated 6.25 12-1-2017 60,000 61,290General Motors Financial Company Incorporated 3.25 5-15-2018 135,000 136,768Navient Corporation 4.63 9-25-2017 130,000 130,650Toll Brothers Finance Corporation 4.00 12-31-2018 135,000 138,946
575,017
Health Care: 0.89%
Health Care Equipment & Supplies: 0.11%Hologic Incorporated 144A 5.25 7-15-2022 95,000 99,750
Health Care Providers & Services: 0.78%Fresenius Medical Care Holdings Incorporated 144A 5.63 7-31-2019 55,000 58,713Fresenius Medical Care Holdings Incorporated 6.88 7-15-2017 125,000 125,625HCA Incorporated 8.00 10-1-2018 115,000 124,200Lifepoint Hospitals Incorporated 5.50 12-1-2021 110,000 114,263MPT Operating Partnership LP 6.38 2-15-2022 100,000 103,375Tenet Healthcare Corporation ± 4.63 6-15-2020 120,000 120,900Tenet Healthcare Corporation 6.25 11-1-2018 45,000 47,531
694,607
Industrials: 1.12%
Aerospace & Defense: 0.20%Huntington Ingalls Industries Incorporated 144A 5.00 12-15-2021 170,000 175,950
Airlines: 0.23%American Airlines Group Incorporated 6.13 6-1-2018 100,000 103,750United Continental Holdings Incorporated 6.38 6-1-2018 100,000 104,312
208,062
Commercial Services & Supplies: 0.11%Clean Harbors Incorporated 5.13 6-1-2021 100,000 102,375
Machinery: 0.15%Case New Holland Industrial Incorporated 7.88 12-1-2017 65,000 66,788Meritor Incorporated 6.75 6-15-2021 65,000 67,275
134,063
Trading Companies & Distributors: 0.43%Aircastle Limited 4.63 12-15-2018 100,000 103,500Ashtead Capital Incorporated 144A 6.50 7-15-2022 100,000 103,625H&E Equipment Services Incorporated 7.00 9-1-2022 100,000 104,570United Rentals Incorporated 6.13 6-15-2023 70,000 73,886
385,581
The accompanying notes are an integral part of these financial statements.
Copyright © 2017 www.secdatabase.com. All Rights Reserved.Please Consider the Environment Before Printing This Document
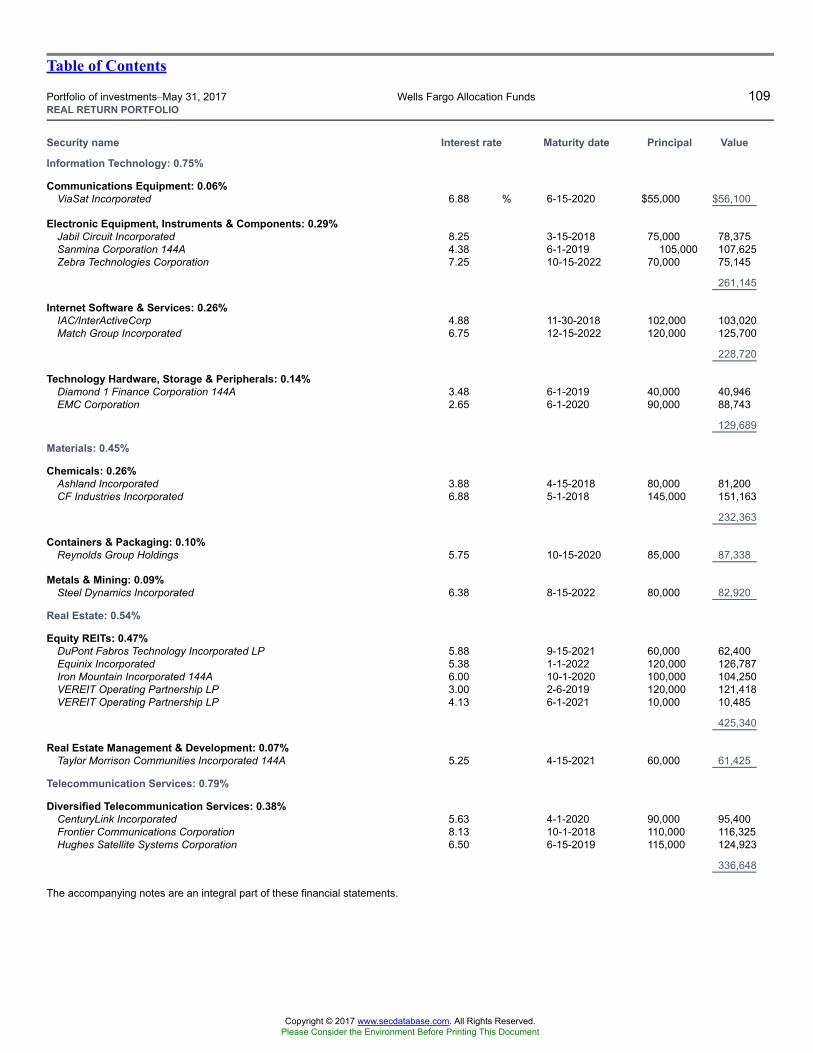
Table of Contents
Portfolio of investments�May 31, 2017 Wells Fargo Allocation Funds 109REAL RETURN PORTFOLIO
Security name Interest rate Maturity date Principal Value
Information Technology: 0.75%
Communications Equipment: 0.06%ViaSat Incorporated 6.88 % 6-15-2020 $55,000 $56,100
Electronic Equipment, Instruments & Components: 0.29%Jabil Circuit Incorporated 8.25 3-15-2018 75,000 78,375Sanmina Corporation 144A 4.38 6-1-2019 105,000 107,625Zebra Technologies Corporation 7.25 10-15-2022 70,000 75,145
261,145
Internet Software & Services: 0.26%IAC/InterActiveCorp 4.88 11-30-2018 102,000 103,020Match Group Incorporated 6.75 12-15-2022 120,000 125,700
228,720
Technology Hardware, Storage & Peripherals: 0.14%Diamond 1 Finance Corporation 144A 3.48 6-1-2019 40,000 40,946EMC Corporation 2.65 6-1-2020 90,000 88,743
129,689
Materials: 0.45%
Chemicals: 0.26%Ashland Incorporated 3.88 4-15-2018 80,000 81,200CF Industries Incorporated 6.88 5-1-2018 145,000 151,163
232,363
Containers & Packaging: 0.10%Reynolds Group Holdings 5.75 10-15-2020 85,000 87,338
Metals & Mining: 0.09%Steel Dynamics Incorporated 6.38 8-15-2022 80,000 82,920
Real Estate: 0.54%
Equity REITs: 0.47%DuPont Fabros Technology Incorporated LP 5.88 9-15-2021 60,000 62,400Equinix Incorporated 5.38 1-1-2022 120,000 126,787Iron Mountain Incorporated 144A 6.00 10-1-2020 100,000 104,250VEREIT Operating Partnership LP 3.00 2-6-2019 120,000 121,418VEREIT Operating Partnership LP 4.13 6-1-2021 10,000 10,485
425,340
Real Estate Management & Development: 0.07%Taylor Morrison Communities Incorporated 144A 5.25 4-15-2021 60,000 61,425
Telecommunication Services: 0.79%
Diversified Telecommunication Services: 0.38%CenturyLink Incorporated 5.63 4-1-2020 90,000 95,400Frontier Communications Corporation 8.13 10-1-2018 110,000 116,325Hughes Satellite Systems Corporation 6.50 6-15-2019 115,000 124,923
336,648
The accompanying notes are an integral part of these financial statements.
Copyright © 2017 www.secdatabase.com. All Rights Reserved.Please Consider the Environment Before Printing This Document
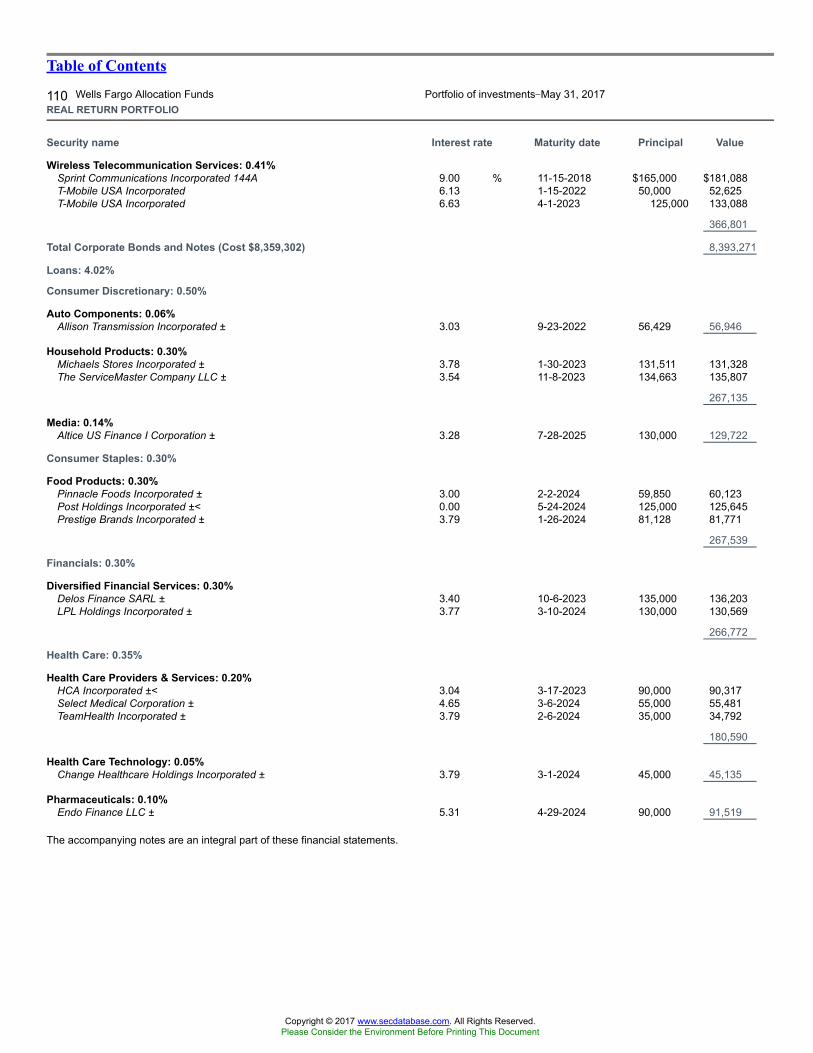
Table of Contents
110 Wells Fargo Allocation Funds Portfolio of investments�May 31, 2017REAL RETURN PORTFOLIO
Security name Interest rate Maturity date Principal Value
Wireless Telecommunication Services: 0.41%Sprint Communications Incorporated 144A 9.00 % 11-15-2018 $165,000 $181,088T-Mobile USA Incorporated 6.13 1-15-2022 50,000 52,625T-Mobile USA Incorporated 6.63 4-1-2023 125,000 133,088
366,801
Total Corporate Bonds and Notes (Cost $8,359,302) 8,393,271
Loans: 4.02%
Consumer Discretionary: 0.50%
Auto Components: 0.06%Allison Transmission Incorporated ± 3.03 9-23-2022 56,429 56,946
Household Products: 0.30%Michaels Stores Incorporated ± 3.78 1-30-2023 131,511 131,328The ServiceMaster Company LLC ± 3.54 11-8-2023 134,663 135,807
267,135
Media: 0.14%Altice US Finance I Corporation ± 3.28 7-28-2025 130,000 129,722
Consumer Staples: 0.30%
Food Products: 0.30%Pinnacle Foods Incorporated ± 3.00 2-2-2024 59,850 60,123Post Holdings Incorporated ±< 0.00 5-24-2024 125,000 125,645Prestige Brands Incorporated ± 3.79 1-26-2024 81,128 81,771
267,539
Financials: 0.30%
Diversified Financial Services: 0.30%Delos Finance SARL ± 3.40 10-6-2023 135,000 136,203LPL Holdings Incorporated ± 3.77 3-10-2024 130,000 130,569
266,772
Health Care: 0.35%
Health Care Providers & Services: 0.20%HCA Incorporated ±< 3.04 3-17-2023 90,000 90,317Select Medical Corporation ± 4.65 3-6-2024 55,000 55,481TeamHealth Incorporated ± 3.79 2-6-2024 35,000 34,792
180,590
Health Care Technology: 0.05%Change Healthcare Holdings Incorporated ± 3.79 3-1-2024 45,000 45,135
Pharmaceuticals: 0.10%Endo Finance LLC ± 5.31 4-29-2024 90,000 91,519
The accompanying notes are an integral part of these financial statements.
Copyright © 2017 www.secdatabase.com. All Rights Reserved.Please Consider the Environment Before Printing This Document
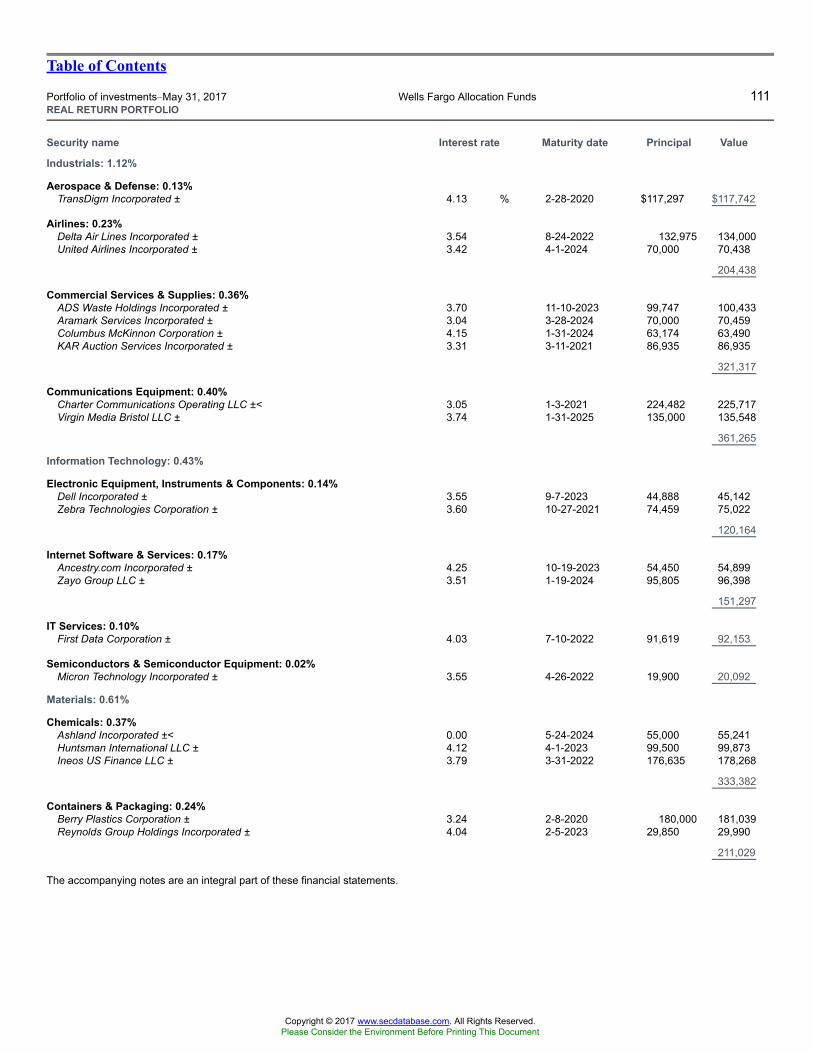
Table of Contents
Portfolio of investments�May 31, 2017 Wells Fargo Allocation Funds 111REAL RETURN PORTFOLIO
Security name Interest rate Maturity date Principal Value
Industrials: 1.12%
Aerospace & Defense: 0.13%TransDigm Incorporated ± 4.13 % 2-28-2020 $117,297 $117,742
Airlines: 0.23%Delta Air Lines Incorporated ± 3.54 8-24-2022 132,975 134,000United Airlines Incorporated ± 3.42 4-1-2024 70,000 70,438
204,438
Commercial Services & Supplies: 0.36%ADS Waste Holdings Incorporated ± 3.70 11-10-2023 99,747 100,433Aramark Services Incorporated ± 3.04 3-28-2024 70,000 70,459Columbus McKinnon Corporation ± 4.15 1-31-2024 63,174 63,490KAR Auction Services Incorporated ± 3.31 3-11-2021 86,935 86,935
321,317
Communications Equipment: 0.40%Charter Communications Operating LLC ±< 3.05 1-3-2021 224,482 225,717Virgin Media Bristol LLC ± 3.74 1-31-2025 135,000 135,548
361,265
Information Technology: 0.43%
Electronic Equipment, Instruments & Components: 0.14%Dell Incorporated ± 3.55 9-7-2023 44,888 45,142Zebra Technologies Corporation ± 3.60 10-27-2021 74,459 75,022
120,164
Internet Software & Services: 0.17%Ancestry.com Incorporated ± 4.25 10-19-2023 54,450 54,899Zayo Group LLC ± 3.51 1-19-2024 95,805 96,398
151,297
IT Services: 0.10%First Data Corporation ± 4.03 7-10-2022 91,619 92,153
Semiconductors & Semiconductor Equipment: 0.02%Micron Technology Incorporated ± 3.55 4-26-2022 19,900 20,092
Materials: 0.61%
Chemicals: 0.37%Ashland Incorporated ±< 0.00 5-24-2024 55,000 55,241Huntsman International LLC ± 4.12 4-1-2023 99,500 99,873Ineos US Finance LLC ± 3.79 3-31-2022 176,635 178,268
333,382
Containers & Packaging: 0.24%Berry Plastics Corporation ± 3.24 2-8-2020 180,000 181,039Reynolds Group Holdings Incorporated ± 4.04 2-5-2023 29,850 29,990
211,029
The accompanying notes are an integral part of these financial statements.
Copyright © 2017 www.secdatabase.com. All Rights Reserved.Please Consider the Environment Before Printing This Document
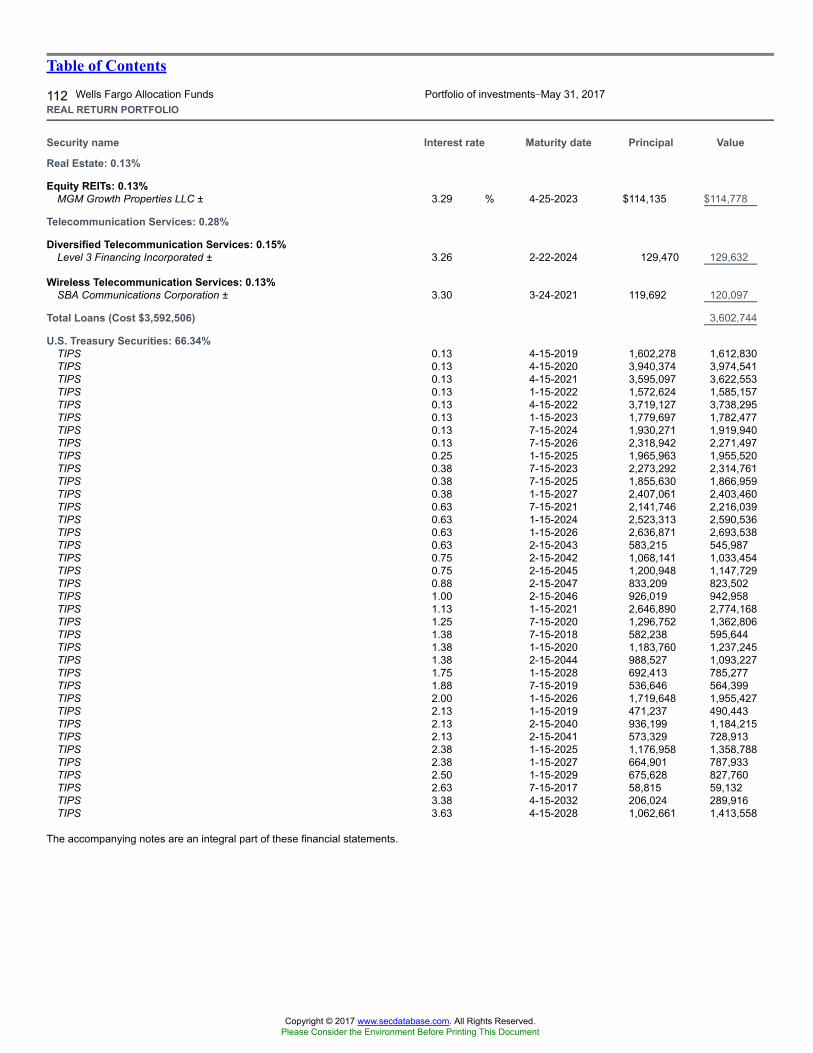
Table of Contents
112 Wells Fargo Allocation Funds Portfolio of investments�May 31, 2017REAL RETURN PORTFOLIO
Security name Interest rate Maturity date Principal Value
Real Estate: 0.13%
Equity REITs: 0.13%MGM Growth Properties LLC ± 3.29 % 4-25-2023 $114,135 $114,778
Telecommunication Services: 0.28%
Diversified Telecommunication Services: 0.15%Level 3 Financing Incorporated ± 3.26 2-22-2024 129,470 129,632
Wireless Telecommunication Services: 0.13%SBA Communications Corporation ± 3.30 3-24-2021 119,692 120,097
Total Loans (Cost $3,592,506) 3,602,744
U.S. Treasury Securities: 66.34%TIPS 0.13 4-15-2019 1,602,278 1,612,830TIPS 0.13 4-15-2020 3,940,374 3,974,541TIPS 0.13 4-15-2021 3,595,097 3,622,553TIPS 0.13 1-15-2022 1,572,624 1,585,157TIPS 0.13 4-15-2022 3,719,127 3,738,295TIPS 0.13 1-15-2023 1,779,697 1,782,477TIPS 0.13 7-15-2024 1,930,271 1,919,940TIPS 0.13 7-15-2026 2,318,942 2,271,497TIPS 0.25 1-15-2025 1,965,963 1,955,520TIPS 0.38 7-15-2023 2,273,292 2,314,761TIPS 0.38 7-15-2025 1,855,630 1,866,959TIPS 0.38 1-15-2027 2,407,061 2,403,460TIPS 0.63 7-15-2021 2,141,746 2,216,039TIPS 0.63 1-15-2024 2,523,313 2,590,536TIPS 0.63 1-15-2026 2,636,871 2,693,538TIPS 0.63 2-15-2043 583,215 545,987TIPS 0.75 2-15-2042 1,068,141 1,033,454TIPS 0.75 2-15-2045 1,200,948 1,147,729TIPS 0.88 2-15-2047 833,209 823,502TIPS 1.00 2-15-2046 926,019 942,958TIPS 1.13 1-15-2021 2,646,890 2,774,168TIPS 1.25 7-15-2020 1,296,752 1,362,806TIPS 1.38 7-15-2018 582,238 595,644TIPS 1.38 1-15-2020 1,183,760 1,237,245TIPS 1.38 2-15-2044 988,527 1,093,227TIPS 1.75 1-15-2028 692,413 785,277TIPS 1.88 7-15-2019 536,646 564,399TIPS 2.00 1-15-2026 1,719,648 1,955,427TIPS 2.13 1-15-2019 471,237 490,443TIPS 2.13 2-15-2040 936,199 1,184,215TIPS 2.13 2-15-2041 573,329 728,913TIPS 2.38 1-15-2025 1,176,958 1,358,788TIPS 2.38 1-15-2027 664,901 787,933TIPS 2.50 1-15-2029 675,628 827,760TIPS 2.63 7-15-2017 58,815 59,132TIPS 3.38 4-15-2032 206,024 289,916TIPS 3.63 4-15-2028 1,062,661 1,413,558
The accompanying notes are an integral part of these financial statements.
Copyright © 2017 www.secdatabase.com. All Rights Reserved.Please Consider the Environment Before Printing This Document
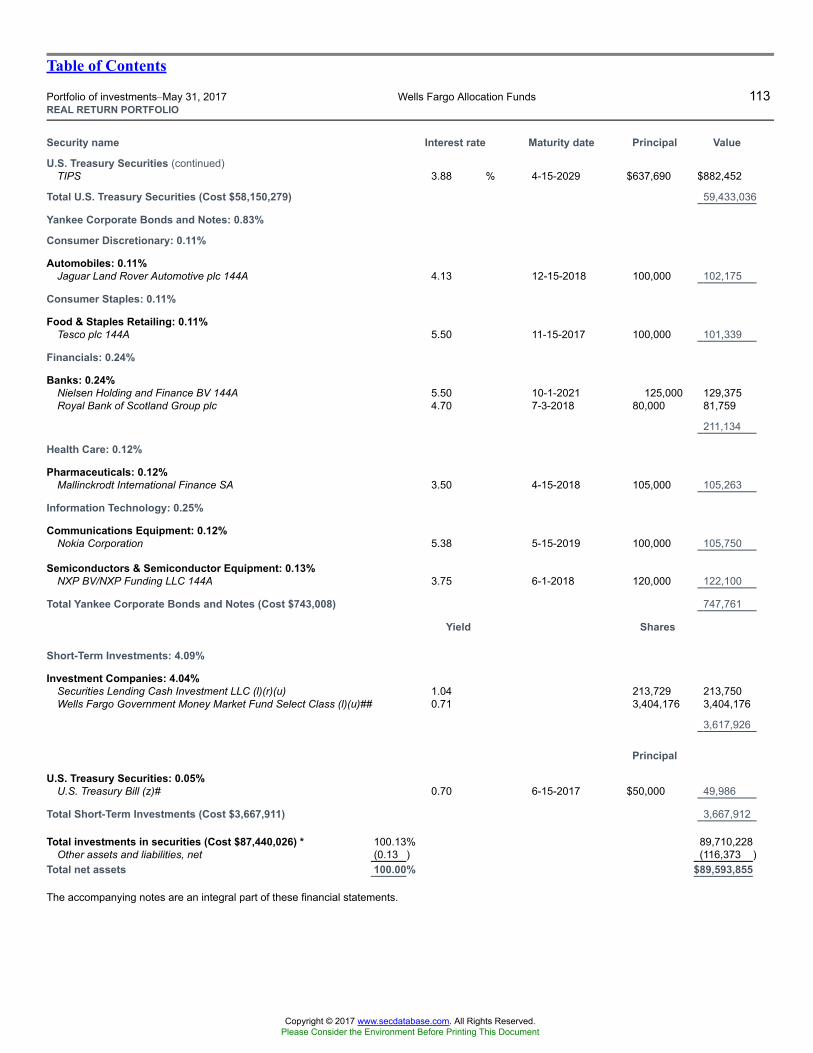
Table of Contents
Portfolio of investments�May 31, 2017 Wells Fargo Allocation Funds 113REAL RETURN PORTFOLIO
Security name Interest rate Maturity date Principal Value
U.S. Treasury Securities (continued)TIPS 3.88 % 4-15-2029 $637,690 $882,452
Total U.S. Treasury Securities (Cost $58,150,279) 59,433,036
Yankee Corporate Bonds and Notes: 0.83%
Consumer Discretionary: 0.11%
Automobiles: 0.11%Jaguar Land Rover Automotive plc 144A 4.13 12-15-2018 100,000 102,175
Consumer Staples: 0.11%
Food & Staples Retailing: 0.11%Tesco plc 144A 5.50 11-15-2017 100,000 101,339
Financials: 0.24%
Banks: 0.24%Nielsen Holding and Finance BV 144A 5.50 10-1-2021 125,000 129,375Royal Bank of Scotland Group plc 4.70 7-3-2018 80,000 81,759
211,134
Health Care: 0.12%
Pharmaceuticals: 0.12%Mallinckrodt International Finance SA 3.50 4-15-2018 105,000 105,263
Information Technology: 0.25%
Communications Equipment: 0.12%Nokia Corporation 5.38 5-15-2019 100,000 105,750
Semiconductors & Semiconductor Equipment: 0.13%NXP BV/NXP Funding LLC 144A 3.75 6-1-2018 120,000 122,100
Total Yankee Corporate Bonds and Notes (Cost $743,008) 747,761
Yield Shares
Short-Term Investments: 4.09%
Investment Companies: 4.04%Securities Lending Cash Investment LLC (l)(r)(u) 1.04 213,729 213,750Wells Fargo Government Money Market Fund Select Class (l)(u)## 0.71 3,404,176 3,404,176
3,617,926
Principal
U.S. Treasury Securities: 0.05%U.S. Treasury Bill (z)# 0.70 6-15-2017 $50,000 49,986
Total Short-Term Investments (Cost $3,667,911) 3,667,912
Total investments in securities (Cost $87,440,026) * 100.13% 89,710,228Other assets and liabilities, net (0.13 ) (116,373 )
Total net assets 100.00% $89,593,855
The accompanying notes are an integral part of these financial statements.
Copyright © 2017 www.secdatabase.com. All Rights Reserved.Please Consider the Environment Before Printing This Document
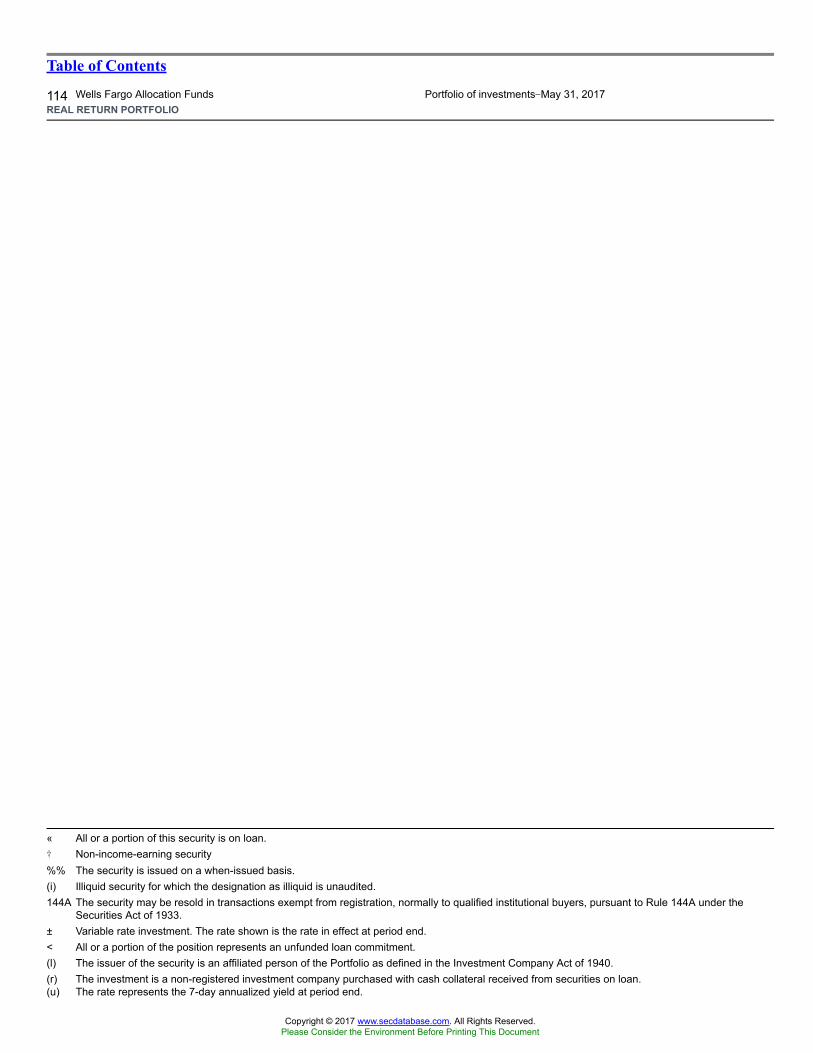
Table of Contents
114 Wells Fargo Allocation Funds Portfolio of investments�May 31, 2017REAL RETURN PORTFOLIO
« All or a portion of this security is on loan.� Non-income-earning security%% The security is issued on a when-issued basis.(i) Illiquid security for which the designation as illiquid is unaudited.144A The security may be resold in transactions exempt from registration, normally to qualified institutional buyers, pursuant to Rule 144A under the
Securities Act of 1933.± Variable rate investment. The rate shown is the rate in effect at period end.< All or a portion of the position represents an unfunded loan commitment.(l) The issuer of the security is an affiliated person of the Portfolio as defined in the Investment Company Act of 1940.(r) The investment is a non-registered investment company purchased with cash collateral received from securities on loan.(u) The rate represents the 7-day annualized yield at period end.
Copyright © 2017 www.secdatabase.com. All Rights Reserved.Please Consider the Environment Before Printing This Document
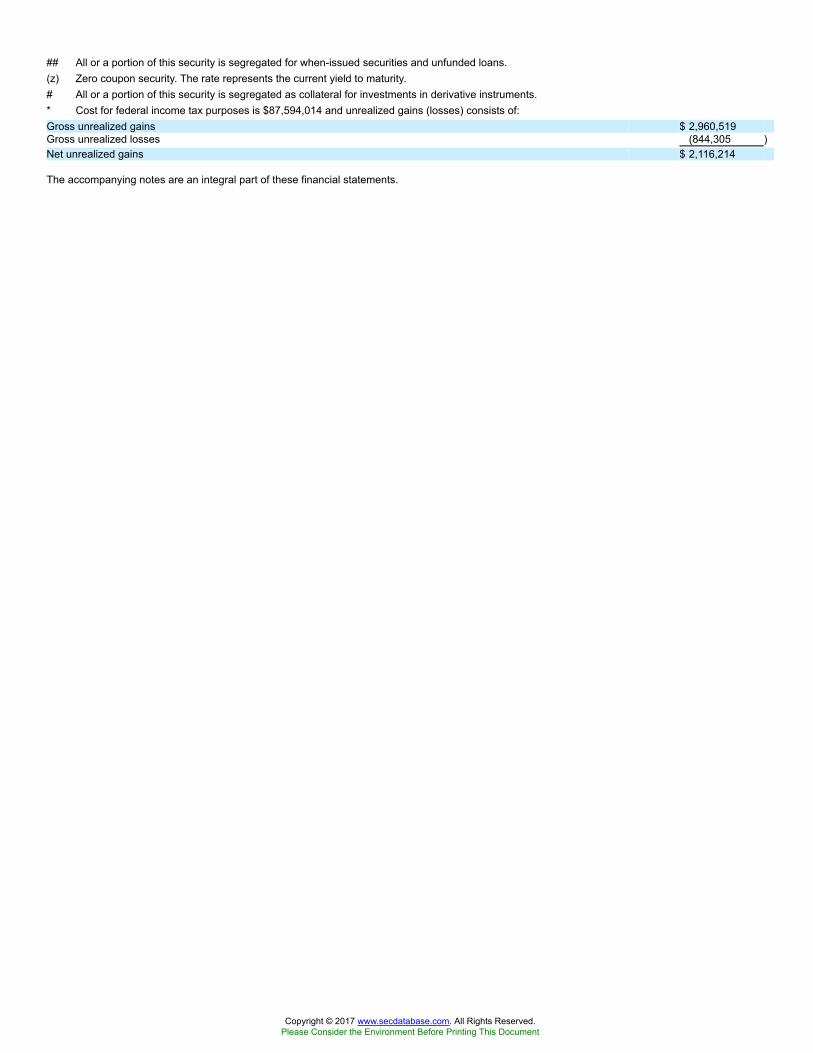
## All or a portion of this security is segregated for when-issued securities and unfunded loans.(z) Zero coupon security. The rate represents the current yield to maturity.# All or a portion of this security is segregated as collateral for investments in derivative instruments.* Cost for federal income tax purposes is $87,594,014 and unrealized gains (losses) consists of:Gross unrealized gains $ 2,960,519Gross unrealized losses (844,305 )Net unrealized gains $ 2,116,214
The accompanying notes are an integral part of these financial statements.
Copyright © 2017 www.secdatabase.com. All Rights Reserved.Please Consider the Environment Before Printing This Document
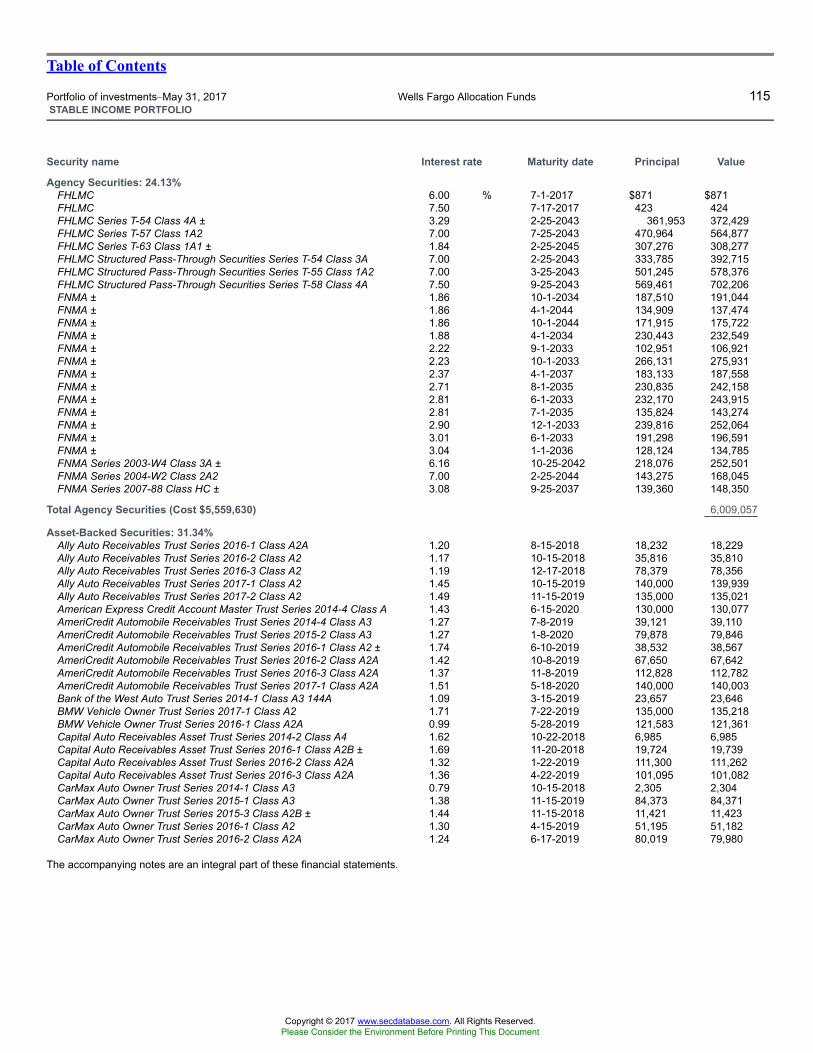
Table of Contents
Portfolio of investments�May 31, 2017 Wells Fargo Allocation Funds 115STABLE INCOME PORTFOLIO
Security name Interest rate Maturity date Principal Value
Agency Securities: 24.13%FHLMC 6.00 % 7-1-2017 $871 $871FHLMC 7.50 7-17-2017 423 424FHLMC Series T-54 Class 4A ± 3.29 2-25-2043 361,953 372,429FHLMC Series T-57 Class 1A2 7.00 7-25-2043 470,964 564,877FHLMC Series T-63 Class 1A1 ± 1.84 2-25-2045 307,276 308,277FHLMC Structured Pass-Through Securities Series T-54 Class 3A 7.00 2-25-2043 333,785 392,715FHLMC Structured Pass-Through Securities Series T-55 Class 1A2 7.00 3-25-2043 501,245 578,376FHLMC Structured Pass-Through Securities Series T-58 Class 4A 7.50 9-25-2043 569,461 702,206FNMA ± 1.86 10-1-2034 187,510 191,044FNMA ± 1.86 4-1-2044 134,909 137,474FNMA ± 1.86 10-1-2044 171,915 175,722FNMA ± 1.88 4-1-2034 230,443 232,549FNMA ± 2.22 9-1-2033 102,951 106,921FNMA ± 2.23 10-1-2033 266,131 275,931FNMA ± 2.37 4-1-2037 183,133 187,558FNMA ± 2.71 8-1-2035 230,835 242,158FNMA ± 2.81 6-1-2033 232,170 243,915FNMA ± 2.81 7-1-2035 135,824 143,274FNMA ± 2.90 12-1-2033 239,816 252,064FNMA ± 3.01 6-1-2033 191,298 196,591FNMA ± 3.04 1-1-2036 128,124 134,785FNMA Series 2003-W4 Class 3A ± 6.16 10-25-2042 218,076 252,501FNMA Series 2004-W2 Class 2A2 7.00 2-25-2044 143,275 168,045FNMA Series 2007-88 Class HC ± 3.08 9-25-2037 139,360 148,350
Total Agency Securities (Cost $5,559,630) 6,009,057
Asset-Backed Securities: 31.34%Ally Auto Receivables Trust Series 2016-1 Class A2A 1.20 8-15-2018 18,232 18,229Ally Auto Receivables Trust Series 2016-2 Class A2 1.17 10-15-2018 35,816 35,810Ally Auto Receivables Trust Series 2016-3 Class A2 1.19 12-17-2018 78,379 78,356Ally Auto Receivables Trust Series 2017-1 Class A2 1.45 10-15-2019 140,000 139,939Ally Auto Receivables Trust Series 2017-2 Class A2 1.49 11-15-2019 135,000 135,021American Express Credit Account Master Trust Series 2014-4 Class A 1.43 6-15-2020 130,000 130,077AmeriCredit Automobile Receivables Trust Series 2014-4 Class A3 1.27 7-8-2019 39,121 39,110AmeriCredit Automobile Receivables Trust Series 2015-2 Class A3 1.27 1-8-2020 79,878 79,846AmeriCredit Automobile Receivables Trust Series 2016-1 Class A2 ± 1.74 6-10-2019 38,532 38,567AmeriCredit Automobile Receivables Trust Series 2016-2 Class A2A 1.42 10-8-2019 67,650 67,642AmeriCredit Automobile Receivables Trust Series 2016-3 Class A2A 1.37 11-8-2019 112,828 112,782AmeriCredit Automobile Receivables Trust Series 2017-1 Class A2A 1.51 5-18-2020 140,000 140,003Bank of the West Auto Trust Series 2014-1 Class A3 144A 1.09 3-15-2019 23,657 23,646BMW Vehicle Owner Trust Series 2017-1 Class A2 1.71 7-22-2019 135,000 135,218BMW Vehicle Owner Trust Series 2016-1 Class A2A 0.99 5-28-2019 121,583 121,361Capital Auto Receivables Asset Trust Series 2014-2 Class A4 1.62 10-22-2018 6,985 6,985Capital Auto Receivables Asset Trust Series 2016-1 Class A2B ± 1.69 11-20-2018 19,724 19,739Capital Auto Receivables Asset Trust Series 2016-2 Class A2A 1.32 1-22-2019 111,300 111,262Capital Auto Receivables Asset Trust Series 2016-3 Class A2A 1.36 4-22-2019 101,095 101,082CarMax Auto Owner Trust Series 2014-1 Class A3 0.79 10-15-2018 2,305 2,304CarMax Auto Owner Trust Series 2015-1 Class A3 1.38 11-15-2019 84,373 84,371CarMax Auto Owner Trust Series 2015-3 Class A2B ± 1.44 11-15-2018 11,421 11,423CarMax Auto Owner Trust Series 2016-1 Class A2 1.30 4-15-2019 51,195 51,182CarMax Auto Owner Trust Series 2016-2 Class A2A 1.24 6-17-2019 80,019 79,980
The accompanying notes are an integral part of these financial statements.
Copyright © 2017 www.secdatabase.com. All Rights Reserved.Please Consider the Environment Before Printing This Document
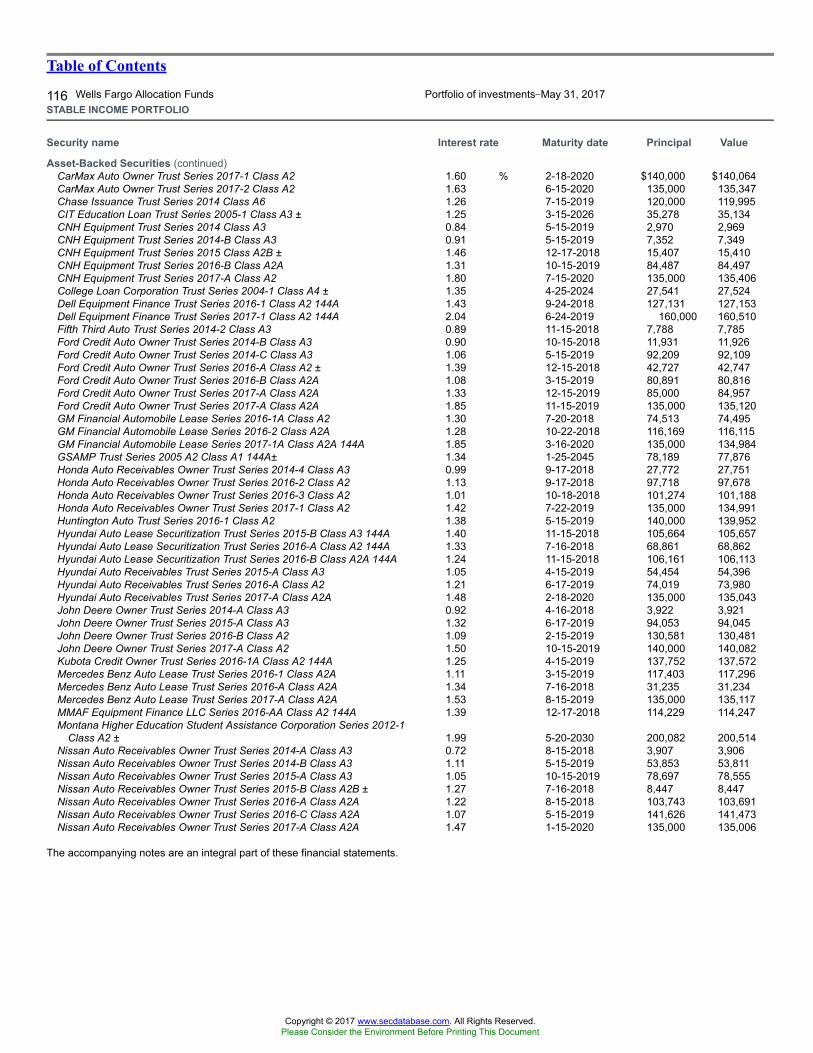
Table of Contents
116 Wells Fargo Allocation Funds Portfolio of investments�May 31, 2017STABLE INCOME PORTFOLIO
Security name Interest rate Maturity date Principal Value
Asset-Backed Securities (continued)CarMax Auto Owner Trust Series 2017-1 Class A2 1.60 % 2-18-2020 $140,000 $140,064CarMax Auto Owner Trust Series 2017-2 Class A2 1.63 6-15-2020 135,000 135,347Chase Issuance Trust Series 2014 Class A6 1.26 7-15-2019 120,000 119,995CIT Education Loan Trust Series 2005-1 Class A3 ± 1.25 3-15-2026 35,278 35,134CNH Equipment Trust Series 2014 Class A3 0.84 5-15-2019 2,970 2,969CNH Equipment Trust Series 2014-B Class A3 0.91 5-15-2019 7,352 7,349CNH Equipment Trust Series 2015 Class A2B ± 1.46 12-17-2018 15,407 15,410CNH Equipment Trust Series 2016-B Class A2A 1.31 10-15-2019 84,487 84,497CNH Equipment Trust Series 2017-A Class A2 1.80 7-15-2020 135,000 135,406College Loan Corporation Trust Series 2004-1 Class A4 ± 1.35 4-25-2024 27,541 27,524Dell Equipment Finance Trust Series 2016-1 Class A2 144A 1.43 9-24-2018 127,131 127,153Dell Equipment Finance Trust Series 2017-1 Class A2 144A 2.04 6-24-2019 160,000 160,510Fifth Third Auto Trust Series 2014-2 Class A3 0.89 11-15-2018 7,788 7,785Ford Credit Auto Owner Trust Series 2014-B Class A3 0.90 10-15-2018 11,931 11,926Ford Credit Auto Owner Trust Series 2014-C Class A3 1.06 5-15-2019 92,209 92,109Ford Credit Auto Owner Trust Series 2016-A Class A2 ± 1.39 12-15-2018 42,727 42,747Ford Credit Auto Owner Trust Series 2016-B Class A2A 1.08 3-15-2019 80,891 80,816Ford Credit Auto Owner Trust Series 2017-A Class A2A 1.33 12-15-2019 85,000 84,957Ford Credit Auto Owner Trust Series 2017-A Class A2A 1.85 11-15-2019 135,000 135,120GM Financial Automobile Lease Series 2016-1A Class A2 1.30 7-20-2018 74,513 74,495GM Financial Automobile Lease Series 2016-2 Class A2A 1.28 10-22-2018 116,169 116,115GM Financial Automobile Lease Series 2017-1A Class A2A 144A 1.85 3-16-2020 135,000 134,984GSAMP Trust Series 2005 A2 Class A1 144A± 1.34 1-25-2045 78,189 77,876Honda Auto Receivables Owner Trust Series 2014-4 Class A3 0.99 9-17-2018 27,772 27,751Honda Auto Receivables Owner Trust Series 2016-2 Class A2 1.13 9-17-2018 97,718 97,678Honda Auto Receivables Owner Trust Series 2016-3 Class A2 1.01 10-18-2018 101,274 101,188Honda Auto Receivables Owner Trust Series 2017-1 Class A2 1.42 7-22-2019 135,000 134,991Huntington Auto Trust Series 2016-1 Class A2 1.38 5-15-2019 140,000 139,952Hyundai Auto Lease Securitization Trust Series 2015-B Class A3 144A 1.40 11-15-2018 105,664 105,657Hyundai Auto Lease Securitization Trust Series 2016-A Class A2 144A 1.33 7-16-2018 68,861 68,862Hyundai Auto Lease Securitization Trust Series 2016-B Class A2A 144A 1.24 11-15-2018 106,161 106,113Hyundai Auto Receivables Trust Series 2015-A Class A3 1.05 4-15-2019 54,454 54,396Hyundai Auto Receivables Trust Series 2016-A Class A2 1.21 6-17-2019 74,019 73,980Hyundai Auto Receivables Trust Series 2017-A Class A2A 1.48 2-18-2020 135,000 135,043John Deere Owner Trust Series 2014-A Class A3 0.92 4-16-2018 3,922 3,921John Deere Owner Trust Series 2015-A Class A3 1.32 6-17-2019 94,053 94,045John Deere Owner Trust Series 2016-B Class A2 1.09 2-15-2019 130,581 130,481John Deere Owner Trust Series 2017-A Class A2 1.50 10-15-2019 140,000 140,082Kubota Credit Owner Trust Series 2016-1A Class A2 144A 1.25 4-15-2019 137,752 137,572Mercedes Benz Auto Lease Trust Series 2016-1 Class A2A 1.11 3-15-2019 117,403 117,296Mercedes Benz Auto Lease Trust Series 2016-A Class A2A 1.34 7-16-2018 31,235 31,234Mercedes Benz Auto Lease Trust Series 2017-A Class A2A 1.53 8-15-2019 135,000 135,117MMAF Equipment Finance LLC Series 2016-AA Class A2 144A 1.39 12-17-2018 114,229 114,247Montana Higher Education Student Assistance Corporation Series 2012-1
Class A2 ± 1.99 5-20-2030 200,082 200,514Nissan Auto Receivables Owner Trust Series 2014-A Class A3 0.72 8-15-2018 3,907 3,906Nissan Auto Receivables Owner Trust Series 2014-B Class A3 1.11 5-15-2019 53,853 53,811Nissan Auto Receivables Owner Trust Series 2015-A Class A3 1.05 10-15-2019 78,697 78,555Nissan Auto Receivables Owner Trust Series 2015-B Class A2B ± 1.27 7-16-2018 8,447 8,447Nissan Auto Receivables Owner Trust Series 2016-A Class A2A 1.22 8-15-2018 103,743 103,691Nissan Auto Receivables Owner Trust Series 2016-C Class A2A 1.07 5-15-2019 141,626 141,473Nissan Auto Receivables Owner Trust Series 2017-A Class A2A 1.47 1-15-2020 135,000 135,006
The accompanying notes are an integral part of these financial statements.
Copyright © 2017 www.secdatabase.com. All Rights Reserved.Please Consider the Environment Before Printing This Document
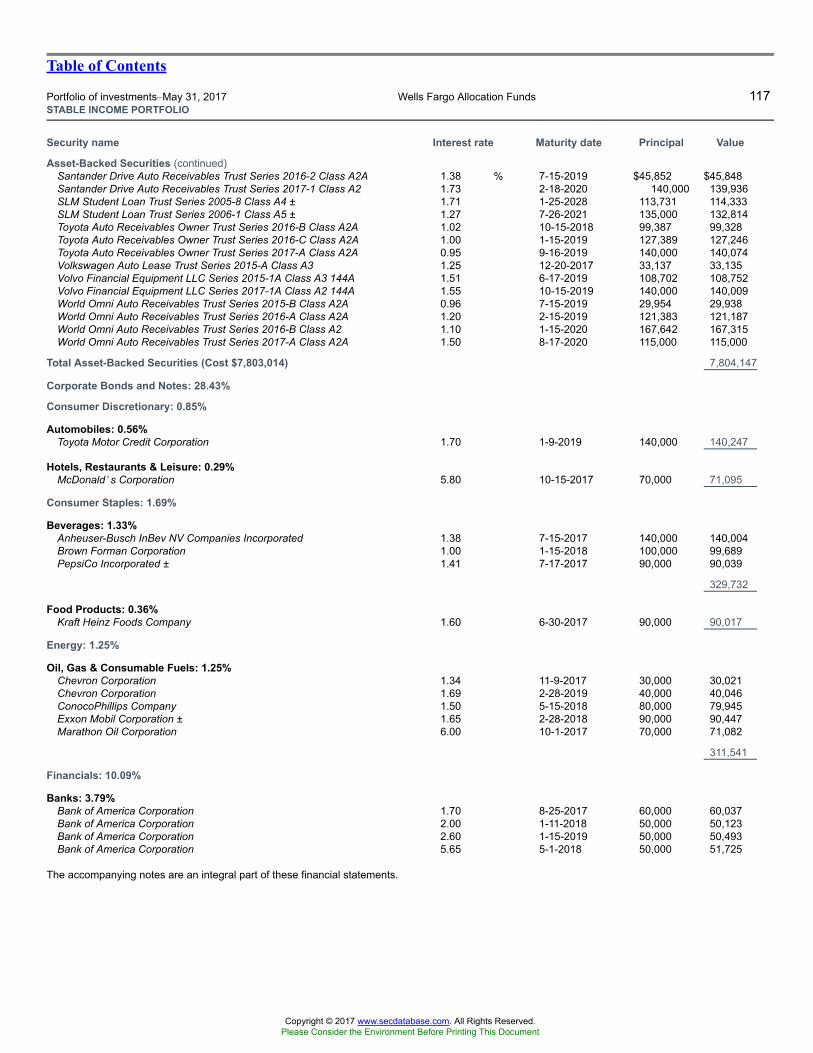
Table of Contents
Portfolio of investments�May 31, 2017 Wells Fargo Allocation Funds 117STABLE INCOME PORTFOLIO
Security name Interest rate Maturity date Principal Value
Asset-Backed Securities (continued)Santander Drive Auto Receivables Trust Series 2016-2 Class A2A 1.38 % 7-15-2019 $45,852 $45,848Santander Drive Auto Receivables Trust Series 2017-1 Class A2 1.73 2-18-2020 140,000 139,936SLM Student Loan Trust Series 2005-8 Class A4 ± 1.71 1-25-2028 113,731 114,333SLM Student Loan Trust Series 2006-1 Class A5 ± 1.27 7-26-2021 135,000 132,814Toyota Auto Receivables Owner Trust Series 2016-B Class A2A 1.02 10-15-2018 99,387 99,328Toyota Auto Receivables Owner Trust Series 2016-C Class A2A 1.00 1-15-2019 127,389 127,246Toyota Auto Receivables Owner Trust Series 2017-A Class A2A 0.95 9-16-2019 140,000 140,074Volkswagen Auto Lease Trust Series 2015-A Class A3 1.25 12-20-2017 33,137 33,135Volvo Financial Equipment LLC Series 2015-1A Class A3 144A 1.51 6-17-2019 108,702 108,752Volvo Financial Equipment LLC Series 2017-1A Class A2 144A 1.55 10-15-2019 140,000 140,009World Omni Auto Receivables Trust Series 2015-B Class A2A 0.96 7-15-2019 29,954 29,938World Omni Auto Receivables Trust Series 2016-A Class A2A 1.20 2-15-2019 121,383 121,187World Omni Auto Receivables Trust Series 2016-B Class A2 1.10 1-15-2020 167,642 167,315World Omni Auto Receivables Trust Series 2017-A Class A2A 1.50 8-17-2020 115,000 115,000
Total Asset-Backed Securities (Cost $7,803,014) 7,804,147
Corporate Bonds and Notes: 28.43%
Consumer Discretionary: 0.85%
Automobiles: 0.56%Toyota Motor Credit Corporation 1.70 1-9-2019 140,000 140,247
Hotels, Restaurants & Leisure: 0.29%McDonald�s Corporation 5.80 10-15-2017 70,000 71,095
Consumer Staples: 1.69%
Beverages: 1.33%Anheuser-Busch InBev NV Companies Incorporated 1.38 7-15-2017 140,000 140,004Brown Forman Corporation 1.00 1-15-2018 100,000 99,689PepsiCo Incorporated ± 1.41 7-17-2017 90,000 90,039
329,732
Food Products: 0.36%Kraft Heinz Foods Company 1.60 6-30-2017 90,000 90,017
Energy: 1.25%
Oil, Gas & Consumable Fuels: 1.25%Chevron Corporation 1.34 11-9-2017 30,000 30,021Chevron Corporation 1.69 2-28-2019 40,000 40,046ConocoPhillips Company 1.50 5-15-2018 80,000 79,945Exxon Mobil Corporation ± 1.65 2-28-2018 90,000 90,447Marathon Oil Corporation 6.00 10-1-2017 70,000 71,082
311,541
Financials: 10.09%
Banks: 3.79%Bank of America Corporation 1.70 8-25-2017 60,000 60,037Bank of America Corporation 2.00 1-11-2018 50,000 50,123Bank of America Corporation 2.60 1-15-2019 50,000 50,493Bank of America Corporation 5.65 5-1-2018 50,000 51,725
The accompanying notes are an integral part of these financial statements.
Copyright © 2017 www.secdatabase.com. All Rights Reserved.Please Consider the Environment Before Printing This Document
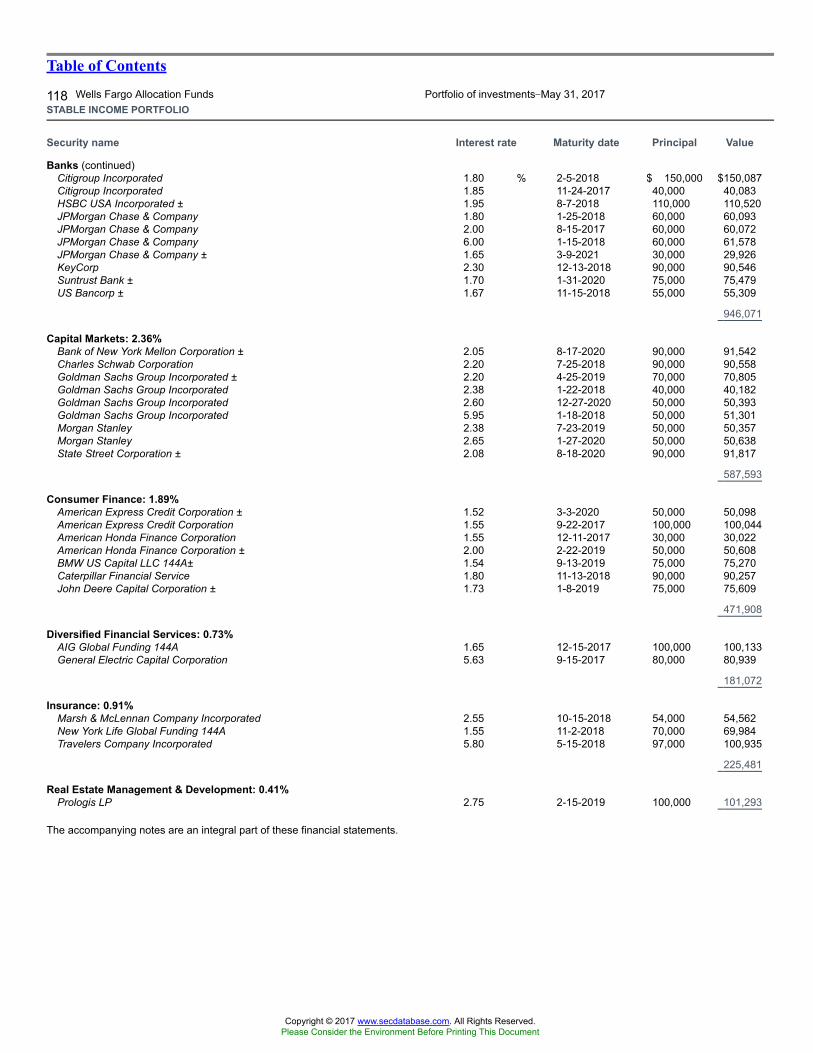
Table of Contents
118 Wells Fargo Allocation Funds Portfolio of investments�May 31, 2017STABLE INCOME PORTFOLIO
Security name Interest rate Maturity date Principal Value
Banks (continued)Citigroup Incorporated 1.80 % 2-5-2018 $ 150,000 $150,087Citigroup Incorporated 1.85 11-24-2017 40,000 40,083HSBC USA Incorporated ± 1.95 8-7-2018 110,000 110,520JPMorgan Chase & Company 1.80 1-25-2018 60,000 60,093JPMorgan Chase & Company 2.00 8-15-2017 60,000 60,072JPMorgan Chase & Company 6.00 1-15-2018 60,000 61,578JPMorgan Chase & Company ± 1.65 3-9-2021 30,000 29,926KeyCorp 2.30 12-13-2018 90,000 90,546Suntrust Bank ± 1.70 1-31-2020 75,000 75,479US Bancorp ± 1.67 11-15-2018 55,000 55,309
946,071
Capital Markets: 2.36%Bank of New York Mellon Corporation ± 2.05 8-17-2020 90,000 91,542Charles Schwab Corporation 2.20 7-25-2018 90,000 90,558Goldman Sachs Group Incorporated ± 2.20 4-25-2019 70,000 70,805Goldman Sachs Group Incorporated 2.38 1-22-2018 40,000 40,182Goldman Sachs Group Incorporated 2.60 12-27-2020 50,000 50,393Goldman Sachs Group Incorporated 5.95 1-18-2018 50,000 51,301Morgan Stanley 2.38 7-23-2019 50,000 50,357Morgan Stanley 2.65 1-27-2020 50,000 50,638State Street Corporation ± 2.08 8-18-2020 90,000 91,817
587,593
Consumer Finance: 1.89%American Express Credit Corporation ± 1.52 3-3-2020 50,000 50,098American Express Credit Corporation 1.55 9-22-2017 100,000 100,044American Honda Finance Corporation 1.55 12-11-2017 30,000 30,022American Honda Finance Corporation ± 2.00 2-22-2019 50,000 50,608BMW US Capital LLC 144A± 1.54 9-13-2019 75,000 75,270Caterpillar Financial Service 1.80 11-13-2018 90,000 90,257John Deere Capital Corporation ± 1.73 1-8-2019 75,000 75,609
471,908
Diversified Financial Services: 0.73%AIG Global Funding 144A 1.65 12-15-2017 100,000 100,133General Electric Capital Corporation 5.63 9-15-2017 80,000 80,939
181,072
Insurance: 0.91%Marsh & McLennan Company Incorporated 2.55 10-15-2018 54,000 54,562New York Life Global Funding 144A 1.55 11-2-2018 70,000 69,984Travelers Company Incorporated 5.80 5-15-2018 97,000 100,935
225,481
Real Estate Management & Development: 0.41%Prologis LP 2.75 2-15-2019 100,000 101,293
The accompanying notes are an integral part of these financial statements.
Copyright © 2017 www.secdatabase.com. All Rights Reserved.Please Consider the Environment Before Printing This Document
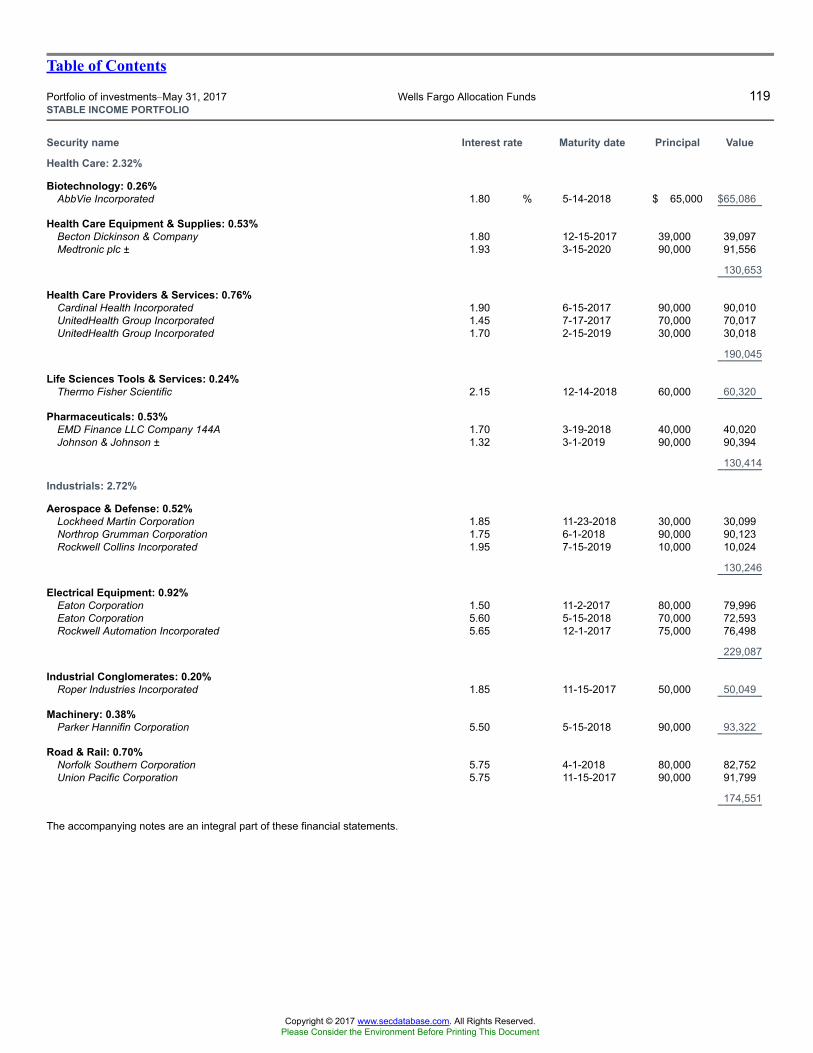
Table of Contents
Portfolio of investments�May 31, 2017 Wells Fargo Allocation Funds 119STABLE INCOME PORTFOLIO
Security name Interest rate Maturity date Principal Value
Health Care: 2.32%
Biotechnology: 0.26%AbbVie Incorporated 1.80 % 5-14-2018 $ 65,000 $65,086
Health Care Equipment & Supplies: 0.53%Becton Dickinson & Company 1.80 12-15-2017 39,000 39,097Medtronic plc ± 1.93 3-15-2020 90,000 91,556
130,653
Health Care Providers & Services: 0.76%Cardinal Health Incorporated 1.90 6-15-2017 90,000 90,010UnitedHealth Group Incorporated 1.45 7-17-2017 70,000 70,017UnitedHealth Group Incorporated 1.70 2-15-2019 30,000 30,018
190,045
Life Sciences Tools & Services: 0.24%Thermo Fisher Scientific 2.15 12-14-2018 60,000 60,320
Pharmaceuticals: 0.53%EMD Finance LLC Company 144A 1.70 3-19-2018 40,000 40,020Johnson & Johnson ± 1.32 3-1-2019 90,000 90,394
130,414
Industrials: 2.72%
Aerospace & Defense: 0.52%Lockheed Martin Corporation 1.85 11-23-2018 30,000 30,099Northrop Grumman Corporation 1.75 6-1-2018 90,000 90,123Rockwell Collins Incorporated 1.95 7-15-2019 10,000 10,024
130,246
Electrical Equipment: 0.92%Eaton Corporation 1.50 11-2-2017 80,000 79,996Eaton Corporation 5.60 5-15-2018 70,000 72,593Rockwell Automation Incorporated 5.65 12-1-2017 75,000 76,498
229,087
Industrial Conglomerates: 0.20%Roper Industries Incorporated 1.85 11-15-2017 50,000 50,049
Machinery: 0.38%Parker Hannifin Corporation 5.50 5-15-2018 90,000 93,322
Road & Rail: 0.70%Norfolk Southern Corporation 5.75 4-1-2018 80,000 82,752Union Pacific Corporation 5.75 11-15-2017 90,000 91,799
174,551
The accompanying notes are an integral part of these financial statements.
Copyright © 2017 www.secdatabase.com. All Rights Reserved.Please Consider the Environment Before Printing This Document

Table of Contents
120 Wells Fargo Allocation Funds Portfolio of investments�May 31, 2017STABLE INCOME PORTFOLIO
Security name Interest rate Maturity date Principal Value
Information Technology: 0.97%
Electronic Equipment, Instruments & Components: 0.24%Corning Incorporated 1.50 % 5-8-2018 $60,000 $59,977
IT Services: 0.20%Visa Incorporated 1.20 12-14-2017 50,000 49,993
Software: 0.20%Microsoft Corporation 1.10 8-8-2019 50,000 49,560
Technology Hardware, Storage & Peripherals: 0.33%Apple Incorporated 1.55 2-8-2019 50,000 50,086Hewlett Packard Enterprise Company 2.45 10-5-2017 33,000 33,087
83,173
Materials: 1.47%
Chemicals: 1.27%Chevron Phillips Chemical Company 144A 1.70 5-1-2018 75,000 75,076Ecolab Incorporated 1.45 12-8-2017 60,000 59,969Praxair Incorporated 1.05 11-7-2017 90,000 89,867The Sherwin-Williams Company 1.35 12-15-2017 90,000 89,929
314,841
Paper & Forest Products: 0.20%Georgia Pacific LLC 144A 2.54 11-15-2019 50,000 50,457
Real Estate: 1.15%
Equity REITs: 1.15%Boston Properties LP 3.70 11-15-2018 90,000 92,105ERP Operating LP 5.75 6-15-2017 30,000 30,035Realty Income Corporation 2.00 1-31-2018 73,000 73,120UDR Incorporated 4.25 6-1-2018 90,000 92,171
287,431
Utilities: 5.92%
Electric Utilities: 4.50%Alabama Power Company 5.50 10-15-2017 90,000 91,289Commonwealth Edison Company 2.15 1-15-2019 50,000 50,329Duke Energy Carolinas 5.25 1-15-2018 55,000 56,308Entergy Gulf States Louisiana LLC 6.00 5-1-2018 90,000 93,540Florida Power & Light Company 5.55 11-1-2017 115,000 117,004Florida Power & Light Company 5.80 9-15-2017 80,000 81,000Kansas City Power & Light Company 6.38 3-1-2018 75,000 77,467MidAmerican Energy Holdings Company 5.30 3-15-2018 55,000 56,606Northern States Power Company of Minnesota 5.25 3-1-2018 70,000 71,964PacifiCorp 5.50 1-15-2019 100,000 105,955Public Service Company of Colorado 5.80 8-1-2018 59,000 61,780Public Service Electric & Gas Company 5.30 5-1-2018 84,000 86,910Union Electric Company 6.40 6-15-2017 120,000 120,168Xcel Energy Incorporated 1.20 6-1-2017 50,000 50,000
1,120,320
The accompanying notes are an integral part of these financial statements.
Copyright © 2017 www.secdatabase.com. All Rights Reserved.Please Consider the Environment Before Printing This Document
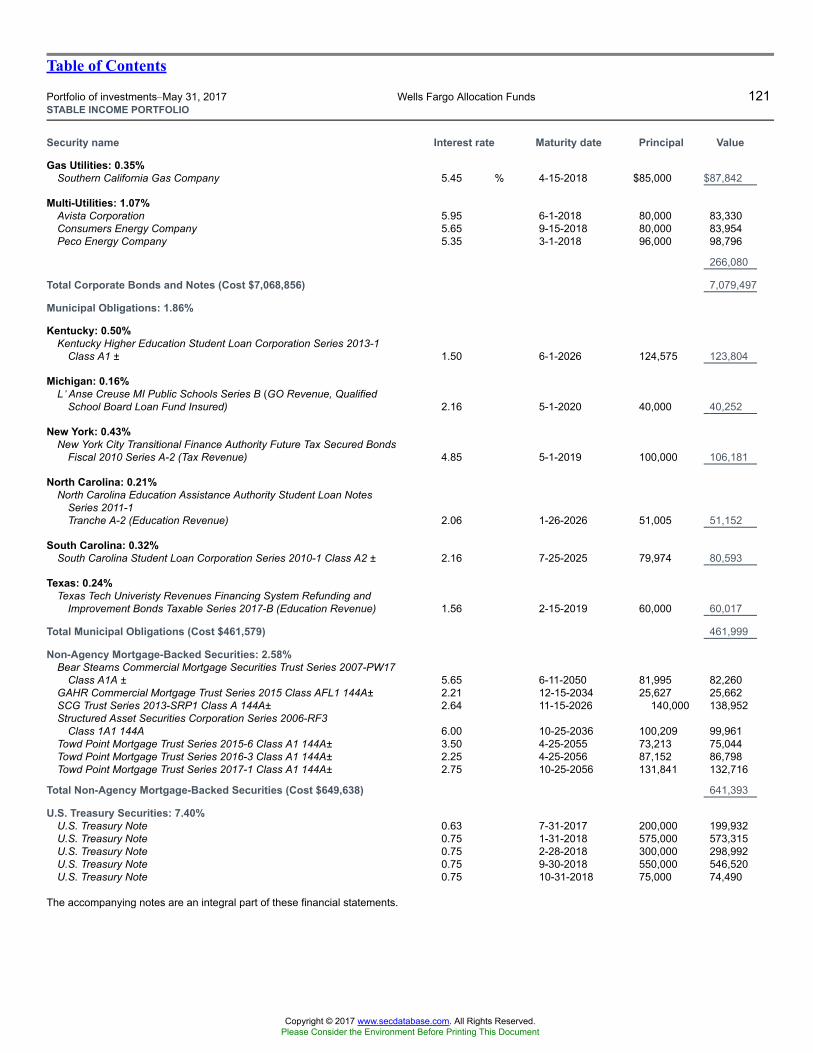
Table of Contents
Portfolio of investments�May 31, 2017 Wells Fargo Allocation Funds 121STABLE INCOME PORTFOLIO
Security name Interest rate Maturity date Principal Value
Gas Utilities: 0.35%Southern California Gas Company 5.45 % 4-15-2018 $85,000 $87,842
Multi-Utilities: 1.07%Avista Corporation 5.95 6-1-2018 80,000 83,330Consumers Energy Company 5.65 9-15-2018 80,000 83,954Peco Energy Company 5.35 3-1-2018 96,000 98,796
266,080
Total Corporate Bonds and Notes (Cost $7,068,856) 7,079,497
Municipal Obligations: 1.86%
Kentucky: 0.50%Kentucky Higher Education Student Loan Corporation Series 2013-1
Class A1 ± 1.50 6-1-2026 124,575 123,804
Michigan: 0.16%L�Anse Creuse MI Public Schools Series B (GO Revenue, Qualified
School Board Loan Fund Insured) 2.16 5-1-2020 40,000 40,252
New York: 0.43%New York City Transitional Finance Authority Future Tax Secured Bonds
Fiscal 2010 Series A-2 (Tax Revenue) 4.85 5-1-2019 100,000 106,181
North Carolina: 0.21%North Carolina Education Assistance Authority Student Loan Notes
Series 2011-1Tranche A-2 (Education Revenue) 2.06 1-26-2026 51,005 51,152
South Carolina: 0.32%South Carolina Student Loan Corporation Series 2010-1 Class A2 ± 2.16 7-25-2025 79,974 80,593
Texas: 0.24%Texas Tech Univeristy Revenues Financing System Refunding and
Improvement Bonds Taxable Series 2017-B (Education Revenue) 1.56 2-15-2019 60,000 60,017
Total Municipal Obligations (Cost $461,579) 461,999
Non-Agency Mortgage-Backed Securities: 2.58%Bear Stearns Commercial Mortgage Securities Trust Series 2007-PW17
Class A1A ± 5.65 6-11-2050 81,995 82,260GAHR Commercial Mortgage Trust Series 2015 Class AFL1 144A± 2.21 12-15-2034 25,627 25,662SCG Trust Series 2013-SRP1 Class A 144A± 2.64 11-15-2026 140,000 138,952Structured Asset Securities Corporation Series 2006-RF3
Class 1A1 144A 6.00 10-25-2036 100,209 99,961Towd Point Mortgage Trust Series 2015-6 Class A1 144A± 3.50 4-25-2055 73,213 75,044Towd Point Mortgage Trust Series 2016-3 Class A1 144A± 2.25 4-25-2056 87,152 86,798Towd Point Mortgage Trust Series 2017-1 Class A1 144A± 2.75 10-25-2056 131,841 132,716
Total Non-Agency Mortgage-Backed Securities (Cost $649,638) 641,393
U.S. Treasury Securities: 7.40%U.S. Treasury Note 0.63 7-31-2017 200,000 199,932U.S. Treasury Note 0.75 1-31-2018 575,000 573,315U.S. Treasury Note 0.75 2-28-2018 300,000 298,992U.S. Treasury Note 0.75 9-30-2018 550,000 546,520U.S. Treasury Note 0.75 10-31-2018 75,000 74,490
The accompanying notes are an integral part of these financial statements.
Copyright © 2017 www.secdatabase.com. All Rights Reserved.Please Consider the Environment Before Printing This Document
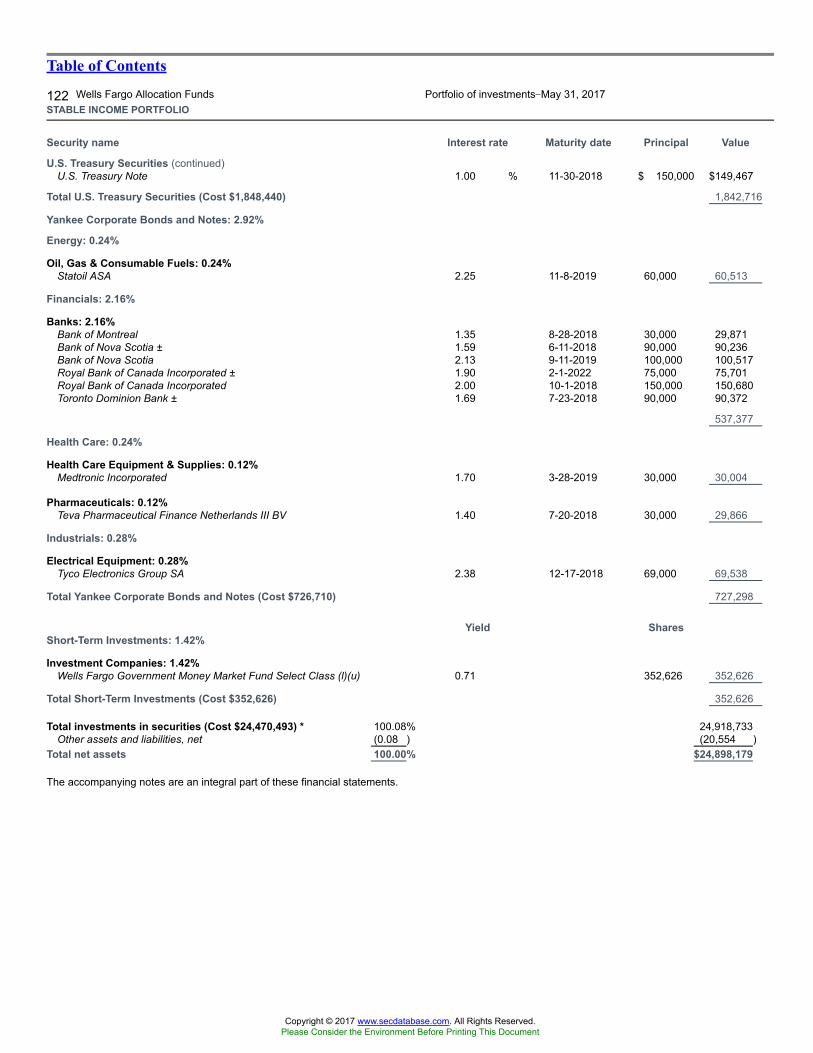
Table of Contents
122 Wells Fargo Allocation Funds Portfolio of investments�May 31, 2017STABLE INCOME PORTFOLIO
Security name Interest rate Maturity date Principal Value
U.S. Treasury Securities (continued)U.S. Treasury Note 1.00 % 11-30-2018 $ 150,000 $149,467
Total U.S. Treasury Securities (Cost $1,848,440) 1,842,716
Yankee Corporate Bonds and Notes: 2.92%
Energy: 0.24%
Oil, Gas & Consumable Fuels: 0.24%Statoil ASA 2.25 11-8-2019 60,000 60,513
Financials: 2.16%
Banks: 2.16%Bank of Montreal 1.35 8-28-2018 30,000 29,871Bank of Nova Scotia ± 1.59 6-11-2018 90,000 90,236Bank of Nova Scotia 2.13 9-11-2019 100,000 100,517Royal Bank of Canada Incorporated ± 1.90 2-1-2022 75,000 75,701Royal Bank of Canada Incorporated 2.00 10-1-2018 150,000 150,680Toronto Dominion Bank ± 1.69 7-23-2018 90,000 90,372
537,377
Health Care: 0.24%
Health Care Equipment & Supplies: 0.12%Medtronic Incorporated 1.70 3-28-2019 30,000 30,004
Pharmaceuticals: 0.12%Teva Pharmaceutical Finance Netherlands III BV 1.40 7-20-2018 30,000 29,866
Industrials: 0.28%
Electrical Equipment: 0.28%Tyco Electronics Group SA 2.38 12-17-2018 69,000 69,538
Total Yankee Corporate Bonds and Notes (Cost $726,710) 727,298
Yield SharesShort-Term Investments: 1.42%
Investment Companies: 1.42%Wells Fargo Government Money Market Fund Select Class (l)(u) 0.71 352,626 352,626
Total Short-Term Investments (Cost $352,626) 352,626
Total investments in securities (Cost $24,470,493) * 100.08% 24,918,733Other assets and liabilities, net (0.08 ) (20,554 )
Total net assets 100.00% $24,898,179
The accompanying notes are an integral part of these financial statements.
Copyright © 2017 www.secdatabase.com. All Rights Reserved.Please Consider the Environment Before Printing This Document

Table of Contents
Portfolio of investments�May 31, 2017 Wells Fargo Allocation Funds 123STABLE INCOME PORTFOLIO
Copyright © 2017 www.secdatabase.com. All Rights Reserved.Please Consider the Environment Before Printing This Document
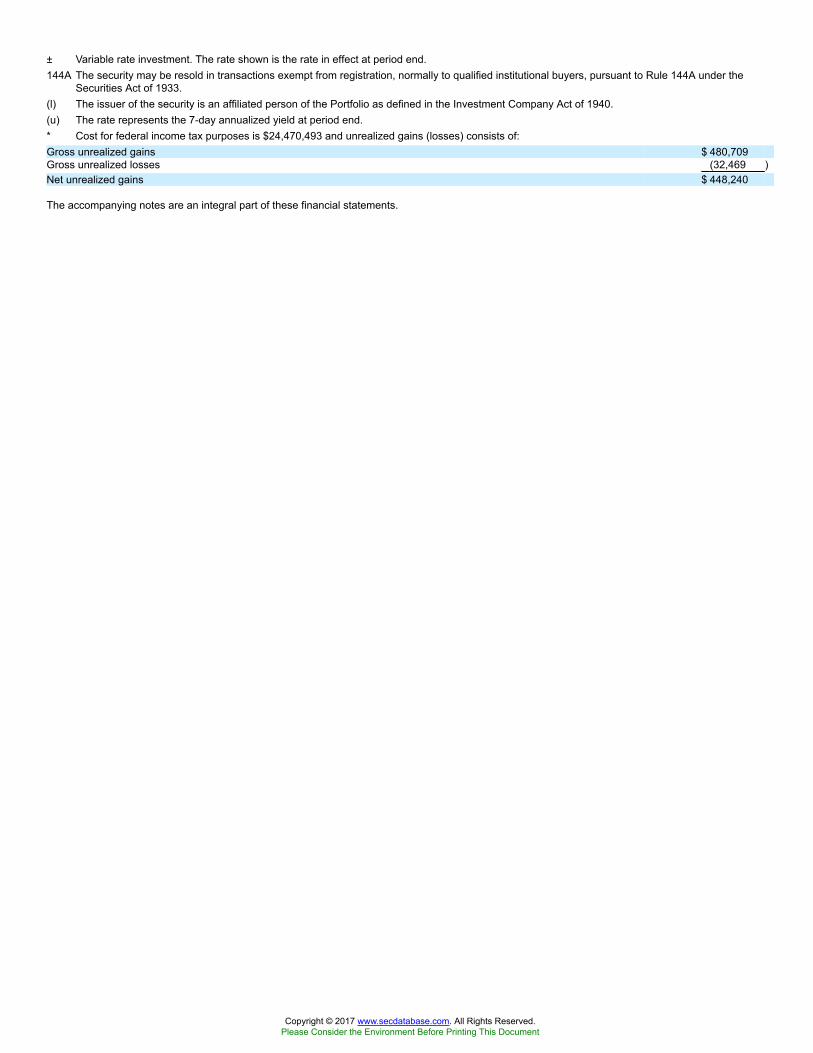
± Variable rate investment. The rate shown is the rate in effect at period end.144A The security may be resold in transactions exempt from registration, normally to qualified institutional buyers, pursuant to Rule 144A under the
Securities Act of 1933.(l) The issuer of the security is an affiliated person of the Portfolio as defined in the Investment Company Act of 1940.(u) The rate represents the 7-day annualized yield at period end.* Cost for federal income tax purposes is $24,470,493 and unrealized gains (losses) consists of:Gross unrealized gains $ 480,709Gross unrealized losses (32,469 )Net unrealized gains $ 448,240
The accompanying notes are an integral part of these financial statements.
Copyright © 2017 www.secdatabase.com. All Rights Reserved.Please Consider the Environment Before Printing This Document
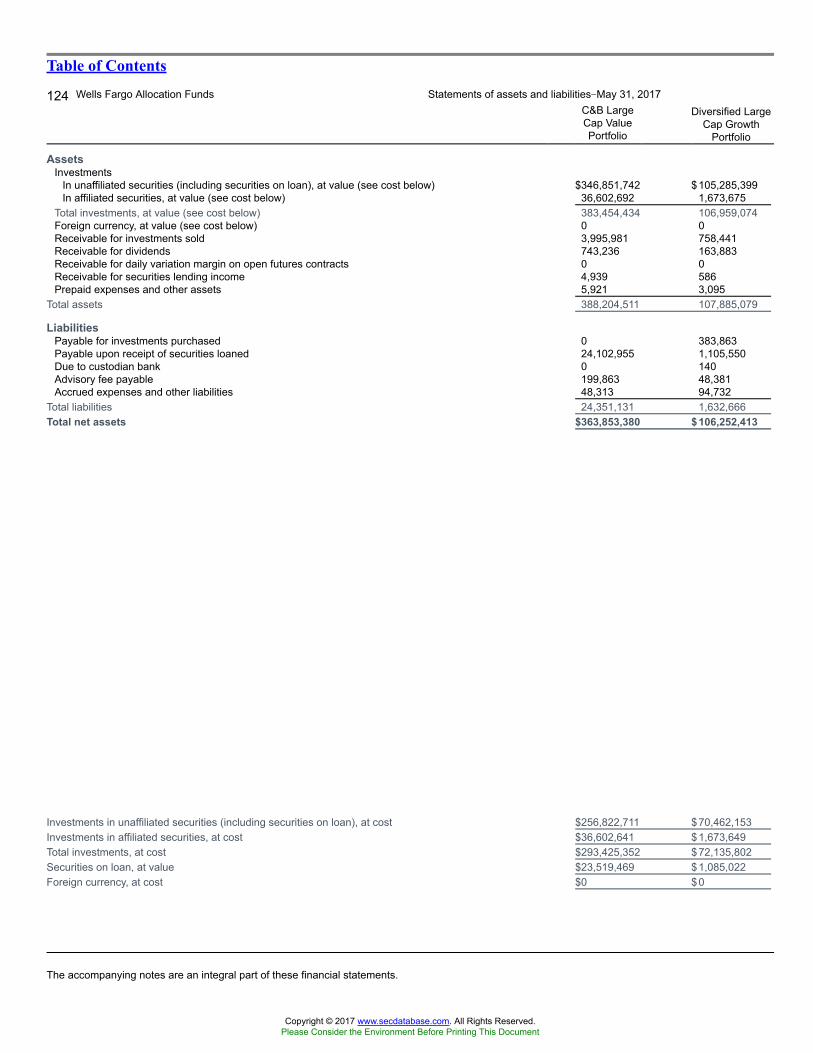
Table of Contents
124 Wells Fargo Allocation Funds Statements of assets and liabilities�May 31, 2017C&B LargeCap ValuePortfolio
Diversified LargeCap Growth
Portfolio
AssetsInvestments
In unaffiliated securities (including securities on loan), at value (see cost below) $346,851,742 $105,285,399In affiliated securities, at value (see cost below) 36,602,692 1,673,675
Total investments, at value (see cost below) 383,454,434 106,959,074Foreign currency, at value (see cost below) 0 0Receivable for investments sold 3,995,981 758,441Receivable for dividends 743,236 163,883Receivable for daily variation margin on open futures contracts 0 0Receivable for securities lending income 4,939 586Prepaid expenses and other assets 5,921 3,095
Total assets 388,204,511 107,885,079
LiabilitiesPayable for investments purchased 0 383,863Payable upon receipt of securities loaned 24,102,955 1,105,550Due to custodian bank 0 140Advisory fee payable 199,863 48,381Accrued expenses and other liabilities 48,313 94,732
Total liabilities 24,351,131 1,632,666Total net assets $363,853,380 $106,252,413
Investments in unaffiliated securities (including securities on loan), at cost $256,822,711 $70,462,153Investments in affiliated securities, at cost $36,602,641 $1,673,649Total investments, at cost $293,425,352 $72,135,802Securities on loan, at value $23,519,469 $1,085,022Foreign currency, at cost $0 $0
The accompanying notes are an integral part of these financial statements.
Copyright © 2017 www.secdatabase.com. All Rights Reserved.Please Consider the Environment Before Printing This Document
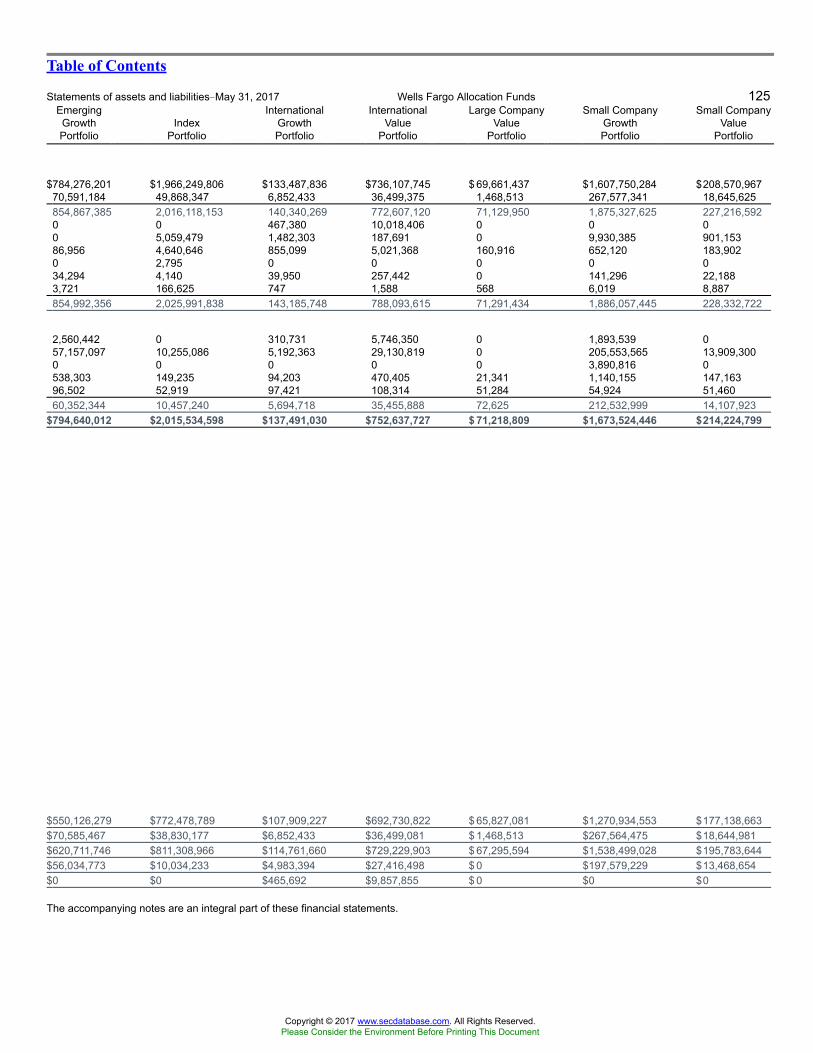
Table of Contents
Statements of assets and liabilities�May 31, 2017 Wells Fargo Allocation Funds 125EmergingGrowthPortfolio
IndexPortfolio
InternationalGrowthPortfolio
InternationalValue
Portfolio
Large CompanyValue
Portfolio
Small CompanyGrowthPortfolio
Small CompanyValue
Portfolio
$784,276,201 $1,966,249,806 $133,487,836 $736,107,745 $ 69,661,437 $1,607,750,284 $208,570,96770,591,184 49,868,347 6,852,433 36,499,375 1,468,513 267,577,341 18,645,625854,867,385 2,016,118,153 140,340,269 772,607,120 71,129,950 1,875,327,625 227,216,5920 0 467,380 10,018,406 0 0 00 5,059,479 1,482,303 187,691 0 9,930,385 901,15386,956 4,640,646 855,099 5,021,368 160,916 652,120 183,9020 2,795 0 0 0 0 034,294 4,140 39,950 257,442 0 141,296 22,1883,721 166,625 747 1,588 568 6,019 8,887854,992,356 2,025,991,838 143,185,748 788,093,615 71,291,434 1,886,057,445 228,332,722
2,560,442 0 310,731 5,746,350 0 1,893,539 057,157,097 10,255,086 5,192,363 29,130,819 0 205,553,565 13,909,3000 0 0 0 0 3,890,816 0538,303 149,235 94,203 470,405 21,341 1,140,155 147,16396,502 52,919 97,421 108,314 51,284 54,924 51,46060,352,344 10,457,240 5,694,718 35,455,888 72,625 212,532,999 14,107,923
$794,640,012 $2,015,534,598 $137,491,030 $752,637,727 $ 71,218,809 $1,673,524,446 $214,224,799
$550,126,279 $772,478,789 $107,909,227 $692,730,822 $ 65,827,081 $1,270,934,553 $177,138,663$70,585,467 $38,830,177 $6,852,433 $36,499,081 $ 1,468,513 $267,564,475 $18,644,981$620,711,746 $811,308,966 $114,761,660 $729,229,903 $ 67,295,594 $1,538,499,028 $195,783,644$56,034,773 $10,034,233 $4,983,394 $27,416,498 $ 0 $197,579,229 $13,468,654$0 $0 $465,692 $9,857,855 $ 0 $0 $0
The accompanying notes are an integral part of these financial statements.
Copyright © 2017 www.secdatabase.com. All Rights Reserved.Please Consider the Environment Before Printing This Document
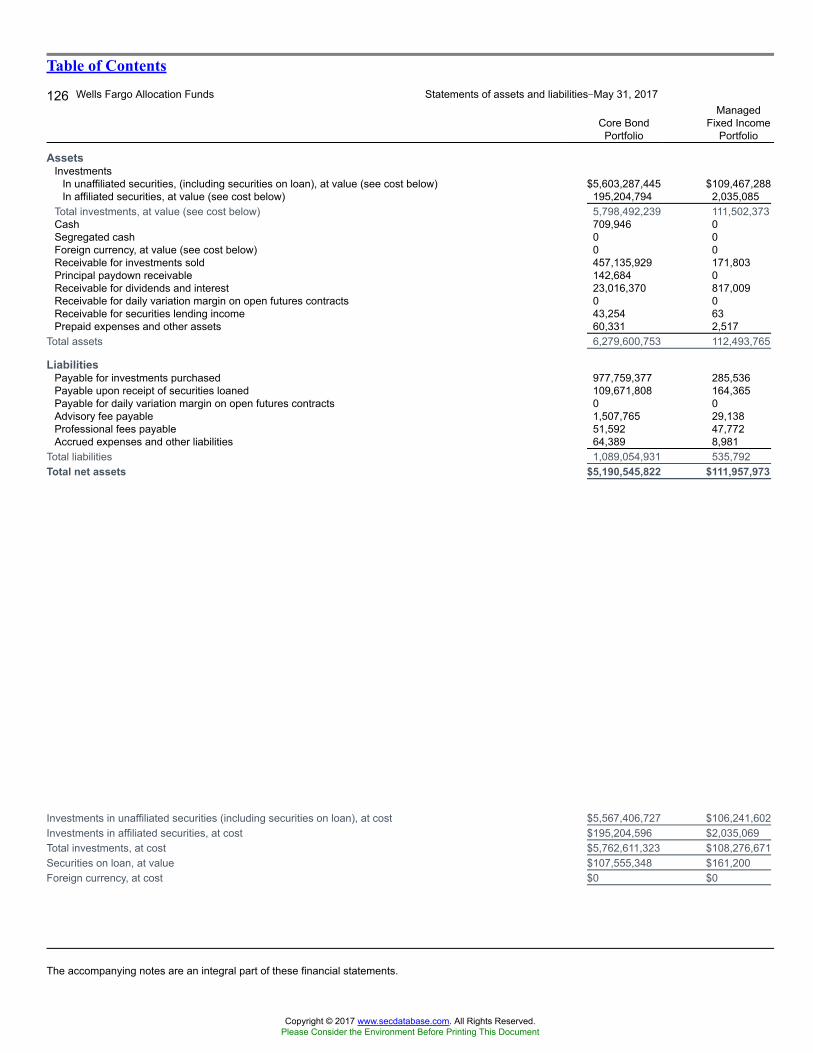
Table of Contents
126 Wells Fargo Allocation Funds Statements of assets and liabilities�May 31, 2017
Core BondPortfolio
ManagedFixed Income
Portfolio
AssetsInvestments
In unaffiliated securities, (including securities on loan), at value (see cost below) $5,603,287,445 $109,467,288In affiliated securities, at value (see cost below) 195,204,794 2,035,085
Total investments, at value (see cost below) 5,798,492,239 111,502,373Cash 709,946 0Segregated cash 0 0Foreign currency, at value (see cost below) 0 0Receivable for investments sold 457,135,929 171,803Principal paydown receivable 142,684 0Receivable for dividends and interest 23,016,370 817,009Receivable for daily variation margin on open futures contracts 0 0Receivable for securities lending income 43,254 63Prepaid expenses and other assets 60,331 2,517
Total assets 6,279,600,753 112,493,765
LiabilitiesPayable for investments purchased 977,759,377 285,536Payable upon receipt of securities loaned 109,671,808 164,365Payable for daily variation margin on open futures contracts 0 0Advisory fee payable 1,507,765 29,138Professional fees payable 51,592 47,772Accrued expenses and other liabilities 64,389 8,981
Total liabilities 1,089,054,931 535,792Total net assets $5,190,545,822 $111,957,973
Investments in unaffiliated securities (including securities on loan), at cost $5,567,406,727 $106,241,602Investments in affiliated securities, at cost $195,204,596 $2,035,069Total investments, at cost $5,762,611,323 $108,276,671Securities on loan, at value $107,555,348 $161,200Foreign currency, at cost $0 $0
The accompanying notes are an integral part of these financial statements.
Copyright © 2017 www.secdatabase.com. All Rights Reserved.Please Consider the Environment Before Printing This Document
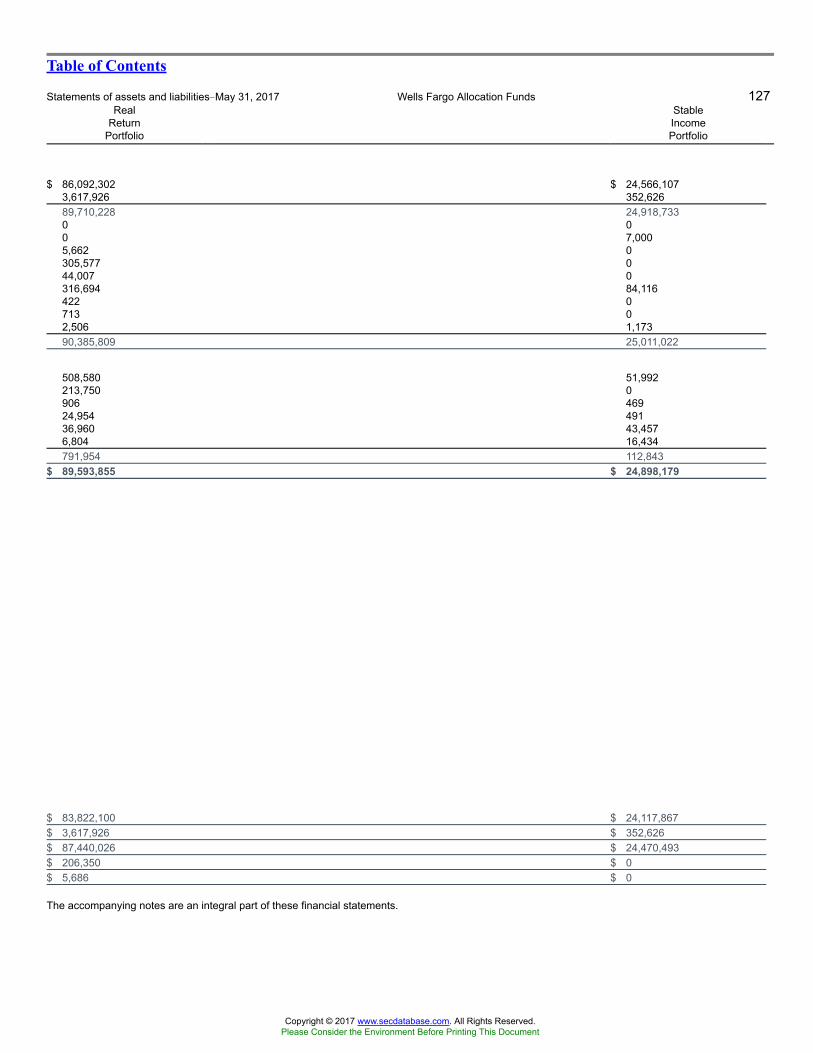
Table of Contents
Statements of assets and liabilities�May 31, 2017 Wells Fargo Allocation Funds 127Real
ReturnPortfolio
StableIncomePortfolio
$ 86,092,302 $ 24,566,1073,617,926 352,62689,710,228 24,918,7330 00 7,0005,662 0305,577 044,007 0316,694 84,116422 0713 02,506 1,17390,385,809 25,011,022
508,580 51,992213,750 0906 46924,954 49136,960 43,4576,804 16,434791,954 112,843
$ 89,593,855 $ 24,898,179
$ 83,822,100 $ 24,117,867$ 3,617,926 $ 352,626$ 87,440,026 $ 24,470,493$ 206,350 $ 0$ 5,686 $ 0
The accompanying notes are an integral part of these financial statements.
Copyright © 2017 www.secdatabase.com. All Rights Reserved.Please Consider the Environment Before Printing This Document

Table of Contents
128 Wells Fargo Allocation Funds Statements of operations�year ended May 31, 2017C&B LargeCap ValuePortfolio
DiversifiedLarge Cap
Growth Portfolio
Investment incomeDividends* $5,815,429 $ 1,227,649Income from affiliated securities 56,445 5,447Securities lending income, net 57,157 11,232Interest 0 0Other income 2,708 106
Total investment income 5,931,739 1,244,434
ExpensesAdvisory fee 2,184,413 715,634Custody and accounting fees 24,552 53,050Professional fees 44,139 48,045Shareholder report expenses 1,059 2,044Trustees� fees and expenses 12,567 23,297Other fees and expenses 9,077 13,367
Total expenses 2,275,807 855,437Less: Fee waivers and/or expense reimbursements 0 (170,505 )
Net expenses 2,275,807 684,932Net investment income (loss) 3,655,932 559,502
REALIZED AND UNREALIZED GAINS (LOSSES) ON INVESTMENTSNet realized gains (losses) on:
Unaffiliated securities 33,005,049 16,539,179Affiliated securities 2 43Futures transactions 0 0
Net realized gains (losses) on investments 33,005,051 16,539,222
Net change in unrealized gains (losses) on:Unaffiliated securities 22,347,091 (1,622,623 )Affiliated securities 51 26Futures transactions 0 0
Net change in unrealized gains (losses) on investments 22,347,142 (1,622,597 )Net realized and unrealized gains (losses) on investments 55,352,193 14,916,625Net increase in net assets resulting from operations $59,008,125 $ 15,476,127
* Net of foreign dividend withholding taxes in the amount of $109,753 $4,009
Copyright © 2017 www.secdatabase.com. All Rights Reserved.Please Consider the Environment Before Printing This Document

The accompanying notes are an integral part of these financial statements.
Copyright © 2017 www.secdatabase.com. All Rights Reserved.Please Consider the Environment Before Printing This Document
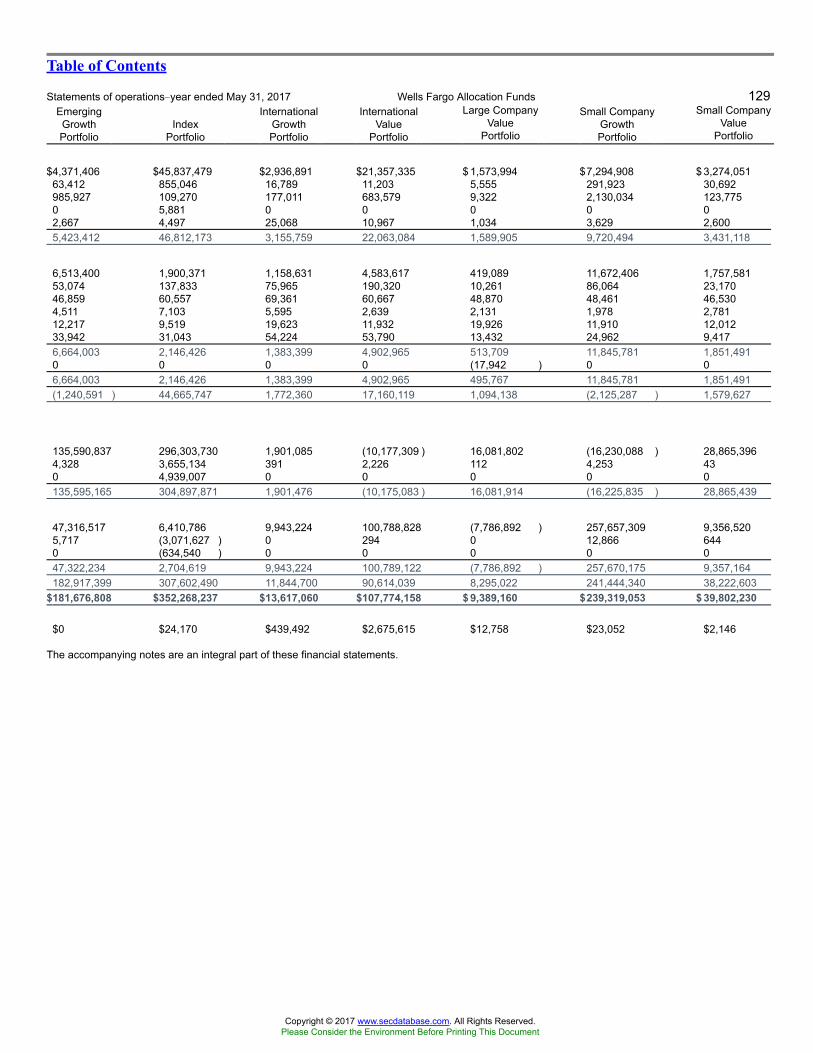
Table of Contents
Statements of operations�year ended May 31, 2017 Wells Fargo Allocation Funds 129EmergingGrowthPortfolio
IndexPortfolio
InternationalGrowthPortfolio
InternationalValue
Portfolio
Large CompanyValue
Portfolio
Small CompanyGrowthPortfolio
Small CompanyValue
Portfolio
$4,371,406 $45,837,479 $2,936,891 $21,357,335 $ 1,573,994 $7,294,908 $ 3,274,05163,412 855,046 16,789 11,203 5,555 291,923 30,692985,927 109,270 177,011 683,579 9,322 2,130,034 123,7750 5,881 0 0 0 0 02,667 4,497 25,068 10,967 1,034 3,629 2,6005,423,412 46,812,173 3,155,759 22,063,084 1,589,905 9,720,494 3,431,118
6,513,400 1,900,371 1,158,631 4,583,617 419,089 11,672,406 1,757,58153,074 137,833 75,965 190,320 10,261 86,064 23,17046,859 60,557 69,361 60,667 48,870 48,461 46,5304,511 7,103 5,595 2,639 2,131 1,978 2,78112,217 9,519 19,623 11,932 19,926 11,910 12,01233,942 31,043 54,224 53,790 13,432 24,962 9,4176,664,003 2,146,426 1,383,399 4,902,965 513,709 11,845,781 1,851,4910 0 0 0 (17,942 ) 0 06,664,003 2,146,426 1,383,399 4,902,965 495,767 11,845,781 1,851,491(1,240,591 ) 44,665,747 1,772,360 17,160,119 1,094,138 (2,125,287 ) 1,579,627
135,590,837 296,303,730 1,901,085 (10,177,309 ) 16,081,802 (16,230,088 ) 28,865,3964,328 3,655,134 391 2,226 112 4,253 430 4,939,007 0 0 0 0 0135,595,165 304,897,871 1,901,476 (10,175,083 ) 16,081,914 (16,225,835 ) 28,865,439
47,316,517 6,410,786 9,943,224 100,788,828 (7,786,892 ) 257,657,309 9,356,5205,717 (3,071,627 ) 0 294 0 12,866 6440 (634,540 ) 0 0 0 0 047,322,234 2,704,619 9,943,224 100,789,122 (7,786,892 ) 257,670,175 9,357,164182,917,399 307,602,490 11,844,700 90,614,039 8,295,022 241,444,340 38,222,603
$181,676,808 $352,268,237 $13,617,060 $107,774,158 $ 9,389,160 $239,319,053 $ 39,802,230
$0 $24,170 $439,492 $2,675,615 $12,758 $23,052 $2,146
The accompanying notes are an integral part of these financial statements.
Copyright © 2017 www.secdatabase.com. All Rights Reserved.Please Consider the Environment Before Printing This Document
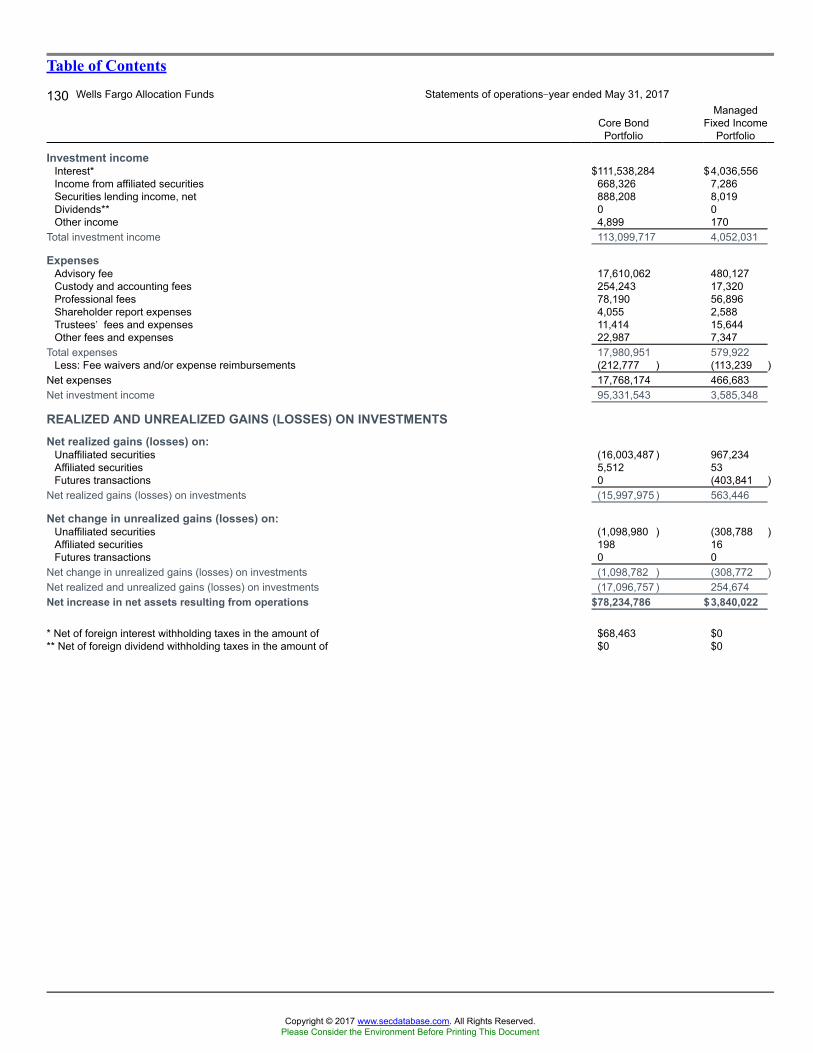
Table of Contents
130 Wells Fargo Allocation Funds Statements of operations�year ended May 31, 2017
Core BondPortfolio
ManagedFixed Income
Portfolio
Investment incomeInterest* $111,538,284 $4,036,556Income from affiliated securities 668,326 7,286Securities lending income, net 888,208 8,019Dividends** 0 0Other income 4,899 170
Total investment income 113,099,717 4,052,031
ExpensesAdvisory fee 17,610,062 480,127Custody and accounting fees 254,243 17,320Professional fees 78,190 56,896Shareholder report expenses 4,055 2,588Trustees� fees and expenses 11,414 15,644Other fees and expenses 22,987 7,347
Total expenses 17,980,951 579,922Less: Fee waivers and/or expense reimbursements (212,777 ) (113,239 )
Net expenses 17,768,174 466,683Net investment income 95,331,543 3,585,348
REALIZED AND UNREALIZED GAINS (LOSSES) ON INVESTMENTSNet realized gains (losses) on:
Unaffiliated securities (16,003,487 ) 967,234Affiliated securities 5,512 53Futures transactions 0 (403,841 )
Net realized gains (losses) on investments (15,997,975 ) 563,446
Net change in unrealized gains (losses) on:Unaffiliated securities (1,098,980 ) (308,788 )Affiliated securities 198 16Futures transactions 0 0
Net change in unrealized gains (losses) on investments (1,098,782 ) (308,772 )Net realized and unrealized gains (losses) on investments (17,096,757 ) 254,674Net increase in net assets resulting from operations $78,234,786 $3,840,022
* Net of foreign interest withholding taxes in the amount of $68,463 $0** Net of foreign dividend withholding taxes in the amount of $0 $0
Copyright © 2017 www.secdatabase.com. All Rights Reserved.Please Consider the Environment Before Printing This Document

The accompanying notes are an integral part of these financial statements.
Copyright © 2017 www.secdatabase.com. All Rights Reserved.Please Consider the Environment Before Printing This Document
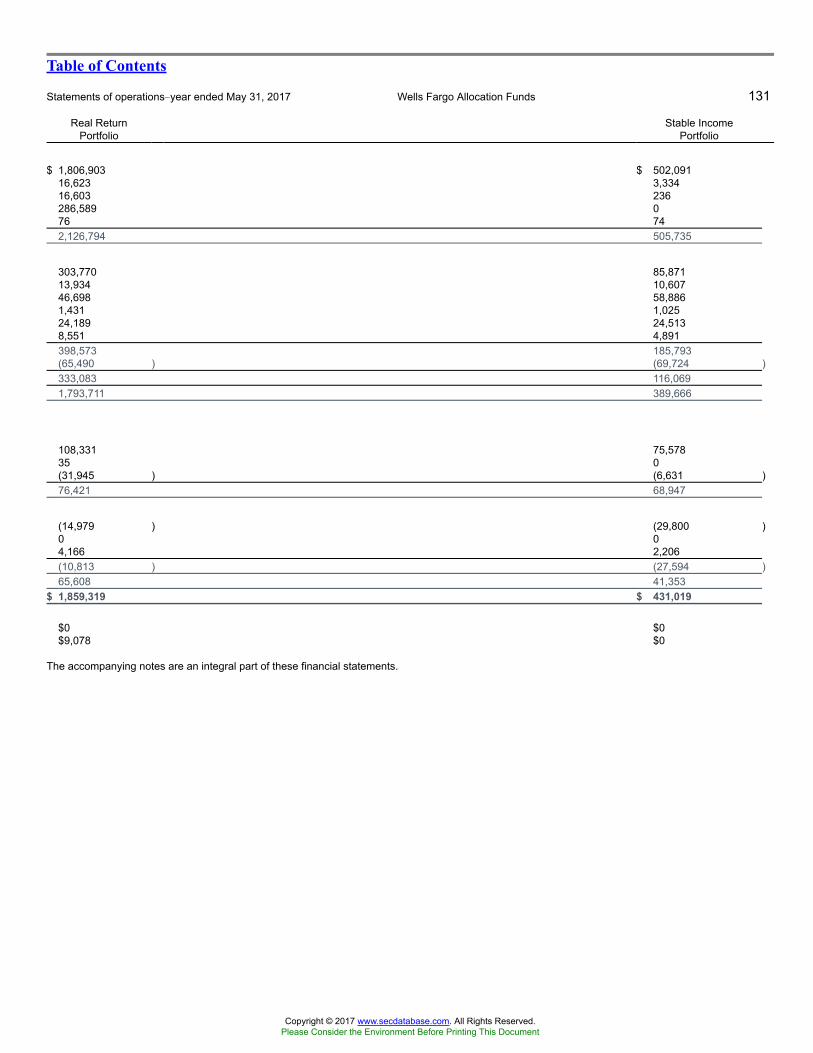
Table of Contents
Statements of operations�year ended May 31, 2017 Wells Fargo Allocation Funds 131
Real ReturnPortfolio
Stable IncomePortfolio
$ 1,806,903 $ 502,09116,623 3,33416,603 236286,589 076 742,126,794 505,735
303,770 85,87113,934 10,60746,698 58,8861,431 1,02524,189 24,5138,551 4,891398,573 185,793(65,490 ) (69,724 )333,083 116,0691,793,711 389,666
108,331 75,57835 0(31,945 ) (6,631 )76,421 68,947
(14,979 ) (29,800 )0 04,166 2,206(10,813 ) (27,594 )65,608 41,353
$ 1,859,319 $ 431,019
$0 $0$9,078 $0
The accompanying notes are an integral part of these financial statements.
Copyright © 2017 www.secdatabase.com. All Rights Reserved.Please Consider the Environment Before Printing This Document

Table of Contents
132 Wells Fargo Allocation Funds Statements of changes in net assetsC&B Large Cap Value PortfolioYear ended
May 31, 2017Year ended
May 31, 2016
OperationsNet investment income $3,655,932 $4,128,282Net realized gains on investments 33,005,051 14,000,084Net change in unrealized gains (losses) on investments 22,347,142 (18,760,215 )
Net increase (decrease) in net assets resulting from operations 59,008,125 (631,849 )
Capital share transactionsTransactions in investors� beneficial interests
Contributions 92,843,484 38,393,377Withdrawals (80,962,518 ) (80,332,043 )
Net increase (decrease) in net assets resulting from capital share transactions 11,880,966 (41,938,666 )Total increase (decrease) in net assets 70,889,091 (42,570,515 )
Net assetsBeginning of period 292,964,289 335,534,804End of period $363,853,380 $292,964,289
Copyright © 2017 www.secdatabase.com. All Rights Reserved.Please Consider the Environment Before Printing This Document

The accompanying notes are an integral part of these financial statements.
Copyright © 2017 www.secdatabase.com. All Rights Reserved.Please Consider the Environment Before Printing This Document
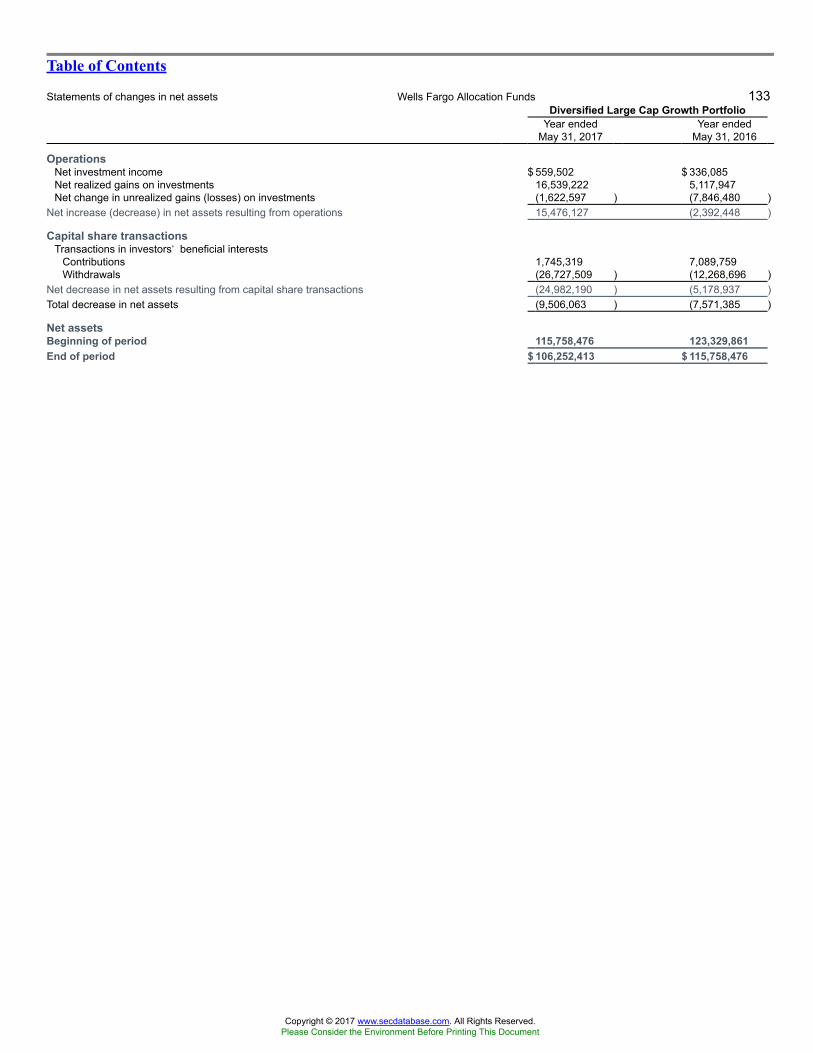
Table of Contents
Statements of changes in net assets Wells Fargo Allocation Funds 133Diversified Large Cap Growth Portfolio
Year endedMay 31, 2017
Year endedMay 31, 2016
OperationsNet investment income $ 559,502 $ 336,085Net realized gains on investments 16,539,222 5,117,947Net change in unrealized gains (losses) on investments (1,622,597 ) (7,846,480 )
Net increase (decrease) in net assets resulting from operations 15,476,127 (2,392,448 )
Capital share transactionsTransactions in investors� beneficial interests
Contributions 1,745,319 7,089,759Withdrawals (26,727,509 ) (12,268,696 )
Net decrease in net assets resulting from capital share transactions (24,982,190 ) (5,178,937 )Total decrease in net assets (9,506,063 ) (7,571,385 )
Net assetsBeginning of period 115,758,476 123,329,861End of period $ 106,252,413 $ 115,758,476
Copyright © 2017 www.secdatabase.com. All Rights Reserved.Please Consider the Environment Before Printing This Document

The accompanying notes are an integral part of these financial statements.
Copyright © 2017 www.secdatabase.com. All Rights Reserved.Please Consider the Environment Before Printing This Document
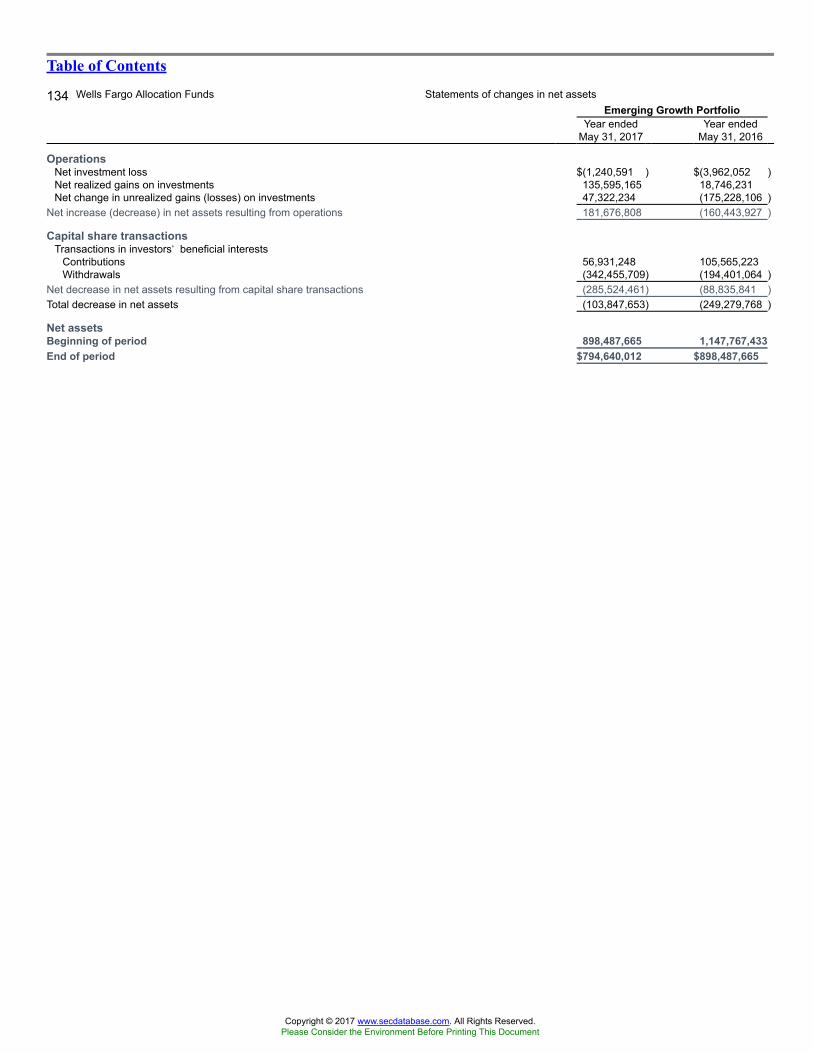
Table of Contents
134 Wells Fargo Allocation Funds Statements of changes in net assetsEmerging Growth Portfolio
Year endedMay 31, 2017
Year endedMay 31, 2016
OperationsNet investment loss $(1,240,591 ) $(3,962,052 )Net realized gains on investments 135,595,165 18,746,231Net change in unrealized gains (losses) on investments 47,322,234 (175,228,106 )
Net increase (decrease) in net assets resulting from operations 181,676,808 (160,443,927 )
Capital share transactionsTransactions in investors� beneficial interests
Contributions 56,931,248 105,565,223Withdrawals (342,455,709) (194,401,064 )
Net decrease in net assets resulting from capital share transactions (285,524,461) (88,835,841 )Total decrease in net assets (103,847,653) (249,279,768 )
Net assetsBeginning of period 898,487,665 1,147,767,433End of period $794,640,012 $898,487,665
Copyright © 2017 www.secdatabase.com. All Rights Reserved.Please Consider the Environment Before Printing This Document

The accompanying notes are an integral part of these financial statements.
Copyright © 2017 www.secdatabase.com. All Rights Reserved.Please Consider the Environment Before Printing This Document
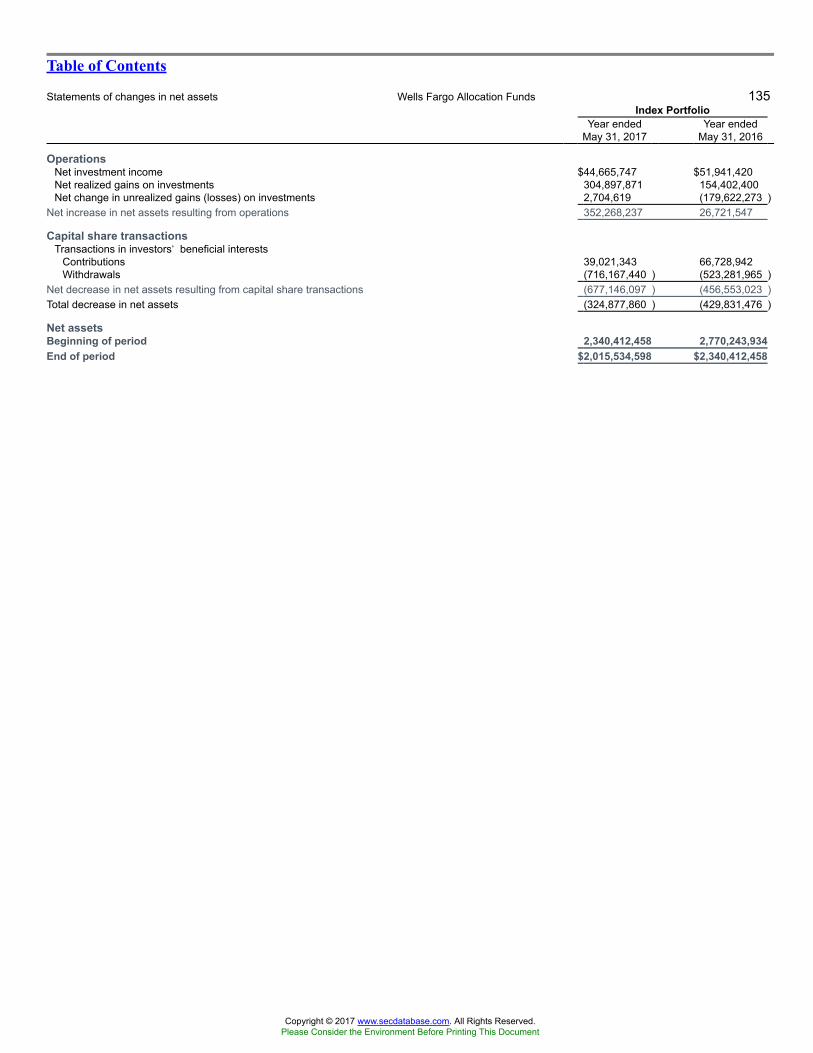
Table of Contents
Statements of changes in net assets Wells Fargo Allocation Funds 135Index Portfolio
Year endedMay 31, 2017
Year endedMay 31, 2016
OperationsNet investment income $44,665,747 $51,941,420Net realized gains on investments 304,897,871 154,402,400Net change in unrealized gains (losses) on investments 2,704,619 (179,622,273 )
Net increase in net assets resulting from operations 352,268,237 26,721,547
Capital share transactionsTransactions in investors� beneficial interests
Contributions 39,021,343 66,728,942Withdrawals (716,167,440 ) (523,281,965 )
Net decrease in net assets resulting from capital share transactions (677,146,097 ) (456,553,023 )Total decrease in net assets (324,877,860 ) (429,831,476 )
Net assetsBeginning of period 2,340,412,458 2,770,243,934End of period $2,015,534,598 $2,340,412,458
Copyright © 2017 www.secdatabase.com. All Rights Reserved.Please Consider the Environment Before Printing This Document

The accompanying notes are an integral part of these financial statements.
Copyright © 2017 www.secdatabase.com. All Rights Reserved.Please Consider the Environment Before Printing This Document

Table of Contents
136 Wells Fargo Allocation Funds Statements of changes in net assetsInternational Growth Portfolio
Year endedMay 31, 2017
Year endedMay 31, 2016
OperationsNet investment income $1,772,360 $1,728,257Net realized gains (losses) on investments 1,901,476 (1,635,815 )Net change in unrealized gains (losses) on investments 9,943,224 (20,243,476 )
Net increase (decrease) in net assets resulting from operations 13,617,060 (20,151,034 )
Capital share transactionsTransactions in investors� beneficial interests
Contributions 4,029,844 15,674,750Withdrawals (28,532,489 ) (5,551,430 )
Net increase (decrease) in net assets resulting from capital share transactions (24,502,645 ) 10,123,320Total decrease in net assets (10,885,585 ) (10,027,714 )
Net assetsBeginning of period 148,376,615 158,404,329End of period $137,491,030 $148,376,615
Copyright © 2017 www.secdatabase.com. All Rights Reserved.Please Consider the Environment Before Printing This Document

The accompanying notes are an integral part of these financial statements.
Copyright © 2017 www.secdatabase.com. All Rights Reserved.Please Consider the Environment Before Printing This Document
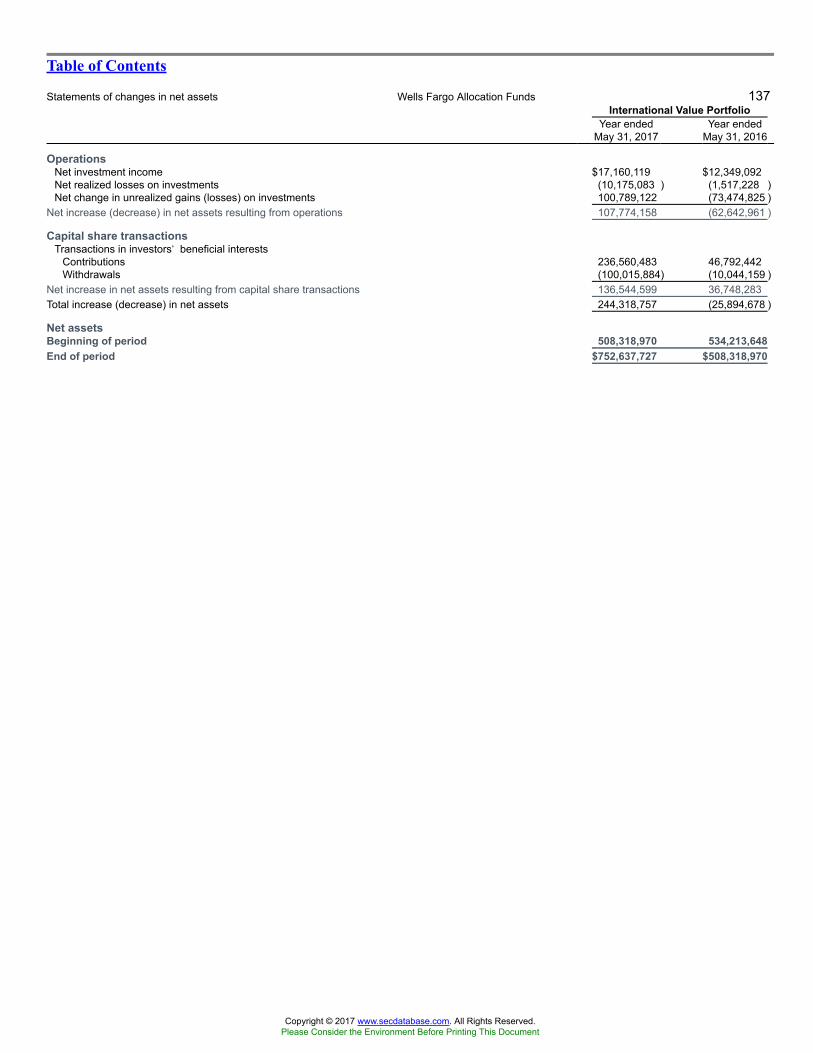
Table of Contents
Statements of changes in net assets Wells Fargo Allocation Funds 137International Value Portfolio
Year endedMay 31, 2017
Year endedMay 31, 2016
OperationsNet investment income $17,160,119 $12,349,092Net realized losses on investments (10,175,083 ) (1,517,228 )Net change in unrealized gains (losses) on investments 100,789,122 (73,474,825 )
Net increase (decrease) in net assets resulting from operations 107,774,158 (62,642,961 )
Capital share transactionsTransactions in investors� beneficial interests
Contributions 236,560,483 46,792,442Withdrawals (100,015,884) (10,044,159 )
Net increase in net assets resulting from capital share transactions 136,544,599 36,748,283Total increase (decrease) in net assets 244,318,757 (25,894,678 )
Net assetsBeginning of period 508,318,970 534,213,648End of period $752,637,727 $508,318,970
Copyright © 2017 www.secdatabase.com. All Rights Reserved.Please Consider the Environment Before Printing This Document

The accompanying notes are an integral part of these financial statements.
Copyright © 2017 www.secdatabase.com. All Rights Reserved.Please Consider the Environment Before Printing This Document
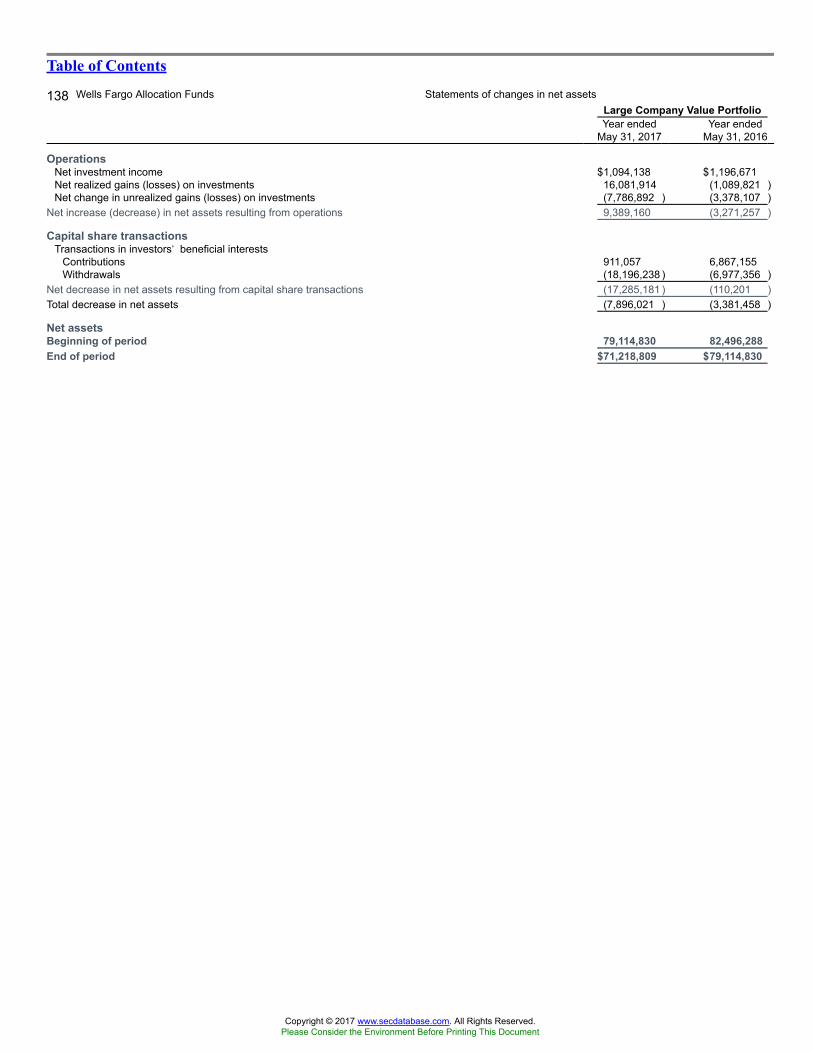
Table of Contents
138 Wells Fargo Allocation Funds Statements of changes in net assetsLarge Company Value PortfolioYear ended
May 31, 2017Year ended
May 31, 2016
OperationsNet investment income $1,094,138 $1,196,671Net realized gains (losses) on investments 16,081,914 (1,089,821 )Net change in unrealized gains (losses) on investments (7,786,892 ) (3,378,107 )
Net increase (decrease) in net assets resulting from operations 9,389,160 (3,271,257 )
Capital share transactionsTransactions in investors� beneficial interests
Contributions 911,057 6,867,155Withdrawals (18,196,238 ) (6,977,356 )
Net decrease in net assets resulting from capital share transactions (17,285,181 ) (110,201 )Total decrease in net assets (7,896,021 ) (3,381,458 )
Net assetsBeginning of period 79,114,830 82,496,288End of period $71,218,809 $79,114,830
Copyright © 2017 www.secdatabase.com. All Rights Reserved.Please Consider the Environment Before Printing This Document

The accompanying notes are an integral part of these financial statements.
Copyright © 2017 www.secdatabase.com. All Rights Reserved.Please Consider the Environment Before Printing This Document
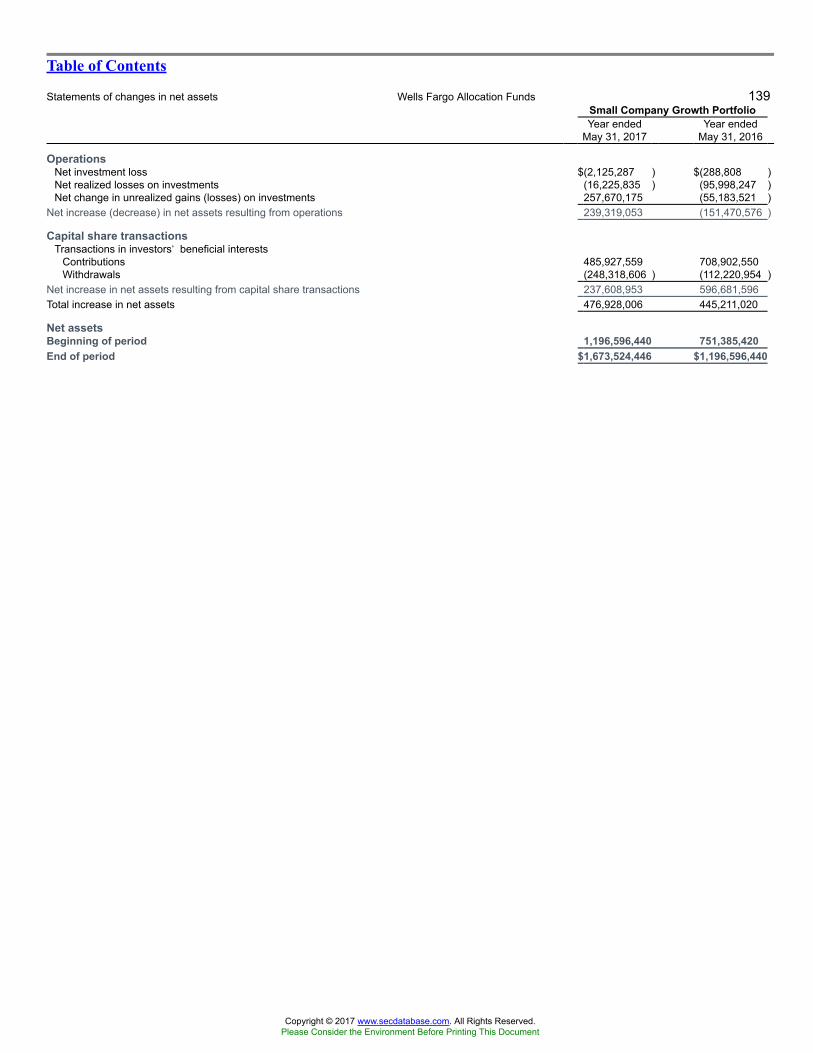
Table of Contents
Statements of changes in net assets Wells Fargo Allocation Funds 139Small Company Growth PortfolioYear ended
May 31, 2017Year ended
May 31, 2016
OperationsNet investment loss $(2,125,287 ) $(288,808 )Net realized losses on investments (16,225,835 ) (95,998,247 )Net change in unrealized gains (losses) on investments 257,670,175 (55,183,521 )
Net increase (decrease) in net assets resulting from operations 239,319,053 (151,470,576 )
Capital share transactionsTransactions in investors� beneficial interests
Contributions 485,927,559 708,902,550Withdrawals (248,318,606 ) (112,220,954 )
Net increase in net assets resulting from capital share transactions 237,608,953 596,681,596Total increase in net assets 476,928,006 445,211,020
Net assetsBeginning of period 1,196,596,440 751,385,420End of period $1,673,524,446 $1,196,596,440
Copyright © 2017 www.secdatabase.com. All Rights Reserved.Please Consider the Environment Before Printing This Document

The accompanying notes are an integral part of these financial statements.
Copyright © 2017 www.secdatabase.com. All Rights Reserved.Please Consider the Environment Before Printing This Document

Table of Contents
140 Wells Fargo Allocation Funds Statements of changes in net assetsSmall Company Value PortfolioYear ended
May 31, 2017Year ended
May 31, 2016
OperationsNet investment income $1,579,627 $1,286,924Net realized gains on investments 28,865,439 12,552,384Net change in unrealized gains (losses) on investments 9,357,164 (24,625,962 )
Net increase (decrease) in net assets resulting from operations 39,802,230 (10,786,654 )
Capital share transactionsTransactions in investors� beneficial interests
Contributions 22,385,660 36,132,062Withdrawals (65,532,861 ) (23,471,861 )
Net increase (decrease) in net assets resulting from capital share transactions (43,147,201 ) 12,660,201Total increase (decrease) in net assets (3,344,971 ) 1,873,547
Net assetsBeginning of period 217,569,770 215,696,223End of period $214,224,799 $217,569,770
Copyright © 2017 www.secdatabase.com. All Rights Reserved.Please Consider the Environment Before Printing This Document

The accompanying notes are an integral part of these financial statements.
Copyright © 2017 www.secdatabase.com. All Rights Reserved.Please Consider the Environment Before Printing This Document
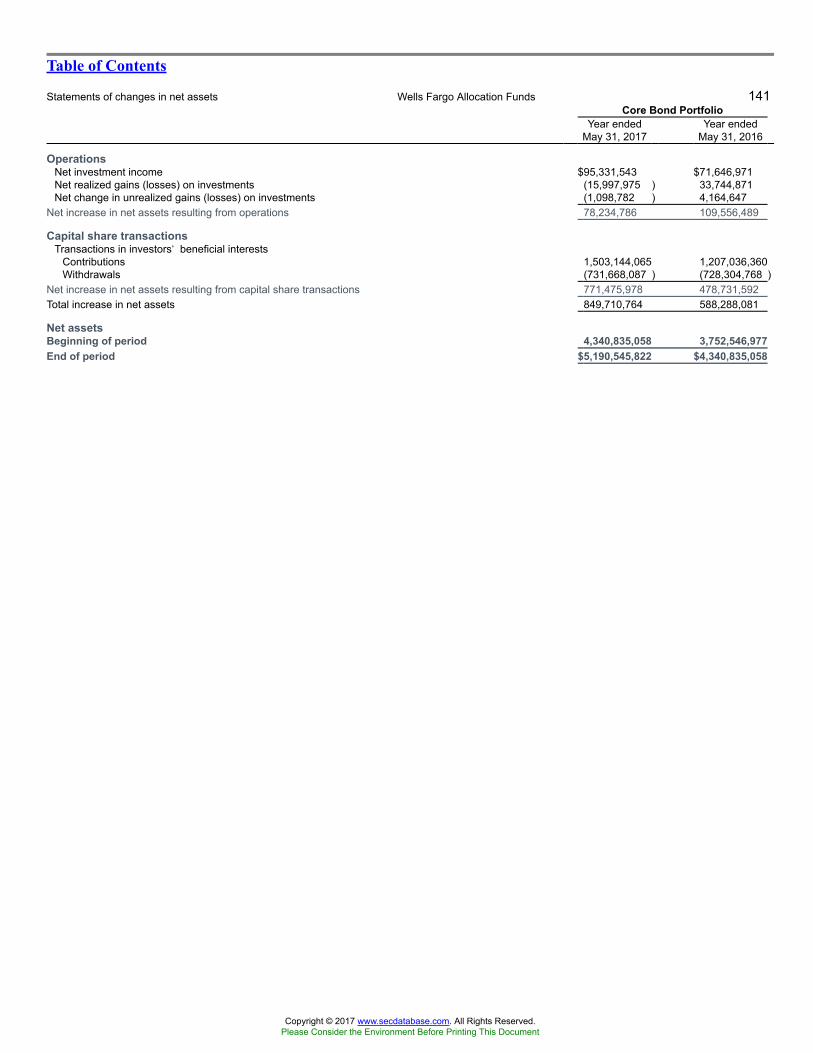
Table of Contents
Statements of changes in net assets Wells Fargo Allocation Funds 141Core Bond Portfolio
Year endedMay 31, 2017
Year endedMay 31, 2016
OperationsNet investment income $95,331,543 $71,646,971Net realized gains (losses) on investments (15,997,975 ) 33,744,871Net change in unrealized gains (losses) on investments (1,098,782 ) 4,164,647
Net increase in net assets resulting from operations 78,234,786 109,556,489
Capital share transactionsTransactions in investors� beneficial interests
Contributions 1,503,144,065 1,207,036,360Withdrawals (731,668,087 ) (728,304,768 )
Net increase in net assets resulting from capital share transactions 771,475,978 478,731,592Total increase in net assets 849,710,764 588,288,081
Net assetsBeginning of period 4,340,835,058 3,752,546,977End of period $5,190,545,822 $4,340,835,058
Copyright © 2017 www.secdatabase.com. All Rights Reserved.Please Consider the Environment Before Printing This Document

The accompanying notes are an integral part of these financial statements.
Copyright © 2017 www.secdatabase.com. All Rights Reserved.Please Consider the Environment Before Printing This Document
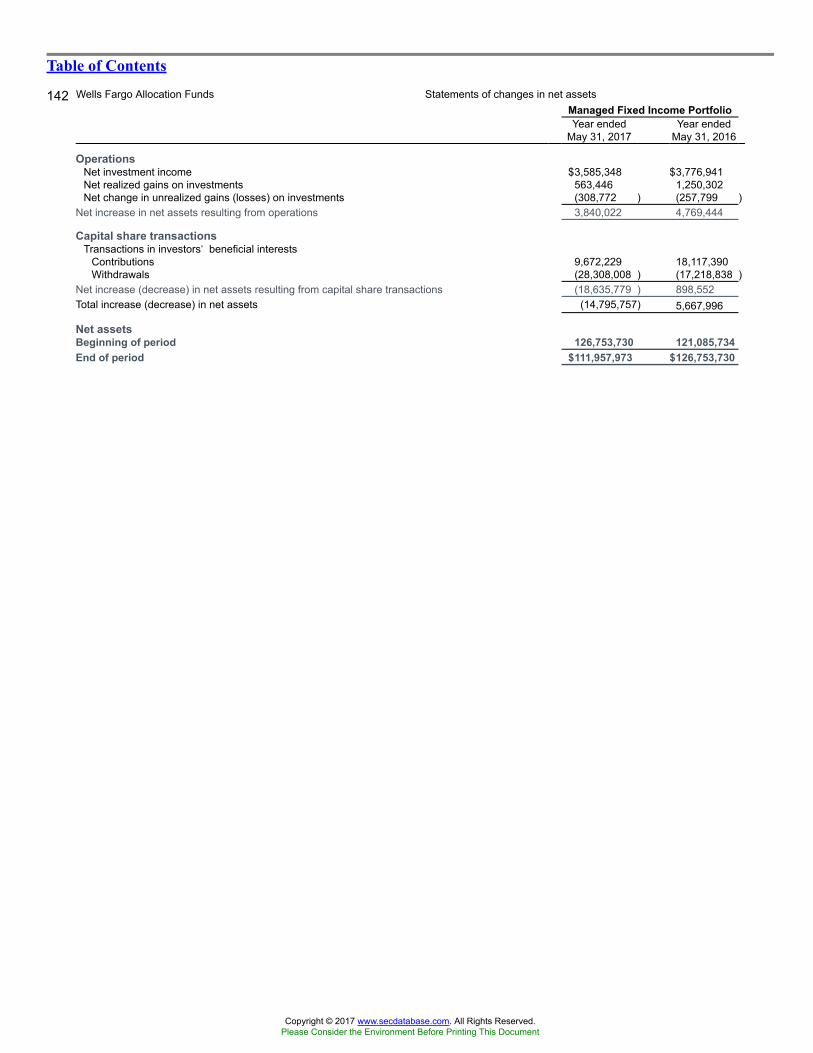
Table of Contents
142 Wells Fargo Allocation Funds Statements of changes in net assetsManaged Fixed Income PortfolioYear ended
May 31, 2017Year ended
May 31, 2016
OperationsNet investment income $3,585,348 $3,776,941Net realized gains on investments 563,446 1,250,302Net change in unrealized gains (losses) on investments (308,772 ) (257,799 )
Net increase in net assets resulting from operations 3,840,022 4,769,444
Capital share transactionsTransactions in investors� beneficial interests
Contributions 9,672,229 18,117,390Withdrawals (28,308,008 ) (17,218,838 )
Net increase (decrease) in net assets resulting from capital share transactions (18,635,779 ) 898,552Total increase (decrease) in net assets (14,795,757) 5,667,996
Net assetsBeginning of period 126,753,730 121,085,734End of period $111,957,973 $126,753,730
Copyright © 2017 www.secdatabase.com. All Rights Reserved.Please Consider the Environment Before Printing This Document

The accompanying notes are an integral part of these financial statements.
Copyright © 2017 www.secdatabase.com. All Rights Reserved.Please Consider the Environment Before Printing This Document
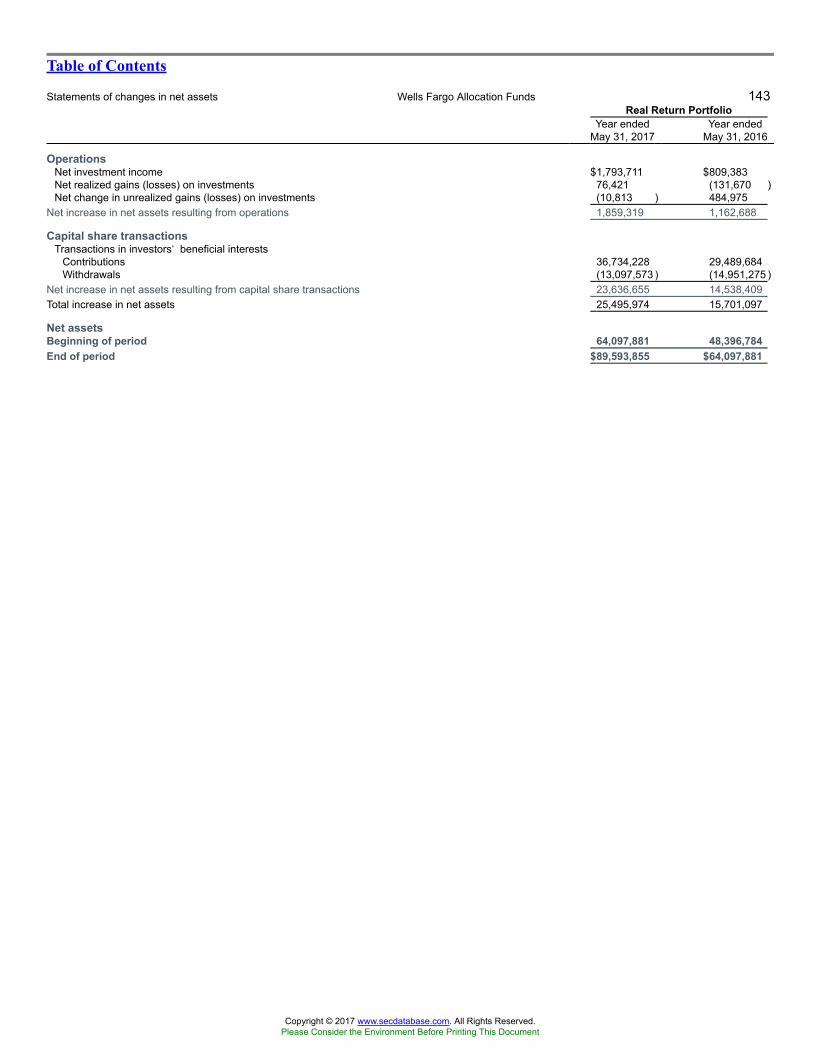
Table of Contents
Statements of changes in net assets Wells Fargo Allocation Funds 143Real Return Portfolio
Year endedMay 31, 2017
Year endedMay 31, 2016
OperationsNet investment income $1,793,711 $809,383Net realized gains (losses) on investments 76,421 (131,670 )Net change in unrealized gains (losses) on investments (10,813 ) 484,975
Net increase in net assets resulting from operations 1,859,319 1,162,688
Capital share transactionsTransactions in investors� beneficial interests
Contributions 36,734,228 29,489,684Withdrawals (13,097,573 ) (14,951,275 )
Net increase in net assets resulting from capital share transactions 23,636,655 14,538,409Total increase in net assets 25,495,974 15,701,097
Net assetsBeginning of period 64,097,881 48,396,784End of period $89,593,855 $64,097,881
Copyright © 2017 www.secdatabase.com. All Rights Reserved.Please Consider the Environment Before Printing This Document

The accompanying notes are an integral part of these financial statements.
Copyright © 2017 www.secdatabase.com. All Rights Reserved.Please Consider the Environment Before Printing This Document
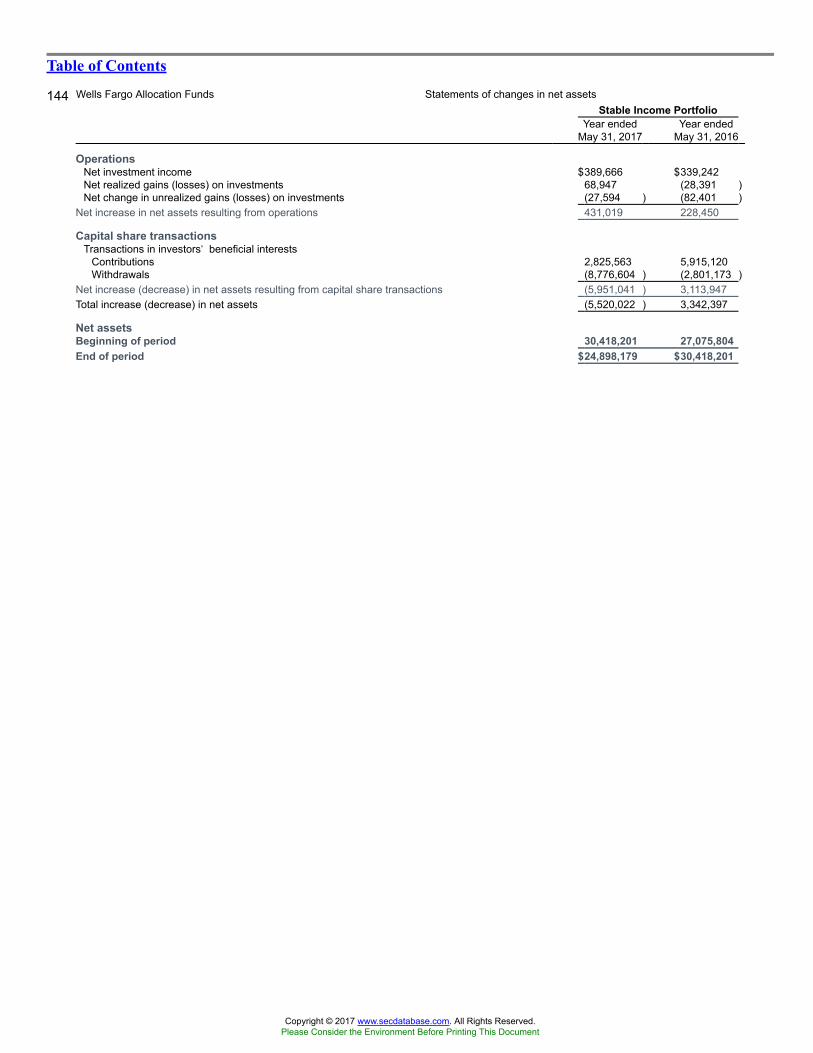
Table of Contents
144 Wells Fargo Allocation Funds Statements of changes in net assetsStable Income Portfolio
Year endedMay 31, 2017
Year endedMay 31, 2016
OperationsNet investment income $389,666 $339,242Net realized gains (losses) on investments 68,947 (28,391 )Net change in unrealized gains (losses) on investments (27,594 ) (82,401 )
Net increase in net assets resulting from operations 431,019 228,450
Capital share transactionsTransactions in investors� beneficial interests
Contributions 2,825,563 5,915,120Withdrawals (8,776,604 ) (2,801,173 )
Net increase (decrease) in net assets resulting from capital share transactions (5,951,041 ) 3,113,947Total increase (decrease) in net assets (5,520,022 ) 3,342,397
Net assetsBeginning of period 30,418,201 27,075,804End of period $24,898,179 $30,418,201
Copyright © 2017 www.secdatabase.com. All Rights Reserved.Please Consider the Environment Before Printing This Document

The accompanying notes are an integral part of these financial statements.
Copyright © 2017 www.secdatabase.com. All Rights Reserved.Please Consider the Environment Before Printing This Document
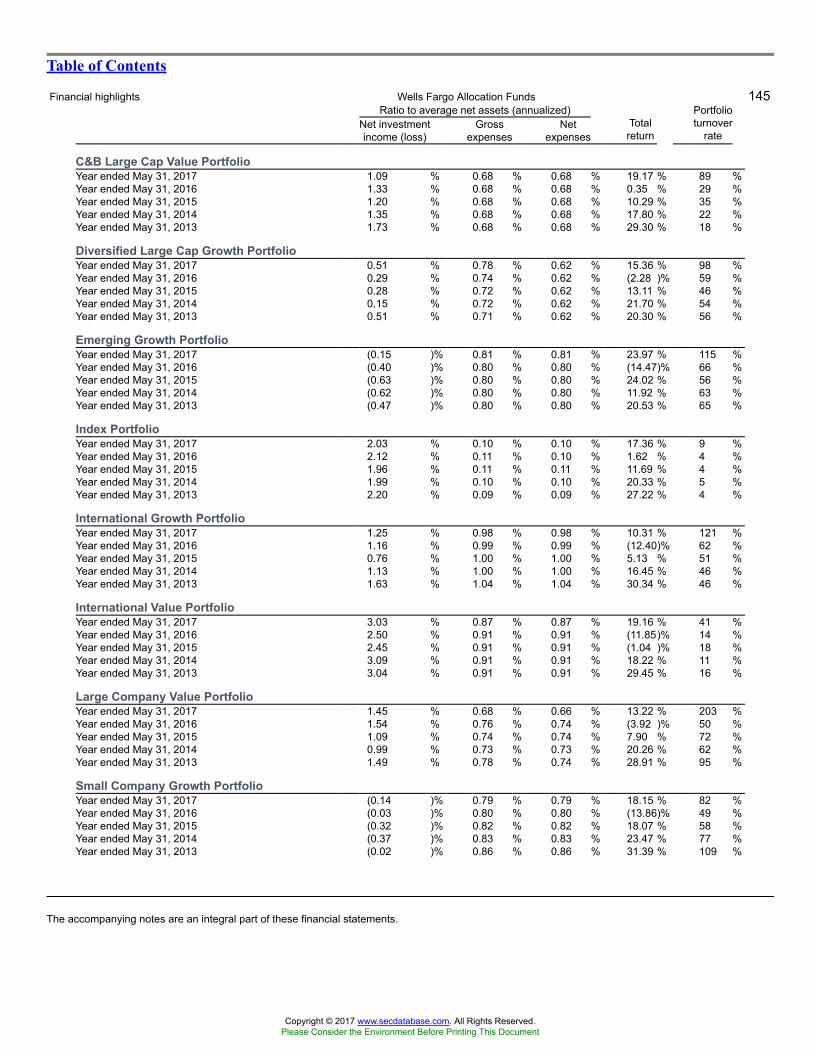
Table of Contents
Financial highlights Wells Fargo Allocation Funds 145Ratio to average net assets (annualized)
Net investmentincome (loss)
Grossexpenses
Netexpenses
Totalreturn
Portfolioturnover
rate
C&B Large Cap Value PortfolioYear ended May 31, 2017 1.09 % 0.68 % 0.68 % 19.17 % 89 %Year ended May 31, 2016 1.33 % 0.68 % 0.68 % 0.35 % 29 %Year ended May 31, 2015 1.20 % 0.68 % 0.68 % 10.29 % 35 %Year ended May 31, 2014 1.35 % 0.68 % 0.68 % 17.80 % 22 %Year ended May 31, 2013 1.73 % 0.68 % 0.68 % 29.30 % 18 %
Diversified Large Cap Growth PortfolioYear ended May 31, 2017 0.51 % 0.78 % 0.62 % 15.36 % 98 %Year ended May 31, 2016 0.29 % 0.74 % 0.62 % (2.28 )% 59 %Year ended May 31, 2015 0.28 % 0.72 % 0.62 % 13.11 % 46 %Year ended May 31, 2014 0.15 % 0.72 % 0.62 % 21.70 % 54 %Year ended May 31, 2013 0.51 % 0.71 % 0.62 % 20.30 % 56 %
Emerging Growth PortfolioYear ended May 31, 2017 (0.15 )% 0.81 % 0.81 % 23.97 % 115 %Year ended May 31, 2016 (0.40 )% 0.80 % 0.80 % (14.47)% 66 %Year ended May 31, 2015 (0.63 )% 0.80 % 0.80 % 24.02 % 56 %Year ended May 31, 2014 (0.62 )% 0.80 % 0.80 % 11.92 % 63 %Year ended May 31, 2013 (0.47 )% 0.80 % 0.80 % 20.53 % 65 %
Index PortfolioYear ended May 31, 2017 2.03 % 0.10 % 0.10 % 17.36 % 9 %Year ended May 31, 2016 2.12 % 0.11 % 0.10 % 1.62 % 4 %Year ended May 31, 2015 1.96 % 0.11 % 0.11 % 11.69 % 4 %Year ended May 31, 2014 1.99 % 0.10 % 0.10 % 20.33 % 5 %Year ended May 31, 2013 2.20 % 0.09 % 0.09 % 27.22 % 4 %
International Growth PortfolioYear ended May 31, 2017 1.25 % 0.98 % 0.98 % 10.31 % 121 %Year ended May 31, 2016 1.16 % 0.99 % 0.99 % (12.40)% 62 %Year ended May 31, 2015 0.76 % 1.00 % 1.00 % 5.13 % 51 %Year ended May 31, 2014 1.13 % 1.00 % 1.00 % 16.45 % 46 %Year ended May 31, 2013 1.63 % 1.04 % 1.04 % 30.34 % 46 %
International Value PortfolioYear ended May 31, 2017 3.03 % 0.87 % 0.87 % 19.16 % 41 %Year ended May 31, 2016 2.50 % 0.91 % 0.91 % (11.85)% 14 %Year ended May 31, 2015 2.45 % 0.91 % 0.91 % (1.04 )% 18 %Year ended May 31, 2014 3.09 % 0.91 % 0.91 % 18.22 % 11 %Year ended May 31, 2013 3.04 % 0.91 % 0.91 % 29.45 % 16 %
Large Company Value PortfolioYear ended May 31, 2017 1.45 % 0.68 % 0.66 % 13.22 % 203 %Year ended May 31, 2016 1.54 % 0.76 % 0.74 % (3.92 )% 50 %Year ended May 31, 2015 1.09 % 0.74 % 0.74 % 7.90 % 72 %Year ended May 31, 2014 0.99 % 0.73 % 0.73 % 20.26 % 62 %Year ended May 31, 2013 1.49 % 0.78 % 0.74 % 28.91 % 95 %
Small Company Growth PortfolioYear ended May 31, 2017 (0.14 )% 0.79 % 0.79 % 18.15 % 82 %Year ended May 31, 2016 (0.03 )% 0.80 % 0.80 % (13.86)% 49 %Year ended May 31, 2015 (0.32 )% 0.82 % 0.82 % 18.07 % 58 %Year ended May 31, 2014 (0.37 )% 0.83 % 0.83 % 23.47 % 77 %Year ended May 31, 2013 (0.02 )% 0.86 % 0.86 % 31.39 % 109 %
The accompanying notes are an integral part of these financial statements.
Copyright © 2017 www.secdatabase.com. All Rights Reserved.Please Consider the Environment Before Printing This Document
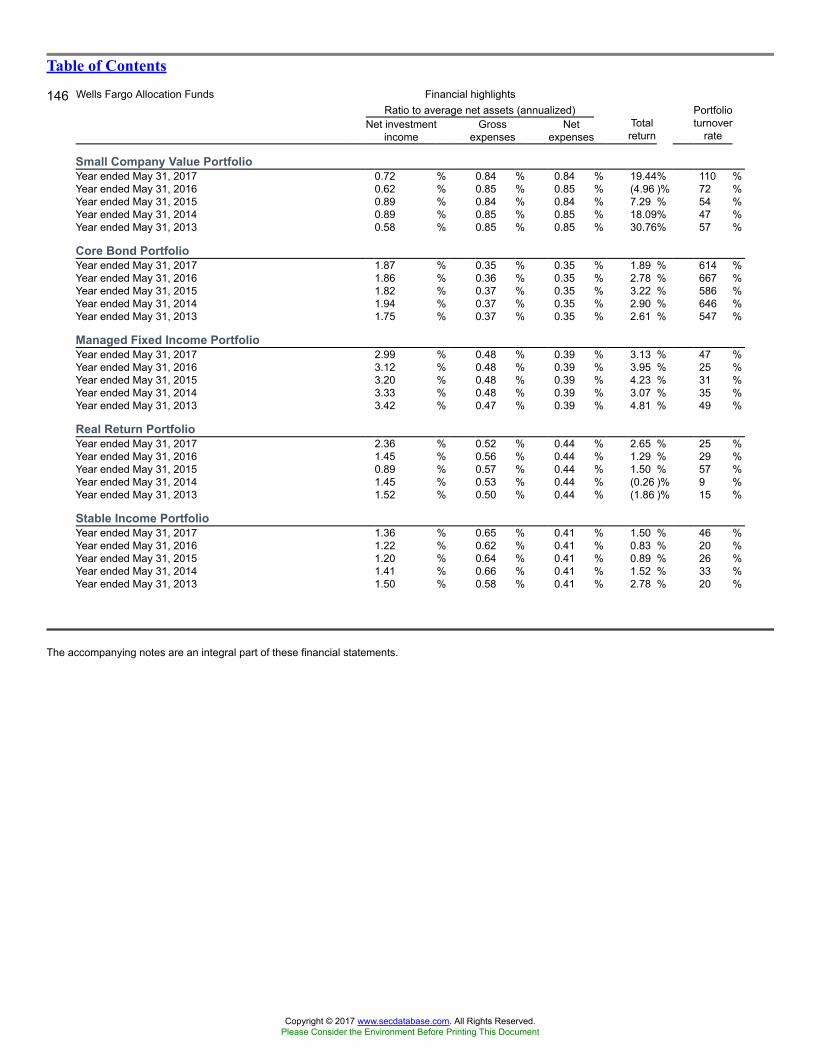
Table of Contents
146 Wells Fargo Allocation Funds Financial highlightsRatio to average net assets (annualized)
Net investmentincome
Grossexpenses
Netexpenses
Totalreturn
Portfolioturnover
rate
Small Company Value PortfolioYear ended May 31, 2017 0.72 % 0.84 % 0.84 % 19.44% 110 %Year ended May 31, 2016 0.62 % 0.85 % 0.85 % (4.96 )% 72 %Year ended May 31, 2015 0.89 % 0.84 % 0.84 % 7.29 % 54 %Year ended May 31, 2014 0.89 % 0.85 % 0.85 % 18.09% 47 %Year ended May 31, 2013 0.58 % 0.85 % 0.85 % 30.76% 57 %
Core Bond PortfolioYear ended May 31, 2017 1.87 % 0.35 % 0.35 % 1.89 % 614 %Year ended May 31, 2016 1.86 % 0.36 % 0.35 % 2.78 % 667 %Year ended May 31, 2015 1.82 % 0.37 % 0.35 % 3.22 % 586 %Year ended May 31, 2014 1.94 % 0.37 % 0.35 % 2.90 % 646 %Year ended May 31, 2013 1.75 % 0.37 % 0.35 % 2.61 % 547 %
Managed Fixed Income PortfolioYear ended May 31, 2017 2.99 % 0.48 % 0.39 % 3.13 % 47 %Year ended May 31, 2016 3.12 % 0.48 % 0.39 % 3.95 % 25 %Year ended May 31, 2015 3.20 % 0.48 % 0.39 % 4.23 % 31 %Year ended May 31, 2014 3.33 % 0.48 % 0.39 % 3.07 % 35 %Year ended May 31, 2013 3.42 % 0.47 % 0.39 % 4.81 % 49 %
Real Return PortfolioYear ended May 31, 2017 2.36 % 0.52 % 0.44 % 2.65 % 25 %Year ended May 31, 2016 1.45 % 0.56 % 0.44 % 1.29 % 29 %Year ended May 31, 2015 0.89 % 0.57 % 0.44 % 1.50 % 57 %Year ended May 31, 2014 1.45 % 0.53 % 0.44 % (0.26 )% 9 %Year ended May 31, 2013 1.52 % 0.50 % 0.44 % (1.86 )% 15 %
Stable Income PortfolioYear ended May 31, 2017 1.36 % 0.65 % 0.41 % 1.50 % 46 %Year ended May 31, 2016 1.22 % 0.62 % 0.41 % 0.83 % 20 %Year ended May 31, 2015 1.20 % 0.64 % 0.41 % 0.89 % 26 %Year ended May 31, 2014 1.41 % 0.66 % 0.41 % 1.52 % 33 %Year ended May 31, 2013 1.50 % 0.58 % 0.41 % 2.78 % 20 %
The accompanying notes are an integral part of these financial statements.
Copyright © 2017 www.secdatabase.com. All Rights Reserved.Please Consider the Environment Before Printing This Document
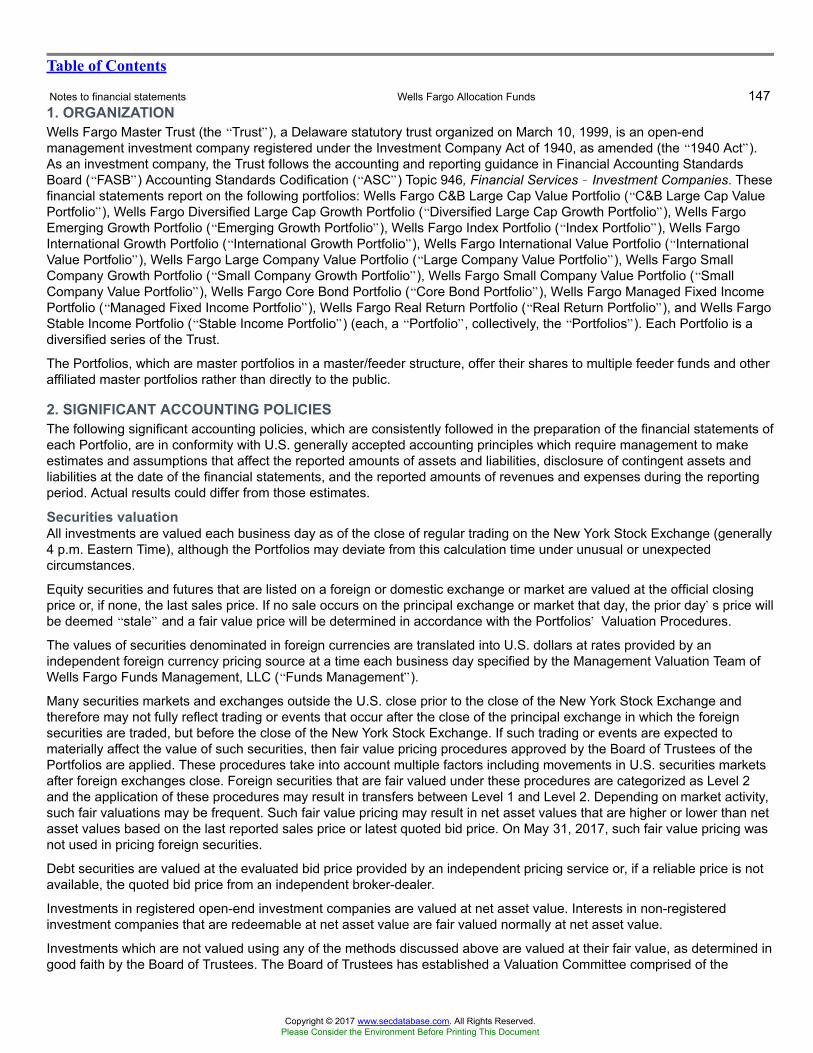
Table of Contents
Notes to financial statements Wells Fargo Allocation Funds 1471. ORGANIZATIONWells Fargo Master Trust (the �Trust�), a Delaware statutory trust organized on March 10, 1999, is an open-endmanagement investment company registered under the Investment Company Act of 1940, as amended (the �1940 Act�).As an investment company, the Trust follows the accounting and reporting guidance in Financial Accounting StandardsBoard (�FASB�) Accounting Standards Codification (�ASC�) Topic 946, Financial Services � Investment Companies. Thesefinancial statements report on the following portfolios: Wells Fargo C&B Large Cap Value Portfolio (�C&B Large Cap ValuePortfolio�), Wells Fargo Diversified Large Cap Growth Portfolio (�Diversified Large Cap Growth Portfolio�), Wells FargoEmerging Growth Portfolio (�Emerging Growth Portfolio�), Wells Fargo Index Portfolio (�Index Portfolio�), Wells FargoInternational Growth Portfolio (�International Growth Portfolio�), Wells Fargo International Value Portfolio (�InternationalValue Portfolio�), Wells Fargo Large Company Value Portfolio (�Large Company Value Portfolio�), Wells Fargo SmallCompany Growth Portfolio (�Small Company Growth Portfolio�), Wells Fargo Small Company Value Portfolio (�SmallCompany Value Portfolio�), Wells Fargo Core Bond Portfolio (�Core Bond Portfolio�), Wells Fargo Managed Fixed IncomePortfolio (�Managed Fixed Income Portfolio�), Wells Fargo Real Return Portfolio (�Real Return Portfolio�), and Wells FargoStable Income Portfolio (�Stable Income Portfolio�) (each, a �Portfolio�, collectively, the �Portfolios�). Each Portfolio is adiversified series of the Trust.
The Portfolios, which are master portfolios in a master/feeder structure, offer their shares to multiple feeder funds and otheraffiliated master portfolios rather than directly to the public.
2. SIGNIFICANT ACCOUNTING POLICIESThe following significant accounting policies, which are consistently followed in the preparation of the financial statements ofeach Portfolio, are in conformity with U.S. generally accepted accounting principles which require management to makeestimates and assumptions that affect the reported amounts of assets and liabilities, disclosure of contingent assets andliabilities at the date of the financial statements, and the reported amounts of revenues and expenses during the reportingperiod. Actual results could differ from those estimates.
Securities valuationAll investments are valued each business day as of the close of regular trading on the New York Stock Exchange (generally4 p.m. Eastern Time), although the Portfolios may deviate from this calculation time under unusual or unexpectedcircumstances.
Equity securities and futures that are listed on a foreign or domestic exchange or market are valued at the official closingprice or, if none, the last sales price. If no sale occurs on the principal exchange or market that day, the prior day�s price willbe deemed �stale� and a fair value price will be determined in accordance with the Portfolios� Valuation Procedures.
The values of securities denominated in foreign currencies are translated into U.S. dollars at rates provided by anindependent foreign currency pricing source at a time each business day specified by the Management Valuation Team ofWells Fargo Funds Management, LLC (�Funds Management�).
Many securities markets and exchanges outside the U.S. close prior to the close of the New York Stock Exchange andtherefore may not fully reflect trading or events that occur after the close of the principal exchange in which the foreignsecurities are traded, but before the close of the New York Stock Exchange. If such trading or events are expected tomaterially affect the value of such securities, then fair value pricing procedures approved by the Board of Trustees of thePortfolios are applied. These procedures take into account multiple factors including movements in U.S. securities marketsafter foreign exchanges close. Foreign securities that are fair valued under these procedures are categorized as Level 2and the application of these procedures may result in transfers between Level 1 and Level 2. Depending on market activity,such fair valuations may be frequent. Such fair value pricing may result in net asset values that are higher or lower than netasset values based on the last reported sales price or latest quoted bid price. On May 31, 2017, such fair value pricing wasnot used in pricing foreign securities.
Debt securities are valued at the evaluated bid price provided by an independent pricing service or, if a reliable price is notavailable, the quoted bid price from an independent broker-dealer.
Investments in registered open-end investment companies are valued at net asset value. Interests in non-registeredinvestment companies that are redeemable at net asset value are fair valued normally at net asset value.
Investments which are not valued using any of the methods discussed above are valued at their fair value, as determined ingood faith by the Board of Trustees. The Board of Trustees has established a Valuation Committee comprised of the
Copyright © 2017 www.secdatabase.com. All Rights Reserved.Please Consider the Environment Before Printing This Document

Trustees and has delegated to it the authority to take any actions regarding the valuation of portfolio securities that theValuation Committee deems necessary or appropriate, including determining the fair value of portfolio securities, unless
Copyright © 2017 www.secdatabase.com. All Rights Reserved.Please Consider the Environment Before Printing This Document
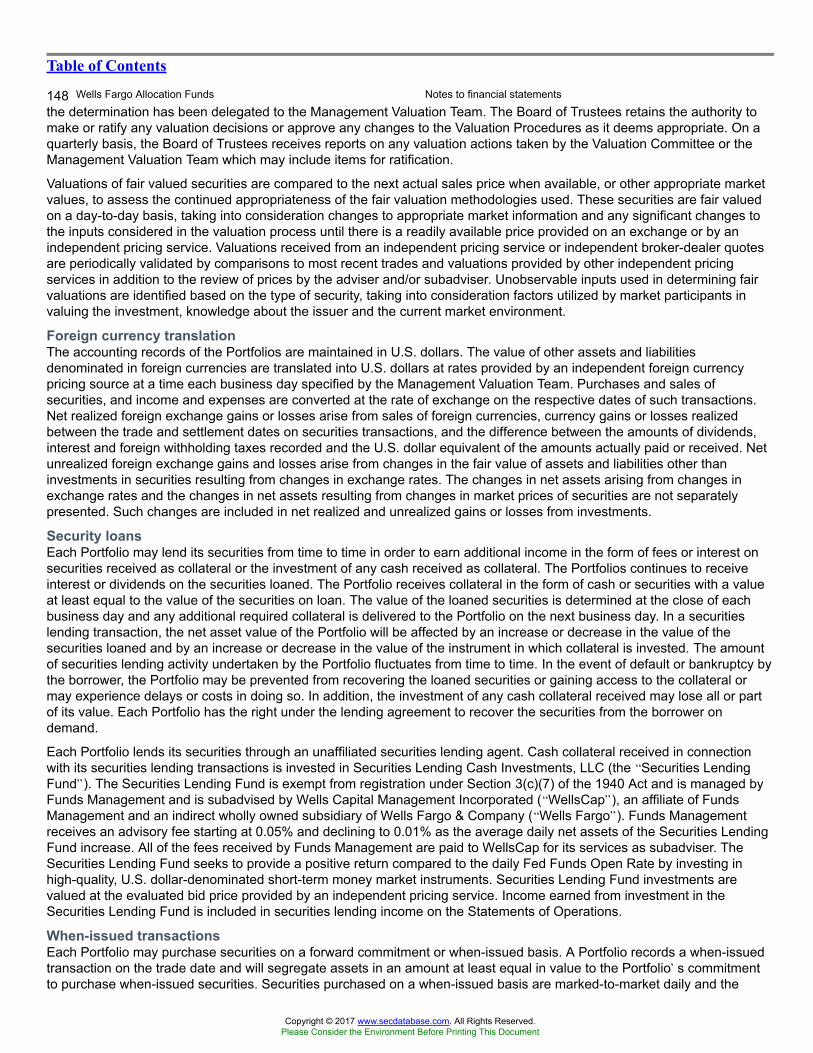
Table of Contents
148 Wells Fargo Allocation Funds Notes to financial statements
the determination has been delegated to the Management Valuation Team. The Board of Trustees retains the authority tomake or ratify any valuation decisions or approve any changes to the Valuation Procedures as it deems appropriate. On aquarterly basis, the Board of Trustees receives reports on any valuation actions taken by the Valuation Committee or theManagement Valuation Team which may include items for ratification.
Valuations of fair valued securities are compared to the next actual sales price when available, or other appropriate marketvalues, to assess the continued appropriateness of the fair valuation methodologies used. These securities are fair valuedon a day-to-day basis, taking into consideration changes to appropriate market information and any significant changes tothe inputs considered in the valuation process until there is a readily available price provided on an exchange or by anindependent pricing service. Valuations received from an independent pricing service or independent broker-dealer quotesare periodically validated by comparisons to most recent trades and valuations provided by other independent pricingservices in addition to the review of prices by the adviser and/or subadviser. Unobservable inputs used in determining fairvaluations are identified based on the type of security, taking into consideration factors utilized by market participants invaluing the investment, knowledge about the issuer and the current market environment.
Foreign currency translationThe accounting records of the Portfolios are maintained in U.S. dollars. The value of other assets and liabilitiesdenominated in foreign currencies are translated into U.S. dollars at rates provided by an independent foreign currencypricing source at a time each business day specified by the Management Valuation Team. Purchases and sales ofsecurities, and income and expenses are converted at the rate of exchange on the respective dates of such transactions.Net realized foreign exchange gains or losses arise from sales of foreign currencies, currency gains or losses realizedbetween the trade and settlement dates on securities transactions, and the difference between the amounts of dividends,interest and foreign withholding taxes recorded and the U.S. dollar equivalent of the amounts actually paid or received. Netunrealized foreign exchange gains and losses arise from changes in the fair value of assets and liabilities other thaninvestments in securities resulting from changes in exchange rates. The changes in net assets arising from changes inexchange rates and the changes in net assets resulting from changes in market prices of securities are not separatelypresented. Such changes are included in net realized and unrealized gains or losses from investments.
Security loansEach Portfolio may lend its securities from time to time in order to earn additional income in the form of fees or interest onsecurities received as collateral or the investment of any cash received as collateral. The Portfolios continues to receiveinterest or dividends on the securities loaned. The Portfolio receives collateral in the form of cash or securities with a valueat least equal to the value of the securities on loan. The value of the loaned securities is determined at the close of eachbusiness day and any additional required collateral is delivered to the Portfolio on the next business day. In a securitieslending transaction, the net asset value of the Portfolio will be affected by an increase or decrease in the value of thesecurities loaned and by an increase or decrease in the value of the instrument in which collateral is invested. The amountof securities lending activity undertaken by the Portfolio fluctuates from time to time. In the event of default or bankruptcy bythe borrower, the Portfolio may be prevented from recovering the loaned securities or gaining access to the collateral ormay experience delays or costs in doing so. In addition, the investment of any cash collateral received may lose all or partof its value. Each Portfolio has the right under the lending agreement to recover the securities from the borrower ondemand.
Each Portfolio lends its securities through an unaffiliated securities lending agent. Cash collateral received in connectionwith its securities lending transactions is invested in Securities Lending Cash Investments, LLC (the �Securities LendingFund�). The Securities Lending Fund is exempt from registration under Section 3(c)(7) of the 1940 Act and is managed byFunds Management and is subadvised by Wells Capital Management Incorporated (�WellsCap�), an affiliate of FundsManagement and an indirect wholly owned subsidiary of Wells Fargo & Company (�Wells Fargo�). Funds Managementreceives an advisory fee starting at 0.05% and declining to 0.01% as the average daily net assets of the Securities LendingFund increase. All of the fees received by Funds Management are paid to WellsCap for its services as subadviser. TheSecurities Lending Fund seeks to provide a positive return compared to the daily Fed Funds Open Rate by investing inhigh-quality, U.S. dollar-denominated short-term money market instruments. Securities Lending Fund investments arevalued at the evaluated bid price provided by an independent pricing service. Income earned from investment in theSecurities Lending Fund is included in securities lending income on the Statements of Operations.
When-issued transactionsEach Portfolio may purchase securities on a forward commitment or when-issued basis. A Portfolio records a when-issuedtransaction on the trade date and will segregate assets in an amount at least equal in value to the Portfolio�s commitmentto purchase when-issued securities. Securities purchased on a when-issued basis are marked-to-market daily and the
Copyright © 2017 www.secdatabase.com. All Rights Reserved.Please Consider the Environment Before Printing This Document
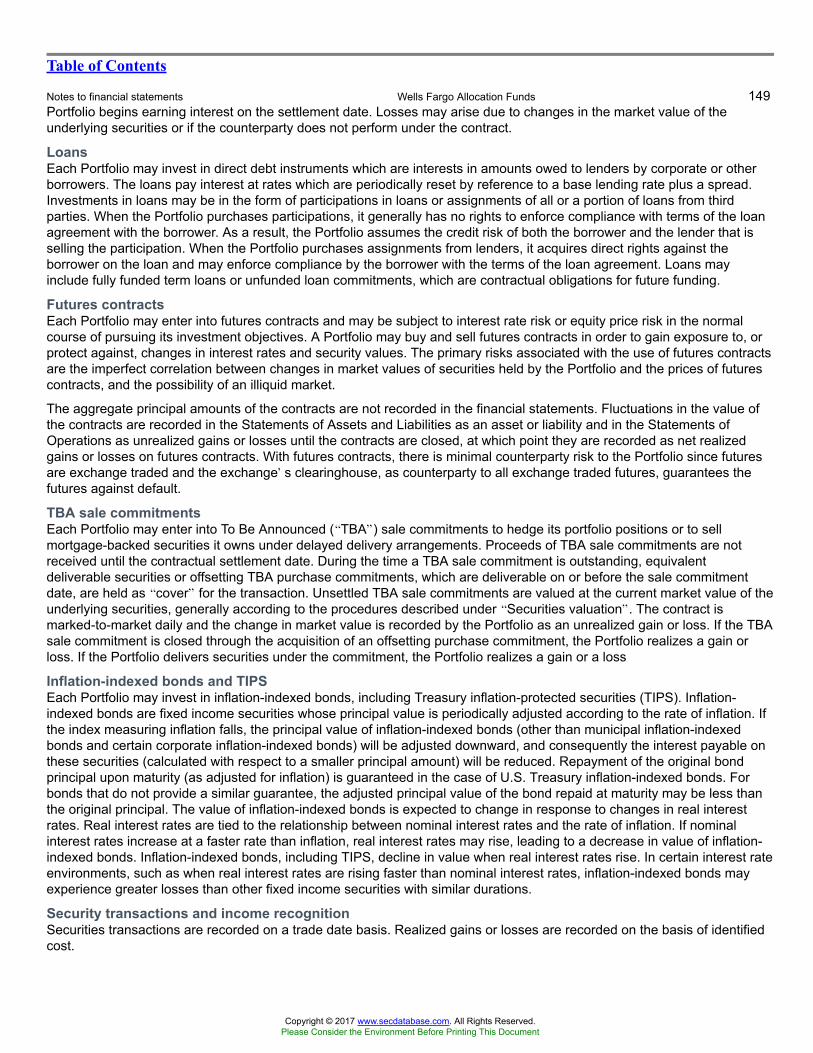
Table of Contents
Notes to financial statements Wells Fargo Allocation Funds 149Portfolio begins earning interest on the settlement date. Losses may arise due to changes in the market value of theunderlying securities or if the counterparty does not perform under the contract.
LoansEach Portfolio may invest in direct debt instruments which are interests in amounts owed to lenders by corporate or otherborrowers. The loans pay interest at rates which are periodically reset by reference to a base lending rate plus a spread.Investments in loans may be in the form of participations in loans or assignments of all or a portion of loans from thirdparties. When the Portfolio purchases participations, it generally has no rights to enforce compliance with terms of the loanagreement with the borrower. As a result, the Portfolio assumes the credit risk of both the borrower and the lender that isselling the participation. When the Portfolio purchases assignments from lenders, it acquires direct rights against theborrower on the loan and may enforce compliance by the borrower with the terms of the loan agreement. Loans mayinclude fully funded term loans or unfunded loan commitments, which are contractual obligations for future funding.
Futures contractsEach Portfolio may enter into futures contracts and may be subject to interest rate risk or equity price risk in the normalcourse of pursuing its investment objectives. A Portfolio may buy and sell futures contracts in order to gain exposure to, orprotect against, changes in interest rates and security values. The primary risks associated with the use of futures contractsare the imperfect correlation between changes in market values of securities held by the Portfolio and the prices of futurescontracts, and the possibility of an illiquid market.
The aggregate principal amounts of the contracts are not recorded in the financial statements. Fluctuations in the value ofthe contracts are recorded in the Statements of Assets and Liabilities as an asset or liability and in the Statements ofOperations as unrealized gains or losses until the contracts are closed, at which point they are recorded as net realizedgains or losses on futures contracts. With futures contracts, there is minimal counterparty risk to the Portfolio since futuresare exchange traded and the exchange�s clearinghouse, as counterparty to all exchange traded futures, guarantees thefutures against default.
TBA sale commitmentsEach Portfolio may enter into To Be Announced (�TBA�) sale commitments to hedge its portfolio positions or to sellmortgage-backed securities it owns under delayed delivery arrangements. Proceeds of TBA sale commitments are notreceived until the contractual settlement date. During the time a TBA sale commitment is outstanding, equivalentdeliverable securities or offsetting TBA purchase commitments, which are deliverable on or before the sale commitmentdate, are held as �cover� for the transaction. Unsettled TBA sale commitments are valued at the current market value of theunderlying securities, generally according to the procedures described under �Securities valuation�. The contract ismarked-to-market daily and the change in market value is recorded by the Portfolio as an unrealized gain or loss. If the TBAsale commitment is closed through the acquisition of an offsetting purchase commitment, the Portfolio realizes a gain orloss. If the Portfolio delivers securities under the commitment, the Portfolio realizes a gain or a loss
Inflation-indexed bonds and TIPSEach Portfolio may invest in inflation-indexed bonds, including Treasury inflation-protected securities (TIPS). Inflation-indexed bonds are fixed income securities whose principal value is periodically adjusted according to the rate of inflation. Ifthe index measuring inflation falls, the principal value of inflation-indexed bonds (other than municipal inflation-indexedbonds and certain corporate inflation-indexed bonds) will be adjusted downward, and consequently the interest payable onthese securities (calculated with respect to a smaller principal amount) will be reduced. Repayment of the original bondprincipal upon maturity (as adjusted for inflation) is guaranteed in the case of U.S. Treasury inflation-indexed bonds. Forbonds that do not provide a similar guarantee, the adjusted principal value of the bond repaid at maturity may be less thanthe original principal. The value of inflation-indexed bonds is expected to change in response to changes in real interestrates. Real interest rates are tied to the relationship between nominal interest rates and the rate of inflation. If nominalinterest rates increase at a faster rate than inflation, real interest rates may rise, leading to a decrease in value of inflation-indexed bonds. Inflation-indexed bonds, including TIPS, decline in value when real interest rates rise. In certain interest rateenvironments, such as when real interest rates are rising faster than nominal interest rates, inflation-indexed bonds mayexperience greater losses than other fixed income securities with similar durations.
Security transactions and income recognitionSecurities transactions are recorded on a trade date basis. Realized gains or losses are recorded on the basis of identifiedcost.
Copyright © 2017 www.secdatabase.com. All Rights Reserved.Please Consider the Environment Before Printing This Document

Table of Contents
150 Wells Fargo Allocation Funds Notes to financial statements
Dividend income is recognized on the ex-dividend date, except for certain dividends from foreign securities which arerecorded as soon as the custodian verifies the ex-dividend date.
Interest income is accrued daily and bond discounts are accreted and premiums are amortized daily based on the effectiveinterest method. To the extent debt obligations are placed on non-accrual status, any related interest income may bereduced by writing off interest receivables when the collection of all or a portion of interest has been determined to bedoubtful based on consistently applied procedures and the fair value has decreased. If the issuer subsequently resumesinterest payments or when the collectability of interest is reasonably assured, the debt obligation is removed from non-accrual status.
Income from foreign securities is recorded net of foreign taxes withheld where recovery of such taxes is not assured.
Federal and other taxesEach Portfolio is treated as a separate entity for federal income tax purposes. Each Portfolio is not required to pay federalincome taxes on its net investment income and net capital gain as they are treated as partnerships for federal income taxpurposes. All interest, dividends, gains and losses of a Portfolio are deemed to have been �passed through� to the interestholders in proportion to their holdings of the Portfolio regardless of whether such interest, dividends and gains have beendistributed by the Portfolio.
Each Portfolio�s income tax returns and all financial records supporting those returns for the prior three fiscal years aresubject to examination by the federal revenue authority. Management has analyzed each Portfolio�s tax positions taken onfederal, state, and foreign tax returns for all open tax years and does not believe that there are any uncertain tax positionsthat require recognition of a tax liability.
3. FAIR VALUATION MEASUREMENTSFair value measurements of investments are determined within a framework that has established a fair value hierarchybased upon the various data inputs utilized in determining the value of each Portfolio�s investments. The three-levelhierarchy gives the highest priority to unadjusted quoted prices in active markets for identical assets or liabilities (Level 1)and the lowest priority to unobservable inputs (Level 3). Each Portfolio�s investments are classified within the fair valuehierarchy based on the lowest level of input that is significant to the fair value measurement. The inputs are summarizedinto three broad levels as follows:
∎ Level 1 � quoted prices in active markets for identical securities
∎ Level 2 � other significant observable inputs (including quoted prices for similar securities, interest rates, prepaymentspeeds, credit risk, etc.)
∎ Level 3 � significant unobservable inputs (including the Portfolio�s own assumptions in determining the fair value ofinvestments)
The inputs or methodologies used for valuing investments in securities are not necessarily an indication of the riskassociated with investing in those securities.
Copyright © 2017 www.secdatabase.com. All Rights Reserved.Please Consider the Environment Before Printing This Document
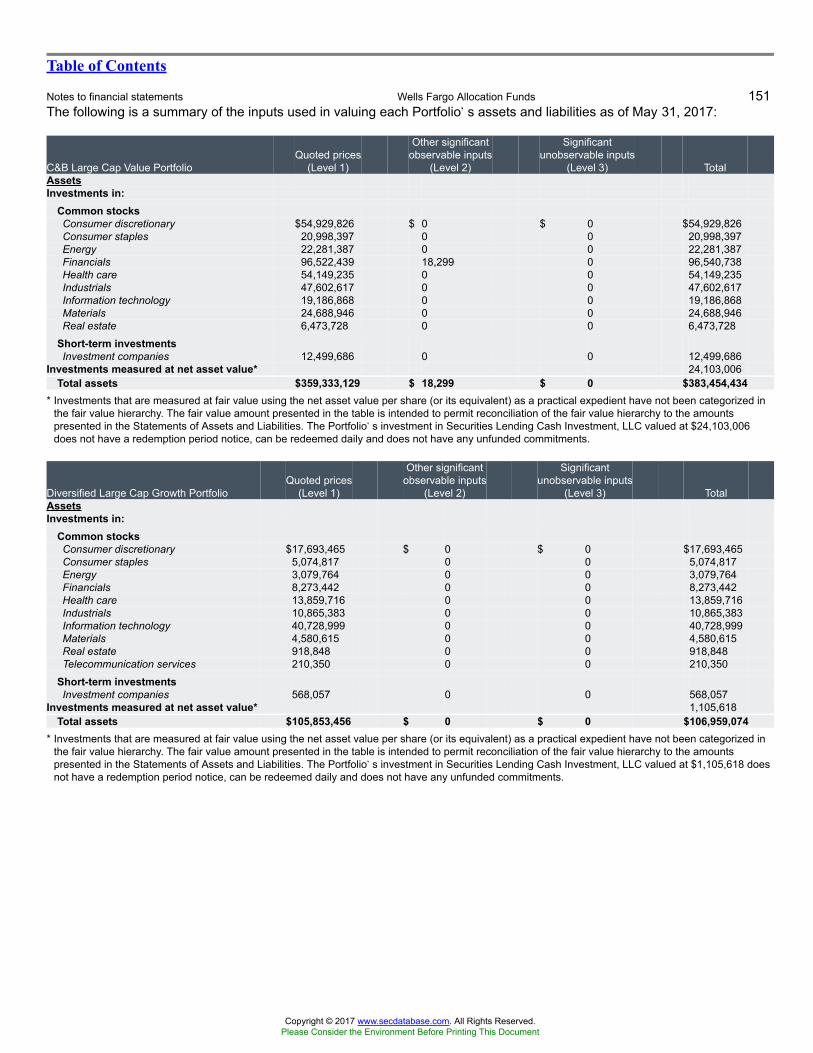
Table of Contents
Notes to financial statements Wells Fargo Allocation Funds 151The following is a summary of the inputs used in valuing each Portfolio�s assets and liabilities as of May 31, 2017:
C&B Large Cap Value PortfolioQuoted prices
(Level 1)
Other significantobservable inputs
(Level 2)
Significantunobservable inputs
(Level 3) TotalAssetsInvestments in:
Common stocksConsumer discretionary $54,929,826 $ 0 $ 0 $54,929,826Consumer staples 20,998,397 0 0 20,998,397Energy 22,281,387 0 0 22,281,387Financials 96,522,439 18,299 0 96,540,738Health care 54,149,235 0 0 54,149,235Industrials 47,602,617 0 0 47,602,617Information technology 19,186,868 0 0 19,186,868Materials 24,688,946 0 0 24,688,946Real estate 6,473,728 0 0 6,473,728
Short-term investmentsInvestment companies 12,499,686 0 0 12,499,686
Investments measured at net asset value* 24,103,006Total assets $359,333,129 $ 18,299 $ 0 $383,454,434
* Investments that are measured at fair value using the net asset value per share (or its equivalent) as a practical expedient have not been categorized inthe fair value hierarchy. The fair value amount presented in the table is intended to permit reconciliation of the fair value hierarchy to the amountspresented in the Statements of Assets and Liabilities. The Portfolio�s investment in Securities Lending Cash Investment, LLC valued at $24,103,006does not have a redemption period notice, can be redeemed daily and does not have any unfunded commitments.
Diversified Large Cap Growth PortfolioQuoted prices
(Level 1)
Other significantobservable inputs
(Level 2)
Significantunobservable inputs
(Level 3) TotalAssetsInvestments in:
Common stocksConsumer discretionary $17,693,465 $ 0 $ 0 $17,693,465Consumer staples 5,074,817 0 0 5,074,817Energy 3,079,764 0 0 3,079,764Financials 8,273,442 0 0 8,273,442Health care 13,859,716 0 0 13,859,716Industrials 10,865,383 0 0 10,865,383Information technology 40,728,999 0 0 40,728,999Materials 4,580,615 0 0 4,580,615Real estate 918,848 0 0 918,848Telecommunication services 210,350 0 0 210,350
Short-term investmentsInvestment companies 568,057 0 0 568,057
Investments measured at net asset value* 1,105,618Total assets $105,853,456 $ 0 $ 0 $106,959,074
* Investments that are measured at fair value using the net asset value per share (or its equivalent) as a practical expedient have not been categorized inthe fair value hierarchy. The fair value amount presented in the table is intended to permit reconciliation of the fair value hierarchy to the amountspresented in the Statements of Assets and Liabilities. The Portfolio�s investment in Securities Lending Cash Investment, LLC valued at $1,105,618 doesnot have a redemption period notice, can be redeemed daily and does not have any unfunded commitments.
Copyright © 2017 www.secdatabase.com. All Rights Reserved.Please Consider the Environment Before Printing This Document
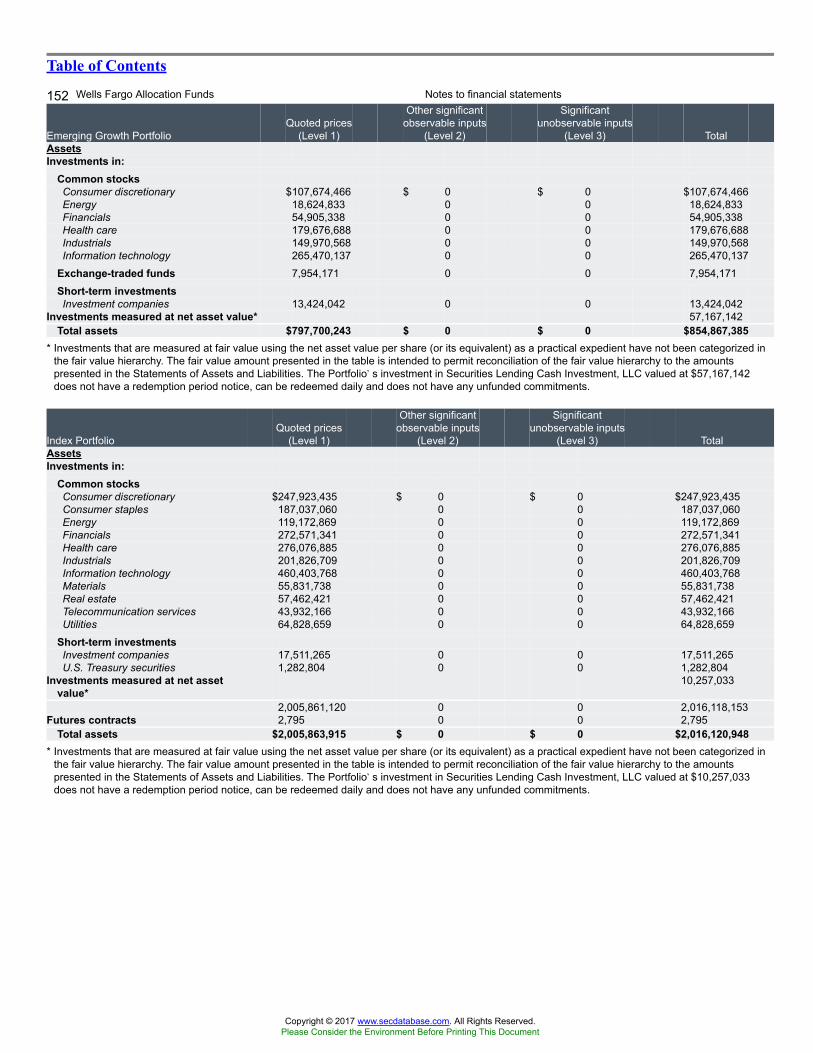
Table of Contents
152 Wells Fargo Allocation Funds Notes to financial statements
Emerging Growth PortfolioQuoted prices
(Level 1)
Other significantobservable inputs
(Level 2)
Significantunobservable inputs
(Level 3) TotalAssetsInvestments in:
Common stocksConsumer discretionary $107,674,466 $ 0 $ 0 $107,674,466Energy 18,624,833 0 0 18,624,833Financials 54,905,338 0 0 54,905,338Health care 179,676,688 0 0 179,676,688Industrials 149,970,568 0 0 149,970,568Information technology 265,470,137 0 0 265,470,137
Exchange-traded funds 7,954,171 0 0 7,954,171Short-term investmentsInvestment companies 13,424,042 0 0 13,424,042
Investments measured at net asset value* 57,167,142Total assets $797,700,243 $ 0 $ 0 $854,867,385
* Investments that are measured at fair value using the net asset value per share (or its equivalent) as a practical expedient have not been categorized inthe fair value hierarchy. The fair value amount presented in the table is intended to permit reconciliation of the fair value hierarchy to the amountspresented in the Statements of Assets and Liabilities. The Portfolio�s investment in Securities Lending Cash Investment, LLC valued at $57,167,142does not have a redemption period notice, can be redeemed daily and does not have any unfunded commitments.
Index PortfolioQuoted prices
(Level 1)
Other significantobservable inputs
(Level 2)
Significantunobservable inputs
(Level 3) TotalAssetsInvestments in:
Common stocksConsumer discretionary $247,923,435 $ 0 $ 0 $247,923,435Consumer staples 187,037,060 0 0 187,037,060Energy 119,172,869 0 0 119,172,869Financials 272,571,341 0 0 272,571,341Health care 276,076,885 0 0 276,076,885Industrials 201,826,709 0 0 201,826,709Information technology 460,403,768 0 0 460,403,768Materials 55,831,738 0 0 55,831,738Real estate 57,462,421 0 0 57,462,421Telecommunication services 43,932,166 0 0 43,932,166Utilities 64,828,659 0 0 64,828,659
Short-term investmentsInvestment companies 17,511,265 0 0 17,511,265U.S. Treasury securities 1,282,804 0 0 1,282,804
Investments measured at net assetvalue*
10,257,033
2,005,861,120 0 0 2,016,118,153Futures contracts 2,795 0 0 2,795
Total assets $2,005,863,915 $ 0 $ 0 $2,016,120,948* Investments that are measured at fair value using the net asset value per share (or its equivalent) as a practical expedient have not been categorized in
the fair value hierarchy. The fair value amount presented in the table is intended to permit reconciliation of the fair value hierarchy to the amountspresented in the Statements of Assets and Liabilities. The Portfolio�s investment in Securities Lending Cash Investment, LLC valued at $10,257,033does not have a redemption period notice, can be redeemed daily and does not have any unfunded commitments.
Copyright © 2017 www.secdatabase.com. All Rights Reserved.Please Consider the Environment Before Printing This Document
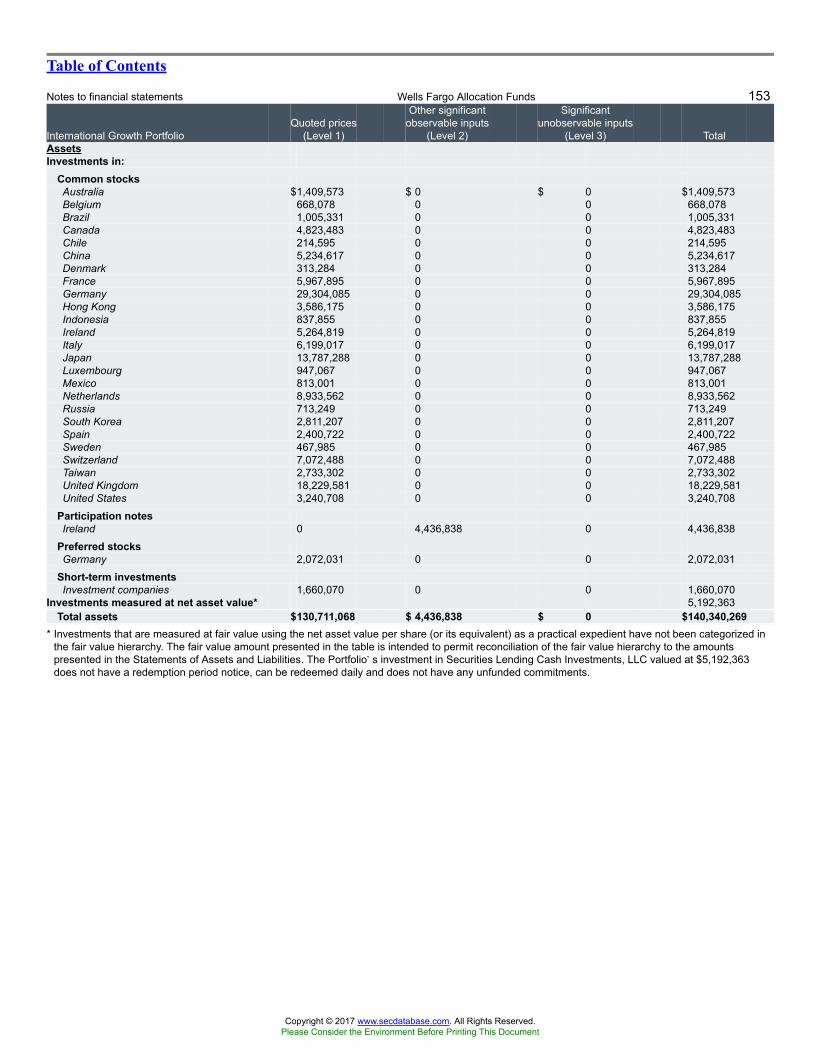
Table of Contents
Notes to financial statements Wells Fargo Allocation Funds 153
International Growth PortfolioQuoted prices
(Level 1)
Other significantobservable inputs
(Level 2)
Significantunobservable inputs
(Level 3) TotalAssetsInvestments in:
Common stocksAustralia $1,409,573 $ 0 $ 0 $1,409,573Belgium 668,078 0 0 668,078Brazil 1,005,331 0 0 1,005,331Canada 4,823,483 0 0 4,823,483Chile 214,595 0 0 214,595China 5,234,617 0 0 5,234,617Denmark 313,284 0 0 313,284France 5,967,895 0 0 5,967,895Germany 29,304,085 0 0 29,304,085Hong Kong 3,586,175 0 0 3,586,175Indonesia 837,855 0 0 837,855Ireland 5,264,819 0 0 5,264,819Italy 6,199,017 0 0 6,199,017Japan 13,787,288 0 0 13,787,288Luxembourg 947,067 0 0 947,067Mexico 813,001 0 0 813,001Netherlands 8,933,562 0 0 8,933,562Russia 713,249 0 0 713,249South Korea 2,811,207 0 0 2,811,207Spain 2,400,722 0 0 2,400,722Sweden 467,985 0 0 467,985Switzerland 7,072,488 0 0 7,072,488Taiwan 2,733,302 0 0 2,733,302United Kingdom 18,229,581 0 0 18,229,581United States 3,240,708 0 0 3,240,708
Participation notesIreland 0 4,436,838 0 4,436,838
Preferred stocksGermany 2,072,031 0 0 2,072,031
Short-term investmentsInvestment companies 1,660,070 0 0 1,660,070
Investments measured at net asset value* 5,192,363Total assets $130,711,068 $ 4,436,838 $ 0 $140,340,269
* Investments that are measured at fair value using the net asset value per share (or its equivalent) as a practical expedient have not been categorized inthe fair value hierarchy. The fair value amount presented in the table is intended to permit reconciliation of the fair value hierarchy to the amountspresented in the Statements of Assets and Liabilities. The Portfolio�s investment in Securities Lending Cash Investments, LLC valued at $5,192,363does not have a redemption period notice, can be redeemed daily and does not have any unfunded commitments.
Copyright © 2017 www.secdatabase.com. All Rights Reserved.Please Consider the Environment Before Printing This Document
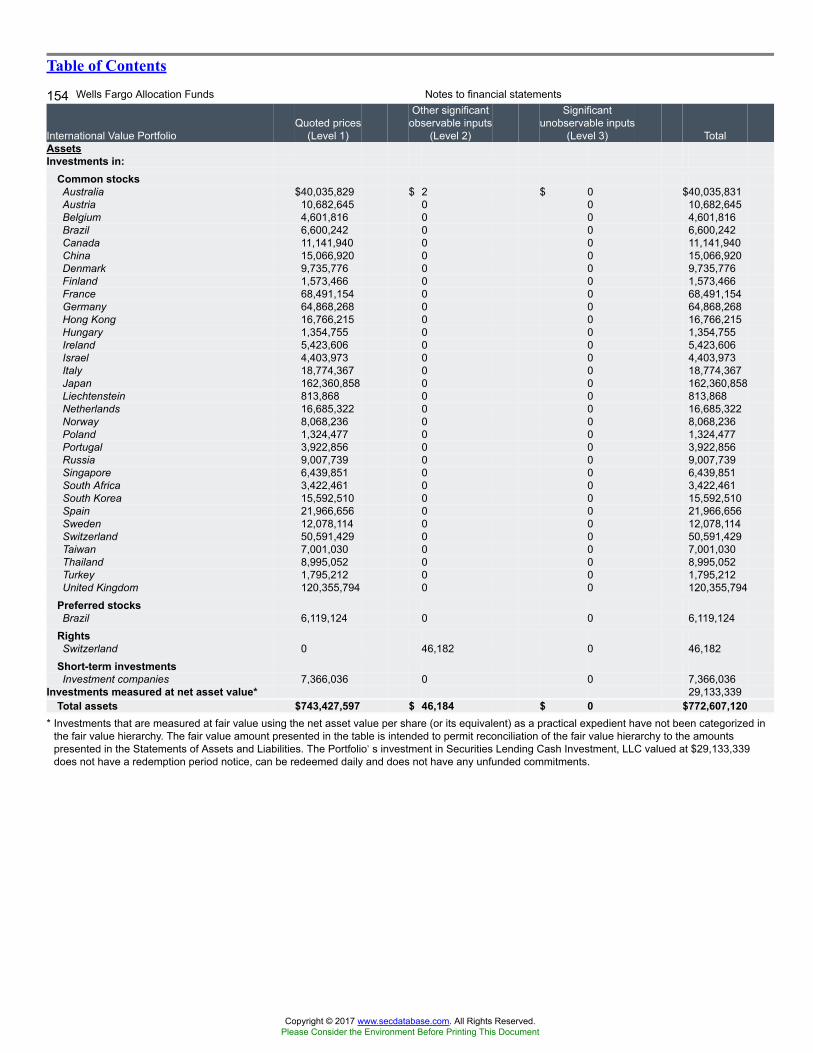
Table of Contents
154 Wells Fargo Allocation Funds Notes to financial statements
International Value PortfolioQuoted prices
(Level 1)
Other significantobservable inputs
(Level 2)
Significantunobservable inputs
(Level 3) TotalAssetsInvestments in:
Common stocksAustralia $40,035,829 $ 2 $ 0 $40,035,831Austria 10,682,645 0 0 10,682,645Belgium 4,601,816 0 0 4,601,816Brazil 6,600,242 0 0 6,600,242Canada 11,141,940 0 0 11,141,940China 15,066,920 0 0 15,066,920Denmark 9,735,776 0 0 9,735,776Finland 1,573,466 0 0 1,573,466France 68,491,154 0 0 68,491,154Germany 64,868,268 0 0 64,868,268Hong Kong 16,766,215 0 0 16,766,215Hungary 1,354,755 0 0 1,354,755Ireland 5,423,606 0 0 5,423,606Israel 4,403,973 0 0 4,403,973Italy 18,774,367 0 0 18,774,367Japan 162,360,858 0 0 162,360,858Liechtenstein 813,868 0 0 813,868Netherlands 16,685,322 0 0 16,685,322Norway 8,068,236 0 0 8,068,236Poland 1,324,477 0 0 1,324,477Portugal 3,922,856 0 0 3,922,856Russia 9,007,739 0 0 9,007,739Singapore 6,439,851 0 0 6,439,851South Africa 3,422,461 0 0 3,422,461South Korea 15,592,510 0 0 15,592,510Spain 21,966,656 0 0 21,966,656Sweden 12,078,114 0 0 12,078,114Switzerland 50,591,429 0 0 50,591,429Taiwan 7,001,030 0 0 7,001,030Thailand 8,995,052 0 0 8,995,052Turkey 1,795,212 0 0 1,795,212United Kingdom 120,355,794 0 0 120,355,794
Preferred stocksBrazil 6,119,124 0 0 6,119,124
RightsSwitzerland 0 46,182 0 46,182
Short-term investmentsInvestment companies 7,366,036 0 0 7,366,036
Investments measured at net asset value* 29,133,339Total assets $743,427,597 $ 46,184 $ 0 $772,607,120
* Investments that are measured at fair value using the net asset value per share (or its equivalent) as a practical expedient have not been categorized inthe fair value hierarchy. The fair value amount presented in the table is intended to permit reconciliation of the fair value hierarchy to the amountspresented in the Statements of Assets and Liabilities. The Portfolio�s investment in Securities Lending Cash Investment, LLC valued at $29,133,339does not have a redemption period notice, can be redeemed daily and does not have any unfunded commitments.
Copyright © 2017 www.secdatabase.com. All Rights Reserved.Please Consider the Environment Before Printing This Document
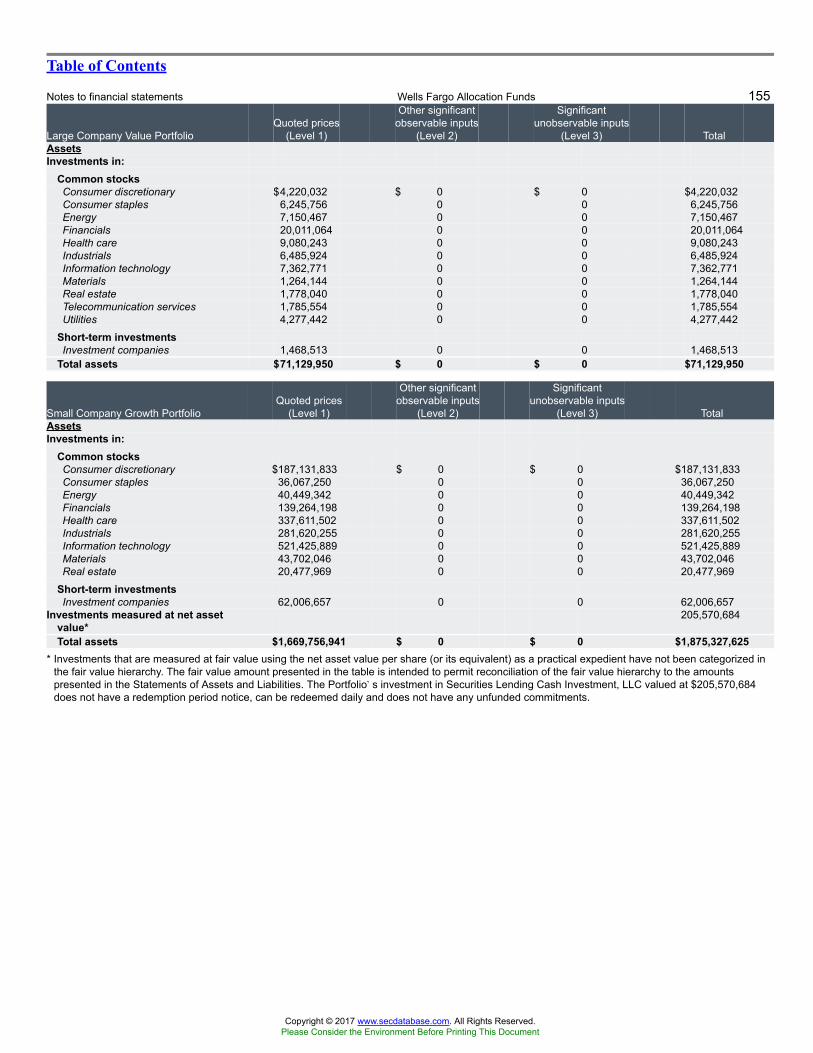
Table of Contents
Notes to financial statements Wells Fargo Allocation Funds 155
Large Company Value PortfolioQuoted prices
(Level 1)
Other significantobservable inputs
(Level 2)
Significantunobservable inputs
(Level 3) TotalAssetsInvestments in:
Common stocksConsumer discretionary $4,220,032 $ 0 $ 0 $4,220,032Consumer staples 6,245,756 0 0 6,245,756Energy 7,150,467 0 0 7,150,467Financials 20,011,064 0 0 20,011,064Health care 9,080,243 0 0 9,080,243Industrials 6,485,924 0 0 6,485,924Information technology 7,362,771 0 0 7,362,771Materials 1,264,144 0 0 1,264,144Real estate 1,778,040 0 0 1,778,040Telecommunication services 1,785,554 0 0 1,785,554Utilities 4,277,442 0 0 4,277,442
Short-term investmentsInvestment companies 1,468,513 0 0 1,468,513
Total assets $71,129,950 $ 0 $ 0 $71,129,950
Small Company Growth PortfolioQuoted prices
(Level 1)
Other significantobservable inputs
(Level 2)
Significantunobservable inputs
(Level 3) TotalAssetsInvestments in:
Common stocksConsumer discretionary $187,131,833 $ 0 $ 0 $187,131,833Consumer staples 36,067,250 0 0 36,067,250Energy 40,449,342 0 0 40,449,342Financials 139,264,198 0 0 139,264,198Health care 337,611,502 0 0 337,611,502Industrials 281,620,255 0 0 281,620,255Information technology 521,425,889 0 0 521,425,889Materials 43,702,046 0 0 43,702,046Real estate 20,477,969 0 0 20,477,969
Short-term investmentsInvestment companies 62,006,657 0 0 62,006,657
Investments measured at net assetvalue*
205,570,684
Total assets $1,669,756,941 $ 0 $ 0 $1,875,327,625* Investments that are measured at fair value using the net asset value per share (or its equivalent) as a practical expedient have not been categorized in
the fair value hierarchy. The fair value amount presented in the table is intended to permit reconciliation of the fair value hierarchy to the amountspresented in the Statements of Assets and Liabilities. The Portfolio�s investment in Securities Lending Cash Investment, LLC valued at $205,570,684does not have a redemption period notice, can be redeemed daily and does not have any unfunded commitments.
Copyright © 2017 www.secdatabase.com. All Rights Reserved.Please Consider the Environment Before Printing This Document
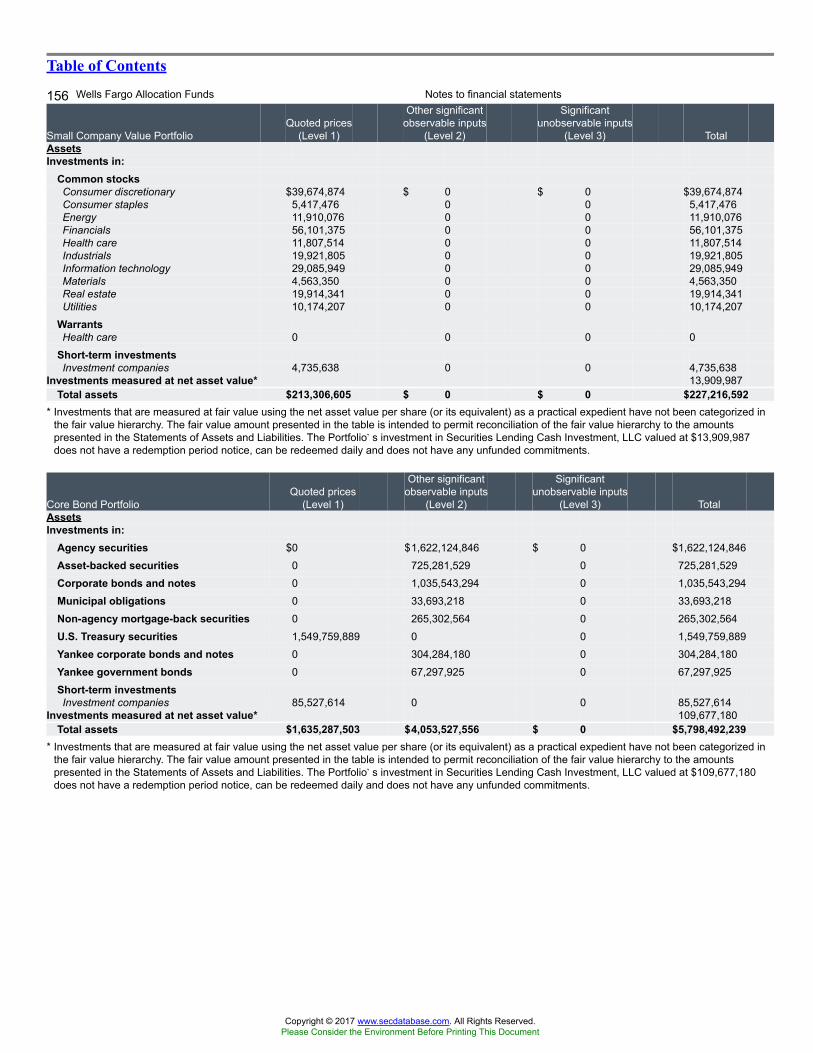
Table of Contents
156 Wells Fargo Allocation Funds Notes to financial statements
Small Company Value PortfolioQuoted prices
(Level 1)
Other significantobservable inputs
(Level 2)
Significantunobservable inputs
(Level 3) TotalAssetsInvestments in:
Common stocksConsumer discretionary $39,674,874 $ 0 $ 0 $39,674,874Consumer staples 5,417,476 0 0 5,417,476Energy 11,910,076 0 0 11,910,076Financials 56,101,375 0 0 56,101,375Health care 11,807,514 0 0 11,807,514Industrials 19,921,805 0 0 19,921,805Information technology 29,085,949 0 0 29,085,949Materials 4,563,350 0 0 4,563,350Real estate 19,914,341 0 0 19,914,341Utilities 10,174,207 0 0 10,174,207
WarrantsHealth care 0 0 0 0
Short-term investmentsInvestment companies 4,735,638 0 0 4,735,638
Investments measured at net asset value* 13,909,987Total assets $213,306,605 $ 0 $ 0 $227,216,592
* Investments that are measured at fair value using the net asset value per share (or its equivalent) as a practical expedient have not been categorized inthe fair value hierarchy. The fair value amount presented in the table is intended to permit reconciliation of the fair value hierarchy to the amountspresented in the Statements of Assets and Liabilities. The Portfolio�s investment in Securities Lending Cash Investment, LLC valued at $13,909,987does not have a redemption period notice, can be redeemed daily and does not have any unfunded commitments.
Core Bond PortfolioQuoted prices
(Level 1)
Other significantobservable inputs
(Level 2)
Significantunobservable inputs
(Level 3) TotalAssetsInvestments in:
Agency securities $0 $1,622,124,846 $ 0 $1,622,124,846Asset-backed securities 0 725,281,529 0 725,281,529Corporate bonds and notes 0 1,035,543,294 0 1,035,543,294Municipal obligations 0 33,693,218 0 33,693,218Non-agency mortgage-back securities 0 265,302,564 0 265,302,564U.S. Treasury securities 1,549,759,889 0 0 1,549,759,889Yankee corporate bonds and notes 0 304,284,180 0 304,284,180Yankee government bonds 0 67,297,925 0 67,297,925Short-term investmentsInvestment companies 85,527,614 0 0 85,527,614
Investments measured at net asset value* 109,677,180Total assets $1,635,287,503 $4,053,527,556 $ 0 $5,798,492,239
* Investments that are measured at fair value using the net asset value per share (or its equivalent) as a practical expedient have not been categorized inthe fair value hierarchy. The fair value amount presented in the table is intended to permit reconciliation of the fair value hierarchy to the amountspresented in the Statements of Assets and Liabilities. The Portfolio�s investment in Securities Lending Cash Investment, LLC valued at $109,677,180does not have a redemption period notice, can be redeemed daily and does not have any unfunded commitments.
Copyright © 2017 www.secdatabase.com. All Rights Reserved.Please Consider the Environment Before Printing This Document
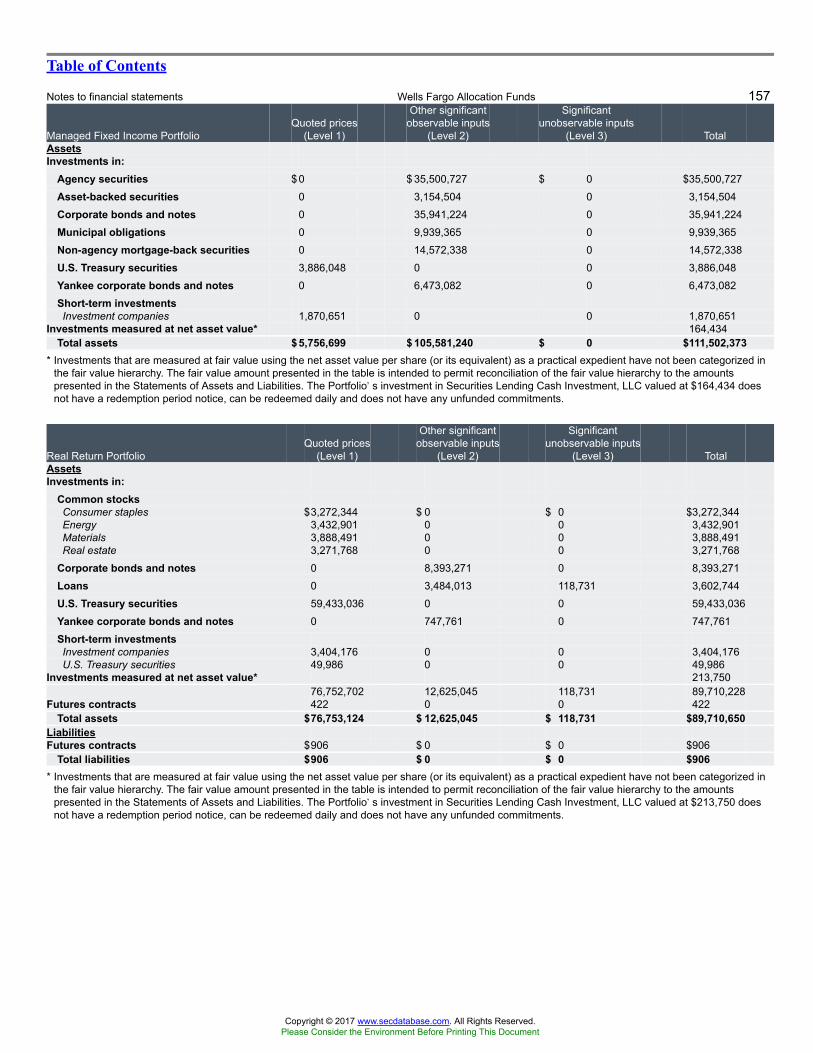
Table of Contents
Notes to financial statements Wells Fargo Allocation Funds 157
Managed Fixed Income PortfolioQuoted prices
(Level 1)
Other significantobservable inputs
(Level 2)
Significantunobservable inputs
(Level 3) TotalAssetsInvestments in:
Agency securities $0 $ 35,500,727 $ 0 $35,500,727Asset-backed securities 0 3,154,504 0 3,154,504Corporate bonds and notes 0 35,941,224 0 35,941,224Municipal obligations 0 9,939,365 0 9,939,365Non-agency mortgage-back securities 0 14,572,338 0 14,572,338U.S. Treasury securities 3,886,048 0 0 3,886,048Yankee corporate bonds and notes 0 6,473,082 0 6,473,082Short-term investmentsInvestment companies 1,870,651 0 0 1,870,651
Investments measured at net asset value* 164,434Total assets $5,756,699 $ 105,581,240 $ 0 $111,502,373
* Investments that are measured at fair value using the net asset value per share (or its equivalent) as a practical expedient have not been categorized inthe fair value hierarchy. The fair value amount presented in the table is intended to permit reconciliation of the fair value hierarchy to the amountspresented in the Statements of Assets and Liabilities. The Portfolio�s investment in Securities Lending Cash Investment, LLC valued at $164,434 doesnot have a redemption period notice, can be redeemed daily and does not have any unfunded commitments.
Real Return PortfolioQuoted prices
(Level 1)
Other significantobservable inputs
(Level 2)
Significantunobservable inputs
(Level 3) TotalAssetsInvestments in:
Common stocksConsumer staples $3,272,344 $ 0 $ 0 $3,272,344Energy 3,432,901 0 0 3,432,901Materials 3,888,491 0 0 3,888,491Real estate 3,271,768 0 0 3,271,768
Corporate bonds and notes 0 8,393,271 0 8,393,271Loans 0 3,484,013 118,731 3,602,744U.S. Treasury securities 59,433,036 0 0 59,433,036Yankee corporate bonds and notes 0 747,761 0 747,761Short-term investmentsInvestment companies 3,404,176 0 0 3,404,176U.S. Treasury securities 49,986 0 0 49,986
Investments measured at net asset value* 213,75076,752,702 12,625,045 118,731 89,710,228
Futures contracts 422 0 0 422Total assets $76,753,124 $ 12,625,045 $ 118,731 $89,710,650
LiabilitiesFutures contracts $906 $ 0 $ 0 $906
Total liabilities $906 $ 0 $ 0 $906* Investments that are measured at fair value using the net asset value per share (or its equivalent) as a practical expedient have not been categorized in
the fair value hierarchy. The fair value amount presented in the table is intended to permit reconciliation of the fair value hierarchy to the amountspresented in the Statements of Assets and Liabilities. The Portfolio�s investment in Securities Lending Cash Investment, LLC valued at $213,750 doesnot have a redemption period notice, can be redeemed daily and does not have any unfunded commitments.
Copyright © 2017 www.secdatabase.com. All Rights Reserved.Please Consider the Environment Before Printing This Document
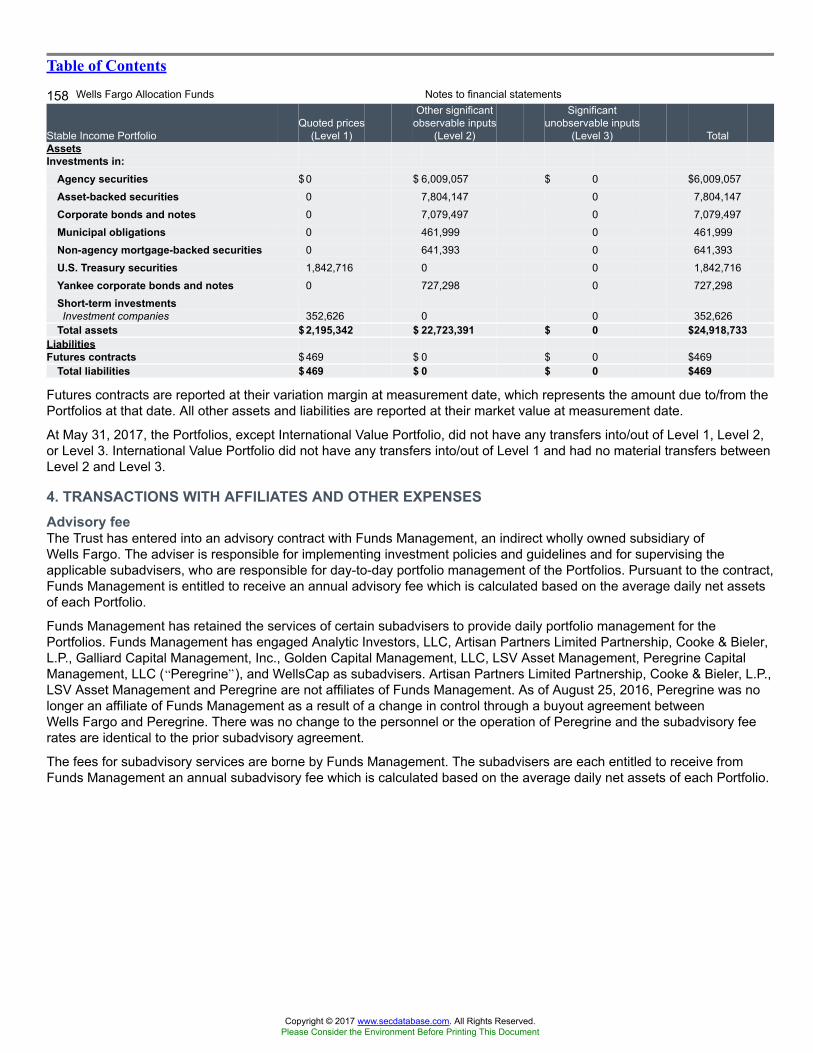
Table of Contents
158 Wells Fargo Allocation Funds Notes to financial statements
Stable Income PortfolioQuoted prices
(Level 1)
Other significantobservable inputs
(Level 2)
Significantunobservable inputs
(Level 3) TotalAssetsInvestments in:
Agency securities $0 $ 6,009,057 $ 0 $6,009,057Asset-backed securities 0 7,804,147 0 7,804,147Corporate bonds and notes 0 7,079,497 0 7,079,497Municipal obligations 0 461,999 0 461,999Non-agency mortgage-backed securities 0 641,393 0 641,393U.S. Treasury securities 1,842,716 0 0 1,842,716Yankee corporate bonds and notes 0 727,298 0 727,298Short-term investmentsInvestment companies 352,626 0 0 352,626
Total assets $2,195,342 $ 22,723,391 $ 0 $24,918,733LiabilitiesFutures contracts $469 $ 0 $ 0 $469
Total liabilities $469 $ 0 $ 0 $469
Futures contracts are reported at their variation margin at measurement date, which represents the amount due to/from thePortfolios at that date. All other assets and liabilities are reported at their market value at measurement date.
At May 31, 2017, the Portfolios, except International Value Portfolio, did not have any transfers into/out of Level 1, Level 2,or Level 3. International Value Portfolio did not have any transfers into/out of Level 1 and had no material transfers betweenLevel 2 and Level 3.
4. TRANSACTIONS WITH AFFILIATES AND OTHER EXPENSESAdvisory feeThe Trust has entered into an advisory contract with Funds Management, an indirect wholly owned subsidiary ofWells Fargo. The adviser is responsible for implementing investment policies and guidelines and for supervising theapplicable subadvisers, who are responsible for day-to-day portfolio management of the Portfolios. Pursuant to the contract,Funds Management is entitled to receive an annual advisory fee which is calculated based on the average daily net assetsof each Portfolio.
Funds Management has retained the services of certain subadvisers to provide daily portfolio management for thePortfolios. Funds Management has engaged Analytic Investors, LLC, Artisan Partners Limited Partnership, Cooke & Bieler,L.P., Galliard Capital Management, Inc., Golden Capital Management, LLC, LSV Asset Management, Peregrine CapitalManagement, LLC (�Peregrine�), and WellsCap as subadvisers. Artisan Partners Limited Partnership, Cooke & Bieler, L.P.,LSV Asset Management and Peregrine are not affiliates of Funds Management. As of August 25, 2016, Peregrine was nolonger an affiliate of Funds Management as a result of a change in control through a buyout agreement betweenWells Fargo and Peregrine. There was no change to the personnel or the operation of Peregrine and the subadvisory feerates are identical to the prior subadvisory agreement.
The fees for subadvisory services are borne by Funds Management. The subadvisers are each entitled to receive fromFunds Management an annual subadvisory fee which is calculated based on the average daily net assets of each Portfolio.
Copyright © 2017 www.secdatabase.com. All Rights Reserved.Please Consider the Environment Before Printing This Document
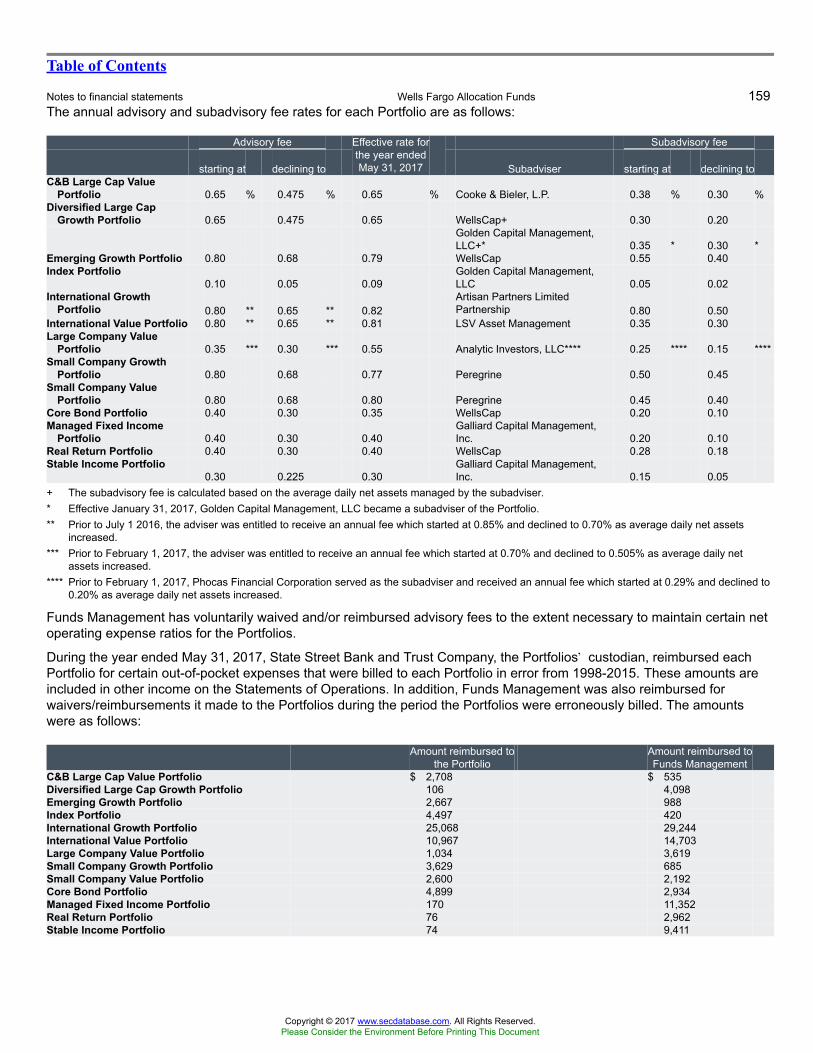
Table of Contents
Notes to financial statements Wells Fargo Allocation Funds 159The annual advisory and subadvisory fee rates for each Portfolio are as follows:
Advisory fee Subadvisory fee
starting at declining to
Effective rate forthe year endedMay 31, 2017 Subadviser starting at declining to
C&B Large Cap ValuePortfolio 0.65 % 0.475 % 0.65 % Cooke & Bieler, L.P. 0.38 % 0.30 %
Diversified Large CapGrowth Portfolio 0.65 0.475 0.65 WellsCap+ 0.30 0.20
Golden Capital Management,LLC+* 0.35 * 0.30 *
Emerging Growth Portfolio 0.80 0.68 0.79 WellsCap 0.55 0.40Index Portfolio
0.10 0.05 0.09Golden Capital Management,LLC 0.05 0.02
International GrowthPortfolio 0.80 ** 0.65 ** 0.82
Artisan Partners LimitedPartnership 0.80 0.50
International Value Portfolio 0.80 ** 0.65 ** 0.81 LSV Asset Management 0.35 0.30Large Company Value
Portfolio 0.35 *** 0.30 *** 0.55 Analytic Investors, LLC**** 0.25 **** 0.15 ****Small Company Growth
Portfolio 0.80 0.68 0.77 Peregrine 0.50 0.45Small Company Value
Portfolio 0.80 0.68 0.80 Peregrine 0.45 0.40Core Bond Portfolio 0.40 0.30 0.35 WellsCap 0.20 0.10Managed Fixed Income
Portfolio 0.40 0.30 0.40Galliard Capital Management,Inc. 0.20 0.10
Real Return Portfolio 0.40 0.30 0.40 WellsCap 0.28 0.18Stable Income Portfolio
0.30 0.225 0.30Galliard Capital Management,Inc. 0.15 0.05
+ The subadvisory fee is calculated based on the average daily net assets managed by the subadviser.* Effective January 31, 2017, Golden Capital Management, LLC became a subadviser of the Portfolio.** Prior to July 1 2016, the adviser was entitled to receive an annual fee which started at 0.85% and declined to 0.70% as average daily net assets
increased.*** Prior to February 1, 2017, the adviser was entitled to receive an annual fee which started at 0.70% and declined to 0.505% as average daily net
assets increased.**** Prior to February 1, 2017, Phocas Financial Corporation served as the subadviser and received an annual fee which started at 0.29% and declined to
0.20% as average daily net assets increased.
Funds Management has voluntarily waived and/or reimbursed advisory fees to the extent necessary to maintain certain netoperating expense ratios for the Portfolios.
During the year ended May 31, 2017, State Street Bank and Trust Company, the Portfolios� custodian, reimbursed eachPortfolio for certain out-of-pocket expenses that were billed to each Portfolio in error from 1998-2015. These amounts areincluded in other income on the Statements of Operations. In addition, Funds Management was also reimbursed forwaivers/reimbursements it made to the Portfolios during the period the Portfolios were erroneously billed. The amountswere as follows:
Amount reimbursed tothe Portfolio
Amount reimbursed toFunds Management
C&B Large Cap Value Portfolio $ 2,708 $ 535Diversified Large Cap Growth Portfolio 106 4,098Emerging Growth Portfolio 2,667 988Index Portfolio 4,497 420International Growth Portfolio 25,068 29,244International Value Portfolio 10,967 14,703Large Company Value Portfolio 1,034 3,619Small Company Growth Portfolio 3,629 685Small Company Value Portfolio 2,600 2,192Core Bond Portfolio 4,899 2,934Managed Fixed Income Portfolio 170 11,352Real Return Portfolio 76 2,962Stable Income Portfolio 74 9,411
Copyright © 2017 www.secdatabase.com. All Rights Reserved.Please Consider the Environment Before Printing This Document
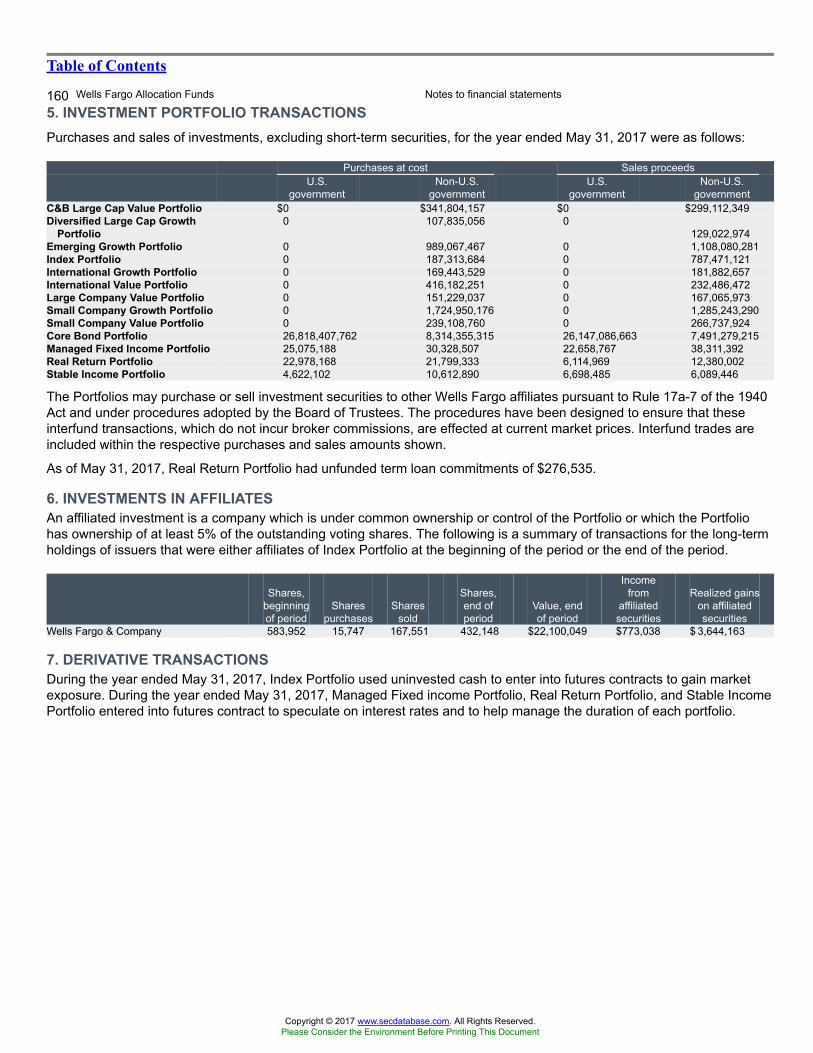
Table of Contents
160 Wells Fargo Allocation Funds Notes to financial statements
5. INVESTMENT PORTFOLIO TRANSACTIONSPurchases and sales of investments, excluding short-term securities, for the year ended May 31, 2017 were as follows:
Purchases at cost Sales proceedsU.S.
governmentNon-U.S.
governmentU.S.
governmentNon-U.S.
governmentC&B Large Cap Value Portfolio $0 $341,804,157 $0 $299,112,349Diversified Large Cap Growth
Portfolio0 107,835,056 0
129,022,974Emerging Growth Portfolio 0 989,067,467 0 1,108,080,281Index Portfolio 0 187,313,684 0 787,471,121International Growth Portfolio 0 169,443,529 0 181,882,657International Value Portfolio 0 416,182,251 0 232,486,472Large Company Value Portfolio 0 151,229,037 0 167,065,973Small Company Growth Portfolio 0 1,724,950,176 0 1,285,243,290Small Company Value Portfolio 0 239,108,760 0 266,737,924Core Bond Portfolio 26,818,407,762 8,314,355,315 26,147,086,663 7,491,279,215Managed Fixed Income Portfolio 25,075,188 30,328,507 22,658,767 38,311,392Real Return Portfolio 22,978,168 21,799,333 6,114,969 12,380,002Stable Income Portfolio 4,622,102 10,612,890 6,698,485 6,089,446
The Portfolios may purchase or sell investment securities to other Wells Fargo affiliates pursuant to Rule 17a-7 of the 1940Act and under procedures adopted by the Board of Trustees. The procedures have been designed to ensure that theseinterfund transactions, which do not incur broker commissions, are effected at current market prices. Interfund trades areincluded within the respective purchases and sales amounts shown.
As of May 31, 2017, Real Return Portfolio had unfunded term loan commitments of $276,535.
6. INVESTMENTS IN AFFILIATESAn affiliated investment is a company which is under common ownership or control of the Portfolio or which the Portfoliohas ownership of at least 5% of the outstanding voting shares. The following is a summary of transactions for the long-termholdings of issuers that were either affiliates of Index Portfolio at the beginning of the period or the end of the period.
Shares,beginningof period
Sharespurchases
Sharessold
Shares,end ofperiod
Value, endof period
Incomefrom
affiliatedsecurities
Realized gainson affiliatedsecurities
Wells Fargo & Company 583,952 15,747 167,551 432,148 $22,100,049 $773,038 $ 3,644,163
7. DERIVATIVE TRANSACTIONSDuring the year ended May 31, 2017, Index Portfolio used uninvested cash to enter into futures contracts to gain marketexposure. During the year ended May 31, 2017, Managed Fixed income Portfolio, Real Return Portfolio, and Stable IncomePortfolio entered into futures contract to speculate on interest rates and to help manage the duration of each portfolio.
Copyright © 2017 www.secdatabase.com. All Rights Reserved.Please Consider the Environment Before Printing This Document

Table of Contents
Notes to financial statements Wells Fargo Allocation Funds 161At May 31, 2017, the Portfolios had long and short futures contracts outstanding as follows:
Expiration date Counterparty Contracts Type
Contractvalue at
May 31, 2017Unrealized
gains (losses)Index Portfolio 6-15-2017 Societe Generale 38 Long S&P 500 Index $22,905,450 $ 483,460Real Return Portfolio 9-20-2017 JPMorgan 3 Long 10-Year U.S. Treasury Notes 378,891 2,127Real Return Portfolio 9-29-2017 JPMorgan 10 Short 2-Year U.S. Treasury Notes 2,164,844 (641 )Real Return Portfolio 9-29-2017 JPMorgan 16 Short 5-Year U.S. Treasury Notes 1,893,000 (2,774 )Stable Income Portfolio 9-29-2017 JPMorgan 10 Short 5-Year U.S. Treasury Notes 1,183,125 (1,661 )
The Portfolios had average notional amounts in futures contracts during the year ended May 31, 2017 as follows:
Long contracts Short contractsIndex Portfolio $25,281,706 $ 0Managed Fixed Income Portfolio 793,143 0Real Return Portfolio 337,321 3,162,309Stable Income Portfolio 0 1,311,633
As of May 31 2017, Stable Income Portfolio had segregated $7,000 as cash collateral for open futures contracts.
The receivable and payable for daily variation margin on open futures contracts reflected in the Statements of Assets andLiabilities only represents the current day�s variation margin. The realized gains or losses and change in unrealized gainsor losses on derivative instruments are reflected in the Statements of Operations.
For certain types of derivative transactions, the Portfolios have entered into International Swaps and DerivativesAssociation, Inc. master agreements (�ISDA Master Agreements�) or similar agreements with approved counterparties.The ISDA Master Agreements or similar agreements may have requirements to deliver/deposit securities or cash to/with anexchange or broker-dealer as collateral and allows the Portfolios to offset, with each counterparty, certain derivativefinancial instrument�s assets and/or liabilities with collateral held or pledged. Collateral requirements differ by type ofderivative. Collateral or margin requirements are set by the broker or exchange clearing house for exchange tradedderivatives while collateral terms are contract specific for over-the-counter traded derivatives. Cash collateral that has beenpledged to cover obligations of the Portfolios under ISDA Master Agreements or similar agreements, if any, will be reportedseparately in the Statements of Assets and Liabilities. Securities pledged as collateral, if any, for the same purpose arenoted in the Portfolio of Investments or Summary Portfolio of Investments. With respect to balance sheet offsetting, absentan event of default by the counterparty or a termination of the agreement, the reported amounts of financial assets andfinancial liabilities in the Statements of Assets and Liabilities are not offset across transactions between each Portfolio andthe applicable counterparty. A reconciliation of the gross amounts on the Statements of Assets and Liabilities to the netamounts by derivative type, including any collateral exposure, is as follows:
Derivative type Counterparty
Gross amountsof assets in theStatements of
Assets andLiabilities
Amountssubject to
nettingagreements
Collateralreceived
Net amountof assets
Index Portfolio Futures � variation margin Societe Generale $ 2,795 $ 0 $ 0 $ 2,795Real Return Portfolio Futures � variation margin JPMorgan 422 (422 ) 0 0
Derivative type Counterparty
Gross amountsof liabilities in the
Statements ofAssets andLiabilities
Amountssubject to
nettingagreements
Collateralpledged1
Net amountof liabilities
Real Return Portfolio Futures � variationmargin
JPMorgan $ 906 $ (422 ) $ (484 ) $ 0
Stable Income Portfolio Futures � variationmargin
JPMorgan 469 0 (469 ) 0
1 Collateral pledged within this table is limited to the collateral for the net transaction with the counterparty.
Copyright © 2017 www.secdatabase.com. All Rights Reserved.Please Consider the Environment Before Printing This Document
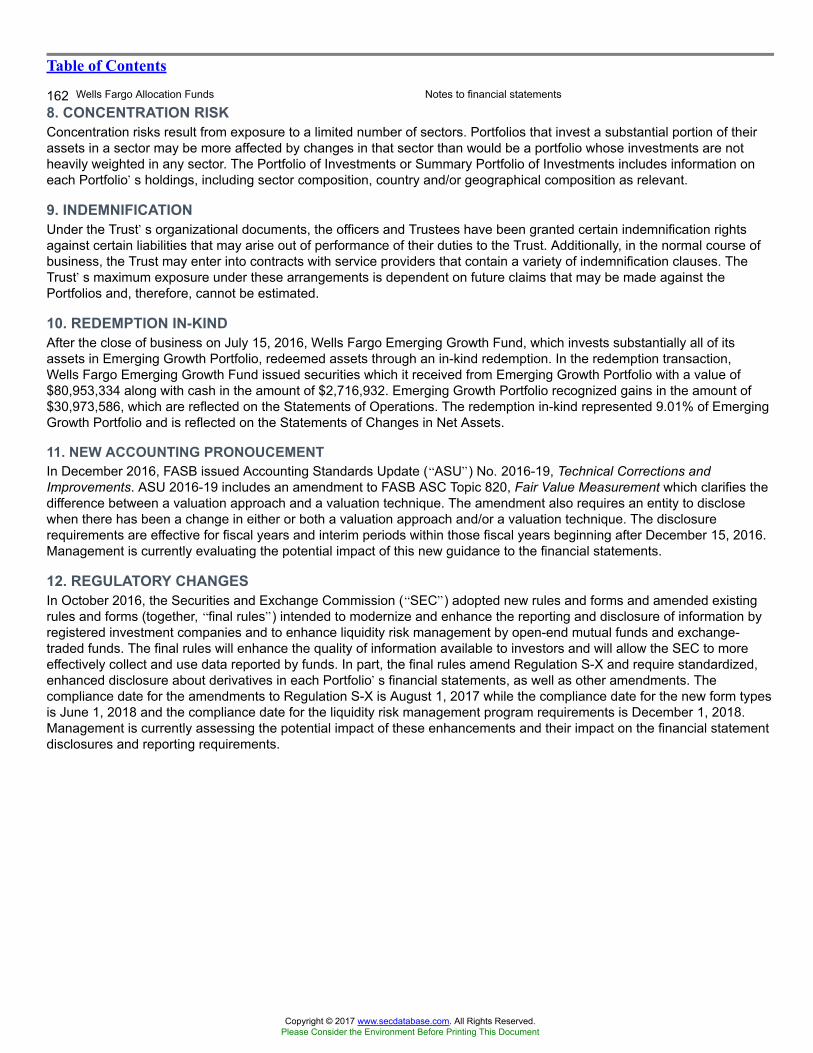
Table of Contents
162 Wells Fargo Allocation Funds Notes to financial statements
8. CONCENTRATION RISKConcentration risks result from exposure to a limited number of sectors. Portfolios that invest a substantial portion of theirassets in a sector may be more affected by changes in that sector than would be a portfolio whose investments are notheavily weighted in any sector. The Portfolio of Investments or Summary Portfolio of Investments includes information oneach Portfolio�s holdings, including sector composition, country and/or geographical composition as relevant.
9. INDEMNIFICATIONUnder the Trust�s organizational documents, the officers and Trustees have been granted certain indemnification rightsagainst certain liabilities that may arise out of performance of their duties to the Trust. Additionally, in the normal course ofbusiness, the Trust may enter into contracts with service providers that contain a variety of indemnification clauses. TheTrust�s maximum exposure under these arrangements is dependent on future claims that may be made against thePortfolios and, therefore, cannot be estimated.
10. REDEMPTION IN-KINDAfter the close of business on July 15, 2016, Wells Fargo Emerging Growth Fund, which invests substantially all of itsassets in Emerging Growth Portfolio, redeemed assets through an in-kind redemption. In the redemption transaction,Wells Fargo Emerging Growth Fund issued securities which it received from Emerging Growth Portfolio with a value of$80,953,334 along with cash in the amount of $2,716,932. Emerging Growth Portfolio recognized gains in the amount of$30,973,586, which are reflected on the Statements of Operations. The redemption in-kind represented 9.01% of EmergingGrowth Portfolio and is reflected on the Statements of Changes in Net Assets.
11. NEW ACCOUNTING PRONOUCEMENTIn December 2016, FASB issued Accounting Standards Update (�ASU�) No. 2016-19, Technical Corrections andImprovements. ASU 2016-19 includes an amendment to FASB ASC Topic 820, Fair Value Measurement which clarifies thedifference between a valuation approach and a valuation technique. The amendment also requires an entity to disclosewhen there has been a change in either or both a valuation approach and/or a valuation technique. The disclosurerequirements are effective for fiscal years and interim periods within those fiscal years beginning after December 15, 2016.Management is currently evaluating the potential impact of this new guidance to the financial statements.
12. REGULATORY CHANGESIn October 2016, the Securities and Exchange Commission (�SEC�) adopted new rules and forms and amended existingrules and forms (together, �final rules�) intended to modernize and enhance the reporting and disclosure of information byregistered investment companies and to enhance liquidity risk management by open-end mutual funds and exchange-traded funds. The final rules will enhance the quality of information available to investors and will allow the SEC to moreeffectively collect and use data reported by funds. In part, the final rules amend Regulation S-X and require standardized,enhanced disclosure about derivatives in each Portfolio�s financial statements, as well as other amendments. Thecompliance date for the amendments to Regulation S-X is August 1, 2017 while the compliance date for the new form typesis June 1, 2018 and the compliance date for the liquidity risk management program requirements is December 1, 2018.Management is currently assessing the potential impact of these enhancements and their impact on the financial statementdisclosures and reporting requirements.
Copyright © 2017 www.secdatabase.com. All Rights Reserved.Please Consider the Environment Before Printing This Document
Table of Contents
Report of independent registered public accounting firm Wells Fargo Allocation Funds 163BOARD OF TRUSTEES AND SHAREHOLDERS OF WELLS FARGO MASTER TRUST:
We have audited the accompanying statements of assets and liabilities, including the portfolios of investments (or summaryportfolios of investments for Wells Fargo Index Portfolio and Wells Fargo Core Bond Portfolio), of the Wells Fargo C&BLarge Cap Value Portfolio, Wells Fargo Diversified Large Cap Growth Portfolio, Wells Fargo Emerging Growth Portfolio,Wells Fargo Index Portfolio, Wells Fargo International Growth Portfolio, Wells Fargo International Value Portfolio, WellsFargo Large Company Value Portfolio, Wells Fargo Small Company Growth Portfolio, Wells Fargo Small Company ValuePortfolio, Wells Fargo Core Bond Portfolio, Wells Fargo Managed Fixed Income Portfolio, Wells Fargo Real ReturnPortfolio, and Wells Fargo Stable Income Portfolio, thirteen of the portfolios constituting the Wells Fargo Master Trust(collectively the �Portfolios�), as of May 31, 2017, and the related statements of operations for the year then ended, thestatements of changes in net assets for each of the years in the two-year period then ended, and the financial highlights foreach of the years in the five-year period then ended. These financial statements and financial highlights are theresponsibility of the Portfolios� management. Our responsibility is to express an opinion on these financial statements andfinancial highlights based on our audits.
We conducted our audits in accordance with the standards of the Public Company Accounting Oversight Board (UnitedStates). Those standards require that we plan and perform the audit to obtain reasonable assurance about whether thefinancial statements and financial highlights are free of material misstatement. An audit includes examining, on a test basis,evidence supporting the amounts and disclosures in the financial statements. Our procedures included confirmation ofsecurities owned as of May 31, 2017, by correspondence with the custodian and brokers, or by other appropriate auditingprocedures. An audit also includes assessing the accounting principles used and significant estimates made bymanagement, as well as evaluating the overall financial statement presentation. We believe that our audits provide areasonable basis for our opinion.
In our opinion, the financial statements and financial highlights referred to above present fairly, in all material respects, thefinancial position of the Portfolios as of May 31, 2017, the results of their operations for the year then ended, the changes intheir net assets for each of the years in the two-year period then ended, and the financial highlights for each of the years inthe five-year period then ended, in conformity with U.S. generally accepted accounting principles.
Boston, MassachusettsJuly 26, 2017
Copyright © 2017 www.secdatabase.com. All Rights Reserved.Please Consider the Environment Before Printing This Document
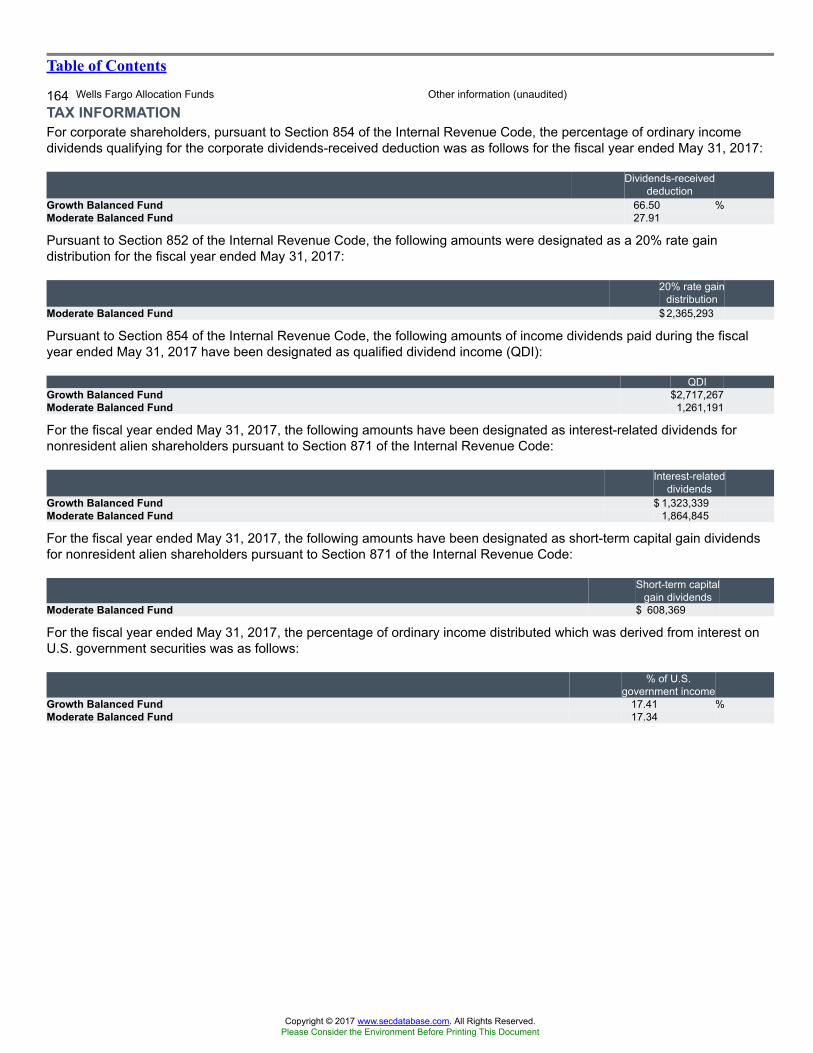
Table of Contents
164 Wells Fargo Allocation Funds Other information (unaudited)
TAX INFORMATIONFor corporate shareholders, pursuant to Section 854 of the Internal Revenue Code, the percentage of ordinary incomedividends qualifying for the corporate dividends-received deduction was as follows for the fiscal year ended May 31, 2017:
Dividends-receiveddeduction
Growth Balanced Fund 66.50 %Moderate Balanced Fund 27.91
Pursuant to Section 852 of the Internal Revenue Code, the following amounts were designated as a 20% rate gaindistribution for the fiscal year ended May 31, 2017:
20% rate gaindistribution
Moderate Balanced Fund $2,365,293
Pursuant to Section 854 of the Internal Revenue Code, the following amounts of income dividends paid during the fiscalyear ended May 31, 2017 have been designated as qualified dividend income (QDI):
QDIGrowth Balanced Fund $2,717,267Moderate Balanced Fund 1,261,191
For the fiscal year ended May 31, 2017, the following amounts have been designated as interest-related dividends fornonresident alien shareholders pursuant to Section 871 of the Internal Revenue Code:
Interest-relateddividends
Growth Balanced Fund $ 1,323,339Moderate Balanced Fund 1,864,845
For the fiscal year ended May 31, 2017, the following amounts have been designated as short-term capital gain dividendsfor nonresident alien shareholders pursuant to Section 871 of the Internal Revenue Code:
Short-term capitalgain dividends
Moderate Balanced Fund $ 608,369
For the fiscal year ended May 31, 2017, the percentage of ordinary income distributed which was derived from interest onU.S. government securities was as follows:
% of U.S.government income
Growth Balanced Fund 17.41 %Moderate Balanced Fund 17.34
Copyright © 2017 www.secdatabase.com. All Rights Reserved.Please Consider the Environment Before Printing This Document
Table of Contents
Other information (unaudited) Wells Fargo Allocation Funds 165PROXY VOTING INFORMATIONA description of the policies and procedures used to determine how to vote proxies relating to portfolio securities isavailable without charge, upon request, by calling 1-800-222-8222, visiting our website at wellsfargofunds.com, or visitingthe SEC website at sec.gov. Information regarding how the proxies related to portfolio securities were voted during the mostrecent 12-month period ended June 30 is available on the website at wellsfargofunds.com or by visiting the SEC websiteat sec.gov.
PORTFOLIO HOLDINGS INFORMATIONThe complete portfolio holdings are publicly available on the website (wellsfargofunds.com) on a one-month delayedbasis. In addition, top ten holdings information (excluding derivative positions) is publicly available on the website on amonthly, seven-day or more delayed basis. Each Fund and Portfolio files its complete schedule of portfolio holdings with theSEC for the first and third quarters of each fiscal year on Form N-Q, which is available by visiting the SEC website atsec.gov. In addition, each Form N-Q may be reviewed and copied at the SEC�s Public Reference Room in Washington,DC, and at regional offices in New York City, at 233 Broadway, and in Chicago, at 175 West Jackson Boulevard, Suite 900.Information about the Public Reference Room may be obtained by calling 1-800-SEC-0330.
Copyright © 2017 www.secdatabase.com. All Rights Reserved.Please Consider the Environment Before Printing This Document
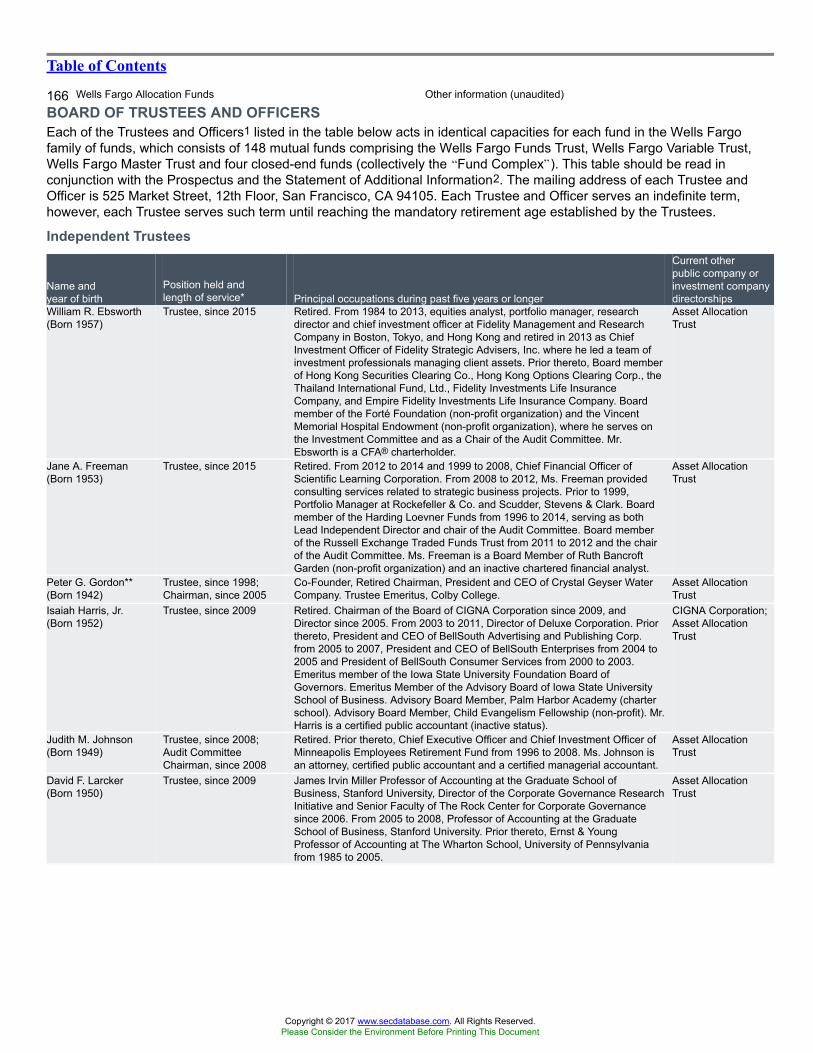
Table of Contents
166 Wells Fargo Allocation Funds Other information (unaudited)
BOARD OF TRUSTEES AND OFFICERSEach of the Trustees and Officers1 listed in the table below acts in identical capacities for each fund in the Wells Fargofamily of funds, which consists of 148 mutual funds comprising the Wells Fargo Funds Trust, Wells Fargo Variable Trust,Wells Fargo Master Trust and four closed-end funds (collectively the �Fund Complex�). This table should be read inconjunction with the Prospectus and the Statement of Additional Information2. The mailing address of each Trustee andOfficer is 525 Market Street, 12th Floor, San Francisco, CA 94105. Each Trustee and Officer serves an indefinite term,however, each Trustee serves such term until reaching the mandatory retirement age established by the Trustees.
Independent Trustees
Name andyear of birth
Position held andlength of service* Principal occupations during past five years or longer
Current otherpublic company orinvestment companydirectorships
William R. Ebsworth(Born 1957)
Trustee, since 2015 Retired. From 1984 to 2013, equities analyst, portfolio manager, researchdirector and chief investment officer at Fidelity Management and ResearchCompany in Boston, Tokyo, and Hong Kong and retired in 2013 as ChiefInvestment Officer of Fidelity Strategic Advisers, Inc. where he led a team ofinvestment professionals managing client assets. Prior thereto, Board memberof Hong Kong Securities Clearing Co., Hong Kong Options Clearing Corp., theThailand International Fund, Ltd., Fidelity Investments Life InsuranceCompany, and Empire Fidelity Investments Life Insurance Company. Boardmember of the Forté Foundation (non-profit organization) and the VincentMemorial Hospital Endowment (non-profit organization), where he serves onthe Investment Committee and as a Chair of the Audit Committee. Mr.Ebsworth is a CFA® charterholder.
Asset AllocationTrust
Jane A. Freeman(Born 1953)
Trustee, since 2015 Retired. From 2012 to 2014 and 1999 to 2008, Chief Financial Officer ofScientific Learning Corporation. From 2008 to 2012, Ms. Freeman providedconsulting services related to strategic business projects. Prior to 1999,Portfolio Manager at Rockefeller & Co. and Scudder, Stevens & Clark. Boardmember of the Harding Loevner Funds from 1996 to 2014, serving as bothLead Independent Director and chair of the Audit Committee. Board memberof the Russell Exchange Traded Funds Trust from 2011 to 2012 and the chairof the Audit Committee. Ms. Freeman is a Board Member of Ruth BancroftGarden (non-profit organization) and an inactive chartered financial analyst.
Asset AllocationTrust
Peter G. Gordon**(Born 1942)
Trustee, since 1998;Chairman, since 2005
Co-Founder, Retired Chairman, President and CEO of Crystal Geyser WaterCompany. Trustee Emeritus, Colby College.
Asset AllocationTrust
Isaiah Harris, Jr.(Born 1952)
Trustee, since 2009 Retired. Chairman of the Board of CIGNA Corporation since 2009, andDirector since 2005. From 2003 to 2011, Director of Deluxe Corporation. Priorthereto, President and CEO of BellSouth Advertising and Publishing Corp.from 2005 to 2007, President and CEO of BellSouth Enterprises from 2004 to2005 and President of BellSouth Consumer Services from 2000 to 2003.Emeritus member of the Iowa State University Foundation Board ofGovernors. Emeritus Member of the Advisory Board of Iowa State UniversitySchool of Business. Advisory Board Member, Palm Harbor Academy (charterschool). Advisory Board Member, Child Evangelism Fellowship (non-profit). Mr.Harris is a certified public accountant (inactive status).
CIGNA Corporation;Asset AllocationTrust
Judith M. Johnson(Born 1949)
Trustee, since 2008;Audit CommitteeChairman, since 2008
Retired. Prior thereto, Chief Executive Officer and Chief Investment Officer ofMinneapolis Employees Retirement Fund from 1996 to 2008. Ms. Johnson isan attorney, certified public accountant and a certified managerial accountant.
Asset AllocationTrust
David F. Larcker(Born 1950)
Trustee, since 2009 James Irvin Miller Professor of Accounting at the Graduate School ofBusiness, Stanford University, Director of the Corporate Governance ResearchInitiative and Senior Faculty of The Rock Center for Corporate Governancesince 2006. From 2005 to 2008, Professor of Accounting at the GraduateSchool of Business, Stanford University. Prior thereto, Ernst & YoungProfessor of Accounting at The Wharton School, University of Pennsylvaniafrom 1985 to 2005.
Asset AllocationTrust
Copyright © 2017 www.secdatabase.com. All Rights Reserved.Please Consider the Environment Before Printing This Document
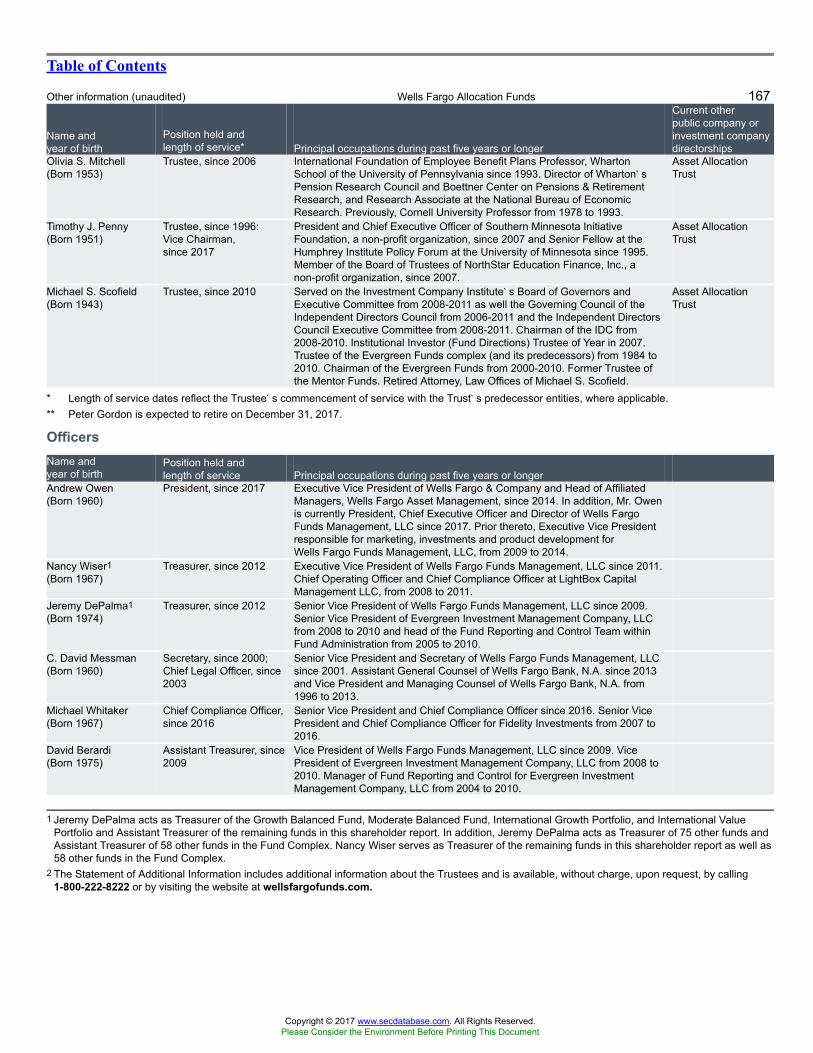
Table of Contents
Other information (unaudited) Wells Fargo Allocation Funds 167
Name andyear of birth
Position held andlength of service* Principal occupations during past five years or longer
Current otherpublic company orinvestment companydirectorships
Olivia S. Mitchell(Born 1953)
Trustee, since 2006 International Foundation of Employee Benefit Plans Professor, WhartonSchool of the University of Pennsylvania since 1993. Director of Wharton�sPension Research Council and Boettner Center on Pensions & RetirementResearch, and Research Associate at the National Bureau of EconomicResearch. Previously, Cornell University Professor from 1978 to 1993.
Asset AllocationTrust
Timothy J. Penny(Born 1951)
Trustee, since 1996:Vice Chairman,since 2017
President and Chief Executive Officer of Southern Minnesota InitiativeFoundation, a non-profit organization, since 2007 and Senior Fellow at theHumphrey Institute Policy Forum at the University of Minnesota since 1995.Member of the Board of Trustees of NorthStar Education Finance, Inc., anon-profit organization, since 2007.
Asset AllocationTrust
Michael S. Scofield(Born 1943)
Trustee, since 2010 Served on the Investment Company Institute�s Board of Governors andExecutive Committee from 2008-2011 as well the Governing Council of theIndependent Directors Council from 2006-2011 and the Independent DirectorsCouncil Executive Committee from 2008-2011. Chairman of the IDC from2008-2010. Institutional Investor (Fund Directions) Trustee of Year in 2007.Trustee of the Evergreen Funds complex (and its predecessors) from 1984 to2010. Chairman of the Evergreen Funds from 2000-2010. Former Trustee ofthe Mentor Funds. Retired Attorney, Law Offices of Michael S. Scofield.
Asset AllocationTrust
* Length of service dates reflect the Trustee�s commencement of service with the Trust�s predecessor entities, where applicable.** Peter Gordon is expected to retire on December 31, 2017.
OfficersName andyear of birth
Position held andlength of service Principal occupations during past five years or longer
Andrew Owen(Born 1960)
President, since 2017 Executive Vice President of Wells Fargo & Company and Head of AffiliatedManagers, Wells Fargo Asset Management, since 2014. In addition, Mr. Owenis currently President, Chief Executive Officer and Director of Wells FargoFunds Management, LLC since 2017. Prior thereto, Executive Vice Presidentresponsible for marketing, investments and product development forWells Fargo Funds Management, LLC, from 2009 to 2014.
Nancy Wiser1(Born 1967)
Treasurer, since 2012 Executive Vice President of Wells Fargo Funds Management, LLC since 2011.Chief Operating Officer and Chief Compliance Officer at LightBox CapitalManagement LLC, from 2008 to 2011.
Jeremy DePalma1(Born 1974)
Treasurer, since 2012 Senior Vice President of Wells Fargo Funds Management, LLC since 2009.Senior Vice President of Evergreen Investment Management Company, LLCfrom 2008 to 2010 and head of the Fund Reporting and Control Team withinFund Administration from 2005 to 2010.
C. David Messman(Born 1960)
Secretary, since 2000;Chief Legal Officer, since2003
Senior Vice President and Secretary of Wells Fargo Funds Management, LLCsince 2001. Assistant General Counsel of Wells Fargo Bank, N.A. since 2013and Vice President and Managing Counsel of Wells Fargo Bank, N.A. from1996 to 2013.
Michael Whitaker(Born 1967)
Chief Compliance Officer,since 2016
Senior Vice President and Chief Compliance Officer since 2016. Senior VicePresident and Chief Compliance Officer for Fidelity Investments from 2007 to2016.
David Berardi(Born 1975)
Assistant Treasurer, since2009
Vice President of Wells Fargo Funds Management, LLC since 2009. VicePresident of Evergreen Investment Management Company, LLC from 2008 to2010. Manager of Fund Reporting and Control for Evergreen InvestmentManagement Company, LLC from 2004 to 2010.
1 Jeremy DePalma acts as Treasurer of the Growth Balanced Fund, Moderate Balanced Fund, International Growth Portfolio, and International ValuePortfolio and Assistant Treasurer of the remaining funds in this shareholder report. In addition, Jeremy DePalma acts as Treasurer of 75 other funds andAssistant Treasurer of 58 other funds in the Fund Complex. Nancy Wiser serves as Treasurer of the remaining funds in this shareholder report as well as58 other funds in the Fund Complex.
2 The Statement of Additional Information includes additional information about the Trustees and is available, without charge, upon request, by calling1-800-222-8222 or by visiting the website at wellsfargofunds.com.
Copyright © 2017 www.secdatabase.com. All Rights Reserved.Please Consider the Environment Before Printing This Document
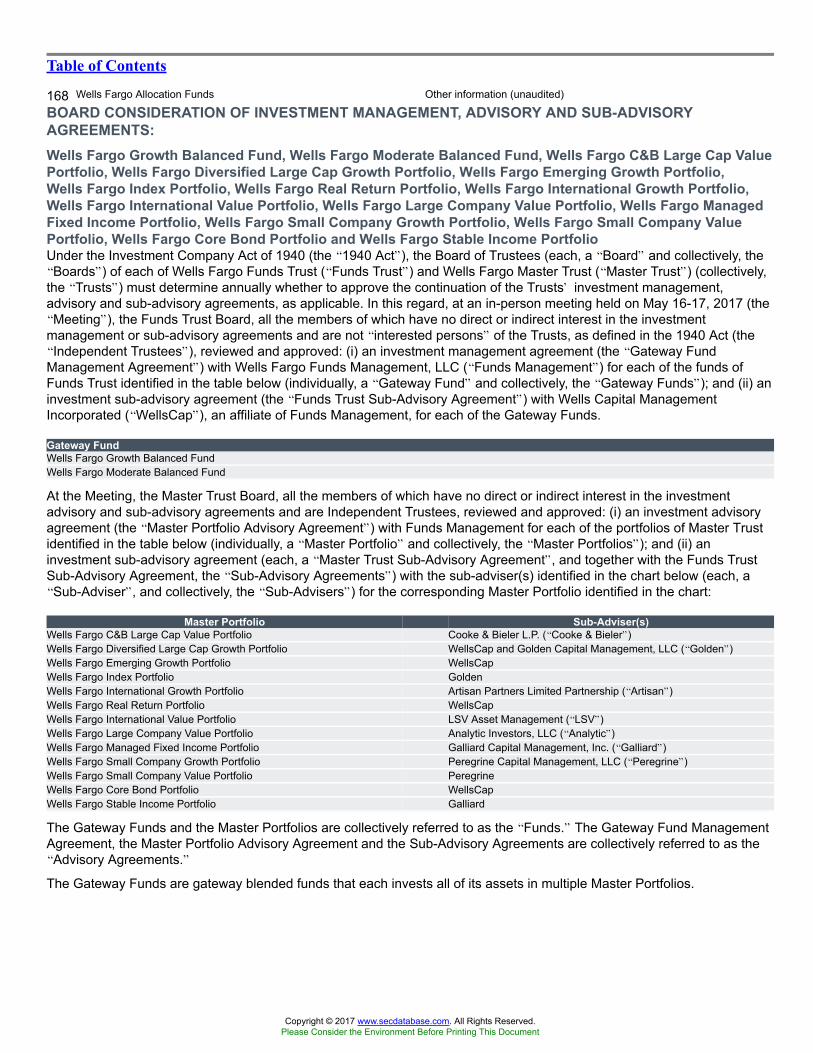
Table of Contents
168 Wells Fargo Allocation Funds Other information (unaudited)
BOARD CONSIDERATION OF INVESTMENT MANAGEMENT, ADVISORY AND SUB-ADVISORYAGREEMENTS:Wells Fargo Growth Balanced Fund, Wells Fargo Moderate Balanced Fund, Wells Fargo C&B Large Cap ValuePortfolio, Wells Fargo Diversified Large Cap Growth Portfolio, Wells Fargo Emerging Growth Portfolio,Wells Fargo Index Portfolio, Wells Fargo Real Return Portfolio, Wells Fargo International Growth Portfolio,Wells Fargo International Value Portfolio, Wells Fargo Large Company Value Portfolio, Wells Fargo ManagedFixed Income Portfolio, Wells Fargo Small Company Growth Portfolio, Wells Fargo Small Company ValuePortfolio, Wells Fargo Core Bond Portfolio and Wells Fargo Stable Income PortfolioUnder the Investment Company Act of 1940 (the �1940 Act�), the Board of Trustees (each, a �Board� and collectively, the�Boards�) of each of Wells Fargo Funds Trust (�Funds Trust�) and Wells Fargo Master Trust (�Master Trust�) (collectively,the �Trusts�) must determine annually whether to approve the continuation of the Trusts� investment management,advisory and sub-advisory agreements, as applicable. In this regard, at an in-person meeting held on May 16-17, 2017 (the�Meeting�), the Funds Trust Board, all the members of which have no direct or indirect interest in the investmentmanagement or sub-advisory agreements and are not �interested persons� of the Trusts, as defined in the 1940 Act (the�Independent Trustees�), reviewed and approved: (i) an investment management agreement (the �Gateway FundManagement Agreement�) with Wells Fargo Funds Management, LLC (�Funds Management�) for each of the funds ofFunds Trust identified in the table below (individually, a �Gateway Fund� and collectively, the �Gateway Funds�); and (ii) aninvestment sub-advisory agreement (the �Funds Trust Sub-Advisory Agreement�) with Wells Capital ManagementIncorporated (�WellsCap�), an affiliate of Funds Management, for each of the Gateway Funds.
Gateway FundWells Fargo Growth Balanced FundWells Fargo Moderate Balanced Fund
At the Meeting, the Master Trust Board, all the members of which have no direct or indirect interest in the investmentadvisory and sub-advisory agreements and are Independent Trustees, reviewed and approved: (i) an investment advisoryagreement (the �Master Portfolio Advisory Agreement�) with Funds Management for each of the portfolios of Master Trustidentified in the table below (individually, a �Master Portfolio� and collectively, the �Master Portfolios�); and (ii) aninvestment sub-advisory agreement (each, a �Master Trust Sub-Advisory Agreement�, and together with the Funds TrustSub-Advisory Agreement, the �Sub-Advisory Agreements�) with the sub-adviser(s) identified in the chart below (each, a�Sub-Adviser�, and collectively, the �Sub-Advisers�) for the corresponding Master Portfolio identified in the chart:
Master Portfolio Sub-Adviser(s)Wells Fargo C&B Large Cap Value Portfolio Cooke & Bieler L.P. (�Cooke & Bieler�)Wells Fargo Diversified Large Cap Growth Portfolio WellsCap and Golden Capital Management, LLC (�Golden�)Wells Fargo Emerging Growth Portfolio WellsCapWells Fargo Index Portfolio GoldenWells Fargo International Growth Portfolio Artisan Partners Limited Partnership (�Artisan�)Wells Fargo Real Return Portfolio WellsCapWells Fargo International Value Portfolio LSV Asset Management (�LSV�)Wells Fargo Large Company Value Portfolio Analytic Investors, LLC (�Analytic�)Wells Fargo Managed Fixed Income Portfolio Galliard Capital Management, Inc. (�Galliard�)Wells Fargo Small Company Growth Portfolio Peregrine Capital Management, LLC (�Peregrine�)Wells Fargo Small Company Value Portfolio PeregrineWells Fargo Core Bond Portfolio WellsCapWells Fargo Stable Income Portfolio Galliard
The Gateway Funds and the Master Portfolios are collectively referred to as the �Funds.� The Gateway Fund ManagementAgreement, the Master Portfolio Advisory Agreement and the Sub-Advisory Agreements are collectively referred to as the�Advisory Agreements.�
The Gateway Funds are gateway blended funds that each invests all of its assets in multiple Master Portfolios.
Copyright © 2017 www.secdatabase.com. All Rights Reserved.Please Consider the Environment Before Printing This Document
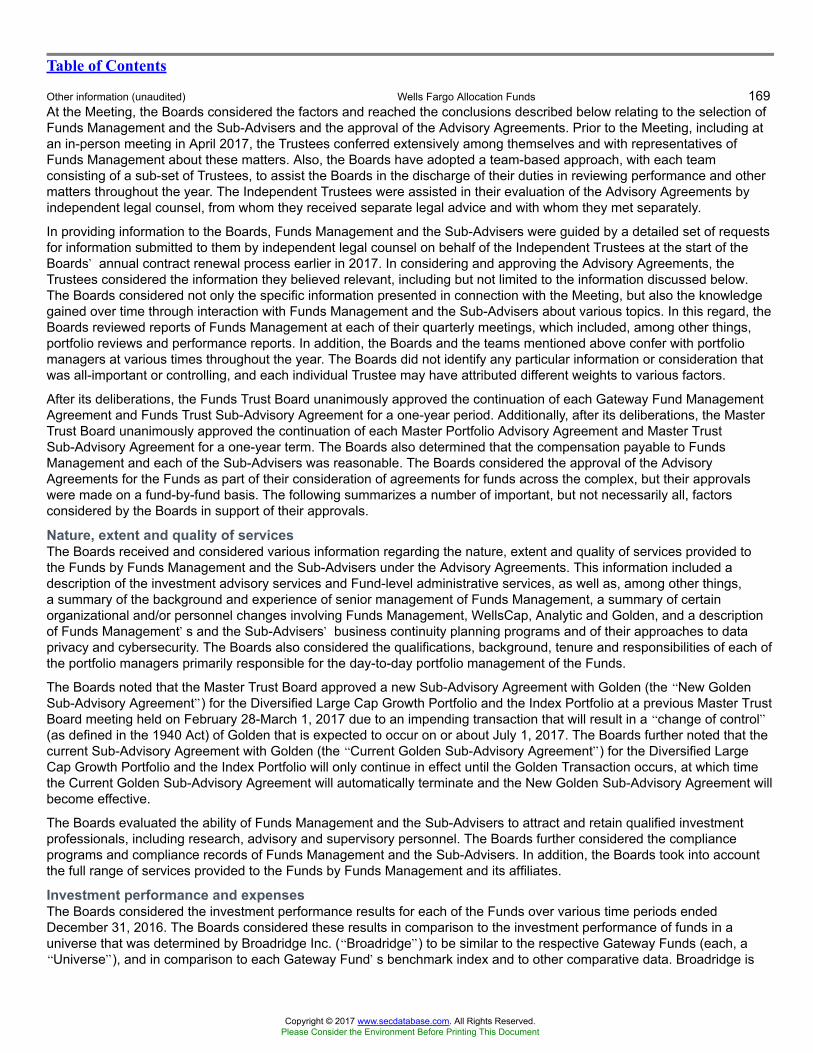
Table of Contents
Other information (unaudited) Wells Fargo Allocation Funds 169At the Meeting, the Boards considered the factors and reached the conclusions described below relating to the selection ofFunds Management and the Sub-Advisers and the approval of the Advisory Agreements. Prior to the Meeting, including atan in-person meeting in April 2017, the Trustees conferred extensively among themselves and with representatives ofFunds Management about these matters. Also, the Boards have adopted a team-based approach, with each teamconsisting of a sub-set of Trustees, to assist the Boards in the discharge of their duties in reviewing performance and othermatters throughout the year. The Independent Trustees were assisted in their evaluation of the Advisory Agreements byindependent legal counsel, from whom they received separate legal advice and with whom they met separately.
In providing information to the Boards, Funds Management and the Sub-Advisers were guided by a detailed set of requestsfor information submitted to them by independent legal counsel on behalf of the Independent Trustees at the start of theBoards� annual contract renewal process earlier in 2017. In considering and approving the Advisory Agreements, theTrustees considered the information they believed relevant, including but not limited to the information discussed below.The Boards considered not only the specific information presented in connection with the Meeting, but also the knowledgegained over time through interaction with Funds Management and the Sub-Advisers about various topics. In this regard, theBoards reviewed reports of Funds Management at each of their quarterly meetings, which included, among other things,portfolio reviews and performance reports. In addition, the Boards and the teams mentioned above confer with portfoliomanagers at various times throughout the year. The Boards did not identify any particular information or consideration thatwas all-important or controlling, and each individual Trustee may have attributed different weights to various factors.
After its deliberations, the Funds Trust Board unanimously approved the continuation of each Gateway Fund ManagementAgreement and Funds Trust Sub-Advisory Agreement for a one-year period. Additionally, after its deliberations, the MasterTrust Board unanimously approved the continuation of each Master Portfolio Advisory Agreement and Master TrustSub-Advisory Agreement for a one-year term. The Boards also determined that the compensation payable to FundsManagement and each of the Sub-Advisers was reasonable. The Boards considered the approval of the AdvisoryAgreements for the Funds as part of their consideration of agreements for funds across the complex, but their approvalswere made on a fund-by-fund basis. The following summarizes a number of important, but not necessarily all, factorsconsidered by the Boards in support of their approvals.
Nature, extent and quality of servicesThe Boards received and considered various information regarding the nature, extent and quality of services provided tothe Funds by Funds Management and the Sub-Advisers under the Advisory Agreements. This information included adescription of the investment advisory services and Fund-level administrative services, as well as, among other things,a summary of the background and experience of senior management of Funds Management, a summary of certainorganizational and/or personnel changes involving Funds Management, WellsCap, Analytic and Golden, and a descriptionof Funds Management�s and the Sub-Advisers� business continuity planning programs and of their approaches to dataprivacy and cybersecurity. The Boards also considered the qualifications, background, tenure and responsibilities of each ofthe portfolio managers primarily responsible for the day-to-day portfolio management of the Funds.
The Boards noted that the Master Trust Board approved a new Sub-Advisory Agreement with Golden (the �New GoldenSub-Advisory Agreement�) for the Diversified Large Cap Growth Portfolio and the Index Portfolio at a previous Master TrustBoard meeting held on February 28-March 1, 2017 due to an impending transaction that will result in a �change of control�(as defined in the 1940 Act) of Golden that is expected to occur on or about July 1, 2017. The Boards further noted that thecurrent Sub-Advisory Agreement with Golden (the �Current Golden Sub-Advisory Agreement�) for the Diversified LargeCap Growth Portfolio and the Index Portfolio will only continue in effect until the Golden Transaction occurs, at which timethe Current Golden Sub-Advisory Agreement will automatically terminate and the New Golden Sub-Advisory Agreement willbecome effective.
The Boards evaluated the ability of Funds Management and the Sub-Advisers to attract and retain qualified investmentprofessionals, including research, advisory and supervisory personnel. The Boards further considered the complianceprograms and compliance records of Funds Management and the Sub-Advisers. In addition, the Boards took into accountthe full range of services provided to the Funds by Funds Management and its affiliates.
Investment performance and expensesThe Boards considered the investment performance results for each of the Funds over various time periods endedDecember 31, 2016. The Boards considered these results in comparison to the investment performance of funds in auniverse that was determined by Broadridge Inc. (�Broadridge�) to be similar to the respective Gateway Funds (each, a�Universe�), and in comparison to each Gateway Fund�s benchmark index and to other comparative data. Broadridge is
Copyright © 2017 www.secdatabase.com. All Rights Reserved.Please Consider the Environment Before Printing This Document
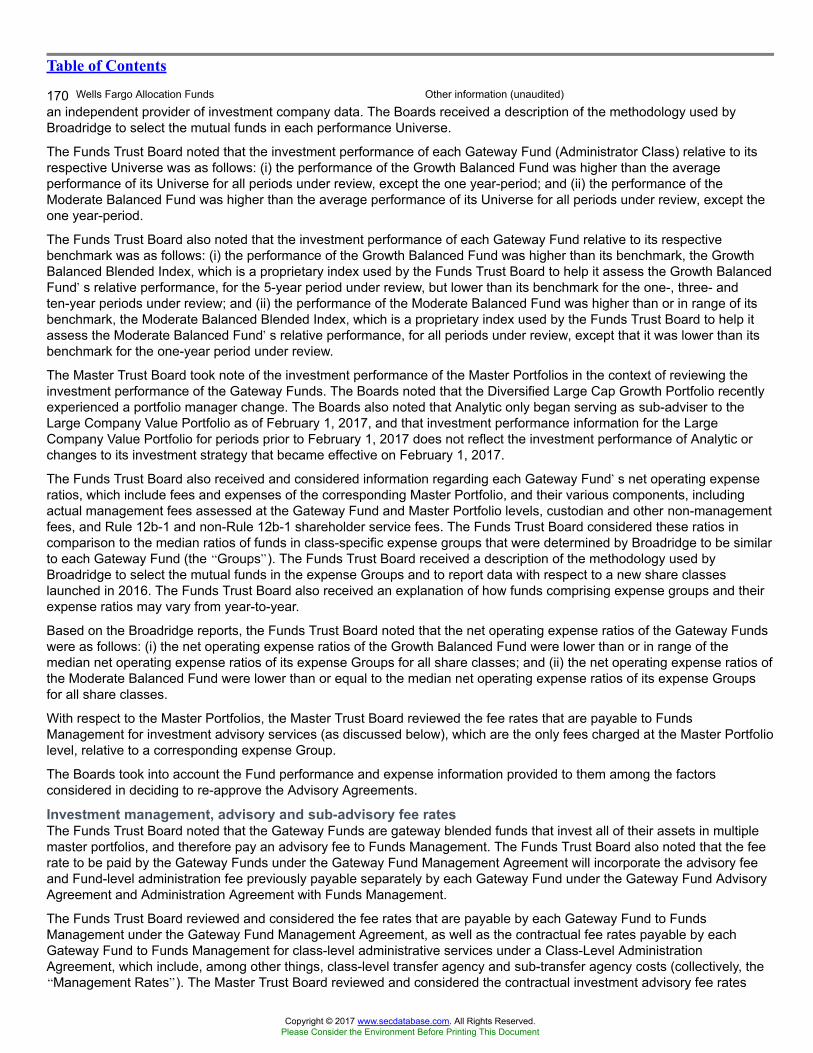
Table of Contents
170 Wells Fargo Allocation Funds Other information (unaudited)
an independent provider of investment company data. The Boards received a description of the methodology used byBroadridge to select the mutual funds in each performance Universe.
The Funds Trust Board noted that the investment performance of each Gateway Fund (Administrator Class) relative to itsrespective Universe was as follows: (i) the performance of the Growth Balanced Fund was higher than the averageperformance of its Universe for all periods under review, except the one year-period; and (ii) the performance of theModerate Balanced Fund was higher than the average performance of its Universe for all periods under review, except theone year-period.
The Funds Trust Board also noted that the investment performance of each Gateway Fund relative to its respectivebenchmark was as follows: (i) the performance of the Growth Balanced Fund was higher than its benchmark, the GrowthBalanced Blended Index, which is a proprietary index used by the Funds Trust Board to help it assess the Growth BalancedFund�s relative performance, for the 5-year period under review, but lower than its benchmark for the one-, three- andten-year periods under review; and (ii) the performance of the Moderate Balanced Fund was higher than or in range of itsbenchmark, the Moderate Balanced Blended Index, which is a proprietary index used by the Funds Trust Board to help itassess the Moderate Balanced Fund�s relative performance, for all periods under review, except that it was lower than itsbenchmark for the one-year period under review.
The Master Trust Board took note of the investment performance of the Master Portfolios in the context of reviewing theinvestment performance of the Gateway Funds. The Boards noted that the Diversified Large Cap Growth Portfolio recentlyexperienced a portfolio manager change. The Boards also noted that Analytic only began serving as sub-adviser to theLarge Company Value Portfolio as of February 1, 2017, and that investment performance information for the LargeCompany Value Portfolio for periods prior to February 1, 2017 does not reflect the investment performance of Analytic orchanges to its investment strategy that became effective on February 1, 2017.
The Funds Trust Board also received and considered information regarding each Gateway Fund�s net operating expenseratios, which include fees and expenses of the corresponding Master Portfolio, and their various components, includingactual management fees assessed at the Gateway Fund and Master Portfolio levels, custodian and other non-managementfees, and Rule 12b-1 and non-Rule 12b-1 shareholder service fees. The Funds Trust Board considered these ratios incomparison to the median ratios of funds in class-specific expense groups that were determined by Broadridge to be similarto each Gateway Fund (the �Groups�). The Funds Trust Board received a description of the methodology used byBroadridge to select the mutual funds in the expense Groups and to report data with respect to a new share classeslaunched in 2016. The Funds Trust Board also received an explanation of how funds comprising expense groups and theirexpense ratios may vary from year-to-year.
Based on the Broadridge reports, the Funds Trust Board noted that the net operating expense ratios of the Gateway Fundswere as follows: (i) the net operating expense ratios of the Growth Balanced Fund were lower than or in range of themedian net operating expense ratios of its expense Groups for all share classes; and (ii) the net operating expense ratios ofthe Moderate Balanced Fund were lower than or equal to the median net operating expense ratios of its expense Groupsfor all share classes.
With respect to the Master Portfolios, the Master Trust Board reviewed the fee rates that are payable to FundsManagement for investment advisory services (as discussed below), which are the only fees charged at the Master Portfoliolevel, relative to a corresponding expense Group.
The Boards took into account the Fund performance and expense information provided to them among the factorsconsidered in deciding to re-approve the Advisory Agreements.
Investment management, advisory and sub-advisory fee ratesThe Funds Trust Board noted that the Gateway Funds are gateway blended funds that invest all of their assets in multiplemaster portfolios, and therefore pay an advisory fee to Funds Management. The Funds Trust Board also noted that the feerate to be paid by the Gateway Funds under the Gateway Fund Management Agreement will incorporate the advisory feeand Fund-level administration fee previously payable separately by each Gateway Fund under the Gateway Fund AdvisoryAgreement and Administration Agreement with Funds Management.
The Funds Trust Board reviewed and considered the fee rates that are payable by each Gateway Fund to FundsManagement under the Gateway Fund Management Agreement, as well as the contractual fee rates payable by eachGateway Fund to Funds Management for class-level administrative services under a Class-Level AdministrationAgreement, which include, among other things, class-level transfer agency and sub-transfer agency costs (collectively, the�Management Rates�). The Master Trust Board reviewed and considered the contractual investment advisory fee rates
Copyright © 2017 www.secdatabase.com. All Rights Reserved.Please Consider the Environment Before Printing This Document
Table of Contents
Other information (unaudited) Wells Fargo Allocation Funds 171that are payable by the Master Portfolios to Funds Management for investment advisory services under the Master PortfolioAdvisory Agreement (the �Advisory Agreement Rates�). The Boards also reviewed and considered the contractualinvestment sub-advisory fee rates that are payable by Funds Management to the Sub-Advisers for investment sub-advisoryservices (the �Sub-Advisory Agreement Rates�).
Among other information reviewed by the Funds Trust Board was a comparison of each Gateway Fund�s ManagementRate, which include the advisory fees paid at the Master Portfolio level, with the average contractual investmentmanagement fee rates of funds in the expense Groups at a common asset level as well as transfer agency costs of thefunds in the expense Groups. The Funds Trust Board noted that the Management Rates of the Gateway Funds were asfollows: (i) the Management Rates of the Growth Balanced Fund were lower than the sum of the management fee rates andtransfer agency costs of its respective expense Groups for all share classes; and (ii) the Management Rates of theModerate Balanced Fund were lower than the sum of the management fee rates and transfer agency costs of its respectiveexpense Groups for all share classes.
The Master Trust Board reviewed a comparison of the Advisory Agreement Rates of each Master Portfolio with those ofother funds in each Master Portfolio�s respective expense Group at a common asset level. The Master Trust Board notedthat the Advisory Agreement Rates of each Master Portfolio were lower than or equal to the median rate for the MasterPortfolio�s respective expense Group. The Master Trust Board also discussed and accepted Funds Management�sproposal to revise the Advisory Agreement for the Core Bond Portfolio, Managed Fixed Income Portfolio, and Real ReturnPortfolio to reduce the advisory fees paid by those Master Portfolios to Funds Management.
The Boards also received and considered information about the portions of the total management fees that were retainedby Funds Management after payment of the fees to the Sub-Advisers for sub-advisory services. With respect to the MasterPortfolios sub-advised by Artisan, Cooke & Bieler, LSV, and Peregrine, the Master Trust Board considered this amount incomparison to the median amount retained by advisers to funds in a sub-advised expense universe that was determined byBroadridge to be similar to the respective Master Portfolio. In assessing the reasonableness of these amounts, the Boardsreceived and evaluated information about the nature and extent of responsibilities retained and risks assumed by FundsManagement and not delegated to or assumed by the Sub-Advisers, and about Funds Management�s on-going oversightservices. Given the current affiliation between Funds Management and WellsCap, Analytic, Golden and Galliard, theBoards ascribed limited relevance to the allocation of the fees between them. With respect to Artisan, Cooke & Bieler, LSV,and Peregrine, the Master Trust Board considered that the Sub-Advisory Agreement Rates paid to each of theseSub-Advisers had been negotiated by Funds Management on an arm�s-length basis.
Other than with respect to the Diversified Large Cap Growth Portfolio and the Real Return Portfolio, the Boards alsoreceived and considered information about the nature and extent of services offered and fee rates charged by FundsManagement and the Sub-Advisers to other types of clients with investment strategies similar to those of the Funds. In thisregard, the Boards received information about the significantly greater scope of services, and compliance, reporting andother legal burdens and risks of managing mutual funds compared with those associated with managing assets ofnon-mutual fund clients such as collective funds or institutional separate accounts.
Based on its consideration of the factors and information it deemed relevant, including those described here, the FundsTrust Board determined that the compensation payable to Funds Management under the Gateway Fund ManagementAgreement and to WellsCap under the Funds Trust Sub-Advisory Agreement was reasonable, and the Master Trust Boarddetermined that the compensation payable to Funds Management under the Master Portfolio Advisory Agreement and toeach Sub-Adviser under each Master Trust Sub-Advisory Agreement was reasonable.
ProfitabilityThe Boards received and considered information concerning the profitability of Funds Management, as well as theprofitability of Wells Fargo as a whole, from providing services to the Funds and the fund family as a whole. The Boardsalso received and considered information concerning the profitability of WellsCap, Peregrine, Galliard and Golden, if any,from providing services to the fund family as a whole, noting that certain of the Sub-Adviser�s profitability information withrespect to providing services to the Funds was subsumed in the Wells Fargo and Funds Management profitability analysis.The Boards noted that Peregrine�s profitability information was only subsumed in the Wells Fargo and Funds Managementprofitability analysis through August 31, 2016, at which time Peregrine became unaffiliated with Funds Management. TheBoards also noted that Analytic became a wholly-owned subsidiary of WellsCap on October 1, 2016, but that Analytic�sprofitability information with respect to subadvising the Large Company Value Portfolio was not subsumed in the WellsFargo and Funds Management profitability analysis because Analytic did not begin subadvising the Large Company ValuePortfolio until after December 31, 2016. The Boards did not receive or consider profitability
Copyright © 2017 www.secdatabase.com. All Rights Reserved.Please Consider the Environment Before Printing This Document
Table of Contents
172 Wells Fargo Allocation Funds Other information (unaudited)
information with respect to Artisan, Cooke & Bieler, and LSV, as the sub-advisory fees paid to them had been negotiated byFunds Management on an arm�s-length basis.
Funds Management reported on the methodologies and estimates used in calculating profitability, including a description ofthe methodology used to allocate certain expenses. Among other things, the Boards noted that the levels of profitabilityreported on a fund-by-fund basis varied widely, depending on factors such as the size and type of fund. Based on its review,the Boards did not deem the profits reported by Funds Management or Wells Fargo from its services to the Funds to be at alevel that would prevent the Boards from approving the continuation of the Advisory Agreements.
Economies of scaleWith respect to possible economies of scale, the Boards noted the existence of breakpoints in each Master Portfolio�sadvisory fee structure and each Gateway Fund�s management fee structure, which operate generally to reduce the Funds�expense ratios as the Funds grow in size. They considered that, for a small fund or a fund that shrinks in size, breakpointsconversely can result in higher fee levels. The Boards also considered that, in addition to management fee breakpoints,competitive fee rates set at the outset without regard to breakpoints and fee waiver and expense reimbursementarrangements are means of sharing potential economies of scale with shareholders of the Funds. The Master Trust Boardalso discussed and accepted Funds Management�s proposal to revise the Advisory Agreement for the Core Bond Portfolio,Managed Fixed Income Portfolio, and Real Return Portfolio to reduce the advisory fees paid by those Master Portfolios toFunds Management. The Boards considered Funds Management�s view, which Funds Management indicated wassupported by independent third-party industry studies that were summarized for the Boards, that any analyses of potentialeconomies of scale in managing a particular fund are inherently limited in light of the joint and common costs andinvestments that Funds Management incurs across the fund family as a whole.
The Boards concluded that the Funds� fee and expense arrangements, including contractual breakpoints, constituted areasonable approach to sharing potential economies of scale with the Funds and their shareholders.
Other benefits to Funds Management and the Sub-AdvisersThe Boards received and considered information regarding potential �fall-out� or ancillary benefits received by FundsManagement and its affiliates, including WellsCap, Analytic, Golden and Galliard, and by Artisan, Cooke & Bieler, LSV andPeregrine, as a result of their relationships with the Funds. Ancillary benefits could include, among others, benefits directlyattributable to other relationships with the Funds and benefits potentially derived from an increase in Funds Management�sand the Sub-Advisers� business as a result of their relationships with the Funds. The Boards noted that various affiliates ofFunds Management may receive distribution-related fees, shareholder servicing payments and sub-transfer agency fees inrespect of shares sold or held through them and services provided.
The Boards also reviewed information about soft dollar credits earned and utilized by WellsCap, Artisan, Cooke & Bieler,Golden, and Peregrine, fees earned by Funds Management and WellsCap from managing a private investment vehicle forthe fund family�s securities lending collateral and commissions earned by an affiliated broker from portfolio transactions.
Based on their consideration of the factors and information they deemed relevant, including those described here, theBoards did not find that any ancillary benefits received by Funds Management and its affiliates, including WellsCap,Analytic, Golden and Galliard, or by Artisan, Cooke & Bieler, LSV or Peregrine, were unreasonable.
ConclusionAt the Meeting, after considering the above-described factors and based on its deliberations and its evaluation of theinformation described above, the Funds Trust Board unanimously approved the continuation of each Gateway FundManagement Agreement and Funds Trust Sub-Advisory Agreement for a one-year period. Additionally, at the Meeting, afterconsidering the above-described factors and based on its deliberations and its evaluation of the information describedabove, the Master Trust Board unanimously approved the continuation of each Master Portfolio Advisory Agreement andMaster Trust Sub-Advisory Agreement for a one-year term. The Boards also determined that the compensation payable toFunds Management and each of the Sub-Advisers was reasonable.
Copyright © 2017 www.secdatabase.com. All Rights Reserved.Please Consider the Environment Before Printing This Document
Table of Contents
List of abbreviations Wells Fargo Allocation Funds 173The following is a list of common abbreviations for terms and entities that may have appeared in this report.
ACA � ACA Financial Guaranty CorporationADR � American depositary receiptADS � American depositary sharesAGC � Assured Guaranty CorporationAGM � Assured Guaranty MunicipalAmbac � Ambac Financial Group IncorporatedAMT � Alternative minimum taxAUD � Australian dollarBAN � Bond anticipation notesBHAC � Berkshire Hathaway Assurance CorporationBRL � Brazilian realCAB � Capital appreciation bondCAD � Canadian dollarCCAB � Convertible capital appreciation bondCDA � Community Development AuthorityCDO � Collateralized debt obligationCHF � Swiss francCOP � Colombian pesoCLP � Chilean pesoDKK � Danish kroneDRIVER � Derivative inverse tax-exempt receiptsDW&P � Department of Water & PowerDWR � Department of Water ResourcesECFA � Educational & Cultural Facilities AuthorityEDA � Economic Development AuthorityEDFA � Economic Development Finance AuthorityETF � Exchange-traded fundEUR � EuroFDIC � Federal Deposit Insurance CorporationFFCB � Federal Farm Credit BanksFGIC � Financial Guaranty Insurance CorporationFHA � Federal Housing AdministrationFHLB � Federal Home Loan BankFHLMC � Federal Home Loan Mortgage CorporationFICO � The Financing CorporationFNMA � Federal National Mortgage AssociationFSA � Farm Service AgencyGBP � Great British poundGDR � Global depositary receiptGNMA � Government National Mortgage AssociationGO � General obligationHCFR � Healthcare facilities revenueHEFA � Health & Educational Facilities AuthorityHEFAR � Higher education facilities authority revenueHFA � Housing Finance AuthorityHFFA � Health Facilities Financing AuthorityHKD � Hong Kong dollarHUD � Department of Housing and Urban DevelopmentHUF � Hungarian forintIDA � Industrial Development AuthorityIDAG � Industrial Development AgencyIDR � Indonesian rupiahIEP � Irish poundJPY � Japanese yenKRW � Republic of Korea wonLIBOR � London Interbank Offered RateLIFER � Long Inverse Floating Exempt Receipts
LIQ � Liquidity agreementLLC � Limited liability companyLLLP � Limited liability limited partnershipLLP � Limited liability partnershipLOC � Letter of credit
Copyright © 2017 www.secdatabase.com. All Rights Reserved.Please Consider the Environment Before Printing This Document
LP � Limited partnershipMBIA � Municipal Bond Insurance AssociationMFHR � Multifamily housing revenueMSTR � Municipal securities trust receiptsMTN � Medium-term noteMUD � Municipal Utility DistrictMXN � Mexican pesoMYR � Malaysian ringgitNational � National Public Finance Guarantee CorporationNGN � Nigerian nairaNOK � Norwegian kroneNZD � New Zealand dollarPCFA � Pollution Control Financing AuthorityPCL � Public Company LimitedPCR � Pollution control revenuePFA � Public Finance AuthorityPFFA � Public Facilities Financing AuthorityPFOTER � Puttable floating option tax-exempt receiptsPJSC � Public Joint Stock Companyplc � Public limited companyPLN � Polish zlotyPUTTER � Puttable tax-exempt receiptsR&D � Research & developmentRadian � Radian Asset AssuranceRAN � Revenue anticipation notesRDA � Redevelopment AuthorityRDFA � Redevelopment Finance AuthorityREIT � Real estate investment trustROC � Reset option certificatesRON � Romanian leiRUB � Russian rubleSAVRS � Select auction variable rate securitiesSBA � Small Business AuthoritySDR � Swedish depositary receiptSEK � Swedish kronaSFHR � Single-family housing revenueSFMR � Single-family mortgage revenueSGD � Singapore dollarSPA � Standby purchase agreementSPDR � Standard & Poor�s Depositary ReceiptsSPEAR � Short Puttable Exempt Adjustable ReceiptsSTRIPS � Separate trading of registered interest and
principal securitiesTAN � Tax anticipation notesTBA � To be announcedTHB � Thai bahtTIPS � Treasury inflation-protected securitiesTRAN � Tax revenue anticipation notesTRY � Turkish liraTTFA � Transportation Trust Fund AuthorityTVA � Tennessee Valley AuthorityZAR � South African rand
Copyright © 2017 www.secdatabase.com. All Rights Reserved.Please Consider the Environment Before Printing This Document

Table of Contents
This page is intentionally left blank.
Copyright © 2017 www.secdatabase.com. All Rights Reserved.Please Consider the Environment Before Printing This Document

Table of Contents
This page is intentionally left blank.
Copyright © 2017 www.secdatabase.com. All Rights Reserved.Please Consider the Environment Before Printing This Document

Table of Contents
This page is intentionally left blank.
Copyright © 2017 www.secdatabase.com. All Rights Reserved.Please Consider the Environment Before Printing This Document
Table of Contents
For more informationMore information about Wells Fargo Funds isavailable free upon request. To obtain literature,please write, email, visit the Funds� website, or call:Wells Fargo FundsP.O. Box 8266Boston, MA 02266-8266Email: [email protected]: wellsfargofunds.comIndividual investors: 1-800-222-8222Retail investment professionals: 1-888-877-9275Institutional investment professionals:1-866-765-0778
This report and the financial statements contained herein are submitted forthe general information of the shareholders of the Funds. If this report isused for promotional purposes, distribution of the report must beaccompanied or preceded by a current prospectus. Before investing, pleaseconsider the investment objectives, risks, charges, and expenses of theinvestment. For a current prospectus and, if available, a summaryprospectus, containing this information, call 1-800-222-8222 or visit theFunds� website at wellsfargofunds.com. Read the prospectus carefullybefore you invest or send money.Wells Fargo Asset Management (WFAM) is a trade name used by the asset managementbusinesses of Wells Fargo & Company. Wells Fargo Funds Management, LLC, a wholly ownedsubsidiary of Wells Fargo & Company, provides investment advisory and administrativeservices for Wells Fargo Funds. Other affiliates of Wells Fargo & Company provide subadvisoryand other services for the funds. The funds are distributed by Wells Fargo Funds Distributor,LLC, Member FINRA, an affiliate of Wells Fargo & Company. Neither Wells Fargo FundsManagement nor Wells Fargo Funds Distributor has Fund customer accounts/assets, andneither provides investment advice/recommendations or acts as an investment advice fiduciaryto any investor.
NOT FDIC INSURED ? NO BANK GUARANTEE ? MAY LOSE VALUE
© 2017 Wells Fargo Funds Management, LLC. All rights reserved.
303852 07-17AAFLD/AR110 05-17
Copyright © 2017 www.secdatabase.com. All Rights Reserved.Please Consider the Environment Before Printing This Document
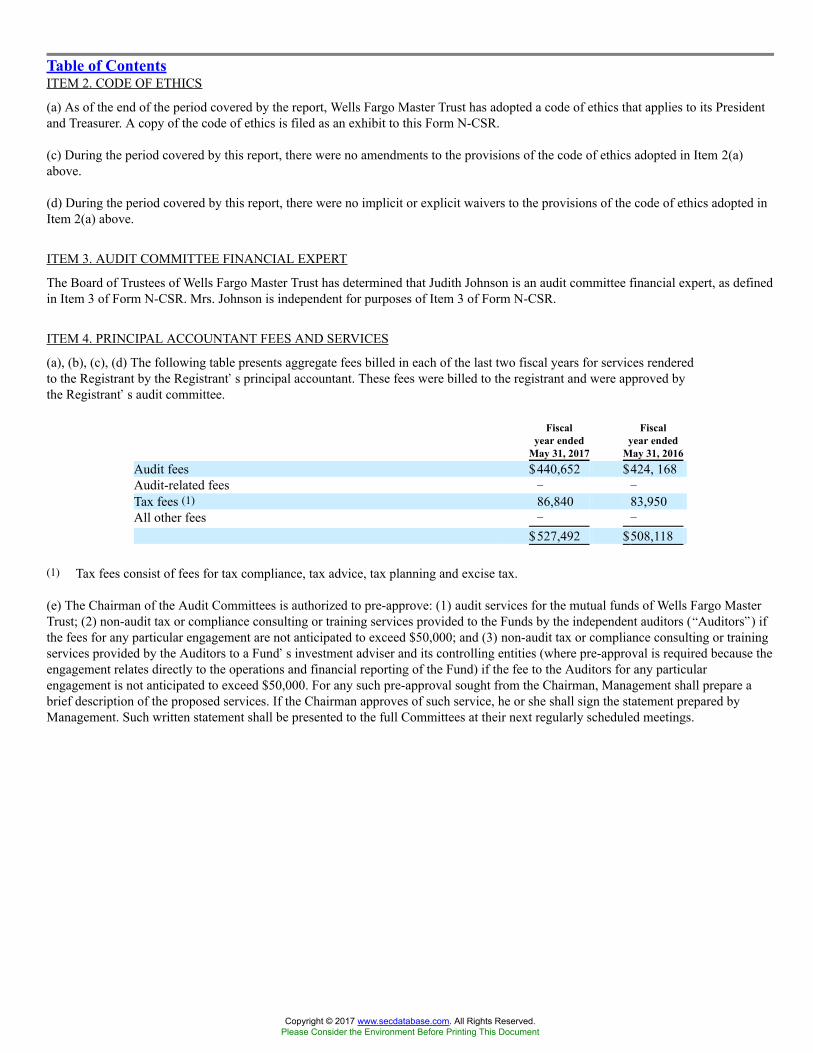
Table of ContentsITEM 2. CODE OF ETHICS
(a) As of the end of the period covered by the report, Wells Fargo Master Trust has adopted a code of ethics that applies to its Presidentand Treasurer. A copy of the code of ethics is filed as an exhibit to this Form N-CSR.
(c) During the period covered by this report, there were no amendments to the provisions of the code of ethics adopted in Item 2(a)above.
(d) During the period covered by this report, there were no implicit or explicit waivers to the provisions of the code of ethics adopted inItem 2(a) above.
ITEM 3. AUDIT COMMITTEE FINANCIAL EXPERT
The Board of Trustees of Wells Fargo Master Trust has determined that Judith Johnson is an audit committee financial expert, as definedin Item 3 of Form N-CSR. Mrs. Johnson is independent for purposes of Item 3 of Form N-CSR.
ITEM 4. PRINCIPAL ACCOUNTANT FEES AND SERVICES
(a), (b), (c), (d) The following table presents aggregate fees billed in each of the last two fiscal years for services renderedto the Registrant by the Registrant�s principal accountant. These fees were billed to the registrant and were approved bythe Registrant�s audit committee.
Fiscal Fiscalyear ended year ended
May 31, 2017 May 31, 2016Audit fees $440,652 $424, 168Audit-related fees � �Tax fees (1) 86,840 83,950All other fees � �
$527,492 $508,118
(1) Tax fees consist of fees for tax compliance, tax advice, tax planning and excise tax.
(e) The Chairman of the Audit Committees is authorized to pre-approve: (1) audit services for the mutual funds of Wells Fargo MasterTrust; (2) non-audit tax or compliance consulting or training services provided to the Funds by the independent auditors (�Auditors�) ifthe fees for any particular engagement are not anticipated to exceed $50,000; and (3) non-audit tax or compliance consulting or trainingservices provided by the Auditors to a Fund�s investment adviser and its controlling entities (where pre-approval is required because theengagement relates directly to the operations and financial reporting of the Fund) if the fee to the Auditors for any particularengagement is not anticipated to exceed $50,000. For any such pre-approval sought from the Chairman, Management shall prepare abrief description of the proposed services. If the Chairman approves of such service, he or she shall sign the statement prepared byManagement. Such written statement shall be presented to the full Committees at their next regularly scheduled meetings.
Copyright © 2017 www.secdatabase.com. All Rights Reserved.Please Consider the Environment Before Printing This Document
Table of Contents(f) Not applicable
(g) Not applicable
(h) Not applicable
ITEM 5. AUDIT COMMITTEE OF LISTED REGISTRANTS
Not applicable.
ITEM 6. INVESTMENTS
A Portfolio of Investments for each fund (except for Wells Fargo Index Portfolio and Wells Fargo Core Bond Portfolio) is included aspart of the report to shareholders filed under Item 1 of this Form. Wells Fargo Index Portfolio and Wells Fargo Core Bond Portfolioincluded a Summary Portfolio of Investments under Item 1. A Portfolio of Investments for each of Wells Fargo Index Portfolio andWells Fargo Core Bond Portfolio is filed under this Item.
Copyright © 2017 www.secdatabase.com. All Rights Reserved.Please Consider the Environment Before Printing This Document
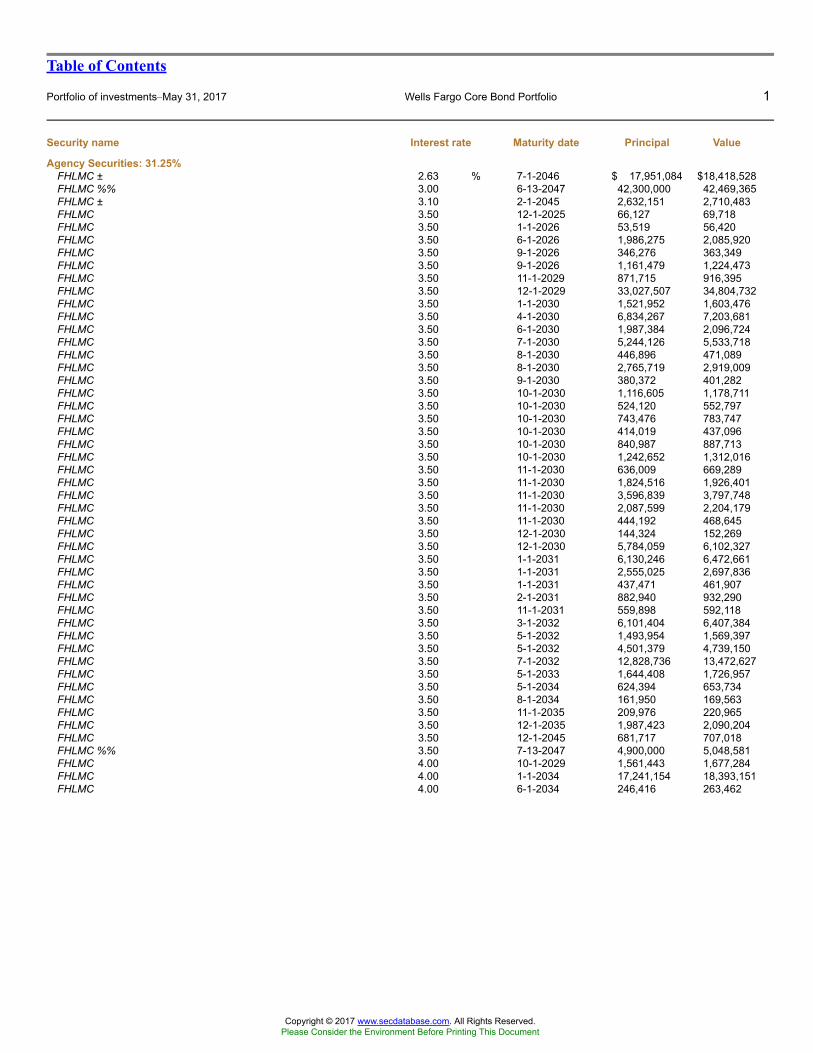
Table of Contents
Portfolio of investments�May 31, 2017 Wells Fargo Core Bond Portfolio 1
Security name Interest rate Maturity date Principal Value
Agency Securities: 31.25%FHLMC ± 2.63 % 7-1-2046 $ 17,951,084 $18,418,528FHLMC %% 3.00 6-13-2047 42,300,000 42,469,365FHLMC ± 3.10 2-1-2045 2,632,151 2,710,483FHLMC 3.50 12-1-2025 66,127 69,718FHLMC 3.50 1-1-2026 53,519 56,420FHLMC 3.50 6-1-2026 1,986,275 2,085,920FHLMC 3.50 9-1-2026 346,276 363,349FHLMC 3.50 9-1-2026 1,161,479 1,224,473FHLMC 3.50 11-1-2029 871,715 916,395FHLMC 3.50 12-1-2029 33,027,507 34,804,732FHLMC 3.50 1-1-2030 1,521,952 1,603,476FHLMC 3.50 4-1-2030 6,834,267 7,203,681FHLMC 3.50 6-1-2030 1,987,384 2,096,724FHLMC 3.50 7-1-2030 5,244,126 5,533,718FHLMC 3.50 8-1-2030 446,896 471,089FHLMC 3.50 8-1-2030 2,765,719 2,919,009FHLMC 3.50 9-1-2030 380,372 401,282FHLMC 3.50 10-1-2030 1,116,605 1,178,711FHLMC 3.50 10-1-2030 524,120 552,797FHLMC 3.50 10-1-2030 743,476 783,747FHLMC 3.50 10-1-2030 414,019 437,096FHLMC 3.50 10-1-2030 840,987 887,713FHLMC 3.50 10-1-2030 1,242,652 1,312,016FHLMC 3.50 11-1-2030 636,009 669,289FHLMC 3.50 11-1-2030 1,824,516 1,926,401FHLMC 3.50 11-1-2030 3,596,839 3,797,748FHLMC 3.50 11-1-2030 2,087,599 2,204,179FHLMC 3.50 11-1-2030 444,192 468,645FHLMC 3.50 12-1-2030 144,324 152,269FHLMC 3.50 12-1-2030 5,784,059 6,102,327FHLMC 3.50 1-1-2031 6,130,246 6,472,661FHLMC 3.50 1-1-2031 2,555,025 2,697,836FHLMC 3.50 1-1-2031 437,471 461,907FHLMC 3.50 2-1-2031 882,940 932,290FHLMC 3.50 11-1-2031 559,898 592,118FHLMC 3.50 3-1-2032 6,101,404 6,407,384FHLMC 3.50 5-1-2032 1,493,954 1,569,397FHLMC 3.50 5-1-2032 4,501,379 4,739,150FHLMC 3.50 7-1-2032 12,828,736 13,472,627FHLMC 3.50 5-1-2033 1,644,408 1,726,957FHLMC 3.50 5-1-2034 624,394 653,734FHLMC 3.50 8-1-2034 161,950 169,563FHLMC 3.50 11-1-2035 209,976 220,965FHLMC 3.50 12-1-2035 1,987,423 2,090,204FHLMC 3.50 12-1-2045 681,717 707,018FHLMC %% 3.50 7-13-2047 4,900,000 5,048,581FHLMC 4.00 10-1-2029 1,561,443 1,677,284FHLMC 4.00 1-1-2034 17,241,154 18,393,151FHLMC 4.00 6-1-2034 246,416 263,462
Copyright © 2017 www.secdatabase.com. All Rights Reserved.Please Consider the Environment Before Printing This Document
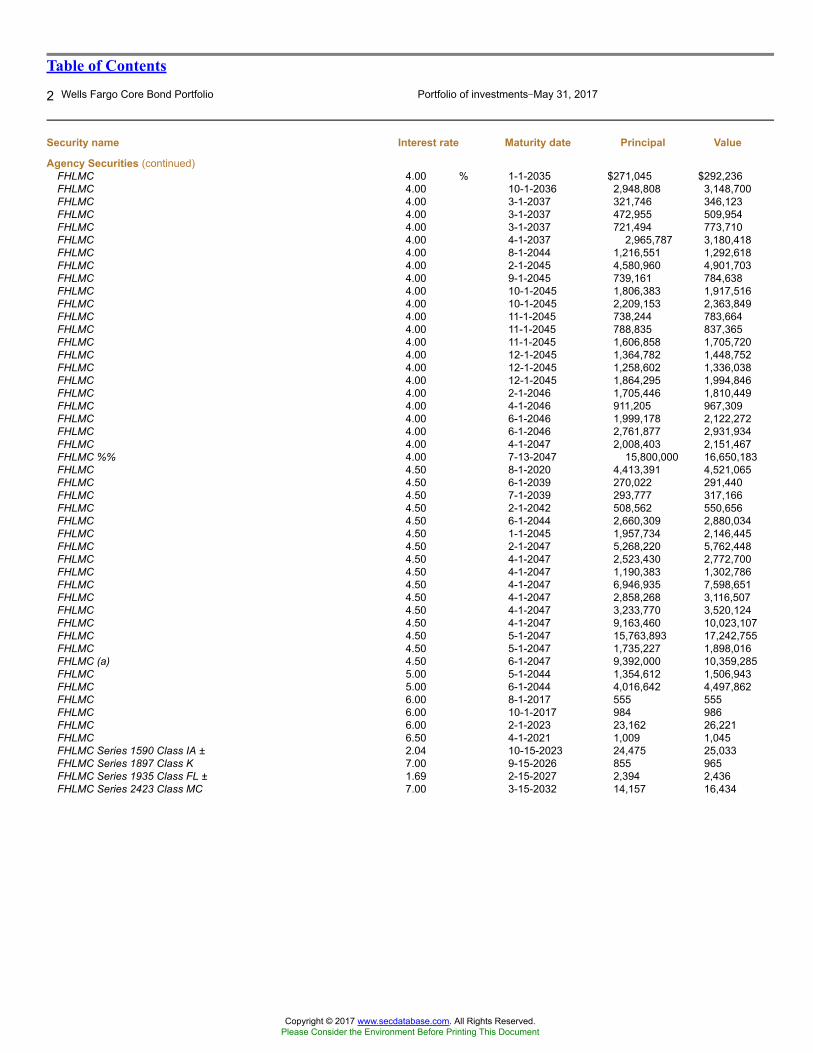
Table of Contents
2 Wells Fargo Core Bond Portfolio Portfolio of investments�May 31, 2017
Security name Interest rate Maturity date Principal Value
Agency Securities (continued)FHLMC 4.00 % 1-1-2035 $271,045 $292,236FHLMC 4.00 10-1-2036 2,948,808 3,148,700FHLMC 4.00 3-1-2037 321,746 346,123FHLMC 4.00 3-1-2037 472,955 509,954FHLMC 4.00 3-1-2037 721,494 773,710FHLMC 4.00 4-1-2037 2,965,787 3,180,418FHLMC 4.00 8-1-2044 1,216,551 1,292,618FHLMC 4.00 2-1-2045 4,580,960 4,901,703FHLMC 4.00 9-1-2045 739,161 784,638FHLMC 4.00 10-1-2045 1,806,383 1,917,516FHLMC 4.00 10-1-2045 2,209,153 2,363,849FHLMC 4.00 11-1-2045 738,244 783,664FHLMC 4.00 11-1-2045 788,835 837,365FHLMC 4.00 11-1-2045 1,606,858 1,705,720FHLMC 4.00 12-1-2045 1,364,782 1,448,752FHLMC 4.00 12-1-2045 1,258,602 1,336,038FHLMC 4.00 12-1-2045 1,864,295 1,994,846FHLMC 4.00 2-1-2046 1,705,446 1,810,449FHLMC 4.00 4-1-2046 911,205 967,309FHLMC 4.00 6-1-2046 1,999,178 2,122,272FHLMC 4.00 6-1-2046 2,761,877 2,931,934FHLMC 4.00 4-1-2047 2,008,403 2,151,467FHLMC %% 4.00 7-13-2047 15,800,000 16,650,183FHLMC 4.50 8-1-2020 4,413,391 4,521,065FHLMC 4.50 6-1-2039 270,022 291,440FHLMC 4.50 7-1-2039 293,777 317,166FHLMC 4.50 2-1-2042 508,562 550,656FHLMC 4.50 6-1-2044 2,660,309 2,880,034FHLMC 4.50 1-1-2045 1,957,734 2,146,445FHLMC 4.50 2-1-2047 5,268,220 5,762,448FHLMC 4.50 4-1-2047 2,523,430 2,772,700FHLMC 4.50 4-1-2047 1,190,383 1,302,786FHLMC 4.50 4-1-2047 6,946,935 7,598,651FHLMC 4.50 4-1-2047 2,858,268 3,116,507FHLMC 4.50 4-1-2047 3,233,770 3,520,124FHLMC 4.50 4-1-2047 9,163,460 10,023,107FHLMC 4.50 5-1-2047 15,763,893 17,242,755FHLMC 4.50 5-1-2047 1,735,227 1,898,016FHLMC (a) 4.50 6-1-2047 9,392,000 10,359,285FHLMC 5.00 5-1-2044 1,354,612 1,506,943FHLMC 5.00 6-1-2044 4,016,642 4,497,862FHLMC 6.00 8-1-2017 555 555FHLMC 6.00 10-1-2017 984 986FHLMC 6.00 2-1-2023 23,162 26,221FHLMC 6.50 4-1-2021 1,009 1,045FHLMC Series 1590 Class IA ± 2.04 10-15-2023 24,475 25,033FHLMC Series 1897 Class K 7.00 9-15-2026 855 965FHLMC Series 1935 Class FL ± 1.69 2-15-2027 2,394 2,436FHLMC Series 2423 Class MC 7.00 3-15-2032 14,157 16,434
Copyright © 2017 www.secdatabase.com. All Rights Reserved.Please Consider the Environment Before Printing This Document
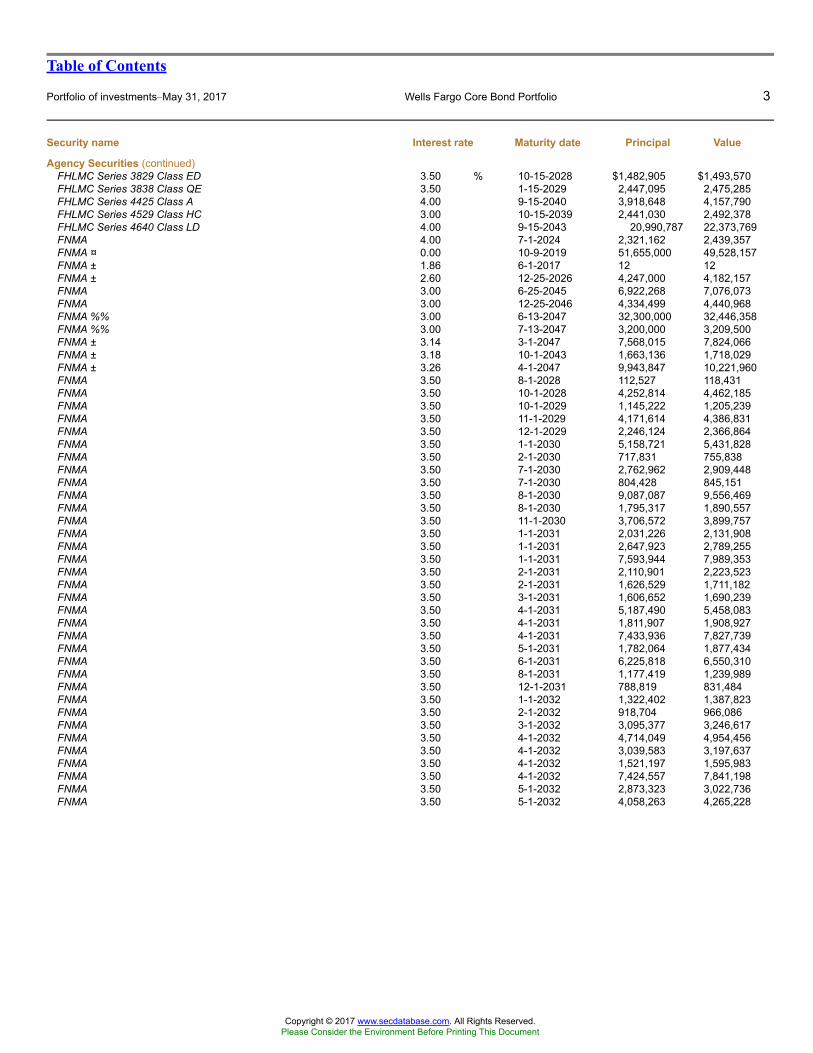
Table of Contents
Portfolio of investments�May 31, 2017 Wells Fargo Core Bond Portfolio 3
Security name Interest rate Maturity date Principal Value
Agency Securities (continued)FHLMC Series 3829 Class ED 3.50 % 10-15-2028 $1,482,905 $1,493,570FHLMC Series 3838 Class QE 3.50 1-15-2029 2,447,095 2,475,285FHLMC Series 4425 Class A 4.00 9-15-2040 3,918,648 4,157,790FHLMC Series 4529 Class HC 3.00 10-15-2039 2,441,030 2,492,378FHLMC Series 4640 Class LD 4.00 9-15-2043 20,990,787 22,373,769FNMA 4.00 7-1-2024 2,321,162 2,439,357FNMA ¤ 0.00 10-9-2019 51,655,000 49,528,157FNMA ± 1.86 6-1-2017 12 12FNMA ± 2.60 12-25-2026 4,247,000 4,182,157FNMA 3.00 6-25-2045 6,922,268 7,076,073FNMA 3.00 12-25-2046 4,334,499 4,440,968FNMA %% 3.00 6-13-2047 32,300,000 32,446,358FNMA %% 3.00 7-13-2047 3,200,000 3,209,500FNMA ± 3.14 3-1-2047 7,568,015 7,824,066FNMA ± 3.18 10-1-2043 1,663,136 1,718,029FNMA ± 3.26 4-1-2047 9,943,847 10,221,960FNMA 3.50 8-1-2028 112,527 118,431FNMA 3.50 10-1-2028 4,252,814 4,462,185FNMA 3.50 10-1-2029 1,145,222 1,205,239FNMA 3.50 11-1-2029 4,171,614 4,386,831FNMA 3.50 12-1-2029 2,246,124 2,366,864FNMA 3.50 1-1-2030 5,158,721 5,431,828FNMA 3.50 2-1-2030 717,831 755,838FNMA 3.50 7-1-2030 2,762,962 2,909,448FNMA 3.50 7-1-2030 804,428 845,151FNMA 3.50 8-1-2030 9,087,087 9,556,469FNMA 3.50 8-1-2030 1,795,317 1,890,557FNMA 3.50 11-1-2030 3,706,572 3,899,757FNMA 3.50 1-1-2031 2,031,226 2,131,908FNMA 3.50 1-1-2031 2,647,923 2,789,255FNMA 3.50 1-1-2031 7,593,944 7,989,353FNMA 3.50 2-1-2031 2,110,901 2,223,523FNMA 3.50 2-1-2031 1,626,529 1,711,182FNMA 3.50 3-1-2031 1,606,652 1,690,239FNMA 3.50 4-1-2031 5,187,490 5,458,083FNMA 3.50 4-1-2031 1,811,907 1,908,927FNMA 3.50 4-1-2031 7,433,936 7,827,739FNMA 3.50 5-1-2031 1,782,064 1,877,434FNMA 3.50 6-1-2031 6,225,818 6,550,310FNMA 3.50 8-1-2031 1,177,419 1,239,989FNMA 3.50 12-1-2031 788,819 831,484FNMA 3.50 1-1-2032 1,322,402 1,387,823FNMA 3.50 2-1-2032 918,704 966,086FNMA 3.50 3-1-2032 3,095,377 3,246,617FNMA 3.50 4-1-2032 4,714,049 4,954,456FNMA 3.50 4-1-2032 3,039,583 3,197,637FNMA 3.50 4-1-2032 1,521,197 1,595,983FNMA 3.50 4-1-2032 7,424,557 7,841,198FNMA 3.50 5-1-2032 2,873,323 3,022,736FNMA 3.50 5-1-2032 4,058,263 4,265,228
Copyright © 2017 www.secdatabase.com. All Rights Reserved.Please Consider the Environment Before Printing This Document
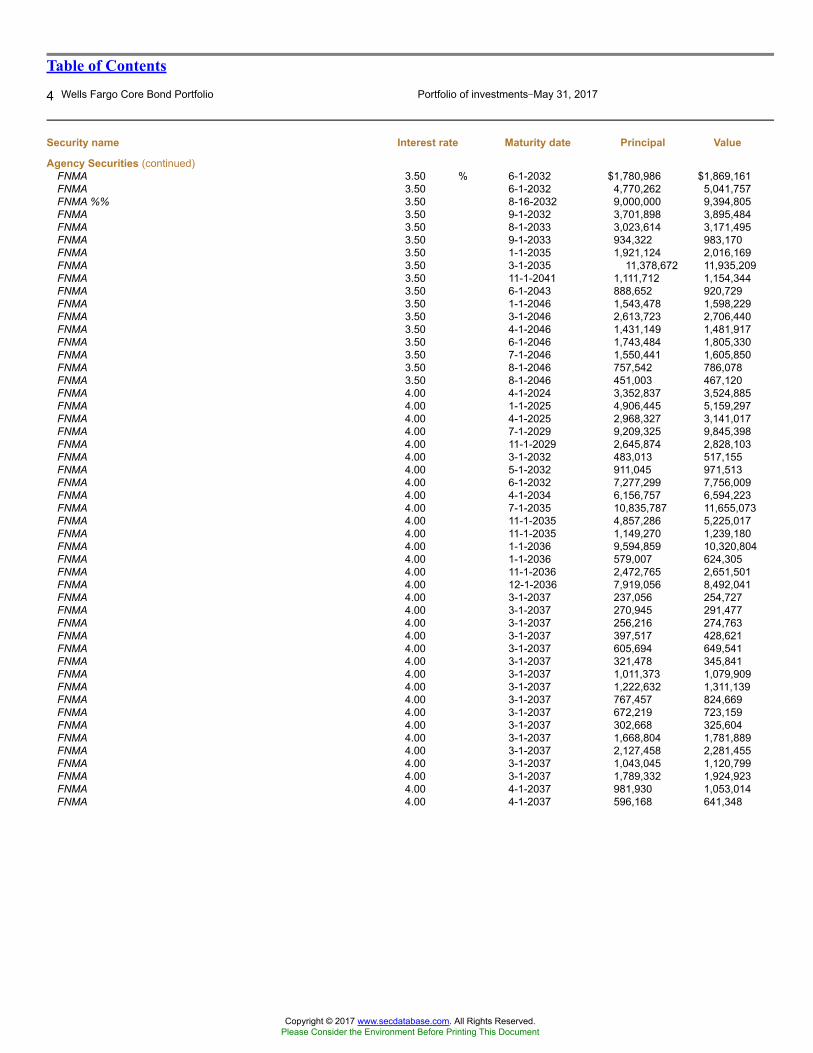
Table of Contents
4 Wells Fargo Core Bond Portfolio Portfolio of investments�May 31, 2017
Security name Interest rate Maturity date Principal Value
Agency Securities (continued)FNMA 3.50 % 6-1-2032 $1,780,986 $1,869,161FNMA 3.50 6-1-2032 4,770,262 5,041,757FNMA %% 3.50 8-16-2032 9,000,000 9,394,805FNMA 3.50 9-1-2032 3,701,898 3,895,484FNMA 3.50 8-1-2033 3,023,614 3,171,495FNMA 3.50 9-1-2033 934,322 983,170FNMA 3.50 1-1-2035 1,921,124 2,016,169FNMA 3.50 3-1-2035 11,378,672 11,935,209FNMA 3.50 11-1-2041 1,111,712 1,154,344FNMA 3.50 6-1-2043 888,652 920,729FNMA 3.50 1-1-2046 1,543,478 1,598,229FNMA 3.50 3-1-2046 2,613,723 2,706,440FNMA 3.50 4-1-2046 1,431,149 1,481,917FNMA 3.50 6-1-2046 1,743,484 1,805,330FNMA 3.50 7-1-2046 1,550,441 1,605,850FNMA 3.50 8-1-2046 757,542 786,078FNMA 3.50 8-1-2046 451,003 467,120FNMA 4.00 4-1-2024 3,352,837 3,524,885FNMA 4.00 1-1-2025 4,906,445 5,159,297FNMA 4.00 4-1-2025 2,968,327 3,141,017FNMA 4.00 7-1-2029 9,209,325 9,845,398FNMA 4.00 11-1-2029 2,645,874 2,828,103FNMA 4.00 3-1-2032 483,013 517,155FNMA 4.00 5-1-2032 911,045 971,513FNMA 4.00 6-1-2032 7,277,299 7,756,009FNMA 4.00 4-1-2034 6,156,757 6,594,223FNMA 4.00 7-1-2035 10,835,787 11,655,073FNMA 4.00 11-1-2035 4,857,286 5,225,017FNMA 4.00 11-1-2035 1,149,270 1,239,180FNMA 4.00 1-1-2036 9,594,859 10,320,804FNMA 4.00 1-1-2036 579,007 624,305FNMA 4.00 11-1-2036 2,472,765 2,651,501FNMA 4.00 12-1-2036 7,919,056 8,492,041FNMA 4.00 3-1-2037 237,056 254,727FNMA 4.00 3-1-2037 270,945 291,477FNMA 4.00 3-1-2037 256,216 274,763FNMA 4.00 3-1-2037 397,517 428,621FNMA 4.00 3-1-2037 605,694 649,541FNMA 4.00 3-1-2037 321,478 345,841FNMA 4.00 3-1-2037 1,011,373 1,079,909FNMA 4.00 3-1-2037 1,222,632 1,311,139FNMA 4.00 3-1-2037 767,457 824,669FNMA 4.00 3-1-2037 672,219 723,159FNMA 4.00 3-1-2037 302,668 325,604FNMA 4.00 3-1-2037 1,668,804 1,781,889FNMA 4.00 3-1-2037 2,127,458 2,281,455FNMA 4.00 3-1-2037 1,043,045 1,120,799FNMA 4.00 3-1-2037 1,789,332 1,924,923FNMA 4.00 4-1-2037 981,930 1,053,014FNMA 4.00 4-1-2037 596,168 641,348
Copyright © 2017 www.secdatabase.com. All Rights Reserved.Please Consider the Environment Before Printing This Document
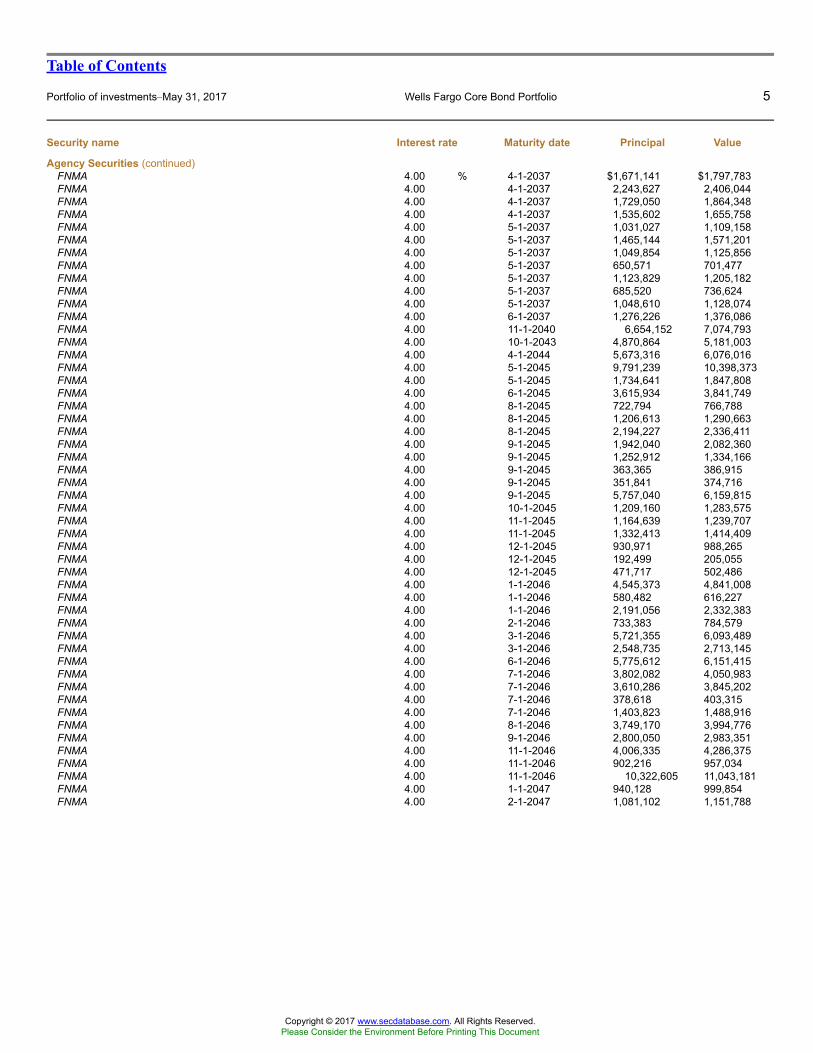
Table of Contents
Portfolio of investments�May 31, 2017 Wells Fargo Core Bond Portfolio 5
Security name Interest rate Maturity date Principal Value
Agency Securities (continued)FNMA 4.00 % 4-1-2037 $1,671,141 $1,797,783FNMA 4.00 4-1-2037 2,243,627 2,406,044FNMA 4.00 4-1-2037 1,729,050 1,864,348FNMA 4.00 4-1-2037 1,535,602 1,655,758FNMA 4.00 5-1-2037 1,031,027 1,109,158FNMA 4.00 5-1-2037 1,465,144 1,571,201FNMA 4.00 5-1-2037 1,049,854 1,125,856FNMA 4.00 5-1-2037 650,571 701,477FNMA 4.00 5-1-2037 1,123,829 1,205,182FNMA 4.00 5-1-2037 685,520 736,624FNMA 4.00 5-1-2037 1,048,610 1,128,074FNMA 4.00 6-1-2037 1,276,226 1,376,086FNMA 4.00 11-1-2040 6,654,152 7,074,793FNMA 4.00 10-1-2043 4,870,864 5,181,003FNMA 4.00 4-1-2044 5,673,316 6,076,016FNMA 4.00 5-1-2045 9,791,239 10,398,373FNMA 4.00 5-1-2045 1,734,641 1,847,808FNMA 4.00 6-1-2045 3,615,934 3,841,749FNMA 4.00 8-1-2045 722,794 766,788FNMA 4.00 8-1-2045 1,206,613 1,290,663FNMA 4.00 8-1-2045 2,194,227 2,336,411FNMA 4.00 9-1-2045 1,942,040 2,082,360FNMA 4.00 9-1-2045 1,252,912 1,334,166FNMA 4.00 9-1-2045 363,365 386,915FNMA 4.00 9-1-2045 351,841 374,716FNMA 4.00 9-1-2045 5,757,040 6,159,815FNMA 4.00 10-1-2045 1,209,160 1,283,575FNMA 4.00 11-1-2045 1,164,639 1,239,707FNMA 4.00 11-1-2045 1,332,413 1,414,409FNMA 4.00 12-1-2045 930,971 988,265FNMA 4.00 12-1-2045 192,499 205,055FNMA 4.00 12-1-2045 471,717 502,486FNMA 4.00 1-1-2046 4,545,373 4,841,008FNMA 4.00 1-1-2046 580,482 616,227FNMA 4.00 1-1-2046 2,191,056 2,332,383FNMA 4.00 2-1-2046 733,383 784,579FNMA 4.00 3-1-2046 5,721,355 6,093,489FNMA 4.00 3-1-2046 2,548,735 2,713,145FNMA 4.00 6-1-2046 5,775,612 6,151,415FNMA 4.00 7-1-2046 3,802,082 4,050,983FNMA 4.00 7-1-2046 3,610,286 3,845,202FNMA 4.00 7-1-2046 378,618 403,315FNMA 4.00 7-1-2046 1,403,823 1,488,916FNMA 4.00 8-1-2046 3,749,170 3,994,776FNMA 4.00 9-1-2046 2,800,050 2,983,351FNMA 4.00 11-1-2046 4,006,335 4,286,375FNMA 4.00 11-1-2046 902,216 957,034FNMA 4.00 11-1-2046 10,322,605 11,043,181FNMA 4.00 1-1-2047 940,128 999,854FNMA 4.00 2-1-2047 1,081,102 1,151,788
Copyright © 2017 www.secdatabase.com. All Rights Reserved.Please Consider the Environment Before Printing This Document
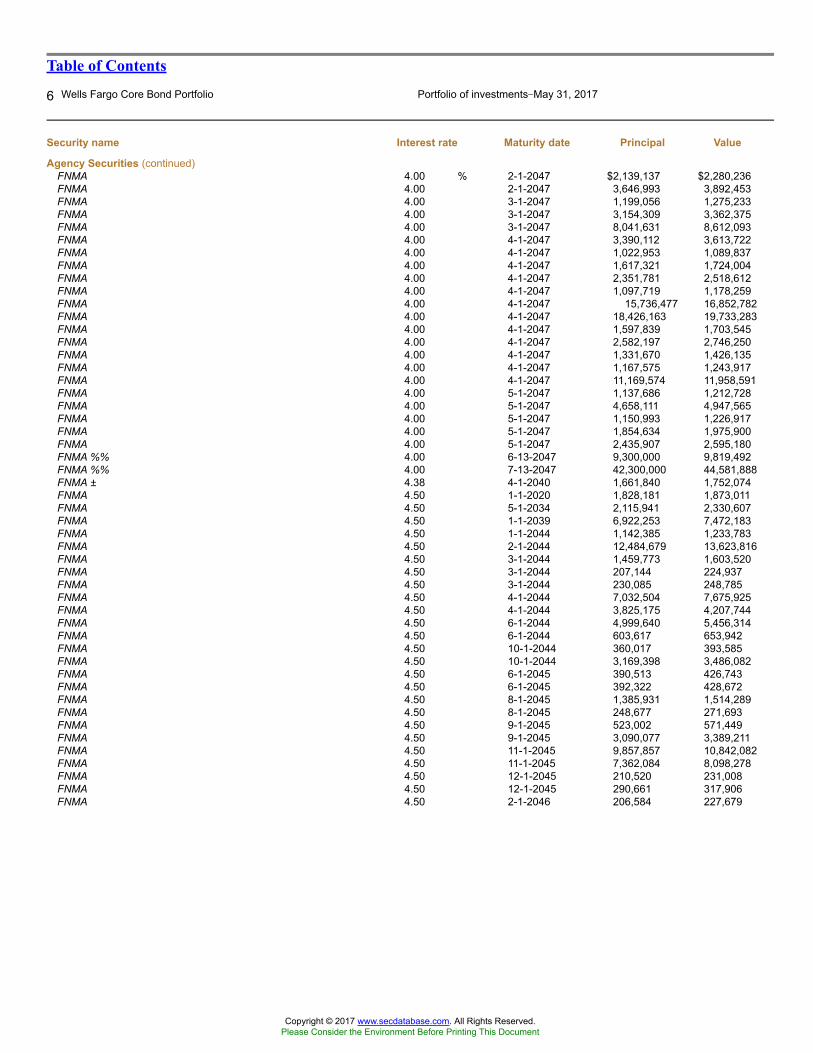
Table of Contents
6 Wells Fargo Core Bond Portfolio Portfolio of investments�May 31, 2017
Security name Interest rate Maturity date Principal Value
Agency Securities (continued)FNMA 4.00 % 2-1-2047 $2,139,137 $2,280,236FNMA 4.00 2-1-2047 3,646,993 3,892,453FNMA 4.00 3-1-2047 1,199,056 1,275,233FNMA 4.00 3-1-2047 3,154,309 3,362,375FNMA 4.00 3-1-2047 8,041,631 8,612,093FNMA 4.00 4-1-2047 3,390,112 3,613,722FNMA 4.00 4-1-2047 1,022,953 1,089,837FNMA 4.00 4-1-2047 1,617,321 1,724,004FNMA 4.00 4-1-2047 2,351,781 2,518,612FNMA 4.00 4-1-2047 1,097,719 1,178,259FNMA 4.00 4-1-2047 15,736,477 16,852,782FNMA 4.00 4-1-2047 18,426,163 19,733,283FNMA 4.00 4-1-2047 1,597,839 1,703,545FNMA 4.00 4-1-2047 2,582,197 2,746,250FNMA 4.00 4-1-2047 1,331,670 1,426,135FNMA 4.00 4-1-2047 1,167,575 1,243,917FNMA 4.00 4-1-2047 11,169,574 11,958,591FNMA 4.00 5-1-2047 1,137,686 1,212,728FNMA 4.00 5-1-2047 4,658,111 4,947,565FNMA 4.00 5-1-2047 1,150,993 1,226,917FNMA 4.00 5-1-2047 1,854,634 1,975,900FNMA 4.00 5-1-2047 2,435,907 2,595,180FNMA %% 4.00 6-13-2047 9,300,000 9,819,492FNMA %% 4.00 7-13-2047 42,300,000 44,581,888FNMA ± 4.38 4-1-2040 1,661,840 1,752,074FNMA 4.50 1-1-2020 1,828,181 1,873,011FNMA 4.50 5-1-2034 2,115,941 2,330,607FNMA 4.50 1-1-2039 6,922,253 7,472,183FNMA 4.50 1-1-2044 1,142,385 1,233,783FNMA 4.50 2-1-2044 12,484,679 13,623,816FNMA 4.50 3-1-2044 1,459,773 1,603,520FNMA 4.50 3-1-2044 207,144 224,937FNMA 4.50 3-1-2044 230,085 248,785FNMA 4.50 4-1-2044 7,032,504 7,675,925FNMA 4.50 4-1-2044 3,825,175 4,207,744FNMA 4.50 6-1-2044 4,999,640 5,456,314FNMA 4.50 6-1-2044 603,617 653,942FNMA 4.50 10-1-2044 360,017 393,585FNMA 4.50 10-1-2044 3,169,398 3,486,082FNMA 4.50 6-1-2045 390,513 426,743FNMA 4.50 6-1-2045 392,322 428,672FNMA 4.50 8-1-2045 1,385,931 1,514,289FNMA 4.50 8-1-2045 248,677 271,693FNMA 4.50 9-1-2045 523,002 571,449FNMA 4.50 9-1-2045 3,090,077 3,389,211FNMA 4.50 11-1-2045 9,857,857 10,842,082FNMA 4.50 11-1-2045 7,362,084 8,098,278FNMA 4.50 12-1-2045 210,520 231,008FNMA 4.50 12-1-2045 290,661 317,906FNMA 4.50 2-1-2046 206,584 227,679
Copyright © 2017 www.secdatabase.com. All Rights Reserved.Please Consider the Environment Before Printing This Document
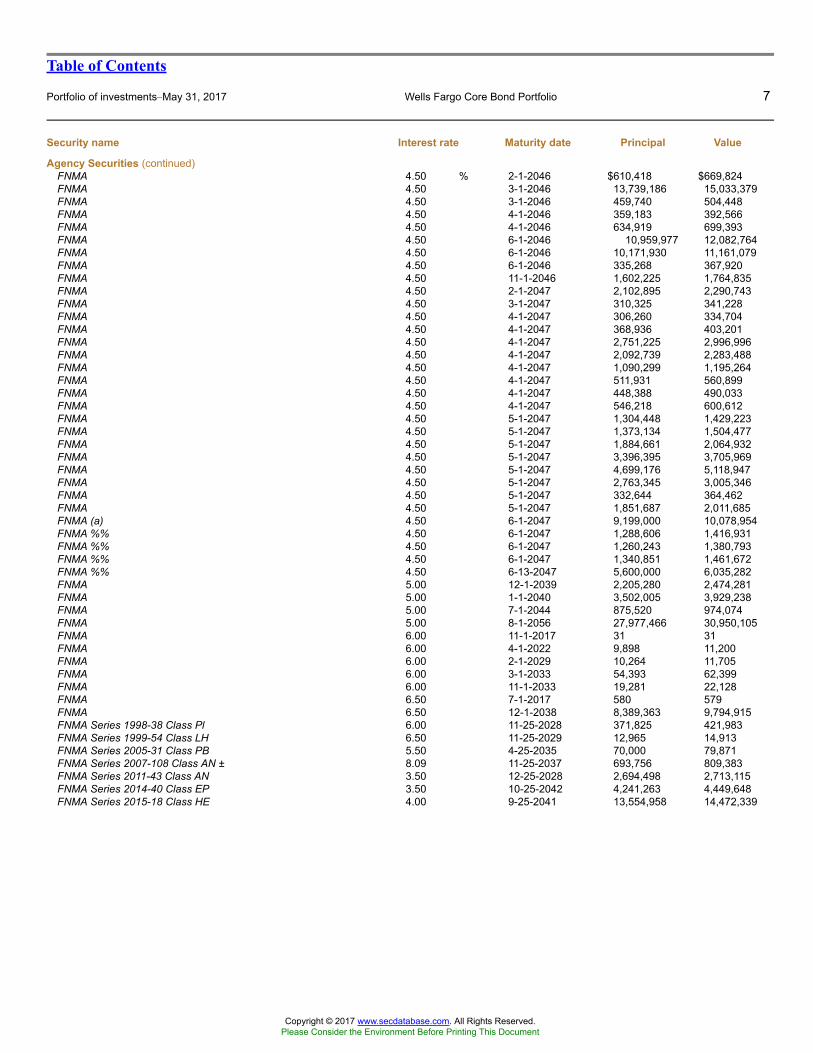
Table of Contents
Portfolio of investments�May 31, 2017 Wells Fargo Core Bond Portfolio 7
Security name Interest rate Maturity date Principal Value
Agency Securities (continued)FNMA 4.50 % 2-1-2046 $610,418 $669,824FNMA 4.50 3-1-2046 13,739,186 15,033,379FNMA 4.50 3-1-2046 459,740 504,448FNMA 4.50 4-1-2046 359,183 392,566FNMA 4.50 4-1-2046 634,919 699,393FNMA 4.50 6-1-2046 10,959,977 12,082,764FNMA 4.50 6-1-2046 10,171,930 11,161,079FNMA 4.50 6-1-2046 335,268 367,920FNMA 4.50 11-1-2046 1,602,225 1,764,835FNMA 4.50 2-1-2047 2,102,895 2,290,743FNMA 4.50 3-1-2047 310,325 341,228FNMA 4.50 4-1-2047 306,260 334,704FNMA 4.50 4-1-2047 368,936 403,201FNMA 4.50 4-1-2047 2,751,225 2,996,996FNMA 4.50 4-1-2047 2,092,739 2,283,488FNMA 4.50 4-1-2047 1,090,299 1,195,264FNMA 4.50 4-1-2047 511,931 560,899FNMA 4.50 4-1-2047 448,388 490,033FNMA 4.50 4-1-2047 546,218 600,612FNMA 4.50 5-1-2047 1,304,448 1,429,223FNMA 4.50 5-1-2047 1,373,134 1,504,477FNMA 4.50 5-1-2047 1,884,661 2,064,932FNMA 4.50 5-1-2047 3,396,395 3,705,969FNMA 4.50 5-1-2047 4,699,176 5,118,947FNMA 4.50 5-1-2047 2,763,345 3,005,346FNMA 4.50 5-1-2047 332,644 364,462FNMA 4.50 5-1-2047 1,851,687 2,011,685FNMA (a) 4.50 6-1-2047 9,199,000 10,078,954FNMA %% 4.50 6-1-2047 1,288,606 1,416,931FNMA %% 4.50 6-1-2047 1,260,243 1,380,793FNMA %% 4.50 6-1-2047 1,340,851 1,461,672FNMA %% 4.50 6-13-2047 5,600,000 6,035,282FNMA 5.00 12-1-2039 2,205,280 2,474,281FNMA 5.00 1-1-2040 3,502,005 3,929,238FNMA 5.00 7-1-2044 875,520 974,074FNMA 5.00 8-1-2056 27,977,466 30,950,105FNMA 6.00 11-1-2017 31 31FNMA 6.00 4-1-2022 9,898 11,200FNMA 6.00 2-1-2029 10,264 11,705FNMA 6.00 3-1-2033 54,393 62,399FNMA 6.00 11-1-2033 19,281 22,128FNMA 6.50 7-1-2017 580 579FNMA 6.50 12-1-2038 8,389,363 9,794,915FNMA Series 1998-38 Class Pl 6.00 11-25-2028 371,825 421,983FNMA Series 1999-54 Class LH 6.50 11-25-2029 12,965 14,913FNMA Series 2005-31 Class PB 5.50 4-25-2035 70,000 79,871FNMA Series 2007-108 Class AN ± 8.09 11-25-2037 693,756 809,383FNMA Series 2011-43 Class AN 3.50 12-25-2028 2,694,498 2,713,115FNMA Series 2014-40 Class EP 3.50 10-25-2042 4,241,263 4,449,648FNMA Series 2015-18 Class HE 4.00 9-25-2041 13,554,958 14,472,339
Copyright © 2017 www.secdatabase.com. All Rights Reserved.Please Consider the Environment Before Printing This Document
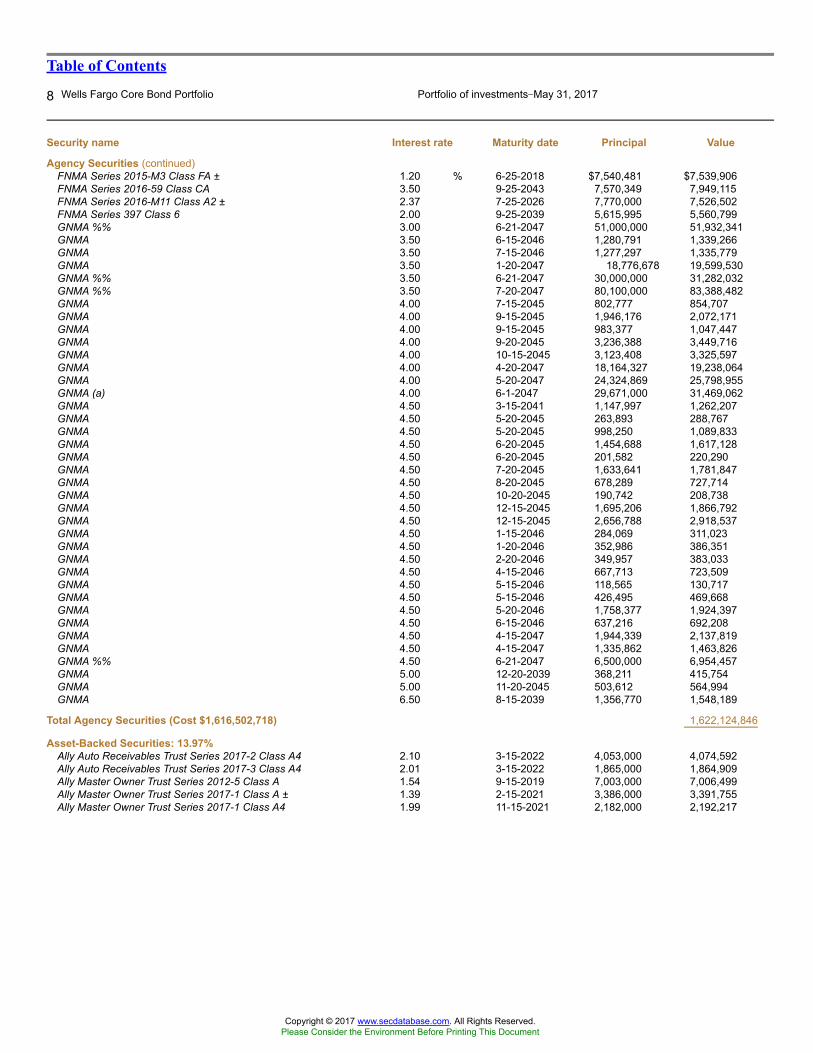
Table of Contents
8 Wells Fargo Core Bond Portfolio Portfolio of investments�May 31, 2017
Security name Interest rate Maturity date Principal Value
Agency Securities (continued)FNMA Series 2015-M3 Class FA ± 1.20 % 6-25-2018 $7,540,481 $7,539,906FNMA Series 2016-59 Class CA 3.50 9-25-2043 7,570,349 7,949,115FNMA Series 2016-M11 Class A2 ± 2.37 7-25-2026 7,770,000 7,526,502FNMA Series 397 Class 6 2.00 9-25-2039 5,615,995 5,560,799GNMA %% 3.00 6-21-2047 51,000,000 51,932,341GNMA 3.50 6-15-2046 1,280,791 1,339,266GNMA 3.50 7-15-2046 1,277,297 1,335,779GNMA 3.50 1-20-2047 18,776,678 19,599,530GNMA %% 3.50 6-21-2047 30,000,000 31,282,032GNMA %% 3.50 7-20-2047 80,100,000 83,388,482GNMA 4.00 7-15-2045 802,777 854,707GNMA 4.00 9-15-2045 1,946,176 2,072,171GNMA 4.00 9-15-2045 983,377 1,047,447GNMA 4.00 9-20-2045 3,236,388 3,449,716GNMA 4.00 10-15-2045 3,123,408 3,325,597GNMA 4.00 4-20-2047 18,164,327 19,238,064GNMA 4.00 5-20-2047 24,324,869 25,798,955GNMA (a) 4.00 6-1-2047 29,671,000 31,469,062GNMA 4.50 3-15-2041 1,147,997 1,262,207GNMA 4.50 5-20-2045 263,893 288,767GNMA 4.50 5-20-2045 998,250 1,089,833GNMA 4.50 6-20-2045 1,454,688 1,617,128GNMA 4.50 6-20-2045 201,582 220,290GNMA 4.50 7-20-2045 1,633,641 1,781,847GNMA 4.50 8-20-2045 678,289 727,714GNMA 4.50 10-20-2045 190,742 208,738GNMA 4.50 12-15-2045 1,695,206 1,866,792GNMA 4.50 12-15-2045 2,656,788 2,918,537GNMA 4.50 1-15-2046 284,069 311,023GNMA 4.50 1-20-2046 352,986 386,351GNMA 4.50 2-20-2046 349,957 383,033GNMA 4.50 4-15-2046 667,713 723,509GNMA 4.50 5-15-2046 118,565 130,717GNMA 4.50 5-15-2046 426,495 469,668GNMA 4.50 5-20-2046 1,758,377 1,924,397GNMA 4.50 6-15-2046 637,216 692,208GNMA 4.50 4-15-2047 1,944,339 2,137,819GNMA 4.50 4-15-2047 1,335,862 1,463,826GNMA %% 4.50 6-21-2047 6,500,000 6,954,457GNMA 5.00 12-20-2039 368,211 415,754GNMA 5.00 11-20-2045 503,612 564,994GNMA 6.50 8-15-2039 1,356,770 1,548,189
Total Agency Securities (Cost $1,616,502,718) 1,622,124,846
Asset-Backed Securities: 13.97%Ally Auto Receivables Trust Series 2017-2 Class A4 2.10 3-15-2022 4,053,000 4,074,592Ally Auto Receivables Trust Series 2017-3 Class A4 2.01 3-15-2022 1,865,000 1,864,909Ally Master Owner Trust Series 2012-5 Class A 1.54 9-15-2019 7,003,000 7,006,499Ally Master Owner Trust Series 2017-1 Class A ± 1.39 2-15-2021 3,386,000 3,391,755Ally Master Owner Trust Series 2017-1 Class A4 1.99 11-15-2021 2,182,000 2,192,217
Copyright © 2017 www.secdatabase.com. All Rights Reserved.Please Consider the Environment Before Printing This Document

Table of Contents
Portfolio of investments�May 31, 2017 Wells Fargo Core Bond Portfolio 9
Security name Interest rate Maturity date Principal Value
Asset-Backed Securities (continued)American Express Credit Account Master Trust Series 2017-1
Class A 1.95 % 9-15-2022 $10,711,000 $10,766,727AmeriCredit Auto Receivables Trust Series 2016-4 Class A3 1.53 7-8-2021 6,530,000 6,507,187Avis Budget Rental Car Funding LLC Series 2014-1A Class A 144A 2.46 7-20-2020 11,595,000 11,638,763Avis Budget Rental Car Funding LLC Series 2014-2A Class A 144A 2.50 2-20-2021 8,701,000 8,677,495Avis Budget Rental Car Funding LLC Series 2017-1a Class A 144A 3.07 9-20-2023 5,812,000 5,795,270Bank of the West Auto Trust Series 2014-1 Class A3 144A 1.09 3-15-2019 447,410 447,198Barclays Dryrock Issuance Trust Series 2017-1 Class A ± 1.32 3-15-2023 3,181,000 3,185,687California Republic Auto Receivables Trust Series 2015-1 Class A4 1.82 9-15-2020 3,366,000 3,370,498California Republic Auto Receivables Trust Series 2015-4
Class A4 144A 2.58 6-15-2021 5,562,000 5,632,118California Republic Auto Receivables Trust Series 2016-1 Class A3 1.89 5-15-2020 4,994,000 5,005,812California Republic Auto Receivables Trust Series 2016-1 Class A4 2.24 10-15-2021 6,135,000 6,185,793California Republic Auto Receivables Trust Series 2016-2 Class A4 1.83 12-15-2021 4,931,000 4,932,050California Republic Auto Receivables Trust Series 2017-1 Class A2 1.64 11-15-2019 4,697,000 4,696,762California Republic Auto Receivables Trust Series 2017-1 Class A3 2.02 3-15-2021 4,397,000 4,399,660California Republic Auto Receivables Trust Series 2017-1 Class A4 2.36 6-15-2022 2,211,000 2,224,795Capital Auto Receivables Asset Trust Series 2014-1 Class A4 1.69 10-22-2018 168,188 168,201Capital Auto Receivables Asset Trust Series 2015-2 Class A2 1.39 9-20-2018 810,314 810,259Capital Auto Receivables Asset Trust Series 2015-2 Class A3 1.73 9-20-2019 4,184,000 4,190,666Capital Auto Receivables Asset Trust Series 2015-2 Class A4 1.97 1-21-2020 4,356,000 4,374,036Capital Auto Receivables Asset Trust Series 2015-3 Class A3 1.94 1-21-2020 4,639,000 4,654,183Capital Auto Receivables Asset Trust Series 2015-4 Class A2 1.62 3-20-2019 2,906,000 2,907,300Capital Auto Receivables Asset Trust Series 2015-4 Class A4 2.01 7-20-2020 2,387,000 2,397,757Capital Auto Receivables Asset Trust Series 2016-1 Class A2A 1.50 11-20-2018 1,759,402 1,759,613Capital Auto Receivables Asset Trust Series 2016-1 Class A4 1.98 10-20-2020 2,455,000 2,464,516Capital Auto Receivables Asset Trust Series 2016-2 Class A2A 1.32 1-22-2019 991,125 990,792Capital Auto Receivables Asset Trust Series 2016-2 Class A3 1.46 6-22-2020 4,283,000 4,276,277Capital Auto Receivables Asset Trust Series 2016-3 Class A2A 1.36 4-22-2019 2,257,119 2,256,827Capital Auto Receivables Asset Trust Series 2016-3 Class A3A 1.54 8-20-2020 3,634,000 3,632,729Capital Auto Receivables Asset Trust Series 2016-3 Class A4 1.69 3-20-2021 2,417,000 2,415,387Capital One Multi Asset Execution Trust Series 2015-A1 Class A 1.39 1-15-2021 86,000 86,004Capital One Multi Asset Execution Trust Series 2017-A1 Class A1 2.00 1-17-2023 3,397,000 3,421,676Flagship Credit Auto Owner Trust Series 2016-3 Class A2 144A 2.05 11-15-2020 2,940,000 2,944,922Ford Credit Floorplan Master Owner Trust Series 2016-3 Class A1 1.55 7-15-2021 7,761,000 7,728,772Hertz Vehicle Financing LLC Series 2013-1A Class A2 144A 1.83 8-25-2019 2,494,000 2,487,803Hertz Vehicle Financing LLC Series 2015-1A Class A 144A 2.73 3-25-2021 14,976,000 14,900,668Hertz Vehicle Financing LLC Series 2015-3A Class A 144A 2.67 9-25-2021 9,811,000 9,696,720Hertz Vehicle Financing LLC Series 2016-2A Class A2 144A 2.95 3-25-2022 2,139,000 2,124,474Hertz Vehicle Financing LLC Series 2016-3A Class A 144A 2.27 7-25-2020 5,551,000 5,522,318Hertz Vehicle Financing LLC Series 2016-3A Class B 144A 3.11 7-25-2020 2,186,000 2,158,350Hertz Vehicle Financing LLC Series 2016-4A Class A 144A 2.65 7-25-2022 5,005,000 4,894,414Honda Auto Receivables Series 2015-1 Class A4 1.32 11-16-2020 3,563,000 3,561,837Hyundai Auto Receivables Trust Series 2017-A Class A4 2.09 4-17-2023 2,834,000 2,851,214Navient Student Loan Trust Series 2014-1 Class A3 ± 1.50 6-25-2031 4,121,000 4,067,631Navient Student Loan Trust Series 2014-AA Class A3 144A± 2.59 10-15-2031 6,169,000 6,291,721Navient Student Loan Trust Series 2014-CTA Class A 144A± 1.69 9-16-2024 3,487,372 3,493,110Navient Student Loan Trust Series 2015-AA Class A2B 144A± 2.19 12-15-2028 4,936,000 5,005,802Navient Student Loan Trust Series 2015-CA Class B 144A 3.25 5-15-2040 2,766,000 2,802,723Navient Student Loan Trust Series 2016-1A Class A 144A± 1.72 2-25-2070 2,441,874 2,413,408Navient Student Loan Trust Series 2016-5A Class A 144A± 2.24 6-25-2065 3,174,625 3,221,237Navient Student Loan Trust Series 2016-7A Class A 144A± 2.14 3-25-2066 6,549,927 6,611,060Navient Student Loan Trust Series 2016-AA Class A2A 144A 3.91 12-15-2045 10,017,000 10,440,774
Copyright © 2017 www.secdatabase.com. All Rights Reserved.Please Consider the Environment Before Printing This Document
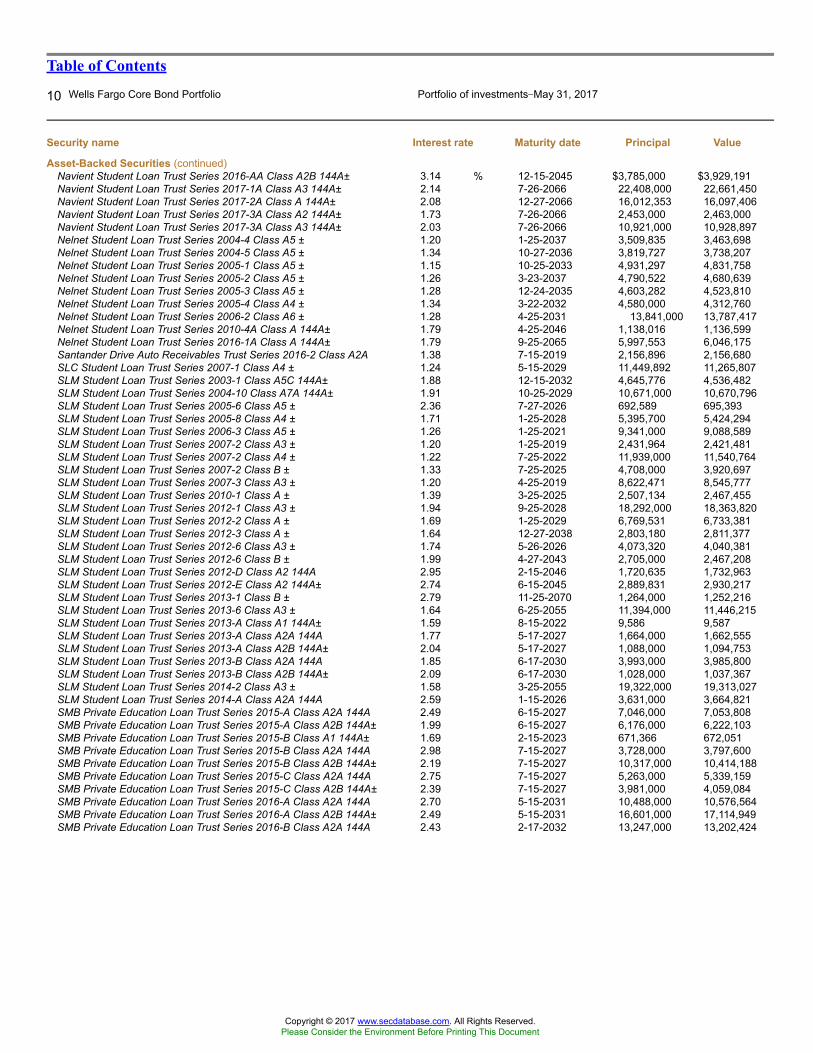
Table of Contents
10 Wells Fargo Core Bond Portfolio Portfolio of investments�May 31, 2017
Security name Interest rate Maturity date Principal Value
Asset-Backed Securities (continued)Navient Student Loan Trust Series 2016-AA Class A2B 144A± 3.14 % 12-15-2045 $3,785,000 $3,929,191Navient Student Loan Trust Series 2017-1A Class A3 144A± 2.14 7-26-2066 22,408,000 22,661,450Navient Student Loan Trust Series 2017-2A Class A 144A± 2.08 12-27-2066 16,012,353 16,097,406Navient Student Loan Trust Series 2017-3A Class A2 144A± 1.73 7-26-2066 2,453,000 2,463,000Navient Student Loan Trust Series 2017-3A Class A3 144A± 2.03 7-26-2066 10,921,000 10,928,897Nelnet Student Loan Trust Series 2004-4 Class A5 ± 1.20 1-25-2037 3,509,835 3,463,698Nelnet Student Loan Trust Series 2004-5 Class A5 ± 1.34 10-27-2036 3,819,727 3,738,207Nelnet Student Loan Trust Series 2005-1 Class A5 ± 1.15 10-25-2033 4,931,297 4,831,758Nelnet Student Loan Trust Series 2005-2 Class A5 ± 1.26 3-23-2037 4,790,522 4,680,639Nelnet Student Loan Trust Series 2005-3 Class A5 ± 1.28 12-24-2035 4,603,282 4,523,810Nelnet Student Loan Trust Series 2005-4 Class A4 ± 1.34 3-22-2032 4,580,000 4,312,760Nelnet Student Loan Trust Series 2006-2 Class A6 ± 1.28 4-25-2031 13,841,000 13,787,417Nelnet Student Loan Trust Series 2010-4A Class A 144A± 1.79 4-25-2046 1,138,016 1,136,599Nelnet Student Loan Trust Series 2016-1A Class A 144A± 1.79 9-25-2065 5,997,553 6,046,175Santander Drive Auto Receivables Trust Series 2016-2 Class A2A 1.38 7-15-2019 2,156,896 2,156,680SLC Student Loan Trust Series 2007-1 Class A4 ± 1.24 5-15-2029 11,449,892 11,265,807SLM Student Loan Trust Series 2003-1 Class A5C 144A± 1.88 12-15-2032 4,645,776 4,536,482SLM Student Loan Trust Series 2004-10 Class A7A 144A± 1.91 10-25-2029 10,671,000 10,670,796SLM Student Loan Trust Series 2005-6 Class A5 ± 2.36 7-27-2026 692,589 695,393SLM Student Loan Trust Series 2005-8 Class A4 ± 1.71 1-25-2028 5,395,700 5,424,294SLM Student Loan Trust Series 2006-3 Class A5 ± 1.26 1-25-2021 9,341,000 9,088,589SLM Student Loan Trust Series 2007-2 Class A3 ± 1.20 1-25-2019 2,431,964 2,421,481SLM Student Loan Trust Series 2007-2 Class A4 ± 1.22 7-25-2022 11,939,000 11,540,764SLM Student Loan Trust Series 2007-2 Class B ± 1.33 7-25-2025 4,708,000 3,920,697SLM Student Loan Trust Series 2007-3 Class A3 ± 1.20 4-25-2019 8,622,471 8,545,777SLM Student Loan Trust Series 2010-1 Class A ± 1.39 3-25-2025 2,507,134 2,467,455SLM Student Loan Trust Series 2012-1 Class A3 ± 1.94 9-25-2028 18,292,000 18,363,820SLM Student Loan Trust Series 2012-2 Class A ± 1.69 1-25-2029 6,769,531 6,733,381SLM Student Loan Trust Series 2012-3 Class A ± 1.64 12-27-2038 2,803,180 2,811,377SLM Student Loan Trust Series 2012-6 Class A3 ± 1.74 5-26-2026 4,073,320 4,040,381SLM Student Loan Trust Series 2012-6 Class B ± 1.99 4-27-2043 2,705,000 2,467,208SLM Student Loan Trust Series 2012-D Class A2 144A 2.95 2-15-2046 1,720,635 1,732,963SLM Student Loan Trust Series 2012-E Class A2 144A± 2.74 6-15-2045 2,889,831 2,930,217SLM Student Loan Trust Series 2013-1 Class B ± 2.79 11-25-2070 1,264,000 1,252,216SLM Student Loan Trust Series 2013-6 Class A3 ± 1.64 6-25-2055 11,394,000 11,446,215SLM Student Loan Trust Series 2013-A Class A1 144A± 1.59 8-15-2022 9,586 9,587SLM Student Loan Trust Series 2013-A Class A2A 144A 1.77 5-17-2027 1,664,000 1,662,555SLM Student Loan Trust Series 2013-A Class A2B 144A± 2.04 5-17-2027 1,088,000 1,094,753SLM Student Loan Trust Series 2013-B Class A2A 144A 1.85 6-17-2030 3,993,000 3,985,800SLM Student Loan Trust Series 2013-B Class A2B 144A± 2.09 6-17-2030 1,028,000 1,037,367SLM Student Loan Trust Series 2014-2 Class A3 ± 1.58 3-25-2055 19,322,000 19,313,027SLM Student Loan Trust Series 2014-A Class A2A 144A 2.59 1-15-2026 3,631,000 3,664,821SMB Private Education Loan Trust Series 2015-A Class A2A 144A 2.49 6-15-2027 7,046,000 7,053,808SMB Private Education Loan Trust Series 2015-A Class A2B 144A± 1.99 6-15-2027 6,176,000 6,222,103SMB Private Education Loan Trust Series 2015-B Class A1 144A± 1.69 2-15-2023 671,366 672,051SMB Private Education Loan Trust Series 2015-B Class A2A 144A 2.98 7-15-2027 3,728,000 3,797,600SMB Private Education Loan Trust Series 2015-B Class A2B 144A± 2.19 7-15-2027 10,317,000 10,414,188SMB Private Education Loan Trust Series 2015-C Class A2A 144A 2.75 7-15-2027 5,263,000 5,339,159SMB Private Education Loan Trust Series 2015-C Class A2B 144A± 2.39 7-15-2027 3,981,000 4,059,084SMB Private Education Loan Trust Series 2016-A Class A2A 144A 2.70 5-15-2031 10,488,000 10,576,564SMB Private Education Loan Trust Series 2016-A Class A2B 144A± 2.49 5-15-2031 16,601,000 17,114,949SMB Private Education Loan Trust Series 2016-B Class A2A 144A 2.43 2-17-2032 13,247,000 13,202,424
Copyright © 2017 www.secdatabase.com. All Rights Reserved.Please Consider the Environment Before Printing This Document
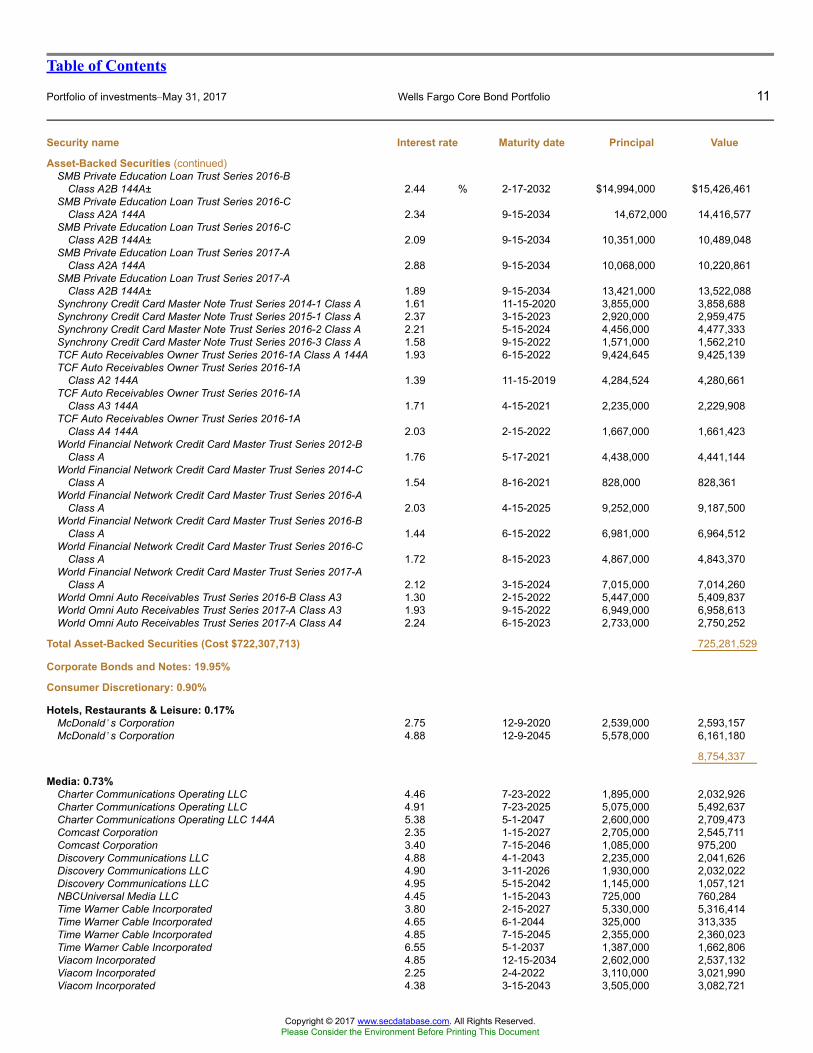
Table of Contents
Portfolio of investments�May 31, 2017 Wells Fargo Core Bond Portfolio 11
Security name Interest rate Maturity date Principal Value
Asset-Backed Securities (continued)SMB Private Education Loan Trust Series 2016-B
Class A2B 144A± 2.44 % 2-17-2032 $14,994,000 $15,426,461SMB Private Education Loan Trust Series 2016-C
Class A2A 144A 2.34 9-15-2034 14,672,000 14,416,577SMB Private Education Loan Trust Series 2016-C
Class A2B 144A± 2.09 9-15-2034 10,351,000 10,489,048SMB Private Education Loan Trust Series 2017-A
Class A2A 144A 2.88 9-15-2034 10,068,000 10,220,861SMB Private Education Loan Trust Series 2017-A
Class A2B 144A± 1.89 9-15-2034 13,421,000 13,522,088Synchrony Credit Card Master Note Trust Series 2014-1 Class A 1.61 11-15-2020 3,855,000 3,858,688Synchrony Credit Card Master Note Trust Series 2015-1 Class A 2.37 3-15-2023 2,920,000 2,959,475Synchrony Credit Card Master Note Trust Series 2016-2 Class A 2.21 5-15-2024 4,456,000 4,477,333Synchrony Credit Card Master Note Trust Series 2016-3 Class A 1.58 9-15-2022 1,571,000 1,562,210TCF Auto Receivables Owner Trust Series 2016-1A Class A 144A 1.93 6-15-2022 9,424,645 9,425,139TCF Auto Receivables Owner Trust Series 2016-1A
Class A2 144A 1.39 11-15-2019 4,284,524 4,280,661TCF Auto Receivables Owner Trust Series 2016-1A
Class A3 144A 1.71 4-15-2021 2,235,000 2,229,908TCF Auto Receivables Owner Trust Series 2016-1A
Class A4 144A 2.03 2-15-2022 1,667,000 1,661,423World Financial Network Credit Card Master Trust Series 2012-B
Class A 1.76 5-17-2021 4,438,000 4,441,144World Financial Network Credit Card Master Trust Series 2014-C
Class A 1.54 8-16-2021 828,000 828,361World Financial Network Credit Card Master Trust Series 2016-A
Class A 2.03 4-15-2025 9,252,000 9,187,500World Financial Network Credit Card Master Trust Series 2016-B
Class A 1.44 6-15-2022 6,981,000 6,964,512World Financial Network Credit Card Master Trust Series 2016-C
Class A 1.72 8-15-2023 4,867,000 4,843,370World Financial Network Credit Card Master Trust Series 2017-A
Class A 2.12 3-15-2024 7,015,000 7,014,260World Omni Auto Receivables Trust Series 2016-B Class A3 1.30 2-15-2022 5,447,000 5,409,837World Omni Auto Receivables Trust Series 2017-A Class A3 1.93 9-15-2022 6,949,000 6,958,613World Omni Auto Receivables Trust Series 2017-A Class A4 2.24 6-15-2023 2,733,000 2,750,252
Total Asset-Backed Securities (Cost $722,307,713) 725,281,529
Corporate Bonds and Notes: 19.95%
Consumer Discretionary: 0.90%
Hotels, Restaurants & Leisure: 0.17%McDonald�s Corporation 2.75 12-9-2020 2,539,000 2,593,157McDonald�s Corporation 4.88 12-9-2045 5,578,000 6,161,180
8,754,337
Media: 0.73%Charter Communications Operating LLC 4.46 7-23-2022 1,895,000 2,032,926Charter Communications Operating LLC 4.91 7-23-2025 5,075,000 5,492,637Charter Communications Operating LLC 144A 5.38 5-1-2047 2,600,000 2,709,473Comcast Corporation 2.35 1-15-2027 2,705,000 2,545,711Comcast Corporation 3.40 7-15-2046 1,085,000 975,200Discovery Communications LLC 4.88 4-1-2043 2,235,000 2,041,626Discovery Communications LLC 4.90 3-11-2026 1,930,000 2,032,022Discovery Communications LLC 4.95 5-15-2042 1,145,000 1,057,121NBCUniversal Media LLC 4.45 1-15-2043 725,000 760,284Time Warner Cable Incorporated 3.80 2-15-2027 5,330,000 5,316,414Time Warner Cable Incorporated 4.65 6-1-2044 325,000 313,335Time Warner Cable Incorporated 4.85 7-15-2045 2,355,000 2,360,023Time Warner Cable Incorporated 6.55 5-1-2037 1,387,000 1,662,806Viacom Incorporated 4.85 12-15-2034 2,602,000 2,537,132Viacom Incorporated 2.25 2-4-2022 3,110,000 3,021,990Viacom Incorporated 4.38 3-15-2043 3,505,000 3,082,721
Copyright © 2017 www.secdatabase.com. All Rights Reserved.Please Consider the Environment Before Printing This Document

37,941,421
Copyright © 2017 www.secdatabase.com. All Rights Reserved.Please Consider the Environment Before Printing This Document
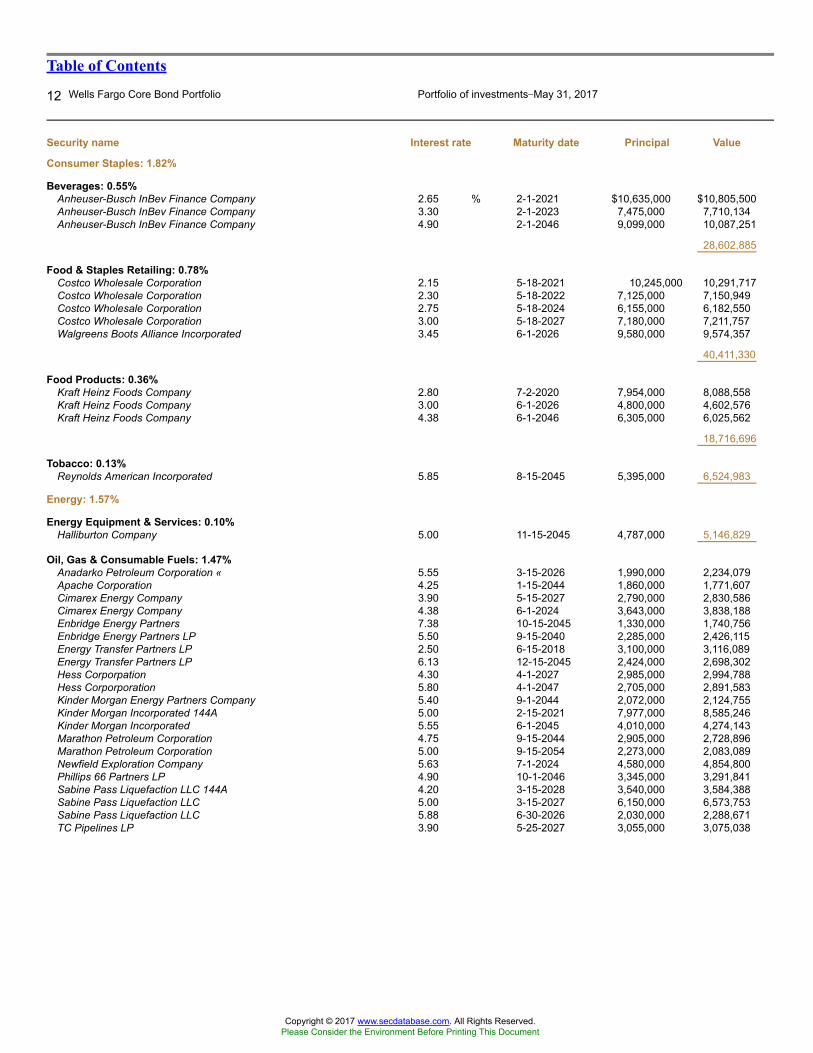
Table of Contents
12 Wells Fargo Core Bond Portfolio Portfolio of investments�May 31, 2017
Security name Interest rate Maturity date Principal Value
Consumer Staples: 1.82%
Beverages: 0.55%Anheuser-Busch InBev Finance Company 2.65 % 2-1-2021 $10,635,000 $10,805,500Anheuser-Busch InBev Finance Company 3.30 2-1-2023 7,475,000 7,710,134Anheuser-Busch InBev Finance Company 4.90 2-1-2046 9,099,000 10,087,251
28,602,885
Food & Staples Retailing: 0.78%Costco Wholesale Corporation 2.15 5-18-2021 10,245,000 10,291,717Costco Wholesale Corporation 2.30 5-18-2022 7,125,000 7,150,949Costco Wholesale Corporation 2.75 5-18-2024 6,155,000 6,182,550Costco Wholesale Corporation 3.00 5-18-2027 7,180,000 7,211,757Walgreens Boots Alliance Incorporated 3.45 6-1-2026 9,580,000 9,574,357
40,411,330
Food Products: 0.36%Kraft Heinz Foods Company 2.80 7-2-2020 7,954,000 8,088,558Kraft Heinz Foods Company 3.00 6-1-2026 4,800,000 4,602,576Kraft Heinz Foods Company 4.38 6-1-2046 6,305,000 6,025,562
18,716,696
Tobacco: 0.13%Reynolds American Incorporated 5.85 8-15-2045 5,395,000 6,524,983
Energy: 1.57%
Energy Equipment & Services: 0.10%Halliburton Company 5.00 11-15-2045 4,787,000 5,146,829
Oil, Gas & Consumable Fuels: 1.47%Anadarko Petroleum Corporation « 5.55 3-15-2026 1,990,000 2,234,079Apache Corporation 4.25 1-15-2044 1,860,000 1,771,607Cimarex Energy Company 3.90 5-15-2027 2,790,000 2,830,586Cimarex Energy Company 4.38 6-1-2024 3,643,000 3,838,188Enbridge Energy Partners 7.38 10-15-2045 1,330,000 1,740,756Enbridge Energy Partners LP 5.50 9-15-2040 2,285,000 2,426,115Energy Transfer Partners LP 2.50 6-15-2018 3,100,000 3,116,089Energy Transfer Partners LP 6.13 12-15-2045 2,424,000 2,698,302Hess Corporpation 4.30 4-1-2027 2,985,000 2,994,788Hess Corporporation 5.80 4-1-2047 2,705,000 2,891,583Kinder Morgan Energy Partners Company 5.40 9-1-2044 2,072,000 2,124,755Kinder Morgan Incorporated 144A 5.00 2-15-2021 7,977,000 8,585,246Kinder Morgan Incorporated 5.55 6-1-2045 4,010,000 4,274,143Marathon Petroleum Corporation 4.75 9-15-2044 2,905,000 2,728,896Marathon Petroleum Corporation 5.00 9-15-2054 2,273,000 2,083,089Newfield Exploration Company 5.63 7-1-2024 4,580,000 4,854,800Phillips 66 Partners LP 4.90 10-1-2046 3,345,000 3,291,841Sabine Pass Liquefaction LLC 144A 4.20 3-15-2028 3,540,000 3,584,388Sabine Pass Liquefaction LLC 5.00 3-15-2027 6,150,000 6,573,753Sabine Pass Liquefaction LLC 5.88 6-30-2026 2,030,000 2,288,671TC Pipelines LP 3.90 5-25-2027 3,055,000 3,075,038
Copyright © 2017 www.secdatabase.com. All Rights Reserved.Please Consider the Environment Before Printing This Document
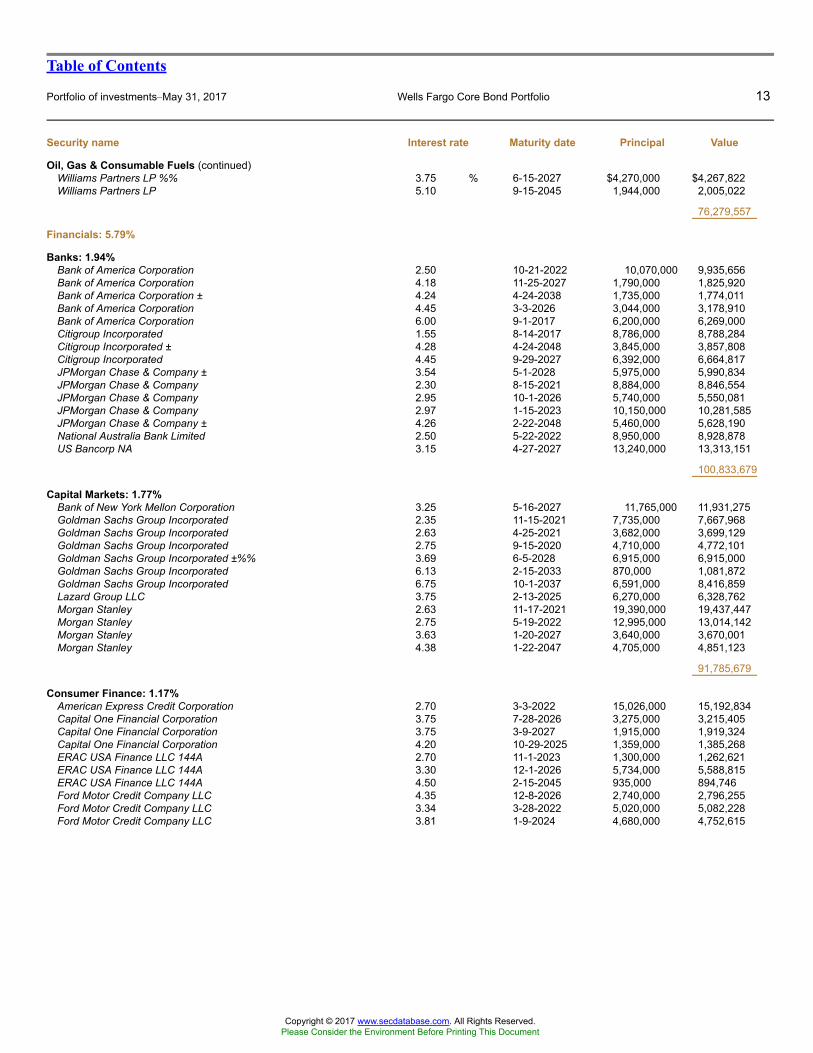
Table of Contents
Portfolio of investments�May 31, 2017 Wells Fargo Core Bond Portfolio 13
Security name Interest rate Maturity date Principal Value
Oil, Gas & Consumable Fuels (continued)Williams Partners LP %% 3.75 % 6-15-2027 $4,270,000 $4,267,822Williams Partners LP 5.10 9-15-2045 1,944,000 2,005,022
76,279,557
Financials: 5.79%
Banks: 1.94%Bank of America Corporation 2.50 10-21-2022 10,070,000 9,935,656Bank of America Corporation 4.18 11-25-2027 1,790,000 1,825,920Bank of America Corporation ± 4.24 4-24-2038 1,735,000 1,774,011Bank of America Corporation 4.45 3-3-2026 3,044,000 3,178,910Bank of America Corporation 6.00 9-1-2017 6,200,000 6,269,000Citigroup Incorporated 1.55 8-14-2017 8,786,000 8,788,284Citigroup Incorporated ± 4.28 4-24-2048 3,845,000 3,857,808Citigroup Incorporated 4.45 9-29-2027 6,392,000 6,664,817JPMorgan Chase & Company ± 3.54 5-1-2028 5,975,000 5,990,834JPMorgan Chase & Company 2.30 8-15-2021 8,884,000 8,846,554JPMorgan Chase & Company 2.95 10-1-2026 5,740,000 5,550,081JPMorgan Chase & Company 2.97 1-15-2023 10,150,000 10,281,585JPMorgan Chase & Company ± 4.26 2-22-2048 5,460,000 5,628,190National Australia Bank Limited 2.50 5-22-2022 8,950,000 8,928,878US Bancorp NA 3.15 4-27-2027 13,240,000 13,313,151
100,833,679
Capital Markets: 1.77%Bank of New York Mellon Corporation 3.25 5-16-2027 11,765,000 11,931,275Goldman Sachs Group Incorporated 2.35 11-15-2021 7,735,000 7,667,968Goldman Sachs Group Incorporated 2.63 4-25-2021 3,682,000 3,699,129Goldman Sachs Group Incorporated 2.75 9-15-2020 4,710,000 4,772,101Goldman Sachs Group Incorporated ±%% 3.69 6-5-2028 6,915,000 6,915,000Goldman Sachs Group Incorporated 6.13 2-15-2033 870,000 1,081,872Goldman Sachs Group Incorporated 6.75 10-1-2037 6,591,000 8,416,859Lazard Group LLC 3.75 2-13-2025 6,270,000 6,328,762Morgan Stanley 2.63 11-17-2021 19,390,000 19,437,447Morgan Stanley 2.75 5-19-2022 12,995,000 13,014,142Morgan Stanley 3.63 1-20-2027 3,640,000 3,670,001Morgan Stanley 4.38 1-22-2047 4,705,000 4,851,123
91,785,679
Consumer Finance: 1.17%American Express Credit Corporation 2.70 3-3-2022 15,026,000 15,192,834Capital One Financial Corporation 3.75 7-28-2026 3,275,000 3,215,405Capital One Financial Corporation 3.75 3-9-2027 1,915,000 1,919,324Capital One Financial Corporation 4.20 10-29-2025 1,359,000 1,385,268ERAC USA Finance LLC 144A 2.70 11-1-2023 1,300,000 1,262,621ERAC USA Finance LLC 144A 3.30 12-1-2026 5,734,000 5,588,815ERAC USA Finance LLC 144A 4.50 2-15-2045 935,000 894,746Ford Motor Credit Company LLC 4.35 12-8-2026 2,740,000 2,796,255Ford Motor Credit Company LLC 3.34 3-28-2022 5,020,000 5,082,228Ford Motor Credit Company LLC 3.81 1-9-2024 4,680,000 4,752,615
Copyright © 2017 www.secdatabase.com. All Rights Reserved.Please Consider the Environment Before Printing This Document
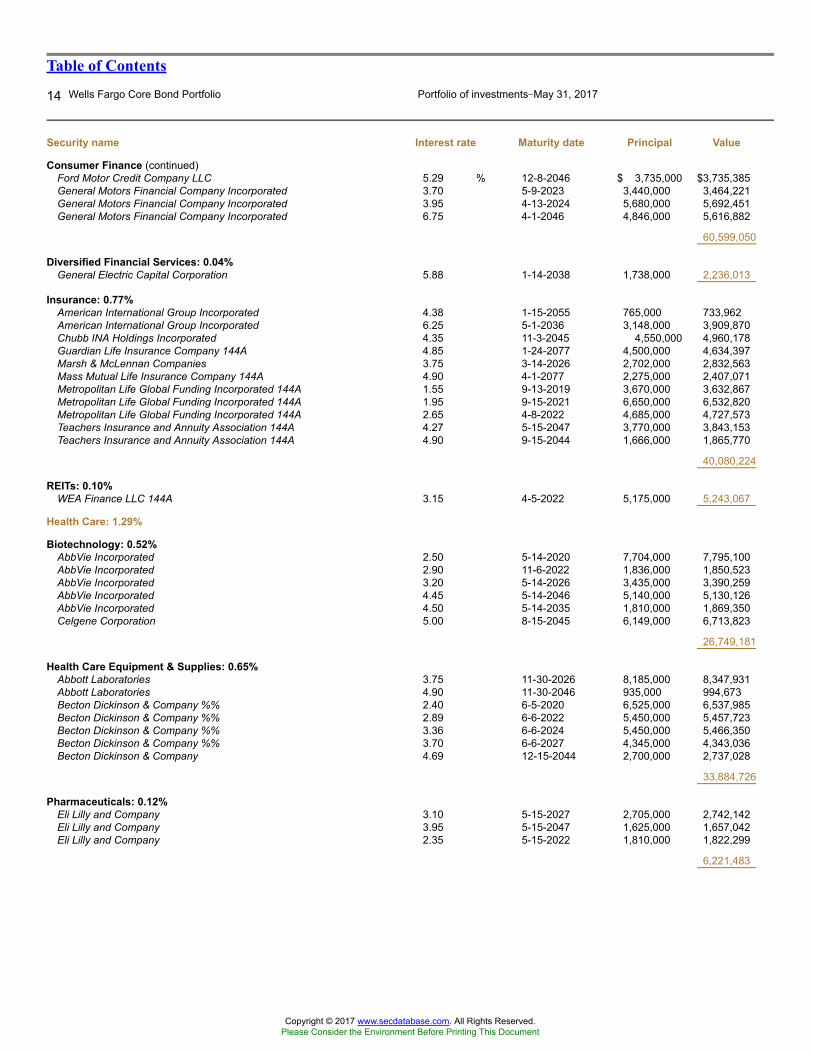
Table of Contents
14 Wells Fargo Core Bond Portfolio Portfolio of investments�May 31, 2017
Security name Interest rate Maturity date Principal Value
Consumer Finance (continued)Ford Motor Credit Company LLC 5.29 % 12-8-2046 $ 3,735,000 $3,735,385General Motors Financial Company Incorporated 3.70 5-9-2023 3,440,000 3,464,221General Motors Financial Company Incorporated 3.95 4-13-2024 5,680,000 5,692,451General Motors Financial Company Incorporated 6.75 4-1-2046 4,846,000 5,616,882
60,599,050
Diversified Financial Services: 0.04%General Electric Capital Corporation 5.88 1-14-2038 1,738,000 2,236,013
Insurance: 0.77%American International Group Incorporated 4.38 1-15-2055 765,000 733,962American International Group Incorporated 6.25 5-1-2036 3,148,000 3,909,870Chubb INA Holdings Incorporated 4.35 11-3-2045 4,550,000 4,960,178Guardian Life Insurance Company 144A 4.85 1-24-2077 4,500,000 4,634,397Marsh & McLennan Companies 3.75 3-14-2026 2,702,000 2,832,563Mass Mutual Life Insurance Company 144A 4.90 4-1-2077 2,275,000 2,407,071Metropolitan Life Global Funding Incorporated 144A 1.55 9-13-2019 3,670,000 3,632,867Metropolitan Life Global Funding Incorporated 144A 1.95 9-15-2021 6,650,000 6,532,820Metropolitan Life Global Funding Incorporated 144A 2.65 4-8-2022 4,685,000 4,727,573Teachers Insurance and Annuity Association 144A 4.27 5-15-2047 3,770,000 3,843,153Teachers Insurance and Annuity Association 144A 4.90 9-15-2044 1,666,000 1,865,770
40,080,224
REITs: 0.10%WEA Finance LLC 144A 3.15 4-5-2022 5,175,000 5,243,067
Health Care: 1.29%
Biotechnology: 0.52%AbbVie Incorporated 2.50 5-14-2020 7,704,000 7,795,100AbbVie Incorporated 2.90 11-6-2022 1,836,000 1,850,523AbbVie Incorporated 3.20 5-14-2026 3,435,000 3,390,259AbbVie Incorporated 4.45 5-14-2046 5,140,000 5,130,126AbbVie Incorporated 4.50 5-14-2035 1,810,000 1,869,350Celgene Corporation 5.00 8-15-2045 6,149,000 6,713,823
26,749,181
Health Care Equipment & Supplies: 0.65%Abbott Laboratories 3.75 11-30-2026 8,185,000 8,347,931Abbott Laboratories 4.90 11-30-2046 935,000 994,673Becton Dickinson & Company %% 2.40 6-5-2020 6,525,000 6,537,985Becton Dickinson & Company %% 2.89 6-6-2022 5,450,000 5,457,723Becton Dickinson & Company %% 3.36 6-6-2024 5,450,000 5,466,350Becton Dickinson & Company %% 3.70 6-6-2027 4,345,000 4,343,036Becton Dickinson & Company 4.69 12-15-2044 2,700,000 2,737,028
33,884,726
Pharmaceuticals: 0.12%Eli Lilly and Company 3.10 5-15-2027 2,705,000 2,742,142Eli Lilly and Company 3.95 5-15-2047 1,625,000 1,657,042Eli Lilly and Company 2.35 5-15-2022 1,810,000 1,822,299
6,221,483
Copyright © 2017 www.secdatabase.com. All Rights Reserved.Please Consider the Environment Before Printing This Document
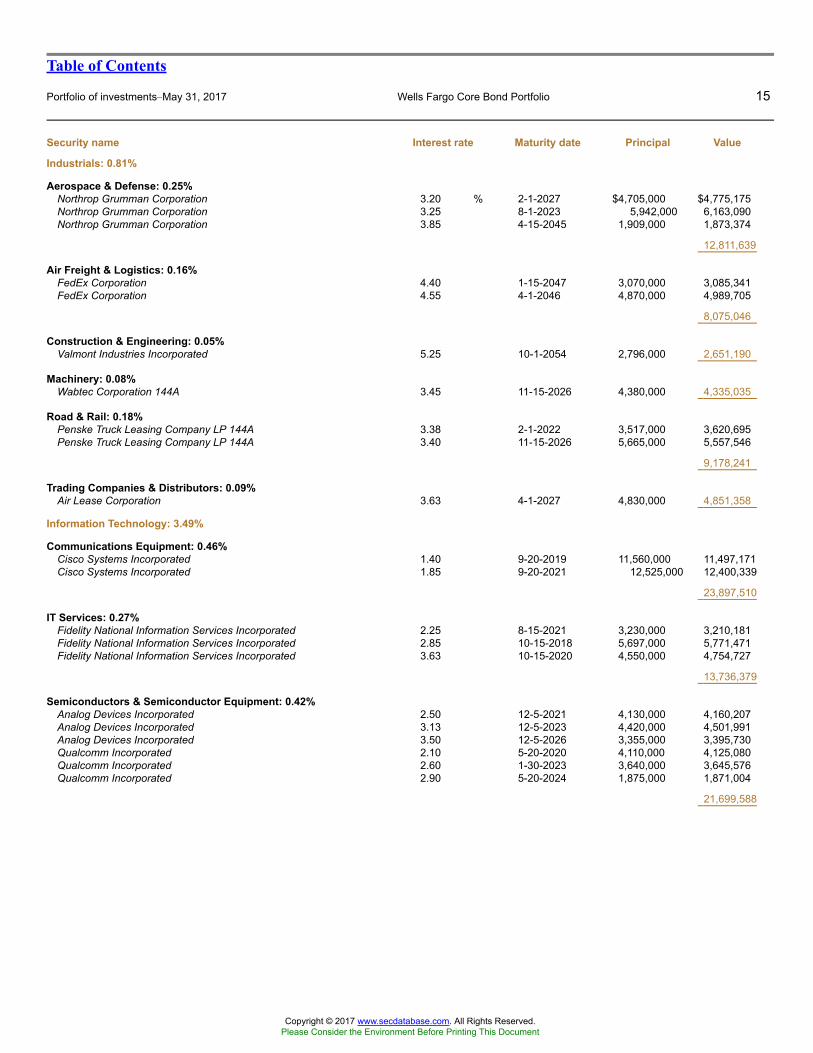
Table of Contents
Portfolio of investments�May 31, 2017 Wells Fargo Core Bond Portfolio 15
Security name Interest rate Maturity date Principal Value
Industrials: 0.81%
Aerospace & Defense: 0.25%Northrop Grumman Corporation 3.20 % 2-1-2027 $4,705,000 $4,775,175Northrop Grumman Corporation 3.25 8-1-2023 5,942,000 6,163,090Northrop Grumman Corporation 3.85 4-15-2045 1,909,000 1,873,374
12,811,639
Air Freight & Logistics: 0.16%FedEx Corporation 4.40 1-15-2047 3,070,000 3,085,341FedEx Corporation 4.55 4-1-2046 4,870,000 4,989,705
8,075,046
Construction & Engineering: 0.05%Valmont Industries Incorporated 5.25 10-1-2054 2,796,000 2,651,190
Machinery: 0.08%Wabtec Corporation 144A 3.45 11-15-2026 4,380,000 4,335,035
Road & Rail: 0.18%Penske Truck Leasing Company LP 144A 3.38 2-1-2022 3,517,000 3,620,695Penske Truck Leasing Company LP 144A 3.40 11-15-2026 5,665,000 5,557,546
9,178,241
Trading Companies & Distributors: 0.09%Air Lease Corporation 3.63 4-1-2027 4,830,000 4,851,358
Information Technology: 3.49%
Communications Equipment: 0.46%Cisco Systems Incorporated 1.40 9-20-2019 11,560,000 11,497,171Cisco Systems Incorporated 1.85 9-20-2021 12,525,000 12,400,339
23,897,510
IT Services: 0.27%Fidelity National Information Services Incorporated 2.25 8-15-2021 3,230,000 3,210,181Fidelity National Information Services Incorporated 2.85 10-15-2018 5,697,000 5,771,471Fidelity National Information Services Incorporated 3.63 10-15-2020 4,550,000 4,754,727
13,736,379
Semiconductors & Semiconductor Equipment: 0.42%Analog Devices Incorporated 2.50 12-5-2021 4,130,000 4,160,207Analog Devices Incorporated 3.13 12-5-2023 4,420,000 4,501,991Analog Devices Incorporated 3.50 12-5-2026 3,355,000 3,395,730Qualcomm Incorporated 2.10 5-20-2020 4,110,000 4,125,080Qualcomm Incorporated 2.60 1-30-2023 3,640,000 3,645,576Qualcomm Incorporated 2.90 5-20-2024 1,875,000 1,871,004
21,699,588
Copyright © 2017 www.secdatabase.com. All Rights Reserved.Please Consider the Environment Before Printing This Document
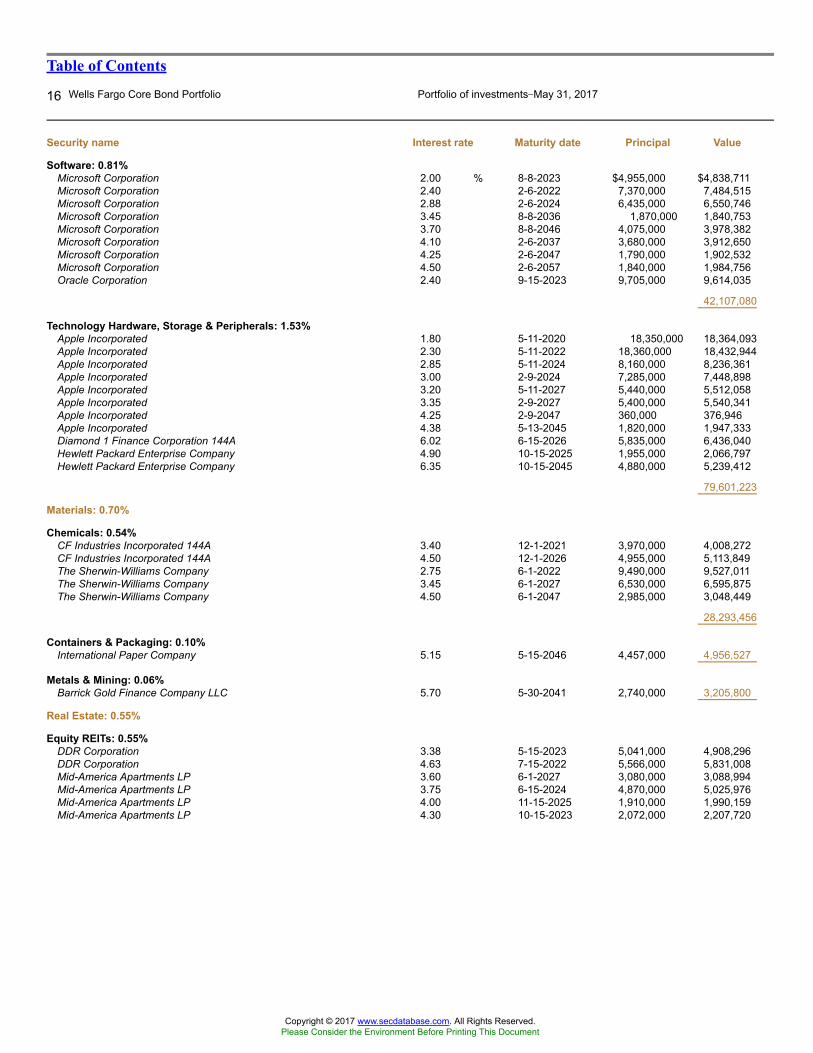
Table of Contents
16 Wells Fargo Core Bond Portfolio Portfolio of investments�May 31, 2017
Security name Interest rate Maturity date Principal Value
Software: 0.81%Microsoft Corporation 2.00 % 8-8-2023 $4,955,000 $4,838,711Microsoft Corporation 2.40 2-6-2022 7,370,000 7,484,515Microsoft Corporation 2.88 2-6-2024 6,435,000 6,550,746Microsoft Corporation 3.45 8-8-2036 1,870,000 1,840,753Microsoft Corporation 3.70 8-8-2046 4,075,000 3,978,382Microsoft Corporation 4.10 2-6-2037 3,680,000 3,912,650Microsoft Corporation 4.25 2-6-2047 1,790,000 1,902,532Microsoft Corporation 4.50 2-6-2057 1,840,000 1,984,756Oracle Corporation 2.40 9-15-2023 9,705,000 9,614,035
42,107,080
Technology Hardware, Storage & Peripherals: 1.53%Apple Incorporated 1.80 5-11-2020 18,350,000 18,364,093Apple Incorporated 2.30 5-11-2022 18,360,000 18,432,944Apple Incorporated 2.85 5-11-2024 8,160,000 8,236,361Apple Incorporated 3.00 2-9-2024 7,285,000 7,448,898Apple Incorporated 3.20 5-11-2027 5,440,000 5,512,058Apple Incorporated 3.35 2-9-2027 5,400,000 5,540,341Apple Incorporated 4.25 2-9-2047 360,000 376,946Apple Incorporated 4.38 5-13-2045 1,820,000 1,947,333Diamond 1 Finance Corporation 144A 6.02 6-15-2026 5,835,000 6,436,040Hewlett Packard Enterprise Company 4.90 10-15-2025 1,955,000 2,066,797Hewlett Packard Enterprise Company 6.35 10-15-2045 4,880,000 5,239,412
79,601,223
Materials: 0.70%
Chemicals: 0.54%CF Industries Incorporated 144A 3.40 12-1-2021 3,970,000 4,008,272CF Industries Incorporated 144A 4.50 12-1-2026 4,955,000 5,113,849The Sherwin-Williams Company 2.75 6-1-2022 9,490,000 9,527,011The Sherwin-Williams Company 3.45 6-1-2027 6,530,000 6,595,875The Sherwin-Williams Company 4.50 6-1-2047 2,985,000 3,048,449
28,293,456
Containers & Packaging: 0.10%International Paper Company 5.15 5-15-2046 4,457,000 4,956,527
Metals & Mining: 0.06%Barrick Gold Finance Company LLC 5.70 5-30-2041 2,740,000 3,205,800
Real Estate: 0.55%
Equity REITs: 0.55%DDR Corporation 3.38 5-15-2023 5,041,000 4,908,296DDR Corporation 4.63 7-15-2022 5,566,000 5,831,008Mid-America Apartments LP 3.60 6-1-2027 3,080,000 3,088,994Mid-America Apartments LP 3.75 6-15-2024 4,870,000 5,025,976Mid-America Apartments LP 4.00 11-15-2025 1,910,000 1,990,159Mid-America Apartments LP 4.30 10-15-2023 2,072,000 2,207,720
Copyright © 2017 www.secdatabase.com. All Rights Reserved.Please Consider the Environment Before Printing This Document
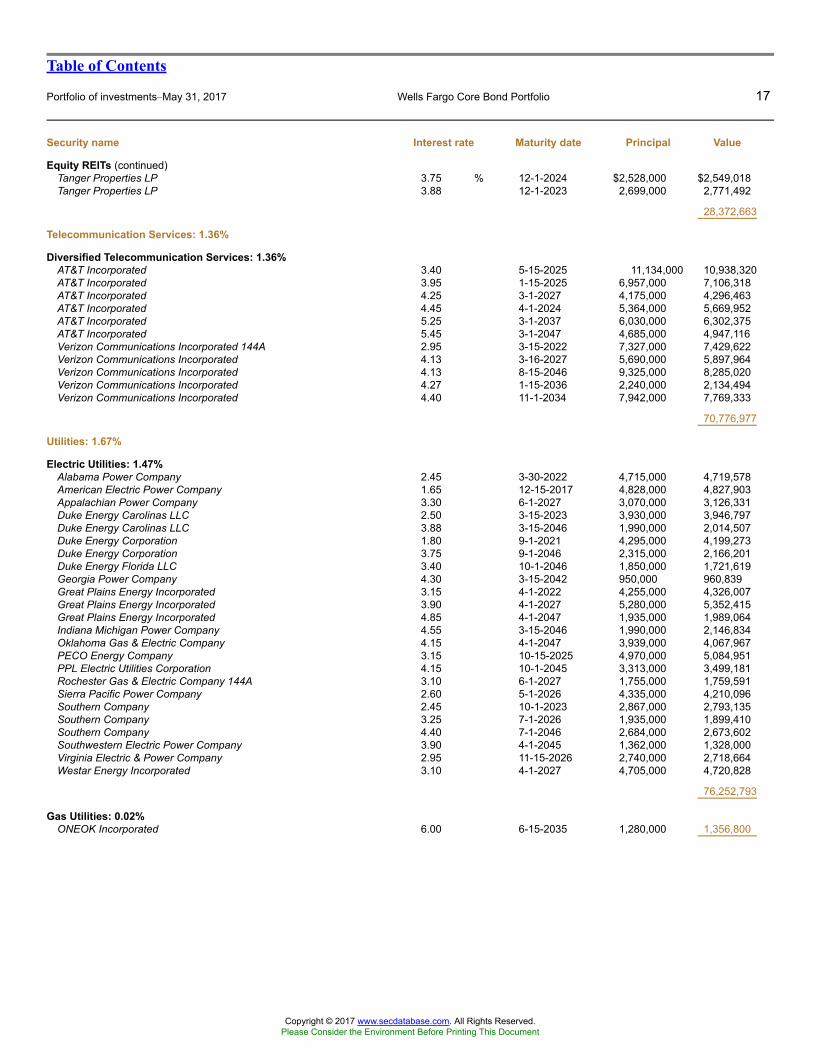
Table of Contents
Portfolio of investments�May 31, 2017 Wells Fargo Core Bond Portfolio 17
Security name Interest rate Maturity date Principal Value
Equity REITs (continued)Tanger Properties LP 3.75 % 12-1-2024 $2,528,000 $2,549,018Tanger Properties LP 3.88 12-1-2023 2,699,000 2,771,492
28,372,663
Telecommunication Services: 1.36%
Diversified Telecommunication Services: 1.36%AT&T Incorporated 3.40 5-15-2025 11,134,000 10,938,320AT&T Incorporated 3.95 1-15-2025 6,957,000 7,106,318AT&T Incorporated 4.25 3-1-2027 4,175,000 4,296,463AT&T Incorporated 4.45 4-1-2024 5,364,000 5,669,952AT&T Incorporated 5.25 3-1-2037 6,030,000 6,302,375AT&T Incorporated 5.45 3-1-2047 4,685,000 4,947,116Verizon Communications Incorporated 144A 2.95 3-15-2022 7,327,000 7,429,622Verizon Communications Incorporated 4.13 3-16-2027 5,690,000 5,897,964Verizon Communications Incorporated 4.13 8-15-2046 9,325,000 8,285,020Verizon Communications Incorporated 4.27 1-15-2036 2,240,000 2,134,494Verizon Communications Incorporated 4.40 11-1-2034 7,942,000 7,769,333
70,776,977
Utilities: 1.67%
Electric Utilities: 1.47%Alabama Power Company 2.45 3-30-2022 4,715,000 4,719,578American Electric Power Company 1.65 12-15-2017 4,828,000 4,827,903Appalachian Power Company 3.30 6-1-2027 3,070,000 3,126,331Duke Energy Carolinas LLC 2.50 3-15-2023 3,930,000 3,946,797Duke Energy Carolinas LLC 3.88 3-15-2046 1,990,000 2,014,507Duke Energy Corporation 1.80 9-1-2021 4,295,000 4,199,273Duke Energy Corporation 3.75 9-1-2046 2,315,000 2,166,201Duke Energy Florida LLC 3.40 10-1-2046 1,850,000 1,721,619Georgia Power Company 4.30 3-15-2042 950,000 960,839Great Plains Energy Incorporated 3.15 4-1-2022 4,255,000 4,326,007Great Plains Energy Incorporated 3.90 4-1-2027 5,280,000 5,352,415Great Plains Energy Incorporated 4.85 4-1-2047 1,935,000 1,989,064Indiana Michigan Power Company 4.55 3-15-2046 1,990,000 2,146,834Oklahoma Gas & Electric Company 4.15 4-1-2047 3,939,000 4,067,967PECO Energy Company 3.15 10-15-2025 4,970,000 5,084,951PPL Electric Utilities Corporation 4.15 10-1-2045 3,313,000 3,499,181Rochester Gas & Electric Company 144A 3.10 6-1-2027 1,755,000 1,759,591Sierra Pacific Power Company 2.60 5-1-2026 4,335,000 4,210,096Southern Company 2.45 10-1-2023 2,867,000 2,793,135Southern Company 3.25 7-1-2026 1,935,000 1,899,410Southern Company 4.40 7-1-2046 2,684,000 2,673,602Southwestern Electric Power Company 3.90 4-1-2045 1,362,000 1,328,000Virginia Electric & Power Company 2.95 11-15-2026 2,740,000 2,718,664Westar Energy Incorporated 3.10 4-1-2027 4,705,000 4,720,828
76,252,793
Gas Utilities: 0.02%ONEOK Incorporated 6.00 6-15-2035 1,280,000 1,356,800
Copyright © 2017 www.secdatabase.com. All Rights Reserved.Please Consider the Environment Before Printing This Document
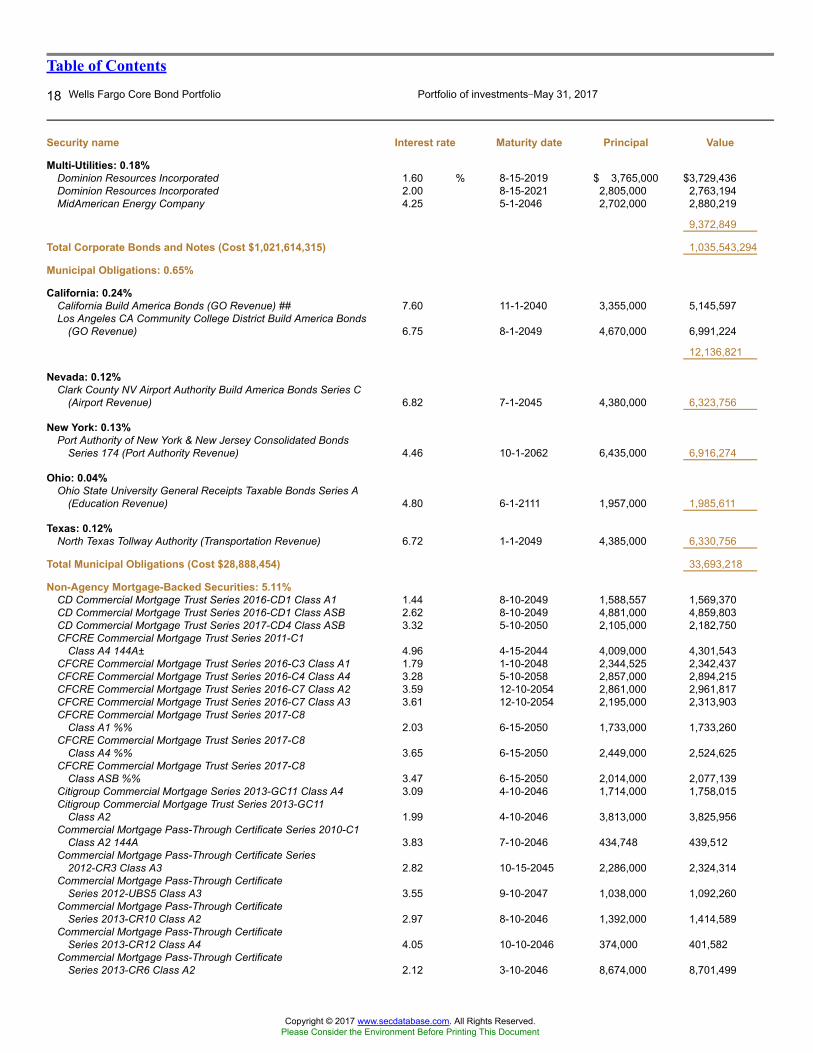
Table of Contents
18 Wells Fargo Core Bond Portfolio Portfolio of investments�May 31, 2017
Security name Interest rate Maturity date Principal Value
Multi-Utilities: 0.18%Dominion Resources Incorporated 1.60 % 8-15-2019 $ 3,765,000 $3,729,436Dominion Resources Incorporated 2.00 8-15-2021 2,805,000 2,763,194MidAmerican Energy Company 4.25 5-1-2046 2,702,000 2,880,219
9,372,849
Total Corporate Bonds and Notes (Cost $1,021,614,315) 1,035,543,294
Municipal Obligations: 0.65%
California: 0.24%California Build America Bonds (GO Revenue) ## 7.60 11-1-2040 3,355,000 5,145,597Los Angeles CA Community College District Build America Bonds
(GO Revenue) 6.75 8-1-2049 4,670,000 6,991,224
12,136,821
Nevada: 0.12%Clark County NV Airport Authority Build America Bonds Series C
(Airport Revenue) 6.82 7-1-2045 4,380,000 6,323,756
New York: 0.13%Port Authority of New York & New Jersey Consolidated Bonds
Series 174 (Port Authority Revenue) 4.46 10-1-2062 6,435,000 6,916,274
Ohio: 0.04%Ohio State University General Receipts Taxable Bonds Series A
(Education Revenue) 4.80 6-1-2111 1,957,000 1,985,611
Texas: 0.12%North Texas Tollway Authority (Transportation Revenue) 6.72 1-1-2049 4,385,000 6,330,756
Total Municipal Obligations (Cost $28,888,454) 33,693,218
Non-Agency Mortgage-Backed Securities: 5.11%CD Commercial Mortgage Trust Series 2016-CD1 Class A1 1.44 8-10-2049 1,588,557 1,569,370CD Commercial Mortgage Trust Series 2016-CD1 Class ASB 2.62 8-10-2049 4,881,000 4,859,803CD Commercial Mortgage Trust Series 2017-CD4 Class ASB 3.32 5-10-2050 2,105,000 2,182,750CFCRE Commercial Mortgage Trust Series 2011-C1
Class A4 144A± 4.96 4-15-2044 4,009,000 4,301,543CFCRE Commercial Mortgage Trust Series 2016-C3 Class A1 1.79 1-10-2048 2,344,525 2,342,437CFCRE Commercial Mortgage Trust Series 2016-C4 Class A4 3.28 5-10-2058 2,857,000 2,894,215CFCRE Commercial Mortgage Trust Series 2016-C7 Class A2 3.59 12-10-2054 2,861,000 2,961,817CFCRE Commercial Mortgage Trust Series 2016-C7 Class A3 3.61 12-10-2054 2,195,000 2,313,903CFCRE Commercial Mortgage Trust Series 2017-C8
Class A1 %% 2.03 6-15-2050 1,733,000 1,733,260CFCRE Commercial Mortgage Trust Series 2017-C8
Class A4 %% 3.65 6-15-2050 2,449,000 2,524,625CFCRE Commercial Mortgage Trust Series 2017-C8
Class ASB %% 3.47 6-15-2050 2,014,000 2,077,139Citigroup Commercial Mortgage Series 2013-GC11 Class A4 3.09 4-10-2046 1,714,000 1,758,015Citigroup Commercial Mortgage Trust Series 2013-GC11
Class A2 1.99 4-10-2046 3,813,000 3,825,956Commercial Mortgage Pass-Through Certificate Series 2010-C1
Class A2 144A 3.83 7-10-2046 434,748 439,512Commercial Mortgage Pass-Through Certificate Series
2012-CR3 Class A3 2.82 10-15-2045 2,286,000 2,324,314Commercial Mortgage Pass-Through Certificate
Series 2012-UBS5 Class A3 3.55 9-10-2047 1,038,000 1,092,260Commercial Mortgage Pass-Through Certificate
Series 2013-CR10 Class A2 2.97 8-10-2046 1,392,000 1,414,589Commercial Mortgage Pass-Through Certificate
Series 2013-CR12 Class A4 4.05 10-10-2046 374,000 401,582Commercial Mortgage Pass-Through Certificate
Series 2013-CR6 Class A2 2.12 3-10-2046 8,674,000 8,701,499
Copyright © 2017 www.secdatabase.com. All Rights Reserved.Please Consider the Environment Before Printing This Document
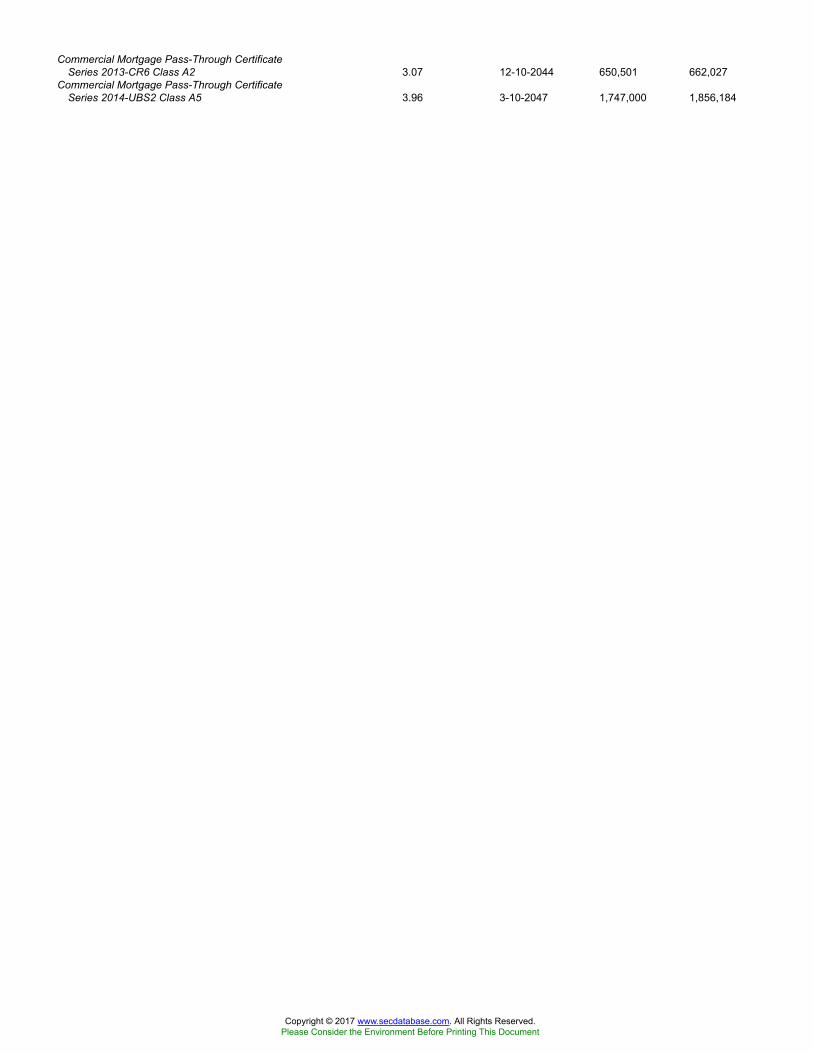
Commercial Mortgage Pass-Through CertificateSeries 2013-CR6 Class A2 3.07 12-10-2044 650,501 662,027
Commercial Mortgage Pass-Through CertificateSeries 2014-UBS2 Class A5 3.96 3-10-2047 1,747,000 1,856,184
Copyright © 2017 www.secdatabase.com. All Rights Reserved.Please Consider the Environment Before Printing This Document
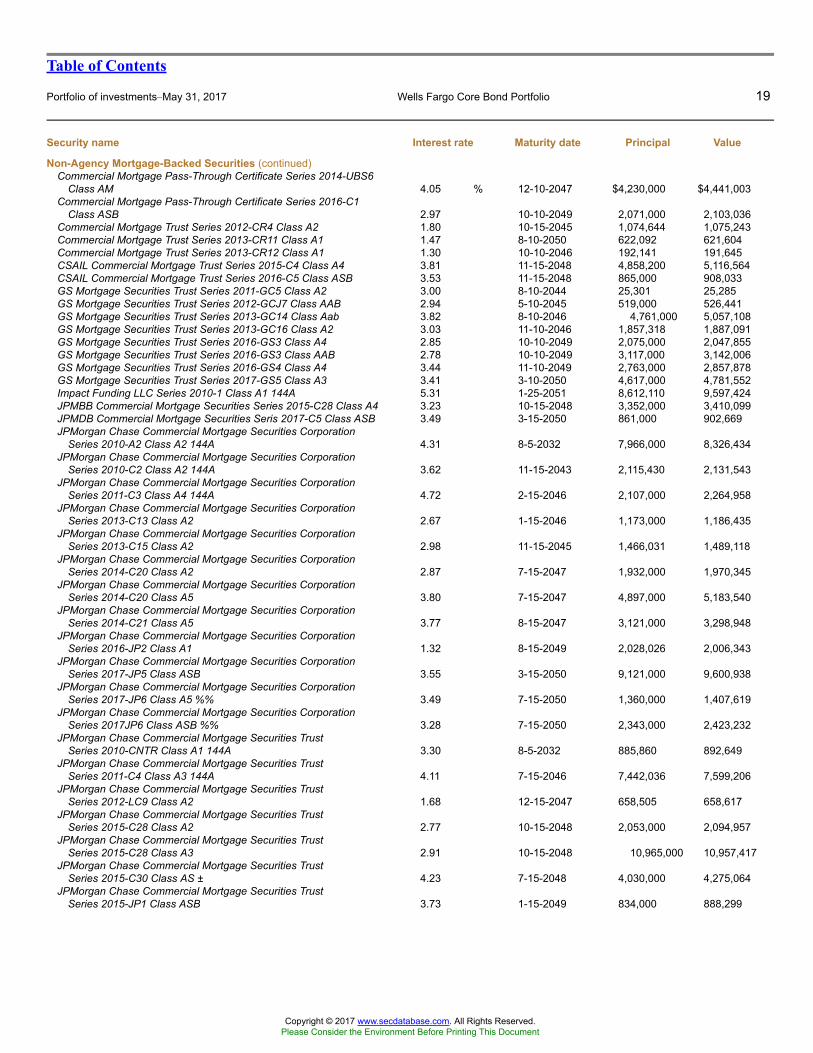
Table of Contents
Portfolio of investments�May 31, 2017 Wells Fargo Core Bond Portfolio 19
Security name Interest rate Maturity date Principal Value
Non-Agency Mortgage-Backed Securities (continued)Commercial Mortgage Pass-Through Certificate Series 2014-UBS6
Class AM 4.05 % 12-10-2047 $4,230,000 $4,441,003Commercial Mortgage Pass-Through Certificate Series 2016-C1
Class ASB 2.97 10-10-2049 2,071,000 2,103,036Commercial Mortgage Trust Series 2012-CR4 Class A2 1.80 10-15-2045 1,074,644 1,075,243Commercial Mortgage Trust Series 2013-CR11 Class A1 1.47 8-10-2050 622,092 621,604Commercial Mortgage Trust Series 2013-CR12 Class A1 1.30 10-10-2046 192,141 191,645CSAIL Commercial Mortgage Trust Series 2015-C4 Class A4 3.81 11-15-2048 4,858,200 5,116,564CSAIL Commercial Mortgage Trust Series 2016-C5 Class ASB 3.53 11-15-2048 865,000 908,033GS Mortgage Securities Trust Series 2011-GC5 Class A2 3.00 8-10-2044 25,301 25,285GS Mortgage Securities Trust Series 2012-GCJ7 Class AAB 2.94 5-10-2045 519,000 526,441GS Mortgage Securities Trust Series 2013-GC14 Class Aab 3.82 8-10-2046 4,761,000 5,057,108GS Mortgage Securities Trust Series 2013-GC16 Class A2 3.03 11-10-2046 1,857,318 1,887,091GS Mortgage Securities Trust Series 2016-GS3 Class A4 2.85 10-10-2049 2,075,000 2,047,855GS Mortgage Securities Trust Series 2016-GS3 Class AAB 2.78 10-10-2049 3,117,000 3,142,006GS Mortgage Securities Trust Series 2016-GS4 Class A4 3.44 11-10-2049 2,763,000 2,857,878GS Mortgage Securities Trust Series 2017-GS5 Class A3 3.41 3-10-2050 4,617,000 4,781,552Impact Funding LLC Series 2010-1 Class A1 144A 5.31 1-25-2051 8,612,110 9,597,424JPMBB Commercial Mortgage Securities Series 2015-C28 Class A4 3.23 10-15-2048 3,352,000 3,410,099JPMDB Commercial Mortgage Securities Seris 2017-C5 Class ASB 3.49 3-15-2050 861,000 902,669JPMorgan Chase Commercial Mortgage Securities Corporation
Series 2010-A2 Class A2 144A 4.31 8-5-2032 7,966,000 8,326,434JPMorgan Chase Commercial Mortgage Securities Corporation
Series 2010-C2 Class A2 144A 3.62 11-15-2043 2,115,430 2,131,543JPMorgan Chase Commercial Mortgage Securities Corporation
Series 2011-C3 Class A4 144A 4.72 2-15-2046 2,107,000 2,264,958JPMorgan Chase Commercial Mortgage Securities Corporation
Series 2013-C13 Class A2 2.67 1-15-2046 1,173,000 1,186,435JPMorgan Chase Commercial Mortgage Securities Corporation
Series 2013-C15 Class A2 2.98 11-15-2045 1,466,031 1,489,118JPMorgan Chase Commercial Mortgage Securities Corporation
Series 2014-C20 Class A2 2.87 7-15-2047 1,932,000 1,970,345JPMorgan Chase Commercial Mortgage Securities Corporation
Series 2014-C20 Class A5 3.80 7-15-2047 4,897,000 5,183,540JPMorgan Chase Commercial Mortgage Securities Corporation
Series 2014-C21 Class A5 3.77 8-15-2047 3,121,000 3,298,948JPMorgan Chase Commercial Mortgage Securities Corporation
Series 2016-JP2 Class A1 1.32 8-15-2049 2,028,026 2,006,343JPMorgan Chase Commercial Mortgage Securities Corporation
Series 2017-JP5 Class ASB 3.55 3-15-2050 9,121,000 9,600,938JPMorgan Chase Commercial Mortgage Securities Corporation
Series 2017-JP6 Class A5 %% 3.49 7-15-2050 1,360,000 1,407,619JPMorgan Chase Commercial Mortgage Securities Corporation
Series 2017JP6 Class ASB %% 3.28 7-15-2050 2,343,000 2,423,232JPMorgan Chase Commercial Mortgage Securities Trust
Series 2010-CNTR Class A1 144A 3.30 8-5-2032 885,860 892,649JPMorgan Chase Commercial Mortgage Securities Trust
Series 2011-C4 Class A3 144A 4.11 7-15-2046 7,442,036 7,599,206JPMorgan Chase Commercial Mortgage Securities Trust
Series 2012-LC9 Class A2 1.68 12-15-2047 658,505 658,617JPMorgan Chase Commercial Mortgage Securities Trust
Series 2015-C28 Class A2 2.77 10-15-2048 2,053,000 2,094,957JPMorgan Chase Commercial Mortgage Securities Trust
Series 2015-C28 Class A3 2.91 10-15-2048 10,965,000 10,957,417JPMorgan Chase Commercial Mortgage Securities Trust
Series 2015-C30 Class AS ± 4.23 7-15-2048 4,030,000 4,275,064JPMorgan Chase Commercial Mortgage Securities Trust
Series 2015-JP1 Class ASB 3.73 1-15-2049 834,000 888,299
Copyright © 2017 www.secdatabase.com. All Rights Reserved.Please Consider the Environment Before Printing This Document
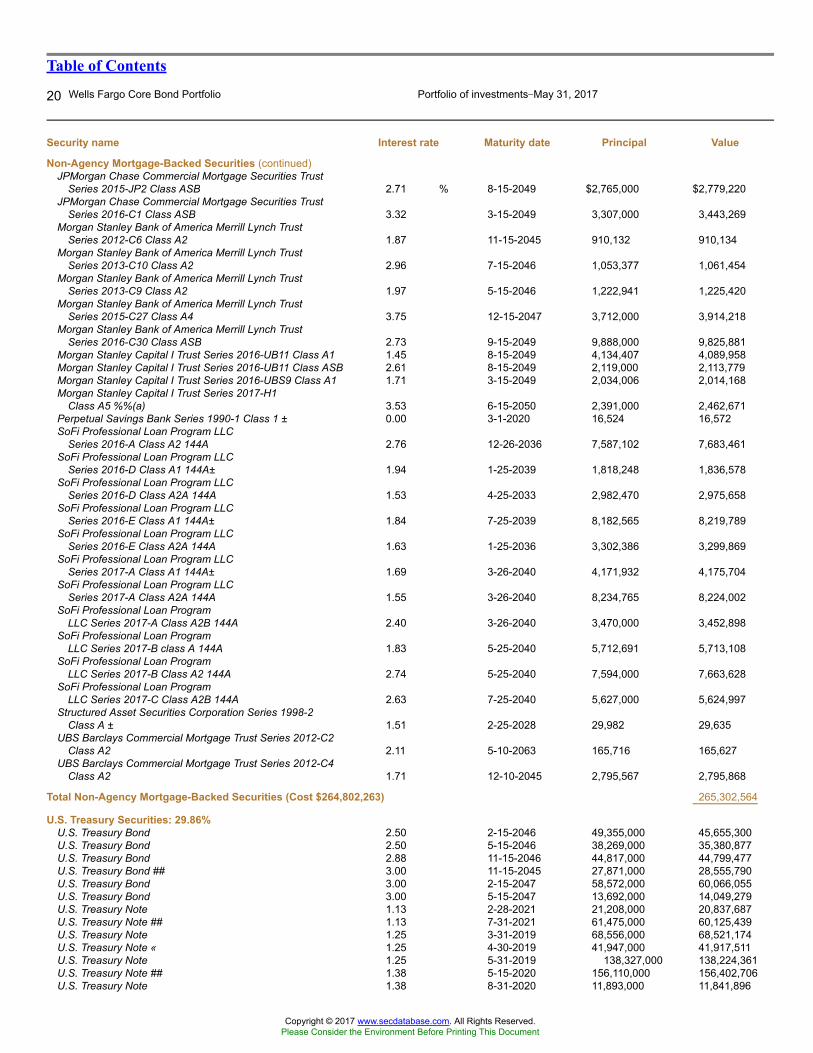
Table of Contents
20 Wells Fargo Core Bond Portfolio Portfolio of investments�May 31, 2017
Security name Interest rate Maturity date Principal Value
Non-Agency Mortgage-Backed Securities (continued)JPMorgan Chase Commercial Mortgage Securities Trust
Series 2015-JP2 Class ASB 2.71 % 8-15-2049 $2,765,000 $2,779,220JPMorgan Chase Commercial Mortgage Securities Trust
Series 2016-C1 Class ASB 3.32 3-15-2049 3,307,000 3,443,269Morgan Stanley Bank of America Merrill Lynch Trust
Series 2012-C6 Class A2 1.87 11-15-2045 910,132 910,134Morgan Stanley Bank of America Merrill Lynch Trust
Series 2013-C10 Class A2 2.96 7-15-2046 1,053,377 1,061,454Morgan Stanley Bank of America Merrill Lynch Trust
Series 2013-C9 Class A2 1.97 5-15-2046 1,222,941 1,225,420Morgan Stanley Bank of America Merrill Lynch Trust
Series 2015-C27 Class A4 3.75 12-15-2047 3,712,000 3,914,218Morgan Stanley Bank of America Merrill Lynch Trust
Series 2016-C30 Class ASB 2.73 9-15-2049 9,888,000 9,825,881Morgan Stanley Capital I Trust Series 2016-UB11 Class A1 1.45 8-15-2049 4,134,407 4,089,958Morgan Stanley Capital I Trust Series 2016-UB11 Class ASB 2.61 8-15-2049 2,119,000 2,113,779Morgan Stanley Capital I Trust Series 2016-UBS9 Class A1 1.71 3-15-2049 2,034,006 2,014,168Morgan Stanley Capital I Trust Series 2017-H1
Class A5 %%(a) 3.53 6-15-2050 2,391,000 2,462,671Perpetual Savings Bank Series 1990-1 Class 1 ± 0.00 3-1-2020 16,524 16,572SoFi Professional Loan Program LLC
Series 2016-A Class A2 144A 2.76 12-26-2036 7,587,102 7,683,461SoFi Professional Loan Program LLC
Series 2016-D Class A1 144A± 1.94 1-25-2039 1,818,248 1,836,578SoFi Professional Loan Program LLC
Series 2016-D Class A2A 144A 1.53 4-25-2033 2,982,470 2,975,658SoFi Professional Loan Program LLC
Series 2016-E Class A1 144A± 1.84 7-25-2039 8,182,565 8,219,789SoFi Professional Loan Program LLC
Series 2016-E Class A2A 144A 1.63 1-25-2036 3,302,386 3,299,869SoFi Professional Loan Program LLC
Series 2017-A Class A1 144A± 1.69 3-26-2040 4,171,932 4,175,704SoFi Professional Loan Program LLC
Series 2017-A Class A2A 144A 1.55 3-26-2040 8,234,765 8,224,002SoFi Professional Loan Program
LLC Series 2017-A Class A2B 144A 2.40 3-26-2040 3,470,000 3,452,898SoFi Professional Loan Program
LLC Series 2017-B class A 144A 1.83 5-25-2040 5,712,691 5,713,108SoFi Professional Loan Program
LLC Series 2017-B Class A2 144A 2.74 5-25-2040 7,594,000 7,663,628SoFi Professional Loan Program
LLC Series 2017-C Class A2B 144A 2.63 7-25-2040 5,627,000 5,624,997Structured Asset Securities Corporation Series 1998-2
Class A ± 1.51 2-25-2028 29,982 29,635UBS Barclays Commercial Mortgage Trust Series 2012-C2
Class A2 2.11 5-10-2063 165,716 165,627UBS Barclays Commercial Mortgage Trust Series 2012-C4
Class A2 1.71 12-10-2045 2,795,567 2,795,868
Total Non-Agency Mortgage-Backed Securities (Cost $264,802,263) 265,302,564
U.S. Treasury Securities: 29.86%U.S. Treasury Bond 2.50 2-15-2046 49,355,000 45,655,300U.S. Treasury Bond 2.50 5-15-2046 38,269,000 35,380,877U.S. Treasury Bond 2.88 11-15-2046 44,817,000 44,799,477U.S. Treasury Bond ## 3.00 11-15-2045 27,871,000 28,555,790U.S. Treasury Bond 3.00 2-15-2047 58,572,000 60,066,055U.S. Treasury Bond 3.00 5-15-2047 13,692,000 14,049,279U.S. Treasury Note 1.13 2-28-2021 21,208,000 20,837,687U.S. Treasury Note ## 1.13 7-31-2021 61,475,000 60,125,439U.S. Treasury Note 1.25 3-31-2019 68,556,000 68,521,174U.S. Treasury Note « 1.25 4-30-2019 41,947,000 41,917,511U.S. Treasury Note 1.25 5-31-2019 138,327,000 138,224,361U.S. Treasury Note ## 1.38 5-15-2020 156,110,000 156,402,706U.S. Treasury Note 1.38 8-31-2020 11,893,000 11,841,896
Copyright © 2017 www.secdatabase.com. All Rights Reserved.Please Consider the Environment Before Printing This Document
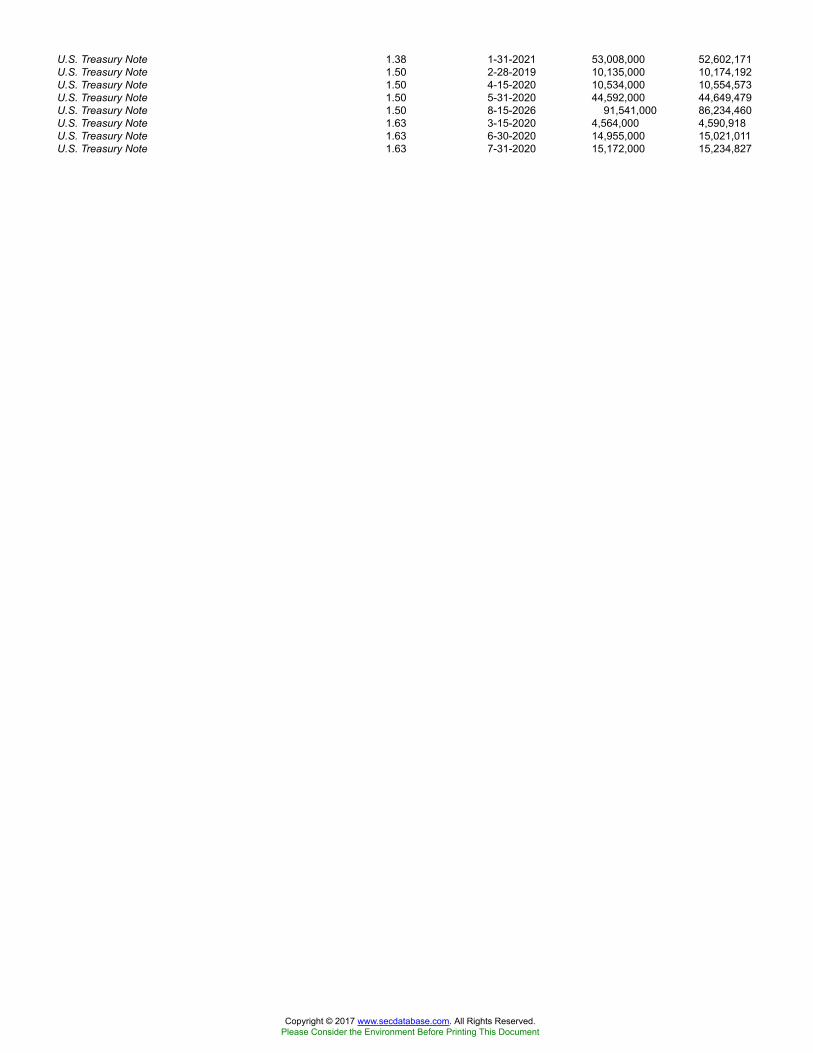
U.S. Treasury Note 1.38 1-31-2021 53,008,000 52,602,171U.S. Treasury Note 1.50 2-28-2019 10,135,000 10,174,192U.S. Treasury Note 1.50 4-15-2020 10,534,000 10,554,573U.S. Treasury Note 1.50 5-31-2020 44,592,000 44,649,479U.S. Treasury Note 1.50 8-15-2026 91,541,000 86,234,460U.S. Treasury Note 1.63 3-15-2020 4,564,000 4,590,918U.S. Treasury Note 1.63 6-30-2020 14,955,000 15,021,011U.S. Treasury Note 1.63 7-31-2020 15,172,000 15,234,827
Copyright © 2017 www.secdatabase.com. All Rights Reserved.Please Consider the Environment Before Printing This Document

Table of Contents
Portfolio of investments�May 31, 2017 Wells Fargo Core Bond Portfolio 21
Security name Interest rate Maturity date Principal Value
U.S. Treasury Securities (continued)U.S. Treasury Note 1.75 % 5-31-2022 $ 63,220,000 $63,210,122U.S. Treasury Note 1.88 1-31-2022 84,123,000 84,625,803U.S. Treasury Note 1.88 3-31-2022 48,674,000 48,942,096U.S. Treasury Note « 1.88 4-30-2022 91,098,000 91,574,807U.S. Treasury Note 2.00 10-31-2021 35,231,000 35,660,395U.S. Treasury Note 2.00 12-31-2021 47,116,000 47,675,503U.S. Treasury Note 2.00 5-31-2024 2,013,000 2,010,091U.S. Treasury Note ## 2.00 11-15-2026 80,882,000 79,453,947U.S. Treasury Note 2.25 2-15-2027 78,420,000 78,643,654U.S. Treasury Note 2.38 5-15-2027 51,760,000 52,524,288
Total U.S. Treasury Securities (Cost $1,547,698,639) 1,549,759,889
Yankee Corporate Bonds and Notes: 5.86%
Consumer Discretionary: 0.08%
Media: 0.08%Grupo Televisa SAB 5.00 5-13-2045 1,985,000 1,901,452Grupo Televisa SAB 6.13 1-31-2046 2,220,000 2,450,704
4,352,156
Energy: 0.78%
Oil, Gas & Consumable Fuels: 0.78%BP Capital Markets plc 3.59 4-14-2027 6,355,000 6,510,259BP Capital Markets plc 3.72 11-28-2028 3,640,000 3,759,141Cenovus Energy Incorporated 144A 5.40 6-15-2047 1,519,000 1,469,036Encana Corporation 6.50 8-15-2034 2,865,000 3,284,599Encana Corporation 6.50 2-1-2038 2,261,000 2,623,456Petroleos Mexicanos Company 2.38 4-15-2025 2,903,200 2,915,817Petroleos Mexicanos Company 2.46 12-15-2025 7,258,500 7,310,195Petroleos Mexicanos Company 5.63 1-23-2046 3,706,000 3,342,812Petroleos Mexicanos Company 144A 6.50 3-13-2027 5,703,000 6,217,981Petroleos Mexicanos Company 6.75 9-21-2047 3,165,000 3,255,203
40,688,499
Financials: 3.59%
Banks: 3.00%Banco Santander SA 3.50 4-11-2022 3,785,000 3,860,231Banco Santander SA 4.25 4-11-2027 4,950,000 5,058,534Barclays plc 4.95 1-10-2047 3,095,000 3,309,465HSBC Holdings plc 2.65 1-5-2022 11,495,000 11,483,471HSBC Holdings plc ± 3.26 3-13-2023 9,565,000 9,734,683HSBC Holdings plc ± 4.04 3-13-2028 3,180,000 3,286,858HSBC Holdings plc 4.38 11-23-2026 5,773,000 6,001,259ING Groep NV 3.15 3-29-2022 4,670,000 4,759,468ING Groep NV 3.95 3-29-2027 5,370,000 5,555,614Japan Bank for International Cooperation 1.50 7-21-2021 19,892,000 19,257,903Japan Bank for International Cooperation 1.75 5-28-2020 6,052,000 5,982,341Japan Bank for International Cooperation 1.88 4-20-2021 6,453,000 6,356,915Japan Bank for International Cooperation 2.25 2-24-2020 18,290,000 18,405,044
Copyright © 2017 www.secdatabase.com. All Rights Reserved.Please Consider the Environment Before Printing This Document
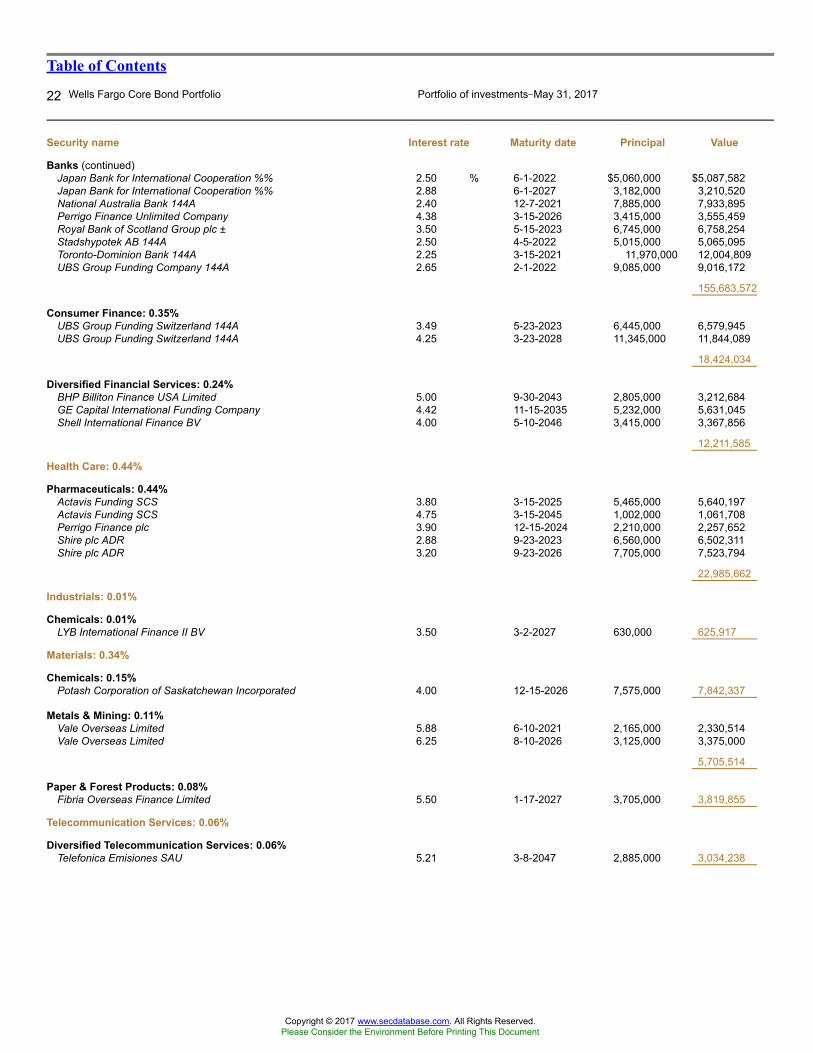
Table of Contents
22 Wells Fargo Core Bond Portfolio Portfolio of investments�May 31, 2017
Security name Interest rate Maturity date Principal Value
Banks (continued)Japan Bank for International Cooperation %% 2.50 % 6-1-2022 $5,060,000 $5,087,582Japan Bank for International Cooperation %% 2.88 6-1-2027 3,182,000 3,210,520National Australia Bank 144A 2.40 12-7-2021 7,885,000 7,933,895Perrigo Finance Unlimited Company 4.38 3-15-2026 3,415,000 3,555,459Royal Bank of Scotland Group plc ± 3.50 5-15-2023 6,745,000 6,758,254Stadshypotek AB 144A 2.50 4-5-2022 5,015,000 5,065,095Toronto-Dominion Bank 144A 2.25 3-15-2021 11,970,000 12,004,809UBS Group Funding Company 144A 2.65 2-1-2022 9,085,000 9,016,172
155,683,572
Consumer Finance: 0.35%UBS Group Funding Switzerland 144A 3.49 5-23-2023 6,445,000 6,579,945UBS Group Funding Switzerland 144A 4.25 3-23-2028 11,345,000 11,844,089
18,424,034
Diversified Financial Services: 0.24%BHP Billiton Finance USA Limited 5.00 9-30-2043 2,805,000 3,212,684GE Capital International Funding Company 4.42 11-15-2035 5,232,000 5,631,045Shell International Finance BV 4.00 5-10-2046 3,415,000 3,367,856
12,211,585
Health Care: 0.44%
Pharmaceuticals: 0.44%Actavis Funding SCS 3.80 3-15-2025 5,465,000 5,640,197Actavis Funding SCS 4.75 3-15-2045 1,002,000 1,061,708Perrigo Finance plc 3.90 12-15-2024 2,210,000 2,257,652Shire plc ADR 2.88 9-23-2023 6,560,000 6,502,311Shire plc ADR 3.20 9-23-2026 7,705,000 7,523,794
22,985,662
Industrials: 0.01%
Chemicals: 0.01%LYB International Finance II BV 3.50 3-2-2027 630,000 625,917
Materials: 0.34%
Chemicals: 0.15%Potash Corporation of Saskatchewan Incorporated 4.00 12-15-2026 7,575,000 7,842,337
Metals & Mining: 0.11%Vale Overseas Limited 5.88 6-10-2021 2,165,000 2,330,514Vale Overseas Limited 6.25 8-10-2026 3,125,000 3,375,000
5,705,514
Paper & Forest Products: 0.08%Fibria Overseas Finance Limited 5.50 1-17-2027 3,705,000 3,819,855
Telecommunication Services: 0.06%
Diversified Telecommunication Services: 0.06%Telefonica Emisiones SAU 5.21 3-8-2047 2,885,000 3,034,238
Copyright © 2017 www.secdatabase.com. All Rights Reserved.Please Consider the Environment Before Printing This Document
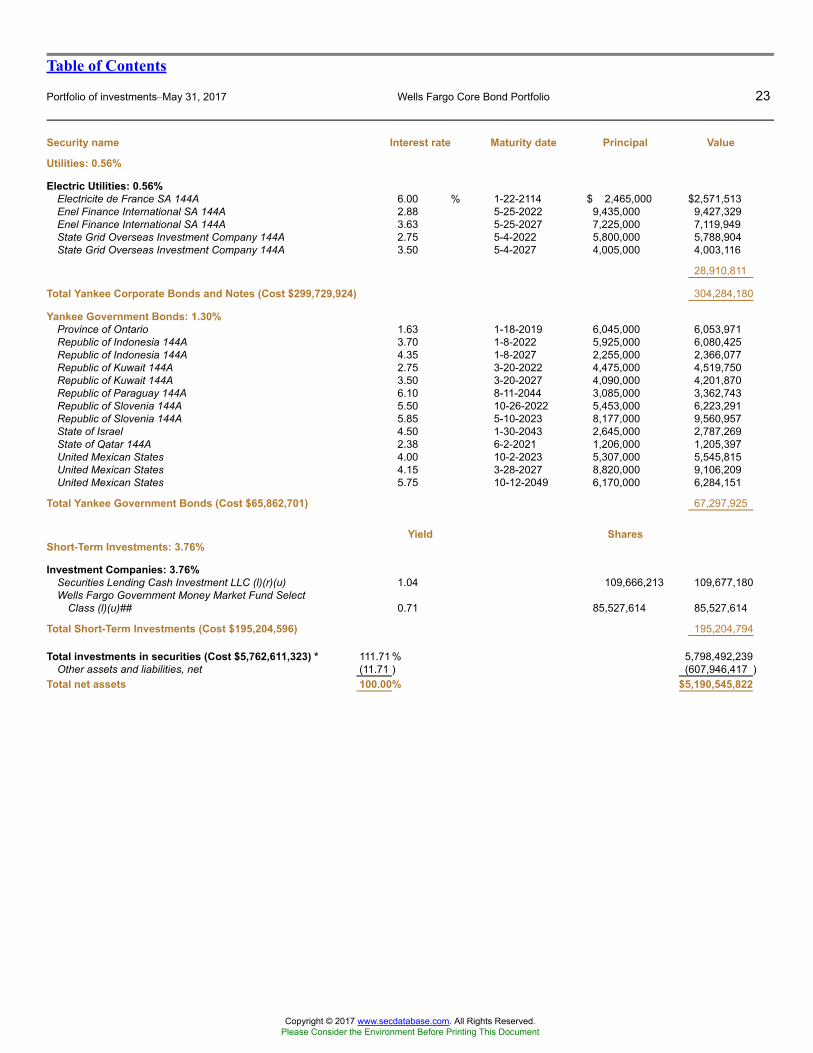
Table of Contents
Portfolio of investments�May 31, 2017 Wells Fargo Core Bond Portfolio 23
Security name Interest rate Maturity date Principal Value
Utilities: 0.56%
Electric Utilities: 0.56%Electricite de France SA 144A 6.00 % 1-22-2114 $ 2,465,000 $2,571,513Enel Finance International SA 144A 2.88 5-25-2022 9,435,000 9,427,329Enel Finance International SA 144A 3.63 5-25-2027 7,225,000 7,119,949State Grid Overseas Investment Company 144A 2.75 5-4-2022 5,800,000 5,788,904State Grid Overseas Investment Company 144A 3.50 5-4-2027 4,005,000 4,003,116
28,910,811
Total Yankee Corporate Bonds and Notes (Cost $299,729,924) 304,284,180
Yankee Government Bonds: 1.30%Province of Ontario 1.63 1-18-2019 6,045,000 6,053,971Republic of Indonesia 144A 3.70 1-8-2022 5,925,000 6,080,425Republic of Indonesia 144A 4.35 1-8-2027 2,255,000 2,366,077Republic of Kuwait 144A 2.75 3-20-2022 4,475,000 4,519,750Republic of Kuwait 144A 3.50 3-20-2027 4,090,000 4,201,870Republic of Paraguay 144A 6.10 8-11-2044 3,085,000 3,362,743Republic of Slovenia 144A 5.50 10-26-2022 5,453,000 6,223,291Republic of Slovenia 144A 5.85 5-10-2023 8,177,000 9,560,957State of Israel 4.50 1-30-2043 2,645,000 2,787,269State of Qatar 144A 2.38 6-2-2021 1,206,000 1,205,397United Mexican States 4.00 10-2-2023 5,307,000 5,545,815United Mexican States 4.15 3-28-2027 8,820,000 9,106,209United Mexican States 5.75 10-12-2049 6,170,000 6,284,151
Total Yankee Government Bonds (Cost $65,862,701) 67,297,925
Yield SharesShort-Term Investments: 3.76%
Investment Companies: 3.76%Securities Lending Cash Investment LLC (l)(r)(u) 1.04 109,666,213 109,677,180Wells Fargo Government Money Market Fund Select
Class (l)(u)## 0.71 85,527,614 85,527,614
Total Short-Term Investments (Cost $195,204,596) 195,204,794
Total investments in securities (Cost $5,762,611,323) * 111.71 % 5,798,492,239Other assets and liabilities, net (11.71 ) (607,946,417 )
Total net assets 100.00% $5,190,545,822
Copyright © 2017 www.secdatabase.com. All Rights Reserved.Please Consider the Environment Before Printing This Document
Table of Contents
24 Wells Fargo Core Bond Portfolio Portfolio of investments�May 31, 2017
± Variable rate investment. The rate shown is the rate in effect at period end.%% The security is issued on a when-issued basis.(a) The security is fair valued in accordance with procedures approved by the Board of Trustees.¤ The security is issued in zero coupon form with no periodic interest payments.144A The security may be resold in transactions exempt from registration, normally to qualified institutional buyers, pursuant to Rule 144A under the
Securities Act of 1933.
Copyright © 2017 www.secdatabase.com. All Rights Reserved.Please Consider the Environment Before Printing This Document
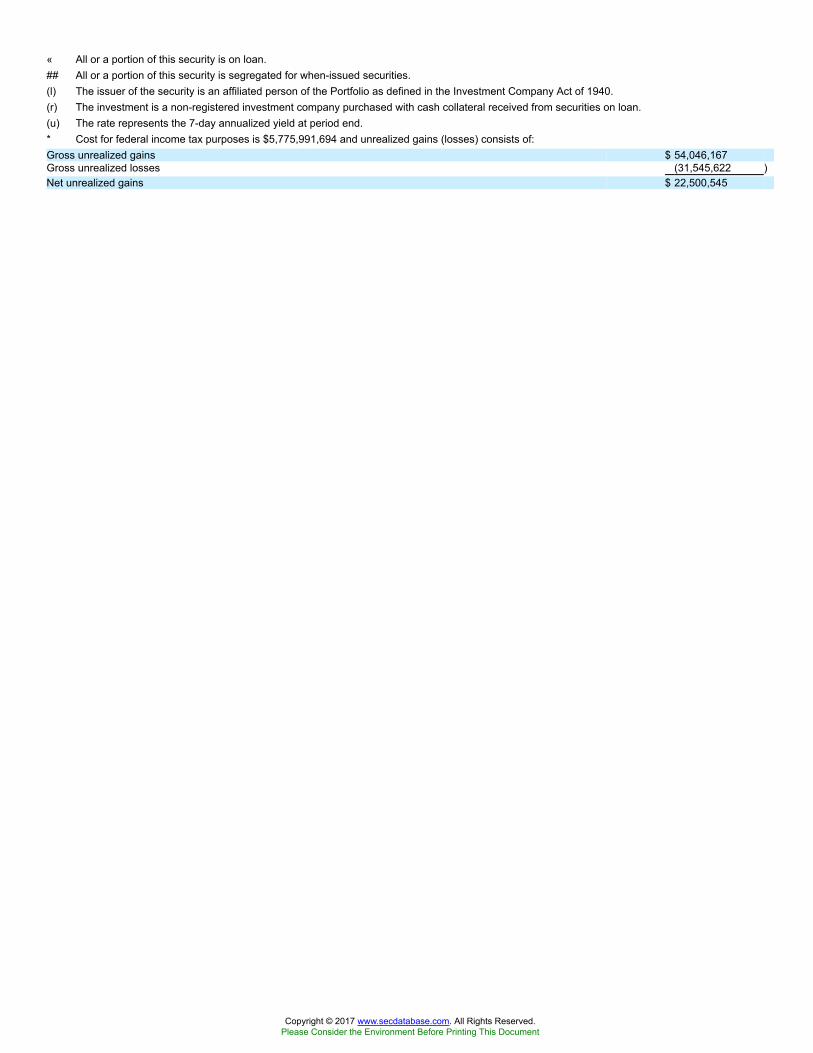
« All or a portion of this security is on loan.## All or a portion of this security is segregated for when-issued securities.(l) The issuer of the security is an affiliated person of the Portfolio as defined in the Investment Company Act of 1940.(r) The investment is a non-registered investment company purchased with cash collateral received from securities on loan.(u) The rate represents the 7-day annualized yield at period end.* Cost for federal income tax purposes is $5,775,991,694 and unrealized gains (losses) consists of:Gross unrealized gains $ 54,046,167Gross unrealized losses (31,545,622 )Net unrealized gains $ 22,500,545
Copyright © 2017 www.secdatabase.com. All Rights Reserved.Please Consider the Environment Before Printing This Document
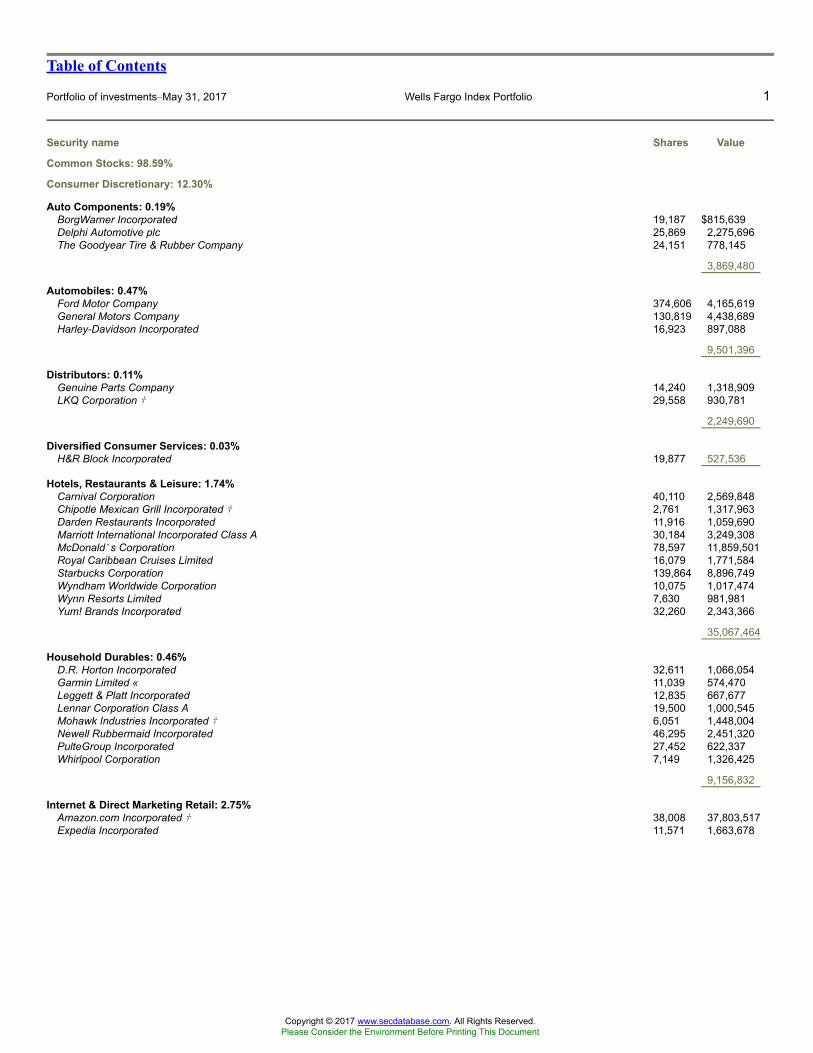
Table of Contents
Portfolio of investments�May 31, 2017 Wells Fargo Index Portfolio 1
Security name Shares Value
Common Stocks: 98.59%
Consumer Discretionary: 12.30%
Auto Components: 0.19%BorgWarner Incorporated 19,187 $815,639Delphi Automotive plc 25,869 2,275,696The Goodyear Tire & Rubber Company 24,151 778,145
3,869,480
Automobiles: 0.47%Ford Motor Company 374,606 4,165,619General Motors Company 130,819 4,438,689Harley-Davidson Incorporated 16,923 897,088
9,501,396
Distributors: 0.11%Genuine Parts Company 14,240 1,318,909LKQ Corporation � 29,558 930,781
2,249,690
Diversified Consumer Services: 0.03%H&R Block Incorporated 19,877 527,536
Hotels, Restaurants & Leisure: 1.74%Carnival Corporation 40,110 2,569,848Chipotle Mexican Grill Incorporated � 2,761 1,317,963Darden Restaurants Incorporated 11,916 1,059,690Marriott International Incorporated Class A 30,184 3,249,308McDonald�s Corporation 78,597 11,859,501Royal Caribbean Cruises Limited 16,079 1,771,584Starbucks Corporation 139,864 8,896,749Wyndham Worldwide Corporation 10,075 1,017,474Wynn Resorts Limited 7,630 981,981Yum! Brands Incorporated 32,260 2,343,366
35,067,464
Household Durables: 0.46%D.R. Horton Incorporated 32,611 1,066,054Garmin Limited « 11,039 574,470Leggett & Platt Incorporated 12,835 667,677Lennar Corporation Class A 19,500 1,000,545Mohawk Industries Incorporated � 6,051 1,448,004Newell Rubbermaid Incorporated 46,295 2,451,320PulteGroup Incorporated 27,452 622,337Whirlpool Corporation 7,149 1,326,425
9,156,832
Internet & Direct Marketing Retail: 2.75%Amazon.com Incorporated � 38,008 37,803,517Expedia Incorporated 11,571 1,663,678
Copyright © 2017 www.secdatabase.com. All Rights Reserved.Please Consider the Environment Before Printing This Document
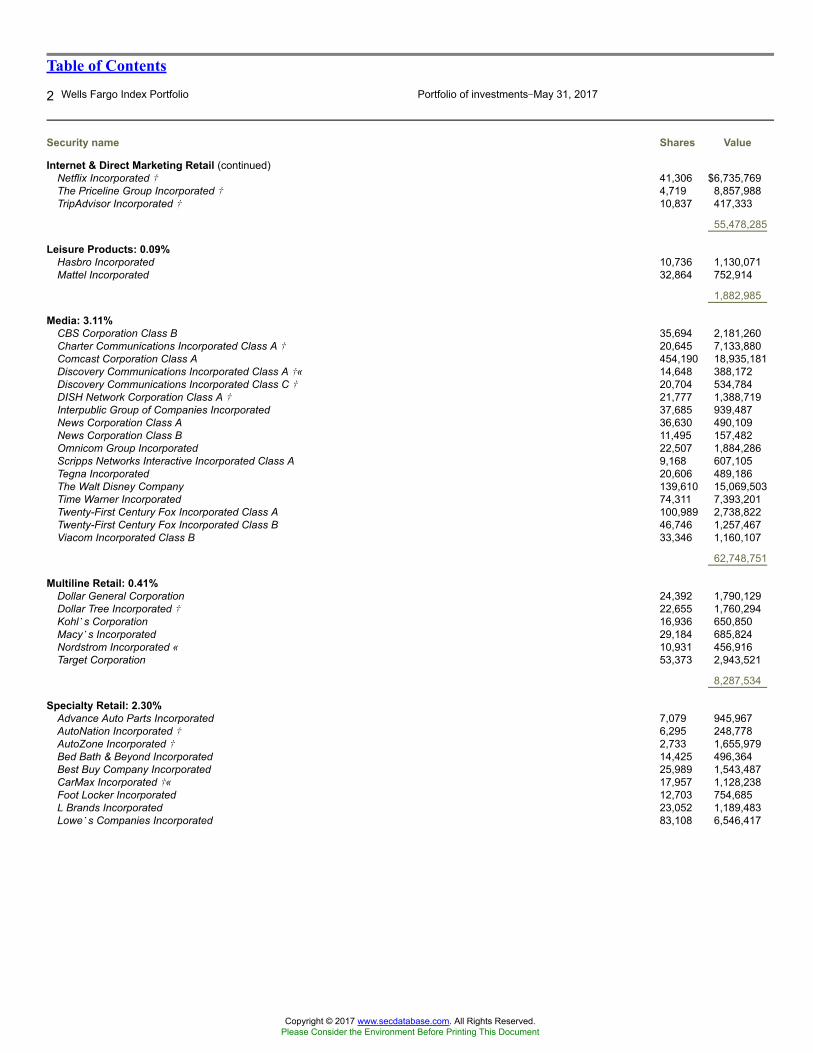
Table of Contents
2 Wells Fargo Index Portfolio Portfolio of investments�May 31, 2017
Security name Shares Value
Internet & Direct Marketing Retail (continued)Netflix Incorporated � 41,306 $6,735,769The Priceline Group Incorporated � 4,719 8,857,988TripAdvisor Incorporated � 10,837 417,333
55,478,285
Leisure Products: 0.09%Hasbro Incorporated 10,736 1,130,071Mattel Incorporated 32,864 752,914
1,882,985
Media: 3.11%CBS Corporation Class B 35,694 2,181,260Charter Communications Incorporated Class A � 20,645 7,133,880Comcast Corporation Class A 454,190 18,935,181Discovery Communications Incorporated Class A �« 14,648 388,172Discovery Communications Incorporated Class C � 20,704 534,784DISH Network Corporation Class A � 21,777 1,388,719Interpublic Group of Companies Incorporated 37,685 939,487News Corporation Class A 36,630 490,109News Corporation Class B 11,495 157,482Omnicom Group Incorporated 22,507 1,884,286Scripps Networks Interactive Incorporated Class A 9,168 607,105Tegna Incorporated 20,606 489,186The Walt Disney Company 139,610 15,069,503Time Warner Incorporated 74,311 7,393,201Twenty-First Century Fox Incorporated Class A 100,989 2,738,822Twenty-First Century Fox Incorporated Class B 46,746 1,257,467Viacom Incorporated Class B 33,346 1,160,107
62,748,751
Multiline Retail: 0.41%Dollar General Corporation 24,392 1,790,129Dollar Tree Incorporated � 22,655 1,760,294Kohl�s Corporation 16,936 650,850Macy�s Incorporated 29,184 685,824Nordstrom Incorporated « 10,931 456,916Target Corporation 53,373 2,943,521
8,287,534
Specialty Retail: 2.30%Advance Auto Parts Incorporated 7,079 945,967AutoNation Incorporated � 6,295 248,778AutoZone Incorporated � 2,733 1,655,979Bed Bath & Beyond Incorporated 14,425 496,364Best Buy Company Incorporated 25,989 1,543,487CarMax Incorporated �« 17,957 1,128,238Foot Locker Incorporated 12,703 754,685L Brands Incorporated 23,052 1,189,483Lowe�s Companies Incorporated 83,108 6,546,417
Copyright © 2017 www.secdatabase.com. All Rights Reserved.Please Consider the Environment Before Printing This Document
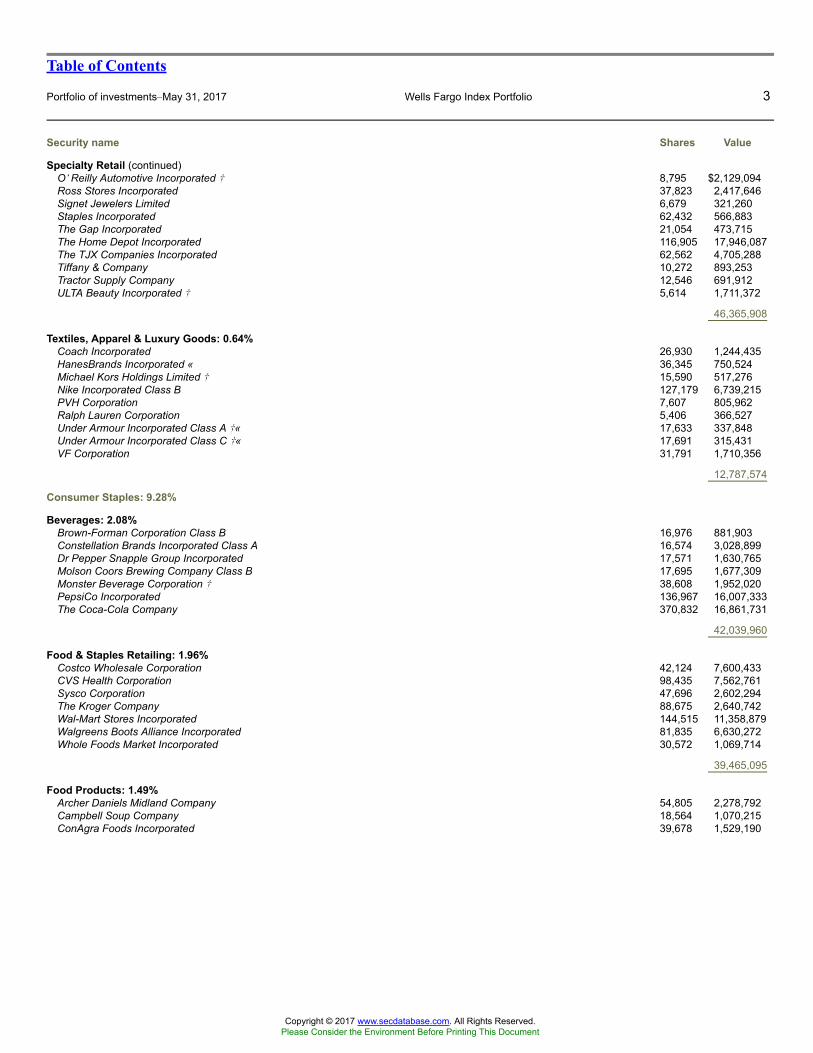
Table of Contents
Portfolio of investments�May 31, 2017 Wells Fargo Index Portfolio 3
Security name Shares Value
Specialty Retail (continued)O�Reilly Automotive Incorporated � 8,795 $2,129,094Ross Stores Incorporated 37,823 2,417,646Signet Jewelers Limited 6,679 321,260Staples Incorporated 62,432 566,883The Gap Incorporated 21,054 473,715The Home Depot Incorporated 116,905 17,946,087The TJX Companies Incorporated 62,562 4,705,288Tiffany & Company 10,272 893,253Tractor Supply Company 12,546 691,912ULTA Beauty Incorporated � 5,614 1,711,372
46,365,908
Textiles, Apparel & Luxury Goods: 0.64%Coach Incorporated 26,930 1,244,435HanesBrands Incorporated « 36,345 750,524Michael Kors Holdings Limited � 15,590 517,276Nike Incorporated Class B 127,179 6,739,215PVH Corporation 7,607 805,962Ralph Lauren Corporation 5,406 366,527Under Armour Incorporated Class A �« 17,633 337,848Under Armour Incorporated Class C �« 17,691 315,431VF Corporation 31,791 1,710,356
12,787,574
Consumer Staples: 9.28%
Beverages: 2.08%Brown-Forman Corporation Class B 16,976 881,903Constellation Brands Incorporated Class A 16,574 3,028,899Dr Pepper Snapple Group Incorporated 17,571 1,630,765Molson Coors Brewing Company Class B 17,695 1,677,309Monster Beverage Corporation � 38,608 1,952,020PepsiCo Incorporated 136,967 16,007,333The Coca-Cola Company 370,832 16,861,731
42,039,960
Food & Staples Retailing: 1.96%Costco Wholesale Corporation 42,124 7,600,433CVS Health Corporation 98,435 7,562,761Sysco Corporation 47,696 2,602,294The Kroger Company 88,675 2,640,742Wal-Mart Stores Incorporated 144,515 11,358,879Walgreens Boots Alliance Incorporated 81,835 6,630,272Whole Foods Market Incorporated 30,572 1,069,714
39,465,095
Food Products: 1.49%Archer Daniels Midland Company 54,805 2,278,792Campbell Soup Company 18,564 1,070,215ConAgra Foods Incorporated 39,678 1,529,190
Copyright © 2017 www.secdatabase.com. All Rights Reserved.Please Consider the Environment Before Printing This Document
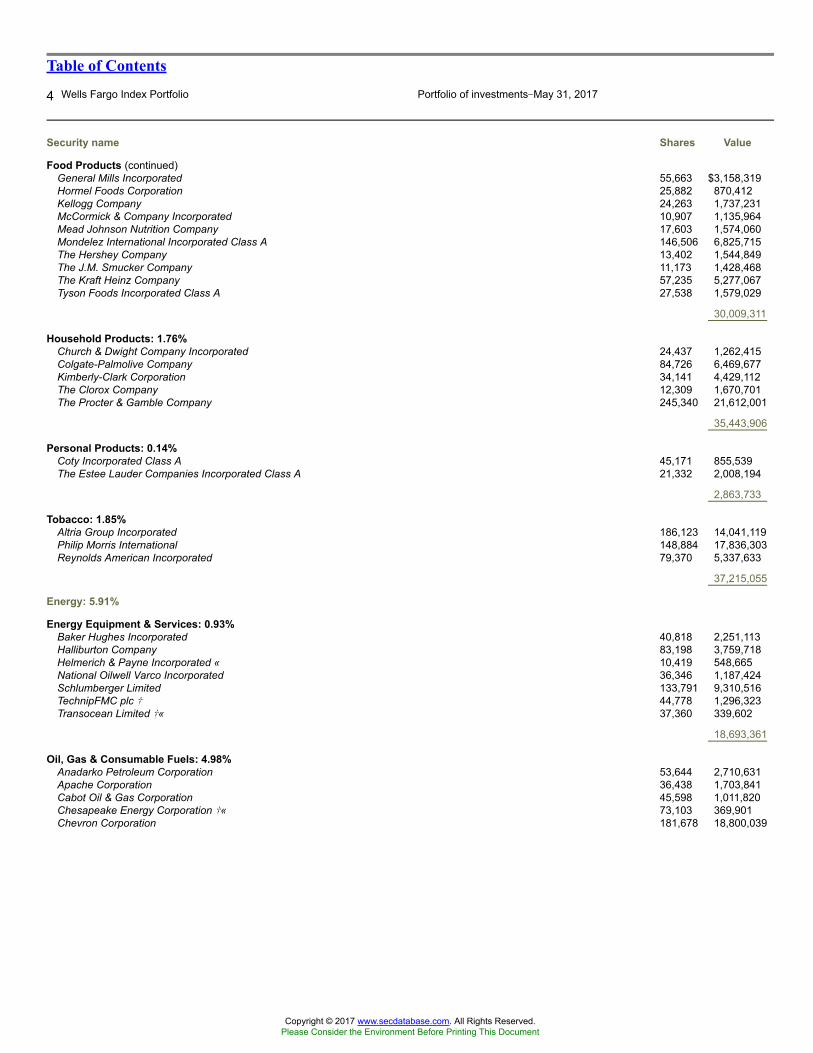
Table of Contents
4 Wells Fargo Index Portfolio Portfolio of investments�May 31, 2017
Security name Shares Value
Food Products (continued)General Mills Incorporated 55,663 $3,158,319Hormel Foods Corporation 25,882 870,412Kellogg Company 24,263 1,737,231McCormick & Company Incorporated 10,907 1,135,964Mead Johnson Nutrition Company 17,603 1,574,060Mondelez International Incorporated Class A 146,506 6,825,715The Hershey Company 13,402 1,544,849The J.M. Smucker Company 11,173 1,428,468The Kraft Heinz Company 57,235 5,277,067Tyson Foods Incorporated Class A 27,538 1,579,029
30,009,311
Household Products: 1.76%Church & Dwight Company Incorporated 24,437 1,262,415Colgate-Palmolive Company 84,726 6,469,677Kimberly-Clark Corporation 34,141 4,429,112The Clorox Company 12,309 1,670,701The Procter & Gamble Company 245,340 21,612,001
35,443,906
Personal Products: 0.14%Coty Incorporated Class A 45,171 855,539The Estee Lauder Companies Incorporated Class A 21,332 2,008,194
2,863,733
Tobacco: 1.85%Altria Group Incorporated 186,123 14,041,119Philip Morris International 148,884 17,836,303Reynolds American Incorporated 79,370 5,337,633
37,215,055
Energy: 5.91%
Energy Equipment & Services: 0.93%Baker Hughes Incorporated 40,818 2,251,113Halliburton Company 83,198 3,759,718Helmerich & Payne Incorporated « 10,419 548,665National Oilwell Varco Incorporated 36,346 1,187,424Schlumberger Limited 133,791 9,310,516TechnipFMC plc � 44,778 1,296,323Transocean Limited �« 37,360 339,602
18,693,361
Oil, Gas & Consumable Fuels: 4.98%Anadarko Petroleum Corporation 53,644 2,710,631Apache Corporation 36,438 1,703,841Cabot Oil & Gas Corporation 45,598 1,011,820Chesapeake Energy Corporation �« 73,103 369,901Chevron Corporation 181,678 18,800,039
Copyright © 2017 www.secdatabase.com. All Rights Reserved.Please Consider the Environment Before Printing This Document
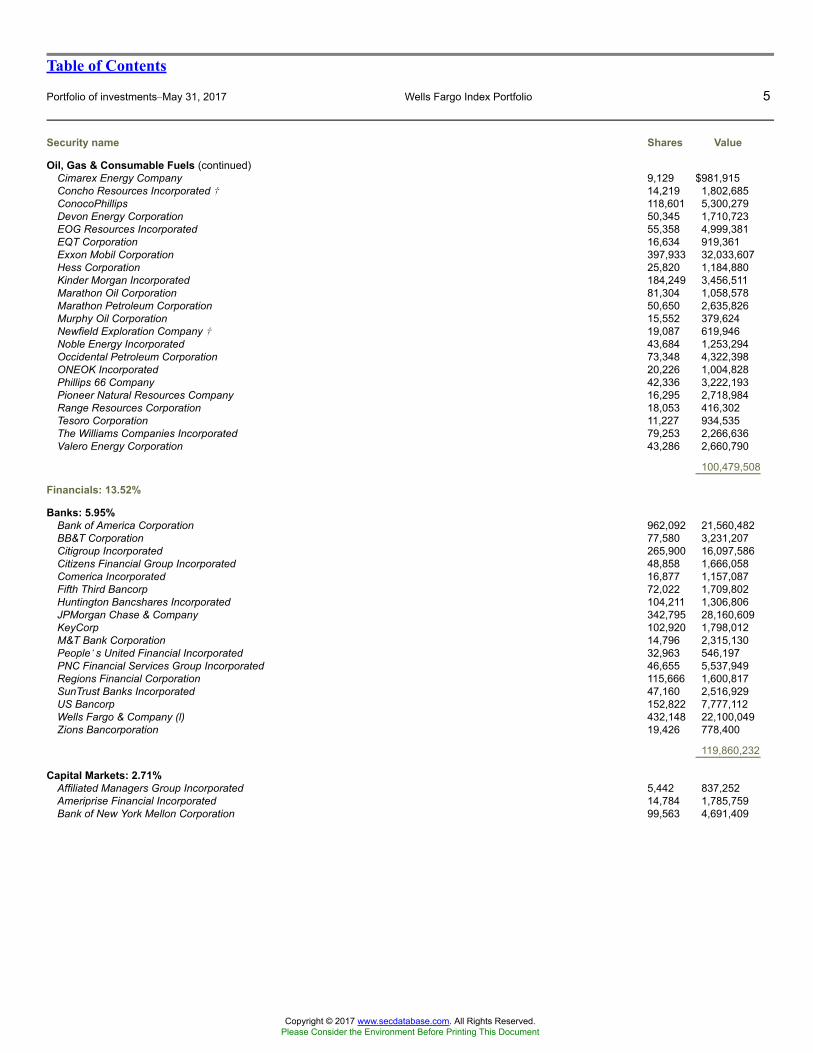
Table of Contents
Portfolio of investments�May 31, 2017 Wells Fargo Index Portfolio 5
Security name Shares Value
Oil, Gas & Consumable Fuels (continued)Cimarex Energy Company 9,129 $981,915Concho Resources Incorporated � 14,219 1,802,685ConocoPhillips 118,601 5,300,279Devon Energy Corporation 50,345 1,710,723EOG Resources Incorporated 55,358 4,999,381EQT Corporation 16,634 919,361Exxon Mobil Corporation 397,933 32,033,607Hess Corporation 25,820 1,184,880Kinder Morgan Incorporated 184,249 3,456,511Marathon Oil Corporation 81,304 1,058,578Marathon Petroleum Corporation 50,650 2,635,826Murphy Oil Corporation 15,552 379,624Newfield Exploration Company � 19,087 619,946Noble Energy Incorporated 43,684 1,253,294Occidental Petroleum Corporation 73,348 4,322,398ONEOK Incorporated 20,226 1,004,828Phillips 66 Company 42,336 3,222,193Pioneer Natural Resources Company 16,295 2,718,984Range Resources Corporation 18,053 416,302Tesoro Corporation 11,227 934,535The Williams Companies Incorporated 79,253 2,266,636Valero Energy Corporation 43,286 2,660,790
100,479,508
Financials: 13.52%
Banks: 5.95%Bank of America Corporation 962,092 21,560,482BB&T Corporation 77,580 3,231,207Citigroup Incorporated 265,900 16,097,586Citizens Financial Group Incorporated 48,858 1,666,058Comerica Incorporated 16,877 1,157,087Fifth Third Bancorp 72,022 1,709,802Huntington Bancshares Incorporated 104,211 1,306,806JPMorgan Chase & Company 342,795 28,160,609KeyCorp 102,920 1,798,012M&T Bank Corporation 14,796 2,315,130People�s United Financial Incorporated 32,963 546,197PNC Financial Services Group Incorporated 46,655 5,537,949Regions Financial Corporation 115,666 1,600,817SunTrust Banks Incorporated 47,160 2,516,929US Bancorp 152,822 7,777,112Wells Fargo & Company (l) 432,148 22,100,049Zions Bancorporation 19,426 778,400
119,860,232
Capital Markets: 2.71%Affiliated Managers Group Incorporated 5,442 837,252Ameriprise Financial Incorporated 14,784 1,785,759Bank of New York Mellon Corporation 99,563 4,691,409
Copyright © 2017 www.secdatabase.com. All Rights Reserved.Please Consider the Environment Before Printing This Document
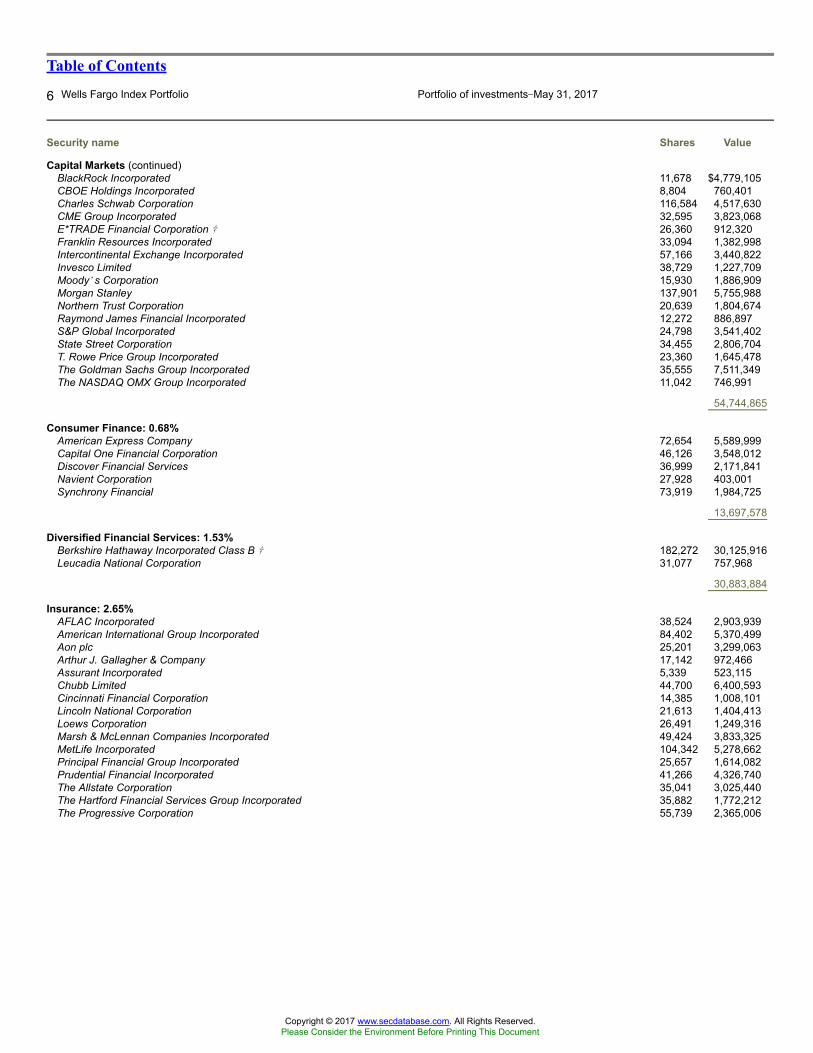
Table of Contents
6 Wells Fargo Index Portfolio Portfolio of investments�May 31, 2017
Security name Shares Value
Capital Markets (continued)BlackRock Incorporated 11,678 $4,779,105CBOE Holdings Incorporated 8,804 760,401Charles Schwab Corporation 116,584 4,517,630CME Group Incorporated 32,595 3,823,068E*TRADE Financial Corporation � 26,360 912,320Franklin Resources Incorporated 33,094 1,382,998Intercontinental Exchange Incorporated 57,166 3,440,822Invesco Limited 38,729 1,227,709Moody�s Corporation 15,930 1,886,909Morgan Stanley 137,901 5,755,988Northern Trust Corporation 20,639 1,804,674Raymond James Financial Incorporated 12,272 886,897S&P Global Incorporated 24,798 3,541,402State Street Corporation 34,455 2,806,704T. Rowe Price Group Incorporated 23,360 1,645,478The Goldman Sachs Group Incorporated 35,555 7,511,349The NASDAQ OMX Group Incorporated 11,042 746,991
54,744,865
Consumer Finance: 0.68%American Express Company 72,654 5,589,999Capital One Financial Corporation 46,126 3,548,012Discover Financial Services 36,999 2,171,841Navient Corporation 27,928 403,001Synchrony Financial 73,919 1,984,725
13,697,578
Diversified Financial Services: 1.53%Berkshire Hathaway Incorporated Class B � 182,272 30,125,916Leucadia National Corporation 31,077 757,968
30,883,884
Insurance: 2.65%AFLAC Incorporated 38,524 2,903,939American International Group Incorporated 84,402 5,370,499Aon plc 25,201 3,299,063Arthur J. Gallagher & Company 17,142 972,466Assurant Incorporated 5,339 523,115Chubb Limited 44,700 6,400,593Cincinnati Financial Corporation 14,385 1,008,101Lincoln National Corporation 21,613 1,404,413Loews Corporation 26,491 1,249,316Marsh & McLennan Companies Incorporated 49,424 3,833,325MetLife Incorporated 104,342 5,278,662Principal Financial Group Incorporated 25,657 1,614,082Prudential Financial Incorporated 41,266 4,326,740The Allstate Corporation 35,041 3,025,440The Hartford Financial Services Group Incorporated 35,882 1,772,212The Progressive Corporation 55,739 2,365,006
Copyright © 2017 www.secdatabase.com. All Rights Reserved.Please Consider the Environment Before Printing This Document
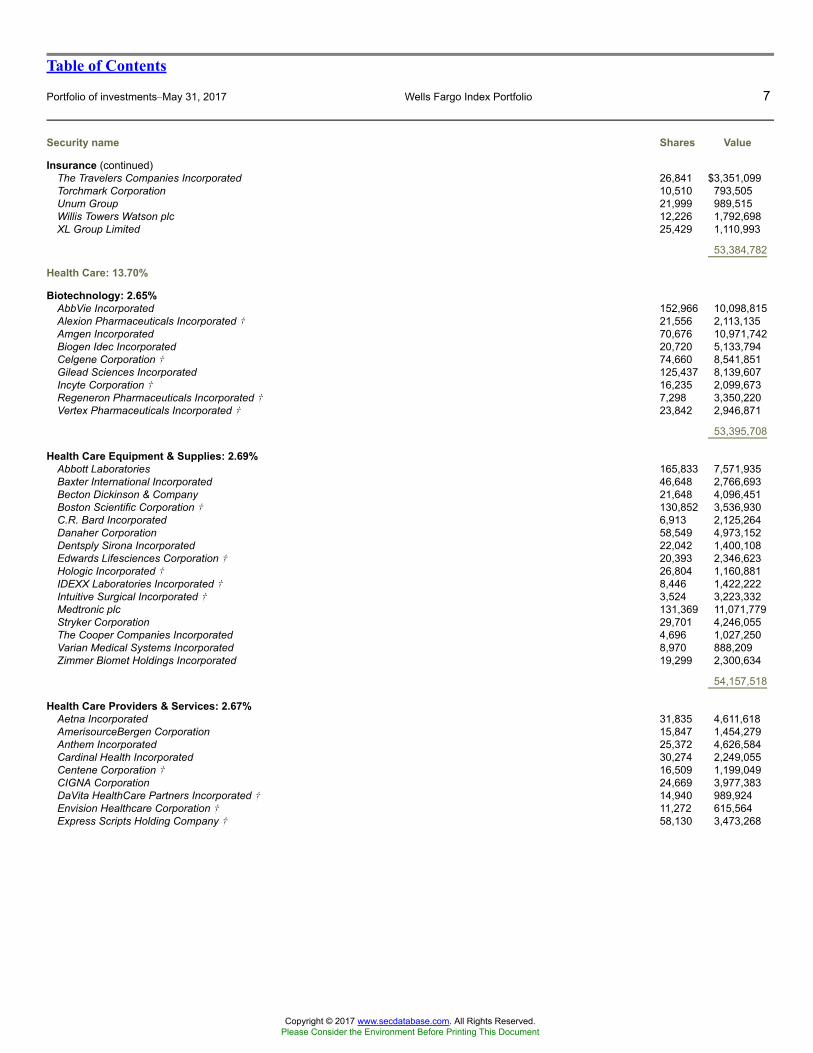
Table of Contents
Portfolio of investments�May 31, 2017 Wells Fargo Index Portfolio 7
Security name Shares Value
Insurance (continued)The Travelers Companies Incorporated 26,841 $3,351,099Torchmark Corporation 10,510 793,505Unum Group 21,999 989,515Willis Towers Watson plc 12,226 1,792,698XL Group Limited 25,429 1,110,993
53,384,782
Health Care: 13.70%
Biotechnology: 2.65%AbbVie Incorporated 152,966 10,098,815Alexion Pharmaceuticals Incorporated � 21,556 2,113,135Amgen Incorporated 70,676 10,971,742Biogen Idec Incorporated 20,720 5,133,794Celgene Corporation � 74,660 8,541,851Gilead Sciences Incorporated 125,437 8,139,607Incyte Corporation � 16,235 2,099,673Regeneron Pharmaceuticals Incorporated � 7,298 3,350,220Vertex Pharmaceuticals Incorporated � 23,842 2,946,871
53,395,708
Health Care Equipment & Supplies: 2.69%Abbott Laboratories 165,833 7,571,935Baxter International Incorporated 46,648 2,766,693Becton Dickinson & Company 21,648 4,096,451Boston Scientific Corporation � 130,852 3,536,930C.R. Bard Incorporated 6,913 2,125,264Danaher Corporation 58,549 4,973,152Dentsply Sirona Incorporated 22,042 1,400,108Edwards Lifesciences Corporation � 20,393 2,346,623Hologic Incorporated � 26,804 1,160,881IDEXX Laboratories Incorporated � 8,446 1,422,222Intuitive Surgical Incorporated � 3,524 3,223,332Medtronic plc 131,369 11,071,779Stryker Corporation 29,701 4,246,055The Cooper Companies Incorporated 4,696 1,027,250Varian Medical Systems Incorporated 8,970 888,209Zimmer Biomet Holdings Incorporated 19,299 2,300,634
54,157,518
Health Care Providers & Services: 2.67%Aetna Incorporated 31,835 4,611,618AmerisourceBergen Corporation 15,847 1,454,279Anthem Incorporated 25,372 4,626,584Cardinal Health Incorporated 30,274 2,249,055Centene Corporation � 16,509 1,199,049CIGNA Corporation 24,669 3,977,383DaVita HealthCare Partners Incorporated � 14,940 989,924Envision Healthcare Corporation � 11,272 615,564Express Scripts Holding Company � 58,130 3,473,268
Copyright © 2017 www.secdatabase.com. All Rights Reserved.Please Consider the Environment Before Printing This Document
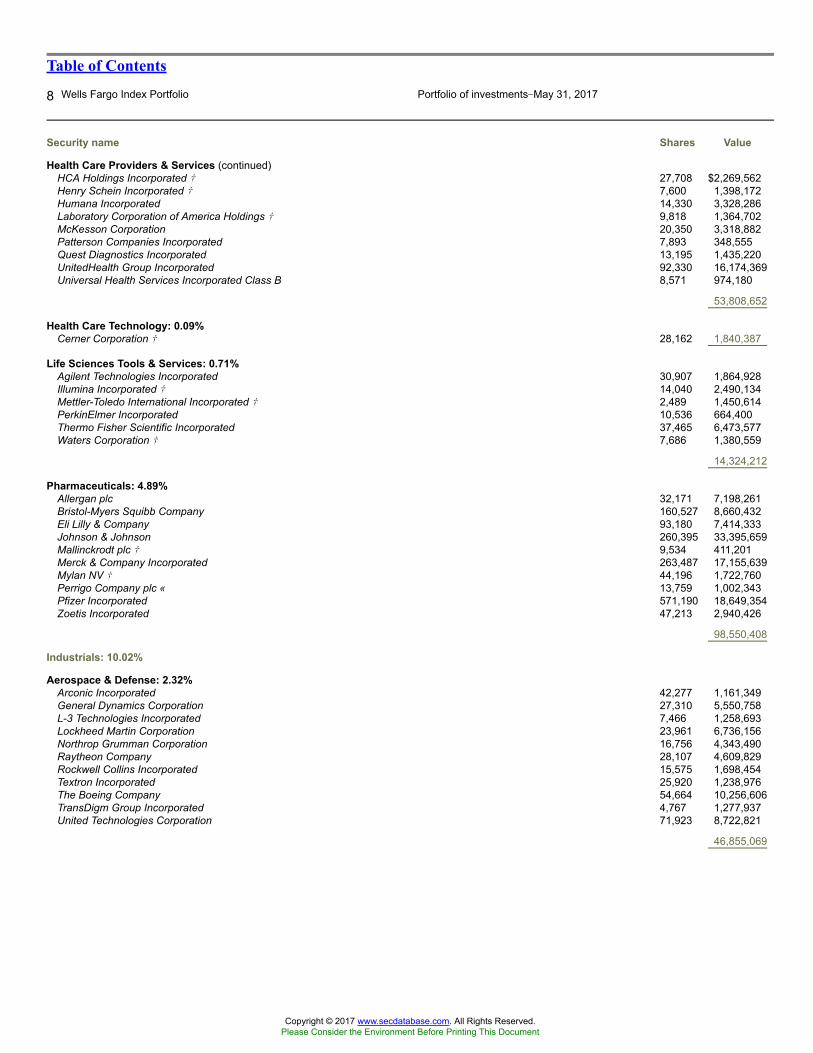
Table of Contents
8 Wells Fargo Index Portfolio Portfolio of investments�May 31, 2017
Security name Shares Value
Health Care Providers & Services (continued)HCA Holdings Incorporated � 27,708 $2,269,562Henry Schein Incorporated � 7,600 1,398,172Humana Incorporated 14,330 3,328,286Laboratory Corporation of America Holdings � 9,818 1,364,702McKesson Corporation 20,350 3,318,882Patterson Companies Incorporated 7,893 348,555Quest Diagnostics Incorporated 13,195 1,435,220UnitedHealth Group Incorporated 92,330 16,174,369Universal Health Services Incorporated Class B 8,571 974,180
53,808,652
Health Care Technology: 0.09%Cerner Corporation � 28,162 1,840,387
Life Sciences Tools & Services: 0.71%Agilent Technologies Incorporated 30,907 1,864,928Illumina Incorporated � 14,040 2,490,134Mettler-Toledo International Incorporated � 2,489 1,450,614PerkinElmer Incorporated 10,536 664,400Thermo Fisher Scientific Incorporated 37,465 6,473,577Waters Corporation � 7,686 1,380,559
14,324,212
Pharmaceuticals: 4.89%Allergan plc 32,171 7,198,261Bristol-Myers Squibb Company 160,527 8,660,432Eli Lilly & Company 93,180 7,414,333Johnson & Johnson 260,395 33,395,659Mallinckrodt plc � 9,534 411,201Merck & Company Incorporated 263,487 17,155,639Mylan NV � 44,196 1,722,760Perrigo Company plc « 13,759 1,002,343Pfizer Incorporated 571,190 18,649,354Zoetis Incorporated 47,213 2,940,426
98,550,408
Industrials: 10.02%
Aerospace & Defense: 2.32%Arconic Incorporated 42,277 1,161,349General Dynamics Corporation 27,310 5,550,758L-3 Technologies Incorporated 7,466 1,258,693Lockheed Martin Corporation 23,961 6,736,156Northrop Grumman Corporation 16,756 4,343,490Raytheon Company 28,107 4,609,829Rockwell Collins Incorporated 15,575 1,698,454Textron Incorporated 25,920 1,238,976The Boeing Company 54,664 10,256,606TransDigm Group Incorporated 4,767 1,277,937United Technologies Corporation 71,923 8,722,821
46,855,069
Copyright © 2017 www.secdatabase.com. All Rights Reserved.Please Consider the Environment Before Printing This Document
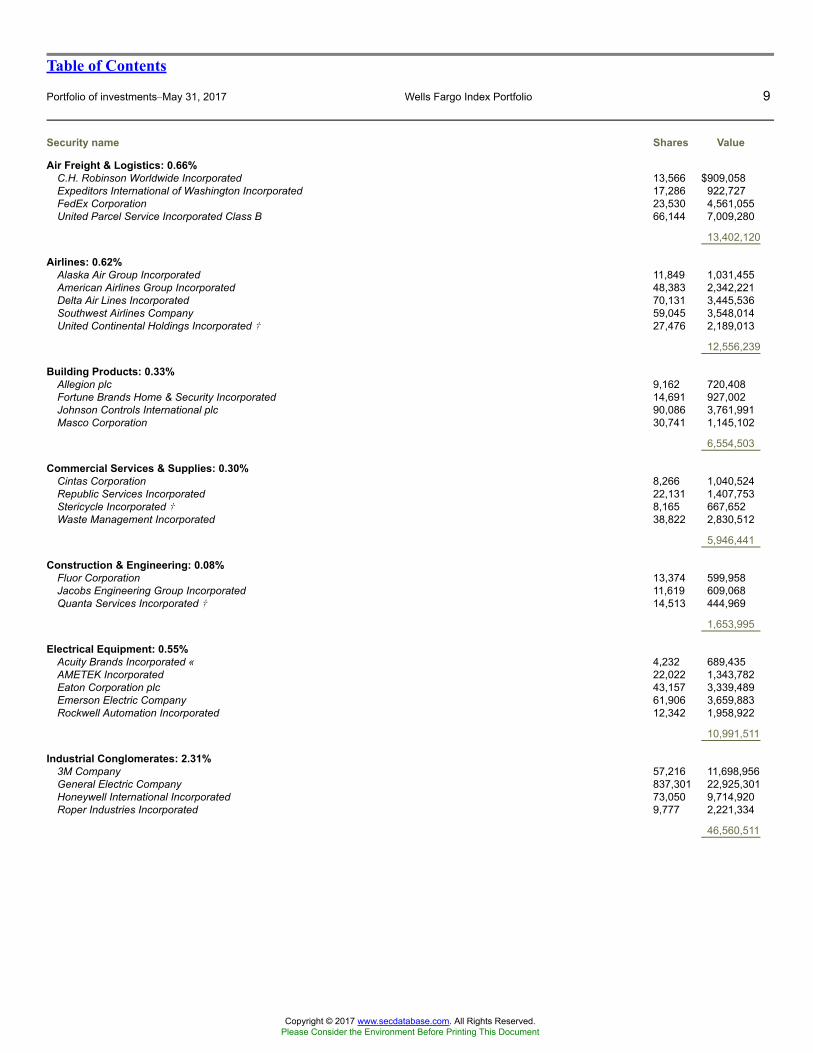
Table of Contents
Portfolio of investments�May 31, 2017 Wells Fargo Index Portfolio 9
Security name Shares Value
Air Freight & Logistics: 0.66%C.H. Robinson Worldwide Incorporated 13,566 $909,058Expeditors International of Washington Incorporated 17,286 922,727FedEx Corporation 23,530 4,561,055United Parcel Service Incorporated Class B 66,144 7,009,280
13,402,120
Airlines: 0.62%Alaska Air Group Incorporated 11,849 1,031,455American Airlines Group Incorporated 48,383 2,342,221Delta Air Lines Incorporated 70,131 3,445,536Southwest Airlines Company 59,045 3,548,014United Continental Holdings Incorporated � 27,476 2,189,013
12,556,239
Building Products: 0.33%Allegion plc 9,162 720,408Fortune Brands Home & Security Incorporated 14,691 927,002Johnson Controls International plc 90,086 3,761,991Masco Corporation 30,741 1,145,102
6,554,503
Commercial Services & Supplies: 0.30%Cintas Corporation 8,266 1,040,524Republic Services Incorporated 22,131 1,407,753Stericycle Incorporated � 8,165 667,652Waste Management Incorporated 38,822 2,830,512
5,946,441
Construction & Engineering: 0.08%Fluor Corporation 13,374 599,958Jacobs Engineering Group Incorporated 11,619 609,068Quanta Services Incorporated � 14,513 444,969
1,653,995
Electrical Equipment: 0.55%Acuity Brands Incorporated « 4,232 689,435AMETEK Incorporated 22,022 1,343,782Eaton Corporation plc 43,157 3,339,489Emerson Electric Company 61,906 3,659,883Rockwell Automation Incorporated 12,342 1,958,922
10,991,511
Industrial Conglomerates: 2.31%3M Company 57,216 11,698,956General Electric Company 837,301 22,925,301Honeywell International Incorporated 73,050 9,714,920Roper Industries Incorporated 9,777 2,221,334
46,560,511
Copyright © 2017 www.secdatabase.com. All Rights Reserved.Please Consider the Environment Before Printing This Document
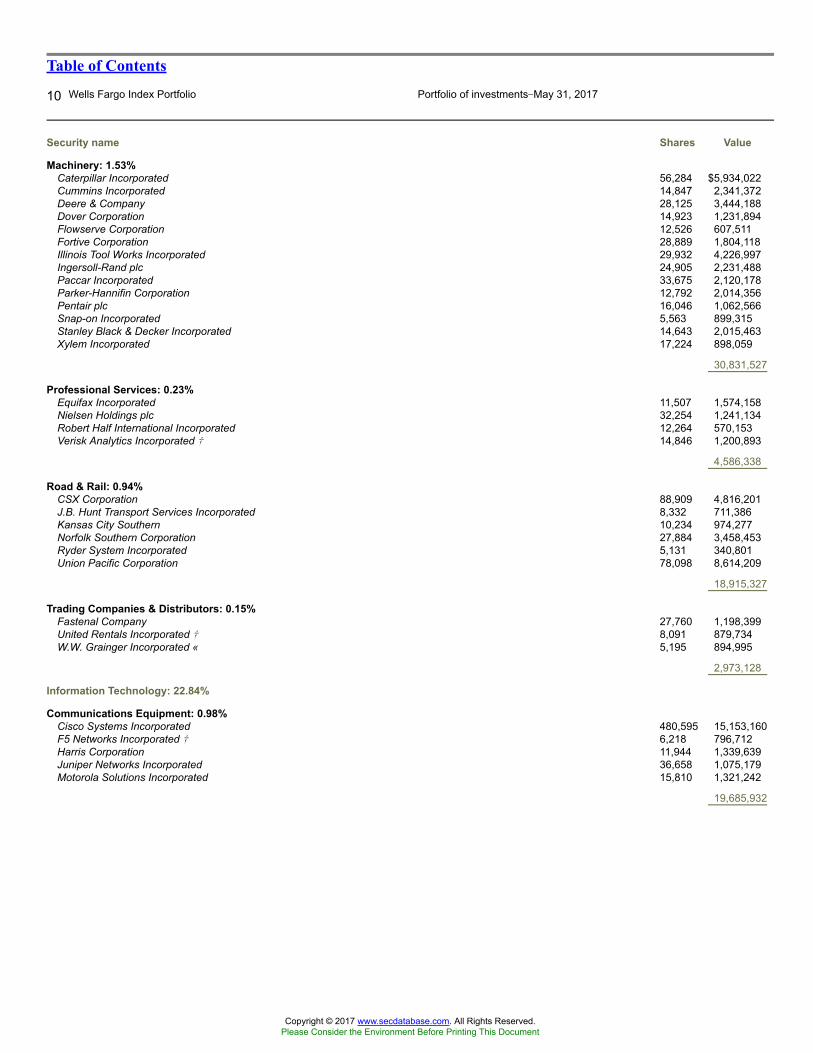
Table of Contents
10 Wells Fargo Index Portfolio Portfolio of investments�May 31, 2017
Security name Shares Value
Machinery: 1.53%Caterpillar Incorporated 56,284 $5,934,022Cummins Incorporated 14,847 2,341,372Deere & Company 28,125 3,444,188Dover Corporation 14,923 1,231,894Flowserve Corporation 12,526 607,511Fortive Corporation 28,889 1,804,118Illinois Tool Works Incorporated 29,932 4,226,997Ingersoll-Rand plc 24,905 2,231,488Paccar Incorporated 33,675 2,120,178Parker-Hannifin Corporation 12,792 2,014,356Pentair plc 16,046 1,062,566Snap-on Incorporated 5,563 899,315Stanley Black & Decker Incorporated 14,643 2,015,463Xylem Incorporated 17,224 898,059
30,831,527
Professional Services: 0.23%Equifax Incorporated 11,507 1,574,158Nielsen Holdings plc 32,254 1,241,134Robert Half International Incorporated 12,264 570,153Verisk Analytics Incorporated � 14,846 1,200,893
4,586,338
Road & Rail: 0.94%CSX Corporation 88,909 4,816,201J.B. Hunt Transport Services Incorporated 8,332 711,386Kansas City Southern 10,234 974,277Norfolk Southern Corporation 27,884 3,458,453Ryder System Incorporated 5,131 340,801Union Pacific Corporation 78,098 8,614,209
18,915,327
Trading Companies & Distributors: 0.15%Fastenal Company 27,760 1,198,399United Rentals Incorporated � 8,091 879,734W.W. Grainger Incorporated « 5,195 894,995
2,973,128
Information Technology: 22.84%
Communications Equipment: 0.98%Cisco Systems Incorporated 480,595 15,153,160F5 Networks Incorporated � 6,218 796,712Harris Corporation 11,944 1,339,639Juniper Networks Incorporated 36,658 1,075,179Motorola Solutions Incorporated 15,810 1,321,242
19,685,932
Copyright © 2017 www.secdatabase.com. All Rights Reserved.Please Consider the Environment Before Printing This Document
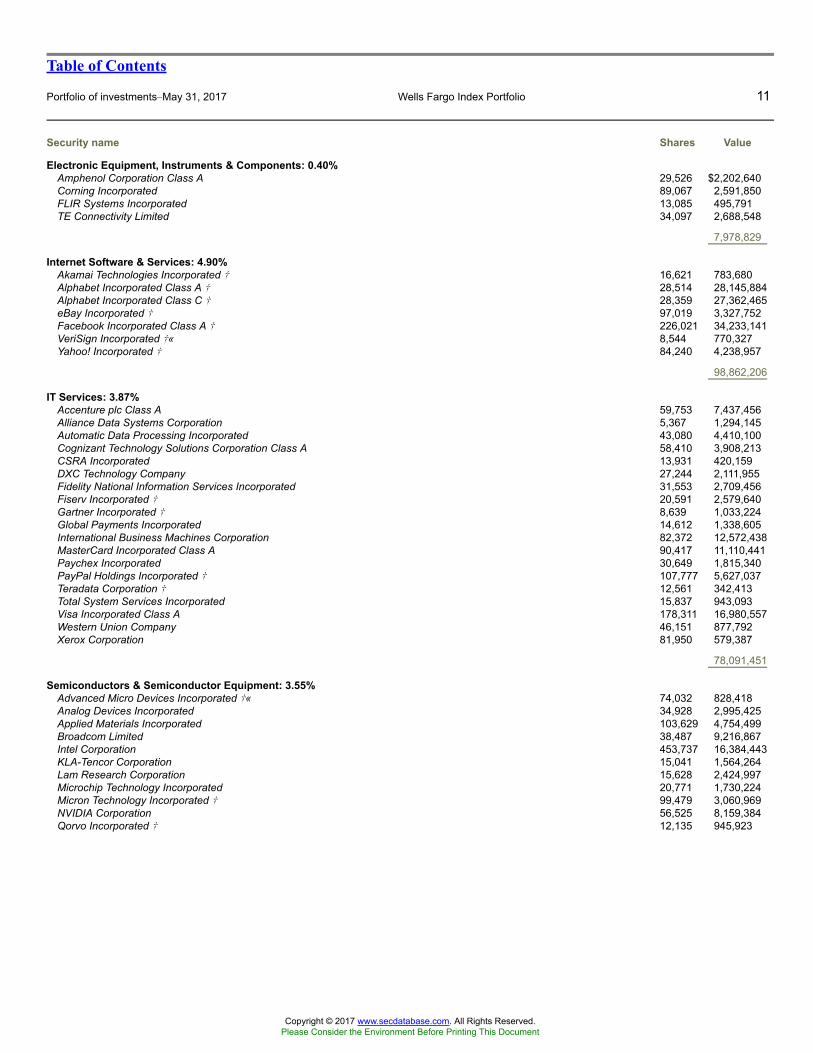
Table of Contents
Portfolio of investments�May 31, 2017 Wells Fargo Index Portfolio 11
Security name Shares Value
Electronic Equipment, Instruments & Components: 0.40%Amphenol Corporation Class A 29,526 $2,202,640Corning Incorporated 89,067 2,591,850FLIR Systems Incorporated 13,085 495,791TE Connectivity Limited 34,097 2,688,548
7,978,829
Internet Software & Services: 4.90%Akamai Technologies Incorporated � 16,621 783,680Alphabet Incorporated Class A � 28,514 28,145,884Alphabet Incorporated Class C � 28,359 27,362,465eBay Incorporated � 97,019 3,327,752Facebook Incorporated Class A � 226,021 34,233,141VeriSign Incorporated �« 8,544 770,327Yahoo! Incorporated � 84,240 4,238,957
98,862,206
IT Services: 3.87%Accenture plc Class A 59,753 7,437,456Alliance Data Systems Corporation 5,367 1,294,145Automatic Data Processing Incorporated 43,080 4,410,100Cognizant Technology Solutions Corporation Class A 58,410 3,908,213CSRA Incorporated 13,931 420,159DXC Technology Company 27,244 2,111,955Fidelity National Information Services Incorporated 31,553 2,709,456Fiserv Incorporated � 20,591 2,579,640Gartner Incorporated � 8,639 1,033,224Global Payments Incorporated 14,612 1,338,605International Business Machines Corporation 82,372 12,572,438MasterCard Incorporated Class A 90,417 11,110,441Paychex Incorporated 30,649 1,815,340PayPal Holdings Incorporated � 107,777 5,627,037Teradata Corporation � 12,561 342,413Total System Services Incorporated 15,837 943,093Visa Incorporated Class A 178,311 16,980,557Western Union Company 46,151 877,792Xerox Corporation 81,950 579,387
78,091,451
Semiconductors & Semiconductor Equipment: 3.55%Advanced Micro Devices Incorporated �« 74,032 828,418Analog Devices Incorporated 34,928 2,995,425Applied Materials Incorporated 103,629 4,754,499Broadcom Limited 38,487 9,216,867Intel Corporation 453,737 16,384,443KLA-Tencor Corporation 15,041 1,564,264Lam Research Corporation 15,628 2,424,997Microchip Technology Incorporated 20,771 1,730,224Micron Technology Incorporated � 99,479 3,060,969NVIDIA Corporation 56,525 8,159,384Qorvo Incorporated � 12,135 945,923
Copyright © 2017 www.secdatabase.com. All Rights Reserved.Please Consider the Environment Before Printing This Document
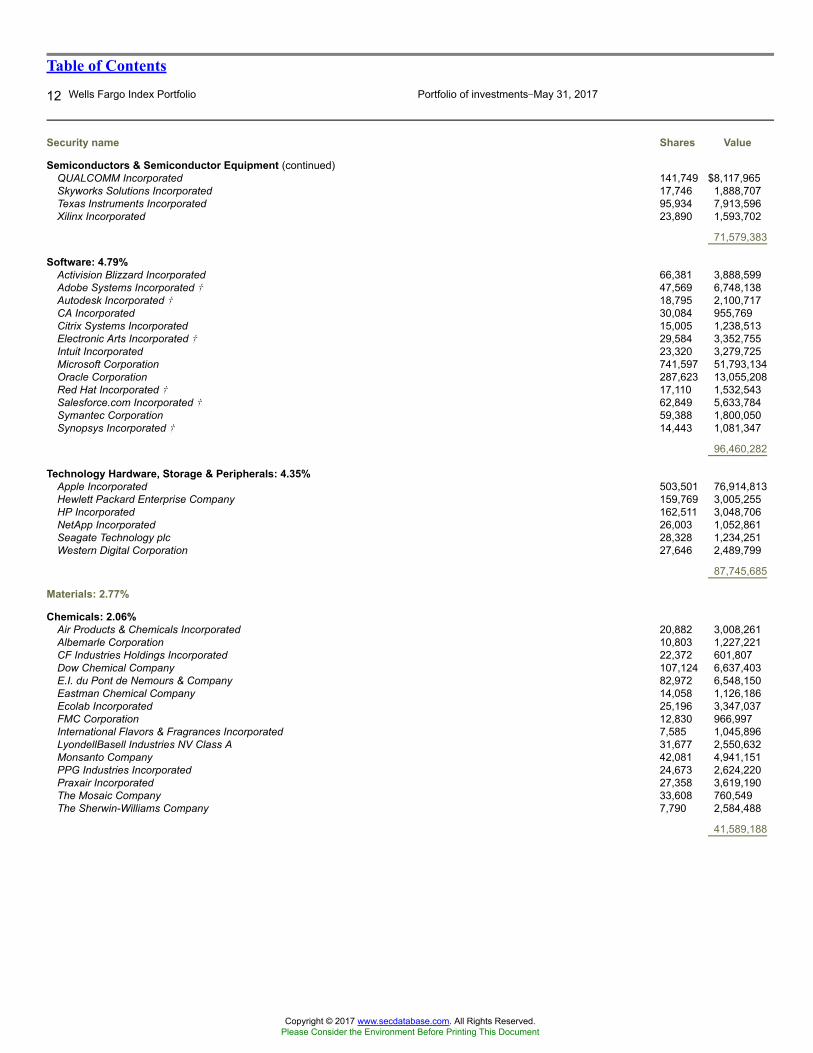
Table of Contents
12 Wells Fargo Index Portfolio Portfolio of investments�May 31, 2017
Security name Shares Value
Semiconductors & Semiconductor Equipment (continued)QUALCOMM Incorporated 141,749 $8,117,965Skyworks Solutions Incorporated 17,746 1,888,707Texas Instruments Incorporated 95,934 7,913,596Xilinx Incorporated 23,890 1,593,702
71,579,383
Software: 4.79%Activision Blizzard Incorporated 66,381 3,888,599Adobe Systems Incorporated � 47,569 6,748,138Autodesk Incorporated � 18,795 2,100,717CA Incorporated 30,084 955,769Citrix Systems Incorporated 15,005 1,238,513Electronic Arts Incorporated � 29,584 3,352,755Intuit Incorporated 23,320 3,279,725Microsoft Corporation 741,597 51,793,134Oracle Corporation 287,623 13,055,208Red Hat Incorporated � 17,110 1,532,543Salesforce.com Incorporated � 62,849 5,633,784Symantec Corporation 59,388 1,800,050Synopsys Incorporated � 14,443 1,081,347
96,460,282
Technology Hardware, Storage & Peripherals: 4.35%Apple Incorporated 503,501 76,914,813Hewlett Packard Enterprise Company 159,769 3,005,255HP Incorporated 162,511 3,048,706NetApp Incorporated 26,003 1,052,861Seagate Technology plc 28,328 1,234,251Western Digital Corporation 27,646 2,489,799
87,745,685
Materials: 2.77%
Chemicals: 2.06%Air Products & Chemicals Incorporated 20,882 3,008,261Albemarle Corporation 10,803 1,227,221CF Industries Holdings Incorporated 22,372 601,807Dow Chemical Company 107,124 6,637,403E.I. du Pont de Nemours & Company 82,972 6,548,150Eastman Chemical Company 14,058 1,126,186Ecolab Incorporated 25,196 3,347,037FMC Corporation 12,830 966,997International Flavors & Fragrances Incorporated 7,585 1,045,896LyondellBasell Industries NV Class A 31,677 2,550,632Monsanto Company 42,081 4,941,151PPG Industries Incorporated 24,673 2,624,220Praxair Incorporated 27,358 3,619,190The Mosaic Company 33,608 760,549The Sherwin-Williams Company 7,790 2,584,488
41,589,188
Copyright © 2017 www.secdatabase.com. All Rights Reserved.Please Consider the Environment Before Printing This Document
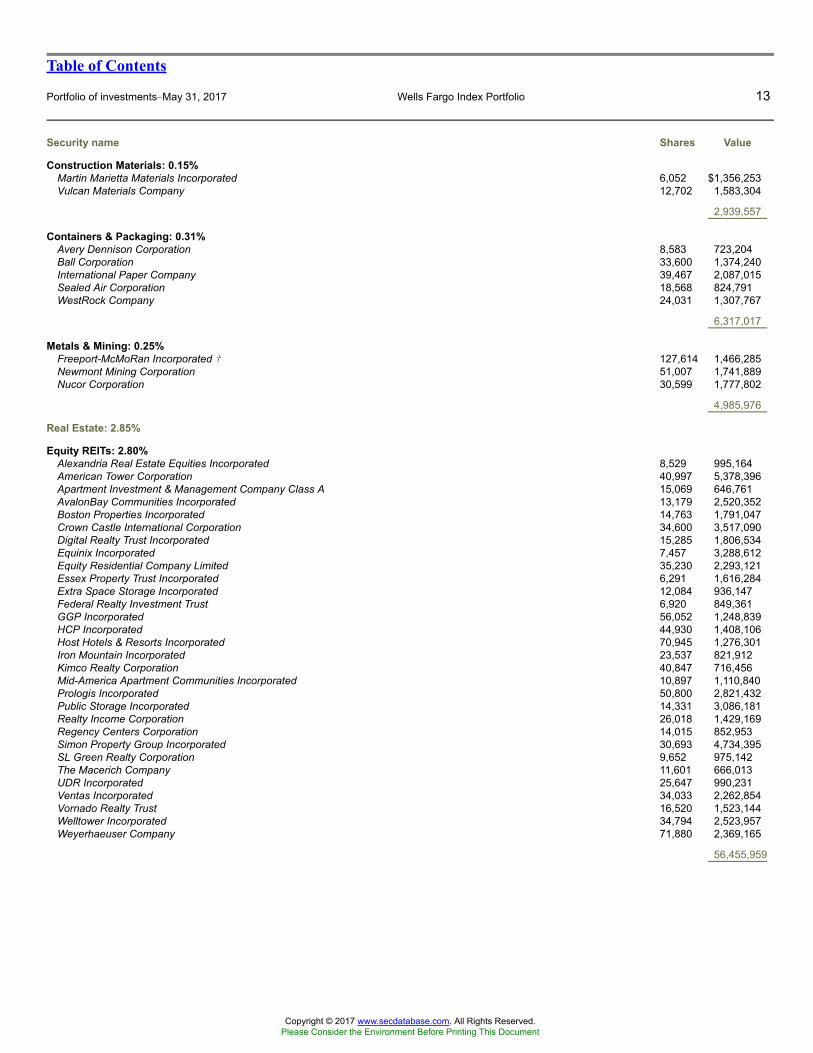
Table of Contents
Portfolio of investments�May 31, 2017 Wells Fargo Index Portfolio 13
Security name Shares Value
Construction Materials: 0.15%Martin Marietta Materials Incorporated 6,052 $1,356,253Vulcan Materials Company 12,702 1,583,304
2,939,557
Containers & Packaging: 0.31%Avery Dennison Corporation 8,583 723,204Ball Corporation 33,600 1,374,240International Paper Company 39,467 2,087,015Sealed Air Corporation 18,568 824,791WestRock Company 24,031 1,307,767
6,317,017
Metals & Mining: 0.25%Freeport-McMoRan Incorporated � 127,614 1,466,285Newmont Mining Corporation 51,007 1,741,889Nucor Corporation 30,599 1,777,802
4,985,976
Real Estate: 2.85%
Equity REITs: 2.80%Alexandria Real Estate Equities Incorporated 8,529 995,164American Tower Corporation 40,997 5,378,396Apartment Investment & Management Company Class A 15,069 646,761AvalonBay Communities Incorporated 13,179 2,520,352Boston Properties Incorporated 14,763 1,791,047Crown Castle International Corporation 34,600 3,517,090Digital Realty Trust Incorporated 15,285 1,806,534Equinix Incorporated 7,457 3,288,612Equity Residential Company Limited 35,230 2,293,121Essex Property Trust Incorporated 6,291 1,616,284Extra Space Storage Incorporated 12,084 936,147Federal Realty Investment Trust 6,920 849,361GGP Incorporated 56,052 1,248,839HCP Incorporated 44,930 1,408,106Host Hotels & Resorts Incorporated 70,945 1,276,301Iron Mountain Incorporated 23,537 821,912Kimco Realty Corporation 40,847 716,456Mid-America Apartment Communities Incorporated 10,897 1,110,840Prologis Incorporated 50,800 2,821,432Public Storage Incorporated 14,331 3,086,181Realty Income Corporation 26,018 1,429,169Regency Centers Corporation 14,015 852,953Simon Property Group Incorporated 30,693 4,734,395SL Green Realty Corporation 9,652 975,142The Macerich Company 11,601 666,013UDR Incorporated 25,647 990,231Ventas Incorporated 34,033 2,262,854Vornado Realty Trust 16,520 1,523,144Welltower Incorporated 34,794 2,523,957Weyerhaeuser Company 71,880 2,369,165
56,455,959
Copyright © 2017 www.secdatabase.com. All Rights Reserved.Please Consider the Environment Before Printing This Document
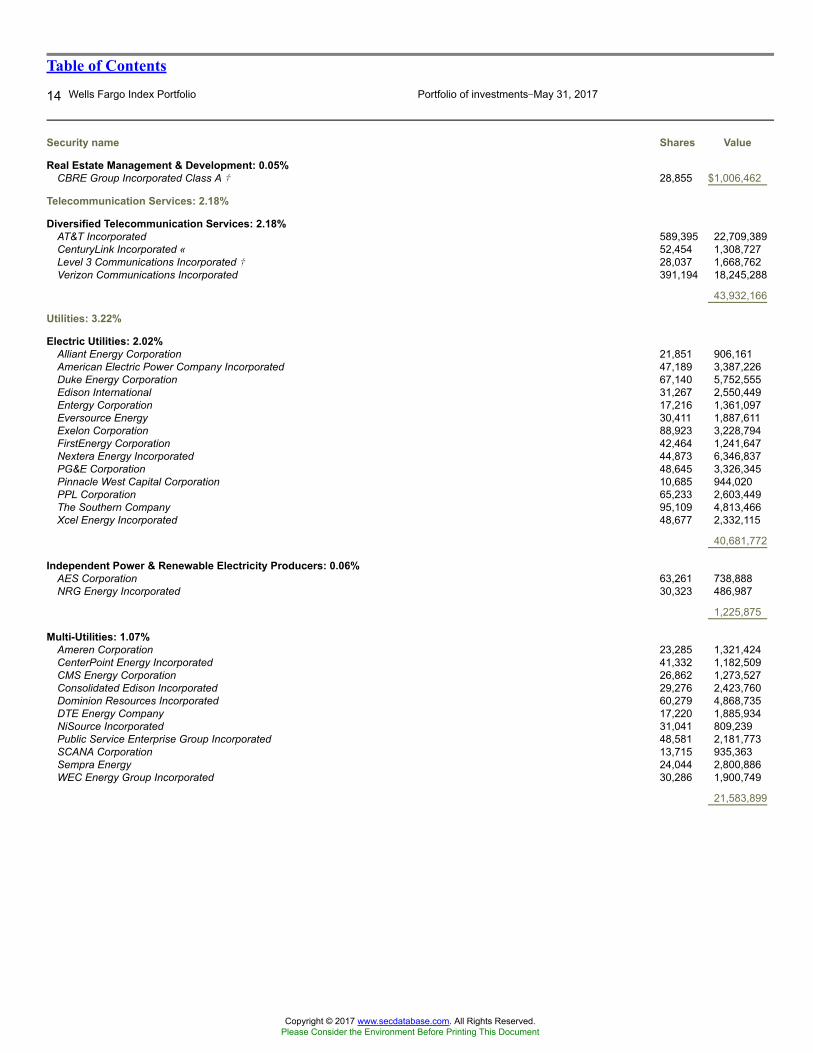
Table of Contents
14 Wells Fargo Index Portfolio Portfolio of investments�May 31, 2017
Security name Shares Value
Real Estate Management & Development: 0.05%CBRE Group Incorporated Class A � 28,855 $1,006,462
Telecommunication Services: 2.18%
Diversified Telecommunication Services: 2.18%AT&T Incorporated 589,395 22,709,389CenturyLink Incorporated « 52,454 1,308,727Level 3 Communications Incorporated � 28,037 1,668,762Verizon Communications Incorporated 391,194 18,245,288
43,932,166
Utilities: 3.22%
Electric Utilities: 2.02%Alliant Energy Corporation 21,851 906,161American Electric Power Company Incorporated 47,189 3,387,226Duke Energy Corporation 67,140 5,752,555Edison International 31,267 2,550,449Entergy Corporation 17,216 1,361,097Eversource Energy 30,411 1,887,611Exelon Corporation 88,923 3,228,794FirstEnergy Corporation 42,464 1,241,647Nextera Energy Incorporated 44,873 6,346,837PG&E Corporation 48,645 3,326,345Pinnacle West Capital Corporation 10,685 944,020PPL Corporation 65,233 2,603,449The Southern Company 95,109 4,813,466Xcel Energy Incorporated 48,677 2,332,115
40,681,772
Independent Power & Renewable Electricity Producers: 0.06%AES Corporation 63,261 738,888NRG Energy Incorporated 30,323 486,987
1,225,875
Multi-Utilities: 1.07%Ameren Corporation 23,285 1,321,424CenterPoint Energy Incorporated 41,332 1,182,509CMS Energy Corporation 26,862 1,273,527Consolidated Edison Incorporated 29,276 2,423,760Dominion Resources Incorporated 60,279 4,868,735DTE Energy Company 17,220 1,885,934NiSource Incorporated 31,041 809,239Public Service Enterprise Group Incorporated 48,581 2,181,773SCANA Corporation 13,715 935,363Sempra Energy 24,044 2,800,886WEC Energy Group Incorporated 30,286 1,900,749
21,583,899
Copyright © 2017 www.secdatabase.com. All Rights Reserved.Please Consider the Environment Before Printing This Document
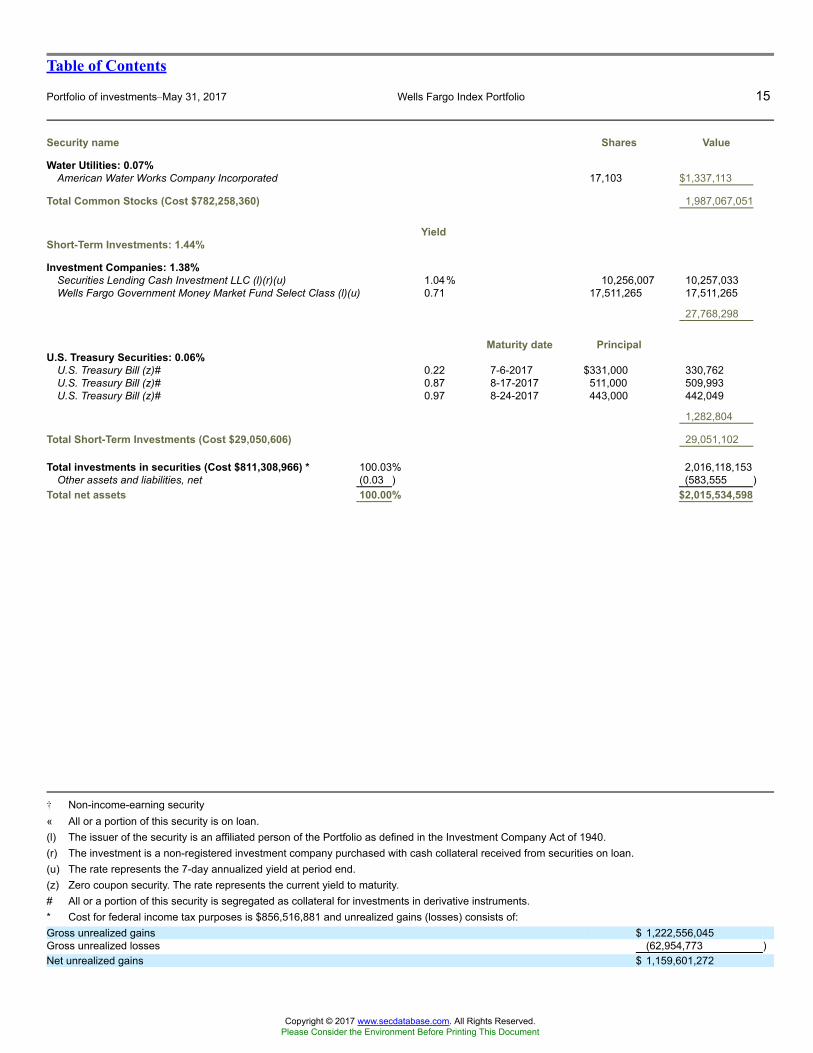
Table of Contents
Portfolio of investments�May 31, 2017 Wells Fargo Index Portfolio 15
Security name Shares Value
Water Utilities: 0.07%American Water Works Company Incorporated 17,103 $1,337,113
Total Common Stocks (Cost $782,258,360) 1,987,067,051
YieldShort-Term Investments: 1.44%
Investment Companies: 1.38%Securities Lending Cash Investment LLC (l)(r)(u) 1.04% 10,256,007 10,257,033Wells Fargo Government Money Market Fund Select Class (l)(u) 0.71 17,511,265 17,511,265
27,768,298
Maturity date PrincipalU.S. Treasury Securities: 0.06%
U.S. Treasury Bill (z)# 0.22 7-6-2017 $331,000 330,762U.S. Treasury Bill (z)# 0.87 8-17-2017 511,000 509,993U.S. Treasury Bill (z)# 0.97 8-24-2017 443,000 442,049
1,282,804
Total Short-Term Investments (Cost $29,050,606) 29,051,102
Total investments in securities (Cost $811,308,966) * 100.03% 2,016,118,153Other assets and liabilities, net (0.03 ) (583,555 )
Total net assets 100.00% $2,015,534,598
� Non-income-earning security« All or a portion of this security is on loan.(l) The issuer of the security is an affiliated person of the Portfolio as defined in the Investment Company Act of 1940.(r) The investment is a non-registered investment company purchased with cash collateral received from securities on loan.(u) The rate represents the 7-day annualized yield at period end.(z) Zero coupon security. The rate represents the current yield to maturity.# All or a portion of this security is segregated as collateral for investments in derivative instruments.* Cost for federal income tax purposes is $856,516,881 and unrealized gains (losses) consists of:Gross unrealized gains $ 1,222,556,045Gross unrealized losses (62,954,773 )Net unrealized gains $ 1,159,601,272
Copyright © 2017 www.secdatabase.com. All Rights Reserved.Please Consider the Environment Before Printing This Document
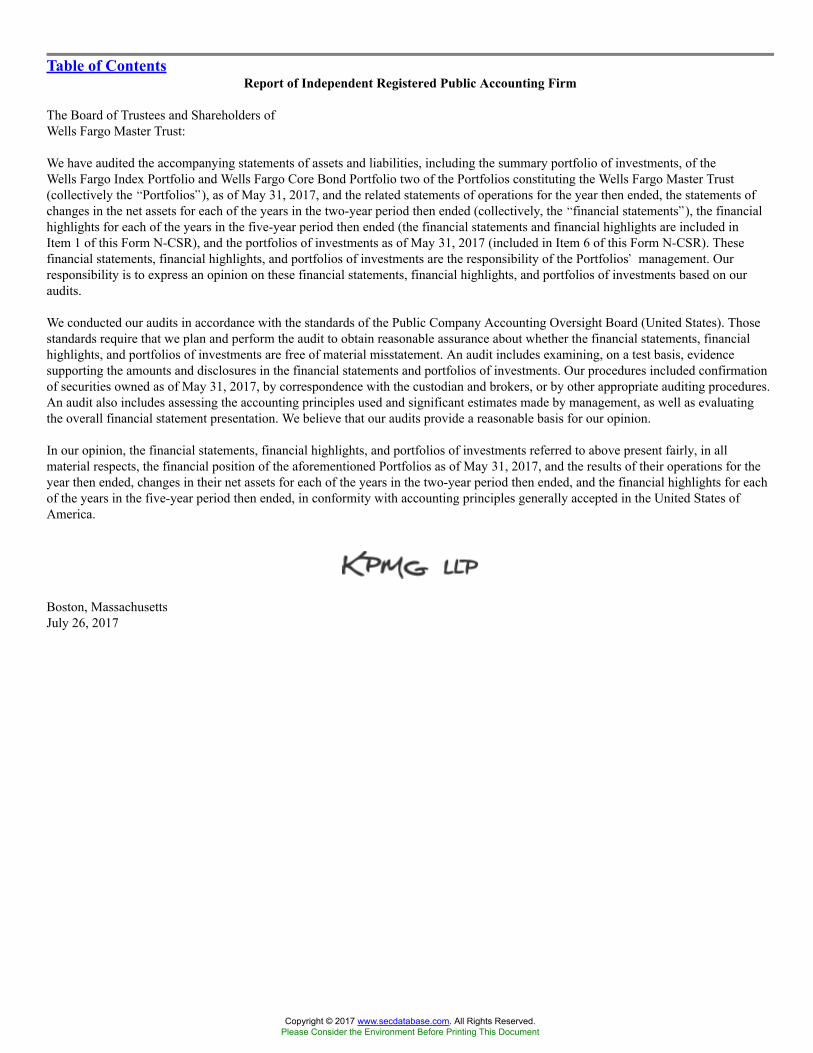
Table of ContentsReport of Independent Registered Public Accounting Firm
The Board of Trustees and Shareholders ofWells Fargo Master Trust:
We have audited the accompanying statements of assets and liabilities, including the summary portfolio of investments, of theWells Fargo Index Portfolio and Wells Fargo Core Bond Portfolio two of the Portfolios constituting the Wells Fargo Master Trust(collectively the �Portfolios�), as of May 31, 2017, and the related statements of operations for the year then ended, the statements ofchanges in the net assets for each of the years in the two-year period then ended (collectively, the �financial statements�), the financialhighlights for each of the years in the five-year period then ended (the financial statements and financial highlights are included inItem 1 of this Form N-CSR), and the portfolios of investments as of May 31, 2017 (included in Item 6 of this Form N-CSR). Thesefinancial statements, financial highlights, and portfolios of investments are the responsibility of the Portfolios� management. Ourresponsibility is to express an opinion on these financial statements, financial highlights, and portfolios of investments based on ouraudits.
We conducted our audits in accordance with the standards of the Public Company Accounting Oversight Board (United States). Thosestandards require that we plan and perform the audit to obtain reasonable assurance about whether the financial statements, financialhighlights, and portfolios of investments are free of material misstatement. An audit includes examining, on a test basis, evidencesupporting the amounts and disclosures in the financial statements and portfolios of investments. Our procedures included confirmationof securities owned as of May 31, 2017, by correspondence with the custodian and brokers, or by other appropriate auditing procedures.An audit also includes assessing the accounting principles used and significant estimates made by management, as well as evaluatingthe overall financial statement presentation. We believe that our audits provide a reasonable basis for our opinion.
In our opinion, the financial statements, financial highlights, and portfolios of investments referred to above present fairly, in allmaterial respects, the financial position of the aforementioned Portfolios as of May 31, 2017, and the results of their operations for theyear then ended, changes in their net assets for each of the years in the two-year period then ended, and the financial highlights for eachof the years in the five-year period then ended, in conformity with accounting principles generally accepted in the United States ofAmerica.
Boston, MassachusettsJuly 26, 2017
Copyright © 2017 www.secdatabase.com. All Rights Reserved.Please Consider the Environment Before Printing This Document
Table of ContentsITEM 7. DISCLOSURE OF PROXY VOTING POLICIES AND PROCEDURES FOR CLOSED-END MANAGEMENTINVESTMENT COMPANIES
Not applicable.
ITEM 8. PORTFOLIO MANAGERS OF CLOSED-END MANAGEMENT INVESTMENT COMPANIES
Not applicable.
ITEM 9. PURCHASES OF EQUITY SECURITIES BY CLOSED-END MANAGEMENT INVESTMENT COMPANY ANDAFFILIATED PURCHASERS
Not applicable.
ITEM 10. SUBMISSION OF MATTERS TO A VOTE OF SECURITY HOLDERS
There have been no material changes to the procedures by which shareholders may recommend nominees to the registrant�s Board ofTrustees that have been implemented since the registrant�s last provided disclosure in response to the requirements of this Item.
ITEM 11. CONTROLS AND PROCEDURES
(a) The President and Treasurer have concluded that the Wells Fargo Master Trust (the �Trust�) disclosure controls and procedures (asdefined in Rule 30a-3(c) under the Investment Company Act of 1940) provide reasonable assurances that material information relatingto the Trust is made known to them by the appropriate persons based on their evaluation of these controls and procedures as of a datewithin 90 days of the filing of this report.
(b) There were no significant changes in the Trust�s internal controls over financial reporting (as defined in Rule 30a-3(d) under theInvestment Company Act of 1940) that occurred during the second fiscal quarter of the period covered by this report that materiallyaffected, or is reasonably likely to materially affect, the registrant�s internal control over financial reporting.
ITEM 12. EXHIBITS
(a)(1) Code of Ethics pursuant to Item 2 of Form N-CSR is filed and attached hereto as Exhibit COE.
(a)(2) Certification pursuant to Rule 30a-2(a) under the Investment Company Act of 1940 (17 CFR 270.30a-2(a)) is filed and attachedhereto as Exhibit 99.CERT.
(a)(3) Not applicable.
(b) Certification pursuant to Rule 30a-2(b) under the Investment Company Act of 1940 (17 CFR 270.30a-2(b)) is filed and attachedhereto as Exhibit 99.906CERT.
Copyright © 2017 www.secdatabase.com. All Rights Reserved.Please Consider the Environment Before Printing This Document
Table of ContentsSIGNATURES
Pursuant to the requirements of the Securities Exchange Act of 1934 and the Investment Company Act of 1940, the registrant hasduly caused this report to be signed on its behalf by the undersigned, thereunto duly authorized.
Wells Fargo Master Trust
By: /s/ Andrew OwenAndrew OwenPresident
Date: July 26, 2017
Pursuant to the requirements of the Securities Exchange Act of 1934 and the Investment Company Act of 1940, this report hasbeen signed below by the following persons on behalf of the registrant and in the capacities and on the date indicated.
Wells Fargo Master Trust
By: /s/ Andrew OwenAndrew OwenPresident
Date: July 26, 2017
By: /s/ Nancy WiserNancy WiserTreasurer
Date: July 26, 2017
By: /s/ Jeremy DePalmaJeremy DePalmaTreasurer
Date: July 26, 2017
Copyright © 2017 www.secdatabase.com. All Rights Reserved.Please Consider the Environment Before Printing This Document
ASSET ALLOCATION TRUSTWELLS FARGO GLOBAL DIVIDEND OPPORTUNITY FUND
WELLS FARGO INCOME OPPORTUNITIES FUNDWELLS FARGO MULTI-SECTOR INCOME FUND
WELLS FARGO UTILITIES & HIGH INCOME FUNDWELLS FARGO FUNDS TRUST
WELLS FARGO MASTER TRUSTWELLS FARGO VARIABLE TRUST
CODE OF ETHICSPolicy on Personal Securities Transactions
RevisedMay 24, 2016
Copyright © 2017 www.secdatabase.com. All Rights Reserved.Please Consider the Environment Before Printing This Document
TABLE OF CONTENTS
1. OVERVIEW 11.1 Code of Ethics 11.2 Standards of Business Conduct 11.3 Your Duties 11.4 Our Duties and Responsibilities to You 2
2. TRADING ON INSIDER INFORMATION 22.1 What is Insider Trading? 22.2 Using Non-Public Information about an Account or our Advisory Activities 3
3. PERSONAL SECURITIES TRANSACTIONS 33.1 Avoid Conflicts of Interest 33.2 Reporting Person 43.3 Reporting Personal Securities Transactions 43.4 New Accounts 53.5 Reports of the CCO 63.6 Your Reports are Kept Confidential 63.7 Exceptions to Reporting 63.8 Summary of What You Need to Report 7
4. TRADING REQUIREMENTS, RESTRICTIONS AND EMPLOYEE COMPENSATION ACCOUNTS 84.1 Pre-Clearance Requirements for Reporting Persons 84.2 How to Pre-Clear Personal Securities Transactions 94.3 Trading Restrictions and Prohibitions 94.4 Ban on Short-Term Trading Profits 124.5 Employee Compensation Related Accounts 124.6 Your Reports are Kept Confidential 14
5. CODE VIOLATIONS 155.1 Investigating Code Violations 155.2 Penalties 155.3 Your Obligation to Report Violations 155.4 Exceptions to the Code 15
6. ANNUAL WRITTEN REPORTS TO THE BOARDS OF TRUSTEES 15
7. RECORD RETENTION 16
APPENDIX A DEFINITIONS 17
APPENDIX B ACKNOWLEDGEMENT AND CERTIFICATION 21
APPENDIX C QUARTERLY PERSONAL SECURITIES TRANSACTIONS REPORT 22
APPENDIX D INITIAL HOLDINGS REPORT 23
APPENDIX E ANNUAL HOLDINGS REPORT 24
Copyright © 2017 www.secdatabase.com. All Rights Reserved.Please Consider the Environment Before Printing This Document
Wells Fargo Funds
1. OVERVIEW
1.1 Code of Ethics
See the Definitionslocated inAppendix A fordefinitions ofcapitalized andcertain other terms
Asset Allocation Trust, Wells Fargo Income Opportunities Fund, Wells Fargo Multi- SectorIncome Fund, Wells Fargo Global Dividend Opportunity Fund and Wells Fargo Utilities & HighIncome Fund, Wells Fargo Funds Trust, Wells Fargo Master Trust and Wells Fargo VariableTrust (including all �feeder funds� of Wells Fargo Master Trust that are advised or administeredby Wells Fargo Funds Management, LLC (�Funds Management�), or, �feeder funds� of AssetAllocation Trust, advised by Grantham, Mayo, Van Otterloo & Co., LLC (�GMO�), each aninvestment adviser registered under the Investment Advisers Act of 1940 (�Advisers Act�), oran affiliate thereof) (each, including the series thereof, a �Wells Fargo Fund� and collectively,the �Wells Fargo Funds�), all registered investment companies under the Investment CompanyAct of 1940 (the �1940 Act�), adopt this Code of Ethics (the �Code�) pursuant to Rule 17j-1under the 1940 Act. The Code outlines the policies and procedures to follow and the guidelinesthat govern Personal Securities Transactions.
The Wells Fargo Funds are committed to maintaining the highest ethical standards. The WellsFargo Funds have a no tolerance policy for dishonesty, self-dealing and trading on material,Non-Public Information.
Each Reporting Person, as defined below, is required to read the Code annually. Additionally,each Reporting Person must certify upon receiving the Code (or any new copy of a revised Codepursuant to Section 1.3 below) that he or she has received, read, understands, and is subject tothe Code�s provisions and reporting requirements.See Appendix B.
1.2 Standards of Business Conduct
You must always observe the highest standards of business conduct and follow all applicablelaws and regulations. You may never:
● Use any device, scheme or artifice to defraud the Wells Fargo Funds;
● Make any untrue statement of a material fact to the Wells Fargo Funds or mislead theWells Fargo Funds by omitting to state a material fact;
● Engage in any act, practice or course of business that would defraud or deceive theWells Fargo Funds;
● Engage in any manipulative practice with respect to the Wells Fargo Funds;
● Engage in any inappropriate trading practices, including price manipulation; or
● Engage in any transaction that may give the appearance of impropriety.
1.3 Your Duties
You have a duty of loyalty to the shareholders of the Wells Fargo Funds. That means you alwaysneed to act in the best interests of the Wells Fargo Funds. You must never do anything thatallows (or appears to allow) you to inappropriately benefit from your relationships with theWells Fargo Funds.
Copyright © 2017 www.secdatabase.com. All Rights Reserved.Please Consider the Environment Before Printing This Document
You cannot engage in activities such as self-dealing and must disclose all conflicts of interestbetween the interests of the Wells Fargo Funds and your personal interests to the ComplianceDepartment.
May 24, 2016 1 Code of Ethics
Copyright © 2017 www.secdatabase.com. All Rights Reserved.Please Consider the Environment Before Printing This Document
Wells Fargo Funds
As a person subject to this Code, you must:● Be ethical;● Act professionally;● Exercise independent judgment;● Comply with all applicable Federal Securities Laws;● Comply with all applicable laws (U.S. Foreign Corrupt Practices Act● (FCPA), the UK Bribery Act 2010 (Bribery Act), and other foreign laws) prohibiting
bribery of government officials or other third parties;1Adhere to all Wells Fargo Fundspolicies;
● Avoid conflicts of interest, and situations which create the perception of a conflict ofinterest. A conflict of interest exists when financial or other incentives motivates aperson to place their or Wells Fargo�s interest ahead of our customer.
● Promptly report violations or suspected violations of the Code to the ComplianceDepartment;
● Cooperate fully, honestly and in a timely manner with a Risk & Compliance Departmentinvestigation or inquiry.
1.4 Our Duties and Responsibilities to You
To help you comply with this Code, the CCO and Compliance Department will:
● Notify you in writing of the Code reporting requirements.
● Make a copy of the Code available and require certification that you have read,understand, and will abide by the Code.
● Make available a revised copy of the Code if there are any material amendments to it andrequire you to certify receipt and understanding of the revised Code.
● Periodically compare all reported Personal Securities Transactions with the portfoliotransactions report of the Wells Fargo Funds. Before we determine if you may haveviolated the Code on the basis of this comparison, we will give you an opportunity toprovide an explanation.
● Review the Code at least once a year to assess its adequacy and effectiveness.
2. TRADING ON INSIDER INFORMATION
The law requires there to be written policies and procedures with enforcement to prevent ReportingPersons from misusing material, non-public information. Funds Management does this by:
● Limiting access to files likely to contain non-public information,● Restricting or monitoring trades, including trades in securities about you might have non-
public information, and● Providing continuing education programs about insider trading.
2.1 What is Insider Trading?
Copyright © 2017 www.secdatabase.com. All Rights Reserved.Please Consider the Environment Before Printing This Document

WARNING!Insider trading isillegal. You could goto prison or be forcedto pay a large fine forparticipating in insidertrading. Wells Fargocould also be fined foryour actions.
Insider trading is generally defined as occurring when a person has possession of material, non-public information about an issuer and engages in a Personal Securities Transaction involvingsecurities issued by the issuer, or discloses the information to others who then trade in theissuer�s securities.
May 24, 2016 2 Code of Ethics
Copyright © 2017 www.secdatabase.com. All Rights Reserved.Please Consider the Environment Before Printing This Document
Wells Fargo Funds
Information is considered material if there is a substantial likelihood that a reasonable investorwould consider it important in deciding how to act. Information is considered non-public whenit has not been made available to investors generally. Information becomes public once it ispublicly disseminated. Limited disclosure does not make the information public (for example, ifan insider makes information available to a select group of individuals, it is not public).
Examples of illegal and prohibited insider trading and related activity include, but are not limited to, thefollowing:
● Tipping of material, non-public information is illegal and prohibited. Tipping occurs whennon-public information about an issuer is given to someone else who then trades in securitiesof the issuer.
● Front running is illegal and prohibited. Front running is trading ahead of an Account in thesame or equivalent security (such as options) in order to make a profit or to avoid a loss.
● Scalping is illegal and prohibited. Scalping is purchasing or selling a security (or anequivalent security) for a personal account prior to a recommend/buy or recommend/sell thatsecurity or equivalent for an Account.
2.2 Using Non-Public Information about an Account or our Advisory Activities
You may not:
● Share with any other person (unless permitted or required by law, it�s necessary to carry outduties and appropriate confidentiality protections are in place, as necessary) any non-publicinformation about an Account, including:
¡ Any securities holdings or transactions of an Account;¡ Any securities recommendation made to an Account;¡ Any securities transaction (or transaction under consideration) by an Account,
including information about actual or contemplated investment decisions;¡ Any changes to portfolio management teams of Reportable Funds;¡ any information about planned mergers or liquidations of Reportable Funds; and¡ Any Management Valuation Team proceedings and plans for future actions (either
through attendance at, or receipt of the output from, such proceedings).● Use any non-public information regarding an Account in any way that might compete with,
or be contrary to, the interest of such Account.● Use any non-public information regarding an Account in any way for personal gain.NOTE: Registered Representatives of the Distributor may have other requirements andlimitations set forth in the Written Supervisory Procedures.
3. PERSONAL SECURITIES TRANSACTIONS
3.1 Avoid Conflicts of Interest
When engaging in Personal Securities Transactions, there might be conflicts between the interests of theWells Fargo Funds and your personal interests. Any conflicts that arise in such Personal SecuritiesTransactions must be resolved in a manner that does not inappropriately benefit you or adversely affect theWells Fargo Funds or their shareholders. You shall always place the financial and business interests of theWells Fargo Funds before your own personal financial and business interests.
May 24, 2016 3 Code of Ethics
Copyright © 2017 www.secdatabase.com. All Rights Reserved.Please Consider the Environment Before Printing This Document
Wells Fargo Funds
Examples of inappropriate resolutions of conflicts are:
● Taking an investment opportunity away from a Wells Fargo Fund to benefit a portfolio ofwhich you have Beneficial Ownership;
● Using your position to take advantage of available investments;● Front running a Wells Fargo Fund by trading in securities (or equivalent securities) ahead
of a Wells Fargo Fund;● Taking advantage of information or using Wells Fargo Fund portfolio assets to affect the
market in a way that personally benefits you or a portfolio of which you have BeneficialOwnership;
● Any other behavior determined by the CCO to be or have the appearance of a conflict
3.2 Reporting Person
The Code applies to you if you are a Reporting Person of the Wells Fargo Funds because youmay, at some time, have access to or obtain investment information.
Reporting Persons are:
● All Wells Fargo Fund officers;
● All Wells Fargo Fund trustees, either interested or disinterested;
● Each Wells Fargo Fund employee and any employee of any company in a controlrelationship to the Wells Fargo Funds who, in connection with his or her regularfunctions or duties, makes, participates, in or obtains information regarding, the purchaseor sale of securities by a Wells Fargo Fund, or whose functions relate to the making ofany recommendations with respect to such purchases or sales;
● All natural persons in a control relationship with a Wells Fargo Fund who obtaininformation concerning recommendations made to a Wells Fargo Fund with regard to thepurchase or sale of a Security by a Wells Fargo Fund; or
● Anyone else designated in writing by the Chief Compliance Officer (�CCO�).
Any member of an advisory board to a Wells Fargo Fund (�Advisory Board Member�) will alsobe treated as a Reporting Person solely for purposes of this Code. As a Reporting Person, unlessyou are exempt from reporting as an Independent Trustee (as described in Section 3.7 below),you are required to report your initial holdings when you become a Reporting Person, annualholdings each year, and quarterly transactions in any securities in which you or any ImmediateFamily Member has any direct or indirect beneficial ownership. (You are not required to reporttransactions for, and securities held in, any account over which neither you nor any member ofyour immediate family has any direct or indirect influence or control.)
3.3 Reporting Personal Securities Transactions
Generally, all Reporting Persons must report all Personal Securities Accounts, along with theholdings and transactions of Reportable Securities in those accounts. Personal SecuritiesAccounts include those accounts of Immediate Family Members and accounts in whichReporting Persons are a Beneficial Owner. There are three types of reports:
(1) an initial holdings report that is filed upon becoming a Reporting Person, (2) a quarterlytransaction report, and (3) an annual holdings report.
Copyright © 2017 www.secdatabase.com. All Rights Reserved.Please Consider the Environment Before Printing This Document

May 24, 2016 4 Code of Ethics
Copyright © 2017 www.secdatabase.com. All Rights Reserved.Please Consider the Environment Before Printing This Document
Wells Fargo Funds
Each broker-dealer, bank, or fund company where you have a Personal Securities Account mustreceive a request for the Risk & Compliance Department to receive all account statements andconfirmations from such accounts.1 The Code Team will make this request on behalf of theReporting Person after the accounts are disclosed.
1. Initial Holdings Report. Within 10 days of becoming a Reporting Person:
● All Personal Securities Accounts, including broker name and account numberinformation must be reported to the Code of Ethics team via the Transaction MonitoringSystem (�TMS�).
● Statements (electronic or paper) for all Personal Securities Accounts must be providedby Reporting Persons to the Code Team.
● All holdings of Reportable Securities in Personal Securities Accounts must be input intothe Code of Ethics TMS into an Initial Holdings Report. The information in the reportmust be current as of a date no more than 45 days prior to the date of becoming aReporting Person.
● This Initial Holdings Report must be provided to the Risk & Compliance Department bythe business day immediately before the weekend or holiday if the 10th day falls on aweekend or holiday.
2. Quarterly Transactions Reports. Within 30 days of calendar quarter end:
● Reporting Persons must supply to the Code team a report, most commonly via the Codeof Ethics Transaction Monitoring System, showing all Securities trades made inReporting Persons� Personal Securities Accounts during the quarter. This report andmust be submitted even if there were not any Securities trades transacted during thequarter.
● Reporting Persons will certify as to the correctness and completeness of this report.● This report and certification must be provided to the Code team by the business day
immediately before the weekend or holiday if the 30th day falls on a weekend or holiday.
3. Annual Holdings Reports. Within 30 days of each year end:
● All holdings of Securities in all Personal Securities Accounts, must be reported to theCode Team via the Code of Ethics Transaction Monitoring System. The information inthe report must be current as of a date no more than 45 days prior to when you give usthe report.
● Reporting Persons will certify as to the correctness and completeness of this report.● This report must be provided to the Code Team by the business day immediately before
the weekend or holiday if the 30th day falls on a weekend or holiday.
3.4 New Accounts
Reporting Persons must inform the Code Team via the TMS of any new Personal SecuritiesAccounts established within 10 days of receiving the account number or prior to executing apreclearable transaction, whichever occurs first.
1 All accounts that have the ability to hold Reportable Securities must be included even if the account does not have holdings of those securities at the reportdate.
May 24, 2016 5 Code of Ethics
Copyright © 2017 www.secdatabase.com. All Rights Reserved.Please Consider the Environment Before Printing This Document
Wells Fargo Funds
3.5 Reports of the CCO
Any personal Securities holdings and transaction reports required to be filed by aCCO must be submitted to an alternate designee who will fulfill the duties of theCCO with respect to those reports.
3.6 Your Reports are Kept Confidential
Funds Management will use reasonable efforts to ensure that the informationsubmitted to the Risk & Compliance Department as required by this Code are keptconfidential. Information will be reviewed by members of the Risk & ComplianceDepartment and possibly our senior executives or legal counsel. Data may beprovided to Reportable Fund officers and trustees, and will be provided togovernment authorities upon request or others if required to do so by law or courtorder.
3.7 Exceptions to Reporting
Independent Trustee Reporting Exceptions: If you are an Independent Trustee2, youare exempt from initial and annual holdings reports described in Section 2.3 aboveand may be exempt from transaction reports based on limited access to informationabout portfolio management activities. In lieu of the initial holdings reports, youmust certify upon receiving the Code (or any new copy of a revised Code pursuantto Section 1.3 above) that you acknowledge that you are a Non-Reporting Personsubject to the Code and are not required to submit an initial holdings report.
You are not required to submit quarterly transaction reports, unless you knew at thetime of the transaction, or in the ordinary course of fulfilling your official duties astrustee should have known,3 that, during the 15-day period immediately precedingor following the date of such transaction, the same security was purchased or soldby the Wells Fargo Funds (or any series thereof), or was being considered forpurchase or sale by the Wells Fargo Funds (or any series thereof) or by aninvestment adviser or investment sub-adviser thereto.
A copy of the initial certification form is included as Appendix B. If you are unableto meet the filing exemption, you will be required to report as indicated in section2.3 above for the designated period(s).
Reporting Persons of Funds Management: If you are a Reporting Person who is alsoa Reporting Person under the Funds Management Code of Ethics, you do not needto file duplicate reports specifically under this Code so long as you comply with thereporting requirements under the Funds Management Code of Ethics and the reportsthat you file under the Funds Management Code of Ethics include all holdings andtransactions and other information otherwise required to be reported under thisCode.
Copyright © 2017 www.secdatabase.com. All Rights Reserved.Please Consider the Environment Before Printing This Document
2 Defined as a trustee of the Wells Fargo Funds who is not an �interested person� of the Wells Fargo Funds within the meaning of section 2(a)(19) of the1940 Act. An Advisory Board Member who is not an �interested person� of the Wells Fargo Funds within the meaning of section 2(a)(19) of the 1940 Actwill be treated as an Independent Trustee solely for purposes of this Code.
3 The �should have known� standard does not:● imply a duty of inquiry;● presume I should have deduced or extrapolated from the discussions or memoranda dealing with the Wells Fargo Fund�s investment strategies; or● impute knowledge from my awareness of a Wells Fargo Fund�s holdings, market considerations, or investment policies, objectives and
restrictions.
May 24, 2016 6 Code of Ethics
Copyright © 2017 www.secdatabase.com. All Rights Reserved.Please Consider the Environment Before Printing This Document
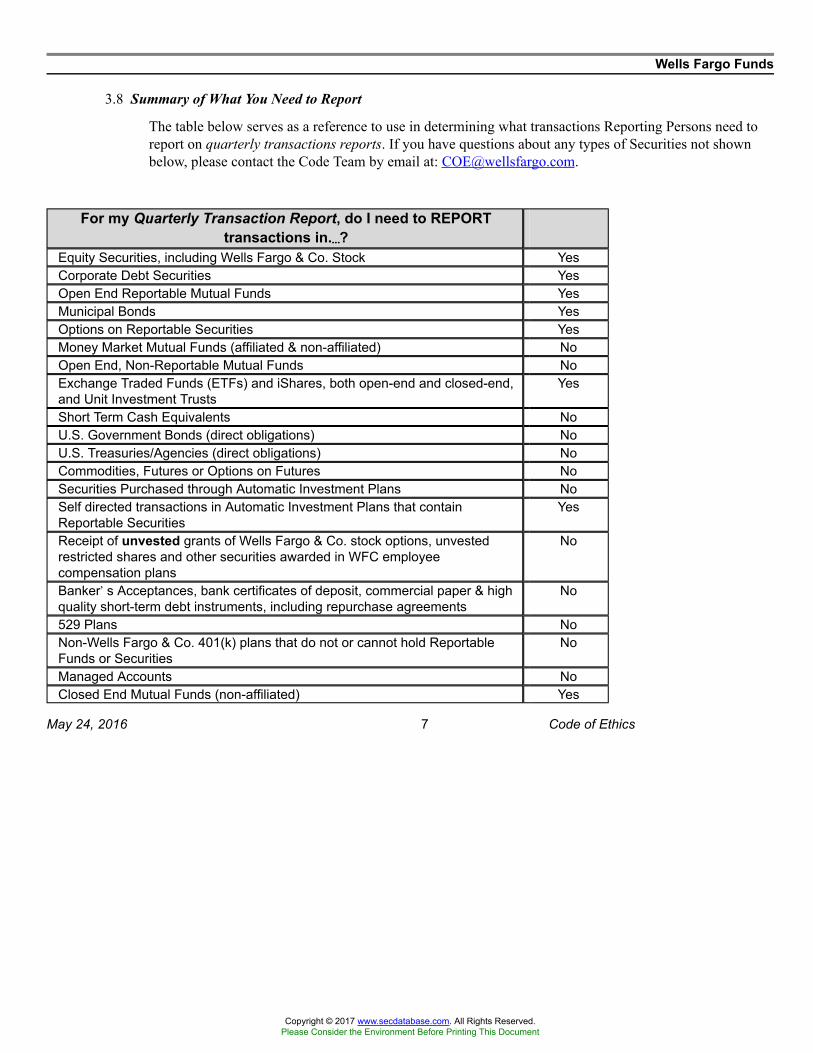
Wells Fargo Funds
3.8 Summary of What You Need to Report
The table below serves as a reference to use in determining what transactions Reporting Persons need toreport on quarterly transactions reports. If you have questions about any types of Securities not shownbelow, please contact the Code Team by email at: [email protected].
For my Quarterly Transaction Report, do I need to REPORTtransactions in.��?
Equity Securities, including Wells Fargo & Co. Stock YesCorporate Debt Securities YesOpen End Reportable Mutual Funds YesMunicipal Bonds YesOptions on Reportable Securities YesMoney Market Mutual Funds (affiliated & non-affiliated) NoOpen End, Non-Reportable Mutual Funds NoExchange Traded Funds (ETFs) and iShares, both open-end and closed-end,and Unit Investment Trusts
Yes
Short Term Cash Equivalents NoU.S. Government Bonds (direct obligations) NoU.S. Treasuries/Agencies (direct obligations) NoCommodities, Futures or Options on Futures NoSecurities Purchased through Automatic Investment Plans NoSelf directed transactions in Automatic Investment Plans that containReportable Securities
Yes
Receipt of unvested grants of Wells Fargo & Co. stock options, unvestedrestricted shares and other securities awarded in WFC employeecompensation plans
No
Banker�s Acceptances, bank certificates of deposit, commercial paper & highquality short-term debt instruments, including repurchase agreements
No
529 Plans NoNon-Wells Fargo & Co. 401(k) plans that do not or cannot hold ReportableFunds or Securities
No
Managed Accounts NoClosed End Mutual Funds (non-affiliated) Yes
May 24, 2016 7 Code of Ethics
Copyright © 2017 www.secdatabase.com. All Rights Reserved.Please Consider the Environment Before Printing This Document
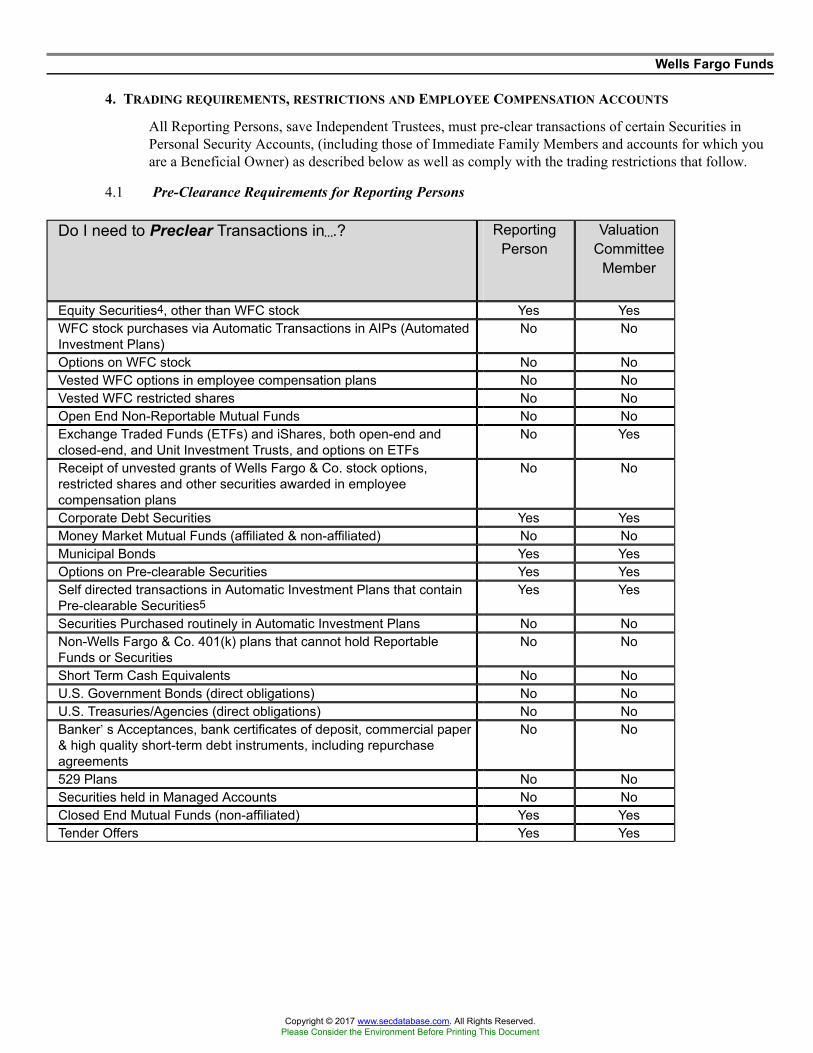
Wells Fargo Funds
4. TRADING REQUIREMENTS, RESTRICTIONS AND EMPLOYEE COMPENSATION ACCOUNTS
All Reporting Persons, save Independent Trustees, must pre-clear transactions of certain Securities inPersonal Security Accounts, (including those of Immediate Family Members and accounts for which youare a Beneficial Owner) as described below as well as comply with the trading restrictions that follow.
4.1 Pre-Clearance Requirements for Reporting Persons
Do I need to Preclear Transactions in�.? ReportingPerson
ValuationCommittee
Member
Equity Securities4, other than WFC stock Yes YesWFC stock purchases via Automatic Transactions in AIPs (AutomatedInvestment Plans)
No No
Options on WFC stock No NoVested WFC options in employee compensation plans No NoVested WFC restricted shares No NoOpen End Non-Reportable Mutual Funds No NoExchange Traded Funds (ETFs) and iShares, both open-end andclosed-end, and Unit Investment Trusts, and options on ETFs
No Yes
Receipt of unvested grants of Wells Fargo & Co. stock options,restricted shares and other securities awarded in employeecompensation plans
No No
Corporate Debt Securities Yes YesMoney Market Mutual Funds (affiliated & non-affiliated) No NoMunicipal Bonds Yes YesOptions on Pre-clearable Securities Yes YesSelf directed transactions in Automatic Investment Plans that containPre-clearable Securities5
Yes Yes
Securities Purchased routinely in Automatic Investment Plans No NoNon-Wells Fargo & Co. 401(k) plans that cannot hold ReportableFunds or Securities
No No
Short Term Cash Equivalents No NoU.S. Government Bonds (direct obligations) No NoU.S. Treasuries/Agencies (direct obligations) No NoBanker�s Acceptances, bank certificates of deposit, commercial paper& high quality short-term debt instruments, including repurchaseagreements
No No
529 Plans No NoSecurities held in Managed Accounts No NoClosed End Mutual Funds (non-affiliated) Yes YesTender Offers Yes Yes
Copyright © 2017 www.secdatabase.com. All Rights Reserved.Please Consider the Environment Before Printing This Document
4 It is not necessary to pre-clear transactions in WFC stock. See restrictions on WFC related issues in Section 4.2.3.5 See additional information regarding AIPs in Section 4.4.
May 24, 2016 8 Code of Ethics
Copyright © 2017 www.secdatabase.com. All Rights Reserved.Please Consider the Environment Before Printing This Document
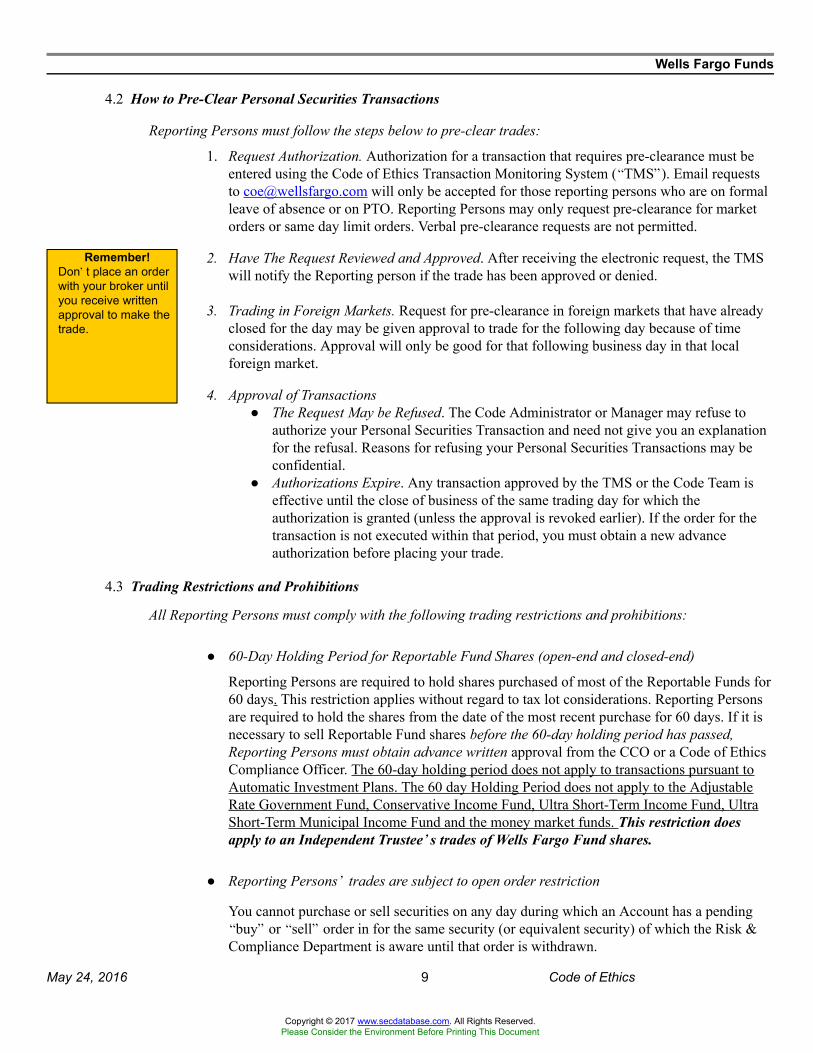
Wells Fargo Funds
4.2 How to Pre-Clear Personal Securities Transactions
Reporting Persons must follow the steps below to pre-clear trades:
1. Request Authorization. Authorization for a transaction that requires pre-clearance must beentered using the Code of Ethics Transaction Monitoring System (�TMS�). Email requeststo [email protected] will only be accepted for those reporting persons who are on formalleave of absence or on PTO. Reporting Persons may only request pre-clearance for marketorders or same day limit orders. Verbal pre-clearance requests are not permitted.
2. Have The Request Reviewed and Approved. After receiving the electronic request, the TMSwill notify the Reporting person if the trade has been approved or denied.
3. Trading in Foreign Markets. Request for pre-clearance in foreign markets that have alreadyclosed for the day may be given approval to trade for the following day because of timeconsiderations. Approval will only be good for that following business day in that localforeign market.
Remember!Don�t place an orderwith your broker untilyou receive writtenapproval to make thetrade.
4. Approval of Transactions● The Request May be Refused. The Code Administrator or Manager may refuse to
authorize your Personal Securities Transaction and need not give you an explanationfor the refusal. Reasons for refusing your Personal Securities Transactions may beconfidential.
● Authorizations Expire. Any transaction approved by the TMS or the Code Team iseffective until the close of business of the same trading day for which theauthorization is granted (unless the approval is revoked earlier). If the order for thetransaction is not executed within that period, you must obtain a new advanceauthorization before placing your trade.
4.3 Trading Restrictions and Prohibitions
All Reporting Persons must comply with the following trading restrictions and prohibitions:
● 60-Day Holding Period for Reportable Fund Shares (open-end and closed-end)
Reporting Persons are required to hold shares purchased of most of the Reportable Funds for60 days. This restriction applies without regard to tax lot considerations. Reporting Personsare required to hold the shares from the date of the most recent purchase for 60 days. If it isnecessary to sell Reportable Fund shares before the 60-day holding period has passed,Reporting Persons must obtain advance written approval from the CCO or a Code of EthicsCompliance Officer. The 60-day holding period does not apply to transactions pursuant toAutomatic Investment Plans. The 60 day Holding Period does not apply to the AdjustableRate Government Fund, Conservative Income Fund, Ultra Short-Term Income Fund, UltraShort-Term Municipal Income Fund and the money market funds. This restriction doesapply to an Independent Trustee��s trades of Wells Fargo Fund shares.
● Reporting Persons� trades are subject to open order restriction
You cannot purchase or sell securities on any day during which an Account has a pending�buy� or �sell� order in for the same security (or equivalent security) of which the Risk &Compliance Department is aware until that order is withdrawn.
May 24, 2016 9 Code of Ethics
Copyright © 2017 www.secdatabase.com. All Rights Reserved.Please Consider the Environment Before Printing This Document
Wells Fargo Funds
● Reporting Persons� trades are subject to a 15-day blackout restriction
There is a �15-day blackout� on purchases or sales of securities bought or sold by anAccount. This means that you may not buy or sell a security (or equivalent security) duringthe 7-day periods immediately preceding and immediately following the date the Accounttrades in the security (�blackout security�). During the blackout period, activity will bemonitored by the Code Team or the Code Administrator and any Personal SecuritiesTransactions during a blackout window will be evaluated and investigated based on eachsituation. Penalties may range from no action to potential disgorgement of profits orpayment of avoided losses (see Section 6 for Code violations and penalties). During ablackout period, purchases of a blackout security may be subject to mandatory divestment.Similarly, during a blackout period, sales of a blackout security may be subject to mandatoryrepurchase.
In the case of a purchase and subsequent mandatory divestment at a higher price, any profitsderived upon divestment may be subject to disgorgement; disgorged profits will be donatedto the Reporting Person�s charity of choice. In the case of a sale and subsequent mandatoryrepurchase at a lower price, the Reporting Person may be required to make up any avoidedlosses, as measured by the difference between the repurchase price and the price at which thesecurity was sold; such avoided losses will be donated to the Reporting Person�s charity ofchoice.
For example, if an Account trades in a blackout security on July 7, July 15 (the 8th dayfollowing the trade date) would be the 1st day Reporting Persons may engage in a PersonalSecurities Transaction involving that security, and any purchases and sales in the blackoutsecurity made on or after June 30 through July 14 could be subject to divestment orrepurchase. Purchases and sales in the security made on or before June 29 (the 8th daybefore the trade date) would not be within the blackout period.
● De minimis exception
There is a De minimis exception to the restrictions described in 4.3.2, and 4.3.3 above (OpenOrder and Blackout). Reporting Persons may purchase and sell Large CapitalizationSecurities of up to $25,000, unless this conflicts with the 60-day short-term profit restrictiondescribed in section 4.4. The De minimis exception does not apply to options.
● IPOs
Reporting Persons are prohibited from purchasing shares in an Initial PublicOffering. Reporting Persons must get written approval from the Code Administrator beforeselling shares that were acquired in an IPO prior to starting work with Wells Fargo.Reporting Persons may, subject to pre-clearance requirements, purchase shares in a PrivatePlacement as long as the position will be less than a 10% interest in the issuer.
● WFC Derivatives
You may not invest or engage in derivative or hedging transactions involving securitiesissued by Wells Fargo & Co, including but not limited to options contracts (other thanemployee stock options), puts, calls, short sales, futures contracts, or other similartransactions regardless of whether you have material inside information.�
● Wells Fargo Fund Closed End Funds
You may not participate in a tender offer made by a closed-end Wells Fargo Fund under theterms of which the number of shares to be purchased is limited to less than all of theoutstanding shares of such closed-end Wells Fargo Fund.
May 24, 2016 10 Code of Ethics
Copyright © 2017 www.secdatabase.com. All Rights Reserved.Please Consider the Environment Before Printing This Document
Wells Fargo Funds
● No Reporting Person may purchase or sell shares of any closed-end Wells Fargo Fund within60 days of the later of
� (i) the initial closing of the issuance of shares of such fund or� (ii) the final closing of the issuance of shares in connection with an
overallotment option.● Reporting Persons may purchase or sell shares of closed-end Wells Fargo Funds only during
the 10-day period following the release of portfolio holdings information to the public forsuch fund, which typically occurs on or about the 15th day following the end of eachcalendar quarter. Certain Reporting Persons, who shall be notified by the Legal Department,are required to make filings with the Securities and Exchange Commission in connectionwith purchases and sales of shares of closed-end Wells Fargo Funds.
● Investment Clubs
Reporting Persons may not participate in the activities of an Investment Club without theprior approval from the Code Administrator. If applicable, trades for an Investment Clubwould need to be pre-cleared.
● Personal Transactions
Reporting Persons are prohibited from executing or processing through a CoveredCompany�s direct access software (TA2000 or any other similar software):
● Reporting Persons� own personal transactions,● Transactions for Immediate Family Members, or● Transactions for accounts of other persons for which the Reporting Person or his
immediate Family Member have been given investment discretion.
This provision does not exclude you from trading directly with a broker/dealer or using abroker/dealer�s software. The foregoing also does not prohibit you from executing orprocessing transactions in Wells Fargo & Co. securities granted to you as compensationthrough an online program designated by Wells Fargo & Co. for such purpose.
● Intention to Buy or Sell for Accounts
Reporting Persons are prohibited from buying or selling securities when they intend, or knowof another�s intention, to purchase or sell that security (or an equivalent security) for anAccount. This prohibition applies whether the Personal Securities Transaction is in the samedirection (e.g., two purchases or two sales) or the opposite direction (e.g., a purchase andsale) as the transaction for the Account.
● Reporting Persons must not attempt to manipulate the market
Reporting Persons must not execute any transactions intended to raise, lower, or maintain theprice of any security or to create a false appearance of active trading.
● Excessive Trading
Excessive Trading for Personal Securities Accounts is strongly discouraged and PersonalSecurities Accounts will be monitored for Excessive Trading activity and reported tomanagement. Additional restrictions may be imposed by the Compliance Department on aReporting Person if Excessive Trading is noted for a Personal Securities Account.
May 24, 2016 11 Code of Ethics
Copyright © 2017 www.secdatabase.com. All Rights Reserved.Please Consider the Environment Before Printing This Document
Wells Fargo Funds
4.4 Ban on Short-Term Trading Profits
There is a ban on short-term trading profits. Reporting Persons are not permitted to buy and sell, or selland buy, the same Pre-clearable Security (or equivalent security) within 60 calendar days and make aprofit; this will be considered short-term trading.
● This prohibition applies without regard to tax lot.● Short sales are subject to the 60 day profit ban.
If a Reporting Person makes a profit on an involuntary call of an option, those profits are excluded fromthis ban; however, buying and selling options within 60 calendar days resulting in profits is prohibited.Settlement/expiration date on the opening option transaction must be at least 60 days out.
Sales or purchases made at the original purchase or sale price or at a loss are not prohibited during the 60calendar day profit holding period.
You may be required to disgorge any profits you make from any sale before the 60-day period expires. Incounting the 60 calendar days, multiple transactions in the same security (or Equivalent Security) will becounted in such a manner as to produce the shortest time period between transactions.
Although certain transactions may be deemed de minimis (i.e., the exceptions noted in Section 4.3),they are still subject to the ban on short-term trading profits and are required to be input into theCode of Ethics Transactions Monitoring System.
The ban on short-term trading profits does not apply to transactions that involve:
● Securities not requiring pre-clearance (i.e., ETFs)● Same-day sales of securities acquired through the exercise of employee stock options or
other Wells Fargo & Co. securities granted to you as compensation or through the delivery(constructive or otherwise) of previously owned employer stock to pay the exercise price andtax withholding;
● Commodities, futures (including currency futures), options on futures and options oncurrencies; or
● Automated purchases or sales that were done as part of an Automatic Investment Plan(�AIP�). However, any self-directed purchases or sales outside the pre-set schedule orallocation of the AIP, or other changes to the pre-set schedule or allocation of the AIP, withina 60-day period, are subject to the 60-day ban on short term profit.
4.5 Employee Compensation Related Accounts
1. 401(k) Plans
Initial Holding Report:● Reporting Persons who have an established Wells Fargo 401(k) plan with a non-zero
balance are required to report their 401(k) balances in Reportable Funds as part of theInitial Holdings Reporting process. In addition, Reporting Persons are required to furnishto the Code Team, in writing, the investment allocation percentages for Reportable Fundsin their Wells Fargo 401(K).
● 401(k) Plans that are external to Wells Fargo are required to be reported if, regardless ofthe balance,, the plan is capable of holding Reportable Funds or Reportable Securities.
Quarterly Transaction Report:● Reporting Persons are required to report self-directed transactions in Reportable Funds in
Wells Fargo 401(k) plans that occurred outside of the previously reported investmentallocations. This reporting may be made on behalf of the Reporting Person by the 401(k)plan administration area to Risk & Compliance.
Copyright © 2017 www.secdatabase.com. All Rights Reserved.Please Consider the Environment Before Printing This Document

May 24, 2016 12 Code of Ethics
Copyright © 2017 www.secdatabase.com. All Rights Reserved.Please Consider the Environment Before Printing This Document
Wells Fargo Funds
● Reporting Persons are required to report transactions in Reportable Funds or Securities in401(k) plans held outside of Wells Fargo.
● Reporting Persons are not required to report bi-weekly payroll contributions, periodiccompany matches, or profit sharing contributions.
Annual Holdings Report:● Reporting Persons are required to update their holdings in Wells Fargo 401(k) plans in
their Annual Holdings Report. This update may be made on behalf of the ReportingPerson by the 401(k) plan administration area to Risk & Compliance.
● If an external 401(k) account holds Reportable Funds or Securities, Reporting Persons arerequired to update these holdings in their Annual Holdings Report.
Pre-Clearance:● Only Management Valuation Committee members are required to pre-clear transactions in
Reportable Funds in a 401(k) plan.
2. Wells Fargo Employee Stock Options & Restricted Shares
Initial Holdings Report:● The Wells Fargo Advisors brokerage account associated with Reporting Persons� Long
Term Incentive Compensation Plan (�LTICP�) is a Reportable Security Account and mustbe reported in the Initial Holding Report.
● Reporting Persons are not required to report the grant or vesting of WFC employee stockoptions.
● Reporting Persons are required to report vested, delivered restricted shares held in anyReportable Security Account, including the Shareowner Services Account and/or theWells Fargo Advisors account associated with their LTICP.
Quarterly Transaction Report:● All Reporting Person directed transactions in LTICP holdings are reportable on the
Quarterly Transaction Report, i.e., exercising of WFC options and disposition of WFCRestricted shares.
● The exercise of employee stock options is a reportable transaction.● Reporting Persons are encouraged to report the vesting and delivery of restricted shares
for any Reportable Security Account, including the Wells Fargo Advisors accountassociated with their LTICP.
● Reporting Persons are not required to report the grant or vesting of WFC employee stockoptions.
Annual Holdings Report:● Reporting Persons are required to report vested holdings of restricted shares in Reportable
Security Accounts, such as the Shareowner Services account and/or the Wells FargoAdvisors brokerage account associated with a LTICP.
● Reporting Persons are not required to report holdings of employee stock options in LTICP.
Pre-Clearance:● Preclearance is not required prior to the sale of LTICP restricted shares.● The exercise of stock options from LTICP is not pre-clearable in the Code of Ethics
Transaction Monitoring System. However, Reporting Persons are requested to inform theCode Team via an email to [email protected] of the transaction details, as exercising ofthe options will flag in the Code of Ethics Transaction Monitoring System.
Copyright © 2017 www.secdatabase.com. All Rights Reserved.Please Consider the Environment Before Printing This Document

May 24, 2016 13 Code of Ethics
Copyright © 2017 www.secdatabase.com. All Rights Reserved.Please Consider the Environment Before Printing This Document
Wells Fargo Funds
3. Wells Fargo Employee Stock Purchase Plan (ESPP)Initial Holdings Report:● This is a Reportable Security Account and must be included in a Reporting Person�s
Initial Holding Report.
Quarterly Transaction Report:● Sells of shares from Reporting Persons� ESPP are reportable on the Quarterly Transaction
Report.
Annual Holdings Report:● Reporting Persons are required to update holdings of ESPP accounts in the Annual
Holdings Report.
Pre-Clearance:● Transactions in the ESPP do not require pre-clearance.
4. Wells Fargo Health Services AccountInitial Holdings Report:● Wells Fargo HSAs are reportable when the balance reaches threshold that allows the
Reporting Person to invest in Reportable Funds.Quarterly Transaction Report:● Sells of shares of Reportable Funds are reportable on the Quarterly Transaction Report.Annual Holdings Report:● Reporting Persons are required to update holdings of balances invested in Reportable
Funds on the Annual Holdings Report.Pre-Clearance:● Transactions in HSA accounts do not require pre-clearance.
5. Wells Fargo Deferred Compensation Plans● Wells Fargo Deferred Compensation Plans are not Reportable Accounts.
4.6 Your Reports are Kept Confidential
We will use reasonable efforts to ensure that the reports you submit to us under this Code are keptconfidential. The reports will be reviewed by members of the Compliance Department andpossibly our senior executives or legal counsel. Reports may be provided to Wells Fargo Fundofficers and trustees, and will be provided to government authorities upon request or others ifrequired to do so by law or court order.
May 24, 2016 14 Code of Ethics
Copyright © 2017 www.secdatabase.com. All Rights Reserved.Please Consider the Environment Before Printing This Document
Wells Fargo Funds
5. CODE VIOLATIONS
5.1 Investigating Code Violations
The CCO is responsible for enforcing the Code. The CCO or his or her designee isresponsible for investigating any suspected violation of the Code and if the CCO selects adesignee, the designee will report the results of each investigation to the CCO. This includesnot only instances of violations against the letter of the Code, but also any instances that maygive the appearance of impropriety. The CCO is responsible for reviewing the results of anyinvestigation of any reported or suspected violation of the Code in coordination with thedesignee. Any confirmed violation of the Code will be reported to the Wells Fargo Funds�Boards of Trustees.
5.2 Penalties
If you violate the provisions of the Code, the Wells Fargo Funds have the right to impose onyou one or more of the following penalties as they may deem appropriate:
● Censure you;● Suspend your authority to act on behalf of the Wells Fargo Funds; and/or● Recommend specific sanctions, such as disgorgement of profits, imposition of
fines, and/or termination of your employment.
5.3 Your Obligation to Report Violations
You must report any violations or suspected violations of the Code to the CCO or to amember of the Compliance Department. Your reports will be treated confidentially and willbe investigated promptly and appropriately. Violations include:
● Non-compliance with applicable laws, rules, and regulations;● Fraud or illegal acts involving any aspect of our business;● Material misstatements in reports;● Any activity that is specifically prohibited by the Code; and● Deviations from required controls and procedures that safeguard clients and us.
5.4 Exceptions to the Code
The CCO is responsible for enforcing the Code. The CCO (or his or her designee for anyexceptions sought by the CCO) may grant certain exceptions to the Code in compliance withapplicable law, provided any requests and any approvals granted must be submitted andobtained, respectively, in advance and in writing. The CCO or designee may refuse toauthorize any request for exception under the Code and is not required to furnish anyexplanation for the refusal.
6. ANNUAL WRITTEN REPORTS TO THE BOARDS OF TRUSTEES
Issues and Violations under the Code. At least annually, the CCO provides written reports to the WellsFargo Funds� Boards of Trustees. The reports must describe any issues or material violations that aroseduring the previous year under the Code and any resulting sanctions. Any exceptions granted under theCode must also be described. The CCO may report to the Wells Fargo Funds� Boards more frequently asthe CCO deems necessary or appropriate, and shall do so as requested by the Boards.
May 24, 2016 15 Code of Ethics
Copyright © 2017 www.secdatabase.com. All Rights Reserved.Please Consider the Environment Before Printing This Document
Wells Fargo Funds
Our Certification to the Boards. Each report must be accompanied by a certification to the Boards thatWells Fargo Funds has adopted procedures reasonably necessary to prevent Reporting Persons fromviolating the Code.
Annual Review. The CCO reviews the Code at least once a year to assess the adequacy of the Code andhow effectively it works. As part of the annual report to the Wells Fargo Funds� Boards, the CCOidentifies any recommended changes in existing restrictions or procedures based on its experience underthe Code, evolving industry practices, or developments in applicable laws or regulations.
The Funds� Boards must approve all material amendments within six months following adoption.
7. RECORD RETENTION
We will keep the following records in an easily accessible place at our principal place of business, and willmake the records available to the SEC or any representative from the SEC at any time and from time totime for reasonable periodic, special or other examination:
1. Code of Ethics. A copy of this Code and all previous versions of the Code that have beenin effect for the last 5 years.
2. Violations. A record of all Code violations and actions taken as a result of thoseviolations for at least five years after the end of the fiscal year in which the violationoccurs.
3. Required Reports. All reports required by the Code including records of the proceduresfollowed in connection with the pre-clearance requests of investment personnel and anyinformation provided in lieu of the reports required under Section 2.2 above. Allinformation relied on by the CCO or designee in authorizing any securities transactions,along with any reasons supporting such decision. All reports used in post-trademonitoring and review will also be maintained. Each required report will be maintainedfor at least five years after the end of the fiscal year in which the report is made or theinformation provided.
4 REPORTING Persons List. A list of all persons who are, or have been, required to makereports pursuant to the Code, or who were responsible for reviewing these reports, withinthe past five years.
5. Board Reports. Copies of any reports given to the Wells Fargo Funds� Boards for at leastfive years after the end of the fiscal year in which it was made.
May 24, 2016 16 Code of Ethics
Copyright © 2017 www.secdatabase.com. All Rights Reserved.Please Consider the Environment Before Printing This Document
Wells Fargo Funds
APPENDIX ADEFINITIONS
General Note:The definitions and terms used in the Code are intended to mean the same as they do under the 1940 Act and the otherFederal Securities Laws. If a definition hereunder conflicts with the definition in the 1940 Act or other Federal SecuritiesLaws, or if a term used in the Code is not defined, you should follow the definitions and meanings in the 1940 Act or otherFederal Securities Laws, as applicable.
Automatic Investment Plan A program that allows a person to purchase or sell securities, automatically and on aregular basis in accordance with a pre-determined schedule and allocation, without anyfurther action by the person. An Automatic Investment Plan includes a SIP (systematicinvestment plan), SWP (systematic withdrawal plan), SPP (stock purchase plan), DRIP(dividend reinvestment plan), or employer-sponsored plan.
Beneficial Owner You are the �beneficial owner� of any securities in which you have a direct or indirectFinancial or Pecuniary Interest, whether or not you have the power to buy and sell, or tovote, the securities.
In addition, you are the �beneficial owner� of securities in which an Immediate FamilyMember has a direct or indirect Financial or Pecuniary Interest, whether or not you orthe Immediate Family Member has the power to buy and sell, or to vote, the securities.For example, you have Beneficial Ownership of securities in trusts of which ImmediateFamily Members are beneficiaries.
You are also the �beneficial owner� of securities in any account, including but not limitedto those of relatives, friends and entities in which you have a non-controlling interest,over which you exercise investment discretion. Such accounts do not include accountsyou manage on behalf of Wells Fargo Funds Management, LLC or any other affiliate ofWells Fargo & Company, or on behalf of Grantham, Mayo, Van Otterloo & Co., LLC.
Control The power to exercise a controlling influence over the management or policies of acompany, unless the power is solely the result of an official position with such company.Owning 25% or more of a company�s outstanding voting securities is presumed to giveyou control over the company. (See Section 2(a)(9) of the 1940 Act for a completedefinition.)
Federal Securities Laws The Securities Act of 1933 (15 U.S.C. 77a-aa), the Securities Exchange Act of 1934(15 U.S.C. 78a�mm), the Sarbanes-Oxley Act of 2002 (Pub. L. 107-204, 116 Stat. 745(2002)), the Investment Company Act of 1940 (15 U.S.C. 80a), the Investment AdvisersAct of 1940 (15 U.S.C. 80b), Title V of the Gramm-Leach-Biley Act (Pub. L. No.100-102, 113 Stat. 1338 (1999)), any rules adopted by the SEC under any of these statutes,the Bank Secrecy Act (31 U.S.C. 5311- 5314; 5316-5332) as it applies to funds andinvestment advisers, and any rules adopted thereunder by the SEC or the Department ofthe Treasury.
Appendix A 17 Definitions
Copyright © 2017 www.secdatabase.com. All Rights Reserved.Please Consider the Environment Before Printing This Document
Wells Fargo Funds
Financial or PecuniaryInterest The opportunity for you or your Immediate Family Member, directly or indirectly, to
profit or share in any profit derived from a transaction in the subject securities whetherthrough any contract, arrangement, understanding, relationship or otherwise. Thisstandard looks beyond the record owner of securities to reach the substance of a particulararrangement. You not only have a Financial or Pecuniary Interest in securities held byyou for your own benefit, but also securities held (regardless of whether or how theyare registered) by others for your benefit, such as securities held for you by custodians,brokers, relatives, executors, administrators, or trustees. The term also includes anysecurity owned by an entity directly or indirectly controlled by you, which may includecorporations, partnerships, limited liability companies, trusts and other types of legalentities. You or your Immediate Family Member may have a Financial or PecuniaryInterest in:
● Your accounts or the accounts of Immediate Family Members;
● A partnership or limited liability company, if you or an Immediate Family Memberis a general partner or a managing member;
● A corporation or similar business entity, if you or an Immediate Family Member hasor shares investment control; or
● A trust, if you or an Immediate Family Member is a beneficiary.
High quality short-termdebt instrument Any instrument that has a maturity at issuance of less than 366 days and that is rated
in one of the two highest rating categories by a nationally recognized statistical ratingorganization such as Moody�s Investors Service.
Immediate Family Member Any of the following persons, including any such relations through adoption, who residein the same household with you:
● spouse ● grandparent ● mother-in-law● domestic partner ● grandchild ● father-in-law● parent ● brother ● daughter-in-law● stepparent ● sister ● son-in-law● child ● sister-in-law● stepchild ● brother-in-law
Immediate Family Member also includes any other relationship that the CCO determinescould lead to possible conflicts of interest, diversions of corporate opportunity, orappearances of impropriety.
Independent Trustee A trustee of a Wells Fargo Fund who is not an �interested person� of the Wells Fargo Fundwithin the meaning of Section 2(a)(19) of the 1940 Act. An Advisory Board Memberwho is not an �interested person� of the Wells Fargo Funds within the meaning of section2(a)(19) of the 1940 Act will be treated as an Independent Trustee solely for purposes ofthis Code.
Appendix A 18 Definitions
Copyright © 2017 www.secdatabase.com. All Rights Reserved.Please Consider the Environment Before Printing This Document
Wells Fargo Funds
Investment Persons Any of the following individuals:
● any employee of Wells Fargo Funds (or of any company in a control relationshipto the Fund) who, in connection with his/her regular functions or duties, makes orparticipates in making recommendations regarding the purchase or sale of securitiesby a Wells Fargo Fund;
● any natural person who controls a Wells Fargo Fund and who obtains informationconcerning recommendations made to a Wells Fargo Fund regarding the purchase orsale of securities by the Wells Fargo Fund; and
● any Reporting Person otherwise designated by the Code of Ethics ComplianceOfficer in writing that such person is an Investment Person.
Interested Trustee A trustee of a Wells Fargo Fund who is an �interested person� of the Fund within themeaning of Section 2(a)(19) of the 1940 Act.
IPO An initial public offering, or the first sale of a company�s securities to public investors.Specifically it is an offering of securities registered under the Securities Act of 1933,the issuer of which, immediately before registration, was not subject to the reportingrequirements of Section 13 or Section 15(d) of the Securities Exchange Act of 1934.
Non-Public Information Any information that is not generally available to the general public in widelydisseminated media reports, SEC filings, public reports, prospectuses, or similarpublications or sources.
Personal Securities Account Any holding of Securities of which you have Beneficial Ownership, other than a holdingof Securities previously approved by the Code of Ethics Compliance Officer over whichyou have no direct influence or Control. A Personal Securities Account is not limited tosecurities accounts maintained at brokerage firms, but also includes holdings of Securitiesowned directly by you or an Immediate Family Member or held through a retirement planof Wachovia, Wells Fargo & Co. or any other employer.
Personal SecuritiesTransaction A purchase or sale of a Security, of which you have or acquire Beneficial Ownership.
Private Placement An offering that is exempt from registration under the Securities Act of 1933, as amended,pursuant to Section 4(2) or Section 4(6) thereof or Rule 504, 505 or 506 thereunder.
Purchase or Sale of a Security Includes, among other things, gifting or the writing of an option to purchase or sell asecurity.
Appendix A 19 Definitions
Copyright © 2017 www.secdatabase.com. All Rights Reserved.Please Consider the Environment Before Printing This Document
Wells Fargo Funds
Security/Securities As defined under Section 2(a)(36) of the 1940 Act or Section 202(a)(18) of the AdvisersAct, except that it does not include direct obligations of the U.S. Government; bankers�acceptances; bank certificates of deposit; commercial paper; high quality short-term debtinstruments, including repurchase agreements; shares issued by affiliated or unaffiliatedmoney market mutual funds; or shares issued by open-end registered investmentcompanies other than the Wells Fargo Funds.
Appendix A 20 Definitions
Copyright © 2017 www.secdatabase.com. All Rights Reserved.Please Consider the Environment Before Printing This Document
Wells Fargo Funds
APPENDIX BACKNOWLEDGEMENT AND CERTIFICATION
I certify that I have received, read, and understand that I am subject to the Code of Ethics Policy on Personal SecuritiesTransactions dated , 20 for Wells Fargo Funds.
In addition to certifying that I will provide complete and accurate reporting as required by the Code and have complied withall requirements of the Code, I certify that I will not:
● Execute any prohibited purchases and/or sales, directly or indirectly, that are outside those permissible by the Code● Employ any device, scheme or artifice to defraud any Wells Fargo Fund● Engage in any act, practice or course of business which operates or would operate as a fraud or deceit upon any
Wells Fargo Fund● Make any untrue statement of a material fact, or omit to state a material fact necessary in order to make the
statements, in light of the circumstances under which they are made, not misleading● Engage in any manipulative practice with respect to any Wells Fargo Fund● Disclose any proprietary or non-public information in an inappropriate manner
In conjunction with this Code, please select ONE of the below:
☐ I acknowledge that, as an Independent Trustee, I am a Non-Reporting Person subject to the Code of EthicsPolicy on Personal Securities Transactions for Wells Fargo Funds. As such, I further acknowledge that I am notrequired to submit an initial holdings report.
☐ I acknowledge that, as an Interested Trustee, officer or employee of Wells Fargo Funds, I am a ReportingPerson subject to the Code of Ethics Policy on Personal Securities Transactions for Wells Fargo Funds. As such, Ifurther acknowledge that I am required to submit an initial holdings report.
☐ I understand that unless I am exempt I violate this Code if I fail to submit a record of my PersonalSecurities Transactions within thirty calendar days after the end of each quarter.
Signature Date
Name (Print)
PLEASE SUBMIT FORM TO THE COMPLIANCE DEPARTMENT (FAX 704-383-2259)
Appendix B 21 Acknowledgement and Certification
Copyright © 2017 www.secdatabase.com. All Rights Reserved.Please Consider the Environment Before Printing This Document
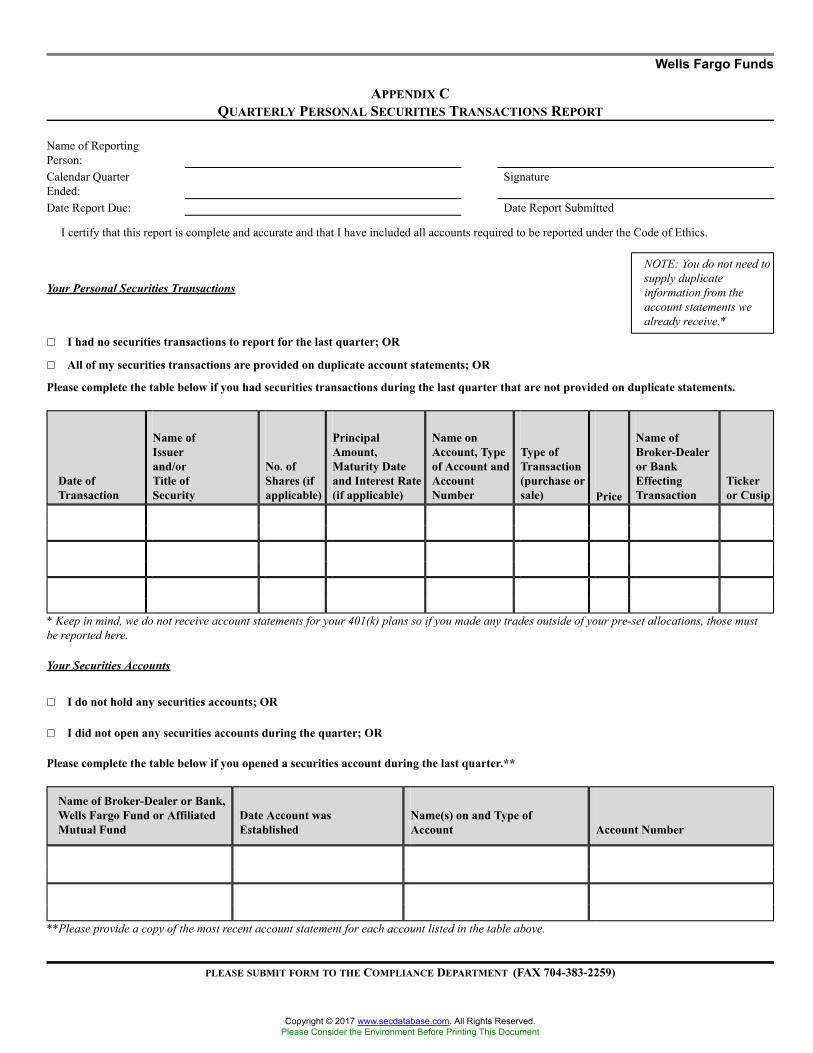
Wells Fargo Funds
APPENDIX CQUARTERLY PERSONAL SECURITIES TRANSACTIONS REPORT
Name of ReportingPerson:Calendar Quarter SignatureEnded:Date Report Due: Date Report Submitted
I certify that this report is complete and accurate and that I have included all accounts required to be reported under the Code of Ethics.
Your Personal Securities Transactions
NOTE: You do not need tosupply duplicateinformation from theaccount statements wealready receive.*
☐ I had no securities transactions to report for the last quarter; OR
☐ All of my securities transactions are provided on duplicate account statements; OR
Please complete the table below if you had securities transactions during the last quarter that are not provided on duplicate statements.
Date ofTransaction
Name ofIssuerand/orTitle ofSecurity
No. ofShares (ifapplicable)
PrincipalAmount,Maturity Dateand Interest Rate(if applicable)
Name onAccount, Typeof Account andAccountNumber
Type ofTransaction(purchase orsale) Price
Name ofBroker-Dealeror BankEffectingTransaction
Tickeror Cusip
* Keep in mind, we do not receive account statements for your 401(k) plans so if you made any trades outside of your pre-set allocations, those mustbe reported here.
Your Securities Accounts
☐ I do not hold any securities accounts; OR
☐ I did not open any securities accounts during the quarter; OR
Please complete the table below if you opened a securities account during the last quarter.**
Name of Broker-Dealer or Bank,Wells Fargo Fund or AffiliatedMutual Fund
Date Account wasEstablished
Name(s) on and Type ofAccount Account Number
**Please provide a copy of the most recent account statement for each account listed in the table above.
PLEASE SUBMIT FORM TO THE COMPLIANCE DEPARTMENT (FAX 704-383-2259)
Copyright © 2017 www.secdatabase.com. All Rights Reserved.Please Consider the Environment Before Printing This Document

Appendix C 22 Quarterly Personal Securities Transactions Report
Copyright © 2017 www.secdatabase.com. All Rights Reserved.Please Consider the Environment Before Printing This Document
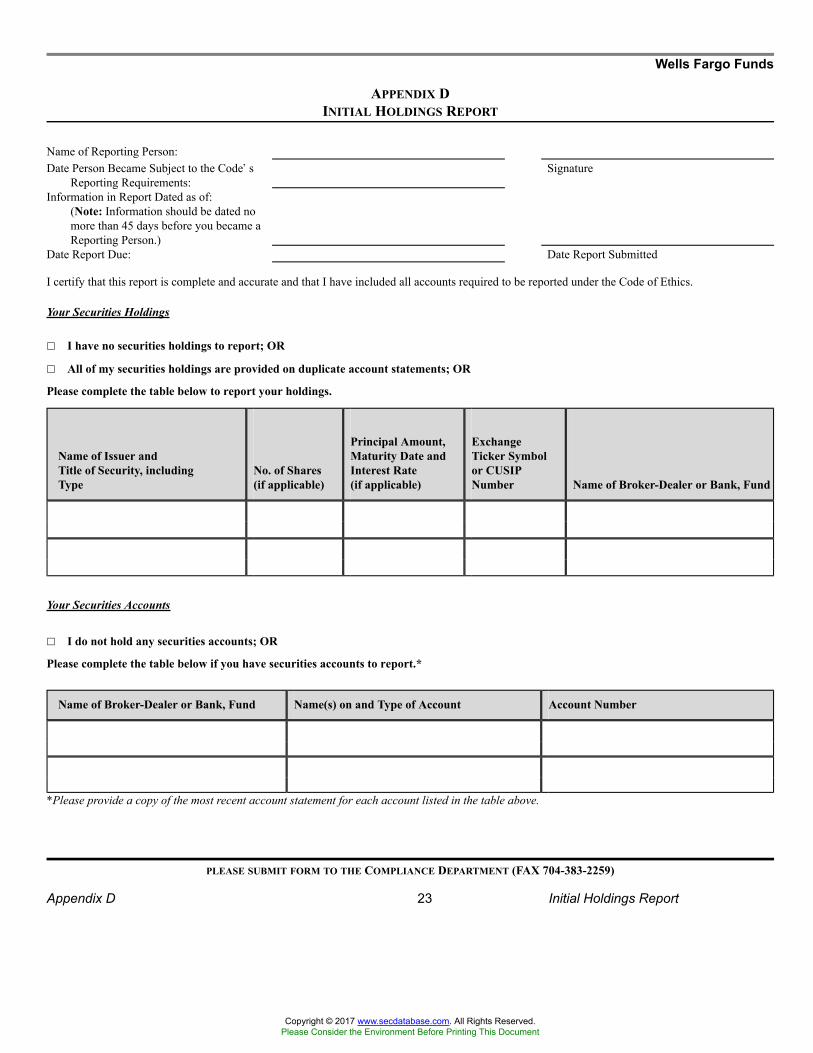
Wells Fargo Funds
APPENDIX DINITIAL HOLDINGS REPORT
Name of Reporting Person:Date Person Became Subject to the Code�s
Reporting Requirements:Signature
Information in Report Dated as of:(Note: Information should be dated nomore than 45 days before you became aReporting Person.)
Date Report Due: Date Report Submitted
I certify that this report is complete and accurate and that I have included all accounts required to be reported under the Code of Ethics.
Your Securities Holdings
☐ I have no securities holdings to report; OR
☐ All of my securities holdings are provided on duplicate account statements; OR
Please complete the table below to report your holdings.
Name of Issuer andTitle of Security, includingType
No. of Shares(if applicable)
Principal Amount,Maturity Date andInterest Rate(if applicable)
ExchangeTicker Symbolor CUSIPNumber Name of Broker-Dealer or Bank, Fund
Your Securities Accounts
☐ I do not hold any securities accounts; OR
Please complete the table below if you have securities accounts to report.*
Name of Broker-Dealer or Bank, Fund Name(s) on and Type of Account Account Number
*Please provide a copy of the most recent account statement for each account listed in the table above.
PLEASE SUBMIT FORM TO THE COMPLIANCE DEPARTMENT (FAX 704-383-2259)
Appendix D 23 Initial Holdings Report
Copyright © 2017 www.secdatabase.com. All Rights Reserved.Please Consider the Environment Before Printing This Document
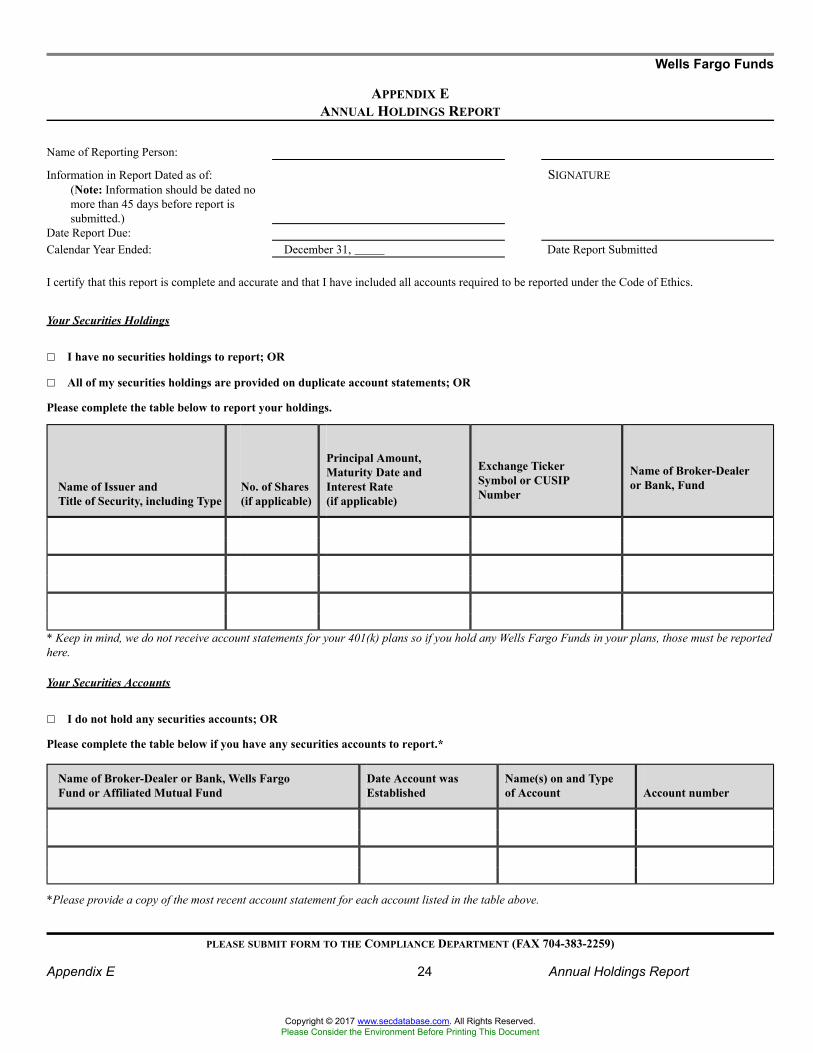
Wells Fargo Funds
APPENDIX EANNUAL HOLDINGS REPORT
Name of Reporting Person:
Information in Report Dated as of:(Note: Information should be dated nomore than 45 days before report issubmitted.)
SIGNATURE
Date Report Due:Calendar Year Ended: December 31, Date Report Submitted
I certify that this report is complete and accurate and that I have included all accounts required to be reported under the Code of Ethics.
Your Securities Holdings
☐ I have no securities holdings to report; OR
☐ All of my securities holdings are provided on duplicate account statements; OR
Please complete the table below to report your holdings.
Name of Issuer andTitle of Security, including Type
No. of Shares(if applicable)
Principal Amount,Maturity Date andInterest Rate(if applicable)
Exchange TickerSymbol or CUSIPNumber
Name of Broker-Dealeror Bank, Fund
* Keep in mind, we do not receive account statements for your 401(k) plans so if you hold any Wells Fargo Funds in your plans, those must be reportedhere.
Your Securities Accounts
☐ I do not hold any securities accounts; OR
Please complete the table below if you have any securities accounts to report.*
Name of Broker-Dealer or Bank, Wells FargoFund or Affiliated Mutual Fund
Date Account wasEstablished
Name(s) on and Typeof Account Account number
*Please provide a copy of the most recent account statement for each account listed in the table above.
PLEASE SUBMIT FORM TO THE COMPLIANCE DEPARTMENT (FAX 704-383-2259)
Appendix E 24 Annual Holdings Report
Copyright © 2017 www.secdatabase.com. All Rights Reserved.Please Consider the Environment Before Printing This Document
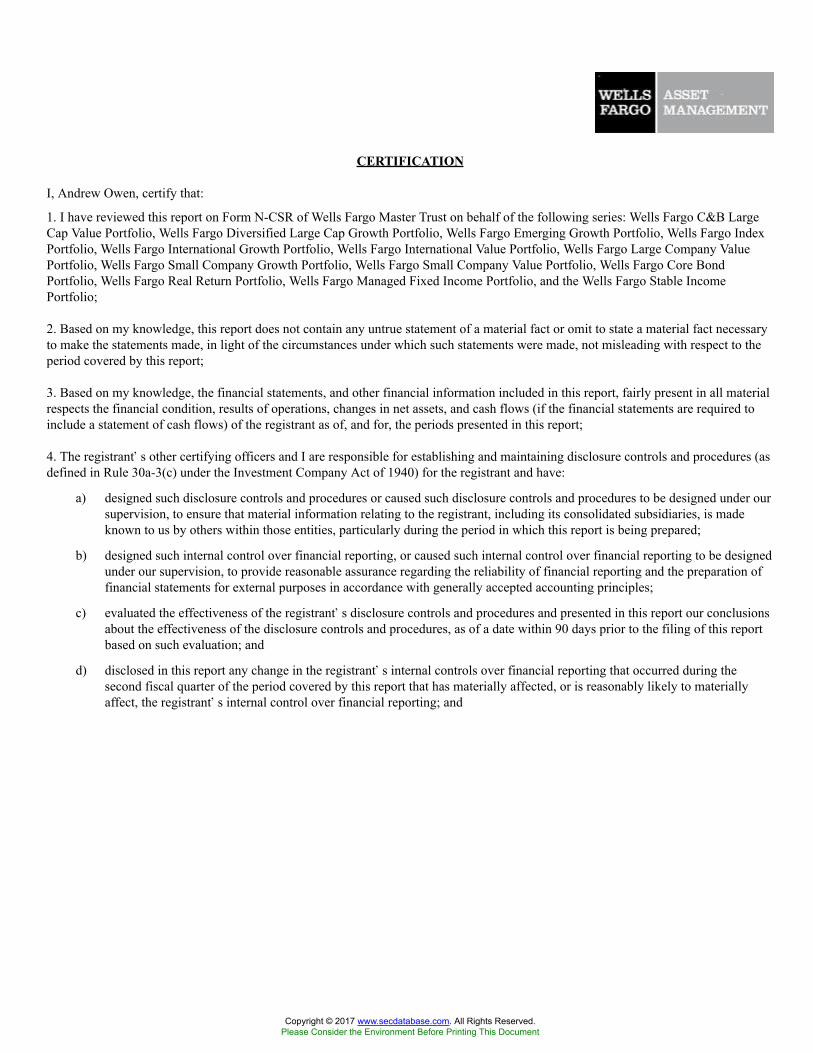
CERTIFICATION
I, Andrew Owen, certify that:
1. I have reviewed this report on Form N-CSR of Wells Fargo Master Trust on behalf of the following series: Wells Fargo C&B LargeCap Value Portfolio, Wells Fargo Diversified Large Cap Growth Portfolio, Wells Fargo Emerging Growth Portfolio, Wells Fargo IndexPortfolio, Wells Fargo International Growth Portfolio, Wells Fargo International Value Portfolio, Wells Fargo Large Company ValuePortfolio, Wells Fargo Small Company Growth Portfolio, Wells Fargo Small Company Value Portfolio, Wells Fargo Core BondPortfolio, Wells Fargo Real Return Portfolio, Wells Fargo Managed Fixed Income Portfolio, and the Wells Fargo Stable IncomePortfolio;
2. Based on my knowledge, this report does not contain any untrue statement of a material fact or omit to state a material fact necessaryto make the statements made, in light of the circumstances under which such statements were made, not misleading with respect to theperiod covered by this report;
3. Based on my knowledge, the financial statements, and other financial information included in this report, fairly present in all materialrespects the financial condition, results of operations, changes in net assets, and cash flows (if the financial statements are required toinclude a statement of cash flows) of the registrant as of, and for, the periods presented in this report;
4. The registrant�s other certifying officers and I are responsible for establishing and maintaining disclosure controls and procedures (asdefined in Rule 30a-3(c) under the Investment Company Act of 1940) for the registrant and have:
a) designed such disclosure controls and procedures or caused such disclosure controls and procedures to be designed under oursupervision, to ensure that material information relating to the registrant, including its consolidated subsidiaries, is madeknown to us by others within those entities, particularly during the period in which this report is being prepared;
b) designed such internal control over financial reporting, or caused such internal control over financial reporting to be designedunder our supervision, to provide reasonable assurance regarding the reliability of financial reporting and the preparation offinancial statements for external purposes in accordance with generally accepted accounting principles;
c) evaluated the effectiveness of the registrant�s disclosure controls and procedures and presented in this report our conclusionsabout the effectiveness of the disclosure controls and procedures, as of a date within 90 days prior to the filing of this reportbased on such evaluation; and
d) disclosed in this report any change in the registrant�s internal controls over financial reporting that occurred during thesecond fiscal quarter of the period covered by this report that has materially affected, or is reasonably likely to materiallyaffect, the registrant�s internal control over financial reporting; and
Copyright © 2017 www.secdatabase.com. All Rights Reserved.Please Consider the Environment Before Printing This Document
5. The registrant�s other certifying officers and I have disclosed, based on our most recent evaluation, to the registrant�s auditors andthe audit committee of the registrant�s Board of Trustees (or persons performing the equivalent functions):
a) all significant deficiencies in the design or operation of internal controls over financial reporting which are reasonably likely toadversely affect the registrant�s ability to record, process, summarize, and report financial information; and
b) any fraud, whether or not material, that involves management or other employees who have a significant role in the registrant�sinternal controls over financial reporting.
Date: July 26, 2017
/s/ Andrew OwenAndrew OwenPresidentWells Fargo Master Trust
Exhibit 99.CERT
Copyright © 2017 www.secdatabase.com. All Rights Reserved.Please Consider the Environment Before Printing This Document
CERTIFICATION
I, Nancy Wiser, certify that:
1. I have reviewed this report on Form N-CSR of Wells Fargo Master Trust on behalf of the following series: Wells Fargo C&B LargeCap Value Portfolio, Wells Fargo Diversified Large Cap Growth Portfolio, Wells Fargo Emerging Growth Portfolio, Wells Fargo IndexPortfolio, Wells Fargo Large Company Value Portfolio, Wells Fargo Small Company Growth Portfolio, Wells Fargo Small CompanyValue Portfolio, Wells Fargo Core Bond Portfolio, Wells Fargo Real Return Portfolio, Wells Fargo Managed Fixed Income Portfolio,and Wells Fargo Stable Income Portfolio;
2. Based on my knowledge, this report does not contain any untrue statement of a material fact or omit to state a material fact necessaryto make the statements made, in light of the circumstances under which such statements were made, not misleading with respect to theperiod covered by this report;
3. Based on my knowledge, the financial statements, and other financial information included in this report, fairly present in all materialrespects the financial condition, results of operations, changes in net assets, and cash flows (if the financial statements are required toinclude a statement of cash flows) of the registrant as of, and for, the periods presented in this report;
4. The registrant�s other certifying officers and I are responsible for establishing and maintaining disclosure controls and procedures (asdefined in Rule 30a-3(c) under the Investment Company Act of 1940) for the registrant and have:
a) designed such disclosure controls and procedures or caused such disclosure controls and procedures to be designed under oursupervision, to ensure that material information relating to the registrant, including its consolidated subsidiaries, is madeknown to us by others within those entities, particularly during the period in which this report is being prepared;
b) designed such internal control over financial reporting, or caused such internal control over financial reporting to be designedunder our supervision, to provide reasonable assurance regarding the reliability of financial reporting and the preparation offinancial statements for external purposes in accordance with generally accepted accounting principles;
c) evaluated the effectiveness of the registrant�s disclosure controls and procedures and presented in this report our conclusionsabout the effectiveness of the disclosure controls and procedures, as of a date within 90 days prior to the filing of this reportbased on such evaluation; and
d) disclosed in this report any change in the registrant�s internal controls over financial reporting that occurred during thesecond fiscal quarter of the period covered by this report that has materially affected, or is reasonably likely to materiallyaffect, the registrant�s internal control over financial reporting; and
Copyright © 2017 www.secdatabase.com. All Rights Reserved.Please Consider the Environment Before Printing This Document

5. The registrant�s other certifying officers and I have disclosed, based on our most recent evaluation, to the registrant�s auditors andthe audit committee of the registrant�s Board of Trustees (or persons performing the equivalent functions):
a) all significant deficiencies in the design or operation of internal controls over financial reporting which are reasonably likely toadversely affect the registrant�s ability to record, process, summarize, and report financial information; and
b) any fraud, whether or not material, that involves management or other employees who have a significant role in the registrant�sinternal controls over financial reporting.
Date: July 26, 2017
/s/ Nancy WiserNancy WiserTreasurerWells Fargo Master Trust
Exhibit 99.CERT
Copyright © 2017 www.secdatabase.com. All Rights Reserved.Please Consider the Environment Before Printing This Document
CERTIFICATION
I, Jeremy DePalma, certify that:
1. I have reviewed this report on Form N-CSR of Wells Fargo Master Trust on behalf of the following series: Wells Fargo InternationalGrowth Portfolio and Wells Fargo International Value Portfolio;
2. Based on my knowledge, this report does not contain any untrue statement of a material fact or omit to state a material fact necessaryto make the statements made, in light of the circumstances under which such statements were made, not misleading with respect to theperiod covered by this report;
3. Based on my knowledge, the financial statements, and other financial information included in this report, fairly present in all materialrespects the financial condition, results of operations, changes in net assets, and cash flows (if the financial statements are required toinclude a statement of cash flows) of the registrant as of, and for, the periods presented in this report;
4. The registrant�s other certifying officers and I are responsible for establishing and maintaining disclosure controls and procedures (asdefined in Rule 30a-3(c) under the Investment Company Act of 1940) for the registrant and have:
a) designed such disclosure controls and procedures or caused such disclosure controls and procedures to be designed under oursupervision, to ensure that material information relating to the registrant, including its consolidated subsidiaries, is madeknown to us by others within those entities, particularly during the period in which this report is being prepared;
b) designed such internal control over financial reporting, or caused such internal control over financial reporting to be designedunder our supervision, to provide reasonable assurance regarding the reliability of financial reporting and the preparation offinancial statements for external purposes in accordance with generally accepted accounting principles;
c) evaluated the effectiveness of the registrant�s disclosure controls and procedures and presented in this report our conclusionsabout the effectiveness of the disclosure controls and procedures, as of a date within 90 days prior to the filing of this reportbased on such evaluation; and
d) disclosed in this report any change in the registrant�s internal controls over financial reporting that occurred during thesecond fiscal quarter of the period covered by this report that has materially affected, or is reasonably likely to materiallyaffect, the registrant�s internal control over financial reporting; and
5. The registrant�s other certifying officers and I have disclosed, based on our most recent evaluation, to the registrant�s auditors andthe audit committee of the registrant�s Board of Trustees (or persons performing the equivalent functions):
a) all significant deficiencies in the design or operation of internal controls over financial reporting which are reasonably likely toadversely affect the registrant�s ability to record, process, summarize, and report financial information; and
Copyright © 2017 www.secdatabase.com. All Rights Reserved.Please Consider the Environment Before Printing This Document
b) any fraud, whether or not material, that involves management or other employees who have a significant role in the registrant�sinternal controls over financial reporting.
Date: July 26, 2017
/s/ Jeremy DePalmaJeremy DePalmaTreasurerWells Fargo Master Trust
Exhibit 99.CERT
Copyright © 2017 www.secdatabase.com. All Rights Reserved.Please Consider the Environment Before Printing This Document
SECTION 906 CERTIFICATION
Pursuant to 18 U.S.C. § 1350, the undersigned officer of Wells Fargo Master Trust (the �Trust�), hereby certifies, to the best of hisknowledge, that the Trust�s report on Form N-CSR for the year ended May 31, 2017 (the �Report�) fully complies with therequirements of Section 15(d) of the Securities Exchange Act of 1934 and that the information contained in the Report fairly presents, inall material respects, the financial condition and results of operations of the Trust.
Date: July 26, 2017
By: /s/ Andrew OwenAndrew OwenPresidentWells Fargo Master Trust
This certification is being furnished to the Securities and Exchange Commission pursuant to Rule 30a-2(b) under the InvestmentCompany Act of 1940, as amended, and 18 U.S.C. Section 1350 and is not being filed as part of the Form N-CSR with the Securitiesand Exchange Commission.
Exhibit 99.906CERT
Copyright © 2017 www.secdatabase.com. All Rights Reserved.Please Consider the Environment Before Printing This Document
SECTION 906 CERTIFICATION
Pursuant to 18 U.S.C. § 1350, the undersigned officer of Wells Fargo Master Trust (the �Trust�), hereby certifies, to the best of herknowledge, that the Trust�s report on Form N-CSR for the year ended May 31, 2017 (the �Report�) fully complies with therequirements of Section 15(d) of the Securities Exchange Act of 1934 and that the information contained in the Report fairly presents, inall material respects, the financial condition and results of operations of the Trust.
Date: July 26, 2017
By: /s/ Nancy WiserNancy WiserTreasurerWells Fargo Master Trust
This certification is being furnished to the Securities and Exchange Commission pursuant to Rule 30a-2(b) under the InvestmentCompany Act of 1940, as amended, and 18 U.S.C. Section 1350 and is not being filed as part of the Form N-CSR with the Securitiesand Exchange Commission.
Exhibit 99.906CERT
Copyright © 2017 www.secdatabase.com. All Rights Reserved.Please Consider the Environment Before Printing This Document

SECTION 906 CERTIFICATION
Pursuant to 18 U.S.C. § 1350, the undersigned officer of Wells Fargo Master Trust (the �Trust�), hereby certifies, to the best of hisknowledge, that the Trust�s report on Form N-CSR for the year ended May 31, 2017 (the �Report�) fully complies with therequirements of Section 15(d) of the Securities Exchange Act of 1934 and that the information contained in the Report fairly presents, inall material respects, the financial condition and results of operations of the Trust.
Date: July 26, 2017
By: /s/ Jeremy DePalmaJeremy DePalmaPresidentWells Fargo Master Trust
This certification is being furnished to the Securities and Exchange Commission pursuant to Rule 30a-2(b) under the InvestmentCompany Act of 1940, as amended, and 18 U.S.C. Section 1350 and is not being filed as part of the Form N-CSR with the Securitiesand Exchange Commission.
Exhibit 99.906CERT
Copyright © 2017 www.secdatabase.com. All Rights Reserved.Please Consider the Environment Before Printing This Document