Wellbore Strengthening In Sandstones by Means of Nanoparticle-Based Drilling Fluids
Upload
khangminh22Category
view
0download
0
Wellbore Pressure Surges Produced by Pipe Movement
ABSTRACT
J. A. BURKHARDT JUNIOR MEMBER AIME
Field measurements and theoretical studies have been made of pressure surges-momentary variations in fluid pressure-produced by movement of pipe in mud-filled boreholes. Pressure measurements were recorded by five pressure gauges located at various positions in the borehole. An important positive pressure peak was found to occur as the casing moved with maximum velocity. Important negative peaks were found as the casing was lifted from the slips and as brakes were applied to stop pipe movement. A rigorously formulated theory has successfully predicted the sequence and magnitudes of these positive and negative surges and has established (l
hasis for understanding how they occur. Both the measurements and theory indicate that the
most important pressure surge is usually due to viscous drag of the flowing mud. The theory of viscous-drag pressure surges has been approximated by simplified graphs and calculation procedures to facilitate ready use in field operations. Comparison of measured results with those prediGted by the simplified theory shows that the magnitude of this surge can be predicted accurately.
INTRODUCTION
It is widely recognized that raising or lowering pipe in a fluid-filled borehole produces momentary variations in fluid pressure, commonly caIled pressure surges. Both negative (or "swabbing") surges and positive (or "fracturing"') surges may occur. In 1934, Cannon' measured the negative surges and showed that they could be large enough to cause flow of formation fluids into the weIlbore and, in extreme cases, lead to blowout conditions. Later, Goins' measured the positive surges associated with lowering pipe. His results and subsequent field operations strikingly demonstrated that pressure surges could be an important factor in some cases of lost returns. In addition, although the evidence is less clear than in the case of blowouts and lost returns, other investigators"'" feel that pressure surges probably play a part in many instances of miner gas cutting, salt-water flow and other hole trouble.
The importance of pressure surges in drilling operations led naturaIly to attempts to explain the physical causes, nature and magnitude of the surges. Cardwell' was the first to publish a theory which alIowed the quantitative prediction of momentary pressure variations. He assumed that the drilling fluid was a 300-cp Newtonian fluid in turbulent flow. Most field muds have
Original manuscript received in Society of Petroleum Engineers office July 21, 1960. Revised manuscript received March 5, 1961. Paper presented at 35th Annual Fall Meeting of SPE, Oct. 2-5, 1960. in Denver.
lReferences given at end of paper . SPE 1546-G
./UNE, 1961
HUMBLE OIL & REFINING CO. HOUSTON, TEX.
a considerably lower viscosity and are generally believed to be Bingham plastic in nature." However, Cardwell's results were useful because they were presented in a form convenient for field use and, in some cases, gave a reasonably accurate predicted value for the maximum pressure surge.
Subsequently, Ormsby' published a more comprehensive theory of pressure surges. He discussed both laminar and turbulent flow and considered the theory of mud-bypass devices for reducing pressure surges. As a consequence of his more rigorous approach, his results were more accurate but more complex and difficult to use. Further, both Ormsby and Cardwell considered only the pressure surge arising from viscous drag of the moving mud.
Clark3" later published idealized graphs of surges and
presented equations for predicting their magnitUdes. In addition to pressure variations arising from viscous drag, he considered those caused by inertial effects. His theory was in this respect more complete than those of CardweIl and Ormsby, although he did not discuss pressures due to breaking of the gel. Furthermore, his equations, while not exceptionally complicated, were too complex for ready use at a drilIing location.
One difficulty common to all three theories is that none was tested rigorously by direct comparison with measured pressure surges. Their accuracy, therefore, could, not be demonstrated. Further, the two theories based on most realistic assumptions (Ormsby and Clark) required the solution of one or more rather complex algebraic equations.
The research described in this paper was undertaken to supplement that described and to overcome some of the difficulties noted. It seemed obvious that a fully satisfactory study of pressure surges should encompass three main phases.
I. A valid theory useful in all field situations must be developed. This theory must be based upon realistic assumptions, must be formulated rigorously and should lead to clear concepts whereby the nature of pressure surges can be easily understood.
2. The theory, however complex and involved, ultimately must be presented in simplified form for convenient field use. This may involve extensive machine computations and the use of figures and empirical equations.
3. The accuracy of the simplified equations must be established by comparing measured pressure surges with those predicted by the theory. These must agree both in their characteristic nature and in magnitude. This means that careful measurements of surges occurring in actual field operations must be made.
595
Dow
nloaded from http://onepetro.org/JPT/article-pdf/13/06/595/2238106/spe-1546-g-pa.pdf by guest on 30 January 2022

THEORETICAL DESCRIPTION OF PRESSURESURGE GENERATION
A qualitative understanding of pressure surges is perhaps best achieved by first examining an experimental measurement. Fig. 1 shows the several positive and negative pressure fluctuations produced when a single joint of casing was lowered into a mud-filled borehole. The casing-running operations were customary: (1) the casing was lifted a foot or so from the slips; (2) the added joint was lowered smoothly; (3) it was braked to a stop; and (4) it was set in the slips.
The immediate cause of all pressure surges observed during this operation was the natural resistance of the mud column to motion. Movement of the mud column is related directly to motion of the displacing pipe string. In understanding how the pressure variations arise, it is necessary to consider the velocity and acceleration of the pipe string.
Fig. 2 shows the pipe velocities and accelerations measured during the same time interval that the pressures in Fig. 1 were observed. Certain corresponding features are immediately apparent. A large positive pressure surge (b) in Fig. 1 occurred at the maximum pipe velocity (B) in Fig. 2, suggesting that viscous drag
+500 JOINT 44
b
+400
+200 e
1/1 Q. ., ~ :::>
VI
~ +100
~ :::> 1/1 1/1
'" Ii: d
0 c.
-100
-200 c
a
o TIME~
FIG. I-TYPICAL PRESSURE·SURGE PATTERN MEASURED AS A JOINT OF CASING WAS LOWERED INTO THE WELLBORE.
596
of the flowing mud is an important factor in producing some pressure surges. One or mere negative pressure peaks (c) occurred as the pipe string was suddenly decelerated (C) by application of the brakes. This indicates that inertial effects can also cause pressure surges. Another negative pressure surge (a) invariably occurred as the casing was lifted from the slips (A). The theoretical analysis to follow shows that this might be due either to breaking of the mud gel or to inertial effects.
In summary, a preliminary comparison of Figs. 1 and 2 reveals that each individual pressure peak in the surge pattern may be due to one or more of three effects - viscous drag, inertia and breaking of mud gel. An adequate theory must explain and correctly predict the magnitudes of each of these effects. The following paragraphs consider the theoretical aspects of the three proposed mechanisms.
PRESSURE GENERATED BY BREAKING THE MUD GEL
An expression for the pressure required to break the mud gel and start circulation has been given by Melrose, et at.' The important parameters are the hole diameter Dh , the outside and inside pipe diameters Dp and D,. the length of pipe L in the hole and the mud gel strength t.
Inside the pipe,
p = 4Lt Di
In the annulus,
p= ~4_L--=:t~ Dh - D"
(1)
(2)
Once the pressure required to break the gel is exceeded and the pipe begins to move, this mechanism is no longer important. Any subsequent pressure surges which occur must be explained by such effects as the inertia and viscous drag of the mud.
PRESSURE GENERATED BY INERTIA OF THE MUD COLUMN
The inertial-pres sure-surge component is due to the tendency of the mud column to resist a change in motion, as described by Newton's laws of motion. Following Clark; the inertial-pressure-surge component is expressed for the following .
For closed pipe strings, Lpap D'p
p = (D' - D') g h p
JOINT 44 1812.1856'
...... / L VELOCITY
Time, sec.
B
(3)
~
1 ''5 o
o ~ -1
-2
FIG. 2-TYPICAL PIPE VELOCITIES AND ACCELERATIONS MEAS· URED AS A JOINT OF CASING WAS LOWERED INTO
THE WELLllORE.
JOURNAL OF PETROLEUM TECHNOLOGY
Dow
nloaded from http://onepetro.org/JPT/article-pdf/13/06/595/2238106/spe-1546-g-pa.pdf by guest on 30 January 2022

For open pipe strings,
P = Lpap (D'p - D',) g(D\ - D2p + D'i) .
where ap = pipe acceleration, p = mud density, and g = acceleration of gravity.
PRESSURE GENERATED BY VISCOUS
DRAG OF THE MUD COLUMN
(4)
The theoretical treatments of the pressure-surge components arising from inertial effects and gel breaking are relatively straightforward. However, the theoretical treatment' of the pressure-surge component due to viscous drag is considerably more difficult. Various limitations of the theories of Cardwell: Ormsby' and Clarks,s have been noted. The theory presented here supplements previous work by the utilization of recent advances of the technology of mud flow in annuli and pipes and by a more rigorous inclusion of the effects of the moving pipe walls on the mud flow in the annulus. Since the moving pipe walls greatly influence the mud velocity in the annulus (and, hence, the pressure surge), the procedure for calculating the pressure surge follows a description of the effect of the moving pipe walls on the annulus mud velocity.
The principal mathematical difficulty in describing viscous-drag pressure surges is the effect of the moving pipe walls on the annular mud velocity. The moving pipe walls transport mud in the direction of motion of the pipe, and at the same time the volume of the pipe displaces mud in an opposite direction to the pipe's motion. The "effective" mud velocity that produces pressure surges is a combination of the mud velocity due to the pipe displacing mud and due to the tendency of the pipe walls to transport mud. The mud velocity due to the pipe displacing the mud is simply related to the cross-sectional area of the pipe and of the annulus and the velocity of the pipe. However, the component of mud velocity arising from the moving pipe walls is not a simple relationship. The procedure for arriving at the value of this velocity component is: (1) theoretically describe the velocity profile of the mud due to the moving pipe; and then (2) integrate the velocity profile to obtain a component of the effective mud velocity due to the moving pipe walls. The following paragraphs outline the considerations used in describing the velocity profile and integrating it to obtain a usable resultant component of mud velocity.
The velocity profile depends upon several factorsthe nature of the fluid (whether Bingham or Newtonian), the geometry (annular of parallel plates), the type of flow (laminar or turbulent) and the pipe velocity. These will be considered in turn.
Beck" has shown that most drilling muds can be approximated as Bingham plastics. Melrose' has shown that the movement of Bingham and Newtonian fluids in a fixed annulus can be accurately approximated by flow between fixed parallel plates, provided the ratio Dpj Dh is 0.5 or greater. These two findings indicate that the velocity profile of a driIIing mud in an annulus should be quite similar to the profile of a Bingham fluid between paralIel plates.
The effect of type of flow remains to be considered. For turbulent flow of Newtonian fluids, the effects of a moving surface on the velocity profile has been measured by LauferlO and caculated by Pai." Although the drilling mud is believed to be Bingham rather than
JUNE. 1961
Newtonian in nature, the velocity profiles of either fluid in turbulent flow should be similar. In developing the theory reported here, the method of Pai was used to calculate velocity profiles due to the moving surface when the annular mud flow was turbulent. Classical methods were used to calculate velocity profiles due to the moving pipe wall when the mud flow was laminar.
The velocity profiles for a number of different annular geometries were calculated. An average velocity of the mud resulting from the moving pipe wall was obtained by integration of the velocity profile. Fig. 3 shows the results of the integration in a form suitable for convenient use. Here, the component V m, of effective mud velocity due to the moving pipe wall is related to pipe velocity V p by a proportionality constant K.
V m, = - K V p (5) The value of the constant K depends upon the ratio
of pipe and hole diameters according to the curves shown in Fig 3. Since the mud "clinging" to the pipe must, in effect, displace an equal volume of mud in the opposite direction of the pipe's velocity to maintain a volumetric balance of mud and volume of the hole, V m, is in opposition to Vp; hence, the negative sign occurs in Eq. 5.
In drilling and completing operations, the pressure surges result from pipe string being moved into or out of a borehole. These pipe strings are either open to mud flow in the pipe bore or closed so that no mud flows in the pipe bore. The component of mud velocity due to the moving pipe wall, V mB> is the same whether the pipe string is open or closed.
Viscous-Drag Pressure SUrges with Closed Pipe String
The theoretical descriptions of viscous-drag surges in open and closed pipe strings are qualitatively similar. The equations differ somewhat in form and concept, however, and it therefore is desirable to discuss the two situations separately. In this section, closed pipe strings are considered. Closed pipe strings are pipe strings that do not allow mud to flow from the annulus into the pipe bore, and they are typified by casing strings with float shoes.
Determination of the Effective Annular Mud Velocity. In addition to the component of effective velocity due to mud clinging to the inner moving annular wall (Eq. 5), there is a component V da due to volumetric mud flow produced by the displacing pipe. This is determined from the relative cross-sectional areas of the annulus and the closed pipe.
Kas defined in
Yms:-KYp
.5 J:-I I I ~
1 ---r-1 .4
=L Turbulent Flow L Laminar Flow
.3
.2
.1
-, o .4 .5 .6 .7 .8 .9
Dp/Dh - Ratio of Pipe Diameter to Hole Diameter
I
1.0
FIG. 3-MuD "CLINGING" CONSTANT RELATING PIPE VELOCITY TO THE COMPONENT OF ANNULAR MUD VELOCITY DUE TO
MOVING PIPE WALLS AS A FUNCTION OF RATIO OF ANNULAR DIAMETERS.
597
Dow
nloaded from http://onepetro.org/JPT/article-pdf/13/06/595/2238106/spe-1546-g-pa.pdf by guest on 30 January 2022

D'p V [~] v"" = - D\ - D'p P mIn (6)
The average effective annular mud velocity V", is the sum of Eqs. 5 and 6.
( D'p ) [ft]
V"" = - D',. _ D'r, + K VI' "min (7 )
The average effective annular mud velocity is the mud velocity which produces the viscous drag component of surge pressure, and its frame of reference is the wellbore walL The following section describes the procedure for obtaining the numerical value of pressure surge from this average effective annular mud velocity, V,,,,
Pressure Generated Due to the Mud Flow in an Annulus. The pressure gradients associated with the flow of Bingham plastics in pipes and annuli have been described by Melrose, et al." A computational procedure adapted from that of Melrose was used to calculate the pressure gradients generated by viscous drag of a mud column. Since these calculations are fully covered in the literature",12,13 only the essential information for using the procedure will be described.
A dimensionless quantity, fluid conductance y, relates the viscous-drag pressure gradients of Bingham plastics to those of Newtonian fluids. Fig. 4 is a graph of the fluid conductance for pipes and annuli as a function of another dimensionless quantity called the plasticity S. The plasticity for an annulus is defined to be
S = 2394 (D" - Dp)T" (8) fLp Va,
Here, T" and fLp are the mud yield point and plastic viscosity. The calculation of the plasticity from Eq. 8
leads directly to the determination of conductance y from Fig. 4.
A modified friction factor-Reynolds number chart for use with Bingham plastics is shown in Fig. 5. The Reynolds number for annular flow of Bingham plastics is defined by
R, = 15,44(D" ~ Dp) V,"'"tJ• (9)
fL"
From Fig. 5, a value of the friction factor t is obtained, knowing the numerical values of fluid conductance (y) and Reynolds number (R,). And with this friction factor t, the pressure surge generated by the average effective mud velocity in the annulus resulting from the movement of closed pipe in the borehole is given by the conventional Fanning equation
b.P _ tV'", P (PSi)_ 10 L - 9.282 X 10' (D" - Dp) ft ... ( )
In those situations where the hole or pipe geometry changes, the contribution to the pressure gradients for each particular geometry should be calculated. The total pressure is the sum of the separate components.
Viscous-Drag Pressure Surges with Open Pipe Strings For purposes of discussion, open pipe strings are de
fined as those which have openings connecting the annulus and pipe bore at the bottom of the string, such as a bit on drill pipe or a fill-up shoe on a casing string.
To determine the effective annular mud velocity that generates the viscous-drag pressure-surge component, a statement must be made about how the additional mud flow path of the pipe bore is related to the annular mud flow path. The criterion used to describe
,C,~="~,c=i:~"~""'1 ",'" I:; '1' [,":,' c,-'i',," , ,_,i" , ,'1:' :~=::=f'" '":c "'''~,,' ,,"::~:--:~:--' :'d' ":::L::::H":.-C=:,:~ - :' ',= •• 'c.:" :" ~I c I ,x L'c:'~c:~::'-~.cci'-~~ "cC """:'E::, -, __ --~=:- ' ,=~-=' -=i.'" c:L c
~ ~"T+- :~'"h,.;.f-Pipe'~i .. ~~;~L:"~jl :."" o_,~,~":, --- ,~-~"~j'~~!L~[~
::: ..!
c: .~ .. c:
" E ."
;:: 0.1
" u c: 2 u ::> .., c: 0
U
.01
10 100 1000
Plasticity S, dimensionless
FIG. 4-FLUID COND];CTANCE OF PIPES AND ANNlJLl AS A FmiCTION OF PLASTICITY.
598
Dow
nloaded from http://onepetro.org/JPT/article-pdf/13/06/595/2238106/spe-1546-g-pa.pdf by guest on 30 January 2022

5 U o
u.. c o
.~ ll:
1.0 1.0.8 .6
I 4 3
I
Conductance, y
0.1 .08 .06 .04 .03 .02 I I I I I
100,000 1 ,noD, 000
Reynolds Number, Re
FIG. 5-MoDIFIED FRICTION FACTOR-REYNOLDS N C~IIlER DIAGRAM FUR USE WITH BINGIIA'>I PLASTICS.
a relationship between these two paralIel flow paths was that the total pressure surge generated in the pipe bore must equal the total pressure surge generated in the annulus.
P b = Pa (11)
This equal pressure condition is obtained by partitioning the mud flow between the two paths in various ratios until equal pressures are generated in both flow paths. This final pressure should be identical to that which actually occurs; thus, it is the surge pre~sure.
The complexity of the calculations of viscous-drag pressure surges for various geometries of the annulus and pipe bore, plus the trial-and-error procedure of partitioning the mud between the two flow paths, requires the use of a high-speed computing machine. These computational complexities are minimized by an approximate procedure presented in a later section.
Effective Mud Velocities for Pressure-Surge Generation. As before, the effective average annulus mud velocity is the sum of components due to mud displacement and moving pipe wall. Thus,
( - 576 q" ) [ ft ]
V,,, = - 7r(D\ _ D2p) + KV" min' (12)
where qa is the volumetric mud flow in the annulus measured with respect to the fixed wall. The effective average velocity of the mud in the pipe bore with respect to the walls of the pipe bore is
Vb' = 576 {~b} [~], . . (13) 7rD-, mill
and the pressure in the pipe bore is generated by the relative flow {q.} of the mud and pipe walls, irrespective of which is considered to be moving.
Pressure Generated in the Annulus and Pipe Bore. The pressure generated in the annulus of open pipe
JVNE, 1961
strings is computed in the same way as outlined for closed pipe except V" is defined by Eq. 12. The pressure generated in the pipe bore uses the same procedures as outlined for the annulus. The changed geometry causes Eqs. 8, 9 and 10 to become:
S = 2394 (D i ) To (14) /Lp Vb,
15.44 (D i ) Vb. p . R,=~------'- (15)
and f:::.P f V'", p L - 9.282 X 10' Di (~~i) _ (16)
For each change in diameter of the pipe bore and the annulus, the pressure gradient will be different and the pressure generated in each of the flow paths will be the sum of the contributions from each change of diameter.
In developing the theory and graphs described herein, the pfJcess of partitioning the mud flow, computing the pressures, repartitioning the flow, etc., was continued until the pressure generated in the annulus was within 5 psi of that generated in the pipe bore. When this condition was met, the pressure generated in either path was considered to be identical to the pressure surge.
The constants appearing in Eqs. 5 through 16 are pooled conversion factors to make the equations numerically correct when the dimensions of the parameters are those listed in the table of nomenclature of the symbols.
QUALITATIVE COMPARISON OF PREDTCTEll AND OBSERVED SURGES
The pipe velocity and accelerations depicted in Fig. 2 were used to calculate a surge pattern from the theoretical treatment of the surge components associated with the inertial and viscous-drag effects. The com-
599
Dow
nloaded from http://onepetro.org/JPT/article-pdf/13/06/595/2238106/spe-1546-g-pa.pdf by guest on 30 January 2022

puted pattern is shown in Fig. 6. A comparison of the computed pattern in Fig. 6 with the measured patterns in Fig. 1 clearly demonstrates the similarity of the computed and measured surge patterns.
SUMMARY OF THEORETICAL ASPECTS OF PRESSURE-SURGE GENERATION
A theoretical treatment of surge pressure generation has been formulated in terms of quantities that can be measured: pipe velocity, pipe acceleration, mud properties, hole size and pipe-string size. The theory predicts a surge pattern from pipe velocity and acceleration that is similar in detail with the measured surge patterns.
The last requirement of the theory, that it quantitatively predict the magnitude of the major peaks and valleys of the measured surge patterns, will be demonstrated following the discussion of field measurements of pressure surges.
FIELD MEASUREMENTS OF PRESSURE SURGE
It has been noted previously that measured surge pressures were qualitatively in agreement with those predicted. This section of the report will present field data that will permit a quantitative evaluation of the theory.
DESCRIPTION OF PROCEDURE A 9% -in., 40-lb/ft casing string was set and ce
mented at 2,100 ft in a field well to form a "wellbore" of uniform diameter into which a smaller casing string was lowered. This second string consisted of 48 joints of 7-in., 23-lb/ft casing equipped with a differential fill-up collar. Normal casing handling procedures were followed. Measurements of (1) instantaneous mud pressure as a function of time, (2) position of the casing as a function of time and (3) mud properties were made during the running of the casing string.
Pressure Measurements Five subsurface pressure gauges were used to record
instantaneous mud pressure. Two gauges were placed at the bottom of the hole, two at the bottom of the casing string and one inside the moving string above the fill-up collar. Since the average running time for a joint of casing was less than 20 seconds, the pressure fluctuations recorded on the gauge charts were examined by microscopic techniques.
A comparison of the pressures measured by two different types of subsurface gauges located adjacent to
400
JOO JOINT 44 .~ 1812.1856'
u 200
i 100 ! ~ !
0..
-100
-200
2 6 10 12 14 16 18
Time, sec.
FIG. 6--THEORETICAL PRESSURE-SURGE PATTERN COMPUTED FROM PIPE VELOCITY AND ACCELERATION OCCURRING AS A
CASING JOINT Is LOWERED.
600
each other was used to estimate the preCIsIOn of the pressure measurements. It was found that the two gauges at the bottom of the hole and the two at the bottom of the moving pipe all recorded approximately the same values for pressure surges. The pressure data presented in this report are the average of the four readings. Characteristics of the gauges in measuring transient pressures were such that the deviations of the measurements were generally less than 10 per cent, with extreme differences of 30 per cent occasionally observed.
Pipe-Movement Measurements Movement of the casing string as a function of time
was measured by three procedures. 1. A telephoto movie camera photographed marks at
one-foot intervals on the casing string as the casing was being lowered into the hole. The pipe velocity was obtained by determining its position as a function of time.
2. A rig runner pointer was also photographed with a second movie camera and the pipe velocity computed.
3. The last device used to measure the pipe movement was a DC voltage generator driven by a rig runner line. The voltage output of the generator was proportional to the speed of the rig runner line and was recorded with a strip-chart recorder.
Acceleration of the pipe was obtained by numerical differentiation of data obtained by each of these three measurements.
The three measurements of pipe velocity were generally in good agreement. The two camera devices correlated within 2 per cent deviation at velocities of 1 ft/sec or greater. The recorder deviated 3 to 5 per cent from the camera in the velocity range of 1 ft/sec or greater. Fig. 2 is a typical pipe-string velocity and acceleration chart measured as an added joint of casing was lowered into the hole.
Mud Property Measurements Properties of the mud were measured at various
times during the casing running operation. Table 1 is a listing of the measured mud properties. A constantspeed rotary viscometer was used to measure the initial and three-minute gel strengths, ~o and ~" the plastic viscosity ,/Lv and the yield point To. The Marsh funnel viscosity, the compressibility and the density p were measured, as was the API filtration rate.
Differential Fill-Up Collar Measurements were made with the differential fill-up
collar operative, as well as closed and inoperative. This permitted an evaluation of the utility of such a device and, more important, provided data to check the theory of pressure surges for both open and closed pipe strings.
RESULTS AND COMPARISON WITH THEORY This research was undertaken to describe pressure
surges qualitatively as well as quantitatively. It previously has been noted that certain pressure peaks occurred at maximum pipe velocity or acceleration. The pipe motion, of course, was related to pipe handling operations on the rig floor.
The theoretical predictions were compared to the measured surge patterns at four characteristic points(1.) the maximum value of the first negative peak, (2) the maximum value of the first negative braking peak, (3) the maximum value of the second negative braking peak and (4) the maximum value of the major positive peak.
JOURNAL OF PETROLEUM TECHNOLOGY
Dow
nloaded from http://onepetro.org/JPT/article-pdf/13/06/595/2238106/spe-1546-g-pa.pdf by guest on 30 January 2022

TABLE I-MUD PROPERTIES DURING PRESSURE SURGE MEASUREMENTS Gel Strength Plastic
Time of Ib/100 ft' Viscosity Yield Point
Mud Wt.
Day Initial 3·Min (cp) (lb/100 ft') (lb/gal)
Filtration Rote
(cc/30 min API)
Compressibility
(per cent)
Funnel Viscosity (secondsl
8,45 AM 11 22 14 6 8,55 9 32 12 7 9,10 9,25 9 36 12 8 9,35 9 38 12 8
10,00 9 41 12 8 3.00 PM 13.2 6 4,30 10 28 14 6 4,50 12 38 12.5 6.5
An experimental difficulty produced a minor limitation to the verification of the theory. As it was designed to do, the automatic fill-up collar closed the pipe string during the negative surges, preventing an evaluation of the negative surge for an open pipe string. Therefore, the negative pressure surges obtained while the fill-up collar was operating were not used. The comparisons of negative surges were limited to the measurements made while the differential fill-up collar was permanently closed and inoperative. Comparisons of the positive viscous-drag surges measured with the fill-up device operative are presented in a later section of the report.
Negative Surges Due to Lifting Pipe String Off Slips Measured values of the initial negative surge peakes
were compared to computed values that arise from inertial and gel-breaking effects. The velocity component is of little interest at this particular instant, for the velocity of the mud is essentially zero (Fig. 2). Table 2 lists the measured surges and the computed inertial and gel-breaking surge pressures. The gel strength of the mud was taken to be the measured average three-minute strength ~3 of 32.9 IbllOO ft' as three minutes was the approximate time involved in adding a new casing joint.
The results in Table 2 show that this negative surge peak could arise from either the gel-breaking pressure or the inertial pressure, depending upon the value of the acceleration and the gel strength of the mud in particular cases.
Negative Surges Due to Braking the Pipe
A comparison of the measured and predicted surges which result from applying the brakes to stop the down-
TABLE 2-COMPARISON OF MEASURED AND COMPUTED SURGE OCCURRING AS THE PIPE IS LIFTED FROM THE SLIPS
Joint No.
38 29 40 41 42 .013 44 45 46 47 48
Avg. Pipe Depth
(It)
1576 1617 1660 1704 1747 1791 1834 1878 1920 1964 2008
First Negative Surge. in psi/l,OOO ft 01 Pipe
Calculated as Due to
Acceleration of Mud Breaking of Gel Measured (Eq. 4) (Eq. 2)
61 ---s9 ~ 76 63 60 67 59 60 87 99 60
102 107 60 109 160 60 127 117 60 36 60 1~2 195 60 102 138 60
81 130 60
10.8 10.9 10.75 10.85 10.85 10.85
10.9
12.5
12.3
o o 41
43
ward travel of the pipe is shown in Table 3. The predicted surge was obtained by computing the positive value of the surge due to the velocity of the pipe and subtracting the negative surge due to pipe deceleration. Considering the errors involved in the measured value of surge pressure and in the determination of pipe acceleration, the agreement is reasonably good on the first deceleration surge and better on the second. The average deviation between measured and calculated values is 36 psi/l,OOO ft of pipe (a discrepancy of 36 per cent) for the first deceleration surge and 18 psi/l,OOO ft of pipe (a discrepancy of 18 per cent) for the second.
Positive Surges Due to Pipe Velocity The maximum values of the observed positive surges
were compared to the viscous-drag surges computed when the instantaneous pipe velocity was a maximum. This comparison for the closed pipe string is shown in Table 4.
Agreement between measured and calculated values is excellent, the difference being in every case less than the experimental error in measuring pressure and instantaneous pipe velocity. The actual difference between measured and predicted values averaged 32 psi, a discrepancy of about 13 per cent. In planning field operations, it is important that these large surges can be predicted accurately.
Summary of Comparisons The comparisons listed in Tables 2, 3 and 4 confirm
the theory as a quantitative means of predicting pressure surges. Although several large deviations are present in the comparisons, the deviations are generally well within the experimental accuracy. Agreement is especially good in the case of viscous-drag pressures, which are the largest and therefore most important pressure peaks of the pressure-surge pattern.
FIELD UTILIZATION OF THEORY FOR PRESSURE-SURGE PREDICTIONS
Previous sections of this paper emphasize the theoretical description of surge pressure patterns and how this theory corresponds to the observed surges. In this section, the application of the theory to the control of pressure surges in field operations will be discussed. Effective field use requires the development of a simple,
TAIIlE 3-COMPARISON OF MEASURED AND COMPUTED PRESSURE SURGES DUE TO A VISCOUS DRAG AND INERTIAL SURGE COMPONENTS OCCURRING AS THE PIPE IS BRAKED TO A STOP
Joint No. 38 39 40 41 42 43 44 45 46 47 48
Avg. Pipe Depth
(It)
first Pipe Deceleration Surge in psi/1 ,000 It 01 pipe
Second Pipe Deceleration Surge in psi/l.000 ft 01 pipe
JUlI'E, 1961
1576 1617 1660 1704 1747 1791 1834 .1878 1920 1964 2008
Measured
-·149 -146
.. 94 - 54 + 1 - 48 - 61
-159
Calculated
-153 -·225
-. 92 -110 + 36 -111 - 59
-109
Measured Calculated - 60 - 63
.- 86 - 86 74 - 78
-'108 - 77 -122 - 98 -154 -149
- 86 - 91 - 86 -147
601
Dow
nloaded from http://onepetro.org/JPT/article-pdf/13/06/595/2238106/spe-1546-g-pa.pdf by guest on 30 January 2022

TABLE 4-COMPARISON OF MEASURED AND COMPUTED PRESSURE SURGE DUE TO VISCOUS·DRAG SURGE COMPONENT OCCURRING AS THE PIPE IS
LOWERED INTO THE WELLBORE
Joint No. ~
39 40 41 42 43 44 45 46 47 48
Avg. Pipe Depth _Ifti. __
1576 1617 1660 1704 1747 1791 1834 1878 1920 1964 2008
Maximum Positive Pressure Surge in psi!l ,000 ft of pipe
Measured
254 230 241 241 257 250 233 226 218 229 226
Calculated
287 295 311 260 319 279 260 246 246 222 216
straightforward procedure for accurately computing the pressure surges which may occur.
The simplifications necessary are (1) the determination of which of the pressure peaks are largest and, hence, most important and (2) a simple method of computing these largest peaks-be they positive or negative.
IDENTIFICATION OF IMPORTANT SURGES The characteristically largest pressure surges were
identified from field observations of the various positive and negative surge peaks occurring as added joints of casing were lowered into the hole. Fig. 7 is a compilation of the maximum surge values. The data from Joints 38 through 48 measured with the fill-up device closed and inoperative (closed pipe) clearly show that the largest surge is a positive one. Table 4 shows this positive peak to be associated with the viscous drag of the mud that occurs at maximum pipe velocity.
The data measured with the differential fill-up device operative, Joints 4 through 37 in Fig. 7, show the measured negative surges to be somewhat greater than the corresponding positive surges. But as previously stated, the differential fill-up collar in its normal operating condition closed the casing string during the negative surges and opened the casing to mud flow during the positive surges. The casing string, when running Joints 4 through 37, thus appeared to be a closed pipe for negative surges and an open pipe for positive surges. In many assemblies, such as drill strings, the bore of the pipe would be opened to flow during both surges.
To gain an insight into the surges occurring in this
500
400
100
Fdl Up Collar Operative ~Fill Up Collor -!-----; Permanently Closed
o Largest Negative Peak
• Largest Positive Peak
---Computed Largest Negative Surge Assumi ng the Pipe to be Open for Negative Surges
I ~--I ~ ~ -. I· -. I I I I I
I I I 1
I
1
o 0 _ -1--
20
500
o ..,0..,0- _00 I
1'25 1000
30 I'
45 :50
2000
FIG. 7--LAHGEST MEASuHED POSITIVE A'iD NEGATIVE PHESSLHL
SPHGES AS A FUNCTION OF DEPTH.
602
open-pipe case, the inertial and gel-breaking pressures were calculated with Eq. 4 and with Eq. 2, respectively. These computed negative surges were less than the measured positive surges. (See Fig. 7.)
For field use in controlling pressure surges, it is thus normally sufficient to consider only the major pressure peak arising from the viscous drag of the mud at maximum pipe velocity. The computational procedure previously described for the viscous-drag component of surge pressure generation is complex. A straightforward procedure for estimating this surge pressure is presented in the following section.
APPROXL\fATE PROCEDURE FOR COMPUTING VISCOUS·DRAG PRESSURE SURGES
The approximate procedure for computing viscousdrag components of pressure surges is a simplification of the theory given in a previous section. The central idea of the simplification is to fit approximate equations to theoretical results computed for specific conditions and to state these approximate equations in terms of pipe velocity, mud properties, hole size and pipe geometry. Using a high-speed computer, over 500 combinations of pipe and hole sizes and mud properties were used to evaluate the approximate equations for the conditions most often encountered in field operations.
Fig 8 is a typical graph showing computed pressure surge vs instantaneous pipe velocity. Also shown in Fig. 8 are the two approximate equations used to fit the computed curves. In the laminar flow region, the curve can be approximated by an equation of the form
P, = !f; V p + r [psijl,OOO ft of pipe] (17) For the turbulent flow region,
P, = BV:' [psijl,OOO ft of pipe] . (18) The curve-fitting parameters, !f;, rand B were evalu
ated for a range of mud properties, hole sizes and pipestring geometries. The dependence of these three parameters upon the several variables was found to differ for open and closed pipe strings. These two cases, therefore, are discussed separately.
Closed Pipe
For a closed pipe string, Eqs. 17 and 18 were found to be expressible as the folIowing.
For laminar flow-closed pipe, p., = Bftp V p + To/0.3(D" - D,.)
[psijl,OOO ft of pipe] (19)
For turbulent flow-closed pipe, P, = A }Lp021 pOs" V-" [psi/l,OOO ft pipe] (20)
In these equations, the pipe velocity and mud properties,ftp> To and p, appear directly. The remaining parameters, B, D, and A, are associated with pipe and hole geometries.
The numerical values of A and B evolved by curve fitting are plotted in Figs. 9 and 10 as a function of hole size fer various pipe strings. The nominal casing sizes represent all weights of casing and standard couplings. The driII pipe strings are 31/2 -in. fuII hole with 4Vs -in. tool joints, and 5-in. extra hole with 6% -in OD tool joints. Each drill string had sufficient drill colIars to place 40,000 Ib on the bit in 12-1b/gal mud.
Next, it was desirable to study the effect of different tool joint sizes, casing-protector bushings size and number as weII as size of driII collars upon the constants A and B. Using the computer, pressure surges were calculated using a number of different driII strings with nominal 31/2 - or 5-in. pipe but with various drill-collar sizes
JOlJR:\'A L {H' PET RO i,EUM TECIIl'(OLO (; Y
Dow
nloaded from http://onepetro.org/JPT/article-pdf/13/06/595/2238106/spe-1546-g-pa.pdf by guest on 30 January 2022

and lengths, various tool joints, etc. If the clearances (Dh - D'i), (D" - D dc ) and (D" - Db) were always greater than 1 in. and if the length of the drill collars did not exceed that required to place 80,000 Ib on the bit in 12-1b/gal mud, then the maximum variation in A or B from the tabulated values was less than 8 per cent at a depth of 12,000 ft. Thus, the numerical values of A and B as tabulated may be used with confidence for the drill strings and casing strings most often used in the field.
The parameter D, is an empirically determined effective outer diameter of the pipe string. For casing strings, it was found that this empirical value was nearly identical to the average diameter of the pipe and collars.
D,,+D, .. Dc = -2-[m.]. (21)
Because of the larger clearance, however, De of drill strings turned out to be quite insensitive to usual variations in drill strings of a specific nominal size Fig. 11 is a graph of (D" - De) vs D" for 3112- and 5-in. nominal drill strings.
Open Pipe
The approximation is completed by modifying 19 and 20 for closed pipe string to cover open strings. The modification is as follows.
220
200
180 -- Computed Curve
- - - Approximate Equations
160
CII 140 a. a. ---0
0 120 0
':::::: tI) a. .; 100 :; tI) tI) CII
a:: CII 80 ~ :::>
VI
60
40 A: ..-::
20
0 0 200 400
Instantaneous Peak Pipe Velocity, ft/min.
Eqs. pipe
600
FIG. 8--RIGOROUS AND ApPROXIMATE TIIEORl:TICAL RELATIOl\
SIIIP BETWEEN VISCOGs·DRAG PRESSURE SGRGE
AND PIPE VELOCITY.
JUNE, 1961
For laminar flow-open pipe,
P, = f3B /L"V" + Tu/0.3(D" - DJ [psi/1,000 ft of pipe] (22)
For turbulent flow-open pipe, P, = IX Ap-v"·21 qU,SUU V,,'"
[psi/1,000 ft of pipe] (23) where the coefficients of the openings, IX and f3, are used to adjust the closed-pipe equations for open pipe. The values of IX and f3 are plotted in Figs. 12 and 13 as a function of hole sizes for various nominal casing and drill-pipe sizes. A 1 liz -in. orifice was assumed to represent all fill-up devices used on casing strings. For drill-pipe strings, three-nozzle jet bits whose nozzles varied in sizes from 1/4 to 9/16 in. were used as orifices. In general, the sizes of the jet nozzles were found not to affect appreciably the calculated surge. The IX and f3 plotted for drill pipe were obtained from calculations using %- or 7/16-in. diameter jet bit nozzles as orifices.
Calculations of cases with the same mud and pipe geometry showed that the mud flow regime in the annulus of open pipe may be laminar but may shift to
.00100
7" 9-5/8"
4.1/2" 5-1/2" .00080 - 10-3/4"
<C
c: '" .00060 '0
;;; Q;
0 u c: .00040 '" ::>
-e ::>
I-
.00020
16
Hole Diameter, inches
FIG. 9-TuRBULENT FLOW GEOMETRY COEFFICIENT A AS A
FUNCTION OF WELLIlORE SIZE AND NOMINAL PIPE-STRING SIZE.
.060 r------------,------, 7-5/8" 8-5/8"
.050 10-3/4"
.040 5·1/2" Drill CO
c: 4.1/2" 7" Pipe
'" '0
Qj .030 0
u ~ c:
'E .020 0
.J
.010
16
Hole Diameter, inches
FIG. lO-LAJ\lINAR FLOW GEO~IETRY COEFFIClE.VI' lJ AS .\ FLJ.~cTIO" OF WEi.LIlORE SIZE A'iD NO\JlNAL PIPE-STlll';G SIZE.
Dow
nloaded from http://onepetro.org/JPT/article-pdf/13/06/595/2238106/spe-1546-g-pa.pdf by guest on 30 January 2022
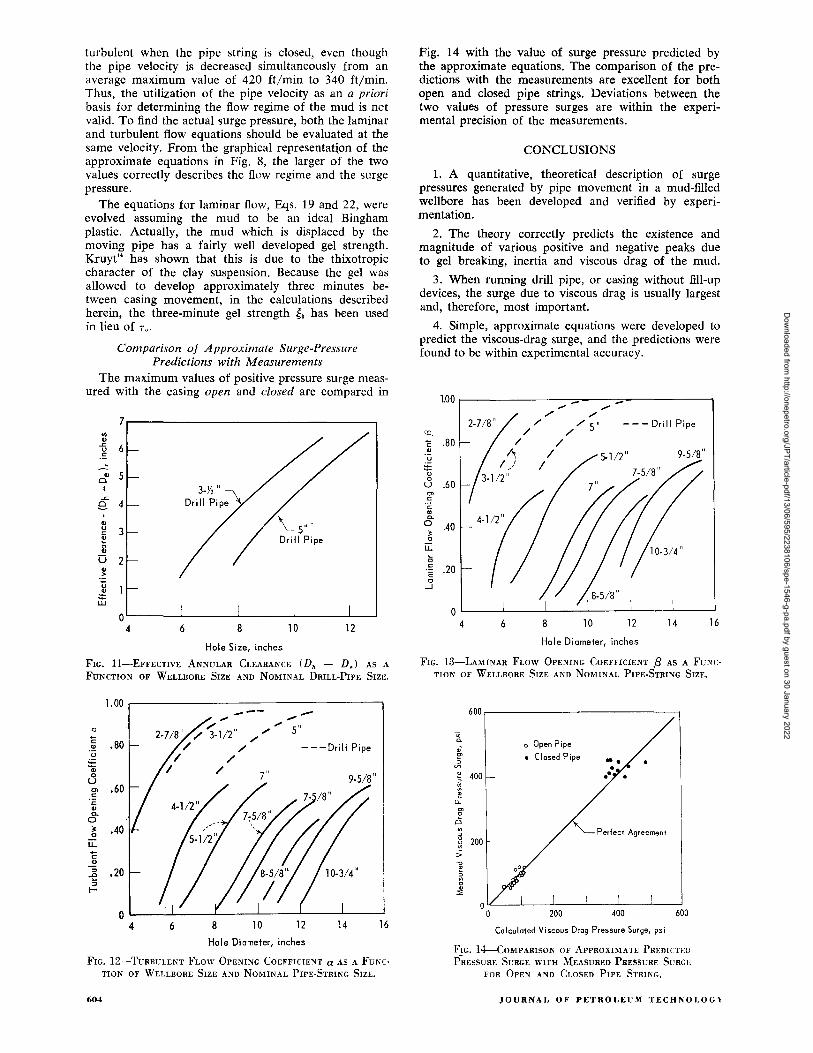
turbulent when the pipe string is closed, even though the pipe velocity is decreased simultaneously from an average maximum value of 420 £t/min to 340 £t/min. Thus, the utilization of the pipe velocity as an a priori basis for determining the flow regime of the mud is not valid. To find the actual surge pressure, both the laminar and turbulent flow equations should be evaluated at the same velocity. From the graphical representation of the approximate equations in Fig. 8, the larger of the two values correctly describes the flow regime and the surge pressure.
The equations for laminar flow, Eqs. 19 and 22, were evolved assuming the mud to be an ideal Bingham plastic. Actually, the mud which is displaced by the moving pipe has a fairly well developed gel strength. Kruyt14 has shown that this is due to the thixotropic character of the clay suspension. Because the gel was allowed to develop approximately three minutes between casing movement, in the calculations described herein, the three-minute gel strength ~3 has been used in lieu of To'
Comparison of Approximate Surge-Pressure Predictions with Measurements
The maximum values of positive pressure surge measured with the casing open and closed are compared in
7,-------------------------------, I/)
" ..<= 6 u
c:
.-.:: " 5 0 I
..<= e- 4
" u 3 c:
" g U 2 " > U .! W
o~-----L------~------~-----L--~
4 6 8 10 12
Hole Size, inches
FIG. ll-EFFECTIVE ANNULAR CLEARANCE (Dh - D,) AS A
FUNCTION
1.00
" 'E .80 " 'u
~ ~ 0
u C> .60 .= c
" 0. 0 ~ .40 0
u.. -c
" "5 .20 ..a :; t-
O 4
OF WELLBORE SIZE AND NOMINAL DRILL-PIPE SIZE.
--- -,," 5 11
.... " 2-7/8" / 3-1/2"
/ /
/ /
---Drill Pipe I
I
6
/ 7"
8 10 12 14
Hole Diameter, inches
16
FIG. I2-TuRBULENT FLOW OPENING COEFFICIENT a AS A FUNC
TION OF WELLBORE SIZE AND NOMINAL PIPE-STRING SIZE.
604
Fig. 14 with the value of surge pressure predicted by the approximate equations. The comparison of the predictions with the measurements are excellent for both open and closed pipe strings. Deviations between the two values of pressure surges are within the experimental precision of the measurements.
CONCLUSIONS
L A quantitative, theoretical description of surge pressures generated by pipe movement in a mud-filled wellbore has been developed and verified by experimentation.
2. The theory correctly predicts the existence and magnitude of various positive and negative peaks due to gel breaking, inertia and viscous drag of the mud.
3_ When running drill pipe, or casing without fill-up devices, the surge due to viscous drag is usually largest and, therefore, most important.
4_ Simple, approximate equations were developed to predict the viscous-drag surge, and the predictions were found to be within experimental accuracy.
1.00 ,--------------=-----;;;;-'----------,
cr:. c: .80 " u
" o u .60 0> c: c:
" a. c; .40 o
u. (;
.§ .20
" ...I
..... ;0'
" " / /5' ---Drill Pipe / /
/ / ~ I
/) / 3-1/2"
o~--~-----L----~----L---~----~
4 6 8 10 12 14 16
Hole Diameter, inches
FIG. I3-LAMINAR FLOW OPENING COEFFICIENT [3 AS A FUNC
TION OF WELLBORE SIZE AND NOMINAL PIPE-STRING SIZE_
600r---------------------------~
.~
~
'" Jl ~ 400 ~ ~
~ D-
'" o o ~
5 ~ 200
;>
-0
~ ~ o ~
'"
a Open Pipe
• Closed Pipe
200 400 600
Calculated Viscous Drag Pressure Surge, psi
FIG. I4-COMPARISON OF ApPROXIMATE PREDICTED
PRESSURE SURGE WITH MEASURED PRESSURE SURGE
FOR OPEN AND CLOSED PIPE STRING.
JOURNAL OF PETROLEUM 'I'ECHNOLOGl
Dow
nloaded from http://onepetro.org/JPT/article-pdf/13/06/595/2238106/spe-1546-g-pa.pdf by guest on 30 January 2022

NOMENCLATURE
A = empirical geometry coefficient, turbulent flow ap = acceleration of pipe, ft/sec' B = empirical geometry coefficient, laminar flow
D; = inside diameter of pipe, in. D, = inside diameter of hole, in. Dp = outside diameter of pipe, in. Dc = outside diameter of casing coupling, in.
D,} = outside diameter of tool joint, in. DdC = outside diameter of drill collar, in. D. = outside diameter of rubber casing-protector
bushings, in. D. = empirical effective pipe string outside diam-
eter, in. t = friction factor g = acceleration of gravity, ft/sec' L = length of pipe section, ft P = pressure, psi
Po = annulus pressure, psi p. = pipe bore pressure, psi P, = pressure surge, psi/I,OOO ft of pipe
!:!.P d' '/f L = pressure gra lent, pSI t
qo = mud flow in annulus measured with respect to the fixed wall of the hole, ft'/min
{q.} = mud flow in pipe bore measured with respect to pipe walls, ft' /min
R. = Reynolds number S = plasticity
Va, = effective annulus mud velocity, ft/min Vb. = effective pipe-bore mud velocity, ft/min V d• = annulus component of mud velocity due to
displacement, ft/min V"" = annulus component of mud velocity due to
moving surface, ft/min V p = velocity of pipe, ft/min
a = empirical opening coefficient, turbulent flow (3 = empirical opening coefficient, laminar flow y = fluid conductance p = mud weight, Ib/gal
To = yield point, lb/IOO ft'
JUNE, 1961
fJ-p = plastic viscosity, cp ~ = gel strength, lb/IOO ft' ~o = initial gel strength, lb/IOO fe ~, = three-minute gel strength, Ib/lOO ft2
ACKNOWLEDGMENTS
The author expresses his gratitude and indebtedness to R. J. Blackwell, G. W. Binkley, J. E. Eckel and J. A. Rickard for their contributions to many phases of the work described in this paper. The help and cooperation extended by field and engineering personnel of the Humble Oil & Refining Co. are also gratefully acknowledged.
REFERENCES
1. Cannon, George E.: "Changes in Hydrostatic Pressure Due to Withdrawing Drill Pipe from the Hole", Drill. and Prod. Prac., API (1934) 42.
2. Goins, W. C., Jr., Weichert, J. P., Burba, J. L., Jr., Dawson, D. D., Jr. and Teplitz, A. J.: "Down-the-Hole Pressure Surges and Their Effect on Loss of Circulation", Drill. and Prod. Prac., API (1951) 125.
3. Clark, K H., Jr.: "Bottom-Hole Pressure Surges While Running Pipe", ASME Paper No. 54-PET-22 presented at the Pet. Mech. Eng. Conf., Los Angeles, Calif. (Sept., 1954); also published in Pet. Eng. (1955) 27, B-68.
4. Eckel, J. K: Oil and Gas Jour. (1959) 57, No. 13,96. 5. Cardwell, W. T., Jr.: "Pressure Changes in Drilling Wells
Caused by Pipe Movement", Drill. and Prod. Prac., API (1953) 97.
6. Beck, R. W., Nuss, W. F. and Dunn, T. H.: "Flow Properties of Drilling Muds", Drill. and Prod. Prac., API (1947) 9.
7. Ormsby, George S.: "Calculation and Control of Mud Pressures in Drilling and Completion Operations", Drill. and Prod. Prac., API (1954) 44.
8. Clark, E. H., Jr.: "A Graphic View of Pressure Surges and Lost Circulation", Drill. and Prod. Prac., API (1956) 424.
9. Melrose, 1. c., Savins, 1. G., Foster, W. R. and Parrish, E. R.: "A Practical Utilization of the Theory of Bingham Plastic Flow in Stationary Pipes and Annuli", Trans., AIME (1958) 213, 316.
10. Laufer, J.: Jour. 0/ Aero. Sci. (1950) 17, 277. n. Pai, S. I.: Jour. 0/ Appl. Meeh. (1953) 20, 109. 12. Piggott, R. J. S.: Mech. Eng. (1933) 55, 497. 13. Hedstrom, B. O. A.: Ind. Eng. Chem. (1952) 44, 651. 14. Kruyt, H. R.: Colloid Science, 1, Elsevier Publishing Co.,
Amsterdam, 364. ***
605
Dow
nloaded from http://onepetro.org/JPT/article-pdf/13/06/595/2238106/spe-1546-g-pa.pdf by guest on 30 January 2022
Copyright © 2022 FDOKUMEN