WELL CONTROL CAPACITY-BASED RISK ANALYSIS OF ...
10
Volume 25 Issue 2 Article 22 WELL CONTROL CAPACITY-BASED RISK ANALYSIS OF GAS CUT IN WELL CONTROL CAPACITY-BASED RISK ANALYSIS OF GAS CUT IN DEEPWATER DRILLING DEEPWATER DRILLING Yuqiang Xu College of Petroleum Engineering, China University of Petroleum (Beijing), Beijing, China. College of Petroleum Engineering, China University of Petroleum (East China), Qingdao, Shandong, China. Zhichuan Guan College of Petroleum Engineering, China University of Petroleum (East China), Qingdao, Shandong, China., [email protected] Yan Jin College of Petroleum Engineering, China University of Petroleum (Beijing), Beijing, China. Hua Pang College of Petroleum Engineering, China University of Petroleum (East China), Qingdao, Shandong, China. Yongwang Liu College of Petroleum Engineering, China University of Petroleum (East China), Qingdao, Shandong, China. See next page for additional authors Follow this and additional works at: https://jmstt.ntou.edu.tw/journal Recommended Citation Recommended Citation Xu, Yuqiang; Guan, Zhichuan; Jin, Yan; Pang, Hua; Liu, Yongwang; Zhang, Bo; and Sheng, Yanan (2017) "WELL CONTROL CAPACITY-BASED RISK ANALYSIS OF GAS CUT IN DEEPWATER DRILLING," Journal of Marine Science and Technology: Vol. 25 : Iss. 2 , Article 22. DOI: 10.6119/JMST-016-1129-2 Available at: https://jmstt.ntou.edu.tw/journal/vol25/iss2/22 This Research Article is brought to you for free and open access by Journal of Marine Science and Technology. It has been accepted for inclusion in Journal of Marine Science and Technology by an authorized editor of Journal of Marine Science and Technology.
-
Upload
khangminh22 -
Category
Documents
-
view
2 -
download
0
Transcript of WELL CONTROL CAPACITY-BASED RISK ANALYSIS OF ...

Volume 25 Issue 2 Article 22
WELL CONTROL CAPACITY-BASED RISK ANALYSIS OF GAS CUT IN WELL CONTROL CAPACITY-BASED RISK ANALYSIS OF GAS CUT IN DEEPWATER DRILLING DEEPWATER DRILLING
Yuqiang Xu College of Petroleum Engineering, China University of Petroleum (Beijing), Beijing, China. College of Petroleum Engineering, China University of Petroleum (East China), Qingdao, Shandong, China.
Zhichuan Guan College of Petroleum Engineering, China University of Petroleum (East China), Qingdao, Shandong, China., [email protected]
Yan Jin College of Petroleum Engineering, China University of Petroleum (Beijing), Beijing, China.
Hua Pang College of Petroleum Engineering, China University of Petroleum (East China), Qingdao, Shandong, China.
Yongwang Liu College of Petroleum Engineering, China University of Petroleum (East China), Qingdao, Shandong, China.
See next page for additional authors
Follow this and additional works at: https://jmstt.ntou.edu.tw/journal
Recommended Citation Recommended Citation Xu, Yuqiang; Guan, Zhichuan; Jin, Yan; Pang, Hua; Liu, Yongwang; Zhang, Bo; and Sheng, Yanan (2017) "WELL CONTROL CAPACITY-BASED RISK ANALYSIS OF GAS CUT IN DEEPWATER DRILLING," Journal of Marine Science and Technology: Vol. 25 : Iss. 2 , Article 22. DOI: 10.6119/JMST-016-1129-2 Available at: https://jmstt.ntou.edu.tw/journal/vol25/iss2/22
This Research Article is brought to you for free and open access by Journal of Marine Science and Technology. It has been accepted for inclusion in Journal of Marine Science and Technology by an authorized editor of Journal of Marine Science and Technology.
WELL CONTROL CAPACITY-BASED RISK ANALYSIS OF GAS CUT IN DEEPWATER WELL CONTROL CAPACITY-BASED RISK ANALYSIS OF GAS CUT IN DEEPWATER DRILLING DRILLING
Acknowledgements Acknowledgements College of Petroleum Engineering, China University of Petroleum (East China), Qingdao, Shandong, China.
Authors Authors Yuqiang Xu, Zhichuan Guan, Yan Jin, Hua Pang, Yongwang Liu, Bo Zhang, and Yanan Sheng
This research article is available in Journal of Marine Science and Technology: https://jmstt.ntou.edu.tw/journal/vol25/iss2/22
Journal of Marine Science and Technology, Vol. 25, No. 2, pp. 205-212 (2017 ) 205 DOI: 10.6119/JMST-016-1129-2
WELL CONTROL CAPACITY-BASED RISK ANALYSIS OF GAS
CUT IN DEEPWATER DRILLING
Yuqiang Xu1, 2, Zhichuan Guan2, Yan Jin1, Hua Pang2,
Yongwang Liu2, Bo Zhang2, and Yanan Sheng2
Key words: risk analysis, gas cut, well control capacity, deepwater drilling.
ABSTRACT
Gas cutting typically occurs in deepwater drilling of high- pressure gas reservoirs. If gas cutting is not detected in a timely manner or if the designed well control capacity is insufficient, blowout and other accidents may occur. To address this pro- blem, this paper presents a gas-liquid flow model and kill mo- del in deepwater drilling for the simulation analysis of the gas cutting and killing processes in deepwater drilling. By calcu- lating the maximum allowable killing casing pressure, well con- trol risks under various overflow rates, formation pressures, and kill rates were analyzed, and a well control capacity-based risk analysis method for gas cutting in deepwater drilling was esta- blished. In this method, the well control capacity under various drilling conditions was considered. Moreover, by using this me- thod, the well control risk after a gas cut under various condi-tions can be analyzed to obtain the safe construction parameter range and overflow monitoring index. An example is presented to demonstrate that the established method can be used to recom- mend safe overflow range, maximum allowable formation pres- sure prediction error in the current condition, and safety kill rate range under specific working conditions. Thus, the proposed me- thod has practical application in dynamic risk assessment of gas cutting in deepwater drilling.
I. INTRODUCTION
Deepwater oil and gas resources have been majorly explored for fossil energy in the 21st century (Khain and Polyakova, 2004; Xu et al., 2014). Compared with conventional drilling, deepwater
drilling entails a more demanding environment with stricter re-quirements of well control (Botrel and Isambourg, 2001; Chu, 2012). First, as the water depth increases, the formation frac- ture pressure decreases, safe density window narrows, and kick tolerance decreases (Avelar et al., 2009; Zhou et al., 2012), which is more likely to lead to a gas cut. Second, the deepwater high- static-pressure environment reduces the overall scale of bubbles when they reach the seafloor wellhead, which is not conducive to the early detection of a gas cut by monitoring overflow (Ren et al., 2011). Moreover, the bubbles tend to rapidly rise and ex- pand once they enter the riser. This imposes a large burden on the well control equipment if a killing well is used and may lead to well killing failure because of excessive pressure (Ren et al., 2012).
Recently, researchers have extensively researched on the early detection of gas cuts in deepwater drilling (Zhuo et al., 2009; Chen et al., 2014) and have made great progress in related monitoring equipment and methods. These efforts have aimed to achieve timely warning of a gas cut to implement necessary well control measures and have improved the accuracy and timeliness of gas cut monitoring in deepwater drilling (David et al., 2001; Gupta et al., 2013; Zhou et al., 2013), resulting in more time for subsequent well control (Johnson et al., 2014; Meng et al., 2015). However, many problems, such as safety concerns when the overflow increases and whether the current well control ability meets the safety requirements when a gas cut occurs in deepwater drilling, remain to be investigated. Therefore, in addition to the timely monitoring of gas cuts, analyzing the well control risks under various conditions after a gas cut is necessary to ensure that the gas cut is controlled under the existing conditions. This can provide technical sup- port for overflow monitoring and well control measures under various conditions and can facilitate the dynamic risk assess- ment of gas cuts in deepwater drilling on the basis of well con-trol capacity.
II. MATERIALS AND METHODS
To study the risks of a gas cut in deepwater drilling, the gas cutting and well killing processes and the influence of various
Paper submitted 10/19/15; revised 11/02/16; accepted 11/29/16. Author for correspondence: Zhichuan Guan (e-mail: [email protected]). 1 College of Petroleum Engineering, China University of Petroleum (Beijing), Beijing, China.
2 College of Petroleum Engineering, China University of Petroleum (East China), Qingdao, Shandong, China.
206 Journal of Marine Science and Technology, Vol. 25, No. 2 (2017 )
factors such as overflow, formation pressure, and killing meas- urements on well control risks under the existing conditions of well control capacity must be analyzed. Accordingly, a gas- liquid flow model and kill model in deepwater drilling must be established, and the critical indicatormaximum allowable killing casing pressuremust be calculated to analyze the effect of va- rious factors on well control capacity.
1. Gas-Liquid Flow Model and Kill Model in Deepwater Drilling
1) Gas-Liquid Flow Model in Deepwater Drilling
Recently, the wellbore annulus multiphase flow model has been developed to meet the accuracy requirements of design and on-site construction (Gao et al., 2008; Ning et al., 2008; Song and Guan, 2011; Xu et al., 2014). However, because of the unique environmental factors, such as deep water depth and low temperature, associated with deepwater drilling, the temperature accuracy strongly influences the rheology, density, and type of two-phase flow of the annulus drilling fluid (Gao et al., 2008; Ning et al., 2008; Song and Guan, 2011). Therefore, the accuracies of the seawater temperature and wellbore heat transfer models must be improved.
The deepwater temperature model is based on a large set of measured data and has regional characteristics. In this paper, we use the temperature-depth model of South China Sea, established by Gao et al. (2008), as the seawater temperature model.
When the water depth is > 200 m, the temperature at regions with a depth of > 200 m can be calculated using the following formula:
0 3
1 2sea 2 ( ) /
( C), 200 m1 h a a
a aT a h
e
(1)
where a0, a1, a2, and a3 are dimensionless empirical coefficients: a0 = 130.1, a1 = 39.4, a2 = 2.307, and a3 = 402.7. Tsea (C) is the seawater temperature and h (m) is the seawater depth.
The temperature at regions with a depth of < 200 m can be calculated using various fitted equations according to the season:
Spring: sea
(200 ) 13.7, 0 200 m
200ST h h
T h
(2)
Summer: sea
sea
, 0 20 m;
(200 ) 13.7( 20), 20 200 m
180
S
S
T T h
T h hT h
(3)
Autumn: sea
sea
, 0 50 m;
(200 ) 13.7( 50), 50 200 m
150
S
S
T T h
T h hT h
(4)
Winter: sea
sea
, 0 100 m;
(200 ) 13.7( 100),100 200 m
100
S
S
T T h
T h hT h
(5)
where Ts (C) is the sea surface temperature . Because Eqs. (2)-(5) are empirical fitted equations, the units of Ts and h should not be considered in the calculation process.
Unsteady wellbore multiphase flow control equations in deep- water drilling were established on the basis of the drift flow model described by Sun et al. (2013). The specific model has been discussed in the relevant literature (Song and Guan, 2011; Sun et al., 2013) and is therefore not detailed in this paper.
2) Well Killing Model in Deepwater Drilling
The most commonly used well killing methods include the engineer’s method, driller’s method, and circulate and weight method, and each method has its unique characteristics (Kerr, 2010; Luo et al., 2011). The driller’s method, which mainly com- prises the following seven stages, is used in this study:
(1) The original drilling fluid replaces seawater within a choke; (2) The top of the gas column appears at the seafloor BOP
(blowout preventer); (3) The top of the gas column reaches the choker line top; (4) The bottom of the gas column appears at the seafloor BOP; (5) The bottom of the gas column reaches the choker line top; (6) The killing fluid is injected from the wellhead and reaches
the bit; and (7) The killing fluid reaches the choker line top.
Stages (1)-(5) constitute the first loop cycle, and Stages (6)-(7)
constitute the second loop cycle. At the end of the second loop cycle, if the casing pressure drops to 0, it indicates that well killing has been achieved; otherwise, well killing should be con- tinued until the casing pressure drops to 0.
Accordingly, the well kill model combined with the two- phase flow model was established when gas cutting occurred in deepwater drilling. The following are the continuity equations in various phases:
Gas continuity equation:
g( ) ( )0a g g a g gS E S E V
t z
(6)
Liquid continuity equation:
g[ (1 )] [ (1 ) ]0a l g a l gS E S E V
t z
(7)
Gas-liquid two-phase hybrid equation:
2 2[ (1 ) ] [ (1 ) ]
( ) [ (1 )] 0
a g g g a l g l a g g g a l g l
a a fr a g g l g
S E V S E V S E V S E V
t z
P PS S S E E g
z z
(8)
where g and l (Kg/m3) are the gas and liquid densities, re-
Y. Xu et al.: Risk Analysis of Gas Cut in Deepwater Drilling 207
spectively; Eg is the air void; Vg and Vl (m/s) are the gas and liquid speeds, respectively; Sa (m2) is the wellbore annulus
cross-sectional area; and fr
P
z
(Pa/m) is the friction loss.
2. Numerical Calculation Methods of the Ttemperature Model and Gas-Liquid Flow and Kill Models
To calculate the differential equations, the gas-liquid flow and kill models were discretized as follows:
(1) Temperature model
Within the drill pipe:
[ ( , ) ( , )]
ln( )1 1
( , ) ( , ) 2
( , ) ( , 1)( , ) ( , )
( , ) ( 1, )( , ) ( , ) ( , )
a p
po
pi
pi pi po po dp
p pp p p p
p pcp p p p
T i k T i k
dd
h i k d h i k d
T i k T i kS V i k c i k
z
T i k T i kQ i k S i k c i k
t
(9)
After finishing the formula:
1 1 1 1 1( , ) ( 1, ) ( , 1) ( , )p p p aAT i k B T i k C T i k D T i k F (10)
where
1
ln( )1 1
( , ) ( , ) 2
( , ) ( , ) ( , ) ( , )
po
pi
pi pi po po dp
p p p p p p p
Ad
d
h i k d h i k d
S V i k c i k S i k c i k
z t
(11)
1
( , ) ( , )p p pS i k c i kB
t
(12)
1
( , ) ( , )p p p pS V i k c i kC
z
(13)
1
ln( )1 1
( , ) ( , ) 2
po
pi
pi pi po po dp
Dd
d
h i k d h i k d
(14)
1 ( , )cpF Q i k (15)
Wellbore annulus in the formation section:
2[ ( , ) ( , )]
( ) 2
[ ( , ) ( , )]
ln( )1 1
( , ) ( , ) 2
( , 1) ( , )( , ) ( , )
( , ) ( 1, )( , ) ( , ) ( , )
f co af a
co a f
a p
po
pi
pi pi po po dp
a aa a a a
a aca a a a
d UT i k T i k
d U f t
T i k T i k
dd
h i k d h i k d
T i k T i kS V i k c i k
z
T i k T i kQ i k S i k c i k
t
(16)
After completion:
2 2 2
2 2 2
( , ) ( , ) ( 1, )
( , 1) ( , )
a p a
a f
A T i k B T i k C T i k
D T i k E T i k F
(17)
where
2
2
( ) 2
ln( )1 1
( , ) ( , ) 2
( , ) ( , )
( , ) ( , )
f co a
co a f
po
pi
pi pi po po dp
a a a a
a a a
d UA
d U f t
dd
h i k d h i k d
S V i k c i k
z
S i k c i k
t
(18)
2
ln( )1 1
( , ) ( , ) 2
po
pi
pi pi po po dp
Bd
d
h i k d h i k d
(19)
2
( , ) ( , )a a aS i k c i kC
t
(20)
2
( , ) ( , )a a a aS V i k c i kD
z
(21)
2
2
( ) 2f co a
co a f
d UE
d U f t
(22)
2 ( , )caF Q i k (23)
Wellbore annulus in the water section:
208 Journal of Marine Science and Technology, Vol. 25, No. 2 (2017 )
a p
pi pi
[ ( , ) ( , )]
ln( ) ln( )1 1
( , ) ( , ) 2 2
[T ( , ) T ( , )]
ln( )1 1
h ( , )d ( , ) 2
( , 1) ( , )( , ) ( , )
( ,( , ) ( , ) ( , )
s a
ro io
ri ii
ri ri io io r i
po
pi
po po dp
a aa a a a
aca a a a
T i k T i kd d
d d
h i k d h i k d
i k i k
dd
i k h i k d
T i k T i kS V i k c i k
z
T i kQ i k S i k c i k
) ( 1, )aT i k
t
(24)
After completion:
3 3 3 3
3 3
( , ) ( , ) ( 1, ) ( , 1)
( , )
a p a a
s
A T i k B T i k C T i k D T i k
E T i k F
(25)
where
3
ln( ) ln( )1 1
( , ) ( , ) 2 2
ln( )1 1
( , ) ( , ) 2
( , ) ( , ) ( , ) ( , )
ro io
ri ii
ri ri io io r i
po
pi
pi pi po po dp
a a a a a a a
Ad d
d d
h i k d h i k d
dd
h i k d h i k d
S V i k c i k S i k c i k
z t
(26)
3
ln( )1 1
( , ) ( , ) 2
po
pi
pi pi po po dp
Bd
d
h i k d h i k d
(27)
3
( , ) ( , )a a aS i k c i kC
t
(28)
3
( , ) ( , )a a a aS V i k c i kD
z
(29)
3
ln( ) ln( )1 1
( , ) ( , ) 2 2
ro io
ri ii
ri ri io io r i
Ed d
d d
h i k d h i k d
(30)
3 ( , )caF Q i k . (31)
(2) Gas-liquid flow and kill models Gas continuity equation:
1 11
1 1
1 1
( ) ( )
2
n na g g g j a g g g j
n n n n
a g g a g g a g g a g gj j j j
S V E S V E
zS E S E S E S E
t
(32)
Liquid continuity equation:
1 11
1 1
1 1
( ) ( )
2
n na l l l j a l l l j
n n n n
a l l a l l a l l a l lj j j j
S V E S V E
zS E S E S E S E
t
(33)
Gas-liquid two-phase hybrid equation:
1 11 1
1 11
2 2 1 2 2 11
1 11
[( ) ( )2
( ) ( ) ]
[( ) ( ) ]
[ ] [ ]2
2
n n n nj j g g g l l l j g g g l l l j
n ng g g l l l j g g g l l l j
n ng g g l l l j g g g l l l j
n ng g l l j g g l l j
zP P E V E V E V E V
t
E V E V E V E V
E V E V E V E V
zE g E g E g E g
z P
z
1 1
1
n n
fric fricj j
P
z
(34)
After completion:
1 11
n nj j A B C DP P M M M M (35)
where
1
1
11
[( )2
( )
( )
( ) ]
nA g g g l l l j
ng g g l l l j
ng g g l l l j
ng g g l l l j
zM E V E V
t
E V E V
E V E V
E V E V
(36)
2 2 1
2 2 11
( )
( )
nB g g g l l l j
ng g g l l l j
M E V E V
E V E V
(37)
1
11
1 11
[ ( ) ] ]
[ ( ) ] ]
[ ] ] [ ] ]2
nC g g l l j
ng g l l j
n ng g l l j g g l l j
M E g E g dz
E g E g dz
zE g E g E g E g
(38)
Y. Xu et al.: Risk Analysis of Gas Cut in Deepwater Drilling 209
Table 1. Specifications of NH3-2.
Well depth/m 3630 Water depth/m 1298
Riser internal diameter/mm 482.6 Riser external diameter/mm 533.4
Delivery rat/(L/s) 27.1 Rotate speed/rpm 80
Initial viscosity/Pa.s 55 Bottom hole formation pressure/MPa 43.9
Drilling fluid density/(g/cm3) 1.14 Geothermal gradient/(C/m) 0.0463
Blowout preventer rated working pressure/MPa 103
Table 2. Casing parameters.
Borehole size/mm
Casing external diameter/mm
Casing internal diameter/mm
Casing depth/m
Steel grade Buckle typeTensile
strength/kNCollapsing
strength/MPa Internal pressure
strength/MPa
914.4 914.4 882.14 1407 X-56 D-90/MTD-60/MT
40495 /27391
18.55 /7.31
18.75 /28.13
660.4 508 482.6 2000 X-56 S-90/MT 9474 10.00 21.10
444.5 339.7 315.34 2800 N-80Q SL-BOSS 6926 15.60 34.61
311.15 Open hole section 3625
1 11
1 1
1
[ ( ) ] ] [ ( ) ] ]
2
n nD fric j fric j
n n
fric fricj j
P PM dz dz
z z
z P P
z z
. (39)
3. Calculation Method for Maximum Allowable Killing Casing Pressure
According to the offshore drilling manual (Dong et al., 2011), the maximum allowable killing casing pressure should not ex- ceed the minimum value of the wellhead rated working pressure, 80% of the casing internal pressure strength, and permitted cas-ing pressure by weak formation fracture pressure. Therefore, the maximum allowable killing casing pressure can be calculated as follows:
(1) Determine the wellhead rated working pressure, Pwh, ac-
cording to the wellhead equipment type; (2) Determine the casing internal pressure strength, Pci, (i is the
casing level) of various casing levels according to the ce- mented casing types. For two or more casing levels (not tie- back liner), select the minimum value of each level’s casing internal pressure strength;
(3) Determine the open hole formation fracture pressure, Pfmin, and its depth H according to the casing program and for- mation fracture pressure profile; and
(4) Determine the maximum allowable killing casing pressure, Pj, under various killing fluid density, j, according to the spare killing fluid density of various as follows:
wh c fminP = min P , min (0.8 P ), (P ) 0.00981 Hj i j . (40)
III. RESULTS AND DISCUSSION
In addition to equipment failure and human error, crucial fac- tors such as formation pressure prediction error, timely warn- ing of overflow value, and killing parameter (such as kill rate) design affect the gas cut and well killing safety. These factors can be quantified and evaluated through calculation and are con- ducive to dynamic risk assessment of gas cutting in deepwater drilling by analyzing the impact of these factors on well control risks.
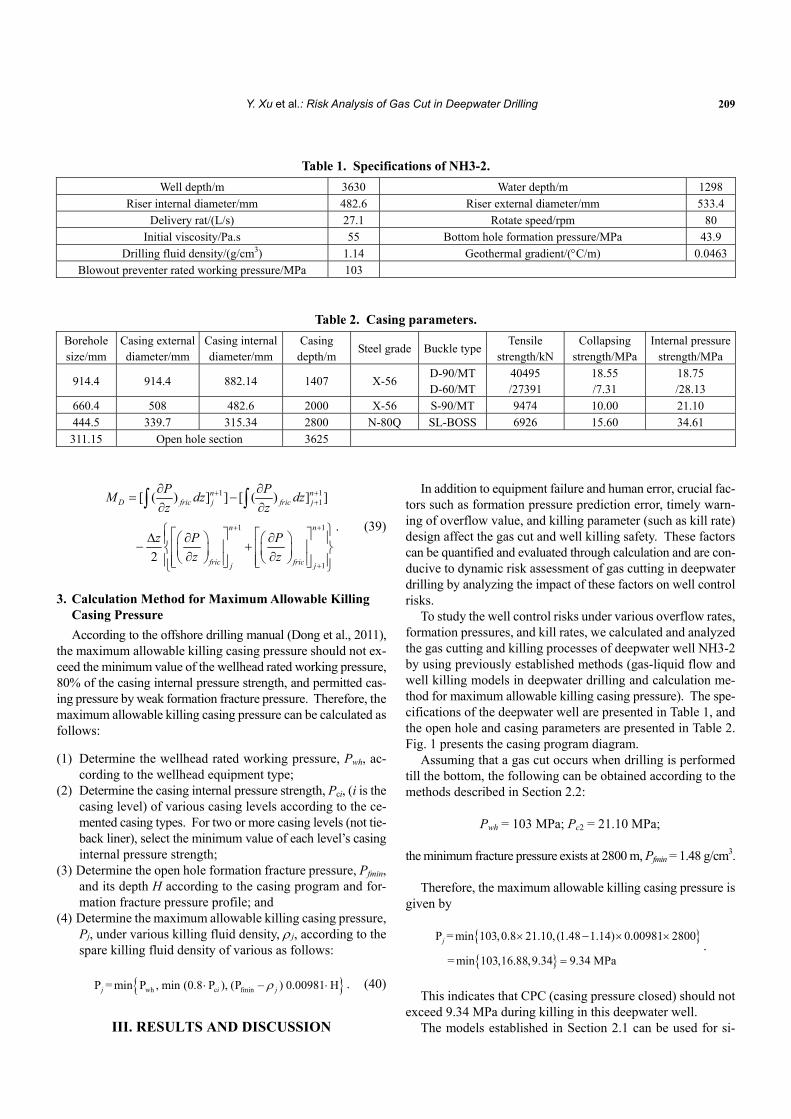
To study the well control risks under various overflow rates, formation pressures, and kill rates, we calculated and analyzed the gas cutting and killing processes of deepwater well NH3-2 by using previously established methods (gas-liquid flow and well killing models in deepwater drilling and calculation me- thod for maximum allowable killing casing pressure). The spe- cifications of the deepwater well are presented in Table 1, and the open hole and casing parameters are presented in Table 2. Fig. 1 presents the casing program diagram.
Assuming that a gas cut occurs when drilling is performed till the bottom, the following can be obtained according to the methods described in Section 2.2:
Pwh = 103 MPa; Pc2 = 21.10 MPa;
the minimum fracture pressure exists at 2800 m, Pfmin = 1.48 g/cm3.
Therefore, the maximum allowable killing casing pressure is given by
P = min 103,0.8 21.10, (1.48 1.14) 0.00981 2800
= min 103,16.88,9.34 9.34 MPa
j
.
This indicates that CPC (casing pressure closed) should not exceed 9.34 MPa during killing in this deepwater well.
The models established in Section 2.1 can be used for si-
210 Journal of Marine Science and Technology, Vol. 25, No. 2 (2017 )
Water Depth 1298 m
Conductor Depth 1407 m
Surface Casing 2000 m
Technical Casing 2800 m
Open hole section
Bottom hole 3652 m Fig. 1. Schematic of the casing program.
16
0 2 4 6
C
B
Overflow value/m3
Cas
ing
Pres
sure
Pea
k/M
Pa
8 10 12
14
12
10
8
6
4
42 MPa43 MPa44 MPa45 MPa
Fig. 2. Casing pressure peak changes with overflow rate under various
formation pressures.
mulating the gas cutting and killing processes under various overflow rates, formation pressures, and kill rates and for ana- lyzing the impact of various factors on well control risks.
1. Influence of Overflow Rate on Well Control under Various Conditions
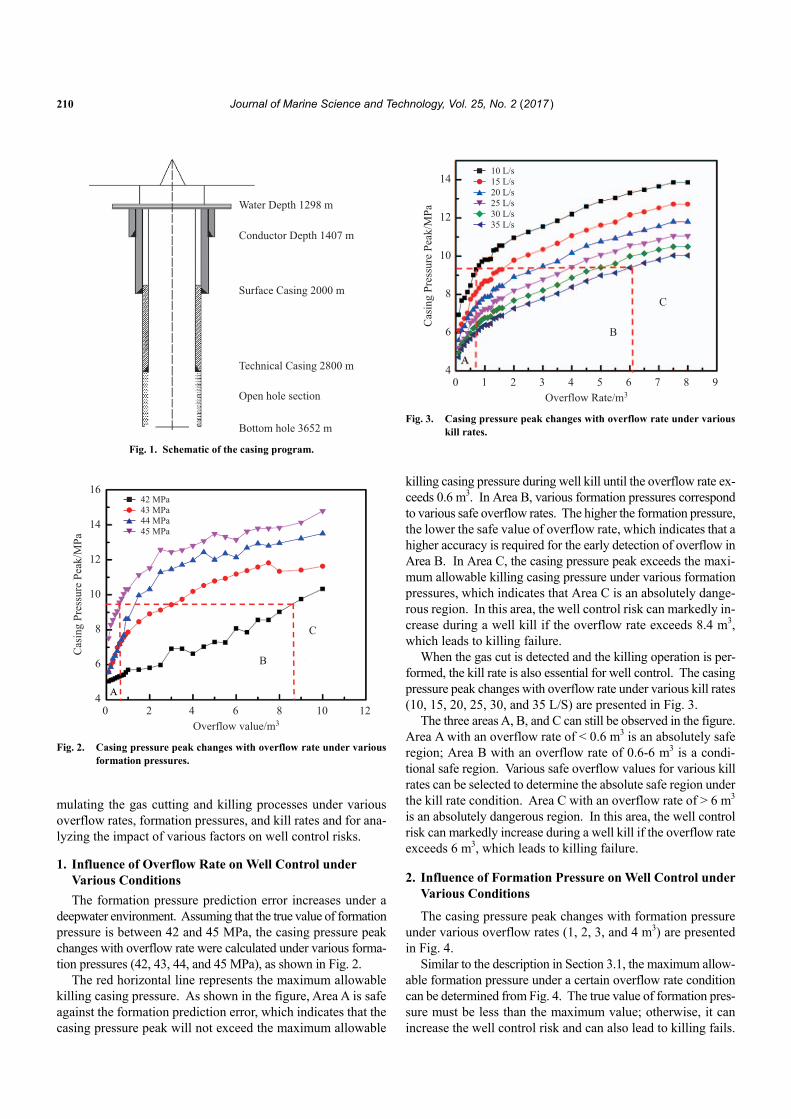
The formation pressure prediction error increases under a deepwater environment. Assuming that the true value of formation pressure is between 42 and 45 MPa, the casing pressure peak changes with overflow rate were calculated under various forma- tion pressures (42, 43, 44, and 45 MPa), as shown in Fig. 2.
The red horizontal line represents the maximum allowable killing casing pressure. As shown in the figure, Area A is safe against the formation prediction error, which indicates that the casing pressure peak will not exceed the maximum allowable
0 1 2 4
C
B
Overflow Rate/m3
Cas
ing
Pres
sure
Pea
k/M
Pa
6 83 5 7 9
14
12
10
8
6
4
10 L/s
30 L/s
15 L/s20 L/s25 L/s
35 L/s
Fig. 3. Casing pressure peak changes with overflow rate under various
kill rates.
killing casing pressure during well kill until the overflow rate ex- ceeds 0.6 m3. In Area B, various formation pressures correspond to various safe overflow rates. The higher the formation pressure, the lower the safe value of overflow rate, which indicates that a higher accuracy is required for the early detection of overflow in Area B. In Area C, the casing pressure peak exceeds the maxi- mum allowable killing casing pressure under various formation pressures, which indicates that Area C is an absolutely dange- rous region. In this area, the well control risk can markedly in- crease during a well kill if the overflow rate exceeds 8.4 m3, which leads to killing failure.
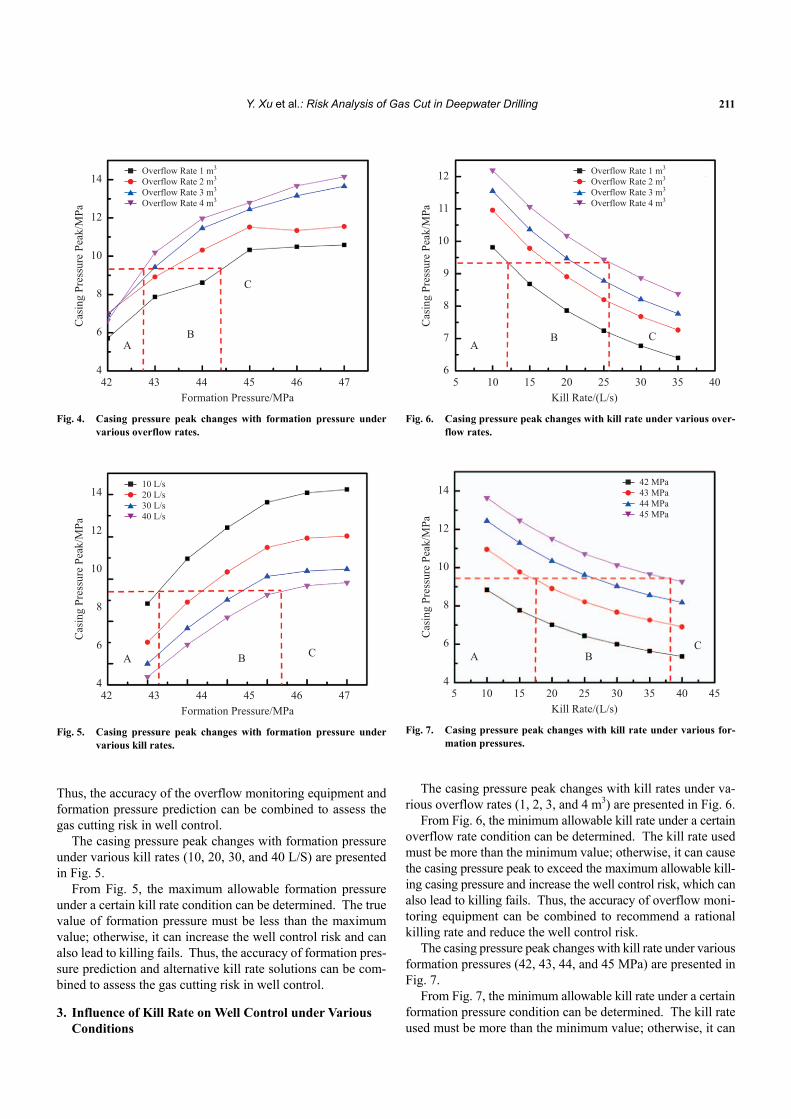
When the gas cut is detected and the killing operation is per- formed, the kill rate is also essential for well control. The casing pressure peak changes with overflow rate under various kill rates (10, 15, 20, 25, 30, and 35 L/S) are presented in Fig. 3.
The three areas A, B, and C can still be observed in the figure. Area A with an overflow rate of < 0.6 m3 is an absolutely safe region; Area B with an overflow rate of 0.6-6 m3 is a condi-tional safe region. Various safe overflow values for various kill rates can be selected to determine the absolute safe region under the kill rate condition. Area C with an overflow rate of > 6 m3 is an absolutely dangerous region. In this area, the well control risk can markedly increase during a well kill if the overflow rate exceeds 6 m3, which leads to killing failure.
2. Influence of Formation Pressure on Well Control under Various Conditions
The casing pressure peak changes with formation pressure under various overflow rates (1, 2, 3, and 4 m3) are presented in Fig. 4.
Similar to the description in Section 3.1, the maximum allow- able formation pressure under a certain overflow rate condition can be determined from Fig. 4. The true value of formation pres- sure must be less than the maximum value; otherwise, it can increase the well control risk and can also lead to killing fails.
Y. Xu et al.: Risk Analysis of Gas Cut in Deepwater Drilling 211
42 43 44 46
C
BA
Formation Pressure/MPa
Cas
ing
Pres
sure
Pea
k/M
Pa
45 47
14
12
10
8
6
4
Overflow Rate 1 m3
Overflow Rate 2 m3
Overflow Rate 3 m3
Overflow Rate 4 m3
Fig. 4. Casing pressure peak changes with formation pressure under
various overflow rates.
42 43 44 46
CBA
Formation Pressure/MPa
Cas
ing
Pres
sure
Pea
k/M
Pa
45 47
14
12
10
8
6
4
10 L/s20 L/s30 L/s40 L/s
Fig. 5. Casing pressure peak changes with formation pressure under
various kill rates.
Thus, the accuracy of the overflow monitoring equipment and formation pressure prediction can be combined to assess the gas cutting risk in well control.
The casing pressure peak changes with formation pressure under various kill rates (10, 20, 30, and 40 L/S) are presented in Fig. 5.
From Fig. 5, the maximum allowable formation pressure under a certain kill rate condition can be determined. The true value of formation pressure must be less than the maximum value; otherwise, it can increase the well control risk and can also lead to killing fails. Thus, the accuracy of formation pres- sure prediction and alternative kill rate solutions can be com-bined to assess the gas cutting risk in well control.
3. Influence of Kill Rate on Well Control under Various Conditions
5 10 15 25
CBA
Kill Rate/(L/s)
Cas
ing
Pres
sure
Pea
k/M
Pa
20 30 35 40
12
11
10
9
8
7
6
Overflow Rate 1 m3
Overflow Rate 2 m3
Overflow Rate 3 m3
Overflow Rate 4 m3
Fig. 6. Casing pressure peak changes with kill rate under various over-
flow rates.
5 10 15 353020
CBA
Kill Rate/(L/s)
Cas
ing
Pres
sure
Pea
k/M
Pa
25 4540
14
12
10
8
6
4
42 MPa43 MPa44 MPa45 MPa
Fig. 7. Casing pressure peak changes with kill rate under various for-
mation pressures.
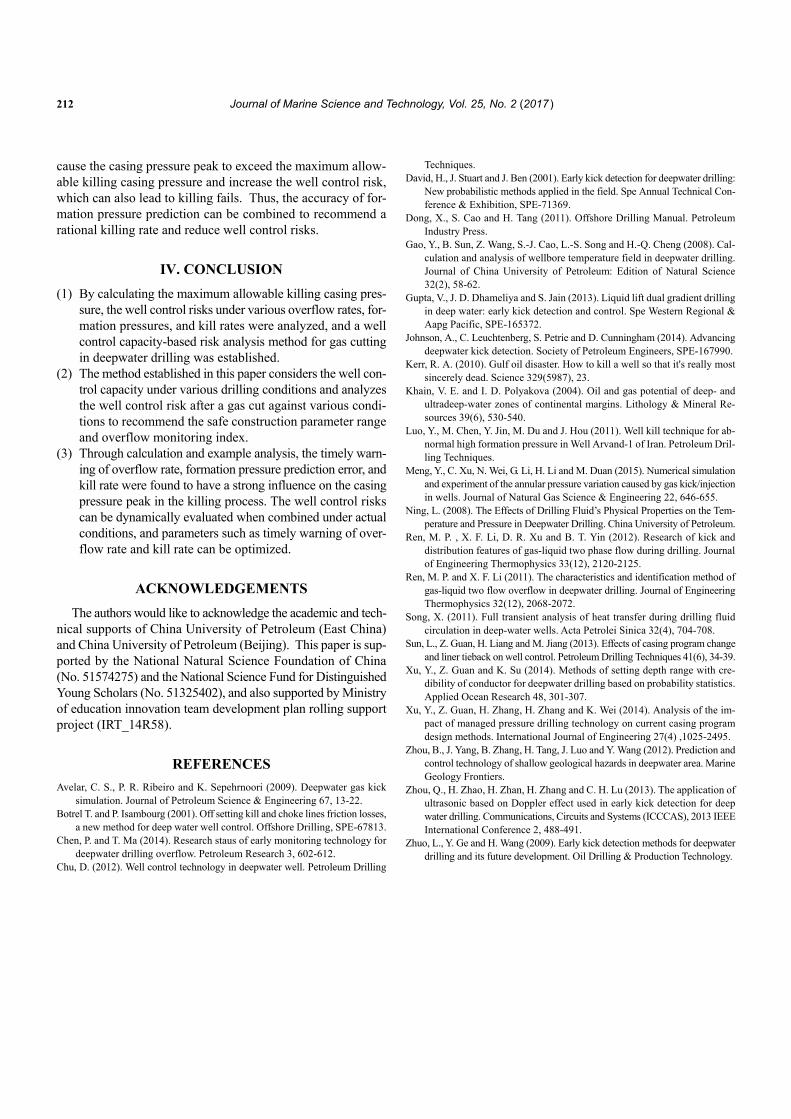
The casing pressure peak changes with kill rates under va-
rious overflow rates (1, 2, 3, and 4 m3) are presented in Fig. 6. From Fig. 6, the minimum allowable kill rate under a certain
overflow rate condition can be determined. The kill rate used must be more than the minimum value; otherwise, it can cause the casing pressure peak to exceed the maximum allowable kill- ing casing pressure and increase the well control risk, which can also lead to killing fails. Thus, the accuracy of overflow moni- toring equipment can be combined to recommend a rational killing rate and reduce the well control risk.
The casing pressure peak changes with kill rate under various formation pressures (42, 43, 44, and 45 MPa) are presented in Fig. 7.
From Fig. 7, the minimum allowable kill rate under a certain formation pressure condition can be determined. The kill rate used must be more than the minimum value; otherwise, it can
212 Journal of Marine Science and Technology, Vol. 25, No. 2 (2017 )
cause the casing pressure peak to exceed the maximum allow- able killing casing pressure and increase the well control risk, which can also lead to killing fails. Thus, the accuracy of for- mation pressure prediction can be combined to recommend a rational killing rate and reduce well control risks.
IV. CONCLUSION
(1) By calculating the maximum allowable killing casing pres- sure, the well control risks under various overflow rates, for- mation pressures, and kill rates were analyzed, and a well control capacity-based risk analysis method for gas cutting in deepwater drilling was established.
(2) The method established in this paper considers the well con- trol capacity under various drilling conditions and analyzes the well control risk after a gas cut against various condi-tions to recommend the safe construction parameter range and overflow monitoring index.
(3) Through calculation and example analysis, the timely warn- ing of overflow rate, formation pressure prediction error, and kill rate were found to have a strong influence on the casing pressure peak in the killing process. The well control risks can be dynamically evaluated when combined under actual conditions, and parameters such as timely warning of over- flow rate and kill rate can be optimized.
ACKNOWLEDGEMENTS
The authors would like to acknowledge the academic and tech- nical supports of China University of Petroleum (East China) and China University of Petroleum (Beijing). This paper is sup- ported by the National Natural Science Foundation of China (No. 51574275) and the National Science Fund for Distinguished Young Scholars (No. 51325402), and also supported by Ministry of education innovation team development plan rolling support project (IRT_14R58).
REFERENCES
Avelar, C. S., P. R. Ribeiro and K. Sepehrnoori (2009). Deepwater gas kick simulation. Journal of Petroleum Science & Engineering 67, 13-22.
Botrel T. and P. Isambourg (2001). Off setting kill and choke lines friction losses, a new method for deep water well control. Offshore Drilling, SPE-67813.
Chen, P. and T. Ma (2014). Research staus of early monitoring technology for deepwater drilling overflow. Petroleum Research 3, 602-612.
Chu, D. (2012). Well control technology in deepwater well. Petroleum Drilling
Techniques. David, H., J. Stuart and J. Ben (2001). Early kick detection for deepwater drilling:
New probabilistic methods applied in the field. Spe Annual Technical Con- ference & Exhibition, SPE-71369.
Dong, X., S. Cao and H. Tang (2011). Offshore Drilling Manual. Petroleum Industry Press.
Gao, Y., B. Sun, Z. Wang, S.-J. Cao, L.-S. Song and H.-Q. Cheng (2008). Cal- culation and analysis of wellbore temperature field in deepwater drilling. Journal of China University of Petroleum: Edition of Natural Science 32(2), 58-62.
Gupta, V., J. D. Dhameliya and S. Jain (2013). Liquid lift dual gradient drilling in deep water: early kick detection and control. Spe Western Regional & Aapg Pacific, SPE-165372.
Johnson, A., C. Leuchtenberg, S. Petrie and D. Cunningham (2014). Advancing deepwater kick detection. Society of Petroleum Engineers, SPE-167990.
Kerr, R. A. (2010). Gulf oil disaster. How to kill a well so that it's really most sincerely dead. Science 329(5987), 23.
Khain, V. E. and I. D. Polyakova (2004). Oil and gas potential of deep- and ultradeep-water zones of continental margins. Lithology & Mineral Re-sources 39(6), 530-540.
Luo, Y., M. Chen, Y. Jin, M. Du and J. Hou (2011). Well kill technique for ab- normal high formation pressure in Well Arvand-1 of Iran. Petroleum Dril- ling Techniques.
Meng, Y., C. Xu, N. Wei, G. Li, H. Li and M. Duan (2015). Numerical simulation and experiment of the annular pressure variation caused by gas kick/injection in wells. Journal of Natural Gas Science & Engineering 22, 646-655.
Ning, L. (2008). The Effects of Drilling Fluid’s Physical Properties on the Tem- perature and Pressure in Deepwater Drilling. China University of Petroleum.
Ren, M. P. , X. F. Li, D. R. Xu and B. T. Yin (2012). Research of kick and distribution features of gas-liquid two phase flow during drilling. Journal of Engineering Thermophysics 33(12), 2120-2125.
Ren, M. P. and X. F. Li (2011). The characteristics and identification method of gas-liquid two flow overflow in deepwater drilling. Journal of Engineering Thermophysics 32(12), 2068-2072.
Song, X. (2011). Full transient analysis of heat transfer during drilling fluid circulation in deep-water wells. Acta Petrolei Sinica 32(4), 704-708.
Sun, L., Z. Guan, H. Liang and M. Jiang (2013). Effects of casing program change and liner tieback on well control. Petroleum Drilling Techniques 41(6), 34-39.
Xu, Y., Z. Guan and K. Su (2014). Methods of setting depth range with cre- dibility of conductor for deepwater drilling based on probability statistics. Applied Ocean Research 48, 301-307.
Xu, Y., Z. Guan, H. Zhang, H. Zhang and K. Wei (2014). Analysis of the im- pact of managed pressure drilling technology on current casing program design methods. International Journal of Engineering 27(4) ,1025-2495.
Zhou, B., J. Yang, B. Zhang, H. Tang, J. Luo and Y. Wang (2012). Prediction and control technology of shallow geological hazards in deepwater area. Marine Geology Frontiers.
Zhou, Q., H. Zhao, H. Zhan, H. Zhang and C. H. Lu (2013). The application of ultrasonic based on Doppler effect used in early kick detection for deep water drilling. Communications, Circuits and Systems (ICCCAS), 2013 IEEE International Conference 2, 488-491.
Zhuo, L., Y. Ge and H. Wang (2009). Early kick detection methods for deepwater drilling and its future development. Oil Drilling & Production Technology.