The Welfare State in East Asia: An Ideal-Typical Welfare Regime
Upload
khangminh22Category
view
1download
0
DOCUMENT RESUME
ED 396 054 UD 031 012
AUTHOR Moore, Kristin A.; And OthersTITLE The JOBS Evaluation: How Well Are They Faring? AFDC
Families with Preschool-Aged Children in Atlanta atthe Outset of the JOBS Evaluation.
INSTITUTION Child Trends, Inc., Washington, DC.; ManpowerDemonstration Research Corp., New York, N.Y.
SPONS AGENCY Office of the Assistant Secretary for Planning andEvaluation (DHHS), Washington, D.C.; Office ofVocational and Adult Education (ED) , Washington,DC.
PUB DATE Sep 95CONTRACT HHS-100-89-0030NOTE 278p.
PUB TYPE Reports Evaluative/Feasibility (142)
EDRS PRICE MF01/PC12 Plus Postage.DESCRIPTORS *Day Care; Family Characteristics; *Job Training;
Mothers; Participation; *Preschool Children;Preschool Education; Program Evaluation; *SchoolReadiness; Stereotypes; Urban Areas; Urban Youth;*Welfare Recipients
IDENTIFIERS *Aid to Families with Dependent Children; Georgia.(Fulton County); Joi.! Opportunities and Ba'sic Skills
Program; Welfare to Work Programs
ABSTRACTTo learn more about how welfare reform affects
children, a child-focused study was conducted as part of the largerJob Opportunities and Basic Skills Training (JOBS) evaluation. Thisstudy assess the impacts of mothers' mandatory participation inwelfare-to-work programs on outcomes for children using a sample of790 participants. It provides an early look at the experiences andcharacteristics of mothers and their preschool-aged childrenreceiving aid to families with dependent children in one of threesites in Fulton County (Georgia). On an assessment of schoolreadiness, 4 in 10 children answered half or fewer than half of theitems correctly, suggesting that many lack needed skills for school.Two-thirds of the women in this study have only one or two children,and most had positive attitudes toward work, findings thatcontradicted some common stereotypes about welfale mothers. Importantchanges were underway within just a few months oi entering the JOBSprogram, with the most obvious change being the substantial increasein the proportion of children in child care on a regular basis. Womenin program groups were also more likely to have participated ineducation or job training programs since entering the evaluation.Early data suggest that mandatory work or training has the potentialto affect the lives of two generations. Five appendixes discuss studymethodology, and present three instruments used in the study.(Contains 7 tables, 41 figures, 24 tables in Appendix B, and 159references.) (SLD)

TheJOBS
EvaluationINION111011MI
How Well Are They Faring? AFDC
Families with Preschool-Aged Children in
Atlanta at the Outset of the JOBS Evaluation
U.S. DEPARTMENT OF EDUCATIONOft:* of Edict Vona 11Onn and MteroyeswMEDUCATIONAL RESOURCES INFORMATION
CENTER IERICI
yfanIs documont Ms bow, t woducod itsfrom tto wood or orgonuatoo
oryostkoct 0.0 IMmor dosoires rum* boon rn le migirOv*
NtOtoductoo quaker
POniis 04 voro, ot oposOnd stanO in too dmtoont do not rocessardy npnbloirin odxmlOEM posdmo of gmlect
PERMISSION TO REPRODUCE ANDDISSEMINATE THIS MATERIAL
HAS BEEN GRANTED BY
'cr( 6-1-rn A . tirrfc,0,h; \A Ty\eAci.5
TO THE EDUCATIONAL RESOURCESINFORMATION CENTER (ERIC)
U.S. Department of Health and Human ServicesAdministration for Children and Families
Office of the Assistant Secretary forPlanning and Evaluation
U.S. Department of EducationOffice of the Under Secretary
Office of Vocational and Adult Education

The Manpower Demonstration Research Corporation is conducting the JOBS Evaluation under a contract with
the U.S. Department of Health and Human Services ( HHS), funded by HHS under a competitive award,
Contract No. HHS-100-89-0030. HHS is also receiving funding for the evaluation from the U.S. Department
of Education. The study of one of the sites in the evaluation. Riverside County (California), is also conducted
under a contract from the California Department of Social Services (CDSS). CDSS. in turn, is receiving
funding from the California State Job Training Coordinating Council, the California Department of Education.
HHS, and the Ford Foundation. Additional funding to support the Child Outcomes portion of the study is
provided by the following foundations: the Foundation for Child Developnynt, the William T. Grant
Foundation, and an anonymous funder.
The findings and conclusions presented herein do not necessarily represent the official positions or policies
of the funders.
Publications from the JOBS Evaluation
From Welfare to Work. Judith M. Gueron and Edward Pauly. 1991. New York: Russell Sage
Foundation.
The Saturation Work Initiative Model in San Diego: .4 Five-Year Follow-up Study. Daniel
Friedlander and Gayle Hamilton. 1993. New York: Manpower Demonstration Research
Corporation.
The JOBS Evaluation: Early Lessons from Seven Sites. Gayle Hamilton and Thomas Brock. 1994.
Washington. D.C.: U.S. Department of Health and Human Services and U.S. Department of
Education.
Five Years After: The Long-Term Effects of Welfare-to-Work Programs. Daniel Friedlander and
Gary Burtless. 1995. New York: Russell Sage Foundation.
The JOBS Evaluation: Adult Education for People on AFDC A Synthesis of Research. U.S.
Department of Education and U.S. Department of Health and Human Services. 1995. Washington.
D.C.: U.S. Department of Health and Human Services, Office of the Assistant Secretary for
Planning and Evaluation.
The JOBS Evaluation: Early Findings on Program Impacts in Three Sites. U.S. Department of
Health and Human Services and U.S. Department of Education. 1995. Washington. D.C.: U.S.
Department of Health and Human Services, Office of the Assistant Secretary for Planning and
Evaluation.
The JOBS Evaluation: How Well Are They Faring? AFDC Families with Preschool-Aged Children
in Atlanta at the Outset of the JOBS Evaluation. U.S. Department of Health and Human Services
and U.S. Department of Education. 1995. Washington, D.C.: U.S. Department of Health and
Human Services, Office of the Assistant Secretary for Phiming and Evaluation.
The JOBS Evaluation: Monthly Participation Rates in Three Sites and Factors Affecting
Participation Levels in Welfare-to-Work Programs. U.S. Department of Health and Human
Services and U.S. Department of Education. 1995. Washington, D.C.: U.S. Department of Health
and Human Services, Office of the Assistant Secretary for Planning and Evaluation.
3

The JOBS Evaluation
How Well Are They Faring?AFDC Families with Preschool-Aged Children in Atlanta
at the Outset of the JOBS Evaluation
U.S. Department of Health and Human ServicesU.S. Department of Education
U.S. Department of Health and Human ServicesOffice of the Assistant Secretary for Planning and Evaluation
September 1995
Prepared under subcontract tothe Manpower Demonstration
Research Corporation by:
Kristin A. MooreMartha J. Zaslow
Mary Jo CoiroSuzanne M. MillerChild Trends, Inc.
andEllen B. MagenheimSwarthmore College

PREFACE
As this report is being released, a major overhaul of the nation's welfare system is under
way. Although children comprise the majority of Aid to Families with Dependent Children (AFDC)recipients, they are rarely the focus of the current welfare reform debate. Many questions about thewell-being of children on welfare remain unasked and unanswered
To learn more about how welfare reform affects children, a child-focused study wasundertaken :ts part of the larger Job Opportunities and Basic Skills Training (JOBS) Evaluation,
which is being conducted by the Manpower Demonstration Research Corporation, under contract
to the US. Department of Health and Human Services. This Child Outcomes Study, beingimplemented by Child Trends, Inc., will assess the impacts of mothers' mandatory participation inwelfare-to-work programs on outcomes for children.
This first report on children in AFDC families provides an early look at the experiences andcharacteristics of AFDC mothers and their preschool-aged children in one of three sites--FultonCounty, Georgia--near the start of the evaluation. As one might expect, the families in this study aredisadvantaged in many ways. Four in 10 mothers, more than twice as many as in the generalpopulation, were assessed to have high levels of depressive symptoms. On an assessment of schoolreadiness, four in 10 children answered half or fewer of the items correctly, suggesting that many
lack the skills expected by schools.
But the women and children in this sample also contradict many common stereotypes about
welfare families that they tend to have large numbers of children, for example, or that the mothers
do not want to work Instead, two-thirds of the women in the study had only one or two children,
and most had positive attitudes about work Moreover, the families in this study were heterogeneous
with respect to work experiences, literacy skills, and the availability of social supports, suggestingthe importance of varied cpproaches to helping mothers move from welfare to work
Important changes were already underway in the lives of mothers and children within just
a few months of entering the JOBS Program. The most obvious change was the substantial increasein the proportion of children in child care on a regular basis. Also, women in the program groups
were significantly more likely than women in the control group to have participated in educationor job training programs since entering the evaluation.
These findings provide a rich portrait of the lives and circumstances offamilies on AFDC.
The early data also suggest that mandatory work or training has the potential to affect the lives of
two generations. Subsequent reports will examine the impact of mothers' participation in JOBS on
children's well-being.

COI!ITENTS
PrefaceExecutive Summary xiii
Chapters
THE FAMILY SUPPORT ACT AND THE JOBS PROGRAM 1
Overview 1
Key questions for Chapter 1 1
What policy concerns led to the creation of the JOBS Proram? 1
The Family Support Act and JOBS 3
Why consider children in a program aimed primarily at parents 4Two-generational Programs 5
By what pathways might JOBS affect children? 6The JOBS Evaluation 8
The JOBS Child Outcomes Study Design and Methods 9
Sources of data 10
Sample. design, and data collection. 10
Limitations of the data 12
Analysis strategy 12Heterogeneity of the AFDC population. 13
Summary 13
Key Questions for the Report 14
2 THE COMMUNITY CONTEXT 17
Background 17
Key Questions for Chapter 2 17
Demographic Profile of Fulton County 17
Neighborhoods of the Descriptive Sample 22S ummary 23
3 THE MOTHERS 24
Background 24Key Questions for Chapter 3 24Findings 25
Profile of the Fulton County Descriptive Sample 25Maternal Well-being 40
Summary 45
II

4 SOCIAL AND ECONOMIC SUPPORT FOR MOTHERS WHO RECEIVE
AFDC 46
Background 46
Key Questions for Chapter 4 46
Findings 47
The Fathers 47
Social Support Networks 51
Summary 55
5 THE CHILDREN 57
Background 57
Key Questions for Chapter 5 59
Characteristics of the children 59
Measures 59
Peabody Picture Vocabulary Test - Revised 59
Caldwell Preschool Inventory 60
Personal Maturity Scale 60
Child Health status 61
Findings 61
Summary 69
6 HOME ENVIRONMENTS 71
Background 71
Economic hardship and specific features of the homf; environment 71
Associations between poverty and parenting behaviors. 72
Reliance on the HOME-SF for reporting on the home environments
of families. 73
Key Questions for Chapter 6 74
Findings 74
Summary 81
7 CHILD CARE 83
Background 83
Amount of care. 84
Type of care. 84
Payment for child care 85
Quality 86
Key Questions for Chapter 7 87
Findings 87
Summary 100

8 SUBGROUP DIFFERENCES IN MATERNAL AND CHILD WELL-BEING . . 101
Background 131Key Questioris for Chapter 8 102Analyses of Subgroups 102Findings 107
Maternal Education 107Number of Children 107Duration on Welfare 108Housing Type 109Reading Literacy 109Math Literacy 110Depressive Symptoms 110Locus of Control 111Barriers to Work Index 111Social Support Index 112
Summary 112
9 CUMULATIVE FAMILY RISK AND PROTECTIVE FACTORS AND CHILDWELL-BEING 113
Background 113Key Questions for Chapter 9 114Findings 114
Risk Factors and Children's Development 114Cumulative Family Risks and Children's Cognitive Attainment. 116Personal Maturity Scale. 118Health 118Cognitive and Emotional Stimulation in the Home: The HOMEScale. 119
Protective Factors and Children's Development 120Association Between Risk and Protective Factors 125
Summary 128
10 IMPLICATIONS 129
iv

REFERENCES
APPENDICES
Appendix A
Appendix B
131
Appendix CAppendix DAppendix E
Description of Weighting Procedures, Control Variables, andAnalytic Subgroups 145
Regression Analyses for Subgroup Differences in Maternal ax.dChild Characteristics 149
Test of Applied Literacy Skills Document Literacy Levels 192
CASAS Scale Score Interpretations for Gain Appraisal Math Test . . 193
Belief That Mothers Should Not Work Scale 194

TABLES
PAGETABLE NUMBER
3.1 Demographics of Descriptive Sample Compared to JOBS EvaluationTotal Fulton County Sample 26
5.1 Children's Adjusted Means on Peabody Picture VocabularyTest-Revised, Preschool Inventory, and Personal MaturityScale, and Adjusted Percentage of Children with Favorable HealthRating for Subgroups Based on Child Gender, Mothers' DemographicCharacteristics, Literacy Levels, and Psychological Well-Being 67
6.1 Means of Home-SF Scales for Descriptive and NLSY-CS Data Sets . . . 77
6.2 Association Between HOME Scales and Measures of ChildDevelopment 82
7.1 Proportion of Families Showing an Increase in Use of Child Carefrom Two Months Prior to Random Assignment to Two MonthsAfter Random Assignment, by Group 91
7.2 Proportion of Families Using Sole Maternal Care, Formal ChildCare, and Informal Child Care as their Primary Arrangement,by Group 95
8.1 Maternal and Child Well-being at the Time of the DescriptiveSurvey as Related to Baselines Measures of Maternal and FamilyBackground 103
vi

APPENDIX 13 TABLES
TABLE PAGENUMBER
3.1-1 OLS Regression Analyses of Subgroups Predicting Number
of Birth Children Living in Household at Descriptive Study 150
3.1-2 Logistic Regression Analyses of Subgroups Predicting Women
Who Have Never Worked Full-time During their Child's Life
Before Random Assignment 152
3.1-3 OLS Regression Analyses of Subgroups Predicting Belief that
Mothers Should Not Be Employed Mean Score 154
3.1-4 Logistic Regression Analyses of Subgroups Predicting Scores
on the Center for Epidemiological Studies Depression Scale (CES-D)
That Are Above a Clinical Cut-Off 156
3.1-5 OLS Regression Analyses of Subgroups Predicting a More Internal
Locus of Control 158
3.1-6 OLS Regression Analyses of Subgroups Pr.fdicting Number of Difficult
Life Circumstances 160
4.1-1 OLS Regression Analyses of Subgroups Predicting Level of
Emotional Support 162
4.1-2 OLS Regression Analyses of Subgroups Predicting Level of
Instrumental Support 164
1t.1_3 OLS Regression Analyses of Subgroups Predicting Satisfaction
with Emotional Support 166
5.1-1 OLS Regression Analyses of Subgroups Predicting Peabody Picture
Vocabulary Te t-Revised (PPVT-R) Standard Scores 168
5.1-2 OLS Regression Analyses of Subgroups Predicting Preschool
Inventory (PSI) Total Scores 170
5.1-3 OLS Rezression Analyses of Subgroups Predicting Personal
Maturity Scale Mean Scores (PMS) 172
vii
PAGETABLE NUMBER
5.1-4 Logistic Regression Analyses of Subgroups Predicting Rating ofChild's Health As Excellent With No Limiting Condition 174
6.1-1 OLS Regression Analyses of Subgroups Predicting HOMETotal Scale Scores 176
6.1-2 OLS Regression Analyses of Subgroups Predicting HOMECognitive Stimulation Subsea le Scores 178
6.1-3Socioemotional Subsea le Scores 180
OLS Regression Analyses of Subgroups Predicting HOME
6.2-1 OLS Regression Analyses of HOME Scales PredictingPeabody Picture Vocabulary Test-Revised (PPVT-R)Standard Scores 182
6.2-2 OLS Regression Analyses of HOME Scales Predicting PreschoolInventory (PSI) Total Scores 183
6.2-3 OLS Regression Analyses of HOME Scales Predicting PersonalMaturity Scale Mean Scores 184
6.2-4 Logistic Regression Analyses of HOME Scales PredictingRating of Child's Health As Excellent With No Limiting Condition . . 185
7.1-1 Logistic Regression Analyses of Subgroups PredictingTwenty-five Percent or More of Child's Life in any Crre BeforeRandom Assignment . 186
7.1-2 Logistic Regression Analyses of Subgroups PredictingTwenty-five Percent or More of Child's Life in Formal CareBefore Random Assignment. 188
9.1-1 Intercorrelations Between Family Risk Factors 190
Intercorrelations Between Family Protective Factors 191

FIGURLa
PAGE
FIGURE NUMBER
1.1 Potential Pathways of Influence of the JOBS Program onChild Outcomes 6
1.2 Study Design 9
2.1 Fulton County and Atlanta, GA 18
2.2 Rates of Overall Poverty, Child Poverty, and Mother-headedHouseholds in Fulton County Compared to the U.S. as a Wholeand U.S. Metropolitan Areas 19
2.3 Neighborhood Characteristics 22
3.1 Years on AFDC as an Adult on Own Case by Intergenerational Receipt . . 28
3.2 Household Composition 29
3.3 Number of Birth Children in the Household 29
3.4 Contraception Use 30
3.5 Document Literacy Scores 32
3.6 GAIN Appraisal Math Test Scores 33
3.7 Document Literacy Levels by Highest Level of Education Completed .. 34
--- 3.8 GAIN Appraisal Math Test Levels by Highest Level of EducationCompleted 34
i3.9 Occupational Categories for those Currently Working 37
I3.10 Attitudes Toward Employment and Welfare at the Time of the
Descriptive Study Survey 38
I
3.11 Difficult Life Circumstances Experienced in the Past Year
ix
1, ,,
43

PAGEFIGURE NUMBER
4.1 Frequency of Contact in the Past Year Between Focal Children andtheir Biological Fathers Living Outside of the Household 47
4.2 Maternal Satisfaction with Level and Quality of Father Involvementin their Children's Lives 50
4.3 Conflict with Child's Father Among Mothers Who Had ContactWith the Father 50
4.4 Perceptions of Emotional Support Among Mothers 53
4.5 Perceptions of Instrumental Support Among Mothers 54
5.1 Mean Peabody Picture Vocabulary Test-Revised Scores for DescriptiveSample Children and African American Children in a National Sampleof Welfare and Non-Poor Children 62
5.2 Number of Items on the Preschool Inventory Answered Correctly 63
5.3 Mean Ratings on the Personal Maturity Scale 64
5.4 Mothers' Ratings of their Child's Current Health Status 65
6.1 Comparison of Descriptive Data to NLSY-CS 1988 on the HOMETotal Scale: Low Scores 79
6.2 Comparison of Descriptive Data to NLSY-CS 1988 on the HOMETotal Scale: Extremely Low Scores 79
7.1 Primary Child Care Arrangements of Three- and Four-year-oldFocal Children at the Descriptive Survey 93
9.1 Percent of Children Scoring at or Above Median for African AmericanPreschoolers on Peabody Picture Vocabulary Test-Revised, by Numberof Family Risks 116
9.2 Percent of Children With 23 or more of 32 Items Correct onPreschool Inventory, by Number of Family Risks 117
9.3 Percent of Children Scoring > 8.6 of 10 on Personal Maturity Scale,by Number of Family Risks 118

PAGE
FIGURE NUMBER
9.4 Percent of Children in Excellent Health With No Disabilities, by
Number of Family Risks 119
9.5 Percent of Children Above Median on Total HOME Scale, HOMECognitive Subscale, and HOME Emotional Subsea le, by Number of
Family Risks 120
9.6 Percent of Children Scoring at or Above Median for AfricanAmerican Preschoolers on Peabody Picture VocabularyTest-Revised, by Number of Protective Factors 123
9.7 Percent of Children with 23 or more of 32 Items Correct on Preschool
Inventory, by Nurnber of Protective Factors 123
9.8 Percent of Children Scoring > 8.6 of 10 Points on Personal Maturity
Scale, by Number of Protective Factors 124
9.9 Percent of Children in Excellent Health with No Disabilities, by
Number of Protective Factors 124
9.10 Percent of Children Scoring at or Above Median for AfricanAmerican Preschoolers on Peabody Picture Vocabulary Test-
Revised, by Number of Family Risk and Protective Factors 125
9.11 Percent of Children with 23 or More of 32 Items Correct onPreschool Inventory, by Number of Family Risk and
Protective Factors 126
9.12 Percent of Children Scoring > 8.6 of 10 Points on Personal Maturity
Scale, by Number of Family Risk and Protective Factors 126
9.13 Percent of Children in Excellent Health With No Disability, by Number
of Family Risk and Protective Factors 127

Below is a list of acronyms that are frequently used throughout this report:
AFDC = Aid to Families with Dependent Children
FIDCR = Federal Interagency Day Care Requirements
FSA = Family Support Act of 1988
GAIN = Greater Avenues for Independence; California's JOBS program.
GED = General Education Development Certificate
HOME-SF = Home Observation for Measurement of the Environment - Short Form
JOBS = Job Opportunities and Basic Skills Training
MDRC = Manpower Demonstration Research Corporation
NHIS-CH = National Health Interview Survey on Child Health
NLSY-CS = National Longitudinal Survey of Youth - Child Supplement
RAD = Random Assignment Date
TALS = Test of Applied Literacy Skills
WIN = Work Incentive Program
xii

EXECUTIVE SUMMARY
The centerpiece of the 1988 Family Support Act (FSA) is the Job OpportuMties andBasic Skills Training (JOBS) Program, which requires eligible recipients of Aid to Families withDependent Children (AFDC) to participate in educational, job training and work experience, orjob search activities, in order to reduce welfare dependency and promote self-sufficiency.Although most services offered through JOBS are aimed at meeting the needs of adults, there arenumeroms reasons to expect that JOBS may also affect children in families that receive AFDC.
By What Pathways Might JOBS Affect Children?
The legislative debate that led to the passage of the Family Support Act was "two-generational" in focus. That is, lawmakers recognized the implications of poverty and welfaredependency for both parents and children. However, the JOBS Program focuses primarily on theparental generation, although transitional child care and Medicaid benefits mandated under JOBSdo recognize the needs of young children. Because the JOBS program is part of thegovernment's effort to interrupt the inter-generational transmission of poverty, it is important toconsider the possibility of either positive or negative effects on children. There are severalmechanisms by which JOBS could affect children. These include changes in parent education orfamily income; chan2es in the home environment; changes in mothers' psychological well-being;and increased participation in child care (Wilson and Ellwood, 1993; Zaslow, Moore, Morrison,and Coiro, 1995).
As a national policy, the underlying assumption of the FSA is that the needs of poorchildren are best addressed through providing parents with education and job training services.An important potential pathway of influence ofJOBS on children is via increasing maternaleducation, employment skills, and eventually employment. There is ample evidence to supportthe view that maternal education and farnily income are associated with children's development(Desai, Chase-Landsdale, and Michael, 1989; Duncan, Brooks-Gunn, and Klebanov, 1994;Hauser and Mossell, 1985). E-lucation and income gains may produce changes in children'shome environments, such as the provision of more coimitively stimulating materials or activities.These qualities of the home environment are positively associated with children's development(Bradley et al., 1994), and in fact are better predictors of child outcomes than are measures ofparent education or socioeconomic status. However, despite evidence that higher parentaleducational attainment and family income are beneficial for children, we do not know whetherJOBS participation will result in sufficiently lame gains in these areas to influence outcomesamong children.
Implementation of the JOBS mandate among. AFDC mothers may also affect children'sparticipation in non-maternal care. Nleyers (1993) has summarized evidence that participation inwelfare-to-work programs is associated with an increase in the amount of child care used and agreater reliance on formal child care arrangements, such as day care centers. Mothers'participation in JOBS and the provision of child care subsidies for JOBS participants may result

in more children from AFDC families participating in out-of-home, formal child carearrangements. High quality, educationally oriented child care programs are associated withcognitive gains, particularly for children from low-income families. Consequently, the FSA mayprovide an important opportunity to enhance the development of disadvantaged children. On theother hand, if parents place their children in poor quality care in order to fulfill their JOBSparticipation requirements, children's development may well suffer.
Furthermore, JOBS may affect children through changes in maternal psychological well-being. For example, mothers' stress or depression levels may increase in response to theparticipation mandate and the need to arrange child care fairly quickly. By contrast, mothersmay experience decreases in depression and increases in role satisfaction or self-esteem as aresult of gains in their education or job skills, or because participation provides social interaction,a respite from child care, and a sense of future opportunity. These areas of maternal well-beinghave been linked in turn to aspects of the home environment and to children's development (e.g.,Downey and Coyne, 1990).
In sum, prior research suggests that JOBS, tile primarily focused on parental educationand employability, may affect the lives and well-being of young children as well. Botheconomic and non-economic mechanisms for such effects are possible. However, it is not knownwhether effects, if they do occur. will be positive, negative, or a mix of both; or whether anyeffects that are found will be large or modest. It is not known whether effects will differ by areaof child well-being or for different subgroups of the JOBS population. The JOBS ChildOutcomes Study has been designed to allow a careful examination of effects on children, as wellas of the mechanisms by which such effects occur.
The JOBS Evaluation
The legislation recommen2r-d a random assignment evaluation of the JOBS programto test its effectiveness, and this evaluation is currently being conducted by the ManpowerDemonstration Research Corporation (MDRC). The impacts portion of the JOBS Evaluationinvolves random assignment of more than 55.000 JOBS eligibles to either a control group oroneor two program groups, in seven sites around the country. The impact study is designed toexamine the effects of various JOBS approaches on individuals' employment status, earningslevels, receipt and amount of AFDC payments. income levels, and educational attainment, usingtwo types of experimental designs. The design of the impact study, and rationale for choosingeach of the seven sites, are described fully in "The JOBS Evaluatiw: Early Lessons from SevenSites" (Hamilton and Brock, 1994). Because JOBS departs from earlier welfare-to-workprograms by mandating the participation of parents whose children are as young as three years ofage, a special substudy of these parents and children, called the Child Outcomes Study, is beingconducted within the larger JOBS Evaluation to examine outcomes for young children (seeFigure 1).
xiv
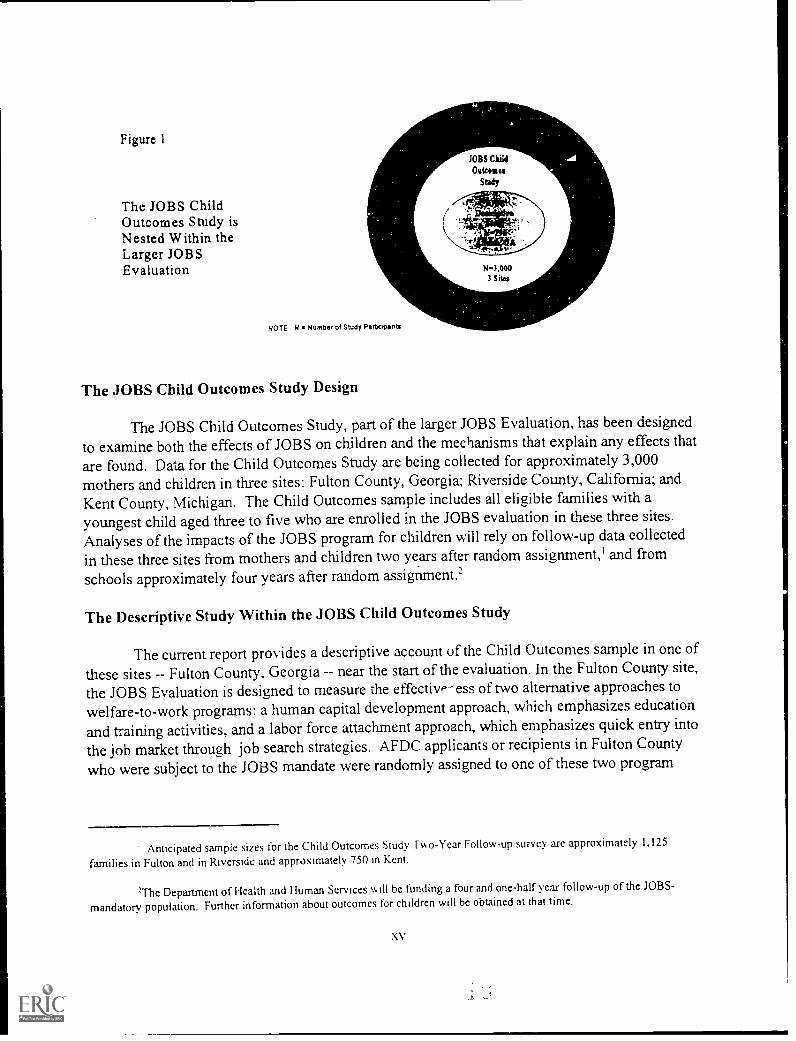
Figure 1JOBS Child
Outmanstud,
The JOBS ChildOutcomes Study is i .
Nested Within theLarger JOBSEvaluation N.9.000
3 St lea
NOTE N Number of Study Parbemante
The JOBS Child Outcomes Study Design
The JOBS Child Outcomes Study, part of the larger JOBS Evaluation, has been designed
to examine both the effects of JOBS on children and the mechanisms that explain any effects that
are found. Data for the Child Outcomes Study are being collected for approximately 3,000mothers and children in three sites: Fulton County, Georgia; Riverside County, California; and
Kent County, Michigan. The Child Outcomes sample includes all eligible families with a
youngest child aged three to five who are enrolled in the JOBS evaluation in these three sitesAnalyses of the impacts of the JOBS program for children will rely on follow-up data collected
in these three sites from mothers and children two years after random assignment,' and from
schools approximately four years after random assignment.'
The Descriptive Study Within the JOBS Child Outcomes Study
The current report provides a descriptive account of the Child Outcomes sample in one of
these sites -- Fulton County, Georgia -- near the start of the evaluation. In the Fulton County site,
the JOBS Evaluation is designed to measure the effectiv,--ess of two alternative approaches to
welfare-to-work programs: a human capital development approach, which emphasizes education
and training activities, and a labor force attachment approach, which emphasizes quick entry into
the job market through job search strategies. AFDC applicants or recipients in Fulton County
who were subject to the JOBS mandate were randomly assigned to one of these two program
Anticipated sample sizes for the Child Outcomes Study T- o-Year Follow-up survey are approximately 1.125
families in Fulton and in Riverside and approximately 750 in Kent.
=The Department of Health and Human Services will be funding a four and one-half year follow-up of the JOBS-
mandatory population. Further information about outcomes for children will be obtained at that time.
X V

groups, or to a control group. Those in the control group, while eligible for AFDC benefits, werenot required to participate in any JOBS activities.'
This descriptive account of mothe-,.s and young children in the Fulton County site close tothe start of the JOBS Evaluation will be referred to as the Descriptive Study, and the sample forthis study as the Descriptive sample. For all participants in the JOBS Evaluation, including thosein the Descriptive Study, we have baseline data, collected just prior to random assignment toeither a program or control group. Baseline data include characteristics of the mothers andfamilies at the time of random assignment, as well as a limited set of questions concerningmaternal attitudes and subjective well-being. In addition, for the participants in the DescriptiveStudy, we also have data from a survey collected in respondents' homes on average three monthsafter random assignment. This Descriptive survey included interviews with the mothers,assessments of the children, and direct observations of the home environment.
Seven hundred and ninety respondents from tne JOBS Child Outcomes Study in FuhonCounty participated in the DescriptIve survey. All are mothers whose youngest childwasbetween the ages of three and five at the time of random assignment in the JOBS Evaluation, andall of these mothers were 20 years of age or older when they were assigned to a group within theJOBS Evaluation. Ninety-six percent are African American. Although none of the mothers wereteenagers at the time of the Descriptive Study, 40 percent were 19 or younger at the birth of theiroldest child living in the household. The present report refers to the child of between three andfive years as the "focal" child, or .he child whose circumstances and development were focusedupon in the study. If the mother had two children between the ages of three and five, one waschosen randomly to be the focal child.
Key Questions and Selected Findings From the Report
The purposes of this report are to describe the lives and circumstances of this sample ofAFDC families with preschool-aged children in Fulton County, Georgia and to inform policymakers about the mothers' goals and the development of their children. In addition, the studyprovides a context within which we will examine later impacts of the JOBS program on children.Below we summarize key findings from the tepon.
What is the community context of families in the Descriptive Study?
Fulton County, Georgia, includes most of the city of Atlanta. as well as suburban andrural areas. Compared to both the United States as a whole and U.S. metropolitan areas, FultonCounty' has higher rates of overall poverty, child poverty, and mother-headed households. FultonCounty was selected as a site for the JOBS Evaluation because it represents a southern, urban site
'Respondents in the control group are not ehgible for JOBS services. but are eligible for all other employment andtraining services in the community, and they can on their on obtain access to child care funded by the JOBS program.
xvi

with a welfare population that is rc .tively disadvantaged compared to other sites (Hamilton andBrock, 1994).
Mothers in the Descriptive Study were asked to describe their neighborhoods. At thetime of random assignment, about two-thirds of the sample reported that they lived in public (39percent) or subsidized (29 percent) housing.' At the time of the Descriptive survey, about halfof the sample (55 percent) reported that "very few" of the other mothers in their neighborhoodsworked regularly at paid jobs. Four in 10 mothers described their neighborhoods as a "not toogood" or an "awful" place to raise children, and about twc in 10 mothers described theirneighborhoods as an "excellent" or a "very good" place to raise children.
How job-ready are mothers in the Descriptive sample in terms of fertility plans,education, reading and math literacy, labor force experience, attitudes regardingwork and welfare, and psychological well-being?
Mothers in the Descriptive sample varied substantially in terms of their apparentpreparedness to pursue JOBS activities and employment. The majority of the mothers have hadsome previous experience in the labor force, although much of that experience was in low-paying, low-wage jobs. Two-thirds of the women are high school graduates or have a GED,suggesting that they are at a point where they could benefit from job training or furthereducation, or could take an entry level job.
Despite the fact that most of the mothers in the Descriptive sample have a high schooldiploma or a GED, more than half of the mothers have low levels of basic reading and mathliteracy. Fifty-three percent of the sample have low levels of basic reading literacy, based ontheir scores on the Test of Applied Literacy Skills document literacy scale. Even among womenwith high school diplomas, 46 percent scored in this range. Sixty-two percent of the samplescored below seventh grade levels on the Greater Avenues for Independence (GAIN) AppraisalMath test. Only 14 percent of the women with high school diplomas scored in the highest levelon the GAIN Appraisal Math test, indicating functioning at least at a high school entry level inbasic reading and math. While the test scores point to low levels of reading and math literacy formany mothers in the Descriptive sample, we note that it is possible that having a high schooldiploma might be more important in acquiring a job than one's tested literacy level.
Data from the Descriptive Study contradict the stereotype that welfare mothers tend tohave many children. Most mothers in the Descriptive sample have few children. Sixty-fivepercent had only one or two birth children living in the household at the time of the Descriptivesurvey, and only 13 percent had four or more birth children. Seventy-two percent of thehouseholds in the Descriptive Study consist only of the respondent and her child(ren). The total
'A public housing project is operated by the local government to provide housing for low-income people. Receiving arent subsidy, participating in a housing program like Section 8, or living in a building renovated by the government is not
defined as living in a public housing project.
xvii

household size was small, with nearly three-quarters of the households composed of four orfewer people.
A woman's current fertility status and childbearing plans are important determinants ofthe likelihood that she will participate successfully in education and/or employment activities(Long, 1990; Moore et al., 1993). Women who want to have additional children may be a groupparticularly likely to drop out of JOBS activities due to pregnancy, whereas women who havealready had all of the children they plan to have may participate more actively in JOBS. Most ofthe women in the Descriptive Study expressed a desire to limit their faniily size, with 96 percentneither being pregnant nor wanting to become pregnant. The majority reported using effectivecontraception or sterilization to avoid unwanted pregnancies (see Figure 2). Sixty-six percent ofthe women reported that they were not trying to become pregnant and were using a very reliablebirth control method, such as the Pill, IUD, Depo Provera, or sterilization; the majority of these.had a tubal ligation. On the other hand, 30 percent of the mothers responded that they were nottrying to become pregnant, but were either using an unreliable method of birth control or werenot using any birth control. As the women were not asked questions about their sexual activity,it is not clear whether contraceptive non-users are at risk of pregnancy or whether they are notsexually active.
all Using Vcry Reliable Birth Control
Using Unreliable or No Birth Control
.33 Hoping or Trying to Become Pregnant
Pregnant
:q*
FIGURE 2
CONTRACEPTION USE
(66%)
xviii
(30%)

Although there were variations in ratings, most of the respondents expressed positiveattitudes toward employment, negative attitudes toward welfare, and a sense that they could
locate child care if they become employed (see Figure 3).
FIGURE 3ATTITUDES TOWARD EMPLOYMENT AND WELFARE AT
THE TIME OF THE DESCRIPTIVE STUDY SURVEYCompletely trueSomewhat true
Neither true or untrueSomewhat untrue
Hot et all true Wirt31
0% 10% 20% 30% 40% 50% SO%
MOVIII Jets mate' Ns Mambo,
ComPletelY misSomewhat true
Neither true or untrueSomewhat untrue
Not et al true
Completely trueSomewhat true
Nrthr true or untrueSomewh.:1 untrue
Not at all true
13%
10%
20%
23%
34%
0% 10% 20% 30% 40% 50% 80%Even kw-baying Job la battet than been en views
13%
14%
22%
20%
0% 10% 20% 30% 40% 50% 80%
tfa wrong lo stay en teettent it you can bet a pb. won ob you tont I
Completely PIASomewhat OW
Nether true or untrue a%Somewhat untme 13%
Not at all true 7%
0% 10%
24%
50%
20% 30% 40% 50% 80%
0 I Om tob. I hunt! ane zonteene thal I num w tete can ef my chill non
In terms of educational attainment, attitudes about welfare and employment, and fertility
status, many mothers in the Descriptive Study appear to be in a good position to participate inand benefit from JOBS. However, other characteristics of the mothers may impede theirparticipation. A substantial proportion of mothers in the Descriptive Study (42 percent) reporteddepressive symptoms high enough to be considered in the clinically depressed range. Other
studies using the same measure of depressive symptomatology in community-wide samples havefound much lower rates of depressive symptoms, ranging from 9 to 20 percent. Further, most
women in the Descriptive Study have experienced difficult life circumstances, includingproblems with housing, or having a relative or close friend in jail. Smaller groups of women alsoreported health-related barriers to employment or substance-use problems.
What assistance do the children's fathers provide to the mothers? Who other thanthe father provides emotional, childrearing, and economic support to these mothers,
and to what extent?
Contact between the focal children and their biological fathers was limited. Only 16
percent of the mothers in the Descriptive sample had ever been married to the focal child's father.
Further. only 2 percent of the children's biological fathers lived in the same household at the time
of the Descriptive survey.
xix

Mothers report that only one-fifth of the children with non-residential fathers had seentheir fathers at least once a week in the year prior to the Descriptive survey. Mothers reportedthat only 10 percent of the fathers living outside of the household had "often" bought clothes,toys, or presents for the focal children; about 10 percent had "often" served as a babysitter for thefocal children in the past year; and about 4 percent had "often" bought groceries in the past year.Mothers in the Descriptive Study did not often report the family of their child's father as analternative source of support. Indeed, sixty-two percent of the mothers reported that over the pastyear the family of the child's father had done none of the following: bought clothes, toys, orpresents, babysat, or cared for the child overnight.
Few of the mothers in the Descriptive sample reported the establishment of legalpaternity for the focal child, and few reported formal child support agreements. Only 13 percentof the women who had never been married to the focal child's father reported having gone to acourt or child support office to establish paternity, and 2 percent of the never-married women hadhad the biological father sign the birth certificate.
Among the women who did not reside with the child's biological father, 30 percent hadever had child support payments agreed to or awarded to them. Fifty percent of these childsupport arrangements that had been established were court-ordered, and about half (46 percent)arranged through a voluntary written agreement. Formal child support arrangements did notappear to assure payments. Among mothers in the Descriptive sample who had child supportawards, 78 percent reported receiving no money from the father in the year prior to the interview.Among the mothers in the sample without a formal child support agreement, 88 percent reportedthat they had not received money on a regular basis directly from the father. Only 9 percent ofthese women reported that they had legal proceedings to establish paternity "in process" or haveestablished paternity.
Mothers expressed great dissatisfaction with the emotional and financial assistance theywere receiving from the children's fathers, and yet acknowledged that the fathers might not havebeen in a position to provide further economic assistance. Fifty-two percent of the mothers in thissample said that they were very dissatisfied with the amount of love and caring that their child'sfather has shown for the child, and an additional 10 percent were somewhat dissatisfied. Two-thirds of the mothers (66 percent) were similarly very dissatisfied with the amount of money andhelp that the father had been providing for raising the child. However, less than half of thesample, 41 percent, felt that the father could pay more for child support than he did, or could paysomething if he currently paid nothing.
Despite the reported lack of involvement of their children's fathers, many mothers hadother persons to turn to for emotional and instrumental support. Most mothers had frequentcontact with members of their own families. For instance, 63 percent of the respondents who didnot live in the same household as their own mothers saw their mothers once a week or more.About 33 percent of the Descriptive sample reported that their mothers helped to take care oftheir children "quite a bit" or "a lot." Only 10 percent of the mothers said that they had no one
XX
2,1

"who would listen to them, reassure them, or show them that they care." Most respondents didnot feel overburdened by having other people ask them for their support. Many women hadfriends or relatives to turn to for economic or childrearing assistance as well. More than half ofthe respondents felt that it was true most or all of the time that they had someone who would lendthem money in case of an emergency. However, mothers perceived instrumental support (e.g.,economic assistance and help with childrearing) from these other sources to be less availablethan emotional support.
Mothers reporting low levels of social support were more likely to live in public orsubsidized housing, to report high levels of depressive symptomatology, a limited sense ofcontrol over events in their lives, and more barriers to employment. Mothers with low levels ofsocial support also had lower educational attainment and literacy scores.
How are the focal children in the Descriptive Study faring in terms of their cognitivedevelopment, school readiness, socioemotional development, and health at this earlypoint in the JOBS Evaluation? Are there subgroups of children who are at greaterrisk in terms of their developmental status?
Children's developmental status was measured across several domains in order to providea descriptive picture of child well-being. Direct assessments of cognitive development wereobtained, one focusing on receptive vocabulary and one on school readiness. In addition,mothers reported on their perceptions of their children's socioemotional development and healthstatus. At this early point in the JOBS Evaluation, children in the Descriptive sample appear tobe faring poorly on assessments of their receptive vocabulary and school readiness, but-not theirhealth or social maturity as reported by their mothers.
The measure of receptive vocabulary used was the Peabody Picture Vocabulary Test-Revised (PPVT-R). This measure is highly correlated with measures of both intelligence andschool achievement and is a predictor of IQ for African American as well as white children. Yetconcerns about cultural bias have been raised regarding this measure, particularly the possibilitythat it underestimates the cognitive ability of minority children. As a result, we presentcomparative data from a national survey for African American children only.
Children in the Descriptive Study had a mean score of 70. By contrast, African Americanchildren from welfare families in a national sample had a mean score of 76 on this measure, andthose from non-poor families had a mean score of 80 (see Figure 4). Thus, children in theDescriptive Sample had lower scores particularly than their non-poor peers in the national
sample.
xxi

120
110100
906070
6050
4030
2010
0
FIGURE 4
MEAN PEABODY PICTURE VOCABULARY TEST-REVISED SCORES FOR DESCRIPTIVE SAMPLE
CHILDREN AND AFRICAN AMERICANCHILDREN IN A NATIONAL SAMPLE
OF WELFARE AND NON-POOR CHILDREN
JOBS Descriptive Sample African AmericanNLSY-CS Welfare
Afriz:an AmericanNLSY-CS Non-Poor
On average, mothers describe their children as showing fairly high levels of socialmaturity on the Personal Maturity Scale. Although maternal reports of personal maturity do notindicate a problem in this area. it must be noted that assessments of the child from a differentsource, such as a teacher, might result in a differing conclusion.
More than three out of four children were rated by their mothers as currently in excellentor very good health. Approximately half (49 percent) of the children were described by theirmothers as in -excellent" health, and a further 29 percent were described as in "very good"health.
When the ratings of the child's health were combined with a maternal rating concerningthe presence of conditions that limited the child's activities, 47 percent of the children in theDescriptive sample were described as in excellent health with no limiting condition. Thisproportion is lower than the proportion in a national sample of non-poor children. This generallypositive portrayal of the children's health is in keeping with the fact that serious health problemsin the child were a basis of mothers' exemption from JOBS.
Close to the start of the JOBS Evaluation, those children in the Descriptive sampleshowing the least optimal development are those whose mothers have the least education, and thelowest reading and math literacy skills, whose mothers feel the least contol over events in theirlives, and whose mothers perceive the most barriers to employment. In addition, boys in theDescriptive sample show less optimal development than girls on all four measures.
F-

Finally, when mothers were asked to consider all of their children (including the focalchild), a substantial minority (8 percent) reported that they had a child with an illness or handicapthat demanded a great deal of attention or interfered with the mother's ability to work.
How supportive and stimulating are the children's home environments?
Findings from the Descriptive sample are in accord with previous reports that childrenliving in poverty receive less cognitive stimulation and emotional support in their homeenvironments than non-poor children. At the same time there is evidence of variability in thehome environments of the families in the sample. This variability is related to familybackground characteristics, especially the extent of economic deprivation. In addition, the focLlchildren's developmental status at the time of the Descriptive survey is significantly associatedwith the cognitive stimulation and emotional support they receive at home.
The Home Observation for Measurement of the Environment (Short Form), or HOME-SF, was used in the Descriptive Study to measure the emotional support and cognitivestimulation available in the home environment. Other analyses looking at the HOME-SF withinthe National Longitudinal Survey of Youth - Child Supplement indicate that this measure isclosely related to several different indices of family poverty, and further, that the HOME-SF issensitive to smail increments in family income, particularly when looking at the homeenvironments of children born into poverty (Garrett et al., 1994; Moore et al., 1994). Finally, thefull HOME Scale (Caldwell and Bradley, 1984), from which the HOME-SF 's adapted, has beenfound to be i.lated to measures of child cognitive development and IQ, developmental delay, and
poor school performance (Bradley et al., 1989; Elardo, Bradley, and Caldwell, 1975; Gottfried.1984), all important outcomes in the Descriptive sample. Families in the Descriptive sampleshowed, on average, similar levels of emotional support and cognitive stimulation to AFDCfamilies with three- to five-year-olds in a national sample. However, scores were lower in theDescriptive sample and the national sample of AFDC families than in non-poor families in thenational sample, both in terms of cognitive stimulation and emotional support in the home.
Within the Descriptive sample. scores on the two subscales of the HOME-SF were lowerfor families with specific characteristics. Mothers who had not received a high school diploma
or GED, families receiving welfare for two or more years, families living in public housing,families with three or more children, mothers scoring in the lowest groups on reading and mathliteracy, and mothers with less of a sense of control over events in their lives, scored lower on
both the cognitive stimulation and emotional support s-bscales of this measure of the homeenvironment, net of control variables.
After controlling for the influence of child age, gender, and research group, the total scoreand cognitive and socioemotional subscales of the HOME-SF were all significant predictors ofchiidren's scores on the Descriptive Study's measures of receptive vocabulary, school readinessand children's maturity. In addition, higher scores on the cognitive stimulation subscale and the
;

total HOME-SF scale were associated with children receiving a positive health rating from theirmothers.
Are there changes in use of child care for the focal children in the Descriptive Studyin the early months of the JOBS Evaluation?
Previous evaluations of welfare-to-work programs indicate that maternal programparticipation is associated with increased use of child care for young children (Kis''. I. andSilverberg, 1991; Meyers, 1993; Quint, Polit, Bos, and Cave, 1994; Riccio, Friedlander, andFreedman, 1994). In keeping with these earlier findings, there was a substantial increase in theproportion of Descriptive sample children in child care in the two program groups very shortlyafter enrollment in the JOBS Evaluation. Two months prior to random assignment, 44 percent ofthe three- and four-year-olds in the human capital development group were participatingregularly in some form of child care, but two months after random assignment the figure was 72percent. In the labor force artachrnent group, 48 percent of three- and four-year-olds wereparticipating in child care two months prior to random assignment, but 83 percent were receivingsome regular child care two months after random assignment. Over the same time period, use ofchild care in the control group increased only from 43 to 49 percent (an increase that probablyreflects increasing child age and transitions to employment among control group mothers.)
Differential increases in the use of child care in the program groups relative to the controlgroup occurred both for formal and informal care' settings, but as in previous studies of welfare-to-work programs (Kisker and Silverberg, 1991; Meyers, 1993; Quint et al., 1994; Riccio et al1994), we find a particularly marked increase in the use of format child care settings followingenrollment in JOBS.
The greater use of regular child care at the time of the Descriptive survey for the twoprogram groups appears to be a reflection of their greater participation in employment andeducational activities, not a difrerential propensity to use child care. There was a strongrelationship between maternal participation in educational and/or employment activitiesfollowing random assignment and the use of regular child care for the child. This relationshipheld in both the program and control groups. By the time of the Descriptive survey (on averagethree months after random assignment) program group mothers were substantially more likely tobe participating in educational or employment activities than were control group mothers.
There was a statistically significant difference between research groups in the primaryform of child care used by families with three- and four-year-olds at the time of the Descriptivesurvey. The most frequently reported primary care arrangement for children in the control groupwas care by the mother (used by 53 percent of control group families with three- and four-year-
'Formal care includes care in child care centers, preschools. nursery schools, Head Start, kindergarten, and before-and-after school programs. Informal care includes care by a relative or non-relative babysitter.
xxiv
N.

olds).6 By conast, care in a formal child care setting was the most frequently noted primarycare arrangement for chldren in either program group (used by 53 percent of human capitaldevelopment group children and 54 percent of labor force attachment group children).
Federal recommendations exist for formal child care settings in the form of the 1980Federal Interagency Daycare Requirements (FIDCR). The 1980 FIDCR were never implemented
as national regulations, yet researchers frequently refer to the FIDCR recommendations as abenchmark against which to measure the quality of center care. For children between three and
five years of age, the FIDCR recommendations are for group sizes of 16 or smaller, and for staff-to-child ratios of 1:8 or better. The requirements for group size and ratio in the state ofGeorgiadepart substantially from the FIDCR recommendations, allowing group sizes of up to 36 andratios of up to 1:18 for four-year-olds. Among three- and four-year-old children in theDescriptive Study whose primary arrangement was a formal one, and for whom data on both
group size and ratio were available, 34 percent were in settings that met both of these FIDCRrecommendations; 17 percent were in settings that trt..t one of the recommendations; and 49
percent were in settings that met neither recommendation.
Sixty-seven percent of mothers with three- and four-year-olds in some form of regularchild care at the time of the Descriptive Study reported that someone else paid some or all of the
cost of the primary care arrangement. The most common source of assistance, according to themothers, was the welfare office. Among those mothers whose child had a regular child carearrangement, rnothe_s in the program groups were more likely than those in the control group toreceive assistance for child care from the welfare office. Sixty-seven percent of those in thehuman capital development group, 64 percent in the labor force attachment group, and 47 percent
of the control group reported getting help from the welfare office.'
Only a minority (21 percent) of the Descriptive sample mothers reported paying anything
towards the cost of the primary child care arrangement. Among those mothers with three- andfour-year-old children who paid something for care, 74 percent reported paying $0.50 or less perhour.' Considering payments toward the cost of child care for all children in the household,mothers in our sample reported paying $19.11 per week on average. We note, however, that thisfigure does not take into account either the number of children in the household in care or
number of hours in care.
The children's primary care arrangement is the arrangement that they were in for the most hours each week. This can
include sole maternal care.
'These differences were statistically significant: Chi square (2) = 8.29, 2 < 05.
'We note that this figure does not take into account variation in cost per hour according to numty'r of hours in care.
XXV

Does mothers' psychological well-being, approximately three months after randomassignment to the JOBS Evaluation, vary by baseline characteristics? How does thewell-being of children differ by baseline characteristics?
Althout; all AFDC mothers are economically disadvantaged, as a group they varysubstantially on several important characteristics that may be related to maternal and child well-being. For example, some families have been on welfare longer than others, and some have lesseducation and lower literacy skills than others. Can we identify factors such as these,documented at the time of random assignment, that are associated with differences in the well-being of the mothers and children at the time of the Descriptive Study?
Measures of maternal and child well-being at the time of the Descriptive Study wereexamined in light of the following characteristics documented at baseline: maternal education,family size, duration of welfare receipt, residence in public or subsidized housing, reading andmath literacy, depression, locus of control (sense of control over events in one's life), sense ofsocial support, and perception of barriers to employment. Mother and child well-being at thetime of the Descriptive Study varied significantly with regard to these baseline characteristics.The associations are profiled variable by variable in the full report.
It is noteworthy that in many instances, however, the same baseline characteristics thatwere associated with well-being among the mothers at the time of the Descriptive Study werealso found to be related to their children's well-being. In particular, low maternal education,long-term welfare dependency, residence in public housing, low maternal reading and mathliteracy test scores, and poor maternal psychological well-being at baseline were all associatedwith lower scores on measures of the developmental status of the children, measures of the homeenvironment, and measures of maternal circumstances at the time of the Descriptive Study.
Baseline characteristics can thus be used to identify meaningful subgroups of familieswho appear to be faring more and less well close to the start of participation in the JOBSProgram. It will be important to track the development of mothers and children in these differingsubgroups throughout the course of the JOBS Child Outcomes Study, asking whetherparticipation and program impacts also differ.
How do multiple risk factors combine to affect children's well-being? Is thepresence of protective factors associated with child well-being?
The analyses briefly summarized above consider whether the well-being of mothers andchildren at the time of the Descriptive Study differ for baseline subgroups consideredone at atime, for example according to maternal education at baseline, or according to maternaldepressive symptornatology at baseline. In reality, individual children will have differingprofiles in terms of the number of baseline variables that place them at risk developmentally.Previous research suggests that the number of risk factors to which a child is exposed is an

important predictor of development (e.g., Rutter, 1989; Sameroff, Seifer, Barocas, Zax, andGreenspan, 1987).
Risk Factors and Children's Development
To explore the relationship between number of risk factors and children's well-being, wedeveloped a cumulative risk index formed from the set of subgroup measures assessed at baselineprior to random assignment. These subgroups include maternal educational attainment andliteracy; family size; welfare duration; maternal psychological well-being; and barriers toemployment. Scores on the risk index range from 0 to 10 with a m_tan of 4.6 risk factors. Thechildren divided nearly evenly into three groups according to the number of risk factors: Zero tothree, four to five, and six to ten, indicating the presence in the Descriptive sample of childrenwith few, some, and many risk factors.
Analyses indicate a st-ong association between the accumulation of malernal znd familyrisk factors and the well-being of children in the Descriptive sample. Overall, 29 pe:..:ent of theDescriptive Study children scored at or above the median for a national sample of AfricanAmerican preschool-aged children on the Peabody Picture Vocabulary Test-Revised.9 However,the proportion of children with scores above the median was heavily concentrated among low-risk families, with 39 percent of children with zero to three risks scoring above this cutoff,compared to 17 percent among children with six to ten risks.
Scores on a measure of school readiness, the Preschool Inventory, show a similar pattern.Because national norms are not available for the Preschool Inventory, we have established a cut-point for this sample that identifies those children in the Descriptive sample whose scores are in
the top quartile of the Descriptive survey distribution. Thirty-four percent of the children fromlow-risk environments scored in the top quartile, compared with 30 percent of children whosefamily environments posed four to five risks, and just 16 percent of those in very high-riskfamilies (those with six to ten risk factors).
Children from low-risk family environments were also substantially more likely to bedescribed favorably in terms of scores on the Personal Maturity Scale, while children frommultiple-risk backgrounds were much less often described so positively. In addition, anincreased number of risk factors is associated with a lower likelihood of being rated in excellenthealth with no disabilities. Specifically, 57 percent of children with zero to three risks received apositive health rating, compared to only 37 percent of those with six or more risks.
We also find a strong relationship between the limber of risk factors and the emotionalsupport and cognitive stimulation provided to the child as measured by the short form of the
'We Lced a cutoff based on the median score for African American children because of concerns that the PeabodyPicture Vocabulary Test, like many other tests of achievement, may be racially biased (but comparable results were obtained
using it standard cutoff).
xxvii

HOME Scale. Approximately a third of the Descriptive survey children in families with zero tothree risks enjoyed home environments that were above a designated cutoff in terms of cognitivestimulation and emotional support, while only 12 percent of children in families with six to 10risk factors experienced similarly supportive homes.
Protective Factors and Children's Development
Although increased risk is associated with poorer child outcomes overall, we see in theseanalyses that the presence of risk by no means guarantees that a child will exhibit adverseoutcomes. Based on a typology of protective factors developed by Garmezy (1985), we haveused the measures of the Descriptive Study data to identify protective factors in each of thefollowing categories: child characteristics, warmth and cohesion in the family, and an externalsupport system. While our risk factors are all derived from baseline data, the protective factorsare all based on data collected as part of the Descriptive survey. As for the risk factors, we havecomputed a summary index of protective factors. This ranges from zero to nine with a mean of4.5 protective factors. We again group children into three groups according to the number ofprotective factors: zero to three, four to five, and six to nine.
To parallel the analyses looking at risk factors, we examined whether the number ofprotective factors was relawd to the proportion of children scoring above the cutoffs we defmedon the same four measures of children's developmental status (the Peabody Picture VocabularyTest, the Preschool Inventory, the Personal Maturity Scale, and rating of health). Resultsconsistently indicate that, as the number of protective factors increases, a greater proportion ofchildren score above the positive cutoff we delineated for each of the outcome measures. Forexample, the proportion of children scoring in the upper quartile on the Preschool Inventoryincreases from 15 percent among children with zero to three protective factors, to 36 percentamong children with six or more protective factors. Similarly, the proportion of children inexcellent health with no disabilities increases from 41 to 55 percent, as the number of protectivefactors increases.
Association Between Risk and Protective Factors
Does child well-being reflect the conjoint presence of risk and protective factors for thechildren in the Descriptive Study? To address this question, we grouped children according totheir level of risk, and then within each risk grcup examined the proportion of children withfavorable developmental status according to the number at each level of protective factors. Weused the same categories of risk and protective factors described above, yielding a total of ninegroups of children, ranging from those with few risk and few protective factors, to those withhigh levels of both.
Figure 5 shows that for the Peabody Picture Vocabulary Test, higher numbers ofprotective factors are associated with more optimal outcomes at each level of risk, while at the
xxviii

same time children at greater risk odlibit poorer outcomes overall. A similar pattern wasobserved for scores on the Preschool Inventory.
FIGURE 5
PERCENT OF CHILDREN SCORING AT OR ABOVEMEDIAN FOR AFRICAN AMERICAN PRESCHOOLERS ONPEABODY PICTURE VOCABULARY TEST-REVISED, BY
NUMBER OF FAMILY RISK AND PROTECTIVE FACTORSSO%
40%
30%
20%
10%
43
44% Nob.. of frou.4 Factors0.1 4.3
0-1 0.01ka
40%
4 $ Itlata
Figure 6 illustrates that the pattern is less clear when we consider children'ssocioemotional development. For children with fewer than six risks, more protective factors aregenerally associated with higher scores on the Personal Maturity Scale. However, for childrenwith six or more risk factors, the presence of protective factors does not improve children's well-being. Regardless of the number of protective factors, only 14 to 17 percent of children withhigh levels of risk were rated by their mothers as having high levels of personal maturity.
FIGURE 6PERCENT OF CHILDREN SCORING > 8.6 OF 10 POINTS ON
PERSONAL MATURITY SCALE, BY NUMBER OFFAMILY RISK AND PRO TECTIVE FACTORS
NI Prg_sUv ?actors=°-3 744 11141-11
30%
40%
30%
20%
10%
0
2%
0-3 nue
30%,
.5 Risk. 0-10 Plleke
,
4-10 11140.
If

These analyses illustrate that even within a sample of children who are all at risk byvirtue of living in poverty, those with multiple risk factors are exhibiting less optimaldevelopment. Thus, the risks experienced by the mothers in the first generation are clearlytranslated into diminished opportunities for the children in the next generation. At the sametime, a number of protective factors were found to be associated with more positive developmentfor the children. For measures of cognitive development, protective factors offset the influencesof risk factors. However, for our measure of socioemotional development, protective factors donot offset the influences of risk factors at the highest level of risk.
What Are the Implications of These Findings?
The JOBS program was designed to affect parents directly by providing services aimed atending long-term welfare dependency. Nevertheless, indirect effects on children are alsopossible, if the JOBS program affects parental education, income, mother's psychological well-being, childrearing practices, or child care arrangements. The purpose of the current report is toexplore the circumstances of eligible families at the outset of the program, rather than whetherand how JOBS has impacted children. What have we learned?
A clear theme is that the mothers in the Fulton Descriptive sample are in many wayshighly disadvantaged. On average, their reading and math literacy skills are low. Although theyenjoy social support from family and friends, they report minimal economic or non-economicassistance from the fathers of their children. In addition, they have high rates of depressivesymptoms and they experience numerous difficulties in the course of everyday life. At the sametime, however, we note that most of the mothers in the sample had completed high school or aGED, most had positive attitudes about maternal employment, and most had taken steps to limittheir childbearing.
Similarly, the three-to five-year-old children are also clearly disadvantaged at the outsetof the JOBS program. As rated by their mothers, the children's maturity does not represent aproblem; however, the children's receptive vocabulary is substantially below the mean for anational sample of children; and many of the children appear to lack the skills and knowledgethat would make them ready to enter school. While a large majority of mothers in the sampledescribed their children as in excellent or very good health, these ratings are somewhat lessfavorable than those reported in a national sample of non-poor children. Given that thesechildren are already faring poorly in some respects, it seems entirely appropriate that policymakers, program providers, and the public consider whether and/or how the JOBS program mayaffect children.
A second recurring theme of the analyses is the heterogeneity of the population of welfaremothers eligible for JOBS. For example, some mothers hold positive attitudes about becomingemployed, while a minority feel that mothers with young children should not work. Somemothers have received AFDC for a much longer period of time than others. A substantialproportion of women have high levels of depressive symptoms, but many others do not. Most
XXX

use reliable methods of contraception or have been sterilized, but a minority of mothers are atrisk of an unplanned pregnancy. Because of this variation, it is likely that maternal participationin, and reactions to, JOBS activities will vary. Those mothers who are eager to work, knowwhere they can obtain child care, and have recent employment experience seem more likely torespond favorably to the JOBS mandate. Other mothers face substantial obstacles toparticipation, such as low literacy levels, little support from family and friends, and negativeattitudes about employment. It will be important to determine how both groups respond to theJOBS mandate.
Had the mothers proven to be more uniform in their work attitudes, goals, psychologicalwell-being, skills, and the social support they receive, the JOBS mandate might have moreuniform implications for children. However, early results indicating substantial subgroupvariation suggest that the JOBS program is likely to elicit varied responses from both mothersand children. Hence, subgroup differences should be a critical component of further analyses. Inparticular, multiple risk families stand out as a group whose children are especiallydisadvantaged. On a more positive note, we were also able to identify a set of protective factors,greater numbers of which were associated with more positive child development. The mutualinfluence of risk and protective factors present at the start of the JOBS program may be animportant determinant of both participation in, and impacts of the program.
Finally, the data suggest that the JOBS mandate is translating into initial changes in thelives of many AFDC mothers and their children. The effects of these apparent early changes willcombine with any later program impacts on maternal education, earnings, and self-sufficiency.Thus, early data suggest that the JOBS mandate has the potential to affect the lives of twogenerations, and provide strong reason to track the well-being of both generations over time.

CHAPTER 1THE FAMILY SUPPORT ACT AND THE JOBS PROGRAM
Overview
This report provides a detailed descriptive account of a sample of AFDC mothers andtheir preschool-aged children. The report represents the first data available from the ChildOutcomes Study, a sub-study within the larger evaluation of the Job Opportunities and BasicSkills Training (JOBS) Program being conducted by the Manpower Demonstration ResearchCorporation (MDRC) for the Department of Health and Human Services and the Department ofEducation. Impact results will be available at a later date.
Responding to the interest in and concern about children living on welfare and in poverty,this report provides a broad and rich portrait of a sample of 790 Fulton County (Atlanta), Georgiafamilies whose youngest child was aged three to five at the outset of their mothers' referral to the
JOBS Program. Tht. .2mainder of this chapter provides background information essential tounderstanding how work and welfare affect the well-being of children. We outline the historyand policy issues that led to the JOBS Program, review relevant research studies that havemotivated the current study, and describe the design of the JOBS Child Outcomes Study.Subsequent chapters describe the context of Fulton County, Georgia; the characteristics,attitudes, and experiences of the mothers and their families: the home environments and child
care experiences of the children: and the development and well-being of the children at the outsetof their mothers' contact with the JOBS Program. Finally, we identify several key subgroupsand explore the extent to which members of each subgroup vary in both matrmal and child
characteristics.
Key questions for Chapter I
What policy concerns led to the creation of the JOBS Program?Why consider children in a program aimed primarily at parents?By what pathways might JOBS affect children?What is the design of the JOBS Evaluation and the embedded Child Outcomes
Study?
What poiicy concerns led to the creation of the JOBS Program?
The Aid to Families with Dependent Children (AFDC) program, one of the nation'slargest cash assistance programs, was esta 'ished under the Social Security Act in 1935 primarily
to help the children of widows. At that time, there was public consensus that children should be
raised at home by their mothers; AFDC made this possible for mothers who otherwise could notafford to stay home. However, in the 60 years since the creation of AFDC, both the populationserved by AFDC and U.S. society as a whole have undergone dramatic changes that have
necessitated a re-evaluation of the purposes of t. i program.

First, the proportion of women with children who work outside the home has risendramatically since 1935, so that in 1991, 60 percent of married women with children under agesix were in the labor force (DaVanzo and Rahman, 1993). Second, AFDC today primarily serveschildren of single mothers: of the 1992 caseload, 53 percent of child recipients had parents withno marriage tie, and 30 percent had parents who were divorced or separated (U.S. House ofRepresentatives, 1994). It is, therefore, no longer a program for children of widows. Finally,research has shown that some portion of the AFDC caseload remains dependent on the programfor long periods of time, so that a program designed as a "safety net" has become a long-termprovider for a mhiority of families. Because of their longer spells on welfare, at any given timethese long-term recipients account for a disproportionate share of the caseload. For example, atany one time, 48 percent of the people on welfare are in the midst of "spells" that will last 10years or more (Bane and Ellwood, 1994). These changes, combined with growing concern aboutthe cost of public assistance programs and the availability of a productive American work force,have helped to call into question the assumptions of existing welfare legislation.
As public support for welfare programs has diminished, the number of U.S. childrenliving in poverty has increased. Following two decades in which the proportion of U.S. childrenliving in poverty declined, the 1980s brought an increase in this proportion such that in 1992,more than one in five U.S. childi en under the age of 18 were living in poverty. Among childrenages five and under, one in four was living in poverty in 1992 (U.S. Bureau of the Census, 1993).Further, an accumulating body of evidence suggests that living in poverty, particularly persistentpoverty, has serious negative consequences for the cognitive, emotional. and physical well-beingof children, and also carries enormous costs to society in terms of health insurance,compensatory education, the juvenile justice system, and other services (Duncan, Brooks-Gunnand Klebanov, 1994; Huston, 1991; Moore, Morrison, Zaslow, and Glei, 1994; Zill, Moore,Smith. Stief, and Coiro, in press). These converging lines of evidence have led to renewedpublic interest in policies aimed at helping families, especially families with children, leavewelfare and poverty.
The decades since the 1960s' War on Poverty have witnessed numerous programsintended to reduce poverty, and numerous evaluations of these efforts. Previous evaluations ofprograms designed to assist welfare recipients have generally focused on the behaviors,attainments, and financial circumstances of the adults who receive the welfare grants rather thanon the children who are beneficiaries of these programs. These evaluations indicate that suchprograms have real but modest success in reducing welfare dependency and increasing earnings(Gueron and Pauly, 1991).
For example, the Work Incentive ovrN) program was established in 1967 to provideservices such as education. job training, and social services to AFDC recipients on a primarilyvoluntary basis. WIN gradually evolved to emphasize job search assistance and immediate
I The original AFDC program was expanded in 1950 to utclude parents or adult caretakers in addition to children.
2

employment, and became mandatory for most AFDC recipients without children under age six(Hamilton and Brock, 1994). Evaluations of WIN and similar programs (which allowed statesmore flexibility in the types of sei-vices offered) provided evidence that welfare-to-workprograms could lead to modest but sustained increases in employment and earnings for singleparents on AFDC, and also to decreased welfare expenditures for states.
However, women with young children were typically exempt from participation in suchprograms, and outcomes for children were not examined in the evaluations. An implicitassumption has been that school-aged children whose mothers participated in activities designedto promote self-sufficiency while the children attended school would not be greatly affected bysuch participation -- and that any effects would be positive, reflecting improvements in thefamily's financial circumstances. The most recent national-level welfare reform initiative, theFamily Support Act, extended mandatory welfare-to-work programs to parents with youngchildren, and thus made the issue of the effects of such programs for young children an importantone for policy makers, program providers, and the public (Gueron and Pauly, 1991).
The Family Support Act and JOBS
Demographic changes, concern about child poverty, and accumulating evidence thatwelfare-to-work programs have real but modest effects on welfare dependence convincedconservatives and liberals alike to enact a major reform of the welfare system. In 1988, the U.S.Cormress passed landmark welfare reform legislation -- the Family Support Act (P.L. 100-485,known as FSA) -- that marked a fundamental shift in the philosophy underlying the provision ofwelfare assistance to poor families with children (Zill, Moore, Nord and Stief, 1991). Thecenterpiece of the FSA is the Job Opportunities and Basic Skills Training (JOBS) Program,which aims to "encourage and assist needy children and parents to obtain the education, training,and employment needed to avoid long-term welfare dependence" (Family Support Act, 1988).Like earlier welfare-to-work programs, JOBS Programs offer job readiness activities, and jobdevelopment and job placement. However, states are also required to offer "human capitaldevelopment" activities such as adult education and job skills training. States must also provideat least two of the following: group and individual job search, on-the-job training, worksupplementation programs,' and community work experience or alternative work experience(Hamilton and Brock, 1994). The FSA also includes provisions to facilitate the establishment ofpaternity, and improve the monitoring and enforcement of child support payments. In addition,the FSA required all states to have AFDC-UP programs, which provide benefits to two-parentfamilies when the primary wage earner is unemployed.
Because the JOBS legislation endorses a view of welfare as a reciprocal obligationbetween individuals and government, participation is mandatory for certain segments of theAFDC caseload, and states may impose sanctions (reductions in welfare grants) upon those who
' Work supplementation orograrn; involve subsidi7ed on-the-job training for welfare recipients with a public or private
sector employer.
3
fail to participate. Participation in JOBS is mandatory for all AFDC recipients with children asyoung as age three and, at state option, age one. (Exceptions are made for illness orincapacitation of recipients, those taking care of an ill or incapacitated child or other householdmember, advanced age, age under 16, pregnancy past the first trimester, or living in areas whereprogram services are unavailable.) In order to focus efforts on those most at risk of long-termdependence and on those who are more disadvantaged, the JOBS legislation stated that at least55 percent of JOBS expenditures should be spent on the following groups of AFDC applicantsand recipients: those who have already received AFDC for 36 of the past 60 months; those whoare custodial parents under the age of 24 without a high school diploma or General EducationalDevelopment (GED) certificate, or who have little work experience; and those who are withintwo years of becoming ineligible for AFDC because their youngest child is age 16 or older.
Again recognizing the mutual responsibility between government and individuals, theJOBS legislation requires states to provide supportive services for JOBS-mandatory individuals.States must guarantee child care to each JOBS participant with dependent children if such care isnecessary for the client to attend a JOBS activity or accept a job. States must also reimburseclients for transportation or other expenses (such as fees to take the GED examination) that arerequired for participation. Further, both Medicaid and child care benefits are provided to JOBSparticipants for one year after they leave AFDC for employment.'
Why consider children in a program aimed primarily at parents?
Programs that successfully alter outcomes for children at risk "see the child in the contextof the family, and the family in the context of its surroundings" (Schorr. 1991. p. 267).--Thisecological approach (Bronfenbrenner, 1979, 1986) provides the framework for the JOBS ChildOutcomes Study, in which the lives and circumstances of children living in welfare families areconsidered in light of characteristics of the child, family, community, and policy.
Those few evaluations of programs aimed at poor families that have assessed outcomesfor children as well as adults provide evidence that interventions for disadvantaged families canhave effects on multiple family members. For example, the Negative Income Tax Experiment.which provided a guaranteed minimum income to a sample of low-income families in severalcommunities, was associated with an increase in children's reading achievement (Maynard andMurnane. 1979; Murnane, Maynard, and Ohls, 1981). Not only do programs for AFDC mothershave the potential to affect the well-being of children, but two-generational effects have alsobeen found in the opposite direction, with programs aimed at children affecting parents. Areview of programs that provide educationally-oriented intervention services for young childrensuggests that such programs result in higher rates of maternal employment and more stableemployment (Benasich, Brooks-Gunn. and Clewell. 1992). Thus, the child care benefitsprovided by the JOBS Program may themselves have effects on mothers. Below we discuss a
AFDC recipients are automatically eligible for Medicaid (U.S. House of Representatives, 1994).
4

more recent approach to welfare-to-work programs that explicitly address the needs of both theparental and child generations.
Two-generational Programs. A new model of intervention for low-income familiesalso bears mentioning: those that are explicitly "two-generational" in focus (Smith and Zaslow,1995). Such programs "pursue the dual goals of economic self-sufficiency for families andhealthy development of children" (Smith, Blank. and Collins, 1992, p. 2). Smith and Zaslowsuggest that two-generational programs have the potential to improve children's well-being in thelong term by focusing not just on one area of family functioning but on the multiple challenges
and needs of at-risk families.
Three recent two-generational programs, Project Redirection, New Chance, and EvenStart, provide evidence that such interventions have effects on the experiences of both mothersand children. For example, Project Redirection, a demonstration initiated by MDRC that offeredcomprehensive services to economically disadvantaged mothers aged 17 and younger, was found
to have modest, but significant, positive effects on the cognitive and socioemotionaldevelopment of participants' children five years after the program began (Polit, Quint, andRiccio, 1988). Children in the Project Redirection group were also more likely to have attendedHead Start. These program impacts for children were more powerful than the long-term impactsfound for the mothers who participated in Project Redirection.
Similarly, New Chance. a comprehensive, voluntary program for young women onAFDC who gave birth to their first child at age 19 or younger and who had not obtained a highschool diploma or GED certificate, resulted in more hours of educational activities, and-increasedcompletion of the GED certificate, for mothers in the experimental group compared to those in acontrol group who were not in the program. In addition, the lives of children whose mothersparticipated in New Chance were also positively affected: their home environments were slightly
more emotionally supportive, and their mothers reported somewhat less punitive childrearingattitudes. compared to control group mothers. Furthermore, children of experimental groupmothers were more likely to have been in non-maternal care, especially center-based care (Quint,
Polit, Bos, and Cave, 1994). These differences were apparent 18 months after randomassignment. Results from analyses of observational and survey data collected 21 months afterrandom assignment within the New Chance evaluation were similar to the 18-month data. TheNew Chance program reduced the incidence of harsh parenting behavior, particularly for youngerchildren. In addition, mothers in the experimental group reported spending more time inparenting chores than mothers in the control group (Egeland and Zaslow, 1995). Findings from a42-month survey will provide information regarding the long-term impacts of New Chance(Quint et al., 1994). In addition. the Even Start family literacy program, which provides earlychildhood education, parenting education. and adult educatior to disadvantaged families, had a
positive effect on the presence of reading materials in the home (St. Pierre, Swartz, Murray, Deck
and Nickci. 1993). Thus. although these programs provide more comprehensive services thanJOBS, they suggest ways in which children can be affected by such interventions.
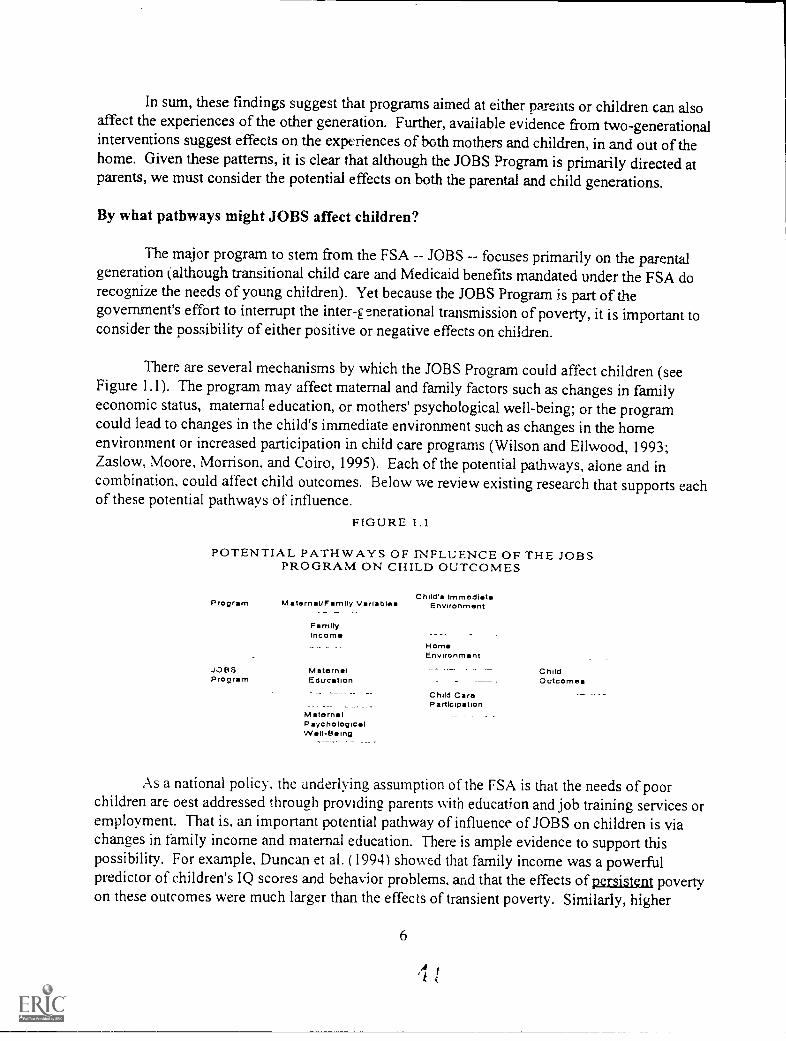
In sum, these findings suggest that programs aimed at either parents or children can alsoaffect the experiences of the other generation. Further, available evidence from two-generationalinterventions suggest effects on the experiences of both mothers and children, in and out of thehome. Given these patterns, it is clear that although the JOBS Program is primarily directed atparents, we must consider the potential effects on both the parental and child generations.
By what pathways might JOBS affect children?
The major program to stem from the FSA -- JOBS -- focuses primarily on the parentalgeneration (although transitional child care and Medicaid benefits mandated under the ESA dorecognize the needs of young children). Yet because the JOBS Program is part of thegovernment's effort to interrupt the inter-ge.nerational transmission of poverty, it is important toconsider the possibility of either positive or negative effects on children.
There are several mechanisms by which the JOBS Program could affect children (seeFigure 1.1). The program may affect maternal and family factors such as changes in familyeconomic status, maternal education, or mothers' psychological well-being; or the programcould lead to changes in the child's immediate environment such as changes in the homeenvironment or increased participation in child care programs (Wilson and Ellwood, 1993;Zaslow, Moore, Morrison, and Coiro, 1995). Each of the potential pathways, alone and incombination, could affect child outcomes. Below we review existing research that supports eachof these potential pathways of influence.
FIGURE 1.1
POTENTIAL PATHWAYS OF INFLUENCE OF THE JOBSPROGRAM ON CHILD OUTCOMES
Child's ImmediateProgram Maternal/Frnlly Variables Environment
FamilyIncorn
HornEnvironmnt
JOBS MaternalProgram Education
Child CareParticipation
MaternalPsychologicalWII-Bing
ChildOutcome
As a national policy, the underlying assumption of the FSA is that the needs of poorchildren are oest addressed throuvh providine parents with education and job training services oremployment. That is, an important potential pathway of influence of JOBS on children is viachanges in family income and maternal education. There is ample evidence to support thispossibility. For example, Duncan et al. (1994) showed that family income was a powerfulpredictor of children's IQ scores and behavior problems, and that the effects of persistent povertyon these outcomes were much larger than the effects of transient poverty. Similarly, higher
6

parent education levels and cognitive attainment are associated with children's development inboth the socioemotional and academic spheres (Desai, Chase-Landsdale, and Michael, 1989;Hauser and Mossell, 1985). Income and education gains may in turn produce changes inchildren's home environments, such as the provision of more cognitively stimulating materials oractivities. These qualities of the home environment are positively associated with children'sdevelopment (Bradley et al., 1994), and in fact are bettei predictors of child outcomes than are
measures of parent education or socioeconomic status.
However, despite the evidence that higher levels of parent education or income arebeneficial for children, there is little evidence of the effects of changes in family economic status
on children. Analyses of survey data indicate that children's outcomes improve when familyeconomic fortunes increase, if family income rises enough to bring the family out of poverty
(Moore et al., 1994). However, the results reflect natural transitions out of poverty and cannotnecessarily be extrapolated to program effects. Nor do we know whether JOBS participation willresult in sufficiently large gains in these areas to produce impacts for children. For example,
MDRC's evaluation of California's JOBS Program, Greater Avenues for Independence (GAIN),
found an average impact on earnings of just over $1000 over a three-year period (Riccio,Friedlander, and Freedman, 1994), and an average 7 percent impact on receipt of a GED or high
school diploma over a two- to three-year period (Martinson and Friedlander, 1994). Similarly,New Chance participants were substantially more likely to obtain a GED than control groupmembers during the first 18 months of the program. though it is not clear whether these program
impacts. or participation in other proeram components. caused the modest impacts of New
Chance on parenting (Quint et al 1994). We do not yet have data to indicate how many JOBSparticipants will attain a GED or nigh school diploma, although Hamilton and Brock (1994)
report that six-month participation rates in some type of JOBS activity are similar to those in
earlier mandatory welfare to-work initiatives.
Furthermore. JOBS may affect children through changes in maternal psychological well-
being. For example. mothers' stress or depression levels may increase in response to theparticipation mandate and the need to arrange child care. By contrast, mothers may experience
decreases in depression and increases in role satisfaction or self-esteem as a result of gains in
their education or job skills or because participation provides social interaction, a respite from
child care, and a sense of future opportunity. These areas of maternal well-being have been
linked in turn to aspects of the home environment and to children's outcomes. For example,depressed mothers are both less warm and more punitive during interactions with their children,
and their children are at risk for a variety of adjustment problems (Downey and Coyne, 1990).
Similarly, child outcomes are less optimal when mothers with a preference not to be employed
are workine (Zaslow. Rabinovich. and Suwalsky. 1991).
Finally, participation in JOBS may affect children's participation in non-maternal care.
N/leyers (1993) has summarized evidence that participation in welfare-to-work programs isassociated with an increase in the amount of child care used and changes in the type of care used.
Thus, the provision of child care subsidies for JOBS participants may result in more children
7

from AFDC families participating in out-of-home child care arrangements. The quality of suchcare, however, is not mandated,' and child care quality is positively associated with childoutcomes across a variety of types of care and domains of child well-being (Hayes, Palmer, andZaslow, 1990). The quality of care may be particularly important for low-income children.Thus, the FSA may provide an important opportunity to enhance the development ofdisadvantaged children. On the other hand, if parents place their children in sub-standard care inorder to fulfill their JOBS participation requirements, children's development may well suffer.
In sum, prior research suggests that JOBS, while primarily focuscd on the self-sufficiencyneeds of parents, may affect the lives and well-being of their young children as well. Botheconomic and non-economic mechanisms for such effects are possible. However, at this time weare agnostic as to whether these effects will be positive or negative, or a mix of both for differentoutcomes or different subgroups of the JOBS population, and as to whether these impacts will belarge or modest. The JOBS Child Outcomes Study, part of the national JOBS Evaluationdescribed below, has been desianed to allow a careful examination of such impacts for children,as well as of the mechanisms by which such impacts occur.
The JOBS Evaluation
The FSA legislation recommended a random assignment evaluation of the JOBS Programto test its effectiveness, and this evaluation is currently being conducted by MDRC. The impactsportion of the JOBS Evaluation involves random assignment of JOBS eligibles to either one ortwo program groups or a control group, in seven sites around the country, involving more than55,000 individuals. The impact study is designed to examine the effects of various JOBSapproaches on individuals' employment status. earnings levels, receipt and amount of AFDCpayments, income levels, and educational attainment, using two types of experimental designs.
The design of the impact study, and rationale for choosing each of the seven sites, aredescribed fully in "The JOBS Evaluation: Early Lessons from Seven Sites" (Hamilton andBrock. 1994). That report describes several key questions that guide the JOBS Evaluation,regarding the feasibility of implementing a large scale, multi-component program like JOBS, andthe effectiveness of such a program for both the AFDC caseload as a whole and particularsubgroups of the caseload. As described previously, one subgroup of particular interest ismothers with young children. Because JOBS departs from earlier welfare-to-work programs bymandating the participation of parents whose children are as young as three years of age,' aspecial substudy of these parents and children. called the Child Outcomes Study, is beingconducted within the larger JOBS Evaluation (see Figure 1.2).
'To receive federal matching funds. states must ensure that JOBS-funded child care meets applicable state and local standards.However. fewer than 25 percent of states have child care regulations that meet minimal professionally-agreed upon standards ofquality (Maynard, Kisker, and Kerachsk.. 1990).
States have the option to mandate the participation of parents IA hose children are as young as one year of age.

FIGURE 1.2STUDY DESIGN
JOBS ChugOutcome**
Study
IOU
N..3.0003 Wise
NOTE. hi Nub.. of Study Portickpoati
The JOBS Child Outcomes Study Design and Methods
The JOBS Child Outcomes Study is a longitudinal investigation of the life circumstancesand development of children ages three to five at the time their mothers enter the JOBS Program.
As noted above, early evaluations of welfare reform initiatives rarely considered the effects of
welfare reform on children, assuming that increases in maternal earnings or employment would
have only beneficial effects on children. However, the Child Outcomes Study recognizes thatsuch programs potentially carry both benefits and hwards for children, perhaps particularly for
young children. This age group was chosen for study because parents with children under agesix have previously been exempt from participation in welfare reform initiatives; thus, little is
known about the impacts of such programs for young children. In addition, because manychildren of this age are not in school, they are most likely to experience changes in their daily
experiences as a result ofJOBS.
Data for the Child Outcomes Study are being collected for approximately 3,000 mothers
and children in three sites: Fulton County, Georgia; Riverside County, California; and Kent
County, Michigan. This includes all eligible families with a youngest child aged three to five
who are enrolled in the JOBS Evaluation in these three sites. Each of these sites uses an
experimental design in which those eligible for the JOBS Program are randomly assigned to
either a control group or one of two program groups, called the human capital development and
labor force attachment groups. Families in the Child Outcomes Study will be drawn from allthree groups. Differences between the two program groups are described in Chapter 2 of this
report, and with greater detail by Hamilton and Brock (1994). Note that JOBS' effects onchildren will be evaluated by comparing outcome data for individuals in these three research
groups, using an experimental design.
Information for the Child Outcomes Study will be obtained from parent report,
interviewer observations, direct assessments of the child, and teacher reports. Analyses of the
9
BEST COPY AVAILABLE

impacts of the JOBS Program for children will rely on follow-up data collected from mothersand children in all three sites two years after random assignment, and from schoolsapproximately four years after random assignment.' The current report provides a descriptiveaccount of the Child Outcomes Study sample in one of these sites -- Fulton County -- at the startof the evaluation.
Sources of data. Data for the current repor ! are derived from four sources, all collectedin the initial phase of the evaluation. Three of these data sources were collected at the JOBSoffice just prior to the random assignment process in all sites; orientation to the JOBS Programoccurred on the same day. Thus these data constitute true "baseline" measures ofthecharacteristics and attitudes of AFDC applicants and recipients, before they began to participatein any JOBS activities. and indeed prior to their being randomly assigned to either the programor the control groups. These data sources are: (a) standard client characteristics (e.g., AFDChistory, educational background) collected by welfare staff during routine intake interviews withclients; (b) a client-completed survey of attitudes and psychological well-being; and (c) client-completed standardized tests of reading and math achievement. Throughout the report, we referto the time period in which these data were collected as the "baseline." Although baseline datawere collected in all seven sites, this report only uses data collected in Fulton County.
The fourth source of data is (d) the Fulton County Descriptive Stud). survey. Data fromthis survey provide the primary focus of the current report. The survey was designed to providedetailed descriptive data on a sample of women and their children in the Child Outcomes Studyliving in Fulton County, Georgia, shortly after the mothers' random assignment as part of theJOBS Evaluation. Topics assessed in the survey include household composition; parenting;maternal psychological well-being; history of child care use and current child care arrangements;availability of social support; and child cognitive and behavioral development.
Sample, design, and data collection. The sample who participated in the DescriptiveStudy, hereafter called the Descriptive sample, are a subset of the total Child Outcomes Studysample for Fulton County. Because of the experimental nature of the 'ORS Fvaluation. .t wasnot necessar) to collect detailed intbrmation about families soon after prouram enrollment fromthe full Child Outcomes Study sample; these data were collected primarily for the current,descriptive report. Funding was obtained from the Department of I lealth and I luman Services toconduct Descriptive surveys with 600 of the expected 1,125 families in Fulton County who willbe eligible for the Child Outcomes Study Two Year Follow-I lp Survey. These 600 families weredrawn from the two program groups in Fulton ('ount Lutman capital development and laborforce attachments groups). In addition, a consortium of private foundations including the
Anticipated ',ample wes for the Child ()income. Sitid 1 v. o-Year 1 -up Siff\ e are approvinatel 1.125 lannlie. in1 ulton ;ind in RI\ er.ide and appro\ imatel -50 in Kent
I he Ikpartnient lealth imd Human Sel" Ice.!ss i i II he funding a lour and one-halt ear -up id. the .1( )115-mandatorpopulation Further information illout outcomes lor children Vs ill he ohtained at that nine
to
Foundation for Child Development, the William T. Grant Foundation, and the Smith RichardsonFoundation, provided funding to collect 200 interviews from members of the control group, to
supplement a foundation-funded observational study ofparent-child interaction among JOBS
families (see Zaslow and Eldred, 1994, for details of this study). Thus, the Descriptive sample
contains families from the control and program groups, all of whom are also included in the
Child Outcomes Study sample and will be eligible for the Two Year Follow-Up Survey. As
Figure 1.2 illustrates, the Descriptive sample is embedded within the full Child Outcomes Study
sample, which is embedded within the larger JOBS Evaluation sample. The nested nature of the
design means that the full range of data collected from participants in the JOBS Evaluation is
available for participants in the Descriptive Study, the focus of the current report.
Descriptive surveys from a final sample of 790 women who were randomly assigned to a
research group in the Fulton County JOBS Evaluation from March 1992 through June 1993 were
obtained. The survey was administered in person, usually in the respondent's home. All mothers
in the Descriptive sample had a child between three and five years of age at the time of their
random assignment. This child was the focus of the in-home survey. Because women withchildren under age three are exempt from the JOBS Program in Atlanta, the focal child was
almost always tt .-. mother's youngest child at the time she entered the JOBS Program. If themother had two children ages three to five, one was chosen randomly to be the focal child!
Descriptive data were collected an average of three months after the mother was
randomly assigned wi hin the JOBS Evaluation, with nearly all interviews conducted between
one and five months post-random assignment. Because of this interval between randomassianment and the interview, many mothers in the sample had already begun to participate inJOBS-related activities, such as schooling or job search, by the time of their interview. For
example, in the first six months of the larger JOBS Evaluation, more than 60 percent of those
assigned to one of the two program groups had participated in some type ofJOBS activity for at
least a day (Hamilton and Brock, 1994). These activities of the mothers often necessitate
changes in the lives of their young children, such as increased participation in child care
proarams. For these reasons, data from the Descriptive survey cannot be viewed as "baseline" in
nature, but for some respondents represent early adaptation to the JOBS mandate. A morecomplete analysis of the impacts of the JOBS Program for mothers and children will be
conducted at a later point in time using follow-up data.
Response Analysis Corporation was responsible for data collection and the training of
interviewers, all of whom were African American females living in the Atlanta area.
interviewers were very carefully trained and monitored to obtain information as completely and
accurately as possible from the mothers. Interviewers also received in-depth training in
conducting child assessments and in ratine the children's home environments.
Throughout thc report. the Descnptive Sample includes all 790 respondents and their children from all three research
groups.

The overall response rate for the Descriptive survey was 87 percent. While this isconsidered a high response rate, it is nevertheless useful to examine whether those whocompleted the survey differ in any way from those who were eligible but did not complete it(e.g., refused, could not be contacted or located). Sampling bias checks were conducted in orderto determine whether those women who were selected for, but did not participate in, theDescriptive Study were different on a set of baseline characteristics from those women who weresurveyed. Note that those who did and did not participate in the Descriptive Study arenevertheless all included in the Child Outcomes sample and are eligible for the Two-YearFollow-Up Survey. Overall, those women who were fielded for, but did not participate in, theDescr.ptive Study were somewhat more advantaged than those women who were surveyed.Women who were not surveyed had significantly higher mean scores on reading and mathliteracy tests, had completed more years of education, had higher mean scores on measures ofsocial support and locus of con'iro1,9 had spent proportionally less time on welfare, and wereproportionally more likely to live in housing other than public or subsidized housing than womenwho completed the Descriptive survey. Although these differences were all significant at the p <.05 level, the magnitude of the difference was small for most of the comparisons. In sum,although women who completed the Descriptive survey were more disadvantaged than thosewho were not interviewed, the obtained sample reflects the previously mentioned focus of theJOBS legislation, those most at risk of long-term dependence on AFDC.
Limitations of the data. The data used in this report are largely self-reports from themothers, with a few exceptions. First, information on standard client characteristics wascollected at baseline by caseworkers in the JOBS office. Second, the interviewers assessedvarious aspects of the home environment and mother-child interactions at the time of theDescriptive survey. In addition, the assessments given to the children by the interNiewers areobjective and well-validated measures of achievement and school readiness. Nevertheless, muchof the data's accuracy cannot be corroborated through other sources, such as the children's fathersor the welfare office. As a result, we indicate throughout this report instances in which readersshould be aware that the information that is presented is from mother-report only.
Analysis strategy. For analyses of subg,roup differences that are described throughoutthis report, focal child age at random assignment, focal child gender. and research groupassignment were used as a standard set of control variables, unless otherwise indicated, forseveral reasons. First, it has been widely documented that age-and gender-related characteristicsin children can elicit unique responses in parents (Bell and Harper, 1977). In addition, age- andgender-related characteristics in children are also strongly associated with children'sdevelopmental status (e.g.. Mussen, 1983). However, because the influences of child age andgender are not generally the focus of analyses presented in this report, they have been statisticallycontrolled. Second. with specific exceptions. we used research group assignment as a controlvariable because the Descriptive survey was not designed to measure early impacts of JOBS. In
'"eorle ,ith an external locus of control are more likek to feel at the mercy of circumstances and environmental events,whereas those with an internal locus of control are more likely to feel efficacious and in comrol of their lives.
12

addition, all analyses are weighted, unless otherwise indicated. Weighting was necessary in
order to correct for differential sampling in one of the program groups. (See Appendix A for a
detailed description of weighting procedures and control variables).
Heterogeneity of the AFDC population.
A theme throughout this report is the heterogeneity of the AFDC population, both
mothers and children. For example, in contrast to the view that welfare is a "way of life" for
most participants, Bane and Ellwood (1994) show that women who receive public assistance do
so for varying lengths of times. Almost half of all beginning spells on welfare end within two
years, and only 14 percent last ten years or more. In addition, Zill et al. (1991) document that,
while women receiving AFDC are disadvantaged, many AFDC mothers have small families,
high school diplomas, and several years of work experience. At the same time, both Bane and
Ellwood (1983) and Zill et al. (1991) observe that women with certain initial characteristics
(such as no high school diploma, teen births. low scores on a test of cognitive achievement, or a
health limitation) are at particular risk for long-term welfare dependence. Bane and Ellwood
(1994) note that more than half of never-married mothers who have not completed high school
and who have no work experience will receive AFDC for more than 10 years.
This view of the AFDC population leads to the hypothesis that different subgroups of the
JOBS-eligible caseload will experience the JOBS Program differently. In fact, Friedlander
(1988) has shown that the impacts of previous welfare-to-work programs vary across differing
subgroups of the AFDC caseload. Therefore, in the following chapters we not only describe the
Descriptive sample as a whole, we also identify several key subgroups and examine the-extent to
which members of the different subgroups vary in both maternal and child characteristics. Using
baseline data, subgroups are identified based on background characteristics of the mother
(education, reading and math literacy, and welfare duration); characteristics of the family
(number of children, housing, and available social support); and indices of maternal subjective
well-being (depression. locus of control, and perception of barriers to employment). Appendix A
describes these subgroups in detail. These analyses pave the way for analyses of between
subgroup impacts. which will be conducted when two-year follow-up data are available, and also
illustrate the heterogeneity found even within a sample of African American mothers withpreschool-aged children who receive AFDC.
Summary
Changes in the population served by AFDC, concerns over the increasing rate of child
poverty in the U.S., and accumulating evidence that welfare-to-work proarams have modest
success in reducing welfare dependence and increasing adults' earnings, have contributed in
recent years to renewed public interest in policies aimed at helping families, especially families
with children, leave velfare and poverty. The Family Support Act of 1988 and its centerpiece,-
the JOBS Program. encourage families on welfare to obtain the education, job skills, and
employment necessary to avoid long-term welfare dependency. JOBS is mandatory for certain
13

segments of the AFDC caseload, including parents with children as young as age three, and alsoprovides participating families with supportive services such as child care and transitionalMedicaid.
Despite evidence of the negative effects of poverty on children's physical, emotional. andcognitive development, little is known about the effects of welfare-to-work programs onchildren. Prior .esearch provides substantial evidence that programs aimed at parents may alsoaffect children, through changes in maternal education, family income, the home environment,maternal psychological well-being, and participation in child care.
Because of the potential for JOBS to affect both parents and children, the evaluation ofthe JOBS Program being conducted by MDRC includes a substudy of the effects ofJOBS onyoung children. The Child Outcomes Study will examine the effects of parents' randomassignment to one of two JOBS program groups, or a control group, on children's well-being.Families with children aged three to five at the time the mother enters the JOBS Evaluation willbe drawn from three sites, and will be followed for at least four years. Data for the ChildOutcomes Study will be collected from interviews with mothers, direct assessments of thechildren, observations of the home environment, and teacher surveys and school records.
The current report presents data drawn primarily from the Descriptive survey, which wasconducted among a subsample of those eligible for the Child Outcomes Study in Fulton County,Georgia. Descriptive surveys were conducted with mothers and children between one and fivemonths after the mothers' random assignment to a research group as part of the JOBS Evaluation.The goal of this report is to present a broad description of the well-being of both mothers andyoung children in the Fulton County JOBS Program, and a portrait of the family and communitycontexts in which they live, at the outset of the JOBS Evaluation. An additional focus is toexamine the extent to which members of key subgroups of the AFDC population vary in bothmaternal and child characteristics.
Key Questions for the Report
The goal of this report is to provide the context within which we will examine laterimpacts of the JOBS Program for children. Several key questions are addressed in this report:
What is the community context of Fulton County, and how do the communitysetting and sample characteristics affect the conclusions that can be drawn? Chapter2 describes Fulton County in terms of size, population characteristics, incomedistribution, and labor market, and compares the population in Fulton County to the U.S.population as a whole. In addition, data from the Descriptive survey are used to describethe housing and communities in which respondents live.
1 4

How job-ready are mothers in the Descriptive sample in terms of fertility plans,education, reading and math literacy, labor force experience, attitudes regardingwork and welfare, and psychological well-being? What stressors and barriers toJOBS participation do they face? Chapter 3 provides a description of the readiness ofmothers to pursue JOBS activities and employment. Although JOBS participation ismandatory, some women will be at a greater disadvantage than others because of loweducational attainment, low reading and math skills, little or no work experience, and
other psychological and attitudinal barriers. In addition to basic demographicinformation about the sample, Chapter 3 provides an account of respondents'contraceptive use; education levels and reading and math literacy test scores; employmentexperience and attitudes toward employment; and psychological well-being.
What assistance do the children's fathers provide to the mothers? Who other thanthe father provides emotional, childrearing, and economic support to these mothers,and to what extent? Chapter 4 describes the economic and childrearing roles that thebiological fathers play in their children's lives, and the mothers' satisfaction with thoseroles. Additionally, respondents' frequency of contact with their own families, and their
access to emotional and childrearing support from multiple sources, are reported.
How are these children faring in terms of their cognitive development, schoolreadiness, socioemotional development, or health? Are there subgroups of childrenwho are showing particularly poor developmental status? Chapter 5 provides data onthe development of the 3- to 5-year-old children in the Descriptive sample, and uses datafrom other sources to compare the Descriptive sample to both non-poor and poor
samples.
How supportive and stimulating are the children's home environments? Becausechanges in children's home environments are one possible mechanism by which JOBS
may affect children, Chapter 6 describes the homes of the children in terms of thecognitive stimulation and emotional support provided to the child. Data from a national-level survey are also examined to provide a comparison ofthe home environments of theDescriptive sample to those of other poor and non-poor children.
What were the child care experiences of children in the Descriptive sample prior totheir enrollment in JOBS? Are there changes in child care use that are related tomothers' participation in JOBS? Chapter 7 describes the children's child carehistories, examines changes in child care use after mothers' enrollment in JOBS, as well
as how quickly changes in child care arrangements come about. This chapter alsodocuments the type and quality of the care children are receiving at the time of the
Descriptive survey.
I 5

Does the mothers' psychological well-being, at the time of the Descriptive Survey,vary according to baseline characteristics? How ,..ioes children's well-being differaccording to baseline characteristics? Chapter 8 provides a summary of the findingsregarding variation in mother and child well-being according to their initialcharacteristics, in order to identify those subgroups of mothers and children who arelikely to experience differential impacts of the JOBS Program.
How do multiple risk factors combine to affect children's well-being? is thepresence of protective factors associated with child well-being? Are protectivefactors associated with child well-being when considered in association with riskfactors? Chapter 9 considers the implications of multiple risk factors for the well-beingof the children, and whether risk factors accumulate to undermine the development ofchildren. In addition, the association between protective factors and children'sdevelopment, as well as the relationship between risk and protective factors, areexamined.
What have we learned? Chapter 10 summarizes the major themes of this report,including both the extent of disadvantage in the Descriptive sample and its substantialheterogeneity. The implications of these findings for participation in, and impacts of, theJOBS Program are discussed.
1 6
Di

CHAPTER 2THE COMMUNITY CONTEXT
Background
The Descriptive survey was conducted with a sample of 790 mothers with young children
living in Fulton County, Georgia. In this chapter we present information on the demographiccharacteristics of Fulton County to provide a broader view of the context of the current study.
Then, we provide a description of the overall Fulton County JOBS sample, as well as of JOBSenrollees with preschool-aged children from all seven sites. Finally, we describe the
neighborhoods in which mothers in the Descriptive sample live. Comparisons of Fulton County
to the United States as a whole are derived from tabulations of the 1990 U.S. Census, unless
otherwise noted.
Key Questions for Chapter 2
What is the community context of Fulton County, and how do the communitysetting and sample characteristics affect the conclusions that can be drawn from the
JOBS Evaluation?How do the Fulton County. JOBS Program, and the clientele it serves, differ fromother sites in the JOBS Evaluation? How do mothers with young children in theJOBS Evaluation differ from other JOBS-mandatory individuals?What are the characteristics of the neighborhoods in which the respondents to theDescriptive survey live?
Demographic Profile of Fulton County
Fulton County, GA is the most populous county in the Atlanta metropolitan areaand includes a variety of socioeconomic groups.
Fulton County includes most of the city of Atlanta, as well as suburban and rural areas
(see Figure 2.1). In 1990, 648,951 persons lived in Fulton County, including 27,860 children
ages three to five (the age of the children in the Descriptive sample). The population of Fulton
County is fairly evenly divided between African Americans (50 percent) and whites (48 percent).
Only 2 percent of the Fulton County population is of Hispanic origin.
The median household income in Fulton County in 1990 was approximately $30,000.
The distribution of income is broad, with 15 percent of the households in Fulton County earning
$75,000 per year or more, and 18 percent reporting household income below the poverty line.
Further, there are marked racial disparities in income. Among whites, the median income falls
between S35,000 and 549,999. while for African Americans the median income falls between
$15,000 and $24,999.
17

FIGURE 2.1FULTON COUNTY AND ATLANTA, GA
,
misimmasimmum
535 &gout sesles6411.151 pen...257.112 household.
77 7-7s Coury
A tlea%
- --G Er0
Reflecting Fulton County's urban character, the industries employing the most people inFulton County are professional and related services (such as health and education); retail trade;and finance, insurance, and real estate. The greatest number of jobs in 1993 (more than 25percent of the total) were in services, which is the fastest growing sector of employment.Although the growth in Atlanta's economy has slowed somewhat in recent years (ResearchAtlanta, 1990), the 1993 unemployment rate in Fulton County was slightly lower than the overallU.S. rate (6.2 percent and 6.8 percent. respectively) (Hamilton and Brock, 1994; U.S. Bureau ofthe Census, 1994).
Growth in Fulton County has proceeded at a slower rate thanmetropolitan area.
The Fulton County population grew only 17 percent from 1982 toto grow by 6 percent from 1991 to 1996 (Atlanta Chamber of Commerce,of the Atlanta metropolitan area as a whole grew 36 percent from 1982 tothere were more new housing units authorized in the Atlanta area in 1992in the U.S.
in the greater Atlanta
1992, and is expected1994). The population1992. In addition,than in any other city

Compared to both the United States as a whole and U.S. metropolitan areas, FultonCounty has higher rates of overall poverty, child poverty, and mother-headedhouseholds (see Figure 2.2; U.S. Bureau of the Census, I992a, I992b).
FIGURE 2.2
RATES OF OVERALL POVERTY, CHILD POVERTY, ANDMOTHER-HEADED HOUSEHOLDS IN FULTON COUNTY
COMPARED TO THE U.S. AS A WHOLE AND U.S.METROPOLITAN AREAS
:00%
10%
60%
40%
II%10% .11%
0%
11%
10%14% 7.14
35%
Persona Ch1141rwa CILLIdnan 6,5 I.
in Peva ry 0-5 in Poverty ockyr-144/414.1 You sohcrial
. _1/ 5_ OM US M //won. lam. A rano lan1to Cowary. C/A
Overall racial differences in income are also apparent for children in Fulton County: of
the children five and under living below the poverty line, 90 percent are African American, and
only 7 percent are white. The relative disadvantage of Fulton County as a context for the JOBSProgram will be important to keep in mind as ciata on the impacts ofJOBS in different sites
become available.
The AFDC caseload in Fulton County grew from 18,507 in 1991 to 23,113 in 1993.
In 1993, the AFDC urant level for a family of three in Fulton County was $280 per
month, which is lower than any other site in the JOBS Evaluation, and is far lower than the
median state benefit level of $366 (U.S. House ofRepresentatives, 1994). To some extent, this
low AFDC grant is offset by higher food stamp payments (the food stamp benefit for a family of
three in 1993 was $292), but Atlanta still has the overall lowest ranking on benefit levels
(combining AFDC and food stamps) among the JOBS Evaluation sites.' Because lower grant
levels may mean that even low-paying jobs are attractive to AFDC recipients, and because such
jobs may result in termination from AFDC, the low benefit level may have importantimplications for later impacts of the JOBS Program in Atlanta (Hamilton and Brock, 1994).
In the other six JOBS Evaluation sites. 1993 AFDC cram levels for a family of three ranged from $324 to $624. 1493
food stamp benefit levels for a family ot three ranged from $202 to $292.
19
BEST COPY AVAILABLE

Approximately 33,000 people live in public housing in Atlanta, in 48 separate housingcrmnunities. The Housing Authority of the City of Atlanta reports that approximately 38percent of these public housing tenants name AFDC as their primary source of income (they mayreceive income from other sources as well).
Georgia's JOBS Program is called PEACH (Positive Employment and CommunityHelp).
Fulton County was selected for the JOBS Evaluation because it represented a southern,urban site with a welfare population that is relatively disadvantaged compared to other sites(Hamilton and Brock, 1994). Fulton County operated a small, mainly voluntary JOBS Programcalled PEACH prior to the JOBS Evaluation, with a strong employment focus. The selection ofFulton County as a site for the JOBS Evaluation necessitated the transition to a larger, mandatoryprogram that included both education and employment services. In 1993, the PEACH programin Fulton County enrolled 3,919 persons in JOBS activities (Hamilton & Brock, 1994).
The JOBS Evaluation in Fulton County is designed to measure the effectiveness of twoalternative approaches to welfare-to-work programs: a human capital development approach,which emphasizes education and training activities, and a labor force attachment approach,which emphasizes quick entry into the job market through "job club" or other job searchstrategies. JOBS-mandatory AFDC applicants or recipients in Fulton County are randomlyassigned to one of these two program groups, or to a control group, which is not required toparticipate in any JOBS activities.' Job search services for the labor force attachment group areprovided by the PEACH staff, whereas the public schools provide most of the educationalservices for the human (:apital development group. This design allows for the directcomparisonof more traditional, labor-market oriented approaches (the labor force attachment group) tolonger-term approaches to increasing self-sufficiency (the human capital development group). Italso allows a comparison of the different ways that these two approaches may affect child well-being. (See Hamilton and Brock (1994) for descriptions of research designs in other sites.)
In Fultpn County, random assignment of AFDC applicants and recipients into the JOBSEvaluation occurred from January 1992 through January 1994. The sample for the DescriptiveStudy all participated in the random assignment process between March 1992 and June 1993.This sample of 790 tirth mothers of children ages three to five includes 369 assigned to thehuman capital development group, 238 assigned to the labor force attachment group, and 183
" Job club is a class conductcd by JOBS Program staff that encourages quick entrv into the labor force by teaching job searchand interviewing skills.
12 Respondents in thc control group are not eligible for JOBS services through PEACH, but are eligible for all otheremployment and training services in thc community.
20

assigned to the control group.' Like several other JOBS Evaluation sites, Fulton County
excluded mothers who are currently teenagers from random assignment, although mothers who
gave birth as teens but are now older mothers were randomly assigned."
Compared to other sites in the JOBS Evaluation, the overall Fulton County JOBSsample (including those in the Descriptive sample and others) is on average older,has received welfare longer, and is more likely to live in public housing, and to haveresided as a child in a household that received AFDC (Hamilton and Brock, 1994).
The average age of respondents in the total Fulton County JOBS sample is 32.7 years, the
oldest of any site in the JOBS Evaluation. Thirty-six percent of the total Fulton County sample
lives in public housing. This is more than twice the proportion of any other JOBS Evaluation
site, and is far higher than the 10 percent of AFDC recipients in the U.S. as a whole who live in
public housing (U.S. House of Representatives. 1994). Forty-six percent of the Fulton County
samr le has received AFDC for at least five years during their adult life (not necessarily five
continuous years). and 18 percent lived as a child in a household that received AFDC for five
years or more (Hamilton and Brock. 1994). Both these proportions are the third highest of any
site in the JOBS Evaluation. More detailed information about the total Fulton County sample is
presented in Chapter 3.
Approximately 40 percent of the total Fulton County JOBS sample had a child agedthree to five at the time of random assignment. This group constitutes the eligiblesample for the Child Outcomes Study.
Because rr.others of preschool-aged children have never before been required to
participate in welfare-to-work proarams, it is useful to consider whether they differ in their
characteristics or attitudes from JOBS enrollees with older, school-age children. Hamilton and
Brock (1994) provide a contrast of mothers with children aged three to five, and mothers with
only older children, using data from all of the sites in the JOBS Evaluation.
'Sample sizes in the three research groups are unequal for a varier. of reasons. More human capital development group
members than labor force attachment group members were included in the sample because of the dearth of knowledge about the
effects of educationally-oriented programs on children's well-being. At the beginning of the Child Outcomes Study, funding was
only available to sample members of the human capital development group and labor force attachment groups; government
funds were not available to interview members of the control eroup. llowever. private funding later became available to sample
some children in the control group who were aees three to four .-Ns a result of the delay in sampling respondents in the control
group. there is a statistically signiaant group difference ( 12.787] - 14 72, 2 = 000) in the average length of time between
random assignment and the Descriptive surv ey (human capital development group = 2.98 months: labor force attachment group
2 th months. Lontrol 3 -I)) months)
"Analyses %kere conducted in order to determine whether respondents in the two program groups and the control group
differed at the time of random assignment on selected subgroup cnaraetertstics including reading and math literacy test scores.
educational attainment, number of moves in the past tv.o years. number of children in the household, measures of maternal
psychological kell-heing. barriers toward employ ment. welfare history. housing status and employment status. Respondents in
the three groups were not hignilicantl dif ferent on any (il these characteristics.
21

Across all seven sites in the JOBS Evaluation, JOBS enrollees with preschool-agedchildren are younger, less likely to have worked full-time for six months or more for the sameemployer, less likely to have ever married, more likely to have grown up in households in whichAFDC was received, and are more likely to be in a JOBS "target" group (e.g., under age 24 withno high school diploma or GED) compared to JOBS enrollees with older children. On the morepositive side, JOBS enrollees with young children have higher average reading and math literacyscores. Their attitudes toward leaving welfare and Obtaining work are also different from JOBSenrollees with school-aged children: they are more likely to report the cost of child care as abarrier to their JOBS participation, and are more likely than mothers with older children to preferpart-time jobs (although the majority of both groups still prefer full-time jobs). Mothers withyoung children are more likely to feel that welfare provides for their families better than theycould by working, and they are more pessimistic about finding jobs that will make them self-sufficient (Hamilton and Brock, 1994, Appendix Tables D.2 and D.3).
Neighborhoods of the Descriptive Sample
Respondents to the Descriptive survey, all of whom are mothers with youngchildren, generally reside in disadvantaged neighborhoods.
About two-thirds of the mothers reported at the time of their random assignment that theylived in public (39 percent) or subsidized (29 percent) housing.' About half of the sample (55percent) reported that "very few" of the other mothers in their neighborhoods work regularly atpaid jobs (see Figure 2.3).
Sma e11%
Host11%
FIGURE 2.3
NEIGHBORHOOD CHARACTERISTICS
Xlmott AllI I%
very I.55%
How many of the mothers you know in yourneighborhood o.ork regularly at paid jobs?
Excellent10% Very Good
I I%
Oood1954
As a place to raise children, would you sayyour ncigborhood is:
A public housing project is operated by the local goernmcnt to provide housing for low-income people. Receiving a rentsubsidy, participating in a housing program like Section 8. or liv ing in a building renovated by the government is not defined asliving in a public housing project.

When asked to rate their neighborhoods, four in ten mothers described theirneighborhoods as a "not too good" or an "awful" place to raise children. At the same time, about
two in ten mothers described their neighborhoods as an "excellent" or a "very good" place to
raise children (see Figure 2.3). Twenty-five percent of the mothers had lived in the same home
since the birth of their three- to five-year-old child. Among those who had moved, it was most
typical to have moved only once, although a few mothers reported moving five or more times in
this interval.
Almost all Descriptive Study surveys were conducted in the respondent's own home.
Interviewers who conducted the surveys were asked to describe characteristics of
the respondents' neighborhoods. More than half of the sample lived in apartment houses and on
residential streets. When asked to rate the exterior of both the respondent's home and other
homes in the neighborhood on a scale from "very poorly kept" (0) to "very well kept" (10),
interviewers generally described the structures as well kept (the average for both the respondents'
and neighbors' homes was 7 on the 0 to 10 scale). Similarly, when asked to rate the condition of
the interior of the residence on a scale from "very poor, major structual damage" (0) to "very
well kept up and in good repair" (10), the average rating was 8, indicating homes in good
condition. Respondents who lived in public housing received significantly poorer ratings than
those who lived in non-public housing on both the exterior and interior of their homes?'
Summary
The description to follow of mothers with young children must be viewed against the
backdrop of Fulton County as a relatively disadvantaged site for a JOBS Program. Fulton
County has higher concentrations of poverty and mother-headed households than the U.S. as a
whole, or than U.S. metropolitan areas, and the AFDC population in Fulton County is
particularly disadvantaged compared to that of other JOBS Evaluation sites. A substantial
minority of the respondents themselves report that their neighborhoods are not good places to
raise children. This context suggests that long-term impacts of the JOBS Program for mothers
and children will reflect not only the initial characteristics of the families and the mothers'
experiences in the program. but also the characteristics of the families' neighborhoods and larger
communities. We turn now to a description of the mothers and children in the Fulton Descriptive
sample.
menor t (768) = 12 28.12 <- 001). intertor t (746) = 8 82, 001).
23

CHAPTER 3THE MOTHERS
Background
One basic premise of the Family Support Act (FSA) of 1988 is that the well-being ofpoor children will be enhanced by increased parental education, job skills, and employment. Asdescribed in Chapter 1, the JOBS Program, while it may involve changes in children's child careexperiences, is not a direct interventign for children. If changes in children's cognitive and socialdevelopment occur, such changes may come about because of changes in the mother: hereducation, employability or actual employment, or her subjective well-being.
At this time, it is not known whether the types of changes that might occur in the lives ofthe mothers will affect the development of their children. In addition, it is not necessarilyexpected that changes in the lives of the mothers will be uniform. Some mothers may find theJOBS Program to be a much wanted route to economic independence, while others might regardthe JOBS mandate as stressful. It is also possible that participation in JOBS might be welcome,yet stressful at the same time. Mothers with considerable social support from friends andrelatives may have little difficulty satisfying JOBS participation requirements, while motherswith low skills, many children, and little work experience may find it more difficult to satisfy theJOBS mandate while being highly supportive of their preschool-aged children. Simiiarly,uniform effects are not anticipated for children. It is probable that multiple factors includingmaternal education and cognitive attainment, family economic status, maternal subjective well-being, and child care arrangements will operate simultaneously to influence children's cognitiveand social development, as well as their emotional and physical well-being. Consequently, it isimportant to describe, at the start of participation in JOBS-related activities, the preparedness ofwomen on AFDC to pursue JOBS activities and employment in terms of their education. laborforce experience, attitudes, and psychological well-being.
:.ey Questions for Chapter 3
How job-ready are these mothers in terms of fertility plans, education, reading andmath literacy, labor force experience, attitudes regarding work and welfare, andpsychological well-being?What stressors and barriers to JOBS participation do these women face?
In this chapter. \e provide a profile of the mothers who participated in the DescriptiveStudy: an account of respondents' current contraceptive use; educational backgrounds andreading and math literacy test scores; employment experience and attitudes toward employment;and maternal subjective well-being. First, the demoaraphic characteristics of our FultonDescriptive sample are described as backaround for subsequent analyses.
24

Findings
Profile of the Fulton County Descriptive Sample
Because mothers who were teenagers at the time of random assignment were excluded
from the sample, respondents in the Descriptive Sample are somewhat older. Most of the
respondents (65 percent) were between the ages of25 and 34 at the time of random assignment.
However, as shown in Table 3.1, the sample is younger than the total Fult:m County JOBS
sample from which it was drawn,' reflecting the fact that all mothers in the Descriptive sample
have at least one preschool-aged child. Whereas only 19 percent of the mothers in theDescriptive sample were ages 35 or older at random assignment, 35 percent of the total Fulton
County JOBS sample fell into that age group (Hamilton and Brock, 1994).
Although not currently teens, many of the respondents to the Descriptive surveywere teenagers at the time of their first birth. Forty percent of the sample were 19or younger at the birth of their oldest child living in the household.The mothers are almost entirely African American (96 percent) and non-immigrant(less than 2 percent of the sample was born outside of the United States).
On a national level, 44 percent of single women receiving AFDC in 1992 were African
American, 39 percent were white, and 16 percent were Hispanic. Amon2 all single mothers in
1992, 30 percent were African American, 59 percent were white, and 11 percent were Hispanic
(Fagnoni et al., 1994). Thus, this sample is disproportionately African American relative to the
national welfare population, and to the population of sin2le mothers.'8
Respondents in the Descriptive sample have a longer welfare history than the typical
AFDC recipient.
At the time the JOBS Program was being initiated in Fulton County, a very high rate of
referrals caused a six-month delay between the time that the income maintenance office referred
AFDC applicants or recipients to JOBS and the time they were actually called for JOBS
orientation. Consequently, some welfare recipients left the rolls before they got to JOBS, and
those women who ended up in the research sample are likely to be slightly more disadvantaged
than the sample would be if there had been no delay (Hamilton and Brock. 1994).
''The total Fulton County sample includes JOBS enrollees ..sith children of all ages. Sixt. percent of respondents had
oungest children v.ho v, ere six !, ears of age or older (11,111111ton and Brock. 1994)
'llowever, as noted in Chapter 2. 50 percent of the Fulton County population is African American and 90 percent of the
po% eft!. population %cith a child under at,e h are African American
S
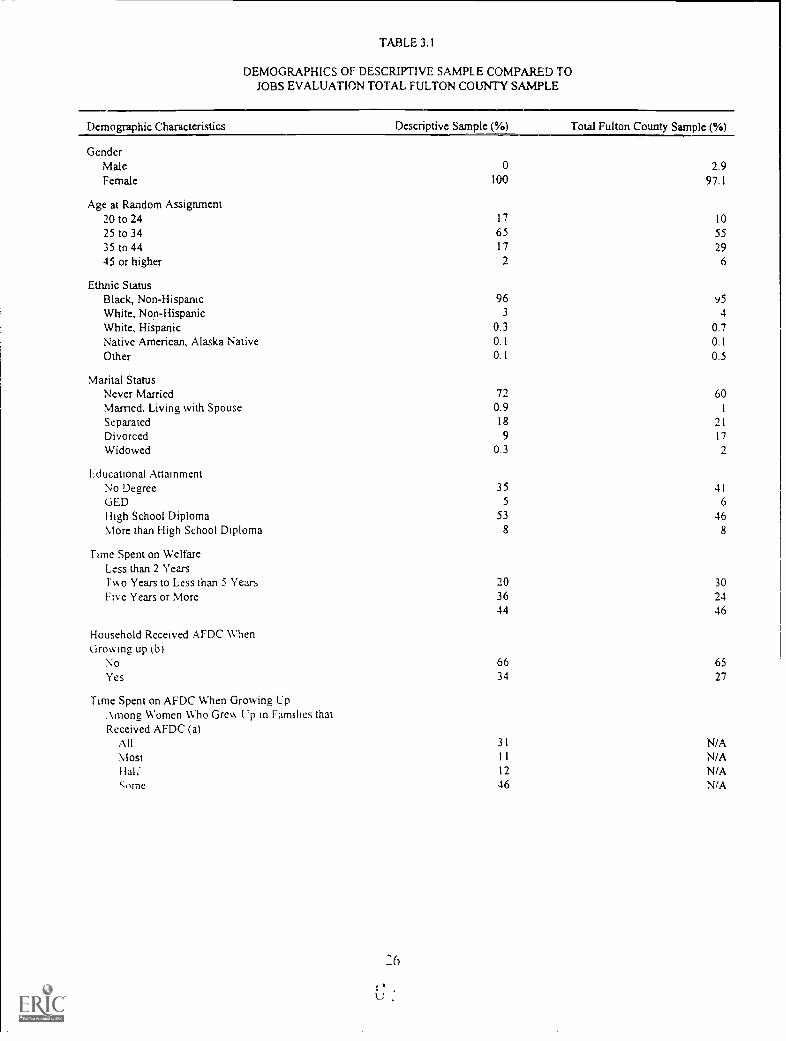
TABLE 3.1
DEMOGRAPHICS OF DESCRIPTIVE SAMPL E COMPARED TOJOBS EVALUATION TOTAL FULTON COUNTY SAMPLE
Demographic Characteristics Descriptive Sample (%) Total Fulton County Sample (%)
GenderMaleFemale
Age at Random Assignment20 to 2425 to 3435 to 4445 or higher
Ethnic StatusBlack, Non-HispanicWhite, Non-HispanicWhite, HispanicNative American, Alaska NativeOther
100
17
6517
2
2.997.1
10
55296
96 953 4
0.3 0.70.1 0.10.1 0.5
Marital StatusNever Married 72 60Married, Living with Spouse 0.9 1
Separated 18 21
Divorced 9 17
Widowed 0.3
Educational AttainmentNo Degree 35 41
GED 5 6
High School Diploma 53 46More than High School Diploma 8 8
Time Spent on WelfareLess than 2 Years1-Nco Years to Less than 5 Years 20 30Five Years or More 36 24
44 46
Household Received AFDC WhenGrowing up
No 66 65
Yes 34 27
Time Spent on AFDC When Growing UpAmong Women Who Gre%k Up in Families thatReceived AFDC (a)
All 31 N/AMost 11 N/AHal: 12 N/Ac:ome. 46 N/A

Demographic Characteristics Descriptive Sample (%) Total Fulton County Sample (%)
Household Income (a)Total Monthly Household Income (c)Less than 5400
27 N/A
$400 to $60038 N/A
$601 to $100030 N/A
$1000 or higher5 N/A
Per Capita Monthly Household Income (a)
Less than $100SlOOto$199
18 N/A
$200 to $39952 N/A
$400 and up28 N/A
3 N/A
Sample Size (Unweighted)790 6,374
SOURCE: Figures for the Descriptive sample are from Child Trends, Inc. calculations of Fulton County Descriptive Study
data.Figures for the total Fulton County Sample are from Hamilton and Brock (1994).
NOTES: (a) This information was collected only for the Descriptive sample throw the survey, and not for others in the total
Fulton C Ay Sample.(b) Eight percent of the total Fulton County Sample responded "Don't Know."
(c) Two people reported SO monthly household income. One person reported 540.000 monthly income and was
dropped from these percentages.
Unless otherwise mentioned. analyses of the Descriptive sample use weighted data.
Due to rounding, percentages may not add up to 100.
27

At the time of random assignment, 44 percent of the sample had received AFDCcumulatively for five years or more as adults, while 20 percent had received AFDC for less thantwo years. These percentages are comparable to the Fulton County sample as a whole (Table3.1). Additionally, 34 percent of the sample reported receiving AFDC as a child, and of these, 31percent reported spending "all" of their time arowing up on AFDC. As shown in Figure 3.1, asmaller proportion of intergenerational welfare recipients than first generation welfare recipientsreceived AFDC for less than two years on their own case.
100
90
g0
70
60
uaSO
SCU.1a. 40
30
20
1 0
FIGURE 3.1
YEARS ON AFDC AS AN ADULT ON OWN CASE BYINTERGENERATIONAL AFDC RECEIPT
80
Lama Vase 2 years
68
2 but lose sass 3 year.
Two Generation. (Received AFDC as a Child)IIIOne Generation (Did not receive AFDC a. Child)
5 or Mars Years
The average household size is small, and two-thirds of the mothers have just one ortwo children.
Data for the Descriptive sample reflect a national trend toward smaller families amongsingle mothers receiving AFDC. Data from the Current Population Survey (CPS) indicate that,the proportion of AFDC families with four or more children under the age of 18 declined from23 percent in 1976, to 13 percent in 1992 (Fagnoni et al.. 1994).
:seventy-two percent of households consist of the respondent and her child(ren) only(Figure 3.2). The total household size is small, with nearly three-quarters of the householdscomposed of four or fewer people. In addition. most mothers have few ctiildren. Sixty-fivepercent had only one or two birth children living in the household and only 13 percent had fouror more birth children (Figure 3.3).
28

Because family size is a predictor of long-term welfare dependency (Hutchens, 1981), we
examined the characteristics at baseline of women with larger families. Women with more
children in the Descriptive sample are less likely to have a high school education, have been on
welfare longer, are more likely to live in public housing than in non-public non-subsidized
housing, have lower reading and math literacy test scores, and are more likely to have an external
locus of control than those women with fewer children (see Appendix B, Table 3.1-1).
FIGURE 3.2
HOUSEHOLD COMPOSITION
(72%)
(21%)
Mathes am! Cadd(hra) O. MI Matas, ClsdI(nraL Iadrrea. tad Hasbaaa Mott., Chador, and Non st awes. sad Para.,Oat," 017
1:23 ell" Cliktraa. sad tarts. Husband th,Oaty -
FIGURE 3.3
NUMBER OF BIRTH CHILDREN IN THE HOUSEHOLD
Five or More4%
Four9%
One27%
Three22%
29
Two38%
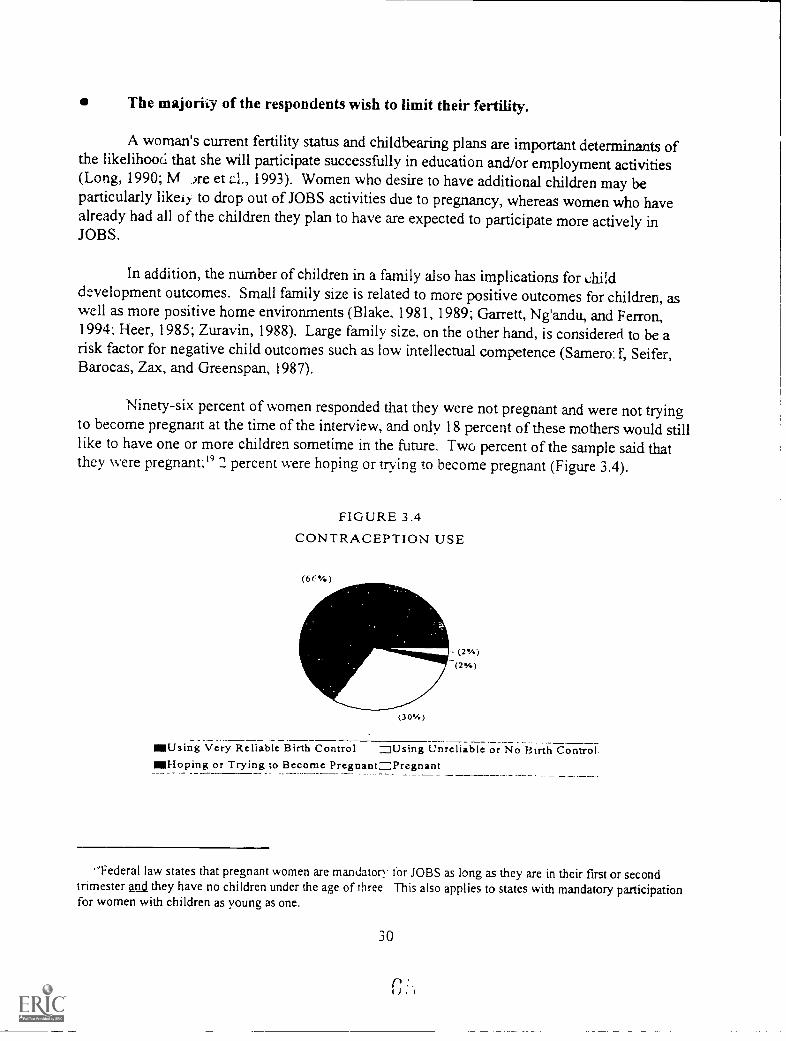
The majority of the respondents wish to limit their fertility.
A woman's current fertility status and childbearing plans are important determinants ofthe likelihood that she will participate successfully in education and/or employment activities(Long, 1990; IV )re et c.1., 1993). Women who desire to have additional children may beparticularly likeiy to drop out ofJOBS activities due to pregnancy, whereas women who havealready had all of the children they plan to have are expected to participate more actively inJOBS.
In addition, the number of children in a family also has implications for childdevelopment outcomes. Small family size is related to more positive outcomes for children, aswell as more positive home environments (Blake, 1981, 1989; Garrett, Ng'andu, and Ferron,1994; Heer, 1985; Zuravin, 1988). Large family size, on the other hand, is considered to be arisk factor for negative child outcomes such as low intellectual competence (Samero: f, Seifer,Barocas, Zax, and Greenspan, 1987).
Ninety-six percent of women responded that they were not pregnant and were not tryingto become pregnant at the time of the interview, and only 18 percent of these mothers would stilllike to have one or more children sometime in the future. Two percent of the sample said thatthey were pregnant;' 2 percent were hoping or trying to become pregnant (Figure 3.4).
FIGURE 3.4
CONTRACEPTION USE
(30%)
III1Using Very Reliable Birth Control =Using Unreliable or No Birth ControTHoping or Trying to Become Pregnant=Pregnant
'Federal law states that pregnant women are mandatory for JOBS as long as they are in their ftrst or secondtrimester and they have no children under the age of three This also applies to states with mandatory participationfor women with children as young as one.
30
t

As illustrated in Figure 3.4, 66 percent of the women reported that they were not trying to
become pregnant and were using a very reliable birth control method, such as the Pill, IUD,
Dego Provera, or sterilization. Similar to results reported by Furstenberg, Brooks-Gunn, and
Morgan (1987), among those women who reported that they were using a method of family
planning or birth control to keep from getting pregnant, 57 percent have had a tubal ligation. On
the other hand, 30 percent of the sample responded that they were not trying to become pregnant,
but were either using an unreliable method of birth control or were not using any birth control
(Figure 3.4); whether or not these women were sexually active is not known.
Education levels among these AFDC mothers are higher than often thought by thegeneral public, although still low compared to non-poor women.
A respondent's education level has implications for her employment success (U.S. Bureau
of the Census, 1991), as well as for outcomes for her children. For example, children who live in
homes with parents who do not have a high school diploma are more likely to drop out of school
themselves (Brizius and Foster, 1993). In addition, mate.aal involvement in adult education and
other programs can aid in the transfer of literacy skills to children (Sticht and McDonald, 1989;
Van Fossen and Sticht, 1991).
As shown in Table 3.1. two-thirds of the sample are high school graduates or have a
GED. This is a slightly higher proportion than reported in the total Fulton County JOBS sample
(60 percent). as well as in a nationally representative sample of AFDC mothers (57 percent; Zill
et al., 1991). Although educational levels in this sample are higher than might be expected, they
are still low when compared to those of non-poor women. Eighty-eight percent of non-poor
women with children under age 18 in 1988 had completed high school or higher levels of
education (Zill et al., 1991).
Attitudes toward schooling are strong predictors of educational attainment (Moore and
Stief, 1991), and are likely to be related to whether a woman obtains additional schooling
through participation in the JOBS Program. Most of the mothers reported positive feelings about
going to classes and doing schoolwork. Eighty-seven percent indicated that they had either
"loved" or "liked" going to classes and doing schoolwork the last time they were enrolled in
school. Nevertheless, at the time of random assignment. most respondents (83 percent) preferred
help looking for a job over going to school to study basic reading and math.
Mothers tended to have low scores on selected standardized tests; however, there is
considerable variation.'
Welfare recipients tend to have average or below average reading and math skills
(Martinson and Friedlander. 1994; Zill et al., 1991). In fact, 31 percent of welfare recipients
'As noted in Chaptcr 1, respondents v.ho completed the Descriptive survey had significantly lower mean scores on reading
and mach literacy tests than those women v. ho were fielded for, hut did not complete, the Descriptive survey.
3 I

have been estimated to have basic cognitive skills below those of the minimum skill level ofwomen in the lowest occupation class, manual operatives (Zill et al., 1991). This represents alabor market disadvantage because literacy is strongly associated with employment opportunities(Cohen, Golonka, Maynard, Ooms, and Owen, 1994). Lower-skilled individuals are less likelyto participate in the labor force (Kirsch, Jungeblut, Jenkins, and Kolstad, 1993). Additionally,those marginally literate individuals who are in the labor force earn only one-third as much asthose in the top literacy skills group (Cohen et al., 1994).
Immediately before they were randomly assigned to the JOBS Program,respondents completed standardized reading and math literacy tests.
The document literacy scale of the Test of Applied Literacy skills (TALS), which wasdeveloped by the Educational Testing Service (ETS), was selected because it is a good measureof broad reading and math skills that are used in everyday life. The TALS requires readers tolocate and use information contained in materials such as tables, schedules, charts, graphs, maps,and forms (Kirsch et al., 1993).
The ETS divides literacy scores into five levels (see Appendix C). Scoring in Level 3, 4or 5 indicates an ability to integrate multiple pieces of information from one or more documents,or an ability to progress through complex tables or graphs which contain information that isirrelevant to the primary task. Scoring in Levels I or 2 on the TALS indicates difficulty inperforming tasks that require inteuation of information from various parts of a document. Forexample, a person scoring in Level 1 or 2 has difficulty using a map of a hospital campus (Kirschet al., 1993). As shown in Figure 3.5, 53 percent of the respondents scored in Level 1 or 2 on theTALS document literacy scale, indicating low levels of basic literacy.
FIGURE 3.5DOCUMENT LITERACY SCORES
Level 334%
Level 413% Level 5
0 4%
Level 113%
IMO
Level 240%
NOTE Level 5 is the highest level: Level 1 is the lowest level.

The Greater Avenues for Independence (GAIN) Appraisal math test used in the
California GAIN program is designed to assess a participant's ability to perform basic math
computation and to apply basic math skills in a functional or "life-skills" context. The
Comprehensive Adult Student Assessment System (CASAS) has divided scale scores into four
levels (see Appendix D) based on eight years of California educational achievement data for
approximately 200,000 students in Adult Basic Education and English as a Second Language
classes (Armstrong et al., 1989). Scoring in Level C or D indicates functioning at least at a
seventh to eighth grade level. At the minimum, individuals scoring in Level C or higher are able
to handle basic computational skills in a fimctional setting related to employment. People who
score in Levels A or B are determined to be in need of basic education (Armstrong et at, 1989).
Sixty-two percent of the Descriptive sample scored in Level A or B on the GAIN Appraisal math
test (Figure 3.6), indicating math skills below seventh grade levels.
FIGURE 3.6
GAIN APPRAISAL MATH TEST SCORES
Level AI I%
NOTE: Level D is the highest level; Level A is the lowest level.
Level B51%
For some respondents, high school completion was not an indicator of job readiness.
Data from several national studies have revealed that large numbers of persons who hold
high school degrees but acquired no further schooling, obtain scores on standardized tests that
indicate they function in the lowest literacy levels (Cohen et al., 1994). Data from the
Descriptive Study support this pattern.
As illustrated in Figure 3.7, among women with high school diplomas, 46 percent scored
in Levels 1 or 2 on the TALS. Fifty-seven percent of the women with high school diplomas
scored in Levels A or B on the GAIN Appraisal math test (Figure 3.8). However, it is possible
that having a high school diploma might be more important in acquiring a job than one's literacy
level, as measured on a test.
33

FIGURE 3.7
DOCUMENT LITERACY LEVELS BY HIGHEST LEVEL OFEDUCATION COMPLETED
60%
50%
40%
30%
20%
10%
0% 0% 0%
51%Level I
;InLevel 2=Level 3=Level 4=Level 5 43%
No Degree GED High S :hoot Diploma More than High School(270) (0-32) (o..407) Diploma (n..57)NOTE: Level I is the lowest level; Level 5 is the highest level.
70%
60%
50%
40%
10%
20%
10%
0%
FIGURE 3.8
GAIN APPRAISAL MATH TEST LEVELS BY HIGHESTLEVEL OF EDUCATION COMPLETED
I%
71.-evI A=Evsl 3 I
,111.11G=..vci
37%
No Owe. GED(2$11)
NOTP S ovel A U. loset level. Level tOt. tle blithest level
HIII3 Schaal Diplosa Mon. titan High 3olmelllambeet (.0.1n
Some women participated in training and employment-related activities during theyear preceding random assignment.
Fifteen percent of the sample were involved in some sort of educational or employmentprogram, such as GED preparation, vocational education and skills training, or job search, in the12 months prior to random assignment. The most common activity was vocational education andskills training.
At the time of random assignment. more than one out of 10 respondents in the samplewere currently involved in some type of educational or employment-related activity. Vocationaleducation and skills training was again the most frequently mentioned program. Between random
34
(;!

assignment and the time of the Descriptive Study, nearly three out of 10 women participated in
some type of school or job training program for a month or more.
Became the Descriptive survey was conducted an average of three months after randomassignment, we anticipated that there might be very early effects of the JOBS Program on
participation. Indeed, respondents in both the human capital development group (38 percent) and
labor force attachment (29 percent) groups were significantly more likely' than women in the
control group (4 percent) to have participated in educational or job training programs since their
random assignment dates (RAD), even after controlling for focal child age at RAD and focal
child gender.'
The majority of respondents had some experience in the labor force, althoughemployment rates were lower following the birth of the focal child.
The va.A majority of respondents have worked for pay at some point in their lives.
Including all types of paid jobs on a regular or irregular basis, 83 percent of the sample reportedhaving some experience working for pay, and 64 percent had worked full time for six months or
more for one employer. Only 59 percent, however, reported working outside of the home for one
month or more since the birth of the focal child. A spell of employment may include more than
one job, with, for example, a second job beginning immediately upon the end of the first. The
average lenth of such spells of employment since the birth of the focal child was 13 months.
Of the respondents who have worked outside the home since their child was born, 66
percent reported working full time during any of these months, with the average length-of full
time spells of employment reported at 15 months. Paid work inside the home was much less
common. with only 8 percent of respondents reporting paid work in their homes for one month or
more.
Mothers who never worked full time between the birth of their child and their random
assignment date (RAD) are different than women who had worked full time during this time
period. Respondents who had never worked between the birth of their child and RAD were less
likely to have a high school diploma or GED, had more children, had been on welfare longer, and
were more likely to live in public or subsidized housing than those women who had worked full
time at some point in their child's life before RAD. In addition, respondents who had not worked
full time tended to have lower reading and math literacy test scores, had a more external locus of
-' I ogistic regression:s. < 000 for human capital de,.elopment and labor force attachment group mothers.
'Because onl 3- to 4-year-old children v.ere included in the control group for thc Descriptive Study, the analyses in this
paragraph were conducted on a subsamplc of respondents with 3- to 4-year-old children from all three research groups, who
u,ere randomlv asigned to the JOBS 1,%aluation after the funding became available for sampling members of the control group,
using a sample size of 509
35

control, and perceived higher barriers to employment than mothers who had been in the workforce full time before random assignment (see Appendix B, Table 3.1-2).
Seventeen percent of respondents reported current employment, typically worldngin low-wage, low-benefit, part-time jobs.
This level of employment is higher than found in other samples, where only 6 percent ofwomen receiving AFDC benefits have been reported to work (U.S. House of Representatives,1994). The Descriptive Study figures are more consistent with findings from an earlier timeperiod during which AFDC work incentives were greater (Moffitt, 1992). However, it ispossible that some of the mothers who reported current employment were no longer receivingAFDC benefits at that time. Analyses were conducted on a subsample of respondents with 3- to4-year-old children, selecting families in the labor force attachment and human capitaldevelopment groups who entered the Descriptive sample in the same time period as families inthe control group (see previous footnote) in order to determine whether the higher level ofemployment reflects an early response to the program mandate. After controlling for focal childage at random assignment and focal child gender, women in the labor force attachment group (23percent) were significantly more likely than either those in the human capital development group(16 percent) or the control group (11 percent) to be employed at the time of the Descriptiveinterview."
Respondents who were currently employed reported a median job tenure of three months,working an average of 28 hours per week with an average pre-tax wage estimated to be $5.50 perhour.24 The data suggest that the currently employed program participants are working-at low-wage jobs, many on a part-time basis, with few fringe benefits. For example, only 15 percentreported having a health plan and just 19 percent received paid sick days. Low-wage, low-benefit part-time work is not uncommon in the sectors in which sample members' employment isconcentrated: technical, sales, and administration, and the service sector (Figure 3.9). Theconcentration of program participants in these sectors is consistent with other research (e.g., Zillet al., 1991) regarding employment patterns of AFDC recipients. Respondents who are notcurrently working reported an average period of 30 months since last working for pay.
Logistic regression: 2 = .002 for the labor force attachment group.
"Several assumptions were made in order to calculate this hourl, wage. It was assumed that the respondentworked five daysper week in ordcr to compute an hourly wage, Second, only people who reported earnings as gross income were included.Third, people who did not prkw yie a specific amount in response to thc earnmgs i,iestion were not included in the calculation ofhourly wages. As a resuit of these assumptions, the sample size was much smaller (n=114).
36

FIGURE 3.9
OCCUPATIONAL CATEGORIES FOR THOSECURRENTLY WORKING
Service51%
Farming, Forestry, and Fishing
Technical, Sales, and Administrative Support36%
Precision Production, craft, andRepair, 0.11%
Managerial and Professional2%
Operators, Fabricators, and Laborers10%
NOTES: Occupational Categories are from: U.S. Department of Commerce (1990). 1990 Censusof population occupational classification system. Washington, DC: Bureau of the Census.
Most of the respondents expressed positive attitudes toward employment at the time
of the Descriptive survey.
Studies in the child development literature have found that negative effects of maternal
employment on children are more likely when the mother has negative attitudes about
employment than when she has neutral or positive feelings (Zaslow r!t al., 1991). Also, in one
welfare-to-work study, negative attitudes toward work were found to predict less favorable
supervisor ratings when employment was secured (Johnson, Messe, and Crano, 1984). Thus,
attitudes toward employment might help to explain variation in job success among women
enrolled in JOBS, as well as child adjustment.
Women were asked to respond to a series of questions regarding their attitudes toward
employment and welfare. Using an 11-point scale ranging from 0 (not at all true) to 10
(completely true), respondents were asked to indicate how true each statement was for them. A
"5" is the midpoint of the scale. In general. women in this AFDC sample held moderately to
strongly positive attitudes about employment (above 5 on the 0-10 scale; Figure 3.10).
37

FIGURE 3.10ATTITUDES TOWARD EMPLOYMENT AND WELFARE AT
THE TIME OF THE DESCRIPTIVE STUDY SURVEY
Completely trueSomewhat true
Neither true or untrue 7%Somewhat untrue II%
Net el al eve
CompWialy trueSomewhat true 17%
Neither true or untrue 13%Somewhat untrue
Not at st true 33%
10% 20% 30% 40% 50%
31%
0% 20% 30% 40% 50% 60%
Having a job makes life Interesting
10%
27%
Completely trueSomewhat true
Nether true or untrueSomewhat untrue
Not et all true
The money I make at a Job isn't worth the hassle
GO%
0% 10% 20% 30% 40% 50%
To me. work is nothing more than making a living
Completely true 34%Somewhat true 23%
Neither true or untrue 13%Somewhat untrue 20%
Not at al 1/1JO 10%
60%
0% 10% 20% 30% 40% 50%
Even a low-paying )0b is bettor than being on welfare
Completely tnre 31%Somewhat true 23%
Norther true or untive 13%Somewhat untrue 20%
Not at all true 14%
Compistaly trueSomewhat true
Norther true or untrueSomewhat untrue
Not at all tru
Completely trueSomewhat true
Norther true Of WAIL,
Somewhat untrueNot at el true
60%
0% 10% 20% 30% 40% 50% 60%
Ins wrong to slay on wears rf you cart gat a Job, even a foo you don't 13te
6%11%
6%
53%
0% 10% 20% 30% 40% 50% 60%
It's unfak to make people On wetter* get a Job W they don't want to
13%7%
24%50%
0% 10% 20% 30% 40% 50% 00%
,1 I got a lob, I could find someone that I trust to take C/I1 of my chddren
.4I
3 8

As illustrated in Figure 3.10, one out of two women responded that it was "completely
true" that having a job makes life interesting. Only one in ten women responded that it was
"completely true" that the money that they make at a job is not worth the hassle. Four in ten
women responded that the statement "To me, work is nothing more than making a living" was
"somewhat untrue" or "not at all true," indicating that many respondents believe there Li some
intrinsic value to employment. On the other hand, 22 percent agreed completely that work is
nothing more than making a living.
More than one-third of the mothers thought that it was "completely true" that it would be
better to have a low paying job than to be on welfare. Additionally, about one-third of the
mothers responded "completely true" to the statement "It's v. rig to stay on welfare if yor, can
get a job, even a job you don't like." Only 6 percent of motE:s felt that it was "completely true"
that it is unfair to make people on welfare get a job if they do not want to work.'
Most of the respondents did not see barriers to locating child ire while employed.
As depicted in Figure 3.10, nearly three out of four women responded that the statement
"If I got a job, I could fmd someone I trust to take care of my children," was "completely true" or
"somewhat true," suggesting that they did not perceive strong child care barriers toward
employment.
Women who believe that mothers should not be employed are different from those
who do not object to mothers working.
A five-item scale indicating attitudes toward maternal employment was formed from data
collected in the interview. The scale has a Cronbach coefficient alpha (a measure of internal
consistency) of .73 (see Appendix E). Hi2her scores indicate a stronger belief that mothers
should not work and should stay at home with their children. The average score on this scale
was 2.78 out of 10 (SD=2.14), indicating a high level of acceptance of maternal employment
among mothers in the sample.
Nevertheless, there are subgroups of women who are less likely to believe that mothers
should be employed. Women with a stronger belief that mothers should not work outside the
home are significantly more likely to have lower levels of education and literacy; to reside in
public housing; to be on welfare longer; and have more negative psychological well-bting
(higher levels of depressive symptoms, perceive more barriers to working, more external locus of
control, and less social support) (see Appendix B. Table 3.1-3).
Fhe same tv.o questioas v,ere asked shortly before riuidom assignment ming a different response scale. Nevertheless,
respondents attitudes at baseline were positively correlated with the same attitudes at the Descriptive survey.
39

Maternal Well-being
A large proportion of mothers who receive AFDC report high levels of d -pressivesymptoms.
Depression is defined as a negative mood state so extreme that it interferes with dailyfunctioning and productive activity. In general, the highest rates of depression are found amongpersons with low incomes, women, persons with young children, young adults, unmarriedpeople, the poorly educated, and the unemployed (Eatk,:s and Kessler, 1981; Hall, Gurley, Sachs,and Kryscio, 1991; Hall, Williams, and Greenberg, 1985; Merman and Weissman., 1989; Orr,James, Burns, and Thompson, 1989). Consequently, single mothers on AFDC with youngchildren are at especially high risk for developing depressive symptoms. In samples of low-income women with young children, depression rates have been found to range from 48 to 60percent (Hall et al., 1981, 1991; Quint et al., 1994).
In the Washington State Family Income Study (Weeks et al., 1990), the pul_slic assistancesample was found to have a greater percentage of mothers who reported high levels of dei;ressionthan control groups. Longer duration on welfare was associated with more depression.However, women in the Washington State Family Income Study who were enrolled in a schoolor training program, and those with jobs, were less likely to be depressed (Weeks et al., 1990).Other studies have also found that employed women tend to have better psychological health(Kraus and Markides, 1985; Ross, Mirowsky and Goldstein, 1990).
In addition to the negative ramifications of depression for mothers themselves, 'a-varietyof child development studies have found that children of depressed parents display Ifioher levelsof both externalizing and internalizing behavior problems. often have deficits in social andacademic competence, and are in poorer physical health than children ofnon-depressed parents(Downey and Coyne, 1990). Thus, if any changes occur in mothers' depression as a result ofJOBS panicipation, this may have implications for the development of their children.
The 20-item Center for Epidemiological Studies Depression Scale (CES-D) was includedin the Descriptive survey to measure mothers' depression.' The CES-D measures levels ofdepressive symptomatology ir ti-e general population (Devins and Orme, 1985) and has beenfound to distinguish between ically depressed patients and others. A CES-D score greaterthan 15 out of 60 indicates high level of depressive symptoms, and only 20 percent of people incommunity samples score in this range (Comstock and Helsing, 1976). CES-D scores greaterthan 15 can be further divided into mild (16-20.5), moderate (21-30.5), and severe (31 or higher)levels of depressive symptomatology (Devins and Orme, 1985).
'A four-item version of the CES-D used at baseline was significantl and positi%ely associated with the 20-item version usedin the Descriptive survey. Cronbach coefficient alphas (measures of internal consistency) were similar for the baseline andDescriptive survey ,,ersions of the scales
40
;

Forty-two percent of the entire Descriptive sample were assessed to have a high level
of depressive symptoms. Breaking this group down further, 15 percent had mild
depressive symptoms, 20 percent had moderate depressive symptoms, and 7 percent
had severe depressive symptoms.
Women with CES-D scores greater than 15 out of 60 had been on weifare longer, and had
lower literacy and math test scores, a more external locus of control, higher levels of family-
related barriers toward work, and lower levels of social support than those women who scored
below 16 on the CES-D (see Appendix B, Table 3.1-4). Moreover, despite the high percentage
of the sample who had high levels of depressive symptomatology, only 3 percent of women had
received professional treatment for a personal, emotional, behavioral, or mental problem in the
past 12 months. Only 8 percent felt or had someone suggest that they needed professional help
for any personal problem.
Mothers with a more internal locus of control are advantaged relative to those
mothers with a more external locus of control.
People with an external locus of control are more likely to feel at the mercy of
circumstances and environmental events, whereas those with an internal locus of control are
more likely to feel efficacious and in control of their own destinies. In general, an internal locus
of control is more conducive to educational and occupational success than an external locus of
control (Hill et al.. 1985). If women gain feelings of personal control through participation in
JOBS, education and/or employment, they may be better off in many ways. Locus of control
might also help to explain variation in maternal participation and job success among JOBS
eligibles.
In addition, a greater sense of efficacy and control may lead to beneficial consequences
for the children, perhaps due to a woman's increased sense of confidence and control in the
parenting role. For example. Stevens (1988) found that for low-income, African American
mothers of young children, a more internal locus of control was the only significant predictor of
whether mothers provided stimulating environments for their children.
Locus of control was measured in the Descriptive survey using a seven-item scale
developed by Pearlin. Menachan, Liebermann. and Mullan (1981).' Using this scale, the State
of Washington Family Income Study found a significantly greater prevalence of low personal
control among a public assistance sample than among comparison groups (Weeks et a., 1990).
Employment and enrollment in school or vocational training programs were linked to feelings of
mater personal control.
three-item .ersion of the locus 01 control (master. scaie used at baseline vv as significantly and positively associated with
the seven-item version used in the Descriptive survey. cioubach coefficient alphas (measures of internal consistency) were
similar for the baseline and Descriptive survey versions of' the st.ales
4 1

Mothers in the Descriptive Study who reported a more internal locus of control weresignificantly more likely to have a high school degree or GED, had fewer children, had.been onwelfare for a shorter period of time, were less likely to live in public housing, had higher readingand math literacy test scores, and had better psychological well-being (e.g., had lower levels ofdepressive symptoms, had lower family barriers to employment, and higher social support levels)than those women with a more external locus of control (see Appendix B, Table 3.1-5).
Many women have experienced multiple difficult life circumstances.
Within the low income population, the degree of environmental stress variessubstantially. Some welfare mothers may reside with relatives in a middle-class neighborhoodwith low crime rates. Others may live in rental housing in disorganized urban settings rife withproblems. In addition to neighborhood problems and disorganization, personal lifecircumstances are likely to vary among families as well.
Among low-income women, maternal stress due to negative life circumstances is relatedto higher depressive symptoms (Hall et al.. 1985), as well as poorer caregiving behavior (Piantaand Egeland, 1990). Further, maternal stress is associated with socioemotional, behavioral, andcognitive difficulties in children (Pianta, Egeland, and Sroufe, 1990). In sum, it is possible thatfamilies under strain from multiple difficulties are less likely to be successful participants inJOBS and less successful parents as well.
A 13-item scale, adapted from the Difficult Life Circumstances scale (Barnard, 1988),'was used to measure the hassles and problems of daily life among mothers in the Descriptivesample. Difficult life circumstances included problems such as having the electricity or phonecut off, having problems with neighbors. or having a lot of arguments with a partner, boyfriend,or husband. In the 12 months prior to the Descriptive survey, AFDC mothers experienced, onaverage, three out of the 13 difficult life circumstances enumerated. Only 11 percent of thesample had not experienced any difficult life circumstances. The three most frequentlyexperienced events reflected extremely difficult life circumstances (FiRure 3.11). Theseincluded: having a relative or close friend in jail, having a relative or close friend die or bekilled, and having trouble findinu a good place to live. Smaller proportions of women haddifficulty paying bills, and experienced interpersonal problems with neighbors and partners. Inaddition. women who reported more difficult life circumstances had higher literacy test scoresand higher levels of depressive symptoms at baseline than those women who experienced fewerdifficult life circumstances (see Appendix B. Table 3.1-6).
`'le!.eral items from the original scale were not included for two reasons I }the!, were ot a highly sensitive nature; and (2)they showed no N.anabilit) in a pretest with low-income mothers
42

FIGURE 3.11
DIFFICULT LIFE CIRCUMSTANCES EXPERIENCED IN THE PAST YEAR
Rspondent or children been robbed.mugged. or attacked.
Res pondnt was abused.
Had trouble finding place to liv.
Been hassled by bill collectors.
Had electricity or phone cut oft.
Had relative or close friend In Ai.
Had people trying in hom thI respondntwrshed weren't there.
Had neighbors giving problems.
9%
14%
in 33%26 %
37%
18%
23%
40 %
Someone close died or was killed last 39%year.
Lived in a household when someone hasproblems wrth substancec
Someone clos to respondenthas problem with substancos.
12 %
Had ergumnts with partner. boyfriend 23 %or husband.
Had problems wth former boyfnends or 28 %former husband.
33 %
In general, AFDC mothers did not report feeling extremely weary from parenting.
Only 11 percent of the sample reported that they felt worn out from raising a family
"most'' or "all of the time," through 59 percent said that they "always" or "sometimes" felt
rushed. Eighty-seven percent of the women responded "never" or "now and then" to the question
"Do you have time on your hands that you don't know what do with?" This indicates that
although most of these mothers are not unduly stressed due to family responsibilities, they do not
feel that they have much idle time either.
Most respondents do not have personal health-related barriers to employment.
Maternal and child health problems are reasons for exemption from the JOBS mandate;
thus, women with serious health problems. as well as those caring for children with health
problems. are not included in the JOBS Evaluation. Nevertheless, we anticipate that there will be
mothers who have health Hrairments that are not sufficiently severe to result in their being
exempt from the mandate. but which they feel are sufficiently severe to make it difficult for them
to manage participation in JOBS in addition to childrearing.
Mothers in poor health and mothers with some kind of physical impairment are known to
have Ionizer welfare spells (Adler. 1988). JOBS education and work requirements are to be
highly problematic for mothers who have young children and who are in anything short of good
43
AST ""/ AVAILAR F

health. Consequently, women with even slight health impairments may be less likely to be activeparticipants. Health status of the mother is also known to be a significant predictor of childhealth and emotional well-being (Boyer, 1991; Center for the Future of Children, 1992; U.S.Congress, 1988).
Most mothers describe themselves as being in good but not excellent health. Eighty-fivepercent of the Descriptive sample reported that they did not have any health problems orimpairments that would keep them from working, or limit the kind or amount of work they cando.29 However, only 24 percent of the mothers rated themselves in "excellent" health. Thispercentage is comparable to findings from the 1988 National Health Interview Survey whichindicated that 21 percent of AFDC mothers, compared to 38 percent of non-poor mothers, ratedthemselves in "excellent" health (Zill et al., 1991).
Self-reported substance use and abuse among mothers are infrequent.
Mothers with alcohol and drug problems represent a subgroup with a particularly poorprognosis for JOBS participation and for appropriate childrearing (Deren, 1986; Moore, Krysan,Nord, and Peterson, 1990; Newcomb and Bentler, 1989). Participation in activities such asschool or job training might be very difficult for mothers with substance use problems becauseuse of hard drugs is associated with a greater likelihood of having restricted activity days (Keeret al., 1994). Moreover, mothers with substance abuse problems may require treatment for theirproblem before they are able to participate in employment or educational programs.
Mothers who use drugs or alcohol are also creating risks for their children. In a recentsurvey of illicit drug use in adults, more than one-quarter of adults who used marijuana in thepast year said that they were high while at home caring for their families (Keer et al., 1994). Inaddition, parents with a history of substance use problems are more likely to have a child whodrinks or uses other drugs (Kandel. 1973; Reuter and Conger, 1994).
Fifty-eight percent of the mothers in the Descriptive sample reported using nsl substances,including alcohol, marijuana, cocaine or crack. and other street drugs, in the past 12 months. Ofthe 38 percent who reported using only one substance in the past 12 months, almost all wereusing alcohol. Five percent of women reported using more than one substance in the past 12months. Fourteen percent felt that they should stop or reduce their use of one or moresubstances. Only 10 percent of the sample reported that someone else told them to stop or reducetheir use of one or more substances. However, we note that there is typically a problem withunderreporting of substance use in self-report surveys such as the Descriptive survey (Menschand Kandel. 1988. )
--fv.enty -soul percent ()ilk total JOBS Evaluation Fulton County sample (v,ho arc generally older) "agreed" or "agreed alot" to either having ft health or emotional problem. or having a child or family member v.ith a health or emotional problem(Hamilton and Brock. 1994)
44

Summary
It is apparent that within the Fulton County Descriptive sample, there is a great deal of
heterogeneity with regard to preparedness to pursue JOBS activities and employment. Two-
thirds of the women are high school graduates or have a GED, suggesting that they are ready for
job training or further education or are prepared to take an entry level job. However, more than
half of the mothers had low levels of basic reading and math literacy. In addition, the majority of
the mothers have some experience in the labor force, although much of that experience is in low-
paying, low-benefit jobs.
Although there were variations in ratings, most of the respondents expressed positive
attitudes toward employment, and negative attirudes toward welfare, and few perceived child
care barriers. Additionally, even though the sample is disadvantaged in terms of its welfare
history, many of the women expressed a desire to limit their family size, one key indicator of
successful participation in education and/or employment activities, and the majority reported
using effective contraception or sterilization to avoid unwanted pregnancies.
Although many mothers appear to be job-ready, there are other characteristics that might
impede their participation in JOBS. Most women had experienced difficult life circumstances,
including problems with housing and having a relative or close friend in jail. In addition to the
stress incurred from experiencing these difficult events, many women also reported depressive
symptoms. some severe. Smaller groups of women also reported health-related barriers to
employment, as well as substance-use problems, although underreporting of substance use is
common in self-report surveys. In conclusion, because of the varied levels and combinations of
experiences, attitudes. stressors, and psychological difficulties that women on AFDC experience,
it is likely that there will be differential rates of successful participation in JOBS, as well as
differential outcomes for children.
45

CHAPTER 4SOCIAL AND ECONOMIC SUPPORT FOR MOTHERS WHO RECEIVE AFDC
Background
Previous research has shown that the networks of support available to mothers on AFDCare important factors in both maternal and child well-being (Auslander, 1988; Cohen and Wills,1985; McLanahan, Seltzer, Hanson, and Thomson, 1994). Individuals living in poverty tend tohave support networks that are weaker and smaller than those of the non-poor (Auslander, 1988;Lindblad-Goldberg and Dukes, 1985). Furthermore, single mothers often receive less support forparenting (Weinraub and Wolf, 1987). An additional consideration with low-income singlemothers is that support networks can be draining (Stack, 1974). For example, in one study ofAfrican American, low-income, single-parent families, mothers whose families were alreadyexperiencing high levels of stress felt that they provided more emotional support than theyreceived from their support network members (Lindblad-Goldberg and Dukes, 1985). Whereaslack of social support is associated with negative psychological and physical health outcomes inadults, researchers have found that for those individuals who are experiencing high levels ofstress, social support can act as a buffer against negative outcomes such as depression (Cohenand Wills, 1985; Pearlin et al., 1981; Turner, 1981).
The amount of social support available to mothers may also have implications for theirsuccessful participation in JOBS. Pany (1986) found that among working-class mothers whoexperienced social support deficits and high levels of life stress, paid employment was associatedwith hieh levels of psychiatric symptoms. That is, paid employment was an additional-source oftension. rather than a benefit, for mothers under stress who were caring for young children.
Support can take many forms, including economic assistance and social support. In thischapter. we consider economic support to be monetary assistance provided tither directly orindirectly to the mother. Economic support from family members, particularly absent fathers,can both enhance the family's standard of living and also reduce stress. Social support, which isoften divided into different types of support. has been defined as "...the degree to which aperson's basic social needs are gratified through interaction with others. Basic social needsinclude affection, esteem or approval, belonging, identity, and security" (Thoits, 1982, p. 147).In the present chapter, we will describe respondents' perceptions of support from the fathers oftheir children, as well as the emotional and instrumental support they receive from otherindividuals.
Key Questions for Chapter 4
What assistance do the children's fathers provide to the mothers?Who other than the father provides emotional, childrearing, and economic supportto these mothers, and to what extent?
46
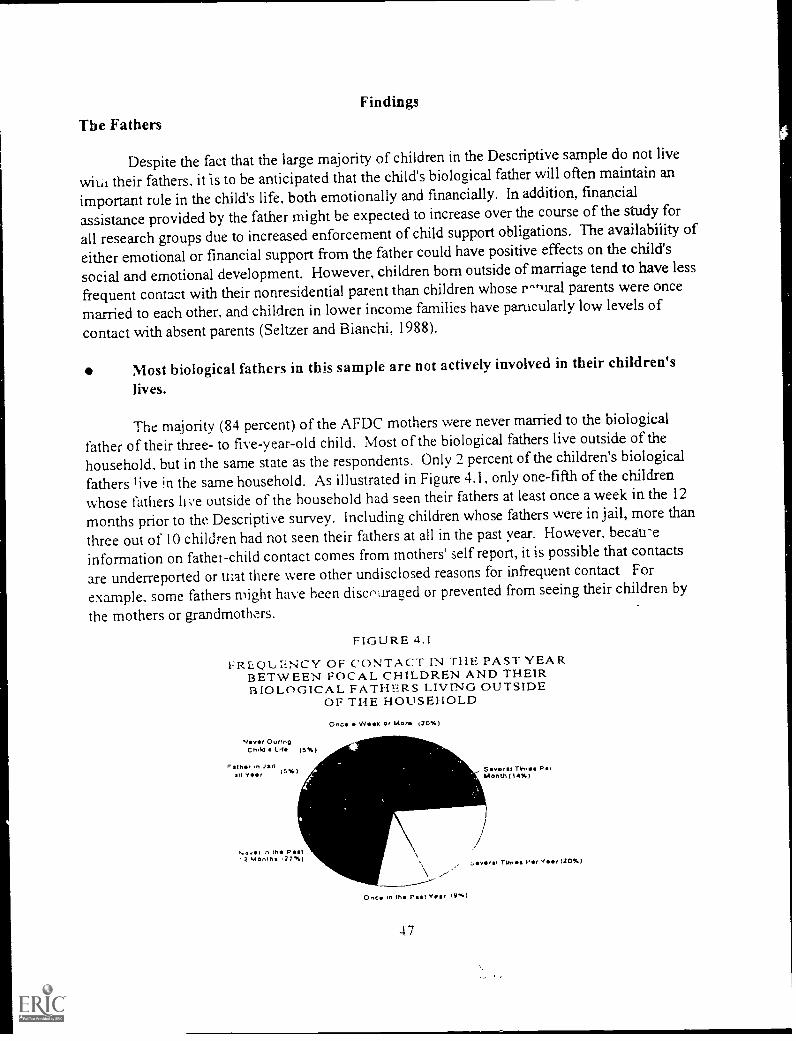
Findings
The Fathers
Despite the fact that the large majority of children in the Descriptive sample do not live
wita their fathers, it is to be anticipated that the child's biological father will often maintain an
important rule in the child's life, both emotionally and financially. In addition, financial
assistance provided by the father might be expected to increase over the course of the study for
all research groups due to increased enforcement of child support obligations. The availabiiity of
either emotional or financial support from the father could have positive effects on the child's
social and emotional development. However, children born outside of marriage tend to have less
frequent contact with their nonresidential parent than children whose r-tural parents were once
married to each other, and children in lower income families have parueularly low levels of
contact with absent parents (Seltzer and Bianchi, 1988).
Most biological fathers in this sample are not actively involved in their children's
lives.
The majority (84 percent) of the AFDC mothers were never married to the biological
father of their three- to five-year-old child. Most of the biological fathers live outside of the
household, but in the same state as the respondents. Only 2 percent of the children's biological
fathers 1 ive in the same household. As illustrated in Figure 4.1, only one-fifth of the children
whose fathers live outside of the household had seen their fathers at least once a week in the 12
months prior to the Descriptive survey. Including children whose fathers were in jail, more than
three out of 10 children had not seen their fathers at all in the past year. However, becau-e
information on fathei-child contact comes from mothers' self report, it is possible that contacts
are underreported or uiat there were other undisclosed reasons for infrequent contact For
example, some fathers might have been discouraged or prevented from seeing their children by
the mothers or grandmothrs.
FIGURE 4.1
FREQUCY OF CONTACT IN THE PAST YEARBETWEEN FOCAL CHILDREN AND THEIRBIOLOG/CAL FATHERS LIVING OUTSIDE
OF THE HOUSEHOLD
Nvor DuringC.d.] Life (5%)
in Jo.)III (5%)Villr
evil, in (n. Pt'2 Monin .27%)
Ones W1( or Moro (20%)
\One* in (NI PII Vorer
4 7
5iierI The.. PrMont/1(14%)
_igne,iTlen Pr V, (20%)
Within the past 12 months, mothers reported that only 10 percent of fathers living outsideof the household had "often" bought clothes, toys, or presents for their children, and only about 4percent had "often" bought groceries. With regard to non-economic support from fathers, 10percent of the fathers "often" babysat for their children in the past year, and 9 percent "often"cared for their children overnight. Among those fathers living outside the household who hadseen their children in the past 12 months, 44 percent had never done any of the following thingsduring that time period: bought clothes, toys, or presents; bought groceries; babysat for theirchildren; or cared for their children overnight.
Some fathers are offering regular economic support, but most are not.
As mentioned in Chapter 1, one important component of the Family Support Act (FSA)of 1988 provides for the strengthening of child support enforcement. In particular, Title I of theFSA was designed to increase the proportion of children with child support awards through theestablishment of paternity, increases in the level of awards, and enforcement of the collection ofawards through the location of missing parents and withholding of support from wages. It isoften noted that the number of people who receive welfare, as well as average welfare payments,could be reduced if absent fathers paid their fair share of child support (e.g., Sorensen, 1995).
The provision of child support has been found to be associated with greater child well-being. However, how these effects on children Lome about is not yet clear. McLanahan et al.(1994) found that for those children born outside of marriage, voluntary payment of child supportwas associated with lower parental conflict and increased contact between the child and thenoncustodial parent. Overall, child support dollars had a more beneficial effect for children than
rdinary dollars, perhaps (as the authors recognize) because the fathers who paid support were aselect group with regaid to their commitments to their children.
It should be stressed that previous research has demonstrated large discrepancies betweencustodial and non-custodial parents' reports of child support payments. Sonenstein and Calhoun(1990) found that on average, non-custodial parents reported paying almost 30 percent more inchild support than custodial parents reported receiving. Moreover, custodial parents were morelikely to report irregular and incomplete payments, whereas non-custodial parents were morelikely to rep:Tt making regular and full payments. Receipt of public assistance such as AFDCwas associated with discrepancies between custodial and non-custodial parents in the report ofchild support payments because child support is often tied to welfare receipt. Consequently, it ispossible that if father reports of child support payments were available in the Descriptive Study,similar discrepancies between custodial and non-custodial parents in the reports would beevident.
48

In the Descriptive sample, only 13 percent of the women who were never married to their
child's father went to a court or child support office to establish paternity," and only 2 percent of
those never-married women had the biological fathers sign the birth certificate. Among those
women whose child's father did not live in the household at the time of the Descriptive survey,
only 30 percent ever had child support payments agreed to or awarded to them. Fifty percent of
these payments were court-ordered, and 46 percent were arranged through a voluntary written
agreement. Among the 30 percent of women who received child support awards, 78 percent did
receive money from the father in the past year. National data suggest similar levels of awards
and payments. Among single mothers living below the poverty level in 1989, only 25 percent
received child support awards, and 69 percent of these received money (U.S. Bureau of the
Census, 1992b).
Among the 70 percent of the mothers who did not have a formal child support agreement
in the year prior to the interview, 88 percent did not receive any money directly from the father.
Only 9 percent of these women without a formal child suppoet agreement have legal proceedings
to establish paternity "in process" or have established paternity. The 12 percent who did collect
money directly from the child's father (rather than through the welfare office) received an
average of $279 per month. Forty-ode percent of the mothers felt that their chiid's father could
either pay more for child support than he did, or pay some amount if he paid nothing, whereas 24
percent fclt that he could not pay anything more. Thirty-five percent of the mothers did not
know whether their child's father could pay more or not.
Most mothers did not receive assistance from the families of the child's biological
father.
Sixty-two percent of mothers reported that the family of their child's father never did any
of the following for the child in the past year: bought clothes, toys. or presents; babysat; or cared
for him or her overnight. On the other hand. 35 percent of the mothers reported that members cf
the father's family bought clothes or toys in the past year. 22 percent said that the father's family
babysat in the past year, and 22 percent reported that the father's family cared for their child
overnight. Ae,ain, we note that this information is from mother-report only. Fathers (and their
families) might provide different information.
Most AFDC mothers were very dissatisfied with the level and quality of father
involvement in their children's lives.
As illustrated in Fitzure 4.2, more than half of the mothers said that they were very
dissatisfied with the amount of love and caring that their child's father has shown for their child.
Seventy-four percent of those %ornen tho .a.ent to a ct,urt or child support office to establish paternity had paternity
levall declared.
4 ()

Two-thirds of the mothers were similarly very dissatisfied with the amount of money and helpthat the fathers have been providing in raising their children.
FIGURE 4.2
MATERNAL SATISFACTION WITH LEVEL AND QUALITYOF FATHER INVOLVEMENT IN THEIR CHILDREN'S LIVES
11%
- A%
-10% 68%-
52%.
5I2efactien ease: low n.1 caret., bather glyes to
9%
12%
S Ilefectien mnery on holp from chNel'schile hem.
Very d....C1ehed 10) Surodorht 44.1401e4 0-41Cal OornorrrnI ...Ode ) MN Very aellerled (10)
_
1.4.10ver leslorme or sDefed5 (5)
Among mothers who had contact with the biological father, one-third reported that theyhad a lot of conflict with their child's father about the amount of money he provides for raisingthe child (10 on an 11-point scale). and more than one-fifth of mothers reported a lot of conflictwith the father about other things having to do with raising the child (Figure 4.3). However,mothers whose children saw their natural fathers more frequently. reported lower levels ofconflict with the fathers. over either the amount of money they provided for raising theirchildren, or other things having to do with raising their children.
FIGURE 4.3CONFLICT WITH CHILD'S FATHER AMONG
MOTHERS WHO HAD CONTACT WITH THE FATHER33% 22%
42%5%
Con31ct w'th Fathw About tb Amount of MoneyProydsd to Child
tme tt-o,
NM No con flitt 101
A tot of coeflici tO)
A htb confItct 11 -41
50
e%
9%
53%
Conflict wIth Foltutr About RaFa(ng th Chad
Ntthitt c*nSkad of hot conflicted 15)

Social Support Networks
Support from a network of friends or relatives can be especially beneficial for those
individuals who are disadvantaged due to poverty or unemployment. Among unemployed
women, the number of social ties in a network is negatively associated with depressive
symptoms (Hall et al., 1985). Moreover, among poor individuals, having more fiiends, at least
one close friend, and frequent contact with members of a social network, are related tc ,etter
health status (Auslander, 1988). However, as mentioned previously, social support networks can
also be exhausting for low-income, single mothers (Lindblad-Goldberg and Dukes, 1985).
Access to social support also contributes to more positive parent-child interactions
(Weinraub and Wolf, 1987). Several studies have demonstrated that tow-income parents, as well
as parents under stress, benefit from social support. Data from the National Survey of Families
and Households revealed that for families with children under the age of five, higher social
support was related to less punitive behavior for parents living in poverty, though not for more
affluent parents (Hashima and Amato, 1994). Additionally, under high levels of stress; mothers
of five-year-old children who were more satisfied with the support they received had more
positive interactions with their children than mothers with lower levels of satisfaction (Crnic and
Greenberg, 1990).
In addition to the amount of contact with members of one's social network, the quality of
the network is also important. In general, members of a social network can provide both
emotional support, "...information that a person is esteemed and accepted," and instrumental
support. "...the provision of financial aid, material resources, and needed services" (Cohen and
Wills. 1985. p. 313). Both types of support have implications for well-being, particularly among
low-income women with young children (Parry, 1986).
Most mothers have frequent contact with members of their own families.
In many ethnic minority communities. the extended family plays a significant role in
numerous aspects of family life, including the provision of material and emotional support, and
assistance with child care (Harrison, Wilson. Pine, Chan, and Buriel. 1990). Among African
Americans. particularly those who are economically disadvantaged, arrangements that allow
relatives and friends to share resources and household tasks are common sources of support
(Gibbs and Huang, 1989; Staples and Johnson. 1993).
As illustrated in Figure 3.2 in Chapter 3. about a quarter of the mothers in the Descriptive
sample lived with relatives andlor non-relatives, in addition to their own children and in some
cases their partner or husband. Thirteen percent of mothers lived in the same household with
their own mothers, an arrangement that is common among low income single-parent African
American families with younti, children (Chase-Lansdale. Brooks-Gunn, and Zamsky, 1994.,
Coll. 1990). Most women whose mothers did not live in the same household still had frequent
contact with them. Sixty-three percent of the respondents whose own mothers lived elsewhere
51

saw them once a week or more: II percent saw their mothers a couple of times per month: andonly 26 percent saw their mothers seldom or never. In addition, 36 percent of the sample saidthat there was someone else who acted as a mother figure to them, and most of these women sawtheir mother figure at least once a week or more often.
Women also had frequent contact with their siblings. More than three-quarters of thesample had brothers or sisters who lived within an hour's travel time, and most of these (65percent) saw them at least once a week during the year prior to the Descriptive survey.
Respondents had less frequent contact with their own ththers than with their mothers orsiblings. Only 21 percent of the women whose fathers did not live in the same household andwere not deceased saw them once a week or more often in the past year. and 68 percent saw themseldom or never in the past year.
Most of the respondents had at least one person in their lives to whom they couldturn for emotional support.
Ninety percent of the mothers said that they had some one "who would listen to them.reassure them, or show them that they care." I lowever. nearly half the sample (46 percent)reported only one such person. and only 17 percent reported three or more people that they couldturn to for emotional support. Frequently mentioned sources of support included therespondent's mother and other female relati \ es. as well as friends and neighbors.
I:sing an 11-point scale ranging from 0 (never true) to 10 (true all the time) respondentswere asked to indicate how true each statement in a series about emotional support was for them.A -5" is the midpoint of the scale. Almost half the sample responded that it was "true all thetime" that they had someone they could reall talk to if they had troubles or needed help tFigure4.4). ilalf of the mothers responded below the midpoint (below 5 on the () to 10 scale) to an itemabout havirw to cope alone if they were feeling exhausted or depressed at the end of a long day.stiggesting that most of the respondents had someone to help them cope with problems andprovide support.
\ early two-thirds of the mothers disagreed that they have no one close t-)\ to visit with it';hey felt lonely at home with their children. rhat is. tney do feel they have friends nearby.Additionally. nearly half of the mothers said that it was "true all the time" that friends or familywould call or come by to check on how things were going if their child were sick (Figure 4.4).

FIGURE A.4
PERCEPTIONS OF EMOTIONAL SUPPORT AMONGMOTHERS
Nhen I have troubles or need help I "avesomeone can really talk to
If I'm feeling exhausted or depressed ikeat the end of a long day. I have to copealone There is no one to help me.
If I feel lonely al home with my cruld(ren)Mere a no one Wing Vase by that I couldover Or go viat
When (my/a) child is sick. friends orfamily call or come by to check howthings are going
; get worn out by Ill the people who askme for help
..,se .1 when people call and ass me tohelp :nem oat
0% 20%
True all the 7.'11.110, T:ue Much orMost of .^e e.6-91
S:,ewhat or a L !te Tr...e
40% 60%
Percent
SO%
NIN Nedher Tru or Untrue (6)
Never True .0;
100%
Most respondents were not ON erly burdened by others asking for their support.
Although other researchers have reported that social support networks can be exhausting
for low-income single moers (Lindblad-(i()1dherg and Dukes. 1985), this does not seem to be
the case for most of the women in the Descriptive sample. Sixty percent of the respondents
answered below the midpoint to the statement "I get worn out by all the people who ask me for
help." indicating that most mothers are not overburdened by others askinp for help. On the other
hand. only 19 percent of the respondents felt that it IA as "true all the time" that the y. liked it when
people called on them for help (Figure 4.4).
Many mothers felt that they had someone to count on for economic aid.
Many women reported that they had friends and family who would provide economic aid
or material resources. two components of instrumental support (Figure 4.5'). More than half of
the respondents felt that it was true all or most of the time that they had someone who would lend
them mone% in case of an emergenc. 1 lov,cva. more than one-third of the NI, omen responded
below the iniupoult (below 5) to tius item.
;-;
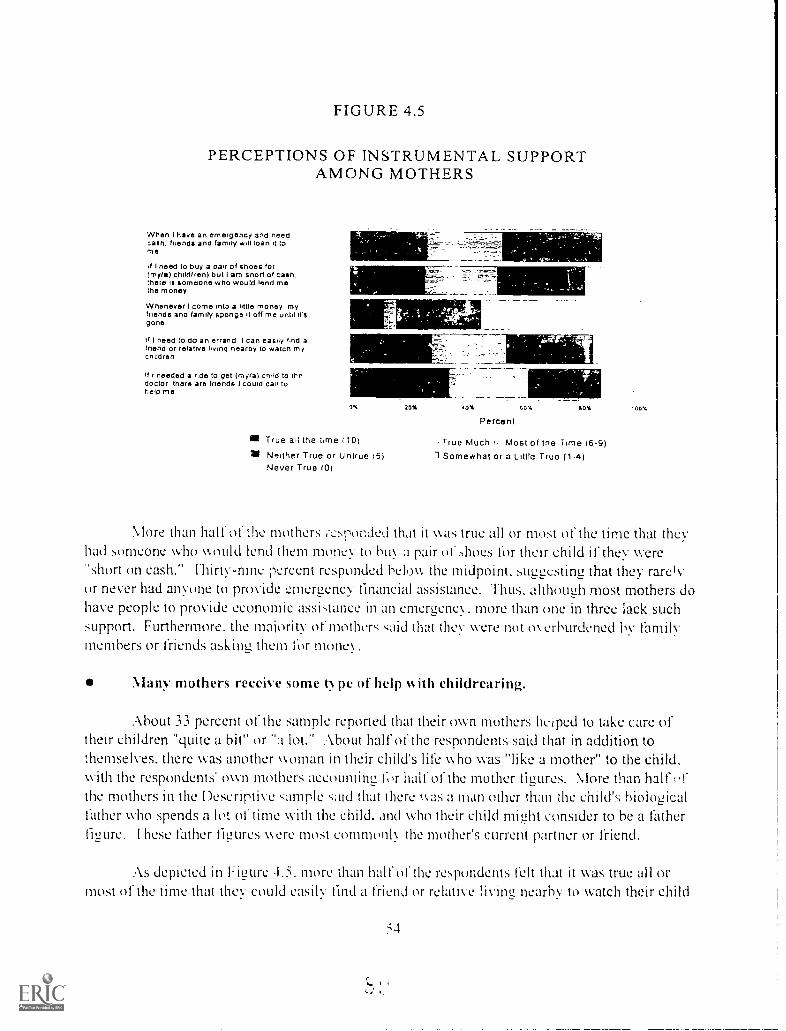
FIGURE 4.5
PERCEPTIONS OF INSTRUMENTAL SUPPORTAMONG MOTHERS
When I have an emergency and needcash, friends and family will loan it to
.11 need to buy a pair of shoes for(my/e) child(ren) but I am short or cash.there is someone who would lend methe money
Whenever I come into a little money myfriends and family sponge it off me until ifsgone
tr I need to do an errand I can easily f.nd afriend or relatrve hving nearby to watch mychildren
Iti needed a r.de to get (my/a) child to ll'edoctor there are friends I could cal, tohelp me
I%
IN True ail the time (10)
M Neither True Or Untrue 15)Never True (0)
20% 43% 60%
Petcent10%
True Much Most of the Time (6-9)1 Somewhat or a Little True (1-4)
00%
More than half of the mothers iesponded that it was true all or most of the time that theyhad someone who would lend them money to buy a pair ofshoes for their child if they were"short on cash." Ihirty-nme percent responded below the midpoint. suggesting that they rarelyor never had anyone to provide emergency financial assistance. Thus. although most mothers dohave people to provide economic assistance in an ernergenc. more than one in three lack suchsupport. Furthermore. the majority of mothers :aid that they were not merburdened by familymembers or friends asking them for mone..
Many mothers receive some n pc of help ss ith childrea ring.
About 33 percent of the sample reported that their own mothers heiped to take care oftheir children "quite a bit" or "a lot." About half ((f the respondents said that in addition tothemselves, there was another woman in their child's life who was "like a mother" to the child.with the respondents' own mothers accounting for half of the mother figures. More than half tit'the mothers in the Descriptive sample :aid that there v.as a man other than the child's biologicallather who spends a lot, of time with the child. and who their child might consider to be a fatherfigure. Ihese father figures were most commonl the mother's current partner or friend.
As depicted in Figure 4.5, more than hallof the respondents felt that it was true all ormost of the time that they could easily find a friend or relative living nearby to watch their child

while they ran an errand, although nearly one-fifth of the sample felt that this was "never true."
Nearly two-thirds of the respondents responded that they would be able to call on friends for a
ride to get their child to a doctor all or most of the time, indicating that they had people in their
support network to help them with needed services. However, more than one in 10 said that this
was "never true."
There are subgroups of women who tend to perceive higher levels of emotional and
instrumental support.
Women who have higher levels of emotional and instrumental support, and are mote
satisfied with the emotional support they receive, are different from those with lower levels of
satisfaction on several sociodemomphic and psycholo2ical inuicators assessed at baseline.
Items related to emotional support and instrumental support were summed to form two separate
indices. Having a high school degree. housimz other than public or subsidized, higher literacy
test scores, lower levels of depressive symptoms. a more internal locus of control, and lower
family barriers to employment were characteristics associated with higher levels of emotional
and instrumental support. Further, women with higher levels of instrumental support tended to
he those who have fewer children and who have been on welfare for shorter periods of time (see
.1ppendix B. Tables 4.1-1 and 4.1-2). Niothers were also asked to rate how satisfied they were
with the emotional support available to them. Women who were less satisfied with the
emotional support that they received tended to have higher levels of depressive symptoms than
those with hitzher levels of satisfaction (see Appendix B. fable 4.1-3).
Sumnr.ry
. \s found in previous research on visitation never-married parents (Seltzer and
Bianchi. 19881. most of the preschool-aged children in the Descriptive sample had infrequent
contact ith their biological fathers, and few received financial support from their fathers. Most
of the mothers of these yountz ehiL.ren were \ er dissatisfied with the emotional and financial
roles that the fathers played. Ilowever, it should be cautioned that information on father
imolvement was obtained from mothers only. Discrepancies between mothers' and fathers'
reports of contact and child support pa ments mie.ht be apparent if' information were also
ailable from fathers.
\ lam mothers in the Descriptive sample had sources of emotional and instrumental
support other than the child's father. NIost mothers had frequent contact with members of their
air 0%\ a families, and most reported that the had at least one person to turn to for emotional
support. In addition. most respondents did not feel o% erbardened by others askimz them for their
support. Manv ). omen also had friends or relatkes h, turn to for economic or childrearing
assistance. a; ehh. !low ever. mothers perceik ed instrumental support (e.g., economic assistance
and help with childrearing ) to be less a iilable than emotional support. Moreover, there were
subizroups of women who were more likel to report hiizher levels ofboth emotional and
I

instrumental support than others. Maternal characteristics measured at baseline including higherlevels of education, not living in public or subsidized housing, higher levels of literacy, lowerlevels of depressive symptornatoloey, having a more internal locus of control, and low fan-nlybarriers to employment were all associated with having higher levels of social support.
In conclusion, although many mothers on AFDC have access to social support. there arestill groups of women who will likely have more difficulties coping with the challenges andstressors of mandatory participation in JOBS because of lack of emotional support or support forchildrearing. Based on previous research. it is probable that women with higher levels of bothemotional and instrumental support will be able to cope more successfully with the changes thatare introduced into their families' lives.

CHAP ER 5THE CHILDREN
Background
The JOBS Child Outcomes Study will examine whether and in what ways children's
development is affected over time by mothers' JOBS participation. Rather than beginning with a
clear, unidirectional hypothesis. however, the possible direction of effects for children, and even
the possibility of any effects. remain open (Zaslow et al.. 1995).
Thus. for example, there is ample evidence that both family income and maternal
education are strong predictors of children's developmental status and academic achievement
(Baydar. Brooks-Gunn, and Furstenberg. 1993: Desai et al., 1989; Duncan et al., 1994; Hauser
and Mossel, 1985). It is therefore possible that children will benefit from mothers' assignment to
participate in JOBS K.cause of improvements in maternal education and family economic status.
Further, previous research has shown welfare mothers to be at risk for lower self-esteem and
sense of efficacy about events in their lives (Zill et al., 1991). JOBS participation may bring
about improvements in mothers' sense of self-esteem or efficacy, for example. because of
successful completion of an educational protztam or entry into the work force. Wilson and
Ellwood (1993) and Zaslow and colleagues (1995) have hypothesized that such changes could
have positive implications for children's interactions with their mothers and for their
development.
Yet the possibility has also been raised that JOBS may have negative effects on children.
Participants at a 1989 conference on the Farnil, Support Act and Children, sponsored by the
Foundafion for Child Development, emphasized that the Fa!lily Support Act might "create new
problems for children by adding strains to family life or by exposing children to poor substitute
care arrangements" (Smith. Blank. and Collins, 1992. p.1). Maternal stress could be increased by
JOBS participation because mothers may tear the possibility of sanctions. because the mandatory
nature ot the program may necessitate activities that conflict with their beliefs about appropriate
maternal roles. or because of greater complexity in family schedules. Furth,rmore. as we will
discuss in greater detail in Chapter 7. the quality of child care that children experience helps
shape their development (Hayes et al.. 1990). For children whose home environments lack
cognitive stimulation and emotional support. child care quality may be an especially important
contributor to development. If mothers JOBS participation results in many of the young
children being placed in child care of poor quality. then JOBS could well have negative
implications for their development.
.fo complete the picture of possible patterns, lk e note that JOBS may have little.or no
impact on children's development if there is minutial program participation, or if mothers
respond to JOBS in multiple Hut counterhalancinu For example, mothers may indeed
show an increase in stress hut simultaneously imotoke their educational status and family
earnings. Finally. JOBS may have differing implications for different subgroups of children.
;7
,
For example. children of mothers who were initially quite depressed and socially isolated mayhave outcomes that differ dramatically from those of children whose mothers had many sourcesof social support and who were not depressed (Moore, Zill, and Stief, 1990).
In sum, there are reasonable bases to hypothesize that JOBS will have positive effects onchildren, negative effects. differing effects for different subgroups, or virtually no effects.Participants at the conference on the Family Support Act and Children stressed the importance ofexamining these alternatives carefully, documenting the development of children at the time theirmothers enter the JOBS Program and over a period of years (Smith et al.. 1992). In the presentreport we take the first step in this direction, documenting the children's development in fourareas (cognitive development, school readiness, personal maturity, and health) shortly after theirmothers enrolled in the JOBS Evaluation.
Our prediction based on previous research must be that the children in the Descriptivesample, because of their family's disadvantaged circumstances, will be at risk in terms of theirhealth and development at this early point in the study. Family poverty, especially persistentfamily poverty, is among the most powerful predictors of poor developmental outcomes forchildren (Duncan et a)., 1994). Zill et al. (in press), analyzing data from the 1986 NationalLongitudinal Survey of Youth-Child Supplement (NI,SY-CS). found that children from AFDCfamilies, when compared with children from non-poor families, were more often reported to bein poor health. had more often repeated a grade in school. had lower scores on a measure ofcognitive development, and exhibited more behavior problems.
While ale developmental status of children from AFDC families was less positive thanthat of non-poor children, till and colleagues (in press) found comparable problems amongchildren from poor families not receiving AFDC. Their rates of health and behavior problems\\ ere tbund to be similar to those of children in AFDC families, though measures of academicand cognitive achievement were somewhat better for these children. Thus. the developmentalstatus of children from welfare families may have more to do w ith economic deprivation than
ith the fact thai their families receive welfare benefits.
till et al. (in press) stress that there i also heterogeneity amono children in AFDCfamilies in terms of development. Just as Duncan et al. (1994) found enduring family poverty tohave particularly negative implications for children's development. Zill and colleagues found lesspositive development particularly in families with longer welfare duration. These findingssuggest that it would be valuable to carry out a detailed examination of the development of thechildren in the Descriptive sample in light of mother and family characteristics. Becausepre\ ious literature (e.g.. taslow and I [ayes. 1986) suggests gender dif ferences in children'sresponse to psychosocial stxss. we e\ amine gender as a subgroup variable for these analyses.

Key Questions for Chapter 5
At this early point in the JOBS Evaluation, is there evidence that the focal children
in the Descriptive sample are faring poorly in ter ms of their cognitive development,
school readiness, socioemotional development, or health?Which subgroups of children are showing particularly poor developmental status?
Looking at all of the children in the family, what is the burden that mothers in the
sample are facing in terms of health, emotional and behavioral problems in their
children?
Before presenting the findings regarding the development of children. we provide a brief
overview of the characteristics of the children and of the measures used to assess their
developmental status and health.
Characteristics of the children
The 790 children were generally between the ages of three and five at the time the mother
was randomly assigned to the JOBS Program. These children are fairly evenly divided among
children ages three (34 pe,cent ). four (42 percent). and five (23 percent), with only nine six-year-
olds (1 percent).' .Approximately equal proportions are male (48 percent) and female (52
percent).
Measures
Children's developmental status was measured across several domains in order to provide
a broad picture of child well-being. Two measures of cognitive development were obtained, as
well as a measure of socioemotional development and a measure of health status.
1-he Peabody Picture Vocabulary Test - Revised32 is a measure of receptive vocabulary
appropriate for children ages two and older. as well as adults (Dunn and Dunn. 1981). Peabody
Picture Vocabulary Test scores are highly correlated with measures of both intelligence and
school achievement. Fo administer the test. the interviewer reads a word (such as "elbow" or
"feather"), and the child is asked to choose one of four picturcs that best portrays that word.
Each child begins at a point expected to he easy for a child of that age. Words become
progressively more difficult, until the child reaches a point at which he or she misses several
words in succession. at which point the test stops. Raw scores on the Peabody Picture
Vocabulary Test are converted into standard scores, based on the child's age. In the Peabody
Pictuic Vocabulary lest standardization sample. the mean standard score is 100. with a standard
deviation of 15. File Peabody is sometimes criticized !-'.)r. -::ultural biases, particularly the
hcAc children turned .,1\ either ,hortl . hotore or alter their i. r. ,.u.t:oin assignment dates
thbough \se used Ihe ro. ised 19811 \ er..tun. hcre Ii)111.2 the l'eabod!. l'uture Vocabulary I eq.

possibility that it underestimates the cognitive abilities of minority children. At the same time,we note that empirical research (e.g., Bracken and Passe, 1983; Kutsick, Vance. Schwarting andWest, 1988) suggests that the measure is a good predictor of IQ scores and achievement amongat-risk preschoolers, and is a predictor of IQ scores for African American as well as ,:hitechildren (Halpin. Simpson. and Martin. 1990). Because of concerns about possible racial biaswith this measure, we will present comparative data from a national survey for African Americanchildren only.
The Caldwell Preschool Inventory is a 32-item inventory of skills and conceptsimportant for preschool children to know hefore entering school (Caldwell. 1970). Areasassessed include knowledge of colors. shapes. and numbers; ability to follow directions;understanding of relationships such as "under" or "behind;" and knowledge of the meaning ofwords such as "dentist" or "breakfast." The 32-item version of the Preschool Inventory has beenused in other largc-scale evaluations, including the National Day Care Study, the Head StartPlanned Variation study. and the evaluation of Even Start. Several of these studies have shownthat Preschool inventory scores are sensitive to positive effects of developmentally orientedpreschool programs. The Preschool Inventory is a useful complement to the Peabody PictureVocabulary Test because it measures abilities directly related to school success, whereas thePeabody Picture Vocabulary Test is typicall ). viewed as a measure of general cognitive ability.
The Preschool Inventon was administered to the child by the interviewer. Scores on thePreschool Inventory represent the total number of items that the child answered correctly. andmay range from 0 to 32. Age-corrected norms are not available, and thus it is expected thatPreschool Inventory scores will vary markedly according to child age.
.1-he Personal Maturity Scale is a 14-item mother report measure of the child'ssocioemotional development and personal maturity adapted from the 1976 National Survey ofChildren. [he Personal 'Maturity Scale includes items such as "Doesn't concentrate, doesn't paydttention for long" and "Is loving and affectionate." w hich the mother rates on a scale from 0 ( mychild is not at all like than to 10 (my child is exactly like that). For the current report. summaryscores on the Personal Nlaturity Scale were computed to indicate the mother's mean response onthe to I() scale across all 14 items.
In the Beginning School Stud>. a study of children's academic and social developmentfrom the first grade forward, teacher-reported scores on the Personal Ntaturity Scale predictedparental and child expectations for the child's achievement. parents' estimate of the child'sacademic ability, and child's end-of-year grades. net of the Lhild's performance on ,tandardizedtests (Alexander and Entwisle. 1988). !hese findings suggest that the Personal Niaturity Scalepmvides a valid measure of socioemotional devlopment that also has important implications forlater academic performance. I lowever. Alexander and Entw isle used teachers' reports ofchildren's maturity w hi le w c obtained mother report. Other research (e.g.. Achenbach.\lc( 'onaughv and I low ell. 1 Q87) has shown that teacher and parent report of childtim's behavior

and competence are only moderately correlated, and we are not aware of prior research using
mother :eport on the Personal Maturity Scale to predict children's achievement.
Child health status was determined from two mother-report items. First, mothers rated
their child's health on a five-point scale ranging from "excellent" to "poor." In addition, mothers
reported whether their child has a disability, illness, emotional problem or mental condition that
limits the child's ability to attend school or engage in other activities. These two items are
combined to form an overall rating of child health, identifying those children whose mothers
describe them as in excellent health with no limiting condition. As noted previously, relying on
maternal report has some limitations; however, no objective data on child health are available.
Each of our measures of developmental status for children in the Descriptive sample can
be placed in the context of other work using the same measure on children of the same or similar
age. The Peabody Picture Vocabulary Test has national norms to which we can relate the results
for the Descriptive sample, and was also administered to children in the National Longitudinal
Survey of Youth-Child Supplement (NLSY-CS). The Preschool Inventory was administered to a
sample of 1,477 children in the evaluation of the Even Start program, which provided early
chi: ihood education, adult education. arid parenting classes to low income families. ThePersonal Maturity Scale was used in the research of Alexander and Entwisle (1988) on
achievement in the first two years of school. Finally, a similar indicator of child health status
was used in the National I lealth Interview Survey on Child Health (NHIS-CH).
Findings
Children in the Descriptive s,ample had mean Peabody Picture Vocabulary Test
scores that NN ere !MN er than the means on this measure for African Americanchildren from welfare and non-poor families in a national sample.
l'he mean on the P2abody Picture Vocabulary Test for the Descriptive Study children was
70. Analyses of 1986 data from the NLSY-CS were conducted to permit comparison of the
mean Peabody Picture Vocabulary Test score in the Descriptive sample to that for African
\merican children from non-poor and welfare families in this national data set.
Analyses with the NLSY-CS are reported here for African American children only
because of the possibility of racial bias with this measure. Although the Peabody Pictuire
Vocabulary Test predicts to measures of intelliaence for black as well as white children (Halpin
et al.. 1990). minority children score lower on the Peabody Picture Vocabulary Test than non-
minority children. There is thus the possibility that this measure under-assesses receptivevocabulary for minority children. In order to determine whether children in the Descriptive
sample show indications of risk in this aspect of their cognitive development, the key comparison
is not with all children of the same ages from a national sample (since this comparison might
show differences that are attributable simply to the racial composition of the samples and their
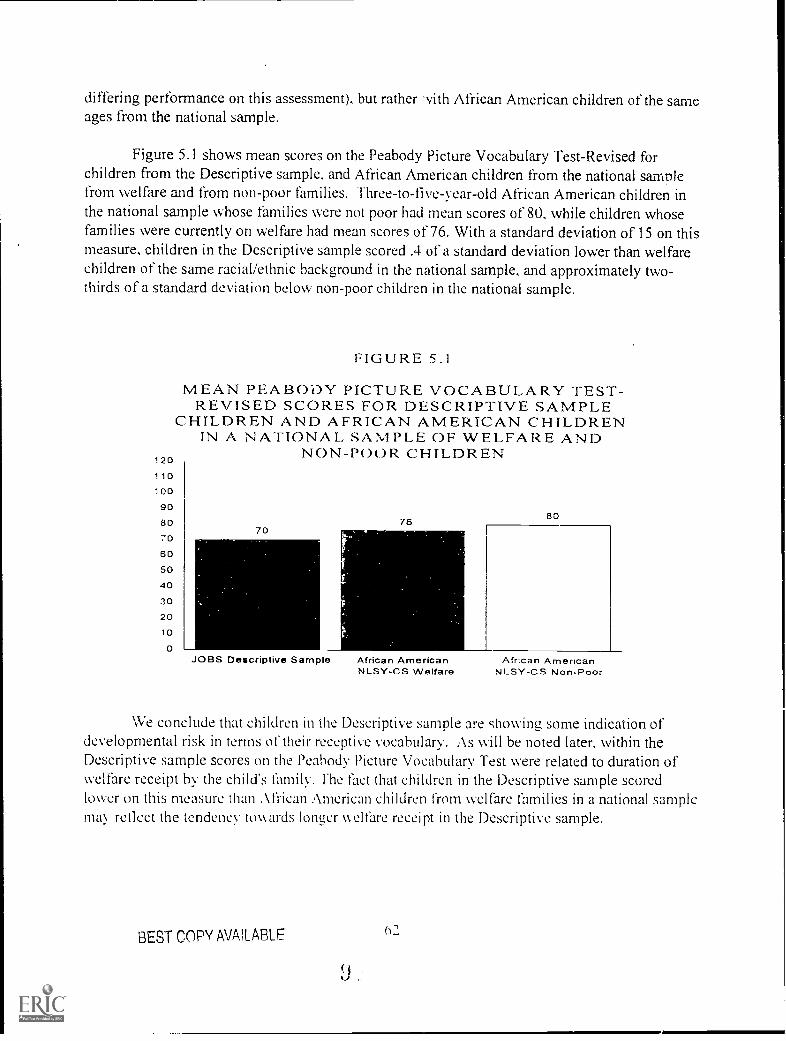
differing performance on this assessment), but rather -vith African American children of the sameages from the national sample.
Figure 5.1 shows mean scores on the Peabody Picture Vocabulary Test-Revised forchildren from the Descriptive sample, and African American children from the national samnlefrom welfare and from non-poor families. 'Three-to-five-year-old African American children inthe national sample whose families were not poor had mean scores of 80, while children whosefamilies were currently on welfare had mean scores of 76. With a standard deviation of 15 on thismeasure, children in the Descriptive sample scored .4 of a standard deviation lower than welfarechildren of the same racial/ethnic background in the national sample, and approximately two-thirds of a standard deviation below non-poor children in the national sample.
120
110100
9080
70
6050
40302010
FIGURE 5.1
MEAN PEABODY PICTURE VOCABULARY TEST-REVISED SCORES FOR DESCRIPTIVE SAMPLE
CHILDREN AND AFRICAN AMERICAN CHILDRENIN A NATIONAL SAMPLE OF WELFARE AND
NON-POOR CHILDREN
JOBS Descriptive Sample African AmericanNLSY-CS Welfare
African AmericanNLSY-CS Non-Poor
We conclude that children in the Descriptive sample are showintz some indication ofdevelopmental risk in terms of their receptive vocabulary. As will be noted later, within theDescriptive sample scores on the Peabody Picture Vocabulary Test were related to duration ofwelfare receipt by the child's family. Ihe fact that children in the Descriptive sample scoredlower on this measure than African American children from welfare families in a national samplema% reflect the tendency towards longer welfare receipt in the Descriptive sample.
BEST COPY AVAILABLE62

On average, children scored correctly on 56 percent of the items on the Preschool
Inventory.
Children on average, answered 18 out of the 32 items Ln the Preschool Inventory
correctly. Figure 5.2 shows the distribution of scores. As can be seen, a substantial proportion
of children in the sample (42 percent) answered half or fewer of the items correctly.
FIGURE 5.2
NUMBER OF ITEMS ON THE PRESCHOOL INVENTORYANSWERED CORRECTLY
1-8 Items17%)
0 le i!onl35%)
25-32 Itierna
17-24 Ittans(41%)
Consistent with our expectation that scores would increase with age, children between 3-
0 (3 years, 0 months) and 3-11 completed 14 Preschool Inventory items on average, while
children between 5-0 and 5-11 completed 23 items on average. However it must be noted that
even the oldest children in the Descriptive sample missed 9 items on average, or approximately a
quarter of these questions relevant to readiness for school.
In the Even Start evaluation, thc Preschool Inventory was administered to 1,477 children
ages three through five at the time of the child's entry into the Even Start program (St. Pierre.
Swartz, Murray. Deck, and Nickel, 1993). Although a low income sample, the Even Start
sample is somewhat more heterogeneous than the Descriptive sample. with only about half of the
Even Start participants receiving their primary income from uovernment assistance, and with
almost half of participants living in two-parent thmilies. Yet at the same time, the parents'
educational attainment was 2enerally lower than that of the JOBS population: only about 20
percent of Even Start participants had either a high school diploma or GED.
As with the JOBS sample, age-related increases on Preschool Inventory scores were
evident in the Even Start sample. with average scores ranging from 10 for three-year-olds to 17
for tive-vear-olds. However, the average pretest Preschool Inventory score for the Even Start
sample was 13 (St. Pierre et al.. 1993). significantly lower than that for the JOBS sample.B This
For the chiference hemeen these mn weans. t(22111 56, E
RFcT rnriv AVAILABLE
01)1

finding suggests that parental education may be a particularly important factor in youngchildren's school entry skills.
On average, mothers describe their children as showing fairly high levels ofmaturity and few problems in terms of their emotional and behavioral development.
The average score on the Personal Maturity Scale for children was eight. Given that anoverall mean of 0 would indicate mothers' perception of an absence of personal maturity in thechild, and a mean of 10 would indicate very high levels of maturity, the sample mean of 8suggests that on average, mothers give their children fairly high ratings on maturity. Figure 5.3illustrates the distribution of scores.
FIGURE 5.3
MEAN RATINGS ON THE PERSONAL MATURITY SCALE
5 6
9-10
NOTE A mean score 010 indicates a lack of maturity and higher level of behavior problems. while ascore of 10 indicates higher levels of personal maturity and fewer behavior problems
Because the response scale for the Personal Nlaturity Scale was adawed for the currentstudy, we can relate findings from the present sample to those from the Beginning School Studyin a broad rather than precise manner. In the Beginning School Study. which focuse6 on firstand second graders. the average Personal Maturity Scale score for African American children inthe first grade also indicated that teachers perceived children as relatively mature. The averagescore on a six-point scale was about five points for African American children, such that itemsreflecting more maturity were rated as between "pretty much like" and "very much like" theaverage child (Alexander and Entwisle.
Approximately half of the children were described by their mothers as in excellenthealth with no limiting condition.
Figure 5.4 shows the distribution of mothers rating,s of their child's health.Approximately half of the mothers (40 perecnn described their child's health as "excellent." anda further 29 percent described the children's health as very good. Thus, more than three out offour children were rated by their mothers as currently in excellent or very good health. This
64

portrayal of the children's health is in keeping with the fact that health problems in the child wete
a basis for mothers' exemption from JOBS.
FIGURE 5.4
MOTHERS' RATINGS OF THEIR CHILD'S CURRENTHEALTH STATUS
F alr
Excellent(49%)
Nine percent said that their child had a disability, illness, emotional problem or mental
condition that limited the child's ability to attend school or engage in other activities, and the
most common such problem was asthma (reported by 46 percent of mothers whose child had a
condition that limited the child's activities). Other conditions reported included blood disorders
or immune deficiency (9 percent of those with a condition), heart trouble (7 percent). and speeeh
impairment (7 percent).
When the item describing the child's health and the item concerning conditions that
limited the child's activities were combined to form an overall rating of child health status. 47
percent of children were described as in "excellent health with no limiting condition." A similar
(thotalh not identical) composite rating of health and limiting conditions was constructed using
data from the I. In the nal ional subsample of children ages three to five, the
proportion described as in excellent health with no limiting conditions was 38 percent among
families receiving welfare. 42 percent among families that were poor but not on welfare, and 52
percent among non-poor families. Thus. the proportion of children receiving a positive health
ratinu, was somewhat higher in the Descriptive sample than in the NHIS-CH sample of welfare
ith the NHIS-CH definition of health limitations being, more encompassing (see
previous footnote). In neither sample did a majority of children from welfare families receive the
most favorable health rating.
' In the Descriptive survey, mothers reported on disabilities, illnesses, emotional problems or mental conditions
that interfered with the child's activities. In the NI IIS-CII, how eer. parents reported the existence of physical
disabilit or illness that interfered w ith the child's acto.itv, hut were asked to report on the presence of mental or
behavioral problems, regardless ol tihether they ortertcred with actmues. Thus, it is not surprising that parents in
the NHIS-CIT would report more conditions than would mothers in the Descriptive sample, and thus would have
fewer children in the "excellent, no limiting condition" categor .

The relatively favorable health of the Descriptive sample compared to the national samplemay also reflect the fact that AFDC recipients who care for an ill or incapacitated family memberare exempt from the JOBS Program. That is. children in particularly poor health would beexcluded from the Descriptive sample.
The children at greatest developmental risk were those whose mothers had one ormore of the following characteristics at baseline: they had not completed high schoolor obtained a GED, received lower reading and math literacy scores, had a moreexternal locus of control, and perceived more barriers to their own employment.Boys were also consistently at greater risk than girls.
Children's scores on the Peabody Picture Vocabulary Test, the Preschool Inventory, thePersonal Maturity Scale and the health status rating were all examined in light of subgroupsformed on the basis of data collected at baseline. For these analyses, we examined child genderas a subgroup variable. Previous research (e.g...Zaslow and Hayes, 1986) suggests that boys maybe more vulnerable to psychosocial stress than girls. Thus, it is important to consider whetherboys in this sample are exhibiting poorer development at the outset of the JOBS Program, andthen when follow-up data are available, to consider whether program impacts differ for familieswith boys and with girls. fable 5.1 shows adjusted means of each measure for the varioussubgroups.
Controlling for the influence of child aue and research group (and child gender. except foranalyses of uender differences). a similar picture emerged when baseline subgroups wereexamined in relation to all four measures of development. First. boys consistently showedpoorer development than uirls. In addition. several maternal characteristics were associated withchildren's development. Children's ievelopment was significantly more negative across all fouroutcome measures when mothers had not completed high school or obtained a GED, and whenthey had lower scores on readinu and math literacy tests. Children also fared worse across allmeasure,: of development %,-hen their mothers had an external rather than internal locus ofcontrol. and when mothers perceived more thmily barriers to their own employment.
IO

TA
BL
E 5
.1
CIH
I D
R1
N'S
LID
ME
AN
S O
N P
FAI3
OD
Y P
ICT
UR
E V
OC
AB
UL
AR
Y T
EST
-RE
VIS
ED
,PR
ESC
HO
OL
IN
VE
NT
OR
Y, A
ND
PE
RSO
NA
L
MA
FU
RI
FY S
CA
LL
, AN
D A
DJU
STE
D P
ER
CE
NT
AG
EO
F C
HIL
DR
EN
WIT
H F
AV
OR
AB
LE
HE
AL
TH
RA
TIN
G F
OR
SU
BG
RO
UPS
BA
SED
ON
CH
ILD
GE
ND
ER
. MO
TH
ER
S D
EM
OG
RA
PHIC
CH
AR
AC
TE
RIS
TIC
S,L
ITE
RA
CY
LE
VE
LS,
AN
D P
SYC
HO
LO
GIC
AL
WE
LL
-BE
ING
Mea
sure
PPV
T-R
(Mea
n)
PSI
(Mea
n)
PMS
(Mea
n)
Chi
ld in
Exc
elle
ntH
ealth
/No
Dis
abili
ty (
Perc
ent)
lota
l Sam
ple
70.0
417
.84
7.45
50
Chi
ld G
ende
rN
Ialc
08 6
5*17
.12*
**7.
34*
Fem
ale
71.3
818
.53
7.56
54
Rec
eive
d hi
gh s
choo
l dip
lom
a or
(iU
)N
o66
.40
16.7
27.
1740
Yes
71.5
5***
18.4
91"
7.60
***
52**
Num
bem
of
child
ren
id)
I.73
.34*
**18
.61*
**7.
5955
*
71.6
3***
17.9
9***
7.49
45
Thr
ee o
r m
ore
lota
l pri
or A
FDC
re.
..elp
t
65.0
216
.50
7.35
43
Les
s th
an 2
yea
rs74
.79
19.0
57.
9450
2 ye
ars
or m
ore,
but
less
than
5 y
ears
70.5
7**
18.1
87.
47**
51
5 ye
ars
or m
ore
67.4
1***
16.7
5***
7.15
***
42
Cur
rent
Hou
sing
Sta
tus
(c)
Publ
ic, e
iner
genc
or
tel
hous
ing
65 9
4***
16.8
1***
7.27
1*49
Subs
idiz
ed h
ousi
ng71
.71
17.6
57.
5144
Non
e of
the
abov
e72
.94
18.5
17.
6053
Scor
e on
TA
LS
liter
aQ te
stL
evel
1 o
r 2
67.7
016
.93
7.10
42
Lev
els
3 th
roug
h 5
(hig
her
liter
acy
skill
s)72
.90*
**18
.84*
**7.
88**
*52
1*
CS
1(c
ontin
ued)

Tab
le 5
.1. c
ontin
ued
Nle
asur
ePP
VT
-R(M
ean)
PSI
(Mea
n)PM
S(M
ean)
Chi
ld in
Exc
elle
ntH
ealth
/No
Dis
abili
ty (
Perc
ent)
SLot
e on
GA
IN A
ppra
kal m
ath
test
Le.
el A
or
1367.83
17.1
97.
1845
1.e:
el C
or
D th
idte
r m
ath
skill
s)73.80***
18.9
4***
7.87
***
54*
I:ep
iess
ion
Scal
e1.
0" a
hid
e de
pres
'i e
70.0
117
.92
7.52
50M
oder
ate
hie
.h d
eprc
,,k e
mpt
oin,
70 9
118
.10
7.06
**51
IIlk
.th1o
niro
l Sca
leM
ore
este
rnal
locu
s of
con
uol
68.27
17.2
37.
1145
Mor
e in
tern
al lo
cus
of-c
ontr
ol70
86*
18.5
9***
7.72
1**
53*
Perc
eptio
n ot
har
rier
s to
i2oi
ng to
%or
kFc
v. h
arri
ers
71.3
419
.84
7.79
59
fAla
n.!.
har
rier
s
so, (
ii I
Supp
ort
68.6
4*18
.98*
7.16***
44**
*
70.3
I17
.89
7.39
43F
ligh
69 9
317
.99
7.53
57**
*
Sam
ple
Size
II
Mw
eigh
tedi
(d)
765
751
771
787
SOl1
RC
E:
Chi
ld [
rend
s, I
nc. c
alcu
latio
ns o
f Fu
lton
Cou
nty
Des
crip
tive
Stud
y da
ta.
NO
II
S.I
nles
s ot
hcm
ise
men
tione
d, a
ll an
al)
ses
use
wei
ghte
d da
ta.
Ihe
Peab
ody
Pict
uie
Voc
abul
ary
Tes
t-R
evis
ed (
PPV
T-R
) is
a s
tand
ard
scor
e, th
ePr
e,ch
ool I
men
tor
(PS1
1 is
a to
tal s
core
, and
the
Pers
onal
Mat
urity
Sca
le (
PNIS
) is
a m
ean
scor
e. O
LS
regr
essi
on a
naly
ses
wer
e co
nduc
ted
for
the
PPV
T-R
,PS
I an
d PM
S sc
ales
. log
istic
reg
ress
ion
anal
yses
wer
e us
ed f
or c
hild
hea
lth r
atin
g. A
ll,.a
naly
ses
cont
rol f
or c
hild
's a
ge a
nd r
esea
rch
grou
p st
atus
and
, exc
ept f
oran
alss
es o
f ge
nder
dif
fere
nces
, als
o co
ntro
l for
chi
ld g
ende
r. M
eans
and
per
cent
ages
wer
e ad
just
ed f
or c
ontr
ol v
aria
bles
. For
exa
mpl
e, h
oldi
ng a
ge, g
ende
r, a
ndre
sear
ch g
roup
con
stan
t, th
e m
ean
PPV
T-R
sco
re f
or c
hild
ren
who
se m
othe
rs d
id n
ot r
ecei
ve a
hig
h sc
hool
dip
lom
a or
GE
D w
as 6
6.40
.A
t-te
st s
tatis
tic w
as a
pplie
d to
dif
fere
nces
bet
wee
n su
bgro
ups.
Sta
tistic
al s
igni
fica
nce
leve
ls a
re in
dica
ted
as *
**2
<.0
01; *
*2 <
.01;
*p
< .0
5.(a
) Si
gnif
ican
ce le
vels
are
in c
ontr
ast t
o fa
mili
es w
ith th
ree
or m
ore
child
ren.
I U
;(h
) Si
gnif
icah
ce le
vels
are
in c
ontr
ast t
o fa
mili
es w
ith le
ss th
an tw
o ye
ars
of A
FDC
rec
eipt
.(c
) Si
gnif
ican
ce le
vels
are
in c
ontr
ast t
o fa
mili
es li
ving
in n
on-p
ublic
, non
-sub
sidi
zed
hous
ing.
(d)
Sam
ple
size
s ar
e un
equa
l due
to m
issi
ng d
ata.

Beyond these common patterns across all four developmental indices, several additionalsubgroup differences were apparent for only some of the outcome measures. For example,children living in families with three or more children had lower scores on the Peabody PictureVocabulary Test and Preschool Inventory, and a less favorable health status, than those livingwith no other children. Children also achieved lower scores on the Peabody Picture Vocabulary
Test, Preschool Inventory, and Personal Maturity Scale when their families lived in publichousing, or when their mothers had received welfare for five years or more. Other subgroupswere associated with lower scores on just one or two measures of child well-being also (seeAppendix B, Fable 5.1-1 to 5.1-4).
Children other than the focal child may also have health or other problems thatpresent a barrier to mothers' JOBS participation.
Seventy-two percent of mothers have children other than the focal child also living in the
household. The vast majority of these children are the mother's birth children, although a few
step- or adoptive children were reported. To be included in the JOBS Evaluation in FultonCounty, the mother could have no children younger than age three; thus. the other children in thehousehold are generally older than the three- to five-year-old child.35 The average age of the
mothers' other children was nine years.
Eiuht percent of the mothers said that one of their children (including the focal child) had
an illness or disability that demanded a lot of her attention or interfered with her ability to work.(Information on the nature and severity of these problems was not obtained.) In addition, 15
percent of the mothers reported that one of their children (including the focal child) had anaccident, injury or poisonina requiring medical attention in the previous year.
Amomt those mothers with school-aued chil .1ren. five percent said that one or more ofthese children was limited from attending school because of a health problem. Ten percentreported that one or more of their school-aucd children had a learning problem that requiredspecial help. Nine percent reported that one or more of their school-aged children either received
or needed help for an emotional. mental. or behavioral problem in the past year.
Summary
Children in the Descriptive sample appear to be faring poorly, particularly in terms oftheir cognitive development. Maternal reports of personal maturity and behavior do not indicate
a problem in this area, although it must be noted that assessments of the child by an impartialobserver miuht result in a differinu conclusion. Although most children were rated by their
In a few cases a mother had more than one child between the ages of duce anl five. In such cases, one child of
this age was randomly desitmated the "focal child."
09

mothers as in excellent or very good health, 9 percent reported that the focal child had a healthlimitation.
Children at greatest risk close to the start of the JOBS Evaluation are those whosemothers have the least education, lower reading and math literacy skills, feel the least controlover events in their lives, and perceive the most barriers to employment. Children who live inlarge families or in public housing, or whose mothers have received welfare for several years, arealso at greater risk.
Finally, when mothers were asked to consider all of their children, a substantial minority(8 percent), reported that they had a child (including the focal child) with an illness or handicapthat demanded a great deal of attention or interfered with their ability to work.
70

CHAPTER 6HOME ENVIRONMENTS
Background
Poverty appears to affect children's development in multiple ways. Clearly, individualswith certain characteristics may be more likely to be poor, and thus selectivity effects may help
explain impacts of poverty on children. In addition, however, it appears that poverty can affect
children though a lack of material resources, through the quality of health and other services
available to the family, the physical and social characteristics of poor neighborhoods, andthrough the home environment. AlthouQh the research is clear that each of these factors isimportant, "most concede that the quality of parenting children receive and the general
conditions of their physical surroundines may play the largest role" (Bradley et al., 1994. p. 347).
If we are to understand the development of children in the Descriptive sample, 1t is of
particular importance that we describe the children's home environments. A portrayal of thehome environments of the children at this early point in the JOBS Child Outcomes Study will
permit us to: (1) understand the degree to which children in the Descriptive sample, relative to
other children. cor-e from home environments that can be described as supportive andstimulating: (2) examine the variability of the children's home environments in reiation to
maternal and family background characteristics: and (3) provide a reference point. early in the
study, for understanding any later changes in the home en\ ironrnent or changes in the children's
development brought about by 3()13S participation.
Ilie body of research on the home environments of families in poverty is increasinglyspecifying which parenting beha\ iors and features of the home environment are affected by
economic hardship, and how these differences come about within families. We briefly review
the e\ idence on these issues before providing a portrayal of the home en\ ironments of the young
children in the Descriptive sample.
Economic hardship and specific features of the home environr.ent. Research points
to differences between poor and non-poor families in terms of both the emotional supportiveness
and cognitive stimulation of interactions \\ ithin the home. For example. using the short form of
the Home Observation tOr Measurement of the Environment (the HOME-SF: Baker and Mott.
1989), a measure that taps both the support and stimulation in the home environment. Garrett and
colleagues (1994) found that poverty was significantly predictive of a less positive home
environment above and beyond the influence of child, mother, and household characteristics in
families with young children.
Recent work permits us to make more specific statements about which aspects of the
home environment are most affected by poveny. Looking first at the affective quality of parent-
child interaction, on average parents enduring economic hardship appear to use harsher
disciplinary practices and to express greater irritability and less warmth towards their children.
71

In work by Mc Loyd and colleagues, for example (Mc Loyd, Jayaratne, Ceballo, and Borquez,1994), unemployment among single African American mothers was found to be associated withmore punitive and coercive disciplinary practices. Conger and colleagues found economicpressure in intact families to be associated with greater expression of hostility to adolescentchildren (Conger, Ge, Elder, Lorenz, and Simons. 1994). Dodge, Pettit, and Bates (1994)confirm the association of lower socio-economic status and harsh disciplinary practices forchildren in the preschool years. In addition they find low income to be associated with adiminished expression of warmth and affection. These patterns of interaction are in turnassociated with less optimal adjustment in the children. For exar ,ple, the harsher interactionpatterns documented by Mc Loyd et al. (1994) and Conger et ai. (1994) had adverse effect7 onadolescent socioemotional adjustment.
In the area of cognitive stimulation. findings indicate that children from low incomefamilies, on average, receive less stimulation related to language and literacy development(Walker, Greenwood, Hart. and Carta, 1994). More specifically, they are exposed to fewer booksand cognitively stimulating toys. Parents in low income families, on average, appear to engagetheir children less often in language games and in interactions that elicit child speech. Parents inpoor families, on average, appear to be less encouraging of intellectual accomplishment (Walkeret al., 1994).
It is crucial to note that while research finds families in poverty to be less supportive andstimulating on average, there is also substantial variation among poor families. As stated byBradley and colleagues. "Poverty is not isomorphic with inadequate parenting. That is, thequality of the home environment is not unitbrm across families living in poverty" (1994. p. 347).In keeping with this portrayal. Lill et al. (in press), looking at AFDC families, poor non-welfare,and non-poor families with three- to five-year-olds in the 1986 National Longitudinal Survey ofYouth-Child Supplement (NLSY-CS), found a higher proportion of AFDC than non-poorfamilies to have HOME-SF scores that fell into a category of "least stimulating and supportivehome environments." Yet at the same time, fully 34 percent of the AFDC families in the samplestudied had home environments that were characterized as "supportive."
Hie implications of these findings for the Descriptive sample are twofold. First, it will becritical to look at both the socioemotional and the cognitive aspects of stimulation in the home.Both aspects appear to differ between poor and non-poor families. Second, we should not expectthe sample to he homogeneous with respect to the home environment. It will be important todescribe and examine the basis for (as well as implications of) variability in home environmentswithin the sample.
Associations between poverty and parenting behaviors. Research conducted duringthe Great Depression found that children were not directly affected by the economic hardshipstheir families were experiencing, but rather were indirectly affected by the psychological distressthe hardship caused their parents, which in turn was associated with irritable and punitiveparenting, behavior (research reviewed in Meloyd, 1990: McLoyd et al., 1994). This same
72

sequence (economic hardship, parental psychological distress, parenting behaviors, childoutcomes) has now been documented in a number of studies of maternal behavior under current
economic conditions.
In their sample of African American single mothers, for example. Mc Loyd et al. (1994)
found current unemployment of the mother to be associated with increased maternal depression.
Maternal depression in turn predicted the heiditened punitiveness in mother-adolescentinteractions that was associated with depressive symptoms and distress in the adolescents.Studying African American families with young children. Leadbeater and Bishop (1994) alsofound maternal depression to be an important predictor of child .iehavior problems.
Several studies have reported that the availability of social support can be an ameliorative
factor in this chain. For example, Hashima and Amato (1994) report that perceived social
support was negatively related to punitive behavior with young children, particularly among lowincome families. McLoyd and colleagues (1994) report that mothers with more social support
reported fewer depressive symptoms and less punishment of their adolescents. Leadbeater andBishop (1994) found greater perceived emotional support by mothers to be associated with fewerchild behavior problems in the preschool period.
In the present context. it will be important to document the relation between baseline
measures of maternal depression and social support. as well as extent of economic deprivation(best captured by welfare duration), and parentinu, behavior at the time of the Descriptive survey.
Reliance on the HOME-SF for reporting on the home environments of families.Althou2h in the Descriptive survey we asked mothers and interviewers to report on numerous
aspects of parenting behavior and the home environment, in the present report we will restrict ouranalyses to those measures that comprise the short form of the HOME Scale.' Our analyseswith the HOME-SF focus on 25 items. based on either maternal report or interviewer rating.The combination of these two sources of information provides an advantaize over reliance on
maternal report alone, because mothers may wish to portray themselves as uniformly supportive.
The total score for a family indicates the number of items out of the 25 that were scoredfaorablv (indicatin2 both cosmitiN e stimulation and emotional support of the child). Ilesocioemotional and cognitive stimulation subscales consist of 11 items and 14 items,
respectively, with a family's score on each subscale indicatimz the number out of these items that
were scored favorably.
Methodoloeical work is in progress with the full set of parenting measures collected as part of the Descriptive
Study to examine whether new composite measures tapping more specific parentine constructs can be created that
are reliable and valid. Depending on the results of this methodological work, future reports of the JOBS Child
Outcomes Study may go beyond the liOME-SF to describe the home env ironment.
One item from the HOME-SF. focusing on contact wtth the child's father was considered inappropriate for the
present sample given the infrequent contact between children in the sample and their fathers (see Chapter 4). This
item Sk ,b omitted from analyses w ith the Descriptive Study sample as w ell as the comparative analyses carried out
ith NLSY-CS data.
73

Our reliance in this report on the HOME-SF is in part based on the fact that this samemeasure is also available in a national data set. the NLSY-CS. We will thus be able to examinedata from our sample in relation to that for both AFDC and non-poor families in the NLSY-CS.Other analyses looking at the HOME-SF within the NLSY-CS indicate that tins measure isclosely related to several different indices of family poverty, and further, that the HOME-SF issensitive to small increments in family income, particularly when looking at the homeenvironments of children born into poverty (Garrett et al., 1994; Moore et al., 1994). Finally, thefull HOME Scale (Caldwell and Bradley, 1984), from which the HOME-SF is adapted, has beenfound to be related to measures of child cognitive development and IQ, developmental delay, andpoor school performance (Bradley et al., 1989; Elardo, Bradley, and Caldwell, 1975; Gottfried,1984). all important outcomes in the Descriptive sample.
Key Questions for Chapter 6
What are the home environments of the families in the Descriptive sample like?How do the Descriptive Study families compare to other welfare, non-welfarepoorand non-poor families in terms of the home environment?Are the cognitive stimulation and emotional support available to the child in thehome related to maternal depression, social support, and the extent of economicdeprivation? To other baseline characteristics?Is there evidence that stimulation and support in the home environment at the timeof the Descriptive survey are related to the available measures of children'sdevelopment?
Findings
In the iarge majority of families, the home environment was described as safe andorganized.
The HOME-S12 cognitive stimulation items describe the safety and organization of thehome environment, materials like books available to the child, and direct interactions and outingsv,ith the child that foster comiitive development. Interviewers rated the home environment assafe and organized for the lame majority of families in the Descriptive sample. For example, inonly 8 percent of the families did the interviewer rate the play environment of the child as havingphysical hazards, and in only 16 percent of the families did the interviewer rate the horne as darkor perceptually monotonous.
74

Most mothers reported that someone in the home was helping the child with basicacademic skills, such as learning colors and shapes. By contrast, cognitivelystimulating material resources in the home, stimulating outings outside of the home,and opportunities to read with the mother, were less consistently available to the
children.
Almost all of the mothers reported that someone at home was helping the child to learn
colors, numbers, the alphabet, shapes and sizes. For example, 98 percent of the mothers reported
that the child received such help at home for learning numbers. However, only 59 percent of thechildren in the sample had 10 or more books of their own, and only 45 percent of the children in
the sample had use of a record player or tape recorder and at least five children's records or tapes.While 70 percent of the mothers reported that the child went on outings with a family member
two to three times a month or more often, only 54 percent of the mothers reported an outing to
any type of museum in the past year. Only 45 percent of the mothers reported that they readstories to the child more than once a week.
Emotional support available to children also presented a mixed picture.
The emotional support subscale of the HOME-SF includes items describing the emotional
tone of the mother's interactions with her child, observed and reported physical punishment ofthe child, and structuring of the child's day so as to provide choices and support.
In some ways. children appeared to be living in emotionally supportive homeenvironments. The large majority of mothers were rated by the interviewers as conversing with
the child at least twice in a positive tone during the interview (83 percent) and talkina in a way
that conveyed positive feeling about the child (91 percent). Physical punishment was rarelyobserved during the course of the interview. Only 1 percent of the mothers were observed to slap
or spank the child. Giving the child latitude in selecting foods is viewed as providing the child
with an opportunity for decision makina, and the large majority of children were given latitude in
choosing what they ate at breakfast or lunch (78 percent).
Yet in other w ays emotional support was more limited. While physical punishment was
rarely observed during the course of the Descriptive survey, by their own report. 26 percent of
the mothers had spanked their children twice or more over the course of the past week. Few of
the children (13 percent) ate a daily meal with both their mother and father or a father figure.
(As reported in Chapter 4. however. 98 percent of the children's fathers do not live in the
household.) In addition. during the home visit. only 28 percent of the mothers introduced the
interviewer to the child by name.
In sum, it appears that on some measures the children in the Descriptive sample quite
consistently received positive cognitive stimulation and emotional support. while on other
measures stimulation and support were less available. We turn now to the question of how the
75

composite measures of cognitive stimulation and emotional support in the Descriptive samplecompare with levels reported in other samples.
Mean scores on the HOME-SF (total score as well as socioemotional and cognitivesubscales) were slightly higher in the Descriptive sample than in a national sampleof AFDC families with three- to five-year-old children, but these small differenceswere not always significant.
As noted above, Zill et al. (in press) have )reviously examined HOME-SF total andsubscale scores for AFDC and non-welfare families in the 1986 wave of the NLSY-CS. For thepresent report, we update the work of Zill and colleagues, looking at the HOME-SF total andsubscale scores of families with three- to five-year-olds in a more recent wave of the NLSY-CSdata set. that from 1988. We will be using a 1988 NLSY-CS sample that randomly selected onepreschool-aged child per family. We can, in this way, compare the identical measure of thehome environment across two AFDC samples with young children. In addition, we can contrastboth AFDC samples with poor families not receiving welfare and with non-poor families in thenational sample.
We should auard against the assumption that the Descriptive sample and the NLSY-CSweltbre sample should look identical in terms of the home environment. Indeed, the two samplesdiffer in certain key respects. Me NLSY-CS sample includes a higher proportion of mothers
ho gave birth for the first time as teenagers. Further. the mean age of the mothers in theNLSY-CS welfare sample is younger than in the Descriptive sample. Consistent with ourprevious report that a high proportion of mothers in the Descriptive sample have taken strongsteps to limit their fertility. family size in the NLSY-CS welfare sample is larger than that in theDescriptive sample. Finally, mothers in the Descriptive sample are almost all African American,while this is not the case in the NLSY-CS welfare sample. In general, the NLSY-CS welfaresample appears to be an even more disadvantaged sample of welfare mothers with preschoolersthan the Descriptive sample. Our recurring observation of heterogeneity among welfare familiesis further underscored by these differences between the two samples.
Fable 6.1 shows means for the HOME-SF total score, emotional support subscale andcognitive stimulation subscale for the Descriptive sample. and the NLSY welfare, non-welfarepoor and non-poor families with three- to five-year-olds." As can be seen. Descriptive Studyfamilies have mean scores that are slightly. hut significantly, higher than those of the NLSY-CSwelfare families on the total score and cognitive subscale. and similar to those of NLSY welfarefamilies on the sociocrnotional subscale.
I.-tests for mtkpendent samples %%or: calculated !,) me ins the DescripuNe Study sample to the NI_SY-CSsample
76
I t

TA
BL
E 6
.1N
IEA
NS
OF
IIO
ME
-SF
SCA
LE
S FO
R D
ESC
RIP
TIV
E A
ND
NL
SY-C
S D
AT
A S
ET
S
I IO
U'.
Scal
e
Des
crip
tive
Sam
ple
(a)
Wel
fare
Fam
ilies
NL
SY-C
S 19
88 (
b)
Poor
, Non
-wel
fare
Fam
ilies
Non
-poo
r, N
on-w
elfa
reFa
mili
es
lota
l liO
ME
'ica
le17
.06
16.3
8**
17.6
8**
19.9
4***
(Ran
ge 0
-25)
(ogn
itive
Stim
ulat
ion
10.5
110
.04*
*10
.65
12.0
0***
Subs
ea le
( R
ange
0-1
4)
Soci
oem
otio
nal S
ubse
a le
6.56
6.35
7.03
***
7.94
***
(Ran
ge 0
-11
)
S( 0
'RC
L.:
Chi
ld 't
rend
s, I
nc. c
alcu
latio
ns o
f E
u,n
Cou
nty
Des
crip
tive
Stud
y Su
rvey
dat
a an
dN
atio
nal L
ongi
tudi
nal S
urve
y of
You
th-C
hild
Sup
plem
ent (
NL
SY-C
S) d
ata,
198
8 co
hort
.
No
I L
S:la
ble
\ alu
es a
re b
ased
on
wei
ghte
d da
ta.
(a)
T-t
ests
for
inde
pend
ent m
e,.n
s w
ere
cond
ucte
d to
com
pare
the
mea
nfo
r th
e D
escr
iptiv
e sa
mpl
e to
the
mea
ns f
or th
e
NL
SY-C
S su
bgro
ups.
Ast
eris
ks in
dica
te N
LSY
-CS
grou
ps th
at d
iffe
r fr
om th
eD
escr
iptiv
e sa
mpl
e. *
* p
< .0
1, *
** p
< .0
01.
(b)
A p
airw
ise
com
pari
son
of m
eans
was
con
duct
ed I
A it
hin
the
abov
e N
LSY
-CS
subg
roup
s.A
ll di
ffer
ence
s be
twee
n
mea
ns in
eac
h su
bgro
up \\
ere
sig
nifi
cant
at
leas
t at t
he .0
5 le
vel.

Mean scores on the HOME-SF were higher for the non-poor families in the NLSY-CS than for the welfare families in either sample.
Comparisons of the means in Table 6.1 show that non-poor families in the NLSY-CS hadhiaher scores on the HOME-SF total scale, emotional support subscale and cognitive stimulationsubscale than families in the Descriptive sample. Within the NLSY-CS sample, statisticalcomparison of the means in the three groups indicates that non-poor families had significantlyhigher scores on all three measures of the home environment than either welfare or poor non-welfare families.
Comparable proportions of Descriptive Study and NLSY-CS welfare families can becharacterized as showing "low" levels of stimulation and support in the homeenvironment. However, a smaller proportion of Descriptive Study than NLSY-CSwelfare families could be characterized as showing "very low" levels of stimulationand support.
As had Zill and colleagues (in press). we used the distribution of scores in the NLSY-CSsample of three- to five-year-olds to oemarcate differing levels of stimulation and support in thehome environment on the HOME-SF total score. We defined "low levels of stimulation andsupport" as HOME-SF total scores in the bottom 28 percent' of the full 1988 NLSY-CS samplewith three- to tive-Rar-olds (a score of 18 or less). We defined "extremely low levels ofstimulation and support" as scores i ithe bottom 10 percent of the full 1988 NLSY-CS samplewith three- to five-year-olds (a score of 15 or less).
As can be seen in Fiaure 6.1. nearly the same proportion of the Descriptive sample andthe NLSY-CS welfare families (56 percent and 57 percent respectively) fell into the "lowstimulation and sppport" category when defined in this way. Thus, more than half of eachsample of welfare families could be characterized as providing relatively low levels of cognitivestimulation and emotional support to their youna children at home. By contrast, only 18 percentof the non-poor families in the NLSY-CS sample with preschoolers could be categorized asshowina "low stimulation and support."
' 'We attempted to use a cutoff indicatim2 the loo,est 25 percent of scores, but due to the distribution of scores inthe NI.SY-('S sample. 28 percent o, as the closest o,e could come to the lowest quartile.
7 8

TO%
60%
50%
40%
30%
20%
10%
0%
FIGURE 6.1
COMPARISON OF DESCRIPTIVE DATA TO NLSY-CS1988 ON THE HOME TOTAL SCALE: LOW SCORES
56% 57%
44%
1 8%
Dscrlothno NLSY. Welter. NLSY Poor.Non-Wertfiro
NOTE "Low score defInd Ign the bottom 28% of NLSY total sample
NLSY Non-Poor.Non-Welforo
The picture differed somewhat when considering the more severe cutoff of "extremely
low levels of stimulation and support." A higher percentage of the NLSY-CS welfare families
than the Fulton County families in the Descriptive sample fell into this category (29 percent and
18 percent respectively: see Figure 6.2). Both samples of welthre families far exceeded the
proportion of non-poor families (Only 4 percent) falling into this extreme category.
35%
30%
25%
20%
'0%
5%
;3%
FIGURE 6.2
COMPARISON OF DESCRIPTIVE DATA TO NLSY-CS1988 ON "FHE HOME TOTAL SCALE:
EXTREMELY LOW SCORES
29%
Decripliy NI. SY Welfare NLSY PoorNon.Welfane
VOTE "Eytremely Low' score defined as bonorn 10% of NLSY total sample
NLSY Non-Poor.Non.W.Itor.
It is clear from these data that the welfare families in both the Descriptive sample and the
NLSY-CS sample show lower levels of stimulation and support in their home environments than
non-poor families. Ilowever, the Descriptive sample has a somewhat more favorable profile in
terms of the home environment than the AFDC families in the NLSY-CS. particularly with
regard to the proportion showing extremely low levels of stimulation and support. These
79

findings again point to the importance of distinguishing among welfare families, and taking intoaccount such factors as maternal age, age at first birth, and family size in understanding theirfamily situations. We turn now to consideration of this variability in the home environmentwithin the Descriptive sample.
The measures of the quality of the home environment for children varied within theDescriptive sample, especially according to markers of extent and duration ofpoverty and disadvantage.
We looked at the cognitive and socioemotional subscales of the HOME-SF in relation tomaternal, child, and family background characteristics at baseline. Controlling for the influenceof child age, gender, and research group, both the cognitive stimulation and emotional supportsubscales of the HOME-SF were significantly lower for families in which the mother had notreceived a high school diploma or GED, had been receiving welfare for two or more years, whenthe family lived in public housing, and when the mother scored in the lowest groups on readingand math literacy tests taken prior to random assig.nment (see Appendix B, Tables 6.1-2 and 6.1-3). All of these are baseline markers of extent of disadvantage.
in addition, scores on both the coimitive and socioemotional subscales of the HOME-SFwere lower when there were three or more children in the family, and when the mother had amore external locus of control. Mothers who reported more barriers to their own employment atbaseline had significantly lower scores on the cognitive. but not the socioemotional. subscale ofthe HOME-SF.
Based on the literature, it was our expectation that the home environment measures wouldalso differ accordinu to mothers baseline reports of their own depressive symptoms and socialsupport. I-here was only partial support for these predictions. No relationship was foundbetween the IOME subscales and our brief baseline index of maternal depressivesmptomatology. However. mothers reportinu less social support at baseline had lower scoreson the cognitive subscale of the I IOM
Controlling fbr the influence of child age and research group. gender differences wereapparent for the socioemotional but not the cognitive subscale. Boys received significantly lessemational support at home than did girls (although the group difference was small; see Appendix'Fable 6.1-3).
In sum. stimulation and support in the home environment do vary in meaningful waysaccording to background characteristics, even within a sample of welfare families. The mostconsistent pattern to emerge is that subgroups characterized by greater economic disadvantagev% ere most likely to receive lower scores on the home environment subscales.

The measures of the home environment were significantly related to children'sdevelopmental status in all areas of development examined in the Descriptive Study
survey.
Data from the Descriptive survey were consistent with other research showing measures
of the home environment to be important predictors of children's development. Net of child age,gender and research group, the three measures of the home environment (the total score andcognitive and socioemotional subscales of the HOME-SF) were all significant predictors of
children's scores on the Peabody Picture Vocabulary Test, the Preschool Inventory, and thePersonal Maturity Scale (see Table 6.2 and Appendix B Tables 6.2-I to 6.2-4). In all instances,
more supportive and stimulating home environments predicted more optimal developmentalstatus. In addition, the cognitive subscale and HOME-SF total score were associated with thechild receiving a positive health rating, while the socioemotional subscale was not. With only asingle exception, then, our measures of the home environment were significant predictors of allindices of children's developmental status at the time of the Descriptive survey.
Summary
Findings from the Descriptive sample are in accord with previous reports that children
living in poverty receive less cognitive stimulation and emotional support in their homeenvironments than non-poor children. At the same time there is evidence of variability in thehome environments of families. This variability is related on the one hand to family backaroundcharacteristics, especially the extent of economic deprivation, and on the other hand to children'sdevelopmental status at the time of the Descriptive survey.
8 I

TA
BL
E 6
.2A
SSO
CIA
IO
N 1
31..1
VIL
NI
I IO
ME
SC
AU
S A
ND
ME
ASt
IRE
S O
F cl
liL
D D
EV
EL
OPM
EN
T (
a)
)Ntl.
. Sca
lePP
VI
-RPS
IPM
SC
hild
in e
x.ce
llent
heal
th/N
o di
sabi
lity
otal
110
111:
Sca
le(R
antle
0-2
51
( og
nitiv
e St
imul
atio
n Su
bsca
le(
Ran
ge 0
-14
)
Soci
oem
otitt
nal S
uhsc
ale
(Ran
ge 0
-11)
+
0
S01
.RC
1::
I re
nds.
Inc
. cal
cula
tions
of
Fulto
n C
ount
\ Des
crip
the
Stud
ysu
rvey
dat
a.
N(
ahle
\ al
lies
are
base
d on
\\ e
ight
cd d
ata.
Stat
istic
al s
igni
fica
nce
leve
ls a
re in
dica
ted
ast"
0.1
2.0
5 an
d po
sitiv
e co
effi
cien
t; "2
if 1
2.0
5 an
a ne
gativ
eco
effi
cien
t; "0
"no
t siu
nifi
cant
.01
,5 r
egre
ssio
n an
al.\s
es \A
cre
cond
ucte
d 1b
r th
e PP
VT
-R. P
SI a
nd M
IS s
cale
s; lo
gist
ic r
egre
ssio
nan
alys
es w
ere
used
lor
heal
th r
atin
g of
chi
ld. A
naly
ses
cont
rol f
or c
hild
's a
ge a
nd g
ende
r, a
nd r
esea
rch
grou
p st
atus
. See
App
endi
x T
able
s 6.
2-1
to 6
.2-4
.(a
) M
easu
res
of c
hild
dev
elop
men
t are
the
Peab
ody
Pict
ure
Voc
abul
ary
Tes
t-R
evis
ed (
PPV
T-R
), th
e Pr
esch
ool
Inve
ntor
y (P
SI),
the
Pers
onal
Mat
urity
Sca
le (
PMS)
. and
a r
atin
g of
chi
ld's
hea
lth.

CHAPTER 7CHILD CARE
Background
There are two central reasons for focusing on child care within the Ft Iton Descriptive
sample. First, there is substantial evidence that the quality of child care that children receive is
important to their development (Hayes et al., 1990). Research in both center care and family day
care settings, using various measures of child care quality, consistently indicates that care quality
is associated with cognitive as well as social developmc:.: in young children. The three- to five-
year-old children in the Descriptive sample, many of whom have not started their primary school
education. are more likely than older children to experience changes in their care routines with
their mothers' participation in JOBS. Because child care arrangements represent an important
pathway through which the JOBS Program might affect children (Zaslow et al., 1995), it is
important to document the type and quality of the child care that children are receiving.
Second. the provision of funds to families to pay for child care is a key component of the
JOBS Proaram. The Family Support Act of 1988 mandates self-sufficiency activities for welfare
mothers. and simultaneously provides for the use of child care in association with these self-sufficiency activities. Mothers in the JOBS Program are guaranteed child care funds "if child
care is necessary tbr the client to attend a proaram activity or accept employment- (Hamilton and
Brock. 1994. p. 73). 'Transitional child care payments are also available for a 12-month period to
clients transitioning from welfare to employment. Both program and control group mothers in
the JOBS Evaluation have access to these funds. Program group mothers can also get help
locating child care through the JOBS Program.
In the Fulton County JOBS Program. mothers are free to choose the type of care they
lt ant. including unlicensed home-based care. licensed care in a home setting. and an established
day care center. Reimbursement rates for child care are established according to the local market
rates. and are generally higher for licensed than for unlicensed providers. Payments for services
delivered are provided directly to the child care providers.
It is important to examine whether. at this early point in the evaluation, more mothers in
the program groups use child care. and child care funds. than mothers in the control group. as a
result of the JOBS participation requirements. As mentioned in Chapter 3. respondents in both
the human capital development group and labor force attachment groups are significantly more
likely than women in the control group to ha%e participated in education or job training progaims
;ince their random assignment dates. [hese experiences may be associated with an increase in
the use of child care in the program groups. A limited hut interesting body of research on child
care use among AFDC and low income families can guide us to more specific predictions and
expectations about child car,: use in the Descriptive sample.

Amount of care. Previous evaluations of welfare-to-work programs show maternalprogram participation to be associated with increased use of child care for young children. Datafrom the Teenage Parent Demonstration are particularly relevant here because, like JOBS, thisprogram involved mandatory participation in self-sufficiency activities for AFDC mothers, andbecause data are available from about the same point in time as in the Descriptive survey: fourmonths following enrollment. At the same time, it should.be kept in mind that the TeenageParent Demonstration targeted teenage mothers rather than the heterogenous population ofwelfare mothers, and that these mothers tended to have a child younger than the children in theDescriptive Study. In the fourth month of the Teenage Parent Demonstration, about 20 percentmore experimental than control group mothers were using child care (Kisker and Silverberg,1991). This pattern of increased use of child care is corroborated in the evaluations of o'herwelfare-to-work pro2rams. includin2 the New Chance Demonstration for teenage AFDCmothers, and the evaluation of California's JOBS Program. GAIN (Meyers, 1993; Quint etal.,1994; Riccio et al., 1994).
Together, these studies lead to the prediction that in the Descriptive sample, a higherproportion of mothers in each of the pro2ram groups than in the control group will be using childcare for the focal child even at this early point in the evaluation.
Tyne of care. A consistent finding in the research on child care is that low incomemothers who use care are more likely than other mothers to rely on "informal" child carearrangements, that is care by relatives and friends. For example. in one recent study focusing onAFDC mothers who were employed. approximately two-thirds reported relying on informal care(Bowen and Neenan. 1993: see also Meyers and van Leuwen. 1992).
Yet some researchers caution that this pattern of reliance on informal child care shouldnot he misinterpreted as the preference of AFDC mothers. Use of "market" or "formal" childcare arrangements by w el thre mothers. that is care in child care centers, preschools, Head Start,after-school programs or organized family day care homes. has been found to be related stronglyto families' use of child care subsidies. suggesting a financial barrier to use of formal care amongwelfare families (Meyers and van Leuwen, 1992: Siegel and Loman, 1991). Further, whenmothers just entering the GAIN program were asked what form of child care they hoped to usewhile they were engaged in education and training activities, a higher proportion pointed toformal care arrangements as their preference than were currently using such care (Meyers andvan Leuwen. 1992). Bowen and Neenan (1993) also report that AFDC mothers who were usingformal child care \ ere luore likely to report preferring their current arrangement than mothersusing informal care.
1.wo studies have reported par iculat I> large increases in the use of formal carearrangements once mothers have started weltbre-to-work programs. Mothers in GAIN not onlyindicated a preference for formal care arrangements at the time of enrollment, as noted above, hutthree months atler enrollment in the program there were already substantial increases in their useof child care centers and licensed dav care homes (Meyers. 1993). In the New Chance
S4

Demonstration, 63 percent of experimental group mothers hut only 33 percent of control group
mothers had used center day care or a preschool for the focal child in the 18 months after the start
of the program. There was also significantly greater use of family day care or care by an
unrelated babysitter in the New Chance experimental group than in the control group, but the
difference was far less marked (28 percent in the experimental group, 24 percent in the control
group). Similarly, a study of single-parent AFDC recipients in Illinois found an increased use of
center-based child care among JOBS participants (Siegel and Loman, 1991). In addition,
MDRC's report "The JOBS Evaluation: Early Lessons From Seven Sites- (Hamilton and Brock.
1994) indicates that in the Fulton County JOBS site, although mothers were free to :noose the
type of child care, the JOBS staff encouraged mothers to use licensed child care settings.
It is important to examine. then. whether assignment to the JOBS Evaluation program
groups in the Descriptive sample is associated with an early increase in all types of child care, or
particularly with an increase in the use of formal care arrangements.
Payment for child care. Low income families are less likely to pay for child care than
are other families. Braylield. Deich. and Hofferth (1993). reporting on data from the National
Child Care Survey, indicate that only 44 percent of employed mothers in low income families
paid for the care of their youngest preschool-aged child. Those low income families with a child
under age five who did pay for care paid only $36 per week, on average, for the care of all
children in the family. Families who were on welfare or had been in the past year paid even less
for child care: $30 per week on average.
Previous research suggests that not all mothers participating in JOBS will report receipt
of child care funds through JOBS. Early reports from the Fulton County site of the JOBS
Nvaluation indicate that six months after the orientation for the JOBS Program. 38 percent of
mothers in the human capital development group. and 47 percent of those in the labor force
attachment group. reported receipt of child care payments or reimbursements. Among those who
actually went on to participate in JOBS educational or employment activities, approximately
two-thirds in each group reported receipt of funds for child care. Further. a recent summary of
state data prepared by the Administration for Children and Families indicates that in fiscal year
1992. about 33 percent of children between the ages of three and live with mothers in the JOBS
Program received Title IV JOBS funds. the child care subsidy provided through JOBS (U.S.
Department of Health and I luman Ser . ices. 1994).
Why might it be the case that some mothers with preschool-aged children in JOBS would
not report receipt ofJOBS child care funds? First. us the research of Braylield and colleagues
( 1993 ) indicates, a substantial proportion of low income mothers do not make any payments for
child care. Second. it is possible that some mothers are unaware of child care benefits for which
they are eligible. In a recent study, NIeyers (1995) found that one-third of single parent AFDC
recipients in a sample drawn from lour California counties were unaware of the child care
-,u6sidy for which they were eligible. fhus. there are reasons why some eligible mothers mav
not report use oi-J0135 child care funds. .11 the same time, there are reasons that mothers may
55
1

report making payments for child care whether or not they also rely on JOBS child care funds.For example. mothers may use child care beyond the hours of their JOBS educational andemployment activities. Further, mothers may choose to pay more for their child care than isreimbursed at market rates with JOBS funds, for example if they choose higher quality care thatis more costly.
The previous research suggests that we will want to ask two key questions regardingpayments for child care in our sample. First, what proportion of mothers report making any.payment towards child care for their three- to five-year-old child? Second, will there be adifference in the proportion of mothers in the program groups and the control group reporting thereceipt of child care subsidies through JOBS? Previous research suggests that only a minority ofmothers in the sample will report makina any payment for the focal child's child care, and thatmany but not all of the mothers in the program aroups will report receipt of child care assistancefrom the JOBS office.
Quality. Recent research on the quality ofcare leads to somewhat contradictorypredictions for the Descriptive sample. Analyses looking at the quality of care provided in childcare centers in relation to family socioeconomic status indicate that low income families usecenter care that varies areatly in terms of quality. On average, however, it is middle class, ratherthan poor or upper-income thmilies. whose children are most likely to he in centers of the poorestquality (Phillips. Voran. Kisker. Howes. and Whitebook. 1994). At the same time, there isevidence that center care in the Atlanta area is. on ayeraae. of particularly low quality. TheNational Child Care Staffing Study (Whitebook, Phillips. and Howes, 1989) studied child carecenters in five metropolitan areas (Atlanta. Detroit. Phoenix. Seattle and Boston), and concludedthat Atlanta offered center care of substantially lower quality than that in the other sites. Thislower quality reflected, at least in part, minimal child care regulations in Atlanta. Both theNational Child Care Stanina Study ( Whitebook et al.. 1989), and more recently the study ofCost. Quality, and Child Outcomes in Child Care Centers (Helbum et al.. 1995) found that betterquality centers are more likely to be found in states with stricter regulations regarding child carequality. Further, child care regulations in Georaia are reported to be "among the least rigorous inthe country- ( Whitehook et al.. 1989. Atlanta report. p. 3). For example. while the FederalInteragency Day Care Requirements (HDCR) recommend a staff-child ratio of 1:8. Georgiapermits ratios of 1:18 for four-year-olds.
We note further that the nature of the AFDC mothers' job training, education, and actualemployment schedules may act as an'impediment to the use of high quality child care.Employment and trainina may occur at irreuular hours (e.g.. evenings, weekends, varying shifts)rather than during the hours high qualit, formal child care may be available (Presser. 1986).
While these findimis do not pertain to all fOrms of care that may he used by Fultonmothers. they do raise the possibility that when Lenter care is used, it may he of highly variablequality. We must carefully examine the possibility that a proportion of the formal care settings
86

used by children in the Descriptive sample will he of poor quality in terms of such quality
markers as group size and staff-child ratio.
Key Questions for Chapter 7
Prior to mothers random assignment to the JOBS Evaluation, what type of child
care had the children experienced? Did these experiences vary with background
characteristics of the families?How can we describe the current child care used by children in terms of amount,
type, quality, and cost?Is there any evidence of early program impacts on amount of care, type of care, or
how and how much families pay for child care?
Findings
In the Descriptive survey, we asked mothers about both their children's child care history
and about their current child care experience. Regarding child care history, data collected using a
retrospective calendar allowed us to examine the child's month-by-month participation in
nonmaternal care, from birth to the time of the Descriptive survey. Mothers were asked during
which months of the child's life the three- to five-year-old child had participated in formal and
informal child care settings. and whether such care was used for 35 hours per week or more.
Thus, we are able to report on mothers' recollections of their children's experiences in formal and
informal care from the time of the child's birth to the time of the Descriptive Study. In some
instances, we look separately at child care prior to and after the mother's random assignment to
the JOBS Evaluation because of the possibility that random assignment to one of the program
groups in the study (i.e., participation in JOBS) may have altered cid care participation in these
familics.
Regarding current child care. we asked mothers to describe up to four current regular
child care arrangements in terms of type of care. hours per week spent in care, number of
children cared for, staff-child ratio. caregiver education and training, and cost of care. We also
asked about mothers' child care preferences and about care settings mothers would not be willing
to use. Throughout this chapter. "regular- child care is defined as an arrangement used at least
once a week for a month or more. In addition, a "formal" child care setting is defined as care in a
center. nursery school, preschool, Head Start. or kindergarten, while an "informal" care setting is
defined as care by a babysitter who is either a relative or nonrelative.
More than half of the tive-year-old focal children i the Descriptive sample (61 percent)
had already started kindergarten. Further, very few of the children in kindergarten (6 percent)
had a before- or atter-school child care arrangement. Because we are particularly interested in
the implications ofJOBS for child care experiences prior to the start of elementary school, the
87

sections that follow will focus specifically on the three- and four-year-old children in Oursample.'
From mothers' reports of child care use prior to their assignment to the JOBSEvaluation, we see a pattern of greater reliance on formal child care in our samplethan is suggested from previous reports of child care use among AFDC families.
Prior to the date of the mothers' random assignment to program or control groups withinthe JOBS Evaluation, 51 percent of the three- and four-year-old children had been cared for atsome time in a formal care setting, and essentially the same proportion (50 percent) had beencared for at some time in an informal care setting, possibilities that wre not mutually exclusive.Only 25 percent of the mothers reported that their three- or four-year-old focal children had neverreceived any regular child care prior to random assignment. Unfortunately, these data do notpermit identification of the context in which formal and informal care were used. For example,we do not know whether informal care was relied upon primarily for employmeit duringevenings or weekends. or occurred during the daytime on weekdays. We do not know if the careused was the mothers' preference or reflected constrained choice.
These data differ from previous reports indicating that AFDC families rely more heavilyon informal types of child care. There are two possible interpretations. First, these data arerestricted to whether or not formal and informal care were ever use and do not reflect hoursspent in these different types of care. Perhaps the previously reported pattern of greater relianceb,. FDC mothers on informal care would emerge if we had information as to extent of use. Thealternative interpretation is that because of differences between the Descriptive sample and othersamples. the mothers in our sample have indeed relied more than other AFDC mothers on formalcare.
Differences in the availability of formal care and in the composition ofour samplerelative to other samples of AFDC mothers miuht contribute to such a pattern. There areregional differences across the I inited States in the relative availability of formal and informalchild care. In the South. the pattern is more heavily weighted towards formal care than in otherregions of the country (Willer et al.. 199 D. and available child care in Fulton County may reflectthis pattern. In addition. although findings are not entirely consistent, there have been somereports that African merican families are more likely than other groups to choose center care(Meyers and van Leuwen. 1992). Thus. the racial composition of the Descriptive sample mayalso help explain the pattern.
In order to !mike in equitao,,: comparison between reearcil croups. these analyses were conducted on a subsample ofDescriptice study respondents w till three- and four-y ear-oid focal children %lio were randomly assigned to the JOBS Evaluationafter funding became aailable for sampling members of the control group. Sample sizes in the tables for this chapter differl.rom those in other chapters accordingly In this chapter. w hen we reter to results for three- and four-year-old focal children, weare referring to the program and control croup children ot this age who enrolled in the study during the same timc period.
1 `)

Even prior to their mothers' participation in the Descriptive survey, children hadparticipated in some regular child care for a substantial part of their lives.
Three- and four-year-old focal children who had ever participated in some form of regularchild care had done so, on average, during 40 percent of the months of their lives. However, therange was substantial. These young children had experienced regular child care during as littleas 2 percent or as much as 98 percent of the months of their lives, up to the point that theirmothers enrolled in the JOBS study.
Use of child care was associated with mothers' employment in the period prior tomothers' participation in the JOBS Evaluation.
Considering the time from the child's birth to enrollment in the evaluation, mothers whoworked full-time were significantly more likely to have children who participated in regular child
care during a substantial part of their lives (defined as at least 25 percent of the months of theirlives). While 70 percent of mothers who had been employed full-time at some point prior to theEvaluation had children who had experienced any regular child care during at least a quarter ofthe months of their lives, only 26 percent of mothers who had not been employed full-time had
children in regular care to this extent.'
Use of child care for the focal child, prior to enrollment in the .JOBS Evaluation,was also related to maternal background characteristics.
Families in which the focal child had experienced any refzular child care during at least 25
percent of the months of his or her life prior to the start of the study differed from families inwhich child care had not been used as extensively or not useu at all. Children who hadexperienced reaular care to a ureater extent were more likely to be the only child in the family, tohave mothers who had completed high school or received a GED at baseline, and to have
mothers who scored hiizher 2adina and math literacy tests a, baselin. Children were lesslikely to have experienced child care for at least 25 percent if the months of their lives when themother had been on welfare for two or more years. and when the mother perceived more barriersto employment (see Appendix B. Table 7.1-1
In a similar way, we asked whether children who had been in formal child carearran2ements for at least 25 percent of the months of their lives differed from those who had notexperienced formal child care as extensively er at all. As for use of any regular child care.children who had experienced a fair amount of formal child care were significantly more likely tohave mothers who had completed high school or a GED upon enteriniz the evaluation, and who
scored hi2her on reading tricl math literacy tests at baseline. In addition, these children were less
hi uuart: I I 1117 X. n 000
89

likely to be from families that had received welfare for two or more years (see Appendix B,Table 7.1-2).
In general, prior use of any regular child care and of formal care for a substantial portionof the child's life appear to be associated with higher education and literacy levels in the mother,and with shorter welfare duration.
Very shortly after enrollment in the JOBS Evaluation, there was a substantialincrease in the proportion of three- and four-year-o1.1 children in child care in thetwo program groups.
To look at changes in child care occurring soon after enrollment in JOBS, we used thecalendar data to examine the time period from two months prior to the date of randomassignment within the JOBS Evaluation, to two months after random assignment. Over this timeperiod, there was a small increase in the proportion of children in the control group in any formof regular child care from 43 percent to 49 percent. This change probably reflects a slow butsteady increase in families' use of regular child care as control group members move off welfareand find jobs at their own initiative, and as children grow older.
However, the increase in the two program groups across this same time period was muchmore dramatic. Two months prior to random assignment. 44 percent of the three- and four-year-olds in the human capital development group were partik.;pating regularly in some form of childcare, but two months after random assignment the figure was 72 percent. In the labor forceattachment group. 48 percent of three- and four-,ear-olds were participating in child care twomonths prior to random assignment, but 83 percent were receiving some regular child care twomonths after random assignment.
rhe proportion of families that showed an increase in their use of child care across thistime interval, either making a transition to using any care when they had not been using careearlier, or using iill time care when they had not done so earlier, differed significantly by group(see Table 7.1). Table 7.1 also shows that families in the labor force attachment group showedthe greatest increase in the use of child care. While participation in the human capitaldevelopment group may he delayed as participants wait for GED or other educational courses tobegin, those in the labor force attachment group are more likely to start piogram participation oremployment quickly. and initiate child care accordingly.'
" described in Chapter 3. vomen in the labor force attachment aroup %%erc significantly more likely than those in either thehuman capital development group or the control group to he emploed at the time of the Descriptive survey.

rABLE 7.1
PROPORTION OF FAMILIES SHOWING AN INCREASE IN USE OF CHILD CARE FROM TWO
MONTHS PRIOR TO RANDOM ASSIGNMENT TO TWO MONTHS AFTER RANDOM ASSIGNMENT. BY
GROUP
Type of Care Human CapitalDevelopment
Group
Labor ForceAttachment
Group
Control Chi-Square (a)
Any care 35 40 1 I 38.8***
Formal care (h) 2.7 30 8 27.9***
Informal care (c) 13 16 3 16.9***
Sample size (Unweighted) 157 146 168
SOURCE: Child Trends, Inc. calculations of Fulton County Descriptive Study data.
NOTES: Sample restricted to families with three- and four-year-old focal children that enrolled in the study
from August, 1992 to June, 1993.Increase in use of child care defined as making transition from no child care to any use of regular child
care, or from less than full-time care to full-time care. Families may have increased in more than one type of care.
(a) A chi-square statistic was applied to differences between the human capital development group.
labor force attachment group and control groups separately for each t pe of care. Statistical significance levels are
indicated as *** p <- .001, ** .01. * .05.
(b) Formal care includes care in child care center, preschool. nursery school. Head Start, kindergarten,
and before- and after-school program.(c) Informal care includes care by a relative or nonrelative babysitter.
91

Table 7.1 shows that these greater increases in use of care in the program groups relativeto the control group occurred both for formal and informal care settings, but were particularlylarge for formal care settings, As in previous studies of welfare-to-work programs, we find aparticularly marked increase in the use of formal child care settings following enrollment inJOBS.
We have fairly detailed information about amount, type, and quality of child care used atthe time of the Descriptive survey. We turn now to a detailed look at current child care use.
Children in the program groups were more likely to be in child care at the time ofthe Descriptive Study than children in the control group.
Turning from child care history and child care transitions to current use of child care, amajority of the three- and four-year-old children were in some regular form of child care at thetime of the Descriptive Study. I lowever, participation in regular child care was greater forchildren in the prouram groups than in the control group. Overall, 63 percent of the three- andlour-year-olds in the sample were participatine in some form of child care on a regular basis atthe time of the Descriptive survey. Only 48 percent of control group children in this age rangewere participatine in child care on a regular basis. compared to 70 percent uf the children in thehuman capital development group and 74 percent of children in the labor force attachment group.a sieniticant uroup difference."
There was a stronu relationship between maternal participation in educational and/oremployment activities following random assignment and the use of regular child care for thechild. This relationship held in both the prouram and control groups. Program group motherswere 16 times more likely to have used a reuular child care arrangement for their children in themonths followine random assiunment when they had participated in an educational oremployment activity. Control uroup mothers who had participated in an activity were 15 timesmore likely to have used reuular child care.'
White the association between child care use and educational or employment activities\\.a, similar in both the program and control uroups. as noted previously, by the time of theDescriptive Study (on average three months alter random assignment). program group motherswere substantially more likely to be participating in educational or employment activities. Thus,the ureater use of reuular child care at the time of the Descriptive survey for the two programgroups appears to he a reflection of their greater participation in employment and educationalactivities, not a differential propensit to use child care.
,..ittate (2) 25 29. a Iii
,1.1-tIc regression. p (100 I tor program a., v.el iN t:ontrol group mother,

Among those three- and four-year-old children receiving some regular child care, only 9
percent had more than one regular arrangement. Further, the use of multiple arrangements did
not differ by group. Because the piecing together of a mosaic of multiple child care
arrangements was not common in our sample, we focus on the characteristics of the children'sprimary arrangement, that is, the arrangement that they were in for the most hours each week.
Care in a child care center, preschool or nursery school was the most frequent form
of primary child care arrangement for the three- and four-year-old children at thetime of the Descriptive Study, apart from sole maternal care.
Figure 7.1 shows the proportion of three- and four-year-olds in our analysis sample using
different types of child care for their primary arrangement. At the time of the Descriptive Study.
a little more than a third of the children (37 percent; were in no regular child care arrangementand were cared for only by the mother. The most frequently used non-maternal child care
arrangement in the sample, used by 35 percent of the families, was care in a center, nursery
school or preschoot. Other commonly used arrangements were Head Start (the primary
arrangement for 14 percent) and care by a relative (12 percent).
FIGURE 7.1
PRIMARY CHILD CARE ARRANGEMENTS OF THREE-AND FOUR-YEAR-OLD CHILDREN AT THE
DESCRIPTIVE SURVEY
Kmatergarten 1%Cafe by Nonrotahv 2%
Care by Relahoo 12%
Mother Cares for Child 37%
H.Cd Start 14%
35%^etie Caro Conter/a4urerYSchooL/Prechool/After School Cate
NOTE Based on %ample ot three- and cour-%ear olds in human capital development, labor lorryattachment, and control families that enrolled in JOBS Evaluation under the same time period(N-.499).
There was a significant difference by group in the primary form of child care used
by families with three- and four-:ear-olds.
Children's primary child care arrangements were further Lharacterized as falling into one
of three categories: (I) sole maternal care: (2) care in an informal setting (by a relative or
();
BEST COPY AVAILABLE
,

nonrelative babysitter); and (3) care in a formal setting (including child care center, preschool,nursery school, Head Start, kindergarten, before or after school program). 46
When summarized in this way, the most frequently noted primary care arrangement forchildren in the control group was care by the mother (used by 53 percent of control groupfamilies with three- and four-year-olds). By contrast, care in a formal care setting was the mostfrequently noted primary care arrangement for children in either program group (used by 53percent of human capital development group children and 54 percent of labor force attachmentgroup children). These differences in primary care arrangement by group were statisticallysignificant (see Table 7.2).
Overall, three- and four-year-old focal children in the program groups spent morehours per week in non-maternal child care than children in the control group.However, considering only those children who were in regular care, groups did notdiffer in the average number of hours in care.
Including both those who had regular child care arrangements and those who did not,three- and four-year-old children spent, on average. 25 hours each week in child care. There wasa significant difference between the program groups and control group in hours per week spent incare, with human capital development group children spending 28 hours on average, labor forceattachment group children 30 hours on average, and control group children 18 hours.'
However, considering only those children in each of the groups who were in some formof regular care, the average number of hours per week did not differ significantly by group(means for human capital development group, labor force attachment group and control groupswere 40, 40 and 37 hours per week respectively). Thus the groups seemed to differ more interms of whether or not children were in a regular arrangement, and in the type of regulararrangement, than in terms of hours spent in child care among those who were participating insuch care.
We note that the Descript0 e suro did not ask Npeciticall about licensed cantil day care As a result, our category"formal child care arrangement" differs from that used in some pro ious studies.
Ft2.494v-15 07. 001.
94

TABLE 7.2PROPORTION OF FAMILIES USING SOLE MATERNAL CARE, FORMAL CHILD CARE, AND
INFORMAL CHILD CARP AS THEIR PRIMARY ARRANGEMENT. BY GROUP
Type of Primary Arrangement Human CapitalDevelopment
Group
Labor ForceAttachment
Group
Control Chi-Square (a)
Maternal care 30 26 53 29.93***
Formal care (b) 53 54 42 6.44*
Informal care (c) 17 10 6 15.92***
Sample size (Unweighted) 195 119 195
SOURCE: Child Trends, Inc. calculations of Fuiton County Descriptive Study data.
NOTES: Percentages do not add up to 100 due to rounding.Sample restricted to families with three- and four-year-old focal children in human capital
development group, labor force attachment aroup and control groups that enrolled in the study from August, 1992
to June, 1993.Primary arrangement is the arrangement currently used for the most hours each week.
(a) A chi-square statistic was applied to differences between the human capital development group,
labor force attachment aroup and control aroup separately for each type of care. Statistical significance levels are
indicated as *** 2 .001. ** 2 .01, * 2- .05.(b) Formal care includes care in child care center, preschoo.. aursery school. Head Start. kindergarten,
and before- and after-school program.(c) Informal care includes care by a relative or nonrelative babysitter.
95

The FIDCR recommendations were used as a reference point for describing thequality of the formal child care settings that children were experiencing.
In 1980, the federal government issued recommendations for group size, caregiver-childratios, and caregiver training for formal child care settings in the form ofthe Federal InteragencyDay Care Requirements (FIDCR). The 1980 FIDCR were never implemented as nationalreaulations, yet they remain widely respected indicators of child care quality. Researchersfrequently refer to FIDCR standards as a benchmark against which to measure center quality.For example, the National Child Care Staffing Study found more high quality child care centersin those locations that adhered more closely to the FIDCR recommendations. While othermethodologically more rigorous approaches are available for the measurement of center quality,these often involve direct observation in the classroom (e.g., the use of the Early ChildhoodEnvironment Rating Scale or ECERS, in the Child Care Staffing Study, Whitebook et al., 1989;and in the study of Cost, Quality, and Child Outcomes in Child Care Centers; Helburnet al.,1995 ). Given the nature of the data available to us in the present study, we will follow closelythe strategy used by Phillips. Howes. and Whitebook. (1992), describing center care in terms ofthe number of FIDCR recommendations centers did and did not meet.
For children between three and five years of age. the FIDCR recommendation is foruroup sizes of 16 or smaller, and for staff to child ratios of 1:8 or better. The FIDCR alsorecommends that careuivers participate regularly in specialized training. The requirements fori2.roup size and ratio in the state of Georgia depart substantially from the FIDCRrecommendations, allowinu group sizes of up to 36 and ratios of up to 1:18 for four-year-olds.
In the Descriptive Study we did not ask mothers whether caregivers were receivingongoing professional training. However, mothers did report on group size and the number ofcareuivers in their child's group. thus permitting tabulation of staffto child ratio. While weshould be careful to view these data as mothers' perception of tfroup size and number ofcareuivers per tfroup. Hofferth. West. Henke. and Kaufman (1994) conclude that maternal reportagrees to a reasonable extent with director report on these particular factors. We do note.however, that in our sample we have missiniz data on group size and number of caregivers forabout 25 percent of the cases for three- and four-year-old focal children who were in formal childcare arranuements other than kinderitarten, indicating some uncertainty among mothers on thisinformation. We hypothesize that those mothers most concerned about child care quality wouldseek out information on uroup size and ratio (as well as caregiver training and education), and beable to report it: and that those not reporting on these care characteristics would be more likely tohe using centers of poorer quality. If this is indeed the case, then our portrayal of cemer carequality below may he somewhat optimistic.
" We did about the education and tramine lesel of the local Lhild\ Lareeisers. flov.eser. mothers in the Descriptive-,uople often had di fflcult ryortme on Lare.21%er eduk..tiwn and trwome his information is rmssing for nearl half of the-ample (18 percent). and thus %+e do not feel confident in reponing summar figures for these child care characteristics.
96

Keeping the limitations of the maternal report data in mind, among mothers with three-and four-year-old children whose primary child care arrangement was a formal arrangement
other than kindergarten, group sizes averaged 18 children, and the ratio of caregivers to children
in formal care settings averaged 1:5 (about one caregiver for every five children). By contrast,when mothers of three- and four-year-old children reported that their primary child care
arrangement was an informal one, group size averaged five children, and the ratio of caregivers
to children averaged 1:2. Thus, it appears that children in formal as opposed to informal settings,
on average experienced substantially different aroup sizes as well as staff/child ratios.
These averages for group size and ratio for formal care do not depart substantially fromFIDCR recommendations. Indeed the average ratio of caregivers to children in formal settings
surpasses that recommended by FIDCR (1:5 as opposed to 1:8). In addition, the average formalcare group size is half that of the FIDCR recommendation. However the averages masksubstantial variation. Accordingly, we turn next to the question of the proportion of children
whose formal care settings met FIDCR recommendations.
According to maternal report, only about a third of the three- and four-year-oldswhose primary child care arrangement was a formal one were in settings that metthe national recommendations for both group size and ratio.
Arnow three- and four-year-old focal children whose primary arranaement was a formal
one, and for whom data on both uroup size and ratio were available. 34 percent were in settings
that met both recommendations, 17 percent were in settinus that met one of therecommendations. and 49 percent were in settinas that met neither the group size nor ratiorecommendations of the FIDCR. The National Child Care Staffing Study, looking at child care
centers in five metropolitan areas. found that a much smaller proportion of child care centers inAtlanta than in the other four study sites met the FIDCR recommendations (including in their
analysis not only aroup size and ratio but also teacher training requirements: Whitebook et al.,
1989). We have found. as have other studies. that welt-are-to-work programs are associated with
an increase in use ofchild care and especially formal child care arrangements. In Fulton County,
unfortunately, the tendency of mothers to enroll their children in formal child care settings means
that many arc in child care that does not meet nationally recommended standards of quality.
A minority of the mothers reported paying anything towards the cost of the primarychild care arrangement for their children.
Overall, onl 21 percent of the mothers whose three- and four-year-olds participated in
some regular child care reported paying anythina towards the cost of the primary arrangement.
Among those mothers with three- and four- ear-old children who paid something for care, 74
percent reported paving SO.50 or less per hour.' When mothers reported making some payment
" We note that tiw; tleure does not take into account ;illation ii coNi per hour according to number of houN in care.

for the focal child's primary child care arrangement, the focal child was significantly more likelyto be in the primary arrangement for 40 or more hours a week (72 percent vs. 47 percent whenthe mother did not make any payment.)5° Considering payments toward the cost of child care forall children in the household, mothers in our sample reported paying $19.11 per week onaverage. We note, however, that this figure does not take into account either the number ofchildren in the household in care or number of hours in care.
We asked also whether mothers who paid were more likely to be using formal child care,and formal care of higher quality, than mothers who were not making any contribution towardsthe cost of the primary arrangement. In both instances the numbers were in the predicteddirection but the differences were not statistically significant. For example, when the primaryarrangement was a formal one. the FIDCR group size recommendation was met for 56 percent ofthe children of mothers who made some payment for the primary arrangement, and 43 percent ofthose who made no payment (a nonsignificant difference).
We asked also whether mothers who reported making some contribution towards the costof the primary arrangement were less likely to report that the welfare office contributed towardsthe cost of care. Mothers were slightly (and nonsignificantly) less likely to report that thewelfare office paid when they themselves made some payment for the primary arrangement (56percent) than when they made no payment (63 percent). Mothers' payment of any of the cost ofthe focal child's primary arrangement, then was most clearly associated with use of full timechild care.
A majority of mothers reported assistance in paying for child care. The welfareoffice was the most frequently reported source of assistance.
Sixty-seven percent of mothers w,ith three- and four-year-olds in some form of regularchild care reported that someone else paid some or all of the cost of the primary carearrangement. Althoutzh this proportion was slightly higher in the human capital developmentgroup and labor force attachment groups than in the control groups (70. (9. and 60 percentrespectively), these szroups" differences were not statistically significant.
The most common source of assistance, accordinu to the mothers. was the welfare office.rnontz those mothers who reported some assistance in paying for their children's primaryarrangement, fully 91 percent reported that the welfare office was a source of such assistance.For those mothers whose child had am, re,,iular cMld care arrangement. 67 percent of those in thehuman capital de\ elopment 12roup. 64 percent in the labor force attachment tzroup, and 47 percentof the control aroup reported gettimz help from the welfare office. These differences werestatistically siuni [leant:: indicating that amoruz mothers using child care reizularly, those in the
.hi quare 11 1 S 15. L 1(0-1
( lii sdildre (21 S c 05

program groups were more likely than those in the control group to receive assistance for child
care from the welfare office. We note that these figures correspond closely with MDRC's reportthat approximately two-thirds of mothers in the Fulton County JOBS Evaluation who had
attended a JOBS employment or educational program reported receiving child care payments or
reimbursements during the six months after program orientation (Hamilton and Brock, 1994).
In sum, our findings are in accord with previous reports that a minority of low income
mothers pay for child care. and that the overall amount paid for all children in the family is, on
average, small. Further. our findings provide some evidence that assignment to one of the JOBS
program groups increases use of JOBS funding for child care among those with regular child care
arrangements.
A small but nontrivial proportion of mothers indicated that problems with child
care had hindered previous employment.
Among mothers of three- and four-year-old children who had been employed during the
last 12 months, 7 percent reported ever having to miss a day of work, 4 percent reported having
to quit a job, and 4 percent reported bein2 fired from a job. because of problems with theirprimary child care arrangement. Further. 16 percent of mothers reported that they had had to turn
down a job ,:ver the past 12 months because they could not arrange for child care.
Most mothers felt that, should they undertake or increase employment oreducational activities, there was a formal child care setting or a relative available to
them as a child care provider.
We asked motl,:a-s whether they had a relative. nonrelative, or formal child care setting
available should they decide to initiate or increase their hours of work or school. Mothers were
free to indicate that more than one type of care was available to them. Among mothers of three-
and four-year-olds. 57 percent answered that they definitely or probably had a relative available
to care for thc child: 39 percent indicated that a nonrelative was available: and 76 percent felt that
a formal care setting would be available.
Mothers most often pointed to formal child care as a setting they would use if they
could choose any for their child.
When asked to list all the forms of care they would choose as a first choice for their
children. 53 percent of the mothers of three- and four-year-olds indicated that center care was one
of their first choices. In addition, 33 percent named Head Start as a setting they would choose.
By contrast. only 20 percent named care by a relative as one of their first choices, and only 2
percent named care by a nonrelative.
When asked what types of child care they would be unwilling to use for their child,
mothers most ofien named care by the child's father (38 percent), care by a nonrelative (32
1_ i-t I

percent), and care by their partner (23 percent). By contrast, only 4 percent of the mothersindicated an unwillingness to use center care.
Summary
In summary, the Descriptive Study data contribute to an emerging picture acrossevaluations of welfare-to-work programs indicating that child care use increases quickly andsubstantially after enrollment among those in the program group or groups, and that AFDCmothers show both a preference for, and izreater increase in the use of, formal child care settings.Yet the opportunity to introduce poor children into high quality formal care settings appearsoften to be missed, at least in a state like Georgia whose child care centers are not required tomeet national child care quality recommendations. In later phases of the JOBS Child OutcomesStudy, it will be cmcial to determine the implications of this varying but often poor qualitytbrrnal child care, as well the implications of other types of early care, for children'sdevelopment.

CHAPTER 8SUBGROUP DIFFERENCES IN MATERNAL AND CHILD WELL-BEING
Background
It is widely known that welfare families are disadvantaged (Zill et al., 1991), and data
presented in the current report support this view. However, poor, African American mothers
with a preschool-aged child who receive or apply for AFDC are often assumed to be
homogeneous when in fact they are highly varied. Although all are economically disadvantaged,
some families have been on welfare longer than others, and some have less education and lower
literacy skills than others. Can we identify factors such as these that are associated withdifferences in the well-being of the mothers and children?
Previous research supports the view that key subgroups will vary in their responses to
welfare-to-work programs. Looking specifically at economic and educational impacts of such
programs. for example, Friedlander (1988) found differences in outcomes according to such
variables documented at baseline as prior welfare receipt and prior earnings. Other baseline
characteristics, such as education, family size. and age of youngest child, were less consistently
related to program impacts.
In the present report, we continue this strategy of analysis for a new set of outcomes: the
consideration of children's development, maternal psychological well-being, and the home
environment. In the Descriptive Study, we are not vet considering the issue of subgroup
differences in program impacts on these variables, as the measures of child development,
maternal well-being and home environment are examined in this report very soon after program
enrollment. However, at this early point in the evaluation we can take a first step towards such
subgroup analyses through careful delineation of a set of baseline subgroups that we think will be
important to the outcomes of this study. Non-experimental analyses, examining the relationship
between the baseline subgroups and measures of child development, maternal well-being and the
home environment irrespective of whether the family is in one of the program groups or the
control group, will help document which subgroup variables appear to be particularly important
to the set of maternal. family, and child \ ariables that we will eventually be examining for
program impacts. These analyses will also help us identify key subgroups that appear to he
faring more and less Ixell close to the start of participation in the JOBS Program.
The delineation of baseline subuoups in the present analyses was facilitated by the
collection of more extensive information prior to random assignment for all participants in the
JOBS Evaluation (including those in the Descriptive Study) than in previous evaluations of
welfare-to-work programs. In particular. the collection of baseline information not only on basic
client characteristics. hut also on maternal attitudes and psychological well-being at baseline (in
the Private Opinion Survey) permits us to extend the set of baseline subgroups beyond those
examined in prior research. Thus here. in addition to defining subgroups on the basis of maternal
education. duration of welfare receipt, family size. housing type, and maternal literacy at

baseline, we also define subgroups based on baseline measures of maternal depression, socialsupport, and sense of control over events, as well as maternal attitudes towards work and welfare.
Previous chapters of this report have already presented subgroup analyses for particularmaternal and dild measures from the Descriptive Study. The purpose of the present chapter isto draw these results together and synthesize them. We will conclude with an overview of whichbaseline subgroups appear, at this early point in the evaluation, to be most consistently related tomeasures of children's development and markers of mothers' readiness to enter employment.
Key Questions for Chapter 8
Does mothers' psychological well-being, approximately three months after randomassignment to the JOBS Evaluation, vary according to baseline characteristics?How does children's well-being differ according to baseline characteristics?
Analyses of Subgroups
Table 8.1 shows the relationship between a variety of measures of maternal and childwell-being (listed along the side of the table) measured, on average, three months after randomassionment, arid several background characteristics measured prior to random assignment (shownacross the top of the table). Although many of these analyses have been presented in earlierchapters (see Appendix B for individual tables), our goal here is to summarize across a variety ofareas of well-being to identify particular background characteristics that are consistently relatedto maternal and child well-being. These analyses will help in the identification of key subgroupsof the JOBS sample who may he differentially affected by the program.
Our approach in considering specific subgroups was to ask whether a backgroundcharacteristic was positively, negatively, or not at all related at a statistically significant level (u
.05) to an indicator of maternal or child well-being. In Table 8.1, a plus sign (+) indicates thatthe two variables are positively and significantly related to one another (for example, womenwith a high school diploma or GED at baseline report more social support at the time of theDescriptive survey than other people). A minus sign (-) means that the two variables have asignificant negative association (for example. women who had been on welfare for more thanfive years at baseline were found to have less social support at the time of the Descriptivesurvey). A zero indicates that no statistically significant association was found. Due to thenature of the data. it should be noted that associatioc are correlational rather than causal. Allassociations were estimated with multiple regression controlling for the age and gender of thechild, and research group. I Iowever. no other background characteristics were statisticallycontrolled in these analyses. Definitions of each subgroup ariable are provided in Appendix A.
1 (12

1 .A
131
I1
\\
1P
,N \I
\ \I)
(I
II
IIII
I III
11
\ 11
(11
II I
I1)
1 S
t RIP
1 1
\1. S
CIL
VE
Y A
's R
I I A
ILD
13A
S1
I IN
E M
I \ M
IRE
SM
AT
ER
NA
L A
ND
FA
MIL
Y B
AC
KO
RO
UN
D
Bas
elin
e S
ubgr
oup
Var
iabl
es
I du,
atio
nal
No
01
\ U.)
1111
1101
1(h
ilthe
n1
lous
ino
I') p
e
koni
pah,
q10.
0111
pal I
-oi
lV
. elIa
rC I
)ura
ti,11
(com
paris
on -
111,
a0: o
r ni
ore
tioni
pal R
onne
ither
pub
lic n
ot
st. h
ool )
duld
i,nt
-2
1-tt
1su
b,id
wed
hou
,ini2
)
1
2 bi
d5
it!le
ss
obti,
than
-;
-tub
-
rsrs
..ttil
t,si
dt/e
d
\ Iita
:\
IIII )
. pt.
I)
Fam
ilyM
ath
Brie
fB
arrie
rsS
ocia
l
(com
par
Dep
ress
ion
I .O
cus
ofto
Wor
kS
uppo
rt1
itera
c)-is
on =
Sca
leC
ontr
olIn
dex
Inde
x
(com
paris
onLo
wes
t(c
ompi
n-(c
ompa
r-(c
ompa
r-(C
ompa
r--
I 0 \i
est
I e e
ls,
Ron
= I
oNk,
ison
=is
on =
ison
=
1 e»
1,, 1
-2)
A-I
1)M
oder
ate)
Ext
erna
l)Lo
w)
Low
)
Hig
h1
ligh
1 A
l `s(
a)M
ath
(h)
Sco
res
Sco
res
Lex
els
3-5
1 eN
, els
C-D
I lig
hIn
tern
alB
inh
I lig
h
)))1
on))
.1
t.I
,1
1),1
11,t,
11I
Indx
td I
00
hiII
00
0I
ot
peop
le w
ilt.,
p)0\
ide
ii..u
ppor
t
0
',upp
iit
0I n
ioli,
Mal
t)0
00
Lott
[tona
l upp
oll
3 ,i(
Ont
inuc
d)

I abl
e 8
I (co
ntin
ued)
Bas
elin
e S
uhgr
ttill)
\ am
bles
I do,
atio
nal
Atta
inm
ent
mpa
rison
1101
s,lit
ittli
No
,I(
hild
h.n
h_om
paris
t tit
3 or
Wok
:,Ii
ildrs
io
\\ el
larc
I ro
rati,
ilie
ompa
rison
--
2 sr
s 1
I lia
isin
gI )
pcl,o
mpa
rison
-ne
ither
pub
lic n
oisl
Ikld
l/ed
holl,
111:
11
l ile
rae)
(com
paris
on,-
-I o
sses
t1
et e
ls1-
21
Mat
h
(com
par
-ison
=l A
mes
!I e
sels
.A
-B1
linet
Dep
ress
ion
Sca
le
(com
par-
ison
= I
oS.
Mod
erai
e)
I ocu
s of
Con
trol
(com
par-
ison
=
Ext
erna
l)
Fam
ilyB
arrie
rsto
Wor
kIn
dex
(com
par-
ison
=
1.ov
.)
Soc
ral
Sup
port
Inde
x
(Com
par-
ison
=
Lour
)
II's
Ilipt I)
oi(
2 Is
la
intik
.()
ait -
;
srs
:t. r
'sub
-P
libli,
sldi
,",d
I b12
1,
I Al '
,tat
SeO
rc,
1 ee
ls 3
-5
Iligh
Mat
h (t
oS
itlre
S1
es e
ls C
-D1
light
Inte
rnal
Hig
hH
igh
ihe
iotts
i eitt
ost:
t.ttiu
rase
ph,to
Iiii
I1)i
Oct
,,111
4or
II lo
re 0
1 m
id s
hie
iiim
ela
;it%
R \D
IJ8e
)
ss lo
s hi
s, p
et,.
cut
or m
ore
olhi
e in
full-
time
cmpl
osm
ent p
rior
toR
AD
id)
(Li
lid id
that
NIti
ther
sS
houl
d N
ttt h
e
tupl
oed
Ssa
le
hild
sup
port
pros
ided
biol
ogic
al ta
iher
td)
11
ti0
00
00 0
5-
0u
00
00
0
(con
tinue
d)

Fab
le 8
I Iiil
iriuc
d
Ilase
lnie
Sub
grou
p V
aria
bles
1 di
k.ili
onal
No
111,
1010
1cm
( fid
dle!
) mor
e,1
111,
11.1
1)
Wel
lare
-
2trl
I lou
sing
I) p
e(c
ompa
rison
-ne
ither
pub
he n
oist
ibsi
di/e
d ho
usin
el
2 1,
111
nun,
:th
an s
'sub
-11
PU
N!,
lith/
ld
o
`..1
.1
1Z,
1,e,
i
:I
'.111
11.
(Ilt
:a11
11 R
.I;o0
z.
( 11
6,1.
1 irc
imis
e, ii
i Mim
e A
nd I
101d
(tie
111)
.01
-I ii
2n11
13,
Ii\1
1
Ippo
o
tieci
t Ihe
of m
ore
ol c
liild
slit
e in
an
regu
lar
child
car
e pr
ior
iiR
AI )
(dite
l
0
0
Fam
ilyM
ath
Brie
f,a
rrie
rsS
ocia
l(c
ompa
rD
epre
ssio
nLo
cus
ofto
Wor
kS
uppo
rtI i
tcra
c,
(com
paris
on
-kon
-I o
cses
tS
cale
(com
par-
Con
trol
(com
par-
Inde
x
(com
par-
Inde
x
(Com
par-
- I o
cic,
tI e
c el
s,is
on -
I ow
,iro
n =
iron
=is
on -
I est
.'s1-
21A
-Ii)
Mod
erat
e)F
xter
nal)
LoN
)Lo
ts I
I Iitr
liH
igh
1M
ath
(I))
Sco
ies
Sco
res
I es
ek )
-I e
s,el
s C
-DH
igh
Inte
rnal
Iligh
Iligh
0 0 0 0 00
0
(con
tinue
d)
iI
II 0 0

Fab
le 8
I (co
ntin
ued)
Bas
elin
e S
tilig
ioup
aria
bles
I du,
a0.1
1.11
No
III
\ tta
inm
ent
t lul
dicn
I lou
sing
I..
pc
hvom
paris
iiii
(esi
mpa
rison
V, d
iare
l)ur
aniin
(com
paris
onH
igh
3 sq
lillI
leIs
som
p.in
stin
neith
er p
ublic
uss
ili
child
r,:1
)2
r,i
suhs
idue
d ho
usin
ei
I
lit'
(I )
(
.'I-
iiis
,.,I.
111,
riIll
,tis
iS
O-
s r
. I,
PO
HL
sith
/s-d
I,s
.l-lis
, ..111
1.1
[[[,
1..[I
nal c
hild
1, 1
to\ I
.iII
1.11
11C
1
III \
it C
HIC
HI I
III
lilt.
Fam
ilyM
ath
Brie
fB
arrie
rsS
ocia
llc
ompa
rD
epre
ssio
nLo
cus
ofto
Wor
kS
uppo
rt1
itera
cds
on =
Sca
leC
ontr
olIn
dex
Inde
x(c
ompa
rison
I ow
est
(com
par-
(com
par-
(com
par-
(Com
par-
7 I o
sses
tI e
vels
,is
on =
I ow
.is
on =
ison
=is
on =
I es
ek 1
-2)
A-B
)M
oder
ate)
Ext
erna
l)Lo
w)
Lovs
)
I hel
lI h
ell
I Al S
imM
ath
(b)
St..
01eS
Sco
res
I oel
s 3-
3I e
sels
C-I
)H
igh
Inte
rnal
Hig
hH
igh
II0
00
Ii0
II0
0
hdd
lid. I
n, c
al_u
latio
n, 0
1 I (
Ilion
ssun
iie
ssop
us e
data
sd il
l xI o
Iid
sI e
st s
it()
plie
d I a
erie
s S
kill,
\litli
',so
les
wer
e m
easu
red
usin
g th
e t A
lN A
ppla
isal
LIM
I es
t(s
.20
-11e
mS
-I)
(Cen
ter
for
I prd
emio
logi
cal S
tudi
es D
epre
ssio
n S
s.al
e)di
I hes
e da
ta s
shile
col
lect
ed a
s pa
rt o
f the
lkso
iptis
q. a
re a
ll re
tro
mA
Dm
spec
e. R
(Ran
doA
ssig
nmen
t Dat
e)(
I lig
se a
ia s
e, d
id n
ot c
ontr
ol to
r gi
onp
heca
lise
empl
os m
cni a
nd c
hild
car
e to
ok p
lace
Mor
e ra
ndom
ass
ignm
ent
it an
ai, ,
e,lo
cal c
hild
.114
1:III
insi
ntlis
. loc
al s
sliil
d ge
nder
and
gio
up a
ssqu
ilnen
t unl
ess
othe
mis
e in
dica
ted
"uen
ilk.a
nt s
it 2
05 a
nd p
osill
se e
oel f
icie
nt-
ant a
t 2.
Os
and
[lega
lise
s_si
ellic
lent
Not
sig
nific
ant

Findings
Maternal Education
Mothers who had a high school diploma or GED at the outset of the JOBS Programhad greater subjective well-being and more employment experience at the time ofthe Descriptive survey, and their children were generally developing morepositively.
Mothers who had a high school diploma et- GED tended to be better off across a wide
range of measures in the Descriptive survey, compared with mothers who had less education.Thus, women with a diploma at baseline had a more internal locus of control and reported higherlevels of social support (both emotional support and instrumental assistance), and they receivedsocial support from a larger number of persons at the time of the Descriptive survey. They werenot more satisfied with the social support that they received. however. Better-educated welfaremothers were more likely to have been employed, and more likely to have been employed full-time, for a quarter or more of the months since the birth of the focal child. In addition, they wereless likely to believe that mothers should not be employed.
Measures of child developmental status were very consistently associated with maternaleducation. Children whose mothers had a hiuh school diploma or GED had higher scores on thePeabody Picture Vocabulary Test - Revised and the Preschool Inventory, measures of receptivevocabulary and school readiness. They were rated hiuher on the Personal Maturity Scale, which
assesses emotional and behavioral development, and they were perceived as havinu better health.In addition, their home environments provided more cognitive stimulation and emotionalwarmth. as assessed by the HOME subscales. As would be expected given their mothers' greaterwork experience, children whose mothers had a hiuh school diploma or GED were more likely' to
hak e been in regular child care, and to have been in formal child care, for a quarter of the months
of their lives or more, prior to the date of random assignment. On the other hand, in this sample,maternal education was unrelated to the amount of contact children had with their fathers or the
father's provision of child support as reported at the time of the Descriptive survey.
Number of Children
Though family size is not related to most mother characteristics in this sample, the
N% e 1 1- being of children was found to be greater when family size was small.
Results for family size are shown in two columns of Table 8.1. The column headed "1"
compares women with one child to those who have three or more children. "Fhe column headed"2" compares women who ha\ e two children with those who have three or more. Looking down
these columns. it is apparent that maternal cluraeteristics were not strongly related to family size.
Indeed. the only significant associations . ere with internal locus of control and instrumemal
I 07

social support. Women who had only one child at baseline were found to have a more internalIceus of control and perceived more instrumental support available to them at the time of theDescriptive :urvey compared with women with larger families. In addition, women with one orwith two children were less likely to be sterilized or using highly effective contraception at thetime of the Descriptive survey than women with larger families. Although women with largerfamilies did not differ in their attitudes regarding employment, they were less likely to haveworked at all and to have worked full-time for at least a quarter of their child's life. However,family size was unrelated to whether child support was received on behalf of the focal child.
As found in studies of the general population (Blake, 1989, 1991), children in one- andtwo-child families attained higher scores on both of the measures of cognitive development, andhad higher scores on the HOME subscales, compared to children in larger families. In addition,compared to those in families of three or more children, only children had higher health ratings,and were more likely to have been in child care for at least a quarter of the months of their lives.On the other hand, only children were less likely to have regular contact with their fathers.
Duration on Welfare
Both mothers and children in families that had received AFDC for less than twoyears were different from mothers and childi.en who had received welfare for longerperiods of time.
We identified women who at baseline had received AFDC for two to five years, andwomen who had received AFDC payments for five or more years. Both of these groups werecompared to women who had been recipients for less than two years. Table 8.1 summarizes that.with respect to the Descriptive survey measures of psychological well-being and social support.women who had received welfare for five years or more were different from those who had beenon welfare for less than two years. whereas on employment history and attitudes scales, bothgroups of ionger-term recipients were different from women on welfare for less than two years.Specifically, women who had received welfare assistance for five or more years had moredepressive symptoms, had less of a sense of control over their lives, and were less likely toreceive instrumental social support. These women. as well as women who had received AFDCfor two to five years. were less likely to have a lengthy work history and were more likely tobelieve that mothers should not be employed. Althouith duration of welfare receipt wasunrelated to use of an effective contraceptive, being on welfare for five or more years wasassociated with a lower probability of receivint4 child sapport.
Compared with the children of short-term 'welfare recipients. children whose mothers hadreceived welfare assistance for two or more . ears scoreu lower on the vocabulary test and on thePersonal Maturity Scale. In addition. the home environments provided by longer-term recipientswere less cegnitively stimulating and less emotionally supportive than those of short-termrecipients. Finally, children of longer-term recipients were less likely to have spent a substantialamount of their lives in any child care or formal child care.
108
i 5

Housing Type
Residence in public housing was related to lower well-being for mothers, and wasassociated with particularly low levels of child development.
The sample was fairly evenly divided among women living at baseline in public housingprojects (39 percent), subsidized housing that was not part of public housing (29 percent), and
housing paid for by themselves or family members (32 percent). Residence in public housing
was most consistently associated with lower well-being for the mothers and children. Women
who lived in public or subsidized housing perceived less social support, and were less likely to
have been employed full-time for a quarter or more of the months since their child was born,compared to other mothers. Further, those who lived in public housing (but not those who livedin subsidized housing) were less likely to feel an internal sense of control over their lives, were
more likely to believe that mothers should not be employed, and were less likely to have been
enr loyed for a quarter of the months since the focal child was born, compared to mothers wholived in neither public nor subsidized housing. Child outcomes were also negativelY associated
with living in public housing, but not with living in subsidized housing. Specifically, childrenliving in public housing had lower scores on the vocabulary test, the Preschool Inventory, thePersonal Maturity Scale. and on the HOME measures of cognitive stimulation and emotional
support.
Reading Literacy
Mothers and children had higher well-being when maternal reading literacy scores
were higher.
Womens scores at baseline on the reading literacy test were, like their education level,
strongly associated with measures of maternal and child well-being. Thus. women with higherreading literacy scores were less likely to have depressive symptoms at the time of the1)eseriptive survey. more likely to indicate an internal locus or control, and more likely to enjoy
instrumental and emotional social support. Women with higher reading literacy were also more
likely to have worked for at least a quarter of the child's life prior to random assignment. Inaddition. women with higher scores were less likely to oppose maternal employment. Somewhat
surprisingly, women with higher literacy reported more difficult life circumstances (e.g..housing. crime, financial problems). They were no more likely to receive child support than
lower scoring mothers.
The vell-heing of children was also k:onsistently higher for those whose mothers scored
higher on the FALS reading literacy test. They had higher scores on both cognitive assessments;
their behavior was rated more positively on the Personal Maturity Scale: their health was
described as hetter: and their home environments were assessed as being more cognitively
stimulating and more emotionally supportive. Utley were also more likely to have been in child
care for at least a quartcr of the months of their lives.
109

Math Literacy
Math proficiency was less consistently related to measures of maternal well-being,but was consistently associated with greater child well-being.
As found for reading literacy, mothers with higher math literacy scores were less likely tobe depressed and tended to have a more internal locus of control. In addition, they were morelikely to have been employed (both full-time and at all) for a quarter of the months of the child'slife, and were less likely to oppose maternal employment. Other measures of maternal well-being were unrelated to math literacy.
As with reading literacy, higher maternal math literacy scores were related to the child'shaving better cognitive and behavioral development, a better health rating, a more stimulatingand supportive home environment, and having spent more time in child care.
Depressive Symptoms
Mothers who described themselves as having higher levels of depressive symptomsat baseline had lower well-being in multiple domains at the time of the DescriptiveSurvey, and described their child's behavior more negatively.
Prior to random assi2nment. mothers completed a brief four-item depression scaleadapted from the CES-D. Scores on this measure were strongly predictive of maternal well-being at the time of the Descriptive survey, but were not strongly related to child well-being. Forexample. mothers with more depressive symptoms were less likely to have an internal locus ofcontrol. less likely to enjoy instrumental and emotional social support. and less satisfied with theemotional support available to them. Moreover, mothers with depressive symptoms reportedmore stressful life events, and were more likely to believe that mothers should not be employedoutside the home. As one might expect, women who had high depressive symptoms at baselinealso reported them at the time of the Descriptive survey.
Consistent with other research (see Downey and Coyne. 1991 for a review), mothers whohad depressive symptoms at baseline reported less maturity on the part of their child. However,other measures of child well-beina and the assessments of the home environment were notrelated to the mother's baseline depression score.
1 10
Locus of Control
Mothers with an internal locus of control at baseline enjoyed greater psychologicalwell-being on measures in the Descriptive survey, and had children who were
developing more optimally.
As with depression. a brief self-administered scale measuring locus of control or mastery
was given to mothers at baseline. Women with a more internal locus of control tended to have
fewer depressive symptoms at the time of the Descriptive survey, perceived the availability of
more instrumental and emotional social support, were more likely to have worked for a quarter or
more of the child's life, and were less likely to believe that mothers should not be employed.
Again, as one would expect, women with a relatively internal locus of control at baseline scored
similarly at the time of the Descriptive survey.
In addition to its association with maternal well-being, a more internal orientation was
consistently associated with more positive child outcomes. Children whose mothers had an
internal locus of control scored higher on the vocabulary test, the Preschool Inventory, thePersonal Maturity Scale, and . e r e more likely to receive a positive health rating, and their homes
were rated as hitzher in cognitive stimulation and emotional support. Time in child care and
father involvement were unrelated to the mother's locus of control.
Barriers to Work Index
Women on welfare who perceived substantial barriers to becoming employed were
not only less likely to have worked, but they and their children were faring morepoorly than those who perceived fewer barriers.
Fight items administered at baseline were combined to construct a scale of the mother's
perception of harriers which could make employment difficult, for example, family health or
emotional problems, concerns about child care, and preferences for staying at home with their
children. Women who perceived more barriers to employment outside of the home tended to
have more depressive symptoms, and a more external locus of control. at the time of the
Descriptive survey. As one would expect. they perceived themselves to have available less
instrumental and emotional social support. though surprisingly they did not differ from mothers
with fewer barriers with regard to the number of people who provided assistance or their
,atisfaction with social support Also. w omen who reported more barriers to employment were
le.;:; likely to have worked during a quarter of the months of the child's life, and were more likely
to believe that motheis should not he employed.
Women who perceived more obstacles to emplo% ment tended to have children who were
developing less well. Their children had lower scores on both of the cognitive assessments, the
Personal \ laturity Scale. and the I {OW cognitive stimulation scale. and were more likely to

receive a negative health rating. Further, their children were less likely to have been in child carefor a quarter of the months of their lives than those whose mothers perceived fewer barriers.
Social Support Index
Greater social support for the mother reported at baseline was associated withbetter psychological well-being and somewhat greater work involvement.
As one would anticipate, women with more social support at baseline continued to havemore support available to them, and be more satisfied with their support, than other mothers atthe time of the Descriptive survey. In addition, they had fewer depressive symptoms and had amore internal locus of control than mothers with less support. They were also more likely tohave worked during a quarter or more of the months their child's life, and were less likely tooppose maternal employment. On the other hand, mothers with higher baseline levels of socialsupport were not more likely to have worked full-time during a quarter of the months of thechild's life, to be users of effective contraception, or to receive child support from the focalchild's father. Greater social support for the mother was related to a better health rating for thechild, and more cognitive stimulation in the home, but was unrelated to other indices of childwell-being.
Summary
In summary, it is clear that families in this sample who may appear homogeneousbecause they are all poor. African American mothers with a preschool-aized child are in facthighly varied. Some subgroups are functionin2 very well despite their marginal economiccircumstances, while others are characterized by poorer psychological well-being, little socialsupport. or less optimal child development. Moreover, in many instances the same subgroupcharacteristics that are associated with lower well-being among the mothers were found to berelated to lower well-beim part of the children. Specifically, low maternal education,long-term welfare dependent residence in public housing, low maternal literacy and math testscores, and poor maternal ps,,chological well-being at baseline were all associated not only withdifficulties for the mother at the time of the Descriptive survey, but with lower scores onmeasures of the home environment and the developmental status of the children as well.
In the next chapter, the examination of these subgroup differences is continued.Specifically, the cumulative effects for children of being in families with multiple baseline riskfactors are examined. In addition. we explore the association between protective factors, riskfactors. and child well-beinc..
1 12

CHAPTER 9CUMULATIVE FAMILY RISK AND PROTECTIVE
FACTORS AND CHILD WELL-BE1NG
Background
The analyses presented thus far suggest that both the well-being of mothers and the
developmental status of children in the Descriptive Study differ according to subgroups defined
at baseline. In particular, those children from families with certain baseline characteristics (e.g.,low maternal education, low maternal reading and math literacy scores, living in public housing)
are experiencing considerably more difficulty than others.
Yet the analyses we have reported on thus far consider the set of subgroup variables one
at a time. In reality, individual children will have differing profiles in terms of the number of
baseline variables that place them at risk developmentally. One child, for example, might have a
mother with limited education and literacy skills, but who has only been on welfare a brief period
of time, who has strong social support, and shows few siuns of depression. Another child, bycontrast. might have a mother who not only has limited educational attainment and achievement,
but who also has been on welfare for a number of years and reports both depression and social
isolafion.
Previous research suguests that the number of risk factors to which a child is exposed is
an important predictor of development (e.u., Luster and McAdoo, 1994). For example, Rutter
(1979) found that the incidence of psychiatric disorder in children was predicted by the number
of familial risks to which they had been exposed (including marital discord, low socioeconomic
status, overcrowding, large family size. paternal criminality, maternal psychiatric disorder, and
placement of the child in out-of-home care). Whereas the presence of a single stressor did not
increase child risk of psychiatric disorder, the presence of multiple stressors did. The presence of
two to three stressors was associated with a fourfold increase in psychiatric disorder: when four
or more stressors were present there was a tenfold increase.
Similarly. Sameroff and colleagues (1987) reported that preschool children with multiple
risk factors had lower IQ scores, as well as lower ratings of social and emotional competence.
Risk factors considered included measures of maternal psychological well-being, childrearing
attitudes and behavior, maternal education. occupation of head of household, social support,
family size, and stressful life events. Sameroff and colleagues note that it was the accumulation
of dif ferent risk variables, rather than the presence of any particular type of risk, that was
predictive of more neuative outcomes in the children.
At the same time, however, research also indicates that some children develop positively
despite the presence of serious stressors in their lives. A urowing body of research documents"resilience" in children, that is. ''the manifestation of competence in children despite exposure to
stressful events" (Garmezy. Masten and Tellegen. 1984. p. 98). Three broad sets of variables

appear to operate to ameliorate the effects of stress on children: child characteristics, familycharacteristics, and external supports (Garmezy, 1985; Luthar and Zig ler, 1991). Childcharacteristics include easy temperament and skill in social interactions. Family characteristicsinclude warmth and affection in parent-child relations, the absence of severe parental criticism ofthe child, and parental psychological well-being and competence in individual functioning.Beyond the family, social support and positive school environments appear important.
Some studies find that just as risk factors can act cumulatively, so can protective factors.Bradley et al. (1984) found that in a sample of premature, low birthweight children living inpoverty, the presence of multiple protective factors substantially increased the young children'schances of functioning in acceptable ranges on a set of health and developmental outcomes. Inaddition, Luster and McAdoo (1994) found that African American children with more familyadvantages (e.g., mothers with at least a high school education; mothers with intelligence scoresabove the mean and high self-esteem; not living in poverty; two or fewer children in the family;and HOME-SF scores above the median) were doing better cognitively and behaviorally thanchildren with fewer advantages.
In the analyses to follow, we ask first whether risk factors, defined in light of our analyseswith baseline subgroups, act cumulatively in predicting the developmental status and health ofthe children in the Descriptive sample. Second. guided by previous research, we identify a set ofvariables that we hypothesize will act as protective factors. We ask then whether the number ofprotective factors is important to the children's health and development. Finally, we examinehow the risk and protective factors operate simultaneously in the lives of the children. If we findthat the number of risk and protective factors in a child's life together predict the child's well-being, this will again underscore the need for researchers and policymakers to view welfarefamilies as varying rather than uniform contexts for children's development.
Key Questions for Chapter 9
How do multiple risk factors combine to affect children's well-being?Is the presence of protective factors associated with child well-being?.--kre protective factors associated with child well-being when considered inassociation with risk factors?
Findings
Risk Factors and Children's Development
lo explore the relationship between number of risk factors and children's well-being, wedeveloped a risk index based on the set of subgroup measures assessed at baseline (prior torandom assignment) and examined throughout this report. By examining the bivariate subgroupanalyses summarized in Chapter 8, we first noted that each subgroup predicted some maternaland child characteristics, and then identified the category within each subgroup that indicated
1 14

"risk" by virtue of an association with less optimal well-being. In addition, we conducted
preliminary analyses to determine whether individual risk factors identified in this way weresignificantly related only to outcomes in the same domain (e.g., maternal cognitive attainment
and child's cognitive development). We found background risk factors to predict children's
development across domains. For example, low maternal education and literacy test scores
predict children's cognitive and socioemotional development, as did mother's psychological
well-being. These preliminary analyses resulted in the identification of the following ten risk
factors:
mother lacks a high school diploma or GED;mother has three or more children;family has been on AFDC for two or more years:family lives in public housing;mother has low reading literacy test scores:mother has low math literacy test scores:mother has moderate/high levels of depressive symptoms;mother has more external locus of control;mother r ::eives numerous barriers to work; andmother lacks social support.
Previous chapters have already documented the relationship of each of these baseline
variables with measures of children's health and development. Further, many of these variables
have been included in previous studies of cumulative risk. For example, Sameroff andcolleagues (1987). too, considered maternal education. family size, maternal psychological well-
being, and social support. Luster and McAdoo (1994) also considered maternal education,
family size. and maternal psychological well-being.
We go beyond the variables included in previous research on cumulative risk in
identifying variables that are important in differentiating among families within a poverty
sample. Previous research indicates duration of welfare receipt (Zill et al., 1991), arid residence
in a neighborhood with a greater concentration of low-income-neighbors (Duncan et al., 1994),
to be associated with more negative child outcomes. In addition, research indicates thatcompletion of high school or a GED does not necessarily assure higher literacy scores (Hamilton
and Brock. 1994), and that maternal literacy predicts ehildren's development (Moore and Snyder.
1991). Mothers who pereeive numerous barriers to work (e.g., children in the family with health
problems, few child care resources) may be least able to take steps toward economic self-
sufficiency at their own initiative or through the JOBS Program.
Prior to the creation of a cumulative risk index, we examined the intercorrelations among
the risk variables to confirm that no pair was so highly correlated that they should not be
considered distinct risk factors (see Appendix Table 9.1-1). None of the correlations was higher
than .51 (the correlation between low reading and math literacy test scores).
115

We therefore proceeded with computation of a cumulative risk index, with each riskfactor coded as a dichotomy, by summing the number of risk indicators present for each family.Scores on the risk index range from 0 to 10 with a mean of 4.6 risk factors. The children dividednearly evenly into three groups accoraing to the number of risk factors: zero to three (n= 216),four to five (n = 230), and six to ten (n= 253), indicating the presence in the Descriptive sampleof children with few, some, and many risk factors.
In the analyses that follow, for each child outcome we define scores that indicate positivedevelopment. We then examine the proportion of children at each level of risk scoring in thispositive range.
The analysis of cumulative risk factors showed strong associations between theaccumulation of maternal and family risk factors and the well-being of the child.We also find a strong relationship between the number of maternal risk factors andthe emotional warmth and cognitive stimulation provided to the child.
Cumulative Family Risks and Children's Cognitive Attainment. Figure 9.1 illustratesthe association between the number of risk factors experienced by the child at baseline and thechild's receptive vocabulary as measured in the Descriptive survey. The bar graph reports theproportion of children in the sample who obtained scores of 79 or higher on the Peabody Picture
FIGURE 9.1
PERCENT OF CHILDREN SCORING AT OR ABOVEMEDIAN FOR AFRICAN AMERICAN PRESCHOOLERS
ON PEABODY PICTURE VOCABULARY TEST-REVISED,BY NUMBER OF FAMILY RISKS
so%
40%
10%
0.3
2a)a.
19%
1.-1 Ft Isks
'1%
1-5 1k toka
ona bet of Family Rt.!"
17%
6 10 Attics
Vocabulary Test, by the number of family risk factors experienced by the child. A score of 79
116
1 5

represents the median test score of a national sample of African American preschool-aged
children.'
Overall, 29 percent of the children scored at or above the median for African American
children on the vocabulary test. The proportion with higher scores was heavily concentrated
among low-risk families, with 39 percent of children with zero to three risks scoring above this
cutoff, compared to less than half that number (17 percent) among children at high risk.
Scores on a measure of school readiness showed a similar pattern (see Figure 9.2).
Because national norms are not available for the Preschool Inventory, we established a cut-point
for this sample that identifies those children in the Descriptive sample whose scores are in the top
quartile of the Descriptive survey distribution. These children correctly compkted 23 or more of
the 32 tasks deemed important for entry into school. The proportion of Descriptive Studychildren correctly completing at least 23 of the 32 tasks varied by risk status. Thirty-four percent
of the children from low-risk environments (zero to three risks) scored in the top quartile,
compared with 30 percent of children whose family environments posed four to five risks, and
just 16 percent of those in very high-risk families (six or more risks).
SO%
(
FIGURE 9.2
PERCENT OF CHILDREN WITH 23 OR MORE OF 32ITEMS CORRECT ON PRESCHOOL INVENTORY, BY
NUMBER OF FAMILY RISKS
14%
0.1 lake 4.5 RIsk
Number of Fern R sekc
: 6%
6.101.t.k
We used a cutoff based on the median score fOr African American children because of concerns that the Peabody Picture
o abulary lest, like many other tests ot achieyement. may he racially biased. I his median score of 79 was based on analyses
ott. - Peabody Picture Vocabulary I est scores of African American preschool-aged children in the NI,SY-CS. We also
replicated these analyses using '4. cutoff of scores of 100 or higher. a score w hich represents the median for children in the test's
national standardization sample. In the Descriptive sample. only 4 percent of the children scored at or above 100 on the
ocabulary test. I {owe% er. the same pattern of results f n relation to nsk f actors was observed. Specifically, only I percent of
children with six to 10 risks scored aboY e the national median, compared to 2 percent of children with four to five risks, and 8
percent of children with zero to three risks.
I 1 7

Personal Maturity Scale. The Personal Maturity Scale reflects mothers' perceptions oftheir children's emotional and behavioral development, and includes items concerning whetherthe child fights, is creative, lies, or has a strong temper. The scale ranges from zero to 10, with10 indicating ugh levels of maturity. In general, mothers tended to be quite positive about theirchildren, with a.1-. it a quater of children receiving scores of 8.6 or higher. The proportion ofchildren with scores in this highest quartile according to number of risk factors is depicted inFigure 9.3. Again, children from low-risk family environments were substantially more likely tobe described as having few developmental or emotional problems, while children from multiple-risk backgrounds were much less often described so positively.
40%
15%
10%
a)72
20%
..
FIGURE 9.3
PERCENT OF CHILDREN SCORING > 8.6 OF 10 POINTSON PERSONAL MATURITY SCALE, BY NUMBER OF
FAMILY RISKS
34%
0-3 Risks
30%
4-5 Risks
\:umber of Family Ricks
16%
6-10 Risk,
Health. Mothers were asked both to provide a global rating of their childs physicalhealth and to report on the presence of any handicap, illness, emotional problem or mentalcondition that limits school attendance, exercise or sports or that requires special medication orequipment. In a sample of preschool-aged children from the National Health Interview Survey ofChild Health, 38 percent of children in welfare families, 42 percent of children in poor non-wel fare families. and 52 percent of children in non-poor families were reported by their mothersto enjoy excellent health with no disabilities, as were 47 percent of the children in theDescriptive sample (see Chapter 5 ).
As were other measures of children's well-being, the health of children in our sample wasrelated to the number of family risk factors. Figure 9.4 shows that children were less likely to berated in excellent health with no disabilities as the number of risk factors increased. Specifically,
118

57 percent of children with zero to three risks received a positive health rating, compared to only
37 percent of those with six or more risks.
FIGURE 9.4
PERCENT OF CHILDREN IN EXCELLENT HEALTH WITHNO DISABILITIES, BY NUMBER OF FAMILY RISKS
'0%
60%
40%
cb
a)0. 30%
20%
57%
0.1 ittskt
50%
45 Ri4k4
Number or Fetrith Rtsit
37%
6-10 Rules
Cognitive and Emotional Stimulation in the Home: The HOME Scale. Theabbreviated HOME Scale, described in Chapter 6. is comprised of two subscales that assess the
cognitive stimulation and emotional support available to the child in the home environ.ment. The
sum of the two subscales provides a total score. To provide a national comparison, we have
tabulated the median I IOME-SF score for preschool-aged children in the NLSY-CS.53 In Figure
9.5. we depict the proportion of children in the Descriptive sample scorino above the national
median on the total scale and on each subscale. according to the number of risk factors.
The presence of multiple risk factors was strongly associated with the quality of
children's home environments. Looking at results for the total HOME scale (top of Fio,ure 9.5).
approximately a third of the Descriptive survey children in families with zero to three risks
enjoyed home environments that were cosmitively and emotionally supportive, while only 12
percent of children in families with six to 10 risk factors experienced similarly supportive homes.
i he evact cutoif s based on the NI.SY sample are the 5nth percentile for the total IIONIF scale. the 41st percentile for the
coenitise stimulation subscale, and the 53rd percentile for the emotional \kamith subscale. Because the subscales have fewer
items or scale points than the full scale. no single scale point coincided eactI s ith the national median. !Therefore on the two
\uhseales. the percentiles chosen represent the points closest to the median. \ppling these cutoffs to thc Descriptive sample
tderitifies 20. 17. and 27 percent of families as scoring ribose the national median on the total, cognitive, and emotional scales.
espcon, el Fewer children rank abo e the national median on the cognane scale than on the emotional warmth scale,
presumahl . because many aspects ot cogninse stimulation are limited for families that lack economic resources.
11 Q

These patterns were replicated when the cognitive and emotional subscales were examinedseparately (see lower panels of Figure 9.5).
FIGURE 9.5PERCENT OF CHILDREN ABOVE MEDIAN ON TOTAL HOME
SCALE, BY NUMBER OF FAMILY RISKSiox.
72%
20%
10%
R isk 4.3 litks 6-10 717kNum ber of FmIy iska
PERCENT OF CHILDREN ABOVE MEDIAN ON HOME COGNITIVESUBSCALE, BY NUMBER OF FAMILY RISKS
26%
0.) RIk.
17%
-5 k,k.uMber o orn ily 7113k
PERCENT OF CHILDREN ABOVE MEDIAN ON HOME EMOTIONALSUBSCALE, BY NI3MBER OF FAMILY RISKS
NO,
1 0
35%
0 1 ittok.
27%
20%
3-3 14 Isk 6-10 R ik.% nI bel of Prntly R l7k
Protective Factors and Children's Development
The above analyses illustrate that. although increased risk is associated with poorer childoutco nes overall, the presence of risk by no means .tuarantees that a child will exhibit adverseoutcomes. Previous research on populations rarwing from children living on the HawaiianIsland of Kauai to those livinu in America's inner cities has documented that some children seemto be resistant to the effects of stress (National Commission on Children. 1991; Werner,13ierroan, and French. 1971: Werner Lind Smith. 1977).
As we have noted, Garmezy (1985) identities three categories of protective factors:personality characteristics of the child, warmth and cohesion in the family environment, and thepresence of an external support system that encourages and strengthens the child's coping. Basedon this typology. we have used the Descriptive Study data to identify the following protectivefactors:

Child ChAracteristic
child is highly sociable and cooperative, as rated by the interviewer:child had no health risks at birth (child was not of low birthweight, and did not requirespecial medical attention as a newborn);
Warmth and Cohesion of Family
mother reports low levels of conflict with the child's father;mother has received child support from the child's father within the last year, or the fatherlives with the mother and child;mother reports high levels of warmth in her relationship with the child;mother reports she does not lose control of her feelings with the child and never feelsworn out with the burdens of parenting:
External Support System
mother reports the child has a substitute parent figure, in addition to his or her biological
parent(s):child's father's family helps the mother with caring for the child, or buys clothes orpresents for the child:child has attended a formal child care arrangement (including kindergarten. Head Start.
nursery school, preschool. or day care center); andmother describes her neighborhood as an excellent or very good place to raise children.
We note that while our risk thctors are all derived from baseline data, the protectivefactors are all based on data collected as part ot- the Descriptive survey, and are thuscontemporaneous with the child outcomes.
.\s, was done for the risk factors, each protective factor was coded as a dichotomy, and we
then computed a summar .. index indicanng The number of protective factors present for eachchild. lthough we identified 1() protecti c ictors, we found that no child had more than nine of:hese: thus the protective index ranges from zero to nine with a mean of 4.5 protective factors.Intercorrelations among the protective factors indicated no pair to he highly correlated (seeAppendix 'Fable 9.1-21. The highest correlation was .25. between the receipt of child supportfrom the child's father and the receipt of non-economic support from the father's family.
To parallel the above analyses looking at risk factors. here we examine whether the
number ot protective factors was related to the proportion of children scoring above the cutoffs
we defined on each of four measures (0' child's developmental status: Peabody Picture
121
Vocabulary Test, Preschool Inventory, Personal Maturity Scale, and health status rating.' Foreach measure of child well-being, we use the same cutoffs reported earlier, to examine thepercentage of children faring well on each measure. We again group children into three groupsaccording to the number of protective factors- zero to three (n = 182), four to five (n = 300), andsix to nine (n = 217). The fact that a substantial proportion of the sample falls into each categorypoints to the variation within this sample in the presence of protective factors. Althoughprotective factors have traditionally been examined only for children at high risk (that is, withmultiple risk factors in their lives), the fact that living in poverty itself constitutes a risk factor forchildren's development su2gests that protective factors may be important for the Descriptivesample as a whole.
Children with a greater number of protective factors were more likely to score inthe upper distribution of measures of heal .h and development.
Figures 9.6 through 9.9 show how the number of protective factors relates to each childdevelopment measure. These figures clearly show that as the number of protective factorsincreases, a izreater proportion of children score at the highest level of each measure. Forexample, Figure 9.7 shows that the proportion of children scoring in the upper quartile on thePreschool Inventory increases from 15 percent among children with zero to three protectivefactors, to 36 percent among children with six or more protective factors. Similarly, theproportion of children rated by their mothers as in excellent health with no disabilities increasesfrom 41 to 55 percent. as thsf number of protective fa.: .s increases (Figure 9.9
in contrast to the analses of risk factors. %c did not eurnine protectise factors in association with children'ssLorcs on the flOME Pre\ ious hterature has iewed the quaht (It the home environment as an importantprotective factor. and thus we has.e used a measure oi maternal warrnth. drawn in pan from the HOME scale, as oneof several protectme factors
122
ft.
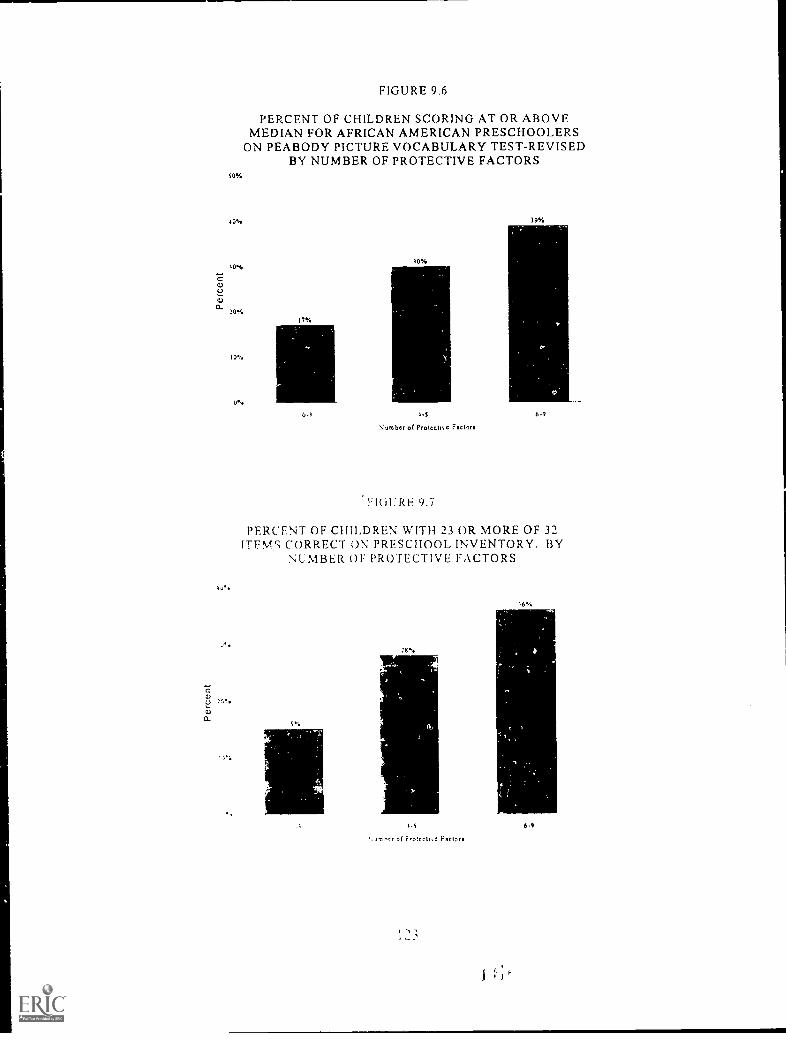
FIGURE 9.6
PERCENT OF CHILDREN SCORING AT OR ABOVEMEDIAN FOR AFRICAN AMERICAN PRESCHOOLERS
ON PEABODY PICTURE VOCABULARY TEST-REVISEDBY NUMBER OF PROTECTIVE FACTORS
SO%
40% 39%
10%
10
0%
17%
0-1 4.5
Number of Protect". C Factors
-1:101;RE 9.7
6-9
PERCENT OF CHILDREN WITH 23 OR MORE OF 32ITEM`i CORRECT ON PRESCHOOL INVENTORY, BY
NUMBER OF PROTECTIVE FACTORS
5%
36%
ta 6.9
!,er of Feotectl.c Factors

a'
FIGURE 9.8
PERCENT OF CHILDREN SCORING > 8.6 OF 10 POINTSON PERSONAL MATURITY SCALE, BY NUMBE,R OF
PROTECTIVE FACTORS
01%
32%
30%
25% 24%
20%20%
15%
10%
5%
00-3 4-5 6-9
Number of Protective Factors
FIGURE 9.9
PERCENT 01: CHILDREN IN EXCELLENT HEALTH WITH NODISABILITIES. BY NUMBER OF PROTECTIVE FACTORS
03f
41%
55%
40%
4.5 6.9
fro tor of Protecti,e F01014
124

Association Between Risk and Protective Factors
Next, we coisider the conjoint association between the presence of risk and protective
factors. These analyses allow one to examine whether protective factors are associated with
more positive development for all children, or only for children at high levels of risk. For theseanalyses we grouped children according to their level of risk, and then within these groupsexamined the proportion of children with favorable developmental status at each level ofprotective factors. We used the same cate2ories of risk and protective factors described above,
yieldin a total of nine uoups of children. ranging from those with few risk and few protectivefactors, to those with high levels of both:5 Figures 9.10 through 9.13 show the association ofrisk and protective factors with each of the four measures of child developmental status
considered above.
FIGURE 9.10
PERCENT OF CHILDREN SCORING AT OR ABOVE MEDIANFOR AFRICAN AMERICAN PRESCHOOLERS ON PEABODYPICTURE VOCABULARY TEST-REVISED, BY NUMBER OF
FAMILY RISK AND PROTECTIVE FACTORS
4,,
IP,
Rtsts
rNs
.04.
40%
Number of Protectiva Factors
511 0.3 3 4-5 IN 5.9
II
Amone children with 0-3 risks, the number ol children w ith 0-3. 4-5. and 6-9 protectiNe factors was 41. 89. and
No. respecto,e1. Among children with 4-5 risks, the number of children w. 0-3. 4-5. and 6-9 protective factors
w a; 60, 106, and 64. respectiel. Arnorni children w oh 6-10 rkks. the number of children with 0-3, 4-5. and 6-9
protective factors w as 81. 105. and (i7. respecti cl
t)

FIGURE 9.11
PERCENT OF CHILDREN WITH 23 OR MORE OF 32 ITEMSCORRECT ON PRESCHOOL INVENTORY, BY NUMBER OF
FAMILY RISK AND PROTECTIVE FACTORS
50%
40%41%
0.1620.
Number of Protoctivo Factors
111 0-3 4.5 II 8-0
40%
4-5 Risks
FIGURE 9.12
15Y.
10%
25%
6-10 Rukg
PERCENT OF CHILDREN SCORING > 8.6 OF ID POINTS ONPERSONAL MATURITY SCALE. BY NUMBER OF FAMILY
RISK AND PROTECTIVE FACTORS
9:..
2115
1.)
4-2
0- :V.
N.anbor of Potocl:vo Factor,
A 0.3 J 4.5 111 841
19%
.1 111.ks l. Ilnka
17%
6.10 Tanks

FIGURE 9.13
PERCENT OF CHILDREN IN EXCELLENT HEALTH WITH NODISABILITIES, BY NUMBER OF FAMILY RISK AND
PROTECTIVE FACTORS
60% 59%
20%
0-3 Ruling
o%
Number Of Protectoia Factors
II 0-3 3 4-5 N
54%
33% 32%
49%
4 Ruts 6-10 It take
For the two cognitive measures considered (Peabody Picture Vocabulary Test andPreschool Inventory), higher numbers of protective factors are associated with moreoptimal development at each level of risk, while at the same time children at greaterrisk exhibit poorer outcomes overall.
For example. Figure 9.10 shows that at each level of risk, children with six to nine
protective factors are approximately twice as likel to score above the median on the PeabodyPicture Vocabulary 'fest than are children with zero to three protective factors. However, fewerthan 30 percent of children at the highest level of risk scored above the median, regardless of the
number of protective factors present.
The association between risk and protective factors is less clear when we considerchildren's socioemotional development and physical health.
Figure 9.12 shows that. for children with fewer than six risks, more protective factors arenerallY associated \Aith higher scores on the Personal Maturity Scale. I lowever. for children
with six or more risk factors. the presence of protective thctors does not improve children's well-
being. Regardless of the number of protectke Mctors. only 14 to 17 percent of children with
high levels of risk NA ere rated by their mothers as high on personal maturity. This patternsuggests that above a certain threshold in terms La- number of risk factors, protective factors nolonger operate as ameliorative for this measure of socioemotional development.
127
H

Figure 9.13 illustrates that in all thme risk groups, children with six or more protectivefactors are more likely to be in excellent health with no disability than children with three orfewer protective factors. However, children with four or five protective factors show an irregularassociation of risk level with health status.
Luthar and Zig ler (1991) describe contrasting theoretical models for the relationshipbetween risk and resilience. In a compensatory or additive model, risk factors are associatedwith lower levels of functioning, and protective factors with higher levels. The simultaneousoperation of risk and protective factors "is a simple counteractive one" (p. 13). By contrast, in aninteractive model, the protective factors operate differently at different levels of risk, forexample, buffering negative effects only for those at high risk. These researchers note thatdifferent models may fit the pattern of findings for different child outcomes. In reviewing theevidence, Luthar and Zigler (1991) note that interaction effects account for very little varianceonce the main effects of risk and protective factors are accounted for.
On the one hand, the findings of the Descriptive Study provide evidence that protectivefactors buffer the negative effects of risk at all levels of risk. particularly for the cognitive childoutcomes. These findings support the compensatory model. Yet at the same time wc must notethat the children in our sample might all be considered at high risk, by dint of their families'poverty. That is, we are portraying the functioning of the protective factors at the upper end ofthe risk continuum. Thus, our analyses, while lending support to the compensatory model,cannot be seen as ruling out the particular version of the interactive model that hypothesizes thatprotective factors operate only for those at high risk.
Summary
These analyses make it very apparent that even among a sample of children who are all atrisk by virtue of living in poverty, those with multiple risk factors are exhibiting less optimaldevelopment. Thus. the risks experienced by the mothers in the first generation are clearlytranslated into diminished opportunities for the children in the next generation. At the sametime, a number of protective factors were found to be associated with more positive developmentfor the children. Analyses suggest that risk and protective factors influence jointly children'scognitive. socioemotional. and physical well-being.
How family risk and protective factors will interact with maternal participation in JOBSactivities. and success in obtaining employment and leaving welfare, remains to be seen. Howthese factors in turn affect the develonment of children over time will he explored with follow-updata from the JOBS [valuation.
12.X

CHAPTER 10IMPLICATIONS
It is well understood that the circumstances of families and the characteristics of parents
have a tremendous influence on the development and well-being of their children (National
Commission on Children, 1991). Only recently, however, has this understanding been
incorporated into programs that explicitly attempt to improve the prospects for children by
investing in their parents (Smith et al., 1992). As discussed in earlier chapters, the JOBS
Program was designed to affect parents directly by providing services aimed at ending long-term
welfare dependency. Nevertheless, indirect effects on children are also possible, if the JOBS
Program affects parental education, income, mother's psychological well-being, the home
environment, or child care arranements. As the long-term evaluation of JOBS proceeds, we
will examine whether and how JOBS has impacts on children. The purpose of this report has
been to explore the circumstances of eligible families soon after their enrollment in the Program.
What have we learned?
A clear theme is that the mothers in the Fulton Descriptive sample are in general highly
disadvantaged. As single mothers on AFDC. their incomes are of course very modest. On
average, their reading and math literacy skills are low. Although they enjoy social support from
family and friends, they report minimal economic or non-economic assistance from the fathers of
their children. In addition, they have high rates of depressive symptoms and they experience
numerous difficulties in the course of everyday life, such as having family members and friends
who are in jail. injured, or killed.
Similarly, the three- to tive-year-old children are also clearly disadvantaged at this early
point in the Evaluation. As rated by their mothers, the children's behavior and maturity do not
represent a problem; however, the children's receptive vocabulary is substantially below the
mean for national samples of children; their health is somewhat less favorable than that reported
for non-poor children; and many of the children appear to lack the skills and knowledge that
would make them ready to enter school. Given that these children are already faring poorly. it
seems entirely appropriate that policy makers, program providers, and the public considerwhether and/or how the JOBS Program may affect children.
A second recurring theme of these analyses is the heterogeneity of the population of
welfare mothers eligible for JOBS. For example, some mothers have no prior work experience.
while others vere workiniz at the time of the Descriptive survey. Some mothers hold positive
attitudes about becoming employed, while a minority feel tliat mothers with young children
should not work. A substantial proportion have hidi levels of depressive symptoms, but many
others do not. A majority use reliable methods of contraception or have been sterilized; but a
minority of mothers are at risk of an unplanned pregnancy. Because of this variation, it is likely
that maternal participation in. and reactions to. JOBS activities will vary. Those mothers who
are eatier to work, know where they can obtain child care, and have recent employment
experience may be more likely to respond to the JOBS mandate. Other mothers face substantial

obstacles to participation, such as low literacy levels, little support from family and friends, andnegative attitudes about employment.
These variations in maternal characteristics are likely to have important implications forthe children's well-being. Thus, for children whose mothers and families are already undersubstantial stress and who have minimal social support. the JOBS mandate may represent a fairlydifficult transition, although the Program may eventually be particularly helpful for suchfamilies. For other children, whose mothers have job skills and employment experience and whoreceive help with childrearing and child care, the JOBS mandate may stimulate and support atransition which is positive for both mother and child.
Had the mothers proven to be more uniform in their work attitudes, goals, psychologicalwell-being, skills, and social support, the JOBS mandate might have more uniform implicationsfor children. The Descriptive data, however, document diversity within the Fulton CountyAFDC sample of such magnitude that it seems unlikely that any impacts on children will beuniform. We have suggested elsewhere that the effects of the JOBS Program could be positive,negative, or neutral; that positive and negative effects could offset one another; or that effects onchildren may vary across subgroups (Zaslow et al., 1995). Early results indicating substantialsubgroup variation suggest that the JOBS Program is likely to elicit varied responses from bothmothers and children and also suggest it will be very important to examine subgroup differences.
In particular. multiple risk families stand out as a group whose children are especiallydisadvantaged. It is striking how the effects of family and maternal risk factors appear tocumulate to undermine the well-being of the children. Whether and how mothers in multiple-risk families can participate in JOBS, and the effects of the program on the children in thesehigh-risk environments, must be examined. Indeed, this particular subgroup of multiple-riskfamilies may need special counseling and services to help the mothers meet the JOBS mandateand to help their children to prosper.
On a more positive note, we were also able to identify a set of protective factors that wereassociated with more positive child development. The mutual influence of risk and protectivefactors present at the start of the JOBS ProQram may be an important determinant of bothparticipation in. and impacts of. the Program.
Finally, the data suggest that the JOBS mandate is translating into initial changes in thelives of many AFDC mothers and their children. Whether or not the program results ineconomic self-sufficiency for AFDC families, the JOBS mandate is producing immediatechanges in mothers' activities and child care arrangements. The effects of these apparent earlychanges will combine with an:, later program impacts on maternal education, earnings, and self-sufficiency. Thus, these early data suggest that the JOBS mandate has the potential to affect thelives of two o.enerations and provide stront.2. reason to track the well-being of both generationsover time.
130

REFERENCES
Achenbach, T.M., McConaughy, S.H., and Howell, C.T. (1987). Child/adolescent behavioraland emotional problems: Implications of cross-informant correlations for situational
specificity. PsycholQgical Bulletin, 101, 213-232.
Adler, M. (1988). Health and disability status of AFDC families. Washington, DC: Office of
the Assistant Secretary for Planning and Evaluation, U. S. Department of Health and
Human Services.
Alexander, K. L., and Entwistle, D. R. (1988). Achievement in the first 2 years of school:
Patterns and processes. Monographs of the Society for Research in Child Development,.
5_1(2), Serial No. 218.
Armstrong, B., Martois, J., Rickard, P., Ackermann, R., Howard, E., and Ilas, R. (1989). GAINappraisal prggram III: Third report. San Diego, CA: Comprehensive Adult Student
Assessment System (CASAS).
Atlanta Chamber of Commerce. (1994). Atlanta MSA Growth Statistics. Atlanta, GA: Atlanta
Chamber of Commerce.
. \uslander. G. (1988). Social networks and the functional health status of the poor: A secondary
analysis of data from the National Survey of Personal Health Practices and
Consequences. Journal of Community Health, 13, 197-209.
Baker. P. C., and Mott, F. L. (1989). NLSY Child Handbook. Columbus, OH: Center for Human
Resource Research.
Bane, M. J.. and Ellwood, D. T. (1994). Welfare realities: From rhetoric to reform.Cambridge. MA: Ilarvard University Press.
Bane, M. J., and Ellwood. D. T. (1983). The Dynamics of Dependence: The Routes to Self-Sufficiency. Cambridge, MA: Urban Systems Research and Engineering.
Barnard, K. E. (1988). Difficult Life Circumstances Scale. Seattle, WA: University of
Washington.
Baydar. N.. Brooks-Gunn. J.. and Furstenberg. F. F. (1993). Early warning signs of functional
illiteracy: Predictors in childhood and adolescence. Child Development, 64, 815-829.
Bell, R. Q.. and I harper, L. V. (1977). Child effects. Frlbaum Associates, Inc.
131

Benasich, A. A., Brooks-Gunn, J., and Clewell, B. C. (1992). How do mothers benefit fromearly intervention programs? kianathf_Appard Developmental ayrdah2g ia, 311-362.
Blake, J. (1981). Family size and the quality of children. Demography,11, 421-442.
Blake, J. (1989). Family size and achievement. Berkeley: University of California Press.
Bowen, G. L., and Neenan, P. A. (1993). Child day care and the employment ofAFDCrecipients with preschool children. Journal of Family and Economic Issues,14, 49-68.
Boyer, E. L. (1991). Ready to Learn: A mandate for the nation. Lawrenceville, NJ: PrincetonUniversity Press.
Bracken, B. A., and Frasse, D. P. (1983). Concurrent validity of the PPVT-R for "at risk"preschool children. Psychology in the Schools, 2..Q, 13-15.
Bradley, R. H., Caldwell, B. M., Rock, S. L., Barnard, K. E., Gray, C., Hammond. M. A.,Mitchell, S.. Siegel, L., Ramey, C., Gottfried. A. W., and Johnson, D. L. (1989). Homeenvironment and cognitive development in the first 3 years of life: A collaborative studyinvolving six sites and three ethnic groups in North America. DevelopmentalPsychology, 25, 217-235.
Bradley. R. H., Whiteside. L., Mundfrom. D. J.. Casey, P. H.. Kelleher, K. J., and Pope, S. K.(1994). Early indications of resilience and their relation to experiences in the homeenvironments of low birthweidt, premature children living in poverty. ChildDevelopment, 65, 346-360.
Brayfield. A.. Deich, S.. and Hofferth. S. 1993). Caring for children in low-income families: Asubstudy of the National Child CaiT Survey. 1990. Washington. DC: The Urban InstitutePress.
Brizius. J. A.. and Foster, S. A. (1993). Generation to generation: Realizing the promise offamily literacy. Ypsilanti, MI: Hiah/Scope Press.
Bronfenbrenner. V. (1979). The ecology of human development. Cambridge, MA: Harvardl'niversity Press.
Bronlenbrenner. V. (1986). Ecology of the family as a context for human development:Research perspectives. Developmental Psychology, 22, 723-742.
Caldwell. B. M. (1970). Cooperative Preschool Inventory.. Monterey. CA: CTB/McGraw-Hill.

Caldwell, B. M. and R.1-1. Bradley. (1984). Home Q19.crvation for measurement of the
environment. Revised edition. Little Rock, AR: University of Arkansas.
Center for the Future of Children and the David and Lucile Packard Foundation. (1992). U. S.
health care for children. The Euture of Children, 2. Los Altos, CA: The Center for the
Future of Children, the David and Lucile Packard Foundation.
Chase-Lansdale, P. L., Brooks-Gunn, J., and Zamsky, E. S. (1994). Young African-American
multigenerational funnies in poverty: Quality of mothering and grandmothering. Child
Development, 51, 373-393.
Cohen, E., Golonka, S., Maynard, R., Ooms, T.. and Owen, T. (1994). Welfare reform and
literacy: Are we making the Qonnection? Report prepared for the Family Impact
Seminar. Philadelphia, PA: National Center on Adult Literacy.
Cohen, S., and Wills, T. A. (1985). Stress, social support. and the buffering hypothesis.
Psychological Bulletin, 98, 310-357.
Coll, C. T. G. (1990). Developmental outcome of minority infants: A process-oriented look
into our beginnings. Child Development, 61. 270-289.
Cornstock, G. W.. and Helsing, K. J. (1976. ) Symptoms of depression in two communities.
Psychological Medicine, 6, 551-563.
Conger, R. D., Ge, X.. Elder. G.11. Jr., Lorenz. F. 0., and Simons. R. L. (1994). Economic
stress, coercive family process. and developmental problems of adolescents. Child
Development, 65, 541-561.
'frnic, K. A.. and Greenberg, M. T. , : 9q0 I. .1inor parenting stresses with young children. Child
Development, 61, 1628-1637.
Dayanzo. J., and Rahman, M. 0. (1993). American families: Trends and correlates.
Population Index, 2. 350-356.
Deren. S. (1986). Children of substance abusers: A review of the literature. Journal of
Substance Abuse Treatment, 3, 77-94.
Desai. S.. Chase-Lansdale. P. L.. and Michael. R. T. 11989). Mother or market: Effects of
maternal employment on intellectual abilities of four-year-old children. Demography, 26,
545-561.
133

Devins, a M., and Orme, C. M. (1985). Center for epidemiologic studies depression scale. InD. J. Keyser, and R. C. Sweetland (Eds. ), Test eritives, (pp. 144-160). Kansas City,MO: Test Corporation of America.
Dodge, K. A., Pettit, G. S., and Bates, J. E. (1994). Socialization mediators of the relationbetween socioeconomic status and child conduct problems. Chad Developaent,t12(2),649-665.
Downey, G. and Coyne, J. C. (1990). Children of depressed parents: An integrative review.Psychological Bulletin, 108 , 50-76.
Duncan, G., Brooks-Gunn, J., and Klebanov, P. K. (1994). Economic deprivation and earlychildhood development. Child Development, 51 296-318.
Dunn. L. M. and Dunn, L. M. (1981). Peabody Picture Vocabulary Test - Revised: Manual.Circle Pines, MN: American Guidance Service.
Eaton, W. W.. and Kessler, L. G. (1981). Rates of symptoms of depression in a national sample.American Journal of Epidemiology, 114, 528-538.
Egeland. B. R.. and Zaslow. M. (1995, March). The effects of the New Chance program onmother-child interaction. In A. C. Huston (Chair), Effects of welfare on children andparenting processes. Symposium conducted at the meeting of the Society for Research inChild Development, Indianapolis, Indiana.
Elardo. R. D.. Bradley, R. H.. Caldwell, B. M. (1975). "The relation of an infant's homeenvironment to mental test performance from six to thirty-six months. ChildDevelopment, 46, 71-76.
Fagnoni, C. M., Brown, K. A.. Baker, L. F.. Bonin. P. J., McDermott, A., and Petersen, C. D.(1994). Families on welfare: Sharp rise in never-married women refleets_societal trend.Washington. DC: U. S. General Accounting Office.
Family Support Act of 1988. (1988). Public Law No. 100-485, 102 Stat. 2342.
Friedlander, D. (1988). Subgroup impacts and performance indicators for selected welfareemployment _program. New York: Manpower Demonstration Research Corporation.
Furstenberg, F. F.. Brooks-Gunn. J., and Morgan, S. P. (1987). Adolescent mothers in later life.New York: Cambridge University Press.
Garfinkel. I.. MeLanahan, S.. and Robins, R. K. (Eds). (1994). Child support and child well-being. Washington. DC: Urban Institute.
134
Garmezy, N. (1985). Stress-resistant children: The search for protective factors. In J. E.
Stevenson (Ed. ), ZeoentRe5earch in developmental psychology (pp. 213-233). Oxford:
Pergamon Press.
a:1,..aczy, N., Masten, A. S., and Tellegen, A. (1984). The study of stress and competence in
children: A building block for developmental psychopathology. Child Qtveloprnent,
97-111.
Garrett. P., Ng'andu, N.. and Ferron, J. (1994). Poverty experiences of young children and the
quality of their home environments. Child Development 6.5, 331-345.
Gibbs, J. T., and Huang, L. N. (1989). Children of color: Psychological interventions with
minorie youth. San Francisco: Jossey-Bass Publishers.
Gottfried, A. W. (1984). Home Environment and Early Cognitive Development. Orlando, FL:
Academic.
Gueron, J. M., and Pauly, E. (1991). From Welfare to Work. New York, NY: Russell Sage
Foundation.
Hall, L A.. Gurley, D. N.. Sachs, B., and Kryscio, R. J. (1991). Psychosocial predictors ofmaternal depressive symptoms, parenting attitudes, and child behavior in single-parentfamilies. NursingResearch, 40, 214-220.
Hall, L. A., Williams, C. A., and Greenberg, R. S. (1985). Supports, stressors, and depressive
symptoms in low-income mothers of young children. American Journal of Public_ Health,
75. 518-522.
Halpin, G.. Simpson, R. G., and Martin, S. L. (1990). An investigation of racial bias in thePeabody Picture Vocabulary Test Revised. EducationaLand PsychgLogical Measurement
50, 183-189.
Hamilton, G., and Brock, T. (1994). The JOBS evaluation: Early lessons frorn_seven sites.
Washington. DC: U. S. Government Printing Office.
Harrison, ,k. 0.. Wilson. M. N., Pine, C. J., Chan, S. Q., and Buriel, R. (1990). Family ecologiesof ethnic minority children. Child Development, 61, 347-362.
Ilashima, P. Y.. and Amato. P. R. (1994). Poverty, social support. and parental behavior. Child
Cv,.elopment, 65, 394-403.
Ilauser, R. M.. and Mossell, P. A. (1985). Fraternal resemblance in educational attainment andoccupational status. American Journal of Sociology, 91, 650-673.
1 3 5

Hayes, C. D., Palmer, J. L, aad Zaslow, M. J. (Eds. ). (1990). Who cares for America'sghildigal_childssiig_palky_Imihr1_221i. Washington, DC: National Academy Press.
Heer, D. M. (1985). Effects of sibling number on child outcomes. Annolligyi11, 27-47.
Helburn, S., Culkin, M. L., Morris, J., Mocan, N., Howes, C., Phillipsen, L., Bryant, D., Clifford,R., Cryer, D., Peisner-Feinberg, E., Burchinal, M., Kagan, S. L., and Rustic, J. (1995).Cost, quality, and child outcomes in child care centers: executive Summary. Denver:The University of Colorado.
Hill, M. S., Augustynick. S., Duncan, G. J., Gurin, G., Gurin, P., Liker, J. K., Morgan, J. N., andPonza, M. (1985). Motivation and economic mobilb.. Research Report Series, Institutefor Social Research, University of Michigan.
Hofferth, S. L., West, J., Henke, R., and Kaufman, P. (1994). Access to early childhoodprograms for children at risk. Washington. D. C. : U. S. Department of Education.
Huston, A. C. (Ed. ) (1991). Children in poverty, child development and public policy.Cambridge. MA: Cambridze University Press.
Hutchens, R. M. (1981). Entry and exit transitions in a govermnent transfer program: The caseof aid to families with dependent children. Journal of Human Resources, 16, 217-237.
Joh-son, C. D., Messe. L. A., and Crano, H. D. (1984). Predicting job performance of lowincome workers: Ihe work opinion questionnaire. Personnel Psychology, 37, 291-299.
Kandei, D. B. (1973). Adolescent marihuana use: Role of parents and peers. Science, 181, 1067-1070.
Keer. D. W.. Colliver, J. D.. Kopstein, A. N.. Hughes. A. L., Gfroerer, J. C., Rice, S. C., andSchoenborn, C. A. (1994). Restricted activity da 's anuse of marijuana or cocaine among persons 18-44 years of age: United States. 1991.Washington. DC: U. S. Department of Health and Human Services, Centers for DiseaseControl and Prevention.
Kirsch. I. S., Jungeblut, A., Jenkins. L.. and Kolstad, A. (1993). Adult literacy in America: Afirst look at the results of the National Adult Literacy Survey. Washington, DC:National Center for Education Statistics.
Kisker. F.. n d Silverberg, M. (1991). Child enre utilization by disadvantaged teenage mothers.Journal of Social Issues, 47, 159-177.
136

Klerman, G. L., and Weissman, M. M. (1989). Increasing rates of depression. Journal of the
Americui Medical Association, 261, 2229-2235.
Kraus, N., and Markides, K. S. (1985). Employment and psychological well-being in Mexican-
American women. Journal of Health and Social Behavior, a , 15-26.
Kutsick, K., Vance, B., Schwarting, F. G., and West, R. (1988). A comparison of three different
measures of intelligence with preschool children identified at risk. Psychology in the
Schools, 25, 270-275.
Leadbeater, B. J. and Bishop, S. J. (1994). Predictors of behavior problems in preschool children of
inner city Afro-American and Puerto Rican adolescent mothers. Child Development, 65,
638-648.
Lindblad-Goldberg, M.. and Dukes. J. L. (1985). Social support in black, low-income, single-parent
families: Normative and dysfunctional patterns. Amei-ican Journal of Orthopsychiatry, 55,
42-58.
Long, S. (1990). Children and welfare: Patterns of multiple program participation. Washington.
DC: Urban Institute Press.
Luster, T., did McAdoo, H.P. (1994). Fectors related to the achievement and adjustmentof young
Afi can American children. Child Development, 65, 1080-1094.
Luthar. S. S.. and Zigler. E. (1991). Vulnerability and competence: A review of research on
resilience in childhood. American Journal of Orrhopsvchiatrv, 61, 6-22.
Martinson. K., and Friedlander, D. (1994. ) GAIN: f3asic education in a welfare-to-work program.
New York: Manpower Demonstration Research Corporation.
Maynard. R.. 1< isker, E. E., and Kerachsky. S. (1990). Child care challenges for low-incomefamilies. New York: The Rockefeller Foundation.
Maynard. R. A.. and Murnane. R. J. (1979). The effects of a negative income tax experiment onschool performance. Journal of Human Resources, 14, 463-476.
NIcLanahan, S.. Seltzer, J. A., Ilanson, I. L. and Fhomson, L. (1994). Child support enforcement
and child well-being: Greater security or greater conflict? In I. Garfinkel. S. McLanahan,
and P. K. Robins (Eds. ), Child support and child well-being. Washington, DC: Urban
Institute.
137

Mc Loyd, V. C. (1990). The impact of economic hardship on black families and children:Psychological distress, parenting, and socioemotional development. Child Development, 61,311-346.
Mc Loyd, V. C., Jayaratne, T. E., Ceballo, R., and Borquez, J. (1994). Unemployment and workinterruption among African American single mothers: Effects on parenting and adolescentsocioemotional Danctioning. child Development, &2), 562-590.
Mensch, B. S.. and Kande!, D. B. (1988). Underreporting of substance use in a nationallongitudinal youth cohort. Public Opinion Quarterly, 52., 100-124.
Meyers, M. K. (1995. February). Child care and welfare reform: Findings from California. Paperpresented at the Workshop on Child Care for Low Income Families, Sponsored by the Boardon Children and Families, National Institute of Medicine Family and child Well-beingNetwork, and the National Institute of Child Health and Human Development, Washington.DC.
Meyers. M. K. (1993). Child care in JOBS employment and training program: What differencedoes quality make? Journal of MarTiage and the Family, 5.1, 767-783.
Meyers, M. K., and van Leuwen. K. (1992). Child care preferences and choices: Are AFDCrecipients unique? Social Work Research and Abstracts, 28, 28-34.
Moffitt, R. (1992). Incentive effects of the U. S. welfare system: A review. Journal of EconomicLiterature, 30, 1-61.
Moore. K. A.. Krysan. M.. Nord, C. W.. and Peterson. J. L. (1990). Who tries illicit drugs? Alongitudinal study. Washin2ton, DC: Child Trends, Inc.
Moore, K. A., Morrison, D. R., Zaslow, NI. J., and Glei. D. A. (1994). Ebbing and flowing, learningand growing: Family economic resources and children's development. Paper presented atthe Workshop on Welfare and Child Development sponsored by the Board on Children andFamilies and the National Institute of Child Health and Human Development's Family andChild Well-Being Network.
Moore, K. A.. Myers. D. F.. Morrison. D. R.. Nord. C. W., Brown, B. V.. and Edmonston, B.(1993 ). Age at first childbirth and later poverty. Journal of Research on Adolescenc; 393-422.
Moore. K. A., Nord. C. W. and Peterson. J. I.. (1989). Nonvoluntary sexual activity amongadolescents. Family Perspectives. 21, 110-114.
138

Moore, K. A., and Snyder, N. 0. (1991). Cognitive attainment among firstborn children ofadolescent mothers. American Sociological Review, a 612-624.
Moore, K. A., and Stief, T. (1991). Attainment among youth fromiamilies that received welfare.
Washington, D. C. : Child Trends, Inc.
Moore, K. A., Zill, N., and Stief, T. (1990). The effects of the Family Stipp t Act on childdevelopment. Paper presented at the Meetir gs of the Population Association of America,
Toronto, Canada.
Murnane, R., Maynard, R. A., and Oh Is, J. C. (1981). Home resources and children's achievement.
The Review of Economics and Statistics, 63, 369-376.
Mussen, P. H. (Ed. ) (1983). Carmichael's Manual of Child Psychology, Volumes I and II. New
York: John Wiley & Sons, Inc.
National Commission on Children. (1091). Beyond rhetoric. Washington, DC: National Commission
on Children.
Newcomb, M. D., and Bentler, P. M. (1989). Substance use and abuse among children and
teenagers. American Psychologist, 44. 242-248.
Orr. S. F., James, S. A., Burns, B. J., and Thompson, B. (1989). Chronic stressors and materna,depression: Implications for prevention. American Journal of Public Health, 79, 1295-
1296.
Parry, G. (1986). Paid employment, life events, social support, and mental health in working-class
mothers. Journal ot- Health and Social Behavior, 27, 193-208.
Pearlin. L. I., Menaghan E. G., Lieberman, M. A., and Mullan. J. T. (1981). he stress process.
journal of Health and Social Behavior. 22, 337-356.
Phillips. D. A., Voran, M.. Kisker. E.. llov.es. C.. and Whitebook. M. (1994. ) Child care for
children in poverty: Opportunity or inequity? Child Development, 472-492.
D. A.. Mmes. C., and Whitebook. M. (1992). The social policy context of childcare:Effects on quality. American Journal of Community Psychology, 20, 25-51.
Pianta. R. C., and Egeland, B. (1990). Life stress and parenting outcomes in a disadvantaged
sample: Results of the mother-child interaction project. Journal of Clinical Child
Psychology, 19, 329-336.
39
Pianta, R. C., Egeland, B., and Sroufe, L. A. (1990). Maternal stress and children's development:Prediction of school outcomes and identification of protective factors. In J. Rolf, A. Masten,D. Cicchetti, K. Nuechterlein, and S. Weintraub (Eds. ), Risk and protective factors in thedevelopment of puchopathology, (pp. 215-235). Cambridge, MA: Cambridge UniversityPress.
Polk, D. F., Quint, J. C., and Riccio, F. (1988). The challenge of serving teenage mothers: Lessonsfrom Proje.ct Redirection. New York: Manpower Demonstration Research Corporation.
Presser, H. (1986). Shiftwork among American women and child care. Journal of Marriage and theFamily, 48, 551-563.
Quint, J. C., Polit, D. F., Bos. H. and Cave, G. (1994). New Chance: Interim findings on ar disadva th r th ohian . New York:
Manpower Demonstration Research Corporation.
Research Atlanta. (19901. The Atlanta Report Card. Atlanta, GA: Research Atlanta.
Reuter. M. A., and Conger, R. D. (1994). Family dysfunction as a mediator in the relationshipbetween parental substance use and adolescent substance use. Paper presented at the biennialmeeting of the Society for Research on Adolescence, San Diego, CA.
Riccio, J., Friedlander. D.. and Freedman. S. (1994). GAIN: Benefits, costs, and three-year impactsof a welfare-to-work program. New York: Manpower Demonstration Research Corporation.
Ross, C. E., Mirowsky. J., and Goldstein, K. (1990). The impact of the family on health: Thedecade in review. Journal of Marriage and the Family, 52, 1059-1078.
Rutter, M. (1979). Protective factors in children's responses to stress and disadvantage. In M. W.Kent and J. Rolf (Eds. ), Primary prevention of psychopathology, Vol. III: SocialCompetence in Children. (pp. 49-74). Hanover, NH: University Press of New England.
Sameroff, A. J., Seifer. R.. Barocas, R.. Zax, M., and Greenspan. S. (1987). Intelligence quotientscores of 4-year-old children: Social-environmental risk factors. Pediatrics, 79, 343-350.
Schorr. I.. B. (1991). Effective programs for children growing up in concentrated poverty. In A.C. Huston ( Ed. ), Children in poverty, child development and public policy (pp. 260-281).Cambridr, M: Cambridae University Press.
Seltzer, J. A., and Bianchi, S. M. (1988). Children's contact with absent parents. Journal ofMarriage and the Family, 50, 663-677.
140
t

Siegel, G.L., and Loman, L.A. (1991). Child care and AFDC recipients in Illinois: Patterns,problems and needs. St. Louis, Missouri: Institute of Applied Research.
Smith, S., Blank, S., and Collins, R. (1992). Pathways to self-sufficiency for two generations:Designing welfare to work programs that strengthen families and benefit children. NewYork: Foundation for Child Development.
Smith. S. and Zaslow, M. J. (1995). Rationale and policy context for two-generation interventions.
In S. Smith (Ed. ), Two-generation programs for families in poverty. Norwood. NJ: Ablex.
Sonenstein, F. L., and Calhoun, C. A. (1990). Determinants of Child Support: A pilot survey of
absent parents. Contemporary Policy Issues 8, 75-94.
Sorensen, E. (1995). Dispelling myths about the benefits of increased child support enforcement.
Washington. DC: The Urban Institute.
Stack, C. (1974). All our kin: Strategies in a black community. NY: Harper and Row.
Staples, R.. and Johnson. L. B. (1993). Black families at the crossroads: Challenges and prospects.
San Francisco: Jossey-Bass Publishers.
Stevens. J. H. (1988). Social support. locus of control, and parenting in three low-income groups of
mothers: Black teenagers, black adults, and white adults. Child Development. 59, 635-642.
Sticht, 1.. and McDonald. B. (1989). Making the nation smarter: The intergenerational transfer of
counitive ability. San Diego, CA: Applied Behavioral and Cognitive Sciences, Inc.
St. Pierre. R.. Swartz. J.. Murray. S.. Deck. D.. and Nickel. P. (1993). National evaluation of the
Even Start family literacy program: Report on effectiveness. Washington, DC: U. S.
Department of Education. Office of Policy and Planning.
*limits. P. A. (1982). Conceptual. methodological. and theoretical problems in studying social
support as a buffer against life strei:s. Journal of I lea lth and Social Behavior, 23, 145-159.
Turner, R. J. (1981). Social support as a contingency in psychological well-being. Journal of Health
and Social Behavior, 22, 357-367.
I., S. 13ureau of the C( nsus. 1991). Money ine(»ne I ht,A,cholds families and person in the
Unitcd States: 1991. Series p60-180. Washington, DC: U. S. Government Printing Office.
U. S. Bureau of the Census. (1992a). Ouneral Population characteristics for the United States:
1990 Census of Population. CP-1-1. Washington. DC: U. S. Government Printing Office.
141

U. S. Bureau of the Census. ( 992b). Statesbook. 112th Edition. Washington, DC: U. S. Government Printing Office.
U. S. Bureau of the Census. (1993). Poverty in the United States: 1992. Series P60-185.Washington, D. C. : U. S. Government Printing Office.
U. S. Bureau of the Census. (1994). Statistical abstract of the United States 1994; The nationaldata book. 114th Edition. Washington, DC: U. S. Government Printing Office.
U. S. Congress. (1988). Healthy Childreru Investing in the future. OTA-H-345. Washington, DC:Government Printing Officf.:t.
U. S. Department of Health and Human Services. (1994). Title IV-A child care FY 1992.Washington, DC: U. S. Government Printing Office.
U. S. House of Representatives, Committee on Ways and Means. (1994). 1994 Green book:Background material and data on pro.grams within the jurisdiction of the Committee on Waysand Means. Washington, DC: U. S. Go \ ernment Printing Office.
Van Fossen, S., and Sticht, T. G. (1991). Teach the mother and reach the child: Reult5 of theIntergenerational Literacy Action Re earch Project. Washington, DC: Wider Opportunitiesfor Women. Inc.
Walker, D.. Greenwood. C.. Ilart, B.. and Carta, J. (1994). Prediction of school outcomes based onearly language production and socioeconomic factors. Child Development, 65, 606-621.
Weeks, G. C., Gecas, V., Lidman, R. NI., Seff, M.. Stromsdorfer, E. W.. and Tarnai, J. (1990).Washington state's family income study: Results from the first year. Olympia, WA:Washington State Institute for Public Policy.
Weinraub, NI., and Wolf. B. (1987). Stressful life events, social supports, and parent childinteraction: Similarities and differences in single parent and two parent families. in C. F.Boukydis (Ed. 1. Research on support l'or_parents and infants in the postnatal period. NewJersey: Ablex Publishing Co.
Werner, E. E., Bierman. J. NI., and French. F. F. (1971). The children of Kauai: A longitudinalstudy from the prenatal period to age ten. 1 lonolulu: The University of Hawaii Press.
'erner. E. E., and Smith. R. S. (1977). Kauai's children come of age. Honolulu: The Universityof Hawaii Press.
Whitebook. M., Phillips. and Howes. C. (1989). National Child Care Staffing,Study AtlantaReport. Oakland. CA. Child Care Employee Project.
142

Willer, B., Hofferth, S., Kisker, E., Divine-Hawkins, P., Farquhar, E., and Glantz., F. (1991). The
dempld and supply gf child care in_1990; killt findings from the National Child Care
Survey 1990 aa.d A psofile of child care .ettings. Washington, DC: NAEYC.
Wilson, J. B., and Ellwood, D. T. (1993). Welfare to work thrgugh the eyes of claildx_o; Jhq
impact on children of_janntal_aaylin-satfrom_AEllciagnapkyinrja. Cambridge, MA:Malcolm Weiner Center for Public Policy, John F. Kennedy School of Government.
Zaslow, M. J., and Eldred, C. A. (1994, August). Observational research within the evaluations of
contrasting programs for welfare families: JOBS and New Chance. In L. Sherrod , Chair),
Child developmen_t and public policy. Symposium conducted at the meeting of the American
Psychological Association, Los Angeles, CA.
Zaslow, M. J., and Hayes, C. (1986). Sex differences in children's response to psychosocial Stress.
In M. Lamb, A. Brown, and B. Roeoff (Eds. 1. Advances in developmental psychology,
Volume. IV (pp. 285-337). Hillsdale, NJ: Erlbaum.
Zaslow, M. J.. Moore, K. A., Morrison, D. R. and Coiro, M. J. (1995). The Family Support Act
and children: Potential pathways of influence. Children and Youth Services Revjew 17,
231-249.
Zaslow, M. J.. Rabinovich, B. A., and Suwalsky. J. T. D. (1991). From maternal employment to
child outcomes: Preexisting group differences and moderatin variables. In J. Lerner and N.
Galambos (Eds). The employment of mothers during the ohildrearing_years (pp. 237-282).
New York: Garland.
till. N., Moore, K. A.. Nord, C. W.. and Stief, T. (1991). Welfare mothers as potential employees:
A statistical profile based m national survey data. Washington, DC: Child Trends, Inc.
till, N., Moore. K. A., Smith, E.- W.. Stiel. T.. and Coiro. M. J. (in press). Fhe life
circumstances and development of children in welfare families: A profile based on
national survey data. In P. L. Chase-Landsdale & J. Rrooks-Gunn (Eds. ), Escape
from Poverty: What Makes a Difference tbr Poor Children? Cambridge: Cambridge
University Press.
Zuravin, S. (1988). Effects of fertility patterns on child abuse and neglect. Journal of Marriage and
the Family, 50, 983-994.
143

APPENDIX A
DESCRIPTION OF WEIGHTING PROCEDURES, CONTROLVARIABLES, AND ANALYTIC SUBGROUPS
I. Weighting
The sample weight used for the Fulton County Descriptive Study data is designed to
correct for the differential sampling in the Labor Force group. The weight was created by using
the sample sizes in the following table and con iputing weights using the formula: WEIGHT = [1
/ (a / b)] * (c / d) e.
For each group (human capital development with and without a high school (HS)
diploma, labor force attachment with and without a HS diploma, and control group with and
without a HS diploma) this formula calculates the factor by which the sample can be multiplied
to obtain a weighted N. To avoid the problem of statistically significant results for even small
differences, which can result from inflated Ns, the second part of calculating the weight involves
down-weighting to the original sample size. This is done by multiplying tlic factor calculated
above by the proportion of the population represented by our sample.
Computed Weights for Descriptive Sample
N inDescriptiveStudy cell
(a)
N inPopulation
(b)
Total N(Descriptive
Study)(c)
Total N(Population)
(d)
ComputedWeight
(e)
Human Capital Development Group
v/ HS diploma/GED 235 318 790 1254 0.85
wo HS diploma GED 125 168 790 1254 0.85
Labor Force Attachment Group
v," LIS diplomaGED 149 ;19 790 1254 1.35
w:o HS diploma/GED 81 164 790 1254 1.28
Control Group
v, 1-IS diploma GED
m, D i IS diplarna (AD
129
L
.S3
1)2
790
:90
1254
L2.2_,
0.89
0 9 1
14 c

II. Control Variables
The following variables were used as controls in all analyses, unless otherwise indicated.Omitted categories for the regression analyses are noted in parentheses:
A. Focal child's age at random assignment (RAD) in monthsB. Focal child's gender (omitted category = girl)C. Group Assignment:
1. human capital development group2. labor force attwhment group3. control group (omitted category)
III. Subgroup Variables
Subgroup analyses were conducted using the following variables constructed frominformation collected at the time of random assignment:
A. Educational AttainmentI. High school diploma. GED, or college2. No degree (omitted categor )
B. Number of children under age 19 living in the household for whom the respondent isthe primary caretaker
,. One child2. Two children3. rhree or more children (omitted category)
C. Welfare duration: 'Finie on own or spouse's AFDC case in adult life, cumulatively1. Five or more years2. Two but less than tive years3. Less than two years (omitted category)
D. Current HousingI . Public Housing2. Subsidized HousingT. Neither public nor subsidized (omitted category)
E. Reading Literacy: lest of Applied Literacy Skills ScoresLevels 1 or 2 (0 to 275: Lowest levels) (omitted category)
2. Leel 3. 4. or 5 (276 to 500: llighest levels)
146

F. Math Literacy: GAIN Appraisal Math test1. Levels A or B (0 to 214; Lowest literacy) (omitted category)
2. Levels C or D (215 to 249; Highest literacy)
G. Locus of Control This is a four-item scale constructed from the following Private
Opinion Survey items:
I have little control over the things that happen to me.
I often feel angry that people like me never get a fair chance to succeed.
Sometimes I feel that I'm being pushed around in life.
There is little that I can do to change many of the important things in my life.
The summary score for the scale was recoded into two categories by dividing the score at
the median:I. Lowtexternal (omitted cateaory)
2. High/internal
H. Brief Depression Seale This is a four-item scale constructed from the following
Private Opinion Su.rvey items:
During the past week...I felt sad.
fel+. depressed.I felt that I could not shake off the blues. even with the help of family and friends.
I felt lonely.
The summary score for the scale was recoded into two categories by dividing the score at
the median:ModerateThigh depressive symptoms
2. Low depressive symptoms (omitted category)
I. Family Barriers to Work Index Fins is an 8-item index created from the following
Private Opinion Survey items:
I can't go to a school or job trainina proaram riaht now because I...
...have a health or emotional problem.
...have a child or family member with a health or emotional problem....already have too much to do durinc the da..
family is having so many problems that I cannot go to a school or training
pro.,!ram right now.
117

My family is having so many problems that I cannot work at a part-time or full-time jobright now.
Right now I'd prefer not to work so I can take care of my family full-time.I do not want a job because I would miss my children too much.I cannot go to a school or job training program right now because I am afraid to leave my
children in day care or with a babysitter.
Summary scores were recoded into two categories by dividing the score at the median:I. High amount of barriers to work2. Low amount of barriers to work (omitted category)
J. Social Support Index. This is a 3-item index created from the following PrivateOpinion Survey items:
When I have an emergency and need cash. friends and family will loan it to me.When I have troubles or need help, I have someone I can really talk to.If I got a job. I could find someone I trust to take care of my children.
Summary scores ,,,.ere recoded into two categories by dividing the score at the median:I. High amount of sources of social support2. Low amount of sources of social support (omitted category)

APPENDIX B
REGRESSION ANALYSES FOR SUBGROUP DIFFERENCESIN MATERNAL AND CHILD CHARACTERISTICS
I 49

AP
PE
ND
IX I
AB
! E 3
I-1
(s
RI
'RI s
sIt
AN
Al 1
SI S
PR
ED
ICI I
NO
NU
MB
ER
UI B
IR II
I CH
ILD
RE
N L
IVIN
ri IN
HO
US
EH
O1
D A
T T
HE
DE
SC
RIP
TIV
E s
rH
DY
(mea
n=2
26, s
d 1
13)
Var
iabl
e D
eso
iptio
nM
odel
IM
odel
2M
odel
3M
odel
4M
odel
5M
odel
6M
odel
7M
odel
8M
odel
9(.
1`47
90)
(N -
790)
(N-7
90)
(N=
790)
(N=
790)
(N=
789)
(N=
7.89
)(N
=77
I)(N
=77
2)
( M
id's
age
in m
onth
s02
*02
***
02**
*.0
1*.0
2***
.02*
*.0
2***
( hi
ld's
gen
der
)I
hoy
0:m
il-
03-
03-
02.0
4-.
04.0
01-
01
llum
an r
apn
al D
o,el
opm
ent (
itoup
- 04
- 12
-I
1-
09-.
12.0
01-
01
I abo
r 1
,,i, .
: tta
aim
ent (
min
i,-
I 6-
25°
- 23
*-
20*
- 25
*-
26*
- 27
*
R r
ecen
.ed
high
,cho
ol d
iplo
ma
t 11.
1)-
47**
*
R h
as b
een
on v
.el f
are
2 )e
ais
but l
e,, 1
11.1
11 5
- 14
R h
as b
een
on A
el ta
re 5
>ca
l, or
inur
e.7
5***
I)I i
es in
pal
l, ho
usin
g31
***
It lit
e. in
,nbo
dtic
,11,
M,1
112
- 03
k s.
0ied
2",
, anJ
abu
se o
n le
adni
g Ith
i.lo
test
(I e
s el
3-5
139
***
R s
,ore
d 2)
5. a
nd a
bio.
e on
in,A
th In
era,
. tes
t (I e
els
C a
nd D
)-.
44**
i
R h
as m
oder
ate
'hig
h de
pres
sise
s n
ipto
ms
R h
as m
ore
inte
rnal
locu
s of
con
trol
R p
erce
n es
hig
h am
ount
of h
arrie
rs to
Ns
orki
ng
R h
as h
igh
amou
nt o
t soc
ial s
uppo
rt
Ri
02"
0002
003
02"
06"*
TV
".0
4***
.05*
**.0
6*"
(con
tinue
d)
7

AP
HN
DIX
1A
131
I. 3
I -1
(con
tinue
d)
Var
iabl
e D
escr
iptio
nM
odel
10
(1,1
-722
)
Mod
el It
(N-7
33)
Mod
el 1
2
(N,-
-726
)
Mod
el 1
3
(N=
708)
Mod
el 1
4
(N=
676)
ChI
ld's
age
Ill 1
1101
1111
s02
"02
***
02**
*.0
2***
(hild
', .,.
.fend
a I
Ibo
). 0
girl)
0400
702
.007
06
Ilum
an C
apita
l Dee
lopm
ent G
roup
- 09
- 10
- II
- 12
-.11
1 ab
or I
ok.e
% n
adim
ent (
nor
m-
25*
- 26
'-3
1"-.
31"
-.25
*
R r
e,ei
red
high
.dio
ol d
yloi
na,(
,1 I)
-.11
Et h
as b
.,n o
n \\
elia
ie 2
, ar
s. h
ut le
ss th
an 3
- 16
R h
a, 1
,.ii o
n \\
el (
.11,
Cca
r:, o
r m
ore
.60"
"
R Il
se, i
n pu
blic
11,
nnan
g12
R li
\ e,
in s
ub-a
di/e
d ho
u im
.:-
13
R l,
Olu
d 27
o m
id a
l,: ,,
n re
adin
g 11
1C1.
1,!,
lest
(1
cul 1
--1(
02
21'.
,,,,,i
,lb,
,,:.
1'o
ath
litet
au)
test
(1
e \ e
l, I
and
I ))
B 1
13, i
ilotle
ldle
111
.11
&pi
,1%
t.! '1
111/
1111
,-
01
- 16
1
-II
R h
a, m
ore
inte
nhil
loot
, a L
ontr
ol24
"-
13
R p
erte
i\e, h
iell
amou
ntI b
arrie
rs to
v.o
rkin
g14
,-.
03
R h
as h
igh
amou
nt 0
1 sn
,.11
sup
port
- 07
-.06
02**
04"
03**
*03
***
St1
t 'R
II
t. ho
d I r
end,
eaku
latio
ns o
l the
1 u
lton
Cou
nt)
Des
crip
tie S
tud)
. dat
a
1\01
1S1
able
\,al
ne, a
re ,.
aNed
on
m. e
ight
ed d
ata
A t
te,t
stat
istic
\\ a
s ap
plie
d to
din
eren
ecs
hem
een
ba,
elin
e su
bgro
ups
Sta
tisnu
al s
igni
tican
ue le
s eI
N a
re In
dica
ted
as *
** E
001,
" E
01 ,
2O
s, t
2 <
10
1
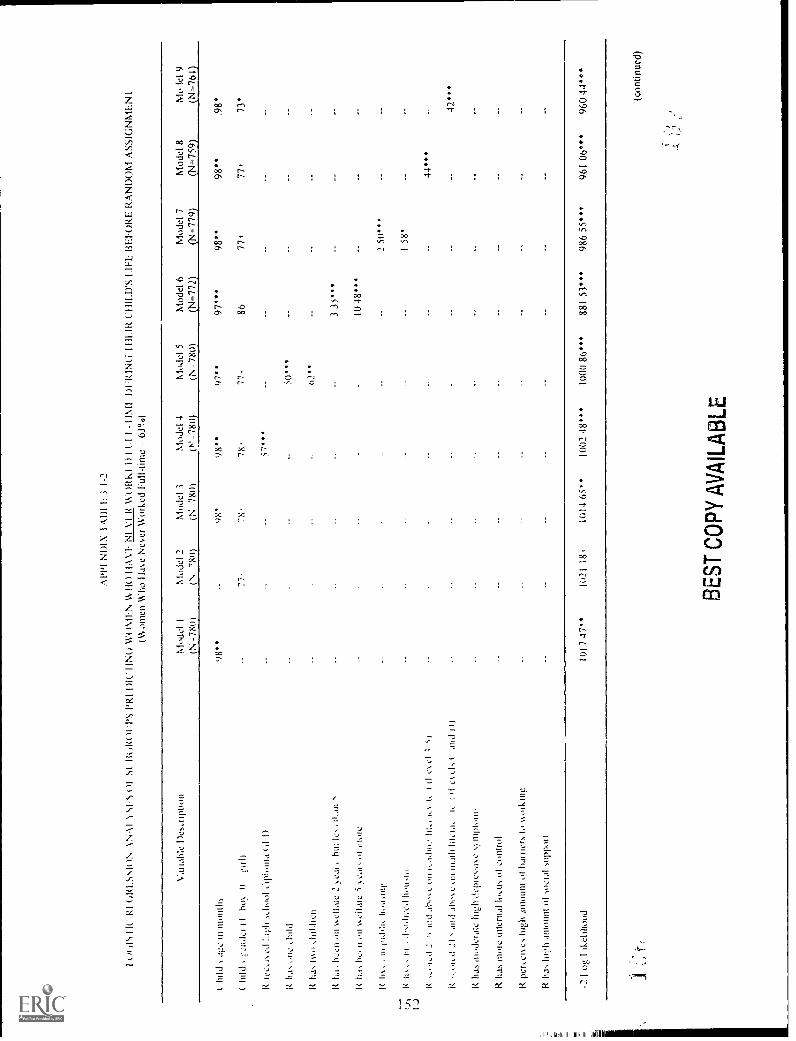
AP
P1
ND
IN I
AB
1 I:
3 1-
2
I( ir
rIS
I I(
' RI G
RI.S
SIo
N \
N A
I 1 S
FS
OF
SI F
R iR
ttlP
S P
RI D
ICIIN
O W
( /M
EN
111
011A
VI-
NI V
I R W
OR
K!
I) I
Li 1
-11
N11
WE
IR (
HIL
D'S
LIF
E B
EF
OR
E R
AN
DO
M A
SS
IGN
ME
N(W
om
en W
ho I)
Ie N
ever
Wor
ked
Ful
l-tim
e -
6390
)
Vai
iabl
e 1)
eNcr
iptio
nM
odel
1IN
-78
u)M
odel
2M
odel
.3
IN '8
0)(N
-78
0)N
IoJe
l 4
IN' -
780)
Mod
el 5
(N-7
80)
Mod
el 6
N=
772
Mod
el 7
N=
779
Mod
el 8
1=75
9
Mol
d 9
N-7
61
( m
Idag
c.. i
ii in
ontli
N98
.*98
"97
"97
***
98.*
98"
.98*
( hi
ldL:
,:ikl
er I
Ibo
v
reo.
1 cd
:1L.
.11:
".1,
001
C11
)1..1
11,1
( d
I)
75,
78.
570
77,
8677
)77
473
*
R h
a,ch
ild:s
0***
It ha
, tvv
ii02
**
R h
a 0:
C11
iicl
Isile
2bu
t Ie
ilijn
A3
35...
liav
be.
vv e
iI,ue
S v
i mow
10 4
8*"
It.11
s, ,
tit 1
,011
1,_
It its
,. tit
.-.1
,1,1
tied
liii
It2
tod
t-s
)
,toct
I 21.
, mid
alto
s,: t
illitl
ili Ik
i,iis
'I\
(.1
0d I
))
R h
a, m
odci
ate
hieh
nipk
ini
01.Ie
inte
rnal
10,
u, 0
1 eo
ntro
l
perc
eive
, hig
h am
ount
ol h
arrie
r, I
k m
g
Rhi
rh a
mou
nt o
l
2 50
"
158
*
44"
42"
-2 1
og
I ike
hhoo
d10
1747
"10
21 1
8110
14 0
5**
1002
48*
**10
(10
86**
*88
1 53
***
986
55**
*96
1 06
***
960
44**
*
(con
tinue
d)
BE
ST
CO
PY
AV
AIL
AB
LE

A15
151.
ND
IX IA
1(11
. 3 1
-2 tc
ontin
ued)
\ `U
tak'
I "'il
l'111
1M
odel
10
Mod
el 1
1M
odel
12
Mod
el 1
3M
odel
14
(N 7
13)
(N-7
25)
(N=
718)
(N=
701)
(N=
6681
hild
's a
ge in
rno
ntlis
!at:n
th:N
I1(
...1
re,c
iSe,
11ii.
,..h
st.h
.tol d
iplo
ma
ii I)
K h
a, o
ne M
4
85
98.
80
984
80
98"
7986 1.
04
1.28
Rr.
So
77
II III
,n
:ii
.I.o
t I,
1h.n
ss
..ai
than
2 -1
7
7 36
**
IIis
iiru
on. I
wo
4.I 4
8,
144
.14;
1 05
.. Iii
90
14f I
An
I
..Ict
ats
prc,
as
e
t,,a
(I
(1
68,
79
K I,
,III
1114
:1,1
1 10
,11,
.1 .0
1111
4.1
61"
90
111.
;d1
.111
1001
'i tI
1.. s
siki
iic08
"0I 6
5"
R h
a hi
gh li
no,4
4 .1
i.iI .
,tipr
ou75
,79
I t.
1II,
. ,Ill
ott,1
13 )
79+
9 to
I992
1 98
***
915
4(34
475
0 99
st )
1 R
II
1ul
d1
1,11
11,
tile
I nht
si C
(411
11 D
escr
ipto
,c S
tud>
dat
a
)I
Ist
I tild
e di
tit. a
te tr
a.,d
on
ssei
ghie
d da
ta1
sitin
ated
odd
s ra
tio, b
a,cd
on
logi
stic
reg
ress
ion
anal
sts
4' E
001,
'4 a
- in
,. a-
05;
*-
10R
esea
rch
grou
p is
not
con
trol
led
beca
use
empl
o m
ein
tool
, pla
,:e b
elow
ran
dom
ass
ignm
ent
I4 -4

AP
PI N
I)1
\ I A
lt1 I
3 1-
3
(11
CI t
il(IN
sIR
)!\.
;1N
.11
`.`,
!!! Y
.13(
!lt! u
l1/
1(-1
1NO
lil
I IL+
111
.% I
My1
111
kti S
1101
11 D
M)
r 15
L.1.
..MP
LOY
IM
LAN
SC
OR
E(m
ean
--2
7)1,
s d
2 14
)
Mod
el 1
Mod
eI 2
Mod
el ;
Moo
d 4
Mod
el 5
Mod
el 6
Mod
el 7
Mod
el 8
Mod
el 9
IN 7
78)
(N-7
781
(N 7
78)
(N-7
78)
(N-7
78)
(N-7
78)
(N, 7
70)
tN=
777)
(N-7
58)
I(I
IIis
rei
Ii I.
(11
ii
-.II
51,
S5,
.11
I
t/i 4-I:
gii1
.11.
h.
1( I(,ic
s1 2
sun)
.sho
Se
4.Iii
csc
l -5)
1( ..
.red
21.
; and
atio
se o
nvi
ii IiI
i.is.
let i
i cc
el, (
and!
),
R h
as in
oder
aic
high
dep
re,-
.0,e
cilip
lsiih
R 1
1.1,
1110
ICoi
,q11
1.51
It pe
Rei
le,
Am
ount
01
(iani
cr, i
o
high
&m
oon(
ot
supp
ort
- 00
111
o2-
00.3
- 00
3-
001
- 00
3-
004
- 00
9
- 00
,1
- 01
- 00
8-
0203
- 01
502
inni
0100
502
- 00
403
10II
1110
1012
- 35
*
- 18 - 2
53* 7I
43*
15
58*
000
000
001
006
003
02f
008
02* (c
ontin
ued)
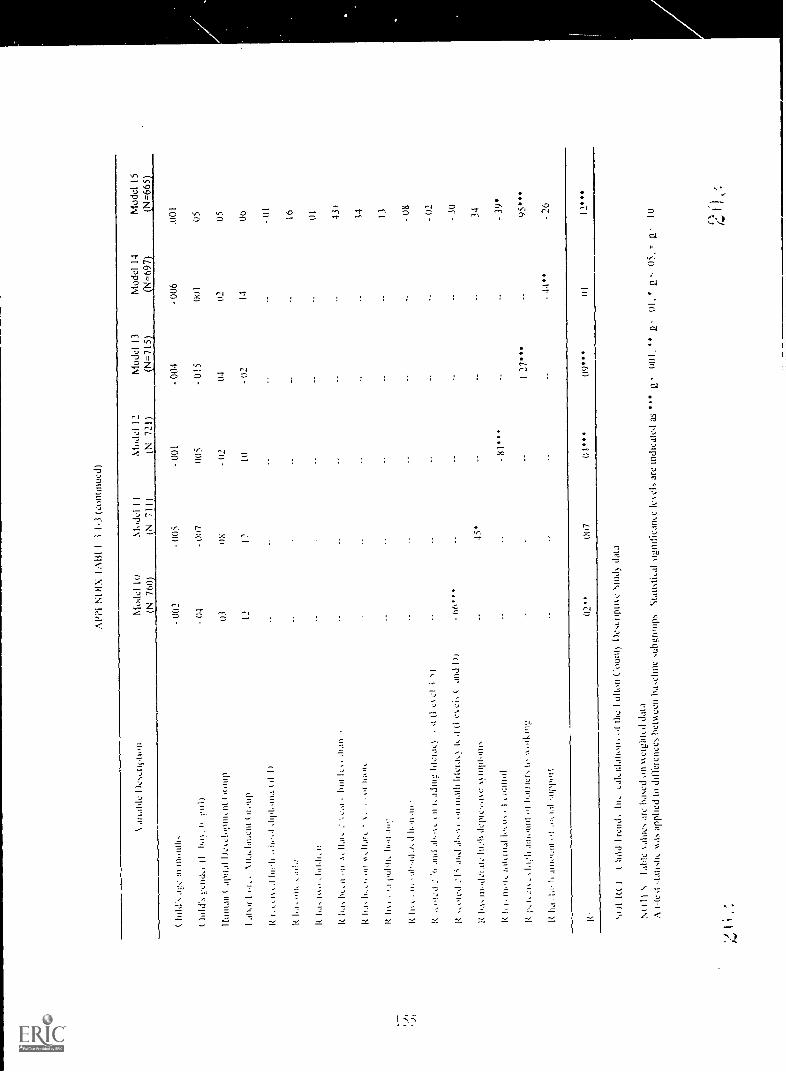
AP
PI.
\ 1I
I 1-3
(C
ontin
ued)
). a
udib
le D
es,ii
rtio
nM
odel
l()IN
760
1M
odel
11
(isl
711)
Mod
el 1
2IN
721
)4=
7I5
Mod
el 1
3M
odel
14
Mod
el 1
5'=
697
N=
665
( In
1d's
-00
2-
005
- 00
1-
004
-006
.001
( Iii
liI'
citi
1bo
.-
- 00
700
5-
015
OW
05
Iltin
tan
( at
ina(
1),
.% e
kvin
, lit
iron!
)01
uti
- 02
0402
05
1 ab
ot I
lta..1
11ne
nt (
1011
1112
- 02
1406
RJ1
1,40
11.1
. ( d
II-
01
It ha
, .n,
I:11d
16
It 1,
1,1,
%.,
Ii.l
bL,1
1..1
. .1,
ILO
,11
111
ILS
I l(la
li
s,1'
1 11
;01,
..
),11
,1t,
ii11
.1,1
1/,.1
11.,1
1,11
1.
.1 .1
11d
.,1`.
.1t.
adnt
1 2
(1.$
)
RtL
I 2 Ic
lid
ai.`
\,,1
1 11
1,10
1 11
1c1.
1,.1
Ii. 4
111:
1.d.
mid
i))-
),(i*
).1,
111
.,1,..
rak
(tw
it di
pilM
,ie '1
1111
1111
1111
N45
*
nit,i
tia11
,ti,
.:10,
11
It,lo
..11
amou
ntt1
.11k
1,1'
,4
Rh
a:, a
il ,a
irpot
i
I 27*
**
- 44
"
43i
14 13 - -02
-30 34 -39
*
9.5.
It02
"00
704
09**
*01
12**
*
)1 R
(Ir
end,
In..
haka
llatto
ns 4
the
1 nI
ton
('oun
t!, 1
)eA
rlpm
e ,0
1,1)
dat
a
tit 1
1 I
`,1
abli:
%at
tic.,
are
base
d on
keI
gIoL
d da
ta
A H
est
a.s.
app
lied
to d
iffer
ence
s be
mee
n ba
selin
e su
bgro
ups
Sta
tisti,
a1 s
igni
licam
e le
,.els
are
indi
cate
d as
**n
oon-
III,
-(4
5,+
210
-
r) (
1,
'1,
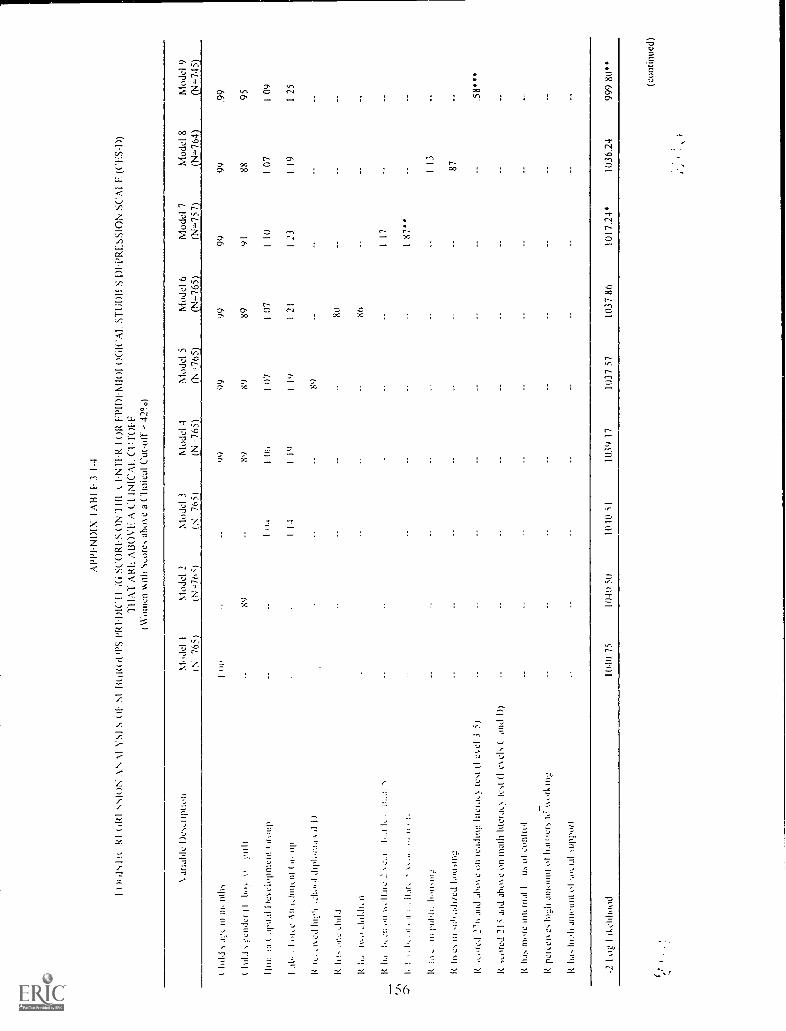
APP
EN
DIX
IA
B1
L-
3 1-
4
It x
ds
I it
RI
OM
ssl
oN .\
\Y
S1 S
nI
SI f
it !R
ol ,P
S PR
ED
ICII
i SC
OR
ES
ON
.111
1 t I
NFI
R I
OR
EPI
DE
NU
OI
STU
DI1
S D
ITR
ESS
ION
SC
AI
F (C
ES-
D)
TH
AT
AR
E A
BO
VE
A C
I IN
ICA
I. C
l1rO
FF(W
omen
mal
l S,o
res
ahoe
a (
lini
cal C
ut-o
ff =
42
0)
\ am
ble
1)e,
..npl
ion
Mod
el 1
Mod
el 2
Mod
el 3
Mod
el 4
Mod
el 5
Mod
el 6
Mod
el 7
Mod
el 8
Mod
el 9
(N 7
65)
(N=
7oi
7)s5
)(N
-76
5)(1
5-'7
65)
(W76
5)(N
=75
7)(N
=76
4)(N
=74
5)
( In
id ..
i..:c
in n
i,ntli
s1
tit,
0000
9999
99.9
9
t hild
...,:
ende
r il
lio)1
i..11
1)89
8989
8991
8895
Iltin
.)ii
t. ar
nai D
etel
opm
eni o
i,up
Iii.
.i1
0,.)
1 07
1 07
110
1 07
I 09
I.1
l .
III.1
: An
1.11
1110
11 (
il. i
ipI
I-1
I10
I10
I21
I 23
I19
1 25
It 1
,..Ic
dlit
irth
..:no
iii d
i('l;
11,1
idi)
89
R li
tne
It1,
.;A
dd!,
n
It h
at.1
1..ii
Hal
e2
h.it.
.
(ft
IIS
IIIi
11.it
,
Rit
tali.
11,
11,I1
,f
II1c
11n,
111;
.2
1( ,t
.n:5
1 27
nan
dJ1
'0%
e o
n te
,niti
yte
.to.
el 3
5)
R s
).ir
ed 2
15 a
nd a
hoe
on in
ath
litei
jlo
a(I
eek
( an
d I)
)
R f
hb m
ore
inic
rnal
1us
al e
ontio
l
R p
erei
t eIo
I,J1
110,
1111
at h
arrie
rs h
iirku
r.:
R h
as11
11'1
1 .1
1110
1.11
11 0
1 ,0
,1.1
1 sl
ipp0
(1
80
117
1 87
"
113
87
58*"
-2 I
og
I ik
ehho
od10
40 7
510
40 5
010
10 S
I10
39 3
710
37 5
710
37 8
6l0
17.2
4*10
36.2
499
9 80
'
(con
tinue
d)

1-\
111
I.3
I.-1
r( o
ntm
ued)
Val
'abl
e D
es...
tuiti
onM
odel
10
(N74
71M
ode]
11
Mod
el 1
2M
odel
13
(lNI
713)
(N70
6)(N
- 69
0)
Mad
e! 1
4
(N-6
69)
mon
ths
(),)
I 00
9999
99
(11
11,1
, gen
d.:1
I0
girl)
909
192
9594
Hum
anai
m1)
clop
tt1A
tt (1
1,up
1 04
`HI
I 04
I 00
1 07
1 al
to! 1
,4,e
10.
hhin
ent (
I19
1 22
ItS1
301.
31
It ie
cish
ool d
tpIt.
t (
I\ 11
,1...
Ill It
lid
.
I idl
e 2
"...I
I-,
but
than
l<I
..'If
of o
ff fr
.;
l<If
[mid
i. 10
.foo
ff
I:f
fit.o
f',I
fI h
oild
if
I:ff.
fl 2
'Is.1
1eui
icad
in::
\ h. a
(1
ccl 3
,)
,..ffi
f.d 2
1, a
nd .s
hfo.
e o
ff m
ath
lih:r
ac. t
est t
lel
s (
1))
ItI_
i- ut
ile in
tern
al lo
...th
id e
olith
)]
It 1h
_ei
hain
el, t
o \\
i.111
:211
56
118
110
99 I 01 1.53
'
79 6I 82 691
17**
.57"
1 69
1 24
68*
73
2I
I ike
lthI
1001
Ca
911
17".
948
8092
396
859
65**
*
ts,
ItlI
(ho
ld,
alci
d m
olls
01
the
l.ulto
n C
otin
t> D
esci
[Nut
t: S
tud\
dat
a
Ni )
IISI a
ble
aloe
s ar
e ha
.cd
oil u
etgI
tttd
dta
\tim
ated
odd
s ra
lios
ba.e
d on
1.1
2.is
ti, [e
gres
sion
alia
l>N
il 1/
41ta
1hilC
alt0
IttlIe
,ttLc
10e
1, a
re in
dh:a
ted
asE
-00
1. '
()I,
2- 0
5, +
2. 1
0
BE
ST
CO
PY
AV
AIL
AB
LE

AM
NIA
X 1
AO
l F 3
I -N
la(
d<I N
NI,
IN A
N A
l `)
NI.
S1,
11),
0011
1'S
NU
N('
1N(,
A M
t MI I
NIII
RN
Al
I 00,
5 01
. CO
N 1
RO
Lto
lean
- 2
1 35
, s d
- 3
54)
Var
iabl
e D
e,oi
ntio
nM
odel
1M
odel
2-
770)
N-7
70)
Mod
el 3
(N-
770)
Mod
el 4
(N-7
70)
Mod
el 5
5(N
-77
0)M
odel
6(N
=77
0)M
odel
7
(N=
764)
Mod
el 8
(N=
769)
Mod
el 9
(N-.
750)
(ol
d , j
e in
mon
th:,
-00
04-
001
005
006
.007
- 00
0300
8
ectid
er I
Ib.
iien
d)2'
126
2426
1528
.16
lloni
anpi
iaI l
)eeI
.'pin
eio
2'-
24-
- 27
- 35
- 25
- 21
..f,c
A0.
1,10
1lei
lt I '
loop
16II
0804
.15
.19
reLe
o.ed
dipl
onid
,(11
Ii
ink!
It It%
)elia
te 2
bid
le, n
ix.
l,,, 4
,11
moi
,
1,,
11,1
1,;1
1'
0
.2-6
and
abo
i,c o
n te
adin
ii,d
ecl 1
-5;
,,oie
d 21
i and
abo
% e
on
mat
h lit
eiao
ii ii
cel
, Ind
In
mod
erat
elug
h de
pre,
,ie s
mpt
om,
prde
i es
high
am
ount
01
harr
ier,
lo o
oikl
iif
has
high
am
ount
Nup
port
1 13
- 49 -1 5
2***
- 75
*
2 04
*
R-
0000
200
300
403
***
01+
.03*
**.0
2*.0
8**
(con
tinue
d)

2
.114
'1 N
1)IX
1 .1
1(1
1.1
1-5
(co
nfirm
ed)
l)L-,
111
(ion
Mod
el(N
-752
.)
Mod
el I
I
(N -
706)
Mod
el 1
2(N
=.7
09)
Mod
el 1
3(N
-.69
2)
Mod
el 1
4(N
=66
4)
(10
1.1
.1,:
iit m
on0h
iI,,
,.:.
1..1
(1
1,0.
0 g
ni)
I kw
I, (
31,1
1,1
I ),..
,,..lo
ptile
nt (
lion
p
1.1
1,.,1
1.4
.e 1
1 i.
i, In
nen(
(iru
ip
1: IL
,cio
lhiz
li ,,t
iool
dip
loni
.1(
II I)
iz1.
,1.
1,..1
,11
I
0 1,
. , IA
., ,i,
d,11
.1
0 1,
,1.
..,...
ii ,1
1...
.Li
fe,..
.ir b
in 1
...,
.ii.
on...
.,
0001
27 - I I 17
- 11
01
19
-,(
1
I 11
001
19
-30 18
0007
24 22 08
01 19 - 46
- 04 18 04 - 17
- 25
izil
,, 6.
, n ,
I.,,,
11.1
le ,
cal .
la 1
11.'1
,
i: lo
,... i
i, 1.
,,l,h
, li,,
;Nni
::
- 7o - 21
INis
-iil
ta,a
01/..
51 lt
ivai
,..74
1:...
,.1..1
2-6
.1nd
,16.
...: o
ut 1
-1,6
11,4
Iii..
.1,1
,. is
st (
I c \
LI I-
")I 3
6
0 ...
.,i..d
21-
.in.
1.16
..e o
n in
alli
lit...
t... t
c,i.
fl eA
cl, (
,Ind
I))
1 69
0 65
0 li,
i, iii
,KIc
iat,
lo;..
11 d
ep6.
..so,
e ,.
.ilip
toill
,98
.96
0 vc
io:n
,C,1
111.
'h d
illom
ll oi
hai
riciN
fo o
lkill
o-1
60.
*-1
14
0 lid
..16.
..11,
iiii.s
init
01 s
o,la
l tal
ppsi
rl71
**37
014
05**
*o|
16**
`,(
)1'0
(1fil
l 1I r
end,
Inc
Ldki
llatio
nN(li
eflio
n C
ount
) D
eser
iptie
data
Na
Iki
%M
lle. a
re 6
.6,e
d on
MeI
ghte
d da
ta
appl
icd
(Mk:
fenc
es b
eRse
ensu
bc6n
ips
Sta
tist
lel e
ls a
re in
dkai
ed**
*00
1, *
* 2
01, *
< .0
5, -
I a

Al'I
'EN
DIX
TA
131
E 3
1-6
S R
kiR
TS
SIU
N A
N,1
1 Y
ST
S (
)I. S
''13(
1RO
UP
S P
RE
DIC
HN
(i N
UM
BI R
01
T I
IFE
CIR
CU
MS
TA
NC
ES
(ilea
n -
3 33
, s d
2 53
)
Var
iabl
e D
esvi
iptio
nM
odel
1M
odel
2M
odel
3M
odel
4M
odel
5M
odel
6M
odel
7M
odel
8M
odel
9(N
-77
7)(N
r.77
7)(N
-777
)(N
-777
)(N
-777
)(N
=77
7)(N
=76
9)(N
=77
6)(N
=75
8)
( lid
d s
ai!e
it, m
onth
s11
0-I
000
.005
003
005
007
007
(10k
Ist.:
,.ndo
Il b
oy 0
ri,i
)I;
1011
1007
1008
Hum
an (
apn
al D
e% e
lopm
ent (
troo
p-
18-
20-
19-
19-.
21-
22-
29
labo
r lin
ce .\
itaa
men
t ( n
oup
- 13
- 16
- 16
- 13
- 14
- 17
- 21
R r
cciv
ed h
igh
Nth
IlkI
Idi
pltn
a(
a il
- 19
R h
.b o
ne .h
ild-
421
I< li
b R
kii J
oldr
en-
31
I( li
a., l
io.n
on
yi.e
llat,
2..,.
.,11
,Im
i I.
.-, 1
111,
1-
26
II dt
,11
011
Vdi
art:
\ CA
IN O
fU
lm,:
- 19
Rbo
ttom
!40
4
1( 1
0,s
in o
thod
lzed
(an
t min
-.13
s.or
ed 2
70 d
nd d
b0%
%.
.1.1
111e
. ille
fdt.!
, IC
A II
eN
cl 3
-5)
49"
R s
eine
d 21
i and
aho
y c
on m
ath
Iner
a,>
test
(1
eids
and
h)
R h
as m
odet
ate
, hig
h de
pres
sive
sv
mpt
onn.
R Il
d.N
mor
e in
tern
al Im
us o
t con
tiol
R p
erce
ives
hig
h am
ount
ol b
arrie
rs to
Yor
king
R h
as h
igh
amou
nt o
t soc
ial s
uppo
rt
0000
00 I
002
003
006
.003
.01
.01
(con
tinue
d)
BE
ST C
OPY
AV
ML
AB
LE

2
AP
P1
ND
IX 1
A11
1 I
iI -
6 (L
ontin
ued)
(N 7
59)
MiR
d.1
11M
odel
12
(N 7
11)
(N -
722)
Mod
el 1
3(N
-715
)M
odel
14
(N-6
97)
111%
1011
1NO
m,
1 1
007
005
006
1%.,
0 12
111)
12.
1208
07
I km
, in
I11
MA
Iili
nctiI
2(1
34-
26-
37
I31
,..1
I ,4,
:c1.
1.1,
Idirc
lul I
hot
hp
R1,
551,
.,1 h
igh
d
-2k
127
- 25
24
1:11
.1o1
,1
1: IL
I.is
.111
1,ii,
2iii
.ki
t I
I:I
oil
CA
!, ,1
lube
11,1
1111
L.
I, .
1Ii
ii v:
Mod
el 1
5(N
=66
6)
005
.000
2
- 39 18 39
r
. ;7*
- 36 37
I(,,1
sul
tu.
tsIu
uilil
t.'It
CS
C)
;--,
)71
**
I:.1
,-J
21sq
loa
th li
tcra
sIe
lI c
i el.
(an
d 1)
)Ii
6-
09
Itii.h
NO
*44
Rd,
. mor
e in
tern
al lo
i.us
..onr
i,i1
-0 2
8-
41+
ref,C
I%e,
tug:
V..1
111M
M! t
li 1/
.1(f
ic-N
hi m
.rkt
11:4
-0 0
9-
17
k ha
,an
isiw
itss
ioal
sop
poit
-0 0
8-
06
R.
006
002
004
05"
S(1
1 P
d.I
rend
s In
c 1,
:alc
ulat
ions
id th
e 1
01km
Cou
nt)
Des
cr 'y
ids
e S
tud)
dat
a
NI I
II S
I abl
e s
allie
s ar
e ba
sed
on k
kciii
lued
(Lo
a
A t-
test
iiith
app
lied
to d
iffer
ence
s be
tvie
en b
asel
ine
subg
roup
sS
tatis
tical
sig
nific
aike
lei,
el; a
rc in
dica
ted
asE
001,
01,
a05
, + g
< 1
0
2 1o
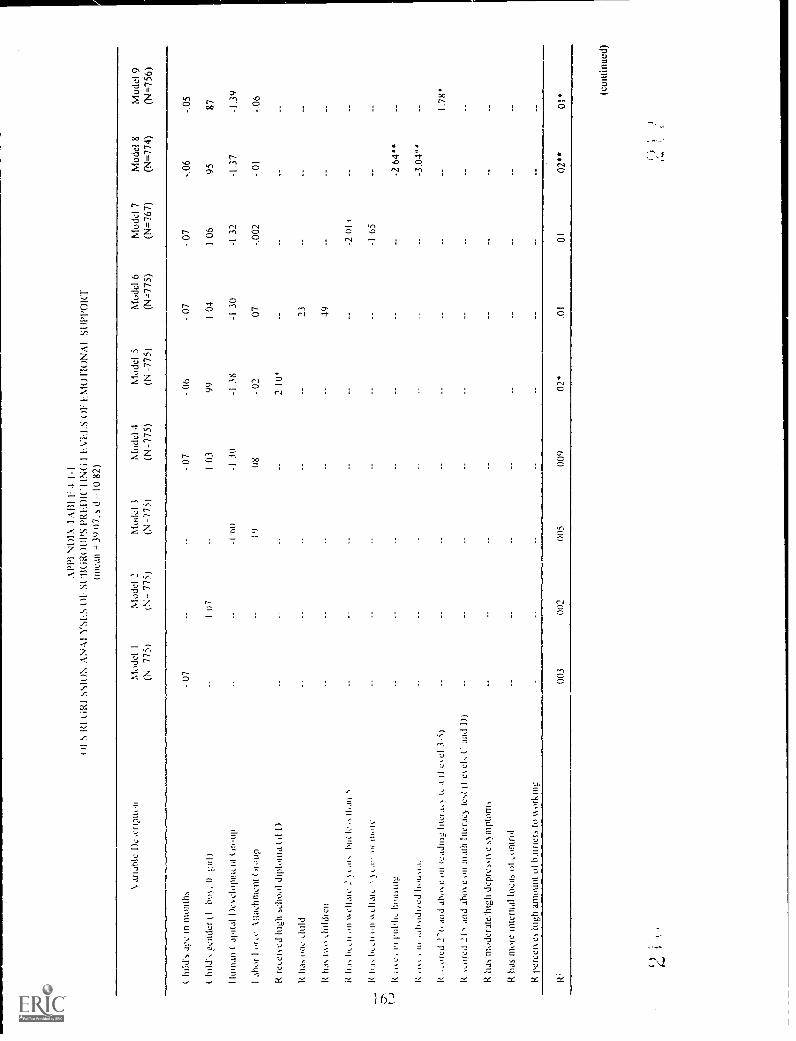
AP
1'1.
ND
IX 1
A13
1 F
4-1
( /I
S R
I (11
(1 S
'sIO
N A
N A
I VS
FS
01.
SIA
IOR
OU
PS
PR
FD
IC IN
G I
EV
11.1
5 O
F E
MO
FIO
NA
! SU
PP
OR
T(n
iean
39 0
7, s
d82
)
aris
tile
Det
crip
tion
Mod
el I
Mod
el 2
Mod
el 3
Mod
el 4
Mod
el 5
Mod
el 6
Mod
el 7
Mod
el 8
Mod
el 9
(N 7
751
tN-
775)
(N-7
75)
(N-7
75)
(N -
775)
(N=
775)
(N=
767)
(4=
774)
(N=
756)
( hi
lds
at,e
in m
onth
s-
07-
07
( hi
ld's
gen
der
tI
hot 0
irlI
I 07
I 03
[Inm
an (
api
tal I
)ct
elo
mm
ia (
noun
-1 6
0-1
30
I sho
t. 1
oRe
Atta
chm
ent (
thw
p-
08
R r
cLei
t ed
high
sch
ool d
iplo
ma
(if l)
R h
as o
ne ,h
ild
R h
s, it
to h
ddre
n
h.ii
on tt
elI
ii2
Loi.
liii
It o
Uo.
in
lit.,n
in v
o.11
m,
flwie
ruhh
s. h
ousi
ng
..dts
idire
d 11
011,
1.1t
.
2-6
and
_ih,
utun
rea
dmil
Iuic
u.L
ill e
tc1
kut
rcd
21)
and
shot
c o
n m
ath
Incr
act t
est i
i es
els
(' an
d I)
)
R h
as m
oder
ate:
high
dep
resq
v e
st m
plom
s
R h
as m
ore
inte
rnal
locu
s tu
t eon
trol
R p
erce
R e
s hi
gh a
mou
nt 0
1 b.
uner
s to
t ot
k tu
g
- O
h
99 -I 3
8
- 02
2 10
*
- 07 1 04
-1 3
0
07 23 49
- 07
- 06
- 05
1 06
9587
-1 3
2-I
37
-1.3
9
- 00
2-
01-
06
-2 0
1,
-1 6
5
-2 6
4"
-3.0
4"
I .7)
i*
R:
003
002
005
009
02*
.01
0102
**01
* (con
tinue
d)
1

NDIX FAlil I
4I-
I (co
ntin
ued)
laria
hle
In..o
iptio
nM
..del
10
Mod
el 1
1M
odel
12
Mod
el 1
3M
odel
14
C. 758)
(N -711)
(N721)
(N=7I5)
(N=689)
lidin
mo
- (1
6t
d. a
Li.,:
.nt
hs00
0605
- C
2
( hi
ld's
:Nik
ki. t
I1)
0)ii
girl/
I 03
I 21
94
99
99
I Ini
lian
I api
tal D
es e
lopm
ent t
rro
up-1
27
-1
12
- 84
-I 12
-I 13
Ial
,or
1 ol
Le \
ita,..
lunc
iit (
noun
0142
- 32
- 20
- 7(1
iC 1
,....i
cd
hi,..
11 s
rhoo
l dip
lom
a( il
1)
2 03*
.30
R It
... Iv
", d
nIdi
,o09
kl.a
.t..,.
.1no
tt.1
1are
2 ..
.a ,
hut l
ess
Ohm
..,
,..11
.ii,..
, ,L
ar..
ot li
oqc
.34
IC 1
0..,
in p
ir1,1
1, Ih
.tisi
n..
-I 4
2
lc
11,,
II! ,I
II11/
ed 1
1,I1
1.1:
1!,.
-2 38*
I,-.
. 1..1
2-5,
and
abo
se .1
1 re
ad.n
...lit
c:a,
le a
(I ,
:s e
l 1-5
tI 35
I C. .
.. l
e d
2 1
i an
d ab
ose
on in
ath
Ilici
a,: t
est 1
1 e
s el
s l.
and
I ) )
,I
fr-I
-I 34
I: ha
s i.i
..d,:i
ate
hitq
l dep
ress
Re
.IIIii
t .11
IS-5
32
4 64
R h
is m
ole
inte
rnal
locu
s u,
tL,qinol
358
9.*
2 37**
K p
r,..e
i \ e
s Iti
.2.1
1,un
ount
ot b
arrio
s to
.,,,
nrki
n,.2
-2 12**
-1
48+
0302
*08
***
,1 0
Kt
IIii
ldI r
ends
. In,
,alo
rlatio
ns.t
th.s
. 1 ti
lton
ount
Des
crip
tn,c
',In
d!, d
ata
Nt )
1 1
I abl
e %
dine
s ar
e ha
s.:L
I on
ssei
glit.
:d d
ata
sAa_
s ap
plie
d to
dul
lere
r,e,
hem
cel
l bas
elin
e Ilt
ibgt
olip
sS
talis
tiLal
sig
iii li
can5
e le
els
are
indi
cate
d a
On!
,1.
11,
a< 0
5; +
210
ES
T C
OP
Y A
VA
ILA
BLE

AP
PE
ND
IX T
AW
E 4
1-2
()I S
RI G
RE
SS
ION
AN
A1
YS
I SS
UB
GR
OU
PS
PR
FD
IC U
M; L
EV
ELS
OF
INS
TR
UM
EN
TA
L S
UP
PO
RT
(mea
n -
31 7
2, s
d =
11
95)
\la
ble
1)c,
,r. 1
1,11
Mod
el 1
Mod
el 2
(N 7
76i
(N -
77o)
Mod
el 3
IN 7
761
Mod
el 4
(N=
776)
Mod
el 5
(N=
776)
Mod
el 6
(N=
776)
Mod
el 7
(N=
768)
Mod
el 8
(N=
775)
Mod
el 9
(N=
758)
( In
ld's
a12
e in
mon
th,
- lo
- 11
*-
094*
- 09
*-
08-
09+
( tu
ld. 1
....e
nder
(1
bo, 0
gul
l-
io?
- 0)
- 13
- 09
- 32
- 22
- 40
Hum
an t
amta
l 1/..
clop
inen
t (m
op-
2818
0612
- 06
05-
01
1 ab
or I
or, e
Ana
chm
cni (
noun
4396
.81
7876
8477
R r
eceo
.ed
high
sch
ool d
iplo
nhi.
(iI-1
)3
18**
*
R th
is o
ne c
hild
2 32
*
R IL
L, tv
.0 c
hild
ren
94
R h
a, b
een
on ,,
,,c1
tar,
2 >
cam
, bLa
lc, ,
tlia
n-
_ IC
ii,L
,oii
N,,e
lhir,
Nc,
111,
i 111
,1).
, ii
ii !M
N'.
11,4
3,11
;1
1:.4
) .4
!;:d
i
,,oie
d 27
(, a
nd a
hmm
c ni
eadi
ng im
Lia
Lilt
em e
l 3-5
)
seor
ed 2
15 a
nd a
hoe
on in
ath
liter
ac)
test
II e
% e
ls (
and
lit
R h
a:, m
oder
atel
high
dep
ress
ie s
mpt
oins
R h
its m
ore
inte
rnal
locu
s ,m
1 co
n;)1
R p
erce
o. e
; hig
h am
ount
of b
arrie
rs to
kor
kiii.
..4
- 43 -3
18
-2 5
3'
-4 2
2***
2 55
"
R00
5,00
602
"01
02'
03"
.02*
(con
tinue
d)

\d)I
X I
A11
11 4
1-2
(co
ntin
ued)
tabl
e 1)
esLr
iptio
nN
1odu
l 10
Mod
el 1
1M
odel
12
Mod
el 1
3(N
759
)(N
=71
3)(N
-..7
23)
(N=
7I6)
Mod
el 1
4(N
=69
0)
C lo
ld's
.1.,.
.,- in
nio
ntlh
-II
'-
lot
- 12
*-
10r-
k11
11,1
Nsl
ide!
(1
bo)
0 ga
l)-
2'07
18lb
- 04 - 03
!Ioni
an t
.spi
tal D
es e
lopm
ent (
'loo
p14
2649
6I08
lal
lot'
1 or
..e.th
adirl
icrit
(iro
ny9:
3994
1 23
19
K tc
.Lis
I 61l
i ,.1
1,10
1 di
plom
a. c
a I)
2 4
It lia
,.w, i
lild
83
I: ha
, ito
.hild
rcii
11
l< 1
1.1.
1,,i,
on
Ael
kile
2cm
, hit
li,,
01,1
0 i
76
R It
j, 1,
,,:11
till
1AC
ILIft
: i )
i.IIN
ol I
ngi,.
- 42
It ii.
..lit
pob
lit h
ousi
q-1
02
I< 1
,..
n.nb
odric
,1 li
on a
n!,
-3 4
00'
I: -.
0,-1
. .:,
and
obse
,,n
rt.,1
,Inq,
Inci
a,. I
CN
I (I c
%C
l 1 )
I 16
I: .,,
,,red
215
and
al,.
..Ne
on 1
11,It
h 11
1c1.
10 li
st (
I i%
ek C
. and
I))
I(t
)-1
39
lz. I
,a, i
ii1-.
1crd
ieliW
II de
Pre
NN
IC S
5ni
plou
ns-4
il**
*-4
.41.
)***
It II,
t, in
, ,. I
nk:m
.116
),n,
01
,..,ti
lhn
3 28
"'1
74 t
l per
,..ci
, sh
i,,21
1,11
liolil
lt til
ba;
Ilers
it, %
At/1
1.11
1g-2
72*
*-2
25'
II00
902
**03
'02
'08
***
\( ii
1 I
(II.
.1I r
ends
Inc
,aku
l.ilio
ns ,t
(he
I til
ton
Cou
nt D
esoi
ptis
e S
tud)
dat
a
NI1
11 S
1 ah
!,:d
ues
ate
base
d on
sse
ight
ed d
ata
1-le
O s
iulis
lisi
iNap
plie
d to
din
e' e
nk..e
s be
tsse
en b
asel
ine
subg
roup
sS
tatis
tka,
sig
nilk
anLe
les
els
at: i
ndic
ated
as
"00
1,2
< 0
1, *
05,
f10
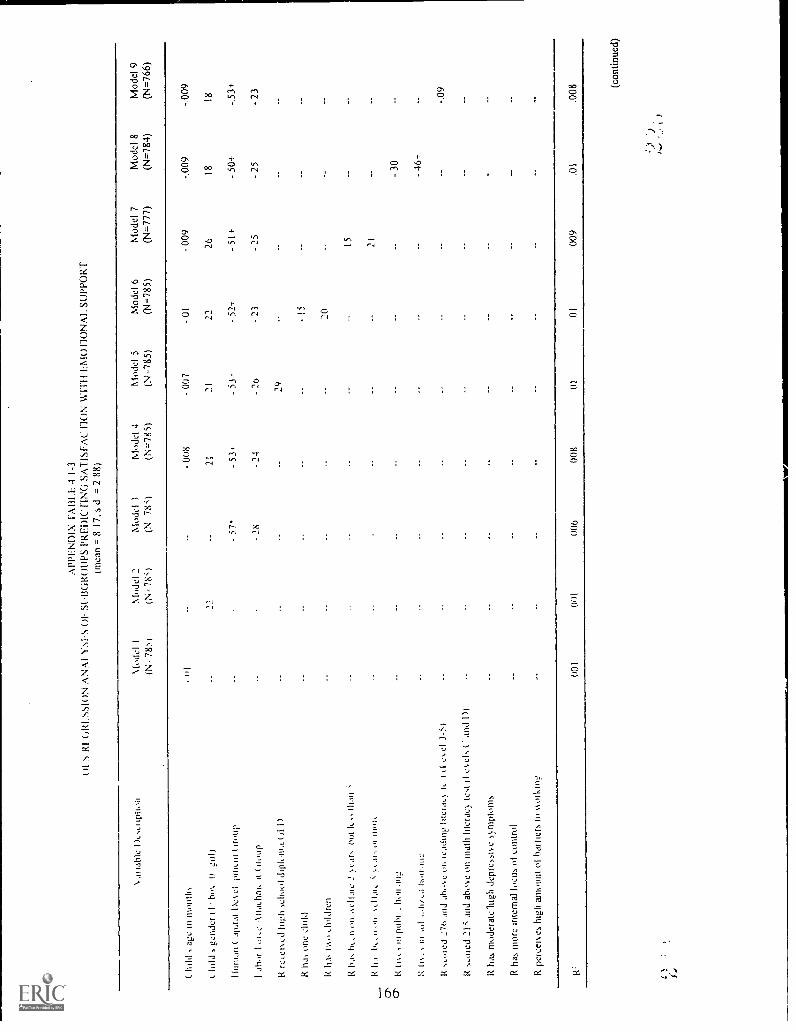
APP
EN
DIX
FA
III.
E 4
1-3
IIs
RI
OR
EsS
ION
AN
AI
N.5
1-5
01-
SHIG
R()
UPS
PR
ED
IC F
ING
SA
TIS
FAC
noN
Ero
o nO
NA
L S
UPP
OR
T(m
ean
= 8
17,
s d
= 2
88)
\ at t
able
1),
.,tru
ptio
nM
odel
1N
tude
l 2M
odel
3M
odel
4M
odel
5M
odel
6M
odel
7M
odel
8M
odel
9
IN-
78),
IN=
7851
(N-
78)
(N-7
85)
(N-7
85)
(N=
785)
(N=
777)
(N=
784)
(N=
766)
(. h
ilt!,
age
in m
onth
,
I. h
ild' g
ende
r (
I-
hm,
1111
111,
111(
vita
l Des
el i
mm
it I
irot
tp
1 dh
.ot
I ot
.c A
llach
nlit
irou
p
R r
c,et
scd
high
sch
ool d
uplo
ttua(
t I)
R h
as o
ne a
dd
R h
as I
sso
,Inl
dren
R h
as h
uu o
ilId
le 2
ea. 1
,111
IL
than
R h
as
.1
crII
1,,,
,1)
1161
._
r I
mi
th.tr
,Itr
2
R27
6 an
drc
adm
e lu
tera
, h.
(I tn
. el 3
-!,)
R s
,ore
d 21
s a
nd a
bose
on
111,
1111
lite
raQ
, tc,
d tI
eel
C a
nd 1
)1
R h
a.%
rno
dera
te.b
igh
depr
esit,
e s
nipt
onts
R h
as m
ore
inte
rnal
locu
s of
con
trol
R p
erce
n, e
s hi
gh a
mou
nt o
lha
ttler
S11
1 1,
,11k
111,
2
11
- 00
8-
007
2121
- 57
*53
*-
53*
- 28
- 24
29
-01
- 52
-*
- 23 20
- 00
9-.
009
- 00
9
2618
18
- 51
+-
50+
-.53
+
- 25
- 25
- 23
15 21
- 30 - 46
+
- 09
001
onl
006
008
0101
009
.01
.008
(con
tinuc
d)
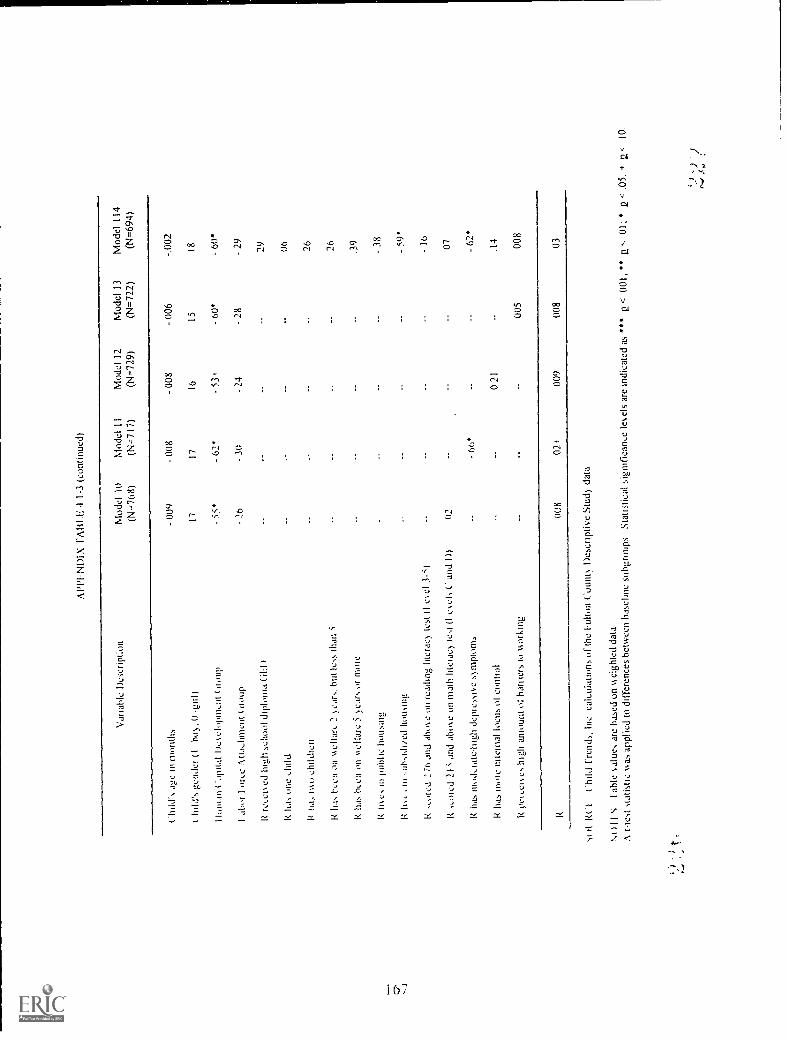
AP
PL
MA
X T
AB
LL 4
1-3
(co
n(nu
ted)
Var
iabl
e D
escr
ipko
nM
odel
10
Mod
el II
Mod
el 1
2M
odel
13
Mod
el 1
14
(N-7
68)
(N-4
717)
(N=
729)
(N=
722)
(N=
694)
age
in m
onth
s-
009
luld
's g
ende
r (I
ho),
U 0
1117
I Ion
ian
Cdp
ital I
icsc
hrni
nclit
C lu
p-
55*
I.1
t,FO
Re
Atl.
hAnt
ellt
(MIM
I-
26
It re
set%
ed
hig(
i sch
ool d
iplo
ma:
6El)
It ha
s on
e ar
id
It ha
, nto
chi
ldre
n
It ha
s be
en o
n st
ella
r,. 2
)ca
rs. b
ut le
ss th
an
K h
as h
1 en
on
s)el
fare
5 >
cars
or
mot
e
K In
es in
pub
lic h
ousi
ng
l Ii.
HI
hous
ing
K s
sorc
d 2
71i ,
ind
bine
on
read
ing
Ilich
ic1
leS
t I I
cid
3-51
It
stoi
ed 2
15 a
nd A
nne
on m
ath
litel
ac)
test
(I e
s ck
C a
nd I)
)02
It ha
s m
oder
ate:
high
dep
ress
i)e N
ympt
orn,
It ha
s m
ore
inte
rnal
locu
s ol
con
trol
ilch.
cisc
s hi
gh a
mou
nt o
t har
riers
to s
)ork
ing
- 00
8-
008
- 00
6-.
002
1716
1518
- 62
'. 5
34-
60*
- 60
*
- 30
- 24
- 28
- 29 29 06 26 26 .39
- 38 - 59
*
- 66
'
0 21
005
- 16 07 - 62
*
.14 00
8
008
024
009
008
03
stK
( 'I
Chi
ld F
rend
s, In
c ca
lcul
atio
ns o
f the
Ful
ton
Cou
nt)
Des
crip
tive
Stu
d) d
ata
1'st
)11
S1
able
sal
ues
are
base
d on
sse
ight
ed d
ata
A t-
test
sta
tistic
N5i
1.-3
app
lied
to d
iffer
ence
s be
twee
n ba
selin
e su
bgro
ups
Sta
tistic
al s
igni
fican
ce le
s el
s ar
e in
dica
ted
as<
001
,2
.,.01
;2
< .0
5, +
210
.

oc
AP
PE
ND
IX T
AB
LE 5
1-1
01 S
R1.
610
550
s A
NA
1s1
SS
ili(I
RM
1)
PR
I IB
C lI
M i
PE
AB
OD
Y P
ICH
IRF
VO
CA
BU
LAR
Y T
ES
I-R
EV
ISE
D (
PP
VI-
-R)
ST
AN
DA
RD
SC
OR
ES
(PP
V1
P. m
ean-
69 8
8; P
PV
T s
d =
,15
85)
-..o
Litil
e D
esst
iptu
nM
odel
1(N
- 76
5)M
odel
2(N
765
1M
odel
3
(N -
764)
Mod
el 4
(N.-
765)
Mod
el 5
(N-7
65)
Mod
el 6
(N=
765)
Mod
el 7
(N-7
57)
Mod
el 8
(N=
764)
t tol
d s
age
in m
i -nt
h,21
"20
"22
".2
5***
21"
21**
( U
S, g
ende
r ;1
ho
0g,
1:i
-2 4
8-2
73'
-2 7
9*-2
48*
-3 0
6**
-2 6
2*
'Ioni
an 1
api
tal 1
),:,
.11.
1.11
1,14
1111
,111
41-
51-
62-
71-
67-
55
1ih
of 1
- or
o: -
Nna
,hm
em(
if ou
p3
13*
2 31
2 10
1 72
2 06
2 27
I( r
e,co
.ed
hi:d
i s,h
ool d
ipim
na (
,11)
cI c
i13
lia,
iini
.. (f
old
8 32
***
1t h
as v
ao ,1
1ild
n.n
6 61
**
I( h
a he
e II
11 ,,
. Mu,
.'\ c
at .
hut 1
, - M
ai; 5
-4 2
2*
R 1
1.1,
6,-
,:i ii
li%k1
1,11
L' '
-o..1
1, 0
1 III
.1t
.:-7
38*
**
-7 (
10**
ircd
7Th
mid
aho
sre
adirt
1111
:1,1
i1 le
,111
01:
1
red
21, m
id d
isi
e or
111
3111
'Okl
a,le
"1 (
1 c
Cr.
I
-1 Aul
d D
i
-1 2
3
K lu
.0m
mku
ile 1
1:01
thpi
c,,u
e ,n
icto
ul,
R h
as m
ore
1111
011.
11 1
0,t1
, 111
,111
1101
P. p
ert.e
o,eN
hrg
h am
ount
ol h
arrie
rs 1
0 A
orko
hl
It ha
, MO
.111
1..1
1111
01
Noe
1,1
1 su
ppor
t
P.(il
"00
600
8.1
03**
*05
***
08**
*05
*"
(con
tinue
d)

All'
EN
IAX
5 1
-1 (
cont
inue
d)
\....r
iabl
e I )
, s.Il
PlIi
itt (
elM
odel
9
((5-
757)
Mod
el 1
0
05-.
764)
Mod
el 1
1
(N=
700)
Mod
el 1
2(N
---:
711)
Mod
el 1
3(N
=70
5)
Mod
el 1
4
(N=
692)
Mod
el 1
5(N
=-6
58)
( hl
Idag
e itt
typi
tlihs
20"
17'
17"
17"
18'
17'
.22
(111
1,1%
. gen
der
(1-2
82*
-2 4
1'-2
79'
-2 5
9'-2
80'
-2 4
3'-2
23+
Hum
an C
apita
) I I
e\el
.)in
icnt
- -,
2-
53-I
16
- 48
- 90
-.62
-99
I.l
'It.1
5 hi
ll, ii
IS S
ili
\ I C
s1:1
\Id
lSliI
i 55
III,
..111
11
k II
I/
2 lil
t.' 7
3.2
1,4
2 54
*2
812
73".
2 65
+
2.86
*
5 46
"
',Ass
5 42
I( h
a, h
ccii
,3,1
1.11
iH
s
ha.
"iII
Is.
11,
hill
I,-3
21"
-2 7
8
I(I
IIl
;,
l.illC
-Ili-
.5ii-
Ishi
:51I
ss1,
slI.!
-4 6
0"
- 47
.,-.1
II.I
41 c
,I1
(37
di.
test
II d
eli a
nd In
9"2
24
1(III
38
Ir...
.,I
so.
- 48
Isis
]ni
Lim
o, i
ilisi
Ltil
ILI,
I
-2 7
11-1
05
-18
- 82
DO
I.*03
"'02
"
ii1-
(tI
lind
I.1
.1th
e I
lIlt I
.111
51t
`,11
i.1)
.1'1
31
I'1
I Al&
3,1
.1.
11 ik
e011
ed d
dla
.1,
lied
It Ji
ltcic
ttsc
betm
eent
,..be
lii:
si.2
,1,1
-1,.L
ein
diw
ited
,00
1.2.
illE
.05
. +IU
BE
ST C
OPY
AV
AIL
AB
LE

AP
PI-
ND
IX T
AR
! E 5
1-2
YS
1.S
oF
MIR
A:M
IPS
PR
ED
ICT
ING
PR
ES
CIR
ML
(PS
I mea
n=17
90,
PS
I s.d
=6
23,)
OM
' (P
SI)
TO
TA
L S
CO
RE
S
Var
iabl
e lie
, ipt
ion
Mod
el 1
Mod
el 2
Mod
el 3
Mod
el 4
Mod
el 5
Mod
el 6
Mod
el 7
Mod
el 8
(N 7
511
(N=
751)
(N=
751)
(N=
751)
(N'.7
51)
(N=
751)
(N=
757)
(N=
750)
( M
id ,
age
in n
mot
h,44
."44
".45
."45
".4
5".
MU
.. ge
nder
hiU
pill
-111
-1 4
1".
-1.4
3."
-1.3
7".
-1 4
6".
1101
11,1
11C
apua
l I i.
elo
pmen
i1
78"
- 23
- 27
- 29
- 30
-.24
1 M
ot F
orce
ttai
nnen
t (iro
up2
52".
4233
2536
41
re,e
ls.e
d hi
ghdi
plom
a (1
1 I)
I 77*
"
R h
a, im
aol
d2.
11".
K h
as !v
itt iM
ildre
n1
49."
R h
a, b
een
on v
icIta
re 2
ears
but
ith
in .
- 87
+
It ha
. bee
n iin
lAel
tare
S s
c,iis
-2 3
0."
1: h
i sii
pohl
i,-1
.70"
Ksi
ihsi
daed
iii
-.86
+
,.ind
2-h
_in
21i a
nd M
oe o
n m
ath
led
II es
. el,
( ' a
nd D
i
K h
as 1
110d
.:Litc
hig
h de
pres
,o, c
:1.1
11pt
oni,
R h
as m
ore
inte
rnal
01 c
cntr
ol
perL
etve
s M
Litt
amou
nt o
t bar
riers
to IA
oils
iniz
R h
as h
igh
amou
nt o
t soc
ial s
uppo
rt
l<1.
;(4
18*
02."
(con
tinue
d)
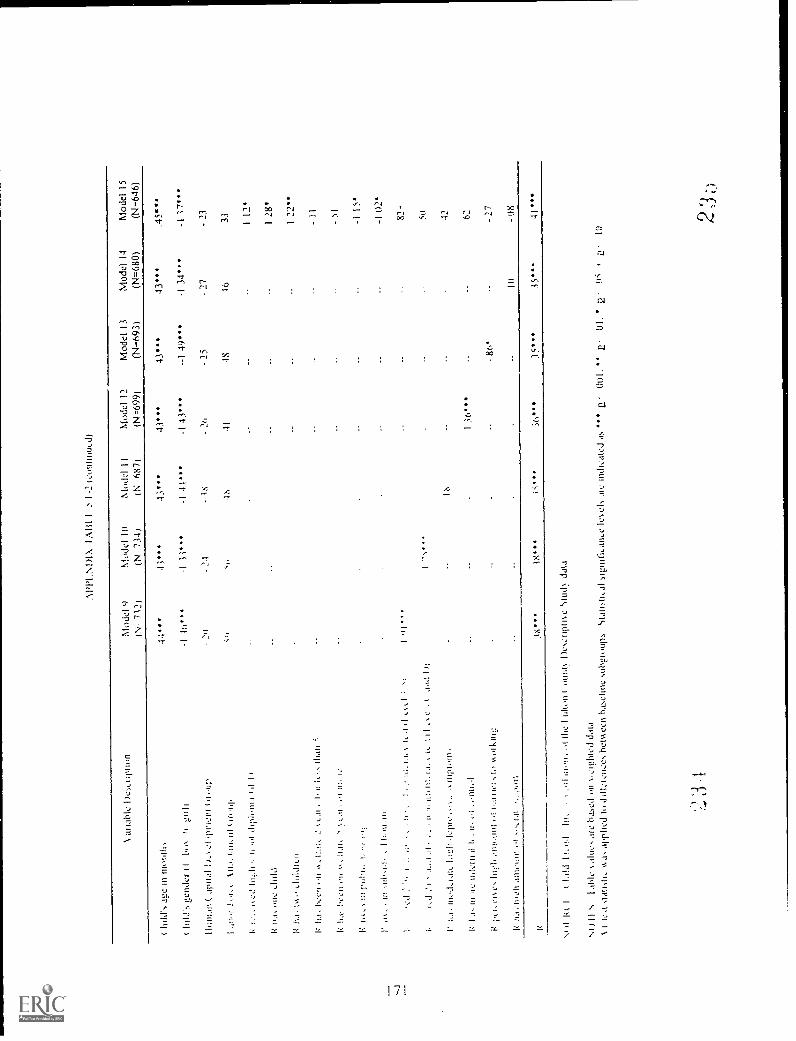
.110
1.1\
1)1X
I M
11 I
1-2
(Con
two,
d)
\ am
ble
1)cs
,(11
1tio
nM
odel
9M
odel
10
Mod
el I
IM
odel
12
Mod
el 1
3M
odel
14
Mod
el 1
5
iN-
712)
(N 7
34)
(N 6
87)
(N=
699)
0.1=
693)
(N=
680)
(N=
646)
45*.
.
-1 1
7*
- 23
si,
4N41
4816
33 I 12
*
1 28
'
1 22
"
- II
- )1 -I
1 5*
-I 0
2*
hild
's g
e44
"41
...43
"'43
***
43**
*43
***
1111
,1ge
nder
(I
-I 1
6".
i 31"
*-1
41*
**-1
43**
*1
49**
*d
34**
*
11))
01.)
6( a
plia
l 1/,
\T
rier
)) )
)1.4
11,
- 21
1-
2.1
-18
- 26
- 25
- 27
o.(i
iie
l( .1
.1,i
III
I
82-
I' ha
. in.
,d..i
ak I
.P.2
11.1
cpre
VV
.....
.\ in
pi,-
01-
IN-1
2
in q
e 11
.teri
lal
Ik.
ii, H
.,11
0,-1
I 36
..62
I(i-
,),..
ele.
lu;:h
.1,1
1..1
101.
a ha
ilicI
s I.
, v.0
11sl
iw-
86*
- 27
I(ila
, itil
l ain
ciiI
I) .0
,.).
.lat
-.,
10-0
8
I(36
***
35...
is...
41""
..11
1kk
I(
02 I
ii1,1
11h
e I
)1I)
,,i1(
oun
t',I
ud d
ata
N1)
11I
able
\ ah
le, t
iC b
aNed
011
1I.
c1gl
itcd
data
Ist
sla
n-ah
. v. a
= 1
11,1
1cd
Idi
ILre
inc
hctii
ecii
hals
ell1
n:.1
1.: i
ntik
:Med
as
***
2'.
001,
2 V
()I,
--
10
o..1
0
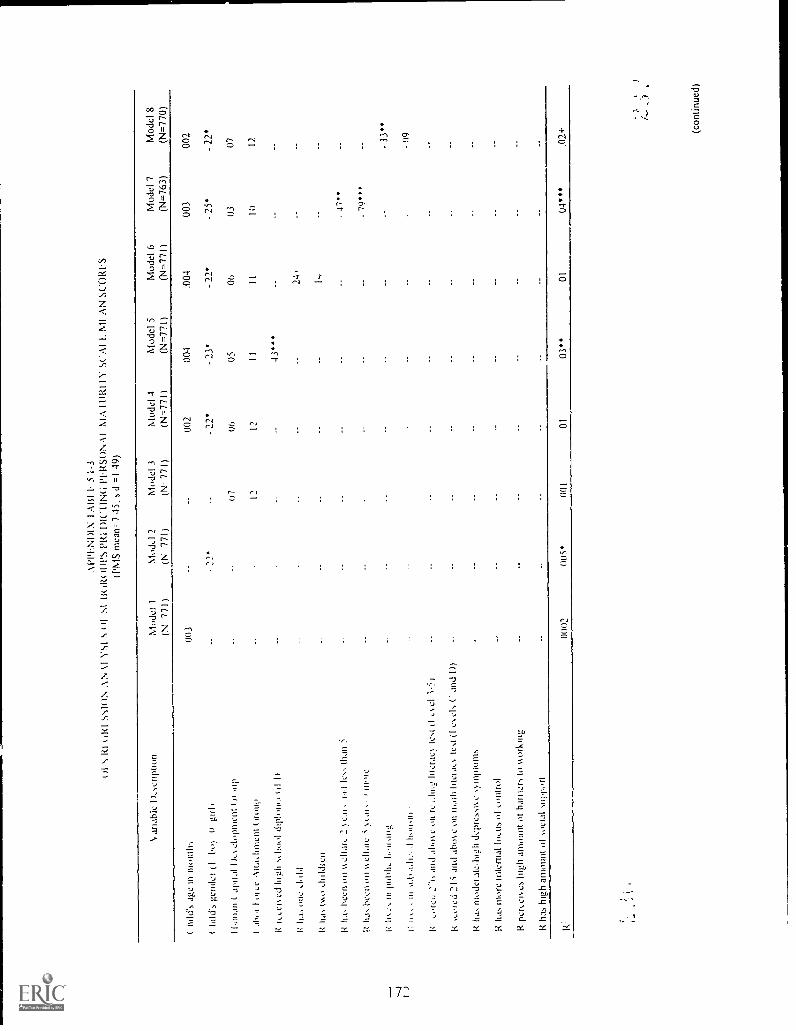
All'
EN
DIX
1 A
111
I. 5
1-3
s R
I (JR
( W
ON
AN
11
YS
I S (
0 S
t tR
ilt(
it II'
S l'
RI D
IC"I
ING
PlIR
SO
N A
I MA
[UR
I I V
SC
Al I
. MI
AN
SC
OR
I.S(I
IMS
mea
n, 7
45,
s d
=1
49)
\act
able
1),
,crip
tion
Mod
el 1
Mod
i.I 2
Mod
el 3
(N 7
71)
(N 7
71i
(N-7
71)
Mod
el 4
(N-7
71)
Mod
el 5
(N=
771)
Mod
el 6
(N=
771)
Mod
el 7
(N=
763)
Mod
el 8
(N=
770)
( hi
ld's
age
in n
o in
tlh00
300
200
4.0
0400
3.0
02
( lu
ld's
gen
det (
11,
0)II
gull
- 22
*-
22*
- 23
*-
22*
- 25
*-
22*
I l.a
nan
( ai
ntal
1),
A c
lopm
ent t
ii.ii
ii01
(JO
0506
0307
I.1
1,r
1 tir
o: A
lialim
cni (
atm
!,12
12II
1110
.12
It ii.
,en.
ed h
n.ili
,Slio
ol d
iplo
in.i
til I)
43**
*
Itlia
, one
Jo
li124
'
It ha
-, 0
.i.0
Juld
ren
1.4
It ita
, bee
n on
%%
char
, 2 ,c
m.
tut l
e., t
han
5-
47**
It lId
s br
'Cil
1,11
1%01
,11e
i,,L
,ti ,.
I 111
.,fe
79I:
IR ,.
, m p
ut,h
, li..
aang
- 33
**
c, 0
,-
tn -
,13,
4,11
.., .1
11.1
.I0 .
-119
It,..
.cci
, rh
and
alio
\ e ii
n re
,,lin
s.ri
Ilicr
at.:
te,tt
l i. e
l 1-5
1
1: ',
wed
2Is
and
Arm
,: on
iii.i
th (
itera
t. 1c
,1(1
c%
ch
C a
nd I)
)
It ha
, mod
erat
e, h
igh
&pi
t:Nin
e ,)
,inpi
oins
R h
as m
ore
inte
rnal
!taw
s ot
will
rol
R p
ert.c
m, e
s hi
gh a
mou
nt i.
it th
uitc
N to
v,o
rkin
g
R h
a.-,
hig
h am
ount
01
soci
al -
.impo
rt
R:
0002
005*
001
0103
**01
04**
*
(con
tinue
d)

.\N
DI
It(-
3 ko
nitit
tled)
,111
,11.
1c1
/..M
odel
10
(N 7
S1)
1N 7
51)
:.:Id
III in
.,nth
,00
4
tt t;
2!
aplu
l/e
1d,t1
)111
C11
1ilt
-or
I.it
t,II 1
.t: \
:11t
1.-1
11itt
titit
12
14t:I
s C
tI 11
11,
dIpI
ttlita
t tI
I
I?'1
1,1
lit_
,ItItt
i
03, i
t ,1:
11
h t
,
RIit,
,I 10
1:
I,.I.
1,11
'.111
(ti
.t..
.441
c\cl
7S'"'
I(.
;-1
tet t
l c%
,:km
id 1
0
. /..I.
III,
,1
1i
0003
07
Mod
el 1
1M
odel
12
Mod
el 1
3M
odel
14
Mod
el 1
5(N
-70
71(N
---7
191
(N1=
711)
(N=
695)
(N=
662)
- 00
1-0
0200
006
001
-000
2
-IS
-22'
-20,
-18,
0;11
ov10
02
1212
1710 04 - - 00
4
-44"
- 00
0
14 42"
26
1401
02'
Os'
"05
***
(old
I :k
11,1
-H
0[10
1116
, 011
11c
1lil
t...o
nt%
data
,111
1,11
,1c
1, -
dm.,
it vs
etv
hic.
1 do
ld
stat
hu,
glop
:0 (
0 dd
lcle
ikeh
hC
lvC
el.o
b,ttl
oop,
1/4-
datn
ti,a1
.132
.011
1,.tm
e lo
ck a
te in
di,..
.ded
'ti
001,
" a
.01
,n
05,
a10
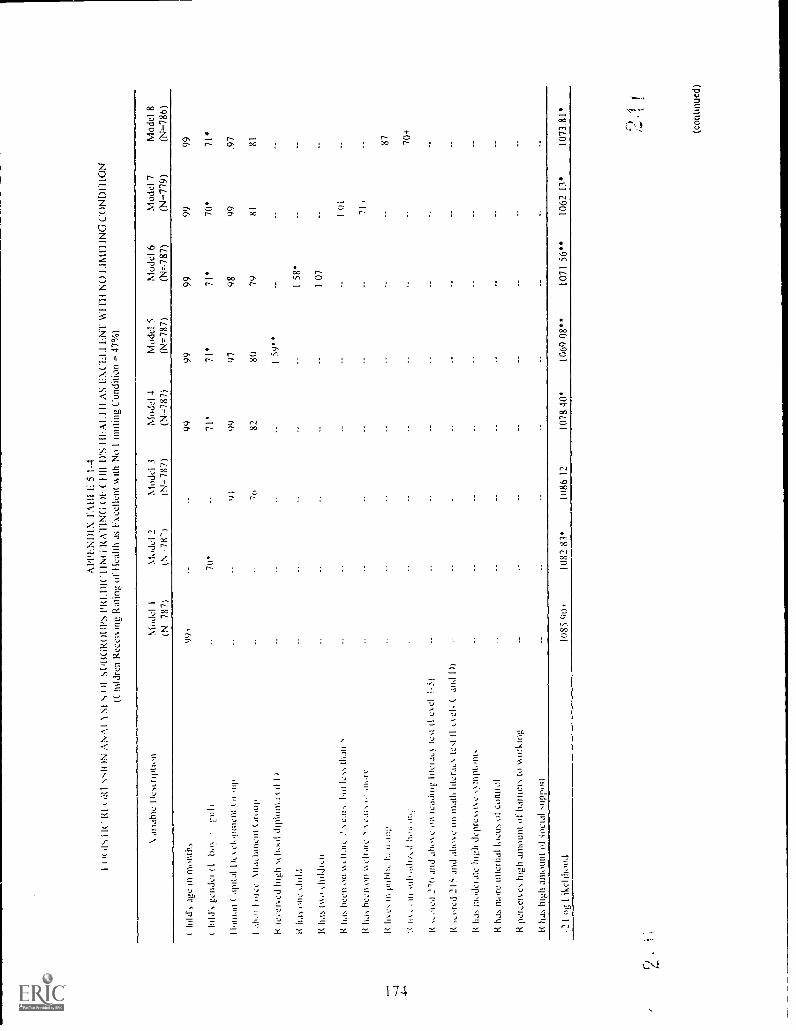
AP
PLN
DI X
FA
BI E
5 1
-4
III'
s 11
C R
IIO
N A
N A
l \ S
I SS
tiliG
RO
UP
S P
RI.D
ICH
NO
RA
TIN
G O
F (
1111
D'S
IlLA
I.1 II
AS
EX
CLI
A L
NT
WIT
H N
O 1
.IMH
ING
CO
ND
I] IO
N((
hild
ren
Rec
eo. m
g R
atin
g oi
l lea
lth a
s F
xeIle
ttt o
ith
No
I[li
lting
Con
ditio
n =
47%
)
A a
mbl
e I l
esir
tow
nM
odel
1M
odel
2
(N 7
871
(N -
78")
Mod
el 3
(N,-
787)
Mod
el 4
(N-7
87)
Mod
el 5
(N=
787)
Mod
el 6
(N=
787)
Mod
el 7
(N-=
779)
Mod
el 8
(N:=
786)
(hi
ld's
age
in m
onth
s99
r99
9999
9999
(1i
i Id.
.., g
codc
i I1
bo%
%
gull
70*
71'
71'
71'
70"
71*
I kin
an (
'api
t al
1 4.
cl, .
ploo
ll 1
, .91
,9
199
9798
99.9
7
1al
to,
1 or
rx M
tar.
htne
nt C
artu
p71
,82
8079
8181
K ic
celie
d hi
gh 1
eIlO
ol d
iplt/
n1,1
l II
I/
1 59
'
K h
as o
ne J
old
1 58
"
It ha
s P
a, ,h
ddir,
nI 0
7
K II
,IN b
een
on %
%di
al, 2
cal,
1,91
lev,
Ilim
i'',
k ha
s be
en o
fi .e
l tal
e..;
sC
,R, t
I dh.
rc
101
71 r
1: li
e In
1,9
b11,
li. 9
.;:t.
,287
I: nt
, .in
,uh,
n11.
1,(1
11.n
i.n.:.
70+
R ..
...,ie
d 2'
( an
d al
lot,:
on
read
uig
Inci
a...
test
il c
s el
1-5
1
I< s
Lore
d 21
' and
aho
se o
n 11
14l1
1 lit
eraL
s te
st II
Lsc
k (
and
Di
R h
as m
odei
ate
hig
h de
pres
so,
inpk
.nis
R h
as m
ore
inte
rnal
locu
s ot
Con
tiol
pek;
eies
hig
h am
ount
of b
arrie
rs to
st.o
rkin
g
R h
as h
igh
amou
nt 0
1 io
eial
sup
port
21 o
g 1
ikeh
hood
1085
90
t10
82 8
3"1(
186
1210
78 4
0410
69 0
8'"
1071
56"
1062
13*
1073
.81'
(con
tinue
d)
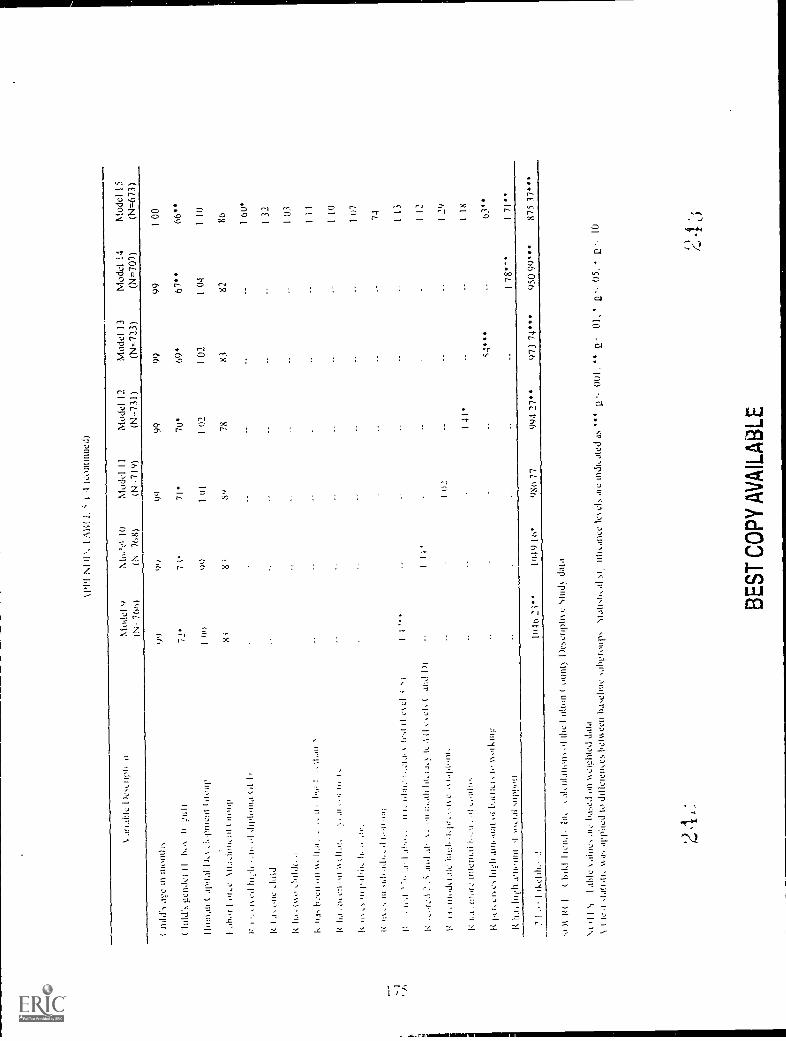
FPI
NI
)1'.
1.-1
1il
4 (c
ontin
ued)
I )C
,Liit
i,N
lode
l 9(N
- 76
toM
o.':1
10
Mod
elI
I
IN'7
1,8)
(N-7
19)
Mod
el 1
2(N
-731
)M
odel
13
(N=
723)
Mod
el 1
4
(N=
707)
Mod
el 1
5
(N=
673)
I Il
ild's
;lee
in m
onth
,.9'
)99
9099
9999
1 00
Clu
ld'h
-:.c
ri.lv
r Il
I,,.
li:p
ill72
*7
i'71
'70
*69
*67
**66
**
llinn
au (
J1,
1411
1)0.
,Lon
ent i
liour
I(H
i9(
)I
III1
021
021
041
10
I oho
r 1
or,e
sitt
.i,io
n, ;I
t1.
iiiii
ips
8 +
N9
7883
8286
I:1.
..,1,
..,1
hi,..
1, .,
ii, .4
dip
lom
a (,
1 If
1 6U
I!,IL
I, ,,t
ic A
ild1
32
1:11
.1. i
v,,,
...1.
11,1
1,.
1 03
l'. Il
l, t1
/4:e
ll1.
11 l,
11.
11,
.:.1
/4li
,14
1'I
.:L
ill '
Ii
I
I: lia
i hi
.en
iIl 1
/4,,
11.1
1,`,
....1
1, ,,
i I, i
,I 1
0
ItII,
,..,
ill ii
iiiill
li.ii
.II.,
I 07
ir.ii%
., in
-.id
. ail.
d i.
iii ii
ii
1.:
.1,..
i '',.
.lt...
1 ,II
..k,..
....
ii R
1,1
:1,..
1,i,.
.i,t..
,Il.
1( II
(' \
CI
I,',
II '
"
I:-,
...r:
.1 -
2i; j
otI,I
I`\ '
.Il I
tt.lii
i ill,
i.h.
It..1
(1 c
\ C
I, (
ai,.1
1 il
111
'
1,11
,1_,
iiio
deL
ue h
ie.4
.4 p
i, -i
t e .1
.1.1
.114
.
r h.
,. .in
,a,i
iiier
n.ii
4,..1
, -,1
,..iii
i,4
147,
1,C
ii, I
iii.li
aill"
illit
.; 1,
.tuttA
, tt.
viiik
iiqr
R h
a. Il
ieh
amou
nt ,1
,ii,i
al a
lppo
u
I ,I
il,c1
111,
.12;
"11
)19
111*
Pt 1
(I
,In
,, .
1101
131t
on, o
t the
1(
Oul
u.)
Des
crip
li)S
ind
data
'.,1,
a,e,
1v.
iight
ed d
ata
I.1
, app
lied
to d
illet
eikc
sba
chlic
,u1i
0oup
,N
t.111
.Ths
.,11S
1le
I9.
2
1 41
*
74 113
I12
I :29
118
54'0
*63
I 78*
-'I 7
1**
glit
7799
427
**97
3 74
050
994'
875
37
els
.1Ie
uld
h.,i1
t1.-
001
.' 2
01,
05,
210
BE
ST
CO
PY
AV
AIL
AB
LE

AP
PLN
DIX
LA
W F
6 1
-1(
)1 S
RI (
'RI S
SIO
N A
NA
1 Y
SLS
01
81.1
110k
0UP
S P
RI:D
ICH
NO
HO
ME
IOT
A! S
('AII.
SC
OR
ES
loud
110
MI:
Sca
le m
ean
-17
06,5
d -
2 78
)
Var
iabl
e D
esor
ptio
nM
odel
1
(N-7
81)
Mod
el 2
(N-7
81)
Mod
el 3
(N-7
81)
Mod
el 4
(N--
781)
Mod
el 5
(N=
781)
Mod
el 6
(N-7
81)
Mod
el 7
(N=
773)
Mod
el 8
(N=
780)
(hi
ld's
age
in in
iiinl
i5-
01-
009
- 00
3-
001
- 00
4-
008
(Iii
lds
gend
er )
1ho
>../
..,/n
1)-
32-
33 i
- 35
4-
33i
- 41
*-
31
I !W
WII
( a)
nal 1
)o. c
lopm
ent 1
aou
p-
31-
28-
32-
30-
34-
28
I MO
( F
ore.
: AlL
hhill
.:111
( ou
pO
ni /
0804
0612
K 6
.<ci
sed
Inuh
-.s
hoo!
dip
lom
a 01
Ii1
20"
"
K h
as o
ne L
Inld
K h
as o
no d
uldr
en
K h
as b
een
id)
arN
u le
ss th
an 5
K h
a. b
een
on s
.u.li
arc
ears
ro
wor
e
.ny
0i
oh u
i ,;
1 !W
I:
.sor
I 27r
, and
aho
c e
on 1
,adi
nt ln
erar
_ft-
Sill
Ltd
s,or
ed 2
IS a
nd a
br.%
c o
n in
ath
Illeo
r..)
test
11
e< e
k C
and
0/
l< h
as m
oder
ate
hugh
dep
rcss
lus>
II/p
hut:,
l< h
as m
ore
inte
rnal
loi_
US
II 0,
1111
.01
perc
en e
s hi
gh a
mou
nt o
l hai
rier,
to ii
.ork
ing
P h
.15
high
am
ount
or
sm.:
[di s
uppo
rt
594
80*
- 71
"
18
0009
DuO
004
008
05."
03**
*05
*"03
" (con
tinue
d)

ND
1X 1
Alil
1: 6
I -1
t.,..
ontin
ued)
rtab
k I 4
.1,1
111l
Iiql
Mod
el 9
(N-
700)
Mod
el 1
0IN
702
.M
odel
11
(N -
713)
Mod
el 1
2(N
725
)M
odel
13
(N=
717)
Mod
el 1
4(N
=70
1)M
odel
15
(N=
667)
( to
ld's
,Le
to m
onth
-.-
004
--
Ul
- 01
- 01
008
001
ItId.
cnde
i (I
1.. o
1.01
)45
- 31
19.
44*
- 42
*3b
,-.
43*
Ilohl
an I.
api
tal D
o.el
.;...
iciit
....o
p-
3--
(4-
42-
37-
3839
47.
1 ..1
0: N
t1.3
.11,
1.11
.1,1
11,
t18
lil-
o2-
0108
65-
07
It1.
- ..!
..ed
high
....1
1 .1
11,1
,.6,..
( 'I
17U 44 45
,
k It.
i, k.
:C11
oil
v6.1
1.1;
,.._
ai;
1:1
I,,, !
hall
S-
58*
IL h
a;i1
c ,1
01.1
IL h
..,
.-
70*
R lo
eN1,
1113
11,
I.
- 13
.,51
*
Hid
H.,.
ra,
4.11
1 ec
,i 1
I36
I6
01.1
11i l
aci.s
,s. I
L(
I82
k h,
,t, in
cJci
.ii..
110,
d,i.
h.,6
.,.,,i
iiiito
in.
212
k h.
1_, I
II.-;
, 1:.t
.111
,11
i, ,t1
,t
....
,..I
784
14
V N
r..e
ics1
.111
.1m
..,,t0
,.I 1
3,...
,1, 1
., c,
-0.0
4.-
60"
- 1U
k 3a
.. 10
01 a
mou
nt ,.
1....
.1.1
1.,
iA
I34
35.
oh*"
07.
010;
*02
**0)
14**
*
IIIL
(I
( ho
d I:L
odIII
,10
11-0
( ow
l() D
e.ur
iptic
e `3
1.1.
.1da
ta
'1.1
1',
1 ab
h.ii
itA W
ild\ M
ist
'AA
arpl
icd
hetc
seen
ha.
clin
esi
eltil
ican
ce Ic
ceic
ale
indb
..ate
d .0
***
001.
"01
,2
05,
1
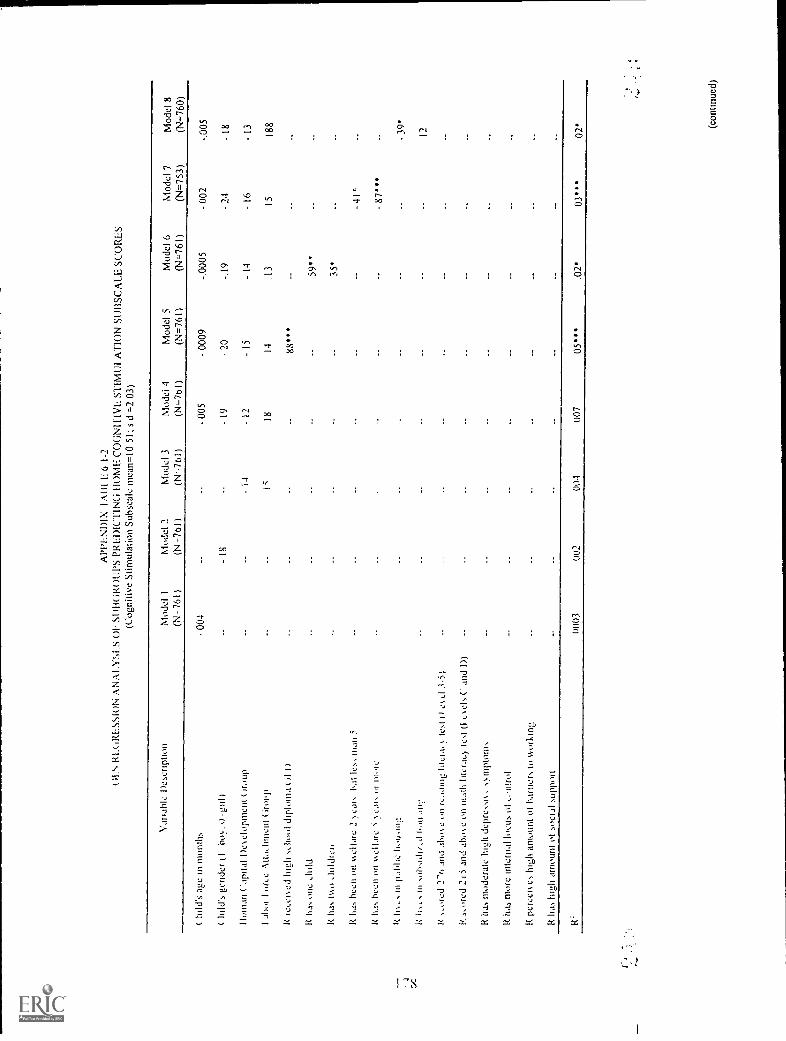
I
AP
PE
ND
IX lA
ltl E
6 1
-2U
IR
IAIR
ES
SIO
N A
NA
INM
.S (
)I. S
I IliG
RO
UP
S P
RE
DIC
TIN
G II
OM
E C
OG
NIF
IVE
ST
IMU
I AT
1ON
SI1
13S
CA
LE S
CO
RE
S(C
ogni
tive
Stim
ulat
ion
Sub
sea
le m
ean=
10 5
1; s
d =
2 03
)
Var
iabl
e D
escr
iptio
nM
odel
1(N
-761
)M
odel
2(N
-761
)M
odel
3(N
.76I
)M
odei
4(1
4761
)M
odel
5(N
=76
I)M
odel
6(N
=76
1)M
odel
7(N
=75
3)M
odel
8(N
=76
0)
t.hi
ld's
age
in m
onth
s-
004
- 00
5-
0009
-.00
05-
002
-.00
5
( M
id's
gen
der
t Ibo
y. 0
-gu
ll-
1819
20-.
19-
24-
18
Ilum
an C
apita
l Des
, elo
pmem
( ir
,oip
- 14
- 12
- 15
14-
16-
13
I abo
r I "
(Lc
Atta
Llin
icin
Gro
up15
1814
.13
1518
8
I< r
ecei
sed
high
,L1r
ool d
iplo
ma(
il I)
88..
R h
a, o
ne c
hild
.59"
R h
a, ts
%o
Add
ict,
35"
R h
as b
een
on s
ielia
re 2
.e..1
1',
kit 1
,:,-.
man
5-
41°
R h
a, b
een
on 1
1eII.
Iri '
` e.
II, IA
111
101c
874.
R li
sc, i
n pi
ddle
liou
.iiii!
- 39
'
R 1
;,...
III s
oh%
Idli,
d ho
il.11
12
s.,r
cd 2
i, iri
d ,s
hose
ii rc
..din
g lu
tcra
, tes
tes
....1
3-5
)
K. ,
core
d 21
5 an
d ah
ose
on m
ath
liter
acy
test
(I e
sels
C a
nd I)
)
R h
as m
oder
ate
high
dep
re,,R
, N
y m
mom
,
R h
as m
ore
inte
rnal
locu
s 01
L.,n
trol
R p
eree
is e
s hi
gh a
mou
nt o
t ban
ter,
to s
s.or
king
R h
as h
igh
amou
nt o
t soo
il su
ppon
0003
002
004
007
05**
*.0
2'03
""02
' (con
tinue
d)
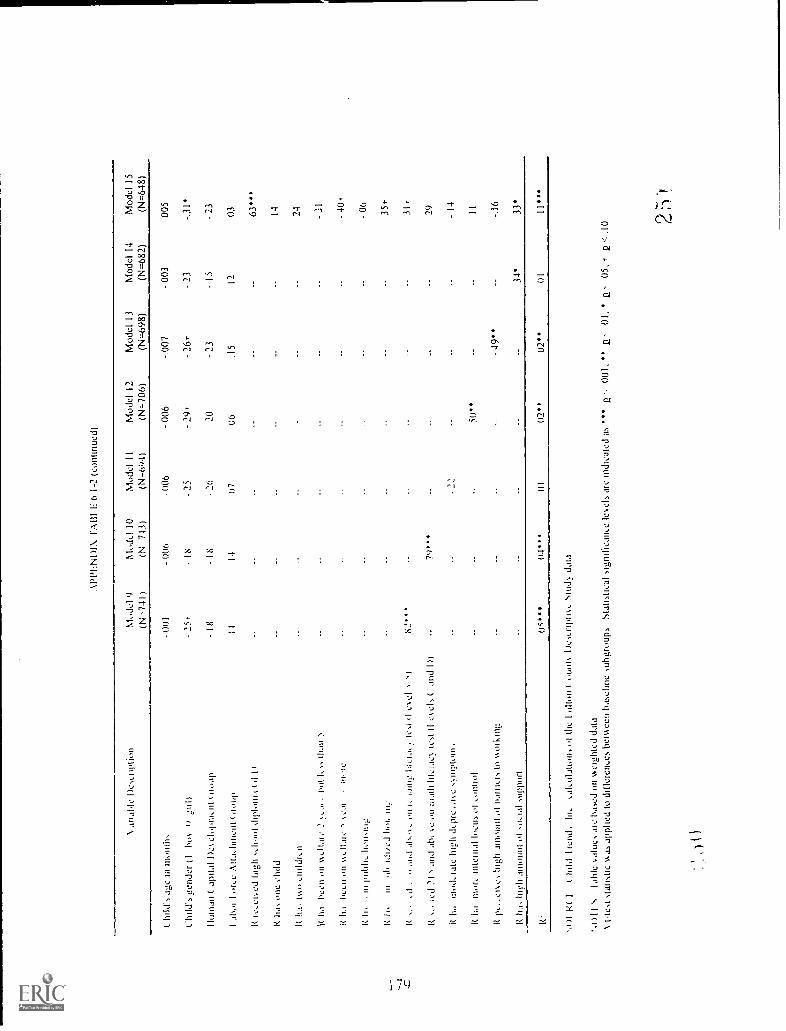
AP
PLI
ND
IN. 1
'MM
F 6
1-2
(co
ntin
ued)
aria
hle
Des
trip
tion
Mod
el 0
(N-7
41)
Mod
d 10
Mod
el 1
1
IN 7
43)
(N-6
04)
Mod
el 1
2(N
=70
6)M
odel
13
(N.-
698)
Mod
el 1
4
(N=
682)
Mod
el 1
5
(N=
648)
( !o
ld's
age
in m
onth
.-
001
- 00
6-
006
- 00
6-.
007
- 00
300
5
Chi
ld's
gen
der
(1ho
s-
25,
IS-
25-
29,
- 26
i--
23-.
31*
Iluni
an (
api
tal D
e% e
lopi
lklit
(no
on-
IS-
IS-
26-
20-
23-
15-
23
Ial
to!
I 4.1
-Ce
AII.
1,11
111C
111
1414
0706
.15
1203
R (
C,e
lt ed
liplo
nia
1,1
I)
K h
as o
ne c
hild
lia. i
sso
11.1
. hcu
uii
%lt_
110
11,
11 IL
, 111
.111
.1
63 14 24 -
R 1
1.i
14:A
.11
011
%%
,.11.
ilk"
.1Ill
tre
K li
s.1
6 pu
hli,
luttu
uu
- 40
'
- 06
R II
,in
ot,
liou
35+
-
,,. I
I.it
I. on
Iliel
,kI e
s.el
,-`)
31,
Kie
d 2)
, and
al),
sc
on m
ath
litci
ae.
(est
(I e
els
( an
d I)
)
k It
utuu
diat
c Iit
Iu &
pie
--
14
K h
a m
ore
inte
inal
locu
s 01
:ont
iol
50`
11
kc,
hig
h am
ount
ot l
iii ic
r, to
sso
ikin
g-
49**
-.16
K h
i hig
h am
ount
01
so,:i
al s
uppo
rt34
*33
*
00,*
04"*
(Il
02"
0201
II
II K
( 1
( hi
ld1
rend
. hi,
Ole
I ollo
n (
Stu
d". d
ata
IllId
Ne,
,alu
es a
te b
ased
on
v.ei
ghte
d da
ta.\
t-te
st s
tatis
tic s
sa.,
appl
ied
to d
iller
enk.
es h
emed
i ba.
selin
e su
bgro
ups
Sta
tistic
al s
igni
licam
e lo
rds
are
indi
cate
d a:
, " a
-, 0
01,
201
.2,
05, I
la<
.10 2
5
;) I

AP
PE
ND
IX T
A13
1 IL
6 1
-301
.S R
EG
RE
SS
ION
AN
Al Y
SE
S O
F S
(113
GR
OU
PS
PR
ED
ICT
ING
110
ME
SO
CIO
LMO
FIO
NA
I. S
UB
SC
ALE
SC
OR
ES
(Soc
ioem
otio
nal S
ubse
a le
inea
n=6
56, s
d =
1.47
)
Var
iabl
e D
escr
iptio
nM
odel
1(N
-757
)M
odel
2(N
-757
)M
odel
3(N
-757
)M
odel
4(N
=75
7)M
odel
5(1
.1=
757)
Mod
el 6
(N=
757)
Mod
el 7
(N=
749)
Mod
el 8
(N=
756)
Chi
ld s
age
in m
outh
s-
003
- 00
2-
0002
.001
.000
1-.
001
(hild
's g
ende
r il-
bos
. 0-
girl)
3-
24'
- 24
2326
- 23
I fin
nan
Cap
ital D
es s
lopm
ent 1
ii,m
p13
13-
1414
- l6
-.13
I abo
r E
oree
Atta
chm
ent G
roup
- 09
- 07
-.09
11-.
11-.
07
R r
em e
ised
hig
h w
hool
dip
lom
a. (
iFD
38**
*
R h
as o
ne c
hild
48*"
K h
as ts
so L
liddr
ui25
'
R h
as b
een
on s
s cl
1,u
e 2
ears
. but
kss
than
537
'
M.e
n m
mii
oclia
msc
ai, o
r m
ole
publ
is h
ousi
ng3.
3'
Is Ir
usi
th,h
.11,
..-m
l10
270
and
al,,m
s c
on le
adin
g lu
eras
.s te
st ii
eV
el 3
-:;)
l< ,,
orcd
21)
and
abo
me
on m
ath
Iiter
acte
st (
I em
els
(an
d I)
)
has
mod
erai
ehig
h de
pres
sise
s>
mpt
oms
R h
as in
ure
inte
rnal
locu
s ol
con
trol
pefte
ises
hig
h am
ount
of b
arrie
rs to
sso
rkm
g
R h
as h
igh
amou
nt o
l soc
ial s
uppo
rt
R00
0400
6*00
100
802
**02
.04*
".0
2"
'
(con
tinue
d)

AP
PE
ND
IX IA
B1
E. 6
1-3
(co
ntin
ued)
Mod
el 9
(N 7
41)
Mod
el 1
0M
odel
11
(N 7
42)
(N 6
97)
Mod
el 1
2(N
--70
7)M
odel
13
(N=
700)
Mod
el 1
4(N
=68
5)M
odel
15
(N=
653)
( hi
lds
age
in-
0009
00-
004
004
- 00
4-.
002
- 00
2
(ge
nd,r
(1
bo II
rn11
27*
- 22
*-
23*
24*
25*
22*
- 21
4
I Inm
an (
api
tal 1
)e%
dop
rnen
t (H
opp
IS-
1 I
-11
13-
10-
18-
19
1 ah
,.1 t
otce
Alta
clun
ci0
Ii .
.up
- 0;
- 06
- 08
- O
S-
07-
07I
I
K ic
ied
high
...W
A d
ipl,n
na.1
3
ft ha
, one
add
K
ha, h
i.en
iii %
%JI
M,:
21,
11
I( h
aoi
in"(
e
wad
i, ht
Ii101
.!
K-1
11,0
,11/
..,11
ioni
ng
1(ic
d 2"
!,,1
1,,,c
iii 1
,-.1
d111
!..2
I ii
Ii
IClii
c d
r)
.284 20 - 27 - 36
*
- O
S
18 UI
1,d
215
and
ahe
(I o
,c1-
, ( a
nd 1
))67
4**
51..,
Ft h
an im
,der
ate
high
dcp
rehe
001
03
K h
,.im
ole
'men
ial
01 L
oniro
l28
*00
6
Khi
gh a
liwtin
t oI l
imne
rs to
\%i1
,ing
- 16
- 00
05
I( h
a, h
igh
amou
ntso
oal m
:ppo
004
06
K00
OW
"00
802
*01
008
08..
101
I hild
1 r
I, .
nhili
on, i
I the
( °i
nn)
Des
crip
tive
Sill
ily d
ala
NM
I',I
alto
: .ci
ghlc
d da
tat-
te,t
stat
ist!,
Aa.
, app
lied
io d
iffer
ence
s he
m c
ell h
a,el
ine
whg
ioup
s M
atiN
tical
sig
nilic
ane
le%
els
tire
indi
cate
d as
***
e-
2.-
01, k
05,
210
).1
BE
ST
CO
PY
AV
AIL
AB
LE

APP
EN
DIX
TA
BL
E 6
.2-1
OE
S R
EG
RE
SSIO
N A
NA
LY
SES
OF
IlO
ME
SC
AL
ES
PRE
DIC
TIN
G P
EA
BO
DY
PIC
TU
RE
VO
CA
BU
LA
RY
TE
ST-R
EV
ISE
D (
PPV
T-R
) ST
AN
DA
RD
SCO
RE
S(P
PVT
-R m
ean-
69.8
8; s
.d.
16.0
3)
Var
iabl
e D
escr
iptio
nM
odel
1M
odel
2M
odel
3M
odel
4M
odel
5M
odel
6M
odel
7
Chi
ld's
aue
in m
onth
s.1
0*.0
8*.0
8*.0
8*.0
8*
Chi
ld's
uen
der
(1-b
oy, 0
- gi
rl)
-.07
1-.
08*
-.07
+-.
07 I
-.06
Hum
an C
apita
l Dev
elop
men
t Gro
up.0
4.0
1.0
4.0
2.0
4
l.abo
r F
orce
Atta
chm
ent G
roup
.14*
*.1
2*.1
11*
.13*
.131
*
IhO
ME
( o
Lm
itive
Stim
ulat
ion
Sub-
Scal
e.2
7***
11O
ME
,,,t_
io-
Em
otio
nal
Sub
-Sca
le.1
2**
IluM
l.1
otal
SLa
lc.2
6***
I:01
*.0
05.0
1**
.03*
*10
1*,
.04*
**.0
9***
1hd
d Ir
cnds
. tub
. Lal
cula
tions
old
ie N
ikon
oun
t lks
cic
Stud
> d
ata
NU
I 1
1Sla
ble
n.al
ues
arc
base
d on
sei
ghic
d da
ta1.
stim
ated
odd
s ra
tios
base
d on
logi
stic
reg
ress
ion
anal
ysis
Stat
istic
al s
igni
fica
nce
lecl
s ar
c in
dica
ted
as *
* a
< 0
01;
a <
,a
< .0
5, +
,

AP
PE
ND
IX T
AL3
LE 6
.2-2
S R
I:tiR
ES
SIO
N A
NA
LYS
ES
01.
}R
ALE
SC
ALE
S P
RE
DIC
TIN
G P
RE
SC
HO
OL
INV
EN
TO
RY
TO
TA
L S
CO
RE
S(P
SI m
ean-
17.8
9; s
.d. 6
.19)
Var
iabl
e D
escr
iptio
nM
odel
IM
odel
2M
odel
3M
odel
4M
odel
5M
odel
6M
odel
7
hild
's a
ge in
mon
ths
.57*
**.5
8***
Clu
ld'5
gen
dei (
Ibo
y,
lum
an C
apita
l Dev
elop
men
t Gro
up
-.10
*
.16*
**
-.12
***
.007
-.11
***
.02
-.10
**
.01
-.10
**
.02
1 ab
or I
e A
ttaLh
inen
ttr
oop
11**
*.0
6.0
6.0
6.0
6
1105
11..
tiiiie
Stim
ulat
Rin
Sub
-Sca
le
I It )
\11.
1..n
totio
nal S
ub-S
cale
hi )
\1I
I ota
l Sca
le
.184
.**
1<:
34**
*01
*03
***
.35*
**.4
0***
.39*
**.4
2***
,1 It
PA
Ihi
llI r
.IRIN
,.11,
11LS
1101
1,i
th..
Ilii
i tIti
lli',
1)e,
, iip
mc
Stti
d, d
ata
s, a
re tl
,tlIll
v.e
ighi
cd d
ata
Iiij
itjie
l odd
, r a
tio, b
ased
on
Iogi
stiL
reg
ress
ion
,:ria
l1/2
,1,
SIjI
IsIi.
,ii ,i
gni I
kal
i,: le
% e
kin
di,a
ted
as2
001.
**
E -
,2
05.
E10

AP
PE
ND
IX T
AB
LE 6
.2-3
01 S
Ri G
RE
SS
ION
AN
ALY
SE
S O
F II
UM
E S
CA
LES
PR
ED
ICT
ING
PE
RS
ON
AL
MA
I UR
ITY
SC
ALE
ME
AN
SC
OR
ES
(PM
S m
ean-
7 43
., s.
d.-1
.49)
Var
iabl
e D
escr
iptio
nM
odel
1M
odel
2M
odel
3M
odel
4M
odel
5M
odel
6M
odel
7
Chi
ld's
dee
in m
onth
s
(.hi
ld'N
1. e
nder
tI
bo ,
0 gi
rl)
.006
-.00
2
-.07
+
-.00
2
-.06
-.00
2
-.05
- .0
02
-.05
lum
an C
apita
l Dev
elop
men
t Gro
up.0
4.0
4.0
5.0
5.0
6
Labo
r F
or L
e A
ttach
men
t Gro
up.0
5.0
6.0
6.0
6.0
6
i0M
F. C
oeni
tke
Stim
ulat
ion
Sub
-Sca
le2
5*
*4
I It 0
.11:
soc
io-L
inut
iona
l Sub
-Sca
le
110N
1L 1
01,0
Sid
le.3
2***
R00
004
005
00 '
007
07**
*07
***
l***
iiIk
tI
t Io;
,1I t
,nd,
.ili
cI i
dion
I. 0
:int)
I )[1
0tu
d, d
dia
I1/
4I a
bh.
arc
ha,c
d on
v.:O
iled
d ia
Ann
atcd
odd
., N
ow,
nrc
gres
sion
ana
l!.si
s:N
tanN
0,41
,igni
livan
Lc Ie
cI
aR: I
ndic
ated
aN
"4
2.-
001.
"o
,2-
OS
, +-
2

APP
EN
DIX
TA
BL
E 6
.2-4
LO
GIS
VIC
RE
GR
ESS
ION
AN
AL
YSE
S O
F H
OM
E S
CA
LE
S PR
ED
ICT
ING
RA
TIN
G O
F C
HIL
D'S
HE
AL
TH
AS
EX
CE
LL
EN
T W
ITH
NO
LIM
ITIN
G C
ON
DIT
ON
(Chi
klre
n R
ecei
ving
Rat
ing
of H
ealth
as
Exc
elle
nt w
ith N
o L
imiti
ng C
ondi
tion
47%
)
Var
iabl
e D
escr
iptio
nM
odel
IM
odel
2M
odel
3M
odel
4M
odel
5M
odel
6M
odel
7
agc
99.9
9.9
9.9
9.9
9
('hild
'sv.
ende
rbo
) , 0
gir
l).6
6**
.67*
*.6
8*.6
7**
.69*
lum
an C
apita
l Dev
elop
men
t Gro
up.9
5.9
71.
00.9
81.
00
Lab
or F
orce
Atta
chm
ent G
roup
.83
.89
.88
.89
.39
I IO
MI
Coe
uitie
Stim
ulat
ion
Sub-
Scal
e1.
14"*
110M
L S
ok.:
io-L
mon
onal
Sub
-Sca
le1.
03
I It
IM
F. lo
ml S
t ale
1.08
"
Mod
el C
hi S
quar
e1
167.
45**
1 02
.8.8
9420
.50"
9.29
16.7
0**
-2 1
oil
I ik
ehho
od95
6.82
950.
5295
6.95
949.
0893
7.47
948.
6894
1.27
s-,t
11I(
)I
(hi
ldI
ndIi
,. ,a
kula
tion,
ot t
he I
idto
n C
ount
> 1
),:,,
ript
is.e
Stu
ds d
ata
Nt)
11.`
,la
hlc
altic
.Nar
e ha
Ned
In
,Aci
ghte
d da
ta1
stan
at,:d
odd;
rat
ios
ha.,e
d nn
logh
tle r
egre
...,o
r,n
.111
.11
le%
els
are
indi
cate
d a
< 0
01,
u,
205
,--
. .10
'
iI

AP
PI-
ND
IX F
AB
I E 7
I
I ( X
dS
I I(
RF
OR
LSS
ION
NA
1 Y
sES
OF
SU
BO
RO
IP
RE
DIC
IIMi
PF
RC
INT
OR
MO
RE
OF
CH
ILD
'S L
IFE
IN A
NY
CA
RE
BE
FO
RE
RA
ND
OM
AS
SIG
NM
EN
T(m
ean
= 0
44,
s d
= 0
50)
ambl
e D
escr
iptio
nM
odel
1M
odel
2M
odel
3M
odel
4M
odel
5M
odel
6M
odel
7M
odel
8M
odel
9(N
=77
6)(N
=77
6)(N
=77
6)(N
=76
8)(N
=77
5)(N
=75
5)(N
=75
7)(N
=70
9)(N
=72
0)
( hi
ld's
age
in m
onth
s
Chi
ld's
gen
der
(1ho'.
Iigi
rl)
R r
ecei
sed
high
s.z
hooi
dip
lom
a (ii
1)
R h
as o
ne c
hild
R h
as ts
o ch
ildre
n
R h
as b
een
on v
,ella
re 2
ars
bin
1,:s
s M
an .;
R h
a, b
een
t,n s
iella
te )
>ca
l, of
fllO
re
It IIC
1.1
',LI
M],
OC
I`I
cr,
s.or
ed 2
Th
and
alto
s,.
u iL
Any
. Iii.
i.iIc
at.s
eI
R ',
wed
215
and
Jilt
's,:
on m
ath
Mem
.% te
lo.
els
( an
d 1)
)
R h
as m
odel
ate
hig
h de
pies
sise
sym
ptom
s
R h
as m
ore
inte
rnal
locu
s ol
Lon
trol
R p
erce
is e
s hi
gh a
mou
nt o
f har
riers
to %
sork
ing
R h
is h
igh
amou
nt o
f:soc
ial s
uppo
rt
1 04
I 04
I 04*
**1
04**
*1
04**
*I 0
41
04**
*1.
03*"
I.03*
*
112
113
112
1 25
1.11
119
1 15
1.23
I16
2 67
...
89.,
I 20
35*"
0 16
***
u 81 1 04
2 22
***
2 03
**
1.02
I 23
-2 1
og
1 ik
ehho
od10
45 4
1007
410
3395
7 8
1041
898
8.9
990.
095
7.5
970.
3
(con
tinue
d)

01-N
DIX
TA
W L
7 I-
1 (c
ontin
ued)
arra
ble
Des
krip
tion
Mod
el 1
0M
odel
II
(NI -
7121
(N=
697)
Chi
ld s
age
in m
onth
s1
03"
0-...
"
Chi
ld's
gen
der
(Ibo
yI
18I 2
0
R r
e,ei
i.ed
high
,ieh
ool d
iplo
ma
OLD
It ha
, one
Jud
d
R h
j is
didd
ren
It ha
., be
en o
n i,s
el la
c 2
Ca'
s. b
ut IC
SN
than
k ha
s be
en o
n vi
ella
re 5
ems
or m
ore
R In
,:s
pubh
e ho
usin
g
I n.-
in .o
bsid
iied
hou
ing
s.or
edan
d al
um: o
n re
adin
g In
ciai
.) te
stcc
i 3-5
1
21i m
id a
boie
on
mat
h lil
er.i.
te,t
t.an
d III
it ha
, moi
t.i a
te !u
ghsn
ytoi
ns
it ha
, mor
e In
tern
al I
.nI i
.orn
rol
high
am
ount
iit b
arrie
r, to
!kin
gII
57**
*
R h
a hi
gh a
mou
nt o
t irc
itI u
ppor
tI 2
0
-2 1
1 ik
ehho
nd94
9 8
939
2
1111
'kt I
I hild
Iren
d.a
l,ula
tion,
ii il
. ID
escr
iptn
,e S
ind>
dat
a
's!a
ble
,,,al
ues
are
ha,e
d iii
iici
ghte
d da
taLs
tuna
tA o
dd, r
atio
s ba
sed
an l
islic
reg
iess
ion
.111
.11)
515
'*
2- 0
1,*
2 05
, + a
c 10
Res
earc
h gr
oup
is n
ot c
ontr
olle
d be
caus
e
child
car
e m
i ik
plai
x he
hue
ran
dom
ass
ignm
ent
t
BE
ST
CO
PY
AV
AIL
AB
LE

AP
PE
ND
IX T
AB
LE 7
1-2
(XIIS
II(' R
I (IR
I SS
It iN
AN
AI
SI:1
3(11
(01,
PS
PR
I:DIC
INO
1W
EN
TY
-FIV
E P
ER
('l N
10K
MO
RE
OF
CII
ILD
'S L
IFE
IN
FO
RM
AI.
CA
RE
BE
FOR
E R
AN
DO
M A
SSIG
NM
EN
T(m
ean
0.25
; s d
0 43
)
V il
l All:
: Des
crip
tion
Mod
el I
Mod
el 2
Mod
el 3
Mod
el 4
Mod
el 5
Mod
el 6
Mod
el 7
Mod
el 8
Mod
el 9
IN-7
82)
(N-7
82)
(N .7
82)
(N=
774)
(N=
78I)
(N=
761)
(N=
763)
(N=
714)
(N=
726)
( hd
d's
age
m m
ontlh
04I 0
4",
I 04'
"1
04**
*1
04**
*1
04**
*1
04"
1.03
1 03
1
( U
SN
gen
der
(1ho
!.0
iatil
)I M
i1
()I 0
8I
131
081
10I 0
61.
111.
11
R ti
...cl
ied
high
sch
ool d
iplo
ma
(ILI
)I 8
8R
ha.
, one
add
I 38
K IL
L, o
.,, a
ddlo
iI 3
6
R h
.b h
eun
,in v
,ella
re 2
CM
, bl/1
le,
0 46
than
R h
a., h
eLli
on
III
OC
R ii
e(it
OC
ciy1
K ,,
ored
21i
and
aho
ieii
mat
h Iit
ri te
st 0
cid
, Ian
d I)
)
ITIII
dera
te Ii
gb
depr
e,hi
iei m
ptoi
n,
ha.s
mor
e in
tern
al 1
0, ii
, it C
lIntr
ol
perc
el%
cs h
igh
amou
nt 0
1 ha
rrie
rs to
%%
oil..
.mg
R h
as h
igh
anlo
unt o
Iia
l sup
port
0 35
0**
1 37
I 23
1 54
'
1 63
"
1 18
I 28
-2 1
og
I ;ke
lihoo
d86
5 0
853
186
2 0
832
086
2 2
840
283
9 I
789
I80
2 2
(con
tinue
d)

AP
PI.N
IHN
I A
Ii1 I.
7 1
-2 (
conl
inue
dl
\.ifia
bIt.
IN
I()L
fel 1
0M
odel
11
(N-7
031
In 1
1101
3111
,
:4ci
)Jci
(1
1).
I)L.
90
R tc
,cR
eJ h
iOdi
plom
a( d
R h
i. R
. hild
ren
Ild, 6
C.1
1 kg
) lS
clf.t
ie 2
but I
., th
..1
It. h
a be
t.0ii
sse.
:101
c
R 1
1%,
1;1
II\I:I
CLI
i.jdi
IiLi
i.te
i ii e
s.-I
:Ian
d ab
ose
mat
hLt
d cs
el, (
.Hid
1))
(1,
Ise
NtIr
ct.
Rii
11.'1
, Int
erna
lol
pti.i
se. 1
1101
1,1
1011
11i
I (1.
1(1-
1,r
R ii
, 111
1.:1
1 am
ount
ot
supp
ui
I 03"
1 03
"
it'2
II 96
-I I
ke h
hood
ii R
II
I 1,1
I /e
/iih
e I u
llon
e ',b
ids
data
)11
.)I a
ble
s ak
a . a
re b
a,ed
ii ss
urlu
Ld d
ata
I .(ii
iidIe
d od
d, r
atio
, baz
,ed
tut l
ift..
bats
' rev
re,to
it2
(WI.
s' 2
01,
2O
S.
210
Res
earc
h gr
oup
is p
ot c
ontio
lled
beca
use
child
took
1)1
30: h
ilOre

AP
PLN
DIX
lAIll
Ii 9
I-I
!NI I
It(
( )1
(R11
.A IR
AS
l)F
TW
EE
N F
AM
ILY
RIS
K Ir
A(
1OR
S
Iani
iIR
isk
I auo
r1
34
56
78
910
1R
espo
nden
t did
not
rec
eise
hig
h sc
hool
dip
lom
aor
GI I
)I I
*"28
'''28
***
- 05
08*
01
2R
espo
nden
t ILI
A th
ree
or n
iore
chi
ldre
n11
"13
'"14
"03
09*
08*
- 01
1-z
nput
ider
it ha
, bee
n on
seI
tirc
isso
sca
rs o
rnt
ore
2ii
1716
***
0312
""14
""02
PZ
eqh
fidcl
it In
cin
pub
lic h
ousi
ng09
*12
"-
02II "
04.0
5
sR
eipt
inde
nt s
core
d be
loss
276
on
liter
acy
test
0024
..18
""04
II es
els
1-2
losk
er r
eadi
ng li
tera
cy
1,,p
orld
errt
icd
bk.:l
oss
Is o
il m
ath
litcr
a,t,:
st
0422
***
14*"
- 02
(I e
s el
, 1 a
nd li
1,ik
er ii
ih s
kid,
lcpi
idci
ii ha
, mod
erat
e 11
1.41
th.p
ress
is19
- 04
194.
.
1.3,
I.t.1
1,.1
11it-
. 01
24**
*
ol b
arrie
rs io
15cs
orki
mt
111
lesp
ii.Ic
zii h
is lo
tc a
rllou
llt O
r so
cidt
sup
port
Sot
-k
((
hild
[ren
ds, I
ncca
lcul
atio
ns o
f the
Ful
ton
Cou
nts
l)scr
iptis
e S
urse
y da
ta
NO
N 1
I abl
e %
dine
s ar
c ba
sed
on s
seig
hted
dat
aS
tatis
tical
sig
nific
ance
loel
s ar
e in
dica
ted
a. "
E11
0"
-*
c()
5.
1
BE
ST
CO
PY
AV
AIL
AB
LE

AP
P1
DIX
1,A
RII:
9 1
-2IN
( IR
K! 1
\13
1: 1
WI:E
N F
AM
11 )
PR
011
1.-1
11/1
.. 1
AC
1(11
6
.011
11.,
Pro
tcaR
e 1
14
56
78
910
I1.
III Id
1, I
tyhl
,da
d ,,.
,.,pe
rdtt%
c
hJd
0,,
rkk
dt tr
nh
01 Is0
03 - 00
-07-
02
02 02
- 08
'
- 01
- 04
- 01
09*
- 02
06+
04
R.
rcp.
,rt,
1ov,
.,1
, 0(1
,3, r
c,.1
p1,!
,
1.1t
hin
thc
dr
p .1
,1en
thi
ck11
,.:
thc
tcp,
i,d,
,c,
11(1
1.cf
lc<
,A11
1o,
111
111;
11;1
07 03
00 . ,0 15
^",
-07
- 01
-
13
-0) 25 -
07'
- 04 - 02 04 - 02
- 02 - 03 02
- 01
-R
..it.
. 01c
dlo
toc
0200
09'
:1(
,.1o9
"
,i.tiI
07,
1,. 1
:c.p
.01,
tic,.1
1) 1
.11
1.1
11;1
.111
1/,'
;,0t1
d
c,...
cile
ntc,
,p!
c (0
A11
1.-
L111
1Irt
.:11
\111
10.
11)
.1,1
1 IL
Id,
. 11,
111A
I:111
011
11c
1111
111C
01,
111V
, 1h:
sow
n', e
',11
/%c,
data
A 1
11; a
hk ,1
111.
,, A
IL 1
1,1,
...1
.11
)A,1
41,1
cd 1
11.1
`11
t11.
1,11
`,1
,'111
11,..
1/1
1.ar
c m
il, c
,..1
'"00
1 ' p
"1p

APPENDIX C
TEST OF APPLIED LITERACY SKILLSDOCUMENT LITERACY LEVELS
Level 1: Scale range 0-225Tasks in this level tend to require the reader either to locate a piece of information based on a
literal match or to enter information from personal knowledge onto a document. Little, if any,distracting information is present. Average difficulty value of tasks in this level: 195
Level 2: Scale range 226-275Tasks in this level are more varied than those in Level 1. Some require the reader to match a
single piece of information; however, several distractors may be present, or the match mayrequire low-level inferences. Tasks in this level may also ask the reader to cycle throughinformation in a document or to integrate information from various parts of a document.Average difficulty value of tasks in this level: 249
Level 3: Scale range 276-325Some tasks in this level require the reader to integrate multiple pieces of information from one ormore documents. Others ask readers to cycle through rather complex tables or graphs whichcontain information that is irrelevant or inappropriate to the task. Average difficulty value of
tasks in this level: 302
Level 4: Scale range 326-375.lasks in this level, like those in the previous levels, ask readers to perform multiple-featurematches, cycle through documents, and integrate information; however, they require a greaterdegree of inferencinu. Many of these tasks require readers to provide numerous responses but do
not designate how many responses are needed. Conditional information is also present in thedocument tasks in this level and must he taken into account by the reader. Average difficulty
\ alue of tasks i .1 this level: 340
Level 5: Scale range 376-500l'asks in this level require the reader to search through complex displays that contain multipledistractors, to make high-level text-based inferences, and to use specialized knowledge. Averagedifficulty value of tasks in this level: 391
SOCRCE: Kirsch et al., 1993.
192
A
1=1E1111

APPENDIX D
CASAS SCALE SCORE INTERPRETATIONSFOR GAIN APPRAISAL MATH TEST
Level A: Below 200Participants functioning below 200 have difficulty with the basic computational sl-**Is necessary
to function in employment and in the community. These adults can handle routine, entry-level
jobs. They are not able to compute wages and deductions on paychecks.
Level B: 200-214These adults can function in intermediate level Adult Basic Education programs but have
difficulty pursuing other than entry-level programs. They can perform basic computations, and
are functioning below a seventh grade level.
Level C: 215-224Participants functioning between 215 and 224 are able to handle basic computational skills in a
functional setting related to employment. They have difficulty following more complex sets of
directions and are functioning below a high school level.
Level I): 225 and aboveParticipants functioning at or above 225 can function at a high school entry level in basic math,
and if they do not have a high school diploma, can profit from instruction at the high school
level. They can usually perform work that invokes following oral and written directions in
familiar and some unfamiliar situations. Those participants 18 years of age and above can profit
Crom instruction in ( iED preparation and, in a short time, have a high probability of passing the
GED test.
()1 'RCF: Adapted from Armstrong et al.. 1989. p. 12.

APPENDIX E
BELIEF THAT MOTHERS SHOULD NOT WORK SCALE
This scale was formed by taking the mean of the following five items taken from the Descriptivesurvcy55:
1) When children are young, mothers should not work outside the home.2) If a mother has a choice about whether or not to work, it is better for her children if she staysborne and cares for them.3) Making welfare mothers work is bad for their children.4) I do not want a job because I would miss my children too much.5) Having a working mother may be OK for some children, but not for mine.
"Responses to these items were on an I I-point scale, where was "not at all true," and 10 was "completely true."
.14. Cy
Copyright © 2022 FDOKUMEN