web annex b. systematic literature review and network meta ...
257
WEB ANNEX B. SYSTEMATIC LITERATURE REVIEW AND NETWORK META-ANALYSIS ASSESSING FIRST-LINE ART TREATMENTS Steve Kanters, Jeroen Jansen, Michael Zoratti, Jamie Forrest, Brittany Humphries, Jonathon Campbell In: Updated recommendations on first-line and second-line antiretroviral regimens and post-exposure prophylaxis and recommendations on early infant diagnosis of HIV: interim guidelines. Supplement to the 2016 consolidated guidelines on the use of antiretroviral drugs for treating and preventing HIV infection
-
Upload
khangminh22 -
Category
Documents
-
view
0 -
download
0
Transcript of web annex b. systematic literature review and network meta ...
WEB ANNEX B. SYSTEMATIC LITERATURE REVIEW AND
NETWORK META-ANALYSIS ASSESSING FIRST-LINE ART
TREATMENTS
Steve Kanters, Jeroen Jansen, Michael Zoratti, Jamie Forrest,
Brittany Humphries, Jonathon Campbell
In:
Updated recommendations on first-line and second-line
antiretroviral regimens and post-exposure prophylaxis and
recommendations on early infant diagnosis of HIV: interim
guidelines. Supplement to the 2016 consolidated guidelines
on the use of antiretroviral drugs for treating and preventing
HIV infection

2
WHO/CDS/HIV/18.25
© World Health Organization 2018
Some rights reserved. This work is available under the Creative Commons Attribution-NonCommercial-
ShareAlike 3.0 IGO licence (CC BY-NC-SA 3.0 IGO; https://creativecommons.org/licenses/by-nc-
sa/3.0/igo).
Under the terms of this licence, you may copy, redistribute and adapt the work for non-commercial
purposes, provided the work is appropriately cited, as indicated below. In any use of this work, there
should be no suggestion that WHO endorses any specific organization, products or services. The use of
the WHO logo is not permitted. If you adapt the work, then you must license your work under the same
or equivalent Creative Commons licence. If you create a translation of this work, you should add the
following disclaimer along with the suggested citation: “This translation was not created by the World
Health Organization (WHO). WHO is not responsible for the content or accuracy of this translation. The
original English edition shall be the binding and authentic edition”.
Any mediation relating to disputes arising under the licence shall be conducted in accordance with the
mediation rules of the World Intellectual Property Organization.
Suggested citation. Kanters S, Jansen J, Zoratti M, Forrest J, Humphries B, Campbell J. Web Annex B.
Systematic literature review and network meta-analysis assessing first-line antiretroviral treatments
In: Updated recommendations on first-line and second-line antiretroviral regimens and post-exposure
prophylaxis and recommendations on early infant diagnosis of HIV: interim guidelines. Supplement to
the 2016 consolidated guidelines on the use of antiretroviral drugs for treating and preventing HIV
infection. Geneva: World Health Organization; 2018 (WHO/CDS/HIV/18.25). Licence: CC BY-NC-SA 3.0
IGO.
Cataloguing-in-Publication (CIP) data. CIP data are available at http://apps.who.int/iris.
Sales, rights and licensing. To purchase WHO publications, see http://apps.who.int/bookorders. To
submit requests for commercial use and queries on rights and licensing, see
http://www.who.int/about/licensing.
Third-party materials. If you wish to reuse material from this work that is attributed to a third party,
such as tables, figures or images, it is your responsibility to determine whether permission is needed for
that reuse and to obtain permission from the copyright holder. The risk of claims resulting from
infringement of any third-party-owned component in the work rests solely with the user.
General disclaimers. The designations employed and the presentation of the material in this publication
do not imply the expression of any opinion whatsoever on the part of WHO concerning the legal status
of any country, territory, city or area or of its authorities, or concerning the delimitation of its frontiers
or boundaries. Dotted and dashed lines on maps represent approximate border lines for which there
may not yet be full agreement.
3
The mention of specific companies or of certain manufacturers’ products does not imply that they are
endorsed or recommended by WHO in preference to others of a similar nature that are not mentioned.
Errors and omissions excepted, the names of proprietary products are distinguished by initial capital
letters.
All reasonable precautions have been taken by WHO to verify the information contained in this
publication. However, the published material is being distributed without warranty of any kind, either
expressed or implied. The responsibility for the interpretation and use of the material lies with the
reader. In no event shall WHO be liable for damages arising from its use.
The named authors alone are responsible for the views expressed in this publication.
This publication forms part of the WHO guideline entitled Updated recommendations on first-line and
second-line antiretroviral regimens and post-exposure prophylaxis and recommendations on early infant
diagnosis of HIV: interim guidelines. Supplement to the 2016 consolidated guidelines on the use of
antiretroviral drugs for treating and preventing HIV infection. It is being made publicly available as
supplied by those responsible for its development for transparency purposes and information, as
required by WHO (see the WHO handbook for guideline development, 2nd edition (2014)).
4
CONTENTS
Abbreviations .............................................................................................................................................. 14
Executive Summary ..................................................................................................................................... 17
1. Introduction ......................................................................................................................................... 23
2. Objectives ............................................................................................................................................ 24
3. Methodology ....................................................................................................................................... 25
3.1. Systematic literature review ........................................................................................................ 25
3.1.1. Sources ............................................................................................................................... 27
3.1.2. Search strategy ................................................................................................................... 27
3.1.3. Study selection .................................................................................................................... 28
3.1.4. Study quality ........................................................................................................................ 28
3.1.5. Data extraction .................................................................................................................... 29
3.2. Analyses ...................................................................................................................................... 30
3.2.1. Network meta-analyses ....................................................................................................... 30
3.2.2. Evaluation of consistency between direct and indirect comparisons .................................. 30
3.2.3. Node definitions and backbone adjustments ...................................................................... 31
3.2.4. Models ................................................................................................................................. 32
3.2.5. Adjusted analysis ................................................................................................................ 33
3.2.6. Presentation of results ........................................................................................................ 33
3.2.7. Software .............................................................................................................................. 33
4. Adults and adolescents ........................................................................................................................ 34
4.1. Systematic literature review study selection ............................................................................... 34
4.2. Analysis set study selection ........................................................................................................ 37
4.3. Results ........................................................................................................................................ 39
4.3.1. Viral suppression ................................................................................................................. 40
4.3.2. Increase in CD4 cell counts ................................................................................................ 41
4.3.3. Mortality ............................................................................................................................... 43
4.3.4. AIDS defining illnesses ....................................................................................................... 43
5
4.3.5. Discontinuations .................................................................................................................. 44
4.3.6. Discontinuations due to adverse events ............................................................................. 45
4.3.7. Treatment-related and emergent adverse events ............................................................... 45
4.3.8. Treatment-related and treatment-emergent serious adverse events .................................. 47
4.3.9. Regimen substitutions ......................................................................................................... 47
4.4. GRADE tables ............................................................................................................................. 48
5. TB Co-infected Individuals ................................................................................................................... 58
5.1. The INSPIRING trial .................................................................................................................... 58
5.1.1. Systematic literature review study selection ....................................................................... 60
5.2. Results ........................................................................................................................................ 62
5.2.1. Efficacy ................................................................................................................................ 62
5.2.2. Tolerability ........................................................................................................................... 63
5.2.3. Safety .................................................................................................................................. 65
5.3. GRADE tables ............................................................................................................................. 66
6. Pregnant and breastfeeding women ................................................................................................... 68
6.1. Systematic literature review study selection ............................................................................... 68
6.2. Summary of the evidence base ................................................................................................... 68
6.3. GRADE tables ............................................................................................................................. 73
7. Children and adolescents .................................................................................................................... 76
7.1. Summary of the evidence base ................................................................................................... 76
7.2. GRADE tables ............................................................................................................................. 78
8. Discussion ............................................................................................................................................ 87
9. Conclusions .......................................................................................................................................... 89
Appendix A: Search strategy ....................................................................................................................... 90
Appendix B: Search strategies for sub populations .................................................................................... 93
Appendix C: Trends in observed treatment effects across follow-up times............................................... 95
Appendix D: List of included studies ......................................................................................................... 100
Appendix E: Characteristics of included studies ....................................................................................... 125
Appendix F: Patient characteristics in included studies ........................................................................... 138
Appendix G: Quality assessments of included studies ............................................................................. 151

6
Appendix H: Network diagrams ................................................................................................................ 160
TB Subpopulation .................................................................................................................................. 173
Appendix I: Included trials by analysis ...................................................................................................... 181
Appendix J: Cross tables ............................................................................................................................ 185
Appendix K: GRADE summary tables for children and adolescents ......................................................... 208
References ................................................................................................................................................ 232
7
Tables
Table 1: Scope of the literature review in PICOS form ................................................................. 25
Table 2: Summary of the GRADE quality of evidence assessments for all outcomes for the DTG
vs EFV comparison ........................................................................................................................ 49
Table 3: Summary of the GRADE quality of evidence assessments for all outcomes for the
EFV400 vs EFV comparison ........................................................................................................... 53
Table 4: Summary of the GRADE quality of evidence assessments for all outcomes for the DTG
vs EFV400 comparison .................................................................................................................. 56
Table 5: Cross table of odds ratios with 95% credible intervals comparing the relative efficacy of
ARVs for viral suppression at 24 weeks from the fixed-effects network meta-analyses in HIV-TB
co-infected patients ...................................................................................................................... 62
Table 6: Cross table of odds ratios with 95% credible intervals comparing the relative efficacy of
ARVs for mean change in CD4 cell counts at 24 weeks from the fixed-effects network meta-
analyses in HIV-TB co-infected patients ....................................................................................... 63
Table 7: Data for treatment comparisons of interest for discontinuations due to adverse events
outcome in HIV-TB co-infected patients ....................................................................................... 64
Table 8: Data for treatment comparisons of interest for discontinuations due to adverse events
outcome in HIV-TB co-infected patients ....................................................................................... 64
Table 10: Data for treatment comparisons of interest for the treatment-emergent serious
adverse events .............................................................................................................................. 65
Table 11: Summary of the GRADE quality of evidence assessments for outcomes in the first-line
treatment of HIV-TB co-infected patients .................................................................................... 66
Table 12: Summary of the Tsepamo study of DTG/TDF/FTC vs EFV/TDF/FTC in pregnant and
breastfeeding women initiated on first-line ART ......................................................................... 71
Table 13: Summary of evidence among pregnant and breastfeeding women on first-line ART . 72
Table 14: Summary of the GRADE quality of evidence assessments for outcomes in the first-line
treatment of pregnancy and breastfeeding women .................................................................... 73
Table 15: Studies of RAL-based regimens for neonates and infants ............................................ 77

8
Table 16: Summary of the GRADE quality of evidence assessments for efficacy, safety, and
tolerability outcomes for the use of DTG vs EFV, LPV/r, and RAL in the first-line treatment of
children and adolescents .............................................................................................................. 80
Table 17: Summary of the GRADE quality of evidence assessments for efficacy, safety, and
tolerability outcomes for the use of RAL vs EFV, LPV/r, and NVP in the first-line treatment of
children and adolescents .............................................................................................................. 84
Table 18: Systematic literature search strategy ........................................................................... 90
Table 19: Systematic literature search to identify non-RCT study designs .................................. 93
Table 20: Systematic literature review terms to identify the specific sub-populations of interest
....................................................................................................................................................... 93
Table 21: List of included studies with corresponding publications .......................................... 100
Table 22: List of included studies with corresponding publications for the TB sub-population 118
Table 23: List of included studies with corresponding publications for the children and
adolescent sub-population ......................................................................................................... 120
Table 24: List of included studies with corresponding publications for the pregnant and
breastfeeding women ................................................................................................................. 122
Table 25: Trial characteristics for principal systematic literature review .................................. 125
Table 26: Trial characteristics for studies selected in the systematic literature review among TB
co-infected patients .................................................................................................................... 136
Table 27: Patient characteristics across the 76 randomized controlled trials included in the
principal analysis ......................................................................................................................... 138
Table 28: Patient characteristics in the principal analysis in the systematic literature review
among TB co-infected patients ................................................................................................... 149
Table 29: Cochrane risk of bias quality assessment for randomized controlled trials, arranged by
review sub-population ................................................................................................................ 151
Table 30: Critical appraisal of non-randomized studies using the Tool to Assess the Risk of Bias
in Cohort Studies, developed by the Clinical Advances through Research and Information
Translation (CLARITY) group ....................................................................................................... 157
9
Table 31: Cross table of odds ratios with 95% credible intervals comparing the relative efficacy
of ARVs for viral suppression at 48 weeks from the fixed-effects network meta-analyses ....... 185
Table 32: Cross table of odds ratios with 95% credible intervals comparing the relative efficacy
of ARVs for viral suppression at 96 weeks from the fixed-effects network meta-analyses ....... 187
Table 33: Cross table of odds ratios with 95% credible intervals comparing the relative efficacy
of ARVs for viral suppression at 144 weeks from the fixed-effects network meta-analyses ..... 189
Table 34: Cross table of odds ratios with 95% credible intervals comparing the relative efficacy
of ARVs for mean change in CD4 cell counts at 48 weeks from network meta-analyses .......... 190
Table 35: Cross table of odds ratios with 95% credible intervals comparing the relative efficacy
of ARVs for mean change in CD4 cell counts at 96 weeks from network meta-analyses .......... 192
Table 36: Cross table of odds ratios with 95% credible intervals comparing the relative efficacy
of ARVs for mean change in CD4 cell counts at 144 weeks from network meta-analyses ........ 194
Table 37: Cross table of odds ratios with 95% credible intervals from network meta-analyses
comparing ARVs in terms of discontinuation ............................................................................. 196
Table 38: Cross table of odds ratios with 95% credible intervals from network meta-analyses
comparing ARVs in terms of discontinuation due to adverse events ........................................ 198
Table 39: Cross table of odds ratios with 95% credible intervals from the network meta-analyses
comparing ARVs in terms of treatment-related adverse events ................................................ 200
Table 40: Cross table of odds ratios with 95% credible intervals from the network meta-analyses
comparing ARVs in terms of treatment-emergent adverse events ........................................... 202
Table 41: Cross table of odds ratios with 95% credible intervals from network meta-analyses
comparing ARVs in terms of treatment emergent serious adverse events ............................... 204
Table 42: Cross table of odds ratios with 95% credible intervals comparing the relative efficacy
of ARVs for viral suppression at 48 weeks from the fixed-effects network meta-analyses in HIV-
TB co-infected patients ............................................................................................................... 206
Table 43: Cross table of odds ratios with 95% credible intervals comparing the relative efficacy
of ARVs for mean change in CD4 cell counts at 48 weeks from network meta-analyses in HIV-TB
co-infected patients .................................................................................................................... 206

10
Table 44: Cross table of odds ratios with 95% credible intervals from network meta-analyses
comparing ARVs in terms of mortality in HIV-TB co-infected patients in HIV-TB co-infected
patients ....................................................................................................................................... 207
Table 45: GRADE summary of evidence for the DTG vs EFV comparison in children and
adolescents ................................................................................................................................. 208
Table 46: GRADE summary of evidence for the DTG vs LPV/r comparison in children and
adolescents ................................................................................................................................. 212
Table 47: GRADE summary of evidence for the DTG vs RAL comparison in children and
adolescents ................................................................................................................................. 216
Table 48: GRADE summary of evidence for the RAL vs EFV comparison in children and
adolescents ................................................................................................................................. 220
Table 49: GRADE summary of evidence for the RAL vs LPV/r comparison in children and
adolescents ................................................................................................................................. 224
Table 50: GRADE summary of evidence for the RAL vs NVP comparison in children and
adolescents ................................................................................................................................. 228

11
Figures
Figure 1: Flow diagram for principal systematic literature review on adults and adolescents ... 36
Figure 2: Network of all studies included in the principal analysis .............................................. 38
Figure 3: Forest plot of select ARVs comparisons with respect to viral suppression at A. 48
weeks and B. 96 weeks according to fixed-effects network meta-analysis ................................ 41
Figure 4: Forest plot of select ARVs comparisons with respect to mean change in CD4 cell counts
at A. 48 weeks and B. 96 weeks according to fixed-effects network meta-analysis ................... 42
Figure 5: Forest plot of select ARVs comparisons with respect to mortality according to fixed-
effects network meta-analysis ...................................................................................................... 43
Figure 6: Forest plot of select ARVs comparisons with respect to the proportion of patients
developing AIDS defining illnesses according to fixed-effects network meta-analysis................ 44
Figure 7: Forest plot comparing pair-wise and NMA estimated relative effects of different ARVs
with respect discontinuations (all cause) ..................................................................................... 45
Figure 8: Forest plot comparing pair-wise and NMA estimated relative effects of select ARVs
with respect discontinuations due to adverse events .................................................................. 45
Figure 9: Forest plot of select ARVs comparisons with respect to A. treatment related adverse
events and B. treatment emergent adverse events according to fixed-effects and random-
effects network meta-analysis ...................................................................................................... 46
Figure 10: Forest plot of select ARVs comparisons with respect to A. treatment related serious
adverse events and B. treatment emergent serious adverse events according to fixed-effects
network meta-analysis .................................................................................................................. 47
Figure 11: Forest plot comparing pair-wise and NMA estimated relative effects of different ARVs
with respect regimen substitution (48 weeks) ............................................................................. 48
Figure 12: Modified FDA snapshot analysis of the percentage of participants (95% CI) with HIV-1
RNA <50 copies/mL ....................................................................................................................... 59
Figure 13: Flow diagram for principal literature review on TB co-infected individuals and first-
line ART regimens ......................................................................................................................... 60
Figure 14: Complete network of evidence for patients with HIV-TB co-infection ....................... 61
12
Figure 15: Flow diagram for principal systematic literature review on pregnant and
breastfeeding women and first line ART regimens ...................................................................... 70
Figure 16: Flow diagram for principal systematic literature review on adolescents and first line
ART regimens ................................................................................................................................ 76
Figure 17: Proportion of patients experiencing a treatment emergent serious adverse event or
adverse event ................................................................................................................................ 95
Figure 18: Proportion of patients experiencing a treatment related serious adverse event or
adverse event ................................................................................................................................ 96
Figure 19: Proportion of patients discontinuing treatment and discontinuing treatment due to
an adverse event ........................................................................................................................... 97
Figure 20: Proportion of patients that died and developed an AIDS defining illness .................. 98
Figure 21: Proportion of patients switching treatments during study ......................................... 99
Figure 22: Network diagram of trials informing viral suppression at 48 weeks (A); 96 weeks (B);
and 144 weeks (C). ...................................................................................................................... 160
Figure 23: Network diagram of the 66 trials informing mean change from baseline in CD4 cell
counts at 48 weeks (A); 96 weeks (B); and 144 weeks (C). ........................................................ 162
Figure 24: Network diagram of the trials informing mortality ................................................... 164
Figure 25: Network diagram of the comparative trials reporting AIDS defining illnesses outcome
..................................................................................................................................................... 165
Figure 26: Network diagram of the trials informing discontinuation due adverse events among
first-line HIV patients .................................................................................................................. 166
Figure 27: Network diagram of the trials informing retention among first-line HIV patients ... 167
Figure 28: Network diagram of the trials informing the treatment-related adverse events
analysis ........................................................................................................................................ 168
Figure 29: Network diagram of the trials informing the treatment-emergent adverse events
analysis ........................................................................................................................................ 169
Figure 30: Network diagram of the trials informing the treatment-related serious adverse
events analysis ............................................................................................................................ 170
13
Figure 31: Network diagram of the trials informing drug emergent serious adverse events
among first-line HIV patients ...................................................................................................... 171
Figure 32: Network diagram of the trials informing regimen substitutions .............................. 172
Figure 33: Network diagram of trials informing viral suppression at the 24-week (A) and 48-
week (B) timepoints in HIV-TB co-infected patients. ................................................................. 173
Figure 34: Network diagram of the trials informing mean change from baseline in CD4 cell
counts at 24-week (A) and 48-week (B) timepoints in HIV-TB co-infected patients. ................. 174
Figure 35: Network diagram of the trials informing Mortality in HIV-TB co-infected patients . 176
Figure 36: Network diagram of the comparative trials reporting AIDS defining illnesses outcome
in HIV-TB co-infected patients .................................................................................................... 177
Figure 37: Network diagram of the trials informing discontinuation due adverse events in HIV-
TB co-infected patients ............................................................................................................... 178
Figure 38: Network diagram of the trials informing retention among first-line HIV patients ... 178
Figure 39: Network diagram of the trials informing the treatment-related serious adverse
events analysis in HIV-TB co-infected patients ........................................................................... 179
Figure 40: Network diagram of the trials informing treatment emergent serious adverse events
in HIV-TB co-infected patients .................................................................................................... 180

14
Abbreviations
3TC Lamivudine
ABC Abacavir
ADI AIDS-defining illness
AIDS Acquired immunodeficiency syndrome
ATV/r Ritonavir-boosted atazanavir
ART Antiretroviral therapy
ARV Antiretroviral agent/drug
AZT Zidovudine
BIC Bictegravir
bid Twice daily
CD4 Cluster of differentiation 4
CENTRAL Cochrane Central Register of Controlled Trials
CI Confidence interval
CLARITY Clinical Advances through Research and Information Translation
CrI Credible interval
CROI Conference on Retroviruses and Opportunistic Infections
d4T Stavudine
ddI Didanosine
DIC Deviance information criterion
DOR Doravirine
DRV/r Ritonavir-boosted darunavir
DTG Dolutegravir
EFV Efavirenz – Standard 600mg once daily dose
EFV400 Efavirenz – 400mg once daily dose
EMBASE Excerpta Medica database
ETR Etravirine
EVG Elvitegravir
FTC Emtricitabine
15
GRADE Grading of Recommendations Assessment, Development and Evaluation
HBV Hepatitis B virus
HIV Human immunodeficiency virus
IAS International AIDS Society
IDU Injection drug user
INSTI Integrase strand transfer inhibitors
IQR Interquartile range
ITT Intention to treat
LPV/r Ritonavir-boosted lopinavir
MCMC Markov Chain Monte Carlo
MEDLINE Medical Literature Analysis and Retrieval System Online
NFV Nelfinavir
NMA Network meta-analysis
NNRTI Nonnucleoside reverse transcriptase inhibitor
NRTI Nucleoside reverse transcriptase inhibitors
MD Mean difference
OR Odds ratio
PI/r Ritonavir-boosted protease inhibitor
PICOS Population, interventions, comparisons, outcomes, study design
PLHIV People living with HIV
qd Once daily
RAL Raltegravir
RCT Randomized-controlled trial
RPV Rilpivirine
RR Relative risk
SD Standard deviation
SE Standard error
SLR Systematic literature review
TAF Tenofovir alafenamide

16
TB Tuberculosis
TDF Tenofovir disoproxil fumarate
XTC Lamivudine or Emtricitabine
17
Executive Summary
Background: In 2015, the WHO conducted evidence synthesis to update the 2013 Consolidated
guidelines on the use of antiretrovirals for treating and preventing HIV. At the time, the combination of
efavirenz, tenofovir disoproxil and lamivudine (or emtricitabine) [EFV + TDF + XTC] was the preferred
first-line therapy. Results of the 2015 systematic literature review (SLR) and network meta-analysis
(NMA) revealed improved tolerability and efficacy with dolutegravir (DTG) and low-dose efavirenz
(EFV400). Despite this evidence, DTG and EFV400 were recommended as alternative first-line regimens
rather than the preferred treatment. This was due to the high price of DTG and uncertainty around sub-
populations; rendering it difficult to recommend for low and middle income countries under the public
health approach. With numerous changes, including the availability of generic fixed dose combinations
of DTG +TDF + XTC and a growing evidence base among sub-populations, we sought to update the SLR
and NMA in order to determine the efficacy and safety of DTG and EFV400 relative to EFV.
Objective: The objective of this project is to compare the efficacy and safety of first-line ART regimens.
Given the knowledge accumulated through previous guidelines and knowledge of current literature
results, this project is centred on the following research question:
1. Should DTG be recommended as the preferred first-line antiretroviral agent in combination with
age-appropriate backbone (TDF + XTC for adults and adolescents) for the treatment of HIV?
2. Should EFV400 be preferred over EFV (standard-dose) for the first-line antiretroviral agent in
combination with age-appropriate backbone for the treatment of HIV?
Methods: Systematic database searches were conducted on 12 February 2018 to identify publications
reporting on relevant randomised controlled trials (RCTs) in the following databases: MEDLINE, EMBASE,
and Cochrane Central Register of Controlled Trials through Ovid. The current systematic review is an
update on a review completed in May 2015 (Global Evaluative Sciences). Further manual searches of the
2016, 2017 and 2018 Conference on Retroviruses and Opportunistic Infections (CROI), the 2016 AIDS
conference, and the 2017 International AIDS Society (IAS) conference were conducted. Additional
studies were identified through a review of clinical trial registries and the reference lists of identified
publications. All steps of the SLR were conducted independently and in duplicate. The same searches as
in 2015 were used in 2018. Study eligibility was expanded to include newer treatments. Namely
bictegravir, doravirine and tenofovir alafenamide. Data were extracted for trial characteristics, subject
characteristics and outcomes. The outcomes included: viral suppression at all available thresholds, mean
18
change in CD4 cell counts, mortality, AIDS defining illnesses, retention, discontinuation due to adverse
events, treatment related adverse events and regimen switching. This process was repeated for the
TBHIV co-infection, pregnant and breastfeeding women, and children sub-populations.
Data were analysed using NMA similar to in the 2015 evidence synthesis. NMA build upon the more
traditional pairwise meta-analyses by considering all treatment simultaneously for the analysis of a
single outcome. The analyses were performed in a Bayesian framework. For each outcome of interest,
fixed- or random-effects models were applied. Given that the research questions focus on the third
agents of ART with a specific backbone (XTC+ TDF), we chose to define the nodes in terms of specific
antivirals rather than specific ART regimens. Defining nodes according to a single ARV rather than the
full regimen significantly simplified the interpretation of modelling and results. The analyses used an
arm-specific meta-regression adjustment to account for differences in backbones, which was critical
given the importance of the SINGLE trial which compares DTG to EFV, but with different backbones. This
approach allowed us to use SINGLE rather than ignore it. Analyses restricting to comparisons with the no
differences in backbones were conducted as sensitivity analyses. Additionally, we conducted analyses
that made adjustments for differences in baseline CD4, HIV RNA and proportion of males.
To assess the overall quality of evidence, we used the Grading of Recommendations Assessment,
Development and Evaluation (GRADE) system for rating overall quality of evidence with adjustments for
the NMA methods employed. Adjustments to the direct or indirect estimate quality of evidence using
network estimates could be rated up for gained precision and rated down for evidence of lack of
transitivity.
Results: A total of 2815 citations were identified through database searches for the SLR update. Based
on the original review (May 2015) and the current update, 163 publications describing 90 trials were
identified and included in the systematic literature review for adults and adolescents. Of the 17 new
trials added to the evidence base, 4 included DTG (ARIA, GS-US380-1489; GS-US-380-1490, and
SSAT066), 3 included DOR (DRIVE AHEAD, DRIVE FORWARD, and 1439-007 Study), 2 included BIC, and 3
were endonodal on EVG/c comparing TAF to TDF. Despite the large number of trials in the evidence base
as a whole, there are three key trials that very much inform the comparisons of interest: SINGLE (DTG +
ABC + XTC vs EFV + TDF + XTC), SPRING-1 (DTG + 2 NRTIs vs EFV + 2 NRTIs) and ENCORE1 (DTG + TDF +
XTC vs EFV + TDF + XTC). These are the trials involved in the head to head comparisons of interest. No
evidence was available to describe the use of EFV400 in any of the sub-populations and as such only the
comparison of DTG vs EFV was considered in the sub-populations.

19
An analysis set was formed using a subset of the SLR. On the basis of our 2015 analysis, we removed
studies of indinavir, fosamprenavir, unboosted atazanavir, saquinavir, nelfinavir, and triple NRTIs from
the analysis set. Five trials were removed for having a raltegravir backbone, which could not be handled
in the model. From the review update, we excluded: GS-US-141-1475 used a non-FDA approved dose of
BIC; and GS-US-299-0102 was an endonodal trial that did not connect to the overall network (cobicistat
boosted darunavir). The network was well-connected, with EFV serving as the most well-connected
node. Overall, the principal analysis set of studies included 65 trials in which 33,148 patients were
randomized to 151 treatment arms (12 treatments). A combination of direct and indirect evidence was
available for all treatment comparisons except those involving EFV400, bictegravir and rilpivirine.
Results were quite similar to those from the 2015 review. All analyses appeared to meet the consistency
assumption for NMA. There were a few differences. We note that while no analysis required meta-
regression adjustments previously, there was one analysis that did require an adjustment for imbalances
in the proportion of males; namely, the analysis for discontinuations. Another difference is that the
fixed-effects model was more often favoured in these analyses, while the random-effects were more
commonly used in the 2015 analyses. This suggests a reduction in heterogeneity and it may be due to
the removal of the older treatment nodes.
There was high quality evidence of improved viral suppression (odds ratio [OR]: 1.93; 95% credible
interval [CrI]: 1.52, 2.47 at 96 weeks), discontinuations (OR: 0.49; 95% CrI: 0.44, 0.62) and
discontinuations due to AEs (OR: 0.30; 95% CrI: 0.19, 0.47) for DTG relative the EFV. This was supported
by moderate quality evidence of improvements in CD4 cell counts (mean difference: 22.87; 95% CrI:
8.29, 37.40), and both treatment-related (OR: 0.33; 95% CrI: 0.25, 0.44) and treatment-emergent AEs
(OR: 0.63; 95% CrI: 0.38, 1.11). Due to low numbers of events, imprecise estimates and some risk of bias,
there was on low to very low quality evidence for efficacy at 144 weeks, mortality and ADIs, SAEs and
regimen substitutions.
For EFV400 relative to standard dose EFV, high quality evidence was obtained for discontinuations due
to AEs (OR: 0.42; 95% CrI: 0.22, 0.77). Otherwise, efficacy and safety tended to have moderate quality
evidence due to imprecision. Similar to above, mortality and ADIs, treatment related AEs and SAEs, and
regimen substitutions had low to very low quality evidence. Finally with respect to adults and
adolescents, due to the indirectness, there was no high quality evidence comparing DTG to EFV400.
There was moderate evidence of DTG leading to less discontinuations and having better long-term viral
suppression.

20
The results of the systematic literature review failed to identify a wealth of evidence for the treatment
of patients with HIV-TB co-infection. However, an interim analysis from the ongoing INSPIRING trial was
identified from the CROI 2018 conference. INSPIRING (NCT02178592) is a Phase III, open-label
randomized controlled trial enrolling HIV-TB co-infected adult patients for treatment with twice-daily
DTG 50 mg or once-daily EFV 600 mg. It included 113 patients and only the 24 week interim analysis
results were available. The evidence base consisted of 1378 patients enrolled in 13 treatment arms
across 6 RCTs. The evidence was limited to 5 treatments: NVP, DTG, EFV, and RAL (400 mg; 800 mg). No
evidence was identified for patients treated with EFV400.
There was no statistically significant difference between DTG and EFV (OR: 0.54; 95% CrI: 0.19, 1.57) or
between RAL400 and RAL800; however, the estimate suggests lower odds of suppression (in accordance
with the FDA Snapshot algorithm). This difference appears to be driven by the larger number of
discontinuations among the DTG arm of the INSPIRING trial. DTG appeared to lead to larger increases in
CD4 (mean difference: 52.52 cells/mm3; 95% CrI: 14.93, 89.61). Outside of the moderate quality
evidence supporting DTG relative to EFV with respect to change in CD4 cell counts, the evidence was of
low to very low quality based on very small event counts and short follow-up.
Two studies were identified with respect to pregnant and breastfeeding women: the DolPHIN 1 trial and
the Tsepamo study. The Tsepamo study was a large cohort study of 1,729 pregnant women initiating
DTG/TDF/XTC and 4,593 women initiating EFV/TDF/XTC in Botswana. The proportion of pregnancies
with any adverse birth outcome was similar across treatment arms with 33.2% of DTG-managed
pregnancies and 35.0% of EFV-managed pregnancies resulting in an adverse outcome. Similarly, severe
birth outcomes were reported in 10.7% of DTG-managed and 11.3% of EFV-managed pregnancies. For a
variety of safety outcomes, there was moderate quality evidence due to the risk of bias associated with
an observational study, though with respect to safety, a large cohort study such as this one is among the
most desirable studies to have.
Finally for children, there was a real lack of evidence with respect to DTG, which was only reported in a
single study among treatment experienced patients (i.e., not eligible). No comparative studies included
RAL. However, two RAL studies were identified in neonates and infants, which both concluded that RAL
was tolerable among infants. Given the lack of comparative evidence in the children and adolescent
subgroup, we reference the results of the adult and adolescent review and downgrade the quality of
evidence by one level for indirectness.

21
Discussion: The purpose of this study was to support the 2018 update to the consolidated guidelines on
the use of antiretrovirals for treating and preventing HIV with respect to the choice of first-line ART. The
two questions of interest were whether DTG and/or EFV400, each with an XTC + TDF backbone, should
be the preferred first-line ART regimen rather than their current designation of alternative first-line ART
regimen. This extensive systematic literature review and network meta-analysis to evaluate the
comparative efficacy and safety of these and other ART regimens drew strong conclusions about the
improved efficacy and tolerability of DTG relative to EFV. Moreover, the evidence synthesis supports the
use of DTG among sub-populations, which was not the case in 2015. Specifically, results of this study
suggest comparable safety among pregnant women initiating treatment and results were not
demonstrably worse among TB-HIV co-infected individuals. Unfortunately, evidence was lacking with
respect to first-line children. Overall, the evidence more strongly supports the choice of DTG as the
preferred first-line regimen.
Our study has numerous strengths and limitations. First, the use of NMA allowed for analytic
adjustments to account for differences in backbones and provide an unbiased estimate of the
comparison between DTG and EFV despite the critical trial having different backbones. Second, by
combining direct and indirect evidence, some of findings can be seen as having stronger evidence than
previously perceived when strong findings are supported by both sources of evidence. With respect to
limitations, first, the evidence for the comparisons of interest continued to be somewhat limited in sub-
populations. For EFV400, it was completely missing. Most notably for DTG, there was an absence of
evidence within children. This was also the case in people pre-exposed to ARVs, though that was
somewhat expected. Even in pregnancy and TB, much of the evidence is still to come. Second, some
significant outcomes were limited by a very low number of events, including mortality, regimen
substitutions, serious adverse events, and ADIs. This influenced the precision of our estimates with
respect to these outcomes and, in some cases, precluded the conduct of evidence synthesis through
NMA. Third, treatment-related adverse events were both inconsistently defined and inconsistently
reported. This limitation was mitigated by considering both treatment-related and treatment-emergent
adverse events. Additionally, studies of shorter duration are, by their nature, less likely to identify
adverse events than longer-term trials. Despite this, the evidence was collected through a rigorous
systematic review process in accordance with the practices and recommendations set forth by the
Cochrane Collaboration, including both broad and targeted searches of the literature, critical appraisal
of the identified studies, and consultation with subject matter experts.
22
Dolutegravir in combination with lamivudine/emtricitabine and tenofovir disoproxil fumarate is an
effective, safe and tolerable ART regimen. Across a variety of outcomes, evidence strongly suggests that
it is superior to the current efavirenz-based preferred first-line ART regimen. With a new affordable
generic fixed dose combination and comparable outcomes among sub-populations, the evidence
supports the choice of a dolutegravir based preferred first-line regimen. Conclusions regarding low-dose
efavirenz are unchanged since 2015. Low-dose efavirenz appears to be more tolerable, but with lack of
evidence in sub-populations it is likely best to be considered an alternative first-line regimen.
23
1. Introduction
The efficacy and safety of initial HIV antiretroviral therapy (ART) has important improved over the years
and more than 17 million people living with HIV (PLHIV) are currently receiving life-saving ART.1
Improvements in potency, tolerability, simplicity and availability of first-line ART have resulted in
increased life expectancy and quality of life for PLHIV, when treatments are accessed in a timely and
consistent manner. Hence, the selection of first-line ART has important public health and programmatic
implications. With the effectiveness and safety of regimens as key considerations, many ART
programmes, particularly in low- and middle-income settings, are influenced by the World Health
Organization (WHO) ART guidelines.2
Clinical guidelines are developed through multi-step processes that ensure that they are feasible within
the current clinical environment and that they are evidence based. A key step involves evidence
synthesis whereby all of the evidence is collected and analysed so as to provide an overview of the
therapeutic landscape. In 2015, the WHO conducted evidence synthesis to update the 2013
Consolidated guidelines on the use of antiretrovirals for treating and preventing HIV. At the time, the
hypothesis was that integrase inhibitor (INSTI) based regimens or low-dose efavirenz (EFV400) based
regimens would challenge preferred recommended first-line regimen. The 2013 guidelines
recommended, for adults and adolescents, a first-line ART consisting of two nucleos(t)ide reverse
transcriptase inhibitors (NRTIs) and a non-nucleoside reverse transcriptase inhibitor (NNRTI).3 In
particular, the combination of efavirenz, tenofovir disoproxil and lamivudine (or emtricitabine) [EFV +
TDF + XTC] was the preferred option as first-line therapy.3 Results of the 2015 systematic literature
review (SLR) and network meta-analysis (NMA) revealed improved tolerability and efficacy with INSTIs
and EFV400, with dolutegravir (DTG) having the highest estimated tolerability and safety.4
Despite this evidence, DTG and EFV400 were recommended as alternative first-line regimens rather
than the preferred treatment.5 This was due to uncertainty around sub-populations and an expensive
price rendering it difficult to recommend for low and middle income countries. With numerous changes,
including the availability of generic fixed dose combinations of DTG +TDF + XTC, the 2018 SLR and NMA
aimed to determine the efficacy and safety of DTG and EFV400 relative to EFV600. This report presents
the findings of an updated SLR and NMA that was commissioned to shed light on this very topic.

24
2. Objectives
The objective of this project is to compare the efficacy and safety of first-line ART regimens. Given the
knowledge accumulated through previous guidelines and knowledge of current literature results, this
project is centred on the following research question:
3. Should DTG be recommended as the preferred first-line antiretroviral agent in combination with
age-appropriate backbone (TDF + XTC for adults and adolescents) for the treatment of HIV?
4. Should EFV400 be preferred over EFV (standard-dose) for the first-line antiretroviral agent in
combination with age-appropriate backbone for the treatment of HIV?

25
3. Methodology
3.1. Systematic literature review
Table 1 describes the PICOS (population, interventions, comparator, outcomes, study design) criteria
used to guide the selection of studies that were included in this systematic literature review. Note that
both research questions are captured by this single PICOS.
Table 1: Scope of the literature review in PICOS form
Criteria Definition
Population Inclusion criteria:
Treatment-naïve adults and adolescents (12 years and above) living with
HIV
Subgroups of interest:
Children
Adolescents
Pregnant and breastfeeding women
TB co-infected patients
People with prior exposure to ARVs
Interventions DTG + 2NRTI
EFV400 + 2NRTI
Raltegravir (RAL) + 2NRTI
Elvitegravir boosted with cobicistat EVG/c + 2NRTI
Bictegravir (BIC) + 2 NRTI
Doravirine (DOR) + 2NRTI
Rilpivirine (RPV) + 2 NRTI
Nevirapine (NVP) + 2 NRTI
Darunavir boosted with ritonavir (DRV/r) + 2 NRTI
Atazanavir boosted with ritonavir (ATV/r) + 2 NRTI
Lopinavir boosted with ritonavir (LPV/r) + 2 NRTI
Comparator EFV600 + 2 NRTI
Outcomes Viral suppression at 48 and 96 weeks
Change from baseline CD4 at 48 and 96 weeks

26
Mortality
Retention
Discontinuations due to adverse events
Treatment emergent adverse events
Severe adverse events
Development of drug resistance
Study design Inclusion criteria:
Randomized controlled trials (RCTs)
Additionally, for subgroups:
Single-arm non-randomized controlled trials
Prospective and retrospective cohort studies
Case-control studies
Controlled and uncontrolled longitudinal studies (cohorts or case series)
Language Only studies published in English will be included
*Note: Except for DTG, EFV400 and EFV600 treatments are required to provide indirect evidence
The population listed above, treatment-naïve adults and adolescents, represents the principal analysis
for this evidence synthesis project. This systematic literature review includes reviews and analyses for a
variety of sub-populations: Adolescents and children; TB co-infected patients; Pregnant and
breastfeeding women; and people with prior exposure to ARVs. Although the principal inclusion criteria
described above was broad enough to capture these sub-populations, less restrictive criteria on study
design were required to obtain meaningful evidence on them. Thus, additional searches were conducted
for each sub-population, with the exception of adults and people with prior exposure to ARVs. Note that
no RCTs pertaining to or describing patients with prior exposure to ARVs were identified and hence no
evidence base exists within the identified parameters for this sub-population. No analyses were
conducted for this sub-population either.
Treatments were differentiated according to the specific drugs, doses, and frequencies of administration.
The only drugs that were considered interchangeable were lamivudine (3TC) and emtricitabine (FTC)
due to their molecular likeness, referred to here as XTC. Non-standard doses were not considered
reason for exclusion at the study selection process; however, non-standard doses that did not serve as
connectors (i.e. were not compared to two or more treatments of interest) were excluded in the final
27
selection stage (following full text selection). ART regimens with a single antiviral agent and those with
two agents that included one or more NRTI were not considered eligible. Similarly, with the exception of
boosted regimens, ART regimens with four or more agents were not eligible (e.g. NNRTI+PI+2NRTI).
Trials that had mixed backbones were included if the backbones were equally distributed across arms.
Trials where backbones were selected prior to randomization were considered eligible. Trials failing to
report on backbone distribution or reporting imbalanced backbone distributions were excluded. Further
details on how regimens were defined for analytical purposes are provided below (Section 3.2.3).
The eligibility criteria remained generally unchanged relative to the 2015 SLR; however, there were a
few additions with respect to interventions. Two new treatments, BIC and DOR, were added to the
network. The motivation for adding them is that they might provide additional indirect evidence to the
comparisons of interest and that there may be some secondary utility to understanding their efficacy
and safety relative to the treatments of interest. Additionally, the use of tenofovir alafenamide (TAF) as
a backbone was now permitted given that the evidence base for this treatment has grown substantially
since 2015.
3.1.1. Sources
A comprehensive systematic search of the literature was conducted on using the following databases:
Medical Literature Analysis and Retrieval System Online (MEDLINE), Excerpta Medica database
(EMBASE), and Cochrane Central Register of Controlled Trials (CENTRAL). The current systematic review
is an update on a review completed in May 2015 (Global Evaluative Sciences). Therefore, searches were
restricted from 01 January 2015 to the search date, 12 February 2018.
Further manual searches of the 2016, 2017 and 2018 Conference on Retroviruses and Opportunistic
Infections (CROI), the 2016 AIDS conference, and the 2017 International AIDS Society (IAS) conference
were conducted. Conference abstracts identified through the EMBASE search were eligible for inclusion.
Additional studies were identified through a review of clinical trial registries and the reference lists of
identified publications.
3.1.2. Search strategy
The general search strategy involved identifying papers according to the population of interest, and the
inclusion of interventions and comparators of interest, and the restriction to randomized controlled
trials. Population was identified as having HIV or AIDS and not being treatment experienced or failing

28
treatment. Our search further restricted on publication types that were not of interest (i.e., newsletters
and reviews). The specific search strategy is presented in Appendix A. The additional search strategies
for each subpopulation are presented in Appendix B.
3.1.3. Study selection
Two investigators, working independently, scanned all abstracts and proceedings identified in the
literature search. The same two investigators independently reviewed abstracts and proceedings
potentially relevant in full-text. If any discrepancies occurred between the studies selected by the two
investigators, a third investigator provided arbitration. Full-text screening was conducted for each
specific question.
3.1.4. Study quality
The validity of individual randomized controlled trials was assessed using the Risk of Bias instrument,
endorsed by the Cochrane Collaboration.6 This instrument is used to evaluate 7 key domains: sequence
generation; allocation concealment; blinding of participants and personnel; blinding of outcome
assessors; incomplete outcome data; selective outcome reporting; and other sources of bias.
The validity of non-randomized studies, including single-arm trials, cohort studies, and observational
study studies, were evaluated using the Tool to Assess the Risk of Bias in Cohort Studies, developed by
the Clinical Advances through Research and Information Translation (CLARITY) group at McMaster
University. This 8-item instrument is used to evaluate various aspects of the research design and study
execution, including selection of patients, differences in patient characteristics, and the assessment of
outcomes.
We employed the Grading of Recommendations Assessment, Development and Evaluation (GRADE)
system for rating overall quality of evidence.7-12 Most recently, GRADE has issued guidance on network
meta-analysis.13 We applied GRADE in the following manner. First, the GRADE system was applied to the
direct evidence as is done with pairwise meta-analyses. If only indirect evidence existed, we used the
NMA estimate and evaluated the shortest indirect pathway with the largest number of trials. As neither
of these combined direct and indirect evidence, we referred to this stage as the assessment of
uncombined evidence. Specifically, for each outcome, the rating began as high-quality evidence and
were potentially rated down by one or more of five categories of limitations: (1) risk of bias, (2)
consistency, (3) directness, (4) imprecision, and (5) reporting bias. The second stage involved rating the
combined evidence, which is the NMA evidence for comparisons assessed according to pairwise meta-
29
analyses in the first stage. In this stage, we began with the score from the first stage. We rated down if
the comparison was within a loop in which there was evidence on inconsistency (i.e. lack of transitivity)
or if the estimate became imprecise. Alternatively, we rated up if a direct estimate that was graded
down for imprecision in the first stage and became precise in the NMA. The quality of evidence for each
main outcome can be determined after considering each of these elements, and categorized as either
high (We are very confident that the true effect lies close to that of the estimate of the effect),
moderate (We are moderately confident in the effect estimate: The true effect is likely to be close to the
estimate of the effect, but there is a possibility that it is substantially different), low (Our confidence in
the effect estimate is limited: The true effect may be substantially different from the estimate of the
effect ), or very low (We have very little confidence in the effect estimate: The true effect is likely to be
substantially different from the estimate of effect).14
3.1.5. Data extraction
Two investigators, working independently, extracted data on study characteristics, interventions, patient
characteristics at baseline, and outcomes for the study populations of interest for the final list of
selected eligible studies. Any discrepancies observed between the data extracted by the two data
extractors were resolved by involving a third reviewer and coming to a consensus. Data is provided in a
Microsoft Excel Workbook with sheets corresponding to the different information categories.
For each continuous outcome, the change from baseline at the end of the randomized phase was
extracted, along with the corresponding sample size, standard deviation (SD) for mean change from
baseline and measures of uncertainty (i.e. standard error (SE), 95% confidence intervals (CI), and p-value)
for all relevant intervention groups.
If the change from baseline was not provided, we extracted the score at the follow-up time point of
interest and the baseline score, and calculated the change in such cases, the standard error of change
was estimated by combining the standard errors at both time points and using an outcome specific
correlation coefficient (ρ) in the following equation:
𝑆𝐸(𝜃) = √𝑉𝑎𝑟(𝑌1) + 𝑉𝑎𝑟(𝑌2) − 2𝑆𝐷1𝑆𝐷2𝜌 /√𝑛
The outcome specific correlation can be obtained by first deriving the correlation from studies that
reported both change and measurements at the both time points. Given that this was not available for
30
the outcomes of interest, we used the conservative measure of 0.5. In cases where interquartile ranges
(IQR) were provided, the length of the IQR was divided by 1.35 to estimate standard deviation.
If the SE was not reported, it was calculated according to the following hierarchy: based on the reported
95% CI by intervention group; SD by intervention group along with sample size; 95% CI of the difference
between intervention groups; p-values by intervention groups; p-values for the difference between
intervention groups. In cases where standard deviations were not provided, the average standard
deviation among reported studies was used. Measures of dispersion were imputed for trials in which
dispersion measures were not reported. Mean standard deviation was used for imputation and standard
errors were derived from these.
3.2. Analyses
In this section, we describe the methods used to conduct the statistical analyses.
3.2.1. Network meta-analyses
When sufficient data were available for quantitative evidence synthesis, a conventional pairwise meta-
analysis was employed as a first step. When multiple treatments were available within the evidence
base, we employed network meta-analyses (NMA). All NMAs were conducted within the Baian
framework using Baian hierarchical models. Under the assumption of consistency, the NMA model
relates the data from the individual studies to basic parameters reflecting the (pooled) relative
treatment effect and safety profiles between interventions. Based on these parameters, the relative
treatment effects between each of the contrasts in the network were obtained.
For each outcome and subgroup of interest, fixed or random-effects models were applied. Model
selection was conducted using the deviance information criterion (DIC) according to NICE conventions.15
The DIC provides a measure of model fit that penalizes for model complexity. Through the use of the DIC,
the fixed effects models were often favoured. Model fit was also assessed using leverage plots and any
outliers identified in this fashion were investigated further. The model with the best fit was chosen as
the primary analysis model. In situations with very limited and sparse data, a narrative review was used
as an alternative to quantitative analysis. The latter were restricted to the sub-population analyses.
3.2.2. Evaluation of consistency between direct and indirect comparisons
Prior to the NMA, the consistency between direct and indirect comparisons was evaluated for networks
that consisted of closed loops. For each of the comparisons (i.e. contrasts) that were part of a closed
31
loop made up of more than 1 RCT, we split the available trials into direct and indirect information. For
each contrast in question, two (pooled) relative treatment effect estimates were obtained, one with
independent-means (or independent-effects) models using only the trials providing direct comparisons,
and one based on an NMA of the remaining trials providing only indirect evidence. This iterative
technique is called edge-splitting.16 The difference in estimates generated by the two sets of evidence
was evaluated with the Bucher test for inconsistency.17
3.2.3. Node definitions and backbone adjustments
Given that the research questions for this project concern third agent antivirals (i.e., non-backbone
antivirals); we chose to define the nodes in terms of specific antivirals rather than specific ART regimens.
All treatments with multiple standard doses or frequency of administration were not differentiated on
this basis. For example, nevirapine 200 mg twice daily (bid) was considered equivalent to nevirapine 400
mg once daily (qd). The only treatment with multiple doses that were distinguished in the analysis was
efavirenz (600 mg qd) and low dose efavirenz (400 mg qd). Defining nodes according to a single ARV
rather than the full regimen importantly simplified the interpretation of modelling and results.
Nonetheless it is important to account for differences in backbone therapies. RCTs that use the same
backbone in all trial arms do not require any adjustment in terms of backbones; however, RCTs
employing different backbones require adjustments in order to properly measure the effect attributable
to the antiviral agent comparison being estimated. Two approaches were used to address differences in
backbone regimens. First, backbone regimens were categorized as TDF + XTC (the reference category),
TAF + XTC, abacavir (ABC) + XTC, zidovudine (AZT) + XTC, and as other. The other category included
treatments such as stavudine (d4T) and didanosine (ddI) as well as the agents contained in the previous
categories. We used arm-specific meta-regression to adjust estimates according to differences in
backbones according to these categories. The alternative approach was to simply reduce the evidence
base to trials that did not differ with respect to backbones.
The most notable trial to differ in backbones was the SINGLE trial comparing EFV to DTG,18 which is
central to the research questions. Otherwise, trials that differed in backbones tended to be older or to
be endonodal. Endonodal trials are those that compare a node to itself. Indeed, some trials differing in
backbone only were included to improve the backbone meta-regression adjustments. Such trials,
comparing EFV to EFV, were only of interest in the analysis using meta-regression adjustments for

32
differences in backbones. The adjusted model served as the primary analysis; however, in outcomes
where differences in backbones were restricted to endonodal trials or a few older trials with dated
regimens, the restricted model was used instead.
3.2.4. Models
All outcomes were either binary or continuous. Viral suppression and CD4 outcomes were frequently
reported at multiple time points and were analysed separately for each of the three time points of
interest: 24 weeks, 48 weeks, and 96 weeks. The remaining outcomes tended to be reported at a single
time point, which varied and typically coincided with trial duration. During the feasibility assessment
stage, the relationship between follow-up time and outcomes was explored. The figures in Appendix C
consider trends in both proportions and odds ratios across time. The odds ratios are the more important
consideration given they represent the effect being modelled. In these figures odds ratios at multiple
time points within a single trial were connected to further help determine whether follow-up time is an
effect modifier to relative treatment effects. As can be seen in these figures, the odds ratios tend to be
stable over time or include an equal amount of downward and upward trends. On this basis, we
modelled the relative treatment effects on all remaining variables using the outcomes combined across
multiple time points. For studies reporting one of these outcomes at multiple time points, the values at
longest follow-up were used.
For binary outcomes (mortality, AIDS defining illnesses, viral suppression, loss to follow-up, serious
adverse events, and regimen substitutions) we used a logistic regression model with the logit link
function and a binomial likelihood. We chose to present results as odds ratios (OR) for these models so
as to avoid the ceiling effect that limits relative risks (RR) for outcomes with proportions around 0.8 to
0.95. To test for the presence of heterogeneity both the fixed-effects and random-effects models were
employed. For the random-effects model, the conventional non-informative prior, a uniform distribution
between 0 and 2, was applied to the between-trial standard deviation.15 For continuous outcomes
(increase in CD4 count) we used linear regression models with an identity link and normal likelihood.
The data was arm based, and we modelled the differences in change from baseline between all
informed treatment comparisons. Estimates of comparative efficacy were represented as mean
differences.
33
3.2.5. Adjusted analysis
Adjusted analyses came in two flavours. First, we conducted meta-regression adjustments to evaluate
whether differences in baseline CD4, baseline log transformed viral load, and proportion of males
impacted relative efficacy and safety estimated. Second, we conducted sensitivity analyses. For viral
suppression, we deemed the intention-to-treat (ITT) outcomes for our primary analysis and considered
the per-protocol outcomes as a sensitivity analysis. Additionally, multiple cut-off values were reported
for the definition of viral suppression. Newer trials tend to use a cut-off of <50 copies/mL, but some
trials used higher cut-off values, <200 and <400 copies/ml, due to limited sensitivity of older assays.
While the cut-off does affect the absolute count, we found no evidence to suggest that these alter
relative treatment effects. Thus, for the primary analysis, all trials were included regardless of cut-off
used, and as a sensitivity analysis only trials using the <50 copies/mL were included. In trials where
multiple cut-off values were reported, <50 copies/ml was favoured to <200 copies/ml, which was
favoured to <400 copies/ml.
3.2.6. Presentation of results
The primary output of the Baian NMA are posterior distributions of the relative treatment effects
between all interventions in the networks, e.g. odds ratios for discontinuation and mean change from
baseline in CD4 cell counts. The results for all outcomes are presented with NMA cross-tables as OR or
mean differences (MD). The posterior distributions of relative treatment effects and modelled outcomes
were summarized by the median and 95% credible intervals (CrIs), which were constructed from the
2.5th and 97.5th percentiles. As this project pertains to questions particular to three treatments, forest
plots are used to describe these in the main text and cross tables are provided in the Appendices for a
more in-depth look.
3.2.7. Software
The parameters of the different models were estimated using a Markov Chain Monte Carlo (MCMC)
method implemented in the JAGS software package. A first series of iterations from the JAGS sampler
were discarded as ‘burn-in’ and the inferences were based on additional iterations using two chains.
Convergence of the chains was confirmed by the Gelman-Rubin statistic. All analyses were performed
using R version 3.4.1 (http://www.r-project.org/) and JAGS version 4.3 (OpenBUGS Project Management
Group).
34
4. Adults and adolescents
4.1. Systematic literature review study selection
Following the PICOS outlined in Table 1 and employing the search strategies specified in Appendix A, a
total of 2815 citations were identified through database searches for the SLR update; of these 204 were
selected for full-text review. The flow diagram for study inclusion is presented Figure 1. Based on the
original review (May 2015) and the current update, 163 publications describing 90 trials were identified
and included in the systematic literature review.18-180 We note that these trials are restricted to those of
the primary analysis. Trials pertaining to subpopulations, such as TB, have been excluded from this study
selection. Further details on these sub-populations are provided in Sections 5, 6 and 7.
Of the 17 new trials added to the evidence base, 4 included DTG (ARIA, GS-US380-1489; GS-US-380-
1490, and SSAT066),34,55,124,148 3 included DOR (DRIVE AHEAD, DRIVE FORWARD, and 1439-007
Study),58,59,99,117 2 included BIC,55,148 and 3 were endonodal on EVG/c comparing TAF to TDF.24,147,149 With
respect to the DTG trials, ARIA compared DTG to ATV/r among a sample of women only; SSAT066
compared DTG to RAL and EVG/c; while the remaining two trials were comparisons to BIC. Standard
dose efavirenz continued to be central as it was included in 5 trials; however, there were no new trials
comparing EFV to DTG or to EFV400. Just as in 2015, ENCORE1 was the only trial that included EFV400,
pitting it against standard dose EFV. The NAMSAL trial (NCT02777229) is ongoing aiming to compare
EFV400 to DTG and results are expected later this year.
As such, despite the large number of trials in the evidence base as a whole, there are three key trials
that very much inform the comparisons of interest: SINGLE (DTG + ABC + XTC vs EFV + TDF + XTC),
SPRING-1 (DTG + 2 NRTIs vs EFV + 2 NRTIs) and ENCORE1 (DTG + TDF + XTC vs EFV + TDF +
XTC).18,21,22,64,159,166,170,171 These are the trials involved in the head to head comparisons of interest. They
were all multinational, double-blind, placebo-controlled randomized trials. SRING-1 was a Phase II trial,
while the others were Phase III trials. Spring-1 randomized 205 patients, SINGLE randomized 833
patients and ENCORE1 randomized 636 patients. Writing in The Lancet Infectious Diseases, the
ENCORE1 study investigators concluded that EFV400 was non-inferior to EFV over 96 weeks with fewer
treatment-related adverse events and supported the use of EFV400 in routine care. While positive
conclusions were also drawn for the SINGLE trial, there was confounding due to the difference in
backbones. This is why the adjustments for differences in backbones were critical to this evidence
synthesis.

35
We note that no evidence was available to describe the use of EFV400 in any of the sub-populations and
as such only the comparison of DTG vs EFV was considered in the sub-populations.
The full list of included trials, including the studies included in the various sub-population reviews, is
provided in Appendix D.

Figure 1: Flow diagram for principal systematic literature review on adults and adolescents
4.2. Analysis set study selection
Feasibility, applicability, and relevance considerations led to the removal of several studies or study
arms from the analysis set. Following our 2015 analysis, it became clear that older treatments that are
no longer used in most settings had very little connectivity to the network and therefore provided
negligible additional information regarding the research questions. In fact, at times they displayed
evidence of loop inconsistency (disagreement between direct and indirect evidence). As such, we chose
to remove studies of indinavir, fosamprenavir, unboosted atazanavir, saquinavir, nelfinavir, and triple
NRTIs from the analysis set. To be clear, these were included in the SLR, but were removed from the
analysis set. Five trials were excluded for having a RAL backbone, which could not be handled in the
model. From the review update, GS-US-141-1475 and GS-US-299-0102 were excluded: GS-US-141-1475
used a non-FDA approved dose of BIC; and GS-US-299-0102 was an endonodal trial that did not connect
to the overall network (Cobicistat boosted DRV). Figure 2 presents the analysis set represented as a
network diagram.

38
Figure 2: Network of all studies included in the principal analysis
Legend: Circles (nodes) in the diagrams represent individual treatments, lines between circles represent
availability of head-to-head evidence between two treatments, and the numbers on the lines are the
number of RCTs informing each head-to-head comparison. Blue: NNRTIs; Green: Protease inhibitors;
Orange: Integrase inhibitors.
The network was well-connected, with EFV serving as the most well-connected node. Overall, the
principal analysis set of studies included 65 trials in which 33,148 patients were randomized to 151
treatment arms (12 treatments). A single study compared EFV to EFV400, with no indirect evidence
identified. A combination of direct and indirect evidence was available for all other treatment
comparisons except BIC and RPV. We kept both so as to have comparisons of these with the remainder
of the therapeutic landscape, but their inclusion provided no additional information to the comparisons
of interest.
Summaries of trial characteristics, patient characteristics, and critical appraisal quality assessments are
presented in Appendices E, F, and G, respectively. With respect to trial characteristics, trials ranged from
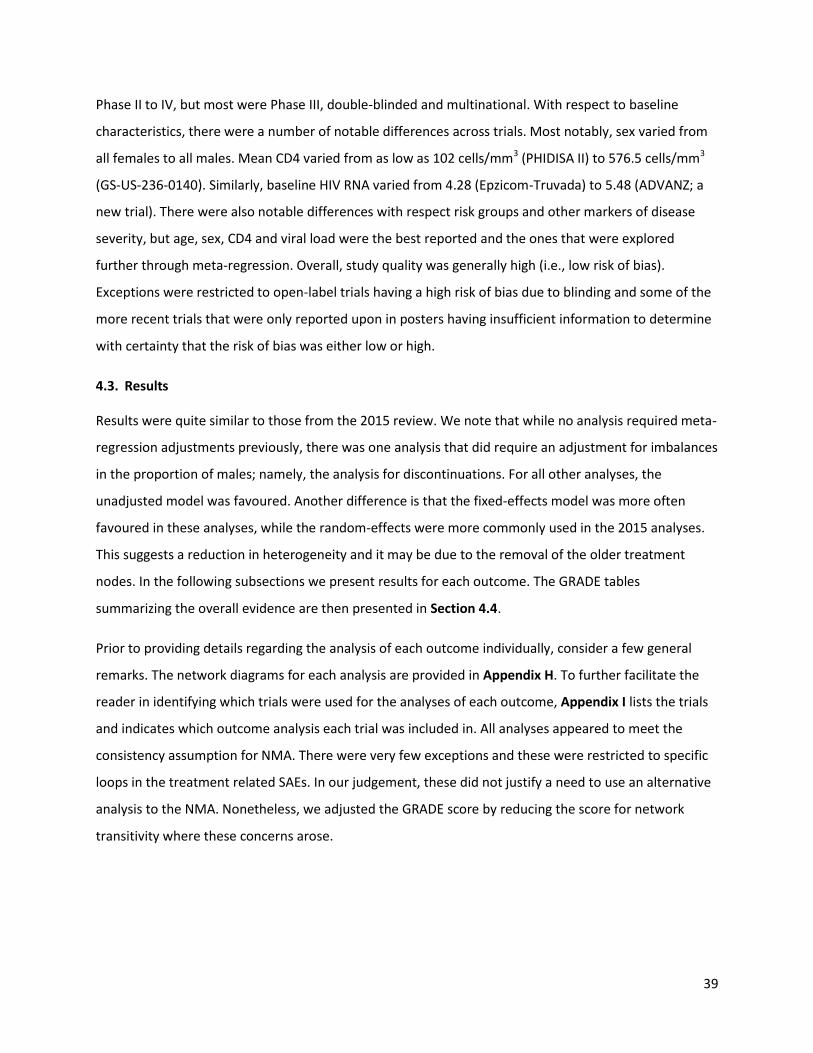
39
Phase II to IV, but most were Phase III, double-blinded and multinational. With respect to baseline
characteristics, there were a number of notable differences across trials. Most notably, sex varied from
all females to all males. Mean CD4 varied from as low as 102 cells/mm3 (PHIDISA II) to 576.5 cells/mm3
(GS-US-236-0140). Similarly, baseline HIV RNA varied from 4.28 (Epzicom-Truvada) to 5.48 (ADVANZ; a
new trial). There were also notable differences with respect risk groups and other markers of disease
severity, but age, sex, CD4 and viral load were the best reported and the ones that were explored
further through meta-regression. Overall, study quality was generally high (i.e., low risk of bias).
Exceptions were restricted to open-label trials having a high risk of bias due to blinding and some of the
more recent trials that were only reported upon in posters having insufficient information to determine
with certainty that the risk of bias was either low or high.
4.3. Results
Results were quite similar to those from the 2015 review. We note that while no analysis required meta-
regression adjustments previously, there was one analysis that did require an adjustment for imbalances
in the proportion of males; namely, the analysis for discontinuations. For all other analyses, the
unadjusted model was favoured. Another difference is that the fixed-effects model was more often
favoured in these analyses, while the random-effects were more commonly used in the 2015 analyses.
This suggests a reduction in heterogeneity and it may be due to the removal of the older treatment
nodes. In the following subsections we present results for each outcome. The GRADE tables
summarizing the overall evidence are then presented in Section 4.4.
Prior to providing details regarding the analysis of each outcome individually, consider a few general
remarks. The network diagrams for each analysis are provided in Appendix H. To further facilitate the
reader in identifying which trials were used for the analyses of each outcome, Appendix I lists the trials
and indicates which outcome analysis each trial was included in. All analyses appeared to meet the
consistency assumption for NMA. There were very few exceptions and these were restricted to specific
loops in the treatment related SAEs. In our judgement, these did not justify a need to use an alternative
analysis to the NMA. Nonetheless, we adjusted the GRADE score by reducing the score for network
transitivity where these concerns arose.

40
4.3.1. Viral suppression
Viral suppression was among the best reported outcomes. The definition of viral suppression was a
composite of the various thresholds reported in the included studies (i.e. <20-50 copies/mL; <200
copies/mL; <400 copies/mL). The <50 mL threshold was favoured and was by far the most commonly
reported threshold. Sensitivity analyses restricting the evidence base to only trials using the <50 mL
threshold yielded similar results, thus supporting the composite approach (results not shown).
Additionally, many trials used the Food and Drug Administration Snapshot algorithm, whereby
discontinuations are considered failures. This approach was used throughout the evidence base, even in
trials that did not explicitly use this approach. A consequence of this approach is that differences in viral
load suppression can either be driven by differences in efficacy (i.e., improved ability of the drug to
suppress the virus) or differences in tolerability (i.e., an increased propensity to stay on the drug) or
both. As such, while we consider viral suppression an efficacy outcome, in actuality it is difficult to
disaggregate efficacy from tolerability and this should be kept in mind while interpreting the results. The
reported analyses are restricted to intention to treat (ITT) results, but per-protocol results were also
analysed (results not shown). The per-protocol results did not resolve the issue around determining
whether differences are due to efficacy or tolerability. We note that Walmsley et al note that a large
difference between DTG and EFV in the SINGLE trial was due to tolerability. The networks used for
analysis at the 48, 96, and 144-week timepoints are presented in Error! Reference source not found. in
Appendix H. Notably, evidence on EFV400 was only available at the 46 and 96- week time points.
For the analysis of viral suppression at 48 weeks, evidence was derived from 53 trials of 115 treatments
arms including 26,410 patients. The results of the fixed-effects NMA for the comparisons of interest are
presented in Figure 3, below, and all comparisons in Error! Reference source not found. of Appendix J.
Based on the available evidence, DTG was statistically significantly more effective than standard dose
EFV in achieving viral suppression at 48 weeks (OR: 1.86; 95% CrI: 1.44, 2.40). In fact, it was statistically
superior to all other treatments except EFV400 (OR 1.61, 95% CrI 0.97, 2.70) against which it was
marginally significantly better. The comparison between DTG and EFV400 was based only on indirect
evidence. EFV400 was not statistically distinguishable from standard dose EFV.
For the analysis of viral suppression at 96 weeks, evidence was derived from 28 trials of 63 treatments
arms including 16,495 patients. The results of the fixed-effects NMA for the comparisons of interest are
also presented in Figure 3, below, and all comparisons in Error! Reference source not found. of
Appendix J. Treatment was DTG was associated with a higher proportion of patients achieving viral

41
suppression compared to all other treatments, though the comparison to RPV was not statistically
significant (OR 1.44, 95% CrI 0.98, 2.10). At this time point, treatment with DTG was associated with a
statistically significantly higher proportion of patient achieving viral suppression compared to EFV400
(OR 2.00, 95% CrI 1.20, 3.37). Similarly to at 48 weeks, EFV400 was not statistically distinguishable from
standard dose EFV.
The analysis of viral suppression at 144 weeks was based on evidence from 6 trials of 13 treatment arms
enrolling 5,274 patients. Given that EFV400 was not available at this time point, results of the fixed-
effects NMA for viral suppression at 144 weeks are only presented in Error! Reference source not found.
of Appendix J. DTG continued to demonstrate superior viral suppression, although only half the
comparisons were statistically significant. This was likely due to the smaller number of trials and patients.
Nonetheless, among the significant comparisons was that against EFV (OR: 1.44; 95% CrI: 1.08, 1.94).
Figure 3: Forest plot of select ARVs comparisons with respect to viral suppression at A. 48 weeks and
B. 96 weeks according to fixed-effects network meta-analysis
4.3.2. Increase in CD4 cell counts
The network of evidence for change in CD4 cell count at 48 weeks is based on 44 trials comprising 94
treatment arms including 23,789 patients. The results of the fixed-effects NMA for the comparisons of
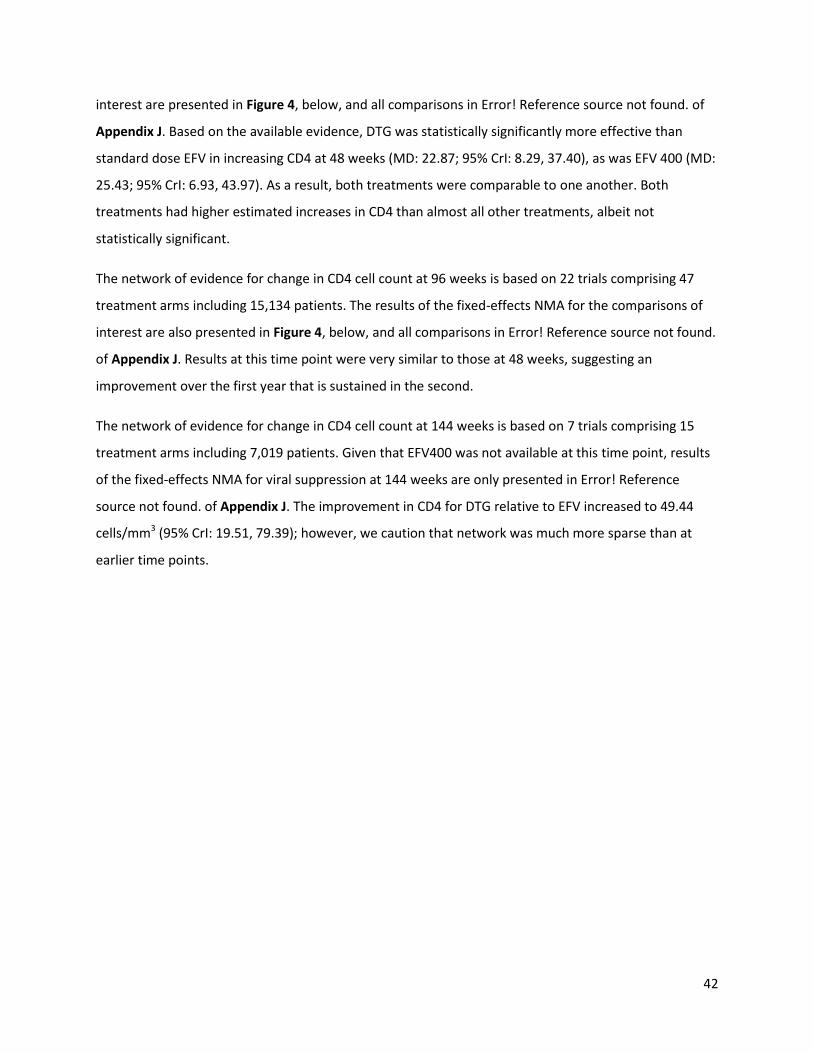
42
interest are presented in Figure 4, below, and all comparisons in Error! Reference source not found. of
Appendix J. Based on the available evidence, DTG was statistically significantly more effective than
standard dose EFV in increasing CD4 at 48 weeks (MD: 22.87; 95% CrI: 8.29, 37.40), as was EFV 400 (MD:
25.43; 95% CrI: 6.93, 43.97). As a result, both treatments were comparable to one another. Both
treatments had higher estimated increases in CD4 than almost all other treatments, albeit not
statistically significant.
The network of evidence for change in CD4 cell count at 96 weeks is based on 22 trials comprising 47
treatment arms including 15,134 patients. The results of the fixed-effects NMA for the comparisons of
interest are also presented in Figure 4, below, and all comparisons in Error! Reference source not found.
of Appendix J. Results at this time point were very similar to those at 48 weeks, suggesting an
improvement over the first year that is sustained in the second.
The network of evidence for change in CD4 cell count at 144 weeks is based on 7 trials comprising 15
treatment arms including 7,019 patients. Given that EFV400 was not available at this time point, results
of the fixed-effects NMA for viral suppression at 144 weeks are only presented in Error! Reference
source not found. of Appendix J. The improvement in CD4 for DTG relative to EFV increased to 49.44
cells/mm3 (95% CrI: 19.51, 79.39); however, we caution that network was much more sparse than at
earlier time points.

43
Figure 4: Forest plot of select ARVs comparisons with respect to mean change in CD4 cell counts at A.
48 weeks and B. 96 weeks according to fixed-effects network meta-analysis
4.3.3. Mortality
The evidence base for mortality in first-line treatment consisted of 21,604 patients enrolled in 29 trials
consisting of 62 treatment arms. The network of evidence is presented in Error! Reference source not
found. of Appendix H. Although mortality was considered a very important outcome by the guideline
development group, the trials were underpowered for this outcome. Mortality across trials was low,
with the exception of PHIDISA II which compared EFV (106/872, 12.2%) to LPV/r (102/873, 11.7%). In all,
there were 391 deaths in the evidence base, but many comparisons with 0 events can render estimates
unreliable. Consider that there were only 5 deaths in each of DTG and EFV400 in the evidence base As a
result
Given the small number of events, there are limitations to synthesizing the evidence through an NMA
which may produce wide credible intervals. However, select comparisons are presented in Error!
Reference source not found.. There was no statistically significant difference between mortality
outcomes in patients treated with DTG, EFV, and EFV400.

44
Figure 5: Forest plot of select ARVs comparisons with respect to mortality according to fixed-effects
network meta-analysis
4.3.4. AIDS defining illnesses
The evidence base for AIDS defining illnesses in first-line treatment consisted of 9,722 patients enrolled
in 18 trials consisting of 40 treatment arms. The network of evidence is presented in Error! Reference
source not found. of Appendix H. Similar issues to those seen in mortality were present in the ADI
analysis. For example, 12.3% (14/144) of patients enrolled in the EFV arm of the Altair trial reported
ADIs while no patients (0%) reported ADIs in the EFV arm of GS-US-236-0102 (0/352), SPRING-1 (0/50),
and Protocol 004 (0/38) trials. Few ADIs were reported for patients treated with DTG (SPRING-1, 2/51,
3.9%) and for patients treated with EFV400 (ENCORE1, 14/321, 4.4%). Given the small number of events,
there are limitations to synthesizing the evidence through an NMA which may produce wide and non-
meaningful CrIs. However, select comparisons are presented in Error! Reference source not found..
There was no statistically significant difference between mortality outcomes in patients treated with
DTG, EFV, and EFV400.
Figure 6: Forest plot of select ARVs comparisons with respect to the proportion of patients developing
AIDS defining illnesses according to fixed-effects network meta-analysis
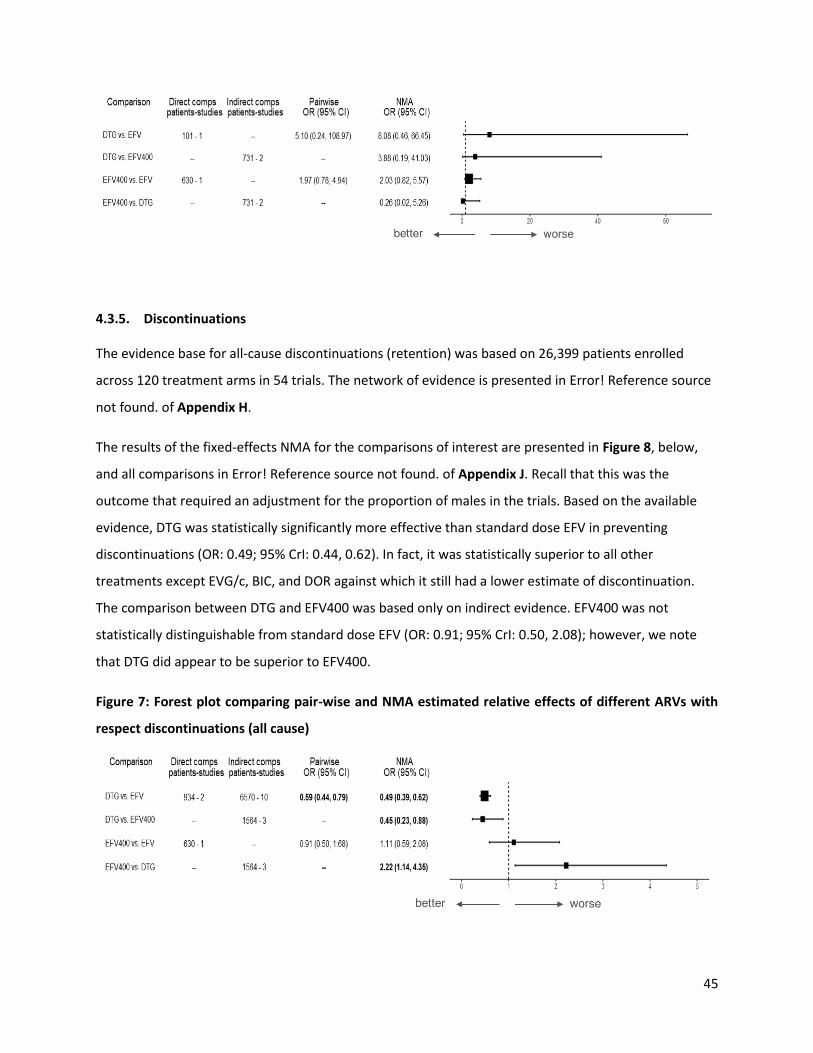
45
4.3.5. Discontinuations
The evidence base for all-cause discontinuations (retention) was based on 26,399 patients enrolled
across 120 treatment arms in 54 trials. The network of evidence is presented in Error! Reference source
not found. of Appendix H.
The results of the fixed-effects NMA for the comparisons of interest are presented in Figure 8, below,
and all comparisons in Error! Reference source not found. of Appendix J. Recall that this was the
outcome that required an adjustment for the proportion of males in the trials. Based on the available
evidence, DTG was statistically significantly more effective than standard dose EFV in preventing
discontinuations (OR: 0.49; 95% CrI: 0.44, 0.62). In fact, it was statistically superior to all other
treatments except EVG/c, BIC, and DOR against which it still had a lower estimate of discontinuation.
The comparison between DTG and EFV400 was based only on indirect evidence. EFV400 was not
statistically distinguishable from standard dose EFV (OR: 0.91; 95% CrI: 0.50, 2.08); however, we note
that DTG did appear to be superior to EFV400.
Figure 7: Forest plot comparing pair-wise and NMA estimated relative effects of different ARVs with
respect discontinuations (all cause)
46
4.3.6. Discontinuations due to adverse events
The evidence base for discontinuations due to adverse events was based on 54 trials of 26,165 patients
enrolled in 118 treatment arms. The network of evidence is presented in Error! Reference source not
found. of Appendix H.
Figure 8: Forest plot comparing pair-wise and NMA estimated relative effects of select ARVs with
respect discontinuations due to adverse events
The results of the fixed-effects NMA for the comparisons of interest are presented in Figure 9, below,
and all comparisons in Error! Reference source not found. of Appendix J. It is for this outcome that both
DTG and EFV400 shine, with both having the lowest odds of discontinuation due to adverse events and
both being superior to standard dose EFV. This time EFV400 and DTG were not statistically differentiable.
4.3.7. Treatment-related and emergent adverse events
The evidence for treatment-related adverse events included 15,599 patients enrolled in 61 treatment
arms across 27 trials and that for emergent adverse events included 18,915 patients in 70 treatment
arms across 32 trials. The results of the fixed-effects NMAs are presented in Error! Reference source not
found. and Error! Reference source not found.. Key comparisons are presented in Figure 9. While none
of the treatments were distinguishable with respect to treatment emergent AEs, both DTG and EFV400
had lower odds of leading to a treatment-related AE. Moreover, DTG had lower odds than EFV400.
Overall, BIC had the lowest odds of treatment-related AEs, followed by DOR, DRV/r and then DTG.
Treatments were generally less distinguishable with respect to emergent AEs.

47
Figure 9: Forest plot of select ARVs comparisons with respect to A. treatment related adverse events
and B. treatment emergent adverse events according to fixed-effects and random-effects network
meta-analysis
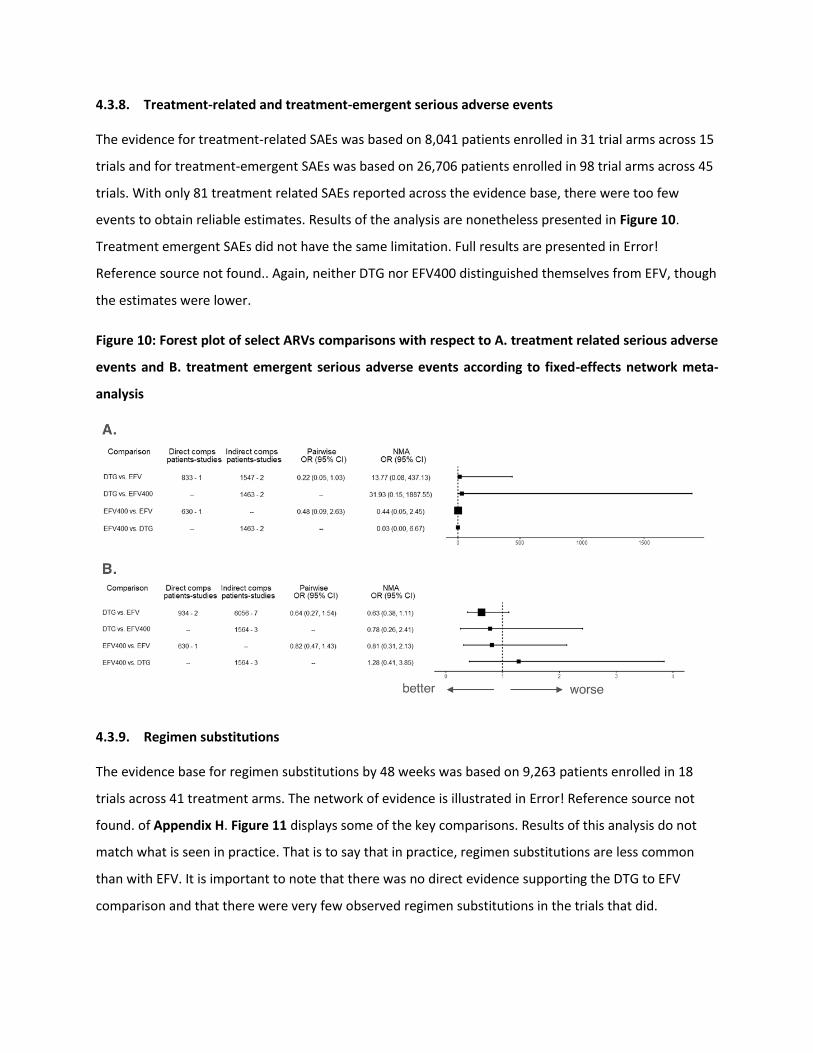
4.3.8. Treatment-related and treatment-emergent serious adverse events
The evidence for treatment-related SAEs was based on 8,041 patients enrolled in 31 trial arms across 15
trials and for treatment-emergent SAEs was based on 26,706 patients enrolled in 98 trial arms across 45
trials. With only 81 treatment related SAEs reported across the evidence base, there were too few
events to obtain reliable estimates. Results of the analysis are nonetheless presented in Figure 10.
Treatment emergent SAEs did not have the same limitation. Full results are presented in Error!
Reference source not found.. Again, neither DTG nor EFV400 distinguished themselves from EFV, though
the estimates were lower.
Figure 10: Forest plot of select ARVs comparisons with respect to A. treatment related serious adverse
events and B. treatment emergent serious adverse events according to fixed-effects network meta-
analysis
4.3.9. Regimen substitutions
The evidence base for regimen substitutions by 48 weeks was based on 9,263 patients enrolled in 18
trials across 41 treatment arms. The network of evidence is illustrated in Error! Reference source not
found. of Appendix H. Figure 11 displays some of the key comparisons. Results of this analysis do not
match what is seen in practice. That is to say that in practice, regimen substitutions are less common
than with EFV. It is important to note that there was no direct evidence supporting the DTG to EFV
comparison and that there were very few observed regimen substitutions in the trials that did.
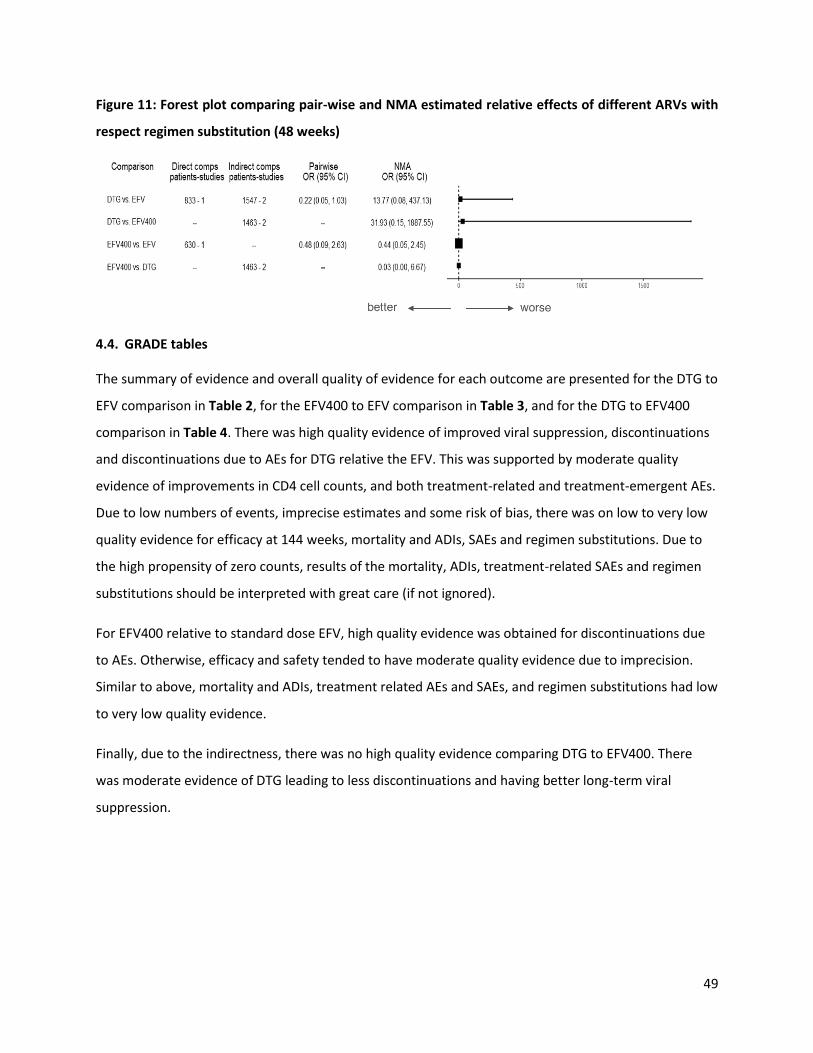
49
Figure 11: Forest plot comparing pair-wise and NMA estimated relative effects of different ARVs with
respect regimen substitution (48 weeks)
4.4. GRADE tables
The summary of evidence and overall quality of evidence for each outcome are presented for the DTG to
EFV comparison in Table 2, for the EFV400 to EFV comparison in Table 3, and for the DTG to EFV400
comparison in Table 4. There was high quality evidence of improved viral suppression, discontinuations
and discontinuations due to AEs for DTG relative the EFV. This was supported by moderate quality
evidence of improvements in CD4 cell counts, and both treatment-related and treatment-emergent AEs.
Due to low numbers of events, imprecise estimates and some risk of bias, there was on low to very low
quality evidence for efficacy at 144 weeks, mortality and ADIs, SAEs and regimen substitutions. Due to
the high propensity of zero counts, results of the mortality, ADIs, treatment-related SAEs and regimen
substitutions should be interpreted with great care (if not ignored).
For EFV400 relative to standard dose EFV, high quality evidence was obtained for discontinuations due
to AEs. Otherwise, efficacy and safety tended to have moderate quality evidence due to imprecision.
Similar to above, mortality and ADIs, treatment related AEs and SAEs, and regimen substitutions had low
to very low quality evidence.
Finally, due to the indirectness, there was no high quality evidence comparing DTG to EFV400. There
was moderate evidence of DTG leading to less discontinuations and having better long-term viral
suppression.

Table 2: Summary of the GRADE quality of evidence assessments for all outcomes for the DTG vs EFV comparison
Outcome Direct Effect
Uncombined Estimates Combined Estimates
Risk of
Bias
Incons
istenc
y
Indirec
tness
Impre
cision
Public
ation
Bias
Quality
of direct
evidenc
e
Odds ratio
(95% CrI)
Absolute
effects
Indirect
evidenc
e
precisio
n
Networ
k
Transiti
vity
Overall
quality
of
evidenc
e
Viral supp. at
48 weeks
1.79
(1.25, 2.58)
0 0 0 0 0
High
1.86
(1.44, 2.40)
74 per
1,000
(47 to 98)
0 0
High
Viral supp. at
96 weeks
1.65
(1.21, 2.24)
0 0 0 0 0
High
1.93
(1.52, 2.47)
94 per
1,000
(63 to 121)
0 0
High
Viral supp. at
144 weeks
1.44
(1.08, 1.92)
-1 0 0 -1 0
Low
1.44
(1.08, 1.92)
39 per
1,000
(-11 to 83)
0 0
Low
Change in
CD4 at 48
weeks
58.76
(36.80,
80.71)
0 0 0 0 0
High
-- 24.27
cells/ml
(5.89,
43.18)
0 -1
Modera
te
Change in
CD4 at 96
41.76
(13.83,
0 0 0 0 0
High
-- 25.94
cells/ml
-1 0
Modera

51
Outcome Direct Effect
Uncombined Estimates Combined Estimates
Risk of
Bias
Incons
istenc
y
Indirec
tness
Impre
cision
Public
ation
Bias
Quality
of direct
evidenc
e
Odds ratio
(95% CrI)
Absolute
effects
Indirect
evidenc
e
precisio
n
Networ
k
Transiti
vity
Overall
quality
of
evidenc
e
weeks 69.69) (2.95,
48.74)
te
Change in
CD4 at 144
weeks
46.91
(16.70,
77.12)
-1 0 -1 0 0
Low
-- 49.63
cells/ml
(20.12,
79.58)
0 0
Low
Mortality
0.20
(0.01, 4.16)
0 0 0 -2 0
Low
0.64
(0.09, 4.87)
-4 per
1,000
(-12 to 9)
0 0
Low
AIDS defining
illness
5.10
(0.24,
108.97)
0 0 0 -2 0
Low
8.08
(0.46,
66.45)
127 per
1,000
(-13 to 550)
0 0
Low
Discontinuati
ons
0.59
(0.44, 0.79)
0 0 0 0 0
High
0.49
(0.39, 0.62)
-78 per
1,000
(-54 to -
101)
0 0
High
Discontinuati 0.26 0 0 0 0 0 0.30 -43 per 0 0
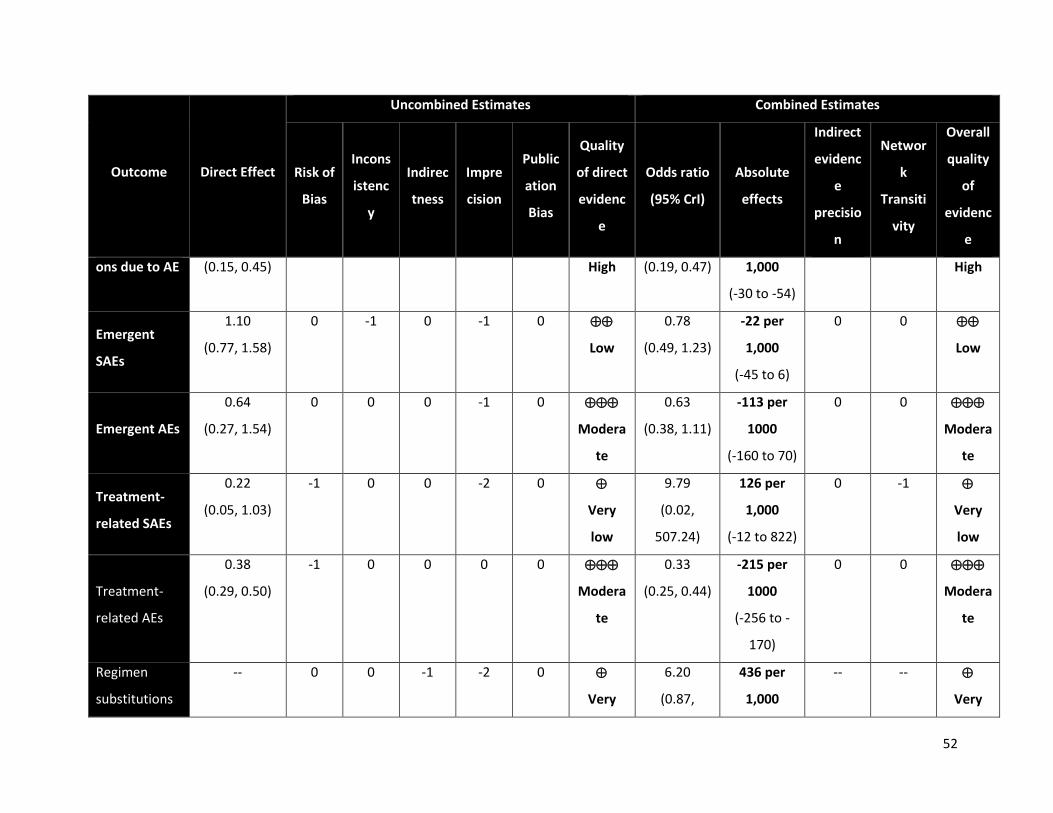
52
Outcome Direct Effect
Uncombined Estimates Combined Estimates
Risk of
Bias
Incons
istenc
y
Indirec
tness
Impre
cision
Public
ation
Bias
Quality
of direct
evidenc
e
Odds ratio
(95% CrI)
Absolute
effects
Indirect
evidenc
e
precisio
n
Networ
k
Transiti
vity
Overall
quality
of
evidenc
e
ons due to AE (0.15, 0.45) High (0.19, 0.47) 1,000
(-30 to -54)
High
Emergent
SAEs
1.10
(0.77, 1.58)
0 -1 0 -1 0
Low
0.78
(0.49, 1.23)
-22 per
1,000
(-45 to 6)
0 0
Low
Emergent AEs
0.64
(0.27, 1.54)
0 0 0 -1 0
Modera
te
0.63
(0.38, 1.11)
-113 per
1000
(-160 to 70)
0 0
Modera
te
Treatment-
related SAEs
0.22
(0.05, 1.03)
-1 0 0 -2 0
Very
low
9.79
(0.02,
507.24)
126 per
1,000
(-12 to 822)
0 -1
Very
low
Treatment-
related AEs
0.38
(0.29, 0.50)
-1 0 0 0 0
Modera
te
0.33
(0.25, 0.44)
-215 per
1000
(-256 to -
170)
0 0
Modera
te
Regimen
substitutions
-- 0 0 -1 -2 0
Very
6.20
(0.87,
436 per
1,000
-- --
Very
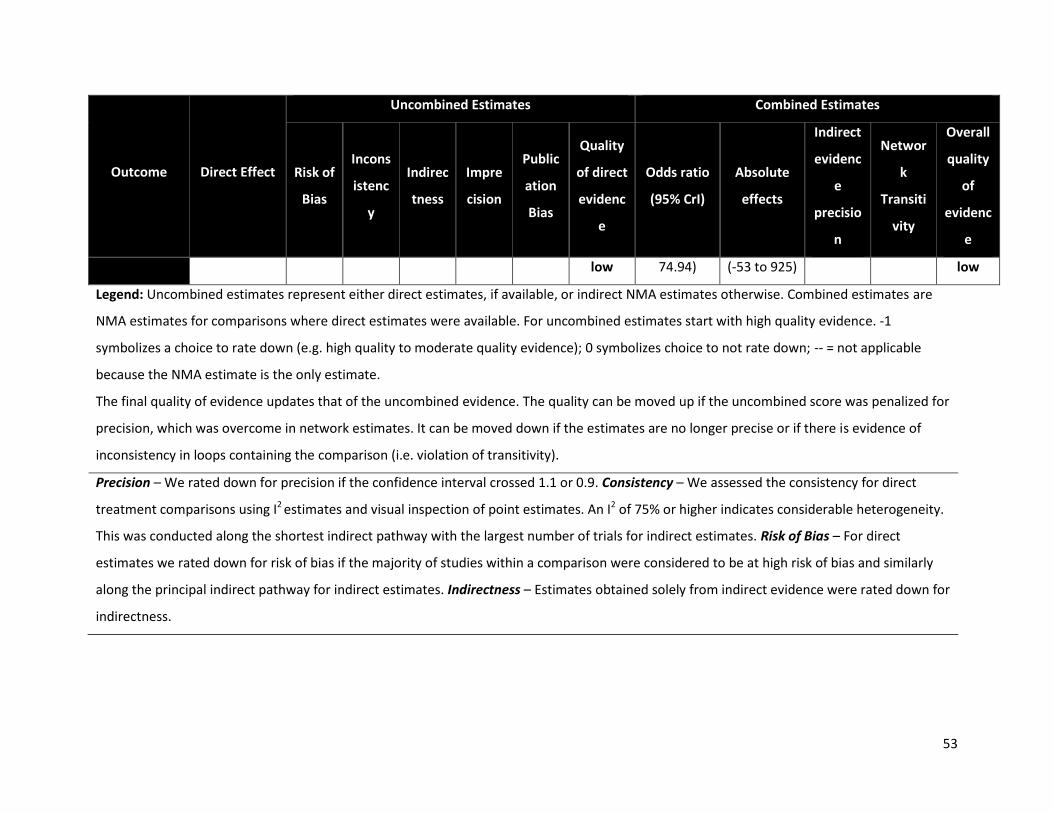
53
Outcome Direct Effect
Uncombined Estimates Combined Estimates
Risk of
Bias
Incons
istenc
y
Indirec
tness
Impre
cision
Public
ation
Bias
Quality
of direct
evidenc
e
Odds ratio
(95% CrI)
Absolute
effects
Indirect
evidenc
e
precisio
n
Networ
k
Transiti
vity
Overall
quality
of
evidenc
e
low 74.94) (-53 to 925) low
Legend: Uncombined estimates represent either direct estimates, if available, or indirect NMA estimates otherwise. Combined estimates are
NMA estimates for comparisons where direct estimates were available. For uncombined estimates start with high quality evidence. -1
symbolizes a choice to rate down (e.g. high quality to moderate quality evidence); 0 symbolizes choice to not rate down; -- = not applicable
because the NMA estimate is the only estimate.
The final quality of evidence updates that of the uncombined evidence. The quality can be moved up if the uncombined score was penalized for
precision, which was overcome in network estimates. It can be moved down if the estimates are no longer precise or if there is evidence of
inconsistency in loops containing the comparison (i.e. violation of transitivity).
Precision – We rated down for precision if the confidence interval crossed 1.1 or 0.9. Consistency – We assessed the consistency for direct
treatment comparisons using I2 estimates and visual inspection of point estimates. An I2 of 75% or higher indicates considerable heterogeneity.
This was conducted along the shortest indirect pathway with the largest number of trials for indirect estimates. Risk of Bias – For direct
estimates we rated down for risk of bias if the majority of studies within a comparison were considered to be at high risk of bias and similarly
along the principal indirect pathway for indirect estimates. Indirectness – Estimates obtained solely from indirect evidence were rated down for
indirectness.
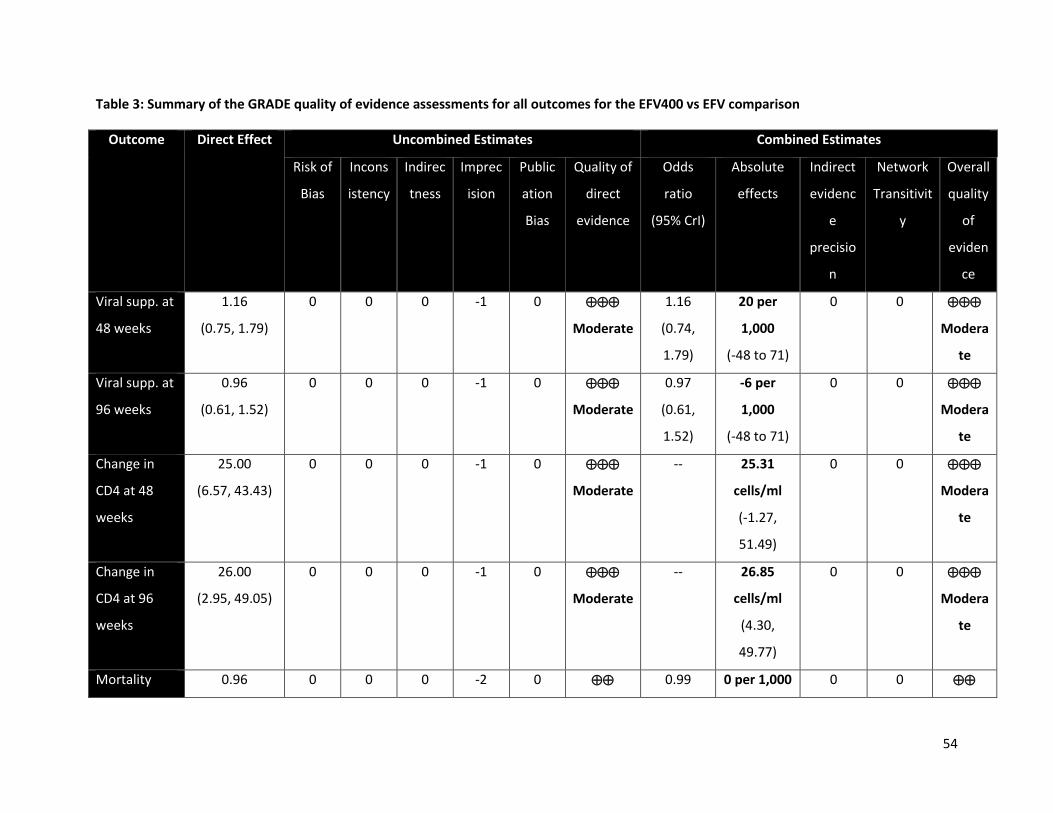
54
Table 3: Summary of the GRADE quality of evidence assessments for all outcomes for the EFV400 vs EFV comparison
Outcome Direct Effect Uncombined Estimates Combined Estimates
Risk of
Bias
Incons
istency
Indirec
tness
Imprec
ision
Public
ation
Bias
Quality of
direct
evidence
Odds
ratio
(95% CrI)
Absolute
effects
Indirect
evidenc
e
precisio
n
Network
Transitivit
y
Overall
quality
of
eviden
ce
Viral supp. at
48 weeks
1.16
(0.75, 1.79)
0 0 0 -1 0
Moderate
1.16
(0.74,
1.79)
20 per
1,000
(-48 to 71)
0 0
Modera
te
Viral supp. at
96 weeks
0.96
(0.61, 1.52)
0 0 0 -1 0
Moderate
0.97
(0.61,
1.52)
-6 per
1,000
(-48 to 71)
0 0
Modera
te
Change in
CD4 at 48
weeks
25.00
(6.57, 43.43)
0 0 0 -1 0
Moderate
-- 25.31
cells/ml
(-1.27,
51.49)
0 0
Modera
te
Change in
CD4 at 96
weeks
26.00
(2.95, 49.05)
0 0 0 -1 0
Moderate
-- 26.85
cells/ml
(4.30,
49.77)
0 0
Modera
te
Mortality 0.96 0 0 0 -2 0 0.99 0 per 1,000 0 0

55
(0.28, 3.36) Low (0.11,
7.69)
(-23 to 8) Low
AIDS defining
illness
1.97
(0.78, 4.94)
0 0 0 -2 0
Low
2.03
(0.82,
5.57)
20 per
1,000
(-4 to 81)
0 0
Low
Discontinuati
ons
0.91
(0.50, 1.68)
0 0 0 -1 0
Moderate
0.91
(0.50,
1.68)
-6 per
1,000
(-64 to 96)
0 0
Modera
te
Discontinuati
ons due to
AE
0.42
(0.23, 0.79)
0 0 0 0 0
High
0.42
(0.22,
0.77)
-35 per
1,000
(-50 to -13)
0 0
High
Emergent
SAEs
0.70
(0.40, 1.22)
0 0 0 -1 0
Moderate
0.69
(0.33,
1.47)
-30 per
1,000
(-64 to 21)
0 0
Modera
te
Emergent
AEs
0.82
(0.47, 1.43)
0 0 0 -1 0
Moderate
0.81
(0.31,
2.13)
-30 per
1,000
(-133 to 44)
0 0
Modera
te
Treatment-
related SAEs
0.48
(0.09, 2.63)
-1 0 0 -2 0
Very low
0.43
(0.01,
15.13)
-6 per
1,000
(-15 to 15)
0 -1
Very
low
Treatment-
related AEs
0.70
(0.51, 0.96)
-1 0 0 -1 0
Low
0.70
(0.51,
-80 per
1,000
0 0
Low
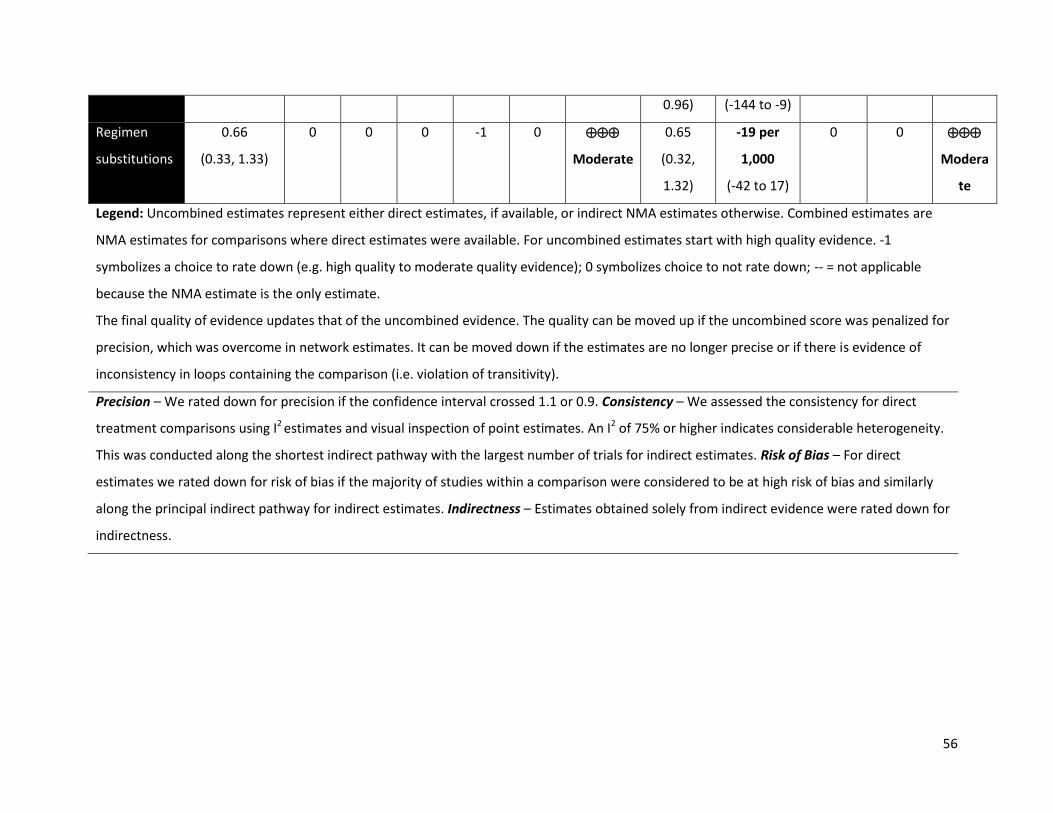
56
0.96) (-144 to -9)
Regimen
substitutions
0.66
(0.33, 1.33)
0 0 0 -1 0
Moderate
0.65
(0.32,
1.32)
-19 per
1,000
(-42 to 17)
0 0
Modera
te
Legend: Uncombined estimates represent either direct estimates, if available, or indirect NMA estimates otherwise. Combined estimates are
NMA estimates for comparisons where direct estimates were available. For uncombined estimates start with high quality evidence. -1
symbolizes a choice to rate down (e.g. high quality to moderate quality evidence); 0 symbolizes choice to not rate down; -- = not applicable
because the NMA estimate is the only estimate.
The final quality of evidence updates that of the uncombined evidence. The quality can be moved up if the uncombined score was penalized for
precision, which was overcome in network estimates. It can be moved down if the estimates are no longer precise or if there is evidence of
inconsistency in loops containing the comparison (i.e. violation of transitivity).
Precision – We rated down for precision if the confidence interval crossed 1.1 or 0.9. Consistency – We assessed the consistency for direct
treatment comparisons using I2 estimates and visual inspection of point estimates. An I2 of 75% or higher indicates considerable heterogeneity.
This was conducted along the shortest indirect pathway with the largest number of trials for indirect estimates. Risk of Bias – For direct
estimates we rated down for risk of bias if the majority of studies within a comparison were considered to be at high risk of bias and similarly
along the principal indirect pathway for indirect estimates. Indirectness – Estimates obtained solely from indirect evidence were rated down for
indirectness.
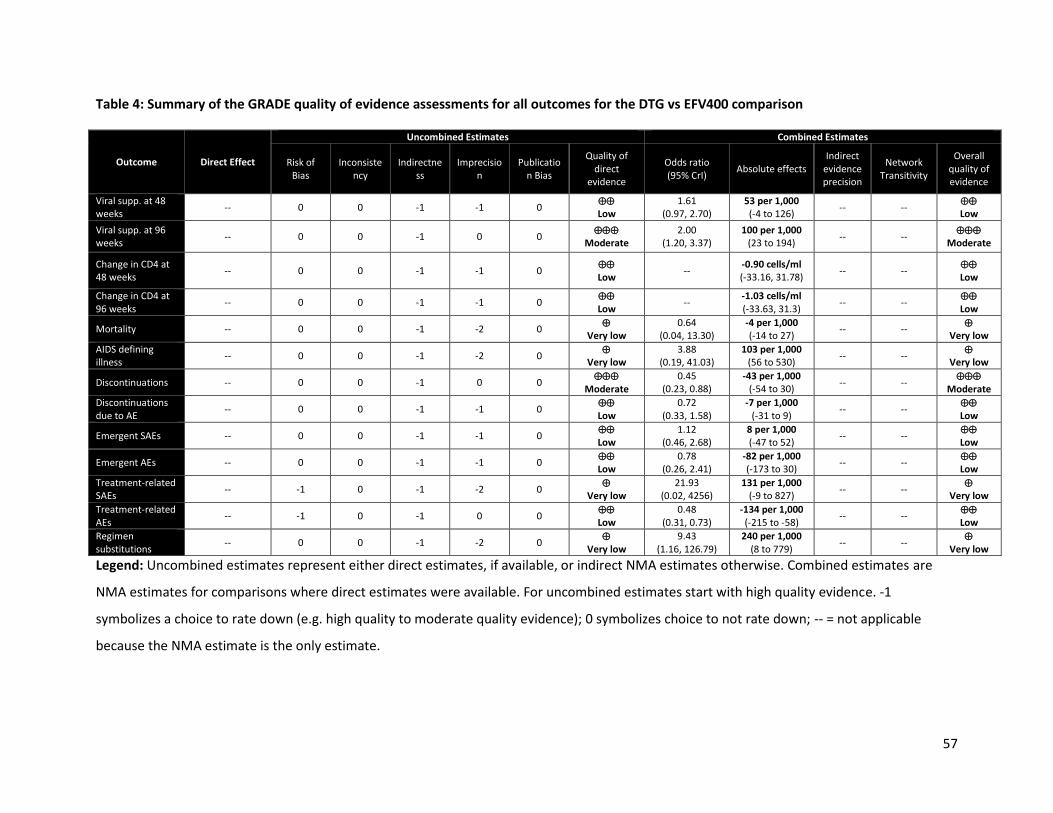
57
Table 4: Summary of the GRADE quality of evidence assessments for all outcomes for the DTG vs EFV400 comparison
Outcome Direct Effect
Uncombined Estimates Combined Estimates
Risk of Bias
Inconsistency
Indirectness
Imprecision
Publication Bias
Quality of direct
evidence
Odds ratio (95% CrI)
Absolute effects Indirect
evidence precision
Network Transitivity
Overall quality of evidence
Viral supp. at 48 weeks
-- 0 0 -1 -1 0 Low
1.61 (0.97, 2.70)
53 per 1,000 (-4 to 126)
-- -- Low
Viral supp. at 96 weeks
-- 0 0 -1 0 0
Moderate 2.00
(1.20, 3.37) 100 per 1,000
(23 to 194) -- --
Moderate
Change in CD4 at 48 weeks
-- 0 0 -1 -1 0 Low
-- -0.90 cells/ml (-33.16, 31.78)
-- -- Low
Change in CD4 at 96 weeks
-- 0 0 -1 -1 0 Low
-- -1.03 cells/ml (-33.63, 31.3)
-- -- Low
Mortality -- 0 0 -1 -2 0
Very low 0.64
(0.04, 13.30) -4 per 1,000 (-14 to 27)
-- --
Very low
AIDS defining illness
-- 0 0 -1 -2 0
Very low 3.88
(0.19, 41.03) 103 per 1,000
(56 to 530) -- --
Very low
Discontinuations -- 0 0 -1 0 0
Moderate 0.45
(0.23, 0.88) -43 per 1,000
(-54 to 30) -- --
Moderate
Discontinuations due to AE
-- 0 0 -1 -1 0 Low
0.72 (0.33, 1.58)
-7 per 1,000 (-31 to 9)
-- -- Low
Emergent SAEs -- 0 0 -1 -1 0 Low
1.12 (0.46, 2.68)
8 per 1,000 (-47 to 52)
-- -- Low
Emergent AEs -- 0 0 -1 -1 0 Low
0.78 (0.26, 2.41)
-82 per 1,000 (-173 to 30)
-- -- Low
Treatment-related SAEs
-- -1 0 -1 -2 0
Very low 21.93
(0.02, 4256) 131 per 1,000
(-9 to 827) -- --
Very low
Treatment-related AEs
-- -1 0 -1 0 0 Low
0.48 (0.31, 0.73)
-134 per 1,000 (-215 to -58)
-- -- Low
Regimen substitutions
-- 0 0 -1 -2 0
Very low 9.43
(1.16, 126.79) 240 per 1,000
(8 to 779) -- --
Very low
Legend: Uncombined estimates represent either direct estimates, if available, or indirect NMA estimates otherwise. Combined estimates are
NMA estimates for comparisons where direct estimates were available. For uncombined estimates start with high quality evidence. -1
symbolizes a choice to rate down (e.g. high quality to moderate quality evidence); 0 symbolizes choice to not rate down; -- = not applicable
because the NMA estimate is the only estimate.
58
The final quality of evidence updates that of the uncombined evidence. The quality can be moved up if the uncombined score was penalized for
precision, which was overcome in network estimates. It can be moved down if the estimates are no longer precise or if there is evidence of
inconsistency in loops containing the comparison (i.e. violation of transitivity).
Precision – We rated down for precision if the confidence interval crossed 1.1 or 0.9. Consistency – We assessed the consistency for direct
treatment comparisons using I2 estimates and visual inspection of point estimates. An I2 of 75% or higher indicates considerable heterogeneity.
This was conducted along the shortest indirect pathway with the largest number of trials for indirect estimates. Risk of Bias – For direct
estimates we rated down for risk of bias if the majority of studies within a comparison were considered to be at high risk of bias and similarly
along the principal indirect pathway for indirect estimates. Indirectness – Estimates obtained solely from indirect evidence were rated down for
indirectness.

5. TB Co-infected Individuals
The results of the systematic literature review failed to identify a wealth of evidence for the treatment
of patients with HIV-TB co-infection. However, an interim analysis from the ongoing INSPIRING trial was
identified from the CROI 2018 conference. Given the direct relevance and impact the findings of this trial
have in relation to the research question, we first provide an overall of the interim findings and
supplement this with an NMA of all available evidence to provide an overview of the evidence landscape.
5.1. The INSPIRING trial
In this review, the evidence for HIV-TB co-infected patients treated with DTG is based on a 24-week
interim analysis from the INSPIRING trial which was presented at the CROI 2018 conference.
INSPIRING (NCT02178592) is a Phase III, open-label randomized controlled trial enrolling HIV-TB co-
infected adult patients for treatment with twice-daily DTG 50 mg or once-daily EFV 600 mg. Patients
were receiving rifampin-based TB therapy. The trial is anticipated to be completed by the end of
December 2019.
A summary of the evidence on the DTG vs EFV comparison is presented in Treatment with DTG led to
relative increases in CD4 cell counts but was not distinguishable from EFV with respect to viral
suppression (Figure 12). By 24 weeks, DTG was well tolerated though the evidence on safety and
tolerability was based on very few events. As discussed in the previous section, viral suppression was
defined using the FDA Snapshot algorithm and differences here were driven by differences in
discontinuations. The difference in discontinuations were not due to AEs
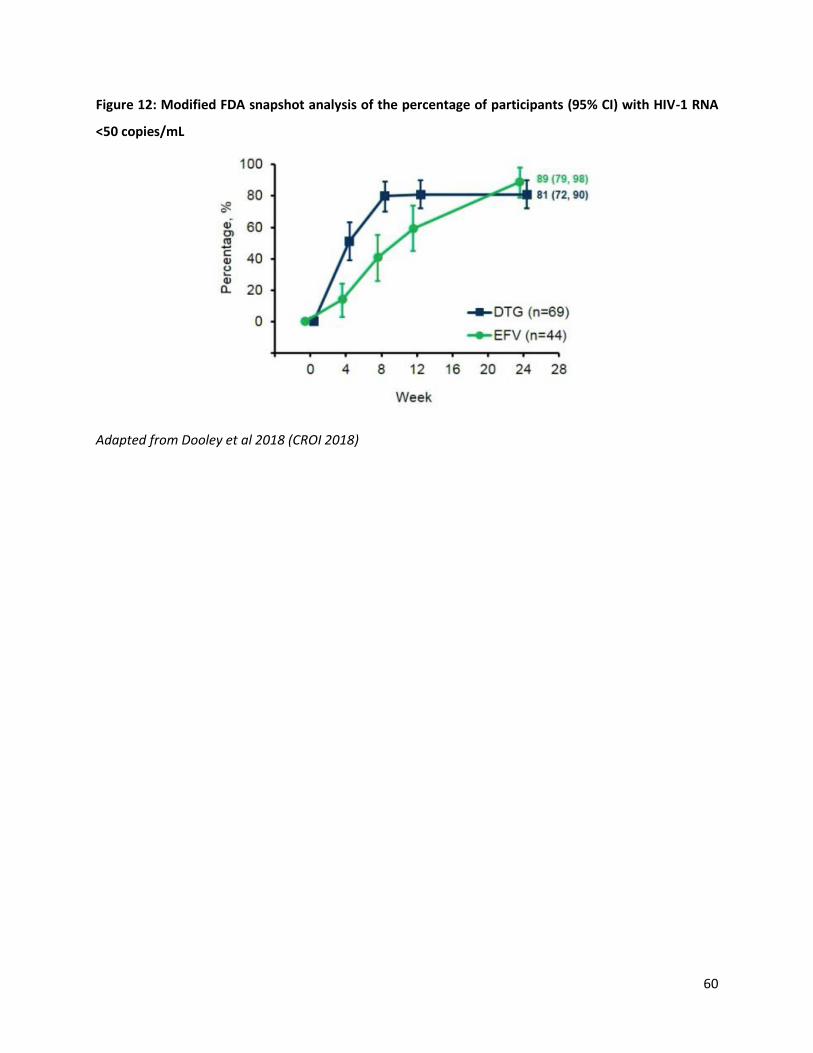
60
Figure 12: Modified FDA snapshot analysis of the percentage of participants (95% CI) with HIV-1 RNA
<50 copies/mL
Adapted from Dooley et al 2018 (CROI 2018)
5.1.1. Systematic literature review study selection
A subgroup systematic literature review was conducted to describe and synthesize the evidence for the first-line treatment of HIV-TB co-infected
patients. While the primary search strategy did not exclude patients with TB co-infection, we supplemented this search with a more sensitive,
targeted strategy (Appendix B). The flow of information diagram is presented in Error! Reference source not found.. Overall, 10 studies were
identified.
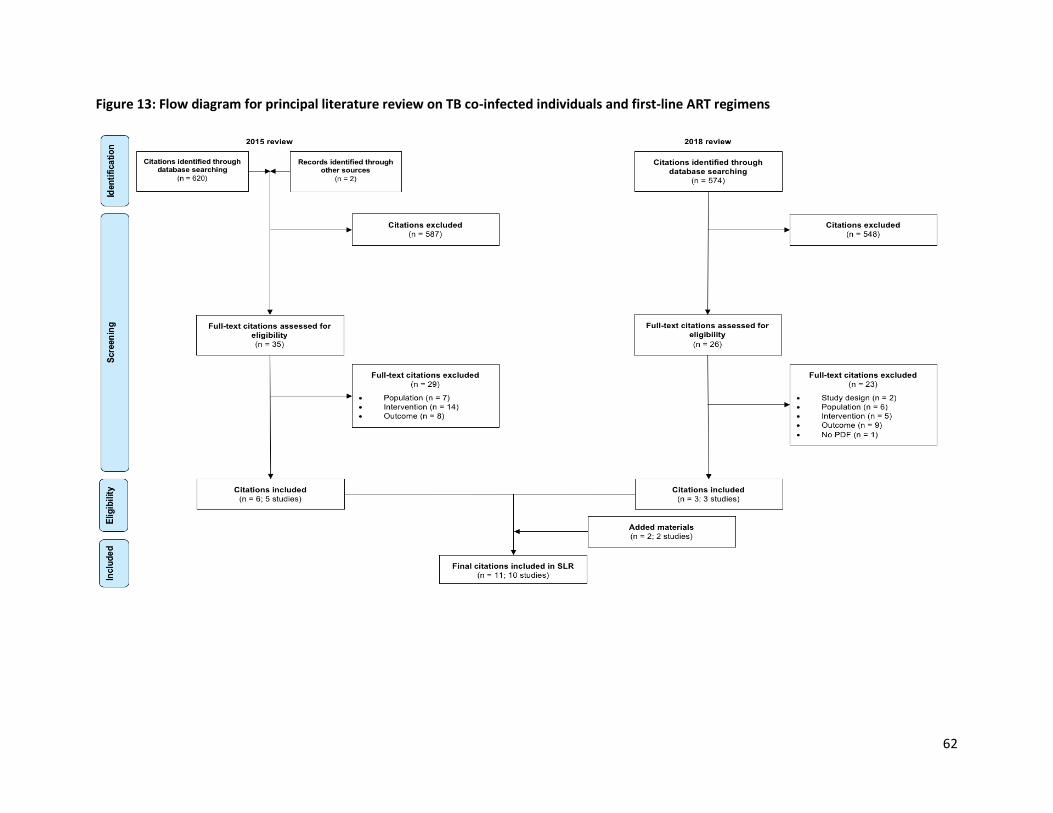
62
Figure 13: Flow diagram for principal literature review on TB co-infected individuals and first-line ART regimens

As with the principal analysis, some studies were excluded from the analysis set. In this case, three trials
were non-comparative and could not be used in the analysis. These are ANRS 129 BKVIR, HIV-TB
Pharmagene and TB-HAART. This was determined at the feasibility stage and could not be determined at
the SLR stage. Also, the Sinha et al, 2013 was a prelude to Sinha et al, 2017 and was therefore not used
in the analyses.
The complete network of evidence for the analysis set of the HIV-TB co-infected sub-population is
presented in Error! Reference source not found.. The evidence base consisted of 1378 patients enrolled
in 13 treatment arms across 6 RCTs. The evidence was limited to 5 treatments: NVP, DTG, EFV, and RAL
(400 mg; 800 mg). No evidence was identified for patients treated with EFV400.
Figure 14: Complete network of evidence for patients with HIV-TB co-infection
Legend: Circles (nodes) in the diagrams represent individual treatments, lines between circles represent
availability of head-to-head evidence between two treatments, and the numbers on the lines are the
number of RCTs informing each head-to-head comparison. Blue: NNRTIs; Green: Protease inhibitors;
Orange: Integrase inhibitors.
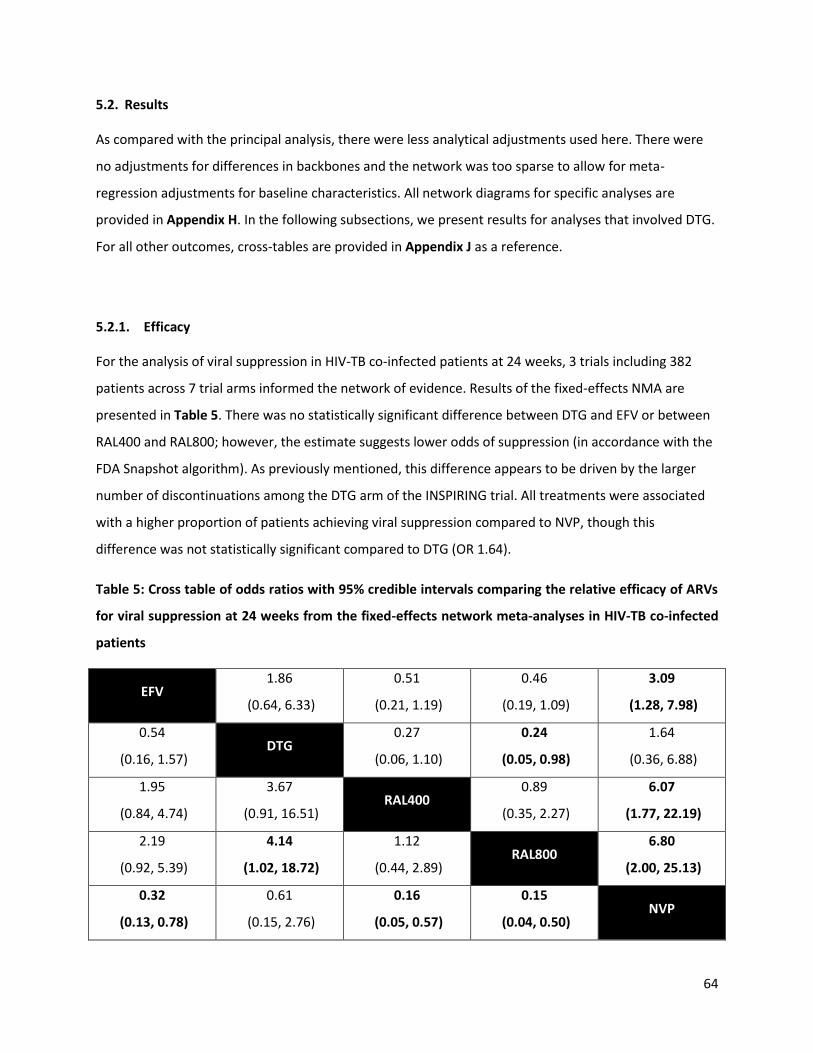
64
5.2. Results
As compared with the principal analysis, there were less analytical adjustments used here. There were
no adjustments for differences in backbones and the network was too sparse to allow for meta-
regression adjustments for baseline characteristics. All network diagrams for specific analyses are
provided in Appendix H. In the following subsections, we present results for analyses that involved DTG.
For all other outcomes, cross-tables are provided in Appendix J as a reference.
5.2.1. Efficacy
For the analysis of viral suppression in HIV-TB co-infected patients at 24 weeks, 3 trials including 382
patients across 7 trial arms informed the network of evidence. Results of the fixed-effects NMA are
presented in Table 5. There was no statistically significant difference between DTG and EFV or between
RAL400 and RAL800; however, the estimate suggests lower odds of suppression (in accordance with the
FDA Snapshot algorithm). As previously mentioned, this difference appears to be driven by the larger
number of discontinuations among the DTG arm of the INSPIRING trial. All treatments were associated
with a higher proportion of patients achieving viral suppression compared to NVP, though this
difference was not statistically significant compared to DTG (OR 1.64).
Table 5: Cross table of odds ratios with 95% credible intervals comparing the relative efficacy of ARVs
for viral suppression at 24 weeks from the fixed-effects network meta-analyses in HIV-TB co-infected
patients
EFV 1.86
(0.64, 6.33)
0.51
(0.21, 1.19)
0.46
(0.19, 1.09)
3.09
(1.28, 7.98)
0.54
(0.16, 1.57) DTG
0.27
(0.06, 1.10)
0.24
(0.05, 0.98)
1.64
(0.36, 6.88)
1.95
(0.84, 4.74)
3.67
(0.91, 16.51) RAL400
0.89
(0.35, 2.27)
6.07
(1.77, 22.19)
2.19
(0.92, 5.39)
4.14
(1.02, 18.72)
1.12
(0.44, 2.89) RAL800
6.80
(2.00, 25.13)
0.32
(0.13, 0.78)
0.61
(0.15, 2.76)
0.16
(0.05, 0.57)
0.15
(0.04, 0.50) NVP

65
Values represent the effect of the treatment lower on the diagonal to the one higher on it. Bold values
indicate comparisons that are statistically significant. Odds ratios above 1 indicate higher efficacy in viral
suppression. DTG: dolutegravir; EFV: efavirenz; NVP: nevirapine; RAL400: raltegravir 400; RAL800:
raltegravir 800
The network of evidence for change in CD4 count at 24 weeks in HIV-TB co-infected patients was based
on 3 trials of 8 treatment arms consisting of 371 patients. The network of evidence at the 24-, 48-, and
96-week time points are presented in Error! Reference source not found. of Appendix H.
Table 6: Cross table of odds ratios with 95% credible intervals comparing the relative efficacy of ARVs
for mean change in CD4 cell counts at 24 weeks from the fixed-effects network meta-analyses in HIV-
TB co-infected patients
EFV -52.52
(-89.61, -14.93)
5.76
(-23.84, 35.48)
52.52
(14.93, 89.61) DTG
58.28
(10.72, 106.04)
-5.76
(-35.48, 23.84)
-58.28
(-106.04, -10.72) NVP
Values represent the effect of the row treatment relative to the column treatment. Bold values indicate
comparisons that are statistically differentiable. DTG: dolutegravir; EFV: efavirenz; NVP: nevirapine;
Results of the fixed effects NMA are presented in Error! Reference source not found.. Treatment with
DTG was associated with statistically significant increases in CD4 cell count compared to all other
treatments in the network. No other comparisons were statistically significant.
5.2.2. Tolerability
The evidence base for discontinuations due to adverse events was based on 4 trials of 524 patients
enrolled in 9 treatment arms. The network of evidence is presented in Error! Reference source not
found. of Appendix H. A summary of the evidence, arranged by treatment and trial, is presented in Error!
Reference source not found.. The proportion of patients with a discontinuation due to adverse events
varied across treatments. There are limitations to synthesizing evidence by NMA when there are a small
number of events and analyses may generate non-meaningfully wide CrIs. With no such events observed
in the DTG arm, an NMA was conducted for the GRADE table (below) but results should be disregarded.
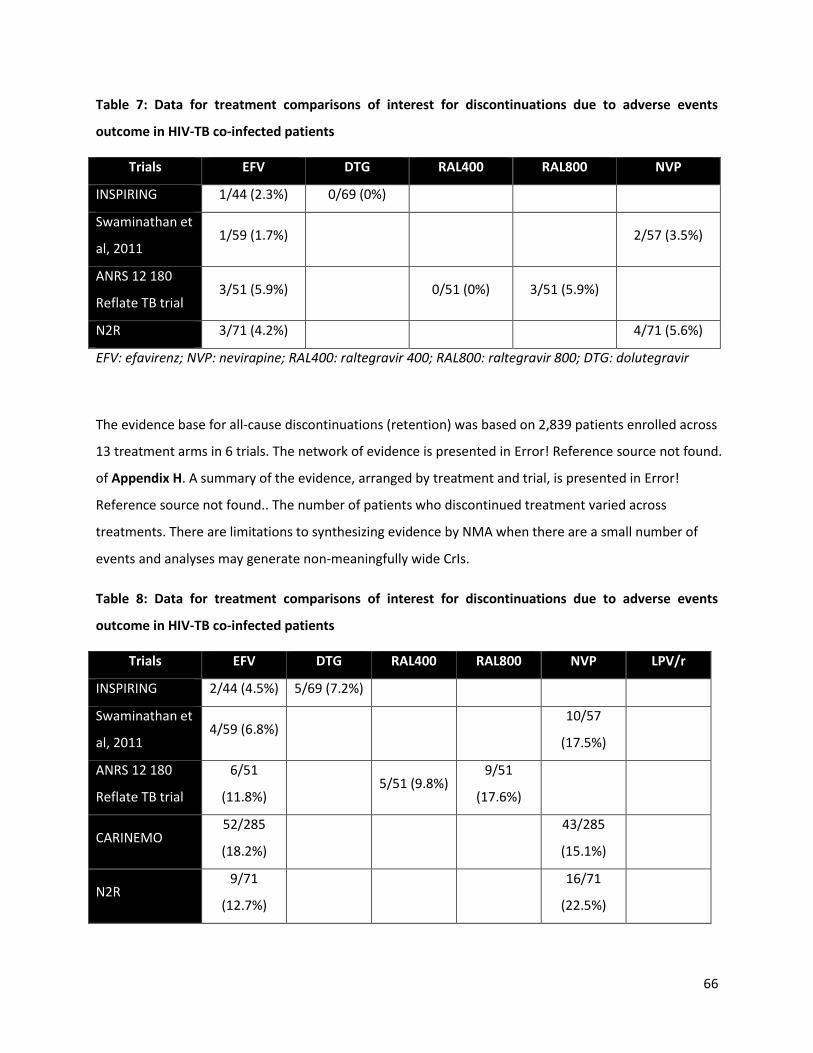
66
Table 7: Data for treatment comparisons of interest for discontinuations due to adverse events
outcome in HIV-TB co-infected patients
Trials EFV DTG RAL400 RAL800 NVP
INSPIRING 1/44 (2.3%) 0/69 (0%)
Swaminathan et
al, 2011 1/59 (1.7%)
2/57 (3.5%)
ANRS 12 180
Reflate TB trial 3/51 (5.9%)
0/51 (0%) 3/51 (5.9%)
N2R 3/71 (4.2%)
4/71 (5.6%)
EFV: efavirenz; NVP: nevirapine; RAL400: raltegravir 400; RAL800: raltegravir 800; DTG: dolutegravir
The evidence base for all-cause discontinuations (retention) was based on 2,839 patients enrolled across
13 treatment arms in 6 trials. The network of evidence is presented in Error! Reference source not found.
of Appendix H. A summary of the evidence, arranged by treatment and trial, is presented in Error!
Reference source not found.. The number of patients who discontinued treatment varied across
treatments. There are limitations to synthesizing evidence by NMA when there are a small number of
events and analyses may generate non-meaningfully wide CrIs.
Table 8: Data for treatment comparisons of interest for discontinuations due to adverse events
outcome in HIV-TB co-infected patients
Trials EFV DTG RAL400 RAL800 NVP LPV/r
INSPIRING 2/44 (4.5%) 5/69 (7.2%)
Swaminathan et
al, 2011 4/59 (6.8%)
10/57
(17.5%)
ANRS 12 180
Reflate TB trial
6/51
(11.8%) 5/51 (9.8%)
9/51
(17.6%)
CARINEMO 52/285
(18.2%)
43/285
(15.1%)
N2R 9/71
(12.7%)
16/71
(22.5%)

67
EFV: efavirenz; NVP: nevirapine; RAL400: raltegravir 400; RAL800: raltegravir 800; DTG: dolutegravir;
LPV/r: ritonavir-boosted lopinavir
5.2.3. Safety
The network of evidence for all treatment emergent SAEs (i.e. all SAEs) is presented in Error! Reference
source not found. of Appendix H. This analysis was based on 2,726 patients enrolled in 5 trials consisting
of 11 treatment arms. Data collected from trials is presented in Error! Reference source not found..
Again, small sample sizes were a major limiting factor. The odds of experiencing an SAE while on DTG
were 0.48 times those of experiencing an SAE while on EFV (95% CrI: 0.12, 1.90). There were more
events when it came to overall AEs and here, DTG was found to be safer than EFV (OR: 0.26; 95% CrI:
0.08, 0.84).
Table 9: Data for treatment comparisons of interest for the treatment-emergent serious adverse
events
Trials EFV DTG RAL400 RAL800 NVP LPV/r
INSPIRING 5/44
(11.4%) 4/69 (5.8%)
Swaminathan et
al, 2011 4/59 (6.8%)
5/57 (8.8%)
ANRS 12 180
Reflate TB trial
19/51
(37.3%)
17/51
(33.3%)
17/51
(33.3%)
CARINEMO 70/288
(24.3%)
74/285
(26%)
EFV: efavirenz; NVP: nevirapine; RAL400: raltegravir 400; RAL800: raltegravir 800; DTG: dolutegravir;
LPV/r: ritonavir-boosted lopinavir
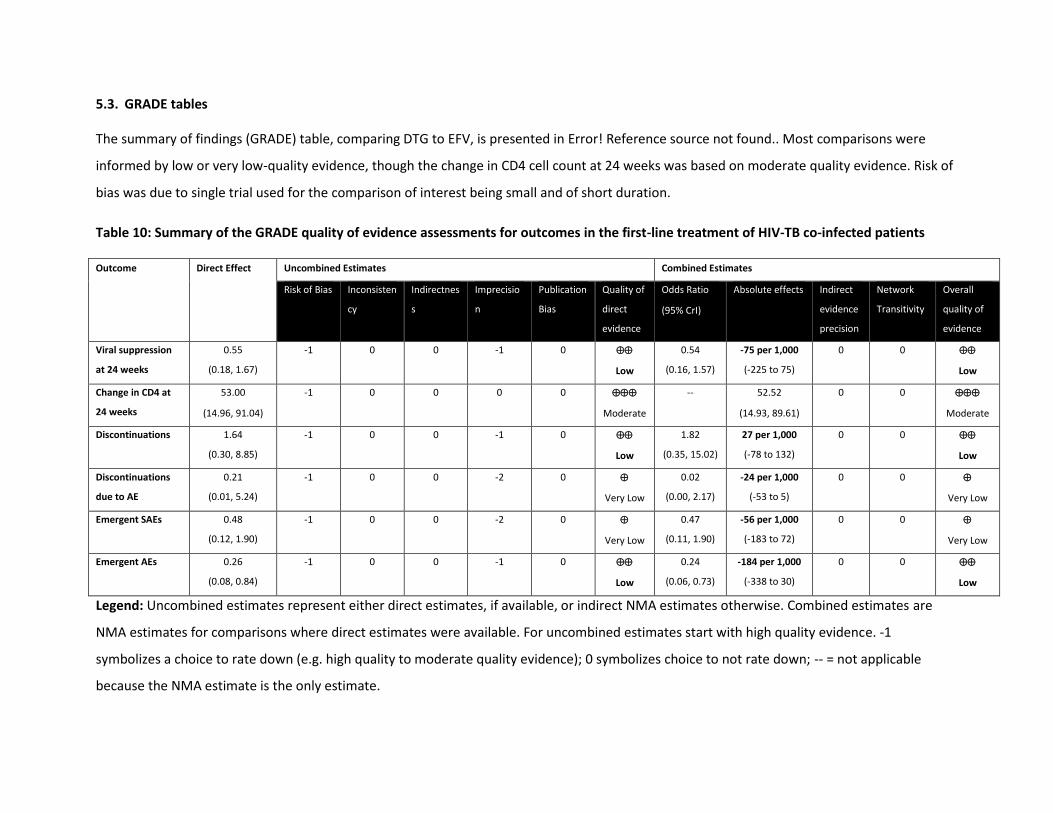
5.3. GRADE tables
The summary of findings (GRADE) table, comparing DTG to EFV, is presented in Error! Reference source not found.. Most comparisons were
informed by low or very low-quality evidence, though the change in CD4 cell count at 24 weeks was based on moderate quality evidence. Risk of
bias was due to single trial used for the comparison of interest being small and of short duration.
Table 10: Summary of the GRADE quality of evidence assessments for outcomes in the first-line treatment of HIV-TB co-infected patients
Outcome Direct Effect Uncombined Estimates Combined Estimates
Risk of Bias Inconsisten
cy
Indirectnes
s
Imprecisio
n
Publication
Bias
Quality of
direct
evidence
Odds Ratio
(95% CrI)
Absolute effects Indirect
evidence
precision
Network
Transitivity
Overall
quality of
evidence
Viral suppression
at 24 weeks
0.55
(0.18, 1.67)
-1 0 0 -1 0
Low
0.54
(0.16, 1.57)
-75 per 1,000
(-225 to 75)
0 0
Low
Change in CD4 at
24 weeks
53.00
(14.96, 91.04)
-1 0 0 0 0
Moderate
-- 52.52
(14.93, 89.61)
0 0
Moderate
Discontinuations 1.64
(0.30, 8.85)
-1 0 0 -1 0
Low
1.82
(0.35, 15.02)
27 per 1,000
(-78 to 132)
0 0
Low
Discontinuations
due to AE
0.21
(0.01, 5.24)
-1 0 0 -2 0
Very Low
0.02
(0.00, 2.17)
-24 per 1,000
(-53 to 5)
0 0
Very Low
Emergent SAEs 0.48
(0.12, 1.90)
-1 0 0 -2 0
Very Low
0.47
(0.11, 1.90)
-56 per 1,000
(-183 to 72)
0 0
Very Low
Emergent AEs 0.26
(0.08, 0.84)
-1 0 0 -1 0
Low
0.24
(0.06, 0.73)
-184 per 1,000
(-338 to 30)
0 0
Low
Legend: Uncombined estimates represent either direct estimates, if available, or indirect NMA estimates otherwise. Combined estimates are
NMA estimates for comparisons where direct estimates were available. For uncombined estimates start with high quality evidence. -1
symbolizes a choice to rate down (e.g. high quality to moderate quality evidence); 0 symbolizes choice to not rate down; -- = not applicable
because the NMA estimate is the only estimate.

69
The final quality of evidence updates that of the uncombined evidence. The quality can be moved up if the uncombined score was penalized for
precision, which was overcome in network estimates. It can be moved down if the estimates are no longer precise or if there is evidence of
inconsistency in loops containing the comparison (i.e. violation of transitivity).
Precision – We rated down for precision if the confidence interval crossed 1.1 or 0.9. Consistency – We assessed the consistency for direct
treatment comparisons using I2 estimates and visual inspection of point estimates. An I2 of 75% or higher indicates considerable heterogeneity.
This was conducted along the shortest indirect pathway with the largest number of trials for indirect estimates. Risk of Bias – For direct
estimates we rated down for risk of bias if the majority of studies within a comparison were considered to be at high risk of bias and similarly
along the principal indirect pathway for indirect estimates. Indirectness – Estimates obtained solely from indirect evidence were rated down for
indirectness.
6. Pregnant and breastfeeding women
6.1. Systematic literature review study selection
A subgroup systematic literature review was conducted to describe and synthesize the evidence for the
first-line treatment of pregnant and breastfeeding women. While the primary search strategy did not
exclude pregnant and breastfeeding women, we supplemented this search with a more sensitive,
targeted strategy (Appendix B). The flow of information diagram is presented in Figure 15. Overall, 15
studies were identified.
6.2. Summary of the evidence base
In the previous review (2015), 9 studies in treatment-naïve pregnant and breastfeeding women were
identified. However, no closed networks of evidence could be established (i.e. the evidence could not be
synthesized through an NMA). Several studies were identified through the current update, but most
were excluded from the analysis as they could only be synthesized through a descriptive summary.
With respect to the research question, which is focused on the efficacy and safety of DTG relative to EFV,
we identified two studies of relevance: the DolPHIN 1 trial and the Tsepamo study. The DolPHIN 1 trial is
an open-label, phase II/III randomized controlled pilot study comparing DTG/TDF/XTC to EFV/TDF/XTC
(standard of care). This is primarily a pharmacokinetics study with limited clinical outcomes and a very
small sample size with 8 patients in each treatment arm in the current interim analysis. A larger, phase
III trial is underway (DolPHIN-2, NCT03249181). This open-label randomized controlled trial was planned
to begin in January 2018 and is anticipated to be completed in March 2021 with an estimated enrolment
of 250 adult patients in South Africa and Uganda.
The Tsepamo study was a large cohort study of pregnant women initiating DTG/TDF/XTC or
EFV/TDF/XTC across 8 government hospitals in Botswana. A large sample of patients was enrolled, with
1,729 patients treated with DTG and 4,593 treated with EFV. It is noteworthy that Botswana was the
first country to recommend DTG/TDF/XTC for initiation in pregnancy. The proportion of pregnancies
with any adverse birth outcome was similar across treatment arms with 33.2% of DTG-managed
pregnancies and 35.0% of EFV-managed pregnancies resulting in an adverse outcome. Similarly, severe
birth outcomes were reported in 10.7% of DTG-managed and 11.3% of EFV-managed pregnancies. A
summary of the outcomes from the Tsepamo study is presented in Table 12.

71

Figure 15: Flow diagram for principal systematic literature review on pregnant and breastfeeding women and first line ART regimens
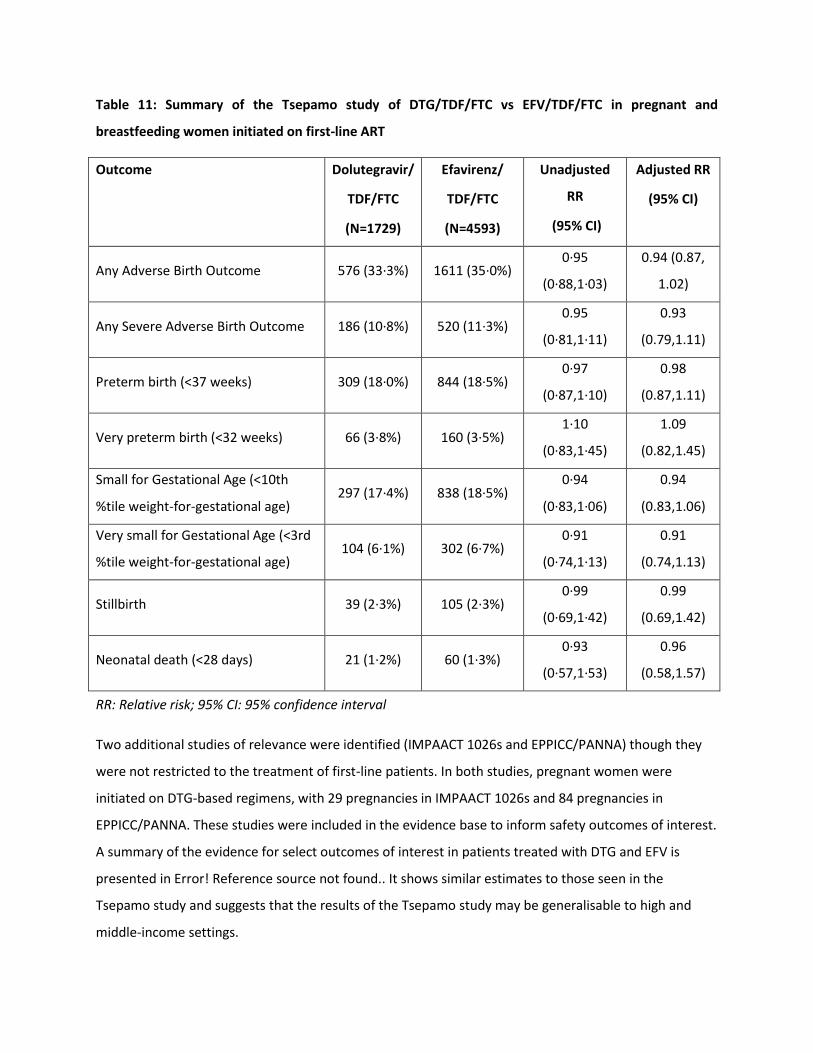
Table 11: Summary of the Tsepamo study of DTG/TDF/FTC vs EFV/TDF/FTC in pregnant and
breastfeeding women initiated on first-line ART
Outcome Dolutegravir/
TDF/FTC
(N=1729)
Efavirenz/
TDF/FTC
(N=4593)
Unadjusted
RR
(95% CI)
Adjusted RR
(95% CI)
Any Adverse Birth Outcome 576 (33·3%) 1611 (35·0%) 0·95
(0·88,1·03)
0.94 (0.87,
1.02)
Any Severe Adverse Birth Outcome 186 (10·8%) 520 (11·3%) 0.95
(0·81,1·11)
0.93
(0.79,1.11)
Preterm birth (<37 weeks) 309 (18·0%) 844 (18·5%) 0·97
(0·87,1·10)
0.98
(0.87,1.11)
Very preterm birth (<32 weeks) 66 (3·8%) 160 (3·5%) 1·10
(0·83,1·45)
1.09
(0.82,1.45)
Small for Gestational Age (<10th
%tile weight-for-gestational age) 297 (17·4%) 838 (18·5%)
0·94
(0·83,1·06)
0.94
(0.83,1.06)
Very small for Gestational Age (<3rd
%tile weight-for-gestational age) 104 (6·1%) 302 (6·7%)
0·91
(0·74,1·13)
0.91
(0.74,1.13)
Stillbirth 39 (2·3%) 105 (2·3%) 0·99
(0·69,1·42)
0.99
(0.69,1.42)
Neonatal death (<28 days) 21 (1·2%) 60 (1·3%) 0·93
(0·57,1·53)
0.96
(0.58,1.57)
RR: Relative risk; 95% CI: 95% confidence interval
Two additional studies of relevance were identified (IMPAACT 1026s and EPPICC/PANNA) though they
were not restricted to the treatment of first-line patients. In both studies, pregnant women were
initiated on DTG-based regimens, with 29 pregnancies in IMPAACT 1026s and 84 pregnancies in
EPPICC/PANNA. These studies were included in the evidence base to inform safety outcomes of interest.
A summary of the evidence for select outcomes of interest in patients treated with DTG and EFV is
presented in Error! Reference source not found.. It shows similar estimates to those seen in the
Tsepamo study and suggests that the results of the Tsepamo study may be generalisable to high and
middle-income settings.
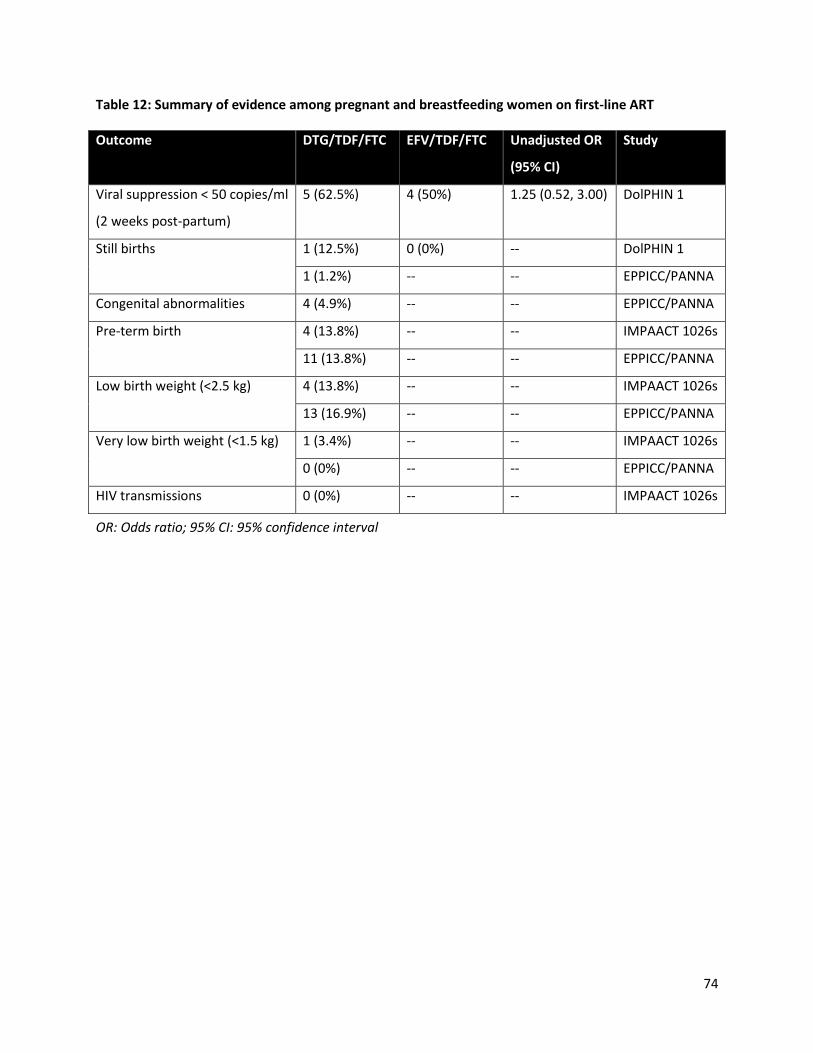
74
Table 12: Summary of evidence among pregnant and breastfeeding women on first-line ART
Outcome DTG/TDF/FTC EFV/TDF/FTC Unadjusted OR
(95% CI)
Study
Viral suppression < 50 copies/ml
(2 weeks post-partum)
5 (62.5%) 4 (50%) 1.25 (0.52, 3.00) DolPHIN 1
Still births 1 (12.5%) 0 (0%) -- DolPHIN 1
1 (1.2%) -- -- EPPICC/PANNA
Congenital abnormalities 4 (4.9%) -- -- EPPICC/PANNA
Pre-term birth 4 (13.8%) -- -- IMPAACT 1026s
11 (13.8%) -- -- EPPICC/PANNA
Low birth weight (<2.5 kg) 4 (13.8%) -- -- IMPAACT 1026s
13 (16.9%) -- -- EPPICC/PANNA
Very low birth weight (<1.5 kg) 1 (3.4%) -- -- IMPAACT 1026s
0 (0%) -- -- EPPICC/PANNA
HIV transmissions 0 (0%) -- -- IMPAACT 1026s
OR: Odds ratio; 95% CI: 95% confidence interval

6.3. GRADE tables
The summary of findings (GRADE) table, comparing DTG to EFV, is presented in Error! Reference source not found.. Most outcomes were
evaluated to be of moderate quality evidence due to the risk of bias associated with an observational study, though with respect to safety, a
large cohort study such as this one is among the most desirable studies to have. The evidence for viral suppression 2-weeks post-partum was
considered to be of very low quality largely due to the very small sample sizes.
Table 13: Summary of the GRADE quality of evidence assessments for outcomes in the first-line treatment of pregnancy and breastfeeding
women
Outcome Risk of
bias
Inconsist
ency
Indirect-
ness
Imprecisi
on
Publicati
on Bias
Relative
risks
Absolute
effect
DTG
sample
size
EFV
sample
size
Quality
of
evidence
Viral supp. (2
weeks post-
partum)
-1 0 0 -2 0 1.25
(0.52, 3.00)
125 per
1,000
(260 to
1000)
5 (62.5%) 4 (50%)
Very low
Any Adverse
Birth
Outcome
-1 0 0 0 0 0.94
(0.87, 1.02)
22 per
1,000
(-50 to 5)
576
(33·3%)
1611
(35·0%)
Moderat
e
Any Severe
Adverse
Birth Outcome
-1 0 0 0 0 0.93
(0.79,1.11)
-9 per
1,000
(-26 to 9)
186
(10·8%)
520
(11·3%)
Moderat
e
Preterm birth -1 0 0 0 0 0.98 -3 per 309 844

76
(0.87,1.11) 1,000
(-25 to 18)
(18·0%) (18·5%) Moderat
e
Very preterm
birth
-1 0 0 0 0 1.09
(0.82,1.45)
4 per 1,000
(-7 to 14)
66 (3·8%) 160
(3·5%)
Moderat
e
Small for
Gestational
Age
-1 0 0 0 0 0.94
(0.83,1.06)
-9 per
1,000
(-31 to 12)
297
(17·4%)
838
(18·5%)
Moderat
e
Very small for
Gestational
Age
-1 0 0 0 0 0.91
(0.74,1.13)
3 per 1,000
(-16 to 11)
104
(6·1%)
302
(6·7%)
Moderat
e
Stillbirth -1 0 0 0 0 0.99
(0.69,1.42)
*
1 per 1,000
(-9 to 8)
39 (2·3%) 105
(2·3%)
Moderat
e
Neonatal
death
-1 0 0 0 0 0.96
(0.58,1.57)
-1 per
1,000
(-7 to 6)
21 (1·2%) 60 (1·3%)
Moderat
e
Legend: Uncombined estimates represent either direct estimates, if available, or indirect NMA estimates otherwise. Combined estimates are
NMA estimates for comparisons where direct estimates were available. For uncombined estimates start with high quality evidence. -1
symbolizes a choice to rate down (e.g. high quality to moderate quality evidence); 0 symbolizes choice to not rate down; -- = not applicable
because the NMA estimate is the only estimate.

77
The final quality of evidence updates that of the uncombined evidence. The quality can be moved up if the uncombined score was penalized for
precision, which was overcome in network estimates. It can be moved down if the estimates are no longer precise or if there is evidence of
inconsistency in loops containing the comparison (i.e. violation of transitivity).
Precision – We rated down for precision if the confidence interval crossed 1.1 or 0.9. Consistency – We assessed the consistency for direct
treatment comparisons using I2 estimates and visual inspection of point estimates. An I2 of 75% or higher indicates considerable heterogeneity.
This was conducted along the shortest indirect pathway with the largest number of trials for indirect estimates. Risk of Bias – For direct
estimates we rated down for risk of bias if the majority of studies within a comparison were considered to be at high risk of bias and similarly
along the principal indirect pathway for indirect estimates. Indirectness – Estimates obtained solely from indirect evidence were rated down for
indirectness.
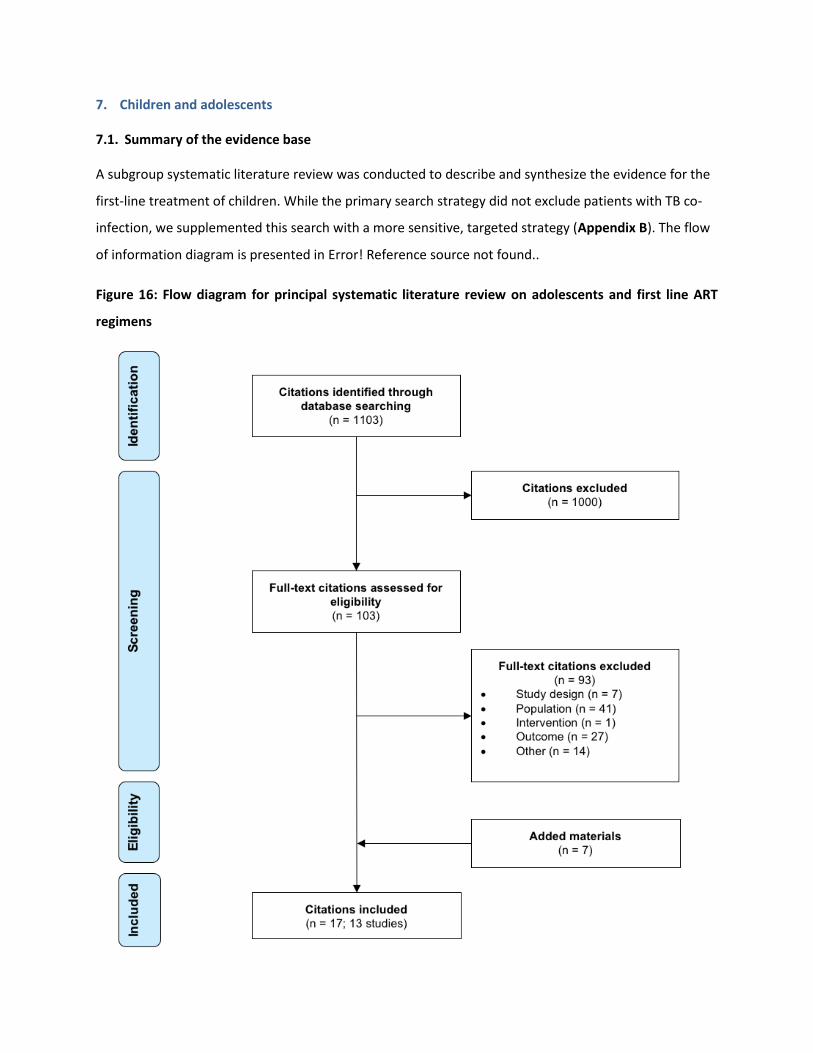
7. Children and adolescents
7.1. Summary of the evidence base
A subgroup systematic literature review was conducted to describe and synthesize the evidence for the
first-line treatment of children. While the primary search strategy did not exclude patients with TB co-
infection, we supplemented this search with a more sensitive, targeted strategy (Appendix B). The flow
of information diagram is presented in Error! Reference source not found..
Figure 16: Flow diagram for principal systematic literature review on adolescents and first line ART
regimens
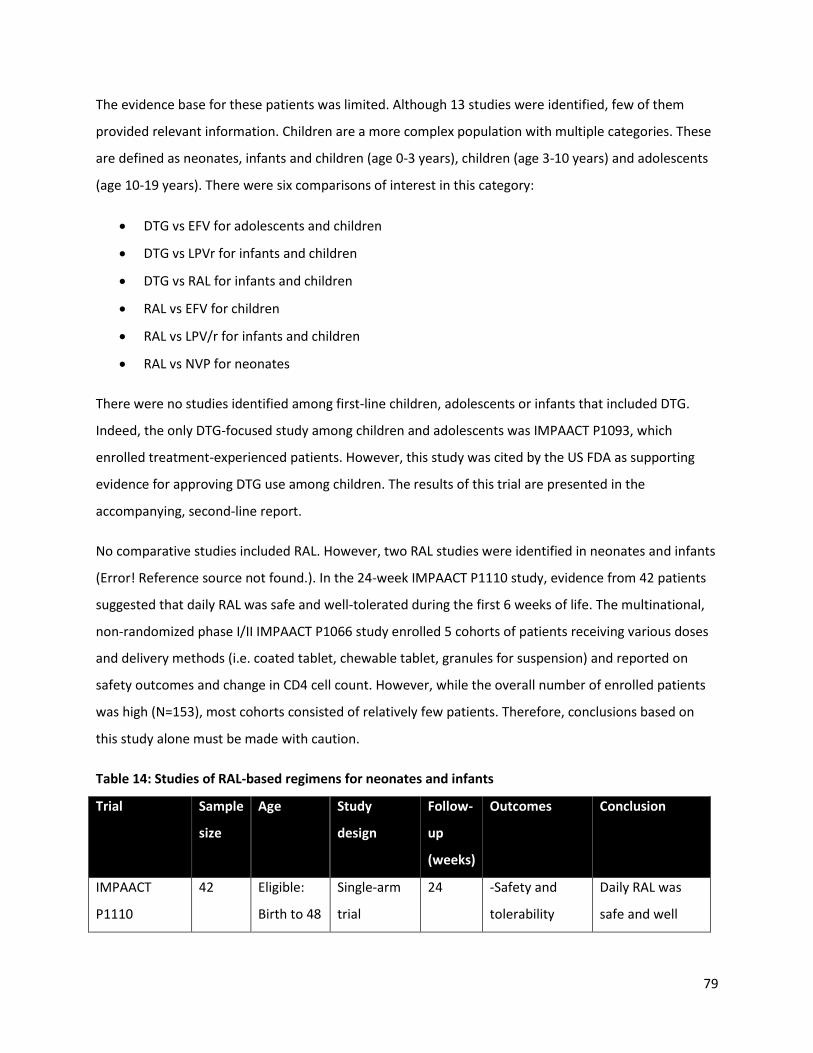
79
The evidence base for these patients was limited. Although 13 studies were identified, few of them
provided relevant information. Children are a more complex population with multiple categories. These
are defined as neonates, infants and children (age 0-3 years), children (age 3-10 years) and adolescents
(age 10-19 years). There were six comparisons of interest in this category:
DTG vs EFV for adolescents and children
DTG vs LPVr for infants and children
DTG vs RAL for infants and children
RAL vs EFV for children
RAL vs LPV/r for infants and children
RAL vs NVP for neonates
There were no studies identified among first-line children, adolescents or infants that included DTG.
Indeed, the only DTG-focused study among children and adolescents was IMPAACT P1093, which
enrolled treatment-experienced patients. However, this study was cited by the US FDA as supporting
evidence for approving DTG use among children. The results of this trial are presented in the
accompanying, second-line report.
No comparative studies included RAL. However, two RAL studies were identified in neonates and infants
(Error! Reference source not found.). In the 24-week IMPAACT P1110 study, evidence from 42 patients
suggested that daily RAL was safe and well-tolerated during the first 6 weeks of life. The multinational,
non-randomized phase I/II IMPAACT P1066 study enrolled 5 cohorts of patients receiving various doses
and delivery methods (i.e. coated tablet, chewable tablet, granules for suspension) and reported on
safety outcomes and change in CD4 cell count. However, while the overall number of enrolled patients
was high (N=153), most cohorts consisted of relatively few patients. Therefore, conclusions based on
this study alone must be made with caution.
Table 14: Studies of RAL-based regimens for neonates and infants
Trial Sample
size
Age Study
design
Follow-
up
(weeks)
Outcomes Conclusion
IMPAACT
P1110
42 Eligible:
Birth to 48
Single-arm
trial
24 -Safety and
tolerability
Daily RAL was
safe and well

80
NCT01780831 hours tolerated during
the first 6 weeks
of life.
IMPAACT
P1066
NCT00485264
153 Eligible: 4
weeks to
18 years
Comparative
cohort
48 -Immunologic
response
-Safety and
tolerability
-Retention
Only available
from
ClinicalTrials.gov
record
7.2. GRADE tables
Given the lack of comparative evidence in the children and adolescent subgroup, we reference the
results of the adult and adolescent review and downgrade the quality of evidence by one level for
indirectness. Table 13 presents the summary of findings (GRADE) table for efficacy, safety, and
tolerability outcomes for comparisons to DTG. Treatment with DTG was associated with a higher
proportion of patients achieving viral suppression at both 48 and 96 weeks compared to either EFV,
LPV/r, or RAL, though this was based on moderate (vs EFV) and low-quality evidence (LPV/r; RAL). The
evidence on changes in CD4 cell count was mixed, however, with statistically significant increase at all
time points compared to EFV (low quality evidence) and not statistically significant differences
compared to either LPV/r or RAL based on very low-quality evidence. Given the lack of evidence
identified, conclusions regarding comparisons on mortality and ADIs should be avoided. However,
treatment was DTG was generally associated with fewer discontinuations, though only the comparison
with EFV was considered to be moderate quality. Evidence on serious adverse events, both treatment-
related and emergent, was based on low or very low-quality evidence. These findings, particularly the
relatively few studies identified relevant to the research question in children and adolescents, highlights
the need for ongoing research on the use of DTG in the first-line treatment of HIV-infected children.
The GRADE table for the efficacy, safety, and tolerability outcomes for comparisons to RAL is presented
in Error! Reference source not found.. Treatment with RAL was associated with a higher proportion of
patients achieving viral suppression at both 48 and 96 weeks compared to EFV, LPV/r, and NVP, though

81
this was largely based on low quality evidence. No statistically significant differences were observed
with respect to change in CD4 cell count based on low or very low-quality evidence. However, treatment
with RAL was associated with fewer discontinuations, discontinuations due to adverse events, and fewer
emergent serious adverse events compared to EFV (moderate quality evidence), LPV/r (low quality
evidence), and NVP (low quality evidence). The evidence for emergent adverse events, treatment-
related SAEs, and treatment-related adverse events was sparse and was largely considered to be of very
low quality. As with the evidence for DTG, the evidence on the use of RAL in the first-line treatment of
children is sparse and was generally considered to be low quality according to the GRADE assessments.
Again, we highlight the need for ongoing research to further inform this evidence base.
A detailed summary of the GRADE assessments for the evidence in children and adolescents is
presented in Appendix K.
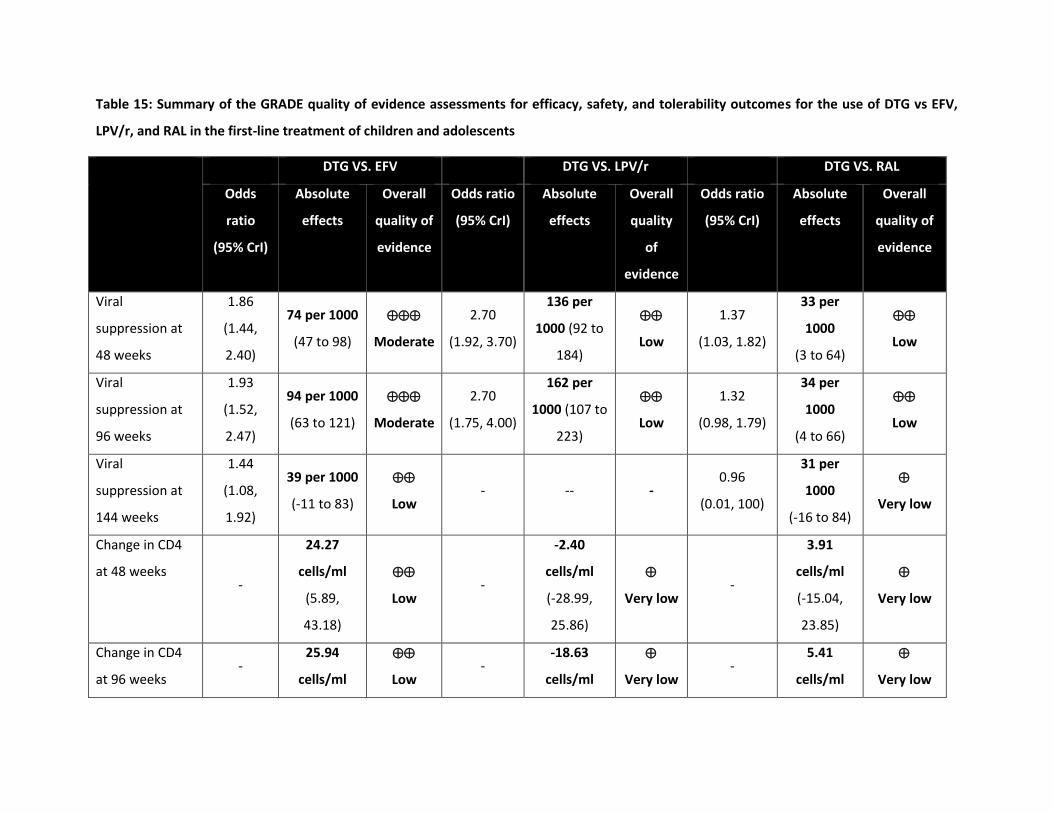
Table 15: Summary of the GRADE quality of evidence assessments for efficacy, safety, and tolerability outcomes for the use of DTG vs EFV,
LPV/r, and RAL in the first-line treatment of children and adolescents
DTG VS. EFV DTG VS. LPV/r DTG VS. RAL
Odds
ratio
(95% CrI)
Absolute
effects
Overall
quality of
evidence
Odds ratio
(95% CrI)
Absolute
effects
Overall
quality
of
evidence
Odds ratio
(95% CrI)
Absolute
effects
Overall
quality of
evidence
Viral
suppression at
48 weeks
1.86
(1.44,
2.40)
74 per 1000
(47 to 98)
Moderate
2.70
(1.92, 3.70)
136 per
1000 (92 to
184)
Low
1.37
(1.03, 1.82)
33 per
1000
(3 to 64)
Low
Viral
suppression at
96 weeks
1.93
(1.52,
2.47)
94 per 1000
(63 to 121)
Moderate
2.70
(1.75, 4.00)
162 per
1000 (107 to
223)
Low
1.32
(0.98, 1.79)
34 per
1000
(4 to 66)
Low
Viral
suppression at
144 weeks
1.44
(1.08,
1.92)
39 per 1000
(-11 to 83)
Low - -- -
0.96
(0.01, 100)
31 per
1000
(-16 to 84)
Very low
Change in CD4
at 48 weeks -
24.27
cells/ml
(5.89,
43.18)
Low -
-2.40
cells/ml
(-28.99,
25.86)
Very low -
3.91
cells/ml
(-15.04,
23.85)
Very low
Change in CD4
at 96 weeks -
25.94
cells/ml
Low -
-18.63
cells/ml
Very low -
5.41
cells/ml
Very low

83
DTG VS. EFV DTG VS. LPV/r DTG VS. RAL
Odds
ratio
(95% CrI)
Absolute
effects
Overall
quality of
evidence
Odds ratio
(95% CrI)
Absolute
effects
Overall
quality
of
evidence
Odds ratio
(95% CrI)
Absolute
effects
Overall
quality of
evidence
(2.95,
48.74)
(-54.43,
18.83)
(-27.41,
40.74)
Change in CD4
at 144 weeks -
49.63
cells/ml
(20.12,
79.58)
Low -
9.27
cells/ml
(-89.80,
100.65)
Very low -
11.54
cells/ml
(-79.64,
95.93)
Very low
Mortality 0.64
(0.09,
4.87)
-4 per 1000
(--9 to 12)
Very low
0.47
(0.05, 4.17)
-4 per 1000
(-10 to 12)
Very low
0.87
(0.13, 7.14)
-1 per 1000
(-8 to 15)
Low
AIDS defining
illnesses
8.08
(0.46,
66.45)
127 per
1000
(-13 to 550)
Very low
7.14
(0.32,
100.00)
127 per
1000
(-12 to 551)
Very low
8.33
(0.30,
100.00)
126 per
1000 (-16
to 552)
Very low
Discontinuations 0.49
(0.39,
0.62)
-43 per
1000
(-54 to -30)
Moderate
0.44
(0.32, 0.60)
-65 per 1000
(-104 to -38)
Low
0.76
(0.58, 0.99)
-8 per 1000
(-25 to 4)
Low
Discontinuations
due to AEs
0.30
(0.19,
0.47)
-78 per
1000
(-101 to -
Moderate
0.23
(0.11, 0.46)
-107 per
1000
(-146 to -69)
Low
0.72
(0.37, 1.41)
-9 per 1000
(--57 to --3)
Low
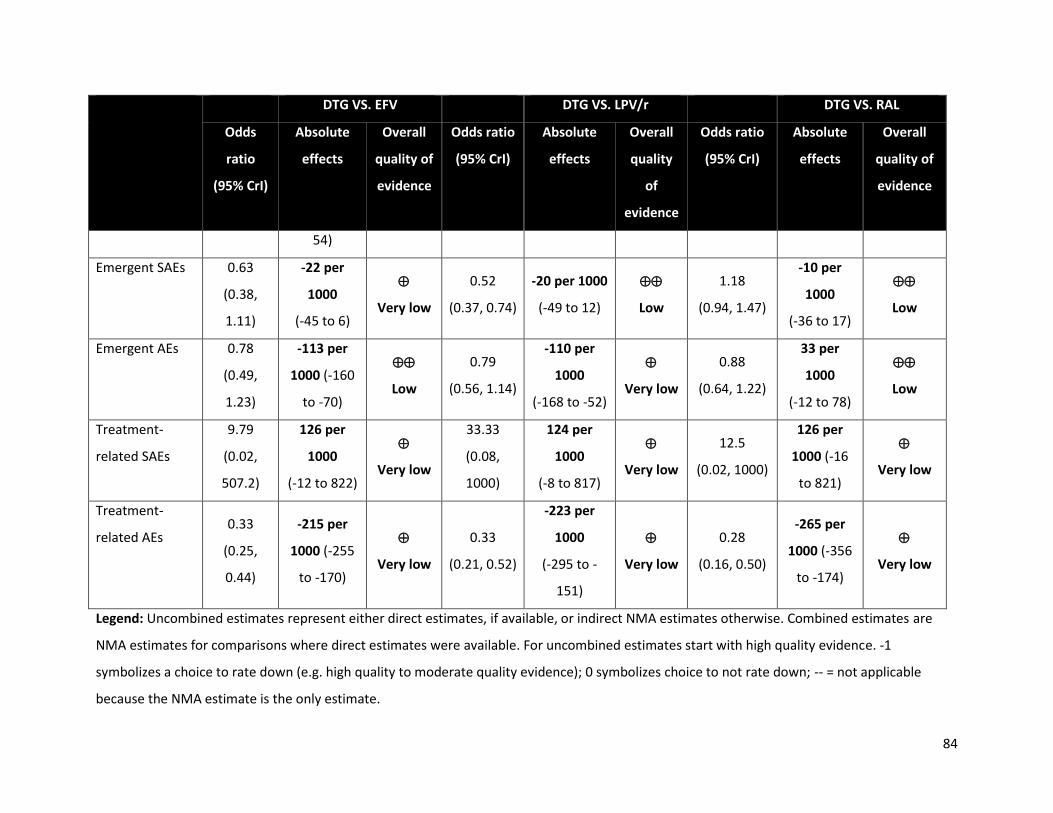
84
DTG VS. EFV DTG VS. LPV/r DTG VS. RAL
Odds
ratio
(95% CrI)
Absolute
effects
Overall
quality of
evidence
Odds ratio
(95% CrI)
Absolute
effects
Overall
quality
of
evidence
Odds ratio
(95% CrI)
Absolute
effects
Overall
quality of
evidence
54)
Emergent SAEs 0.63
(0.38,
1.11)
-22 per
1000
(-45 to 6)
Very low
0.52
(0.37, 0.74)
-20 per 1000
(-49 to 12)
Low
1.18
(0.94, 1.47)
-10 per
1000
(-36 to 17)
Low
Emergent AEs 0.78
(0.49,
1.23)
-113 per
1000 (-160
to -70)
Low
0.79
(0.56, 1.14)
-110 per
1000
(-168 to -52)
Very low
0.88
(0.64, 1.22)
33 per
1000
(-12 to 78)
Low
Treatment-
related SAEs
9.79
(0.02,
507.2)
126 per
1000
(-12 to 822)
Very low
33.33
(0.08,
1000)
124 per
1000
(-8 to 817)
Very low
12.5
(0.02, 1000)
126 per
1000 (-16
to 821)
Very low
Treatment-
related AEs 0.33
(0.25,
0.44)
-215 per
1000 (-255
to -170)
Very low
0.33
(0.21, 0.52)
-223 per
1000
(-295 to -
151)
Very low
0.28
(0.16, 0.50)
-265 per
1000 (-356
to -174)
Very low
Legend: Uncombined estimates represent either direct estimates, if available, or indirect NMA estimates otherwise. Combined estimates are
NMA estimates for comparisons where direct estimates were available. For uncombined estimates start with high quality evidence. -1
symbolizes a choice to rate down (e.g. high quality to moderate quality evidence); 0 symbolizes choice to not rate down; -- = not applicable
because the NMA estimate is the only estimate.

85
The final quality of evidence updates that of the uncombined evidence. The quality can be moved up if the uncombined score was penalized for
precision, which was overcome in network estimates. It can be moved down if the estimates are no longer precise or if there is evidence of
inconsistency in loops containing the comparison (i.e. violation of transitivity).
Precision – We rated down for precision if the confidence interval crossed 1.1 or 0.9. Consistency – We assessed the consistency for direct
treatment comparisons using I2 estimates and visual inspection of point estimates. An I2 of 75% or higher indicates considerable heterogeneity.
This was conducted along the shortest indirect pathway with the largest number of trials for indirect estimates. Risk of Bias – For direct
estimates we rated down for risk of bias if the majority of studies within a comparison were considered to be at high risk of bias and similarly
along the principal indirect pathway for indirect estimates. Indirectness – Estimates obtained solely from indirect evidence were rated down for
indirectness.

86
Table 16: Summary of the GRADE quality of evidence assessments for efficacy, safety, and tolerability outcomes for the use of RAL vs EFV,
LPV/r, and NVP in the first-line treatment of children and adolescents
RAL vs EFV RAL vs LPV/r RAL vs NVP
Odds ratio
(95% CrI)
Absolute
effects
Overall
quality of
evidence
Odds ratio
(95% CrI)
Absolute
effects
Overall
quality
of
evidence
Odds ratio
(95% CrI)
Absolute
effects
Overall
quality
of
evidence
Viral
suppression at
48 weeks
1.36
(1.04,
1.78)
41 per 1000
(9 to 70)
Low
1.96
(1.43, 2.78)
103 per
1000 (56 to
153)
Low
1.56
(1.14, 2.17) 61 per 1000
(20 to 104)
Low
Viral
suppression at
96 weeks
1.47
(1.11,
1.97)
59 per 1000
(23 to 92)
Moderate
2.08
(1.35, 3.03)
128 per
1000 ( 71 to
190)
Low
2.50
(1.47, 4.35) 166 per 1000
(75 to 266)
Low
Viral
suppression at
144 weeks
1.50
(0.08,
29.57)
61 per 1000
(13 to 104)
Low - -- -
2.27
(0.03,
100.00)
143 per 1000
(29 to 275)
Very
low
Change in CD4
at 48 weeks
20.37
(3.34,
37.54)
20.37
cells/ml
(3.34 to
37.54)
Very low
-6.17
(-32.17,
20.40)
-6.17
cells/ml
(-32.17 to
20.40)
Very
low
15.09
(-6.87,
37.89)
15.09
cells/ml
(-6.87 to
37.89)
Very
low
Change in CD4
at 96 weeks
22.53
(-0.24,
22.53
cells/ml
Low
-23.81
(-55.27,
-23.81
cells/ml
Very
35.90
(-4.38,
35.90
cells/ml
Very
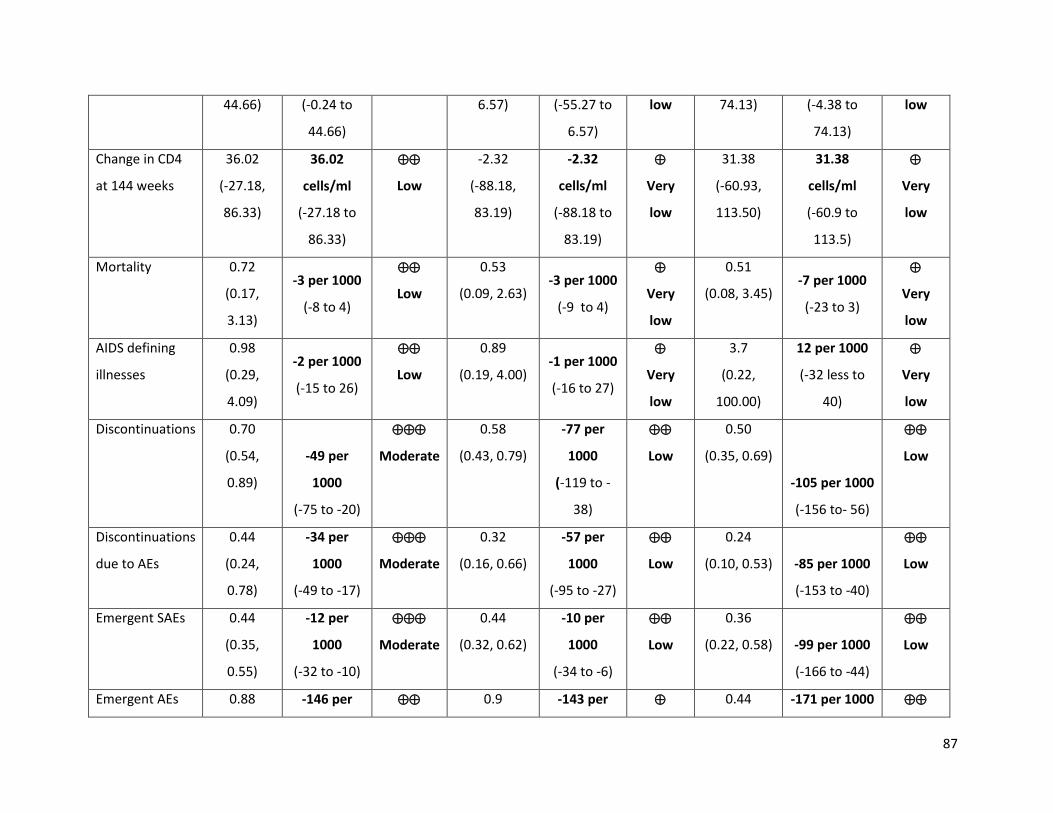
87
44.66) (-0.24 to
44.66)
6.57) (-55.27 to
6.57)
low 74.13) (-4.38 to
74.13)
low
Change in CD4
at 144 weeks
36.02
(-27.18,
86.33)
36.02
cells/ml
(-27.18 to
86.33)
Low
-2.32
(-88.18,
83.19)
-2.32
cells/ml
(-88.18 to
83.19)
Very
low
31.38
(-60.93,
113.50)
31.38
cells/ml
(-60.9 to
113.5)
Very
low
Mortality 0.72
(0.17,
3.13)
-3 per 1000
(-8 to 4)
Low
0.53
(0.09, 2.63) -3 per 1000
(-9 to 4)
Very
low
0.51
(0.08, 3.45) -7 per 1000
(-23 to 3)
Very
low
AIDS defining
illnesses
0.98
(0.29,
4.09)
-2 per 1000
(-15 to 26)
Low
0.89
(0.19, 4.00) -1 per 1000
(-16 to 27)
Very
low
3.7
(0.22,
100.00)
12 per 1000
(-32 less to
40)
Very
low
Discontinuations 0.70
(0.54,
0.89)
-49 per
1000
(-75 to -20)
Moderate
0.58
(0.43, 0.79)
-77 per
1000
(-119 to -
38)
Low
0.50
(0.35, 0.69)
-105 per 1000
(-156 to- 56)
Low
Discontinuations
due to AEs
0.44
(0.24,
0.78)
-34 per
1000
(-49 to -17)
Moderate
0.32
(0.16, 0.66)
-57 per
1000
(-95 to -27)
Low
0.24
(0.10, 0.53) -85 per 1000
(-153 to -40)
Low
Emergent SAEs 0.44
(0.35,
0.55)
-12 per
1000
(-32 to -10)
Moderate
0.44
(0.32, 0.62)
-10 per
1000
(-34 to -6)
Low
0.36
(0.22, 0.58) -99 per 1000
(-166 to -44)
Low
Emergent AEs 0.88 -146 per 0.9 -143 per 0.44 -171 per 1000

88
(0.69,
1.11)
1000
(-193 to -
102)
Low (0.68, 1.18) 1000
(-199 to 87)
Very
low
(0.29, 0.68) (-235 to -99) Low
Treatment-
related SAEs
0.77
(0.02,
8.90)
-1 per 1000
(-11 to 20)
Very low
3.12
(0.01,
1000.00)
6 per 1000
(-89 to 28)
Very
low
0.68
(0, 1000.00) 0 per 1000
(-889 to 25)
Very
low
Treatment-
related AEs
1.23
(0.81,
1.90)
50 per 1000
(-29 to 133)
Very low
1.18
(0.69, 2.00) 41 per 1000
(-62 to 146)
Very
low
1.41
(0.85, 2.50) 78 per 1000
(-26 to 183)
Very
low
Legend: Uncombined estimates represent either direct estimates, if available, or indirect NMA estimates otherwise. Combined estimates are
NMA estimates for comparisons where direct estimates were available. For uncombined estimates start with high quality evidence. -1
symbolizes a choice to rate down (e.g. high quality to moderate quality evidence); 0 symbolizes choice to not rate down; -- = not applicable
because the NMA estimate is the only estimate.
The final quality of evidence updates that of the uncombined evidence. The quality can be moved up if the uncombined score was penalized for
precision, which was overcome in network estimates. It can be moved down if the estimates are no longer precise or if there is evidence of
inconsistency in loops containing the comparison (i.e. violation of transitivity).
Precision – We rated down for precision if the confidence interval crossed 1.1 or 0.9. Consistency – We assessed the consistency for direct
treatment comparisons using I2 estimates and visual inspection of point estimates. An I2 of 75% or higher indicates considerable heterogeneity.
This was conducted along the shortest indirect pathway with the largest number of trials for indirect estimates. Risk of Bias – For direct
estimates we rated down for risk of bias if the majority of studies within a comparison were considered to be at high risk of bias and similarly
along the principal indirect pathway for indirect estimates. Indirectness – Estimates obtained solely from indirect evidence were rated down for
indirectness.

8. Discussion
The purpose of this study was to support the 2018 update to the consolidated guidelines on the use of
antiretrovirals for treating and preventing HIV with respect to the choice of first-line ART. The two
questions of interest were whether DTG and/or EFV400, each with an XTC + TDF backbone, should be
the preferred first-line ART regimen rather than their current designation of alternative first-line ART
regimen. This extensive systematic literature review and network meta-analysis to evaluate the
comparative efficacy and safety of these and other ART regimens drew strong conclusions about the
improved efficacy and tolerability of DTG relative to EFV. Moreover, the evidence synthesis supports the
use of DTG among sub-populations, which was not the case in 2015. Specifically, results of this study
suggest comparable safety among pregnant women initiating treatment and results were not
demonstrably worse among TB-HIV co-infected individuals. Unfortunately, evidence was lacking with
respect to first-line children. Overall, the evidence more strongly supports the choice of DTG as the
preferred first-line regimen.
Despite strong evidence of improved efficacy and tolerability of DTG relative to EFV in the 2015,4 other
factors prevented its recommendation as the preferred first-line regimen.5 These factors were: the
unavailability of a fixed-dose combination with XTC and TDF, the high price, and the uncertainty around
its use in sub-populations. All of these factors have now been overcome. A generic fixed-dose
combination with TDF and lamivudine, referred to as TLD,181 is now available and studies among sub-
populations have begun to report results. It is in this context that this study was undertaken. For adults
and adolescents, the principal population, there were only a few new trials with the treatments of
interest and no new trials for the comparisons of interest. It is therefore not at all surprising that the
conclusions were similar to the previous set of analyses. There continues to be high quality evidence of
improved viral suppression, discontinuations and discontinuations due to AEs for DTG relative the EFV.
Across all outcomes, the results of DTG were favourable, with the only exceptions being in outcomes
that are plagued with very low number of events. While we demonstrated improved safety with DTG
relative to EFV in terms of overall AEs, it is understood that the specific adverse events experienced with
each differ, where DTG is more likely to lead to headaches and EFV has a higher propensity for
neuropsychiatric side effects.182
The evidence on EFV400 compared to standard dose EFV (600mg qd) comes entirely from the ENCORE1
trial.21 Evidence from this trial suggests that low dose EFV is non-inferior to the standard dose, with

90
respect to efficacy and safety. It also suggests improved retention compared to standard dose EFV. Our
study also displayed improved discontinuations due to adverse events among EFV400. Despite this
difference, comparisons of low dose EFV to DTG using indirect evidence showed that DTG tended to
have better retention and lower discontinuations due to adverse events. Moreover, these showed that
DTG was more effective with respect to viral suppression.
Critical to the public health approach that is favoured by the WHO, is the ability to prescribe treatment
regardless of TB co-infection, pregnancy and ideally to children as well. By having the simplest treatment
algorithm, we can ensure that task shifting and non-centralized care can continue in low-income settings,
which has been so critical to the success of the fight against HIV/AIDS. No eligible studies were identified
with respect to EFV400 among sub-populations and thus the second research question could not be
tackled outside of the principal population. Only a handful of eligible studies providing insights on the
first research question (DTG vs EFV) were identified. None were identified for children, so we relied on
information on adults and adolescents to inform children and adolescents. Although we downgraded
the strength of evidence for indirectness, it may not be too much of a stretch to believe the efficacy
observed in adults would translate into children aged 3 years or more. For infants, the comparisons of
interest were with RAL and a similar was used.
Although a trial was available comparing DTG to EFV among TB-HIV co-infected patients, it must be
recognized that the trial was both small and that only 24 week results were available. As such the
evidence was of low quality. Evidence appears to suggest negligible difference between treatments.
Pregnancy was the sub-population with the richest evidence base. Pregnancy was also a focal point of
discussion during the Guideline Development Group meetings, but not exactly in line with this research.
While the evidence base was convincing with respect to the use of DTG as a first-line regimen among
pregnant women, there is a signal that DTG in preconception may be problematic.183 That issue falls
outside the scope of the current study.
Our study has numerous strengths and limitations. First, the use of NMA allowed for analytic
adjustments to account for differences in backbones and provide an unbiased estimate of the
comparison between DTG and EFV despite the critical trial having different backbones. Second, by
combining direct and indirect evidence, some of findings can be seen as having stronger evidence than
previously perceived when strong findings are supported by both sources of evidence. With respect to
limitations, first, the evidence for the comparisons of interest continued to be somewhat limited in sub-
populations. For EFV400, it was completely missing. Most notably for DTG, there was an absence of

91
evidence within children. This was also the case in people pre-exposed to ARVs, though that was
somewhat expected. Even in pregnancy and TB, much of the evidence is still to come. Second, some
significant outcomes were limited by a very low number of events, including mortality, regimen
substitutions, serious adverse events, and ADIs. This influenced the precision of our estimates with
respect to these outcomes and, in some cases, precluded the conduct of evidence synthesis through
NMA. Third, treatment-related adverse events were both inconsistently defined and inconsistently
reported. This limitation was mitigated by considering both treatment-related and treatment-emergent
adverse events. Additionally, studies of shorter duration are, by their nature, less likely to identify
adverse events than longer-term trials. Despite this, the evidence was collected through a rigorous
systematic review process in accordance with the practices and recommendations set forth by the
Cochrane Collaboration, including both broad and targeted searches of the literature, critical appraisal
of the identified studies, and consultation with subject matter experts.
9. Conclusions
Dolutegravir in combination with lamivudine/emtricitabine and tenofovir disoproxil fumarate is an
effective, safe and tolerable ART regimen. Across a variety of outcomes, evidence strongly suggests
that it is superior to the current efavirenz-based preferred first-line ART regimen. With a new affordable
generic fixed dose combination and comparable outcomes among sub-populations, the evidence
supports the choice of a dolutegravir based preferred first-line regimen. Conclusions regarding low-dose
efavirenz are unchanged since 2015. Low-dose efavirenz appears to be more tolerable, but with lack of
evidence in sub-populations it is likely best to be considered an alternative first-line regimen.
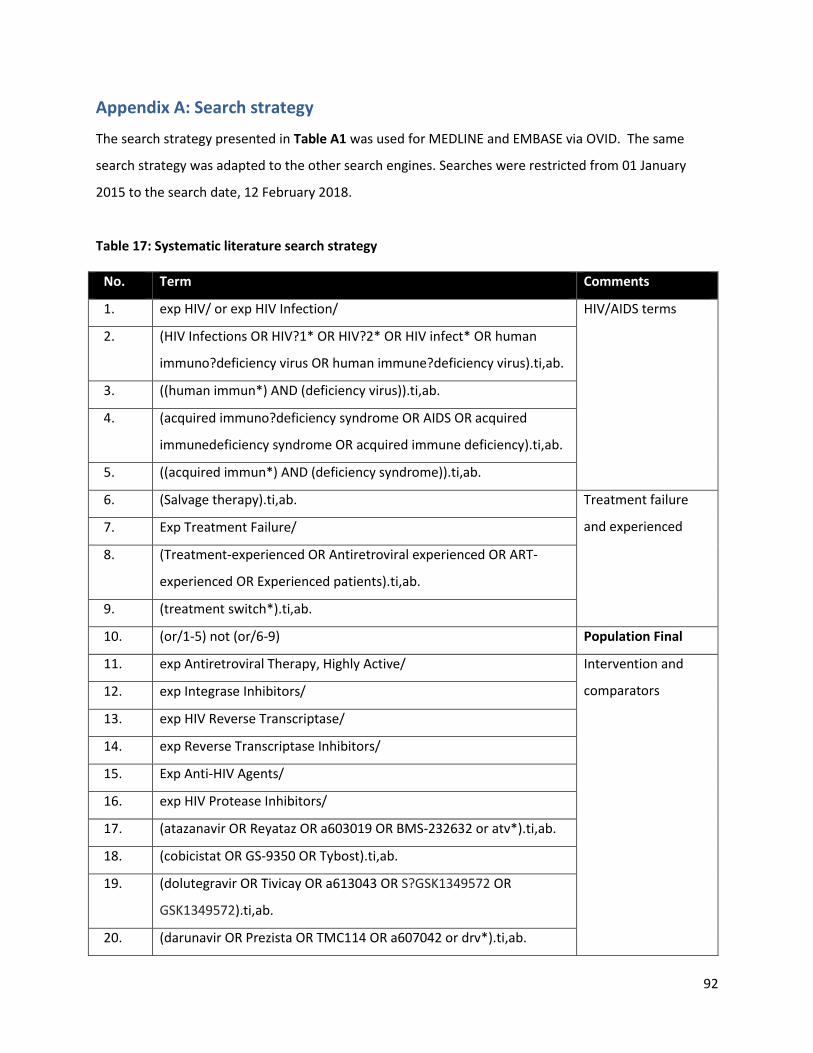
92
Appendix A: Search strategy
The search strategy presented in Table A1 was used for MEDLINE and EMBASE via OVID. The same
search strategy was adapted to the other search engines. Searches were restricted from 01 January
2015 to the search date, 12 February 2018.
Table 17: Systematic literature search strategy
No. Term Comments
1. exp HIV/ or exp HIV Infection/ HIV/AIDS terms
2. (HIV Infections OR HIV?1* OR HIV?2* OR HIV infect* OR human
immuno?deficiency virus OR human immune?deficiency virus).ti,ab.
3. ((human immun*) AND (deficiency virus)).ti,ab.
4. (acquired immuno?deficiency syndrome OR AIDS OR acquired
immunedeficiency syndrome OR acquired immune deficiency).ti,ab.
5. ((acquired immun*) AND (deficiency syndrome)).ti,ab.
6. (Salvage therapy).ti,ab. Treatment failure
and experienced 7. Exp Treatment Failure/
8. (Treatment-experienced OR Antiretroviral experienced OR ART-
experienced OR Experienced patients).ti,ab.
9. (treatment switch*).ti,ab.
10. (or/1-5) not (or/6-9) Population Final
11. exp Antiretroviral Therapy, Highly Active/ Intervention and
comparators
12. exp Integrase Inhibitors/
13. exp HIV Reverse Transcriptase/
14. exp Reverse Transcriptase Inhibitors/
15. Exp Anti-HIV Agents/
16. exp HIV Protease Inhibitors/
17. (atazanavir OR Reyataz OR a603019 OR BMS-232632 or atv*).ti,ab.
18. (cobicistat OR GS-9350 OR Tybost).ti,ab.
19. (dolutegravir OR Tivicay OR a613043 OR S?GSK1349572 OR
GSK1349572).ti,ab.
20. (darunavir OR Prezista OR TMC114 OR a607042 or drv*).ti,ab.
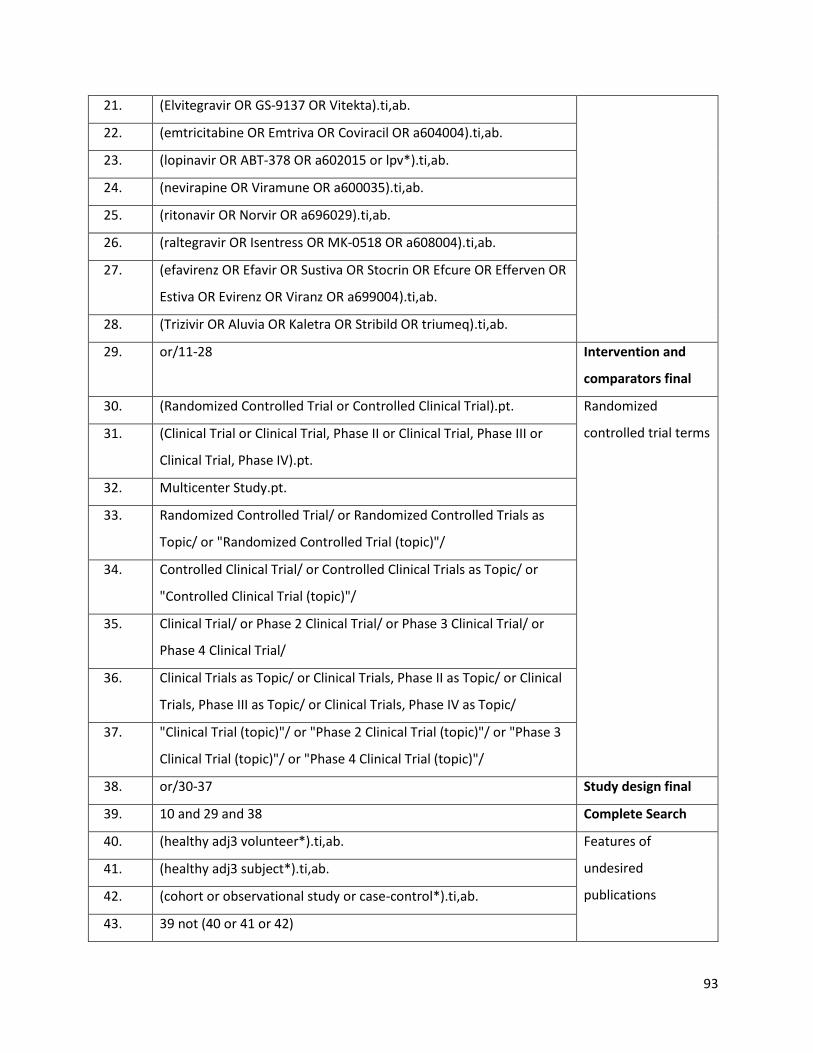
93
21. (Elvitegravir OR GS-9137 OR Vitekta).ti,ab.
22. (emtricitabine OR Emtriva OR Coviracil OR a604004).ti,ab.
23. (lopinavir OR ABT-378 OR a602015 or lpv*).ti,ab.
24. (nevirapine OR Viramune OR a600035).ti,ab.
25. (ritonavir OR Norvir OR a696029).ti,ab.
26. (raltegravir OR Isentress OR MK-0518 OR a608004).ti,ab.
27. (efavirenz OR Efavir OR Sustiva OR Stocrin OR Efcure OR Efferven OR
Estiva OR Evirenz OR Viranz OR a699004).ti,ab.
28. (Trizivir OR Aluvia OR Kaletra OR Stribild OR triumeq).ti,ab.
29. or/11-28 Intervention and
comparators final
30. (Randomized Controlled Trial or Controlled Clinical Trial).pt. Randomized
controlled trial terms 31. (Clinical Trial or Clinical Trial, Phase II or Clinical Trial, Phase III or
Clinical Trial, Phase IV).pt.
32. Multicenter Study.pt.
33. Randomized Controlled Trial/ or Randomized Controlled Trials as
Topic/ or "Randomized Controlled Trial (topic)"/
34. Controlled Clinical Trial/ or Controlled Clinical Trials as Topic/ or
"Controlled Clinical Trial (topic)"/
35. Clinical Trial/ or Phase 2 Clinical Trial/ or Phase 3 Clinical Trial/ or
Phase 4 Clinical Trial/
36. Clinical Trials as Topic/ or Clinical Trials, Phase II as Topic/ or Clinical
Trials, Phase III as Topic/ or Clinical Trials, Phase IV as Topic/
37. "Clinical Trial (topic)"/ or "Phase 2 Clinical Trial (topic)"/ or "Phase 3
Clinical Trial (topic)"/ or "Phase 4 Clinical Trial (topic)"/
38. or/30-37 Study design final
39. 10 and 29 and 38 Complete Search
40. (healthy adj3 volunteer*).ti,ab. Features of
undesired
publications
41. (healthy adj3 subject*).ti,ab.
42. (cohort or observational study or case-control*).ti,ab.
43. 39 not (40 or 41 or 42)
94
44. 43 not (cost minimi* or cost-utilit* or health utility* or economic
evaluation* or economic review* or cost outcome or cost analys?s
or economic analys?s or budget* impact analys?s).ti,ab.
45. 44 not (review or letter or meta-analysis or case report or case
series or posters or News or Newspaper article or meeting abstracts
or lectures or interview or historical article or handbooks or
guidelines or guidebooks or essays or editorial or comment or
clinical conference or catalogs or case reports).pt.
mp denotes multi-purpose and implies a search through all fields; .sh. denotes a Medical Subject
Heading (MeSH) term; ti,ab. denotes a search for terms in title and abstract; exp denotes explode and
implies that a term and a collection of variations on that term are searched for; * is used for truncation;
? is a single space wildcard term.
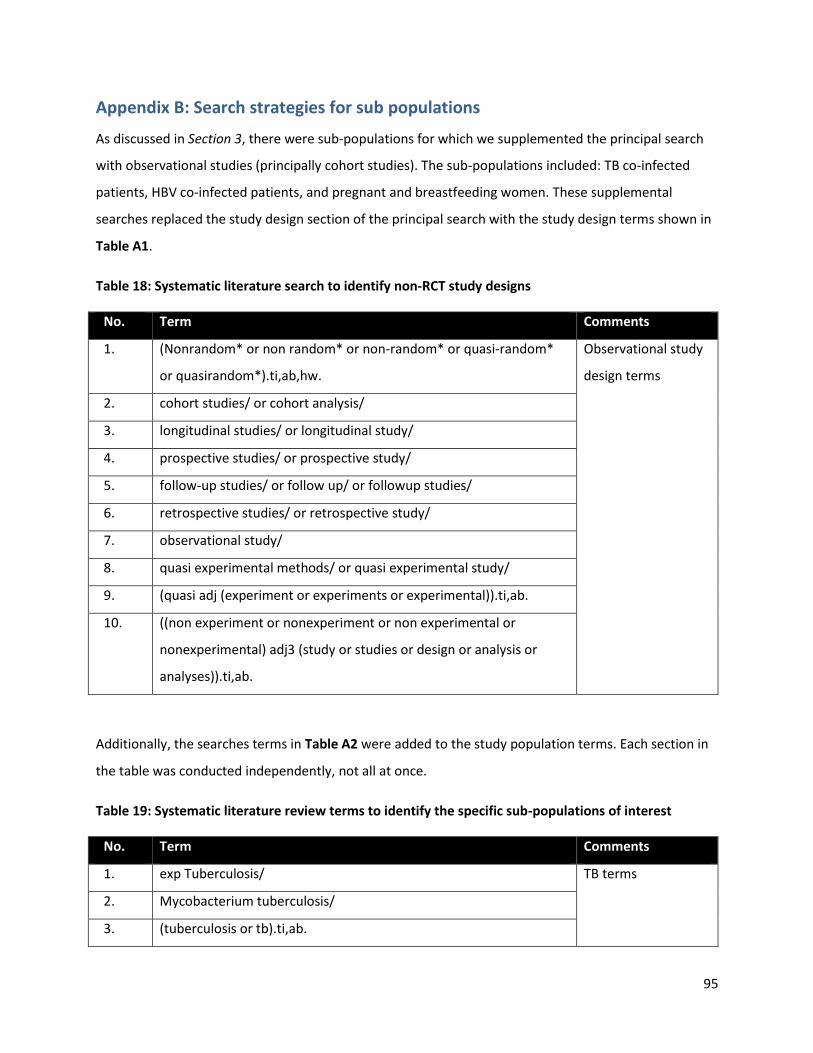
95
Appendix B: Search strategies for sub populations
As discussed in Section 3, there were sub-populations for which we supplemented the principal search
with observational studies (principally cohort studies). The sub-populations included: TB co-infected
patients, HBV co-infected patients, and pregnant and breastfeeding women. These supplemental
searches replaced the study design section of the principal search with the study design terms shown in
Table A1.
Table 18: Systematic literature search to identify non-RCT study designs
No. Term Comments
1. (Nonrandom* or non random* or non-random* or quasi-random*
or quasirandom*).ti,ab,hw.
Observational study
design terms
2. cohort studies/ or cohort analysis/
3. longitudinal studies/ or longitudinal study/
4. prospective studies/ or prospective study/
5. follow-up studies/ or follow up/ or followup studies/
6. retrospective studies/ or retrospective study/
7. observational study/
8. quasi experimental methods/ or quasi experimental study/
9. (quasi adj (experiment or experiments or experimental)).ti,ab.
10. ((non experiment or nonexperiment or non experimental or
nonexperimental) adj3 (study or studies or design or analysis or
analyses)).ti,ab.
Additionally, the searches terms in Table A2 were added to the study population terms. Each section in
the table was conducted independently, not all at once.
Table 19: Systematic literature review terms to identify the specific sub-populations of interest
No. Term Comments
1. exp Tuberculosis/ TB terms
2. Mycobacterium tuberculosis/
3. (tuberculosis or tb).ti,ab.

96
4. exp Hepatitis B/ HBV terms
5. exp Hepatitis B virus/
6. (HBaSq).ti,ab,kw.
7. exp Pregnant Women/ Pregnant and
breastfeeding
women terms
8. exp Mothers/
9. exp Breast Feeding/
10. exp Infectious Disease Transmission, Vertical/
11. Adolescent/ Adolescents
12. (adolescent* or teen*).tw.
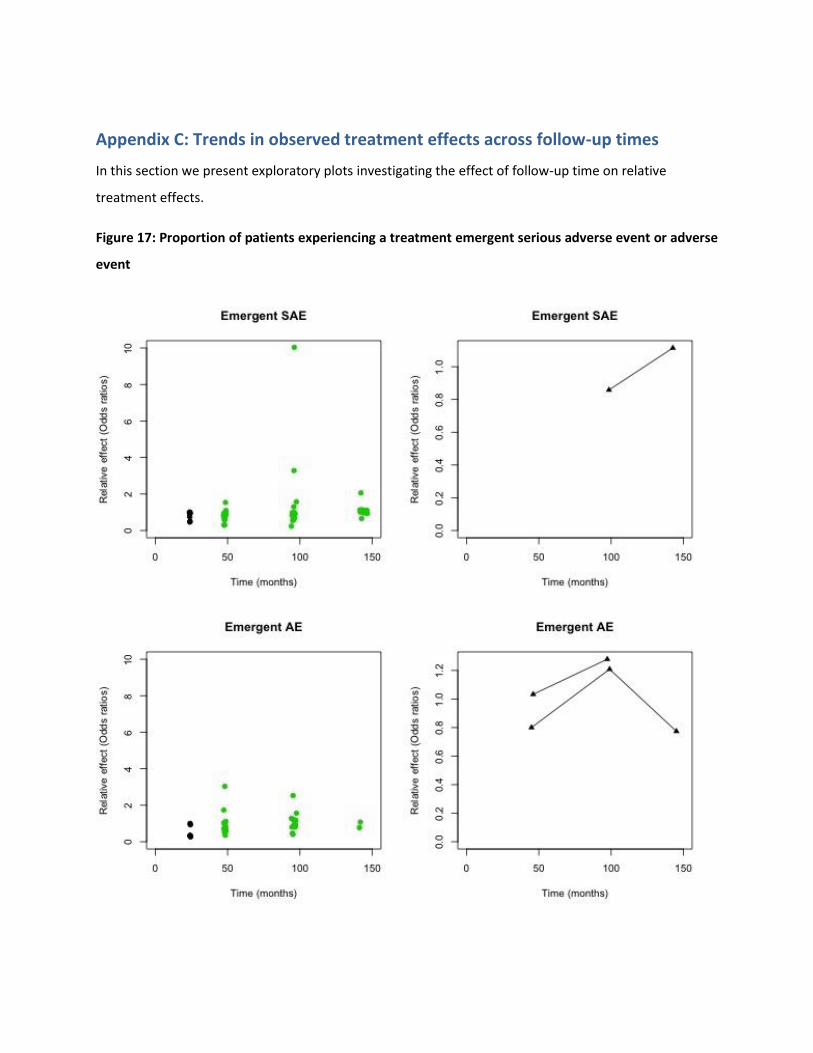
Appendix C: Trends in observed treatment effects across follow-up times
In this section we present exploratory plots investigating the effect of follow-up time on relative
treatment effects.
Figure 17: Proportion of patients experiencing a treatment emergent serious adverse event or adverse
event

98
Legend: The left panels present proportions reported at each time point. The right panels present the
odds ratios for each outcome over time. Connected points indicate a pair of odds ratios from a single RCT.
Figure 18: Proportion of patients experiencing a treatment related serious adverse event or adverse
event
Legend: The left panels present proportions reported at each time point. The right panels present the
odds ratios for each outcome over time. Connected points indicate a pair of odds ratios from a single RCT.

99
Figure 19: Proportion of patients discontinuing treatment and discontinuing treatment due to an
adverse event
Legend: The left panels present proportions reported at each time point. The right panels present the
odds ratios for each outcome over time. Connected points indicate a pair of odds ratios from a single RCT.
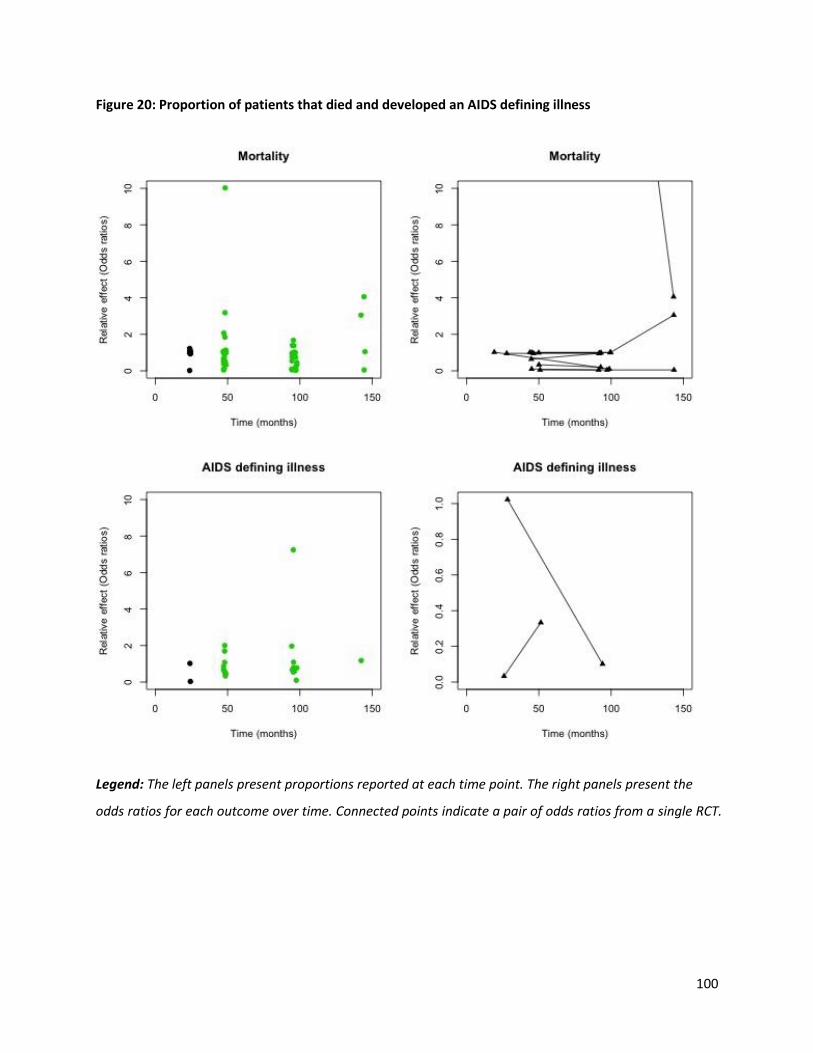
100
Figure 20: Proportion of patients that died and developed an AIDS defining illness
Legend: The left panels present proportions reported at each time point. The right panels present the
odds ratios for each outcome over time. Connected points indicate a pair of odds ratios from a single RCT.

101
Figure 21: Proportion of patients switching treatments during study
Legend: The left panels present proportions reported at each time point. The right panels present the
odds ratios for each outcome over time. Connected points indicate a pair of odds ratios from a single RCT.
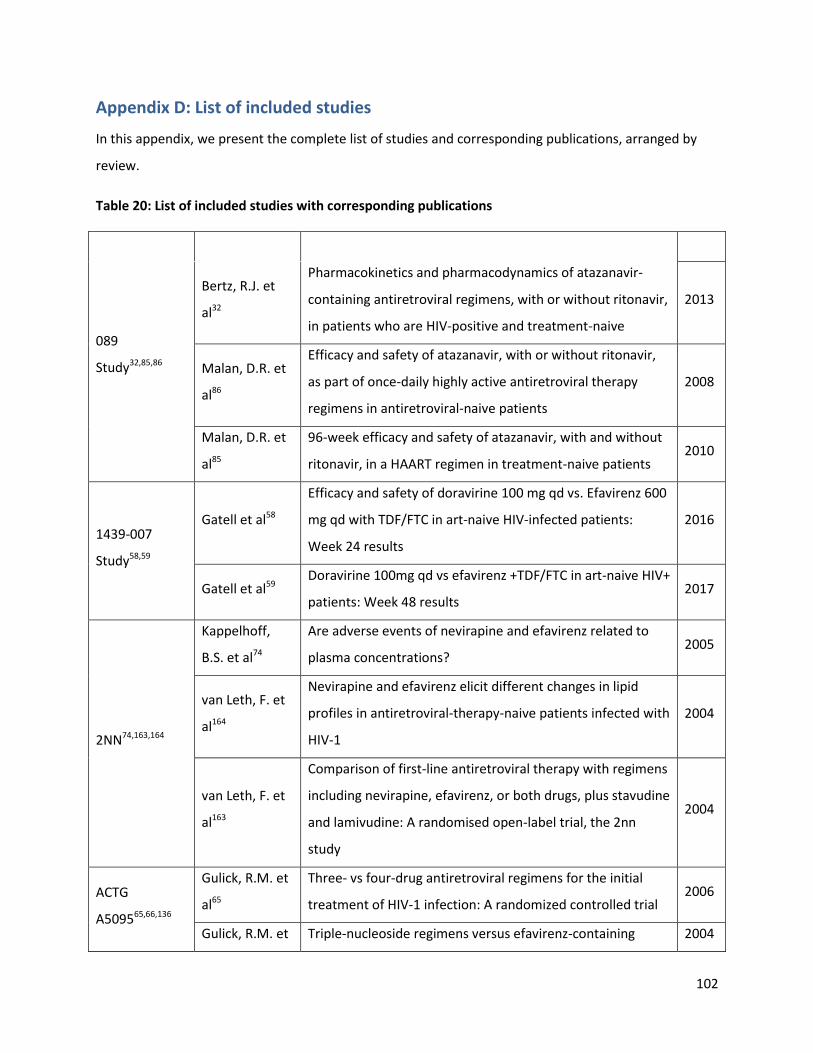
102
Appendix D: List of included studies
In this appendix, we present the complete list of studies and corresponding publications, arranged by
review.
Table 20: List of included studies with corresponding publications
Trial ID Author Title Year
089
Study32,85,86
Bertz, R.J. et
al32
Pharmacokinetics and pharmacodynamics of atazanavir-
containing antiretroviral regimens, with or without ritonavir,
in patients who are HIV-positive and treatment-naive
2013
Malan, D.R. et
al86
Efficacy and safety of atazanavir, with or without ritonavir,
as part of once-daily highly active antiretroviral therapy
regimens in antiretroviral-naive patients
2008
Malan, D.R. et
al85
96-week efficacy and safety of atazanavir, with and without
ritonavir, in a HAART regimen in treatment-naive patients 2010
1439-007
Study58,59
Gatell et al58
Efficacy and safety of doravirine 100 mg qd vs. Efavirenz 600
mg qd with TDF/FTC in art-naive HIV-infected patients:
Week 24 results
2016
Gatell et al59 Doravirine 100mg qd vs efavirenz +TDF/FTC in art-naive HIV+
patients: Week 48 results 2017
2NN74,163,164
Kappelhoff,
B.S. et al74
Are adverse events of nevirapine and efavirenz related to
plasma concentrations? 2005
van Leth, F. et
al164
Nevirapine and efavirenz elicit different changes in lipid
profiles in antiretroviral-therapy-naive patients infected with
HIV-1
2004
van Leth, F. et
al163
Comparison of first-line antiretroviral therapy with regimens
including nevirapine, efavirenz, or both drugs, plus stavudine
and lamivudine: A randomised open-label trial, the 2nn
study
2004
ACTG
A509565,66,136
Gulick, R.M. et
al65
Three- vs four-drug antiretroviral regimens for the initial
treatment of HIV-1 infection: A randomized controlled trial 2006
Gulick, R.M. et Triple-nucleoside regimens versus efavirenz-containing 2004
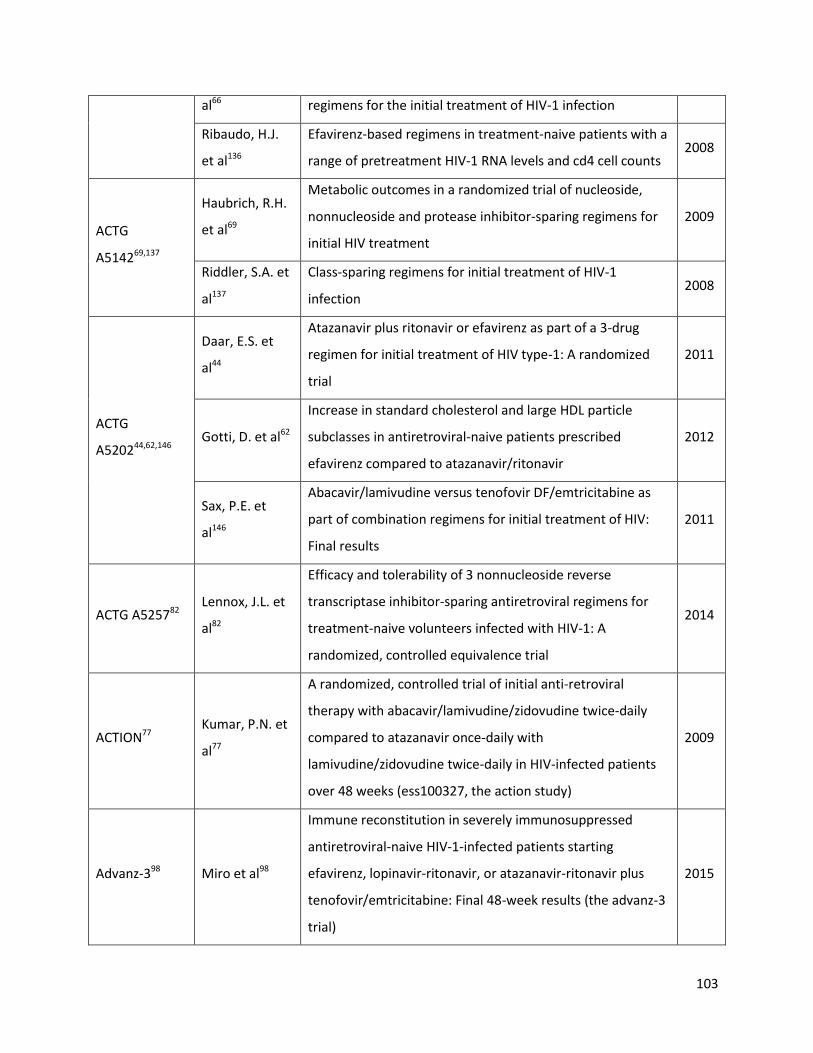
103
al66 regimens for the initial treatment of HIV-1 infection
Ribaudo, H.J.
et al136
Efavirenz-based regimens in treatment-naive patients with a
range of pretreatment HIV-1 RNA levels and cd4 cell counts 2008
ACTG
A514269,137
Haubrich, R.H.
et al69
Metabolic outcomes in a randomized trial of nucleoside,
nonnucleoside and protease inhibitor-sparing regimens for
initial HIV treatment
2009
Riddler, S.A. et
al137
Class-sparing regimens for initial treatment of HIV-1
infection 2008
ACTG
A520244,62,146
Daar, E.S. et
al44
Atazanavir plus ritonavir or efavirenz as part of a 3-drug
regimen for initial treatment of HIV type-1: A randomized
trial
2011
Gotti, D. et al62
Increase in standard cholesterol and large HDL particle
subclasses in antiretroviral-naive patients prescribed
efavirenz compared to atazanavir/ritonavir
2012
Sax, P.E. et
al146
Abacavir/lamivudine versus tenofovir DF/emtricitabine as
part of combination regimens for initial treatment of HIV:
Final results
2011
ACTG A525782 Lennox, J.L. et
al82
Efficacy and tolerability of 3 nonnucleoside reverse
transcriptase inhibitor-sparing antiretroviral regimens for
treatment-naive volunteers infected with HIV-1: A
randomized, controlled equivalence trial
2014
ACTION77 Kumar, P.N. et
al77
A randomized, controlled trial of initial anti-retroviral
therapy with abacavir/lamivudine/zidovudine twice-daily
compared to atazanavir once-daily with
lamivudine/zidovudine twice-daily in HIV-infected patients
over 48 weeks (ess100327, the action study)
2009
Advanz-398 Miro et al98
Immune reconstitution in severely immunosuppressed
antiretroviral-naive HIV-1-infected patients starting
efavirenz, lopinavir-ritonavir, or atazanavir-ritonavir plus
tenofovir/emtricitabine: Final 48-week results (the advanz-3
trial)
2015

104
AI424-008106 Murphy, R.L. et
al106
Dose-ranging, randomized, clinical trial of atazanavir with
lamivudine and stavudine in antiretroviral-naive subjects:
48-week results
2003
Albini et al,
201220 Albini, L. et al20
A randomized, pilot trial to evaluate glomerular filtration
rate by creatinine or cystatin c in naive HIV-infected patients
after tenofovir/emtricitabine in combination with
atazanavir/ritonavir or efavirenz
2012
ALERT152 Smith, K.Y. et
al152
Fosamprenavir or atazanavir once daily boosted with
ritonavir 100 mg, plus tenofovir/emtricitabine, for the initial
treatment of HIV infection: 48-week results of alert
2008
ALTAIR128 Puls, R.L. et
al128
Efavirenz versus boosted atazanavir or zidovudine and
abacavir in antiretroviral treatment-naive, HIV-infected
subjects: Week 48 data from the Altair study
2010
ARIA124 Porteiro et
al124
Fixed-dose combination dolutegravir, abacavir, and
lamivudine versus ritonavir-boosted atazanavir plus
tenofovir disoproxil fumarate and emtricitabine in previously
untreated women with HIV-1 infection (aria): Week 48
results from a randomised, open-label, non-inferiority,
phase 3b study
2017
ARTEMIS
23,52,79,96,115,119,16
0
Arathoon, E. et
al23
Effects of once-daily darunavir/ritonavir versus
lopinavir/ritonavir on metabolic parameters in treatment-
naive HIV-1-infected patients at week 96: Artemis
2013
Fatkenheuer,
G. et al52
Artemis 96-week comparison of liver tolerability of once-
daily darunavir/ritonavir (DRV/r) versus lopinavir/ ritonavir
(LPV/r) in treatment-naive patients
2009
Lazzarin, A. et
al79
Artemis: 192-week efficacy and safety of once daily
darunavir/ritonavir (DRV/r) versus lopinavir/r (LPV/r) in
treatment-naive HIV-1-infected adults
2011
Mills, A.M. et
al96
Once-daily darunavir/ritonavir vs. Lopinavir/ritonavir in
treatment-naive, HIV-1-infected patients: 96-week analysis 2009
Orkin, C. et Final 192-week efficacy and safety of once-daily 2013

105
al115 darunavir/ritonavir compared with lopinavir/ritonavir in HIV-
1-infected treatment-naive patients in the ARTEMIS trial
Ortiz, R. et al119
Efficacy and safety of once-daily darunavir/ritonavir versus
lopinavir/ritonavir in treatment-naive HIV-1-infected
patients at week 48
2008
Termini, R. et
al160
Use of once-daily darunavir/r (800/100mg) in treatment-
naive patients co-infected with hepatitis b and/or c. Data
from the ARTEMIS study
2009
ARTEN121,123,153
Podzamczer, D.
et al123
Comparison of lipid profile with nevirapine versus
atazanavir/ritonavir, both combined with tenofovir DF and
emtricitabine (TDF/FTC), in treatment-naive HIV-1-infected
patients: ARTEN study week-48 results
2009
Podzamczer, D.
et al121
Lipid profiles for nevirapine vs. Atazanavir/ritonavir, both
combined with tenofovir disoproxil fumarate and
emtricitabine over 48 weeks, in treatment-naive HIV-1-
infected patients (the ARTEN study)
2011
Soriano, V. et
al153
Nevirapine versus atazanavir/ritonavir, each combined with
tenofovir disoproxil fumarate/emtricitabine, in
antiretroviral-naive HIV-1 patients: The ARTEN trial
2011
ASSERT104,125,158
Moyle, G.J. et
al104
96-week results of abacavir/lamivudine versus
tenofovir/emtricitabine, plus efavirenz, in antiretroviral-
naive, HIV-1-infected adults: Assert study
2013
Post, F.A. et
al125
Randomized comparison of renal effects, efficacy, and safety
with once-daily abacavir/lamivudine versus
tenofovir/emtricitabine, administered with efavirenz, in
antiretroviral-naive, HIV-1-infected adults: 48-week results
from the assert study
2010
Stellbrink, H.J.
et al158
Comparison of changes in bone density and turnover with
abacavir-lamivudine versus tenofovir-emtricitabine in HIV-
infected adults: 48-week results from the assert study
2010
ATADAR90,91 Martinez et Differential body composition effects of protease inhibitors 2015

106
al91 recommended for initial treatment of HIV infection: A
randomized clinical trial
Martinez, E. et
al90
Early lipid changes with atazanavir/ritonavir or
darunavir/ritonavir 2014
ATLANTIC162 van Leeuwen,
R. et al162
A randomized trial to study first-line combination therapy
with or without a protease inhibitor in HIV-1-infected
patients
2003
Avihingsanon
et al, 201027
Avihingsanon,
A. et al27
Efficacy of tenofovir disoproxil fumarate/emtricitabine
compared with emtricitabine alone in antiretroviral-naïve
HIV-HBV coinfection in Thailand
2010
BASIC168 Vrouenraets,
S.M. et al168
Randomized comparison of metabolic and renal effects of
saquinavir/r or atazanavir/r plus tenofovir/emtricitabine in
treatment-naive HIV-1-infected patients
2011
CASTLE73,87,101,1
02
Johnson, M.
and Moyle,
G.73
Castle study: 96-week efficacy & safety of ATV/r versus
LPV/r in antiretroviral-naive HIV-1-infected patients 2009
Malan, N. et
al87
Gastrointestinal tolerability and quality of life in
antiretroviral-naive HIV-1-infected patients: Data from the
castle study
2010
Molina, J.M. et
al102
Once-daily atazanavir/ritonavir compared with twice-daily
lopinavir/ritonavir, each in combination with tenofovir and
emtricitabine, for management of antiretroviral-naive HIV-1-
infected patients: 96-week efficacy and safety results of the
castle study
2010
Molina, J.M. et
al101
Once-daily atazanavir/ritonavir versus twice-daily
lopinavir/ritonavir, each in combination with tenofovir and
emtricitabine, for management of antiretroviral-naive HIV-1-
infected patients: 48 week efficacy and safety results of the
castle study
2008
CCTG 58933 Bowman, V. et
al33
48 week results of a pilot randomized study of an nucleoside
reverse 2011

107
transcriptase inhibitor (NRTI)-sparing regimen of raltegravir
(RAL) +
lopinavir/ritonavir (LPV/r) versus efavirenz/tenofovir
disoproxil fumarate
/emtricitabine (EFV/TDF/FTC) in antiretroviral
CNA3002446 DeJesus, E. et
al46
Abacavir versus zidovudine combined with lamivudine and
efavirenz, for the treatment of antiretroviral-naive HIV-
infected adults
2004
CNA3014167 Vibhagool, A.
et al167
Triple nucleoside treatment with abacavir plus the
lamivudine/zidovudine combination tablet (com) compared
to indinavir/com in antiretroviral therapy-naive adults:
Results of a 48-week open-label, equivalence trial (cna3014)
2004
CNAAB3005157 Staszewski, S.
et al157
Abacavir-lamivudine-zidovudine vs indinavir-lamivudine-
zidovudine in antiretroviral-naive HIV-infected adults: A
randomized equivalence trial
2001
CNAF300793 Matheron, S.
et al93
Triple nucleoside combination
zidovudine/lamivudine/abacavir versus
zidovudine/lamivudine/nelfinavir as first-line therapy in HIV-
1-infected adults: A randomized trial
2003
COMBINE53 Fisac, C. et al53
A comparison of the effects of nevirapine and nelfinavir on
metabolism and body habitus in antiretroviral-naive human
immunodeficiency virus-infected patients: A randomized
controlled study
2003
COMBINE122 Podzamczer, D.
et al122
A randomized clinical trial comparing nelfinavir or nevirapine
associated to zidovudine/lamivudine in HIV-infected naive
patients (the combine study)
2002
CTN17767,68
Harris, M. et
al67
A randomized, open-label study of a nucleoside analogue
reverse transcriptase inhibitor-sparing regimen in
antiretroviral-naive HIV-infected patients
2009
Harris, M. et
al68
NRTI Sparing Trial (CTN 177): Antiviral and Metabolic Effects
of 2009

108
Nevirapine (NVP) + Lopinavir/ritonavir (LPV/r) vs.
Zidovudine/lamivudine (AZT/3TC) + NVP vs. AZT/3TC + LPV/r
DAUFIN133 Rey, D. et al133
High rate of early virological failure with the once-daily
tenofovir/lamivudine/nevirapine combination in naive HIV-
1-infected patients
2009
DAYANA78 Landman, R. et
al78
Evaluation of four tenofovir-containing regimens as first-line
treatments in Cameroon and Senegal: The ANRS 12115
Dayana trial
2014
DRIVE
AHEAD117 Orkin et al117
Similar Efficacy and Safety By Subgroup in DRIVE-AHEAD:
DOR/3TC/TDF vs EFV/FTC/TDF 2018
DRIVE
FORWARD99 Molina et al99
Doravirine is non-inferior to darunavir/r in phase 3
treatment naïve trial at week 48 2017
ECHO103 Molina, J.M. et
al103
Rilpivirine versus efavirenz with tenofovir and emtricitabine
in treatment-naive adults infected with HIV-1 (echo): A
phase 3 randomised double-blind active-controlled trial
2011
ENCORE121,22,64
Amin, J. et al21
Efficacy of 400 mg efavirenz versus standard 600 mg dose in
HIV-infected, antiretroviral-naive adults (encore1): A
randomised, double-blind, placebo-controlled, non-
inferiority trial
2014
Amin, J. et al22
Efficacy and safety of efavirenz 400 mg daily versus 600 mg
daily: 96-week data from the randomised, double-blind,
placebo-controlled, non-inferiority ENCORE1 study
2015
Encore1 Study
Group64
Efficacy and safety of efavirenz 400 mg daily versus 600 mg
daily: 96-week data from the randomised, double-blind,
placebo-controlled, non-inferiority encore1 study
2015
Epzicom-
Truvada
111,112
Nishijima, T. et
al112
Abacavir/lamivudine versus tenofovir/emtricitabine with
atazanavir/ritonavir for treatment-naive Japanese patients
with HIV-1 infection: A randomized multicenter trial
2013
Nishijima, T. et
al111
Once-daily darunavir/ritonavir and abacavir/lamivudine
versus tenofovir/emtricitabine for treatment-naive patients
with a baseline viral load of more than 100 000 copies/ml
2013

109
FLAMINGO37,10
0
Clotet, B. et
al37
Once-daily dolutegravir versus darunavir plus ritonavir in
antiretroviral-naive adults with HIV-1 infection (FLAMINGO):
48-week results from the randomised open-label phase 3b
study
2014
Molina, J. et
al100
Once-daily dolutegravir versus darunavir plus ritonavir for
treatment-naive adults with HIV-1 infection (FLAMINGO): 96
week results from a randomised, open-label, phase 3b study
2015
GEMINI169 Walmsley, S. et
al169
Gemini: A noninferiority study of saquinavir/ritonavir versus
lopinavir/ritonavir as initial HIV-1 therapy in adults 2009
GESIDA 390331 Berenguer, J.
et al31
Didanosine, lamivudine, and efavirenz versus zidovudine,
lamivudine, and efavirenz for the initial treatment of HIV
type 1 infection: Final analysis (48 weeks) of a prospective,
randomized, noninferiority clinical trial, gesida 3903
2008
GS-US-141-
1475
143,144
Sax et al144
Bictegravir versus dolutegravir, each with emtricitabine and
tenofovir alafenamide, for initial treatment of HIV-1
infection: A randomised, double-blind, phase 2 trial
2017
Sax et al143 Randomized trial of bictegravir or dolutegravir with FTC/TAF
for initial HIV therapy 2017
GS-US-236-
0102
145,178,180
Sax, P.E. et
al145
Co-formulated elvitegravir, cobicistat, emtricitabine, and
tenofovir versus co-formulated efavirenz, emtricitabine, and
tenofovir for initial treatment of HIV-1 infection: A
randomised, double-blind, phase 3 trial, analysis of results
after 48 weeks.[erratum appears in lancet. 2012 aug
25;380(9843):730]
2012
Wohl, D.A. et
al178
A randomized, double-blind comparison of single-tablet
regimen elvitegravir/cobicistat/emtricitabine/tenofovir df
versus single-tablet regimen
efavirenz/emtricitabine/tenofovir df for initial treatment of
HIV-1 infection: Analysis of week 144 results
2014
Zolopa, A. et
al180
A randomized double-blind comparison of co-formulated
elvitegravir/cobicistat/emtricitabine/tenofovir disoproxil 2013

110
fumarate versus efavirenz/emtricitabine/tenofovir disoproxil
fumarate for initial treatment of HIV-1 infection: Analysis of
week 96 results
GS-US-236-
0103
48,108,114,116,118,13
8,140
DeJesus, E. et
al48
Co-formulated elvitegravir, cobicistat, emtricitabine, and
tenofovir disoproxil fumarate versus ritonavir-boosted
atazanavir plus co-formulated emtricitabine and tenofovir
disoproxil fumarate for initial treatment of HIV-1 infection: A
randomised, double-blind, phase 3, non-inferiority trial
2012
Nathan, C. et
al108
Long-term efficacy and safety of
elvitegravir/cobicistat/emtricitabine/tenofovir df versus
atazanavir plus ritonavir plus emtricitabine/tenofovir
2014
Orkin, C. et
al118
A randomized study comparing a three- and four-drug
HAART regimen in first-line therapy (quad study) 2005
Orkin, C. et
al114
Week 144 efficacy and safety data:
Elvitegravir/cobicistat/emtricitabine/tenofovir df (stribild)
demonstrates durable efficacy and differentiated safety
compared to atazanavir boosted by ritonavir plus
emtricitabine/tenofovir df at week 144 in treatment-naive
HIV-1-infected patients
2014
Orkin, C. et
al116
Week 96 efficacy and safety data: Elvitegravir/cobicistat/
emtricitabine/tenofovir df (quad) compared to atazanavir
boosted by ritonavir plus emtricitabine/tenofovir df in
treatment-naive HIV-1-infected patients
2013
Rockstroh, J. et
al138
Elvitegravir/cobicistat/emtricitabine/tenofovir df (quad) has
durable efficacy and differentiated safety compared to
atazanavir boosted by ritonavir plus emtricitabine/tenofovir
df at week 96 in treatment-naive HIV-1-infected patients
2012
Rockstroh, J.K.
et al140
A randomized, double-blind comparison of coformulated
elvitegravir/ cobicistat/emtricitabine/tenofovir df vs
ritonavir-boosted atazanavir plus coformulated
emtricitabine and tenofovir df for initial treatment of HIV-1
2013
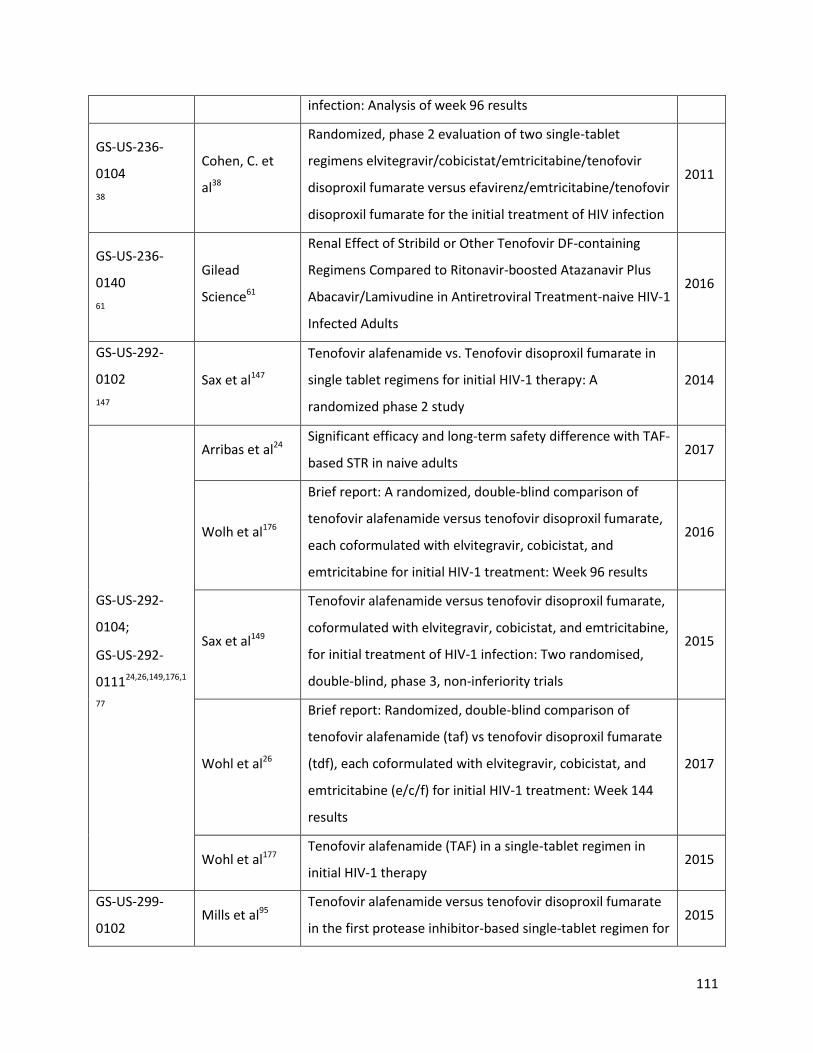
111
infection: Analysis of week 96 results
GS-US-236-
0104
38
Cohen, C. et
al38
Randomized, phase 2 evaluation of two single-tablet
regimens elvitegravir/cobicistat/emtricitabine/tenofovir
disoproxil fumarate versus efavirenz/emtricitabine/tenofovir
disoproxil fumarate for the initial treatment of HIV infection
2011
GS-US-236-
0140
61
Gilead
Science61
Renal Effect of Stribild or Other Tenofovir DF-containing
Regimens Compared to Ritonavir-boosted Atazanavir Plus
Abacavir/Lamivudine in Antiretroviral Treatment-naive HIV-1
Infected Adults
2016
GS-US-292-
0102
147
Sax et al147
Tenofovir alafenamide vs. Tenofovir disoproxil fumarate in
single tablet regimens for initial HIV-1 therapy: A
randomized phase 2 study
2014
GS-US-292-
0104;
GS-US-292-
011124,26,149,176,1
77
Arribas et al24 Significant efficacy and long-term safety difference with TAF-
based STR in naive adults 2017
Wolh et al176
Brief report: A randomized, double-blind comparison of
tenofovir alafenamide versus tenofovir disoproxil fumarate,
each coformulated with elvitegravir, cobicistat, and
emtricitabine for initial HIV-1 treatment: Week 96 results
2016
Sax et al149
Tenofovir alafenamide versus tenofovir disoproxil fumarate,
coformulated with elvitegravir, cobicistat, and emtricitabine,
for initial treatment of HIV-1 infection: Two randomised,
double-blind, phase 3, non-inferiority trials
2015
Wohl et al26
Brief report: Randomized, double-blind comparison of
tenofovir alafenamide (taf) vs tenofovir disoproxil fumarate
(tdf), each coformulated with elvitegravir, cobicistat, and
emtricitabine (e/c/f) for initial HIV-1 treatment: Week 144
results
2017
Wohl et al177 Tenofovir alafenamide (TAF) in a single-tablet regimen in
initial HIV-1 therapy 2015
GS-US-299-
0102 Mills et al95
Tenofovir alafenamide versus tenofovir disoproxil fumarate
in the first protease inhibitor-based single-tablet regimen for 2015
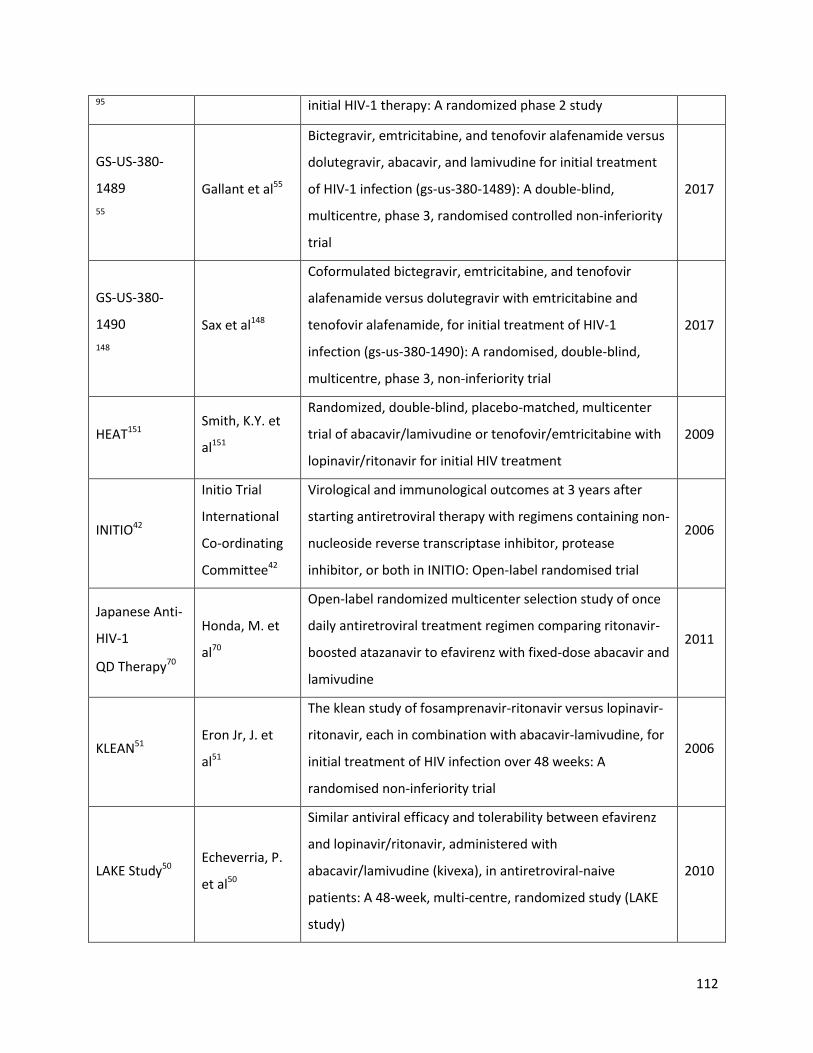
112
95 initial HIV-1 therapy: A randomized phase 2 study
GS-US-380-
1489
55
Gallant et al55
Bictegravir, emtricitabine, and tenofovir alafenamide versus
dolutegravir, abacavir, and lamivudine for initial treatment
of HIV-1 infection (gs-us-380-1489): A double-blind,
multicentre, phase 3, randomised controlled non-inferiority
trial
2017
GS-US-380-
1490
148
Sax et al148
Coformulated bictegravir, emtricitabine, and tenofovir
alafenamide versus dolutegravir with emtricitabine and
tenofovir alafenamide, for initial treatment of HIV-1
infection (gs-us-380-1490): A randomised, double-blind,
multicentre, phase 3, non-inferiority trial
2017
HEAT151 Smith, K.Y. et
al151
Randomized, double-blind, placebo-matched, multicenter
trial of abacavir/lamivudine or tenofovir/emtricitabine with
lopinavir/ritonavir for initial HIV treatment
2009
INITIO42
Initio Trial
International
Co-ordinating
Committee42
Virological and immunological outcomes at 3 years after
starting antiretroviral therapy with regimens containing non-
nucleoside reverse transcriptase inhibitor, protease
inhibitor, or both in INITIO: Open-label randomised trial
2006
Japanese Anti-
HIV-1
QD Therapy70
Honda, M. et
al70
Open-label randomized multicenter selection study of once
daily antiretroviral treatment regimen comparing ritonavir-
boosted atazanavir to efavirenz with fixed-dose abacavir and
lamivudine
2011
KLEAN51 Eron Jr, J. et
al51
The klean study of fosamprenavir-ritonavir versus lopinavir-
ritonavir, each in combination with abacavir-lamivudine, for
initial treatment of HIV infection over 48 weeks: A
randomised non-inferiority trial
2006
LAKE Study50 Echeverria, P.
et al50
Similar antiviral efficacy and tolerability between efavirenz
and lopinavir/ritonavir, administered with
abacavir/lamivudine (kivexa), in antiretroviral-naive
patients: A 48-week, multi-centre, randomized study (LAKE
study)
2010
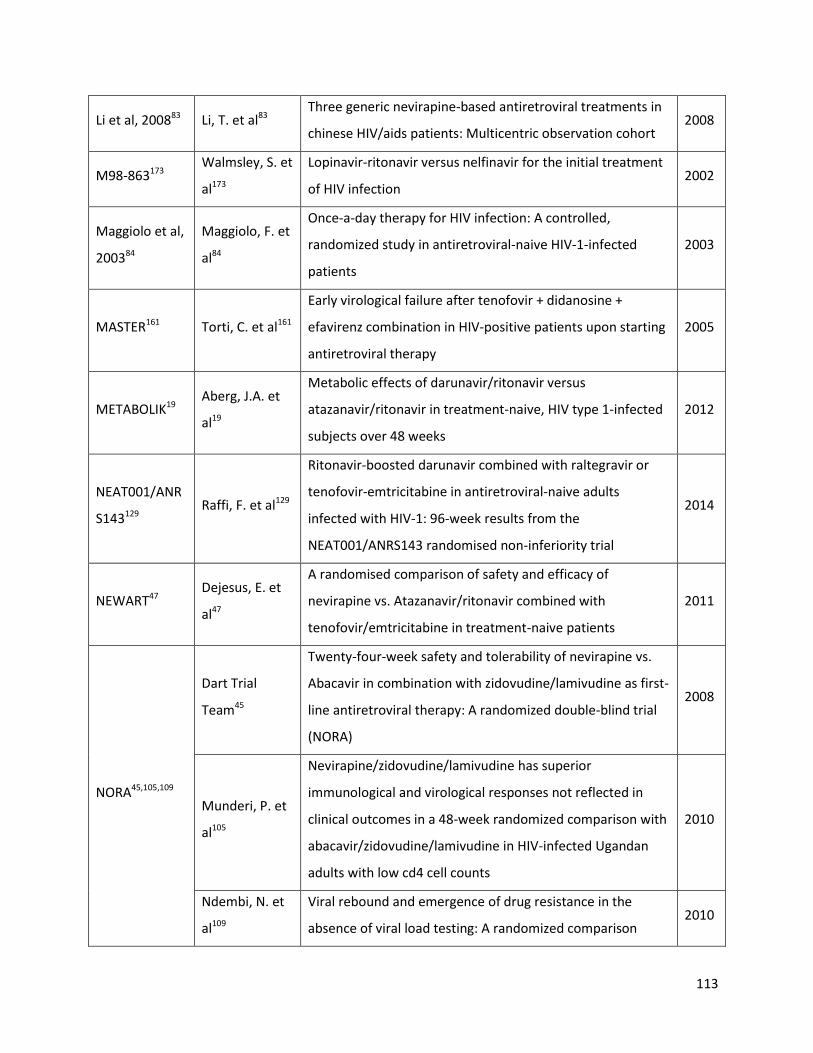
113
Li et al, 200883 Li, T. et al83 Three generic nevirapine-based antiretroviral treatments in
chinese HIV/aids patients: Multicentric observation cohort 2008
M98-863173 Walmsley, S. et
al173
Lopinavir-ritonavir versus nelfinavir for the initial treatment
of HIV infection 2002
Maggiolo et al,
200384
Maggiolo, F. et
al84
Once-a-day therapy for HIV infection: A controlled,
randomized study in antiretroviral-naive HIV-1-infected
patients
2003
MASTER161 Torti, C. et al161
Early virological failure after tenofovir + didanosine +
efavirenz combination in HIV-positive patients upon starting
antiretroviral therapy
2005
METABOLIK19 Aberg, J.A. et
al19
Metabolic effects of darunavir/ritonavir versus
atazanavir/ritonavir in treatment-naive, HIV type 1-infected
subjects over 48 weeks
2012
NEAT001/ANR
S143129 Raffi, F. et al129
Ritonavir-boosted darunavir combined with raltegravir or
tenofovir-emtricitabine in antiretroviral-naive adults
infected with HIV-1: 96-week results from the
NEAT001/ANRS143 randomised non-inferiority trial
2014
NEWART47 Dejesus, E. et
al47
A randomised comparison of safety and efficacy of
nevirapine vs. Atazanavir/ritonavir combined with
tenofovir/emtricitabine in treatment-naive patients
2011
NORA45,105,109
Dart Trial
Team45
Twenty-four-week safety and tolerability of nevirapine vs.
Abacavir in combination with zidovudine/lamivudine as first-
line antiretroviral therapy: A randomized double-blind trial
(NORA)
2008
Munderi, P. et
al105
Nevirapine/zidovudine/lamivudine has superior
immunological and virological responses not reflected in
clinical outcomes in a 48-week randomized comparison with
abacavir/zidovudine/lamivudine in HIV-infected Ugandan
adults with low cd4 cell counts
2010
Ndembi, N. et
al109
Viral rebound and emergence of drug resistance in the
absence of viral load testing: A randomized comparison 2010

114
between zidovudine-lamivudine plus nevirapine and
zidovudine-lamivudine plus abacavir
OzCombo136 Carr, A. et al36
A randomised, open-label comparison of three highly active
antiretroviral therapy regimens including two nucleoside
analogues and indinavir for previously untreated HIV-1
infection: The OzCombo1 study
2000
OzCombo254 French, M. et
al54
Randomized, open-label, comparative trial to evaluate the
efficacy and safety of three antiretroviral drug combinations
including two nucleoside analogues and nevirapine for
previously untreated HIV-1 infection: The ozcombo 2 study
2002
PEARLS35 Campbell, T.B.
et al35
Efficacy and safety of three antiretroviral regimens for initial
treatment of HIV-1: A randomized clinical trial in diverse
multinational settings
2012
PHIDISA II94,132
Matthews,
G.V. et al94
Impact of lamivudine on HIV and hepatitis b virus-related
outcomes in HIV/hepatitis b virus individuals in a
randomized clinical trial of antiretroviral therapy in southern
Africa
2011
Ratsela, A. et
al132
A randomized factorial trial comparing 4 treatment regimens
in treatment-naive HIV-infected persons with aids and/or a
cd4 cell count <200 cells/mul in South Africa
2010
PROGRESS134,13
5
Reynes, J. et
al134
Examination of noninferiority, safety, and tolerability of
lopinavir/ritonavir and raltegravir compared with
lopinavir/ritonavir and tenofovir/ emtricitabine in
antiretroviral-naive subjects: The progress study, 48-week
results
2011
Reynes, J. et
al135
Lopinavir/ritonavir combined with raltegravir or
tenofovir/emtricitabine in antiretroviral-naive subjects: 96-
week results of the progress study
2013
Protocol
00463,88,89,107
Gotuzzo, E. et
al63
Sustained efficacy and safety of raltegravir after 5 years of
combination antiretroviral therapy as initial treatment of
HIV-1 infection: Final results of a randomized, controlled,
2012

115
phase II study (protocol 004)
Markowitz, M.
et al89
Rapid and durable antiretroviral effect of the HIV-1 integrase
inhibitor raltegravir as part of combination therapy in
treatment-naive patients with HIV-1 infection: Results of a
48-week controlled study
2007
Markowitz, M.
et al88
Sustained antiretroviral effect of raltegravir after 96 weeks
of combination therapy in treatment-naive patients with
HIV-1 infection
2009
Murray, J.M. et
al107
Antiretroviral therapy with the integrase inhibitor raltegravir
alters decay kinetics of HIV, significantly reducing the second
phase
2007
RADAR28-30
Bedimo, R.28
Radar study: Raltegravir combined with boosted darunavir
has similar safety and antiviral efficacy as
tenofovir/emtricitabine combined with boosted darunavir in
antiretroviral-naive patients
2011
Bedimo, R. et
al29
Standard Triple Therapy Controls HIV Better Than
Raltegravir/Darunavir at 48 Weeks RADAR Study 2013
Bedimo, R.J. et
al30
The RADAR study: Week 48 safety and efficacy of raltegravir
combined with boosted darunavir compared to
tenofovir/emtricitabine combined with boosted darunavir in
antiretroviral-naive patients. Impact on bone health
2014
SEARCH 003120 Phanuphak, N.
et al120
A 72-week randomized study of the safety and efficacy of a
stavudine to zidovudine switch at 24 weeks compared to
zidovudine or tenofovir disoproxil fumarate when given with
lamivudine and nevirapine
2012
SENC113 Nunez, M. et
al113
SENC (Spanish efavirenz vs. Nevirapine comparison) trial: A
randomized, open-label study in HIV-infected naive
individuals
2002
Sierra-Madero
et al, 2010150
Sierra-Madero,
J. et al150
Prospective, randomized, open label trial of efavirenz vs
lopinavir/ritonavir in HIV+ treatment-naive subjects with
cd4+<200 cell/mm3 in Mexico
2010

116
SINGLE18,170-172
Walmsley et
al170
Brief report: Dolutegravir plus abacavir/lamivudine for the
treatment of HIV-1 infection in antiretroviral therapy-naive
patients: Week 96 and week 144 results from the single
randomized clinical trial.[erratum appears in j acquir
immune defic syndr. 2016 jan 1;71(1):E33]
2015
Walmsley, S. et
al172
Dolutegravir regimen statistically superior to
tenofovir/emtricitabine/efavirenz: 96-wk data 2014
Walmsley, S. et
al171
Dolutegravir Regimen Statistically Superior to
Efavirenz/Tenofovir/Emtricitabine: 96-Week Results From
the SINGLE Study (ING114467)
2014
Walmsley, S.L.
et al18
Dolutegravir plus abacavir-lamivudine for the treatment of
HIV-1 infection 2013
SOLO60 Gathe, J.C., Jr.
et al60
SOLO: 48-week efficacy and safety comparison of once-daily
fosamprenavir /ritonavir versus twice-daily nelfinavir in
naive HIV-1-infected patients
2004
SPARTAN75 Kozal, M.J. et
al75
A nucleoside- and ritonavir-sparing regimen containing
atazanavir plus raltegravir in antiretroviral treatment-naive
HIV-infected patients: SPARTAN study results
2012
SPRING-1159,166
Stellbrink, H.J.
et al159
Dolutegravir in antiretroviral-naive adults with HIV-1: 96-
week results from a randomized dose-ranging study 2013
van Lunzen, J.
et al166
Once daily dolutegravir (S/GSK1349572) in combination
therapy in antiretroviral-naive adults with HIV: Planned
interim 48-week results from SPRING-1, a dose-ranging,
randomised, phase 2b trial
2012
SPRING-2130,131
Raffi, F. et al131
Once-daily dolutegravir versus raltegravir in antiretroviral-
naive adults with HIV-1 infection: 48-week results from the
randomised, double-blind, non-inferiority SPRING-2 study
2013
Raffi, F. et al130
Once-daily dolutegravir versus twice-daily raltegravir in
antiretroviral-naive adults with HIV-1 infection (SPRING-2
study): 96-week results from a randomised, double-blind,
non-inferiority trial
2013

117
SPRING-2/
SINGLE43
Curtis, LD. et
al43
Once-Daily Dolutegravir (DTG; GSK1349572) Has a Renal
Safety Profile Comparable to Raltegravir (RAL) and Efavirenz
in Antiretroviral (ART)-Naive Adults: 48 Week Results From
SPRING-2 (ING113086) and SINGLE (ING114467)
2013
SPRING-2/
SINGLE/
FLAMINGO/
SAILING97
Min, S. et al97
Efficacy and Safety of Dolutegravir (DTG) in Hepatitis (HBV or
HCV) Co-infected Patients: Results from the Phase 3
Program
2014
Squires et al,
200472,155
Jemsek, J.G. et
al72
Body fat and other metabolic effects of atazanavir and
efavirenz, each administered in combination with
zidovudine plus lamivudine, in antiretroviral-naive HIV-
infected patients
2006
Squires, K. et
al155
Comparison of once-daily atazanavir with efavirenz, each in
combination with fixed-dose zidovudine and lamivudine, as
initial therapy for patients infected with HIV
2004
SSAT06634 Bracchi et al34 A randomized comparison of integrase inhibitors with
TDF/FTC on renal markers 2017
STaR39,40,165
Cohen, C. et
al39
Star study: Single-tablet regimen rilpivirine/
emtricitabine/tenofovir DF maintains noninferiority to
efavirenz/emtricitabine/tenofovir DF and has minimal
impact on fasting lipids in art-naive adults through week 96
2013
Cohen, C. et
al40
Week 48 results from a randomized clinical trial of
rilpivirine/ emtricitabine/tenofovir disoproxil fumarate vs.
Efavirenz/emtricitabine/ tenofovir disoproxil fumarate in
treatment-naive HIV-1-infected adults
2014
Van Lunzen et
al165
Rilpivirine vs. Efavirenz-based single-tablet regimens in
treatment-naive adults: Week 96 efficacy and safety from a
randomized phase 3b study
2016
START i156 Squires, K.E. et
al156
A comparison of stavudine plus lamivudine versus
zidovudine plus lamivudine in combination with indinavir in
antiretroviral naive individuals with HIV infection: Selection
2000
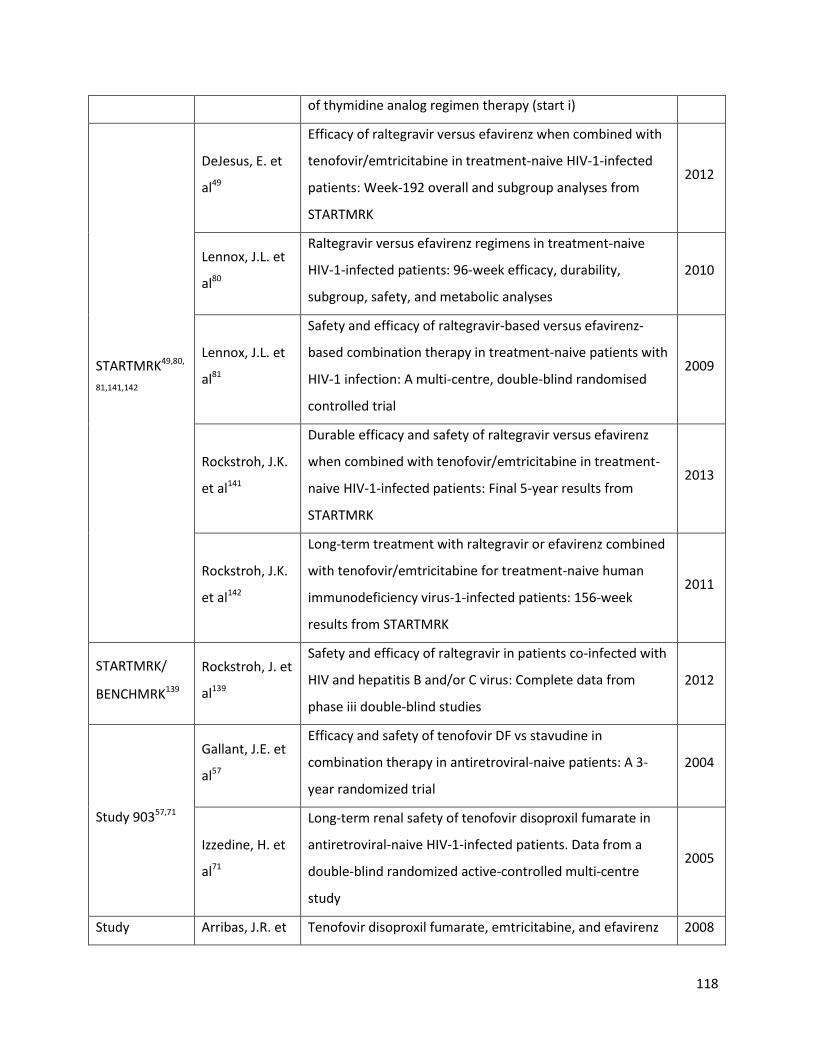
118
of thymidine analog regimen therapy (start i)
STARTMRK49,80,
81,141,142
DeJesus, E. et
al49
Efficacy of raltegravir versus efavirenz when combined with
tenofovir/emtricitabine in treatment-naive HIV-1-infected
patients: Week-192 overall and subgroup analyses from
STARTMRK
2012
Lennox, J.L. et
al80
Raltegravir versus efavirenz regimens in treatment-naive
HIV-1-infected patients: 96-week efficacy, durability,
subgroup, safety, and metabolic analyses
2010
Lennox, J.L. et
al81
Safety and efficacy of raltegravir-based versus efavirenz-
based combination therapy in treatment-naive patients with
HIV-1 infection: A multi-centre, double-blind randomised
controlled trial
2009
Rockstroh, J.K.
et al141
Durable efficacy and safety of raltegravir versus efavirenz
when combined with tenofovir/emtricitabine in treatment-
naive HIV-1-infected patients: Final 5-year results from
STARTMRK
2013
Rockstroh, J.K.
et al142
Long-term treatment with raltegravir or efavirenz combined
with tenofovir/emtricitabine for treatment-naive human
immunodeficiency virus-1-infected patients: 156-week
results from STARTMRK
2011
STARTMRK/
BENCHMRK139
Rockstroh, J. et
al139
Safety and efficacy of raltegravir in patients co-infected with
HIV and hepatitis B and/or C virus: Complete data from
phase iii double-blind studies
2012
Study 90357,71
Gallant, J.E. et
al57
Efficacy and safety of tenofovir DF vs stavudine in
combination therapy in antiretroviral-naive patients: A 3-
year randomized trial
2004
Izzedine, H. et
al71
Long-term renal safety of tenofovir disoproxil fumarate in
antiretroviral-naive HIV-1-infected patients. Data from a
double-blind randomized active-controlled multi-centre
study
2005
Study Arribas, J.R. et Tenofovir disoproxil fumarate, emtricitabine, and efavirenz 2008
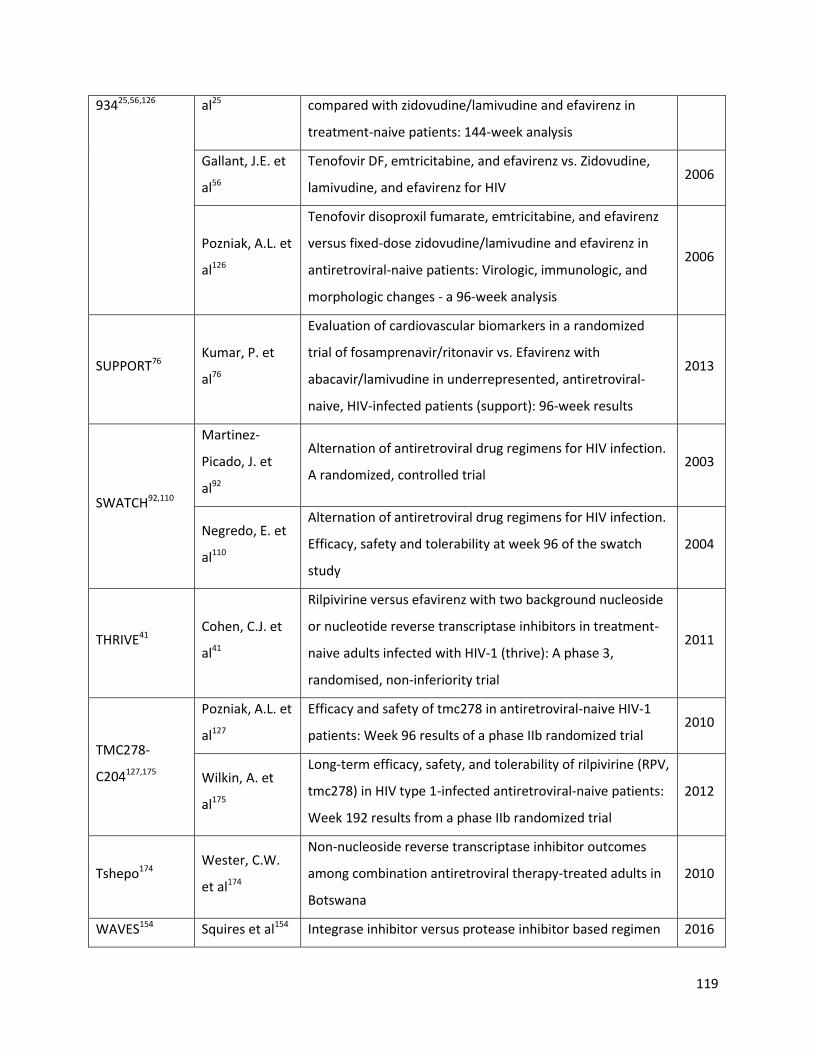
119
93425,56,126 al25 compared with zidovudine/lamivudine and efavirenz in
treatment-naive patients: 144-week analysis
Gallant, J.E. et
al56
Tenofovir DF, emtricitabine, and efavirenz vs. Zidovudine,
lamivudine, and efavirenz for HIV 2006
Pozniak, A.L. et
al126
Tenofovir disoproxil fumarate, emtricitabine, and efavirenz
versus fixed-dose zidovudine/lamivudine and efavirenz in
antiretroviral-naive patients: Virologic, immunologic, and
morphologic changes - a 96-week analysis
2006
SUPPORT76 Kumar, P. et
al76
Evaluation of cardiovascular biomarkers in a randomized
trial of fosamprenavir/ritonavir vs. Efavirenz with
abacavir/lamivudine in underrepresented, antiretroviral-
naive, HIV-infected patients (support): 96-week results
2013
SWATCH92,110
Martinez-
Picado, J. et
al92
Alternation of antiretroviral drug regimens for HIV infection.
A randomized, controlled trial 2003
Negredo, E. et
al110
Alternation of antiretroviral drug regimens for HIV infection.
Efficacy, safety and tolerability at week 96 of the swatch
study
2004
THRIVE41 Cohen, C.J. et
al41
Rilpivirine versus efavirenz with two background nucleoside
or nucleotide reverse transcriptase inhibitors in treatment-
naive adults infected with HIV-1 (thrive): A phase 3,
randomised, non-inferiority trial
2011
TMC278-
C204127,175
Pozniak, A.L. et
al127
Efficacy and safety of tmc278 in antiretroviral-naive HIV-1
patients: Week 96 results of a phase IIb randomized trial 2010
Wilkin, A. et
al175
Long-term efficacy, safety, and tolerability of rilpivirine (RPV,
tmc278) in HIV type 1-infected antiretroviral-naive patients:
Week 192 results from a phase IIb randomized trial
2012
Tshepo174 Wester, C.W.
et al174
Non-nucleoside reverse transcriptase inhibitor outcomes
among combination antiretroviral therapy-treated adults in
Botswana
2010
WAVES154 Squires et al154 Integrase inhibitor versus protease inhibitor based regimen 2016
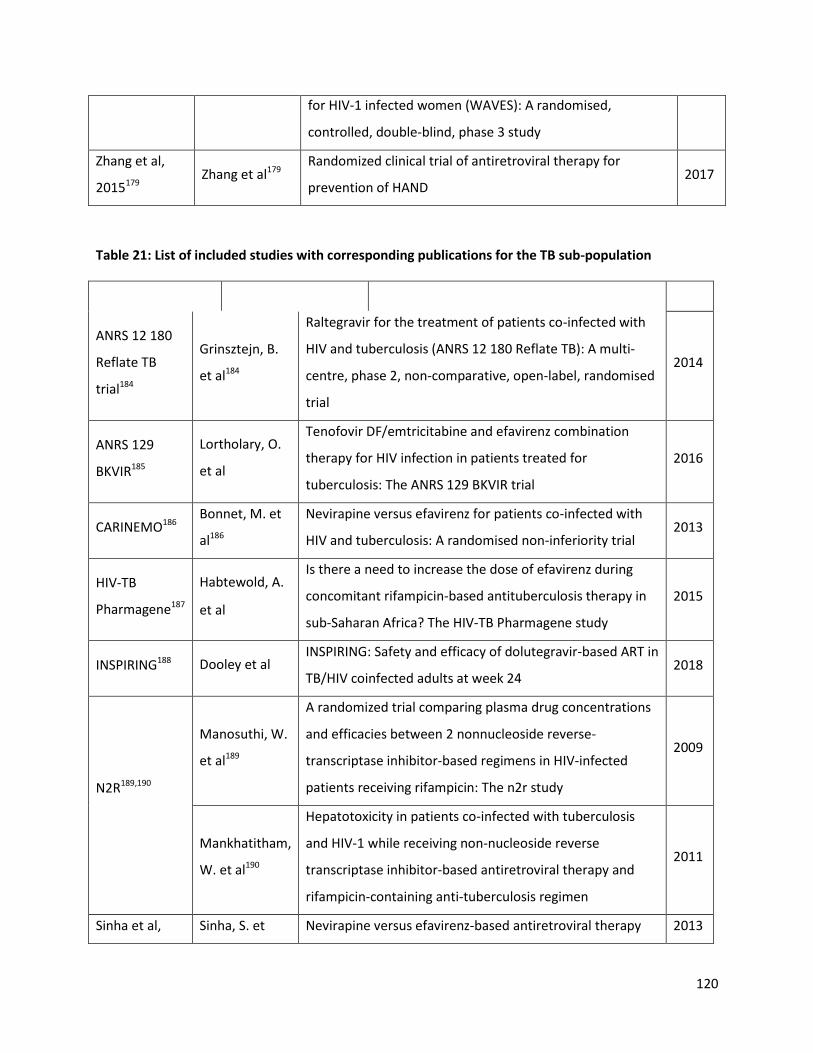
120
for HIV-1 infected women (WAVES): A randomised,
controlled, double-blind, phase 3 study
Zhang et al,
2015179 Zhang et al179
Randomized clinical trial of antiretroviral therapy for
prevention of HAND 2017
Table 21: List of included studies with corresponding publications for the TB sub-population
Trial ID Author Title Year
ANRS 12 180
Reflate TB
trial184
Grinsztejn, B.
et al184
Raltegravir for the treatment of patients co-infected with
HIV and tuberculosis (ANRS 12 180 Reflate TB): A multi-
centre, phase 2, non-comparative, open-label, randomised
trial
2014
ANRS 129
BKVIR185
Lortholary, O.
et al
Tenofovir DF/emtricitabine and efavirenz combination
therapy for HIV infection in patients treated for
tuberculosis: The ANRS 129 BKVIR trial
2016
CARINEMO186 Bonnet, M. et
al186
Nevirapine versus efavirenz for patients co-infected with
HIV and tuberculosis: A randomised non-inferiority trial 2013
HIV-TB
Pharmagene187
Habtewold, A.
et al
Is there a need to increase the dose of efavirenz during
concomitant rifampicin-based antituberculosis therapy in
sub-Saharan Africa? The HIV-TB Pharmagene study
2015
INSPIRING188 Dooley et al INSPIRING: Safety and efficacy of dolutegravir-based ART in
TB/HIV coinfected adults at week 24 2018
N2R189,190
Manosuthi, W.
et al189
A randomized trial comparing plasma drug concentrations
and efficacies between 2 nonnucleoside reverse-
transcriptase inhibitor-based regimens in HIV-infected
patients receiving rifampicin: The n2r study
2009
Mankhatitham,
W. et al190
Hepatotoxicity in patients co-infected with tuberculosis
and HIV-1 while receiving non-nucleoside reverse
transcriptase inhibitor-based antiretroviral therapy and
rifampicin-containing anti-tuberculosis regimen
2011
Sinha et al, Sinha, S. et Nevirapine versus efavirenz-based antiretroviral therapy 2013
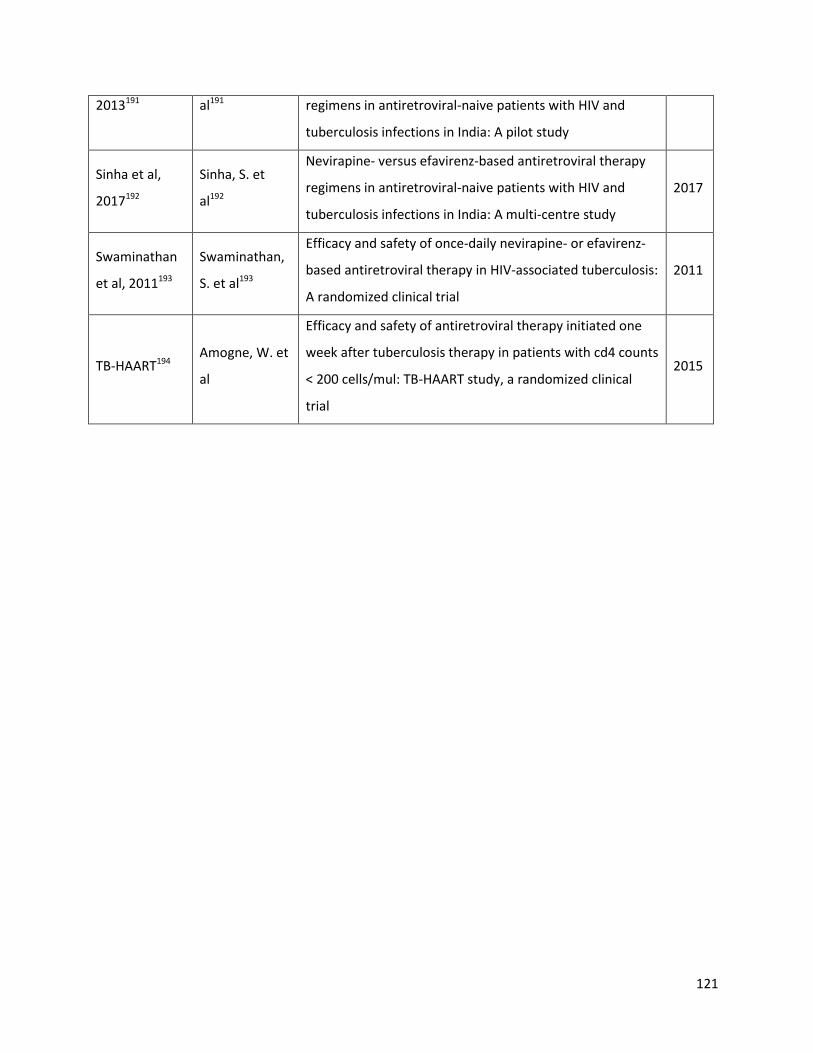
121
2013191 al191 regimens in antiretroviral-naive patients with HIV and
tuberculosis infections in India: A pilot study
Sinha et al,
2017192
Sinha, S. et
al192
Nevirapine- versus efavirenz-based antiretroviral therapy
regimens in antiretroviral-naive patients with HIV and
tuberculosis infections in India: A multi-centre study
2017
Swaminathan
et al, 2011193
Swaminathan,
S. et al193
Efficacy and safety of once-daily nevirapine- or efavirenz-
based antiretroviral therapy in HIV-associated tuberculosis:
A randomized clinical trial
2011
TB-HAART194 Amogne, W. et
al
Efficacy and safety of antiretroviral therapy initiated one
week after tuberculosis therapy in patients with cd4 counts
< 200 cells/mul: TB-HAART study, a randomized clinical
trial
2015
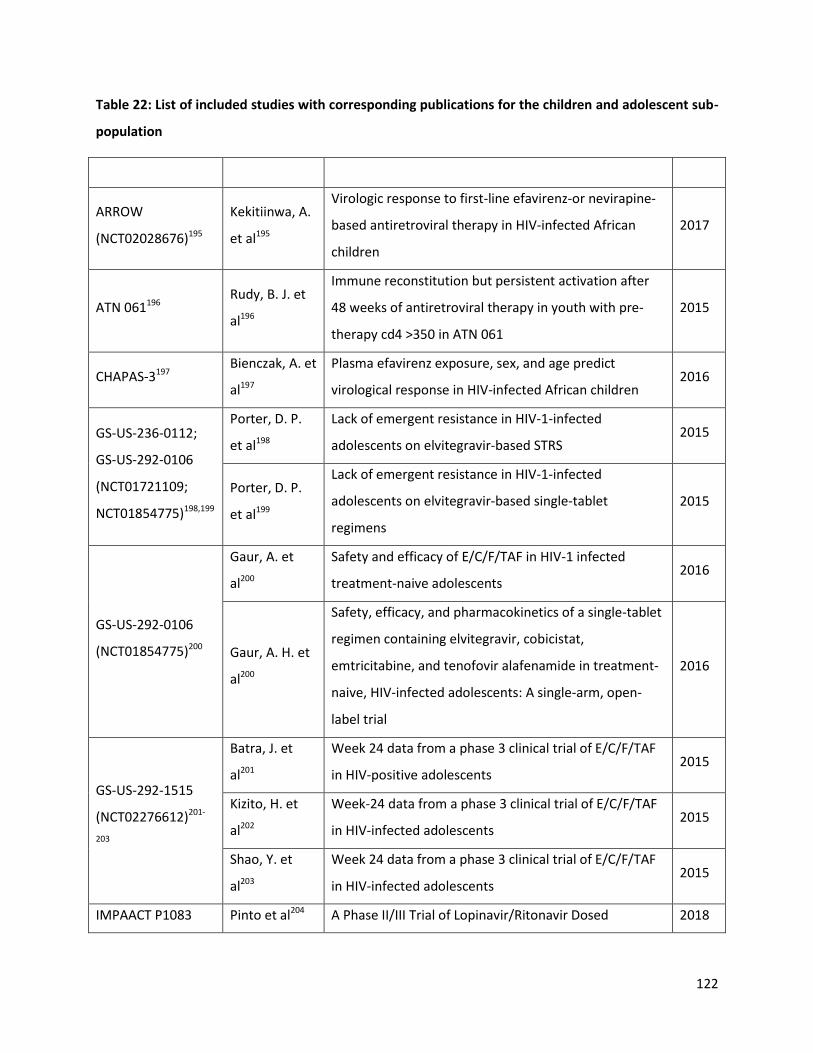
122
Table 22: List of included studies with corresponding publications for the children and adolescent sub-
population
Trial ID Author Title Year
ARROW
(NCT02028676)195
Kekitiinwa, A.
et al195
Virologic response to first-line efavirenz-or nevirapine-
based antiretroviral therapy in HIV-infected African
children
2017
ATN 061196 Rudy, B. J. et
al196
Immune reconstitution but persistent activation after
48 weeks of antiretroviral therapy in youth with pre-
therapy cd4 >350 in ATN 061
2015
CHAPAS-3197 Bienczak, A. et
al197
Plasma efavirenz exposure, sex, and age predict
virological response in HIV-infected African children 2016
GS-US-236-0112;
GS-US-292-0106
(NCT01721109;
NCT01854775)198,199
Porter, D. P.
et al198
Lack of emergent resistance in HIV-1-infected
adolescents on elvitegravir-based STRS 2015
Porter, D. P.
et al199
Lack of emergent resistance in HIV-1-infected
adolescents on elvitegravir-based single-tablet
regimens
2015
GS-US-292-0106
(NCT01854775)200
Gaur, A. et
al200
Safety and efficacy of E/C/F/TAF in HIV-1 infected
treatment-naive adolescents 2016
Gaur, A. H. et
al200
Safety, efficacy, and pharmacokinetics of a single-tablet
regimen containing elvitegravir, cobicistat,
emtricitabine, and tenofovir alafenamide in treatment-
naive, HIV-infected adolescents: A single-arm, open-
label trial
2016
GS-US-292-1515
(NCT02276612)201-
203
Batra, J. et
al201
Week 24 data from a phase 3 clinical trial of E/C/F/TAF
in HIV-positive adolescents 2015
Kizito, H. et
al202
Week-24 data from a phase 3 clinical trial of E/C/F/TAF
in HIV-infected adolescents 2015
Shao, Y. et
al203
Week 24 data from a phase 3 clinical trial of E/C/F/TAF
in HIV-infected adolescents 2015
IMPAACT P1083 Pinto et al204 A Phase II/III Trial of Lopinavir/Ritonavir Dosed 2018

123
(NCT01172535)204 According to the WHO Pediatric Weight Band Dosing
Guidelines
IMPAACT P1093205 IMPAACT
Network205
IMPAACT P1093. Phase I/II, Multi-Center, Open-Label
Pharmacokinetic, Safety, Tolerability and Antiviral
Activity of Dolutegravir (GSK1349572), a Novel
Integrase Inhibitor, in Combination Regimens in HIV-1
Infected Infants, Children and Adolescents
2018
MONOD-ANRS-
12206
(NCT01127204)206,20
7
Amani-Bosse
C et al206
Virological response and resistances over 12 months
among HIV-infected children less than two years
receiving first-line lopinavir/ritonavir-based
antiretroviral therapy in Cote d'Ivoire and Burkina Faso:
The MONOD-ANRS 12206 cohort
2017
Pressiat C, et
al207
Suboptimal co-trimoxazole prophylactic concentrations
in HIV-infected children according to the WHO
guidelines
2017
PAINT
(NCT00799864)208
Lombaard, J.
et al208
Week 48 safety and efficacy of a rilpivirine (tmc278)-
based regimen in HIV-infected treatment-naive
adolescents: Paint phase ii trial
2015
Gopalan, B. P. et
al209
Gopalan, B. P.
et al209
Sub-therapeutic nevirapine concentration during
antiretroviral treatment initiation among children living
with HIV: Implications for therapeutic drug monitoring
2017
Shiau, S. et al210 Shiau, S. et
al210
Early age at start of antiretroviral therapy associated
with better virologic control after initial suppression in
HIV-infected infants
2017

124
Table 23: List of included studies with corresponding publications for the pregnant and breastfeeding
women
Trial ID Author Title Year
BAN211 Jamieson, D.J.
et al211
Maternal and infant antiretroviral regimens to prevent
postnatal HIV-1 transmission: 48-week follow-up of the
ban randomised controlled trial
2012
DART212 Gibb, D. et
al212
Pregnancy and infant outcomes among HIV-infected
women taking long-term ART with and without
tenofovir in the DART trial
2012
DolPHIN 1
(NCT02245022)213 Waitt et al213
DolPHIN-1: Dolutegravir vs Efavirenz when Initiating
Treatment in Late Pregnancy –An Interim Analysis 2018
IMPAACT 1026s
(NCT00042289)214,21
5
Stek, A. et
al214
Pharmacokinetics of increased dose darunavir during
late pregnancy and postpartum 2016
Mulligan et
al215
Dolutegravir pharmacokinetics in pregnant and
postpartum women living with HIV 2018
Lamorde et al216 Lamorde et
al216
Pharmacokinetics, pharmacodynamics and
pharmacogenomics of efavirenz 400mg once-daily
during pregnancy and postpartum
2017
MMA BANA Study
(NCT00270296)217,21
8
Shapiro R217 Antiretroviral regimens in pregnancy and breast-feeding
in Botswana 2010
Shapiro, R.L.
et al218
HIV transmission and 24-month survival in a
randomized trial of HAART to prevent MTCT during
pregnancy and breastfeeding in Botswana
2013
Ngoma 2015219 Ngoma, M. S.
et al219
Efficacy of who recommendation for continued
breastfeeding and maternal cart for prevention of
perinatal and postnatal HIV transmission in Zambia
2015
PROMISE
1077BF/1077FF
(NCT01061151;
NCT01253538)220,221
Fowler, M. G.
et al220
Benefits and risks of antiretroviral therapy for perinatal
HIV prevention 2016
Fowler, M.G.
et al221
PROMISE: Efficacy and safety of 2 strategies to prevent
perinatal HIV transmission 2015

125
PROMOTE
(NCT00993031)
222-226
Cohan, D. et
al222
Efficacy and safety of lopinavir/ritonavir versus
efavirenz-based antiretroviral therapy in HIV-infected
pregnant Ugandan women
2015
Koss, C. A. et
al223
Hair concentrations of antiretrovirals predict viral
suppression in HIV-infected pregnant and breastfeeding
Ugandan women
2015
Cohan, D. et
al224
Efficacy and safety of LPV/r versus EFV in HIV+ pregnant
and breast-feeding Ugandan Women 2014
Koss225
Risk Factors for Preterm Birth among HIV-Infected
Pregnant Ugandan Women Randomized to
Lopinavir/ritonavir- or Efavirenz-based Antiretroviral
Therapy
2011
Natureeba226
Lopinavir/Ritonavir-Based Antiretroviral Treatment
(ART) Versus Efavirenz-Based ART for the Prevention of
Malaria Among HIV-Infected Pregnant Women
2014
Samuel 2014227 Samuel, M. et
al227
Antenatal atazanavir: A retrospective analysis of
pregnancies exposed to atazanavir 2014
SMAC228-232
Giuliano, M.
et al228
High cmv igg antibody levels are associated to a lower
cd4+ response to antiretroviral therapy in HIV-infected
women
2017
Palombi, L. et
al229
Drug resistance mutations 18 months after
discontinuation of nevirapine-based art for prevention
of mother-to-child transmission of HIV in Malawi
2015
Andreotti, M.
et al230
The impact of HBV or HCV infection in a cohort of HIV-
infected pregnant women receiving a nevirapine-based
antiretroviral regimen in Malawi
2014
Palombi, L. et
al231
Antiretroviral prophylaxis for breastfeeding
transmission in Malawi: Drug concentrations, virological
efficacy and safety
2012
Giuliano, M.
et al232
Maternal Antiretroviral Therapy for the Prevention of
Mother-To-Child Transmission of HIV in Malawi: 2013
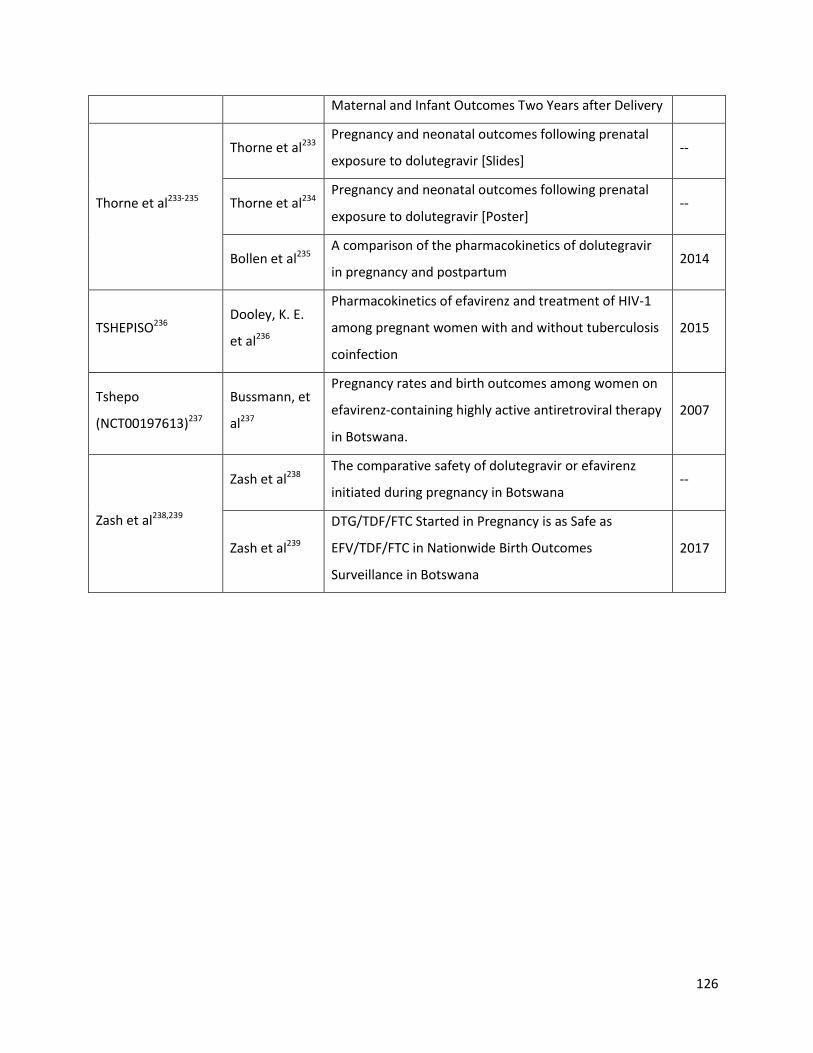
126
Maternal and Infant Outcomes Two Years after Delivery
Thorne et al233-235
Thorne et al233 Pregnancy and neonatal outcomes following prenatal
exposure to dolutegravir [Slides] --
Thorne et al234 Pregnancy and neonatal outcomes following prenatal
exposure to dolutegravir [Poster] --
Bollen et al235 A comparison of the pharmacokinetics of dolutegravir
in pregnancy and postpartum 2014
TSHEPISO236 Dooley, K. E.
et al236
Pharmacokinetics of efavirenz and treatment of HIV-1
among pregnant women with and without tuberculosis
coinfection
2015
Tshepo
(NCT00197613)237
Bussmann, et
al237
Pregnancy rates and birth outcomes among women on
efavirenz-containing highly active antiretroviral therapy
in Botswana.
2007
Zash et al238,239
Zash et al238 The comparative safety of dolutegravir or efavirenz
initiated during pregnancy in Botswana --
Zash et al239
DTG/TDF/FTC Started in Pregnancy is as Safe as
EFV/TDF/FTC in Nationwide Birth Outcomes
Surveillance in Botswana
2017
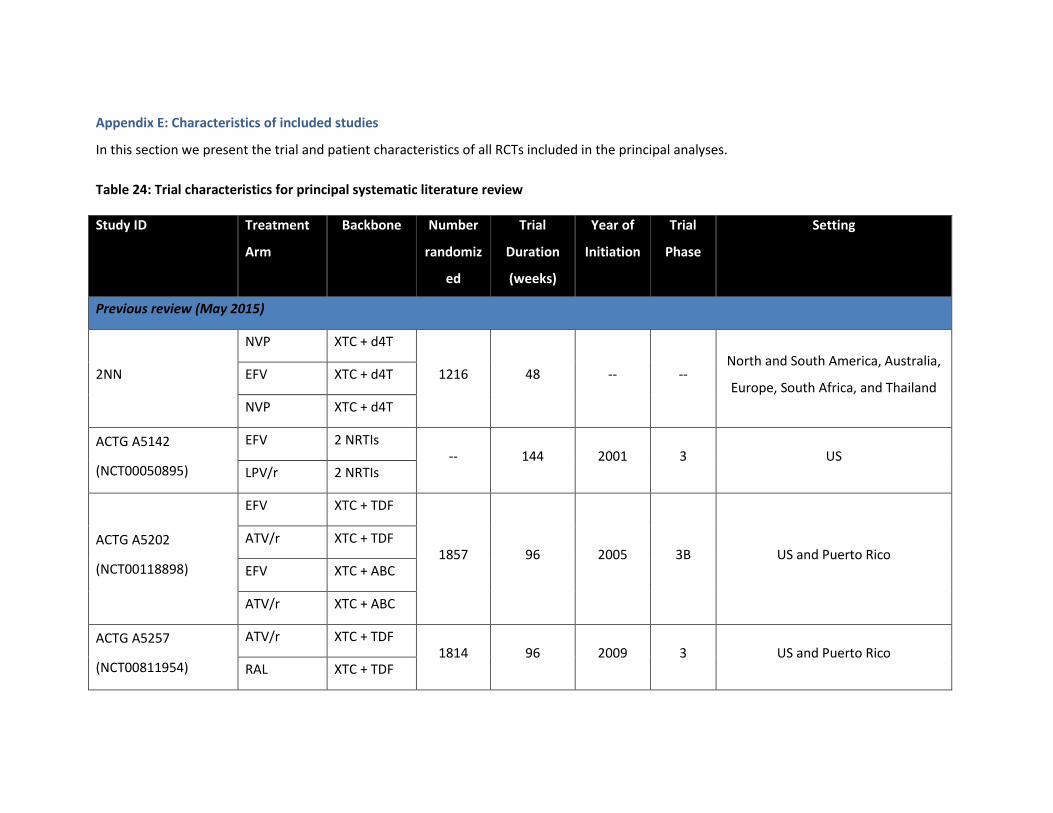
Appendix E: Characteristics of included studies
In this section we present the trial and patient characteristics of all RCTs included in the principal analyses.
Table 24: Trial characteristics for principal systematic literature review
Study ID Treatment
Arm
Backbone Number
randomiz
ed
Trial
Duration
(weeks)
Year of
Initiation
Trial
Phase
Setting
Previous review (May 2015)
2NN
NVP XTC + d4T
1216 48 -- -- North and South America, Australia,
Europe, South Africa, and Thailand EFV XTC + d4T
NVP XTC + d4T
ACTG A5142
(NCT00050895)
EFV 2 NRTIs -- 144 2001 3 US
LPV/r 2 NRTIs
ACTG A5202
(NCT00118898)
EFV XTC + TDF
1857 96 2005 3B US and Puerto Rico ATV/r XTC + TDF
EFV XTC + ABC
ATV/r XTC + ABC
ACTG A5257
(NCT00811954)
ATV/r XTC + TDF 1814 96 2009 3 US and Puerto Rico
RAL XTC + TDF

128
Study ID Treatment
Arm
Backbone Number
randomiz
ed
Trial
Duration
(weeks)
Year of
Initiation
Trial
Phase
Setting
DRV/r XTC + TDF
Albini et al, 2012 EFV XTC + TDF
91 48 2007 -- Italy ATV/r XTC + TDF
Altair
(NCT00335322)
EFV XTC + TDF 322 48 2007 4 Australia
ATV/r XTC + TDF
DAYANA Trial
(NCT00573001)
NVP XTC + TDF 120 96 2008 3 Senegal and Cameroon
EFV XTC + TDF
ARTEMIS
(NCT00258557)
DRV/r XTC + TDF 689 192 2005 3
North and South America, Europe,
and Asia LPV/r XTC + TDF
ARTEN
NVP XTC + TDF
576 48 -- --
Argentina, Germany, Italy, Mexico,
Portugal, Romania, Spain,
Switzerland, and the United
Kingdom
NVP XTC + TDF
ATV/r XTC + TDF
ASSERT
(NCT00549198)
EFV XTC + ABC 185 96 2007 4 Europe
EFV XTC + TDF
ATADAR
(NCT01274780)
DRV/r XTC + TDF 180 96 2011 4 Spain
ATV/r XTC + TDF
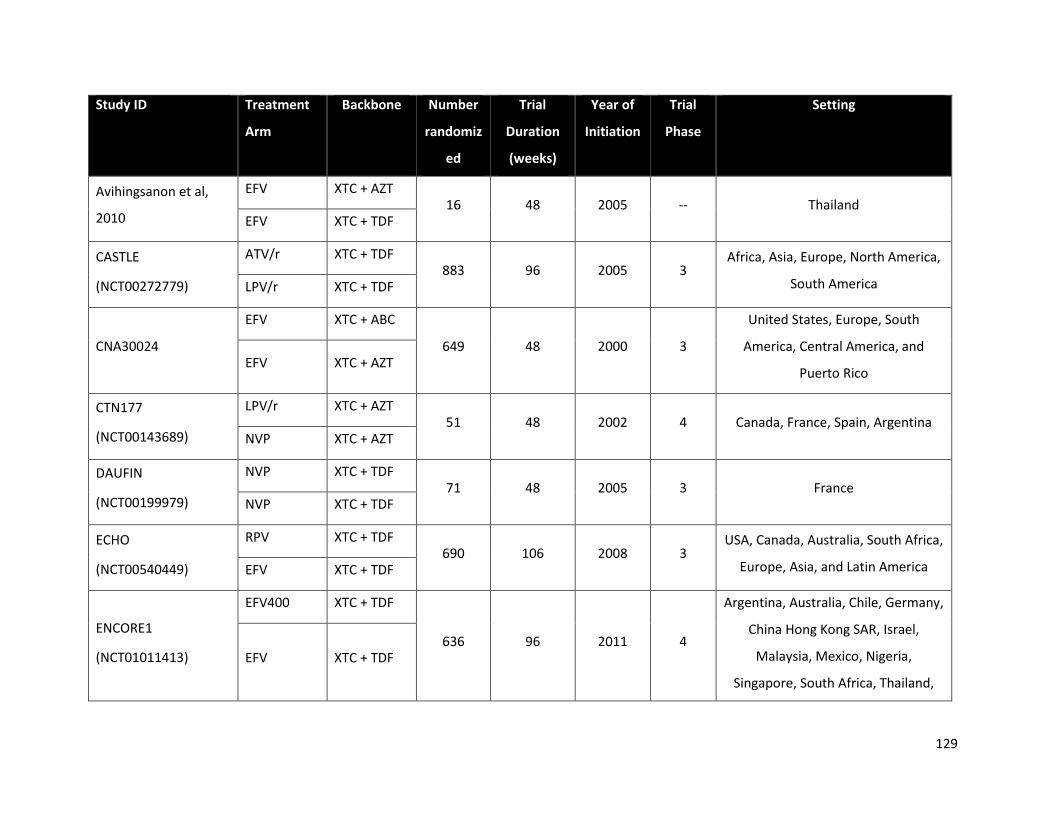
129
Study ID Treatment
Arm
Backbone Number
randomiz
ed
Trial
Duration
(weeks)
Year of
Initiation
Trial
Phase
Setting
Avihingsanon et al,
2010
EFV XTC + AZT 16 48 2005 -- Thailand
EFV XTC + TDF
CASTLE
(NCT00272779)
ATV/r XTC + TDF 883 96 2005 3
Africa, Asia, Europe, North America,
South America LPV/r XTC + TDF
CNA30024
EFV XTC + ABC
649 48 2000 3
United States, Europe, South
America, Central America, and
Puerto Rico EFV XTC + AZT
CTN177
(NCT00143689)
LPV/r XTC + AZT 51 48 2002 4 Canada, France, Spain, Argentina
NVP XTC + AZT
DAUFIN
(NCT00199979)
NVP XTC + TDF 71 48 2005 3 France
NVP XTC + TDF
ECHO
(NCT00540449)
RPV XTC + TDF 690 106 2008 3
USA, Canada, Australia, South Africa,
Europe, Asia, and Latin America EFV XTC + TDF
ENCORE1
(NCT01011413)
EFV400 XTC + TDF
636 96 2011 4
Argentina, Australia, Chile, Germany,
China Hong Kong SAR, Israel,
Malaysia, Mexico, Nigeria,
Singapore, South Africa, Thailand,
EFV XTC + TDF

130
Study ID Treatment
Arm
Backbone Number
randomiz
ed
Trial
Duration
(weeks)
Year of
Initiation
Trial
Phase
Setting
and the United Kingdom
Epzicom-Truvada
(NCT00544128)
ATV/r XTC + TDF 109 96 2007 4
Germany, China Hong Kong SAR,
Israel, Malaysia, Mexico, Nigeria ATV/r XTC + ABC
FLAMINGO
(NCT01449929)
DTG XTC + ABC
488 96 2011 3B Singapore, South Africa, Thailand,
and the United Kingdom
DRV/r XTC + ABC
DTG XTC + TDF
DRV/r XTC + TDF
GESIDA 3903
(NCT00256828)
EFV XTC + ddI 376 48 2004 4 Spain
EFV XTC + AZT
GS-US-236-0102
(NCT01095796)
EVG/c XTC + TDF 700 48 2010 3 North America
EFV XTC + TDF
GS-US-236-0103
(NCT01095796)
EVG/c XTC + TDF 715 96 2010 3
Australia, Europe, North America,
and Thailand ATV/r XTC + TDF
GS-US-236-0104
(NCT00869557)
EVG/c XTC + TDF 71 48 2009 2 the USA
EFV XTC + TDF
HEAT LPV/r XTC + ABC 694 96 2005 4 the USA and Puerto Rico

131
Study ID Treatment
Arm
Backbone Number
randomiz
ed
Trial
Duration
(weeks)
Year of
Initiation
Trial
Phase
Setting
(NCT00244712) LPV/r XTC + TDF
Lake Study
(NCT00318123)
EFV XTC + ABC 126 48 2004 3 Spain and Italy
LPV/r XTC + ABC
Li et al, 2008
(NCT00618176)
NVP AZT + ddI
198 52 2005 4 China NVP XTC + d4T
NVP XTC + AZT
Maggiolo et al, 2003 EFV XTC + AZT
68 52 -- -- Italy EFV XTC + ddI
MASTER
LPV/r XTC + AZT
30 28 2003 -- Italy EFV XTC + TDF
EFV ddI + TDF
METABOLIK DRV/r XTC + TDF
65 48 -- 4 US ATV/r XTC + TDF
NEWART
(NCT00552240)
NVP XTC + TDF 152 48 2007 4 US
ATV/r XTC + TDF
OzCombo 2 NVP XTC + AZT 70 52 1997 -- Australia

132
Study ID Treatment
Arm
Backbone Number
randomiz
ed
Trial
Duration
(weeks)
Year of
Initiation
Trial
Phase
Setting
NVP XTC + d4T
NVP ddI + D4T
PEARLS
(NCT00084136)
EFV XTC + TDF
1045 192 2005 4
Brazil, Haiti, India, Malawi, Peru,
South Africa, Thailand, the USA and
Zimbabwe EFV XTC + AZT
Protocol 004
(NCT00100048)
RAL XTC + TDF 201 240 2005 2
United States, Canada, Latin
America, Thailand, and Australia EFV XTC + TDF
SEARCH 003
(NCT00669487)
NVP XTC + d4T
150 72 2008 3 Thailand NVP XTC + AZT
NVP XTC + TDF
SENC NVP ddI + d4T
67 48 1999 -- Spain EFV ddI + d4T
Sierra-Madero et al,
2010
(NCT00162643)
EFV XTC + AZT
189 48 2004 4 Mexico LPV/r XTC + AZT
SINGLE
(NCT01263015)
DTG XTC + ABC 833 48 2011 3
Australia, Belgium, Canada,
Denmark, France, Germany, Italy, EFV XTC + TDF

133
Study ID Treatment
Arm
Backbone Number
randomiz
ed
Trial
Duration
(weeks)
Year of
Initiation
Trial
Phase
Setting
Netherlands, Romania, Spain, United
Kingdom, and United States
SPRING-1
(NCT00951015)
DTG 2 NRTIs 205 48 2009 2
France, Germany, Italy, Russia,
Spain, and the USA EFV 2 NRTIs
SPRING-2
(NCT01227824)
DTG XTC + ABC
827 96 2010 3 Canada, the USA, Australia, and
Europe
RAL XTC + ABC
DTG XTC + TDF
RAL XTC + TDF
STaR
(NCT01309243)
RPV XTC + TDF
799 96 2011 3B
United States, Australia, Austria,
Belgium, Canada, France, Germany,
Italy, Netherlands, Portugal, Puerto
Rico, Spain, Switzerland, and United
Kingdom
EFV XTC + TDF
STARTMRK
(NCT00369941)
RAL XTC + TDF
566 96 2006 3
Australia, Brazil, Canada, Chile,
Colombia, France, Germany, India,
Italy, Mexico, Peru, Spain, Thailand,
and the USA
EFV XTC + TDF
Study 903 EFV XTC + TDF 602 144 2000 3 South America, Europe, and the USA
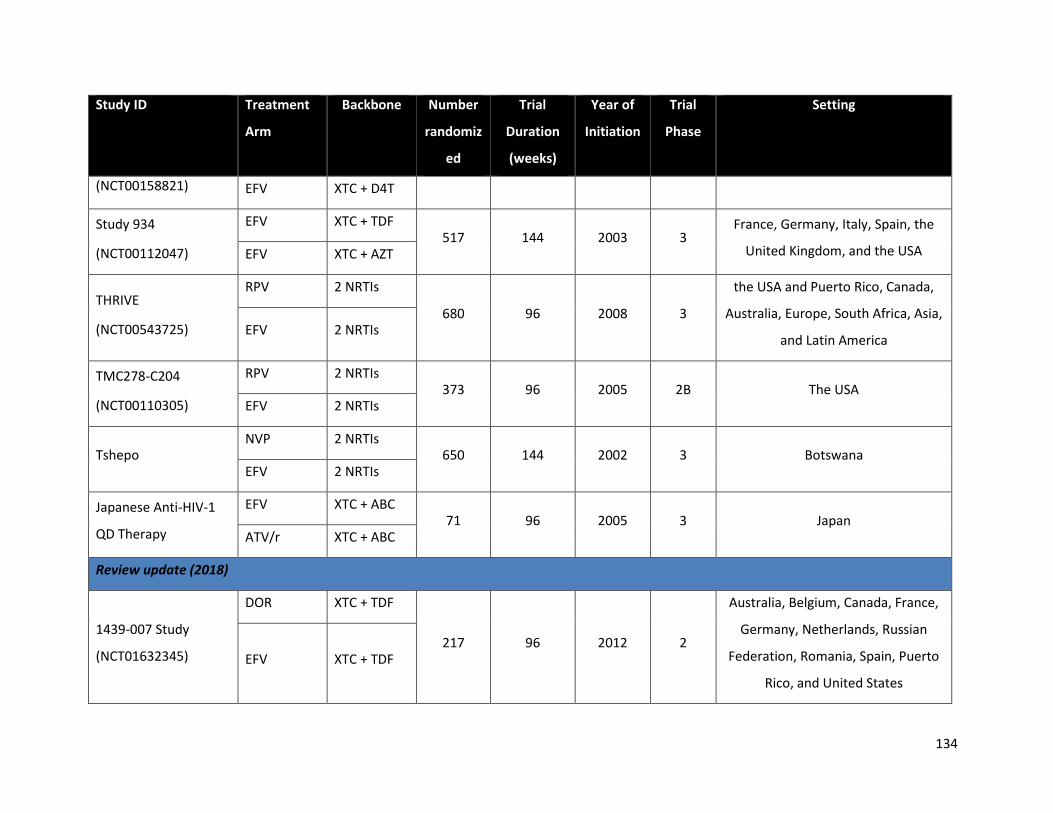
134
Study ID Treatment
Arm
Backbone Number
randomiz
ed
Trial
Duration
(weeks)
Year of
Initiation
Trial
Phase
Setting
(NCT00158821) EFV XTC + D4T
Study 934
(NCT00112047)
EFV XTC + TDF 517 144 2003 3
France, Germany, Italy, Spain, the
United Kingdom, and the USA EFV XTC + AZT
THRIVE
(NCT00543725)
RPV 2 NRTIs
680 96 2008 3
the USA and Puerto Rico, Canada,
Australia, Europe, South Africa, Asia,
and Latin America EFV 2 NRTIs
TMC278-C204
(NCT00110305)
RPV 2 NRTIs 373 96 2005 2B The USA
EFV 2 NRTIs
Tshepo NVP 2 NRTIs
650 144 2002 3 Botswana EFV 2 NRTIs
Japanese Anti-HIV-1
QD Therapy
EFV XTC + ABC 71 96 2005 3 Japan
ATV/r XTC + ABC
Review update (2018)
1439-007 Study
(NCT01632345)
DOR XTC + TDF
217 96 2012 2
Australia, Belgium, Canada, France,
Germany, Netherlands, Russian
Federation, Romania, Spain, Puerto
Rico, and United States
EFV XTC + TDF

135
Study ID Treatment
Arm
Backbone Number
randomiz
ed
Trial
Duration
(weeks)
Year of
Initiation
Trial
Phase
Setting
Advanz-3
(NCT00532168)
EFV XTC + TDF
89 48 2007 4 Spain ATV/r XTC + TDF
LPV/r XTC + TDF
ARIA
(NCT01910402)
DTG ABC + XTC
499 48 2013 3b
United States, Argentina, Canada,
France, Italy, Mexico, Portugal,
Puerto Ricco, Russian Federation,
South Africa, Spain, Thailand, and
United Kingdom
ATV/r XTC + TDF
DRIVE AHEAD
(NCT02403674)
DOR XTC + TDF 734 96 2015 3
Africa, Asia, Europe, Latin America,
and North America EFV XTC + TDF
DRIVE FORWARD
(NCT02275780)
DOR 2 NRTIs
769 96 2014 3
Argentina, Australia, Austria,
Canada, Chile, Denmark, France,
Germany, Italy, Romania, Russia,
South Africa, Spain, United Kingdom,
and United States
DRV/r 2 NRTIs
GS-US-236-0140
(NCT02246998)
EVG/c XTC + TDF 72 24 2014 4
Belgium, France, Ireland, Spain, and
United Kingdom ATV/r XTC + TDF
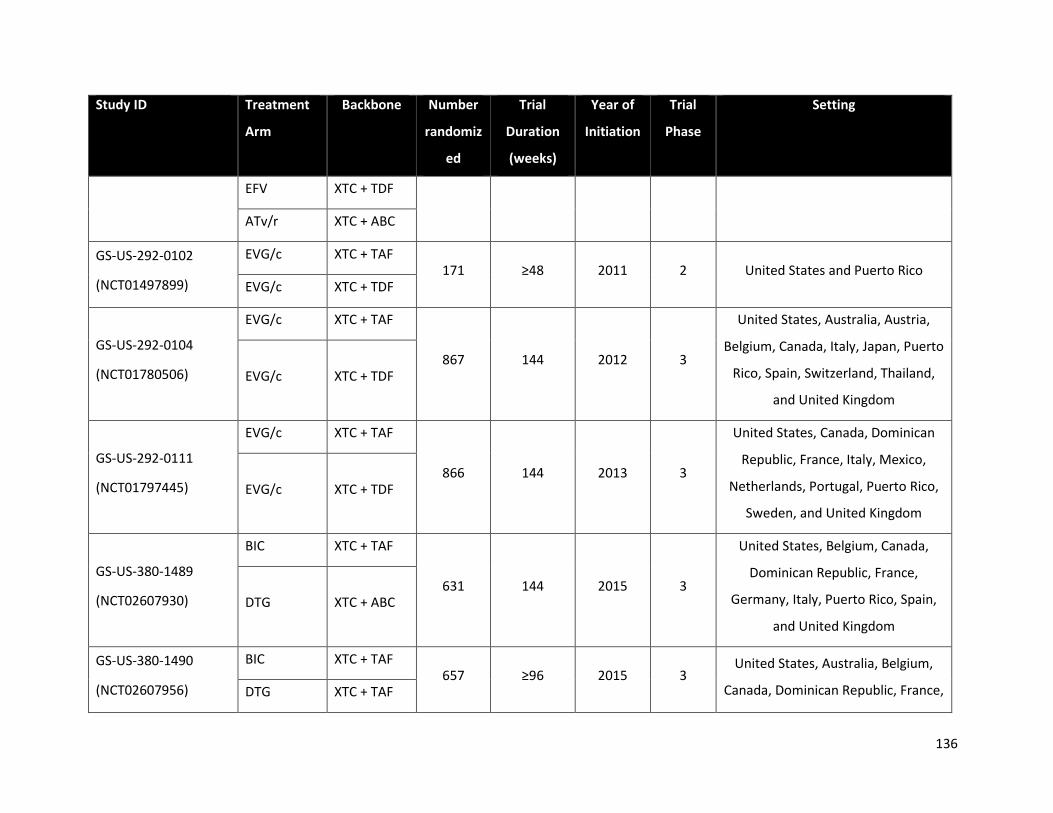
136
Study ID Treatment
Arm
Backbone Number
randomiz
ed
Trial
Duration
(weeks)
Year of
Initiation
Trial
Phase
Setting
EFV XTC + TDF
ATv/r XTC + ABC
GS-US-292-0102
(NCT01497899)
EVG/c XTC + TAF 171 ≥48 2011 2 United States and Puerto Rico
EVG/c XTC + TDF
GS-US-292-0104
(NCT01780506)
EVG/c XTC + TAF
867 144 2012 3
United States, Australia, Austria,
Belgium, Canada, Italy, Japan, Puerto
Rico, Spain, Switzerland, Thailand,
and United Kingdom
EVG/c XTC + TDF
GS-US-292-0111
(NCT01797445)
EVG/c XTC + TAF
866 144 2013 3
United States, Canada, Dominican
Republic, France, Italy, Mexico,
Netherlands, Portugal, Puerto Rico,
Sweden, and United Kingdom
EVG/c XTC + TDF
GS-US-380-1489
(NCT02607930)
BIC XTC + TAF
631 144 2015 3
United States, Belgium, Canada,
Dominican Republic, France,
Germany, Italy, Puerto Rico, Spain,
and United Kingdom
DTG XTC + ABC
GS-US-380-1490
(NCT02607956)
BIC XTC + TAF 657 ≥96 2015 3
United States, Australia, Belgium,
Canada, Dominican Republic, France, DTG XTC + TAF

137
Study ID Treatment
Arm
Backbone Number
randomiz
ed
Trial
Duration
(weeks)
Year of
Initiation
Trial
Phase
Setting
Germany, Italy, Puerto Rico, Spain,
and United Kingdom
SSAT066
(NCT02351908)
RAL XTC + TDF
60 48 2015 4 United Kingdom DTG XTC + TDF
EVG/c XTC + TDF
WAVES
(NCT01705574)
EVG/c XTC + TDF
575 96 2012 3
United States, Belgium, Dominican
Republic, France, Italy, Mexico,
Portugal, Puerto Rico, Russian
Federation, Thailand, Uganda, and
United Kingdom
ATV/r XTC + TDF
Zhang et al, 2015
(NCT01340950)
NVP XTC + AZT 250 96 2010 4 China
EFV XTC + TDF
ABC: abacavir; ATV/r: ritonavir-boosted atazanavir; AZT: zidovudine; DRV/r: ritonavir-boosted darunavir; DTG: dolutegravir; EFV: efavirenz;
EVG/c: Elvitegravir/cobicistat; LPV/r: ritonavir-boosted lopinavir; NRTI: non-nucleoside reverse transcriptase inhibitor; NVP: nevirapine; RAL:
raltegravir; RPV: rilpivirine; TDF: Tenofovir disoproxil fumerate; XTC: lamivudine or emtricitabine

138
Table 25: Trial characteristics for studies selected in the systematic literature review among TB co-infected patients
Study ID Treatment
Arm
Backbone Number
randomiz
ed
Trial
Duration
(weeks)
Year of
Initiation
Trial
Phase
Setting
Previous review (May 2015)
ANRS 12 180 Reflate
TB trial
EFV XTC + TDF
155 48 2009 2 Brazil, France RAL400 XTC + TDF
RAL800 XTC + TDF
CARINEMO EFV XTC + TDF
570 48 2007 2-3 Mozambique RAL400 XTC + TDF
N2R EFV XTC + d4T
142 48 2007 3 Thailand NVP XTC + d4T
Phidisa II
(NCT00342355)
EFV ddI + AZT
1771 144 2004 4 South Africa LPV/r ddI + AZT
EFV XTC + d4T
LPV/r XTC + d4T
Sinha et al, 2013 EFV 2NRTIs
142 96 2007 3 India NVP 2NRTIs
Swaminathan et al, EFV XTC + ddI 116 96 2006 3 India
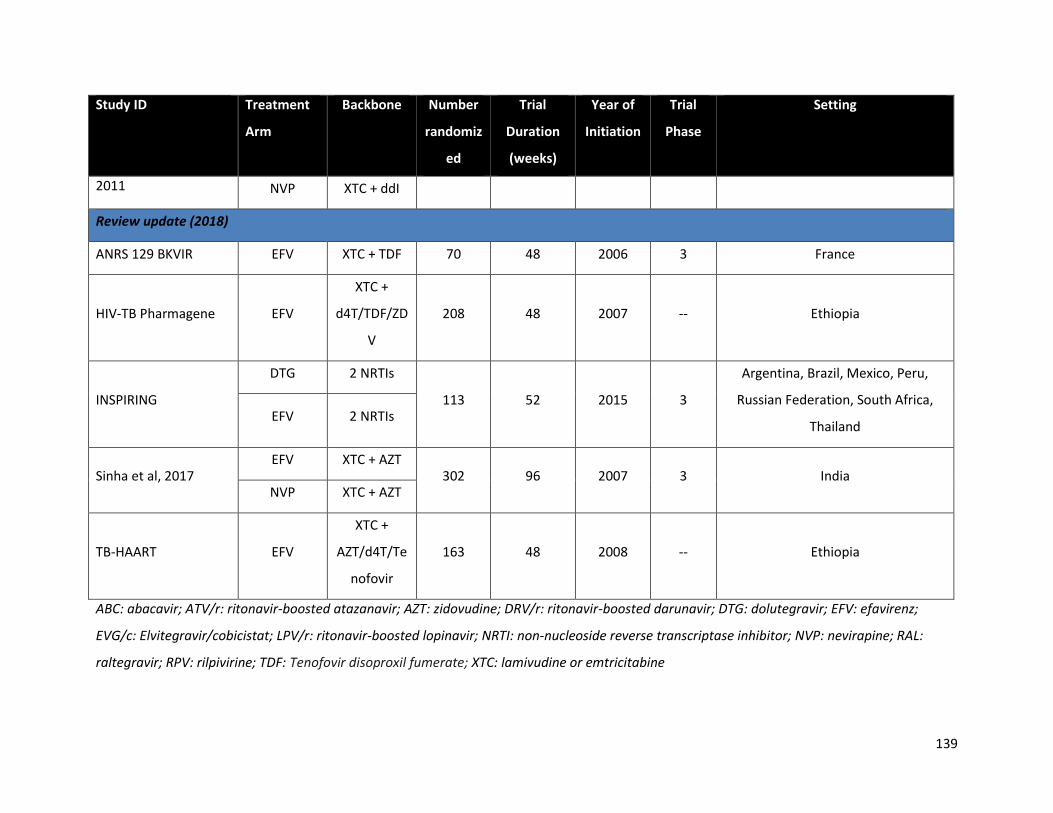
139
Study ID Treatment
Arm
Backbone Number
randomiz
ed
Trial
Duration
(weeks)
Year of
Initiation
Trial
Phase
Setting
2011 NVP XTC + ddI
Review update (2018)
ANRS 129 BKVIR EFV XTC + TDF 70 48 2006 3 France
HIV-TB Pharmagene EFV
XTC +
d4T/TDF/ZD
V
208 48 2007 -- Ethiopia
INSPIRING
DTG 2 NRTIs
113 52 2015 3
Argentina, Brazil, Mexico, Peru,
Russian Federation, South Africa,
Thailand EFV 2 NRTIs
Sinha et al, 2017 EFV XTC + AZT
302 96 2007 3 India NVP XTC + AZT
TB-HAART EFV
XTC +
AZT/d4T/Te
nofovir
163 48 2008 -- Ethiopia
ABC: abacavir; ATV/r: ritonavir-boosted atazanavir; AZT: zidovudine; DRV/r: ritonavir-boosted darunavir; DTG: dolutegravir; EFV: efavirenz;
EVG/c: Elvitegravir/cobicistat; LPV/r: ritonavir-boosted lopinavir; NRTI: non-nucleoside reverse transcriptase inhibitor; NVP: nevirapine; RAL:
raltegravir; RPV: rilpivirine; TDF: Tenofovir disoproxil fumerate; XTC: lamivudine or emtricitabine

140
Appendix F: Patient characteristics in included studies
Table 26: Patient characteristics across the 76 randomized controlled trials included in the principal analysis
Study ID Treatment
Arm
Age
mean (SE)
Males
n (%)
AIDS-
defining
illness
n (%)
Baseline
CD4
(cells/mm3)
Mean (SE)
Baseline
viral load
(log
copies/mL)
Mean (SE)
Men who
have sex
with men
n (%)
Persons
who inject
drugs
n (%)
Previous review (May 2015)
2NN
NVP 34† (0.6) 220 (63%) 44 (20%) 200† (12.24) 4.7† (0.05) 58 (26%) 11 (5%)
EFV 35† (0.37) 400 (64%) 84 (21%) 190† (10) 4.7† (0.04) 117 (29%) 21 (5%)
NVP 34† (0.41) 387 (61%) 86 (22%) 170† (9.41) 4.7† (0.04) 102 (26%) 13 (3%)
ACTG A5142 EFV 39 (0.57) 250 (81%) -- 195† (9.42) 4.8† (0.05) -- --
LPV/r 37 (0.57) 253 (77%) -- 190† (9.37) 4.8† (0.05) -- --
ACTG A5202
EFV 39† (0.45) 464 (85%) 70 (15%) 234† (7.94) 4.7 (0.02) -- --
ATV/r 39† (0.52) 465 (83%) 70 (15%) 224† (8.24) 4.7 (0.03) -- --
EFV 37† (0.48) 465 (79%) 88 (19%) 225† (7.59) 4.7 (0.02) -- --
ATV/r 38† (0.52) 463 (84%) 83 (18%) 236† (9.43) 4.6 (0.03) -- --
ACTG A5257 ATV/r 37† (0.37) 605 (76%) -- 309 (7.68) 4.6† (0.03) 330 (55%) 15 (3%)
RAL 36† (0.37) 603 (75%) -- 306 (8.1) 4.7† (0.03) 324 (54%) 15 (3%)
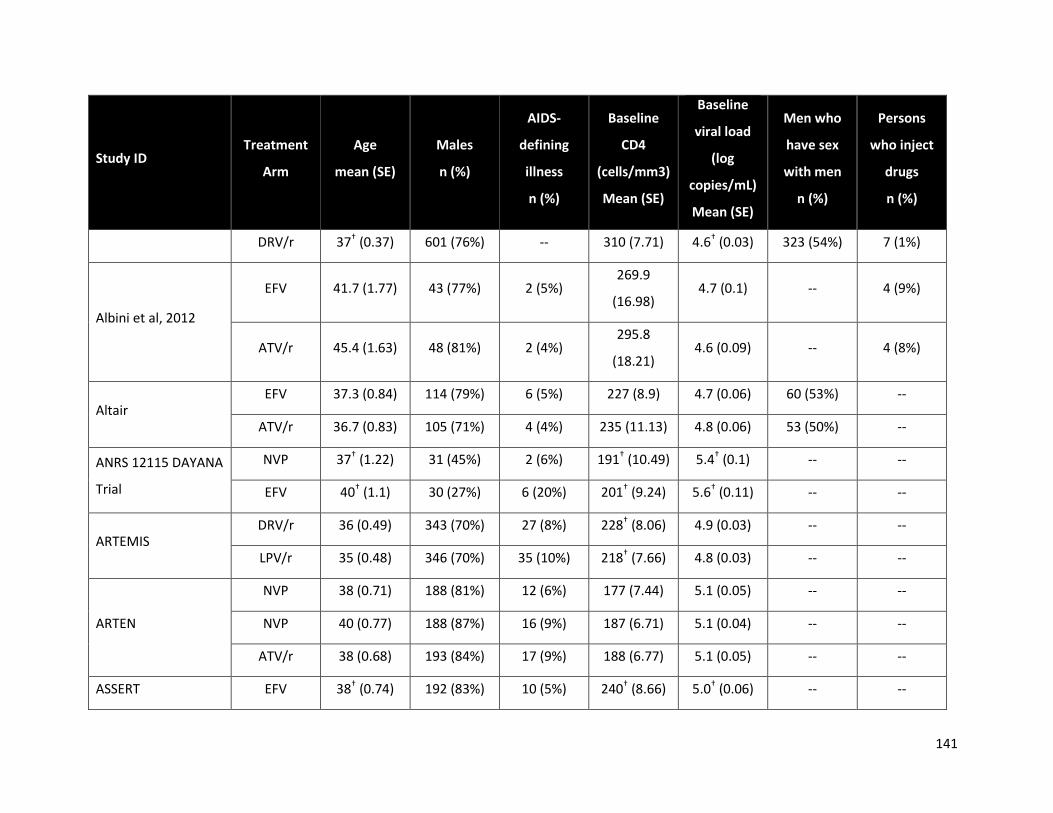
141
Study ID Treatment
Arm
Age
mean (SE)
Males
n (%)
AIDS-
defining
illness
n (%)
Baseline
CD4
(cells/mm3)
Mean (SE)
Baseline
viral load
(log
copies/mL)
Mean (SE)
Men who
have sex
with men
n (%)
Persons
who inject
drugs
n (%)
DRV/r 37† (0.37) 601 (76%) -- 310 (7.71) 4.6† (0.03) 323 (54%) 7 (1%)
Albini et al, 2012
EFV 41.7 (1.77) 43 (77%) 2 (5%) 269.9
(16.98) 4.7 (0.1) -- 4 (9%)
ATV/r 45.4 (1.63) 48 (81%) 2 (4%) 295.8
(18.21) 4.6 (0.09) -- 4 (8%)
Altair EFV 37.3 (0.84) 114 (79%) 6 (5%) 227 (8.9) 4.7 (0.06) 60 (53%) --
ATV/r 36.7 (0.83) 105 (71%) 4 (4%) 235 (11.13) 4.8 (0.06) 53 (50%) --
ANRS 12115 DAYANA
Trial
NVP 37† (1.22) 31 (45%) 2 (6%) 191† (10.49) 5.4† (0.1) -- --
EFV 40† (1.1) 30 (27%) 6 (20%) 201† (9.24) 5.6† (0.11) -- --
ARTEMIS DRV/r 36 (0.49) 343 (70%) 27 (8%) 228† (8.06) 4.9 (0.03) -- --
LPV/r 35 (0.48) 346 (70%) 35 (10%) 218† (7.66) 4.8 (0.03) -- --
ARTEN
NVP 38 (0.71) 188 (81%) 12 (6%) 177 (7.44) 5.1 (0.05) -- --
NVP 40 (0.77) 188 (87%) 16 (9%) 187 (6.71) 5.1 (0.04) -- --
ATV/r 38 (0.68) 193 (84%) 17 (9%) 188 (6.77) 5.1 (0.05) -- --
ASSERT EFV 38† (0.74) 192 (83%) 10 (5%) 240† (8.66) 5.0† (0.06) -- --
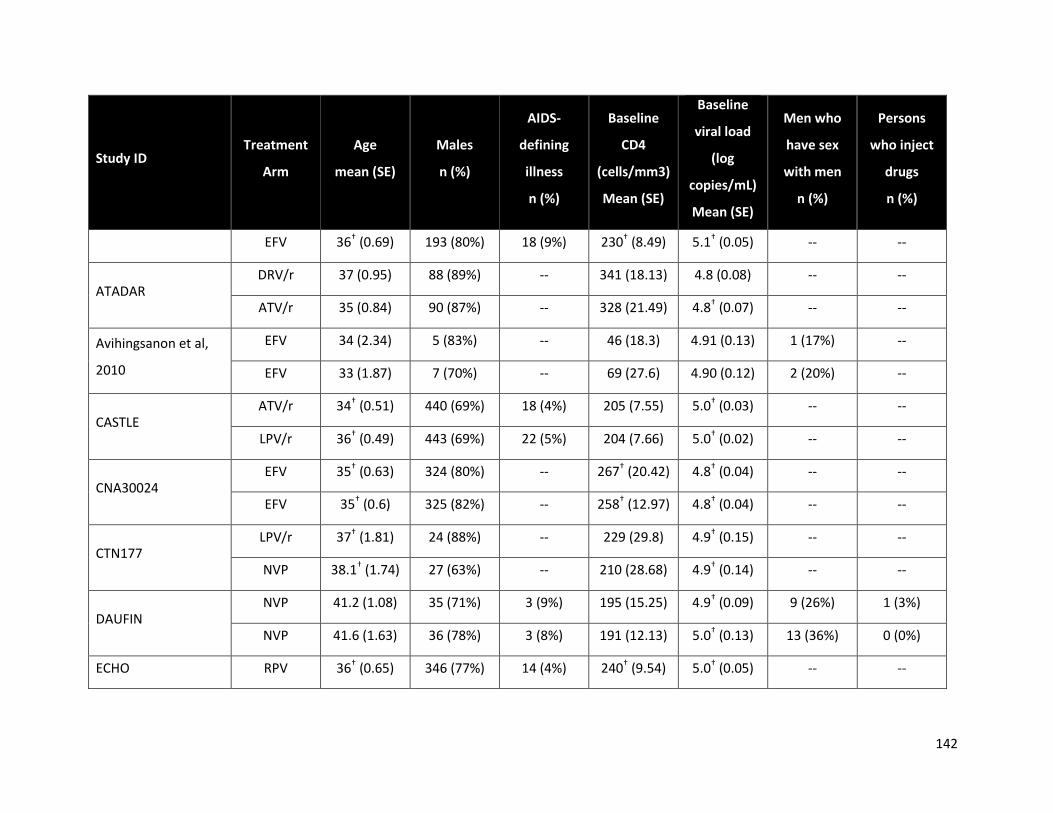
142
Study ID Treatment
Arm
Age
mean (SE)
Males
n (%)
AIDS-
defining
illness
n (%)
Baseline
CD4
(cells/mm3)
Mean (SE)
Baseline
viral load
(log
copies/mL)
Mean (SE)
Men who
have sex
with men
n (%)
Persons
who inject
drugs
n (%)
EFV 36† (0.69) 193 (80%) 18 (9%) 230† (8.49) 5.1† (0.05) -- --
ATADAR DRV/r 37 (0.95) 88 (89%) -- 341 (18.13) 4.8 (0.08) -- --
ATV/r 35 (0.84) 90 (87%) -- 328 (21.49) 4.8† (0.07) -- --
Avihingsanon et al,
2010
EFV 34 (2.34) 5 (83%) -- 46 (18.3) 4.91 (0.13) 1 (17%) --
EFV 33 (1.87) 7 (70%) -- 69 (27.6) 4.90 (0.12) 2 (20%) --
CASTLE ATV/r 34† (0.51) 440 (69%) 18 (4%) 205 (7.55) 5.0† (0.03) -- --
LPV/r 36† (0.49) 443 (69%) 22 (5%) 204 (7.66) 5.0† (0.02) -- --
CNA30024 EFV 35† (0.63) 324 (80%) -- 267† (20.42) 4.8† (0.04) -- --
EFV 35† (0.6) 325 (82%) -- 258† (12.97) 4.8† (0.04) -- --
CTN177 LPV/r 37† (1.81) 24 (88%) -- 229 (29.8) 4.9† (0.15) -- --
NVP 38.1† (1.74) 27 (63%) -- 210 (28.68) 4.9† (0.14) -- --
DAUFIN NVP 41.2 (1.08) 35 (71%) 3 (9%) 195 (15.25) 4.9† (0.09) 9 (26%) 1 (3%)
NVP 41.6 (1.63) 36 (78%) 3 (8%) 191 (12.13) 5.0† (0.13) 13 (36%) 0 (0%)
ECHO RPV 36† (0.65) 346 (77%) 14 (4%) 240† (9.54) 5.0† (0.05) -- --
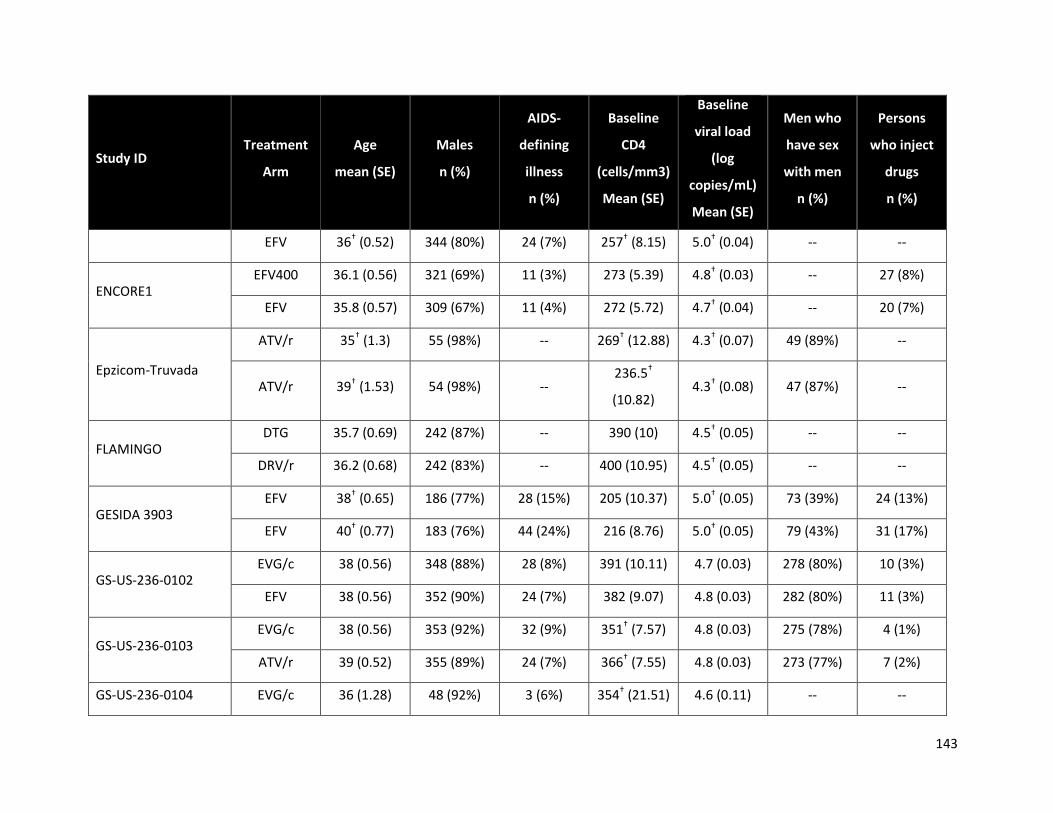
143
Study ID Treatment
Arm
Age
mean (SE)
Males
n (%)
AIDS-
defining
illness
n (%)
Baseline
CD4
(cells/mm3)
Mean (SE)
Baseline
viral load
(log
copies/mL)
Mean (SE)
Men who
have sex
with men
n (%)
Persons
who inject
drugs
n (%)
EFV 36† (0.52) 344 (80%) 24 (7%) 257† (8.15) 5.0† (0.04) -- --
ENCORE1 EFV400 36.1 (0.56) 321 (69%) 11 (3%) 273 (5.39) 4.8† (0.03) -- 27 (8%)
EFV 35.8 (0.57) 309 (67%) 11 (4%) 272 (5.72) 4.7† (0.04) -- 20 (7%)
Epzicom-Truvada
ATV/r 35† (1.3) 55 (98%) -- 269† (12.88) 4.3† (0.07) 49 (89%) --
ATV/r 39† (1.53) 54 (98%) -- 236.5†
(10.82) 4.3† (0.08) 47 (87%) --
FLAMINGO DTG 35.7 (0.69) 242 (87%) -- 390 (10) 4.5† (0.05) -- --
DRV/r 36.2 (0.68) 242 (83%) -- 400 (10.95) 4.5† (0.05) -- --
GESIDA 3903 EFV 38† (0.65) 186 (77%) 28 (15%) 205 (10.37) 5.0† (0.05) 73 (39%) 24 (13%)
EFV 40† (0.77) 183 (76%) 44 (24%) 216 (8.76) 5.0† (0.05) 79 (43%) 31 (17%)
GS-US-236-0102 EVG/c 38 (0.56) 348 (88%) 28 (8%) 391 (10.11) 4.7 (0.03) 278 (80%) 10 (3%)
EFV 38 (0.56) 352 (90%) 24 (7%) 382 (9.07) 4.8 (0.03) 282 (80%) 11 (3%)
GS-US-236-0103 EVG/c 38 (0.56) 353 (92%) 32 (9%) 351† (7.57) 4.8 (0.03) 275 (78%) 4 (1%)
ATV/r 39 (0.52) 355 (89%) 24 (7%) 366† (7.55) 4.8 (0.03) 273 (77%) 7 (2%)
GS-US-236-0104 EVG/c 36 (1.28) 48 (92%) 3 (6%) 354† (21.51) 4.6 (0.11) -- --

144
Study ID Treatment
Arm
Age
mean (SE)
Males
n (%)
AIDS-
defining
illness
n (%)
Baseline
CD4
(cells/mm3)
Mean (SE)
Baseline
viral load
(log
copies/mL)
Mean (SE)
Men who
have sex
with men
n (%)
Persons
who inject
drugs
n (%)
EFV 35 (2) 23 (91%) 1 (4%) 436† (31.07) 4.6 (0.15) -- --
HEAT LPV/r 38† (0.53) 343 (84%) 55 (16%) 214 (10.18) 4.9† (0.05) -- --
LPV/r 38† (0.51) 345 (80%) 57 (17%) 193 (10.06) 4.8† (0.05) -- --
Lake Study EFV 39 (1.06) 63 (86%) 5 (7%) 193 (15.37) 5.4 (0.74) 30 (47%) --
LPV/r 37 (1.19) 63 (87%) 5 (8%) 191 (16) 5.3 (0.69) 25 (39%) --
Li et al, 2008
NVP 35.8 (1.08) 65 (52%) -- 221.8 (9.1) 4.4 (0.08) -- --
NVP 40.1 (1.3) 69 (45%) -- 218.5
(10.11) 4.5 (0.09) -- --
NVP 37.3 (1.19) 64 (48%) -- 224 (9.19) 4.4 (0.08) -- --
Maggiolo et al, 2003 EFV 37 (--) 26 (76%) 21 (64%) 175 (22.91) 5.22 (0.09) 5 (15%) 6 (18%)
EFV 40 (--) 28 (82%) 18 (55%) 184 (21.53) 5.21 (0.09) 3 (9%) 10 (28%)
MASTER
LPV/r 41† (2.96) 9 (78%) 2 (22%) 218† (47.41) 4.4† (0.26) 1 (11%) 3 (33%)
EFV 42† (0.94) 10 (100%) 2 (20%) 116† (21.55) 4.6† (0.27) 2 (20%) 4 (40%)
EFV 38† (2.68) 11 (73%) 1 (9%) 113† (42.21) 4.8† (0.2) 2 (18%) 2 (18%)
METABOLIK DRV/r 36.5† (1.34) 34 (85%) 0 (0%) 267 (17.9) 5 (0.14) -- --

145
Study ID Treatment
Arm
Age
mean (SE)
Males
n (%)
AIDS-
defining
illness
n (%)
Baseline
CD4
(cells/mm3)
Mean (SE)
Baseline
viral load
(log
copies/mL)
Mean (SE)
Men who
have sex
with men
n (%)
Persons
who inject
drugs
n (%)
ATV/r 35† (1.62) 31 (87%) 1 (3%) 316 (27.8) 4.6 (0.13) -- --
NEWART
NVP 38 (1.11) 75 (87%) -- 178.9
(12.16) 4.9 (0.09) -- --
ATV/r 36 (0.89) 77 (92%) -- 183.5
(12.68) 4.9 (0.08) -- --
OzCombo 2
NVP 40 (1.92) 34 (97%) -- 448 (50.98) 4.5 (0.16) -- --
NVP 37 (1.55) 37 (89%) -- 398 (50.95) 4.6 (0.15) -- --
NVP 39 (1.72) 20 (95%) -- 357 (57.55) 4.7 (0.16) -- --
PEARLS EFV 38.3 (2.03) 22 (96%) 57 (11%) 169 (6.54) 5.0† (0.03) -- --
EFV 35 (0.4) 519 (54%) 53 (10%) 162 (6.5) 5.0† (0.03) -- --
Phidisa II
EFV 35 (0.35) 526 (51%) -- 107† (3.8) 5.1 (0.02) -- --
LPV/r 35 (0.39) 526 (54%) -- 104† (3.81) 5.2 (0.03) -- --
EFV 35.3 (0.26) 444 (67%) -- 102† (4.11) 5.1 (0.02) -- --
LPV/r 35.3 (0.26) 440 (68%) -- 112† (3.62) 5.2 (0.02) -- --
Protocol 004 RAL 35.5† (0.26) 444 (69%) 12 (29%) 338 (29.83) 4.6 (0.09) -- --

146
Study ID Treatment
Arm
Age
mean (SE)
Males
n (%)
AIDS-
defining
illness
n (%)
Baseline
CD4
(cells/mm3)
Mean (SE)
Baseline
viral load
(log
copies/mL)
Mean (SE)
Men who
have sex
with men
n (%)
Persons
who inject
drugs
n (%)
EFV 35.6† (0.26) 443 (68%) 14 (37%) 280 (24.98) 4.8 (0.08) -- --
SEARCH 003
NVP 34 (0.97) 41 (76%) 0 (0%) 157 (13.43) 4.9 (0.1) -- --
NVP 36 (1.04) 38 (68%) 2 (4%) 174 (13.72) 4.9 (0.09) -- --
NVP 35 (1.29) 48 (48%) 3 (6%) 154 (12.74) 4.8 (0.09) -- --
SENC NVP 34† (1.13) 49 (43%) 2 (6%) 353† (23.67) 4.4† (0.07) 14 (39%) 14 (39%)
EFV 35† (0.98) 51 (45%) 5 (16%) 416† (31.93) 4.4† (0.08) 14 (45%) 10 (32%)
Sierra-Madero et al,
2010
EFV 35† (0.9) 36 (78%) 36 (38%) 79† (15.29) -- -- --
LPV/r 35† (1.04) 31 (77%) 43 (46%) 69.7†
(15.37) -- -- --
SINGLE DTG 36.7 (0.29) 95 (83%) 17 (4%) 334.5 (7.32) 4.7 (0.04) 277 (67%) 21 (5%)
EFV 36 (0.34) 94 (87%) 17 (4%) 339 (7.28) 4.7 (0.04) 297 (71%) 8 (2%)
SPRING-1 DTG 36 (0.57) 322 (70%) 0 (0%) 327 (20.86) 4.4 (0.1) -- --
EFV 36 (0.55) 327 (76%) 1 (2%) 328 (21.07) 4.5 (0.1) -- --
SPRING-2 DTG 37† (0.92) 51 (88%) 8 (2%) 359† (7.09) 4.5† (0.04) -- --
RAL 40† (1.67) 50 (88%) 8 (2%) 362† (7.38) 4.6† (0.03) -- --
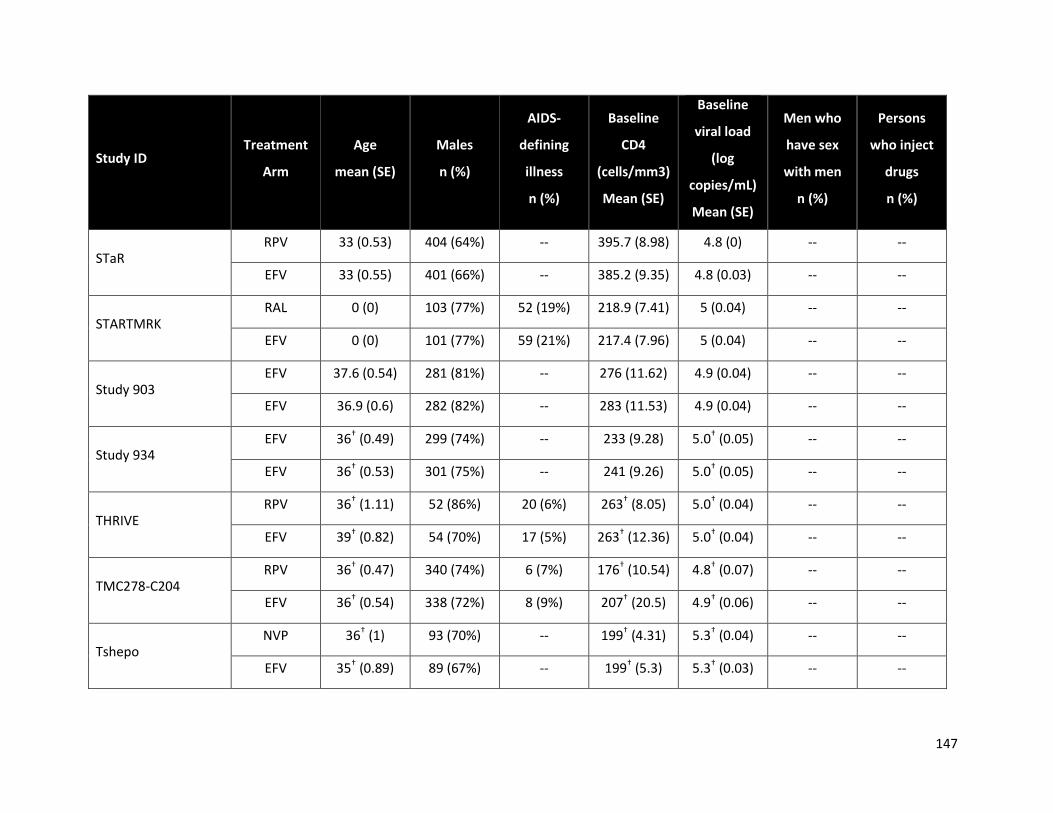
147
Study ID Treatment
Arm
Age
mean (SE)
Males
n (%)
AIDS-
defining
illness
n (%)
Baseline
CD4
(cells/mm3)
Mean (SE)
Baseline
viral load
(log
copies/mL)
Mean (SE)
Men who
have sex
with men
n (%)
Persons
who inject
drugs
n (%)
STaR RPV 33 (0.53) 404 (64%) -- 395.7 (8.98) 4.8 (0) -- --
EFV 33 (0.55) 401 (66%) -- 385.2 (9.35) 4.8 (0.03) -- --
STARTMRK RAL 0 (0) 103 (77%) 52 (19%) 218.9 (7.41) 5 (0.04) -- --
EFV 0 (0) 101 (77%) 59 (21%) 217.4 (7.96) 5 (0.04) -- --
Study 903 EFV 37.6 (0.54) 281 (81%) -- 276 (11.62) 4.9 (0.04) -- --
EFV 36.9 (0.6) 282 (82%) -- 283 (11.53) 4.9 (0.04) -- --
Study 934 EFV 36† (0.49) 299 (74%) -- 233 (9.28) 5.0† (0.05) -- --
EFV 36† (0.53) 301 (75%) -- 241 (9.26) 5.0† (0.05) -- --
THRIVE RPV 36† (1.11) 52 (86%) 20 (6%) 263† (8.05) 5.0† (0.04) -- --
EFV 39† (0.82) 54 (70%) 17 (5%) 263† (12.36) 5.0† (0.04) -- --
TMC278-C204 RPV 36† (0.47) 340 (74%) 6 (7%) 176† (10.54) 4.8† (0.07) -- --
EFV 36† (0.54) 338 (72%) 8 (9%) 207† (20.5) 4.9† (0.06) -- --
Tshepo NVP 36† (1) 93 (70%) -- 199† (4.31) 5.3† (0.04) -- --
EFV 35† (0.89) 89 (67%) -- 199† (5.3) 5.3† (0.03) -- --
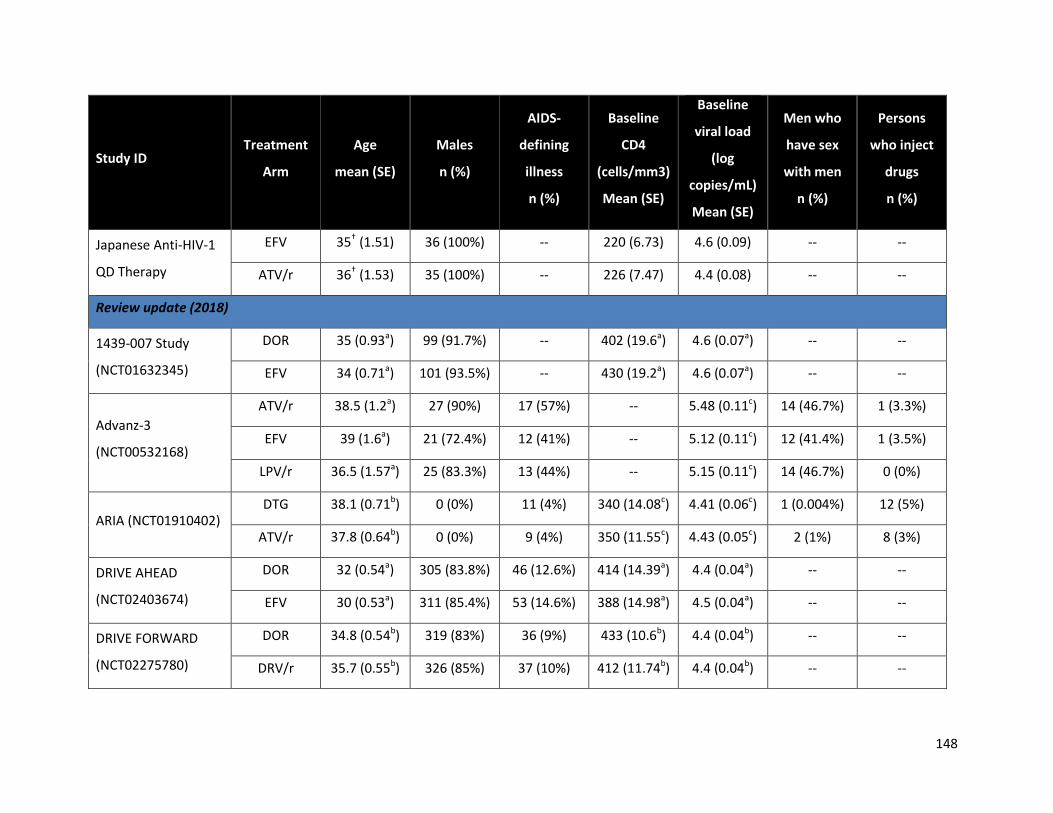
148
Study ID Treatment
Arm
Age
mean (SE)
Males
n (%)
AIDS-
defining
illness
n (%)
Baseline
CD4
(cells/mm3)
Mean (SE)
Baseline
viral load
(log
copies/mL)
Mean (SE)
Men who
have sex
with men
n (%)
Persons
who inject
drugs
n (%)
Japanese Anti-HIV-1
QD Therapy
EFV 35† (1.51) 36 (100%) -- 220 (6.73) 4.6 (0.09) -- --
ATV/r 36† (1.53) 35 (100%) -- 226 (7.47) 4.4 (0.08) -- --
Review update (2018)
1439-007 Study
(NCT01632345)
DOR 35 (0.93a) 99 (91.7%) -- 402 (19.6a) 4.6 (0.07a) -- --
EFV 34 (0.71a) 101 (93.5%) -- 430 (19.2a) 4.6 (0.07a) -- --
Advanz-3
(NCT00532168)
ATV/r 38.5 (1.2a) 27 (90%) 17 (57%) -- 5.48 (0.11c) 14 (46.7%) 1 (3.3%)
EFV 39 (1.6a) 21 (72.4%) 12 (41%) -- 5.12 (0.11c) 12 (41.4%) 1 (3.5%)
LPV/r 36.5 (1.57a) 25 (83.3%) 13 (44%) -- 5.15 (0.11c) 14 (46.7%) 0 (0%)
ARIA (NCT01910402) DTG 38.1 (0.71b) 0 (0%) 11 (4%) 340 (14.08c) 4.41 (0.06c) 1 (0.004%) 12 (5%)
ATV/r 37.8 (0.64b) 0 (0%) 9 (4%) 350 (11.55c) 4.43 (0.05c) 2 (1%) 8 (3%)
DRIVE AHEAD
(NCT02403674)
DOR 32 (0.54a) 305 (83.8%) 46 (12.6%) 414 (14.39a) 4.4 (0.04a) -- --
EFV 30 (0.53a) 311 (85.4%) 53 (14.6%) 388 (14.98a) 4.5 (0.04a) -- --
DRIVE FORWARD
(NCT02275780)
DOR 34.8 (0.54b) 319 (83%) 36 (9%) 433 (10.6b) 4.4 (0.04b) -- --
DRV/r 35.7 (0.55b) 326 (85%) 37 (10%) 412 (11.74b) 4.4 (0.04b) -- --

149
Study ID Treatment
Arm
Age
mean (SE)
Males
n (%)
AIDS-
defining
illness
n (%)
Baseline
CD4
(cells/mm3)
Mean (SE)
Baseline
viral load
(log
copies/mL)
Mean (SE)
Men who
have sex
with men
n (%)
Persons
who inject
drugs
n (%)
GS-US-236-0140
(NCT02246998)
ATV/r 34 (1.98b) 17 (100%) -- 600 (51.36b) -- -- --
ATV/r 34 (1.77b) 15 (93.8%) -- 524 (44.78b) -- -- --
EFV 34 (2.26b) 15 (93.8%) -- 553 (50.86b) -- -- --
EVG/c 36 (1.91b) 17 (100%) -- 552 (41.91b) -- -- --
GS-US-292-0102
(NCT01497899)
EVG/c 35 (1.06b) 108 (96.4%) -- 404 (17.08b) 4.63 (0.05b) -- --
EVG/c 37 (1.39b) 57 (98.3%) -- 394 (27.52b) 4.69 (0.08b) -- --
GS-US-292-0104
(NCT01780506)
EVG/c 35 (0.48b) 364 (83.7%) -- 437 (10.73b) 4.55 (0.03b) -- --
EVG/c 36 (0.51b) 376 (87%) -- 426 (10.21b) 4.55 (0.03b) -- --
GS-US-292-0111
(NCT01797445)
EVG/c 35 (0.52b) 369 (85.6%) -- 414 (9.96b) 4.53 (0.03b) -- --
EVG/c 36 (0.52b) 364 (83.7%) -- 431 (10.87b) 4.5 (0.03b) -- --
GS-US-380-1489
(NCT02607930)
DTG 32 (2.09c) 282 (90%) 15 (5%) 443 (12.13c) 4.51 (0.03c) 250 (79%) 4 (1%)
BIC 31 (2.21c) 285 (91%) 12 (4%) 450 (11.85c) 4.42 (0.04c) 251 (80%) 5 (2%)
GS-US-380-1490
(NCT02607956)
BIC 33 (0.78c) 280 (88%) 24 (8%) 440 (12.37c) 4.43 (0.04c) 237 (74%) 3 (1%)
DTG 34 (0.77c) 288 (89%) 26 (8%) 441 (12.23c) 4.45 (0.03c) 250 (77%) 6 (2%)
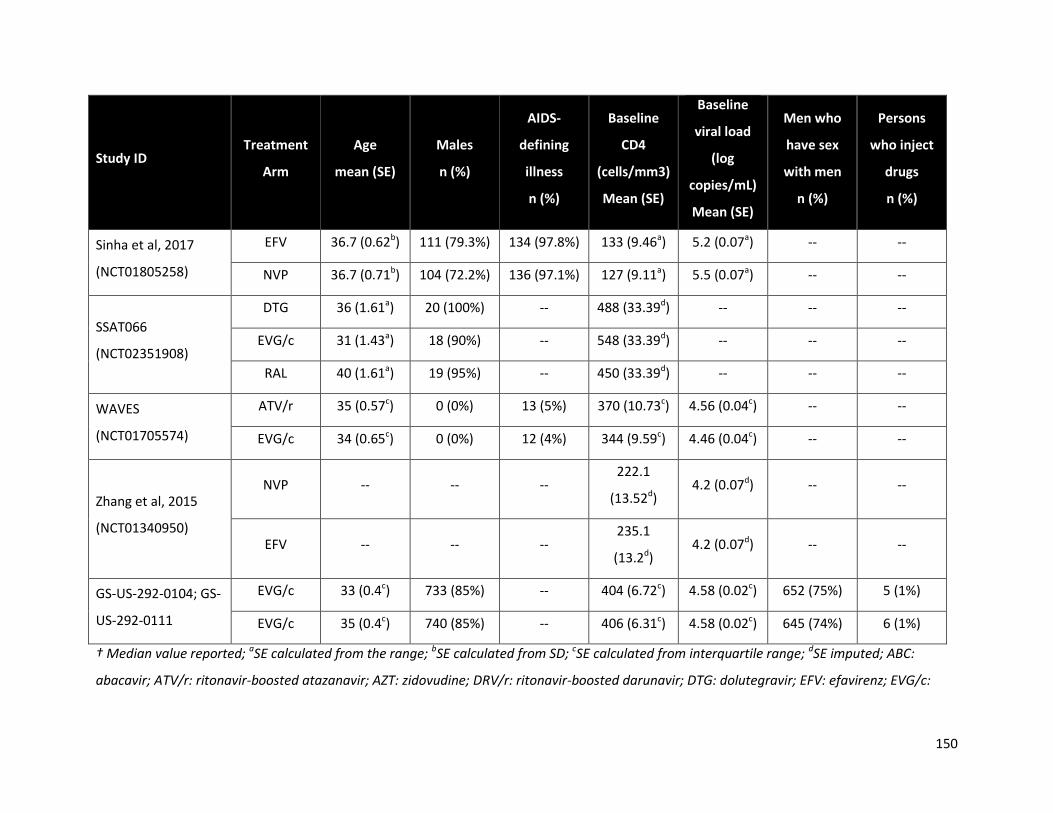
150
Study ID Treatment
Arm
Age
mean (SE)
Males
n (%)
AIDS-
defining
illness
n (%)
Baseline
CD4
(cells/mm3)
Mean (SE)
Baseline
viral load
(log
copies/mL)
Mean (SE)
Men who
have sex
with men
n (%)
Persons
who inject
drugs
n (%)
Sinha et al, 2017
(NCT01805258)
EFV 36.7 (0.62b) 111 (79.3%) 134 (97.8%) 133 (9.46a) 5.2 (0.07a) -- --
NVP 36.7 (0.71b) 104 (72.2%) 136 (97.1%) 127 (9.11a) 5.5 (0.07a) -- --
SSAT066
(NCT02351908)
DTG 36 (1.61a) 20 (100%) -- 488 (33.39d) -- -- --
EVG/c 31 (1.43a) 18 (90%) -- 548 (33.39d) -- -- --
RAL 40 (1.61a) 19 (95%) -- 450 (33.39d) -- -- --
WAVES
(NCT01705574)
ATV/r 35 (0.57c) 0 (0%) 13 (5%) 370 (10.73c) 4.56 (0.04c) -- --
EVG/c 34 (0.65c) 0 (0%) 12 (4%) 344 (9.59c) 4.46 (0.04c) -- --
Zhang et al, 2015
(NCT01340950)
NVP -- -- -- 222.1
(13.52d) 4.2 (0.07d) -- --
EFV -- -- -- 235.1
(13.2d) 4.2 (0.07d) -- --
GS-US-292-0104; GS-
US-292-0111
EVG/c 33 (0.4c) 733 (85%) -- 404 (6.72c) 4.58 (0.02c) 652 (75%) 5 (1%)
EVG/c 35 (0.4c) 740 (85%) -- 406 (6.31c) 4.58 (0.02c) 645 (74%) 6 (1%)
† Median value reported; aSE calculated from the range; bSE calculated from SD; cSE calculated from interquartile range; dSE imputed; ABC:
abacavir; ATV/r: ritonavir-boosted atazanavir; AZT: zidovudine; DRV/r: ritonavir-boosted darunavir; DTG: dolutegravir; EFV: efavirenz; EVG/c:

151
Elvitegravir/cobicistat; LPV/r: ritonavir-boosted lopinavir; NRTI: non-nucleoside reverse transcriptase inhibitor; NVP: nevirapine; RAL: raltegravir;
RPV: rilpivirine; TDF: Tenofovir disoproxil fumerate; XTC: lamivudine or emtricitabine
Table 27: Patient characteristics in the principal analysis in the systematic literature review among TB co-infected patients
Study ID Treatment
Arm
Age
mean (SE)
Males
n (%)
AIDS-
defining
illness
n (%)
Baseline
CD4
(cells/mm3)
Mean (SE)
Baseline
viral load
(log
copies/mL)
Mean (SE)
Men who
have sex
with men
n (%)
Persons
who inject
drugs
n (%)
Previous review (May 2015)
ANRS 12 180 Reflate
TB trial
EFV 35 (1.64c) 39 (76) -- 129 (27.02 c) 4.9 (0.1c) -- --
RAL400 37 (1.34c) 35 (69) -- 115 (16.91 c) 4.9 (0.12 c) -- --
RAL800 38 (1.03c) 38 (75) -- 166 (29.48 c) 5.5 (0.04 c) -- --
CARINEMO EFV 33 (0.53c) 171 (60) 15 (5) 86 (4.21 c) 5.5 (0.04 c) -- --
RAL400 33 (0.53c) 160 (56) 19 (7) 92 (4.56 c) 5.7 (0.04 c) -- --
N2R EFV 35.7 (0.95b) 46 (64.8) -- 74.8 (8.09 b) 5.75 (0.02 c) -- --
NVP 38 (1.07b) 49 (69) -- 55.8 (6.8 b) 5.75 (0.03 c) -- --
Sinha et al, 2013 EFV 34.8 (0.47b) 319 (83) -- 139 (7.12a) 5.19 (0.06a) -- --
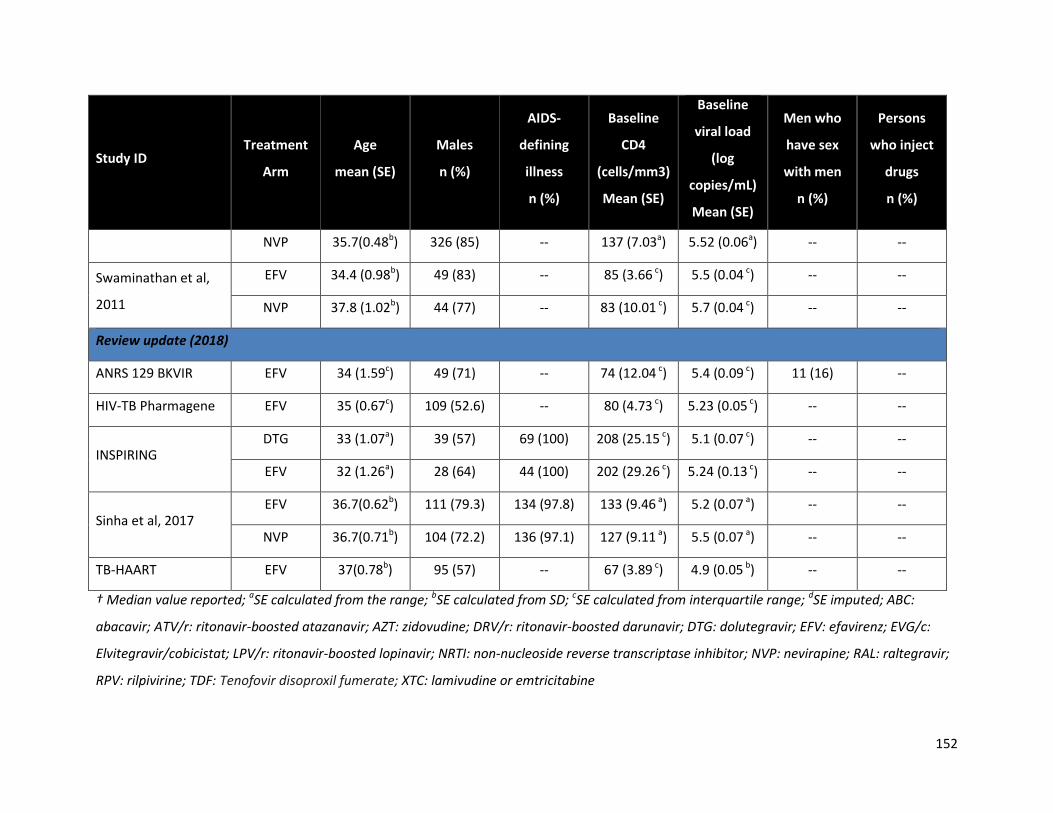
152
Study ID Treatment
Arm
Age
mean (SE)
Males
n (%)
AIDS-
defining
illness
n (%)
Baseline
CD4
(cells/mm3)
Mean (SE)
Baseline
viral load
(log
copies/mL)
Mean (SE)
Men who
have sex
with men
n (%)
Persons
who inject
drugs
n (%)
NVP 35.7(0.48b) 326 (85) -- 137 (7.03a) 5.52 (0.06a) -- --
Swaminathan et al,
2011
EFV 34.4 (0.98b) 49 (83) -- 85 (3.66 c) 5.5 (0.04 c) -- --
NVP 37.8 (1.02b) 44 (77) -- 83 (10.01 c) 5.7 (0.04 c) -- --
Review update (2018)
ANRS 129 BKVIR EFV 34 (1.59c) 49 (71) -- 74 (12.04 c) 5.4 (0.09 c) 11 (16) --
HIV-TB Pharmagene EFV 35 (0.67c) 109 (52.6) -- 80 (4.73 c) 5.23 (0.05 c) -- --
INSPIRING DTG 33 (1.07a) 39 (57) 69 (100) 208 (25.15 c) 5.1 (0.07 c) -- --
EFV 32 (1.26a) 28 (64) 44 (100) 202 (29.26 c) 5.24 (0.13 c) -- --
Sinha et al, 2017 EFV 36.7(0.62b) 111 (79.3) 134 (97.8) 133 (9.46 a) 5.2 (0.07 a) -- --
NVP 36.7(0.71b) 104 (72.2) 136 (97.1) 127 (9.11 a) 5.5 (0.07 a) -- --
TB-HAART EFV 37(0.78b) 95 (57) -- 67 (3.89 c) 4.9 (0.05 b) -- --
† Median value reported; aSE calculated from the range; bSE calculated from SD; cSE calculated from interquartile range; dSE imputed; ABC:
abacavir; ATV/r: ritonavir-boosted atazanavir; AZT: zidovudine; DRV/r: ritonavir-boosted darunavir; DTG: dolutegravir; EFV: efavirenz; EVG/c:
Elvitegravir/cobicistat; LPV/r: ritonavir-boosted lopinavir; NRTI: non-nucleoside reverse transcriptase inhibitor; NVP: nevirapine; RAL: raltegravir;
RPV: rilpivirine; TDF: Tenofovir disoproxil fumerate; XTC: lamivudine or emtricitabine

Appendix G: Quality assessments of included studies
The following table summarizes the critical appraisals for randomized and non-randomized studies using
the Cochrane Risk of Bias instrument and the Tool to Assess the Risk of Bias in Cohort Studies,
developed by the Clinical Advances through Research and Information Translation (CLARITY) group,
respectively.
Table 28: Cochrane risk of bias quality assessment for randomized controlled trials, arranged by
review sub-population
Trial Sequence
generation
Allocation
concealment
Blinding Incomplete
outcome
data
Selective
outcome
reporting
Other
sources
of bias
Population
1439-007 Study Unclear Unclear Unclear Low Low Unclear Principal,
2018
2NN Low Low High Low Low Low Principal,
2015
ACTG A5142 Low Low High Unclear Low Low Principal,
2015
ACTG A5202 Low Low High Low Low Low Principal,
2015
ACTG A5257 Low Low High Low Low Low Principal,
2015
Advanz-3 Low Low High High Low Unclear Principal,
2018
Albini et al, 2012 Low Low Unclear Low Low Low Principal,
2015
Altair Low Low High Low Low Low Principal,
2015
ANRS 12 180
Reflate TB trial Low Low High Low Low Low HIV/TB
ANRS 12115
DAYANA Trial Low Low High Low Unclear Low
Principal,
2015

154
ARIA Low Low High Low Low Unclear Principal,
2018
ARROW Unclear Unclear High Low Low High Children
ARTEMIS Low Low High Low Low Low Principal,
2015
ARTEN Unclear Low High Low Low Low Principal,
2015
ASSERT Unclear Low High High Low Low Principal,
2015
ATADAR Low Low High Low Low Low
Principal,
2015
(updated)
Avihingsanon et
al, 2010 Low Low High Low Low High
Principal,
2015
BAN Low Unclear High High Low High Pregnancy
CARINEMO Low Low High Low Low Low HIV/TB
CASTLE Low Low High Low Low Low Principal,
2015
CNA30024 Unclear Low Low Low Low Low Principal,
2015
CTN177 Low Low High Low Unclear Low Principal,
2015
DAUFIN Unclear Low High High Low Low Principal,
2015
DolPHIN 1 Unclear Unclear High Low Low High Pregnancy
DRIVE AHEAD Unclear Unclear Low Unclear Unclear Unclear Principal,
2018
DRIVE FORWARD Unclear Unclear Unclear Unclear Unclear Unclear Principal,
2018
ECHO Low Low Low Low Low Low Principal,
2015
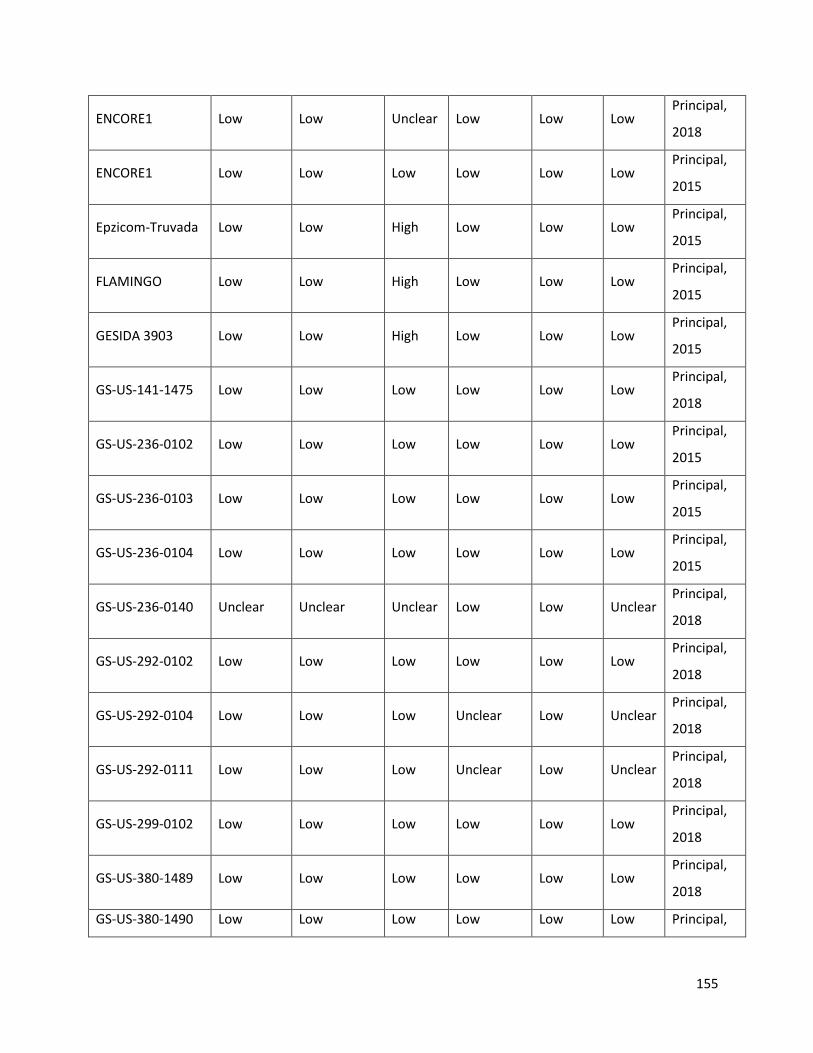
155
ENCORE1 Low Low Unclear Low Low Low Principal,
2018
ENCORE1 Low Low Low Low Low Low Principal,
2015
Epzicom-Truvada Low Low High Low Low Low Principal,
2015
FLAMINGO Low Low High Low Low Low Principal,
2015
GESIDA 3903 Low Low High Low Low Low Principal,
2015
GS-US-141-1475 Low Low Low Low Low Low Principal,
2018
GS-US-236-0102 Low Low Low Low Low Low Principal,
2015
GS-US-236-0103 Low Low Low Low Low Low Principal,
2015
GS-US-236-0104 Low Low Low Low Low Low Principal,
2015
GS-US-236-0140 Unclear Unclear Unclear Low Low Unclear Principal,
2018
GS-US-292-0102 Low Low Low Low Low Low Principal,
2018
GS-US-292-0104 Low Low Low Unclear Low Unclear Principal,
2018
GS-US-292-0111 Low Low Low Unclear Low Unclear Principal,
2018
GS-US-299-0102 Low Low Low Low Low Low Principal,
2018
GS-US-380-1489 Low Low Low Low Low Low Principal,
2018
GS-US-380-1490 Low Low Low Low Low Low Principal,
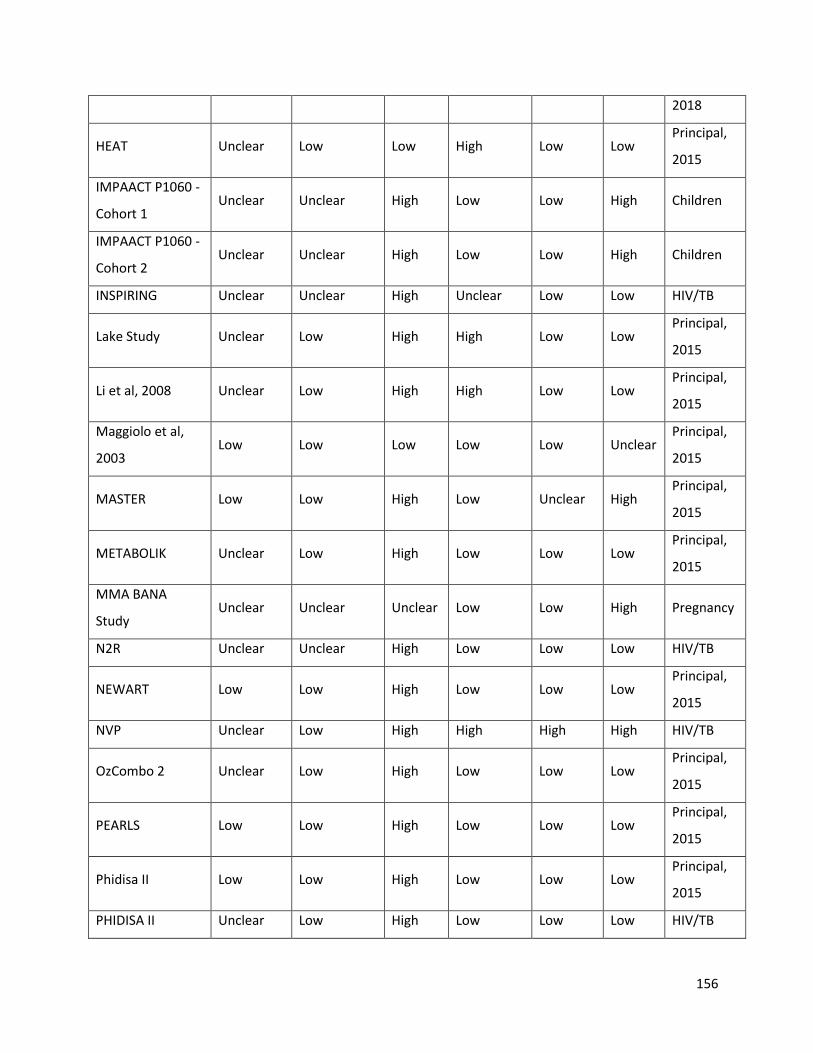
156
2018
HEAT Unclear Low Low High Low Low Principal,
2015
IMPAACT P1060 -
Cohort 1 Unclear Unclear High Low Low High Children
IMPAACT P1060 -
Cohort 2 Unclear Unclear High Low Low High Children
INSPIRING Unclear Unclear High Unclear Low Low HIV/TB
Lake Study Unclear Low High High Low Low Principal,
2015
Li et al, 2008 Unclear Low High High Low Low Principal,
2015
Maggiolo et al,
2003 Low Low Low Low Low Unclear
Principal,
2015
MASTER Low Low High Low Unclear High Principal,
2015
METABOLIK Unclear Low High Low Low Low Principal,
2015
MMA BANA
Study Unclear Unclear Unclear Low Low High Pregnancy
N2R Unclear Unclear High Low Low Low HIV/TB
NEWART Low Low High Low Low Low Principal,
2015
NVP Unclear Low High High High High HIV/TB
OzCombo 2 Unclear Low High Low Low Low Principal,
2015
PEARLS Low Low High Low Low Low Principal,
2015
Phidisa II Low Low High Low Low Low Principal,
2015
PHIDISA II Unclear Low High Low Low Low HIV/TB
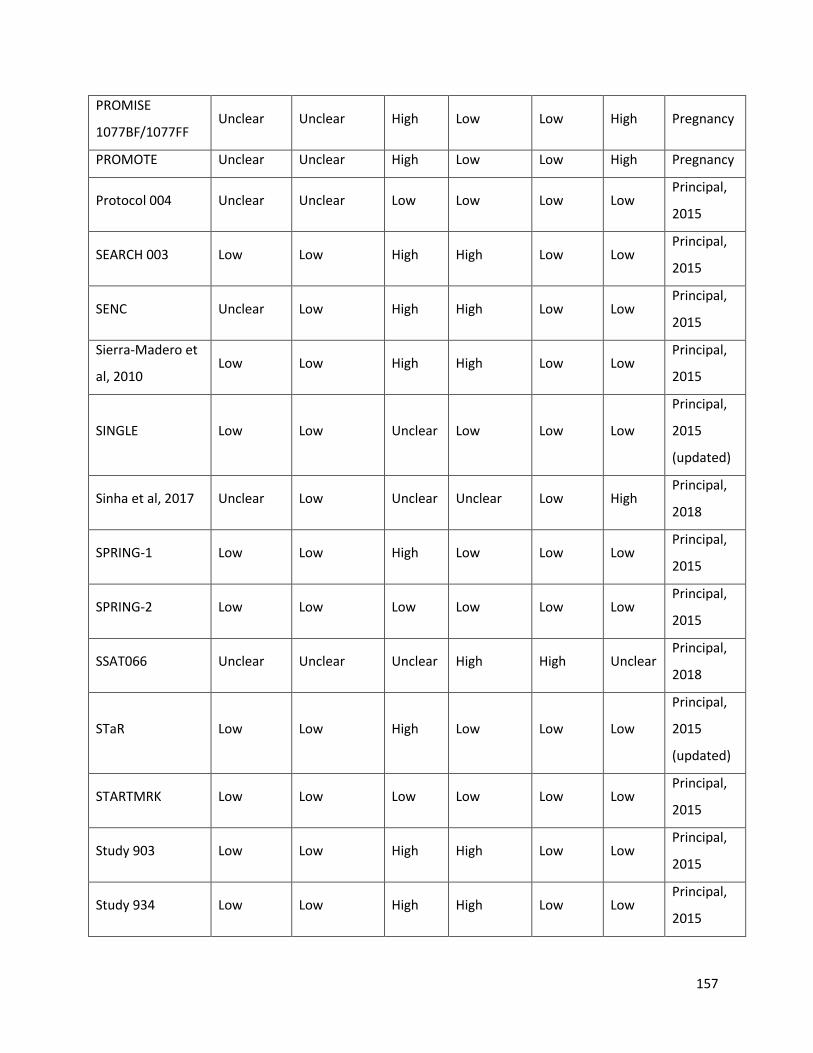
157
PROMISE
1077BF/1077FF Unclear Unclear High Low Low High Pregnancy
PROMOTE Unclear Unclear High Low Low High Pregnancy
Protocol 004 Unclear Unclear Low Low Low Low Principal,
2015
SEARCH 003 Low Low High High Low Low Principal,
2015
SENC Unclear Low High High Low Low Principal,
2015
Sierra-Madero et
al, 2010 Low Low High High Low Low
Principal,
2015
SINGLE Low Low Unclear Low Low Low
Principal,
2015
(updated)
Sinha et al, 2017 Unclear Low Unclear Unclear Low High Principal,
2018
SPRING-1 Low Low High Low Low Low Principal,
2015
SPRING-2 Low Low Low Low Low Low Principal,
2015
SSAT066 Unclear Unclear Unclear High High Unclear Principal,
2018
STaR Low Low High Low Low Low
Principal,
2015
(updated)
STARTMRK Low Low Low Low Low Low Principal,
2015
Study 903 Low Low High High Low Low Principal,
2015
Study 934 Low Low High High Low Low Principal,
2015

158
Swaminathan et
al, 2011 Low Low High Low Low Low HIV/TB
TB-HAART Unclear Unclear High High Low Low HIV/TB
THRIVE Low Low Low Low Low Low Principal,
2015
TMC278-C204 Low Low High Low Low Low Principal,
2015
Tshepo Low Low High Unclear Low Low Principal,
2015
Tshepo Unclear Unclear High Unclear High Low Pregnancy
Japanese Anti-
HIV-1 QD Therapy Unclear Low High Low Unclear Low
Principal,
2015
WAVES Low Low Low Low Low Low Principal,
2018
Zhang et al, 2015 Unclear Unclear Unclear Unclear Unclear Unclear Principal,
2018

Table 29: Critical appraisal of non-randomized studies using the Tool to Assess the Risk of Bias in Cohort Studies, developed by the Clinical
Advances through Research and Information Translation (CLARITY) group
Trial
Was
selection of
exposed and
non-exposed
cohorts
drawn from
the same
population?
Can we be
confident
in the
assessment
of
exposure?
Can we
be
confident
that the
outcome
of
interest
was not
present
at start of
study?
Q4*
Can we be
confident
in the
assessment
of the
presence or
absence of
prognostic
factors?
Can we be
confident
in the
assessment
of
outcome?
Was the
follow up
of cohorts
adequate?
Were co-
Interventions
similar
between
groups?
Population
HIV-TB
Pharmagene Probably Probably
Definitely
Definitely
Definitely
Definitely
Probably
Definitely HIV/TB
ANRS 129
BKVIR N/A Probably
Definitely
N/A
Definitely
Definitely
Definitely
N/A HIV/TB
DART Definitely Definitely
Definitely
Probably
Probably
Definitely
Probably
Definitely Pregnancy
IMPAACT
1026s N/A Probably
Definitely
N/A Probably no
Definitely
Probably
N/A Pregnancy
Ngoma et al, N/A Probably Definitely N/A Probably Definitely Probably N/A Pregnancy

160
2015 no no
Samuel et al,
2014 N/A Probably
Definitely
N/A
Definitely
Definitely
Probably
no N/A Pregnancy
SMAC Definitely Probably Definitely
Probably
Probably Probably
Definitely
Definitely Pregnancy
TSHEPISO Definitely Definitely
Definitely
Definitely
Probably no
Definitely
Definitely
Definitely Pregnancy
Zash et al,
2018 Definitely Probably
Definitely
Definitely
Probably Probably
Probably
Definitely Pregnancy
Thorne et al,
2017 N/A Probably
Definitely
N/A Probably
Definitely
Probably
N/A Pregnancy
Lamorde et al,
2017 N/A Probably
Probably
N/A Probably Probably
Probably
N/A Pregnancy
IMPAACT
P1030 N/A
Definitely
Definitely
N/A
Definitely
Definitely
Definitely
N/A Children
IMPAACT
P1083 N/A
Definitely
Definitely
N/A
Definitely
Definitely
Definitely
N/A Children
PACTG1030 N/A Definitely
Definitely
N/A Probably no
Definitely
Definitely
N/A Children
IMPAACT
P1110 N/A
Definitely
Definitely
N/A Probably no
Definitely
Definitely
N/A Children
IMPAACT
P1066 N/A Probably
Probably
N/A Probably no Probably
Definitely
N/A Children
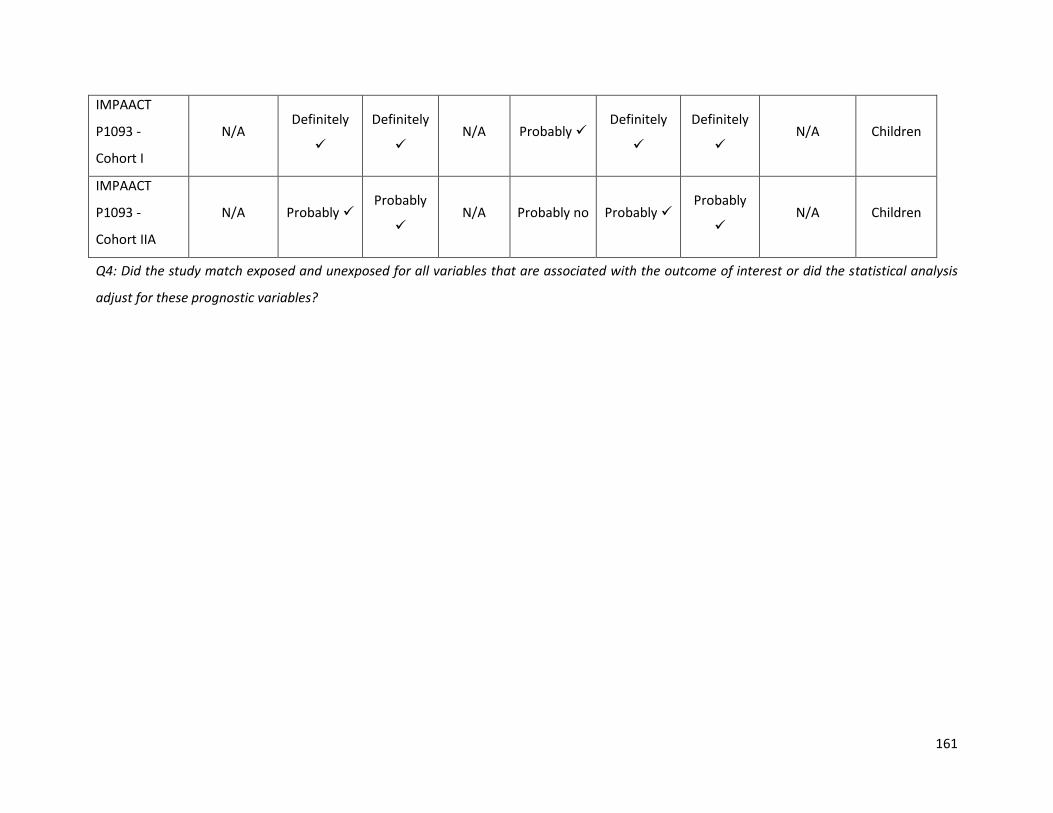
161
IMPAACT
P1093 -
Cohort I
N/A Definitely
Definitely
N/A Probably
Definitely
Definitely
N/A Children
IMPAACT
P1093 -
Cohort IIA
N/A Probably Probably
N/A Probably no Probably
Probably
N/A Children
Q4: Did the study match exposed and unexposed for all variables that are associated with the outcome of interest or did the statistical analysis
adjust for these prognostic variables?

Appendix H: Network diagrams
Figure 22: Network diagram of trials informing viral suppression at 48 weeks (A); 96 weeks (B); and
144 weeks (C).
(A)

163
(B)
(C)
Legend: Circles (nodes) in the diagrams represent individual treatments, lines between circles represent
availability of head-to-head evidence between two treatments, and the numbers on the lines are the

164
number of RCTs informing each head-to-head comparison. Blue: NNRTIs; Green: Protease inhibitors;
Orange: Integrase inhibitors.
Figure 23: Network diagram of the 66 trials informing mean change from baseline in CD4 cell counts at
48 weeks (A); 96 weeks (B); and 144 weeks (C).
(A)
(B)

165
(C)
Legend: Circles (nodes) in the diagrams represent individual treatments, lines between circles represent
availability of head-to-head evidence between two treatments, and the numbers on the lines are the
number of RCTs informing each head-to-head comparison. Blue: NNRTIs; Green: Protease inhibitors;
Orange: Integrase inhibitors.

166
Figure 24: Network diagram of the trials informing mortality
Legend: Circles (nodes) in the diagrams represent individual treatments, lines between circles represent
availability of head-to-head evidence between two treatments, and the numbers on the lines are the
number of RCTs informing each head-to-head comparison. Blue: NNRTIs; Green: Protease inhibitors;
Orange: Integrase inhibitors.

167
Figure 25: Network diagram of the comparative trials reporting AIDS defining illnesses outcome
Legend: Circles (nodes) in the diagrams represent individual treatments, lines between circles represent
availability of head-to-head evidence between two treatments, and the numbers on the lines are the
number of RCTs informing each head-to-head comparison. Blue: NNRTIs; Green: Protease inhibitors;
Orange: Integrase inhibitors.

168
Figure 26: Network diagram of the trials informing discontinuation due adverse events among first-
line HIV patients
Legend: Circles (nodes) in the diagrams represent individual treatments, lines between circles represent
availability of head-to-head evidence between two treatments, and the numbers on the lines are the
number of RCTs informing each head-to-head comparison. Blue: NNRTIs; Green: Protease inhibitors;
Orange: Integrase inhibitors.
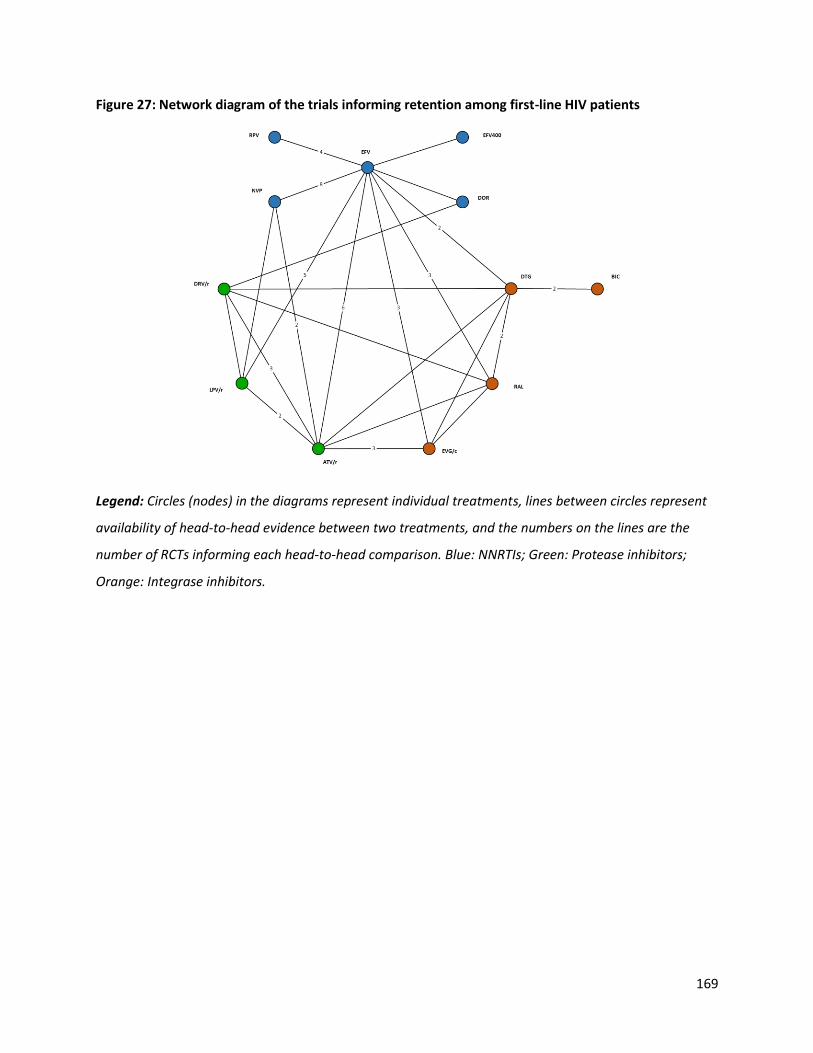
169
Figure 27: Network diagram of the trials informing retention among first-line HIV patients
Legend: Circles (nodes) in the diagrams represent individual treatments, lines between circles represent
availability of head-to-head evidence between two treatments, and the numbers on the lines are the
number of RCTs informing each head-to-head comparison. Blue: NNRTIs; Green: Protease inhibitors;
Orange: Integrase inhibitors.

170
Figure 28: Network diagram of the trials informing the treatment-related adverse events analysis
Legend: Circles (nodes) in the diagrams represent individual treatments, lines between circles represent
availability of head-to-head evidence between two treatments, and the numbers on the lines are the
number of RCTs informing each head-to-head comparison. Blue: NNRTIs; Green: Protease inhibitors;
Orange: Integrase inhibitors.

171
Figure 29: Network diagram of the trials informing the treatment-emergent adverse events analysis
Legend: Circles (nodes) in the diagrams represent individual treatments, lines between circles represent
availability of head-to-head evidence between two treatments, and the numbers on the lines are the
number of RCTs informing each head-to-head comparison. Blue: NNRTIs; Green: Protease inhibitors;
Orange: Integrase inhibitors.

172
Figure 30: Network diagram of the trials informing the treatment-related serious adverse events
analysis
Legend: Circles (nodes) in the diagrams represent individual treatments, lines between circles represent
availability of head-to-head evidence between two treatments, and the numbers on the lines are the
number of RCTs informing each head-to-head comparison. Blue: NNRTIs; Green: Protease inhibitors;
Orange: Integrase inhibitors.
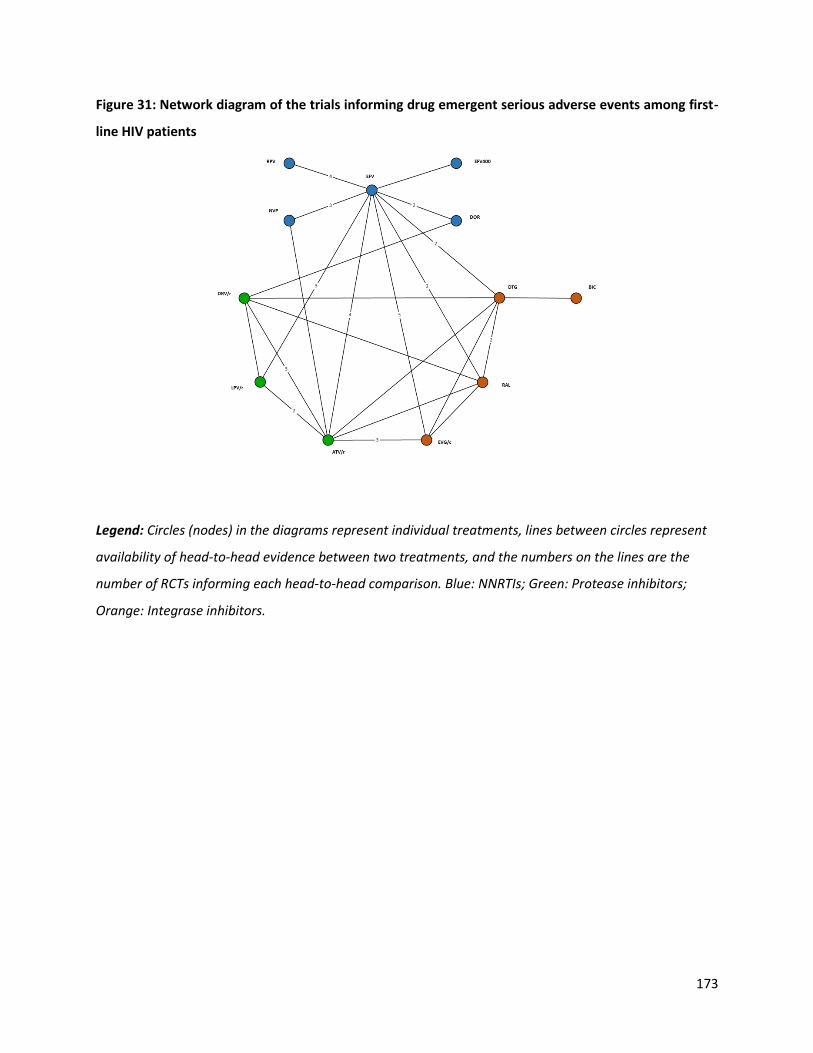
173
Figure 31: Network diagram of the trials informing drug emergent serious adverse events among first-
line HIV patients
Legend: Circles (nodes) in the diagrams represent individual treatments, lines between circles represent
availability of head-to-head evidence between two treatments, and the numbers on the lines are the
number of RCTs informing each head-to-head comparison. Blue: NNRTIs; Green: Protease inhibitors;
Orange: Integrase inhibitors.
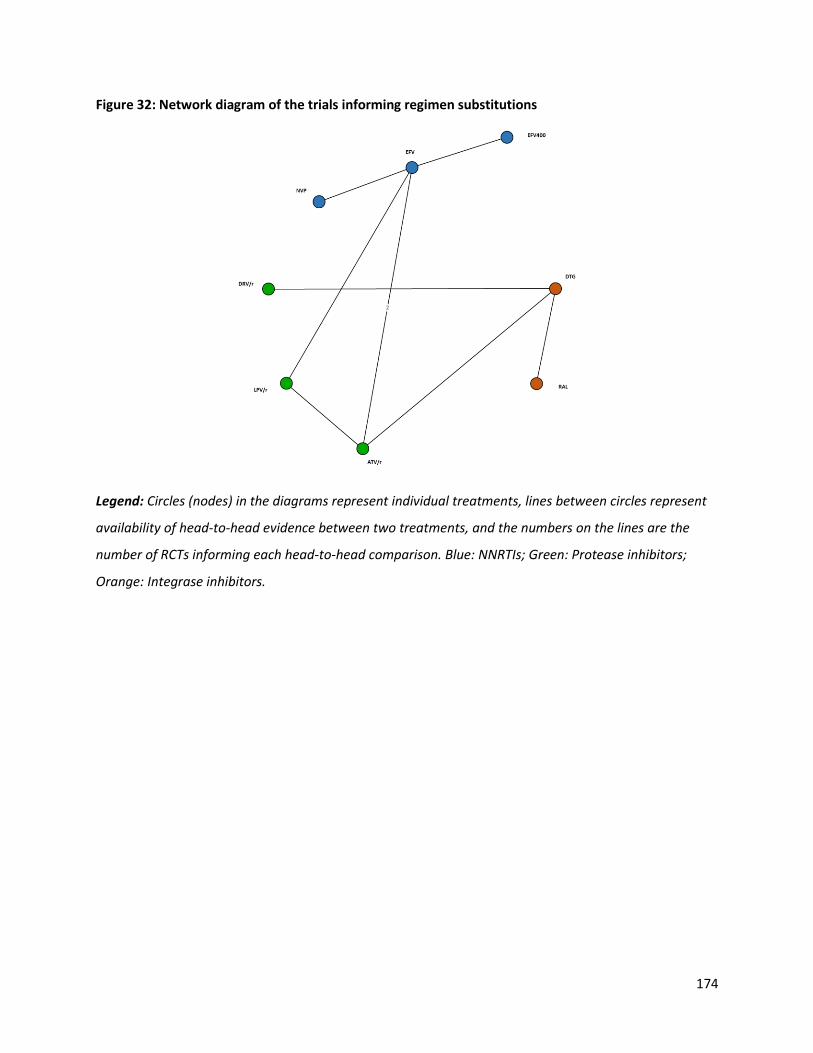
174
Figure 32: Network diagram of the trials informing regimen substitutions
Legend: Circles (nodes) in the diagrams represent individual treatments, lines between circles represent
availability of head-to-head evidence between two treatments, and the numbers on the lines are the
number of RCTs informing each head-to-head comparison. Blue: NNRTIs; Green: Protease inhibitors;
Orange: Integrase inhibitors.
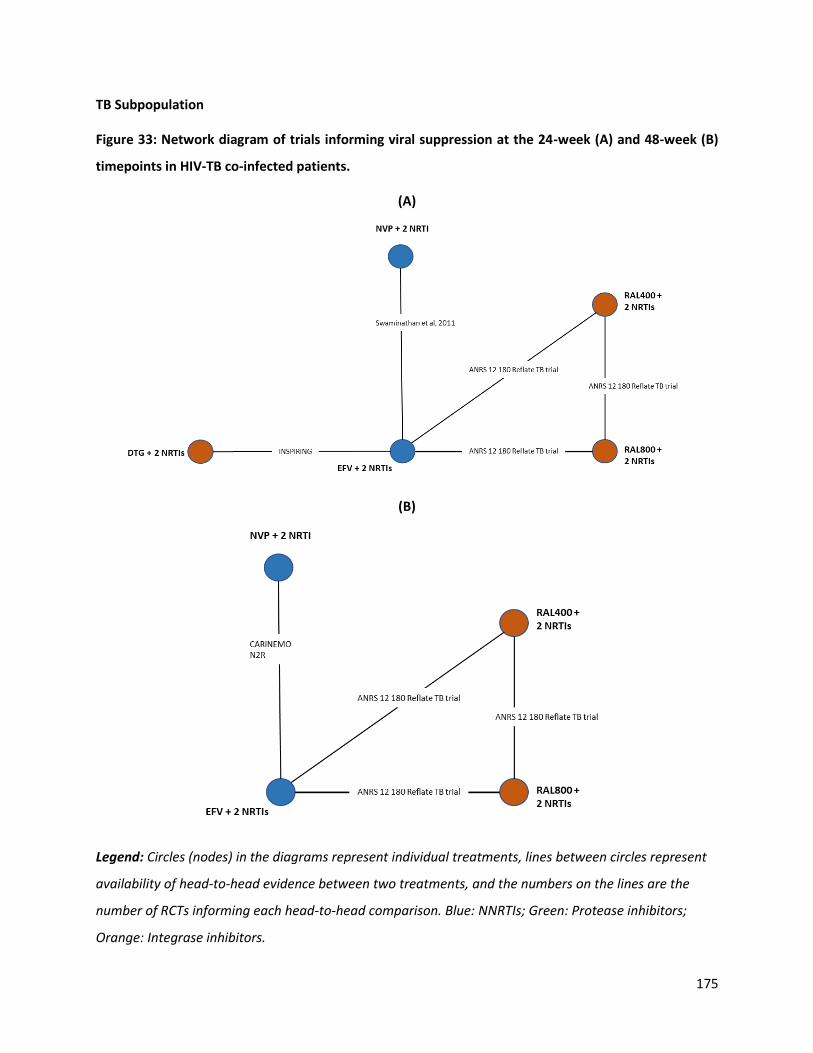
175
TB Subpopulation
Figure 33: Network diagram of trials informing viral suppression at the 24-week (A) and 48-week (B)
timepoints in HIV-TB co-infected patients.
(A)
(B)
Legend: Circles (nodes) in the diagrams represent individual treatments, lines between circles represent
availability of head-to-head evidence between two treatments, and the numbers on the lines are the
number of RCTs informing each head-to-head comparison. Blue: NNRTIs; Green: Protease inhibitors;
Orange: Integrase inhibitors.

176
Figure 34: Network diagram of the trials informing mean change from baseline in CD4 cell counts at
24-week (A) and 48-week (B) timepoints in HIV-TB co-infected patients.
(A)
(B)

177
Legend: Circles (nodes) in the diagrams represent individual treatments, lines between circles represent
availability of head-to-head evidence between two treatments, and the numbers on the lines are the
number of RCTs informing each head-to-head comparison. Blue: NNRTIs; Green: Protease inhibitors;
Orange: Integrase inhibitors.
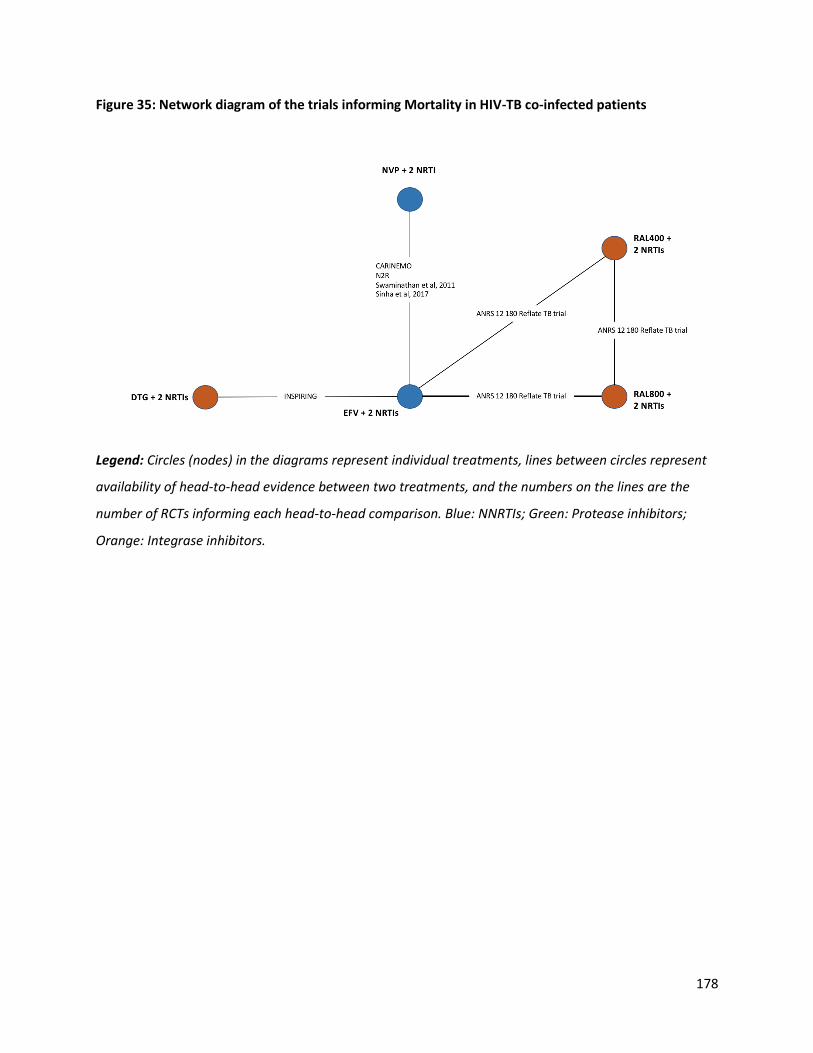
178
Figure 35: Network diagram of the trials informing Mortality in HIV-TB co-infected patients
Legend: Circles (nodes) in the diagrams represent individual treatments, lines between circles represent
availability of head-to-head evidence between two treatments, and the numbers on the lines are the
number of RCTs informing each head-to-head comparison. Blue: NNRTIs; Green: Protease inhibitors;
Orange: Integrase inhibitors.

179
Figure 36: Network diagram of the comparative trials reporting AIDS defining illnesses outcome in
HIV-TB co-infected patients
Legend: Circles (nodes) in the diagrams represent individual treatments, lines between circles represent
availability of head-to-head evidence between two treatments, and the numbers on the lines are the
number of RCTs informing each head-to-head comparison. Blue: NNRTIs; Green: Protease inhibitors;
Orange: Integrase inhibitors.

180
Figure 37: Network diagram of the trials informing discontinuation due adverse events in HIV-TB co-
infected patients
Legend: Circles (nodes) in the diagrams represent individual treatments, lines between circles represent
availability of head-to-head evidence between two treatments, and the numbers on the lines are the
number of RCTs informing each head-to-head comparison. Blue: NNRTIs; Green: Protease inhibitors;
Orange: Integrase inhibitors.
Figure 38: Network diagram of the trials informing retention among first-line HIV patients
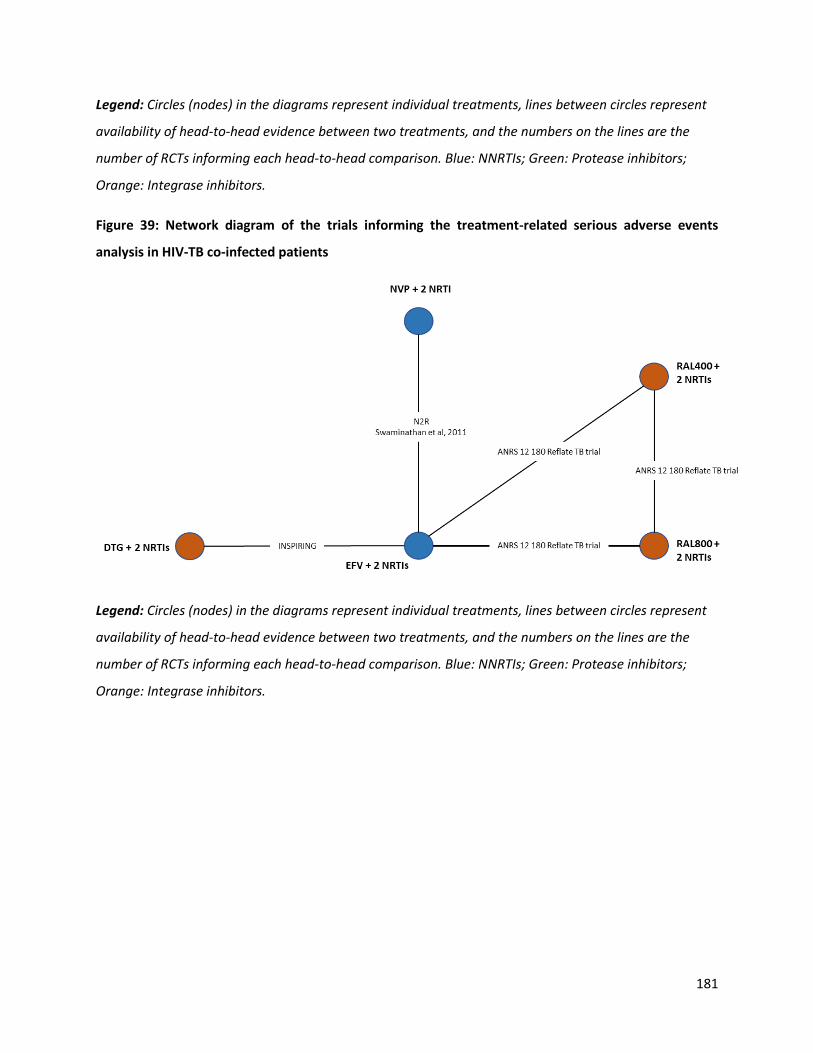
181
Legend: Circles (nodes) in the diagrams represent individual treatments, lines between circles represent
availability of head-to-head evidence between two treatments, and the numbers on the lines are the
number of RCTs informing each head-to-head comparison. Blue: NNRTIs; Green: Protease inhibitors;
Orange: Integrase inhibitors.
Figure 39: Network diagram of the trials informing the treatment-related serious adverse events
analysis in HIV-TB co-infected patients
Legend: Circles (nodes) in the diagrams represent individual treatments, lines between circles represent
availability of head-to-head evidence between two treatments, and the numbers on the lines are the
number of RCTs informing each head-to-head comparison. Blue: NNRTIs; Green: Protease inhibitors;
Orange: Integrase inhibitors.

182
Figure 40: Network diagram of the trials informing treatment emergent serious adverse events in HIV-
TB co-infected patients
Legend: Circles (nodes) in the diagrams represent individual treatments, lines between circles represent
availability of head-to-head evidence between two treatments, and the numbers on the lines are the
number of RCTs informing each head-to-head comparison. Blue: NNRTIs; Green: Protease inhibitors;
Orange: Integrase inhibitors.
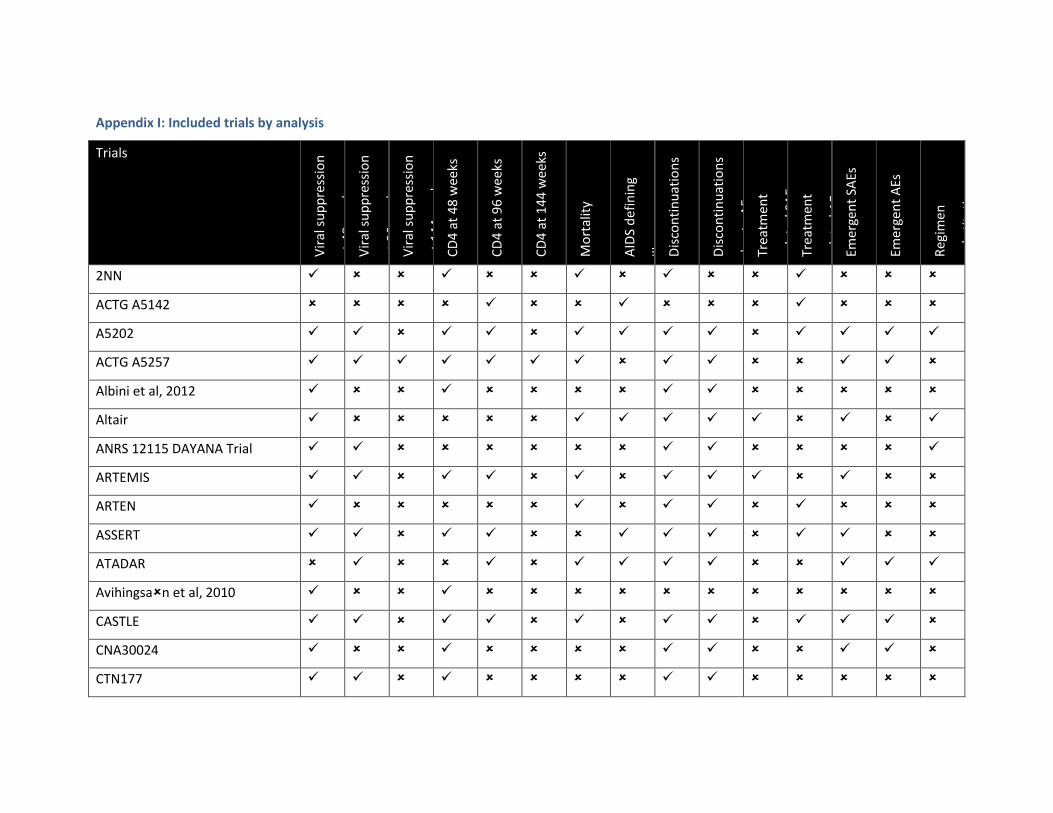
Appendix I: Included trials by analysis
Trials
Vir
al s
up
pre
ssio
n
at 4
8 w
eeks
V
iral
su
pp
ress
ion
at 9
6 w
eeks
V
iral
su
pp
ress
ion
at 1
44
wee
ks
CD
4 a
t 4
8 w
eeks
CD
4 a
t 9
6 w
eeks
CD
4 a
t 1
44
we
eks
Mo
rtal
ity
AID
S d
efin
ing
illn
esse
s D
isco
nti
nu
atio
ns
Dis
con
tin
uat
ion
s
du
e to
AEs
Tr
eatm
ent
rela
ted
SA
Es
Trea
tmen
t
rela
ted
AEs
Em
erge
nt
SAEs
Emer
gen
t A
Es
Reg
imen
sub
stit
uti
on
s
2NN
ACTG A5142
A5202
ACTG A5257
Albini et al, 2012
Altair
ANRS 12115 DAYANA Trial
ARTEMIS
ARTEN
ASSERT
ATADAR
Avihingsan et al, 2010
CASTLE
CNA30024
CTN177

184
DAUFIN
ECHO
ENCORE1
Epzicom-Truvada
FLAMINGO
GESIDA 3903
GS-US-236-0102
GS-US-236-0103
GS-US-236-0104
HEAT
Japanese Anti-HIV-1 QD Therapy
Lake
Li et al, 2008
MASTER
METABOLIK
Maggiolo et al, 2003
NEWART
OzCombo2
PEARLS
PHIDISA II
Protocol 004

185
SEARCH 003
SENC
Sierra-Madero et al, 2010
SINGLE
SPRING-1
SPRING-2
STaR
STARTMRK
Study 903
Study 934
THRIVE
TMC278-C204
Tshepo
1439-007 Study
Advanz-3
ARIA
DRIVE AHEAD
DRIVE FORWARD
GS-US-236-0140
GS-US-292-0102
GS-US-292-0104
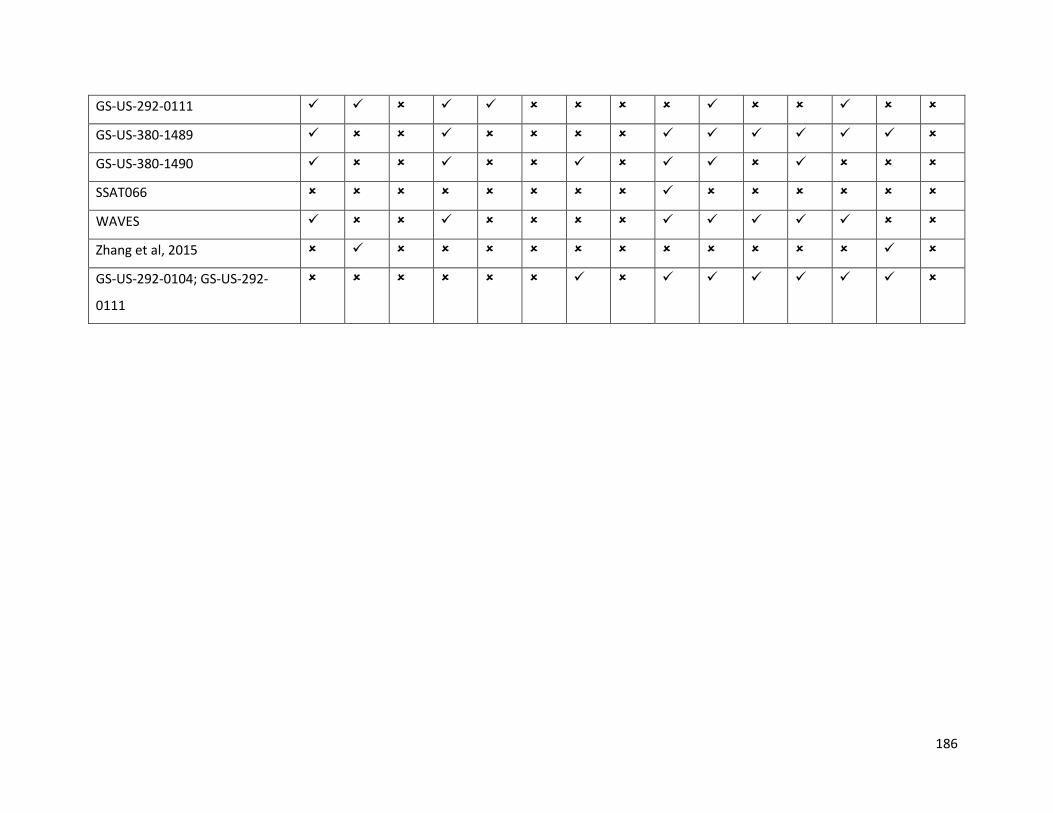
186
GS-US-292-0111
GS-US-380-1489
GS-US-380-1490
SSAT066
WAVES
Zhang et al, 2015
GS-US-292-0104; GS-US-292-
0111
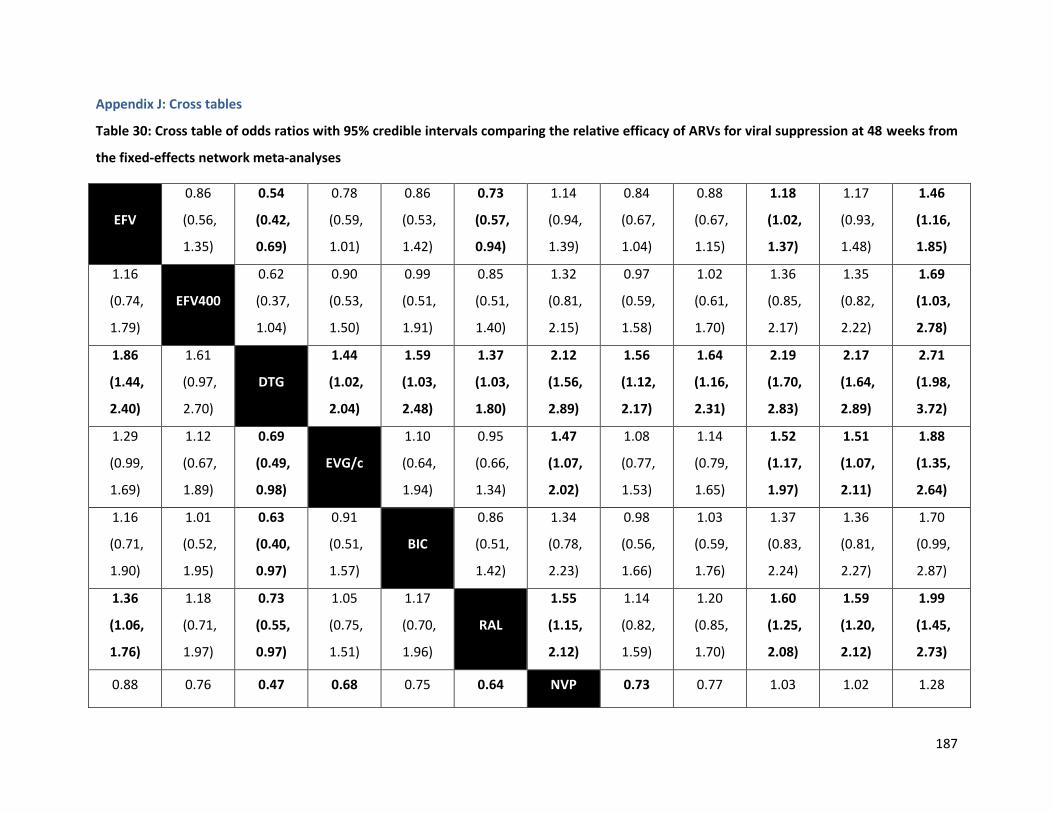
187
Appendix J: Cross tables
Table 30: Cross table of odds ratios with 95% credible intervals comparing the relative efficacy of ARVs for viral suppression at 48 weeks from
the fixed-effects network meta-analyses
EFV
0.86
(0.56,
1.35)
0.54
(0.42,
0.69)
0.78
(0.59,
1.01)
0.86
(0.53,
1.42)
0.73
(0.57,
0.94)
1.14
(0.94,
1.39)
0.84
(0.67,
1.04)
0.88
(0.67,
1.15)
1.18
(1.02,
1.37)
1.17
(0.93,
1.48)
1.46
(1.16,
1.85)
1.16
(0.74,
1.79)
EFV400
0.62
(0.37,
1.04)
0.90
(0.53,
1.50)
0.99
(0.51,
1.91)
0.85
(0.51,
1.40)
1.32
(0.81,
2.15)
0.97
(0.59,
1.58)
1.02
(0.61,
1.70)
1.36
(0.85,
2.17)
1.35
(0.82,
2.22)
1.69
(1.03,
2.78)
1.86
(1.44,
2.40)
1.61
(0.97,
2.70)
DTG
1.44
(1.02,
2.04)
1.59
(1.03,
2.48)
1.37
(1.03,
1.80)
2.12
(1.56,
2.89)
1.56
(1.12,
2.17)
1.64
(1.16,
2.31)
2.19
(1.70,
2.83)
2.17
(1.64,
2.89)
2.71
(1.98,
3.72)
1.29
(0.99,
1.69)
1.12
(0.67,
1.89)
0.69
(0.49,
0.98)
EVG/c
1.10
(0.64,
1.94)
0.95
(0.66,
1.34)
1.47
(1.07,
2.02)
1.08
(0.77,
1.53)
1.14
(0.79,
1.65)
1.52
(1.17,
1.97)
1.51
(1.07,
2.11)
1.88
(1.35,
2.64)
1.16
(0.71,
1.90)
1.01
(0.52,
1.95)
0.63
(0.40,
0.97)
0.91
(0.51,
1.57)
BIC
0.86
(0.51,
1.42)
1.34
(0.78,
2.23)
0.98
(0.56,
1.66)
1.03
(0.59,
1.76)
1.37
(0.83,
2.24)
1.36
(0.81,
2.27)
1.70
(0.99,
2.87)
1.36
(1.06,
1.76)
1.18
(0.71,
1.97)
0.73
(0.55,
0.97)
1.05
(0.75,
1.51)
1.17
(0.70,
1.96)
RAL
1.55
(1.15,
2.12)
1.14
(0.82,
1.59)
1.20
(0.85,
1.70)
1.60
(1.25,
2.08)
1.59
(1.20,
2.12)
1.99
(1.45,
2.73)
0.88 0.76 0.47 0.68 0.75 0.64 NVP 0.73 0.77 1.03 1.02 1.28
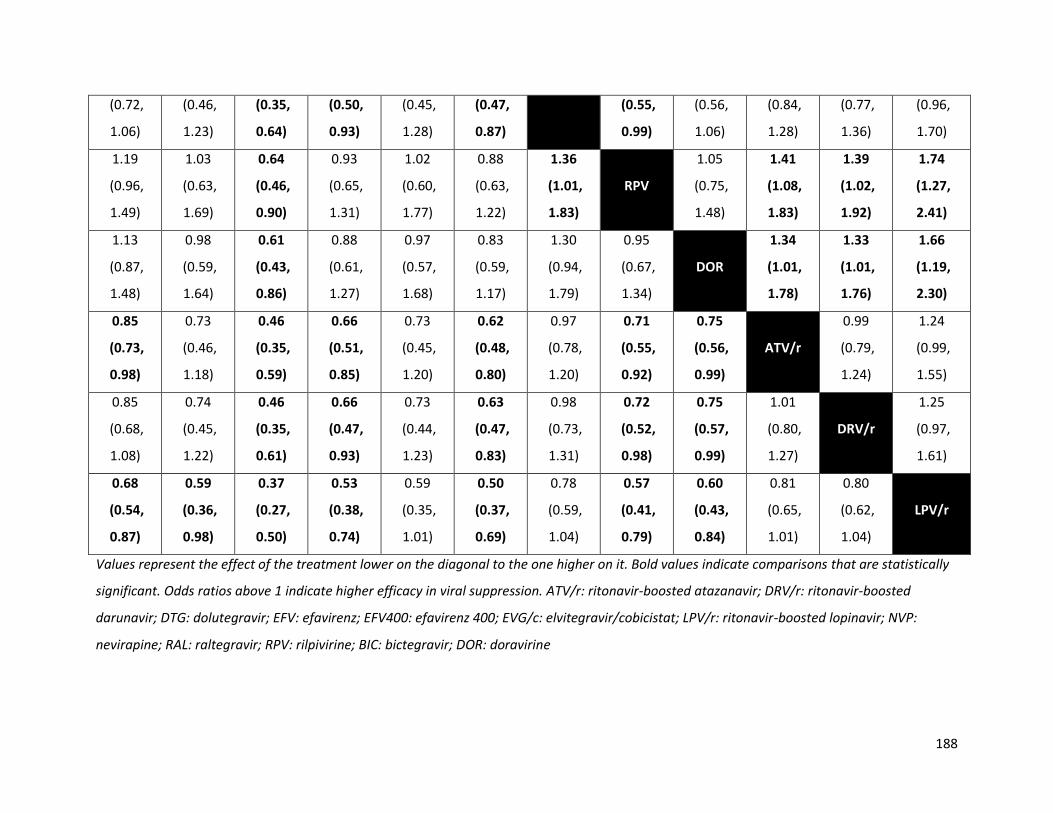
188
(0.72,
1.06)
(0.46,
1.23)
(0.35,
0.64)
(0.50,
0.93)
(0.45,
1.28)
(0.47,
0.87)
(0.55,
0.99)
(0.56,
1.06)
(0.84,
1.28)
(0.77,
1.36)
(0.96,
1.70)
1.19
(0.96,
1.49)
1.03
(0.63,
1.69)
0.64
(0.46,
0.90)
0.93
(0.65,
1.31)
1.02
(0.60,
1.77)
0.88
(0.63,
1.22)
1.36
(1.01,
1.83)
RPV
1.05
(0.75,
1.48)
1.41
(1.08,
1.83)
1.39
(1.02,
1.92)
1.74
(1.27,
2.41)
1.13
(0.87,
1.48)
0.98
(0.59,
1.64)
0.61
(0.43,
0.86)
0.88
(0.61,
1.27)
0.97
(0.57,
1.68)
0.83
(0.59,
1.17)
1.30
(0.94,
1.79)
0.95
(0.67,
1.34)
DOR
1.34
(1.01,
1.78)
1.33
(1.01,
1.76)
1.66
(1.19,
2.30)
0.85
(0.73,
0.98)
0.73
(0.46,
1.18)
0.46
(0.35,
0.59)
0.66
(0.51,
0.85)
0.73
(0.45,
1.20)
0.62
(0.48,
0.80)
0.97
(0.78,
1.20)
0.71
(0.55,
0.92)
0.75
(0.56,
0.99)
ATV/r
0.99
(0.79,
1.24)
1.24
(0.99,
1.55)
0.85
(0.68,
1.08)
0.74
(0.45,
1.22)
0.46
(0.35,
0.61)
0.66
(0.47,
0.93)
0.73
(0.44,
1.23)
0.63
(0.47,
0.83)
0.98
(0.73,
1.31)
0.72
(0.52,
0.98)
0.75
(0.57,
0.99)
1.01
(0.80,
1.27)
DRV/r
1.25
(0.97,
1.61)
0.68
(0.54,
0.87)
0.59
(0.36,
0.98)
0.37
(0.27,
0.50)
0.53
(0.38,
0.74)
0.59
(0.35,
1.01)
0.50
(0.37,
0.69)
0.78
(0.59,
1.04)
0.57
(0.41,
0.79)
0.60
(0.43,
0.84)
0.81
(0.65,
1.01)
0.80
(0.62,
1.04)
LPV/r
Values represent the effect of the treatment lower on the diagonal to the one higher on it. Bold values indicate comparisons that are statistically
significant. Odds ratios above 1 indicate higher efficacy in viral suppression. ATV/r: ritonavir-boosted atazanavir; DRV/r: ritonavir-boosted
darunavir; DTG: dolutegravir; EFV: efavirenz; EFV400: efavirenz 400; EVG/c: elvitegravir/cobicistat; LPV/r: ritonavir-boosted lopinavir; NVP:
nevirapine; RAL: raltegravir; RPV: rilpivirine; BIC: bictegravir; DOR: doravirine
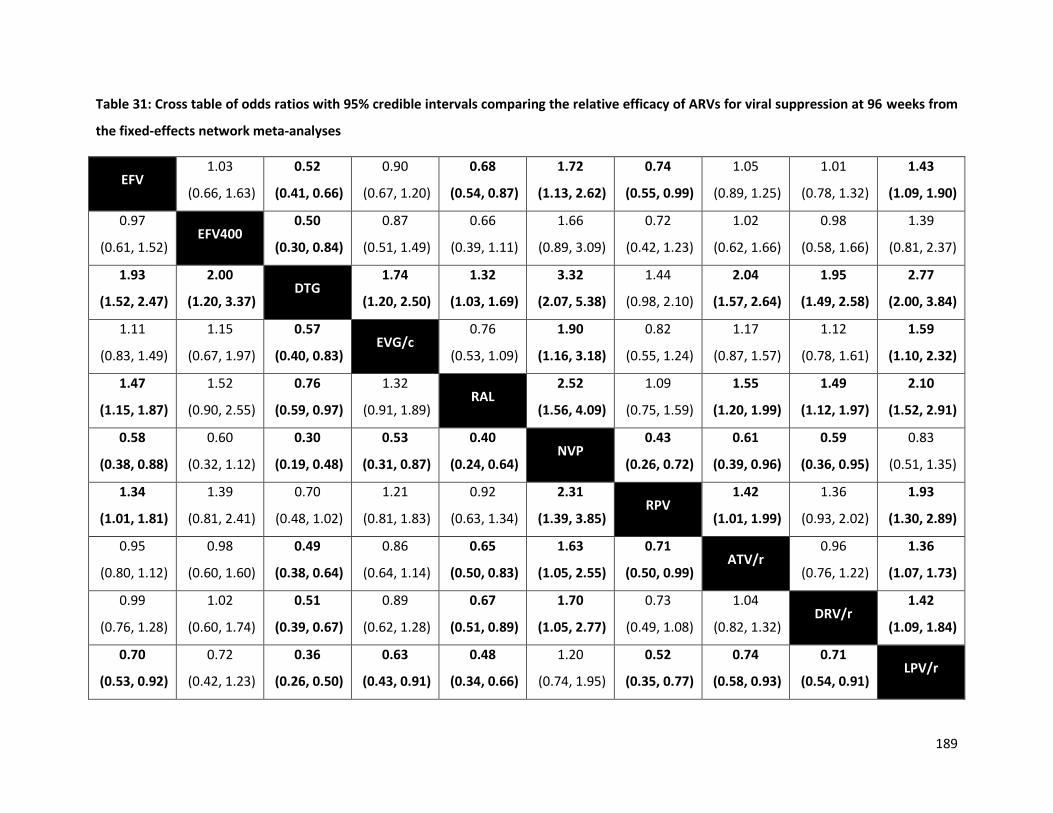
189
Table 31: Cross table of odds ratios with 95% credible intervals comparing the relative efficacy of ARVs for viral suppression at 96 weeks from
the fixed-effects network meta-analyses
EFV 1.03
(0.66, 1.63)
0.52
(0.41, 0.66)
0.90
(0.67, 1.20)
0.68
(0.54, 0.87)
1.72
(1.13, 2.62)
0.74
(0.55, 0.99)
1.05
(0.89, 1.25)
1.01
(0.78, 1.32)
1.43
(1.09, 1.90)
0.97
(0.61, 1.52) EFV400
0.50
(0.30, 0.84)
0.87
(0.51, 1.49)
0.66
(0.39, 1.11)
1.66
(0.89, 3.09)
0.72
(0.42, 1.23)
1.02
(0.62, 1.66)
0.98
(0.58, 1.66)
1.39
(0.81, 2.37)
1.93
(1.52, 2.47)
2.00
(1.20, 3.37) DTG
1.74
(1.20, 2.50)
1.32
(1.03, 1.69)
3.32
(2.07, 5.38)
1.44
(0.98, 2.10)
2.04
(1.57, 2.64)
1.95
(1.49, 2.58)
2.77
(2.00, 3.84)
1.11
(0.83, 1.49)
1.15
(0.67, 1.97)
0.57
(0.40, 0.83) EVG/c
0.76
(0.53, 1.09)
1.90
(1.16, 3.18)
0.82
(0.55, 1.24)
1.17
(0.87, 1.57)
1.12
(0.78, 1.61)
1.59
(1.10, 2.32)
1.47
(1.15, 1.87)
1.52
(0.90, 2.55)
0.76
(0.59, 0.97)
1.32
(0.91, 1.89) RAL
2.52
(1.56, 4.09)
1.09
(0.75, 1.59)
1.55
(1.20, 1.99)
1.49
(1.12, 1.97)
2.10
(1.52, 2.91)
0.58
(0.38, 0.88)
0.60
(0.32, 1.12)
0.30
(0.19, 0.48)
0.53
(0.31, 0.87)
0.40
(0.24, 0.64) NVP
0.43
(0.26, 0.72)
0.61
(0.39, 0.96)
0.59
(0.36, 0.95)
0.83
(0.51, 1.35)
1.34
(1.01, 1.81)
1.39
(0.81, 2.41)
0.70
(0.48, 1.02)
1.21
(0.81, 1.83)
0.92
(0.63, 1.34)
2.31
(1.39, 3.85) RPV
1.42
(1.01, 1.99)
1.36
(0.93, 2.02)
1.93
(1.30, 2.89)
0.95
(0.80, 1.12)
0.98
(0.60, 1.60)
0.49
(0.38, 0.64)
0.86
(0.64, 1.14)
0.65
(0.50, 0.83)
1.63
(1.05, 2.55)
0.71
(0.50, 0.99) ATV/r
0.96
(0.76, 1.22)
1.36
(1.07, 1.73)
0.99
(0.76, 1.28)
1.02
(0.60, 1.74)
0.51
(0.39, 0.67)
0.89
(0.62, 1.28)
0.67
(0.51, 0.89)
1.70
(1.05, 2.77)
0.73
(0.49, 1.08)
1.04
(0.82, 1.32) DRV/r
1.42
(1.09, 1.84)
0.70
(0.53, 0.92)
0.72
(0.42, 1.23)
0.36
(0.26, 0.50)
0.63
(0.43, 0.91)
0.48
(0.34, 0.66)
1.20
(0.74, 1.95)
0.52
(0.35, 0.77)
0.74
(0.58, 0.93)
0.71
(0.54, 0.91) LPV/r

190
Values represent the effect of the treatment lower on the diagonal to the one higher on it. Bold values indicate comparisons that are statistically
significant. Odds ratios above 1 indicate higher efficacy in viral suppression. ATV/r: ritonavir-boosted atazanavir; DRV/r: ritonavir-boosted
darunavir; DTG: dolutegravir; EFV: efavirenz; EFV400: efavirenz 400; EVG/c: elvitegravir/cobicistat; LPV/r: ritonavir-boosted lopinavir; NVP:
nevirapine; RAL: raltegravir; RPV: rilpivirine

Table 32: Cross table of odds ratios with 95% credible intervals comparing the relative efficacy of ARVs for viral suppression at 144 weeks
from the fixed-effects network meta-analyses
EFV 0.69
(0.52, 0.93)
0.78
(0.57, 1.07)
0.67
(0.48, 0.92)
1.54
(0.87, 2.77)
0.95
(0.66, 1.38)
1.18
(0.76, 1.83)
1.44
(1.08, 1.94) DTG
1.13
(0.74, 1.74)
0.96
(0.63, 1.48)
2.22
(1.17, 4.28)
1.38
(0.86, 2.20)
1.71
(1.01, 2.88)
1.28
(0.94, 1.75)
0.89
(0.58, 1.36) EVG/c
0.85
(0.59, 1.24)
1.97
(1.03, 3.84)
1.22
(0.90, 1.66)
1.51
(0.99, 2.32)
1.50
(1.08, 2.08)
1.04
(0.68, 1.60)
1.17
(0.81, 1.70) RAL
2.30
(1.20, 4.50)
1.43
(1.02, 2.01)
1.77
(1.22, 2.57)
0.65
(0.36, 1.15)
0.45
(0.23, 0.86)
0.51
(0.26, 0.97)
0.43
(0.22, 0.83) NVP
0.62
(0.31, 1.22)
0.77
(0.37, 1.59)
1.05
(0.72, 1.52)
0.72
(0.45, 1.17)
0.82
(0.60, 1.11)
0.70
(0.50, 0.98)
1.61
(0.82, 3.20) ATV/r
1.24
(0.87, 1.77)
0.85
(0.55, 1.31)
0.59
(0.35, 0.99)
0.66
(0.43, 1.01)
0.57
(0.39, 0.82)
1.30
(0.63, 2.71)
0.81
(0.56, 1.15) DRV/r
Values represent the effect of the row treatment relative to the column treatment. Bold values indicate comparisons that are statistically
differentiable. Odds ratios above 1 indicate higher efficacy in viral suppression. ATV/r: ritonavir-boosted atazanavir; DRV/r: ritonavir-boosted
darunavir; DTG: dolutegravir; EFV: efavirenz; EVG/c: elvitegravir/cobicistat; NVP: nevirapine; RAL: raltegravir
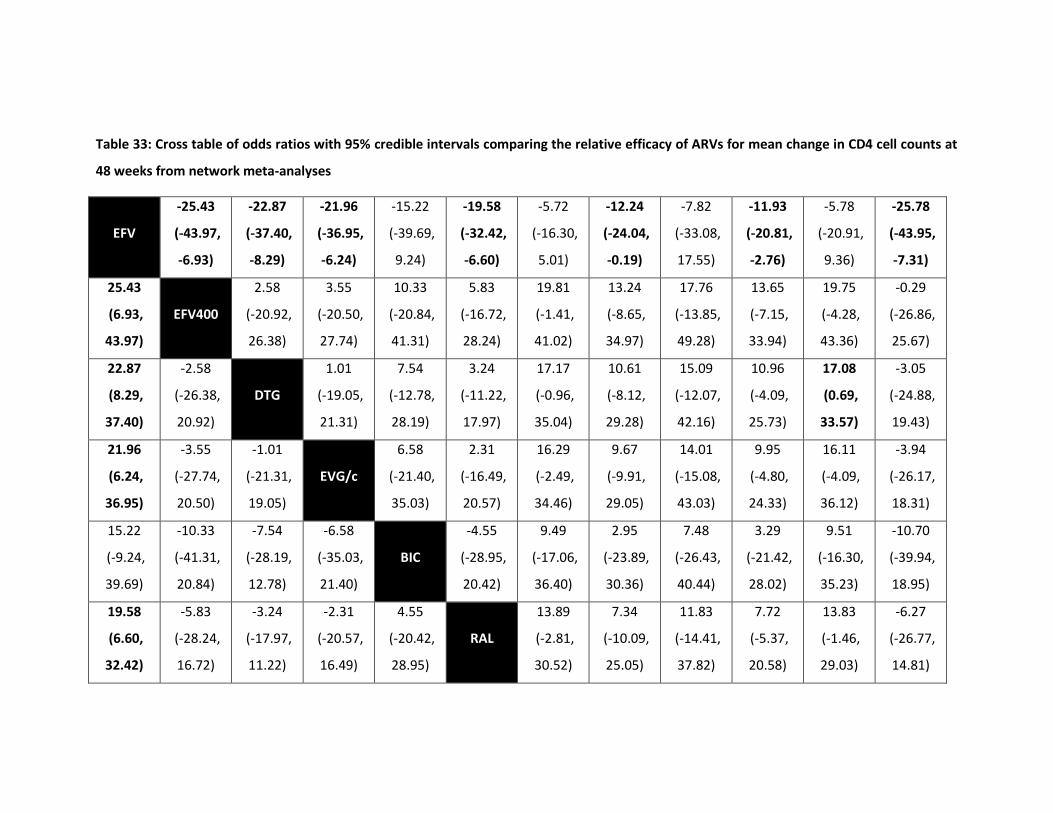
Table 33: Cross table of odds ratios with 95% credible intervals comparing the relative efficacy of ARVs for mean change in CD4 cell counts at
48 weeks from network meta-analyses
EFV
-25.43
(-43.97,
-6.93)
-22.87
(-37.40,
-8.29)
-21.96
(-36.95,
-6.24)
-15.22
(-39.69,
9.24)
-19.58
(-32.42,
-6.60)
-5.72
(-16.30,
5.01)
-12.24
(-24.04,
-0.19)
-7.82
(-33.08,
17.55)
-11.93
(-20.81,
-2.76)
-5.78
(-20.91,
9.36)
-25.78
(-43.95,
-7.31)
25.43
(6.93,
43.97)
EFV400
2.58
(-20.92,
26.38)
3.55
(-20.50,
27.74)
10.33
(-20.84,
41.31)
5.83
(-16.72,
28.24)
19.81
(-1.41,
41.02)
13.24
(-8.65,
34.97)
17.76
(-13.85,
49.28)
13.65
(-7.15,
33.94)
19.75
(-4.28,
43.36)
-0.29
(-26.86,
25.67)
22.87
(8.29,
37.40)
-2.58
(-26.38,
20.92)
DTG
1.01
(-19.05,
21.31)
7.54
(-12.78,
28.19)
3.24
(-11.22,
17.97)
17.17
(-0.96,
35.04)
10.61
(-8.12,
29.28)
15.09
(-12.07,
42.16)
10.96
(-4.09,
25.73)
17.08
(0.69,
33.57)
-3.05
(-24.88,
19.43)
21.96
(6.24,
36.95)
-3.55
(-27.74,
20.50)
-1.01
(-21.31,
19.05)
EVG/c
6.58
(-21.40,
35.03)
2.31
(-16.49,
20.57)
16.29
(-2.49,
34.46)
9.67
(-9.91,
29.05)
14.01
(-15.08,
43.03)
9.95
(-4.80,
24.33)
16.11
(-4.09,
36.12)
-3.94
(-26.17,
18.31)
15.22
(-9.24,
39.69)
-10.33
(-41.31,
20.84)
-7.54
(-28.19,
12.78)
-6.58
(-35.03,
21.40)
BIC
-4.55
(-28.95,
20.42)
9.49
(-17.06,
36.40)
2.95
(-23.89,
30.36)
7.48
(-26.43,
40.44)
3.29
(-21.42,
28.02)
9.51
(-16.30,
35.23)
-10.70
(-39.94,
18.95)
19.58
(6.60,
32.42)
-5.83
(-28.24,
16.72)
-3.24
(-17.97,
11.22)
-2.31
(-20.57,
16.49)
4.55
(-20.42,
28.95)
RAL
13.89
(-2.81,
30.52)
7.34
(-10.09,
25.05)
11.83
(-14.41,
37.82)
7.72
(-5.37,
20.58)
13.83
(-1.46,
29.03)
-6.27
(-26.77,
14.81)

193
5.72
(-5.01,
16.30)
-19.81
(-41.02,
1.41)
-17.17
(-35.04,
0.96)
-16.29
(-34.46,
2.49)
-9.49
(-36.40,
17.06)
-13.89
(-30.52,
2.81)
NVP
-6.58
(-22.46,
9.33)
-2.18
(-29.45,
25.28)
-6.26
(-19.89,
7.38)
-0.04
(-18.49,
18.35)
-20.06
(-41.12,
0.70)
12.24
(0.19,
24.04)
-13.24
(-34.97,
8.65)
-10.61
(-29.28,
8.12)
-9.67
(-29.05,
9.91)
-2.95
(-30.36,
23.89)
-7.34
(-25.05,
10.09)
6.58
(-9.33,
22.46)
RPV
4.45
(-23.45,
32.55)
0.32
(-14.52,
15.23)
6.53
(-12.84,
25.58)
-13.54
(-35.26,
8.47)
7.82
(-17.55,
33.08)
-17.76
(-49.28,
13.85)
-15.09
(-42.16,
12.07)
-14.01
(-43.03,
15.08)
-7.48
(-40.44,
26.43)
-11.83
(-37.82,
14.41)
2.18
(-25.28,
29.45)
-4.45
(-32.55,
23.45)
DOR
-4.23
(-29.79,
21.48)
2.02
(-21.04,
25.34)
-18.02
(-47.98,
11.76)
11.93
(2.76,
20.81)
-13.65
(-33.94,
7.15)
-10.96
(-25.73,
4.09)
-9.95
(-24.33,
4.80)
-3.29
(-28.02,
21.42)
-7.72
(-20.58,
5.37)
6.26
(-7.38,
19.89)
-0.32
(-15.23,
14.52)
4.23
(-21.48,
29.79)
ATV/r
6.19
(-8.31,
20.60)
-13.85
(-30.90,
3.13)
5.78
(-9.36,
20.91)
-19.75
(-43.36,
4.28)
-17.08
(-33.57,
-0.69)
-16.11
(-36.12,
4.09)
-9.51
(-35.23,
16.30)
-13.83
(-29.03,
1.46)
0.04
(-18.35,
18.49)
-6.53
(-25.58,
12.84)
-2.02
(-25.34,
21.04)
-6.19
(-20.60,
8.31)
DRV/r
-20.05
(-41.21,
1.46)
25.78
(7.31,
43.95)
0.29
(-25.67,
26.86)
3.05
(-19.43,
24.88)
3.94
(-18.31,
26.17)
10.70
(-18.95,
39.94)
6.27
(-14.81,
26.77)
20.06
(-0.70,
41.12)
13.54
(-8.47,
35.26)
18.02
(-11.76,
47.98)
13.85
(-3.13,
30.90)
20.05
(-1.46,
41.21)
LPV/r
Values represent the effect of the row treatment relative to the column treatment. Bold values indicate comparisons that are statistically
differentiable. ATV/r: ritonavir-boosted atazanavir; DRV/r: ritonavir-boosted darunavir; DTG: dolutegravir; EFV: efavirenz; EFV400: efavirenz 400;
EVG/c: elvitegravir/cobicistat; LPV/r: ritonavir-boosted lopinavir; NVP: nevirapine; RAL: raltegravir; RPV: rilpivirine; BIC: bictegravir; DOR:
doravirine
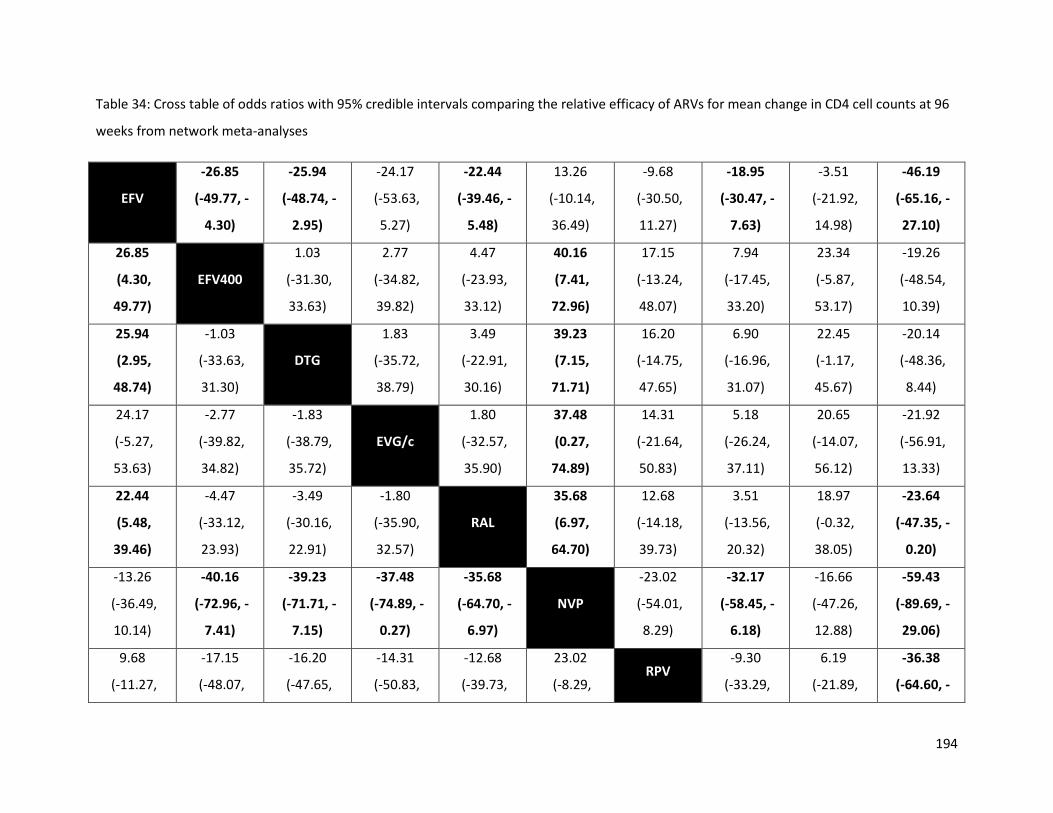
194
Table 34: Cross table of odds ratios with 95% credible intervals comparing the relative efficacy of ARVs for mean change in CD4 cell counts at 96
weeks from network meta-analyses
EFV
-26.85
(-49.77, -
4.30)
-25.94
(-48.74, -
2.95)
-24.17
(-53.63,
5.27)
-22.44
(-39.46, -
5.48)
13.26
(-10.14,
36.49)
-9.68
(-30.50,
11.27)
-18.95
(-30.47, -
7.63)
-3.51
(-21.92,
14.98)
-46.19
(-65.16, -
27.10)
26.85
(4.30,
49.77)
EFV400
1.03
(-31.30,
33.63)
2.77
(-34.82,
39.82)
4.47
(-23.93,
33.12)
40.16
(7.41,
72.96)
17.15
(-13.24,
48.07)
7.94
(-17.45,
33.20)
23.34
(-5.87,
53.17)
-19.26
(-48.54,
10.39)
25.94
(2.95,
48.74)
-1.03
(-33.63,
31.30)
DTG
1.83
(-35.72,
38.79)
3.49
(-22.91,
30.16)
39.23
(7.15,
71.71)
16.20
(-14.75,
47.65)
6.90
(-16.96,
31.07)
22.45
(-1.17,
45.67)
-20.14
(-48.36,
8.44)
24.17
(-5.27,
53.63)
-2.77
(-39.82,
34.82)
-1.83
(-38.79,
35.72)
EVG/c
1.80
(-32.57,
35.90)
37.48
(0.27,
74.89)
14.31
(-21.64,
50.83)
5.18
(-26.24,
37.11)
20.65
(-14.07,
56.12)
-21.92
(-56.91,
13.33)
22.44
(5.48,
39.46)
-4.47
(-33.12,
23.93)
-3.49
(-30.16,
22.91)
-1.80
(-35.90,
32.57)
RAL
35.68
(6.97,
64.70)
12.68
(-14.18,
39.73)
3.51
(-13.56,
20.32)
18.97
(-0.32,
38.05)
-23.64
(-47.35, -
0.20)
-13.26
(-36.49,
10.14)
-40.16
(-72.96, -
7.41)
-39.23
(-71.71, -
7.15)
-37.48
(-74.89, -
0.27)
-35.68
(-64.70, -
6.97)
NVP
-23.02
(-54.01,
8.29)
-32.17
(-58.45, -
6.18)
-16.66
(-47.26,
12.88)
-59.43
(-89.69, -
29.06)
9.68
(-11.27,
-17.15
(-48.07,
-16.20
(-47.65,
-14.31
(-50.83,
-12.68
(-39.73,
23.02
(-8.29, RPV
-9.30
(-33.29,
6.19
(-21.89,
-36.38
(-64.60, -
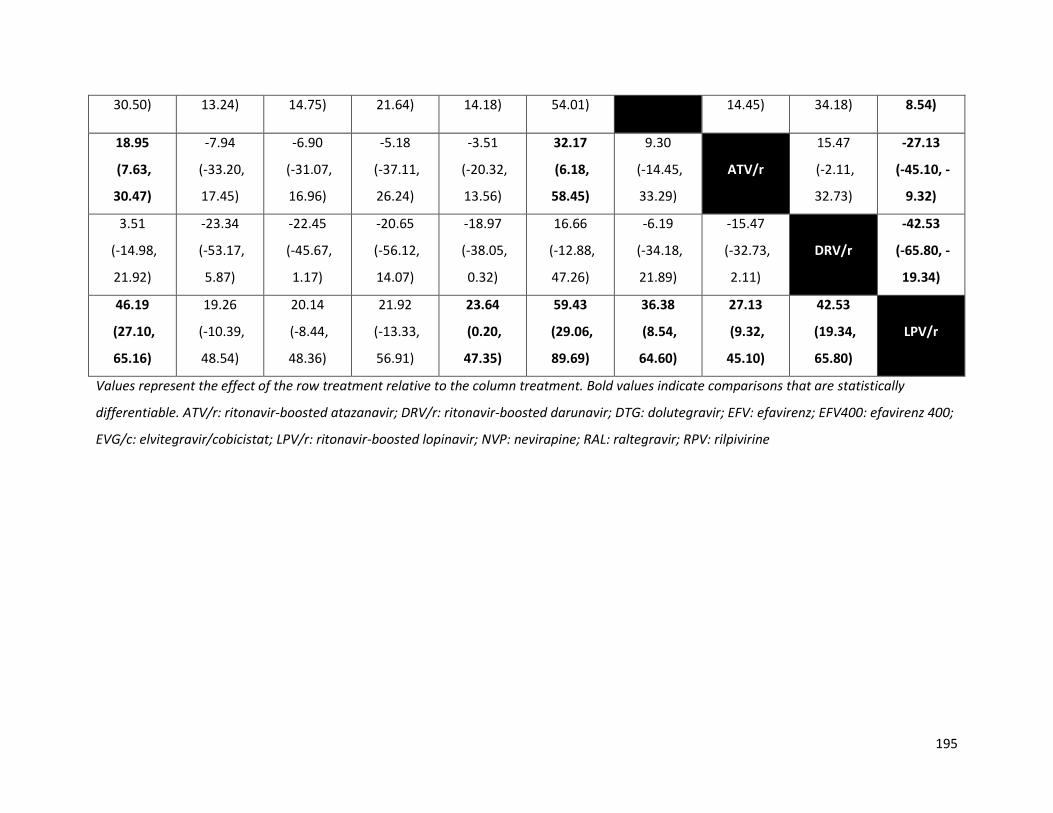
195
30.50) 13.24) 14.75) 21.64) 14.18) 54.01) 14.45) 34.18) 8.54)
18.95
(7.63,
30.47)
-7.94
(-33.20,
17.45)
-6.90
(-31.07,
16.96)
-5.18
(-37.11,
26.24)
-3.51
(-20.32,
13.56)
32.17
(6.18,
58.45)
9.30
(-14.45,
33.29)
ATV/r
15.47
(-2.11,
32.73)
-27.13
(-45.10, -
9.32)
3.51
(-14.98,
21.92)
-23.34
(-53.17,
5.87)
-22.45
(-45.67,
1.17)
-20.65
(-56.12,
14.07)
-18.97
(-38.05,
0.32)
16.66
(-12.88,
47.26)
-6.19
(-34.18,
21.89)
-15.47
(-32.73,
2.11)
DRV/r
-42.53
(-65.80, -
19.34)
46.19
(27.10,
65.16)
19.26
(-10.39,
48.54)
20.14
(-8.44,
48.36)
21.92
(-13.33,
56.91)
23.64
(0.20,
47.35)
59.43
(29.06,
89.69)
36.38
(8.54,
64.60)
27.13
(9.32,
45.10)
42.53
(19.34,
65.80)
LPV/r
Values represent the effect of the row treatment relative to the column treatment. Bold values indicate comparisons that are statistically
differentiable. ATV/r: ritonavir-boosted atazanavir; DRV/r: ritonavir-boosted darunavir; DTG: dolutegravir; EFV: efavirenz; EFV400: efavirenz 400;
EVG/c: elvitegravir/cobicistat; LPV/r: ritonavir-boosted lopinavir; NVP: nevirapine; RAL: raltegravir; RPV: rilpivirine
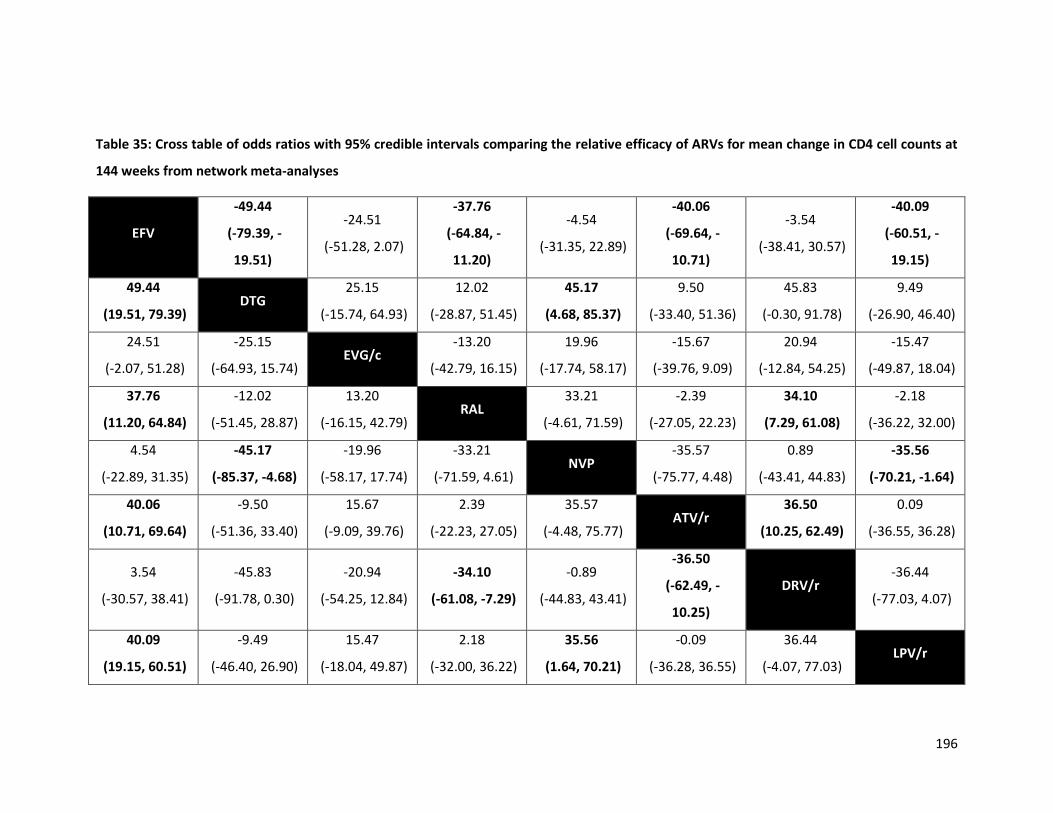
196
Table 35: Cross table of odds ratios with 95% credible intervals comparing the relative efficacy of ARVs for mean change in CD4 cell counts at
144 weeks from network meta-analyses
EFV
-49.44
(-79.39, -
19.51)
-24.51
(-51.28, 2.07)
-37.76
(-64.84, -
11.20)
-4.54
(-31.35, 22.89)
-40.06
(-69.64, -
10.71)
-3.54
(-38.41, 30.57)
-40.09
(-60.51, -
19.15)
49.44
(19.51, 79.39) DTG
25.15
(-15.74, 64.93)
12.02
(-28.87, 51.45)
45.17
(4.68, 85.37)
9.50
(-33.40, 51.36)
45.83
(-0.30, 91.78)
9.49
(-26.90, 46.40)
24.51
(-2.07, 51.28)
-25.15
(-64.93, 15.74) EVG/c
-13.20
(-42.79, 16.15)
19.96
(-17.74, 58.17)
-15.67
(-39.76, 9.09)
20.94
(-12.84, 54.25)
-15.47
(-49.87, 18.04)
37.76
(11.20, 64.84)
-12.02
(-51.45, 28.87)
13.20
(-16.15, 42.79) RAL
33.21
(-4.61, 71.59)
-2.39
(-27.05, 22.23)
34.10
(7.29, 61.08)
-2.18
(-36.22, 32.00)
4.54
(-22.89, 31.35)
-45.17
(-85.37, -4.68)
-19.96
(-58.17, 17.74)
-33.21
(-71.59, 4.61) NVP
-35.57
(-75.77, 4.48)
0.89
(-43.41, 44.83)
-35.56
(-70.21, -1.64)
40.06
(10.71, 69.64)
-9.50
(-51.36, 33.40)
15.67
(-9.09, 39.76)
2.39
(-22.23, 27.05)
35.57
(-4.48, 75.77) ATV/r
36.50
(10.25, 62.49)
0.09
(-36.55, 36.28)
3.54
(-30.57, 38.41)
-45.83
(-91.78, 0.30)
-20.94
(-54.25, 12.84)
-34.10
(-61.08, -7.29)
-0.89
(-44.83, 43.41)
-36.50
(-62.49, -
10.25)
DRV/r -36.44
(-77.03, 4.07)
40.09
(19.15, 60.51)
-9.49
(-46.40, 26.90)
15.47
(-18.04, 49.87)
2.18
(-32.00, 36.22)
35.56
(1.64, 70.21)
-0.09
(-36.28, 36.55)
36.44
(-4.07, 77.03) LPV/r
197
Values represent the effect of the row treatment relative to the column treatment. Bold values indicate comparisons that are statistically
differentiable. ATV/r: ritonavir-boosted atazanavir; DRV/r: ritonavir-boosted darunavir; DTG: dolutegravir; EFV: efavirenz; EVG/c:
elvitegravir/cobicistat; LPV/r: ritonavir-boosted lopinavir; NVP: nevirapine; RAL: raltegravir

198
Table 36: Cross table of odds ratios with 95% credible intervals from network meta-analyses comparing ARVs in terms of discontinuation
EFV
0.90
(0.48,
1.69)
2.02
(1.60,
2.54)
1.56
(1.21,
2.02)
1.29
(0.76,
2.13)
1.56
(1.24,
1.97)
0.61
(0.47,
0.78)
1.36
(1.10,
1.69)
1.50
(1.02,
2.23)
1.14
(0.98,
1.32)
1.11
(0.89,
1.40)
0.78
(0.63,
0.97)
1.11
(0.59,
2.07)
EFV400
2.25
(1.14,
4.41)
1.74
(0.88,
3.45)
1.43
(0.63,
3.16)
1.74
(0.88,
3.39)
0.68
(0.35,
1.31)
1.52
(0.78,
2.94)
1.67
(0.79,
3.52)
1.27
(0.66,
2.42)
1.24
(0.63,
2.43)
0.88
(0.45,
1.67)
0.50
(0.39,
0.63)
0.45
(0.23,
0.88)
DTG
0.77
(0.56,
1.08)
0.64
(0.40,
1.00)
0.77
(0.60,
0.99)
0.30
(0.21,
0.43)
0.68
(0.49,
0.92)
0.75
(0.49,
1.14)
0.57
(0.45,
0.72)
0.55
(0.42,
0.72)
0.39
(0.29,
0.53)
0.64
(0.49,
0.82)
0.58
(0.29,
1.14)
1.29
(0.93,
1.78)
EVG/c
0.82
(0.47,
1.43)
1.00
(0.73,
1.36)
0.39
(0.27,
0.56)
0.87
(0.63,
1.21)
0.96
(0.62,
1.51)
0.73
(0.57,
0.93)
0.71
(0.52,
0.97)
0.50
(0.36,
0.69)
0.78
(0.47,
1.31)
0.70
(0.32,
1.58)
1.57
(1.00,
2.52)
1.21
(0.70,
2.13)
BIC
1.21
(0.73,
2.07)
0.47
(0.27,
0.84)
1.06
(0.61,
1.85)
1.17
(0.63,
2.20)
0.89
(0.53,
1.49)
0.87
(0.51,
1.48)
0.61
(0.36,
1.06)
0.64
(0.51,
0.81)
0.58
(0.29,
1.14)
1.29
(1.01,
1.65)
1.00
(0.74,
1.38)
0.83
(0.48,
1.38)
RAL
0.39
(0.28,
0.55)
0.87
(0.65,
1.19)
0.96
(0.64,
1.46)
0.73
(0.58,
0.92)
0.72
(0.55,
0.92)
0.50
(0.38,
0.68)
1.64
(1.28,
2.12)
1.48
(0.76,
2.86)
3.31
(2.35,
4.68)
2.57
(1.79,
3.68)
2.11
(1.19,
3.74)
2.56
(1.82,
3.61)
NVP
2.24
(1.60,
3.14)
2.47
(1.56,
3.94)
1.88
(1.45,
2.45)
1.83
(1.33,
2.53)
1.29
(0.96,
1.75)

199
0.73
(0.59,
0.91)
0.66
(0.34,
1.29)
1.48
(1.08,
2.03)
1.15
(0.83,
1.59)
0.94
(0.54,
1.63)
1.14
(0.84,
1.55)
0.45
(0.32,
0.62)
RPV
1.10
(0.71,
1.72)
0.84
(0.65,
1.08)
0.82
(0.60,
1.11)
0.58
(0.43,
0.78)
0.66
(0.45,
0.98)
0.60
(0.28,
1.26)
1.34
(0.88,
2.05)
1.04
(0.66,
1.62)
0.85
(0.45,
1.59)
1.04
(0.68,
1.57)
0.41
(0.25,
0.64)
0.91
(0.58,
1.42)
DOR
0.76
(0.51,
1.12)
0.74
(0.52,
1.05)
0.52
(0.34,
0.79)
0.88
(0.76,
1.02)
0.79
(0.41,
1.51)
1.77
(1.39,
2.24)
1.37
(1.07,
1.75)
1.13
(0.67,
1.88)
1.36
(1.09,
1.72)
0.53
(0.41,
0.69)
1.20
(0.92,
1.55)
1.32
(0.89,
1.95)
ATV/r
0.98
(0.79,
1.21)
0.69
(0.55,
0.85)
0.90
(0.71,
1.12)
0.81
(0.41,
1.58)
1.81
(1.39,
2.36)
1.40
(1.03,
1.92)
1.15
(0.68,
1.95)
1.40
(1.08,
1.80)
0.55
(0.39,
0.75)
1.22
(0.90,
1.66)
1.35
(0.95,
1.92)
1.02
(0.83,
1.27)
DRV/r
0.71
(0.55,
0.90)
1.27
(1.03,
1.58)
1.14
(0.60,
2.21)
2.57
(1.90,
3.48)
1.99
(1.45,
2.75)
1.64
(0.95,
2.81)
1.98
(1.48,
2.66)
0.78
(0.57,
1.04)
1.74
(1.28,
2.35)
1.92
(1.26,
2.91)
1.45
(1.17,
1.81)
1.42
(1.11,
1.83)
LPV/r

200
Table 37: Cross table of odds ratios with 95% credible intervals from network meta-analyses comparing ARVs in terms of discontinuation due
to adverse events
EFV
2.39
(1.30,
4.53)
3.34
(2.13,
5.28)
1.72
(1.13,
2.67)
2.35
(0.59,
9.55)
2.31
(1.41,
3.82)
0.52
(0.29,
0.90)
2.58
(1.80,
3.74)
2.45
(1.41,
4.38)
1.12
(0.80,
1.58)
1.43
(0.90,
2.27)
0.72
(0.46,
1.10)
0.42
(0.22,
0.77)
EFV400
1.39
(0.63,
3.05)
0.72
(0.33,
1.54)
0.99
(0.21,
4.68)
0.97
(0.44,
2.13)
0.22
(0.09,
0.50)
1.08
(0.51,
2.21)
1.03
(0.44,
2.36)
0.47
(0.23,
0.96)
0.60
(0.27,
1.30)
0.30
(0.14,
0.64)
0.30
(0.19,
0.47)
0.72
(0.33,
1.58)
DTG
0.52
(0.29,
0.93)
0.71
(0.19,
2.76)
0.69
(0.39,
1.22)
0.16
(0.08,
0.30)
0.77
(0.43,
1.39)
0.73
(0.37,
1.49)
0.34
(0.21,
0.55)
0.43
(0.25,
0.74)
0.22
(0.12,
0.38)
0.58
(0.37,
0.89)
1.38
(0.65,
3.02)
1.94
(1.07,
3.50)
EVG/c
1.36
(0.32,
5.94)
1.34
(0.72,
2.49)
0.30
(0.16,
0.55)
1.50
(0.85,
2.64)
1.42
(0.72,
2.89)
0.66
(0.44,
0.97)
0.84
(0.47,
1.46)
0.42
(0.24,
0.71)
0.43
(0.10,
1.70)
1.01
(0.21,
4.66)
1.41
(0.36,
5.40)
0.74
(0.17,
3.08)
BIC
0.98
(0.23,
4.16)
0.22
(0.05,
0.97)
1.10
(0.25,
4.66)
1.04
(0.23,
4.63)
0.48
(0.12,
1.96)
0.61
(0.15,
2.54)
0.31
(0.07,
1.29)
0.43
(0.26,
0.71)
1.03
(0.47,
2.30)
1.44
(0.82,
2.56)
0.75
(0.40,
1.39)
1.02
(0.24,
4.40)
RAL
0.22
(0.11,
0.45)
1.11
(0.60,
2.07)
1.06
(0.51,
2.24)
0.49
(0.28,
0.83)
0.62
(0.34,
1.12)
0.31
(0.17,
0.57)
1.92
(1.11,
4.63
(2.00,
6.45
(3.32,
3.32
(1.83,
4.56
(1.03,
4.45
(2.23, NVP
4.99
(2.58,
4.74
(2.20,
2.17
(1.36,
2.77
(1.48,
1.39
(0.76,

201
3.43) 10.90) 12.77) 6.24) 20.98) 9.10) 9.89) 10.41) 3.55) 5.29) 2.57)
0.39
(0.27,
0.55)
0.92
(0.45,
1.95)
1.30
(0.72,
2.32)
0.67
(0.38,
1.17)
0.91
(0.21,
3.95)
0.90
(0.48,
1.67)
0.20
(0.10,
0.39)
RPV
0.95
(0.49,
1.90)
0.44
(0.26,
0.72)
0.56
(0.31,
1.00)
0.28
(0.16,
0.49)
0.41
(0.23,
0.71)
0.97
(0.42,
2.27)
1.36
(0.67,
2.73)
0.70
(0.35,
1.38)
0.96
(0.22,
4.26)
0.94
(0.45,
1.94)
0.21
(0.10,
0.45)
1.05
(0.53,
2.02)
DOR
0.46
(0.24,
0.85)
0.58
(0.31,
1.09)
0.29
(0.15,
0.56)
0.89
(0.63,
1.25)
2.12
(1.04,
4.43)
2.96
(1.80,
4.87)
1.53
(1.03,
2.29)
2.09
(0.51,
8.67)
2.05
(1.20,
3.54)
0.46
(0.28,
0.74)
2.29
(1.39,
3.82)
2.17
(1.18,
4.11)
ATV/r
1.27
(0.82,
1.99)
0.64
(0.42,
0.97)
0.70
(0.44,
1.11)
1.66
(0.77,
3.66)
2.32
(1.35,
4.06)
1.20
(0.69,
2.14)
1.65
(0.39,
6.87)
1.60
(0.89,
2.93)
0.36
(0.19,
0.68)
1.80
(1.00,
3.25)
1.71
(0.92,
3.25)
0.78
(0.50,
1.22)
DRV/r
0.50
(0.31,
0.78)
1.39
(0.91,
2.16)
3.32
(1.56,
7.20)
4.64
(2.63,
8.30)
2.40
(1.40,
4.16)
3.27
(0.77,
13.93)
3.21
(1.76,
5.98)
0.72
(0.39,
1.32)
3.59
(2.05,
6.35)
3.40
(1.78,
6.76)
1.56
(1.03,
2.40)
1.99
(1.27,
3.20)
LPV/r
Values represent the effect of the row treatment relative to the column treatment. Odds ratios above 1 indicate higher rates of discontinuation
due to adverse events. Bold values indicate comparisons that are statistically differentiable. ATV/r: ritonavir-boosted atazanavir; DRV/r: ritonavir-
boosted darunavir; DTG: dolutegravir; EFV: efavirenz; EFV400: efavirenz 400; EVG/c: elvitegravir/cobicistat; LPV/r: ritonavir-boosted lopinavir;
NVP: nevirapine; RAL: raltegravir; RPV: rilpivirine; BIC: bictegravir; DOR: doravirine

Table 38: Cross table of odds ratios with 95% credible intervals from the network meta-analyses comparing ARVs in terms of treatment-
related adverse events
EFV
1.42
(1.04,
1.95)
2.99
(2.26,
3.93)
2.79
(2.01,
3.90)
4.33
(3.02,
6.24)
0.81
(0.58,
1.13)
1.13
(0.85,
1.49)
2.43
(1.70,
3.54)
3.56
(2.75,
4.64)
1.19
(1.02,
1.39)
3.35
(2.29,
4.88)
0.96
(0.74,
1.25)
0.70
(0.51,
0.96)
EFV400
2.09
(1.38,
3.20)
1.96
(1.24,
3.09)
3.05
(1.88,
4.92)
0.57
(0.36,
0.90)
0.79
(0.52,
1.21)
1.71
(1.06,
2.79)
2.51
(1.66,
3.77)
0.84
(0.59,
1.19)
2.35
(1.43,
3.83)
0.68
(0.44,
1.01)
0.33
(0.25,
0.44)
0.48
(0.31,
0.73)
DTG
0.94
(0.62,
1.42)
1.45
(1.10,
1.91)
0.27
(0.18,
0.42)
0.38
(0.26,
0.56)
0.82
(0.52,
1.30)
1.20
(0.82,
1.76)
0.40
(0.30,
0.53)
1.12
(0.70,
1.81)
0.32
(0.22,
0.47)
0.36
(0.26,
0.50)
0.51
(0.32,
0.81)
1.07
(0.71,
1.62)
EVG/c
1.55
(0.96,
2.49)
0.29
(0.18,
0.47)
0.40
(0.27,
0.61)
0.87
(0.53,
1.43)
1.28
(0.84,
1.94)
0.43
(0.32,
0.57)
1.20
(0.73,
1.97)
0.34
(0.23,
0.51)
0.23
(0.16,
0.33)
0.33
(0.20,
0.53)
0.69
(0.52,
0.91)
0.64
(0.40,
1.04)
BIC
0.19
(0.11,
0.31)
0.26
(0.16,
0.41)
0.56
(0.34,
0.94)
0.82
(0.52,
1.29)
0.28
(0.19,
0.40)
0.77
(0.46,
1.30)
0.22
(0.14,
0.34)
1.23
(0.88,
1.72)
1.75
(1.11,
2.77)
3.67
(2.37,
5.65)
3.43
(2.15,
5.55)
5.33
(3.25,
8.73)
RAL
1.39
(0.90,
2.14)
2.99
(1.83,
4.95)
4.38
(2.87,
6.67)
1.47
(1.02,
2.12)
4.12
(2.49,
6.82)
1.18
(0.77,
1.82)
0.89
(0.67,
1.27
(0.83,
2.65
(1.79,
2.48
(1.63,
3.85
(2.44,
0.72
(0.47, NVP
2.15
(1.37,
3.17
(2.17,
1.06
(0.78,
2.97
(1.86,
0.86
(0.59,

203
1.18) 1.92) 3.89) 3.76) 6.07) 1.12) 3.44) 4.61) 1.42) 4.74) 1.25)
0.41
(0.28,
0.59)
0.58
(0.36,
0.94)
1.23
(0.77,
1.93)
1.15
(0.70,
1.88)
1.78
(1.06,
2.97)
0.33
(0.20,
0.55)
0.46
(0.29,
0.73)
RPV
1.47
(0.93,
2.27)
0.49
(0.33,
0.73)
1.37
(0.81,
2.32)
0.40
(0.25,
0.62)
0.28
(0.22,
0.36)
0.40
(0.27,
0.60)
0.84
(0.57,
1.22)
0.78
(0.52,
1.19)
1.22
(0.78,
1.91)
0.23
(0.15,
0.35)
0.32
(0.22,
0.46)
0.68
(0.44,
1.08)
DOR
0.33
(0.25,
0.45)
0.94
(0.70,
1.26)
0.27
(0.19,
0.39)
0.84
(0.72,
0.98)
1.20
(0.84,
1.70)
2.51
(1.88,
3.34)
2.35
(1.74,
3.16)
3.63
(2.51,
5.26)
0.68
(0.47,
0.98)
0.95
(0.70,
1.28)
2.04
(1.38,
3.07)
2.99
(2.21,
4.04)
ATV/r
2.81
(1.88,
4.19)
0.81
(0.63,
1.03)
0.30
(0.20,
0.44)
0.43
(0.26,
0.70)
0.89
(0.55,
1.42)
0.84
(0.51,
1.37)
1.30
(0.77,
2.19)
0.24
(0.15,
0.40)
0.34
(0.21,
0.54)
0.73
(0.43,
1.23)
1.07
(0.79,
1.43)
0.36
(0.24,
0.53)
DRV/r
0.29
(0.18,
0.45)
1.04
(0.80,
1.36)
1.48
(0.99,
2.25)
3.10
(2.14,
4.46)
2.90
(1.98,
4.27)
4.50
(2.92,
6.93)
0.84
(0.55,
1.29)
1.17
(0.80,
1.71)
2.52
(1.61,
4.01)
3.70
(2.56,
5.37)
1.24
(0.97,
1.59)
3.46
(2.20,
5.49)
LPV/r
Values represent the effect of the row treatment relative to the column treatment. Odds ratios above 1 indicate higher rates of treatment-related
adverse events. Bold values indicate comparisons that are statistically differentiable. ATV/r: ritonavir-boosted atazanavir; DRV/r: ritonavir-
boosted darunavir; DTG: dolutegravir; EFV: efavirenz; EFV400: efavirenz 400; EVG/c: elvitegravir/cobicistat; LPV/r: ritonavir-boosted lopinavir;
NVP: nevirapine; RAL: raltegravir; RPV: rilpivirine; BIC: bictegravir; DOR: doravirine
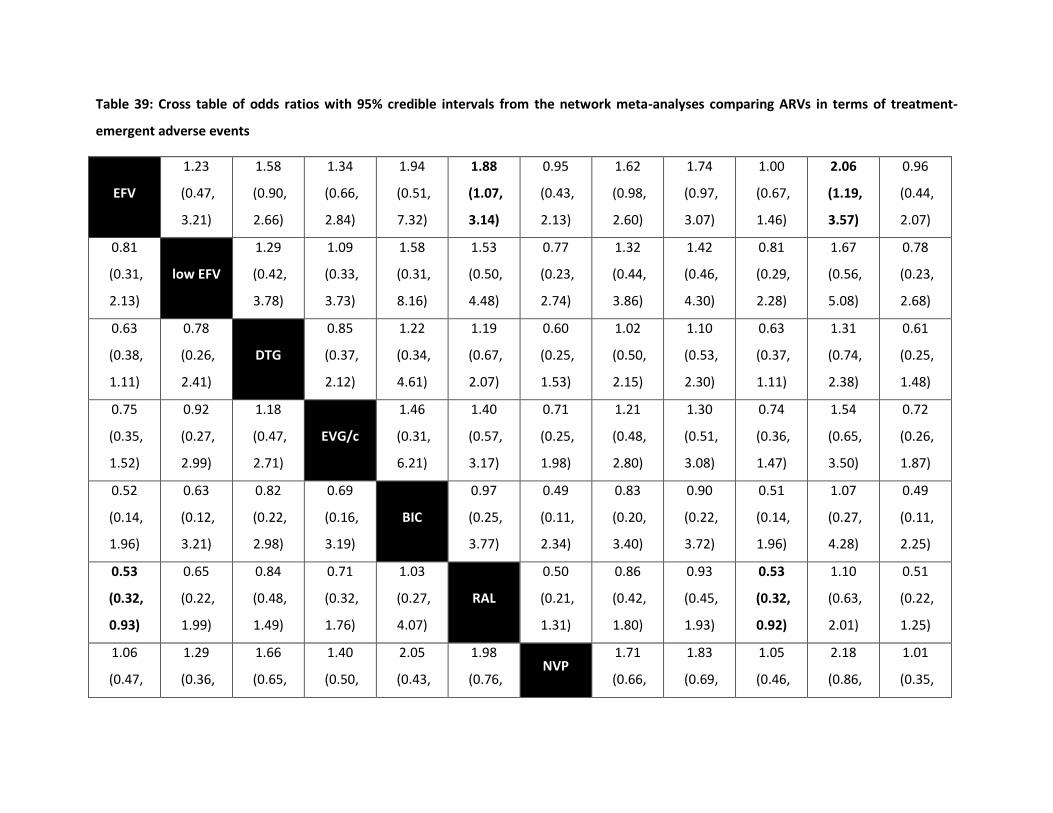
Table 39: Cross table of odds ratios with 95% credible intervals from the network meta-analyses comparing ARVs in terms of treatment-
emergent adverse events
EFV
1.23
(0.47,
3.21)
1.58
(0.90,
2.66)
1.34
(0.66,
2.84)
1.94
(0.51,
7.32)
1.88
(1.07,
3.14)
0.95
(0.43,
2.13)
1.62
(0.98,
2.60)
1.74
(0.97,
3.07)
1.00
(0.67,
1.46)
2.06
(1.19,
3.57)
0.96
(0.44,
2.07)
0.81
(0.31,
2.13)
low EFV
1.29
(0.42,
3.78)
1.09
(0.33,
3.73)
1.58
(0.31,
8.16)
1.53
(0.50,
4.48)
0.77
(0.23,
2.74)
1.32
(0.44,
3.86)
1.42
(0.46,
4.30)
0.81
(0.29,
2.28)
1.67
(0.56,
5.08)
0.78
(0.23,
2.68)
0.63
(0.38,
1.11)
0.78
(0.26,
2.41)
DTG
0.85
(0.37,
2.12)
1.22
(0.34,
4.61)
1.19
(0.67,
2.07)
0.60
(0.25,
1.53)
1.02
(0.50,
2.15)
1.10
(0.53,
2.30)
0.63
(0.37,
1.11)
1.31
(0.74,
2.38)
0.61
(0.25,
1.48)
0.75
(0.35,
1.52)
0.92
(0.27,
2.99)
1.18
(0.47,
2.71)
EVG/c
1.46
(0.31,
6.21)
1.40
(0.57,
3.17)
0.71
(0.25,
1.98)
1.21
(0.48,
2.80)
1.30
(0.51,
3.08)
0.74
(0.36,
1.47)
1.54
(0.65,
3.50)
0.72
(0.26,
1.87)
0.52
(0.14,
1.96)
0.63
(0.12,
3.21)
0.82
(0.22,
2.98)
0.69
(0.16,
3.19)
BIC
0.97
(0.25,
3.77)
0.49
(0.11,
2.34)
0.83
(0.20,
3.40)
0.90
(0.22,
3.72)
0.51
(0.14,
1.96)
1.07
(0.27,
4.28)
0.49
(0.11,
2.25)
0.53
(0.32,
0.93)
0.65
(0.22,
1.99)
0.84
(0.48,
1.49)
0.71
(0.32,
1.76)
1.03
(0.27,
4.07)
RAL
0.50
(0.21,
1.31)
0.86
(0.42,
1.80)
0.93
(0.45,
1.93)
0.53
(0.32,
0.92)
1.10
(0.63,
2.01)
0.51
(0.22,
1.25)
1.06
(0.47,
1.29
(0.36,
1.66
(0.65,
1.40
(0.50,
2.05
(0.43,
1.98
(0.76, NVP
1.71
(0.66,
1.83
(0.69,
1.05
(0.46,
2.18
(0.86,
1.01
(0.35,
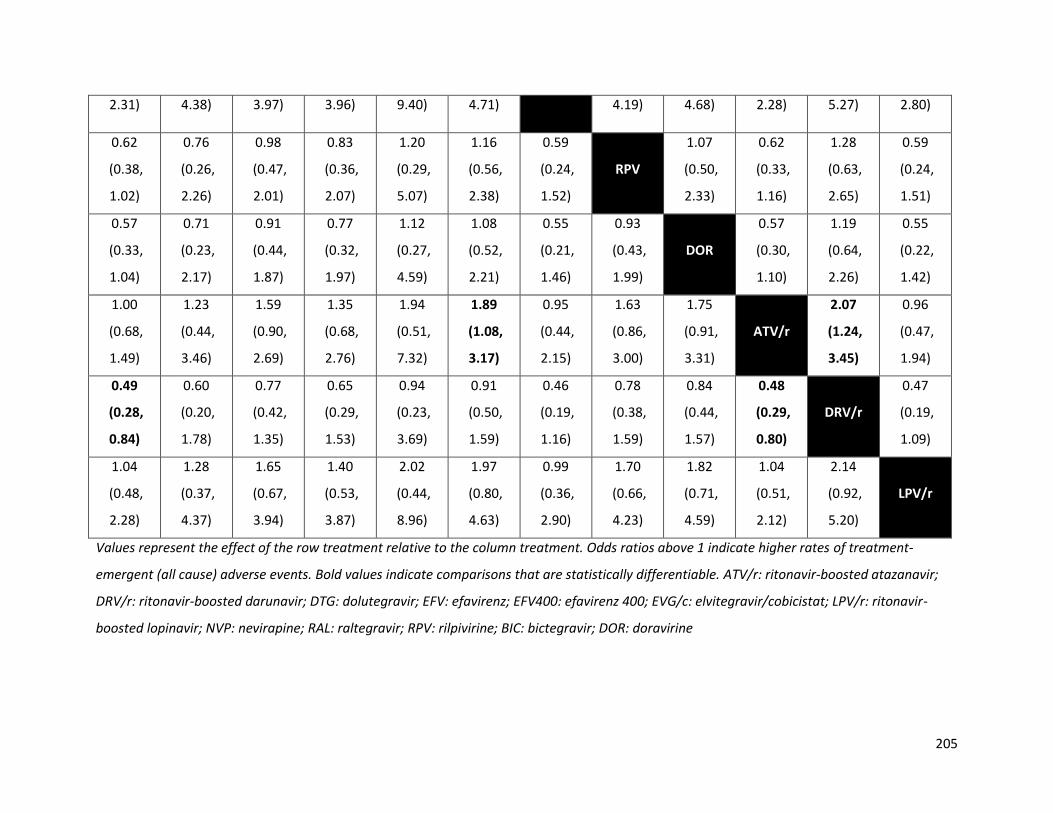
205
2.31) 4.38) 3.97) 3.96) 9.40) 4.71) 4.19) 4.68) 2.28) 5.27) 2.80)
0.62
(0.38,
1.02)
0.76
(0.26,
2.26)
0.98
(0.47,
2.01)
0.83
(0.36,
2.07)
1.20
(0.29,
5.07)
1.16
(0.56,
2.38)
0.59
(0.24,
1.52)
RPV
1.07
(0.50,
2.33)
0.62
(0.33,
1.16)
1.28
(0.63,
2.65)
0.59
(0.24,
1.51)
0.57
(0.33,
1.04)
0.71
(0.23,
2.17)
0.91
(0.44,
1.87)
0.77
(0.32,
1.97)
1.12
(0.27,
4.59)
1.08
(0.52,
2.21)
0.55
(0.21,
1.46)
0.93
(0.43,
1.99)
DOR
0.57
(0.30,
1.10)
1.19
(0.64,
2.26)
0.55
(0.22,
1.42)
1.00
(0.68,
1.49)
1.23
(0.44,
3.46)
1.59
(0.90,
2.69)
1.35
(0.68,
2.76)
1.94
(0.51,
7.32)
1.89
(1.08,
3.17)
0.95
(0.44,
2.15)
1.63
(0.86,
3.00)
1.75
(0.91,
3.31)
ATV/r
2.07
(1.24,
3.45)
0.96
(0.47,
1.94)
0.49
(0.28,
0.84)
0.60
(0.20,
1.78)
0.77
(0.42,
1.35)
0.65
(0.29,
1.53)
0.94
(0.23,
3.69)
0.91
(0.50,
1.59)
0.46
(0.19,
1.16)
0.78
(0.38,
1.59)
0.84
(0.44,
1.57)
0.48
(0.29,
0.80)
DRV/r
0.47
(0.19,
1.09)
1.04
(0.48,
2.28)
1.28
(0.37,
4.37)
1.65
(0.67,
3.94)
1.40
(0.53,
3.87)
2.02
(0.44,
8.96)
1.97
(0.80,
4.63)
0.99
(0.36,
2.90)
1.70
(0.66,
4.23)
1.82
(0.71,
4.59)
1.04
(0.51,
2.12)
2.14
(0.92,
5.20)
LPV/r
Values represent the effect of the row treatment relative to the column treatment. Odds ratios above 1 indicate higher rates of treatment-
emergent (all cause) adverse events. Bold values indicate comparisons that are statistically differentiable. ATV/r: ritonavir-boosted atazanavir;
DRV/r: ritonavir-boosted darunavir; DTG: dolutegravir; EFV: efavirenz; EFV400: efavirenz 400; EVG/c: elvitegravir/cobicistat; LPV/r: ritonavir-
boosted lopinavir; NVP: nevirapine; RAL: raltegravir; RPV: rilpivirine; BIC: bictegravir; DOR: doravirine
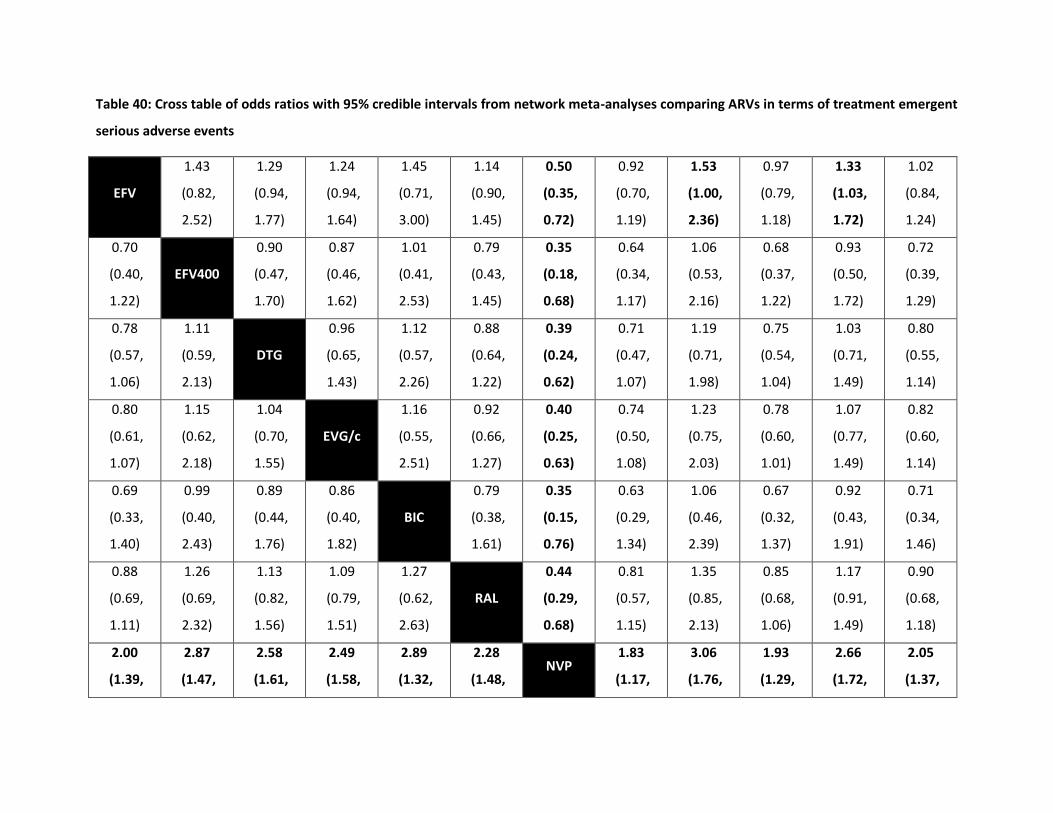
Table 40: Cross table of odds ratios with 95% credible intervals from network meta-analyses comparing ARVs in terms of treatment emergent
serious adverse events
EFV
1.43
(0.82,
2.52)
1.29
(0.94,
1.77)
1.24
(0.94,
1.64)
1.45
(0.71,
3.00)
1.14
(0.90,
1.45)
0.50
(0.35,
0.72)
0.92
(0.70,
1.19)
1.53
(1.00,
2.36)
0.97
(0.79,
1.18)
1.33
(1.03,
1.72)
1.02
(0.84,
1.24)
0.70
(0.40,
1.22)
EFV400
0.90
(0.47,
1.70)
0.87
(0.46,
1.62)
1.01
(0.41,
2.53)
0.79
(0.43,
1.45)
0.35
(0.18,
0.68)
0.64
(0.34,
1.17)
1.06
(0.53,
2.16)
0.68
(0.37,
1.22)
0.93
(0.50,
1.72)
0.72
(0.39,
1.29)
0.78
(0.57,
1.06)
1.11
(0.59,
2.13)
DTG
0.96
(0.65,
1.43)
1.12
(0.57,
2.26)
0.88
(0.64,
1.22)
0.39
(0.24,
0.62)
0.71
(0.47,
1.07)
1.19
(0.71,
1.98)
0.75
(0.54,
1.04)
1.03
(0.71,
1.49)
0.80
(0.55,
1.14)
0.80
(0.61,
1.07)
1.15
(0.62,
2.18)
1.04
(0.70,
1.55)
EVG/c
1.16
(0.55,
2.51)
0.92
(0.66,
1.27)
0.40
(0.25,
0.63)
0.74
(0.50,
1.08)
1.23
(0.75,
2.03)
0.78
(0.60,
1.01)
1.07
(0.77,
1.49)
0.82
(0.60,
1.14)
0.69
(0.33,
1.40)
0.99
(0.40,
2.43)
0.89
(0.44,
1.76)
0.86
(0.40,
1.82)
BIC
0.79
(0.38,
1.61)
0.35
(0.15,
0.76)
0.63
(0.29,
1.34)
1.06
(0.46,
2.39)
0.67
(0.32,
1.37)
0.92
(0.43,
1.91)
0.71
(0.34,
1.46)
0.88
(0.69,
1.11)
1.26
(0.69,
2.32)
1.13
(0.82,
1.56)
1.09
(0.79,
1.51)
1.27
(0.62,
2.63)
RAL
0.44
(0.29,
0.68)
0.81
(0.57,
1.15)
1.35
(0.85,
2.13)
0.85
(0.68,
1.06)
1.17
(0.91,
1.49)
0.90
(0.68,
1.18)
2.00
(1.39,
2.87
(1.47,
2.58
(1.61,
2.49
(1.58,
2.89
(1.32,
2.28
(1.48, NVP
1.83
(1.17,
3.06
(1.76,
1.93
(1.29,
2.66
(1.72,
2.05
(1.37,
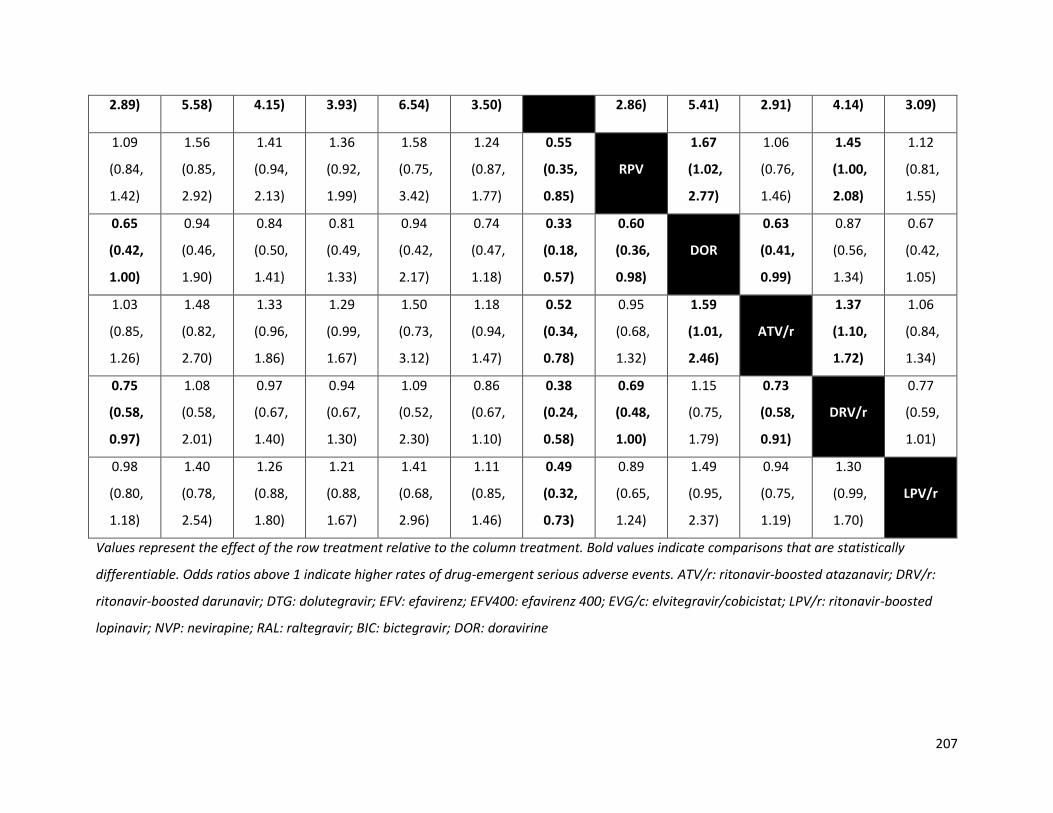
207
2.89) 5.58) 4.15) 3.93) 6.54) 3.50) 2.86) 5.41) 2.91) 4.14) 3.09)
1.09
(0.84,
1.42)
1.56
(0.85,
2.92)
1.41
(0.94,
2.13)
1.36
(0.92,
1.99)
1.58
(0.75,
3.42)
1.24
(0.87,
1.77)
0.55
(0.35,
0.85)
RPV
1.67
(1.02,
2.77)
1.06
(0.76,
1.46)
1.45
(1.00,
2.08)
1.12
(0.81,
1.55)
0.65
(0.42,
1.00)
0.94
(0.46,
1.90)
0.84
(0.50,
1.41)
0.81
(0.49,
1.33)
0.94
(0.42,
2.17)
0.74
(0.47,
1.18)
0.33
(0.18,
0.57)
0.60
(0.36,
0.98)
DOR
0.63
(0.41,
0.99)
0.87
(0.56,
1.34)
0.67
(0.42,
1.05)
1.03
(0.85,
1.26)
1.48
(0.82,
2.70)
1.33
(0.96,
1.86)
1.29
(0.99,
1.67)
1.50
(0.73,
3.12)
1.18
(0.94,
1.47)
0.52
(0.34,
0.78)
0.95
(0.68,
1.32)
1.59
(1.01,
2.46)
ATV/r
1.37
(1.10,
1.72)
1.06
(0.84,
1.34)
0.75
(0.58,
0.97)
1.08
(0.58,
2.01)
0.97
(0.67,
1.40)
0.94
(0.67,
1.30)
1.09
(0.52,
2.30)
0.86
(0.67,
1.10)
0.38
(0.24,
0.58)
0.69
(0.48,
1.00)
1.15
(0.75,
1.79)
0.73
(0.58,
0.91)
DRV/r
0.77
(0.59,
1.01)
0.98
(0.80,
1.18)
1.40
(0.78,
2.54)
1.26
(0.88,
1.80)
1.21
(0.88,
1.67)
1.41
(0.68,
2.96)
1.11
(0.85,
1.46)
0.49
(0.32,
0.73)
0.89
(0.65,
1.24)
1.49
(0.95,
2.37)
0.94
(0.75,
1.19)
1.30
(0.99,
1.70)
LPV/r
Values represent the effect of the row treatment relative to the column treatment. Bold values indicate comparisons that are statistically
differentiable. Odds ratios above 1 indicate higher rates of drug-emergent serious adverse events. ATV/r: ritonavir-boosted atazanavir; DRV/r:
ritonavir-boosted darunavir; DTG: dolutegravir; EFV: efavirenz; EFV400: efavirenz 400; EVG/c: elvitegravir/cobicistat; LPV/r: ritonavir-boosted
lopinavir; NVP: nevirapine; RAL: raltegravir; BIC: bictegravir; DOR: doravirine
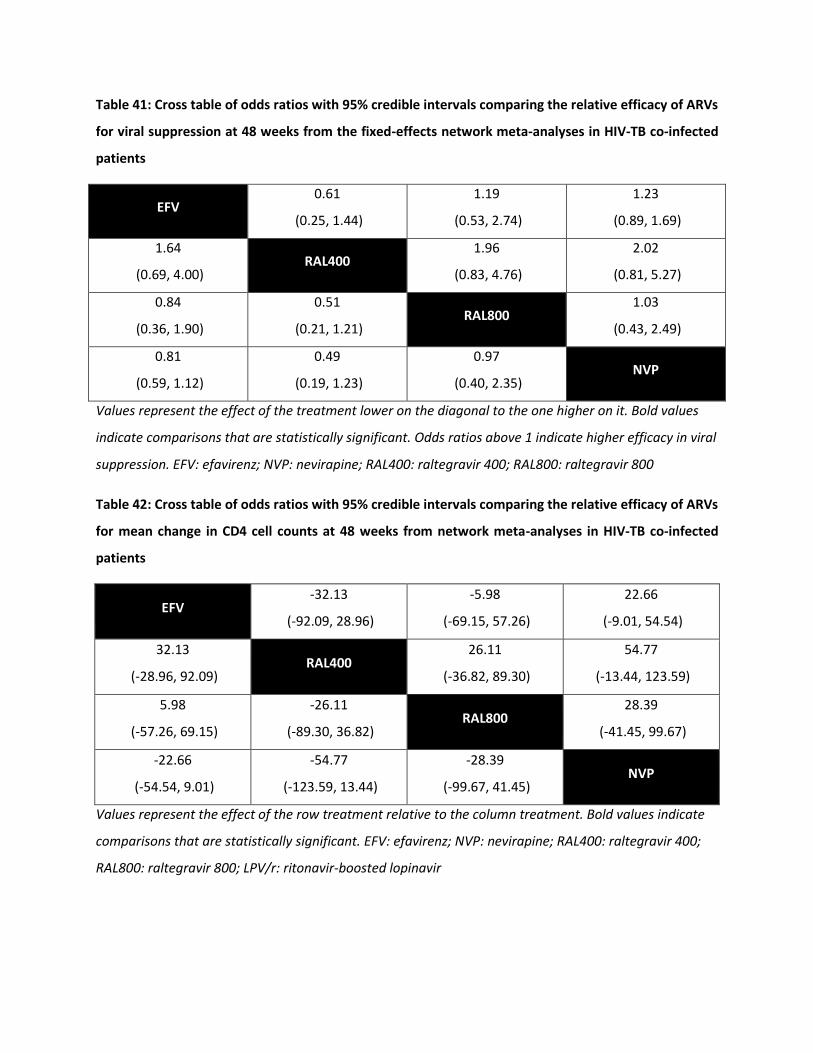
Table 41: Cross table of odds ratios with 95% credible intervals comparing the relative efficacy of ARVs
for viral suppression at 48 weeks from the fixed-effects network meta-analyses in HIV-TB co-infected
patients
EFV 0.61
(0.25, 1.44)
1.19
(0.53, 2.74)
1.23
(0.89, 1.69)
1.64
(0.69, 4.00) RAL400
1.96
(0.83, 4.76)
2.02
(0.81, 5.27)
0.84
(0.36, 1.90)
0.51
(0.21, 1.21) RAL800
1.03
(0.43, 2.49)
0.81
(0.59, 1.12)
0.49
(0.19, 1.23)
0.97
(0.40, 2.35) NVP
Values represent the effect of the treatment lower on the diagonal to the one higher on it. Bold values
indicate comparisons that are statistically significant. Odds ratios above 1 indicate higher efficacy in viral
suppression. EFV: efavirenz; NVP: nevirapine; RAL400: raltegravir 400; RAL800: raltegravir 800
Table 42: Cross table of odds ratios with 95% credible intervals comparing the relative efficacy of ARVs
for mean change in CD4 cell counts at 48 weeks from network meta-analyses in HIV-TB co-infected
patients
EFV -32.13
(-92.09, 28.96)
-5.98
(-69.15, 57.26)
22.66
(-9.01, 54.54)
32.13
(-28.96, 92.09) RAL400
26.11
(-36.82, 89.30)
54.77
(-13.44, 123.59)
5.98
(-57.26, 69.15)
-26.11
(-89.30, 36.82) RAL800
28.39
(-41.45, 99.67)
-22.66
(-54.54, 9.01)
-54.77
(-123.59, 13.44)
-28.39
(-99.67, 41.45) NVP
Values represent the effect of the row treatment relative to the column treatment. Bold values indicate
comparisons that are statistically significant. EFV: efavirenz; NVP: nevirapine; RAL400: raltegravir 400;
RAL800: raltegravir 800; LPV/r: ritonavir-boosted lopinavir
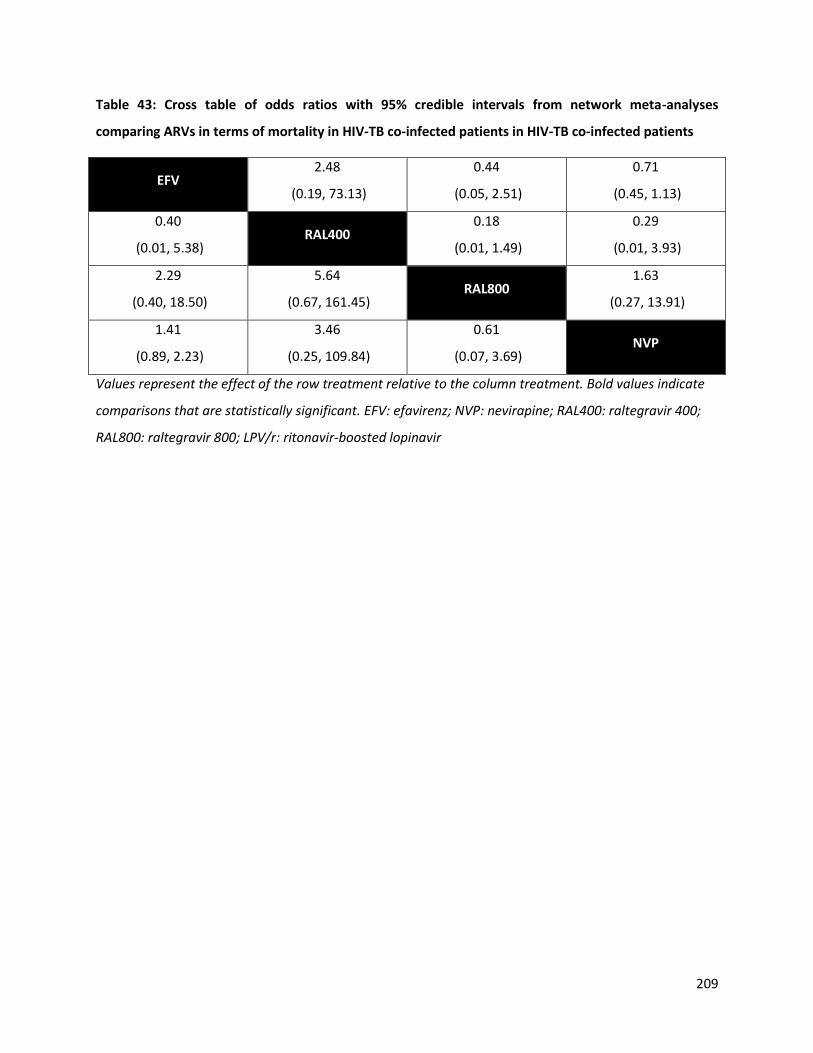
209
Table 43: Cross table of odds ratios with 95% credible intervals from network meta-analyses
comparing ARVs in terms of mortality in HIV-TB co-infected patients in HIV-TB co-infected patients
EFV 2.48
(0.19, 73.13)
0.44
(0.05, 2.51)
0.71
(0.45, 1.13)
0.40
(0.01, 5.38) RAL400
0.18
(0.01, 1.49)
0.29
(0.01, 3.93)
2.29
(0.40, 18.50)
5.64
(0.67, 161.45) RAL800
1.63
(0.27, 13.91)
1.41
(0.89, 2.23)
3.46
(0.25, 109.84)
0.61
(0.07, 3.69) NVP
Values represent the effect of the row treatment relative to the column treatment. Bold values indicate
comparisons that are statistically significant. EFV: efavirenz; NVP: nevirapine; RAL400: raltegravir 400;
RAL800: raltegravir 800; LPV/r: ritonavir-boosted lopinavir

Appendix K: GRADE summary tables for children and adolescents
Table 44: GRADE summary of evidence for the DTG vs EFV comparison in children and adolescents
Outcome Direct Effect
Uncombined Estimates Combined Estimates
Risk of
Bias
Incons
istenc
y
Indirec
tness
Impre
cision
Public
ation
Bias
Quality
of direct
evidenc
e
Odds ratio
(95% CrI)
Absolute
effects
Indirect
evidenc
e
precisio
n
Networ
k
Transiti
vity
Overall
quality
of
evidenc
e
Viral supp. at
48 weeks
1.79
(1.25, 2.58) 0 0 -1 0 0
Modera
te
1.86
(1.44, 2.40)
74 per
1000 (47 to
98)
0 0
Modera
te
Viral supp. at
96 weeks
1.65
(1.21, 2.24) 0 0 -1 0 0
Modera
te
1.93
(1.52, 2.47)
94 per
1000 (63 to
121)
0 0
Modera
te
Viral supp. at
144 weeks
1.44
(1.08, 1.92) -1 0 -1 -1 0
Low
1.44
(1.08, 1.92)
39 per
1000
(-11 to 83)
0 0
Low
Change in
CD4 at 48
weeks
58.76
(36.80,
80.71)
0 0 -1 0 0
Modera
te
-
24.27
cells/ml
(5.89,
43.18)
0 -1
Low

211
Outcome Direct Effect
Uncombined Estimates Combined Estimates
Risk of
Bias
Incons
istenc
y
Indirec
tness
Impre
cision
Public
ation
Bias
Quality
of direct
evidenc
e
Odds ratio
(95% CrI)
Absolute
effects
Indirect
evidenc
e
precisio
n
Networ
k
Transiti
vity
Overall
quality
of
evidenc
e
Change in
CD4 at 96
weeks
41.76
(13.83,
69.69)
0 0 -1 0 0
Modera
te
-
25.94
cells/ml
(2.95,
48.74)
-1 0
Low
Change in
CD4 at 144
weeks
46.91
(16.70,
77.12)
-1 0 -1 0 0
Low -
49.63
cells/ml
(20.12,
79.58)
0 0
Low
Mortality 0.20
(0.01, 4.16) 0 0 -1 -2 0
Very
low
0.64
(0.09, 4.87)
-4 per 1000
(--9 to 12) 0 0
Very
low
AIDS defining
illness
5.10
(0.24,
108.97)
0 0 -1 -2 0
Very
low
8.08
(0.46,
66.45)
127 per
1000
(-13 to 550)
0 0
Very
low
Discontinuati
ons
0.59
(0.44, 0.79) 0 0 -1 0 0
Modera
te
0.49
(0.39, 0.62)
-43 per
1000
(-54 to -30)
0 0
Modera
te

212
Outcome Direct Effect
Uncombined Estimates Combined Estimates
Risk of
Bias
Incons
istenc
y
Indirec
tness
Impre
cision
Public
ation
Bias
Quality
of direct
evidenc
e
Odds ratio
(95% CrI)
Absolute
effects
Indirect
evidenc
e
precisio
n
Networ
k
Transiti
vity
Overall
quality
of
evidenc
e
Discontinuati
ons due to AE
0.26
(0.15, 0.45) 0 0 -1 0 0
Modera
te
0.30
(0.19, 0.47)
-78 per
1000
(-101 to -
54)
0 0
Modera
te
Emergent
SAEs
1.10
(0.77, 1.58) 0 -1 -1 -1 0
Very
low
0.63
(0.38, 1.11)
-22 per
1000
(-45 to 6)
0 0
Very
low
Emergent AEs 0.64
(0.27, 1.54) 0 0 -1 -1 0
Low
0.78
(0.49, 1.23)
-113 per
1000 (-160
to -70)
0 0
Low
Treatment-
related SAEs
0.22
(0.05, 1.03) -1 0 -1 -2 0
Very
low
9.79
(0.02,
507.2)
126 per
1000
(-12 to 822)
0 -1
Very
low
Treatment-
related AEs
0.38
(0.29, 0.50) -1 0 -1 0 0
Very
low
0.33
(0.25, 0.44)
-215 per
1000 (-255
to -170)
0 0
Very
low

213
Outcome Direct Effect
Uncombined Estimates Combined Estimates
Risk of
Bias
Incons
istenc
y
Indirec
tness
Impre
cision
Public
ation
Bias
Quality
of direct
evidenc
e
Odds ratio
(95% CrI)
Absolute
effects
Indirect
evidenc
e
precisio
n
Networ
k
Transiti
vity
Overall
quality
of
evidenc
e
Regimen
substitutions -- 0 0 -2 -2 0
Modera
te
6.20
(0.87,
74.94)
223 per
1,000
(-7 to 764)
-- --
Modera
te
Legend: Uncombined estimates represent either direct estimates, if available, or indirect NMA estimates otherwise. Combined estimates are
NMA estimates for comparisons where direct estimates were available. For uncombined estimates start with high quality evidence. -1
symbolizes a choice to rate down (e.g. high quality to moderate quality evidence); 0 symbolizes choice to not rate down; -- = not applicable
because the NMA estimate is the only estimate.The final quality of evidence updates that of the uncombined evidence. The quality can be
moved up if the uncombined score was penalized for precision, which was overcome in network estimates. It can be moved down if the
estimates are no longer precise or if there is evidence of inconsistency in loops containing the comparison (i.e. violation of transitivity).
Precision – We rated down for precision if the confidence interval crossed 1.1 or 0.9. Consistency – We assessed the consistency for direct
treatment comparisons using I2 estimates and visual inspection of point estimates. An I2 of 75% or higher indicates considerable heterogeneity.
This was conducted along the shortest indirect pathway with the largest number of trials for indirect estimates. Risk of Bias – For direct
estimates we rated down for risk of bias if the majority of studies within a comparison were considered to be at high risk of bias and similarly
along the principal indirect pathway for indirect estimates. Indirectness – Estimates obtained solely from indirect evidence were rated down for
indirectness.

214
Table 45: GRADE summary of evidence for the DTG vs LPV/r comparison in children and adolescents
Outcome Direct Effect
Uncombined Estimates Combined Estimates
Risk of
Bias
Incons
istenc
y
Indirec
tness
Impre
cision
Public
ation
Bias
Quality
of direct
evidenc
e
Odds ratio
(95% CrI)
Absolute
effects
Indirect
evidenc
e
precisio
n
Networ
k
Transiti
vity
Overall
quality
of
evidenc
e
Viral supp. at
48 weeks -- 0 0 -2 0 0
Low
2.70
(1.92, 3.70)
136 per
1000 (92 to
184)
-- --
Low
Viral supp. at
96 weeks -- 0 0 -2 0 0
Low
2.70
(1.75, 4.00)
162 per
1000 (107
to 223)
-- --
Low
Viral supp. at
144 weeks -- 0 0 -2 -1 0 - - -- -- -- -
Change in
CD4 at 48
weeks
-- 0 0 -2 -1 0
Very
low
-
-2.40
cells/ml
(-28.99,
25.86)
-- --
Very
low
Change in
CD4 at 96
weeks
-- 0 0 -2 -1 0
Very
low
-
-18.63
cells/ml
(-54.43,
-- --
Very
low

215
Outcome Direct Effect
Uncombined Estimates Combined Estimates
Risk of
Bias
Incons
istenc
y
Indirec
tness
Impre
cision
Public
ation
Bias
Quality
of direct
evidenc
e
Odds ratio
(95% CrI)
Absolute
effects
Indirect
evidenc
e
precisio
n
Networ
k
Transiti
vity
Overall
quality
of
evidenc
e
18.83)
Change in
CD4 at 144
weeks
-- 0 0 -2 -1 0
Very
low
-
9.27
cells/ml
(-89.80,
100.65)
-- --
Very
low
Mortality -- 0 0 -2 -1 0
Very
low
0.47
(0.05, 4.17)
-4 per 1000
(-10 to 12) -- --
Very
low
AIDS defining
illness -- 0 0 -2 0 0
Very
low
7.14
(0.32,
100.00)
127 per
1000
(-12 to 551)
-- --
Very
low
Discontinuati
ons -- 0 0 -2 0 0
Low
0.44
(0.32, 0.60)
-65 per
1000
(-104 to -
38)
-- --
Low
Discontinuati
ons due to AE -- 0 0 -2 0 0
Low
0.23
(0.11, 0.46)
-107 per
1000 -- --
Low

216
Outcome Direct Effect
Uncombined Estimates Combined Estimates
Risk of
Bias
Incons
istenc
y
Indirec
tness
Impre
cision
Public
ation
Bias
Quality
of direct
evidenc
e
Odds ratio
(95% CrI)
Absolute
effects
Indirect
evidenc
e
precisio
n
Networ
k
Transiti
vity
Overall
quality
of
evidenc
e
(-146 to -
69)
Emergent
SAEs -- 0 0 -2 -1 0
Low
0.52
(0.37, 0.74)
-20 per
1000
(-49 to 12)
-- --
Low
Emergent AEs -- -1 0 -2 -1 0
Very
low
0.79
(0.56, 1.14)
-110 per
1000
(-168 to -
52)
-- --
Very
low
Treatment-
related SAEs -- -1 0 -2 0 0
Very
low
33.33
(0.08,
1000)
124 per
1000
(-8 to 817)
-- --
Very
low
Treatment-
related AEs -- 0 0 -2 0 0
Very
low
0.33
(0.21, 0.52)
-223 per
1000
(-295 to -
151)
-- --
Very
low
Regimen -- 0 0 -2 -1 0 7.69 234 per -- --
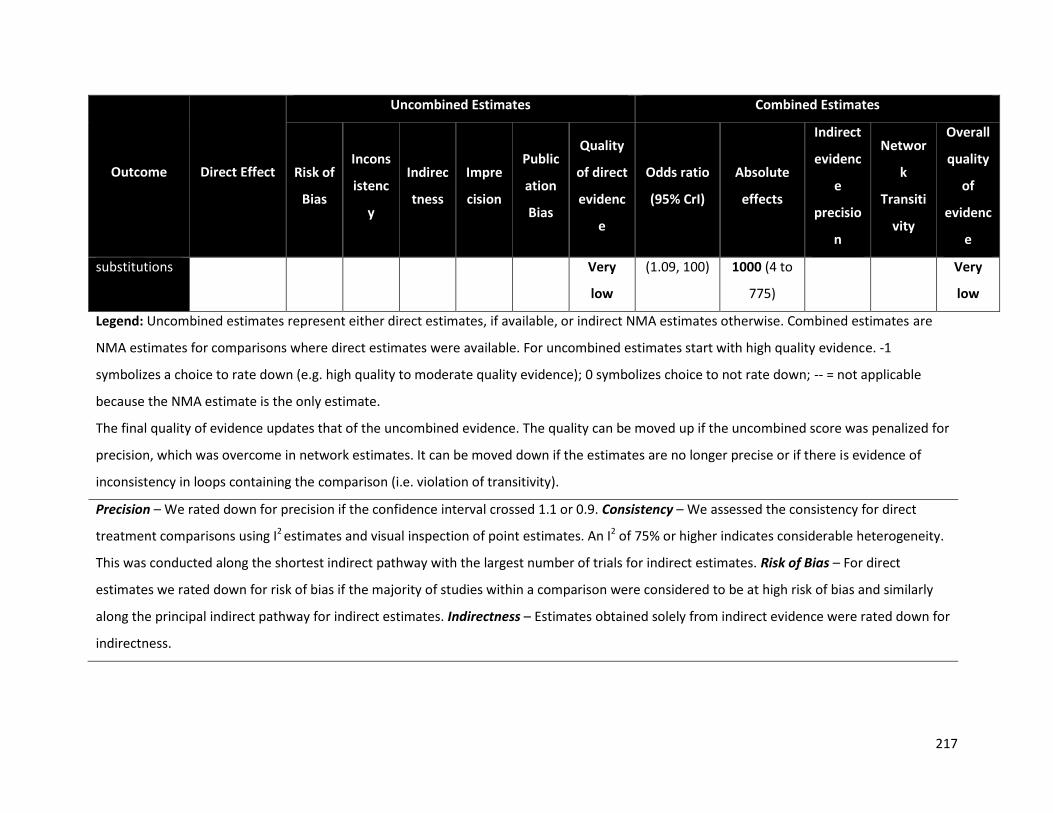
217
Outcome Direct Effect
Uncombined Estimates Combined Estimates
Risk of
Bias
Incons
istenc
y
Indirec
tness
Impre
cision
Public
ation
Bias
Quality
of direct
evidenc
e
Odds ratio
(95% CrI)
Absolute
effects
Indirect
evidenc
e
precisio
n
Networ
k
Transiti
vity
Overall
quality
of
evidenc
e
substitutions Very
low
(1.09, 100) 1000 (4 to
775)
Very
low
Legend: Uncombined estimates represent either direct estimates, if available, or indirect NMA estimates otherwise. Combined estimates are
NMA estimates for comparisons where direct estimates were available. For uncombined estimates start with high quality evidence. -1
symbolizes a choice to rate down (e.g. high quality to moderate quality evidence); 0 symbolizes choice to not rate down; -- = not applicable
because the NMA estimate is the only estimate.
The final quality of evidence updates that of the uncombined evidence. The quality can be moved up if the uncombined score was penalized for
precision, which was overcome in network estimates. It can be moved down if the estimates are no longer precise or if there is evidence of
inconsistency in loops containing the comparison (i.e. violation of transitivity).
Precision – We rated down for precision if the confidence interval crossed 1.1 or 0.9. Consistency – We assessed the consistency for direct
treatment comparisons using I2 estimates and visual inspection of point estimates. An I2 of 75% or higher indicates considerable heterogeneity.
This was conducted along the shortest indirect pathway with the largest number of trials for indirect estimates. Risk of Bias – For direct
estimates we rated down for risk of bias if the majority of studies within a comparison were considered to be at high risk of bias and similarly
along the principal indirect pathway for indirect estimates. Indirectness – Estimates obtained solely from indirect evidence were rated down for
indirectness.
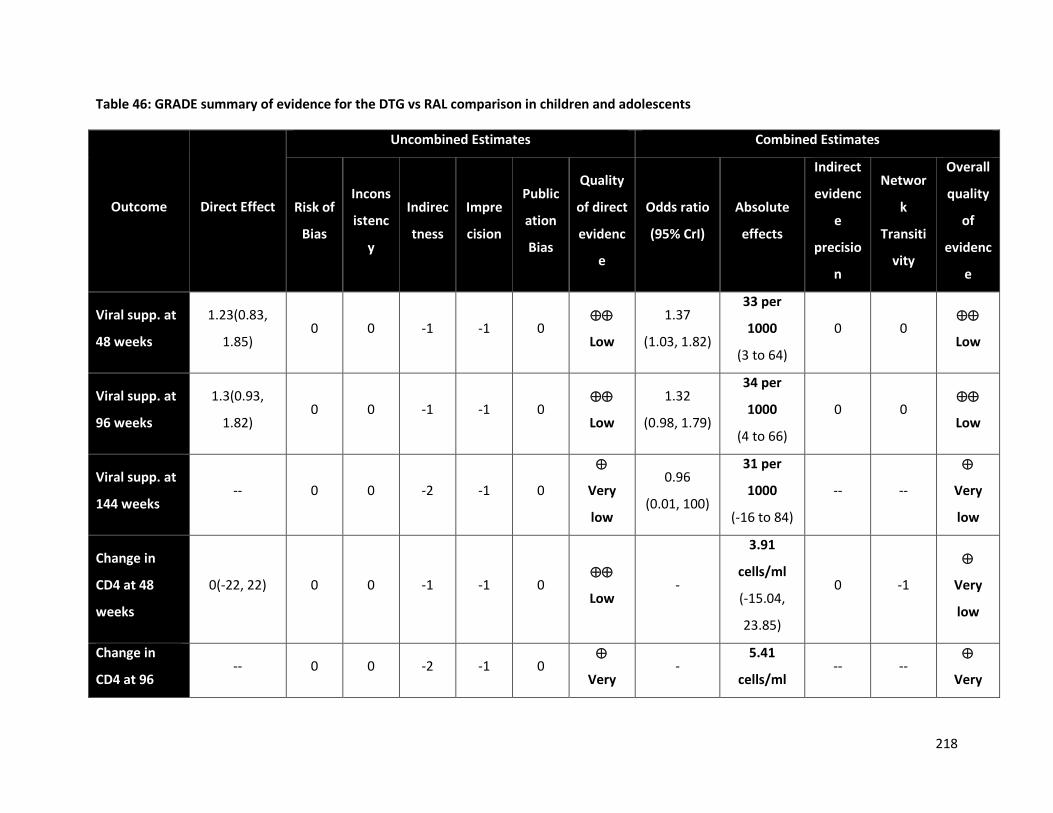
218
Table 46: GRADE summary of evidence for the DTG vs RAL comparison in children and adolescents
Outcome Direct Effect
Uncombined Estimates Combined Estimates
Risk of
Bias
Incons
istenc
y
Indirec
tness
Impre
cision
Public
ation
Bias
Quality
of direct
evidenc
e
Odds ratio
(95% CrI)
Absolute
effects
Indirect
evidenc
e
precisio
n
Networ
k
Transiti
vity
Overall
quality
of
evidenc
e
Viral supp. at
48 weeks
1.23(0.83,
1.85) 0 0 -1 -1 0
Low
1.37
(1.03, 1.82)
33 per
1000
(3 to 64)
0 0
Low
Viral supp. at
96 weeks
1.3(0.93,
1.82) 0 0 -1 -1 0
Low
1.32
(0.98, 1.79)
34 per
1000
(4 to 66)
0 0
Low
Viral supp. at
144 weeks -- 0 0 -2 -1 0
Very
low
0.96
(0.01, 100)
31 per
1000
(-16 to 84)
-- --
Very
low
Change in
CD4 at 48
weeks
0(-22, 22) 0 0 -1 -1 0
Low -
3.91
cells/ml
(-15.04,
23.85)
0 -1
Very
low
Change in
CD4 at 96 -- 0 0 -2 -1 0
Very -
5.41
cells/ml -- --
Very

219
Outcome Direct Effect
Uncombined Estimates Combined Estimates
Risk of
Bias
Incons
istenc
y
Indirec
tness
Impre
cision
Public
ation
Bias
Quality
of direct
evidenc
e
Odds ratio
(95% CrI)
Absolute
effects
Indirect
evidenc
e
precisio
n
Networ
k
Transiti
vity
Overall
quality
of
evidenc
e
weeks low (-27.41,
40.74)
low
Change in
CD4 at 144
weeks
-- 0 0 -2 -1 0
Very
low
-
11.54
cells/ml
(-79.64,
95.93)
-- --
Very
low
Mortality 1(0.06,
16.67) 0 0 -1 -1 0
Low
0.87
(0.13, 7.14)
-1 per 1000
(-8 to 15) 0 0
Low
AIDS defining
illness -- 0 0 -2 -1 0
Very
low
8.33
(0.30,
100.00)
126 per
1000 (-16
to 552)
-- --
Very
low
Discontinuati
ons
0.74(0.51,
1.06) 0 0 -1 -1 0
Low
0.76
(0.58, 0.99)
-8 per 1000
(-25 to 4) 0 0
Low
Discontinuati
ons due to AE 1(0.41, 2.44) 0 0 -1 -1 0
Low
0.72
(0.37, 1.41)
-9 per 1000
(--57 to --3) 0 0
Low
Emergent 0.92(0.69, 0 0 -1 -1 0 1.18 -10 per 0 0
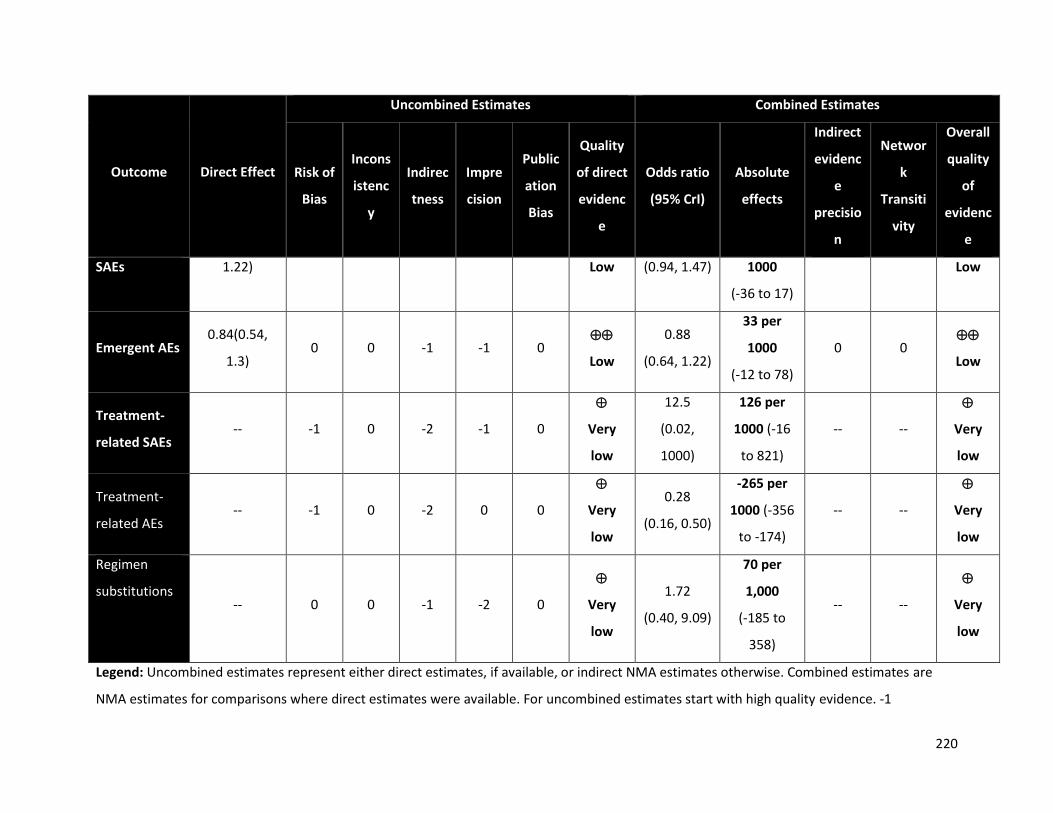
220
Outcome Direct Effect
Uncombined Estimates Combined Estimates
Risk of
Bias
Incons
istenc
y
Indirec
tness
Impre
cision
Public
ation
Bias
Quality
of direct
evidenc
e
Odds ratio
(95% CrI)
Absolute
effects
Indirect
evidenc
e
precisio
n
Networ
k
Transiti
vity
Overall
quality
of
evidenc
e
SAEs 1.22) Low (0.94, 1.47) 1000
(-36 to 17)
Low
Emergent AEs 0.84(0.54,
1.3) 0 0 -1 -1 0
Low
0.88
(0.64, 1.22)
33 per
1000
(-12 to 78)
0 0
Low
Treatment-
related SAEs -- -1 0 -2 -1 0
Very
low
12.5
(0.02,
1000)
126 per
1000 (-16
to 821)
-- --
Very
low
Treatment-
related AEs -- -1 0 -2 0 0
Very
low
0.28
(0.16, 0.50)
-265 per
1000 (-356
to -174)
-- --
Very
low
Regimen
substitutions -- 0 0 -1 -2 0
Very
low
1.72
(0.40, 9.09)
70 per
1,000
(-185 to
358)
-- --
Very
low
Legend: Uncombined estimates represent either direct estimates, if available, or indirect NMA estimates otherwise. Combined estimates are
NMA estimates for comparisons where direct estimates were available. For uncombined estimates start with high quality evidence. -1

221
symbolizes a choice to rate down (e.g. high quality to moderate quality evidence); 0 symbolizes choice to not rate down; -- = not applicable
because the NMA estimate is the only estimate.
The final quality of evidence updates that of the uncombined evidence. The quality can be moved up if the uncombined score was penalized for
precision, which was overcome in network estimates. It can be moved down if the estimates are no longer precise or if there is evidence of
inconsistency in loops containing the comparison (i.e. violation of transitivity).
Precision – We rated down for precision if the confidence interval crossed 1.1 or 0.9. Consistency – We assessed the consistency for direct
treatment comparisons using I2 estimates and visual inspection of point estimates. An I2 of 75% or higher indicates considerable heterogeneity.
This was conducted along the shortest indirect pathway with the largest number of trials for indirect estimates. Risk of Bias – For direct
estimates we rated down for risk of bias if the majority of studies within a comparison were considered to be at high risk of bias and similarly
along the principal indirect pathway for indirect estimates. Indirectness – Estimates obtained solely from indirect evidence were rated down for
indirectness.

222
Table 47: GRADE summary of evidence for the RAL vs EFV comparison in children and adolescents
Outcome Direct Effect
Uncombined Estimates Combined Estimates
Risk of
Bias
Incons
istenc
y
Indirec
tness
Impre
cision
Public
ation
Bias
Quality
of direct
evidenc
e
Odds ratio
(95% CrI)
Absolute
effects
Indirect
evidenc
e
precisio
n
Networ
k
Transiti
vity
Overall
quality
of
evidenc
e
Viral supp. at
48 weeks
1.33
(0.87, 2.04) 0 0 -1 -1 0
Low
1.36
(1.04, 1.78)
41 per
1000 (9 to
70)
0 0
Low
Viral supp. at
96 weeks
1.12
(0.77, 1.64) 0 0 -1 -1 0
Low
1.47
(1.11, 1.97)
59 per
1000
(23 to 92)
+1 0
Modera
te
Viral supp. at
144 weeks
1.44
(1.00, 2.08) 0 0 -1 -1 0
Low
1.50
(0.08,
29.57)
61 per
1000
(13 to 104)
0 0
Low
Change in
CD4 at 48
weeks
7.01
(-42.06,
56.08)
0 0 -1 -1 0
Low
20.37
(3.34,
37.54)
20.37
cells/ml
(3.34 to
37.54)
0 -1
Very
low
Change in
CD4 at 96
10.06
(-14.76, 0 0 -1 -1 0
Low
22.53
(-0.24,
22.53
cells/ml 0 0
Low
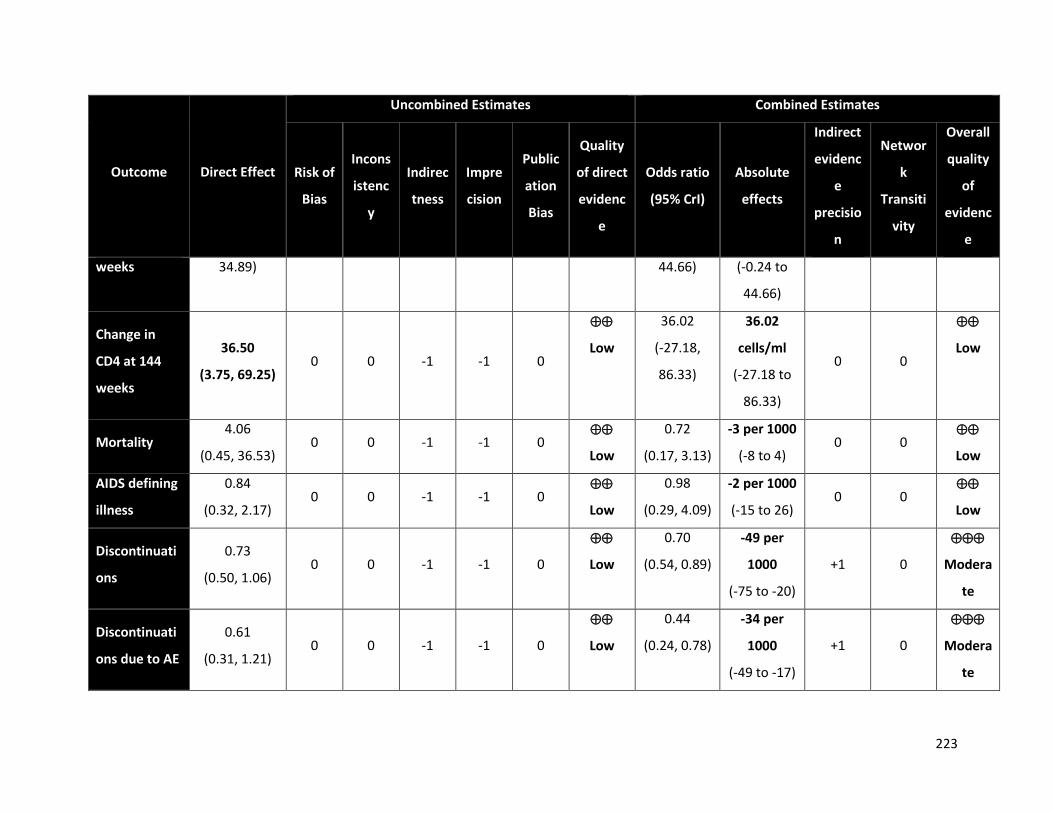
223
Outcome Direct Effect
Uncombined Estimates Combined Estimates
Risk of
Bias
Incons
istenc
y
Indirec
tness
Impre
cision
Public
ation
Bias
Quality
of direct
evidenc
e
Odds ratio
(95% CrI)
Absolute
effects
Indirect
evidenc
e
precisio
n
Networ
k
Transiti
vity
Overall
quality
of
evidenc
e
weeks 34.89) 44.66) (-0.24 to
44.66)
Change in
CD4 at 144
weeks
36.50
(3.75, 69.25) 0 0 -1 -1 0
Low
36.02
(-27.18,
86.33)
36.02
cells/ml
(-27.18 to
86.33)
0 0
Low
Mortality 4.06
(0.45, 36.53) 0 0 -1 -1 0
Low
0.72
(0.17, 3.13)
-3 per 1000
(-8 to 4) 0 0
Low
AIDS defining
illness
0.84
(0.32, 2.17) 0 0 -1 -1 0
Low
0.98
(0.29, 4.09)
-2 per 1000
(-15 to 26) 0 0
Low
Discontinuati
ons
0.73
(0.50, 1.06) 0 0 -1 -1 0
Low
0.70
(0.54, 0.89)
-49 per
1000
(-75 to -20)
+1 0
Modera
te
Discontinuati
ons due to AE
0.61
(0.31, 1.21) 0 0 -1 -1 0
Low
0.44
(0.24, 0.78)
-34 per
1000
(-49 to -17)
+1 0
Modera
te

224
Outcome Direct Effect
Uncombined Estimates Combined Estimates
Risk of
Bias
Incons
istenc
y
Indirec
tness
Impre
cision
Public
ation
Bias
Quality
of direct
evidenc
e
Odds ratio
(95% CrI)
Absolute
effects
Indirect
evidenc
e
precisio
n
Networ
k
Transiti
vity
Overall
quality
of
evidenc
e
Emergent
SAEs
0.75
(0.42, 1.33) 0 0 -1 -1 0
Low
0.44
(0.35, 0.55)
-12 per
1000
(-32 to -10)
+1 0
Modera
te
Emergent AEs 0.96
(0.64, 1.45) 0 0 -1 -1 0
Low
0.88
(0.69, 1.11)
-146 per
1000
(-193 to -
102)
0 0
Low
Treatment-
related SAEs
1.00
(0.33, 2.99) -1 0 -1 -1 0
Very
low
0.77
(0.02, 8.90) -1 per 1000
(-11 to 20)
0 0
Very
low
Treatment-
related AEs
1.23
(0.88, 1.71) -1 0 -1 -1 0
Very
low
1.23
(0.81, 1.90)
50 per
1000
(-29 to 133)
0 0
Very
low
Regimen
substitutions
--
0 0 -1 -1 0
Very
low
3.60
(0.27,
62.66)
124 per
1,000
(-42 to 739)
-- --
Very
low
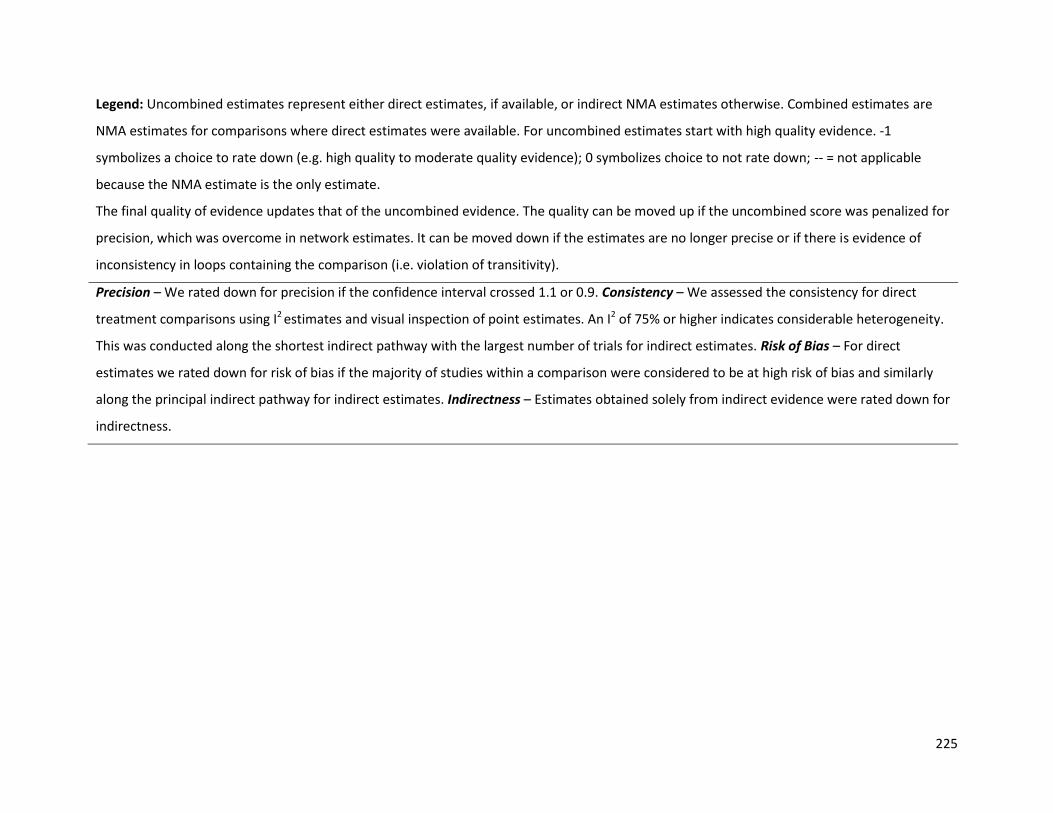
225
Legend: Uncombined estimates represent either direct estimates, if available, or indirect NMA estimates otherwise. Combined estimates are
NMA estimates for comparisons where direct estimates were available. For uncombined estimates start with high quality evidence. -1
symbolizes a choice to rate down (e.g. high quality to moderate quality evidence); 0 symbolizes choice to not rate down; -- = not applicable
because the NMA estimate is the only estimate.
The final quality of evidence updates that of the uncombined evidence. The quality can be moved up if the uncombined score was penalized for
precision, which was overcome in network estimates. It can be moved down if the estimates are no longer precise or if there is evidence of
inconsistency in loops containing the comparison (i.e. violation of transitivity).
Precision – We rated down for precision if the confidence interval crossed 1.1 or 0.9. Consistency – We assessed the consistency for direct
treatment comparisons using I2 estimates and visual inspection of point estimates. An I2 of 75% or higher indicates considerable heterogeneity.
This was conducted along the shortest indirect pathway with the largest number of trials for indirect estimates. Risk of Bias – For direct
estimates we rated down for risk of bias if the majority of studies within a comparison were considered to be at high risk of bias and similarly
along the principal indirect pathway for indirect estimates. Indirectness – Estimates obtained solely from indirect evidence were rated down for
indirectness.

226
Table 48: GRADE summary of evidence for the RAL vs LPV/r comparison in children and adolescents
Outcome Direct Effect
Uncombined Estimates Combined Estimates
Risk of
Bias
Incons
istenc
y
Indirec
tness
Impre
cision
Publi
catio
n
Bias
Quality
of direct
evidenc
e
Odds ratio
(95% CrI)
Absolute
effects
Indirect
evidenc
e
precisio
n
Networ
k
Transiti
vity
Overall
quality
of
evidenc
e
Viral supp. at
48 weeks -- 0 0 -2 0 0
Low
1.96
(1.43, 2.78)
103 per 1000
(56 to 153) -- --
Low
Viral supp. at
96 weeks -- 0 0 -2 0 0
Low
2.08
(1.35, 3.03)
128 per 1000
( 71 to 190) -- --
Low
Viral supp. at
144 weeks -- 0 0 -2 -1 0 - - -- -- -- -
Change in
CD4 at 48
weeks
-- 0 0 -2 -1 0
Very
low
-6.17
(-32.17,
20.40)
-6.17
cells/ml
(-32.17 to
20.40)
-- --
Very
low
Change in
CD4 at 96
weeks
-- 0 0 -2 -1 0
Very
low
-23.81
(-55.27,
6.57)
-23.81
cells/ml
(-55.27 to
6.57)
-- --
Very
low
Change in -- 0 0 -2 -1 0 -2.32 -2.32 -- --

227
Outcome Direct Effect
Uncombined Estimates Combined Estimates
Risk of
Bias
Incons
istenc
y
Indirec
tness
Impre
cision
Publi
catio
n
Bias
Quality
of direct
evidenc
e
Odds ratio
(95% CrI)
Absolute
effects
Indirect
evidenc
e
precisio
n
Networ
k
Transiti
vity
Overall
quality
of
evidenc
e
CD4 at 144
weeks
Very
low
(-88.18,
83.19)
cells/ml
(-88.18 to
83.19)
Very
low
Mortality -- 0 0 -2 -1 0
Very
low
0.53
(0.09, 2.63)
-3 per 1000
(-9 to 4) -- --
Very
low
AIDS defining
illness -- 0 0 -2 0 0
Very
low
0.89
(0.19, 4.00)
-1 per 1000
(-16 to 27) -- --
Very
low
Discontinuati
ons -- 0 0 -2 0 0
Low
0.58
(0.43, 0.79)
-77 per 1000
(-119 to -38) -- --
Low
Discontinuati
ons due to AE -- 0 0 -2 0 0
Low
0.32
(0.16, 0.66)
-57 per 1000
(-95 to -27) -- --
Low
Emergent
SAEs -- 0 0 -2 -1 0
Low
0.44
(0.32, 0.62)
-10 per 1000
(-34 to -6) -- --
Low
Emergent AEs -- -1 0 -2 -1 0 0.9 -143 per -- --
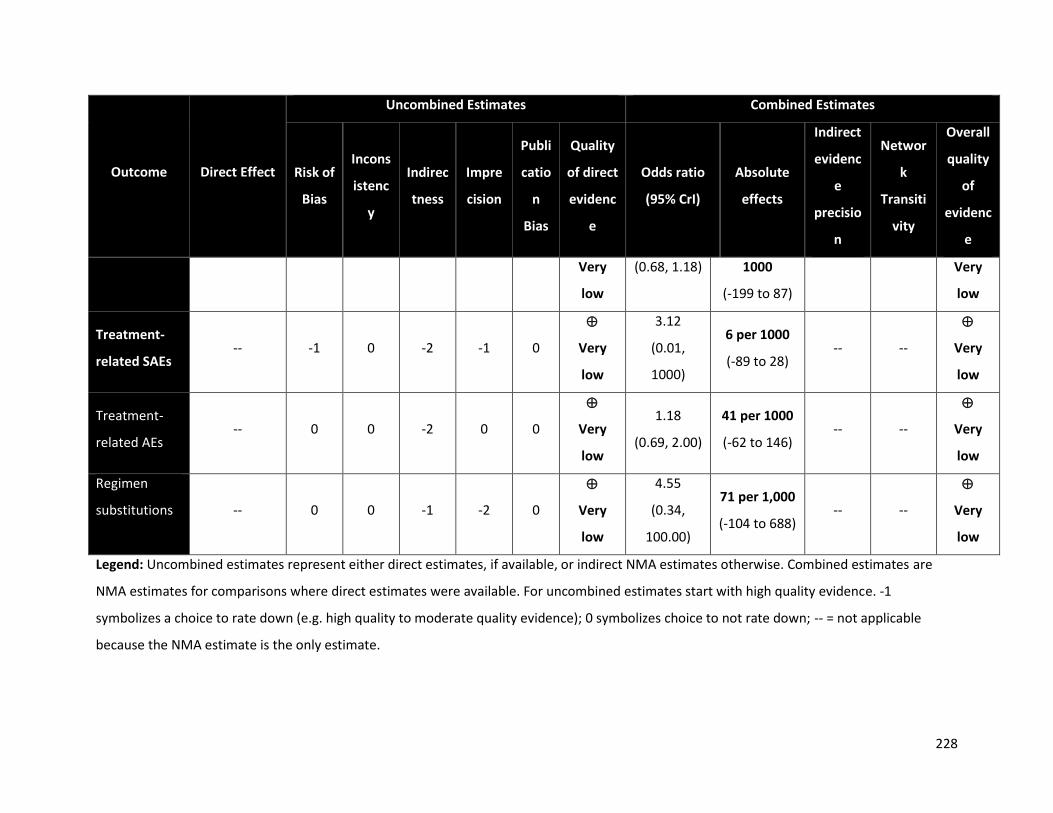
228
Outcome Direct Effect
Uncombined Estimates Combined Estimates
Risk of
Bias
Incons
istenc
y
Indirec
tness
Impre
cision
Publi
catio
n
Bias
Quality
of direct
evidenc
e
Odds ratio
(95% CrI)
Absolute
effects
Indirect
evidenc
e
precisio
n
Networ
k
Transiti
vity
Overall
quality
of
evidenc
e
Very
low
(0.68, 1.18) 1000
(-199 to 87)
Very
low
Treatment-
related SAEs -- -1 0 -2 -1 0
Very
low
3.12
(0.01,
1000)
6 per 1000
(-89 to 28) -- --
Very
low
Treatment-
related AEs -- 0 0 -2 0 0
Very
low
1.18
(0.69, 2.00)
41 per 1000
(-62 to 146) -- --
Very
low
Regimen
substitutions -- 0 0 -1 -2 0
Very
low
4.55
(0.34,
100.00)
71 per 1,000
(-104 to 688) -- --
Very
low
Legend: Uncombined estimates represent either direct estimates, if available, or indirect NMA estimates otherwise. Combined estimates are
NMA estimates for comparisons where direct estimates were available. For uncombined estimates start with high quality evidence. -1
symbolizes a choice to rate down (e.g. high quality to moderate quality evidence); 0 symbolizes choice to not rate down; -- = not applicable
because the NMA estimate is the only estimate.

229
The final quality of evidence updates that of the uncombined evidence. The quality can be moved up if the uncombined score was penalized for
precision, which was overcome in network estimates. It can be moved down if the estimates are no longer precise or if there is evidence of
inconsistency in loops containing the comparison (i.e. violation of transitivity).
Precision – We rated down for precision if the confidence interval crossed 1.1 or 0.9. Consistency – We assessed the consistency for direct
treatment comparisons using I2 estimates and visual inspection of point estimates. An I2 of 75% or higher indicates considerable heterogeneity.
This was conducted along the shortest indirect pathway with the largest number of trials for indirect estimates. Risk of Bias – For direct
estimates we rated down for risk of bias if the majority of studies within a comparison were considered to be at high risk of bias and similarly
along the principal indirect pathway for indirect estimates. Indirectness – Estimates obtained solely from indirect evidence were rated down for
indirectness.
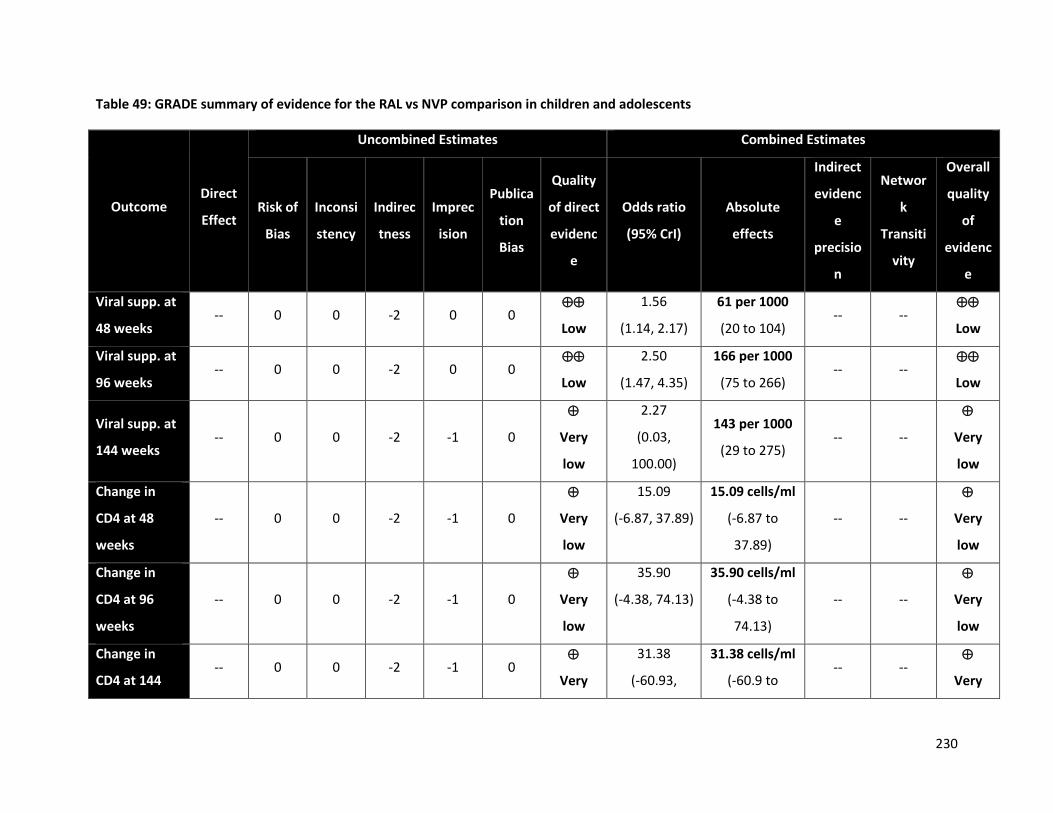
230
Table 49: GRADE summary of evidence for the RAL vs NVP comparison in children and adolescents
Outcome Direct
Effect
Uncombined Estimates Combined Estimates
Risk of
Bias
Inconsi
stency
Indirec
tness
Imprec
ision
Publica
tion
Bias
Quality
of direct
evidenc
e
Odds ratio
(95% CrI)
Absolute
effects
Indirect
evidenc
e
precisio
n
Networ
k
Transiti
vity
Overall
quality
of
evidenc
e
Viral supp. at
48 weeks -- 0 0 -2 0 0
Low
1.56
(1.14, 2.17)
61 per 1000
(20 to 104) -- --
Low
Viral supp. at
96 weeks -- 0 0 -2 0 0
Low
2.50
(1.47, 4.35)
166 per 1000
(75 to 266) -- --
Low
Viral supp. at
144 weeks -- 0 0 -2 -1 0
Very
low
2.27
(0.03,
100.00)
143 per 1000
(29 to 275) -- --
Very
low
Change in
CD4 at 48
weeks
-- 0 0 -2 -1 0
Very
low
15.09
(-6.87, 37.89)
15.09 cells/ml
(-6.87 to
37.89)
-- --
Very
low
Change in
CD4 at 96
weeks
-- 0 0 -2 -1 0
Very
low
35.90
(-4.38, 74.13)
35.90 cells/ml
(-4.38 to
74.13)
-- --
Very
low
Change in
CD4 at 144 -- 0 0 -2 -1 0
Very
31.38
(-60.93,
31.38 cells/ml
(-60.9 to -- --
Very
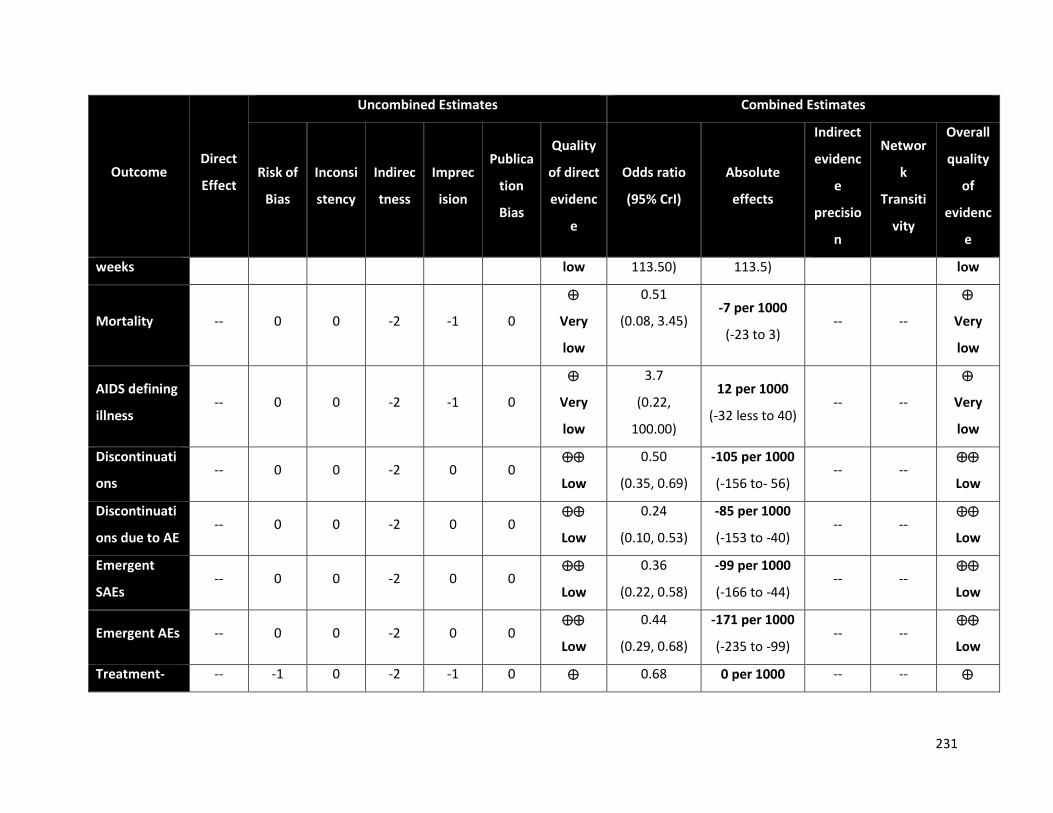
231
Outcome Direct
Effect
Uncombined Estimates Combined Estimates
Risk of
Bias
Inconsi
stency
Indirec
tness
Imprec
ision
Publica
tion
Bias
Quality
of direct
evidenc
e
Odds ratio
(95% CrI)
Absolute
effects
Indirect
evidenc
e
precisio
n
Networ
k
Transiti
vity
Overall
quality
of
evidenc
e
weeks low 113.50) 113.5) low
Mortality -- 0 0 -2 -1 0
Very
low
0.51
(0.08, 3.45) -7 per 1000
(-23 to 3) -- --
Very
low
AIDS defining
illness -- 0 0 -2 -1 0
Very
low
3.7
(0.22,
100.00)
12 per 1000
(-32 less to 40) -- --
Very
low
Discontinuati
ons -- 0 0 -2 0 0
Low
0.50
(0.35, 0.69)
-105 per 1000
(-156 to- 56) -- --
Low
Discontinuati
ons due to AE -- 0 0 -2 0 0
Low
0.24
(0.10, 0.53)
-85 per 1000
(-153 to -40) -- --
Low
Emergent
SAEs -- 0 0 -2 0 0
Low
0.36
(0.22, 0.58)
-99 per 1000
(-166 to -44) -- --
Low
Emergent AEs -- 0 0 -2 0 0
Low
0.44
(0.29, 0.68)
-171 per 1000
(-235 to -99) -- --
Low
Treatment- -- -1 0 -2 -1 0 0.68 0 per 1000 -- --
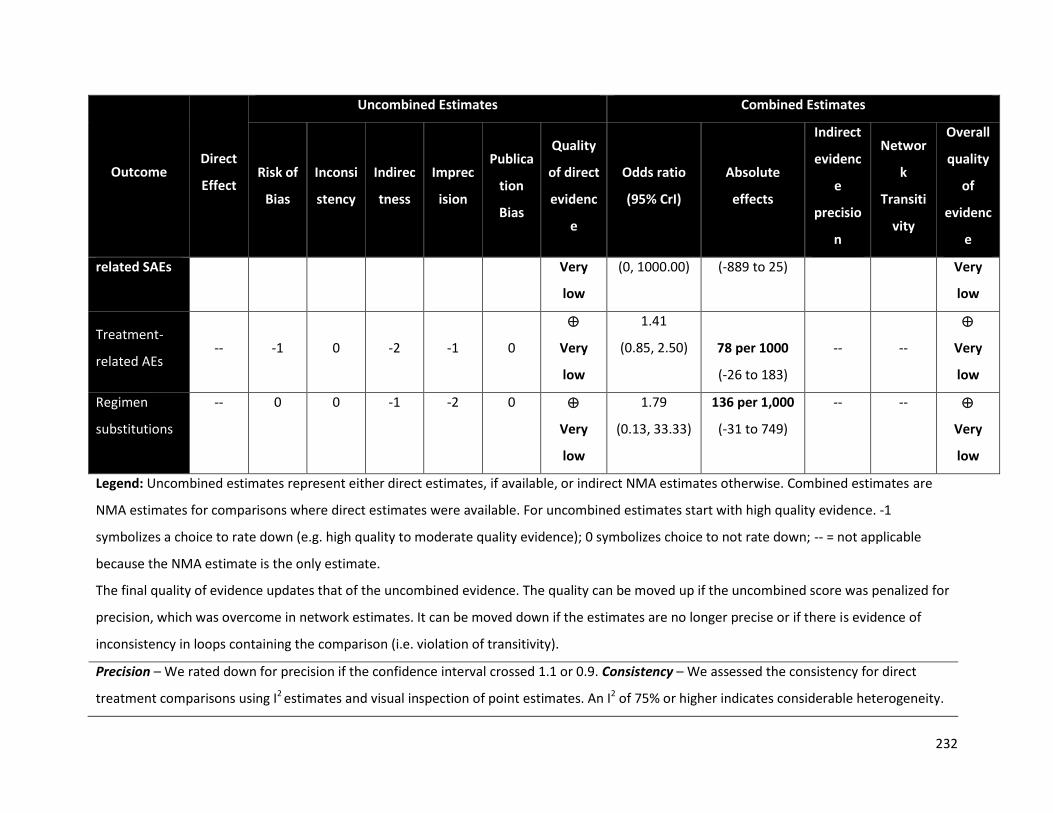
232
Outcome Direct
Effect
Uncombined Estimates Combined Estimates
Risk of
Bias
Inconsi
stency
Indirec
tness
Imprec
ision
Publica
tion
Bias
Quality
of direct
evidenc
e
Odds ratio
(95% CrI)
Absolute
effects
Indirect
evidenc
e
precisio
n
Networ
k
Transiti
vity
Overall
quality
of
evidenc
e
related SAEs Very
low
(0, 1000.00) (-889 to 25) Very
low
Treatment-
related AEs -- -1 0 -2 -1 0
Very
low
1.41
(0.85, 2.50) 78 per 1000
(-26 to 183)
-- --
Very
low
Regimen
substitutions
-- 0 0 -1 -2 0
Very
low
1.79
(0.13, 33.33)
136 per 1,000
(-31 to 749)
-- --
Very
low
Legend: Uncombined estimates represent either direct estimates, if available, or indirect NMA estimates otherwise. Combined estimates are
NMA estimates for comparisons where direct estimates were available. For uncombined estimates start with high quality evidence. -1
symbolizes a choice to rate down (e.g. high quality to moderate quality evidence); 0 symbolizes choice to not rate down; -- = not applicable
because the NMA estimate is the only estimate.
The final quality of evidence updates that of the uncombined evidence. The quality can be moved up if the uncombined score was penalized for
precision, which was overcome in network estimates. It can be moved down if the estimates are no longer precise or if there is evidence of
inconsistency in loops containing the comparison (i.e. violation of transitivity).
Precision – We rated down for precision if the confidence interval crossed 1.1 or 0.9. Consistency – We assessed the consistency for direct
treatment comparisons using I2 estimates and visual inspection of point estimates. An I2 of 75% or higher indicates considerable heterogeneity.

233
This was conducted along the shortest indirect pathway with the largest number of trials for indirect estimates. Risk of Bias – For direct
estimates we rated down for risk of bias if the majority of studies within a comparison were considered to be at high risk of bias and similarly
along the principal indirect pathway for indirect estimates. Indirectness – Estimates obtained solely from indirect evidence were rated down for
indirectness.
234
References
1. World Health Organization. Global update on HIV treatment 2013: results, impact and
opportunities. 2013.
2. World Health Organization. March 2014 supplement to the 2013 consolidated guidelines on
the use of antiretroviral drugs for treating and preventing HIV infection: recommendations
for a public health approach. 2014.
3. World Health Organization. Consolidated guidelines on the use of antiretroviral drugs for
treating and preventing HIV infection. Geneva Switzerland2013.
4. Kanters S, Vitoria M, Doherty M, et al. Comparative efficacy and safety of first-line
antiretroviral therapy for the treatment of HIV infection: a systematic review and network
meta-analysis. Lancet HIV. Nov 2016;3(11):e510-e520.
5. World Health Organization. Consolidated guidelines on the use of antiretroviral drugs for
treating and preventing HIV infection Recommendations for a public health approach -
Second edition. Geneva, Switzerland2016.
6. Higgins JP, Altman DG, Gotzsche PC, et al. The Cochrane Collaboration's tool for assessing
risk of bias in randomised trials. BMJ. 2011;343:d5928.
7. Guyatt GH, Oxman AD, Kunz R, et al. GRADE guidelines 6. Rating the quality of evidence--
imprecision. J Clin Epidemiol. Dec 2011;64(12):1283-1293.
8. Guyatt GH, Oxman AD, Kunz R, et al. GRADE guidelines: 7. Rating the quality of evidence--
inconsistency. J Clin Epidemiol. Dec 2011;64(12):1294-1302.
9. Guyatt GH, Oxman AD, Montori V, et al. GRADE guidelines: 5. Rating the quality of evidence-
-publication bias. J Clin Epidemiol. Dec 2011;64(12):1277-1282.
10. Guyatt GH, Oxman AD, Kunz R, et al. GRADE guidelines: 8. Rating the quality of evidence--
indirectness. J Clin Epidemiol. Dec 2011;64(12):1303-1310.
11. Guyatt GH, Oxman AD, Sultan S, et al. GRADE guidelines: 9. Rating up the quality of
evidence. J Clin Epidemiol. Dec 2011;64(12):1311-1316.
12. Guyatt GH, Oxman AD, Vist G, et al. GRADE guidelines: 4. Rating the quality of evidence--
study limitations (risk of bias). J Clin Epidemiol. Apr 2011;64(4):407-415.
13. Puhan MA, Schunemann HJ, Murad MH, et al. A GRADE Working Group approach for rating
the quality of treatment effect estimates from network meta-analysis. BMJ. 2014;349:g5630.
14. Guyatt G, Oxman A, Vist G, et al. GRADE: an emerging consensus on rating quality of
evidence and strength of recommendations. BMJ. 2008;336:924-926.

235
15. Dias S, Welton N, Sutton A, Ades A. Technical Support Document 2: A generalized linear
modelling framework for pairwise and network meta-analysis of randomized controlled
trials. 2011.
16. Dias S, Welton NJ, Caldwell DM, Ades AE. Checking consistency in mixed treatment
comparison meta-analysis. Statistics in medicine. 2010;29(7-8):932-944.
17. Bucher HC, Guyatt Gh Fau - Griffith LE, Griffith Le Fau - Walter SD, Walter SD. The results of
direct and indirect treatment comparisons in meta-analysis of randomized controlled trials.
19970826 DCOM- 19970826 (0895-4356 (Print)).
18. Walmsley SL, Antela A, Clumeck N, et al. Dolutegravir plus abacavir-lamivudine for the
treatment of HIV-1 infection. N Engl J Med. Nov 7 2013;369(19):1807-1818.
19. Aberg JA, Tebas P, Overton ET, et al. Metabolic effects of darunavir/ritonavir versus
atazanavir/ritonavir in treatment-naive, HIV type 1-infected subjects over 48 weeks. AIDS
Res Hum Retroviruses. Oct 2012;28(10):1184-1195.
20. Albini L, Cesana BM, Motta D, et al. A randomized, pilot trial to evaluate glomerular filtration
rate by creatinine or cystatin C in naive HIV-infected patients after tenofovir/emtricitabine in
combination with atazanavir/ritonavir or efavirenz. J Acquir Immune Defic Syndr. Jan 1
2012;59(1):18-30.
21. Amin J, Becker S, Belloso W, et al. Efficacy of 400 mg efavirenz versus standard 600 mg dose
in HIV-infected, antiretroviral-naive adults (ENCORE1): A randomised, double-blind, placebo-
controlled, non-inferiority trial. Lancet. 2014;383(9927):1474-1482.
22. Amin JML, Praphan Phanupak SF, Lerato Mohapi,, Brenda Crabtree-Ramirez HJ, Suresh
Kumar, Alan Winston,, Man-Po Lee WB, David A Cooper, and Sean Emery. Efficacy and safety
of efavirenz 400 mg daily versus 600 mg daily: 96-week data from the randomised, double-
blind, placebo-controlled, non-inferiority ENCORE1 study. Lancet Infect Dis. 2015.
23. Arathoon E, Schneider S, Baraldi E, et al. Effects of once-daily darunavir/ritonavir versus
lopinavir/ritonavir on metabolic parameters in treatment-naive HIV-1-infected patients at
week 96: ARTEMIS. Int J STD AIDS. Jan 2013;24(1):12-17.
24. Arribas J, Thompson M, Sax PE, et al. Significant efficacy & long-term safety difference with
taf-based str in naïve adults. Conference on Retroviruses and Opportunistic Infections; 2017;
Seattle, USA.
25. Arribas JR, Pozniak AL, Gallant JE, et al. Tenofovir disoproxil fumarate, emtricitabine, and
efavirenz compared with zidovudine/lamivudine and efavirenz in treatment-naive patients:
144-week analysis. J Acquir Immune Defic Syndr. Jan 1 2008;47(1):74-78.
236
26. Arribas JR, Thompson M, Sax PE, et al. Brief Report: Randomized, Double-Blind Comparison
of Tenofovir Alafenamide (TAF) vs Tenofovir Disoproxil Fumarate (TDF), Each Coformulated
With Elvitegravir, Cobicistat, and Emtricitabine (E/C/F) for Initial HIV-1 Treatment: Week 144
Results. Journal of Acquired Immune Deficiency Syndromes: JAIDS. Jun 01 2017;75(2):211-
218.
27. Avihingsanon A, Lewin SR, Kerr S, et al. Efficacy of tenofovir disoproxil
fumarate/emtricitabine compared with emtricitabine alone in antiretroviral-naive HIV-HBV
coinfection in Thailand. Antivir Ther. 2010;15(6):917-922.
28. Bedimo R. RADAR study: Raltegravir combined with boosted Darunavir has similar safety and
antiviral efficacy as tenofovir/emtricitabine combined with boosted darunavir in
antiretroviral-naive patients. the 6th IAS Conference on HIV Pathogenesis, Treatment and
Prevention (IAS 2011); 2011; Rome Italy
29. Bedimo R. Standard Triple Therapy Controls HIV Better Than Raltegravir/Darunavir at 48
Weeks RADAR Study 2013.
30. Bedimo RJ, Drechsler H, Jain M, et al. The RADAR study: Week 48 safety and efficacy of
RAltegravir combined with boosted DARunavir compared to tenofovir/emtricitabine
combined with boosted darunavir in antiretroviral-naive patients. Impact on bone health.
PLoS ONE. 2014;9(8).
31. Berenguer J, Gonzalez J, Ribera E, et al. Didanosine, lamivudine, and efavirenz versus
zidovudine, lamivudine, and efavirenz for the initial treatment of hiv type 1 infection: Final
analysis (48 weeks) of a prospective, randomized, noninferiority clinical trial, GESIDA 3903.
Clin Infect Dis. 15 Oct 2008;47(8):1083-1092.
32. Bertz RJ, Persson A, Chung E, et al. Pharmacokinetics and pharmacodynamics of atazanavir-
containing antiretroviral regimens, with or without ritonavir, in patients who are HIV-
positive and treatment-naive. J Hum Pharma Drug Ther. Mar 2013;33(3):284-294.
33. Bowman V. GR, S. Jain, M. Goicoechea, M. Dube, S. Kerkar, S. Schneider, C. Kemper, C.,
Diamond SS, A. Hermes, K. Bailey, E. Daar, R. Haubrich, California Collaborative Treatment,
Group AICT. 48 week results of a pilot randomized study of an nucleoside reverse
transcriptase inhibitor (NRTI)-sparing regimen of raltegravir (RAL) + lopinavir/ritonavir
(LPV/r) versus efavirenz/tenofovir disoproxil fumarate/emtricitabine (EFV/TDF/FTC) in
antiretro. the 6th IAS Conference on HIV Pathogenesis, Treatment and Prevention (IAS 2011).
2011.
34. Bracchi M, Pagani N, Dalla Pria A, et al. A randomized comparison of integrase inhibitors
with TDF/FTC on renal markers. Antiviral Therapy. 2017;22 (Supplement 1):A25.
237
35. Campbell TB, Smeaton LM, Kumarasamy N, et al. Efficacy and safety of three antiretroviral
regimens for initial treatment of HIV-1: a randomized clinical trial in diverse multinational
settings. PLoS Med. 2012;9(8):e1001290.
36. Carr A, Chuah J, Hudson J, et al. A randomised, open-label comparison of three highly active
antiretroviral therapy regimens including two nucleoside analogues and indinavir for
previously untreated HIV-1 infection: the OzCombo1 study. AIDS. Jun 2000;14(9):1171-1180.
37. Clotet B, Feinberg J, van Lunzen J, et al. Once-daily dolutegravir versus darunavir plus
ritonavir in antiretroviral-naive adults with HIV-1 infection (FLAMINGO): 48 week results
from the randomised open-label phase 3b study. Lancet. Jun 28 2014;383(9936):2222-2231.
38. Cohen C, Elion R, Ruane P, et al. Randomized, phase 2 evaluation of two single-tablet
regimens elvitegravir/cobicistat/emtricitabine/tenofovir disoproxil fumarate versus
efavirenz/emtricitabine/tenofovir disoproxil fumarate for the initial treatment of HIV
infection. AIDS. Mar 27 2011;25(6):F7-12.
39. Cohen C, Wohl D, Arribas J, et al. STaR Study: Single-Tablet Regimen
Rilpivirine/Emtricitabine/Tenofovir DF Maintains Non-Inferiority to
Efavirenz/Emtricitabine/Tenofovir DF in ART-Naïve Adults Week 96 Results. European AIDS
Conference; 2013; Brussels, Belgium.
40. Cohen C, Wohl D, Arribas JR, et al. Week 48 results from a randomized clinical trial of
rilpivirine/ emtricitabine/tenofovir disoproxil fumarate vs. efavirenz/emtricitabine/ tenofovir
disoproxil fumarate in treatment-naive HIV-1-infected adults. AIDS. 2014;28(7):989-997.
41. Cohen CJ, Andrade-Villanueva J, Clotet B, et al. Rilpivirine versus efavirenz with two
background nucleoside or nucleotide reverse transcriptase inhibitors in treatment-naive
adults infected with HIV-1 (THRIVE): a phase 3, randomised, non-inferiority trial. Lancet. Jul
16 2011;378(9787):229-237.
42. Committee ITIC-o, Yeni P, Cooper DA, et al. Virological and immunological outcomes at 3
years after starting antiretroviral therapy with regimens containing non-nucleoside reverse
transcriptase inhibitor, protease inhibitor, or both in INITIO: open-label randomised trial.
Lancet. Jul 22 2006;368(9532):287-298.
43. Curtis LD SM, G Nichols, B Wynne, C Stainsby, A Aylott, S Piscitelli, J Goodrich, SPRING-2 and
SINGLE teams Once-Daily Dolutegravir (DTG; GSK1349572) Has a Renal Safety Profile
Comparable to Raltegravir (RAL) and Efavirenz in Antiretroviral (ART)-Naive Adults: 48 Week
Results From SPRING-2 (ING113086) and SINGLE (ING114467) 2013.

238
44. Daar ES, Tierney C, Fischl MA, et al. Atazanavir plus ritonavir or efavirenz as part of a 3-drug
regimen for initial treatment of HIV-1: A randomized trial. Ann Intern Med. April
2011;154(7):445-456.
45. Dart Trial T. Twenty-four-week safety and tolerability of nevirapine vs. abacavir in
combination with zidovudine/lamivudine as first-line antiretroviral therapy: a randomized
double-blind trial (NORA). Tropical Med Int Health. Jan 2008;13(1):6-16.
46. DeJesus E, Herrera G, Teofilo E, et al. Abacavir versus zidovudine combined with lamivudine
and efavirenz, for the treatment of antiretroviral-naive HIV-infected adults. Clin Infect Dis.
Oct 1 2004;39(7):1038-1046.
47. Dejesus E, Mills A, Bhatti L, Conner C, Storfer S. A randomised comparison of safety and
efficacy of nevirapine vs. atazanavir/ritonavir combined with tenofovir/emtricitabine in
treatment-naive patients. Int J Clin Pract. Dec 2011;65(12):1240-1249.
48. DeJesus E, Rockstroh JK, Henry K, et al. Co-formulated elvitegravir, cobicistat, emtricitabine,
and tenofovir disoproxil fumarate versus ritonavir-boosted atazanavir plus co-formulated
emtricitabine and tenofovir disoproxil fumarate for initial treatment of HIV-1 infection: a
randomised, double-blind, phase 3, non-inferiority trial. Lancet. Jun 30
2012;379(9835):2429-2438.
49. DeJesus E, Rockstroh JK, Lennox JL, et al. Efficacy of raltegravir versus efavirenz when
combined with tenofovir/emtricitabine in treatment-naive HIV-1-infected patients: week-
192 overall and subgroup analyses from STARTMRK. HIV Clin Trials. Jul-Aug 2012;13(4):228-
232.
50. Echeverria P, Negredo E, Carosi G, et al. Similar antiviral efficacy and tolerability between
efavirenz and lopinavir/ritonavir, administered with abacavir/lamivudine (Kivexa), in
antiretroviral-naive patients: a 48-week, multicentre, randomized study (Lake Study).
Antiviral Research. Feb 2010;85(2):403-408.
51. Eron J, Jr., Yeni P, Gathe J, Jr., et al. The KLEAN study of fosamprenavir-ritonavir versus
lopinavir-ritonavir, each in combination with abacavir-lamivudine, for initial treatment of
HIV infection over 48 weeks: a randomised non-inferiority trial.[Erratum appears in Lancet.
2006 Oct 7;368(9543):1238]. Lancet. Aug 5 2006;368(9534):476-482.
52. Fatkenheuer G, Kelly M, Van Wijngaerden E, et al. ARTEMIS 96-week comparison of liver
tolerability of once-daily darunavir/ritonavir (DRV/r) versus lopinavir/ ritonavir (LPV/r) in
treatment-naive patients. HIV Medicine. October 2009;10:100.
53. Fisac C, Virgili N, Ferrer E, et al. A comparison of the effects of nevirapine and nelfinavir on
metabolism and body habitus in antiretroviral-naive human immunodeficiency virus-

239
infected patients: a randomized controlled study. J Clin Endocrinol Metab. Nov
2003;88(11):5186-5192.
54. French M, Amin J, Roth N, et al. Randomized, open-label, comparative trial to evaluate the
efficacy and safety of three antiretroviral drug combinations including two nucleoside
analogues and nevirapine for previously untreated HIV-1 Infection: the OzCombo 2 study.
HIV Clin Trials. May-Jun 2002;3(3):177-185.
55. Gallant J, Lazzarin A, Mills A, et al. Bictegravir, emtricitabine, and tenofovir alafenamide
versus dolutegravir, abacavir, and lamivudine for initial treatment of HIV-1 infection (GS-US-
380-1489): a double-blind, multicentre, phase 3, randomised controlled non-inferiority trial.
The Lancet. 4 - 10 November 2017;390(10107):2063-2072.
56. Gallant JE, DeJesus E, Arribas JR, et al. Tenofovir DF, emtricitabine, and efavirenz vs.
zidovudine, lamivudine, and efavirenz for HIV. N Engl J Med. Jan 19 2006;354(3):251-260.
57. Gallant JE, Staszewski S, Pozniak AL, et al. Efficacy and safety of tenofovir DF vs stavudine in
combination therapy in antiretroviral-naive patients: a 3-year randomized trial. JAMA. Jul 14
2004;292(2):191-201.
58. Gatell J RFPASDPJHCAKTMHDM-RJXXTH. Efficacy and safety of doravirine 100 mg QD vs.
efavirenz 600 mg QD with TDF/FTC in ART-naive HIV-infected patients: Week 24 results.
Journal of the International AIDS Society. IAS Conference on HIV Pathogenesis, Treatment
and Prevention Vancouver, BC Canada;Vol.18, pp.36-7, CONFERENCE START:2015 Jul 2019
CONFERENCE END: 2015 Jul 2022.
59. Gatell Jm RFPASDPJHCAKTMXXTH. Doravirine 100mg QD vs efavirenz +TDF/FTC in ART-naive
HIV+ patients: week 48 results. Topics in antiviral medicine. Conference: 23rd conference on
retroviruses and opportunistic infections, CROI. 2016. United states. Conference start:
20160222.Conference end: 20160225 24(E-1):183.
60. Gathe JC, Jr., Ive P, Wood R, et al. SOLO: 48-week efficacy and safety comparison of once-
daily fosamprenavir /ritonavir versus twice-daily nelfinavir in naive HIV-1-infected patients.
AIDS. Jul 23 2004;18(11):1529-1537.
61. Gilead Sciences. Renal Effect of Stribild or Other Tenofovir DF-containing Regimens
Compared to Ritonavir-boosted Atazanavir Plus Abacavir/Lamivudine in Antiretroviral
Treatment-naive HIV-1 Infected Adults. 2018;
https://clinicaltrials.gov/ct2/show/NCT02246998.
62. Gotti D, Cesana BM, Albini L, et al. Increase in standard cholesterol and large HDL particle
subclasses in antiretroviral-naive patients prescribed efavirenz compared to
atazanavir/ritonavir. HIV Clin Trials. Sep-Oct 2012;13(5):245-255.
240
63. Gotuzzo E, Markowitz M, Ratanasuwan W, et al. Sustained efficacy and safety of raltegravir
after 5 years of combination antiretroviral therapy as initial treatment of HIV-1 infection:
final results of a randomized, controlled, phase II study (Protocol 004). J Acquir Immune Defic
Syndr. Sep 1 2012;61(1):73-77.
64. Group ES, Carey D, Puls R, et al. Efficacy and safety of efavirenz 400 mg daily versus 600 mg
daily: 96-week data from the randomised, double-blind, placebo-controlled, non-inferiority
ENCORE1 study.[Erratum appears in Lancet Infect Dis. 2015 Jul;15(7):761; PMID: 26122437].
The Lancet Infectious Diseases. Jul 2015;15(7):793-802.
65. Gulick RM, Ribaudo HJ, Shikuma CM, et al. Three- vs four-drug antiretroviral regimens for
the initial treatment of HIV-1 infection: a randomized controlled trial. JAMA. Aug 16
2006;296(7):769-781.
66. Gulick RM, Ribaudo HJ, Shikuma CM, et al. Triple-nucleoside regimens versus efavirenz-
containing regimens for the initial treatment of HIV-1 infection. N Engl J Med. Apr 29
2004;350(18):1850-1861.
67. Harris M, Cote H, Ochoa C, et al. A randomized, open-label study of a nucleoside analogue
reverse transcriptase inhibitor-sparing regimen in antiretroviral-naive HIV-infected patients.
J Acquir Immune Defic Syndr. Mar 1 2009;50(3):335-337.
68. Harris MCO, C. Allavena3, E. Negredo4, A. Thorne1, P. Cahn2, C. Zala2,, F. Raffi3 BC, J.
Singer1, J.S.G. Montaner1 and the CTN 177 study team. NRTI Sparing Trial (CTN 177):
Antiviral and Metabolic Effects of Nevirapine (NVP) + Lopinavir/ritonavir (LPV/r) vs.
Zidovudine/lamivudine (AZT/3TC) + NVP vs. AZT/3TC + LPV/r. International AIDS Conference;
2014; Melbourne Australia.
69. Haubrich RH, Riddler SA, DiRienzo AG, et al. Metabolic outcomes in a randomized trial of
nucleoside, nonnucleoside and protease inhibitor-sparing regimens for initial HIV treatment.
AIDS. Jun 1 2009;23(9):1109-1118.
70. Honda M, Ishisaka M, Ishizuka N, Kimura S, Oka S, Japanese Anti HIVQDTSG. Open-label
randomized multicenter selection study of once daily antiretroviral treatment regimen
comparing ritonavir-boosted atazanavir to efavirenz with fixed-dose abacavir and
lamivudine. Internal Medicine. 2011;50(7):699-705.
71. Izzedine H, Hulot JS, Vittecoq D, et al. Long-term renal safety of tenofovir disoproxil
fumarate in antiretroviral-naive HIV-1-infected patients. Data from a double-blind
randomized active-controlled multicentre study. Nephrol Dial Transplant. Apr
2005;20(4):743-746.
241
72. Jemsek JG, Arathoon E, Arlotti M, et al. Body fat and other metabolic effects of atazanavir
and efavirenz, each administered in combination with zidovudine plus lamivudine, in
antiretroviral-naive HIV-infected patients. Clin Infect Dis. Jan 15 2006;42(2):273-280.
73. Johnson M, Moyle G. CASTLE study: 96-week efficacy & safety of ATV/r versus LPV/r in
antiretroviral-naive HIV-1-infected patients. HIV Medicine. April 2009;10:17.
74. Kappelhoff BS, van Leth F, Robinson PA, et al. Are adverse events of nevirapine and efavirenz
related to plasma concentrations? Antivir Ther. 2005;10(4):489-498.
75. Kozal MJ, Lupo S, DeJesus E, et al. A nucleoside- and ritonavir-sparing regimen containing
atazanavir plus raltegravir in antiretroviral treatment-naive HIV-infected patients: SPARTAN
study results. HIV Clin Trials. May-Jun 2012;13(3):119-130.
76. Kumar P, DeJesus E, Huhn G, et al. Evaluation of cardiovascular biomarkers in a randomized
trial of fosamprenavir/ritonavir vs. efavirenz with abacavir/lamivudine in underrepresented,
antiretroviral-naive, HIV-infected patients (SUPPORT): 96-week results. BMC Infectious
Diseases. 07 Jun 2013;13(1).
77. Kumar PN, Salvato P, LaMarca A, et al. A randomized, controlled trial of initial anti-retroviral
therapy with abacavir/lamivudine/zidovudine twice-daily compared to atazanavir once-daily
with lamivudine/zidovudine twice-daily in HIV-infected patients over 48 weeks (ESS100327,
the ACTION Study). AIDS Res Ther. Apr 9 2009;6:3.
78. Landman R, Koulla-Shiro S, Sow PS, et al. Evaluation of four tenofovir-containing regimens as
first-line treatments in Cameroon and Senegal: The ANRS 12115 DAYANA trial. Antivir Ther.
2014;19(1):51-59.
79. Lazzarin A, Orkin C, De Jesus E, et al. Artemis: 192-Week efficacy and safety of once daily
darunavir/ritonavir (DRV/r) versus lopinavir/R (LPV/r) in treatment-naive HIV-1-infected
adults. Infection. March 2011;39:S26-S27.
80. Lennox JL, Dejesus E, Berger DS, et al. Raltegravir versus Efavirenz regimens in treatment-
naive HIV-1-infected patients: 96-week efficacy, durability, subgroup, safety, and metabolic
analyses.[Erratum appears in J Acquir Immune Defic Syndr. 2011 Dec 1;58(4):e120 Note:
Dosage error in article text]. J Acquir Immune Defic Syndr. Sep 2010;55(1):39-48.
81. Lennox JL, DeJesus E, Lazzarin A, et al. Safety and efficacy of raltegravir-based versus
efavirenz-based combination therapy in treatment-naive patients with HIV-1 infection: a
multicentre, double-blind randomised controlled trial. Lancet. Sep 5 2009;374(9692):796-
806.
82. Lennox JL, Landovitz RJ, Ribaudo HJ, et al. Efficacy and tolerability of 3 nonnucleoside
reverse transcriptase inhibitor-sparing antiretroviral regimens for treatment-naive
242
volunteers infected with HIV-1: A Randomized, controlled equivalence trial. Ann Intern Med.
07 Oct 2014;161(7):461-471.
83. Li T, Dai Y, Kuang J, et al. Three generic nevirapine-based antiretroviral treatments in Chinese
HIV/AIDS patients: multicentric observation cohort. PLoS ONE. 2008;3(12):e3918.
84. Maggiolo F, Ripamonti D, Gregis G, et al. Once-a-day therapy for HIV infection: a controlled,
randomized study in antiretroviral-naive HIV-1-infected patients. Antivir Ther. Aug
2003;8(4):339-346.
85. Malan DR, Krantz E, David N, et al. 96-week efficacy and safety of atazanavir, with and
without ritonavir, in a HAART regimen in treatment-naive patients. JIAPAC. Jan-Feb
2010;9(1):34-42.
86. Malan DR, Krantz E, David N, et al. Efficacy and safety of atazanavir, with or without
ritonavir, as part of once-daily highly active antiretroviral therapy regimens in antiretroviral-
naive patients. J Acquir Immune Defic Syndr. Feb 1 2008;47(2):161-167.
87. Malan N, Su J, Mancini M, et al. Gastrointestinal tolerability and quality of life in
antiretroviral-naive HIV-1-infected patients: data from the CASTLE study. AIDS Care. Jun
2010;22(6):677-686.
88. Markowitz M, Nguyen BY, Gotuzzo E, et al. Sustained antiretroviral effect of raltegravir after
96 weeks of combination therapy in treatment-naive patients with HIV-1 infection. J Acquir
Immune Defic Syndr. Nov 1 2009;52(3):350-356.
89. Markowitz M, Nguyen BY, Gotuzzo E, et al. Rapid and durable antiretroviral effect of the HIV-
1 Integrase inhibitor raltegravir as part of combination therapy in treatment-naive patients
with HIV-1 infection: results of a 48-week controlled study. J Acquir Immune Defic Syndr. Oct
1 2007;46(2):125-133.
90. Martinez E, Gonzalez-Cordon A, Ferrer E, et al. Early lipid changes with atazanavir/ritonavir
or darunavir/ritonavir. HIV Medicine. July 2014;15(6):330-338.
91. Martinez E, Gonzalez-Cordon A, Ferrer E, et al. Differential body composition effects of
protease inhibitors recommended for initial treatment of HIV infection: a randomized clinical
trial. Clinical Infectious Diseases. Mar 01 2015;60(5):811-820.
92. Martinez-Picado J, Negredo E, Ruiz L, et al. Alternation of antiretroviral drug regimens for
HIV infection. A randomized, controlled trial. Ann Intern Med. Jul 15 2003;139(2):81-89.
93. Matheron S, Descamps D, Boue F, et al. Triple nucleoside combination
zidovudine/lamivudine/abacavir versus zidovudine/lamivudine/nelfinavir as first-line
therapy in HIV-1-infected adults: a randomized trial. Antivir Ther. Apr 2003;8(2):163-171.
243
94. Matthews GV, Manzini P, Hu Z, et al. Impact of lamivudine on HIV and hepatitis B virus-
related outcomes in HIV/hepatitis B virus individuals in a randomized clinical trial of
antiretroviral therapy in southern Africa. Aids. Sep 10 2011;25(14):1727-1735.
95. Mills A, Crofoot G, Jr., McDonald C, et al. Tenofovir Alafenamide Versus Tenofovir Disoproxil
Fumarate in the First Protease Inhibitor-Based Single-Tablet Regimen for Initial HIV-1
Therapy: A Randomized Phase 2 Study. Journal of Acquired Immune Deficiency Syndromes:
JAIDS. Aug 01 2015;69(4):439-445.
96. Mills AM, Nelson M, Jayaweera D, et al. Once-daily darunavir/ritonavir vs. lopinavir/ritonavir
in treatment-naive, HIV-1-infected patients: 96-week analysis. Aids. Aug 24
2009;23(13):1679-1688.
97. Min S, Roberts J, Almond S, et al. Efficacy and Safety of Dolutegravir (DTG) in Hepatitis (HBV
or HCV) Co-infected Patients: Results From the Phase 3 Program International AIDS
Conference; 2014; Melbourne, Australia.
98. Miro JM, Manzardo C, Ferrer E, et al. Immune Reconstitution in Severely Immunosuppressed
Antiretroviral-Naive HIV-1-Infected Patients Starting Efavirenz, Lopinavir-Ritonavir, or
Atazanavir-Ritonavir Plus Tenofovir/Emtricitabine: Final 48-Week Results (The Advanz-3
Trial). Journal of Acquired Immune Deficiency Syndromes: JAIDS. Jun 01 2015;69(2):206-215.
99. Molina et al. Doravirine is non-inferior to darunavir/r in phase 3 treatment naïve trial at
week 48. Conference of Retroviruses and Opportunistic Infection (CROI); 2017; Seattle WA.
100. Molina JBCM, JvLP, ALP, et al. Once-daily dolutegravir versus darunavir plus ritonavir for
treatment-naive adults with HIV-1 infection (FLAMINGO): 96 week results from a
randomised, open-label, phase 3b study. 2015.
101. Molina JM, Andrade-Villanueva J, Echevarria J, et al. Once-daily atazanavir/ritonavir versus
twice-daily lopinavir/ritonavir, each in combination with tenofovir and emtricitabine, for
management of antiretroviral-naive HIV-1-infected patients: 48 week efficacy and safety
results of the CASTLE study. Lancet. Aug 23 2008;372(9639):646-655.
102. Molina JM, Andrade-Villanueva J, Echevarria J, et al. Once-daily atazanavir/ritonavir
compared with twice-daily lopinavir/ritonavir, each in combination with tenofovir and
emtricitabine, for management of antiretroviral-naive HIV-1-infected patients: 96-week
efficacy and safety results of the CASTLE study. J Acquir Immune Defic Syndr. Mar
2010;53(3):323-332.
103. Molina JM, Cahn P, Grinsztejn B, et al. Rilpivirine versus efavirenz with tenofovir and
emtricitabine in treatment-naive adults infected with HIV-1 (ECHO): a phase 3 randomised
double-blind active-controlled trial. Lancet. Jul 16 2011;378(9787):238-246.

244
104. Moyle GJ, Stellbrink HJ, Compston J, et al. 96-Week results of abacavir/lamivudine versus
tenofovir/emtricitabine, plus efavirenz, in antiretroviral-naive, HIV-1-infected adults: ASSERT
study. Antivir Ther. 2013;18(7):905-913.
105. Munderi P, Walker AS, Kityo C, et al. Nevirapine/zidovudine/lamivudine has superior
immunological and virological responses not reflected in clinical outcomes in a 48-week
randomized comparison with abacavir/zidovudine/lamivudine in HIV-infected Ugandan
adults with low CD4 cell counts. HIV Medicine. May 2010;11(5):334-344.
106. Murphy RL, Sanne I, Cahn P, et al. Dose-ranging, randomized, clinical trial of atazanavir with
lamivudine and stavudine in antiretroviral-naive subjects: 48-week results. AIDS. Dec 5
2003;17(18):2603-2614.
107. Murray JM, Emery S, Kelleher AD, et al. Antiretroviral therapy with the integrase inhibitor
raltegravir alters decay kinetics of HIV, significantly reducing the second phase. AIDS. Nov 12
2007;21(17):2315-2321.
108. Nathan C, Jean-Michel M, Keith H, et al. Long-term efficacy and safety of
elvitegravir/cobicistat/emtricitabine/tenofovir DF versus atazanavir plus ritonavir plus
emtricitabine/tenofovir. J Intern AIDS Soc. May 2014;17:23-24.
109. Ndembi N, Goodall RL, Dunn DT, et al. Viral rebound and emergence of drug resistance in
the absence of viral load testing: A randomized comparison between zidovudine-lamivudine
plus nevirapine and zidovudine-lamivudine plus abacavir. J Infect Dis. January
2010;201(1):106-113.
110. Negredo E, Paredes R, Peraire J, et al. Alternation of antiretroviral drug regimens for HIV
infection. Efficacy, safety and tolerability at week 96 of the Swatch Study. Antivir Ther. Dec
2004;9(6):889-893.
111. Nishijima T, Komatsu H, Teruya K, et al. Once-daily darunavir/ritonavir and
abacavir/lamivudine versus tenofovir/emtricitabine for treatment-naive patients with a
baseline viral load of more than 100 000 copies/ml. AIDS. Mar 13 2013;27(5):839-842.
112. Nishijima T, Takano M, Ishisaka M, et al. Abacavir/lamivudine versus tenofovir/emtricitabine
with atazanavir/ritonavir for treatment-naive Japanese patients with HIV-1 infection: a
randomized multicenter trial. Internal Medicine. 2013;52(7):735-744.
113. Nunez M, Soriano V, Martin-Carbonero L, et al. SENC (Spanish efavirenz vs. nevirapine
comparison) trial: a randomized, open-label study in HIV-infected naive individuals. HIV Clin
Trials. May-Jun 2002;3(3):186-194.
114. Orkin C, Clumeck N, Girard PM, et al. Week 144 efficacy and safety data:
Elvitegravir/Cobicistat/Emtricitabine/Tenofovir DF (Stribild) demonstrates durable efficacy
245
and differentiated safety compared to Atazanavir boosted by Ritonavir plus
Emtricitabine/Tenofovir DF at week 144 in treatment-naive HIV-1-infected patients. HIV
Medicine. April 2014;15:114.
115. Orkin C, DeJesus E, Khanlou H, et al. Final 192-week efficacy and safety of once-daily
darunavir/ritonavir compared with lopinavir/ritonavir in HIV-1-infected treatment-naive
patients in the ARTEMIS trial. HIV Medicine. Jan 2013;14(1):49-59.
116. Orkin C, Rockstroh J, DeJesus E, et al. Week 96 efficacy and safety data:
Elvitegravir/cobicistat/ emtricitabine/tenofovir DF (Quad) compared to atazanavir boosted
by ritonavir plus emtricitabine/tenofovir DF in treatment-naive HIV-1-infected patients. HIV
Medicine. April 2013;14:56.
117. Orkin CM, Squires KE, Molina J, et al. Similar Efficacy and Safety By Subgroup in DRIVE-
AHEAD: DOR/3TC/TDF vs EFV/FTC/TDF. Conference for Retroviruses and Oportunistic
Infections; 2018; Boston MA.
118. Orkin C, Stebbing J, Nelson M, et al. A randomized study comparing a three- and four-drug
HAART regimen in first-line therapy (QUAD study). J Antimicrob Chemother. Feb
2005;55(2):246-251.
119. Ortiz R, Dejesus E, Khanlou H, et al. Efficacy and safety of once-daily darunavir/ritonavir
versus lopinavir/ritonavir in treatment-naive HIV-1-infected patients at week 48. AIDS. Jul 31
2008;22(12):1389-1397.
120. Phanuphak N, Ananworanich J, Teeratakulpisarn N, et al. A 72-week randomized study of the
safety and efficacy of a stavudine to zidovudine switch at 24 weeks compared to zidovudine
or tenofovir disoproxil fumarate when given with lamivudine and nevirapine. Antivir Ther.
2012;17(8):1521-1531.
121. Podzamczer D, Andrade-Villanueva J, Clotet B, et al. Lipid profiles for nevirapine vs.
atazanavir/ritonavir, both combined with tenofovir disoproxil fumarate and emtricitabine
over 48 weeks, in treatment-naive HIV-1-infected patients (the ARTEN study). HIV Medicine.
Jul 2011;12(6):374-382.
122. Podzamczer D, Ferrer E, Consiglio E, et al. A randomized clinical trial comparing nelfinavir or
nevirapine associated to zidovudine/lamivudine in HIV-infected naive patients (the Combine
Study). Antivir Ther. Jun 2002;7(2):81-90.
123. Podzamczer D, Soriano V, Andrade-Villanueva J, et al. Comparison of lipid profile with
nevirapine versus atazanavir/ritonavir, both combined with tenofovir DF and emtricitabine
(TDF/FTC), in treatment-naive HIV-1-infected patients: ARTEN study week-48 results. HIV
Medicine. October 2009;10:26.
246
124. Porteiro N, Walmsley S, Falco V, et al. Fixed-dose combination dolutegravir, abacavir, and
lamivudine versus ritonavir-boosted atazanavir plus tenofovir disoproxil fumarate and
emtricitabine in previously untreated women with HIV-1 infection (ARIA): week 48 results
from a randomised, open-label, non-inferiority, phase 3b study. The Lancet HIV. December
2017;4(12):e536-e546.
125. Post FA, Moyle GJ, Stellbrink HJ, et al. Randomized comparison of renal effects, efficacy, and
safety with once-daily abacavir/lamivudine versus tenofovir/emtricitabine, administered
with efavirenz, in antiretroviral-naive, HIV-1-infected adults: 48-week results from the
ASSERT study. J Acquir Immune Defic Syndr. Sep 2010;55(1):49-57.
126. Pozniak AL, Gallant JE, DeJesus E, et al. Tenofovir disoproxil fumarate, emtricitabine, and
efavirenz versus fixed-dose zidovudine/lamivudine and efavirenz in antiretroviral-naive
patients: virologic, immunologic, and morphologic changes--a 96-week analysis. J Acquir
Immune Defic Syndr. Dec 15 2006;43(5):535-540.
127. Pozniak AL, Morales-Ramirez J, Katabira E, et al. Efficacy and safety of TMC278 in
antiretroviral-naive HIV-1 patients: week 96 results of a phase IIb randomized trial. AIDS. Jan
2 2010;24(1):55-65.
128. Puls RL, Srasuebkul P, Petoumenos K, et al. Efavirenz versus boosted atazanavir or
zidovudine and abacavir in antiretroviral treatment-naive, HIV-infected subjects: week 48
data from the Altair study. Clin Infect Dis. Oct 1 2010;51(7):855-864.
129. Raffi F, Babiker AG, Richert L, et al. Ritonavir-boosted darunavir combined with raltegravir or
tenofovir-emtricitabine in antiretroviral-naive adults infected with HIV-1: 96 week results
from the NEAT001/ANRS143 randomised non-inferiority trial. Lancet. Nov 29
2014;384(9958):1942-1951.
130. Raffi F, Jaeger H, Quiros-Roldan E, et al. Once-daily dolutegravir versus twice-daily raltegravir
in antiretroviral-naive adults with HIV-1 infection (SPRING-2 study): 96 week results from a
randomised, double-blind, non-inferiority trial. Lancet Infect Dis. 2013;13(11):927-935.
131. Raffi F, Rachlis A, Stellbrink HJ, et al. Once-daily dolutegravir versus raltegravir in
antiretroviral-naive adults with HIV-1 infection: 48 week results from the randomised,
double-blind, non-inferiority SPRING-2 study. Lancet. Mar 2 2013;381(9868):735-743.
132. Ratsela A, Polis MA, Dhlomo S, et al. A randomized factorial trial comparing 4 treatment
regimens in treatment-naive HIV-infected persons with AIDS and/or a CD4 cell count <200
Cells/muL in South Africa. J Infect Dis. 15 Nov 2010;202(10):1529-1537.
247
133. Rey D, Hoen B, Chavanet P, et al. High rate of early virological failure with the once-daily
tenofovir/lamivudine/nevirapine combination in naive HIV-1-infected patients. J Antimicrob
Chemother. Feb 2009;63(2):380-388.
134. Reynes J, Lawal A, Pulido F, et al. Examination of noninferiority, safety, and tolerability of
lopinavir/ritonavir and raltegravir compared with lopinavir/ritonavir and tenofovir/
emtricitabine in antiretroviral-naive subjects: the progress study, 48-week results. HIV Clin
Trials. Sep-Oct 2011;12(5):255-267.
135. Reynes J, Trinh R, Pulido F, et al. Lopinavir/ritonavir combined with raltegravir or
tenofovir/emtricitabine in antiretroviral-naive subjects: 96-week results of the PROGRESS
study. AIDS Res Hum Retroviruses. Feb 2013;29(2):256-265.
136. Ribaudo HJ, Kuritzkes DR, Lalama CM, et al. Efavirenz-based regimens in treatment-naive
patients with a range of pretreatment HIV-1 RNA levels and CD4 cell counts. J Infect Dis. Apr
1 2008;197(7):1006-1010.
137. Riddler SA, Haubrich R, DiRienzo AG, et al. Class-sparing regimens for initial treatment of
HIV-1 infection. N Engl J Med. May 15 2008;358(20):2095-2106.
138. Rockstroh J, DeJesus E, Henry K, et al. Elvitegravir/cobicistat/emtricitabine/tenofovir DF
(QUAD) has durable efficacy and differentiated safety compared to atazanavir boosted by
ritonavir plus emtricitabine/tenofovir DF at week 96 in treatment-naive HIV-1-infected
patients. J Intern AIDS Soc. 11 Nov 2012;15:23.
139. Rockstroh J, Teppler H, Zhao J, et al. Safety and efficacy of raltegravir in patients with HIV-1
and hepatitis B and/or C virus coinfection. HIV Med. Feb 2012;13(2):127-131.
140. Rockstroh JK, Dejesus E, Henry K, et al. A randomized, double-blind comparison of
coformulated elvitegravir/ cobicistat/emtricitabine/tenofovir DF vs ritonavir-boosted
atazanavir plus coformulated emtricitabine and tenofovir DF for initial treatment of HIV-1
infection: Analysis of week 96 results. J Acquir Immune Defic Syndr. 15 Apr 2013;62(5):483-
486.
141. Rockstroh JK, DeJesus E, Lennox JL, et al. Durable efficacy and safety of raltegravir versus
efavirenz when combined with tenofovir/emtricitabine in treatment-naive HIV-1-infected
patients: final 5-year results from STARTMRK. J Acquir Immune Defic Syndr. May 1
2013;63(1):77-85.
142. Rockstroh JK, Lennox JL, Dejesus E, et al. Long-term treatment with raltegravir or efavirenz
combined with tenofovir/emtricitabine for treatment-naive human immunodeficiency virus-
1-infected patients: 156-week results from STARTMRK. Clin Infect Dis. Oct 2011;53(8):807-
816.
248
143. Sax PE. Randomized trial of bictegravir or dolutegravir with FTC/TAF for initial HIV therapy.
Conference on Retroviruses and Opportunistic Infections; 2017; Seattle, WA.
144. Sax PE, DeJesus E, Crofoot G, et al. Bictegravir versus dolutegravir, each with emtricitabine
and tenofovir alafenamide, for initial treatment of HIV-1 infection: a randomised, double-
blind, phase 2 trial. The Lancet. HIV. Apr 2017;4(4):e154-e160.
145. Sax PE, DeJesus E, Mills A, et al. Co-formulated elvitegravir, cobicistat, emtricitabine, and
tenofovir versus co-formulated efavirenz, emtricitabine, and tenofovir for initial treatment
of HIV-1 infection: a randomised, double-blind, phase 3 trial, analysis of results after 48
weeks.[Erratum appears in Lancet. 2012 Aug 25;380(9843):730]. Lancet. Jun 30
2012;379(9835):2439-2448.
146. Sax PE, Tierney C, Collier AC, et al. Abacavir/lamivudine versus tenofovir DF/emtricitabine as
part of combination regimens for initial treatment of HIV: final results. J Infect Dis. Oct 15
2011;204(8):1191-1201.
147. Sax PE, Zolopa A, Brar I, et al. Tenofovir alafenamide vs. tenofovir disoproxil fumarate in
single tablet regimens for initial HIV-1 therapy: a randomized phase 2 study. J Acquir
Immune Defic Syndr. Sep 1 2014;67(1):52-58.
148. Sax Pe PAMMLKEDESHJAAWKSJRJGWC. Coformulated bictegravir, emtricitabine, and
tenofovir alafenamide versus dolutegravir with emtricitabine and tenofovir alafenamide, for
initial treatment of HIV-1 infection (GS-US-380-1490): a randomised, double-blind,
multicentre, phase 3, non-inferiority trial. Lancet. 2017(pagination).
149. Sax Pe WDYMTPFDESMPATMPDMJMOSK. Tenofovir alafenamide versus tenofovir disoproxil
fumarate, coformulated with elvitegravir, cobicistat, and emtricitabine, for initial treatment
of HIV-1 infection: two randomised, double-blind, phase 3, non-inferiority trials. Lancet
(London, England).385(9987):2606-2615.
150. Sierra-Madero J, Villasis-Keever A, Mendez P, et al. Prospective, randomized, open label trial
of Efavirenz vs Lopinavir/Ritonavir in HIV+ treatment-naive subjects with CD4+<200
cell/mm3 in Mexico. J Acquir Immune Defic Syndr. Apr 2010;53(5):582-588.
151. Smith KY, Patel P, Fine D, et al. Randomized, double-blind, placebo-matched, multicenter
trial of abacavir/lamivudine or tenofovir/emtricitabine with lopinavir/ritonavir for initial HIV
treatment. AIDS. Jul 31 2009;23(12):1547-1556.
152. Smith KY, Weinberg WG, DeJesus E, et al. Fosamprenavir or atazanavir once daily boosted
with ritonavir 100 mg, plus tenofovir/emtricitabine, for the initial treatment of HIV infection:
48-week results of ALERT. AIDS Res Ther 2008;5(5).
249
153. Soriano V, Arasteh K, Migrone H, et al. Nevirapine versus atazanavir/ritonavir, each
combined with tenofovir disoproxil fumarate/emtricitabine, in antiretroviral-naive HIV-1
patients: the ARTEN Trial. Antivir Ther. 2011;16(3):339-348.
154. Squires K, Kityo C, Hodder S, et al. Integrase inhibitor versus protease inhibitor based
regimen for HIV-1 infected women (WAVES): a randomised, controlled, double-blind, phase
3 study. The Lancet. HIV. Sep 2016;3(9):e410-e420.
155. Squires K, Lazzarin A, Gatell JM, et al. Comparison of once-daily atazanavir with efavirenz,
each in combination with fixed-dose zidovudine and lamivudine, as initial therapy for
patients infected with HIV. J Acquir Immune Defic Syndr. Aug 15 2004;36(5):1011-1019.
156. Squires KE, Gulick R, Tebas P, et al. A comparison of stavudine plus lamivudine versus
zidovudine plus lamivudine in combination with indinavir in antiretroviral naive individuals
with HIV infection: selection of thymidine analog regimen therapy (START I). AIDS. Jul
2000;14(11):1591-1600.
157. Staszewski S, Keiser P, Montaner J, et al. Abacavir-lamivudine-zidovudine vs indinavir-
lamivudine-zidovudine in antiretroviral-naive HIV-infected adults: A randomized equivalence
trial.[Erratum appears in JAMA 2001 Jun 13;285(22):2858]. JAMA. Mar 7 2001;285(9):1155-
1163.
158. Stellbrink HJ, Orkin C, Arribas JR, et al. Comparison of changes in bone density and turnover
with abacavir-lamivudine versus tenofovir-emtricitabine in HIV-infected adults: 48-week
results from the ASSERT study. Clin Infect Dis. Oct 15 2010;51(8):963-972.
159. Stellbrink HJ, Reynes J, Lazzarin A, et al. Dolutegravir in antiretroviral-naive adults with HIV-
1: 96-week results from a randomized dose-ranging study. AIDS. Jul 17 2013;27(11):1771-
1778.
160. Termini R, Lazzarin A, Orani A, Vanden Abeele C, Lavreys L. Use of once-daily darunavir/r
(800/100mg) in treatment-naive patients co-infected with hepatitis b and/or c. Data from
the artemis study. Vol 372009.
161. Torti C, Quiros-Roldon E, Regazzi M, et al. Early virological failure after tenofovir +
didanosine + efavirenz combination in HIV-positive patients upon starting antiretroviral
therapy. Antivir Ther. 2005;10(4):505-513.
162. van Leeuwen R, Katlama C, Murphy RL, et al. A randomized trial to study first-line
combination therapy with or without a protease inhibitor in HIV-1-infected patients. AIDS.
May 2 2003;17(7):987-999.
163. van Leth F, Phanuphak P, Ruxrungtham K, et al. Comparison of first-line antiretroviral
therapy with regimens including nevirapine, efavirenz, or both drugs, plus stavudine and

250
lamivudine: a randomised open-label trial, the 2NN Study. Lancet. Apr 17
2004;363(9417):1253-1263.
164. van Leth F, Phanuphak P, Stroes E, et al. Nevirapine and efavirenz elicit different changes in
lipid profiles in antiretroviral-therapy-naive patients infected with HIV-1. PLoS Med. Oct
2004;1(1):e19.
165. van Lunzen J, Antinori A, Cohen CJ, et al. Rilpivirine vs. efavirenz-based single-tablet
regimens in treatment-naive adults: week 96 efficacy and safety from a randomized phase
3b study. AIDS. Jan 2016;30(2):251-259.
166. van Lunzen J, Maggiolo F, Arribas JR, et al. Once daily dolutegravir (S/GSK1349572) in
combination therapy in antiretroviral-naive adults with HIV: planned interim 48 week results
from SPRING-1, a dose-ranging, randomised, phase 2b trial. Lancet Infect Dis. Feb
2012;12(2):111-118.
167. Vibhagool A, Cahn P, Schechter M, et al. Triple nucleoside treatment with abacavir plus the
lamivudine/zidovudine combination tablet (COM) compared to indinavir/COM in
antiretroviral therapy-naive adults: results of a 48-week open-label, equivalence trial
(CNA3014). Curr Med Res Opin. Jul 2004;20(7):1103-1114.
168. Vrouenraets SM, Wit FW, Fernandez Garcia E, et al. Randomized comparison of metabolic
and renal effects of saquinavir/r or atazanavir/r plus tenofovir/emtricitabine in treatment-
naive HIV-1-infected patients. HIV Medicine. Nov 2011;12(10):620-631.
169. Walmsley S, Avihingsanon A, Slim J, et al. Gemini: a noninferiority study of
saquinavir/ritonavir versus lopinavir/ritonavir as initial HIV-1 therapy in adults. J Acquir
Immune Defic Syndr. Apr 1 2009;50(4):367-374.
170. Walmsley S, Baumgarten A, Berenguer J, et al. Brief Report: Dolutegravir Plus
Abacavir/Lamivudine for the Treatment of HIV-1 Infection in Antiretroviral Therapy-Naive
Patients: Week 96 and Week 144 Results From the SINGLE Randomized Clinical
Trial.[Erratum appears in J Acquir Immune Defic Syndr. 2016 Jan 1;71(1):e33]. Journal of
Acquired Immune Deficiency Syndromes: JAIDS. Dec 15 2015;70(5):515-519.
171. Walmsley S, Berenguer J, Khuong-Josses MA, et al. Dolutegravir Regimen Statistically
Superior to Efavirenz/Tenofovir/Emtricitabine: 96-Week Results From the SINGLE Study
(ING114467). Conference on Retrovirues and Opportunistic Infections; 2014; Boston, USA.
172. Walmsley S, Berenguer J, Khuong-Josses MA, et al. Dolutegravir Regimen Statistically
Superior To Tenofovir/Emtricitabine/Efavirenz: 96-Wk Data. Topics in Antiviral
Medicine.Conference:21st Conference on Retroviruses and Opportunistic Infections, CROI
2014 (2021)United States. Conference Start: 20140303 Conference End: 20140306.

251
Conference Publication: (20140568 pages). 20140322 (e-20140301) (pp 20140261-
20140262).
173. Walmsley S, Bernstein B, King M, et al. Lopinavir-ritonavir versus nelfinavir for the initial
treatment of HIV infection. N Engl J Med. Jun 27 2002;346(26):2039-2046.
174. Wester CW, Thomas AM, Bussmann H, et al. Non-nucleoside reverse transcriptase inhibitor
outcomes among combination antiretroviral therapy-treated adults in Botswana. AIDS. Jan
2010;24 Suppl 1:S27-36.
175. Wilkin A, Pozniak AL, Morales-Ramirez J, et al. Long-term efficacy, safety, and tolerability of
rilpivirine (RPV, TMC278) in HIV type 1-infected antiretroviral-naive patients: week 192
results from a phase IIb randomized trial. AIDS Res Hum Retroviruses. May 2012;28(5):437-
446.
176. Wohl D, Oka S, Clumeck N, et al. Brief Report: A Randomized, Double-Blind Comparison of
Tenofovir Alafenamide Versus Tenofovir Disoproxil Fumarate, Each Coformulated With
Elvitegravir, Cobicistat, and Emtricitabine for Initial HIV-1 Treatment: Week 96 Results.
Journal of Acquired Immune Deficiency Syndromes: JAIDS. May 01 2016;72(1):58-64.
177. Wohl D PATMDEPDMJMCGCCMHMS. Tenofovir alafenamide (TAF) in a single-tablet regimen
in initial HIV-1 therapy. Topics in antiviral medicine.Vol.23, pp.47-8, CONFERENCE
START:2015 Feb 2023 CONFERENCE END: 2015 Feb 2026.
178. Wohl DA, Cohen C, Gallant JE, et al. A Randomized, Double-Blind Comparison of Single-
Tablet Regimen Elvitegravir/Cobicistat/Emtricitabine/Tenofovir DF Versus Single-Tablet
Regimen Efavirenz/Emtricitabine/Tenofovir DF for Initial Treatment of HIV-1 Infection:
Analysis of Week 144 Results. J Acquir Immune Defic Syndr. 2014;65(3):e118-e121.
179. Zhang F, Heaton R, Wu H, et al. Randomized clinical trial of antiretroviral therapy for
prevention of HAND. Topics in Antiviral Medicine. July 2015;23 (E-1):25.
180. Zolopa A, Sax PE, DeJesus E, et al. A randomized, double-blind comparison of co-formulated
elvitegravir/cobicistat/emtricitabine/tenofovir DF versus efavirenz/emtricitabine/tenofovir
DF for initial treatment of HIV-1 infection: Analysis of week 96 results. J Acquir Immune Defic
Syndr. 2013.
181. UNAIDS. New high-quality antiretroviral therapy to be launched in South Africa, Kenya and
over 90 low-and middle-income countries at reduced price. 2017.
182. Kenedi CA, Goforth HW. A systematic review of the psychiatric side-effects of efavirenz. AIDS
Behav. Nov 2011;15(8):1803-1818.
183. Organization WH. Potential safety issue affecting women living with HIV using dolutegravir
at the time of conception. 2018;

252
http://www.who.int/medicines/publications/drugalerts/Statement_on_DTG_18May_2018fi
nal.pdf?ua=1. Accessed 18 May 2018.
184. Grinsztejn B, De Castro N, Arnold V, et al. Raltegravir for the treatment of patients co-
infected with HIV and tuberculosis (ANRS 12 180 Reflate TB): A multicentre, phase 2, non-
comparative, open-label, randomised trial. The Lancet Infectious Diseases. June
2014;14(6):459-467.
185. Lortholary O, Roussillon C, Boucherie C, et al. Tenofovir DF/emtricitabine and efavirenz
combination therapy for HIV infection in patients treated for tuberculosis: the ANRS 129
BKVIR trial. Journal of Antimicrobial Chemotherapy. Mar 2016;71(3):783-793.
186. Bonnet M, Bhatt N, Baudin E, et al. Nevirapine versus efavirenz for patients co-infected with
HIV and tuberculosis: a randomised non-inferiority trial. Lancet Infect Dis. Apr
2013;13(4):303-312.
187. Habtewold A, Makonnen E, Amogne W, et al. Is there a need to increase the dose of
efavirenz during concomitant rifampicin-based antituberculosis therapy in sub-Saharan
Africa? The HIV-TB pharmagene study. Pharmacogenomics. 2015;16(10):1047-1064.
188. Dooley K, Kaplan R, Mwelase N, et al. Safety and efficacy of dolutegravir-based ART in
TB/HIV coinfected adults at week 24. Conference on Retroviruses and Opportunistic
Infections (CROI); 2018; Boston MA.
189. Manosuthi W, Sungkanuparph S, Tantanathip P, et al. A randomized trial comparing plasma
drug concentrations and efficacies between 2 nonnucleoside reverse-transcriptase inhibitor-
based regimens in HIV-infected patients receiving rifampicin: the N2R Study. Clin Infect Dis.
Jun 15 2009;48(12):1752-1759.
190. Mankhatitham W, Lueangniyomkul A, Manosuthi W. Hepatotoxicity in patients co-infected
with tuberculosis and HIV-1 while receiving non-nucleoside reverse transcriptase inhibitor-
based antiretroviral therapy and rifampicin-containing anti-tuberculosis regimen. Southeast
Asian J Trop Med Public Health. 2011;42(3):651-658.
191. Sinha S, Raghunandan P, Chandrashekhar R, et al. Nevirapine versus efavirenz-based
antiretroviral therapy regimens in antiretroviral-naive patients with HIV and tuberculosis
infections in India: a pilot study. BMC infectious diseases. 2013;13:482.
192. Sinha S GKTSDSRSPRM. Nevirapine- versus Efavirenz-based antiretroviral therapy regimens
in antiretroviral-naive patients with HIV and Tuberculosis infections in India: a multi-centre
study. BMC infectious diseases. 2017;17(1).

253
193. Swaminathan S, Padmapriyadarsini C, Venkatesan P, et al. Efficacy and safety of once-daily
nevirapine- or efavirenz-based antiretroviral therapy in HIV-associated tuberculosis: a
randomized clinical trial. Clinical Infectious Diseases. Oct 2011;53(7):716-724.
194. Amogne W, Aderaye G, Habtewold A, et al. Efficacy and Safety of Antiretroviral Therapy
Initiated One Week after Tuberculosis Therapy in Patients with CD4 Counts < 200 Cells/muL:
TB-HAART Study, a Randomized Clinical Trial. PLoS ONE [Electronic Resource].
2015;10(5):e0122587.
195. Kekitiinwa A, Szubert AJ, Spyer M, et al. Virologic Response to First-line Efavirenz-or
Nevirapine-based Antiretroviral Therapy in HIV-infected African Children. Pediatric Infectious
Disease Journal. 01 Jun 2017;36(6):588-594.
196. Rudy Bj KBGWCSKBJLSWCMAAEPPGHSG. Immune reconstitution but persistent activation
after 48 weeks of antiretroviral therapy in youth with pre-therapy CD4 >350 in ATN 061.
Journal of acquired immune deficiency syndromes. 2015;69(1 // NIAID):52-60.
197. Bienczak A, Denti P, Cook A, et al. Plasma efavirenz exposure, sex, and age predict virological
response in HIV-infected African children. Journal of Acquired Immune Deficiency
Syndromes. 01 Oct 2016;73(2):161-168.
198. Porter DP, Bennett SR, Quirk E, Miller MD, White KL. Lack of emergent resistance in HIV-1-
infected adolescents on elvitegravir-based STRs. Topics in Antiviral Medicine. July 2015;23 (E-
1):438.
199. Porter DP, Bennett SR, Quirk E, Miller MD, White KL, Robinson C. Lack of emergent
resistance in HIV-1-infected adolescents on elvitegravir-based single-tablet regimens. HIV
Medicine. April 2015;2):14-15.
200. Gaur A, Kizito H, Chakraborty R, et al. Safety and efficacy of E/C/F/TAF in HIV-1 infected
treatment-naive adolescents. Topics in Antiviral Medicine. June 2016;24 (E-1):343.
201. Batra J, Kizito H, Gaur A, et al. Week 24 data from a phase 3 clinical trial of E/C/F/TAF in HIV-
positive adolescents. Journal of the International AIDS Society. April 2015;2):22.
202. Kizito H, Gaur A, Prasitsuebsai W, et al. Week-24 data from a phase 3 clinical trial of
E/C/F/TAF in HIV-infected adolescents. Topics in Antiviral Medicine. July 2015;23 (E-1):438-
439.
203. Shao Y BSRCAQELEGAPWKKWT. Week 24 data from a Phase 3 clinical trial of E/C/F/TAF in
HIV-infected adolescents. HIV medicine. Annual Conference of the British HIV Association,
BHIVA 2015 Brighton United Kingdom;Vol.16, pp.15, CONFERENCE START:2015 Apr 2021
CONFERENCE END: 2015 Apr 2024.

254
204. Pinto JA, Capparelli EV, Warshaw M, et al. A Phase II/III Trial of Lopinavir/Ritonavir Dosed
According to the WHO Pediatric Weight Band Dosing Guidelines. Pediatr Infect Dis J. Feb
2018;37(2):e29-e35.
205. IMPAACT Network. Phase I/II, Multi-Center, Open-Label Pharmacokinetic, Safety, Tolerability
and Antiviral Activity of Dolutegravir (GSK1349572), a Novel Integrase Inhibitor, in
Combination Regimens in HIV-1 Infected Infants, Children and Adolescents.
206. Amani-Bosse C DDLMKA-FMCMDSEABMRCNGSYC. Virological response and resistances over
12 months among HIV-infected children less than two years receiving first-line
lopinavir/ritonavir-based antiretroviral therapy in Cote D'Ivoire and Burkina Faso: the
MONOD ANRS 12206 cohort. Journal of the international AIDS society. 2017;20(1).
207. Pressiat C M-AVYCTJMDDLA-FMBSEFYDLGMK. Suboptimal cotrimoxazole prophylactic
concentrations in HIV-infected children according to the WHO guidelines. British journal of
clinical pharmacology. 2017;83(12):2729-2740.
208. Lombaard J, Bunupuradah T, Flynn P, et al. Week 48 safety and efficacy of a rilpivirine
(TMC278)-based regimen in HIV-infected treatment-naive adolescents: PAINT phase II trial.
Journal of the International AIDS Society. 2015;4):9.
209. Gopalan BP, Mehta K, D'Souza R R, et al. Sub-therapeutic nevirapine concentration during
antiretroviral treatment initiation among children living with HIV: Implications for
therapeutic drug monitoring. PLoS ONE. August 2017;12 (8) (no pagination)(e0183080).
210. Shiau S, Strehlau R, Technau KG, et al. Early age at start of antiretroviral therapy associated
with better virologic control after initial suppression in HIV-infected infants. Aids. 28 Jan
2017;31(3):355-364.
211. Jamieson DJ, Chasela CS, Hudgens MG, et al. Maternal and infant antiretroviral regimens to
prevent postnatal HIV-1 transmission: 48-week follow-up of the BAN randomised controlled
trial. Lancet. Jun 30 2012;379(9835):2449-2458.
212. Gibb DM, Kizito H, Russell EC, et al. Pregnancy and infant outcomes among HIV-infected
women taking long-term ART with and without tenofovir in the DART trial. PLoS Med.
2012;9(5):e1001217.
213. Waitt CJ, Walimbwa SI, Orrell C, et al. DolPHIN-1: Dolutegravir vs Efavirenz when Initiating
Treatment in Late Pregnancy – An Interim Analysis. Conference on Retroviruses and
Opportunistic Infections; 2018; Boston, USA.
214. Stek A, Best BM, Capparelli E, et al. Pharmacokinetics of increased dose darunavir during late
pregnancy and postpartum. Topics in Antiviral Medicine. June 2016;24 (E-1):324.

255
215. Mulligan N, Best BM, Wang J, et al. Dolutegravir pharmacokinetics in pregnant and
postpartum women living with HIV. Aids. Mar 27 2018;32(6):729-737.
216. Lamorde M, Wang X, Neary M, et al. Pharmacokinetics, pharmacodynamics and
pharmacogenomics of efavirenz 400mg once-daily during pregnancy and
postpartum. IAS Conference on HIV Science; 2017; Paris, France.
217. Shapiro RL, Hughes MD, Ogwu A, et al. Antiretroviral regimens in pregnancy and breast-
feeding in Botswana. N Engl J Med. Jun 17 2010;362(24):2282-2294.
218. Shapiro RL, Kitch D, Ogwu A, et al. HIV transmission and 24-month survival in a randomized
trial of HAART to prevent MTCT during pregnancy and breastfeeding in Botswana. Aids. Jul
31 2013;27(12):1911-1920.
219. Ngoma MS, Misir A, Mutale W, et al. Efficacy of WHO recommendation for continued
breastfeeding and maternal cART for prevention of perinatal and postnatal HIV transmission
in Zambia. Journal of the International AIDS Society. 2015;18:19352.
220. Fowler MG, Qin M, Fiscus SA, et al. Benefits and Risks of Antiretroviral Therapy for Perinatal
HIV Prevention. New England Journal of Medicine. 11 03 2016;375(18):1726-1737.
221. Fowler MG, Qin M, Fiscus SA, et al. PROMISE: Efficacy and safety of 2 strategies to prevent
perinatal HIV transmission. Topics in Antiviral Medicine. July 2015;23 (E-1):13-14.
222. Cohan D, Natureeba P, Koss CA, et al. Efficacy and safety of lopinavir/ritonavir versus
efavirenz-based antiretroviral therapy in HIV-infected pregnant Ugandan women. Aids. 14
Jan 2015;29(2):183-191.
223. Koss CA, Natureeba P, Mwesigwa J, et al. Hair concentrations of antiretrovirals predict viral
suppression in HIV-infected pregnant and breastfeeding Ugandan women. Aids. 24 Apr
2015;29(7):825-830.
224. Cohan D, Natureeba P, Plenty A, et al. Efficacy and safety of LPV/r versus EFV in HIV+
pregnant and breast-feeding Ugandan women. Conference on Retroviruses and
Opportunistic Infections; 2014; Boston, USA.
225. Koss CA, Natureeba P, Plenty A, et al. Risk factors for preterm birth among HIV-infected
pregnant Ugandan women randomized to lopinavir/ritonavir- or efavirenz-based
antiretroviral therapy. J Acquir Immune Defic Syndr. Oct 1 2014;67(2):128-135.
226. Natureeba P, Ades V, Luwedde F, et al. Lopinavir/ritonavir-based antiretroviral treatment
(ART) versus efavirenz-based ART for the prevention of malaria among HIV-infected
pregnant women. J Infect Dis. Dec 15 2014;210(12):1938-1945.
227. Samuel M, Bradshaw D, Perry M, et al. Antenatal atazanavir: a retrospective analysis of
pregnancies exposed to atazanavir. Infect Dis Obstet Gynecol. 2014;2014:961375.
256
228. Giuliano M, Pirillo MF, Liotta G, et al. High CMV IgG antibody levels are associated to a lower
CD4+ RESPONSE to antiretroviral therapy in HIV-infected women. J Clin Virol. Nov
2017;96:17-19.
229. Palombi L, Galluzzo CM, Andreotti M, et al. Drug resistance mutations 18 months after
discontinuation of nevirapine-based ART for prevention of mother-to-child transmission of
HIV in Malawi. Journal of Antimicrobial Chemotherapy. October 2015;70(10):2881-2884.
230. Andreotti M, Pirillo MF, Liotta G, et al. The impact of HBV or HCV infection in a cohort of HIV-
infected pregnant women receiving a nevirapine-based antiretroviral regimen in Malawi.
BMC Infect Dis. Apr 4 2014;14:180.
231. Palombi L, Pirillo MF, Andreotti M, et al. Antiretroviral prophylaxis for breastfeeding
transmission in Malawi: drug concentrations, virological efficacy and safety. Antivir Ther.
2012;17(8):1511-1519.
232. Giuliano M, Andreotti M, Liotta G, et al. Maternal antiretroviral therapy for the prevention
of mother-to-child transmission of HIV in Malawi: maternal and infant outcomes two years
after delivery. PLoS One. 2013;8(7):e68950.
233. Thorne C, Favarato G, Peters G, et al. Pregnancy and neonatal outcomes following prenatal
exposure to dolutegravir (Slides). IAS Conference on HIV Science; 2017; Paris, France.
234. Thorne C, Favarato G, Peters G, et al. Pregnancy and neonatal outcomes following prenatal
exposure to dolutegravir (Poster). IAS Conference on HIV Science; 2017; Paris, France.
235. Bollen P. A comparison of the pharmacokinetics of dolutegravir in pregnancy and
postpartum. 18th International Workshop on Clinical Pharmacology of Antiviral Therapy;
2017; Chicago, USA.
236. Dooley KE, Denti P, Martinson N, et al. Pharmacokinetics of efavirenz and treatment of HIV-1
among pregnant women with and without tuberculosis coinfection. Journal of Infectious
Diseases. 15 Jan 2015;211(2):197-205.
237. Bussmann H, Wester CW, Wester CN, et al. Pregnancy rates and birth outcomes among
women on efavirenz-containing highly active antiretroviral therapy in Botswana. J Acquir
Immune Defic Syndr. Jul 1 2007;45(3):269-273.
238. Zash R, Jacobson D, Diseko M, et al. The comparative safety of dolutegravir or efavirenz
initiated during pregnancy in Botswana. The Lancet Global Health.
239. Zash R, Jacobson D, Diseko M, et al. DTG/TDF/FTC Started in Pregnancy is as Safe as
EFV/TDF/FTC in Nationwide Birth Outcomes Surveillance in Botswana. IAS Conference on
HIV Science; 2017; Paris, France.

257