Weathering and evolution of soils formed on granitic, glacial deposits: results from chronosequences...
29
Ž . Catena 45 2001 19–47 www.elsevier.comrlocatercatena Weathering and evolution of soils formed on granitic, glacial deposits: results from chronosequences of Swiss alpine environments M. Egli a, ) , P. Fitze a , A. Mirabella b a Department of Physical Geography, UniÕersity of Zurich, Winterthurerstrasse 190, 8057 Zurich, Switzerland ¨ ¨ b Istituto Sperimentale per lo Studio e la Difesa del Suolo, Piazza D’Azeglio 30, 50121 Firenze, Italy Received 7 April 2000; received in revised form 13 December 2000; accepted 13 February 2001 Abstract Two soil chronosequences of mountainous ecosystems in Switzerland served as the basis to calculate the accumulation of soil organic matter, transformation of pedogenic Fe and Al and net Ž . losses of the main elements Ca, Mg, K, Na, Fe, Al, Mn and Si by means of mass-balance calculations. Elemental losses due to deglaciation and exposure to the weathering environment were calculated. These mass balance calculations indicate that extensive mineral weathering Ž resulted in significant leaching losses of Si, major base cations, and Al particularly from the . upper horizons . The losses are especially pronounced in the early stages of soil formation. In most cases, the exponential decay model incorporating an asymptotic or logarithmic regression model seems to provide a good description of weathering. The greatest changes in the soil chemistry of these alpine soils on granitic host material occurred within the first 3000–4000 years of soil development. Later, the weathering rates decreased rapidly and the overall depletion of w x w x elements nearly reached an asymptote. We also found that the mean ratio of Al Fe r Al Fe of t d d t the fine earth of the A, E and B horizons is closely linked to the duration of soil development. A very rapid decrease of this ratio also occurred at the beginning of soil evolution in order to reach asymptotic values after about 3000 years. Consequently, this ratio could be a good indicator of the age of alpine soils. Furthermore, there is a close relationship between the mass of organic C or N in the whole profile and the soil age: the older the soil the higher the corresponding mass per unit area. The chronofunctions presented give a first attempt of the chemical soil evolution in the Alps. However, only little data has been available up until now regarding alpine soils, and this fact ) Corresponding author. Tel.: q 41-1-6355-114; fax: q 41-1-6356-848. Ž . E-mail address: [email protected] M. Egli . 0341-8162r01r$ - see front matter q 2001 Elsevier Science B.V. All rights reserved. Ž . PII: S0341-8162 01 00138-2
Transcript of Weathering and evolution of soils formed on granitic, glacial deposits: results from chronosequences...
Ž .Catena 45 2001 19–47www.elsevier.comrlocatercatena
Weathering and evolution of soils formed ongranitic, glacial deposits: results from
chronosequences of Swiss alpine environments
M. Egli a,), P. Fitze a, A. Mirabella b
a Department of Physical Geography, UniÕersity of Zurich, Winterthurerstrasse 190, 8057 Zurich, Switzerland¨ ¨b Istituto Sperimentale per lo Studio e la Difesa del Suolo, Piazza D’Azeglio 30, 50121 Firenze, Italy
Received 7 April 2000; received in revised form 13 December 2000; accepted 13 February 2001
Abstract
Two soil chronosequences of mountainous ecosystems in Switzerland served as the basis tocalculate the accumulation of soil organic matter, transformation of pedogenic Fe and Al and net
Ž .losses of the main elements Ca, Mg, K, Na, Fe, Al, Mn and Si by means of mass-balancecalculations. Elemental losses due to deglaciation and exposure to the weathering environmentwere calculated. These mass balance calculations indicate that extensive mineral weathering
Žresulted in significant leaching losses of Si, major base cations, and Al particularly from the.upper horizons . The losses are especially pronounced in the early stages of soil formation. In
most cases, the exponential decay model incorporating an asymptotic or logarithmic regressionmodel seems to provide a good description of weathering. The greatest changes in the soilchemistry of these alpine soils on granitic host material occurred within the first 3000–4000 yearsof soil development. Later, the weathering rates decreased rapidly and the overall depletion of
w x w xelements nearly reached an asymptote. We also found that the mean ratio of Al Fe r Al Fe oft d d t
the fine earth of the A, E and B horizons is closely linked to the duration of soil development. Avery rapid decrease of this ratio also occurred at the beginning of soil evolution in order to reachasymptotic values after about 3000 years. Consequently, this ratio could be a good indicator of theage of alpine soils. Furthermore, there is a close relationship between the mass of organic C or Nin the whole profile and the soil age: the older the soil the higher the corresponding mass per unitarea. The chronofunctions presented give a first attempt of the chemical soil evolution in the Alps.However, only little data has been available up until now regarding alpine soils, and this fact
) Corresponding author. Tel.: q41-1-6355-114; fax: q41-1-6356-848.Ž .E-mail address: [email protected] M. Egli .
0341-8162r01r$ - see front matter q2001 Elsevier Science B.V. All rights reserved.Ž .PII: S0341-8162 01 00138-2
( )M. Egli et al.rCatena 45 2001 19–4720
inhibits a more detailed observation of the changes that have occurred over a period of 2000–8000years of soil formation under similar climatic conditions. q 2001 Elsevier Science B.V. All rightsreserved.
Keywords: Weathering; Chronosequences; Soil forming; Alpine environment
1. Introduction
Ž .Jenny 1941, 1980 defined any dependent soil property as a function of a number ofindependent soil properties or state factors such as the parent material, the climate, thetopography, the age of the soil and the role of organisms. Soil sequences can beclassified based on a single variable if other conditions affecting soil development aresubordinate or relatively constant. Commonly, the following sequences are differenti-
Ž . Žated: lithosequences differences in parent mineralogy , climosequences differences in. Žprecipitation andror temperature , toposequences lateral variations in slope and topog-
. Ž .raphy , chronosequences effect of time on chemical weathering , and biosequencesŽ .variation in biota and its influence on chemical weathering . Soil sequences may giveinsight into the influence of a state factor on the weathering rates. Knowledge ofchemical weathering is fundamental to the successful analysis of environmental issuessuch as the influence of acid deposition on soils, biomass production in forestry andagriculture systems, global warming or the level of atmospheric CO over geological2
Ž . Ž .time scales e.g., Berner, 1995 . As also outlined by Theurillat et al. 1998 , scientificunderstanding of subalpine and alpine soils in the European Alps is limited. InSwitzerland, few studies have been published on the formation and evolution of such
Ž .soils with respect to the chemistry and soil mineralogy e.g., Righi et al., 1999 . Weinvestigated two soil chronosequences of alpine environments with similar geological
Žconditions and climates. The investigation sites are situated near Gletsch proglacial area. Žof the Rhone glacier, canton of Valais and in the Upper Lauterbrunnen Valley canton
.of Berne .
2. Materials and methods
2.1. Theoretical background
Usually, weathering rates of such soils are derived by means of concentration profilesof immobile elements such as Ti or Zr. Long-term weathering rates are determined bycomparing the chemistry and mineralogy of soil profiles of known age and the fresh
Ž .source rock composition April et al., 1986; Eggenberger, 1995 . Such calculations arebased on enrichmentrdepletion factors determined using immobile element contents.This method has been applied to several investigation areas on silicate host materialŽe.g., Langley-Turnbaugh and Bockheim, 1998; Nieuwenhuyse and van Breemen, 1997;
.Eggenberger, 1995; White, 1995 . This procedure has recently been revised by Egli andŽ .Fitze 2000 .
( )M. Egli et al.rCatena 45 2001 19–47 21
Two important assumptions concerning elemental components are required in theŽ .mass balance calculations using immobile elements White, 1995 . The first involves the
determination of the composition of the parent material. For soils developed in sites onbedrock, the potential errors are confined to local heterogeneities in bedrock composi-tion. The estimate of the initial composition becomes more difficult when soils aredeveloped on sedimentary parent materials such as alluvial terraces or loess deposits.For such deposits, the least weathered horizon in the soil profile is assumed to be theparent material. The second requirement is that weatherable elements must be ratioedagainst an inert component i, present in both the parent material and the soil. Ti and Zrare considered to be almost immobile. Some investigations point out, however, that
Žunder certain circumstances these metals may also be slightly weathered Nieuwenhuyse.and van Breemen, 1997; Cornu et al., 1999 .
The derivation of mass-balance equations and their applications to pedologic pro-Ž . Ž .cesses are discussed in detail by Brimhall and Dietrich 1987 , Brimhall et al. 1991 ,
Ž . Ž . Ž .Chadwick et al. 1990 , Merritts et al. 1992 and Egli and Fitze 2000 . Mass-balancecalculations and especially the calculation of time-averaged weathering rates of soilprofiles or soil horizons are usually made by the following equations.
Volumetric changes that occur during pedogenesis are determined by adopting theŽ .classical definition of strain, ´ Brimhall and Dietrich, 1987i,w
D zw´ s y1 1Ž .i ,w
D z
Ž .with D z as the columnar height m of a representative elementary volume of protoreŽ .‘p’ and D z is the weathered equivalent height m ‘w’.w
The calculation of the open-system mass transport function t is defined byj,wŽ .Chadwick et al. 1990
r Cw j ,wt s ´ q1 y1 2Ž . Ž .j ,w i ,wž /r Cp j ,p
Ž .with C as the concentration of element j in protolith kgrt , C as the concentrationj,p j,wŽ .of element j in the weathered product kgrt , and with r and r being the bulkp w
Ž 3.density trm of the protore and weathered soil, respectively. With n soil layers theŽ .calculation of changes in mass of element j is given by Egli and Fitze, 2000
n 1m s C r t D z . 3Ž .Ýj ,flux Ž z . j ,p p j ,w ww ž /´ q1i ,was1
2.2. Soil material
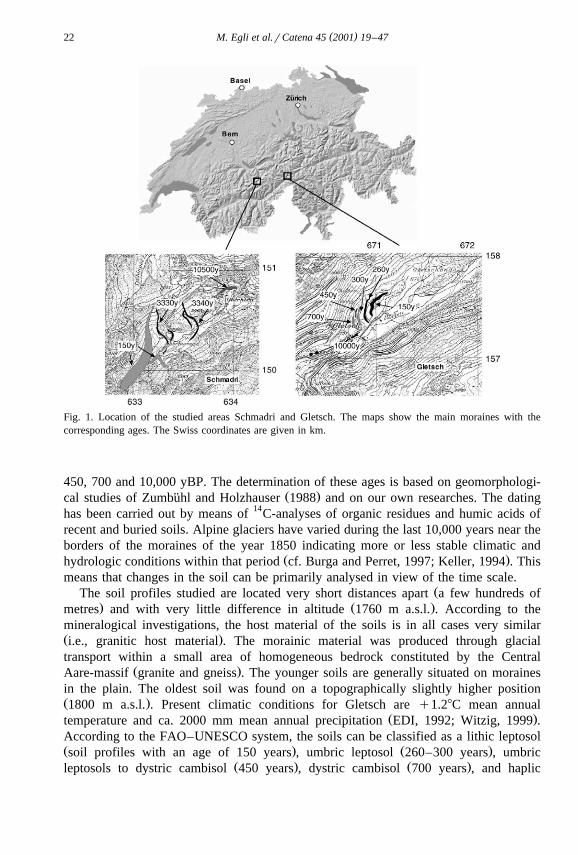
Ž .A sequence of six soil profiles in the proglacial area of Gletsch Fig. 1 and withinŽ .the border of the Egesen glacial stage was investigated. In Gletsch Valais , different
glacial stages can be distinguished which allow, therefore, a clearly datable start ofgenesis to be assigned to the studied soils. These have the following ages: 150, 260, 300,
( )M. Egli et al.rCatena 45 2001 19–4722
Fig. 1. Location of the studied areas Schmadri and Gletsch. The maps show the main moraines with thecorresponding ages. The Swiss coordinates are given in km.
450, 700 and 10,000 yBP. The determination of these ages is based on geomorphologi-Ž .cal studies of Zumbuhl and Holzhauser 1988 and on our own researches. The dating¨
has been carried out by means of 14C-analyses of organic residues and humic acids ofrecent and buried soils. Alpine glaciers have varied during the last 10,000 years near theborders of the moraines of the year 1850 indicating more or less stable climatic and
Ž .hydrologic conditions within that period cf. Burga and Perret, 1997; Keller, 1994 . Thismeans that changes in the soil can be primarily analysed in view of the time scale.
ŽThe soil profiles studied are located very short distances apart a few hundreds of. Ž .metres and with very little difference in altitude 1760 m a.s.l. . According to the
mineralogical investigations, the host material of the soils is in all cases very similarŽ .i.e., granitic host material . The morainic material was produced through glacialtransport within a small area of homogeneous bedrock constituted by the Central
Ž .Aare-massif granite and gneiss . The younger soils are generally situated on morainesin the plain. The oldest soil was found on a topographically slightly higher positionŽ .1800 m a.s.l. . Present climatic conditions for Gletsch are q1.28C mean annual
Ž .temperature and ca. 2000 mm mean annual precipitation EDI, 1992; Witzig, 1999 .According to the FAO–UNESCO system, the soils can be classified as a lithic leptosolŽ . Ž .soil profiles with an age of 150 years , umbric leptosol 260–300 years , umbric
Ž . Ž .leptosols to dystric cambisol 450 years , dystric cambisol 700 years , and haplic
( )M. Egli et al.rCatena 45 2001 19–47 23
Ž . Ž .podzol 10,000 years . The following sampling strategy was chosen Witzig, 1999 . Twoto four soil cores were excavated by means of a special core sampler for the less-devel-
Ž .oped soils 150–700 years . The soil cores had a diameter of 7.5 cm and a length of 50Ž .cm. From these profiles, several depths 0–5, 5–15, 15–25, 25–35, 35–45 cm were
collected and each depth combined into one sample. Additional soil material wascollected from excavated profile pits. The samples from the soil cores and from theprofile pits were replicates and thus enabled a representative sampling of each site. Eachsample had a final weight of about 2–4 kg. This procedure additionally allowed thedetermination of some physical properties such as bulk density and the ratio of fine earthto soil skeleton. The oldest soil was sampled by means of an excavated soil profileŽ .usually at 10-cm intervals and with respect to the soil horizons . Bulk density wasdetermined by a specific soil core sampler.
ŽSeveral clear glaciation stages can be distinguished for the Schmadri site Upper.Lauterbrunnen Valley; Fig. 1 but only two of them have silicate host rocks with the
same petrography. These two sites are characterised by granitic tills. The soils developedon these sites have ages of 3300 and 10,500 years, respectively. These dates have been
Ž .obtained during geomorphological studies in this area Wipf, 1994 . The different glacialstages could be distinguished by geomorphological mapping as well as by 14C-datingthat allowed the study of soils with a clear datable genesis. Soil samples were taken
Ž .from profile pits and soil cores 2–4 kg for each sample . Both soils are haplic podzolsŽ .FAO with well-expressed eluvial and illuvial horizons. The younger soil has, incontrast to the older one, thinner layers and is less deeply weathered. The bedrock
Ž .belongs to the same geological massif Aare-massif as the one of the Gletsch site.The soils are located within short distances at an altitude between 2000 and 2050 m
a.s.l. The present climatic conditions are comparable with those of Gletsch. Mean annualtemperature and mean annual precipitation is ca. 0.58C and ca. 2000 mm, respectively.
2.3. Soil analysis
Ž .Element pools in the soil Ca, Mg, K, Na, Fe, Al, Mn, Si, Ti and Zr were determinedŽ .applying a method of total disintegration. Oven-dried 708C samples were dissolved
Ž .with a mixture of HF, HCl, HNO and H BO according to Fitze and Kagi 1999 .¨3 3 3
Elemental concentrations of Ca, Mg, K, Na, Fe, Mn, Al, Si, Ti and Zr were analysed byŽ .atomic absorption spectroscopy AAS or graphite furnace AAS. Additionally, the
dithionite-, oxalate- and pyrophosphate-extractable fractions were measured for theŽ .elements Fe, Al and Si Fitze and Kagi, 1999 . The dithionite-fraction of these elements¨
is referred to in text as the index ‘d’. For the Gletsch site, furthermore, the fraction -32mm was analysed regarding its total chemistry. The fraction -32 mm was obtained bywet sieving. Total C and N contents in the soil were measured with a CHN analyser.
Ž .Soil pH in 0.01 M CaCl was determined on air-dried samples using a soilrsolution2Ž .ratio of 1:2.5. In order to assess the whole chemistry of the soil, fine earth -2 mm as
Ž .well as the skeleton )2 mm; no upper boundary were analysed regarding its contentŽ .of elements. X-ray diffraction diagrams from 28–658 2u , with 0.028 2u at 2 s intervals
Ž .were obtained with oriented clay specimens MgCl saturated and with untreated,2Ž .fine-ground soil samples fraction -2 mm using a Philips APD 1700 diffractometer
( )M. Egli et al.rCatena 45 2001 19–4724
equipped with Cu–Ka radiation. The data were analysed with the computer codeDMSNT in order to have an overview of possible occurring minerals. The clay fractionwas obtained from the soil after destruction of organic matter with diluted sodium
Ž .acetate buffered H O pH 5 . Oriented clay samples were made by smearing the2 2
material on glass slides. Normative mineral composition was calculated for bulk soilŽ .samples skeleton and fine earth from total chemical analysis and according to the
following criteria. Feldspars were subdivided into their end members. The meancomposition of biotite, illite, chlorite, vermiculite was estimated assuming low to mid Fe
Žconcentrations in the corresponding minerals and a low substitution of Si by Al cf..Tuchschmid, 1995; Eggenberger, 1995 . The percentage of each mineral was calculated
using an eight-equation system based on Ca, Mg, K, Na, Al, Fe, Si and Ti contents inthe soil or bedrock. Total Fe-oxides and -hydroxides were estimated using the values
Ž .obtained by means of dithionite extraction. Imogolite-type material ITM , henceforthreferred to the sum of imogolite and proto-imogolite allophane, was determined accord-
Ž . Ž .ing to Parfitt and Hemni 1982 , as allophane%q imogolite%sSi oxalate %P7.1.Organically bound Al and oxides or hydroxides were estimated by means of thedithionite extract minus ITM.
Ž .After a pretreatment of the samples with H O 3% , particle size distribution of the2 2
soils was measured by a combined method consisting of sieving the coarser particlesŽ . Ž .2000–32 mm and the measurement of the finer particles -32 mm by means of an
Ž .X-ray-sedimentometer SediGraph 5100 .
3. Results and discussion
3.1. Particle size distribution and soil skeleton
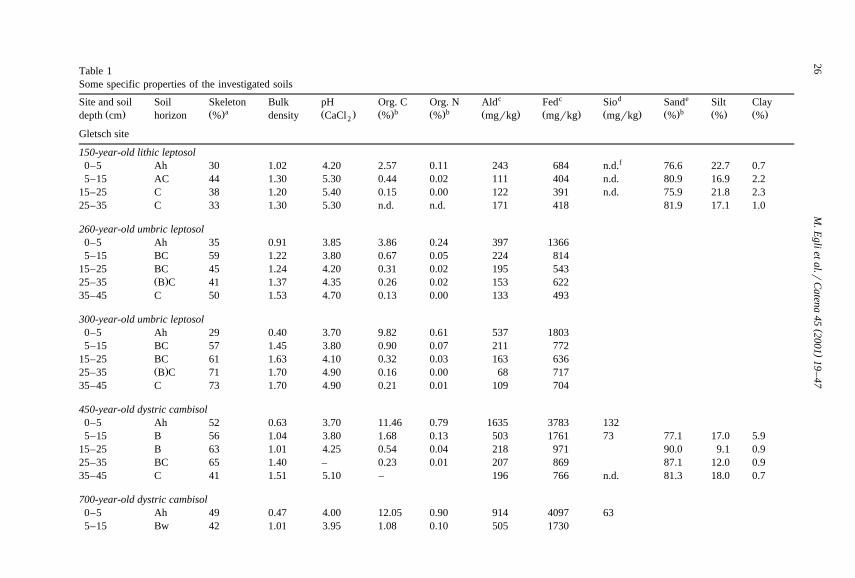
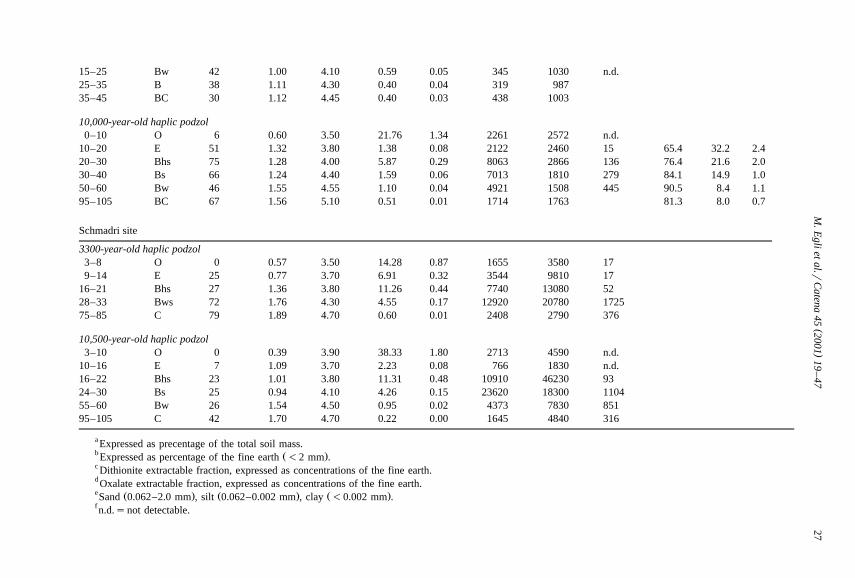
Alpine soils are investigated less often due to their limited accessibility and also dueto their physical properties. These are often soils with a high proportion of soil skeleton.Table 1 illustrates this fact: the soil skeleton varies from 0% up to 80% of the mass ofthe investigated soils. In soil science, one usually deals with material with a diameter-2 mm and surmises that the analysis of this fraction adequately represents thechemical status. Studies on the chemical properties of the skeleton are rarely done.However, the chemistry of the soil skeleton is needed in order to calculate weatheringmass balances for alpine soils. The determination of bulk density requires that the stonymaterial is not too voluminous. The skeleton proportion in the soil may, furthermore,vary within short distances. Thus, the acquisition of a meaningful value of bulk densityis not always guaranteed. Care must also be taken to ensure that representative volumes
Ž .are sampled in order to assess the variability of skeleton content cf. Corti et al., 1998 .All soils of the investigation areas are characterised by a sandy to silty-sandy textureŽ . Ž .Table 1 . In contrast to Righi et al. 1999 , no significant trends of higher clay contents
Ž .with increasing age could be found for the investigated soils Gletsch site . However, theclay amount produced during soil evolution with respect to the whole soil profile
2 Ž .increases with the age of the soil from 2.54 kgrm for a profile of 30 cm for the lithicŽ . 2 Ž . Ž .leptosol 150 years to 8.79 kgrm profile of 1 m for the podzol 10,000 years at the
( )M. Egli et al.rCatena 45 2001 19–47 25
investigation site Gletsch. The production of clays during pedogenesis was obtained byŽ .subtracting the lithogenic clay content sbackground value from the total content
measured in the soil profile. Although the maximum clay concentrations in the differentsoils do not show a significant trend with time, the mass of produced clays, which isbound to the depth of the soil profile, gives this tendency of higher values withincreasing age.
3.2. Total contents
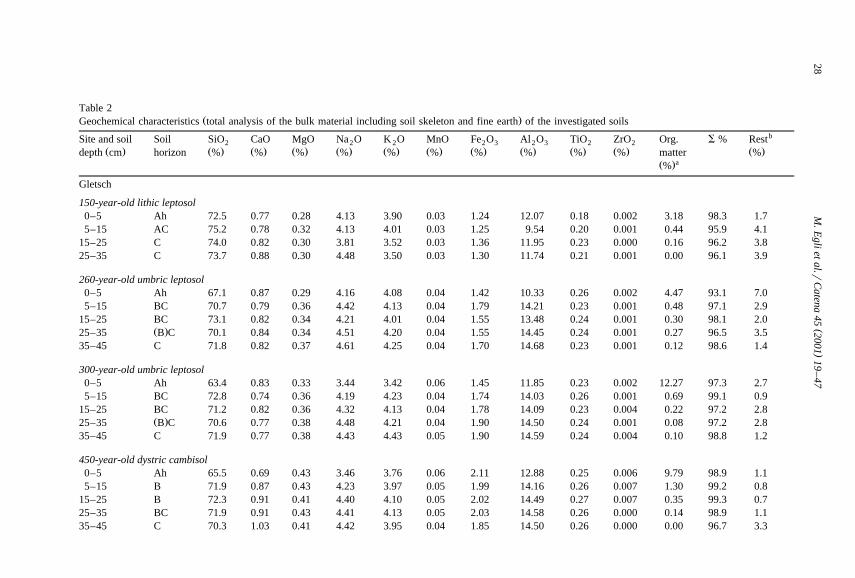
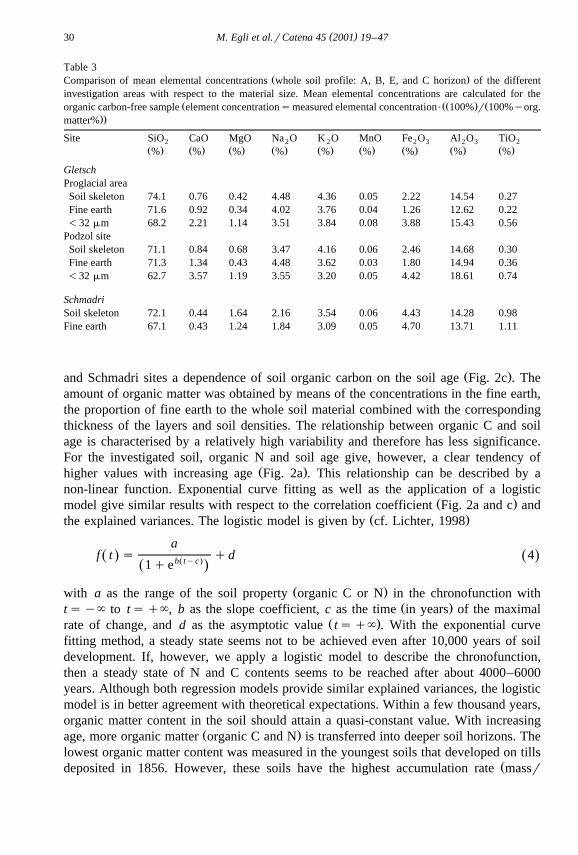
The main geochemical data are given in Table 2. The composition of the investigatedmaterial clearly reflects its granitic character. The skeleton has chemical properties that
Ž .differ from those of the fine earth or the fraction -32 mm Table 3 . The differences inthese properties are due to the alteration that has been acquired by weathering andpedological processes. In terms of chemical properties of the soil skeleton, the fine earthand the fraction -32 mm, the data highlights the existence of several trends. The soilskeleton has the highest SiO , Na O and K O content. The concentrations of these2 2 2
compounds decrease with decreasing material size. The weathering of primary silicatescombined with the fact that K or Na is trapped only to a smaller extent into secondarymineral phases reflects these losses. Na O and CaO should be attributed only to albite2
Ž .and anorthite, respectively. The Na OrCaO ratio wt.% varies between 4.2 and 5.9 in2
the soil skeleton and changes into 3.3–4.4 in the fine earth and 1.0–1.6 in the fraction-32 mm. At both investigation sites, a clear tendency is observable with decliningratios from the coarser to the smaller particles. The smaller ratio in the finer fractionssuggests a preferential chemical or physical weathering of Na-plagioclase. This observa-
Ž .tion is in agreement with results of Hardy et al. 1999 who examined podzoluvisols. Incontrast, Al and Fe are enriched in the fraction -32 mm of the Gletsch site. The fineearth seems, however, to be depleted in Fe and Al: the weathering of primary mineralsleads to the formation of secondary phases with a small grain size or to solubilisedproducts. This results in enrichment of Fe and Al in fine to very fine particles and the
Ž .fraction between 32 mm and 2 mm is depleted with these elements. Eggenberger 1995made similar observations with cryptopodzols in Southern Switzerland: Si and Nacontents decreased with decreasing grain size and Al and Fe were concentrated in thesmaller fractions.
3.3. Chronofunctions of organic C and N
Many methods usually used to distinguish soils of different ages do not work in areasŽ .on crystalline bedrock in the Swiss Alps Fitze, 1982 . Soil pH, translocation of organic
matter, and development of typical spodic horizons all seem to attain a steady stateŽ .within a few hundred years. According to Lichter 1998 , who investigated soils
developed on sand dunes, organic C and N contents may after 500 years already reachŽ .quasi steady-state conditions. In contrast, Liski et al. 1998 demonstrated with a soil
chronosequence that the amount of organic C in Finnish forest soils may stabilise afterca. 2000 years. In older soils, organic matter may also decrease, if, for instance, thereservoir of nutrients decreases with time. Our investigation illustrates for the Gletsch
()
M.E
glietal.r
Catena
452001
19–
4726Table 1
Some specific properties of the investigated soilsc c d eSite and soil Soil Skeleton Bulk pH Org. C Org. N Ald Fed Sio Sand Silt Clay
a b b bŽ . Ž . Ž . Ž . Ž . Ž . Ž . Ž . Ž . Ž . Ž .depth cm horizon % density CaCl % % mgrkg mgrkg mgrkg % % %2
Gletsch site
150-year-old lithic leptosolf0–5 Ah 30 1.02 4.20 2.57 0.11 243 684 n.d. 76.6 22.7 0.7
5–15 AC 44 1.30 5.30 0.44 0.02 111 404 n.d. 80.9 16.9 2.215–25 C 38 1.20 5.40 0.15 0.00 122 391 n.d. 75.9 21.8 2.325–35 C 33 1.30 5.30 n.d. n.d. 171 418 81.9 17.1 1.0
260-year-old umbric leptosol0–5 Ah 35 0.91 3.85 3.86 0.24 397 13665–15 BC 59 1.22 3.80 0.67 0.05 224 814
15–25 BC 45 1.24 4.20 0.31 0.02 195 543Ž .25–35 B C 41 1.37 4.35 0.26 0.02 153 622
35–45 C 50 1.53 4.70 0.13 0.00 133 493
300-year-old umbric leptosol0–5 Ah 29 0.40 3.70 9.82 0.61 537 18035–15 BC 57 1.45 3.80 0.90 0.07 211 772
15–25 BC 61 1.63 4.10 0.32 0.03 163 636Ž .25–35 B C 71 1.70 4.90 0.16 0.00 68 717
35–45 C 73 1.70 4.90 0.21 0.01 109 704
450-year-old dystric cambisol0–5 Ah 52 0.63 3.70 11.46 0.79 1635 3783 1325–15 B 56 1.04 3.80 1.68 0.13 503 1761 73 77.1 17.0 5.9
15–25 B 63 1.01 4.25 0.54 0.04 218 971 90.0 9.1 0.925–35 BC 65 1.40 – 0.23 0.01 207 869 87.1 12.0 0.935–45 C 41 1.51 5.10 – 196 766 n.d. 81.3 18.0 0.7
700-year-old dystric cambisol0–5 Ah 49 0.47 4.00 12.05 0.90 914 4097 635–15 Bw 42 1.01 3.95 1.08 0.10 505 1730
()
M.E
glietal.r
Catena
452001
19–
4727
15–25 Bw 42 1.00 4.10 0.59 0.05 345 1030 n.d.25–35 B 38 1.11 4.30 0.40 0.04 319 98735–45 BC 30 1.12 4.45 0.40 0.03 438 1003
10,000-year-old haplic podzol0–10 O 6 0.60 3.50 21.76 1.34 2261 2572 n.d.
10–20 E 51 1.32 3.80 1.38 0.08 2122 2460 15 65.4 32.2 2.420–30 Bhs 75 1.28 4.00 5.87 0.29 8063 2866 136 76.4 21.6 2.030–40 Bs 66 1.24 4.40 1.59 0.06 7013 1810 279 84.1 14.9 1.050–60 Bw 46 1.55 4.55 1.10 0.04 4921 1508 445 90.5 8.4 1.195–105 BC 67 1.56 5.10 0.51 0.01 1714 1763 81.3 8.0 0.7
Schmadri site
3300-year-old haplic podzol3–8 O 0 0.57 3.50 14.28 0.87 1655 3580 179–14 E 25 0.77 3.70 6.91 0.32 3544 9810 17
16–21 Bhs 27 1.36 3.80 11.26 0.44 7740 13080 5228–33 Bws 72 1.76 4.30 4.55 0.17 12920 20780 172575–85 C 79 1.89 4.70 0.60 0.01 2408 2790 376
10,500-year-old haplic podzol3–10 O 0 0.39 3.90 38.33 1.80 2713 4590 n.d.
10–16 E 7 1.09 3.70 2.23 0.08 766 1830 n.d.16–22 Bhs 23 1.01 3.80 11.31 0.48 10910 46230 9324–30 Bs 25 0.94 4.10 4.26 0.15 23620 18300 110455–60 Bw 26 1.54 4.50 0.95 0.02 4373 7830 85195–105 C 42 1.70 4.70 0.22 0.00 1645 4840 316
a Expressed as precentage of the total soil mass.b Ž .Expressed as percentage of the fine earth -2 mm .c Dithionite extractable fraction, expressed as concentrations of the fine earth.dOxalate extractable fraction, expressed as concentrations of the fine earth.e Ž . Ž . Ž .Sand 0.062–2.0 mm , silt 0.062–0.002 mm , clay -0.002 mm .f n.d.snot detectable.
()
M.E
glietal.r
Catena
452001
19–
4728
Table 2Ž .Geochemical characteristics total analysis of the bulk material including soil skeleton and fine earth of the investigated soils
bSite and soil Soil SiO CaO MgO Na O K O MnO Fe O Al O TiO ZrO Org. S % Rest2 2 2 2 3 2 3 2 2Ž . Ž . Ž . Ž . Ž . Ž . Ž . Ž . Ž . Ž . Ž . Ž .depth cm horizon % % % % % % % % % % matter %
aŽ .%
Gletsch
150-year-old lithic leptosol0–5 Ah 72.5 0.77 0.28 4.13 3.90 0.03 1.24 12.07 0.18 0.002 3.18 98.3 1.75–15 AC 75.2 0.78 0.32 4.13 4.01 0.03 1.25 9.54 0.20 0.001 0.44 95.9 4.1
15–25 C 74.0 0.82 0.30 3.81 3.52 0.03 1.36 11.95 0.23 0.000 0.16 96.2 3.825–35 C 73.7 0.88 0.30 4.48 3.50 0.03 1.30 11.74 0.21 0.001 0.00 96.1 3.9
260-year-old umbric leptosol0–5 Ah 67.1 0.87 0.29 4.16 4.08 0.04 1.42 10.33 0.26 0.002 4.47 93.1 7.05–15 BC 70.7 0.79 0.36 4.42 4.13 0.04 1.79 14.21 0.23 0.001 0.48 97.1 2.9
15–25 BC 73.1 0.82 0.34 4.21 4.01 0.04 1.55 13.48 0.24 0.001 0.30 98.1 2.0Ž .25–35 B C 70.1 0.84 0.34 4.51 4.20 0.04 1.55 14.45 0.24 0.001 0.27 96.5 3.5
35–45 C 71.8 0.82 0.37 4.61 4.25 0.04 1.70 14.68 0.23 0.001 0.12 98.6 1.4
300-year-old umbric leptosol0–5 Ah 63.4 0.83 0.33 3.44 3.42 0.06 1.45 11.85 0.23 0.002 12.27 97.3 2.75–15 BC 72.8 0.74 0.36 4.19 4.23 0.04 1.74 14.03 0.26 0.001 0.69 99.1 0.9
15–25 BC 71.2 0.82 0.36 4.32 4.13 0.04 1.78 14.09 0.23 0.004 0.22 97.2 2.8Ž .25–35 B C 70.6 0.77 0.38 4.48 4.21 0.04 1.90 14.50 0.24 0.001 0.08 97.2 2.8
35–45 C 71.9 0.77 0.38 4.43 4.43 0.05 1.90 14.59 0.24 0.004 0.10 98.8 1.2
450-year-old dystric cambisol0–5 Ah 65.5 0.69 0.43 3.46 3.76 0.06 2.11 12.88 0.25 0.006 9.79 98.9 1.15–15 B 71.9 0.87 0.43 4.23 3.97 0.05 1.99 14.16 0.26 0.007 1.30 99.2 0.8
15–25 B 72.3 0.91 0.41 4.40 4.10 0.05 2.02 14.49 0.27 0.007 0.35 99.3 0.725–35 BC 71.9 0.91 0.43 4.41 4.13 0.05 2.03 14.58 0.26 0.000 0.14 98.9 1.135–45 C 70.3 1.03 0.41 4.42 3.95 0.04 1.85 14.50 0.26 0.000 0.00 96.7 3.3
()
M.E
glietal.r
Catena
452001
19–
4729
700-year-old dystric cambisol0–5 Ah 63.6 0.76 0.40 3.34 3.57 0.12 1.94 12.03 0.24 0.003 10.95 97.0 3.15–15 Bw 73.0 0.71 0.41 4.08 4.20 0.05 1.63 12.69 0.22 0.002 1.12 98.1 1.9
15–25 Bw 71.5 0.87 0.41 4.27 3.86 0.04 1.70 13.75 0.23 0.000 0.60 97.2 2.825–35 B 74.5 0.87 0.44 4.02 3.74 0.04 1.68 13.40 0.25 0.001 0.44 99.4 0.635–45 BC 75.3 0.87 0.38 3.92 3.84 0.04 1.63 12.14 0.25 0.004 0.49 98.9 1.1
10,000-year-old haplic podzol0–10 O 43.3 0.76 0.32 2.03 1.88 0.01 1.18 8.71 0.27 0.010 36.13 94.6 5.4
10–20 E 71.0 1.23 0.36 3.93 3.84 0.04 1.93 13.87 0.32 0.003 1.21 97.7 2.320–30 Bhs 70.2 0.86 0.50 4.01 3.89 0.05 2.18 14.08 0.30 0.003 2.64 98.7 1.330–40 Bs 69.8 1.03 0.52 4.31 3.92 0.05 2.21 14.59 0.32 0.000 0.97 97.7 2.350–60 Bw 68.8 1.03 0.47 4.49 3.92 0.04 1.97 14.20 0.28 0.000 1.05 96.3 3.795–105 BC 69.8 1.00 0.54 4.42 3.88 0.04 2.01 14.47 0.27 0.000 0.30 96.8 3.2
Schmadri
3300-year-old haplic podzol3–8 O 38.7 0.31 0.55 1.20 2.21 0.01 1.36 8.61 1.10 0.069 25.28 79.3 20.79–14 E 61.7 0.22 1.04 1.84 3.37 0.03 3.59 13.37 1.17 0.010 9.18 95.5 4.5
16–21 Bhs 61.3 0.28 1.14 1.62 3.03 0.04 4.50 11.79 1.00 0.016 14.61 99.3 0.728–33 Bws 62.9 0.35 1.61 2.37 3.30 0.08 4.65 15.37 0.81 0.005 2.29 93.8 6.275–85 C 66.5 0.43 1.73 2.88 3.63 0.07 4.48 15.02 0.85 0.005 0.22 95.8 4.2
10,500-year-old haplic podzol3–10 O 21.8 0.77 0.24 0.31 0.71 0.01 1.25 3.72 0.51 0.027 67.84 97.1 2.9
10–16 E 75.6 0.15 0.57 1.00 3.13 0.01 1.33 10.47 1.23 0.020 3.66 97.1 2.916–22 Bhs 54.5 0.46 1.05 1.05 2.48 0.03 7.46 11.88 1.09 0.011 15.43 95.4 4.624–30 Bs 61.3 0.34 1.51 1.82 2.91 0.05 5.54 14.61 0.89 0.011 5.66 94.6 5.455–60 Bw 67.8 0.46 1.63 2.35 2.93 0.06 4.66 13.18 0.89 0.012 1.25 95.2 4.895–105 C 68.7 0.56 1.69 2.47 3.38 0.06 4.25 15.01 0.83 0.005 0.22 97.1 2.9
aCalculated as organic mattersorg. CP1.72.b Ž .Includes mostly adsorbed and crystalline H O calculated as the difference to 100% .2
( )M. Egli et al.rCatena 45 2001 19–4730
Table 3Ž .Comparison of mean elemental concentrations whole soil profile: A, B, E, and C horizon of the different
investigation areas with respect to the material size. Mean elemental concentrations are calculated for theŽ ŽŽ . Žorganic carbon-free sample element concentrationsmeasured elemental concentrationP 100% r 100%yorg.
..matter%
Site SiO CaO MgO Na O K O MnO Fe O Al O TiO2 2 2 2 3 2 3 2Ž . Ž . Ž . Ž . Ž . Ž . Ž . Ž . Ž .% % % % % % % % %
GletschProglacial areaSoil skeleton 74.1 0.76 0.42 4.48 4.36 0.05 2.22 14.54 0.27Fine earth 71.6 0.92 0.34 4.02 3.76 0.04 1.26 12.62 0.22-32 mm 68.2 2.21 1.14 3.51 3.84 0.08 3.88 15.43 0.56
Podzol siteSoil skeleton 71.1 0.84 0.68 3.47 4.16 0.06 2.46 14.68 0.30Fine earth 71.3 1.34 0.43 4.48 3.62 0.03 1.80 14.94 0.36-32 mm 62.7 3.57 1.19 3.55 3.20 0.05 4.42 18.61 0.74
SchmadriSoil skeleton 72.1 0.44 1.64 2.16 3.54 0.06 4.43 14.28 0.98Fine earth 67.1 0.43 1.24 1.84 3.09 0.05 4.70 13.71 1.11
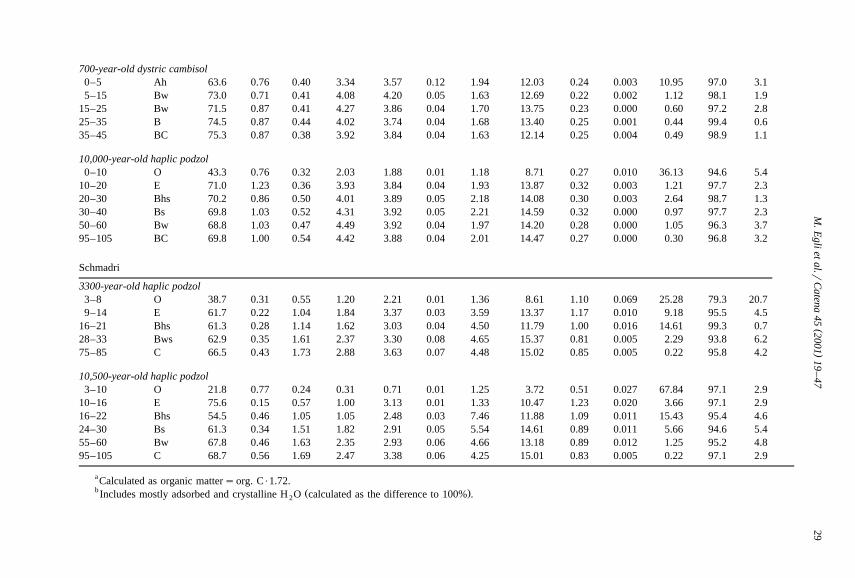
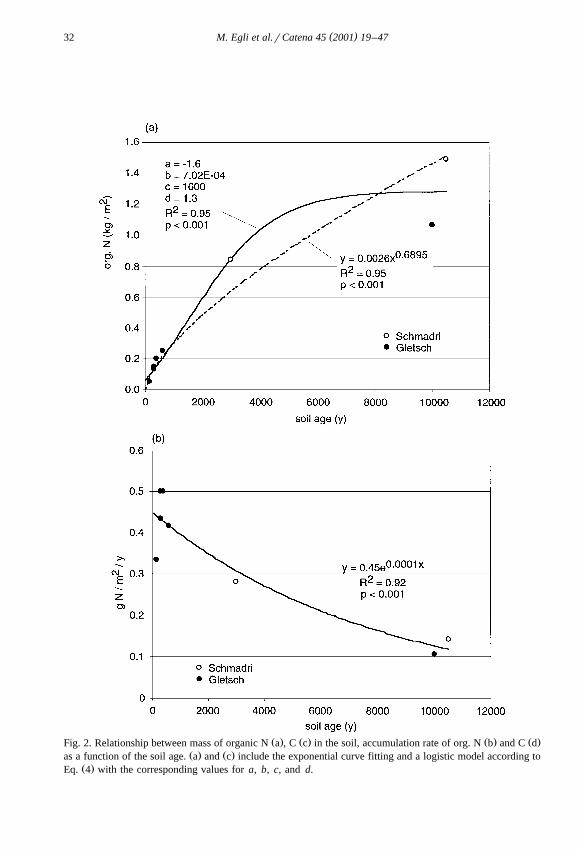
Ž .and Schmadri sites a dependence of soil organic carbon on the soil age Fig. 2c . Theamount of organic matter was obtained by means of the concentrations in the fine earth,the proportion of fine earth to the whole soil material combined with the correspondingthickness of the layers and soil densities. The relationship between organic C and soilage is characterised by a relatively high variability and therefore has less significance.For the investigated soil, organic N and soil age give, however, a clear tendency of
Ž .higher values with increasing age Fig. 2a . This relationship can be described by anon-linear function. Exponential curve fitting as well as the application of a logistic
Ž .model give similar results with respect to the correlation coefficient Fig. 2a and c andŽ .the explained variances. The logistic model is given by cf. Lichter, 1998
af t s qd 4Ž . Ž .bŽ tyc.1qeŽ .
Ž .with a as the range of the soil property organic C or N in the chronofunction withŽ .tsy` to tsq`, b as the slope coefficient, c as the time in years of the maximal
Ž .rate of change, and d as the asymptotic value tsq` . With the exponential curvefitting method, a steady state seems not to be achieved even after 10,000 years of soildevelopment. If, however, we apply a logistic model to describe the chronofunction,then a steady state of N and C contents seems to be reached after about 4000–6000years. Although both regression models provide similar explained variances, the logisticmodel is in better agreement with theoretical expectations. Within a few thousand years,organic matter content in the soil should attain a quasi-constant value. With increasing
Ž .age, more organic matter organic C and N is transferred into deeper soil horizons. Thelowest organic matter content was measured in the youngest soils that developed on tills
Ždeposited in 1856. However, these soils have the highest accumulation rate massr
( )M. Egli et al.rCatena 45 2001 19–47 31
. Ž .arearyear of organic N and C Fig. 2b and d . The accumulation rate is here defined asa net value comprising the production rate minus the decomposition rate. The soils withan age of 300–700 years exhibit already higher values of organic C and N contents, buta slightly lower accumulation rate. Mean annual rates of C and N accumulation through400 years of soil development are in the range of 6.7–9 grm2ryear for C and
2 Ž .0.33–0.50 grm ryear for N Fig. 2d and b . These values are very consistent with ratesŽ 2reported from other, Holocene-aged chronosequences Lichter, 1998: 9 g Crm ryear
2 .and 0.32 g Nrm ryear; Schlesinger, 1990 . The long term accumulation rates for thepodzols investigated are in the range of 2–4 g Crm2ryear. These values match well
Ž .with those given by Jersak et al. 1995 who measured for 12,000-year-old podzolsaccumulation rates of 1–3 g Crm2ryear.
3.4. Chronosequences of Al and Fe contentsd d
The dithionite reagent extracts various forms of organic and inorganic Al and Fe. TheŽfollowing forms of Al are reported to be dissolved Wada, 1977; Shoji and Fujiwara,.1984; Borggaard, 1988; Dahlgren and Ugolini, 1991 : organic Al, noncrystalline and
Ž .crystalline oxyhydroxides e.g., Al substituted in ferrihydrite and goethite , some Al inhydroxy interlayers and allophanes. The dithionite procedure usually extracts organi-cally-bound Fe, noncrystalline and crystalline Fe-oxyhydroxides and also to a small
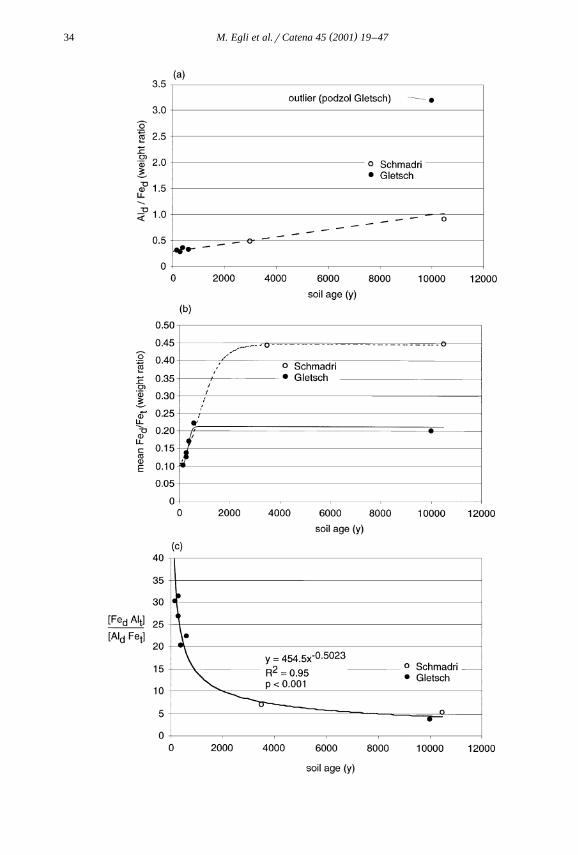
Ž .extent Fe-bearing silicates, especially nontronite Borggaard, 1988 .Ž .Fitze 1982 observes that the ratio Al rFe in the B horizon seems to be a goodd d
indicator of the age of Swiss Alpine soils. The older the soil the higher is this ratio. ThisŽmeans that, with increasing time, more Al is released from the minerals in order to form
.the secondary phases listed above through weathering relative to Fe. Additionally, Al ismore intensively eluviated from the E to the B horizon with increasing age, which leadsto increased dithionite extractable concentrations in the B horizon. Analyses of coatingsin the spodic horizons confirm this result showing that the Al rFe ratio increases fromd d
the interior and less weathered part to the exterior parts. Hence, the Al rFe ratio seemsd d
to be a function of time in the investigated soils at the Gletsch and Schmadri site.Ž .Usually higher values are found in older soils Fig. 3a . This finding is consistent with
Ž . Ž .the conclusions of Fitze 1982 . However, the oldest soils 10,000 years show consider-able variations. Unusually high values are found at the Gletsch site. According to FitzeŽ .1982 , Al rFe values of podzols with an age near 10,000 years in different parts ofd d
Ž .the Alps were often of the same order in most cases near 1 . At the Gletsch site, valuesŽ .up to a ratio of 3.87 means3.19 for the B horizon of the podzol are measured.
Obviously, the conditions of Al release relative to Fe are more favorable at the Gletschsite than in other investigated areas.
Ž .For the Gletsch site, the Fe and Al contents in the fine earth are lower Table 1 .d d
Most presumably, the rather scarce content of biotite in the bedrock affects the release ofFe that is kept at low level, and thus, weathering products of Al are relatively richer
Žcompared to Fe oxides and hydroxides. The mean ratio of Fe to Fe A, E and Bd t. Ž .horizon is plotted in Fig. 3b with ts total content . Obviously, after a relative short
period of pedogenesis, this ratio attains an asymptotic value, which seems, however, tobe lower for the Gletsch site than for the Schmadri site. The lower release of Fe at the
( )M. Egli et al.rCatena 45 2001 19–4732
Ž . Ž . Ž . Ž .Fig. 2. Relationship between mass of organic N a , C c in the soil, accumulation rate of org. N b and C dŽ . Ž .as a function of the soil age. a and c include the exponential curve fitting and a logistic model according to
Ž .Eq. 4 with the corresponding values for a, b, c, and d.

( )M. Egli et al.rCatena 45 2001 19–47 33
Ž .Fig. 2 continued .
Ž .Gletsch site may explain the high Al rFe ratio 3.19 in the corresponding haplicd d
podzol. Although the total Al contents do not vary greatly between the two investigationsites, the rate of Al formation is higher at the Schmadri site. This fact might be due to ad
Ž .higher proportion of Al in phyllo-silicates biotite and illite which obviously tend to be
( )M. Egli et al.rCatena 45 2001 19–4734
( )M. Egli et al.rCatena 45 2001 19–47 35
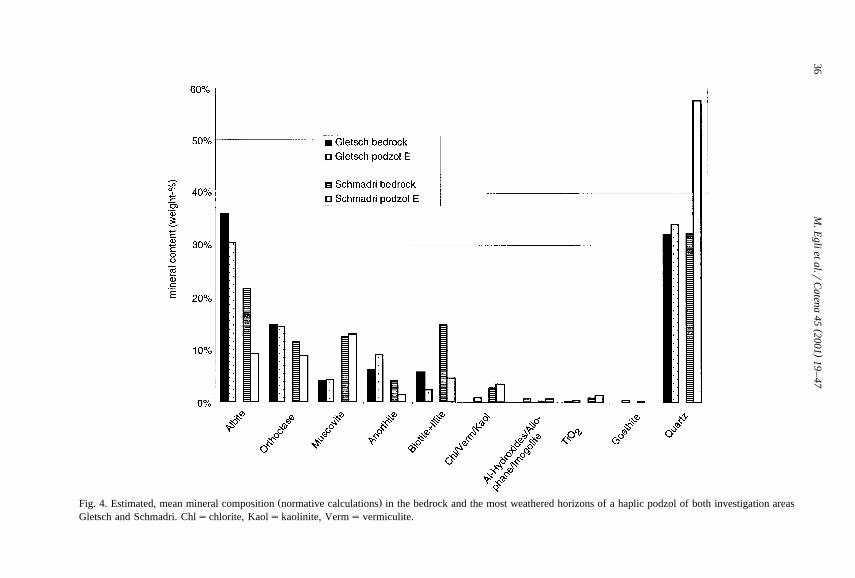
weathered more easily. Normative calculations at both sites presume a higher decline inbiotitesq illites at the Schmadri site during the soil development of about 10,000 yearsŽ . Ž .Fig. 4 . Fitze 1982 already hypothesised that different contents of muscovite or biotitemight influence the corresponding oxide and hydroxide formation rate in podzols.
Žw x. Žw x.The ratio of Al Fe r Al Fe considers the production of dithionite extractablet d d tŽ . ŽFe and Al in relation to their total content Al and Fe . If this ratio mean concentra-t t
.tions of the AqEqB horizons is computed against the duration of soil developmentŽ .Fig. 3c , then a very close relationship and a well-expressed chronofunction can beobserved. A very rapid decrease of this ratio occurs in the first 2000 years leading to theattainment of asymptotic values after about 3000 years. At least for the investigatedareas, this ratio is thus a good indicator of the soil age. It furthermore confirms the
Ž . Žhypothesis of Fitze 1982 that differences in the mineralogy i.e., the content of.muscovite and biotite of the parent material lead to varying Al rFe ratios.d d
3.5. Mass balance calculations: collapse, dilatation
Strain, mass fractions added to or subtracted from each horizon, and loss or gain ofŽ . Ž .elements during pedogenesis are calculated according to Eqs. 1 – 3 . Chemical compo-
sition and bulk density of the parent material were assumed to be best described by theC horizon of the youngest soil of the Gletsch proglacial area. Due to the topographically
Ž .slightly different position, the C horizon of the podzol 10,000 years was defined as theparent material. The calculation procedure for the soils of the Schmadri site is based onthe chemistry of the corresponding C horizons that are assumed to represent the parent
Ž .material Table 2 . Immobile elements are needed in order to calculate gains or losses ofelements. In our soils Zr and Ti have been measured. Ti had in all soils three orders ofmagnitude higher concentrations than Zr. The Zr concentration itself showed very largevariations in the soil profiles and thus might rather indicate fractionation. Calculatedstrains and transfer functions by means of Zr gave no reasonable results.
Positive strains are in most cases observed in the topsoil. Positive values are mainlydue to the presence of organic matter that has a lower bulk density and lowerconcentrations of immobile elements than mineral soil material and thus contributes to
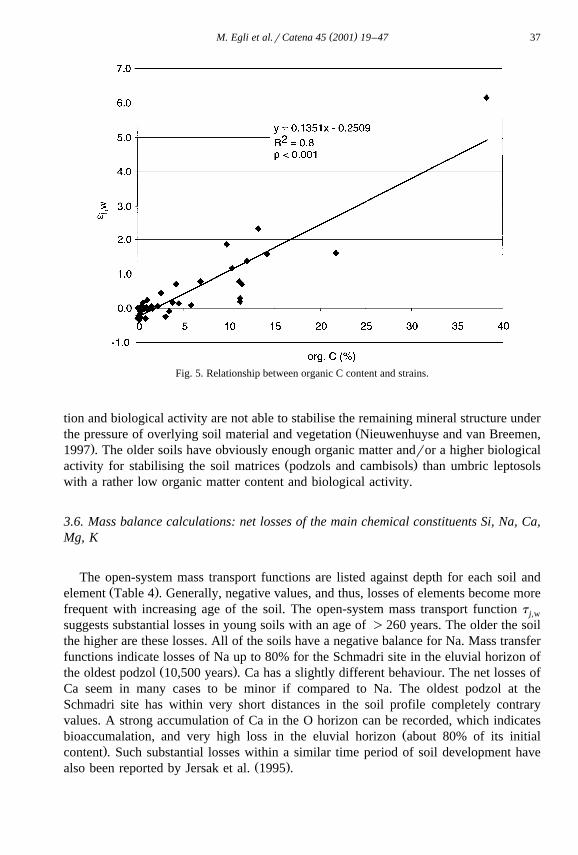
Ž .dilatation. Additionally, the formation of bio pores, which is a main soil-formingprocess also in young soils, contributes to positive strains. The significance of organiccarbon on the strain ´ of the investigated soils is illustrated in Fig. 5. A strongi,w
correlation between organic carbon and ´ is demonstrated. The development ofi,wŽ .strains with depth is different for each soil Table 4 . The haplic podzol and the dystric
cambisol of the Gletsch site show nearly isovolumetric weathering below the organic-matter-rich layer. In contrast, the haplic podzols of the Schmadri site have strain values)0 and thus indicate dilatation. Collapse is to be expected when chemical weatheringand subsequent leaching has removed part of the minerals, and organic matter incorpora-
Ž . Ž . Ž .Fig. 3. Chronofunctions of a the Al rFe ratio dsdithionite extractable fraction in the B horizon, b thed dŽ .mean ratio of Fe to Fe in the A, E and B horizon, and c the mean Al rFe ratio of the A, E, and Bd t d d
horizons in response to the corresponding total contents.
()
M.E
glietal.r
Catena
452001
19–
4736
Ž .Fig. 4. Estimated, mean mineral composition normative calculations in the bedrock and the most weathered horizons of a haplic podzol of both investigation areasGletsch and Schmadri. Chlschlorite, Kaolskaolinite, Verms vermiculite.
( )M. Egli et al.rCatena 45 2001 19–47 37
Fig. 5. Relationship between organic C content and strains.
tion and biological activity are not able to stabilise the remaining mineral structure underŽthe pressure of overlying soil material and vegetation Nieuwenhuyse and van Breemen,
.1997 . The older soils have obviously enough organic matter andror a higher biologicalŽ .activity for stabilising the soil matrices podzols and cambisols than umbric leptosols
with a rather low organic matter content and biological activity.
3.6. Mass balance calculations: net losses of the main chemical constituents Si, Na, Ca,Mg, K
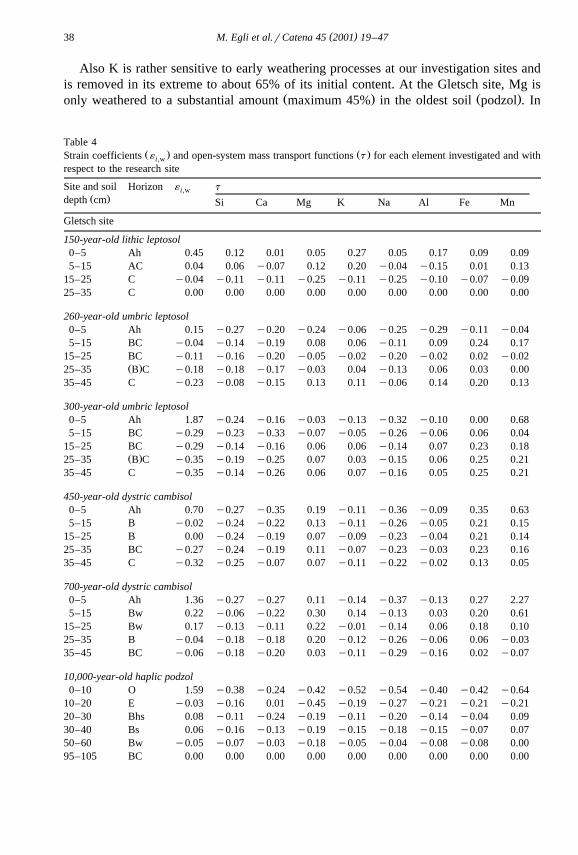
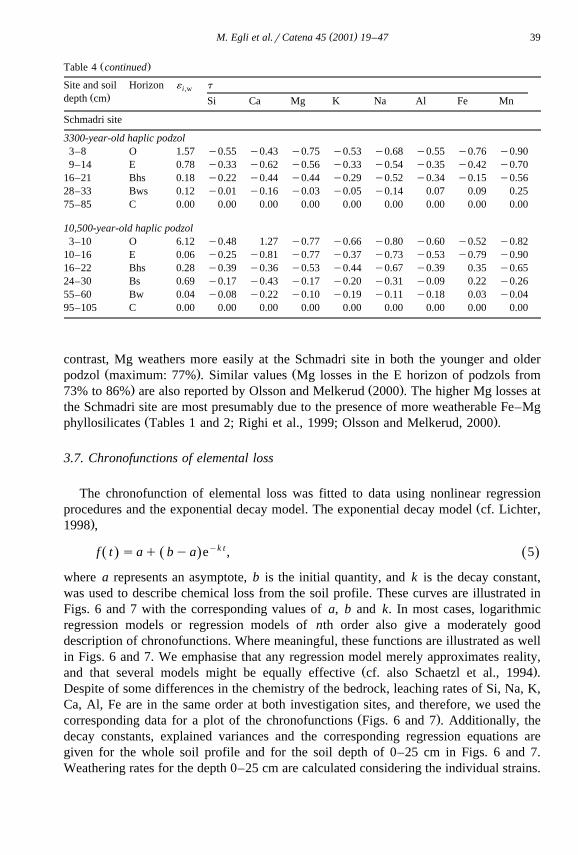
The open-system mass transport functions are listed against depth for each soil andŽ .element Table 4 . Generally, negative values, and thus, losses of elements become more
frequent with increasing age of the soil. The open-system mass transport function t j,w
suggests substantial losses in young soils with an age of )260 years. The older the soilthe higher are these losses. All of the soils have a negative balance for Na. Mass transferfunctions indicate losses of Na up to 80% for the Schmadri site in the eluvial horizon of
Ž .the oldest podzol 10,500 years . Ca has a slightly different behaviour. The net losses ofCa seem in many cases to be minor if compared to Na. The oldest podzol at theSchmadri site has within very short distances in the soil profile completely contraryvalues. A strong accumulation of Ca in the O horizon can be recorded, which indicates
Žbioaccumalation, and very high loss in the eluvial horizon about 80% of its initial.content . Such substantial losses within a similar time period of soil development have
Ž .also been reported by Jersak et al. 1995 .
( )M. Egli et al.rCatena 45 2001 19–4738
Also K is rather sensitive to early weathering processes at our investigation sites andis removed in its extreme to about 65% of its initial content. At the Gletsch site, Mg is
Ž . Ž .only weathered to a substantial amount maximum 45% in the oldest soil podzol . In
Table 4Ž . Ž .Strain coefficients ´ and open-system mass transport functions t for each element investigated and withi,w
respect to the research site
Site and soil Horizon ´ ti,wŽ .depth cm Si Ca Mg K Na Al Fe Mn
Gletsch site
150-year-old lithic leptosol0–5 Ah 0.45 0.12 0.01 0.05 0.27 0.05 0.17 0.09 0.095–15 AC 0.04 0.06 y0.07 0.12 0.20 y0.04 y0.15 0.01 0.13
15–25 C y0.04 y0.11 y0.11 y0.25 y0.11 y0.25 y0.10 y0.07 y0.0925–35 C 0.00 0.00 0.00 0.00 0.00 0.00 0.00 0.00 0.00
260-year-old umbric leptosol0–5 Ah 0.15 y0.27 y0.20 y0.24 y0.06 y0.25 y0.29 y0.11 y0.045–15 BC y0.04 y0.14 y0.19 0.08 0.06 y0.11 0.09 0.24 0.17
15–25 BC y0.11 y0.16 y0.20 y0.05 y0.02 y0.20 y0.02 0.02 y0.02Ž .25–35 B C y0.18 y0.18 y0.17 y0.03 0.04 y0.13 0.06 0.03 0.00
35–45 C y0.23 y0.08 y0.15 0.13 0.11 y0.06 0.14 0.20 0.13
300-year-old umbric leptosol0–5 Ah 1.87 y0.24 y0.16 y0.03 y0.13 y0.32 y0.10 0.00 0.685–15 BC y0.29 y0.23 y0.33 y0.07 y0.05 y0.26 y0.06 0.06 0.04
15–25 BC y0.29 y0.14 y0.16 0.06 0.06 y0.14 0.07 0.23 0.18Ž .25–35 B C y0.35 y0.19 y0.25 0.07 0.03 y0.15 0.06 0.25 0.21
35–45 C y0.35 y0.14 y0.26 0.06 0.07 y0.16 0.05 0.25 0.21
450-year-old dystric cambisol0–5 Ah 0.70 y0.27 y0.35 0.19 y0.11 y0.36 y0.09 0.35 0.635–15 B y0.02 y0.24 y0.22 0.13 y0.11 y0.26 y0.05 0.21 0.15
15–25 B 0.00 y0.24 y0.19 0.07 y0.09 y0.23 y0.04 0.21 0.1425–35 BC y0.27 y0.24 y0.19 0.11 y0.07 y0.23 y0.03 0.23 0.1635–45 C y0.32 y0.25 y0.07 0.07 y0.11 y0.22 y0.02 0.13 0.05
700-year-old dystric cambisol0–5 Ah 1.36 y0.27 y0.27 0.11 y0.14 y0.37 y0.13 0.27 2.275–15 Bw 0.22 y0.06 y0.22 0.30 0.14 y0.13 0.03 0.20 0.61
15–25 Bw 0.17 y0.13 y0.11 0.22 y0.01 y0.14 0.06 0.18 0.1025–35 B y0.04 y0.18 y0.18 0.20 y0.12 y0.26 y0.06 0.06 y0.0335–45 BC y0.06 y0.18 y0.20 0.03 y0.11 y0.29 y0.16 0.02 y0.07
10,000-year-old haplic podzol0–10 O 1.59 y0.38 y0.24 y0.42 y0.52 y0.54 y0.40 y0.42 y0.64
10–20 E y0.03 y0.16 0.01 y0.45 y0.19 y0.27 y0.21 y0.21 y0.2120–30 Bhs 0.08 y0.11 y0.24 y0.19 y0.11 y0.20 y0.14 y0.04 0.0930–40 Bs 0.06 y0.16 y0.13 y0.19 y0.15 y0.18 y0.15 y0.07 0.0750–60 Bw y0.05 y0.07 y0.03 y0.18 y0.05 y0.04 y0.08 y0.08 0.0095–105 BC 0.00 0.00 0.00 0.00 0.00 0.00 0.00 0.00 0.00
( )M. Egli et al.rCatena 45 2001 19–47 39
Ž .Table 4 continued
Site and soil Horizon ´ ti,wŽ .depth cm Si Ca Mg K Na Al Fe Mn
Schmadri site
3300-year-old haplic podzol3–8 O 1.57 y0.55 y0.43 y0.75 y0.53 y0.68 y0.55 y0.76 y0.909–14 E 0.78 y0.33 y0.62 y0.56 y0.33 y0.54 y0.35 y0.42 y0.70
16–21 Bhs 0.18 y0.22 y0.44 y0.44 y0.29 y0.52 y0.34 y0.15 y0.5628–33 Bws 0.12 y0.01 y0.16 y0.03 y0.05 y0.14 0.07 0.09 0.2575–85 C 0.00 0.00 0.00 0.00 0.00 0.00 0.00 0.00 0.00
10,500-year-old haplic podzol3–10 O 6.12 y0.48 1.27 y0.77 y0.66 y0.80 y0.60 y0.52 y0.82
10–16 E 0.06 y0.25 y0.81 y0.77 y0.37 y0.73 y0.53 y0.79 y0.9016–22 Bhs 0.28 y0.39 y0.36 y0.53 y0.44 y0.67 y0.39 0.35 y0.6524–30 Bs 0.69 y0.17 y0.43 y0.17 y0.20 y0.31 y0.09 0.22 y0.2655–60 Bw 0.04 y0.08 y0.22 y0.10 y0.19 y0.11 y0.18 0.03 y0.0495–105 C 0.00 0.00 0.00 0.00 0.00 0.00 0.00 0.00 0.00
contrast, Mg weathers more easily at the Schmadri site in both the younger and olderŽ . Žpodzol maximum: 77% . Similar values Mg losses in the E horizon of podzols from
. Ž .73% to 86% are also reported by Olsson and Melkerud 2000 . The higher Mg losses atthe Schmadri site are most presumably due to the presence of more weatherable Fe–Mg
Ž .phyllosilicates Tables 1 and 2; Righi et al., 1999; Olsson and Melkerud, 2000 .
3.7. Chronofunctions of elemental loss
The chronofunction of elemental loss was fitted to data using nonlinear regressionŽprocedures and the exponential decay model. The exponential decay model cf. Lichter,
.1998 ,
f t saq bya eyk t , 5Ž . Ž . Ž .
where a represents an asymptote, b is the initial quantity, and k is the decay constant,was used to describe chemical loss from the soil profile. These curves are illustrated inFigs. 6 and 7 with the corresponding values of a, b and k. In most cases, logarithmicregression models or regression models of nth order also give a moderately gooddescription of chronofunctions. Where meaningful, these functions are illustrated as wellin Figs. 6 and 7. We emphasise that any regression model merely approximates reality,
Ž .and that several models might be equally effective cf. also Schaetzl et al., 1994 .Despite of some differences in the chemistry of the bedrock, leaching rates of Si, Na, K,Ca, Al, Fe are in the same order at both investigation sites, and therefore, we used the
Ž .corresponding data for a plot of the chronofunctions Figs. 6 and 7 . Additionally, thedecay constants, explained variances and the corresponding regression equations aregiven for the whole soil profile and for the soil depth of 0–25 cm in Figs. 6 and 7.Weathering rates for the depth 0–25 cm are calculated considering the individual strains.
( )M. Egli et al.rCatena 45 2001 19–4740
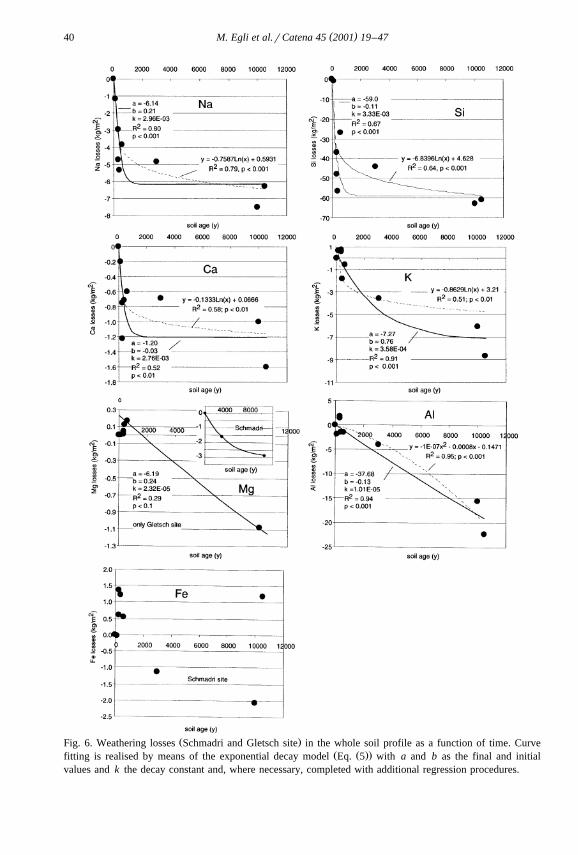
Ž .Fig. 6. Weathering losses Schmadri and Gletsch site in the whole soil profile as a function of time. CurveŽ Ž ..fitting is realised by means of the exponential decay model Eq. 5 with a and b as the final and initial
values and k the decay constant and, where necessary, completed with additional regression procedures.
( )M. Egli et al.rCatena 45 2001 19–47 41
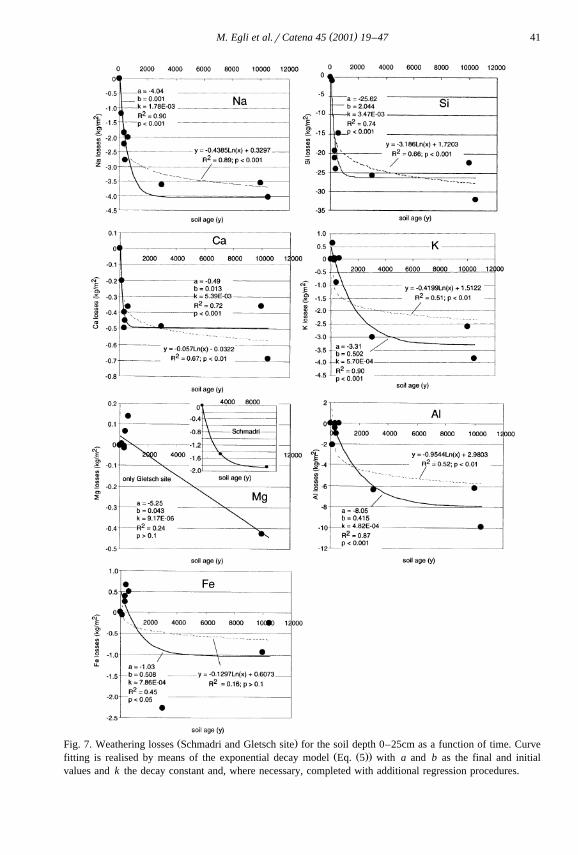
Ž .Fig. 7. Weathering losses Schmadri and Gletsch site for the soil depth 0–25cm as a function of time. CurveŽ Ž ..fitting is realised by means of the exponential decay model Eq. 5 with a and b as the final and initial
values and k the decay constant and, where necessary, completed with additional regression procedures.
( )M. Egli et al.rCatena 45 2001 19–4742
Ž Ž ..The results, thus, refer to D z cf. Eq. 1 . We found that the exponential decay modelincorporating an asymptote generally provides a good fit for the description of weather-ing. Many of the chemical depletion rates seem initially to be very rapid and thendecrease with time, approaching an asymptote. Quantities of Na and Si were depleted toasymptotic minima within 1500–2500 years for both the topsoil and the whole soilprofile, whereas Al decreased more gradually. Potassium exhibits an intermediatebehaviour. Asymptotic values are reached for the soil depth 0–25 cm after about6000–7000 years and with respect to the whole soil after about 10,000 years. However,
Ž .the curves indicate for some elements Na, Si, Ca already after 2000–3000 years nochange in time, and thus, almost no leaching. This might be questioned. The exponentialdecay model presumably also leads to that rather unrealistic result due to the lack ofsufficient data points especially during the time period of 2000–8000 years. Logarithmicregressions of nth order might give more meaningful results. This is especially the case
Ž .for Na, Si and Ca cf. Table 5 . Depletion or weathering rates comprises the loss of anelement per unit area and time. Weathering rates change also with soil development. In
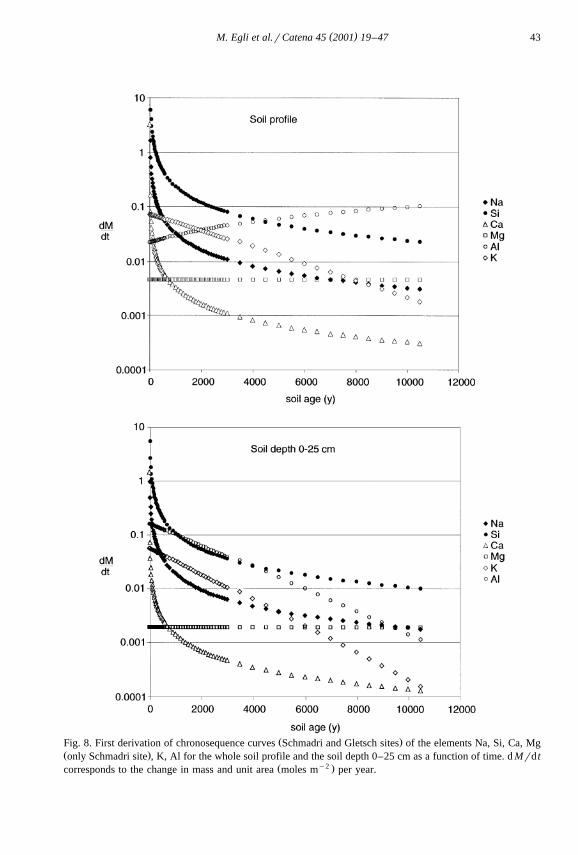
Ž .Fig. 8, the derivation of the chronofunctions according to Table 5 of the elements Ca,Mg, K, Na, Si, Al are presented.
The relative order of chemical removal from the most to least rapidly depletedelement is given in Fig. 8. The leaching rates are expressed as a change of moles my2 inrelation to the age of the soil. For the whole soil profile the order of elemental loss is
Ž .initially SiGNaGCa)K)Al) Mg and for the soil depth 0–25 cm SiGNaGCaŽ .GAlGK) Mg . After 10,000 years of soil development, these orders have distinctly
Ž .changed and become Al)Si) Mg GNaGK)Ca for the whole soil profile andŽ .Si)NaG Mg GAl)KGCa for the soil depth 0–25 cm. For these orders, only the
Mg release rates of the Gletsch site are considered, and thus, bracketed. Mg weatheringŽ .seems to be much faster at the Schmadri site Figs. 6 and 7 . Mass balance calculations
and chronofunction modelling indicate changing weathering rates with soil development.Si, Na, K and Ca initially weather quickly to already reach very low values after about
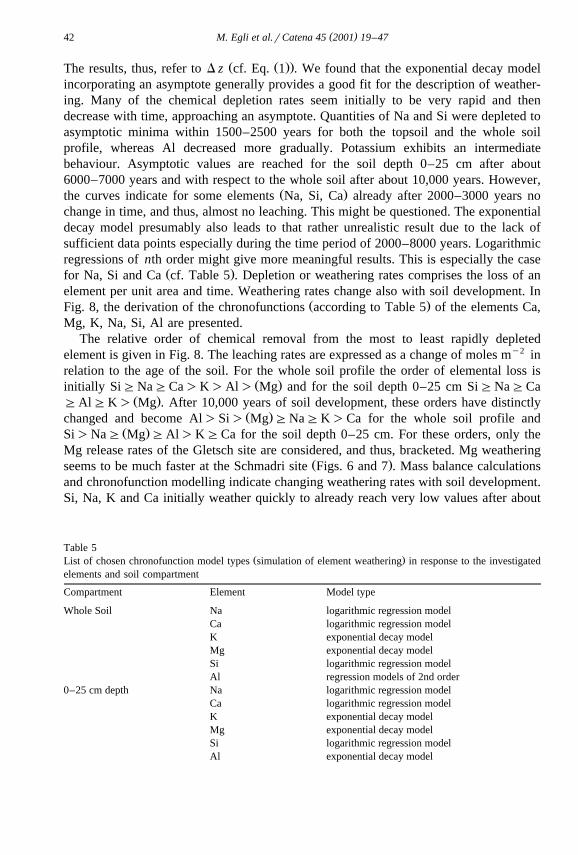
Table 5Ž .List of chosen chronofunction model types simulation of element weathering in response to the investigated
elements and soil compartment
Compartment Element Model type
Whole Soil Na logarithmic regression modelCa logarithmic regression modelK exponential decay modelMg exponential decay modelSi logarithmic regression modelAl regression models of 2nd order
0–25 cm depth Na logarithmic regression modelCa logarithmic regression modelK exponential decay modelMg exponential decay modelSi logarithmic regression modelAl exponential decay model
( )M. Egli et al.rCatena 45 2001 19–47 43
Ž .Fig. 8. First derivation of chronosequence curves Schmadri and Gletsch sites of the elements Na, Si, Ca, MgŽ .only Schmadri site , K, Al for the whole soil profile and the soil depth 0–25 cm as a function of time. d Mrd t
Ž y2 .corresponds to the change in mass and unit area moles m per year.
( )M. Egli et al.rCatena 45 2001 19–4744
4000 years. The order of element depletion is consistent with mineral weathering. Albiteand orthoclase components showed a distinct decrease for both investigation sites. Dueto the absence of amphiboles, pyroxenes and apatite, Na and K losses must beprincipally explained by changes in the albite and orthoclase content. Additionally,biotiteq illite weathered distinctly at least at the Schmadri site where relatively high Mgleaching rates have been recorded. Regarding weathering rates, there are some differ-ences observable between the whole soil profile and the soil depth 0–25 cm. Obviously,weathering rates of Al are much faster in the topsoil than those observed over the wholeprofile. These differences indicate that Al is quickly removed from the topsoil andpartially re-precipitated in the lower horizons and therefore accounts for the lowerleaching rates there. Additionally, acidification is slower with respect to the whole soilprofile and the consequent release of Al retarded. Furthermore, leaching of base cationsfrom the topsoil is equally rapid or even more intense than in the whole soil profile.Changes in soil properties across the chronosequences illustrate classic patterns of
Ž .podzolisation. Within short periods of time -2000 years substantial losses of basecations occur. With a certain time lag, Al and Fe are leached and the typical horizonswith eluvial and spodic characteristics are differentiated. These results are consistent
Žwith soil formation and podzolisation of soils developed from postglacial tills Righi et. Ž .al., 1999 . Righi et al. 1999 reported that weathering of trioctahedral minerals was
almost complete after 3000 years. Furthermore, the contrasted chemical evolutionobserved in the soil depth 0–25 cm and the whole soil profile is in good agreement with
Ž . Žthe concept of podzolisation, in respect of the eluvial E horizons and illuvial Bw, Bh.and Bs horizons horizons, which develop in podzols. However, our results do not allow
us to draw conclusions about the mechanisms of podzolisation which are still a matter ofŽcontroversy De Coninck, 1980; Ugolini et al., 1991; Gustafsson et al., 1995; Barrett,
.1997 . The low pH and the metal complexing properties of organic acids lead toincreased depletion rates of base cations but also to higher leaching rates of Al and Fe.In the lower compartment, that includes the B and C horizon, base cations and Si areleached leaving an Al and Fe residue.
4. Conclusions
Mass balance calculations indicate that extensive mineral weathering resulted inŽsignificant leaching losses of Si, major base cations, and Al particularly from upper
.horizons . These losses are especially pronounced in the early stages of soil formation.The exponential decay model incorporating an asymptote or logarithmic regressionmodel seems to provide a good fit for the description of weathering. The depletion ratesof base cations and Si seem initially to be very rapid and then decrease with time,approaching an asymptote. Aluminium seems to exhibit a varying weathering behaviour,with higher rates in the topsoil and a rather linear release with respect to the whole soilprofile. Regarding the whole soil profile, the production of dithionite extractable Fe andAl as well as the accumulation of organic C and N are initially very rapid and seem toreach asymptotic values after about 3000 years. Our investigations reveal that thegreatest changes in soil chemistry of alpine soils on granitic host material occur within
( )M. Egli et al.rCatena 45 2001 19–47 45
the first 3000–4000 years of soil development. Element leaching is rapidly slowed downafter this period.
However, few data are available for alpine soils detailing the changes within a periodof 2000–8000 years of soil development. The curves computed by means of specificregression models are lacking, therefore, in data for precisely this period of soildevelopment. Thus, the curves obtained still have a speculative character. This problemhas to be seen in context of the deglaciation in the postglacial period. Alpine glaciershave varied during the last 10,000 years near the borders of the moraines of the year1850. This fact makes it difficult to find sites with an undisturbed soil development inthe Alps with a weathering period between 500 and 10,000 years. Hence, furtherresearch is urged for this period of soil formation. Additionally, there are not manyinvestigations in the Alps, especially in alpine climate zones near or above thetimberline, with respect to chemical weathering rates. Knowledge of chemical weather-ing is, however, fundamental to the successful analysis of important environmentalissues such as acidification of soils or global warming.
Acknowledgements
This research was supported by a grant from the Kommission zur Forderung des¨Ž .akademischen Nachwuchses Universitat Zurich and by the Consiglio Nationale delle¨ ¨
Ž .Ricerche Italy . We are indebted to A. Stahel and K. Stahr for the access to the X-rayŽdiffractometer, to B. Kaegi for the laboratory work, to Dr. R. Funck Perkin Elmer,
.Switzerland for the Zr-analysis and to Dr. Melkerud and Dr. Boettinger for their helpfulcomments on an earlier version of the manuscript.
References
April, R., Newton, R., Truettner Coles, L., 1986. Chemical weathering in two Adirondack watersheds: pastand present-day rates. Geological Society of America Bulletin 97, 1232–1238.
Barrett, L.R., 1997. Podzolization under forest and stump prairie vegetation in northern Michigan. Geoderma78, 37–58.
Berner, R.A., 1995. Chemical weathering and its effect on atmospheric CO and climate. In: White, A.F.,2Ž .Brantley, S.L. Eds. , Chemical Weathering Rates of Silicate Minerals. Mineralogical Society of America,
Reviews in Mineralogy, vol. 31, pp. 565–583.Borggaard, O.K., 1988. Phase indication by selective dissolution techniques. In: Stucki, W., Goodman, B.A.,
Ž .Schwertmann, U. Eds. , Iron in Soils and Clay Minerals. Reidel, Dordrecht, pp. 83–89.Brimhall, G.H., Dietrich, W.E., 1987. Constitutive mass balance relations between chemical composition,
volume, density, porosity, and strain in metasomatic hydrochemical systems: Results on weathering andpedogenesis. Geochimica et Cosmochimica Acta 51, 567–587.
Brimhall, G.H., Lewis, C.J., Ford, C., Bratt, J., Taylor, G., Warin, O., 1991. Quantitative geochemicalapproach to pedogenesis: importance of parent material reduction, volumetric expansion, and eolian influxin laterization. Geoderma 51, 51–91.
Burga, C., Perret, R., 1997. Vegetation und Klima der Schweiz seit dem jungeren Eiszeitalter. Ott Verlag,¨Thun.
Chadwick, O.A., Brimhall, G.H., Hendricks, D.M., 1990. From a black to a gray box—a mass balanceinterpretation of pedogenesis. Geomorphology 3, 369–390.
( )M. Egli et al.rCatena 45 2001 19–4746
Cornu, S., Lucas, Y., Lebon, E., Ambrosi, J.P., Luziao, F., Rouiller, J., Bonnay, M., Neal, C., 1999. Evidenceof titanium moblity in soil profiles, Manaus, central Amazonia. Geoderma 91, 281–295.
Ž .Corti, G., Ugolini, F.C., Agnelli, A., 1998. Classing the soil skeleton greater than two millimeters : proposedapproach and procedure. Soil Science Society of America Journal 62, 1620–1629.
Dahlgren, R.A., Ugolini, F.C., 1991. Distribution and characterization of short-range-order minerals inSpodosols from the Washington Cascades. Geoderma 48, 391–413.
De Coninck, F., 1980. Major mechanisms in formation of spodic horizons. Geoderma 24, 101–128.Ž .EDI Eidgenossisches Departement des Innern , 1992. Hydrologischer Atlas der Schweiz. Landeshydrologie¨
Und-Geologie, Bern, Switzerland.Eggenberger, U., 1995. Mineral weathering in soils: experiments, field studies, and modeling, PhD Thesis,
University of Berne, Switzerland.Egli, M., Fitze, P., 2000. Formulation of pedologic mass balance based on immobile elements: a revision. Soil
Science 165, 437–443.Fitze, P.F., 1982. Zur Relativdatierung von Moranen aus der Sicht der Bodenentwicklung in den kristallinen¨
Zentralalpen. Catena 9, 265–306.Fitze, P., Kagi, B., 1999. Laboranleitung zur Untersuchung von Boden und Wasser. Geographisches Institut¨
der Universitat Zurich, Zurich, Switzerland.¨ ¨ ¨Gustafsson, J.P., Bhattacharya, P., Bain, D.C., Fraser, A.R., McHardy, W.J., 1995. Podzolisation mechanisms
and the synthesis of imogolite in northern Scandinavia. Geoderma 66, 167–184.Hardy, M., Jamagne, M., Elsass, F., Robert, M., Chesneau, D., 1999. Mineralogical development of the silt
Ž .fractions of a Podzoluvisol on loess in the Paris Basin France . European Journal of Soil Science 50,443–456.
Jenny, H., 1941. Factors of Soil Formation. McGraw-Hill, New York.Jenny, H., 1980. The Soil Resource. Springer, New York.Jersak, J., Amundson, R., Brimhall, G., 1995. A mass balance analysis of podzolization: examples from the
notheastern United States. Geoderma 66, 15–42.Keller, O., 1994. Entstehung und Entwicklung des Bodensees-Ein geologischer Lebenslauf. In: Maurer, H.
Ž .Ed. , Umweltwandel am Bodensee. UVK Fachverlag fur Wissenschaft und Studium, St. Gallen, pp.¨33–92.
Langley-Turnbaugh, S.J., Bockheim, J.G., 1998. Mass balance of soil evolution on late Quaternary marineterraces in coastal Oregon. Geoderma 84, 265–288.
Lichter, J., 1998. Rates of weathering and chemical depletion in soils across a chronosequence of LakeMichigan sand dunes. Geoderma 85, 255–282.
Liski, J., Ilvesniemi, H., Makela, A., Starr, M., 1998. Model analysis of the effect of soil age, fire and¨ ¨harvesting on the carbon storage of boreal forest soils. European Journal of Soil Science 49, 407–416.
Merritts, D.J., Chadwick, O.A., Hendricks, D.M., Brimhall, G.H., Lewis, C.J., 1992. The mass balance of soilevolution on late Quaternary marine terraces, northern California. GSA Bulletin 104, 1456–1470.
Nieuwenhuyse, A., van Breemen, N., 1997. Quantitative aspects of weathering and neoformation in selectedCosta Rican volcanic soils. Journal of the Soil Science Society of America 61, 1450–1458.
Olsson, M.T., Melkerud, P.-A., 2000. Weathering in three podzolized pedons on glacial deposits in northernSweden and central Finland. Geoderma 94, 149–161.
Parfitt, R.L., Hemni, T., 1982. Comparison of an oxalate-extraction method and an infrared spectroscopicmethod for determining allophane in soil clays. Soil Science and Plant Nutrition 28, 183–190.
Righi, D., Huber, K., Keller, C., 1999. Clay formation and podzol development from postglacial moraines inSwitzerland. Clay Minerals 34, 319–332.
Schaetzl, R.J., Barrett, L.R., Winkler, J.A., 1994. Choosing models for soil chronofunctions and fitting them todata. European Journal of Soil Science 45, 219–232.
Schlesinger, W.H., 1990. Evidence from chronosequence studies for a low carbon-storage potential of soils.Nature 348, 232–234.
Shoji, S., Fujiwara, Y., 1984. Active aluminium and iron in the humus horizons of andosols from northeasternJapan: their forms, properties, and significance in clay weathering. Soil Science 137, 216–226.
Theurillat, J.P., Felber, F., Geissler, P., Gobat, J.M., Fierz, M., Fischlin, A., Kupfer, P., Schlussel, A., Velluti,¨ ¨C., Zhao, G.-F., Williams, J., 1998. Sensitivity of plant and soil ecosystems of the alps to climate change.
( )M. Egli et al.rCatena 45 2001 19–47 47
Ž .In: Cebon, P., Dahinden, U., Davies, H.C., Imboden, D., Jaeger, C.C. Eds. , Views from the Alps. MITPress, Massachusetts, pp. 225–308.
Tuchschmid, M.P., 1995. Mineralogische und geochemische Charakterisierung von Bodenprofilen zur Darstel-lung der naturlichen bzw. anthropogenen Schwermetallfraktionen in Boden. Eidg. Forschungsanstalt fur¨ ¨ ¨
Ž .Wald, Schnee und Landschaft WSL , Birmensdorf, Switzerland.Ugolini, F.C., Dahlgren, R., La Mama, J., Nuhn, W., Zachara, J., 1991. Mineralogy and weathering processes
in recent and holocene tephra deposits in the Pacific Northwest, USA. Geoderma 51, 277–299.Ž .Wada, K., 1977. Allophane and imogolite. In: Dixon, J.B., Weed, S.B. Eds. , Minerals in Soil Environment.
Soil Science Society of America, Madison, WI, pp. 603–638.White, A.F., 1995. Chemical weathering rates of silicate minerals in soils. In: White, A.F., Brantley, S.L.
Ž .Eds. , Chemical Waethering Rates of Silicate Minerals. Reviews in Mineralogy, vol. 31, MineralogicalSociety of America, pp. 407–461.
Ž .Wipf, A., 1994. Gletschergeschichtliche Untersuchungen im Hinteren Lauterbrunnental BE , Diplomarbeit,Geographisches Institut, Universitat Zurich, Switzerland.¨ ¨
Witzig, J., 1999. Pedogenese und Verwitterungsraten ausgewahlter alpiner Boden unterschiedlichen Alters auf¨ ¨kristallinem Untergund, Diplomarbeit, Universitat Zurich, Switzerland.¨ ¨
Zumbuhl, H.J., Holzhauser, H., 1988. Alpengletscher in der Kleinen Eiszeit, Die Alpen, Z. d. Schw.¨Alpen-Clubs, pp. 129–322.