We wish to thank Anonymous Referee #1 for his thorough and ...
32
We wish to thank Anonymous Referee #1 for his thorough and useful comments. We have now revised our manuscript in accordance with the comments raised by the referee. We believe that this revision has substantially improved the quality of the manuscript. Please find below how we have addressed each comment, point by point. Comment 1 Page 3, line 22: I understand that a deposit of fine, cohesive sediment will decrease the supply of dissolved oxygen to the deposit-underlying sediment and so decrease the decomposition of organic matter in this sediment with oxygen as electron acceptor. If so, the contribution of anaerobic pathways to the overall decomposition will increase and the upwards diffusing reduced soluble end-products of this decomposition will likely be oxidised with oxygen at the oxic–anoxic boundary somewhere inside the deposit or in the deposit overlying seawater. That is, the re- oxidation of reduced substances (line 24) is not inhibited but simply relocated. Of course, this would not apply for reduced solid phases, but this perhaps needs to be clarified. Indeed, this is correct and we have therefore rephrased this part to clarify better how a physical barrier alters the contribution of anaerobic pathways: Page 3, line 22: “Firstly, the formation of a physical barrier increases the contribution of anaerobic pathways to the overall decomposition and relocates the re-oxidation of reduced solutes upwards (Colden and Lipcius 2015; Hohaia et al. 2014). Under these circumstances, reduced solid phases would only oxidise when sediment reworking or irrigation of large burrows by macrofauna brings them to the oxic layer.” Comment 2 Page 4, line 5: In my book, bioturbation includes the displacement of particles and the irrigation of burrows. In line 5, it reads ‘bioturbation or bio-irrigation’, so I assume that the authors do not consider burrow irrigation as a form of bioturbation. Perhaps this needs to be clarified as well. Kristensen et al. (2012) proposed to use bioturbation as an umbrella term, incorporating both burrow ventilation and particle reworking. Indeed, burrow ventilation is a mechanism evolved by infauna to enable a constant supply of fresh nutrients and oxygen by pumping overlying water into their burrows, and as a transport process clearly associated with bioturbation. However, since we aimed at disentangling the mechanisms of deposition-induced alteration of SCOC (burrow ventilation, macrofauna respiration or particle mixing into oxic layers) we preferred to distinguish between bioturbation (i.e. particle reworking) and bio-irrigation (i.e. burrow ventilation). We incorporated this rationale in the manuscript: Page 3, line 27: “Though both processes are interrelated and sometimes grouped under the umbrella term ‘bioturbation’ (Kristensen et al., 2012), we opted to use them as separate concepts, in order to clearly distinguish between particle reworking and solute transfer. Bioturbation and bio-irrigation can be significantly altered under…” Comment 3 Page 4, line 27. The authors state that their control (T0) did not receive a layer of pre- treated sediment. In line 30, however, they explain that the control did receive a 0.5 cm frozen mud cake, which consisted of pre-treated sediment and luminophores.
-
Upload
khangminh22 -
Category
Documents
-
view
0 -
download
0
Transcript of We wish to thank Anonymous Referee #1 for his thorough and ...
We wish to thank Anonymous Referee #1 for his thorough and useful comments. We have now revised
our manuscript in accordance with the comments raised by the referee. We believe that this revision
has substantially improved the quality of the manuscript. Please find below how we have addressed
each comment, point by point.
Comment 1 Page 3, line 22: I understand that a deposit of fine, cohesive sediment will decrease
the supply of dissolved oxygen to the deposit-underlying sediment and so decrease
the decomposition of organic matter in this sediment with oxygen as electron
acceptor. If so, the contribution of anaerobic pathways to the overall decomposition
will increase and the upwards diffusing reduced soluble end-products of this
decomposition will likely be oxidised with oxygen at the oxic–anoxic boundary
somewhere inside the deposit or in the deposit overlying seawater. That is, the re-
oxidation of reduced substances (line 24) is not inhibited but simply relocated. Of
course, this would not apply for reduced solid phases, but this perhaps needs to be
clarified.
Indeed, this is correct and we have therefore rephrased this part to clarify better how
a physical barrier alters the contribution of anaerobic pathways:
Page 3, line 22: “Firstly, the formation of a physical barrier increases the contribution
of anaerobic pathways to the overall decomposition and relocates the re-oxidation of
reduced solutes upwards (Colden and Lipcius 2015; Hohaia et al. 2014). Under these
circumstances, reduced solid phases would only oxidise when sediment reworking or
irrigation of large burrows by macrofauna brings them to the oxic layer.”
Comment 2 Page 4, line 5: In my book, bioturbation includes the displacement of particles and
the irrigation of burrows. In line 5, it reads ‘bioturbation or bio-irrigation’, so I
assume that the authors do not consider burrow irrigation as a form of bioturbation.
Perhaps this needs to be clarified as well.
Kristensen et al. (2012) proposed to use bioturbation as an umbrella term,
incorporating both burrow ventilation and particle reworking. Indeed, burrow
ventilation is a mechanism evolved by infauna to enable a constant supply of fresh
nutrients and oxygen by pumping overlying water into their burrows, and as a
transport process clearly associated with bioturbation. However, since we aimed at
disentangling the mechanisms of deposition-induced alteration of SCOC (burrow
ventilation, macrofauna respiration or particle mixing into oxic layers) we preferred to
distinguish between bioturbation (i.e. particle reworking) and bio-irrigation (i.e.
burrow ventilation). We incorporated this rationale in the manuscript:
Page 3, line 27: “Though both processes are interrelated and sometimes grouped under
the umbrella term ‘bioturbation’ (Kristensen et al., 2012), we opted to use them as
separate concepts, in order to clearly distinguish between particle reworking and solute
transfer. Bioturbation and bio-irrigation can be significantly altered under…”
Comment 3 Page 4, line 27. The authors state that their control (T0) did not receive a layer of pre-
treated sediment. In line 30, however, they explain that the control did receive a 0.5
cm frozen mud cake, which consisted of pre-treated sediment and luminophores.

How did this layer affect the mud–seawater solute exchange and the behaviour of
macroinfauna? I feel the authors should discuss this.
Our objective to disentangle the different mechanisms of altered oxygen consumption
necessitated the application of a luminophore-spiked mud cake on all treatments
(including the control sediments). Without such thin cake on the control the
importance of particle mixing and disturbance of the sediment matrix at the sediment-
water interface for deposition-altered functioning would have been impossible to
investigate. Moreover, though luminophores are in essence inert particles, the
absence of such a luminophore mud cake on the natural sediment in the control could
potentially have introduced bias between treatments due to species specific responses
to e.g. small modifications in physico-chemistry of the sediment matrix, hence creating
an experimental artefact. The high survival and appearance of clear bioturbation signs
at the sediment surface, already the day after application of the mud cake in the
control (photos are included in Supplementary material Annex 2), indicate that the
application of the thin deposit evoked fast migration to the sediment-water interface
in the control. However, we do not believe that this thin deposition and subsequent
fast disturbance related to benthos migration significantly altered functioning at the
longer term, i.e. at the end of the experiment 14 days after addition of the mud cakes.
This hypothesis is supported by the high survival but lower bioturbation and bio-
irrigation in the control as compared to the T1 treatment. Collectively, this suggests a
fast recovery of the sediment-water solute exchange following the deposition of the
thin mud cake in the control. Indeed the measured oxygen penetration depth and
SCOC in the control are comparable in magnitude to the diffusive and sediment
community oxygen fluxes measured in the same habitat and season in previous studies
(Van Colen et al. 2012; see manuscript for full reference). We have added this rationale
in the revised manuscript:
Page 4, line 31: “… on top of the natural sediment surface. The addition of this mud
cake ensured the quantification of particle mixing in these treatments and avoided
potential bias between treatments due to species specific responses to the physico-
chemical environment created by the mud cake. The addition of a luminophore mud
cake on top of the sediment surface in the control treatment did not profoundly affect
the natural oxygen fluxes or oxygen penetration depth. Our measured values were
comparable in magnitude to those of previous studies in the same habitat and season
(Van Colen et al. 2012; Annex 1), and clear bioturbation signs on the sediment surface
soon after deposition indicate fast migration to the sediment-water interface (Annex
2).”
Comment 4 Page 5, line 3. The deposit was free of organic matter, so its oxygen demand must
have been low increasing the penetration of oxygen into the layer. How do the
authors know that this deposit ‘prohibited (passive) exchange of dissolved oxygen
between the sampled community and the water column’? Did you measure the
penetration of oxygen into the freshly deposited layers with microelectrodes and did
you find the oxic-anoxic boundary somewhere inside the layer? If so, how did the four
different deposits (0.5, 1, 2, 5 mm) perform in regard to this penetration?
The oxygen penetration depth varied from shallower in the control to deeper below
the sediment-water interface in the more extreme deposits (that were largely
depleted in organic matter as compared to the control). However, oxygen penetration

depth remained restricted to the deposited layer for all treatments. Thus, oxygen did
not diffuse below the deposited layers into the natural community. The vertical
profiles of oxygen penetration are submitted as supplementary material to the
manuscript, to which we now refer in the text (Page 5, line 3; Page 9, line 32; See
comment 3).
Comment 5 Page 5, line 33. Here, BMU is defined as ‘biological-mediated oxygen uptake’. I found
this misleading because biological mediated oxygen consumption is also included in
estimates of DOU, that is, the consumption by bacterial processes, micro- and meio-
fauna. I believe that this contribution to the overall sediment oxygen consumption
should be termed ‘macrofauna mediated oxygen uptake’.
We agree that the terminology we used was potentially confusing and have therefore
followed the suggestion by this referee to change this term to ‘macrofauna-mediated
oxygen uptake’ in the revised version of the manuscript.
Comment 6 Page 8. Please consider moving numbers in parentheses to a table; this would
improve the readability of your text.
We have accepted this comment. We now refer to Tables 2 and 4 in the revised
manuscript which contain the results of the statistical test.
Comment 7 Page 8, line 37. ‘biotic-mediated oxygen consumption’. See comment above and
please use terms consistently.
This inconsistency apparently remained unnoticed by me and the co-authors, and we
have now corrected this throughout the revised manuscript.
Comment 8 Page 9, lines 14–28. I recommend moving this section to the introduction, so the
discussion starts with your results.
We have adopted this comment.
Comment 9 Page 9, line 31. Please show the oxygen penetration data in the Results section.
See also reply to comment 4. Oxygen penetration depths are now provided as
supplementary material to the manuscript.
Comment 10 Page 23, line 6. ‘benthic-mediated oxygen uptake (BMU)’. See comment above and
please use terms consistently.
Complied with this comment; see also reply to comment 7.

We are thankful for the useful comments of Anonymous Referee #2. We have revised the figure and
table captions accordingly:
The current table legend is more like discussion, and a mere descriptive of data is preferred. It would
be more appropriate that the authors simply provide the objective data, and let the readers to judge
whether your conclusion or interpretation are reasonable or not.
Comment 1 For example, in Table 1 (page 16) (1) Table legend. The top 3 species with the
cumulative contribution (>50%) to the total dissimilarity between treatments. The
SIMPER analysis, and the cumulative contribution can be described as footnote. (2)
Treatment. Please explain what these treatment mean. For example. What does T0-
1 refer to. Please simply state what these data represent. In addition, the cumulative
contribution column is redundant and can be deleted, or the contribution column can
be deleted because these two column are essentially the same.
We deleted the ‘Contribution’ column from the table and rewrote the caption as
follows, according to the referee’s suggestions:
“The three species with highest cumulative contribution (> 50 %) to the total
dissimilarity between treatments. The first column shows the treatments being
compared (e.g. T0-1: a comparison between treatments T0 and T1).”
We added a footnote to the table:
“Results from a SIMPER analysis.”
Comment 2 As for Table 2 (page 17) (1) In table legend, Please do not start with “Results ...”.
Please go straight forward what you want to present. For example, statistical factors
(2) Is it necessary to show all these factors?
We agree that a mere representation of F- and p-values could be sufficient for a decent
understanding of our results. All unnecessary columns (i.e. df, SS and MS) were
therefore deleted in the revised manuscript. We suggest the following caption, based
on the referee’s comment:
“Statistical factors from 2-factor blocked ANOVA tests with ‘Treatment’ (4 levels) and
‘Tank’ as factors. M1 till M4 stand for motility classes, as defined by Solan et al. (2004)
(M1: living fixed in a tube, M2: sessile, but not fixed in a tube, M3: slow movement
through the sediment, M4: free movement in a burrow system). Significant pair-wise
differences between treatments are given in the table. All results for species and
functional groups are given for densities.”
Comment 3 As for Table 3 (page 19). Please consider whether all these equations need to be
shown in a table. Maybe the equations could be placed in the supplementary
materials.
We opted to present the results of the linear regressions entirely in the main
manuscript, as it provides a complete understanding of the strength and direction of
the relationship between the response and predictor variables. Therefore, we would
prefer to keep the results as they are currently presented in the table.
In accordance to Comment 2, we opted to rewrite the caption of this table:

“Linear regressions of sediment community oxygen consumption (SCOC) against sets of
species (or functional group) densities, and ecosystem processes (bio-irrigation - Q -
and bioturbation - ����), and of bio-irrigation against the densities of species. Only
significant models (P (slope) < 0.05) were considered. M2 and M3 are motility classes
as defined by Solan et al. (2004) – M2: sessile, but not fixed in a tube, M3: slow
movement through the sediment.”
Comment 4 Figure 1. please explain the x axis, i.e., what the treatment of 0, 1, 2 and 5 mean.
We added the next sentence to the figure caption of this and the next two figures:
“The four treatments represent the thickness of the applied sediment layer (in cm).”

1
Functional trait responses to sediment deposition reduce
macrofauna-mediated ecosystem functioning in an estuarine
mudflat Sebastiaan Mestdagh1, Leila Bagaço1, Ulrike Braeckman1, Tom Ysebaert2,3, Bart De Smet1, 4, Tom
Moens1, Carl Van Colen1 5
1Ghent University, Marine Biology Research Group, Krijgslaan 281/S8, B-9000 Ghent, Belgium; 2Department of Estuarine and Delta Systems, NIOZ Royal Netherlands Institute for Sea Research and Utrecht
University, P.O. Box 140, 4400 AC Yerseke, The Netherlands; 3Wageningen University and Research, Wageningen Marine Research, P.O. Box 77, 4400 AB Yerseke, The 10
Netherlands; 4Present address: Flanders Marine Institute, Wandelaarkaai 7, 8400 Oostende, Belgium
Correspondence to: Sebastiaan Mestdagh ([email protected])

2
Abstract. Human activities, among which dredging and land use change in river basins, are altering estuarine
ecosystems. These activities may result in changes in sedimentary processes, affecting biodiversity of sediment
macrofauna. As macrofauna control sediment chemistry and fluxes of energy and matter between water column
and sediment, changes in the structure of macrobenthic communities could affect the functioning of an entire
ecosystem. We assessed the impact of sediment deposition on intertidal macrobenthic communities and on rates 5
of an important ecosystem function, i.e. sediment community oxygen consumption (SCOC). An experiment was
performed with undisturbed sediment samples from the Scheldt river estuary (SW Netherlands). The samples were
subjected to four sedimentation regimes: one control and three with a deposited sediment layer of 1, 2 or 5 cm.
Oxygen consumption was measured during incubation at ambient temperature. Luminophores applied at the
surface, and a seawater-bromide mixture, served as tracers for bioturbation and bio-irrigation, respectively. After 10
incubation, the macrofauna was extracted, identified and counted, and classified into functional groups based on
motility and sediment reworking capacity. Total macrofaunal densities dropped already under the thinnest
deposits. The most affected fauna were surficial and low-motile animals, occurring at high densities in the control.
Their mortality resulted in a drop in SCOC, which decreased steadily with increasing deposit thickness, while bio-
irrigation and bioturbation activity showed increases in the lower sediment deposition regimes, but decreases in 15
the more extreme treatments. The initial increased activity likely counteracted the effects of the drop in low-motile,
surficial fauna densities, resulting in a steady rather than sudden fall in oxygen consumption. We conclude that the
functional identity in terms of motility and sediment reworking can be crucial in our understanding of the
regulation of ecosystem functioning and the impact of habitat alterations such as sediment deposition.
Key words: biogeochemical cycling, bio-irrigation, bioturbation, ecosystem functioning, functional traits, 20
macrobenthos, SCOC, sediment deposition
3
1 Introduction
It is widely accepted that biodiversity plays an important role in ecosystem functioning. A higher biodiversity can
convey a higher resilience and a more efficient functioning of ecosystems in terms of, among others, nutrient
cycling and primary productivity (Cardinale et al., 2012; Hooper et al., 2005). Since biodiversity-mediated 5
ecosystem functioning depends on the functional identities of the species present in the community and their
densities (Braeckman et al., 2010; Van Colen et al., 2013), functional community descriptors often predict
functioning better than taxonomic diversity (Wong and Dowd, 2015). Functional traits, e.g. in terms of motility or
sediment reworking rate, can be an indication for a species’ behaviour. By being able to rework more or less
sediment, species can differentially influence biogeochemical cycling (Wrede et al., 2017). Furthermore, variations 10
in population densities of individual species can influence the ecosystem functioning as well (e.g. Braeckman et
al., 2010). Habitat changes that alter densities and/or induce behavioural change of specific functional groups of
organisms, e.g. top predators or key players in biogeochemical cycling (Allen and Clarke, 2007; Villnäs et al.,
2012), are therefore likely to change the functioning of ecosystems. Natural disturbances occur frequently in
coastal and estuarine ecosystems, and recent intense anthropogenic activities often significantly reduce ecosystem 15
resilience (Alestra and Schiel, 2015). An important example of such a human-induced change in coastal and
estuarine habitats is sediment deposition. Natural sedimentation is caused by surface runoff from the catchment
area or by tidal movements; the former can be intensified by land use change (Thrush et al., 2004). Furthermore,
dredging and dumping activities also contribute to sediment deposition, either directly or by creating sediment
plumes that subsequently settle down on the seabed (Van Lancker and Baeye, 2015). Such deposition events are 20
expected to alter the productivity of coastal soft-sediment habitats via direct and indirect mechanisms that affect
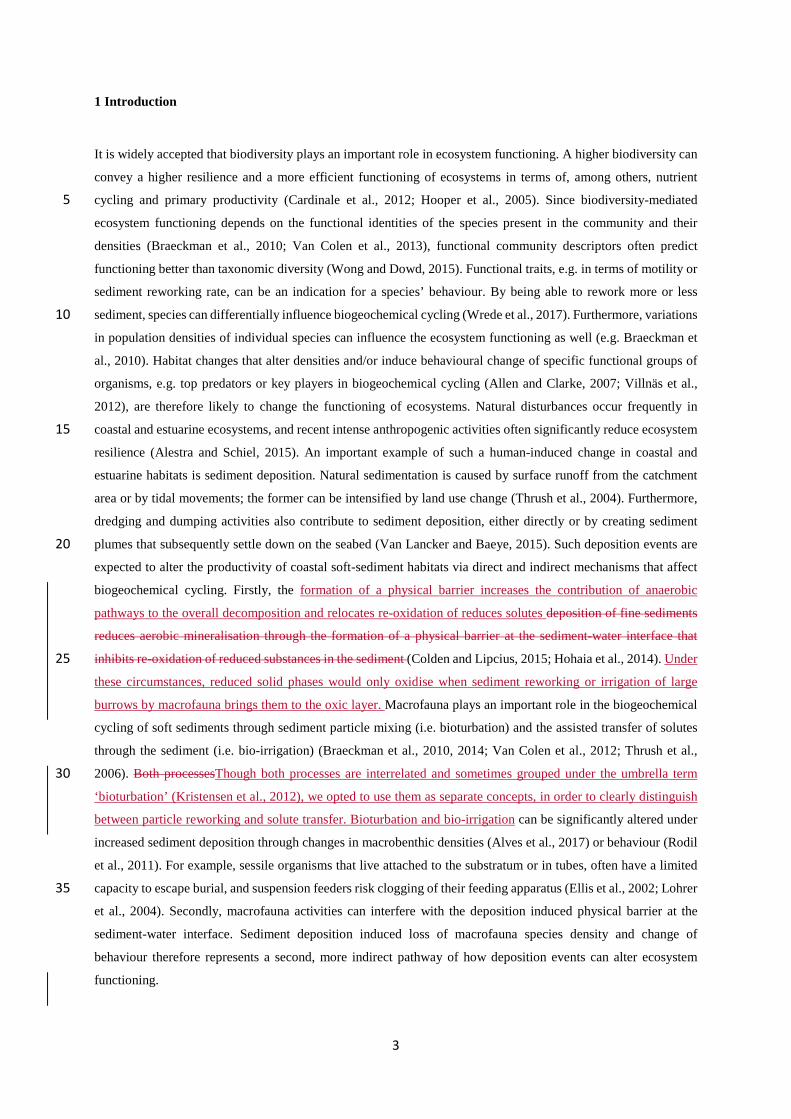
biogeochemical cycling. Firstly, the formation of a physical barrier increases the contribution of anaerobic
pathways to the overall decomposition and relocates re-oxidation of reduces solutes deposition of fine sediments
reduces aerobic mineralisation through the formation of a physical barrier at the sediment-water interface that
inhibits re-oxidation of reduced substances in the sediment (Colden and Lipcius, 2015; Hohaia et al., 2014). Under 25
these circumstances, reduced solid phases would only oxidise when sediment reworking or irrigation of large
burrows by macrofauna brings them to the oxic layer. Macrofauna plays an important role in the biogeochemical
cycling of soft sediments through sediment particle mixing (i.e. bioturbation) and the assisted transfer of solutes
through the sediment (i.e. bio-irrigation) (Braeckman et al., 2010, 2014; Van Colen et al., 2012; Thrush et al.,
2006). Both processesThough both processes are interrelated and sometimes grouped under the umbrella term 30
‘bioturbation’ (Kristensen et al., 2012), we opted to use them as separate concepts, in order to clearly distinguish
between particle reworking and solute transfer. Bioturbation and bio-irrigation can be significantly altered under
increased sediment deposition through changes in macrobenthic densities (Alves et al., 2017) or behaviour (Rodil
et al., 2011). For example, sessile organisms that live attached to the substratum or in tubes, often have a limited
capacity to escape burial, and suspension feeders risk clogging of their feeding apparatus (Ellis et al., 2002; Lohrer 35
et al., 2004). Secondly, macrofauna activities can interfere with the deposition induced physical barrier at the
sediment-water interface. Sediment deposition induced loss of macrofauna species density and change of
behaviour therefore represents a second, more indirect pathway of how deposition events can alter ecosystem
functioning.
4
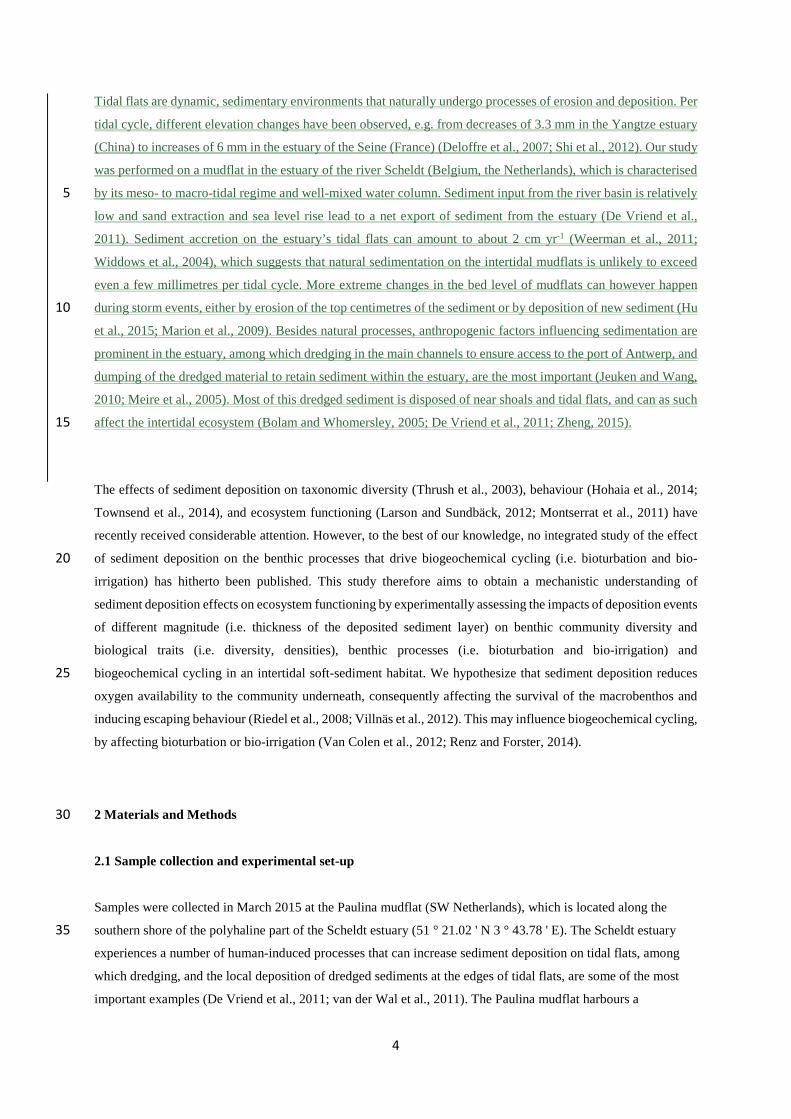
Tidal flats are dynamic, sedimentary environments that naturally undergo processes of erosion and deposition. Per
tidal cycle, different elevation changes have been observed, e.g. from decreases of 3.3 mm in the Yangtze estuary
(China) to increases of 6 mm in the estuary of the Seine (France) (Deloffre et al., 2007; Shi et al., 2012). Our study
was performed on a mudflat in the estuary of the river Scheldt (Belgium, the Netherlands), which is characterised
by its meso- to macro-tidal regime and well-mixed water column. Sediment input from the river basin is relatively 5
low and sand extraction and sea level rise lead to a net export of sediment from the estuary (De Vriend et al.,
2011). Sediment accretion on the estuary’s tidal flats can amount to about 2 cm yr-1 (Weerman et al., 2011;
Widdows et al., 2004), which suggests that natural sedimentation on the intertidal mudflats is unlikely to exceed
even a few millimetres per tidal cycle. More extreme changes in the bed level of mudflats can however happen
during storm events, either by erosion of the top centimetres of the sediment or by deposition of new sediment (Hu 10
et al., 2015; Marion et al., 2009). Besides natural processes, anthropogenic factors influencing sedimentation are
prominent in the estuary, among which dredging in the main channels to ensure access to the port of Antwerp, and
dumping of the dredged material to retain sediment within the estuary, are the most important (Jeuken and Wang,
2010; Meire et al., 2005). Most of this dredged sediment is disposed of near shoals and tidal flats, and can as such
affect the intertidal ecosystem (Bolam and Whomersley, 2005; De Vriend et al., 2011; Zheng, 2015). 15
The effects of sediment deposition on taxonomic diversity (Thrush et al., 2003), behaviour (Hohaia et al., 2014;
Townsend et al., 2014), and ecosystem functioning (Larson and Sundbäck, 2012; Montserrat et al., 2011) have
recently received considerable attention. However, to the best of our knowledge, no integrated study of the effect
of sediment deposition on the benthic processes that drive biogeochemical cycling (i.e. bioturbation and bio-20
irrigation) has hitherto been published. This study therefore aims to obtain a mechanistic understanding of
sediment deposition effects on ecosystem functioning by experimentally assessing the impacts of deposition events
of different magnitude (i.e. thickness of the deposited sediment layer) on benthic community diversity and
biological traits (i.e. diversity, densities), benthic processes (i.e. bioturbation and bio-irrigation) and
biogeochemical cycling in an intertidal soft-sediment habitat. We hypothesize that sediment deposition reduces 25
oxygen availability to the community underneath, consequently affecting the survival of the macrobenthos and
inducing escaping behaviour (Riedel et al., 2008; Villnäs et al., 2012). This may influence biogeochemical cycling,
by affecting bioturbation or bio-irrigation (Van Colen et al., 2012; Renz and Forster, 2014).
2 Materials and Methods 30
2.1 Sample collection and experimental set-up
Samples were collected in March 2015 at the Paulina mudflat (SW Netherlands), which is located along the
southern shore of the polyhaline part of the Scheldt estuary (51 ° 21.02 ' N 3 ° 43.78 ' E). The Scheldt estuary 35
experiences a number of human-induced processes that can increase sediment deposition on tidal flats, among
which dredging, and the local deposition of dredged sediments at the edges of tidal flats, are some of the most
important examples (De Vriend et al., 2011; van der Wal et al., 2011). The Paulina mudflat harbours a

5
functionally rich benthic macrofaunal community that is numerically dominated by polychaetes (Van Colen et
al., 2008, 2010).
Twenty-four cylindrical sediment corers (10 cm inner diameter, 29 cm length) were used to randomly collect
cores within a 5 x 5 m patch of sediment, consisting of 46 ± 0.9 % mud (<63 µm), 22.9 ± 0.4 % very fine sand
(63 – 125 µm), 21.7 ± 0.6 % fine sand (125 – 250 µm) and 9.4 ± 0.2 % medium sand (250 µm – 500 µm). 5
Additional sediment for the experimental deposition treatments had been collected at the same site a few days
before the start of the experiment. This additional sediment was sieved over a 1 mm mesh, dried in the lab at 60
°C, heated in a muffle furnace at 500 °C to remove all organic matter (so that treatment effects could be
unambiguously assigned to the physical smothering effect), rinsed with demineralized water, and subsequently
sieved again. 10
All cores were cut to 9 cm, and each core was subsequently subjected to one of four treatments, each with six
replicates. Each treatment except the control (T0) consisted of the application of a layer of the pre-treated
sediment with a thickness of 1 (T1), 2 (T2) or 5 cm (T5), including a 0.5 cm thick frozen mud cake containing
“Magenta” luminophores (Environmental Tracing Systems Ltd., Helensburgh, UK; median grain size 65 µm)
and pre-treated sediment in a 1:1 volume:volume ratio to measure bioturbation activity. The control treatment 15
only received a luminophore cake on top of the natural sediment surface. The addition of this mud cake ensured
the quantification of particle mixing in these treatments and avoided potential bias between treatments due to
species specific responses to the physico-chemical environment created by the mud cake. The addition of a
luminophore mud cake on top of the sediment surface in the control treatment did not profoundly affect the
natural oxygen fluxes or oxygen penetration depth. Our measured values were comparable in magnitude to those 20
of previous studies in the same habitat and season (Van Colen et al., 2012; Annex 1), and clear bioturbation
signs on the sediment surface soon after deposition indicate fast migration to the sediment-water interface
(Annex 2).
Seawater from the sampling location (10 °C and a salinity of 20.3, kept still in barrels in the lab for half a day to
allow suspended sediment to sink down) was carefully added on top of each core, up to the top edge of the corer. 25
After addition of the water, the added sediment layers compacted to an average of 1.09 ± 0.18 (T1), 1.52 ± 0.10
(T2) and 3.75 ± 0.11 cm (T5), respectively. The cores were incubated in two tanks under ambient temperature
and salinity conditions, filled until half the corer height to buffer for small changes in temperature, and provided
with a constant air supply through bubbling underneath the water surface in each core. Each tank had a total
capacity of 12 corers, and contained three replicates of each treatment. Oxygen did not penetrate deeper than the 30
lower boundary of the deposited sediment layers in the deposition treatments, hence the sediment deposition
created a physical barrier at the sediment-water interface prohibiting (passive) exchange of dissolved oxygen
between the sampled community and the water column at the onset of the experiment (Annex 1). The experiment
ran for 15 days, with different measurements taking place during this period. After letting the cores rest to regain
biogeochemical equilibria, sediment oxygen profiles were measured on days 7 and 8, oxygen fluxes on day 12, 35
followed by two days of measuring bio-irrigation and a final day on which the cores were sliced for further
analysis.

6
2.2 Biogeochemical cycling
For the SCOC measurements, all cores were equipped with a magnetic stirring ring and sealed with an air-tight
lid, fitted with two luer stopcocks enabling the sampling of the overlying water for the measurement of sediment-
water column exchange of oxygen. During five hours (approximately one-hour intervals), 40-ml water samples 5
were collected through one of the stopcocks using a glass syringe. Replacement water was added by opening the
second stopcock and allowing tank water to flow in. The water samples were treated with Winkler reagents
(Parsons et al., 1984) and stored at 4 °C until Winkler titration (Mettler Toledo G20, DGi 101-Mini oxygen
electrode, LabX Light Titration software, Columbus, OH, USA). Sediment community oxygen consumption rates
(SCOC) were then calculated from the linear decline in oxygen concentration, according to Eq. (1): 10
���� = −��
�
� (1)
where ��
� is the change in oxygen concentration in the overlying water (in mmol L-1 d-1), V is the volume of the
overlying water (in L), and A is the sediment surface area (in m2).
For the measurement of diffusive oxygen uptake (DOU), vertical sediment oxygen profiles were measured with a
Unisense OX100 Clark-type needle electrode (Unisense, Aarhus, Denmark). Three profiles were measured in each 15
core and the result was averaged, to account for spatial variability in the sediment. The DOU could then be
calculated by multiplying the negative slope of the initial decrease in oxygen concentration, by its diffusion
coefficient (Glud, 2008). The oxygen uptake that could be attributed to macrofaunal respiration was calculated by
the formulae described in Mahaut et al. (1995), in which ash-free dry weights (AFDW), calculated from wet
weights of the animals (see further) is used to calculate respiration rates: 20
� = 0.0174��.���� (2)
where R is the respiration rate in mg C d-1 and W the mean individual AFDW in mg C. The amount of carbon was
estimated to be 50 % for all species (Wijsman et al., 1999). Since this formula is only valid for the temperature
range of 15 to 20 °C, a Q10 of 2 was then assumed to correct the bias, and a respiratory quotient of 0.85 was used
to calculate the oxygen consumption, here characterised as faunal uptake (FU; Braeckman et al., 2010; Mahaut et 25
al., 1995). The remaining part of SCOC, after subtraction of DOU and FU, is the biologicallymacrofauna-mediated
oxygen uptake (BMUMMU ), caused indirectly by stimulation of aerobic remineralisation by macrofaunal
bioturbation and irrigation.
2.3 Bio-irrigation and bioturbation 30
One day after the oxygen flux measurements, water was siphoned off from each core and replaced by a NaBr-
seawater mixture to assess bio-irrigation. The NaBr solution had the same density as the seawater; both were mixed
to obtain a solution with a final concentration of 0.1 M NaBr. The solution was added with 100 mL syringes on
all cores until as close as possible to the edge, which amounted to 700 ml for T0, T1 and T2, and 600 ml for T5. 35
A first sample of 2 ml was taken immediately after adding the mixture and subsequently after 1, 2, 18 and 21

7
hours. The bromide concentrations were measured with ion-chromatography and used to calculate bio-irrigation
rates:
� = −��
�������
����
� (3)
where Q is the bio-irrigation rate, VOW is the volume of the overlying water in L, COW is the initial concentration
of bromide in the overlying water (mol L-1), CPW the bromide concentration in the pore water and ����
� the change 5
of bromide concentration in the overlying water over time (in mol L-1 d-1). For CPW, an estimation was made by
measuring the background concentration in untreated seawater.
On the 14th day of the experiment, the remaining water was siphoned off the cores, which were subsequently sliced
per 5 mm from the top until 2 cm into the natural sediment. Deeper slices were cut at a thickness of 10 mm. The
sediment in each slice was thoroughly homogenised, after which 5 to 10 mL was sampled and frozen at -20 °C, 10
awaiting further processing for the quantification of bioturbation.
The samples were subsequently dried for 48 hours at 60 °C; water was then carefully added again, after which the
sediment was spread open in a 55 mm inner diameter Petri dish. Each sample was photographed under UV light
(365 nm peak wavelength) and luminophores were counted with computer scripts in Matlab v8.1 (MathWorks
Inc., 2013) and R (R Development Core Team, 2013). A vertical profile of luminophore pixel counts was 15
constructed for each sediment core and additional R scripts were used to fit the profiles to a non-local bioturbation
model from which the biodiffusion coefficient (����, in cm2 d-1) was calculated (Wheatcroft et al., 1990). Since
luminophores were only applied on the sediment-water interface, the measured profiles represent disturbance of
the surface by bioturbating fauna, rather than providing a total picture of the sediment mixing underneath the
surface. 20
2.4 Macrofauna
The remaining 85 to 90 % of the sediment was rinsed over a 500 µm mesh-sized sieve to collect the macrofauna.
The animals were stained with a Rose Bengal dye in order to facilitate the identification. Organisms were identified 25
to species level, except for Oligochaeta and Spio sp. After identification, all animals were weighed to assess their
biomass. The ash-free dry weight (AFDW) was determined by using conversion factors from wet weights
(Sistermans et al., 2006). Biomasses were used to calculate the faunal respiration (Mahaut et al., 1995).
2.5 Data analysis 30
Diversity indices (Shannon-Wiener diversity H’ (base e), Pielou’s evenness J’ and species richness S) were
calculated with Primer v6.1 (Clarke and Gorley, 2006). All taxa were assigned to functional groups based on their
motility (from M1 – living fixed in a tube – till M4 – free three-dimensional movement through a burrow system)
and sediment reworking activity (surficial modifiers, biodiffusors, upward conveyors and downward conveyors), 35

8
according to Queiros et al. (2013). All downward conveyors in our study were also classified as upward conveyors,
since they can perform both sediment reworking activities.
Differences between the treatments for all biotic and abiotic variables, including all species’ densities, were first
tested by a 2-way ANOVA, where “Tank” and “Treatment” were used as factors. Since these analyses
demonstrated that there were no interaction effects of tank and treatment, a blocked-design ANOVA was applied, 5
with “Tank” as the blocking factor. A Tukey HSD test was used for pairwise comparisons in case of a significant
treatment effect. In case the assumptions of normality (tested with a Shapiro-Wilk test) and homogeneity of
variances (assessed with Levene’s test) for ANOVA were not met, a fourth-root transformation was performed on
the data. Differences in community composition were tested with multivariate two-way permutational analysis of
variance (PERMANOVA; Anderson et al., 2008). A Similarity Percentages analysis (SIMPER), based on a Bray-10
Curtis similarity matrix, was used to determine the species which contributed most to the differences between
treatments. When a significant treatment effect was found, pairwise PERMANOVA tests were performed in order
to detect differences between the treatments. The PERMANOVA tests were followed by a PERMDISP test to
define whether the found effects are influenced by heterogeneity of multivariate dispersions.
Linear regressions were applied to find relationships between the different response variables. Most importantly, 15
relationships were identified between ecosystem functioning (SCOC), benthic processes (bioturbation, bio-
irrigation) and the various biotic variables, including densities of all individual species. Further regression tests
investigated the contribution of individual species to the density – ecosystem functioning relationship, by using
the densities of all taxa as predictor variables. The optimal model was selected via stepwise combined backward
and forward selection. The variance inflation factor (VIF) was used to determine multicollinearity of the predictor 20
variables. All assumptions for linear regression were tested on the residuals and met (no outliers and normal
distribution).
All statistical analyses were performed with R v3.0.3 (R Development Core Team, 2013), except the
PERMANOVA and SIMPER tests, for which Primer v6.1 with PERMANOVA+ add-on was used (Clarke and
Gorley, 2006). 25
3 Results
3.1 Macrofauna
30
Sediment deposition affected community structure with the community present in T5 differing significantly from
the control (2-factor Permanova pseudo-F = 2.457, P = 0.013; pair-wise comparisons T0-5: P = 0.010). The
PERMDISP test was not significant for either the main test or the pair-wise comparison (main test F = 0.858, P =
0.5795; T0-T5: P = 0.6282). Species that contributed most to the dissimilarity in community structure between
these treatments were Aphelochaeta marioni and Oligochaeta spp. (Table 1). Densities of Polydora cornuta (T0: 35
381.97 ± 131.50 ind m-2, T1: 169.77 ± 53.68 ind m-2, T2: 42.44 ± 26.84 ind m-2, T5: 0 ± 0 ind m-2) and Scrobicularia
plana (T0: 403.19 ± 60.77 ind m-2, T1: 381.97 ± 80.53 ind m-2, T2: 106.10 ± 51.11 ind m-2, T5: 106.10 ± 83.28
ind m-2)(Table 2) were significantly lower in T5 (P. cornuta T0-T5: P = 0.003, T1-T5: P = 0.014; S. plana T0-T5:
9
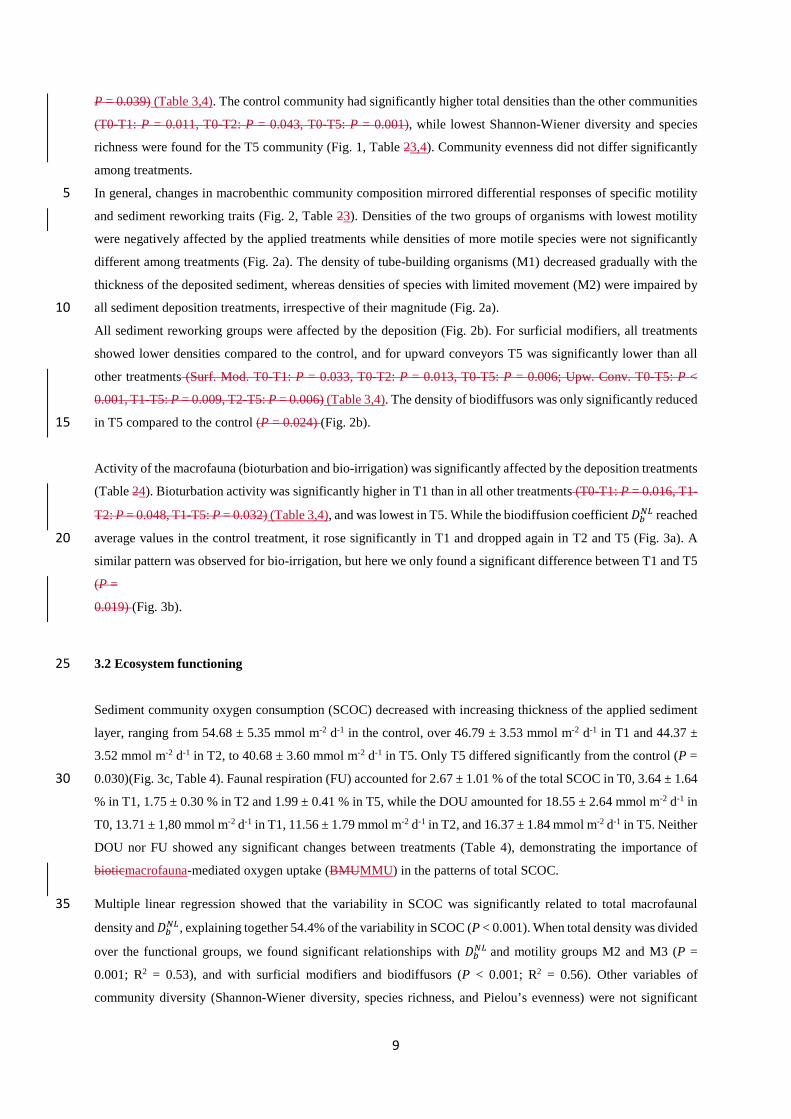
P = 0.039) (Table 3,4). The control community had significantly higher total densities than the other communities
(T0-T1: P = 0.011, T0-T2: P = 0.043, T0-T5: P = 0.001), while lowest Shannon-Wiener diversity and species
richness were found for the T5 community (Fig. 1, Table 23,4). Community evenness did not differ significantly
among treatments.
In general, changes in macrobenthic community composition mirrored differential responses of specific motility 5
and sediment reworking traits (Fig. 2, Table 23). Densities of the two groups of organisms with lowest motility
were negatively affected by the applied treatments while densities of more motile species were not significantly
different among treatments (Fig. 2a). The density of tube-building organisms (M1) decreased gradually with the
thickness of the deposited sediment, whereas densities of species with limited movement (M2) were impaired by
all sediment deposition treatments, irrespective of their magnitude (Fig. 2a). 10
All sediment reworking groups were affected by the deposition (Fig. 2b). For surficial modifiers, all treatments
showed lower densities compared to the control, and for upward conveyors T5 was significantly lower than all
other treatments (Surf. Mod. T0-T1: P = 0.033, T0-T2: P = 0.013, T0-T5: P = 0.006; Upw. Conv. T0-T5: P <
0.001, T1-T5: P = 0.009, T2-T5: P = 0.006) (Table 3,4). The density of biodiffusors was only significantly reduced
in T5 compared to the control (P = 0.024) (Fig. 2b). 15
Activity of the macrofauna (bioturbation and bio-irrigation) was significantly affected by the deposition treatments
(Table 24). Bioturbation activity was significantly higher in T1 than in all other treatments (T0-T1: P = 0.016, T1-
T2: P = 0.048, T1-T5: P = 0.032) (Table 3,4), and was lowest in T5. While the biodiffusion coefficient ���� reached
average values in the control treatment, it rose significantly in T1 and dropped again in T2 and T5 (Fig. 3a). A 20
similar pattern was observed for bio-irrigation, but here we only found a significant difference between T1 and T5
(P =
0.019) (Fig. 3b).
3.2 Ecosystem functioning 25
Sediment community oxygen consumption (SCOC) decreased with increasing thickness of the applied sediment
layer, ranging from 54.68 ± 5.35 mmol m-2 d-1 in the control, over 46.79 ± 3.53 mmol m-2 d-1 in T1 and 44.37 ±
3.52 mmol m-2 d-1 in T2, to 40.68 ± 3.60 mmol m-2 d-1 in T5. Only T5 differed significantly from the control (P =
0.030)(Fig. 3c, Table 4). Faunal respiration (FU) accounted for 2.67 ± 1.01 % of the total SCOC in T0, 3.64 ± 1.64 30
% in T1, 1.75 ± 0.30 % in T2 and 1.99 ± 0.41 % in T5, while the DOU amounted for 18.55 ± 2.64 mmol m-2 d-1 in
T0, 13.71 ± 1,80 mmol m-2 d-1 in T1, 11.56 ± 1.79 mmol m-2 d-1 in T2, and 16.37 ± 1.84 mmol m-2 d-1 in T5. Neither
DOU nor FU showed any significant changes between treatments (Table 4), demonstrating the importance of
bioticmacrofauna-mediated oxygen uptake (BMUMMU ) in the patterns of total SCOC.
Multiple linear regression showed that the variability in SCOC was significantly related to total macrofaunal 35
density and ����, explaining together 54.4% of the variability in SCOC (P < 0.001). When total density was divided
over the functional groups, we found significant relationships with ����
and motility groups M2 and M3 (P =
0.001; R2 = 0.53), and with surficial modifiers and biodiffusors (P < 0.001; R2 = 0.56). Other variables of
community diversity (Shannon-Wiener diversity, species richness, and Pielou’s evenness) were not significant
10
predictors of ecosystem functioning. While no single species was found to contribute significantly to ����, a
combination of several species contributed significantly to the variability in SCOC (P < 0.001; R2 = 0.56). The
taxa with a significant contribution were A. marioni and Cyathura carinata (Table 5). The statistically optimal
model for bio-irrigation included Hediste diversicolor and P. cornuta as positive contributors to this process (P <
0.001; R2 = 0.73)(Table 3)5). 5
4 Discussion
Tidal flats are dynamic, sedimentary environments that naturally undergo processes of erosion and deposition. Per
tidal cycle, different elevation changes have been observed, e.g. from decreases of 3.3 mm in the Yangtze estuary 10
(China) to increases of 6 mm in the estuary of the Seine (France) (Deloffre et al., 2007; Shi et al., 2012). Our study
was performed on a mudflat in the estuary of the river Scheldt (Belgium, the Netherlands), which is characterised
by its meso- to macro-tidal regime and well-mixed water column. Sediment input from the river basin is relatively
low and sand extraction and sea level rise lead to a net export of sediment from the estuary (De Vriend et al.,
2011). Sediment accretion on the estuary’s tidal flats can amount to about 2 cm yr-1 (Weerman et al., 2011; 15
Widdows et al., 2004), which suggests that natural sedimentation on the intertidal mudflats is unlikely to exceed
even a few millimetres per tidal cycle. More extreme changes in the bed level of mudflats can however happen
during storm events, either by erosion of the top centimetres of the sediment or by deposition of new sediment (Hu
et al., 2015; Marion et al., 2009). Besides natural processes, anthropogenic factors influencing sedimentation are
prominent in the estuary, among which dredging in the main channels to ensure access to the port of Antwerp, and 20
dumping of the dredged material to retain sediment within the estuary, are the most important (Jeuken and Wang,
2010; Meire et al., 2005). Most of this dredged sediment is disposed of near shoals and tidal flats, and can as such
affect the intertidal ecosystem (Bolam and Whomersley, 2005; De Vriend et al., 2011; Zheng, 2015).
Our results show that even thin sediment deposits can cause a drop in total macrofaunal density, mainly by
impacting the highly abundant surface-dwelling animals with low motility (Figs 1-2a,b). These animals, which 25
belong to reworking and motility class 2 due to their sessile lifestyle (Solan et al., 2004), lack the capacity to escape
the deposited sediment and are not adapted to living in deeper sediment layers (Essink, 1999). Since the oxygen
penetration depth never exceeded the thickness of the deposited sediment layer (Annex 1), we can assume that
oxygen stress was a major driver for the observed decrease in faunal densities. In treatments T1 and T2, oxygen
stress was possibly reduced by the increased activity of the macrofauna, due to the animals still being able to 30
disturb the surface and oxygenate the underlying sediment. Hypoxia can induce escaping behaviour in benthic
fauna, as observed in our intermediate treatments, and increase mortality when more severe (Riedel et al., 2008;
Villnäs et al., 2012).
Being identified as significant contributors to changes in SCOC, surface-dwelling and low-motile animals are
expected to show density patterns similar to those of SCOC itself. However, SCOC only gradually declined with 35
increasing thickness of the deposited sediment, and this decrease became significant only in the most extreme
treatment (T5). Since DOU proved to be constant over all treatments and macrofaunal respiration was negligible
compared to the total oxygen consumption, the observed changes in SCOC could be attributed to oxygen uptake

11
caused indirectly by activity of the benthos (i.e. bioturbation and/or bio-irrigation). However, both bio-irrigation
and bioturbation, the latter of which was linearly related to SCOC, showed that activity increased in treatments T1
and T2. This activity was likely caused by animals for which we found a linear relationship with bioturbation or
bio-irrigation, like H. diversicolor, that are highly mobile and can bury upwards towards the surface, thereby partly
irrigating the sediment. Hediste diversicolor is a ‘gallery-diffusor’, which combines biodiffusion in a dense gallery 5
system with biotransport to the bottoms of the tubes (François et al., 2002; Hedman et al., 2011), as well as a well-
known bioirrigator (Kristensen and Hansen, 1999; Riisgaard and Larsen, 2005). Its activity can be expected to
result in the oxygenation of deeper sediment layers, but this effect was probably not sufficient to counteract the
loss of less mobile, surface-dwelling fauna. Consequently, we observed a gradual and significant decline in SCOC,
caused by the disappearance of an abundant group of organisms. Upon addition of the thick sediment layer in 10
treatment T5, species richness dropped significantly and the densities of upward conveyors decreased
considerably, hence preventing the transport of organically rich deep sediment to the surface, through the deposited
layer. As a result, the deposited sediment essentially functioned as a barrier, preventing contact between sediment
organic matter and oxygen in the water column, and therefore reducing microbial degradation and respiration.
Through alterations in functional trait abundances and community composition, natural and anthropogenic 15
disturbances can affect the entire ecosystem functioning (Bolam et al., 2002; Rodil et al., 2011). In the case of
burial by sediment deposition, our experiment revealed that SCOC can be affected by causing mortality among
surface-dwelling and low motile animals, forming the most abundant functional groups of macrobenthos in our
system. Macrobenthic diversity and abundance have been shown to exert some control on the magnitude of solute
fluxes across the sediment-water interface (Herman et al., 1999; Thrush et al., 2006). Furthermore, previous studies 20
have shown that functional traits of species can be of great importance to explain ecosystem functioning, rather
than or additional to taxonomic diversity (Braeckman et al., 2010; Hooper et al., 2005). Our results highlight the
importance of both macrofaunal densities, and the functional identity of species. It is clear that taxonomic diversity
alone was not sufficient to explain the changes in ecosystem functioning in our experiment, whereas closer
inspection of the functional identities provided more realistic insights. 25
It should be noted that the sediment we used for deposition was completely defaunated and did not contain organic
matter. Whereas the aim of using defaunated sediment was to allow a better mechanistic understanding of the
consequences of sediment deposition, it does not reflect natural conditions. Dredged material from the bottom of
the estuary is much richer in organic material and might lead to different results in a similar experiment. Cottrell
et al. (2016) showed that benthic species can have a variable tolerance for changes in the enrichment of the 30
sediment, with higher mortalities under high organic loading (and hence likely stronger impacts on macrofauna-
mediated biogeochemical cycling).
5 Conclusion 35
Our experiment revealed new insights into the effects of sediment deposition on the intertidal benthic ecosystem.
We found a negative effect on ecosystem functioning, with alterations in macrofauna community structure and
activity as the underlying mechanisms. With increasing thickness of the deposited sediment layer, a shift to lower

12
densities of low-motile and surface-dwelling animals resulted in decreased functioning, even though this was
initially dampened by an increased activity of more motile and deeper-living fauna. The latter were responsible
for a sustained oxygen penetration through the deposited layer under intermediate treatments, but failed to
efficiently do so under more extreme circumstances. It was clear that taxonomic diversity did not suffice to explain
changes in functioning, while the functional identity of species did give us important additional insights. 5
Data availability
All data will be deposited in the VLIZ Marine Data Archive (http://mda.vliz.be/introduction.php).
Author contributions 10
SM, LB and CVC devised the experiments. SM and LB carried out the experimental work and collected all data.
SM and CVC led the writing of the manuscript, to which all authors contributed. All authors declare that they do
not have any conflict of interest.
Acknowledgements 15
Sebastiaan Mestdagh acknowledges a PhD grant from the Special Research Fund (BOF) of Ghent University. BOF
also provided additional financial support through GOA projects 01GA1911W and 01G02617. Ulrike Braeckman
and Carl Van Colen are post-doctoral fellows of the Flemish Research Fund (FWO). We would like to thank the
laboratory staff at the Marine Biology Research Group of Ghent University who assisted us with our research:
Niels Viaene for help during sampling and Bart Beuselinck for grain size analysis. In addition, we want to thank 20
the lab technicians Jan Sinke and Peter van Breugel at the Royal Dutch Institute for Sea Research (NIOZ –
Yerseke) for analysing bromide samples.
References
Alestra, T. and Schiel, D. R. Impacts of local and global stressors in intertidal habitats: influence of altered nutrient, 25
sediment and temperature levels on the early life history of three habitat-forming macroalgae. - J. Exp. Mar. Bio.
Ecol. 468:29–36, 2015.
Allen, J. I. and Clarke, K. R. Effects of demersal trawling on ecosystem functioning in the North Sea: a modelling
study. - Mar. Ecol. Prog. Ser. 336:63–75, 2007.
Alves, R. M. S., Vanaverbeke, J., Bouma, T. J., Guarini, J. M., Vincx, M., and Van Colen, C. Effects of temporal 30
fluctuation in population processes of intertidal Lanice conchilega (Pallas, 1766) aggregations on its ecosystem
engineering. - Estuar. Coast. Shelf Sci. 188:88–98, 2017.
Anderson, M. J. A new method for non-parametric multivariate analysis of variance. - Austral Ecol. 26:32–46,

13
2001.
Anderson, M. J., Gorley, R. N., and Clarke, K. R. PERMANOVA+ for PRIMER: guide to software and statistical
methods. - PRIMER-E, 2008.
Bolam, S. G., Fernandes, T. F., and Huxham, M. Diversity, biomass, and ecosystem processes in the marine
benthos. - Ecol. Monogr. 72(4):599–615, 2002. 5
Bolam, S. G. and Whomersley, P. Development of macrofaunal communities on dredged material used for mudflat
enhancement: a comparison of three beneficial use schemes after one year. - Mar. Pollut. Bull. 50:40–47, 2005.
Braeckman, U., Foshtomi, M. Y., Van Gansbeke, D., Meysman, F., Soetaert, K., Vincx, M., and Vanaverbeke, J.
Variable importance of macrofaunal functional biodiversity for biogeochemical cycling in temperate coastal
sediments. - Ecosystems 17(4):720–37, 2014. 10
Braeckman, U., Provoost, P., Gribsholt, B., Van Gansbeke, D., Middelburg, J. J., Soetaert, K., Vincx, M., and
Vanaverbeke, J. Role of macrofauna functional traits and density in biogeochemical fluxes and bioturbation. -
Mar. Ecol. Prog. Ser. 399:173–86, 2010.
Cardinale, B. J., Duffy, J. E., Gonzalez, A., Hooper, D. U., Perrings, C., Venail, P., Narwani, A., Mace, G. M.,
Tilman, D., Wardle, D. A., Kinzig, A. P., Daily, G. C., Loreau, M., Grace, J. B., Larigauderie, A., and Srivastava, 15
D. S. Biodiversity loss and its impact on humanity. - Nature 486:59–67, 2012.
Clarke, K. R. and Gorley, R. N. PRIMER v6: user manual/tutorial. - PRIMER-E, 2006.
Colden, A. M. and Lipcius, R. N. Lethal and sublethal effects of sediment burial on the eastern oyster crassostrea
virginica. - Mar. Ecol. Prog. Ser. 527:105–17, 2015.
Cottrell, R. S., Black, K. D., Hutchison, Z. L., and Last, K. S. The influence of organic material and temperature 20
on the burial tolerance of the blue mussel, Mytilus edulis: considerations for the management of marine aggregate
dredging. - PLoS One 11(1):e0147534, 2016.
De Vriend, H. J., Wang, Z., Ysebaert, T., Herman, P. M. J., and Ding, P. Eco-morphological problems in the
yangtze estuary and the western scheldt. - Wetlands 31:1033–42, 2011.
Deloffre, J., Verney, R., Lafite, R., Lesueur, P., Lesourd, S., and Cundy, A. B. Sedimentation on intertidal mudflats 25
in the lower part of macrotidal estuaries: sedimentation rhythms and their preservation. - Mar. Geol. 241(1–4):19–
32, 2007.
Ellis, J., Cummings, V., Hewitt, J., Thrush, S., and Norkko, A. Determining effects of suspended sediment on
condition of a suspension feeding bivalve (Atrina zelandica): results of a survey, a laboratory experiment and a
field transplant experiment. - J. Exp. Mar. Bio. Ecol. 267:147–74, 2002. 30
Essink, K. Ecological effects of dumping of dredged sediments; options for managements. - J. Coast. Conserv.
5:69–80, 1999.
François, F., Gerino, M., Stora, G., Durbec, J., and Poggiale, J. Functional approach to sediment reworking by
gallery-forming macrobenthic organisms: modeling and application with the polychaete Nereis diversicolor. - Mar.

14
Ecol. Prog. Ser. 229:127–36, 2002.
Glud, R. N. Oxygen dynamics of marine sediments. - Mar. Biol. Res. 4:243–89, 2008.
Hedman, J. E., Gunnarsson, J. S., Samuelsson, G., and Gilbert, F. Particle reworking and solute transport by the
sediment-living polychaetes Marenzelleria neglecta and Hediste diversicolor. - J. Exp. Mar. Bio. Ecol. 407:294–
301, 2011. 5
Herman, P. M. J., Middelburg, J. J., van de Koppel, J., and Heip, C. H. R. Ecology of estuarine macrobenthos. -
Adv. Ecol. Res. 29:195–240, 1999.
Hohaia, A., Vopel, K., and Pilditch, C. A. Thin terrestrial sediment deposits on intertidal sandflats: effects on pore
water solutes and juvenile bivalve burial behaviour. - Biogeosciences 11:2225–35, 2014.
Hooper, D. U., Chapin, F. S., Ewel, J. J., Hector, A., Inchausti, P., Lavorel, S., and Lawton, J. H. Effects of 10
biodiversity on ecosystem functioning: a consensus of current knowledge. - Ecol. Monogr. 75(1):3–35, 2005.
Hu, Z., Lenting, W., Van Der Wal, D., and Bouma, T. J. Continuous monitoring bed-level dynamics on an intertidal
flat: introducing novel, stand-alone high-resolution sed-sensors. - Geomorphology 245:223–30, 2015.
Jeuken, M. C. J. L. and Wang, Z. B. Impact of dredging and dumping on the stability of ebb-flood channel systems.
- Coast. Eng. 57(6):553–66, 2010. 15
Kristensen, E., Penha-Lopes, G., Delefosse, M., Valdemarsen, T., Quintana, C. O., and Banta, G. T. What is
bioturbation? The need for a precise definition for fauna in aquatic sciences. - Mar. Ecol. Prog. Ser. 446: 285-302,
2012.
Kristensen, K. and Hansen, K. Transport of carbon dioxide and ammonium in bioturbated (Nereis diversicolor)
coastal, marine sediments. - Biogeochemistry 45:147–68, 1999. 20
Larson, F. and Sundbäck, K. Recovery of microphytobenthos and benthic functions after sediment deposition. -
Mar. Ecol. Prog. Ser. 446: 31-44, 2012.
Lohrer, A. M., Thrush, S. F., Hewitt, J. E., Berkenbusch, K., Ahrens, M., and Cummings, V. J. Terrestrially derived
sediment: response of marine macrobenthic communities to thin terrigenous deposits. - Mar. Ecol. Prog. Ser.
273:121–38, 2004. 25
Mahaut, M. L., Sibuet, M., and Shirayama, Y. Weight-dependent respiration rates in deep-sea organisms. - Deep.
Res. Part I 42(9):1575–82, 1995.
Marion, C., Anthony, E. J., and Trentesaux, A. Short-term (≤2 yrs) estuarine mudflat and saltmarsh sedimentation:
high-resolution data from ultrasonic altimetery, rod surface-elevation table, and filter traps. - Estuar. Coast. Shelf
Sci. 83(4):475–84, 2009. 30
Meire, P., Ysebaert, T., Van Damme, S., Van Den Bergh, E., Maris, T., and Struyf, E. The Scheldt estuary: a
description of a changing ecosystem. - Hydrobiologia 540:1–11, 2005.
Montserrat, F., Suykerbuyk, W., Al-Busaidi, R., Bouma, T. J., van der Wal, D., and Herman, P. M. J. Effects of

15
mud sedimentation on lugworm ecosystem engineering. - J. Sea Res. 65:170–81, 2011.
Parsons, T. R., Maita, Y., and Lalli, C. M. A Manual of Chemical and Biological Methods for Seawater Analysis.
1st ed. New York: Pergamon Press, 1984.
Queirós, A. M., Birchenough, S. N. R., Bremner, J., Godbold, J. A., Parker, R. E., Romero-Ramirez, A., Reiss, H.,
Solan, M., Somerfield, P. J., Van Colen, C., Van Hoey, G., and Widdicombe, S. A bioturbation classification of 5
European marine infaunal invertebrates. - Ecol. Evol. 3(11):3958–85, 2013.
R Development Core Team. R: a language and environment for statistical computing edited by R. D. C. Team. -
R Found. Stat. Comput, 2013.
Renz, J. R. and Forster, S. Effects of bio-irrigation by the three sibling species of Marenzelleria spp. on solute
fluxes and porewater nutrient profiles. - Mar. Ecol. Prog. Ser. 505:145–59, 2014. 10
Riedel, B., Zuschin, M., Haselmair, A., and Stachowitsch, M. Oxygen depletion under glass: behavioural responses
of benthic macrofauna to induced anoxia in the northern Adriatic. - J. Exp. Mar. Bio. Ecol. 367(1):17–27, 2008.
Riisgaard, H. U. and Larsen, P. S. Water pumping and analysis of flow in burrowing zoobenthos: an overview. -
Aquat. Ecol. 39:237–58, 2005.
Rodil, I. F., Lohrer, A. M., Chiaroni, L. D., Hewitt, J. E., and Thrush, S. F. Disturbance of sandflats by thin 15
terrigenous sediment deposits: consequences for primary production and nutrient cycling. - Ecol. Appl. 21(2):416–
26, 2011.
Shi, B. W., Yang, S. L., Wang, Y. P., Bouma, T. J., and Zhu, Q. Relating accretion and erosion at an exposed tidal
wetland to the bottom shear stress of combined current-wave action. - Geomorphology 138(1):380–89, 2012.
Sistermans, W. C. H., Hummel, H., Dekker, A., and Dek, L. A. Inventarisatie Macrofauna Westerschelde Najaar 20
2005: Rapportage in Het Kader van de Evaluatie van de Verdieping van de Westerschelde. NIOO-CEME,
Yerseke, 2006.
Solan, M., Cardinale, B. J., Downing, A. L., Engelhardt, K. A. M., Ruesink, J. L., and Srivastava, D. S. Extinction
and ecosystem function in the marine benthos. - Science (80-. ). 306(5699):1177–80, 2004.
Thrush, S. F., Hewitt, J. E., Cummings, V. J., Ellis, J. I., Hatton, C., Lohrer, A., and Norkko, A. Muddy waters: 25
elevating sediment input to coastal and estuarine habitats. - Front. Ecol. Environ. 2(6):299–306, 2004.
Thrush, S. F., Hewitt, J. E., Gibbs, M., Lundquist, C., and Norkko, A. Functional role of large organisms in
intertidal communities: community effects and ecosystem function. - Ecosystems 9:1029–40, 2006.
Thrush, S. F., Hewitt, J. E., Norkko, A., Cummings, V. J., and Funnell, G. A. Macrobenthic recovery processes
following catastrophic sedimentation on estuarine sandflats. - Ecol. Appl. 13(5):1433–55, 2003. 30
Townsend, M., Thrush, S. F., Hewitt, J. E., Lohrer, A. M., and McCartain, L. Behavioural changes in the tellinid
bivalve Macomona liliana (Iredale, 1915) following exposure to a thin terrigenous sediment deposition event:
evidence from time-lapse photography. - Cah. Biol. Mar. 55:475–83, 2014.

16
Van Colen, C., Montserrat, F., Vincx, M., Herman, P. M. J., Ysebaert, T., and Degraer, S. Macrobenthic recovery
from hypoxia in an estuarine tidal mudflat. - Mar. Ecol. Prog. Ser. 372:31–42, 2008.
Van Colen, C., De Backer, A., Meulepas, G., van der Wal, D., Vincx, M., Degraer, S., and Ysebaert, T. Diversity,
trait displacement and shifts in assemblage structure of tidal flat deposit feeders along a gradient of hydrodynamic
stress. - Mar. Ecol. Prog. Ser. 406: 79-89, 2010. 5
Van Colen, C., Rossi, F., Montserrat, F., Andersson, M. G. I., Gribsholt, B., Herman, P. M. J., Degraer, S., Vincx,
M., Ysebaert, T., and Middelburg, J. J. Organism-sediment interactions govern post-hypoxia recovery of
ecosystem functioning. - PLoS One 7(11):e49795, 2012.
Van Colen, C., Thrush, S. F., Vincx, M., and Ysebaert, T. Conditional responses of benthic communities to
interference from an intertidal bivalve. - PLoS One 8(6):e65861, 2013. 10
Van Lancker, V. and Baeye, M. Wave glider monitoring of sediment transport and dredge plumes in a shallow
marine sandbank environment. - PLoS One 10(6):e0128948, 2015.
Villnäs, A., Norkko, J., Lukkari, K., Hewitt, J., and Norkko, A. Consequences of increasing hypoxic disturbance
on benthic communities and ecosystem functioning. - PLoS One 7(10):e44920, 2012.
van der Wal, D., Forster, R. M., Rossi, F., Hummel, H., Ysebaert, T., Roose, F., and Herman, P. M. J. Ecological 15
evaluation of an experimental beneficial use scheme for dredged sediment disposal in shallow tidal waters. - Mar.
Pollut. Bull. 62:99–108, 2011.
Weerman, E. J., Herman, P. M. J., and Van De Koppel, J. Top-down control inhibits spatial self-organization of a
patterned landscape. - Ecology 92(2):487–95, 2011.
Wheatcroft, R. A., Jumars, P. A., Smith, C. R., and Nowell, A. R. M. A mechanistic view of the particulate 20
biodiffusion coefficient: step lengths, rest periods and transport directions. - J. Mar. Res. 48:177–207, 1990.
Widdows, J., Blauw, A., Heip, C. H. R., Herman, P. M. J., Lucas, C. H., Middelburg, J. J., Schmidt, S., Brinsley,
M. D., Twisk, F., and Verbeek, H. Role of physical and biological processes in sediment dynamics of a tidal flat
in Westerschelde estuary, SW Netherlands. - Mar. Ecol. Prog. Ser. 274:41–56, 2004.
Wijsman, J. W. M., Herman, P. M. J., and Gomoiu, M. T. Spatial distribution in sediment characteristics and 25
benthic activity on the northwestern Black Sea shelf. - Mar. Ecol. Prog. Ser. 181:25–39, 1999.
Wong, M. C. and Dowd, M. Patterns in taxonomic and functional diversity of macrobenthic invertebrates across
seagrass habitats: a case study in Atlantic Canada. - Estuaries and Coasts 38:2323–36, 2015.
Wrede, A., Dannheim, J., Gutow, L., and Brey, T. Who really matters : influence of German Bight key bioturbators
on biogeochemical cycling and sediment turnover biogeochemical cycling and sediment turnover. - J. Exp. Mar. 30
Bio. Ecol. 488:92–101, 2017.
Zheng, B. Sustainabililty of the multi-channel system in the Westerschelde under influence of dredging and
disposal. Pp. 65–70 in E-proceedings of the 36th IAHR World Congress. The Hague, The Netherlands: IAHR,
2015.

17

18
TABLE 1: The three species with highest cumulative contribution (> 50 %) to the total dissimilarity between
treatments*. The first column shows the treatments being compared (e.g. T0-1: a comparison between treatments
T0 and T1).
Treatments Average dissimilarity Species Cumulative contribution
T0-1 42.14
Aphelochaeta marioni 37.61 %
Oligochaeta spp. 59.97 %
Polydora cornuta 65.83 %
T0-2 36.49
Aphelochaeta marioni 37.86 %
Oligochaeta spp. 54.76 %
Polydora cornuta 62.00 %
T0-5 48.60
Aphelochaeta marioni 35.25 %
Oligochaeta spp. 57.60 %
Polydora cornuta 64.39 %
T1-2 38.74
Oligochaeta spp. 26.49 %
Aphelochaeta marioni 52.01 %
Hediste diversicolor 60.03 %
T1-5 42.42
Aphelochaeta marioni 24.20 %
Oligochaeta spp. 46.10 %
Scrobicularia plana 56.55 %
T2-5 41.15
Oligochaeta spp. 31.12 %
Aphelochaeta marioni 56.73 %
Hediste diversicolor 65.37 %
* Results from a SIMPER analysis
5

19
TABLE 2: Densities (in ind m-2) of all identified taxa in the macrobenthic communities. All values are means ±
standard errors.
Species T0 T1 T2 T5
Polychaeta
Aphelochaeta marioni 3225.54 ± 724.49 1379.34 ± 388.17 1570.33 ± 358.12 1167.14 ± 267.92
Eteone longa 21.11 ± 21.22 84.88 ± 42.44 63.66 ± 28.47 21.11 ± 21.22
Hediste diversicolor 594.18 ± 107.37 551.74 ± 121.53 530.52 ± 129.08 233.43 ± 60.77
Heteromastus filiformis 254.65 ± 73.51 127.32 ± 46.49 254.65 ± 131.50 84.88 ± 26.84
Polydora cornuta 381.97 ± 131.50 169.77 ± 53.68 42.44 ± 26.84 0.00 ± 0.00
Pygospio elegans 297.09 ± 102.21 148.54 ± 76.51 169.77 ± 42.44 0.00 ± 0.00
Spio sp. 21.22 ± 21.22 0.00 ± 0.00 0.00 ± 0.00 0.00 ± 0.00
Streblospio benedicti 63.66 ± 43.49 0.00 ± 0.00 42.44 ± 26.84 0.00 ± 0.00
Oligochaeta spp. 2058.40 ± 343.88 997.37 ± 271.92 1846.20 ± 251.98 933.71 ± 295.26
Bivalvia
Cerastoderma edule 42.44 ± 26.84 42.44 ± 26.84 0.00 ± 0.00 0.00 ± 0.00
Macoma balthica 63.66 ± 43.49 233.43 ± 76.51 127.32 ± 32.87 148.54 ± 51.11
Scrobicularia plana 403.19 ± 60.77 381.97 ± 80.53 106.10 ± 51.11 106.10 ± 83.28
Gastropoda
Hydrobia ulvae 106.10 ± 51.11 169.77 ± 53.68 148.54 ± 60.77 212.21 ± 117.00
Crustacea
Bathyporeia pilosa 0.00 ± 0.00 21.22 ± 21.22 0.00 ± 0.00 21.22 ± 21.22
Cyathura carinata 636.62 ± 103.96 424.41 ± 78.26 445.63 ± 107.79 509.30 ± 65.75

20
TABLE 3: Statistical factors from 2-factor blocked ANOVA tests with ‘Treatment’ (4 levels) and ‘Tank’ (2 levels)
as factors. M1 till M4 stand for motility classes, as defined by Solan et al. (2004) (M1: living fixed in a tube, M2:
sessile, but not fixed in a tube, M3: slow movement through the sediment, M4: free movement in a burrow system).
Significant pair-wise differences between treatments are given in the table. All results for species and functional
groups are given for densities.2: Results for the factor ‘Treatment’ from a 2-factor blocked ANOVA tests with 5
‘Treatment’ (4 levels) and ‘Tank’ (2 levels) as factors. M1 till M4 stand for motility classes, as defined by Solan
et al. (2004) (M1: living fixed in a tube, M2: sessile, but not fixed in a tube, M3: slow movement through the
sediment, M4: free movement in a burrow system). Significant pair-wise differences between treatments are given
in the table. In case of heterogeneity of the variances, a fourth root transformation was applied on the data.
Source F value P Pair-wise
significance
Transformation
M1 12.221 <0.001* 0-5, 1-5, 2-5 Fourth root
M2 7.013 0.002* 0-1, 0-2, 0-5
M3 3.05 0.054
M4 2.284 0.112
Surficial modifiers 6.087 0.004* 0-1, 0-2, 0-5
Biodiffusors 4.336 0.017* 0-5
Upward conveyors 10.112 <0.001* 0-1, 0-2, 0-5
Downward conveyors 24.371 <0.001* 0-5, 1-5, 2-5 Fourth root
Polychaeta
Aphelochaeta marioni 4.648 0.013* 0-1, 0-5
Eteone longa 1.103 0.372
Hediste diversicolor 2.284 0.112
Heteromastus filiformis 1.154 0.353
Polydora cornuta 7.254 0.002* 0-2, 0-5, 1-5 Fourth root
Pygospio elegans 5.155 0.009* 0-5, 2-5 Fourth root
Spio sp. 1 0.414
Streblospio benedicti 1.879 0.167
Oligochaeta spp. 3.873 0.026* None
Bivalvia
Cerastoderma edule 1.583 0.226
Limecola balthica 1.939 0.158
Scrobicularia plana 5.337 0.008* 0-2, 0-5
Gastropoda
Peringia ulvae 0.329 0.804
Crustacea
Bathyporeia pilosa 0.704 0.561
Cyathura carinata 1.055 0.391
���� 4.826 0.012* 0-1, 1-2, 1-5 Fourth root
Q 4.177 0.020* 1-5

21
SCOC 3.358 0.041* 0-5
DOU 2.178 0.124
FU 0.869 0.475
Total density 8.346 0.001* 0-1, 0-2, 0-5
H’ 4.983 0.010* 1-5
J’ 2.594 0.083
Species richness 6.697 0.003* 0-5, 1-5, 2-5

22
TABLE 4: Overview of the p-values for all pair-wise tests (Tukey post-hoc test), performed when the main test
provided significant results. All results for species and functional groups represent densities.
Source T0-T1 T0-T2 T0-T5 T1-T2 T1-T5 T2-T5
M1 0.466 0.312 < 0.001* 0.990 0.0028 0.004*
M2 0.017* 0.015* 0.002* 1.000 0.805 0.838
Surficial modifiers 0.033* 0.013* 0.006* 0.974 0.850 0.980
Upward conveyors 0.016* 0.036* < 0.001* 0.982 0.186 0.095
Downward conveyors 0.102 0.289 < 0.001* 0.927 < 0.001* < 0.001*
Biodiffusors 0.156 0.959 0.024* 0.344 0.780 0.067
Aphelochaeta marioni 0.035* 0.065 0.017* 0.989 0.986 0.913
Polydora cornuta 0.896 0.044* 0.003* 0.167 0.014* 0.611
Pygospio elegans 0.463 0.981 0.010* 0.687 0.194 0.023*
Scrobicularia plana 0.997 0.039* 0.039* 0.060 0.060 1.000
���� 0.016* 0.949 0.087 0.048* 0.032* 0.997
Q 0.104 0.705 0.794 0.541 0.016* 0.222
SCOC 0.338 0.145 0.030* 0.951 0.552 0.850
Total density 0.011* 0.043* 0.001* 0.921 0.560 0.240
H’ 0.430 0.721 0.171 0.076 0.007* 0.691
Species richness 0.973 0.918 0.009* 0.714 0.003* 0.035*
Significant P-values (P < 0.05) are indicated with *

23
TABLE 5: Linear regressions of sediment community oxygen consumption (SCOC) against sets of species (or
functional group) densities, and ecosystem processes (bio-irrigation - Q - and bioturbation - ����), and of bio-
irrigation against the densities of species. Only significant models (P (slope) < 0.05) were considered. M2 and M3
are motility classes as defined by Solan et al. (2004) – M2: sessile, but not fixed in a tube, M3: slow movement
through the sediment. 5
Response/predictor Regression equation R2 P
SCOC
x1: Total density y = 3.35×10-3x1 + 1.03×102x2 + 25.6 0.544
0.0001
x2: ���� 0.0224
SCOC
x1: M2
y = 3.16×10-3x1 + 5.43×10-3x2 + 1.02×102x3 0.529
0.0176
x2: M3 0.0404
x3: ���� 0.0260
SCOC
x1: Surficial modifiers
y = 2.92×10-3x1 + 5.63×10-3x2 + 1.05×102x3 0.557
0.0359
x2: Biodiffusors 0.0135
x3: ���� 0.0196
SCOC
x1: A. marioni y = 4.53×10-3x1 + 2.52×10-2x2 + 25.9 0.556
0.0008
x2: C. carinata 0.0016
Q
x1: A. marioni
y = -5.76×10-6x1 + 5.00×10-5x2 + 3.81×10-5x3 –
6.33×10-5x4 – 1.60×10-4x5 + 2.78×10⁻² 0.730
0.0330
x2: H. diversicolor 0.0002
x3: P. cornuta 0.0306
x4: P. elegans 0.0030
x5: S. benedicti 0.0068

24
Figure 1: Bar charts representing total macrofaunal densities (ind m-2), species richness, Shannon-Wiener
diversity, and Pielou's evenness per treatment. Error bars represent mean ± standard error, letters above
the error bars indicate pair-wise significant differences. The four treatments represent the thickness of the
applied sediment layer (in cm). 5

25
Figure 2: (a) Bar chart showing the densities of the four motility classes per treatment, in ind m-2. M1:
organisms living fixed in a tube, M2: sessile, but not fixed in a tube, M3: slowly moving organisms, M4: free
movement through a burrow system. (b) Bar chart showing the densities in, ind m-2, of the four main
functional groups, based on sediment reworking activity. S: Surficial modifiers, B: biodiffusors, UC: 5
upward conveyors, DC: downward conveyors. Error bars represent mean ± standard error, letters above
the error bars indicate pair-wise significant differences. The four treatments represent the thickness of the
applied sediment layer (in cm).
10

26

27
Figure 3: (a) Bar chart representing the mean bioturbation activity (by means of the biodiffusion coefficient
� !", in cm2 d-1) per treatment ± standard error. (b) Bar chart representing the mean bio-irrigation (in mL
min-1) per treatment ± standard error. (c) Bar chart representing the mean oxygen consumption (in mmol
m-2 d-1) per treatment ± standard error. The different components of total sediment community oxygen
consumption (SCOC) are represented in the chart: diffusive oxygen uptake (DOU), with error bars, faunal 5
uptake (FU), with error bars, and the remaining benthicmacrofauna-mediated oxygen uptake (BMUMMU ).
The topmost error bars represent the mean ± standard error of the total SCOC (= DOU + FU + BMU).
Letters above the error bars indicate pair-wise significant differences. The four treatments represent the
thickness of the applied sediment layer (in cm).
10