
Water washing of axial flow compressors: numerical study on ...
16
Water washing of axial flow compressors: numerical study on the fate of injected droplets Giuliano Agati 1,* , Francesca Di Gruttola 1 , Serena Gabriele 2 , Domenico Simone 3 , Paolo Venturini 1 , and Domenico Borello 1 1 Sapienza Università di Roma, Dipartimento di Ingegneria Meccanica e Aerospaziale, via Eudossiana 18, 00184, Roma (Italy) 2 Baker Hughes, Viale F. Matteucci, 2, Florence, Italy 3 Aerospace Engineering, University of Brasilia (UnB) at Gama, 72444-240 Brasilia, DF, Brazil Abstract. In turbomachinery applications blade fouling represents a main cause of performance degradation. Among the different techniques currently available, online water washing is one of the most effective in removing deposit from the blades. Since this kind of washing is applied when the machine is close to design conditions, injected droplets are strongly accelerated when they reach the rotor blades and the understanding of their interaction with the blades is not straightforward. Moreover, undesirable phenomena like blades erosion or liquid film formation can occur. The present study aims at assessing droplets dragging from the injection system placed at the compressor inlet till the first stage rotor blades, with a focus on droplets impact locations, on the washing process and the associated risk of erosion. 3D numerical simulations of the whole compressor geometry (up to the first rotor stage) are performed by using Ansys Fluent to account for the asymmetric distribution of the sprays around of the machine struts, IGV and rotor blades. The simulations are carried out by adopting the k-ε realizable turbulence model with standard wall functions, coupled with the discrete- phase model to track injected droplets motion. Droplets-wall interaction is also accounted for by adopting the Stanton-Rutland model which define a droplet impact outcome depending on the impact conditions. The induced erosion is evaluated by adopting an erosion model previously developed by some of the authors and implemented in Fluent through the use of a User Defined Function (UDF). Two sets of simulations are performed, by considering the rotor still and rotating, representative of off-line and on-line water washing conditions, respectively. In the rotating simulation, the Multiple Reference Frame Model is used. The obtained results demonstrate that the washing process differs substantially between the fixed and the rotating case. Moreover, to quantify the water washing effectiveness and the erosion risk, new indices were introduced and computed for the main components of the machine. These indices can be considered as useful prescriptions in the optimization process of water washing systems. * Corresponding author: [email protected] © The Authors, published by EDP Sciences. This is an open access article distributed under the terms of the Creative Commons Attribution License 4.0 (http://creativecommons.org/licenses/by/4.0/). E3S Web of Conferences 197, 11015 (2020) 75° National ATI Congress https://doi.org/10.1051/e3sconf/202019711015
-
Upload
khangminh22 -
Category
Documents
-
view
3 -
download
0
Transcript of Water washing of axial flow compressors: numerical study on ...
Water washing of axial flow compressors: numerical study on the fate of injected droplets
Giuliano Agati1,*, Francesca Di Gruttola1, Serena Gabriele2, Domenico Simone3, Paolo Venturini1, and Domenico Borello1
1Sapienza Università di Roma, Dipartimento di Ingegneria Meccanica e Aerospaziale, via Eudossiana 18, 00184, Roma (Italy) 2Baker Hughes, Viale F. Matteucci, 2, Florence, Italy 3Aerospace Engineering, University of Brasilia (UnB) at Gama, 72444-240 Brasilia, DF, Brazil
Abstract. In turbomachinery applications blade fouling represents a main cause of performance degradation. Among the different techniques currently available, online water washing is one of the most effective in removing deposit from the blades. Since this kind of washing is applied when the machine is close to design conditions, injected droplets are strongly accelerated when they reach the rotor blades and the understanding of their interaction with the blades is not straightforward. Moreover, undesirable phenomena like blades erosion or liquid film formation can occur. The present study aims at assessing droplets dragging from the injection system placed at the compressor inlet till the first stage rotor blades, with a focus on droplets impact locations, on the washing process and the associated risk of erosion. 3D numerical simulations of the whole compressor geometry (up to the first rotor stage) are performed by using Ansys Fluent to account for the asymmetric distribution of the sprays around of the machine struts, IGV and rotor blades. The simulations are carried out by adopting the k-ε realizable turbulence model with standard wall functions, coupled with the discrete-phase model to track injected droplets motion. Droplets-wall interaction is also accounted for by adopting the Stanton-Rutland model which define a droplet impact outcome depending on the impact conditions. The induced erosion is evaluated by adopting an erosion model previously developed by some of the authors and implemented in Fluent through the use of a User Defined Function (UDF). Two sets of simulations are performed, by considering the rotor still and rotating, representative of off-line and on-line water washing conditions, respectively. In the rotating simulation, the Multiple Reference Frame Model is used. The obtained results demonstrate that the washing process differs substantially between the fixed and the rotating case. Moreover, to quantify the water washing effectiveness and the erosion risk, new indices were introduced and computed for the main components of the machine. These indices can be considered as useful prescriptions in the optimization process of water washing systems.
* Corresponding author: [email protected]
© The Authors, published by EDP Sciences. This is an open access article distributed under the terms of the Creative Commons Attribution License 4.0 (http://creativecommons.org/licenses/by/4.0/).
E3S Web of Conferences 197, 11015 (2020)75° National ATI Congress
https://doi.org/10.1051/e3sconf/202019711015
1 Introduction
Nowadays the use of gas turbine is one of the key technologies for power production. This means that there is an increasing interest in reducing its environmental impact while keeping constant (or possibly increasing) its efficiency and economic sustainability. From this point of view, performance deterioration in gas turbine engines are mainly related to compressor issues [1,2]. Blade fouling is one of the most relevant derating sources in compressors. Solid particles entrained by the inlet air flow pass the filtering system and reach the compressor blades, where they can interact by depositing (or eroding) the wall surfaces. Deposit depends on several aspects, such as particle properties, impact velocity and angle as well as engine operating conditions [3,4]. The growth of deposit layer leads to a variation of the airfoil ge-ometry, thus increasing pressure drops and altering the aerodynamic performance of the in-volved blades. Some key features of particles deposition formation, for instance, were high-lighted in [5], while in [6] the physics behind the accumulation of particulate in the wall region in cooled turbine stages was investigated. Gas turbines engines losses can be classified as recoverable, non-recoverable and permanent [1,7]. The former losses are those that can be recovered during the engine operation, without any parts replacements. The class of non-recoverable losses comprises those that can be re-covered only after a minor overhaul. Permanent losses, on the contrary, cannot be recovered even after a major overhaul, and permanently reduce the engine efficiency. Blade fouling lies in the class of recoverable losses, and its effect on the machine performance can be reduced by adopting on-line and off-line water washing [8,9]. However, especially on-line water washing may provoke erosion on the compressor rotor blades, due to the high speed impact of water droplets on the rotating blades (this is called Water Droplet Erosion, WDE). Since erosion is classified as non-recoverable loss, there may be the paradox that to reduce a recov-erable loss, a technique is used that could cause a permanent loss. Therefore, it is worth stud-ying the fate of the injected droplets and their effect on washing efficiency. To simulate WDE, a proper model is needed, accounting for the specificities of the consid-ered application. An accurate WDE model has to account for all parameters influencing the process (i.e., impact velocity, droplets diameter, impact angle, number of impacts, hardness and roughness of the target material [10,11]). Liquid erosion is a common issue in some other applications (i.e., fogging systems and overspray in gas turbines [12,13], rain erosion in wind turbines [14], wet steam flow in steam turbines [15-17]). However, no models are available for the specific application in study and the ones developed for other applications are not appropriate because they neglect some aspects that become critical in this case. The present contribution represents a step of an on-going large research program aiming at analyzing the performance deterioration and the structural issues associated to the WDE pro-cess. Such research intends taking into account the erosion, pressure losses, formation of water layer on the solid walls, as well as the reduction of blade resistant section subjected to the centrifugal force acting on the rotating blades. Recently research activities were devoted to study the liquid/solid erosion process in tur-bomachinery applications. In [18], the severity of erosion damage due to droplet impact in multi-MW wind turbine was studied by evaluating the water hammer pressure. An algorithm to simulate long time erosion process accounting for the shape modification of a blade was presented in [20]. The same approach was used in [20] to study the erosion time evolution on the blade of an induced draft fan. In [21] we studied the erosion of a large centrifugal fan due to particle erosion. The effect of rotation on flow field was studied in [24]. Moreover, in
2
E3S Web of Conferences 197, 11015 (2020)75° National ATI Congress
https://doi.org/10.1051/e3sconf/202019711015
a series of other publications [22-25] the authors presented an experiment-based model spe-cifically developed for simulating WDE during compressor water washing processes, ac-counting for the main parameters affecting the phenomenon. Here, we applied the model developed in [22-25] to study the droplet fate (impact, splashing, generation of liquid film) during both off-line and on-line water washing (WW). Some in-dexes are introduced to quickly visualize indications about the effect of the injection system and the washing process on each part of the machine, focusing the attention on the rotor stage that is the most exposed to the risk of erosion. In this step the influence of geometry modifi-cation due to the erosion is still not taken into account.
2 Models and computational approach
The study reproduces the flow in the inlet section of a compressor, considering inlet region, struts, IGV and the first rotor. Two configurations were considered where the rotor is treated as non-rotating and rotating at design conditions. Such configurations are representative of the off-line and on-line WW respectively. The simulations are carried out by using Ansys Fluent. The study of a multi-phase flow was based on a Eulerian-Lagrangian one-way cou-pling approach. The turbulent field is modeled by using Unsteady (U)-RANS employing the well-established, widely-accepted k-ε realizable model. Standard wall-function was used for the near-wall treatment. The SIMPLEC scheme was selected for the pressure-velocity cou-pling. Spatial discretization for the pressure term was achieved by a second order upwind scheme while for all the other variables a first order scheme is adopted [26]. For all the simulations here investigated, the stationary fluid flow was firstly solved. The convergence thresholds imposed are equal to 1.0E-05 for the continuity equation, 1.0E-06 for the energy one and a value of 1.0E-03 for the k and ε equations. The non-rotating simu-lation took 5282 iterations to converge. The rotating simulation was initialized with the con-verged solution of the static one and needed 4640 more iterations to reach the convergence. After that, transient simulations were run. The injected droplets were tracked until all of them reached their final destination, i.e. either they exited the domain or they deposited on one of the solid surfaces. In the transient simulations a time step dt=3.0E-05 was set for the fluid flow while the integration of droplets motion equation is achieved by an automated tracking scheme that permits to switch between a numerically stable implicit lower order scheme and a trapezoidal higher order one. Moreover, the accuracy control option permits the solution of droplets motion equation to be within a tolerance of 1.0E-05. In the rotating simulation, the Frozen Rotor approach (i.e. the Multiple Reference Frame Model) was adopted. The rotor cell zone (rotating with an angular velocity ω=7800 rpm with respect to the negative x-axis) is solved in the relative reference frame [26]. Because of the high rotation speed, the flow solution is less stable and, to guarantee the reaching of conver-gent solution, the angular velocity was increased gradually starting from the non-rotating solution. Initially, an angular velocity ω= -4800 rpm was imposed to the rotor cell zone and only after this solution converged, rotational speed was increased up to the desired value. The fate of the injected droplets depends on the outcome of their possible impact on the solid walls. Ansys Fluent has a specific boundary condition to deal with droplets collision on solid surfaces on the basis of impact conditions. The adopted model is the Stanton-Rutland model [28], which distinguishes four different impact regimes, depending on the local wall temper-ature and on the impact energy. Here it is worth to mention that in this model the fate of an impacting droplet can be sticking, spreading, splashing or rebounding, as illustrated in Fig.1.
3
E3S Web of Conferences 197, 11015 (2020)75° National ATI Congress
https://doi.org/10.1051/e3sconf/202019711015
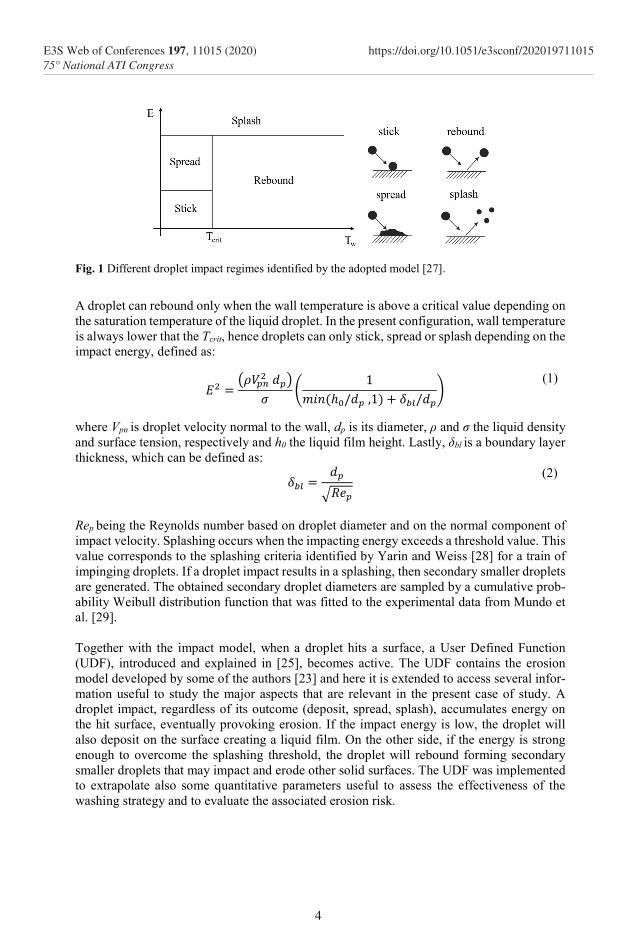
Fig. 1 Different droplet impact regimes identified by the adopted model [27].
A droplet can rebound only when the wall temperature is above a critical value depending on the saturation temperature of the liquid droplet. In the present configuration, wall temperature is always lower that the Tcrit, hence droplets can only stick, spread or splash depending on the impact energy, defined as:
𝐸 =
𝜌𝑉 𝑑
𝜎
1
𝑚𝑖𝑛 (ℎ /𝑑 ,1) + 𝛿 /𝑑
(1)
where Vpn is droplet velocity normal to the wall, dp is its diameter, ρ and σ the liquid density and surface tension, respectively and h0 the liquid film height. Lastly, δbl is a boundary layer thickness, which can be defined as:
𝛿 =
𝑑
𝑅𝑒
(2)
Rep being the Reynolds number based on droplet diameter and on the normal component of impact velocity. Splashing occurs when the impacting energy exceeds a threshold value. This value corresponds to the splashing criteria identified by Yarin and Weiss [28] for a train of impinging droplets. If a droplet impact results in a splashing, then secondary smaller droplets are generated. The obtained secondary droplet diameters are sampled by a cumulative prob-ability Weibull distribution function that was fitted to the experimental data from Mundo et al. [29]. Together with the impact model, when a droplet hits a surface, a User Defined Function (UDF), introduced and explained in [25], becomes active. The UDF contains the erosion model developed by some of the authors [23] and here it is extended to access several infor-mation useful to study the major aspects that are relevant in the present case of study. A droplet impact, regardless of its outcome (deposit, spread, splash), accumulates energy on the hit surface, eventually provoking erosion. If the impact energy is low, the droplet will also deposit on the surface creating a liquid film. On the other side, if the energy is strong enough to overcome the splashing threshold, the droplet will rebound forming secondary smaller droplets that may impact and erode other solid surfaces. The UDF was implemented to extrapolate also some quantitative parameters useful to assess the effectiveness of the washing strategy and to evaluate the associated erosion risk.
4
E3S Web of Conferences 197, 11015 (2020)75° National ATI Congress
https://doi.org/10.1051/e3sconf/202019711015
3 Simulation details
3.1 Numerical domain and computational mesh
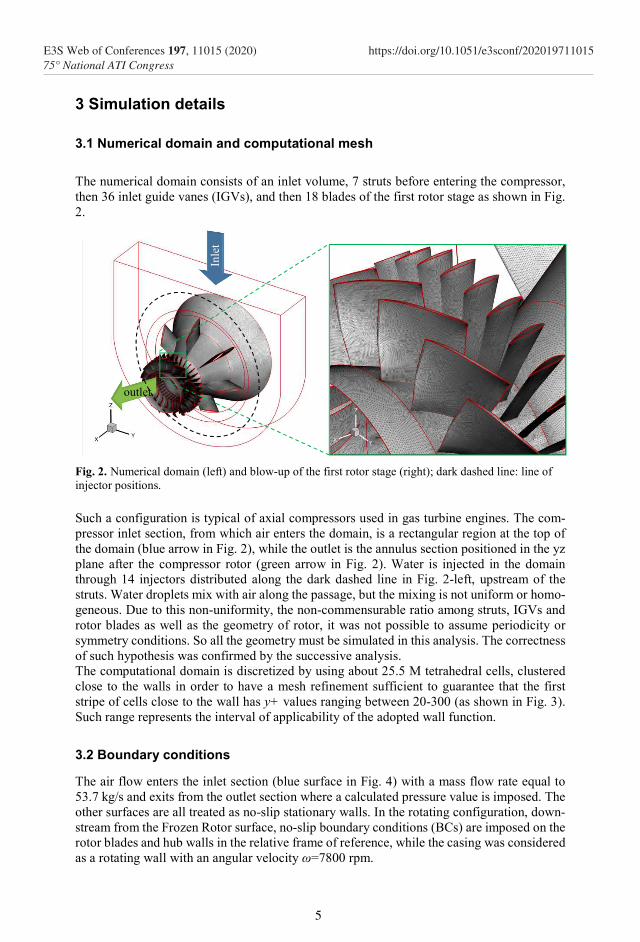
The numerical domain consists of an inlet volume, 7 struts before entering the compressor, then 36 inlet guide vanes (IGVs), and then 18 blades of the first rotor stage as shown in Fig. 2.
Fig. 2. Numerical domain (left) and blow-up of the first rotor stage (right); dark dashed line: line of injector positions.
Such a configuration is typical of axial compressors used in gas turbine engines. The com-pressor inlet section, from which air enters the domain, is a rectangular region at the top of the domain (blue arrow in Fig. 2), while the outlet is the annulus section positioned in the yz plane after the compressor rotor (green arrow in Fig. 2). Water is injected in the domain through 14 injectors distributed along the dark dashed line in Fig. 2-left, upstream of the struts. Water droplets mix with air along the passage, but the mixing is not uniform or homo-geneous. Due to this non-uniformity, the non-commensurable ratio among struts, IGVs and rotor blades as well as the geometry of rotor, it was not possible to assume periodicity or symmetry conditions. So all the geometry must be simulated in this analysis. The correctness of such hypothesis was confirmed by the successive analysis. The computational domain is discretized by using about 25.5 M tetrahedral cells, clustered close to the walls in order to have a mesh refinement sufficient to guarantee that the first stripe of cells close to the wall has y+ values ranging between 20-300 (as shown in Fig. 3). Such range represents the interval of applicability of the adopted wall function.
3.2 Boundary conditions
The air flow enters the inlet section (blue surface in Fig. 4) with a mass flow rate equal to 53.7 kg/s and exits from the outlet section where a calculated pressure value is imposed. The other surfaces are all treated as no-slip stationary walls. In the rotating configuration, down-stream from the Frozen Rotor surface, no-slip boundary conditions (BCs) are imposed on the rotor blades and hub walls in the relative frame of reference, while the casing was considered as a rotating wall with an angular velocity ω=7800 rpm.
Inle
t
outlet
5
E3S Web of Conferences 197, 11015 (2020)75° National ATI Congress
https://doi.org/10.1051/e3sconf/202019711015
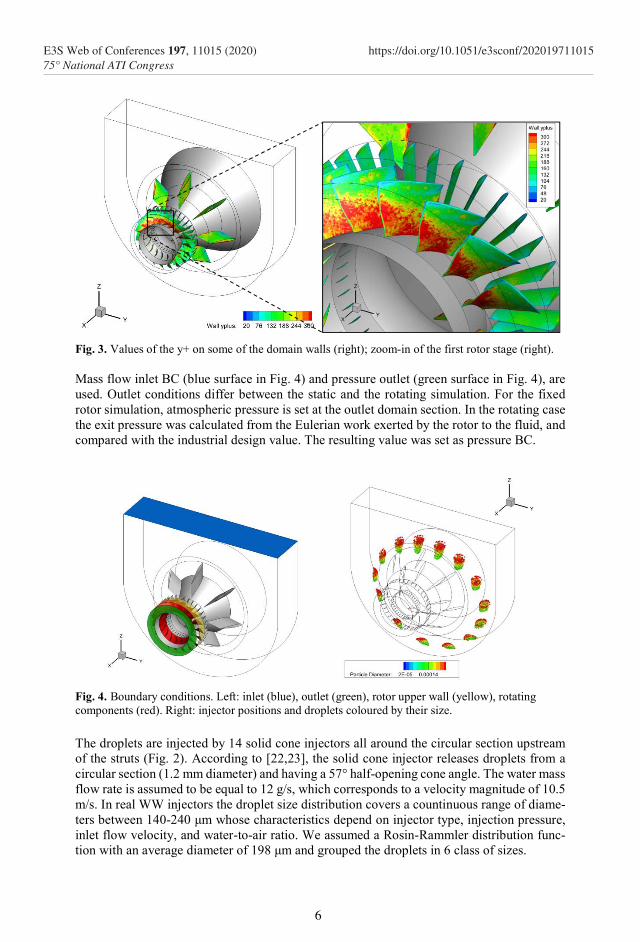
Fig. 3. Values of the y+ on some of the domain walls (right); zoom-in of the first rotor stage (right). Mass flow inlet BC (blue surface in Fig. 4) and pressure outlet (green surface in Fig. 4), are used. Outlet conditions differ between the static and the rotating simulation. For the fixed rotor simulation, atmospheric pressure is set at the outlet domain section. In the rotating case the exit pressure was calculated from the Eulerian work exerted by the rotor to the fluid, and compared with the industrial design value. The resulting value was set as pressure BC.
Fig. 4. Boundary conditions. Left: inlet (blue), outlet (green), rotor upper wall (yellow), rotating components (red). Right: injector positions and droplets coloured by their size.
The droplets are injected by 14 solid cone injectors all around the circular section upstream of the struts (Fig. 2). According to [22,23], the solid cone injector releases droplets from a circular section (1.2 mm diameter) and having a 57° half-opening cone angle. The water mass flow rate is assumed to be equal to 12 g/s, which corresponds to a velocity magnitude of 10.5 m/s. In real WW injectors the droplet size distribution covers a countinuous range of diame-ters between 140-240 μm whose characteristics depend on injector type, injection pressure, inlet flow velocity, and water-to-air ratio. We assumed a Rosin-Rammler distribution func-tion with an average diameter of 198 μm and grouped the droplets in 6 class of sizes.
6
E3S Web of Conferences 197, 11015 (2020)75° National ATI Congress
https://doi.org/10.1051/e3sconf/202019711015
Droplets may escape from the numerical domain through both inlet and outlet sections. How-ever, if a droplet hits a wall it may splash generating secondary smaller droplets according to the model explained in Sect. 2, and a liquid film can form on the impacted surface.
3.3 Performed simulations
Two simulations reproducing the off-line and on-line WW processes of the first stage of a typical compressor used in gas turbine engines are carried out. Off-line WW is performed periodically and involves the turbine shutting down and then the injection of properly nebu-lized water for 20-30 minutes. The turbine is put on idle, but its speed is much smaller than the design one (usually less than 20%). On the contrary, on-line WW is performed when the engine is at nominal load. Therefore, for simulating the off-line WW condition here we as-sumed that the turbine is shut-down, while for on-line one it is running at its nominal rota-tional speed. For each of these conditions water is injected within the domain trough the injectors as described in Sections 3.1. and 3.2. The flow field analysis supports the study of droplets/walls interaction with the aim of examining washing effectiveness. Such analysis is carried out on the basis of quantitative parameters properly introduced by the authors. Such parameters are useful to better understand the behavior of a real compressor under WW con-ditions, to evaluate the effectiveness of the washing system, and to study the quantities that most affect the erosion phenomena.
4 Results and Discussion
The relevant outcomes of the present work are presented in the following sections.
4.1 Flow field
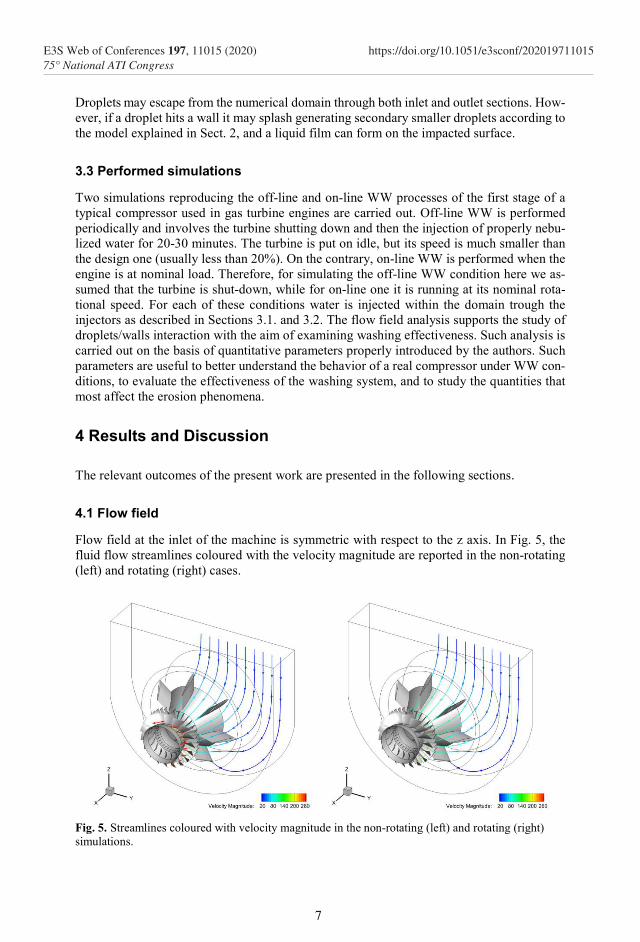
Flow field at the inlet of the machine is symmetric with respect to the z axis. In Fig. 5, the fluid flow streamlines coloured with the velocity magnitude are reported in the non-rotating (left) and rotating (right) cases.
Fig. 5. Streamlines coloured with velocity magnitude in the non-rotating (left) and rotating (right) simulations.
7
E3S Web of Conferences 197, 11015 (2020)75° National ATI Congress
https://doi.org/10.1051/e3sconf/202019711015
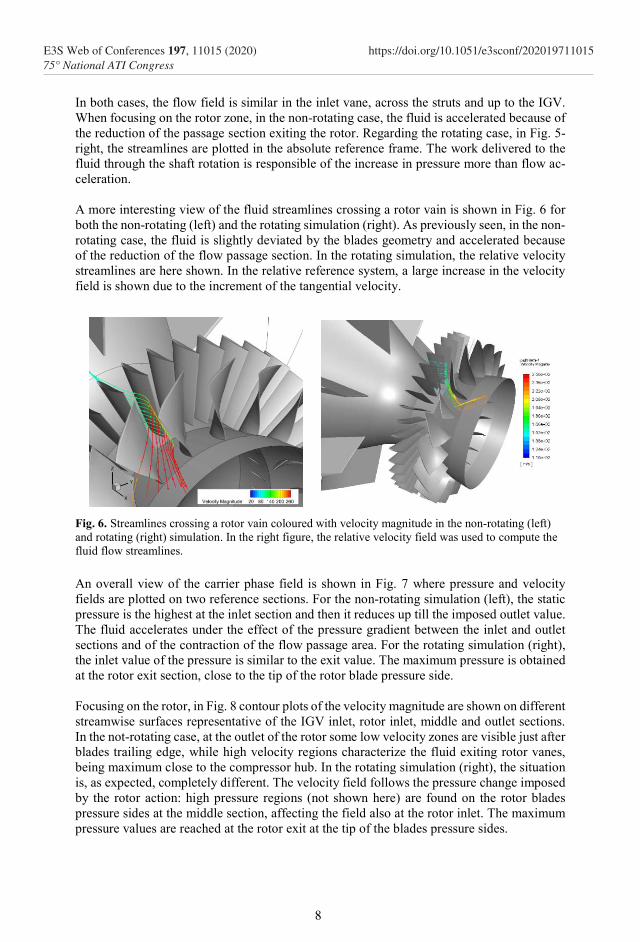
In both cases, the flow field is similar in the inlet vane, across the struts and up to the IGV. When focusing on the rotor zone, in the non-rotating case, the fluid is accelerated because of the reduction of the passage section exiting the rotor. Regarding the rotating case, in Fig. 5-right, the streamlines are plotted in the absolute reference frame. The work delivered to the fluid through the shaft rotation is responsible of the increase in pressure more than flow ac-celeration. A more interesting view of the fluid streamlines crossing a rotor vain is shown in Fig. 6 for both the non-rotating (left) and the rotating simulation (right). As previously seen, in the non-rotating case, the fluid is slightly deviated by the blades geometry and accelerated because of the reduction of the flow passage section. In the rotating simulation, the relative velocity streamlines are here shown. In the relative reference system, a large increase in the velocity field is shown due to the increment of the tangential velocity.
Fig. 6. Streamlines crossing a rotor vain coloured with velocity magnitude in the non-rotating (left) and rotating (right) simulation. In the right figure, the relative velocity field was used to compute the fluid flow streamlines.
An overall view of the carrier phase field is shown in Fig. 7 where pressure and velocity fields are plotted on two reference sections. For the non-rotating simulation (left), the static pressure is the highest at the inlet section and then it reduces up till the imposed outlet value. The fluid accelerates under the effect of the pressure gradient between the inlet and outlet sections and of the contraction of the flow passage area. For the rotating simulation (right), the inlet value of the pressure is similar to the exit value. The maximum pressure is obtained at the rotor exit section, close to the tip of the rotor blade pressure side. Focusing on the rotor, in Fig. 8 contour plots of the velocity magnitude are shown on different streamwise surfaces representative of the IGV inlet, rotor inlet, middle and outlet sections. In the not-rotating case, at the outlet of the rotor some low velocity zones are visible just after blades trailing edge, while high velocity regions characterize the fluid exiting rotor vanes, being maximum close to the compressor hub. In the rotating simulation (right), the situation is, as expected, completely different. The velocity field follows the pressure change imposed by the rotor action: high pressure regions (not shown here) are found on the rotor blades pressure sides at the middle section, affecting the field also at the rotor inlet. The maximum pressure values are reached at the rotor exit at the tip of the blades pressure sides.
8
E3S Web of Conferences 197, 11015 (2020)75° National ATI Congress
https://doi.org/10.1051/e3sconf/202019711015
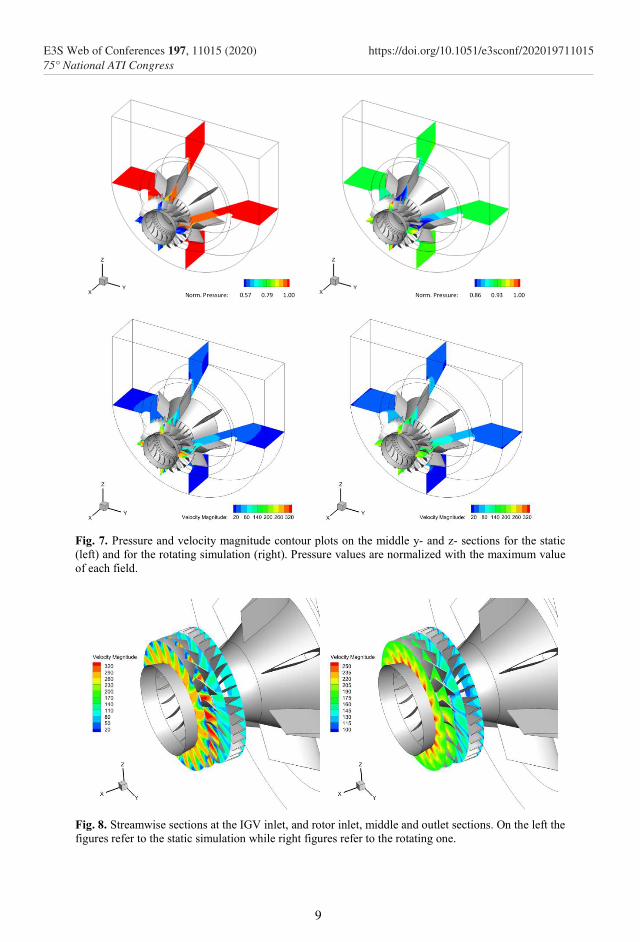
Fig. 7. Pressure and velocity magnitude contour plots on the middle y- and z- sections for the static (left) and for the rotating simulation (right). Pressure values are normalized with the maximum value of each field.
Fig. 8. Streamwise sections at the IGV inlet, and rotor inlet, middle and outlet sections. On the left the figures refer to the static simulation while right figures refer to the rotating one.
9
E3S Web of Conferences 197, 11015 (2020)75° National ATI Congress
https://doi.org/10.1051/e3sconf/202019711015
4.2 Droplets behaviour and washing effectiveness
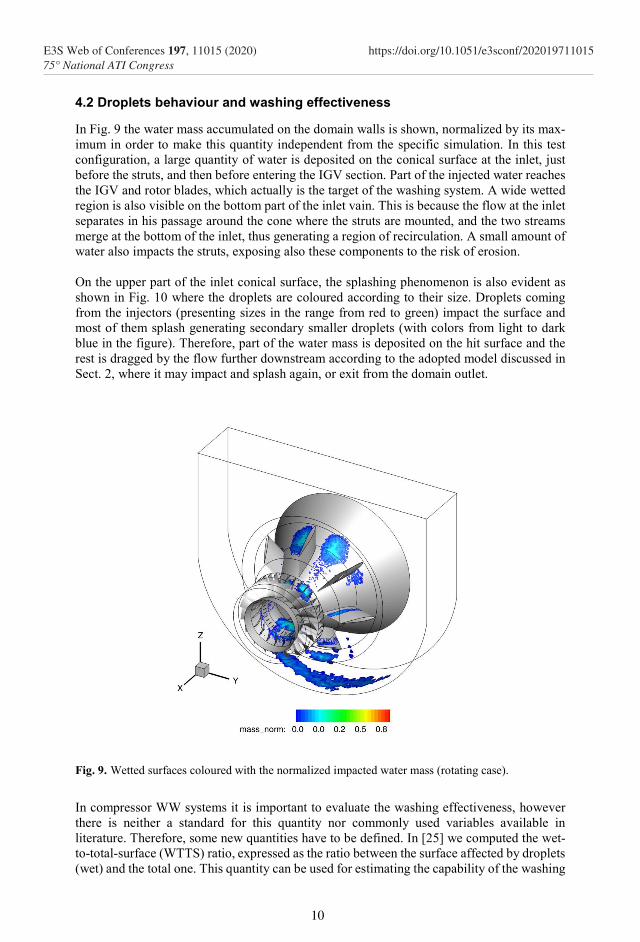
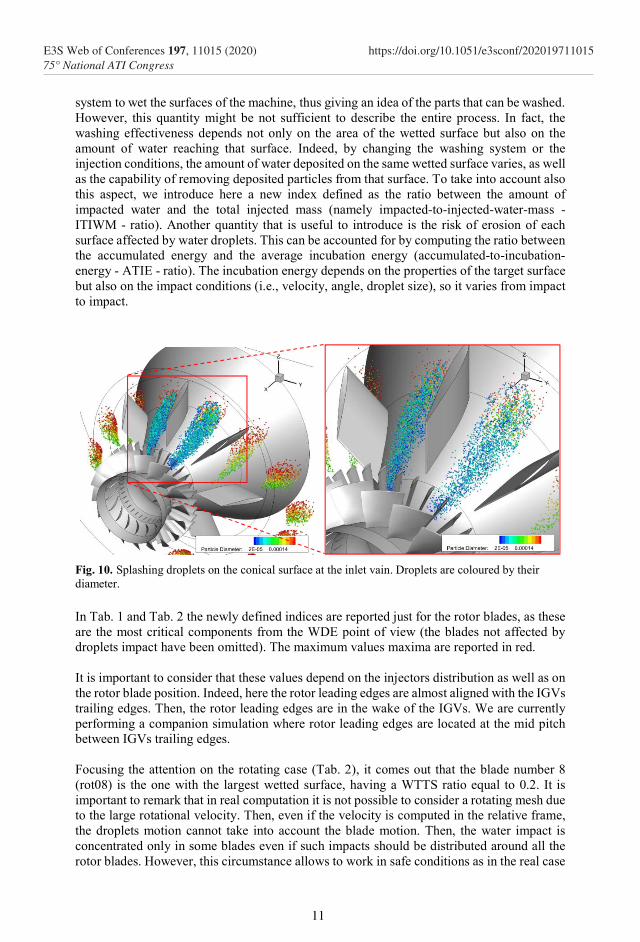
In Fig. 9 the water mass accumulated on the domain walls is shown, normalized by its max-imum in order to make this quantity independent from the specific simulation. In this test configuration, a large quantity of water is deposited on the conical surface at the inlet, just before the struts, and then before entering the IGV section. Part of the injected water reaches the IGV and rotor blades, which actually is the target of the washing system. A wide wetted region is also visible on the bottom part of the inlet vain. This is because the flow at the inlet separates in his passage around the cone where the struts are mounted, and the two streams merge at the bottom of the inlet, thus generating a region of recirculation. A small amount of water also impacts the struts, exposing also these components to the risk of erosion. On the upper part of the inlet conical surface, the splashing phenomenon is also evident as shown in Fig. 10 where the droplets are coloured according to their size. Droplets coming from the injectors (presenting sizes in the range from red to green) impact the surface and most of them splash generating secondary smaller droplets (with colors from light to dark blue in the figure). Therefore, part of the water mass is deposited on the hit surface and the rest is dragged by the flow further downstream according to the adopted model discussed in Sect. 2, where it may impact and splash again, or exit from the domain outlet.
Fig. 9. Wetted surfaces coloured with the normalized impacted water mass (rotating case).
In compressor WW systems it is important to evaluate the washing effectiveness, however there is neither a standard for this quantity nor commonly used variables available in literature. Therefore, some new quantities have to be defined. In [25] we computed the wet-to-total-surface (WTTS) ratio, expressed as the ratio between the surface affected by droplets (wet) and the total one. This quantity can be used for estimating the capability of the washing
10
E3S Web of Conferences 197, 11015 (2020)75° National ATI Congress
https://doi.org/10.1051/e3sconf/202019711015
system to wet the surfaces of the machine, thus giving an idea of the parts that can be washed. However, this quantity might be not sufficient to describe the entire process. In fact, the washing effectiveness depends not only on the area of the wetted surface but also on the amount of water reaching that surface. Indeed, by changing the washing system or the injection conditions, the amount of water deposited on the same wetted surface varies, as well as the capability of removing deposited particles from that surface. To take into account also this aspect, we introduce here a new index defined as the ratio between the amount of impacted water and the total injected mass (namely impacted-to-injected-water-mass - ITIWM - ratio). Another quantity that is useful to introduce is the risk of erosion of each surface affected by water droplets. This can be accounted for by computing the ratio between the accumulated energy and the average incubation energy (accumulated-to-incubation-energy - ATIE - ratio). The incubation energy depends on the properties of the target surface but also on the impact conditions (i.e., velocity, angle, droplet size), so it varies from impact to impact.
Fig. 10. Splashing droplets on the conical surface at the inlet vain. Droplets are coloured by their diameter.
In Tab. 1 and Tab. 2 the newly defined indices are reported just for the rotor blades, as these are the most critical components from the WDE point of view (the blades not affected by droplets impact have been omitted). The maximum values maxima are reported in red. It is important to consider that these values depend on the injectors distribution as well as on the rotor blade position. Indeed, here the rotor leading edges are almost aligned with the IGVs trailing edges. Then, the rotor leading edges are in the wake of the IGVs. We are currently performing a companion simulation where rotor leading edges are located at the mid pitch between IGVs trailing edges. Focusing the attention on the rotating case (Tab. 2), it comes out that the blade number 8 (rot08) is the one with the largest wetted surface, having a WTTS ratio equal to 0.2. It is important to remark that in real computation it is not possible to consider a rotating mesh due to the large rotational velocity. Then, even if the velocity is computed in the relative frame, the droplets motion cannot take into account the blade motion. Then, the water impact is concentrated only in some blades even if such impacts should be distributed around all the rotor blades. However, this circumstance allows to work in safe conditions as in the real case
11
E3S Web of Conferences 197, 11015 (2020)75° National ATI Congress
https://doi.org/10.1051/e3sconf/202019711015
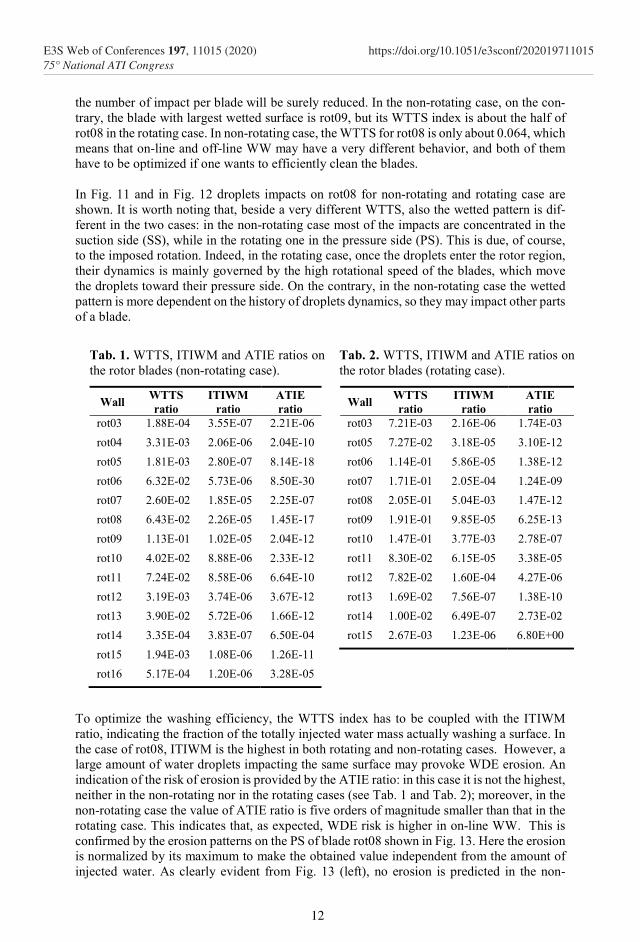
the number of impact per blade will be surely reduced. In the non-rotating case, on the con-trary, the blade with largest wetted surface is rot09, but its WTTS index is about the half of rot08 in the rotating case. In non-rotating case, the WTTS for rot08 is only about 0.064, which means that on-line and off-line WW may have a very different behavior, and both of them have to be optimized if one wants to efficiently clean the blades. In Fig. 11 and in Fig. 12 droplets impacts on rot08 for non-rotating and rotating case are shown. It is worth noting that, beside a very different WTTS, also the wetted pattern is dif-ferent in the two cases: in the non-rotating case most of the impacts are concentrated in the suction side (SS), while in the rotating one in the pressure side (PS). This is due, of course, to the imposed rotation. Indeed, in the rotating case, once the droplets enter the rotor region, their dynamics is mainly governed by the high rotational speed of the blades, which move the droplets toward their pressure side. On the contrary, in the non-rotating case the wetted pattern is more dependent on the history of droplets dynamics, so they may impact other parts of a blade.
Tab. 1. WTTS, ITIWM and ATIE ratios on the rotor blades (non-rotating case).
Wall WTTS ratio
ITIWM ratio
ATIE ratio
rot03 1.88E-04 3.55E-07 2.21E-06
rot04 3.31E-03 2.06E-06 2.04E-10
rot05 1.81E-03 2.80E-07 8.14E-18
rot06 6.32E-02 5.73E-06 8.50E-30
rot07 2.60E-02 1.85E-05 2.25E-07
rot08 6.43E-02 2.26E-05 1.45E-17
rot09 1.13E-01 1.02E-05 2.04E-12
rot10 4.02E-02 8.88E-06 2.33E-12
rot11 7.24E-02 8.58E-06 6.64E-10
rot12 3.19E-03 3.74E-06 3.67E-12
rot13 3.90E-02 5.72E-06 1.66E-12
rot14 3.35E-04 3.83E-07 6.50E-04
rot15 1.94E-03 1.08E-06 1.26E-11
rot16 5.17E-04 1.20E-06 3.28E-05
Tab. 2. WTTS, ITIWM and ATIE ratios on the rotor blades (rotating case).
Wall WTTS ratio
ITIWM ratio
ATIE ratio
rot03 7.21E-03 2.16E-06 1.74E-03
rot05 7.27E-02 3.18E-05 3.10E-12
rot06 1.14E-01 5.86E-05 1.38E-12
rot07 1.71E-01 2.05E-04 1.24E-09
rot08 2.05E-01 5.04E-03 1.47E-12
rot09 1.91E-01 9.85E-05 6.25E-13
rot10 1.47E-01 3.77E-03 2.78E-07
rot11 8.30E-02 6.15E-05 3.38E-05
rot12 7.82E-02 1.60E-04 4.27E-06
rot13 1.69E-02 7.56E-07 1.38E-10
rot14 1.00E-02 6.49E-07 2.73E-02
rot15 2.67E-03 1.23E-06 6.80E+00
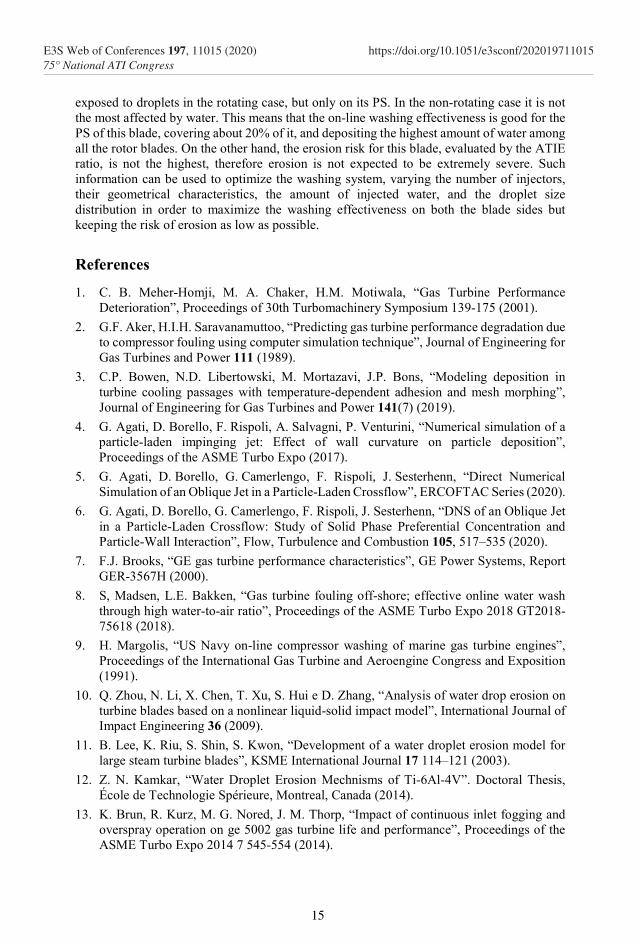
To optimize the washing efficiency, the WTTS index has to be coupled with the ITIWM ratio, indicating the fraction of the totally injected water mass actually washing a surface. In the case of rot08, ITIWM is the highest in both rotating and non-rotating cases. However, a large amount of water droplets impacting the same surface may provoke WDE erosion. An indication of the risk of erosion is provided by the ATIE ratio: in this case it is not the highest, neither in the non-rotating nor in the rotating cases (see Tab. 1 and Tab. 2); moreover, in the non-rotating case the value of ATIE ratio is five orders of magnitude smaller than that in the rotating case. This indicates that, as expected, WDE risk is higher in on-line WW. This is confirmed by the erosion patterns on the PS of blade rot08 shown in Fig. 13. Here the erosion is normalized by its maximum to make the obtained value independent from the amount of injected water. As clearly evident from Fig. 13 (left), no erosion is predicted in the non-
12
E3S Web of Conferences 197, 11015 (2020)75° National ATI Congress
https://doi.org/10.1051/e3sconf/202019711015
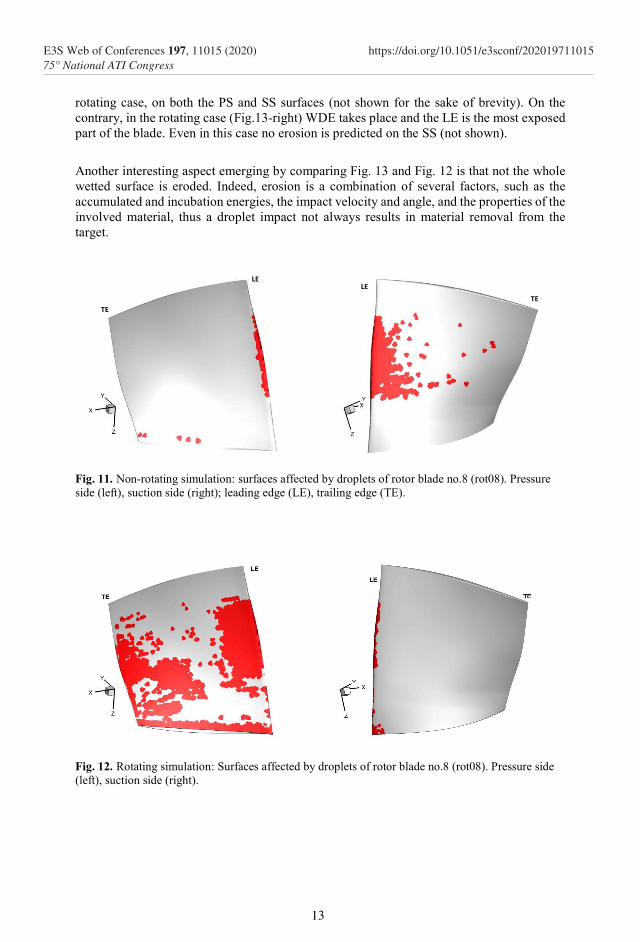
rotating case, on both the PS and SS surfaces (not shown for the sake of brevity). On the contrary, in the rotating case (Fig.13-right) WDE takes place and the LE is the most exposed part of the blade. Even in this case no erosion is predicted on the SS (not shown).
Another interesting aspect emerging by comparing Fig. 13 and Fig. 12 is that not the whole wetted surface is eroded. Indeed, erosion is a combination of several factors, such as the accumulated and incubation energies, the impact velocity and angle, and the properties of the involved material, thus a droplet impact not always results in material removal from the target.
Fig. 11. Non-rotating simulation: surfaces affected by droplets of rotor blade no.8 (rot08). Pressure side (left), suction side (right); leading edge (LE), trailing edge (TE).
Fig. 12. Rotating simulation: Surfaces affected by droplets of rotor blade no.8 (rot08). Pressure side (left), suction side (right).
TE
LE LE
TE
13
E3S Web of Conferences 197, 11015 (2020)75° National ATI Congress
https://doi.org/10.1051/e3sconf/202019711015
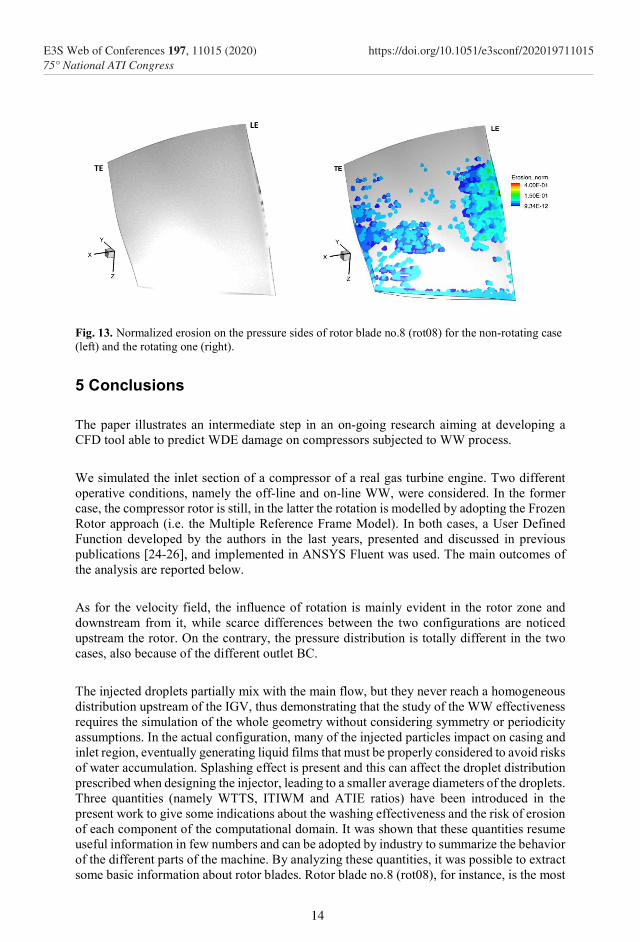
Fig. 13. Normalized erosion on the pressure sides of rotor blade no.8 (rot08) for the non-rotating case (left) and the rotating one (right).
5 Conclusions
The paper illustrates an intermediate step in an on-going research aiming at developing a CFD tool able to predict WDE damage on compressors subjected to WW process.
We simulated the inlet section of a compressor of a real gas turbine engine. Two different operative conditions, namely the off-line and on-line WW, were considered. In the former case, the compressor rotor is still, in the latter the rotation is modelled by adopting the Frozen Rotor approach (i.e. the Multiple Reference Frame Model). In both cases, a User Defined Function developed by the authors in the last years, presented and discussed in previous publications [24-26], and implemented in ANSYS Fluent was used. The main outcomes of the analysis are reported below.
As for the velocity field, the influence of rotation is mainly evident in the rotor zone and downstream from it, while scarce differences between the two configurations are noticed upstream the rotor. On the contrary, the pressure distribution is totally different in the two cases, also because of the different outlet BC.
The injected droplets partially mix with the main flow, but they never reach a homogeneous distribution upstream of the IGV, thus demonstrating that the study of the WW effectiveness requires the simulation of the whole geometry without considering symmetry or periodicity assumptions. In the actual configuration, many of the injected particles impact on casing and inlet region, eventually generating liquid films that must be properly considered to avoid risks of water accumulation. Splashing effect is present and this can affect the droplet distribution prescribed when designing the injector, leading to a smaller average diameters of the droplets. Three quantities (namely WTTS, ITIWM and ATIE ratios) have been introduced in the present work to give some indications about the washing effectiveness and the risk of erosion of each component of the computational domain. It was shown that these quantities resume useful information in few numbers and can be adopted by industry to summarize the behavior of the different parts of the machine. By analyzing these quantities, it was possible to extract some basic information about rotor blades. Rotor blade no.8 (rot08), for instance, is the most
LE
TE
14
E3S Web of Conferences 197, 11015 (2020)75° National ATI Congress
https://doi.org/10.1051/e3sconf/202019711015
exposed to droplets in the rotating case, but only on its PS. In the non-rotating case it is not the most affected by water. This means that the on-line washing effectiveness is good for the PS of this blade, covering about 20% of it, and depositing the highest amount of water among all the rotor blades. On the other hand, the erosion risk for this blade, evaluated by the ATIE ratio, is not the highest, therefore erosion is not expected to be extremely severe. Such information can be used to optimize the washing system, varying the number of injectors, their geometrical characteristics, the amount of injected water, and the droplet size distribution in order to maximize the washing effectiveness on both the blade sides but keeping the risk of erosion as low as possible.
References
1. C. B. Meher-Homji, M. A. Chaker, H.M. Motiwala, “Gas Turbine Performance Deterioration”, Proceedings of 30th Turbomachinery Symposium 139-175 (2001).
2. G.F. Aker, H.I.H. Saravanamuttoo, “Predicting gas turbine performance degradation due to compressor fouling using computer simulation technique”, Journal of Engineering for Gas Turbines and Power 111 (1989).
3. C.P. Bowen, N.D. Libertowski, M. Mortazavi, J.P. Bons, “Modeling deposition in turbine cooling passages with temperature-dependent adhesion and mesh morphing”, Journal of Engineering for Gas Turbines and Power 141(7) (2019).
4. G. Agati, D. Borello, F. Rispoli, A. Salvagni, P. Venturini, “Numerical simulation of a particle-laden impinging jet: Effect of wall curvature on particle deposition”, Proceedings of the ASME Turbo Expo (2017).
5. G. Agati, D. Borello, G. Camerlengo, F. Rispoli, J. Sesterhenn, “Direct Numerical Simulation of an Oblique Jet in a Particle-Laden Crossflow”, ERCOFTAC Series (2020).
6. G. Agati, D. Borello, G. Camerlengo, F. Rispoli, J. Sesterhenn, “DNS of an Oblique Jet in a Particle-Laden Crossflow: Study of Solid Phase Preferential Concentration and Particle-Wall Interaction”, Flow, Turbulence and Combustion 105, 517–535 (2020).
7. F.J. Brooks, “GE gas turbine performance characteristics”, GE Power Systems, Report GER-3567H (2000).
8. S, Madsen, L.E. Bakken, “Gas turbine fouling off-shore; effective online water wash through high water-to-air ratio”, Proceedings of the ASME Turbo Expo 2018 GT2018-75618 (2018).
9. H. Margolis, “US Navy on-line compressor washing of marine gas turbine engines”, Proceedings of the International Gas Turbine and Aeroengine Congress and Exposition (1991).
10. Q. Zhou, N. Li, X. Chen, T. Xu, S. Hui e D. Zhang, “Analysis of water drop erosion on turbine blades based on a nonlinear liquid-solid impact model”, International Journal of Impact Engineering 36 (2009).
11. B. Lee, K. Riu, S. Shin, S. Kwon, “Development of a water droplet erosion model for large steam turbine blades”, KSME International Journal 17 114–121 (2003).
12. Z. N. Kamkar, “Water Droplet Erosion Mechnisms of Ti-6Al-4V”. Doctoral Thesis, École de Technologie Spérieure, Montreal, Canada (2014).
13. K. Brun, R. Kurz, M. G. Nored, J. M. Thorp, “Impact of continuous inlet fogging and overspray operation on ge 5002 gas turbine life and performance”, Proceedings of the ASME Turbo Expo 2014 7 545-554 (2014).
15
E3S Web of Conferences 197, 11015 (2020)75° National ATI Congress
https://doi.org/10.1051/e3sconf/202019711015
14. M.H. Keegan, D.H. Nash, M.M. Stack, “On erosion issues associated with the leading edge of wind turbine blades”, Journal of Physics D: Applied Physics 46(38) (2013).
15. V.A. Ryzhenkov, A.I. Lebedeva, A.F. Mednikov, “Erosion wear of the blades of wet-steam turbine stages: Present state of the problem and methods for solving it”, Thermal Engineering 58(9) 713-718 (2011).
16. K. Tsubouchi, N. Yasugahira, S. Yoshida, R. Kaneko, T. Sato, “Evaluation of water droplet erosion for advanced large steam turbine”, International Joint Power Generation Conference, ASME (1990).
17. M. Ahmad, M. Schatz, M.V. Casey, “Experimental investigation of droplet size influence on low pressure steam turbine blade erosion”, Wear 303(1-2) 83-86 (2013).
18. A. Corsini, A. Castorrini, E. Morei, F. Rispoli, F. Sciulli, P. Venturini, “Modeling of rain drop erosion in a multi-MW wind turbine”, ASME Turbo Expo GT2015-42174 (2015).
19. A. Castorrini, A. Corsini, F. Morabito, F. Rispoli, P. Venturini, “Numerical simulation with adaptive boundary method for predicting time evolution of erosion processes, ASME Turbo Expo GT2017-64675 (2017).
20. A. Castorrini, A. Corsini, F. Rispoli, P. Venturini, “Numerical simulation of the blade aging process in an induced draft fan due to long time exposition to fly ash particles”, ASME Turbo Expo GT2018-76740 (2018).
21. L. Cardillo, A. Corsini, G. Delibra, F. Rispoli, A.G. Sheard, P. Venturini, “Simulation of particle-laden flows in a large centrifugal fan for erosion prediction”, Proceedings of the ASME Turbo Expo (2014).
22. M. Andreoli, S. Gabriele, P. Venturini, D. Borello, “New model to predict water droplets erosion based on erosion test curves. Application to on-line water washing of a compressor”, ASME Turbo Expo GT2019-92033 (2019).
23. P. Venturini, M. Andreoli, D. Borello and F. Rispoli, S. Gabriele, “Modelling of water droplets erosion on a subsonic compressor cascade”. Flow, Turbulence and Combustion (2019).
24. D. Borello, A. Salvagni, K. Hanjalić, “Effects of rotation on flow in an asymmetric rib-roughened duct: LES study”, International Journal of Heat and Fluid Flow 55 104-119, (2015).
25. F. Di Gruttola, G. Agati, P. Venturini, D. Borello, F. Rispoli, S. Gabriele, D. Simone, “Numerical study of erosion due to online water washing in axial flow compressors, ASME Turbo Expo GT2020-14767 (2020)
26. ANSYS Fluent Theory Guide, release 19. ANSYS, Inc., Southpointe (2018).
27. D.W. Stanton, C. J. Rutland, “Multi-dimensional modelling of thin liquid films and spray-wall interactions resulting from impinging sprays”, International Journal of Heat and Mass Transfer 41 3037–3054 (1998).
28. A.L. Yarin, D.A. Weiss, “Impact of drops on solid surfaces: self-similar capillary waves, and splashing as a new type of kinematic discontinuity”, J Fluid Mech 283 141-73 (1995).
29. C. Mundo, M. Sommerfeld, C. Tropea, “Droplet-wall collisions: experimental studies of the deformation and breakup process”, International Journal of Multiphase Flow 21(2) 151-173 (1995).
16
E3S Web of Conferences 197, 11015 (2020)75° National ATI Congress
https://doi.org/10.1051/e3sconf/202019711015