water safety plan (wsp) for municipal committee jacobabad (mcj)
94
Water Governance and Capacity Building Support WGCB Jacobabad Milestone-Development of Water Safety Plan (WSP) WATER SAFETY PLAN (WSP) FOR MUNICIPAL COMMITTEE JACOBABAD (MCJ)
-
Upload
khangminh22 -
Category
Documents
-
view
1 -
download
0
Transcript of water safety plan (wsp) for municipal committee jacobabad (mcj)

Water Governance and Capacity Building Support
WGCB Jacobabad
Milestone-Development of Water Safety Plan (WSP)
WATER SAFETY PLAN (WSP) FOR
MUNICIPAL COMMITTEE
JACOBABAD (MCJ)

This Report was made possible by the support of the American people through the United States
Agency for International Development (USAID). The contents are the sole responsibility of HANDS
and do not necessarily reflect the views of USAID or the U.S. government.
Submitted to: Hafeezullah Samo
COR-USAID
Submitted by: Ghulam Mustafa Zaor
Chief of Party- CoP-
WG&CB Activity
Tel: +92.21. 34532804
Email: [email protected]
Contract Number: No. 72039119C00001
Date: 04-02-2021
WATER SAFETY PLAN (WSP) FOR
MUNICIPAL COMMITTEE
JACOBABAD (MCJ)

i
Contents LIST OF FIGURES ........................................................................................................................................... iv
LIST OF ABBREVIATIONS ............................................................................................................................ v
EXECUTIVE SUMMARY ............................................................................................................................... vi
CHAPTER 1: INTRODUCTION ...................................................................................................................... 1
1.1 Background of the Assignment .................................................................................................................... 1
1.2 WSP Approach ............................................................................................................................................ 2
1.3 Brief Methodology ...................................................................................................................................... 4
CHAPTER 2: MANAGEMENT HIERARCHY OF MCJ AND WSP TEAM ................................................. 5
2.1 Organizational and Management Hierarchy of MCJ ................................................................................... 5
2.2 Assembly of WSP Team ............................................................................................................................. 6
CHAPTER 3: WATER SUPPLY SYSTEM OF JACOBABAD ...................................................................... 9
3.1 Description of the Water Supply System .................................................................................................... 9
3.2 Population and Water Demand .................................................................................................................... 13
3.3 Water Supply Capacity and Infrastructure .................................................................................................. 13
3.4 Water Supply and Distribution Network ..................................................................................................... 15
CHAPTER 4: IDENTIFICATION OF HAZARDS AND RISK ASSESSMENT ............................................ 18
4.1 Hazard Identification and Risk Assessment at Canal Intake (Source) ........................................................ 20
4.2 Hazard Identification and Risk Assessment at Lagoons and Rising Main .................................................. 21
4.3 Hazard Identification and Risk Assessment Water Treatment Plant ........................................................... 22
4.4 Hazard Identification and Risk Assessment at Water Supply and Distribution Network ........................... 23
CHAPTER 5: CONTROL MEASURES, VALIDATION OF CONTROL MEASURES, AND
REASSESSMENT OF RISK RATING ............................................................................................................. 25
5. 1 Control Measures at Intake (Source) .......................................................................................................... 25
5.2 Control Measures at Lagoons ...................................................................................................................... 28
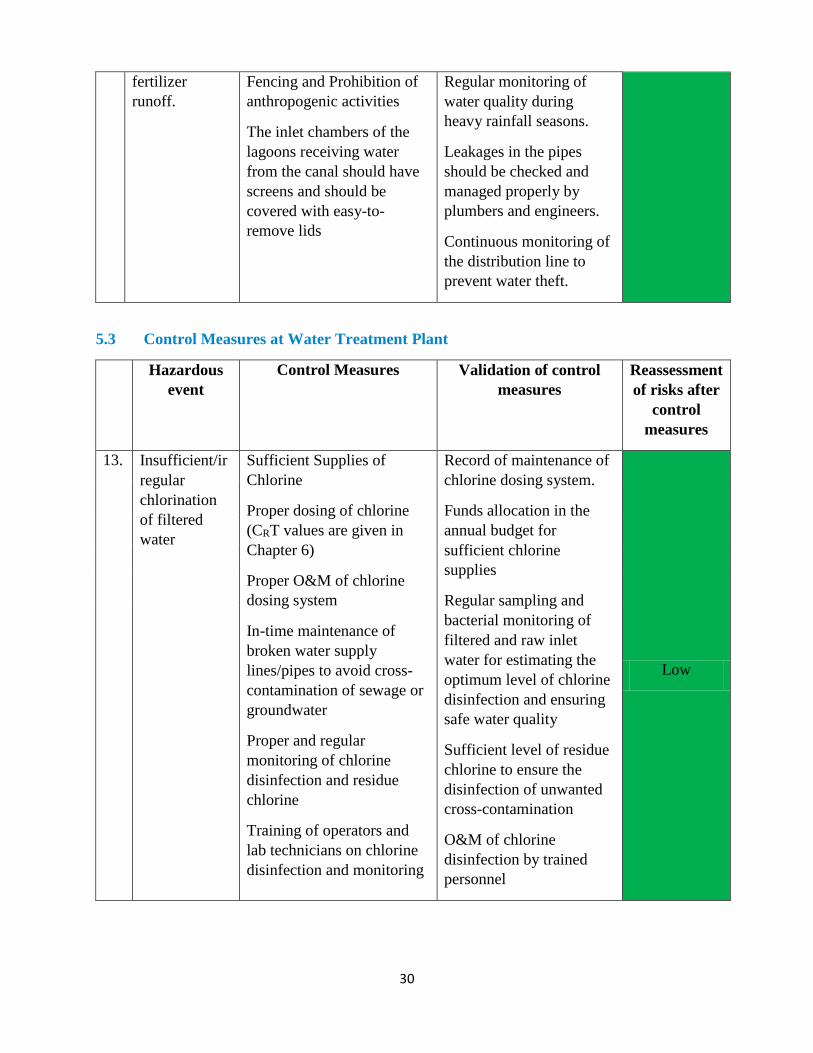
5.3 Control Measures at Water Treatment Plant ............................................................................................... 30
5.4 Control Measures at Distribution Network (Control Measures) ................................................................. 33
5.5 Energy (electricity/fuel) requirements for operation of the water system ................................................... 35
CHAPTER 6: OPERATIONAL MONITORING PLAN AND MANAGEMENT STRATEGIES FOR WSP 37
6.1 Operational Monitoring Plan (OMP) ........................................................................................................... 37
6.2 Verification Monitoring Plan (VMP) .......................................................................................................... 58
6.3 WSP Auditing .............................................................................................................................................. 61
6.4 Management Procedures ............................................................................................................................. 62
6.5 Emergency response plan ............................................................................................................................ 63

ii
6.6 Water Availability Plans for Summers, Winter, and Canal Closure ........................................................... 65
6.7 Water Requirement by 2050 ........................................................................................................................ 65
6.8 Supporting Programs ................................................................................................................................... 66
6.9 Communication Strategy ............................................................................................................................. 67
6.10 Establishing Alternate Sources for Safe Drinking Water Supply ............................................................ 69
6.11 Human Resources Management ............................................................................................................... 70
6.13 Outsourcing the Water Supply ................................................................................................................. 70
6.13 WSP Steering Committee ........................................................................................................................ 71
ANNEXURES ................................................................................................................................................... 72
Annex-1: Organogram of Municipal Committee Jacobabad (Additions) .......................................................... 73
Annex-2: Zone Wise Distribution Networks ..................................................................................................... 74
Annex-3: Power and chemical requirements for different scenarios for operation of the water system at MCJ
80
Annex-4: PQSCA Standards for Drinking Water Quality 4639-2004(R) .......................................................... 82
iii
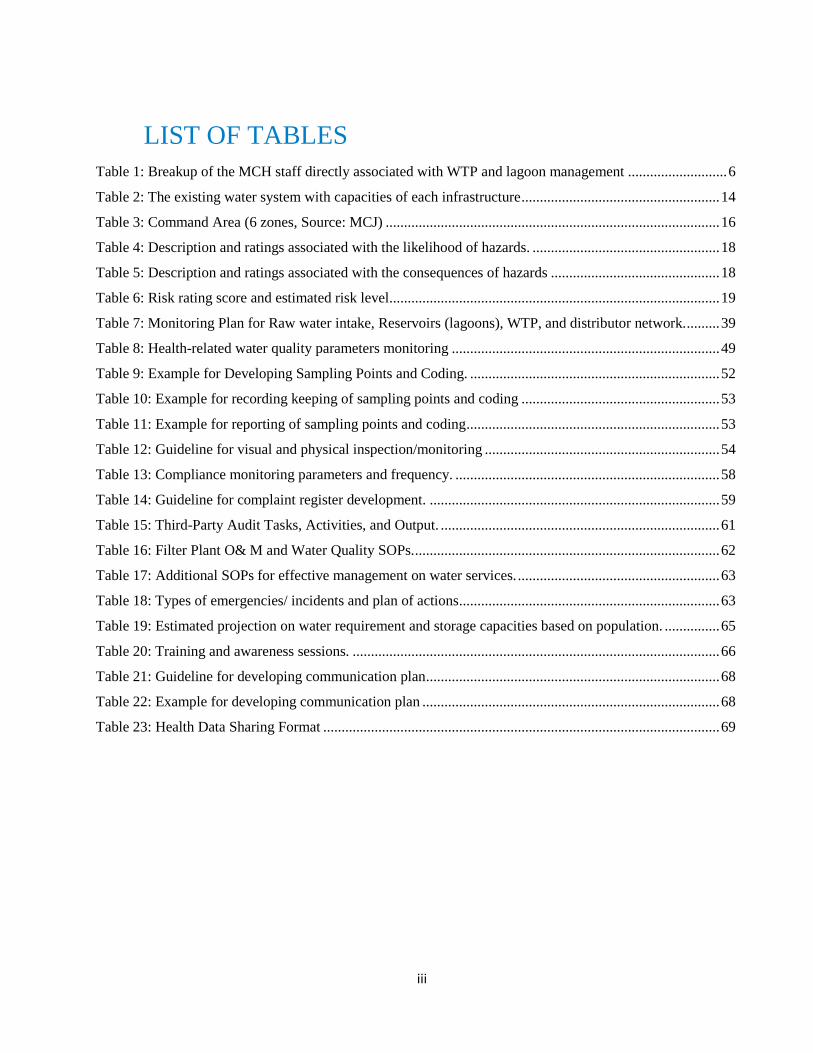
LIST OF TABLES
Table 1: Breakup of the MCH staff directly associated with WTP and lagoon management ........................... 6
Table 2: The existing water system with capacities of each infrastructure ...................................................... 14
Table 3: Command Area (6 zones, Source: MCJ) ........................................................................................... 16
Table 4: Description and ratings associated with the likelihood of hazards. ................................................... 18
Table 5: Description and ratings associated with the consequences of hazards .............................................. 18
Table 6: Risk rating score and estimated risk level.......................................................................................... 19
Table 7: Monitoring Plan for Raw water intake, Reservoirs (lagoons), WTP, and distributor network. ......... 39
Table 8: Health-related water quality parameters monitoring ......................................................................... 49
Table 9: Example for Developing Sampling Points and Coding. .................................................................... 52
Table 10: Example for recording keeping of sampling points and coding ...................................................... 53
Table 11: Example for reporting of sampling points and coding ..................................................................... 53
Table 12: Guideline for visual and physical inspection/monitoring ................................................................ 54
Table 13: Compliance monitoring parameters and frequency. ........................................................................ 58
Table 14: Guideline for complaint register development. ............................................................................... 59
Table 15: Third-Party Audit Tasks, Activities, and Output. ............................................................................ 61
Table 16: Filter Plant O& M and Water Quality SOPs. ................................................................................... 62
Table 17: Additional SOPs for effective management on water services. ....................................................... 63
Table 18: Types of emergencies/ incidents and plan of actions ....................................................................... 63
Table 19: Estimated projection on water requirement and storage capacities based on population. ............... 65
Table 20: Training and awareness sessions. .................................................................................................... 66
Table 21: Guideline for developing communication plan ................................................................................ 68
Table 22: Example for developing communication plan ................................................................................. 68
Table 23: Health Data Sharing Format ............................................................................................................ 69
iv
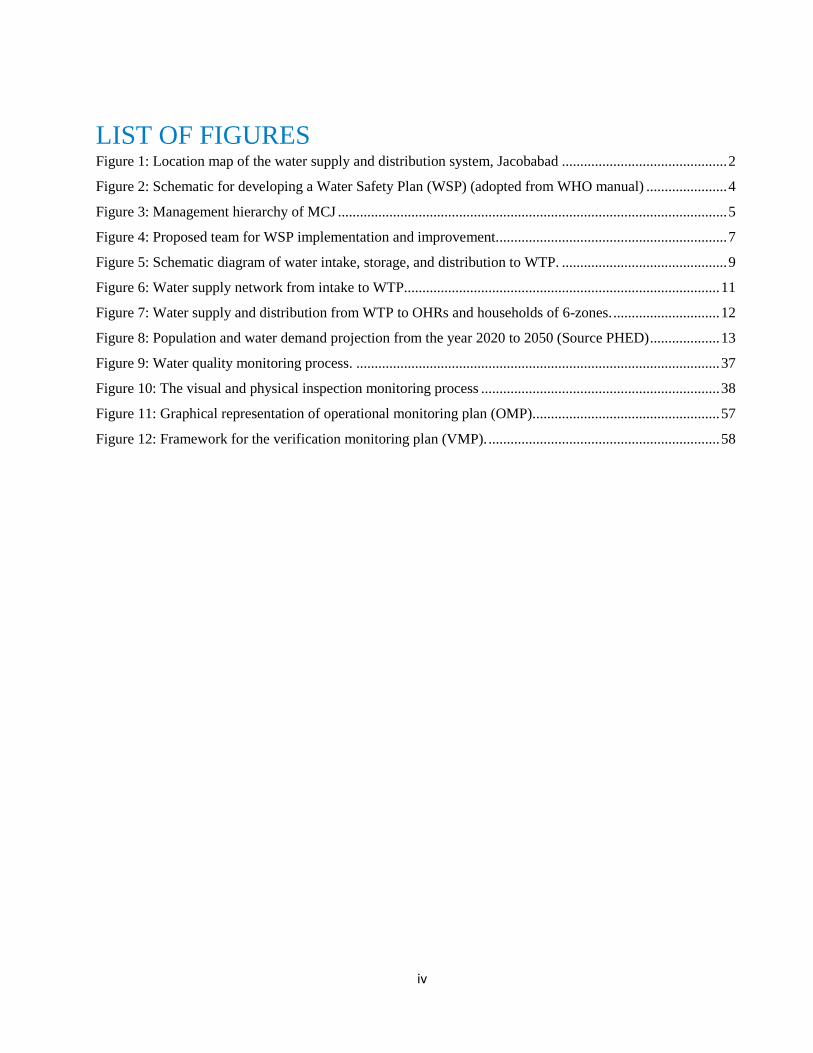
LIST OF FIGURES
Figure 1: Location map of the water supply and distribution system, Jacobabad ............................................. 2
Figure 2: Schematic for developing a Water Safety Plan (WSP) (adopted from WHO manual) ...................... 4
Figure 3: Management hierarchy of MCJ .......................................................................................................... 5
Figure 4: Proposed team for WSP implementation and improvement............................................................... 7
Figure 5: Schematic diagram of water intake, storage, and distribution to WTP. ............................................. 9
Figure 6: Water supply network from intake to WTP...................................................................................... 11
Figure 7: Water supply and distribution from WTP to OHRs and households of 6-zones. ............................. 12
Figure 8: Population and water demand projection from the year 2020 to 2050 (Source PHED) ................... 13
Figure 9: Water quality monitoring process. ................................................................................................... 37
Figure 10: The visual and physical inspection monitoring process ................................................................. 38
Figure 11: Graphical representation of operational monitoring plan (OMP)................................................... 57
Figure 12: Framework for the verification monitoring plan (VMP). ............................................................... 58
v
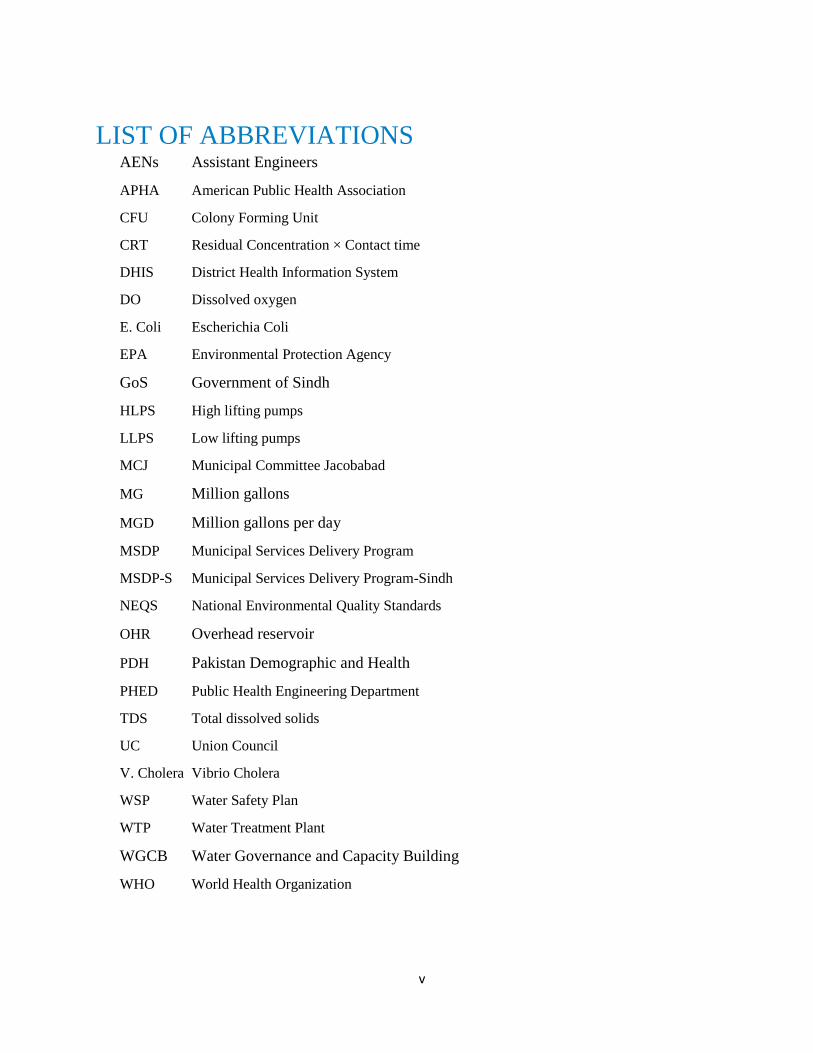
LIST OF ABBREVIATIONS
AENs Assistant Engineers
APHA American Public Health Association
CFU Colony Forming Unit
CRT Residual Concentration × Contact time
DHIS District Health Information System
DO Dissolved oxygen
E. Coli Escherichia Coli
EPA Environmental Protection Agency
GoS Government of Sindh
HLPS High lifting pumps
LLPS Low lifting pumps
MCJ Municipal Committee Jacobabad
MG Million gallons
MGD Million gallons per day
MSDP Municipal Services Delivery Program
MSDP-S Municipal Services Delivery Program-Sindh
NEQS National Environmental Quality Standards
OHR Overhead reservoir
PDH Pakistan Demographic and Health
PHED Public Health Engineering Department
TDS Total dissolved solids
UC Union Council
V. Cholera Vibrio Cholera
WSP Water Safety Plan
WTP Water Treatment Plant
WGCB Water Governance and Capacity Building
WHO World Health Organization
vi
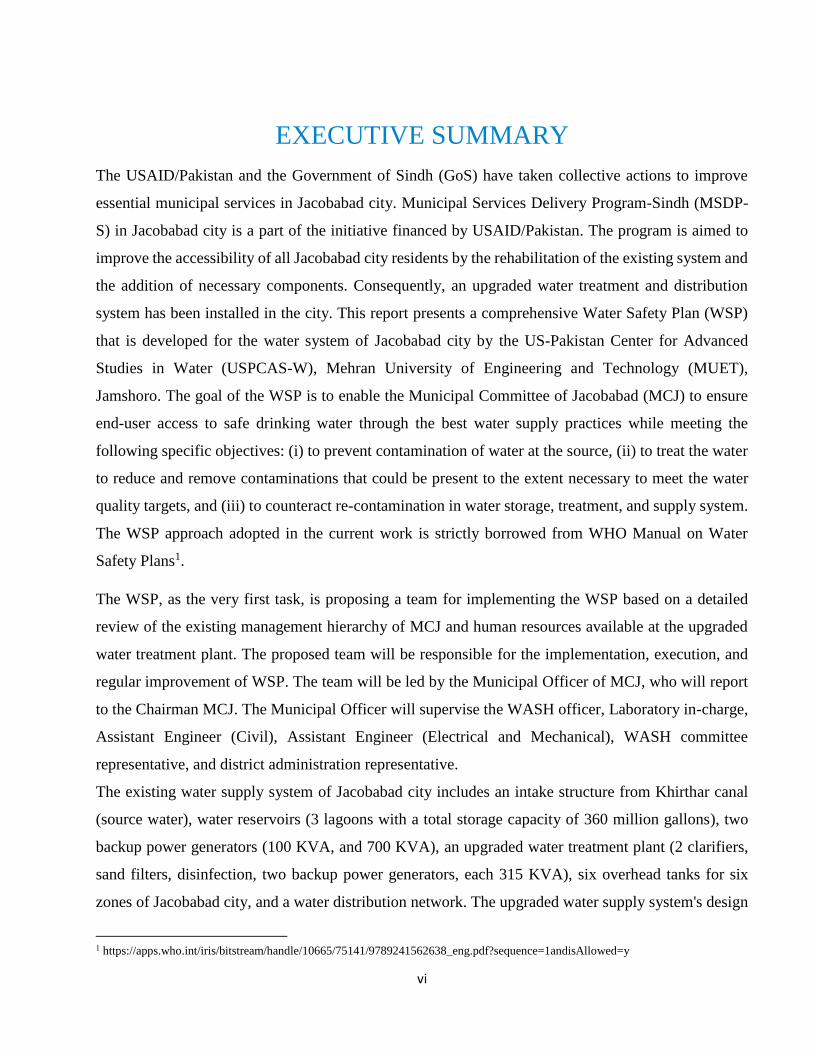
EXECUTIVE SUMMARY
The USAID/Pakistan and the Government of Sindh (GoS) have taken collective actions to improve
essential municipal services in Jacobabad city. Municipal Services Delivery Program-Sindh (MSDP-
S) in Jacobabad city is a part of the initiative financed by USAID/Pakistan. The program is aimed to
improve the accessibility of all Jacobabad city residents by the rehabilitation of the existing system and
the addition of necessary components. Consequently, an upgraded water treatment and distribution
system has been installed in the city. This report presents a comprehensive Water Safety Plan (WSP)
that is developed for the water system of Jacobabad city by the US-Pakistan Center for Advanced
Studies in Water (USPCAS-W), Mehran University of Engineering and Technology (MUET),
Jamshoro. The goal of the WSP is to enable the Municipal Committee of Jacobabad (MCJ) to ensure
end-user access to safe drinking water through the best water supply practices while meeting the
following specific objectives: (i) to prevent contamination of water at the source, (ii) to treat the water
to reduce and remove contaminations that could be present to the extent necessary to meet the water
quality targets, and (iii) to counteract re-contamination in water storage, treatment, and supply system.
The WSP approach adopted in the current work is strictly borrowed from WHO Manual on Water
Safety Plans1.
The WSP, as the very first task, is proposing a team for implementing the WSP based on a detailed
review of the existing management hierarchy of MCJ and human resources available at the upgraded
water treatment plant. The proposed team will be responsible for the implementation, execution, and
regular improvement of WSP. The team will be led by the Municipal Officer of MCJ, who will report
to the Chairman MCJ. The Municipal Officer will supervise the WASH officer, Laboratory in-charge,
Assistant Engineer (Civil), Assistant Engineer (Electrical and Mechanical), WASH committee
representative, and district administration representative.
The existing water supply system of Jacobabad city includes an intake structure from Khirthar canal
(source water), water reservoirs (3 lagoons with a total storage capacity of 360 million gallons), two
backup power generators (100 KVA, and 700 KVA), an upgraded water treatment plant (2 clarifiers,
sand filters, disinfection, two backup power generators, each 315 KVA), six overhead tanks for six
zones of Jacobabad city, and a water distribution network. The upgraded water supply system's design
1 https://apps.who.int/iris/bitstream/handle/10665/75141/9789241562638_eng.pdf?sequence=1andisAllowed=y

vii
capacity is 14.5 million gallons per day (MGD), to cover projected water supply up to the year 2050.
Currently, 12,005 connections are provided to the citizens of Jacobabad, with current water demand of
2.65 MGD. According to an estimate by the Public Health Engineering Department (PHED), the total
water demand will increase to 9.2 MGD based on 30,000 connections by 2050.
Hazards and risks were identified and assessed with their likelihood and severity and final risk rating,
based on the detailed and systematic field observation and monitoring of water quality. The risk ratings
were obtained by multiplying scores for likelihood with the severity of hazards (0-50). A
brainstorming session was organized to assign a class for each risk (low, medium, moderately high,
and high) against each component of water supply, i.e., intake, reservoirs, pumping stations, water
treatment plant, overhead reservoirs, and distribution system. Identifying hazardous events and risk
rating included causes of deterioration of water quality, whereas health-related indicators were of
prime focus for risk assessment. The risk assessment exercise led to the development of relevant
control measures and validation of control measures for each identified hazardous event. Furthermore,
more than one control and validation measures were described for a single hazardous event. The risks
were reassessed, considering the adoption of the proposed control measures. Electric power shortage
can be considered as a significant challenge for the efficient operation of the water system. The
estimated power requirement to meet water demand for 30,000 connections and to meet maximum
water demand by 2050 is about 784,000 KW/month. This estimated power requirement can help MCJ
to negotiate with power supply authorities and arrange fuel for alternate power supply (in-house
generators) or install a solar power system.
A detailed operational monitoring plan for the water system of Jacobabad is developed, based on risk
assessment, validation of control measures, and reassessment of risk rating, which provides the
location of monitoring, frequency, method, and responsibility of implementation of control actions.
This detailed monitoring plan is then used to generate specific, measurable health-related control
actions (Table 8) and visual/physical inspection measures. For effective implementation of WSP,
monitoring plan, WSP auditing, management procedures, emergency response plan, supporting
programs, and communication strategy has been developed. In addition, alternate sources for safe
water supply are identified, in case of canal closure for a longer period, which includes (i) groundwater
extraction, (ii) installation of RO plant, and (iii) water supply through tanker in extreme emergency
viii
situation. A Steering Committee is suggested as an advisory body and to steer the WSP
implementation, compromises of Deputy commissioner (convener), district health officer (member),
academia representative (2 nominated members), NGO representative (nominated member), Mohalla
WASH committee representative (2 nominated members), and CMO (Secretary). The WSP Steering
Committee will make policy decisions, guide the WSP team of MCJ in the execution of WSP. Further,
it will ensure effective monitoring through regular reporting. The committee will set targets and ensure
compliance as per the WSP in Jacobabad. The committee will meet quarterly to review the progress
and implementation status of the WSP and will discuss issues, provide guidelines and make
suggestions to the WSP team to ensure successful compliance of WSP. The committee may constitute
a sub-committee for a specific task to be accomplished, as and when necessary.
1
CHAPTER 1: INTRODUCTION
1.1 Background of the Assignment
The USAID/Pakistan and the Government of Sindh (GoS) have taken collective actions to
improve essential municipal services in Jacobabad city. Municipal Services Delivery Program-
Sindh (MSDP-S) in Jacobabad city is a part of this initiative financed by USAID. The program
is aimed to improve the accessibility of all Jacobabad city residents to safely managed drinking
water by the rehabilitation of the existing system and the addition of necessary components.
As a result, the water treatment and distribution system has been upgraded, and the essential
municipal infrastructure installed in the city. A map of the water intake and storage system
location, water filter plant, and water supply distribution network for Jacobabad city, built as
an outcome of combined efforts of GoS and USAID, is given in Figure 1. A detailed description
is provided in Chapter-3 of this report.
Jacobabad city, capital of district Jacobabad and center of Jacobabad Taluka, is ranked 9th
largest city in Sindh, Pakistan. The city is subdivided into eight Union Councils (UCs), namely
Soomra Mohalla, Lashari Mohalla, Shah Gazi Mohalla, Drakhan Mohalla, Phool Bagh, Mochi
Basti, Jaffarabad Mohalla, and Dastagir Colony, managed and operated by Municipal
Corporation Jacobabad (MCJ). The population of Jacobabad was 191,076 persons as per the
census 2018, with an average annual population growth of 1.89%2. The total area covered by
the eight union councils is approximately 10.25 square kilometers. Jacobabad lies in a drought-
prone geographic zone, with extremely hot summers, mild winters, and an average annual
rainfall of 122.5 mm. The groundwater of Jacobabad city is brackish in most areas, highly
contaminated, and unfit for human consumption. The city is the center for the rice crop and is
supported by the irrigation of surface water from the Khirthar canal and groundwater.
A comprehensive Water Safety Plan (WSP) for the newly upgraded water system of Jacobabad
city is required to ensure safe water access during its operation. This draft “Water Safety Plan
(WSP) for Municipal Committee Jacobabad (MCJ)” has been prepared by the US-Pakistan
Center for Advanced Studies in Water (USPCAS-W), Mehran University of Engineering and
Technology (MUET), Jamshoro, under the “Water Governance and Capacity Building –
WGCB” Program funded by USAID/ Pakistan.
2 https://www.citypopulation.de/en/pakistan/distr/admin/805__jacobabad/

2
Figure 1: Location map of the water supply and distribution system, Jacobabad
1.2 WSP Approach
The USPCAS-W has developed the Water Safety Plan (WSP) in consultation with Municipal
Committee Jacobabad, the local community, and other relevant stakeholders to ensure safe
drinking water supply while adopting a risk management approach that encompasses all steps
of the water supply system from source to the end-user/consumer. The work scope for
developing a comprehensive WSP covers a comprehensive system assessment for hazards
identification, identification of controls to ensure meeting health-based targets, risk
management, and surveillance approach for the water system of Jacobabad.

3
The work includes safety plans for all activities, starting from the water source, treatment, and
supply to end-users/consumers. The WSP is developed following the WSP manual, WHO3 to
preventive management framework for safe drinking water.
1.2.1 Terms of References (TORs)
The terms of the references (TORs) of the WSP framework are given below:
1) Health-based targets (based on an evaluation of health concerns),
2) System assessment to determine whether the water supply chain from the source
through treatment to the point of consumption, as a whole, can deliver water of a quality
that meets the health-based targets
3) Operational monitoring of the control measures in the supply chain which is of
particular importance in securing drinking-water safety
4) Management plans (documenting the system assessment and monitoring; describing
actions to be taken in normal operation and incident conditions – including upgrade and
improvement), documentation, and communication
5) A system of independent surveillance that verifies that the above are operating properly
1.2.2 Objectives of the WSP
The specific objective of the WSP is to enable MCJ to ensure safe drinking water through the
best water supply practices. These objectives are given the following:
1) To prevent contamination of water at source;
2) To treat the water to reduce and remove contamination to the extent necessary to meet the
water quality targets; and,
3) To counteract re-contamination during storage, distribution, and handling of drinking
water.
4) To meet the international standards and practices, using the WHO Manual on Water Safety
Plans4 as a guide.
3 Water Safety Plan Manual: Step-by-step risk management for drinking water supply, WHO, 2009 4 https://apps.who.int/iris/bitstream/handle/10665/75141/9789241562638_eng.pdf?sequence=1&isAllowed=y

4
1.3 Brief Methodology
The WSP was developed based on the objectives mentioned earlier and the guidelines of the
WSP manual of WHO (Water Safety Plan Manual: Step-by-Step risk management for drinking
water supply5). The schematic of the process adopted for the development of WSP is given in
Figure 2.
WSP Team Preparation
- Proposition of WSP team in accordance
with existing management hierarchy of
MCJ
System Assessment
- Describe the water supply system
- Identify the hazards and assess the risks
- Determine and validate control measures,
re-assess the risks
- Develop, implement, and maintain an
improvement/upgrade WSP plan
- Develop operational and management plan
WSP Improvement Plan
Review and Revision of the WSP if
and when needed and/or following
the incident
WSP consultation and feedback;
consumers satisfaction based
WSP/system improvements
System Improvement Plan
(Proposed minor/major
improvement in the water
system to meet water
demand and ensure water
quality)
Operational and Management
Monitoring Plan
- Define and develop a monitoring plan of
control measures, system operations and
management
- Verification Monitoring Plan of the WSP
Incident(s)
(emergency)
Management and Communication
- Propose/Plan all management procedures
- Develop/Plan supporting programmes
- Communication consultation and consumer
feedback plan
Figure 2: Schematic for developing a Water Safety Plan (WSP) (adopted from WHO
manual)
The WSP has the following major components:
MCJ management hierarchy and proposed team for WSP execution
System assessment of water supply system
Developed control measures and proposed improvements/upgrades of the system
Developed SOPs for water quality laboratory operations and water quality analysis
Management and operational strategies plans
Management and operational monitoring plans
HR and financial management and communication plans
Consultation and consumers’ feedback plan
5 Bartram J, Corrales L, Davison A, Deere D, Drury D, Gordon B, Howard G, Rinehold A, Stevens M. Water safety plan manual: step-by-step risk management for drinking-water suppliers. World Health Organization. Geneva, 2009

5
CHAPTER 2: MANAGEMENT HIERARCHY OF
MCJ AND WSP TEAM
2.1 Organizational and Management Hierarchy of MCJ
The Municipal Committee Jacobabad (MCJ) is led by the Chief Municipal Officer (CMO),
under the supervision of Chairman and Vice Chairman of MCJ. The CMO directly supervises
the municipal engineer, chief officer, accounts officer, revenue officer, and taxation officer.
The detailed organogram is given in Annex-1, and a summary of the hierarchy is shown in
Figure 3.
Figure 3: Management hierarchy of MCJ.
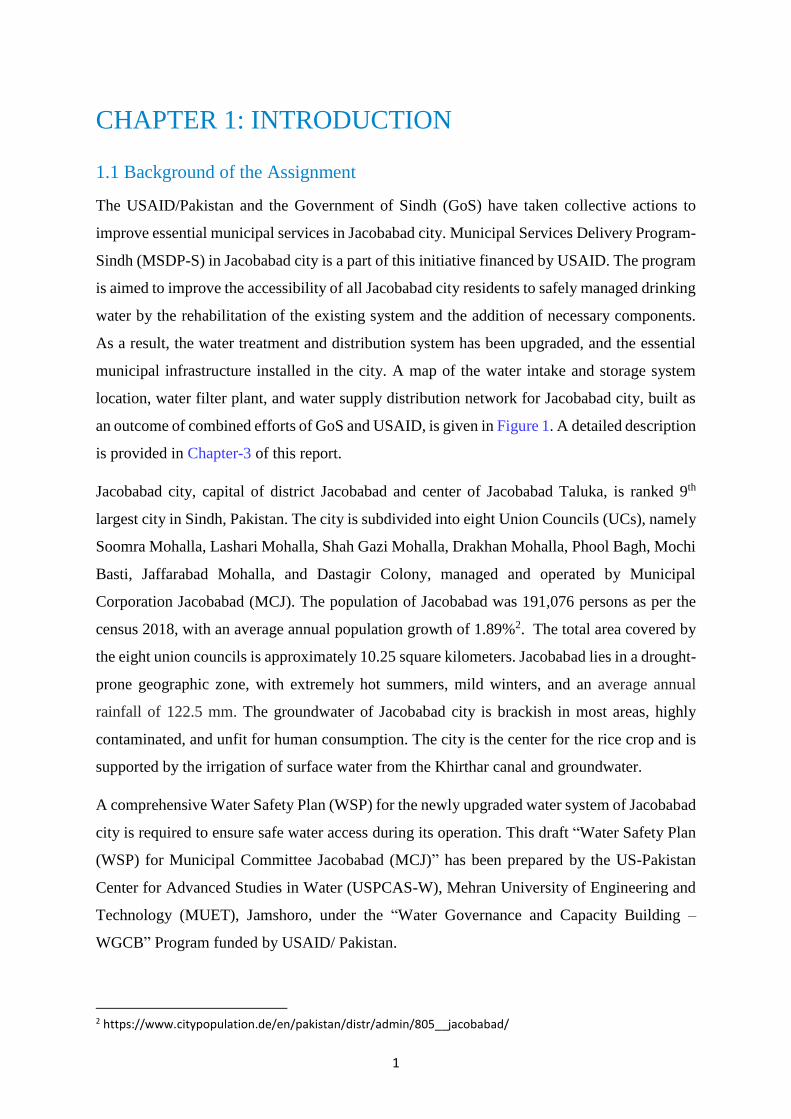
Based on the data collected during the field visit of USPCAS-W team, the total number of
current staff is 38 (directly associated with the Water Treatment Plant (WTP) and lagoon O&M
and management), excluding the higher management. A breakup of staff members with their
general roles is given in Table 1.
Chairman
Cheif Municial Officer
Cheif Officer
Office Superintendent
Council Officer
Municipal Engineer
AEN
(M&E)AEN (Civil)
WASH Officer
Account Officer
Revenue Officer
Texation Officer
Vice Chairman
6
Table 1: Breakup of the MCH staff directly associated with WTP and lagoon management.
Position Number of staff
Plant supervisor for overall supervision from lagoons to WTP and supply and distribution
1
Civil Engineer for plant and lagoons monitoring and supervision 1
Plumbers for plumbing and line maintenance 8
Valve man for overhead reservoirs (OHRs) filling and distribution 9
Patrolling officers for patrolling on water distribution line and power line
3
Low lifting pump (LLP) operators 2
High lifting pump (HLP) operators 2
Plant pump operators for plant operation and associated activities
6
Lab technicians for water sampling and laboratory analysis 3
Plant shift in-charge of plant supervision 3
Watchman 1
Additional staff*
WASH revenue officer 1
Sub-engineer on the distribution network 1
*With shared activities of WTP and MCJ and placement in MCJ main office
Most of the WTP maintenance work is currently being outsourced, like the pumps, valves,
electrical repairs, etc. and there is no designated staff/personnel on MCJ payroll for WTP
housekeeping.
Financially, MCJ depends heavily on grants from the GoS for the water system’s operation
instead of relying on revenue generation from commercial activities and water supply
connections. However, MCJ has a vibrant vision of ensuring the water system’s financial
sustainability and maintenance by generating revenue from the end-users in Jacobabad city.
For this, a three-year business plan has been jointly developed by the HANDS Pakistan and
MCJ and under approval from relevant authorities.
2.2 Assembly of WSP Team
The WSP team will be responsible for implementing, executing, and refining the WSP,
composed of the technically capable team leaders from MCJ, representatives of WASH
coordinators from relevant communities, and district administration officials nominated for the
purpose. The WSP team leader will act as a coordinator to engage senior MCJ management
and supervise WSP team members to execute the tasks defined in the WSP. The proposed
organogram and composition of the WSP team is given in Figure 4.
7
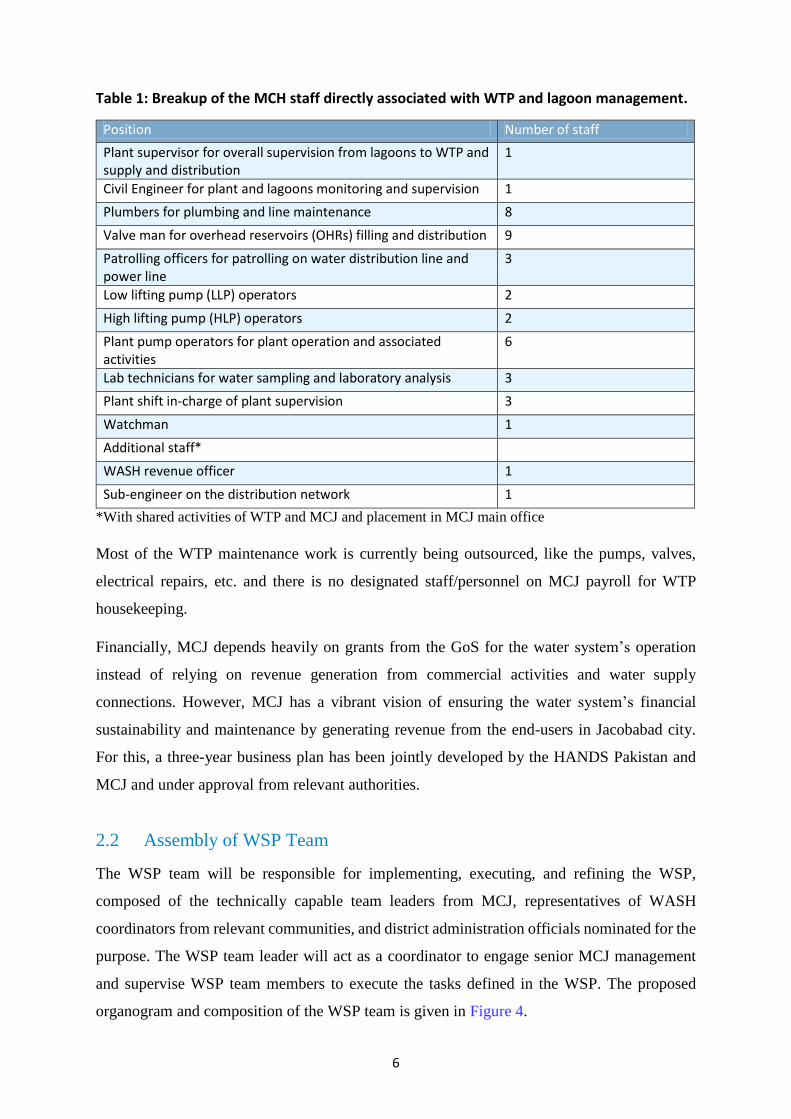
Responsibilities of WSP team members
WSP Team Leader: The Municipal Officer will act as the team leader of WSP and engage
senior management of MCJ for continuous improvement of WSP. He/she will supervise
Assistant Engineers (AENs), laboratory in-charge, and revenue/tax officer, and also liaison
with the Deputy Commissioner Jacobabad and the WASH committee through their
representatives.
Figure 4: Proposed team for WSP implementation and improvement.
Deputy Commissioner office representative: Deputy Commissioner office will nominate a
representative to coordinate with WSP team. The representative will participate in all the WSP
progress review meetings and share the district administration's progress and developments.
He will also address any relevant issue concerning district administrating units, such as issuing
an early warning to the WSP team for water quality monitoring in case of an outbreak of any
water-borne disease in the communities.
Assistant Engineer (Electrical and Mechanical): The Assistant Engineer (E&M) will be
responsible for electrical and mechanical work and troubleshooting under the WSP team
leader’s supervision. AEN (E&M) will utilize the current workforce under his leadership for
the operation of pumps. Training sessions for continuous capacity building will be arranged
under AEN (E&M), and additional staff will be hired, depending upon review of WSP cycles.
Assistant Engineer (Civil): He/She will supervise a team of experts to operate the water
treatment plant (WTP), distribution network, overhead tanks, and maintenance issues. Training
and additional staff requirement will be identified by AEN (Civil) and communicated to the
team leader during the execution of the WSP cycle.

8
WASH officer: WASH officer will be responsible for routine monitoring of water system
including water sampling, ensuring following of SOPs for water sampling, corrective measures
monitoring.
Water Quality Laboratory in-charge: Operation of water quality laboratory, development and
following SOPs for water sampling and analysis, and taking samples from intake, influent, and
effluent of WTP from an intermediate stage of WTP will be prime responsibilities of the
laboratory in-charge. The lab in-charge will work closely with AEN (Civil) to share water
analysis results while reporting directly to the team leader.
Revenue/Tax Officer: This office will ensure maximum revenue generation from water end-
user (both domestic and commercial) to ensure financial sustainability. The revenue office will
get direction from the team leader and liaison with the deputy commissioner officer and WASH
committee.

9
CHAPTER 3: WATER SUPPLY SYSTEM OF
JACOBABAD
3.1 Description of the Water Supply System
The water supply system in Jacobabad was established in the early 1960s by the Public Health
Engineering Department (PHED), Sindh. The system consisted of only one lagoon (storage
capacity 110 MG) receiving water through natural gravity flow following low lifting pumps
(LLPS) supported water intake from the Khirthar canal. After gravity settling of silt and manual
chlorine dosing, high lifting pumps (HLPS) supply and distribute the water from the lagoon to
Jacobabad city. However, the water supply system was insufficient due to rapid population
growth and the non-availability of required resources for efficient operation and maintenance.
In the year 2004/05, water supply improvement projects were started and reached completion
in 2008. These initial improvement projects were mainly focused on the construction and
rehabilitation of intake lagoons 1 and 2 (storage capacity of 110 MG each), filtration plant
including clarifiers and six filtration beds, and a newly placed distribution system for supply
and distribution to Jacobabad city. The schematic diagram for water intake from the canal,
storage in lagoons, and distribution to WTP is shown in Figure 5. Despite these significant
improvement and rehabilitation projects, the overall system lacked water supply as per the
demand of different Jacobabad city zones, timely maintenance of required pressure, and access
to safe drinking water in the distribution network, especially in tail-end areas.
Figure 5: Schematic diagram of water intake, storage, and distribution to WTP.
During 2012-2020, a progressive water system improvement project was initiated and
implemented under the USAID-supported MSDP-Sindh with improved operational capacities
of 14.5 MGD. This latest improvement project included the installation of an additional lagoon
(lagoon-3, 140 MG of storage capacity), new HLPS and raw water distribution line, and

10
installation of a new clarifier tank, four filtration beds, alum and chlorine dozing systems, new
supply and distribution pumps and panels for safe supply of filtered water, construction of six
overhead reservoirs (OHRs), newly developed distribution line for supply and distribution
from the treatment plant to OHRs, and a well-integrated network covering the 6-zones and
eight union councils. A well-equipped water quality laboratory is also established to ensure the
regular monitoring of water quality from catchment to end-user distribution. The layout maps
of the old and new water infrastructures are shown in Figure 6 and Figure 7.
Water withdrawal occurs from the Khirthar canal for intake to the three lagoons for
storage.
Raw water is pumped from lagoons to the water treatment plant (WTP) for filtration,
bacterial disinfection, and storage in an underground filtered/cleared water tank.
From underground storage of cleared/filtered water at WTP, water is pumped to six (6)
OHRs located into six (6) zones within Jacobabad city integrated with a closed supply
loop.
Water is supplied to the end-users through gravity-driven flow and pressure through a
closed-loop distribution network to most of the Jacobabad population surrounding the
6-zones.

11
Figure 6: Water supply network from intake to WTP.
16’’ 16’’
24’’
24’’
24’’
24’’
HLPs
HLPs
16’’
22 Km
Khirthar Canal
Filtered Water
Underground
Storage Tank
0.5 MG
Chlorination
Disinfection
Dozing
LLPs
Clarifiers
s
Sand Filters
Supply and
Distribution
to 6 OHRs
Alum
Dozing
Distribution
Pumps

12
Figure 7: Water supply and distribution from WTP to OHRs and households of 6-
zones.
Distribution
Pumps
Integrated
water supply
distribution
network at exit
of each OHR
0.75’’ 0.75’’ 0.75’’ 0.75’’
0.75’’’
6’’ 6’’
8’’ 8’’
12’’
24’’
Filtered Water Underground Storage Tank
0.5 MG
7 Km loop
Chlorine
dosing
OHR
147 km long
distribution
network
End
users
Closed
manifold loop
of distribution
line for filling of
each OHR
Sand Filters

13
3.2 Population and Water Demand
The projected population and water demand from the year 2020 to 2050 (source: PHED; WTP
Operational and Maintenance Manual MCJ) for Jacobabad city are summarized in Figure 8,
based on water consumption of 30 gallons per capita per day and population growth rate 1.69%.
Figure 8: Population and water demand projection from the year 2020 to 2050 (Source
PHED)
3.3 Water Supply Capacity and Infrastructure
After upgradation through the USAID supported MSDP water improvement project, the
extended water supply capacity is 14.5 MGD (65,917 m3/day) to meet 50-years projected
demands. All the water supply network components, including water intake and transmission,
storage, pumping at various stages, and treatment and distribution systems, have been designed
based on the needed improvement in already installed water supply infrastructures. Significant
enhancements included improving intake and lagoons, supply pumps, clarifiers, construction
of overhead reservoirs, and a newly placed distribution network of domestic water to Jacobabad
residents. The existing distribution system and capacities are summarized in Error! Reference
ource not found., which were previously shown in Figure 6 and Figure 7.
2020 2025 2030 2035 2040 2045 2050
Population 197158 211454 227795 245400 264366 284797 306807
Water demand 5.91 6.34 6.83 7.36 7.93 8.54 9.2
0
1
2
3
4
5
6
7
8
9
10
0
50,000
100,000
150,000
200,000
250,000
300,000
350,000
Wat
er d
eman
d, M
GD
Po
pu
lati
on

14
Table 2: The existing water system with capacities of each infrastructure.
Intake Five (5) intake lines from the Khirthar canal, two lifting pumps
supported intakes (one old and one new), and distribution to
lagoon-1 and lagoon-3, with natural gravity catchment to lagoon-1
and lagoon-2
Storage/retention Three (3) storage lagoons with a total 360 MGD capacity, including
newly structured lagoon-3 (capacity 140 MG)
The storage capacity of these lagoons during the canal closure
period is sufficient to supply water for 45 days at a constant raw
water supply of around 8 MGD per day to the WTP (25 days for
maximum water consumption, if the system operates at full
capacity, i.e., 14.5 MGD).
Pumping station Old and new pumping system with a common 24-inch diameter
manifold between the old and new lagoons and 22 km long raw
water distribution line
Filtration plant:
Clarifier, alum, and
chlorine dosing
systems
New clarifier tank and automatic alum and chlorine dozing systems
Distribution pumps Total 12 supply and distribution pumps, including six newly
installed pumps for supply and filling to OHRs
Distribution network
to OHRs
Seven (7) km long 24-inch diameter supply and OHRs filling line
with the closed filling loop between the treatment plant and six
OHRs
Overhead reservoirs Six (6) OHRs of total 1.21 MGD capacity, at an elevated height of
25 to 28 meters above the ground level for continuous gravity-
driven water supply and distribution to respective distribution
zones
Water supply network Newly integrated water distribution pipe network of various pipe
sizes from 12-inches to 0.75-inches, from the OHRs, in all 6-zones
covering all eight union councils

15
Water quality
laboratory
Well-equipped water quality laboratory for periodic water quality
analysis and ensuring water quality surveillance as per the WHO
guidelines
Power generation
facility
In-house power generation facility has two power generators at
intake/lagoons (100 KVA and 700 KVA) and two power generators
(315 KVA each) at the water treatment plant.
3.4 Water Supply and Distribution Network
Under the USAID funded MSDP project, an integrated new water supply distribution network
is laid, covering all 6-zones and eight union councils of Jacobabad city. The distribution
network includes six OHRs, approximately twenty-five meters above the ground level, a
transmission loop from the manifold at the treatment plant to feed/fill the six OHRs. These
OHRs are divided into 6-zones, keeping in view each zone’s domestic demand features and
topography. The estimated water demand for these 6-zones is around 2.65 MGD based on the
currently connected registered 12,005 connections. Each connection covers an average of 7
members per household at a consumption capacity of 30 gallons/capita/day (source: HANDS
Pakistan). The water demand is estimated to rise to 6.3 MGD based on the targeted 30,000
connections. Each zone’s water distribution network consists of different pipe sizes for water
distribution, ranging from 12-inches (pipes exiting from OHRs) to 0.75-inches (inlet points
near the users/households). The distribution network is designed to supply water from the
OHRs using gravity-driven continuous water flow at an optimal pressure to tail-end users. A
schematic of the transmission loop connected with 6 OHRs is shown earlier in Figure 7. The
zone-wise distribution networks are presented in Annex-2, and the command area of each zone
is provided in Table 3 (source: MCJ).

16
Table 3: Command Area (6 zones, Source: MCJ).
Zone # 1(37.1 km)
Police Force Ground OHR
Sub zone 1-A:
i) Afzal Khan Khoso road
(Partial).
ii) Shaikh Mohalla.
iii) Drakhan Mohalla.
iv) Sonara Bazzar.
v) Pir Bukhari area
(Partial).
Sub zone 1-B
i) Haq Bahoo Mohalla.
ii) Kalati khan Brohi.
iii) Soomro village.
iv) Ahmed Mian Soomro
village.
Sub zone 1-C
i) Shidi Mohalla.
ii) Graveyard opposite
area.
iii) Gulaab Maachi village
and adjacent area.
Zone # 2(20 km)
Bus Stand OHR
Sub zone 2-A
i) Brohi Mohalla
ii) Cinema road.
iii) Eidgah Mohalla.
iv) Saddar Bazar
v) Dangar Mohalla
vi) Lashari Mohalla
(Partial)
vii) Quetta road (Partial)
Sub zone 2-B
i) Garhi Sabhayo.
ii) Moladad crossing area.
iii) Mochi Basti (Partial
area)
Zone # 3(30 km)
TMA OHR
Sub zone 3-A
i) Civil hospital quarters
ii) PTCL Colony
iii) Dastagir colony (Muhajir
colony)
iv) St. Johns School road area.
Sub zone 3-B
i) Civil court
ii) SP House
iii) Shahbaz Colony
iv) Purani Mal piri.
v) Masjid Pir Bukhari area
(Partial)
vi) Shaikh Abdul Nabi road
vii) Family line
viii) Afzal khan khoso road
(Partial)
Sub zone 3-C
i) DC office
ii) Quaid-e-Azam road area
iii) Shah Ghazi Mohalla
iv) Bano Bazar
v) Saddar Bazar
vi) Lashari Mohalla (Partial)
vii) G.P.O.

17
Zone # 4(14.4 km)
Mochi Basti OHR
i) Mochi Basti (Partial)
ii) Allahabad colony
(Partially half area)
iii) Railway quarters
iv) Gharibabad Mohalla
v) Christian colony
vi) Wapda colony (Partial)
vii) Mukhtiarkar road.
viii) Quetta road (Partial)
Zone # 5(26 km)
Numaish Ground OHR
(To be Tested &
Commissioned)
Sub zone 5-A
i) Shikarpur road
ii) Channa Mohalla
(partial)
iii) Wapda colony
(Partial)
iv) Mir Azmat khan
road
(Partial)
v) Kareemabad.
vi) Bhitai colony.
vii) Central Jail
Sub zone 5-B
i) Janu Bela
(Pechuha Goth)
ii) Jat Mohalla
iii) Jaffarabad
Mohalla.
Zone # 6(20 km)
Circuit House OHR
(To be Tested &
Commissioned)
i) Sub zone 6-A
ii) Market Police station
road area
iii) ADC Colony
iv) Chana Mohalla
(partial)
v) JEMS Hospital Area
vi) Bismillah Bagh.
vii) Sub zone 6-B
viii) Mir Azmat khan
Mohalla (Partial)
ix) Panhwar Mohalla
x) Phool Bagh Area

18
CHAPTER 4: IDENTIFICATION OF HAZARDS
AND RISK ASSESSMENT The team of USPCAS-W conducted various field surveys at the water intake site, lagoons,
water filtration (treatment) plant, OHR sites, and within communities with installed water
connections. The team also interviewed the operational staff, laboratory personnel, and local
community members and reviewed the data and documents provided by the MCJ. Risks
prioritization matrix was prepared using semi-qualitative approach, considering the detailed
and systematic field observation, adopted from WHO guidelines6 and Water Quality Research
Australia (WQRA)7. The hazards and risks are identified and assessed with their likelihood (1
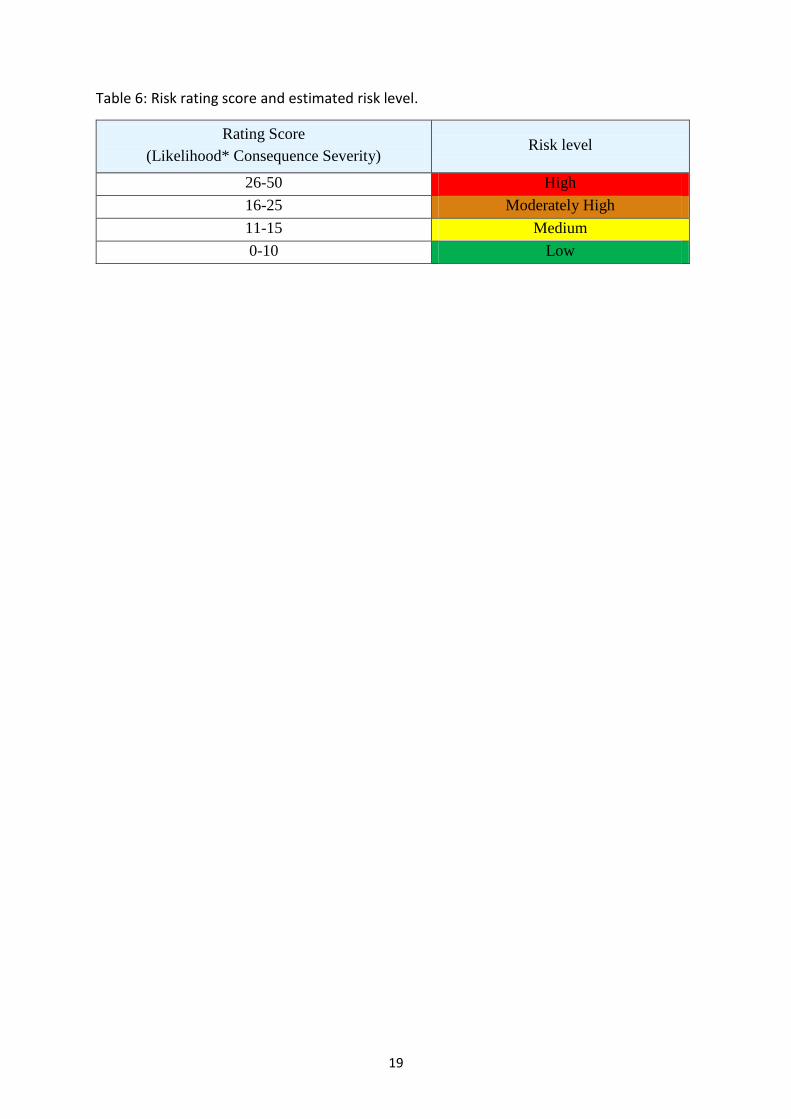
to 5, Table 5Table 4) and severity (1 to 10, Table 5). Then final risk ratings were obtained by
multiplying cores for likelihood with the severity of hazards (0-50). The risk ratings were
assigned risk levels as per the criteria set in Table 6.
Table 4: Description and ratings associated with the likelihood of hazards.
Likelihood Rating Frequency
Almost
certain
5 Once per day/present at almost all locations
Likely 4 Once per week/present at 80% of the locations
Moderately
likely
3 Once per month/present at 50% of the locations
Unlikely 2 Once per year/present at 20% of the locations
Rarely 1 Once in five years/present at 10% of the locations
Table 5: Description and ratings associated with the consequences of hazards.
Consequence Rating Severity
Catastrophic 10 Potentially lethal to all people; death expected from exposure
Major 7 Potentially harmful to all; significant illness from exposure
Moderate 5 Potentially harmful to vulnerable groups following chronic
exposure; large aesthetic impact
Minor 2 Small aesthetic impact
Insignificant 1 No impact or not detectable
6 Water Safety Plan Manual: Step-by-step risk management for drinking water supply, WHO, 2009 7 Research Report 78, Water Quality Research Australia (WQRA), 2009
19
Table 6: Risk rating score and estimated risk level.
Rating Score
(Likelihood* Consequence Severity) Risk level
26-50 High
16-25 Moderately High
11-15 Medium
0-10 Low

20
4.1 Hazard Identification and Risk Assessment at Canal Intake (Source)
# Hazardous
event/parameter Impacts
Likelihood
(1-5)
Severity
(1-10)
Risk
Rating
Risk
Profile
1. Intake structure
Low gravity flow to the
lagoon, silting, reduction in
water supply
Silting of lagoon, low gravity to lagoon.
Improper placement of intake conduits.
Broken and non-functional pipes, valves, fittings,
pumps.
5 7 35 High
2. Flood in Indus river High level of sediments in Khirthar Canal. 2 5 10 Low
3. Detection of E.Coli, Total
coliform in Canal water
The presence of microbial contamination might
compromise consumers’ health but a subsequent
treatment plant is designed to reduce/eliminate
pathogens from water.
4 2 8 Low
4. Human access or activities Water withdrawal, including pumping can be affected
adversely. 4 6 24
Mod.
High
5. Wastewater discharge at
upstream of canal
High turbidity in canal water. Presence of algae and
sediment in canal water.
Enhanced silting in the lagoon, reduction of storage
capacity
3 5 15 Medium
6. Electricity Failure,
Unavailability and Theft
Reduction of raw water supply to treatment plant
leading to poor quality of water in distribution
network due to intermittent operation of treatment
plant
5 5 25 Mod.
High
21
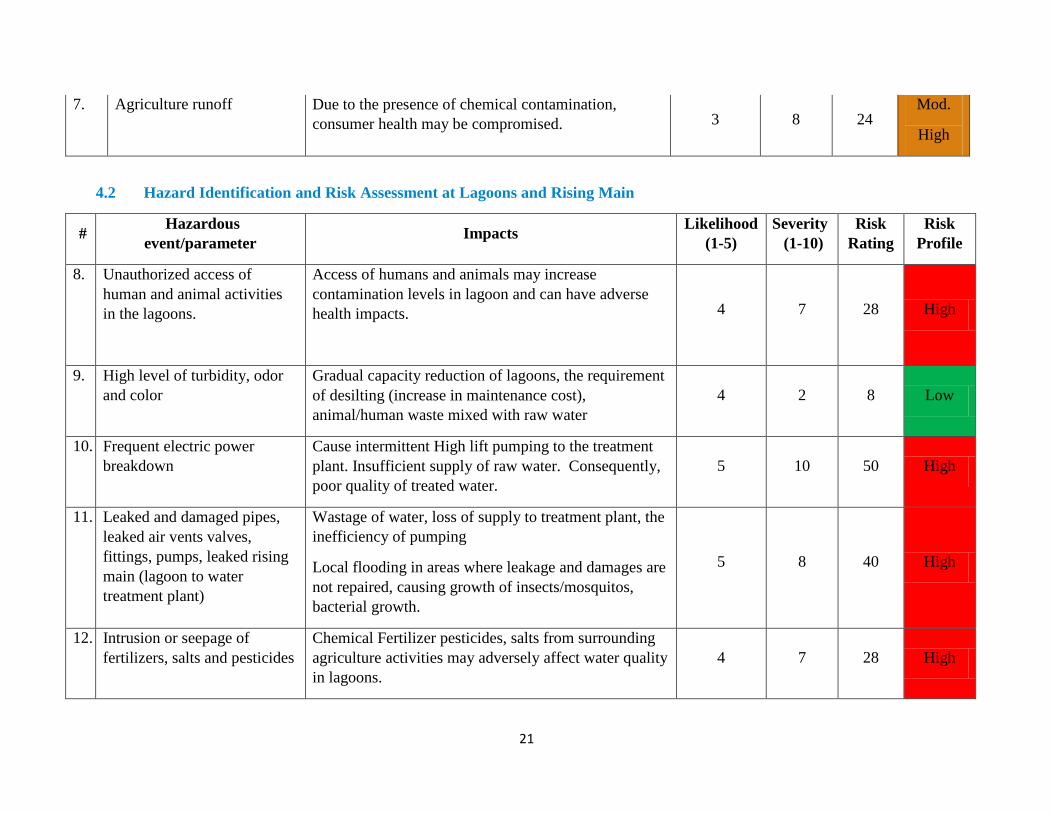
7. Agriculture runoff Due to the presence of chemical contamination,
consumer health may be compromised. 3 8 24 Mod.
High
4.2 Hazard Identification and Risk Assessment at Lagoons and Rising Main
# Hazardous
event/parameter Impacts
Likelihood
(1-5)
Severity
(1-10)
Risk
Rating
Risk
Profile
8. Unauthorized access of
human and animal activities
in the lagoons.
Access of humans and animals may increase
contamination levels in lagoon and can have adverse
health impacts. 4 7 28 High
9. High level of turbidity, odor
and color
Gradual capacity reduction of lagoons, the requirement
of desilting (increase in maintenance cost),
animal/human waste mixed with raw water
4 2 8 Low
10. Frequent electric power
breakdown
Cause intermittent High lift pumping to the treatment
plant. Insufficient supply of raw water. Consequently,
poor quality of treated water.
5 10 50 High
11. Leaked and damaged pipes,
leaked air vents valves,
fittings, pumps, leaked rising
main (lagoon to water
treatment plant)
Wastage of water, loss of supply to treatment plant, the
inefficiency of pumping
Local flooding in areas where leakage and damages are
not repaired, causing growth of insects/mosquitos,
bacterial growth.
5 8 40 High
12. Intrusion or seepage of
fertilizers, salts and pesticides
Chemical Fertilizer pesticides, salts from surrounding
agriculture activities may adversely affect water quality
in lagoons.
4 7 28 High
22
from surrounding rice crops
and fertilizer runoff.
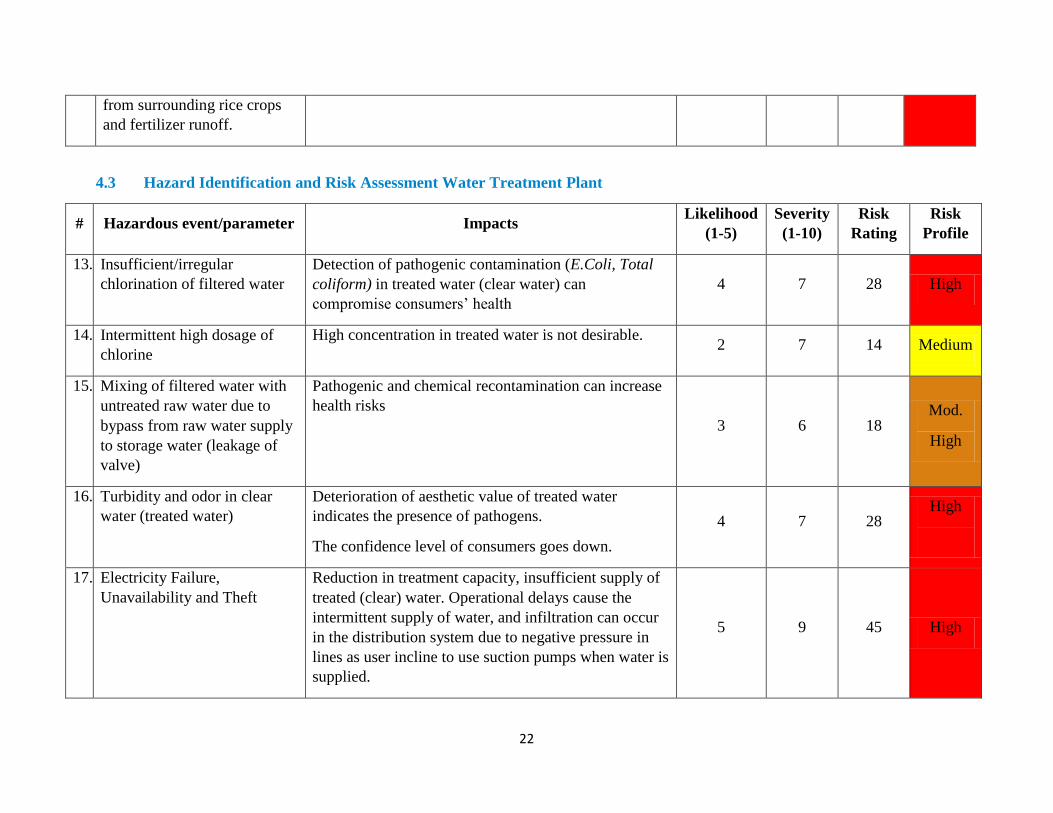
4.3 Hazard Identification and Risk Assessment Water Treatment Plant
# Hazardous event/parameter Impacts Likelihood
(1-5)
Severity
(1-10)
Risk
Rating
Risk
Profile
13. Insufficient/irregular
chlorination of filtered water
Detection of pathogenic contamination (E.Coli, Total
coliform) in treated water (clear water) can
compromise consumers’ health
4 7 28 High
14. Intermittent high dosage of
chlorine
High concentration in treated water is not desirable. 2 7 14 Medium
15. Mixing of filtered water with
untreated raw water due to
bypass from raw water supply
to storage water (leakage of
valve)
Pathogenic and chemical recontamination can increase
health risks
3 6 18 Mod.
High
16. Turbidity and odor in clear
water (treated water)
Deterioration of aesthetic value of treated water
indicates the presence of pathogens.
The confidence level of consumers goes down.
4 7 28 High
17. Electricity Failure,
Unavailability and Theft
Reduction in treatment capacity, insufficient supply of
treated (clear) water. Operational delays cause the
intermittent supply of water, and infiltration can occur
in the distribution system due to negative pressure in
lines as user incline to use suction pumps when water is
supplied.
5 9 45 High

23
18. Leaked pipes, malfunctioned
valves, fittings, pumps,
compressors etc.
Insufficient dosage of alum and chlorine results in
incomplete removal of particular matters and
disinfection. This situation may cause adverse health
impacts among consumers.
4 7 28 High
19. Insufficient storage capacity
of the clear water reservoir
(underground tank)
0.5 MGD storage and demand is 2.65 MGD.
5 6 30 High
20. Water treatment plant
operation is not synchronized
with pump operator at lagoon
The communication gap between pumping station at
lagoon and treatment plant. 2 10 20 Mod.
High
21. Water Quality Laboratory Irregular operations of water quality laboratory 5 7 35 High
4.4 Hazard Identification and Risk Assessment at Water Supply and Distribution Network
# Hazardous event/parameter Impacts Likelihood
(1-5)
Severity
(1-10)
Risk
Rating
Risk
Profile
22. Line leakages and cross
contamination of the
sewerage and groundwater in
the distribution network
Improper chlorine dosage or low level of residual
chlorine in water supply to the distributions
Adverse health impacts
4 7 28 High
23. Low concentration of residual
chlorine in distribution
network
Adverse health impacts
4 7 28 High
24. Cross-contamination due to
sewage and groundwater
intrusion
Turbidity due to infiltration (negative suction) or cross-
contamination, indication of pathogens. Can cause
adverse health impacts
5 7 35 High
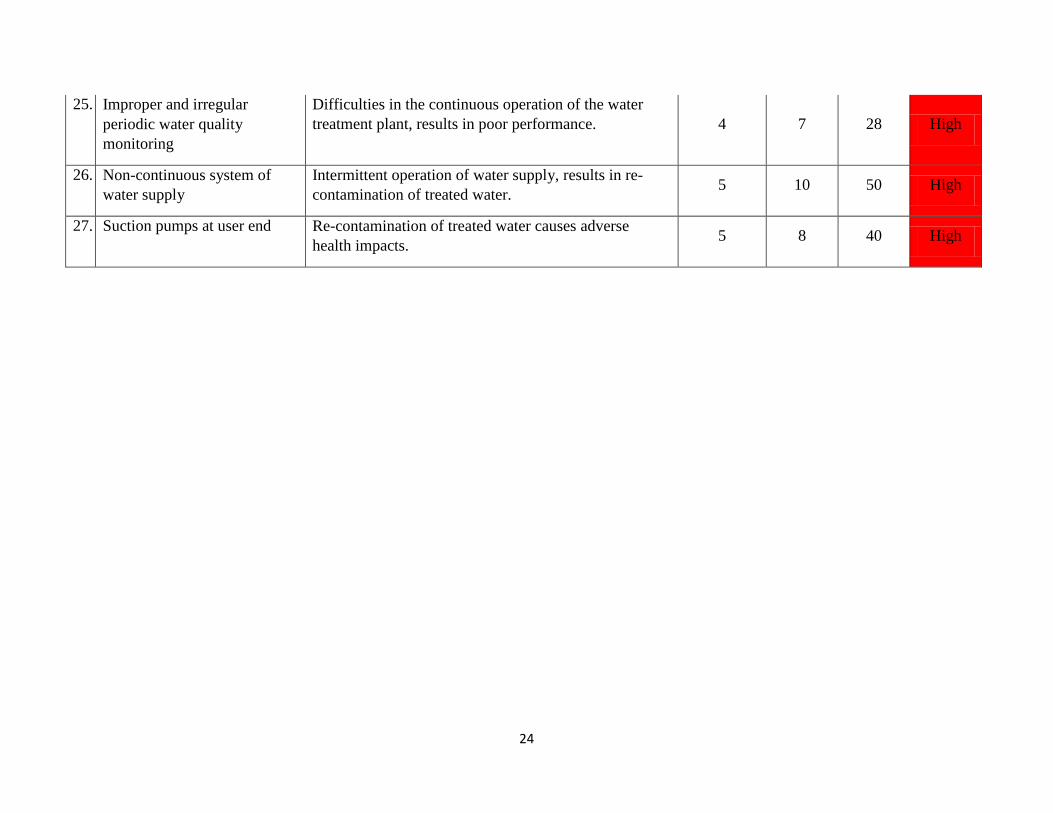
24
25. Improper and irregular
periodic water quality
monitoring
Difficulties in the continuous operation of the water
treatment plant, results in poor performance. 4 7 28 High
26. Non-continuous system of
water supply
Intermittent operation of water supply, results in re-
contamination of treated water. 5 10 50 High
27. Suction pumps at user end Re-contamination of treated water causes adverse
health impacts. 5 8 40 High
25
CHAPTER 5: CONTROL MEASURES, VALIDATION
OF CONTROL MEASURES, AND REASSESSMENT
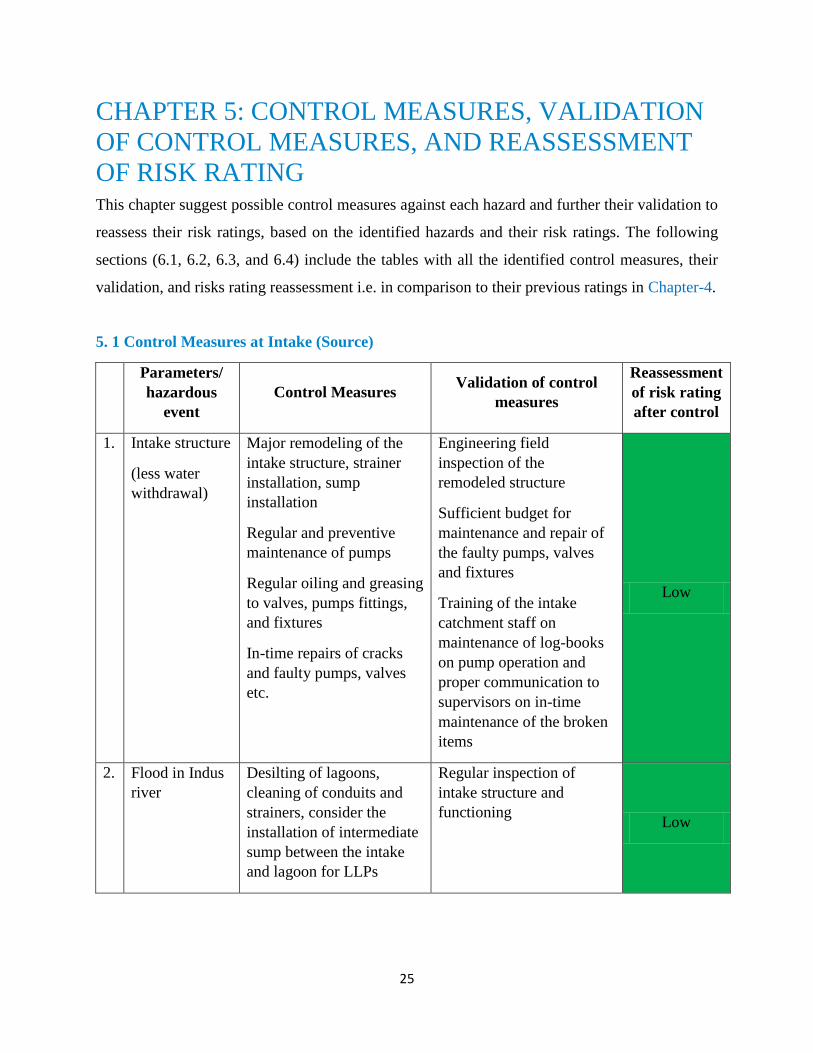
OF RISK RATING This chapter suggest possible control measures against each hazard and further their validation to
reassess their risk ratings, based on the identified hazards and their risk ratings. The following
sections (6.1, 6.2, 6.3, and 6.4) include the tables with all the identified control measures, their
validation, and risks rating reassessment i.e. in comparison to their previous ratings in Chapter-4.
5. 1 Control Measures at Intake (Source)
Parameters/
hazardous
event
Control Measures Validation of control
measures
Reassessment
of risk rating
after control
1. Intake structure
(less water
withdrawal)
Major remodeling of the
intake structure, strainer
installation, sump
installation
Regular and preventive
maintenance of pumps
Regular oiling and greasing
to valves, pumps fittings,
and fixtures
In-time repairs of cracks
and faulty pumps, valves
etc.
Engineering field
inspection of the
remodeled structure
Sufficient budget for
maintenance and repair of
the faulty pumps, valves
and fixtures
Training of the intake
catchment staff on
maintenance of log-books
on pump operation and
proper communication to
supervisors on in-time
maintenance of the broken
items
Low
2. Flood in Indus
river
Desilting of lagoons,
cleaning of conduits and
strainers, consider the
installation of intermediate
sump between the intake
and lagoon for LLPs
Regular inspection of
intake structure and
functioning Low
26
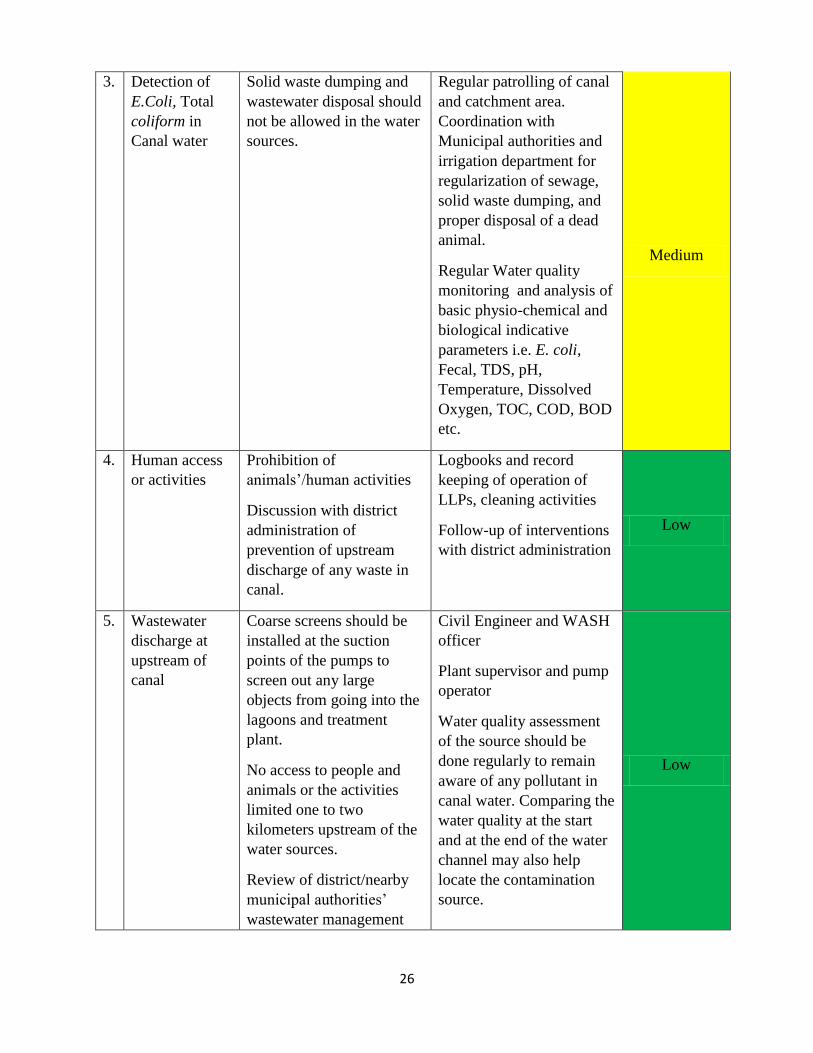
3. Detection of
E.Coli, Total
coliform in
Canal water
Solid waste dumping and
wastewater disposal should
not be allowed in the water
sources.
Regular patrolling of canal
and catchment area.
Coordination with
Municipal authorities and
irrigation department for
regularization of sewage,
solid waste dumping, and
proper disposal of a dead
animal.
Regular Water quality
monitoring and analysis of
basic physio-chemical and
biological indicative
parameters i.e. E. coli,
Fecal, TDS, pH,
Temperature, Dissolved
Oxygen, TOC, COD, BOD
etc.
Medium
4. Human access
or activities
Prohibition of
animals’/human activities
Discussion with district
administration of
prevention of upstream
discharge of any waste in
canal.
Logbooks and record
keeping of operation of
LLPs, cleaning activities
Follow-up of interventions
with district administration
Low
5. Wastewater
discharge at
upstream of
canal
Coarse screens should be
installed at the suction
points of the pumps to
screen out any large
objects from going into the
lagoons and treatment
plant.
No access to people and
animals or the activities
limited one to two
kilometers upstream of the
water sources.
Review of district/nearby
municipal authorities’
wastewater management
Civil Engineer and WASH
officer
Plant supervisor and pump
operator
Water quality assessment
of the source should be
done regularly to remain
aware of any pollutant in
canal water. Comparing the
water quality at the start
and at the end of the water
channel may also help
locate the contamination
source.
Low
27
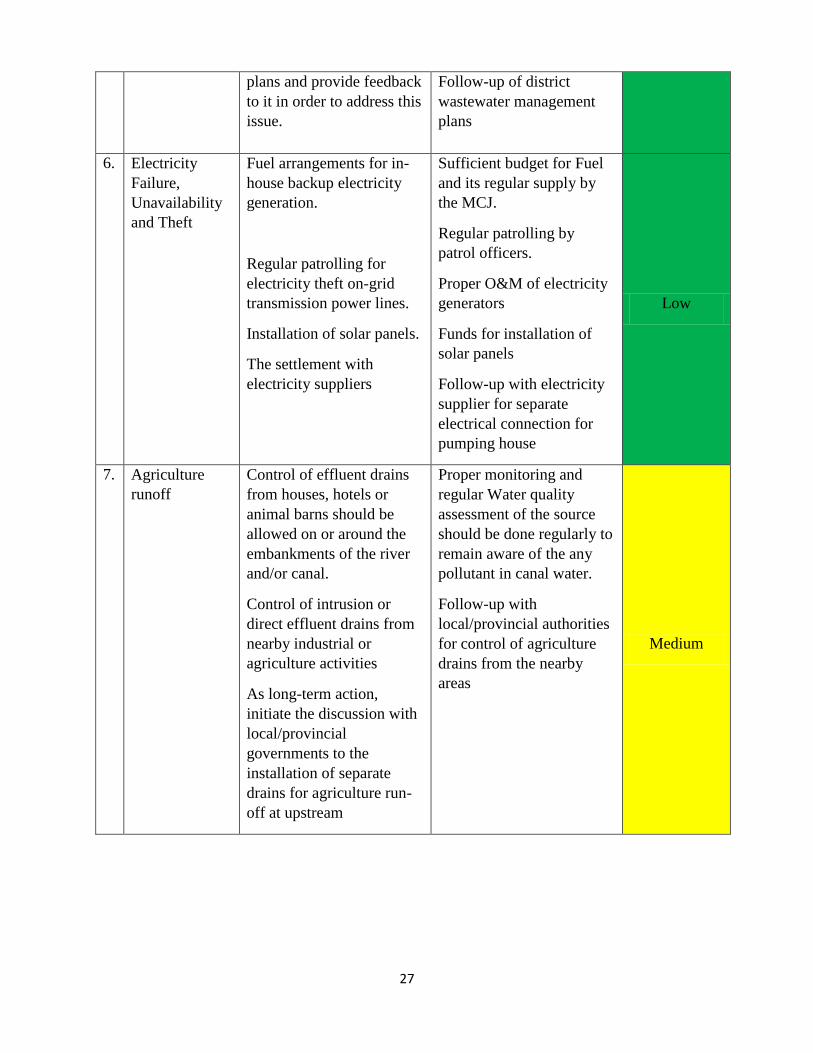
plans and provide feedback
to it in order to address this
issue.
Follow-up of district
wastewater management
plans
6. Electricity
Failure,
Unavailability
and Theft
Fuel arrangements for in-
house backup electricity
generation.
Regular patrolling for
electricity theft on-grid
transmission power lines.
Installation of solar panels.
The settlement with
electricity suppliers
Sufficient budget for Fuel
and its regular supply by
the MCJ.
Regular patrolling by
patrol officers.
Proper O&M of electricity
generators
Funds for installation of
solar panels
Follow-up with electricity
supplier for separate
electrical connection for
pumping house
Low
7. Agriculture
runoff
Control of effluent drains
from houses, hotels or
animal barns should be
allowed on or around the
embankments of the river
and/or canal.
Control of intrusion or
direct effluent drains from
nearby industrial or
agriculture activities
As long-term action,
initiate the discussion with
local/provincial
governments to the
installation of separate
drains for agriculture run-
off at upstream
Proper monitoring and
regular Water quality
assessment of the source
should be done regularly to
remain aware of the any
pollutant in canal water.
Follow-up with
local/provincial authorities
for control of agriculture
drains from the nearby
areas
Medium

28
5.2 Control Measures at Lagoons
Hazardous
event
Control Measures Validation of control
measures
Reassessment
of risk rating
after control
8. Unauthorized
access of
human and
animal
activities in the
lagoons.
Fencing around the lagoons
should be constructed to
restrict unauthorized
personnel and animal
activities in the lagoons.
Water analysis should be
performed frequently. Solid
waste dumping and
wastewater disposal in the
lagoons should be
prevented.
Prohibition of
animals/human activities
Fencing of lagoons.
Regular patrolling and
prohibition of
animals’/human activities.
Awareness on involved
risks and controls. Regular
Water quality monitoring
and analysis of basic
physio-chemical and
biological indicative
parameters i.e. E. coli,
Fecal, TDS, pH,
Temperature, Dissolved
Oxygen, TOC, COD,
BOD etc.
Low
9. High level of
turbidity, odor
and color
Regular De-silting and de-
weeding of lagoons beds
Provided funds for de-
weeding de- silting
programs for lagoons are
also vital for the proper
functioning of the whole
treatment process
Low
Animal/human activities
should be prohibited.
Arrangement of Dyke
repair and fencing.
Dyke and fencing for
avoiding surface run-off
Water quality at the inlet
and outlet of lagoons should
be assessed.
Sampling and lab analysis
Swimming and washing
clothes in the lagoons
should not be allowed. Solid
waste dumping and
wastewater disposal in the
Regular patrolling of
lagoons areas
Control human/animal
activities
29
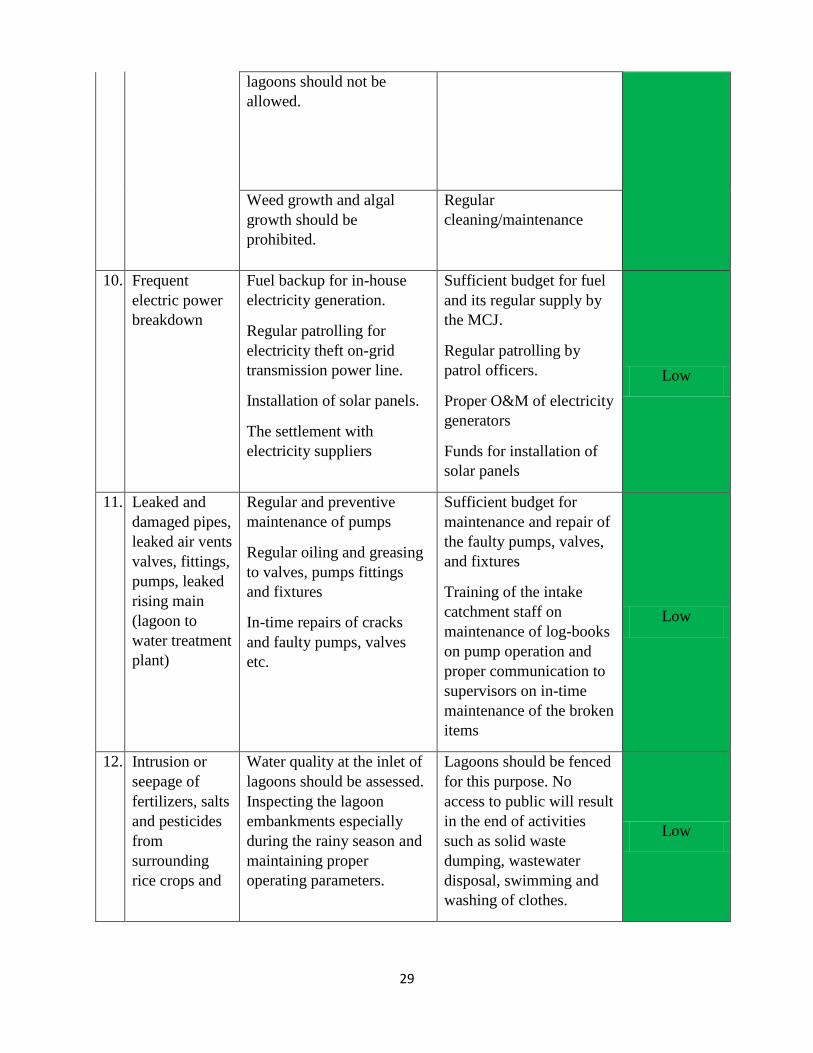
lagoons should not be
allowed.
Weed growth and algal
growth should be
prohibited.
Regular
cleaning/maintenance
10. Frequent
electric power
breakdown
Fuel backup for in-house
electricity generation.
Regular patrolling for
electricity theft on-grid
transmission power line.
Installation of solar panels.
The settlement with
electricity suppliers
Sufficient budget for fuel
and its regular supply by
the MCJ.
Regular patrolling by
patrol officers.
Proper O&M of electricity
generators
Funds for installation of
solar panels
Low
11. Leaked and
damaged pipes,
leaked air vents
valves, fittings,
pumps, leaked
rising main
(lagoon to
water treatment
plant)
Regular and preventive
maintenance of pumps
Regular oiling and greasing
to valves, pumps fittings
and fixtures
In-time repairs of cracks
and faulty pumps, valves
etc.
Sufficient budget for
maintenance and repair of
the faulty pumps, valves,
and fixtures
Training of the intake
catchment staff on
maintenance of log-books
on pump operation and
proper communication to
supervisors on in-time
maintenance of the broken
items
Low
12. Intrusion or
seepage of
fertilizers, salts
and pesticides
from
surrounding
rice crops and
Water quality at the inlet of
lagoons should be assessed.
Inspecting the lagoon
embankments especially
during the rainy season and
maintaining proper
operating parameters.
Lagoons should be fenced
for this purpose. No
access to public will result
in the end of activities
such as solid waste
dumping, wastewater
disposal, swimming and
washing of clothes.
Low
30
fertilizer
runoff.
Fencing and Prohibition of
anthropogenic activities
The inlet chambers of the
lagoons receiving water
from the canal should have
screens and should be
covered with easy-to-
remove lids
Regular monitoring of
water quality during
heavy rainfall seasons.
Leakages in the pipes
should be checked and
managed properly by
plumbers and engineers.
Continuous monitoring of
the distribution line to
prevent water theft.
5.3 Control Measures at Water Treatment Plant
Hazardous
event
Control Measures Validation of control
measures
Reassessment
of risks after
control
measures
13. Insufficient/ir
regular
chlorination
of filtered
water
Sufficient Supplies of
Chlorine
Proper dosing of chlorine
(CRT values are given in
Chapter 6)
Proper O&M of chlorine
dosing system
In-time maintenance of
broken water supply
lines/pipes to avoid cross-
contamination of sewage or
groundwater
Proper and regular
monitoring of chlorine
disinfection and residue
chlorine
Training of operators and
lab technicians on chlorine
disinfection and monitoring
Record of maintenance of
chlorine dosing system.
Funds allocation in the
annual budget for
sufficient chlorine
supplies
Regular sampling and
bacterial monitoring of
filtered and raw inlet
water for estimating the
optimum level of chlorine
disinfection and ensuring
safe water quality
Sufficient level of residue
chlorine to ensure the
disinfection of unwanted
cross-contamination
O&M of chlorine
disinfection by trained
personnel
Low

31
14. Intermittent
high dosage
of chlorine
Maintenance automatic
chlorination system
Review of logbook of
automatic chlorination
system and records of
residual chlorine in treated
water.
Low
15. Mixing of
filtered water
with untreated
raw water due
to bypass
from raw
water supply
to storage
water
(leakage of
valve)
Maintenance of leaked
valves
Coordination between
treatment plant operator and
pump operator at lagoon
Review of maintenance
logbook
Record of coordination
between plant and pump
operators Low
16. High turbidity
and odor in
clear water
(treated
water)
Sufficient Supplies of alum
Proper and optimum dosing
of alum (to be determined
by jar tests)
Proper O&M of alum
solution preparation and
dosing
Controlled operation of
clarifiers and sand filters in
accordance with the inlet
raw water turbidity and
alkalinity
Regular and proper
backwashing to avoid the
flocs blockage, chocking
and formation of cracks in
sand beds
Proper and regular
monitoring of turbidity at
plant inlet and outlets
Record of alum purchase
and daily dosing
In-time O&M of alum
dosing system.
Sufficient funds for alum
supplies and dosing
system
Regular turbidity
monitoring of filtered and
inlet raw water for
estimating the optimum
level of alum dosing and
clarifiers and sand filters
controlled operations
Optimized and controlled
backwashing procedures
SOPS Follow-ups on
maintenance of clarifiers
and sand filters
Trained personnel on
Alum, Clarifiers and sand
Low

32
Training of operators and
lab technicians on chlorine
disinfection and monitoring
filters operation and
maintenance.
Filter media should be
replaced once the
filtration efficiency drops
below a certain threshold
even after backwash.
17. Electricity
Failure,
Unavailability
and Theft
Fuel Backup for in-house
electricity generation.
Installation of solar panels.
The settlement with
electricity suppliers
Sufficient budget for Fuel
and its regular supply by
the MCJ.
Regular patrolling by
patrol officers.
Proper O&M of electricity
generators
Funds for installation of
solar panels
Low
18. Leaked pipes,
malfunctioned
valves,
fittings,
pumps,
compressors
etc.
Regular and preventive
maintenance of pumps
Regular oiling and greasing
to valves, pumps fittings
and fixtures
In-time repairs of cracks
and faulty pumps, valves
etc.
Sufficient budget for
maintenance and repair of
the faulty pumps, valves
and fixtures
Training of the plant
operators on maintenance
of log-books on pump
operation and proper
communication to
supervisors on in-time
maintenance of the broken
items
Low
19. Insufficient
storage
capacity of
clear water
reservoir
(underground
tank)
Construction of extended
storage capacity
Budget allocation of
extended storage
Follow-up of construction
activities Low

33
20. Water
treatment
plant
operation is
not
synchronized
with pump
operator at
lagoon
Enhance coordination
between pumps and plant
operators
Review of communication
records between operators
Low
21. Water Quality
Laboratory
Availability of chemicals
and lab supplies for running
the lab sampling and regular
analysis
Development of SOPs for
sampling, basic water
quality analysis
Proper training and capacity
building of lab staff
Sufficient funds for the
procurement of lab
chemicals and supplies for
smooth lab operations.
Training records of lab
personnel for monitoring
and maintaining the water
quality control from
catchment to distribution
area
Review of SOPs
Low
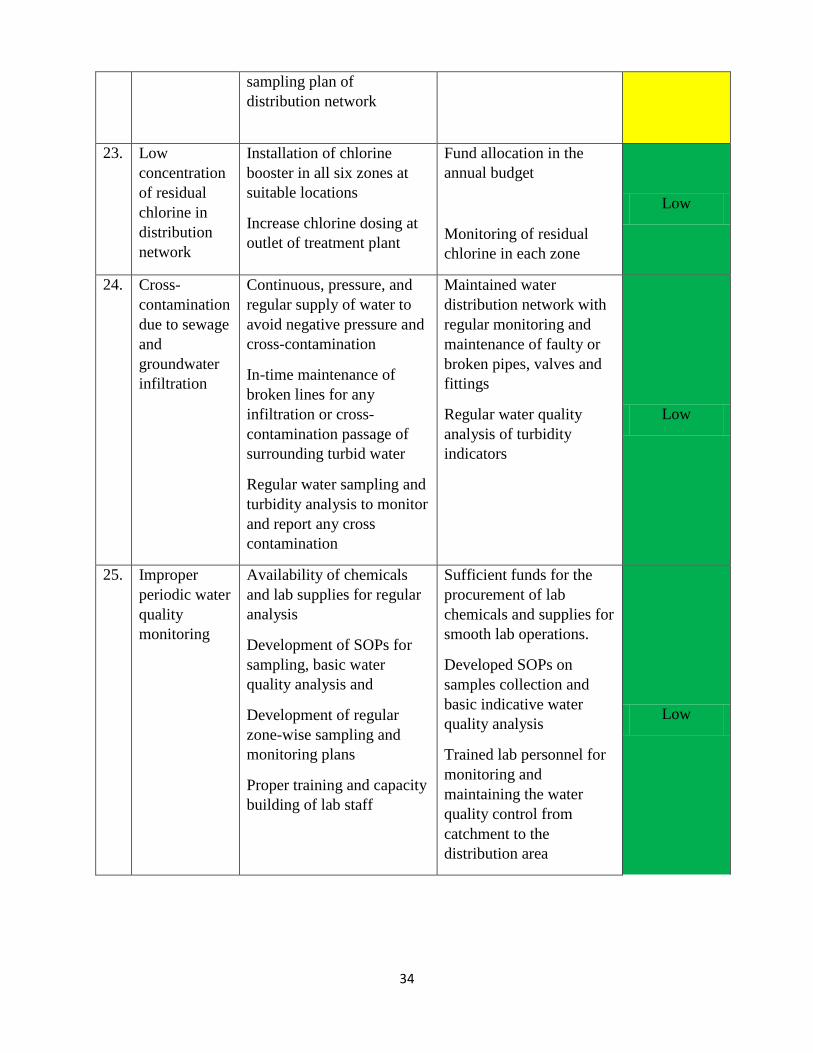
5.4 Control Measures at Distribution Network (Control Measures)
Hazardous
event
Control Measures Validation of control
measures Reassessment
of risk after
control
22. Line leakages
and cross
contamination
of the
sewerage and
groundwater
in the
distribution
network
Proper and optimum
Chlorine dosing
Regular analysis of Residual
chlorine and other microbial
water quality parameters at
distribution loops, OHRs
and random points along the
distribution system and
point of use.
Development or
improvement in SOPs and
Maintenance of line
leakage
Zone-wise Regular
analysis of Residual
chlorine and microbial
disinfection
Trained personnel on
monitoring and
surveillance of water
distribution network
Medium
34
sampling plan of
distribution network
23. Low
concentration
of residual
chlorine in
distribution
network
Installation of chlorine
booster in all six zones at
suitable locations
Increase chlorine dosing at
outlet of treatment plant
Fund allocation in the
annual budget
Monitoring of residual
chlorine in each zone
Low
24. Cross-
contamination
due to sewage
and
groundwater
infiltration
Continuous, pressure, and
regular supply of water to
avoid negative pressure and
cross-contamination
In-time maintenance of
broken lines for any
infiltration or cross-
contamination passage of
surrounding turbid water
Regular water sampling and
turbidity analysis to monitor
and report any cross
contamination
Maintained water
distribution network with
regular monitoring and
maintenance of faulty or
broken pipes, valves and
fittings
Regular water quality
analysis of turbidity
indicators
Low
25. Improper
periodic water
quality
monitoring
Availability of chemicals
and lab supplies for regular
analysis
Development of SOPs for
sampling, basic water
quality analysis and
Development of regular
zone-wise sampling and
monitoring plans
Proper training and capacity
building of lab staff
Sufficient funds for the
procurement of lab
chemicals and supplies for
smooth lab operations.
Developed SOPs on
samples collection and
basic indicative water
quality analysis
Trained lab personnel for
monitoring and
maintaining the water
quality control from
catchment to the
distribution area
Low

35
26. Non-
continuous
system of
water supply
Fuel Backup for in-house
electricity generation.
Regular patrolling for
electricity theft on grid
transmission power line.
Installation of solar panels.
Settlement with electricity
suppliers
Sufficient budget for fuel
and its regular supply by
the MCJ.
Regular patrolling by
patrol officers.
Proper O&M of electricity
generators
Funds for installation of
solar panels
Low
27. Suction
pumps at user
end
Continuous water supply at
least for duration (pre-
schedule water supply to
informed consumers).
Removal of suction pumps
at end-user level.
Involvement of WASH
committee.
Periodic checking of
illegal suction pumps
Minutes of meeting of
WASH committee
Monitoring of water
supply schedule
Low
5.5 Energy (electricity/fuel) requirements for operation of the water system
The frequency and duration of electric power breakdown currently hardly fill the OHRs due to lull
in water supply operation during that period. In this case, the consumers use suction pumps to
collect as much water as possible when water is supplied, which cause negative pressure in the
water distribution line. This negative pressure ultimately causes the infiltration of contaminated
water. As a result, both the quantity and quality of water supply compromised and consumer
confidence on the water supply system will be evaporated. It is of prime importance to operate the
water supply system at pressurized mode. This practice will discourage the use of suction pumps
by end-user and help mitigate the issue of cross-contamination. However, electric supply is a major
challenge for continuous operation of the water system. The power demand can be meet by backup
power generators in case of power breakdown from an electricity supplier. An estimated power is
469,800 KW per month for 6.6 MGD water supply and 783,900 KW/month for maximum water
supply of 9.2 MGD. A breakup of power requirement is given in Annx-12. These estimations will
be helpful in power arrangement from the supplier or fuel arrangement for stand-by power
generator.

36
Continuous water supply from OHRs to end-user throughout a day is preferable. However, it will
require consumer behavior changes because underground or storage tanks are not installed at
houses, and people have to practice to keep the water-tap running. This practice makes a flood-
like situation in the streets if the water supply is continuous. The community needs to be educated
to install overhead (or underground) tanks for water storage with a level-controller switch.

37
CHAPTER 6: OPERATIONAL MONITORING PLAN
AND MANAGEMENT STRATEGIES FOR WSP
This chapter provides the overall guidelines to ensure the implementation of the Water Safety Plan.
The data and the analytical framework provided in other sections of the report form the basis for
devising WSP implementation strategies. The topics covered in this chapter are the development
of operational monitoring plan, validation monitoring plan, WSP audit, emergency response plan,
management procedures to be adopted, supporting programs, communication strategy,
identification of alternate sources for water, human resource management, alternate management,
and implementation of WSP and formation of steering committee to perform the advisory role and
foster the overall implementation of WSP.
6.1 Operational Monitoring Plan (OMP)
The primary purpose of OMP is to check if the system is performing as per the prescribed
procedures and control measures. OMP is designed monitor water quality parameters and physical
inspections. The proposed monitoring process covers all the aspects from the intake/catchment to
the water supply distribution. The monitoring process mainly divided into two parts, i.e. health-
related indicators monitoring and visual & physical inspection and monitoring.
Water quality monitoring
The water system operation monitoring of health-related water quality indicators relies on water
quality parameters E. coli, total coliform, turbidity, and chemical parameters, including chlorine
doses, CRt values8, and alum dosing. Water quality monitoring is to be done at each step of the
water supply chain from intake to end-user level (Figure 9).
Figure 9: Water quality monitoring process.
8 CRt value = Residual chlorine concentration x time of contact
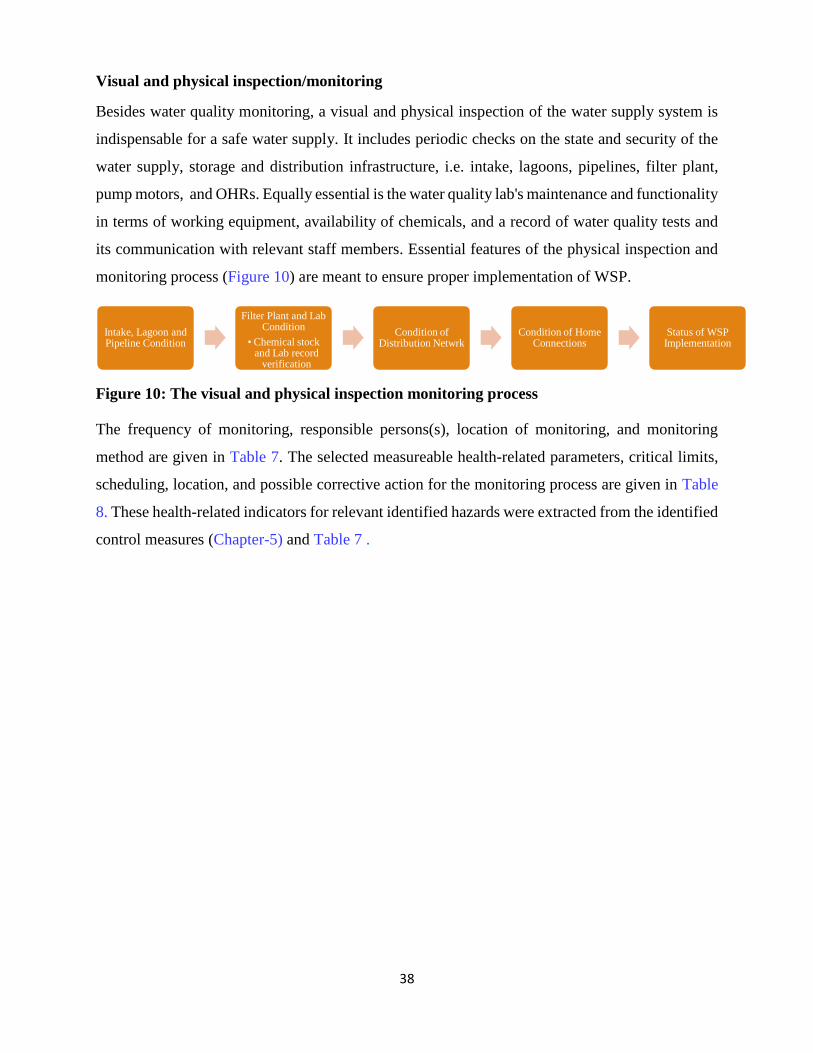
38
Visual and physical inspection/monitoring
Besides water quality monitoring, a visual and physical inspection of the water supply system is
indispensable for a safe water supply. It includes periodic checks on the state and security of the
water supply, storage and distribution infrastructure, i.e. intake, lagoons, pipelines, filter plant,
pump motors, and OHRs. Equally essential is the water quality lab's maintenance and functionality
in terms of working equipment, availability of chemicals, and a record of water quality tests and
its communication with relevant staff members. Essential features of the physical inspection and
monitoring process (Figure 10) are meant to ensure proper implementation of WSP.
Figure 10: The visual and physical inspection monitoring process
The frequency of monitoring, responsible persons(s), location of monitoring, and monitoring
method are given in Table 7. The selected measureable health-related parameters, critical limits,
scheduling, location, and possible corrective action for the monitoring process are given in Table
8. These health-related indicators for relevant identified hazards were extracted from the identified
control measures (Chapter-5) and Table 7 .
Intake, Lagoon and Pipeline Condition
Filter Plant and Lab Condition
• Chemical stock and Lab record
verification
Condition of Distribution Netwrk
Condition of Home Connections
Status of WSP Implementation

39
Table 7: Monitoring Plan for Raw water intake, Reservoirs (lagoons), WTP, and distributor network.
Parameters/
Hazardous event
Hazardous control
measure Where When How Who Impacts
Intake structure
(less water
withdrawal)
Major remodeling of intake
structure, strainer installation,
sump installation
Regular and preventive
maintenance of pumps
Regular oiling and greasing to
valves, pumps fittings and
fixtures
In-time repairs of cracks and
faulty pumps, valves etc.
Onsite
Inspection
Bi-weekly
Design phase
Construction
phase
Weekly
Physical inspection of
strainer
Design diagram
Installation activities
Flow to and levels in
lagoon
AEN (Civil) No silting of
conduits and
lagoon
Retention of
maximum storage
capacity at
lagoons
Flood in Indus river Cleaning of conduits and
strainers, consider installation of
intermediate sump between the
intake and lagoon for LLPs
Onsite Before and
after flood
prediction
Physical cleaning
Installation of sump
AEN (Civil) Less silting in
lagoon, no
overflow from
lagoons
Detection of E.Coli,
Total coliform in
Canal water
No access of animal Onsite
inspection
Weekly Proper fencing AEN (Civil) Reduced
contamination
Solid waste dumping and
wastewater disposal should not be
allowed in the water sources.
Prohibition of animals/human
activities within 2 Km area
Onsite
inspection
As per
requirement
Illegal houses and
building should be
removed
Sub Engineer
(Civil)
Proper space will
be created beside
canal
Microbial contamination in canal
water due to sewage or animal
waste
contamination.
Lab analysis Weekly Solid waste dumping and
wastewater disposal
should not be allowed in
the water sources.
WASH officer Reduced
contamination
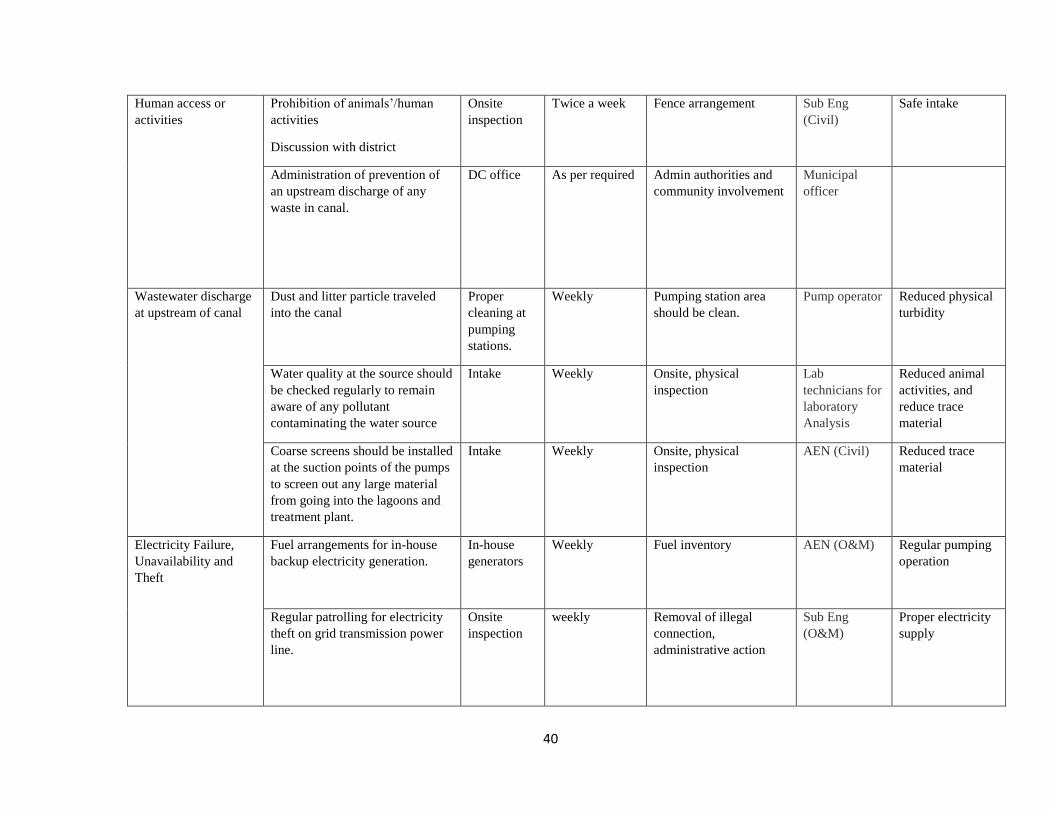
40
Human access or
activities
Prohibition of animals’/human
activities
Discussion with district
Onsite
inspection
Twice a week Fence arrangement
Sub Eng
(Civil)
Safe intake
Administration of prevention of
an upstream discharge of any
waste in canal.
DC office As per required Admin authorities and
community involvement
Municipal
officer
Wastewater discharge
at upstream of canal
Dust and litter particle traveled
into the canal
Proper
cleaning at
pumping
stations.
Weekly Pumping station area
should be clean.
Pump operator Reduced physical
turbidity
Water quality at the source should
be checked regularly to remain
aware of any pollutant
contaminating the water source
Intake Weekly Onsite, physical
inspection
Lab
technicians for
laboratory
Analysis
Reduced animal
activities, and
reduce trace
material
Coarse screens should be installed
at the suction points of the pumps
to screen out any large material
from going into the lagoons and
treatment plant.
Intake Weekly Onsite, physical
inspection
AEN (Civil) Reduced trace
material
Electricity Failure,
Unavailability and
Theft
Fuel arrangements for in-house
backup electricity generation.
In-house
generators
Weekly Fuel inventory AEN (O&M) Regular pumping
operation
Regular patrolling for electricity
theft on grid transmission power
line.
Onsite
inspection
weekly Removal of illegal
connection,
administrative action
Sub Eng
(O&M)
Proper electricity
supply
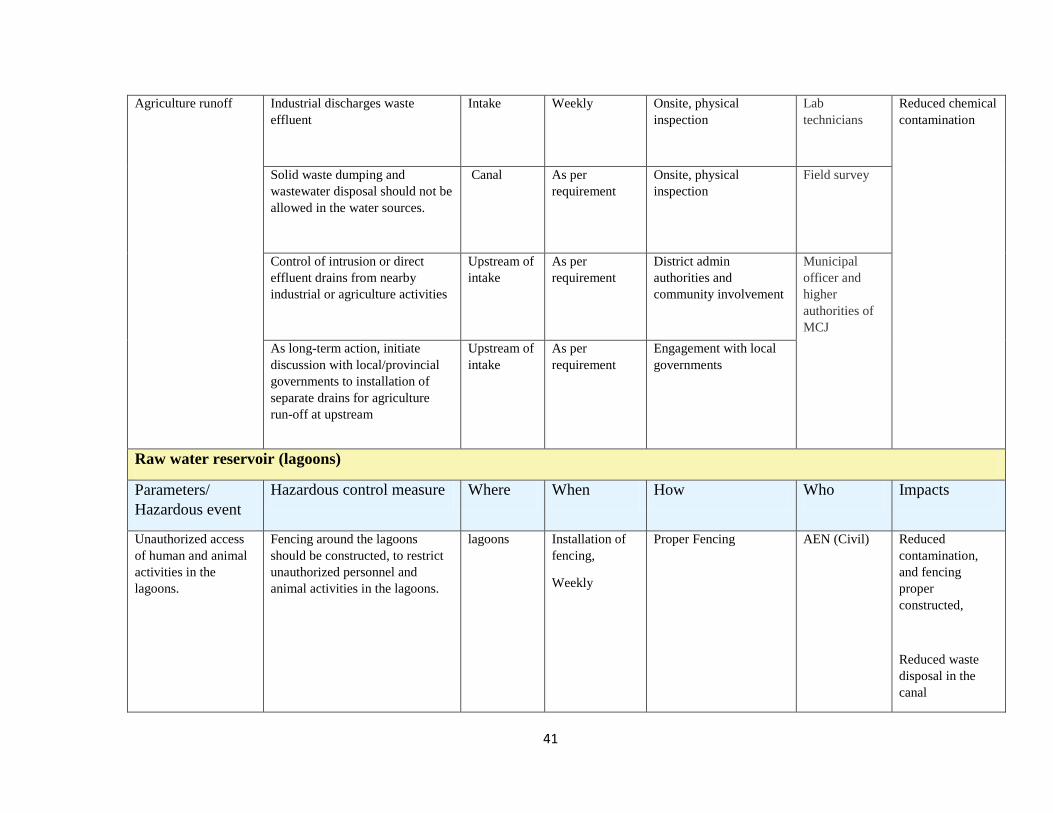
41
Agriculture runoff Industrial discharges waste
effluent
Intake Weekly Onsite, physical
inspection
Lab
technicians
Reduced chemical
contamination
Solid waste dumping and
wastewater disposal should not be
allowed in the water sources.
Canal As per
requirement
Onsite, physical
inspection
Field survey
Control of intrusion or direct
effluent drains from nearby
industrial or agriculture activities
Upstream of
intake
As per
requirement
District admin
authorities and
community involvement
Municipal
officer and
higher
authorities of
MCJ
As long-term action, initiate
discussion with local/provincial
governments to installation of
separate drains for agriculture
run-off at upstream
Upstream of
intake
As per
requirement
Engagement with local
governments
Raw water reservoir (lagoons)
Parameters/
Hazardous event
Hazardous control measure Where When How Who Impacts
Unauthorized access
of human and animal
activities in the
lagoons.
Fencing around the lagoons
should be constructed, to restrict
unauthorized personnel and
animal activities in the lagoons.
lagoons Installation of
fencing,
Weekly
Proper Fencing AEN (Civil) Reduced
contamination,
and fencing
proper
constructed,
Reduced waste
disposal in the
canal
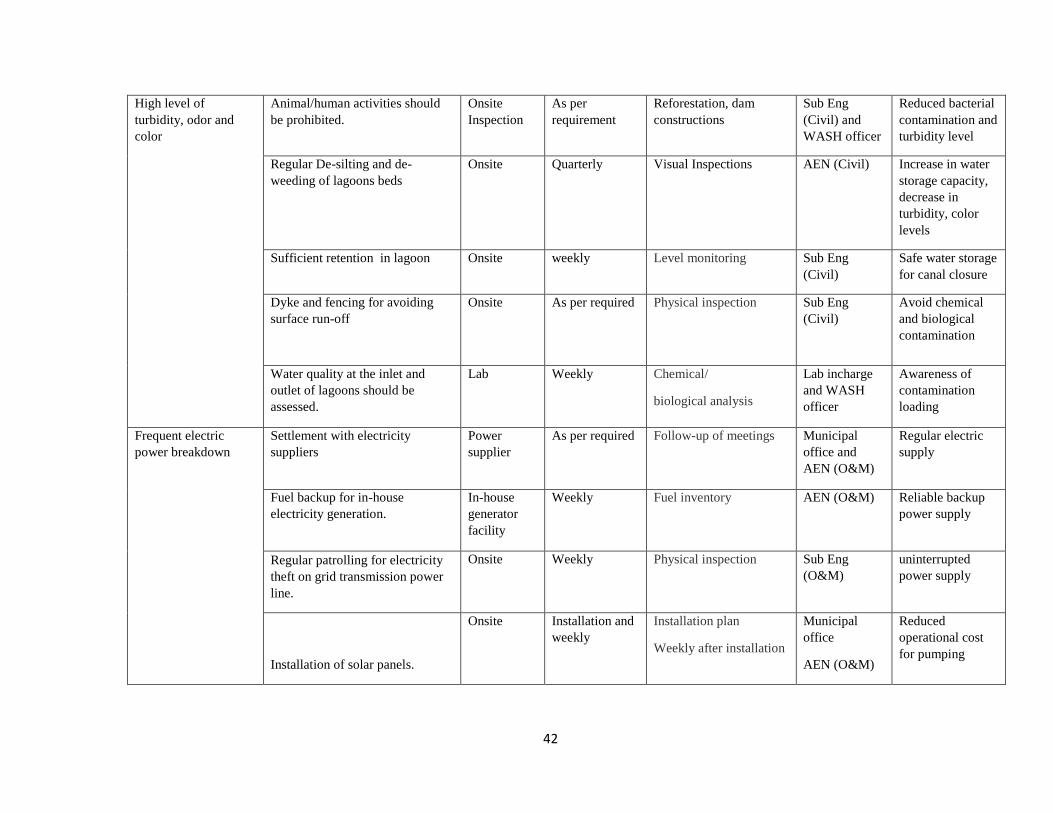
42
High level of
turbidity, odor and
color
Animal/human activities should
be prohibited.
Onsite
Inspection
As per
requirement
Reforestation, dam
constructions
Sub Eng
(Civil) and
WASH officer
Reduced bacterial
contamination and
turbidity level
Regular De-silting and de-
weeding of lagoons beds
Onsite Quarterly Visual Inspections AEN (Civil) Increase in water
storage capacity,
decrease in
turbidity, color
levels
Sufficient retention in lagoon Onsite weekly Level monitoring Sub Eng
(Civil)
Safe water storage
for canal closure
Dyke and fencing for avoiding
surface run-off
Onsite As per required Physical inspection Sub Eng
(Civil)
Avoid chemical
and biological
contamination
Water quality at the inlet and
outlet of lagoons should be
assessed.
Lab Weekly Chemical/
biological analysis
Lab incharge
and WASH
officer
Awareness of
contamination
loading
Frequent electric
power breakdown
Settlement with electricity
suppliers
Power
supplier
As per required Follow-up of meetings Municipal
office and
AEN (O&M)
Regular electric
supply
Fuel backup for in-house
electricity generation.
In-house
generator
facility
Weekly Fuel inventory AEN (O&M) Reliable backup
power supply
Regular patrolling for electricity
theft on grid transmission power
line.
Onsite Weekly Physical inspection Sub Eng
(O&M)
uninterrupted
power supply
Installation of solar panels.
Onsite Installation and
weekly
Installation plan
Weekly after installation
Municipal
office
AEN (O&M)
Reduced
operational cost
for pumping

43
Leaked and damaged
pipes, leaked air vents
valves, fittings,
pumps, leaked rising
main (lagoon to water
treatment plant)
Regular and preventive
maintenance of pumps
Regular oiling and greasing to
valves, pumps fittings and
fixtures
In-time repairs of cracks and
faulty pumps, valves etc.
Onsite
inspection
Weekly O&M record AEN (O&M) Reduced water
wastage and
prevent cross-
contamination
Intrusion or seepage
of fertilizers, salts and
pesticides from
surrounding rice crops
and fertilizer runoff.
Water quality at the inlet of
lagoons should be assessed.
Inspecting the lagoon
embankments, especially during
the rainy season. Maintaining
proper operating parameters.
Fencing and Prohibition of
anthropogenic activities
The inlet chambers of the lagoons
receiving water from canal should
have screens and should be
covered with easy-to-remove lids
Onsite
inspection
Monthly Visual inspection AEN (Civil)
Maintain less
contaminated
water storage
Water treatment plant (WTP)
Parameters/Hazar
dous Events
Hazardous control measure Where to
monitor
When to
monitor
How to monitor Who to
monitor
Impacts
Insufficient/irregular
chlorination of filtered
water
Sufficient Supplies of Chlorine
Proper dosing of chlorine
Proper O&M of chlorine dosing
system
In-time maintenance of broken
water supply lines/pipes to avoid
Lab
Analysis
Daily
Dosing rate record,
CT time,
Residual chlorine
concentration record
Lab technician
WASH officer
Reduced
Contamination
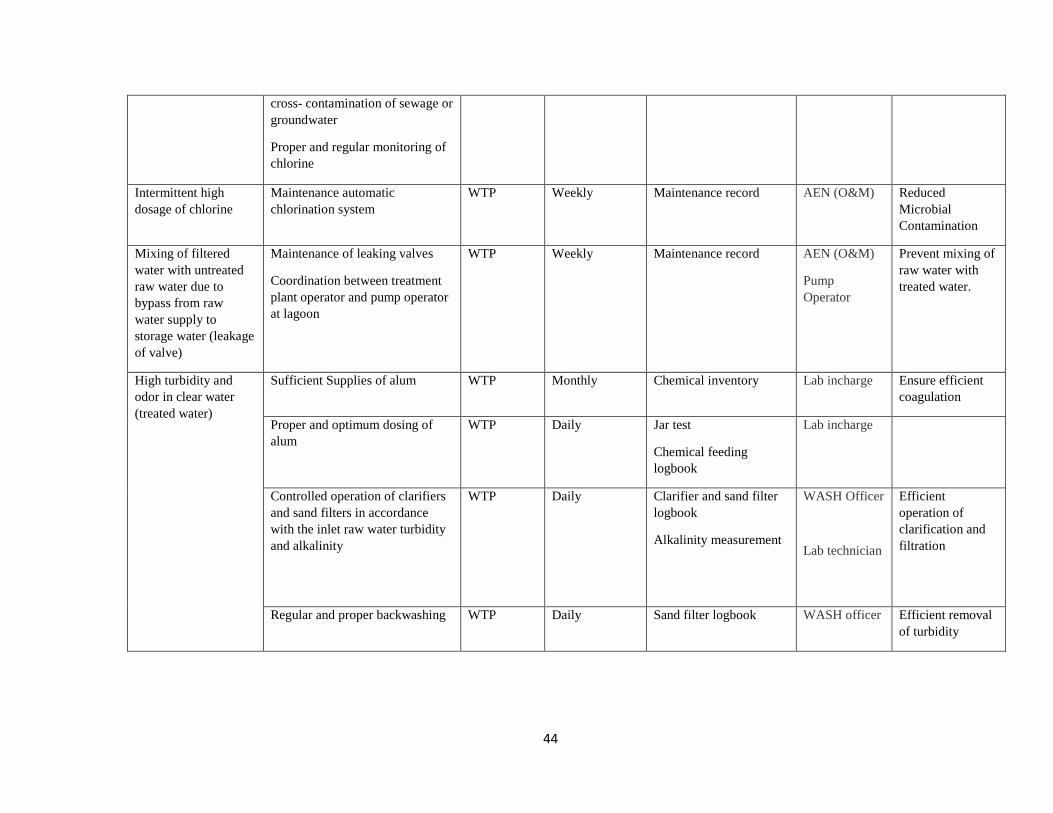
44
cross- contamination of sewage or
groundwater
Proper and regular monitoring of
chlorine
Intermittent high
dosage of chlorine
Maintenance automatic
chlorination system
WTP Weekly Maintenance record AEN (O&M) Reduced
Microbial
Contamination
Mixing of filtered
water with untreated
raw water due to
bypass from raw
water supply to
storage water (leakage
of valve)
Maintenance of leaking valves
Coordination between treatment
plant operator and pump operator
at lagoon
WTP Weekly Maintenance record AEN (O&M)
Pump
Operator
Prevent mixing of
raw water with
treated water.
High turbidity and
odor in clear water
(treated water)
Sufficient Supplies of alum WTP Monthly Chemical inventory Lab incharge Ensure efficient
coagulation
Proper and optimum dosing of
alum
WTP Daily Jar test
Chemical feeding
logbook
Lab incharge
Controlled operation of clarifiers
and sand filters in accordance
with the inlet raw water turbidity
and alkalinity
WTP Daily Clarifier and sand filter
logbook
Alkalinity measurement
WASH Officer
Lab technician
Efficient
operation of
clarification and
filtration
Regular and proper backwashing WTP Daily Sand filter logbook WASH officer Efficient removal
of turbidity

45
Proper and regular monitoring of
turbidity at plant inlet and outlets
WTP Daily Laboratory logbook Lab incharge
and WASH
officer
Training of operators and lab
technicians on chlorine
disinfection and monitoring
WTP As per needed Lab progress report Municipal
officer and lab
incharge
Electricity Failure,
Unavailability
Fuel Backup for in-house
electricity generation
WTP Monthly Fuel inventory record AEN (O&M) Continuous
operation of WTP
Installation of solar panels. As per needed Lab progress reports Municipal
officer and
AEN (O&M)
Alternate power
supply
Settlement with electricity
suppliers
As per needed Minutes of meeting Municipal
officer
Continuous power
supply
Leaked pipes,
malfunctioned valves,
fittings, pumps,
compressors etc.
Regular and preventive
maintenance of pumps
Regular oiling and greasing to
valves, pumps fittings and
fixtures
In-time repairs of cracks and
faulty pumps, valves etc.
WTP Weekly Maintenance record AEN (O&M) Proper operation
of WTP
Insufficient storage
capacity of clear water
reservoir
(underground tank)
Construction of extended storage
capacity
WTP As per needed Annual progress reports
and minutes of meeting
Municipal
office and
AEN (Civil)
Continuous
supply of clear
wat
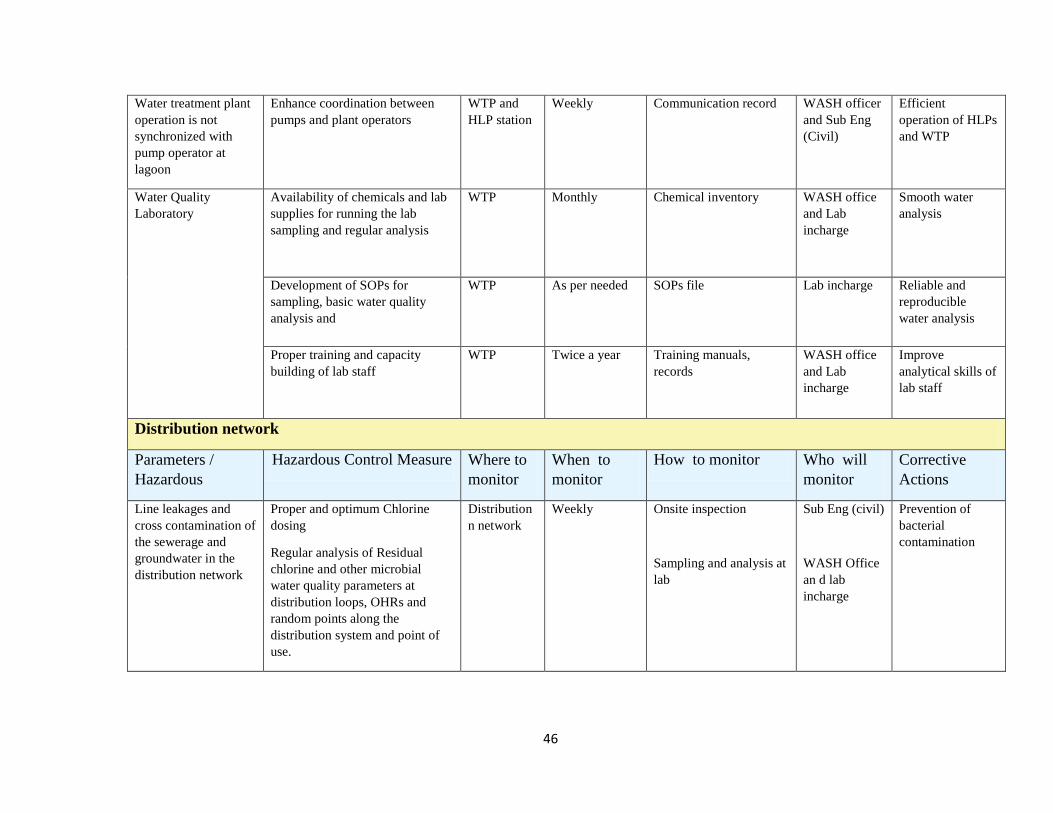
46
Water treatment plant
operation is not
synchronized with
pump operator at
lagoon
Enhance coordination between
pumps and plant operators
WTP and
HLP station
Weekly Communication record WASH officer
and Sub Eng
(Civil)
Efficient
operation of HLPs
and WTP
Water Quality
Laboratory
Availability of chemicals and lab
supplies for running the lab
sampling and regular analysis
WTP Monthly Chemical inventory WASH office
and Lab
incharge
Smooth water
analysis
Development of SOPs for
sampling, basic water quality
analysis and
WTP As per needed SOPs file Lab incharge Reliable and
reproducible
water analysis
Proper training and capacity
building of lab staff
WTP Twice a year Training manuals,
records
WASH office
and Lab
incharge
Improve
analytical skills of
lab staff
Distribution network
Parameters /
Hazardous
Hazardous Control Measure Where to
monitor
When to
monitor
How to monitor Who will
monitor
Corrective
Actions
Line leakages and
cross contamination of
the sewerage and
groundwater in the
distribution network
Proper and optimum Chlorine
dosing
Regular analysis of Residual
chlorine and other microbial
water quality parameters at
distribution loops, OHRs and
random points along the
distribution system and point of
use.
Distribution
n network
Weekly Onsite inspection
Sampling and analysis at
lab
Sub Eng (civil)
WASH Office
an d lab
incharge
Prevention of
bacterial
contamination

47
Low concentration of
residual chlorine in
distribution network
Installation of chlorine booster in
all six zone at suitable locations
OHRs
Weekly Onsite inspection AEN (Civil)
WASH officer
Reduce
contamination. No
biological count
will observed in
distribution
network Increase chlorine dosing at outlet
of treatment plant
Lab analysis daily Chlorination record Lab incharge
Cross-contamination
due to sewage and
groundwater
infiltration
Continuous, pressure, and regular
supply of water to avoid negative
pressure and cross-contamination
Pumping
stations and
distribution
network
Weekly Water audit, Visual
Inspection
AEN (Civil)
WASH officer
Prevent
infiltration of
contamination
into distribution
network
In-time maintenance of broken
lines for any infiltration or cross-
contamination passage of
surrounding turbid water
Distribution
network
Weekly Visual inspection, leak
detection
Sub Eng
(Civil)
Regular water sampling and
turbidity analysis to monitor and
report any cross contamination
OHRs and
at different
locations in
distribution
network
Weekly Onsite turbidity analysis
biological analysis
record in lab
WASH officer
Lab in charge
Improper periodic
water quality
monitoring
Availability of chemicals and lab
supplies for regular analysis
Chemical
store
Monthly Chemical inventory WASH officer
and Lab
incharge
Regular water
quality
monitoring

48
Development of SOPs for
sampling, basic water quality
analysis
Water
quality
laboratory
As per needed SOPs files Lab incharge
and WASH
officer
Reproducible and
reliable water
analysis
Development of regular zone-
wise sampling and monitoring
plans
Monthly Sampling plan and
analysis record
WASH officer
Proper training and capacity
building of lab staff
Twice a year Training manuals WASH officer
and lab
incharge
Non-continuous
system of water
supply
Fuel Backup for in-house
electricity generation.
WTP Monthly Fuel inventory record AEN (O&M) Continuous water
supply
Regular patrolling for electricity
theft on grid transmission power
line.
WTP Weekly Visual inspection
Installation of solar panels WTP As per needed Lab progress reports Municipal
officer and
AEN (O&M)
Alternate power
supply
The settlement with electricity
suppliers
As per needed Minutes of meeting Municipal
officer
Continuous power
supply

49
Table 8: Health-related water quality parameters monitoring
What to
check
Why to check Critical
limits
Where to check When to
check
Who can
check
Corrective actions if
critical limits
exceeded
Intake Lagoon WTP OHRs House /
End-
user
E.coli, Total
Coliform
Indicators of pathogens ND/100ml1 Daily Lab tech.
WASH
officer
Adjust Cl2 dose
Weekly
Turbidity Indicator of microbial
and chemical
contamination
<5NTU2 Daily Lab tech.
AEN
(civil)
Increase alum dose,
backwash sand filter
check cross-
contamination in the
distribution network
Weekly
Chlorine Residual chlorine to
prevent microbial re-
contamination
0.5-1.5 mg/l
0.2-0.5 mg/l
Daily Lab tech. Adjust Cl2 dose
Weekly
pH acid or basic character,
process optimization,
contamination
6.5-8.5 Daily Lab tech.
Field visit
Check the source of pH
variation at source or at
WTP weekly
Color Indication of inorganic
or organic
contamination
15 TCU3 Weekly WASH
officer
Check the source of
color at WTP, lagoon,
canal Daily
Taste Not
objectionabl
Daily WASH
officer

50
Indication of inorganic
or organic
contamination
e /
acceptable
Weekly Check the source of taste
causing contamination at
WTP, lagoon, canal
Total
Dissolved
solids
Indicator of salts < 1000
mg/L
Daily
Lab Tech.
Field visit
Not likely as the source
is Indus river
Possible mixing of
saline water into the
system, check the
source. Check
infiltration
Monthly
Total hardness Dissolved minerals < 500 mg/l
as CaCO3
Weekly Lab tech. Not likely as the source
is Indus river
Possible mixing of
saline water into the
system, check the
source. Check
infiltration
Monthly
Aluminum High Al concentration
can have adverse health
impacts
< 500 mg/l Daily Lab tech
Adjust alum dosing
before clarifier
Monthly
CRt value4
(chlorine)9
The efficiency of the
disinfection process
8-10 for 4
log removal
of bacteria;
20-40 for 4
log removal
Daily Lab tech.
WASH
officer
Increase chlorine dose or
contact time.
9 Water Reuse: Issues, Technologies, and Applications, McGraw Hills, 2007.
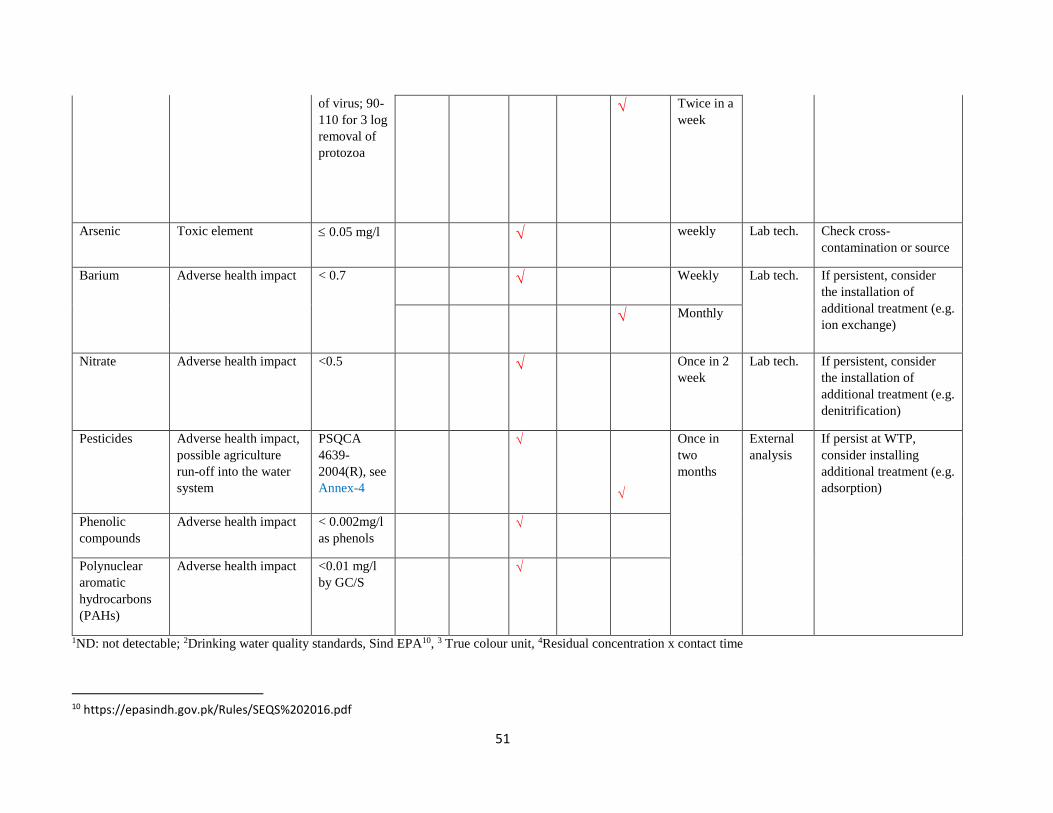
51
of virus; 90-
110 for 3 log
removal of
protozoa
Twice in a
week
Arsenic Toxic element 0.05 mg/l weekly Lab tech. Check cross-
contamination or source
Barium Adverse health impact < 0.7 Weekly Lab tech. If persistent, consider
the installation of
additional treatment (e.g.
ion exchange) Monthly
Nitrate Adverse health impact <0.5 Once in 2
week
Lab tech. If persistent, consider
the installation of
additional treatment (e.g.
denitrification)
Pesticides Adverse health impact,
possible agriculture
run-off into the water
system
PSQCA
4639-
2004(R), see
Annex-4
Once in
two
months
External
analysis
If persist at WTP,
consider installing
additional treatment (e.g.
adsorption)
Phenolic
compounds
Adverse health impact < 0.002mg/l
as phenols
Polynuclear
aromatic
hydrocarbons
(PAHs)
Adverse health impact <0.01 mg/l
by GC/S
1ND: not detectable; 2Drinking water quality standards, Sind EPA10, 3 True colour unit, 4Residual concentration x contact time
10 https://epasindh.gov.pk/Rules/SEQS%202016.pdf
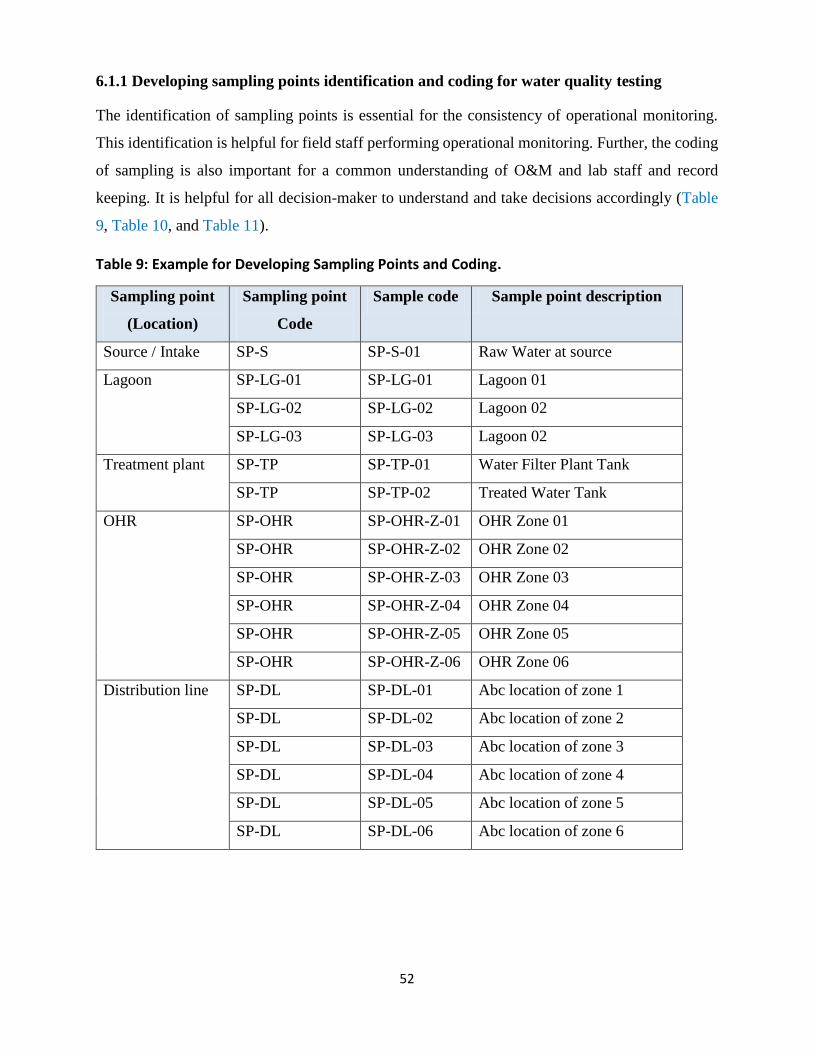
52
6.1.1 Developing sampling points identification and coding for water quality testing
The identification of sampling points is essential for the consistency of operational monitoring.
This identification is helpful for field staff performing operational monitoring. Further, the coding
of sampling is also important for a common understanding of O&M and lab staff and record
keeping. It is helpful for all decision-maker to understand and take decisions accordingly (Table
9, Table 10, and Table 11).
Table 9: Example for Developing Sampling Points and Coding.
Sampling point
(Location)
Sampling point
Code
Sample code Sample point description
Source / Intake SP-S SP-S-01 Raw Water at source
Lagoon SP-LG-01 SP-LG-01 Lagoon 01
SP-LG-02 SP-LG-02 Lagoon 02
SP-LG-03 SP-LG-03 Lagoon 02
Treatment plant SP-TP SP-TP-01 Water Filter Plant Tank
SP-TP SP-TP-02 Treated Water Tank
OHR SP-OHR SP-OHR-Z-01 OHR Zone 01
SP-OHR SP-OHR-Z-02 OHR Zone 02
SP-OHR SP-OHR-Z-03 OHR Zone 03
SP-OHR SP-OHR-Z-04 OHR Zone 04
SP-OHR SP-OHR-Z-05 OHR Zone 05
SP-OHR SP-OHR-Z-06 OHR Zone 06
Distribution line SP-DL SP-DL-01 Abc location of zone 1
SP-DL SP-DL-02 Abc location of zone 2
SP-DL SP-DL-03 Abc location of zone 3
SP-DL SP-DL-04 Abc location of zone 4
SP-DL SP-DL-05 Abc location of zone 5
SP-DL SP-DL-06 Abc location of zone 6

53
Table 10: Example for recording keeping of sampling points and coding
Sampling
point and
code
Date Collected
by
Type of test
performed
Tests
result
Critical
limit
Remarks Tests
performed
by
SP-S-01 dd/mm/
yyyy
Mr./Ms. pH
7.5 7 – 8.5 Fit Mr./Ms.
SP-TP-01 dd/mm/
yyyy
Mr./Ms. pH
9.5 7 – 8.5 Unfit Mr./Ms.
Table 11: Example for reporting of sampling points and coding
Sampling
Code
Reporting
Period
Type
of
Test
Testing
Frequency
Results in comparison of WHO
Standard
Comments
Week
1
Week
2
Week
3
Week
4
SP-S-01 Jan01-31,
20--
pH Weekly

54
6.1.2 Visual and physical inspection/monitoring
The selected parameters for visual and physical inspection and monitoring are developed by team
experts after situation analysis of MCJ system. Table 12 provides the inspection frequency,
responsible person, critical limits, corrective actions and whom to report for visual and physical
inspection/monitoring.
Table 12: Guideline for visual and physical inspection/monitoring
What to
inspect
Inspection
frequency
Who to
inspect
Critical limit
(or target
condition)
Corrective
action if critical
limit is
exceeded
Who needs
to be
informed
Intake, Lagoon and Pipeline
Motor
Condition Weekly
Operators Working
Condition Repair of motor
Plant
Supervisor
Pipes
Condition Weekly
Operators Clear from
silt, no
leakages
Repair of pipes
Plant
Supervisor
Turbidity Weekly
Operators Required
storage time,
no human or
animal
intervention
Sufficient water
retention time
and secure
lagoons
Plant
Supervisor
Fencing
Security Weekly
Operators No entry
human and
animal entry
Repair of
fencing
Plant
Supervisor
Lagoon
Condition Monthly
Operators No silt, no
vegetation
Cleaning of
Lagoons
Plant
Supervisor
Pipeline
Condition Weekly
Patrolling
Officers and
Supervisor
No leakages Repair of pipes
Plant
Supervisor
Water Quality Testing
Lab
Condition Monthly Lab Incharge
Proper
hygienic and
working
condition
Proper cleaning
and disinfection
Plant
Supervisor

55
Availability
of Chemicals Monthly Lab Incharge
Quarterly
Stocks of
Chemicals
In time
communication
Plant
Supervisor
Testing
reports and
records
Fortnightly Lab Incharge Required
Tests are done
Increased lab
quality control
measures
Plant
Supervisor
OHR and distribution network
OHR
Condition Monthly
Maintenance -
Engineer
Valve Man
Plumbers
No leakages Repair OHR
Plant
Supervisor
OHR filling Daily Plant operators
Valve Man
OHRs are
filled as per
the demand
Fill the OHRs
Plant
Supervisor
Network
Condition Weekly
Maintenance -
Engineer
Valve Man
Plumbers
No leakage
and mix with
drainage
Repair pipeline
Change pipeline
Plant
Supervisor
Illegal
Connections Periodic
Maintenance -
Engineer
Valve Man
Patrolling
Officer
No illegal
connections
Removal of
connection
Legal action
Plant
Supervisor
Essential backups for running system
Mechanical
equipment Monthly
Maintenance -
Engineer
Availability
of equipment
Availability of
equipment
Plant
Supervisor
Power supply
backup Weekly
Maintenance -
Engineer
Availability
of oil for 15
days
Availability of
oil for 15 days
Plant
Supervisor
Vehicles and
PoL Monthly
Maintenance -
Engineer
Availability
of vehicles
and PoL for
Availability of
vehicles and PoL
for essential
operations
Plant
Supervisor

56
essential
operations
Human resources development program
Staff
Trainings Periodic
Plant
Supervisor
Necessary
trainings are
conducted
Arrange
necessary
trainings for staff
CMO
Community engagement programs
Awareness
sessions Periodic WASH Officer
Essential
awareness
sessions are
conducted
Arrange essential
awareness
sessions
CMO
Revenue generation and tax collection
Bills and
Taxes are
collected
Monthly Revenue
Officer
Minimum
recovery
amount is
collected
Meetings with
community,
mohalla wash
committees
CMO
WSP implementation
Safe Water
Supply from
source to tap
Quarterly
All Units
Progress
Meeting
Safe water is
supplied from
source to tap
Immediate
actions to
resolve the
issues
WSP Team
and Steering
committee
A graphical description of the OMP is given in Figure 11.

57
Figure 11: Graphical representation of operational monitoring plan (OMP).
16’’ 16’’
24’’
24’’
24’’
24’’
HLPs
HLPs
16’’
22 Km
Khirthar Canal
Filtered Water
Underground
Storage Tank
0.5 MG
Chlorination
Disinfection
Dozing
LLPs
Clarifiers
s
Sand Filters
Supply and
Distribution
to 6 OHRs
Alum
Dozing
Distribution
Pumps
OM for Source WQT: Turbidity, E.coli, Total Coliform Visual / Physical Inspections: Condition and Security of pipes and motors, compliance checkup
OM for Lagoons WQT: Turbidity, E.coli, Total Coliform, pH Visual / Physical Inspections: Condition and Security of motors, fencing, infrastructure, vegetation, human and animal interference, compliance checkup
OM for Pipelines Visual / Physical Inspections: Condition and Security of supply pipes
OM for Water Treatment Plant WQT: Turbidity, E.coli, Total Coliform, pH, alum, chlorine, Visual / Physical Inspections: Condition and Security of motors, fencing, infrastructure, vegetation, algae, human and animal interference
OM for Distribution Network WQT: Turbidity, E.coli, Total Coliform, pH, alum, chlorine, Visual / Physical Inspections: Condition and Security of pipes, illegal connections, infrastructure

58
6.2 Verification Monitoring Plan (VMP)
VMP is an important check to monitor and confirm that drinking water quality standards are being
met or not, end-users are satisfied or not, and the WSP is being implemented and updated
appropriately. The VMP framework is shown in Figure 12, which consists of four main
components compliance monitoring, auditing, consumer satisfaction, and improvement in the
system.
Figure 12: Framework for the verification monitoring plan (VMP).
6.2.1 In house compliance monitoring
A committee comprises members from different departments of MCJ and one member each from
the NGO and Mohalla wash committee will be formed to check the compliance of the monitoring
system. The committee will report to CMO. The committee will check compliance monitoring as
and when required.
6.2.2 Third party compliance monitoring
A third-party (accredited water quality lab) conducts the water quality testing to confirm
compliance with drinking water quality standards and ascertain regularity in water testing. MCJ
and third party should agree on parameters and frequency of compliance monitoring. Third-party
Verification
Compliance Monitoring
Consumer Satisfaction
Auditing
Improvement in the system

59
must be responsible for reporting and suggestions for improvements in the system to meet water
quality standards. Some critical parameters are suggested in Table 13.
Table 13: Compliance monitoring parameters and frequency.
Parameter Frequency
Location Target Value Tested at
(Lab Name)
Working condition
of motors at intake
Monthly Intake Working
condition
Secure lagoon
Monthly Lagoon No human and
animal
intervention
Secure water
pipeline from lagoon
to filter plant
Monthly Pipeline No damaged
pipeline
Continuous water
supply from lagoon
to filter plant
Fortnightly Lagoons
and
Filter
Plant
Continuous
water supply
Complete water
testing
Monthly Lab In time tests are
done, and
results are
shared
Tests will be
verified from
USPCAS-W
Lab
Water supply to HH Monthly All
Zones
All Zones
6.2.3 Consumer satisfaction
Consumer satisfaction is an essential feature for any water supply entity, which can be monitored
and verified through different ways and means while ensuring openness and accountability in the
system. The system's openness and transparency can be achieved through a better communication
strategy involving consumer access to the information periodically. It may include information
sharing in case of emergency or incident, supplier performance on a monthly or quarterly basis
such as a summary of the complaints received and resolved. The following methods can be adopted
to assess consumer satisfaction;
a. Consumer complaint registration

60
b. Consumer satisfaction surveys
c. Supplier meetings with community
a. Consumer complaint registration
The supplier must establish the complaint registration system. For the purpose a Management
Information System (MIS) is already been developed and will be implemented soon at MCJ level
to register the complaints from consumers. Meanwhile it is suggested to maintain a complaint
register (example shown in Table 14) with responsibility assigned to a suitable staff member. The
register should be easily accessible to the consumers who should be made aware of how, when and
whom to contact in case of a complaint. The responsible staff member shall keep track of all the
complaints and present these to the concerned authority on weekly basis, or more frequently as
may be determined.
The MCJ can also display the contact numbers and email IDs at public places for receiving
complaints. The MCJ should make responsible some person to follow-up for consumer satisfaction
against the complaint.
Table 14: Example for complaint register development.
Complain Action Consumer Feed Back
Date
received
Complain
received
by
Complain/
Nature of
Complain
Address /
Contact
no
Forwarded
to
Date
action
taken
Action
taken
by
Specific
action
taken
Consumer
Feedback
Taken
by
Taken
through
b. Consumer satisfaction surveys
Consumer satisfaction surveys can be conducted through a third-party on an annual basis.
Moreover, academic researchers (MS and PhD scholars) can also be supported for this purpose.
The independent surveys can be a good guideline for MCJ to prepare future WSP implementation
strategy from a consumer perspective.
c. MCJ meetings with community
The MCJ top management must hold periodic meetings with communities. This process will
provide first-hand information to the management regarding consumer satisfaction, and it may also
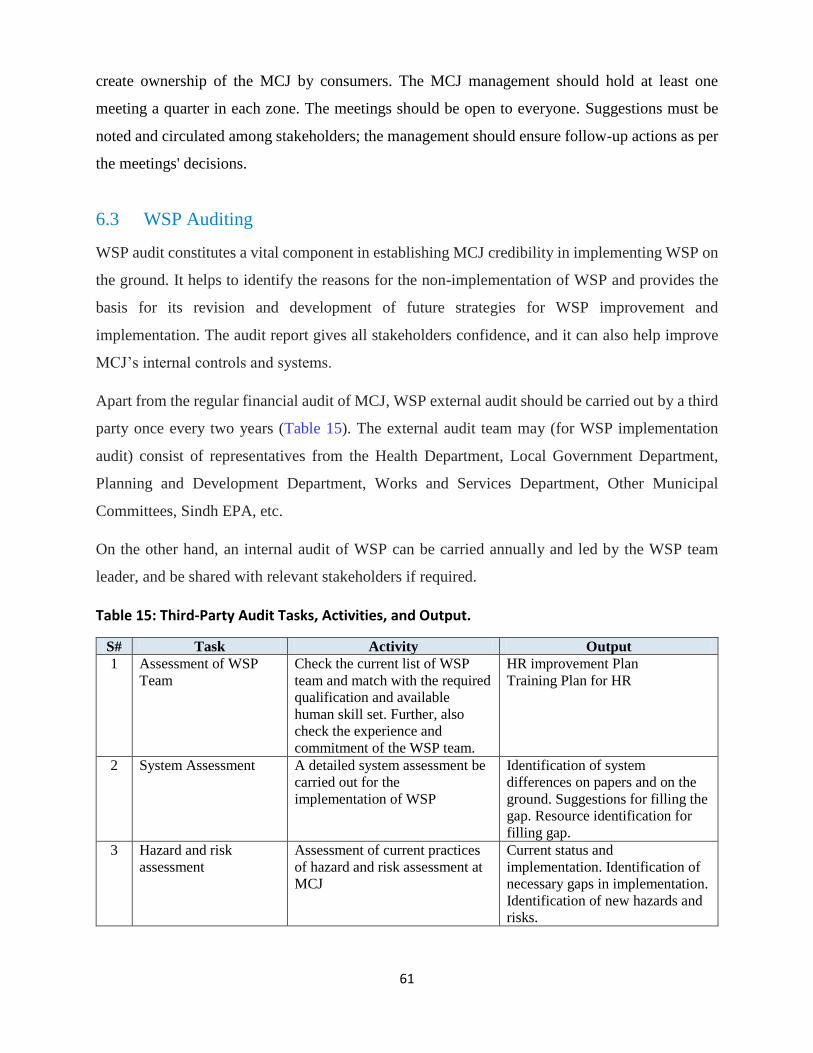
61
create ownership of the MCJ by consumers. The MCJ management should hold at least one
meeting a quarter in each zone. The meetings should be open to everyone. Suggestions must be
noted and circulated among stakeholders; the management should ensure follow-up actions as per
the meetings' decisions.
6.3 WSP Auditing
WSP audit constitutes a vital component in establishing MCJ credibility in implementing WSP on
the ground. It helps to identify the reasons for the non-implementation of WSP and provides the
basis for its revision and development of future strategies for WSP improvement and
implementation. The audit report gives all stakeholders confidence, and it can also help improve
MCJ’s internal controls and systems.
Apart from the regular financial audit of MCJ, WSP external audit should be carried out by a third
party once every two years (Table 15). The external audit team may (for WSP implementation
audit) consist of representatives from the Health Department, Local Government Department,
Planning and Development Department, Works and Services Department, Other Municipal
Committees, Sindh EPA, etc.
On the other hand, an internal audit of WSP can be carried annually and led by the WSP team
leader, and be shared with relevant stakeholders if required.
Table 15: Third-Party Audit Tasks, Activities, and Output.
S# Task Activity Output
1 Assessment of WSP
Team
Check the current list of WSP
team and match with the required
qualification and available
human skill set. Further, also
check the experience and
commitment of the WSP team.
HR improvement Plan
Training Plan for HR
2 System Assessment A detailed system assessment be
carried out for the
implementation of WSP
Identification of system
differences on papers and on the
ground. Suggestions for filling the
gap. Resource identification for
filling gap.
3 Hazard and risk
assessment
Assessment of current practices
of hazard and risk assessment at
MCJ
Current status and
implementation. Identification of
necessary gaps in implementation.
Identification of new hazards and
risks.
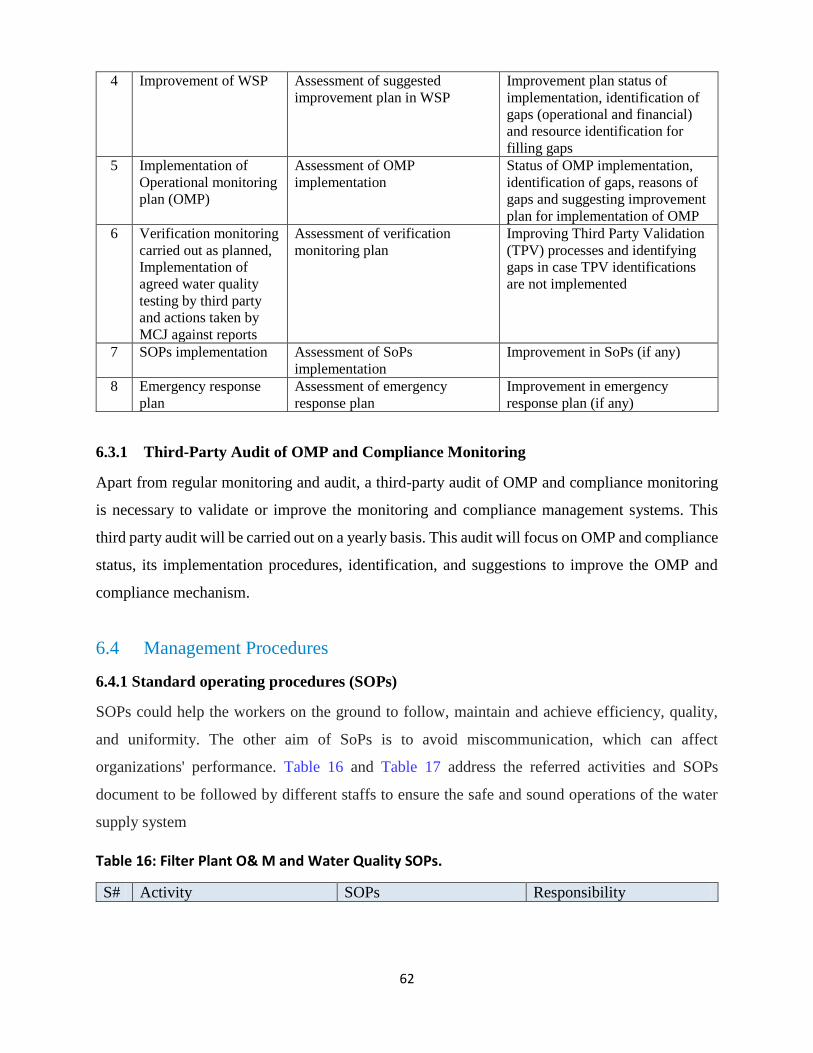
62
4 Improvement of WSP Assessment of suggested
improvement plan in WSP
Improvement plan status of
implementation, identification of
gaps (operational and financial)
and resource identification for
filling gaps
5 Implementation of
Operational monitoring
plan (OMP)
Assessment of OMP
implementation
Status of OMP implementation,
identification of gaps, reasons of
gaps and suggesting improvement
plan for implementation of OMP
6 Verification monitoring
carried out as planned,
Implementation of
agreed water quality
testing by third party
and actions taken by
MCJ against reports
Assessment of verification
monitoring plan
Improving Third Party Validation
(TPV) processes and identifying
gaps in case TPV identifications
are not implemented
7 SOPs implementation Assessment of SoPs
implementation
Improvement in SoPs (if any)
8 Emergency response
plan
Assessment of emergency
response plan
Improvement in emergency
response plan (if any)
6.3.1 Third-Party Audit of OMP and Compliance Monitoring
Apart from regular monitoring and audit, a third-party audit of OMP and compliance monitoring
is necessary to validate or improve the monitoring and compliance management systems. This
third party audit will be carried out on a yearly basis. This audit will focus on OMP and compliance
status, its implementation procedures, identification, and suggestions to improve the OMP and
compliance mechanism.
6.4 Management Procedures
6.4.1 Standard operating procedures (SOPs)
SOPs could help the workers on the ground to follow, maintain and achieve efficiency, quality,
and uniformity. The other aim of SoPs is to avoid miscommunication, which can affect
organizations' performance. Table 16 and Table 17 address the referred activities and SOPs
document to be followed by different staffs to ensure the safe and sound operations of the water
supply system
Table 16: Filter Plant O& M and Water Quality SOPs.
S# Activity SOPs Responsibility
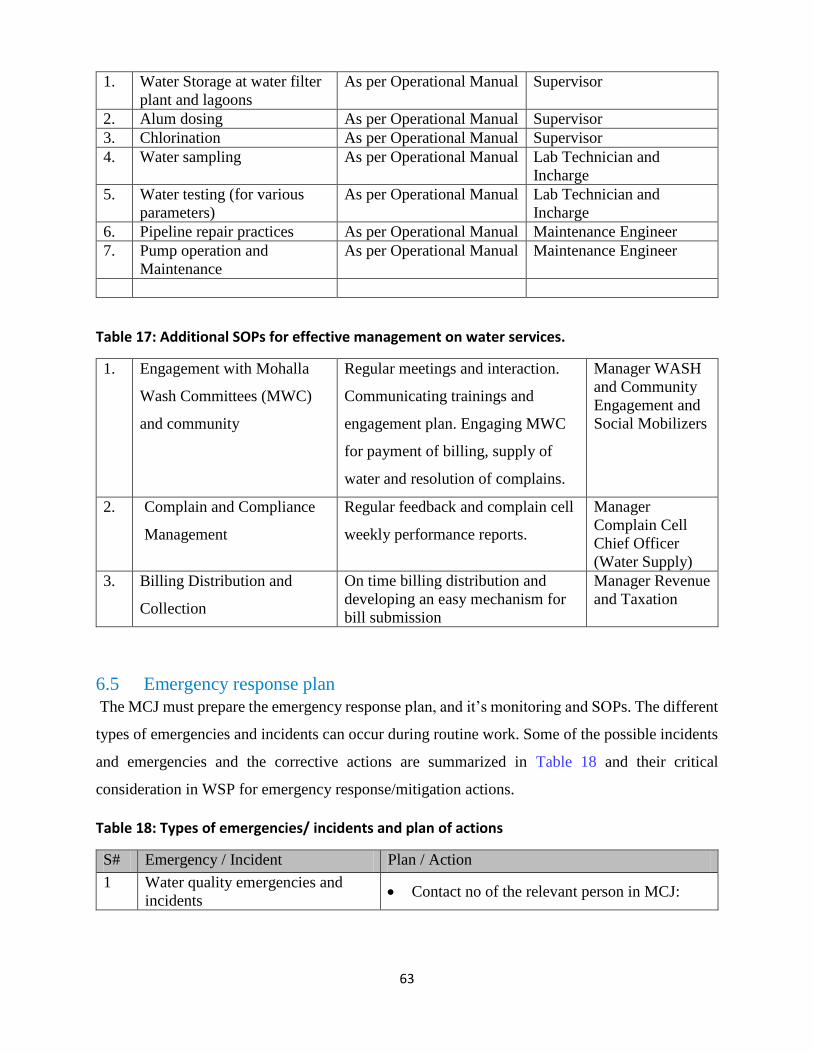
63
1. Water Storage at water filter
plant and lagoons
As per Operational Manual Supervisor
2. Alum dosing As per Operational Manual Supervisor
3. Chlorination As per Operational Manual Supervisor
4. Water sampling As per Operational Manual Lab Technician and
Incharge
5. Water testing (for various
parameters)
As per Operational Manual Lab Technician and
Incharge
6. Pipeline repair practices As per Operational Manual Maintenance Engineer
7. Pump operation and
Maintenance
As per Operational Manual Maintenance Engineer
Table 17: Additional SOPs for effective management on water services.
1. Engagement with Mohalla
Wash Committees (MWC)
and community
Regular meetings and interaction.
Communicating trainings and
engagement plan. Engaging MWC
for payment of billing, supply of
water and resolution of complains.
Manager WASH
and Community
Engagement and
Social Mobilizers
2. Complain and Compliance
Management
Regular feedback and complain cell
weekly performance reports.
Manager
Complain Cell
Chief Officer
(Water Supply)
3. Billing Distribution and
Collection
On time billing distribution and
developing an easy mechanism for
bill submission
Manager Revenue
and Taxation
6.5 Emergency response plan
The MCJ must prepare the emergency response plan, and it’s monitoring and SOPs. The different
types of emergencies and incidents can occur during routine work. Some of the possible incidents
and emergencies and the corrective actions are summarized in Table 18 and their critical
consideration in WSP for emergency response/mitigation actions.
Table 18: Types of emergencies/ incidents and plan of actions
S# Emergency / Incident Plan / Action
1 Water quality emergencies and
incidents Contact no of the relevant person in MCJ:
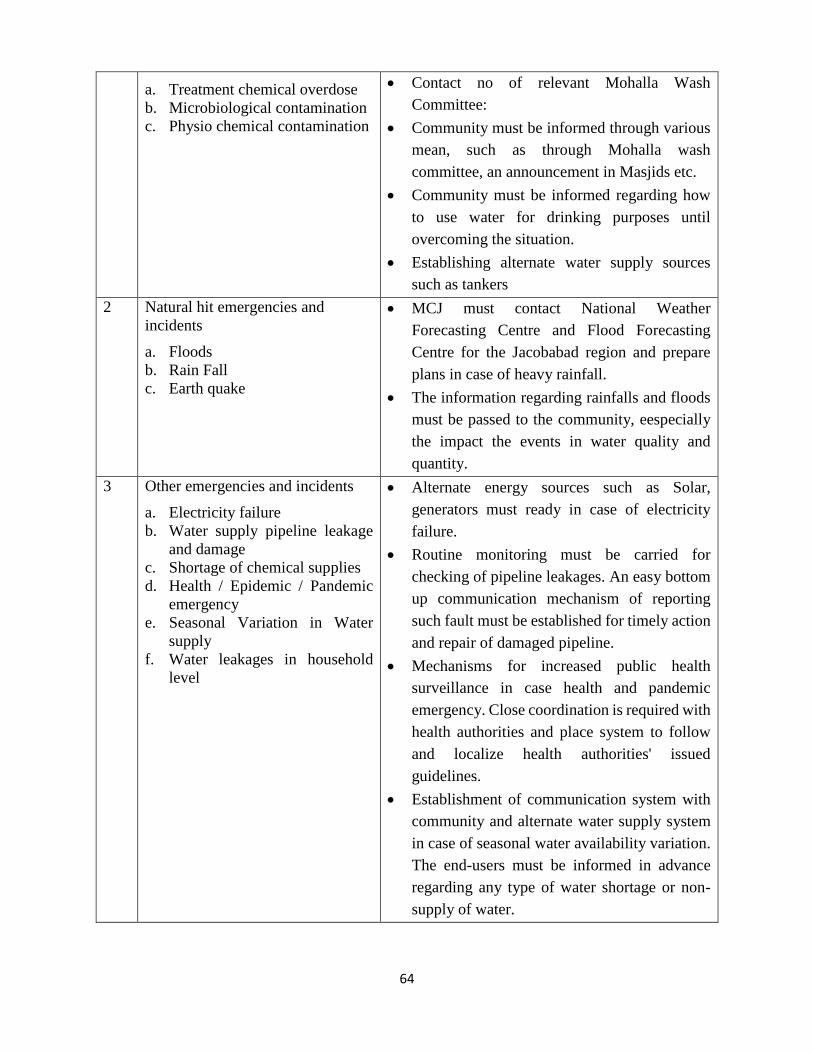
64
a. Treatment chemical overdose
b. Microbiological contamination
c. Physio chemical contamination
Contact no of relevant Mohalla Wash
Committee:
Community must be informed through various
mean, such as through Mohalla wash
committee, an announcement in Masjids etc.
Community must be informed regarding how
to use water for drinking purposes until
overcoming the situation.
Establishing alternate water supply sources
such as tankers
2 Natural hit emergencies and
incidents
a. Floods
b. Rain Fall
c. Earth quake
MCJ must contact National Weather
Forecasting Centre and Flood Forecasting
Centre for the Jacobabad region and prepare
plans in case of heavy rainfall.
The information regarding rainfalls and floods
must be passed to the community, eespecially
the impact the events in water quality and
quantity.
3 Other emergencies and incidents
a. Electricity failure
b. Water supply pipeline leakage
and damage
c. Shortage of chemical supplies
d. Health / Epidemic / Pandemic
emergency
e. Seasonal Variation in Water
supply
f. Water leakages in household
level
Alternate energy sources such as Solar,
generators must ready in case of electricity
failure.
Routine monitoring must be carried for
checking of pipeline leakages. An easy bottom
up communication mechanism of reporting
such fault must be established for timely action
and repair of damaged pipeline.
Mechanisms for increased public health
surveillance in case health and pandemic
emergency. Close coordination is required with
health authorities and place system to follow
and localize health authorities' issued
guidelines.
Establishment of communication system with
community and alternate water supply system
in case of seasonal water availability variation.
The end-users must be informed in advance
regarding any type of water shortage or non-
supply of water.

65
The MCJ must incorporate the philosophy of
every drop counts. To this, they establish the
system and encourage regular water fitting
inspection at HH level to avoid wastage of
water. The Mohalla Wash Committees can be
equipped to do the job of regular inspection of
HH fittings.
Apart from actions and plan, it is advised to practice these emergencies to the MCJ systems and
operations; further the practice will help MCJ identify the gaps and improve the system.
6.6 Water Availability Plans for Summers, Winter, and Canal Closure
Water availability in main canal varies with every season and it peaks during the months of May
to Sep and reduces the water flows in the remaining months. Further, as Jacobabad is a hot area
during summers and temperature reaches 48o C, the evaporation must be accounted for during
water storage. It is also famous that Jacobabad is a winter holiday city for nearby Baluchistan
areas, and the population increases in the winter season, so MCJ must account for this population
variation for water availability during the winter season.
6.7 Water Requirement by 2050
Based on the census report 2017, the Jacobabad city population was 191,076, residing in 33,195
housing units, which makes 5.76 average HH size. The population growth rate was 1.9%. Based
on the above figures, projections of water and water infrastructure requirement by 2050 were made
(Table 19).
Table 19: Estimated projection on water requirement and storage capacities based on
population.
Year Population No of
House
Units
Water
Requirement
(MGD)
Water Storage in No
of Days (based on
existing capacity of
250 MGD of
Lagoon 1 and 3 )
Water Storage in
No of Days (based
on existing capacity
of 360 MGD of
Lagoon 1, 2 and 3 )
2020 202,176 35,123 6.06 41 59
2025 222,126 38,589 6.66 38 54
2030 244,045 42,398 7.32 34 49
2035 268,128 46,581 8.04 31 45
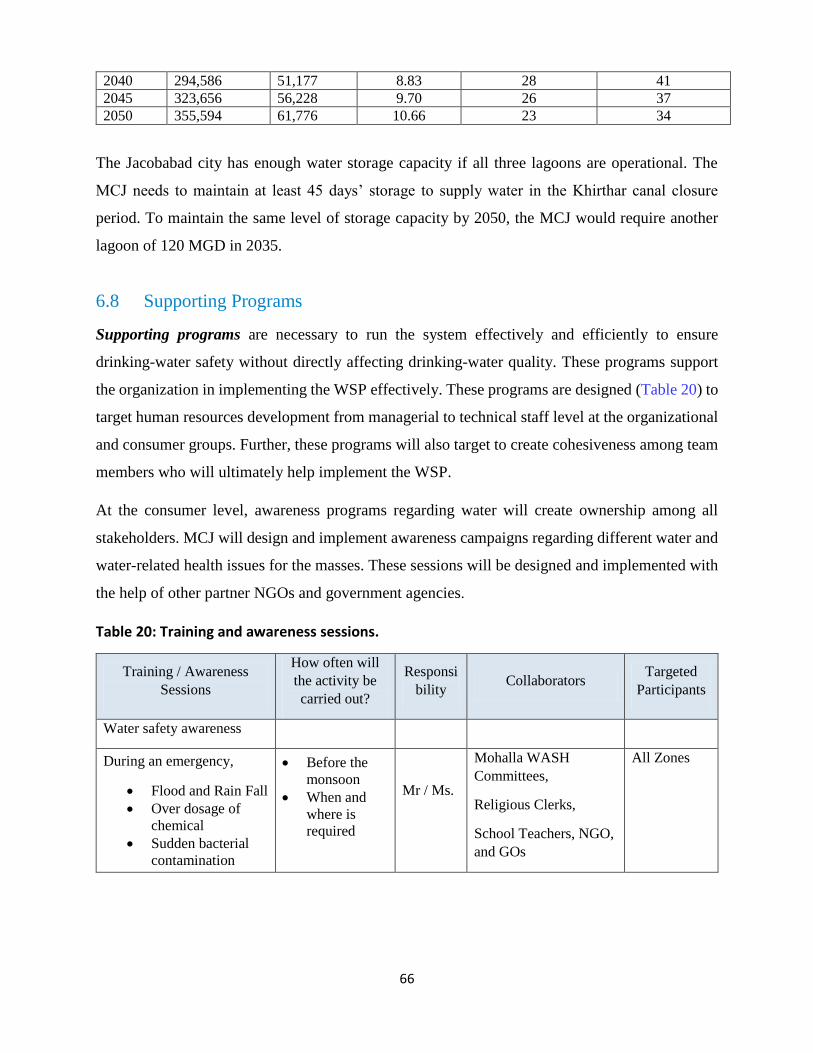
66
2040 294,586 51,177 8.83 28 41
2045 323,656 56,228 9.70 26 37
2050 355,594 61,776 10.66 23 34
The Jacobabad city has enough water storage capacity if all three lagoons are operational. The
MCJ needs to maintain at least 45 days’ storage to supply water in the Khirthar canal closure
period. To maintain the same level of storage capacity by 2050, the MCJ would require another
lagoon of 120 MGD in 2035.
6.8 Supporting Programs
Supporting programs are necessary to run the system effectively and efficiently to ensure
drinking-water safety without directly affecting drinking-water quality. These programs support
the organization in implementing the WSP effectively. These programs are designed (Table 20) to
target human resources development from managerial to technical staff level at the organizational
and consumer groups. Further, these programs will also target to create cohesiveness among team
members who will ultimately help implement the WSP.
At the consumer level, awareness programs regarding water will create ownership among all
stakeholders. MCJ will design and implement awareness campaigns regarding different water and
water-related health issues for the masses. These sessions will be designed and implemented with
the help of other partner NGOs and government agencies.
Table 20: Training and awareness sessions.
Training / Awareness
Sessions
How often will
the activity be
carried out?
Responsi
bility Collaborators
Targeted
Participants
Water safety awareness
During an emergency,
Flood and Rain Fall
Over dosage of
chemical
Sudden bacterial
contamination
Before the
monsoon
When and
where is
required
Mr / Ms.
Mohalla WASH
Committees,
Religious Clerks,
School Teachers, NGO,
and GOs
All Zones

67
During normal situation
Sessions on water
cleaning techniques
Water
Conservation
Techniques
Water and Health
6 session in a
year covering all
zones
Mr. / Ms.
NGOs and Mohalla
WASH Committees
All Zones
Household Pluming
Inspection Program 2 times in a year Mr. / Ms.
NGOs and Mohalla
WASH Committees
All Zones
Household sanitation and
hygiene
Household water treatment
and safe storage;
6 session in a
year covering all
zones
Mr. / Ms.
NGOs and Mohalla
WASH Committees and
Health Department
All Zones
Community sanitation and
clean-up campaigns; 2 times in a year Mr. / Ms.
NGOs and Mohalla
WASH Committees,
Youth and Community
All Zones
Plantation Drive Feb-March and
Aug-Sept Mr. / Ms.
NGOs and Mohalla
WASH Committees,
Youth and Community
All Zones
eespecially
public spaces
School education
programmes (Competition
drive among schools,
speeches contest etc.
2 times in a year Mr. / Ms.
Education Department,
NGOs and Mohalla
WASH Committee
All Govt and
Pvt School
children
Water treatment
operator/caretaker training
programmes;
Quarterly
Refreshers Mr. / Ms.
MCJ, NGOs, Health
department
All relevant
staff
members of
MCJ
Emergency drills (rain and
flooding events, water
contamination, water
shortages)
Quarterly Mr. / Ms.
MCJ, NGOs, Health
department and Mohalla
WASH Committee
6.9 Communication Strategy
Communication is known as the blood vessels in any organization. It is a significant component
of any successful initiative or project. Effective communication strategy includes all stakeholders,
partners, collaborators, relevant government organizations, and end-users. MCJ communication
strategy's main motto is “inclusion of all” and plans to achieve this target.

68
6.9.1 Communication plan
Following guideline in Table 21 and Table 22, MCJ can develop their communication plan for
essential activities helpful for WSP.
Table 21: Guideline for developing communication plan
Table 22: Guidelines for developing communication plan
Activity Target
Audience/
Stakeholder
Group
Aim Communication Tools Who to
Action?
By When? Costs?
Awareness
Session for water
savings
Community ,
Mohalla
WASH
Committee
(MWC),
Religious
groups
To raise
awareness
regarding
importance
of water
and its
saving
Meetings and general
workshops with community
and MWC, lecture series at
schools and colleges,
Communication material
display at various places,
using local media sources
MCJ, DC
office,
Local
Leadership,
NGOs
Twice in a
year
PKR
……
Activity Target
Audience/
Stakeholder
Group
Aim Communication
Tools
Who to
Action?
By When? Costs?
Activity /
Type of
activity
Identify the
Target Audience
by considering
the following:
Who will benefit
from the
initiative/project?
Who are the key
internal and
external
Stakeholders?
What do you
intend to
communicate
to the
stakeholder(s)
groups?
What are the
key points
stakeholder(s)
groups need
to understand
and act upon?
What
communication
methods/tools are
most appropriate
for the
stakeholder(s)
groups?
eg, electronic,
verbal, graphical,
written, etc
Who will be
responsible
for
implementing
each action?
When must
the action be
implemented?
What are
the costs
associated
with each
action?

69
The primary purpose of communication strategy will include the components such as
communication within the organization, outside of the organization, with local government, and
with end-users (regarding water saving, conservation etc.), consumer feedback, and so on.
6.9.2 Coordination between MCJ and Health Department
The coordination between water suppliers and health authorities is critical for supplying safe water.
MCJ and Health Department and private health practitioners must be on board to communicate
and coordinate in reporting status and illnesses occurring in the city. This coordination will work
as whistle-blowers, and prompt actions can be taken within time in case of any water-borne
diseases in the city or particular Mohalla or ward.
Health authorities in government hospitals are already collecting and compiling data at the district
level. Data on any kind of outbreak related to water borne disease be immidiatdly shared with MCJ
and specific and timely action must be ensured to avoid health implication of such desease. In
addition to the MCJ should also coordinate with private health practioners to create a database.
Further a health coordination team should be formed and activated for such data collection at MCJ
level.
Table 23: Health Data Sharing Format
Type of Patients Type Illness Potential Cause
No of Patients
Male (Adult)
Female (Adult)
Male (Kids)
Female (Kids)
6.10 Establishing Alternate Sources for Safe Drinking Water Supply
6.10.1 Groundwater
The current practices for drinking water involve jerry cans supplied through water vendors using
donkey carts. These vendors extract groundwater (Tanka) from surrounding areas having sweet
water zones nearby the city. Additionally, it is recommended to explore groundwater near the

70
Khirthar canal area to establish an alternate water source. Canal bank filtration may also be used
to extract seepage water, which will require just disinfection. In this matter, USPCAS-W has
already conducted a study in Jamshoro11. A similar study is proposed to utilise canal bank filtration
even for regular water extraction, which may decrease chemical consumption and water treatment
costs.
6.10.2 RO plants
In case of any emergency and disturbance in safe water supply, it is suggested to install at least
one RO plant in each Union Council as an alternate source for safe drinking water for the
community.
6.10.3 Safe drinking water supply through tankers
In case of any emergency and disturbance in safe water supply, it is suggested to have water tankers
supply in disturbed Mohallas or settlements.
6.11 Human Resources Management
MCJ will engage available human resources for the water supply system's best efficiency for
implementing the water safety plan. For water supply, MCJ will implement the suggested HR
structure in this WSP (Chapter 2)
6.12 Outsourcing the Water Supply
Outsourcing is one of the options for better service and sustainable operations and implementation
of WSP. It can be done by engaging one company or multiple companies like one in each zone to
create competition. Same companies can also be involved in drainage and waste collection. In this
case, the MCJ water supply unit will sell water to bulk buyers and monitor water supply and water
quality. And the MCJ drainage unit will be able to monitor the drainage system and waste
collection from the city.
11 https://water.muet.edu.pk/rbfza.pdf

71
6.13 WSP Steering Committee
The Steering Committee of the WSP will be formed to play the advisory role and steer the WSP
implementation. It will provide strategic leadership. The Committee will have the authority to
make decisions following the WSP scope and approach. The WSP Steering Committee will make
policy decisions, guide the WSP team (see in chapter 2) in the execution of WSP. Further, it will
ensure effective monitoring through regular reporting. The committee will set targets and ensure
compliance as per the WSP in Jacobabad. The committee will comprise of two types of
memberships a) position-based membership b) nomination-based membership. The recommended
composition of the steering committee and ToRs are as follows;
Composition of WSP Steering Committee
1. Deputy Commissioner (Convener of the Committee)
2. District Health Officer (Member)
3. District Nazim (Member)
4. Academia Representatives (2 members) (Nominee Members)
5. Business Community Representative (Nominee Member)
6. NGO Representative (Nominee Member)
7. Mohalla WASH Committee Representatives (2 Members) (Nominee Member)
8. CMO (Member/ Secretary)
TORs of the WSP Steering Committee
1. The committee will meet quarterly to review the progress and implementation status of the
WSP
2. The committee will discuss issues, provide guidelines and make suggestions to the WSP
Team to ensure successful WSP
3. The committee may constitute a sub-committee for a specific task to be accomplished as and
when necessary
4. Tenure of the nominated members will be three years.

72
ANNEXURES
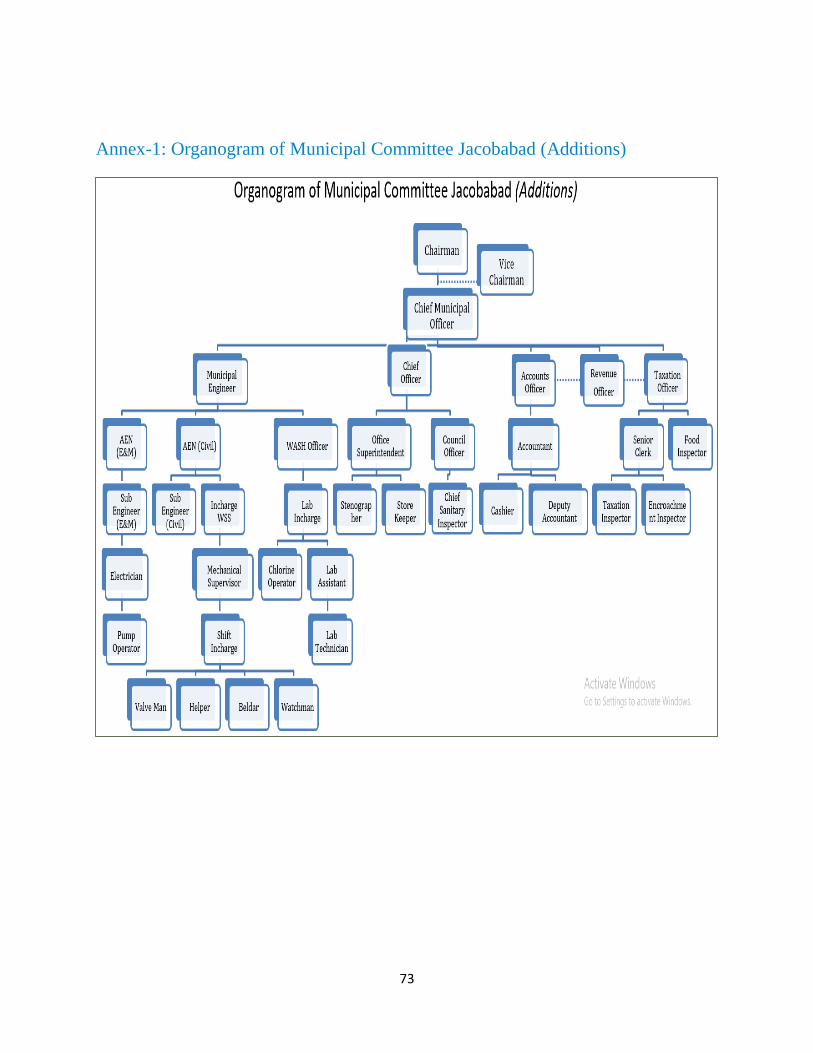
73
Annex-1: Organogram of Municipal Committee Jacobabad (Additions)

74
Annex-2: Zone Wise Distribution Networks
Annex-2A: Zone-1 Water Distribution network

75
Annex-2B: Zone-2 Water Distribution network

76
Annex-2C: Zone-3 Water Distribution network

77
Annex-2D: Zone-4 Water Distribution network
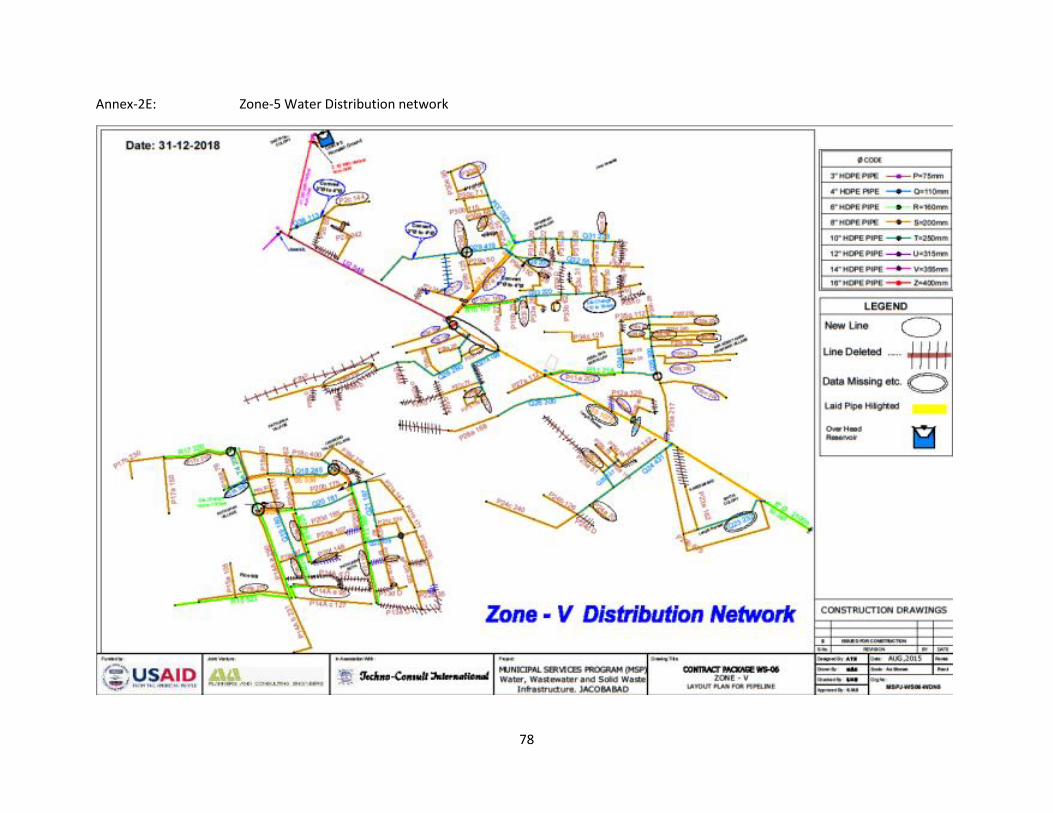
78
Annex-2E: Zone-5 Water Distribution network

79
Annex-2F: Zone-6 Water Distribution network
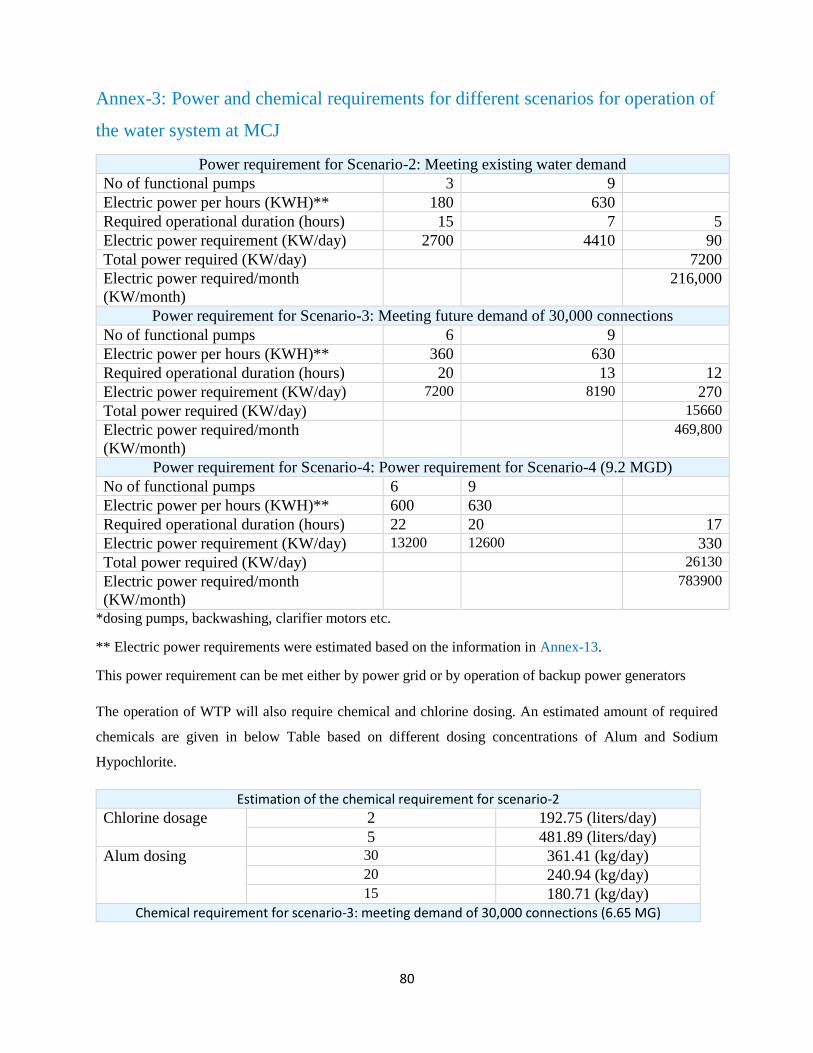
80
Annex-3: Power and chemical requirements for different scenarios for operation of
the water system at MCJ
Power requirement for Scenario-2: Meeting existing water demand
No of functional pumps 3 9
Electric power per hours (KWH)** 180 630
Required operational duration (hours) 15 7 5
Electric power requirement (KW/day) 2700 4410 90
Total power required (KW/day) 7200
Electric power required/month
(KW/month)
216,000
Power requirement for Scenario-3: Meeting future demand of 30,000 connections
No of functional pumps 6 9
Electric power per hours (KWH)** 360 630
Required operational duration (hours) 20 13 12
Electric power requirement (KW/day) 7200 8190 270
Total power required (KW/day) 15660
Electric power required/month
(KW/month)
469,800
Power requirement for Scenario-4: Power requirement for Scenario-4 (9.2 MGD)
No of functional pumps 6 9
Electric power per hours (KWH)** 600 630
Required operational duration (hours) 22 20 17
Electric power requirement (KW/day) 13200 12600 330
Total power required (KW/day) 26130
Electric power required/month
(KW/month)
783900
*dosing pumps, backwashing, clarifier motors etc.
** Electric power requirements were estimated based on the information in Annex-13.
This power requirement can be met either by power grid or by operation of backup power generators
The operation of WTP will also require chemical and chlorine dosing. An estimated amount of required
chemicals are given in below Table based on different dosing concentrations of Alum and Sodium
Hypochlorite.
Estimation of the chemical requirement for scenario-2
Chlorine dosage 2 192.75 (liters/day)
5 481.89 (liters/day)
Alum dosing 30 361.41 (kg/day) 20 240.94 (kg/day) 15 180.71 (kg/day)
Chemical requirement for scenario-3: meeting demand of 30,000 connections (6.65 MG)

81
Chlorine dosage 2 483.70
5 1209.26
Alum dosing
Chlorine dosage
30 906.94
2 483.70
5 1209.26

82
Annex-4: PQSCA Standards for Drinking Water Quality
4639-2004(R)

83
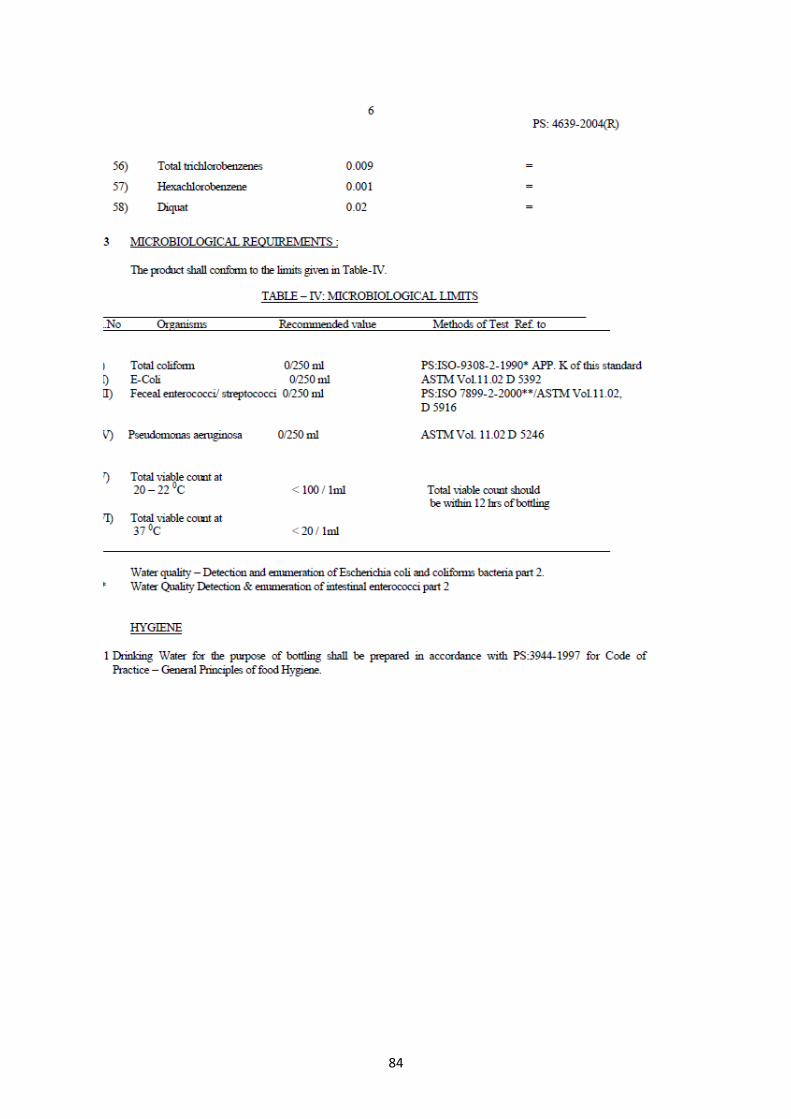
84