Water quality index and pollution loading capacity of Setu ...
7
* Corresponding author: [email protected] Water quality index and pollution loading capacity of Setu Babakan, Jakarta-Indonesia Arina Khofiyanida and Margaretha Widyastuti * Department of Environmental Geography, Faculty of Geography, Universitas Gadjah Mada, 55281 Yogyakarta Special Region Indonesia Abstract. Setu Babakan in the City of Jakarta Selatan contributes economically as a water tourist attraction. With its location in an urban area, growing human activities in its surroundings pose threats of contamination and reduction to its water quality. This research set out to analyze the water quality based on the Class II water quality standard issued in the Governmental Regulation No. 82 of 2001, determine the water quality index, and assess the pollution loading capacity of Setu Babakan. It drew on primary data collected by sampling water at four points in the inlet, middle, and outlet. The parameters observed were temperature, TDS, TSS, pH, nitrate, phosphate, detergent, BOD, and COD, using the CCME method to determine the water quality index and the Regulation of the Minister of Environment No. 28 of 2009 to examine the pollutant loading capacity. The results showed that (1) the pH, TSS, BOD, COD, phosphate, and detergents levels had exceeded the water quality standards, (2) the water quality index of Setu Babakan was categorized as marginal to fair, and (3) this body of water could no longer carry pollutant loads that contributed to TSS, BOD, and COD accumulation. 1 Introduction Water, a crucial part of natural resources to sustain the life of all living organisms, requires carefully planned concerted efforts to preserve and maintain its quality and quantity so that they can make good use of it [1, 2]. Water quality assessment is, therefore, necessary in finding out whether or not a body of water can fulfill human needs, starting from drinking to other varying purposes, such as aquaculture, industry, and animal husbandry. For humans and other living beings, water can be straightforwardly extractable from surface water, including natural and artificial reservoirs locally called situ. Situ is the term used by the people of Jawa Barat to refer to a body of water that resembles a small lake [3]. Setu Babakan is situated in an urban area, precisely at Serengseng Sawah Subdistrict, Jagakarsa District, the City of Jakarta Selatan. Urban areas are known for their high population density, which may bring about pollution issues [4]. For instance, the majority of urban populations have unfortunately developed a behavior of discarding their refuses directly to the river, and there is a growing number in industrial estates that dispose of improperly treated wastes into the environment, introducing pollutants to waters [5]. Since contaminants can affect the overall quality of waters, human activities are often associated with the reduced usability of several bodies of water [6]. As for Setu Babakan, pollution threats are attributable to its location, which is in the center of a settlement area. Activities taking place in the surrounding households generate domestic waste that potentially affects its water quality. The development of residential buildings is responsible for high accumulations of pollutant loads and has, therefore, led to decreased capacities to self-purify [7]. Besides, ongoing aquaculture activities at this reservoir can be detrimental to water quality parameters as they alter the physical, chemical, and biological properties of the water. Uneaten fish food is likely to accumulate at the bottom of the lake and decompose with the help of microorganisms, producing toxic substances like ammonia, nitrite, and sulfur [8]. Pollution occurs if the observed parameters are above their respective threshold or outside the predetermined range published in relevant documents or legal products. At this state, the pollutant loading capacity has been exceeded, or the water quality status has turned into contaminated. Setu Babakan is a water feature with an economic function, that is, as a water tourist attraction. However, substantial amounts of human activities around it potentially introduce contaminants into its water, modifying the quality and causing pollution. For these reasons, studies on its latest water quality and pollutant loading capacity become necessary so as to suppress the detrimental effects of physical development and maintain its function as a clean freshwater resource. Accordingly, this research attempted to (a) analyze the water quality based on the Class II water quality standard [9], (b) determine the water quality index, and (c) assess the pollutant loading capacity of Setu Babakan. © The Authors, published by EDP Sciences. This is an open access article distributed under the terms of the Creative Commons Attribution License 4.0 (http://creativecommons.org/licenses/by/4.0/). E3S Web of Conferences 200, 02028 (2020) https://doi.org/10.1051/e3sconf/202020002028 ICST 2020
-
Upload
khangminh22 -
Category
Documents
-
view
1 -
download
0
Transcript of Water quality index and pollution loading capacity of Setu ...
* Corresponding author: [email protected]
Water quality index and pollution loading capacity of Setu Babakan, Jakarta-Indonesia
Arina Khofiyanida and Margaretha Widyastuti*
Department of Environmental Geography, Faculty of Geography, Universitas Gadjah Mada, 55281 Yogyakarta Special Region Indonesia
Abstract. Setu Babakan in the City of Jakarta Selatan contributes economically as a water tourist attraction. With its location in an urban area, growing human activities in its surroundings pose threats of contamination
and reduction to its water quality. This research set out to analyze the water quality based on the Class II water quality standard issued in the Governmental Regulation No. 82 of 2001, determine the water quality index, and assess the pollution loading capacity of Setu Babakan. It drew on primary data collected by sampling water at four points in the inlet, middle, and outlet. The parameters observed were temperature, TDS, TSS, pH, nitrate, phosphate, detergent, BOD, and COD, using the CCME method to determine the water quality index and the Regulation of the Minister of Environment No. 28 of 2009 to examine the pollutant loading capacity. The results showed that (1) the pH, TSS, BOD, COD, phosphate, and detergents levels had exceeded the water quality standards, (2) the water quality index of Setu Babakan was categorized as marginal to fair, and (3) this body of water could no longer carry pollutant loads that contributed to TSS,
BOD, and COD accumulation.
1 Introduction
Water, a crucial part of natural resources to sustain the life of all living organisms, requires carefully planned
concerted efforts to preserve and maintain its quality and
quantity so that they can make good use of it [1, 2]. Water
quality assessment is, therefore, necessary in finding out
whether or not a body of water can fulfill human needs,
starting from drinking to other varying purposes, such as
aquaculture, industry, and animal husbandry. For humans
and other living beings, water can be straightforwardly
extractable from surface water, including natural and
artificial reservoirs locally called situ. Situ is the term used
by the people of Jawa Barat to refer to a body of water that resembles a small lake [3].
Setu Babakan is situated in an urban area, precisely at
Serengseng Sawah Subdistrict, Jagakarsa District, the
City of Jakarta Selatan. Urban areas are known for their
high population density, which may bring about pollution
issues [4]. For instance, the majority of urban populations
have unfortunately developed a behavior of discarding
their refuses directly to the river, and there is a growing
number in industrial estates that dispose of improperly
treated wastes into the environment, introducing
pollutants to waters [5]. Since contaminants can affect the overall quality of waters, human activities are often
associated with the reduced usability of several bodies of
water [6]. As for Setu Babakan, pollution threats are
attributable to its location, which is in the center of a
settlement area. Activities taking place in the surrounding
households generate domestic waste that potentially
affects its water quality. The development of residential buildings is responsible for high accumulations of
pollutant loads and has, therefore, led to decreased
capacities to self-purify [7]. Besides, ongoing aquaculture
activities at this reservoir can be detrimental to water
quality parameters as they alter the physical, chemical,
and biological properties of the water. Uneaten fish food
is likely to accumulate at the bottom of the lake and
decompose with the help of microorganisms, producing
toxic substances like ammonia, nitrite, and sulfur [8].
Pollution occurs if the observed parameters are above
their respective threshold or outside the predetermined range published in relevant documents or legal products.
At this state, the pollutant loading capacity has been
exceeded, or the water quality status has turned into
contaminated.
Setu Babakan is a water feature with an economic
function, that is, as a water tourist attraction. However,
substantial amounts of human activities around it
potentially introduce contaminants into its water,
modifying the quality and causing pollution. For these
reasons, studies on its latest water quality and pollutant
loading capacity become necessary so as to suppress the detrimental effects of physical development and maintain
its function as a clean freshwater resource. Accordingly,
this research attempted to (a) analyze the water quality
based on the Class II water quality standard [9], (b)
determine the water quality index, and (c) assess the
pollutant loading capacity of Setu Babakan.
© The Authors, published by EDP Sciences. This is an open access article distributed under the terms of the Creative Commons Attribution License 4.0
(http://creativecommons.org/licenses/by/4.0/).
E3S Web of Conferences 200, 02028 (2020) https://doi.org/10.1051/e3sconf/202020002028ICST 2020
2 Methods
This research employed a survey method, that is, a data
collection technique involving measurements in the field.
Research variables, data acquisition methods, and data
analyses are explained as follows.
The water quality data of Setu Babakan were
measured directly in the field and further tested in the
laboratory for these parameters: temperature, Total Dissolved Solid (TDS), Total Suspended Solid (TSS), pH,
Biochemical Oxygen Demand (BOD), Chemical Oxygen
Demand (COD), nitrate (NO3), phosphate (PO4), and
detergents, with the Class II water quality standard as a
reference for comparison [9]. This study, however, did not
observe Dissolved Oxygen (DO) due to limitations in
tools and instruments. The reservoir water was collected
from around 08.00 until 11.00 am WIB (Western
Indonesian Time) at four points determined with
purposive sampling technique (namely: Inlet 1, Inlet 2,
middle, and outlet of Setu Babakan) by following the
guidelines proposed in [10], i.e., starting from the bottom
to the water surface and the results are in composites. Due
to a lack of permits from the site manager, the researchers
were only able to collect one sample from the middle.
Given that the CCME (Canadian Council Minister of the
Environment) method requires a time-series data, the
water sampling was carried out at four different times,
namely August, October, and December 2019 and
February 2020.
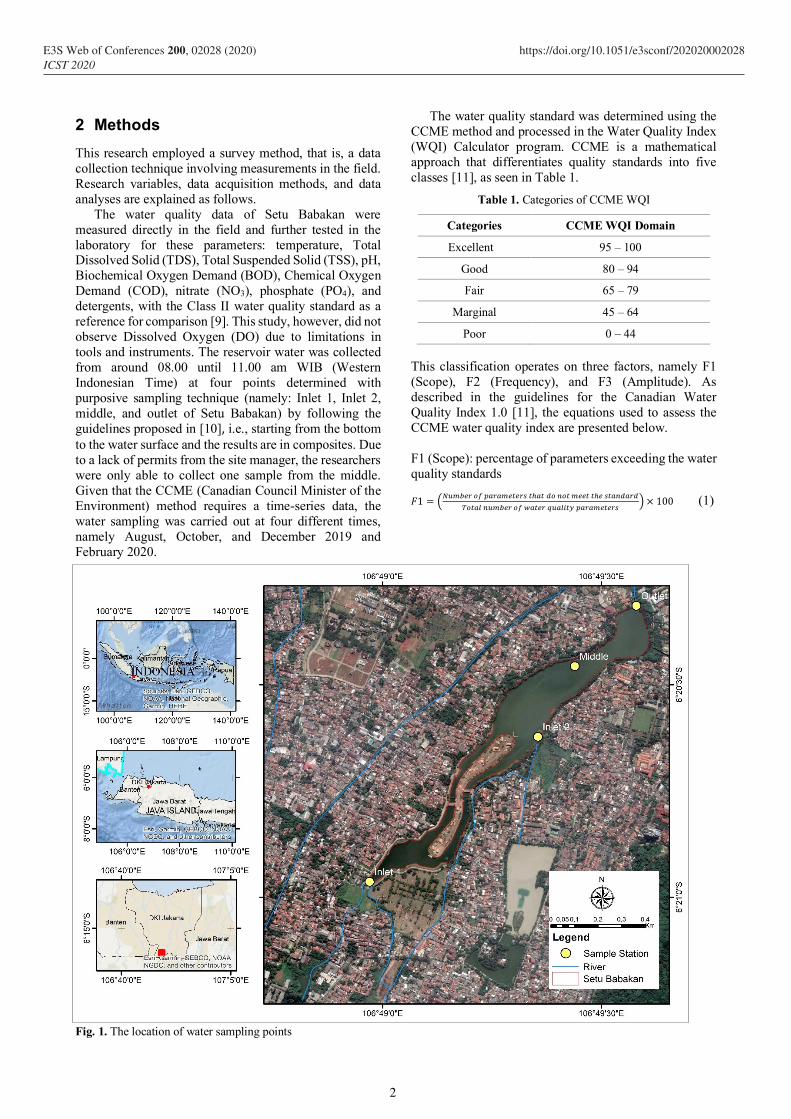
Fig. 1. The location of water sampling points
The water quality standard was determined using the
CCME method and processed in the Water Quality Index
(WQI) Calculator program. CCME is a mathematical
approach that differentiates quality standards into five
classes [11], as seen in Table 1.
Table 1. Categories of CCME WQI
Categories CCME WQI Domain
Excellent 95 – 100
Good 80 – 94
Fair 65 – 79
Marginal 45 – 64
Poor 0 – 44
This classification operates on three factors, namely F1
(Scope), F2 (Frequency), and F3 (Amplitude). As
described in the guidelines for the Canadian Water
Quality Index 1.0 [11], the equations used to assess the
CCME water quality index are presented below.
F1 (Scope): percentage of parameters exceeding the water
quality standards
𝐹1 = (𝑁𝑢𝑚𝑏𝑒𝑟 𝑜𝑓 𝑝𝑎𝑟𝑎𝑚𝑒𝑡𝑒𝑟𝑠 𝑡ℎ𝑎𝑡 𝑑𝑜 𝑛𝑜𝑡 𝑚𝑒𝑒𝑡 𝑡ℎ𝑒 𝑠𝑡𝑎𝑛𝑑𝑎𝑟𝑑
𝑇𝑜𝑡𝑎𝑙 𝑛𝑢𝑚𝑏𝑒𝑟 𝑜𝑓 𝑤𝑎𝑡𝑒𝑟 𝑞𝑢𝑎𝑙𝑖𝑡𝑦 𝑝𝑎𝑟𝑎𝑚𝑒𝑡𝑒𝑟𝑠) × 100 (1)
2
E3S Web of Conferences 200, 02028 (2020) https://doi.org/10.1051/e3sconf/202020002028ICST 2020
F2 (Frequency): percentage of test results (in every
parameter) that do not meet or have exceeded the water
quality standards
𝐹2 = (𝑁𝑢𝑚𝑏𝑒𝑟 𝑜𝑓 𝑡𝑒𝑠𝑡 𝑟𝑒𝑠𝑢𝑙𝑡𝑠 𝑡ℎ𝑎𝑡 𝑑𝑜 𝑛𝑜𝑡 𝑚𝑒𝑒𝑡 𝑡ℎ𝑒 𝑠𝑡𝑎𝑛𝑑𝑎𝑟𝑑
𝑇𝑜𝑡𝑎𝑙 𝑛𝑢𝑚𝑏𝑒𝑟 𝑜𝑓 𝑑𝑎𝑡𝑎 𝑡𝑒𝑠𝑡𝑖𝑛𝑔 𝑜𝑟 𝑐𝑜𝑙𝑙𝑒𝑐𝑡𝑖𝑜𝑛) × 100 (2)
F3 (Amplitude): the number of values that do not meet or
have exceeded the water quality standards (in percent)
a. Excursion value (Ei) calculation
For data with values exceeding the upper threshold,
the excursion value was computed using the
equation below:
𝐸𝑥𝑐𝑢𝑟𝑠𝑖𝑜𝑛 =
𝑇𝑒𝑠𝑡 𝑟𝑒𝑠𝑢𝑙𝑡𝑠 𝑡ℎ𝑎𝑡 𝑑𝑜 𝑛𝑜𝑡 𝑚𝑒𝑒𝑡 𝑡ℎ𝑒 𝑠𝑡𝑎𝑛𝑑𝑎𝑟𝑑
𝑄𝑢𝑎𝑙𝑖𝑡𝑦 𝑠𝑡𝑎𝑛𝑑𝑎𝑟𝑑− 1 (3)
Meanwhile, for data with values below the lower
threshold, the equation below was applied:
𝐸𝑥𝑐𝑢𝑟𝑠𝑖𝑜𝑛 = 𝑄𝑢𝑎𝑙𝑖𝑡𝑦 𝑠𝑡𝑎𝑛𝑑𝑎𝑟𝑑
𝑇𝑒𝑠𝑡 𝑟𝑒𝑠𝑢𝑙𝑡𝑠 𝑡ℎ𝑎𝑡 𝑑𝑜 𝑛𝑜𝑡 𝑚𝑒𝑒𝑡 𝑡ℎ𝑒 𝑠𝑡𝑎𝑛𝑑𝑎𝑟𝑑− 1 (4)
b. The Normalized Sum of Excursions (NSE)
𝑁𝑆𝐸 = ∑(𝐸𝑥𝑐𝑢𝑟𝑠𝑖𝑜𝑛)
𝑇𝑜𝑡𝑎𝑙 𝑛𝑢𝑚𝑏𝑒𝑟 𝑜𝑓 𝑡𝑒𝑠𝑡𝑖𝑛𝑔 (5)
𝐹3 = (𝑁𝑆𝐸
0,01 𝑁𝑆𝐸+0,01) (6)
WQI (the CCME method) =
100 − √𝐹12+𝐹22+𝐹32
1,732 (7)
The pollutant loading capacity of Setu Babakan was
computed using a mathematical formula proposed in [12].
It drew on water quality data, i.e., BOD, COD, and TSS,
lake morphometry characteristics, and outlet discharge
records. The lake morphometry characteristics included
average depth, lake surface area, and water volume. The
water volume of the lake was extracted from the
bathymetric map and calculated using the equation
proposed in [13] that assumes the cross-section of the lake
to resemble a cone. As for the discharge at the outlet, it
was measured by the buoy method. The pollutant loading
capacity calculation was divided into three stages, as described below.
a. Lake Morphological and Hydrological
Characteristics
𝑍 = 100 ×𝑉
𝐴 (8)
𝜌 =𝑄0
𝑉 (9)
where:
Z = Average depth of the lake (m)
V = Water volume (in millions m3) A = Water surface area (ha)
ρ = Water flushing rate (1/year)
Q0 = Lake outflow discharge (in millions
m3/year) during dry years
b. Pollutant Load Allocations (Pa)
[𝑃𝑎]𝑆𝑇𝐷 = [𝑃𝑎]𝑖 + [𝑃𝑎]𝐷𝐴𝑆 + [𝑃𝑎]𝑑 (10)
where:
[Pa]STD = Maximum level of Pa, as required by
the water quality standard (mg m–3)
[Pa]I = Level of Pa, as measured during lake
observation (mg m–3)
[Pa]DAS = Pa from the catchment (mg m–3)
[Pa]d = Pa from the wastes generated by
activities around the lake (mg m–3)
c. Pa Loading Capacity of the Lake Water
𝑅 =1
(1+0,747𝜌0,507) (12)
𝐿 =[𝑃𝑎]𝑑𝑍𝜌
1−𝑅 (13)
𝐿𝑎 = 𝐿 ×𝐴
100 (14)
where:
R = Internal Pa from lake sediments
L = Pa of waste loading capacity per unit of lake area (mg/Pa/m2year)
La = Total Pa of the waste loading capacity of the
lake waters (Kg Pa/year)
3 Results and discussion
3.1 Water quality
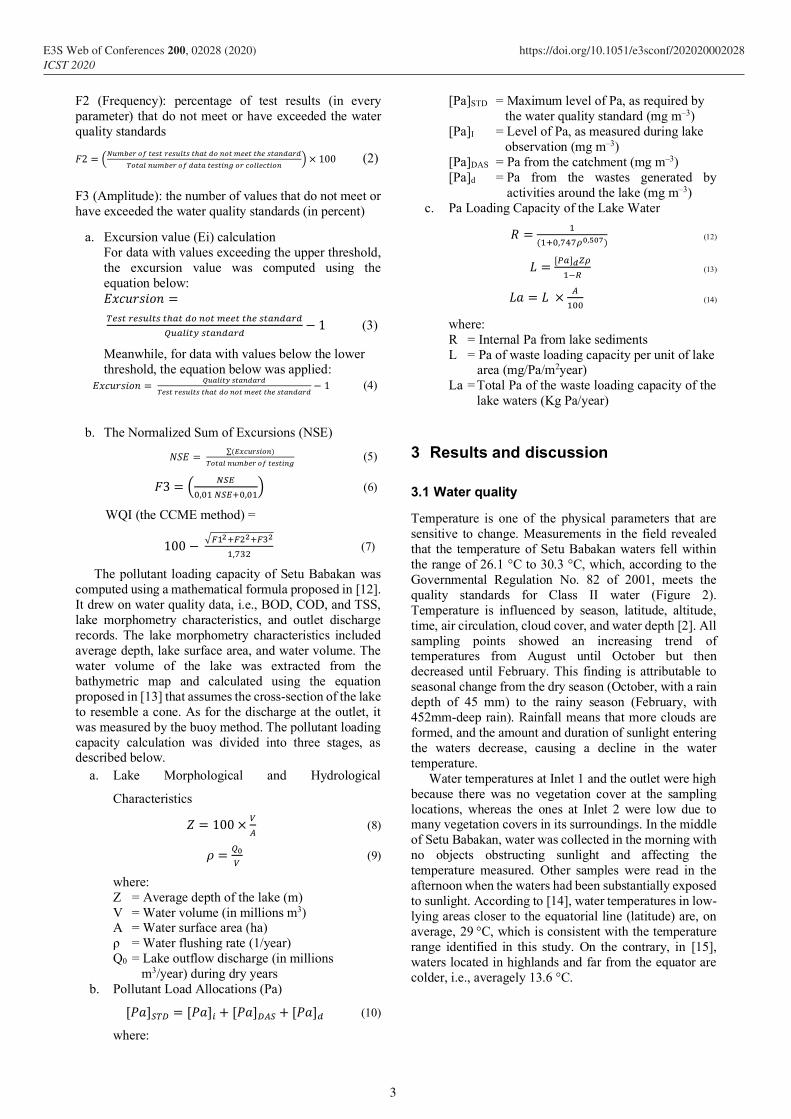
Temperature is one of the physical parameters that are
sensitive to change. Measurements in the field revealed
that the temperature of Setu Babakan waters fell within
the range of 26.1 °C to 30.3 °C, which, according to the
Governmental Regulation No. 82 of 2001, meets the
quality standards for Class II water (Figure 2).
Temperature is influenced by season, latitude, altitude,
time, air circulation, cloud cover, and water depth [2]. All
sampling points showed an increasing trend of temperatures from August until October but then
decreased until February. This finding is attributable to
seasonal change from the dry season (October, with a rain
depth of 45 mm) to the rainy season (February, with
452mm-deep rain). Rainfall means that more clouds are
formed, and the amount and duration of sunlight entering
the waters decrease, causing a decline in the water
temperature.
Water temperatures at Inlet 1 and the outlet were high
because there was no vegetation cover at the sampling
locations, whereas the ones at Inlet 2 were low due to many vegetation covers in its surroundings. In the middle
of Setu Babakan, water was collected in the morning with
no objects obstructing sunlight and affecting the
temperature measured. Other samples were read in the
afternoon when the waters had been substantially exposed
to sunlight. According to [14], water temperatures in low-
lying areas closer to the equatorial line (latitude) are, on
average, 29 °C, which is consistent with the temperature
range identified in this study. On the contrary, in [15],
waters located in highlands and far from the equator are
colder, i.e., averagely 13.6 °C.
3
E3S Web of Conferences 200, 02028 (2020) https://doi.org/10.1051/e3sconf/202020002028ICST 2020
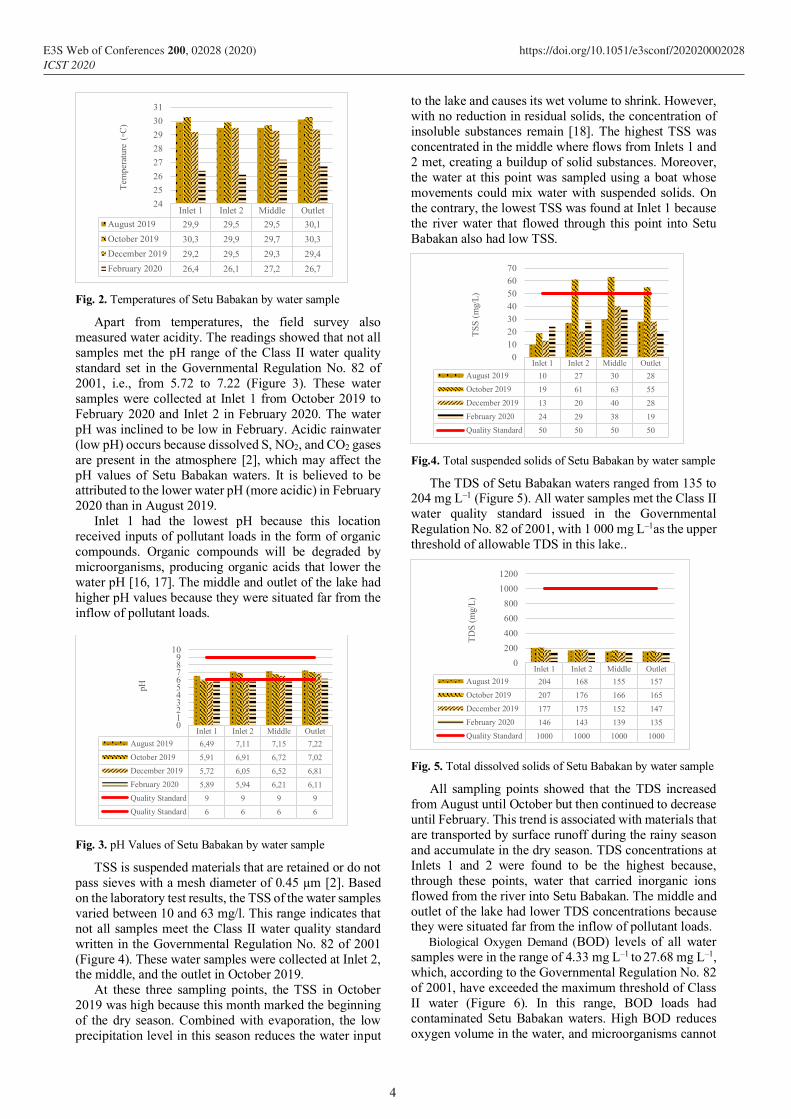
Fig. 2. Temperatures of Setu Babakan by water sample
Apart from temperatures, the field survey also
measured water acidity. The readings showed that not all
samples met the pH range of the Class II water quality
standard set in the Governmental Regulation No. 82 of
2001, i.e., from 5.72 to 7.22 (Figure 3). These water
samples were collected at Inlet 1 from October 2019 to
February 2020 and Inlet 2 in February 2020. The water
pH was inclined to be low in February. Acidic rainwater
(low pH) occurs because dissolved S, NO2, and CO2 gases
are present in the atmosphere [2], which may affect the
pH values of Setu Babakan waters. It is believed to be attributed to the lower water pH (more acidic) in February
2020 than in August 2019.
Inlet 1 had the lowest pH because this location
received inputs of pollutant loads in the form of organic
compounds. Organic compounds will be degraded by
microorganisms, producing organic acids that lower the
water pH [16, 17]. The middle and outlet of the lake had
higher pH values because they were situated far from the
inflow of pollutant loads.
Fig. 3. pH Values of Setu Babakan by water sample
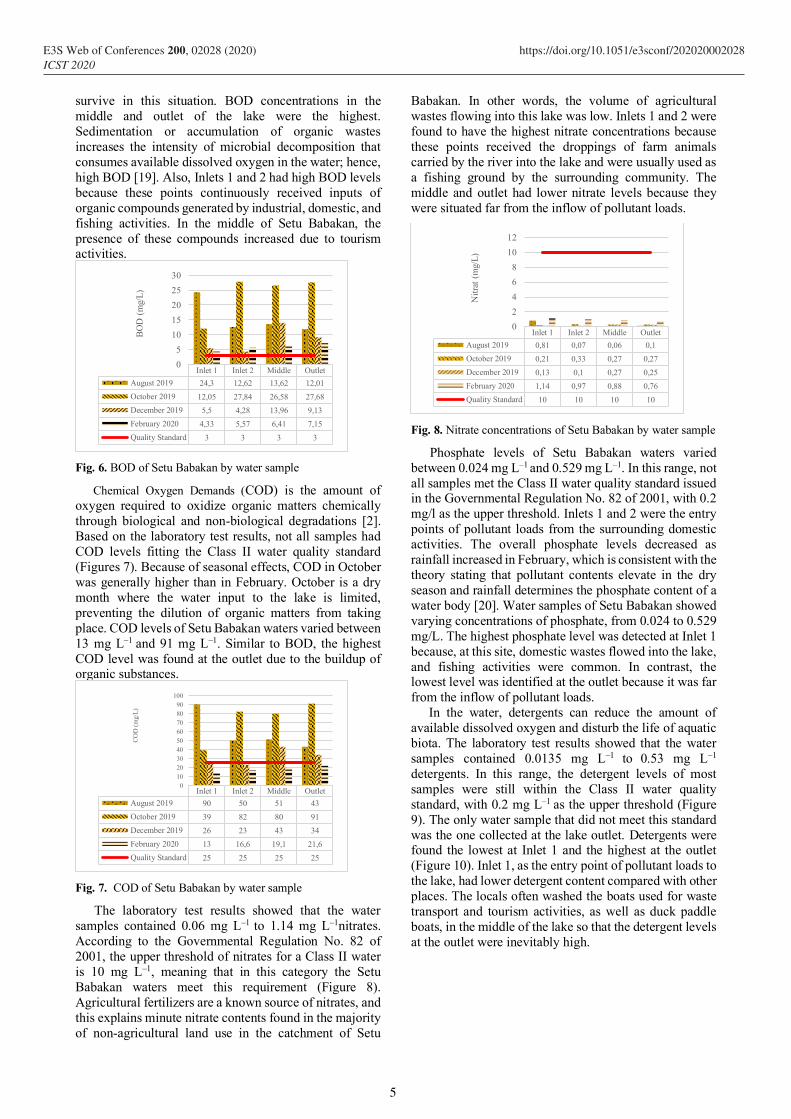
TSS is suspended materials that are retained or do not
pass sieves with a mesh diameter of 0.45 µm [2]. Based
on the laboratory test results, the TSS of the water samples
varied between 10 and 63 mg/l. This range indicates that
not all samples meet the Class II water quality standard
written in the Governmental Regulation No. 82 of 2001
(Figure 4). These water samples were collected at Inlet 2, the middle, and the outlet in October 2019.
At these three sampling points, the TSS in October
2019 was high because this month marked the beginning
of the dry season. Combined with evaporation, the low
precipitation level in this season reduces the water input
to the lake and causes its wet volume to shrink. However,
with no reduction in residual solids, the concentration of
insoluble substances remain [18]. The highest TSS was
concentrated in the middle where flows from Inlets 1 and
2 met, creating a buildup of solid substances. Moreover,
the water at this point was sampled using a boat whose
movements could mix water with suspended solids. On
the contrary, the lowest TSS was found at Inlet 1 because
the river water that flowed through this point into Setu
Babakan also had low TSS.
Fig.4. Total suspended solids of Setu Babakan by water sample
The TDS of Setu Babakan waters ranged from 135 to 204 mg L–1 (Figure 5). All water samples met the Class II
water quality standard issued in the Governmental
Regulation No. 82 of 2001, with 1 000 mg L–1as the upper
threshold of allowable TDS in this lake..
Fig. 5. Total dissolved solids of Setu Babakan by water sample
All sampling points showed that the TDS increased
from August until October but then continued to decrease
until February. This trend is associated with materials that
are transported by surface runoff during the rainy season
and accumulate in the dry season. TDS concentrations at
Inlets 1 and 2 were found to be the highest because,
through these points, water that carried inorganic ions
flowed from the river into Setu Babakan. The middle and
outlet of the lake had lower TDS concentrations because they were situated far from the inflow of pollutant loads.
Biological Oxygen Demand (BOD) levels of all water
samples were in the range of 4.33 mg L–1 to 27.68 mg L–1,
which, according to the Governmental Regulation No. 82
of 2001, have exceeded the maximum threshold of Class
II water (Figure 6). In this range, BOD loads had
contaminated Setu Babakan waters. High BOD reduces
oxygen volume in the water, and microorganisms cannot
Inlet 1 Inlet 2 Middle Outlet
August 2019 29,9 29,5 29,5 30,1
October 2019 30,3 29,9 29,7 30,3
December 2019 29,2 29,5 29,3 29,4
February 2020 26,4 26,1 27,2 26,7
24
25
26
27
28
29
30
31
Tem
per
ature
(◦C
)
Inlet 1 Inlet 2 Middle Outlet
August 2019 6,49 7,11 7,15 7,22
October 2019 5,91 6,91 6,72 7,02
December 2019 5,72 6,05 6,52 6,81
February 2020 5,89 5,94 6,21 6,11
Quality Standard 9 9 9 9
Quality Standard 6 6 6 6
0123456789
10
pH
Inlet 1 Inlet 2 Middle Outlet
August 2019 10 27 30 28
October 2019 19 61 63 55
December 2019 13 20 40 28
February 2020 24 29 38 19
Quality Standard 50 50 50 50
0
10
20
30
40
50
60
70
TS
S (
mg/
L)
Inlet 1 Inlet 2 Middle Outlet
August 2019 204 168 155 157
October 2019 207 176 166 165
December 2019 177 175 152 147
February 2020 146 143 139 135
Quality Standard 1000 1000 1000 1000
0
200
400
600
800
1000
1200
TD
S (
mg/
L)
4
E3S Web of Conferences 200, 02028 (2020) https://doi.org/10.1051/e3sconf/202020002028ICST 2020
survive in this situation. BOD concentrations in the
middle and outlet of the lake were the highest.
Sedimentation or accumulation of organic wastes
increases the intensity of microbial decomposition that
consumes available dissolved oxygen in the water; hence,
high BOD [19]. Also, Inlets 1 and 2 had high BOD levels
because these points continuously received inputs of
organic compounds generated by industrial, domestic, and
fishing activities. In the middle of Setu Babakan, the
presence of these compounds increased due to tourism activities.
Fig. 6. BOD of Setu Babakan by water sample
Chemical Oxygen Demands (COD) is the amount of
oxygen required to oxidize organic matters chemically
through biological and non-biological degradations [2].
Based on the laboratory test results, not all samples had
COD levels fitting the Class II water quality standard
(Figures 7). Because of seasonal effects, COD in October
was generally higher than in February. October is a dry
month where the water input to the lake is limited,
preventing the dilution of organic matters from taking
place. COD levels of Setu Babakan waters varied between
13 mg L–1 and 91 mg L–1. Similar to BOD, the highest
COD level was found at the outlet due to the buildup of organic substances.
Fig. 7. COD of Setu Babakan by water sample
The laboratory test results showed that the water
samples contained 0.06 mg L–1 to 1.14 mg L–1nitrates.
According to the Governmental Regulation No. 82 of
2001, the upper threshold of nitrates for a Class II water
is 10 mg L–1, meaning that in this category the Setu
Babakan waters meet this requirement (Figure 8).
Agricultural fertilizers are a known source of nitrates, and
this explains minute nitrate contents found in the majority
of non-agricultural land use in the catchment of Setu
Babakan. In other words, the volume of agricultural
wastes flowing into this lake was low. Inlets 1 and 2 were
found to have the highest nitrate concentrations because
these points received the droppings of farm animals
carried by the river into the lake and were usually used as
a fishing ground by the surrounding community. The
middle and outlet had lower nitrate levels because they
were situated far from the inflow of pollutant loads.
Fig. 8. Nitrate concentrations of Setu Babakan by water sample
Phosphate levels of Setu Babakan waters varied
between 0.024 mg L–1 and 0.529 mg L–1. In this range, not
all samples met the Class II water quality standard issued in the Governmental Regulation No. 82 of 2001, with 0.2
mg/l as the upper threshold. Inlets 1 and 2 were the entry
points of pollutant loads from the surrounding domestic
activities. The overall phosphate levels decreased as
rainfall increased in February, which is consistent with the
theory stating that pollutant contents elevate in the dry
season and rainfall determines the phosphate content of a
water body [20]. Water samples of Setu Babakan showed
varying concentrations of phosphate, from 0.024 to 0.529
mg/L. The highest phosphate level was detected at Inlet 1
because, at this site, domestic wastes flowed into the lake,
and fishing activities were common. In contrast, the lowest level was identified at the outlet because it was far
from the inflow of pollutant loads.
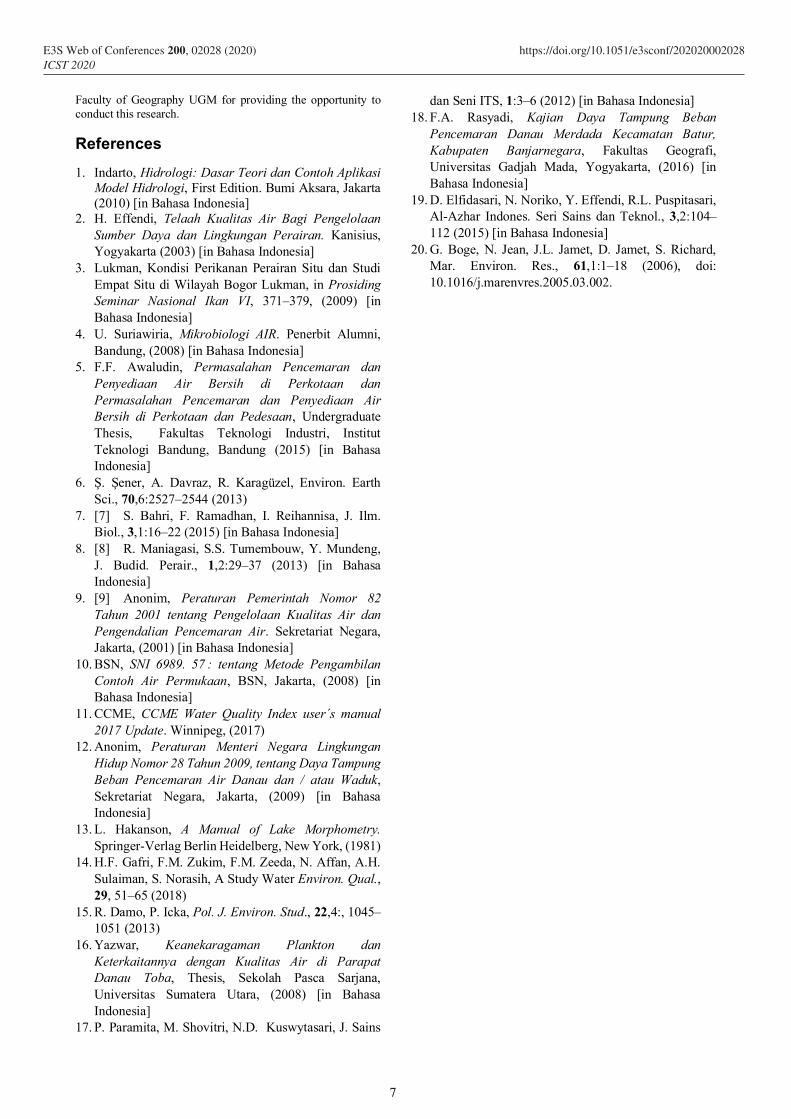
In the water, detergents can reduce the amount of
available dissolved oxygen and disturb the life of aquatic
biota. The laboratory test results showed that the water
samples contained 0.0135 mg L–1 to 0.53 mg L–1
detergents. In this range, the detergent levels of most
samples were still within the Class II water quality
standard, with 0.2 mg L–1 as the upper threshold (Figure
9). The only water sample that did not meet this standard
was the one collected at the lake outlet. Detergents were found the lowest at Inlet 1 and the highest at the outlet
(Figure 10). Inlet 1, as the entry point of pollutant loads to
the lake, had lower detergent content compared with other
places. The locals often washed the boats used for waste
transport and tourism activities, as well as duck paddle
boats, in the middle of the lake so that the detergent levels
at the outlet were inevitably high.
Inlet 1 Inlet 2 Middle Outlet
August 2019 24,3 12,62 13,62 12,01
October 2019 12,05 27,84 26,58 27,68
December 2019 5,5 4,28 13,96 9,13
February 2020 4,33 5,57 6,41 7,15
Quality Standard 3 3 3 3
0
5
10
15
20
25
30
BO
D (
mg/
L)
Inlet 1 Inlet 2 Middle Outlet
August 2019 90 50 51 43
October 2019 39 82 80 91
December 2019 26 23 43 34
February 2020 13 16,6 19,1 21,6
Quality Standard 25 25 25 25
0
10
20
30
40
50
60
70
80
90
100
CO
D (
mg/L
)
Inlet 1 Inlet 2 Middle Outlet
August 2019 0,81 0,07 0,06 0,1
October 2019 0,21 0,33 0,27 0,27
December 2019 0,13 0,1 0,27 0,25
February 2020 1,14 0,97 0,88 0,76
Quality Standard 10 10 10 10
0
2
4
6
8
10
12
Nit
rat
(mg/
L)
5
E3S Web of Conferences 200, 02028 (2020) https://doi.org/10.1051/e3sconf/202020002028ICST 2020
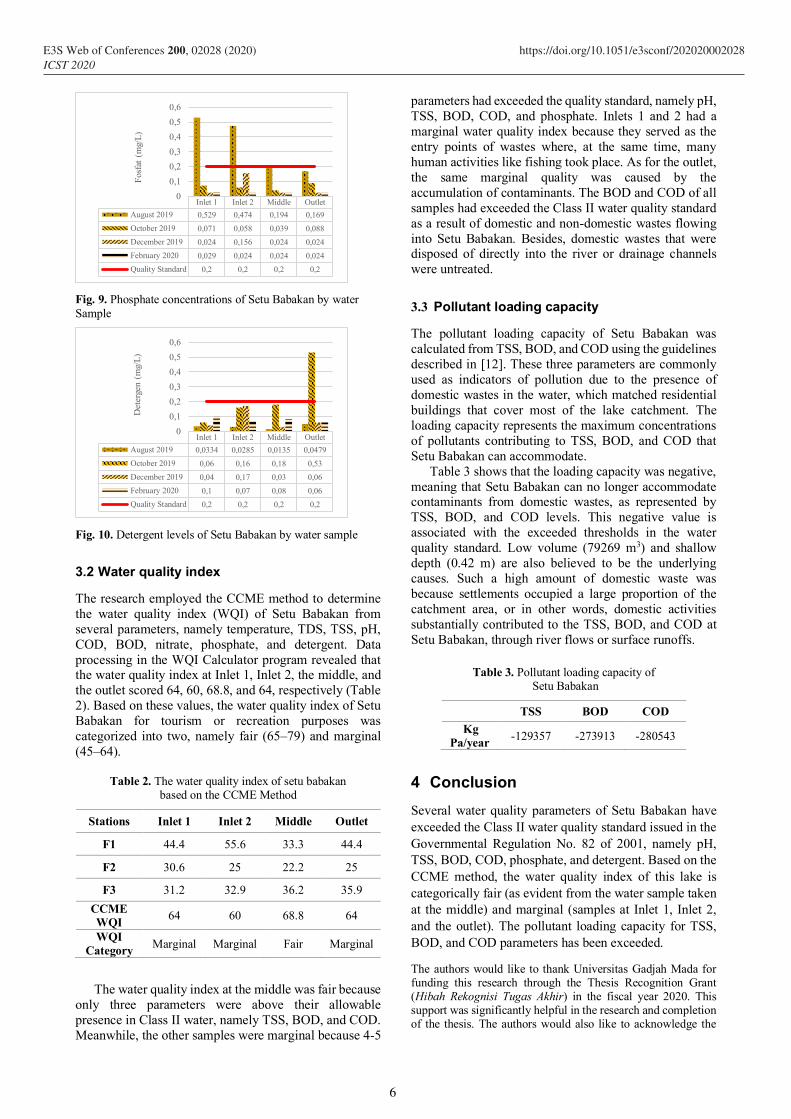
Fig. 9. Phosphate concentrations of Setu Babakan by water
Sample
Fig. 10. Detergent levels of Setu Babakan by water sample
3.2 Water quality index
The research employed the CCME method to determine
the water quality index (WQI) of Setu Babakan from
several parameters, namely temperature, TDS, TSS, pH,
COD, BOD, nitrate, phosphate, and detergent. Data
processing in the WQI Calculator program revealed that the water quality index at Inlet 1, Inlet 2, the middle, and
the outlet scored 64, 60, 68.8, and 64, respectively (Table
2). Based on these values, the water quality index of Setu
Babakan for tourism or recreation purposes was
categorized into two, namely fair (65–79) and marginal
(45–64).
Table 2. The water quality index of setu babakan
based on the CCME Method
Stations Inlet 1 Inlet 2 Middle Outlet
F1 44.4 55.6 33.3 44.4
F2 30.6 25 22.2 25
F3 31.2 32.9 36.2 35.9
CCME
WQI 64 60 68.8 64
WQI
Category Marginal Marginal Fair Marginal
The water quality index at the middle was fair because
only three parameters were above their allowable
presence in Class II water, namely TSS, BOD, and COD.
Meanwhile, the other samples were marginal because 4-5
parameters had exceeded the quality standard, namely pH,
TSS, BOD, COD, and phosphate. Inlets 1 and 2 had a
marginal water quality index because they served as the
entry points of wastes where, at the same time, many
human activities like fishing took place. As for the outlet,
the same marginal quality was caused by the
accumulation of contaminants. The BOD and COD of all
samples had exceeded the Class II water quality standard
as a result of domestic and non-domestic wastes flowing
into Setu Babakan. Besides, domestic wastes that were disposed of directly into the river or drainage channels
were untreated.
3.3 Pollutant loading capacity
The pollutant loading capacity of Setu Babakan was
calculated from TSS, BOD, and COD using the guidelines
described in [12]. These three parameters are commonly
used as indicators of pollution due to the presence of
domestic wastes in the water, which matched residential
buildings that cover most of the lake catchment. The
loading capacity represents the maximum concentrations
of pollutants contributing to TSS, BOD, and COD that
Setu Babakan can accommodate.
Table 3 shows that the loading capacity was negative,
meaning that Setu Babakan can no longer accommodate contaminants from domestic wastes, as represented by
TSS, BOD, and COD levels. This negative value is
associated with the exceeded thresholds in the water
quality standard. Low volume (79269 m3) and shallow
depth (0.42 m) are also believed to be the underlying
causes. Such a high amount of domestic waste was
because settlements occupied a large proportion of the
catchment area, or in other words, domestic activities
substantially contributed to the TSS, BOD, and COD at
Setu Babakan, through river flows or surface runoffs.
Table 3. Pollutant loading capacity of
Setu Babakan
TSS BOD COD
Kg
Pa/year -129357 -273913 -280543
4 Conclusion
Several water quality parameters of Setu Babakan have
exceeded the Class II water quality standard issued in the
Governmental Regulation No. 82 of 2001, namely pH,
TSS, BOD, COD, phosphate, and detergent. Based on the
CCME method, the water quality index of this lake is
categorically fair (as evident from the water sample taken
at the middle) and marginal (samples at Inlet 1, Inlet 2,
and the outlet). The pollutant loading capacity for TSS,
BOD, and COD parameters has been exceeded.
The authors would like to thank Universitas Gadjah Mada for funding this research through the Thesis Recognition Grant (Hibah Rekognisi Tugas Akhir) in the fiscal year 2020. This support was significantly helpful in the research and completion of the thesis. The authors would also like to acknowledge the
Inlet 1 Inlet 2 Middle Outlet
August 2019 0,529 0,474 0,194 0,169
October 2019 0,071 0,058 0,039 0,088
December 2019 0,024 0,156 0,024 0,024
February 2020 0,029 0,024 0,024 0,024
Quality Standard 0,2 0,2 0,2 0,2
0
0,1
0,2
0,3
0,4
0,5
0,6
Fosf
at (
mg/
L)
Inlet 1 Inlet 2 Middle Outlet
August 2019 0,0334 0,0285 0,0135 0,0479
October 2019 0,06 0,16 0,18 0,53
December 2019 0,04 0,17 0,03 0,06
February 2020 0,1 0,07 0,08 0,06
Quality Standard 0,2 0,2 0,2 0,2
0
0,1
0,2
0,3
0,4
0,5
0,6
Det
erge
n (
mg/
L)
6
E3S Web of Conferences 200, 02028 (2020) https://doi.org/10.1051/e3sconf/202020002028ICST 2020
Faculty of Geography UGM for providing the opportunity to
conduct this research.
References
1. Indarto, Hidrologi: Dasar Teori dan Contoh Aplikasi
Model Hidrologi, First Edition. Bumi Aksara, Jakarta
(2010) [in Bahasa Indonesia]
2. H. Effendi, Telaah Kualitas Air Bagi Pengelolaan
Sumber Daya dan Lingkungan Perairan. Kanisius,
Yogyakarta (2003) [in Bahasa Indonesia]
3. Lukman, Kondisi Perikanan Perairan Situ dan Studi
Empat Situ di Wilayah Bogor Lukman, in Prosiding
Seminar Nasional Ikan VI, 371–379, (2009) [in
Bahasa Indonesia]
4. U. Suriawiria, Mikrobiologi AIR. Penerbit Alumni,
Bandung, (2008) [in Bahasa Indonesia]
5. F.F. Awaludin, Permasalahan Pencemaran dan
Penyediaan Air Bersih di Perkotaan dan
Permasalahan Pencemaran dan Penyediaan Air
Bersih di Perkotaan dan Pedesaan, Undergraduate
Thesis, Fakultas Teknologi Industri, Institut
Teknologi Bandung, Bandung (2015) [in Bahasa
Indonesia]
6. Ş. Şener, A. Davraz, R. Karagüzel, Environ. Earth
Sci., 70,6:2527–2544 (2013)
7. [7] S. Bahri, F. Ramadhan, I. Reihannisa, J. Ilm.
Biol., 3,1:16–22 (2015) [in Bahasa Indonesia]
8. [8] R. Maniagasi, S.S. Tumembouw, Y. Mundeng,
J. Budid. Perair., 1,2:29–37 (2013) [in Bahasa
Indonesia]
9. [9] Anonim, Peraturan Pemerintah Nomor 82
Tahun 2001 tentang Pengelolaan Kualitas Air dan
Pengendalian Pencemaran Air. Sekretariat Negara,
Jakarta, (2001) [in Bahasa Indonesia]
10. BSN, SNI 6989. 57 : tentang Metode Pengambilan
Contoh Air Permukaan, BSN, Jakarta, (2008) [in
Bahasa Indonesia]
11. CCME, CCME Water Quality Index user´s manual
2017 Update. Winnipeg, (2017)
12. Anonim, Peraturan Menteri Negara Lingkungan
Hidup Nomor 28 Tahun 2009, tentang Daya Tampung
Beban Pencemaran Air Danau dan / atau Waduk,
Sekretariat Negara, Jakarta, (2009) [in Bahasa
Indonesia]
13. L. Hakanson, A Manual of Lake Morphometry.
Springer-Verlag Berlin Heidelberg, New York, (1981)
14. H.F. Gafri, F.M. Zukim, F.M. Zeeda, N. Affan, A.H.
Sulaiman, S. Norasih, A Study Water Environ. Qual.,
29, 51–65 (2018)
15. R. Damo, P. Icka, Pol. J. Environ. Stud., 22,4:, 1045–
1051 (2013)
16. Yazwar, Keanekaragaman Plankton dan
Keterkaitannya dengan Kualitas Air di Parapat
Danau Toba, Thesis, Sekolah Pasca Sarjana,
Universitas Sumatera Utara, (2008) [in Bahasa
Indonesia]
17. P. Paramita, M. Shovitri, N.D. Kuswytasari, J. Sains
dan Seni ITS, 1:3–6 (2012) [in Bahasa Indonesia]
18. F.A. Rasyadi, Kajian Daya Tampung Beban
Pencemaran Danau Merdada Kecamatan Batur,
Kabupaten Banjarnegara, Fakultas Geografi,
Universitas Gadjah Mada, Yogyakarta, (2016) [in
Bahasa Indonesia]
19. D. Elfidasari, N. Noriko, Y. Effendi, R.L. Puspitasari,
Al-Azhar Indones. Seri Sains dan Teknol., 3,2:104–
112 (2015) [in Bahasa Indonesia]
20. G. Boge, N. Jean, J.L. Jamet, D. Jamet, S. Richard,
Mar. Environ. Res., 61,1:1–18 (2006), doi:
10.1016/j.marenvres.2005.03.002.
7
E3S Web of Conferences 200, 02028 (2020) https://doi.org/10.1051/e3sconf/202020002028ICST 2020