water - MDPI
25
Citation: Krupa, E.; Aubakirova, M.; Romanova, S. Factors Affecting Water Quality and the Structure of Zooplankton Communities in Wastewater Reservoirs of the Right-Bank Sorbulak Canal System (South-Eastern Kazakhstan). Water 2022, 14, 1784. https://doi.org/ 10.3390/w14111784 Academic Editor: Roohollah Noori Received: 25 March 2022 Accepted: 29 May 2022 Published: 1 June 2022 Publisher’s Note: MDPI stays neutral with regard to jurisdictional claims in published maps and institutional affil- iations. Copyright: © 2022 by the authors. Licensee MDPI, Basel, Switzerland. This article is an open access article distributed under the terms and conditions of the Creative Commons Attribution (CC BY) license (https:// creativecommons.org/licenses/by/ 4.0/). water Article Factors Affecting Water Quality and the Structure of Zooplankton Communities in Wastewater Reservoirs of the Right-Bank Sorbulak Canal System (South-Eastern Kazakhstan) Elena Krupa 1,2, * , Moldir Aubakirova 1 and Sophia Romanova 1 1 Institute of Zoology, Almaty 050060, Kazakhstan; [email protected] (M.A.); [email protected] (S.R.) 2 Kazakh Agency of Applied Ecology, Almaty 050010, Kazakhstan * Correspondence: [email protected]; Tel.: +7-272-694876 Abstract: This work aims to assess the main factors that determined the variability of environmental and biological variables in wastewater reservoirs of the Right-Bank Sorbulak Canal system (South- Eastern Kazakhstan). We used standard methods for the collection and analysis of data, as well as the principal components analysis (PCA) to assess the relationship between environmental and biological indicators. The average depth of the surveyed reservoirs was 4.1–10.0 m, temperature— 21.7–25.7 ◦ C, pH—9.41–10.00, permanganate index—16.22–19.07 mgO/dm 3 , N-NO 2 —0.03–0.13, N-NO 3 —1.28–3.00, N-NH 4 —0.30–0.53, PO 4 —0.14–0.39, Si—3.69–8.26, Mn—0.03–0.07, Fe—0.34– 0.38 mg/dm 3 . The content of Cd, Co, Pb, Zn, and Cr was low, Cu—0.012–0.036 mg/dm 3 . The water quality is influenced by the wastewater composition, chemical interactions, morphometric and physical-chemical conditions of the reservoir, pollution of the coastal area, and secondary water pollution. Changes in the species composition and zooplankton abundance reflected the instability of external conditions. PCA showed the priority influence of carbonates, bicarbonates, magnesium, temperature, nutrients, and heavy metals on zooplankton structure. The results obtained demonstrate the indicator significance of zooplankton, and the methodological approaches can be used to assess water bodies with the complex pollution located in other regions. Keywords: influence; heavy metals; nutrients; principal component analysis; seasonal dynamic; secondary pollution; self-purification 1. Introduction The growth of the earth’s population causes an annual increase in the volume of wastewater containing a complex set of organic and toxic compounds [1,2]. A significant part of wastewater is discharged into natural water bodies [3], causing considerable damage to biological resources and human health [4]. The growing practice of reusing wastewater in agriculture [5] and drinking water [6] increases environmental and human health risks. Pollutants entering aquatic ecosystems with wastewater undergo transformation. These processes are determined by a complex of natural and climatic factors (temperature, current, mineralization, pH value) [7], chemical interactions [8], accumulation in bottom sediments [9], and living organisms [10]. Increased total dissolved solids (TDS) and an alkaline environment contribute to the transition of heavy metals into a sparingly soluble inactive form [7], with the reverse effect of temperature [11]. The transformation of pollutants largely depends on the morphometric characteristics of the water body [12]. Shallow water bodies warm up better; they have no or weakly expressed temperature stratification, higher nutrient turnover rate [13], and larger relative areas occupied by macrophytes [14]. The critical nutrient level for lakes to become turbid is higher for smaller Water 2022, 14, 1784. https://doi.org/10.3390/w14111784 https://www.mdpi.com/journal/water
-
Upload
khangminh22 -
Category
Documents
-
view
1 -
download
0
Transcript of water - MDPI
Citation: Krupa, E.; Aubakirova, M.;
Romanova, S. Factors Affecting Water
Quality and the Structure of
Zooplankton Communities in
Wastewater Reservoirs of the
Right-Bank Sorbulak Canal System
(South-Eastern Kazakhstan). Water
2022, 14, 1784. https://doi.org/
10.3390/w14111784
Academic Editor: Roohollah Noori
Received: 25 March 2022
Accepted: 29 May 2022
Published: 1 June 2022
Publisher’s Note: MDPI stays neutral
with regard to jurisdictional claims in
published maps and institutional affil-
iations.
Copyright: © 2022 by the authors.
Licensee MDPI, Basel, Switzerland.
This article is an open access article
distributed under the terms and
conditions of the Creative Commons
Attribution (CC BY) license (https://
creativecommons.org/licenses/by/
4.0/).
water
Article
Factors Affecting Water Quality and the Structure ofZooplankton Communities in Wastewater Reservoirs of theRight-Bank Sorbulak Canal System (South-Eastern Kazakhstan)Elena Krupa 1,2,* , Moldir Aubakirova 1 and Sophia Romanova 1
1 Institute of Zoology, Almaty 050060, Kazakhstan; [email protected] (M.A.);[email protected] (S.R.)
2 Kazakh Agency of Applied Ecology, Almaty 050010, Kazakhstan* Correspondence: [email protected]; Tel.: +7-272-694876
Abstract: This work aims to assess the main factors that determined the variability of environmentaland biological variables in wastewater reservoirs of the Right-Bank Sorbulak Canal system (South-Eastern Kazakhstan). We used standard methods for the collection and analysis of data, as wellas the principal components analysis (PCA) to assess the relationship between environmental andbiological indicators. The average depth of the surveyed reservoirs was 4.1–10.0 m, temperature—21.7–25.7 ◦C, pH—9.41–10.00, permanganate index—16.22–19.07 mgO/dm3, N-NO2—0.03–0.13,N-NO3—1.28–3.00, N-NH4—0.30–0.53, PO4—0.14–0.39, Si—3.69–8.26, Mn—0.03–0.07, Fe—0.34–0.38 mg/dm3. The content of Cd, Co, Pb, Zn, and Cr was low, Cu—0.012–0.036 mg/dm3. Thewater quality is influenced by the wastewater composition, chemical interactions, morphometricand physical-chemical conditions of the reservoir, pollution of the coastal area, and secondary waterpollution. Changes in the species composition and zooplankton abundance reflected the instabilityof external conditions. PCA showed the priority influence of carbonates, bicarbonates, magnesium,temperature, nutrients, and heavy metals on zooplankton structure. The results obtained demonstratethe indicator significance of zooplankton, and the methodological approaches can be used to assesswater bodies with the complex pollution located in other regions.
Keywords: influence; heavy metals; nutrients; principal component analysis; seasonal dynamic;secondary pollution; self-purification
1. Introduction
The growth of the earth’s population causes an annual increase in the volume ofwastewater containing a complex set of organic and toxic compounds [1,2]. A significantpart of wastewater is discharged into natural water bodies [3], causing considerabledamage to biological resources and human health [4]. The growing practice of reusingwastewater in agriculture [5] and drinking water [6] increases environmental and humanhealth risks.
Pollutants entering aquatic ecosystems with wastewater undergo transformation.These processes are determined by a complex of natural and climatic factors (temperature,current, mineralization, pH value) [7], chemical interactions [8], accumulation in bottomsediments [9], and living organisms [10]. Increased total dissolved solids (TDS) andan alkaline environment contribute to the transition of heavy metals into a sparinglysoluble inactive form [7], with the reverse effect of temperature [11]. The transformationof pollutants largely depends on the morphometric characteristics of the water body [12].Shallow water bodies warm up better; they have no or weakly expressed temperaturestratification, higher nutrient turnover rate [13], and larger relative areas occupied bymacrophytes [14]. The critical nutrient level for lakes to become turbid is higher for smaller
Water 2022, 14, 1784. https://doi.org/10.3390/w14111784 https://www.mdpi.com/journal/water
Water 2022, 14, 1784 2 of 25
lakes [15]. Macrophytes intensively absorb heavy metals [10], but after death, they couldbe a source of secondary pollution of a water body.
The impact of wastewater on aquatic ecosystems depends both on its origin (indus-trial, agricultural, livestock, domestic wastewater) and on the composition of biologicalcommunities [16,17]. In the lakes of the Kola Peninsula (Karelia, northwest Russia) pollutedby industrial effluents, the biomass of phytoplankton and fish was higher, and that ofmacrozoobenthos was lower than in the reference lake of the same system [18]. In India,zooplankton of sewage-fed fishponds was more diverse but less variable than in naturalfishponds [19]. Industrial effluents in three tributaries of the Calcasieu Estuary (Louisiana,USA) had a more significant negative impact on planktonic invertebrates than agriculturaleffluents [20].
Anthropogenic activities almost entirely subsidize wastewater reservoirs. The con-tinuous influx of pollutants with wastewater causes differences between wastewaterreservoirs and natural water bodies, characterized by a seasonal dependence on nutrientsupply [21]. Toxic compounds in wastewater distort the natural processes of eutrophica-tion of water bodies associated with organic matter accumulation. Toxicants suppressthe primary producers [22] and disrupt the transformation of nutrients. As a result, thecomposition and structure of biological communities under conditions of toxic pollutiondo not reflect the level of accumulation of organic matter in the aquatic ecosystem, i.e.,its trophic status.
Sorbulak (South-East Kazakhstan) is one of the largest wastewater reservoirs globally.Together with shallow ponds, Sorbulak stores wastewater from the Almaty and Almatyregion, with about two million people [23]. The shortage of water resources in the regionnecessitates the reusing of wastewater, which is associated with risks to human health andnatural ecosystems [4,5]. Due to the climatic conditions of South-Eastern Kazakhstan, thewater of the Sorbulak system is used in the largest volumes from May to September [23],when the demand for water resources is maximum. It is necessary to constantly monitorwater quality in wastewater reservoirs to reduce risks, especially during the six-monthgrowing season. The literature provides information on the chemical composition of waterand the structure of zooplankton communities in Sorbulak, less often in ponds, only forone of the summer months of 1985, 1998, 2000, 2001, and 2017 [24–27]. This study isbased on semi-annual data that allow us to assess the formation of the quality of waterresources in wastewater reservoirs during the period of their most intensive use. Itspurpose is to evaluate the main factors determining the spatial and temporal variability ofenvironmental indicators and the structure of zooplankton communities under conditionsof mixed pollution of the Sorbulak reservoir and two wastewater ponds from May toSeptember 2021.
2. Materials and Methods2.1. Description of Study Area
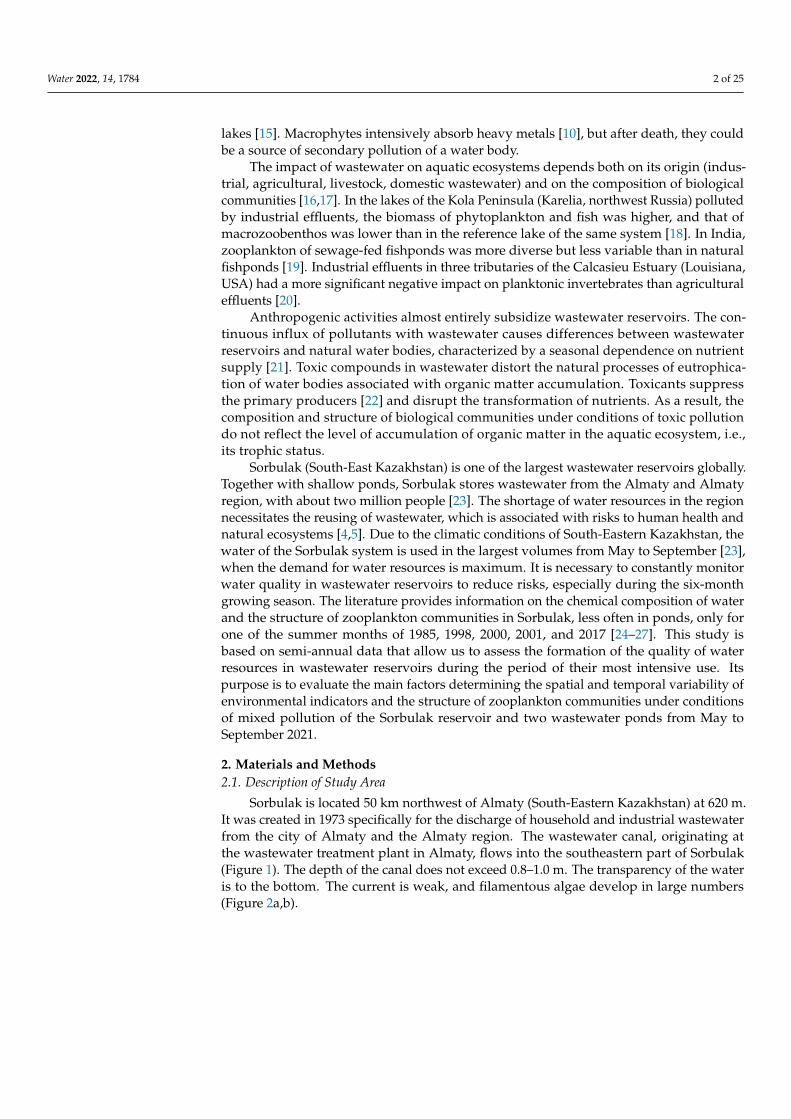
Sorbulak is located 50 km northwest of Almaty (South-Eastern Kazakhstan) at 620 m.It was created in 1973 specifically for the discharge of household and industrial wastewaterfrom the city of Almaty and the Almaty region. The wastewater canal, originating atthe wastewater treatment plant in Almaty, flows into the southeastern part of Sorbulak(Figure 1). The depth of the canal does not exceed 0.8–1.0 m. The transparency of the wateris to the bottom. The current is weak, and filamentous algae develop in large numbers(Figure 2a,b).
Water 2022, 14, 1784 3 of 25Water 2022, 14, x FOR PEER REVIEW 3 of 25
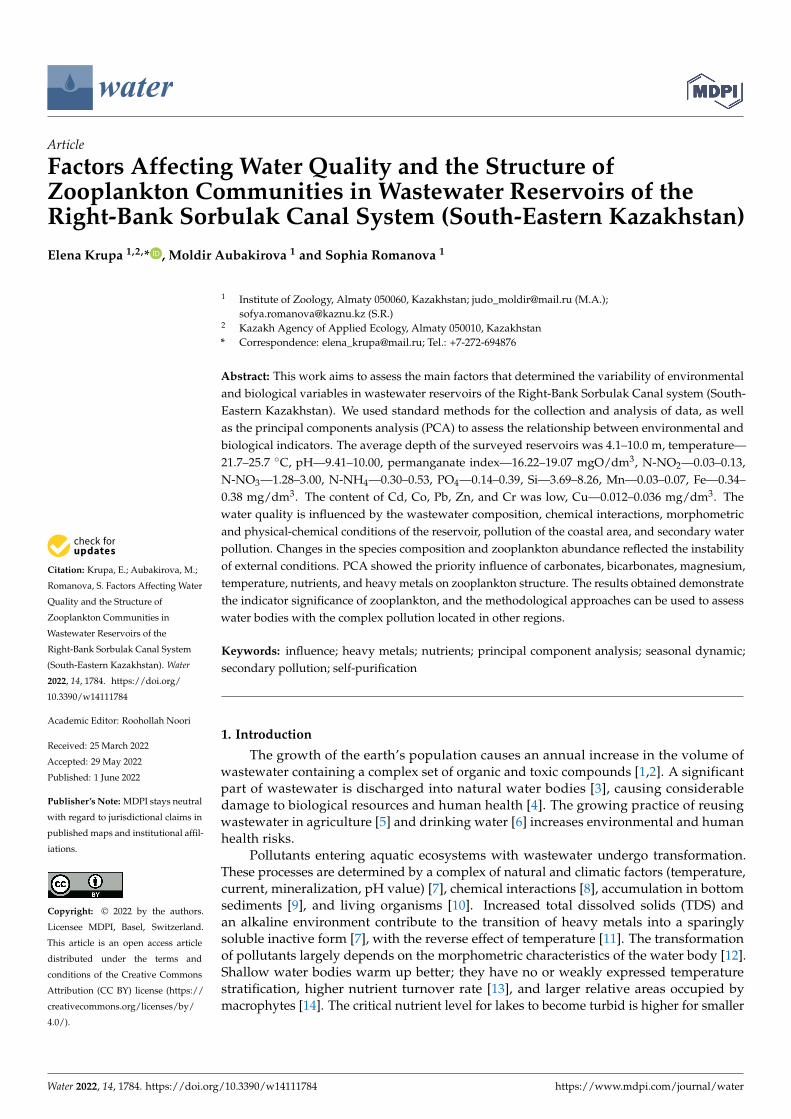
Figure 1. The layout and coordinates of sampling stations in wastewater reservoirs of the Right-Bank Sorbulak Canal system, 2021. Black circles are the sampling stations. The dotted line shows the emergency wastewater canal through which water from RSC 8 can be discharged into the Ili River.
Sorbulak has the shape of an irregular triangle, and it is divided into two parts by an island (Figure 1). Its area with maximum filling reaches 58 km2, the length of the coastline is 33.5 km, and the water volume is about 1000 million m3. The northern part of the reser-voir is deep (19.0–25.0 m). The southern and southeastern parts are shallow, with 1.5–5.0 m. Depending on the water level, the average depth reaches 10.0–15.5 m. From the west-ern bay of Sorbulak, part of the water is annually withdrawn for irrigation of fodder crops such as corn and alfalfa. With a decrease in the level, the shallow coastal zone of Sorbulak becomes swampy and covered with a crust of cyanobacteria (Figure 2c,d).
By the end of 1980, the filling of Sorbulak had reached a critical level, and there was a threat of a dam breakthrough. In 1995, an emergency Right-Bank Sorbulak Canal (RSC) was built, through which part of the wastewater, bypassing Sorbulak, can be discharged into shallow ponds (RSC ponds) and further, if it is necessary, to the Ili River. The emer-gency release of water threatens the Ili River and Balkhash, the largest fishery lake in Ka-zakhstan. In a chain, the ponds are located east of Sorbulak at 615–618 m. The ponds have a serial number by the distance from the inflowing canal (RSC No. 1–8). The ponds have an indented coastline (Figure 1). The largest of them is the penultimate one (RSC 7) and the last one (RSC 8), with an area of 3.5 and 0.4 km2, respectively. The water area of the ponds varies significantly as it depends on the volume of incoming effluents. The maxi-mum depths do not exceed 7–8 m, with average depths of 2.7–6.0 m. Water transparency is most often low. The water color is green mainly because of the significant number of planktonic algae, especially in RSC 7 (Figure 2e,f).
Figure 1. The layout and coordinates of sampling stations in wastewater reservoirs of the Right-BankSorbulak Canal system, 2021. Black circles are the sampling stations. The dotted line shows theemergency wastewater canal through which water from RSC 8 can be discharged into the Ili River.
Sorbulak has the shape of an irregular triangle, and it is divided into two parts by anisland (Figure 1). Its area with maximum filling reaches 58 km2, the length of the coastline is33.5 km, and the water volume is about 1000 million m3. The northern part of the reservoiris deep (19.0–25.0 m). The southern and southeastern parts are shallow, with 1.5–5.0 m.Depending on the water level, the average depth reaches 10.0–15.5 m. From the westernbay of Sorbulak, part of the water is annually withdrawn for irrigation of fodder cropssuch as corn and alfalfa. With a decrease in the level, the shallow coastal zone of Sorbulakbecomes swampy and covered with a crust of cyanobacteria (Figure 2c,d).
By the end of 1980, the filling of Sorbulak had reached a critical level, and there was athreat of a dam breakthrough. In 1995, an emergency Right-Bank Sorbulak Canal (RSC) wasbuilt, through which part of the wastewater, bypassing Sorbulak, can be discharged intoshallow ponds (RSC ponds) and further, if it is necessary, to the Ili River. The emergencyrelease of water threatens the Ili River and Balkhash, the largest fishery lake in Kazakhstan.In a chain, the ponds are located east of Sorbulak at 615–618 m. The ponds have a serialnumber by the distance from the inflowing canal (RSC No. 1–8). The ponds have anindented coastline (Figure 1). The largest of them is the penultimate one (RSC 7) and thelast one (RSC 8), with an area of 3.5 and 0.4 km2, respectively. The water area of the pondsvaries significantly as it depends on the volume of incoming effluents. The maximumdepths do not exceed 7–8 m, with average depths of 2.7–6.0 m. Water transparency is mostoften low. The water color is green mainly because of the significant number of planktonicalgae, especially in RSC 7 (Figure 2e,f).
Water 2022, 14, x FOR PEER REVIEW 3 of 25
Figure 1. The layout and coordinates of sampling stations in wastewater reservoirs of the Right-Bank Sorbulak Canal system, 2021. Black circles are the sampling stations. The dotted line shows the emergency wastewater canal through which water from RSC 8 can be discharged into the Ili River.
Sorbulak has the shape of an irregular triangle, and it is divided into two parts by an island (Figure 1). Its area with maximum filling reaches 58 km2, the length of the coastline is 33.5 km, and the water volume is about 1000 million m3. The northern part of the reser-voir is deep (19.0–25.0 m). The southern and southeastern parts are shallow, with 1.5–5.0 m. Depending on the water level, the average depth reaches 10.0–15.5 m. From the west-ern bay of Sorbulak, part of the water is annually withdrawn for irrigation of fodder crops such as corn and alfalfa. With a decrease in the level, the shallow coastal zone of Sorbulak becomes swampy and covered with a crust of cyanobacteria (Figure 2c,d).
By the end of 1980, the filling of Sorbulak had reached a critical level, and there was a threat of a dam breakthrough. In 1995, an emergency Right-Bank Sorbulak Canal (RSC) was built, through which part of the wastewater, bypassing Sorbulak, can be discharged into shallow ponds (RSC ponds) and further, if it is necessary, to the Ili River. The emer-gency release of water threatens the Ili River and Balkhash, the largest fishery lake in Ka-zakhstan. In a chain, the ponds are located east of Sorbulak at 615–618 m. The ponds have a serial number by the distance from the inflowing canal (RSC No. 1–8). The ponds have an indented coastline (Figure 1). The largest of them is the penultimate one (RSC 7) and the last one (RSC 8), with an area of 3.5 and 0.4 km2, respectively. The water area of the ponds varies significantly as it depends on the volume of incoming effluents. The maxi-mum depths do not exceed 7–8 m, with average depths of 2.7–6.0 m. Water transparency is most often low. The water color is green mainly because of the significant number of planktonic algae, especially in RSC 7 (Figure 2e,f).
Figure 2. Wastewater canal 6 km upstream of the confluence with Sorbulak (a,b), the coastal zone ofSorbulak (c,d), RSC 8 (e), suspension of cyanobacteria in RSC 7 (f). Photos by E. Krupa.
Water 2022, 14, 1784 4 of 25
Wastewater treatment discharged into Sorbulak began in 1980. First, mechanicalwastewater treatment is carried out, and then the water passes through sand traps. Thenext stage is biological treatment in special pools, where the air is injected. After biologicaltreatment, the water enters the radial settling tanks and further through the canal Sorbulakand ponds. The main share falls on the sewerage of multi-apartment residential buildings(39.0–53.0%) and public utilities (26.8–30.4%). The share of industrial wastewater variesfrom 16.3 to 65.8%. Until the beginning of 2000, the leading suppliers of industrial wastew-ater were motor transport, locomotive depots, machine building, metalworking, printing,food, light, fuel, woodworking, chemical industries, etc. The closure of many industrialenterprises by the 2000s led to a significant decrease in the share of industrial wastewaterto the above minimum value. The share of atmospheric precipitation does not exceed 19%(in dry years, it is much less), and groundwater—9% [23]. Pre-treated wastewater containsorganic, biogenic, suspended solids, surfactants, metals, phenols, fats, dyes, oil products,cyanides, formaldehyde, etc. [28]. Until 2002, elevated concentrations of cadmium (up to0.078 mg/dm3), copper (up to 0.024 mg/dm3), lead, and zinc (up to 0.047 mg/dm3) wererecorded in water [29]. By 2017, the share of industrial effluents decreased as the content ofheavy metals [24].
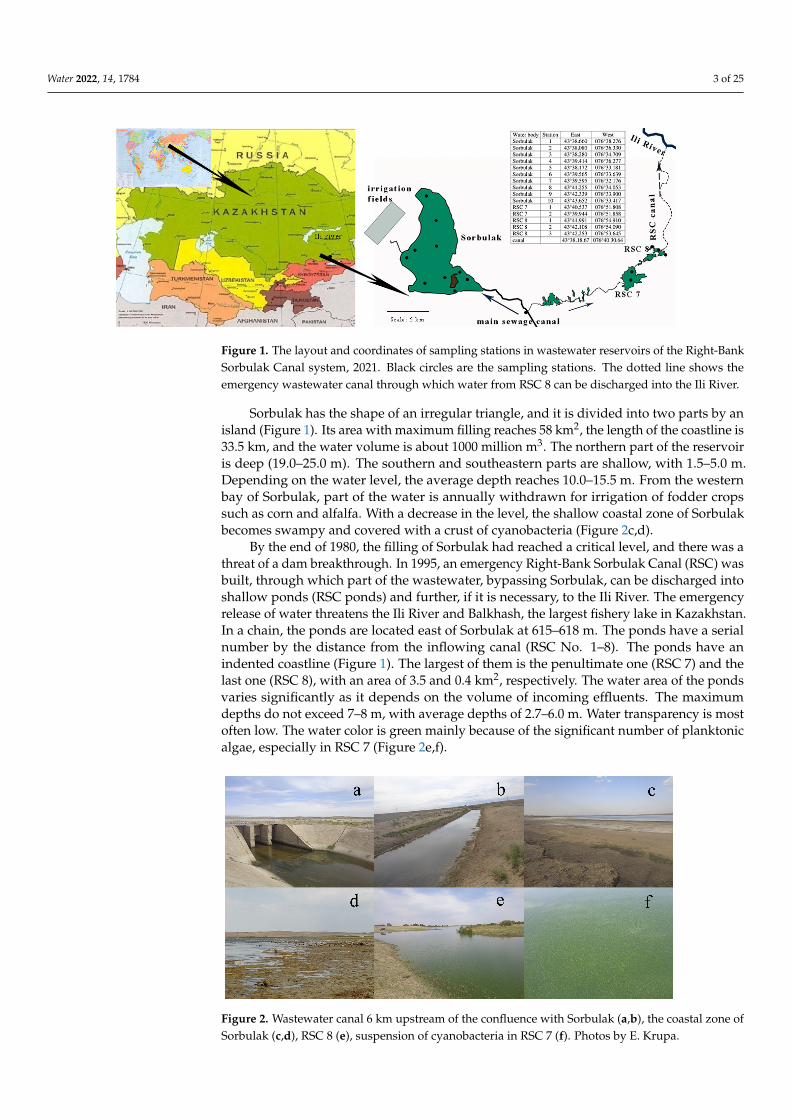
Although Sorbulak and ponds are fed mainly by wastewater, many birds live onthe islands and coastal zones (Figure 3a,b). The concentration of birds in this area isdue to several reasons–the location of the reservoirs on the path of bird migration, ageneral shortage of water resources in the region, a good food supply, and a relatively lowdisturbance factor. Sorbulak and the entire system of wastewater reservoirs is a crucialornithological area, and it is included in the list of wetlands of regional importance [30].Carp species of fish live in the reservoirs, among which Cyprinus carpio Linnaeus reachesthe largest number and larger mass than individuals from natural water bodies.
Water 2022, 14, x FOR PEER REVIEW 4 of 25
Figure 2. Wastewater canal 6 km upstream of the confluence with Sorbulak (a,b), the coastal zone of Sorbulak (c,d), RSC 8 (e), suspension of cyanobacteria in RSC 7 (f). Photos by E. Krupa.
Wastewater treatment discharged into Sorbulak began in 1980. First, mechanical wastewater treatment is carried out, and then the water passes through sand traps. The next stage is biological treatment in special pools, where the air is injected. After biological treatment, the water enters the radial settling tanks and further through the canal Sorbu-lak and ponds. The main share falls on the sewerage of multi-apartment residential build-ings (39.0–53.0%) and public utilities (26.8–30.4%). The share of industrial wastewater var-ies from 16.3 to 65.8%. Until the beginning of 2000, the leading suppliers of industrial wastewater were motor transport, locomotive depots, machine building, metalworking, printing, food, light, fuel, woodworking, chemical industries, etc. The closure of many industrial enterprises by the 2000s led to a significant decrease in the share of industrial wastewater to the above minimum value. The share of atmospheric precipitation does not exceed 19% (in dry years, it is much less), and groundwater—9% [23]. Pre-treated wastewater contains organic, biogenic, suspended solids, surfactants, metals, phenols, fats, dyes, oil products, cyanides, formaldehyde, etc. [28]. Until 2002, elevated concentra-tions of cadmium (up to 0.078 mg/dm3), copper (up to 0.024 mg/dm3), lead, and zinc (up to 0.047 mg/dm3) were recorded in water [29]. By 2017, the share of industrial effluents decreased as the content of heavy metals [24].
Although Sorbulak and ponds are fed mainly by wastewater, many birds live on the islands and coastal zones (Figure 3a,b). The concentration of birds in this area is due to several reasons–the location of the reservoirs on the path of bird migration, a general shortage of water resources in the region, a good food supply, and a relatively low dis-turbance factor. Sorbulak and the entire system of wastewater reservoirs is a crucial orni-thological area, and it is included in the list of wetlands of regional importance [30]. Carp species of fish live in the reservoirs, among which Cyprinus carpio Linnaeus reaches the largest number and larger mass than individuals from natural water bodies.
Figure 3. Great cormorant (Phalacrocorax carbo) on a sandy spit in the northern part of Sorbulak (a), pelican colony (Pelecanus crispus) on the island (b), animals at the watering place (c). Photos by A. Gavrilov and E. Krupa.
Due to the high level of toxic pollution of wastewater reservoirs, especially in the first twenty years of their existence, fishing and the use of Sorbulak and ponds water for irri-gation (except for irrigation of industrial crops) were officially prohibited. However, there are currently about 70 farms around the Right-Bank Sorbulak Canal system, and wastewater is used to irrigate fodder crops (corn, alfalfa). Domestic animals (horses, cows, and sheep) from the same farmers use water for drinking (Figure 3c). The meat of these animals and fish is sold in large quantities in Almaty, while the content of heavy metals in the liver and muscle tissue of the fish reaches a high level [24]. The authors link patho-logical changes in the internal organs of fish with exposure to toxic substances.
2.2. Field Sampling Material sampling was carried out in Sorbulak and two ponds (RSC 7 and RSC 8)
once a month from April to September 2021 using a grid of 15 stations (Figure 2, black
Figure 3. Great cormorant (Phalacrocorax carbo) on a sandy spit in the northern part of Sorbulak (a),pelican colony (Pelecanus crispus) on the island (b), animals at the watering place (c). Photos by A.Gavrilov and E. Krupa.
Due to the high level of toxic pollution of wastewater reservoirs, especially in thefirst twenty years of their existence, fishing and the use of Sorbulak and ponds water forirrigation (except for irrigation of industrial crops) were officially prohibited. However,there are currently about 70 farms around the Right-Bank Sorbulak Canal system, andwastewater is used to irrigate fodder crops (corn, alfalfa). Domestic animals (horses, cows,and sheep) from the same farmers use water for drinking (Figure 3c). The meat of theseanimals and fish is sold in large quantities in Almaty, while the content of heavy metals inthe liver and muscle tissue of the fish reaches a high level [24]. The authors link pathologicalchanges in the internal organs of fish with exposure to toxic substances.
2.2. Field Sampling
Material sampling was carried out in Sorbulak and two ponds (RSC 7 and RSC 8)once a month from April to September 2021 using a grid of 15 stations (Figure 2, blackcircles). In June, additional samples were taken in the wastewater canal, 6 km upstreamof its confluence with Sorbulak. The pH and water temperature were measured using anAMTAST portable waterproof Pen pH meter. Water transparency was determined using
Water 2022, 14, 1784 5 of 25
a Secchi disk with a diameter of 30 cm. At each station, water samples were taken toanalyze the chemical composition (Ca, Mg, Na + K, Cl, SO4, CO3, HCO3), total dissolvedsolids (TDS), the content of nitrite-nitrogen (N-NO2), nitrate-nitrogen (N-NO3), ammoniumnitrogen (N-NH4), phosphates (PO4), total iron (Fe), silicon (Si), manganese (Mn), oxygen,readily oxidizable organic substances (PI permanganate index), cadmium (Cd), lead (Pb),Zn (zinc), copper (Cu), chromium (Cr), cobalt (Co), as well as zooplankton samples. Atdepths of less than 5 m, hydrochemical samples were taken from the surface horizon. Atdepths of more than 5 m, samples were taken using a bathometer with a volume of 1 dm3 atdifferent horizons (at least three horizons). Water was poured into a container, mixed, andone integral sample was taken. Samples for TDS were taken in plastic containers with avolume of 1 dm3, heavy metals—0.5 dm3 (conservation with concentrated chemically purenitric acid), nutrients—in glass containers with a volume of 0.5 dm3 (conservation with 1cm3 of chloroform), readily oxidizable organic substances (permanganate index PI)—inglass containers with a volume of 0.25 dm3 (conservation with sulfuric acid), oxygen—inoxygen bottles with a ground stopper with a volume of 0.25 dm3 (conservation with asolution of Mn chloride in an alkaline medium). Water samples were delivered to thelaboratory for further analysis within 24 h. Zooplankton samples were collected using asmall Juday plankton net (top length 12 cm, bottom length 45 cm, input diameter 12 cm,mesh size 64 µm) by pulling it from the bottom to the surface [31]. Samples were fixedwith a 4% formaldehyde solution. A total of 84 water samples were taken for each type ofanalysis.
2.3. Laboratory Analysis
Conventional methods of chemical analysis of water samples were used [32]. Thecontent of N-NO2, N-NO3, N-NH4, PO4, Si, Mn, and Fe was determined photometrically.We used Griess and Nessler reagents, metallic cadmium, and ammonium molybdate incombination with ascorbic and sulfosalicylic acids depending on the analysis. The contentof readily oxidizable organic substances (PI) was determined under acidic conditions byKubel’s method. The total hardness of water was determined by the volumetric com-plexometric method with the eriochrome black indicator. The error in determining themain ions in water was 0.5–5.0%, depending on the analysis. Heavy metals were deter-mined by inductively coupled plasma mass spectrometry using a plasma quadrupole massspectrometer ELAN-9000, Waltham, Massachusetts, USA (ST RK ISO 17294–1–2011) inthe low-background measurement laboratory, Institute of Nuclear Physics (Almaty). Thedetection limits for heavy metals are (in mg/dm3): for Cd—0.00006, for Co—0.00007, forCr—0.0004, for Cu—0.0005, for Pb—0.00005, for Zn—0.001.
Species identification of planktonic invertebrates was carried out using keys [33–35].The abundance of organisms was calculated according to [31]. At the beginning, a samplewas brought to a certain volume (150–500 cm3). After thorough mixing, three sub-sampleswere taken from the sample using a 1 cm3 stamp pipette. In this sub-sample, all encoun-tered individuals and age stages of certain species (the most numerous) were counted inBogorov’s cell. Then the sample was concentrated to a volume of 125–150 cm3. Threesub-samples were retaken from it, where less abundant age stages or species were counted.The whole procedure was repeated once more while the sample was concentrated to avolume of 50 cm3. In the end, with its volume of 20–25 cm3, the sample was viewed inits entirety for counting large and rare species of planktonic invertebrates. The resultsof counting individuals are recalculated per 1 m3 using the formula (separately for eachsample dilution):
N =n × (V1/V2)
V3(1)
Water 2022, 14, 1784 6 of 25
where N—abundance (ind./m3), n—number of individuals in a portion, V1—dilutionvolume (cm3), V2—subsample volume (cm3), and V3—filtered water volume (m3). Thefiltered volume of water was calculated by the formula:
V3 = h × πr2 (2)
where r is the radius of the inner ring of the Juday net, h is the length of the net pulling(water column height), m.
Males, females, copepodites, and nauplii of Copepoda as well as cladoceran’s females,females with eggs, males (if they were present), and juveniles were counted separately. Thetotal abundance was found for each species of planktonic invertebrates; for each crustaceanspecies, the total abundance was calculated by summing the abundance of individual ageand size stages. The total abundance of zooplankton was determined by summing upthe abundance of all species found in the sample. The mass of individuals/species wasdetermined by the formulas of the dependence between mass and body length to calculatethe biomass [36].
The average number of species per sample, Shannon Ab (bit/ind), Shannon Bi(bit/mg) [37], and average individual mass (mg) [38] were determined to characterizethe zooplankton communities. Calculating the Shannon Ab leads to underestimating largespecies with low abundance. Shannon Bi considers the contribution of large species butunderestimates the role of small species. Therefore, it is recommended to use both versionsof the Shannon index to describe the structure of biological communities [39].
The calculation of the Shannon index based on log 2 was performed in the Primer 5Software. The average mass of an individual in zooplankton communities was calculatedby dividing the total biomass by the total abundance.
2.4. Statistical Analysis
Statistical analysis of the data was performed using the Statistica 12 and R programs.For all variables, mean values with the standard error were calculated. For the analysis,27 environmental variables were used (depth, temperature, transparency, water pH, TDS,hardness, content of Ca, Mg, Na + K, Cl, SO4, CO3, HCO3, N-NO2, N-NO3, N-NH4, PO4,Fe, Si, Mn, PI, Cd, Pb, Zn, Cu, Cr, Co) and 12 biological variables (abundance and biomassof rotifers, cladocerans and copepods, total abundance and biomass, species number,Shannon Ab and Shannon Bi, the average mass of an individual). We checked the type ofdata distribution according to Kolmogorov –Smirnov and Lilliefors and Shapiro–Wilk’stest [40] in Statistica 12 Software. After a statistical estimation of distribution, the datawere transformed by taking their logarithm (if the distribution is shifted to the right) ortaking the cube root (if the distribution is shifted to the left). Re-checking the transformeddata showed their complete or almost complete compliance with the normal distribution,provided that the data were separated by water bodies.
Graphs of the seasonal dynamics of variables were built using the ggplot 2 package [41].Principal component analysis (PCA) was carried out in the R program to reduce the datadimension with minimal loss of information [42]. The data were standardized usingthe scale.unit = TRUE function. The PCA results provided in the factoextra R package(FactoMineR library) were extracted and visualized. Eigenvalues were calculated usingthe fviz_eig () function to determine the contribution of each variable to the total varianceof the principal components. The contribution of variables to the principal componentsPC1 (Dim.1) and PC2 (Dim.2) was estimated using the head(var$contrib) function. Acorrelation circle was built, and the quality of representation of variables was calculatedusing the head(var$cos2) function to visualize and evaluate correlations between variables.Their location within the correlation circle allows assessing the relationship between thevariables. Positively correlated variables are located in the same quadrant. Variables witha negative correlation are located in opposite quadrants. A high cos2 indicates a goodrepresentation of the variable in the main component. In this case, the variable is locatedclose to the circumference of the correlation circle and is colored red. A low cos2 indicates
Water 2022, 14, 1784 7 of 25
that the variable is not fully represented in the main component and is close to the centerof the circle. To assess the factors influencing the zooplankton communities’ structure, weconsidered the correlation of environmental variables and their contribution to the totalvariance and chose 17 environmental variables (TDS, Ca, SO4, Mg, HCO3, Hardness, pH,transparency, temperature, PO4, N-NO2, Zn, Pb, CO3, N-NO3, Si).
3. Results3.1. Environmental Variables3.1.1. Hydrological Characteristic
From spring to autumn 2021, the coastline of Sorbulak receded by about 180–200 m(Figure 3c,d) and 10–30 m in ponds. The decrease in the water level was associated with areduction in the volume of incoming wastewater from spring to autumn, which could bejudged by the depth of the canal (visual observations). In addition to a decrease in inflow,the shallowing of Sorbulak occurred due to the withdrawal of water for irrigation.
3.1.2. Hydrophysical Characteristics
The average depth of Sorbulak is about twice that of ponds (Table 1). The highest watertransparency was recorded in RSC 7, and the lowest in RSC 8. All wastewater reservoirsare warm water, with a higher water temperature in the ponds. The water had an alkalinereaction, with the maximum pH values in the ponds. In the wastewater canal, the watertemperature in summer reached 28.0 ◦C, at a pH of 9.8.
Table 1. Physical-chemical variables of wastewater reservoirs of the Right-Bank Sorbulak Canalsystem, 2021 (average values with standard deviation, n = 84 for each variable).
VariableWater Body
* MPCSorbulak RSC 7 RSC 8
Depth average, m 10.0 ± 8.3 4.6 ± 1.4 4.1 ± 1.7 -Transparency, m 0.87 ± 0.61 1.16 ± 1.02 0.25 ± 0.10 -
Temperature surface, ◦C 21.7 ± 4.2 24.7 ± 1.2 22.7 ± 3.1 -Temperature bottom, ◦C 20.1 ± 3.8 25.7 ± 0.8 22.7 ± 2.2 -
pH surface 9.41 ± 0.19 9.51 ± 0.17 10.00 ± 0.30 ** 6.5–6.8pH bottom 9.06 ± 0.42 9.59 ± 0.15 9.75 ± 0.20 ** 6.5–6.8
Oxygen, mg/dm3 11.95 ± 3.65 11.50 ± 3.22 12.20 ± 2.18 ** >6.0TDS, mg/dm3 1340.0 ± 150.4 546.2 ± 84.9 464.5 ± 67.7 -
Hardness, mg-eq/dm3 6.20 ± 0.29 3.70 ± 0.37 2.64 ± 0.40 -PI, mgO/dm3 19.07 ± 4.01 17.36 ± 3.28 16.22 ± 4.37 -
N-NO2, mg/dm3 0.05 ± 0.05 0.13 ± 0.15 0.03 ± 0.03 0.02N-NO3, mg/dm3 0.68 ± 0.53 3.00 ± 4.13 1.28 ± 2.44 9.10N-NH4, mg/dm3 0.30 ± 0.30 0.37 ± 0.39 0.53 ± 0.54 0.50
PO4, mg/dm3 0.26 ± 0.09 0.39 ± 0.16 0.14 ± 0.09 ** 0.05Si, mg/dm3 3.69 ± 1.10 8.26 ± 1.82 7.03 ± 1.63 10.0
Mn, mg/dm3 0.03 ± 0.03 0.05 ± 0.02 0.07 ± 0.03 0.01Fe, mg/dm3 0.34 ± 0.14 0.37 ± 0.09 0.38 ± 0.13 0.10Cd, mg/dm3 0.0001 ± 0.000002 0.0001 ± 0.000002 0.0001 ± 0.000002 0.0005Co, mg/dm3 0.0002 ± 0.00001 0.0003 ± 0.0001 0.0002 ± 0.0002 0.010Cr, mg/dm3 0.0070 ± 0.0025 0.0060 ± 0.0030 0.0050 ± 0.0020 0.001–0.005Cu, mg/dm3 0.0115 ± 0.0079 0.0255 ± 0.0284 0.0359 ± 0.0175 0.001Pb, mg/dm3 0.0010 ± 0.0024 0.0008 ± 0.00039 0.0007 ± 0.0007 0.01Zn, mg/dm3 0.0053 ± 0.0033 0.0110 ± 0.0087 0.0085 ± 0.0059 0.01
Note. * MPC, maximum permissible concentration [43]. ** There is no MPC, only the recommended standard. Adash means no MPC or the recommended standard.
Vertical stratification of water temperature and pH was recorded only in the northernbay of Sorbulak, with depths of more than 15–25 m. The average temperature of the bottomlayers of water was 4.5–8.0 ◦C lower than on the surface. The difference in pH was 0.17–1.13.
Water 2022, 14, 1784 8 of 25
At depths of 6.0–10.0 m, the differences in these variables reached 0.2–3.3 ◦C and 0.04–0.31◦C, respectively. In shallow ponds, the temperature and pH of the water at the surface andthe bottom practically did not differ.
Bottom sediments are black and gray silts, clay, in ponds with many detritus, inthe deep part of Sorbulak with the smell of hydrogen sulfide. The thickness of the near-bottom hydrogen sulfide layer was 5–7 m. At the end of summer and autumn, the smell ofhydrogen sulfide was also recorded in the near-bottom layers of some shallow areas of thewater area (eastern bay).
The coastal zone of Sorbulak, especially the shallowest southern and western parts, isovergrown with comb pondweed Stuckenia pectinata L. With a seasonal decrease in waterlevel, the area occupied by pondweed increased three to four times. There is no pondweedin the ponds. Along the banks of the canal connecting ponds No. 7 and 8, the common reedPhragmites australis (Cav.) Trin grows. ex Steud.
3.2. Hydrochemical and Toxicological Variables
In June 2021, the water in the wastewater canal had the following characteristics. TDSwas equal to 557.6 mg/dm3, content of N-NO2—0.31, N-NO3—9.87, N-NH4—1.63, PO4—1.0, Si—5.72, Fe—0.62 mg/dm3, PI—13.4 mgO/dm3. The content of heavy metals was ata low level: Cd—0.0001, Co—0.0003, Cr—0.0061, Cu—0.0009, Pb—0.00001, Zn—0.0046mg/dm3.
The water in the ponds is slightly mineralized (Table 1). In Sorbulak, the average valueof TDS is more than twice as high as in the ponds and the canal. According to its chemicalcomposition, the water belonged to the chloride class, the sodium group of the second type(ClNa
II). Sulfates (SNaII) prevail in Sorbulak only in April. Sorbulak water is of medium
hardness, and it is soft in ponds. The oxygen content in the surface layers was at a highlevel. The highest average content of N-NO2, N-NO3, PO4, and Si was found in RSC 7,N-NH4—in RSC 8, and PI—in Sorbulak. The average Mn and Fe content in the ponds andSorbulak did not differ significantly. The content of Zn, Cr, and Pb was at a low level, Cd,and in some cases Co below the detection limit. The Cu content was generally elevated,with a maximum in RSC 8.
3.3. Dynamics during the Six Warm Months
In Sorbulak, the temperature of surface water layers increased from 15.52 ◦C in Aprilto 27.34 ◦C in August and decreased to 22.19 ◦C in September. In ponds, the averagewater temperature was 17.80–18.00, 25.97–26.10, and 21.60–23.35 ◦C, respectively. Watertransparency in Sorbulak increased from 0.40–0.49 m in April and May to 1.06 m in Augustand 1.90 m in September. In RSC 8, the average value of the variable varied within 0.12–0.38m. In RSC 7, the maximum water transparency was in April (3.0 m) and the minimum inJuly (0.4 m). The minimum oxygen content in the surface water layers in Sorbulak andRSC 7 was in July (6.97 and 8.00 mg/dm3), in RSC 8—in August (8.30 mg/dm3). In otherperiods, the oxygen content varied within 10.40–16.05 mg/dm3. From April to September,TDS increased from 1047.2 to 1435.9 mg/dm3 in Sorbulak, from 537.1 to 634.9 in RSC 7,and from 360.3 to 523.7 mg/dm3 in RSC 8. The largest amount of easily oxidizable organicsubstances (PI = 21.07–25.00 mgO/dm3) was registered in May, with a minimum in Apriland September (PI = 11.67–15.00 mgO/dm3).
The seasonal dynamics of nitrogen and phosphorus compounds in Sorbulak and RSC7 did not follow clear patterns, with a weakly expressed trend of decreasing from April toSeptember (Figure 4). In RSC 8, the maximum N-NO2, N-NO3, and PO4 were recorded inJune, and N-NH4—in July. In Sorbulak, the highest amount of Cu was detected in June, inponds in August. In August, an increased amount of Cr was registered in Sorbulak.
Water 2022, 14, 1784 9 of 25
Water 2022, 14, x FOR PEER REVIEW 9 of 25
June, and N-NH4—in July. In Sorbulak, the highest amount of Cu was detected in June, in ponds in August. In August, an increased amount of Cr was registered in Sorbulak.
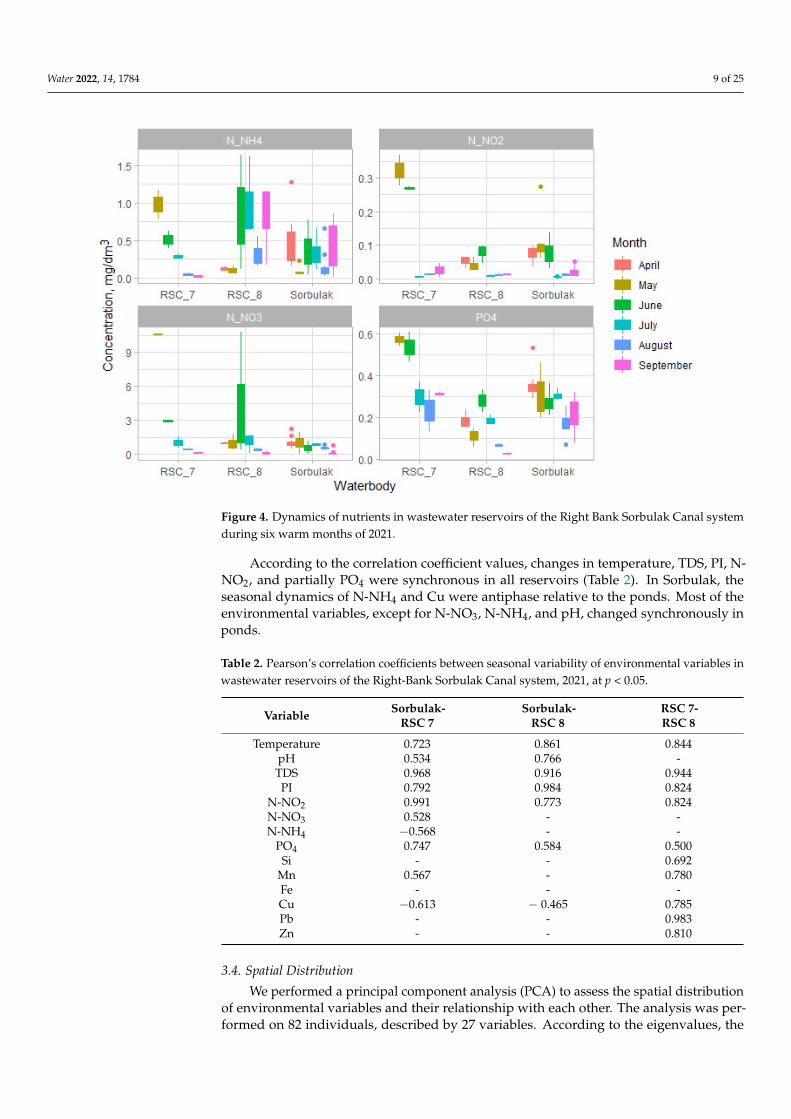
Figure 4. Dynamics of nutrients in wastewater reservoirs of the Right Bank Sorbulak Canal system during six warm months of 2021.
According to the correlation coefficient values, changes in temperature, TDS, PI, N-NO2, and partially PO4 were synchronous in all reservoirs (Table 2). In Sorbulak, the sea-sonal dynamics of N-NH4 and Cu were antiphase relative to the ponds. Most of the envi-ronmental variables, except for N-NO3, N-NH4, and pH, changed synchronously in ponds.
Table 2. Pearson’s correlation coefficients between seasonal variability of environmental variables in wastewater reservoirs of the Right-Bank Sorbulak Canal system, 2021, at p < 0.05.
Variable Sorbulak- RSC 7
Sorbulak- RSC 8
RSC 7- RSC 8
Temperature 0.723 0.861 0.844 pH 0.534 0.766 - TDS 0.968 0.916 0.944 PI 0.792 0.984 0.824
N-NO2 0.991 0.773 0.824 N-NO3 0.528 - - N-NH4 −0.568 - -
PO4 0.747 0.584 0.500 Si - - 0.692
Mn 0.567 - 0.780 Fe - - - Cu −0.613 − 0.465 0.785 Pb - - 0.983 Zn - - 0.810
3.4. Spatial Distribution We performed a principal component analysis (PCA) to assess the spatial distribu-
tion of environmental variables and their relationship with each other. The analysis was
Figure 4. Dynamics of nutrients in wastewater reservoirs of the Right Bank Sorbulak Canal systemduring six warm months of 2021.
According to the correlation coefficient values, changes in temperature, TDS, PI, N-NO2, and partially PO4 were synchronous in all reservoirs (Table 2). In Sorbulak, theseasonal dynamics of N-NH4 and Cu were antiphase relative to the ponds. Most of theenvironmental variables, except for N-NO3, N-NH4, and pH, changed synchronously inponds.
Table 2. Pearson’s correlation coefficients between seasonal variability of environmental variables inwastewater reservoirs of the Right-Bank Sorbulak Canal system, 2021, at p < 0.05.
Variable Sorbulak-RSC 7
Sorbulak-RSC 8
RSC 7-RSC 8
Temperature 0.723 0.861 0.844pH 0.534 0.766 -TDS 0.968 0.916 0.944PI 0.792 0.984 0.824
N-NO2 0.991 0.773 0.824N-NO3 0.528 - -N-NH4 −0.568 - -
PO4 0.747 0.584 0.500Si - - 0.692
Mn 0.567 - 0.780Fe - - -Cu −0.613 − 0.465 0.785Pb - - 0.983Zn - - 0.810
3.4. Spatial Distribution
We performed a principal component analysis (PCA) to assess the spatial distributionof environmental variables and their relationship with each other. The analysis was per-formed on 82 individuals, described by 27 variables. According to the eigenvalues, the
Water 2022, 14, 1784 10 of 25
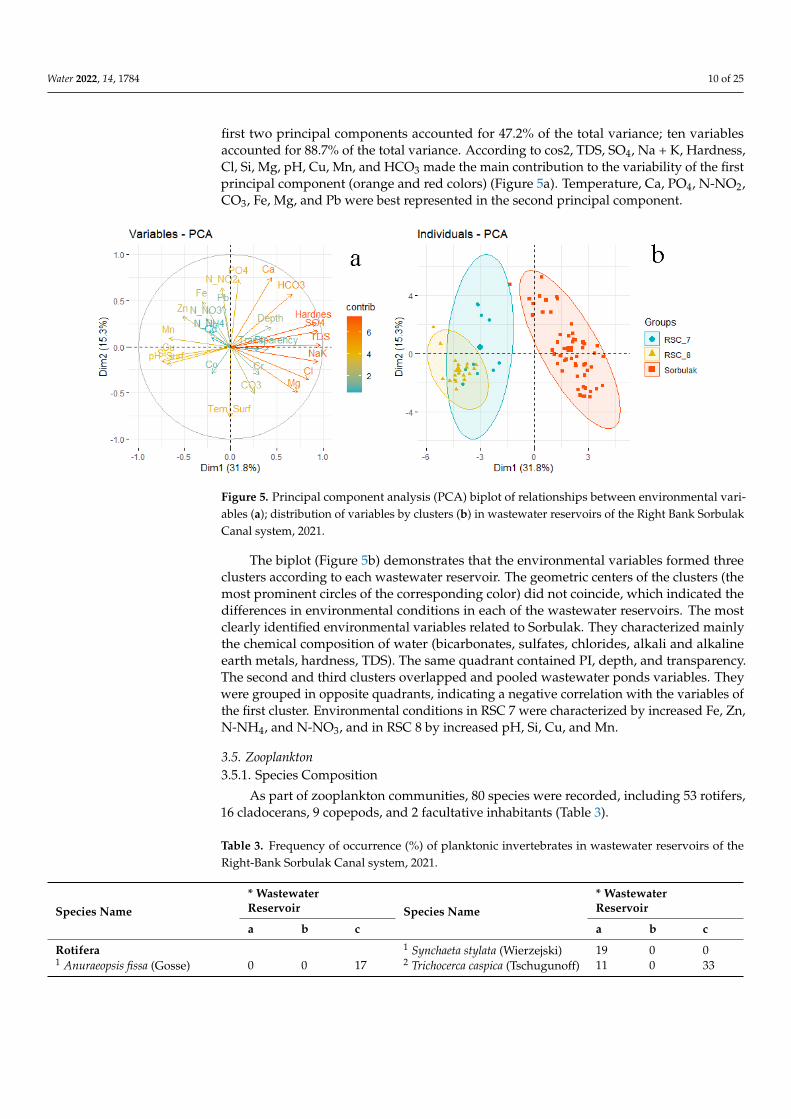
first two principal components accounted for 47.2% of the total variance; ten variablesaccounted for 88.7% of the total variance. According to cos2, TDS, SO4, Na + K, Hardness,Cl, Si, Mg, pH, Cu, Mn, and HCO3 made the main contribution to the variability of the firstprincipal component (orange and red colors) (Figure 5a). Temperature, Ca, PO4, N-NO2,CO3, Fe, Mg, and Pb were best represented in the second principal component.
Water 2022, 14, x FOR PEER REVIEW 10 of 25
performed on 82 individuals, described by 27 variables. According to the eigenvalues, the first two principal components accounted for 47.2% of the total variance; ten variables accounted for 88.7% of the total variance. According to cos2, TDS, SO4, Na + K, Hardness, Cl, Si, Mg, pH, Cu, Mn, and HCO3 made the main contribution to the variability of the first principal component (orange and red colors) (Figure 5a). Temperature, Ca, PO4, N-NO2, CO3, Fe, Mg, and Pb were best represented in the second principal component.
Figure 5. Principal component analysis (PCA) biplot of relationships between environmental varia-bles (a); distribution of variables by clusters (b) in wastewater reservoirs of the Right Bank Sorbulak Canal system, 2021.
The biplot (Figure 5b) demonstrates that the environmental variables formed three clusters according to each wastewater reservoir. The geometric centers of the clusters (the most prominent circles of the corresponding color) did not coincide, which indicated the differences in environmental conditions in each of the wastewater reservoirs. The most clearly identified environmental variables related to Sorbulak. They characterized mainly the chemical composition of water (bicarbonates, sulfates, chlorides, alkali and alkaline earth metals, hardness, TDS). The same quadrant contained PI, depth, and transparency. The second and third clusters overlapped and pooled wastewater ponds variables. They were grouped in opposite quadrants, indicating a negative correlation with the variables of the first cluster. Environmental conditions in RSC 7 were characterized by increased Fe, Zn, N-NH4, and N-NO3, and in RSC 8 by increased pH, Si, Cu, and Mn.
3.5. Zooplankton 3.5.1. Species Composition
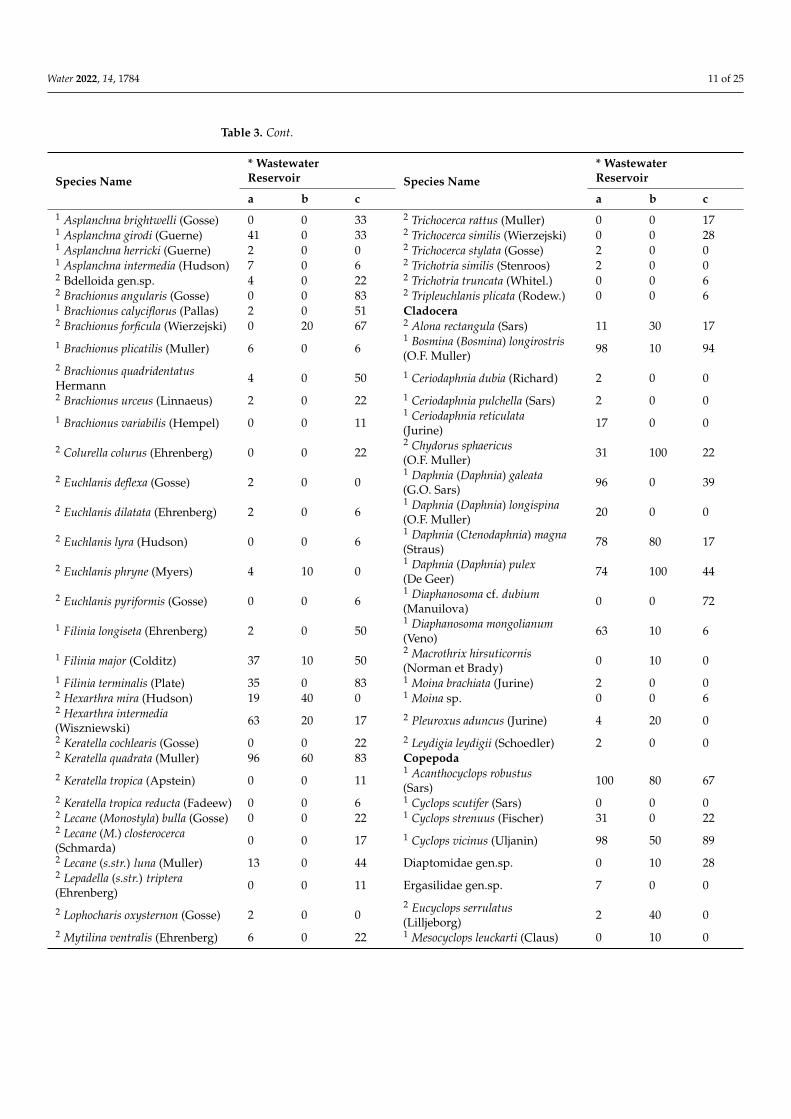
As part of zooplankton communities, 80 species were recorded, including 53 rotifers, 16 cladocerans, 9 copepods, and 2 facultative inhabitants (Table 3).
Table 3. Frequency of occurrence (%) of planktonic invertebrates in wastewater reservoirs of the Right-Bank Sorbulak Canal system, 2021.
Species Name * Wastewater Reservoir Species Name
* Wastewater Reservoir
a b c a b c Rotifera 1 Synchaeta stylata (Wierzejski) 19 0 0
1 Anuraeopsis fissa (Gosse) 0 0 17 2 Trichocerca caspica (Tschugunoff)
11 0 33
1 Asplanchna brightwelli (Gosse) 0 0 33 2 Trichocerca rattus (Muller) 0 0 17 1 Asplanchna girodi (Guerne) 41 0 33 2 Trichocerca similis (Wierzejski) 0 0 28 1 Asplanchna herricki (Guerne) 2 0 0 2 Trichocerca stylata (Gosse) 2 0 0
Figure 5. Principal component analysis (PCA) biplot of relationships between environmental vari-ables (a); distribution of variables by clusters (b) in wastewater reservoirs of the Right Bank SorbulakCanal system, 2021.
The biplot (Figure 5b) demonstrates that the environmental variables formed threeclusters according to each wastewater reservoir. The geometric centers of the clusters (themost prominent circles of the corresponding color) did not coincide, which indicated thedifferences in environmental conditions in each of the wastewater reservoirs. The mostclearly identified environmental variables related to Sorbulak. They characterized mainlythe chemical composition of water (bicarbonates, sulfates, chlorides, alkali and alkalineearth metals, hardness, TDS). The same quadrant contained PI, depth, and transparency.The second and third clusters overlapped and pooled wastewater ponds variables. Theywere grouped in opposite quadrants, indicating a negative correlation with the variables ofthe first cluster. Environmental conditions in RSC 7 were characterized by increased Fe, Zn,N-NH4, and N-NO3, and in RSC 8 by increased pH, Si, Cu, and Mn.
3.5. Zooplankton3.5.1. Species Composition
As part of zooplankton communities, 80 species were recorded, including 53 rotifers,16 cladocerans, 9 copepods, and 2 facultative inhabitants (Table 3).
Table 3. Frequency of occurrence (%) of planktonic invertebrates in wastewater reservoirs of theRight-Bank Sorbulak Canal system, 2021.
Species Name* WastewaterReservoir Species Name
* WastewaterReservoir
a b c a b c
Rotifera 1 Synchaeta stylata (Wierzejski) 19 0 01 Anuraeopsis fissa (Gosse) 0 0 17 2 Trichocerca caspica (Tschugunoff) 11 0 33
Water 2022, 14, 1784 11 of 25
Table 3. Cont.
Species Name* WastewaterReservoir Species Name
* WastewaterReservoir
a b c a b c1 Asplanchna brightwelli (Gosse) 0 0 33 2 Trichocerca rattus (Muller) 0 0 171 Asplanchna girodi (Guerne) 41 0 33 2 Trichocerca similis (Wierzejski) 0 0 281 Asplanchna herricki (Guerne) 2 0 0 2 Trichocerca stylata (Gosse) 2 0 01 Asplanchna intermedia (Hudson) 7 0 6 2 Trichotria similis (Stenroos) 2 0 02 Bdelloida gen.sp. 4 0 22 2 Trichotria truncata (Whitel.) 0 0 62 Brachionus angularis (Gosse) 0 0 83 2 Tripleuchlanis plicata (Rodew.) 0 0 61 Brachionus calyciflorus (Pallas) 2 0 51 Cladocera2 Brachionus forficula (Wierzejski) 0 20 67 2 Alona rectangula (Sars) 11 30 17
1 Brachionus plicatilis (Muller) 6 0 61 Bosmina (Bosmina) longirostris(O.F. Muller)
98 10 94
2 Brachionus quadridentatusHermann
4 0 50 1 Ceriodaphnia dubia (Richard) 2 0 0
2 Brachionus urceus (Linnaeus) 2 0 22 1 Ceriodaphnia pulchella (Sars) 2 0 0
1 Brachionus variabilis (Hempel) 0 0 111 Ceriodaphnia reticulata(Jurine)
17 0 0
2 Colurella colurus (Ehrenberg) 0 0 222 Chydorus sphaericus(O.F. Muller)
31 100 22
2 Euchlanis deflexa (Gosse) 2 0 01 Daphnia (Daphnia) galeata(G.O. Sars)
96 0 39
2 Euchlanis dilatata (Ehrenberg) 2 0 61 Daphnia (Daphnia) longispina(O.F. Muller)
20 0 0
2 Euchlanis lyra (Hudson) 0 0 61 Daphnia (Ctenodaphnia) magna(Straus)
78 80 17
2 Euchlanis phryne (Myers) 4 10 01 Daphnia (Daphnia) pulex(De Geer)
74 100 44
2 Euchlanis pyriformis (Gosse) 0 0 61 Diaphanosoma cf. dubium(Manuilova)
0 0 72
1 Filinia longiseta (Ehrenberg) 2 0 501 Diaphanosoma mongolianum(Veno)
63 10 6
1 Filinia major (Colditz) 37 10 502 Macrothrix hirsuticornis(Norman et Brady)
0 10 0
1 Filinia terminalis (Plate) 35 0 83 1 Moina brachiata (Jurine) 2 0 02 Hexarthra mira (Hudson) 19 40 0 1 Moina sp. 0 0 62 Hexarthra intermedia(Wiszniewski)
63 20 17 2 Pleuroxus aduncus (Jurine) 4 20 0
2 Keratella cochlearis (Gosse) 0 0 22 2 Leydigia leydigii (Schoedler) 2 0 02 Keratella quadrata (Muller) 96 60 83 Copepoda2 Keratella tropica (Apstein) 0 0 11
1 Acanthocyclops robustus(Sars)
100 80 67
2 Keratella tropica reducta (Fadeew) 0 0 6 1 Cyclops scutifer (Sars) 0 0 02 Lecane (Monostyla) bulla (Gosse) 0 0 22 1 Cyclops strenuus (Fischer) 31 0 222 Lecane (M.) closterocerca(Schmarda)
0 0 17 1 Cyclops vicinus (Uljanin) 98 50 89
2 Lecane (s.str.) luna (Muller) 13 0 44 Diaptomidae gen.sp. 0 10 282 Lepadella (s.str.) triptera(Ehrenberg)
0 0 11 Ergasilidae gen.sp. 7 0 0
2 Lophocharis oxysternon (Gosse) 2 0 02 Eucyclops serrulatus(Lilljeborg)
2 40 0
2 Mytilina ventralis (Ehrenberg) 6 0 22 1 Mesocyclops leuckarti (Claus) 0 10 0
Water 2022, 14, 1784 12 of 25
Table 3. Cont.
Species Name* WastewaterReservoir Species Name
* WastewaterReservoir
a b c a b c2 Notommata collaris (Ehrenberg) 2 0 0 1 Sinodiaptomus sarsi (Rylov) 0 20 67
2 Notommatidae gen.sp. 2 20 282 Thermocyclops vermifer(Lindberg)
0 0 61
1 Polyarthra dolichoptera (Idelson) 22 0 17 Others1 Polyarthra major (Burchhardt) 13 0 0 Oligochaeta gen.sp. 2 10 01 Pompholyx sulcata (Hudson) 17 0 50 Ostracoda gen.sp. 2 90 171 Synchaeta kitina (Roussel.) 37 0 0 Nematoda gen.sp. 2 0 6
* Note. The letters indicate wastewater reservoir: a—Sorbulak, b—RSC 7, c—RSC 8. The numbers indicate:1—pelagic species, 2—thicket species, which may also occur in the pelagic zone.
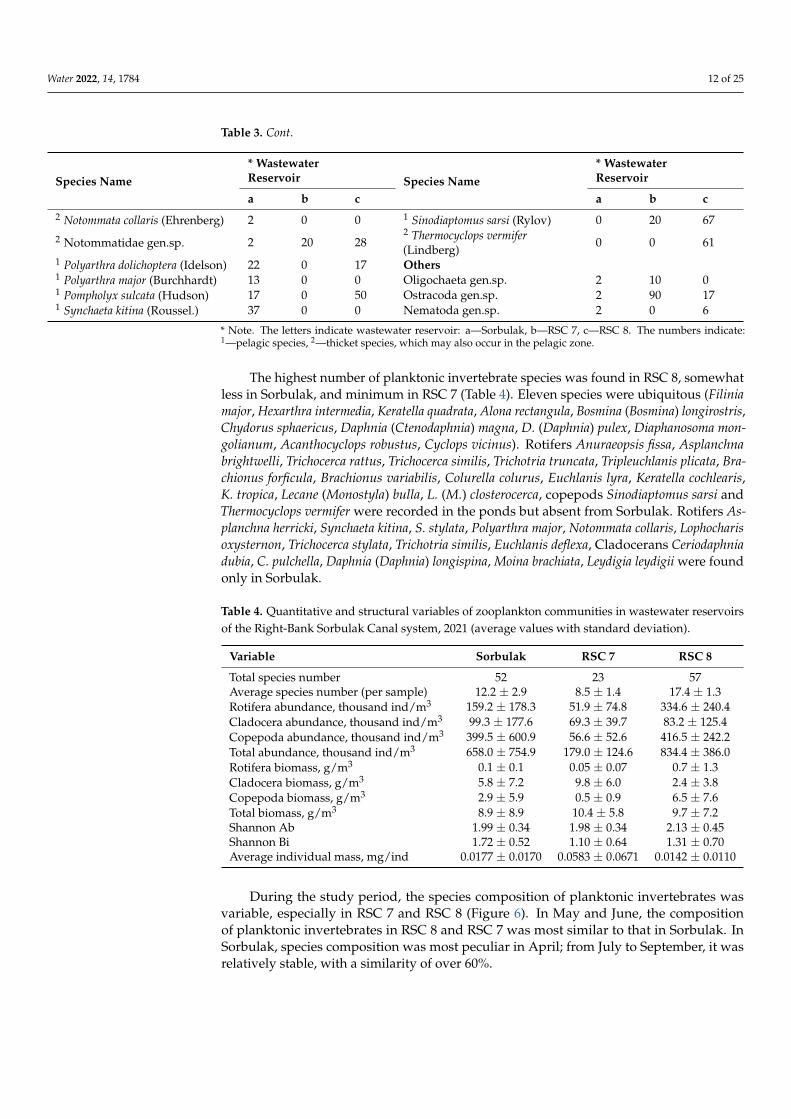
The highest number of planktonic invertebrate species was found in RSC 8, somewhatless in Sorbulak, and minimum in RSC 7 (Table 4). Eleven species were ubiquitous (Filiniamajor, Hexarthra intermedia, Keratella quadrata, Alona rectangula, Bosmina (Bosmina) longirostris,Chydorus sphaericus, Daphnia (Ctenodaphnia) magna, D. (Daphnia) pulex, Diaphanosoma mon-golianum, Acanthocyclops robustus, Cyclops vicinus). Rotifers Anuraeopsis fissa, Asplanchnabrightwelli, Trichocerca rattus, Trichocerca similis, Trichotria truncata, Tripleuchlanis plicata, Bra-chionus forficula, Brachionus variabilis, Colurella colurus, Euchlanis lyra, Keratella cochlearis,K. tropica, Lecane (Monostyla) bulla, L. (M.) closterocerca, copepods Sinodiaptomus sarsi andThermocyclops vermifer were recorded in the ponds but absent from Sorbulak. Rotifers As-planchna herricki, Synchaeta kitina, S. stylata, Polyarthra major, Notommata collaris, Lophocharisoxysternon, Trichocerca stylata, Trichotria similis, Euchlanis deflexa, Cladocerans Ceriodaphniadubia, C. pulchella, Daphnia (Daphnia) longispina, Moina brachiata, Leydigia leydigii were foundonly in Sorbulak.
Table 4. Quantitative and structural variables of zooplankton communities in wastewater reservoirsof the Right-Bank Sorbulak Canal system, 2021 (average values with standard deviation).
Variable Sorbulak RSC 7 RSC 8
Total species number 52 23 57Average species number (per sample) 12.2 ± 2.9 8.5 ± 1.4 17.4 ± 1.3Rotifera abundance, thousand ind/m3 159.2 ± 178.3 51.9 ± 74.8 334.6 ± 240.4Cladocera abundance, thousand ind/m3 99.3 ± 177.6 69.3 ± 39.7 83.2 ± 125.4Copepoda abundance, thousand ind/m3 399.5 ± 600.9 56.6 ± 52.6 416.5 ± 242.2Total abundance, thousand ind/m3 658.0 ± 754.9 179.0 ± 124.6 834.4 ± 386.0Rotifera biomass, g/m3 0.1 ± 0.1 0.05 ± 0.07 0.7 ± 1.3Cladocera biomass, g/m3 5.8 ± 7.2 9.8 ± 6.0 2.4 ± 3.8Copepoda biomass, g/m3 2.9 ± 5.9 0.5 ± 0.9 6.5 ± 7.6Total biomass, g/m3 8.9 ± 8.9 10.4 ± 5.8 9.7 ± 7.2Shannon Ab 1.99 ± 0.34 1.98 ± 0.34 2.13 ± 0.45Shannon Bi 1.72 ± 0.52 1.10 ± 0.64 1.31 ± 0.70Average individual mass, mg/ind 0.0177 ± 0.0170 0.0583 ± 0.0671 0.0142 ± 0.0110
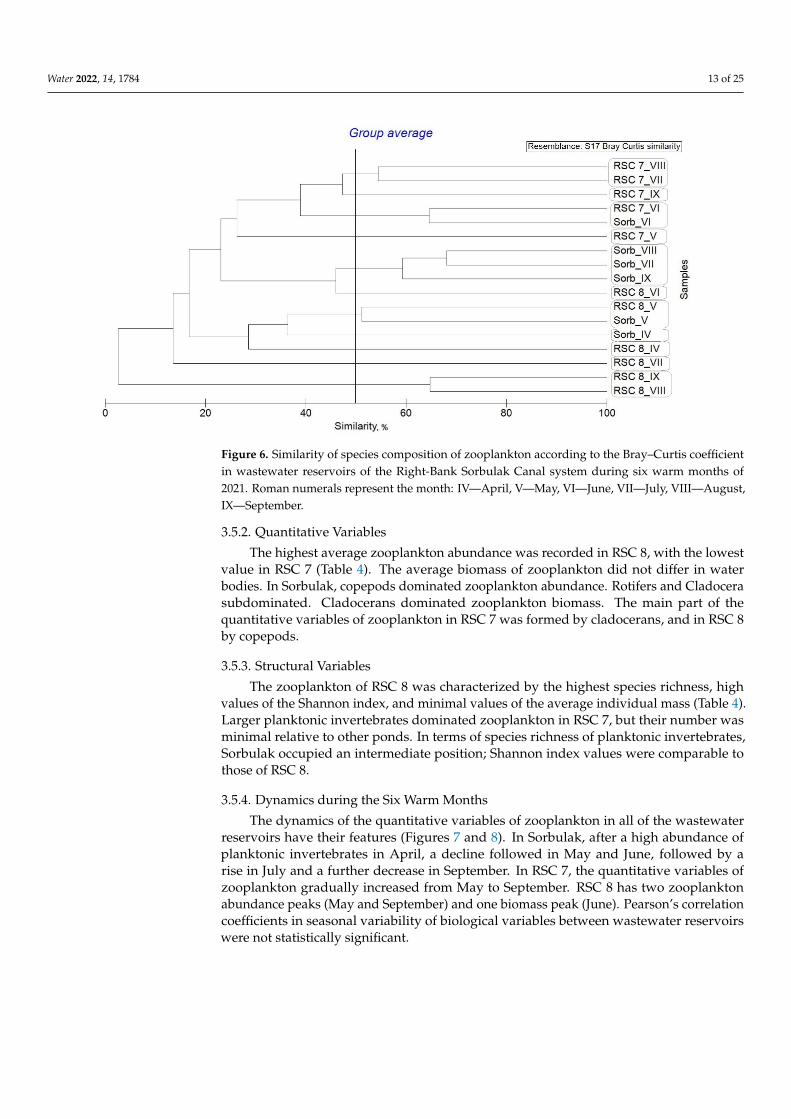
During the study period, the species composition of planktonic invertebrates wasvariable, especially in RSC 7 and RSC 8 (Figure 6). In May and June, the compositionof planktonic invertebrates in RSC 8 and RSC 7 was most similar to that in Sorbulak. InSorbulak, species composition was most peculiar in April; from July to September, it wasrelatively stable, with a similarity of over 60%.
Water 2022, 14, 1784 13 of 25Water 2022, 14, x FOR PEER REVIEW 13 of 25
Figure 6. Similarity of species composition of zooplankton according to the Bray–Curtis coefficient in wastewater reservoirs of the Right-Bank Sorbulak Canal system during six warm months of 2021. Roman numerals represent the month: IV—April, V—May, VI—June, VII—July, VIII—August, IX—September.
3.5.2. Quantitative Variables The highest average zooplankton abundance was recorded in RSC 8, with the lowest
value in RSC 7 (Table 4). The average biomass of zooplankton did not differ in water bod-ies. In Sorbulak, copepods dominated zooplankton abundance. Rotifers and Cladocera subdominated. Cladocerans dominated zooplankton biomass. The main part of the quan-titative variables of zooplankton in RSC 7 was formed by cladocerans, and in RSC 8 by copepods.
3.5.3. Structural Variables The zooplankton of RSC 8 was characterized by the highest species richness, high
values of the Shannon index, and minimal values of the average individual mass (Table 4). Larger planktonic invertebrates dominated zooplankton in RSC 7, but their number was minimal relative to other ponds. In terms of species richness of planktonic inverte-brates, Sorbulak occupied an intermediate position; Shannon index values were compa-rable to those of RSC 8.
3.5.4. Dynamics during the Six Warm Months The dynamics of the quantitative variables of zooplankton in all of the wastewater
reservoirs have their features (Figures 7 and 8). In Sorbulak, after a high abundance of planktonic invertebrates in April, a decline followed in May and June, followed by a rise in July and a further decrease in September. In RSC 7, the quantitative variables of zoo-plankton gradually increased from May to September. RSC 8 has two zooplankton abun-dance peaks (May and September) and one biomass peak (June). Pearson’s correlation coefficients in seasonal variability of biological variables between wastewater reservoirs were not statistically significant.
Figure 6. Similarity of species composition of zooplankton according to the Bray–Curtis coefficientin wastewater reservoirs of the Right-Bank Sorbulak Canal system during six warm months of2021. Roman numerals represent the month: IV—April, V—May, VI—June, VII—July, VIII—August,IX—September.
3.5.2. Quantitative Variables
The highest average zooplankton abundance was recorded in RSC 8, with the lowestvalue in RSC 7 (Table 4). The average biomass of zooplankton did not differ in waterbodies. In Sorbulak, copepods dominated zooplankton abundance. Rotifers and Cladocerasubdominated. Cladocerans dominated zooplankton biomass. The main part of thequantitative variables of zooplankton in RSC 7 was formed by cladocerans, and in RSC 8by copepods.
3.5.3. Structural Variables
The zooplankton of RSC 8 was characterized by the highest species richness, highvalues of the Shannon index, and minimal values of the average individual mass (Table 4).Larger planktonic invertebrates dominated zooplankton in RSC 7, but their number wasminimal relative to other ponds. In terms of species richness of planktonic invertebrates,Sorbulak occupied an intermediate position; Shannon index values were comparable tothose of RSC 8.
3.5.4. Dynamics during the Six Warm Months
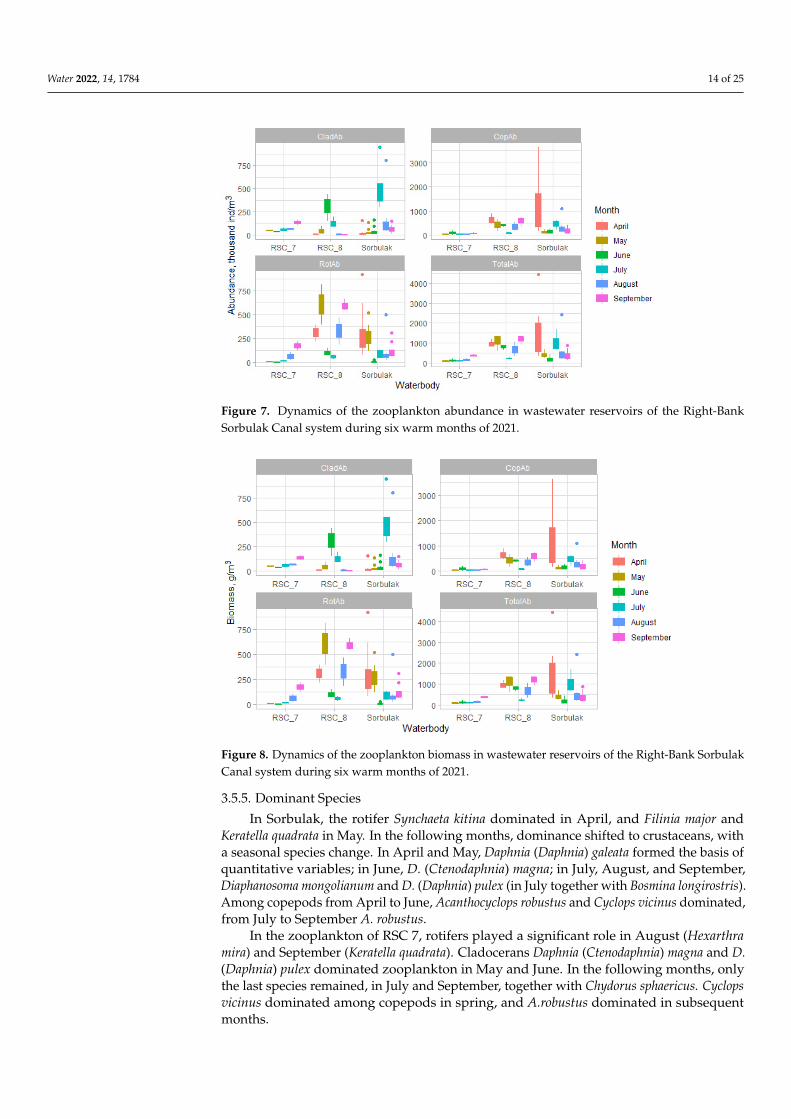
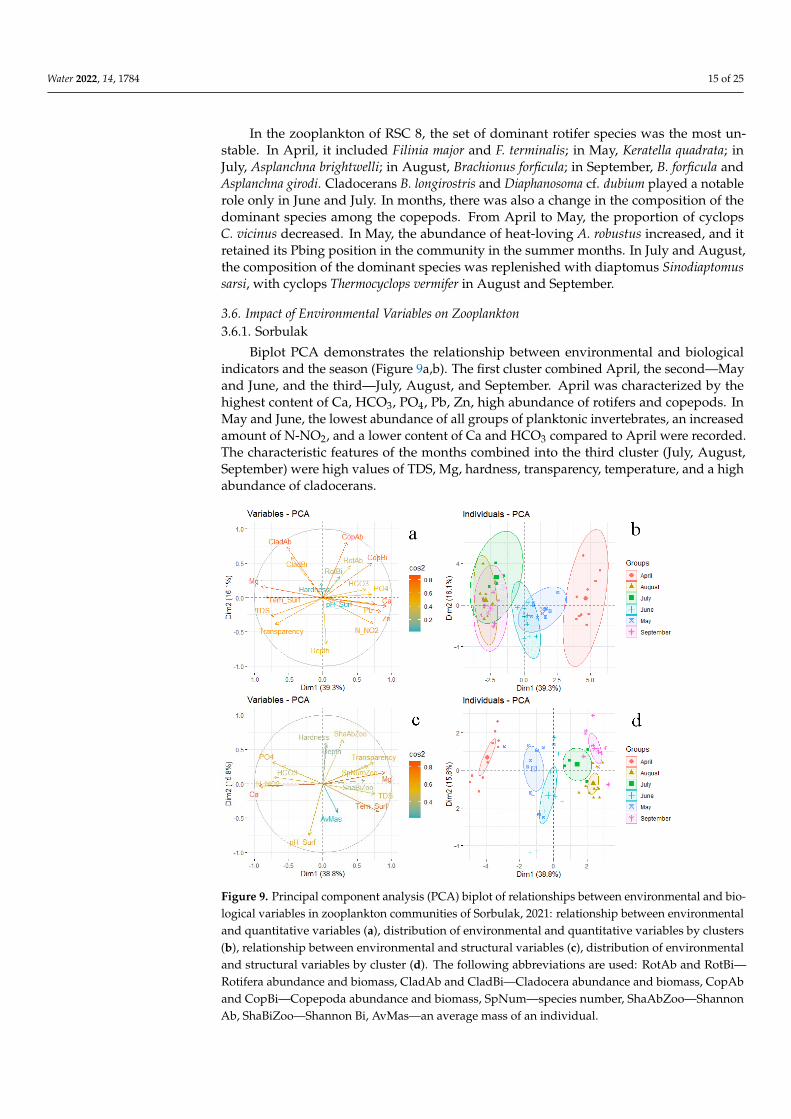
The dynamics of the quantitative variables of zooplankton in all of the wastewaterreservoirs have their features (Figures 7 and 8). In Sorbulak, after a high abundance ofplanktonic invertebrates in April, a decline followed in May and June, followed by arise in July and a further decrease in September. In RSC 7, the quantitative variables ofzooplankton gradually increased from May to September. RSC 8 has two zooplanktonabundance peaks (May and September) and one biomass peak (June). Pearson’s correlationcoefficients in seasonal variability of biological variables between wastewater reservoirswere not statistically significant.
Water 2022, 14, 1784 14 of 25Water 2022, 14, x FOR PEER REVIEW 14 of 25
Figure 7. Dynamics of the zooplankton abundance in wastewater reservoirs of the Right-Bank Sor-bulak Canal system during six warm months of 2021.
Figure 8. Dynamics of the zooplankton biomass in wastewater reservoirs of the Right-Bank Sorbu-lak Canal system during six warm months of 2021.
3.5.5. Dominant Species In Sorbulak, the rotifer Synchaeta kitina dominated in April, and Filinia major and
Keratella quadrata in May. In the following months, dominance shifted to crustaceans, with a seasonal species change. In April and May, Daphnia (Daphnia) galeata formed the basis of quantitative variables; in June, D. (Ctenodaphnia) magna; in July, August, and September, Diaphanosoma mongolianum and D. (Daphnia) pulex (in July together with Bosmina longiros-tris). Among copepods from April to June, Acanthocyclops robustus and Cyclops vicinus dominated, from July to September A. robustus.
In the zooplankton of RSC 7, rotifers played a significant role in August (Hexarthra mira) and September (Keratella quadrata). Cladocerans Daphnia (Ctenodaphnia) magna and D. (Daphnia) pulex dominated zooplankton in May and June. In the following months, only
Figure 7. Dynamics of the zooplankton abundance in wastewater reservoirs of the Right-BankSorbulak Canal system during six warm months of 2021.
Water 2022, 14, x FOR PEER REVIEW 14 of 25
Figure 7. Dynamics of the zooplankton abundance in wastewater reservoirs of the Right-Bank Sor-bulak Canal system during six warm months of 2021.
Figure 8. Dynamics of the zooplankton biomass in wastewater reservoirs of the Right-Bank Sorbu-lak Canal system during six warm months of 2021.
3.5.5. Dominant Species In Sorbulak, the rotifer Synchaeta kitina dominated in April, and Filinia major and
Keratella quadrata in May. In the following months, dominance shifted to crustaceans, with a seasonal species change. In April and May, Daphnia (Daphnia) galeata formed the basis of quantitative variables; in June, D. (Ctenodaphnia) magna; in July, August, and September, Diaphanosoma mongolianum and D. (Daphnia) pulex (in July together with Bosmina longiros-tris). Among copepods from April to June, Acanthocyclops robustus and Cyclops vicinus dominated, from July to September A. robustus.
In the zooplankton of RSC 7, rotifers played a significant role in August (Hexarthra mira) and September (Keratella quadrata). Cladocerans Daphnia (Ctenodaphnia) magna and D. (Daphnia) pulex dominated zooplankton in May and June. In the following months, only
Figure 8. Dynamics of the zooplankton biomass in wastewater reservoirs of the Right-Bank SorbulakCanal system during six warm months of 2021.
3.5.5. Dominant Species
In Sorbulak, the rotifer Synchaeta kitina dominated in April, and Filinia major andKeratella quadrata in May. In the following months, dominance shifted to crustaceans, witha seasonal species change. In April and May, Daphnia (Daphnia) galeata formed the basis ofquantitative variables; in June, D. (Ctenodaphnia) magna; in July, August, and September,Diaphanosoma mongolianum and D. (Daphnia) pulex (in July together with Bosmina longirostris).Among copepods from April to June, Acanthocyclops robustus and Cyclops vicinus dominated,from July to September A. robustus.
In the zooplankton of RSC 7, rotifers played a significant role in August (Hexarthramira) and September (Keratella quadrata). Cladocerans Daphnia (Ctenodaphnia) magna and D.(Daphnia) pulex dominated zooplankton in May and June. In the following months, onlythe last species remained, in July and September, together with Chydorus sphaericus. Cyclopsvicinus dominated among copepods in spring, and A.robustus dominated in subsequentmonths.
Water 2022, 14, 1784 15 of 25
In the zooplankton of RSC 8, the set of dominant rotifer species was the most un-stable. In April, it included Filinia major and F. terminalis; in May, Keratella quadrata; inJuly, Asplanchna brightwelli; in August, Brachionus forficula; in September, B. forficula andAsplanchna girodi. Cladocerans B. longirostris and Diaphanosoma cf. dubium played a notablerole only in June and July. In months, there was also a change in the composition of thedominant species among the copepods. From April to May, the proportion of cyclopsC. vicinus decreased. In May, the abundance of heat-loving A. robustus increased, and itretained its Pbing position in the community in the summer months. In July and August,the composition of the dominant species was replenished with diaptomus Sinodiaptomussarsi, with cyclops Thermocyclops vermifer in August and September.
3.6. Impact of Environmental Variables on Zooplankton3.6.1. Sorbulak
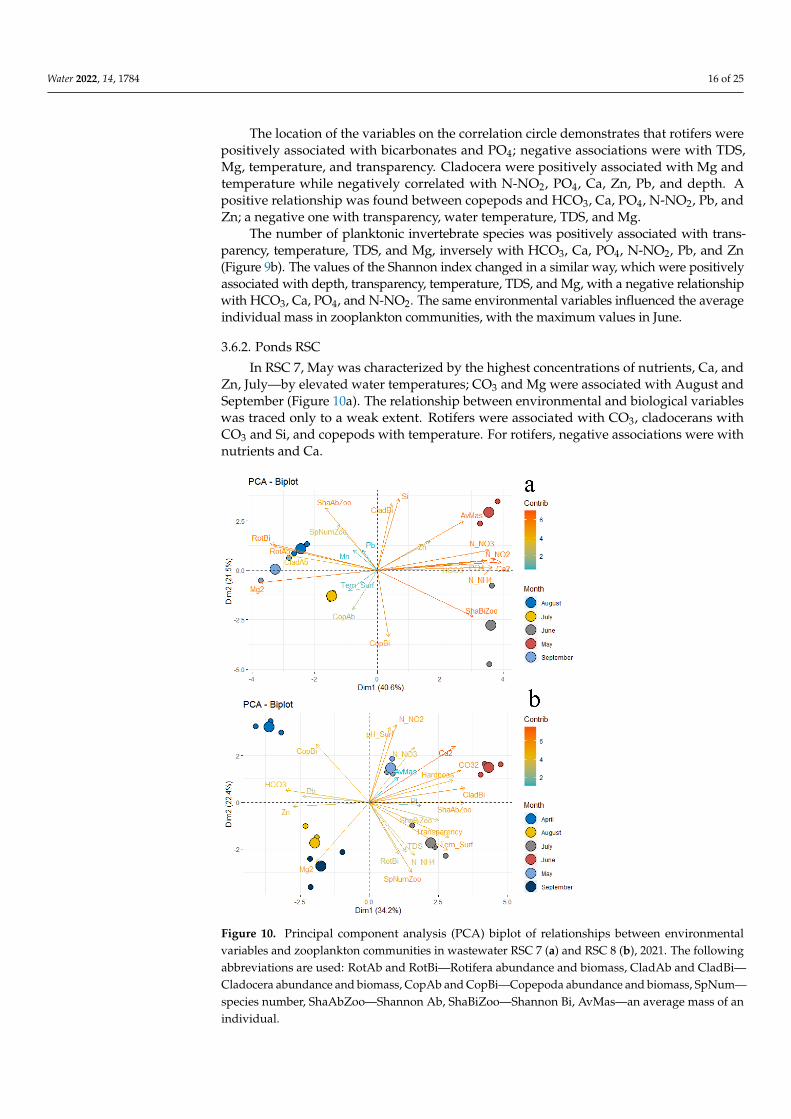
Biplot PCA demonstrates the relationship between environmental and biologicalindicators and the season (Figure 9a,b). The first cluster combined April, the second—Mayand June, and the third—July, August, and September. April was characterized by thehighest content of Ca, HCO3, PO4, Pb, Zn, high abundance of rotifers and copepods. InMay and June, the lowest abundance of all groups of planktonic invertebrates, an increasedamount of N-NO2, and a lower content of Ca and HCO3 compared to April were recorded.The characteristic features of the months combined into the third cluster (July, August,September) were high values of TDS, Mg, hardness, transparency, temperature, and a highabundance of cladocerans.
Water 2022, 14, x FOR PEER REVIEW 15 of 25
the last species remained, in July and September, together with Chydorus sphaericus. Cy-clops vicinus dominated among copepods in spring, and A.robustus dominated in subse-quent months.
In the zooplankton of RSC 8, the set of dominant rotifer species was the most unsta-ble. In April, it included Filinia major and F. terminalis; in May, Keratella quadrata; in July, Asplanchna brightwelli; in August, Brachionus forficula; in September, B. forficula and Asplanchna girodi. Cladocerans B. longirostris and Diaphanosoma cf. dubium played a notable role only in June and July. In months, there was also a change in the composition of the dominant species among the copepods. From April to May, the proportion of cyclops C. vicinus decreased. In May, the abundance of heat-loving A. robustus increased, and it re-tained its Pbing position in the community in the summer months. In July and August, the composition of the dominant species was replenished with diaptomus Sinodiaptomus sarsi, with cyclops Thermocyclops vermifer in August and September.
3.6. Impact of Environmental Variables on Zooplankton 3.6.1. Sorbulak
Biplot PCA demonstrates the relationship between environmental and biological in-dicators and the season (Figure 9a,b). The first cluster combined April, the second—May and June, and the third—July, August, and September. April was characterized by the highest content of Ca, HCO3, PO4, Pb, Zn, high abundance of rotifers and copepods. In May and June, the lowest abundance of all groups of planktonic invertebrates, an in-creased amount of N-NO2, and a lower content of Ca and HCO3 compared to April were recorded. The characteristic features of the months combined into the third cluster (July, August, September) were high values of TDS, Mg, hardness, transparency, temperature, and a high abundance of cladocerans.
Figure 9. Principal component analysis (PCA) biplot of relationships between environmental and biological variables in zooplankton communities of Sorbulak, 2021: relationship between environ-mental and quantitative variables (a), distribution of environmental and quantitative variables by
Figure 9. Principal component analysis (PCA) biplot of relationships between environmental and bio-logical variables in zooplankton communities of Sorbulak, 2021: relationship between environmentaland quantitative variables (a), distribution of environmental and quantitative variables by clusters(b), relationship between environmental and structural variables (c), distribution of environmentaland structural variables by cluster (d). The following abbreviations are used: RotAb and RotBi—Rotifera abundance and biomass, CladAb and CladBi—Cladocera abundance and biomass, CopAband CopBi—Copepoda abundance and biomass, SpNum—species number, ShaAbZoo—ShannonAb, ShaBiZoo—Shannon Bi, AvMas—an average mass of an individual.
Water 2022, 14, 1784 16 of 25
The location of the variables on the correlation circle demonstrates that rotifers werepositively associated with bicarbonates and PO4; negative associations were with TDS,Mg, temperature, and transparency. Cladocera were positively associated with Mg andtemperature while negatively correlated with N-NO2, PO4, Ca, Zn, Pb, and depth. Apositive relationship was found between copepods and HCO3, Ca, PO4, N-NO2, Pb, andZn; a negative one with transparency, water temperature, TDS, and Mg.
The number of planktonic invertebrate species was positively associated with trans-parency, temperature, TDS, and Mg, inversely with HCO3, Ca, PO4, N-NO2, Pb, and Zn(Figure 9b). The values of the Shannon index changed in a similar way, which were positivelyassociated with depth, transparency, temperature, TDS, and Mg, with a negative relationshipwith HCO3, Ca, PO4, and N-NO2. The same environmental variables influenced the averageindividual mass in zooplankton communities, with the maximum values in June.
3.6.2. Ponds RSC
In RSC 7, May was characterized by the highest concentrations of nutrients, Ca, andZn, July—by elevated water temperatures; CO3 and Mg were associated with August andSeptember (Figure 10a). The relationship between environmental and biological variableswas traced only to a weak extent. Rotifers were associated with CO3, cladocerans withCO3 and Si, and copepods with temperature. For rotifers, negative associations were withnutrients and Ca.
Water 2022, 14, x FOR PEER REVIEW 17 of 25
Figure 10. Principal component analysis (PCA) biplot of relationships between environmental var-iables and zooplankton communities in wastewater RSC 7 (a) and RSC 8 (b), 2021. The following abbreviations are used: RotAb and RotBi—Rotifera abundance and biomass, CladAb and CladBi—Cladocera abundance and biomass, CopAb and CopBi—Copepoda abundance and biomass, SpNum—species number, ShaAbZoo—Shannon Ab, ShaBiZoo—Shannon Bi, AvMas—an average mass of an individual.
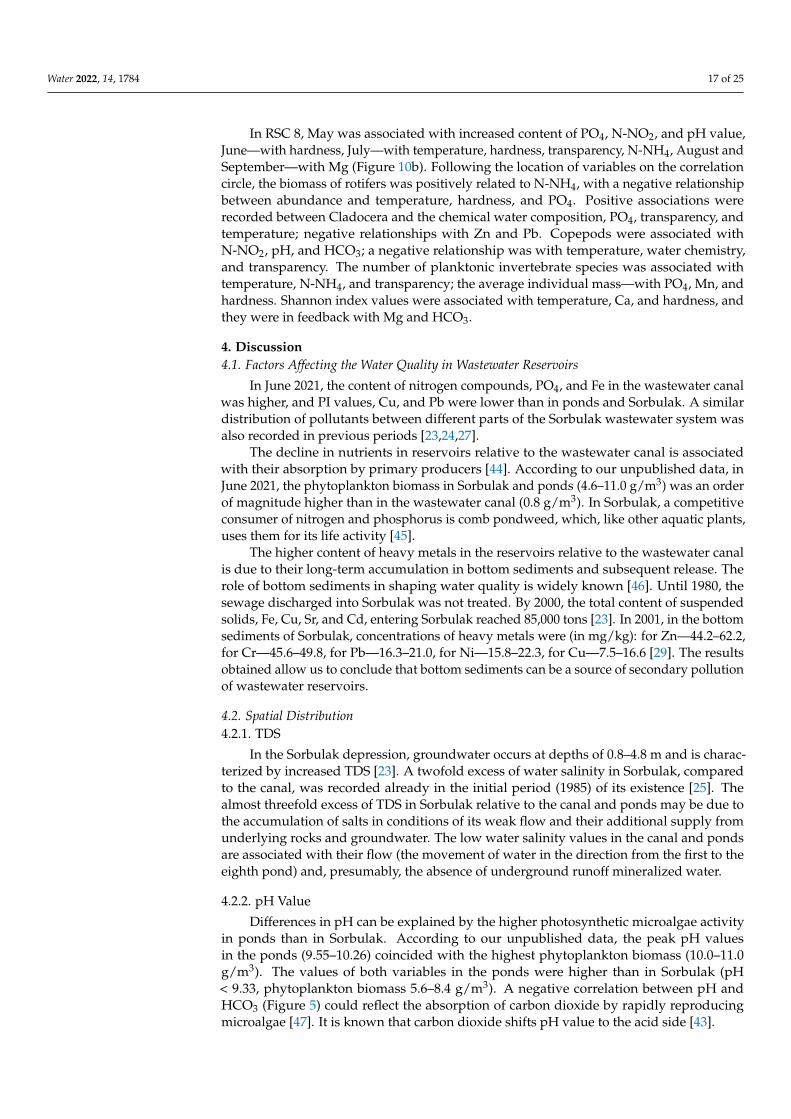
In RSC 8, May was associated with increased content of PO4, N-NO2, and pH value, June—with hardness, July—with temperature, hardness, transparency, N-NH4, August and September—with Mg (Figure 10b). Following the location of variables on the correla-tion circle, the biomass of rotifers was positively related to N-NH4, with a negative rela-tionship between abundance and temperature, hardness, and PO4. Positive associations were recorded between Cladocera and the chemical water composition, PO4, transpar-ency, and temperature; negative relationships with Zn and Pb. Copepods were associated with N-NO2, pH, and HCO3; a negative relationship was with temperature, water chem-istry, and transparency. The number of planktonic invertebrate species was associated with temperature, N-NH4, and transparency; the average individual mass—with PO4, Mn, and hardness. Shannon index values were associated with temperature, Ca, and hardness, and they were in feedback with Mg and HCO3.
4. Discussion 4.1. Factors Affecting the Water Quality in Wastewater Reservoirs
In June 2021, the content of nitrogen compounds, PO4, and Fe in the wastewater canal was higher, and PI values, Cu, and Pb were lower than in ponds and Sorbulak. A similar
Figure 10. Principal component analysis (PCA) biplot of relationships between environmentalvariables and zooplankton communities in wastewater RSC 7 (a) and RSC 8 (b), 2021. The followingabbreviations are used: RotAb and RotBi—Rotifera abundance and biomass, CladAb and CladBi—Cladocera abundance and biomass, CopAb and CopBi—Copepoda abundance and biomass, SpNum—species number, ShaAbZoo—Shannon Ab, ShaBiZoo—Shannon Bi, AvMas—an average mass of anindividual.
Water 2022, 14, 1784 17 of 25
In RSC 8, May was associated with increased content of PO4, N-NO2, and pH value,June—with hardness, July—with temperature, hardness, transparency, N-NH4, August andSeptember—with Mg (Figure 10b). Following the location of variables on the correlationcircle, the biomass of rotifers was positively related to N-NH4, with a negative relationshipbetween abundance and temperature, hardness, and PO4. Positive associations wererecorded between Cladocera and the chemical water composition, PO4, transparency, andtemperature; negative relationships with Zn and Pb. Copepods were associated withN-NO2, pH, and HCO3; a negative relationship was with temperature, water chemistry,and transparency. The number of planktonic invertebrate species was associated withtemperature, N-NH4, and transparency; the average individual mass—with PO4, Mn, andhardness. Shannon index values were associated with temperature, Ca, and hardness, andthey were in feedback with Mg and HCO3.
4. Discussion4.1. Factors Affecting the Water Quality in Wastewater Reservoirs
In June 2021, the content of nitrogen compounds, PO4, and Fe in the wastewater canalwas higher, and PI values, Cu, and Pb were lower than in ponds and Sorbulak. A similardistribution of pollutants between different parts of the Sorbulak wastewater system wasalso recorded in previous periods [23,24,27].
The decline in nutrients in reservoirs relative to the wastewater canal is associatedwith their absorption by primary producers [44]. According to our unpublished data, inJune 2021, the phytoplankton biomass in Sorbulak and ponds (4.6–11.0 g/m3) was an orderof magnitude higher than in the wastewater canal (0.8 g/m3). In Sorbulak, a competitiveconsumer of nitrogen and phosphorus is comb pondweed, which, like other aquatic plants,uses them for its life activity [45].
The higher content of heavy metals in the reservoirs relative to the wastewater canalis due to their long-term accumulation in bottom sediments and subsequent release. Therole of bottom sediments in shaping water quality is widely known [46]. Until 1980, thesewage discharged into Sorbulak was not treated. By 2000, the total content of suspendedsolids, Fe, Cu, Sr, and Cd, entering Sorbulak reached 85,000 tons [23]. In 2001, in the bottomsediments of Sorbulak, concentrations of heavy metals were (in mg/kg): for Zn—44.2–62.2,for Cr—45.6–49.8, for Pb—16.3–21.0, for Ni—15.8–22.3, for Cu—7.5–16.6 [29]. The resultsobtained allow us to conclude that bottom sediments can be a source of secondary pollutionof wastewater reservoirs.
4.2. Spatial Distribution4.2.1. TDS
In the Sorbulak depression, groundwater occurs at depths of 0.8–4.8 m and is charac-terized by increased TDS [23]. A twofold excess of water salinity in Sorbulak, comparedto the canal, was recorded already in the initial period (1985) of its existence [25]. Thealmost threefold excess of TDS in Sorbulak relative to the canal and ponds may be due tothe accumulation of salts in conditions of its weak flow and their additional supply fromunderlying rocks and groundwater. The low water salinity values in the canal and pondsare associated with their flow (the movement of water in the direction from the first to theeighth pond) and, presumably, the absence of underground runoff mineralized water.
4.2.2. pH Value
Differences in pH can be explained by the higher photosynthetic microalgae activityin ponds than in Sorbulak. According to our unpublished data, the peak pH valuesin the ponds (9.55–10.26) coincided with the highest phytoplankton biomass (10.0–11.0g/m3). The values of both variables in the ponds were higher than in Sorbulak (pH< 9.33, phytoplankton biomass 5.6–8.4 g/m3). A negative correlation between pH andHCO3 (Figure 5) could reflect the absorption of carbon dioxide by rapidly reproducingmicroalgae [47]. It is known that carbon dioxide shifts pH value to the acid side [43].
Water 2022, 14, 1784 18 of 25
4.2.3. Nutrients
Municipal, livestock, and agricultural effluents are the primary sources of nutrientsupply to aquatic ecosystems [48]. Aquatic and semi-aquatic birds also enrich waterbodies with nitrogen and phosphorus [49]. Primary producers consume nutrients fortheir growth [50]. Their death leads to the accumulation of these compounds in bottomsediments [45] and secondary pollution of water bodies [51]. Desorption of nitrogen is moreactive than phosphorus and depends on temperature. The solubility of iron phosphates isaffected by Ca [52]. In turn, iron stimulates phosphorus binding in bottom sediments [53].Positive relationships between Fe and PO4 were established for the lakes of NorthernKazakhstan [54].
Differences in the average content of nutrients between Sorbulak and ponds are dueto many reasons. In addition to wastewater, grazing and watering of animals (Figure 3c)is an additional source of nutrients for Sorbulak and, to a lesser extent, ponds. Colonialbird species (pelicans, cormorants, gulls) nesting on the islands contributed to the organicpollution of these water bodies (Figure 3a,b). Compared with ponds, the lower content ofnitrogen in Sorbulak may be due to its absorption by combed pondweed in shallow watersand burial in bottom sediments of deep-water parts. Obviously, secondary pollution ofponds occurs due to intensive desorption from bottom sediments in shallow depths andhigh temperatures of the bottom layer. A particular contribution to the enrichment of pondswith nutrients caused by polluted runoff from overlying shallow ponds. In them and theponds we examined, the desorption of pollutants from bottom sediments occurs due to highwater temperatures in summer. Chemical interactions [52,53] also affect the accumulationof nutrients in the examined wastewater reservoirs. For Sorbulak, the Pearson correlationcoefficient between PO4 and Fe was 0.547, and between PO4 and Ca was 0.641, at p < 0.05.For ponds, the relationship between PO4 and Fe was not statistically significant; a moresubstantial relationship was noted between PO4 and Ca (r = 0.840, p < 0.05).
4.2.4. Silicon, Iron, and Manganese
Silicon enters aquatic ecosystems due to chemical weathering and dissolution ofsilicon-containing minerals [43], with industrial wastewater, due to the death of plants andalgae [55]. The content of Si in the surface waters of the humid zone correlates with organicmatter [56]. Silicon contributes to water enrichment with Fe and Mn [57]. Manganeseenters aquatic ecosystems through the leaching of ferromanganese ores, emissions, andeffluents from industrial enterprises [43]. Inside the water body, the release of Mn occursdue to the decomposition of aquatic animals, algae, and higher aquatic plants. With asufficient amount of oxygen, the formation of sparingly soluble MnO2 contributes to itsaccumulation in bottom sediments [58]. The return of Mn to water most intensively occurstogether with PO4 under anaerobic conditions [59].
According to the references, the increased combined content of Si, Fe, and Mn inponds may be associated with chemical interactions between these elements. In addition towastewater, the sources of their receipt are the processes of secondary pollution of ponds,including the death of planktonic algae. A substantial amount of Si and PO4 was recordedin RSC 7, where in summer, the water is a green suspension of planktonic algae (Figure 2e).
4.2.5. Heavy Metals
Heavy metals get into wastewater and further into Sorbulak and ponds, mainly withindustrial wastewater. Due to socio-economic reasons, from the 1990s to 2005, the share ofindustrial effluents in the total volume of wastewater declined [23], which led to a decreasein the overall level of toxic pollution of wastewater reservoirs. In 2000–2002, the contentof heavy metals varied within the following limits (mg/dm3): Cd—from 0.005 to 0.078,Cu—from 0.002 to 0.024, Pb—from 0.006 to 0.047, Zn—from 0.014 to 0.047 [29]. In thesummer of 2017, the content of Cd and Pb was below the detection limit; the content of Cuand Zn in Sorbulak and RSC 8 was significantly lower than the MPC, but high in RSC 7(Zn was 0.037, Cu was 0.043 mg/dm3) [24]. For six months of 2021, the concentrations of
Water 2022, 14, 1784 19 of 25
Cd, Cr, Co, Pb, and Zn in all water bodies were below the MPC. The widespread increasein Cu (up to 0.0115–0.0359 mg/dm3, with a maximum in ponds) may be associated with anincrease in textile production in Almaty (from 5.0 to 23.7%) in recent years [60]. Copper,along with zinc, is used to manufacture paints and dyeing fabrics [23].
Differences in the spatial distribution of heavy metals in the surveyed wastewaterbodies are determined by a complex of local physicochemical factors. The migratoryof heavy metals depends on the form of their occurrence (cationic or anionic) and thephysicochemical conditions of the water body [61]. The entry of heavy metals into the waterfrom bottom sediments is stimulated by anaerobic conditions [62], high temperatures, andlow water pH values [11]. Binding with CO3
2− and Cl− leads to the formation of sparinglysoluble complexes and the accumulation of heavy metals in bottom sediments [61]. Cuand Pb are almost completely precipitated under alkaline conditions (pH > 6); Zn bindswith Mn and Fe oxides and precipitates more intensively with an increase in TDS [11]. Sicontributes to water enrichment with Zn and Cu [57].
High pH values contribute to the accumulation of metals in bottom sediments and thepurification of the water column in all wastewater reservoirs. In Sorbulak, in addition, theburial of heavy metals in bottom sediments occurs due to temperature stratification (in thedeep part, the temperature of the bottom layers is 7–8 ◦C lower than on the surface) and ahigh concentration of complexing ions (CO3
2−, Cl−). In shallow ponds, the temperatureof the bottom layers in summer reaches 25.5–26.0 ◦C, which can stimulate the desorptionof heavy metals from sediments to water. Chemical interactions between Si, Zn, and Cucontribute to their joint accumulation in ponds. An additional influx of heavy metals intoponds can occur due to polluted runoff from overlying ponds (Figure 1).
4.2.6. Dynamic during Six Warm Months
For natural water bodies, the supply of nutrients is positively correlated with precipi-tation, with a maximum in the spring [63]. In the reservoirs examined, only four indicators(temperature, TDS, PI, N-NO2) changed to one degree or another synchronously, whichmay indicate common predictors of their seasonal dynamics. These include natural andclimatic factors (seasonal changes in air temperature and precipitation) and changes in thevolume of incoming wastewater.
Differences in the seasonal dynamics of most of the environmental variables betweenSorbulak and ponds are due to the specific conditions for transforming pollutants in eachof them. As mentioned above, a significant factor determining water quality in reservoirsis the desorption of organic and toxic substances from bottom sediments. The rate ofthese processes, in addition to the complex and often non-linear influence of severalother factors [8], positively depends on temperature [7,11]. Perhaps it is no coincidencethat the highest content of heavy metals was recorded at the end of summer, against thebackground of maximum water heating in shallow ponds. In Sorbulak, a factor in reducingtoxic pollution of the water column is increased TDS value. The Pb and Zn content inSorbulak decreased statistically significantly with an increase in water salinity (r = −0.694and r = −0.460, p < 0.05). There was a weak correlation between TDS and Pb content inponds (r = −0.380). A lead deposition is enhanced in the presence of carbonates [61,63],the amount of which in the examined reservoirs was positively related to TDS. Thus, thehydrochemical conditions of reservoirs stimulate the purification of the water column andthe accumulation of pollutants in bottom sediments; however, under certain conditions,it becomes the cause of secondary pollution of water bodies. It should also be taken intoaccount that heavy metals, once entering the aquatic ecosystem, remain there indefinitelysince they do not undergo biodegradation [11]. The removal of heavy metals from thesurveyed reservoirs is carried out due to unauthorized catching of fish, in the organs andtissues of which there is an intensive accumulation of heavy metals [28].
Water 2022, 14, 1784 20 of 25
4.3. Zooplankton4.3.1. Species Composition
Species of planktonic invertebrates, which are the most common in wastewater reser-voirs, inhabit water bodies of various types, including those with an increased amountof readily oxidizable organic substances and nutrients [64]. D. (C.) magna, D. (Daphnia)pulex, and A. robustus dominated the zooplankton of Sorbulak starting from the first yearsof its existence when wastewater was not treated [25]. It also indicates their resistanceto a wide gradient of environmental conditions. D. magna is morphologically adapted totrophic water bodies dominated by filamentous cyanobacteria due to the thickening of thebristles of the filter apparatus [65]. B. longirostris is also found in water bodies with a highabundance of cyanobacteria [66]. D. mongolianum prefers sulfate-chloride alkaline eutrophicwaters [67]. Dominance in 2021 of this species, which was absent earlier [24–27], may beassociated with a decrease in the toxic pollution of wastewater reservoirs. Cyclopoidcopepods A. robustus (previously identified as A. trajani) and C. vicinus inhabit the waterbodies of Kazakhstan with a high level of organic and toxic pollution [64]. In general, mostspecies of planktonic invertebrates recorded in ponds prefer shallow water bodies withrapidly changing environmental conditions [34,36,68] and an increased level of organicpollution [39]. In Sorbulak, both thicket and planktonic species were encountered, whichreflected the diversity of biotopes in this reservoir.
The dominance of large Daphnia in summer contributes to the purification of the watercolumn of reservoirs from bacterioplankton and phytoplankton and an increase in watertransparency [69]. A positive, statistically significant relationship between Daphnia biomassand water transparency was registered only in ponds (r = 0.681, p < 0.05).
The composition of dominant species in Sorbulak and ponds was variable, especiallyamong rotifers, which may reflect dynamic changes in environmental conditions [70],including those not taken into account in this study. The number of planktonic invertebratespecies in reservoirs decreased along the phosphorus load gradient. It was also noted inother urbanized water bodies [16].
4.3.2. Quantitative Variables
Higher quantitative variables of zooplankton in the surveyed wastewater reservoirs,compared with natural water bodies of Kazakhstan [71], are due to the constant influx ofnutrients with wastewater. Favorable conditions for planktonic invertebrates in 2021 arealso due to a significant decrease in the toxic pollution of wastewater reservoirs due to theclosure in recent decades of most industrial enterprises previously located in Almaty [23].According to our data, the ratio of the organic and toxic components in the total pollutionlevel is the main factor in forming the species composition and structure of zooplanktoncommunities in technical reservoirs of Kazakhstan [71]. This is because organic andnutrient substances determine the abundance of bacterioplankton and phytoplanktonand, consequently, the trophic conditions of planktonic invertebrates; on the other hand,chemical interactions between heavy metals and organic substances can reduce the toxicityof the last one [11].
4.3.3. Dynamics during Six Warm Months
In temperate and arid water bodies, temperature and seasonal variability in precipita-tion [71] are among the main predictors of the intra-annual dynamics of the compositionand structure of biological communities. In a tropical climate, a constant influx of nutrientsinto water bodies with wastewater causes a uniform distribution of biological variablesthroughout the year [16]. Still, in natural water bodies of the region, seasonal dynamicsdepend on the supply of nutrients from the catchment area during the monsoon period.
Differences in environmental variables (reasons discussed above) determined theasynchrony of the seasonal dynamics of zooplankton in wastewater reservoirs, despitetheir territorial proximity and feeding from the same source. In the surveyed wastewaterreservoirs, the seasonal dynamics of zooplankton had pronounced maxima: in Sorbulak, in
Water 2022, 14, 1784 21 of 25
April and July; in RSC 7, in September; and in RSC 8, in May and September. Thus, theseasonal dynamics of biological variables were associated with the seasonal temperaturegradient, but in each wastewater reservoir, it was determined by an additional set ofenvironmental indicators.
4.4. Impact of Environmental Variables on Zooplankton Communities
Depending on the water body, the factors influencing planktonic invertebrates weresomewhat different. The influence of the same environmental variables on taxonomicgroups could be either positive or negative. The different nature of the relationship betweenbiological and environmental variables is maybe due to the non-linear response of speciesto changes in environmental conditions. Previously, we found that the optimal values forplanktonic invertebrates occupy the middle of the variation series when the gradient ofecological variables is relatively wide [54,71].
Almost all taxonomic groups of zooplankton were associated with CO3 and/or HCO3.It could indirectly reflect the biotic relationships between zooplankton and phytoplankton,which are not considered in this study, and the significant role of anions in the formationof water alkalinity [43] and the transformation of heavy metals [61]. The positive effect ofwater temperature on the abundance of Cladocera, among which Bosmina, Daphnia, andCeriodaphnia dominated, is due to their thermophilicity [72,73]. Freshwater cladocerans,except Polyphemidae, are sensitive to Mg [74]. The positive relationship between theabundance of cladocerans and Mg in wastewater reservoirs confirms our earlier conclu-sion [75] about the resistance of some Daphnia species to this cation. With a low level oftoxic pollution of wastewater reservoirs in 2021, the relationship between cladocerans andZn and Pb content was negative. It indicates that even low concentrations of heavy metalscould have a negative effect on filter feeders species [76]. Cyclopoida is more resistant totoxic pollution [63], which is also confirmed in this work.
The obtained correlations between environmental and biological parameters cannotalways be explained. This is due to the insufficiency of our knowledge about the ecologicalpreferences of planktonic invertebrates and the influence of many multidirectional factorsin the conditions of complex pollution of wastewater reservoirs.
5. Conclusions
Water quality in wastewater reservoirs is formed under the influence of a complexof interrelated factors. Organic matter and nutrients enter reservoirs with wastewater,polluted surface runoff, due to the vital activity of domestic animals and near-waterbird species, and heavy metals mainly with wastewater. In turn, the toxic pollution ofwastewater entering the reservoirs depends on the volume of industrial effluents and theefficiency of their treatment. The increase in the content of copper in the water against thebackdrop of the growth of textile production in the past few years indicated insufficientlyeffective wastewater treatment from heavy metals. Further transformation of the pollutantswas determined by the physicochemical conditions in each of the wastewater reservoirs.The participation of bottom sediments in the purification and secondary pollution of thewater column largely depends on the prevailing depths. In shallow ponds, the desorptionof heavy metals from bottom sediments occurs more intensively due to better heating of thebottom layers. In the deep-water Sorbulak, water purification is facilitated by temperaturestratification, increased mineralization, and large areas occupied by macrophytes. Thejoint accumulation of some pollutants (Si, Mn, Zn, Cu) may be due to their chemicalinteraction. Zooplankton was represented mainly by eurybiont species enduring a widegradient of environmental conditions. The change in the species composition of planktonicinvertebrates during the semi-annual warm period reflected the instability of externalconditions in wastewater reservoirs. The constant supply of nutrients with wastewaterhas led to a high abundance of zooplankton in wastewater reservoirs throughout theentire research period. Zooplankton communities were mainly affected by carbonates,bicarbonates, temperature, magnesium, nutrients, and heavy metals. The results obtained
Water 2022, 14, 1784 22 of 25
indicated that even low concentrations of heavy metals could harm the Cladocera, whileCyclopoida is more resistant to toxic pollution. In general, chemical and biological variablesindicated a high level of organic pollution and relatively low toxic pollution of Sorbulak andponds. Thus, at present, the reuse of wastewater is relatively safe, but constant monitoringof its quality is necessary.
Author Contributions: E.K. analyzed the data, wrote an article, prepared figures and tables; M.A.wrote part of the article, reviewed drafts of the article; S.R. performed hydrochemical analysis ofsamples, reviewed drafts of the article. All authors have read and agreed to the published version ofthe manuscript.
Funding: This work was funded by the Committee of Science, Ministry of Education and Science,Republic of Kazakhstan, Grant no. AP08855655 “Assessment of the ecological state of wastewaterstorages of the system of the Right-Bank Sorbulak Canal for the development of the scientific basis forwastewater disposal”, Institute of Zoology. The funders had no role in study design, data collection,and analysis, decision to publish, or preparation of the manuscript.
Data Availability Statement: No new data were created or analyzed in this study. Data sharing isnot applicable to this article.
Acknowledgments: The authors are sincerely grateful to G. Hörmann (Germany, University of Kiel)for teaching the basics of the R Software.
Conflicts of Interest: The authors declare no conflict of interest.
References1. Kaboosi, K. The assessment of treated wastewater quality and the effects of mid–term irrigation on soil physical and chemical
properties (case study: Bandargaz-treated wastewater). Appl. Water Sci. 2017, 7, 2385–2396. [CrossRef]2. Rogowska, J.; Cieszynska-Semenowicz, M.; Ratajczyk, W.; Wolska, L. Micropollutants in treated wastewater. Ambio 2020, 49,
487–503. [CrossRef] [PubMed]3. Shukri, A.A.; Kyambadde, J.; Hawumba, J.F. The impact of Kalerwe abattoir wastewater effluent on the water quality of the
Nsooba Channel. Agric. Res. Technol. 2017, 6, 6–13.4. Santos, R.M.B.; Monteiro, S.M.V.; Cortes, R.M.V.; Pacheco, F.A.L.; Fernandes, L.F.S. Seasonal Differences in Water Pollution and
Liver Histopathology of Iberian Barbel (Luciobarbus bocagei) and Douro Nase (Pseudochondrostoma duriense) in an AgriculturalWatershed. Water 2022, 14, 444. [CrossRef]
5. Malikula, R.S.; Kaonga, C.C.; Mapoma, H.W.T.; Thulu, F.G.D.; Chiipa, P. Heavy Metals and Nutrients Loads in Water, Soil, andCrops Irrigated with Effluent from WWTPs in Blantyre City, Malawi. Water 2022, 14, 121. [CrossRef]
6. Angelakis, A.N.; Shane, A.S. Wastewater Treatment and Reuse: Past, Present, and Future. Water 2015, 7, 4887–4895. [CrossRef]7. Li, H.; Shi, A.; Li, M.; Zhang, X. Effect of pH, Temperature, Dissolved Oxygen, and Flow Rate of Overlying Water on Heavy
Metals Release from Storm Sewer Sediments. J. Chem. 2013, 2013, 434012. [CrossRef]8. Caporale, A.G.; Violante, A. Chemical Processes Affecting the Mobility of Heavy Metals and Metalloids in Soil Environments.
Curr. Pollut. Rep. 2016, 2, 15–27. [CrossRef]9. Shikhaleeva, G.N.; Chursina, O.D.; Shikhaleev, I.I.; Kiryushkina, A.N.; Kuzmina, I.S. Spatio–time distribution of heavy metals in
bottom sediments of the southern part of the Kuyal’nitsky liman. Bull. ONU Chem. 2014, 19, 59–69.10. Hassanzadeh, M.; Zarkami, R.; Sadeghi, R. Uptake and accumulation of heavy metals by water body and Azolla filiculoides in the
Anzali wetland. Appl. Water Sci. 2021, 11, 91. [CrossRef]11. Moore, D.; Ramamurthy, S. Heavy Metals in Natural Waters: Monitoring and Impact Assessment; Mir: Moscow, Russia, 1987; p. 288.12. Maksimovich, N.G.; Pyankov, S.V. Small Reservoirs: Ecology and Safety; Perm State National Research University: Perm, Russia,
2012; p. 256.13. Biggs, J.; von Fumetti, S.; Kelly-Quinn, M. The importance of small waterbodies for biodiversity and ecosystem services:
Implications for policy makers. Hydrobiologia 2017, 793, 3–39. [CrossRef]14. Poddubnyi, S.A.; Papchenkov, V.G.; Chemeris, E.V.; Bobrov, A. Overgrowing of Protected Shallow Waters in the Upper Volga
Reservoirs in Relation to Their Morphometry. Inland Water Biol. 2017, 10, 64–72. [CrossRef]15. Scheffer, M.; van Nes, E.H. Shallow lakes theory revisited: Various alternative regimes driven by climate, nutrients, depth and
lake size. Hydrobiologia 2007, 584, 455–466. [CrossRef]16. Razak, S.B.A.; Sharip, Z. Spatio-temporal variation of zooplankton community structure in tropical urban waterbodies along
trophic and urban gradients. Ecol. Process. 2019, 8, 44. [CrossRef]17. Ju, Y.R.; Lo, W.T.; Chen, C.F.; Chen, C.W.; Huang, Z.L.; Dong, C.D. Effect of metals on zooplankton abundance and distribution in
the coast of southwestern Taiwan. Environ. Sci. Pollut. Res. 2019, 26, 33722–33731. [CrossRef]
Water 2022, 14, 1784 23 of 25
18. Holopainen, I.J.; Holopainen, A.L.; Hämäläinen, H.; Rahkola-Sorsa, M.; Tkatcheva, V.; Viljanen, M. Effects of mining industrywaste waters on a shallow lake ecosystem in Karelia, north-west Russia. Hydrobiologia 2003, 506, 111–119. [CrossRef]
19. Saha, S.; Saha, T.; Basu, P. Seasonal Changes in Zooplankton and Macro-fauna Populations of the East Calcutta Wetland FishPonds. Proc. Zool. Soc. 2017, 70, 156–164. [CrossRef]
20. Vecchione, M. Zooplankton Distribution in Three Estuarine Bayous with Different Types of Anthropogenic Influence. Estuaries1989, 12, 169–179. [CrossRef]
21. Zaderev, E.S.; Tolomeev, A.P.; Drobotov, A.V.; Kolmakova, A.A. Influence of weather conditions on the spatial and seasonaldynamics of dissolved and suspended biogenic elements in the water column of the meromictic lake Shira. Sib. Ecol. J. 2014, 4,515–530.
22. Wang, W.X. Prediction of metal toxicity in aquatic organisms. Chin. Sci. Bull. 2013, 58, 194–202. [CrossRef]23. Dostay, Z.D.; Tyumenev, S.D. Management of Water Supply and Sewerage of the City of Almaty; Euro Print: Almaty, Kazakhstan, 2009;
p. 176.24. Krupa, E.; Barinova, S.; Romanova, S.; Aubakirova, M.; Ainabaeva, N. Planktonic invertebrates in the assessment of long–term
change in water quality of the Sorbulak wastewater disposal system (Kazakhstan). Water 2020, 12, 3409. [CrossRef]25. Kiseleva, V.A. Seasonal dynamics of hydrocenoses of the Small Sorbulak Lake (Almaty region) as a probable cause of summer–
autumn migration of migratory birds. Selevinia 2014, 1, 137–143.26. Matmuratov, S.A.; Bragin, B.I.; Troshina, T.T.; Krupa, E.G. Features of the formation of the ecological and toxicological situation in
the discharge zone of the Sorbulak canal into the Ili River. In Problems of Protection and Sustainable Use of Biodiversity of Fauna inKazakhstan; Kaganat: Almaty, Kazakhstan, 1999; pp. 132–133.
27. Aubakirova, M.O.; Krupa, E.G. Comprehensive assessment of the ecological state of wastewater storage tanks of the system ofthe Right–Bank Sorbulak Canal. Bull. KazNU 2019, 2, 120–128.
28. Bekkazinova, D.B.; Aleksanova, A.G. The content of heavy metals (Cd, Zn, Co, Ni, Cu) in the wastewater of the Almaty city. Bull.Kazakh Natl. Med. Univ. 2010, 4, 168–171.
29. Krupa, E.G.; Amirgaliev, N.A.; Shapovalov, V. Characteristics of the hydrocenosis of the Sorbulak storage pond in terms oftoxicological and biological indicators. In Modern Problems of Aquatic Toxicology; Printhous: Borok, Russia, 2002; pp. 166–167.
30. Sklyarenko, S.L.; Welsh, D.R.; Brombacher, M. Key Ornithological Territories of Kazakhstan; Association for the Conservation ofBiodiversity of Kazakhstan: Almaty, Kazakhstan, 2008; p. 18.
31. Kiselev, I.A. Research Methods of Plankton. In Life of the Fresh Water of the USSR; Pavlovsky, E.N., Zhadin, V.I., Eds.; Academy ofSciences: Moscow/Leningrad, Russia, 1956; pp. 188–253.
32. Fomin, G.S. Water Control of Chemical, Bacterial, and Radiation Safety According to International Standards; NGO Alternative: Moscow,Russia, 1995; p. 618.
33. Kutikova, L.A. Rotifers of the Fauna of the USSR; Science: Leningrad, Russia, 1964; p. 744.34. Tsalolikhin, S.Y. Key to Freshwater Invertebrates in Russia and Adjacent Territories; Zoological Institute: St. Petersburg, Russia, 1995; p.
628.35. Krupa, E.G.; Dobrokhotova, O.V.; Stuge, T.S. Fauna of Calanoida (Crustacea: Copepoda) of Kazakhstan and Adjacent Territories; Etalon
Print: Almaty, Kazakhstan, 2016; p. 208.36. Balushkina, E.V.; Vinberg, G.G. The relationship between the length and body weight of planktonic crustaceans. In Experimental
and Field Studies of the Biological Foundations of Lake Productivity; Vinberg, G.G., Ed.; Institute of Lake and River Fishery: Leningrad,Russia, 1979; pp. 58–79.
37. Magurran, E. Ecological Diversity and Its Measurement; Mir: Moscow, Russia, 1998; p. 184.38. Andronikova, I.N. Structural and Functional Organization of Zooplankton of Lake Ecosystems of Various Trophic Types; Nauka: St.
Petersburg, Russia, 1996; p. 189.39. Shitikov, V.K.; Rosenberg, G.S.; Zinchenko, T.D. Quantitative Hydroecology: Methods of Systemic Identification; Institute of Ecology of
the Volga Basin of the Russian Academy of Sciences: Togliatti, Russia, 2003; 463p, ISBN 5-93424-109-5. (In Russian)40. Glantz, S.A. Primer of Biostatistics; Mir: Moscow, Russia, 1998; p. 459.41. Mastitsky, S.E.; Shitikov, V.K. Statistical Analysis and Data Visualization with R; University of Colorado: Boulder, CO, USA, 2014; p.
459.42. Kabacoff, R. R in Action; University of Connecticut, Manning Publications Co.: Connecticut, NE, USA, 2011; p. 771.43. Guseva, T.V. Hydrochemical Variables of the State of the Environment; Social and Environmental Union: Moscow, Russia, 2002; p. 148.44. Drake, J.L.; Carpenter, E.J.; Cousins, M.; Nelson, K.L.; Guido-Zarate, A.; Loftin, K. Effects of light and nutrients on seasonal
phytoplankton succession in a temperate eutrophic coastal lagoon. Hydrobiologia 2010, 654, 177–192. [CrossRef]45. Wang, L.; Liu, Q.; Hu, C.; Liang, R.; Qiu, J.; Wang, Y. Phosphorus release during decomposition of the submerged macrophyte
Potamogeton crispus. Limnology 2018, 19, 355–366. [CrossRef]46. Wang, B.; Wang, Y.; Wang, W. Retention and mitigation of metals in sediment, soil, water, and plant of a newly constructed
root–channel wetland (China) from slightly polluted source water. SpringerPlus 2014, 3, 1–16. [CrossRef]47. Engel, F.; Attermeyer, K.; Weyhenmeyer, G.A. A simplified approach to detect a significant carbon dioxide reduction by
phytoplankton in lakes and rivers on a regional and global scale. Sci. Nat. 2020, 107, 1–29. [CrossRef]

Water 2022, 14, 1784 24 of 25
48. Lawniczak, A.E.; Zbierska, J.; Nowak, B.; Achtenberg, K.; Grzeskowiak, A.; Kanas, K. Impact of agriculture and land use onnitrate contamination in groundwater and running waters in central-west Poland. Environ. Monit. Assess. 2016, 188, 1–172.[CrossRef]
49. Krylov, A.V.; Kulakov, D.V.; Kasyanov, N.A.; Tselmovich, O.L.; Papchenkov, V.G. The influence of bird colonies on the zooplanktonin the Rybinsk Reservoir overgrown shallows. Inland Water Biol. 2009, 2, 157–161. [CrossRef]
50. Shah, M.; Hashmi, H.N.; Ali, A.; Ghumman, A.R. Performance assessment of aquatic macrophytes for treatment of municipalwastewater. J. Environ. Health Sci. Eng. 2014, 12, 1–12. [CrossRef]
51. Tsvetkova, L.I. Bottom sediments as a source of phosphorus and its role in the eutrophication of water bodies. Bull. Civ. Eng.2017, 6, 199–205. [CrossRef]
52. Savenko, V.S.; Savenko, A.V. Geochemistry of Phosphorus in the Global Hydrological Cycle; GEOS: Moscow, Russia, 2007; p. 248.53. Bakker, E.S.; Van Donk, E.; Immers, A.K. Lake restoration by in-lake iron addition: A synopsis of iron impact on aquatic organisms
and shallow lake ecosystems. Aquat. Ecol. 2016, 50, 121–135. [CrossRef]54. Krupa, E.; Romanova, S.; Berkinbaev, G.; Yakovleva, N.; Sadvakasov, E. Zooplankton as Indicator of the Ecological State of
Protected Aquatic Ecosystems (Lake Borovoe, Burabay National Nature Park, Northern Kazakhstan). Water 2020, 12, 2580.[CrossRef]
55. Kolesnikov, M.P. Forms of Si in plants. Adv. Biol. Chem. 2001, 41, 301–332.56. Ryzhakov, A.V.; Vapirov, V.V.; Stepanova, I.A. Si in surface waters of the humid zone (the case of Karelian waterbodies). Trans.
Karelian Res. Cent. Russ. Acad. Sci. 2019, 3, 52–60.57. Goncharuk, V.V.; Chebotareva, R.D.; Bashtan, S.Y.; Kosorukov, A.A.; Demchenko, V.Y.; Kaganov, V.Y. Influence of Si on the mineral
composition of water. Chem. Technol. Water 2012, 34, 249–259.58. Ogryzkova, O.S.; Eirikh, A.N.; Serykh, T.G.; Dryupina, E.Y.; Uskov, T.N.; Papina, T.S. Seasonal changes in the content of Mn in the
water of the Novosibirsk reservoir. Izv. Altai State Univ. 2014, 2, 176–180.59. Gashkina, N.A. Spatiotemporal variability of the chemical composition of the waters of small lakes in current conditions of
environmental change. In Candidate in Geography, Vernadsky Institute of Geochemistry and Analytical Chemistry; Russian Academy ofSciences: Moscow, Russia, 2014.
60. Abishev, U.S. Report on the Results of Marketing Research. Textile Production NURSULTAN; 2020. Available online: https://atameken.kz/uploads/content/files/ (accessed on 15 March 2020).
61. Davydova, O.A.; Klimov, E.S.; Vaganova, E.S.; Vaganov, A.S. Influence of Physical and Chemical Factors on the Content of Heavy Metalsin Aquatic Ecosystems; Ulyanovsk State Technical University: Ulyanovsk, Russia, 2014; p. 167.
62. Dolgov, S.V.; Koronkevich, N.I. Current Features and Dynamics of Nutrient Balance in the Kud’ma River Basin. 2. SeasonalRemoval of Nitrogen and Phosphorus. Water Resour. 2021, 48, 794–803. [CrossRef]
63. Ezekwe, I.C.; Aisubeogun, A.O.; Chima, G.N.; Odubo, E. TDS–Eh graph analysis: A new water quality index and rural watersupply implications of a river affected by mining in southeastern Nigeria. Front. Earth Sci. 2012, 6, 66–74. [CrossRef]
64. Krupa, E.; Aubakirova, M. Acanthocyclops robustus Mirabdullayev et Defaye (Copepoda, Cyclopoida) as an indicator of the ecolog-ical state of water bodies in Kazakhstan. In Proceedings of the International Symposium on Water, Ecology and Environment,Beijing, China, 5–6 December 2020.
65. Wejnerowski, L.; Cerbin, S.; Dziuba, M.K. Setae thickening in Daphnia magna alleviates the food stress caused by the filamentouscyanobacteria. Aquat. Ecol. 2017, 51, 485–498. [CrossRef]
66. Adamczuk, M. Past, present, and future roles of small cladoceran Bosmina longirostris (O. F. Müller, 1785) in aquatic ecosystems.Hydrobiologia 2016, 767, 1–11. [CrossRef]
67. Korovchinsky, N.M. Cladocerans of the Order Ctenopoda in the World Fauna; Association of Scientific Publications KMK: Moscow,Russia, 2004; p. 410.
68. Podshivalina, V.N.; Sheveleva, N.G. First record of Sinodiaptomus sarsi (Copepoda: Calanoida) from the East European Plain.Zoosystematica Ross. 2020, 29, 60–69. [CrossRef]
69. Ha, J.Y.; Saneyoshi, M.; Park, H.D.; Toda, H.; Kitano, S.; Homma, T.; Hanazato, T. Lake restoration by biomanipulation usingpiscivore and Daphnia stocking; results of the biomanipulation in Japan. Limnology 2013, 14, 19–30. [CrossRef]
70. Mukhortova, O.V.; Bolotov, S.E.; Tarasova, N.G.; Bykova, S.V.; Umanskaya, M.V.; Gorbunov, M.Y.; Krasnova, E.; Krivina, E.S.;Burkova, T.N. Zoplankton of the urbanized water body and factors determining its development (on the example of LakeBolshoye Vasilyevskoye, Tolyatti, Samara region). Volga Ecol. J. 2015, 4, 409–421.
71. Krupa, E.G. Zooplankton of limnic and lotic ecosystems of Kazakhstan. In Structure, Patterns of Formation; Palmarium AcademicPublishing: Saarbrucken, Germany, 2012; p. 346.
72. Verbitsky, V.B.; Verbitskaya, T.I.; Malysheva, O.A. The influence of various temperature regimes on the abundance dynamics andthermal tolerance of cladoceran Ceriodaphnia quadrangula (O.F. Müller, 1785). Inland Water Biol. 2009, 2, 67–71. [CrossRef]
73. Verbitskii, V.B.; Verbitskaya, T.I. Thermal preference and avoidance in cladoceran Daphnia magna Strauss (Crustacea, Cladocera)acclimated to a constant temperature. Biol. Bull. 2012, 39, 93–98. [CrossRef]

Water 2022, 14, 1784 25 of 25
74. Vinberg, G.G. On some features of the action of ions on biological objects. Biol. J. 1933, 6, 519–527.75. Krupa, E.G.; Stuge, T.S.; Lopareva, T.Y.; Shaukharbaeva, D.S. Distribution of Planktonic Crustaceans in Lake Balkhash in Relation
to Environmental Factors. J. Inland Water Biol. 2008, 1, 150–157. [CrossRef]76. Braginsky, L.P.; Velichko, I.M.; Shcherban, E.P. Freshwater Plankton in a Toxic Environment; Naukova dumka: Kyiv, Ukraine, 1987;
p. 346.