Water flows, energy demand, and market analysis of the informal water sector in Kisumu, Kenya
19
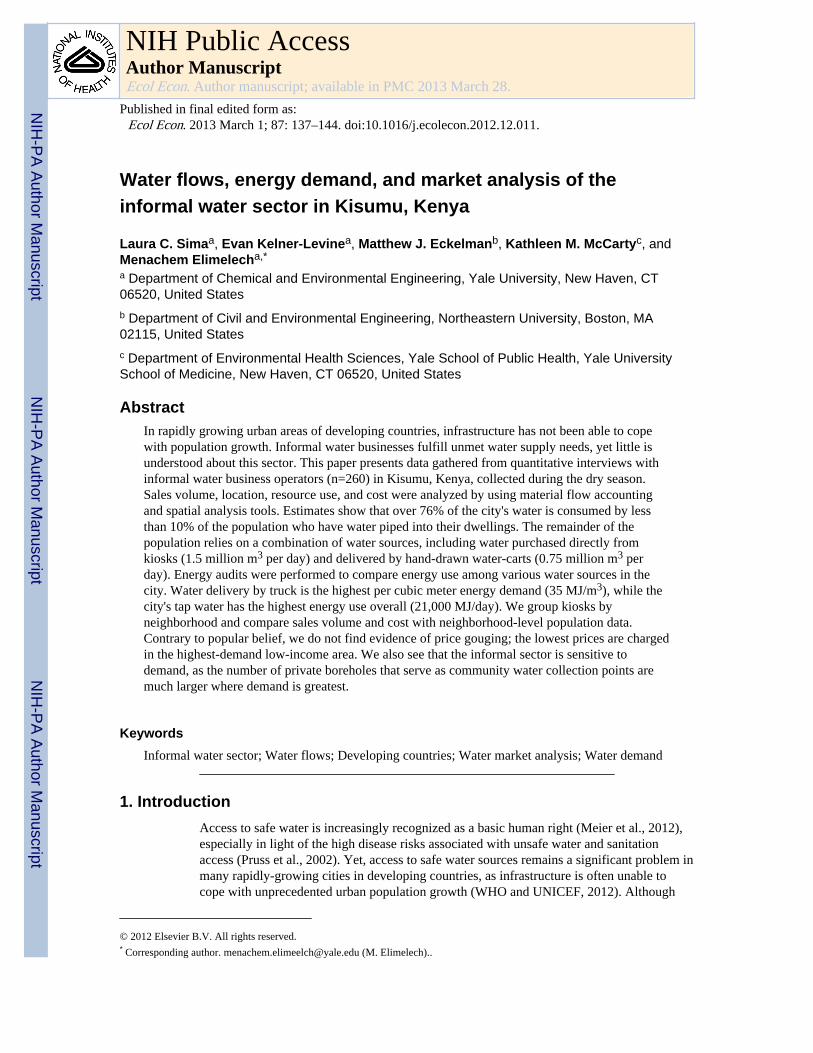
Water flows, energy demand, and market analysis of the informal water sector in Kisumu, Kenya Laura C. Sima a , Evan Kelner-Levine a , Matthew J. Eckelman b , Kathleen M. McCarty c , and Menachem Elimelech a,* a Department of Chemical and Environmental Engineering, Yale University, New Haven, CT 06520, United States b Department of Civil and Environmental Engineering, Northeastern University, Boston, MA 02115, United States c Department of Environmental Health Sciences, Yale School of Public Health, Yale University School of Medicine, New Haven, CT 06520, United States Abstract In rapidly growing urban areas of developing countries, infrastructure has not been able to cope with population growth. Informal water businesses fulfill unmet water supply needs, yet little is understood about this sector. This paper presents data gathered from quantitative interviews with informal water business operators (n=260) in Kisumu, Kenya, collected during the dry season. Sales volume, location, resource use, and cost were analyzed by using material flow accounting and spatial analysis tools. Estimates show that over 76% of the city's water is consumed by less than 10% of the population who have water piped into their dwellings. The remainder of the population relies on a combination of water sources, including water purchased directly from kiosks (1.5 million m 3 per day) and delivered by hand-drawn water-carts (0.75 million m 3 per day). Energy audits were performed to compare energy use among various water sources in the city. Water delivery by truck is the highest per cubic meter energy demand (35 MJ/m 3 ), while the city's tap water has the highest energy use overall (21,000 MJ/day). We group kiosks by neighborhood and compare sales volume and cost with neighborhood-level population data. Contrary to popular belief, we do not find evidence of price gouging; the lowest prices are charged in the highest-demand low-income area. We also see that the informal sector is sensitive to demand, as the number of private boreholes that serve as community water collection points are much larger where demand is greatest. Keywords Informal water sector; Water flows; Developing countries; Water market analysis; Water demand 1. Introduction Access to safe water is increasingly recognized as a basic human right (Meier et al., 2012), especially in light of the high disease risks associated with unsafe water and sanitation access (Pruss et al., 2002). Yet, access to safe water sources remains a significant problem in many rapidly-growing cities in developing countries, as infrastructure is often unable to cope with unprecedented urban population growth (WHO and UNICEF, 2012). Although © 2012 Elsevier B.V. All rights reserved. * Corresponding author. [email protected] (M. Elimelech).. NIH Public Access Author Manuscript Ecol Econ. Author manuscript; available in PMC 2013 March 28. Published in final edited form as: Ecol Econ. 2013 March 1; 87: 137–144. doi:10.1016/j.ecolecon.2012.12.011. NIH-PA Author Manuscript NIH-PA Author Manuscript NIH-PA Author Manuscript
Transcript of Water flows, energy demand, and market analysis of the informal water sector in Kisumu, Kenya
Water flows, energy demand, and market analysis of theinformal water sector in Kisumu, Kenya
Laura C. Simaa, Evan Kelner-Levinea, Matthew J. Eckelmanb, Kathleen M. McCartyc, andMenachem Elimelecha,*
a Department of Chemical and Environmental Engineering, Yale University, New Haven, CT06520, United Statesb Department of Civil and Environmental Engineering, Northeastern University, Boston, MA02115, United Statesc Department of Environmental Health Sciences, Yale School of Public Health, Yale UniversitySchool of Medicine, New Haven, CT 06520, United States
AbstractIn rapidly growing urban areas of developing countries, infrastructure has not been able to copewith population growth. Informal water businesses fulfill unmet water supply needs, yet little isunderstood about this sector. This paper presents data gathered from quantitative interviews withinformal water business operators (n=260) in Kisumu, Kenya, collected during the dry season.Sales volume, location, resource use, and cost were analyzed by using material flow accountingand spatial analysis tools. Estimates show that over 76% of the city's water is consumed by lessthan 10% of the population who have water piped into their dwellings. The remainder of thepopulation relies on a combination of water sources, including water purchased directly fromkiosks (1.5 million m3 per day) and delivered by hand-drawn water-carts (0.75 million m3 perday). Energy audits were performed to compare energy use among various water sources in thecity. Water delivery by truck is the highest per cubic meter energy demand (35 MJ/m3), while thecity's tap water has the highest energy use overall (21,000 MJ/day). We group kiosks byneighborhood and compare sales volume and cost with neighborhood-level population data.Contrary to popular belief, we do not find evidence of price gouging; the lowest prices are chargedin the highest-demand low-income area. We also see that the informal sector is sensitive todemand, as the number of private boreholes that serve as community water collection points aremuch larger where demand is greatest.
KeywordsInformal water sector; Water flows; Developing countries; Water market analysis; Water demand
1. IntroductionAccess to safe water is increasingly recognized as a basic human right (Meier et al., 2012),especially in light of the high disease risks associated with unsafe water and sanitationaccess (Pruss et al., 2002). Yet, access to safe water sources remains a significant problem inmany rapidly-growing cities in developing countries, as infrastructure is often unable tocope with unprecedented urban population growth (WHO and UNICEF, 2012). Although
© 2012 Elsevier B.V. All rights reserved.* Corresponding author. [email protected] (M. Elimelech)..
NIH Public AccessAuthor ManuscriptEcol Econ. Author manuscript; available in PMC 2013 March 28.
Published in final edited form as:Ecol Econ. 2013 March 1; 87: 137–144. doi:10.1016/j.ecolecon.2012.12.011.
NIH
-PA Author Manuscript
NIH
-PA Author Manuscript
NIH
-PA Author Manuscript

access to improved water sources has increased in Asia to meet the MillenniumDevelopment Goals, this is not the case in sub-Saharan Africa, where only 61% of thepopulation has improved water access (WHO and UNICEF, 2012). The problem isespecially acute in rapidly urbanizing regions, where the rate of urban expansion exceedsthose of economic growth and infrastructure development (Gulyani et al., 2005). As a result,many people turn to informal water services, such as small-scale water vendors and bottledwater delivery, for their drinking water (Sima and Elimelech, 2011). Studies show that morethan 25% of the population in Latin American cities and 50% of the population in Africancities depend on the informal water sector (Solo, 1999a). In Kenya, only 14% of urbanhouseholds have private connections (Kenya Open Data Project, 2012). Interruption ofservices as a result of unreliable electricity, over-utilized systems, and leaks undermineservices for even those with private connections (Gulyani et al., 2005). Furthermore,negative or low pressure which results from intermittent piped water supplies contributes torecontamination of treated water (Geldreich, 1996; Kumpel and Nelson, 2011). Research hasshown that the small-scale private sector has been estimated to account for 85% of allprivate-sector investment in water security (Kariuki and Schwartz, 2005).
Regardless of distribution mode or treatment technology, the supply of high-quality drinkingwater can carry a high environmental burden. Treatment via conventional means has beenshown to produce 300 g of CO2 equivalent per cubic meter of water treated (Vince et al.,2008a). Even more alarming, especially in cities with aging piped distribution systems, arethe high energy and monetary costs associated with pumping water (Colombo and Karney,2002; Filion et al., 2004; Hertsin et al., 2011; Vince et al., 2008b). Life cycle impacts formunicipal water treatment and distribution (Lundin and Morrison, 2002; Mohapatra, 2002;Stokes and Horvath, 2005) and for water bottle distribution (Larson and Larson, 2006) havebeen investigated previously, but little is known about the impact of informal water supplysystems. Estimating such impacts first requires a thorough understanding of water supplynetworks, but this presents a difficult logistical challenge due to the lack of regulation orregistration of nontraditional supply mechanisms. Considering the rate of growth within theinformal water sector and its prominent role in water supply in developing cities, it is ofparamount importance to better understand the sector, including its environmental impacts.
Access to sufficient volumes of safe drinking water is an important means to curtailing thespread of waterborne and water-associated diseases and reducing child mortality(Montgomery and Elimelech, 2007). Understanding of the informal water services sector iscrucial to curtail the spread of waterborne diseases, manage resource use, and improveservices in any municipality where the sector plays an important role. Unlike rural water andsanitation interventions where sustainability metrics have been presented previously(Montgomery et al., 2009), there exist no objective measures of sustainability for urbaninformal systems. Due to the unregulated and often illegal character of the sector,information is difficult to gather. To date, over 10,000 water businesses have beendocumented in 49 countries, but very few published studies are quantitative or comparativein nature (Solo, 1999a).
In studying the informal sector in Kisumu, our purpose is to quantify resource flows in theinformal system, and examine spatial variation in pricing, demand, and water source. Wecompare resource use in the informal sector to the conventional municipal sector, and usecensus data to gain a better understanding of spatial variation in the informal sector. While itis outside of the scope of this study to create a precise mass-balance of all water used in thecity, we did seek to a statistically significant sample within the city to credibly compare thescale of energy use and pricing across different water provision types and locations.Furthermore, the data gathering and analysis techniques presented here could be used by cityplanners to understand the sector in other areas where it plays a prominent role.
Sima et al. Page 2
Ecol Econ. Author manuscript; available in PMC 2013 March 28.
NIH
-PA Author Manuscript
NIH
-PA Author Manuscript
NIH
-PA Author Manuscript

2. Methodological and Ideological Options2.1. Study Site
With an official population of nearly one million (2009 Kenyan Census), Kisumu, which islocated on the banks of Lake Victoria (Fig. 1) has grown by 80% in the previous decade(Kenya Bureau of Statistics, 1999). Water shortages have been reported in Kisumu since the1980s (KIWASCO, 2007). KIWASCO, the Kisumu Integrated Water and SewerageCompany, a semi-private company and municipal water provider, reports that the waterdemand was nearly three times greater than production capacity in 2007 (KIWASCO, 2007).By 2007, only 36% of the city's population had service coverage (Schwartz and Sanga,2010). As a result, the majority of the city's population lacks a sufficient quantity of waterfor uses such as cooking and cleaning (Wagah et al., 2010).
2.2. Data CollectionPreliminary data collection occurred in July and August of 2008 and 2009. Data weregathered by using a “bottom-up” approach, (Whittington et al., 1991) through directinterviews with operators. After a series of open-ended interviews, we defined a set ofstandard interview questions to collect data from the heads of large water companies andmunicipal water managers. Questions were structured, but also open-ended, allowing fornatural conversation.
Water kiosk operators, water baggie vendors, and water cart vendors were each asked asurvey translated to Kiswahili and back-translated to English for accuracy. Four nativeSwahili-speaking enumerators carried out these surveys. Selection of kiosks operators forinclusion was not randomized; we interviewed operators at nearly all kiosks in the city.Water cart vendors were interviewed as they collected water at one of the kiosks. Thelocation of all kiosks was recorded by using eTrex handheld GPS devices. Water baggievendors were surveyed as they worked at the market and bus depot.
In addition, we collected data about bottled water sales in the city. A standardized surveytranslated to Kiswahili was used to collect data from wholesale bottled water distributors,small grocery stores, street peddlers, and other small shops. Sales data from the largestsupermarkets and bottled water vendors in the city were supplied voluntarily to the principalinvestigator after detailed conversations about the project.
We collected water demand data from 2008 to 2009 from the municipal water provider,KIWASCO. Demographic information for each neighborhood was obtained from the 1999(World Resources Institute, 1999) and 2009 (Kenya Open Data Project, 2012) Kenyancensus.
2.3. MeasuresAll interviews were used to gather data about average water sales volume(s) of the particularcompany/person, source of water, cost to acquire water, price charged to consumer, and theuse of resources, including electricity and chemicals for treatment. In addition, we gatheredinformation from companies that utilized motorized vehicle transportation on weeklydistances driven and fuel efficiency of vehicle fleets. Data collected from the municipalityincluded the number of public and private connections in each area of the city, the totalvolume of water sold to each area, and the mean energy consumption for pumpingthroughout the city. Census data were grouped by neighborhood within the city. We utilizedmeasures of water source and sanitation use by each resident in 2009 (Kenya Open DataProject, 2012). Population density growth was examined by subtracting 1999 (Kenya Bureau
Sima et al. Page 3
Ecol Econ. Author manuscript; available in PMC 2013 March 28.
NIH
-PA Author Manuscript
NIH
-PA Author Manuscript
NIH
-PA Author Manuscript

of Statistics, 1999; World Resources Institute, 1999) density from 2009 density (KenyaOpen Data Project, 2012).
3. Data Analysis3.1. Material Flow Analysis
Information from all interviews was combined to calculate a flow analysis and energy useprofile for various sectors in the water sector. Material flow analysis is a data analysis toolof industrial ecology and has been previously employed for the assessment of variousenvironmental issues in developing countries (Binder et al., 1997; Giljum, 2004; Streicher-Porte et al., 2005). It uses mass balance principles to create a model of the stocks and flowsof a resource or resources through a bounded system. As such, it can be applied at differentscales, ranging from individual industrial processes to cities to entire national economies(Fischer-Kowalski and Huttler, 2008). At larger scales, material flow analysis normallyrelies on high-quality aggregated datasets, prepared by municipal or higher-level authorities.Such data are hard to come by in developing areas, mostly due to a lack of funding. Mostimportantly, by their very nature, the activities and impacts of the informal water servicessector are not included in such governmental studies. STAN, a software that supports suchanalysis with consideration to data uncertainties, was used to aggregate and analyze datacollected from interviews (Cencic and Rechberger, 2008).
In order to calculate cumulative energy demand (Hirst, 1974; Huijbregts et al., 2010), wefirst defined boundaries. We consider extraction of water from the environment (e.g., riveror groundwater) to delivery to the household. We do not account for wastewater dischargesbecause the informal system does not deal with wastewater directly. The design of thesystem of flows is based on information acquired in interviews, and verified by results ofsurvey data. Although stock-and-flow diagrams are used, water is not stored by any of theseintermediary agents (or is stored for a comparatively short amount of time) and we areconcerned primarily with flow of resources. We combined data from municipal databases,aggregated estimates based on operator responses to survey questions, and water bottledistributor sales records to calculate water flows among different parts of the informal watersector.
Cumulative energy demand is calculated by using similar methods for both the municipaland the private water treatment plant. In both cases, we consider the use of chemicals,energy to operate the plants, and replacement of degrading pipes (for the municipal system),as well as the average monthly water output by each. For the Nyamasaria private watertreatment plant, we were supplied with the average monthly use of diesel to run an incomingwater pump, chemicals to treat water (aluminum sulfate, sodium carbonate, calciumhypochlorite), and electricity use by the operators from their records. For the municipalsystem, we collected information on chemical use, electricity use, and pipe construction overtime. We computed energy required to produce chemicals to operate the plants bymultiplying the primary energy equivalent (the energy necessary for mining, transporting,and manufacturing the chemical) of each chemical, available from literature, (Hellstrom,1997; Lundin et al., 2000) with estimated material use from interviews. Fuel use andelectricity were each multiplied by the energy requirements to produce each energy source.Specifically, the primary energy for the production of electricity in Kenya was drawn fromthe International Energy Agency's non-OECD Country energy balance database,(International Energy Agency (IEA), 2010) while that for the production of diesel fuel usedto operate water pumps was drawn from the ecoinvent life cycle inventory database(Ecoinvent, 2010) Embodied energy associated with routine maintenance to the pipedmunicipal system was calculated by using the previous year's replacement rates, combinedwith an estimate of energy required for the replacement of piped water conduits (which
Sima et al. Page 4
Ecol Econ. Author manuscript; available in PMC 2013 March 28.
NIH
-PA Author Manuscript
NIH
-PA Author Manuscript
NIH
-PA Author Manuscript

takes into account materials used as well as construction) (Ecoinvent, 2010). We assumeenergy used during construction of the water treatment plants to be negligible in comparisonto the energy required to operate plants during their lifetime, as was shown for waterinfrastructure elsewhere, (Mo et al., 2010) and do not calculate this energy use.
The use of resources by trucks for the entire sector (four trucks) was estimated by usinginformation provided by one business owner who supplied 50% of the market. We weregiven information about average monthly sales for the previous year (of which we took anaverage), as well as monthly petroleum expenditures. We assumed that majority of theresource use would be accounted for by fuel combustion, as has been previouslydemonstrated for the freight industry in the US (Facanha and Horvath, 2006). Thus, we usefuel use as a proxy for cumulative energy demands of trucking. Primary energy for dieselproduction is computed by using databases described above (Ecoinvent, 2010).
3.2. Spatial and Statistical Analyses of Kiosk DataData were entered into and analyzed by using SPSS Version 19.0 (IBM, Armonk, NY). Thegrouping of spatial information from interviews to neighborhood locations was completedwith the use of ArcGIS 9.10 (Esri Software, Redlands, CA). Census data from smaller“sublocations” were aggregated into larger neighborhoods to allow for qualitativecomparison with kiosk response data (see Fig. 1 for final locations). Spatial joining was usedto combine data collected from interviews with water kiosk operators to five neighborhoodswithin the city. Data from five areas of the city, including pricing and sales volume, arecompared by using the F-test in analysis of variance. Frequencies of different kiosk sourcewater within the city are compared between neighborhoods by using the Fisher's test. Pricingand demand of kiosks that extract water from different sources (tap water or groundwater)were compared by using the two-tailed t-test.
4. Results4.1. Types of Water Services
Several types of water businesses are identified in Kisumu. A private small-scale watertreatment plant, Nyamasaria, operates outside of town. Two water truck companies collectwater from this private treatment plant and deliver it to consumers. Water kiosks arecollection points where consumers refill containers; they provide water from city taps orboreholes. Water cart vendors are laborers that deliver containers filled with water toindividual households. They charge per container and collect empty containers whendelivering filled ones. Bottled water is sold by large grocery stores, wholesalers, smallshops, and street vendors. Water baggie vendors fill small plastic bags with water and sellthese at public spaces such as the market. Two hundred and forty-five kiosks were identifiedin Kisumu.
4.2. Mass Flow of Water Sales in KisumuThe majority of volumetric water flows in the city are conventional — treated municipalwater is delivered to the private taps of registered households. Indeed, less than 25% of thetotal accounted-for-flow was delivered to users via informal services (Fig. 2). Although thevolume of water flowing in the informal sector is only a minor fraction of total water flow inthe city, the majority of city residents rely on this water. Fig. 3 shows the percent ofhouseholds that use various water sources. As this figure demonstrates, the informal sector issupplying more than 50% of households in Kisumu (Wagah et al., 2010).
Water flow in the informal sector is presented in Fig. 4. As anticipated, the largest flow isthat of water sold at kiosks that supply over 600 m3 of potable water per day. The majority
Sima et al. Page 5
Ecol Econ. Author manuscript; available in PMC 2013 March 28.
NIH
-PA Author Manuscript
NIH
-PA Author Manuscript
NIH
-PA Author Manuscript

of the water sold at kiosks comes from municipal tap water (548 m3/day), while a smallernumber supplied directly from groundwater via boreholes (109 m3/day). Notably, a smallprivate water treatment plant in a peri-urban area, Nyamasaria, supplies nearly as muchwater (365 m3/day) as all of the kiosks combined. Although the largest amount of waterfrom both kiosks (403 m3/day) and the private water treatment plant (160 m3/day) is solddirectly to households living in the vicinity of the facility, a significant portion of water fromkiosks (173 m3/day) and the private water treatment plant (105 m3/day) is also sold to watercart vendors who push wooden carts to transport water to other areas of the city. Thesevendors, in turn, sell the majority of their water to individual households (201 m3/day) aswell as small businesses (77 m3/day). Surprisingly, relatively little water (120 m3/day) istransported via trucks.
4.3. Cumulative Energy DemandCumulative energy demand is analyzed for each water supply mode. Total daily energydemand is higher for municipal treatment and pump stations than other water provisionmeans (Fig. 5). This includes life-cycle energy equivalent for the chemicals used in watertreatment, energy used to treat water, and energy used to pump water to households. Trucks,which transport less than 1% of the total water in the city, use nearly 20% the energy of theentire municipal system. Scaling energy demand to the volume of water produced (i.e., MJ/m3), makes it apparent that the transport of water by trucks around town is the leastresource-efficient means of water delivery. Even the Nyamasaria treatment plant isinefficient in comparison to the municipality, possibly as a result of efficiencies of scale.Inefficiencies in the trucking sector were anticipated prior to analysis, but the scale ofinefficiency is surprising. Parallel systems for the rich and poor will greatly exacerbateresource use within cities overall, while increasing the socioeconomic divide in urban areas.
4.4. Spatial Analysis of Kiosk DataTable 1 summarizes data describing kiosks by neighborhood within the city. There aresignificant neighborhood-by-neighborhood differences in price paid for water from kiosks(pb0.001), water source for kiosks (p=0.019), and type of kiosk operator (p=0.042). Table 2summarizes neighborhood-level census results, including population density, populationgrowth, water source of residents, and sanitation coverage within each area. Manyatta, anunplanned development, has the highest population density (15,500 persons/km2) and thelargest rate of growth (3640 more persons/km2 than the previous decade). Southernneighborhood, on the other hand, has the lowest population density (1780 persons/km2), andhas actually seen a decline in the rate of population growth (310 less persons/km2 than theprevious decade).
Water prices at kiosks are highly variable among different areas in Kisumu (variance 25.10,range 1–40 Kenyan Shillings/20 L container). Price charged does differ significantly amongthe neighborhoods (p<0.001), but the largest prices are not found in the areas with a highdemand, as measured by length of line waiting to refill water at a kiosk (Table 1), populationdensity or rate of population growth (Table 2). Rather, price seems to be the highest in areaswhere consumers can afford to pay larger fees. In the central market area, most consumersare small businesses, and the prices charged here are much higher than elsewhere.
The length of lines at various kiosks can be used to approximate demand, assuming that thefilling rate is similar among locations. Lines are longest in Manyatta, which is theneighborhood with the largest population density, population growth, and lack of pipedwater from the municipality (Wagah et al., 2010). The surrounding neighborhood, Nyawita-Migosi, which has the second-largest population density (Table 2), also suffers from longerlines (Table 1). In these areas, KIWASCO has struggled to provide adequate pressure to the
Sima et al. Page 6
Ecol Econ. Author manuscript; available in PMC 2013 March 28.
NIH
-PA Author Manuscript
NIH
-PA Author Manuscript
NIH
-PA Author Manuscript

tap-water kiosks (KIWASCO, 2007). Based on census data, these are also the areas withlarge percentage use of water cart vendors and ground water sources for drinking (Table 2).
There is no clear relationship between the source of water sold at kiosks and pricing. Acomparison of water pricing at kiosks that sell treated municipal water and those that sellgroundwater from boreholes (Table 3) shows no clear price trends across neighborhoods. Inone area, Kaloleni-Northern, kiosks selling from groundwater are actually chargingsignificantly more (p=0.03) than those selling municipal water. Municipal water is treatedand considered to be of greater quality, so price differences may be characteristic of locationof the types of kiosks in this area, rather than of a preferential valuation of borehole water.There is also a lack of trends when considering the length of line (a proxy for demand)between kiosks selling municipal tap or ground water (Table 3).
5. DiscussionWe demonstrate that data can be gathered, and triangulated, from a variety of sources todescribe informal water businesses. Although the informal water sector accounts for only25% of the total water flows within the city, it is responsible for supplying over 50% of thepopulation with their primary water sources. The importance of the informal sector has beenrecognized by other sources (Whittington et al., 1991; Zuin et al., 2011), but this article addsto the literature by quantifying this volumetrically, rather than in regard to percentage of thepopulation served alone. By using material flow analysis, we show that over 30% of the totalwater (200 m3/day) from kiosks being transported by hand-drawn water carts, nearly fivetimes is the volume transported by water trucks (45 m3/day). This most likely reflectsKisumu's current level of development. Past studies have shown that, in Latin America,operators prefer trucks to donkey-drawn-carts as urban areas have developed (Solo, 1999a).
Water treatment and distribution in the informal sector is associated with a larger energydemand per volume of water. For water treatment, the small private Nyamasaria plant isinefficient in comparison to the municipality, likely because it operates intermittently and isunable to take advantage of efficiencies of scale. Inefficiencies in the trucking sector (incomparison to piped systems delivery) were anticipated prior to analysis, but the scale ofinefficiency is larger than anticipated likely as a result of irregular demand and routes. Weare unable to quantify energy use by hand-drawn carts or boreholes as these both rely onhuman labor. Currently, this human-labor dependent water provision is most significant inthe informal sector, but we can anticipate that, as has happened in Latin American cities,(Solo, 1999a) economic development will increase the prevalence of trucking. Water truckdelivery is the most energy-intensive form of water delivery in the city. The municipalsystem is currently the largest energy user-per-day in the water sector, but continued growthin Kisumu, if not matched by infrastructure investment, is likely to exacerbate resource usein the city by increasing dependence on energy-intensive trucking.
We demonstrate that spatial analysis is a useful means of analyzing variability in informalwater kiosk pricing and demand. Other studies have suggested that walking distance – asignificant contributor to time spent gathering water (Zuin et al., 2011) – is an importantfactor in the decision to purchase water from one source over another (Alcorn et al., 2011;Mu et al., 1990). Further, a recent study has shown the link between walking distance andhealth in sub-Saharan Africa (Pickering and Davis, 2012). Nonetheless, we are unaware ofother studies that have examined the relationship between location and prices charged bykiosks. In Kisumu, we find that water prices vary significantly by neighborhood within thecity. Furthermore, we show that prices are not demand-sensitive because water is not mostexpensive where demand (measured as average length of lines) is highest. Rather, the largestprices are charged in to businesses in the central market area and in the wealthier Southern
Sima et al. Page 7
Ecol Econ. Author manuscript; available in PMC 2013 March 28.
NIH
-PA Author Manuscript
NIH
-PA Author Manuscript
NIH
-PA Author Manuscript

neighborhood, reflecting the ability of consumers to pay in each neighborhood. This findingcontradicts conventional opinion that private providers take advantage of poor urbanresidents (Solo, 1999a). Instead, we find that, in neighborhoods with the highest demand,private boreholes are more likely to sell water as kiosks. Other spatial studies of kioskpricing would be necessary to verify the universality of these findings in other areas.
We find that households purchasing from the informal sector in Kisumu use less water per-capita than households with formal utility connections. Although we noticed that water forcleaning or washing was being collected from stagnant ponds or the lake, our intervieweesdid not offer any additional sources of water for cooking and drinking for which we did notaccount. This was confirmed by the household survey data in Kisumu collected during thesame time period (Wagah et al., 2010). In Nairobi, Kenya an end-user study in informalsettlements con-firmed that urban water use per capita has decreased by more than 25% overthe past 40 years, with the decrease attributable to the rise in the percentage of householdsthat rely on informal door-to-door water vendors (Gulyani et al., 2005). Informal operatorsare vilified in many areas because there is a fear that low-income consumers will economizewater use since they are charged much higher per-volume fees than wealthier families withutility connections (Solo, 1999b). Per-capita water consumption below certain levels is notrecommended as it may increase the likelihood of disease transmission due to insufficientresources for hygiene and drinking (Gleick, 1996; Howard and Bartram, 2003; World Bank,2004).
It is worth noting that in Kisumu, Kenya, during the time of the study, a neighborhooddelegated management approach was implemented in the Nyalenda neighborhood (Schwartzand Sanga, 2010). Based on our data, Nyalenda was the unplanned developmentneighborhood with the lowest kiosk prices and shortest lines. Legalization and regulation ofinformal water businesses have been recommended as a way to minimize the negativeexternalities of informal water services (Sima and Elimelech, 2011; Zuin et al., 2011) inother contexts. Neighborhood-level price and demand data and analysis, as presented in thispaper, could aid in designing regulations for the informal sector.
We faced several limitations in analyzing this data. Although human labor is undeniably asignificant form of energy used in Kisumu's informal sector, we did not include it incumulative energy demand calculations. As such, we were unable to compare energy use ofwater delivered via hand-drawn carts with water delivered via pipes or trucks. Furthermore,we discuss trends and similarities between neighborhood-level water kiosk and census data,but we cannot demonstrate statistical significance in these associations due to the smallnumber of neighborhoods (n=5) in Kisumu. Finally, data was collected during the dryseason, and may not be representative of the wet season.
6. ConclusionBottom-up data collection and analysis are useful tools for understanding the informal watersector. This sector relies heavily on human labor in Kisumu, although the largest non-renewable energy expenditure is that of water delivery by truck. In Kisumu, we do not findevidence that prices are exploitative, and find, to the contrary, that they are responsive to theability to pay of consumers. Nonetheless, per unit, water is more expensive when purchasedfrom the informal sector than when provided directly by the municipality during the dryseason. Parallel systems for the rich and poor will greatly exacerbate resource use withincities overall, while increasing the socioeconomic divide in urban areas. The informal watersector is meeting a need unmet by the municipality, but in a less resource-efficient and moreexpensive way.
Sima et al. Page 8
Ecol Econ. Author manuscript; available in PMC 2013 March 28.
NIH
-PA Author Manuscript
NIH
-PA Author Manuscript
NIH
-PA Author Manuscript

AcknowledgmentsThe authors would like to thank Allie Eleveld (Director, Safe Water and Aids Project, Kisumu, Kenya) for logisticsupport during data collection. This work was funded by various sources including the Lindsay Fellowship forResearch in Africa (Yale), the NSF Graduate Research Fellowship, Coca-Cola World Studies Fellowship (Yale),and the Center for Industrial Ecology in Developing Countries (Yale). KMM was supported by the NationalInstitute of Health (NIH) grant L30 CA124219-03 during the preparation of this manuscript.
ReferencesAlcorn T, Opryszko M, Schwab K. Formative ethnographic research to improve the evaluation of a
novel water system in Ghana. American Journal of Tropical Medicine and Hygiene. 2011; 84:801–805. [PubMed: 21540392]
Binder C, Schertenleib R, Diaz J, Bader HP, Baccini P. Regional water balance as a tool for watermanagement in developing countries. International Journal of Water Resources Development. 1997;13:5–20.
Cencic, O.; Rechberger, H. Material flow analysis with software STAN.. In: Verlag, S., editor.Environmental Informatics and Industrial Ecology. Lüneburg: 2008.
Colombo AF, Karney BW. Energy and costs of leaky pipes: toward comprehensive picture. Journal ofWater Resources Planning and Management. 2002; 128:441–451.
Ecoinvent. Ecoinvent Life Cycle Inventory Database v2.2. Swiss Center for Life Cycle Inventories;2010.
Facanha C, Horvath A. Environmental assessment of freight transportation in the US. TheInternational Journal of Life Cycle Assessment. 2006; 11:236–247.
Filion YR, MacLean HL, Karney BW. Life-cycle energy analysis of a water distribution system.Journal of Infrastructure Systems. 2004; 10:120–130.
Fischer-Kowalski M, Huttler W. Society's metabolism: the intellectual history of materials flowanalysis, part II, 1970–1998. Journal of Industrial Ecology. 2008; 2:107–136.
Geldreich, E. Microbial Quality of Water Supply in Distribution Systems. Lewis Publishers; BocaRaton: 1996.
Giljum S. Trade, materials flows, and economic development in the south: the example of Chile.Journal of Industrial Ecology. 2004; 8:241–261.
Gleick PH. Basic water requirements for human activities: meeting basic needs. Water International.1996; 21(2):83–92.
Gulyani S, Talukdar D, Kariuki RM. Universal (non)service? Water markets, household demand andthe poor in Urban Kenya. Urban Studies. 2005; 42
Hellstrom D. An energy analysis for a wastewater treatment plant: an estimation of physical resources.Water Environmental Research. 1997; 69:44–51.
Hertsin LM, Filon YR, Hall KR. Evaluating the environmental impacts of water distribution systemsby using EIO-LCA-based multi-objective optimization. Journal of Water Resource Planning andManagement. 2011; 137:162–172.
Hirst E. Food-related energy requirements. Science. 1974; 184:134–138. [PubMed: 17791434]
Howard, G.; Bartram, J. Domestic Water Quantity, Service, Level and Health. World HealthOrganization; Geneva, Switzerland: 2003.
Huijbregts MAJ, Hellweg S, Frischknecht R, Hendriks HWM, Hungerbuhler K, Hendriks AJ.Cumulative energy demand as predictor for the environmental burden of commodity production.Environmental Science and Technology. 2010; 44:2189–2196. [PubMed: 20108964]
International Energy Agency (IEA). Energy Balances of Non-OECD Countries. Organization forEconomic Co-operation and Development (OECD); 2010.
Kariuki M, Schwartz J. Small-scale private service providers of water supply and electricity. 2005World Bank Policy Research Working Paper, 3727.
Kenya Bureau of Statistics. Population Figures for Towns and Municipalities. Republic of Kenya;1999.
Kenya Open Data Project. 2009 Kenyan Census. 2012.
Sima et al. Page 9
Ecol Econ. Author manuscript; available in PMC 2013 March 28.
NIH
-PA Author Manuscript
NIH
-PA Author Manuscript
NIH
-PA Author Manuscript

KIWASCO. Kisumu Water and Sewerage Company Strategic Plan 2007–2012. 2007.
Kumpel, E.; Nelson, K. Impact of Water Quality of Conversion from Intermittent to Continuous WaterSupply in Urban South India, Water and Health: Where Science Meets Policy. University of NorthCarolina; Chapel Hill, NC: 2011.
Larson, A.; Larson, J. Bottled Water: Pouring Resources Down the Drain Earth Policy Institute Report.2006.
Lundin M, Morrison GM. A life cycle assessment based procedure for development of environmentalsustainability indicators for urban water systems. Urban Water. 2002; 4:145–152.
Lundin M, Bengtosson M, Molander S. Life cycle assessment of wastewater systems: influence ofsystem boundaries and scale on calculated environmental loads. Environmental Science andTechnology. 2000; 34:180–186.
Meier, B.; Kayser, G.; Amjad, U.; Bartram, J. Implementing an Evolving Human Right Through Waterand Sanitation Policy. 2012.
Mo W, Nasiri F, Eckelman MJ, Zhang Q, Zimmerman JB. Measuring the embodied energy in drinkingwater supply systems: a case study in the Great Lakes Region. Environmental Science andTechnology. 2010; 44:9516–9521. [PubMed: 21105699]
Mohapatra PK. Improving eco-efficiency of Amsterdam water supply: a LCA approach. Journal ofWater Supply Resources Technology: Aqua. 2002; 51:217–227.
Montgomery M, Elimelech M. Water and sanitation in developing countries: including health in theequation. Environmental Science and Technology. 2007; 41
Montgomery M, Bartram J, Elimelech M. Increasing functional sustainability of water and sanitationsupplies in rural sub-Saharan Africa. Environmental Engineering Science. 2009; 26:1017–1023.
Mu X, Whittington D, Briscoe J. Modeling village water demand behavior: a discrete choice approach.Water Resources Research. 1990; 26:521–529.
Pickering AJ, Davis J. Freshwater availability and water fetching distance affect child health in sub-Saharan Africa. Environmental Science and Technology. 2012; 46:2391–2397. [PubMed:22242546]
Pruss A, Kay D, Fewtrell L, Bartram J. Estimating the burden of disease from water, sanitation, andhygiene at a global level. Environmental Health Perspectives. 2002; 110:537–542. [PubMed:12003760]
Schwartz K, Sanga A. Partnerships between utilities and small-scale providers: delegated managementin Kisumu, Kenya. Physics and Chemistry of the Earth. 2010; 25:765–771.
Sima, L.; Elimelech, M. Informal small-scale water services in developing countries: the business ofwater for those without formal municipal connections.. In: Selendy, J., editor. Water andSanitation Related Diseases and the Environment: Challenges, Interventions, and PreventativeMeasures. Wiley International; 2011.
Solo TM. Small-scale entrepreneurs in the urban water and sanitation market. Environment andUrbanization. 1999a; 11:117–132.
Solo TM. Small-scale entrepreneurs in the urban water and sanitation market. Water and Sanitation.1999b; 11
Stokes J, Horvath A. Life cycle energy assessment of alternative water supply systems. InternationalJournal of Life Cycle Assessment. 2005; 11:335–343.
Streicher-Porte M, Widmer R, Jain A, Bader HP, Scheidegger R, Kytzia S. Key drivers of the e-wasterecycling system: assessing and modelling e-waste processing in the informal sector in Delhi.Environmental Impact Assessment Review. 2005; 25:472–491.
Vince F, Aoustin E, Breant P, Marchal F. LCA tool for environmental evaluation of potable waterproduction. Desalination. 2008a; 220:37–56.
Vince F, Austin E, Breant P, Marchal F. LCA tool for environmental evaluation of potable waterproduction. Desalination. 2008b; 220:37–56.
Wagah GG, Onyango GM, Kibwage JK. Accessibility of water services in Kisumu Municipality,Kenya. Journal of Geography and Regional Planning. 2010; 3:114–125.
Whittington D, Laura DT, Mu X. A study of water vending and willingness to pay for water inOnitsha, Nigeria. World Development. 1991; 19:179–198.
Sima et al. Page 10
Ecol Econ. Author manuscript; available in PMC 2013 March 28.
NIH
-PA Author Manuscript
NIH
-PA Author Manuscript
NIH
-PA Author Manuscript

WHO. UNICEF. WHO. , editor. Progress on Sanitation and Drinking Water. 2012 Update (Geneva).2012.
World Bank. Water Resources Sector Strategy: Strategic Directions for World Bank Engagement.2004.
World Resources Institute. Kenyan Census. 1999.
Zuin V, Ortolano L, Alvarinho M, Russel K, Thebo A, Musimpua O, Davis J. Water supply servicesfor Africa's urban poor: the role of resale. Journal of Water and Health. 2011; 9:773–784.[PubMed: 22048436]
Sima et al. Page 11
Ecol Econ. Author manuscript; available in PMC 2013 March 28.
NIH
-PA Author Manuscript
NIH
-PA Author Manuscript
NIH
-PA Author Manuscript

Fig. 1.Map of Kisumu, including neighborhood boundaries used for data analysis.
Sima et al. Page 12
Ecol Econ. Author manuscript; available in PMC 2013 March 28.
NIH
-PA Author Manuscript
NIH
-PA Author Manuscript
NIH
-PA Author Manuscript

Fig. 2.The volumetric distribution of water provided to households by water source.
Sima et al. Page 13
Ecol Econ. Author manuscript; available in PMC 2013 March 28.
NIH
-PA Author Manuscript
NIH
-PA Author Manuscript
NIH
-PA Author Manuscript

Fig. 3.The per-household distribution of water provided to households by water source.
Sima et al. Page 14
Ecol Econ. Author manuscript; available in PMC 2013 March 28.
NIH
-PA Author Manuscript
NIH
-PA Author Manuscript
NIH
-PA Author Manuscript

Fig. 4.Volumetric flow of water in the informal sector. Analysis and image were created withSTAN, a free software that supports material flow analysis. All values above are cubicmeters/day.
Sima et al. Page 15
Ecol Econ. Author manuscript; available in PMC 2013 March 28.
NIH
-PA Author Manuscript
NIH
-PA Author Manuscript
NIH
-PA Author Manuscript

Fig. 5.Resource use by service type. Total daily resource use by service type (A), and totalresource use per household serviced per day (B). Numbers are estimated based on flowvolumes presented in Fig. 4, resource use measures and estimates provided by operators ofthe businesses, and energy estimates for various resources collected from availableliterature.
Sima et al. Page 16
Ecol Econ. Author manuscript; available in PMC 2013 March 28.
NIH
-PA Author Manuscript
NIH
-PA Author Manuscript
NIH
-PA Author Manuscript

NIH
-PA Author Manuscript
NIH
-PA Author Manuscript
NIH
-PA Author Manuscript
Sima et al. Page 17
Tabl
e 1
Des
crip
tion
of k
iosk
cha
ract
eris
tics
base
d on
sur
vey
resp
onse
s by
nei
ghbo
rhoo
d in
Kis
umu,
Ken
ya.
Kal
olen
i-N
orth
ern
n=47
Man
yatt
a n=
15N
yale
nda
n =
44N
yaw
ita-
Mig
osi n
=64
Sout
hern
n=5
p-V
alue
Pric
e (K
Sh/2
0 L
), m
ean
(±st
dev)
11.4
(±
8.11
)2.
82 (
±0.
75)
2.74
(±
0.65
)4.
16 (
±3.
03)
4.8
(±5.
72)
< 0
.001
Num
ber
of je
rryc
ans
wai
ting
to b
e fi
lled,
mea
n (±
std
ev)
17.3
(±
25.1
5)24
.9 (
±53
.5)
7.88
(±
6.8)
21.2
(±
22.1
)6
(±13
.42)
0.03
7
Kio
sk is
dra
win
g w
ater
fro
m m
unic
ipal
sys
tem
, n (
%)
32 (
68%
)10
(67
%)
39 (
89%
)56
(87
%)
5 (1
00%
)0.
019
Kio
sk is
ope
rate
d by
0.04
2
a
hou
seho
ld, n
(%)
35 (
76%
)8
(53%
)36
(84
%)
41 (
64%
)5
(100
%)
a
sm
all b
usin
ess,
n (
%)
11 (
24%
)7
(47%
)3
(7%
)17
(27
%)
0 (0
%)
a
wom
en's
gro
up, n
(%)
2 (4
.3%
)0
(0%
)6
(14%
)6
(9.4
%)
0 (0
%)
Ecol Econ. Author manuscript; available in PMC 2013 March 28.

NIH
-PA Author Manuscript
NIH
-PA Author Manuscript
NIH
-PA Author Manuscript
Sima et al. Page 18
Tabl
e 2
Des
crip
tion
of d
emog
raph
ic in
form
atio
n ba
sed
on c
ensu
s da
ta b
y ne
ighb
orho
od in
Kis
umu,
Ken
ya.
Kal
olen
i-N
orth
ern
Man
yatt
aN
yale
nda
Nya
wit
a-M
igos
iSo
uthe
rn
Popu
latio
n de
nsity
200
9 (r
esid
ents
/km
2 )71
9815
,501
7713
10,6
7117
60
Popu
latio
n gr
owth
, 199
9–20
09 (
resi
dent
s/km
2 )57
8.95
3641
.05
2523
.01
1138
.34
–319
.22
Sour
ce o
f dr
inki
ng w
ater
F
rom
a b
oreh
ole
spri
ng o
f w
ell
542
(22%
)24
,312
(32
%)
3883
(6.
4%)
9035
(26
%)
92 (
1%)
P
iped
into
dw
ellin
g47
57 (
19%
)17
99 (
2.4%
)28
35 (
5%)
3116
(9%
)43
04 (
47%
)
P
iped
for
m c
omm
unity
loca
tion
11,3
80 (
46%
)25
,941
(34
%)
46,6
13 (
77%
)73
42 (
21%
)37
57 (
41%
)
W
ater
car
t ven
dor
7963
(32
%)
22,5
86 (
30%
)48
56 (
8%)
14,4
85 (
42%
)11
00 (
12%
)
Sour
ce o
f sa
nita
tion
C
onne
cted
to m
ain
sew
er15
,713
(64
%)
3199
(4%
)74
1 (1
%)
7696
(22
%)
5544
(61
%)
P
riva
te s
anita
tion
with
sep
tic ta
nk98
4 (4
%)
2231
(3%
)24
56 (
4%)
7366
(21
%)
2896
(32
%)
P
riva
te la
trin
e91
1 (4
%)
4653
(6%
)31
79 (
5%)
1441
(4%
)18
3 (2
%)
U
ncov
ered
latr
ine
6869
(28
%)
65,1
09 (
86%
)53
,179
(88
%)
17,7
53 (
51%
)42
1 (5
%)
Ecol Econ. Author manuscript; available in PMC 2013 March 28.

NIH
-PA Author Manuscript
NIH
-PA Author Manuscript
NIH
-PA Author Manuscript
Sima et al. Page 19
Tabl
e 3
Des
crip
tion
of w
ater
pri
cing
and
line
leng
th (
prox
y fo
r de
man
d) a
t kio
sks
supp
lied
by w
ater
fro
m th
e m
unic
ipal
ity a
nd f
rom
bor
ehol
es b
y ne
ighb
orho
od in
Kis
umu,
Ken
ya.
Pri
ces
(Ken
yan
shill
ings
/20
L)
Lin
e L
engt
h (#
of
20 L
con
tain
ers
to b
e fi
lled)
Pip
ed w
ater
Gro
undw
ater
p-V
alue
Pip
ed w
ater
Gro
undw
ater
p-V
alue
Kal
olen
i-N
orth
ern,
mea
n (±
std)
9.8
(±6.
8)14
(±
10)
0.03
21 (
±27
)12
(±
21)
0.14
1
Man
yatta
, mea
n (±
std)
3.2
(±0.
7)2.
15 (
±0.
3)0.
1833
(±
65)
9.0
(±11
)0.
12
Nya
lend
a, m
ean
(± s
td)
2.8
(±0.
7)2.
5 (±
0.6)
0.91
7.3
(±6.
2)12
(±
12)
0.06
Nya
wita
-Mig
osi,
mea
n (±
std
)4.
3 (±
3.1)
3.1
(±2.
5)0.
7422
(±
22)
18 (
±21
)0.
83
Sout
hern
, mea
n (±
std
)4.
8 (±
5.7)
––
6.0
(±13
)–
–
Ecol Econ. Author manuscript; available in PMC 2013 March 28.