Waste Management Treatment Technologies and Methods
532
Waste Management Treatment Technologies and Methods MHRD Government of India Ministry of Human Resource Development First Edition Waste Management Treatment Technologies and Methods
-
Upload
khangminh22 -
Category
Documents
-
view
2 -
download
0
Transcript of Waste Management Treatment Technologies and Methods
Waste Management Treatment Technologies and Methods
MHRD Government of IndiaMinistry of Human Resource Development
First Edition
Wa
st
e M
an
ag
em
en
t T
re
at
me
nt
Te
ch
no
log
ies
an
d M
et
ho
ds

Contents About the Book
Acknowledgement
Block 1 Waste Management Technologies
Chapters
1. Understanding Waste Management 03
2. Properties of Municipal Solid Waste & Characteristics of Hazardous Solid
Waste 35
3. Solid Waste Generation and Collection 60
4. Handling, Separation, Storage & Disposal of Solid Waste 80
5. Processing and Conversion Technologies of Solid Waste 110
Block 2 Water Security
Chapters
1. Water Issues 151
2 Waste Water Management 177
3. Alternative Technologies for Waste Water Treatment 199
4. Clean Water Solutions 214
5. Testing of Water, Waste Water, Soil and Solid Waste 239
Block 3 Waste Management Banks
Chapters
1. Waste Banks 201
2. Reuse/Recycle Method 227
3. Simple Daily Banks 250
4. Waste to Wealth through Banks 279
5 Strategies and Precautions 307
Block 4 Reclamation and Remediation
Chapters
1. Assessment of Contamination before Reclamation and Remediation 345
2. Waste Management Technologies 367
3. Landfill Reclamation 388
4. Bioremediation 406
5. Multi-Criteria Decision Analysis 422
Authors’ Profile

About the Book Waste has been a major environmental issue everywhere since the industrial revolution. Besides the waste we create at home, school and other public places, there are also those from hospitals, industries, farms and other sources. A rising quality of life, and high rates of resource consumption patterns have had an unintended and negative impact on the urban environment - generation of wastes far beyond the handling capacities of urban governments and agencies. Cities are now grappling with the problems of high volumes of waste, the costs involved, the disposal technologies and methodologies, and the impact of wastes on the local and global environment. But these problems have also provided a window of opportunity for cities to find solutions - involving the community and the private sector; involving innovative technologies and disposal methods; and involving behaviour changes and awareness raising. These issues have been amply demonstrated by good practices from many cities around the world. This book is divided in to four blocks. Block 1 deals with Waste Management Technologies, Block 2 deals with Water Security, Block 3 deals with Waste Management Banks, and finally, Block 4 deals with Reclamation and Remediation.
The assessment of environmental pollution is being extensively carried out to mitigate through
interventions. The growth of urbanization and industrialization led to increase in deterioration of
various components of environment including water resources. Several factors contributed to the
development of science of environmental pollution in recent years, namely, the rapid strides in
chemical, metallurgical and nuclear industries, vast use of fertilisers and pesticides in agriculture,
deforestation; discharge of sewage and industrial wastes in oceans, rivers and groundwater streams
and dumping of nuclear products in the underground pockets. The general sphere of course material
on water security is the interaction between man and his environment at global scale and India in
particular.
The book explains the basic issues of water availability globally and distribution in India’s
administrative State geographical territory and on watershed concept. Attention of communities
have grown on water issues extending from quantitative to qualitative aspects with economic
growth and pollution of aquatic resources became matter of discussion. The issues of water use;
generation of wastewater leading to pollution; treatment of wastewater and scope of conventional
and alternative technologies; and testing of water and wastewater for various uses impacting health
of human beings and ecology at large are covered in this treatise.
The book shall be useful in understanding various aspects of water pollution and remediation
techniques for securing water for its beneficial uses. The threat to maintain water resources widely
covered under various blocks of this compendium on water security concept although presented
with a over view of some problems that affect aquatic environments, such as eutrophication, are
local in nature and can be solved at a local scale, provided sufficient financial and technical resources
are made available, other problems are more regional or global and require efforts on the part of
the international community to ameliorate conditions worldwide. For example, climate change and
variability threaten the quality of aquatic ecosystems on a global scale, and requires international
efforts to curb emissions of greenhouse gases that seem to be accelerating rates of climate change.
It is thus the inter linking of various management modals can be developed to resolve the issues of
quantity and quality aspects by business managers to revenue generation along with serving the
requirement of one and all in the society.
In general, the significant increase of waste generation and its effects on sanitation, environmental, economical and social life associated with solid waste management suggest the researchers and society that the proper management of the waste through waste banks should be the very first priority for the community. The content of “Waste Management Banks” has been brought out incorporating key topics, latest advancements in the field of waste management banks which include waste to wealth, zero waste city, re-use and recycle methods with caselets. The contents are thoroughly reviewed and presented according to their needs. In the end, review questions, activity and references are provided. This course content includes 5 blocks which cover all the fundamental concepts of waste management banks include collection, separation, reuse, recycle and disposal of wastes.
Waste handling professionals, who are involved in collection, transport, processing, recycling or disposal of waste, are in direct contact with the waste, touching it or inhaling it and being at the risk of even ingesting it accidentally. However, even the most innocuous of wastes, such as the municipal solid waste generated from households, can have components with properties detrimental to the health and well-being of the individual as well as the environment, and create untold harm. For instance, are the everyday items like batteries, paints and insecticides that have been categorized as household/ domestic hazardous waste.
The hazards associated with other wastes coming from manufacturing industries (chemical), nuclear power plants (radioactive) or hospitals and healthcare institutions (biomedical) are several degrees more harmful and the exposure to such wastes – in the absence of adequate safety precautions – can lead to morbidity or even be fatal.
In addition, the contingency of accidental spillage, mishaps, and security lapses emerging from human error or mechanical failure, cannot be denied. Be it the Chernobyl tragedy or the Bhopal gas tragedy, the loss of life and property due to hazardous chemicals still haunts mankind’s collective memory.
Hence, irrespective of whether it is the question of following day-to-day routine or remaining prepared for untold disasters, it is of the utmost importance for a waste management professional to understand the hazards associated with waste – not only to the individual but to the surrounding environment as well.

Acknowledgement
This book represents the collective efforts of many remarkable individuals.
We would like to thank the contributors to this volume for their collective
wisdom, experience and insight. Envisioned by Shri VLVSS Subba Rao, Senior
Economic Advisor, MHRD, the book took shape under his keen guidance.
We would like to thank our Subject authors: Dr. Vandana Mathur, Accredited
Entrepreneurial Motivational Trainer, NIESBUD; Mr. R M Bharadwaj, retired
Scientist from Central Pollution Control Board, Ministry of Environment
Forests & Climate Change, Govt. of India; Dr Leon Raj, Scientist at CSIR-
North East Institute of Science and Technology, Jorhat, Assam; Dr Deepti
Sharma, Founder-Director, TerraNero Environmental Solutions Pvt. Ltd.
We would like to thank Major Shiva Kiran, Consultant, MGNCRE; Vani G,
MGNCRE and MGNCRE team members including Editor, Ms. V Anasuya and
Designer, Mr. G Sivaram for extending their support in completing this book.


2 MGNCRE | Waste Management Technologies
Contents
Chapter 1 - Understanding Waste Management
1.1 Meaning of Waste Management
1.2 Sources of solid waste
1.3 Types of solid waste
1.4 Composition of solid waste and its determination
1.5 Types of materials recovered from Municipal Solid Waste
Chapter 2 - Properties of Municipal Solid Waste & Characteristics of Hazardous Solid Waste
2.1 Physical properties of Municipal solid waste
2.2 Chemical properties of Municipal solid waste
2.3 Biological properties of Municipal solid waste
2.4 Transformation of Municipal solid waste
2.5 Characteristics of Hazardous solid waste & its harmful effects
Chapter 3- Solid Waste Generation and Collection
3.1 Quantities of solid waste
3.2 Measurements and methods to measure solid waste quantities
3.3 Solid waste generation and collection
3.4 Factors affecting solid waste generation rate
3.5 Quantities of materials recovered from MSW
Chapter 4- Handling, Separation, Storage & Disposal of Solid Waste
4.1 Handling, Separation & Storage of solid waste
4.2 Combustion and energy recovery from Municipal solid waste
4.3 Landfill - Classification, planning, sitting, permitting & landfill processes
4.4 Differentiate sanitary landfill and incineration as final disposal system for solid waste
4.5 Biochemical processes
Chapter 5- Processing and Conversion Technologies of Solid Waste
5.1 Processing of solid waste at residential, commercial and industrial site
5.2 Biological and chemical conversion technologies
5.3 Recycling of materials found in solid waste
5.4 Organic waste treatment and new technologies
5.5 Incentives, financial and technical assistance for power generation from waste in India

3 MGNCRE | Waste Management Technologies
Chapter1 Understanding Waste
Management
Introduction
Waste has been a major environmental issue everywhere since the industrial revolution. Besides the
waste we create at home, school and other public places, there are also those from hospitals,
industries, farms and other sources. A rising quality of life, and high rates of resource consumption
patterns have had an unintended and negative impact on the urban environment - generation of
wastes far beyond the handling capacities of urban governments and agencies. Cities are now
grappling with the problems of high volumes of waste, the costs involved, the disposal technologies
and methodologies, and the impact of wastes on the local and global environment.
But these problems have also provided a window of opportunity for cities to find solutions -
involving the community and the private sector; involving innovative technologies and disposal
methods; and involving behaviour changes and awareness raising. These issues have been amply
demonstrated by good practices from many cities around the world.
Objectives of the Block
• To know the concept of waste management & its importance and benefits.
• To understand the sources, types and composition of Municipal Solid Waste(MSW).
1.1 Meaning of Waste Management
Waste is anything your business intends to discard, or handles or produces and is not wanted or
required. Disposing of waste can have a significant impact on the environment. Producing excessive
amounts of waste is often a sign that your business processes may be inefficient. It is in your
interests to identify ways of reducing the amount of waste your business generates.
The amount and type of waste you produce will depend largely on the type of business you operate.
For example, manufacturing businesses tend to produce more waste than those in service industries.
Waste can be solid, liquid, or gaseous and each type has different methods of disposal and
management. Waste management is now not about merely dumping the unwanted things in a
random way but it has become a systematic process consisting of collection, transportation, proper
disposal of garbage, sewage and other waste products. This also offers various solutions for recycling
the items, putting the waste to productive use.

4 MGNCRE | Waste Management Technologies
Waste management deals with all types of waste, including industrial, biological and household. In
some cases waste can pose a threat to human health. Waste is produced by human activity, for
example, the extraction and processing of raw materials. Waste management is intended to reduce
adverse effects of waste on human health, the environment or aesthetics.
Waste management simply means the collection, transport, processing or disposal, managing and
monitoring of waste materials to minimize its consequences on humans and environment. Waste
management (or waste disposal) are the activities and actions required to manage waste from its
inception to its final disposal. This includes the collection, transport, treatment and disposal of
waste, together with monitoring and regulation of the waste management process.Waste
management practices are not uniform among countries (developed and developing nations);
regions (urban and rural areas), and residential and industrial sectors can all take different
approaches.
A large portion of waste management practices deal with Municipal solid waste (MSW) which is the
bulk of the waste that is created by household, industrial, and commercial activity.
There is a need for a complete rethinking of "waste" - to analyse if waste is indeed waste. A
rethinking that calls for
• WASTE to become WEALTH
• REFUSE to become RESOURCE
• TRASH to become CASH
There is a clear need for the current approach of waste disposal that is focused on municipalities and
uses high energy/high technology, to move more towards waste processing and waste recycling
(that involves public-private partnerships, aiming for eventual waste minimization - driven at the
community level, and using low energy/low technology resources. Some of the defining criteria for
future waste minimization programmes will include deeper community participation, understanding
economic benefits/recovery of waste, focusing on life cycles (rather than end-of-pipe solutions),
decentralized administration of waste, minimizing environmental impacts, reconciling investment
costs with long-term goals.
What is the Waste Management Hierarchy?
You can save money if you manage your waste well and choose the best waste management options
for your business. You need to choose the best waste management options for dealing with each
type of waste your business produces.
Waste Management Hierarchy
You should follow the waste management hierarchy when choosing a waste option. The waste
hierarchy can help you to choose the least environmentally damaging option, in order
• Reduce - the most cost-effective option is to cut the amount of waste you produce in the
first place.

5 MGNCRE | Waste Management Technologies
• Reuse - products and materials can be reused by your own business or another organisation.
• Recycle and compost - these options ensure that benefit is still gained from goods and
materials that have reached the end of their useful life.
• Recover energy - some facilities use waste to generate energy or produce biofuel.
• Dispose - the least sustainable option is to bury waste at landfill sites or burn it without
recovering energy, as these do not lead to any benefit from the waste.
You must declare on your waste transfer note or hazardous waste consignment note that you have
applied the waste management hierarchy.
Figure 1.1 Waste management hierarchy ( sourcewww.open.edu/openlearncreate)
When choosing a waste option for your business, you should consider
• what waste facilities are available near your business premises.
• the type of waste you have to dispose of.
• the cost or profit involved in dealing with your waste.
• the environmental impacts of disposing of your waste.
• You should select the best waste management option available as part of a co-ordinated
plan to improve the way you deal with waste.
• Whichever waste management options you choose, you must comply with waste legislation
and your duty of care for waste.
• What is waste (trash, garbage, rubbish, refuse)?

6 MGNCRE | Waste Management Technologies
Difference between Trash and Garbage
Trash Solid waste from places like your attic, backyard or study. Trash items include paper and card
boxes and the like.
Garbage This is waste from kitchen and bathroom. They also include waste from cooking food and
from food storage facilities.
Waste are items we (individuals, offices, schools, industries, hospitals) don’t need and discard.
Sometimes there are things we have that the law requires us to discard because they can be
harmful. Waste comes in infinite sizes—some can be as small as an old toothbrush, or as large as the
body of a school bus.
Waste at Home
Everyone creates waste, although some people are very environmentally conscious and create very
little. Likewise, some countries do a very good job creating less waste and managing the rest. Others
are pretty horrible and have created huge environmental problems for the people and animals living
there.
Waste Fact Did you know?
Europe creates about over 1.8 billion tonnes of waste each year. This means each person creates
about 3.5tonnes on average.
Waste fact Did you know?
In 2010, Americans generated about 250 million tons of trash and recycled and composted over 85
million tons of this material, equivalent to a 34.1 percent recycling rate. On average, we recycled and
composted 1.51 pounds out of our individual waste generation of 4.43 pounds per person per day.
—EPA, USA.
All over the world, communities handle their waste or trash differently. Some common methods of
managing their waste include landfilling, recycling and composting. Other communities strongly
embark on waste reduction and litter prevention/control aimed at reducing the production of waste
in the first place. Some communities also engage in waste-to-energy plants and hazardous waste
disposal programs.
Importance of Waste Management
According to some research reports, every year, 62 million tonnes of waste is generating out of
which only 28% of waste is recycled and 72% is left on the roads and the landfill areas for several
years, which is fraught with hazardous consequences. Presently, most of the developing countries
are facing almost similar situation. Therefore, segregating various kinds of wastes from the
households, efficient waste collection systems, proper disposal, and sustainable recovery are very
much needed processes in modern-day world.

7 MGNCRE | Waste Management Technologies
Nothing is waste until it cannot be used anymore in any way. We generally see wastes piled up but
do not think deep enough on how to use them. Today there are many innovations available in waste
management like recycling wastes into usable products, generating methane or fuels, manufacturing
new products for home/commercial usage such as fence posts, furniture and so on. Therefore, the
importance of managing waste in a very effective way has enhanced many folds now-a-days.
What can be done to manage waste in a scientific way?
An effective strategy to dispose various wastes can offer many solutions for the various problems
associated with waste materials. The most efficient way to deal the waste is to recycle and compost.
It ensures there is gradual improvement of new and cost-effective facilities, which aims to
encourage higher environmental protection standards.
Efficient management of Landfills : Most landfills lack proper on-site waste management thus
contributing to some additional threats to the environment. After certain period, these landfills tend
to leak and pollute ground water and other neighbouring environmental habitats making waste
management a very difficult task. These landfills also generate potentially unsafe gases.
Most of the laws and regulation guiding the operations of landfills are often slack at monitoring and
regulating the different types of wastes like medical waste, municipal waste, special waste or
hazardous waste. This slackness of the laws contributes towards significant increases in toxicity and
hazardous waste to a point where the landfill waste problems often lasts up to many decades.
Concept of 3R: Keeping the nature of waste generated by the households and industries in view, the
three R’s mantra of Reuse, Reduce and Recycle appears be more suitable to meet this challenge.
Care should be taken to see that these options should be taken up under a well sustainable
framework.
Zero Waste System: Industries can play a very significant role by streamlining the process of waste
management for the entire organization through the one central system. Companies can deal
effectively with hazardous waste regulations about the generation of their waste, its handling,
transportation and safe disposal of the waste. In fact they can very well attain “zero waste to
landfill” targets as part of sustainability initiatives.
More emphasis should be given to responsible resource use with an objective of avoidance,
maximizing recycling and waste reduction methods. This involves techniques such as repair of
broken things instead of buying new, purchasing and re-using second-hand items, and designing
reusable and recyclable products.
Benefits of Waste Management
The benefits of managing wastes are very clear from the following

8 MGNCRE | Waste Management Technologies
• Saving Natural Resources: It is a matter of serious concern for us when we see that many
natural resources such as trees, gas, and water are diminishing very rapidly. We all know
that paper, cupboards, paper cups, and many other products are made from trees. However,
trees are cut down on a large scale every year and new trees are not replacing them at the
rate they are cut. Therefore, we should think to recycle paper products so that there is no
need of cutting new trees. It is also quite possible to reuse plastic and metal items. Some
countries have established certain sites where people can bring and sell old newspapers,
metal items or glass. These products are recycled and used again.
• Producing energy: Recycling is a great way to produce energy. By recycling something, we
save energy because more energy is usually needed to produce a new item. For example, it
is possible to get energy from recycling the waste. In Mukesh Ambani’s house, garbage is
used to create electricity. It is reported that electricity is generating from the waste by a
special system in their house. First, the dry and wet wastes are separated, after which the
electricity is generated. Electricity in such a large house is being produced by recycling the
wastes.
• Reduce pollution: Recycling is a one of the most powerful tools to save nature and humanity.
Making more people aware is a contribution in a better future. The more people start to
manage their waste, the better planet we will have to live in. Apart from leaving a lot of
waste, humanity pollutes the environment by producing various products. Factories
considerably pollute the atmosphere with smoke by manufacturing processes. Recycling
reduces pollution and helps save energy. Sounds like a win-win solution.
• Recycling Rubbish: Rubbish is a big problem for aquatic life too. A lot of rubbish is thrown
away into the sea and ocean. There are large areas of waste called “waste islands,” which
are made of rubbish that has been accumulated in one place. Recycling rubbish is important
for nature and humanity. Recycling begins with rubbish management. It means that paper
items can be collected into a paper bin for paper waste, glass into a glass bin and so on.
Indian Scenario on Waste management
Under Indian scenario, the approach towards solid waste management is not scientific, at least for a
common person. As the number of industries is increasing day by day due to a rapid increase in
urbanization, this is eventually leading to the generation of municipal solid waste at a significantly
high rate. In today’s time, this problem has become so disturbing that a small rain creates conditions
like floods in towns and cities.
If we look at the condition that was existing during few decades ago, it gives us an impression that it
was far better than the present. During those days not only, the roads but even the streets of small
towns used to be cleaned every day. Cleaning of drainages used to a part of everyday life and
generally, no one would deliberately put garbage in the drainage. The silts and litter collected from
the houses used to convert into organic fertilizers.
9 MGNCRE | Waste Management Technologies
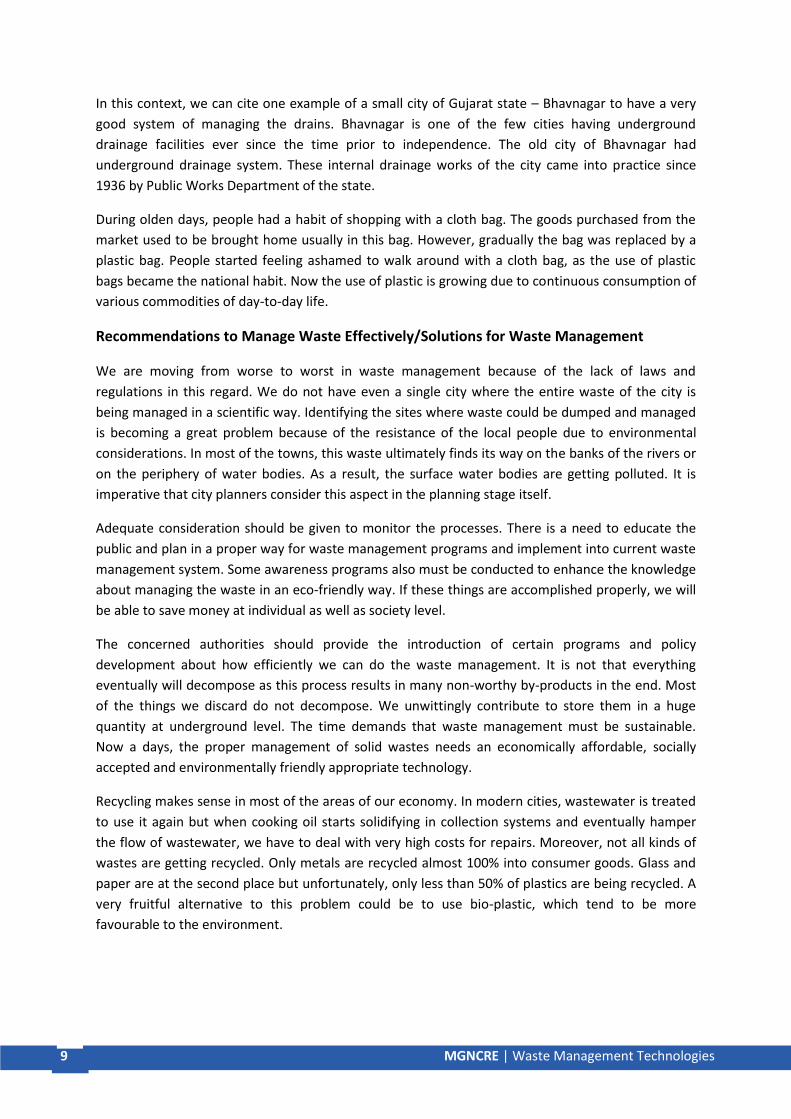
In this context, we can cite one example of a small city of Gujarat state – Bhavnagar to have a very
good system of managing the drains. Bhavnagar is one of the few cities having underground
drainage facilities ever since the time prior to independence. The old city of Bhavnagar had
underground drainage system. These internal drainage works of the city came into practice since
1936 by Public Works Department of the state.
During olden days, people had a habit of shopping with a cloth bag. The goods purchased from the
market used to be brought home usually in this bag. However, gradually the bag was replaced by a
plastic bag. People started feeling ashamed to walk around with a cloth bag, as the use of plastic
bags became the national habit. Now the use of plastic is growing due to continuous consumption of
various commodities of day-to-day life.
Recommendations to Manage Waste Effectively/Solutions for Waste Management
We are moving from worse to worst in waste management because of the lack of laws and
regulations in this regard. We do not have even a single city where the entire waste of the city is
being managed in a scientific way. Identifying the sites where waste could be dumped and managed
is becoming a great problem because of the resistance of the local people due to environmental
considerations. In most of the towns, this waste ultimately finds its way on the banks of the rivers or
on the periphery of water bodies. As a result, the surface water bodies are getting polluted. It is
imperative that city planners consider this aspect in the planning stage itself.
Adequate consideration should be given to monitor the processes. There is a need to educate the
public and plan in a proper way for waste management programs and implement into current waste
management system. Some awareness programs also must be conducted to enhance the knowledge
about managing the waste in an eco-friendly way. If these things are accomplished properly, we will
be able to save money at individual as well as society level.
The concerned authorities should provide the introduction of certain programs and policy
development about how efficiently we can do the waste management. It is not that everything
eventually will decompose as this process results in many non-worthy by-products in the end. Most
of the things we discard do not decompose. We unwittingly contribute to store them in a huge
quantity at underground level. The time demands that waste management must be sustainable.
Now a days, the proper management of solid wastes needs an economically affordable, socially
accepted and environmentally friendly appropriate technology.
Recycling makes sense in most of the areas of our economy. In modern cities, wastewater is treated
to use it again but when cooking oil starts solidifying in collection systems and eventually hamper
the flow of wastewater, we have to deal with very high costs for repairs. Moreover, not all kinds of
wastes are getting recycled. Only metals are recycled almost 100% into consumer goods. Glass and
paper are at the second place but unfortunately, only less than 50% of plastics are being recycled. A
very fruitful alternative to this problem could be to use bio-plastic, which tend to be more
favourable to the environment.

10 MGNCRE | Waste Management Technologies
Various communities from all walks of life whether urban or rural should be educated about the
harmful impact of waste on infrastructure and public health through multimedia and how waste
collection services can be improved to at local level. People should understand if they are not able to
manage them, these waste materials might cause a serious hazard to human health as well as to the
environment.
In fact, it is rarely better to simply throw something away than to reuse it or recycle it. We must
always have in mind that our main and ultimate objective of waste management program is to keep
the Earth clean and to conduct our activities in an eco-friendly way so that we can leave a more
hygienic and healthier environment for future generations.
1.2 Sources of Solid Waste
Eight main sources of solid waste are as follows:
1. Municipal solid waste 2. Industrial solid waste 3. Mining solid waste 4. Fertilizers 5. Pesticides and
Biocides 6. Excretory products of humans and livestock 7. Electronic wastes 8. Hospital Wastes.
1. Municipal Solid Waste
These are solid waste from home, offices, stores, schools, hospitals, hotels etc. These domestic solid
wastes one usually, thrown in municipal garbage collecting cans or on road side open waste lands.
They are collected by municipality vehicles to certain garbage disposal site. They are dumped over a
large area of land which becomes the breeding ground of flies and rats. Usually they are not burnt to
reduce the volume because burning would cause air pollution which is still more dangerous.
2. Industrial Solid Waste
Most of the toxic industrial waste are dumped on waste lands for slow and gradual decomposition.
Some industries dump their effluents on barren land, road sides creating very unhygienic
environment for the local population. Some of the effluents have heavy metals which pollute the
ground water through seepage during the monsoon season. Some heavy metals have been found
slowly accumulating on farmland soils. One such most toxic heavy metal is cadmium which is present
in traces in some fertilizers.
3. Mining Solid Waste
They include mine dust, rock tailing, slack and slag. Open cast mining completely spoil the
surrounding soil. Toxic chemicals and metals present in the mining wastes destroy vegetation and
produce many deformities in animals and human beings.
4. Fertilizers
Chemical fertilizers increase soil fertility and gives better crop yield in lesser time. Shortly, the land
becomes saline, acidic or alkaline and loses fertility.
5. Pesticides and Biocides
These toxic chemicals used in crop field which are not eco-friendly. They enter into crop and then
into primary and secondary consumers. Even human beings are affected due to bio-magnification.

11 MGNCRE | Waste Management Technologies
6. Excretory Products of Humans and Livestock
In underdeveloped and developing countries, the poor sanitary conditions aggravate soil pollution.
The excreta of man and animals, digested sewage sludge used as manure pollute the soil. Several
germs present in such wastes contaminate soil, vegetables, and water bodies causing severe health
hazards.
7. Electronic Waste
The latest solid waste that has appeared in last twenty years commonly known as e-waste is no less
harmful. Irreparable computer and electronic goods. Frequently, more efficient and user-friendly
electronic items appear in the market thus discarding the old generation equipment which simply
become garbages or solid wastes.
Over half of the e-wastes generated in developed countries are exported to developing countries
where they ultimately increase the e-garbage proportions.
8. Hospital Waste
Hospitals generate hazardous wastes that contain disinfectants, other harmful chemicals and
pathogenic microorganism. Such wastes require careful treatment and disposal. The use of
incinerators is crucial for disposal of hospital wastes.
Table 1.1 Sources & Types of Solid Waste (Source: Franklin Association 1999)
Source of Municipal Solid Waste
Type of Solid Waste
Residential Food waste, food container and packer, can, bottles, papers and
newspapers, clothes, garden waste, e-waste, furniture waste
Commercial Centre (Office lot, small
shape, restaurant)
Vary type of papers and boxes, food waste, food container and packer, can, bottles
Institutional (school, university, college,
hospital) Office waste, food waste, garden waste, furniture waste
Industry (factory) Office waste, cafeteria waste, processing waste
City Centre (drainage and road)
Vary type of garden waste, construction waste, public waste

12 MGNCRE | Waste Management Technologies
Every day, tonnes of solid waste is disposed of at various landfill sites. This waste comes from
homes, offices, industries and various other agricultural related activities. These landfill sites
produce foul smell if waste is not stored and treated properly. It can pollute the surrounding air and
can seriously affect the health of humans, wildlife and our environment. The following are major
sources of solid waste
Residential
Residences and homes where people live are some of the major sources of solid waste. Garbage
from these places include food wastes, plastics, paper, glass, leather, cardboard, metals, yard
wastes, ashes and special wastes like bulky household items like electronics, tyres, batteries, old
mattresses and used oil. Most homes have garbage bins where they can throw away their solid
wastes in and later the bin is emptied by a garbage collecting firm or person for treatment.
Industrial
Industries are known to be one of the biggest contributors of solid waste. They include light and
heavy manufacturing industries, construction sites, fabrication plants, canning plants, power and
chemical plants. These industries produce solid waste in form of housekeeping wastes, food wastes,
packaging wastes, ashes, construction and demolition materials, special wastes, medical wastes as
well as other hazardous wastes.
Commercial
Commercial facilities and buildings are yet another source of solid waste today. Commercial
buildings and facilities in this case refer to hotels, markets, restaurants, go downs, stores and office
buildings. Some of the solid wastes generated from these places include plastics, food wastes,
metals, paper, glass, wood, cardboard materials, special wastes and other hazardous wastes.
Institutional
The institutional centers like schools, colleges, prisons, military barracks and other government
centers also produce solid waste. Some of the common solid wastes obtained from these places
include glass, rubber waste, plastics, food wastes, wood, paper, metals, cardboard materials,
electronics as well as various hazardous wastes.
Construction and Demolition Areas
Construction sites and demolition sites also contribute to the solid waste problem. Construction sites
include new construction sites for buildings and roads, road repair sites, building renovation sites
and building demolition sites. Some of the solid wastes produced in these places include steel
materials, concrete, wood, plastics, rubber, copper wires, dirt and glass.
Municipal Services
The urban centers also contribute immensely to the solid waste crisis in most countries today. Some
of the solid waste brought about by the municipal services include, street cleaning, wastes from
parks and beaches, wastewater treatment plants, landscaping wastes and wastes from recreational
areas including sludge.
13 MGNCRE | Waste Management Technologies
Treatment Plants and Sites
Heavy and light manufacturing plants also produce solid waste. They include refineries, power
plants, processing plants, mineral extraction plants and chemicals plants. Among the wastes
produced by these plants include, industrial process wastes, unwanted specification products,
plastics, metal parts just to mention but a few.
Agriculture
Crop farms, orchards, dairies, vineyards and feedlots are also sources of solid wastes. Among the
wastes they produce include agricultural wastes, spoiled food, pesticide containers and other
hazardous materials.
Biomedical
This refers to hospitals and biomedical equipment and chemical manufacturing firms. In hospitals
there are different types of solid wastes produced. Some of these solid wastes include syringes,
bandages, used gloves, drugs, paper, plastics, food wastes and chemicals. All these require proper
disposal or else they will cause a huge problem to the environment and the people in these facilities.
Municipal Sources of Waste
This includes trash or garbage from households, schools, offices, market places, restaurants and
other public places. They include everyday items like food debris, used plastic bags, soda cans and
plastic water bottles, broken furniture, grass clippings, product packaging, broken home appliances
and clothing.
Waste Composition
Medical/Clinical Sources of Waste
Medical/clinical waste, normally refers to waste produced from health care facilities, such as
hospitals, clinics, surgical theatre’s, veterinary hospitals and labs. They tend to be classified as hazard
waste rather than general waste. Items in this group include surgical items, pharmaceuticals, blood,
body parts, wound dressing materials, needles and syringes
Agricultural Sources of Waste
Typically, this is waste generated by agricultural activities. These include horticulture, fruit growing,
seed growing, livestock breeding, market gardens and seedling nurseries. Waste items in this group
include empty pesticide containers, old silage wrap, out of date medicines and wormers, used tires,
surplus milk, cocoa pods and corn husks.
End-of-life Automobiles
Automobile Scrap
14 MGNCRE | Waste Management Technologies
When cars are old and not working again, where do they end up? Many people just leave them to
rust in the fields, but there is a better way to deal with them. In many cities, these vehicles are sent
to the plant, where all the removable parts are taken out for recycling. The rest is flattened up and
shredded into pieces for recycling. The last bits that cannot be used again is sent to a landfill.
Industrial Sources of Waste
Since the industrial revolution, the rise in the number of industries manufacturing glass, leather,
textile, food, electronics, plastic and metal products has significantly contributed to waste
production. Take a look at the things in your home, every item there was probably manufactured
and possibly, waste was produced as a result.
Construction/Demolition Sources of Waste
Construction waste is that resulting from the construction of roads and building. Sometimes old
buildings and structures are pulled down (demolished) to make space for new ones. This is
particularly common in old cities that are modernizing. This is called demolition waste. Waste items
include concrete debris, wood, earth, huge package boxes and plastics from the building materials
and the like.
Electronic Sources of Waste
This is waste from electronic and electrical devices. Think of DVD and music players, TV, Telephones,
computers, vacuum cleaners and all the other electrical stuff in your home. These are also called e-
waste, e-scrap, or waste electrical and electronic equipment (WEEE)
Some e-waste (like TV) contains lead, mercury, cadmium, and brominated flame retardants. These
are harmful to humans and the environment. It is therefore important that the right authorities
ensure the proper disposal of such waste.
There are several methods of managing all the various types of waste. Some of these methods cause
additional harm to the environment, but not doing anything is not an option.
1.3 Types of Solid Waste
In a broad sense, waste can be classified into four major types as urban waste, industrial waste,
biomass waste, and biomedical waste. With terms that are more specific, waste can be categorized
as
• Solid Waste: Solid rubbish consists of number of items found in household along with some
commercial as well as industrial locations.
• Liquid Waste: Households and industries generate liquid waste.
• Organic Waste: Consisting of organic material such as food, garden and lawn clippings
organic waste includes animal and plant based material and degradable carbon such as
paper, cardboard and timber, commonly found in household.
• Agricultural Waste: Waste generated by agriculture includes waste from crops and livestock.

15 MGNCRE | Waste Management Technologies
• Bio-medical Waste: Bio-medical waste means any waste, which is generating during the
diagnosis, treatment, or immunization of human beings or animals.
• Recyclable Rubbish Recyclable rubbish consists of all waste items that convert into products
and use again as all types of metals, paper, and organic wastes.
Types/Methods/Techniques of Waste Management
Solid waste can be classified into different types depending on their source
a) Household waste is generally classified as municipal waste,
b) Industrial waste as hazardous waste, and
c) Biomedical waste or hospital waste as infectious waste.
Municipal Solid Waste
Municipal solid waste consists of household waste, construction and demolition debris, sanitation
residue, and waste from streets. This garbage is generated mainly from residential and commercial
complexes. With rising urbanization and change in lifestyle and food habits, the amount of municipal
solid waste has been increasing rapidly and its composition changing. In 1947, cities and towns in
India generated an estimated 6 million tonnes of solid waste, it was about 48 million tonnes in 1997 .
More than 25% of the municipal solid waste is not collected at all; 70% of the Indian cities lack
adequate capacity to transport it and there are no sanitary landfills to dispose of the waste. The
existing landfills are neither well equipped nor well managed and are not lined properly to protect
against contamination of soil and groundwater.
Garbage the four broad categories:
• Organic waste: kitchen waste, vegetables, flowers, leaves, fruits.
• Toxic waste: old medicines, paints, chemicals, bulbs, spray cans, fertilizer and pesticide
containers, batteries, shoe polish etc.
• Recyclable paper, glass, metals, plastics.
• Soiled hospital waste such as cloth soiled with blood and other body fluids.
Over the last few years, the consumer market has grown rapidly leading to products being packed in
cans, aluminium foils, plastics, and other such nonbiodegradable items that cause incalculable harm
to the environment. In India, some municipal areas have banned the use of plastics and they seem to
have achieved success. For example, today one will not see a single piece of plastic in the entire
district of Ladakh where the local authorities imposed a ban on plastics in 1998. Other states should
follow the example of this region and ban the use of items that cause harm to the environment. One
positive note is that in many large cities, shops have begun packing items in reusable or
biodegradable bags. Certain biodegradable items can also be composted and reused. In fact, proper
handling of the biodegradable waste will considerably lessen the burden of solid waste that each city
has to tackle.

16 MGNCRE | Waste Management Technologies
There are different categories of waste generated, each take their own time to degenerate (as
illustrated in the table below).
The type of litter we generate and the approximate time it takes to degenerate
Table 1.2 Type of litter & approximate time (Source: slideplayer.com/8987510)
Type of litter Approximate time it takes to degenerate the litter
Organic waste such as vegetable and
fruit peels, leftover foodstuff, etc. A week or two.
Paper 10–30 days
Cotton cloth 2–5 months
Wood 10–15 years
Woollen items 1 year
Tin, aluminium, and other metal items
Such as cans 100–500 years
Plastic bags one million years?
Glass bottles undetermined
Hazardous waste
Industrial and hospital waste is considered hazardous as they may contain toxic substances. Certain
types of household waste are also hazardous. Hazardous wastes could be highly toxic to humans,
animals, and plants; are corrosive, highly inflammable, or explosive; and react when exposed to
certain things e.g. gases. India generates around 7 million tonnes of hazardous wastes every year,
most of which is concentrated in four states Andhra Pradesh, Bihar, Uttar Pradesh, and Tamil Nadu.
Household waste that can be categorized as hazardous waste include old batteries, shoe polish,
paint tins, old medicines, and medicine bottles.
Hospital waste contaminated by chemicals used in hospitals is considered hazardous. These
chemicals include formaldehyde and phenols, which are used as disinfectants, and mercury, which is
used in thermometers or equipment that measure blood pressure. Most hospitals in India do not
have proper disposal facilities for these hazardous wastes. In the industrial sector, the major
generators of hazardous waste are the metal, chemical, paper, pesticide, dye, refining, and rubber
goods industries. Direct exposure to chemicals in hazardous waste such as mercury and cyanide can
be fatal.

17 MGNCRE | Waste Management Technologies
Hospital Waste
Hospital waste is generated during the diagnosis, treatment, or immunization of human beings or
animals or in research activities in these fields or in the production or testing of biologicals. It may
include wastes like sharps, soiled waste, disposables, anatomical waste, cultures, discarded
medicines, chemical wastes, etc. These are in the form of disposable syringes, swabs, bandages,
body fluids, human excreta, etc. This waste is highly infectious and can be a serious threat to human
health if not managed in a scientific and discriminate manner. It has been roughly estimated that of
the 4 kg of waste generated in a hospital at least 1 kg would be infected.
Surveys carried out by various agencies show that the health care establishments in India are not
giving due attention to their waste management. After the notification of the Bio-medical Waste
(Handling and Management) Rules, 1998, these establishments are slowly streamlining the process
of waste segregation, collection, treatment, and disposal. Many of the larger hospitals have either
installed the treatment facilities or are in the process of doing so.
Generally, waste could be liquid or solid waste. Both of them could be hazardous. Liquid and solid
waste types can also be grouped into organic, re-usable and recyclable waste.
Let us see some details below
Liquid Type
Waste can come in non-solid form. Some solid waste can also be converted to a liquid waste form
for disposal. It includes point source and non-point source discharges such as storm water and
wastewater. Examples of liquid waste include wash water from homes, liquids used for cleaning in
industries and waste detergents.
Solid Type
Solid waste predominantly, is any garbage, refuse or rubbish that we make in our homes and other
places. These include old car tyres, old newspapers, broken furniture and even food waste. They
may include any waste that is non-liquid.
Hazardous Type
Hazardous or harmful waste are those that potentially threaten public health or the environment.
Such waste could be inflammable (can easily catch fire), reactive (can easily explode), corrosive (can
easily eat through metal) or toxic (poisonous to human and animals). In many countries, it is
required by law to involve the appropriate authority to superwise the disposal of such hazardous
waste. Examples include fire extinguishers, old propane tanks, pesticides, mercury-containing
equipment (e.g, thermostats) and lamps (e.g. fluorescent bulbs) and batteries.
Organic Type
Organic waste comes from plants or animals sources. Commonly, they include food waste, fruit and
vegetable peels, flower trimmings and even dog poop can be classified as organic waste. They are
biodegradable (this means they are easily broken down by other organisms over time and turned
into manure). Many people turn their organic waste into compost and use them in their gardens.

18 MGNCRE | Waste Management Technologies
Recyclable Type
Recycling is processing used materials (waste) into new, useful products. This is done to reduce the
use of raw materials that would have been used. Waste that can be potentially recycled is termed
"Recyclable waste". Aluminium products (like soda, milk and tomato cans), Plastics (grocery
shopping bags, plastic bottles), Glass products (like wine and beer bottles, broken glass), Paper
products (used envelopes, newspapers and magazines, cardboard boxes) can be recycled and fall
into this category.
16 Major Classification of Solid Waste
Some of the major various classification of solid waste are as follows 1. Municipal Waste 2.
Domestic/ Residential Waste 3. Commercial Waste 4. Garbage 5. Rubbish 6. Institutional Waste 7.
Ashes 8. Bulky Wastes 9. Street Sweeping 10. Dead Animals 10. Dead Animals 11. Construction and
Demolition Wastes 12.Industrial Wastes 13. Hazardous Wastes 14.Sewage Wastes 15.
Biomedical/Hospital Waste 16. Plastics.
Solid waste is the material generated from various human activities and which is normally disposed
as useless and unwanted. A comprehensive classification of wastes is described below (Manual on
Municipal Solid waste Management, 2000).
1. Municipal Waste
Municipal waste includes waste resulting from municipal activities and services such as street
wastes, dead animals, market wastes and abandoned vehicles. However, the term is commonly
applied in a wider sense to incorporate domestic wastes and commercial wastes.
2. Domestic / Residential Waste
This category of waste comprises the solid wastes that originate from single and multi-family house
hold units. These wastes are generated as a consequence of house hold activities such as cooking,
cleaning, repairs, hobbies, redecoration, empty containers packaging, clothing, old books, paper and
old furnishings.
3. Commercial Waste
Commercial waste are solid wastes that originate in offices, wholesale and retail stores, restaurants,
hotels, markets, warehouses and other commercial establishments. Some of these wastes are
further classified as garbage and others as rubbish.
4. Garbage
Garbage is the term applied to animal and vegetable waste resulting from the handling, storage,
sale, cooking and serving food. Such wastes contain putrescible organic matter, which produces
strong odours and therefore attracts rats, flies and other vermin. It requires immediate attention in
its storage, handling and disposal.
5. Rubbish

19 MGNCRE | Waste Management Technologies
Rubbish is general term applied to solid wastes originating in households, commercial
establishments and institutions, excluding garbage & ashes.
6. Institutional Waste
Institutional wastes are those arising from institutions such as schools, universities, hospitals and
research institutes. It includes wastes, which are classified as garbage and rubbish, as well as wastes,
which are considered to be hazardous to public health and to the environment.
7. Ashes
Ashes are the residues from the burning of wood, coal, charcoal, coke and other combustible
materials for cooking and heating in houses, institutions and small industrial establishments. When
produced in large quantities at power generation plants and factories, these wastes are classified as
industrial wastes. Ashes consist of a fine powdery residue, cinders and clinker often mixed with small
pieces of metal and glass.
8. Bulky Waste
Bulky household waste can’t be accommodated in the normal storage containers of households. For
this reason they require special collection. In developed countries residential bulky wastes include
household furniture and “white goods” appliances such as stoves, washing machines and
refrigerators, mattresses and springs, rugs, TV sets, water heaters, tyres, lawn mowers, auto parts,
tree and brush debris, and so forth.
Commercial bulky wastes include packaging and containers in a wide range of sizes, including
corrugated cardboard, and wood boxes, fiber, plastic and steel drums usually under 40 gallons
(0.15m3), loose and bundled paper (office, printouts), bundles of textiles and plastics, bales of
corrugated and paper, furniture and equipment, and flat and wire banding. Industrial bulky waste
includes dunnage, including crates, cartons, pallets, skids; large and small steel, fibre, and plastic
drums; bales and rolls of paper, plastics, and textiles; miscellaneous metal boxes, tubing, rod,
punchings, and skeleton; wire, rope, and metal banding; and paper, textile, and plastic streamers
(William D. Robinson, 1986).
9. Street Sweeping,
This term applies to wastes that are collected from streets, walkways, alleys, parks and vacant lots.
In the more affluent countries, manual street sweeping has virtually disappeared but it still
commonly takes place in developing countries, where littering of public places is a far more
widespread and acute problem. Street wastes include paper, cardboard, plastic, dirt, dust, leaves
and other vegetable matter.
10. Dead Animals
This is term applied to dead animals that die naturally or accidentally killed. This category does not
include carcass and animal parts from slaughterhouses, which are regarded as industrial wastes.
Dead animals are divided into 2 groups, large and small. Among the large animals are Horses, Cows,
Goats, Sheep and the like. Small animals include dogs, cats, rabbits and rats. The reason for this
differentiation is that large animals require special equipment for lifting and handling during their

20 MGNCRE | Waste Management Technologies
removal. If not collected promptly, dead animals are a threat to public health because they attract
flies and other vermin as they putrefy. Their presence in public places is particularly offensive and
emits foul smell from the aesthetic point of view.
11. Construction and Demolition Waste
Construction and demolition waste are the waste materials generated by the construction,
refurbishment, repair and demolition of houses, commercial buildings and other structures. It mainly
consists of earth, stones, concrete, bricks, lumber, roofing materials, plumbing materials, heating
systems and electrical wires and parts of general municipal waste stream, but when generated in
large amounts at building and demolition sites, it is generally removed by contractors for filling low
lying areas and by urban local bodies for disposal at landfills. While retrievable items such as bricks,
wood metal are recycled, the concrete and masonry waste accounting for 50% of the waste from
construction and demolition activities, are not been currently recycled in India. Concrete and
masonry waste can be recycled by sorting, crushing and sieving into recycled aggregates. These
recycled aggregates can be used to make concrete for road construction and building material.
This category waste is complex due to the different types of building materials being used but in
general may comprise of major components like Cement concrete, Bricks, Cement plaster, Steel
(from RCC, door/ window frames, roofing support etc., Rubble, Stone (marble, granite, sand stone),
Timber/wood and a few minor components like Conduits (iron, plastic), Pipes (GI, iron, plastic),
Electrical fixtures (copper/ aluminium wiring, wooden baton, Bakelite, wire insulation, plastic
switches), Panels (wooden, laminated), Others (Glazed tiles, glass panels).
12. Industrial Waste
In this category are the discarded solid material of manufacturing processes and industrial
operations. They cover a vast range of substances which are unique to each industry. For this reason
they are considered separately from municipal wastes. However, solid wastes from small industrial
plants and ash from power plants are frequently disposed of at municipal landfills.
The major generators in the industrial solid wastes are the thermal power plants producing coal ash,
the integrated Iron and steel mills producing blast furnace slag and steel melting slag, non-ferrous
industries like aluminium, zinc, and copper producing red mud and tailings, sugar industries
generating press mud, pulp and paper industries producing lime and fertilizer and allied industries
producing gypsum.
13. Hazardous Wastes
Hazardous wastes may be defined as wastes of industrial, institutional or consumer origin which
because of their physical, chemical or biological characteristics are potentially dangerous to human
and the environment. In some cases although the active agents may be liquid or gaseous, they are
classified as solid waste because they are confined in solid containers. Typical examples are solvents,
paints and pesticides whose spent containers are frequently mixed with municipal wastes and
become part of urban waste stream.

21 MGNCRE | Waste Management Technologies
14. Sewage Waste
The solid by-products of sewage treatment are classified as sewage wastes. They are mostly organic
and derive from the treatment of organic sludge from both the raw and treated sewage. The
inorganic fraction of the raw sewage such as grit is separated at a preliminary stage of treatment,
but because it entrains putrescible organic matter which may contain pathogens, must be
buried/disposed off without delay.
The bulk of treated dewatered sludge is useful as a soil conditioner but invariably its use for this
purpose is uneconomical. The solid sludge therefore enters the stream of municipal wastes unless
special arrangements are made for its disposal.
15. Biomedical/Hospital Waste
Hospital waste is generated during the diagnosis, treatment, or immunization of human beings or
animals or in research activities in these fields or in the production or testing of biological. It may
include wastes like sharps, soiled waste, disposables, anatomical waste, cultures, discarded
medicines, chemical wastes, etc.
These are in the form of disposable syringes, swabs, bandages, body fluids, human excreta, etc. This
waste is highly infectious and can be a serious threat to human health if not managed in a scientific
and discriminate manner. It has been roughly estimated that of the 4 kg of waste generated in a
hospital at least 1 kg would be infected.
These wastes are categorized into 10 different categories as
• Human anatomical waste (tissues, organs, body parts etc.)
• Animal waste
• Microbiology and biotechnology waste, such as, laboratory cultures, microorganisms, human
and animal cell cultures, toxins etc.
• Waste sharps such as, hypodermic needles, syringes, scalpels, broken glass etc
• Discarded medicines and cyto-toxic drugs
• Soiled waste, such as dressings, bandages, plaster casts, material contaminated with blood
etc
• Solid waste (disposal items like tubes, catheters etc., excluding sharps)
• Liquid waste generated from any of the infected areas
• Incineration ash
• Chemical waste

22 MGNCRE | Waste Management Technologies
Surveys carried out by various agencies show that the health care establishments in India are not
giving due attention to their waste management. After the notification of the Bio-medical Waste
(Handling and Management) Rules, 1998, these establishments are slowly streamlining the process
of waste segregation, collection, treatment and disposal. Many of the larger hospitals have either
installed the treatment facilities or are in the process of doing so.
16. Plastics
Plastics, due to their versatility in use and impact on environment can be grouped under a different
category of solid waste. Plastic with its exclusive qualities of being light yet strong and economical,
has invaded every aspect of our day-to-day life.
1.4 Composition of Solid Waste
The composition of municipal solid waste varies greatly from municipality to municipality and it
changes significantly with time. In municipalities which have a well developed waste recycling
system, the waste stream mainly consists of intractable wastes such as plastic film and non-
recyclable packaging materials.
• Composition is the term used to describe the individual components that make up a solid
waste stream and their relative distribution.
• Information on the composition of solid wastes is important in evaluating equipment needs,
systems and management programme and plans.
• The residential and commercial portion makes up about 50 to 75 percent of total MSW
generated in a community.
• The actual percentage distribution will depend on
• The extent of construction and demolition activities.
• The extent of the municipal services provided.
• The types of water and wastewater treatment process that are used.

23 MGNCRE | Waste Management Technologies
Table 1.3 Composition of municipal solid waste (Source: slideplayer.com/slide/6288311)
ComponentPercent by Weight Moisture percent
Range Typical Range Typical
Organic
Food wastes 6 – 26 15 50 – 80 70
Paper 25 – 45 40 4 – 10 6
Cardboard 3 – 15 4 4 – 8 5
Plastics 2 – 8 3 1 – 4 2
Textiles 0 – 4 2 6 – 15 10
Rubber 0 – 2 0.5 1 – 4 2
Leather 0 – 2 0.5 8 – 12 10
Yard wastes 0 – 20 12 30 – 80 60
Wood 1 – 4 2 15 – 40 20
Misc. organics
Inorganics
Glass 4 – 16 8 1 – 4 2
Tin cans 2 – 8 6 2 – 4 3
Aluminum 0 – 1 1 2 – 4 2
Other metal 1 – 4 2 2 – 6 3
Dirt, ash etc 0 – 10 4 6 – 12 8
Waste composition depends on a wide range of factors such as food habits, cultural traditions,
climate and income (Srivastava et al., 2014; Patel et al., 2014; Naveen et al., 2013; Gupta et al.,2013;
Kumar et al., 2009). Many categories of municipal solid waste are found such as food waste, rubbish,
commercial waste, institutional waste, street sweeping waste, industrial waste, construction and
demolition waste, and sanitation waste. Municipal solid waste contains compostable organic matter
(fruit and vegetable peels, food waste), recyclables (paper, plastic, glass, metals, etc.), toxic
substances (paints, pesticides, used batteries, medicines), and soiled waste (bloodstained cotton,
sanitary napkins, disposable syringes) (Kaushal et al., 2012; Upadhyay et al., 2012; Reddy and Galab,
1998). Of these papers, plastics, yard debris, food waste, wood, textiles, disposable diapers, bones,
leather and other organics are combustible materials although glass, metal and aluminium are non-
combustible materials (Srivastava et al., 2014; Denison and Ruston, 1990). The composition of
municipal solid waste at generation sources and collection points was determined on a wet weight
basis and it consists mainly of a large organic fraction (40%–60%), ash and fine earth (30%–40%),
paper (3%–6%) and plastic, and glass and metals (each less than 1%). The C/N ratio ranges between
800 and 1000 kcal/kg (Sharholy et al., 2008)

24 MGNCRE | Waste Management Technologies
Figure 1.2 Composition of Indian Municipal Solid Waste ( www.eai.in/ref/ae/wte/typ/msw)
Contents
1. Composition of MSW
2. Composition of Recyclables and Informal Recycling
1. Composition of MSW
A major fraction of urban MSW in India is organic matter (51%). Recyclables are 17.5 % of the MSW
and the rest 31% is inert waste. The average calorific value of urban MSW is 7.3 MJ/kg (1,751
Kcal/kg) and the average moisture content is 47% (Table 6). It has to be understood that this
composition is at the dump and not the composition of the waste generated. The actual percentage
of recyclables discarded as waste in India is unknown due to informal picking of waste which is
generally not accounted. Accounting wastes collected informally will change the composition of
MSW considerably and help estimating the total waste generated by communities.
The large fraction of organic matter in the waste makes it suitable for aerobic and anaerobic
digestion. Significant recyclables percentage after informal recycling suggests that efficiency of
existing systems should be increased. Recycling and composting efficiency are greatly reduced due
to the general absence of source separation. Absence of source separation also strikes centralized
aerobic or anaerobic digestion processes off the list. Anaerobic digestion is highly sensitive to feed
quality and any impurity can upset the entire plant. Aerobic digestion leads to heavy metals leaching
into the final compost due to presence of impurities and makes it unfit for use on agricultural soils.
In such a situation the role of waste to energy technologies and sanitary land filling increases
significantly. This is due to the flexibility of waste-to-energy technologies in handling mixed wastes.
Sanitary landfilling needs to be practiced to avoid negative impacts of open dumping and open
burning of wastes on public health, and on air, water and land resources. Therefore, increasing
source separation rates is always the long term priority.

25 MGNCRE | Waste Management Technologies
2. Composition of Recyclables and Informal Recycling
A significant amount of recyclables are separated from MSW prior to and after formal collection by
the informal recycling sector. The amount of recyclables separated by the informal sector after
formal collection is as much as 21%. The amount of recyclables separated prior to collection is
generally not accounted for by the formal sector and could be as much as four times the amount of
recyclables separated after formal collection. Comparing the percentage of recyclables in MSW in
metro cities with that in smaller cities clearly shows the increased activity of informal sector in
metros and other large cities. Increased presence of informal sector in large cities explains the huge
difference in recyclables composition between large and small cities, observed by PerinazBhada, et
al. In metro cities, which generally have a robust presence of informal recycling sector, the amount
of recyclables at the dump is 16.28%, whereas in smaller cities where the presence of informal
sector is smaller, the composition of recyclables is 19.23%. The difference of 3% in the amount of
recyclables at the dump indicates the higher number of waste pickers and their activity in larger
cities.
Following major categories of waste are generally found in MSW of India
• Biodegradable Waste: Food and kitchen waste, green waste (vegetables, flowers, leaves,
fruits)and paper.
• Recyclable Material: Paper, glass, bottles, cans, metals, certain plastics, etc.
• Inert Waste Matter: C&D, dirt, debris.
• Composite waste: Waste clothing, Tetra packs, waste plastics such as toys.
• Domestic Hazardous Waste (also called “household hazardous waste”) and toxic waste
Waste medicine, e-waste, paints, chemicals, light bulbs, fluorescent tubes, spray cans, fertilizer and
pesticide containers, batteries, and shoe polish. MSW in India has approximate 40–60%
compostable, 30–50% inert waste and 10% to 30% recyclable. Analysis carried out by NEERI reveals
that in totality Indian waste consists of Nitrogen content (0.64 ± 0.8) %, Phosphorus (0.67 ± 0.15)%,
Potassium (0.68 ± 0.15)%, and C/N ration (26 ± 5) %.
Determination of the Composition of MSW in the Field
• Determination of the composition is not an easy task because the heterogeneous nature
of solid wastes.
• More generalized field procedures based on common sense and random sampling
techniques have evolved.
• The procedure for residential MSW can be summarized as following.
• The load is first quartered.

26 MGNCRE | Waste Management Technologies
• One part is then selected for additional quartering unit a sample size of about 200 lb is
obtained.
• It is important to maintain the integrity of each selected quarter regardless of the odour
and physical decay.
• Make sure that all the components are measured.
• The field procedure for component identification for commercial and industrial waste
involves the analysis of representative waste samples taken directly from the source, not
from a mixed waste load in a collection vehicle. Due to the fact that these wastes are so
variable.
Future Changes in Waste Composition
In terms of solid waste management planning, knowledge of future trends in the composition of
solid waste and quantities are of great importance.
Food Waste
The quantity of residential food waste collected has changed significantly over the years as a result
of technical advances and change in public health. Food processing and packaging industry and the
use of kitchen food waste grinders shave affected the quantity of food waste. The percentage of
food waste, by weight, has decreased from about 14% in the early 60s to about 9% in 1992.
Paper and Cardboard
The percentage of paper and cardboard found in MSW has increased greatly over the past half
century, rising from about 20% in the early 1940s to about 40% in 1992. If the postal rate for bulk
mail were increased to first class mail, a significant reduction would occur in the amount of paper
collected for disposal.
Yard Waste
The percentage of yard waste has also increased significantly, due primarily to passage of laws that
prohibit burning of yard wastes. By weight, yard waste currently accounts for about 16-24% of the
waste stream. Environmental conditions such as droughts have also affected the quantities of yard
wastes collected in certain locations.
Plastics
The percentage of plastics in solid waste has increased significantly during the past 50 years. The use
of plastics has increased from almost non- measurable quantities in the early 1940s to 7% in 1992. It
is anticipated the use of plastic will continue to increase, but at a slower rate than during the past 25
years.
1.5 Types of Materials Recovered from MSW
The types of materials recovered from MSW are

27 MGNCRE | Waste Management Technologies
• Aluminium
• Paper
• Plastics
• Glass
• Ferrous Metals (Iron and Steel)
• Non ferrous metals
• Yard waste collected separately
• Construction and demolition wastes
Fig 1.3 Flow chart of existing MSW Management system in India (www.researchgate.net/figure)
Recycling is the best way to solve solid waste management problem. This process exists in all cities.
However, the recycling system differs from developing countries and developed countries.
Developed countries have well organized source separation and recycling system while in the
developing countries the system of recycling is not effective because it is still in the hands of
informal sectors.
The major types of recyclable wastes recovered included paper, plastics, ferrous metal and non-
ferrous metal, which accounted for about 97% of the waste recovered. The remaining 3% include
electrical & electronic equipment, wood, textile, rubber tyres and glass. Following major categories
of waste are generally found in MSW of India:

28 MGNCRE | Waste Management Technologies
Biodegradable Waste Food and kitchen waste, green waste (vegetables, flowers, leaves, fruits) and
paper. Recyclable Material Paper, glass, bottles, cans, metals, certain plastics, etc.
Municipal Solid Waste management is a major environmental issue in India. Due to rapid increase in
urbanization, industrialization and population, the generation rate of municipal solid waste in Indian
cities and towns is also increased. Mismanagement of Municipal Solid Waste can cause adverse
environmental impacts, public health risks and other socio-economic problems.
Resource recovery is using wastes as an input material to create valuable products as new outputs.
The aim is to reduce the amount of waste generated, therefore reducing the need for landfill space
and also extracting maximum value from waste. Resource recovery delays the need to use raw
materials in the manufacturing process. Materials found in municipal solid waste can be used to
make new products. Plastic, paper, aluminium, glass and metal are examples of where value can be
found in waste.
Resource recovery goes further than just the management of waste. Life-cycle analysis (LCA) can be
used to compare the resource recovery potential of different treatment technologies. Improvements
to administration, source separation and collection, reuse and recycling are important. For example,
organic materials can be treated with anaerobic digestion and turned into energy, compost or
fertilizer.
Resource recovery can also be an aim in the context of sanitation. Here, the term refers to
approaches to recover the resources that are contained in wastewater and human excreta (urine
and faeces). The term "toilet resources" has come into use recently. Those resources include
nutrients (nitrogen and phosphorus), organic matter, energy and water. This concept is also referred
to as ecological sanitation. Separation of waste flows can help make resource recovery simpler.
Examples include keeping urine separate from faeces (as in urine diversion toilets) and keeping
greywater and blackwater separate in municipal wastewater systems.
The following resources can be recovered
Water In many water-scarce areas there are increasing pressures to recover water from wastewater.
In 2006, the World Health Organization, in collaboration with the Food and Agriculture Organization
of the United Nations (FAO) and the United Nations Environment Program (UNEP), developed
guidelines for safe use of wastewater. In addition, many national governments have their own
regulations regarding the use of recovered water. Singapore for example aims to recover enough
water from its wastewater systems to meet the water needs of half the city. They call this NEWater.
Another related concept for wastewater reuse is sewer mining.
Energy: The production of biogas from wastewater sludge is now common practice at wastewater
treatment plants. In addition, a number for methods have been researched regarding use of
wastewater sludge and excreta as fuel sources.

29 MGNCRE | Waste Management Technologies
Fertilizing nutrients: A human excreta contains nitrogen, phosphorus, potassium and other
micronutrients that are needed for agricultural production. These can be recovered through
chemical precipitation or stripping processes, or simply by use of the wastewater or sewage sludge.
However, reuse of sewage sludge poses risks due to high concentrations of undesirable compounds,
such as heavy metals, environmental persistent pharmaceutical pollutants and other chemicals.
Since the majority of fertilizing nutrients are found in excreta, it can be useful to separate the
excreta fractions of wastewater (e.g. toilet waste) from the rest of the wastewater flows. This
reduces the risk for undesirable compounds and reduces the volume that needs to be treated before
applying recovered nutrients in agricultural production.
Other methods are also being developed for transforming wastewater into valuable products.
Growing Black Soldier Flies in excreta or organic waste can produce fly larvae as a protein feed.
Other researchers are harvesting fatty acids from wastewater to make bioplastics.
Types of Materials Recovered from Municipal Solid Waste
• Biodegradable waste food and kitchen waste, green waste, paper (most can be recycled
although some difficult to compost plant material may be excluded)
• Recyclable materials paper, cardboard, glass, bottles, jars, tin cans, aluminium cans,
aluminium foil, metals, certain plastics, fabrics, clothes, tyres, batteries, etc.
• Inert waste construction and demolition waste, dirt, rocks, debris.
• Electrical and electronic waste (WEEE) - electrical appliances, light bulbs, washing
machines, TVs, computers, screens, mobile phones, alarm clocks, watches, etc.
• Composite wastes: waste clothing, Tetra Packs, waste plastics such as toys.
• Hazardous waste including most paints, chemicals, tyres, batteries, light bulbs, electrical
appliances, fluorescent lamps, aerosol spray cans, and fertilizers.
• Toxic waste including pesticides, herbicides, and fungicides.
• Biomedical waste -expired pharmaceutical drugs, etc.
Activity
Play your part!
Reduce, re-use and recycle. Efficient and effective waste management is best achieved at household
levels. If every person gets involved, we can have a powerful effect on our environment in a positive
way.
Many times, people want to do the right things but they feel they are alone, and their actions will
not make any difference — YES IT WILL!!
There are millions of great teens like you who appreciate the magnitude of the waste problem and
are doing the right things to help. But we can do more and get others who are not doing well to do
better.
30 MGNCRE | Waste Management Technologies
Here is what you can do!
Reduce creating waste
The next time you change the waste-bin bag, take a look inside it. Is there anything that could have
not ended up there? Probably. Try cutting the waste you produce at home into half. For example,
Use proper towels and ceramic plates at home instead of paper towels, disposable spoons and paper
plates.
Get your own shopping bag instead of bringing home plastic bags each time you go grocery
shopping.
Use old post package boxes to send parcels instead of buying new ones.
More on waste reduction
Re-use things that end up as waste
There are things that can be used over and over again package boxes, gift wrappers, clothing,
furniture and even playing toys. If even you have outgrown them, you can give it out to someone
who has a need for it. Do not be too quick to throw them away.
To do Activity
Overview
In this activity, students will learn about the 4Rs hierarchy by watching a video of students
demonstrating ways to practice the 4Rs. Working in groups, they will use 4Rs pictographs to
brainstorm ways to practice the 4Rs.
Objectives
Students will
1. Explain the need for each of the 4Rs.
2. Give at least two ways to practice of each of the 4Rs, i.e. Reduce, Reuse, Recycle and Rot
(Compost).
Teacher Background
The 4Rs (Reduce, Reuse,Recycle and Rot/Compost) are organized in a hierarchy, or order of
importance. The first goal is to reduce the amount of waste we generate. If we use less stuff, we
reduce the amount of waste produced. Some ways to reduce waste include buying products with
minimal packaging, using a cloth bag instead of paper or plastic and buying durable products with a
longer life span. When waste does occur, the next level in the hierarchy is to reuse items. The reuse
of items does not require the expense of energy or newmaterials because the manufacturing
process is not involved. Some ways to reuse items include using both sides of a piece of paper,
saving and using plastic or paper grocery bags for future visits and donating unwanted items such as
clothing, books or toys to a charity.

31 MGNCRE | Waste Management Technologies
If waste items cannot be reused, the next level is recycling. For example, paper can be recycled to
produce new paper. Glass can be recycled to produce new bottles or kitchen tile. Recycling
conserves natural resources, reduces air and water pollution and saves energy. Finally, organic
materials (originally living plants or animals) that cannot be reused or recycled can be decomposed
(rot) to produce compost, a rich soil amendment that helps plants grow.
Materials
Students
• “4Rs Pictographs” with labels (one set per group of four)
• “Kids Doing the 4Rs” worksheet (one per student)
• Teacher
• Doing the 4Rs Reduce, Reuse,Recycle, Rot video
• “4Rs Pictographs” (without labels) overheads
• Rubric overhead
• Rubrics (one per student)
Preparation
Be prepared to divide the class into groups of four for part of the activity.ITY
Discussion
• Ask students whether they can name the 4Rs. Write them on the board.
• Explain that the 4Rs are arranged in a hierarchy of importance, and guide them to list in the
correct hierarchy (Reduce, Reuse, Recycle, Rot/Compost). Give another example of a
hierarchy.
• Show an overhead of the lesson rubric, and review the expectations for this lesson.
Procedure
• Before showing the video, inform the students that they will be looking for examples of
students practicing the 4Rs.
• Ask them to write down several examples for each of the 4Rs while they watch the video.
• Show the video Doing the 4Rs.
• Organize the students into groups of four. Pass out one set of the “4Rs Pictographs” to each
group.
• Ask each group to cut out the pictographs.

32 MGNCRE | Waste Management Technologies
• Provide a definition for each of the four pictographs and have the groups identify which
pictograph represents each of the 4Rs. Ask them to write the name of each pictograph
below the picture.
• Have them place the 4Rs pictographs in the correct hierarchy.
• Have them brainstorm examples of 4R practices shown in the video.
Wrap-Up
• Put up the “4Rs Pictographs” overheads one at a time.Have groups name and provide a
definition for the pictograph and provide examples of how to practice that particular R.
• Ask students to address why each of the 4Rs is important.
• Pass out “Kids Doing the 4Rs” worksheet to each student. Have students write down two
examples for each of the 4Rs that they would like to implement at home or school.
Final Assessment Idea
Have students draw or create their own pictograph showing one way to practice each of the 4Rs at
home or school. In groups, have them present their pictographs and the group members can choose
which of the 4Rs each pictograph represents.
Summary
In Chapter 1, you have learnt that
• Wastes are items we (individuals, offices, schools, industries, hospitals) don’t need and
discard.
• Waste management simply means the collection, transport, processing or disposal,
managing and monitoring of waste materials to minimize its consequences on humans and
environment.
Eight main sources of solid wastes are as follows:
1. Municipal solid wastes 2. Industrial Solid Wastes 3. Mining solid wastes 4. Fertilizers 5.
Pesticides and Biocides 6. Excretory products of humans and livestock 7. Electronic wastes 8.
Hospital Wastes.
• In a broad sense, waste can be classified into four major types as urban waste, industrial waste, biomass waste, and biomedical waste. The composition of municipal solid waste varies greatly from municipality to municipality and it changes significantly with time.
• The types of materials recovered from MSW are
33 MGNCRE | Waste Management Technologies
• Aluminium
• Paper
• Plastics
• Glass Ferrous Metals (Iron and Steel)
• Non ferrous metals
• Yard waste collected separately
• Construction and demolition wastes
However, the recycling system differs from developing countries and developed countries.
Model Questions
1. What is the importance of waste management in present scenario?
2. What are the first few steps to initiate a waste management programme in your locality?
3. What are the different types of waste?
Suggested Reading
John Pichtel. “Waste Management Practices Municipal, Hazardous, and Industrial” (Parts I & II).
Taylor & Francis Group. 2005.
References
1. Jayaraman G (2013) On track for a clean sweep, India today.
2. Joshi R, Ahmed S (2016) Status and challenges of municipal solid waste management in India
A review. Environ Chem Pollution Waste Manage.
3. Kumar P (2016) Packaging Industry in India.
4. Kumar S, Smith SR, Fowler G, Velis C, Kumar J, et al. (2017) Challenges and opportunities
associated with waste management in India.
5. Lahiry H (2017) Down to earth. India’s challenges in waste management.
6. Mahanti JC (2017) Recycling of used paper packaging, socio-economic perspective. Indian
agro & recycled paper mills association. Paper India.
7. Panchal M, Karthikeyan KS, Singh PS (2016) Plastic packaging-the sustainable choice, A
report on plastic industry.
8. Singhal S, Pandey S (2001) Solid waste management in India status and future directions.
TERI Information monitor on environmental science 6 1-4.
9. TERI (2012) Yamuna, the poisoned river, Study sponsored by UNICEF and posted by TERI.

34 MGNCRE | Waste Management Technologies
Chapter 2 Properties of Municipal Solid
Waste & Characteristics of Hazardous solid
waste
Introduction
The properties of Municipal solid waste describe the physical, chemical & biological properties
associated with MSW and perform calculations using properties.
Objectives
• To introduce the reader to the physical, chemical & biological properties of Municipal solid
waste.
• To know the all transformations that can affect the form and composition of Municipal solid
waste.
• To find the characteristics of hazardous solid waste & its harmful effects.
2.1 Physical Properties of MSW
This includes the determination of percent contents of various ingredients of the solid waste.
• Bulk Density is generally calculated.
• Function of location, season, storage time, equipment used, processing (compaction,
shredding, etc.)
• Used in volume calculations.
The major physical properties measured in waste are (1) density, (2) size distribution of components,
and (3) moisture content. Other characteristics which may be used in making decision about solid
waste management are (1) colour, (2) voids, (3) shape of components, (4) optical property, (5)
magnetic properties and (6) electric properties. Optical property can be used to segregate opaque
materials from transparent substances which would predominately contain glass and plastic.
Magnetic separators are designed based on the magnetic characteristics of the waste. Moisture
content is essential for leachate calculation and composting. Density is used to assess volume of
transportation vehicle and size of the disposal facility. Shape can be used for segregation as flaky
substance will behave differently compared to non-flaky substance.
Density of waste, i.e. its mass per unit volume (kg/m3). It is a critical factor in the design of a Solid
waste management system i.e. the design of sanitary landfills, storage, types of collection and
transport vehicles etc. For an efficient operation of landfill, compaction of wastes to optimum
density is essential.

35 MGNCRE | Waste Management Technologies
• Any normal compaction equipment can achieve reduction in volume of wastes by 75%,
which increases an initial density from 100kg/m3 to 400kg/m3.
• Municipal solid wastes as delivered in compaction vehicles have been found to have an
average density of about 300 kg/m3.
• A waste collection vehicle can drag four times the weight of waste in its compacted state
than when it is un- compacted.
Important physical characteristics of MSW include specific weight, moisture content, particle size
and size distribution, field capacity and compacted waste porosity. The discussion is limited to an
analysis of residential, commercial and some industrial solid wastes.
Specific Weight
Specific weight is defined as the weight of a material per unit volume (e.g., lb/ft3. lb/yd3). Specific
weight expressed as lb/yd3 is commonly referred to in the solid waste literature incorrectly as
density. Because the specific weight of MSW is often reported as loose, as found in containers,
uncompacted, compacted, and the like, the basis used for the reported values should always be
noted. Specific weight data are often needed to assess the total mass and volume of waste that
must be managed. Typical specific weights for various wastes as found in containers, compacted or
uncompacted. Because the specific weights of solid wastes vary markedly with geographic location,
season of the year and length of time in storage, great care should be used in selecting typical
values. Municipal solid wastes as delivered in compaction vehicles have been found to vary from 300
to 700 lb/yd3; a typical value is about 500 lb/yd3.
Moisture Content
The moisture content of solid wastes usually is expressed in one of two ways. In the wet-weight
method of measurement, the moisture in a sample is expressed as a percentage of the wet weight of
the material; in the dry-weight, it is expressed as a percentage of the dry weight of the material. The
wet- weight method is used most commonly in the field of solid waste management. In equation
form, the wet - weight moisture content is expressed as follows
M=(A-B)/A x100
Where
M=moisture content,%
A=initial weight of sample as delivered, lb(kg)
B= weight of sample after drying at 105 degree C, lb(kg)
The moisture content will vary from 15-40 % depending on the composition of the wastes, the
season of the year and the humidity and weather conditions, particularly rain.
• Moisture increases the weight of solid wastes and thereby, the cost of collection and
transport.
• It is a critical determinant in the economic feasibility of waste treatment by incineration
because wet waste consumes energy for evaporation of water and in raising the
temperature of water vapour.

36 MGNCRE | Waste Management Technologies
Particle Size and Distribution
The size and size distribution of the component materials in solid wastes are an important
consideration the recovery of materials, especially with mechanical means such as trammel screens
and magnetic separators. It plays a significant role in the design of mechanical separators and
shredders. The size of a waste component may be defined by one or more of the following
measures:
S_c=L
S_c=((L+w)/2)
S_c=((L+w+h)/3)
S_c=(L x w)^(1?2)
S_c=(Lxwxh)^(1?3)
Where
S_c= size of component, in(mm)
L=length, in(mm)
w=width, in(mm)
h=height, in(mm)
• The major means of controlling particle size is through shredding.
• Shredding increases homogeneity increases the surface area/volume ratio and reduces the
potential of liquid flow paths through the waste.
• Particle size will also influence waste packing densities.
• Particle size reduction could increase biogas production through the increased surface area
available to degradation by bacteria.
• Optical property can be used to separate opaque materials from transparent substances
which majorly contains glass and plastic.
• Shape can be used for segregation as flaky substance will behave differently compared to
non-flaky substance.
• Magnetic separators are designed based on the magnetic characteristics of the waste.
Field Capacity
The field capacity of solid waste is the total amount of moisture that can be retained in a waste
sample subject to the downward pull of gravity. The field capacity of waste materials is of critical
importance in determining the formation of leachate in landfills. Water in excess of the field capacity
will be released as leachate.

37 MGNCRE | Waste Management Technologies
Table2.1 Physical properties of MSW
Physical properties in brief-
Moisture Content
Moisture content is a critical determinant in the economic feasibility of waste treatment by
incineration since energy must be supplied for evaporation of water and in raising the temperature
of the water vapour.
Moisture content also plays an important role in other processing methods such as composting and
anaerobic digestion.
Particle Size
The measurement of the size distribution of particles in the waste stream is important because of its
significance in the design of mechanical separators and shredders. The results of the analysis are
expressed in the manner used for the particle analysis of soils namely a plot of particles size against
% less than a given value.
Density
Knowledge of the density of waste i.e. mass per unit volume is essential for the design of all
elements of the solid waste management system. For example, in high income countries,
considerable benefit is derived through the use of compaction vehicles on collection routes because
the waste is typically of low density. However, in India and other developing countries such as
Thailand, Indonesia etc. due to higher initial density the compaction ratio obtained rarely exceeds
1.5.
Field Capacity
Field capacity of solid waste is total amount of moisture that can be retained in waste sample
subject to downward pull of gravity. Field capacity of critically important in determining the
formation of leachate in landfills. Water excess of field capacity can be released as leachate and field

38 MGNCRE | Waste Management Technologies
capacity varies with degree of applied pressure and state of decomposed moisture of waste.
Permeability The Hydraulic conductivity of compacted waste is an important physical property to a
large extent governs movement of liquid and gases in landfill.
2.2 Chemical Properties of MSW
Chemical properties of MSW are very important in evaluating the alternative processing and
recovery options. Knowledge of the classification is essential for the proper understanding of the
behaviour of waste, as it moves through the waste management system.
• Used primarily for combustion and waste to energy (WTE) calculations but can also be used
to estimate biological and chemical behaviours.
• Waste consists of combustible (i.e. paper) and non-combustible materials (i.e. glass).
Important chemical properties measured for solid waste are (1) moisture (water content can change
chemical and physical properties), (2) volatile matter, (3) ash, (4) fixed carbon, (5) fusing point of
ash, (6) calorific value, (7) percent of carbon, hydrogen, oxygen, sulphur and ash. Proximate analysis
of waste aims to determine moisture, volatile matter, ash and fixed carbon. Ultimate analysis of
waste aims to analyse percent of carbon, hydrogen, oxygen, sulphur and ash.
Solid waste production is a function of land use as well as its composition is inversely proportional to
the possible soil damage and bacterial contamination of the environment (Achudume and Olawale
2009; Lober 1996; Omuta 1999; Shakibaie et al. 2009). Wet waste will host more bacteria compared
to dry waste. The nutrition in waste also acts as a key factor which decides population balance of
species in the waste and immediate environment. Toxic elements discourage multi-cellular organism
in the waste. But micro-organisms may still persist at places which may favour some species of micro
organism. Saprophytes and fungi will flourish in decomposable matter.
Chemical properties includes-
• Lipids
• Carbohydrates
• Proteins
• Natural fibres
• Synthetic organic material (plastics)
• Non-combustibles
• Heating value
• Ultimate analysis
• Proximate analysis
Lipids- This class of compounds includes fats, oils and grease and the principal sources of lipids are
garbage, cooking oils and fats.
Lipids have high heating values, about 38,000 KJ/Kg, which makes them suitable for energy recovery.
Since lipids become liquid at temperatures slightly above ambient, they add to the liquid content
during waste decomposition. Though they are biodegradable, the rate of biodegradation is relatively
slow because lipids have a low solubility in water.

39 MGNCRE | Waste Management Technologies
Carbohydrates- These are found primarily in food and yard wastes, which emcompass sugar and
polymer of sugars (e.g., Starch, cellulose, etc.) with general formula (CH2O) X. Carbohydrates are
readily biodegraded to products such as carbon dioxide, water and methane. Decomposing
carbohydrates attract flies and rats and therefore, should not be left exposed for long duration.
Proteins - There are compounds containing carbon, hydrogen, oxygen and nitrogen and consist of an
organic acid with a substituted amine group (NH2). They are mainly found in food and garden
wastes. The partial decomposition of these compounds can result in the production of amines that
have unpleasant odours.
Natural Fibres - They are found in paper products, food and yard wastes that are resistant to
biodegradation. They are a highly combustible solid waste, having a high proportion of paper and
wood products, they are suitable for incineration.
Synthetic organic material (Plastics) - They are highly resistant to biodegradation and therefore, are
objectionable and of special concern in Solid waste management. Plastics have a high heating value,
about 32,000 KJ/Kg, which makes them very suitable for incineration.
Information on the chemical composition of the components that constitute MSW is important in
evaluating alternative processing and recovery options. For example, the feasibility of combustion
depends on the chemical composition of the solid wastes. If solid wastes are to be used as fuel, the
four most important properties to be known are
Proximate analysis
Fusing point of ash
Ultimate analysis (major elements)
Energy content
Proximate Analysis
• Proximate analysis for the combustible components of MSW includes the following
tests.
• Moisture (loss of moisture when heated to 105 degree C for 1 h).
• Volatile combustible matter (additional loss of weight on ignition at 950 degree C in a
covered crucible).
• Fixed carbon (combustible residue left after volatile matter is removed).
• Ash (weight of residue after combustion in an open crucible).
Fusing Point of Ash
The fusing point of ash is defined as that temperature at which the ash resulting from the burning of
waste will form a solid (clinker) by fusion and agglomeration. Typical fusing temperatures for the
formation of clinker from solid waste range from 2000 to 2200 degree F.
Ultimate Analysis of Solid Waste Components

40 MGNCRE | Waste Management Technologies
The ultimate analysis of a waste component typically involves the determination of the percent
C(Carbon), H(Hydrogen), O(Oxygen), N(Nitrogen), S(Sulphur) and ash. Because of the concern over
the emission of chlorinated compounds during combustion, the determination of halogens is often
included in an ultimate analysis. The results of the ultimate analysis are used to characterize the
chemical composition of the organic matter in MSW. They are also used to define the proper mix of
waste materials to achieve suitable C/N ratios for biological conversion processes.
Energy Content of Solid Waste Components
The energy content of the organic components in MSW can be determined
• By using a full scale boiler as a calorimeter
• By using a laboratory bomb calorimeter
• By calculation, if the elemental composition is known
Table 2.2 Chemical properties of MSW
Chemical Properties in Brief
pH A 5 gm portion of the powdered sample is mixed with 50 ml of distilled water by stirring and pH
is then measured by a pH meter. The pH of fresh solid waste is normally around 7. During
decomposition it tends to become acidic and stabilized solid waste has an alkaline pH. Organic
content A 10 gm portion of the dried ground sample is placed in a silica dish and slowly heated in an
electric furnace to 700 degree Celsius for 30 min. The residue is weighed and the loss of weight
represents the organic content and is expressed as percent by weight. The knowledge of organic
content helps assess the feasibility of biological processing-composting and anaerobic digestion.
Carbon Content
The carbon is determined by using the New Zealand formula in which the percent organic matter is
divided by 1.724. Nitrogen content Total nitrogen is obtained by Kjeldahl method and the

41 MGNCRE | Waste Management Technologies
phosphorous and potassium are estimated by using phosphomolybdic and flame photometric
method. Nitrogen, phosphorous and potash values are important in composting.
Toxicity
Toxicity characteristics include heavy metals, pesticides, insecticides etc. Heavy metals are present in
municipal solid waste due to the waste from small scale industries. As some of the heavy metals
leach out, testing for heavy metals is often carried out. Toxicity Characteristics Leaching Procedure
(TCLP) test is invariably carried out if the waste is suspected to be toxic in nature.
2.3 Biological Properties of Municipal Solid Waste
The most important biological characteristic of the organic fraction of MSW is that almost all the
organic components can be converted biologically to gases and relatively inert organic and inorganic
solids.
• The production of odours and the generation of flies are also related to the putrescible
nature of the organic materials. The organic fraction of MSW (excluding plastics, rubber and
leather) can be classified as:
• Water-soluble constituents - sugars, starches, amino acids and various organic acids
• Hemi cellulose - a product of 5 and 6-carbon sugars
• Cellulose - a product of 6-carbon sugar glucose
• Fats, oils and waxes - esters of alcohols and long-chain fatty acids
• Lignin - present in some paper products
• Lignocellulose - combination of lignin and cellulose
• Proteins - amino acid chains
Volatile solids (VS) content, determined by ignition at 550 degree C, is often used as a measure of
the biodegradability of the organic fraction of MSW. The use of VS in describing the biodegradability
of the organic fraction of MSW is misleading, as some of the organic constituents of MSW are highly
volatile but low in biodegradability (e.g., newsprint and certain plant trimmings). Alternatively, the
lignin content of a waste can be used to estimate the biodegradable fraction, using the following
relationship
BF=0.83- 0.028LC
Where
• BF= biodegradable fraction expressed on a volatile solids (VS) basis
• 0.83=empirical constant
• 0.028=empirical constant
• LC=lignin content of the VS expressed as a percent of dry weight

42 MGNCRE | Waste Management Technologies
The biodegradability of several of the organic compounds found in MSW, based on lignin content.
Wastes with high lignin contents, such as newsprint, are significantly less biodegradable than the
other organic wastes found in MSW. The rate at which the various components can be degraded
varies markedly. For practical purposes, the principal organic waste components in MSW are often
classified as rapidly and slowly decomposable.
Production of Odours
Odours can develop when solid wastes are stored for long periods of time on-site between
collections, in transfer stations and in landfills. The development of odours in on-site storage
facilities is more significant in warm climates. Typically, the formation of odours results from the
anaerobic decomposition of the readily decomposable organic components found in MSW. For
example, under anaerobic (reducing) conditions, sulphate can be reduced to sulphide
(S-2), which subsequently combines with hydrogen to form H2S.
The black colour of solid wastes that have undergone anaerobic decomposition in a landfill is
primarily due to the formation of metal sulphides. If were not for the formation of a variety of
sulphides, odour problems at landfills could be quite significant.
The biochemical reduction of an organic compound containing a sulphur radical can lead to the
formation of malodorous compounds such as methyl mercaptan and amino butyric acid. The methyl
mercaptan can be hydrolyzed biochemically to methyl alcohol and hydrogen sulphide
? CH?_3SH+H_2 0??CH?_4 0H+H_2 S
Fig 2.1 Biological properties of MSW ( Source: www.slideshare.net/biological characteristics)
Solid waste can host an array of insects, arthropod and annelids. The examples of insects include
cockroaches, dung beetles, ants, termites, mosquitoes, honey bees and house flies. Some of the
arthropods in solid waste are spiders and scorpions.
Annelids in solid waste include centipede, millipede and earthworm. In some of the waste dumps
adjacent to forest area attract wild life as well. While herbivores are attracted towards vegetables
and food carnivores are attracted towards hospital waste and other animals which come to eat solid
waste. Solid waste dumps attract and host rats, lizards, snakes and street dogs depending on the

43 MGNCRE | Waste Management Technologies
food available. Due to the absence of agricultural land honey bees in urban area are attracted to left
over sweet drinks in trash for collecting nectar.
Micro-organisms play an important role in the decomposition of decomposable fraction of solid
waste. Thermophilic bacteria would breakdown of proteins and other easily biodegradable material.
Fungi and actinomycetes would degrade complex organic matter like cellulose and lignin.
Streptomyces and micromonospora species are commonly observed actinomycetes in compost.
Thermonomyces sp., asperigallus and penicillium dupontii fumigatus are common fungi observed in
compost. Most of these organisms will be present in municipal solid waste even before composting
(CPHEEO 2000).
Biodegradability of MSW
• The most important biological characteristic of the organic fraction of MSW is that almost
all the organic components can be converted biologically to gases and relatively inert
organic and inorganic solids.
• The production of odours and the generation of flies are also related to the putrescible
nature of the organic materials. These will be discussed when talking about landfill
processes.
• Volatile solids (VS), determined by ignition at 550 Degree C, is often used as a measure of
the biodegradability of the organic fraction of MSW.
• Some of the organic constituents of MSW are highly volatile but low in biodegradability (e.g.
Newsprint) due to lignin content.
• The rate at which the various components can be degraded varies markedly. For practical
purposes, the principal organic waste components in MSW are often classified as rapidly and
slowly decomposable.
2.4 Transformation of Municipal Solid Waste
Physical Transformations
The principal physical transformations that may occur in the operation of solid waste management
systems include
Component separation,
Mechanical volume reduction and
Mechanical size reduction.
Physical transformations do not involve a change in phase (e.g., solid to gas), unlike chemical and
biological transformation processes.
Component Separation

44 MGNCRE | Waste Management Technologies
Component separation is the term used to describe the process of separating, by manual and/or
mechanical means. Component separation is used to transform a heterogeneous waste into a
number of more-or-less homogeneous components. Component separation is a necessary operation
in the recovery of reusable and recyclable materials from MSW, in the removal of contaminants
from separated materials to improve specifications of the separated material, in the removal of
hazardous wastes from MSW and where energy and conversion products are to be recovered from
processed wastes.
Mechanical Volume Reduction
Volume reduction (sometimes known as densification) is the term used to describe the process
whereby the initial volume occupied by waste is reduced, usually by the application of force or
pressure.
In most cities, the vehicles used for the collection of solid wastes are equipped with compaction
mechanisms to increase the amount of waste collected per trip. Paper, cardboard, plastics and
aluminium and tin cans removed from MSW for recycling are baled to reduce storage volume,
handling costs and shipping costs to processing centers. At disposal sites solid wastes are compacted
to use the available land effectively.
Mechanical Size Reduction
Size reduction is the term applied to the transformation processes used to reduce the size of the
waste materials. The objective of size reduction is to obtain a final product that is reasonably
uniform and considerably reduced in size in comparison with its original form. Size reduction does
not necessarily imply volume reduction. In some situations, the total volume of the material after
size reduction may be greater than that of the original volume. In practice, the term shredding,
grinding and milling are used to describe mechanical size-reduction operations.
2.4.2 Chemical Transformations
Chemical transformations of solid waste typically involve a change of phase (e.g., solid to liquid, solid
to gas, etc.) to reduce the volume and /or to recover conversion products, the principle chemical
processes used to transform MSW include
• Combustion(chemical oxidation),
• Pyrolysis and
• Gasification.
• All three of these processes are often classified as thermal processes.
Combustion (chemical oxidation) : Combustion is defined as the chemical reaction of oxygen with
organic materials to produce oxidized compounds accompanied by the emission of light and rapid
generation of heat. In the presence of excess air and under ideal conditions, the combustion of the
organic fraction of MSW can be represented by the following equation
Organic matter+excessair?N_2+CO?_2+H_2O+O_2+ash+heat

45 MGNCRE | Waste Management Technologies
Excess air is used to ensure complete combustion. The end products derived from the combustion of
MSW, equation includes hot combustion gases-composed primarily of nitrogen (N2), carbon dioxide
(CO2), water (H2O), oxygen(O2)and non-combustible residue. In practice, small amounts of
ammonia (NH3). Sulphur dioxide (SO2), Nitrogen oxides (NOx) and trace gases will also be present,
depending on the nature of the waste materials.
Pyrolysis: Because most organic substances are thermally unstable, they can be split, through a
combination of thermal cracking and condensation reactions in an oxygen-free atmosphere, into
gaseous, liquid and solid fractions. In contrast with the combustion process, which is highly
exothermic, the pyrolytic process is highly endothermic. For this reason, destructive distillation is
often used as an alternative term for pyrolysis. The characteristics of the three major component
fractions resulting from the pyrolysis of the organic portion of MSW are
A gas stream containing primarily Hydrogen (H2). Methane(CH4), Carbon monoxide(CO), Carbon
dioxide(CO2) and various other gases, depending on the organic characteristics of the waste material
being pyrolyzed; A tar and/or oil stream that is liquid at room temperature and contains chemicals
such as acetic acid, acetone and metham and a char consisting of almost pure carbon plus any inert
material that may have entered the process.
Gasification: The gasification process involves partial combustion of a carbonaceous fuel so as to
generate a combustible fuel gas rich in carbon monoxide, hydrogen and some saturated
hydrocarbons, principally methane. The combustible fuel gas can then be combusted in an internal
combustion engine or boiler. When a gasifier is operated at atmospheric pressure with air as the
oxidant, the end products of the gasification process are
A low-Btu gas typically containing Carbondioxide (CO2), Carbon monoxide (CO), Hydrogen (H2),
Methane(CH4) and Nitrogen(N2); A char containing carbon and the inerts originally in the fuel and
condensable liquids resembling pyrolytic oil.
Fig 2.2 Gasification basics (source http//www.waste2energyworld.com)

46 MGNCRE | Waste Management Technologies
Biological Transformations
The biological transformations of the organic fraction of MSW may be used to reduce the volume
and weight of the material; to produce compost, a humus-like material that can be used as a soil
conditioner; and to produce methane. The principal organisms involved in the biological
transformations of organic wastes are bacteria, fungi, yeasts and actinomycetes. These
transformations may be accomplished either aerobically or anaerobically depending on the
availability of oxygen. The principal differences between the aerobic and anaerobic conversion
reactions are the nature of the end products and the fact oxygen must be provided to accomplish
the aerobic conversion. Biological processes that have been used for the conversion of the organic
fraction of MSW include aerobic composting, anaerobic digestion and high-solids anaerobic
digestion.
Aerobic Composting
The organic fraction of MSW will undergo biological decomposition. The extent and the period of
time over which the decomposition occurs will depend on the nature of the waste, the moisture
content, the available nutrients and other environmental factors. Yard wastes and the organic
fraction of MSW can be converted to a stable organic residue known as compost in a reasonably
short period of time. Composting the organic fraction of MSW under aerobic conditions can be
represented by the following equation
Organic matter+ O_2+nutrients? new cells+Resistant organic matter+?CO?_2+H_2
O+?NH?_3+?SO?_2+heat
In equation, the principal end products are new cells, resistant organic matter, carbon dioxide,
water, ammonia and sulphate. Compost is the resistant organic matter that remains. The resistant
organic matter usually contains a high percentage of lignin, which is difficult to convert biologically in
a relatively short time. Lignin, found most commonly in newsprint, is the organic polymer that holds
together the cellulose fibres in trees and certain plants.
Anaerobic Digestion
The biodegradable portion of the organic fraction of MSW can be converted biologically under
anaerobic conditions to a gas containing carbon dioxide and methane (CH4). This conversion can be
represented by the following equation
Organic matter+H_2 O+nutrients? new cells+ Resistant organic
matter+?CO?_2+?CH?_4+?NH?_3+H_2S+heat
Thus, the principal end products are carbon dioxide, methane, ammonia, hydrogen sulphide and
resistant organic matter. In most anaerobic conversion processes carbon dioxide and methane
constitute over 99 percent of the total gas produced.
Importance of Transformation
Typically waste transformations are used
1. To improve the efficiency of solid waste management systems.

47 MGNCRE | Waste Management Technologies
2. To recover reusable and recyclable materials.
3. To recover conversion products and energy.
The organic fraction of MSW can be converted to usable products and ultimately to energy in a
number of ways including
1. Combustion to produce steam and electricity.
2. Pyrolysis to produce a synthetic gas, liquid or solid fuel, and solids.
3. Gasification to produce a synthetic fuel.
4. Biological conversion to produce compost.
5. Bio digestion to generate methane and to produce a stabilized organic humus.
2.5 Characteristics of Hazardous Solid Waste & its Harmful Effects
The terms “hazard” and “risk” are often interchanged, and thought to have similar meanings to most
of us. In reference to chemicals though, the terms are quite different.
Hazard – refers to the inherent properties of a chemical substance that make it capable of causing
harm to a person or the environment.
Risk – is the possibility of harm arising from a particular exposure to a chemical substance, under
specific conditions.
To understand risk, we need to know both what the inherent hazard is and the degree of exposure.
With every hazardous material, there is a risk of potential harm being done, which is increased by
how much of the hazardous material is exposed to certain things. An example being hydrofluoric
acid, this chemical is used in pharmaceuticals which is generally a safe practice, however, if someone
working with this acid accidentally gets it on themselves, it will likely cause 3rd degree burns.
Potential exposure to the chemical is high if the chemical is handled with bare hands without proper
personal protection equipment (PPE). This creates a high-risk situation.
Once we understand the risk of something, we can then either reduce it or manage it. Many
businesses are not able to reduce the amount of waste they create so they must look to manage it.
In the example above, a way to reduce the hazard is to handle the chemical properly and the person
handling it wears the proper personal protection equipment, which lowers the risk of burns. If a
chemical is no longer needed for production, another way to lower the exposure risk is to look for
the best environmental waste disposal method to minimize the impact on humans and the
environment.
How Chemicals Move Throughout the Environment
The different ways a person can come into contact with hazardous chemicals are called exposure
pathways. There are three basic exposure pathways inhalation, ingestion, and dermal (skin) contact.
Since chemicals can move through air, soil and water, they can be found in the air we breathe, the

48 MGNCRE | Waste Management Technologies
soil our plants grow in, water we drink, and the food we eat. Some common ways a person may be
exposed to hazardous chemicals include
Water – Exposure can occur when people drink, shower, bath, or swim in contaminated
groundwater or surface water. If someone goes swimming in waters that have been polluted by
chemicals, they may not realize it until they’re having a reaction.
Soil, Sediment, or Dust – Exposure can occur if contaminated soil, sediment or dust is inhaled or
makes direct contact with skin. This form of exposure is very common in children and is currently a
huge problem in Imperial County, California.
Air – Exposure can occur when people breathe in hazardous chemical vapors or air that is
contaminated by hazardous chemicals or dust.
Food – Exposure can occur when people eat certain foods that have been contaminated. Food
contamination can occur if the food has come into contact with hazardous chemicals either through
water, or in secondary consumers being contaminated by primary consumers
When it comes to hazardous waste disposal and management, understanding the waste your
organization generates is imperative. Hazardous waste is heavily regulated, and thus cannot just be
tossed out with your everyday trash. To know if your organization is handling hazardous waste, the
first step is to assess its characteristics.
When categorizing hazardous waste, the EPA breaks it down by four characteristics
• Ignitability or something flammable
• Corrosivity, or something that can rust or decompose
• Reactivity, or something explosive
• Toxicity, or something poisonous
These high level categories each have their own characteristics that further help you as a generator
define with what your are dealing.
Ignitability
There are three types of ignitable forms
• Liquids with a flash point–the lowest temperature at which fumes above waste ignite–of 60
degrees Celsius or 140 degrees Fahrenheit. Examples include alcohol, gasoline, and acetone.
• Solids that spontaneously combust.
• Oxidizers and compressed gasses.
Corrosivity
Corrosive substances, such as hydrochloric acid, nitric acid, and sulphuric acid, have the ability eat
through containers, causing the leakage of harmful materials. A corrosive is anything liquid with a pH
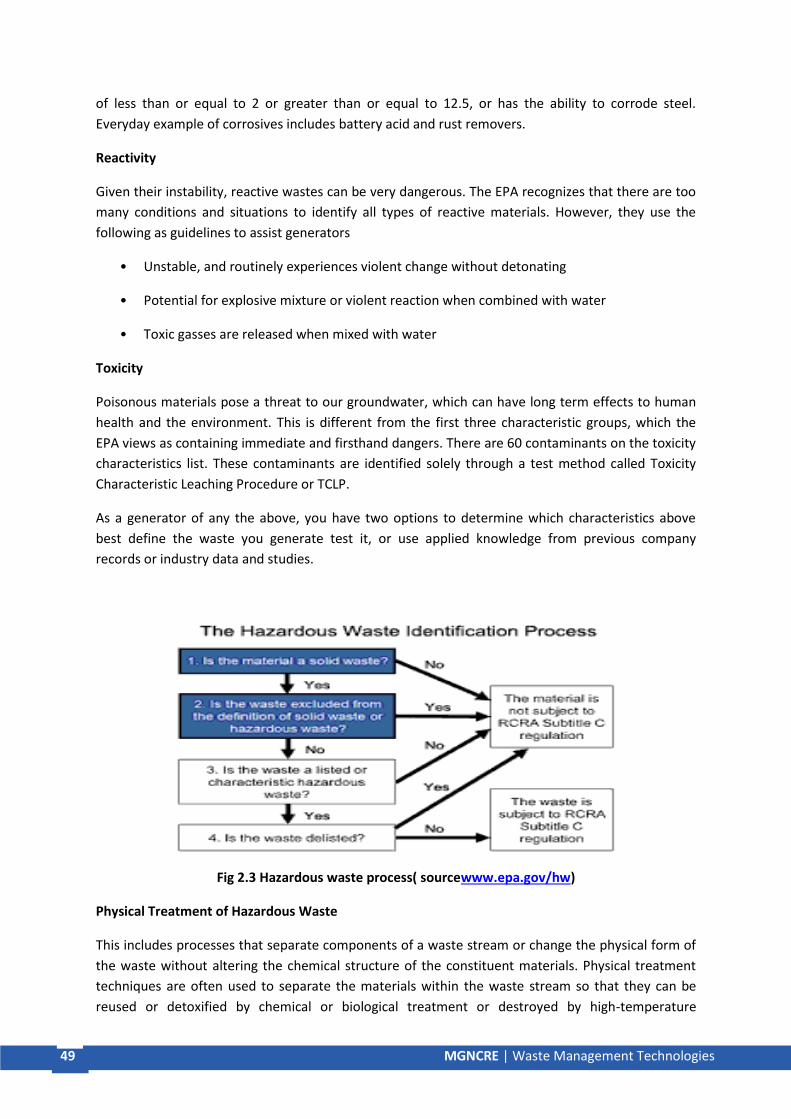
49 MGNCRE | Waste Management Technologies
of less than or equal to 2 or greater than or equal to 12.5, or has the ability to corrode steel.
Everyday example of corrosives includes battery acid and rust removers.
Reactivity
Given their instability, reactive wastes can be very dangerous. The EPA recognizes that there are too
many conditions and situations to identify all types of reactive materials. However, they use the
following as guidelines to assist generators
• Unstable, and routinely experiences violent change without detonating
• Potential for explosive mixture or violent reaction when combined with water
• Toxic gasses are released when mixed with water
Toxicity
Poisonous materials pose a threat to our groundwater, which can have long term effects to human
health and the environment. This is different from the first three characteristic groups, which the
EPA views as containing immediate and firsthand dangers. There are 60 contaminants on the toxicity
characteristics list. These contaminants are identified solely through a test method called Toxicity
Characteristic Leaching Procedure or TCLP.
As a generator of any the above, you have two options to determine which characteristics above
best define the waste you generate test it, or use applied knowledge from previous company
records or industry data and studies.
Fig 2.3 Hazardous waste process( sourcewww.epa.gov/hw)
Physical Treatment of Hazardous Waste
This includes processes that separate components of a waste stream or change the physical form of
the waste without altering the chemical structure of the constituent materials. Physical treatment
techniques are often used to separate the materials within the waste stream so that they can be
reused or detoxified by chemical or biological treatment or destroyed by high-temperature

50 MGNCRE | Waste Management Technologies
incineration. These processes are very useful for separating hazardous materials from an otherwise
non-hazardous waste stream so that they may be treated in a more concentrated form, separating
various hazardous components for different treatment processes, and preparing a waste stream for
ultimate destruction in a biological or thermal treatment process.
Physical treatment processes are important to most integrated waste treatment systems regardless
of the nature of the waste materials or the ultimate technologies used for treatment or destruction.
The physical processes that are commonly used in waste treatment operations are as follows
• Screening is a process for removing particles from waste streams, and it is used to protect
downstream pre-treatment processes.
• Sedimentation is a process for removing suspended solid particles from a waste stream.
Sedimentation is usually accomplished by providing sufficient time and space in special tanks
or holding ponds for settling. Chemical coagulating agents are often added to encourage the
settling of fine particles.
• Flotation is a process for removing solids from liquids by floating the particles to the surface
by using tiny air bubbles. Flotation is useful for removing particles too small to be removed
by sedimentation.
• Filtration is a process for separating liquids and solids by using various types of porous
materials. There are many types of filters designed to achieve various levels of separation.
• Centrifugation is a process for separating solid and liquid components of a waste stream by
rapidly rotating a mixture of solids and liquids inside a vessel. Centrifugation is most often
used to dewater sludges.
• Dialysis is a process for separating components in a liquid stream by using a membrane.
Components of a liquid stream will diffuse through the membrane if a stream with a greater
concentration of the component is on the other side of the membrane. Dialysis is used to
extract pure process solutions from mixed waste streams.
• Electrodialysis is an extension of dialysis. This process is used to separate the components of
an ionic solution by applying an electric current to the solution, which causes ions to move
through the dialysis membrane. It is very effective for extracting acids and metal salts from
solutions.
• Reverse osmosis separates components in a liquid stream by applying external pressure to
one side of a membrane so that solvent will flow in the opposite direction.
• Ultrafiltration is similar to reverse osmosis, but the separation begins at higher molecular
weights. The result is that dissolved components with low molecular weights will pass
through the membrane with the bulk liquid while the higher-molecular-weight components
become concentrated through the loss of solvent. Ultrafiltration systems can handle much
more corrosive fluids than reverse-osmosis units.
51 MGNCRE | Waste Management Technologies
• Distillation is a process for separating liquids with different boiling points. The mixed-liquid
stream is exposed to increasing amounts of heat, and the various components of the
mixture are vapourised and recovered. The vapour may be recovered and re-boiled several
times to effect a complete separation of components.
• Solvent extraction is a process for separating liquids by mixing the stream with a solvent
which is immiscible with part of the waste but which will extract certain components of the
waste stream. The extracted components are then removed from the immiscible solvent for
reuse or disposal.
• Evaporation is a process for concentrating non-volatile solids in a solution by boiling off the
liquid portion of the waste stream. Evaporation units are often operated under some degree
of vacuum to lower the heat required to boil the solution.
• Adsorption is a process for removing low concentrations of organic materials on the surface
of a porous material, usually activated carbon. The carbon is replaced and regenerated with
heat or a suitable solvent when its capacity to attract organic substances is reduced.
Chemical Treatment of Hazardous Waste
Chemical treatment processes alter the chemical structure of the constituents of the waste to
produce either an innocuous or a less hazardous material. Chemical processes are attractive because
they produce minimal air emissions, they can often be carried out on the site of the waste
generator, and some processes can be designed and constructed as mobile units.
The five chemical treatment operations commonly used in treating wastes are as follows:
• Neutralisation is a process for reducing the acidity or alkalinity of a waste stream by mixing
acids and bases to produce a neutral solution. This has proven to be a viable waste
management process.
• Precipitation is a process for removing soluble compounds contained in a waste stream. A
specific chemical is added to produce a precipitate. This type of treatment is applicable to
streams containing heavy metals.
• Ion exchange is used to remove from solution ions derived from inorganic materials. The
solution is passed over a resin bed, which exchanges ions for the inorganic substances to be
removed. When the bed loses its capacity to remove the component, it can be regenerated
with a caustic solution.
• De-chlorination is a process for stripping chlorine atoms from chlorinated compounds such
as polychlorinated biphenyls (PCBs). One of the processes uses a metallic sodium reagent to
break the chlorine bond.
• Oxidation-reduction is a process for detoxifying toxic wastes in which the chemical bonds
are broken by the passage of electronics from one reactant to another.
Biological Treatment of Hazardous Waste

52 MGNCRE | Waste Management Technologies
Biological waste treatment is a generic term applied to processes that use micro-organisms to
decompose organic wastes either into water, carbon dioxide, and simple inorganic substances, or
into simpler organic substances, such as aldehydes and acids. Typically, the micro-organisms used in
a biological process are present in the incoming waste. In some instances, micro-organisms that
were developed to attack specific compounds are injected into a waste stream.
The purpose of a biological treatment system is to control the environment for micro-organisms so
that their growth and activity are enhanced, and to provide a means for maintaining high
concentrations of the micro-organisms in contact with the wastes. Since biological treatment
systems do not alter or destroy inorganic substances, and high concentrations of such materials can
severely inhibit decomposition activity, chemical or physical treatment may be required to extract
inorganic materials from a waste stream prior to biological treatment.
There are five principal types of conventional biological treatment. Treatment with activated sludge
involves exposing waste to a biological sludge that is continuously extracted from the clarified waste
stream and recycled. In the aerated lagoon method, waste is agitated with air in large enclosures to
increase oxygen-dependent biological oxidation. In treatment using trickling filters, wastes are
allowed to trickle through a bed of rocks coated with micro-organisms that alter the waste
components by using them as food. Waste stabilisation ponds are ponds in which wastes are
allowed to decompose over long periods of time, aeration is provided only by wind action. Anaerobic
digestion is a method for decomposing organic matter by using anaerobic organisms in closed
vessels in the absence of air; methane may be produced in the process.
Incineration and Pyrolysis of Hazardous Waste
Incineration and Pyrolysis techniques reduce the volume or toxicity of organic wastes by exposing
them to high temperatures. When organic chemical wastes are subjected to temperatures of 800-
3000°F (430-1700°C), they break down into simpler and less toxic forms.
If the wastes are heated in the presence of oxygen, combustion occurs, and the process is known as
incineration. Incineration systems are designed to accept specific types of materials; they vary
according to feed mechanisms, operating temperatures, equipment design, and other parameters.
The main products from complete incineration include water, carbon dioxide, ash, and certain acids
and oxides, depending upon the waste in question.
If the wastes are exposed to high temperatures in an oxygen-starved environment, the process is
known as Pyrolysis. The products of this process are simpler organic compounds, which may be
recovered or incinerated, and a char or ash.
Hazardous waste incineration and Pyrolysis systems include single-chamber liquid systems, rotary
kilns, and fluidised-bed incineration systems. In a single-chamber liquid system a brick-lined
combustion chamber contains liquids that are burned in suspension; in addition to being the primary
parts of an incineration system, these units are used as afterburners for rotary kilns.
A rotary kiln is a versatile large refractory-lined cylinder capable of burning virtually any liquid or
solid organic waste, the unit is rotated to improve turbulence in the combustion zone. Fluidised-bed
incineration uses a stationary vessel within which solid and liquid wastes are injected into a heated,

53 MGNCRE | Waste Management Technologies
extremely agitated bed of inert granular material; the process promotes rapid heat exchange and
can be designed to scrub off the gases.
Solidification and Stabilisation of Hazardous Waste
Solidification and stabilisation are treatment systems designed to accomplish one or more of the
following —improve handling and the physical characteristic of the waste; decrease the surface area
across which transfer or loss of contained pollutants can occur; and limit the solubility of, or
detoxify, any hazardous constituents contained in the wastes.
In solidification these results are obtained primarily, but not exclusively, via the production of a
monolithic block of treated waste with high structural integrity. Stabilisation techniques limit the
solubility or detoxify waste contaminants even though the physical characteristics of the waste may
not be changed. Stabilisation usually involves the addition of materials that ensure that the
hazardous constituents are maintained in their least soluble or least toxic form.
Disposal of Hazardous Waste
Ultimately, after all treatment is completed, there remains an inorganic valueless residue that must
be disposed of safely. There are five options for disposing of hazardous waste as follows
(i) Underground injection wells are steel and concrete-encased shafts placed deep below the surface
of the earth into which hazardous wastes are deposited by force and under pressure. Some liquid
waste streams are commonly disposed of in underground injection wells.
(ii) Surface impoundment involves natural or engineered depressions or diked areas that can be used
to treat, store, or dispose of hazardous waste. Surface impoundments are often referred to as pits,
ponds, lagoons, and basins.
(iii) Landfills are disposal facilities where hazardous waste is placed in or on land. Properly designed
and operated landfills are lined to prevent leakage and contain systems to collect potentially
contaminated surface water run-off. Most landfills isolate wastes in discrete cells or trenches,
thereby preventing potential contact of incompatible wastes.
(iv) Land treatment is a disposal process in which hazardous waste is applied onto or incorporated
into the soil surface. Natural microbes in the soil break down or immobilise the hazardous
constituents. Land treatment facilities are also known as land application or land farming facilities.
(v) Waste piles are non-containerised accumulations of solid, non-flowing hazardous waste. While
some are used for final disposal, many waste piles are used for temporary storage until the waste is
transferred to its final disposal site.
Of the hazardous waste disposed of on land, nearly 60% is disposed of in underground injection
wells, approximately 35% in surface impoundments, 5% in landfills; and less than 1% in waste piles
or by land application.
To do Activity
Reuse or Recycle Which Comes First?

54 MGNCRE | Waste Management Technologies
Introduction
In this activity, students will explore the 4Rs hierarchy by looking at the benefits of reusing a plastic
bottle before recycling it. They will work in pairs to identify the amount of energy required to
manufacture a water bottle and compare the amount of energy necessary to manufacture, reuse or
recycle a plastic bottle.
Teacher Background
Reuse and recycling are quite different, but are often considered the same practice. Recycling
involves the process of taking a product, deconstructing it and using the materials in
remanufacturing a new product. A product that gets recycled may not always get remanufactured
into the same product again. Recycling products conserves the resources and energy used during the
early parts of the manufacturing process; however, the process of remanufacturing recycled
products still requires energy and resources. Reuse involves the process of taking a product or
material in its current form and using it for the same or different purpose without changing its
original form. The practice of reuse reduces solid waste, conserves even more non-renewable
resources, and reduces emissions such as carbon dioxide released during the manufacturing process.
Reusing items also saves money and landfill space, creates local jobs and keeps resources in our local
economy.
Materials
Students
“Energy of Making Plastic” worksheet
Teacher
• “Making Plastic” overhead
• “Energy of Making Plastic” worksheet overhead
• "Energy of Making Plastic" worksheet answers
• Plastic soda or water bottle
• Rubric overhead
• Rubrics (one per student)
Preparation
Be prepared to put students into pairs for part of the activity.
Discussion
• Explain that many of the things we use everyday are made, or “manufactured,” in factories
using some kind of raw material. Ask the students what paper is manufactured from. Explain
that the process of making things for people to use has several steps Draw T-chart on board

55 MGNCRE | Waste Management Technologies
as shown below and fill in first column only Manufacturing Steps Manufacturing a Plastic
Bottle Collecting raw materials Drilling for oil.
Cleaning materials Cleaning or refining the oil (“refining”),Making item Making oil into
plastic, shaping plastic into bottles,filling bottles with a drink. Packing Packed bottles into
boxes. Transporting to store transport to stores in trucks trains, boats. Selling to Customer
Store sells bottles.Use of Product Purchase bottle and use it.
• Explain another example of something that is manufactured such as a plastic bottle. Ask the
students what the bottle is made from. Show a clear plastic bottle. Explain that plastic
bottles are made from black, liquid oil that is pumped out of the ground. The atoms in the oil
are rearranged and combined with other things during manufacture to make plasticsolid but
a little flexible, fairly clear. Show the overhead “Making Plastic.” Complete the T-chart by
writing down the steps to manufacturing a plastic bottle.
• Ask students what they might do with a plastic bottle when they’re finished drinking the
contents? Record their answers on the board. Ask the students if they can think of ways to
use the bottle again. Explain that there is an important step in the 4Rs hierarchy that comes
before recycling Reuse. When we reuse something, it is used for a new purpose. When we’re
finally done with it, we can still recycle the bottle. When the bottle gets recycled, it will go
back to the manufacturing part of our process to get made into a new thing, instead of
having to pump more oil and make more plastic. Refer to T-chart and draw a line labelled
recycling connecting back into manufacturing from bottom.
• Ask students to name items they often recycle but do not reuse. Write the names of these
items on the board. Why do people use some things only once before recycling? Examine
some of the reasons that people do not reuse items before recycling; i.e., convenience,
durability, accessibility to purchasing a new item, cost, it can’t be refilled, it’s dirty, etc.
• Ask students to define reuse (to use again) and write their definition on the board. Then ask
them to define recycle (making something old into something new, the process of
remanufacturing used materials into new products).
• Tell the students that they will learn why reuse is so important and why it comes before
recycling in the 4Rs hierarchy by looking at how much energy is saved by reusing a plastic
bottle before it is recycled.
• Post the overhead of the rubric, and review with the class the expectations for this lesson.
Procedure
• Explain that if a bottle is reused to carry water or something else instead of buying a new
one, we save natural resources and energy.
• Ask the student to consider how much energy might be saved by reusing a bottle. Define
energy the capacity for doing work. Explain that energy is stored in food, batteries, and
different fuels like gas. Energy is carried by electricity, waves of water or sound, and moving

56 MGNCRE | Waste Management Technologies
objects. Have the students discuss different ways that they use energy and identify where it
comes from.
• Ask the students to describe where is energy might be used to make a plastic bottle? Show
the overhead “Energy of Making Plastic.” Discuss and circle the different energy sources and
inputs required to manufacture and transport a plastic product.
• Have the students describe where is energy used if a plastic bottle is reused? Where is
energy used if you buy a new bottle made from recycled plastic? Is the energy required to
reuse a product different from the type of energy used to remanufacture a new product
from recycled material? Discuss the differences.
• Tell the students that they will work with a partner to compare the amount of energy
required to make a new plastic bottle, reuse a bottle and recycle a bottle.
• Assign the students to work in pairs. Hand out a worksheet “Energy of Making Plastic” to
each pair of students. Model how to complete the worksheet.
Wrap-Up
• Come back together as a class and discuss their findings with a series of questions, for
example
• How many energy units are required to reuse a plastic bottle versus buying a new bottle
made from recycled plastic?
• If you reuse a plastic bottle before recycling it, how many energy units are you saving? (A
bottle’s worth of energy for each time you reuse it.)
• Which action conserves more natural resources reusing or recycling?
• Did anyone think of some other things that are saved when you reuse, besides energy?
(Go back to the overhead “Making Plastic” to discuss other resource inputs and pollution outputs.
An interesting fact toshare is that local environmental scientists have figured out that it takes more
water to make the bottle than a plastic water bottle actually contains for you to drink. The process
of moving the materials and bottles around and manufacturing thebottles produces both air and
water pollution. Time, money, and landfill space are other savings associated with reuse.)
• Ask students to describe other things that people throw away that could be reused?
• Explain when an item such as a plastic bottle is reused, all of the resources and energy
required to make plastic and manufacture and transport a new bottle are conserved. Even if
the new bottle was recycled, energy and resources are still required to transform the
recycled plastic into a new product—so reuse before you recycle!
Final Assessment Idea
Have students write a paragraph describing why reuse is placed before recycling in the 4Rs
hierarchy, citing at least three benefits of reusing something before it is recycled or thrown away.

57 MGNCRE | Waste Management Technologies
Have them describe one specific example of an item from home that can be reused before it is
recycled.
Summary
• Physical characteristics of MSW include specific weight, moisture content, particle size and
size distribution, field capacity and compacted waste porosity.
• Chemical properties measured for solid waste are (1) moisture (water content can change
chemical and physical properties), (2) volatile matter, (3) ash, (4) fixed carbon, (5) fusing
point of ash, (6) calorific value, (7) percent of carbon, hydrogen, oxygen, sulphur and ash.
• The most important biological characteristic of the organic fraction of MSW is that almost all
the organic components can be converted biologically to gases and relatively inert organic
and inorganic solids.
• All transformations can affect the composition of MSW.
• When it comes to hazardous waste disposal and management, understanding the waste
your organization generates is imperative.
Model Questions
1. What are the characteristics of solid waste?
2. How to accelerate the biodegradation of Municipal solid waste?
3. Explain Hazardous waste & its harmful effects.
References
1. Blight GE, Mbande CM (1996) Some problems of waste management in developing countries. J
Solid Waste TechnolManag 23(1)19–27.
2. Carboo D, Fobil JN (2006) Physico-chemical analysis of municipal solid waste (MSW) in the Accra
metropolis. West Africa J ApplEcol Cointreau S (1982) Environmental management of urban solid
wastes in developing countries a project guide. Urban Development Department, World Bank,
Washington.
3. CPCB (Central Pollution Control Board) (2009) Assessment of plastic waste and its management
at airports and railway stations in Delhi
4. CPHEEO (Central Public Health and Environmental Engineering Organisation) (2000) Manual on
municipal solid waste management. Ministry of Urban Development, and Government of India

58 MGNCRE | Waste Management Technologies
Chapter 3 Solid Waste Generation and
Collection
Introduction
Solid waste collection means the act of removing solid waste from the premises of a primary
generating source to a place of solid waste disposal. The solution to many of the problems of solid
waste management is the careful selection and operation of solid waste collection equipment that is
efficient and yet responsive to the physical and socio-economic conditions of the various
neighbourhoods in which service is supplied.
Objectives
• To find out the quantities of solid waste generation and collection.
• To know the methods used to measure solid waste quantities.
• To understand the factors affecting solid waste generation rate.
3.1 Quantities of Solid Waste
The management of municipal solid waste in India has surfaced or continued to be a severe problem
not only because of environmental and aesthetic concerns but also because of the enormous
quantities generated every day. Even though only 31% of Indian population resides in urban areas,
this population of 377million (Census of India, 2011) generates a gigantic 1,43,449 metric tonnes per
day of municipal solid waste, as per the Central Pollution Control Board (CPCB), 2014-15 and these
figures increase every day with an increase in population. To further add to the problem, the total
number of towns (statutory and census) in the country have also increased from 5,161 in 2001 to
7,936 in 2011, thus increasing the number of municipal waste generation by 2,775 within a decade.
The management of municipal solid waste is one of the main functions of all Urban Local Bodies
(ULBs) in the country. All ULBs are required to meticulously plan, implement and monitor all systems
of urban service delivery especially that of municipal solid waste. With limited financial resources,
technical capacities and land availability, urban local bodies are constantly striving to meet this
challenge.
The quantity and composition of MSW generated in the ULB determine collection, processing, and
disposal options that could be adopted. They are dependent on the population, demographic details,
principal activities in the city or town, income levels, and lifestyle of the community. Waste
generation is strongly dependent on the local economy, lifestyle, and infrastructure. It has been well
established that waste generation of an area is proportional to average income of the people of that
area. It is also observed that generation of organic, plastic, and paper waste is high in high income
areas.
An assessment states that the per capita waste generation is increasing by about 1.3% per year.
With an urban growth rate of 3.0%–3.5% per year, the annual increase in waste quantities may be

59 MGNCRE | Waste Management Technologies
considered at 5% per year. Impacts of increasing ULB jurisdiction should also be considered while
assessing future waste generation rates. Several studies were conducted by Central Pollution Control
Board (CPCB) over the last 2 decades to arrive at waste generation details and composition of MSW
generated in the country.
Summaries of the several findings are listed below:
1996 - The characterisation studies carried out by National Environmental Engineering Research
Institute (NEERI) in 1996 indicate that MSW contains large organic fraction (30%–40%); ash and fine
earth (30%–40%); paper (3%–6%); along with plastic, glass, and metal (each less than 1%). The
calorific value of refuse ranges between 800 and 1,000 kilocalorie per kilogram (kcal/kg) and carbon-
to-nitrogen (C/N) ratio ranges between 20 and 30. Study revealed that quantum of waste generation
varies between 0.2 and 0.4 kg/capita/day in the urban centres and goes up to 0.5 kg/capita/day in
metropolitan cities. The study was carried out in 43 cities of varying sizes. The results were
presented in a report published by NEERI “Strategy Paper on Solid Waste Management in India”
(1996).
1999-2000 - The study conducted by CPCB through Environment Protection Training and Research
Institute (EPTRI) in 1999–2000 in 210 Class I cities and 113 Class II towns indicated that Class I cities
generated 48,134 tons per day (TPD) of MSW while Class II towns generated 3,401 TPD of MSW. The
study revealed that waste generation rate in Class I cities was approximately 0.34 kg/capita/day
while the waste generation rate in Class II towns was found to be 0.14 kg/capita/day.
2004-2005 - NEERI’s study “Assessment of Status of Municipal Solid Wastes Management in Metro
Cities and State Capitals” in 2004–2005 assessed 59 cities (35 metro cities and 24 state capitals).
Studies have revealed that waste generation rate varies from 0.12 to 0.60 kg/capita/day. Analysis of
physical composition indicates that total compostable matter in the waste is 40%–60%, while
recyclable fraction is 10%–25%. The moisture content in the MSW is 30%–60%, while the C/N ratio is
20–40.
2010-2011 - The survey conducted by the Central Institute of Plastics Engineering and Technology
(CIPET) at the instance of CPCB has reported generation of 50,592 TPD of MSW in 2010–2011 in the
same 59 cities.
2014-2015 - As per CPCB, 1,43,449 TPD of MSW was generated for 34 states and union territories
during 2013–2014. The average rate of waste generation in India, based on this data, is 0.11
kg/capita/day. Out of the total waste generated, approximately 1,17,644 TPD (82%) of MSW was
collected and 32,871 TPD (22.9%) was processed or treated.
Other studies and observations indicate that waste generation rate is between 200 and 300
gm/capita/day in small towns and cities with a population below 2,00,000. It is usually 300–350
gm/capita/day in cities with a population between 2,00,000 and 5,00,000; 350–400 gm/capita/day in
cities with a population between 5,00,000 and 10,00,000.
The quantities of solid waste generated and collected are of importance in determining compliance
with federal and state waste diversion programmes, selecting specific equipment and designing of
waste collection routes, materials recovery facilities and disposal facilities. Compliance with Federal
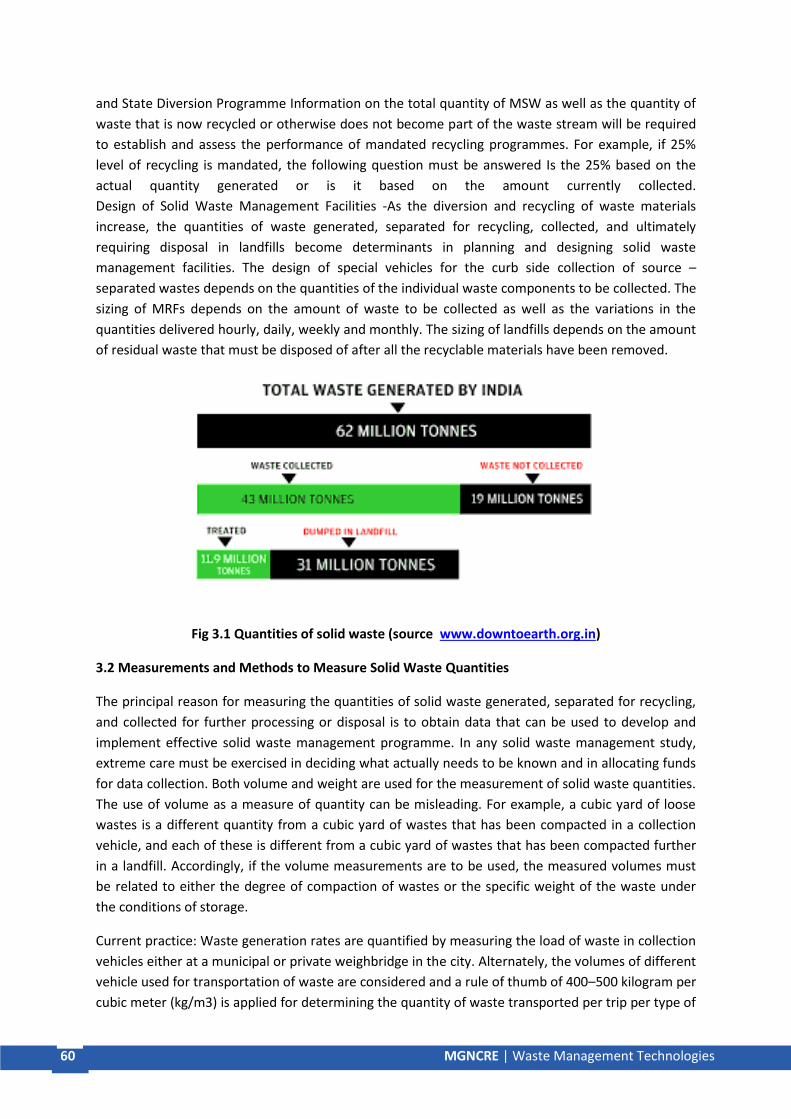
60 MGNCRE | Waste Management Technologies
and State Diversion Programme Information on the total quantity of MSW as well as the quantity of
waste that is now recycled or otherwise does not become part of the waste stream will be required
to establish and assess the performance of mandated recycling programmes. For example, if 25%
level of recycling is mandated, the following question must be answered Is the 25% based on the
actual quantity generated or is it based on the amount currently collected.
Design of Solid Waste Management Facilities -As the diversion and recycling of waste materials
increase, the quantities of waste generated, separated for recycling, collected, and ultimately
requiring disposal in landfills become determinants in planning and designing solid waste
management facilities. The design of special vehicles for the curb side collection of source –
separated wastes depends on the quantities of the individual waste components to be collected. The
sizing of MRFs depends on the amount of waste to be collected as well as the variations in the
quantities delivered hourly, daily, weekly and monthly. The sizing of landfills depends on the amount
of residual waste that must be disposed of after all the recyclable materials have been removed.
Fig 3.1 Quantities of solid waste (source www.downtoearth.org.in)
3.2 Measurements and Methods to Measure Solid Waste Quantities
The principal reason for measuring the quantities of solid waste generated, separated for recycling,
and collected for further processing or disposal is to obtain data that can be used to develop and
implement effective solid waste management programme. In any solid waste management study,
extreme care must be exercised in deciding what actually needs to be known and in allocating funds
for data collection. Both volume and weight are used for the measurement of solid waste quantities.
The use of volume as a measure of quantity can be misleading. For example, a cubic yard of loose
wastes is a different quantity from a cubic yard of wastes that has been compacted in a collection
vehicle, and each of these is different from a cubic yard of wastes that has been compacted further
in a landfill. Accordingly, if the volume measurements are to be used, the measured volumes must
be related to either the degree of compaction of wastes or the specific weight of the waste under
the conditions of storage.
Current practice: Waste generation rates are quantified by measuring the load of waste in collection
vehicles either at a municipal or private weighbridge in the city. Alternately, the volumes of different
vehicle used for transportation of waste are considered and a rule of thumb of 400–500 kilogram per
cubic meter (kg/m3) is applied for determining the quantity of waste transported per trip per type of

61 MGNCRE | Waste Management Technologies
vehicle. A summation of the quantities of waste transported by each vehicle type multiplied by the
total number of trips to the landfill by similar vehicles determines the total quantity of waste
transported in the ULB. The practice of an eye estimate of waste quantity transported is not reliable
as many times trucks carrying waste are half full or carry light material.
The quantity of waste measured at transfer stations or processing or disposal sites also does not
accurately reflect waste generation rates, since these measurements do not include waste disposed
at unauthorised places, vacant lots, alleys, ditches etc, waste recovered by kabadi system, waste
recovered by informal waste collectors or waste pickers from the streets, bins and intermediate
transfer points etc.
To avoid confusion, solid waste quantities should be expressed in terms of weight. Weight is the only
accurate basis for records because tonnages can be measured directly, regardless of the degree of
compaction. Weight records are also necessary in the transport of the solid wastes because the
quantity that can be hauled usually is restricted by highway weight limit rather than by volume. The
volume and weight are equally important with respect to the capacity of the landfills.
Waste quantities are usually estimated on the basis of data gathered by conducting a waste
characterization study, using previous waste generation data or some combination of the two
approaches. It will be helpful to remember that most measurements of waste quantities do not
accurately represent what they are reported or assumed to represent. For example, in predicting
residential waste generation rates, the measured rate seldom reflects the true rates because there
are confounding factors (e.g., onsite storage and the use of alternative disposal locations) that make
the true rate difficult to assess. For U.S, most solid waste generation rates reported in the literature
before 1990 are usually based on measurement of the amount of waste collected, not the actual
amount generated.
Methods Commonly used to Estimate Waste Quantities
Load-count analysis
Weight – volume analysis
Materials- balance analysis
Load-Count Analysis: The number of individual loads and the corresponding waste characteristics
(type of waste, estimated volume) are noted over a specified time period. If scales are available,
weight data are also recorded & unit generation rates are determined by using the field data and
where necessary published data.
Weight - Volume Analysis: Weight –Volume data obtained by weighing and measuring each load
provides better information on the specific weight of the various forms of solid wastes at a given
location. However, the question remains what information is needed in terms of study objectives.
Materials- Balance Analysis: The only way to determine the generation and movement of solid
wastes with any degree of reliability is to perform a detailed mass balance analysis for each
generation source, such as an individual home or a commercial or industrial activity. The approach to
be followed in the preparation of a Materials Mass Balance Analysis is as follows:

62 MGNCRE | Waste Management Technologies
• First, draw a system boundary around the unit to be studied to simplify the mass balance
computations.
• Second, identify all the activities that cross or occur within the boundary and affect the
generation of wastes.
• Third; identify the rate of waste generation associated with each of these activities.
• Fourth, determine the quantity of waste generated, collected and stored.
Statistical Analysis of Measured Waste Quantities: In developing solid waste management
systems, it is often necessary to determine the statistical characteristics of the observed
solid waste generation rates. For many large industrial activities it would be impractical to
provide container capacity to handle the largest conceivable quantity of solid waste to be
generated in a given day. The container capacity to be provided must be based on a
statistical analysis of the generation rates and the characteristics of the collection system.
The density of waste (mass per unit volume, kg/m3) determines the storage and transportation
volume requirements. MSW density in India is typically around 450–500 kg/m3.
• Method for Bulk Density Measurement
• Materials and Apparatus
• Wooden box of l m3 capacity
• Wooden box of 1 ft3 capacity
• Spring balance weighing upto 50 kg.
Procedure: A composite sample of MSW collected from different parts of the heap should be taken
in the smaller 1 ft3 box and weighed with the help of a spring balance. After weighing, contents of
this smaller box (1 ft3) should be emptied into the bigger 1 m3 box. This is repeated until the larger
box is filled to the top. Once the larger box is filled, the weight of the waste is noted. The waste
should not be compacted by pressure. Repeat the entire procedure thrice and take the average
weight to arrive at the weight per cubic meter.
3.3 Solid Waste Generation and Collection
The term “solid waste collection” is taken to include the initial storage of waste at the household,
shop or business premises, the loading, unloading and transfer of waste, and all stages of
transporting the waste until it reaches its final destination – a treatment plant or disposal site. The
sweeping of streets and public places, the cleaning of open storm drains and the removal of these
wastes are also included. The collection system must be designed and operated in an integrated
way. This means that all of the links in the management chain should be considered when any part
of the system is being designed, so that all system components are compatible. For example, the
method of loading a collection truck must suit the containers that are used to store the waste. As
another example if waste is to be recycled, the collection stage should be designed so that there is
the minimum degree of contamination of the material destined for recycling. Again, if waste is to be
deposited at a landfill, the trucks that take it there must be suitable for driving on the landfill.

63 MGNCRE | Waste Management Technologies
Collection of segregated municipal waste is an essential step in MSWM. Inefficient waste collection
services have an impact on public health and aesthetics of towns and cities. Collection of wet, dry
and domestic hazardous waste separately ensures maximum recovery of recyclables. It also
enhances the potential of cost-effective treatment of such wastes which can then easily meet the
minimum quality criteria defined for different products, eg. production of compost from pure
organic waste.
Waste collection services are divided into primary and secondary collection. Primary collection refers
to the process of collecting, lifting and removal of segregated solid waste from source of its
generation including households, shops, offices, markets, hotels, institutions and other residential or
non-residential premises and taking the waste to a storage depot or transfer station or directly to
the disposal site, depending on the size of the city and the waste management system prevalent in
the city. Primary collection must ensure separate collection of certain waste streams or fractions
depending on the separation and reuse system applied by the respective town or city. Primary
collection refers to the collection of waste from source of generation.
Secondary collection includes picking up waste from community bins, waste storage depots, or
transfer stations and transporting it to waste processing sites or to the final disposal site. At the
secondary collectionpoints, segregated waste must be stored on-site in separate covered bins or
containers for further collection and should be kept separate during all steps of waste collection,
transportation, and processing. Further, ULBs should ensure that at the secondary storage points the
waste is should be attended daily or before container starts overflowing. A well synchronized
primary and secondary collection and transportation system, with regular and well communicated
intervals of operation (with respect to primary collection), is essential to avoid containers overflow
and waste littering. Further, the transport vehicles should be compatible with the equipment design
at the waste storage depot and should be able to transport segregated waste. They should also be
easy to maintain. It should be ensured that waste collected from the doorstep in motorized vehicles
should be either directly transported to the processing facility or through material recovery facility
or transfer station, or waste storage depots for facilitating, sorting, and bulk transfer of waste. The
vehicles used for transportation should be covered and not visible to public. It should have a facility
to prevent spillage of waste and leachate en-route to the processing or disposal facility.
In India, rapid urbanization and uncontrolled growth rate of population are main reasons for MSW to
become an acute problem. According to population size per capita waste generation rate and its
growth during a decade, It is anticipated that population of India would be about 1,823 million by
2051 and about 300 million tons per annum of MSW will be generated that will require around
1,450 km of land to dispose it in a systematic manner, if ULBs in India continue to rely on landfill
route for MSW management (Position paper on the solid waste management sector in India, 2009).
However, these projections are on conservative side, keeping 1.33% annual growth in per capita
generation of MSW (Bhide&Shekdar, 1998; CPCB, 2000; Pappu, Saxena, &Asolekar, 2007; Shekdar,
1999). Therefore, with 5% annual growth in per capita generation landfill area required for disposal
of waste could be many folds (CPCB, 2013).
Planning Commission Report (2014) reveals that 377 million people residing in urban area generate
62 million tons of MSW per annum currently and it is projected that by 2031 these urban centers will
generate 165 million tons of waste annually and by 2050 it could reach 436 million tons. To
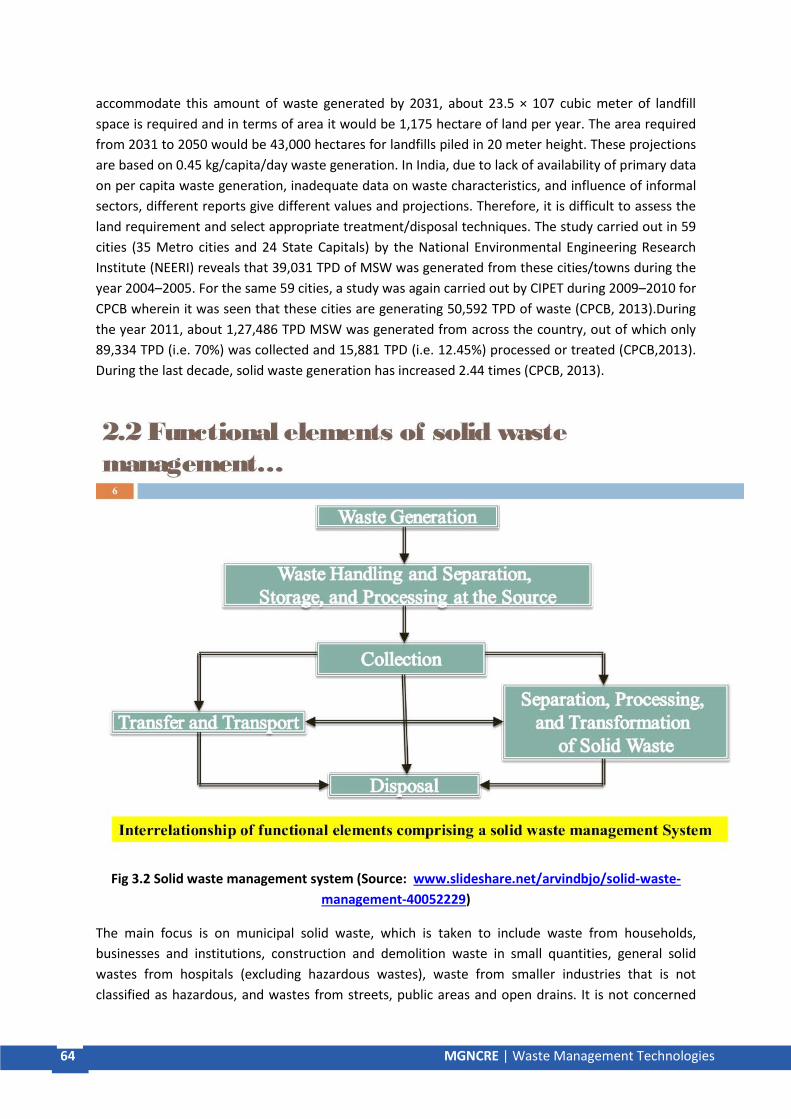
64 MGNCRE | Waste Management Technologies
accommodate this amount of waste generated by 2031, about 23.5 × 10⁷ cubic meter of landfill
space is required and in terms of area it would be 1,175 hectare of land per year. The area required
from 2031 to 2050 would be 43,000 hectares for landfills piled in 20 meter height. These projections
are based on 0.45 kg/capita/day waste generation. In India, due to lack of availability of primary data
on per capita waste generation, inadequate data on waste characteristics, and influence of informal
sectors, different reports give different values and projections. Therefore, it is difficult to assess the
land requirement and select appropriate treatment/disposal techniques. The study carried out in 59
cities (35 Metro cities and 24 State Capitals) by the National Environmental Engineering Research
Institute (NEERI) reveals that 39,031 TPD of MSW was generated from these cities/towns during the
year 2004–2005. For the same 59 cities, a study was again carried out by CIPET during 2009–2010 for
CPCB wherein it was seen that these cities are generating 50,592 TPD of waste (CPCB, 2013).During
the year 2011, about 1,27,486 TPD MSW was generated from across the country, out of which only
89,334 TPD (i.e. 70%) was collected and 15,881 TPD (i.e. 12.45%) processed or treated (CPCB,2013).
During the last decade, solid waste generation has increased 2.44 times (CPCB, 2013).
Fig 3.2 Solid waste management system (Source: www.slideshare.net/arvindbjo/solid-waste-
management-40052229)
The main focus is on municipal solid waste, which is taken to include waste from households,
businesses and institutions, construction and demolition waste in small quantities, general solid
wastes from hospitals (excluding hazardous wastes), waste from smaller industries that is not
classified as hazardous, and wastes from streets, public areas and open drains. It is not concerned

65 MGNCRE | Waste Management Technologies
with wastes from agriculture, larger industries or the mining industries which normally handle their
own wastes. Such wastes are generated in huge quantities in many countries, but the systems for
collecting, treating and disposing of them are separate from the systems used for municipal solid
waste.
The total generation of municipal solid waste in 2015 was 262.4 million tons (U.S. short tons, unless
specified) of MSW in 2015, approximately 3.5 million tons more than the amount generated in 2014.
MSW generated in 2015 increased to 4.48 pounds per person per day. This is an increase from the
259 million tons generated in 2014 and the 208.3 million tons in 1990.
Fig 3.3 Total MSW generation (Source: www.epa.gov/facts-and-figures-about-materials-waste-
and-recycling)
Per capita MSW generation increased from 4.45 pounds per person per day in 2014 to 4.48 pounds
per person per day in 2015, which is one of the lowest estimates since 1990. MSW generation per
person per day peaked in 2000.Paper and paperboard products made up the largest percentage of
all the materials in MSW, at 25.9 percent of total generation. Generation of paper and paperboard
products declined from 84.8 million tons in 2005 to 68.1 million tons in 2015. Generation of
newspapers has been declining since 2000, and this trend is expected to continue, partly due to
decreased page size, but mainly due to the increased digitization of news. The generation of office-
type (high grade) papers also has been in decline, due at least partially to the increased use of the
electronic transmission of reports, etc. Paper and paperboard products have ranged between 33 and
27 percent of generation since 2005.
Yard trimmings comprised the third largest material category, estimated at 34.7 million tons, or 13.3
percent of total generation, in 2015. This compares to 35 million tons (16.8 percent of total
generation) in 1990. The decline in yard trimmings generation since 1990 is largely due to state
legislation discouraging yard trimmings disposal in landfills, including source reduction measures

66 MGNCRE | Waste Management Technologies
such as backyard composting and leaving grass trimmings on the yard. In 2015, plastic products
generation was 34.5 million tons, or 13.1 percent of generation. This was an increase of 3.1 million
tons from 2010 to 2015, and it came from durable goods and the containers and packaging
categories. Plastics generation has grown from 8.2 percent of generation in 1990 to 13.1 percent in
2015. Plastics generation as a percent of total generation has grown slightly over the past five years.
In 2015, 3.1 million tons of selected consumer electronics were generated, representing less than 2
percent of MSW generation. Selected consumer electronics include products such as TVs, VCRs, DVD
players, video cameras, stereo systems, telephones, and computer equipment. Examples of Regional
or Inter-Municipal Arrangements currently under Development.
Gujarat: Regional landfill sites have been identified in Gujarat 45 sites have been proposed for 161
municipalities; with a maximum transport distance of 25 km. Proposals envisage private sector
involvement and the Gujarat State Waste Management Company will be the sole contracting agent.
Memorandum of understanding will be signed between the cooperating municipalities and the state
nodal agency. Nine sites are at an advanced stage of construction of sanitary landfill facilities.
Kerala: A study conducted by Suchitwa Mission recommended that the 14 districts in the state be
divided into 6 zones, each with its own landfill site for receiving waste from all towns in that
particular zone. The feasibility study for construction of one regional landfill has commenced.
West Bengal: In the Kolkata Metropolitan Development Authority area, six municipalities propose to
use one common landfill site. Regional landfills are also being planned in other parts of the state
such as the Asansol Municipal Corporation and Durgapur Municipal Corporation. The municipalities
of Ranigunj, Jamuria, and Kulti, under the nodal Asansol Durgapur Development Authority, have
developed a regional engineered landfill facility. A public private partnership was formed for project
implementation.
Maharashtra: The Mumbai Metropolitan Regional Development Authority has decided to develop a
regional landfill facility to cater to 2,500 tons of waste with a design period of 25 years. Urban local
bodies (ULBs) in the metropolitan region from six municipal corporations or councils are envisaged
to use this facility such as Kalyan–Dombivali, Bhiwandi–Nizampur, Ulhasnagar, Ambarnath, and
Kulgaon–Badlapur.
Orissa: The cities of Bhubaneswar and Cuttack have associated to commission a common municipal
solid waste management facility for treating approximately 600 tonnes of waste from both ULBs.
The Orissa Industrial Infrastructure Development Corporation is acting as transaction advisory to
facilitate this project. The selected concessionaire will be responsible for designing and constructing
the requisite transfer station; transporting waste from the transfer station to the waste
management facility; and identifying, designing, constructing, and operating waste management
facilities based on appropriate technologies selected by the concessionaire.
Andhra Pradesh: The state government has developed a strategy and issued comprehensive
guidelines for setting up regional facilities. 124 ULBs have been clubbed into 19 clusters. Five
facilities were established and operated through private sector concession agreements.

67 MGNCRE | Waste Management Technologies
Current Scenario in India
India, as a developing country, itself is also not an exception from the group of the developing
countries. The situation in different states and different cities is different in respect to the
management of solid waste. The quantity of municipal solid waste generated depends upon a
number of factors such as food habits, standard of living and degree of commercial and industrial
activity. The quantity of urban solid wastes varies seasonally and also from place to place. Data on
quantity variation and generation are useful in planning collection and disposal systems. There are
no authentic reports available on the generation of solid waste in Indian cities except for a few
metro cities. In the absence of house to house collection data, the quantity of waste generation is
assessed by direct ways like typical area study, truck load or using density and correction factor
methods. A study conducted by WHO on Rapid Assessment of source of Air, Water and Land
Pollution, the per capita of municipal solid waste generated in lower income areas in South East Asia
was 0.4 kg/day. While Central Pollution Control Board (CPCB) through its surveys has reported that
in metro cities like Mumbai, Delhi, Kolkata and Chennai, the generation of solid waste varies from
0.45 kg/capita/day to 0.62 kg/capita/day. In other cities the per capita contribution ranges from 0.17
kg/capita/day in Kohima to 0.76 kg/capita/day in Port Blair. According to the survey conducted by
CPCB in 59 Indian cities, the total per day waste generation is 39031 tonnes per day and the average
waste generation is 661.55 tonnes per day. The average per capita per day generated waste in above
mentioned 59 cities is 0.40 kg. The result shows that the coastal cities are generating more waste
than the cities located in the interior part of the country. In Indian waste there is a small percentage
of recyclable material and more of compostable and inert materials like ash and road dust. There is
very large informal sector of rag pickers which collects recyclable waste from the streets, bins and
disposal sites. They take away paper, plastic, metal, glass, rubber etc. for their livelihood, but a small
quantity of recyclable material is still left behind.
The developed countries have collection efficiency of the waste is more than 85% overall. On the
other hand, India has collection efficiency is less than 60% as comparing to the developed countries
it is very poor. And Delhi, capital city, has the efficiency of solid waste collection is below than the
country’s average. Thus the efficiency of the solid waste collection is calculated for the different
cities of India. The results show that the biggest city of India, Mumbai, has the maximum solid waste
collection efficiency. Delhi, the capital city, generates maximum waste and has lowest solid waste
collection efficiency according to the data. Chennai, Ahmedabad, Lucknow and Faridabad have good
collection efficiency of the waste collection.
3.4 Factors Affecting Solid Waste Generation Rate
The generation rate is the amount of waste generated by one person, one household (or one
appropriate unit 14 for other types of generator) in one day. Usually it is expressed in terms of
weight. The per capita generation rate, when multiplied by the population served, gives an
indication of the total amount of waste to be collected and disposed. Generation rates measured at
households may therefore overestimate the quantities that require collection and disposal, as
suggested in example. It is common to quote estimates of the collection efficiency – the percentage
of generated waste that is collected – as an indication of the success of the waste collection service.

68 MGNCRE | Waste Management Technologies
If the total amount of waste to be collected is overestimated, the estimate of the collection
efficiency that is based on this estimate will be too low.
Fig 3.4 Factors affecting waste generation rate (source www.slideshare.net/mihretdananto)
Example
Uncertainty about total waste quantity
In one particular African city, when the city council’s solid waste management system had almost
completely broken down, it was estimated by a consultancy study that the city was generating 1,400
tons of wastes per day. However, as the collection system was being improved, it was found that
when the collection capacity had reached 400 tons per day there was very little waste left in the city
– apart from some peripheral areas where waste was buried on-site. This suggests that studies
based on household surveys may greatly overestimate the amount of waste that needs be collected.
Such differences may be due to on-site disposal, recycling, feeding waste to animals, or inaccuracies
in the household survey methodology
• Source reduction and recycling activities
• Public attitudes and legislation
• Geographic and physical factors
Source reduction and recycling activities- Waste reduction may occur through the design,
manufacture and packaging of products with minimum toxic content, minimum volume of materials
and/or a longer useful life. Source reduction will likely become an important factor in reducing the
quantity of waste generated in the future. Because source reduction is not a major element in waste
reduction at the present time, it is difficult to estimate the actual impact that the source reduction
programme have had or will have on the total quantity of waste generated.
Ways in which source reduction can be achieved follow:
• Decrease unnecessary or excessive packaging,

69 MGNCRE | Waste Management Technologies
• Develop and use products with greater durability and repairability (e.g., more durable
appliances and tyres)
• Substitute reusable products for disposal in place of single-use products (e.g., reusable
plates and cutlery, refillable beverage containers, cloth diapers and towels)
• Use fewer resources (e.g., two – sided copying)
• Increase the recycled materials content of products
• Develop rate structure that encourages generators to produce less waste. The existence of
recycling programs within a community definitely affects the quantities of wastes collected
for further processing or disposal.
Effect of Public Attitudes and Legislation on Waste Generation- Significant reduction in the
quantities of solid waste generated occur when and if people are willing to change their habits and
lifestyle to conserve natural resources and reduce the economic burdens associated with the
management of solid wastes. A program of continuing education is essential in bringing about a
change in public attitude. Perhaps the most important factor affecting the generation of certain
types of wastes is the existence of regulations concerning the use of specific materials (e.g.,
regulations dealing with packaging and beverage container materials and the beverage container
with deposit laws)
Geographic and Physical Factors-The climate influences both the amount of certain types of solid
waste generated and the time period over which the wastes are generated (e.g., yard and garden
wastes). The quantities of certain type of solid wastes are also affected by the season of the year
(e.g., the quantities of food wastes related to the growing season for vegetables and fruits ).Use of
kitchen food waste grinder definitely reduces the quantity of kitchen wastes collected whether they
affect quantities of waste generated is not clear because the use of home grinders varies widely
throughout the country.
Frequency of collection when unlimited collection services is provided, more wastes are generated.
For example, if a homeowner is limited to one or two containers per week, he may store newspaper
or other materials with unlimited services, the homeowner would tend to throw them away. In this
situation the quantity of wastes generated may actually be the same, but the quantity collected is
considerably different the fundamental question of the effect of collection frequency on the waste
generation remains unanswered.
Characteristics of Service Area peculiarities of the service area can influence the quantity of solid
waste generated. For example, the quantities of yard wastes generated on a per capita basis are
considerably greater in many wealthier neighbourhoods than in other parts of the town. Other
factors include the size of lot, the degree of landscaping and the frequency of yard maintenance.
3.5 Quantities of materials recovered from MSW
The degree of recycling depends on the type of recycling programme that is in effect and on local
regulations. Data on the quantities of hazardous waste found in MSW are quite variable, depending
on the method used to classify the hazardous waste materials. Thus, it is difficult to draw any firm

70 MGNCRE | Waste Management Technologies
conclusions concerning the actual quantities involved. The goal of a waste characterization study is
to identify the sources, characteristics, and quantities of the waste generated. Waste
characterization study is difficult to perform because of the large number of sources and the limited
number of waste samples that can be analyzed. The typical steps involved in a waste
characterization study are as follows
• Gather Existing Information,
• Identify Waste Generation Sources and Waste Characteristics,
• Develop Sampling Methodology,
• Conduct Field Studies,
• Conduct Market Surveys for Special Wastes and Assess Factors Affecting Waste Generation
Rates.
To assess the quantity of waste that is currently diverted, it will be necessary to first develop data on
the total quantity of waste generated. The total waste generated will be made up of the amount of
waste now placed in a landfill and the amount of waste now diverted. In determining the amount of
waste diverted, a number of ambiguities will arise in the interpretation of what exactly is a waste
material. Some states have ruled that federal and state mandated diversion percentages must be
based on waste materials that are now discharged to landfills. Thus, if a material is considered a
waste by a discharger, but is now totally recycled, it could be considered in determining the
percentages diversion.
Fig 3.5 Quantities of materials recovered from MSW (source link.springer.com/chapter/10.1007)
The SWM(Solid Waste Management) Rules, 2016 defines “Materials Recovery Facility” (MRF) means
a facility where non-compostable solid waste can be temporarily stored by the local body or any
person or agency authorised by any of them to facilitate segregation, sorting and recovery of
recyclables from various components of waste by authorised informal sector of waste pickers,
informal recyclers or any other work force engaged by the local body for the purpose before the
waste is delivered or taken up for its processing or disposal; Material recovery starts at the primary

71 MGNCRE | Waste Management Technologies
level, by households who segregate recyclables like newspapers, cardboard, plastics, bottles, etc.
from waste to sell such material to local recyclers, scrap dealers or haulers. The item that cannot be
sold to the kabadi system is discarded and becomes part of the MSW. Waste pickers pick up parts of
this waste to earn their living. Well-segregated recyclables can directly be transferred to a
processing site or to the recyclable market depending on local conditions.
The dry fraction of the segregated waste may be further segregated locally, at the transfer station or
at the processing plant. The dry waste fraction can be segregated at the ward level, where waste
from one or more wards is collected and segregated. Different recyclables are either sent directly to
locally available recycling facilities or sold to wholesale dealers. The residual waste, depending on
the composition, is sent for processing or disposal—compost, refuse derived fuel (RDF), landfilling.
Where decentralised compost facilities are available, the wet waste fraction is processed locally. The
dry waste fraction may also be transported to the waste transfer station where it is further
segregated. Municipal corporations can also appoint informal waste pickers for manual sorting of
waste at the transfer station. Segregation at the transfer station is through manual or mechanised
segregation. Technical Aspects of Processing and Treatment of municipal solid waste 215– Where
the dry waste fraction reaches the processing site (compost or RDF) directly, manual or mechanical
pre-sorting should be carried out to recover recyclable material. This also ensures good quality
process output. In case regional processing or disposal facilities exist, transfer of recyclables to the
regional facility should be avoided. The dry waste fraction should be sorted out either at the ward
level or transfer station level. If this is not possible, appropriate sorting facilities should be available
at the regional facility.
Special waste including domestic hazardous waste that is collected either along with the dry waste
fraction or separately is also to be segregated at the material recovery facility (MRF) and disposed
according to the nature of the waste. Recyclable waste should be sent to the recycling industry, and
hazardous waste should be disposed at the nearest treatment, storage, and disposal facility (TSDF)
or as specified by the SPCB or PCC.
MRF units employ varying combinations of manual and mechanical processes, based on the type of
facility, availability of equipment, labour availability, and associated cost implications. MRF units
employing manual labour for sorting operations have relatively lower costs, but may also operate at
lower efficiencies compared with mechanical sorting facilities. An MRF unit, depending on the level
of complexity, will consist of a combination of units in varying degrees of mechanisation.
Pre-sorting Bulky and contaminated wastes hamper further sorting or processing in the facility;
mechanical or manual pre-sorting is essential to separate out these wastes. Manual sorting results in
higher labour costs and lower processing rates. Manual sorters remove bulky waste as the waste
passes along a conveyor belt, which carries the pre-sorted waste to the mechanised sorting unit of
the facility.
Mechanical sorting Mechanical processes based on principles of electromagnetic, fluid mechanics,
pneumatics, etc. are used to segregate the different waste streams in the pre-sorted waste.
Mechanical processes require specialised equipment for segregation of municipal waste.
Mechanical sorting typically employs the following processes:

72 MGNCRE | Waste Management Technologies
Screening: Screening achieves an efficient separation of particles into two or more size distributions.
Two types of screens are used in MRF centres disc screens and trommels.
Ferrous Metal Separation: In the second stage, electromagnets are used for separating heavy
ferrous metals from mixed waste.
Air Classification: The residual waste stream is passed through an air stream with sufficient velocity
to separate light materials from heavy material, specifically for separating out lightweight plastics
and paper from the mixed stream. Three types of air classifiers may be employed
• horizontal air classifier,
• vibrating incline air classifier, and
incline air classifier. Heavy or bulky plastics are sorted out either in the pre-processing line
(manually) or in the “detect and routing” systems, employed at later stages of material recovery.
Non-ferrous Metal Separation: The non-ferrous metal separator segregates zinc, aluminium,
copper, lead, nickel, and other precious metal from commingled waste. An eddy current separator
removes non-ferrous items from the commingled waste based on their electrical conductivity.
Detect and Route System This system separates various grades of paper, plastics, and glass, which
are not sorted out in the air classifier. This system works in two stages. The first stage employs
programmed optical sensors to determine the nature of different materials. In the second stage,
based on information received from the sensor, sorted material is routed to appropriate bins by
directional air jets.
Size reduction Sorted materials after segregation are usually too large for further use or processing;
they should be reduced to smaller sizes.
Baling Sorted and sized material is baled for further processing or use.
To do Activity
Overview
In this lesson, students will practice critical thinking skills while examining their own values related to
reducing waste and the consumption of resources. Students will have the opportunity to express
their own values and opinions about different waste reduction statements. Then they will share
their opinions about the waste reduction statements with other students in small groups and
explore how their values may differ from others.
Objectives
Students will
1. Express their values about reducing waste.
2. Describe whether their values about reducing waste changed because of discussions with other
students.

73 MGNCRE | Waste Management Technologies
3. Understand and apply the term “evidence.”
Teacher Background
People express a wide variety of opinions, values and behaviours related to the environment. Values
represent how a person rates the usefulness or importance of a principle or ideal. Values provide the
foundation for beliefs that drive decision making and behaviour. People can also value material
objects for their worth. Producing these objects requires the use of natural resources, which can be
classified as renewable or non-renewable. Consumption of some of these resources may eventually
lead to either the loss or the near loss of these resources within the current century. Students can
develop the ability to think critically and carefully about their values, can develop their own
opinions, and can learn to convey and justify their thoughts in order to make decisions based on
their values. During the decision-making process, students may attempt to locate additional
evidence that may support their opinions on topics such as reducing waste. Through this process
students can discuss their values with others and be exposed to values and opinions that differ from
their own. By looking at both sides of an issue, students can learn the importance of respecting the
values and opinions of others.
Materials
Students
• “Value Statements” & “Fast Facts” (one per student)
• “Student Reflection” worksheet(one per student)
Teacher
• “Value Statements” &“Fast Facts” overhead
• Rubic overhead
• Rubics (one per student)
Preparation
Be prepared to assign the students into five groups. Each group will be assigned to one of five
different value statements.
Discussion
• Ask students to think about different ways that people dispose of waste materials; some
may help reduce waste and others may not. For example, some people are very careful—
before they throw something away, they consider whether it can be reused, recycled, or
composted. They use recycling and compost bins and produce very little waste. Other people
do not recycle much and sometimes even contribute to litter by throwing waste on the
ground or out of a car window.
• Ask students to share some examples of things that people might throw away that could be
of value to someone else.

74 MGNCRE | Waste Management Technologies
• Define the word ”value” “the quality of an object that makes it desired or wanted.” If we
value something like a material object, we will sometimes pay or do much to getit. A value
may also be defined as “the beliefs of an individual or social group that guide how decisions
are made.” For example, a school may have a recycling club made up of students who
believe that recycling is important.The students participating have the common goal of
reducing waste at school through recycling.
• Ask students to name something that they value. Explain that this can be an object, belief or
principle. Share some examples as needed to start the discussion.
• You may want to specifically discuss examples of principles or beliefs that people value so
that students understand the difference between valuing material things and beliefs or
principles. For example, Cesar Chavez fought for the rights of migrant farm workers who
experienced unsafe working conditions and low wages, and Dr. Martin LutherKing Jr. sought
equal protection for citizens of all races during the Civil Rights Movement.
• Explain that people may base their values on factual information or evidence; e.g., some
people choose tobring a cloth bag to the store when shopping instead ofusing a paper bag.
The practice of usinga cloth bag shows that they value the resources needed to make a
paper bag by reducing the amount of paper they use.
• It is important for students to be able to justify their values and to answer questions about
their values based onfactual evidence.
Procedure
• Organize the students into five groups.
• Pass out a “Value Statements” card to each student in the group. There are five versions of
the value statement cards so each group will have different statements. Forexample, all
students in group one will have a card titled“Group One.”
• Post up the overhead for one of the group value statements and model for the students how
to fill it out. For each statement have them circle a number. A “10” signifies that you strongly
agree with the statement. A “1”signifies that you strongly disagree with the statement.
• Next, ask the students to answer the questions below each statement that ask them to cite
factual evidence to support their opinions. Factual information is located on the back of their
value statement cards.
• When the students are done filling out the card, ask them to take turns sharing their
opinions about the value statements, citing evidence to support their opinions.
• Ask each group to share one or two value statements they discussed with the entire class,
citing examples of how their opinions were similar or different.
• Have the students return to their seats.

75 MGNCRE | Waste Management Technologies
• Pass out the “Student Reflection” worksheet to each student and have them answer the
questions.
Wrap-Up
• Ask students to raise their hands if any of their values changed after talking with a partner
who had a different value. Ask for students to share what evidence persuaded or influenced
them to change their values.
• Ask students whether there were any value statements they had difficulty agreeing or
disagreeing with. What additional evidence or factual information would have helped them
better understand the waste reduction value statement?
Final Assessment Idea
Have students write their own value statements about reducing waste. Ask them to cite evidence
supporting their beliefs, where they located the information, and whether they have additional
questions they would like to research.
Summary
• Solid waste collection means the act of removing solid waste from the premises of a primary
generating source.
• Both volume and weight are used for the measurement of solid waste quantities.
• In 2015, plastic products generation was 34.5 million tons & 3.1 million tons of selected
consumer electronics were generated.
• Source reduction, recycling activities, public attitudes and geographic factors affect the solid
waste generation rate.
• Material recovery starts at the primary level, by households who segregate recyclables like
newspapers, cardboard, plastics, bottles, etc. from waste to sell such material to local
recyclers, scrap dealers or haulers.
Model Questions
1. What is the quantity of solid waste collected & recycled in India?
2. Find the methods used to measure solid waste quantities?
3. What are the factors affecting solid waste generation rate?
References
1] Buchner M (2012) 3 Alternative ideas for waste management in developing countries.
2] Green Machine (2017) Municipal solid waste recycling processing systems.
3] Jayaraman G (2013) On track for a clean sweep, India today.

76 MGNCRE | Waste Management Technologies
4] Joshi R, Ahmed S (2016) Status and challenges of municipal solid waste management in India
A review.
Environ Chem Pollution Waste Manage.
5] Kumar P (2016) Packaging Industry in India.
6] Kumar S, Smith SR, Fowler G, Velis C, Kumar J, et al. (2017) Challenges and opportunities
associated with waste management in India.
7] Lahiry H (2017) Down to earth. India’s challenges in waste management.
8] Mahanti JC (2017) Recycling of used paper packaging, socio-economic perspective. Indian
agro& recycled paper mills association. Paper India.
9] Panchal M, Karthikeyan KS, Singh PS (2016) Plastic packaging-the sustainable choice, A
report on plastic industry.
10] Singhal S, Pandey S (2001) Solid waste management in India status and future directions.
TERI Information monitor on environmental science 6 1-4.
11] TERI (2012) Yamuna, the poisoned river, Study sponsored by UNICEF and posted by TERI.

77 MGNCRE | Waste Management Technologies
Chapter 4 Handling, Separation, Storage &
Disposal of solid waste
Introduction
The handling, separation, storage and processing of solid wastes at the source before they are
collected is the second of the six functional elements in the solid waste management system
because this element can have a significant effect on the characteristics on the waste, on
subsequent functional elements, on public health and on public attitudes concerning the operation
of the waste management system. It is important to understand what this elements involves.
Objectives
• To define fundamentals of waste handling, separation, storage and disposal of solid waste.
• To evaluate storage of solid wastes at the sources and its effects.
• To assess the disposal of Municipal solid waste
4.1 Handling, Separation & Storage of Solid Waste
Handling
In general, Handling refers to the activities associated with managing solid wastes until they are
placed in the containers used for their storage before collection or return to drop-off and recycling
centers. The specific activities associated with handling waste materials at the source of generation
will vary depending on
• Types of waste materials that is separated for reuse and recycling.
• The extent to which these materials are separated from the waste stream.
• Type of collection service where handling may also be required to move the loaded
containers to the collection point and to return the empty containers to the point where
they are stored between collections.
Onsite handling refers to the activities associated with handling of solid waste until they are placed
in the containers used for their storage before collection. Depending on the type of collection
service, handling may also be required to move the loaded containers to the collection point and to
return the empty containers to the point where they are stored between collections. Chutes for use
in apartment buildings are available in diameters from 12 to 36 in (3- 9.15) cm. The most common
size is 24 inch in diameter. All the available chutes can be furnished with suitable intake doors.
In some of the more recent apartment building developments underground pneumatic transport
systems have been used in conjunction with the individual apartment chutes. The underground

78 MGNCRE | Waste Management Technologies
pneumatics systems are used to transport the wastes from the chute discharge points in each
building to a central location for storage in large containers or onsite processing.
Waste Handling and Separation at commercial Buildings
• Collected in large containers mounted with rollers.
• Once filled, these containers removed by service elevators and emptied into
1. Large storage containers
2. Compactors used with storage containers
3. Stationary compactors with designed container
4. Other processing equipments.
• In many office and commercial buildings, the papers collected for recycling.
• The waste to be recycled stored in separate containers
• In large commercial facilities baling equipment used for paper and can crushers used for
aluminium cans.
Figure 4.1 Functional elements of SWM system (Source www.slideplayer.com (ECH 4102
Environmental health engineering ppt)

79 MGNCRE | Waste Management Technologies
Figure 4.2 On-site handling ( https//www.drdarrinlew.us/environmental-engineering-2/onsite-
handling-and-storage.html)
Separation
The separation of waste paper, cardboard, aluminium cans, glass and plastic containers at the
source. It is the most effective ways to achieve recovery and reuse of material stored in a separate
container until they are collected.
Compaction
Two principal types of compactors used for processing of wastes in residential dwellings Small
(individual) home and apartment compaction units and large compactors used to compact wastes
from a large number of apartments.
1. Home and Apartment Compaction Units

80 MGNCRE | Waste Management Technologies
• Small compactors manufactured based on the ratio of loose paper and corrugated paper.
• It reduces the volume of waste upto 70%.
They can be used for only small proportion of the solid waste generated.
The drawback of compaction, if the wastes to be separated into components at MRF, the compacted
waste have to be broken up before sorting.
Also by compacting, the waste may become so saturated with the liquids present in the food waste
that the recovery of paper or other components may not be feasible.
2. Compactors for large Apartment Buildings
Compactor is installed at the bottom of the solid waste chute.
Wastes falling through chute active the compactor by means of photoelectric cells or limit switches.
The compressed waste may be formed into bales and loaded automatically into metal container or
paper bags. When a bale formed or container or bag filled, the compactor shutdown
automatically and warning light turns on. The operator tie and remove the bale from
compactor, or remove the full bag and replace it with empty one. The compactors reduce the
volume, the weight remains same. The compacted volume 20 to 60% less of the original
volume.
Storage
The first phase to manage solid waste is at home level. It requires facilities for temporarily storing of
refuse on the premises.
Individual house holders (or) tenants have responsibility for onsite storage of solid waste.
Four factors that should be considered in the on-site storage of solid waste are
1. The effects of storage on the waste components.
2. Type of container to be used
3. The location of containers
4. Public health and aesthetics
Effects of Storage on Waste Components
The effects based on the characteristics of waste being stored
These effects of storing wastes include
1. Microbiological decomposition
2. The absorption of fluids
3. The contamination of waste components

81 MGNCRE | Waste Management Technologies
1. Microbiological decomposition
• Food and other waste placed in containers immediately start microbiological decomposition
(putrefaction) as a result growth of bacteria and fungi.
• For extended period of time, flies start breed and odours.
2. The absorption of fluids
• Waste components have initial moisture contents are stored together, paper will absorb
moisture from food waste and garden trimmings.
• Degree of absorption depends on time the waste stored until collection
• If stored more than a week in enclosed container, the moisture distributed throughout the
waste .
3. The contamination of waste components
Most serious effect of on site storage
Major waste components contaminated by small amount of waste like motor oils, cleaners and
paints.
It reduces the value of individual components for recycling.
Storage Container
The types and capacities of containers depend on
• Characteristics and types of solid waste to be collected
• The type of collection system in use
• The collection frequency
The space available for placement of containers.
Container storage locations depends on
• Type of dwelling or commercial facilities
• The available space
• Access to collection services
Residential Dwellings
• Between collections, containers used in low-rise detached dwellings placed
1. at the sides or rear of the house
2. in alleys, where alley collection is used

82 MGNCRE | Waste Management Technologies
3.In or next to garage/carport or some common location specifically designed for that
purpose.
• Two or more dwellings located close, a concrete pad open or surrounded by wooden
enclosure.
• For low- and medium-rise apartment buildings include basement storage and outdoor storage.
• In large high-rise apartments, waste storage and processing equipment is located in the
basement of the building.
Storage containers as per Indian Conditions
• The segregation of garbage at source is primarily meant to keep solid waste generated
separately in different containers (i.e.) bio degradable waste in one container (GREEN) and
non-biodegradable waste in another container (RED).
• The storage of garbage used by pedestrians (or) the floating populations, bins should be
located at regular intervals. The bins should be placed on “TWO BINS BASIS”
• Some types of receptacles presently used for storage are
(a) Buckets
(b) Plastics / HDPE / MDPE bins
(c) Plastic bags
(d) Metal bins with (or) without lids.
The MSW Rules, 2000 describes, “The littering of municipal solid waste shall be prohibited in cities,
towns and in urban areas notified by the State Government”
Plastic liners for cans and wrapping for garbage reduce the need for cleaning of cans and containers.
It avoids bad odours, rat and fly breeding.
Galvanized metal is preferable for garbage storage because it is resistant to corrosion.
Bulk containers are recommended where large volumes of refuse are generated such as hotels,
restaurants, apartment houses, shopping centres.
They should have tightly fitting covers.
They must be of such size that, when full, can be lifted easily by one man.
They should be located in a cool place over platforms, at least 30 cm above ground level.
The bins must be emptied at least daily and maintained in clean conditions.
An adequate number of suitable containers should be provided with proper platforms with stand.
Suitable containers shall be water tight, rust resistant, tight fitting covers, fire resistant,
enough size, light in weight, side handle & washable.

83 MGNCRE | Waste Management Technologies
4.2 Combustion and energy recovery from Municipal solid waste
Combustion is actually a scientific term for burning. We are all aware of burning, but did you know
that burning is actually a chemical reaction? Combustion is a chemical process where any fuel
has a reaction with air (oxidant) to produce heat energy. And when this heat energy releases it
will also produce light in the form of a flame. This is the visible part of the reaction, the flames.
The general exothermic reaction of combustion can be expressed as Hydrocarbon + Oxygen →
Carbon Dioxide + Water + Heat Energy
Examples of Combustion
• Burning of Wood or Coal to heat your home
• Burning of Petrol or Diesel to run your Car
• Combustion of Natural Gas or LPG to cook for on your stovetop
• For the production of energy in thermal power plants
Fireworks
Combustion is a chemical process or a reaction between Fuel (Hydrocarbon) and Oxygen. When fuel
and oxygen react it releases the heat and light energy. Heat and light energy then result in the flame.
So, the formula for Combustion reaction is Hydrocarbon + Oxygen = Heat energy. Combustion is
used in car motors and rocket engines and many other machineries. There are 5 different types of
combustion. Let us learn about types of combustion.
Types of Combustion
1] Complete Combustion
One of the types of combustion is Complete Combustion. Complete combustion occurs in an
unlimited supply of air, oxygen in particular. Also, complete combustion is also known as clean
combustion. Here the hydrocarbon will burn out completely with the oxygen and leave only two
byproducts, water, and carbon dioxide.
An example of this is when a candle burns. The heat from the wick will vaporize the wax which reacts
with the oxygen in the air. The two products of the reaction are water and carbon dioxide. In an
ideal situation all the wax burns up and complete combustion takes place.
2] Incomplete Combustion
Incomplete combustion takes place when the air is in limited supply. And as opposed to complete
combustion it is otherwise known as dirty combustion. Due to lack of oxygen, the fuel will not react
completely. This, in turn, produces carbon monoxide and soot instead of carbon dioxide.

84 MGNCRE | Waste Management Technologies
An example is burning of paper. It leaves behind ash (a form of soot) as a by product. In a complete
combustion, the only products are water and carbon dioxide. Also, incomplete combustion produces
less energy than complete combustion.
3] Rapid Combustion
Another type of combustion is Rapid Combustion. Rapid energy needs external heat energy for the
reaction to occur. The combustion produces a large amount of heat and light energy and does so
rapidly. The combustion will carry on as long as the fuel is available.
An example is when you light a candle. The heat energy is provided when we light the candle with a
matchstick. And it will carry on till the wax burns out. Hence it is a rapid combustion
4] Spontaneous Combustion
As the name suggests the combustion occurs spontaneously. This means that it requires no external
energy for the combustion to start. It happens due to self-heating. A substance with low-ignition
temperatures gets heated and this heat is unable to escape.
The temperature rises above ignition point and in the presence of sufficient oxygen combustion will
happen. The reaction of alkali metals with water is an example.
5] Explosive Combustion
Energy Recovery from Waste
Combustion of MSW grew in the 1980s, with more than 15 percent of all U.S. MSW being combusted
by the early 1990s. The majority of the non-hazardous waste incinerators were recovering energy by
this time and had installed pollution control equipment. With the newly recognized threats posed
by mercury and dioxin emissions, the EPA enacted the Maximum Achievable Control Technology
(MACT) regulations in the 1990s. As a result, most existing facilities had to be retrofitted with air
pollution control systems or be shut down.
Economics
The upfront capital needed to build an MSW combustion plant can be a significant hurdle when
building a new facility. A new plant typically requires at least $100 million upfront to finance the
construction; larger plants may require double to triple that amount. The economic benefits of MSW
combustion may take several years to be fully realized. Long-term contracts (generally 30 years) are
often developed between the facility and municipality to secure a guaranteed waste stream. MSW
Combustion facilities typically collect a tipping fee from the independent contractors that drop the
waste off on a daily basis. The facilities also receive income from utilities after the electricity
generated from the waste is sold to the grid. A possible third stream of revenue for the facilities
comes from the sale of both ferrous (iron) and non-ferrous scrap metal collected from the post-
combusted ash stream.
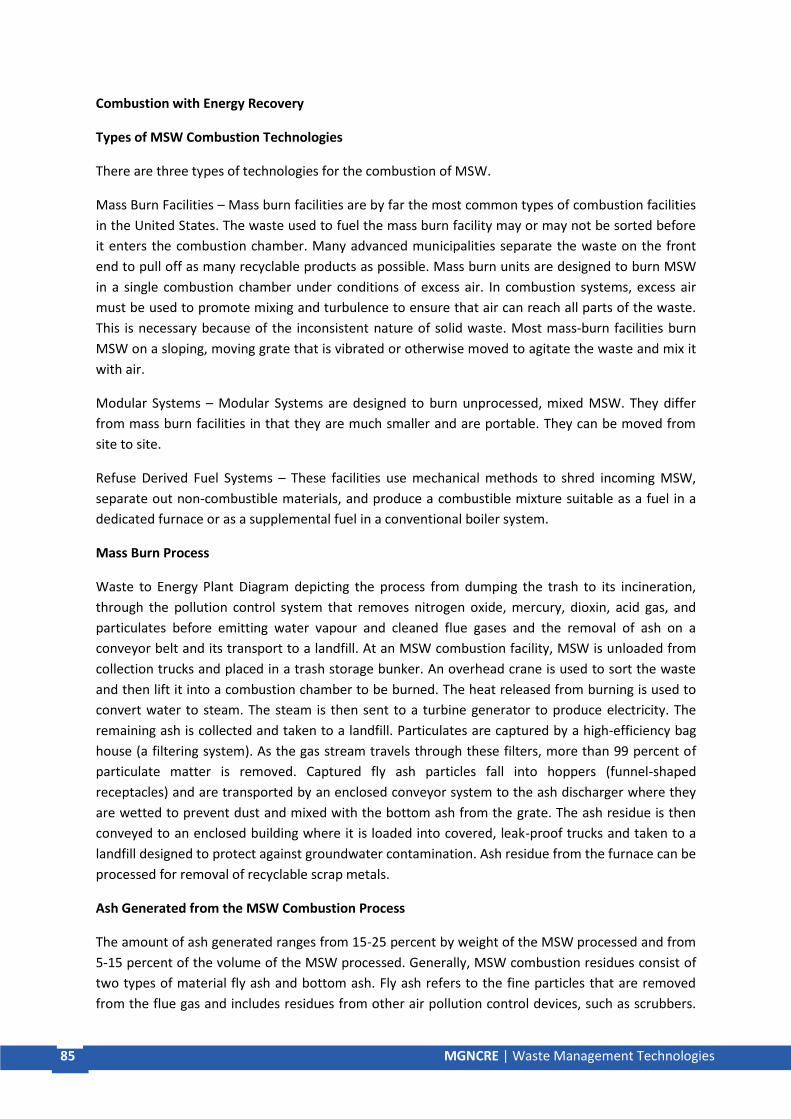
85 MGNCRE | Waste Management Technologies
Combustion with Energy Recovery
Types of MSW Combustion Technologies
There are three types of technologies for the combustion of MSW.
Mass Burn Facilities – Mass burn facilities are by far the most common types of combustion facilities
in the United States. The waste used to fuel the mass burn facility may or may not be sorted before
it enters the combustion chamber. Many advanced municipalities separate the waste on the front
end to pull off as many recyclable products as possible. Mass burn units are designed to burn MSW
in a single combustion chamber under conditions of excess air. In combustion systems, excess air
must be used to promote mixing and turbulence to ensure that air can reach all parts of the waste.
This is necessary because of the inconsistent nature of solid waste. Most mass-burn facilities burn
MSW on a sloping, moving grate that is vibrated or otherwise moved to agitate the waste and mix it
with air.
Modular Systems – Modular Systems are designed to burn unprocessed, mixed MSW. They differ
from mass burn facilities in that they are much smaller and are portable. They can be moved from
site to site.
Refuse Derived Fuel Systems – These facilities use mechanical methods to shred incoming MSW,
separate out non-combustible materials, and produce a combustible mixture suitable as a fuel in a
dedicated furnace or as a supplemental fuel in a conventional boiler system.
Mass Burn Process
Waste to Energy Plant Diagram depicting the process from dumping the trash to its incineration,
through the pollution control system that removes nitrogen oxide, mercury, dioxin, acid gas, and
particulates before emitting water vapour and cleaned flue gases and the removal of ash on a
conveyor belt and its transport to a landfill. At an MSW combustion facility, MSW is unloaded from
collection trucks and placed in a trash storage bunker. An overhead crane is used to sort the waste
and then lift it into a combustion chamber to be burned. The heat released from burning is used to
convert water to steam. The steam is then sent to a turbine generator to produce electricity. The
remaining ash is collected and taken to a landfill. Particulates are captured by a high-efficiency bag
house (a filtering system). As the gas stream travels through these filters, more than 99 percent of
particulate matter is removed. Captured fly ash particles fall into hoppers (funnel-shaped
receptacles) and are transported by an enclosed conveyor system to the ash discharger where they
are wetted to prevent dust and mixed with the bottom ash from the grate. The ash residue is then
conveyed to an enclosed building where it is loaded into covered, leak-proof trucks and taken to a
landfill designed to protect against groundwater contamination. Ash residue from the furnace can be
processed for removal of recyclable scrap metals.
Ash Generated from the MSW Combustion Process
The amount of ash generated ranges from 15-25 percent by weight of the MSW processed and from
5-15 percent of the volume of the MSW processed. Generally, MSW combustion residues consist of
two types of material fly ash and bottom ash. Fly ash refers to the fine particles that are removed
from the flue gas and includes residues from other air pollution control devices, such as scrubbers.

86 MGNCRE | Waste Management Technologies
Fly ash typically amounts to 10-20 percent by weight of the total ash. The rest of the MSW
combustion ash is called bottom ash (80-90 percent by weight). The main chemical components of
bottom ash are silica (sand and quartz), calcium, iron oxide, and aluminium oxide. Bottom ash
usually has a moisture content of 22-62 percent by dry weight. The chemical composition of the ash
varies depending on the original MSW feedstock and the combustion process. The ash that remains
from the MSW combustion process is sent to landfills.
Explosive Combustion happens when the reaction occurs very rapidly. The reaction occurs when
something ignites to produce heat, light and sound energy, the simple way to describe is it to call it
an explosion. Some classic examples are firecrackers or blowing up of dynamite. Energy recovery
from waste is the conversion of non-recyclable waste materials into usable heat, electricity, or fuel
through a variety of processes including combustion, gasification, pyrolization, anaerobic digestion
and landfill gas recovery. This process is often called waste to energy. Energy recovery from the
combustion of municipal solid waste is a key part of the non-hazardous waste management
hierarchy, which ranks various management strategies from most to least environmentally
preferred. Energy recovery ranks below source reduction and recycling/reuse but above treatment
and disposal. Confined and controlled burning, known as combustion, can not only decrease the
volume of solid waste destined for landfills, but can also recover energy from the waste burning
process. This generates a renewable energy source and reduces carbon emissions by offsetting the
need for energy from fossil sources and reduces methane generation from landfills.
Figure 4.3 Waste to energy plant diagram (Source www.ecomaine.org)
Basic Techniques of Energy Recovery from Waste
Energy can be recovered from the organic fraction of waste (biodegradable as well as non-
biodegradable) through thermal, thermo-chemical and biochemical methods.
A brief description of the commonly applied technologies for energy generation from waste is as
follows:

87 MGNCRE | Waste Management Technologies
Anaerobic Digestion/Biomethanation
In this process, the organic fraction of the waste is segregated and fed into a closed container
(biogas digester). In the digester, the segregated waste undergoes biodegradation in presence of
methanogenic bacteria and under anaerobic conditions, producing methane-rich biogas and
effluent. The biogas can be used either for cooking/heating applications, or for generating motive
power or electricity through dual-fuel or gas engines, low-pressure gas turbines, or steam turbines.
The sludge from anaerobic digestion, after stabilization, can be used as a soil conditioner. It can even
be sold as manure depending upon its composition, which is determined mainly by the composition
of the input waste.
Combustion/Incineration
In this process, wastes are directly burned in presence of excess air (oxygen) at high temperatures
(about 800°C), liberating heat energy, inert gases, and ash. Combustion results in transfer of 65%–
80% of heat content of the organic matter to hot air, steam, and hot water. The steam generated, in
turn, can be used in steam turbines to generate power.
Pyrolysis/Gasification
Pyrolysis is a process of chemical decomposition of organic matter brought about by heat. In this
process, the organic material is heated in absence of air until the molecules thermally break down to
become a gas comprising smaller molecules (known collectively as syngas)Gasification can also take
place as a result of partial combustion of organic matter in presence of a restricted quantity of
oxygen or air. The gas so produced is known as producer gas. The gases produced by pyrolysis
mainly comprise carbon monoxide (25%), hydrogen and hydrocarbons (15%), and carbon dioxide
and nitrogen (60%). The next step is to ‘clean’ the syngas or producer gas. Thereafter, the gas is
burned in internal combustion (IC) engine generator sets or turbines to produce electricity.
Landfill Gas recovery
The waste dumped in a landfill becomes subjected, over a period of time, to anaerobic conditions.
As a result, its organic fraction slowly volatilizes and decomposes, leading to production of ‘landfill
gas’, which contains a high percentage of methane (about 50%). It can be used as a source of energy
either for direct heating/cooking applications or to generate power through IC engines or turbines.
Case study (Source MNRE (http//mnre.gov.in/nmp/technology-we.pdf), with additional research
from EAI)
Evaluating the indian market for distributed energy generation from sewage and municipal solid
waste
The Background
The Bill & Melinda Gates Foundation is dedicated to bringing innovations in health, development,
and learning to the global community. The Water, Sanitation and Hygiene division of the Foundation
was keen on exploring possibilities to implement solutions in India that could convert waste,
especially non sewer faecal sledges or faecal sludge and municipal waste (a problem) into energy (an
opportunity). The foundation (client) was looking to fund innovative solutions in the domain of non-

88 MGNCRE | Waste Management Technologies
sewer faecal sludge to high value energy products. In this context, they approached EAI to undertake
a study.
The Solution
Identification of Prospective Companies
EAI team along with the Gates Foundation visited a wide range of companies, research
organizations, academia and industry experts to understand the potential and challenges in deriving
energy from sewage waste, municipal solid waste and mixed waste.
EAI then provided a detailed analysis of the companies visited and provided recommendations for
the possible grant or investment opportunities and strong partners to the client.
Technology Landscape Analysis
EAI also assisted the foundation by preparing a technical and process document which detailed
The diverse pathways for waste to energy in India and the characteristics of each pathway.
The optimum size of the waste-based power plants and the economically feasible feedstock costs for
both kW size plants and MW size plants.
Potential for carbon credit financing.
Helping a Medium Size Indian Corporate Understand the Critical Aspects of the Indian Waste to
Energy Landscape
4.3 Landfill - Classification, planning, sitting, permitting & landfill processes
A landfill is a large outdoor site specifically designed for the disposal of waste. Not all landfills are the
same. Different kinds of landfills accept different kinds of waste including
Industrial waste
Hazardous waste
Construction and demolition debris
Municipal Solid Waste (MSW), commonly defined as household trash or garbage.
When you think of a landfill, you probably are thinking of the landfill that accepts your household
trash or garbage.
A landfill site (also known as a tip, dump, rubbish dump, garbage dump or dumping ground and
historically as a madden) is a site for the disposal of waste materials by burial. It is the oldest form of
waste treatment (although the burial part is modern; historically, refuse was just left in piles or
thrown into pits). Historically, landfills have been the most common method of organized waste
disposal and remain so in many places around the world. Some landfills are also used for waste
management purposes, such as the temporary storage, consolidation and transfer, or processing of

89 MGNCRE | Waste Management Technologies
waste material (sorting, treatment, or recycling). Unless they are stabilized, these areas may
experience severe shaking or soil liquefaction of the ground during a large earthquake.
Land filling is the ultimate disposal process for Municipal Solid Waste (MSW) management. The
quantity of MSW for land disposal can be substantially reduced by setting up of waste processing
facilities and recycling the waste materials as much as possible. A few Urban Local Bodies (ULBs)
have attempted to demonstrate “Zerogarbage” on Municipal Solid Wastes Management (MSWM) by
adopting method of recycling/reusing and processing of wastes. Still, some inert wastes are left out
for disposal. It is estimated that the inert wastes for landfilling occupies 40-55% of the total wastes
depending upon type of city.
The landfill is an unavoidable component in MSW Management and its planning and design,
construction, operation & maintenance involves technical skills and safety measures in terms of
health and environmental protection. The Municipal Solid wastes (Management & Handling) Rules,
2000 specify relevant points with regard to site selection for proposed landfill site, facilities requires
at landfill site, specification for landfilling, pollution prevention, water quality monitoring, ambient
air quality monitoring, plantation at landfill site, closure of landfill site/ post closure, etc. These
specific provisions are to be implemented as per rules and need to be ensured during the planning
and design stage. The adequacy and performance of these provisions are to be monitored by the
regulating authorities (SPCBs/PCCs) during issue of consent/authorization. Central Pollution Control
Board (CPCB) has made an effort to bring out the present document incorporating the check-list for
quick review during monitoring of the landfill facilities all stages right from planning to commission
of landfill facilities. Information on a few existing/operating landfill facilities set up by the local
bodies is also presented in this document for reference purpose.
Regulatory aspects/provision of MSW Landfills
Under section 6 (3) of the MSW (M&H) Rules, 2000 State Pollution Control Board (SPCBs) or
Pollution Control Committee (PCCs), shall issue authorization in Form-III to the municipal authority
or an operator of a facility within forty-five days stipulating compliance criteria and standards as
specified in Schedule II, III and IV including such other conditions, as may be necessary. SPCBs/PCCs,
after the receipt of application from the municipal authority or the operator of a facility including
landfills, shall examine the proposal taking into consideration the views of other agencies like the
State Urban Development department, the Town and Country Planning department, Air port or Air
Base authority, the ground Water Board or any such other Agency prior to issuing the authorization.
Landfills as per MSW rules
Requisites of Landfills
The Sl. No.6.under Schedule-II of MSW Rules, 2000 prescribes that landfilling shall be permitted to
non-biodegradable, inert waste and other wastes that are not suitable either for recycling or for
biological process. Landfilling shall also be carried out for residues of waste processing facilities as
well as pre-processing rejects from waste processing facilities. Landfilling of mixed waste shall be
avoided unless the same is found unsuitable for waste processing. Under unavoidable circumstances
or till installation of alternate facilities, landfilling shall be done following proper norms.
Specifications for landfill Sites

90 MGNCRE | Waste Management Technologies
(a) Site selection
Landfill identification shall be done by ‘Development Authorities’ for the area falling under
‘Development Authority’, otherwise it shall be done by the concerned Municipal authority. The site
selection shall be done based on examination of environmental issues. The landfill site shall be
planned and designed with proper documentation of a phased construction plan as well as a closure
plan. The landfill facility shall be nearby waste processing plant or an integral part of it. The landfill
site shall be designed for 20-25 years. The proposed landfill site should be away from habitation
clusters, forest areas, water bodies, monuments, national Parks, Wetlands and places of important
cultural, historical or religious interest. Also, approval shall be taken from the concerned authorities
in case the landfill site is located within 20 km from the airport/airbase.
(b) Facilities at Site
The landfill shall be fenced with proper gate at entrance for monitoring incoming wastes/vehicles, to
prevent entry of cattle, to keep record movement of vehicles and wastes, etc. Also, provision of
weigh-bridge may be made for assessing quantum of wastes. Drinking water and other sanitary
facilities and other safety measures including health check up shall be provided to workers.
(c) Specification for land filling
Waste subjected to land filling shall be compacted in thin layers to achieve maximum capacity of
landfill. The disposed wastes shall be covered immediately/at the end of working day with 10 cm of
soil. Prior to commencing monsoon period, an immediate soil cover of 40-65 cm thickness shall be
placed on the landfill with compaction to prevent rainwater infiltration. Proper drainage to be
provided to divert run-off water from the active landfill cell.
After completion of landfill, a final capping shall be provided with
(i) A barrier of soil covers of 60 cm of clay or amended soil with permeability of 1X10⁻⁷ cm/sec
(ii) On top of the barrier soil layer, there shall be a drainage layer of 15 cm and
(iii) On top of the drainage layer, there shall be vegetation layer of 45 cm to support natural plant
growth to minimize soil erosion.
(d) Pollution Prevention
In order to prevent pollution problems from landfill operation the necessary steps should be taken
viz.
(i) Diversion of storm water to minimize leachate generation and to avoid flooding/water logging.
(ii) Construction of non-permeable linings system at the base and walls of waste disposal area
against contamination from domestic hazardous wastes. The liner shall be a composite barrier
having 1.5 mm HDPE.
(f) Ambient air quality monitoring
91 MGNCRE | Waste Management Technologies
Installation of landfill gas control system including gas collection system shall be made at landfill site
to minimize odour generation, prevent off-site migration of gases and to protect vegetation planted
permeability least than 1X10⁻⁷ cm/sec. The water table should be at least 2 m below the base clay or
amended soil barrier layer.
(e) Water quality monitoring
Ground water quality to be monitored within 50 m periphery of landfill site. Also, ground water
quality data to be generated before construction of landfill site for future reference.The
concentration of methane gas at the landfill site shall not exceed 25 LEL. The landfill gas collected
from the facility shall be utilized either direct thermal application or power generation, otherwise,
landfill gas shall be flared to prevent direct escape. Passive venting will be allowed if flaring is not
possible.
(g) Plantation at Landfill site
A vegetative cover shall be provided over completed site as follows;
(i) Selected species of locally adopted non-edible perennial plants that resistance to drought and
extreme temperature shall be allowed to grow.
(ii) The roots of the plants grown should not penetrate more than 30 cm.
(iii) The plant species shall have ability to thrive on low nutrient soil and
(iv) the density of plantation shall be sufficient to minimize soil erosion.
(h) Closure of landfill site and post- care
The post-closure care of landfill site shall be conducted after fifteen years and long term monitoring
to assess;
(i) Maintaining integrity and effectiveness of final cover and repair required.
(ii) Efficiency of leachate collection system.
(iii) Ground water quality and action required to improve.
(iv) Maintenance and operation of gas collection system to meet the standards. The closed landfill
may be used for human settlement after 15 years of post closure care by ensuring gaseous emission
and leachate compliance.
(i) Special provisions for hilly areas
Cities/ towns located in hilly areas shall adopt location specific methods of disposal with permission
of concerned SPCB/PCCs.
Landfill processes

92 MGNCRE | Waste Management Technologies
One of several landfills used by Dryden, Ontario, Canada. Typically, operators of well-run landfills for
non-hazardous waste meet predefined specifications by applying techniques to
• confine waste to as small an area as possible
• compact waste to reduce volume
• they can also cover waste (usually daily) with layers of soil or other types of material such as
woodchips and fine particles.
During landfill processes, a scale or weighbridge may weigh waste collection vehicles on arrival and
personnel may inspect loads for wastes that do not accord with the landfill's waste-acceptance
criteria. Afterward, the waste collection vehicles use the existing road network on their way to the
tipping face or working front, where they unload their contents. After loads are deposited,
compactors or bulldozers can spread and compact the waste on the working face. Before leaving the
landfill boundaries, the waste collection vehicles may pass through a wheel-cleaning facility. If
necessary, they return to the weighbridge for re-weighing without their load. The weighing process
can assemble statistics on the daily incoming waste tonnage, which databases can retain for record
keeping. In addition to trucks, some landfills may have equipment to handle railroad containers. The
use of "rail-haul" permits landfills to be located at more remote sites, without the problems
associated with many truck trips. Typically, in the working face, the compacted waste is covered with
soil or alternative materials daily. Alternative waste-cover materials include chipped wood or other
"green waste”, several sprayed-on foam products, chemically "fixed" bio-solids, and temporary
blankets. Blankets can be lifted into place at night and then removed the following day prior to
waste placement. The space that is occupied daily by the compacted waste and the cover material is
called a daily cell. Waste compaction is critical to extending the life of the landfill. Factors such as
waste compressibility, waste-layer thickness and the number of passes of the compactor over the
waste affect the waste densities.
Advantages
Landfills are often the most cost-efficient way to dispose of waste, especially in countries with large
open spaces. While resource recovery and incineration both require extensive investments in
infrastructure, and material recovery also requires extensive manpower to maintain, landfills have
fewer fixed—or ongoing—costs, allowing them to compete favourably. In addition, landfill gas can
be upgraded to natural gas—landfill gas utilization—which is a potential revenue stream. Another
advantage is having a specific location for disposal that can be monitored, where waste can be
processed to remove all recyclable materials before tipping.
Social and environmental impact
Landfill operation in Hawaii. Note that the area being filled is a single, well-defined "cell" and that a
protective landfill liner is in place (exposed on the left) to prevent contamination by leachates
migrating downward through the underlying geological formation. Landfills have the potential to
cause a number of issues. Infrastructure disruption, such as damage to access roads by heavy
vehicles, may occur. Pollution of local roads and water courses from wheels on vehicles when they
leave the landfill can be significant and can be mitigated by wheel washing systems. Pollution of the

93 MGNCRE | Waste Management Technologies
local environment, such as contamination of groundwater or aquifers or soil contamination may
occur as Leachate
In some places, efforts are made to capture and treat leachate from landfills before it reaches
groundwater aquifers. However, liners always have a lifespan, though it may be 100 years or more.
Eventually, every landfill liner will leak, allowing pollutants to contaminate groundwater.
Figure 4.4 Landfill (Source https//www.epa.gov/landfills/municipal-solid-waste-landfills)
Why do we need any landfills?
Waste reduction, reuse and recycling divert large parts of our waste from landfills, but not all of it.
That waste must be managed safely to protect human health and the environment.
Landfill Site of Ahmedabad
Ahmedabad Urban Development Authority (AUDA) has constructed a common landfill site at
Fatehwadi (Ahmedabad) for sharing this facility by 12 Nagar Palikas of West AUDA area. The landfill

94 MGNCRE | Waste Management Technologies
area of 1178 sq. km. will take care of 200 TPD MSW generated by 12 Nagar Palikasviz.Chandkheda,
Kali, Ranip, Ghatlodia, Chandlodia, Memnagar, Thaltej,Bodakdev, Vastrapur, Vejalpur, Jodhpur and
Sarkhej Nagar Palika. Total population is estimated to be 10 lacs and waste generation of 200TPD.
The average annual rainfall is 300mm, the depth of groundwater table is 6 meters and the soil is
sandy. AUDA has constructed a common landfill site at Fatehwadi village with a disposal capacity of
1,45,534 cum and designed for 50TPD (8 years). The size of the landfill is 151m X 122m X 7.9m.
Leachate collection and treatment facility
150 mm diameter HDPE perforated pipe having holes of 10mm@ centre to centre at 150 mm
distance are laid in drainage layer. Leachate will be collected in leachate collection tank having size
of 2m X 2m X 3m height. The collected leachate will be pumped out in tanker and discharges in to
nearby trunk sewer line.
Gas collection
Gas collection vent pipe having 230mm diameter size HDPE pipe having holes of 10mm @ c/c
150mm distance has been provided.
Stormwater drainage
Stormwater drainage system has been provided on outer side of top service road and at the bottom of edge of the cell to drain out storm water.
Other information
The waste processing (aerobic compost) plant of capacity 150 TPD is under execution. It is planned
to fix up operation and maintenance agency for landfill cell and compost plant.
4.4 Differentiate sanitary landfill and incineration as final disposal system for solid waste
A landfill is a solid waste disposal method in which discarded materials are buried between layers of
earth in an attempt to reduce public health hazards caused by decaying refuse. According to the
Environmental Protection Agency (EPA), there are more than 10,000 old municipal landfills and more
than 1,754 active landfills in the United States as of 2007. Though modern landfills are required to
be impermeable waste containers, most of the older landfills were simply holes dug in the ground
where everything from cans of paint to old washing machines was buried. However, even the
newest landfill containers have been found to leak over time. The use of landfills has contributed to
both air and water pollution.
Specifications for Sanitary Landfills
(i) The department in the business allocation of land assignment shall provide suitable site for setting
up of the solid waste processing and treatment facilities and notify such sites.
(ii) The sanitary landfill site shall be planned, designed and developed with proper documentation of
construction plan as well as a closure planin a phased manner. In case a new landfill facility is being
established adjoining an existing landfill site, the closure plan of existing landfill should form a part
of the proposal of such new landfill.

95 MGNCRE | Waste Management Technologies
(iii) The landfill sites shall be selected to make use of nearby wastes processing facilities. Otherwise,
wastes processing facility shall be planned as an integral part of the landfill site.
(iv)Landfill sites shall be set up as per the guidelines of the Ministry of Urban Development,
Government of India and Central Pollution Control Board.
(v)The existing landfill sites which are in use for more than five years shall be improved in
accordance with the specifications given in this Schedule.
(vi)The landfill site shall be large enough to last for at least 20-25 years and shall develop ‘landfill
cells’ in a phased manner to avoid water logging and misuse.
(vii) The landfill site shall be 100 meter away from river, 200 meter from a pond, 200 meter from
Highways, Habitations, Public Parks and water supply wells and 20 km away from Airports or
Airbase. However in a special case, landfill site may be set up within a distance of 10 and 20 km away
from the Airport/Airbase after obtaining no objection certificate from the civil aviation authority/Air
force as the case may be. The Landfill site shall not be permitted within the flood plains as recorded
for the last 100 years, zone of coastal regulation, wetland, Critical habitat areas, sensitive
ecofragileareas..
(viii) The sites for landfill and processing and disposal of solid waste shall be incorporated in the
Town Planning Department’s land-use plans.
(ix) A buffer zone of no development shall be maintained around solid waste processing and disposal
facility, exceeding five Tonnes per day of installed capacity. This will be maintained within the total
area of the solid waste processing and disposal facility. The buffer zone shall be prescribed on case
to case basis by the local body in consultation with concerned State Pollution Control Board.
(x) The biomedical waste shall be disposed of in accordance with the Bio-medical Waste
Management Rules, 2016, as amended from time to time. The hazardous waste shall be managed in
accordance with the Hazardous and Other Wastes (Management and Trans boundary Movement)
Rules, 2016, as amended from time to time. The E-waste shall be managed in accordance with the e-
waste (Management ) Rules, 2016 as amended from time to time.
(xi) Temporary storage facility for solid waste shall be established in each landfill site to
accommodate the waste in case of non- operation of waste processing and during emergency or
natural calamities.
Land disposal is the most common management strategy for municipal solid waste. Refuse can be
safely deposited in a sanitary landfill, a disposal site that is carefully selected, designed, constructed,
and operated to protect the environment and public health. One of the most important factors
relating to landfilling is that the buried waste never comes in contact with surface water or
groundwater. Engineering design requirements include a minimum distance between the bottom of
the landfill and the seasonally high groundwater table. Most new landfills are required to have an
impermeable liner or barrier at the bottom, as well as a system of groundwater-monitoring wells.
Completed landfill sections must be capped with an impermeable cover to keep precipitation or
surface runoff away from the buried waste. Bottom and cap liners may be made of flexible plastic
membranes, layers of clay soil, or a combination of both.

96 MGNCRE | Waste Management Technologies
Figure 4.5 Sanitary landfill vs incinerator
( Source: https//sciencing.com/landfills-vs-incinerators-5523826.html)
Constructing the landfill
The basic element of a sanitary landfill is the refuse cell. This is a confined portion of the site in
which refuse is spread and compacted in thin layers. Several layers may be compacted on top of one
another to a maximum depth of about 3 metres (10 feet). The compacted refuse occupies about
one-quarter of its original loose volume. At the end of each day’s operation, the refuse is covered
with a layer of soil to eliminate windblown litter, odours, and insect or rodent problems. One refuse
cell thus contains the daily volume of compacted refuse and soil cover. Several adjacent refuse cells
make up a lift, and eventually a landfill may comprise two or more lifts stacked one on top of the
other. The final cap for a completed landfill may also be covered with a layer of topsoil that can
support vegetative growth.
Daily cover soil may be available on-site, or it may be hauled in and stockpiled from off-site sources.
Various types of heavy machinery, such as crawler tractors or rubber-tired dozers, are used to
spread and compact the refuse and soil. Heavy steel-wheeled compactors may also be employed to
achieve high-density compaction of the refuse.
The area and depth of a new landfill are carefully staked out, and the base is prepared for
construction of any required liner and leachate-collection system. Where a plastic liner is used, at
least 30 cm (12 inches) of sand is carefully spread over it to provide protection from landfill vehicles.
At sites where excavations can be made below grade, the trench method of construction may be
followed. Where this is not feasible because of topography or groundwater conditions, the area
method may be practiced, resulting in a mound or hill rising above the original ground. Since no
ground is excavated in the area method, soil usually must be hauled to the site from some other
location. Variations of the area method may be employed where a landfill site is located on sloping
ground, in a valley, or in a ravine. The completed landfill eventually blends in with the landscape.

97 MGNCRE | Waste Management Technologies
Controlling by-products
Organic material buried in a landfill decomposes by anaerobic microbial action. Complete
decomposition usually takes more than 20 years. One of the by-products of this decomposition is
methane gas. Methane is poisonous and explosive when diluted in the air, and it can flow long
distances through porous layers of soil. If it is allowed to collect in basements or other confined
areas, dangerous conditions may arise. In modern landfills, methane movement is controlled by
impermeable barriers and by gas-venting systems. In some landfills the methane gas is collected and
recovered for use as a fuel. A highly contaminated liquid called leachate is another by-product of
decomposition in sanitary landfills. Most leachate is the result of runoff that infiltrates the refuse
cells and comes in contact with decomposing garbage. If leachate reaches the groundwater or seeps
out onto the ground surface, serious environmental pollution problems can occur, including the
possible contamination of drinking-water supplies. Methods of controlling leachate include the
interception of surface water in order to prevent it from entering the landfill and the use of
impermeable liners or barriers between the waste and the groundwater. New landfill sites should
also be provided with groundwater-monitoring wells and leachate-collection and treatment systems.
Landfill Problems
Many landfills, especially older landfills in rural areas, are prone to producing leachate. Leachate is
an often toxic liquid that results from rain passing through a landfill and seeping into the ground
water. As rainwater passes through the landfill, it picks up organic and inorganic materials that
contain elements harmful to humans. For example, heavy metals, pesticides and solvents combine
with the water that eventually makes its way into 40 percent of municipal drinking water and 90
percent of rural drinking water. Dangerous gases emitted from the decaying contents of landfills
increase air pollution. Studies on how close you live to a landfill show a marked likelihood of
developing certain illnesses, including diabetes.
Incinerators
Incineration is a disposal method in which solid organic wastes are subjected to combustion so as to
convert them into residue and gaseous products. This method is useful for disposal of both
municipal solid waste and solid residue from waste water treatment. This process reduces the
volumes of solid waste by 80 to 95 percent. Incineration and other high temperature waste
treatment systems are sometimes described as "thermal treatment". Incinerators convert waste
materials into heat, gas, steam, and ash. Incineration is carried out both on a small scale by
individuals and on a large scale by industry. It is used to dispose of solid, liquid and gaseous waste. It
is recognized as a practical method of disposing of certain hazardous waste materials (such as
biological medical waste). Incineration is a controversial method of waste disposal, due to issues
such as emission of gaseous pollutants. Incineration is common in countries such as Japan where
land is more scarce, as the facilities generally do not require as much area as landfills. Waste-to-
energy (WtE) and energy-from-waste (EfW) are broad terms for facilities that burn waste in a
furnace or boiler to generate heat, steam or electricity. Combustion in an incinerator is not always
perfect and there have been concerns about pollutants in gaseous emissions from incinerator stacks.
Particular concern has focused on some very persistent organic compounds such as dioxins, furans,
and PAHs, which may be created and which may have serious environmental consequences.

98 MGNCRE | Waste Management Technologies
Some solid waste, especially health-care waste, is destroyed using incinerators, which burn
discarded materials into ash. According to the EPA, Pennsylvania, Maine and Minnesota are the top
three states that use combustion to destroy solid waste, with Alaska, Oregon, Virginia, New York and
Florida following closely behind. But even if there is little or no waste incinerated in your state, this
does not mean that potentially toxic incinerated material is not present in your area. Incinerator ash
is exported to other states to be used as landfill cover, contributing to the landfill leachate that
seeps into the water supply.
Burning is a very effective method of reducing the volume and weight of solid waste. In modern
incinerators the waste is burned inside a properly designed furnace under very carefully controlled
conditions. The combustible portion of the waste combines with oxygen, releasing mostly carbon
dioxide, water vapour, and heat. Incineration can reduce the volume of uncompacted waste by more
than 90 percent, leaving an inert residue of ash, glass, metal, and other solid materials called bottom
ash. The gaseous by-products of incomplete combustion, along with finely divided particulate
material called fly ash, are carried along in the incinerator airstream. Fly ash includes cinders, dust,
and soot. In order to remove fly ash and gaseous by-products before they are exhausted into the
atmosphere, modern incinerators must be equipped with extensive emission control devices. Such
devices include fabric baghouse filters, acid gas scrubbers, and electrostatic precipitators. Bottom
ash and fly ash are usually combined and disposed of in a landfill. If the ash is found to contain toxic
metals, it must be managed as a hazardous waste.
Municipal solid-waste incinerators are designed to receive and burn a continuous supply of refuse. A
deep refuse storage pit, or tipping area, provides enough space for about one day of waste storage.
The refuse is lifted from the pit by a crane equipped with a bucket or grapple device. It is then
deposited into a hopper and chute above the furnace and released onto a charging grate or stoker.
The grate shakes and moves waste through the furnace, allowing air to circulate around the burning
material. Modern incinerators are usually built with a rectangular furnace, although rotary kiln
furnaces and vertical circular furnaces are available. Furnaces are constructed of refractory bricks
that can withstand the high combustion temperatures.
Combustion in a furnace occurs in two stages primary and secondary. In primary combustion,
moisture is driven off, and the waste is ignited and volatilized. In secondary combustion, the
remaining unburned gases and particulates are oxidized, eliminating odours and reducing the
amount of fly ash in the exhaust. When the refuse is very moist, auxiliary gas or fuel oil is sometimes
burned to start the primary combustion.
In order to provide enough oxygen for both primary and secondary combustion, air must be
thoroughly mixed with the burning refuse. Air is supplied from openings beneath the grates or is
admitted to the area above. The relative amounts of this underfire air and overfire air must be
determined by the plant operator to achieve good combustion efficiency. A continuous flow of air
can be maintained by a natural draft in a tall chimney or by mechanical forced-draft fans.
Incinerator Problems
Burning waste emits toxic gases and particulates (which can settle in your lungs) into the air. It is not
confined to the area where it is incinerated, as air currents can distribute the toxins this burning
produces around the world. Both air emissions and incinerator ash include heavy metals and

99 MGNCRE | Waste Management Technologies
chemicals, such as cadmium, mercury, sulphuric acid and hydrogen chloride, as well as the deadly
poison dioxin.
Solutions
Every man, woman and child in the United States throws away 4.5 pounds of trash every day. By
practicing the principles of “reduce, reuse and recycle,” you can be instrumental in helping to solve
our waste management problems. The EPA projects that our landfills and incinerators can only
handle the solid waste our growing population produces for another 20 years. If you choose
products with minimal or biodegradable packaging, purchase products with long lives, reuse an
existing item in a different way and recycle your discards properly, the waste management system
will be less impacted. Contact your legislator to promote recycling in your area and to make him
aware of the increasing dangers of discarded electronics. Computers, printers and televisions
contain toxic materials and need to be disposed of carefully.
Case study (Source MNRE (http//mnre.gov.in/nmp/technology-we.pdf), with additional research
from EAI)
Helping a medium size Indian corporate understand the critical aspects of the Indian waste to energy
landscape
EAI was retained to assist a second generation Indian entrepreneur keen on entering the Indian
waste to energy sector.
The EAI team provided clarity to the client on both the technology and processes involved in the
conversion of the diverse waste feedstock into energy. These involved all the prominent processes –
anaerobic digestion, pyrolysis, incineration and gasification.
The EAI team provided the client comprehensive technical and feasibility analyses for the two
shortlisted routed – anaerobic digestion and gasification. Special emphasis was laid on providing
clarity to the client on the pros and cons of each technology. Our team also provided clear
breakdowns of both capital and operational costs to the client for the two shortlisted routes so that
the client appreciated the total project cost comprehensively.
EAI’s service also included assisting in vendor in evaluating cutting edge technical solutions for
gasification, such as plasma arc gasification.
4.5 Biochemical processes
Biomethanation-
Biomethanation is the anaerobic (in the absence of free oxygen) fermentation of biodegradable
matter in an enclosed space under controlled conditions of temperature, moisture, pH, etc. The
waste mass undergoes decomposition due to microbial activity, thereby generating biogas
comprising mainly of methane and carbon dioxide (CO2), and also digested sludge, which is almost
stabilised but may contain some pathogen. Due to the anaerobic environment, hydrogen sulfide
(H2S) is generated with varying percentage depending on the sulphur content in the system (in the
form of protein, sulphate, etc.). Like composting, biomethanation is one of the most technically

100 MGNCRE | Waste Management Technologies
viable options for Indian municipal solid waste (MSW) due to the presence of high organic and
moisture content.
Simple small to medium scale systems have been developed in India, especially for cattle manure;
these plants are called Gobar Gas Plants. According to the Ministry of New and Renewable Energy
(MNRE), 4.3 million family type biogas plants have been installed in India. Toilet linked biogas plants
have been installed at family, community and institutional levels. Application of biomethanation for
MSW can be seen broadly in three categories
(i) small biogas plants for canteen waste;
(ii) medium-sized digesters for market waste (flower, fruit, vegetable, slaughterhouse, etc.);
(iii) and large-scale plants.
There are some well-known examples of installation of MSW based biogas plants
(i) 16 tonnes MSW plus 4 tonnes per day (TPD) slaughterhouse waste based facility in Vijayawada;
(ii) 30 TPD flower fruit market waste based biogas plant in Koyambedu, Chennai; and
(iii)500 TPD MSW based facility at Lucknow. So far, large biogas plants fed with MSW have not been
successful in India although such plants have been successful in some other countries. The failure of
MSW based biogas plants is not related to the basic technology; this is more due to lack of
understanding of the process and planning capability and due to mismatch between the
expectations of the concessionaire and the consignee with respect to quality and quantity of MSW
supply. However, there are ongoing attempts by different urban local bodies (ULBs) to set up MSW
based biogas plants. Medium to large digesters are appropriately designed and engineered for
smooth operation.
Merits of Biomethanation Process
• Energy generation, the produced biogas can be used for cooking or for the production of
electricity and heat.
• Biogas may also be cleaned by removing CO2 and H2S. The resulting methane enriched
biogas containing more than 90% methane (CH4) is somewhat like compressed natural gas
(CNG). However, for this gas to be used as automotive fuel, the percentage of CO2 has to be
less than 5%, which corresponds to methane percentage of 95% or more. H2S has to be less
than 10 parts per million (ppm) for use in automobiles. Use of this fuel is more benign for
the environment than using petroleum-based automotive fuels. Like composting,
biomethanation also leads to reduced landfill requirement, thus extending the life of existing
landfills.
• Biomethanation of biodegradable organic material would result in stabilised sludge which
can be used as a soil conditioner and fertiliser. However, pathogen kill or inactivation may
not be complete during anaerobic digestion with the relatively short hydraulic retention
time (HRT) designed for optimisation of biogas production. Therefore, aerobic composting of

101 MGNCRE | Waste Management Technologies
the sludge is recommended to pass the material through temperature cycle of above 60°C–
70°C for at least 2 days.
• Although the total system of biomethanation is more cost intensive than the total system of
open aerobic composting, biomethanation has certain advantages with respect to much less
odour and bird menace. The time frame (cycle time) is also less, so that less land is required
for the same capacity. These two can be a big advantage where the only available sites are
close to habitation. This way, biomethanation can be compared to in-vessel composting,
which is again more expensive than open aerobic composting.
Applicability of Biomethanation
Biomethanation is ideal for wet organic wastes, e.g., cooked food. Biomethanation plants require a
consistent source of degradable organic matter, free from inert and toxic material. Slaughter house
waste is eminently suitable for biomethanation.
Odour problems are also considerably reduced by adopting biomethanation. If the proposed waste
processing site is in close proximity to residential areas, biomethanation is a preferred treatment
option, especially considering odour issues.
Anaerobic digestion technology can be adopted in both
–– decentralised systems—up to 5 TPD (much smaller quantities can be processed where O&M is
not outsourced); and
–– centralised systems—in modules of up to 50 TPD digesters (for higher capacity in one digester,
the size may become unwieldy and difficult to maintain).
The design of the plant has to be done according to the substrate (feed material) for smooth
functioning. The next most important challenge is to make the digester leak-proof. Proper O&M is a
critical factor for ensuring the success of the biogas plant which can be achieved through a well-
defined standard operating procedure (SOP). Economic viability of the plants is ensured when there
is a sustainable and viable market for the generated biogas in the vicinity of the plant and the sludge
manure produced during the process.
Figure 4.6 Biochemical processes
(Source: https//www.google.com/search?biw=820&bih=456&tbm=isch&sa=1&ei=6SdgXNKoJ9mv9QOCwIrYCg&q)

102 MGNCRE | Waste Management Technologies
Composting
Municipal solid waste (MSW) primarily consists of organic, inorganic and inert fractions. Under
natural conditions, the organic fraction of waste continually decomposes, accompanied by a strong
foul odour and production of gases, which are predominantly methane or CO2 depending on the
aerobic condition of the decomposing mass. Vector infestation during the natural decomposition is a
common phenomenon. Composting is a process of controlled decomposition of the organic waste,
typically in aerobic conditions, resulting in the production of stable humus-like product, i.e.,
compost. Considering the typical composition of wastes and the climatic conditions, composting is
highly relevant in India and should be considered in all municipal solid waste management (MSWM)
concepts. Composting of the segregated wet fraction of waste is preferred. Mixed waste
composting, with effective and appropriate pre-treatment of feedstock, may be considered as an
interim solution; in such cases, stringent monitoring of the compost quality is essential.
Benefits of Composting
• The real economic benefits of compost use include improved soil quality, enhanced water
retention capacity of soil, increased biological activity, micronutrient content, and improved
pest resistance of crops.
• Composting minimises or avoids GHG emissions from anaerobic decomposition of organic
waste (such as in a large unturned heap).
• Composting increases the design life of other waste management facilities.
• Stringent design requirements and associated costs for catering to management of leachate
from organic waste decomposition may be reduced in those landfills that do not receive
organic waste.
• Compost is particularly useful as organic manure; it contains macronutrients (nitrogen,
phosphorous, and potassium) as well as micronutrients. When used in conjunction with
chemical fertilisers, optimum results are obtained.
• The use of compost reduces the dependency on chemical fertilisers for agricultural
operations. When used as a soil amendment, compost reduces the need for water,
fertilisers, and pesticides. Compost acts as a soil conditioner, therefore supporting the long-
term fertility of soil.
• Compost may be used to revitalise vegetation habitats and add life to marginal,
impoverished soils and waste lands.
• Compost may also be used as a bio matrix in remediation of chemical contaminants and as a
remediated soil in contaminated sites; compost helps in binding heavy metals and other
contaminants, reducing leachate and bio-absorption.

103 MGNCRE | Waste Management Technologies
To do Activity
What Is Biodegradable?
Overview
Students will watch a video that introduces the process of decomposition in a compost bin or pile.
They will classify found objects collected on school grounds as biodegradable or nonbiodegradable.
OBJECTIVES
Students will
1. define the differences between things that are biodegradable and nonbiodegradable.
2. identify five materials that are biodegradable and five that are nonbiodegradable.
Teacher Background
Items that we use every day are made from materials that can be classified as biodegradable or
nonbiodegradable. Some of these materials such as plastics and metals are considered
nonbiodegradable. These materials will not decompose or biodegrade over a short period of time
and will often remain intact in the environment for many years. In contrast, biodegradable materials
such as food, plant trimmings and paper will decompose under ideal conditions over a relatively
short period of time. Composting is a great way to turn biodegradable materials into compost, a rich
soil amendment for plants. Air, moisture, and microbial activity in a composting are essential to the
process of decomposition. When materials end up in a landfill, they will remain there for many years
because of a lack of air, moisture and microbial activity. One easy way to reduce waste is to compost
biodegradable materials at home or school. Some cities are even collecting food scraps and other
organic materials in curb side bins usually with plant debris or wood. These materials will get
composted on a much larger municipal scale.
Materials
Students
Plastic or paper bags(one per group)
“Biodegradable nonbiodegradable” worksheet
Teacher
❑Do the Rot Thing video
❑Examples of biodegradable and nonbiodegradable materials
❑Rubric overhead
❑Rubrics (one per student)
Preparation
Collect plastic or paper bags from home or grocery stores. Organize students into groups of three to
four (you will need an even number of groups).
Discussion

104 MGNCRE | Waste Management Technologies
1. Ask students to name items that get thrown away at school and at home. Record their suggestions
on the board. Explain that some of the items listed on the board are biodegradable (circle these
items) such as notebook paper, leaves and food scraps, which means they can easily decay.
2. Pass around some examples of biodegradable items. Ask students whether they can share some
examples of items that may not decompose or decay over time. Have students point out
nonbiodegradable items on the board and underline them. Pass around some examples of
nonbiodegradable items.
3 Ask students whether they use more biodegradable or more nonbiodegradable materials.
4. Have students share their ideas on how to recycle biodegradable materials. Explain that these
materials can be recycled through composting.
5. Tell the students that they will learn about biodegradable materials by watching a video of things
decomposing overtime in a compost bin and collecting examples of biodegradable and
nonbiodegradable materials outside.
6. Show an overhead of the lesson rubric, and review the expectations for this lesson.
Procedure
1. Show the video Do the Rot Thing. Prepare the students to watch the video by assigning them to
look for the differences between biodegradable and nonbiodegradable materials.
2. Lead students in a discussion about the video that will provide examples of the differences
between biodegradable and nonbiodegradable. Review and define the concepts presented in the
video.
3. Organize students into small groups. Assign half of the groups to take bags outdoors and collect
items that they think are biodegradable, e.g., leaves, twigs, food scraps, etc. The other half will
collect items that they think are nonbiodegradable, e.g., metals, plastics, rocks.
4. Pair up small groups (one biodegradable and one nonbiodegradable), and ask the groups to switch
bags and examine the examples collected by the other group. For example, students in a group that
collected nonbiodegradable items will examine biodegradable items collected by another group.
5. In groups, students will classify the items as biodegradable (organic materials from once living
organisms) and nonbiodegradable (usually from non-living origins, such as metal, rock, etc.). Some
items may be moved from one collection into another if there is a group consensus.
6. As a class, discuss examples in each group that were difficult to classify.
7. Ask students how they could test objects to find out whether they are biodegradable. What
evidence would they expect to observe that would indicate that the object is biodegradable? For
example, what conditions are necessary for things to decompose (air, water, heat, etc.)?
8. Assign students to write a list of at least five items that are biodegradable and five items that are
nonbiodegradable.

105 MGNCRE | Waste Management Technologies
Wrap-Up
1. Have students compare and contrast the materials shown in the video to the materials collected
outside. Discuss similarities and differences.
2. Ask the students whether they think they can find materials that are biodegradable at home.
Discuss ways to recycle these materials such as starting a compost bin.
Final Assessment Idea
Have students write a description of the differences between items that are biodegradable versus
those that are nonbiodegradable in their own words.
Summary
1. Onsite handling refers to the activities associated with handling of solid waste until they are
placed in the containers used for their storage before collection.
2. Combustion is a chemical process or a reaction between Fuel (Hydrocarbon) and Oxygen.
3. A landfill is a large outdoor site specifically designed for the disposal of waste.
4. The basic element of a sanitary landfill is the refuse cell whereas Incineration is a disposal
method in which solid organic wastes are subjected to combustion so as to convert them into
residue and gaseous products.
5. Bio methanation is the anaerobic (in the absence of free oxygen) fermentation of
biodegradable matter in an enclosed space under controlled conditions of temperature,
moisture, pH, etc.
Model questions
Q1. What are the rules and regulations guiding waste management in India?
Q2. What are the common methods of waste disposal?
Q3. Discuss the easy and effective ways for individuals to handle waste.

106 MGNCRE | Waste Management Technologies
References
1] All India Institute of Local Self Government (2012). Reference Material on Municipal Solid
Waste Management for Urban Local Bodies –Collection, Transfer and Transportation of Waste
Components. Part I.Mumbai India.
2] Blue Ridge Environmental Defense League (2009). Waste GasificationImpacts On the
Environment and Public Health.
3] Central Pollution Control Board (2011-12). Annual Report.
4] Central Pollution Control Board (2011) Implementation of E-Waste Rules, 2011. New Delhi.
5]Central Pollution Control Board (2003). Guidelines for the Selection of Site for Landfilling.
New Delhi.
6] Ministry of Environment and Forests (2011). E Waste (Management and Handling) Rules, 2011.
Gazette of India, S.O. 1125 (E). Government of India; New Delhi
7] Ministry of Environment & Forests (2000). Municipal Solid Waste Management
(Management & Handling) Rules, 2000. Gazette of India, S.O. 783 (E). Government of India. New
Delhi

107 MGNCRE | Waste Management Technologies
Chapter 5 Processing and Conversion
Technologies of Solid Waste
Introduction
Presently, the society is facing a serious challenge for the effective management of the increasing
amount of produced municipal solid wastes. These problems led to serious public concerns, which in
turn resulted in political actions aiming to reduce the amount of wastes reaching the environment.
These actions aim to promote sustainable waste management solutions. The main objective of these
policies is to promote the recycling of municipal solid waste and the conversion of waste to energy
and valuable chemicals.
Objectives are:
• To discuss processing of solid waste at residential, commercial and industrial site.
• To explain conversion technologies.
• To highlight the method of recycling of materials found in solid waste.
• To find out organic waste treatment and new technologies.
• To tell the government schemes for power generation from waste in India.
5.1 Processing of solid waste at residential, commercial and industrial site
On site processing is one of the most effective and sustainable ways to achieve resource recovery.
• It reduces hazards and diverts different fractions of material present in the waste stream to
locations for appropriate treatment in the solid waste management.
• It reduces the quantity of general waste and minimizes the toxicity of the general waste stream (if
hazardous materials are diverted).
• It minimizes the cost of the operation and reduces maintenance problems of biological - treatment
and recycling technologies. The
economic viability of most biological treatment options largely depends on separation of waste
materials at source.
• Without sorting at source, expensive pre-sorting and final refining
Grinding, sorting, compaction, shredding, composting, and hydropulpery are all onsite processing
methods used to
(1) reduce the volume, (2) alter the physical form, or (3) recover usable materials from solid wastes.

108 MGNCRE | Waste Management Technologies
Grinding: Home grinders are used primarily for waste from the preparation, cooking, and serving
foods, and they cannot be used for large bones or other bulky items. Functionally, grinders render
the material that passes through them suitable for transport through the sewer system. However,
because the organic material added to sewage has resulted in overloading many treatment facilities,
it has been necessary, in some communities, to forbid the installation of grinders in new
developments until additional treatment capacity becomes available. In terms of the collection
operation, the use of home grinders does not have significant impact on the volume of solid wastes
collected. In some cases where grinders are used, it has been possible to increase the time period
between collections pickups because wastes that might readily decay are not stored.
Sorting: The sorting or separation of waste materials into newspapers, aluminium cans, and glass
and others by hand at the household is one of the most positive ways to achieve the recovery and
reuse materials.
Compaction: Within the past few years, a number of small compactors designed for home use have
appeared on the market for compaction of loose paper and cardboard. Although it is possible to
reduce the original volume of wastes placed in them by up to 70 percent, they can be used only for a
small proportion of the wastes actually generated.
Composting: It is an effective way of reducing the volume and altering the physical composition of
solid waste while at the same time producing a useful by-product.
Home incineration: Until recently, home incineration, burning combustible materials in fireplaces
and burning rubbish in crude backyard incinerators was a common practice. Backyard incineration is
now banned in many countries. The design of small outdoor and indoor incinerators has improved.
The simplest outdoor incinerator consists of a metal drum with holes punched near the bottom.
The more elaborated units are lined with refractory brick and are equipped with cast-iron grates and
small chimneys.
Shredding and Pulping are alternative processing operations that have been used, both in
conjunction with the previous methods and by themselves, for reducing the volume of wastes that
must be handled. Where shredding is used alone without the addition of water, the volume of
wastes has often been observed to increase. Although the system works well and the volume of
solid wastes is reduced, it is expensive. Special equipment may be required to remove and empty
the full pulp containers. An alternative is to discharge the pulped material to the local sewer. This is
often done in small operations where a pulper is used to destroy outdated confidential documents.
Because the discharge of pulped material increases the organic loading on local treatment facilities,
the use of pulverizes may be restricted if the treatment capacity is limited.
Commercial wastes are those produced from businesses such as food and drink establishments,
shops, banks and by public administration offices. These wastes contain similar materials to
residential waste, although the proportions may vary. For example, a restaurant will produce more
food waste than a normal household and an insurance office will produce more paper and less food
waste.
There are also many industrial facilities in Ethiopia that process agricultural products such as cotton,
flour, hides and skins. Other important industries include plastic and resin manufacturing, textiles,

109 MGNCRE | Waste Management Technologies
cement, metallurgical, foods, general chemicals and pharmaceuticals. All these industries
manufacture useful products and contribute to the country’s economy but, at the same time, they
can also be a major contributor to the country’s solid waste and pollution problems.
The composition of the waste produced by industry depends very much on the nature of the
industry concerned. For example, animal hide processing produces large amounts of biodegradable
waste (animal parts), while the construction industry produces a lot of excavated soil, rock and
demolition waste (bricks, stones, wood, glass, etc.). For this reason, industrial waste is usually
processed and disposed of by the industry itself, often using specialised technologies. These wastes
can be classed as either hazardous or nonhazardous depending on the inherent dangers associated
with their physical and chemical properties.
Figure 5.1 Processing of solid waste (Source https//en.wikipedia.org/wiki/Waste)
Disposal Methods
Depending upon the characteristics of the wastes, different types of disposal methods can be used
for hazardous and non-hazardous industrial wastes. The most predominant and widely practised
methods for wastes disposal are
(a) Landfill, (b) Incineration and (c) Composting.
For thousands of years, man has disposed the waste products in a variety of ways, the disposal
method might reflect convenience, expedience, expense, or best available technology. There were
no major ecological or health hazards associated with these practices until the last century. Explosive
increase in the amount of chemical waste produced and the indiscriminate dumping of hazardous
industrial waste in the last few decades has created health and ecological crisis in many areas of the
world. In many instances, leachate from the wastes dumped by one generation haunts the later
generation in the form of ground water and subsoil water contamination. The recent discovery of
volatile organic chemicals from landfills and industrial disposal ponds is disturbing because many of
these chemicals are known or suspected carcinogens and are not removed easily by natural
geochemical processes. The risk of the contamination of groundwater supplies due to leachates
from landfills depends on several factors; toxicity and volume of the contaminant generated at each

110 MGNCRE | Waste Management Technologies
site, the nature of the geologic medium underlying the site, and the hydrologic conditions dominant
in the area.
In the past, the least expensive and most widely used waste management option for both municipal
and industrial waste has been the sanitary landfill, where wastes are compacted and covered with
earth. In any geographic area other than arid zones, the fill is subjected to percolating rainwater or
snowmelt which eventually flows out from the bottom of the landfill site and moves into the local
groundwater system. Leachate is a liquid that is formed as infiltrating water migrates through the
waste material extracting water-soluble compounds and particulate matter. The mass of leachate is
directly related to precipitation, assuming the waste lies above the water table. Much of the annual
precipitation, including snowmelt is removed by surface run off and evaporation; it is only the
remainder that is available to form leachate. Since the landfill covers to a large extent and controls
leachate generation, it is exceedingly important that the cover be properly designed, maintained and
monitored in order to minimise leachate production. Fortunately, many substances are removed
from the leachate as it filters through the unsaturated zones, but leachate may pollute groundwater
and even streams. These leachates, can contain large amount of inorganic and organic
contaminants. At some sites, the leachate is collected and treated. But even in the best engineered
sites, some leachate escapes into the groundwater system because no permanent engineering
solution has been found to isolate the leachate completely from the groundwater.
It is now recognised that the interaction between leachate and soil are actually very complex and
depend both on the nature of soil and on the leachate. When leachate percolates through solid
wastes that are undergoing decomposition, both biological materials and chemical constituents are
picked up. Recent research in the United Kingdom (U.K) has, however, shown that chemical and
biological phenomena in landfill such as microbiological process; neutralisation; precipitation and
complexion; oxidation and reduction; volatilisation; adsorption reduce the quantity and quality of
polluting leachate from landfill site and achieve some degree of onsite treatment or immobilisation.
In spite of all these, the leachate often pose severe disposal problem at a landfill site. Two of the
most economic but efficacious purification methods are spraying over grassland or percolation
through an aerobic bed of sand or gravel. In general, it has been found that the quantity of leachate
is a direct function of the amount of external water entering the landfill. In fact, if a landfill is
constructed properly, the production of measurable quantities of leachate can be eliminated. When
sewage sludge is to be added to the solid wastes to increase the amount of methane produced,
leachate control facilities must be provided. In some cases leachate treatment facilities may also be
required. The pollution of static water ditches, rivers or the sea can occur when a sanitary landfill
adjoins a body of water. The normal source of the leachate causing this pollution is rain falling on the
surface of the fill, percolating through it, and passing over an impermeable base to water at a lower
level. The quantity of leachate can be substantially increased when upland water drains across the
site of the landfill, but the worst case is when a stream crosses the site. The solutions to these
problems lie in appropriate site engineering such as
(i) Diversion or culverting of all water courses which flow across the site,
(ii) Diversion of upland water by means of drainage ditches along appropriate contours,
(iii)Containment of leachate arising from precipitation by the construction of an impermeable barrier
where necessary, such as a clay embankment adjoining a river,
111 MGNCRE | Waste Management Technologies
(iv) Grading the final level of the site so that part of precipitation is drained across surface, thereby
reducing percolation below the level needed to produce a leachate.
Works of this nature will obviously add to the cost of a sanitary landfill project. However, when
capital expenditure is spread over the life of the project, the cost/ton of waste disposed might be
less than for any alternative method of disposal.
Furthermore, some of these forms of expenditure, such as culverts or river walls, represent capital
assets of continuing value when the reclaimed land is handed over for its final use, perhaps for
agriculture or recreation. Incineration of hazardous industrial waste has been advocated in
developed countries. Guidelines for safe incineration of hazardous chemical waste have been drawn
up by United States Environmental Protection Agency. Incineration of hazardous waste is a process
requiring sophisticated expensive incinerators and a high degree of technological expertise for
satisfactory operation. The capital cost of incinerator is high, especially if it is intended for hazardous
wastes and gas scrubbing equipment is required. Some wastes such as oils and organic solvents can
be readily treated by incineration. If financial constraints come in the way of purchasing
sophisticated incinerators then the utilisation of open pit incinerator under careful technical
supervision can be considered as an option.
5.2 Biological and chemical conversion technologies
Conversion technologies are an array of emerging technologies capable of converting post-recycling
residual solid waste into useful products and chemicals, green fuels like ethanol and biodiesal and
clean renewable energy.
Sample Conversion Technologies
Thermal
Pyrolysis is the thermal processing of waste in the absence of oxygen.
Gasification is the thermal processing of waste with a limited amount of oxygen using some
combination of heat, pressure and steam to convert materials directly into a gas.
Chemical
Acid Hydrolysis is the chemical decomposition of waste using acid and water to split chemical bonds.
Biological
• Anaerobic digestion is the bacterial breakdown of organic materials in the absence of
oxygen.
• Aerobic digestion is essentially composting.
• Bioenergy conversion technologies-
• Direct combustion processes.
• Thermochemical processes.

112 MGNCRE | Waste Management Technologies
• Biochemical processes.
Figure 5.2- Conversion technologies (Source https//slideplayer.com/slide/5755243)
There are five fundamental forms of biomass energy use.
(1) The "traditional domestic" use in developing countries (fuelwood, charcoal and agricultural
residues) for household cooking (e.g. the "three stone fire"), lighting and space-heating. In this role-
the efficiency of conversion of the biomass to useful energy generally lies between 5% and 15%.
(2) the "traditional industrial" use of biomass for the processing of tobacco, tea, pig iron, bricks &
tiles, etc, where the biomass feedstock is often regarded as a "free" energy source. There is
generally little incentive to use the biomass efficiently so conversion of the feedstock to useful
energy commonly occurs at an efficiency of 15% or less.
(3) "Modern industrial." Industries are experimenting with technologically advanced thermal
conversion technologies which are itemised below. Expected conversion efficiencies are between 30
and 55%.
(4) Newer "chemical conversion" technologies ("fuel cell") which are capable of by-passing the
entropy-dictated Carnot limit which describes the maximum theoretical conversion efficiencies of
thermal units.
(5) "Biological conversion" techniques, including anaerobic digestion for biogas production and
fermentation for alcohol.
In general, biomass-to-energy conversion technologies have to deal with a feedstock which can be
highly variable in mass and energy density, size, moisture content, and intermittent supply.
Therefore, modern industrial technologies are often hybrid fossil-fuel/biomass technologies which
use the fossil fuel for drying, preheating and maintaining fuel supply when the biomass supply is
interrupted.

113 MGNCRE | Waste Management Technologies
Direct combustion processes
Co-firing-
Feedstocks used are often residues such as woodchips, sawdust, bark, hogfuel, black liquor, bagasse,
straw, municipal solid waste (MSW), and wastes from the food industry.
Direct combustion furnaces can be divided into two broad categories and are used for producing
either direct heat or steam. Dutch ovens, spreader-stoker and fuel cell furnaces employ two-stages.
The first stage is for drying and possible partial gasification, and the second for complete
combustion. More advanced versions of these systems use rotating or vibrating grates to facilitate
ash removal, with some requiring water cooling.
The second group, include suspension and fluidised bed furnaces which are generally used with fine
particle biomass feedstocks and liquids. In suspension furnaces the particles are burnt whilst being
kept in suspension by the injection of turbulent preheated air which may already have the biomass
particles mixed in it. In fluidised bed combustors, a boiling bed of pre-heated sand (at temperatures
of 500 to 900°C) provides the combustion medium, into which the biomass fuel is either dropped (if
it is dense enough to sink into the boiling sand) or injected if particulate or fluid. These systems
obviate the need for grates, but require methods of preheating the air or sand, and may require
water cooled injection systems for less bulky biomass feedstocks and liquids.
A modern practice which has allowed biomass feed stocks an early and cheap entry point into the
energy market is the practice of co-firing a fossil-fuel (usually coal) with a biomass feedstock. Co-
firing has a number of advantages, especially where electricity production is an output.
Firstly, where the conversion facility is situated near an agro-industrial or forestry product
processing plant, large quantities of low cost biomass residues are available. These residues can
represent a low cost fuel feedstock although there may be other opportunity costs.
Secondly, it is now widely accepted that fossil-fuel power plants are usually highly polluting in terms
of sulphur, CO2 and other GHGs. Using the existing equipment, perhaps with some modifications,
and co-firing with biomass may represent a cost-effective means for meeting more stringent
emissions targets. Biomass fuel's low sulphur and nitrogen (relative to coal) content and nearly zero
net CO2 emission levels allows biomass to offset the higher sulphur and carbon contents of the fossil
fuel.
Thirdly, if an agro-industrial or forestry processing plant wishes to make more efficient use of the
residues generated by co-producing electricity, but has a highly seasonal component to its operating
schedule, co-firing with a fossil fuel may allow the economic generation of electricity all year round.
Agro-industrial processors such as the sugarcane sugar industry can produce large amounts of
electricity during the harvesting and processing season, however, during the off-season the plant will
remain idle. This has two drawbacks, firstly, it is an inefficient use of equipment which has a limited
life-time, and secondly, electrical distribution utilities will not pay the full premium for electrical
supplies which can't be relied on for year round production. In other words the distribution utility
needs to guarantee year round supply and may therefore, have to invest in its own production
capacity to cover the off-season gap in supply with associated costs in equipment and fuel. If
however, the agro-processor can guarantee electrical supply year-round through the burning of

114 MGNCRE | Waste Management Technologies
alternative fuel supplies then it will make efficient use of its equipment and will receive premium
payments for its electricity by the distribution facility.{GEF, 1992}
Thermo chemical processes-
• Pyrolysis
• Carbonisation
• Gasification
• Catalytic Liquefaction
These processes do not necessarily produce useful energy directly, but under controlled
temperature and oxygen conditions are used to convert the original biomass feedstock into more
convenient forms of energy carriers, such as producer gas, oils or methanol. These carriers are either
more energy dense and therefore reduce transport costs, or have more predictable and convenient
combustion characteristics allowing them to be used in internal combustion engines and gas
turbines.
Pyrolysis
The biomass feedstock is subjected to high temperatures at low oxygen levels, thus inhibiting
complete combustion, and may be carried out under pressure. Biomass is degraded to single carbon
molecules (CH4 and CO) and H2 producing a gaseous mixture called "producer gas." Carbon dioxide
may be produced as well, but under the pyrolytic conditions of the reactor it is reduced back to CO
and H2O; this water further aids the reaction. Liquid phase products result from temperatures which
are too low to crack all the long chain carbon molecules so resulting in the production of tars, oils,
methanol, acetone, etc. Once all the volatiles have been driven off, the residual biomass is in the
form of char which is virtually pure carbon.
Pyrolysis has received attention recently for the production of liquid fuels from cellulosic feedstocks
by "fast" and "flash" pyrolysis in which the biomass has a short residence time in the reactor. A more
detailed understanding of the physical and chemical properties governing the pyrolytic reactions has
allowed the optimisation of reactor conditions necessary for these types of pyrolysis. Further work is
now concentrating on the use of high pressure reactor conditions to produce hydrogen and on low
pressure catalytic techniques (requiring zeolites) for alcohol production from the pyrolytic oil.
Carbonisation
This is an age-old pyrolytic process optimised for the production of charcoal. Traditional methods of
charcoal production have centred on the use of earth mounds or covered pits into which the wood is
piled. Control of the reaction conditions is often crude and relies heavily on experience. The
conversion efficiency using these traditional techniques is believed to be very low; on a weight basis
Openshaw estimates that the wood to charcoal conversion rate for such techniques ranges from 6 to
12 tonnes of wood per tonne of charcoal. {Openshaw, 1980}.

115 MGNCRE | Waste Management Technologies
During carbonisation most of the volatile components of the wood are eliminated; this process is
also called "dry wood distillation." Carbon accumulates mainly due to a reduction in the levels of
hydrogen and oxygen in the wood.
The wood undergoes a number of physico-chemical changes as the temperature rises. Between 100
and 170°C most of the water is evaporated; between 170°C and 270°C gases develop containing
condensible vapours, CO and CO2. These condensible vapours (long chain carbon molecules) form
pyrolysis oil, which can then be used for the production of chemicals or as a fuel after cooling and
scrubbing. Between 270°C and 280°C an exothermic reaction develops which can be detected by the
spontaneous generation of heat.
The modernisation of charcoal production has lead to large increases in production efficiencies with
large-scale industrial production in Brazil now achieving efficiencies of over 30% (by weight).
There are three basic types of charcoal-making
a) Internally heated (by controlled combustion of the raw material),
b) externally heated (using fuelwood or fossil fuels), and
c) hot circulating gas (retort or converter gas, used for the production of chemicals).
Internally heated charcoal kilns are the most common form of charcoal kiln. It is estimated that 10 to
20% of the wood (by weight) is sacrificed, a further 60% (by weight) is lost through the conversion
to, and release of, gases to the atmosphere from these kilns. Externally heated reactors allow
oxygen to be completely excluded, and thus provide better quality charcoal on a larger scale. They
do, however, require the use of an external fuel source, which may be provided from the "producer
gas" once pyrolysis is initiated.
Recirculating heated gas systems offer the potential to generate large quantities of charcoal and
associated by-products, but are presently limited by high investment costs for large scale plant.
Gasification.
High temperatures and a controlled environment lead to virtually all the raw material being
converted to gas. This takes place in two stages. In the first stage, the biomass is partially combusted
to form producer gas and charcoal. In the second stage, the C02 and H2O produced in the first stage
is chemically reduced by the charcoal, forming CO and H2. The composition of the gas is 18 to 20%
H2, an equal portion of CO, 2 to 3% CH4, 8 to 10% CO2, and the rest nitrogen. These stages are
spatially separated in the gasifier, with gasifier design very much dependant on the feedstock
characteristics.
Gasification requires temperatures of about 800°C and is carried out in closed top or open top
gasifiers. These gasifiers can be operated at atmospheric pressure or higher. The energy density of
the gas is generally less than 5.6 MJ/m3, which is low in comparison to natural gas at 38 MJ/m3,
providing only 60% the power rating of diesel when used in a modified diesel engine.
Gasification technology has existed since the turn of the century when coal was extensively gasified
in the UK and elsewhere for use in power generation and in houses for cooking and lighting.

116 MGNCRE | Waste Management Technologies
Gasifiers were used extensively for transport in Europe during World War II due to shortages of oil,
with a closed top design predominating.
A major future role is envisaged for electricity production from biomass plantations and agricultural
residues using large scale gasifiers with direct coupling to gas turbines. The potential gains in
efficiency using such hybrid gasifier/gas turbine systems make them extremely attractive for
electricity generation once commercial viability has been demonstrated. Such systems take
advantage of low grade and cheap feedstocks (residues and wood produced using short rotation
techniques) and the high efficiencies of modern gas turbines to produce electricity at comparable or
less cost than fossil-fuel derived electricity. Net atmospheric CO2 emissions are avoided if growth of
the biomass is managed to match consumption. The use of BIG/STIG (Biomass Integrated Gasifier
Steam Injected Gas turbine) initially and BIG/GTCC (Biomass integrated Gasifier Gas Turbine
Combined Cycle) as the technology matures, is predicted to allow energy conversion efficiencies of
40% to 55%. Modern coal electrical plants have efficiencies of about 35% or less. Combined Heat
and Power systems could eventually provide energy at efficiencies of between 50% to 80%. The use
of low-grade feedstocks combined with high conversion efficiencies makes these systems
economically competitive with cheap coal-based plants and energetically competitive with natural
gas-based plants.
Studies are continuing in the use of such technologies for the cost effective treatment of MSW e.g. in
the Netherlands a study by Faaij et al. {1992} considers that "gasification can become a strong
competitor to anaerobic digestion, composting and incineration for biomass waste treatment." This
is based on the use of BIG/STIG technology with the system gasification using Atmospheric
Circulating Fluidized Bed (ACFB) technology. They expect the potential to be "realised within 4 to 7
years". {Faaij et al., 1992}
Catalytic Liquefaction
This technology has the potential to produce higher quality products of greater energy density.
These products should also require less processing to produce marketable products.
Catalytic liquefaction is a low temperature, high pressure thermochemical conversion process
carried out in the liquid phase. It requires either a catalyst or a high hydrogen partial pressure.
Technical problems have so far limited the opportunities of this technology.
Biochemical processes-
• Anaerobic Fermentation
• Methane Production in Landfills
• Ethanol Fermentation
Biodiesel
The use of micro-organisms for the production of ethanol is an ancient art. However, in more recent
times such organisms have become regarded as biochemical "factories" for the treatment and
conversion of most forms of human generated organic waste. Microbial engineering has encouraged

117 MGNCRE | Waste Management Technologies
the use of fermentation technologies (aerobic and anaerobic) for use in the production of energy
(biogas) and fertiliser, and for the use in the removal of unwanted products from water and waste
streams.
Anaerobic Fermentation
Anaerobic reactors are generally used for the production of methane rich biogas from manure
(human and animal) and crop residues. They utilise mixed methanogenic bacterial cultures which are
characterised by defined optimal temperature ranges for growth. These mixed cultures allow
digesters to be operated over a wide temperature range i.e. above 0°C up to 60°C.
When functioning well, the bacteria convert about 90% of the feedstock energy content into biogas
(containing about 55% methane), which is a readily useable energy source for cooking and lighting.
The sludge produced after the manure has passed through the digester is non-toxic and odourless.
Also, it has lost relatively little of its nitrogen or other nutrients during the digestion process thus,
making a good fertiliser. In fact, compared to cattle manure left to dry in the field the digester sludge
has a higher nitrogen content; many of the nitrogen compounds in fresh manure become volatised
whilst drying in the sun. On the other hand, in the digested sludge little of the nitrogen is volatised,
and some of the nitrogen is converted into urea. Urea is more readily accessible by plants than many
of the nitrogen compounds found in dung, and thus the fertiliser value of the sludge may actually be
higher than that of fresh dung.
Anaerobic digesters of various types were widely distributed throughout India and China. Extension
programmes promote biogas plants as ideal candidates for rural village use due to their energy and
fertiliser production potential along with their improved health benefits. Health benefits primarily
arise from the cleaner combustion products of biogas as opposed to other biomass or fossil fuels
which may be used in the domestic environment, these two countries now have an estimated 5 to 6
million units in use.
Reliability problems have arisen from a number of problems i.e. construction defects, the mixed
nature of the bacterial population, the digesters requirements for water and the maintenance of the
optimum nitrogen ratio of the medium. Another problem is the digester's demand for dung, which
may have alternative uses.
Modern designs have answered many of these problems and digesters are again becoming useful,
especially with regard to the potential of digesters to remove toxic nutrients such as nitrates from
water supplies; levels of which are now much more stringently controlled in many industrialised
countries. The combination of energy production with the ability to enhance crop yields makes
biogas technology a good candidate for more widespread use now that reliable operation can be
demonstrated. Recent Danish commercial experience with large scale digesters provides a useful
example.
Methane Production in Landfills
Anaerobic digestion in landfills is brought about by the microbial decomposition of the organic
matter in refuse. The levels of organic matter produced per capita vary considerably from developed
to developing countries e.g. the percentage of Municipal Solid Waste (MSW) which is putrescible in
Sierra Leone is about 90% {Steele, 1992}, compared to about 60% for US MSW. The reduced levels of
putrescibles in US MSW are a result of the increased proportions of plastics, metals and glass, mostly

118 MGNCRE | Waste Management Technologies
from packaging {Slivka et al., 1992}. Landfill-generated gas is on average half methane and half
carbon dioxide with an energy content of 18 to 19 MJ/m3. Its production does not occur under
pressure, and thus recovery processes must be active.
Commercial production of land-gas can also aid with the leaching problems now increasingly
associated with landfill sites. Local communities neighbouring land fill sites are becoming more
aware of the potential for heavy metals and nutrients to leach into aquifers. Landfill processing
reduces the volume of sludge to be disposed of, and the nutrient content, thus facilitating proper
disposal.
Methane is a powerful greenhouse gas, with substantial amounts being derived from unutilized
methane production from landfill sites. Its recovery therefore, not only results in the stabilisation of
the landfill site, allowing faster reuse of the land, but also serves to lessen the impact of biospheric
methane emissions on global warming.
Ethanol Fermentation
Ethanol is mainly used as a substitute for imported oil in order to reduce their dependence on
imported energy supplies. The substantial gains made in fermentation technologies now make the
production of ethanol for use as a petroleum substitute and fuel enhancer, both economically
competitive (given certain assumptions) and environmentally beneficial. For example, subsidies for
alcohol production in Brazil are now becoming regarded as detrimental to the stability of the ethanol
market, and thus obsolete. In Zimbabwe, foreign exchange savings are seen as a major bonus, which
along with the employment and environmental benefits have made the long term future and
expansion of the this programme a priority for the Zimbabwean government.
The most commonly used feedstock in developing countries is sugarcane, due to its high productivity
when supplied with sufficient water. Where water availability is limited, sweet sorghum or cassava
may become the preferred feedstocks. Other advantages of sugarcane feedstock include the high
residue energy potential and modern management practices which make sustainable and
environmentally benign production possible whilst at the same time allowing continued production
of sugar. Other feedstocks include saccharide-rich sugarbeet, and carbohydrate rich potatoes, wheat
and maize.
One of the most promising fermentation technologies to be identified recently is the "Biostil"
process which uses centrifugal yeast reclamation, and continuous evaporative removal of the
ethanol. This allows the fermentation medium to be continuously sterilised and minimises water
use. The Biostil process markedly lowers the production of stillage, whilst the non-stop nature of the
fermentation process allows substrate concentrations to be constantly kept at optimal levels and
therefore fermentation efficiency is maximised. Improved varieties of yeast, produced through
clonal selection techniques have also raised the tolerance levels of the yeast to alcohol
concentrations, again improving efficiency.
Recent advances in the use of cellulosic feedstock, may allow the competitive production of alcohol
from woody agricultural residues and trees to become economically competitive in the medium
term. Since 1982, prices have fallen from about US$ 45 per GJ (95 c/l) to about US$ 13 per GJ (28 c/l)
for ethanol, and for methanol, projected prices have been reduced from US$ 16 per GJ (27 c/l) to

119 MGNCRE | Waste Management Technologies
$15 per GJ (25 c/l) and could fall to prices competitive with gasoline produced from oil priced at US$
25 per barrel.
Biodiesel
The use of vegetable oils for combustion in diesel engines has occurred for over 100 years. In fact,
Rudolf Diesel tested his first prototype on vegetable oils, which can be used, "raw", in an emergency.
Whilst it is feasible to run diesel engines on raw vegetable oils, in general the oils must first be
chemically transformed to resemble petroleum-based diesel more closely.
The raw oil can be obtained from a variety of annual and perennial plant species. Perennials include,
oil palms, coconut palms, physica nut and Chinese Tallow Tree. Annuals include, sunflower,
groundnut, soybean and rapeseed. Many of these plants can produce high yields of oil, with positive
energy and carbon balances.
Transformation of the raw oil is necessary to avoid problems associated with variations in feedstock.
The oil can undergo thermal or catalytic cracking, Kolbe electrolysis, or transesterification processes
in order to obtain better characteristics. Untreated oil causes problems through incomplete
combustion, resulting in the build up of sooty residues, waxes, gums etc. Also, incorrect viscosities
can result in poor atomization of the oil also resulting in poor combustion. Oil polymerisation can
lead to deposition on the cylinder walls.
Generally, the chemical processing required to avoid these problems is simple, and in the case of
soyabean oil may be carried out in existing petroleum refineries. The use of diesel powered vehicles
is widespread throughout agriculture, and biodiesel provides an environmentally friendly, CO2-
neutral alternative. It is now being widely promoted in the EC and elsewhere, as its use does not
require major modification to existing diesel engines.
A bio-chemical conversion system for lignocellulosic biomass will generally consist of a pretreatment
step to release the C6 and C5 sugars followed by conversion of the polysaccharides into products like
fuels or chemicals. Second-generation cellulosic ethanol production is the best known example.
Fundamental biomass characteristics that influence the potential success of biochemical conversion
of lignocellulose biomass into fuels and chemicals are:
Lignin content: Lignin can hardly be degraded by enzymes and microorganisms. Secondly, it acts as a
shield that prohibits the bioconversion of cellulose and hemicellulose. The higher the lignin content,
the more difficult it is to use lignocellulose as feedstock in biochemical conversion processes. Lignin
is also associated with formation of antiquality compounds or inhibitors, such as polyphenols. These
may hinder downstream fermentation processes.
High carbohydrate content: The main components of interest in biochemical conversion of
(lignocellulosic) biomass are cellulose and hemicellulose, which are carbohydrate polymers
consisting of sugar polymers. High cellulose and hemicellulose content will make biomass more
suitable for biochemical conversion.
Low ash content: As with the other two conversion methods, ash or inorganic material cannot be
converted within biochemical processes and generally adds to the costs of conversion.

120 MGNCRE | Waste Management Technologies
Protein: This may also be relevant from another point of view. Protein could be extracted and
valorized so a higher content could be desirable if the protein can be removed.
In biochemical conversion, biomass molecules are broken down into smaller molecules by bacteria
or enzymes. This process is much slower than thermochemical conversion, but does not require
much external energy. The three principal routes for biochemical conversion are
•Digestion (anaerobic and aerobic)
•Fermentation
•Enzymatic or acid hydrolysis
The main products of anaerobic digestion are methane and carbon dioxide in addition to a solid
residue. Bacteria access oxygen from the biomass itself instead of from ambient air. Aerobic
digestion, or composting, is also a biochemical breakdown of biomass, except that it takes place in
the presence of oxygen. It uses different types of microorganisms that access oxygen from the air,
producing carbon dioxide, heat and a solid digestate.
In fermentation, part of the biomass is converted into sugars using acid or enzymes. The sugar is
then converted into ethanol or other chemicals with the help of yeasts. The lignin is not converted
and is left either for combustion or for thermochemical conversion into chemicals. Unlike in
anaerobic digestion, the product of fermentation is liquid.
Fermentation of starch and sugar-based feedstock (i.e., corn and sugarcane) into ethanol is fully
commercial, but this is not the case with cellulosic biomass because of the expense and difficulty in
breaking down (hydrolyzing) the materials into fermentable sugars. Ligno-cellulosic feedstock, like
wood, requires hydrolysis pre-treatment (acid, enzymatic, or hydrothermal) to break down the
cellulose and hemicellulose into simple sugars needed by the yeast and bacteria for the
fermentation process. Acid hydrolysis technology is more mature than enzymatic hydrolysis
technology, though the latter could have a significant cost advantage.
Biomass biochemical conversion technologies refer to the conversion of biomass into corresponding
products through certain physical, chemical, and biological pre-treatments. Pre-treatments in the
biochemical conversion technologies of biomass aim to help reach ideal conversion effects, not to
produce final products, which is the essential difference between the aforementioned physical and
chemical conversion of biomass. In addition, biochemical conversion technologies of biomass are
more moderate than the other two.
Biomass can be turned into different products, such as hydrogen, biogas, ethanol, acetone, butanol,
organic acids (pyruvate, lactate, oxalic acid, levulinic acid, citric acid), 2,3-butanediol, 1,4-butanediol,
isobutanol, xylitol, mannitol, and xanthan gum by selecting different microorganisms in the process
of biochemical conversion (Chen, 2010). On the one hand, such products can synthetize
replacements of petroleum-based products. On the other hand, the products can replace products
derived from grains, such as ethanol.
Compared with other conversion technologies, biomass biochemical conversion technologies are
moderate, pure, clean, and efficient. Moreover, biomass can be turned into various intermediates by
screening different enzymes or microorganisms through biochemical conversion technologies, thus
121 MGNCRE | Waste Management Technologies
providing many platform substances for the conversion of renewable materials, fuels, and chemicals.
As a result, people pay much attention to biochemical conversion technologies of biomass.
Advantages and limitations of techniques
Biochemical conversion pathways and the enzyme catalysts that enable their success have
significant advantages. Biotechnology is a relatively new toolkit, and innovations are being rapidly
developed. Exemplary areas include synthetic biology, as well as the genomics realm. Genetic
manipulation of organisms for industrial purposes has a long history, but engineers have recently
pushed the ease of manipulating microbial genomes with the aim of synthesizing entirely new
biological organisms. Biofuel and bioproduct synthesis has been a popular ‘test bed’ for emerging
tools of synthetic biology. In the area of genomics and bioinformatics, available microbial sequence
information that drives discovery of novel biocatalysts has exploded, driven by dramatic reduction in
DNA sequencing costs. With the ability to sequence DNA from uncultured organisms, a vast
unexplored territory of microbe diversity is accessed. While techno-economic modelling by NREL
currently predicts that the MESP for ethanol produced by biochemical conversion and by thermo
chemical conversion are quite similar (Foust et al., 2009), thermo chemical approaches utilize
relatively more mature technologies, and arguably may demonstrate with slower rates of progress
relative to the ‘younger’ field of biotechnology.
A limitation associated with use of biochemical catalysts for biomass conversion is their intrinsic
stability. While the use of biological agents as catalysts for converting recalcitrant lignocellulose to
sugars is attractive from a capital cost viewpoint due to their compatibility with mild reaction
conditions, this also means that care must be taken to maintain appropriate conditions such as
temperature and pH during hydrolysis. Since processes cannot be undertaken under sterile
conditions, industrial-scale reactions must utilize enzymes and organisms that are robust enough to
withstand contamination by naturally occurring organisms.
Environmental Benefits
Conversion technologies have a number of environmental benefits.
Conversion technologies often incorporate pre-processing subsystems to produce a more
homogeneous feedstock. This provides the opportunity to recover chlorine-containing plastic (as a
recyclable), which could otherwise contribute to the formation of organic compounds or trace
contaminants.
Syngas produced by thermal conversion technologies is a much more homogeneous and cleaner
burning fuel than MSW.
Conversion technology processes occur in a reducing environment, so that formation of unwanted
organic compounds or trace contaminants is precluded or minimized.
Conversion technologies are closed pressurized systems such that there are no direct air emission
points. Contaminants are removed from the syngas and/or from the flue gases before being
exhausted from a stack.

122 MGNCRE | Waste Management Technologies
The volume of syngas produced in the conversion of the feedstock is considerably lower than the
volume of flue gases formed by WTE facilities. Smaller gas volumes are easier and less costly to treat.
Pre-cleaning of syngas is possible, thus reducing the potential for corrosion in power generation
equipment and reducing overall air emissions. Sulphur compounds can be removed by commercially
available equipment and recovered as marketable sulphur or gypsum.
Syngas produced by thermal conversion technologies is a much more homogeneous and cleaner-
burning fuel than MSW.
Methane emissions from landfills are significant even with energy recovery.
Using a conversion technology to convert the carbon content of the MSW to combustible syngas,
instead of allowing it to degrade in a landfill to methane, eliminates this environmental impact.
The inert, glassy slag recovered from high-temperature gasification is similar to that produced from
steel mills and coal-fired power plants. It can be used for making roofing tiles and as sandblasting
grit or asphalt filler.
Renewable energy and fuels
In creating electricity and useful by-products, conversion technologies typically reduce the amount
of MSW by more than 95%.
The use of MSW for power generation results in significant savings in the use of fossil fuels and their
associated life-cycle impacts from the mining and transportation of the fuels.
Conversion technologies typically reduce the amount of MSW by more than 95%. Another advantage
of conversion technologies is the production of renewable energy. MSW is often classified as a
renewable fuel under state Renewable Portfolio Standards (RPS) programmes in the US. "Green
power" from MSW and other renewable sources commands a premium price in some states.
Another option with syngas produced using a conversion technology is its further processing to
produce methanol (a feedstock for many chemical processes) or ethanol (a valuable transportation
fuel).
Barriers to the implementation of conversion technologies
Despite the success of conversion technologies in Europe and Japan, no MSW facilities have yet been
constructed at a commercial scale in North America none of these lengthy procurement processes
have ended with a "buy decision.
Examples of barriers that appear to restrain further development of conversion technologies include
Lack of regulations needed for permits
• Financial risk
• Technical risk
• Economics

123 MGNCRE | Waste Management Technologies
Reluctance of cities and counties to take on environmental groups or to commit to the public
education required for successful sitting and permitting.
Some of these barriers have precluded demonstration scale projects from going forward when
economics was not even a primary consideration. This makes it more difficult to move these
promising technologies from small scale to commercial scale, where costs will be much more
competitive. With the exception of the decision by the City of Edmonton in Canada to continue with
its MSW gasification demonstration scale project, there is still a lot of looking but no buying going
on. This has been very frustrating and costly for conversion technology suppliers.
As cities and counties progress their evaluations and continue to face both increasing costs from
landfills and increasing pressure to make wiser MSW management choices, removal of the
regulatory and economic barriers is expected, allowing implementation of conversion technologies
to proceed.
5.3 Recycling of materials found in solid waste
Recycling is processing used materials (waste) into new, useful products. This is done to reduce the
use of raw materials that would have been used. Recycling also uses less energy and great way of
controlling air, water and land pollution.
Recycling includes the collection, sorting, marketing, and processing, of materials removed from the
solid waste stream, and the transformation or remanufacture of those materials for use as feedstock
for new products and/or other productive uses. Successful recycling includes an examination of the
solid waste stream to determine what is recyclable and marketable. Recycling efforts can be
implemented in the residential, commercial and industrial sectors.
Municipal solid waste (MSW) is comprised of a number of solid waste streams. The three principal
solid waste streams that compose MSW are
• Residential solid waste: Solid waste generated from single-family residences, and multifamily
residences. Recyclables prevalent in the residential waste stream include paper, plastics, metals,
food scraps, yard trimmings, textiles and personal electronics.
• Commercial solid waste: Solid waste generated from businesses, offices, stores, markets,
institutions, government, and other commercial establishments. Recyclables common in the
commercial waste stream include paper, plastic, metals, food, yard trimmings, lumber, textiles, and
electronic devices.
• Industrial solid waste: Solid waste generated from non-process lines, shipping, plant offices; solid
wastes not regulated under the Clean Water Act, Clean Air Act, and Subtitle C of the Resource
Conservation and Recovery Act; Other solid waste streams that may also be a part of MSW include
• Bio-medical wastes treated waste, where allowed, generated from hospitals and other acute care
facilities, health research institutions and homes that result from the use and administration of
medications, surgery or other medical procedures, or medical or health research and development.
• Bio solids typically waste generated from the de-watering of municipally generated wastewater.

124 MGNCRE | Waste Management Technologies
• Construction and demolition debris materials resulting from the construction and demolition
(C&D) of buildings and other structures, including materials such as metals, wood, gypsum, asphalt
shingles, roofing, concrete, rocks, rubble, soil, paper, plastics and glass, but excluding putrescible
wastes. C&D components can be a significant portion of the MSW stream with a high potential for
recycling. Non-recyclable C&D wastes may be disposed in municipal solid waste landfills or specially
designated landfills, or if cleaned of unacceptable debris, used for land reclamation.
• Other : there are a host of other separately managed solid wastes that may be a part of
MSW such as tires, street sweepings, storm catchment wastes, automotive shredding fluff,
carpet, white goods, furniture and mattresses. Recycling material from the waste stream can
be encouraged through several approaches, including
• Ordinances/legislation/mandatory programs
• Voluntary programs at businesses or institutions
• Reward or incentive based programs
• Recyclables can be collected through a variety of approaches, including
• Curb side collection of commingled recyclables (single-stream collection)
• Curb side collection of source separated recyclables
• Curb side collection of mixed MSW
• Drop-off and buy-back programs
• Deposit ordinances and legislation
• Commercial and industrial collections specific to the participating generator.
It is not sufficient to just encourage recycling and collect recyclable materials. The efficacy of these
programs is dependent on a number of factors, including location, demographics, and availability of
processing capacity and markets.
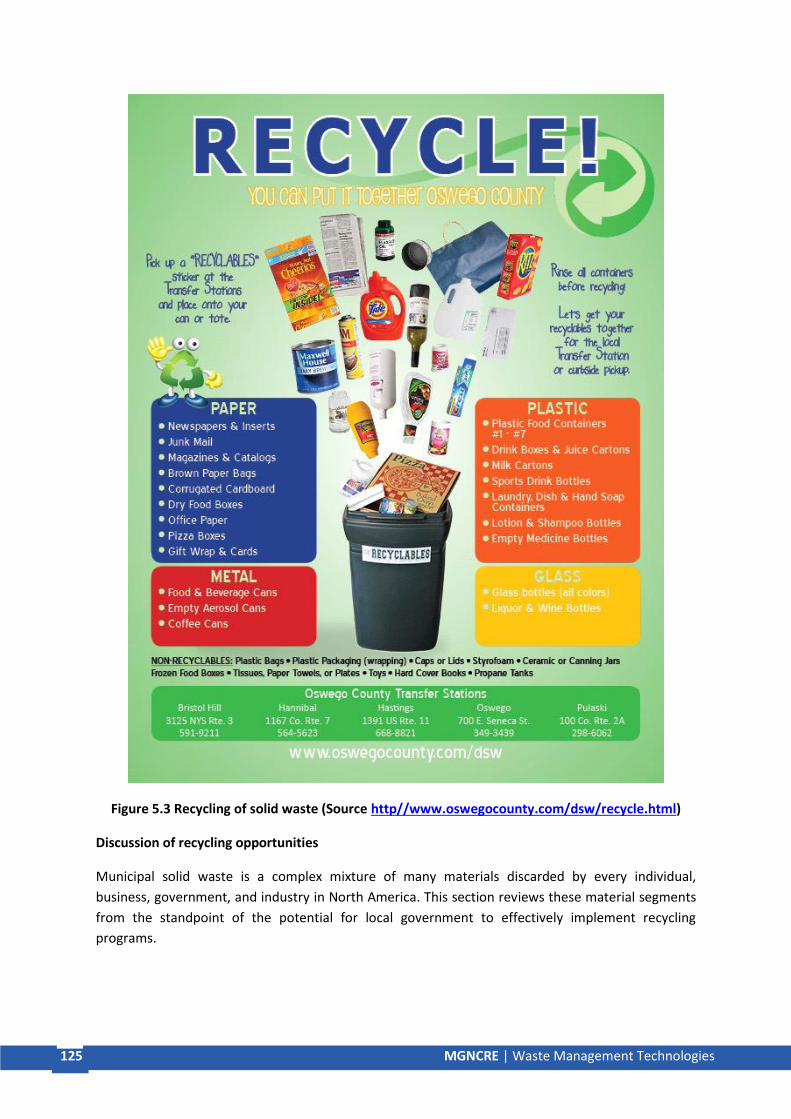
125 MGNCRE | Waste Management Technologies
Figure 5.3 Recycling of solid waste (Source http//www.oswegocounty.com/dsw/recycle.html)
Discussion of recycling opportunities
Municipal solid waste is a complex mixture of many materials discarded by every individual,
business, government, and industry in North America. This section reviews these material segments
from the standpoint of the potential for local government to effectively implement recycling
programs.

126 MGNCRE | Waste Management Technologies
A. Paper
Paper, which is found in everything from packaging to mail to office supplies, makes up the largest
percentage of the municipal solid waste stream. It is also one of the most recovered materials, as
recycling opportunities are often readily available. Opportunities to recycle may be reduced if the
paper products are contaminated by such constituents as wax and adhesives, but recyclers are
increasingly finding ways to overcome these obstacles.
1. Packaging : Paper packaging (paperboard), such as cereal and pasta boxes, is often itself made
from recycled paper stock
2. Cardboard : Corrugated cardboard boxes make up the largest percentage of shipping boxes. When
disposed of, this material is called Old Corrugated Cardboard (OCC) and has a long-established niche
in the recycled paper market. OCC has a strong recycling market domestically and abroad, and is
often compacted in bailers to reduce the volume of shipping.
3. Newsprint and Magazines : Newsprint and magazines can be effectively taken out of the municipal
solid waste stream through curbside collection or drop-off centers. Old newsprint is recycled by de-
inking mills. Markets for recycled magazines and other coated papers can be limited.
4. Office Paper: High-grade de-inking grades such as office papers are utilized to produce tissue
products such as paper towels, toilet paper, and facial tissue.
5. Mixed Paper : Mixed paper is a large portion of the municipal solid waste stream. The potential for
recycling this material can be hampered by contaminants such as coated paper stock, pressure
sensitive labels, metal foils, and organic materials. Limiting or eliminating the presence of such
contaminants could improve the recyclability of these papers. Utilization of this material as a
feedstock for composting or as a fuel in a waste-to energy facility should be considered.
B. Containers
1. Ferrous Metal : Food cans are a major source of ferrous metal in the municipal solid waste stream.
The market for scrap ferrous is stable, and recovery of ferrous from collected recyclables is relatively
simple because of its magnetic characteristics. Scrap metal processors play an integral role in the
processing and aggregation of scrap metal.
2. Aluminium : Aluminium beverage containers constitute the major portion of aluminium in the
municipal solid waste stream. The recovery market is strong. Public education and cooperative
efforts, including some state-wide bottle/can deposit programs, during the past 20 to 30 years have
proven effective at recovering aluminium.
3. Glass : Glass containers come in two versions – refillable and non-refillable – and many colours
(clear, green, brown, blue), which affects the marketability of recovered product.
The dominant share of the market is non-refillable food and beverage containers. Markets for glass
containers are well-established but, recovered glass must meet strict industry specifications for
quality, including sorting by colour. Material recovery facilities (MRFs) can separate and process
recovered glass containers, turning it into a glass cullet. Source separating glass by colour before it

127 MGNCRE | Waste Management Technologies
reaches the MRF can also improve the quality and marketability of the cullet. Markets for glass are
more limited in rural areas, where transportation costs can render recycling cost prohibitive
4. Plastic : Plastic containers continue to gain an increasing share of the consumer packaging market.
Most plastic products carry a code indicating what type of plastic resin(s) are used in the product,
thus facilitating separation and recycling of single-resin plastic products. However, some plastic
containers, (such as squeezable bottles and flexible pouches), may be a mix of several plastic resins,
which complicates their recyclability. The plastics industry is working to develop an infrastructure to
make recycling of more complex plastic containers a viable option.
5. Composite Packaging : Composite packaging, a combination of different types of packing
materials, is frequently utilized for beverages and select foodstuffs. This packaging group includes
plastic coated paper milk containers and paper/plastic/foil "aseptic" packs for juice and sauces.
Composite packaging is difficult to recycle, though processing approaches are under development.
C. Food Scraps
Commercial food scraps along with yard trimmings, represent the most easily separated organic
wastes in the municipal solid waste stream. The major sources of commercial food scraps are food
service establishments, grocery and super stores and the warehouse/distribution industry.
Many local governments are increasingly seeking ways to implement separate collection systems for
these commercial, large-scale food scraps, while also evaluating the addition of household food
scraps to curb side organics collection programs. This would allow the capture of these materials for
composting or anaerobic digestion.
D. Vegetative Wastes
Vegetative wastes include, yard wastes, street sweeping waste, lawn service wastes, nursery wastes
and other similar organics. Soiled paper waste may also be added to this category. There are several
ways to recycle or reuse vegetative wastes including mulching; on-site composting by generators
(e.g. residences, nurseries, or horticulture activities); through organized collection systems with
centralized composting or anaerobic digestion operations.
Residential or "backyard" composting can complement large scale composting or anaerobic
digestion.
E. Non-food/beverage container glass
Small quantities of glass, such as broken dishes or window panes, and ceramics are present in the
solid waste stream, but the chemistry of this glass is not compatible with container glass. This type
of mixed glass can be crushed and used in insulation or "glassphalt", (which is road asphalt that
includes a percentage of recycled glass). State and federal regulations play a role in the marketability
of recovered material for these uses.
F. Household Hazardous Wastes (HHW) /Paints/Pesticides/Unregulated Hazardous Wastes
These wastes are a very small portion (typically less than 1 percent) of the municipal solid waste
stream. Removal of these products from the disposed waste stream does not result in measurable

128 MGNCRE | Waste Management Technologies
reductions in weight or volume, but does result in the reduction of some toxic materials from the
residential solid waste stream. HHW is typically considered a universal waste exempt from federal
disposal restrictions though the same products disposed by small businesses are banned from
landfills. Thus, many communities and agencies nation-wide have developed permanent or recurring
HHW and very small quantity generator hazardous waste collection programs. Collected materials
require special handling and if they are hazardous wastes must be disposed of as such. Some
producers (such as agricultural pesticide manufacturers) are developing extended producer
responsibility programs to take back products and empty containers.
G. Construction & Demolition Debris
Construction and demolition debris is sometimes disposed of in separate inert or demolition debris
landfills rather than MSW landfills because of the different nature of the material and the existence
of regulations allowing and/or making alternate disposal facilities cost competitive. Depending on
the building activity and age of the building stock in an area, C&D debris can represent a significant
portion of the municipal solid waste stream. Much of this waste is recoverable, and can be
reclaimed, reused, or recycled. If collected mixed, processing is required to separate the material
components and render them suitable for marketing. Materials can also be source separated on site,
which reduces the need for processing, and facilitates re-use and recycling.
H. Batteries
Consumers tend to consider all household batteries as hazardous waste. However, batteries contain
varying degrees of toxic and corrosive materials that help define the appropriate management
system. Some may be more suited for recycling, some for disposal within an MSW landfill, and some
for handling as a hazardous waste.
A number of communities have started collection programs for batteries. Options include
• Deposit programs that encourage their return to dealers.
• Collection at household hazardous waste collection days.
• Separate collection at the source with recyclables or MSW.
• Producer responsibility requirements to collect and process the batteries.
The advantage of collecting batteries as part of household hazardous waste collections is that it
sends a clear message to the public that these products are not benign and they require special
handling. This may discourage their use except where necessary. Careful consideration of costs and
processing capacity for these materials must be used when implementing a program to ensure its
long term viability.
I. Other Recyclable Materials
There are many types of waste materials that do not fit neatly into categories. These include tyres,
used oil and filters, discarded appliances ("white goods"), discarded electronic waste (“e-waste”) and
similar hard to collect difficult-to-process materials. These materials need specialized collection and
processing systems in order to successfully remove them from the waste stream. Recovered tyres,

129 MGNCRE | Waste Management Technologies
for example, can be burned in some facilities as a fuel to generate electricity, made into new durable
products, processed to manufacture new rubber products, or even formed into reefs to provide
marine habitats.
Here is how paper waste is recycled
Collection, transportation and storage
The biggest task for paper recycling companies is probably the collection, transporting and sorting of
waste paper. This is because we always add paper to other waste items and get them contaminated
with food, plastics and metals. Sometimes collected paper is sent back to the landfills because they
are too contaminated for use. Try to keep waste paper in separate grades at home or in the office —
example, do not mix newspapers and corrugated boxes up.
Recycle paper types
All paper recovered is sent to the recycling center, where it is packed, graded, put into bales and
sent to the paper mill. At the mill, all the paper is stored in a warehouse until it is needed.
Repulping and Screening
From the storage shelves, they are moved into a big paper-grinding machine called a vat (pulper).
Here the paper is chopped into tiny pieces, mixed with water and chemicals and heated up to break
it down into organic plant material called fibre. After, it is screened to remove contaminants such as
bits of plastic and globs of glue.
Deinking
This involves ‘washing’ the pulp with chemicals to remove printing ink and glue residue. Sometimes,
a process called floatation is applied to further remove stubborn stains and stickies. Floatation
involves the use of chemicals and air to create bubbles which absorb the stickies in the pulp.
Refining, Bleaching and Colour Stripping
Refining involves beating the recycled pulp to make them ideal for paper-making. After refining,
additional chemicals are added to remove any dyes from the paper. It is then bleached to whiten
and brighten it up.
Paper making
At this stage, the pulp is ready to be used for paper. Sometimes new pulp (virgin pulp) is added to
give it extra strength and smoothness. Water is added to the pulp and sprayed onto a large metal
screen in continuous mode. The water is drained on the screen and the fibres begin to bond with
each other. As it moves through the paper-making machines, press rollers squeeze out more water,
heat them dry and coat them up. They are then finished into rolls.
Importance and benefits of waste recycling
Recycling helps protect the environment

130 MGNCRE | Waste Management Technologies
This is because the recyclable waste materials would have been burned or ended up in the landfill.
Pollution of the air, land, water and soil is reduced.
Recycling conserves natural resources
Recycling more waste means that we do not depend too much on raw (natural) resources, which are
already massively depleted.
Recycling saves energy
It takes more energy to produce items with raw materials than from recycling used materials. This
means we are more energy efficient and the prices of products can come down.
Recycling creates jobs
People are employed to collect, sort and work in recycling companies. Others also get jobs with
businesses that work with these recycling units. There can be a ripple of jobs in the municipality.
5.4 Organic waste treatment and new technologies
Waste Management offers a variety of organic treatment and remediation solutions for recycling
industrial byproducts. Whether your treatment priorities are driven by economics, transportation
haul distances, technological preferences, or the support of environmental stewardship. Waste
Management can assess each of the available options and recommend the organic solutions most
appropriate to your needs.
Waste Management's organic technologies include
Plastics Recovery - Using a pyrolysis process, it can convert difficult-to-recycle plastics into a high-
value synthetic crude oil. This oil can, in turn, be converted into ultra-low sulfur diesel and other
transportation fuels and petroleum products.
Thermo chemical Technologies - These are working with technology partners to process various
waste streams through the use of gasification, plasma and pyrolysis processes to create additional
waste-to-biofuels options.
Organics Recovery Unit (ORU) - ORU uses indirect heat to drive organic material, water and solids
from soil or other media. This process is suitable for chlorinated solvents, organic dyes and dye
intermediates, pesticides and herbicides, process wastes, refinery wastes, semi-volatile organics, and
Volatile Organic Compounds (VOCs).
Composting is a managed process which utilizes microorganisms naturally present in organic matter
and soil to decompose organic material. These microorganisms require basic nutrients, oxygen, and
water in order for decomposition to occur at an accelerated pace. The end-product, compost, is a
dark brown, humus-like material which can be easily and safely handled, stored, and used as a
valuable soil conditioner. The composting process is dependent upon several factors, including the
population of microorganisms, carbon to nitrogen ratio, oxygen level, temperature, moisture,
surface area, pH, and time.

131 MGNCRE | Waste Management Technologies
Figure 5.4 Organic waste treatment(Source https//www.researchgate.net/figure/Schematic-
overview-of-organic-waste-management)
Aerobic Composting
The composting process involves microorganisms feeding on organic material and consuming
oxygen. The process generates heat, drives off moisture, and reduces bulky organic waste into a
beneficial soil-like material containing nutrients, humus and microorganisms in just a few months.
Material in an unmanaged pile of organic debris will eventually break down but the process will take
a long time and may result in odour or other nuisance problems due to poor aeration.
Composting is an excellent method of recycling grass clippings. However, do not compost grass
clippings or any other plant residues that have been treated with herbicides. If carried out properly,
it can reduce the potential weed seeds and diseases from being reintroduced into the fields. The
finished compost is a stable organic material which is a useful soil conditioner or nutrient source.
Due to the characteristics of fresh grass clippings (high-moisture, high-nitrogen content and small
particle size), co-composting with a high-carbon bulking agent is essential.
Unacceptable materials for composting Chemically treated wood products, plastic (e.g. pots, bags
and sheet film), unprocessed sod and chunks of soil, large bulky items (e.g. stumps, pallets, concrete
and asphalt)
Acceptable Materials for composting Green and woody plant clippings and trimmings, soil, plant
media, untreated wood and uncoated paper scraps
Site Selection for Compost Piles
Proper site selection is a prerequisite to the establishment of safe and effective composting
operations. The location of a composting operation directly impacts the amount of site preparation
required and the measures needed to satisfy environmental and regulatory requirements.
Protection of Water Resources
Sites need to be evaluated for their potential impact on water resources. Of primary concern are
proximity to public water supplies, wetlands, floodplains, surface waters, and depth to groundwater.
Below are guidelines from the “Guide to Agricultural Composting”

132 MGNCRE | Waste Management Technologies
Composting Basics
There are five main areas that must be “controlled” during composting.
Feedstock and Nutrient Balance
Composting, or controlled decomposition, requires a proper balance of “green” organic materials
and “brown” organic materials. “Green” organic material includes grass clippings, food scraps, and
manure, which contain large amounts of nitrogen. “Brown” organic materials include dry leaves,
wood chips, and branches, which contain large amounts of carbon but little nitrogen. Obtaining the
right nutrient mix requires experimentation and patience. It is part of the art and science of
composting.
Particle Size
Grinding, chipping, and shredding materials increases the surface area on which microorganisms can
feed. Smaller particles also produce a more homogeneous compost mixture and improve pile
insulation to help maintain optimum temperatures (see below). If the particles are too small,
however, they might prevent air from flowing freely through the pile.
Moisture Content
Microorganisms living in a compost pile need enough moisture to survive. Water is the key element
that helps transports substances within the compost pile and makes the nutrients in organic material
accessible to the microbes. Organic material contains some moisture in varying amounts, but
moisture also might come in the form of rainfall or intentional watering.
Oxygen Flow
Turning the pile, placing the pile on a series of pipes, or including bulking agents such as wood chips
and shredded newspaper all help aerate the pile. Aerating the pile allows decomposition to occur at
a faster rate than anaerobic conditions. Care must be taken, however, not to provide too much
oxygen, which can dry out the pile and impede the composting process.
Temperature
Microorganisms require a certain temperature range for optimal activity. Certain temperatures
promote rapid composting and destroy pathogens and weed seeds. Microbial activity can raise the
temperature of the pile’s core to at least 140° F. If the temperature does not increase, anaerobic
conditions (i.e., rotting) occur. Controlling the previous four factors can bring about the proper
temperature.
Onsite Composting
Organizations that are going to compost small amounts of wasted food can compost onsite.
Composting can significantly reduce the amount of wasted food that is thrown away. Yard trimmings
and small quantities of food scraps can be composted onsite. Animal products and large quantities
of food scraps are not appropriate for onsite composting.
The climate and seasons changes will not have a big effect on onsite composting. Small adjustments
can be made when changes happen such as when the rainy season approaches.
Food scraps need to be handled properly so they don’t cause odours or attract unwanted insects or
animals.

133 MGNCRE | Waste Management Technologies
Onsite composting takes very little time or equipment. Education is the key. Local communities
might hold composting demonstrations and seminars to encourage homeowners or businesses to
compost on their own properties.
Creating compost can take up to two years, but manual turning can speed up the process to
between three to six months.
Compost, however, should not be used as potting soil for houseplants because of the presence of
weed and grass seeds.
You can leave grass clippings on the lawn-known as “grass cycling.” These cuttings will decompose
naturally and return some nutrients back to the soil, similar to composting.
You can put leaves aside and use them as mulch around trees and scrubs to retain moisture.
Vermicomposting
Red worms in bins feed on food scraps, yard trimmings, and other organic matter to create compost.
The worms break down this material into high quality compost called castings. Worm bins are easy
to construct and are also available for purchase. One pound of mature worms (approximately 800-
1,000 worms) can eat up to half a pound of organic material per day. The bins can be sized to match
the volume of food scraps that will be turned into castings.
It typically takes three to four months to produce usable castings. The castings can be used as
potting soil. The other byproduct of vermicomposting known as “worm tea” is used as a high-quality
liquid fertilizer for houseplants or gardens.
Things to Think About
• Ideal for apartment dwellers or small offices.
• Schools can use vermiculture to teach children conservation and recycling.
• It is important to keep the worms alive and healthy by providing the proper conditions and
sufficient food.
• Prepare bedding, bury garbage, and separate worms from their castings.
• Worms are sensitive to changes in climate.
• Extreme temperatures and direct sunlight are not healthy for the worms.
• The best temperatures for vermicomposting range from 55° F to 77° F.
• In hot, arid areas, the bin should be placed under the shade.
• Vermicomposting indoors can avoid many of these problems.
Aerated (Turned) Windrow Composting
Aerated or turned windrow composting is suited for large volumes such as that generated by entire
communities and collected by local governments, and high volume food-processing businesses (e.g.,

134 MGNCRE | Waste Management Technologies
restaurants, cafeterias, packing plants). It will yield significant amounts of compost, which might
require assistance to market the end-product. Local governments may want to make the compost
available to residents for a low or no cost.
This type of composting involves forming organic waste into rows of long piles called “windrows”
and aerating them periodically by either manually or mechanically turning the piles. The ideal pile
height is between four and eight feet with a width of 14 to 16 feet. This size pile is large enough to
generate enough heat and maintain temperatures. It is small enough to allow oxygen flow to the
windrow's core.
Large volumes of diverse wastes such as yard trimmings, grease, liquids, and animal byproducts
(such as fish and poultry wastes) can be composted through this method.
Things to Think About
• Windrow composting often requires large tracts of land, sturdy equipment, a continual
supply of labour to maintain and operate the facility, and patience to experiment with
various materials mixtures and turning frequencies.
• In a warm, arid climate, windrows are sometimes covered or placed under a shelter to
prevent water from evaporating.
• In rainy seasons, the shapes of the pile can be adjusted so that water runs off the top of the
pile rather than being absorbed into the pile.
• Windrow composting can work in cold climates. Often the outside of the pile might freeze,
but in its core, a windrow can reach 140° F.
• Leachate is liquid released during the composting process. This can contaminate local
ground water and surface-water supplies. It should be collected and treated.
• Windrow composting is a large-scale operation and might be subject to regulatory
enforcement, zoning, and sitting requirements. Compost should be tested in a laboratory for
bacterial and heavy metal content.
• Odours also need to be controlled. The public should be informed of the operation and have
a method to address any complaints about animals or bad odours.
Aerated Static Pile Composting
Aerated static pile composting produces compost relatively quickly (within three to six months). It is
suitable for a relatively homogenous mix of organic waste and work well for larger quantity
generators of yard trimmings and compostable municipal solid waste (e.g., food scraps, paper
products), such as local governments, landscapers, or farms. This method, however, does not work
well for composting animal byproducts or grease from food processing industries.
In aerated static pile composting, organic waste mixed in a large pile. To aerate the pile, layers of
loosely piled bulking agents (e.g., wood chips, shredded newspaper) are added so that air can pass
from the bottom to the top of the pile. The piles also can be placed over a network of pipes that

135 MGNCRE | Waste Management Technologies
deliver air into or draw air out of the pile. Air blowers might be activated by a timer or temperature
sensors.
Things to Think about
• In a warm, arid climate, it may be necessary to cover the pile or place it under a shelter to
prevent water from evaporating.
• In the cold, the core of the pile will retain its warm temperature. Aeration might be more
difficult because passive air flowing is used rather than active turning. Placing the aerated
static piles indoors with proper ventilation is also sometimes an option.
• Since there is no physical turning, this method requires careful monitoring to ensure that the
outside of the pile heats up as much as the core.
• Applying a thick layer of finished compost over the pile may help alleviate any odours. If the
air blower draws air out of the pile, filtering the air through a bio filter made from finished
compost will also reduce any of the odours.
• This method may require significant cost and technical assistance to purchase, install, and
maintain equipment such as blowers, pipes, sensors, and fans.
• Having a controlled supply of air allows construction of large piles, which require less land
than the windrow method.
In-Vessel Composting
In-vessel composting can process large amounts of waste without taking up as much space as the
windrow method and it can accommodate virtually any type of organic waste (e.g., meat, animal
manure, biosolids, food scraps). This method involves feeding organic materials into a drum, silo,
concrete-lined trench, or similar equipment. This allows good control of the environmental
conditions such as temperature, moisture, and airflow. The material is mechanically turned or mixed
to make sure the material is aerated. The size of the vessel can vary in size and capacity.
This method produces compost in just a few weeks. It takes a few more weeks or months until it is
ready to use because the microbial activity needs to balance and the pile needs to cool.
Things to Think About
• Some are small enough to fit in a school or restaurant kitchen.
• Some are very large, similar to the size of school bus. Large food processing plants often use
these.
• Careful control, often electronically, of the climate allows year-round use of this method.
• Use in extremely cold weather is possible with insulation or indoor use.
• Very little odour or leachate is produced.
• This method is expensive and may require technical expertise to operate it properly.
136 MGNCRE | Waste Management Technologies
• Uses much less land and manual labour than windrow composting.
Sites must not be located within 400 feet (Zone I) of a public drinking water supply well or within 250
feet of a private well. For sites located within a Zone II or interim wellhead protection area (½ mile
radius), MassDEP may require that extra precautions be taken in the design or operations depending
on the quantities and types of material to be composted. Sites within Zone II may not be allowed
under certain circumstances.
Under the wetlands regulations, sitting of composting and storage areas is considered to be “normal
improvement of land in agricultural use” when it occurs on land in agricultural use when it is directly
related to the production or raising of certain agricultural commodities, and when it is undertaken in
such a manner as to prevent erosion and siltation of adjacent water bodies and wetlands.
Sites should be located at such a distance to ensure that there will not be any potential adverse
impacts from compost site runoff into surface waters.
Soils should be permeable enough to minimize runoff, yet capable of filtering drainage water.
Excessively drained soils (e.g., sand) should be avoided if possible, as they may lack the physical
properties necessary for effective filtering of potential contaminants. Highly impermeable soils (e.g.,
clay) should also be avoided if possible, as this may lead to poor site drainage and excessive runoff
or erosion.
Sites should be avoided where groundwater rises closer than 4 feet or where bedrock is closer than
5 feet from the surface. Such conditions may lead to an operating surface that is too wet, and it
increases the potential for nutrients to leach into groundwater.
Buffer to Sensitive Land Uses
Buffers, in the way of distance and/or visual screens, can go a long way toward reducing the real or
perceived aggravations of noise, odour, litter, and aesthetic objections often associated with
composting operations. Compost piles should always be distant and downwind from sensitive
neighbours and not sited close to residential property. A distance of at least 250 feet from the
nearest residence to the composting area is recommended, and the composting site should be at
least 50 feet from the property line. More importantly, the buffer must be adequate to satisfy
reasonable neighbour concerns. Keep the activities as far away from the property line as possible.
Available sites should be analyzed for conditions potentially detrimental to production and access.
There needs to be enough space to store and process waste, operate and turn active windrows or
piles, and store and cure finished compost. A facility that is short on space will eventually experience
problems. Composting can have off-site impacts.
Composting can also create water quality problems. Piles should be protected from surface water
and storm water runoff. Piles may need to be protected from rain. This is because a compost pile
can get saturated, stop working and, become anaerobic. This will create odour problems. Saturated
piles will need to be remixed and rebuilt. Runoff from an active compost pile or stored compost can
also create water pollution problems. Standing water can cause odour problems. Compost piles
should always be sited so that runoff is minimized. Any runoff should be collected and used rather
than allowed to leave the property.

137 MGNCRE | Waste Management Technologies
State and Local regulations regarding composting facilities should be thoroughly investigated.
The Basic Composting Process
The general steps in the biological process which creates compost are the same regardless of the
raw materials being composted or the size and complexity of the production facility. A compost must
pass through all of the steps outlined here in order for it to be considered of high enough quality for
use in organic potting mixes.
The progress of organic matter decomposition during composting can be followed by monitoring the
temperature of the compost pile. During the initial phase of composting the temperature of the pile
increases rapidly as the population and activity of decay microorganisms increases in response to the
readily decomposable carbon in the raw materials. The goals are to reach a temperature between
131°F or more and to maintain this temperature range until the microorganisms begin to exhaust
the readily available carbon. During composting the pile is turned and remixed several times to
ensure complete heating and decomposition.
To comply with the National Organic Program standards compost piles must maintain 131-170ºF for
at least 3 days (static pile) or at least 15 days (windrow, turned at least 5 times). High temperatures
are necessary to kill any human pathogens especially if farm manure is a component. Also, weed
seeds and plant diseases are most successfully killed at high temperatures. Most weed seeds are
destroyed at 145°F.
Following the high temperature phase there is an extended period of gradual temperature decline
until the pile reaches ambient air temperature. Now, if the pile is turned, reheating will not occur. At
this point the compost is said to be "near maturity", but to ensure that the compost is stable and
ready to use, most producers allow some extra time for the compost to "cure". How long
composting lasts varies with the method. It could take about 1-2 years in a static unturned pile, 6-9
months if the pile is turned occasionally, or only 1-4 months the pile is turned frequently. Many
types of raw materials can be used for making compost.
Benefits of organic treatment services include
Low remediation expenses- These are environmentally friendly solutions, cost effective, energy
efficient, and the residuals produced are compliant with federal and state treatment standards.
Reduced liability- These organic treatment services are in full compliance with all local, state and
federation regulations, thus minimizing your legal exposure.
Support of environmental stewardship. Organic treatment can help your company better pursue its
environmental stewardship goals.
Beneficial Reuse. Organic treatment allows many liquid wastes to be recycled as fuel.
5.5 Incentives, financial and technical assistance for power generation from waste in India
Government Support for Sewage to Energy Projects
Projects based on high rate biomethanation technology

138 MGNCRE | Waste Management Technologies
Financial assistance of Rs. 2.0 crore / MW will be provided for projects based on power generation
from MSW through high rate biomethanation technology.
Power generation at sewage treatment plants
Financial assistance @ 40% of the project cost subject to a maximum of Rs 2.0 crore/MW shall be
provided for projects for generation of power from biogas being produced at Sewage Treatment
Plants. Project cost will include the cost of engine-genset, H2S removal plant and other related
equipment.
Carbon Credit Benefits of Sewage to Energy
Projects based on generation of electric power from biogas, which is being produced as a result of
digestion of sludge in STPs, are eligible for CDM (Clean Development Mechanism), as it will help in
reducing and stabilizing the emissions due to methane which is a green house gas. Based on the
potential of biogas/power generation from STPs, expenditure on O&M can be offset by earning
‘carbon credits’ on recurring basis. Some sewage treatment plants in India are on the verge of
getting the carbon credits for its efforts for reducing the carbon-dioxide emission in their sewage
treatment plants.
For demonstration projects comprising innovative projects for generation of power from municipal
solid wastes and selected industrial wastes, financial assistance up to 50% of capital cost of the
project limited to Rs. 3.00 crore per MW is provided to the project proponent.
For power generation through Sewage Treatment Plants (STPs), financial assistance up to 50% of the
incremental capital cost for generation of power from biogas being generated at STPs is provided.
In addition to the above, financial incentive at the rate of Rs. 15.00 lakh per MW is given to
Municipal Corporations/ Urban Local Bodies, for supplying the garbage free of cost at the project site
and providing land on a long-term lease, viz. 30 years and above, at a nominal rent.
State Nodal Agencies are given an incentive @ Rs.5.00 lakh per MW of power for promotion, co-
ordination and monitoring of projects.
For financial institutions, a service charge of 2% of the actual subsidy channelled through them to
the promoter or other FIs is allowed, subject to a maximum of Rs.2.00 lakh per project.
There is also a provision for giving 50% of the cost of preparation of Detailed Project Reports (DPR)
or Techno-economic Feasibility Reports, subject to a maximum of Rs.2.00 lakh per report to the
project proponent.
If considered necessary by MNES, financial assistance may also be provided towards full cost of
carrying out studies for assessment of resources for setting up waste-to-energy projects.
For promotional activities, assistance is available for organizing of training courses, workshops and
seminars, awareness generation and publicity.
With growing public awareness about sanitation, and with increasing pressure on the government
and urban local bodies to manage waste more efficiently, the Indian waste to energy sector is poised
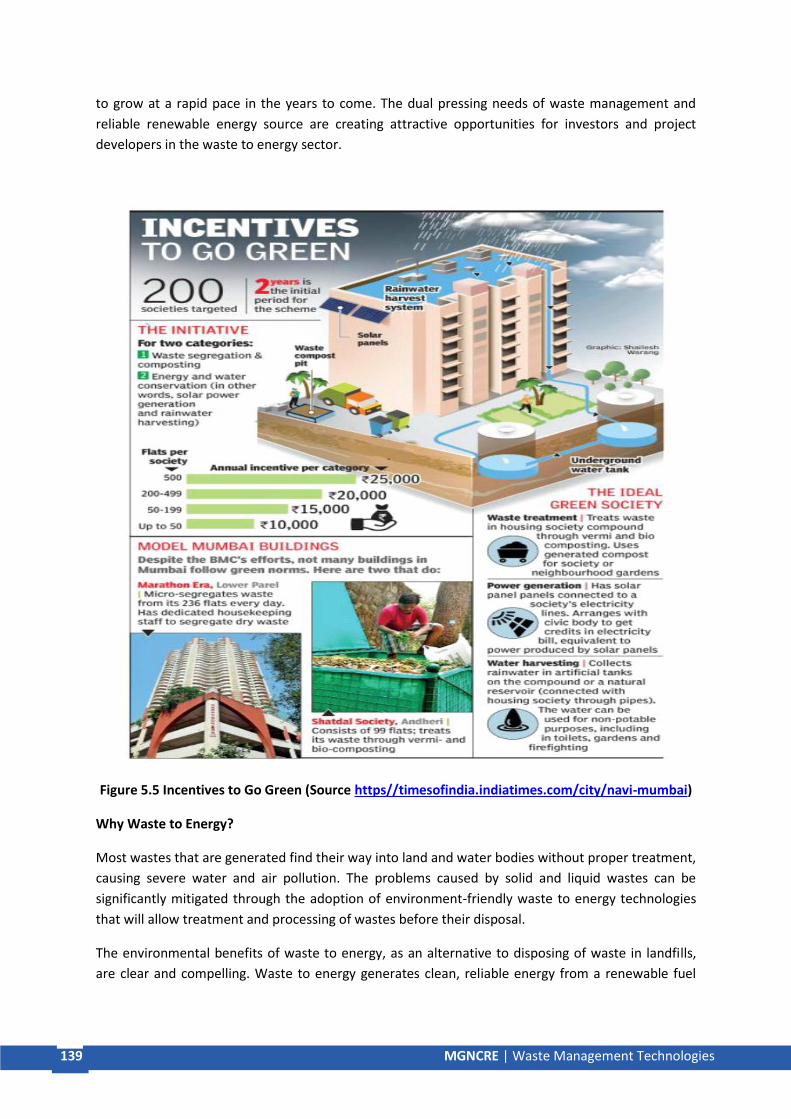
139 MGNCRE | Waste Management Technologies
to grow at a rapid pace in the years to come. The dual pressing needs of waste management and
reliable renewable energy source are creating attractive opportunities for investors and project
developers in the waste to energy sector.
Figure 5.5 Incentives to Go Green (Source https//timesofindia.indiatimes.com/city/navi-mumbai)
Why Waste to Energy?
Most wastes that are generated find their way into land and water bodies without proper treatment,
causing severe water and air pollution. The problems caused by solid and liquid wastes can be
significantly mitigated through the adoption of environment-friendly waste to energy technologies
that will allow treatment and processing of wastes before their disposal.
The environmental benefits of waste to energy, as an alternative to disposing of waste in landfills,
are clear and compelling. Waste to energy generates clean, reliable energy from a renewable fuel

140 MGNCRE | Waste Management Technologies
source, thus reducing dependence on fossil fuels, the combustion of which is a major contributor to
GHG emissions.
These measures would reduce the quantity of wastes, generate a substantial quantity of energy
from them, and greatly reduce pollution of water and air, thereby offering a number of social and
economic benefits that cannot easily be quantified.
In addition to energy generation, waste-to-energy can fetch significant monetary benefits. Some of
the strategic and financial benefits from waste-to-energy business are
Profitability - If the right technology is employed with optimal processes and all components of
waste are used to derive value, waste to energy could be a profitable business. When government
incentives are factored in, the attractiveness of the business increases further.
Government Incentives - The government of India already provides significant incentives for waste
to energy projects, in the form of capital subsidies and feed in tariffs. With concerns on climate
change, waste management and sanitation on the increase (a result of this increasing concern is the
newly formed ministry exclusively for Drinking Water and Sanitation), the government incentives for
this sector is only set to increase in future.
Related Opportunities - Success in municipal solid waste management could lead to opportunities in
other waste such as sewage waste, industrial waste and hazardous waste. Depending on the
technology/route used for energy recovery, eco-friendly and “green” co-products such as charcoal,
compost, nutrient rich digestate (a fertilizer) or bio-oil can be obtained. These co-product
opportunities will enable the enterprise to expand into these related products, demand for which
are increasing all the time.
Emerging Opportunities - With distributed waste management and waste to energy becoming
important priorities, opportunities exist for companies to provide support services like turnkey
solutions. In addition, waste to energy opportunities exist not just in India but all over the world.
Thus, there could be significant international expansion possibilities for Indian companies, especially
expansion into other Asian countries.
The Committee were informed by the Ministry that, at the Central level, various Ministries, i.e.
Ministry of Urban Development, Ministry of Environment, Forest and Climate Change and Ministry
of New and Renewable Energy, etc. are involved in handling Municipal Solid Waste, viz. its collection,
transportation, treatment and safe disposal. On being asked by the Committee about the role of the
respective Ministries/Agencies in Solid Waste Management and Generation of Power from Solid
Waste, the Ministry furnished the following information
"Handling of the Subject at Central Level as per Government of India (Allocation of Business) Rules,
1961 At Central level, following three Ministries are involved in handling the subject of Municipal
Solid Waste in respect of its collection, transportation, treatment and safe disposal -
a) Ministry of Urban Development (MoUD)

141 MGNCRE | Waste Management Technologies
MoUD is the nodal Ministry for formulation of policies, strategies and guidelines and assists the
States by providing financial assistance for development of water supply and sanitation including
municipal solid waste management infrastructure in the cities and towns.
b) Ministry of Environment, Forest and Climate Change (MoEF& CC)
MoEF& CC is involved in framing the rules for management and handling of Municipal Solid Waste
under the –
i) Environment (Protection) Act;
ii) Water(Prevention and Control of Pollution) Act;
iii) Air (Prevention and Control of Pollution) Act; and
iv) Central Pollution Control Board
c) Ministry of New and Renewable Energy (MNRE)
MSW being renewable in nature, MNRE Supports MSW based power generation projects."
The Committee have observed that there is a need for coordinated efforts to be made to solve this
problem of garbage and to make Waste to Energy Projects successful and viable. A Monitoring
Committee, consisting of representatives from all the Central Ministries concerned like the Ministry
of New and Renewable Energy, Ministry Of Urban Development, Ministry of Environment, Forest
and Climate Change, etc., along with the representatives of the State Governments and Urban Local
Bodies, should be established to coordinate the efforts at each level and suggest suitable methods
and technologies to be adopted, on case to case basis, to make Waste to Energy Plants a success.
This Monitoring Committee may also have technical experts, financial analysts, representatives from
private sector, etc.
The Committee were apprised about the following Waste to Wealth Interventions by the
Government
"Waste to Energy Central Electricity Regulatory Commission (CERC) on 07.10.2015 has notified
Generic tariff for Waste-to-Energy of Rs 7.90 per unit of power for RDF (Refuse Derived Fuel). States
have initiated process for determining the tariff. Ministry of Power has revised the Tariff Policy 2006
vide resolution dated 28.01.2016, under the Indian Electricity Act, 2003, making it mandatory for
State DISCOMS to purchase power from Waste-to-Energy plants.
Waste to Compose
M/o Chemicals & Fertilizers has notified on 10.02.2016, the policy on promotion of City Compost,
thereby providing Market Development Assistance of Rs. 1,500 per Metric Tonne to scale up
production and consumption of compost.
M/o Chemicals & Fertilizers has tagged compost manufacturing plants with fertilizer distribution
companies in all States (purchase price of Rs. 2,500 per MT established)"

142 MGNCRE | Waste Management Technologies
The Committee have observed that the Central Electricity Regulatory Commission (CERC) has
notified Generic tariff for Waste-to-Energy of Rs 7.90 per unit of power for RDF (Refuse Derived
Fuel). The Committee noted that fixing of tariff by the CERC is not the right solution and the tariff
should be decided through competitive bidding as this act of tariff determination by the CERC may
encourage inefficiency and non-transparency. Therefore, in view of the Committee, open
competitive bids should be invited as is the case in Andhra Pradesh and Punjab.
The Committee also noted that it has been made mandatory for State DISCOMS to purchase power
from Waste-to-Energy plants at this tariff of Rs 7.90 and this increased cost of electricity would
ultimately be borne by the common consumers. The Committee is of the view that waste disposal is
the responsibility of the State Governments and the ULBs; so the cost should be borne by them and
not the common consumer. To make Waste to Energy Plants viable, the principle of "Polluters Pay,
along with common but differentiated responsibility" should be adopted, i.e. the increased cost
should not be borne by all customers equally instead of the one who produce more solid waste (such
as Restaurants, Hotels, Marriage Halls, other commercial establishments, etc.) should be made to
pay more through a tax/cess/fine.
It has also been noted by the Committee that common people are made to pay twice for the
disposal of same garbage, as in, people pay to the local bodies for collection of garbage from their
home and again a high rate of electricity has been imposed on them to compensate the producer of
electricity from waste. This is a kind of double taxation for the same service. This practice of ensuring
15% to 20% profit to the producer of electricity from waste and taxing common people twice for the
same should be avoided.
When asked by the Committee about the efforts of the Government in the field of Waste to Energy,
the Ministry furnished the following information
"Manual on Municipal Solid Waste Management Ministry of Urban Development (MOUD) and
Central Public Health & Environmental Engineering Organization (CPHEEO) in collaboration with GIZ
have prepared a revised manual for Municipal Solid Waste Management (MSWM). The Ministry of
Urban Development (MoUD), Government of India had developed a Guidance Manual for MSW for
all Urban Local Bodies which is based on learnings from 14 years’ experience gained in India, post
the notification of MSW management and Handling Rules in 2000. This revised manual on MSWM is
designed to support decision makers at State and Urban Local Body levels, technical staff experts
and academia involved in the proper management and implementation of all MSWM related
activities. The manual reflects upon recent technological, managerial, financial and policy level
developments.
To Do Activity
Where in the World Do I Recycle It?
Introduction
Overview

143 MGNCRE | Waste Management Technologies
In this activity, students will use multiple sources of information to research reuse and recycling
options for a variety of household goods.
Objectives
Students will
1. learn about resources they can use to research reuse and recycling options for common
household materials.
2. use reference materials to identify three items that are recyclable in their community and locate
where they can be recycled.
Teacher Background
StopWaste.Org’s Recycling Guide is a resource guide filled with references to locations that accept
materials for reuse and recycling. The “Recycling A–Z” directory lists reuse and recycling businesses
and facilities that accept different categories of materials, from aerosol cans to wood and yard
trimmings. The guide also provides a table of recycling information for residents that lists recycling
service providers and what they collect by city.
Materials
Students
❑From home three items that can be recycled
❑“Where in the World Do I Recycle It?” worksheet(one per student)
❑“Website Directions” handout(one per student)
❑StopWaste.Org Recycling Guide the “Reuse and Recycling Services Directory “pages (one per
student)
Teacher
❑Various discarded items to supplement student supplies
❑Rubric overhead
❑Rubrics (one per student)
Preparation
Collect a wide variety of discarded items, and bring to class for students to research, e.g., eyeglasses,
batteries, motor oil, etc.
Discussion
1. Ask the students whether anyone in their family has ever thrown something away because they
sure whether it could be recycled. Have them share some examples. Look around the classroom, and
point out objects such as aluminium cans, batteries, books, eyeglasses, paint, lightbulbs and paper

144 MGNCRE | Waste Management Technologies
notebooks. Tell them that these items often get discarded after use because people do not know
how or where to reuse or recycle them.
2. Remind students that all these items were made from natural resources. Recycling keeps these
valuable resources out of the landfill. When the items get recycled, they are remanufactured into
new products. Recycling is the process of turning something old into something new.
3. Explain that many cities have different practices for accepting materials for recycling. Ask students
to describe what their recycling bins look like and share examples of what they put in their bins.
Point out the similarities and differences in what students can recycle at home depending on where
they live.
4. Tell the class that not all cities recycle things the same way. Students must first identify their
community or city where they live before discovering whether a certain material can be recycled.
The goal of this activity is to become knowledgeable in using reference materials to find out what is
recyclable in their community.
5. Show an overhead of the lesson rubric, and review the expectations for this lesson.
Procedure
Homework (day before activity)
1. Assign students to bring in three items from home that may or may not be collected for recycling
in their community.
Day of Activity
1. Inform the students that they will determine whether the items brought in from home can be
recycled in their community by conducting research on a website or using a Recycling Guide.
2. Each student should have at least three items to research (pass out items as needed).
3. Tell the students they will be using the Stop Waste. Org Recycling Guide or online version to
conduct their research. Explain that this is a comprehensive guide to reuse and recycling resources.
4. Model how to use the printed guide by looking up an item such as aluminium cans to determine
whether it can be recycled in the city where their school is located.
5. Pass out the StopWaste.Org Recycling Guide to each student or if using a computer, ask students
to go towww.StopWaste.Org, and pass out the directions for using the website.
6. Pass out “Where in the World Do I Recycle It? ” worksheet to each student.
7. Using various resources, have students answer the questions on the worksheet.
8. When they are finished, call on students to report something new they learned through their
research.

145 MGNCRE | Waste Management Technologies
Wrap-Up
1. Discuss and emphasize the wide variety of materials that can be recycled based on the students’
findings.
2. Ask students to share their findings and explain the importance of recycling materials with friends
and family.
Final Assessment Idea
Have students create a poster for the classroom or their home that shows family members what
they can recycle in the city where they live.
Summary
• On site processing is one of the most effective and sustainable ways to achieve resource
recovery.
• Conversion technologies can recover materials otherwise destined for disposal.
• Recycling is processing used materials (waste) into new, useful products.
• Waste Management offers a variety of organic treatment and remediation solutions for
recycling industrial by products.
• For power generation through Sewage Treatment Plants (STPs), financial assistance up to
50% of the incremental capital cost for generation of power from biogas being generated at
STPs is provided.
Model Questions
Q1. What are conversion technologies?
Q2. How paper waste is recycled?
Q3. What are the latest government schemes for power generation from waste in India?
References
1] Central Pollution Control Board (2011-12). Annual Report.
2] Central Pollution Control Board (2011) Implementation of E-Waste Rules, 2011. New Delhi.
3] Environmental Management Centre, LLP (2012). Promoting Recycling in Municipal Solid Waste
Management through Sustainable Business Models, Project Preparation Support for Liveable Cities
in Asia.
4] Ministry of Urban Development (2000). Manual on Municipal Solid Waste Management. Central
Public Health & Environment Engineering Organization Government of India. New Delhi.


147 MGNCRE | E-Waste Management
147 MGNCRE | Water Security RM
Contents Chapter 1 Water Issues
1.1 Overview of Water Security 1.2 Inequitable Global Distribution of water 1.3 Water quality and Consequences of Water Pollution 1.4 Causes and Types of Water Pollution 1.5 Biohazard, Radiation Hazard and Security Threat
Chapter 2 Waste Water Management
2.1 Individual responsibility towards waste water production 2.2 Community responsibility towards waste water disposal 2.3 Municipal responsibility for treating waste water 2.4 Conventional Waste water treatment and Issues facing present day STPs 2.5 Water Reclamation
Chapter 3 Alternative Technologies for Waste Water Treatment
3.1 Alternative technologies for waste water treatment 3.2 Summary of waste water treatment technologies 3.3 Biological Nutrient Removal Systems 3.4 Sludge Management 3.5 Disinfection
Chapter 4 Clean Water Solutions
4.1 Introduction and Ancient Water Technology 4.2 Rainwater Harvesting 4.3 Solution for Flood Management 4.4 Watershed Management 4.5 River Restoration
Chapter 5 Testing of Water, Waste Water, Soil and Solid Waste
5.1 Importance of Water Monitoring 5.2 Water sampling techniques 5.3 Water analysis parameters 5.4 Microbiological Analysis 5.5 Soil Testing 5.6 Toxicity Characteristic Leaching Procedure (TCLP)

148 MGNCRE | E-Waste Management
148 MGNCRE | Water Security RM
Chapter 1 - Water Issues Introduction
Water is essential for domestic purposes, agricultural, industrial, energy production, ecological
sustainability and these uses are highly inter-linked in competition to each other use. Water
consumption pattern in India is around 90% in agriculture, 6% in domestic and 4% for industrial
use. Usage of water by industrial and domestic purposes generates wastewater that may cause
pollution, however agriculture usage largely remains consumptive. Irrigation being a consumptive
user does not generate significant volume of runoff in Indian context and thus runoff water broadly
feed to the aquifer system. The non-consumptive user like household municipal and industrial
sector consume a small part of water and waste water generated in the process return to aquatic
system and pollute it. There is need to understand the consumers, pollution of return water and to
make a synergy between them in a business model based on techno economic feasibility to restore
water quality for optimum uses.
The fresh water resources comprising of rivers, lakes and aquifer system are sustaining through
inflow from water sheds.Water shed retain the rain water through trees, bushes and grass land
which infiltrate to subsurface and surface runoff proliferate by gravity action. Degradation of water
shed in terms of tree cutting, cattle grazing, damming and overexploitation leading to less infiltration
of rain water. Abstraction of surface and ground water in excess to the infiltration is reducing
outflow from the water shed that ultimately reduce perennial flow in the rivers and streams in
plains.
Efforts are required to make the users aware about water conservation, prevention and control of
pollution to sustain it for optimum management of aquatic resources.
Objectives
• To understand the availability of fresh water, consumptive and non-consumptive uses
• Partially non consumptive uses virtually deteriorate the quality of water in the form of
domestic sewage and industrial effluents.
• To orient the non-consumptive uses by better planning mechanism to reduce wastewater
generations
• To design the process for wastewater treatment to meet the present and perspective
requirement for sustainability of water resources
1.1 Overview of Water Security
Water security is defined as, "the reliable availability of an acceptable quantity and quality of water
for health, livelihoods and production, coupled with an acceptable level of water-related risks". It is
concerned with the responsibility for water and integrating water resources management across all
sectors viz. planning, health, agriculture, energy, industry, tourism, education and finance. Release
of sewage and industrial effluents into rivers, streams and ponds lead to water pollution and the
water becomes unusable for its required use. Contamination of a drinking water system can cause
epidemic leading to illness, disease, or even death.
A water resource can be contaminated, damaged or disrupted through intentional actions or by an

149 MGNCRE | E-Waste Management
149 MGNCRE | Water Security RM
accident. Intentional contamination poses one of the most serious threats to a water system
because of the intent to harm human health, aquatic ecology and its unlimited number of user for
beneficial purposes. When a contamination incident happens, it is critical to act quickly and
effectively to protect public health and the environment. Water security planning is critical because
of the increased threat of accidental spillages and intentional discharges from effluent storages in
specific groups of industries not been able to manage the treatment of wastewater due to economic
reasons. There are many ways in which water systems can be threatened by contamination or be
intentionally contaminated. Responding to contamination threats and contamination incidents
requires careful planning and preparation.
Should We Be Concerned About Contamination Threats and Contamination Incidents?
Contamination of water resources could impact the loss of public confidence; disrupt the water
supply system, shortage of clean water to consumers; disrupt businesses and services that depend
on organised water supply. This may create a need to remediate and replace portions of the water
system to make it safe, which could in turn create water shortages or outages; result in significant
costs for remediation or replacement; and impact other critical infrastructures that rely on safe
water, due to interdependencies.
How Serious Could Intentional Water Contamination Be?
There are many ways in which water can be intentionally contaminated, just as there are many
different contaminants. Each contaminant has different effects on humans, animals and the
environment, depending on its concentration (level) and toxicity (harmfulness).Examples of Possible
Contaminants are Pathogenic microorganisms that can impact human health, such as salmonella, E.
coli and Cryptosporidium whereas chemicals, toxic metals and organic compounds such as arsenic,
cadmium, mercury, dioxin & furans, pesticides, chloramines, VOCs and radioactive isotopes can
cause short term as well as long term illnesses. Some of the toxic chemicals persist in water for a
long time before they break down into less harmful chemicals and biochemical. Depletion of oxygen
in river or lake water due to shock loading of Industrial effluent and municipal wastewater
discharges inadvertently lead to fish kill and disrupt intake of water supply systems.
The intentional water contamination is prevailing in the rivers and lakes in the vicinity of all the
urban areas disposing treated partially treated and untreated municipal wastewater. Industries are
also disposing effluents which are leading to pollution of aquatic resources.
1.2 Inequitable Global Distribution of Water
Water is vital to the existences of all living organisms, but this valued resource is increasingly being
threatened as human populations grow and demand more water of high quality for domestic
purposes and economic activities. The distribution of water on the Earth’s surface is extremely
uneven. Only 3% of water on the surface is fresh; the remaining 97% resides in the ocean. Of
freshwater, 69% resides in glaciers, 30% underground (aquifers), and less than 1% is available in
lakes, rivers, and swamps. Looked at another way, only one percent of the water on the Earth’s
surface is usable by humans and other terrestrial life forms, and 99% of the usable quantity is in the
subsurface aquifers. The Distribution of the Earth's Water is depicted in Figure 1.1
Precipitation is the renewable source of freshwater in the surface water courses and subsurface

150 MGNCRE | E-Waste Management
150 MGNCRE | Water Security RM
aquifers. The rainfall map (Map 1.1) pinpoints uneven global distribution of precipitation across the
continents. The white areas on the map had annual rainfall under 400 mm for a year based on a
finding of the study during 2011-12 makes them semi-arid or arid regions whereas more severe
rainfall events to characterize in wet regions.
Figure 1.1: Distribution of the Earth’s Water (Credit: Timothy Bralower)
Availability of Water for Beneficial Uses
The world’s population is growing by about 80 million people a year, implying increased freshwater
demand of about 64 billion cubic meters a year. The expected areas of population growth and
decline in a time frame of 2000-2080 (Map 1.2) have been highlighted in the United Nations World
Water Development Report 3. An estimated 90% of the 3 billion people who are expected to be
added to the population by 2050 will be in developing countries, many in regions where the current
population does not have sustainable access to safe drinking water and adequate sanitation. The
significant world population growth will be in sub-Saharan Africa (32%) and South Asia (30%).
Together, these regions are expected to account for half of world population in 2100. Freshwater
need is expected to increase due to growing population with longer life expectances and
globalization of trade. According to the International Energy Agency, the world will need almost 60%
more energy in 2030 than the prevailing demand. Water is needed for the production of energy of
all types, so expansion of energy supply will affect water resources. Virtual water is goods and
services with substantial water content either in the finished product or in its production. The global
volume of virtual water flows in commodities substantially. Adequate investments in water
management, infrastructure and services can yield a high economic return by avoiding costs related
to water pollution, contamination and disasters. Gains from globalization have not been evenly
distributed.

151 MGNCRE | E-Waste Management
151 MGNCRE | Water Security RM
Map 1.1: Uneven Global Distribution of Precipitation across the Continents
Competition for water use exists at all levels and is forecast to increase with competing demands for
water in almost all countries due to increasing population and economic activities. It is estimated
that in 2030, 47% of world population will be living in areas of high water stress. More than 1 billion
people living in arid and semi-arid parts of the world have access to little or no renewable water
resources. There is a consensus among climate scientists that global warming will intensify,
accelerate or enhance the global hydrologic cycle leading to further uneven distribution either by
draughts or intense events of rainfall.
Indian Scenario
India receives 4000 Km3 of water through rainfall on a geographical area of about 329 Million
Hectare; of this three fourth part occurs only during monsoon. The surface flow is estimated as 1880
Km3. The annual replenlishable ground water resources are about 600 Km3 of which the annual
usable resources are 420 Km3. Inland water resources include both fresh and brackish water bodies.
Inland water resources of the country are classified as rivers and canals; reservoirs; tanks and ponds;
beels, oxbow lakes, derelict water; and brackish water. In India, rivers and canals run throughout the
country with total length extending to 1.9 lakh kilometers and the total water bodies other than
rivers and canal cover an area of around 7.31 Million Hectare (M. ha).State wise details of inland
water resources are given in Table 1.1. The river basins of Brahmaputra, Ganga, Indus and Godavari
putting

152 MGNCRE | E-Waste Management
152 MGNCRE | Water Security RM
Map 1.2: Expected areas of population growth and decline, 2000-2080
together cover more than half of the area of the country. The whole of the west coast stretching
1500 km between Surat in Gujarat and Cape Comorin in Tamilnadu are fed by fourteen medium and
eighteen minor river basins. On the east coast of Peninsular India there are three pockets, which are
out of any major river basins. These three pockets are; the area south of River Cauvery starting from
Madurai to Cape Comorin; the area between Pennar and Cauvery basin wherein Chennai and
Pondicherry are located; and the area between Mahanadi and Godavari basins in Orissa coast.
There is a tremendous variation both in the quantity of discharge from a major basin to minor one
and also in the quality of discharge from region to region. While freshwater is naturally occurring
water with low concentration of salt, brackish water has a salt concentration varying between that
of freshwater and marine water.
All the major river basins are not perennial. Only four of the thirteen major basin posses areas of
high rainfall, i.e. Brahmaputra, Ganga, Mahanadi and Brahmini having annual average discharge of a
minimum of 0.47 million cubic meter per Km2, and they are perennial. Six basins (Krishna, Indus,
Godavari, Narmada, Tapi and Subernrekha) occupy the area of medium rainfall and have annual
average discharge of a minimum of 0.26 million cubic meter per Km2, and the remaining four
(Cauvery, Mahi, Sabarmati and Pennar) occupy the area of low rainfall and have annual average
discharge between of 0.06 and 0.24 million cubic meter per Km2. Thus, many of the major river
basins also go dry during summer leaving no available water for dilution of waste water discharged
in them.

153 MGNCRE | E-Waste Management
153 MGNCRE | Water Security RM
Table 1.1: State wise inland water resources of India
S.
No.
States/Union
Territories
Rivers &
Canals (kms.)
Reservo
irs (Lakh
Ha)
Tanks &
Ponds
(Lakh Ha)
Flood Plain
Derelict
Water
Bodies
(Lakh Ha)
Brackish
Water
(Lakh Ha)
Total
Water
Bodies
(Lakh
Ha)
1
Andhra Pradesh
(including
Telengana) 11514 2.34 5.17 - 0.6 8.11
2 Arunachal Pradesh 2000 - 2.76 0.42 - 3.18
3 Assam 4820 0.02 0.23 1.1 - 1.35
4 Bihar 3200 0.6 0.95 0.05 - 1.6
5 Chhattisgarh 3573 0.84 0.63 - - 1.47
6 Goa 250 0.03 0.03 - . 0.06
7 Gujarat 3865 2.43 0.71 0.12 1 4.26
8 Haryana 5000 0.1 0.1 - 0.2
9 Himachal Pradesh 3000 0.42 0.01 - - 0.43
10 Jammu & Kashmir 27781 0.07 0.17 0.06 - 0.3
11 Jharkhand 4200 0.94 0.29 - - 1.23
12 Karnataka 9000 4.4 2.9 - 0.1 7.4
13 Kerala 3092 0.3 0.3 2.43 2.4 5.43
14 Madhya Pradesh 17088 2.27 0.6 - - 2.87
15 Maharashtra 16000 2.99 0.72 - 0.12 3.83
16 Manipur 3360 0.01 0.05 0.04 - 0.1
17 Meghalaya 5600 0.08 0.02 . - 0.1
18 Mizoram 1395 - 0.02 - - 0.02
19 Nagaland 1600 0.17 0.5 . - 0.67
20 Odisha 4500 2.56 1.23 1.8 4.3 9.89
21 Punjab 15270 0.07 - - 0.07
22 Rajasthan 5290 1.2 1.8 - - 3
23 Sikkim 900 - - 0.03 - 0.03
24 Tamil Nadu 7420 5.7 0.56 0.07 0.6 6.93
25 Tripura 1200 0.05 0.13 - - 0.18
26 Uttar Pradesh 28500 1.38 1.61 1.33 - 4.32
27 Uttarakhand 2686 0.2 0.006 0.003 - 0.209
28 West Bengal 2526 0.17 2.76 0.42 2.1 5.45
29
Andaman & Nicobar
Islands - 0.00367 0.0016 - 0.33 0.33527
30 Chandigarh 2 - - - - 0
32
Daman & Diu Dadra
Nagar Haveli 54 0.05 - - - 0.05
32
Daman & Diu Dadra
Nagar Haveli 12 - - - - 0

154 MGNCRE | E-Waste Management
154 MGNCRE | Water Security RM
33 Delhi 150 0.04 - - - 0.04
34 Lakshadweep - - - - - 0
35 Puducherry 247 - . 0.01 0.01
Total 195095 29.26 24.33 7.98 11.55 73.12
Rainfall pattern study by India Meteorology Department revealed that on an average Meghalaya has
received the highest rainfall of around 3179.74 mm of annual rainfall over the period of 2012 to
2016 followed by Goa and Andaman & Nicobar Islands. The percent departure in annual rainfall from
the normal rainfall is assessed and the Southwest monsoon rainfall and annual rainfall of India for
the period from 2000 to 2016 has been shown in Table 1.2 along with their departures from the
normal rainfall. The rains have been deficient in most of the years with exceptions being 2005, 2010
and 2013.Most of the monsoon in India is under the influence of South-West monsoon from June to
September.
River basin is the most important unit of analysis for any water-related study. River basin, also called
catchment area of the river, is the area from which the rain will flow into that particular river. India
can be divided into 20 river basins. Central Water Commission (CWC) has the responsibility of
planning, development and management of surface water resources of the country. Table 1.3
depicts the river-
Table 1.2: South-West Monsoon and Annual Rainfall along with departure in India
Year SW-Monsoon Rainfall (mm) Annual Rainfall (mm) Rainfall % Departure Rainfall % Departure
2000 798.1 -10% 1035.4 -13%
2001 818.8 -8% 1100.7 -7%
2002 700.5 -21% 935.9 -21%
2003 902.9 2% 1187.3 0%
2004 807.1 -9% 1106.5 -7%
2005 874.3 -1% 1208.3 2%
2006 889.3 0% 1161.6 -2%
2007 943 6% 1179.3 -1%
2008 877.8 -1% 1118 -6%
2009 698.3 -21% 953.7 -20%
2010 911.1 3% 1215.5 2%
2011 901.3 2% 1116.3 -6%
2012 823.9 -7% 1054.7 -11%
2013 937.4 6% 1242.6 5%
2014 781.7 -12% 1044.7 -12%
2015 765.8 -14% 1085 -9%
2016 864.4 -3% 1083.2 -9%
basin wise catchment area, average water resources potential river-basin wise according to the
Reassessment studies conducted by CWC. The total water resource potential, which occurs as a
natural runoff in these rivers, is estimated to be about 1869 BCM. Water availability is highest in
Brahmaputra basin (537.24 BCM) followed by Ganga Basin (525.02 BCM).

155 MGNCRE | E-Waste Management
155 MGNCRE | Water Security RM
In India, industrialisation and urbanisation have not yet reached the peak levels considering ever
increasing demands of the growing population. This translates to a mounting pressure on the
freshwater in the country. The water resources are being increasingly stressed not only by over-
abstraction, but also by pollution and climate change. So, the prospects arising from improved water
management, both
Table 1.3: River Basin Water Availability
S.no Basin Catchment Area
(sq.km)
Average Water
Resources
Potential (BCM)
Utilisable
Surface Water
Resource (BCM)
1) Indus (up to Border) 3,21,289 73.31 46
2) Ganga- Brahmaputra-
Meghna
a) Ganga
8,61,452 525.02 250
b) Brahmaputra
1,94,413 537.24 24
c) Barak & Others
41,723 48.36
3) Godavari
3,12,812 110.54 76.3
4) Krishna
2,58,948 78.12 58
5) Cauvery
81,155 21.36 19
6) Subarnarekha
29,196 12.37 6.8
7) Brahmani-Baitarani
51,822 28.48 18.3
8) Mahanadi
1,41,589 66.88 50
9) Pennar
55,213 6.32 6.9
10) Mahi
34,842 11.02 3.1
11) Sabarmati
21,674 3.81 1.9
12) Narmada
98,796 45.64 34.5
13) Tapi
65,145 14.88 14.5
14) West Flowing Rivers from
Tapi to Tadri
55,940 87.41 11.9
15) West Flowing Rivers from
Tadri to Kanyakumari
56,177 113.53 24.3
16) East Flowing Rivers
between Mahanadi and
Pennar
86,643 22.52 13.1
17) East Flowing Rivers
between Pennar and
Kanyakumari
1,00,139 16.46 16.5
18) West Flowing Rivers of
Kutch & Saurashtra
including Luni
3,21,851 15.1 15
19) Area of inland drainage in
Rajasthan
1,39,917.04 - -
20) Minor rivers draining into
Myanmar (Burma) and
Bangladesh
36,202 31 -
Total
1869.37 690.1

156 MGNCRE | E-Waste Management
156 MGNCRE | Water Security RM
Note: *: Combining Subarnarekha and other small rivers between Subarnarekha and Baitarani
in terms of quality and quantity is indispensable in the context of Indian economy. However, the per
capita availability of water has been estimated to decrease over the decades in India, as shown in
Table 1.4.
Table 1.4: Per Capita Water Availability in India
Year Population (Million)
Per Capita Water Availability (Cubic
Meter/Year) Status
1951 361 5178 1955 395 4732 1991 846 2210 2001 1027 1820 2011 1211 1544 water stressed
Year
Projected Population
(Million)
Anticipated Per capita water availability (cubic
meter/year)
2015 1326 1441 water stressed
2021 1345 1421 water stressed
2031 1463 1306 water stressed
2041 1560 1225 water stressed
2051 1628 1174 water stressed
As per Falkenmark Water Stress Indicator, a per capita availability of less than 1700 cubic meters
(m3) is termed as a water-stressed condition, while in per capita availability falls below 1000 m3; it is
termed as a water scarcity condition. India is currently facing water stressed situation and is moving
towards the water scarcity situation since the gap between water demand and water supply is
gradually getting widened highlighting the dire need to manage water resources for a sustainable
future. The per-capita availability across the river basins of the country is observed that Krishna,
Cauvery, Subarnarekha, Pennar, Mahi, Sabarmati, Tapi, East Flowing Rivers and West Flowing Rivers
of Kutch and Saurashtra including Luni are some of the basins, fall into the category of “water
scarce”- out of which the scarcity can be said to be acute in Cauvery, Pennar, Sabarmati, East
Flowing rivers and West Flowing Rivers of Kutch and Saurashtra including Luni with a per capita
availability of water less than or around 500 cubic meter.
Use Specific Water Demand
The demand for freshwater for various purposes has been increasing and have been assessed by
National Commission on Integrated Water Resources Development (NCIWRD) in 2000. This
assessment is based on the assumption that the irrigation efficiency will increase to 60%. The
demand for water by various uses is given in Table 1.5.

157 MGNCRE | E-Waste Management
157 MGNCRE | Water Security RM
Table 1.5: Projected Water Demand in India (By Different Use)
Sector Water Demand in Km3 (or BCM)
Standing Sub Committee
MoWR, RD & GR National Commission on Integrated Water Resources
Development (NCIWRD)
2010 2025 2050 2010 2025 2050
Low High Low High Low High
Irrigation 688 910 1072 543 557 561 611 628 807
Drinking
Water
56
73
102
42
43
55
62
90
111
Industry 12 23 63 37 37 67 67 81 81
Energy 5 15 130 18 19 31 33 63 70
Other 52 72 80 54 54 70 70 111 111
Total 813 1093 1447 694 710 784 843 973 1180
Ground Water
Total replenishable ground water potential of the country, has been estimated by Ministry of Water
Resources as 431 Km3 cubic kilometer per year. After making provision for drinking, industrial and
other purposes (other than irrigation), which is about 16 percent of total potential, the potential
available for irrigation is 360 Km3 per year. The figure for net draft of ground water considering the
present utilisation indicates that substantial portion of total potential (about 68 percent) is still
remaining untapped. An indicator of whether or not the abstraction of groundwater is sustainable is
the depth to water level. With more extraction of ground water, the depth to water level increases
and the water table moves downward. Such a change is a cause of major concern for agriculture and
irrigation in particular (scenario of groundwater depletion is depicted in Figure 1.2). The depleting
groundwater is also negatively affecting India’s farmland. According to Agriculture Census 2010-
1110, net area irrigated by groundwater is 63.63% (45.17% by tube wells and 18.46% by wells). Since
in India, agriculture is dependent on irrigation which in turn is highly dependent on ground water
resources, thus depleting resources are reducing the country’s cultivated land hence, aggravating
the water woes of the nation.
Figure 1.2: Groundwater Depletion in India

158 MGNCRE | E-Waste Management
158 MGNCRE | Water Security RM
1.3 Water Quality and Consequences of Water Pollution
Water quality refers to the chemical, physical, biological, and radiological characteristics of water. It
is a measure of the condition of water relative to the requirements of one or more biotic species and
to any human need or purpose. The issue of water availability is closely linked with water quality.
The water quality management in India is performed under the provision of Water (Prevention and
Control of Pollution) Act, 1974. The basic objective of this Act is to maintain and restore the
wholesomeness of national aquatic resources by prevention and control of pollution. The Act does
not define the level of wholesomeness to be maintained or restored in different water bodies of the
country. The Central Pollution Control Board (CPCB) has defined the wholesomeness in terms of
protection of human uses, and thus, taken human uses of water as base for identification of water
quality objectives for different water bodies in the country. It was considered ambitious to maintain
or restore all natural water body at pristine level. Planning pollution control activities to attain such a
goal is bound to be deterrent to developmental activities and cost prohibitive. Since the natural
water bodies have got to be used for various competing as well as conflicting demands, the objective
is aimed at restoring and/or maintaining natural water bodies or their parts to such a quality as
needed for their best uses. Thus, a concept of “designated best use” (DBU) was developed.
According to this concept, out of several uses a water body is put to, the use which demands highest
quality of water is termed as “designated best use”, and accordingly the water body is designated.
Primary water quality criteria for different uses have been identified. A summary of the use based
classification system is presented in Table 1.6.
Table 1.6. Use Based Classification of Surface Waters in India
Designated Best Use Quality Class Primary Quality Criteria Drinking water source without
conventional treatment, but
with chlorination A
6.5 to 8.5 (1); 6 or more (2); 2 or less (3);
50, not >5% 200. and not >20%-50 (4); NIL
(5 - 8) Outdoor bathing (organised)
B
6.5 to 8.5 (1); 5 or more(2); 3 or less (3);
500, not >5%-2000, and not >20%-500(4);
NA (5- 8) Drinking water source with
conventional treatment
C
6.5 to 8.5 (1); 4 or more (2); 3 or less (3);
5000, not >5%-20000, and not >20%-5000
(4); NA (5 – 8) Propagation of wildlife and
fisheries D
6.5 to 8.5 (1); 4 or more (2); NA (3 - 4); 1.2
(5); NA (6 - 8) Irrigation, industrial cooling, and
controlled waste disposal E
6.0 to 8.5 (1); NA (2 - 5); 2250 (6); 26 (7); 2
(8)
(1) pH, (2) dissolved oxygen, mg/l (3) BOD,(20c) mg/l (4)total coliform (MPN/100ml)(5)free ammonia
mg/l, (6) electrical conductivity in micromhos/cm, (7) Sodium adsorption ratio, and (8) boron mg/l,
NA = Not applicable
The entire water resources of the country were classified according to their designated best uses by
Central Pollution Control Board (CPCB). For identification of the water bodies or their parts where

159 MGNCRE | E-Waste Management
159 MGNCRE | Water Security RM
water quality is at variance with water quality criteria, measurement of water quality carried to
identify the water bodies or their parts which are in need of improvement (restoration). Based on
monitoring of aquatic resources, large numbers of water bodies were identified as polluted for
taking appropriate measures to restore their water quality. Today almost all policies and
programmes on water quality management are based on this concept including the Ganga Action
Plan, National River Action Plans and National Ganga River Basin Plan. Water quality testing is an
important part of environmental monitoring. When water quality is poor, it affects not only aquatic
life but the surrounding ecosystem as well.
Water quality monitoring carried by CPCB revealed that organic matter & bacterial population of
fecal origin continue to dominate the water pollution problem in India. The Organic pollution as
measured through Biochemical Oxygen Demand (BOD) and Chemical Oxygen Demand (COD) is
considerably high, water bodies are saprobic followed by eutrophicated near large urban centres
due to the discharge of partly treated or untreated wastewater. This results in depletion of oxygen in
these stretches of water bodies.
The rivers and lakes in hilly part of the country are not affected significantly by such pollution, as
there are no large urban centres. Although, high BOD is associated with low Dissolved Oxygen (DO),
but many times DO measurement does not reflect such conclusion due to the fact that the DO is
measured during daytime when the photosynthetic effects are prominent. In such stretches of water
bodies, the diurnal variation in dissolved oxygen is quite large. The dissolved oxygen during daytime
increases to super saturation level whereas at night at the same place the dissolved oxygen goes as
low as below detection limit.
The pathogenic pollution is also one of the major water pollutants in Indian water bodies the main
cause for water borne disease. The majority of surface water sources are contaminated with high
levels of Faecal Coliform bacteria, which are indicators of pathogenic pollution.
The water quality of major rivers varied widely with respect to DO, BOD, Total Coliform (TC) and
Faecal Coliform (FC). The level of DO is observed more than 4 mg/l in river Tapi, Narmada, Brahmini,
Brahmaputra, Subarnarekha and Beas throughout the year, whereas the lowest values are observed
in stretches of river Yamuna (0.1 mg/l), Sabarmati (0.6 mg/l), Mahanadi (1.3 mg/l) Ghaggar (2.6
mg/l) and Godavari (3.1 mg/l) at few locations downstream of urban settlements due to discharge of
untreated/partially treated municipal wastewater, which is responsible for high oxygen demand.
Very high values of Biochemical Oxygen Demand (BOD) are observed in river(s) Sabarmati (475 mg/l)
followed by Ghaggar (180 mg/l), Godavari (78mg/l), Satluj (45mg/l),Yamuna (36 mg/l), Cauvery
(27mg/l), Ganga (17mg/l), Krishna and Tapi (10 mg/l each), Mahanadi (8mg/l) and Brahmani (6mg/l).
The relatively low values of BOD are measured in river(s) Mahi, Narmada, Brahmaputra and Beas.
In respect of Total Coliform and Faecal Coliform Numbers, river Yamuna is leading with highest count
of 2.6 billion MPN/100 ml and 1.7 million MPN/100 ml respectively, followed by Sabarmati (28
million and 2.8 million), Ganga (25 million and 11 million), Brahmaputra (240,000 and 24,000),
Cauvery (160,000 and 28,000), Brahmani(90,000 and 60,000),Satluj (35,000 and 3500),Krishna
(33,300 and 10,000), Mahanadi (30,000 and 17,000), Baitarni (22,000 and 11,000), Ghaggar (14,000
and 2500) and Godavari (5260 and 3640) at certain locations. The river Mahi, Tapi and Narmada are
relatively clean rivers as the number of Total Coliform and Faecal Coliform count are relatively less

160 MGNCRE | E-Waste Management
160 MGNCRE | Water Security RM
than 2400 MPN/100 ml and 210 MPN/100 ml respectively. The results of conductivity, pH,
temperature, nitrogen, phosphate and major ions measurement revealed that conductivity is
conforming to the irrigation requirement in most of the rivers except estuarine parts. The minimum
level of conductivity observed in upper stretches of the rivers ranging between 28-320
micromhos/cm. In estuarine region due to tidal influence the conductivity shoots up ranging
between 11050 micromhos/cm for Krishna estuary to 53100 micromhos/cm for Cauvery estuary.
The nutrients like nitrates & phosphate are enriched downstream of major towns along the rivers
due to discharge of wastewater & solids. In such stretches eutrophication at various levels was
observed. The pH was observed in the range of 6-9 in all the rivers except Sabarmati & Amlakhadi,
where it was abnormally low 1.5 to 2.5 due to discharge of industrial wastewater. The hardness
varies between 50-300 mg/L in most of the rivers. However, some river stretches are having
hardness as high as 1000 to 3000 (Ambika, Mandovi, Khari, Par & Bhadar). Similarly, alkalinity varies
between 50-200 mg/L. Conductivity, total dissolved solid, sodium & chloride showed parallel
pattern in most of the rivers. The conductivity in Himalayan rivers & upper stretches of rivers in
Kerala is observed very low (20 to 150 micromhos/cm). The rivers in plane are having conductivity in
the range of 150-700 micromhos /cm. However, some stretches of the river or their tributaries
showed high level of conductivity (800-2800 micromhos/cm). Similarly, rivers in Kerala, Himachal
Pradesh & Upper Stretches of most of the rivers are having dissolved solids, sodium & chloride in the
range of 50 to 700 mg/L, 6 to 400 mg/L & 10 to 500 mg/L respectively. However in some minor
rivers like Ambika, Amlakhadi, Bhadar, Khari, Mandovi & Par were found abnormally high. An
abridged status of Water Quality of Indian Rivers is presented in Table 1.7.
Table 1.7: Water Quality of Indian Rivers
River Range of Water Quality
Temp. 0C
PH Conductivity
(mhos/cm)
DO
(mg/l)
BOD
(mg/l)
COD
(mg/l)
Total
Coliform
(MPN/100
ml)
Faecal
Coliform
(MPN/100
ml)
Ganga 3-34 6.4-
9.0
19-2720 2.7-
11.5
0.5 –
16.8
1-30 300-25x105 20-11x105
Yamuna 3-34 6.7-
9.8
56-1959 0.1-
22.7
1.0 – 36 1-112 27-
26.3x10⁶
11-
17.2x10⁵
Sabarmati 12-32 2.9-
8.6
269-13530 0.6-
7.9
0.8 –
475
4-1794 210-28x105 28-28x105
Mahi 19-34 7.1-
9.2
175-5720 0.2-
8.5
0.1 –
3.0
9-163 3-2400 3-75
Tapi 20-40 7.4-
9.0
76-700 4.8-
8.8
0.6 –
10.0
8-40 40-2100 2-210
Narmada 6.9-
9.3
102-1341 5.8-
9.8
0.1 –
3.8
6-47 9-2400 2-64
Godavari 22-35 7.0- 118-1400 3.1- 0.5 – 3-96 8-5260 2-3640

161 MGNCRE | E-Waste Management
161 MGNCRE | Water Security RM
9.0 10.9 78.0
Krishna 18-33 6.8-
9.5
28-11050 2.9-
10.9
0.2 –
10.0
3-88 17-33300 3-10000
Cauvery 21-37 2.0-
9.2
31-53100 0.1-
12.6
0.1 –
26.6
30 39-160000 2-28000
Mahanadi 18-38 7.3-
8.9
114-15940 1.3-
10.4
1.0 –
7.6
7-39 15-30000 50-17000
Brahmani 20-38 7.0-
8.4
81-376 5.2-
9.8
1.5 –
6.0
8-13 80-90000 40-60000
Baitarni 24-36 7.3-
8.3
54-78400 6.8-
9.3
2.0 –
6.8
7 900-22000 700-11000
Subarnarekha 18-36 6.5-
8.0
113-355 5.2-
8.5
0.2 –
12.0
4-96 150-1800 70-540
Brahmaputra 15-32 6.5-
9.0
104-684 1.1-
10.5
0.1 –
3.9
6-11 360-
240000
300-24000
Pennar - 7.5-
8.7
364-978 6.0-
9.3
1.0 –
2.9
14-16 - -
Satluj 9-32 6.8-
8.8
131-819 3.8-
11.4
0.1 –
45.0
1-80 8-35000 2-3500
Beas 3-32 7.1-
8.7
53-517 5.2-
11.5
0.3 –
5.0
1-13 2-2400 2-1600
Ghaggar 11-33 7.0-
9.5
320-1012 2.6-
9.6
1-180 4-560 43-14000 9-2500
Amlakhedi 27-32 1.7-
7.2
7160-16770 0-0 485 –
1561.6
1821-
3860
28-1100 3-28
Kali East 15-30 7.2-
8.7
24-1930 6.7-
11.9
1.9 –
67.0
66-421 2100-
48000000
100000-
360000
Ground Water Quality and Health of Rural Population
The rural population of India comprises more than 900 million people residing in about 1.42 million
habitations spread over 15 diverse ecological regions. Rural India is characterised by non-uniformity
in level of awareness, socio-economic development, education, poverty, practices and rituals which
add to the complexity of providing drinking water to such a large population is an enormous
challenge. The health burden of poor water quality is enormous. It is estimated that around 37.7
million Indians are affected by waterborne diseases annually, 1.5 million children are estimated to
die of diarrhoea alone and 73 million working days are lost due to waterborne disease each year.
The resulting economic burden is estimated at about 4000 crore rupees a year.
The problems of chemical contamination are also prevalent in India with 1, 95,813 habitations in the
country are affected by poor water quality. The major chemical parameters of concern are fluoride
and arsenic. Iron is also emerging as a major problem with many habitations showing excess iron in

162 MGNCRE | E-Waste Management
162 MGNCRE | Water Security RM
the water samples. The provision of clean drinking water has been given priority in the Constitution
of India, with Article 47 conferring the duty of providing clean drinking water and improving public
health standards to the State.
The government has undertaken various programmes since independence to provide safe drinking
water to the rural masses. Till the 10th plan, an estimated total of about one lakh crore spent on
providing safe drinking water. One would argue that the expenditure is huge but it is also true that
despite such expenditure lack of safe and secure drinking water continues to be a major hurdle and
a national economic burden. On one hand the pressures of development is changing the distribution
of water in the country, access to adequate water has been cited as the primary factor responsible
for limiting development.
The average availability of water is reducing steadily with the growing population and it is estimated
that by 2020 India will become a water stressed nation. Groundwater is the major source of water in
our country with 85% of the population dependent on it. While accessing drinking water continues
to be a problem, assuring that it is safe is a challenge by itself. Water quality problems are caused by
pollution and over-exploitation.
The rapid pace of industrialisation and greater emphasis on agricultural growth combined with
financial and technological constraints and non-enforcement of laws have led to generation of large
quantities of waste and pollution. The problem is sometimes aggravated due to the non-uniform
distribution of rainfall. Individual practices also play an important role in determining the quality of
water.
Water quality is affected by both point and non-point sources of pollution. These include sewage
discharge, discharge from industries, run-off from agricultural fields and urban run-off. Water quality
is also affected by floods and droughts and can also arise from lack of awareness and education
among users. The need for user involvement in maintaining water quality and looking at other
aspects like hygiene, environment sanitation, storage and disposal are critical elements to maintain
the quality of water resources.
The government policies and programmes have also undergone a series of transition ever since
independence. To begin with, the emphasis was on setting up physical infrastructure in form of hand
pumps. Thereafter one has seen a transition from technology measures to a socio technological
approach seeking close participation of people. A national water policy was drafted in 1987 which
was subsequently revised in 2002. For ensuring sustainability of the systems, steps were initiated in
1999 to institutionalise community participation in the implementation of rural drinking water
supply schemes through the sector reforms project. Sector Reform ushers in a paradigm shift from
“Government oriented supply driven approach” to “People oriented demand responsive approach”.
Water quality monitoring is now being considered an important part of the government programme.
Since 2000, water quality monitoring has been accorded a high priority and institutional mechanisms
have been developed at national, state, district, block and panchayat levels. The government has
also outlined requisite mechanisms to monitor the quality of drinking water and devise effective
Information, Education and Communication (IEC) interventions to disseminate information and
educate people on health and hygiene.

163 MGNCRE | E-Waste Management
163 MGNCRE | Water Security RM
The Government of India launched the National Rural Drinking Water Quality Monitoring and
Surveillance Programme in February 2006. This envisages institutionalisation of community
participation for monitoring and surveillance of drinking water sources at the grassroots level by
gram panchayats and Village Water and Sanitation Committees, followed by checking the positively
tested samples at the district and state level laboratories.
One major problem when it comes to addressing the problems related to water is that the provisions
for water are distributed across various ministries and institutions. With several institutions involved
in water supply, intersectoral coordination becomes critical for the success of any programme.
When it comes to dealing with maintaining water quality, the users and in large the communities
have to play a key role in maintaining hygiene near water sources. One has to improve the ways in
which we collect and store water so as to avoid contamination while collection, storage and use.
With the decentralisation of programmes for water supply it is essential that communities and
institutions like panchayats are actively involved in the planning, implementation and execution of
programmes for water supply. These institutions will also have to undertake the monitoring of water
sources and be made aware so simple remedial measures. It is true that this will require training and
capacity building at a large scale. There can be little doubt that water is a basic necessity for the
survival of humans. There is interplay of various factors that govern access and utilisation of water
resources and in light of the increasing demand for water it becomes important to look for holistic
and people-centred approaches for water management.
Consequences of Water Pollution
Almost all human activities can and do impact adversely upon the water. Water Quality is influenced
by both diffuse pollution from farming and point source pollution from urban and rural populations,
sewage treatment, industrial discharge and farming as principal sources. For agriculture, the key
pollutants include nutrients, pesticides, sediment and faecal microbes. Oxygen consuming
substances and hazardous chemicals are more associated with point source discharges. The
pollution can take many forms and have different effects on the users.
Faecal contamination from sewage makes water aesthetically unpleasant and unsafe for recreational
activities, such as swimming, boating or fishing. Many organic pollutants, including sewage effluent
as well as farm and food-processing wastes consume oxygen, suffocating fish and other aquatic life.
This contamination can affect groundwater resources used for drinking water purposes.
Nutrients, such as nitrates and phosphates, from farm fertilizers to household detergents can 'over
fertilize' the water causing the growth of large mats of algae; some of which can be toxic. When the
algae die, they sink to the bottom, decompose, consume oxygen and damage ecosystems. Due to
the percolation of nutrients to shallow aquifers the chemical conditions in those aquifers tend to
change. Pesticides and veterinary medicines from farmland and chemical contaminants, including
heavy metals, and some industrial chemicals led to threaten wildlife and human health. Some of
these damage the hormonal systems of fish, causing ‘feminisation’.
Metals, such as zinc, lead and cadmium are extremely toxic. Copper complexes are less toxic, and
cobalt and ferrous complexes are only weak toxicants. Concentrations of cyanides in waters

164 MGNCRE | E-Waste Management
164 MGNCRE | Water Security RM
intended for human use, including complex forms, are strictly limited because of their high toxicity.
Organic micro-pollutants, such as pharmaceuticals, hormones and chemical substances used in
products and households can also threaten health. Chlorinated hydrocarbons exist in the natural
systems, several of which are highly toxic to humans. These molecules tend to stay in the
environment for a longer time, and threaten to contaminate aquatic and soil systems.
Sediment runoff from the land can make water muddy, blocking sunlight and, as a result, kill wildlife
aquatic life. Irrigation, especially when used improperly, can bring flows of salts, nutrients and other
pollutants from soils into water. All these pollutants can also make the water unsuitable for drinking
purposes.
Ecological quality and Water Quality are also influenced by the physical management of rivers and
aquifers and the wider hydrological and hydrogeological environment of a river basin. Changes and
disruptions in natural habitats, such as bank-side vegetation, can result from the physical
disturbance through damming, canalization and dredging of rivers, construction of reservoirs, river
bank management and other changes to the hydrological flow, sand and gravel extraction in coastal
waters, and bottom trawling by fishing vessels, etc. Pebble riffles where salmon and other fish
spawn can also be destroyed. Seasonal flow patterns that are vital to many species can also be
changed, as well as the connectivity between habitats, a very important factor for the functioning of
aquatic ecosystems and for the development of the different life stages of aquatic organisms. In
urban agglomerations, storm water carrying contamination from streets and roofs can contribute to
water pollution if discharged directly into water bodies.
Plants and animals aquatic life such as planktons and benthos in lakes, rivers and seas react to
changes in their environment caused by changes in chemical Water Quality and physical disturbance
of their habitat. Changes in species composition of organism groups like phytoplankton, algae,
macrophytes, bottom-dwelling animals and fish can be caused by changes in the climate. They can
also indicate changes in Water Quality caused by eutrophication, organic pollution, hazardous
substances or oil, and hydrological regime.
Over time, with the advent of industrialization and increasing populations, the range of
requirements for water has increased together with greater demands for higher quality water, such
as for drinking and personal hygiene, fisheries, agriculture (irrigation and livestock supply),
navigation for transport of goods, industrial production, cooling in fossil fuel (thermal, gas and later
also in nuclear) power plants, hydropower generation, heat/cold storage in aquifers, recreational
activities such as bathing or fishing and nature conservation like wetlands. Fortunately, the largest
demands for water quantity, such as for agricultural irrigation and industrial cooling, require the
least in terms of water quality (i.e. critical concentrations may only be set for one or two variables).
Drinking water supplies and specialized industrial manufacturers exert the most sophisticated
demands on water quality but their quantitative needs are relatively moderate. In parallel with these
uses, water has been considered the most suitable medium to clean, disperse, transport and dispose
of wastes (domestic and industrial wastes, mine drainage waters, irrigation returns, etc.).
Each water use, including abstraction of water and discharge of wastes, leads however to specific,
and generally rather predictable, impacts on the quality of the aquatic environment. In addition to
165 MGNCRE | E-Waste Management
165 MGNCRE | Water Security RM
these intentional water uses, there are several human activities which have indirect and undesirable,
and sometimes devastating, effects on the aquatic environment. Examples are uncontrolled land use
for urbanisation or deforestation and associated soil erosion, accidental or unauthorised release of
chemical substances, and discharge of untreated wastes or leaching of noxious liquids from solid
waste deposits. Similarly, the uncontrolled and excessive use of fertilisers and pesticides has long-
term effects on ground and surface water resources. Restoration of the natural Water Quality after
such events often takes many years, depending on the geographical scale and intensity of the event.
Pollution of groundwater arises commonly from the percolation of polluted water from the surface,
but also from leaching from contaminated soil, dissolution from oil or dense non-aqueous phase
liquids. When polluted water penetrates to the point of abstraction the consequences are serious.
Because of the slow rate of travel of the water in the aquifer and the large volume of subterranean
water there is usually a considerable time lag between the casual activity and the appearance of the
pollutant in the abstracted water. This will vary according to the hydraulic conductivity, the
hydraulic gradient and the porosity. For similar reasons the time required to flush out the polluted
water will be long, even longer because of the "drag out" effect. Under such circumstances the
recovery process is sometimes regarded as irreversible and the source abandoned.
The continuing increase in socio-economic activities world-wide has been accompanied by an even
faster growth in pollution stress on the aquatic environment. Discharges from wastewater treatment
plants and industry may cause pollution by oxygen consuming substances, nutrients and hazardous
substances. The adverse impacts depend very strongly upon the degree to which (if at all) such
discharges are treated before reaching waterways or whether such pollutants are degraded by the
natural system itself.
By its very nature, the management of diffuse pollution is complex and requires the careful analysis
and understanding of various natural and anthropogenic processes. The estimation of non-point
diffuse loading from the different processes to a water body is not easy, because so many different
factors affect quantity and temporal variations.
Modern day agricultural practices often require high levels of fertilizers and manure; leading to high
nutrient (e.g. nitrogen and phosphorus) surpluses that are transferred to water bodies and
groundwater through various diffuse processes. Excessive nutrient concentrations in water bodies,
however, cause adverse effects by promoting eutrophication, with an associated loss of plant and
animal species. In high nutrient waters with sufficient sunlight, algal slimes can cover stream beds,
plants can choke channels, and blooms of plankton can turn the water murky green. Oxygen
depletion, the introduction of toxins or other compounds produced by plants, reduced water clarity
and fish kills can also result. Excess nutrient levels can also be detrimental to human health.
Pesticides used in agriculture are transported to both surface and groundwaters. Not only do they
threaten both wildlife and human health, but also the excessive sediment runoff from agricultural
land results in turbid waters and the clogging of spawning areas. This in turn leads to loss of aquatic
habitats. Microbial pathogens from animal faeces also can pose a significant health risk. High
concentrations can restrict the recreational and water supply uses of water, cause illness and loss of
productivity in cattle, and limit shellfish aquaculture in estuaries.

166 MGNCRE | E-Waste Management
166 MGNCRE | Water Security RM
In urban areas, where surface runoff is not connected to treatment works, pollutants deposited on
to impervious surfaces (e.g. roads or pavements) are washed into nearby surface waters or percolate
towards the shallow groundwater. Such pollutants include metals, pesticides, hydrocarbons,
solvents, etc., as well as also those derived from various sources including the atmosphere and the
abrasion of roads, tyres and brakes. In some urban areas, surface runoff is discharged into sewers,
which then mixes with sewage on its way to treatment. During periods of large rainfall, the sewage
system is unable to cope with the volume of water. As a result, the flow is directed away from the
treatment works and discharged as a combined sewer overflow (CSO) to surface water. This causes
pollution from not only sewer waste but also urban runoff. In this respect, urban diffuse pollution
ultimately becomes a point source.
1.4 Causes and Types of Water Pollution
Water pollution is the contamination of natural water bodies (e.g. lakes, rivers, sea, ocean, aquifers,
ground water etc.). This form of environmental degradation occurs when pollutants are directly or
indirectly added into the water bodies without proper treatment to remove harmful compounds.
The causes of water pollution include a wide range of chemicals and pathogens as well as physical
parameters. Contaminants may include organic and inorganic substances. Elevated temperatures
can also lead to pollution of water. A common cause of thermal pollution is the use of water as a
coolant by power plants and industrial manufacturers. Elevated water temperatures decrease
oxygen levels, which can kill fish and alter food chain composition, reduce species biodiversity, and
foster invasion by new thermophilic species.
If pollution comes from a single location, such as a discharge pipe attached to a factory, it is known
as point-source pollution. If pollution comes from one single source but from many different
scattered sources. This is called nonpoint-source pollution.
General sources of water pollution are point and non point contaminant sources. Point sources of
water pollution include urban sewage and industrial effluent outfalls from factories etc. that
discharge fluids of varying quality directly into water bodies.Non point sources of water pollution
include contaminants that enter the water supply from soils/groundwater systems and from the
atmosphere via rain water. Soils and groundwaters contain the residue of human agricultural
practices (fertilizers, pesticides, etc.) and improperly disposed of human and industrial wastes.
Atmospheric contaminants are also derived from human practices (such as gaseous emissions from
automobiles, factories and even burning of waste material).
The substances which are responsible for causing water pollution are called water pollutants. Based
on source, water pollutants can be classified as domestic wastes and sewage; surface run-off and
industrial effluents. Domestic waste and sewage is the biggest polluter of surface and ground water
sources in India. This is due to the big lacuna between the amount of sewage generation and the
facilities to dispose it off. The problem is not only the lack of facilities; rather, the non-functioning of
existing facilities / treatment plants is more critical.
The pollutants present on the surface of land, fertilizers, and pesticides added to the soils are
washed down into natural water courses during rains. The flow of fertilizer rich water into streams
and lakes gives rise to eutrophication. Excess of pesticides in water also adversely affect the aquatic
life.
167 MGNCRE | E-Waste Management
167 MGNCRE | Water Security RM
Effluents generated from industries which are directly disposed off into the water streams without
any treatment cause of water pollution. Industrial wastes contain a number of toxic chemicals such
as mercury (Hg), lead (Pb), cadmium (Cd), arsenic (As) etc. Several types of liquid effluents having
toxic chemicals, acids and bases, etc. are also added into the rivers which kills fish and other aquatic
life besides being toxic to human beings. Examples of large scale effluent addition into the rivers are
Yamuna (near Okhla, Delhi), Gomti (near Lucknow), Ganga (near Kanpur), and Hoogli (near Kolkata),
Musi (near Hyderabad), Godavari (near Nasik) etc.
Discharge of effluent above the normal range of temperature is called as thermal pollution. Thermal
pollution occurs as a result of the entry of heated water from industries and power generation
plants. Various processes involved in generating thermal pollution are water for cooling condensers,
feeding boilers for steam generation, auxillary plant cooling, ash handling etc.
The immediate effect of an increase in temperature is a decrease in the oxygen concentration. A
temperature rise of 10°C double the rate of many chemical reactions and so the decay of the organic
matter, rusting of iron, and the solution rate of salts are accelerated. All organisms have a range of
temperature tolerance beyond which they either die or move to more congenital conditions
downstream.
Effects of Water Pollutants
Water pollution is very serious problem as it affects all spheres of life of human, animals, ecosystem,
plants and economic loss. In countries where there are scanty facilities for treating waste water,
people often get exposed to various water-borne diseases such as cholera, diarrhea, etc. In severe
cases, there may be the outbreak of diseases like Hepatitis, tuberculosis, malaria, encephalitis,
filariasis etc. As per the report of World Health Organization (WHO), approximately 3.4 million
people die of water-borne diseases every year in the world. In developed countries, even where
there are better purification practices, people still suffer from the health effects of water pollution.
Excess nitrogen in drinking water also poses serious risks to infants.
Nutrient pollution from land flows down and contaminates the larger water body. It in turns,
promotes the algae growth and subsequently growth of many more water organisms takes place.
The excess growth of algae affects the fish and other aquatic organisms by absorbing and reducing
their oxygen supply. Fishes also die off due to clogging of their gills as a result of algal growth. Thus,
the aquatic ecosystems are affected very adversely disturbing all the food chains.
Animals, both aquatic and terrestrial, are prone to risks generated from the waste water. In a classic
case of marine pollution in recent time, 16000 miles of a US coastline was affected by an oil spill. In
this case, death of many animals has been reported and there was great loss to aquatic fauna.
Animals are also affected by the solid waste thrown into the water bodies, as it harm them in many
ways.
It is quite obvious that increasing water pollution lead to the excessive pressure on the existing
treatment plants as well as the establishment of new treatment plants. Fishing industry is affected
badly as the fishes die due to depletion of oxygen. Recreational and tourism sectors are also affected

168 MGNCRE | E-Waste Management
168 MGNCRE | Water Security RM
negatively as lots of money needs to be spent to clean up the water from algae blooms etc.
Water pollution in natural water bodies can be identified and quantified on the basis of various
parameters, such as, dissolved oxygen (DO), biochemical oxygen demand (BOD), coliform organisms,
pH etc. As per the water quality criteria, the DO levels in source water for drinking water treatment
plant should be between 4-6 mg/L and BOD levels should be between 2-3 mg/L. Moreover Total
Coliforms level should not exceed 5000 MPN/100 ml in water which is safe for various beneficial
purposes as source water. If the water quality of any source is not complying with these criteria, the
water cannot be used for drinking purpose without undergoing complete treatment and for mass
bathing.
Water pollution can be controlled by diluting the water pollutants and accordingly discharge norms
are devised but due to inadequate dilution availability treatment of wastewater are necessitated.
The various methods for the control of water pollution can be adopted for sewage pollutants to be
treated in sewage treatment plants before their discharge in natural water bodies or the pollution
due to organic insecticides and pesticides can be reduced by the use of very specific and less stable
chemicals in the manufacture of insecticides/pesticides. Moreover, use of bio-fertilizers needs to be
promoted. Thermal pollution can be reduced by employing techniques such as cooling, cooling
ponds, evaporative or wet cooling towers and dry cooling towers. Strict implementation of
legislations for water treatment should be done. No solid waste should be dumped into water
bodies. Dead bodies of animals/human should not be immersed in water sources. Bathing, washing
of clothes, and idol immersion should be strictly restricted in natural water bodies.
Types of Water Pollution
The water pollutants are broadly categorized as organic pollutants, suspended organic and inorganic,
inorganic dissolved salts and metals, Pathogenic microorganism and nutrients. There are industry
specific pollutants based on the process and the product.
Organic pollutants are oxygen demanding wastewater comprising of municipal sewage, Industrial
effluent from food processing industries, canning industries, slaughter houses, paper and pulp mills,
tanneries, breweries, distilleries, etc. have considerable concentration of biodegradable organic
compounds either in suspended, colloidal or dissolved form. These wastes undergo degradation and
decomposition by bacterial activity. The Synthetic Organic Compounds such as pesticides, synthetic
detergents, food additives, pharmaceuticals, insecticides, paints, synthetic fibers, plastics, solvents
and volatile organic compounds (VOCs). Most of these compounds are toxic and resistant to
microbial degradation. Even concentration of some of these in traces may make water unfit for
different uses. The sewage and industrial effluents from agro based sector and agriculture run-off
contains substantial concentration of nutrients like nitrogen and phosphorous. Disposal of
wastewater from these sources stimulate the growth of algae and other aquatic weeds in receiving
waters and reduces DO, leads to eutrophication.
The suspended organic and inorganic pollutants are comprised of food fiber in the sewage, plant
residue in industrial effluents and inorganic silt particles. These are contributed in the water courses
through municipal sewers and the runoff Presence of suspended solids block the sunlight
penetration in the water, which is required for the photosynthesis by benthic flora and fauna.
Settling of suspended solids in the rivers impair the aquatic life and impact diversity of the aquatic

169 MGNCRE | E-Waste Management
169 MGNCRE | Water Security RM
ecosystem undergoes decomposition leading to Creation of anaerobic conditions. The heavy metals
and other inorganic pollutants contributed by sewage and industrial effluents also contaminate the
water. These compounds are non-biodegradable and persist in the environment. These pollutants
include mineral acids, inorganic salts, trace elements, metals, metals compounds, complexes of
metals with organic compounds, cyanides, sulphates, etc. The accumulation of heavy metals may
have adverse effect on aquatic flora and fauna and may constitute a public health problem where
contaminated fish and other organisms are used for food.
The pathogenic microorganisms are largely discharged through sewage and discharge as a major
source or through the wastewater from industries like slaughterhouses. Viruses and bacteria can
cause water borne diseases, such as cholera, typhoid, dysentery, polio and infectious hepatitis in
human.
Besides the organic matter discharged in the water body through sewage and industrial wastes, high
concentration of heavy metals and other inorganic pollutants contaminate the water. These
compounds are non-biodegradable and persist in the environment. These pollutants include mineral
acids, inorganic salts, trace elements, metals, metals compounds; complexes of metals with organic
compounds, cyanides, sulphates, etc. The accumulation of heavy metals adversely affects to aquatic
flora and fauna and constitutes a public health problem where contaminated organisms are used for
food. Ministry of Environment Forests and Climate Change notified general discharge standards
under Environment (Protection) Act, 1986 for various recipient water systems with maximum
allowable concentration for pollutants to regulate the sources of pollution.
1.5 Biohazard, Radiation, Security Threat
Biohazard
Biohazard due to bio-medical waste is generated during the diagnosis, treatment or immunization of
human beings or animals or in research activities pertaining thereto or in the production or testing
of biological products. It include wastes like human anatomical waste, animal waste, microbiology &
biotechnology waste, waste sharps, discarded medicines & cytotoxic drugs, soiled waste, solid
waste, liquid waste, incineration ash, chemical wastes. These wastes are potentially hazardous
because of the potentially infectious in nature as it may pose a serious threat to human health, if its
management is indiscriminate and unscientific. Earlier, bio-medical waste management was not an
integral part of the health care programme. The negligence on the part of health care waste
management is evident from the sporadic epidemics experienced in different parts of the Country.
There should be emphasis on segregation of bio-medical waste at source of generation. Segregation
of wastes at source of generation helps to minimize mixing of bio-medical waste with that of the
sewage and municipal solid waste generated within the health care facilities; to reduce volume of
waste to be handled/treated; to minimize cost of treatment; to minimize toxic emissions; and to
facilitate effective recovery of useful plastics etc. Bio- Medical waste is divided into ten waste
categories and the category-wise bio-medical waste treatment and disposal option by following the
type of colour coded container or bag.
Biological Hazards and Superbugs
Swine flu, bird flu, HIV-Aids, re-emergence of polio, Nipah virus, Hepatitis-C, are biohazards one
might have heard of. Biological hazards are frank and opportunistic pathogens, such as bacteria,

170 MGNCRE | E-Waste Management
170 MGNCRE | Water Security RM
viruses, fungi, protozoa or helminthes. They may get released into the water, or increase in number
due to a hazardous event- an incident or a situation. Biological hazard may happen at any point or all
over the water system- from catchment area to the consumer. The risk depends on the time frame,
population exposed, the magnitude of harm, and its consequences. It is not practical or necessary to
completely eliminate microorganisms from drinking water. However, the number of pathogens
should be kept under acceptable levels. Contamination by pathogens originating from faecal matter-
of human and animal origin- needs to be prevented. This is possible by avoiding back-flow of water
after it is disinfected.
Emergence of ‘superbugs’ like MRSA bacteria (Methicilin resistant Staphylococcus aureus); E. coli
related urinary tract infections, drug-resistent Salmonella, is increasing every year. Pharmaceutical
pollution, improper hospital waste management and rampant use of antibiotics without medical
prescription are some of the reasons why superbugs are on the rise.
Chemical Hazards
Chemical hazards too can compromise water security. Examples are chemicals from the catchment,
such as nitrates, arsenic, fluoride and pesticides, chemicals from reservoir storage, such as algal
toxins, cleaners, liner chemicals, lubricants, etc, or chemicals from the water treatment process,
such as flocculants, pH adjusters, by-products of disinfectants and also chemicals from distribution
systems, for instance copper lead, petroleum or cleaners . Physical biohazards could be sloughed off
biofilm containing millions of bacteria, as well as sediments and re-suspended particulates with
pathogens attached to them.
To prevent such risks, a water safety plan team should be in place. They should study influencing
factors such as variation in weather, accidental or deliberate contamination, waste water treatment
practices, control practices at the source of pollution, water treatment practices, sanitation, hygiene,
distribution and maintenance practices, receiving and storage practices as well as intended use of
water.
Radiation Pollution
Any activity related to the nuclear fuel cycle, that produces or uses radioactive materials generates
radioactive waste. The management of radiation emitting radioactive material is a matter of concern
and is what sets nuclear wastes apart. Public acceptance of nuclear energy largely depends on the
public assurance for safe management of radioactive wastes. Not all nuclear wastes are particularly
hazardous or hard to manage as compared to other toxic industrial wastes. It is also a time of
heightened global concern about nuclear energy after the earthquake and the fear of the radioactive
releases from the affected damaged reactors in Japan. In accordance with international guidelines, a
coherent comprehensive and consistent set of principles and standards are being practiced all over
the world for waste management system.
Radioactive wastes are generated during various operations of the nuclear fuel cycle. Mining,
nuclear power generation, and various processes in industry, defense, medicine and scientific
research produce byproducts that include radioactive wastes. Radioactive waste can be in gas, liquid
or solid form, and its level of radioactivity can vary. The waste can remain radioactive for a few hours
or several months or even hundreds of thousands of years. Depending on the level and nature of
radioactivity, radioactive wastes can be classified as exempt waste, Low & Intermediate level waste

171 MGNCRE | E-Waste Management
171 MGNCRE | Water Security RM
and High Level Waste
Radiation is generated through detonation of nuclear weapons as well as during electricity
generation in nuclear power plants. The presence of radiation pollution is difficult to sense, but the
effects are devastating. It causes cancer, genetic disorders and leads to death.
Liquid wastes have generally high volumes and low levels of radioactivity. They are further classified
as short lived and long lived wastes. Low level nuclear waste usually includes material used to handle
the highly radioactive parts of nuclear reactors (i.e. cooling water pipes and radiation suits) and
waste from medical procedures involving radioactive treatments or x-rays.
Significant quantum of solid LIL wastes of diverse nature gets generated in different nuclear
installations. They are essentially of two types viz. primary wastes comprising of radioactively
contaminated equipment (metallic hardware) spent radiation sources etc. and secondary wastes
resulting from different operational activities, protective rubber and plastic wears, cellulosic and
fibrous material, organic ion exchange resins filter cartridges and others.
The air in the working area and the environment is free from radioactive contamination. The off gas
ventilation system in nuclear power plants play an important role in ensuring clean air. High level
radioactive liquid waste (HLW) containing most (~99%) of the radioactivity in the entire fuel cycle is
produced during reprocessing of spent fuel. Issue of the long lived radioactive waste has been the
focal point of debate for the success of nuclear power. Planning for management of high level
radioactive liquid waste waste thus takes into account the need for their effective isolation from the
biosphere and their continuous surveillance for extended periods of time spanning several
generations. To meet this objective in the long term, waste isolation systems comprising multiple
barriers are employed so as to prevent the movement of radionuclides back to the human
environment.
The primary objective should be of protecting human health, environment and future generations,
the overall philosophy for safe management of radioactive wastes in India, is based on the concept
of “Delay and Delay”; “Dilute and Disperse” and “Concentrate and Contain”.
The effective management involves segregation, characterization, handling, treatment, conditioning
and monitoring prior to final disposal. Proper disposal is essential to ensure protection of the health
and safety of the public and quality of the environment including air, soil, and water supplies.
Radiological hazards associated with short lived wastes <30 years half life get significantly reduced
over a few hundred years by radioactive decay. The high level wastes contain large concentration of
both short and long lived radionuclide’s, warranting high degree of isolation from the biosphere and
usually calls for final disposal into geological formation (repository).A key idea was that long-term
disposal would be best carried out by identifying suitable sites at which the waste could be buried, a
process called deep geological disposal.
Low level waste is comparatively easy to dispose of. The level of radioactivity and the half life of the
radioactive isotopes in low level waste are relatively small. Storing the waste for a period of 10 to 50
years will allow most of the radioactive isotopes in low level waste to decay, at which point the
waste can be disposed of as normal refuse.

172 MGNCRE | E-Waste Management
172 MGNCRE | Water Security RM
This concerns management and disposal of highly radioactive materials created during production of
nuclear power. High level radioactive waste is generally material from the core of the nuclear
reactor or nuclear weapon. The waste includes uranium, plutonium, and other highly radioactive
elements made during fission. Most of the radioactive isotopes in high level waste emit large
amounts of radiation and have extremely long half-lives (some longer than 100,000 years) creating
long time periods before the waste will settle to safe levels of radioactivity. The management of high
level waste in the Indian context encompasses three stages viz. Immobilisation of high level liquid
waste into vitrified borosilicate glasses; engineered interim storage of the vitrified waste for passive
cooling & surveillance over a period of time, qualifying it for ultimate disposal; and Ultimate
storage/disposal of the vitrified waste in a deep geological repository.
Summary
There are competing users of water and the irrigation remains one of the biggest users in India. The
requirement of food for growing population shall be a management issue and the resource
allocation for various users shall be a matter of concern. Irrigation being a consumptive user does
not return water back in the system however a part of it gets feed to the aquifer system. The non
consumptive user like household municipal users and industrial sector largely consume a small part
of water and largely used water in the form of waste water return to aquatic system and pollute it.
There is need to understand the consumers, pollution of return water and to make a synergy
between them by in a business model based on techno economic feasibility.
To Do Activities
• Understand availability of fresh water in time and space at global level
• Understand population density, population growth and reducing per capita water
availability.
• Understand the priority of development authorities on the resource consumption and
efforts for restoration.
• Discuss on the perpetual difficulties in control of water pollution despite
concerted efforts on allocating physical and financial resources.
• Develop passion among the youngsters for management of environment in
sustainable manners
• Develop self help groups on raising the issues related to environmental
degradation.
Self Assessment Questions
1. Whether the availability of water will always remain same despite increasing population?
2. How to augment water resources by reuse and recycling in the densely populated riparian
system?
3. What are the sources of pollution and how to handle non consumptive users?
4. What are options of maintaining water balance among the competitive users?
5. How to deal with the climate change and extremities of floods and draughts to fulfill the
requirement of water?

173 MGNCRE | E-Waste Management
173 MGNCRE | Water Security RM
References
i. Annual Report 2016-17, Department of Animal Husbandry, Dairying & Fisheries, Ministry of
Agriculture & Farmers Welfare
ii. Drinking water quality in rural India: Issues and approaches Background Paper
www.wateraid.org)
iii. Government of India, 2009 (NCIWRD Report, 1999)
iv. The System of Environmental-Economic Accounting: Central Framework (SEEA-CF), 2012,
United Nations Statistics Division
v. The United Nations World Water Development Report 3: Water in a Changing World
vi. Water and Related Statistics, CWC, 2015
vii. www.barc.gov.in/pubaware/nw_n3.html
viii. www.e-education.psu.edu/earth103/node/701
ix. www.cpcb.nic.in/
x. www.cwc.nic.in/

174 MGNCRE | E-Waste Management
174 MGNCRE | Water Security RM
Chapter 2 Waste Water Management
Introduction
Wastewater invariably generate when water is put to use for domestic as well as industrial sector.
The sources of pollution are categorized as point and non-point. Point sources impacting the water
resources in a significant manner whereas non-point sources are contributing only during the
monsoon season only in the large part of Indian sub-continent. Thus the control of pollution from
point sources is the prime requirement and accordingly required to be prioritized.
Water pollution from untreated municipal wastewater is an enormous problem in India with grave
implications for public health as well as environmental quality. Even the big cities are struggling to
put in place expensive wastewater treatment systems and associated infrastructure. It is implausible
that such expensive infrastructure can contribute meaningfully to treat wastewater so that the
water quality of recipient system is maintained for designated uses.
Low-cost, decentralized, bio-treatment systems have potential to improve the water qualityin terms
of removing pollutants from municipal wastewater. Moreover, they are low-cost, quick to deploy,
and easy to operate and maintain, making them ideal for India’s sanitation context. They can be
used extensively in rural areas, small towns, peri-urban areas of large cities, industrial townships or
institutional campuses, as well as for certain types of industries such as agro-food/beverage.
Urbanisation in India is growing at a rapid pace and there may be significant enhancement in
wastewater generation by middle of twenty first century. The pollution of aquatic resources shall
further increase significantly from present levels unless concerted efforts are made by public
authorities, communities and individuals in planning, execution and implementation of projects in
right earnest besides raising awareness.
Objectives
• To understand the requirement of treatment of wastewater
• To understand the improvement of wastewater quality by various treatment methodologies
• To know treatment plant components and technologies evolution over the decades
• To understand the role of individuals in in contribution of load reduction in sewage
treatment plants
• To know how to develop low cost decentralised sewage treatment technologies
2.1 Individual Responsibility towards Waste Water Production
Every person who uses water for daily activities including defecation invariably generate sewages.
Whether we accept it or not, the same waste water returns to us, bringing with it a myriad of
problems. It is advantageous to prevent water pollution at source. As an individual there are a
few things that we can habituate ourselves to do which can reduce water pollution substantially.
A pit latrine was the first system developed to improve the sanitation from age old practice of
open defecation. These toilets are considered a temporary sanitation facility until a new system
for hygienically treating excreta (e.g. a sewerage system or individual sewage treatment system)
is constructed in each household in urban and rural hamlets. The toilets are classified roughly into
175 MGNCRE | E-Waste Management
175 MGNCRE | Water Security RM
four types according to application viz. a toilet in a detached house; a common toilet in an office
or community; a public toilet for unspecified users; and a mobile toilet for mass gathering,
congregations or during disaster.
A septic tank system, a typical on-site treatment facility that consists of a septic tank and a soak
pit is further improvement of sanitation at individual household level that employs technologies
of anaerobic treatment and letting the treated sewage penetrate the ground. It shows stable
performance, provided that the water temperature is kept suitable to digestion and the soil has
good permeability. However, the septic tank has a BOD reducing rate of up to 50%, so if
underground penetration is not feasible due to high groundwater levels, rocky strata, non-
availability of land for soak-pit, another method must be employed to hygienically treat sewage
passing through the septic tank such as anaerobic filter and contact aeration. When this system is
applied to an urban area with high population density, care must be taken not to have an effect
on the surrounding environment.Conventional septic tanks system, if properly designed and with
proper septage removal frequency is maintained then it can effectively remove about 40-50%
organic matter measured as BOD and 50-70% Total Suspended Solids.
Due to rise in groundwater pollution related episodes, unavailability of space for soakage pits and
under rocky strata, soakage pits are avoided and the effluent is commonly discharged to open
storm water drains. It is causing another type of pollution menace such as unsightly conditions,
eutrophication, odour, vector and water related diseases. Some of the interim solutions are the
improved design of septic tanks such as anaerobic baffled reactor or the post treatment of septic
tank effluents by anaerobic filters. Both configurations can partially solve the pollution related
problems by increasing the overall BOD removal to more than 70%. These systems can lessen the
burden of organic pollution without any extra energy cost. The capital cost of these systems may
not be more than 20-30% of the conventional septic tank cost.
Nevertheless, due to the limitation of anaerobic sewage treatment, these systems cannot bring
down the BOD and TSS levels up to the sewage discharge standards. Hence, alternate solution
could be the aerobic type post treatment such as contact aeration. This system can bring down
effluent BOD to less than 30 mg/l and TSS to less than 50 mg/l but at the expense of electrical
power requirement for operating air blower with power.
One such system is the Japanese type Johkasou system. This system is an integrated septic tank
comprising of anaerobic filter followed by contact aeration, final settling tank and effluent
disinfection facility. However, due to high installation and operation and maintenance cost, these
systems are not affordable by economically poor communities. This onsite sewage treatment
system has also been upgraded for removal of nitrogen by providing internal recirculation. There
are many other similar package treatment systems elsewhere which can also be used.
Manual Scavenging
The Manual Scavenging and Construction of Dry Latrines (Prohibition) Act, 1993 was enacted
under Entry 6 of the State List (Public health and sanitation; hospitals and dispensaries). However,
the intent of prohibition of Manual Scavenging is much broader than mere ‘public health and
sanitation’, and is inextricably linked to the Constitutional guarantee to abolish untouchability in
176 MGNCRE | E-Waste Management
176 MGNCRE | Water Security RM
all its practices and forms for which the power to enact was directly derived from the
Fundamental Rights & Directive Principles of State Policy. This is a social welfare legislations
anchored in the fundamental rights enshrined in the Indian Constitution (Articles 15, 17, 21,
23).The practice of manual scavenging involves manual handling/carriage of human excreta by a
person. It serves as a primary instrument to eradicate practice of manual scavenging. The Act
defines manual scavenger as “a person engaged in or employed in manual carriage of human
excreta”. The definition of manual scavenging as per the Act, 1993 does not specifically cover
manual cleaning of septic tanks and sewers cleaning, though it may be implied as “a person
engaged or employed, whether by an individual or an urban local body or any other public or
private agency, for manual cleaning, carrying or disposing untreated human excreta, including a
latrine, a tank, a drain carrying sewage or a sewer line and railway track”. There are established
technologies that convert human excreta into manure in a scientific manner. Sewerage services
should be human centric and made free from all forms of hazard and squalor by the urban local
bodies. The Honourable Supreme Court of India and the Honourable High Courts across the
Country have enforced a ban on manual cleaning of sewers and drains. Therefore, cleaning of
sewers and septic tanks has to be done using mechanical devices. All urban local bodies should
make efforts for mechanization of cleaning of sewers and onsite systems including septic tanks,
etc. The sanitation workers shall be provided adequate protective devices and welfare measures.
They shall be given proper training related to safety and health aspects. As an individual there are
a few things that we can habituate ourselves to do which can reduce water pollution
substantially.
There has been no major effort to create community awareness over the years either about the
likely perils due to poor sewage management or the simple steps that every citizen can take
which will help in reducing sewage generation and promote effective management of its
generation and treatment. The degree of community sensitization and public awareness is low.
There is no system of segregation of black water (from toilets) and grey water (other liquid
wastes) at household level. In most of cities and towns no proper service connections have been
provided to the toilets connecting to sewer collection system.
The recent initiative of Government of India towards Swacch Bharat Abhiyan has sensitized the
public at large for developing facilities for open defecation free society. There is financial support
to economically poor communities from government and the resultant outcomes are
encouraging.
2.2 Community Responsibility towards Waste Water Disposal
Sanitation can be perceived as the conditions and processes relating to people’s health, especially
the systems that supply water and deal with human waste. Such a task would logically cover other
matters such as, solid wastes industrial and other special/hazardous wastes and storm water
drainage. However, the most potent of these pollutants is the sewage. When untreated sewage
accumulates and is allowed to become septic, the decomposition of its organic matter leads to
nuisance conditions including the production of obnoxious gases. In addition, untreated sewage
contains numerous pathogens that dwell in the human intestine tract. Sewage also contains
nutrients, which can stimulate the growth of aquatic plants, and may contain toxic compounds or
compounds that are potentially mutagenic or carcinogenic. For these reasons, the immediate and

177 MGNCRE | E-Waste Management
177 MGNCRE | Water Security RM
nuisance-free removal of sewage from its sources of generation, followed by treatment, reuse, or
dispersal into the environment in an eco-friendly manner is necessary to protect public health and
environment.
The primary responsibility of sewage management lies with municipal authorities and accordingly
infrastructure has to be developed for communities. In view of inadequate resources available with
municipal authorities, development of facilities for collection and treatment of sewage from
households has not taken place appropriately to the required levels.
The pollution of aquatic resources has highlighted the need to develop facilities for collection and
treatment of municipal sewage. The Ministry of Environment Forests & Climate Change has notified
rules for all the new construction projects for development of residential facilities beyond a certain
area is required to provide sewage treatment plants as an integrated part of the project.
Communities should insist on first-level sewage treatment before letting out their waste water. If
the treated water is of a quality suited for reuse in gardens, it should be used within the community.
This way, the fresh water requirement can be reduced. There are many modern, compact and
efficient versions of wastewater treatment plants available in the market today.
It is often the case that the drains open into the nearest river or lake without being treated. As
individual home owners, or residents of a colony, one needs to ensure that water from your toilets
move through a properly constructed septic tank before being let out into the common sewers.
Ensure that no solid waste enters the drainage through your residential premises. Under no
circumstances waste water be allowed to pollute the groundwater or be let into storm water drains.
If the community finds an individual or group polluting the waters, it should be reported to the
pollution control board or civic body with evidence. The community elders should have a discussion
with the polluting party and convince them that pre-treating their effluent is good for the entire
community. Water is a common property- using clean water is everyone’s right, keeping it clean is
everyone’s duty.
The complex question faced by the design and practicing engineers is: What levels of treatment
must be achieved in a given type of treatment and beyond those prescribed by discharge standards
have to ensure protection of the health of the community and the environment? The answer to this
question requires detailed analyses of local conditions and needs, application of scientific knowledge
and engineering judgment based on past experience, and consideration of Central, State, and Local
regulations. In some cases, a detailed assessment is required. The reuse and disposal of sludge are
vexing problems for some urban local bodies and need careful consideration.
2.3 Municipal Responsibility of Treating Waste Water
The Sewage treatment is mandated for municipal authorities under the provisions of Water
(Prevention & Control of Pollution) Act 1974 and Environment (Protection) Act 1986 to solve the
issues associated with the collection, treatment, disposal, and reuse of treated sewage. The ultimate
goal is the protection of public health in a manner commensurate with environmental, economic,
social, and political concerns. To protect public health and environment, it is necessary to have

178 MGNCRE | E-Waste Management
178 MGNCRE | Water Security RM
knowledge of constituents of concern in sewage and impacts of these constituents when sewage is
dispersed into the environment. The transformation and long-term fate of these constituents in
treatment processes, treatment methods which can be used to remove or modify the constituents
found in sewage, and methods for beneficial use or disposal of solids generated by the treatment
systems need careful deliberation.
Till late seventies sewerage and sanitation was not accorded due priority by urban local bodies. The
impetus of International Drinking Water Supply and Sanitation Decade (IDWSSD), 1981-90, had
produced considerable efforts in urban areas in the country to improve health by investment in
water supply and sanitation programmes.These often comprise, in sewerage and sanitation sub-
sector, construction of sewers, on-site sanitation facilities using various types of latrines. Under
certain hydrological conditions,unsewered sanitation can cause severe groundwater
contamination by pathogens and nitrate, which may largely negate the expected health benefits of
such programs. In some circumstances, therefore, the low-cost-technologies may be incompatible.
Though the targets fixed for sewerage and sanitation coverage during the decade at the beginning
of the IDWSSD were laudable, but could not be achieved due to resource constraints and other
impending reasons. Due to these reasons, condition of sanitation has gone from bad to worse till a
concept of river action plan have been introduced for highlighting the pollution of rivers by disposal
of untreated sewage and a comprehensive action was taken to intercept and treat municipal
sewage.
Wastewater Generation and Treatment
Sewerage and sewage treatment is a part of public health and sanitation, and according to the
Indian Constitution, falls within the purview of the State List. Since this is non-exclusive and
essential, the responsibility for providing the services lies within the public domain. The activity
being of a local nature is entrusted to the urban local bodies, which undertake the task of sewerage
and sewage treatment service delivery, with its own staff, equipment and funds. In a few cases, part
of the said work is contracted out to private enterprises. Cities and towns which have sewerage and
sewage treatment facilities are unable to cope-up with the increased burden of providing such
facilities efficiently to the desired level. Issues and constraints that are encountered by the urban
local bodies responsible for providing sewerage and sanitation facilities are compounded due to
various reasons.
The main cause of water pollution is the unintended disposal of untreated, partly treated and non-
point sources of sewage and more important is its effect on human health and environment. The
reasons for the above cited position are almost all local bodies not being financially resourceful to
self-generate the required capital funds and looking up to the State and Central Governments for
outright grant assistance. Lack of institutional arrangements and capacity building to conceive
planning, implementation, procurement of materials, operate and maintain the sewerage system
and sewage treatment plants at desired level of efficiency.
The sewage generated and collected from the residential areas terminates far away beyond the
boundaries of the urban local body and is a “out of sight, out of mind” syndrome. The high cost of
infrastructure investment, continual replacement and on-going O&M costs of centralized sewerage
179 MGNCRE | E-Waste Management
179 MGNCRE | Water Security RM
system facilities take these systems beyond the financial grasp of almost any urban local body in the
country.
It is also necessary to recognize that the practice of piped sewer collection is basically an inheritance
from advanced countries with high water usages, which ensures adequate flushing velocities in their
high per capita water supply rates and do not result in night-soil lumps settling down in pipes and do
not result in choking and hydrogen sulphide gas generation. In the Indian scenario, the per capita
supply is low and inequitable in many cities and that too intermittent and this results in settling
down of night-soil, choking, gasification etc., which necessitates very often the extreme remedies
of cutting open the roads to access and break open the pipes for rectification, etc.
While the conventional sewerage may be an effective system for sewage collection and
transportation and treatment, it also remains as a highly resource-inefficient technology.
Consequentially, high capital cost and continuing significant costs for operation and maintenance of
this system prohibit its widespread adoption in all sizes of urban areas in the country.
Every municipality is responsible for the laying and maintenance of sewage lines as well as for the
treatment of sewage in Sewage Treatment Plants. However, most municipalities are only able to
treat a fraction of the sewage the town generates. Waste water collection takes place through a
series of drains. The construction and maintenance of these drains is the responsibility of municipal
authorities, house owners and business owners. Care needs to be taken that the drains are not
damaged, cracked or leaking, to prevent contamination of soil and ground water.
Over the years, there has been continuous migration of people from rural and semi-urban areas to
cities and towns. The proportion of population residing in urban areas has increased from 27.8% in
2001 to 31.80% in 2011. The number of towns has increased from 5,161 in 2001 to 7,935 in 2011.
The uncontrolled growth in urban areas has left many Indian cities deficient in infrastructural
services as water supply, sewerage, storm water drainage, and solid waste management.
Most urban areas inhabited by slums in the country are plagued by acute problems related to
indiscriminate disposal of sewage. Due to deficient efforts by town/city authorities, sewage and its
management has become a tenacious problem and this is notwithstanding the fact that the large
part of the municipal expenditure is allotted to it. It is not uncommon to find that substantially a
large portion of resources is being utilized on manning sewerage system by Urban Local Bodies for
their operation and maintenance. Despite this, there has been a progressive decline in the standard
of services with respect to collection, transportation, treatment and safe disposal of treated sewage
as well as measures for ensuring safeguard of public health & hygiene and environment. In many
cities and towns in the country, a large quantity of sewage remains unattended giving rise to
insanitary conditions in especially densely populated slums which in turn results in an increase in
morbidity especially due to pathogens, parasitic infections and infestations in all segment of
population particularly with the urban slum dwellers.
It is estimated by Central Pollution Control Board that about 62000 million liters per day (mld) of
wastewater was generated by 422 million urban population in 2015 in India. The municipal
wastewater treatment capacity developed so far was about 23277 mld accounting for 37% of
wastewater generation capacity developed in urban centres. In view of the population increase,
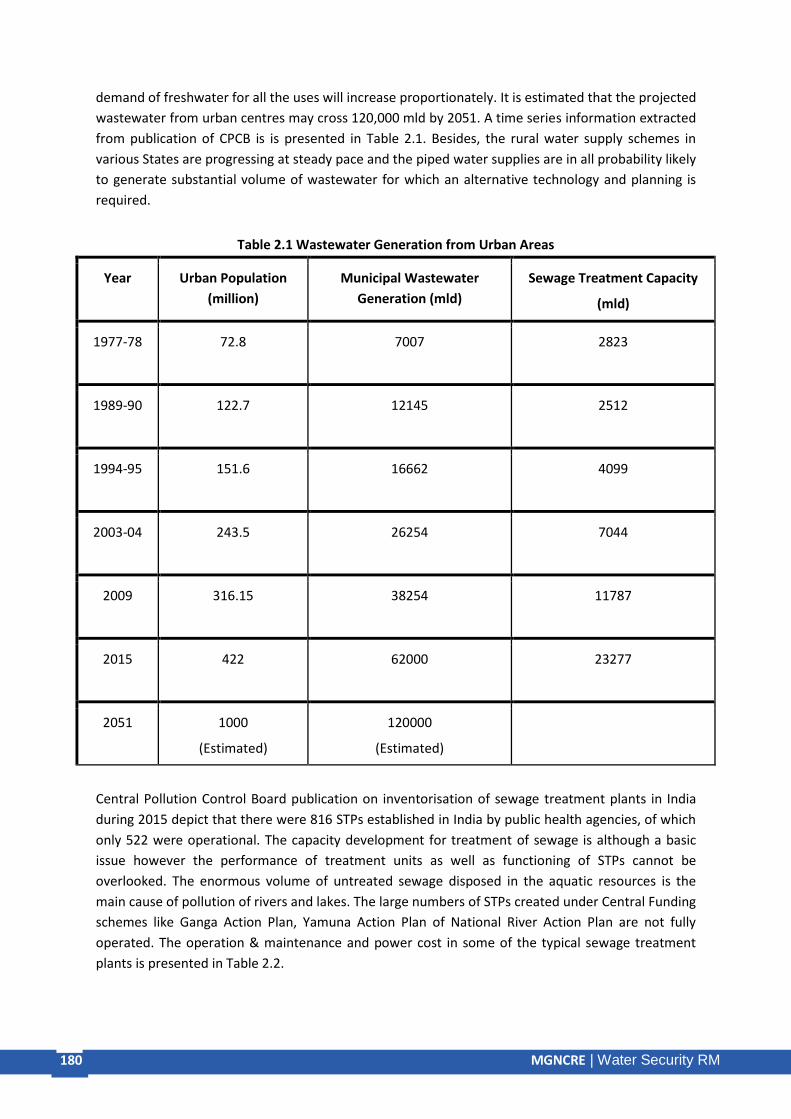
180 MGNCRE | E-Waste Management
180 MGNCRE | Water Security RM
demand of freshwater for all the uses will increase proportionately. It is estimated that the projected
wastewater from urban centres may cross 120,000 mld by 2051. A time series information extracted
from publication of CPCB is is presented in Table 2.1. Besides, the rural water supply schemes in
various States are progressing at steady pace and the piped water supplies are in all probability likely
to generate substantial volume of wastewater for which an alternative technology and planning is
required.
Table 2.1 Wastewater Generation from Urban Areas
Year Urban Population
(million)
Municipal Wastewater
Generation (mld)
Sewage Treatment Capacity
(mld)
1977-78 72.8 7007 2823
1989-90 122.7 12145 2512
1994-95 151.6 16662 4099
2003-04 243.5 26254 7044
2009 316.15 38254 11787
2015 422 62000 23277
2051 1000
(Estimated)
120000
(Estimated)
Central Pollution Control Board publication on inventorisation of sewage treatment plants in India
during 2015 depict that there were 816 STPs established in India by public health agencies, of which
only 522 were operational. The capacity development for treatment of sewage is although a basic
issue however the performance of treatment units as well as functioning of STPs cannot be
overlooked. The enormous volume of untreated sewage disposed in the aquatic resources is the
main cause of pollution of rivers and lakes. The large numbers of STPs created under Central Funding
schemes like Ganga Action Plan, Yamuna Action Plan of National River Action Plan are not fully
operated. The operation & maintenance and power cost in some of the typical sewage treatment
plants is presented in Table 2.2.

181 MGNCRE | E-Waste Management
181 MGNCRE | Water Security RM
Table 2.2: STP - O&M and Power Costs of treated sewage (per m3)
Sewage
Treatment
Plant
Design
Capacity
(MLD)
Sewage
Treatment
Technology
Operation &
Maintenance
Cost
Electrical Power Cost -
Lacs
Total
Cost
Rs./m3
Remarks
Annual-
Rs Lacs
Rs
/
m3
Electrical
Units/Day
Cost
per
Day-
Lacs
Cost
Rs./m3
Sen
Nursing
Home &
Delhi Gate
Nala
Plants-
Delhi
2 x 10
Densadeg
+ Biofor 126 1.73 5,680 0.26 1.28 3.01
With chemical
dosing
STP at
Raja
canal-
Bangalore 40
Extended
aeration 83 0.57 7,863 0.3 0.74 1.31
With
Nitrification &
Denitrification
TTP at V
Valley-
Bangalore 60
Biotower +
Densadeg +
Biofor-F 269 1.14 8,650 0.32 0.54 1.68
With
Chlorination
STP at
Rithala-
Delhi 182
HLASP +
Biofor-F 550 0.87 15,000 0.9 0.38 1.25 No Chlorination
TTP at
Lalbagh-
Bangalore 1.5
Classical
Tertiary
Treatment+
UV+Cl 28 5.11 1450 0.05 3.63 8.74
From Raw
sewage to TTP +
Chlorination
TTP at
Cubbon
park-
Bangalore 1.5
MBR +
UV+Cl 30 5.48 1650 0.06 4.13 9.61
From Raw
sewage
BOD/TSS<3,
Coliform<23mpn
The economic growth of India has progressed significantly for infrastructure development in a
number of sectors however the rural population is devoid of basic infrastructural facilities. It is
required to give parity in terms of water supply and sanitation besides other sectors. This process of
change is likely to generate huge volume of wastewater in rural areas as well. It would be
appropriate to design water and wastewater management plans optimally, so that competing
pressure on water resources can be eased.
There is need to plan strategies and give thrust to policies giving equal weightage to augmentation
of supplied water and development of wastewater treatment facilities, recycling, recovery,

182 MGNCRE | E-Waste Management
182 MGNCRE | Water Security RM
recharging and its storages. The future of urban water supplies for potable uses will grossly depend
on efficient wastewater treatment systems, as the treated wastewater of upstream urban centers
will be the source of water for downstream cities.
Time and Money Loss in terms of DALYs
The Disability-Adjusted-Life-Years (DALY) is a measure of overall disease burden, expressed as the
number of years lost due to ill-health, disability or early death. Originally developed by the WHO,
it is becoming increasingly common in the field of public health and health impact assessment. It
extends the concept of potential years of life lost due to premature death to include equivalent
years of ‘healthy’ life lost by virtue of being in states of poor health or disability. In doing so,
mortality and morbidity are combined into a single common-matrix. As per the WHO report, 80%
of the diseases in human being are water-borne and water-related. It is mainly due to water
pollution or water contamination and water logging. Though water logging may be location and
weather specific but water pollution and contamination is a common phenomenon which can
occur at any place at any point of time if community and authorities are not careful about adverse
impact of indiscriminate disposal of sewage. The indiscriminate disposal of human excreta or
sewage from habitations contain micro-organisms (pathogens) causing water pollution and
harbouring vectors which act as carriers of pathogens. The occurrence of such diseases depends
upon various factors relating to illiteracy, personal hygiene, standard of living, malnutrition, and
adulteration of food items, lack of community awareness and many other factors related to
environmental pollution. No doubts that these factors play important role in occurrence of
diseases but unsafe disposal of untreated or partially treated sewage plays a vital role in
aggravating the chances of occurrence of these communicable diseases. The burden of water
related diseases in India during 1990 was published in World development Report 1993 (Table
2.3). If we merely consider the economic value of life year at the average per capita income of $
300 per year, the annual loss of 30.51 million DALYs is worth of 30.51×300 = $ 9.153 billion
(Exchange rate during 1993, $1 = INR 40). Improvements in water supply and sanitation including
management of municipal solid waste can substantially reduce the incidences and severity of
these diseases, as well as infant mortality associated with diarrhea.
Table 2.3: Burden of Water Related Diseases in India, 1990 (In millions of DALYs)
Diseases Female Male Total
Diarrheal Diseases 14.39 13.64 28.03
Intestinal Helminthes 1 1.06 2.06
Trachoma 0.07 0.04 0.11
Hepatitis 0.17 0.14 0.31
Total – water-borne
and
water-related Diseases
15.63 14.88 30.51

183 MGNCRE | E-Waste Management
183 MGNCRE | Water Security RM
Reduction in morbidity from better water supply and sanitation including safe disposal of municipal
solid waste was estimated as 26% for diarrhoea, 27% for trachoma, 29% for ascaris, 77% for
schistosomiasis, and 78% for dracunculiasis. Mean reduction in diarrhoea-specific mortality was
65%, while overall child mortality was reduced by 55%. It is evident that environmental pollution by
liquid and solid wastes adversely affects the environment and human health directly or indirectly
resulting in loss of life and heavy financial burden on exchequers.
The problem of sanitation is much worse in urban areas due to increasing congestion and density in
cities. Indeed, the environmental and health implications of the very poor sanitary conditions are a
major cause for concern. The study of Water and Sanitation Program (WSP) of World Bank observes
that when mortality impact is excluded, the economic impact for the weaker section of the society
accounting 20% of the households is the highest. The National Urban Sanitation Policy (NUSP) of
2008 has laid down the framework for addressing the challenges of city sanitation. The Policy
emphasizes the need for spreading awareness about sanitation through an integrated city-wide
approach, assigning institutional responsibilities and due regard for demand and supply
considerations, with special focus on the urban poor.
As per 2011 Census, the households having latrine facility within premises was 81.4% which includes
72.6% households having water closets and 7.1% households having pit latrines and 1.70%
households having other latrines (connected to open drains, night soil removed by human etc.,
which was unsafe). Out of 72.6% households, 32.70% households were having water closets with
piped sewer system, 38.20% households were having water closets with septic tank and 1.70%
households were having water closets with pit latrines (ventilated improved pit/open pit etc.). The
remaining household are both sharing public latrines and defecating in open.
2.4 Conventional Waste Water Treatment and Issues Facing Present Day STPs
Sewage, before being discharged of either in river streams or on land, has to be treated so as to
make it safe. The degree of treatment required, however, depends upon the characteristics of the
source of disposal. Sewage can be treated in different ways. Treatment processes are broadly
classified as Preliminary treatment, Primary treatment, Secondary (or Biological) treatment and
Tertiary treatment
Wastewater Treatment Technologies
Wastewater Treatment Plant is a facility designed to receive the waste from domestic, commercial
and industrial sources and to remove materials that damage water quality and compromise public
health and safety when discharged into water receiving systems. The Principal objective of waste
water treatment is generally to allow human and industrial effluents to be disposed of without
danger to human health or unacceptable damage to the natural environment.
Conventional wastewater treatment processes
Conventional wastewater treatment consists of a combination of Physical, chemical, and biological
processes and operations to remove solids, organic matter and, sometimes, nutrients from
wastewater.

184 MGNCRE | E-Waste Management
184 MGNCRE | Water Security RM
Preliminary treatment
The objective of preliminary treatment is the removal of coarse solids and other large materials
often found in raw wastewater. Preliminary treatment consists solely in separating the floating
materials (like dead animals, tree branches, papers, pieces of rags, wood etc.) and also heavy
settleable inorganic solids. It also helps in removing the oils and greases etc. from sewage. The
processes used in preliminary treatment are Screening (for removing floating papers, plastic
pouches, polythene bags, rags, clothes etc.), Grit chambers or Detritus tanks ( for removing grit and
sand), Skimming tanks ( for removing oils and greases).Removal of these materials is necessary to
enhance the operation and maintenance of subsequent treatment units.
Primary treatment
The objective of primary treatment is the removal of settle able organic and inorganic solids by
sedimentation, and the removal of materials that will float (scum) by skimming. This is usually
accomplished by sedimentation in settling basins. The organic solids, which are separated out in the
sedimentation tanks (in primary treatment) are often stabilized by anaerobic decomposition in a
digestion tank or are incinerated. The residue is used for landfills or soil conditioners. The liquid
effluent from primary treatment often contains a large amount of suspended organic material. It
also has a high biochemical oxygen demand (BOD).The processes used in primary treatment are
sedimentation (for removing part of the organic matter from the sewage effluent), sedimentation
aided with coagulation.
Secondary treatment
The objective of secondary treatment is the further treatment of the effluent from primary
treatment to remove the residual organics and suspended solids. In most cases, secondary
treatment follows primary treatment and involves the removal of biodegradable dissolved and
colloidal organic matter using aerobic biological treatment processes. Aerobic biological treatment is
performed in the presence of oxygen by aerobic microorganisms (principally bacteria) that
metabolize the organic matter in the waste water, thereby producing more microorganisms and
inorganic end-products (principally CO2, NH3, and H2O).Several aerobic biological processes are used
for secondary treatment differing primarily in the manner in which oxygen is supplied to the
microorganisms and in the rate at which organisms metabolize the organic matter. Common high-
rate processes include the activated sludge processes, trickling filters or bio filters, oxidation ditches,
and rotating biological contractors (RBC). A combination of two of these processes in series (e.g. bio
filter followed by activated sludge) is sometimes used to treat municipal wastewater containing a
high concentration of organic material from industrial sources.
Various commonly used treatment technologies in India for treatment of sewage and industrial
effluents are summarised herewith.
I. Activated Sludge Process
The most common suspended growth process used for municipal wastewater treatment is the
activated sludge process. The municipal wastewater treatment is the BOD-removal. The removal of
BOD is done by a biological process, such as the suspended growth treatment process. This biological
process is an aerobic process and takes place in the aeration tank, in where the wastewater is
aerated with oxygen. By creating good conditions, bacteria will grow fast. The growth of bacteria

185 MGNCRE | E-Waste Management
185 MGNCRE | Water Security RM
creates flocks and gases. These flocks will removed by a secondary clarifier. In the activated sludge
process, the dispersed-growth reactor is an aeration tank or basin containing as suspension of the
wastewater and microorganisms, the mixed liquor. The contents of the aeration tank are mixed
vigorously by aeration devices which also supply oxygen to the biological suspension. Aeration
devices commonly used include submerged diffusers that release compressed air and mechanical
surface aerators that introduce air by agitating the liquid surface. Hydraulic retention time in the
aeration tanks usually ranges from 3 to 8 hours but can be higher with high BOD5 wastewaters.
Following the aeration step, the microorganisms are separated from the liquid by sedimentation and
the clarified liquid is secondary effluents. A portion of the biological sludge is recycled to the
aeration basin to maintain a high mixed-liquor suspended solids (MLSS) level. The remainder is
removed from the process and sent to sludge processing to maintain a relatively constant
concentration of microorganisms in the system. Several variation of the basic activated sludge
process, such as extended aeration and oxidation ditches, are in common use, but the principal are
similar:
II. Trickling Filters
A trickling filter or bio filter consists of a basin or tower filled with support media such as stones,
plastic shapes, or wooden slats. Wastewater is applied intermittently, or sometimes continuously,
over the media. Microorganisms become attached to the media and form a biological layer or fixed
film. Organic matter in the wastewater diffuses into the film, where it is metabolized. Oxygen is
normally supplied to the film by the natural flow of air either up or down through the media,
depending on the relative temperatures of the wastewater and ambient air. Forced air can also be
supplied by blowers but this is rarely necessary. The thickness of the biofilm increases as new
organisms grow. Periodically, portions of the film 'slough off the media. The sloughed material is
separated from the liquid in a secondary clarifier and discharged to sludge processing. Clarified liquid
from the secondary clarifier is the secondary effluent and a portion is often recycled to the bio filter
to improve hydraulic distribution of the wastewater over the filter.
III. Rotating Biological Contactors
Rotating biological contactors (RBCs) are fixed-film reactors similar to bio filters in that organisms
are attached to support media. In the case of the RBC, the support media are slowly rotating discs
that are partially submerged in flowing wastewater in the reactor. Oxygen is supplied to the
attached biofilm from the air when the film is out of the water and from the liquid when submerged,
since oxygen is transferred to the wastewater by surface turbulence created by the discs rotation.
Sloughed pieces of biofilm are removed in the same manner described for bio filters.
High-rate biological treatment processes, in combination with primary sedimentation, typically
remove 85 % of the BOD5 and SS originally present in the raw wastewater and some of the heavy
metals. Activated sludge generally produces an effluent of slightly higher quality, in terms of these
constituents, than bio filters or RBCs. When coupled with a disinfection step, these processes can
provide substantial but not complete removal of bacteria and virus. However, they remove very little
phosphorus, nitrogen, non-biodegradable organics, or dissolved minerals.
IV. Upflow Anaerobic Sludge Blanket (UASB) Process
UASB is an anaerobic process whilst forming a blanket of granular sludge and suspended in the tank.

186 MGNCRE | E-Waste Management
186 MGNCRE | Water Security RM
Wastewater flows upwards through the blanket and is processed by the anaerobic microorganisms.
The upward flow combined with the settling action of gravity suspends the blanket with the aid of
flocculants. The blanket begins to reach maturity at around 3 months. Small sludge granules begin to
form whose surface area is covered in aggregations of bacteria. In the absence of any support
matrix, the flow conditions create a selective environment in which only those microorganisms,
capable of attaching to each other, survive and proliferate. Eventually the aggregates form into
dense compact biofilms referred to as "granules". Fine granular sludge blanket acts as a filter to
prevent the solids in the incoming wastes to flow through as the liquid part does. So if the hydraulic
retention time (HRT) does not change, which is limited to 1-3 days (the bigger the digester, the
shorter time it is, because the size costs money), the solid retention time (SRT) can be 10-30 days or
more for more effective digestion, depending on the shape of the digestion chamber. It means that
the digester becomes much more efficient without having to increase the size, which costs money.
Standing and hanging baffles are used, with a conic separation with a small outlet at the center will
be much more effective to keep the anaerobic sludge blanket in the lower part of the digester. This
will act as a very good filter to retard the flow of solids in the wastes and prolong the solid retention
time for more bacterial action. However, the digester will be more economic if the loading can be
increased for a specific size of digester with the conic separation.
Bio-Chemical Activities in UASB Digesters Bacterial actions are in 3 phases in the digester and they
occur in sequence:
a) Hydrolysis or solubilization - The first phase takes 10-15 days, and until the complex
organics are solubilized, they cannot be absorbed into the cells of the bacteria where they
are degraded by the endoenzymes;
b) Acidogenesis or acetogenesis - The result from stage one utilized by a second group of
organisms to form organic acids;
c) Methanogenesis - The methane-producing (methanogenic) anaerobic bacteria then use
the product of (2) to complete the decomposition process.
I. Waste Stabilization Ponds
Waste water stabilization pond technology is one of the most important natural methods for
wastewater treatment. Waste stabilization ponds are mainly shallow man-made basins comprising a
single or several series of anaerobic, facultative or maturation ponds. Theprimary treatment takes
place in the anaerobic pond, which is mainly designed for removing suspended solids, and some of
the soluble element of organic matter (BOD). During the secondary stage in the facultative pond
most of the remaining BOD is removed through the coordinated activity of algae and heterotrophic
bacteria. The main function of the tertiary treatment in the maturation pond is the removal of
pathogens and nutrients (especially nitrogen). Waste stabilization pond technology is the most cost-
effective wastewater treatment technology for the removal of pathogenic micro-organisms. The
treatment is achieved through natural disinfection mechanisms. It is particularly well suited for
tropical and subtropical countries because the intensity of the sunlight and temperature are key
factors for the efficiency of the removal processes.
a. Anaerobic ponds
These units are the smallest of the series. Commonly they are 2-5 m deep and receive high organic
loads equivalent to100 g BOD/m3 d. These high organic loads produce strict anaerobic conditions
(no dissolved oxygen) throughout the pond. In general terms, anaerobic ponds function much like

187 MGNCRE | E-Waste Management
187 MGNCRE | Water Security RM
open septic tanks and work extremely well in warm climates. A properly designed anaerobic pond
can achieve around 60% BOD removal at 20 C. One-day hydraulic retention time is sufficient for
wastewater with a BOD of up to 300 mg/l and temperatures higher than 20C. Designers have always
been preoccupied by the possible odour they might cause. However, odour problems can be
minimised in well-designed ponds, if the SO42- concentration in wastewater is less than 500 mg/l.
The removal of organic matter in anaerobic ponds follows the same mechanisms that take place in
any anaerobic reactor.
b. Facultative ponds
These ponds are of two types: primary facultative ponds receive raw wastewater, and secondary
facultative ponds receive the settled wastewater from the first stage (usually the effluent from
anaerobic ponds). Facultative ponds are designed for BOD removal on the basis of a low organic
surface load to permit the development of an active algal population. This way, algae generate the
oxygen needed to remove soluble BOD. Healthy algae populations give water a dark green colour
but occasionally they can turn red or pink due to the presence of purple sulphide-oxidising
photosynthetic activity. This ecological change occurs due to a slight overload. Thus, the change of
colouring in facultative ponds is a qualitative indicator of an optimally performing removal process.
The concentration of algae in an optimally performing facultative pond depends on organic load and
temperature, but is usually in the range 500 to 2000 μg chlorophyll per litre. The photosynthetic
activity of the algae results in a diurnal variation in the concentration of dissolved oxygen and pH
values. Variables such as wind velocity have an important effect on the behaviour of facultative
ponds, as they generate the mixing of the pond liquid. As Mara et al. indicate, a good degree of
mixing ensures a uniform distribution of BOD, dissolved oxygen, bacteria and algae, and hence
better wastewater stabilization.
c. Maturation ponds
These ponds receive the effluent from a facultative pond and its size and number depend on the
required bacteriological quality of the final effluent. Maturation ponds are shallow (1.0-1.5 m) and
show less vertical stratification, and their entire volume is well oxygenated throughout the day. Their
algal population is much more diverse than that of facultative ponds. Thus, the algal diversity
increases from pond to pond along the series. The main removal mechanisms especially of
pathogens and faecal coliforms are ruled by algal activity in synergy with photo-oxidation.On the
other hand, maturation ponds only achieve a small removal of BOD, but their contribution to
nitrogen and phosphorus removal is more significant.
II. Aerated Lagoons
The mechanical-biological purification of the waste water takes place in one or more aerated
lagoons according to the size of the plant, which are followed by an non-aerated sedimentation and
polishing pond. The sewage coming from the canalisation is normally led directly into the first
aerated lagoon without mechanical pre-purification. So the continuous disposal of screenings, sand
and sedimentation sludge and its maintenance efforts can be omitted. Coarse stuff, sand and heavy
sludge settle in the inlet zone while dissolved contaminant are distributed in the whole first lagoon.
Liable to putrefy matter should mainly be stabilized by aerobic processes to avoid odours and
digested sludge coming up to the water surface. According to our experience sludge at the inlet zone
of the first aerated waste water lagoon has to be removed at regular intervals of several years. To

188 MGNCRE | E-Waste Management
188 MGNCRE | Water Security RM
exhaust and bring the sludge out liquid manure-vacuum-tankers are used. Floating solids are
retained by a scum board in the inlet area. They should be removed once or twice a week with a
rake.
III. Oxidation Ponds
Oxidation Ponds are also known as stabilization ponds or lagoons. They are used for simple
secondary treatment of sewage effluents. Within an oxidation pond heterotrophic bacteria degrade
organic matter in the sewage which results in production of cellular material and minerals. The
production of these supports the growth of algae in the oxidation pond. Growth of algal populations
allows furthur decomposition of the organic matter by producing oxygen. The production of this
oxygen replenishes the oxygen used by the heterotrophic bacteria. Typically oxidation ponds need to
be less than 10 feet deep in order to support the algal growth. In addition, the use of oxidation
ponds is largely restricted to warmer climate regions because they are strongly influenced by
seasonal temperature changes. Oxidation ponds also tend to fill, due to the settling of the bacterial
and algal cells formed during the decomposition of the sewage. Overall, oxidation ponds tend to be
inefficient and require large holding capacities and long retention times. The degradation is
relatively slow and the effluents containing the oxidized products need to be periodically removed
from the ponds.
IV. Karnal Technology
The Karnal Technology involves growing tree on ridges 1m wide and 50cm high wand disposing of
the untreated sewage in furrows. The amount of the sewage/ effluents to be disposed off depends
upon the age, type of plants, climatic conditions, soil texture and quality of effluents. The total
discharge of effluent is so regulated that it is consumed within 12-18 hours and there is no standing
water left in the trenches. This technique utilizes the entire biomass as living filter for supplying
nutrients to soil and plant; irrigation renovates the effluent for atmospheric re-charge and ground
storage. Further, as forest plants are to be used for fuel wood, timber or pulp, there is no chance of
pathogens, heavy metals and organic compounds to enter into the human food chain system, a
point that is a limiting factor when vegetables or other crops are grown with sewage. Though most
of the plants are suitable for utilizing the effluents, yet, those tree species which are fast growing
can transpire high amounts of water and are able to with stand high moisture content in the root
environment are most suitable for such purposes. Eucalyptus is one such species, which has the
capacity to transpire large amounts of water, and remains active throughout the year. Other species
suitable for this purpose are poplar and leucaena. Out of these three species, eucalyptus seems to
be the best choice as poplar remains dormant in winter and thus cannot bio-drain effluent during
winter months. However, if area is available and the volume of effluent is small, a combination of
popular and eucalyptus is the best propagation. This technology for sewage water use is relatively
cheap and no major capital is involved. The expenditure of adopting this technology involves cost of
making ridges, cost of plantation and their care.
This system generates gross returns from the sale of fuel wood. The sludge accumulating in the
furrows along with the decaying forest litter can be exploited as an additional source of revenue. As
the sewage water itself provides nutrients and irrigation ameliorates the sodic soil by lowering the
pH, relatively unfertile wastelands can be used for this purpose. This technology is economically
viable as it involves only the cost of water conveyance from source to fields for irrigation and does

189 MGNCRE | E-Waste Management
189 MGNCRE | Water Security RM
not require highly skilled personnel as well. This technology seems to be most appropriate and
economical viable proposition for the rural areas as this technology is used to raise forestry, which
would aid in re-storing environment and to generate biomass.
V. Duckweed
Duckweeds (aquatic plants) are the world smallest and simplest flowering plants. Duckweeds are
floating plants that grow on the surface of still or slow moving waters during warmer weather.
Because duckweeds usually reproduce by budding, they can multiply very quickly and cover the
entire surface of a pond in a short span of time. Small numbers of duckweeds will not harm a pond,
but large numbers will block sunlight from entering the pond and upset the ponds oxygen balance,
placing the fish population in danger. The Lemna spp. are the most common duckweeds. Lemna
grow up to 4 mm wide and have a single root dangling from the leaf of the plant. Duckweeds do not
have true leaves or stems; the roundish, flattened leaflike part of the plant is called a frond. Another
type, watermeal (Wolffia spp.), are the smallest of the duckweeds. These plants are so tiny that they
look like grains of green meal floating on the water surface. They are generally less than 1 mm wide
and barely visible as individuals. This type of duckweed does not have roots. Many times control is
necessary because the duckweeds reproduce rapidly and can cover a pond causing oxygen
problems.
VI. Fluidized Bed Reactor
Aerobic fluidized bed reactors (FBRs) are used as a new technology in wastewater treatment. An
aerobic fluidized bed reactor with granulated activated carbon (GAC) as carrier material can be
operated under different conditions, including batch-loading, semi continuous loading, and
continuous loading. The basic idea behind the Fluidized Bed Reactor is to have a continuous
operating non-clogging bio film reactor which requires (1) no back-washing, (2) has low head loss
and (3) high specific bio film surface area. This is achieved by having the biomass to grow on small
carrier elements that move with the liquid in the reactor. The movement within the reactor is
generated by aeration in the aerobic reactor. These bio-film carriers are made of special grade
plastic density close to that of water. The fluidized bed reactor employs fixed film principle and
makes the treatment process more user friendly because it does not require sludge recycle i.e.
synonymous with conventional ASP. The absence of sludge recycle frees the operator from the
enormous task of measurement and monitoring MLSS levels in the tank and adjusting recycle rations
continuously, due to fluctuating inlet COD loads. FBR produces small quantity of sludge which
requires no further treatment. Fluidized Bed Reactor technology is used in small Sewage Treatment
Plants for treating city wastewater, industrial sewage treatment plant from food waste, paper waste
and chemical waste etc. Due to fixed film nature, these plants accept shock loads much better than
those employed for suspended growth process. Fluidized Bed Reactors are generally tall (6 m and
above), thereby reducing cross-sectional area further.
VII. Sequential Batch Reactor
In this process, the raw sewage free from debris and grit shall be taken up for biological treatment
for removal of organic, nitrogen and phosphorus. The activated sludge bio-system is designed using
Advanced Cyclic Activated Sludge Technology which operates on extended aeration activated sludge
principle for the reduction of carbonaceous BOD, Nitrification, Denitrification as well as phosphorus
removal using energy efficient fine bubble diffused aeration system with automatic control of air
supply based on oxygen uptake rate.

190 MGNCRE | E-Waste Management
190 MGNCRE | Water Security RM
In this form, the sequences of fill, aeration, settle and decant are consecutively and continuously
operated all in the same tank. No secondary clarifier system is required to concentrate the sludge in
the reactor. The return sludge is recycled and the surplus is wasted from the basin itself. The
complete biological operation is divided into (a) Fill Aeration (b) Settlement and (c) Decanting. These
phases in a sequence constitute a cycle. During the period of a cycle, the liquid volume inside the
Reactor increases from a set operating bottom water level. During the Fill-Aeration sequence mixed
liquor from the aeration zone is recycled into the Selector. Aeration ends at a predetermined period
of the cycle to allow the biomass to flocculate and settle under quiescent conditions. After a specific
setting period, the treated supernatant is decanted, using a moving weir Decanter. The liquid level in
the Reactor is so returned to bottom water level after which the cycle is repeated. Solids are
separated from the reactor during the decanting phase. The system selected is capable of achieving
the (i) Bio-degradation of organics present in the wastewater by Extended Aeration Process
(ii) Oxidation of sulphides in the wastewater (iii) Co-current nitrification and denitrification of
Ammonical nitrogen in the aeration zone and (iv) Removal of phosphorous
Tertiary Treatment
Tertiary wastewater treatment is employed when specific wastewater constituents which cannot be
removed by secondary treatment must be removed. The treatment processes are necessary to
remove nitrogen, phosphorus, additional suspended solids, refractory organics, heavy metals and
dissolved solids. Because advanced treatment usually follows high-rate secondary treatment, it is
sometimes referred to as tertiary treatment. However, advanced treatment processes are
sometimes combined with primary or secondary treatment (e.g., chemical addition to primary
clarifiers or aeration basins to remove phosphorus) or used in place of secondary treatment (e.g.,
overland flow treatment of primary effluent).
The septic tank is a kind of sedimentation tank which directly receives raw sewage and removes
about 60 - 70% of the dissolved matter from it. Septic tanks are generally provided in areas where
sewers have not been laid and for serving to the sanitary disposal of sewage produced from isolated
communities, schools, hospitals, other public institutions etc. The improved design of septic tank in
the form of an Imhoff tank does not allow incoming sewage to get mixed up with the sludge
produced, and the outgoing effluent is not allowed to carry with it large amount of organic load, as
in the case of septic tank. These are very economical and do not require skilled supervision during
operations.
Issues Facing Present Day STPs
Operation and maintenance of existing plants and sewage pumping stations is a neglected field, as
nearly 39% plants are not conforming to the general standards prescribed under the Environmental
(Protection) Rules for discharge into streams. STPs are usually run by personals that do not have
adequate knowledge of running the STPs and know only operation of pumps and motors. The
operational parameters are not regularly analyzed hence the day-to-day variation in performance is
not evaluated at most of the STPs. Thus, there is a need that persons having adequate knowledge
and trained to operate the STPs be engaged to manage STPs and an expert be engaged to visit the
STPs at least once a month and advice for improvement of its performance. In a number of cities, the
existing treatment capacity remains underutilized while a lot of sewage is discharged without

191 MGNCRE | E-Waste Management
191 MGNCRE | Water Security RM
treatment in the same city. Auxiliary power back-up facility is required at all the intermediate (IPS) &
main pumping stations (MPS) of all the STPs.
In treatment schemes employing activated-sludge-process, plant operators must recognize the
importance of using Solids Retention Time (SRT) as a plant control parameter because
treatmentefficiency, sludge production, oxygen requirements and nutrients requirements are all
dependent on SRT. Moreover, SRT being the ratio of total suspended solids in the system and that
wasted per day, it is most simple to operate plants on the basis of SRT. Operation of a conventional
activated-sludge-process near 5 day SRT is recommended, as it will provide sufficient safety factor. If
a plant based on conventional activated-sludge-process receives low strength sewage than it was
designed for, then operator has a choice to either operate the plant at higher than 5 day SRT, or he
may opt for energy saving by operating fewer aerators provided mixing requirements of the plant
are still fulfilled. But all this manoeuvring requires a basic knowledge of intricacies of aerobic
biological treatment, which an operator must be equipped with. It is also necessary to recognize the
importance of return flow and waste sludge flow measurement, in addition to influent flow
measurement, as without this it is difficult to have proper control on plant operation and it is not
possible to use SRT as a plant control parameter.
The Central Pollution Control Board has carried out inventorisation of and performance assessment
of sewage treatments in India over the years on a number of occasions. The findings of the latest
study indicate that out of 816 STPs having capacity of 23277MLD in 28 States/UTs of India only 522
STPS are operational, 79 STPs are Non-operational, 145 STPs are under construction and 70 STPs are
proposed for construction.
There are various reasons for non-performance of STPs as per the design criteria and the capacity
utilisation remained considerably at low level. Among the various reasons, few of the reasons are
continuous supply of power, alternate power supply facility was not available in most of the cases
fund shortage was an important factor in poor operation and maintenance of STPs, sludge handing
appeared to be most neglected area in STPs operation, utilization of biogas generated from UASB
reactors or sludge digesters was not adequate, there was no gas generation and utilization in few
STPs in spite of having anaerobic reactors/digesters, only few STPs have the gas generated and was
being utilized as domestic fuel or as fuel for gas engine or duel fuel generator, lack of proper
laboratories at site was another area that needed attention and in majority of the cases, operation
of the STPs was looked after by contractors who deputed unqualified or less qualified staff at site,
which was an important factor responsible for poor operation of STPs.
In the first-of-its-kind success, the creation and maintenance of sewage treatment infrastructure
under Hybrid Annuity based PPP model has taken off, with National Mission of Clean Ganga has
planned for construction and maintenance of Sewage Treatment Plants (STPs) in two major cities in
Ganga river basin - Varanasi and Haridwar.Under this model, the development, operation and
maintenance of the sewage treatment plants will be undertaken by a Special Purpose Vehicle (SPV)
to be created by the winning bidder at the local level. As per this model, 40% of the Capital cost
quoted would be paid on completion of construction while the remaining 60% of the cost will be
paid over the life of the project as annuities along with operation and maintenance cost (O&M)
expenses.
One of the most important features of this model is that both the Annuity and O&M payments are
linked to the performance of the STP. This will ensure continued performance of the assets created

192 MGNCRE | E-Waste Management
192 MGNCRE | Water Security RM
due to better accountability, ownership and optimal performance. Hybrid Annuity based PPP model
has been adopted for the first time in the country in sewage management sector.
2.5Water Reclamation
Water can be reclaimed if Treated waste water does not let out into the environment rather
recycled and reused. Municipal wastewater can be recycled for irrigation purposes or for usage in
industry / thermal power station as utility water (cooling tower/boiler). The wastewater may be
given some form of terminal treatment before its application on land. The remaining nutrients,
organics and water enter into the natural system of recycling and used by plants and microbes of soil
or retained by soil. In the process excess water percolates through the soil medium, gets renovated
and ultimately recharges the groundwater. The principal of reuse /recycling of wastewater differ
from the age-old sewage farming practices as the present technology, called “Land Treatment”
means controlled application of pre-treated wastewater on land surface to achieve a designated
degree of treatment through natural bio-geochemical process wastewater reuse. The land treatment
processes are slow rate treatment of applied wastewater based on assimilative capacity of soil;
economic return from reuse of water and nutrients to produce marketable crops; and water
conservation. Other processes are rapid infiltration for groundwater recharge; recovery of renovated
water; overland flow for wastewater treatment with the help of low permeable and on sloping land;
recycle of renovated water from the system and crop production.
New generation of sewage treatment technologies such as membrane bioreactor (MBR) can treat
the waste water near to the quality of river. With a suitable renovation this treated sewage can also
recharge flood plain of riverine system to get a perennial flow on the river. It is pertinent to mention
that cost for activated sludge process is around Rupees 90 lakhs to 1 crore for 1 MLD sewage while
that of membrane bioreactor it is Rupees 1.3 – 1.5 crore for 1 MLD sewage. If the treated sewage of
MBR technique is recycled to industry the chances of payback is encouraging. In fact there shall be a
paradigm shift with respect to sewage management; i.e from sewage treatment to sewage reuse
and recycling.
There are several opportunities for improving wastewater irrigation practices via improved policies,
institutional dialogues and financial mechanisms, which would reduce the risks in agriculture.
Effluent standards combined with incentives or enforcement can motivate improvements in water
management by household and industrial sectors discharging wastewater from point sources.
Segregation of chemical pollutants from urban wastewater facilitates treatment and reduces risk.
Strengthening institutional capacity and establishing links between water delivery and sanitation
sectors through inter-institutional coordination leads to more efficient management of wastewater
and risk reduction.
Health Aspects
Undesirable constituents in wastewater can harm human health and the environment. Hence,
wastewater irrigation is an issue of concern to public agencies responsible for maintaining public
health and environmental quality. For diverse reasons, many developing countries are still unable to
implement comprehensive wastewater treatment programs. Therefore in the near term, risk
management and interim solutions are needed to prevent adverse impacts from wastewater
irrigation. A combination of source control, and farm-level and post-harvest measures can be used

193 MGNCRE | E-Waste Management
193 MGNCRE | Water Security RM
to protect farm workers and consumers. The WHO guidelines revised in 2006 for wastewater use
suggest measures beyond the traditional recommendations of producing only industrial or non-
edible crops, as in many situations it is impossible to enforce a change in the current cash crop
pattern or provide alternative vegetable supply to urban markets.
Developed economies regard wastewater treatment as vital to protect human health and prevent
the contamination of lakes and rivers. But for most developing countries this solution is prohibitively
expensive. In this case, applying wastewater to agricultural lands is a more economical alternative
and more ecologically sound than uncontrolled dumping of municipal and industrial effluents into
lakes and streams. Obviously the short-term benefits of wastewater irrigation could be offset by the
health and environmental impacts. The first step is to scientifically evaluate these. Once the actual
risks are clear, we can work to reduce them. This means, for example, finding affordable ways of
monitoring the presence of harmful contaminants in wastewater, such as heavy metals that can
accrue in soil and crops. It means looking at farming practices and crops grown to find ways of
minimizing risks of infection for farmers.
The raw domestic wastewaters normally carry the full spectrum of pathogenic microorganisms - the
causative agents of bacterial, virus and protozoan diseases endemic in the community and excreted
by diseased and infected individuals. While recycling and reuse of wastewater for agriculture,
industry and non-potable urban purposes can be a highly effective strategy for developing a
sustainable water resource in water short areas, nutrient conservation and environmental
protection, it is essential to understand the health risks involved and to develop appropriate
strategies for the control of those risks. There is need to concentrate on the control of pathogenic
microorganisms from wastewater in agricultural reuse since this is the most widely practiced form of
reuse in India. However, more and more water specialists, natural resource planners and economists
see water as an economic good and, as time goes on, there will be an increased motivation to divert
recycled wastewater from low income agriculture to areas where the added value of water is
greater, such as industrial and non-potable urban uses including public parks, green belts and golf
courses. As time goes on and water shortages in arid areas increase, there will undoubtedly be an
expansion of the reuse of purified wastewater for industrial and a wide variety of urban non-potable
purposes. Concern for human health and the environment are the most important constraints in the
reuse of wastewater. While the risks do need to be carefully considered, the importance of this
practice for the livelihoods of countless small holders must also be taken into account. There is need
for research on wastewater irrigation is to maximize the benefits to the poor who depend on the
resource while minimizing the risks. Many wastewater irrigators are not landowning farmers, but
landless people that rent small plots to produce income-generating crops such as vegetables that
thrive when watered with nutrient-rich sewage. Across the country these wastewater micro-
economies support countless poor people. Stopping or over-regulating these practices could remove
the only income many landless people have.
Reuse of treated sewage for toilet flush has been recognized as a means of water conservation
especially in high rise apartments, office complexes, multiplexes, etc. Generally, this flushing
consumes about 3 to 4 flushes per day per person and its volume will be about 20 to 30 litres daily.
When a 135 lpcd is supplied, by reusing 30 litres per day per person, we still have to deal with 110
litres per capita daily and this has to be disposed outside the house. But then, the entire 135 lpcd

194 MGNCRE | E-Waste Management
194 MGNCRE | Water Security RM
has to be treated before we can recover the 30 lpcd for toilet flush. Alternatively, there has to be
twin sewerage within the house so that milder grey water can be separately collected and treated
with less strenuous effort before reuse for flush. Such a system is least advisable especially in
modern urban habitations where the potential dangers of cross connection in plumbing and
nuisance value of dealing with a STP within the dwelling boundary are matters of great reluctance
either to be enforced or to be embraced by the occupants. That brings matters to two options
namely, condominiums to have such a facility as a centralized option for the entire condominium or
a habitation to have a dual pipeline from the STP back all the way to the dwellings supplying such
toilet flush grade water. Obviously, such a new dual pipeline all over the habitation is almost next to
impossible to be designed, implemented and attended to in O&M because, here is a system that will
deliver as little as 30 lpcd and its design as a gravity pipeline discharging in short stints for rare
timings in a 24 hours cycle calls for a pressurized system. The net result of all this is the fact that
these are possible only in the case of condominiums and entirely new layouts. In India, the rule of
culture far more outweighs the practicalities and culturally, no one can be forced to avail a water
supply originating from the refuse of the neighbour and receive it into his habitation.
Summary
The wastewater generation and its management is one of the herculean task for government
agencies.The role of individuals, in water use efficiency, reduce the burden on increasing volumes of
wastewater thereby reducing available fresh water in the aquatic resources. There are various
treatment technologies available to meet the requirement of recipient water resources.The cost
benefit analysis of each technologies must be understand in the interest of health impacts on
common citizens which are dependent on utilization of polluted aquatic resources. Impact of
polluted water on fresh water resources has far reaching consequences on the food chain and
biomagnifications in the aquatic life especially fishes. The centralized versus decentralized treatment
technologies should be assessed based on the pollution load generated in a metropolitan city or a
township of few thousand people.It is therefore importance of treatment technologies should be
evaluated and accordingly applied on case by case basis with merits and demarits.
To Do Activities
• Plan a visit to sewage treatment plant and understand contribution of each household
becomes huge volume
• Understand the requirement of various units and their functions.
• Understand requirement of electricity,manpower and laboratory on round the clock basis
without interruption
• To know requirement of resources for operation and maintenance besides civil construction
cost.
• To know the utility and benefits of treatment of wastewater as a renewable resource
• To understand the design parameters and imposition of stringent standards in view of
growing volume of wastewater generation and reduction in river flows
Self Assessment Questions
1. What are the sewage treatment technologies
2. What is the efficiency of various sewage treatment technologies?
3. How can we improve the efficiency of sewage treat plants
195 MGNCRE | E-Waste Management
195 MGNCRE | Water Security RM
4. Why there is gap in generation of sewage and treatment capacity?
5. How can be make the sewage treatment plant sustainable with business modal?
6. What kind of management policies are required to modify present system of operation and
maintenance with PPP modal or Hybrid annuity modal.
References
1. Central Pollution Control Board, Water Quality Criteria and Goal,2001
2. Central Pollution Control Board, Status of Water Quality in India
3. Central Pollution Control Board, Inventorisation of sewage treatment plants in India, 2015
4. World Development Report – World Bank, 1993
5. Metcalf and Eddy, Wastewater Engineering 4th Edition (Treatment and Reuse), 2002,
Mcgraw Higher Ed.
6. Website of National River Conservation Directorate, Ministry of Environment Forests and
ClimateChange
7. Website of National Mission for Clean Ganga

196 MGNCRE | E-Waste Management
196 MGNCRE | Water Security RM
Chapter 3 Alternative Technologies for
Waste Water Treatment
Introduction
The disposal of partially treated and untreated effluents into rivers and lakes from urban areas are
responsible for deterioration of water quality. The available water resources are rapidly depleted
due to increased water demands whereas the available water is getting deteriorated due to disposal
of domestic and industrial effluents. Although, the sewage treatment capacity increased in urban
areas in India however this increase is not adequate to keep pace with escalating generation of
wastewater which results in a large volume of untreated or partially treated wastewater discharge
leading to pollution of water resources.
The conventional mechanised wastewater treatment systems are rather expensive in terms of
installation as well as O&M costs whereas the alternative treatment technologies can be established
and operated with relatively less cost. There are different types of alternative technologies for waste
water treatment practiced in India and the most experienced include, Waste Stabilization Ponds,
Sewage fed Aquaculture, Constructed Wetlands, Polishing Ponds, Duckweed Ponds, and Karnal
Technology.
Sewage fed aquaculture system in conjunction with pisciculture is one such technology which has
the potential of offering effective wastewater treatment besides providing economic returns as well
as generating employment opportunities in the rural areas. The traditional practices of recycling
effluent through agriculture, horticulture and aquaculture have been in used various parts of India.
The practices of using waste as a resource for the sustainable rural and urban development is not
only help in treating the wastewater but also make the system long-lasting. Moreover, the practices
of using wastewater for resources recovery not only reduces the pollution load into the natural
water bodies but also make a continuous system of food production irrespective of any
environmental disparity such as rainfall or drought.
Objectives
• To understand the functioning of conventional wastewater treatment plants and options of
non conventional methodologies
• To know the merits of non conventional alternative technologies for small townships having
various management issues including financial resources.
• To evaluate the pros of cons of alternative technologies to meet the requirement of treated
water discharge norms in contrast to requirements of recipient aquatic system
3.1 Alternative Technologies for Waste Water Treatment
The conventional sewage treatment plants and effluent treatment plants are the optimum
requirement for treatment of wastewater from urban centers. The urban centers have diversified
settlements having septic tanks that release supernatant water to open drains which in turn meet
bigger drains and outfalls in rivers untreated. The drain outfalls from urban areas and the discharges

197 MGNCRE | E-Waste Management
197 MGNCRE | Water Security RM
from small towns as well as rural habitation are not getting treated in view of lack of sewage
treatment plants facility.
The facility development for conventional STPs is cost intensive affair. The huge gap in generation of
sewage and infrastructure development for treatment throughout the country may take long time
and perpetual growth of urban population may outpace the efforts. Thus, the alternative
technologies for waste water treatment by in situ as well as ex situ methodologies are required to
bridge the gap and to finally polish the treated wastewaters to meet the requirement of recipient
water courses, rivers and streams.
The natural low-rate biological treatment systems are one of the alternative technologies for the
treatment of organic wastewaters such as municipal sewage and tend to be lower in cost and less
sophisticated in operation and maintenance. Although such processes tend to be land intensive by
comparison with the conventional high-rate biological processes, they are often more effective in
removing pathogens and do so reliably and continuously if properly designed and not overloaded.
Among the natural biological treatment systems available, stabilization ponds and land treatment
have been used widely around the world. The nutrient film technique is a fairly recent development
of the hydroponic plant growth system with application in the treatment and use of wastewater.
Wastewater Stabilization Ponds
Stabilization ponds are the most suitable wastewater treatment system for effluent use in
agriculture. Stabilization ponds are the preferred wastewater treatment process in developing
countries, where land is often available at reasonable opportunity cost and skilled labour is in short
supply.
Wastewater stabilization pond systems are designed to achieve different forms of treatment in up to
three stages in series, depending on the organic strength of the input waste and the effluent quality
objectives. For ease of maintenance and flexibility of operation, at least two series of ponds in
parallel are incorporated in any design. Strong wastewaters, with Biochemical oxygen Demand
(BOD) concentration in excess of about 300 mg/l, will frequently be introduced into first-stage
anaerobic ponds, which achieve a high volumetric rate of removal. Weaker wastes or, where
anaerobic ponds are environmentally unacceptable, even stronger wastes up to 1000 mg/l BOD may
be discharged directly into primary facultative ponds. Effluent from first-stage anaerobic ponds will
overflow into secondary facultative ponds which comprise the second-stage of biological treatment.
Following primary or secondary facultative ponds, if further pathogen reduction is necessary
maturation ponds can be introduced to provide tertiary treatment.
Anaerobic Ponds
Anaerobic ponds are very cost effective for the removal of BOD, when it is present in high
concentration. Normally, a single, anaerobic pond in each treatment scheme is sufficient if the
strength of the influent wastewater is less than 1000 mg/l BOD. For high strength industrial wastes,
up to three anaerobic ponds in series might be justifiable but the retention time in any of these
ponds should not be less than 1 day.Anaerobic ponds normally have a depth between 2 meter and 5
meter and function as open septic tanks with gas release to the atmosphere. The biochemical

198 MGNCRE | E-Waste Management
198 MGNCRE | Water Security RM
reactions which take place in anaerobic ponds are the same as those occurring in anaerobic
digesters, with a first phase of acidogenesis and a second slower-rate of methanogenesis.
Ambient temperatures in hot-climate countries are conducive to these anaerobic reactions and
expected BOD removals for different retention times in treating sewage conservative removals of
BOD in anaerobic ponds with linear interpolation for operating temperature between 10 and 20°C.
Higher removal rates are possible with industrial wastes, particularly those containing significant
quantities of organic settleable solids. Of course, other environmental conditions in the ponds,
particularly pH, must be suitable for the anaerobic microorganisms bringing about the breakdown of
BOD.
In certain instances, anaerobic ponds become covered with a thick scum layer, which is thought to
be beneficial but not essential, and may give rise to increased fly breeding. Solids in the raw
wastewater, as well as biomass produced, will settle out in first-stage anaerobic ponds and it is
common to remove sludge when it has reached half depth in the pond. This usually occurs after two
years of operation at design flow in the case of municipal sewage treatment.
Facultative Ponds
The effluent from anaerobic ponds require some form of aerobic treatment before discharge or use
and facultative ponds often be more appropriate than conventional forms of secondary biological
treatment for application in specific and geo-climatic conditions. Primary facultative ponds are for
the treatment of weaker wastes and can be introduced in sensitive locations where anaerobic pond
create odour. Solids in the influent to a facultative pond and excess biomass produced in the pond
settle out forming a sludge layer at the bottom. The benthic layer become anaerobic and as a result
of anaerobic breakdown of organics, releases soluble organic products to the water column.
Organic matter dissolved or suspended in the water column gets metabolized by heterotrophic
bacteria, with the uptake of oxygen, as in conventional aerobic biological wastewater treatment
processes. However, unlike in conventional processes, the dissolved oxygen utilized by the bacteria
in facultative ponds is replaced through photosynthetic oxygen production by microalgae, rather
than by aeration equipment. Especially in treating municipal sewage in hot climates, the
environment in facultative ponds is ideal for the proliferation of microalgae. High temperature and
ample sunlight create conditions which encourage algae to utilize the carbon dioxide released by
bacteria in breaking down the organic components of the wastewater and take up nutrients (mainly
nitrogen and phosphorus) contained in the wastewater.
To maintain the balance, necessary to, allow this symbiosis to persist, the organic loading on a
facultative pond must be limited. Even under satisfactory operating conditions, the dissolved oxygen
concentration in a facultative pond varies diurnally as well as over the depth. Maximum dissolved
oxygen occurs at the surface of the pond and usually reach super saturation in tropical regions at the
time of maximum radiation intensity. From that time until sunrise, DO will decline and may well
disappear completely for a short period. For a typical facultative pond depth of 1.5 meter, the water
column is predominantly aerobic at the time of peak radiation and predominantly anaerobic at
sunrise. The pH of the pond contents vary diurnally as algae utilize carbon dioxide throughout
daylight hours and respire, along with bacteria and other organisms, releasing carbon dioxide during
199 MGNCRE | E-Waste Management
199 MGNCRE | Water Security RM
the night.
Wind is considered important to the satisfactory operation of facultative ponds by mixing the
contents and helping to prevent short-circuiting. Intimate mixing of organic substrate and the
degrading organisms is important in any biological reactor but in facultative ponds wind mixing is
considered essential to prevent thermal stratification causing anaerobiosis and failure. Facultative
ponds should be orientated with the longest dimension in the direction of the prevailing wind.
Although completely mixed reactor theory with the assumption of first-order kinetics for BOD
removal can be adopted for facultative pond design. The removal of BOD in facultative ponds is
related to loading and usually averages 70-80%. The retention time in a properly designed
facultative pond will normally be 20-40 days and, with a depth of about 1.5m, the area required will
be significantly greater than for an anaerobic pond. The effluent from a facultative pond treating
municipal sewage in the tropics will normally have a BOD between 50 and 70 mg/l as a result of the
suspended algae. On discharge to surface water, this effluent will not cause problems downstream if
the dilution is of the order of approximately 10 times and any live algae in the effluent might well be
beneficial as a result of photo synthetic oxygen production during daylight hours.
Efficiently operating facultative ponds treating wastewater will contain a mixed population of flora
but flagellate algal genera such as Chlamydomonas, Euglena, Phacus and Pyrobotrys will
predominate. Non-motile forms such as Chlorella, Scenedesmus and various diatom species will be
present in low concentrations unless the pond is underloaded. Algal stratification often occurs in
facultative ponds, particularly in the absence of wind-induced mixing, as motile forms respond to
changes in light intensity and move in a band up and down the water column. The relative numbers
of different genera and their dominance in a facultative pond vary from season to season
throughout the year but species diversity generally decreases with increase in loading. Sometimes,
mobile purple sulphur bacteria appear when facultative ponds are overloaded and sulphide
concentration increases, with the danger of odour production. High ammonia concentrations also
bring on the same problem and are toxic to algae, especially above pH 8.0.
Maintenance of properly designed facultative ponds will be limited to the removal of scum mats,
which tend to accumulate in downwind corners, and the cutting of grass on embankments. To
ensure efficient operation, facultative ponds should be regularly monitored but, even where this is
not possible, they have the reputation of being relatively trouble-free.
Maturation Ponds
The effluent from facultative ponds treating municipal sewage or equivalent input wastewater will
normally contain at least 50 mg/l BOD and if an effluent with lower BOD5 concentration is required
it will be necessary to use maturation ponds. For sewage treatment, two maturation ponds in series,
each with a retention time of 7 days, have been found necessary to produce a final effluent with
BOD < 25 mg/l when the facultative pond effluent had a BOD < 75 mg/l.
A more important function of maturation ponds, however, is the removal of excreted pathogens to
achieve an effluent quality which is suitable for its downstream reuse. Although the longer retention
in anaerobic and facultative pond systems will make them more efficient than conventional
wastewater treatment processes in removing pathogens, the effluent from a facultative pond
treating municipal sewage will generally require further treatment in maturation ponds to reach

200 MGNCRE | E-Waste Management
200 MGNCRE | Water Security RM
effluent standards imposed for reuse in unrestricted irrigation. Faecal coliform bacteria are
commonly used as indicators of excreted pathogens and maturation ponds can be designed to
achieve a given reduction of faecal coliforms (FC). Protozoan cysts and helminth ova are removed by
sedimentation in stabilization ponds and a series of ponds with overall retention of 20 days or more
will produce an effluent totally free of cysts and ova.
Reduction of faecal coliform bacteria in any stabilization pond (anaerobic, facultative and
maturation) is generally taken as following first-order kinetics. Maturation ponds will be aerobic
throughout the water column during daylight hours and the pH will rise above 9.0. The algal
population of many species of non-flagellate unicellular and colonial forms will be distributed over
the full depth of a maturation pond. Large numbers of filamentous algae, particularly blue-greens,
will emerge under very low BOD loading conditions. Very low concentrations of algae in a
maturation pond will indicate excessive algal predation by zooplankton, such as Daphnia sp, and this
will have a deleterious effect on pathogen die-off, which is linked to algal activity.
Overland Treatment of Wastewater
In overland flow treatment, effluent is distributed over gently sloping grassland on fairly
impermeable soil. Ideally, the wastewater moves evenly down the slope to collecting ditches at the
bottom edge of the area and water-tolerant grasses are an essential component of the system. This
form of land treatment requires alternating applications of effluent (usually treated) and resting of
the land, to allow soil reaction and grass cutting. The total area utilized is normally broken up into
small plots to allow this form of intermittent operation and yet achieve continuous treatment of the
flow of wastewater.
Basic site characteristics and design features for overland flow treatment pointed out that steeper
land slopes might be feasible at reduced hydraulic loadings. The ranges given for field area required
and application rates cover the wastewater quality from raw sewage to secondary effluent, with
higher application rates and lower land area requirements being associated with higher levels of pre-
application treatment. Although soil permeability is not critical with this form of land treatment, the
impact on groundwater should not be overlooked in the case of highly permeable soils.
The application rate for wastewaters will depend principally on the type of soil, the quality of
wastewater effluent and the physical and biochemical activity in the near-surface environment.
Rational design procedures, based on the kinetics of BOD removal, have been developed for
overland flow systems. The cover crop is an important component of the overland flow system since
it prevents soil erosion, provides nutrient uptake and serves as a fixed-film medium for biological
treatment. Crops best suited to overland flow treatment are grasses with a long growing season,
high moisture tolerance and extensive root formation. Suspended and colloidal organic materials in
the wastewater are removed by sedimentation and filtration through surface grass and organic
layers. Removal of total nitrogen and ammonia is inversely related to application rate, slope length
and soil temperature. Phosphorus and trace elements removal is by sorption on soil clay colloids and
precipitation as insoluble complexes of calcium, iron and aluminum. Overland flow systems also
remove pathogens from sewage effluent at levels comparable with conventional secondary
treatment systems, without chlorination. The overland flow projects both for wastewater and
effluent quality and for application rates should always be incorporated into the design.

201 MGNCRE | E-Waste Management
201 MGNCRE | Water Security RM
Macrophyte Treatment
Maturation ponds which incorporate floating, submerged or emergent aquatic plant species are
termed macrophyte ponds and these have been used in recent years for upgrading quality of
effluents from stabilization ponds. Macrophytes take up large amounts of inorganic nutrients
(especially N and P) and heavy metals (such as Cd, Cu, Hg and Zn) as a consequence of the growth
requirements and decrease the concentration of algal cells through light shading by the leaf canopy
and, possibly, adherence to gelatinous biomass which grows on the roots.
Floating Aquatic Macrophyte Systems
Floating macrophyte species, with their large root systems, are very efficient at nutrient stripping.
Although several genera have been used in pilot schemes, including Salvinia, Spirodella, Lemna and
Eichornia In tropical regions, water hyacinth doubles in mass about every 6 days and a macrophyte
pond can produce more than 250 kg per hectare per day (dry weight). Nitrogen and phosphorus
reductions up to 80% and 50% have been achieved. In Tamil Nadu, India, studies have indicated that
the coontail, Ceratophyllum demersum, a submerged macrophyte, is very efficient at removing
ammonia (97%) and phosphorus (96%) from raw sewage and also removes 95% of the BOD. It has a
lower growth rate than Eichornia crassipes, which allows less frequent harvesting.
In such macrophyte pond systems, apart from any physical removal processes which might occur
(especially sedimentation) the aquatic vascular plants serve as living substrates for microbial activity,
which removes BOD and nitrogen, and achieves reductions in phosphorus, heavy metals and some
organics through plant uptake. The basic function of the macrophytes in the latter mechanism is to
assimilate, concentrate and store contaminants on a short-term basis. Subsequent harvest of the
plant biomass results in permanent removal of stored contaminants from the pond treatment
system.
The nutrient assimilation capacity of aquatic macrophytes is directly related to growth rate, standing
crop and tissue composition. The potential rate of pollutant storage by an aquatic plant is limited by
the growth rate and standing crop of biomass per unit area. Fly and mosquito breeding is a problem
in floating macrophyte ponds but this can be partially alleviated by introducing larvae-eating fish
species such as Gambusia and Peocelia into the ponds.
The pathogen die-off is poor in macrophyte ponds as a result of light shading, lower dissolved
oxygen and pH compared with algal maturation ponds. Macrophyte ponds can serve a useful
purpose in stripping pond effluents of nutrients and algae and at the same time produce a
harvestable biomass. Floating macrophytes are fairly easily collected by floating harvesters. The
harvested plants might be fed to cattle, used as a green manure in agriculture, composted
aerobically to produce a fertilizer and soil conditioner, or can be converted into biogas in an
anaerobic digester, in which case the residual sludge can then be applied as a fertilizer and soil
conditioner.
Emergent Macrophyte Treatment Systems
In recent years, natural and artificial wetlands and marshes have been used to treat raw sewage and
partially-treated effluents. Natural wetlands are usually unmanaged, whereas artificial systems are
202 MGNCRE | E-Waste Management
202 MGNCRE | Water Security RM
specially designed to maximize performance by providing the optimum conditions for emergent
macrophyte growth. The key features of such reed bed treatment systems are:
The growth rate and pollutant assimilative capacity of emergent macrophytes such as Phragmites
communis and Scirpus lacstris are limited by the culture system, wastewater loading rate, plant
density, climate and management factors. As the emergent macrophytes have more supportive
tissue than floating macrophytes, they might have greater potential for storing the nutrients over a
longer period. Consequently, frequent harvesting might not be so necessary to achieve maximum
nutrient removal although harvesting above-ground biomass once a year should improve overall
nutrient removal efficiency.
Nutrient Film Technique
The nutrient film technique (NFT) is a modification of the hydroponic plant growth system in which
plants are grown directly on an impermeable surface to which a thin film of wastewater is
continuously applied. Root production on the impermeable surface is high and the large surface area
traps and accumulates matter. Plant top-growth provides nutrient uptake, shade for protection
against algal growth and water removal in the form of transpiration, while the large mass of self-
generating root systems and accumulated material serve as living filters. The following mechanisms,
taking place in three plant sections:
• Roughing or preliminary treatment by plant species with large root systems capable of
surviving and growing in a grossly polluted condition. Large sludge accumulations, anaerobic
conditions, trace metal precipitation and entrapment characterize this mechanism. A large
portion of wastewater BOD and suspended solids would thereby are removed.
• Nutrient conversion and recovery due to high biomass production.
• Wastewater polishing during nutrient-limited plant production, depending on the required
effluent quality.
Reed grass is used as the main test species and resulted in the production of better than secondary
effluent quality at an application rate of 10 cm/d of settled domestic sewage and synthetic
wastewater. The highest loading rates achieved are equivalent to treating the sewage generated by
a population of 10,000 on an area of 2 hectare. Plants other than reed grass are also tested and
those that flourished best in the nutrient film treatment system are cattails, bulrush, strawflowers,
Japanese millet, roses, Napier grass, marigolds, wheat and phragmites.
Membrane Filtration
Filtration membranes are classified according to the pore size or the size of solute they screen out.
Microfiltration membranes are porous membranes with pore sizes between 0.1 and 1 micron (1
micron=1000 nanometre). They allow almost all dissolved solids to get through and retain only solids
particles over the pore size. Ultra-filtration membranes are asymmetric or composite membranes
with pore sizes around between 0.005 and 0.05 micron. They allow almost mineral salts and organic
molecules to get through and retain only macromolecules. Nano-filtration membranes are reverse
osmosis with pore sizes around 0.001 micron. They retain multivalent ions and organic solutes that
are larger than 0.001 micron. Reverse osmosis membranes are dense skin, asymmetric or composite
membrane that let water get through and rejects almost all salts. Membranes can reduce
contaminants to the levels required by specific reuse application. Membranes can be added in
existing sewage treatment plant for design requirements. There are limitations of the membrane

203 MGNCRE | E-Waste Management
203 MGNCRE | Water Security RM
technology as the process is only possible after appropriate treatment and has high operation and
maintenance cost. In case of Reverse Osmosis, disposal of rejects with high dissolved solids is a
problem. Membrane filtration is largely used for polishing water for specific uses like industry process
water and high salt aquifer water.
3.2 Summary of Waste Water Treatment Technologies
Urban wastewater treatment has received relatively less attention over many decades compared to
plans and programmes focused on providing safe piped water supply through fresh water treatment.
Water scarcity coupled with the bursting seams of our cities and towns have taken a toll on our
health and environment. The pollution of our lakes and rivers by municipal and industrial
wastewater discharges has reached dangerous levels and is now being recognized by concerned
government agencies. The current urban wastewater management system is a linear treatment
system that is based on disposal. The traditional system needs to be transformed into a sustainable,
closed-loop urban wastewater management system that is based on the conservation of water and
nutrient resources. A huge loss of life-supporting resources is the result of failed organic wastewater
recovery. Wastewater management strategy should result in the reduction of organic matter and
pathogens besides chemical contaminants in surface and groundwater to improve public health.
Effective wastewater treatment management system is well established in developed countries but
is still limited in developing countries. Collection and conveyance of wastewater out of urban
neighborhoods is not yet a service provided to all the population, and adequate treatment is
provided only to a small portion of the collected wastewater. In view of population growth forecasts
the order of priorities in the development of the coverage of wastewater treatment has to increase
by adopting innovative strategy and affordable options.
A key component in any strategy aimed at increasing the coverage of wastewater treatment should
be the application of appropriate wastewater treatment technologies that are effective, simple to
operate, and low cost (in investment and especially in operation and maintenance). Appropriate
technology processes are also more environment-friendly since they consume less energy and
thereby have a positive impact on efforts to mitigate the effects of climate change. Also, with
modern design, appropriate technology processes causing less environmental nuisance than
conventional processes—for example they produce lower amounts of excess sludge and their odor
problems can be more effectively controlled.
The problem with the current treatment technologies is that they are not sustainable. The
conventional centralized system flushes pathogenic bacteria out of the residential area, using large
amounts of water, and often combines the domestic wastewater with rainwater, causing the flow of
large volumes of pathogenic wastewater. In fact, the conventional sanitary system simply transforms
a concentrated domestic health problem into a diffuse health problem for the entire settlement
and/or region. In turn, the wastewater must be treated where the cost of treatment increases as the
flow increases. The abuse of water use for diluting human excreta and transporting them away from
settled areas is increasingly questioned and being considered unsustainable.
Another reason many treatment systems in developing countries are unsustainable and unsuccessful
is that they were simply copied from Western treatment systems without considering the
204 MGNCRE | E-Waste Management
204 MGNCRE | Water Security RM
appropriateness of the technology for the culture, land, and climate. Often, local engineers educated
in Western development programs supported the choice of the inappropriate systems. Many of the
implemented installations were later abandoned due to the high cost of running the system and
repairs. On the other hand, conventional systems may even be technologically inadequate to handle
the locally produced sewage.
Appropriate technology unit processes include (but are not limited to) preliminary treatment by
rotating micro screens; grit chambers; lagoons treatment (anaerobic, facultative and polishing),
including recent developments in improving lagoons performance; anaerobic treatment processes of
various types, mainly, anaerobic lagoons, up flow anaerobic sludge blanket reactors,
physicochemical processes of various types such as chemically enhanced primary treatment;
constructed wetlands; stabilization reservoirs for wastewater reuse and other purposes; overland
flow; infiltration-percolation and septic tanks.
Out of these processes, various combinations can be set up. Combinations can also include some
other simple processes such as sand filtration and dissolved air floatation, which are not considered
appropriate processes per se but are in fact appropriate processes. One interesting combined
process is the generation of effluents suited for reuse in irrigation based on pretreatment by one of
the mentioned unit processes followed by a stabilization reservoir.
Based on experience from past mistakes in sewage treatment technology developers should base
the selection of technology upon specific site conditions and financial resources. One approach to
sustainability is through decentralization of the wastewater management system. Non-centralized
systems are more flexible and can adapt easily to the local conditions of the urban area as well as
grow within the locality as its population increases. This approach leads to treatment and reuse of
water, nutrients, and byproducts of the technology (i.e. energy, sludge, and mineralized nutrients) in
the nearby location of the settlement.
Communities must take great care when reusing wastewater, since both chemical substances and
biological pathogens threaten public health as well as accumulate in the food chain when used to
irrigate crops or in aquaculture. In most cases, industrial pollution poses a greater risk to public
health than pathogenic organisms. Therefore, more emphasis is being placed on the need to
separate domestic and industrial waste and to treat them individually to make recovery and reuse
more sustainable. The system must be able to isolate industrial toxins, pathogens, carbon, and
nutrients.
Although municipal waste water treatment is given impetus under National River Conservation Plan
of Ministry of Environment and Forest, and under Namami Gange programme of Ministry of Water
Resources River Development and Ganga Rejuvenation, Government of India to provide sewage
treatment plant to cities discharging wastewater to rivers. In spite of all these effort and various
schemes, the gap between generation and treatment is still large.
3.3 Biological Nutrient Removal Systems
Nitrogen and phosphorus are the primary causes of eutrophication in surface waters. The most
recognizable manifestations of this eutrophication are algal blooms that occur during the summer.

205 MGNCRE | E-Waste Management
205 MGNCRE | Water Security RM
Chronic symptoms of over-enrichment include low dissolved oxygen, fish kills, murky water, and
depletion of desirable flora and fauna. Excessive amounts of nutrients can stimulate the activity of
microbes, which are harmful to human health. Majority of water body impairments are due to
nutrient-related causes such as nutrients, oxygen depletion, algal growth, ammonia, harmful algal
blooms, biological integrity, and turbidity. In efforts to reduce the nutrient impairments, point
sources viz. industrial and municipal wastewater discharges be prescribed more stringent effluent
limits for nitrogen and phosphorus. To achieve the stringent limits development of facilities, have to
look beyond traditional treatment technologies.
Biological nutrient removal systems remove total nitrogen (TN) and total phosphorus (TP) from
wastewater through the use of microorganisms under different environmental conditions in the
treatment process. Total nitrogen comprises ammonia, nitrate, particulate organic nitrogen, and
soluble organic nitrogen. The biological processes that primarily remove nitrogen are nitrification
and de-nitrification. During nitrification ammonia is oxidized to nitrite by one group of autotrophic
bacteria, most commonly Nitrosomonas. Nitrite is then oxidized to nitrate by another autotrophic
bacteria group, the most common being Nitrobacter.
De-nitrification involves the biological reduction of nitrate to nitric oxide, nitrous oxide, and nitrogen
gas. Both heterotrophic and autotrophic bacteria are capable of denitrification. The most common
and widely distributed denitrifying bacteria are Pseudomonas species, which can use hydrogen,
methanol, carbohydrates, organic acids, alcohols, benzoates, and other aromatic compounds for de-
nitrification. In biological nutrient removal system, nitrification is the controlling reaction because
ammonia oxidizing bacteria lack functional diversity, have stringent growth requirements, and are
sensitive to environmental conditions.
Nitrification by itself does not actually remove nitrogen from wastewater rather, de-nitrification is
needed to convert the oxidized form of nitrogen (nitrate) to nitrogen gas. Nitrification occurs in the
presence of oxygen under aerobic conditions, and denitrification occurs in the absence of oxygen
under anoxic conditions. The total phosphorus comprises soluble and particulate phosphorus.
Particulate phosphorus can be removed from wastewater through solids removal. To achieve low
effluent concentrations, the soluble fraction of phosphorus must also be targeted.
Biological phosphorus removal relies on phosphorus uptake by aerobic heterotrophs capable of
storing orthophosphate in excess of their biological growth requirements. The treatment process
can be designed to promote the growth of these organisms, known as phosphate-accumulating
organisms in mixed liquor. Under anaerobic conditions, phosphate-accumulating organisms convert
readily available organic matter e.g., volatile fatty acids to carbon compounds called poly hydroxy
alkenoates. Phosphate-accumulating organisms use energy generated through the breakdown of
polyphosphate molecules to create poly hydroxy alkenoates. This breakdown results in the release
of phosphorus.
Under aerobic conditions in the treatment process, Phosphate-accumulating organisms use the
stored poly hydroxy alkenoates as energy to take up the phosphorus that was released in the
anaerobic zone, as well as any additional phosphate present in the wastewater. In addition to
reducing the phosphate concentration, the process renews the polyphosphate pool in the return

206 MGNCRE | E-Waste Management
206 MGNCRE | Water Security RM
sludge so that the process can be repeated. Some Phosphate-accumulating organisms use nitrate
instead of free oxygen to oxidize stored poly hydroxy alkenoates and take up phosphorus. These
denitrifying Phosphate-accumulating organisms remove phosphorus in the anoxic zone, rather than
the aerobic zone
Phosphorus can also be removed from wastewater through chemical precipitation. Chemical
precipitation primarily uses aluminum and iron coagulants or lime to form chemical flocs with
phosphorus. These flocs are then settled out to remove phosphorus from the wastewater. However,
compared to biological removal of phosphorus, chemical processes have higher operating costs,
produce more sludge, and result in added chemicals in sludge.
There are number of biological nutrient removal process configurations designed to remove only TN
or TP, while others remove both. The configuration most appropriate for any particular system
depends on the target effluent quality, operator experience, influent quality, and existing treatment
processes, if retrofitting an existing facility. Biological nutrient removal configurations vary based on
the sequencing of environmental conditions (i.e., aerobic, anaerobic, and anoxic) and timing. For
biological nutrient removal systems to result in low total nitrogen and total phosphorus effluent
concentrations, proper operation and control of the systems is essential.
Biological nitrogen removal reaction rates are temperature dependent. Nitrification and de-
nitrification rates increase as temperature increases (until a maximum temperature is reached). In
general, nitrification rates double for every 8 to 10°C rise in temperature. The effect of temperature
on biological phosphorus removal is not completely understood, although rates usually slow at
temperatures above 30°C. Dissolved Oxygen must be present in the aerobic zone for phosphorus
uptake to occur. However, it is important not to over-aerate.
The nitrification and phosphorus removal rates decrease when pH levels drop below 6.9.
Nitrification results in the consumption of alkalinity. As alkalinity is consumed, pH decreases. Thus,
treatment plants with low influent alkalinity may have reduced nitrification rates. Filamentous
growth can cause poor settling of particulate nitrogen and phosphorus in final clarifiers. However,
many conditions necessary to achieve good biological nutrient removal rates, such as low dissolved
oxygen, longer solids retention times, good mixing, also promote filament growth.
3.4 Sludge Management
Sludge in STPs generally refers to the biological organisms, settled organic matter and inert silt which
have a tendency to decay and putrefy and as otherwise has its value as soil fillers in agriculture and
bio methanation. The option for the bio methanation route and derive energy from the same by way
of electricity by igniting the methane gas in specially designed gas engines is the ultimate alternative.
In essence, it stipulates the quantity and volatile portion of the sludge solids given by the BOD load.
The sludge reuse is prevailing for bio methanation and using the methane gas to produce electricity
in a number of STPs and the digested sludge is utilized as soil filler in agriculture and horticulture.
The latter use as soil filler is not easily possible in metropolitan urban centers for want of the farm
land. Transportation of the sludge outside the limits of the metropolitan area is never easy as the
public there object to this due to odour nuisance. Hence, methods such as pellets to marketable soil

207 MGNCRE | E-Waste Management
207 MGNCRE | Water Security RM
fillers or composted organic fertilizers shall have to be practiced.
The practice of transporting of wet sludge in tankers and spraying onto agriculture fields are
reported to be in vogue in various countries where such lands are in plenty. But this practice is not
practiced in India because of the fact that in the arid temperatures in most parts of the country this
may set off an unintentional cycle of airborne aerosol infection. Thus transportation if ever to be
carried out shall have to be only in the form of dewatered sludge cake. The disposal shall have to be
for eco-friendly purposes as agriculture or farm forestry or pellets for marketing as supplemented
organic fertilizers. Another way of utilization of sludge as construction materials as porous
pavements, bricks, etc. are being practiced in developed nations.
Faecal Sludge and Septage Management
Sludge generated in an on-site treatment facility should be regularly extracted and hygienically
treated. The sludge treatment method includes (1) delivery to a sewage treatment facility and
treatment with sludge generated in the sewage treatment process, (2) treatment in a special sludge
treatment facility, (3) solar drying on a floor, and (4) treatment by a mobile dehydrating truck.
Areas which are not served by piped sewer systems can adopt on-site systems. The treatment can be
either on-site or offsite like in the case of septage management. These are interim measures till a
decentralised or a full sewerage system is implemented. It is strongly recommended that the town
planning agencies / authorities / urban local bodies / metropolitan development authorities earmark
adequate spaces for laying of sewer lines, construction of pumping stations and treatment plants.
On-site Sewage Treatment System and Sludge Handling
Unlike off-site centralized treatment (sewerage), on-site sewage treatment features individual and
distributed treatment. The on-site treatment system includes a wide range of facilities, such as a
basic sanitation facility like a pit latrine, a simple sewage treatment system that consists of a septic
tank and a soak pit for anaerobic and penetrating treatment, and an advanced facility like Johkasou
that treats sewage by sophisticated methods. In an urban area with high population density, a
sewerage system intensively treats sewage collected from pipes laid over the wide area, while an on-
site system treats sewage near to its source. Accordingly, the latter uses various kinds of treatment
technologies according to treatment scale and the surrounding conditions. Sludge generated in each
on-site treatment facility is collected and treated.
Basically the septage collected should be treated as it cannot be let into the environment directly.
Because of this, a treatment facility should be set up or the septage added to an existing septage
facility. This implies a near uniform loading on the facility through the all year round instead of
peaking the discharge at certain days alone. This in turn demands the planned septage collection
logistics round the year by the septage trucks. Hence the establishment of a septage collection unit
becomes an adjunct to the decentralized sewerage system where septic tanks are the primary
treatment at households.
The treatment of septage can be opted through existing STPs depending on the concentrations of
BOD, flows and spare capacity available in them or a separate dedicated treatment facility for
septage is developed. The pre-treatment of septage is needed to (a) ensure a flow equalization tank
for the septage flow so that it can be loaded onto the STP at as much uniform flow as possible
208 MGNCRE | E-Waste Management
208 MGNCRE | Water Security RM
through the 24 hours, (b) a degritting facility to segregate the grit content and prevent it from
getting into aeration units & pumps etc. and (c) separate the liquid stream and sludge stream. The
equalization tank may be a relatively deeper tank equipped with sub surface mixers to maintain the
contents in suspension and not surface aerators or diffused air systems which will create odour
problems. The sludge-liquid separation facility can be a filter press or belt press or screw press or
centrifuges depending on the feed solids concentration being within the capacity of this equipment.
Independent Septage Treatment Plant
When the distance or the capacity of the plant becomes a limiting factor, it is not a feasible option to
transport and treat the septage to the sewage treatment facilities. In this case treatment plants
specially meant for septage treatment becomes an attractive option.Independent septage treatment
plants are designed specifically for septage treatment and usually have separate unit processes to
handle both the liquid and solid portions of septage. These facilities include mechanical dewatering,
sludge drying beds, Waste stabilization ponds, etc. The benefit of using these treatment plants is
that they provide a solution to septage management.
Many septage treatment plants use lime to provide both conditioning and stabilization before the
septage is dewatered. Dewatered sludge can be used as organic fertilizer after drying and
composting. The remaining effluent/ filtrate/ supernatant can be released to another treatment
process such as waste stabilization pond, anaerobic baffled reactor, constructed wetland or
combination of these of extended aeration activated sludge where it can undergo further treatment
and then finally can be safely discharged.
Choosing an appropriate septage management method relies not only on technical aspect but also
on regulatory requirements. The management option selected should be in conformity with local,
State, and Central regulations. Some of the factors that determine the process of selection
include: land availability and site conditions, buffer zone requirements, hauling distance, fuel
costs, labour costs, costs of disposal and other legal and regulatory requirements.
3.5 Disinfection
Disinfection of treated sewage is needed when the receiving water quality is affected by the
bacterial consortium (Coliforms) after the discharge.
Disinfection by Chlorination
Chlorination is the most widely used technology in both water supply and sewage treatment. As the
treated sewage is fresh from secondary aerobic biological treatment, the chlorination of such
effluents does not result in hazards. In the case of effluents from anaerobic processes like UASB, the
provision of an aerobic polishing treatment is mandatory before such chlorination. The usual dosage
used is 10 mg/l and the detention time in the contact tank is 30 minutes. Suitable baffles are
provided in these tanks to maximize the duration of contact. These tanks shall not be covered and
free wind must be allowed to blow across the tank. The residual chlorine after the contact has been
generally detected at 1 to 1.5 mg/l at the maximum and there are no offensive odours arising there
from.
De-chlorination

209 MGNCRE | E-Waste Management
209 MGNCRE | Water Security RM
Excess of residual chlorine if any is nullified by de-chlorination chemicals like Sulphur Dioxide (SO2)
gas or salts as Sodium Thiosulfate (Na2S2O3), Sodium Sulphite (Na2SO3), Sodium Bisulfide
(NaHSO3), Sodium Metabisulphite (Na2S2O5), Calcium Thiosulfate (CaS2O3), Ascorbic Acid (Vitamin
C) and Sodium Ascorbate. Sodium Bisulfite is used by some utilities due to its lower cost and higher
rate of de-chlorination. Sodium sulphite tablets are chosen by utilities due to ease of storage and
handling, and its ease of use for dechlorinating constant, low flow rate releases. Sodium Thiosulfate
is used for de-chlorination since it is less hazardous in handling and consumes less oxygen than
sodium Bisulfite and sodium sulphite. Ascorbic acid and sodium Ascorbate are used because they do
not impact DO concentrations. Also, chemicals such as Sodium Metabisulfite, Sodium sulphite and
Sodium Thiosulfate may deplete DO of receiving streams under certain circumstances. Sodium
Metabisulfite and ascorbic acid may decrease the pH of some waters. It is necessary to determine in
the laboratory the choice of the chemical for the given sewage quality and keep stock of the
chemical for a demand of at least a week.
Ultraviolet Radiation Disinfection
Ultraviolet rays are most commonly produced by a low pressure mercury lamp constructed of quartz
or special glass which is transparent and produces a narrow band of radiation energy at 2637 A0
emitted by the mercury vapour etc. Though this is a standard chemistry, in actual practice, its
efficiency is largely constrained by the requirements that (a) The water is free from suspended and
colloidal substances causing turbidity, (b) The water does not contain light absorbing substances
such as phenols, ABS and other aromatic compounds, (c) The water is flowing in thin film sheets and
is well mixed and (d) Adequate intensity and time of exposure of UV rays is well mixed. The
advantage of UV is that exposure is only for short periods, no foreign matter is actually introduced
and no toxic and no odour is produced. Over exposure does not result in any harmful effects. The
disadvantages are that no residual effect is available and there is lack of field test for assessing the
treatment efficiency. Moreover, the apparatus needed is expensive.
Ozonation
It is a faintly blue gas of pungent odour. Being unstable, it breaks down to normal oxygen and
nascent oxygen. This nascent oxygen is a powerful oxidizing agent and germicidal agent. Ozone is
produced by the corona discharge of high voltage into dry air and being unstable has to be produced
on-site. It poses more superior bactericidal properties than chlorine. As Ozone reacts with chemical
impurities prior to attacking the microorganisms, it produces essentially no disinfectant unless ozone
demand of water has been satisfied but much more rapid kills are achieved once free ozone
residuals are available.The efficiency of its disinfection is unaffected by pH or temperature of the
water over a wide range. Among the disadvantages are (a) its high cost of production, (b) its inability
to provide residual protection against recontamination and (c) the compulsion for its generation
onsite due to instability.
Relative Aspects of Disinfection Processes
In a recent finding the US Water Environment Federation (WEF) observed that “disinfection of
wastewater protects the public from potential exposure to pathogenic microorganisms that would
otherwise be present in wastewater effluent that is discharged into water bodies that may be used
for recreation or drinking water. Wastewater disinfection has traditionally been accomplished using
some form of chlorination. In fact, more than 60 percent of the 20,000 municipal wastewater

210 MGNCRE | E-Waste Management
210 MGNCRE | Water Security RM
treatment plants in North America use chlorination as the primary method of disinfecting effluent.
Although an effective disinfectant, chlorine (and related compounds) has come under increased
scrutiny because of regulatory, safety and security issues.
An ongoing unpublished work observes states that after studying the performance of disinfectants
pf chlorination, its variants, solar, UV, Ozone and Peraceitic acid, the faecal coliform removal was
about the same at upto 4<5 log unit except in the case of solar where it was upto 2<3 and total
coliforms < 1000 for all except UV at <100and Ozone at < 50. The occurrence and fate of disinfection
by-products and related residuals are not readily available.
The relative evaluation of the efficiencies of disinfectants vs. their by-products is long engaging the
attention worldwide and reported works are mostly in respect of surface waters, ground waters,
surface runoff waters etc. and not precisely for treated sewage. Further the contents and
compositions of relatively concentrated sewage in India are vastly different.
US-EPA-Design Manual-Municipal Wastewater Disinfection-EPA/625/1-86/021 observes that even
otherwise, the issue of attention has been the disinfection by-products. Though it is contended that
chlorination may result in by-products of Trihalomethanes, it needs to be realized that it is the case
only when chlorination of humic substances takes place and a treated sewage from an aerobic plant
does not purport humic substances. Moreover, the inherent alkalinity in sewage has a beneficial
effect on THM formation potential because alkalinity scavenges any hydroxyl free radicals. In respect
of UV the distribution of biologically stable water is realized by reducing the AOC concentration
using GAC filtration after UV disinfection and as such UV by itself is not a complete treatment. In
respect of Ozonation, the overall effect of ozone on effluent toxicity have found the effects to be
variable as ozonation of secondary sewage can both decrease or increase effluent toxicity, although
overall the effects are generally minor in nature, and considerable research is still needed on the
formation of ozone-byproduct species and the effect of ozone on the treated sewage.
Summary
The sewage treatment technologies have gradually upgraded performance over the time from
primitive oxidation ponds to sophisticated sequential batch reactor. There are options to select
conventional wastewater treatment plants in contrast to non conventional methodologies in view of
constraint of land availability in metropolitan and major urban centres. The merits of non-
conventional alternative technologies for small townships cannot be overlooked in view of operation
and maintenance aspects including requirement of optimum financial resources. The selection of
technologies broadly depends on the requirement of norms and concentration of discharge. The
understanding of treatment technologies vis a vis discharge of treated wastewater to meet the
requirement of recipient water resources should be kept in mind while taking administrative as well
as policy decisions.
To Do Activities
• Visit sewage treatment plants of varying capacity in small and big townships
• Understand ease of operation of non-conventional alternative treatment systems.
• How to maintain bio mass in the non-conventional treatment plants and periodic removal of
sludge
• Resource management through low cost technology using phyto remediation technologies
211 MGNCRE | E-Waste Management
211 MGNCRE | Water Security RM
• Management of water quality parameters in the rivers and streams by introducing
alternative technologies in the changing climate patters
Self-Assessment Questions
1. How to select a treatment technology for treatment of sewage in a metropolitan city?
2. What are the merits and demerits of various wastewater technologies including alternative
methodologies?
3. What are discharge norms to be achieved by wastewater treatment plants?
4. What are the limitations of alternative treatment technologies in view of constraint of land
availability?
5. Whether alternative technologies can be introduced in situ in drains polluting rivers and
drains?
References
1. Central Pollution Control Board, Water Quality Criteria and Goal,2001
2. Central Pollution Control Board, Status of Water Quality in India
3. Central Pollution Control Board, Inventorisation of sewage treatment plants in India, 2015
4. World Development Report – World Bank, 1993
5. Metcalf and Eddy, Wastewater Engineering 4th Edition (Treatment and Reuse), 2002,
MCGRAW
6. Higher Ed.
7. Website of National River Conservation Directorate, Ministry of Environment Forests and
Climate Change
8. Website of National Mission for Clean Ganga
9. Source: United States Environmental Protection Agency Office of Water Washington, DC
20460 (4305T) EPA-823-R-07-002 June 2007
10. US-EPA-Design Manual-Municipal Wastewater Disinfection-EPA/625/1-86/021
212 MGNCRE | E-Waste Management
212 MGNCRE | Water Security RM
Chapter 4 Clean Water Solutions
Introduction
The traditional water conservation structures like tanks, lakes, ponds have been in use in India and
served as sources of water for people by capturing rainfall and surface runoff. In past few decades
many of these structures have been encroached and thus becoming dysfunctional. The usefulness of
these structures still holds good and there has been initiatives across the country for revival of such
systems.
When it comes to dealing with maintaining water quality, the users and in large the communities
have to play a key role in maintaining hygiene near water sources. One has to improve the ways in
which we collect and store water so as to avoid contamination while collection, storage and use.
With the decentralisation of programmes for water supply it is essential that communities and
institutions like panchayats are actively involved in the planning, implementation and execution of
programmes for water supply. Panchayats shall also have to undertake the monitoring of water
sources and be made aware of simple remedial measures. There is interplay of various factors that
govern access and utilisation of water resources and in light of the increasing demand for water it
becomes important to look for holistic and people-centered approaches for water management.
Once contamination is detected in a water source, there is need for treatment. In case of rural areas,
modern water purification technologies might not be viable. In villages, it is important that simple
technologies that are easy to use and can be operated without muchtechnical know-how be
promoted. The price factor is also important as technologies with high operational and recurring
costs might not be useful.
Rain Water Harvesting and subsequent recharge of groundwater can help lower the concentration of
minerals in aquifers and release of water in the catchment area for augmenting river flow. There are
various factors that govern access and utilisation of water resources and in light of the increasing
demand for water it becomes important to look for holistic and people-centered approaches for
water management.
Objectives
• To know the ancient water management systems and resources conservation
• To know the necessity of rainwater harvesting for enrichment of depleted aquifers in
overexploited dark zones
• To know the role of watershed in maintaining ecosystem and harmonization of forestation
and grassland development in sustaining flow in streams and rivers
• To know the extremities of draught and floods and management of water requirements
• To know the importance of recycling, reuse for maintaining requirement of environmental
flows.
• To understand various options of river restoration and control of pollution
• To know the contribution of water reclamation by individuals and communities in maintain
quantity and quality of aquatic resources.

213 MGNCRE | E-Waste Management
213 MGNCRE | Water Security RM
4.1 Introduction and Ancient Water Technology
India is endowed with a rich and vast diversity of natural resources in general and water in
particular. Watersheds play a critical role in the natural functioning of the ecosystem thus
considered as one of the primary planning units in the field of natural resource management. It is
not only the hydrological unit but also socio-political ecological entity, determining food, social, and
economical security and provides life support services to people. Watershed management is a way
of looking at relationships among people, land and water. The existence of the plant and animal
kingdoms depends on water. Water is essential for irrigation, generation of hydro-electricity,
navigation and industries. India has a rich heritage of water conservation.
On an average, every year India gets 4,000 billion cubic meters (BCM, 1 BCM = 1 cu km) of water by
way of mostly rainfall and some snowfall. However, there are considerable spatial and temporal
variations in the distribution of rainfall and hence in availability of water in time and space in the
country. It is estimated that out of the 4000 BCM water, 1869 BCM is available water resource. Out
of this the quantity that can be put to use (Utilizable) is only 1123 BCM (690 BCM from surface water
resources and 433 BCM from ground water resources). The water demand in the year 2000 was 634
BCM and it is going to be 1093 BCM by the year 2025. Efforts, therefore, need to be made to
increase the utilizable quantity by conservation, improving efficiencies and increasing supply
sources.
The annual average rainfall of our country is about 118.28 cm. Mean (1901-2003) rainfall of July is
286.5 mm, which is the highest and contributes 24.2 % of annual average rainfall. The August rainfall
is slightly lower and it contributes 21.2% of annual average rainfall. June and September rainfall are
almost similar and they contribute 13.8 % and 14.2 % of annual average rainfall respectively. The
mean south-west monsoon rainfall (87.72 cm) contributes 74.2 % of annual average rainfall.
Contribution of pre-monsoon rainfall and post-monsoon rainfall in annual average rainfall is mostly
the same (11%). Coefficient of variation is higher during the months of November, December,
January and February.
Majority of this precipitation runs off to sea resulting water scarcity in summer seasons especially in
dryland areas where there is no source of irrigation facility. In such cases many resorts to ground
water over utilization to meet demands. It has led to declining of groundwater level in many parts of
the country.
Floods may occur in the heavy rainfall areas whereas drought breaks out in the low rainfall areas.
Sometimes the summer southwest monsoons break late and close earlier, and in some years break
earlier and close earlier too. Again, at times it doesn't rain in the growing period of crops in the
months of July and August. Sometimes late monsoons also damage crops; therefore, this monsoon
rainfall is very uncertain.
As a result of such irregular, unequal and uncertain monsoon rainfall, natural calamities like flood
and drought have their devastating effects in our country. About one third of the country's area is
drought prone. The south and western parts comprising the states of Rajasthan, Gujarat, Andhra
Pradesh, Madhya Pradesh, Maharashtra, Tamil Nadu and Karnataka are the drought prone states.

214 MGNCRE | E-Waste Management
214 MGNCRE | Water Security RM
On the other hand, north and north eastern regions including states of Uttar Pradesh, Bihar, West
Bengal and Assam are subjected to periodic flooding. This occurrence of flood and drought has
adverse impact on food production and also causes substantial loss of fertile top soil and country’s
wealth. Therefore, integrated development and management of water resources of the country with
scientific data base is a pre-requisite for achieving sustainable development.
Water resource development needs to be at both macro and micro levels. Construction of large
dams and reservoirs for irrigation and power generation are covered under macro level whereas
development programmes at watershed level primarily for conservation of soil and water resources
are covered under micro level.
Ancient Water Technology
Ancient Indians understood the science and art of settlement planning, architecture and governance
of natural resources. Kautilya’s Arthasastra, written around 300 BC discussed about these aspects in
detail. The kings provided fiscal incentives to the communities or individuals who built water
systems.
Archaeologists have found evidence of early Indian hydraulic engineering. Sringaverapura tank near
Allahabad is a remarkable system to convert floodwater of River Ganga into a set of desalting
chambers, including water weirs, to clean the water for drinking. Dholavira, Gujarat of Indus Valley
civilization had built lakes to harvest monsoon runoff for drainage system and drinking water. During
early Harappan phase (2800–2600 BC), rain water-retaining devices (eg. gabarbands and Lothal)
have been discovered in Baluchistan and Sindh Kohistan to store water for irrigation purposes.
In the 3rd century BC, drainage systems included soak-pits built of pottery ring are built in Ujjain and
Taxila were used for the disposal of domestic wastewater which was canalized out from the houses
through earthenware drain-pipes into soak-pits. British Gazettes written of these systems, at times
with awe and mentioned India as a hydraulic society. Ingenious system of flood management of
Bengal was famous in British era.
In South Asia, during the Sangam Period, rainwater harvesting was started to irrigate paddy fields,
and fishing was practiced in lotus ponds. Domestic grey and black water were canalized through
street-side drains, and cesspits were implemented in order to avoid the clogging of the system.
During the 1st century AD, a grand dam was built on the river Cauvery to protect the downstream
populations from floods, and to provide water for irrigation purposes. Katta, sand bores called as
Madakas in Karnataka, Pemghara in Odisha and Johads in Rajasthan, are the oldest systems used to
conserve and recharge ground water. Desert city of Jaisalmer in Rajasthan is a best example of
traditional Indian rain water harvesting. These are the real symbols of ancient India’s scientific
prowess.
Visvesvarayya, the architect of water management in modern India, took inspiration from the
ancient civilizations. Not only in water management, ancient Indian technology adopted simple,
effective and sustainable methods in the domain of water treatment too (eg. reducing fluoride levels
by adding Tulasi, Vetiver, and Drumsticks). We must be proud of our water heritage and relearn its
art and science. Taking a leaf out of the fascinating past of water management and conservation in
India we must solve present water crisis.

215 MGNCRE | E-Waste Management
215 MGNCRE | Water Security RM
4.2Rainwater Harvesting
Rain water harvesting is the technique of collection and storage of rain water at surface or in sub-
surface aquifers, before it is lost as surface run-off. The augmented resource can be harvested in the
time of need. Artificial recharge to ground water is a process by which the ground water reservoir is
augmented at rate exceeding that under natural conditions of replenishment.
The need of rainwater harvesting is to overcome the inadequacy of waters to meet demands; arrest
decline in ground water levels; enhance availability of ground water at specific place and time and
utilize rain water for sustainable development; increase infiltration of rain water in the subsoil which
has decreased drastically in urban areas due to paving of open area; improve ground water quality
by dilution; increase agriculture production and improve ecology of the area by increase in
vegetation cover, etc.
The advantages of rainwater harvesting are recharging cost to sub-surface reservoir is lower than
surface reservoirs; aquifer serves as distribution system; no land is wasted for storage purpose and
no population displacement; ground water is not directly exposed to evaporation and pollution;
storing water underground is environment friendly; increases the productivity of aquifer; reduces
flood hazards and effects rise in ground water levels; mitigates the effects of drought and reduces
soil erosion.
Rainwater can be collected from drainage system, rivers, streams or building roofs, and the water
collected is redirected to a deep pit (well, shaft, or borehole) or reservoir with percolation.
Rainwater harvesting is one of the simplest and oldest methods of augmenting availability of pristine
quality water by communities in water scarce regions worldwide. Rainwater harvesting systems can
range in complexity, from systems that can be installed with minimal skills, to automated systems
that require advanced setup and installation. The basic rainwater harvesting system is to connect all
the water channels in the watershed to porous and permeable strata or for rooftop systems wherein
all the outlets from the building's terrace are connected through a pipe to an underground tank that
stores water.
Rainwater harvesting Systems are ideally sized to meet the water demand for the dry season, since it
must be big enough to support daily water consumption. Specifically, the rainfall capturing area such
as a building roof must be large enough to maintain adequate flow of water. The water storage tank
size should be large enough to contain the captured water. Before a rainwater harvesting system is
built, use of digital tools is useful. For instance, to detect if a region has a high rainwater harvesting
potential, rainwater-harvesting GIS maps can be made using an online interactive tool, or, to
estimate how much water is needed to fulfill a community's water needs. Tools like these can save
time and money before a commitment to build a system is undertaken, in addition to making the
project sustainable and long lasting.
The important aspects to be looked into for designing a rainwater harvesting system to augment
ground water resources are hydrogeology of the area including nature and extent of aquifer, soil
cover, topography, depth to water level and chemical quality of ground water. The availability of
source water, one of the prime requisite for ground water recharge, assessed in terms of non-
committed surplus monsoon runoff; area contributing run off, land use pattern (industrial,
residential, green belt, paved areas, roof top area etc.) and hydro-meteriological characters like
rainfall duration, general pattern and intensity of rainfall.

216 MGNCRE | E-Waste Management
216 MGNCRE | Water Security RM
The potential areas for rainwater harvesting are where ground water levels are declining on regular
basis; substantial amount of aquifer has been de-saturated; availability of ground water is
inadequate in lean months; due to rapid urbanization, infiltration of rain water into subsoil has
decreased drastically and recharging of ground water has diminished. The methods and techniques
of rainwater harvesting in urban areas are roof top rainwater /storm runoff harvesting through
recharge pit, recharge trench, tubewell and recharge well.
Urban Areas
In urban areas, rain water from roof tops of buildings, paved and unpaved areas flows to the
drainage system and does not remain available in the locality of downpour. This water can be
recharged to aquifer and can be utilized gainfully at the time of need. The rain water harvesting
system needs to be designed in a way that it does not occupy large space for collection and recharge
system.
The roof top rain water harvesting through recharge pit is feasible in alluvial areas where permeable
strata is exposed on the land surface or at very shallow depth. The technique is suitable for buildings
having water drainage pipes are constructed for recharging the shallow aquifers. ) Recharge Pits may
be of any shape and size and are generally constructed 1 to 2 meter wide and 2 to 3 meter deep
which are back filled with column of boulders at the bottom, gravels in between and coarse sand at
the top so that the silt content that will come with runoff will be deposited on the top of the coarse
sand layer and can easily be removed. A mesh should be provided at the roof so that leaves or any
other solid waste /debris is prevented from entering the pit and a desilting /collection chamber may
also be provided at the ground to arrest the flow of finer particles to the recharge pit. The top layer
of sand should be cleaned periodically to maintain the recharge rate. By-pass arrangement be
provided before the collection chamber to reject the first showers.
In areas where the shallow aquifers have dried up and existing tube wells are tapping deeper
aquifer, roof to rain water harvesting through existing tube well can be adopted to recharge the
deeper aquifers.PVC pipes of 10 cm diameter are connected to roof drains to collect rainwater. The
first roof runoff is let off through the bottom of drainpipe. After closing the bottom pipe, the
rainwater of subsequent rain showers is taken through an online filter screen. The filter may be
provided before water enters the tubewells. The filter may be onemeter in length. It’s diameter
should vary depending on the area of roof. The filter may be divided into three chambers by erecting
screens so that filter material is not mixed up. The first chamber maybe filled up with gravel , middle
chamber with pebbles and last chamber with bigger pebbles .
Rural Areas
In rural areas, rain water harvesting can be taken up considering watershed as a unit. Surface
spreading techniques are common since space for such systems is available in plenty and quantity of
recharged water is also large. The techniques in forests and rural areas are gully plug, contour bund,
gabion structure, percolation tank, check dam, recharge shaft and dug well recharge. The gully plugs
are built using local stones, clay and bushes across small gullies and streams running down the hill
slopes carrying drainage to tiny catchments during rainy season. Gully plugs help in conservation of
soil and moisture. The sites for gully plugs may be chosen whenever there is a local break in slope to
permit accumulation of adequate water behind the bunds.

217 MGNCRE | E-Waste Management
217 MGNCRE | Water Security RM
The contour bunds are effective methods to conserve soil moisture in watershed for long duration.
These are suitable in low rain fall areas where monsoon run off can be impounded by constructing
bunds on the sloping ground all along the contour of equal elevation. Flowing water can be
intercepted before it attains the erosive velocity by keeping suitable spacing between bunds.
Spacing between two contour bunds depends on the slope the area as the permeability of the soil.
Lesser the permeability of soil, the close should be spacing of bunds. Contour bunding is suitable on
lands with moderate slopes without involving terracing.
The percolation tank is another artificially created surface water body, submerging in its reservoir a
highly permeable land so that surface runoff is made to percolate and recharge the ground water
storage. Percolation tank may be constructed preferably on second to third order streams, located
on highly fractured and weathered rocks, which have lateral continuity downstream. The recharge
area downstream may have sufficient number of wells and cultivable land to benefit from the
augmented ground water. The size of percolation tank should be governed by percolation capacity
of strata in the tank bed. The percolation tanks are mostly earthen dams with masonry structure
only for spillway. The purpose of the percolation tanks is to recharge the ground water storage and
hence seepage below the seat of the bed is permissible.
The Check dams are constructed across small streams having gentle slope. The site selected should
have sufficient thickness of permeable bed or weathered formation to facilitate recharge of stored
water within short span of time. The water stored in these structures is mostly confined to stream
course and the height is normally less than 2 meter and excess water is allowed to flow over the
wall. In order to avoid scouring from excess run off, water cushions are provided at downstream
side. To harness the maximum run off in the stream, series of such check dams can be constructed
to have recharge on regional scale.
Clay filled cement bags arranged as a wall are also being successfully used as a barrier across small
nalas. At places, shallow trench is excavated across the nala and asbestos sheets are put on two
sides. The space between the rows of asbestos sheets across the nala is backfilled with clay. Thus, a
low-cost check dam is created. On the upstream side clay filled cement bags can be stacked in a
slope to provide stability to the structure.
Tamil Nadu was the first State to made rainwater harvesting compulsory for every building to avoid
groundwater depletion. The scheme was launched in 2001 and has been implemented in all rural
areas of Tamil Nadu. It gave excellent results and following the experience other States took it as a
role model. In Bangalore, adoption of rainwater harvesting is mandatory for a particular size of
newly constructed building and the Bangalore Water Supply and Sewerage Board has constructed
“Rain Water Harvesting Theme Park” with different type of rainwater harvesting models are
demonstrated. In Rajasthan, rainwater harvesting has traditionally been practiced in the desert
region whereas in Pune, rainwater harvesting is compulsory for any new housing society to be
approved for habitation.
States of Andhra Pradesh, Gujarat, Haryana, Himachal Pradesh, Kerala, Madhya Pradesh,
Maharashtra, Tamil Nadu, Ranchi Regional Development Authority, Bombay Municipal Corporation
and Pimpri – Chinchwad Municipal Corporation, Municipal Corporation of Ludhiana, Improvement
Trust, Jalandhar, Jaipur Municipal Corporation, Mussorie Dehradun Development Authority, and

218 MGNCRE | E-Waste Management
218 MGNCRE | Water Security RM
Union Territories of Delhi, Daman & Diu and Puducherry have made necessary provision in their
building bye-laws to make installation of rain water harvesting system mandatory. Andaman &
Nicobar, Lakshadweep and Karnataka have initiated action for the purpose. Comprehensive Water
Law be needs to be introduced for taking necessary measures for making roof top rain water
harvesting mandatory throughout the country.
4.3 Solution for Flood Management
Floods have been recurrent phenomenon in many parts of India, causing loss of lives and public
property and bringing untold misery to the people, especially those in the rural areas. There is also a
larger economic impact, as they derail economic activities, thus affecting growth. Indian continent
has peculiar climatic conditions since it has floods in some parts whereas drought in other parts. The
trend of increasing damage and devastation brought by floods has posed a challenge to the
Government as well as to the society at large. The approaches to flood management presently
exercised in India need integrated strategy for policy and management related to floods.
The river systems and associated flood in in India can be broadly divided into Brahmaputra- Ganga
basin; North West part of India comprising of Satluj, Beas, Ravi, Chenab and Jhelum rivers watershed
region; and Central India and Deccan region comprising of Narmada, Tapi , Mahanadi, Godavari,
Krishna and Cauvery river.
The rivers Brahmaputra & Barak and their tributaries covering eight states Assam, Arunachal
Pradesh, Meghalaya, Mozoram, Nothern parts of West Bengal, Sikkim, Manipur, Tripura and
Nagaland. The catchments of these rivers receive very heavy rainfall ranging from 110 to 635
centimeter a year which occurs mostly between the months of May to September. As a result, floods
in this region are severe and quite frequent. Further, the rocks of the hills, where these rivers
originate are fragile and susceptible to erosion thereby causing exceptionally high silt charge in the
rivers. The predominant problems in this region are the flooding caused by spilling of rivers over
their banks, drainage congestion and tendency of some of the rivers to change their courses.
The river Ganga and its numerous tributaries, of which important ones are the Yamuna, the Sone,
the Ghaghra, the Gandak, the Kosi and the Mahananda, covers ten states viz. Uttarakhand, Uttar
Pradesh, Bihar, Jharkand, South and Central parts of West Bengal, parts of Haryana, Himachal
Pradesh, Rajasthan, Madhya Pradesh and Delhi. The normal annual rainfall in this region varies from
60 to 190 centimeter of which more than 80% occurs during the south west monsoon. The rainfall
increases from West to East and from South to North.
The flood problem is mostly confined to the areas on the northern bank of the river Ganga. The
damage is caused by the northern tributaries of the Ganga by spilling over their banks and changing
their courses. Even though the Ganga is a mighty river carrying huge discharges of 57,000 to 85,000
cumec (2 to 3 million cusec), the inundation and erosion problems are confined to relatively few
places. In general, the flood problem increases from the West to the East and from South to North.
The main rivers of north west region are the Sutlej, the Beas, the Ravi, the Chenab and the Jhelum,
the tributaries of Indus, all flowing from the Himalayas. These carry quite substantial discharge
during the monsoon and also large volumes of sediment. They change their courses frequently and
leave behind tracts of sandy material. The region covers the State of Jammu and Kashmir, Punjab

219 MGNCRE | E-Waste Management
219 MGNCRE | Water Security RM
and parts of Himachal Pradesh, Haryana and Rajasthan. The flood problem is relatively less in this
region as compared to Brahmaputra and Ganga basin.. The major problem is that of inadequate
surface drainage which causes inundation and water logging over vast areas.
The important rivers in the central and southern region of the country are the Narmada, the Tapi,
the Mahanadi, the Godavari, the Krishna and the Cauvery. These rivers have mostly well defined
stable courses. They have adequate capacity within the natural banks to carry the flood discharge
except in the delta area. The lower reaches of the important rivers on the East Coast have been
embanked, thus largely eliminating the flood problem.
Statutory Provisions about Flood Management
The subject of flood control, unlike irrigation, does not figure as such in any of the three legislative
lists included in the Constitution State list, Union list and concurrence list of India. However,
Drainage and Embankments, are two of the measures specifically mentioned in entry 17 of List II
(State List). The Regulation and development of inter-State rivers and river valleys to the extent to
which such regulation and development under the control of the Union is declared by Parliament by
law to be expedient in the public interest. Thus, the primary responsibility for flood control lies with
the States. A number of States have already enacted laws with provisions to deal with matters
connected with flood control works. Therefore, the subject “flood management” falls within the
purview of the States. The schemes for flood control are planned, investigated and implemented by
the States as per priorities within the State with their own resources and the role of central
government is technical, advisory, catalytic and promotional in nature.
Existing Flood Management Mechanisms in India
In India, a two tier system of flood management exists. The State Government level mechanism
includes the Water Resources Departments, State Technical Advisory Committee and Flood Control
Board. In some States, the Irrigation Departments and Public Works Departments look after flood
matters. The Central Government mechanism is governed through Central Water Commission,
Brahmaputra Board, Ganga Flood Control Commission, Farraka Barrage Project Authority and
National Disaster Management Authority and various expert committees to enable the State
Governments in addressing flood problems in a comprehensive manner.
The Government of India while framing National Water Policy has laid significant emphasis on the
management of floods. The policy elaborate that “adequate flood cushion should be provided in
water storage projects wherever feasible to facilitate better flood management”. While it recognized
that “physical flood protection works like embankments and dykes will continue to be necessary”, it
laid emphasis on adoption of non -structural measures for the minimization of losses, such as flood
forecasting and warning and flood plain zoning etc.
Presently, there are 878 Hydrological and Hydro-meteorological sites being operated by CWC across
the country covering 20 river basins for gauge, discharge, sediment & water quality observations.
The activity of flood forecasting comprises of Level Forecasting and Inflow Forecasting. The level
forecasts help the user agencies to decide mitigating measures like evacuation of people and shifting
people and their movable property to safer locations. The Inflow Forecasting is used by various dam
authorities in optimum operation of reservoirs for safe passage of flood downstream as well as to
ensure adequate storage in the reservoirs for meeting demand during non-monsoon period.

220 MGNCRE | E-Waste Management
220 MGNCRE | Water Security RM
Flood Management Measures practiced in India
Different measures have been adopted to reduce the flood losses and protect the flood plains by
government agencies. Depending upon the nature of work, flood protection and flood management
measures may be broadly classified as Engineering or Structural Measures and Administrative or
Non-Structural Measures
Engineering /Structural Measures
The engineering measures for flood control are artificially created reservoir behind a dam across a
river; natural depression suitably improved and regulated; diversion of a part of the peak flow to
another river or basin, where such diversion would not cause appreciable damage and constructing
a parallel channel by passing a particular town/reach of the river prone to flooding.
The engineering methods of flood protection, which do not reduce the flood flow but reduce spilling,
are embankments which artificially raise the effective river bank and thereby prevent spilling; and
channel and drainage improvement works, which artificially reduce the flood water level so as to
keep the same, confined within the river banks and thus prevent spilling.
The reservoirs can moderate the intensity and timing of the incoming flood. They store the water
during periods of high discharges in the river and release it after the critical high flow condition is
over, so as to be ready to receive the next wave. Their effectiveness in moderating floods would
depend on the reservoir capacity available at that time for absorbing the flood runoff and their
proximity to the likely damage centre.
The detention Basins are usually formed by utilizing natural depressions/ swamps and lakes by
improving their capacity by constructing encircling embankments and providing suitable devices for
regulating the release of stored waters. The Ghaggar detention basin in Rajasthan is a good example
of detention basin concept. Depressions available upstream of Srinagar City, on the left bank of river
Jhelum, the Mokama Tal area in Bihar and Ottu, Bhindawas, Kotla lakes in Haryana and various
beels/haors of Barak basin are some examples of a few natural basins.
Embankments (including ring bunds and town protection works) confine the flood flows and prevent
spilling thereby reducing the damage. These are generally cheap, quick and most popular method of
flood protection and have been constructed extensively to give considerable protection at
comparatively low costs. In many places, embankments are the only feasible method of preventing
inundation. Embankments are designed and constructed to afford a degree of protection against
floods of a certain frequency and intensity or against the maximum recorded floods till the time of
their planning only (in the absence of detailed hydrological data for longer periods) depending upon
the location protected and their economic justification. Apart from the raising and strengthening
works, erosion along the embankments and natural banks of the river systems has been a serious
problem on which considerable expenditure has been incurred in the past. Particular mention could
be made of the erosion problem of the embankment systems in Assam, Bihar, Uttar Pradesh, Punjab
and West Bengal. The embankments, under serious attack by the major rivers and their tributaries,
have to be suitably protected by spurs, pitching and other suitable anti-erosion measures. On many
embankment systems like the Kosi embankment and Piprasi-Pipraghat embankment on the Gandak
in Bihar, the river attack is so severe that the protection measures required to be taken are large and
cannot be covered under the normal maintenance works.

221 MGNCRE | E-Waste Management
221 MGNCRE | Water Security RM
The channelisation of rivers in certain reaches, in the context of tackling the extensive meandering
problems of the rivers is another option for controlling floods. The method of improving the channel
by improving the hydraulic conditions of the river channels by desilting, dredging, lining etc., to
enable the river to carry its discharges at lower levels or within its banks be adopted although
having constraint of its high cost and other problems. Dredging operations of the Brahmaputra,
which were undertaken in the early seventies on an experimental basis, were discontinued because
of their prohibitive cost and limited benefits. Dredging in selected locations may perhaps be
considered as a component of a package of measures for channel improvement to check the river
bank erosion subject to techno-economic justification. It may be economically justifiable as a
method for channel improvement where navigation is involved. Dredging is sometimes advocated
for clearing river mouth or narrow constrictions.
The surface water drainage congestion due to inadequacy of natural or artificial drainage channels
to carry the storm water discharge within a reasonable period causes damages is another
component of river flooding. It is often difficult to distinguish between flood and drainage
congestion situations. This problem is rather acute in Andhra Pradesh, Bihar, Haryana, Punjab,
Orissa, Uttar Pradesh, Assam, West Bengal, J&K, Gujarat and Tamilnadu. Therefore, improvement of
drainage by construction of new channels or improvement in the discharge capacity of the existing
drainage system is required as an integral part of the flood management programme in the country.
Stress has to be laid on improving the existing natural drainage system in the flood plains so that
what should essentially be flooding of a few days should not get prolonged for months. In this
context, the importance of the system ‘dhars’ or ‘old channels’, which efficiently served the function
of draining away the spillage and surface flows generated by local rains, must be revived. The
blocking of these natural drainage channels, which is normally done in the name of “reclamation for
development” because of paucity of land or vested interest, must be firmly discouraged. This applies
also to all-natural depressions, which are targeted for reclamation.The adequacy of existing sluices
and drainage channels should be reviewed in areas suffering from drainage congestion. If the
capacities of existing sluices in embankments and drainage channels are inadequate, this should be
improved by increasing the vents and improving outfall conditions.
The diversion of flood waters takes a part of the flood discharge to another basin or to the same
basin downstream of the problem area or to a depression where it could be stored for subsequent
release. This measure can be used to manage unusual floods around cities as in the case of flood spill
channel near Srinagar and also in the lower reaches of a river near the sea as in the case of Krishna
Godavari drainage scheme. Important schemes under execution and under planning are the outfall
channel in Jammu and Kashmir, the Damodar in the lower reaches in West Bengal, the Thottapally
Spillway diversion in Kerala, the Kolleru lake diversion into the sea in Andhra Pradesh, the Kama-
Pahari drain in Rajasthan and the Hulwaa drain in Uttar Pradesh.
The watershed management measures include developing and conserving the vegetative and soil
covers and also to undertake structural works like check-dams, detention basins, diversion channels,
etc. In the watershed management of upper catchment, land treatment through afforestation and
grass land development practices should be supplemented by structural works for retarding the
water velocity and arresting silt.

222 MGNCRE | E-Waste Management
222 MGNCRE | Water Security RM
Besides the structural measures the administrative methods or nonstructural measures endeavor to
mitigate the flood damages by facilitating timely evacuation of the people and shifting of their
movable property to safer grounds by having advance warning of incoming flood i.e. flood
forecasting, flood warning in case of threatened inundation; and discouraging creation of valuable
assets/ settlement of the people in the areas subject to frequent flooding i.e. enforcing flood plain
zoning regulation.
Providing absolute protection to all flood prone areas against all magnitude of floods is neither
practically possible nor economically viable. Such an attempt would involve stupendously high cost
for construction and for maintenance. Hence a pragmatic approach in flood management is to
provide a reasonable degree of protection against flood damages at economic cost through a
combination of structural and non-structural measures.
The flood-plain zoning is a concept central to flood plain management and the fact that the flood
plain of a river is essentially its domain and any intrusion into or developmental activity therein must
recognise the river’s ‘right of way’. Flood-plain zoning measures aim at demarcating zones or areas
likely to be affected by floods of different magnitudes or frequencies and probability levels, and
specify the types of permissible developments in these zones, so that whenever floods actually
occur, the damage can be minimised, if not avoided. Unfortunately, while all generally endorse this
approach in principle, scant attention is given to it in actual practice, leading to increased flood
damages.
Flood Proofing
Flood proofing measures adopted in India in the past, consisted in raising a few villages above pre-
determined flood levels and connecting them to nearby roads or high lands. Under this programme,
several thousand villages were raised in Uttar Pradesh in the fifties. In West Bengal and Assam also
land-fills were attempted in villages to keep houses above flood levels even though nearby
agricultural lands were liable to inundation.
Causes for annual floods are well-known and thus timely action should be planned based on lessons
learned from the past experience. In view of climate change, varying precipitation intensity impact
river flow patterns and thus the embankments and reservoirs must be designed to accommodate
worst case scenarios. Works related to watershed management should be prioritized to minimize
the runoff leading to flooding.
4.4 Watershed Management
Watersheds play a critical role in the natural functioning of the Earth thus considered as one of the
primary planning units in the field of natural resource management. Watershed approach is more
rational because land and water resources have optimum interaction and synergetic effect when
developed on watershed basis. The hydrologic unit boundary is important for determining what
areas are involved in contributing runoff, sediment, and pollutants.
The Watershed or hydrological unit is considered as scientific and appropriate base for necessary
surveys and investigations for assessment of natural resources and subsequent planning and
implementation of various development approaches. Drainage basin or hydrologic-unit maps are
necessary tools for many water-resource studies such as flood assessments, water-quality sampling,
water-use reporting, watershed protection, conservation planning, and resource management.

223 MGNCRE | E-Waste Management
223 MGNCRE | Water Security RM
Watershed boundaries define the aerial extent of land surface from which the runoff flows to a
defined drain, channel, stream or river at any particular point. It’s a general phenomenon governed
by the topography of the terrain.The boundary between two adjacent watersheds is called the
drainage divide line. Pour point is the point at which the water flows out of the area. This is the
lowest point in elevation along the boundary or the drainage lines. Depending on the size and
topography, watersheds can contain numerous tributaries, such as streams and ditches, and
ponding areas such as detention structures, natural ponds and wetlands. Boundary of any watershed
plays an important role because hydrologic processes can be described, and to some degree
controlled or managed within a watershed. As watershed boundaries are scalable, in that one can
define a watershed large enough to exhibit or accommodate the ecological processes of interest.
Multiple sizes of watersheds can be delineated, and they can be nested for hierarchical analysis.
Hydrological Units Delineation
The systematic delineation of river basins was first attempted in 1949 in which entire country has
been distinctly, delineated into 6 water resources regions. These regions have been further divided
into 66 major river catchments. It has been extensively used in the planning and development of
surface water resources of the country. The hydrological units are delineated as water resource
region, river basins, river sub-basin, watershed, sub-watershed, mini-watershed and micro-
watershed. The recommended size of the watershed is in the range of 250 to 750 Sq. km. The Soil &
Land Use Survey of India, Dept. of Agriculture and Cooperation published a National level Watershed
Atlas on 1: 1 million scale based on the Irrigation Atlas of India during 2012. It contains hydrological
units of the country categorised in five stages viz. region, basin, catchment, sub-catchment and
watershed.
The river systems of the country have been divided into six water resources region viz., Indus
drainage, Ganges drainage, Brahmaputra drainage, all drainage flowing into Bay of Bengal except the
Ganges and Brahmaputra, all drainage flowing into Arabian Sea except the Indus and the ephemeral
drainage in Rajasthan. These have been further divided into 37 basins and 117 catchments, 588 sub-
catchments and 3851 watersheds. Watershed is a geographical unit with a common natural drainage
outlet. The extent varies from 500 hectare for micro-watershed to 5000 hectare as sub-watershed
For management purposes 5000 ha is considered as a unit of intervention. Over the years, the
concept of watershed development has expanded from simple soil and water conservation to
holistic natural resources development approach. Thus there is a paradigm shift from territory
approach to a systemic approach of development.
Land resources are under tremendous pressure with growing needs of development and exploding
population with attendant increase in the demand for food, fuel, fodder and fiber. The advent of
modern age and newer forces, exacerbated by short-term gain driven motives often lead to over-
exploitation of natural resources, including depletion of soil fertility and degradation of land
resources.
Land being a non-renewable resource, is the central to all primary production systems. In India, the
excessive demand of land for both agricultural and non-agricultural uses have resulted in the
development of vast stretches of different kinds of wastelands such as salt-affected land,
waterlogged areas, gullied/ravinous lands etc. Planned efforts are needed for their rehabilitation.
Over the years, the country’s landmass has suffered from different types of degradation caused by

224 MGNCRE | E-Waste Management
224 MGNCRE | Water Security RM
biotic and abiotic pressures.
An ever-increasing population places enormous demand on land resources which are indispensable
for a country like India with 2.4 % of the worlds’ geographical area supporting over 16 % of the
world’s population. Further, the country has 0.5 % of the worlds grazing lands but has over 18 % of
world’s cattle population. The tremendous pressure on land has led to conversion of forest lands
into urban and industrial areas.
Plan for Water Shed Management to Conserve Water & Augment Flows
The water quality assessment of aquatic resources on long term basis provided information on the
segments of rivers that are not meeting water quality criteria and have been identified as polluted.
Assessment studies carried out on the sources of pollution in the rivers has highlighted the need for
creation of infrastructure facilities (STPs /CETPs/ETPs) for management of wastewater in line with
low flow or no flow of fresh water in the rivers and streams; and waste water flows make the river
perennial.
In order to have a practical solution to augment non-monsoon availability of water, it is necessary to
go through four phases for full scale water shed management in the upper reaches of catchment of
the rivers and streams. The suggested phases for water shed management may be (1) Recognition
phase (2) Restoration phase (3) Protection phase (4) Improvement phase.
1. Recognition Phase – Identification and Recognition of the problem, Analysis of the cause of the
problem and its effect and Development of alternative solutions of problem.
2. Restoration Phase–includes two main steps viz. Selection of best solution to problems identified
and Application of the solution to the problems of the land.
3. Protection Phase–takes case of the general health of the watershed and ensures normal
functioning. The protection is against all factors which may cause determined in watershed
condition.
4. Improvement phase–deals with overall improvement in the watershed and all land is covered.
Attention is paid to agriculture and forest management and production, forage production and
pasture management, socio economic conditions to achieve the objectives of watershed
management.
A three-year plan for watershed development and restoration of river water quality may provide the
insight and understanding to revive the forest cover, rejuvenate moisture content through water
retention structures and augmenting flow in the drainage channels ultimately feeding to river valleys
(Table 4.1).
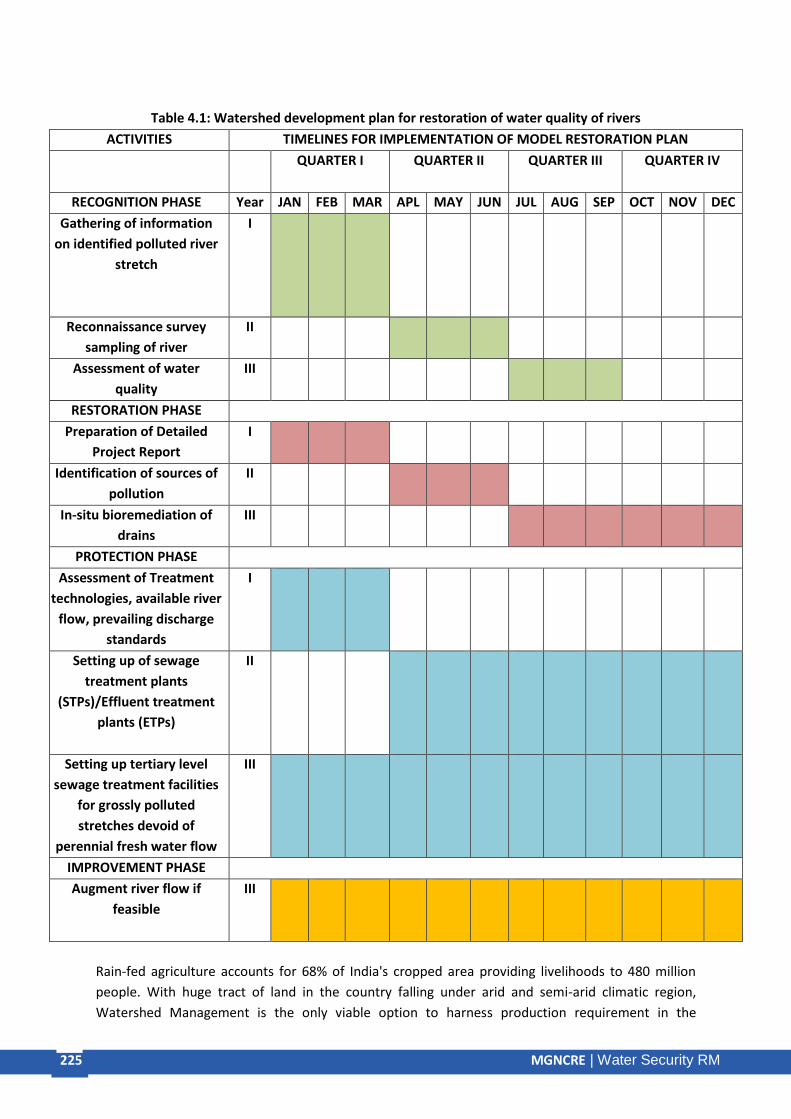
225 MGNCRE | E-Waste Management
225 MGNCRE | Water Security RM
Table 4.1: Watershed development plan for restoration of water quality of rivers
ACTIVITIES TIMELINES FOR IMPLEMENTATION OF MODEL RESTORATION PLAN
QUARTER I QUARTER II
QUARTER III QUARTER IV
RECOGNITION PHASE Year JAN FEB MAR APL MAY JUN JUL AUG SEP OCT NOV DEC
Gathering of information
on identified polluted river
stretch
I
Reconnaissance survey
sampling of river
II
Assessment of water
quality
III
RESTORATION PHASE
Preparation of Detailed
Project Report
I
Identification of sources of
pollution
II
In-situ bioremediation of
drains
III
PROTECTION PHASE
Assessment of Treatment
technologies, available river
flow, prevailing discharge
standards
I
Setting up of sewage
treatment plants
(STPs)/Effluent treatment
plants (ETPs)
II
Setting up tertiary level
sewage treatment facilities
for grossly polluted
stretches devoid of
perennial fresh water flow
III
IMPROVEMENT PHASE
Augment river flow if
feasible
III
Rain-fed agriculture accounts for 68% of India's cropped area providing livelihoods to 480 million
people. With huge tract of land in the country falling under arid and semi-arid climatic region,
Watershed Management is the only viable option to harness production requirement in the

226 MGNCRE | E-Waste Management
226 MGNCRE | Water Security RM
agricultural sector especially in the rain fed un-irrigated areas of the Country.
The Department of Land Resources, Ministry of Rural Development is implementing the Integrated
Watershed Development Programme with an objective to cover 55 million hectare of rain fed land
by 2027. The program is being implemented in all the states of the country. The programme is
financed by central and state government in the ratio of 90:10. The integrated water management
programme is the second largest watershed programme in the world after China. The programme
envisages restoring the ecological balance by harnessing, conserving and developing degraded
natural resources such a soil, vegetative cover & water through watershed management initiatives.
The outcomes of programme are prevention of soil run-off, regeneration of natural vegetation, rain
water harvesting and recharging of the ground water table. This enables multi-cropping and the
introduction of diverse agro-based activities, which help to provide sustainable livelihoods to the
people residing in the watershed area.
Urban Watershed Management
Urban water management is now on the verge of a revolution in response to rapidly escalating
urban demands for water as well as the need to make urban water systems more resilient to climate
change. Growing competition, conflicts, shortages, waste and degradation of water resources make
it imperative to rethink conventional concepts – to shift from an approach that attempts to manage
different aspects of urban water cycle in isolation to an integrated approach supported by all
stakeholders.
Integrated urban water management
The goals of urban water management are to ensure access to water and sanitation infrastructure
and services; manage rainwater, wastewater, storm water drainage, and runoff pollution; control
waterborne diseases and epidemics; and reduce the risk of water-related hazards, including floods,
droughts, and landslides. All the while, water management practices must prevent resource
degradation. Conventional urban water management strategies, however, have strained to meet
demand for drinking water, sanitation, wastewater treatment, and other water-related services.
Some cities in the country face acute water shortages and deteriorating water quality. Integrated
urban water management offers a set of principles that underpin better coordinated, responsive,
and sustainable resource management practice. It is an approach that integrates water sources,
water-use sectors, water services, and water management scales, alternative water sources,
differentiates the qualities and potential uses of water sources. It views water storage, distribution,
treatment, recycling, and disposal as part of the same resource management cycle and seeks to
protect, conserve and exploit water at its source. It accounts for nonurban users that are dependent
on the same water source that aligns formal institutions (organisations, legislation, and policies) and
informal practices (norms and conventions) that govern water in and for cities.
Under integrated urban water management, supply management and demand management are
complementary elements of a single process. There is no one-size-fits-all model nor is any single
method sufficient. Rather, the mix of approaches reflects local socio-cultural and economic
conditions. Transforming entrenched institutional practice in large cities can be difficult. The
greatest opportunities for integrated urban water management to achieve results lie instead with

227 MGNCRE | E-Waste Management
227 MGNCRE | Water Security RM
small- and mid-sized cities, who’s effects on water resources will become increasingly important in
coming decades.
Water availability is not a matter of quantity alone; water quality can, in equal measure, determine
how much is available for particular uses. Degraded urban water resources, often caused by
inadequate treatment of wastewater, have consequences for ecosystems, health, and water-reliant
livelihoods. Throughout history, sufficient water supply and an ability to deal with waste have been
critical for urban settlements to flourish.
Water scarcity problems, exacerbated by poor water quality, may limit the volume of water available
for specific uses. Degradation often results from human activity – intensive agriculture, resource-
heavy industries, and rapid urbanisation – that distorts natural water cycles and processes across the
rural-urban spectrum. In cities, for example, the concentration of built-up impermeable areas means
that less water infiltrates to groundwater. The base flows of streams are affected and the volume of
surface runoff increases. The resulting stormwater flows can convey greater amounts of pollutants,
which reduce water quality. Nonpoint source pollution (e.g., agricultural or mining runoff) can seep
undetected into aquifers, damaging downstream ecosystems and drinking water sources. The effects
of heavy metals are not limited to the degradation of downstream drinking water supply; they can
also affect the quality of food intended for urban markets.
The most common water pollutants are microbes, nutrients, heavy metals, and organic chemicals.
Eutrophication is the predominant water quality concern in India. It is caused by excess
concentrations of nutrients – mainly phosphorus and nitrogen – from agricultural runoff, domestic
sewage, industrial effluents, and the atmospheric derivatives of fossil fuel burning and bush fires.
Mercury, lead, and other heavy metals from industrial and mining activities, coal-fired power plants
and landfills, can accumulate in the tissues of humans and other organisms.
The substances in pharmaceuticals and personal care products – including birth control pills,
painkillers, and antibiotics – are showing up in water in increasing concentrations.These emerging
pollutants are the next challenge in urban water systems. With advances in science and technology
has come knowledge of new contaminants and their impact on human health and the environment.
A number of emerging contaminants (e.g., endocrine disrupting chemicals, pharmaceutically active
compounds, personal care products and disinfectant resistant microorganisms) have been identified.
Their long-term effects on humans and ecosystems are unknown, although some are thought to
imitate the actions of natural hormones in various species and cause public and environmental
health concerns. These contaminants become more concentrated in low-water conditions. As the
knowledge of emerging contaminants and their impacts advances, more stringent water quality
standards will be put in place and in turn will increase the pressure on water utilities.
4.5River Restoration
Water quality assessment activities in India performed by many organization including Central
Pollution Control Board have provided base line information in respect of water bodies covered
under the network locations. Water quality in rivers is deteriorating due to depleting water flow,
aggravated by discharge of pollutants from domestic sewage, industrial effluents and run-off from
agriculture. Most of the surface water bodies in the country are contaminated to some extent due to

228 MGNCRE | E-Waste Management
228 MGNCRE | Water Security RM
organic pollutants and bacteriological contamination. 317 polluted river stretches on 293 rivers and
tributaries have been identified (Table 4.2).
The monitoring locations not meeting the water quality criteria have been identified as polluted and
the sources of pollution are identified for intervention to contain the discharges. The river action
plans are formed on the basis of source identification and enforcement of discharge standards.
Table 4.2: Priority Wise Polluted River Stretches and Towns Along
Priority Class Polluted River Stretches No. of Towns
I 48 110
II 21 55
III 78 171
IV 52 116
V 118 207
TOTAL 317 659
Sewage generation and treatment capacity of the identified cities and towns along the polluted river
locations revealed that there is large gap in the system hence treated/untreated and partially
treated municipal wastewater is flowing into nearby rivers causing pollution in the downstream
reaches. The identified rivers are not polluted in its entire length but the locations or segments are
polluted downstream of urban centers i.e. cities or towns, after meeting a polluted tributary, drains
or any nearby point source.
Sources of Pollution
Broadly sources of pollution are categorized as point sources and non-point sources. Point sources
impacting the water resources in a significant manner whereas non-point sources are contributing
only during the monsoon season or the rainy days which are confined to 40 monsoon days in the
large part of Indian sub-continent. Thus the control of pollution from point sources is the prime
requirement and accordingly required to be prioritized.
Municipal Waste Water
Water pollution from untreated municipal wastewater is an enormous problem in India with grave
implications for public health as well as environmental quality. Even the largest cities are struggling
to put in place expensive wastewater treatment systems and associated infrastructure. It is
implausible that such expensive infrastructure can contribute meaningfully to the water pollution
and sanitation challenge in smaller towns and rural areas in the foreseeable future.
Low-cost, decentralized, wetland-based bio-treatment systems have strong potential to dramatically
improve the water quality and sanitation problems facing much of India. Scientific research has
shown that well designed bio-treatment systems have good performance in terms of removing
pollutants from municipal wastewater. Moreover, they are low-cost, quick to deploy, and easy to
operate and maintain, making them ideal for India’s sanitation context. They can be used extensively

229 MGNCRE | E-Waste Management
229 MGNCRE | Water Security RM
in rural areas, small towns, peri-urban areas of large cities, industrial townships or institutional
campuses, as well as for certain types of industries such as agro-food/beverage.
In addition to contribution towards improved public health and water quality, this approach has
additional potential co-benefits such as employment generation and availability of treated
wastewater for irrigation that can increase farm productivity and incomes. However, these potential
benefits can only be realized if such bio-treatment systems are deployed widely. Prospects of large
scale deployment of bio-treatment systems including potential challenges, sources of finance,
manpower, appropriate government interventions and civil society support needs to be considered.
These approaches have the potential to contribute significantly to the goal of important government
programs such as the Swachh Bharat Mission as well as our commitment to Sustainable
Development Goals.
Municipal Wastewater Generation and Treatment
It is estimated that 62,000 million litres per day (MLD) of domestic sewage is generated from urban
areas in India which is projected to reach 80,000 MLD by 2030. The installed treatment capacity is
about 23,277 MLD from 816 STPs of which only 522 plants are operational, limiting the treatment to
18,883 MLD.
In view of the population increase, demand of freshwater for all the uses will be unmanageable. It is
estimated that the projected wastewater from urban centers may cross 120,000 MLD by 2051 and
the rural India will also generate not less than 50,000 mld in view of water supply designs for
community supplies in rural areas. However, waste water management plans do not address the
pace of wastewater generation.
In addition to these limitations, there are issues with regard to regular operation of these STPs and
compliance to discharge standards. The new standard for sewage treatment plant (with BOD-10
mg/l, COD-50mg/l, Suspended Solids -10mg/l, T-Nitrogen – 10 mg/, Total Coliform < 230 MPN, pH
6.5 -9.0, NH4-N 5 mg/l, PO4-p 2 mg/l) have been proposed with an objective to encourage use of
treated water for non-potable domestic, commercial or industrial use as well as to provide better
assimilating capacity to receiving water bodies. Limitations in managing the treatment of domestic
wastewater in the country are attributed to:
• Lack of sewerage systems for collection and conveyance of sewage (open storm water drains
carry city sewage in many cities)
• Non availability of STPs
• Inappropriate technology and capacity of STPs
• Non-prioritization of wastewater treatment (focus has been on supply of drinking water
rather than wastewater treatment)
• No revenue source to meet the management cost of sewage
• Limitation of skilled manpower, technical know-how on operation
• Non-sustainable approach in design of Sewage management projects
• Water not considered as valuable resources and the concept of Reuse, Recycle & Recovery
not imbibed in project design
• Energy recovery potential not envisaged (there is a potential to meet up to 50% of the
energy requirement through captive generation)

230 MGNCRE | E-Waste Management
230 MGNCRE | Water Security RM
• Multiple agencies are responsible for meeting the objectives
• ULBs are so far immune to enforcement and regulatory provisions
• Lack of awareness on consequences
Industrial Effluents (Wastewater) discharges and Management Aspect
As per an estimate carried by CPCB in the year 2005, about 11000 MLD of wastewater is generated
alone from 17 categories of medium and large scale industries. The quantity of industrial discharge
has increased many folds over the years in allsectors thus requires comprehensive assessment.
Discharge of untreated industrial wastewater through open drains has potential for soil and
groundwater contamination. One of the main challenges in control of wastewater pollution from
industries is non-compliance to discharge standards; the reasons for such non-compliance may be
attributed to:
• Inadequate capacity of ETPs
• Improper selection of treatment technologies
• Poor operation and maintenance of ETP
• Lack of priority or ETP considered as financial liability (Cost centred)
• Failure of regulators to identify the short-comings
• Exploitation of resource limitation of regulators
• Lack of environmental consciousness or self-regulation by industry
Common Effluent Treatment Plant (CETP)
There are large number of highly polluting small scale industries such as tanneries, textile,
electroplating, dye & dye intermediates, food processing etc., which exists in clusters in industrial
estates. These industries collectively have high pollution potential on receiving environment. Having
limited financial resources at their disposal in individual capacity, CETP (Common Effluent Treatment
Plants) are a viable option for SSI units for management of cluster origin industrial wastewater.
Various schemes of Government have been facilitating and encouraging CETPs, over past 2 decades.
The number of CETPs increased from 88 facilities (with a capacity of 560 MLD) in the year 2005 to
193 facilities with treatment capacity of 1500 MLD. However, achievement of satisfactory
performance has been a challenge, including non-compliance to standards due to (i.) discharge of
recalcitrant effluent from heterogeneous chemical industrial sources and (ii) non-compliance to inlet
water quality by member industries.
There is huge potential for utilization of treated wastewater as resource in agriculture, non-potable
urban and Industrial use. Keeping this in view, CPCB has prescribed guidelines for adoption of zero
liquid discharges (ZLD)for major water polluting industries.
Legal and Institutional Provision to control Pollution
Government of India has enacted various Acts and assigned functions to Ministries of Water
resources, urban development and Environment & Climate Change to achieve sustainable
consumptions and usage of water resources. The Water (Prevention and Control of Pollution) Act,
1974 specifies provision for prevention and control of water pollution and maintaining or restoring
of wholesomeness of water. The Act also confers the powers and functions to Central and State
Pollution Control Boards to achieve the objective.
The Water Act mandates the Boards to plan and execute nationwide programme for prevention,

231 MGNCRE | E-Waste Management
231 MGNCRE | Water Security RM
control or abatement of pollution, disseminate information and knowledge by publishing technical
documents and lay down standards for regulatory purpose.
Water quality of natural environment (river, lakes and other water bodies) are mandated under the
provisions of environmental acts. The Water ((Prevention & Control of Pollution) Act, 1974 has
elaborated on the restoration and maintenance of wholesomeness of water. The wholesomeness
has been defined for practical purposes by CPCB in the form of designated best uses of water with a
set of parameters and their limits. The water quality assessment and its interpretation have
highlighted the compliance of water for designated uses and the exceedance of one or more
parameter have been defined as polluted. The regulatory provisions under The Water Act, 1974 are
enshrined in section 18 for the Central Govt. Water being the state subject, the enforcement is
largely confined to the State Govt. Authorities (SPCB/PCC).
The legal and institutional provisions are provided in Water (Prevention and Control of Pollution) Act
1974 wherein standards are developed and enforced for treatment of municipal wastewater by
Pollution Control Boards. There are provisions for tightening of standards by State Pollution Control
Board for site specific requirements, in view of low flow or no flow in stretches of rivers or streams
and for critically polluted areas in view of high concentration of pollution loads in a specific area. The
need based directions for zero discharge are prescribed for grossly polluting industrial units however
such enforcements are non-implementable in case of municipal bodies. The concept of delinking of
sewer to river is gaining momentum in river conservation plans and may bring visible improvement
in water quality of recipient’s water bodies. There is however a need of making the rivers and
streams perennial by introduction of minimum/environmental/ecological flows for maintaining the
biodiversity and sustainable ecosystem of aquatic resources through institutional provisions.
Restoration of Polluted River Stretches
Plan for restoration of polluted river stretches can be executed through two fold concepts. One
concept may target for enhancement of river flow through interventions on the water
sheds/catchment areas for conservation and recharge of rain water for subsequent releases during
lean flow period in a year. This concept will work on dilution of pollutants in the rivers and streams
to reduce concentration to meet desired level of water quality. Other concept of regulation and
enforcement of standards in conjunction with the available flow in rivers /streams and allocation of
discharges with stipulated norms.
Plan for Restoration of Water Quality-Promotional and Statutory intervention
Polluted river stretches throughout the country have been identified for restoration of water quality
through identification of sources of pollution and interventions through treatment for the municipal
as well as industrial effluents.
The river action plans are designed for control of pollution and to restore the water quality of the
rivers. The infrastructure development for treatment of sewage always remains short of the waste
water generation. The ever growing population and increasing water use in the urban centers has
outpaced the plan for creation of infrastructure. The river action plans although have not improve
the quality of the water resources however in absence of such plans, the quality of aquatic resources
would have been further deteriorated.

232 MGNCRE | E-Waste Management
232 MGNCRE | Water Security RM
Restoration Plan - Promotional Intervention
The restoration plan may have a number of steps and the beginning shall be with the reconnaissance
visit including first round of sampling of river/stream/drains and demarcation on the water shed
map. The next step shall be identification of sources of pollution and quantification of pollution load
vis-a-vis the treatment facilities for municipal wastewater and industrial effluents. The third step
shall be towards the treatment technologies, prevailing discharge standards, available flow in the
river/stream and review of discharge standards/stream flow. The fourth step will be assessment of
water quality trend of river/stream and to work out augmentation of river/stream flow. The fifth
and last step is to disseminate the information gathered during the four steps on assessment/
interventions and monitoring of improvement in water quality. The above stated broad concept
shall be followed in the development of water quality management plan for polluted rivers and the
respective stretches of the rivers.
Restoration Plan - Statutory Intervention
Water quality management through setting up of standards for discharge of municipal wastewater
and industrial effluents are enforced through the consent toestablish and consent to operate require
a fresh look in view of ambient water quality requirements of aquatic resources. The prevailing
standards prescribed in the consent to industrial sector and generaldischarge standards adopted for
sewage treatment require change in approach from consumption to disposal to treat,recycle, reuse
and discharge to aquatic system if matches with thenorms of water quality ofaquatic resources.
Water Reclamation or recycling is to put use the treated water to non-potable uses. Over 85% of
wastewater in Israel is treated for reuse, most of it in agricultural irrigation, making it the leading
nation in water recycling. Australia, a water poor nation, uses technologies like ultra-filtration and
reverse osmosis to treat grey water and storm water to potable quality. The costs are high, but the
reclaimed water is used for drinking (potable) water, non-drinking uses in households, watering golf
courses and recreational parks. Industrial uses such as washing and cooling in power stations and
factories, agriculture, horticulture, forestry, pasture, flowers, viticulture and sugar cane growing, fire
fighting, groundwater recharge, environmental flows and wetlands. Australia finds community
attitude and social acceptance to recycled water a challenge, besides its financial cost. However, the
benefits of direct potable reuse may include: Lower energy use, lower greenhouse gas emissions,
lower capital and operational costs, and a more robust, climate-resilient water supply.
In developing countries like India, the problems associated with wastewater reuse arise from its lack
of treatment. The challenge thus is to find such low-cost, low-tech, user friendly methods, which on
one hand avoid threatening our substantial wastewater dependent livelihoods and on the other
hand protect degradation of our valuable natural resources. The use of constructed wetlands is now
being recognized as an efficient technology for wastewater treatment. Compared to the
conventional treatment systems, constructed wetlands need lesser material and energy, are easily
operated, have no sludge disposal problems and can be maintained by untrained personnel. Further
these systems have lower construction, maintenance and operation costs as these are driven by
natural energies of sun, wind, soil, microorganisms, plants and animals. Hence, for planned,
strategic, safe and sustainable use of wastewaters there seems to be a need for policy decisions and
coherent programs encompassing low-cost decentralized waste water treatment technologies, bio-

233 MGNCRE | E-Waste Management
233 MGNCRE | Water Security RM
filters, efficient microbial strains, and organic /inorganic amendments, appropriate crops/ cropping
systems, cultivation of remunerative non-edible crops and modern sewage water application
methods.
Individual Responsibility
The use of water for various household activities generates waste water. The optimum use of water
and good practices lead to saving a lot of water. Water conservation has become essential in all
regions, even where water seems abundant. That’s because our water resources are finite, and they
are getting smaller every year. Use simple tips to save more water, both indoors and in your garden
and yard.In addition to saving money on your utility bill, water conservation helps prevent water
pollution in nearby lakes, rivers, and local watersheds. Conserving water also prevents greenhouse
gas emissions associated with treating and distributing water.
Conserving water can also extend the life of septic system by reducing soil saturation and reducing
pollution due to leaks. Overloading municipal sewer systems can also cause untreated sewage to
flow to lakes and rivers. The smaller the amount of water flowing through these systems, the lower
the likelihood of pollution. In some communities, costly sewage system expansion has been avoided
by community-wide household water conservation. The most effective way to save water is to
upgrade to efficient fixtures. But there are other ways to help reduce the amount of water use at
home.Don’t Use the Toilet as an waste basket. Every time we flush a cigarette butt, facial tissue, or
other small bit of trash, we are wasting litres of water. Put them in the garbage, or better yet,
recycle.
To cut down on water waste, put an inch or two of sand or pebbles inside each of two plastic bottles.
Fill the bottles with water, screw the lids on, and put them in your toilet tank, safely away from the
operating mechanisms. Or, buy an inexpensive tank bank or float booster. This may save couple of
litres of water per day. Replace an old toilet with an ultra-low volume flush modelfor savings in
water and will cut indoor water use. Alternatively, consider purchasing a dual flush toilet or installing
a dual flush converter that turns a standard toilet into a dual flush toilet.
Use Clothes Washer for Only Full Loads and avoid the permanent press cycle, which uses the extra
rinse. For partial loads, adjust water levels to match the size of the load.Consider a High Efficiency
Washing Machine that pay for itself over its lifetime in water and energy savings. New Energy Star
rated washers use less water and energy per load.
Install Water-Saving Showerheads, Shower Timers, and Low-Flow Faucet Aerators for conserving
water. Inexpensive water-saving low-flow showerheads or restrictors are easy for the homeowner to
install. Long showers can use considerable volume of water every unneeded minute.One way to cut
down on water use is to turn off the shower after soaping up, then turn it back on to rinse. A four-
minute shower uses approximately 20 litres of water.
Community Responsibility
Water Conservation by Communities may start with developing a plan to educate and involve
residents in water conservation efforts. Water system manager should prevent leaking and
unwanted wastage of water in gardening, floor washing, car washing. Implement a water-loss

234 MGNCRE | E-Waste Management
234 MGNCRE | Water Security RM
management program through universal metering. Consider a reclaimed wastewater distribution
system for non-potable uses.
Public health department maintain water supplies to residents should insist on Installation of ultra-
low flow toilets and urinals in household and commercial buildings. Retrofit water-saving devices in
common utility places. Community must insist on Installation of faucet aerators and low flow shower
heads in common services areas and buildings. As the common utility appliances or equipment wear
out periodically, society management must replace them with water-saving models.
The policies and programs to encourage water conservation must ensure the utility rate structure
encourages water efficiency, or at least does not encourage water waste. The incentive programs
(rebates/tax credit) to homeowners and businesses to encourage replacement of plumbing fixtures
and appliances with water-efficient models may be offered. Communities must promote water-
efficient landscape practices to home owners and businesses, especially those with large, irrigated
properties. Practices include use of native plants, landscape innovation to reduce water use, and
more efficient irrigation.
The water conservation practices may also be considered while disposal of waste in low income and
un-sewered communities. The perception of onsite/decentralized systems are inferior, old-
fashioned, less technologically advanced, and not as safe as centralized wastewater treatment
systems from both an environmental and public health perspective, many communities have
pursued the construction of centralized systems (collection systems and sewage treatment plants).
Centralized wastewater collection and treatment systems, however, are not the most cost-effective
or environmentally sound option for all situations (e.g., sewage treatment plants can discharge high
point source loadings of pollutants into receiving waters). They are costly to build and operate and
are often infeasible or cost prohibitive, especially in areas with low populations and dispersed
households. Many communities lack both the revenue to fund these facilities and the expertise to
manage the treatment operations. In addition, centralized treatment systems can contribute to
unpredicted growth and development that might threaten water quality. As development patterns
change and increased development occurs in rural areas and on the urban fringe, many communities
are evaluating whether they should invest in centralized sewage treatment plants or continue to rely
on on site wastewater treatment systems. The availability of innovative and alternative onsite
technologies and accompanying management strategies now provides small communities with a
practical, cost-effective alternative to centralized treatment plants.
The water comes out as supernatant from decentralized community managed systems can be
utilized in development of grasslands and in agriculture areas in the vicity.Thus the communities be
made aware of the options of water use and recycling of grey water which will conserve fresh water
use for various purposes.
Summary
The ancient water management systems and resources conservation was helpful in meeting the
needs of small communities. The population growth and improving economic situation has increased
water demand enormously. The necessity of rainwater harvesting for enrichment of depleted

235 MGNCRE | E-Waste Management
235 MGNCRE | Water Security RM
aquifers in overexploited dark zones has been understood and practiced widely throughout the
country. The importance of watershed in maintaining ecosystem and harmonization of forestation
and grassland development should be visualized in sustaining flow in streams and rivers to deal with
extremities of draught and floods and management of water requirements. The importance of
recycling, reuse for maintaining requirement of environmental flows in the rivers should be
recognized for river restoration and control of pollution.
To Do Activities
• To understand the ancient water management system, visit manmade tanks and step wells
in the vicinity
• To understand the watershed and importance of afforestation travel to hill tops to visualize
water divide cliffs forming sub watersheds
• Understand aquatic resources, water scarcity and need of rainwater harvesting
• To know the rejuvenated aquifer regions by rainwater harvesting discuss with panchayat
officials about the steps being taken by them and resultant outputs in their hinterlands
• Learn methodologies for watershed management and water reclamation by introduction of
recycling and reuse of treated wastewater
• To know the impact of floods and damage to communities living along, visit the river reaches
in plains of rivers and streams.
• To know flood forecasting and mitigation measures
• Educate individual and community by raising awareness to save water
• Planning and prioritization of river restoration activities by prevention and control of sources
of pollution
Self Assessment Questions
1. What were the ancient water management system and how they can be restored?
2. What is watershed and how it is maintain ecosystem and feed water to rivers and streams?
3. How rainwater harvesting to be planned and safeguards in maintain subsurface water
quality?
4. How water reclamation be done through recycling and reuse of water and wastewater?
5. How individual and community awareness will help in water conservation?
References
1. www.cpcb.nic.in, Restoration of Polluted River Stretches,2015,Central Pollution Control
Board
2. Anonymous, Modal Hindon Action Plan for development of concept plan polluted river
stretches
3. website of Central Water Commission, www.cwc.nic.in
4. Rain water Harvesting Techniques To Augment Ground Water CGWB, Faridabad
5. Website of Ministry of Water Resources, Central Ground Water Board, Faridabad
6. http://www.india-wris.nrsc.gov.in/wrpinfo/index.php?title=Flood_Management
7. https://www.insightsonindia.com/wp-content/uploads/2017/07/Flood-Management-in-India.pdf
8. Wasteland Atlas of India 2010,Ministry of Rural Development, Govt.of India
9. https://www.researchgate.net/publication/285729512_Integrated_urban_water_managem
ent
236 MGNCRE | E-Waste Management
236 MGNCRE | Water Security RM
Chapter 5 Testing of Water, Waste Water,
Soil and Solid Waste
Introduction
The quality of surface or ground water is a function of either or both natural influences and human
activities. Without human influences, water quality would be determined by the weathering of
bedrock minerals, natural leaching of organic matter from soil and biological processes within the
aquatic environment. As a result, water in the natural environment contains many dissolved
substances and non-dissolved particulate matter. Dissolved salts and minerals are necessary
components of good quality water as they help maintain the health and vitality of the organisms
that rely on this ecosystem service.
Water quality is usually determined by analysing samples of water that were collected during
monitoring of aquatic resource. The results of water quality monitoring are vital to being able to
track both spatial and temporal trends in surface and ground waters.
Typically, water quality is determined by comparing the physical and chemical characteristics of a
water sample to water quality guidelines or standards. Drinking water quality guidelines and
standards are designed to enable the provision of clean and safe water for human consumption,
thereby protecting human health. These are usually determined based on scientifically assessed
acceptable levels of toxicity to either humans or aquatic organisms.
Objectives
• To know the importance of water quality and understand impact of environments
components
• To know how to collect representative samples, preservation, transportation and associated
protocol
• To know the standard operating procedures for analysis of water samples in laboratory
• To know how to interpret analytical reports for logical conclusion
• To know best management laboratory techniques for quality assurance
5.1 Importance of Water Monitoring
The quality of water in various water bodies is rarely constant in time. While there may be some
relationship between the rates of change of different variables, others alter independently. The
larger the number of samples from which the mean is derived, the narrower will be the limits of the
probable difference between the observed and true means. Variations in WQ are caused by changes
(increase or decrease) in the concentration of any of the inputs to a water body system. Such
changes may be natural or man-made and either cyclic or random. Since it is possible for some
changes to occur in combination, the reasons behind variations may sometimes be obscured.
Random variations in the quality of water occur due to unpredictable events. Sudden storms will
lead to increased flows followed by polluted runoff and leaching or to the operation of sewer

237 MGNCRE | E-Waste Management
237 MGNCRE | Water Security RM
overflows. Rainfall effects may be modified by flood control arrangements. There may be accidental
spillages and leakages. Any of these may occur at any time and without warning.
Annual cycles may be the result of regular rainfall patterns, snow melts and seasonal temperature
changes, among others. The seasonal growth and decay of vegetation will also give rise to cyclical
changes in the composition of the water rates of self purification and nitrification are strongly
temperature dependent. There may be daily cycles of natural origin particularly those caused by
photosynthesis and affecting dissolved oxygen and pH, industrial, agricultural and domestic activities
may cause cyclical changes due to cycles of discharge and abstraction. Hydraulic manipulation of
river flow such as by river regulation and dam management for power generation, navigation or
other purposes tend to be cyclical but can occur randomly. River flows in India vary widely especially
where large scale diversions that are permanent in nature adversely affect water quality.
Water quality variability in a river depends on the hydrological regime, i.e. the water discharge
variability, the number of floods per year and their magnitude or the occurrence of low flows.
During flood periods, water quality usually shows marked variations due to the different origins of
the water: surface runoff, sub-surface runoff (i.e. water circulation within the soil layer), and
groundwater discharge. Surface runoff is generally highly turbid and carries large amounts of total
suspended solids, including particulate organic carbon. On the one hand, sub-surface runoff leaches
dissolved organic carbon and nutrients such as Nitrogen and Phosphorus from soils, whereas ground
waters provide most of the elements resulting from rock weathering. On the other hand during low
flows a general deterioration of the water quality can be observed due to a higher concentration of
pollutants. Thermal pollution of the water quality is caused by the use of water as a coolant by
power plants and industrial manufacturers, when returned to the natural environment at a higher
temperature.
Water quality monitoring provides an understanding of water-quality conditions in natural streams,
rivers, ground water and aquatic systems; how those conditions may vary locally, regionally and
nationally; conditions are changing over time; how natural features and human activities affect
those conditions; and where are those effects most pronounced.
Main purposes of a water quality monitoring have been the need to verify whether observed
parameters are suitable for intended uses. However, over the time monitoring has evolved to enable
assessments of the current state of water quantity and quality and its variability in space and time.
Often such assessments are appraisals of the hydrological, morphological, physicochemical,
chemical, biological and/or microbiological conditions in relation to reference conditions, human
health effects and/or the existing or planned uses of water. Such reference conditions may take into
account elevated concentrations of specific determinant parameters due to natural geophysical and
geo-chemical processes to support decision-making and operational water management in critical
situations.
When pollution events occur, reliable data are needed, which may require early warning systems to
signal when critical pollution levels are exceeded or toxic effects occur. In these cases, models can
often support decision-making. The impact monitoring determines trends in the quality of the

238 MGNCRE | E-Waste Management
238 MGNCRE | Water Security RM
aquatic environment and how the environment is affected by the release of contaminants, by other
human activities, and by waste treatment operations.
Background quality monitoring of the aquatic environment is carried out for comparing and
assessing the results of impact monitoring; determine treatment options for polluted water;
determine ecological flows; evaluate the effectiveness of water management/remedial measures.;
and provide the basis of the formulation of science-based environmental policies, and also allow
possible for evaluations that determine of whether or not a policy has resulted in the desired effect
and been cost effective.
When a water quality monitoring is being planned, water-use managers or similar authorities can
reasonably expect that the programme will yield data and information that will be of value for
management decision-making. The analysis of water management issues and objectives is the basis
for specifying the information needs. These are related to uses (e.g. drinking water, wild life
protection, irrigation, recreation) and functions (maintenance of aquatic life) of the watercourse or
groundwater body that put requirements on the quality and availability. Other Issues (e.g. flooding,
sedimentation, salinisation, pollution) that hinder proper use and functioning of the watercourse or
groundwater body; measures taken to address the issues or improve the use or functioning of the
watercourse or groundwater body, including environmental aspects.
We should take into account current or envisaged measures, policies and action plans in water
management. In specifying human uses and the ecological functioning of water bodies and in
identifying pressure factors, issues and targets, the full range of qualitative and quantitative factors
in river-basin management should be considered.
The various functions and uses of water bodies - both ecological and human - must be considered.
Uses may compete or even conflict, in particular if water is scarce or its quality is deteriorating. A
multi-functional approach tries to strike a balance between all desired uses, including ecosystem
functioning. This allows the introduction of a hierarchy of uses, providing flexibility for the different
levels of water resource management policy development, and for prioritisation in scheduling.
The monitoring and assessment of water quality and quantity require adequate financial resources.
Therefore, those responsible for these activities need to demonstrate both the benefits of
monitoring for integrated water resources management and the possible costs, in terms of
environmental degradation and other impacts, of not monitoring. It is well known that often the
prevention of an environmental problem is less costly than its remediation.
While solutions for many environmental problems are expensive and technically challenging, what is
often not recognized is that the cost of well-designed monitoring programmes is generally much less
than either the cost of policy implementation or the monetary benefits associated with the
environmental improvement. This is particularly crucial for countries in which monitoring activities
still seem to be insufficiently funded. All basic components of the hydrological cycle should be
measured or estimated, taking into account temporal and spatial aspects of hydrological and
hydrogeological processes as an important part of any water quality monitoring.

239 MGNCRE | E-Waste Management
239 MGNCRE | Water Security RM
Various types of water quality monitoring programmes can be planned in accordance to objectives,
water bodies, pollutants and water uses, as well as any combination thereof. In practice,
assessments are limited to trend monitoring; basic survey; operational surveillance; background
monitoring; preliminary surveys; emergency surveys; impact surveys; modelling surveys; and early
warning surveillance. The background monitoring of surface waters in clean water reaches has
usually been developed to help the interpretation of trend monitoring which is conducted on time
variations over a long period and the definition of natural, spatial variations.
Models and their related surveys have usually been set up to predict the water quality for
management purposes prior to treatment of wastewater, or to test the impact of a new source of
pollution, and are thus closely connected to operational surveillance and impact surveys. Early
warning surveillance is undertaken for specific uses in the event of any sudden and unpredictable
change in water quality, whereas emergency surveys of a catastrophic event should be followed in
the medium and long-term by impact surveys.
The groundwater monitoring normally includes the testing for long-term changes in water quality in
major aquifers so as to provide a basis for statistical identification of the possible causes of observed
conditions and to provide the statistical basis for the identification of trends.
The Water (Prevention and Control of Pollution) Act, 1974 being implemented in India envisages
water quality monitoring for following target issues:
• For rational planning of pollution control strategies and their prioritization,
• To assess nature and extent of pollution control needed in different water bodies or their
part
• To evaluate effectiveness of pollution control measures already in existence
• To evaluate water quality trend over a period of time
• To assess assimilative capacity of a water body thereby reducing cost on pollution control
• To understand the environmental fate of different pollutants and
• To assess the fitness of water for different uses.
The process of water quality (WQ) monitoring and assessment is a sequence of related activities
starting with the definition of objectives and information needs, and ending with the dissemination
of the information product for use by communities, scientists and decision- makers to effectively
allow the protection and sustainable management of national and transboundary water resources.
The structure of a water quality monitoring (WQM) programme includes the following main
elements:
• Objectives
• Preliminary surveys
• Monitoring design
• Field monitoring operations
• Hydrological monitoring (surface water and groundwater)
• Laboratory activities
• Quality assurance procedures
• Data management and product development

240 MGNCRE | E-Waste Management
240 MGNCRE | Water Security RM
These components and their linkages need to be adequately considered during the planning process
of a water quality monitoring system, so as to ensure that the implementation of the programme
will meet with success and generate the required information products for use by communities,
scientists and decision - makers to effectively allow the protection and sustainable management of
national and trans boundary water resources. This planning process encompasses mainly three
phases. The first phase consists in defining the need for, and establishing the objectives of
monitoring (such as in support or management or research and policy), and what WQ issues are to
be addressed. With the objectives defined it can then be decided what data are needed and how
they will be used.
The second phase comprises the design of the monitoring programme, which should consider and
include the planning of a monitoring network with the choice of locations for the sampling
operations, supported by preliminary investigations (inventories and surveys) needed before the
programme is started, so that issues, problems and risk factors can be clearly identified and
evaluated; the selection of chemical, biological and micro-biological variables, i.e. which variables to
monitor for different uses (i.e. municipal or industrial supply, irrigation, recreation, cooling,
agriculture, drinking water supply, livestock needs etc.), and in relation to different pollution
sources.
The subsequent activities are towards the definition of sampling procedures and operations, such as
in situ measurements with different devices, manual or automated measurements, for sampling of
appropriate media (water, biota, particulate matter), sample pre-treatment and conservation,
identification and shipment; the planning of field measurements (frequency).
The other activity is the assessment of resources required for the monitoring programme, e.g. the
laboratory facilities, the inventory of field stations and groundwater observation wells, equipment
and instruments, vehicles and other transportation means, office and field staff involved in water
quality activities, human resources development and training required, internal and external
communication needs, and, finally, the estimation of costs of the programme.
The third phase comprises the actual operations (implementation) of the programme with the
setting up of a quality assurance system at the strategic/organizational, tactical and operational
levels, essential for ensuring the reliability of information obtained by monitoring, covering field and
laboratory work, data handling and analysis, as well as the application of water quality standards and
indices; and the management of data and development of products, leading to the reporting and
dissemination of results and findings.
5.2 Water Sampling Techniques
The monitoring of water quality to provide reliable and usable data involves many distinct activities
and can be expensive. Thus, the first step in planning the establishment of such a system should be
to define the objectives of monitoring (such as in support or management or research and policy),
and what WQ issues are to be addressed. With the objectives defined it can then be decided what
data are needed and how they will be used. In accordance with the goals, answers or information
that are sought, WQM and assessment can be looked at from different perspectives in terms of basic
variables and present status, time trends and spatial differences, uses, pollution impacts and

241 MGNCRE | E-Waste Management
241 MGNCRE | Water Security RM
management needs for information for decisions and action.
All this will result in different approaches for the design and implementation of monitoring
programmes, to the selection of variables to be measured, to the frequency and location of
measurements, to the additional information needed for interpretation and to the way in which
information is generated and presented to meet particular information requirements.
When establishing monitoring objectives, the intended uses of the water are particularly important.
The environment, aquatic life, drinking-water sources and bathing areas require high quality, while
navigation and water for cooling of industrial processes or cold storage have lesser quality
requirements. In the case of livestock watering, irrigation, boiler water, and fisheries, each demands
a specific level of quality and has its own relative economic importance. To help with the
establishment of objectives, the following questions might be addressed:
I. Why is monitoring going to be conducted? Is it for basic information, planning and policy
information, management and operational information, regulation and compliance,
resource assessment, or other purposes?
II. What information is required on water quality for various uses?
III. Which variables should be measured, at what frequency and in response to which natural or
man-made events?
IV. What is practical in terms of the human and financial resources available for monitoring?
There is little point in setting unrealistic objectives.
V. Which agency is responsible for the different elements of monitoring?
VI. Who is going to use the monitoring data and what is the intended use of the information?
VII. Will monitoring results support management decisions, ensure compliance with standards,
identify priorities for action, provide early warning of future problems or detect gaps in
current knowledge?
A list of monitoring objectives that might be used as the basis for design of sampling networks is
enumerated as an example.
I. Identification of baseline conditions in the water-course system.
II. Detection of any signs of deterioration in water quality.
III. Identification of any water bodies in the water-course system that do not meet the desired
water quality standards.
IV. Identification of any contaminated areas (surface water and/or groundwater).
V. Determination of the extent and effects of specific waste discharges.
VI. Estimation of the pollution load carried by a water-course system and groundwater.
VII. Evaluation of the effectiveness of a water quality management intervention.
VIII. Development of water quality guidelines and/or standards for specific water uses.
IX. Development of regulations covering the quantity and quality of waste discharges.
X. Development of adequate quality assurance/quality control (QA/QC) processes.
XI. Development of a Water pollution Control Programme
With the objectives of the water quality programme defined and the decision on what data are
needed and how they will be used, as a next step the sampling locations and frequencies are then
chosen with a view to obtaining the required information with minimum effort and cost, while
ensuring that the resources are employed to the best advantage.

242 MGNCRE | E-Waste Management
242 MGNCRE | Water Security RM
A monitoring programme commonly covers the water-course system of a catchment area (i.e. a
main river and all its tributaries, streams, brooks, ditches, canals, etc., as well as any lakes or ponds
that discharge into the river or tributaries), or it can comprise an administrative unit, e.g. State, etc.
In some cases groundwater enters the water-course system from an aquifer or a system of aquifers,
all or part of which may lie outside the topographic one. Surface and groundwater catchment areas
not often coincide.
The level of detail that monitoring can provide depends on the density of the network, the
frequency of samplings, the size of the basin and the issues under investigation. For example,when a
station at the outlet of a river basin reports water quality changes, often a more detailed monitoring
network is needed to reveal the source, causal agent and the pathways of pollutants. The interaction
between surface and groundwater’s may also be different in the upper and lower parts of the basin.
In these cases, information is needed for smaller sub-basins. The different sources of WQ pollution,
such as point source (e.g. sewage, industrial leakage to subsurface), or non-point sources (e.g.
agricultural runoff/percolation) also need to be considered.
The monitoring and assessment of groundwater quality is often more complicated because of (i) the
complex structure and composition of aquifers; (ii) the recharge and abstraction conditions of the
aquifer; and (iii) the relatively long time-scales of groundwater movement and residence.
Monitoring networks, the frequency of measurements, the selection of parameters and
determinants, as well as assessment methodologies should be adapted to all these conditions. To
facilitate this, a conceptual model of the river basin might be developed, so that the whole system is
well understood, establishing whether interactions between surface and groundwater exist or not,
so that water quantity and quality can be taken into account.
At the planning stage the following alternatives are important to be considered:
• Fixed site network, useful for public information and broad policy issues; should be limited
to drinking water sources that require regular monitoring;
• Flexible survey approach, more convenient for regulatory purposes, for determining
management options in cases of pollution, and for related investment decision-making;
• Decentralized monitoring alternatives instead of a national network operated by a central
agency ; and
• Monitoring of the quality of the aquatic environment should be coupled with the
appropriate hydrological monitoring.
When starting a monitoring programme it is better to have a complete record of reliable data
concerning water quality at a few sampling stations than to have a lot of data of questionable quality
from many sampling stations. When reported data are not credible and reliable, the programme lose
credibility, and poor or incorrect decisions may be made with potentially serious and costly
consequences.
Selection of Sampling Stations
Processes affecting water quality and their influence should be taken into account when sampling

243 MGNCRE | E-Waste Management
243 MGNCRE | Water Security RM
sites are selected. This requires consideration of: (i) the monitoring objective(s); (ii) some knowledge
of the geography of the water-course system; (iii) actual and potential water uses; (iv) actual and
potential sources of pollution; (v) water control operations; and (vi) local geochemical conditions
and type(s) of the water body (ies). In many cases the precise location of a sampling station can be
made only after a field investigation.
In the specific case of groundwater monitoring programmes the fundamental requirement is to
define in three dimensions the distribution of water quality. This requirement is the same regardless
of the specific objectives of the programme. Thus, in all cases the objective is to obtain
representative samples which fully reflect the conditions of the groundwater in situ at a specific
point, periodically at known times. Having established the objectives of quality assessment, the next
step is then to design the sampling network. This is essentially a function of the sampling point type,
density and location, sampling method and frequency and choice of parameters
As regards the types of sampling sites, the global environment monitoring network defines the
following three types of monitoring stations:
Baseline Stations: Are typically located in headwater lakes, undisturbed upstream river stretches,
and in aquifers where no known direct diffuse or point-sources of pollutants are likely to be found.
They are used to establish the natural water quality conditions; to provide a basis for comparison
with stations having significant direct human impact (i.e., trend and global river flux stations); to
determine, through trend analysis, the influence of long-range transport of contaminants and of
climatic changes.
Trend Stations:Are typically located in major river basins, lakes or aquifers. They are used to follow
long-term changes in water quality related to a variety of pollution sources and land uses; to provide
a basis for the identification of causes or influences on measured conditions or identified trends.
Since trend stations are intended to represent human impacts on water quality, the number of trend
stations is relatively higher than the other categories of stations, in order to cover the variety of
water quality issues facing various basins. Ideally, each country should cover all major human
influences on water quality. Most of the stations are located in basins with a range of pollution-
inducing activities. However, some stations are located in basins with single, dominant activities.
Some trend stations may also serve as river flux stations.
Flux Stations: Are located at the mouth of rivers as they exit to the coastal environment. They are
used to determine integrated annual fluxes of critical pollutants from river basins to oceans or
regional seas, thereby contributing to geochemical cycles. For calculation of chemical fluxes, it is
essential that water flow measurements be obtained at the location of the river flux stations.
Finally, in large programmes involving several parties, institutional issues are very important.
Sampling sites may exist operated by different entities that might not be co-operating. Such issues
should preferably be solved in the early stages in order to streamline the national monitoring and
enable best possible data-sharing.
Preliminary Surveys
Preliminary investigations such as inventories and surveys are needed before any monitoring

244 MGNCRE | E-Waste Management
244 MGNCRE | Water Security RM
programme is started, so that issues, problems and risk factors can be clearly identified and
evaluated, with the overall aim to allow the establishment of monitoring systems as effectively as
possible. These are short-term, limited activities to determine the water quality variability, specific
issues in lakes, river basins and groundwater, the type of monitoring media and pollutants to be
considered, and the technical and financial feasibility of a complete monitoring programme.
Inventories and in-depth surveys provide: (i) relevant background information with respect to the
uses of water; (ii) the possible presence of pollutants not previously monitored; (iii) toxicological
factors; (iv) the natural background concentrations of components in groundwater; and (v) the
spatial and temporal variability of pollutant distributions. Finally, national surveys together with
land-use maps can provide a rapid overview of possible pressures in the basin. In this context, it is
useful to consider homogeneous areas where these preliminary investigations are to be undertaken.
Inventories: These should bring together all the available data, even where data is scattered around
different agencies or institutions. This can involve the registering of historical data, licenses, etc. in
administrative databases, as well as a general screening and interpretation of all the relevant
information. For inventories of pollution sources, this will involve examining information at their
source such as figures concerning production processes and the usage of raw materials, as well as
the investigation of suspect incidents through additional questioning.
Water quality surveys provide a preliminary insight into the functioning of the aquatic ecosystem,
the geochemical characteristics of groundwater and the occurrence of pollution and toxicity in
water. The ecological status of a river, lake and estuary can be assessed by investigating the
qualitative and quantitative structures of the biotic components of ecosystems. Chemical screening
of surface water, sediment and effluents at hot spots and key locations can be performed with the
supporting analyses. Any specific target compounds that inventories suggest might occur can also be
analysed and toxic effects in surface water, sediments and effluents can also be investigated at such
locations.
Preliminary surveys also help to refine the logistical aspects of monitoring. For example, access to
sampling stations is tested and can indicate whether refinements are necessary to the site selection
(a certain site may be found impractical for a variety of reasons, e.g. transport difficulties). Similarly,
operational approaches may be tested such as on-site testing techniques or sample preservation and
transport methods, can be evaluated. Sample volume requirements and preservation methods can
then also be refined.As a final result of the inventory, a listing of sampling sites should be prepared
and sampling stations or wells selected during the design of the monitoring programme.
During the design phase of a water quality programme it is essential that full documentation be
compiled. This should initially cover the description of a monitoring area comprising, as a minimum:
(i) the definition of the extent of the area where water conditions are going to be monitored; (ii) a
summary of the environmental conditions and processes (including human activities) that may affect
WQ; (iii) the availability of meteorological and hydrological information; (iv) a description of the
existing water bodies; and (v) a summary of actual and potential uses of water. Subsequently, the
initial steps of the planning process should then be recorded, starting with the monitoring objectives
through the choosing of sampling locations.

245 MGNCRE | E-Waste Management
245 MGNCRE | Water Security RM
The parameters which characterize water quality comprise physical properties, redox conditions,
inorganic and organic chemicals and biological components (both microbiological and macrobiotic)
which can indicate the ecological health of the aquatic environment. The parameters selected for
evaluation at a station or observation well will be determined largely by the objectives of the
monitoring programme.
Water bodies can be fully characterized by the three major components: hydrodynamics, physico-
chemistry, and biology. A complete assessment of water quality needs therefore to be based on
appropriate monitoring of these components. The selection of variables for any water quality
assessment programme should be indicative of functions and issues in river basins. The selection
must therefore consider known characteristics of the water resource and of the polluting sources.
Classification of water quality variables
The water quality variables may be listed, grouped and classified in different ways. As an example, a
number of broad categories under which determinant parameters may be grouped as follows.
• Basic determinant parameters, e.g. water temperature, pH, conductivity, dissolved oxygen
and discharge, used for a general characterization of water quality.
• Suspended particulate matter, e.g. suspended solids, turbidity and organic matter (Total
Organic Carbon - TOC), Biochemical Oxygen Demand - BOD and Chemical Oxygen Demand -
COD).
• Indicators of pollution with oxygen consuming substances e.g. dissolved oxygen, BOD, COD
and ammonium.
• Indicators of pollution with nutrients and eutrophication effects, e.g. nitrogen and
phosphorus, and various biological effect variables, e.g. chlorophyll and Secchi-disc
transparency.
• Indicators of acidification, e.g. pH, alkalinity, conductivity, sulphate, nitrate, aluminium,
phytoplankton and diatom sampling.
• Specific major ions, e.g. chloride, sulphate, sodium, potassium, calcium and magnesium.
These are essential factors in determining the suitability of water for most uses, such as
public water supply, livestock watering and crop irrigation.
• Specific minor ions, e.g. arsenic, fluoride; the presence of these ions above certain
concentration is toxic to human health.
• Metals, e.g. cadmium, mercury, copper and zinc.
• Organic micro-pollutants, such as pesticides and the numerous chemical substances used in
industrial processes, products and households.
• Indicators of radioactivity, e.g. total alpha and beta activity, 137Cs, 90Sr.
• Microbiological indicator organisms e.g. total coliforms, fecal coliforms and fecal
streptococci bacteria.
• Biological indicators of the ecological quality, e.g. phytoplankton, zooplankton, zoobenthos,
fish and macrophytes.
River basin management and water pollution control have relied for a long time on summary
determinant parameters, such as BOD and COD, indicators widely used to assess the amount of
organic oxygen-consuming pollution in rivers. For human consumption and public water supply, a set
of microbiological indicator organisms (eg. faecal coliform bacteria) have been identified and are

246 MGNCRE | E-Waste Management
246 MGNCRE | Water Security RM
now commonly applied to determine the hygienic suitability of water for drinking.
Typically, drinking water quality is assessed by comparing water samples to drinking water quality
guidelines or standards. Many countries set such guidelines based on the WHO ones and may
modify or tailor them to their domestic context.
Selection of variables
The variables to be measured as part of any given sampling programme should reflect consideration
of the uses to which the water is put as well as any known or anticipated impacts on the water
quality. In addition, the selection of variables to be included in a water quality assessment should be
related to the objectives of the programme. Assessments can be divided broadly into two categories,
use- and impact-orientated, as is described below. However, they can also be based on the widely-
accepted Drivers-Pressures-State-Impact-Responses framework to guide state and trend
assessments of surface and groundwater ecosystems.
There may be need for those responsible for assessments to decide which monitoring activities may
have the highest priority. By using risk assessment techniques (and recording how these were
applied), this could be done using the concept of “expected damage” – that is, determining what
goes wrong when there is insufficient information because of lack of monitoring, or what losses
occur when less than optimal decisions are made as a result.
Selection of variables in relation to water use: Use-orientated assessment tests whether water
quality is satisfactory for specific purposes, such as drinking water supply, industrial use or irrigation.
Many water uses have specific requirements with respect to physical and chemical variables or
contaminants. In cases, therefore, the required quality of water has been defined by guidelines,
standards or maximum allowable concentrations.These consist of recommended (as in the case of
guidelines) or mandatory (as in the case of standards) concentrations of selected variables which
should not be exceeded for the prescribed water use. Existing guidelines and standards define the
minimum set of variables for inclusion in assessment programmes. Other variables can also be
monitored, if necessary, according to special conditions related to the intended use. Acceptable WQ
is also related to water availability. When water is scarce, a lower level of quality may have to be
accepted and the variables measured can be kept to a minimum.
Selection of variables in relation to pollutant sources: Water quality assessment often examines the
effects of specific activities on water quality. Typically, such assessment is undertaken in relation to
effluent discharges, urban or land runoff or accidental pollution incidents. The selection of variables
is governed by knowledge of the pollution sources and the expected impacts on the receiving water
body. It is also desirable to know the quality of the water prior to anthropogenic inputs. This can be
obtained, for example, by monitoring upstream in a river or prior to the development of a proposed
waste disposal facility. When this cannot be done, background WQ from an adjacent,
uncontaminated, water body in the same catchment can be used.
Most of the variables can be measured by various methods and techniques, depending on the
resources available, time constraints (how quickly the results are needed) and the accuracy of the
results required.

247 MGNCRE | E-Waste Management
247 MGNCRE | Water Security RM
Selection of variables for early warning systems: The appropriate indicative variables to be
monitored for early warnings will vary, and should be selected on the basis of the past history of
pollution emergencies (frequently occurring local risk substances); issues specific to the river basin
(e.g. dissolved oxygen, pH); and any additional need to detect specific micro pollutants, such as
heavy metals, harmful organic compounds or pesticides, using advanced technologies
Variables should also be selected for early-warning systems according to the availability of
equipment for in situ measurements and other cost-benefit considerations, due to the high
investment, operating and maintenance costs for automatic measuring devices. Acute toxic effects
may also be recognisable with the help of biological systems examining species from different
trophic levels and with various functions.
Any potentially hazardous pollutants that frequently occur in a river basin in concentrations that
may jeopardise water uses should be targeted by early-warning systems. Simple indicative
parameters such as dissolved oxygen, pH or oil substances can routinely be measured by automatic
in situ sensors. If specific problematic micro pollutants such as pesticides need to be detected, more
advanced analytical systems can be used, although investment, operating and maintenance costs are
high. Toxicological effects in organisms at various trophic levels can be measured with automated
biological early-warning systems.
Early warnings provide enough time for emergency measures to be taken. The locations of early-
warning water quality monitoring sites, including their observational infrastructure (stations), should
therefore be determined with regard to the response time (the interval between the moment of
sampling and the issue of an alarm) and the time any contaminant plume in a river will take to flow
from the warning station to any site downstream where the water is used, such as a water supply
intake. The diffusion of contaminants may be crucially affected by high river discharges. Sampling
points should also be carefully located to ensure that the presence of all the relevant pollutants will
be observed.
The frequency of measurements should be determined by the expected size of contaminant plumes
so that no significant pollution is missed. Plumes will inevitably disperse to some extent between
their discharge source and the sampling location, according to the characteristics of the river.
Furthermore, sampling frequencies should allow sufficient time for action to be taken in the event of
an emergency. Additional and intensified sampling is recommended after any first indication of
accidental pollution. One example of a river basin alarm systems is a Rhine Alarm system.
Regarding contamination plumes in groundwater, observations wells should be monitored at specific
locations to verify whether the plume is not reaching some potential receptors like deeper aquifers,
rivers or surrounding groundwater system.
Selection of Water Quality Monitoring Methods and Techniques
There are a variety of monitoring methods and different levels of technology (from low cost to very
expensive instruments) and techniques available and being developed to address the quality of
water resources around the globe. There is no simple, single method which can be applied across
the board, in every aquatic situation. The challenge for water managers is in the efficient use of a

248 MGNCRE | E-Waste Management
248 MGNCRE | Water Security RM
mixture of technologies specifically to address each particular situation.
Methods for field monitoring
Traditionally, water sampling operations include in situ measurements, sampling of appropriate
media (water, biota, suspended solids), sample pre-treatment and conservation, identification and
shipment. The various alternative methods that may be chosen are elaborated as follows.
Methods for field monitoring are in situ measurements with different devices,manual or automated
measurements, continuous or snap-shot monitoring, water sampling including -grab sampling,depth
integrated sampling, time proportional composite sampling and space composite sampling.Protocols
to ensure the comparability of results and to prevent sample contamination be established for all
monitoring methods. Methods of measuring are determined by a number of factors, the type of
material being monitored - ground- or surface water, bottom or suspended sediment; groundwater
well sampling, the type of sample - grab, composite or integrated; the quality parameter being
analysed; the amount of sample; whether the sample is analysed on the spot or sent back to a
laboratory.
Traditional water sampling for laboratory chemical and biological analysis provides accurate results if
performed with care and sufficient quality assurance procedures are used. They are in many cases
also the only acceptable method when high precision is required. Laboratory analyses may however
be expensive and time consuming.
5.3 Water Analysis Parameters and Methodology
On-site testing
Some water quality parameters must be analysed in the field. On-site monitoring instruments and
field test kits are available that permit analyses of a wide range of variables. This makes it possible to
run a monitoring programme without the need for a fixed laboratory, but raises certain problems of
analytical quality control.
Temporary laboratories
If a monitoring programme is expected to be of short duration, it may be expedient to set up a
temporary laboratory. Sufficient space, water and electricity supplies are essential, but equipment
and supplies can be brought in and then removed after the monitoring programme is completed.
Mobile laboratories
It is possible to set up a laboratory in a suitable motor vehicle, e.g. truck or van, boat or even an
airplane. In effect, this is a variant of on-site testing, but may provide better facilities than field kits.
Temperature
Temperature Should be measured in situ, using a thermometer. Some meters designed to measure
oxygen or conductivity can also measure temperature. As temperature has an influence on so many
other aquatic variables and processes, it is important always to include it in a sampling regime, and
to take and record it at the time of collecting water samples. For a detailed understanding of
biological and chemical processes in water bodies it is often necessary to take a series of
temperature measurements throughout the depth of the water, particularly during periods of
temperature stratification in lakes and reservoirs. There are also gauges for measuring water
temperature in monitoring wells.

249 MGNCRE | E-Waste Management
249 MGNCRE | Water Security RM
pH
pH is a measure of the acidity or alkalinity of a solution. Neutral solutions have a pH of 7, acid
solutions a pH of less than 7, and alkaline solutions a pH greater than 7. The pH should be
determined in the field, immediately after sample collection. There are many portable pH meters on
the market today; the investigator should select the one that suits his needs best.
Conductivity
Conductivity (specific conductance) is a numerical expression of water's ability to conduct an
electric current. Conductivity depends on the concentration of ions in solution. In situ
measurements are preferable. Conductivity is temperature dependent. If the conductivity
measurement is not automatically temperature corrected, then the temperature at the time of
measurement should also be recorded. There are various conductivity meters available which may
also have temperature and salinity determining capabilities.
Alkalinity
Alkalinity Is measured commonly by titration, using either a burette or the drop count technique. A
sample is titrated with an acid solution, which neutralizes the alkaline species present. The endpoint
is determined by observing a colour change or by titrating to a pH value of 4.5, using a pH electrode
as an indicator. The volume of titrant required to change the colour to reach the endpoint is then
used to calculate total alkalinity. Both methods have limitations. Sample colour or turbidity affects
the operator’s ability to detect the colour change. Use of a burette or dropper is tedious and time-
consuming. There are total alkalinity test kits which simplify routine alkalinity measurement, ideal
for field use.
Dissolved Oxygen
Dissolved oxygen (DO) should be measured in situ or in the field, as concentrations may show a large
change in a short time if the sample is not adequately preserved. Even when the sample is
preserved, as in a Winkler analysis, it is advisable to run the titrations within 3 to 6 h from the time
the sample was taken. Dissolved oxygen concentrations may be determined directly with a DO
meter, optode or by a chemical method such as Winkler analysis or the Hach method. The method
chosen will depend on a number of factors including the accuracy and precision required,
convenience, equipment and personnel available and expected interferences. For very precise
measurements the potentiometric method should be considered.The samples for oxygen
determinations are always taken as vertical series starting from the uppermost layer in the
epilimnion (usually one meter) and finishing in the hypolimnion at a depth that is one meter above
the bottom sediment.
Turbidity and Transparency
This is an optical measure of suspended sediment such as clay, silt, organic matter, plankton and
microscopic organisms in a water sample. Whenever possible, turbidity should be measured in-field,
since some of the particulate matter will settle or adhere to the container wall during
transportation. Furthermore, changes in the pH of the sample may cause the precipitation of
carbonates and humic acids, affecting the turbidity of the sample. Turbidity can be measured with
turbidity meters that measure light scattering by the suspended particles.Although optical devices
are available for measuring the intensity of solar radiation at depth in the water column, the very
simple procedure of determining transparency with a Secchi disk still retains its value. The method

250 MGNCRE | E-Waste Management
250 MGNCRE | Water Security RM
is to observe the depth at which a 30 cm-diameter disk, painted white or with black and white
quadrants, disappears from view as it is lowered in the water column. The actual procedure is to
record the point of disappearance as the disk is lowered, allow it to drop a little farther, and then
determine the point of re-emergence as the disk is raised. The mean of the two readings is taken as
the Secchi disk transparency.
Colour
The colour and the turbidity of water indicate the depth to which light is transmitted. This, in turn,
controls the amount of primary productivity that is possible by controlling the rate of photosynthesis
of the algae present. The visible colour of water is the result of the different wavelengths not
absorbed by the water itself or the result of dissolved and particulate substances present. It is
possible to measure both true and apparent colour in water. Minerals such as ferric hydroxide and
organic substances such as humic acids give true colour to water. True colour can only be measured
in a sample after filtration or centrifugation. Apparent colour is caused by coloured particulates and
the refraction and reflection of light on suspended particulates. Polluted water may, therefore, have
quite a strong apparent colour.
Taste and Odour
Water odour is usually the result of labile, volatile organic compounds and may be produced by
phytoplankton and aquatic plants or decaying organic matter. Industrial and human wastes can also
create odours, either directly or as a result of stimulating biological activity. Organic compounds,
inorganic chemicals, oil and gas can all impart odour to water, although an odour does not
automatically indicate the presence of harmful substances. Regarding groundwater, hydrogen
sulfide,(H2S), has a strong odour which can easily be recognised by the human sense of smell.
Residue and Total Suspended Solids
The term “residue” applies to the substances remaining after evaporation of a water sample and its
subsequent drying in an oven at a given temperature. It is approximately equivalent to the total
content of dissolved and suspended matter in the water since half of the bicarbonate (the dominant
anion in most waters) is transformed into CO2 during this process. The term “solids” is widely used
for the majority of compounds which are present in natural waters and remain in a solid state after
evaporation (some organic compounds will remain in a liquid state after the water has evaporated).
Total suspended solids (TSS) and total dissolved solids (TDS) correspond to non-filterable and
filterable residue, respectively.
Total Suspended Solids
Suspended particles affect water clarity and light penetration, temperature, the dissolved
constituents of surface water, the absorption of toxic substances such as organics and heavy metals,
and the composition, distribution and rate of sedimentation of matter. Waters high in suspended
solids may be aesthetically unsatisfactory for recreational activities. Solids’ analyses are important
in the control of biological and physical wastewater treatment processes and for assessing
compliance with guidelines imposed by regulatory agencies for wastewater effluents.Total
suspended solids (TSS) is a measure of the material collected on a glass fibre filter and dried to a
constant weight at 103 to 1050C. If the suspended matter clogs the filter and prolongs filtration, the
difference between the total solids content (also dried at 103 - 1050C) and the total dissolved solids
251 MGNCRE | E-Waste Management
251 MGNCRE | Water Security RM
(filtrate dried to constant weight at 1800C) may be used to estimate the total suspended solids. TSS
can also be determined using optical instruments (backscattering of light).
Chlorophyll
Chlorophyll fluoresces red when excited by blue light and this property can be used to measure
chlorophyll levels and indicate algal biomass. Direct, and continuous, measurement of chlorophyll
fluorescence can be made with a fluorometer which can be used in situ by pumping water through it
or, for some specially designed instruments, by lowering it into the water. Chlorophyll can also be
determined in situ by optical spectral instruments using the reflectance spectra and naturally from
water samples in a laboratory.
Carbon
The principle of all methods for the determination of total carbon (TC) in water is oxidation of the
carbon to carbon dioxide (CO2). Oxidation may be carried out by combustion, chemical reaction by
the wet method using appropriate oxidizing agents, UV irradiation or any other appropriate
procedure. The carbon dioxide formed may be determined directly or indirectly following reduction
to another component (methane, for example).Various analytical methods have been suggested,
some of which are IR spectrometry and flame ionisation following methanisation. A water sample
may contain variable amounts of dissolved and particulate organic carbon, organic carbon
originating from more or less volatile substances, and dissolved mineral carbon (carbonates, carbon
dioxide) and particulate carbon (active charcoal). The different matrices of the specimens that result
from the presence of these forms of carbon in variable proportions must be taken into consideration
before the analysis, because they largely determine what apparatus and procedure to select. Total
fulvic and humic acid content can be determined photometrically and their separate determination
can be made with spectrophotometric methods.
Nutrients
Measurement of nutrients (phosphates, nitrates) is a significant and widespread requirement that is
mostly met currently by water sampling or the deployment of expensive wet chemical water
analysers; however, there are rapid developments in less expensive methods as well. Remote
spectral sensing can be used to obtain information about large-scale distributions of nutrients in
surface water, but direct measurement methods are required for measurements on smaller scales
(e.g. in creeks, rivers, wastewater, outfalls, etc.), for quality assurance and evaluation of the remote
sensing data, and for more accurate measurements. Optical spectral sensing techniques have been
developed recently that provide reagent-free measurement of nutrients using UV absorption
spectrophotometry.
There are in-situ nutrient analysers available for high-frequency time-series determination of
nutrient concentrations in marine and fresh waters. Versions are available for the measurement of
nitrate, phosphate, silicate and ammonia. Some analysers may be deployed unattended for periods
of 1 - 3 months, although much longer deployments have been achieved.
Organic Matter
Organic matter, measured by Dissolved Oxygen, Biochemical Oxygen Demand (BOD) and
ammonium, constitute key indicators of the oxygen content of water bodies. Concentrations of
these determinant parameters normally increase as a result of organic pollution caused by
discharges from waste water treatment plants, industrial effluents and agricultural runoff. Severe
organic pollution may lead to rapid de-oxygenation of river water, a high concentration of ammonia

252 MGNCRE | E-Waste Management
252 MGNCRE | Water Security RM
and the disappearance of fish and aquatic invertebrates. The most important sources of organic
waste load are: household waste water; industries such as paper industries or food processing
industries; and occasionally silage effluents and slurry from agriculture. Increased industrial and
agricultural production, coupled with a greater percentage of the population being connected to
sewerage systems, initially resulted in increases in the discharge of organic waste into surface water
in most developed countries. Over the years the biological treatment of waste water has increased,
and organic discharges have consequently decreased.
Measurement of TOC (total organic carbon) or DOC (dissolved organic carbon) is a much more rapid
means of determining the organic content of water and wastewater than is the measurement of
biochemical oxygen demand (BOD). If the relative concentrations of organic compounds in the
samples do not change greatly, empirical relationships can be established between TOC and BOD or
COD to permit speedy and convenient estimations of the latter. Measurement of TOC can be used to
monitor processes for the treatment or removal of organic contaminants without undue
dependence on the oxidation states, and is valid at low concentrations.
Humus is formed by the chemical and biochemical decomposition of vegetative residues and from
the synthetic activity of micro-organisms. Humus enters water bodies from the soil and from peat
bogs, or it can be formed directly within water bodies as a result of biochemical transformations. It is
operationally separated into fulvic and humic acid fractions, each being an aggregate of many
organic compounds of different masses. Natural organic compounds are not usually toxic, but exert
major controlling effects on the hydrochemical and biochemical processes in a water body. Some
natural organic compounds significantly affect the quality of water for certain uses, especially those
which depend on organoleptic properties (taste and smell). During chlorination for drinking water
disinfection, humic and fulvic acids act as precursor substances in the formation of tribalomethanes
such as chloroform. In addition, substances included in aquatic humus determine the speciation of
heavy metals and some other pollutants because of their high complexing ability. As a result, humic
substances affect the toxicity and mobility of metal complexes. Therefore, measurement of the
concentrations of these substances can be important for determining anthropogenic impacts on
water bodies.
Major ions
The salinity of lake waters depends primarily on the quality of the bedrock, the soil of the
watershed, where the lake is situated and where its water source is. There are great differences in
salinity between different geological areas. Fresh waters contain alkali and alkaline earth
bicarbonate and carbonate, sulphate, chloride in dilutions and largely un-dissociated silicic acids. In
smaller quantities there are a great number of different elements (such as important nutrients
phosphorus and nitrogen, as well as aluminium, iron, manganese, copper, zinc, etc.), which can be
measured everywhere in the globe. The presence of salt can restrict abstraction of water for drinking
water. If water abstraction is excessive, intruding salt water can contaminate the groundwater.
The most common elements which have been monitored from inland surface waters are sodium,
potassium, calcium, magnesium, chloride and sulphur. Sodium (Na) in water exists principally as the
cat ion Na+. Potassium (K) does not exist in nature as a free element, it forms salts as chloride,
bromide, sulphate, nitrate and aluminium silicates. Potassium is an essential element for plant

253 MGNCRE | E-Waste Management
253 MGNCRE | Water Security RM
growth. Calcium (Ca) is the fifth most abundant element in rocks and soils on the earth. In surface
waters calcium is one of the most abundant cat ions because of the weathering of rocks and soils. It
is largely as the Ca2+ ion but complexes can also occur. Magnesium (Mg) is the eighth most
abundant element on the earth. In water it exists largely as Mg2+ ion. It also forms complexes.
Chloride (Cl) does not occur free in nature. The chloride ion is the principal ion in sea water. The
chloride ion is widely distributed in the environment as salts with sodium, potassium and calcium.
Sulphur (S) is the ninth most abundant element on the earth. Sulphur compounds are widely
distributed in minerals and rocks. In water, sulphates occur mainly as free anion SO42-, and form ion
pairs with Ca2+, Mg2+, Na+, Fe2+, Fe3+ and Mn2+.
Sulphide formation in surface waters is principally through anaerobic, bacterial decay of organic
substances in bottom sediments and stratified lakes and reservoirs. Traces of sulphide ion occur in
unpolluted bottom sediments from the decay of vegetation, but the presence of high concentrations
often indicates the occurrence of sewage or industrial wastes. Under aerobic conditions, the
sulphide ion converts rapidly to sulphur and sulphate ions. When appreciable concentrations of
sulphide occur, toxicity and the strong odour of the sulphide ion make the water unsuitable for
drinking water supplies and other uses.
In connection with drinking water supply many times the variable water hardness is used. Water
hardness expresses the sum of all the metallic cations, except for alkali metals. The principal ions
responsible for water hardness are calcium and magnesium.
Silica
Silica is widespread and always present in surface and groundwaters. It exists in water in dissolved,
suspended and colloidal states. Dissolved forms are represented mostly by silicic acid, products of its
dissociation and association, and organo-silicon compounds.Reactive silicon (principally silicic acid
but usually recorded as dissolved silica (SiO2) or sometimes as silicate (H4SiO4) mainly arises from
chemical weathering of siliceous minerals. Silica may be discharged into water bodies with
wastewaters from industries using siliceous compounds in their processes such as potteries, glass
works and abrasive manufacture.
Fluroide
Measurement of fluoride content is especially important when a water body is used for drinking
water supply. At high concentrations fluoride is toxic to humans and animals and can cause bone
diseases. However, a slight increase in natural concentrations can help prevent dental caries
although, at higher concentrations (above 1.5-2.0 mg l-1), mottling of teeth can occur (WHO, 1984).
Where fluoride is known to occur or can be anticipated, it is an essential variable in surveys where
community water supplies are being planned but for long-term monitoring it is less important.
Boron
Boron Is a natural component of freshwaters (groundwater and surface water) arising from the
weathering of rocks, soil leaching, volcanic action and other natural processes. Industries and
municipal wastewaters also contribute boron to surface waters. In addition, agricultural runoff may
contain boron, particularly in areas where it is used to improve crop yields or as a pesticide. Boric
acid, which does not readily dissociate, is the predominant species in freshwaters.

254 MGNCRE | E-Waste Management
254 MGNCRE | Water Security RM
Toxic Metals
The low concentrations of metals in natural waters require determination by instrumental methods.
Photometric methods, sometimes in combination with extraction, are the oldest and most
inexpensive techniques (see various methods handbooks).However, as these have high detection
limits, they can only be used for analysis of comparatively polluted waters. Atomic absorption
methods are the most widely used for detection of lower levels of metals.ICP-MS (Inductively
coupled plasma - mass spectrometry) or ICP-OES (Inductively coupled plasma - Optical Emission
Spectroscopy) are techniques that are a highly sensitive and capable of the determination of a range
of metals and several non-metals.
Atomic Absorption Spectrophotometry (AAS)
Atomic Absorption SpectrophotometryIs commonly used in many analytical laboratories for
determination of trace elements in water samples and in acid digests of sediment or biological
tissues. Atomic absorption spectrophotometry is based on the principle that metallic elements in the
ground state will absorb light of the same wavelength which they emit when excited. When
radiation from a given excited element is passed through a flame containing ground state atoms of
that element, the intensity of the transmitted radiation will decrease in proportion to the amount of
ground state elements in the flame. The lamps used to furnish the light beam are called hollow
cathode lamps and are made of, or lined with the element of interest and filled with an inert gas,
generally neon or argon. When subjected to a current, these lamps emit the spectrum of the
desired element together with that of the filler gas. The metal atoms to be quantified are placed in
the beam of light radiation by aspirating the sample into a flame. The element of interest in the
sample is not excited by the influence of the flame, but merely dissociated from its chemical bonds
and placed in an unexcited, un-ionized "ground" state. The element is then capable of absorbing
radiation from the light source. The amount of radiation absorbed in the flame is proportional to
the concentration of the element present. While the simplest analysis procedure is direct aspiration
of a liquid sample into the atomizer-burner assembly, there may be limitations of delectability or
interferences that make further sample processing necessary to increase concentration or isolate
the element of interest from interfering species.
Gas Chromatography
Gas Chromatography Is a highly sophisticated analytical procedure. It should be used only by
analysts experienced in the techniques required and competent to evaluate and interpret the data.
In gas chromatography (GC) a carrier phase (a carrier gas) and a stationary phase (column packing or
capillary column coating) are used to separate individual compounds. The carrier gas is nitrogen,
argon- methane, helium or hydrogen. For packed columns, the stationary phase is a liquid that has
been coated on an inert granular solid (the column packing) that is held in a length of borosilicate
glass tubing. The column is installed in an oven with the inlet attached to a heated injector block and
the outlet attached to a detector. Precise and constant temperature control of the injector block,
oven and detector is maintained. Stationary phase material and concentration, column length and
diameter, oven temperature, carrier gas flow and detector type (e.g. flame ionization detection for
PAHs, electron capture detection for phenolics, organochlorinated insecticides and PCBs, thermionic
specific detection for nitrogen-containing compounds or organophosphates, mass selective
detection, etc.) are the controlled variables.When the sample solution is introduced into the column
the organic compounds are vaporized and moved through the column by the carrier gas. They travel

255 MGNCRE | E-Waste Management
255 MGNCRE | Water Security RM
through the column at different rates depending on differences in partition coefficients between the
mobile and stationary phases.
Flame Photometry
This makes possible the determination of trace amounts of lithium, potassium, sodium and
strontium, although other methods of analysis for lithium and strontium are preferred.The sample,
after dilution if necessary, is sprayed into a butane- air or propane- air flame. The alkali metals
absorb energy from the flame and become raised to an excited energy state in their atomic form. As
these individual atoms “cool” they fall back into their original unexcited or ground state and re-emit
their absorbed energy by radiation of specific wavelengths, some of which are within the visible
region of the electromagnetic spectrum.This discrete emission is isolated by an optical filter and, for
low concentrations, is proportional to the number of atoms returning to the ground state. This, in
turn, is proportional to the number of atoms excited and, hence, to the concentration of the
element in the solution.The minimum detection level for both potassium and sodium is
approximately 100 μg l- 1. The upper limit is approximately 10.0 mg l- 1, but this may be extended by
diluting the samples.
Quality Assurance Procedures
Quality Assurance (QA) is a management method that is defined as ‘all those planned and systematic
actions needed to provide adequate confidence that a product, service or result will satisfy given
requirements for quality and be fit for use’. It is defined as ‘the sum total of the activities aimed at
achieving that required standard’.Any monitoring programme or assessment must aim to produce
information that is accurate, reliable, comparable, and adequate for the intended purpose. This
means that a clear idea of the type and specifications of the information sought must be known
before the project starts, i.e. there must be a data quality objective. These objectives are qualitative
and quantitative specifications that are used to design the system that will limit the uncertainty to
an acceptable level within the constraints allowed. They are often set by the end users of the data
(usually those funding the project) in conjunction with the technical experts concerned. It is essential
to stress that the trend is to strengthen laboratory quality assurance in a step-by-step approach:
from simple internal quality control measures to laboratory accreditation, and finally to the
application of international standards such as ISO/IEC 17025 covering general requirements for the
competence of calibration and testing laboratories. Components of Quality Assurance are often
grouped under three levels viz. strategic or organizational level (dealing with the quality policy,
objectives and management and usually produced as the Quality Manual); tactical or functional level
(dealing with general practices such as training, facilities, operation of QA); and operational level
(dealing with the Standard Operating Procedures (SOPs) worksheets and other aspects of day to day
operations).
5.4 Microbiological Analysis
There is a strong need for detection of pathogens, onsite and in effectively real time, to avoid the
costs and delays associated with water sampling and lab analysis. There is considerable interest in
the development of toxicity sensing to overcome the problems associated with identification of
individual target species from a large number of possibilities.There are rapid screening technologies,
from which results may be obtained within hours, and there is an obvious push towards desktop and
portable systems. They can detect e.g. the normal intestinal bacterium Escherichia coli as an
“indicator” organism and total coliform bacteria for a wide variety of water testing applications and

256 MGNCRE | E-Waste Management
256 MGNCRE | Water Security RM
in addition the following bioagents may also be detected: clostridium botulinum neurotoxin,
staphylococcal enterotoxins (A and B), bacillus anthracis, yersinia pestis, and also cholera toxin
subunits and tetanus toxin.Methods for detection of the presence of faecal material have been
developed which are based on the presence of “indicator” organisms, such as E coli. Such methods
are cheap and simple to perform and some have been developed into field kits, particularly for use
in developing countries.
However, enumeration of bacteria normally occurring in high numbers in faeces of humans and
homoeothermic animals has been very successfully used for more than a century for the detection
of faecal contamination. This strategy has been of immense importance in protecting humans
against infectious diseases transmitted via water and causing easily extensive epidemics if drinking
water is contaminated but also due to contaminated water supplies, in water used for irrigation and
in recreational waters.Methods for detection of the presence of faecal material have been
developed which are based on the presence of “indicator” organisms, such as E coli. Such methods
are cheap and simple to perform and some have been developed into field kits, particularly for use
in developing countries.
Characteristics of Indicator Organisms
Total Coliforms: Coliforms are a large group of Gram-negative, rod-shaped bacteria that share
several characteristics. The group includes thermo tolerant coliforms and bacteria of faecal origin, as
well as some bacteria that may be isolated from environmental sources. Thus the presence of total
coliforms may or may not indicate faecal contamination. In extreme cases, a high count for the total
coliform group may be associated with a low, or even zero, count for thermo tolerant coliforms.
Such a result might be caused by entry of soil or organic matter into the water or by conditions
suitable for the growth of other types of coliform. In the laboratory total coliforms are grown in or
on a medium containing lactose, at a temperature of 35 or 37 °C. They are provisionally identified by
the production of acid and gas from the fermentation of lactose.
Thermo tolerant (faecal) Coliforms: Coliform organisms which grow at 44 or 44.5 C and ferment
lactose to produce acid and gas are known as thermo tolerant ( faecal ) coliforms. In practice, some
organisms with these characteristics may not be of faecal origin and the term “thermo tolerant
coliform” is, therefore, more correct and is becoming more commonly used. More than 95 per cent
of thermo tolerant coliforms isolated from water are the gut organism Escherichia coli, the presence
of which is definitive proof of faecal contamination.In the laboratory thermo tolerant, coliforms are
grown on media containing lactose, at a temperature of 44 or 44.5 °C. They are provisionally
identified by the production of acid and gas from the fermentation of lactose. Nutrient-rich
environments may encourage the growth or persistence of some species of thermo tolerant coliform
other than E. coli. This possibility should be considered when, for example, an unusually high result
is obtained from water that was thought to be relatively clean. In such a case, the advice of a
microbiology laboratory should be sought for the determination of the more specific indicator, E.
coli.
The presence of faecal streptococci is evidence of faecal contamination. Faecal streptococci tend to
persist longer in the environment than thermo tolerant or total coliforms and are highly resistant to
drying. It is, therefore, possible to isolate faecal streptococci from water that contains few or no
thermo tolerant coliforms as, for example, when the source of contamination is distant in either
257 MGNCRE | E-Waste Management
257 MGNCRE | Water Security RM
time or space from the sampling point. Faecal streptococci grow in or on a medium containing
sodium azide, at a temperature of 37-44 °C. They are usually detected by the reduction of a dye
(generally a tetrazolium-containing compound) or the hydrolysis of aesculin. Routine methods may
give “false positives” and additional confirmatory tests may be required.
Heterotrophic Plate Count: The heterotrophic plate count includes all of the micro-organisms that
are capable of growing in or on a nutrient-rich solid agar medium. Two incubation temperatures and
times are used: 37 °C for 24 hours to encourage the growth of bacteria of mammalian origin, and 22
°C for 72 hours to enumerate bacteria that are derived principally from environmental sources. The
main value of colony counts lies in comparing the results of repeated samples from the same source.
If levels increase substantially from normal values, there may be cause for concern.
Multiple Fermentation Tube Technique:This method is used for the analysis of drinking-water. In
fact, this is the only procedure that can be used if water samples are very turbid. This is the most
fundamental method of conducting bacteriological analyses.Separate analyses are usually conducted
on five portions of each of three serial dilutions of a water sample. Individual portions are used to
inoculate tubes of culture medium five aliquots of water from each of three consecutive 10-fold
dilutions; for example, five aliquots of the sample itself, five of a 1/10 dilution of the sample and five
of a 1/100 dilution. Aliquots may be 1-ml volumes, each added to 10 ml of single strength culture
medium, or 10-ml volumes, each added to 10 ml of double-strength medium. These are incubated at
a standard temperature for a standard period of time.The presence of coliforms is indicated by
turbidity in the culture medium, by a pH change and/or by the presence of gas.MPN index is
determined by comparing the pattern of positive results (the number of tubes showing growth at
each dilution) with statistical tables. The tabulated value is reported as MPN per 100 ml of sample.
To help to reduce the cost a smaller number of tubes is incubated at each dilution, for example three
instead of five. Or, one tube with 50 ml of sample and five tubes with 10 ml of sample are inoculated
and incubated.
Culture Media and Buffered Dilution Water: Each part of the test requires a different type of
medium. Dehydrated powder, packaged in pre-weighed amounts suitable for making one batch of
medium, to be dissolved in an appropriate volume of distilled water, dispensed to culture tubes and
sterilised before use. Ampoules of ready-to-use media are the most convenient form but are the
most expensive and have the shortest shelf-life. Media should be stored in a cool, dark, dry place.
Large bottles containing dehydrated media must be tightly resealed after use to prevent spoilage.
Stock solution of buffered dilution water is prepared by dissolving 34.0 g of potassium dihydrogen
phosphate, KH2PO4, in 500 ml of distilled water. The pH is checked and, if necessary, adjusted to 7.2
by the addition of small quantities of 1 mol l-1 NaOH solution. Distilled water is added to bring the
final volume to 1 litre. The buffered water is stored in a tightly stoppered bottle in the refrigerator.
1.25 ml of stock solution is added to 1 litre of distilled water, mixed well and dispensed into dilution
bottles in quantities that will provide, after sterilisation, 9 or 90 ml. The bottles are loosely capped,
placed in the autoclave, and sterilised for 20 minutes at 121 °C. After the bottles have been removed
from the autoclave, the caps should be tightened and the bottles stored in a clean place until
needed. When enumerating coliforms, lauryl tryptose (lactose) broth is used in the first (isolation or
presumptive) part. In the second (confirmation) part, brilliant green lactose bile (BGLB) broth is used
to confirm total coliforms.

258 MGNCRE | E-Waste Management
258 MGNCRE | Water Security RM
Membrane Filter Technique: This technique is used for larger number of samples. Portable testing
kits are also available for field testing. It gives a direct count of total coliforms and faecal coliforms
present in a given sample of water. A measured volume of water is filtered, under vacuum, through
a cellulose acetate membrane of uniform pore diameter, usually 0.45 µm. Bacteria are retained on
the surface of the membrane which is placed on a suitable selective medium in a sterile container
and incubated at an appropriate temperature. If coliforms and/or faecal coliforms are present in the
water sample, characteristic colonies form that can be counted directly. Membrane filtration and
colony count techniques assume that each bacterium, clump of bacteria, or particle with bacteria
attached, will give rise to a single visible colony. Each of these clumps or particles is, therefore, a
colony forming unit (cfu) and the results are expressed as colony forming units per unit volume. In
the case of thermo tolerant coliform bacteria the result should be reported as thermo tolerant
coliforms cfu per 100 ml.
5.5 Soil Testing and Toxicity Characteristic Leaching Procedure (TCLP)
Soil needs to be tested for fertility, to determine available concentrations of plant nutrients. Also, it
is test for pollution, geotechnical, geo chemical and ecological investigations. For testing soil, 10- 20
sample points are chosen for every 40 acres. Sampling spots can be chosen in a network, z-scheme,
diagonally or along tilling lines. Sampling is done by digging a pit. The soil is vertically cut along the
pit wall to a depth where roots are present.0-30 cm for field crops, 30-60 cm for permanent crops.
Determine the soil unit (or plot). Make a traverse over the soil unit (or plot). Clean the site (with
spade) from where soil sample is to be collected. Insert the spade into soil. Standing on the opposite
side, again insert the spade into soil. A lump of soil is removed. A pit of ‘V’ shape is formed. Its depth
should be 0-6" or 0-9" or 0-12" (i.e., Depth of tillage). Take out the soil-slice (like a bread slice) of ½
inch thick from both the exposed surface of the pit from top to bottom. This slice is also termed
furrow-slice. Usually a composite sample is collected by combining soil from several locations. Up to
1 kg of soil is sent for testing. The composition of soil is affect by depth of the soil sample and timing.
Soil chemistry changes over time as biological and chemical processes breakdown or combine
compounds. Laboratories test soil for major nutrients- N, P, K, secondary nutrients- S, Ca, Mg, micro-
nutrients- Fe, Mn, Cu, Zn, Bo, Mb, Cl. Soil pH is an important quality to test. Common soil
contaminants include Petroleum products, industrial solvents, pesticides, salts and plant fertilizers.
Also, heavy metals like Arsenic, Barium, Cadmium, Copper, Mercury, Lead and Zinc. Lead is
particularly dangerous. Geo technical tests include shear strength, compressive strength,
consolidation, permeability, foundation load, soil index, standard penetration test (SPT), Dynamic
Cone Penetration (DCP)and moisture/density.
Soil Testing Parameters Include physical (texture, structure, permeability, porosity, water holding
capacity, etc.), Chemical (pH, Salinity (EC)- we measure with pH, Cation exchange capacity, etc.) and
Microbial ( soil resporation, enzyme activities, etc.) Soil sampling for industrial pollutants is done in
accordance with ISO norms. Samples are collects from 0-20 cm surface and 20-40 cm sub-surface.
The samples are crushed, mixed, dried, grinded, sieved. For pH, Total nitrogen and total organic
carbon, a fraction of less than 2 mm was used. An aqueous solution of 1:2.5 is made. After mixing
and settling of particulate matter (after 30 min), the pH and EC are checked. Total Nitrogen content
is studied by Kjeldahl method.

259 MGNCRE | E-Waste Management
259 MGNCRE | Water Security RM
Toxicity Characteristic Leaching Procedure (TCLP)
The TCLP is designed to determine the mobility of both organic and inorganic analytes present in
liquid, solid, and multiphasic wastes. If a total analysis of the waste demonstrates that individual
analytes are not present in the waste, or that they are present but at such low concentrations that
the appropriate regulatory levels could not possibly be exceeded, the TCLP need not be run. If an
analysis of any one of the liquid fractions of the TCLP extract indicates that a regulated compound is
present at such high concentrations that, even after accounting for dilution from the other fractions
of the extract, the concentration would be above the regulatory level for that compound, then the
waste is hazardous and it is not necessary to analyze the remaining fractions of the extract. If an
analysis of extract obtained using a bottle extractor shows that the concentration of any regulated
volatile analyte exceeds the regulatory level for that compound, then the waste is hazardous and
extraction using the ZHE is not necessary. However, extract from a bottle extractor cannot be used
to demonstrate that the concentration of volatile compounds is below the regulatory level.
For liquid wastes (i.e., those containing less than 0.5% dry solid material), the waste, after filtration
through a 0.6 to 0.8 µm glass fiber filter, is defined as the TCLP extract. For wastes containing greater
than or equal to 0.5% solids, the liquid, if any, is separated from the solid phase and stored for later
analysis; the particle size of the solid phase is reduced, if necessary. The solid phase is extracted with
an amount of extraction fluid equal to 20 times the weight of the solid phase. The extraction fluid
employed is a function of the alkalinity of the solid phase of the waste. A special extractor vessel is
used when testing for volatile analytes. Following extraction, the liquid extract is separated from the
solid phase by filtration through a 0.6 to 0.8 µm glass fiber filter. If compatible (i.e., multiple phases
will not form on combination), the initial liquid phase of the waste is added to the liquid extract, and
these are analyzed together. If incompatible, the liquids are analyzed separately and the results are
mathematically combined to yield a volume-weighted average concentration.
TCCLP finds out the amount of EPA-listed contaminants are present and likely to be absorbed into
soil and groundwater. It indicates the possible public health or environmental health hazards exist in
the sludge being tested. Here, a soil sample extraction method is employed for chemical analysis. A
collection of four leaching tests are conducted, that follow the tiered approach of leach testing. Each
test is designed to vary a critical release-controlling parameter (pH, liquid-to-solid ratio, leaching
time) to provide leaching data over a broad range of test conditions.
Leaching characterization under LEAF (Leaching Environmental Assessment Framework) consists of
testing using one or more of the following four methods:
Method 1313: pH Dependence: - Liquid-Solid Partitioning (LSP) as a Function of Eluate pH Using a
Parallel Batch Extraction Procedure.
Method 1314: Percolation Column: - Liquid-Solid Partitioning (LSP) as a Function of Liquid-to-Solid
Ratio Using an Up-Flow Percolation Column Procedure
Method 1315: Mass Transfer Rates: - Mass Transfer Rates in Monolithic and Compacted Granular
Materials Using a Semi-dynamic Tank Leaching Procedure
Method 1316: Batch L/S: - Liquid-Solid Partitioning (LSP) as a Function of Liquid-to-Solid Ratio Using
a Parallel Batch Extraction Procedure
SPLP analysis by EPA 1312 is designed to mimic the leaching of contaminants exposed to normal

260 MGNCRE | E-Waste Management
260 MGNCRE | Water Security RM
weathering in situ by acid rain. TCLP extraction is performed by subjecting the material tested to a
simulated landfill leachate. Acetic acid is chosen as the extraction fluid as it is the major component
of typical municipal landfill leachate. The pH is maintained at 4.93. This sample/ acetic acid mixture
is subjected to 18+ - 2 hours of rotary extraction. The resulting liquid is analysed for 39 contaminants
from the EPA’s TCLP final Rule, including 8 metals, 11 organic VOCs, 12 semi-volatile organic
compounds, 6 pesticides and 2 herbicides. The TCLP test must only be done for those wastes which
are destined for a landfill. Otherwise, wrong interpretation is likely. For materials not destined for
landfills, leaching is possible due to acid rain. Hence, such materials are subjected to SPLP. Here,
instead of acetic acid, the test is done with nitric acid and sulphuric acid to simulate acid rain.The
TCLP test method has essentially 6 steps.
STEP 1: Separate the liquid and solid portions of the waste (as needed): Liquids (containing less than
0.5% dry solid material) are filtered through glass fiber to create a TCLP extract. Wastes (containing
0.5% or greater dry matter) are separated and stored for later analysis.
STEP 2: Crush the solid portion of the waste: Using a standard 9.5 mm sieve, we filter solid material
and prepare it for extraction by cutting, crushing or grinding to a particle size of 1 cm or less.
STEP 3: Extract the solid material: Place the crushed solid portion in a system that simulates the
conditions of a landfill by filtering a large quantity of water through it. The solid material is then
extracted for at least 18 hours with a slightly acidic fluid equal to 20 times its weight. The materials
are placed in a tumbler to simulate the leaching action of water seeping through waste in the
landfill.
STEP 4: Final Separation: Collect the leachate from the system. The liquid waste is then separated
from the solid waste through a fiber glass filter. The solid material is discarded and the liquid
components are then assessed.
STEP 5: Recombine the separated liquid portion of the waste (if any) with the collected leachate. The
initial liquid components may be added or may be analyzed separately, depending on compatibility.
STEP 6: Analyze the leachate for constituents of concern. Atomic spectrometry technologies such as
atomic absorption spectrometry (AA), inductively coupled plasma optical emission spectrometry
(ICP-OES), and inductively coupled plasma mass spectrometry (ICP-MS), are often used because they
provide the sensitivity various global regulations require.
The TCLP test is an expensive and time-consuming procedure. It’s important to know that there are
three scenarios where TCLP is not required.If a total analysis of the waste demonstrates that the
individual contaminants are not present in the waste, or present in levels that could not possibly
exceed the regulatory threshold, then the TCLPis not required. For wastes that are 100% physically
solid, the maximum theoretical leachate concentration is 1/20 of the total concentration in the
waste.If this value is below the regulatory threshold, the TCLP need not be run.If the waste is 99.5%
or more liquid, then the waste itself is the extract, and can analyze it directly without performing the
TCLP.
Here are three examples of when it is necessary to run a TCLP. For example, the regulatory level for
the toxicity characteristic for lead (D008) is 5 ppm
1. If a wastewater solution contains 5 ppm or more dissolved lead, then it would be a D008
waste. A lower concentration would not be D008.
2. If a semisolid sludge contains 5 ppm or more total lead, then it would be a D008 waste. A
lower concentration would not be D008.
3. If a solid brick or dry ash contains less than 100 ppm dissolved lead, then the extract could

261 MGNCRE | E-Waste Management
261 MGNCRE | Water Security RM
not possibly have more than 5 ppm lead, and the solid could not be a D008.
4. If a solid brick or dry ash contains 100 ppm (20 times 5 ppm) or more elemental lead, then it
is possible that the extract produced by the TCLP could have 5 ppm or more elemental lead,
therefore the TCLP or an equivalent procedure must be performed. The extraction of sample
involve agitation apparatus that must be capable of rotating the extraction vessel in an end-
over-end fashion at 30 + 2 rpm. Suitable. The Zero-Headspace Extraction Vessel is used only
when the waste is being tested for the mobility of volatile analytes that allows for
liquid/solid separation within the device, and effectively precludes headspace. This type of
vessel allows for initial liquid/solid separation, extraction, and final extract filtration without
opening the vessel. The vessels shall have an internal volume of 500-600 mL, and be
equipped to accommodate a 90-110 mm filter.
When the waste is being evaluated using the nonvolatile extraction, a jar with sufficient capacity to
hold the sample and the extraction fluid is needed. Headspace is allowed in this vessel. The
extraction bottles may be constructed from various materials (such as borosilicate glass bottles),
depending on the analytes to be analyzed and the nature of the waste. Plastic bottles, other than
polytetrafluoroethylene, shall not be used if organics are to be investigated.
Summary
The environmental monitoring of water quality to assess the level of contamination and source
identification is first step for planning of interventions. The appropriate procedures are required to
be followed for generating credible data. Various water quality parameters are required to be tested
for fulfilling the objective of understanding of water quality and to demarcate the measure for
mitigation. The testing of water, waste water, soil and leachate are largely dependent on the
sampling, preservation, transportation and laboratory analysis following quality assurance and
quality control protocols. There is another important part of these whole exercise is to interpret data
for deriving logical conclusion. Thus to plan the environmental monitoring requires through
knowledge of various components so that the output results are comprehensive in scientific arena. It
would be prudent for the business managers to implement scientific approaches based on the
course material for management of environmental parameters holistically.
To Do Activities
• To begin with environmental monitoring of water, prepare a field visit check list
• To know the objective of monitoring and procedures of site selection
• To identify mixing zones, representative depth and sampling for parameters concerned.
• To understand the importance of sample preservation, transportation to laboratory in a
given time frame as per protocol
• To know the quality assurance and quality control in field and laboratory analysis
• To understand the importance of reference materials
• To prepare a report covering all the aspects from planning stage to interpretation of
analytical results for drawing inferences.
Self Assessment Questions
1. To know the requirement of testing of various environmental parameters

262 MGNCRE | E-Waste Management
262 MGNCRE | Water Security RM
2. To know what are the methods of site selection, sampling, preservatives, shelf life of
collected sample and method of analysis’s
3. To know what are the environmental standards
4. To understand the writing of report and interpretation of analysis results
References
i. Website of International Crops Research Institute for the Semi-Arid Tropics, Hyderabad ,
ii. Website of Indian Council of Agricultural Research, New Delhi
iii. www.cpcb.nic.in/legal/ Acts/ Rules
iv. www.cpcb.nic.in/ Guidelines of Water Quality monitoring
v. Examination of Water and Wastewater, American Public Health association,22nd Edition
vi. Anonymous, CPCB, Protocol on Water Quality Monitoring


Contents
Chapter 1 Waste banks
1.1. Concept of Waste Bank
1.2. Importance and need of waste banks
1.3. Waste banks- an organised sector
1.4. Waste circulation through banks
1.5. Advantages of waste Bank
Chapter 2 Reuse / recycle method
2.1. Waste deposition and distribution
2.2. Food waste
2.3. Utilisation of e-waste and plastic lethal waste
2.4. Biodegradable waste
2.5. Importance of reuse and recycling
Chapter 3 Simple daily Banks
3.1. Types of waste banks
3.2. Trash in cash by resale, recycle and reuse
3.3. Local economic development
3.4. Impact of waste Bank to local economy caselets
3.5. Zero waste cities through drop off and buyback centers
Chapter 4 Waste to wealth through banks
4.1. Community-based waste management
4.2. Local economic development
4.3. Community economic development
4.4. Decentralized waste banks
4.5. Trash and garbage banks
Chapter 5 Strategies and Precautions
5.1. Leadership management and incentives
5.2. Household waste management-Indian scenario
5.3. Safety equipment for waste handlers
5.4. Scheme for sustainable waste management

265 MGNCRE | E-Waste Management
265 MGNCRE | Waste Management Banks
Chapter 1 Waste Banks
Introduction
The concept of waste Bank is explained in this block. Moreover, importance and need of waste
banks are explained in detail. Waste banks are an organised sector which include control of
generation, storage collection, transfer and transport, processing and disposal of solid waste. The
challenges of waste Bank organisation such as lack of trained personnel, financial assistance and
knowledge are illustrated. Lastly, advantages of waste Bank is enlisted.
Objective
To study the concept, importance, need and advantages of waste banks
1.1. Concept of Waste Bank
Waste bins located in main room collects wastes of each room, following this, the wastes are
collected and transported to temporary storage site through hired workers of private companies. For
composting wastes collected from several areas of the municipality, communal composting facilities
are used by the municipal workers. Based on the survey reported by, most of the people almost 81%
do not usually sort wastes at home. Sufficient incentives for sorting waste or need to be provided,
waste collectors should be trained for mechanism for treatment of sorting waste. Advantages of
sorting should be explained to all dwellers. Care should be taken for that their waste transporter will
not mix the sorted waste at the local waste transport station.
1.2. Importance and need of waste banks
There are two main components to be noted in waste banks, namely, an economic cost-benefit
estimate and ecological cost-benefit estimate. The former one considers the financial costs and
benefits analysis from economic point of view, and the second section considers the benefits of
reduction in greenhouse gas emission.

266 MGNCRE | E-Waste Management
266 MGNCRE | Waste Management Banks
Figure1.1 A generic form of forward/reverse logistics.
1.3. Waste Banks- an Organised Sector
Zero waste target can be achieved through waste banks. Firstly, educating construction and
Healthcare institutions, developing treatment and recycling infrastructure and establishing drop off
points for large scale trash collection are the initial process of the waste Banks organisation
establishment. Subsequently, the process involved treatment of municipal solid waste, separation of
waste, treatment of bio-waste through decentralized composting units and reversing/ observing
separated dry material by the firm. Following this, waste is treated either by centralised composting
facilities or landfill, and the residues will be collected and treated against payment. Next, it is
Government’s responsibility to check that all Industries have their waste management plants. As the
result, recycled product will appear as raw material on the market. Then, recycling industrial sector
will be established in every City to achieve zero waste. The biowaste producers may have their own
waste management plant which includes feeding animals and composting. Fines will be imposed on
the individuals who do not separate household wastes. So that, municipal waste collectors may
afford little time for characterizing waste according to the nature. With the help of research
Institutes, technologies will be developed to ensure that no more wastes tipped at the landfill.

267 MGNCRE | E-Waste Management
267 MGNCRE | Waste Management Banks
(a) (b)
(c)

268 MGNCRE | E-Waste Management
268 MGNCRE | Waste Management Banks
(d) Containers
Figure 1.2Waste collection
(b)

269 MGNCRE | E-Waste Management
269 MGNCRE | Waste Management Banks
(c)-(e)Types of vehicles
Figure 1.3 Waste transport

270 MGNCRE | E-Waste Management
270 MGNCRE | Waste Management Banks
Figure 1.4 System boundaries and scenarios for waste management

271 MGNCRE | E-Waste Management
271 MGNCRE | Waste Management Banks
Table 1.1 Characterization of ‘biowaste’ and ‘inorganic waste’.
Waste category Sub categories Type of waste Composting and
recycling
Food scraps (kitchen waste) N/A Biowaste CO
Garden waste N/A Biowaste CO
Paper & cardboard Newspapers Inorganic RE
Magazine Inorganic RE
Other paper Inorganic NRE
Card packaging Inorganic NRE
Other card Inorganic NRE
Wood N/A Inorganic NCO
Textile N/A Inorganic NRE
Disposable diapers N/A Inorganic NRE
Rubber & leather N/A Inorganic NRE
Plastic Refuse sacks Inorganic RE
Other plastic film Inorganic NRE
Clear plastic beverage bottles Inorganic RE
Other plastic bottles Inorganic RE
Food packaging Inorganic RE
Other dense plastic Inorganic NRE
Metal Steel beverage cans Inorganic RE
Steel food cans Inorganic RE
Batteries Inorganic NRE
Other steel cans Inorganic RE
Other ferrous metal Inorganic RE
Aluminum beverage cans Inorganic RE
Aluminum foil Inorganic RE
Other non-ferrous metal Inorganic RE
Glass (pottery & ceramics) Brown glass bottles Inorganic RE
Green glass bottles Inorganic RE
Clear glass bottles Inorganic RE
Clear glass jars Inorganic RE
Other glass Inorganic NRE
Other (ash, dirt, dust, soil, ewaste N/A Inorganic NRE
CO: compostable. NCO: non-compostable. RE: recyclable. NRE: non-recyclable

272 MGNCRE | E-Waste Management
272 MGNCRE | Waste Management Banks
Figure 1.5.Flow chart of the household solid waste management system in Jakarta
Figure 1.6 Waste banks – An organised sector
Household (Residential)
Composting Centre
Temporary storage
Home composting
Landfill
Landfill gas to energy

273 MGNCRE | E-Waste Management
273 MGNCRE | Waste Management Banks
Figure 1.7Construction waste banks framework
1.4. Waste Circulation through Banks
Three primary sources of organic waste exist: i) agricultural and forestry activities, ii) urban activity,
and iii) industrial activity [1]. Wastes originating from agricultural and forestry activities include
Construction waste banks
Excavation soil
Excavation activity
Vegetable soil, soil, sand, gravel,
rock and clay
Road work wastes
Road, railroad, airport, runway construction, renovation,
demolition activity
Concrete, broken Asphalt, paving
stone, sand, pebble, railway traverse and
ballast
Demolition wastes
Building demolition activities such as
residential, school, hospital, industrial
buildings
Concrete with steel reinforcement,
roofing construction, tile isolation material, wall materials(brick, stone rubble and fly ash blocks), gypsum and other materials
Complex wastes
Construction, excavation, renovation,
refurbishment, demolition road work and other
construction related activities
Concrete, wall materials(brick
and stone rubble), sand, pebble, wood,
plastics, ceramics, metals, paper and cartoon

274 MGNCRE | E-Waste Management
274 MGNCRE | Waste Management Banks
livestock slurry, manure, crop remains, and waste from pruning and from the maintenance of
woodlands. Industries generate organic wastes, which include the sub products of the agri-food
industry (e.g., bagasse, coffee dregs, remains from slaughterhouses, sub products of the fruit and
legume industries, and milk serum), wool and skin remains, and cellulose sludge. Such organic waste
is increasingly considered not only an environmental problem but also a potential resource whose
recovery could lead to important economic benefits. This paradigm shift is powered partly by
legislation and partly by market forces.
Figure 1.8 Waste collection system diagram

275 MGNCRE | E-Waste Management
275 MGNCRE | Waste Management Banks
Figure 1.9 Recovery service provider

276 MGNCRE | E-Waste Management
276 MGNCRE | Waste Management Banks
1.5. Advantages of Waste Bank
The addition of such wastes to the soil has several advantages, especially the improvement of the
chemical and physical properties of the soil. These wastes (adequately composted) will increase the
humus content and, as a consequence, the water retention capacity of the soil. The wastes also
improve the soil structure, which is fundamental for root penetration and appropriate drainage and
aeration. In addition, organic waste is an important source of nutrients, and its addition to the soils
closes the mineral cycle. In agricultural areas, where soils are not limited by the organic matter
content, as can be the case in Gallize, organic waste can help to ameliorate other adverse effects,
such as acidity. Several studies indicate that these organic materials, if added to acidic soils, can be
effective as acid neutralisers; this effect is associated with an increase in fodder crop yield.
From a biological viewpoint, fertilisation with organic waste also induces an increase in microbial
activity, which in turn improves nutrient availability for plants. Similarly, the addition of organic
waste reduces the amount of chemical fertiliser needed, thus leading to savings in energy and raw
materials, with a concomitant reduction in the greenhouse effect. includes the addition of organic
waste among the management practices related to carbon sequestration. have observed that
organic agriculture systems (no synthetic fertilisers) produce less greenhouse gas than traditional
systems. Solid waste related diseases are parasitic infection, bronchitis, skin diseases,
bronchopneumonia, dysentery, bronchial asthma and allergy conditions, all other respiratory
diseases, typhoid, influenza and trachoma.
1. Recycling minimizes pollution (Web link: Conserve energy future)
All forms of pollution in the modern world emanate from industrial waste. Recycling of these
industrial wastes such as plastics, cans, and chemicals go a long way towards considerably cutting
back on levels of pollution because these waste products are reused rather than just being thrown
away recklessly.
2. Protects the environment
The great benefit of recycling waste material is that it plays a big part in protecting Mother Nature in
the most balanced way. While many trees are felled every day, recycled paper manufactured from
specific trees is continually utilized to reduce deforestation. This classical example demonstrates that
other natural resources can be recycled and made useful this way to conserve the environment.

277 MGNCRE | E-Waste Management
277 MGNCRE | Waste Management Banks
3. Recycling minimizes global warming
It is perfectly true that recycling minimizes global warming and its grave impacts. During waste
disposal, huge amounts of waste are combusted that lead to emission of vast greenhouse gases such
as carbon dioxide, sulfur, and nitrogen, which contribute to climate change and global warming.
Recycling process involves minimal combustion and waste is transformed into reusable materials
with zero or minimal harmful impact on the environment. The whole process of processing and
manufacturing products from waste materials emits few greenhouse gases because the very waste
recycling industries burn little fossil fuels.
4. Conserves natural resources
If the process of recycling used and old materials was not there, it means new products will be
manufactured by extraction of fresh raw materials underneath the earth through the process of
mining and extraction. Recycling is a surefire way of conserving existing raw materials and protecting
them for future use. Taking steps to conserve natural resources like minerals, water and wood
ensures sustainable and optimal use.
5. Recycling cuts down amount of waste in landfill sites
Recycling old and used materials into reusable products enormously reduces the possibility
of choking of landfill sites. This is beneficial because it helps minimize land and water pollution since
landfills contribute mightily to environmental degradation.
6. Recycling ensures sustainable use of resources
Recycling guarantees that existing resources will be used sensibly and sustainably. The recycling
process alleviates the possibility of discriminate use of raw materials when they are obtainable in
huge supply. Governments these days have stepped in to encourage recycling from lower levels, for
instance, schools, small-sized organizations and also at global levels. This means that manufacturing
industries can leave existing natural resources for exploitation by our children in the future without
affecting current production.
7. Recycling contributes to creation of jobs

278 MGNCRE | E-Waste Management
278 MGNCRE | Waste Management Banks
To add to the benefits it brings to the environment; recycling opens up job opportunities. Recycling
means many recycling plants will be set up, thus, leading to a long chain of collection and delivery.
All these activities are performed by humans, so this will trigger an explosion of opportunities.
8. Reduces energy consumption
A lot of energy is used to process raw materials in the course of manufacture. Recycling plays a big
role in reducing energy consumption, which is vital for large-scale production, for instance, mining
and refining. Recycling also renders the whole process of production less expensive, which is a great
victory for manufacturers.

279 MGNCRE | E-Waste Management
279 MGNCRE | Waste Management Banks
Figure 1.10 Dumpsite as a global challenge
Marine
litter
•38 outof50 biggest
landfills are posing
Threat formarine and
Coastal pollution
Climate
change
•With the business as
Usual scenario
Dumpsites will account
8-10 %of the
Anthropogenic GHG in
2025
Waste
trafficking
•US$11billionannually
is the turnover of illegal
waste shipping to
dumpsites
Global
problem
•Represents50% of population and
40 % of the waste of the planet

280 MGNCRE | E-Waste Management
280 MGNCRE | Waste Management Banks
Summary
Fist block reported concept, importance and need of waste banks. Through waste collection
methods and reusing strategies, waste problem can be managed, and also local economy is
improved. The waste banks are organized sector to achieve zero waste cities. Management of food
waste, agro-industrial waste, e-waste and plastic lethal waste are discussed. Advantages of waste
banks are explained in this chapter.
Activity
• Draft the concept of waste bank (2 Pages)
• Prepare caselets on effective utilization of waste banks to achieve zero waste cities (2 Pages)
• Draft the frame work of waste banks – an organized sector (2 Pages)
• Report advantages of waste banks though national and international caselets (2 Pages)
Review questions
1. Explain
(a) Concept of waste bank (b) Importance of waste bank (c) Need of waste bank (d) Waste circulation though banks
2. Why waste banks are named as organized sector?
3. What are all the advantages of waste bank?
References
1. Kahhat, R., Kim, J., Xu, M., Allenby, B., Williams, E., and Zhang, P. (2008). “Exploring e-waste management systems in the United States.” Resources, Conservation and Recycling, 52(7), 955–964.
2. Panda, A., Singh, R. K., and Mishra, D. K. (2010). “Thermolysis of waste plastics to liquid fuel A suitable method for plastic waste management and production of value added products - A world prospective.” Renewable & Sustainable Energy Reviews, 14(1), 233–248.
3. Papargyropoulou E, Lozano, R., Steinberger, J., Wright, N., and Ujang, Z. bin. (2014). “The food waste hierarchy as a framework for the management of food surplus and food waste.” Journal of Cleaner Production, 76(1), 106–115.
4. S.M. Al-Salem, Lettieri, P., and Baeyens, J. (2009). “Recycling and recovery routes of plastic solid waste ( PSW ): A review.” Waste Management, Elsevier Ltd, 29(10), 2625–2643.
5. Rebellón, L.F.M., “Waste Management an integrated vision”, Intech, Croatia
6. Conserve energy future, https://www.conserve-energy-future.com/advantages-and-disadvantages-of-recycling.php

281 MGNCRE | E-Waste Management
281 MGNCRE | Waste Management Banks
Chapter 2 Reuse / Recycle methods Introduction
This block reports waste deposition and distribution methods which include identification and linking
with needy humans - beggars, old age home, orphanages. Perhaps, food wastesare supplied to
animal shelters, gaushalas and piggeries. Also, it explains the collection and re-utilization of E-waste
and plastic Lethal waste by Linking the users with authorized specific dealers. Further, compost and
sell of biodegradable waste is reported.Moreover, process of recycle, reuse and reduce,
namely,'3R'sare detailed.
Objective
To identify the beneficiaries for waste disposal through reuse, reduce and recycle process
2.1. Waste deposition and distribution
Waste deposition and distribution activities include collection transportation and separation
according to the nature of the waste. The waste collection services are provided by the municipality.
A typical model for waste collection method followed by North East Institute of Science and
Technology (NEIST), a constituent laboratory of Council of Scientific and Industrial Research (CSIR), is
shown in the Figure2.1. When compared to collection of unsegregated waste from curbside and
sorting into recyclables and reusable waste, curbside segregation is the most common and
convenient method in waste management. In Figure 2.1, general waste, paper, glass and plastic
wastes are separated in curbside by providing four types of dustbins.
The materials recovery facility (MRF) is retrieval of the hazardous material from a waste plant. This
was first established officially in Philippines with sanctioned project from World Bank in 2001.
Mainly, the municipal waste item was screened though different level and some automated and
manual level of material recovery farming are done and the hazardous item got recovered and can
be utilised for reuse. Firstly, it was limited access to success and later on while developing the
mechanized activity, it becomes a necessary part of hazard waste management. Mainly, in recovery
of materials or MRF, the items of different levels are classified into different categories. As the
organic and inorganic wastes are treated separately so this is a useful tool to handy information over
the waste management. MRF mainly undergoes some plan, structure and procedure of operation as
well as the factors for success and sustained process. The MRF undergoes with some sorting of
waste materials and processed further. The various steps that take place in waste stream sorting are
as follows:

282 MGNCRE | E-Waste Management
282 MGNCRE | Waste Management Banks
Figure 2.1Technology tree for waste management techniques
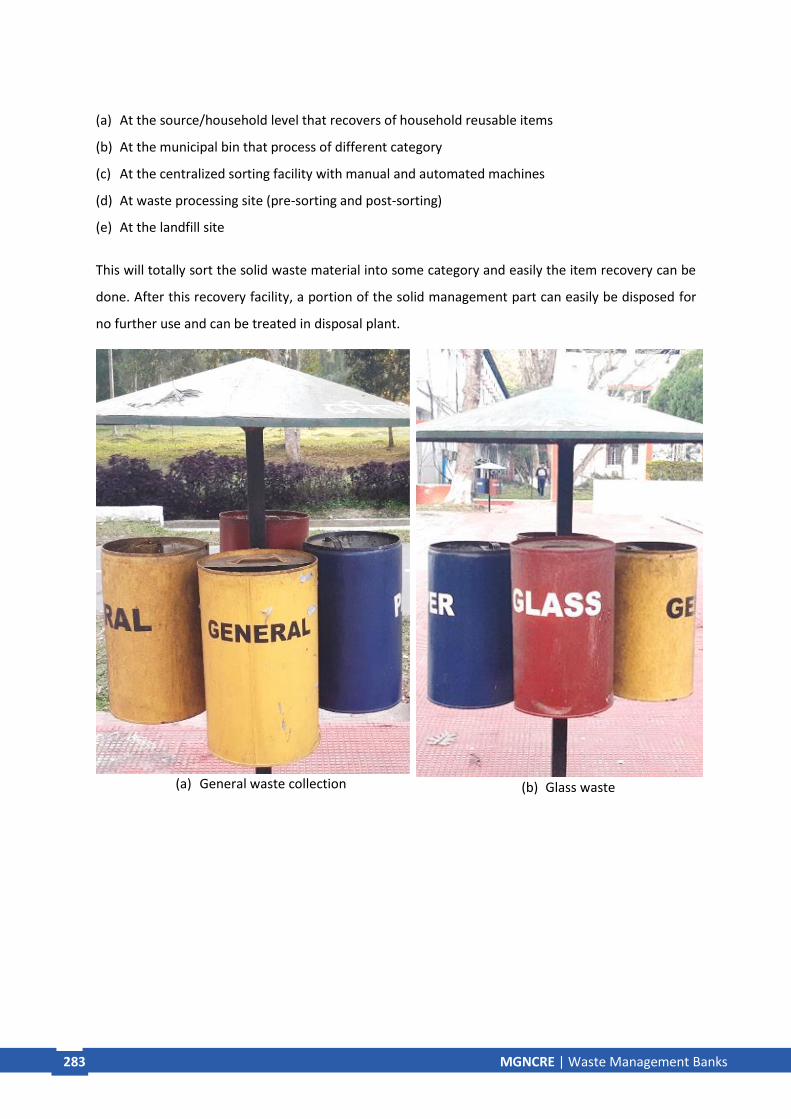
283 MGNCRE | E-Waste Management
283 MGNCRE | Waste Management Banks
(a) At the source/household level that recovers of household reusable items
(b) At the municipal bin that process of different category
(c) At the centralized sorting facility with manual and automated machines
(d) At waste processing site (pre-sorting and post-sorting)
(e) At the landfill site
This will totally sort the solid waste material into some category and easily the item recovery can be
done. After this recovery facility, a portion of the solid management part can easily be disposed for
no further use and can be treated in disposal plant.
(a) General waste collection
(b) Glass waste

284 MGNCRE | E-Waste Management
284 MGNCRE | Waste Management Banks
(c) Paper and plastic waste collection
(d) Waste composition categories.
Figure 2.2 Waste management at CSIR-NEIST
Food waste (Uncooked) Food waste (cooked)
Plastic
285 MGNCRE | E-Waste Management
285 MGNCRE | Waste Management Banks
2.2. Food waste, E-waste and plastic lethal waste
Food waste is food that is discarded or wasted uneaten. The food is wasted in all stages of the food
chain. Sustainable production and consumption approach and tackle food surplus waste are the
solutions suggested by researchers. The framework explains food waste management is shown in
figure2.2.As shown in framework (Figure 2.2), food waste can be supplied to animal shelters,
goshalasand piggeries. Other possible ways of production and disposal of food waste are Consumer
marketing, landfills and greenhouse gases, animal feed, distribution to needy people/organisation
like old age homes, orphanages and beggars, composting, anaerobic digestion, commercialization
food waste, agricultural food waste, cockroach feeding.

286 MGNCRE | E-Waste Management
286 MGNCRE | Waste Management Banks
(a) Food waste management
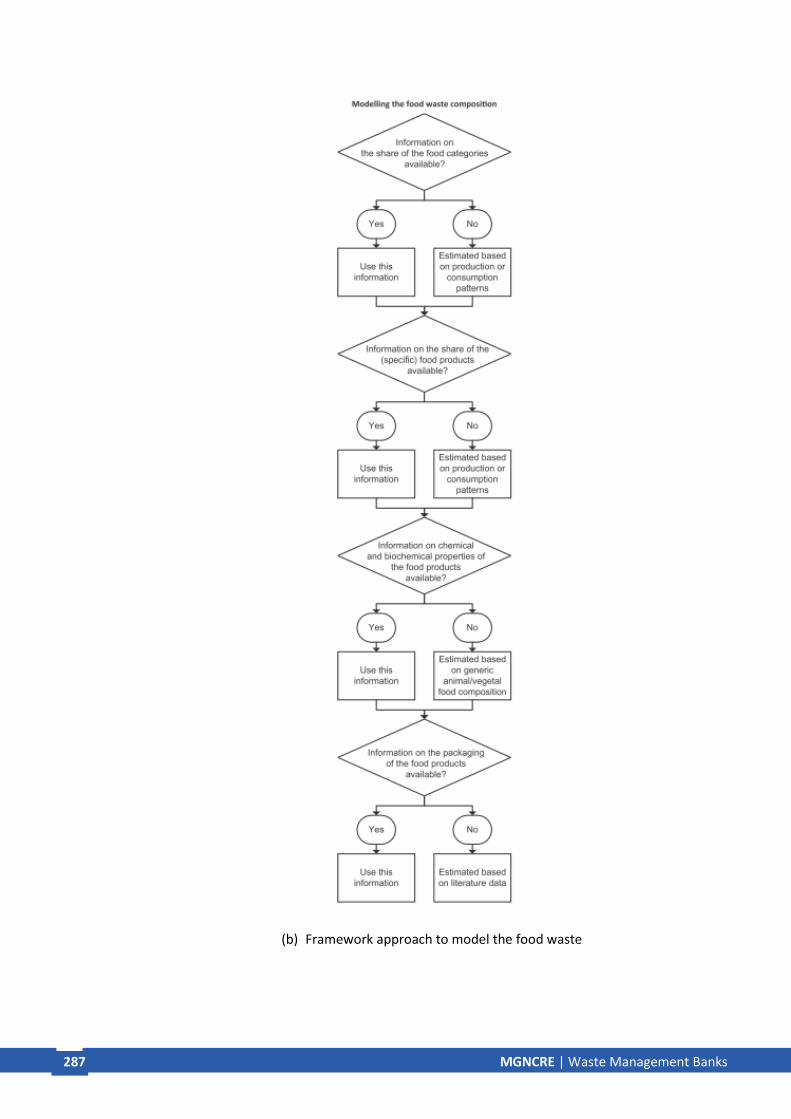
287 MGNCRE | E-Waste Management
287 MGNCRE | Waste Management Banks
(b) Framework approach to model the food waste

288 MGNCRE | E-Waste Management
288 MGNCRE | Waste Management Banks
(c) Sorting of dry waste
(d) Classical plastic bag method of waste collection

289 MGNCRE | E-Waste Management
289 MGNCRE | Waste Management Banks
(e) Sorted dry waste ready for recycle
Figure 2.3Collection and Sorting of different type of wastes

290 MGNCRE | E-Waste Management
290 MGNCRE | Waste Management Banks
Fit for human consumption
Unfit for human consumption
Figure 2.4Surplus food and waste framework(Papargyropoulou E et al. 2014)
2.3. Reutilization of E-Waste and Plastic Lethal Waste
Electronic waste keeps growing around the world. Reportedly, 1.3 million metric tons of e-waste are
sorted in landfills in the United States in 2005. Reuse and recycling services are the best solutions
suggested for end-of-life electronics. It can be achieved deposition through e-market. By offering
discounts for return on deposit, the firm can refurbish or resell to transfer the deposit after
recycling. Therefore, the end-of-life of electronics are deferred until true life.
Food surplus
Prevention
Re-use of human consumption
Food waste
Avoidablefood waste
Recycling
Animal feed
Composting
Prevention
Unavoidable food waste
Recycling
Animal feed
composting
Energy recovery
Anerobic digestion
Disposal
Mo
st favou
rable o
ptio
n Lease favo
urab
le op
tion

291 MGNCRE | E-Waste Management
291 MGNCRE | Waste Management Banks
Figure 2.5 E-Market for returned deposit system(Kahhat et al. 2008)
The plastic bags are inexpensive to produce, easy to carry and store. In United States, out of 1 trillion
waste produced, only 13 percent were recycled, and the remaining were disposed of in landfills. The
framework of plastic waste management is shown in Figure 2.4.
Consumers
E-waste collection
E-waste disposal company
firms
E-markert managemnet
Point of sale

292 MGNCRE | E-Waste Management
292 MGNCRE | Waste Management Banks
Figure 2.6 Plastic waste management(Panda et al. 2010)
Plastic waste management
Land fillingMechanical
Recyling
Isolated/segregated plastic
Primiary product
Mixed plastic
Secondary product
Biological recycling
Biomass
Thermal chemical recycling
Thermal reycling/
incineration
Heat Energy
Feed stock/recycylin
g
Fuel and chemical

293 MGNCRE | E-Waste Management
293 MGNCRE | Waste Management Banks
2.4. Biodegradable Waste
In domestic waste collection, biodegradable wastes are separated, where organic matter in the
waste is broken down into simple organic molecules by composting. The sources of biodegradable
waste can be found in municipal solid waste, food waste, paper waste and biodegradable plastics.
Usually, the biodegradable waste is separated from the mainstream of waste byKerb-side collection
or by sorting method. Kerb-side collection is nothing but removing biodegradable household waste
from the collection units of metropolitan cities, urban and suburban areas.
Figure 2.7 Sorting of biowastes

294 MGNCRE | E-Waste Management
294 MGNCRE | Waste Management Banks
2.5. Importance of Reuse and Recycling
The planet Earth has a limit of natural resources. No resources in infinite. The main strategy to
simplify all this allometric balance is to “Reduce, Reuse and Recycle” – referred to as the three ‘R’s of
change. This simple strategy can be applied to the all extend of planet in terms of reduce the waste
material and can help the natural balance. To change and reduce of all use, we need to dramatically
decrease the pay of pressure that we throw on these natural resources. For instance, an agency
reported that that use of 1-ton industrial paper could save an equivalent to 17 trees and 7000
gallons of water (U.S. Environmental Protection Agency).
Reuse: Various resourceful use of any item will help to not throw an item instead we can think about
how to manage it and innovate some ideas to reuse it. Like some day-to-day items we can make
from our old items and this will not only develop our reuse mentality but also widens our ethnic
style in fashioned manner. We can reuse old clothes as bags instead of using plastic ones. Using
writing skills on both sides of paper will save at least half of previous use. Our ‘no need’ may be of
someone’s need, so by donating old items to poor and needy, can develop the process behind use of
used items.
Figure 2.8 Paper recycling box in an office

295 MGNCRE | E-Waste Management
295 MGNCRE | Waste Management Banks
Figure 2.9. Recyclable items composition at the Recycling Centre
Recycle: Most advanced and modern waste management procedure is recycling of used item. This
technique will not only change the potential of used item to reuse it but also pays no pressure on
natural resources for new regeneration. International Standard Organization (ISO) standards some
item with their marking in various platform for recycling such as ISO 15270:2008 used for plastic
waste material, ISO 14001:2004 used for the management manipulate in environmental recycling.
Energy usage and raw material expenditure is the main saves through the recycling of a product.
Recycling not only reduces the raw item but also decreases the pollution in land, water & air in
terms of newly management waste disposal issue. The green is clean, so to be green, clean all over
the pollutions and need to reuse & recycle for any waste materials.

296 MGNCRE | E-Waste Management
296 MGNCRE | Waste Management Banks
Figure 2.10Impacts and effects of incineration on the environment.

297 MGNCRE | E-Waste Management
297 MGNCRE | Waste Management Banks
Figure 2.11Waste management(Al-Salem et al. 2009)
Figure 2.12Waste stream in boundary system

298 MGNCRE | E-Waste Management
298 MGNCRE | Waste Management Banks
Summary
As can be seen from the above waste collection methods and reusing strategies, waste problem can
be managed, and also local economy is improved. Management of food waste, agro-industrial waste,
e-waste and plastic lethal waste are discussed. Method of collection, process and recycling with the
support of firms are detailed in this block.
Activity
• Prepare caselets for food waste management (2 Pages)
• Prepare caselets for biodegradable waste management (2 Pages)
• Report possible ways of collection and separation of biodegradable waste (2 Pages)
• Prepare caselets for e-waste and plastic lethal waste management followed by developed and
developing countries(2 Pages)
Review questions
• Draw flowchart of following
o Food waste management o Biodegradable waste management o Plastic waste management
• E-waste management
• State the importance of 3Rs such as reuse, recycle and reduce?
• What is mean by return on deposit in e-waste management?
References
1. Kahhat, R., Kim, J., Xu, M., Allenby, B., Williams, E., and Zhang, P. (2008). “Exploring e-waste management systems in the United States.” Resources, Conservation and Recycling, 52(7), 955–964.
2. Panda, A., Singh, R. K., and Mishra, D. K. (2010). “Thermolysis of waste plastics to liquid fuel A suitable method for plastic waste management and production of value added products - A world prospective.” Renewable & Sustainable Energy Reviews, 14(1), 233–248.
3. Papargyropoulou E, Lozano, R., Steinberger, J., Wright, N., and Ujang, Z. bin. (2014). “The food waste hierarchy as a framework for the management of food surplus and food waste.” Journal of Cleaner Production, 76(1), 106–115.
4. S.M. Al-Salem, Lettieri, P., and Baeyens, J. (2009). “Recycling and recovery routes of plastic solid waste ( PSW ): A review.” Waste Management, Elsevier Ltd, 29(10), 2625–2643.
5. Rebellón, L.F.M., “Waste Management an integrated vision”, Intech, Croatia
299 MGNCRE | E-Waste Management
299 MGNCRE | Waste Management Banks
Chapter 3 Simple Daily Waste Banks
Introduction
This block reports types of waste Bank include clothes, books, e-waste, scrap metals, household
items and furniture. Also, it illustrates trash in cash concept true resale, reuse and recycle.
Moreover, local economic development and impact of waste Bank to local economy are detailed
with caselets. Importance of drop off and buybacks centers in zero waste cities is explained.This
study will enhance the management strategies and how waste is increasing from households to the
global level is discussed.
Objective
To study the types of waste banks influencing local economic development.
3.1 Types of Waste Banks
Cloths, books, e-waste, scrap metals, household items, clinical and furniture: Mainly clothing items
are waste giant and this is more issuable products. “Let waste not, no more want not.” This old
heritage spoken dialogue is a fix in the cloths waste only, so we have to fix the culture of
“throwaway” and have to make our innovative mind to recreate any new items like bag, mat, cloth
mat used for outer need. Every household should keep this mind to re-innovate old one clothes to
new one redesigned material and if possible, have to recycle and reuse them by giving them to any
needy one instead of throwing away.

300 MGNCRE | E-Waste Management
300 MGNCRE | Waste Management Banks
Table 3.1 Categories of Infectious Wastes
Waste Category Examples
Isolation wastes Wastes generated by hospitalized patients who are isolated to protect others from communicable diseases
Cultures and stocks of infectious agents Specimens from medical and pathology agents and associated biologicals laboratories
Cultures and stocks of infectious agents from clinical, research, and industrial laboratories; disposable culture dishes and devices used to transfer, inoculate, and mix cultures
Waste from production of biologicals
Discarded live and attenuated vaccines
Human blood and blood products Waste blood, serum, plasma, and blood products
Pathological waste Tissues, organs, body parts, blood, and body fluids removed during surgery, autopsy, and biopsy
Contaminated sharpsb Contaminated hypodermic needles, syringes, scalpel blades,
Pasteur pipettes, and broken glass
Contaminated animal carcasses, body parts, and beddingc
Contaminated animal carcasses, body parts, or bedding of animals that were intentionally exposed to pathogens
Table 3.2Miscellaneous Contaminated Wastes
Miscellaneous Contaminated Wastes Examples
Wastes from surgery and autopsy Soiled dressings, sponges, drapes, lavage tubes, drainage sets, underpads, and surgical gloves
Miscellaneous laboratory wastes Specimen containers, slides and cover slips, disposable gloves, lab coats, and aprons
Dialysis unit wastes Tubing, filters, disposable sheets, towels, gloves, aprons, and lab coats
Contaminated equipment Equipment used in patient care, medical laboratories, research, and in the production and testing of certain pharmaceuticals

301 MGNCRE | E-Waste Management
301 MGNCRE | Waste Management Banks
Figure 3.1Impacts and effects of landfill on the environment.
Electronic Sources of Waste: Mainly, e-wastes include DVD and CD players also CD’s, Television,
Computational items like printer and its materials, UPS and wired item, also vacuum cleaner and its
utilities, electrical stuff like other electronic appliances are which are of no use after the damaging.
These e wastes can be recycled, and these can be sent to the wirehouse for re-usable item recovery.
Some are also called as e-scrap materials or e-waste materials which include TV and another
electronic chipped item that contains harmful things like mercury, lead etc. can be directly given to
the manufacturing company for re-instalment by checking and choking their parts.
• Refrigeration equipment – that requires specialist treatment under the Ozone Depleting Substances regulations

302 MGNCRE | E-Waste Management
302 MGNCRE | Waste Management Banks
• Other large household appliances – that have a metal-rich content and can be easily reprocessed together
• Equipment containing CRTs – due to health and safety concerns relating to broken monitor glass this grouping must be handled separately
• Linear and compact fluorescent tubes – to prevent contamination and to enable easier recycling
• All other WEEE – those where there are no known technical reasons or EH&S concerns which prevent this mixed grouping of WEEE from being reprocessed together
Figure 3.2Block diagram of a mass-burn incinerator.
Household sources of wastes: Mainly, including the garbage from different household items like
vegetable waste, marketing waste, school waste, office related waste, cloths, much materialistic
waste like plastic bottle, plastic Tiffin, cans, food waste etc. All this have to be sort in terms of
various item baskets sorting facility like different organic and inorganic materials sort. Everyday an
average of 20 million tonnes household waste products are being treated all over globe and nearly
this is one-third of the total production of household waste.
Clean
Flue
Gas MSW
Collection
Landfill
Receive,
Storage,
Handling
Combustion
and heat
transfer
Ash disposal
Flue gas
treatment and
cleaning
Metal recovery
Turbine
Generator
Reject
Waste
Steam
Electricity
Ash
Particulate/
Residues
Recyclables
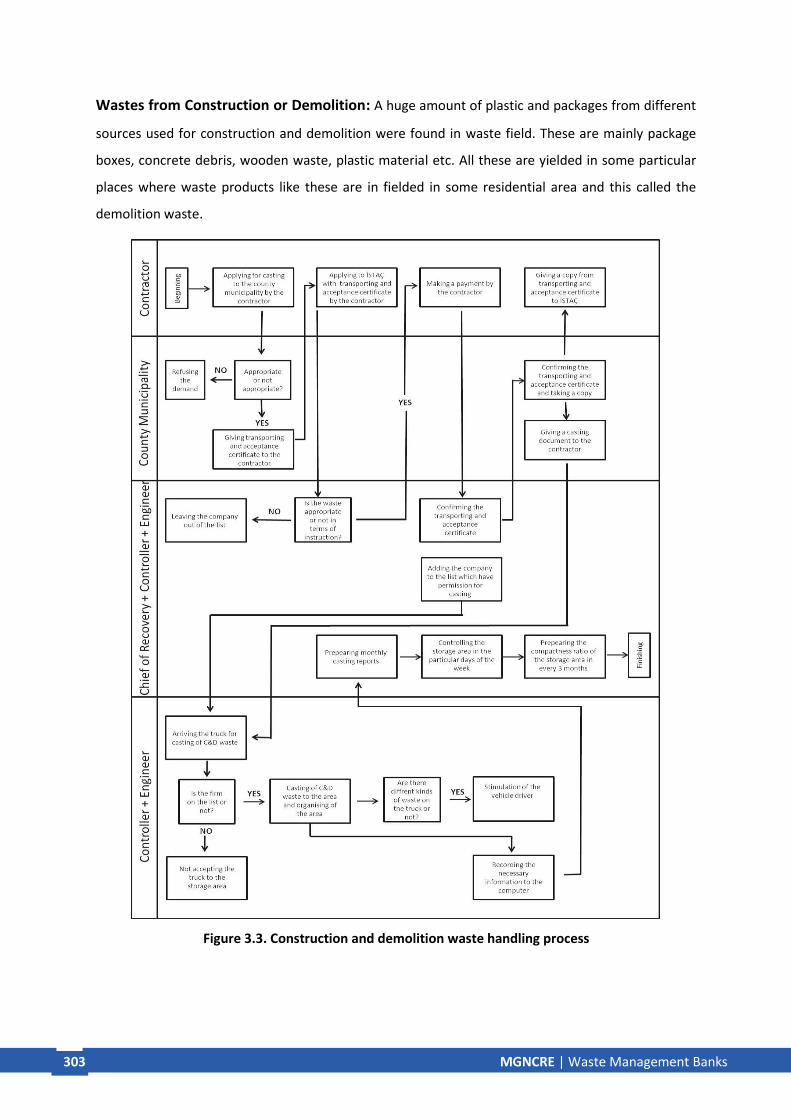
303 MGNCRE | E-Waste Management
303 MGNCRE | Waste Management Banks
Wastes from Construction or Demolition: A huge amount of plastic and packages from different
sources used for construction and demolition were found in waste field. These are mainly package
boxes, concrete debris, wooden waste, plastic material etc. All these are yielded in some particular
places where waste products like these are in fielded in some residential area and this called the
demolition waste.
Figure 3.3. Construction and demolition waste handling process

304 MGNCRE | E-Waste Management
304 MGNCRE | Waste Management Banks
Figure 3.4. Salvaged Building Materials Outlet
Figure 3.5. Salvaged Building Materials Outlet
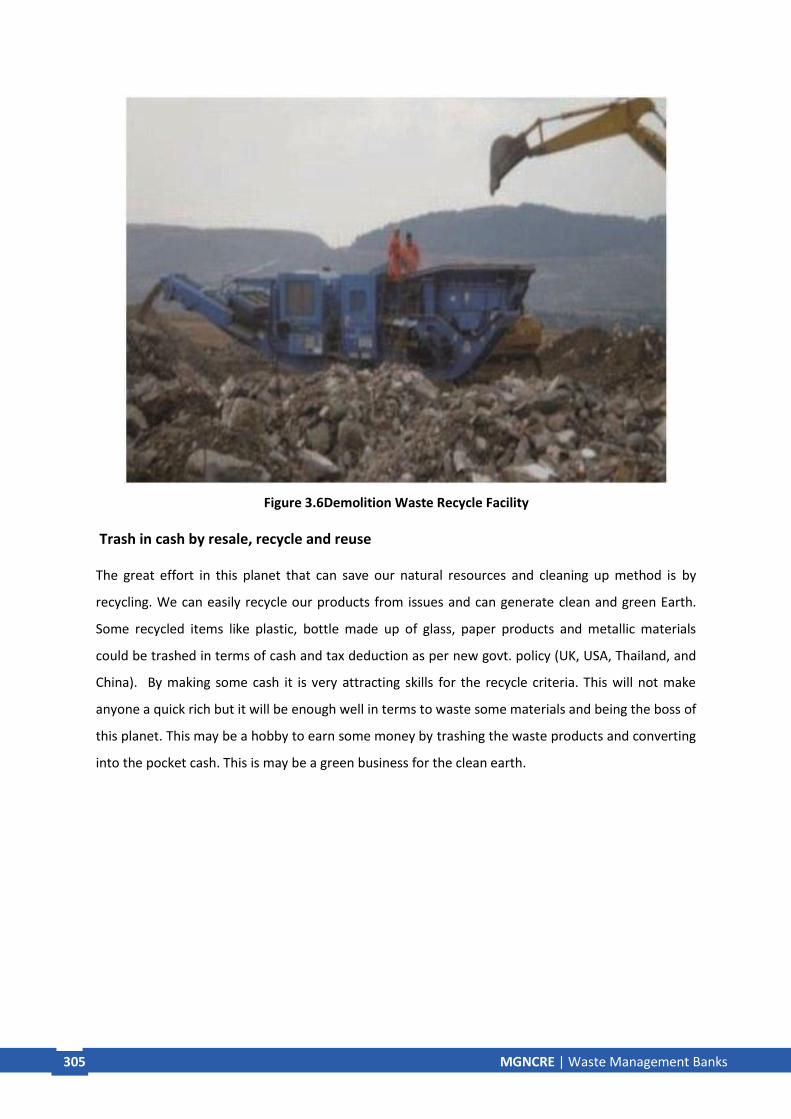
305 MGNCRE | E-Waste Management
305 MGNCRE | Waste Management Banks
Figure 3.6Demolition Waste Recycle Facility
Trash in cash by resale, recycle and reuse
The great effort in this planet that can save our natural resources and cleaning up method is by
recycling. We can easily recycle our products from issues and can generate clean and green Earth.
Some recycled items like plastic, bottle made up of glass, paper products and metallic materials
could be trashed in terms of cash and tax deduction as per new govt. policy (UK, USA, Thailand, and
China). By making some cash it is very attracting skills for the recycle criteria. This will not make
anyone a quick rich but it will be enough well in terms to waste some materials and being the boss of
this planet. This may be a hobby to earn some money by trashing the waste products and converting
into the pocket cash. This is may be a green business for the clean earth.
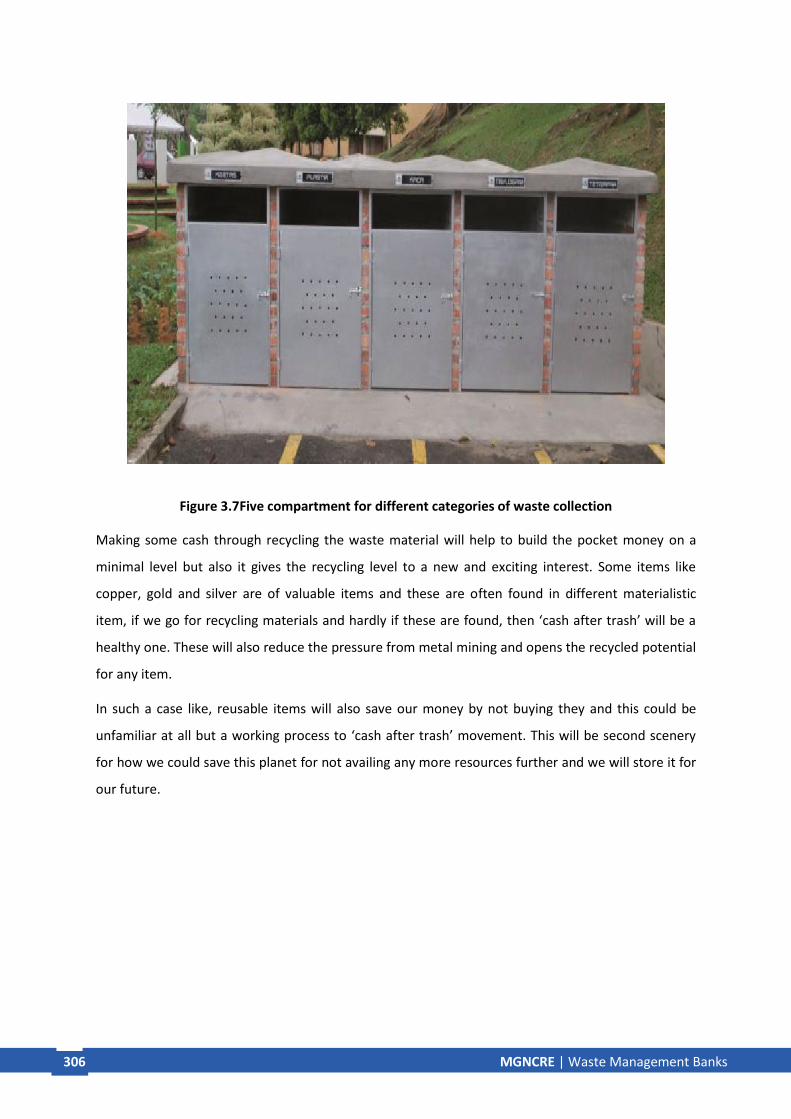
306 MGNCRE | E-Waste Management
306 MGNCRE | Waste Management Banks
Figure 3.7Five compartment for different categories of waste collection
Making some cash through recycling the waste material will help to build the pocket money on a
minimal level but also it gives the recycling level to a new and exciting interest. Some items like
copper, gold and silver are of valuable items and these are often found in different materialistic
item, if we go for recycling materials and hardly if these are found, then ‘cash after trash’ will be a
healthy one. These will also reduce the pressure from metal mining and opens the recycled potential
for any item.
In such a case like, reusable items will also save our money by not buying they and this could be
unfamiliar at all but a working process to ‘cash after trash’ movement. This will be second scenery
for how we could save this planet for not availing any more resources further and we will store it for
our future.

307 MGNCRE | E-Waste Management
307 MGNCRE | Waste Management Banks
Figure 3.8 Schematic representation of recycled product development on E-waste
3.2 Local Economic Development
A public factor is that by recycling material will help nature by reducing the weight of waste in it.
Everything comes under the fact that using plastic bottle to any plastic packing will benefit us in for
short time only, but its bad impact will last for long times. To decompose such a material will be a
burden for us in near future and developing such item will compromise the economic growth. By
manufacturing many and many such items need many raw materials. This will be losing our
planetary resources. But if we go by recycling material and eager to produce materials from the
material, then this will not only save our resources but also produce millions of jobs in recycle
industry. Also, this will save new material cost from growing it like a zero ground to an industrial
level. This will benefit by reducing the cost of the raw material and also to need to recycle gives a
hard and pre-defined item structure in for the laboratory issue. Largely, main issue is the
manufacturer can save up to 85% of the raw material cost by recycling a material other than seeking
a new material from it.
Size reduction Sorting
Melt processingRecycled product

308 MGNCRE | E-Waste Management
308 MGNCRE | Waste Management Banks
Figure 3.9Simplified process flow for a mixed Waste Electrical and Electronic Equipment (WEEE) metal recovery plant.
Mixed
WEEE
Manual
sorting
Opening
shredder
Manual
picking
line
Magnetic
separation
Shredding
Magnetic
separation
Stainless
steel
separator
Eddy
current
separator
Batteries
Toner/ink
Paper
External
Cables
Ferrous
metals
Ferrous
metals
Stainless
steel
Non-metallics
Plastics
Rubbers
Glass
Wood
Stone
Density
separation
Al rich
stream
Cu rich
stream
Large-
capacitors
Motors
Transformers

309 MGNCRE | E-Waste Management
309 MGNCRE | Waste Management Banks
CFCs/ HCFCs PU Foam
(CFC free)
Figure 3.10Simplified process flow for refrigeration equipment.
Figure 3.11Hammer mill
Refrigeration
Equipment
Manual
disassembly
Shredder
& drier
Sieve/
density
separation
Magnetic
separation
Eddy
current
separator
Oil,
refrigerant
( CFC )
Compressor
Glass
Ferrous
metals
Non-
Ferrous
metals
Plastics
Heating
PU Foam

310 MGNCRE | E-Waste Management
310 MGNCRE | Waste Management Banks
Figure 3.12Crusher and Magnetic separator
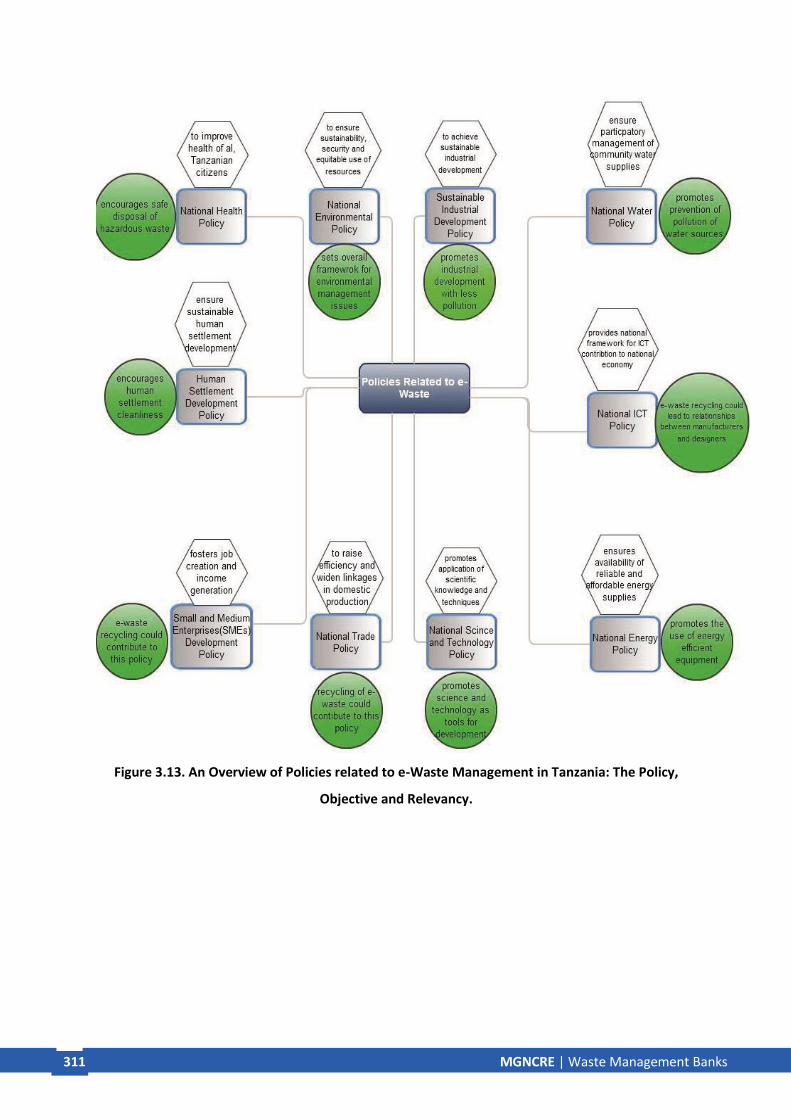
311 MGNCRE | E-Waste Management
311 MGNCRE | Waste Management Banks
Figure 3.13. An Overview of Policies related to e-Waste Management in Tanzania: The Policy,
Objective and Relevancy.

312 MGNCRE | E-Waste Management
312 MGNCRE | Waste Management Banks
Table 3.3 Current and future technology summary.
Current technologies Future technologies
Process
stage
Process Technique Comment Technique Comment
Disassembly Manual Pre-sorted waste then
physically checked
Impaction Mechanical
dismantling under
force with chains
Shredding/
Fragmenting
Various shredding
devices – similar to
above
Automated QZ machine Combination
of devices
above and
sepn
methods
below
Imaging and
recognition
Robotics
Enhanced
fastenings
RF tagging
Size
reduction
Crushing Hammer mill
Granulation
Cryogenics Used in combination with other size-
reduction
methods
Separation Size Screeners/classifiers
Magnetic Low-intensity drum
High-intensity
magnetic field

313 MGNCRE | E-Waste Management
313 MGNCRE | Waste Management Banks
Recycle helps in the industrial extraction and raw material detection process. Also, it gives job
security to a new level of people who can easily depend on collecting household wastes for the
recycle factory. Refining is another need in this development and provides obtaining material and
collects the parts whatever can be used to newly generated items. Also helps in the field lowering
the cost price and saves the expenses from collecting raw one.
Reusing a recycled item also cost-effective in different fields where some estimating value like
10,000tons of waste material can create hardly 6 types of job for refining and extraction and up to 6
times this would be possible. A role of ranging from different material stores to be depicted and
have to shorten the loss of the natural resources in this material and management. Surely this will
develop a huge economic growth at the local level by creating jobs and different level of reefing unit
also for clean and green planet.
3.4 Impact of Waste Bank to Local Economy – Caselets
One case study in Nigeria, Enugu State revealed that due to non-availability of sustainable
management and efficient methods, solid waste management is in child condition in Nigeria. No
practices by locality, no process of development and no need of unused sustained deform the
management of wastes in Nigeria capital. The background behind the locality and economic
condition also matter the management in sustainable development of waste field.
These objectives were addressed primarily using a structured questionnaire administered to a cross-
section of people in three selected local government areas (Enugu East, North and South LGAs
respectively). This case study in Nigeria performed by Dr.Agbaeze E. K ;Dr. I. O. Onwuka and Agbo, C.
C in 2014 (Impact of Sustainable Solid Waste Management on Economic Development – Lessons from
Enugu State Nigeria, 2014) and they prepared some questionnaire and augmented specified report
depend upon field study and perspective of the local people. They found that there is no space
available in Nigeria to prepare a waste damping industry like repair and reusable manner. In Nigeria,
there is no provision of segregation of waste material in damping station. Because technology less
and resources less country like Nigeria can effort such a need in advance and they can use the
landfills for the slummy damping and trends to be very slum. Local manner in this way also being a
non-specified objective as these are not under any certain rules for waste aggregation and waste
sedimentation. Also, such a country has no economic purpose for using recycling and reduction of
waste material for some materials like polythene, plastic bags, metallic cane etc will not be cost
effective after being they are recycled and reused.
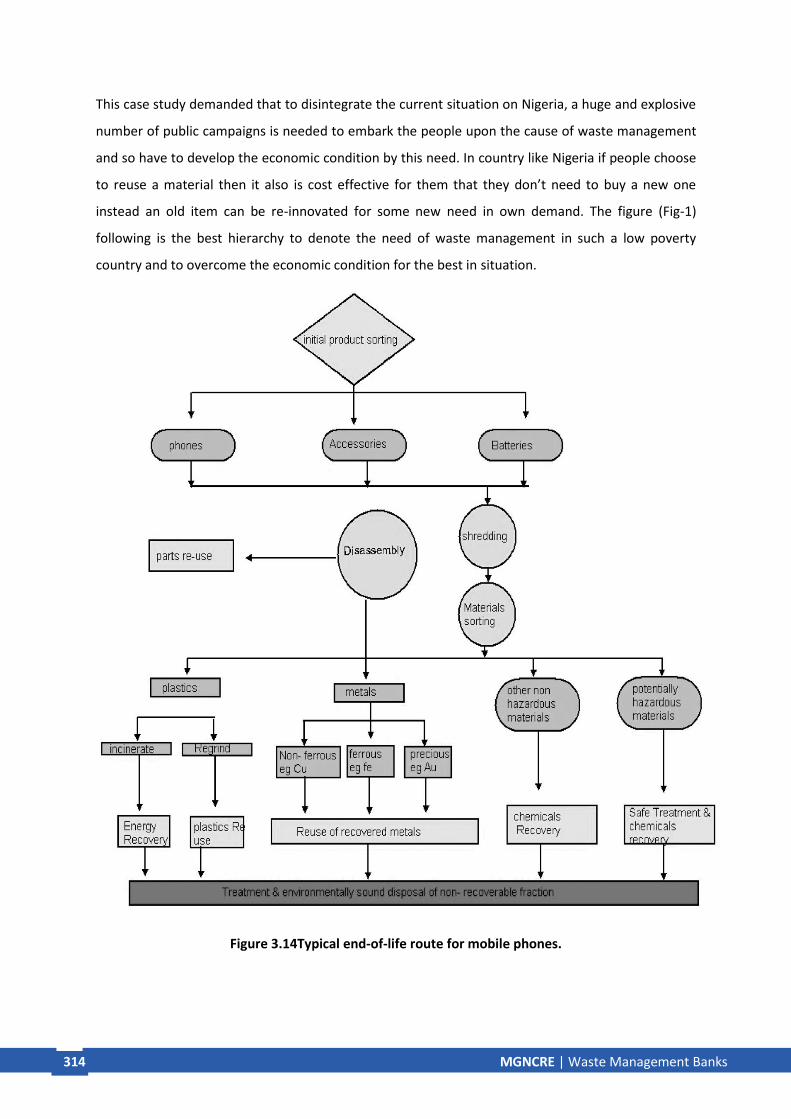
314 MGNCRE | E-Waste Management
314 MGNCRE | Waste Management Banks
This case study demanded that to disintegrate the current situation on Nigeria, a huge and explosive
number of public campaigns is needed to embark the people upon the cause of waste management
and so have to develop the economic condition by this need. In country like Nigeria if people choose
to reuse a material then it also is cost effective for them that they don’t need to buy a new one
instead an old item can be re-innovated for some new need in own demand. The figure (Fig-1)
following is the best hierarchy to denote the need of waste management in such a low poverty
country and to overcome the economic condition for the best in situation.
Figure 3.14Typical end-of-life route for mobile phones.

315 MGNCRE | E-Waste Management
315 MGNCRE | Waste Management Banks
(a) Waste prevention
(b) Hierarchy for most and least desirable
Reduction
Reuse
Recovery
Disposal
Most desirable
Leaset desirable
Waste
Product Prevention
Preparing for reuse
Recycling
Recovery
Disposal

316 MGNCRE | E-Waste Management
316 MGNCRE | Waste Management Banks
(c) Six stages of the hierarchy of resources use
Figure 3.15Solid Waste Management Hierarchy
REDUCTION
PREPARINGFORREUSE
REUSE
REPROCESSING
OTHERRECOVERY
RECTIFICATION
RETURN
WASTE
EXPORTS
NON-WASTE
WASTE
RECOVERY
REPLACEMENT
1
2
3
3.1
3.2
3.3
3.4
4
5
6

317 MGNCRE | E-Waste Management
317 MGNCRE | Waste Management Banks
Table 3.4Composition and property of burnable wastes in Chuo incineration plant
Ca tegory Mean value
Composition, wt%
Burnable components 98.45
paper
kitchen waste plastics wood and grass textile
rubber and leather others
45.00 22.92
15.97
5.74 4.61 0.51
3.70
Inflammable contaminants 1.55
metal glass
stone and ceramics others
0.46 0.32 0.13
0.64
Proximate analysis, wt%
Moisture content
Combustible matter Ash content
38.69
54.58
6.75
Elementary analysis, %
Carbon
Hydrogen
Nitrogen
Oxygen
Combustible sulfur Volatile chlorine
28.5 4.24
0.34
21.33
0.02
0.17
Higher calorific value, kJ/kg
Lower calorific value, kJ/kg
12,263
10,335
Bulk density, kg/L 0.130

318 MGNCRE | E-Waste Management
318 MGNCRE | Waste Management Banks
machine, 15.6 unit: wt%
Figure 3.16.Waste plastics generation by user’s application (Total generation 9.45 million tons, 2010)
Containers & packaging, 44.8
E-wastes &
Dairy
commodities, furniture & toy,
10.6
Building materials,
8.1
Transportation,
5.3
Agriculture &
fishery, 1.7
Others, 5.7 8.2

319 MGNCRE | E-Waste Management
319 MGNCRE | Waste Management Banks
3.5 Zero Waste Cities Though Drop off and Buyback Centres
A global need of waste management which always take a seat of driver for the public growth in
various fields like population, and urban area expansion, economic and constructional development.
Mainly food wastes and food production always being the top in drop off issues in the waste
management criteria. To minimize this issue, we have to recreate some of the centres that can deal
withoffences like this one. One-third of the total global food production is being wasted every year.
In high-income countries like western countries, they waste much more in food waste. But being to
need to think about the poor one, manufacturing cost, distribution cost and the retailing value of the
grocery items everyone should not be waste food items and if no need, no need to cook!
There are some environmental factors that always plays role in waste management and waste drop
off system. They are mainly concerning topic of being the need of drop off and they are mainly-
• Environmental issues: Mainly drop off properly of the municipal waste will consume nothing loss
in the environment and help to build a green and clean planet.
• Socio-economic issues: Much production of wastes will cost the dirty society and hence will
pronounce a less economic development.
• Financial issues: A proper drop off facility will help not to think people about it and no need to
roam for the disposal site visit.
• Legal issues: Some legal norms will help to create control over the waste issue.
Some public company like EDCO and its fellows help to reduce the optimum high in waste
management and controlling the drop off movement. It's convenient to be the movement party!
They will collect all the wastes from waste collection boxes placed by municipal and public bodies
and drop off all the items in the disposal plant. It's called recycling transfer. Also, the recycling point
member will check all these wastes and help them to classify the items that can be used under their
convenient and try to sell with local people and buyback process starts.
Some recycling drop off levels are:
• Public truck scale for certified vehicle
• weights Courteous staff
• Weekday and weekend hour E-waste drop off location
• Household battery drop-off location

320 MGNCRE | E-Waste Management
320 MGNCRE | Waste Management Banks
• Home-generated sharps drop-off location
• Fat, Oil, Grease (FOG) drop-off location Certified used motor oil and oil filter drop-off
Polystyrene (styrofoam)
9. Municipal action plan of 15 years to reach a zero-waste situation
1) Year 1 Disseminate the program and the specific methods to be used among construction
companies and health care institutions.
2) Year 2 Stimulate construction companies to anticipate the law and develop their treatment
and recycling infrastructure. Initiate the collection of dry separated residue from residences
by existing reverse logistics operators. Organize pilot units of decentralized composting and
collect bio-waste from restaurants and pioneering apartment buildings.
3) Year 3 Establish voluntary drop-off points for large-volume trash items. Instruct medical
establishments to separate their contaminated refuse.
4) Year 4 Pass the municipal law of solid waste. Irregular or clandestine deposits receive fines.
Source separation becomes compulsory and is checked by municipal agents. Bio-waste is
collected from residences in closed containers by operators of decentralized composting
units.
5) Year 5 Existing reverse logistics operators absorb all separated dry material.
6) Year 6 The precarious rubble landfill is closed. Health care residues are collected and
treated by private companies against payment.
7) Year 7 Centralized composting facilities are started by private operators Year 8
All industries have their waste management programs.
8) Year 9 Recycled material begins to appear as raw material on the local market.
9) Year 10 Recycling industries establish themselves in the city.
10) Year 11 All producers of bio-waste have their management programs. The municipal landfill
ceases to accept bio-waste.
11) Year 12 Barrels for collection of dry and clean packaging material are posted in the streets.
12) Year 13 Fines are applied to people who do not separate their waste.
13) Year 14 The municipal collection crews do no longer take away separated residues. They
only take refuse, which does not fit the definitions of bio-waste or inert recyclables, to the
correct destination to be defined by the city administration. Year 15 There is no more
waste to be tipped at the landfill.
• Objectives for bottom-up warfare against the landfill
In current system, the more consumption leads to more waste production. And enormously
everyday huge amount of waste is being continuously produced in the field of different sectors. The
issue is how to deal with them and how to manage with all these waste products. Currently, to
321 MGNCRE | E-Waste Management
321 MGNCRE | Waste Management Banks
prevent the waste resource hazard, mainly need is to save the global resource and develop
sustainable consumption in good way. Evidently a significantly high number of global nonrenewable
sources are found where we are using a huge amount of resources from them. But to accomplish the
global need and global supply within some next decades we have to make sure to use the 3 ‘R’ laws-
Reduce, reuse and recycle. The recycling rate of very rare metals is currently high, and people are
significantly covering this matter in some high economised country. The 100% recycling concept of
municipal wastes and recovering the 100% of it is the toughest task in time, but some countries like,
Britain, Canada, Germany and Portugal make it happen. These over the use and over the consuming
countries are alike in western counties and they are challengingly becoming the “Zero waste”
country.
Mainly these zero-waste conceptswere firstly distinguished by the factors of management issues and
the better the management tends to no waste places. The different study proposed that as more be
the consumption, more depletion and degenerating the more wastes its now conventional that to
prove a no waste city. In India, Alappuzha, a coastal city in Kerala has grown its landmark, by
developing a zero-waste city, which is only and only one in India. “Zero Waste Cities” programme
has been developed with the aims of: -
• reducing waste produce;
• increasing and maintaining participation in recycling and composting schemes within the
university
• raising and maintaining awareness of waste issues;
• promoting the Waste Hierarchy – reduce, reuse, recycle;
• providing a diverse range of ways of increasing education and awareness within the university;
• giving a message that is consistent;
• linking in with regional and national campaigns;
Summary
The third block reported the types of waste bank include food, furniture, e-waste and industrial
waste. As can be seen from the above waste collection methods and reusing strategies, waste
problem can be managed, and also local economy is improved. Impact on management of food
waste, agro-industrial waste, e-waste and plastic lethal waste on local economy is discussed. Method
of collection, process and recycling with the support of firms are detailed in this block. In addition,
zero waste cities through drop off and buy back centers are explained in detail.
Activity
• Prepare caselets for different types of waste bank (2 Pages)
• Prepare caselets for trash in cash (2 Pages)
• Report possible ways of local economic development though waste banks (2 Pages)
• Prepare caselets for zero waste cities in developed and developing countries (2 Pages)
Review questions

322 MGNCRE | E-Waste Management
322 MGNCRE | Waste Management Banks
1. Detail the following
(c) Trash in cash
(d) Types of waste banks
(e) Drop off and Buyback centers
(f) Impact of waste banks on local economic development
2. State the importance of 3Rs such as reuse, recycle and reduce in local economic development?
3. What is mean by zero waste city and how to achieve it though waste management?
References
1. Kahhat, R., Kim, J., Xu, M., Allenby, B., Williams, E., and Zhang, P. (2008). “Exploring e-waste
management systems in the United States.” Resources, Conservation and Recycling, 52(7), 955–
964.
2. Panda, A., Singh, R. K., and Mishra, D. K. (2010). “Thermolysis of waste plastics to liquid fuel A
suitable method for plastic waste management and production of value added products - A
world prospective.” Renewable & Sustainable Energy Reviews, 14(1), 233–248.
3. Papargyropoulou E, Lozano, R., Steinberger, J., Wright, N., and Ujang, Z. bin. (2014). “The food
waste hierarchy as a framework for the management of food surplus and food waste.” Journal of
Cleaner Production, 76(1), 106–115.
4. S.M. Al-Salem, Lettieri, P., and Baeyens, J. (2009). “Recycling and recovery routes of plastic solid
waste ( PSW ): A review.” Waste Management, Elsevier Ltd, 29(10), 2625–2643.
5. Rebellón, L.F.M., “Waste Management an integrated vision”, Intech, Croatia

323 MGNCRE | E-Waste Management
323 MGNCRE | Waste Management Banks
Chapter 4 Waste to Wealth through Banks
Introduction
The concept behind “Waste to Wealth” solely means moving on such a platform where un-necessary
items can be utilised for desiring and valuable goods. This is an exit plan for waste production and
blue print for waste management. Science requires energy in terms of this transformation and
productivity ensures economic growth. Exclusively, a new concept got started where; no waste can
be a wealth without discarding the generator. As price rises, market always demands most of wealth
and wealth comes at that time from the waste with high implication of waste generation. But every
waste product is not a secondary benefited product unless and until waste is potentially treated. The
highly attained slogan and everyone should shout it like “Waste to Wealth” movement could provide
the management tactics and hence it enhances the process for valuable energy services. Mainly this
type of operation creates social awareness in collaborating with local and zonal economic growth for
this upcoming green and clean planet.
4.1. Community-Based Waste Management
Current problems in municipal waste management and mainly household waste management
worldwide can be observed and conventionally operate to justify the issue and to get the solution
interview questionnaire is needed. Any community-based simulation gives result of the local level
problem and it’s a good practice for operation of how the different factors influence the global
environment from the solid waste landfill. In any particular area, the need forcommunity-based
system for waste management like recycle and reuse monitoring mitigates the different issues
involved in this matter and a well-organised community can easily solve such an issue. Current SWM
problem and conditions arising due to this in entire global level can be carried to revision and this
should be managed.
Due to low waste collection and illegal dumping widespread, the incineration caused by this has
created some impacts in natural health. This is the reason for increasing many health issues and
social hygiene. A clean environment always feels us a cleaner and good mood, but after having some
weird dirty places near to household seems a bad environment for health and wealth also. Open
waste damping landfills are house and prime sites for breeding and developing for insects and
serpents like houseflies, mosquitoes and different disease spreading vectors. These vectors are
mainly causing some of the life threaten disease like fever,diarrhoea, cholera, dysentery and malaria.

324 MGNCRE | E-Waste Management
324 MGNCRE | Waste Management Banks
Also waste burning is a natural hazard. This causes the disease threaten fumes that consume
different chemicals and acidic materials and they are the most volatile particles in the environment.
Also, these fumes causeodour and infection related to our skin disease which is an uninhabitable
environment. In residential area need of water is just covered from ground waste, but due to
landfills in dumping site the leachate causes the pollution to the ground water and this is an
important problem for the residents itself. Also,wind blows the loose paper sheer and plastic
material from an industrial area to the environment and this intrusion is another aesthetic problem
from waste also.
Mainly in the recycling technology those are proposed on the based on some conditional and to be
achievement strategy, the municipal solid waste management practice is being performed. Huge
number of improvement and importance were seen in last 20 years of this waste management
practice. Also, in the next 20-30 years, a recent study reveals that the impact of waste management
will decrease to a lower rate and in upcoming years, global look will change to cleaner and greener
version.
4.2. Local Economic Development
The main objective of any unimodal explanation is how to develop the sustainable economy from
the waste management services. Global reach is much needed for this kind of development through
the waste management, especially in developing countries. In this type of authorization, mainly the
need is how to overcome a problem with highly appetite social activity. Descriptive research reveals
that in depth study in a municipal area always performs some explanation of how the local
household and stakeholders manage their wastes through the waste banks.
Our society lives in some proper number of rules. All this waste produced from the solid waste
management can be of forming different results. The operational result from World Bank in 2012
shows approximately 1.5 billion MT (Metric tons) solid waste and out of this only 16% is treated
properly. This is expected to be 2.5 billion MT by 2025. Regarding the industrial waste, a study by
Frost & Sullivan estimated that (2011) by the end of 2020 globally 10 billion of MT wastes will be
generated and for this issue, the Gross Domestic Product of any county is lowering because no use
of item for 2nd life and due to un-avoiding condition in recycling issue.
World widely, wastes are just a problem, and no one wants to raise this issue to a global level.
Wastes are collected and they are just dumped in a landfill area. This is unauthorized and generated
in the control facility and the control facility tries to prepare the items for the damping site.
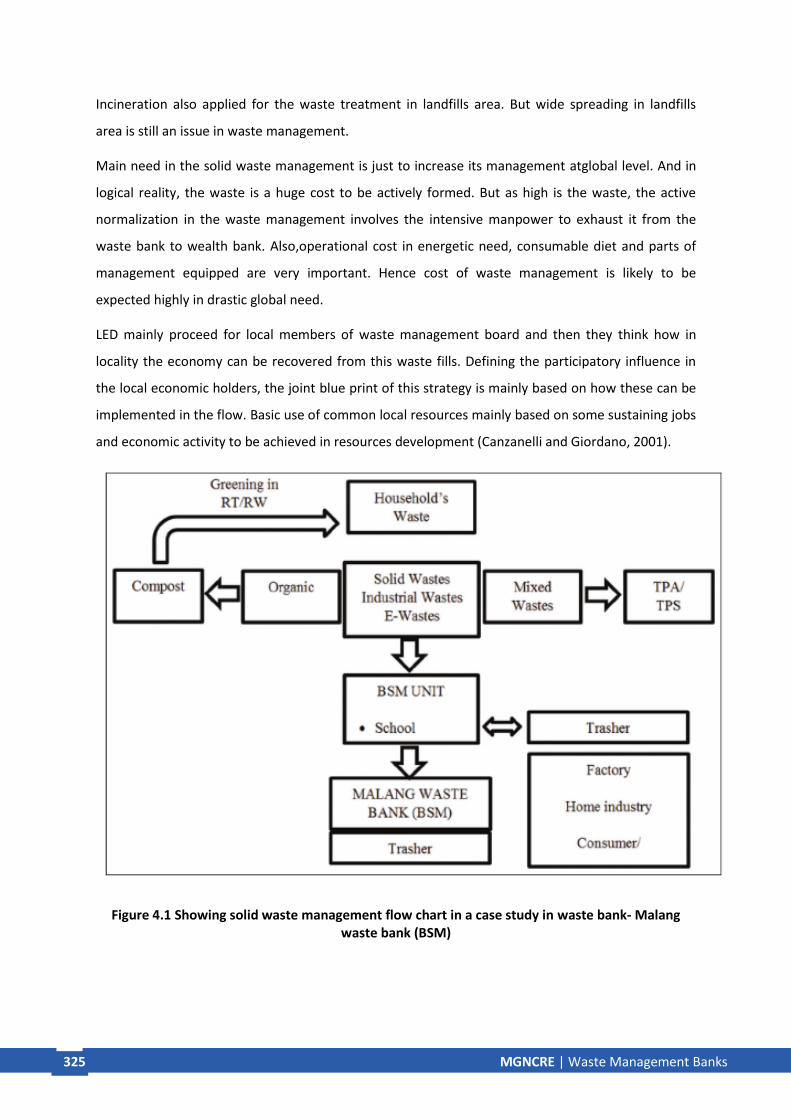
325 MGNCRE | E-Waste Management
325 MGNCRE | Waste Management Banks
Incineration also applied for the waste treatment in landfills area. But wide spreading in landfills
area is still an issue in waste management.
Main need in the solid waste management is just to increase its management atglobal level. And in
logical reality, the waste is a huge cost to be actively formed. But as high is the waste, the active
normalization in the waste management involves the intensive manpower to exhaust it from the
waste bank to wealth bank. Also,operational cost in energetic need, consumable diet and parts of
management equipped are very important. Hence cost of waste management is likely to be
expected highly in drastic global need.
LED mainly proceed for local members of waste management board and then they think how in
locality the economy can be recovered from this waste fills. Defining the participatory influence in
the local economic holders, the joint blue print of this strategy is mainly based on how these can be
implemented in the flow. Basic use of common local resources mainly based on some sustaining jobs
and economic activity to be achieved in resources development (Canzanelli and Giordano, 2001).
Figure 4.1 Showing solid waste management flow chart in a case study in waste bank- Malang waste bank (BSM)

326 MGNCRE | E-Waste Management
326 MGNCRE | Waste Management Banks
Figure 4.2 Li and Yang’s method for panel disassembly.
Cut the edge of LCD glass
Separate upper and lower glass
Ultrasonic removal of liquid crystal
Dry Incineration
Scrap LCD
) ITO glass + polariser filter + liquid crystal (
Liquid crystal Glass with filter
Immerse in liquid nitrogen
Glass with filter
Polariser-free
ITO glass
Polariser
for incineration

327 MGNCRE | E-Waste Management
327 MGNCRE | Waste Management Banks
4.3. Community Economic Development
The part of today’s economy and its forward movement is totally now becoming a part of waste
management, such a folding product of household and business strategy. Another term reveals that
economic implication of any waste production always relies on its productivity and how is it be used
for different expenditures.
Many decisions over the waste management impact the profitable development. The benefits
always over pressure in the firming cost and it tries to reduce the overall other cost with
improvement in productivity. The reducing way of waste material is improved by the productivity in
developing the raw materials from different sources and by recycling the materials is some
insomanistic way. An equal level of optimising for the management of waste arises in some level but
if some public bodies like govt. spends authorities to waste collection from different sources and rely
them to manage all this in some technical skills then waste could be a community wealth.
Applying the effective heat transfer of a heating medium in an external-heating rotary kiln, waste
polyethylene was gasified in the coprocessing with asbestos-containing waste building material. The
resulting flammable gas was used as fuel for a heating gas to melt asbestos(Figure 6).In asbestos
removal works, waste polyethylene generates as protective clothing and shielding curtain Addition
of a flux to asbestos-containing demolition wastes makes the melting range of asbestos at 800 to
900 C. At the similar temperature range, polyethylene was readily converted into a mixture of
hydrogen, methane, ethylene and other hydrocarbons. The gaseous products were supplied to a
furnace to generate heating gas for the pyrolyzer of the asbestos melting system.
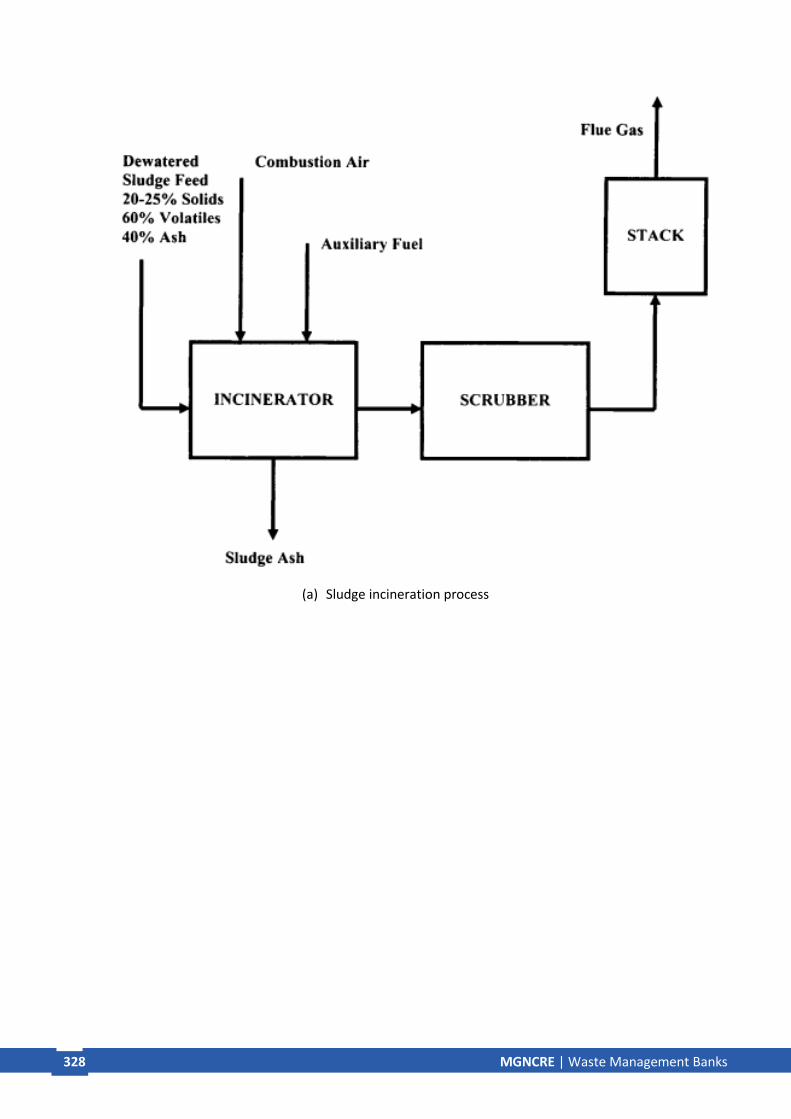
328 MGNCRE | E-Waste Management
328 MGNCRE | Waste Management Banks
(a) Sludge incineration process

329 MGNCRE | E-Waste Management
329 MGNCRE | Waste Management Banks
(b) Multiple hearth incinerator

330 MGNCRE | E-Waste Management
330 MGNCRE | Waste Management Banks
(c) Electric arc furnace
(d) Gaseous fuel production from waste polyethylene in the coprocessing with asbestos containing
demolition wastes
Figure 4.3 Waste management process
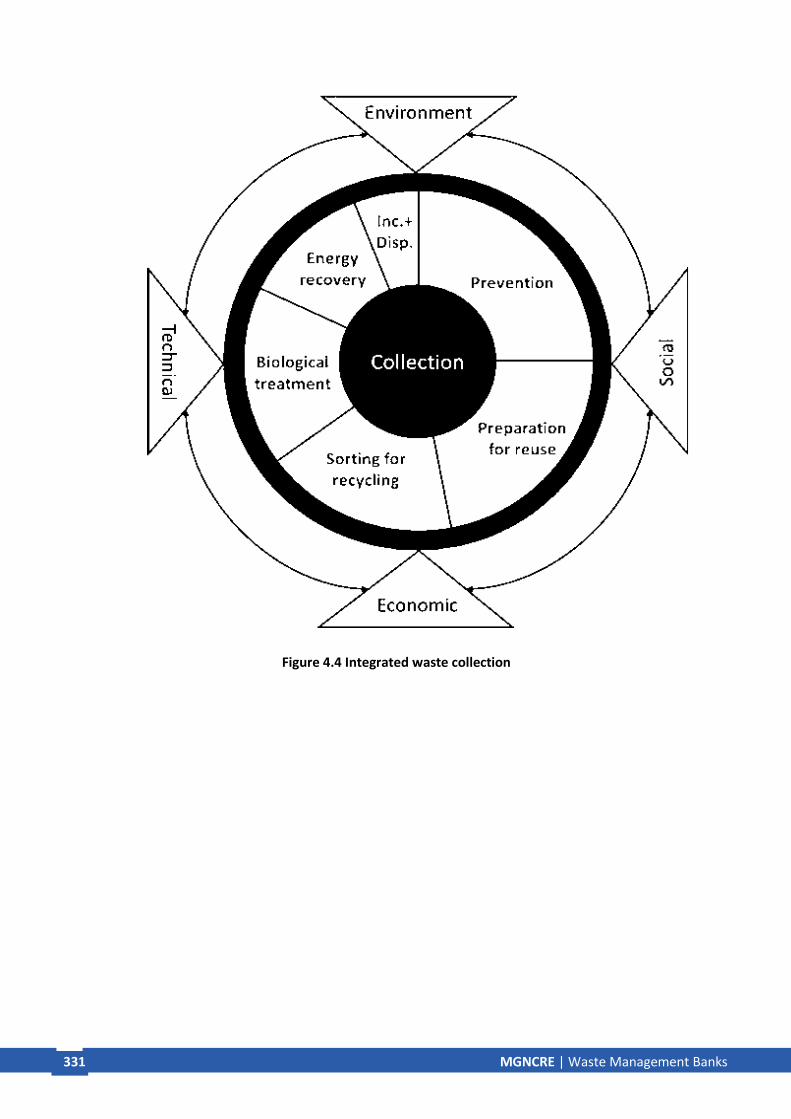
331 MGNCRE | E-Waste Management
331 MGNCRE | Waste Management Banks
Figure 4.4 Integrated waste collection

332 MGNCRE | E-Waste Management
332 MGNCRE | Waste Management Banks
Figure 4.5 Urban waste management

333 MGNCRE | E-Waste Management
333 MGNCRE | Waste Management Banks
Figure 4.6 Flowchart for sustainable development
Table 4.1 summarizes the hierarchy for policy directives and decisions relative to urban waste.
Level 1 World Summits emit general and universal directives for the advancement of
sanitation services
Level 2 National governments structure their pretensions to improve sanitary services in
general and urban waste management in particular through legislation
Level 3 Local administrations are faced with the need for applying the national legislation within
their geographical area of responsibility by way of detailing it and defining specific
procedures of operation with precise timeframes
Level 4 The community at large is expected to obey the established local procedure, supported
by private reverse logistics facilities
4.4. Decentralized Waste Banks
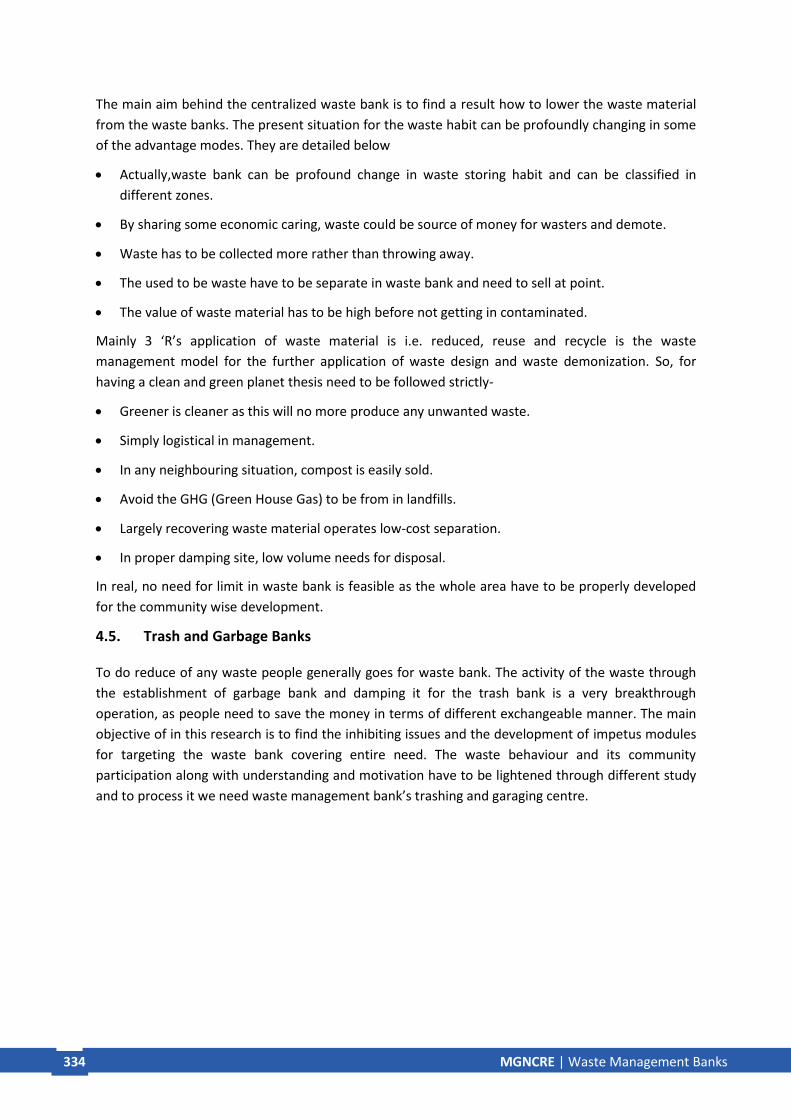
334 MGNCRE | E-Waste Management
334 MGNCRE | Waste Management Banks
The main aim behind the centralized waste bank is to find a result how to lower the waste material
from the waste banks. The present situation for the waste habit can be profoundly changing in some
of the advantage modes. They are detailed below
• Actually,waste bank can be profound change in waste storing habit and can be classified in
different zones.
• By sharing some economic caring, waste could be source of money for wasters and demote.
• Waste has to be collected more rather than throwing away.
• The used to be waste have to be separate in waste bank and need to sell at point.
• The value of waste material has to be high before not getting in contaminated.
Mainly 3 ‘R’s application of waste material is i.e. reduced, reuse and recycle is the waste
management model for the further application of waste design and waste demonization. So, for
having a clean and green planet thesis need to be followed strictly-
• Greener is cleaner as this will no more produce any unwanted waste.
• Simply logistical in management.
• In any neighbouring situation, compost is easily sold.
• Avoid the GHG (Green House Gas) to be from in landfills.
• Largely recovering waste material operates low-cost separation.
• In proper damping site, low volume needs for disposal.
In real, no need for limit in waste bank is feasible as the whole area have to be properly developed
for the community wise development.
4.5. Trash and Garbage Banks
To do reduce of any waste people generally goes for waste bank. The activity of the waste through
the establishment of garbage bank and damping it for the trash bank is a very breakthrough
operation, as people need to save the money in terms of different exchangeable manner. The main
objective of in this research is to find the inhibiting issues and the development of impetus modules
for targeting the waste bank covering entire need. The waste behaviour and its community
participation along with understanding and motivation have to be lightened through different study
and to process it we need waste management bank’s trashing and garaging centre.

335 MGNCRE | E-Waste Management
335 MGNCRE | Waste Management Banks
Figure 4.7 Management model for sorted waste
Table 4.2 Wastes from different source
Industry Wastes produced
Chemical manufacturing Spent solvents and still bottoms
White spirits, kerosene, benzene, xylene, ethyl benzene,
toluene, isopropanol, toluene diisocyanate, ethanol, acetone,
methyl ethyl ketone, tetrahydrofuran, methylene chloride,
1,1,1-trichloroethane, trichloroethylene
Ignitable wastes not otherwise specified (NOS)
Strong acid/alkaline wastes
Ammonium hydroxide, hydrobromic acid, hydrochloric acid,
potassium hydroxide, nitric acid, sulfuric acid, chromic acid,
phosphoric acid
Other reactive wastes
Sodium permanganate, organic peroxides, sodium perchlorate,

336 MGNCRE | E-Waste Management
336 MGNCRE | Waste Management Banks
potassium perchlorate, potassium permanganate,
hypochlorite, potassium sulfide, sodium sulfide
Emission control dusts and sludges
Spent catalysts
Ignitable paint wastes
Ethylene dichloride, benzene, toluene, ethyl benzene, methyl
isobutyl ketone, methyl ethyl ketone, chlorobenzene
Ignitable wastes not otherwise specified (NOS)
Construction Spent solvents
Methyl chloride, carbon tetrachloride, trichlorotrifluoroethane,
toluene, xylene, kerosene, mineral spirits, acetone
Strong acid/alkaline wastes
Ammonium hydroxide, hydrobromic acid, hydrochloric acid,
hydrofluoric acid, nitric acid, phosphoric acid, potassium
hydroxide, sodium hydroxide, sulfuric acid
Metal manufacturing Spent solvents and solvent still bottoms
Tetrachloroethylene, trichloroethylene, methylene chloride,
1,1,1-trichloroethane, carbon tetrachloride, toluene, benzene,
trichlorofluoroethane, chloroform, trichlorofluoromethane,
acetone, dichlorobenzene, xylene, kerosene, white spirits, butyl
alcohol
Strong acid/alkaline wastes
Ammonium hydroxide, hydrobromic acid, hydrochloric acid,
hydrofluoric acid, nitric acid, phosphoric acid, nitrates,
potassium hydroxide, sodium hydroxide, sulfuric acid,
perchloric acid, acetic acid
Spent plating wastes
Heavy metal wastewater sludges

337 MGNCRE | E-Waste Management
337 MGNCRE | Waste Management Banks
Cyanide wastes
Ignitable wastes not otherwise specified (NOS)
Other reactive wastes
Acetyl chloride, chromic acid, sulfides, hypochlorites, organic
peroxides, perchlorates, permanganates
Used oils
Paper industry Halogenated solvents
Carbon tetrachloride, methylene chloride, tetrachloroethylene,
trichloroethylene, 1,1,1,-trichloroethane, mixed spent
halogenated solvents

338 MGNCRE | E-Waste Management
338 MGNCRE | Waste Management Banks
Figure 4.8 Treatment and disposal alternative for industrial waste

339 MGNCRE | E-Waste Management
339 MGNCRE | Waste Management Banks
Figure 4.9 Biological treatment of industrial waste

340 MGNCRE | E-Waste Management
340 MGNCRE | Waste Management Banks
Figure 4.10 Rotary kiln incinerator

341 MGNCRE | E-Waste Management
341 MGNCRE | Waste Management Banks
Figure 4.11 Liquid injection incinerator
Figure 4.12 Cross-section of a secure landfill double-linear system

342 MGNCRE | E-Waste Management
342 MGNCRE | Waste Management Banks
Figure 4.13 Land disposal site cap designed for maximum resistance of infiltration

343 MGNCRE | E-Waste Management
343 MGNCRE | Waste Management Banks
Figure 4.14 Cross-section of a liquid waste impoundment double-liner system

344 MGNCRE | E-Waste Management
344 MGNCRE | Waste Management Banks
Figure 4.15 Cross-section of an incinerator for infectious waste

345 MGNCRE | E-Waste Management
345 MGNCRE | Waste Management Banks
Figure 4.16 Waste minimization techniques
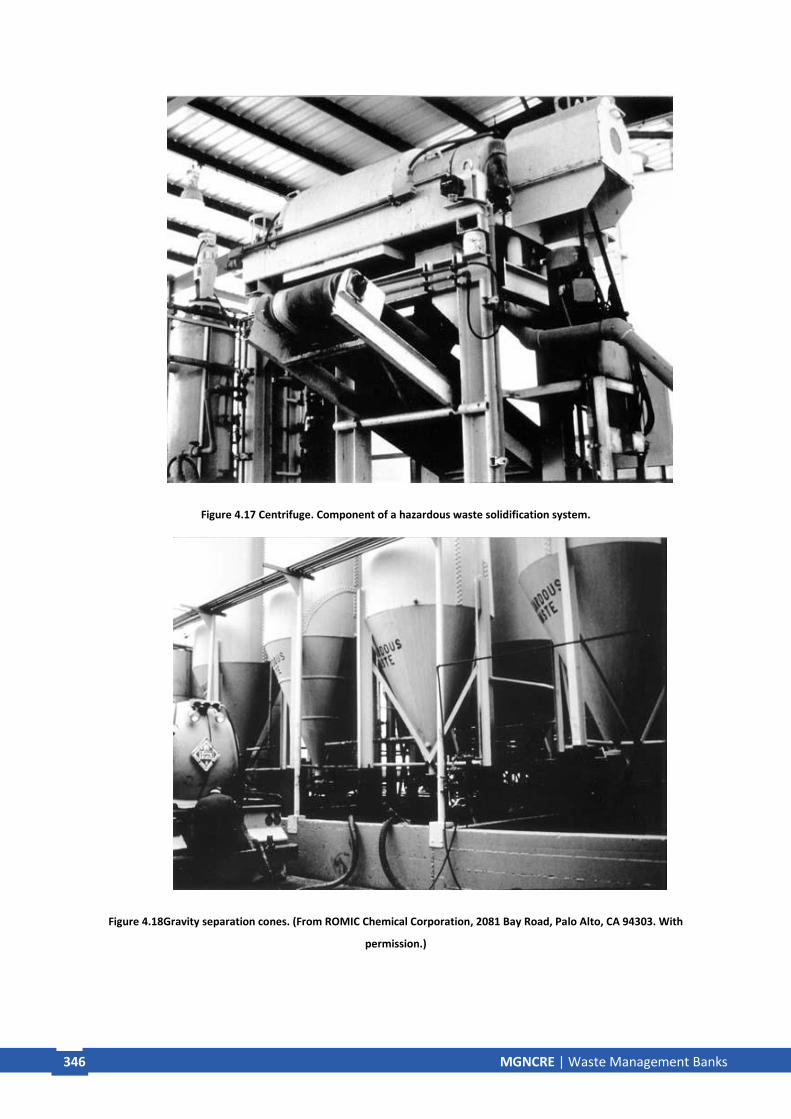
346 MGNCRE | E-Waste Management
346 MGNCRE | Waste Management Banks
Figure 4.17 Centrifuge. Component of a hazardous waste solidification system.
Figure 4.18Gravity separation cones. (From ROMIC Chemical Corporation, 2081 Bay Road, Palo Alto, CA 94303. With
permission.)
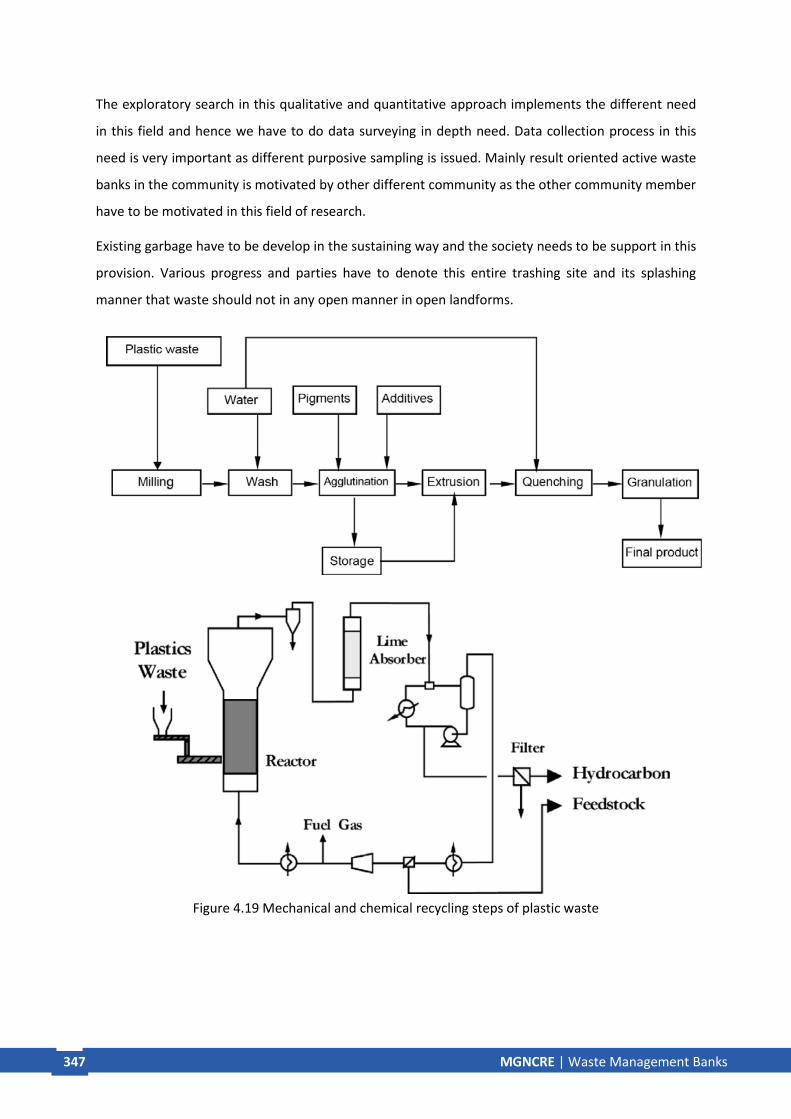
347 MGNCRE | E-Waste Management
347 MGNCRE | Waste Management Banks
The exploratory search in this qualitative and quantitative approach implements the different need
in this field and hence we have to do data surveying in depth need. Data collection process in this
need is very important as different purposive sampling is issued. Mainly result oriented active waste
banks in the community is motivated by other different community as the other community member
have to be motivated in this field of research.
Existing garbage have to be develop in the sustaining way and the society needs to be support in this
provision. Various progress and parties have to denote this entire trashing site and its splashing
manner that waste should not in any open manner in open landforms.
Figure 4.19 Mechanical and chemical recycling steps of plastic waste

348 MGNCRE | E-Waste Management
348 MGNCRE | Waste Management Banks
Summary
Fourth block reported about waste to wealth though waste banks. Also, it detailed community-
based waste management, local economic development and community based economic
development though banks. As can be seen from the above waste collection methods and reusing
strategies, waste problem can be managed, and also local economy is improved. Management
thought decentralized waste banks are discussed. Trash and garbage banks, method of collection,
process and recycling with the support of firms are detailed in this block.
Activity
• Prepare caselets for community-based management (2 Pages)
• Prepare caselets for community economic development though waste banks (2 Pages)
• Report possible ways of local economic development through wastes (2 Pages)
• Prepare caselets for decentralized waste banks, trash and garbage banks (2 Pages)
Review questions
• Explain following
o Community based waste management o Community economic development through waste banks o Local economic development though waste banks
• What is mean by decentralised waste banks?
• State the importance trash and garbage banks?
References
1. Kahhat, R., Kim, J., Xu, M., Allenby, B., Williams, E., and Zhang, P. (2008). “Exploring e-waste management systems in the United States.” Resources, Conservation and Recycling, 52(7), 955–964.
2. Panda, A., Singh, R. K., and Mishra, D. K. (2010). “Thermolysis of waste plastics to liquid fuel A suitable method for plastic waste management and production of value added products - A world prospective.” Renewable & Sustainable Energy Reviews, 14(1), 233–248.
3. Papargyropoulou E, Lozano, R., Steinberger, J., Wright, N., and Ujang, Z. bin. (2014). “The food waste hierarchy as a framework for the management of food surplus and food waste.” Journal of Cleaner Production, 76(1), 106–115.
4. S.M. Al-Salem, Lettieri, P., and Baeyens, J. (2009). “Recycling and recovery routes of plastic solid waste ( PSW ): A review.” Waste Management, Elsevier Ltd, 29(10), 2625–2643.
5. Rebellón, L.F.M., “Waste Management an integrated vision”, Intech, Croatia

349 MGNCRE | E-Waste Management
349 MGNCRE | Waste Management Banks
Chapter 5 Strategies and Precautions
Introduction
The waste management strategy has developed rapidly in last few decades due to needs in
urbanization development and rapid waste generation. The main issue overwhelming in solid waste
management is a challenging task in different areas of the people. Mainly in India, around 42 million
tons of waste products generated yearly. And this annual increase is increasing at a rate of 5% per
year which is mainly a great task to overcome and to need to take this in pilot basis. Possible
strategies and precautions on waste management banks are discussed in this block. this block
detailed leadership management and incentives, household waste management in Indian scenario,
safety equipment for waste handlers and schemes for sustainable waste management.
Objective
To study the strategies and precautions followed for an effective waste bank 5.1. Leadership Management and Incentives
Leader is the head for any movement may it is static or dynamic. Here also,in this case, to move over
from the waste management situation, we need some leadership, and this has to manage all well for
incentive and identical development. The important and how it could be developed for a public issue
is the main reason to be analysed. Some stratification like a leader has to do for waste hazard
movement in different field and have to file it in top priority.

350 MGNCRE | E-Waste Management
350 MGNCRE | Waste Management Banks
Figure 5.1 A phased approach to the implementation of individual producer responsibility.
Own Brand
Only
•
•
•
Individual
Responsibility Step 4 –
Producer only
responsible
for own
products
Step 3 –
Return share
for new
waste, based
on full brand
identification Step 2 –
Return share
for new
waste, based
on sampling
Step 1 –
Market Share
Collective
Responsibility
Washington
State, USA
Maine, USA
Japan PC
Recycling
Manual
counting RFID
Automatic
Recognition Technolog
y

351 MGNCRE | E-Waste Management
351 MGNCRE | Waste Management Banks
Figure 5.2 Initial transport process at waste disposal sites

352 MGNCRE | E-Waste Management
352 MGNCRE | Waste Management Banks
▪ Improving solid waste service delivery and fee collection
For the lower income and developing country, mainly public figures have to increase the waste
delivery services, and this can be utilised in some other sections like to provide some organic
services to the poor one. Though this is inappropriate,but this will help the waste collection support
for the nationalism issue, and this will lead to a major challenge. This movement will also help to
jump and start waste fragile service and conflict over the situations. This will be done if any private
sector leadership strategies come for earthy interest and have to find some public support.
Figure 5.3The extended producer responsibility scheme
▪ Developing waste collection and waste transportation served community
Mainly focusing on the most relevant issues like to develop the developing county, this aims to
improve the services to be served in waste management field and how communities within an area
are accessing the benefit of this services. Some this kind of project will design community
Packedproduct
Packersand
productimporters
Packaging
producer
Recyclers
Consumers
Waste
collectors
Wastemanagers
packagingwaste
packagingwaste
Packaging Fee
Upturn
Recyclable
packagingwaste
Packagingwaste
fromselective
collection
Recyclable
Counterpartsubsidy
Monetaryflow
Materialflow
Rawmaterials
Recycledmaterials
Recycled
materials
SPV

353 MGNCRE | E-Waste Management
353 MGNCRE | Waste Management Banks
development from slummy to cleaner movement. A result-based work in financing and technological
development would help in improving the movement of solid waste. This is not a universal worthy
panacea, but rather this will be the most effective and most helpful investments for the fourth side
development of earth.
There are some rules and govt. introduce regulations which can be very effectively ruled for waste
management development. The following regulations are developed for the waste management
system for controlling the public effectiveness (ASHFAQ, AHMAD, and AMNA KHATOON. "Prevention
of Environmental Degradation by means of solid waste management." I Control Pollution 29.1
(1970)) –
Municipal Solid Waste (Management and Handling Rules) 2000: Rules lay emphasis on
seeking participation of citizens in waste segregation, prohibiting littering of garbage, proper storage
of waste and efficient transportation of waste for its processing and final disposal.
Hazardous Waste (Management and Handling Rules) 1989: To put in place an effective
mechanism to regulate the generation, collection, storage, transport, treatment and disposal of
hazardous wastes both indigenously generated and imported.
RCRA- Nation’s primary laws governing disposal of solid and hazardous waste. Passed on Oct
21, 1976. Hazardous and Solid Waste Amendments to RCRA came in 1984.
Bio-medical Waste (BMW) (Management and Handling Rules) 1998: Adopted and notified
with the objective to stop the indiscriminate disposal of hospital waste/ BMW and ensure that such
waste is handled without any adverse effect on human health and environment.
Recycled Plastics Manufacture and Usage Rules: Notified in 1999, with an amendment in
2003. The objective of rule is to ensure proper collection, segregation, transportation and disposal of
plastic waste (Rajput et al., 2009).

354 MGNCRE | E-Waste Management
354 MGNCRE | Waste Management Banks
Table 5.1 Model to distinguish between individual and collective producer responsibility and individual and collective recycling systems
Financial
responsibility
A: Collective Producer Responsibility:
Based on market share of producers.
E.g. legal requirement within WEEE
Directive for historic waste.
B: Individual Producer Responsibility:
Based on amount of producer’s products
returned for recycling.
E.g. legal requirement within WEEE
Directive for future waste; legal
requirement within Maine and Washington
legislation.
Recycling
system
A1: Non
competitive
Monopolistic
schemes
E.g. Sweden,
the
Netherlands,
Belgium,
Switzerland
Competitive:
E.g. Germany, the UK,
France
B1: Non
competitive
Monopolistic
schemes
E.g. ICT Milieu
1999–2002
Competitive:
E.g. Japan
A2:
Collective
recycling
system
E.g.
Compliance
schemes
such as ERP
A3:
Individual
recycling
system
E.g. Direct
take-back
events or
systems
B2:
Collective
recycling
system
E.g. Group
A and B
compliance
schemes
B3:
Individual
recycling
system
E.g. PC
recycling
in Japan
5.2. Household Waste Management-Indian Scenario
In Indian view, industrialization is the most important and significant role for developing its natural
nomination and also this helps in to overcome the need toincrease in population. Rapid
development of urban areas and growths in industry also leads to the more waste generation.
Recently, mainly e-wastes and paper-plastic wastes are also contributing their values in waste banks
by consuming areas. Electronic and other goods, material and clothes are the main house hold
wastes that are generating the waste field gain. Also wastes may be a potential form of hazard for
the human health and also for another livelihood in environment, as they aspects more in natural
pollution.

355 MGNCRE | E-Waste Management
355 MGNCRE | Waste Management Banks
Table 5.2 Waste banks
Solid waste banks Contribution
(%) Waste characteristics
Domestic (Residential) 52 -80
Major: food wastes. Waste quantity increasing with population increase Minor: paper; plastic; textiles; glass; ceramics; ashes; leather; compound E-waste is emerging as significant wastes Wastes collection by: urban councils; private companies, NGOs and CBOs
Markets 4 -20
Major: vegetable wastes, spoilt fruits; Markets in all (leaves, stalks), Number increasing with population increase Minor: damaged packaging materials- (e.g., sacks, bags,paper, timber) Waste collection: urbancouncils and private
Commercial (excluding markets)
3.7-8
Major: packaging materials; food wastes; Shops, scrap metals in hotels, restaurants, offices, through open pavement trading Minor: glass, hazardous - Mobile open-air traders wastes (e.g. contaminated - Increasing business containers, batteries and - Increasing waste volumes cleaning textiles E-wastes has become significant Waste collection: urban council and private collectors
Institutional (e.g. Government and private-Ministries, Educational establishments, sports facilities, clubs)
5
Major: food wastes, - Expanding in numbers stationery with population increase; Minor: packaging (e.g., cardboard, paper, - E-wastes has become significant plastics) Waste collection: mainly by private companies.
Healthcare(hospitals, clinics, drug 1
1
Major: domestic type of Major hospitals treats own wastes hazardous wastes. Minor: hazardous (e.g., - Clinics dump with other anatomical, contaminated wastes, materials, sharps)
Others 11-11.4 Examples: street sweepings, public park wastes, construction, wastes: collected by: Urban council and private companies
Mainly the approach towards the solid and organic waste management in India is still un-scientific.
And that’s the reason why we lag behind other developing countries. Report estimated that, solid
waste collection in efficiently in India is 70% (Sharholy et al. 2007), whether this proper 100% in the
others developed counties. In India the situation of solid waste generation is tabled in (Table 5.1)

356 MGNCRE | E-Waste Management
356 MGNCRE | Waste Management Banks
and the main sources of solid generation and its types are discussed.
In Indian scenario, even these days also solid waste is dumping without any proper authority and
proper scientifically that treats to a bad impact in environment and heaths. Without any treatment
the dumped wet fields are storing of many indiscriminately unhealthy products and results are
overcoming to neighboring people and environment. Leading from groundwater to air pollution,
release of Smokey and leachate gases and various diseases causing environment is mainly found in
such damping site in India. Study reveals that out of this waste, 80% of them can be utilized if, the
proper measure of recycling or reused are used. Due to outdated technology and no innovative,
improper waste isolation is mitigated in India. Some materialistic item has to be sort and they have
to be properly dumped. Commodities like plastic and paper have to recycle and some other item
that likecloths have to use to replace it. The issues revealing in systematic effort to maintain the
illegal implementation to legal work, developing the human resources, earning the economic
increase from reused method and arrangement in institutional framework will definitely develop
India for sustaining the solid waste mitigation.

357 MGNCRE | E-Waste Management
357 MGNCRE | Waste Management Banks
Table-5.3 Type of Industrial Waste
Source Typical Waste Generators Type of Solid Waste
Residential Household activities
Food waste, paper, cardboard, plastics, wood, glass, metals, electronic items etc.
Industrial Manufacturing units, power plants, process industries etc.
Housekeeping wastes, hazardous wastes, ashes, special wastes etc.
Commercial & Institutional
Hotels, restaurants, markets, office buildings, schools, hospitals, prisons etc.
Bio-medical waste,Food waste, glass, metals, plastic, paper, special wastesetc.
Construction and Demolition
New construction sites, demolition of existing structures, road repair etc.
Wood, steel, concrete, dust etc.
Municipal services Street cleaning, landscaping, parks and other recreational areas, water and wastewater treatment plants
Tree trimmings, general wastes, sludge etc.
Agriculture Crops, orchards, vineyards, dairies, farm etc. Agricultural wastes, hazardous wastes such as pesticides
Mining Open-cast mining, underground mining Mainly inert materials such as ash
5.3. Safety Equipment for Waste Handlers
While handling waste material and waste products, the personal, which is acquainting with this
work, have to protect him from self-security before securing the environment. The protection from
the safety, and this needs in some insomnia and wearing the personal protective equipment (PPE).
While handling all this waste items PPE reduces the direct contact of sharp item to body, protects
from germ to the bodily fluid and blood also secures from splashes present in chemicals. While
handling wastes mainly needed item are:
• Face mask
• Heavy duty, gloves
• Plastic apron
• Clothes that cover the body
• Heavy duty, boots

358 MGNCRE | E-Waste Management
358 MGNCRE | Waste Management Banks
1. Safety Hats/Helmets
(a) Helmet
1. Safety hats protect the employee’s head from injury caused by falling or flying objects.
2. Should be worn in places where construction work is going on or risk of objects falling or
flying is high.
Ought to be worn where equipment operation work is going on.
3. They come in various types depending on the task being performed and risk involved.
2. Ear Protection
(b) Ear protection
1. Ear Protection is meant to protect the employee’s ears from damage as a result of excessive noise levels at the work place.

359 MGNCRE | E-Waste Management
359 MGNCRE | Waste Management Banks
2. They should be worn while the employee is performing a task where noise levels are above normal.
3. Respirators and dust masks
(c) Respirators and dust masks
1. Respirators and dust masksprotect employees from inhaling harmful substances that may
pose a threat to their health thereby making them unproductive.
2. They also minimize odors from especially decaying solid waste.
3. Others protect the employee from inhaling dust that might cause respiratory problems.
4. They come in various types and designs depending on the task being undertaken or being
performed and degree of safety risk involved.

360 MGNCRE | E-Waste Management
360 MGNCRE | Waste Management Banks
4. Safety Coveralls
(d) Safety coveralls
In Solid Waste Management coveralls are meant to:
1. Protect the employees from hazardous Chemicals that may be in the waste in the courseof
solid waste operations.
2. Protect the employee from harmful disease-causing Pathogens.
3. Hinder the spread of disease-causing pathogens from the waste by the employees.

361 MGNCRE | E-Waste Management
361 MGNCRE | Waste Management Banks
5. Safety footwear
(e) Safety footwear
1. Safetyfootwear protect employees from foot injury as a result of Sharp objects piercing
through the soles or from falling objects.
2. They also protect the employee from water borne disease causing pathogens.
3. They ought to have reinforced soles and toe caps to enhance the safety of the employee’s
feet.
4. For employees involved in solid waste management operations, rubber boots are preferred.
This is because of the wet conditions that exist in these operations.
5. They come in various types and designs depending on the task and risks involved.

362 MGNCRE | E-Waste Management
362 MGNCRE | Waste Management Banks
6. Eye protection
(f) Eye protection
Eye protection is important in the following ways:
1. Protect the eyes from sharp objects that may cause injury or lead to eyesight loss.
2. Protect the eyes from harmful chemicals that might be in waste from spilling into the eyes.
3. Protect the eyes from harmful Ultra-Violet sun rays. They come in various shapes, types and
designs to suit different tasks and the safety risks involved. Choose one that fits your task
and assures your safety.
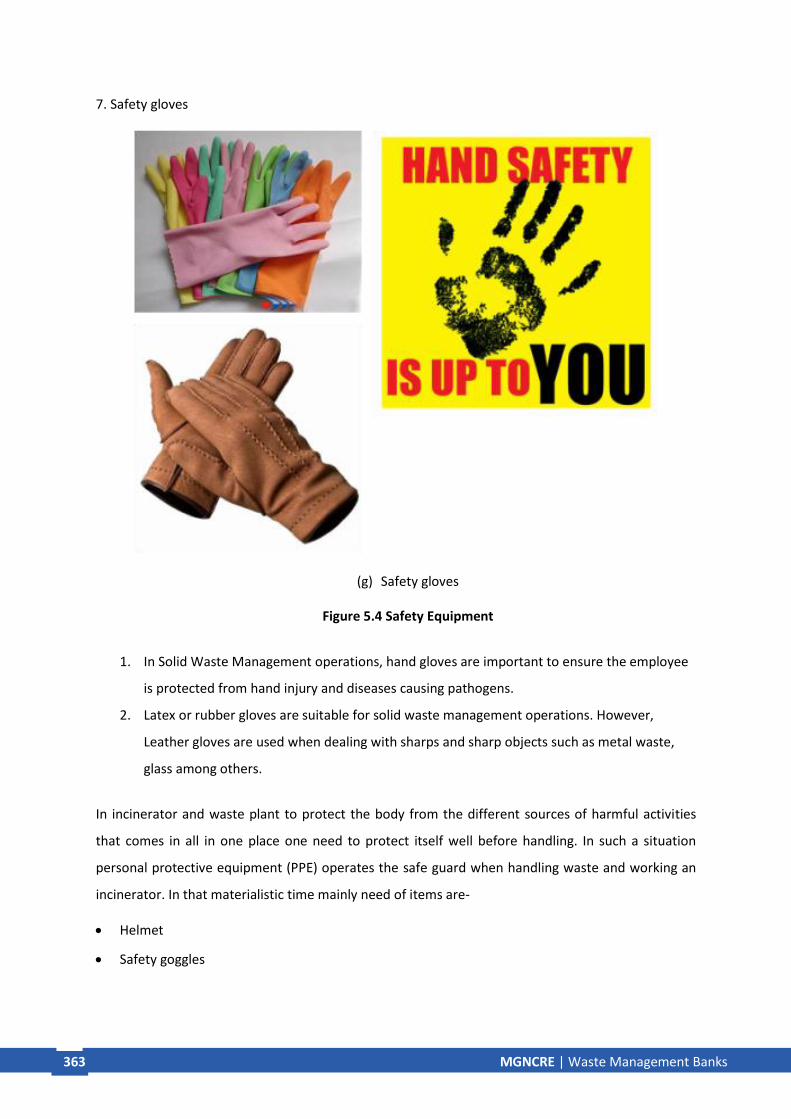
363 MGNCRE | E-Waste Management
363 MGNCRE | Waste Management Banks
7. Safety gloves
(g) Safety gloves
Figure 5.4 Safety Equipment
1. In Solid Waste Management operations, hand gloves are important to ensure the employee
is protected from hand injury and diseases causing pathogens.
2. Latex or rubber gloves are suitable for solid waste management operations. However,
Leather gloves are used when dealing with sharps and sharp objects such as metal waste,
glass among others.
In incinerator and waste plant to protect the body from the different sources of harmful activities
that comes in all in one place one need to protect itself well before handling. In such a situation
personal protective equipment (PPE) operates the safe guard when handling waste and working an
incinerator. In that materialistic time mainly need of items are-
• Helmet
• Safety goggles

364 MGNCRE | E-Waste Management
364 MGNCRE | Waste Management Banks
• Respirator mask
• Heavy duty, heat-resistant gloves
• Apron
• Clothes that cover the body
• Heavy duty, heat-resistant boots
(a) Hazardous waste handling by workers

365 MGNCRE | E-Waste Management
365 MGNCRE | Waste Management Banks
(a) Hazardous waste handling by workers
(b) Hazardous waste handling by workers

366 MGNCRE | E-Waste Management
366 MGNCRE | Waste Management Banks
(c) Workers wearing protective clothing with supplied air respirators (SAR).
(Courtesy of URS Corporation, 100 California Street, San Francisco, CA.)
(d) 4 Workers in Level C protective clothing. (Courtesy of URS Corporation, 100 California Street, San
Francisco, CA.)
Figure 5.5 Hazardous waste management by handlers

367 MGNCRE | E-Waste Management
367 MGNCRE | Waste Management Banks
The site investigation plan should address include
• Scope of the inspection that depends upon the purpose and objectives: The scope is expressed
in terms of issues to be addressed, areas to be inspected, depth of detail required, time
allocated to conduct the inspection, etc. For example, inspections performed in response to
information received concerning alleged violations will generally be comprehensive in scope and
entail a detailed evaluation of all RCRA regulated activities at the site.
• Coordination required with other offices, agencies, or services
• Procedure regarding prior notification, denial of entry, denial of access to records, areas, units,
etc.
• Entering the facility: Is there to be an opening conference? What items should be covered?
Should the inspector proceed with a visual inspection immediately to preclude hasty
adjustments or concealment?
• Summarized findings from the background report
• Applicable regulations, policies, and guidance documents
• Procedure regarding records review, i.e., review on-site, copy for later review, or other
arrangement
• Personnel assigned and duties
• Sampling plan, including list of equipment
• Protective clothing and safety equipment requirements
• Site safety plan — as appropriate
• Contingency plan for emergencies that may arise during the inspection
• Checklists (if any) to be used
• Data Quality Objectives
Risk factors that may increase a worker’s risk for workplace assault as identified by NIOSH are
1. Contact with the public
2. Exchange of money
3. Delivery of passengers, goods, or services
4. Having a mobile workplace, such as a taxicab or police cruiser
5. Working with unstable or volatile persons in health care, social services, or criminal justice
settings

368 MGNCRE | E-Waste Management
368 MGNCRE | Waste Management Banks
6. Working alone or in small numbers
7. Working late at night or during early morning hours
8. Working in high crime areas
9. Guarding valuable property or possessions
10. Working in community-based settings
5.4. Scheme for Sustainable Waste Management
Experts agrees about waste management that this field will stable if we have a long-term procedure
to act this and to achieve such a term end, one need to be very cost effective. The production of any
from waste house should be minimal rather it can be prevented. Dangerous wastes not only cost the
environment but also ageing of live. Another long-term issue can be cover by this though by
preceding some fines for making the environment dirty. This will drop knowing environment
pollution, because for human, money is matter than the environmental cluster. CID (Centre for
Innovation and Development) in 1992 had already experienced this in New Delhi and this is high in
developed country. Try and true method is used for this convenience where test site is firstly
assessed for experimental basis than a sustain management is planned.
Table 5.4Waste plastic treatment methods
Sl.No Treatment method or products Type of waste plastics*
1 Mechanical recycling Mixed plastics, C&P recycling law (household)
PET Bottles, C&P recycling law (household) Industrial wastes of good quality
2 Solid fuel (RPF) Industrial wastes of moderate quality
3 Blast furnace treatment Mixed plastics, C&P recycling law (household)
Mixed plastics from industry
4 Cokes oven treatment Mixed plastics, C&P recycling law
(household) Waste plastics from industry
5 Liquid fuel production Mixed plastics from household Mixed plastics from industry
6 Gasification Mixed plastics, C&P recycling law
(household)
7 Cement kiln treatment Industrial wastes of moderate quality
8 Incineration with power Mixed wastes from household Mixed wastes from industry

369 MGNCRE | E-Waste Management
369 MGNCRE | Waste Management Banks
generation
9 Incineration (no energy recovery) Mixed wastes from household Mixed wastes from industry
10 Landfill Industrial plastic wastes
Table 5.5 Types of laws for recycling and waste management
Law Content
Basic law for establishing the
recycling-based society
Basic framework determining the role of stakeholders for
establishing the sound material-cycle society.
Waste management and public
cleansing law
Defines municipal wastes and industrial wastes. The roles and
duties of a municipality, waste generator, waste management
company, and other stakeholders are strictly provided. The
related regulations and rules define both technical and social
conditions and guidelines to keep the sound business in
addition to construction of a facility, installation and operation
of equipment.
Law for promotion of effective
utilization of resources
Promotion of waste reduction through recycling. The roles and
duties of the stakeholders are mentioned. Promoting reduction
of wastes through recycling and suitable disposal in several
fields of industries and products such as steel production, paper
production, construction, automobile, electric and electronic
equipment, batteries, metal cans and PET bottles.
Containers and packaging recycling
law
Promotion of recycling containers and packaging through
separate collection of those wastes made from paper, metal,
glass, PET and the other plastics by municipalities with
cooperation of citizens. Producers of the material,
manufacturers of the commercial products with containers and
packaging and retail stores cover recycling costs. Recycling
methods are provided in the related regulations.

370 MGNCRE | E-Waste Management
370 MGNCRE | Waste Management Banks
Electric household appliance
recycling law (Home appliance
recycling law)
Forcing consumers to give wastes of home appliances to
retailers with paying recycling fees. Air conditioner,
refrigerator/freezer, television set, washing machine and cloth
dryer are recycled with suitable treatment of fluorocarbons and
other potential hazardous substances.
End-of-life vehicle recycling law
Forcing car owners to cover the cost for suitable disposal of
hazardous wastes and wastes of no commercial value with
recovering valuable resources from end-of-life vehicles.
Construction material recycling act Reducing the amounts of construction and demolition wastes
through recycling.
Food recycling law
Reducing the amounts of food residues from restaurants, food
processing industry and supermarkets through recycling waste
foods.
Law on promoting green purchasing Promoting the national and local governments to buy products
that made from recycled materials.

371 MGNCRE | E-Waste Management
371 MGNCRE | Waste Management Banks
Table 5.6General recommendations concerning plastics.
Materials, plastics Reasons for recommendation
Use as few different types of
plastics as possible
Facilitates sorting materials for recycling Larger amounts of
similar materials increase the value of the scrap
Choose plastics which:3 can be
recycled, i.e. thermoplastics (PET,
polystyrene) and polyolefins
(HDPE,LDPE and PP)3 are
compatible on recycling
Increases possibility of recycling
Choose plastics which can be
incinerated without emission of
hazardous substances. Avoid PVC
and other halogencontaining
polymers
Incineration of plastics is often the most realistic disposal route
In the event of fire in electric and electronic systems, PVC will
evolve chlorine and subsequently hydrochloric acid
Do not use brominated flame
retardants
Legal constraints of RoHS
Toxic substances are emitted during incineration at low
temperature. Some ofthe flame retardants are themselves toxic
(PBB, PBDE)
Avoid adhesive labels on plastic
surfaces
Contaminates material on recycling
We have to adopt and have to move our living policy. The past 3 ‘R’s policy is still in running mode in
developing countries. But developed countries adopt 4 ‘R’s and these are:
• Refuse – Instead of going market to buy a new item one has to try to not to use if is not too need
to use. Refusing to buy non-need item will help in diminishing the waste.
• Reuse–Instead of throwing away a material use innovative mind to create a new one which is
useful and seems to be ethnic design.
• Recycle–Collection of segregate waste and then deriving them which one can be used again will
help to store our resources and not to increase in waste.

372 MGNCRE | E-Waste Management
372 MGNCRE | Waste Management Banks
• Reduce–Also need to reduce the unnecessary item, avoiding over using and trying to be eco-
friendly will reduce waste for wealth.
Table 5.7 Policy instruments on waste prevention
Policy instruments Waste prevention instruments
Regulatory Landfill ban, incineration bans, plastic bag bans, disposable cutlery bans, to-
go or single-use products ban
Market-based PAYT, landfill tax, incineration taxes and fees, extended producer
responsibility principle, precycling insurance, recycling insurance, taxes on
products (packaging, plastic bags)
Information Awareness campaigns, school campaigns, procurement guidelines,
information exchange platforms
Voluntary Home composting, ecodesign of products, designing out waste, bottleless
water, nappy laundry services, planning food meals
Certain amount of waste cannot be prevented while manufacturing a big product. But if we use the
needed item for that particular serviceable material than waste will be reduced. However, we have
to develop our own innovative mind to create something new from the primary wastes which is
easily reusable material. Central Industrial Research (CIR) ministry now implemented some
regulations for disposing waste in some of the heavier factories. Mainly people cooperation is the
only thing in this sustains planning for waste management.
This could be offer for public demand:
• Easy analysis in elaborating the material flow assessment wills asset their importance and
impacts.
• A proper way to find the material flow of any household.
• Accessing public or private trainees in this field for accessing of data collection and providing
report to govt.
• Assist in waste management plan with own interest for the neighboring clean.
If we could plan such a sustain management then the dirty earth which we are living i.e. Earth-1.0
will directly flow and a green and clean earth will come which will be people friendly, environment
friendly, health friendly and mostly technically developed the “Earth -2.0”.

373 MGNCRE | E-Waste Management
373 MGNCRE | Waste Management Banks
Figure 5.6The permitting process (EPA 1998d, Chapter 8).

374 MGNCRE | E-Waste Management
374 MGNCRE | Waste Management Banks
Summary
Block 5 summarizes leadership management in waste banks, and the incentives given for waste
collection and disposal. Also, it explains the household waste management of Indian scenario. It lists
the equipment required for waste handlers. Lastly, it enlists the schemes for sustainable waste
management.
Activity
• Prepare caselets for household waste management in Indian scenario (2 Pages)
• Nature of incentives given to waste handlers and success story (2 Pages)
• Report framework for sustainable waste management (2 Pages)
Review questions
1. Draw flowchart of following
(a) Leadership management (b) Household waste management – Indian scineario
2. State the importance of safety equipment for waste handlers?
3. List out schemes for sustainable waste management?
References
1. Kahhat, R., Kim, J., Xu, M., Allenby, B., Williams, E., and Zhang, P. (2008). “Exploring e-waste management systems in the United States.” Resources, Conservation and Recycling, 52(7), 955–964.
2. Panda, A., Singh, R. K., and Mishra, D. K. (2010). “Thermolysis of waste plastics to liquid fuel A suitable method for plastic waste management and production of value added products - A world prospective.” Renewable & Sustainable Energy Reviews, 14(1), 233–248.
3. Papargyropoulou E, Lozano, R., Steinberger, J., Wright, N., and Ujang, Z. bin. (2014). “The food waste hierarchy as a framework for the management of food surplus and food waste.” Journal of Cleaner Production, 76(1), 106–115.
4. S.M. Al-Salem, Lettieri, P., and Baeyens, J. (2009). “Recycling and recovery routes of plastic solid waste ( PSW ): A review.” Waste Management, Elsevier Ltd, 29(10), 2625–2643.
5. Rebellón, L.F.M., “Waste Management an integrated vision”, Intech, Croatia


Contents
Chapter 1 Assessment of Contamination before Reclamation and Remediation 1.1 Understanding associated hazards with different waste types 1.2Safety considerations 1.3 Sampling & analysis protocols 1.4 Risk assessment of contaminated sites 1.5 Policy framework
Chapter 2 Waste management technologies 2.1 Overview of solid waste management technologies 2.2 Overview of liquid waste management technologies 2.3 Resource recovery 2.4 Socio-cultural aspects 2.5 Eco-friendly innovative technologies and their mainstream use Chapter 3 Landfill reclamation 3.1 Landfill reclamation – an overview 3.2 Landfill mining 3.3 Alternate uses of closed landfills 3.4 Phyto-capping 3.5 Hazardous Waste Landfill Remediation
Chapter 4 Bioremediation 4.1 Overview of processes involved in bioremediation and phytoremediation 4.2 Bioremediation 4.3 Phytoremediation 4.4 Bio-mining of waste 4.5 Soil-related aspects Chapter 5 Multi-Criteria Decision Analysis (MCDA)
5.1 MCDA – Overview, History and Current Trends 5.2 MCDA tools 5.3 MCDA software 5.4 MCDA in waste management
5.5 Drivers for and Challenges against Enhancing the Use of MCDA by Decision-makers in India,
Case Studies &Recommendations

377 MGNCRE | E-Waste Management
377 MGNCRE | Reclamation and Remediation
Chapter 1 Assessment of Contamination before Reclamation and Remediation
Introduction Waste handling professionals, who are involved in collection, transport, processing,
recycling or disposal of waste, are in direct contact with the waste, touching it or inhaling it
and being at the risk of even ingesting it accidentally. However, even the most innocuous of
wastes, such as the municipal solid waste generated from households, can have
components with properties detrimental to the health and well-being of the individual as
well as the environment, and create untold harm. For instance are the everyday items like
batteries, paints and insecticides that have been categorized as household/ domestic
hazardous waste.
The hazards associated with other wastes coming from manufacturing industries (chemical),
nuclear power plants (radioactive) or hospitals and healthcare institutions (biomedical) are
several degrees more harmful and the exposure to such wastes – in the absence of
adequate safety precautions – can lead to morbidity or even be fatal.
In addition, the contingency of accidental spillage, mishaps, and security lapses emerging
from human error or mechanical failure, cannot be denied. Be it the Chernobyl tragedy or
the Bhopal gas tragedy, the loss of life and property due to hazardous chemicals still haunts
mankind’s collective memory.
Hence, irrespective of whether it is the question of following day-to-day routine or
remaining prepared for untold disasters, it is of the utmost importance for a waste
management professional to understand the hazards associated with waste – not only to
the individual but to the surrounding environment as well.
Objectives The objective of this Chapter are to help the reader fully comprehend
• The hazards associated with wastes from different sources, i.e., impact of a given waste
item on human health and the environment
• How to identify a waste as hazardous, based on its labels, physical features and/ or source
• How to protect oneself from hazardous wastes by following adequate safety protocols

378 MGNCRE | E-Waste Management
378 MGNCRE | Reclamation and Remediation
• The risk assessment procedure
• The associated policy framework
1.1 Understanding Associated Hazards with Different Waste Types
Industrial waste – here, the waste is largely chemical, and based on their nature, these chemicals
may be explosive, corrosive, flammable or toxic. Synthetic organics, inorganic metals, salts, acids and
bases, and flammables and explosives are the five categories into which hazardous chemical waste
can be divided. They may injure the handler through direct dermal contact, accidental inhalation or
ingestion.
Biomedical waste – the risk of infection is the most potent risk associated with biomedical waste.
Injury and risk of infection from sharps (syringes, scalpels, and lancets) is another hazard.
Radioactive waste – Wastes generating radioactive radiation (alpha, beta or gamma rays) are
extremely hazardous and can cause immediate death or chronic symptoms depending on the degree
of exposure. Radioactive substances persist in the environment, depending on their half-lives. The
time taken for the radioactivity of a specified isotope to fall to half its original value is called its Half-
life.
Electronic waste – The recycling of electronic waste exposes its handlers to several heavy metals
such as lead, mercury, cadmium, chromium etc. In addition, brominated flame retardants pose a
threat, too. E-waste components such as accumulators and other batteries, glass cullets from
Cathode Ray Tubes (CRTs), Polychlorinated biphenyls (PCB) capacitors and mercury-switches can be
potentially harmful to the handler and need to be regulated.
Municipal Solid Waste – In the absence of cautious segregation, even domestically generated
municipal solid waste may contain some hazardous waste elements. These include - aerosol cans,
batteries, and household kitchen and drain cleaning agents, car batteries and car care products,
cosmetic items, chemical-based insecticides/pesticides, light bulbs, tube-lights and compact
fluorescent lamps (CFL), paint, oil, lubricant and their empty containers.
Another problematic component of the municipal waste that may have health hazards is sanitary
waste. These include used menstrual hygiene products like tampons and sanitary napkins, soiled
diapers, condoms, bandages, soiled cotton and bandages etc. Such items can be infective, and their
careless disposal without adequate segregation at the source creates a serious managerial challenge.
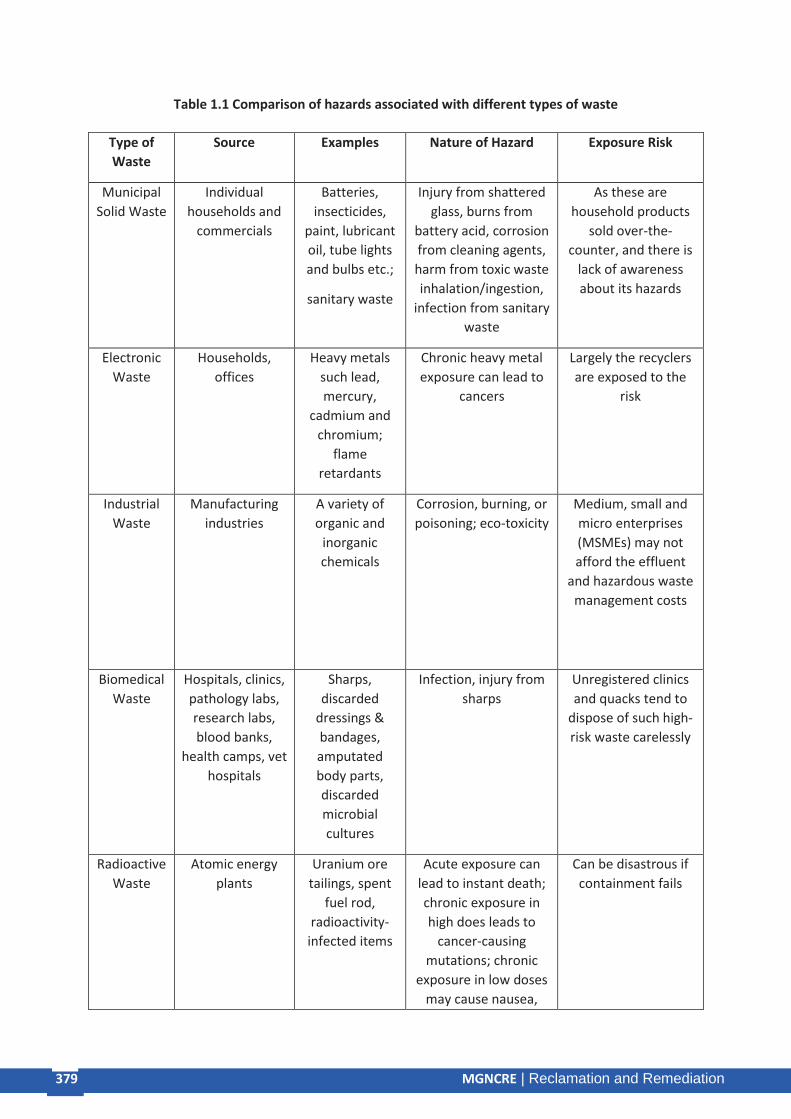
379 MGNCRE | E-Waste Management
379 MGNCRE | Reclamation and Remediation
Table 1.1 Comparison of hazards associated with different types of waste
Type of
Waste
Source Examples Nature of Hazard Exposure Risk
Municipal
Solid Waste
Individual
households and
commercials
Batteries,
insecticides,
paint, lubricant
oil, tube lights
and bulbs etc.;
sanitary waste
Injury from shattered
glass, burns from
battery acid, corrosion
from cleaning agents,
harm from toxic waste
inhalation/ingestion,
infection from sanitary
waste
As these are
household products
sold over-the-
counter, and there is
lack of awareness
about its hazards
Electronic
Waste
Households,
offices
Heavy metals
such lead,
mercury,
cadmium and
chromium;
flame
retardants
Chronic heavy metal
exposure can lead to
cancers
Largely the recyclers
are exposed to the
risk
Industrial
Waste
Manufacturing
industries
A variety of
organic and
inorganic
chemicals
Corrosion, burning, or
poisoning; eco-toxicity
Medium, small and
micro enterprises
(MSMEs) may not
afford the effluent
and hazardous waste
management costs
Biomedical
Waste
Hospitals, clinics,
pathology labs,
research labs,
blood banks,
health camps, vet
hospitals
Sharps,
discarded
dressings &
bandages,
amputated
body parts,
discarded
microbial
cultures
Infection, injury from
sharps
Unregistered clinics
and quacks tend to
dispose of such high-
risk waste carelessly
Radioactive
Waste
Atomic energy
plants
Uranium ore
tailings, spent
fuel rod,
radioactivity-
infected items
Acute exposure can
lead to instant death;
chronic exposure in
high does leads to
cancer-causing
mutations; chronic
exposure in low doses
may cause nausea,
Can be disastrous if
containment fails

380 MGNCRE | E-Waste Management
380 MGNCRE | Reclamation and Remediation
hair-loss, gastro-
intestinal symptoms
etc.
Recognizing waste as hazardous
• Label – Labels containing chemical names or symbols indicating specific dangers are
significant markers in recognizing hazardous waste. Few such labels have been included
here:
• Human senses – pungent odor, visible fumes, dermal irritation, eye watering, corrosive
action
• Biological indicators – bleached leaves of plants and dead animals
• Occupancy and location
Point locations where hazardous wastes are likely to be encountered
Bio-hazard Cytotoxic drug
Figure 1.1: Symbols of hazardous chemicals

381 MGNCRE | E-Waste Management
381 MGNCRE | Reclamation and Remediation
Such locations as enlisted below show a greater likelihood of encountering hazardous wastes, and
hence, visits here must necessarily entail complete awareness regarding the on-going activities and
full regards to personnel safety.
• MSW dumping ground – dumping grounds in India still contain largely mixed-type waste,
and hence, there is high probability of encountering household hazardous waste and
sanitary waste items here. Informal rag-pickers who make their living by collecting dry
recyclables from dumpsites and selling them off are often exposed to this risk.
• Industrial areas – Well-demarcated industrial regions have been planned in India, where
industries of all categories have their manufacturing plants and offices. Such regions are
relatively further from human habitation and the rationale is to –
o reduce risk of exposure to pollutants (despite zero discharge claims, on-ground reality is
that fugitive emissions, spillage and accidental discharge do occur)
o ensure better crisis management
Major industrial regions in India are:
o Mumbai-Pune Industrial Region
o Hugli Industrial Region
o Bangalore-Tamil Nadu Industrial Region
o Gujarat Industrial Region
o Chhotanagpur Industrial Region
o Vishakhapatnam-Guntur Industrial Region
o Gurgaon-Delhi-Meerut Industrial Region
o Kolfam-Thiruvananthapuram Industrial Region
• Hazardous waste Treatment Storage and Disposal Facilities (TSDFs) – Such TSDFs are
mandatory in India for effective resource recovery and safe disposal of hazardous waste in
India. A list of these TSDFs, as per CPCB, has been provided in Table 1.2 below:

382 MGNCRE | E-Waste Management
382 MGNCRE | Reclamation and Remediation
Table 1.2: List of hazardous waste TSDFs in India
S. No. Nameofthe
State/UT
IntegratedTSDFs(wit
hbothSLFand
Incinerator)
TSDFswithOnlyC
ommonIncinerat
ors
TSDFswithonly
CommonSecuredLand
fills
1. AndhraPradesh 1 - -
2. Gujarat 4 2 3
3. Haryana I - -
4. HimachalPradesh - - 1
5. Jharkhand 1 - -
6. Karnataka - 6 2
7. Kerala - -
1
8. MadhyaPradesh 1
- -
9. Maharashtra 3 - 1
10 Odisha - -
1
11 Punjab - -
1
12 Rajasthan - 1 2
13 TamilNadu 1 - I
14 Telangana 1 - -
I5 UP 2 1 1
16 Uttarakhand 1 - -
17 WestBengal 1 -
-
18 Daman,Diu,Dadra&
NagarHaveli
1
- -
TOTAL
18
10
14
Source: http://cpcb.nic.in/uploads/Projects/Hadzardous-Waste/Common_TSDF.pdf
• Bio-medical waste incineration sites – CPCB has enlisted more than 120 common bio-
medical waste incineration facilities all over India, where such waste collected from the
smaller clinics, labs and healthcare institutes can be safely incinerated and disposed.
• E-Waste recycling centers –formal e-waste recycling centers, as discussed above, expose the
recyclers to several heavy metals and flame retardants, which can severely hamper human
health.
• Cement kilns co-processing waste – Ambuja cement kiln at Vapi, Gujarat co-processes the
waste from local paper mills. Similarly, ACC cement kiln near Madukkarai, Tamil Nadu uses

383 MGNCRE | E-Waste Management
383 MGNCRE | Reclamation and Remediation
unrecyclable plastic waste generated in the town as fuel. 52 more such cement kilns, which
co-process non-recyclable plastic or hazardous waste have been enlisted by CPCB.
• Illegal dumping of waste – Unfortunately, hazardous waste generation in India is much in
excess of the volume that can be treated in our current number of TSDFs. As a result, it is
inevitable that significant quantities of such waste are either dumped illegally or released
into the environment with little concern for human health and the environment.
To-do Activity: Make a hypothetical analysis of the quantity of E-waste that will be generated in
various sectors such as malls/ offices/ hospitals/ IT parks, etc. in coming five years considering
all the factors that leads to its generation. Also, based on the kind of E-waste generated
estimate its commercial value.
1.2 Safety Considerations
For hazardous waste -
Detailed awareness about the hazardous waste item being handled
• Material Safety Data Sheet - A Material Safety Data Sheet (MSDS) is a detailed dossier on
almost all chemicals, chemical compounds and chemical mixtures, containing relevant data
regarding the health hazards (health, fire, reactivity and environmental), first aid details,
storage & handling instructions, and combating protocol for accidental release and fire
hazards. MSDS is especially focused on reducing occupational hazards by giving detailed
insights to those working with the chemicals.
• Cross-reactivity
Engineering interventions to reduce risk
Ideally, engineering interventions should render a procedure safe enough to reduce the requirement
of personal protective equipment (PPE). Such interventions include –
o Design change
o Improved ventilation
o Mechanical handling
o Automation
However, in several cases, such interventions still leave space for human exposure to hazards.
Hence, the importance of PPEs cannot be denied.
Personal Protective Equipment (PPE)

384 MGNCRE | E-Waste Management
384 MGNCRE | Reclamation and Remediation
PPEs must essentially cover the intended body part fully, and be of a suitable material that will
withstand the hazard against which it is being worn. Other important aspects that would be of
import while selecting the appropriate PPE are –
• Comfort of the wearer
• Duration of wearing it
• Ease of cleaning and maintenance
• Meeting the country-specific or universally acclaimed quality assurance criteria
PPEs can be divided into two categories –
• Respiratory – PPEs preventing inhalation of air-borne hazardous elements
• Non-respiratory – PPEs preventing dermal contact and injury to the other parts of the body
Given below in Table 1.3 are some PPE designs –
Table 1.3: Personal Protective Equipment
Body Part Protected
PPE Comments
Head Helmet Depending on whether used for fire-fighting or general protection, the material used for the helmets will differ
Eye
Safety goggles
Aimed at protecting the eye and face from mechanical injury or radiation or chemicals; wearing contact lenses or hardened glass
lenses should never be considered a replacement for safety goggles
Safety spectacles
Safety clip-ons
Eye & Face Face-shields
Wire-mesh screen guard
Hand & Arm
Gloves Gloves should extend well beyond the wrist but have no flaring cuffs; when one is handling chemicals, gloves that extend up to the
elbow are preferable
Finger-stalls Where only finger-protection is necessary
Hand-pads Protect palms from excess heat
Foot & Leg
Safety-toe shoes
Foot guards
Conductive Shoes
Gum boots
Full body protection
Overalls Preventing spillage on the person
On several occasions, it has been observed that workmen tend to avoid wearing PPEs, finding them
cumbersome or complaining that it reduced their working efficiency. Raising awareness about the

385 MGNCRE | E-Waste Management
385 MGNCRE | Reclamation and Remediation
harms caused in the absence of PPEs and if possible, associating it with economic sanctions or
disciplinary action can help tackle this.
Understanding the procedure of final disposal of the hazardous chemical
The complete path traversed by the waste from collection and packaging to transport and final
disposal of hazardous waste must be managed by observing every precaution and following the
standard protocols. Awareness among the personnel about this is a must.
Handling emergency situations
Each personnel must be familiar with the crisis management protocol, use of fire extinguisher,
emergency contact numbers and gathering point and basic first aid. The onsite and offsite approach
to crisis management has been outlined in Table 1.4 below:
Table 1.4: A Comparison of Onsite and Offsite Approach of Crisis Management
Onsite Approach Offsite Approach
Emergency planning for combating accidents
where industrial activities are carried on
Emergency planning for the contingency when
impact of an on-site accident crosses the
boundary of the industrial site and impacts
other locations
Alarm system, followed by assemblage and
evacuation are critical
Alarm system/timely information relay to
prevent entries and hasten exits of individuals
Prepared by the local crisis group Prepared by the district crisis group
Calling for assistance from other agencies
First aid and medical assistance
For Biomedical waste
The World Health Organization lays stress on –
• Proper training to the healthcare workers so they understand the risk associated with the
type of waste they are handling – aspects for which they must be trained are –
o Identification of waste type based on color coding
o Packaging of waste to prevent spillage
o Personal hygiene
o Appropriate storage (prior to transportation)
o Appropriate transportation to the own or community bio-medical waste incineration
facility
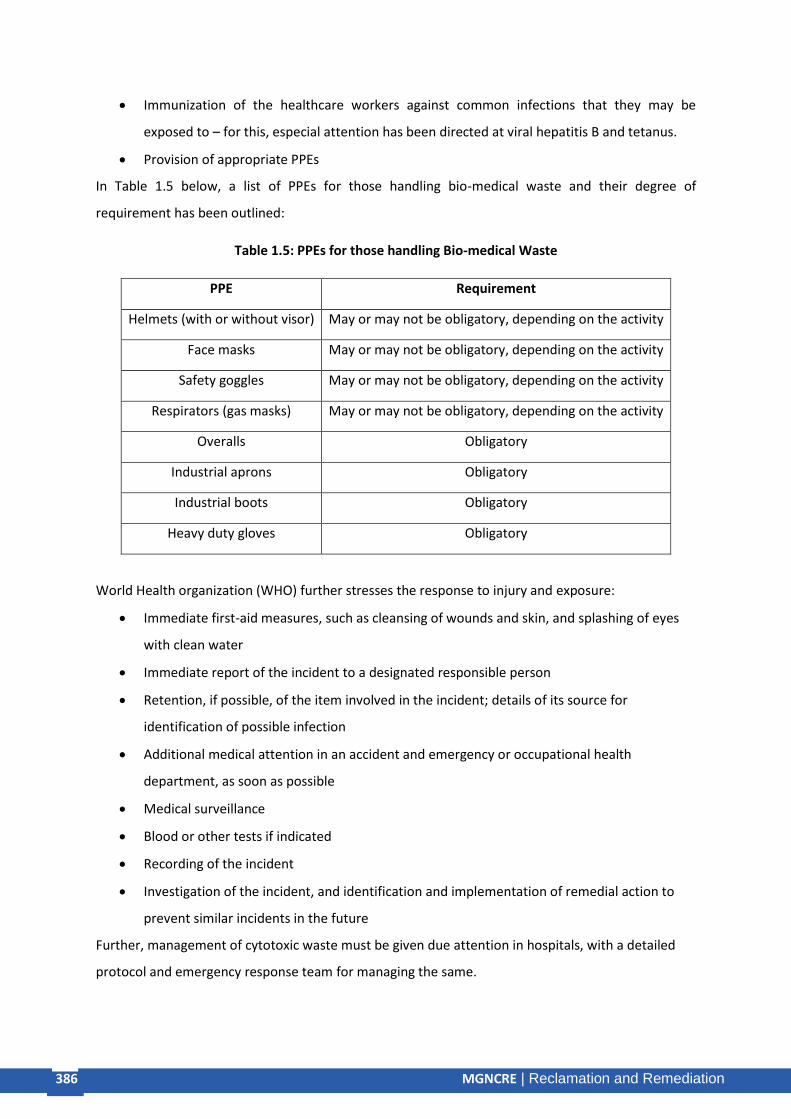
386 MGNCRE | E-Waste Management
386 MGNCRE | Reclamation and Remediation
• Immunization of the healthcare workers against common infections that they may be
exposed to – for this, especial attention has been directed at viral hepatitis B and tetanus.
• Provision of appropriate PPEs
In Table 1.5 below, a list of PPEs for those handling bio-medical waste and their degree of
requirement has been outlined:
Table 1.5: PPEs for those handling Bio-medical Waste
PPE Requirement
Helmets (with or without visor) May or may not be obligatory, depending on the activity
Face masks May or may not be obligatory, depending on the activity
Safety goggles May or may not be obligatory, depending on the activity
Respirators (gas masks) May or may not be obligatory, depending on the activity
Overalls Obligatory
Industrial aprons Obligatory
Industrial boots Obligatory
Heavy duty gloves Obligatory
World Health organization (WHO) further stresses the response to injury and exposure:
• Immediate first-aid measures, such as cleansing of wounds and skin, and splashing of eyes
with clean water
• Immediate report of the incident to a designated responsible person
• Retention, if possible, of the item involved in the incident; details of its source for
identification of possible infection
• Additional medical attention in an accident and emergency or occupational health
department, as soon as possible
• Medical surveillance
• Blood or other tests if indicated
• Recording of the incident
• Investigation of the incident, and identification and implementation of remedial action to
prevent similar incidents in the future
Further, management of cytotoxic waste must be given due attention in hospitals, with a detailed
protocol and emergency response team for managing the same.
387 MGNCRE | E-Waste Management
387 MGNCRE | Reclamation and Remediation
For household hazardous waste
Given the lack of awareness, household hazardous waste is often:
• Dumped with the other dry and wet waste
• Poured down the drain
• Carelessly disposed of on the ground
• Burnt
In all these cases, the risk of harm to the individual householder, formal or informal waste handler,
or even the general public and the environment increases. The most significant way of managing this
risk is –
Raising public awareness
Today, there is little awareness regarding the hazards associated with innocuous-appearing items of
our daily use. Raising public awareness about the same should be managed as a twin approach –
• On the part of the manufacturers of such items, warning should be given regarding careful
handling and safe disposal in large font size, if possible in the local language or at least with
the appropriate symbols so that the message is driven home to the user
• On the part of the local municipality/Panchayat, door-to-door awareness campaigns to the
effect must be planned and executed; it may be of interest to note here that under the
Swachh Bharat Abhiyan (2014-2019), municipalities were funded to organize massive
awareness drives regarding municipal solid waste segregation at source.
Setting up Collection centers
The Solid Waste Management Rules, 2016 mandate the setting up of such common Collection
Centers by the local municipality or Panchayat where information-rich householders can come and
deposit their domestic hazardous waste items.
Planning collective disposal to nearest TSDF
Finally, it is within the purview of the local municipality or Panchayat to co-ordinate with the nearest
hazardous waste TSDF and plan the transport of their collected household hazardous waste for safe
disposal or resource recovery. Understandably, there are much fewer than the required numbers of
TSDFs in the country so far. Hence, the Solid Waste Management Rules, 2016 direct the local
municipality/Panchayat to approach their State Pollution Control Board or Pollution Control
Committee for guidance.

388 MGNCRE | E-Waste Management
388 MGNCRE | Reclamation and Remediation
For Electronic waste
The safety concerns here are largely similar to those outlined above, with stress on –
• Maintaining basic protocols to ensure proper packaging, storage and transport
• Using sturdy work gloves/chemical-resistant disposable gloves, safety goggles, overalls,
boots, and a respirator if need be
For radioactive waste
Several considerations for handling radio-active waste are similar to those outlined above for
hazardous waste. However, the most significant concern in the case of radioactive waste is that of,
of course, penetrative radiation. PPEs to be worn by radioactive waste handlers must ward off
radiations such as the alpha, beta and gamma rays. The type of protection required to prevent
radiation exposure depends on the type of radiation – or more specifically, its penetrative ability.
The same has been outlined in Table 1.6 below:
Table 1.6: Protection against Radiation
Type of
Radiation
Nature Penetrative
ability
Can be stopped
by
PPE Comment
Alpha 2 protons,
2
neutrons
Range in air
about 10 cm
Normal clothing;
even a sheet of
paper can stop it
from penetrating
skin
Overalls; wounds
should be doubly
protected
Respirators
prevent
inhalation of
radioactive
rays
Beta A fast-
moving
electron
Range in air up
to 2 m; can
penetrate skin
up to 0.2-1.3
cm
Walls of a room,
1.3 cm thick
plastic and
aluminum sheet
can prevent it
from penetrating
skin
Protective plastic
suits
Gamma An
electro-
magnetic
radiation
Highly
penetrative;
Range in air up
to 1.6 km
13.8 feet of
water, 6.6 feet of
concrete, or 1.3
feet of lead
Gamma radiation
suit should match
the gamma rays
blocking ability of
13.8 feet of water,
6.6 feet of
concrete, or 1.3
feet of lead
To-Do Activity – Visit to your nearest cement kiln co-processing waste/common bio-medical
waste incineration facility/hazardous waste TSDFs and study hazards associated with further
making a MSDS for the same.

389 MGNCRE | E-Waste Management
389 MGNCRE | Reclamation and Remediation
1.3 Sampling & analysis protocols
The significance of sample planning
The first two aspects to be considered when one initiates the planning for any sampling exercise are
–
• The scientific purpose to be served through the sampling exercise – largely, whatever the
larger scientific aim, the sampling exercise is planned to help assess the physical and
chemical properties of the waste.
• The regulatory framework – the regulatory thresholds or ‘safe limits’ of nearly all types of
hazardous waste items have been enlisted by the MoEFCC.
Other aspects of planning include collection of basic secondary information (location, type of waste,
timing of operation etc.), appointment of well-trained manpower, planning the sampling locations
(apart from project-specific considerations, physical accessibility is important here), number of
samples, efficiently managed logistics (travel to and fro sampling site, time of sampling, sample
transport to laboratory), state-of-the-art equipment for sampling as well as analysis and finally, well-
established protocols. These aspects have been explained in the figure below:
Figure 1.2: Planning Considerations for a Typical Scientific Sampling Exercise
Fundamental statistical concepts
• Size of sample
• Number of samples (spatially, across the site)

390 MGNCRE | E-Waste Management
390 MGNCRE | Reclamation and Remediation
• Sampling frequency (temporally, across the timeline of the study)
Neither time nor budget can feasibly support the testing of 100% of a given population, in most
cases. The best approach is to collect a smaller-sized sub-population from the larger population as a
representative sample. A representative sample is one that accurately mirrors the larger population
and the central tendencies of the population are exhibited by the sample as well. Given the
heterogeneous nature of hazardous waste, the number of samples and frequency of sampling
should be sufficiently high, but volume or size of the sample should be low enough to make safe
transport feasible logistically. Finally, the statistical criteria on the basis of which project-specific
sample size, number and frequency will be determined are the pre-decided error percentage and
confidence level.
Considerations –
• Authoritative sampling or random sampling
As is clear from its name itself, in the case of authoritative sampling, the researcher purposely
selects sampling units based on his/her judgment. It is hence, also called as Judgmental or Purposive
sampling. On the other hand, in the case of random sampling, the probability that any one unit from
the population will be singled out and included in the representative sample is equal and no will is
exercised by the researcher in selecting a particular unit.
If sufficient data regarding the waste to be sampled is available with the researcher, it would make
sense to go for authoritative sampling. Clearly, it makes sense to take a judgment regarding the
sampling procedure only when sufficient information is available to base one’s judgment on.
Alternately, when insufficient information is available, it makes more sense to go for random
sampling.
• Grab sample or Composite sample
A Grab sample is a sample collected once within a given time-frame; it is collected in a short time-
span and hence, yields quicker results. In contrast, a composite sample is an amalgamation of
several discrete grab samples collected at a pre-determined frequency within a given time-frame.
For instance, once every two hours within a 24-hour period.
While a grab sample is simple, cost-effective and quicker, it may not yield a representative sample if
the population is heterogeneous, and the sampling frequency will have to be enhanced to ensure
statistically-credible sampling.
Sampling equipment used
The sampling equipment to be used will be decided on the following criteria –

391 MGNCRE | E-Waste Management
391 MGNCRE | Reclamation and Remediation
• Physical state of the hazardous waste (solid, liquid, semi-solid)
• Chemical nature of the hazardous waste (flammable, corrosive, reactive, toxic)
• How the hazardous waste has been stored (open pile, drum container, lagoon). Alternately,
how accessible the site is
Important considerations are:
• No contamination
• No sample loss
• No change in the physical or chemical characteristics or concentration of the sample in the
period between sample collection and sample analysis
On the above bases, following equipment have been described in Table 1.7 below:
Table 1.7: Sampling Equipment for Hazardous Waste
Sampling Device Suitable for Brief Description
Composite Liquid
Waste Sampler
(CoLiWaSa)
Liquid/slurry stored in shallow
pits, drums, shallow tanks etc.
Glass/plastic/metal can be used; it is a tube
with an end closure that can be
manipulated even while the sampler is
immersed in the liquid to be sampled
Weighted Bottle Liquid/slurry Glass/plastic bottle, sinker, and stopper
with a line used to lower, raise and open
the bottle
Dipper Liquid/slurry A glass/plastic beaker clamped to a
two/three-piece telescoping
aluminum/fiberglass pole that serves as a
handle
Thief Dry granules or powdered waste
(with particle diameter less than
one-third the width of slots)
Two slotted concentric tubes (of
brass/stainless steel); the conical, pointed
tip on the outer tube is rotated to open or
close the equipment
Trier Moist samples or sticky solids
(with particle diameter less than
half the diameter of the trier
tube); it can also be used for
loosening soil
It consists of a tube cut in half
longitudinally, with a sharpened tip
Auger Hard or packed solid waste or soil Sharpened spiral blades are attached to a
central metal shaft
Source: CPCB Manual on Hazardous Waste

392 MGNCRE | E-Waste Management
392 MGNCRE | Reclamation and Remediation
Figure 1.3: Hazardous waste sampling equipment (Weighted bottle, dipper, coliwasa, auger) Source: CPCB Manual on Hazardous Waste
Thus, to summarize in Table 1.8 below:
Table 1.8: Hazardous waste sampling equipment – suitability as per physical state of waste and container type
WasteType Drum Sacks & Bags
Open- Bed
Truck
Closed Bed
Truck
Storage Tanks/Bins
WastePiles
Ponds, Lagoons
&Pits
Convey-or
Pipe

393 MGNCRE | E-Waste Management
393 MGNCRE | Reclamation and Remediation
Free-flowingliquidsandslurrie
s
Coliwasa
N/A N/A Coliwasa
Weightedbottle
N/A Dipper N/A Dipper
Sludge Trier N/A Trier Trier Trier * * * *
Moistpowdersorgra
nules
Trier Trier Trier Trier Trier Trier Trier Shovel Dipper
Drypowdersorgranules
Thief Thief Thief Thief * Trier Thief Shovel Dipper
Sandorpackedpowdersandgran
ules
Auger Auger Auger Auger Thief Thief * Dipper Dipper
Large-grainedsolids
LargeTrier
LargeTrier
LargeTrier
Large Trier
LargeTrier
LargeTrier
LargeTrier Trier Dipper
Source: CPCB Manual on Hazardous Waste * May have to improvise based on actual site conditions; no specific suggestion can be given
Documentation of the chain of custody
It is the chronological documentation of paper trail, which is maintained to ensure the sequence of
collection, transport, processing, treatment and disposal of hazardous waste. It includes sample
seals, logbooks/notebooks and sample analysis request sheets.
A crucial aspect of chain of custody is sample labeling, which must be
• Legibly written or printed
• Gummed using adequate adhesive/tied securely
• Contain accurate description of the sample number, date, time & location of sample
collection, and finally, name of the personnel who did the collection
The logbook or notebook used by the sampling personnel during sample collection should be
further rich in information, including
• Purpose of sampling
• Number and volume of samples
• Details of sampling point location (as from the label, such information cannot be obtained
in much detail), including its brief description
• Name and contact details of the field contact
• Name and contact details of the waste producer
• Sampling and sample preservation methodology
• If possible, some details of the process producing the waste to be sampled
• Physical state of the waste

394 MGNCRE | E-Waste Management
394 MGNCRE | Reclamation and Remediation
• If possible, the estimated waste composition
• Sample number key (so that the sample number mentioned on the label can be further
correlated with other factors)
• General field observations (if anything worthy of note)
The logbook must also contain name and signature of the field
It must be understood that a field logbook/notebook is not a rough document – indeed, it has
immense value as being the first formal report of field conditions; the field logbook/notebook is
one of the first documents required during inspections – general as well as during exceptional
circumstances. Hence, every effort must be made to make legible organized notes, and preserve
the logbook/notebook for future reference.
A second document that needs to be prepared is a Sample Analysis Request Sheet, which the
sampling personnel fills to provide the laboratory personnel with necessary field information such
as sample description, sample identification and the requested analysis.
From the field, post collection, the sample should reach the laboratory for analysis. If the transport
of the sample is not being managed by the same personnel who did the sample collection, the next
link in the chain of custody becomes the personnel who will transport the waste to the laboratory.
Herein, there should be a formal sign-off after which the sampling personnel hands over the
sample analysis request sheet and the samples to the transporting personnel with properly
packaged samples, in spill-proof containers.
That the vehicle is well-maintained, is in good shape, and is driven by a well-trained personnel who
understands the importance of preventing cargo spillage, are basic considerations.
Handing over the samples and the sample analysis request sheet to the laboratory is the next link in
the chain of custody. Here, the necessary data that must go on record includes:
• Name and designation of the laboratory personnel receiving the sample
• Laboratory Sample Number
• Date and time of sample receipt
• Sample allocation
• Analyses to be conducted
1.4 Risk assessment of contaminated sites

395 MGNCRE | E-Waste Management
395 MGNCRE | Reclamation and Remediation
Risk assessment or hazard assessment is required to decide the extent of contaminant remediation
required for a particular site. It helps to arrive at a statistical quantification of the probability that a
hazardous or toxic spillage will harm human beings or the environment or both. It is the first step
towards risk management, as outputs obtained from the risk assessment exercise will be utilized as
inputs for the risk managing exercise.
Purpose of risk assessment
Determining the spatial and temporal extent of contaminant spread in a site is the main purpose of a
risk assessment exercise. For spatial extent, one attempts to ascertain the area and depth-wise
extent of the contaminant spread. For temporal extent, it is required to estimate the current impact
as well as the probability of spread of the contaminant in the future and its future impact on the
receptors. The risk assessment exercise can be classified into four phases:
Figure 1.4: Phases of risk assessment
Essential queries raised during the phases of a risk assessment exercise are:
• What is the concentration (load/dosage) and spatial distribution of harmful pollutants under
consideration?
• Wherefrom did the contaminants reach the site in question?
• What is the physical and chemical nature of the contaminants?
• What is the spatial and depth-wise extent of contamination?
• Are the contaminants stationery or movable?
• If they are movable, what route will they take (air, water, soil)?
• If they are movable, then can pathways be designed to mobilize them away from the site?
• Can the potential receptors (i.e., human beings?Bird? Fish?Mushroom?) of contaminants be
identified?

396 MGNCRE | E-Waste Management
396 MGNCRE | Reclamation and Remediation
• Do tolerance limits exist for the potential receptors with respect to the contaminant in
question?
Based on the above queries, risk assessment exercise arrives at the pathway that a contaminant
from the site will follow to reach a potential receptor. This has been described in Figure 1.5 below:
Figure 1.5: Pathway of Risk Assessment
Based on all the above considerations, a final list and flow-chart of actual activities to be conducted
for risk assessment of a contaminated site has been provided below:
• After getting intimation of site contamination, the first step of action will be to collate all
possible information available
o Through personal conversation or interview sessions with concerned personnel
(owner of the site, local authorities, local residents)
o Through a quick desk review
• Based on the secondary data so collated, the first site visit is planned
• Logistical considerations to be taken are:
o Putting together an experienced team
o Travel to and from the site
o Safety precautions and PPEs
o Sample collection equipment

397 MGNCRE | E-Waste Management
397 MGNCRE | Reclamation and Remediation
• Once at the site, after observing the basic site conditions, the next step would be sample
collection and analysis. This would entail planning as to:
o Number and volume of samples
o Sampling locations
o Sampling procedure
o Chain of custody
• Laboratory analysis
• Processing of results
o Identifying the chemicals and their concentrations
o Identifying their associated hazards (toxicity /corrosiveness /flammability /reactivity)
o Identifying the receptors on which they will act
o Ascertaining the tolerance limits of the receptors
• Modeling studies for forecasting future impacts
• Finalizing the remediation procedure
Figure 1.6: Schematic overview of risk assessment

398 MGNCRE | E-Waste Management
398 MGNCRE | Reclamation and Remediation
1.5 Policy framework
Hazardous and other wastes (Management and transboundary movement) rules, 2016
“Waste” means materials that are not products or by-products, for which the generator has no
further use for the purposes of production, transformation or consumption. “Hazardous waste”
means any waste which by reason of characteristics such as physical, chemical, biological, reactive,
toxic, flammable, explosive or corrosive, causes danger or is likely to cause danger to health or
environment, whether alone or in contact with other wastes or substances.
The responsible agency is the concerned State Pollution Board or the Pollution Control Committees,
along with the State Environment Department. It caters to both solid, semi-solid and liquid
hazardous wastes.
There is stress on resource recovery, whether through reuse and recycling of other wastes or
through energy recovery from co-processing. There are about 1080 registered hazardous waste
recyclers in India; 54 cement plants have been permitted for co-processing; also, about 108
industries are permitted for utilization of hazardous waste. In addition, there are 18 hazardous
waste Treatment, Storage and Disposal Facilities (TSDFs), as highlighted in Table 1.2.
Figure 1.7: Hazardous waste management hierarchy
Import-export of hazardous waste - The Basel Convention, which is an international treaty aimed at
regulating and reducing the transfer of hazardous waste from developed to developing countries,
was ratified by India in 1992. The import and export of hazardous waste in India is governed by the
Hazardous and Other Wastes (Management and Transboundary Movement) Rules, 2016, keeping
into consideration the tenets of the Basel Convention. The Convention was opened for signature on
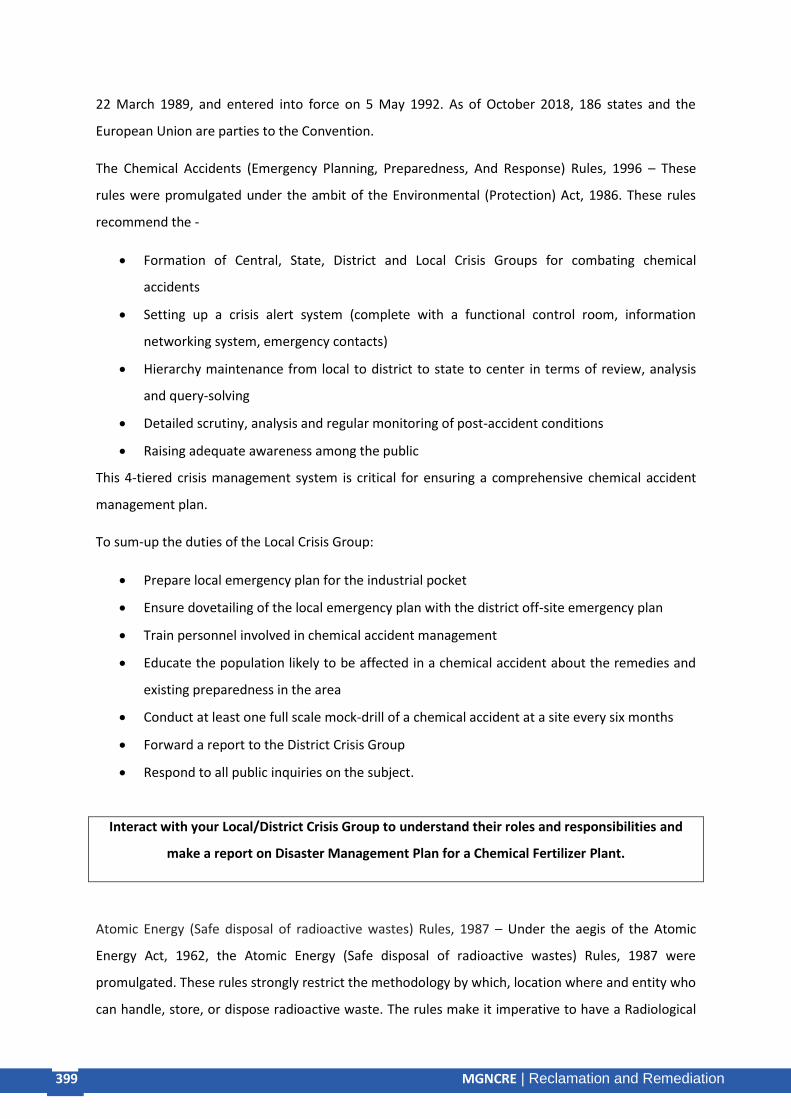
399 MGNCRE | E-Waste Management
399 MGNCRE | Reclamation and Remediation
22 March 1989, and entered into force on 5 May 1992. As of October 2018, 186 states and the
European Union are parties to the Convention.
The Chemical Accidents (Emergency Planning, Preparedness, And Response) Rules, 1996 – These
rules were promulgated under the ambit of the Environmental (Protection) Act, 1986. These rules
recommend the -
• Formation of Central, State, District and Local Crisis Groups for combating chemical
accidents
• Setting up a crisis alert system (complete with a functional control room, information
networking system, emergency contacts)
• Hierarchy maintenance from local to district to state to center in terms of review, analysis
and query-solving
• Detailed scrutiny, analysis and regular monitoring of post-accident conditions
• Raising adequate awareness among the public
This 4-tiered crisis management system is critical for ensuring a comprehensive chemical accident
management plan.
To sum-up the duties of the Local Crisis Group:
• Prepare local emergency plan for the industrial pocket
• Ensure dovetailing of the local emergency plan with the district off-site emergency plan
• Train personnel involved in chemical accident management
• Educate the population likely to be affected in a chemical accident about the remedies and
existing preparedness in the area
• Conduct at least one full scale mock-drill of a chemical accident at a site every six months
• Forward a report to the District Crisis Group
• Respond to all public inquiries on the subject.
Interact with your Local/District Crisis Group to understand their roles and responsibilities and
make a report on Disaster Management Plan for a Chemical Fertilizer Plant.
Atomic Energy (Safe disposal of radioactive wastes) Rules, 1987 – Under the aegis of the Atomic
Energy Act, 1962, the Atomic Energy (Safe disposal of radioactive wastes) Rules, 1987 were
promulgated. These rules strongly restrict the methodology by which, location where and entity who
can handle, store, or dispose radioactive waste. The rules make it imperative to have a Radiological

400 MGNCRE | E-Waste Management
400 MGNCRE | Reclamation and Remediation
Safety Officer to oversee the radioactive waste management and disposal process. The Atomic
Energy Regulatory Board (AERB) is empowered to undertake specific actions to ensure that the
provisions of rules falling within the ambit of the Atomic Energy Act, 1962 are met, with the ultimate
aim of ensuring radiological and industrial safety.
The disposal method outlined by these rules includes:
• Burial into pits
• Incineration
The burial of radioactive waste should be in isolated spots that have been adequately fenced off to
prevent intrusion. Geological, topographical and environmental factors of the site need to be taken
into consideration. Adequate record-maintenance is crucial. Other specific instructions include:
• When more than one radio nuclides is present in the solid waste, the sum of the ratios of the
individual quantities of each of the radioisotopes present and their respective maximum
quantities allowed have been outlined in the text of the Act.
• The depth of the burial pit must be so that at least 120 cm thick compacted earth may be
laid over and above it for closure
• A distance of at least 180 cm is maintained between consecutive pits
• 12 burials per year has been set as the limit
• At least 10 half-lives of the radioactive waste component with the highest half-life need to
have elapsed, before the pit can be opened for reuse
• The burial site must be subjected to regular checking by the Radiological Safety Officer
• The material excavated from a closed pit is released for normal disposal, under the
supervision of the Radiological Safety Officer before reusing the pit (after 10 half-lives have
elapsed)
Another possible option is the incineration of the radioactive waste, though critical care should be
taken to ensure that:
• The incinerator is in working condition and well-maintained
• There is no possibility of release of radioactive nuclei in the air
• Adequate environmental monitoring, and scrupulous record-keeping are being conducted
Bio-Medical Wastes (Management and Handling) Rules, 2016 – These rules aim at streamlined
segregation, collection, processing and safe disposal of waste generated from hospitals, clinics,
pathology labs, research labs, veterinary hospitals, blood banks, various health camps etc. The

401 MGNCRE | E-Waste Management
401 MGNCRE | Reclamation and Remediation
monitoring agencies, in addition to the State Pollution Control Boards/Pollution Control Committees
and Central Pollution Board, following are the prescribed authorities –
• The Ministry of Environment, Forestry & Climate Change
• Ministry of Environment, Forest and Climate Change
• Central or State Ministry of Health and Family Welfare
• Central Ministry for Animal Husbandry and Veterinary or State Department of Animal
Husbandry and Veterinary
• Ministry of Defense
• Central Pollution Control Board
• State Government of Health or Union Territory Government or Administration
• Municipalities or Corporations, Urban Local Bodies and Gram Panchayats.
Color-coding of bio-medical wastes and their treatment/disposal options have been outlined in Table
1.9 below:
Table 1.9: Color-coding of bio-medical wastes and their treatment/disposal options
Color-code Waste Fate
Yellow
Human anatomical
waste
Incineration/plasma pyrolysis or deep burial in sanitary landfill
Animal anatomical
waste
Soiled waste (dressing
& bandages, cotton
swabs etc.)
Incineration/plasma pyrolysis or deep burial in sanitary landfill; if
above options not possible, these waste items can be sterilized
and shredded and preferably sent for energy recovery
Discarded/expired
medicines
To be returned to manufacturer, or incinerated at ≥ 1200°C;
alternately, waste may be encapsulated and transported to a
common bio-medical waste or hazardous waste treatment facility
Chemical waste Incinerated at ≥ 1200°C; alternately, waste may be encapsulated
and transported to a common bio-medical waste or hazardous
waste treatment facility
Chemical liquid waste
Discarded linen,
mattresses
contaminated with
blood/body fluids
Non-chlorinated disinfection followed by incineration/plasma
pyrolysis; if above options not possible, these waste items can be
sterilized and shredded and preferably sent for energy recovery
Microbiology,
biotechnology and
clinical lab waste
Non-chlorinated disinfection (as per World Health Organization or
National AIDS Control Organization guidelines) followed by
incineration
Red Contaminated waste
(recyclable)
Sterilization, followed by shredding; plastic bio-medical waste
should not be sent to landfill; instead effort should be made to
recycle it (by SPCB/PCC-recognized recyclers) or used in fuel
generation or plastic road-making
White Sharps Sterilization, followed by shredding and encapsulation; final

402 MGNCRE | E-Waste Management
402 MGNCRE | Reclamation and Remediation
(Translucent) disposal in SPCB/PCC-recognized iron foundries or sanitary
landfills or concrete pits
Blue Glassware (except
those contaminated
with cytotoxic waste)
Detergent wash and hypochlorite treatment followed by
sterilization; it may then be sent for recycling
Metal implants
Source: Kharat (2016)
The Biomedical Wastes (Management and Handling) Rules, 2016 set revised emission criteria to be
met by the treatment facilities.
Importantly, hazardous micro-organisms and genetically engineered micro-organisms do not fall
within the purview of these rules.
To-Do Activity – Visit a bio-medical waste handling facility nearby and understand its operation;
N.B. National Accreditation Board for Hospitals & Healthcare (NABH)-accredited hospitals are
likely to have bio-medical waste management facilities
The E-Waste (Management) Rules, 2016 – Under the aegis of the Environmental (Protection) Act,
1986, the E-Waste (Management) Rules, 2016 were promulgated to target manufacturers,
consumers, dealers, dismantlers, collection-center managers etc. of e-waste (laptop, cellular phones,
electrical & electronic equipment). The rules aim at enabling recovery and/or reuse of useful
material from e-waste, thereby reducing the hazardous wastes destined for disposal, to ensure the
environmentally sound management of all types of e-waste and to address the safe and
environment-friendly handling, transport, storage, and recycling of e-waste. The concept of
Extended Producer Responsibility (EPR) was introduced through these rules, which made
manufacturers liable for safe disposal of electronic goods. Occupational safety and health aspects of
the workers engaged in recycling will be monitored annually by the Department of Labor in the State
or any other State Government-authorized government agency.
The Batteries (Management & Handling) Rules, 2001 – these rules aim at regulated collection,
proper channelization and recycling of used lead acid batteries; the import of such batteries within
India are also within the ambit of these rules. While these rules make it mandatory for consumers to
return the used batteries (and not dispose them of mixed with their other waste items), it is the
responsibility of the manufacturers/assemblers/re-conditioners/importers to collect the same. The
final fate of these batteries is their recycling by MoEFCC-registered recyclers.
To outline the responsibilities of the manufacturers/assemblers/re-conditioners/importers:

403 MGNCRE | E-Waste Management
403 MGNCRE | Reclamation and Remediation
• ensure that the used batteries are collected back as per the Schedule against new batteries
sold excluding those sold to original equipment manufacturer and bulk consumer(s)
• warrant that used batteries collected are of similar type and specifications as compared to
the new batteries sold
• file six monthly return of sales and buy-back (in June and December)
• encourage collection of used batteries by setting up collection centers individually or in
consortium
• see to it that the next lap of journey – from collection center to the recycler – is also made
with every pre-caution for safety
• make sure the all possible pre-cautions have been taken to ensure safe transport
• ensure all possible means of creating awareness among the general public, using social
interaction tools such as poster/banners/pamphlets etc. regarding
o potential health issues caused by lead
o the fact that it is the solemn duty of each consumer to ensure that their spent lead
batteries are deposited with listed dealers or collection centers
o addresses of dealers and designated collection centers
• the international recycling sign must be imprinted on the batteries
• purchase of recycled lead must be made only from listed recyclers
• ensure that violations by the dealer, if any, are notified to the MoEFCC or State Board, as
relevant
It is the CPCB that scrutinizes and registers potential importers of battery scrap in India.
Solid Waste Management Rules, 2016 - As per these rules, the local government (municipality or
panchayat) is instructed to “establish waste deposition centers for domestic hazardous waste”
wherein the waste generator, having been suitably sensitized to segregate items such as paint cans,
expired medicines etc. is required to deposit the hazardous waste generated in his/her household.
Finally, the local government is required to arrange the transport of this waste to the closest
hazardous waste disposal facility.
Summary:
Thus, to summarize, it is necessary for anyone working in the field of waste management to
understand the nature of hazards associated with different waste types – from the
innocuous municipal solid waste and electronic waste to the radioactive/ nuclear waste and
chemical waste of well-established hazard.

404 MGNCRE | E-Waste Management
404 MGNCRE | Reclamation and Remediation
Hazardous wastes are supposed to be adequately labeled to clarify the hazards associated
with them, but under dire situations, recognition of the hazardous item must depend on the
physical features of the waste item, or its impact on other biological receptors.
Staying alert and understanding the use of safety equipment is key to one’s well-being when
working under high-risk situations. The individual must acquire adequate information about
the features of PPE, and ensure wearing the same.
Risk assessment is a standard protocol for evaluating the risk associated with accidental
spillage or other mishaps. Understanding the tenets of a risk management exercise will help
a waste management professional stay prepared for contingencies.
Lastly, a very thorough set of rules and regulations provide a policy framework for managing
different types of wastes in the Indian context. These rules cover even the minutest aspects
of managing harmful wastes emerging from different sources. This policy framework will
guide waste management professionals in the right direction.
To conclude, it is anticipated that the risks associated with various types of waste are amply
clear for each aspirant who wishes to foray into the field of waste management. These risks
need to be understood clearly, assessed rationally, and converted to opportunity.
Model Questions:
Q1. Prepare a business case for used lead acid battery scrap import in India and its
subsequent sale to recyclers. Would it be more profitable to collect battery scrap from
individual user households in a given Indian city? Compare and analyze.
Q2. Give the details of potential hazards from handling e-waste. Can a sustainable, worker-
friendly business model be prepared for profitable e-waste recycling?
Q3. How would you go about planning a sampling exercise for a distant mountain stream
where liquid hazardous waste was illegally dumped?
Q4. Plan a hard-hitting awareness raising campaign for household hazardous waste
management.
Q5. Analyze where in India would be a likely location for setting up a hazardous waste TSDF,
with the aim of maximizing your profit.
405 MGNCRE | E-Waste Management
405 MGNCRE | Reclamation and Remediation
Reading material: United States Environmental Protection Agency
(2002),https://www.epa.gov/sites/production/files/2015-10/documents/rwsdtg_0.pdf,
August 2002
http://dae.nic.in/?q=node/145
The martin Company
(2009),http://www.northeastern.edu/wanunu/WebsiteMSDSandSOPs/MSDS/Msds_Sulfuric
_Acid.pdf, August 2009
Bureau of India Standards for different types of PPEs
References (Alphabetical Order)
1. Atomic Energy Regulatory Board (2004). AERB SAFETY GUIDELINES- Personnel Protective
Equipment
2. Central Pollution Control Board (2016),
http://cpcb.nic.in/uploads/hwmd/CBWTF_Status_2016.pdf
3. Central Pollution Control Board
(2016),http://cpcb.nic.in/displaypdf.php?id=aHdtZC8xOS5wZGY=, August 2016
4. Central Pollution Control Board (2017),http://cpcb.nic.in/uploads/plasticwaste/Co-
processing_Guidelines_Final_23.05.17.pdf , May 2017
5. Devi, Kuruva&Oggu, Sujana& Singh, T.Charan. (2018). Hazardous Waste Management in India - A Review.
6. Kharat, Dr. D.S. (2016). Biomedical Waste Management Rules, 2016: A review. International
of advanced Research and Development,1, 48-51.
7. World health
Organisation:https://www.who.int/water_sanitation_health/medicalwaste/140to144.pdf?u
a=1

406 MGNCRE | E-Waste Management
406 MGNCRE | Reclamation and Remediation
Chapter 2 Waste Management Technologies
Introduction Waste is anything that has ceased to have utility or value. However, to all intents and
purposes, this definition does not apply to most of the items we daily discard in our bins or
flush out. Most of the waste items have the potential to be used as a resource – either as
raw material for other products or as a source of energy.
Also, while it is true that most waste items are potential resources, it is possible that some
risk of injury /infection/ other harm or environmental damage is associated with them.
Hence, waste management acquires a two-fold process –
• Resource recovery from the waste items
• Safe disposal
These twin purposes can be solved with the aid of technology.
While the hazards associated with waste have been described in the previous Chapter, the
second Chapter focuses on the purpose of resource recovery.
Both conventional as well as new, upcoming technologies for solid and liquid waste
management have been described in this Chapter. While conventional technologies are
well-established and their performance criteria researched and documented for different
field conditions, the newer technologies need to establish their credibility, one case study at
a time. It is important to understand the applicability of conventional as well as newer
technologies – while the former have to be applied to situations where experimentation
cannot be brooked, the latter, with their lower environmental footprint, need to be
established and researched under field conditions.
One non-technical factor that can be often ignored during technical discussions pertaining
to waste management is the socio-cultural aspect – in the present Chapter, the socio-
cultural attitude towards waste management has been included.
Objectives Based on the above background, objectives of this Chapter may be enlisted as:
• Understanding the features of different types of waste items
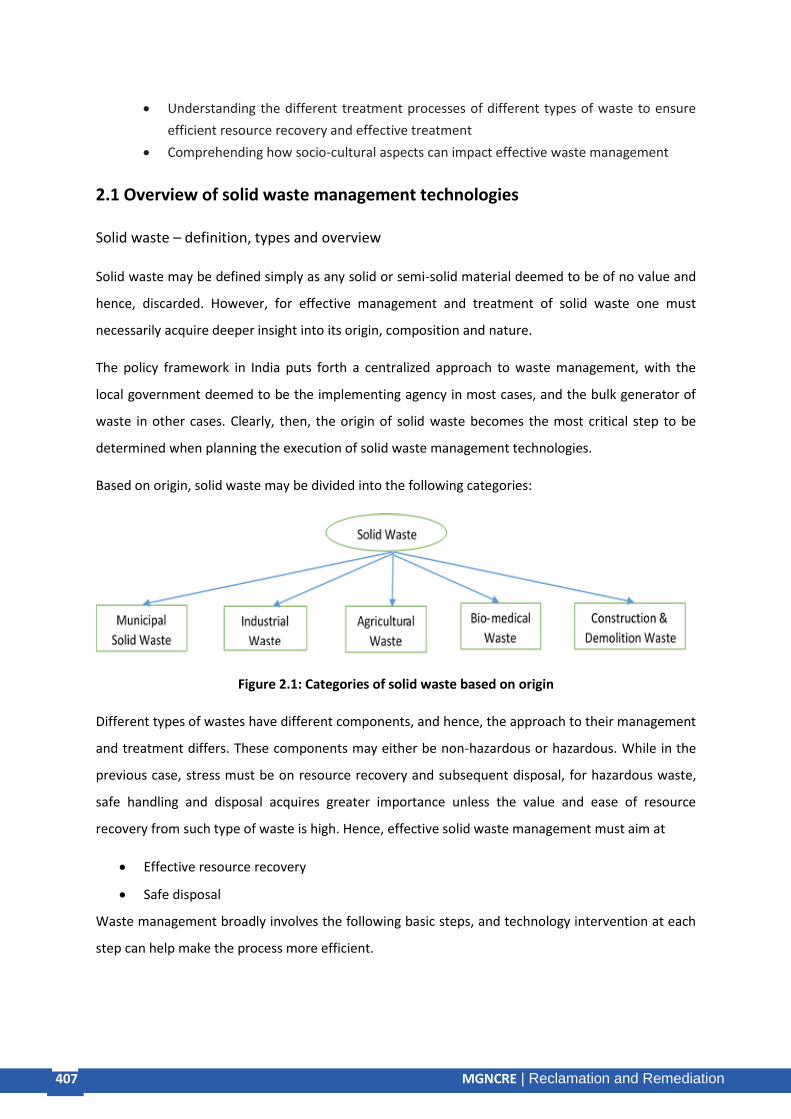
407 MGNCRE | E-Waste Management
407 MGNCRE | Reclamation and Remediation
• Understanding the different treatment processes of different types of waste to ensure
efficient resource recovery and effective treatment
• Comprehending how socio-cultural aspects can impact effective waste management
2.1 Overview of solid waste management technologies
Solid waste – definition, types and overview
Solid waste may be defined simply as any solid or semi-solid material deemed to be of no value and
hence, discarded. However, for effective management and treatment of solid waste one must
necessarily acquire deeper insight into its origin, composition and nature.
The policy framework in India puts forth a centralized approach to waste management, with the
local government deemed to be the implementing agency in most cases, and the bulk generator of
waste in other cases. Clearly, then, the origin of solid waste becomes the most critical step to be
determined when planning the execution of solid waste management technologies.
Based on origin, solid waste may be divided into the following categories:
Figure 2.1: Categories of solid waste based on origin
Different types of wastes have different components, and hence, the approach to their management
and treatment differs. These components may either be non-hazardous or hazardous. While in the
previous case, stress must be on resource recovery and subsequent disposal, for hazardous waste,
safe handling and disposal acquires greater importance unless the value and ease of resource
recovery from such type of waste is high. Hence, effective solid waste management must aim at
• Effective resource recovery
• Safe disposal
Waste management broadly involves the following basic steps, and technology intervention at each
step can help make the process more efficient.

408 MGNCRE | E-Waste Management
408 MGNCRE | Reclamation and Remediation
Figure 2.2: Overview of ideal solid waste management process
In Table 2.1 below, the composition of different waste types has been delineated:
Table 2.1: Components of different waste types with treatment approaches
Type of Waste Composition Nature Treatment
Municipal Solid Waste (MSW)
Kitchen/Wet Waste (leftover food, vegetable/fruit peels, used tea leaves etc.)
Organic, non-hazardous
Composting/Bio-methanation
Dry Waste (plastic/paper wrappings, newspaper, aluminum foils etc.)
Inorganic, non-hazardous
Reuse/Recycle
Household Hazardous Waste (batteries, used spray cans of pesticides/paint, spent medicines,
Inorganic, hazardous
Safe Disposal; Recycle
Sanitary Waste (soiled sanitary pads, baby diapers)
Organic, inorganic, hazardous
Incineration
Electronic Waste (laptops, mobile phones etc.)
Inorganic, hazardous
Safe Disposal; Recycle
Industrial Solid Waste
Hazardous Waste (Chemical sludge, Organic, inorganic, hazardous
Incineration/Secure landfill
Kitchen/Wet Waste Organic, non-hazardous
Composting/Bio-methanation
Agricultural Waste
Straw & chaff, animal fecal matter Organic, non-hazardous
Composting/Safe Incineration
Bio-medical Waste
Blood & tissues, bandage & dressings, used needles, sharps, discarded microbial cultures etc.
Organic, inorganic, hazardous
Incineration/Secure landfill
Construction & Demolition Waste
Concrete, bricks, wood, roofing, tiles, etc.
Inorganic, non-hazardous
Reuse/Recycle
Technology to aid resource recovery
Depending upon the nature of waste, the resource recovery technology differs, and can broadly be
categorized as –
• Composting – organic waste can be composted, i.e., broken down into a nutrient-rich
product that can be used as a fertilizer or soil conditioner. Significant parameters that can
impact the time taken and quality of compost produced are - carbon: nitrogen ratio, particle

409 MGNCRE | E-Waste Management
409 MGNCRE | Reclamation and Remediation
size, moisture content and aeration. Several technologies are available for composting, some
of which have been briefly described below –
o Natural aerobic composting – organic waste is collected in a pit and churned
manually once or twice a day; in about 30-45 days, the waste has been naturally
converted into compost. In densely populated urban areas where it is not possible to
dig such pits, composting bins of any locally suitable material (stainless
steel/brick/wood/PVC mesh) can be used. For indoor use, tumblers (to aid manual
churning) or composting kits with commercially available bacterial cultures to aid
composting can be used.
o Waste composting machines – operating on electricity, these are compact and may
be automated or semi-automated. Organic waste is fed into the machine wherein it
is crushed into bits and churned, inoculated with a bio-culture and provided the
optimum temperature and oxygen levels for composting.
o Vermicomposting – this process involves earthworms (Eisenia foetida,
Eudriluseugeniae and Perionyx excavatus) to help digest the organic waste,
producing castings that can be used as manure.
o Windrow composting – organic waste is spread out into piles and mechanically or
manually churned.
Figure 2.3: a) Composting pit b) Tumbler c) Waste composting machines d) Vermicomposting e)
Windrow composting
• Bio-methanation – This technology involves the anaerobic conversion of organic waste by
micro-organisms into methane gas and a nutrient-rich slurry. Three types of bacteria, i.e.,
fermenting bacteria, organic acid oxidizing bacteria and methanogenic archaea are involved

410 MGNCRE | E-Waste Management
410 MGNCRE | Reclamation and Remediation
in the complete process leading to a cascade of reactions. While the methane gas can be
used for combustion, the slurry is nutrient-rich and can be utilized as field manure. This
model has a potential to generate energy and reduce the load on fossil fuel.
Figure 2.4: Overview of a bio-methanation unit
• Reuse, recycling & upcycling
o Reusing an article after minor repair (if required) is the simplest and most nature-
friendly way of inorganic, non-hazardous waste management. For instance, cleaning
up of glass bottles, strengthened cardboard boxes, wooden crates, metal cans etc.
C&D waste can also be reused as the base material for making roads, as landscape
features, as land-filling material for quarry reclamation etc.
o Pandey and Sharma (2015) indicates that recycling involves processing of the item,
breaking it down into its constituents, and then using these constituents to yield
another product. For instance, some types of plastics can be broken down into
pellets and, these pellets can be further used to manufacture items like toys,
baskets, umbrella handles etc. Likewise, glass can be melted and re-molded. Wood
can be refashioned into smaller wooden articles and metals can be melted and
made into bars for further use.
• Incineration – Incineration should not be confused with open burning, wherein neither the
temperature nor the escape of dangerous flue gases can be controlled and the ash and heat
generated may or may not be utilized. Incineration can be one of the best treatments for
Municipal as well as industrial solid waste in big urbanized cities, as it reduces the quantity
and volume of waste that has to be landfilled. Clearly then, incineration technologies aim at
–
o Temperature control to ensure complete destruction of the type of waste item being
destroyed

411 MGNCRE | E-Waste Management
411 MGNCRE | Reclamation and Remediation
o Stripping of the flue gases of particulate matter and gaseous pollutants
o Reuse of ash as a resource
o Heat recovery
Figure 2.5: Overview of the incineration technology
Bio-medical waste that can be infectious or otherwise harmful to the environment needs to be safely
incinerated. Also, several recyclable items that have already undergone 2-3 cycles of recycling
cannot be recycled anymore and need to be incinerated. In addition, there are certain waste items
that can in principle be recycled but the process is too time or labor-consuming; for such items, the
most ideal fate is to be incinerated. For instance, multi-layer packaging material used in wrapping
chips, biscuits etc.
Landfilling – Secure landfilling to ensure reduced leachate and non-contamination of groundwater
can be the only solution in some cases. For instance, biomedical waste and multi-layer packaging
material in remote villages where safe incinerators or transport of such wastes to the nearest
incinerator are both too expensive options, secure landfill is feasible. A secure landfill must
essentially have the following components –
o A liner system composed of thick clay or geotextile membrane to prevent leachate intrusion into
groundwater
o A leachate collection and treatment system
o Gas recovery pipes
o Capping system

412 MGNCRE | E-Waste Management
412 MGNCRE | Reclamation and Remediation
Figure 2.6: Secure landfill design
Hence, to summarize:
• Organic, non-hazardous waste such as kitchen waste can be converted to manure or bio-gas.
Agricultural waste such as straw etc. which are low in moisture content can be converted to
briquettes and used as fuel; livestock manure can be converted to biogas
• Inorganic, non-hazardous waste can either be reused, recycled or incinerated to yield energy
• Organic/Inorganic, hazardous waste from which no resource recovery is possible should
either be incinerated or buried into septic landfills
• Inorganic, hazardous waste from which resource recovery is possible should only be handled
and processed taking all possible safety precautions
Figure 2.7: Overview of waste management technologies
To-do-activity: Make a team and visit a nearest waste management facility and prepare a Solid
and Liquid Waste Management Plan for your college. (Note: The plan should highlight type and
quantity of waste generated, sources, ideas for optimum utilization of waste and its further
management).

413 MGNCRE | E-Waste Management
413 MGNCRE | Reclamation and Remediation
2.2 Overview of Liquid Waste Management Technologies
Wastewater is largely of domestic or industrial origin.
Stages of conventional wastewater management
Sewage Treatment Plant has three treatment stages: Primary, Secondary and Tertiary.
Pre-treatment: Large solids (i.e. those with a diameter of more than 2cm) and grit (heavy solids) are
removed by screening. These are disposed of in landfills.
Primary treatment: The water is left to stand so that solids can sink to the bottom and oil and grease
can rise to the surface. The solids are scraped off the bottom and the scum is washed off with water
jets. These two substances are combined to form sludge.
Secondary treatment: The sludge is further treated in 'sludge digesters': large heated tanks in which
its chemical decomposition is catalyzed by microorganisms. The sludge is largely converted to
'biogas', a mixture of CH4 and CO2, which is used to generate electricity for the plant. The liquid is
treated by bacteria which break down the organic matter remaining in solution. It is then sent to
oxidation ponds where heterotrophic bacteria continue the breakdown of the organics and solar UV
light destroys the harmful bacteria.
Figure 2.8 Schematic of a typical sewage treatment plant

414 MGNCRE | E-Waste Management
414 MGNCRE | Reclamation and Remediation
Stand-alone technologies
Moving bed bioreactor (MBBR) technology combines the benefits of both activated sludge process
and the fixed film process. It is a continuous flow process that uses media carrier, which yields the
site for attachment of active bacteria in a suspended medium which can be used for wastewater
treatment.The MBBR process uses carrier elements (plastic carriers, PVA Gel beads) to provide sites
for bacteria attachment in a suspended growth medium. The carrier elements allow a higher
biomass concentration to be maintained in the reactor compared to a suspended growth process,
such as activated sludge. The biomass grows on small carrier elements that move along with the
water in the reactor. The movement is caused by aeration in the aerobic version of the reactor and
by a mechanical stirrer in the anoxic/anaerobic version.
Advantages of MBBR
• Compact units with small size.
• Increased treatment capacity.
• Complete solids removal.
• Improved settling characteristics.
• Operation at higher suspended biomass.
• Concentrations resulting in long sludge retention times.
• Enhanced process stability.
• Low head loss.
• No filter channeling.
• No need of periodic backwashing.
• Reduced sludge production.
• Low maintenance compared to other sophisticated technologies.
Disadvantages of MBBR
• Problems due to long start-up times due to bio layer formation on the carrier.
• Difficulties due to control of bio layer thickness.
• High energy consumption due to very high liquid recirculation ratio.
• High investment cost for liquid distribution to obtain uniform fluidization, especially in a
large scale plant.
• The quality of plastic of media varies.
• The verification of whether the media is moving about the entire volume of the tank or
merely clumping at the top layers and if so the method of mixing it up through the tank

415 MGNCRE | E-Waste Management
415 MGNCRE | Reclamation and Remediation
volume without shearing of the biomass on it are issues of infirmity and which may need
gentle movers of the media through the volume of the tank.
• Furthermore, the media is a patented product.
• Higher energy input
Activated sludge process: In activated sludge process, wastewater containing organic matter is
aerated in an aeration basin in which micro-organisms metabolize the suspended and soluble
organic matter. Part of organic matter is synthesized into new cells and part is oxidized to CO2 and
water to derive energy. In activated sludge systems the new cells formed in the reaction are
removed from the liquid stream in the form of a flocculent sludge in settling tanks. A part of this
settled biomass, described as activated sludge is returned to the aeration tank and the remaining
forms waste or excess sludge.
Advantages of ASP
• Capable of removing 97% of suspended solids
• Biological nitrification without adding chemicals
• Oxidation and nitration achieved
• Biological phosphorous removal
• Solids and liquids separation
• Removes organics
• Cost effective
• Easily maintained mechanical work
• Self-sustaining system
Disadvantages of ASP
• Cleaning is a hassle
• Most plants need at least three tanks
• Temperature changes affect the tank greatly
Sequencing batch reactor: The Sequencing batch reactor (SBR) is an activated sludge process
designed to operate under non-steady state conditions. An SBR operates in a true batch mode with
aeration and sludge settlement both occurring in the same tank. The major differences between SBR
and conventional continuous-flow, activated sludge system is that the SBR tank carries out the
functions of equalization aeration and sedimentation in a time sequence rather than in the
conventional space sequence of continuous-flow systems. In addition, the SBR system can be

416 MGNCRE | E-Waste Management
416 MGNCRE | Reclamation and Remediation
designed with the ability to treat a wide range of influent volumes whereas the continuous system is
based upon a fixed influent flow rate. Thus, there is a degree of flexibility associated with working in
a time rather than in a space sequence
Advantages of SBRs
• Equalization, primary clarification, biological treatment, and secondary clarification can be
achieved in a single reactor vessel.
• Operating flexibility and control.
• Potential capital cost savings by eliminating clarifiers and other equipment.
Disadvantages of SBRs
• A higher level of sophistication is required especially for larger systems, of timing units and
controls.
• Higher level of maintenance associated with more sophisticated controls, automated
switches, and automated valves.
• Potential of discharging floating or settled sludge during the draw or decant phase with
some SBR configurations.
• Potential plugging of aeration devices during selected operating cycles, depending on the
aeration system used by the manufacturer.
• Potential requirement for equalization after the SBR, depending on the downstream
processes.
Membrane bioreactor technology: Membrane bioreactor technology is based on biological
treatment followed by membrane separation, system comprising of an intense activated sludge
process with the biomass separation stage carried out by membrane cassettes located outside the
aeration tank in separation membrane tank. The membrane replaces settlement stage in
conventional activated sludge systems and effectively revolutionizes the process. The separation of
biomass from treated water using membrane provides filtered quality final effluent, offering
possibility of reuse. It allows very high biomass mixed liquor suspended solids (MLSS) concentrations
to be developed in the bioreactor without the detrimental effects usually associated with traditional
settlement technique.
417 MGNCRE | E-Waste Management
417 MGNCRE | Reclamation and Remediation
Advantages of MBR
• MBR system is such that it effectively overcomes the limitations associated with poor
settling of sludge in conventional sludge processes.
• It is also a cheaper source of water filtration being more rapidly used today.
• Filtering creates a disinfection barrier
• Produces less waste.
• Allows re-use of water.
Disadvantages of MBR
• Membrane modules are expensive and have to be replaced every 5 to 10 years.
• Cleaning solutions for the system can be considered hazardous waste.
• Requires skilled maintenance.
Upflow anaerobic sludge blanket: Upflow anaerobic sludge blanket (UASB) technology, normally
referred to as UASB reactor, is a form of anaerobic digester that is used in the treatment of
wastewater. The UASB reactor is a methanogenic (methane-producing) digester that evolved from
the anaerobic clarigester. UASB uses an anaerobic process whilst forming a blanket of granular
sludge which suspends in the tank. Wastewater flows upwards through the blanket and is processed
(degraded) by the anaerobic microorganisms. The upward flow combined with the settling action of
gravity suspends the blanket with the aid of flocculants.
The blanket begins to reach maturity at around 3 months. Small sludge granules begin to form
whose surface area is covered in aggregations of bacteria. In the absence of any support matrix, the
flow conditions create a selective environment in which only those microorganisms, capable of
attaching to each other, survive and proliferate. Eventually the aggregates form into dense compact
biofilms referred to as "granules". Biogas with a high concentration of methane is produced as a by-
product, and this may be captured and used as an energy source, to generate electricity for export
and to cover its own running power. The technology needs constant monitoring when put into use
to ensure that the sludge blanket is maintained, and not washed out (thereby losing the effect). The
heat produced as a by-product of electricity generation can be reused to heat the digestion tanks.
Advantages of UASB
• Low land demand.
• Reduction of CH4 emissions from uncontrolled disposal/”open” treatment (ponds) due to
enclosed treatment and gas collection.

418 MGNCRE | E-Waste Management
418 MGNCRE | Reclamation and Remediation
• Reduction of CO2 emissions due to low demand for foreign (fossil) energy and surplus energy
production.
• Low odor emissions in case of optimum operation.
• Hygienic advantages in case of appropriate post-treatment.
• Low degree of mechanization.
• Few process steps (sludge and wastewater are treated jointly).
• Low sludge production, high sludge quality.
• Low demand for foreign exchange due to possible local production of construction material,
plant components, spare parts.
• Low demand for operational means, control and maintenance.
• Correspondingly low investment and operational costs.
Disadvantages of UASB
• Insufficient standardization and adaptation for several implementation possibilities
• Methane and odor emissions (also of end-products) in case of inappropriate plant design or
operation
• Insufficient pathogen removal without appropriate post-treatment
• Sensitivity towards toxic substances
• Long start-up phase before steady state operation, if activated sludge is not sufficiently
available.
• Uncertainties concerning operation/ maintenance due to still low local availability of know-
how and process knowledge.
Table 2.2: A brief comparison of the available technologies
Moving Bed Bioreactor (MBBR)
Sequencing Batch Reactor (SBR)
Membrane Bio-reactor (MBR)
Removal efficiency (%)
> 90% -92% 95-98% 99%
Quality of treated effluent achieved
BOD< 20 mg/L and TSS < 30 mg/L
BOD< 10 mg/L and TSS < 10 mg/L
BOD< 1 mg/L and TSS < 1 mg/L
Hydraulic Retention Time (HRT, hrs)
3.5 - 4.5 hrs Minimum 15 hrs 4-6 hrs
Solids Retention Time (SRT, days)
Minimum 6 days Minimum 20 days 5- 20 days
MLSS (mg/l) 6000 - 9000 mg/l 2000 - 5000 mg/l 8000- 10000 mg/l
BOD Loading (kg/m3.d)
1-1.4 0.1-0.3 COD Loading - 1.2 - 3.2
(kg/m3.d)

419 MGNCRE | E-Waste Management
419 MGNCRE | Reclamation and Remediation
Primary Clarifier Required Not Required Not required
Extra provision for shock
loading/Fluctuations
Equalization Tank must be provided before MBBR tank to handle shock loadings
No equalization tank is required before biological treatment. But Batch discharge may require equalization prior to disinfection
Not required
Process performance
Good, and it works well for low strength sewage.
Good. But process control is more complicated and high peak flows/ shock loadings can disrupt operation.
Excellent. Adaptable to many types of wastewater and it has large dilution capacity for shock and toxic loads. Organic matters (BOD) are well removed because of lower concentration of TSS compared with other process technologies.
Potential of re-use/ recycle
Additional tertiary treatment (micro-filtration/ ultra-filtration etc.)units required in order to make re-cycle quality effluent
Additional tertiary treatment (micro-filtration/ ultra-filtration etc.)units required in order to make re-cycle quality effluent
Treated water by MBR can be reused for various purposes such as toilet flushing, gardening, etc. without further additional treatment
Sludge production
Large quantity of sludge is produced which is undigested in nature and creates odor & nuisance
Lesser quantity of sludge is produced which is partially digested in nature.
Very less quantity of sludge produced, which is almost Nil during first year of operation.
Operation and Maintenance
O&M is cumbersome as the attached media needs to be replaced after suitable duration of time to ensure proper surface area is available for micro-organisms to grow (minimum 20-25% media needs to be replaced in every 3-4 yrs)
Requirement for more than one tank to accommodate cleaning schedules
1. Operation and maintenance works are easy and free from control of sludge bulking because final sedimentation tank is not required. 2. E-coli is blocked by MF membrane with pore size of less than 0.4 micro meters which is generally used for MBR system, hence, requirement of disinfection system is eliminated

420 MGNCRE | E-Waste Management
420 MGNCRE | Reclamation and Remediation
Power consumption
Low power consumption Higher Power consumption than extended aeration and MBBR
Comparatively higher power consumption as permeate produced from MBRs is transparent and fine containing almost no TSS, which is fit for re-use and re-cycle purposes. No further tertiary treatment is required.
Land Area requirement
Very low footprint among all. Moderate Least
Capital Cost
Lowest High Higher (justified where high quality treated water is required and land is a constraint)
2.3 Resource Recovery
The sustainability of the cradle-to-cradle approach is undeniable. It is in this approach wherein we
regard each item – even if labelled as waste – as a potential resource or a raw material for
generating something new. It is in contrast to the cradle-to-grave approach of the past, which was
admittedly more wasteful.
Resource Recovery from waste is a prime example of the cradle-to-cradle approach.
Composting & bio-methanation:
Composting yields manure, which can serve as fertilizer as well as soil conditioner. In addition, it can
be utilized in eco-restoration.
In contrast, bio-methanation yields two products – the methane generated can be used as fuel,
while the slurry generated is rich in nutrient and serve as manure.
Dry Waste Reuse/Recycling

421 MGNCRE | E-Waste Management
421 MGNCRE | Reclamation and Remediation
Figure 2.9: Flow-chart of dry waste management approach
Challenges of resource recovery from dry waste items –
o Poor segregation, which on one hand completely or partially destroys items such as
paper and cloth, or soils them so badly that subsequent efforts at cleaning and
disinfection become too costly to render resource recovery feasible.
o Complex dry waste items such as multi-layer packaging material, computer and
electronic equipment require much effort in dismantling and separation into basic
components. While in the case of the former, end products are not valuable enough to
justify the labor cost, in the case of the latter, i.e., e-waste, the end products are
valuable enough to justify the efforts at recycling.
o Even basic machinery such as shredder and compressor are hitherto unpopular in India
Potential fate of various dry waste items has been enlisted in the Table 3 below:
Table 2.3: Potential fate of dry waste Items
Type of dry waste
Potential Fate
Paper Paper bags, hand-made paper, tissue paper/toilet paper
Cloth Cloth bags, fuel for boilers, fill for soft toys/pillows
Plastic Pelletized, and the pellets sold to industries manufacturing items from it
Glass New containers, bricks
Wood Smaller articles of furniture, packaging, wooden flooring etc.
Metal Formation of metal bars post its sorting, cleaning, melting and purification; bars sold

422 MGNCRE | E-Waste Management
422 MGNCRE | Reclamation and Remediation
to industries manufacturing items from it
C&D waste Land-filling material, landscape material, base-filling of roads, bricks
In India, all dry waste management processes are manual with very little mechanization or
automation. With insufficient segregation, the initial task of cleaning the items uses up labor and
water.
To do Activity : Visit to nearest waste segregation and management centre
Material recovery facility:
MRF, pronounced as murfs, these are automated or semi-automated dry waste management units
popular abroad where glass, metals, paper, and plastic are further separated to specific types as
described below:
Metal – ferrous/non-ferrous
Paper – newspaper, magazine, cardboard boxes, office paper
Plastic – HDPE, PET
Items are sorted, baled, shredded, compacted and packed for supply to industries where these
would be used as raw materials.
Figure 2.10: Material recovery facility photo for representation purposes
Landfill mining
Landfilling continues to be the waste disposal option for most Indian cities. Many landfills have been
in use for several decades and contain waste dumps several hundred feet high. Some landfills (or

423 MGNCRE | E-Waste Management
423 MGNCRE | Reclamation and Remediation
landfill sections) have even been official closed as they cannot take the load of waste anymore.
Importantly, given the poor rates of at-source waste segregation earlier, it is likely that several non-
perishable dry waste items are still lying in the lower layers of a closed landfill. This concept forms
the basis of landfill mining. Landfill mining is an excavation process like conventional mining,
wherein tools similar to conventional mining are made use of to delve deep into closed landfills and
excavate items of potential resale value, or of such hazard as to be deemed necessary to be
removed. Benefits of landfill mining can be summarized below:
o Resource recovery
o A secondary benefit of the process is the release of landfill gas hitherto trapped within
the waste piles.
o Another benefit is that the same landfill site, now that it has become partially
empty, can begin to accept a fresh lot of waste; given that land is a scarce
resource, this can be extremely beneficial
Waste-to-Energy (WtE)
These set of technologies attempt at recovery of energy from the waste, either in the form of
electricity or heat. Refuse-derived fuel (RDF) is a broad term that applies to fuel obtained from
waste, which replaces fossil fuels in residential as well as commercial units.
Several WtE processes and technologies are currently available, which have been summarized in the
figure below:
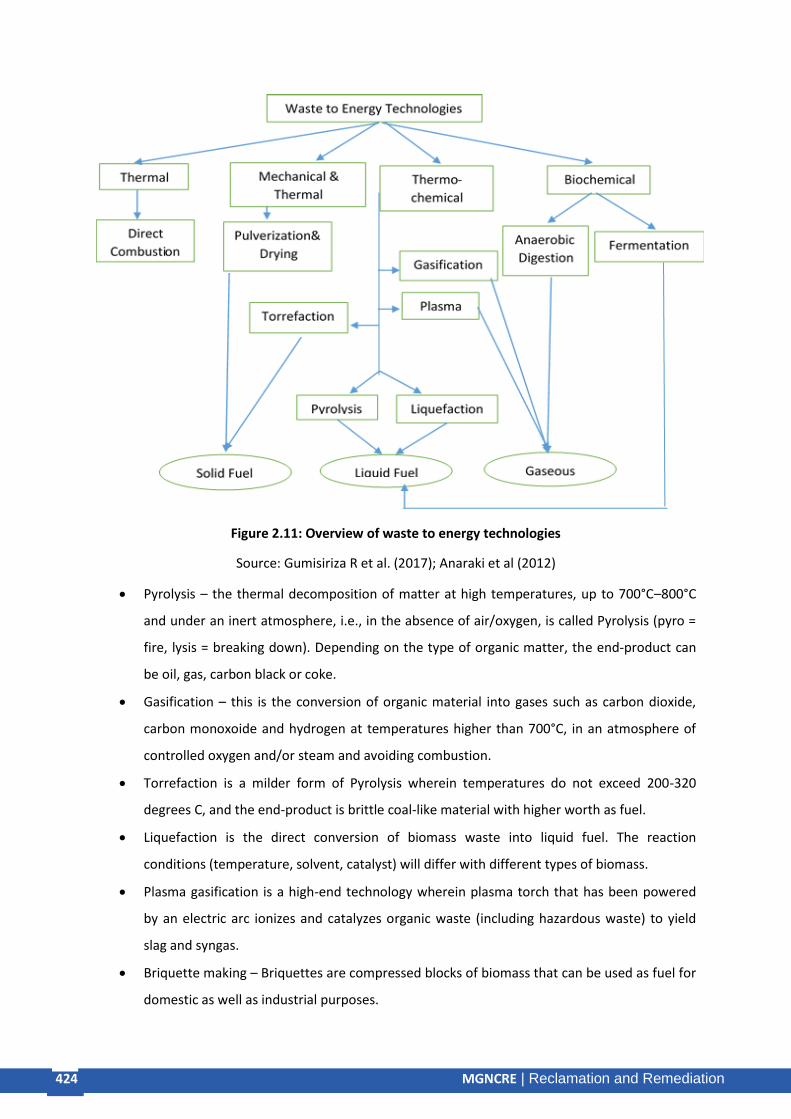
424 MGNCRE | E-Waste Management
424 MGNCRE | Reclamation and Remediation
Figure 2.11: Overview of waste to energy technologies
Source: Gumisiriza R et al. (2017); Anaraki et al (2012)
• Pyrolysis – the thermal decomposition of matter at high temperatures, up to 700°C–800°C
and under an inert atmosphere, i.e., in the absence of air/oxygen, is called Pyrolysis (pyro =
fire, lysis = breaking down). Depending on the type of organic matter, the end-product can
be oil, gas, carbon black or coke.
• Gasification – this is the conversion of organic material into gases such as carbon dioxide,
carbon monoxoide and hydrogen at temperatures higher than 700°C, in an atmosphere of
controlled oxygen and/or steam and avoiding combustion.
• Torrefaction is a milder form of Pyrolysis wherein temperatures do not exceed 200-320
degrees C, and the end-product is brittle coal-like material with higher worth as fuel.
• Liquefaction is the direct conversion of biomass waste into liquid fuel. The reaction
conditions (temperature, solvent, catalyst) will differ with different types of biomass.
• Plasma gasification is a high-end technology wherein plasma torch that has been powered
by an electric arc ionizes and catalyzes organic waste (including hazardous waste) to yield
slag and syngas.
• Briquette making – Briquettes are compressed blocks of biomass that can be used as fuel for
domestic as well as industrial purposes.

425 MGNCRE | E-Waste Management
425 MGNCRE | Reclamation and Remediation
Various Uses of Fly Ash and Bottom Ash
Fly ash is a coal combustion product. It is different from bottom ash, as it comes out of the emission
stacks along with the flue gases while the bottom ash falls to the bottom. Bottom ash has been used
as the alternate for construction material such as earth or sand, in road construction or in cement
kilns for clinker production.
Various uses of Fly Ash have been outlined below:
o Cement clinker production
o Concrete production
o Slope/embankment stabilization
o Road sub-base formation
o Land filling material
o Fly ash bricks - Fly ash brick (FAB) is a building material, specifically masonry units,
containing class C or class F fly ash and water. Compressed at 28 MPa and cured for 24
hours in a 66 °C steam bath, then toughened with an air entrainment agent, the bricks
can last for more than 100 freeze-thaw cycles.
Resource recovery from human sewage
The most important resource to be recovered from sewage is water. While different technologies
have different efficiency, treated sewage can be safely used for flushing and gardening purposes. In
some cases, use of treated sewage for bathing has also been possible. In Singapore, treated sewage
is even consumed as drinking water. Sewage sludge can be utilized as manure or soil conditioner.
To do Activity: Visit the sewage treatment plant of your city
Resource recovery from industrial effluent
While here, too, water forms one of the most significant resources obtained post the treatment,
valuable inorganic and organic substances that can be recovered and reused in the same industrial
processes are also valuable.
To do Activity: Visit the nearest industrial waste management plant and make a report on
different categories of waste and process used for its treatment. Also, make a study of amount of
waste recovered from the waste daily and it’s commercial use and value.
426 MGNCRE | E-Waste Management
426 MGNCRE | Reclamation and Remediation
2.4 Socio-Cultural Aspects
Most waste management technologies are technically sound, but may fail because of associated
socio-cultural factors. Waste management is a highly complex process, and despite the centralized
approach to its treatment, it actually requires active involvement of everyone who generates waste.
While each individual household needs to segregate waste, bulk generators such as hotels,
restaurants, shopping malls, cinema halls, hospitals, etc. need to treat their waste at source as well.
Hence, it is crucial to ensure that existing socio-cultural aspects are understood to the fullest extent
and technologies suitable to the context are selected. The connotation of ‘waste’ in most societies is
negative and those associated with waste handling or management are usually treated with
disparagement and disrespect. Usually, it is those who are the most marginalized by the society, the
unskilled and uneducated, who find their way into the solid waste management industry. The
scenario is gradually changing, with resource recovery from waste and technical aspects of waste
management attracting the educated and technically inclined towards this field.
Role of the rag-pickers & scrap-dealers
These form the lower-most rung of the SWM ladder, collecting items of potential recyclability from
open dumpsites, secondary segregation sites and waste collection vehicles. Sometimes, they even
find ways of illegal entry into city landfill sites. Uneducated, socially ostracized and often abused, the
rag-pickers are parts of the informal waste handling sector in India and other developing countries.
Earning as low as INR 100-150/- a day, rag-pickers are hardly able to get the education and health
benefits they are entitled to. Recent study by Mondal et al (2017) roughly estimated the number of
rag-pickers in India to be about a million, though the actual numbers may vary.
In several of the larger cities, though, the situation is changing for the better. Several Non-
government organizations (NGOs) are coming forwards to organize the rag-pickers into a formal
workforce and take up city waste management with aplomb. These are either functioning on
corporate social responsibility (CSR) funds or becoming self-sustainable from the sale of resources
from waste. However, this initiative needs to spread to smaller towns and villages that are more
remote, and where CSR funds may not reach. Here, government financial aid must be utilized
judiciously, and enthusiastic city volunteers must join hands to ensure that even the remote area
waste handlers are given their due.
To do activity: Interaction with rag pickers and scrap dealers of your city to understand the
commercial aspect of waste recycling and techniques to raise standards of living of them by
making them skilled waste handlers.

427 MGNCRE | E-Waste Management
427 MGNCRE | Reclamation and Remediation
Similar to the rag-pickers, while a small percentage of scrap-dealers are registered with their
respective municipalities, most are functioning without a license. As a result, very little formal data is
available as to the actual quantities of waste recycled and final fate of waste in most of the cities of
India. Scrap-dealers purchase the dry recyclables from the rag-pickers, and compress package and
transport it to the waste recycler.
In the next rung is the Waste Recycler, who purchases the scrap from the scrap-dealer. All waste
recyclers need to be registered with their state’s Pollution Control Board. However, an abysmally
small number of waste recyclers are actually registered, as one of the chief criteria of owning a
waste recycling facility is to show ownership of sufficient land. Hence, even several waste recyclers
continue to operate without a license.
Given the vast number of livelihood options provided by the solid waste industry to the informal
sector, the introduction of automated waste segregation has been looked upon with the fear of
mass unemployment.
Challenges to waste segregation at-source
For an average household, the story of waste ends with the disposal of waste in the dustbin. The
story of waste beyond the dustbin is something that only a handful know. More importantly, it is a
story a very few are interested to know. Most people are completely unaware of –
• The potential resources that can be recovered from waste
• The injury and infection threats faced by other human beings in handling the hazardous
waste discarded by them
This leads to an extremely low household segregation percentage. It has earlier been highlighted
how critical waste segregation at source is, to ensure a high level of resource recovery. Clearly, it is
important to raise the interest of each and every one in waste management activities. A very high
level of awareness drive, making use of social media, print media, electronic media and other
conventional approaches such as street plays, banners, posters, pamphlets, rallies and awareness
lectures is strongly required. A step in this direction has been taken by the Swachh Bharat Abhiyan,
wherein substantial sums have been earmarked for IEC (Information, Education, and
Communication) activities.
However, waste segregation is more of a habit, and it will take time to coax people to break their old
habits and take up new ones.

428 MGNCRE | E-Waste Management
428 MGNCRE | Reclamation and Remediation
Another challenge to waste segregation are local grievances against local municipalities for
• Not providing one extra dustbin – in several small municipalities there are low income group
dwellers who are not inclined to spend money on an extra dustbin required for segregation.
Besides, even for those who are financially capable, getting an extra dustbin from the
municipal authorities assures them of the seriousness with which their local government is
approaching the solid waste management subject.
• Not collecting the segregated waste separately – For household owners who segregate
waste, it is a serious let-downer to observe that it is getting mixed in the waste collection
vehicle. Hence, waste collection vehicles with separate compartments for wet, dry and
hazardous waste are essential.
• Associated grievances – sometimes the waste collection vehicle may skip a locality, or its
timing or frequency of visit is not suitable for the residents. Dirty open gutters, incidents of
waterborne diseases and malaria, flooding due to clogged drains etc. are common enough
issues in small municipalities, and they end up aggravating residents who tend to retaliate by
not segregating the waste deliberately.
Open defecation
Open defecation is a perpetual challenge in the Indian rural areas as well as among the
urban slums. Open defecation is extremely unhealthy, widening the risk of fecal-oral route
infections such as diarrhea, dysentery, typhoid etc. The indignity of squatting in the open
and the safety risk run by the rural women who often go out after the dark or in very early
hours are very serious social aspects of open defecation.
Despite all this, open defecation has deep roots in the Indian culture and personal habits,
such that even financial incentives to build toilets are not ensuring that the newly
constructed toilets are used! Indeed, as per Government of India’s Swachh Bharat Abhiyan
portal, as of Oct 2018, 95% of Indian population had access to toilets, which is much higher
than a 2011 census report that showed only 70% rural Indian households without a toilet;
despite this, the status of Open Defecation Free (ODF) may rightly elude many a village.
Insightful and aggressive awareness drives are crucial to ensure that this scenario changes as
soon as possible.
In urban slums, the challenge of open defecation is not culture or habit-driven but is rather
an outcome of fewer toilet seats than required. Besides, urban work routines being more
strictly time-bound, there is a rush for toilet usage within a very short few hours in the early
part of the day.

429 MGNCRE | E-Waste Management
429 MGNCRE | Reclamation and Remediation
Urban slums are extremely densely populated, and are largely illegal wherein the actual
ground conditions and exact facts and figures may be difficult to ascertain. Hence, exact
number of toilets, how well-maintained they are, accessibility to their septic tanks etc. are
the practical on-field challenges.
Commercial aspects of waste
Unless the commercial aspects of waste become apparent, it is difficult to maintain interest of the
local public and ensure high segregation percentage at source. Hence, it is significant that local
municipalities prepare a business model to make money out of waste, and finally, become capable
of purchasing one type of waste from its residents. For instance, wet waste or kitchen waste is the
type of waste generated in the largest quantity in any municipality, which can be converted to
compost. This compost can replace the fertilizers used in municipality gardens, and sold to city
nurseries, private gardens and also to the nearby farmers. Similarly, with greater attention to
formalizing the workforce represented by rag-pickers and scrap-dealers and joining hands with local
NGOs already working with them, dry waste management can be improved. More volume of dry
waste can be recovered with intervention, and with the help of modern tools, compressed, shredded
and baled more easily. By linking rag-pickers directly to waste recyclers, their income and social
status can be augmented. Creating self-help groups out of rag pickers and training them to manually
upcycle waste is another activity that can help uplift them and make dry waste management more
profitable.
However, currently, segregation at source first, or municipality efforts at waste commercialization
first – this has become a hen and egg problem. It is imperative that both activities are given due
attention simultaneously.
Perception change towards recycled and upcycled products
An important aspect of commercializing waste is the average consumer’s attitude toward the
products obtained from waste. Recycled or upcycled products may not find acceptance among
customers given the common perception of waste as being dirty, unhygienic and unhealthy. In fact,
given the poor level of waste segregation, and the use of post-consumer waste, these concerns are
not wholly invalid either. Quality assurance is, thus, of the prime importance here to:
• Certify that the raw materials used were duly cleaned and disinfected
• The end-product is no less in quality than its counterpart made out of virgin products
In principle, it appears logical that with raw materials available almost for free, the upcycled
products can be cheaper and hence, more competitive. However, the efforts in collecting, cleaning

430 MGNCRE | E-Waste Management
430 MGNCRE | Reclamation and Remediation
and disinfecting them are costly. Therefore, the aim here must be to ensure that as much as possible
of the dry waste items must be prevented from entering the waste stream, i.e., prevented from
getting soiled and sullied and infected, and collected directly from the waste generator.
Thus, to summarize, waste needs to be glamorized, its handlers need to be respected, and its
commercialization should be worked out.
2.5 Eco-friendly innovative technologies and their mainstream use
Managing solid and liquid waste in itself is an eco-friendly activity given that it is aimed at reducing
the pressure of natural regeneration on our various ecosystems.
Technologies less dependent on energy, making use of plants or microbial cultures or green
chemistry were deemed to be eco-friendly. Simple, low maintenance and technically sound unique
solutions that were effective, had a lower ecological footprint and enhanced human welfare were
collated as being innovative.
Automatic segregation of dry waste
Manual segregation of waste is tiring and unhygienic, and can be at least partially replaced by
technical intervention. While not popular in India, Automatic Sorting machines are in use elsewhere.
To put simply, these are conveyor belts with moisture, laser, infra-red, weight and magnetic sensors
that can automatically separate wet waste, paper, plastic and metal. Other technologies such as air
shifting, dry density separators and spirals are also available.

431 MGNCRE | E-Waste Management
431 MGNCRE | Reclamation and Remediation
Figure 2.12: Automatic/Semi-automatic waste segregation – representative picture
Upcycling:
Upcycling may be defined as converting an article into another of greater value. Upcycling is largely
manual, and requires artistic or mechanical skills. Few examples include –
• Conversion of PET bottles to t-shirts
• Conversion of used clothes/leather material to bags
• Upcycled clothing
• Furniture from PET bottles
• PET bottles filled with sand to serve as construction units to replace bricks
• Jewelry, toys, gift items, and home décor items fashioned from a variety of waste
items
Co-incineration in cement kilns
Co-processing of plastic wastes in cement kilns is practiced substantially in different countries as an
environmentally sound option for management of plastic wastes. In a cement kiln, different kinds of
hazardous and non-hazardous wastes including plastic wastes get utilized as Alternative Fuel and
432 MGNCRE | E-Waste Management
432 MGNCRE | Reclamation and Remediation
Raw materials (AFRs). During the usage of plastic wastes in cement kiln as AFRs, the material and
energy value present in them gets fully utilized in the cement kiln as replacement to the fossil raw
materials and fossil fuels that are conventionally utilized in the kiln. The performance evaluation of
co-processing of plastic waste was carried out in ACC Limited, Kymore, Madhya Pradesh.
Plastic roads
The technology for this was developed by the ‘Plastic Man’ of India, Prof Rajagopalan Vasudevan,
Professor of Chemistry at Thiagarajar College of Engineering, Madurai. A Government order in
November 2015 has made it mandatory for all road developers in the country to use waste plastic,
along with bituminous mixes, for roadconstruction. The entire process is very simple. The plastic
waste material is first shredded to a particular size using a shredding machine. The aggregate mix is
heated at 165°c and transferred to the mixing chamber, and the bitumen is heated to 160°c to result
in good binding. It is important to monitor the temperature during heating. The shredded plastic
waste is then added to the aggregate. It gets coated uniformly over the aggregate within 30 to 60
seconds, giving an oily look. The plastic waste coated aggregate is mixed with hot bitumen and the
resulting mix is used for road construction. The road laying temperature is between 110°c to 120°c.
The roller used has a capacity of 8 tons.
Sludge to bricks
Sludge mixed with clay (in proportions dependent on chemical properties of sludge) and co-fired in
brick-making kilns can produce bricks with superior or at least same properties as conventional
bricks. The advantages of using sludge –
o No need to add extra water, as sludge moisture content is sufficiently high
o Virgin clay input is reduced
o Sludge disposal cost is limited only to the transportation of sludge to the kiln site
Phytorid
Phytorid Technology is a self-sustaining technology developed by National Environmental
Engineering Research Institute (NEERI), CSIR that works on the principles of natural wetland. It has
been developed and patented by CSIR-National Environmental Engineering Research Institute (CSIR-
NEERI). The PHYTORID system based on natural treatment method has distinct advantages over
conventional treatment plant. The technology is recommended for decentralized plants with varying
capacities of m3/day to MLD. In this technology, treatment occurs via natural methods such as
filtration, sedimentation and nutrient uptake by plants and microbial action in a constructed system

433 MGNCRE | E-Waste Management
433 MGNCRE | Reclamation and Remediation
which is filled with gravel. Specifically identified different species of plants which are known to have
good nutrient uptake rates are planted in the gravel bed. The system includes screen chamber,
collection cum sedimentation, Phytorid bed and treated water tank.
Figure 2.13: Phytorid technology for sewage treatment
Soil bio-technology
This is a terrestrial wastewater treatment technology designed by IIT Bombay. The underlying
principle is that of trickling filter. Sediments and organic and inorganic pollutants are removed from
wastewater with the basic processes of sedimentation, filtration and biochemistry. The technology
requires no mechanical aeration or sludge removal.
Figure 2.14: Soil biotechnology at Lovegrove, Mumbai
Waterless toilets
Waterless toilets have emerged as the single answer to the dual problems of water availability and
sewage treatment. EcoSan toilets work on a two-pit model requiring no flushing, wherein each pit is
connected to a separate chamber. Usage needs to shift to the second pit once the first chamber is

434 MGNCRE | E-Waste Management
434 MGNCRE | Reclamation and Remediation
filled; by the time the second chamber has also filled up, contents of the first chamber have
converted to manure during the ensuing months and can be used in the fields.
Figure 2.15: EcoSan waterless toilets
DRDO’s anaerobic biotoilets
The fecal matter is digested in the absence of air with the help of a consortium of anaerobic
bacteria. The design of the toilet can be modified to suit local conditions; indeed separate models
have been designed for the Indian Army in snowbound areas, the Indian railways, for coastal
regions, and even for houseboats.
Biodegradable sanitary napkins
Such sanitary napkins, fashioned out of cornstarch, bamboo fiber, banana fiber, pine fiber etc. are
biodegradable unlike the popular commercial brands that use non-biodegradable, synthetic fibers.
The technologies listed above are assuredly newer than the conventional technologies, but have
been tested under Indian conditions for a few years. Most of the above technologies are listed on
the India Water Portal, and in some cases, appearing as an alternative to conventional options.
Hence, to conclude, a variety of solid and liquid waste management technologies are available for
efficient solid and liquid waste management. Clearly, some technologies are well-established with
plenty of case studies to validate their attributes, whereas some technologies are building
their import, one case study at a time. Green technologies largely fall in the second category. It is
important that more and more innovative and green technologies are tested on field and their
suitability under different conditions is tested.

435 MGNCRE | E-Waste Management
435 MGNCRE | Reclamation and Remediation
Summary
Thus, to summarize, firstly, the foundation was laid with the basics of solid and liquid waste
management procedural overview.
Following this, conventional, well-established technologies were described with respect to their
working principle and applicability.
Especial attention was paid to aspects of resource recovery, giving the overview of dry waste
management and waste to energy technologies
Socio-cultural aspects strongly impact the successful waste management in a society - keeping this in
mind, various such non-technological factors that could impact the application of waste
management technologies were included in this Chapter.
Finally, the field of waste management is not untouched by innovation - several new technologies
are jostling for space with the well-established conventional technologies. With their promise of
lower environmental footprint, such green technologies require more and more field applications to
establish their performance criteria.
There are business opportunities associated with both conventional and innovative technologies
that need to be harnessed to create a win-win-win situation for the environment, society and the
business owner as well. It is important that more and more innovative and green technologies are
tested on field and their suitability under different conditions is tested.
Model questions
Q. A city with population 150,000 is divided into six zones with almost same number of people in
each zone. Per capita waste generation in the city is about 260 gm and seven waste collection
vehicles of capacity one tons are assigned in each zone. Using the available standards as to vehicle
mileage, labor charges, loan rates, etc. calculate the various cost heads and per kg cost of waste
collection
Q. What type of industrial waste items can be of disposed in sanitary landfills?
Q. How can one create a business model for uplifting rag pickers?
Q.From among Chemical fertilizers, paper and pulp, brewing and food processing sectors where
Phytorid would be most suitable, how can one implement the technology in treatment of the waste
water from such industries and create a plan for the utilization?
Q. A municipality of area 638 acre has 70% of its land under agricultural production and is in
developing stage. How can one create a business model for solid waste management in the area?

436 MGNCRE | E-Waste Management
436 MGNCRE | Reclamation and Remediation
References
1. Aparna Menon (2016)https://www.thebetterindia.com/43685/plastic-waste-in-road-
construction-plastic-man-india-prof-vasudevan/, February 2, 2016, 3:35 pm
2. Central Pollution Control Board (2001)
http://cpcb.nic.in/displaypdf.php?id=aHdtZC9QdWJsaWNhdGlvbl80MTRfc2VjMTFfMTcucGR
m, February 2001
3. Central Pollution Control Board
(2017)http://kspcb.kar.nic.in/Guidelines_co_processing_plastic_cement_kilns.pdf, May 23,
2017
4. Gumisiriza, R., Hawumba, J. F., Okure, M., & Hensel, O. (2017)."Biomass waste-to-energy
valorisation technologies: a review case for banana processing in Uganda," Biotechnology for
biofuels, 10(1), 11.
5. Mondal, N. K., Siddique, S., Banerjee, M., Roychoudhury, S., Mukherjee, S., Slaughter, M. S.,
... & Ray, M. R. (2017). "Alteration in Leukocyte Subsets and Expressions of FcγR and
Complement Receptors among Female Ragpickers in Eastern India," Safety and health at
work, 8(2), 198-205.
6. Vasudevan Vhttp://swachhbharaturban.gov.in/writereaddata/Day%202%20-
%20All%20PPTs.pdf

437 MGNCRE | E-Waste Management
437 MGNCRE | Reclamation and Remediation
Chapter 3 Landfill Reclamation Introduction
Landfilling continues to be the most common solid waste disposal method across the globe.
The one reason to which its universal popularity can be attributed is its inherent simplicity.
However, the earlier landfilling works were almost always unscientific dumping exercises,
with little regard for leachate formation, groundwater pollution, landfill gas discharge, air
pollution and climate change. With rising population and rising waste generation, most old
landfills have no room for accommodating more waste. Besides, land as a resource is
becoming scarcer and scarcer – hence, it makes little sense to spoil a precious resource such
as this for waste disposal. In addition to these practical and environmental concerns, the
regulatory framework in India has become conscious of resource recovery from landfill sites
and its adequate capping.
Thus, effective landfill management, recovery of resources dumped there in the preceding
years, capping it adequately and putting the land so recovered to other potential usage is
the need of the day.
Objectives
With the above background, the objectives of this Chapter can be enlisted as:
• Understanding the dynamics of a landfill site – how leachate or landfill gas is formed and
how a landfill ‘settles.’
• Elucidating how an unscientific landfill site impacts the environment through groundwater
and air pollution
• Comprehending the concept of landfill reclamation and landfill mining
• Enlisting what alternate uses a reclaimed landfill site can be put to
• Exploring the novel approach of Phyto-capping
• Comprehending the higher safety concerns associated with the landfilling of hazardous
waste
3.1 Landfill Reclamation – An Overview
The necessity of landfill reclamation
438 MGNCRE | E-Waste Management
438 MGNCRE | Reclamation and Remediation
Referred to by various names as ‘dumpsite’, ‘dumping ground’, ‘landfill site’ and ‘garbage dump’,
municipal solid waste management (MSWM) in Indian cities and in other developing countries has
largely centered around this piece of land where largely unsegregated, mixed type of waste is
deposited on a daily basis. Prior to the scientific and technical considerations now being directed at
solid waste management, MSWM in the earlier years happened without much planning. Dumpsites
were largely selected for being sufficiently distant from human habitation and little or no
consideration was spared for leachate percolation or methane generation. However, with rising
populations and shrinking resources, land is becoming scarcer and scarcer. Old dumpsites once far
away from human habitation are now in the middle of full-fledged urban areas; more importantly,
most of these dumpsites are filled to capacity and cannot accommodate more waste. In addition to
this, new government regulations make it mandatory for dumpsites to be capped scientifically so
that the falling rain does not create more leachate. Retro-fitting of old landfills to convert them into
sanitary, lined dumpsites is also encouraged. Clearly, dumping of waste has not remained the
relatively simple, non-technical exercise it once was.
With land for dumping becoming scarcer, it is no wonder that some of the considerations for
selecting the most scientifically sound landfill sites are flouted. For instance, the Kanjur Marg
dumpsite in Mumbai is in close vicinity of the high value mangrove ecosystem while the Guwahati
city dumpsite is on the banks of the internationally recognized Ramsar Wetland, DeeporBeel. The
Mulund dumpsite of Mumbai is barely buffered from human habitation. Clearly, then, it is of
paramount importance that landfills are either capped scientifically or reclaimed partially to create
more airspace. Herein, the relatively novel concepts of ‘landfill reclamation’, ‘landfill mining’,
‘capping’ and alternate uses of reclaimed landfills have gained the attention of urban planners and
researchers alike.
For municipal authorities in India and elsewhere, the approach towards dumpsite management may
be summarized as in the figure below:

439 MGNCRE | E-Waste Management
439 MGNCRE | Reclamation and Remediation
Figure 3.1: Overview of landfill management Disclaimer: Above figure is a general overview; project-specific decisions need to be taken post detailed
feasibility studies
Clearly then, if landfill footprint has to be reduced, landfill reclamation and capping are essential.
Landfill reclamation: definition
Landfill Reclamation may be defined as a set of procedures to ensure recovery of landfill space and
articles of resale value from existing dumpsites. The entire landfill itself can be put up for alternative
uses once through technological intervention it has been confirmed that no potential hazardous
substances (such as methane and leachate) remain underneath, and items of potential reuse/resale
value have been removed. Alternately, as more space is created post landfill reclamation, landfilling
can continue in a dumpsite that had been filled to capacity.
Regulatory framework
Solid Waste Management Rules, 2016 [suppressing The Municipal Solid Wastes (Management and
Handling) Rules, 2000] notified by Ministry of Environment, Forest and Climate Change, made by

440 MGNCRE | E-Waste Management
440 MGNCRE | Reclamation and Remediation
Central Government in exercise of the powers conferred by the Environment (Protection) Act, 1986]
applies to every municipal authority responsible for collection, segregation, storage, transportation,
processing and disposal of municipal solid wastes.
The Solid Waste Management Rules 2016 encourage reclamation of dumpsites, following it up with
capping.
Benefits of landfill reclamation
The potential benefits of landfill reclamation have been enlisted below:
• Sale of dry recyclables, manure, soil or waste that can be burned as fuel, which are obtained
from landfill mining
• Avoiding the acquisition of additional sites for landfilling – by removing waste items of resale
value, one is effectively reducing the volume of waste from the dumpsite and creating more
airspace. Hence, this increases the life span of aging dumping grounds.
• Offsetting the cost of landfill closure – regulations make landfill closure mandatory, which
entails a cost (cost of capping material such as clay, geotextile membrane or PVC etc. itself
can be high). However, with landfill reclamation, this cost can be partially or totally offset.
• Landfill site land may partially become available for resale for other purposes
• At least partial retro-fitting an old, unsanitary landfill site can become possible, as after
excavation, geotextile membranes and leachate pumping system can be laid.
Piggyback landfilling
The concept of continuing to use an existing dumpsite post partial landfill reclamation for fresh
waste dumping has been extended to and named as the Piggyback Landfilling approach – this
implies the construction of a new landfill site on the top of an existing dumpsite or along its side that
has closed or is scheduled to be closed. Hence, it is the vertical or horizontal extension of an existing
dumpsite that has closed or is about to be closed (Stulgis et al. 1996).
The capping of the old dumpsite also serves as the liner of the new piggybacking dumpsite. Suitable
engineering interventions must ensure that the base of the piggyback dumpsite is stable, and is not
disturbed by the natural waste decomposition processes going on in the old dumpsite.
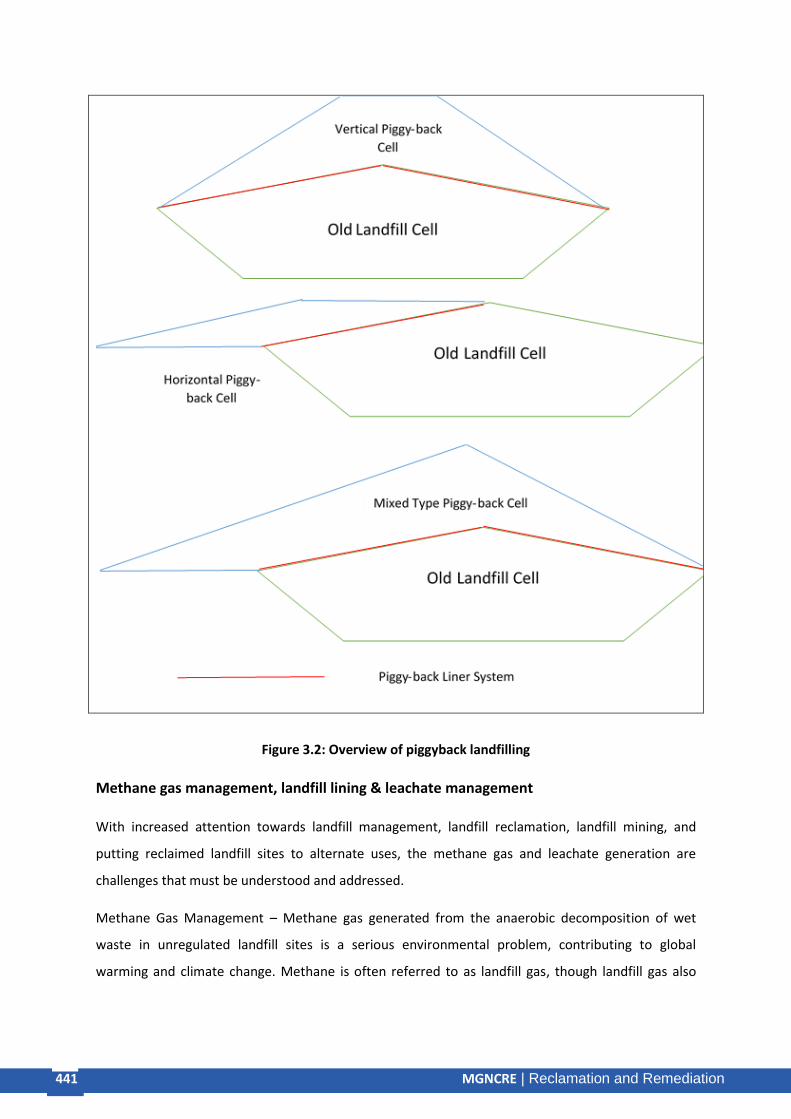
441 MGNCRE | E-Waste Management
441 MGNCRE | Reclamation and Remediation
Figure 3.2: Overview of piggyback landfilling
Methane gas management, landfill lining & leachate management
With increased attention towards landfill management, landfill reclamation, landfill mining, and
putting reclaimed landfill sites to alternate uses, the methane gas and leachate generation are
challenges that must be understood and addressed.
Methane Gas Management – Methane gas generated from the anaerobic decomposition of wet
waste in unregulated landfill sites is a serious environmental problem, contributing to global
warming and climate change. Methane is often referred to as landfill gas, though landfill gas also

442 MGNCRE | E-Waste Management
442 MGNCRE | Reclamation and Remediation
includes carbon dioxide in some proportion. Methane collection from dumpsites and its potential
use as a renewable energy source is a sustainable option with clear environmental benefits.
Collection of methane gas is by installing vertical or horizontal wells in the landfill mass. As per the
USEPA, one vertical well per acre has been recommended while horizontal wells are 50-200 feet
apart. Methane so collected is piped to a collection header with the help of a blower, from which it
is either flared off or used for energy generation.
Landfill Lining & Leachate Management – Landfill leachate is the water that upon percolating down
through the mass of waste in a dumpsite, dissolves soluble components of the waste and becomes
highly concentrated. Source of this water is largely the local precipitation as well as water from the
waste itself that is squeezed out under self-weight of the waste. Leachate is often black or brown in
color and particularly difficult to treat. Leachate management is crucial as the case of unlined
landfills, it percolates through the soil, finally polluting the groundwater. Hence, leachate
management has two major components –
• Ensuring that landfills are lined with HDPE geo-membrane and clay to prevent the leakage of
leachate into the groundwater below. These are called composite liners.
• Collection of the leachate through a network of perforated pipes, collecting the same in a
sump and pumping it out, either vertically or along the slopes of the landfill, to treat it.
Landfill Capping – Once a landfill site has been deemed to be closed, it needs to be ‘capped’, i.e.,
adequately covered with clay/geotextile membrane/vegetation to ensure that the rainfall does not
percolate through the waste, forming leachate. Another purpose served by landfill capping is the
prevention of erosion of the waste mound.
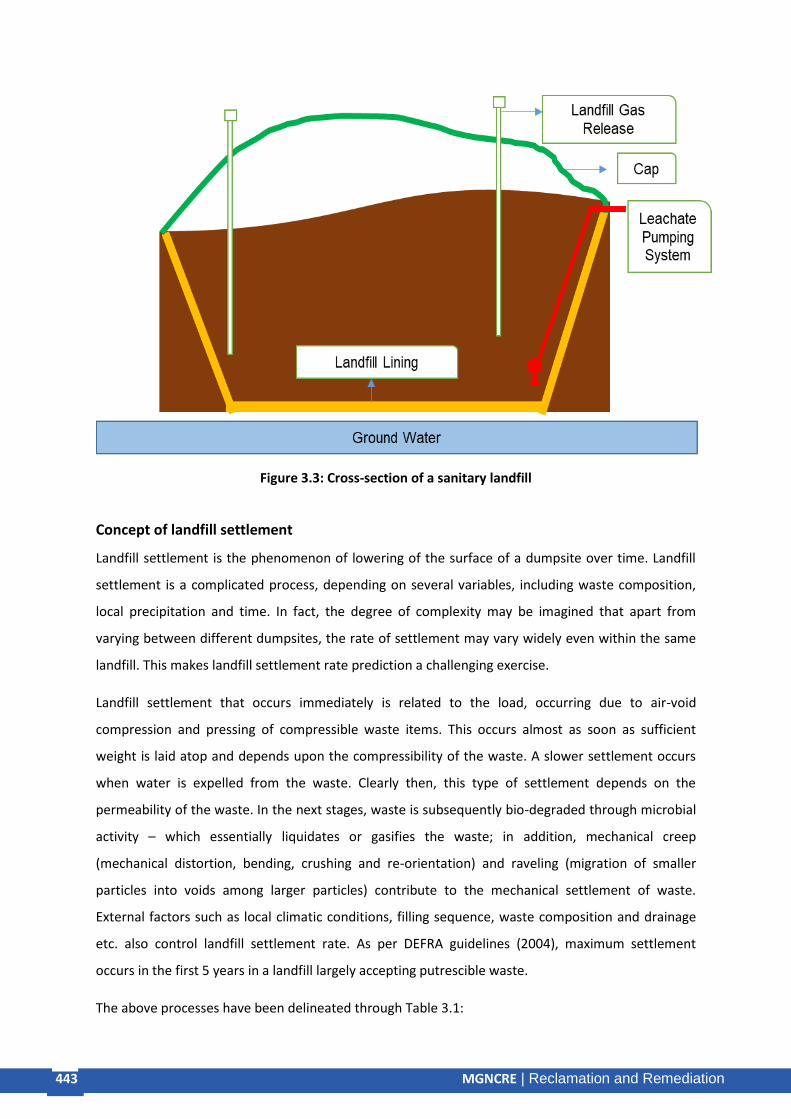
443 MGNCRE | E-Waste Management
443 MGNCRE | Reclamation and Remediation
Figure 3.3: Cross-section of a sanitary landfill
Concept of landfill settlement
Landfill settlement is the phenomenon of lowering of the surface of a dumpsite over time. Landfill
settlement is a complicated process, depending on several variables, including waste composition,
local precipitation and time. In fact, the degree of complexity may be imagined that apart from
varying between different dumpsites, the rate of settlement may vary widely even within the same
landfill. This makes landfill settlement rate prediction a challenging exercise.
Landfill settlement that occurs immediately is related to the load, occurring due to air-void
compression and pressing of compressible waste items. This occurs almost as soon as sufficient
weight is laid atop and depends upon the compressibility of the waste. A slower settlement occurs
when water is expelled from the waste. Clearly then, this type of settlement depends on the
permeability of the waste. In the next stages, waste is subsequently bio-degraded through microbial
activity – which essentially liquidates or gasifies the waste; in addition, mechanical creep
(mechanical distortion, bending, crushing and re-orientation) and raveling (migration of smaller
particles into voids among larger particles) contribute to the mechanical settlement of waste.
External factors such as local climatic conditions, filling sequence, waste composition and drainage
etc. also control landfill settlement rate. As per DEFRA guidelines (2004), maximum settlement
occurs in the first 5 years in a landfill largely accepting putrescible waste.
The above processes have been delineated through Table 3.1:

444 MGNCRE | E-Waste Management
444 MGNCRE | Reclamation and Remediation
Table 3.1: Factors involved in landfill settlement
Stage of Landfill Settlement
Processes Involved
Description Controlling Factors
Immediate Loading Air-void compression and pressing of compressible waste
Compressibility of the waste, fill height, density
Primary Water loss Expulsion of water from the waste
Permeability of the waste
Secondary
Biodegradation Degradation of organic waste by microbial action
Biodegradability of the waste (waste composition), moisture, temperature, pH
Mechanical creep
Mechanical distortion, bending, crushing and re-orientation
Particle stiffness
Raveling Migration of smaller particles into voids among larger particles
3.2 Landfill Mining
Overview
Landfill mining is fast emerging as a sustainable landfill reclamation option, with the help of which
resale-worthy material as well as free airspace for further landfilling are obtained. It is an approach
similar to conventional mining, wherein equipment similar to those used in mining are made use of.

445 MGNCRE | E-Waste Management
445 MGNCRE | Reclamation and Remediation
Figure 3.4: File photos of landfill mining
Benefits
• Dry recyclables of resale value can be obtained from closed landfills. For instance plastic
items, metals and glass can remain unsullied in the landfill environment for long periods and
still have resale value.
• Through the natural process of composting, wet waste deposited in the earlier phase of the
life cycle of the dumpsite has already converted to rich manure. Even if it is impractical to
separate this manure from the mixed low quality dry waste (earlier, waste must have been
dumped unsegregated), it can be used as land filling material for new infrastructural
constructions.
• Moisture loss from the wet waste will be almost complete over the years; hence, the mixed
waste can be converted to briquettes or pelletized and used as fuel
Caution
• Excavation at one site may lead to adjacent areas sinking or collapsing – most landfill sites
are partially reclaimed. Hence, it is possible that excavation at one site causes instability in
other sites; even collapses have been reported. Hence, site characterization study primarily
for safety is a must.

446 MGNCRE | E-Waste Management
446 MGNCRE | Reclamation and Remediation
• Release of odor - this may become unpleasant for the workers on site and nearby residents
(if any).
• Release of methane gas– in most of the landfill dumpsites, waste – largely wet waste – has
been in the process of deposition for several years. Under anaerobic conditions, this
decomposition yields methane gas. Methane is an extremely potent greenhouse gas, the
release of which in the atmosphere is harmful.
• Unearthing of hazardous waste dumped earlier – if initial test pit content analysis or
information from landfill operators reveals this to be the case, adequate precautions must
be taken for the safety of the workers, subsequent handling of the hazardous waste, and its
final disposal.
• Wear-and-tear of excavation equipment may be a serious implication
• Cost of processing of the recovered material may outweigh the benefits – hence, initial
studies must include careful economic consideration.
Spurs to planning
• Ascertaining the policy framework/existing regulations
• Conducting a site characterization study to ascertain composition of material in the landfill,
which will be a function of variables such as local climate, age of the dumpsite, and land use
features nearby
• Assessing the economic benefits likely to ensue from the exercise, and weighing it against
the project costs
• Putting in place a workers’ safety plan
• Management of reclaimed materials from the dumpsite
Procedural overview
Initial data collection to understand the operation history, types of waste dumped earlier,
dimensions of the landfill site, topography of the area and demographic and social features are
important. Such information is collected from the secondary data available with the municipal
authorities and/or through personal interviews and discussion sessions.
A site characterization study is essential to ensure that the site is structurally stable and can offer
products of resale value. Structural stability analysis will also help create working zones in the area
to be excavated.
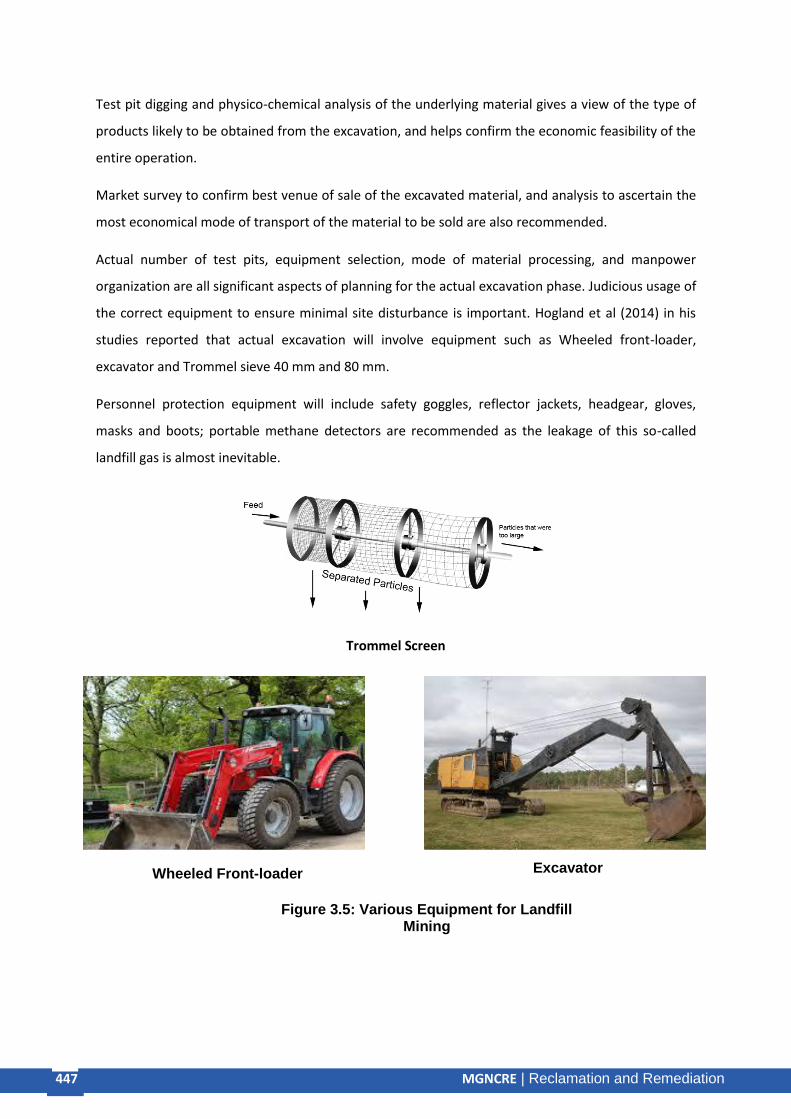
447 MGNCRE | E-Waste Management
447 MGNCRE | Reclamation and Remediation
Test pit digging and physico-chemical analysis of the underlying material gives a view of the type of
products likely to be obtained from the excavation, and helps confirm the economic feasibility of the
entire operation.
Market survey to confirm best venue of sale of the excavated material, and analysis to ascertain the
most economical mode of transport of the material to be sold are also recommended.
Actual number of test pits, equipment selection, mode of material processing, and manpower
organization are all significant aspects of planning for the actual excavation phase. Judicious usage of
the correct equipment to ensure minimal site disturbance is important. Hogland et al (2014) in his
studies reported that actual excavation will involve equipment such as Wheeled front-loader,
excavator and Trommel sieve 40 mm and 80 mm.
Personnel protection equipment will include safety goggles, reflector jackets, headgear, gloves,
masks and boots; portable methane detectors are recommended as the leakage of this so-called
landfill gas is almost inevitable.
Trommel Screen
Wheeled Front-loader
Excavator
Figure 3.5: Various Equipment for Landfill Mining

448 MGNCRE | E-Waste Management
448 MGNCRE | Reclamation and Remediation
Figure 3.6: Overview of landfill mining procedure
Economic Considerations
While economic considerations will largely be project-specific, few broad outlines remain generic.
They have been depicted in Table 3.2 below:
Table 3.2: Landfill mining – economic considerations
Stage of Activity
Cost-Heads
Pre-excavation
Secondary data collection
Test-pit digging
Laboratory-based chemical analysis of the sample to understand waste composition and its worth
Structural stability testing
Market survey for the sale of excavated materials
Prior training to workers in the basics of landfill mining
During excavation
Excavation equipment
Labor
Excavated material temporary storage
Protective equipment for health & safety of workers
Post-excavation
Equipment &labor for screening/sieving
Equipment &labor for material processing
Transport
Cost of landfill lining, leachate management

449 MGNCRE | E-Waste Management
449 MGNCRE | Reclamation and Remediation
Costs associated with landfill reclamation will be project-specific and include miscellaneous costs
associated with the project. The costs for excavating and screening materials include equipment,
labor and O&M costs.
Case studies
Although in its nascent stage in India, landfill mining in the USA and European countries is a well-
established procedure with several case studies documented in peer-reviewed publications. Few
such case studies have been described below:
Guerriero (1996) reported that in 1989, the Town of Thompson, Connecticut, USA initiated landfill
reclamation, with the primary goal of enhancing the life of their landfill. The Connecticut
Department of Environmental Protection allowed landfill mining in one acre area of the oldest part
of the landfill. Test pits were dug to ascertain the content of the waste below, and it was found that
it mostly contained ash from the burning of waste. It was deemed that reclamation would be easier
here as most of the reclaimed material was reusable soil. The project was found to be cost-effective
as compared to simple incineration. Most importantly, the life of the landfill was extended by 18
months.
Guerriero (1996) also mentioned that The Lancaster County Solid Waste Management Authority in
Pennsylvania, USA took up landfill mining and burning the refuse as fuel, with the primary aim of
enhancing landfill capacity, energy production and soil and ferrous metal recovery. The remnant ash
and other waste items that could not be recycled were disposed of in a sanitary landfill nearby. In
the year 1992, about 765 m3 of cover soil and 1530 m3 refuse for fuel had been reclaimed each
week.
Jain et al. (2012) described the landfill reclamation at a Florida landfill site wherein 6.8 ha of unlined
dumpsite was reclaimed. The recovered soil was sold and used as landfill cover.
Hogland et al. (2014) and Bhatnagar et al. (2017) described a landfill mining project in the Baltic Sea
area, namely the Estonian Kudjape Landfill. The Kudjape Landfill site was 5.16 ha in area, with an
estimated 193,000 cubic meter of waste volume. Of this only 57,777 cubic meter was the excavation
volume. The mining continued from May 2012 till 2013. The uppermost 10-year deposition layer was
targeted. Soil recovery and methane degradation were the objectives. The recovered soil fractions of
<10mm particle size showed promise of recovery of metals such as Cr, Cu, Ni, Pb, and Zn.
Hogland et al. (2014) also described landfill mining operations at a Swedish landfill. Spread across 30
ha, the Ragn-Sells AB landfill site at Högbytorp, Sweden had an operational history of municipal as
well as industrial waste disposal. About 150,000-200,000 tons waste was excavated.
To-Do Activity :Visit to the nearest dumping ground and study its shelf life and also prepare a closure plan for future that will generate commercial importance.

450 MGNCRE | E-Waste Management
450 MGNCRE | Reclamation and Remediation
3.3 Alternate Uses of Closed Landfills
Once the landfill has reached its full capacity and decision has been taken to close it after
scientifically capping it, it becomes a piece of land that can be put to multiple uses. In this unit, few
such alternate uses have been collated, based on case studies published in peer-reviewed journals.
Here, too, most of the case studies have been documented from countries other than India –
however, they are comparable and may be emulated under Indian conditions after due diligence on
technical, regulatory and social aspects.
Converted to real estate
The remedial investigations that have to be undertaken for converting a disused landfill to real
estate are much more stringent than for usual landfill remediation projects, given that the human
contact in this case is to be much more than in other projects. Thus, health and safety of the human
occupants acquires paramount importance. This also enhances the financial investment for landfill
reclamation.
Onsite contaminant characterization through chemical and physical tests are recommended, with
especial stress on hazardous waste, presence of landfill gas, concentration of landfill leachate,
impact on nearby ecological features (if any), and finally, structural stability. The concept of landfill
settlement is of paramount consideration here, as differential settlement may negatively impact the
foundations of civil structures set atop a closed landfill. The engineering approach towards building
on a reclaimed dumpsite is comparable to that when constructing over marshy lands and other.
Wiley and Asadi (2002) describe several landfill redevelopment projects wherein real estate projects
were constructed over reclaimed landfills in New Jersey. One community college (Passaic County
Community College, 12 acres), the largest mall in the region (Jersey Gardens Mall, 166 acres), an
office development (Federal Business Centre, 38 acres), and two housing developments (Seaboard
Point Resort and Ashbrook Farm of 12 and 30 acres, respectively) were the five projects. The aspect
most commonly discussed with these case studies was the impact on the nearby wetlands, and the
project proponents’ positive steps towards maintaining and/or remediating the same.
Converted to regions of high ecological value
The conversion of disused dumping ground into areas of high ecological value, such as urban jungles
or biodiversity parks is also gaining merit in urban areas where green space is scarce but valuable.
However, Rawlinson et al (2004) in his study indicated that several constraints to tree growth on
landfill sites have been enumerated (soil depth, site exposure, soil compaction, waterlogging and

451 MGNCRE | E-Waste Management
451 MGNCRE | Reclamation and Remediation
low soil oxygen. Wind-throw of trees is a challenge, too, in the absence of adequate soil depth, for
which Dobson and Mofat (1995) recommend a root depth of 1.5 m.
A notable such case study is the Mahim Nature Park or Maharashtra Nature Park, was set up as an
eco-restoration attempt for the erstwhile Dharavi garbage dumping ground. Spread across 37 acres,
the park is in close vicinity to the Mahim Creek and is a much-needed green lung of Mumbai.
Vaverkova and Adamcova (2018) report the planned forestry reclamation of a dumpsite in
Czechoslovakia that was started in 2009, with the aim to study species survivability. Authors
observed 90% survival over the years.
Converted for recreational purposes
The Freshkills landfill in New York was formally closed down in 2001, post which it is now under
process of reclamation. Reclaimed wetlands, recreational facilities and a public parkland are planned
herein, covering an area of 2200 acres.
Shoreline Park, Mountain View, California (USA) includes an 18-hole golf course, an amphitheater, a
clubhouse and a restaurant – all these facilities have been built over a waste dumpsite. Interestingly,
these recreational features had been planned for this site prior to its operation as a dumping
ground, as early as in 1967. Being a low-lying area, it was required to import earth and raise the
ground level by 20 feet to reduce the risk of flooding. However, these costs being prohibitive, it was
decided that the site be operated as a dumping ground for the garbage from San Francisco city. In
the year 1983, this park was opened to the public. As per local newspaper records, a few incidents of
methane-related fires were reported in the park.
A study conducted by Wiley and Asadi (2002) mentioned an example in which 18-hole golf course
(Bayonne Golf Course 120 acres) was designed over a reclaimed landfill in New Jersey.
Converted for renewable energy production
The major impact of setting up solar panels, be it financial, environmental or social is the land
requirement. Clearly, then, lower the value of land, more suitable it is. Reclaimed landfills, as
discussed above, can be converted to real estate or for recreational purposes – however, it is
possible that the social acceptability of the same can be low. Additionally, it is more suitable that
solar panels are set on reclaimed landfills instead of occupying land of higher environmental or social
value. The United States Environmental Protection Agency (USEPA) has put together a set of best
practices for siting solar photovoltaics on municipal solid waste landfills. An overview of the
procedure has been provided in Figure below.

452 MGNCRE | E-Waste Management
452 MGNCRE | Reclamation and Remediation
Figure 3.7: Overview of setting up solar panels on reclaimed landfills (Source: USEPA)
Although the land area required for a given solar power generation system size is dependent on
individual module efficiency and mounting system, a minimum area of 2 acres has been
recommended by the US EPA. Reclaimed landfills with sections of contiguous lands are preferable.
Other landfill characteristics such as initial waste composition, landfill settlement,
engineered/vegetated capping, topography and demographical features have a role to play in
deciding whether a reclaimed landfill site is suitable for setting up solar panels.
In Table below, the completed solar power projects in MSW landfills in USA have been delineated:
Table 3.3: Landfill reclamation with solar panels: Sites in the USA
Project Location Size
Completion
PVTechnology
BeeRidge Landfill/Rothenbach Park Sarasota,FL 250 kW 2008
Crystalline
Camp Pendleton SanDiego,CA 1.4 MW 2011
Crystalline
EastHampton Landfill Easthampton, MA 2.2 MW 2011
Crystalline
Evergreen Landfill Canton,NC 550 kW 2010
Crystalline
FortCarson AFB Landfill FtCollins,CO 2 MW 2008
ThinFilm
Greenfield Solar Farm Greenfield, MA 2 MW 2012
Crystalline

453 MGNCRE | E-Waste Management
453 MGNCRE | Reclamation and Remediation
GROWSLandfill38 BucksCo, PA 3 MW 2010
Crystalline
HickoryRidge Atlanta,GA 1 MW 2011 ThinFilm
Islip/Blydenburg Hauppauge/Islip,NY 50 kW 2011
Crystalline
MadisonCounty Lincoln,NY 50 kW 2011
ThinFilm
NC StateUniversity– Agricultural
PesticideLandfills
Raleigh,NC 76.5 kW 2007
Crystalline
NellisAirForceBase Las Vegas,NV 14.2 MW 2007
Crystalline
PaulsboroTerminal–Gypsum Landfill Paulsboro,NJ 276 kW 2002
Crystalline
Pennsauken Landfill Pennsauken,NJ 2.1 MW 2008
Crystalline
TessmanRoad* San Antonio,TX 135 kW 2008
ThinFilm
*In the Tessman Road landfill, capping was done with a photo-voltaic cell-integrated geomembrane.
Agriculture/livestock grazing
Agriculture can be taken up on capped landfills provided that adequate arability is provided. For this
the DEFRA guidelines (2004) recommend –
• 1m of soil profile (topsoil and subsoil) where possible
• 1.2m of soil profile in drier areas
• Arable land must drain well and normally needs a remedial drainage system with a minimum of
60cm of soil cover over the drainage pipes
• Adequate considerations have been taken for landfill settlement, which can damage the drainage
system
Alternately, livestock grazing can be taken up on the grasses that have been encouraged to grow on
the capped landfill. Grassland is less demanding on soil than arable crops. As per DEFRA guidelines
(2004), goat, sheep and young stock are suitable animals to be taken up for grazing on reclaimed
landfills.
However, care should be taken that
• Animals grazing and trampling on newly-sown grass and fragile soils can cause damage
• There should be a contingency plan to move livestock if there is signs of damage
• There should be fencing and water supply for stock
Under the following conditions, it is not recommended to plan agriculture/grazing on reclaimed
landfills –
• Sites where there is risk of contamination, disease or vermin
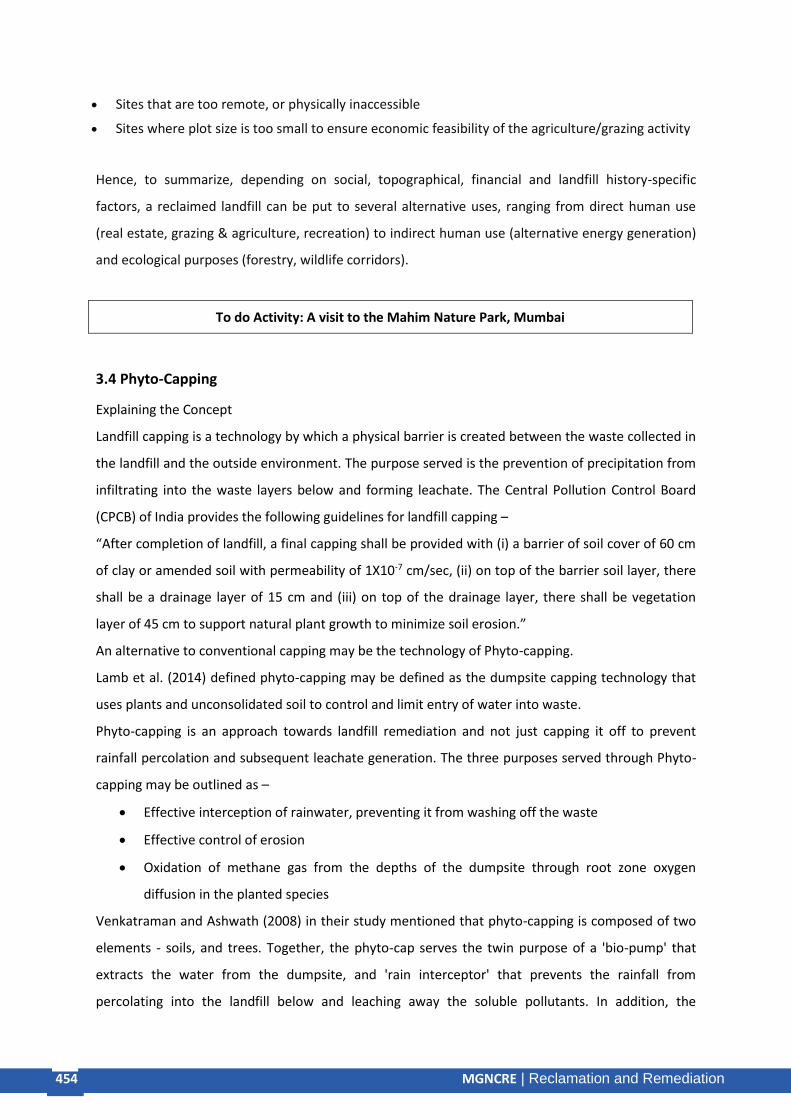
454 MGNCRE | E-Waste Management
454 MGNCRE | Reclamation and Remediation
• Sites that are too remote, or physically inaccessible
• Sites where plot size is too small to ensure economic feasibility of the agriculture/grazing activity
Hence, to summarize, depending on social, topographical, financial and landfill history-specific
factors, a reclaimed landfill can be put to several alternative uses, ranging from direct human use
(real estate, grazing & agriculture, recreation) to indirect human use (alternative energy generation)
and ecological purposes (forestry, wildlife corridors).
To do Activity: A visit to the Mahim Nature Park, Mumbai
3.4 Phyto-Capping
Explaining the Concept
Landfill capping is a technology by which a physical barrier is created between the waste collected in
the landfill and the outside environment. The purpose served is the prevention of precipitation from
infiltrating into the waste layers below and forming leachate. The Central Pollution Control Board
(CPCB) of India provides the following guidelines for landfill capping –
“After completion of landfill, a final capping shall be provided with (i) a barrier of soil cover of 60 cm
of clay or amended soil with permeability of 1X10⁻⁷ cm/sec, (ii) on top of the barrier soil layer, there
shall be a drainage layer of 15 cm and (iii) on top of the drainage layer, there shall be vegetation
layer of 45 cm to support natural plant growth to minimize soil erosion.”
An alternative to conventional capping may be the technology of Phyto-capping.
Lamb et al. (2014) defined phyto-capping may be defined as the dumpsite capping technology that
uses plants and unconsolidated soil to control and limit entry of water into waste.
Phyto-capping is an approach towards landfill remediation and not just capping it off to prevent
rainfall percolation and subsequent leachate generation. The three purposes served through Phyto-
capping may be outlined as –
• Effective interception of rainwater, preventing it from washing off the waste
• Effective control of erosion
• Oxidation of methane gas from the depths of the dumpsite through root zone oxygen
diffusion in the planted species
Venkatraman and Ashwath (2008) in their study mentioned that phyto-capping is composed of two
elements - soils, and trees. Together, the phyto-cap serves the twin purpose of a 'bio-pump' that
extracts the water from the dumpsite, and 'rain interceptor' that prevents the rainfall from
percolating into the landfill below and leaching away the soluble pollutants. In addition, the

455 MGNCRE | E-Waste Management
455 MGNCRE | Reclamation and Remediation
methane inside the layers of waste is oxidizedthrough root zone oxygen diffusion. Small to medium
sites are more suitable for phyto-capping.
The rainfall interception by phyto-capping is in turn managed with the help of three phenomena –
o Canopy interception
o Evapo-transpiration of stored water (in which the roots suck in the water trapped in the
dumpsite like a conventional hydraulic pump)
o Storage of moisture in soil layers
Similarly, the oxidation of methane through plants is with the help of two phenomena –
o Some plants create channels for oxygen diffusion via roots
o Provide shelter to methane-oxidizing bacteria in their root zones (Ding et al. 2005)
Figure 3.8: Conceptual overview of the phyto-capping technology

456 MGNCRE | E-Waste Management
456 MGNCRE | Reclamation and Remediation
Landfill Factors Affecting Growth of Trees
An array of physical, chemical, topographical and edaphic factors affect the growth of trees in
landfills.
Figure 3.9: Factors affecting tree establishment & growth in landfill sites
Source: Rawlinson et al. (2004) History
Phyto-capping was first introduced in 1991 by the Idaho National Engineering and Environmental
Laboratory. It was presented as an alternative to conventional capping. The tree species used were
Salix and Populus, apart from a few shrubs and grasses. Post this, in 1997, the technology was trialed
by the US EPA under different agro-climatic zones. Since then, this capping system has been
approved by the US EPA to be used on a full scale.
Benefits of Phyto-capping
As per Venkatraman and Ashwath (2008), and Yuen et al (2010), phyto-capping was found to be
superior to conventional capping in that it
• Served the second purpose of methane is oxidation through root-zone oxygen diffusion
• Was found to be less expensive

457 MGNCRE | E-Waste Management
457 MGNCRE | Reclamation and Remediation
• Required little skilled engineering intervention and was hence suitable for remote locations
• Prevented erosion of the soil cap
• Reduced wind-blown dust
• Served as a green cover/afforestation project, providing the additional benefits of
o Enhanced biodiversity
o Carbon sequestration
o Opportunity to plant species of commercial importance
• Was suitable even for semi-arid regions where suitable species selection could still ensure
capping, while conventional clay caps dried up and cracked, letting precipitation in
• Provided a physical barrier to prevent vermin access to the waste
• Did not crack due to landfill settlement
• Was aesthetically more pleasing
To compare the phyto-capping procedure with conventional clay caps and geo-membrane cover, the
following table has been prepared:
Table 3.4: Comparison of Phyto-capping, Clay capping and Geo-membrane Cover
Criteria Clay Cap Geo-membrane Phyto-cap
Use of locally available material
Clay may not be the locally available soil and may have to
be transported from elsewhere
Will have to be purchased, hence not
suitable for remote locations
Local soil and plant species strongly recommended
Longevity Can crack or erode, especially under arid conditions
Can get torn Top soil with suitable vegetation layer resists
erosion and cracking
Efficiency at preventing percolation
High (if not eroded/cracked) High (if not torn) Comparable to clay, at times better
Methane oxidation
Not possible Not possible Added benefit
Ecological gains Not possible Not possible Added benefit
Design Criteria
• Selection of species – Salix and Populus were the two tree species used in the first phyto-
capping study, in addition to a few shrubs and grasses. Venkatraman and Ashwath (2009)
made a detailed study of 19 species and found that among these, 10 species were quite
suitable for the Central Queensland region, Australia. These included Melaleuca
leucadendra, which is known to diffuse oxygen into its root zone, Ficusmacrocarpavar. hillii
and Dendrocalamuslatiflorus that showed the maximum methane oxidation. Eucalyptus

458 MGNCRE | E-Waste Management
458 MGNCRE | Reclamation and Remediation
grandis, Glochidionlobocarpum, Hibiscus tiliaceus, and Lophostemonconfertus showed the
highest root depth.
• Rawlinson et al. (2004) studied 11 unsanitary landfills in England with the purpose of
ascertaining tree growth factors and concluded that native species (vs. exotics), shrubs (vs.
trees) and broad-leaved trees (vs. conifers) survived better when planted over dumpsites.
• Optimum depth of soil atop the waste is also a significant design criteria. Venkatraman and
Ashwath (2009) determined the impact of soil depth and arrived at the conclusion that
methane concentrations were higher in thin soil caps. An unconsolidated soil cap of 1400
mm thickness reduced surface methane emissions 45% more than a cap half as thick. Also,
Bogner and Matthews (1999) in their study mentioned that varying soil depth also impacts
methane emission.
• Selection of appropriate soil amendments – Lamb et al. (2014) suggest biosolids, biochar,
compost, or other materials as soil amendments to improve moisture retention in phyto-
capping.
• Porosity of soil –oxidation of methane will depend upon the diffusion of oxygen gas from the
root zone, and the rate of diffusion will, in turn, depend upon the soil porosity (Venkatraman
and Ashwath 2009).
Case Studies of Phyto-capping
The phyto-capping technology was trialed at the Lakes Creek landfill in Rockhampton, Australia
(Venkatraman and Ashwath 2010). The study reported superior performance of the Phyto-cap in
slowing water percolation into the dumpsite as compared to compacted clay. Substantial reduction
in methane emission was also reported.
Karaca et al. (2018) describe the use of Phyto-capping to remediate mine tailing disposal sites. The
authors stressed the importance of soil amendments to help establish the first vegetal layer, and the
right selection of native species to tolerate the bio-toxicity of the underlying waste.
Yuen et al. (2010) describe the outcome of 5 sites in Australia (Lyndhurst, Victoria, McLaren Vale,
South Australia, Henderson, Western Australia, Townsville, Queensland and Lismore, New South
Wales) where phyto-capping was trialed. The most obvious observation was reduction in drainage
over time in all sites but 1.
Albright et al. (2004) report the findings of a study conducted by the US Alternative Covers
Assessment Program wherein phyto-capping efficiency at preventing water percolation was studied
at 12 sites, wherein the alternative of vegetal cover was found to be effective.

459 MGNCRE | E-Waste Management
459 MGNCRE | Reclamation and Remediation
Similarly, Preston and McBride (2004) studied the role of poplar trees in reducing seepage of
precipitation in a decommissioned landfill in southern Ontario, Canada, and found the poplar tree
system to be efficient.
3.5 Hazardous Waste Landfill Remediation
Hazardous Waste – Definition, Identification, Impacts
As per the Hazardous and Other Wastes (Management and Transboundary Movement) Rules, 2016
‘“Hazardous waste” means any waste which by reason of characteristics such as physical, chemical,
biological, reactive, toxic, flammable, explosive or corrosive, causes danger or is likely to cause
danger to health or environment, whether alone or in contact with other wastes or substances.’
Hazardous waste is any substance that can directly harm human beings or the environment, or come
in contact with other components and get converted into potentially harmful products or get bio-
magnified by getting ingested by living organisms and entering the food chain.
As per (Devi et al. 2018), around 4.4 million tons hazardous waste is generated in India per annum.
13 Indian states contribute 97% of the hazardous waste generated annually in the country – these
states are: Maharashtra, Gujarat, Tamil Nadu, Orissa, Madhya Pradesh, Assam, Uttar Pradesh, West
Bengal, Kerala, Andhra Pradesh, Telangana, Karnataka and Rajasthan.
The Hazardous and Other Wastes (Management and Transboundary Movement) Rules, 2016 include
Schedules I, II and III wherein is included a detailed list of hazardous chemicals as well as the
concentrations beyond which some chemicals can be harmful.
As per US EPA, hazardous wastes have been divided into four categories called the F, K, P and U
categories. F list - hazardous waste from non-specific sources, which may have originated from a
number of industrial processes common across industries. In contrast is the K list waste that can be
specifically traced to a particular industry. P and U lists contain chemicals that were commercially
produced but have to be disposed of due to non-use and subsequent end of shelf life. Such
chemicals are either 100% pure or are sole ingredients of a commercial product. Thus, source of the
hazardous waste is an important managerial aspect.
Hazardous Waste Management – Current Practices in India
The Hazardous and Other Wastes (Management and Transboundary Movement) Rules, 2016 provide
a detailed plan for hazardous waste management, which has to be followed by those who generate,
store, transport, treat or dispose hazardous waste. The considerations significant for municipal solid
waste also pertain to hazardous waste, which include reduction in waste generation at source,
prevention of recyclable waste entry into the waste stream, scientific efforts at resource recovery

460 MGNCRE | E-Waste Management
460 MGNCRE | Reclamation and Remediation
and safe disposal. However, the recycling and resource recovery options with this type of waste may
be limited, and its disposal attracts much more stringent criteria given its hazardous nature.
Treatment, Storage and Disposal Facilities (TSDF) have been designed to accept hazardous waste and
provide a centralized facility for multiple generators. Here at the TSDFs, depending on the available
facilities, resource recovery can be attempted prior to disposal.
From source to the TSDF, the significant link in the chain is an effective hazardous waste transport
system that can ensure zero spillage. Given that spillage is quite probable during loading, transport
and unloading, each step of hazardous waste transport needs to be regulated. In this regard,
following are the major considerations:
• Leak-proof containers of sufficient strength
• Containers to be sealed shut to prevent spillage during transport
• Containers to be made of a non-reactive material so as to negate the possibility of cross-
reaction with the hazardous waste
• Potential of gas generation during transport, due to cross-reaction, can be a challenge
leading to distortion or bloating of the container and increased risk of leakage and spillage.
Hence, prevention of gas generation is of paramount importance
• Labeling on the container describing the nature and potential toxicity of the waste being
transported
• Similar label on the transport vehicle, with the addition of first-aid instructions and an
emergency number in case of spillage and exposure
• Vehicle to be well-maintained and in excellent working condition
• Manpower to be well-trained, and with sufficient technical experience in guiding
proceedings post an accidental spillage
Unfortunately, legal hazardous waste management facilities in India are less than required, which
translates into illegal dumping and multifold damages to human health and the environment. The
challenge associated with proper hazardous waste management is its cost, which industries in the
medium, small and micro (MSME) category fail to afford.
Hazardous Waste Landfill Management
The CPCB has outlined a detailed plan for designing a hazardous waste landfill. The purpose of
designing such a landfill is to ensure minimum environmental impact. Guidelines ensure that the
hazardous waste landfill is located at a safe distance from water bodies and its associated
ecosystems, as well as human habitation. Locations with low alternative use value, groundwater

461 MGNCRE | E-Waste Management
461 MGNCRE | Reclamation and Remediation
level at more than 2m depth of the landfill base, and with high clay content in the sub-soil are
preferred. Following are the essential components of a hazardous waste landfill site –
• A liner system for the bottom and sides of the landfill
• A leachate collection and treatment system
• A gas collection facility
• A final cover system as well as intermediate covers (daily or weekly, depending on waste
type)
• A surface water drainage system
• A fence and greenbelt around the landfill site
• An access road
Also required are: a contingency plan for emergency management and safe exit for all in case of
accidents, an environmental monitoring plan along with monitoring facilities, and a closure and post-
closure plan (with especial stress on capping and vegetation layer to ensure no erosion and surface
water drainage) for the hazardous waste landfill site.
In addition to these, management of hazardous waste site will require office space, space to store
liner and cover material (purchased in bulk), equipment shelter, and storage site for special waste.
The life of a hazardous waste landfill can range from 40-65 years, of which 10-25 years are the active
period while next 30 years are the closure and post-closure period, during which the environmental
monitoring (for landfill cover, leachate quality, gas quality, groundwater and air quality) has to be
carried out.
Given the highly reactive nature of hazardous waste items, the hazardous waste landfill site must be
divided into units or cells, and only compatible waste items should be dumped together to avoid the
risk of cross-reaction. Table 1 of the Hazardous and Other Wastes (Management and Transboundary
Movement) Rules, 2016 provide a detailed list of compatible wastes.
It is strongly recommended that hazardous waste landfills are operated in phases, with each phase
being in a different stage of operation. Phase-wise operation leads to better over-all management of
the hazardous waste and helps set site-specific protocols.
Liner and capping material should be of such a chemical nature that they do not react with the
chemical elements in the hazardous waste pile. Composite liners of geo-textile and clay are
recommended.

462 MGNCRE | E-Waste Management
462 MGNCRE | Reclamation and Remediation
Figure 3.10: Overview of Hazardous Waste Landfill Liner and Cover
Liquid Hazardous Waste Management
Further, it must be envisaged that hazardous waste is not always in the solid state – there are free
liquids, industrial sludge and slurries, which require to be de-watered before being dumped in the
landfill. For such waste, a special hazardous waste impoundment needs to be designed in the vicinity
of the landfill site.

463 MGNCRE | E-Waste Management
463 MGNCRE | Reclamation and Remediation
Alternately, research has been on-going for chemical fixation and solidification of liquid hazardous
waste. For instance, Vacenovska and Drochytka (2012) report the use of fly ash to stabilize
hazardous solid waste (industrial sludge from rubber manufacturing plant).
Resource Recovery from Hazardous Waste
Importantly, there are incinerable and/or compostable elements even in hazardous wastes, which
can be separated and used for energy or material recovery. Co-processing of hazardous waste is also
a viable option. Interestingly, the state of Gujarat reported co-processing of hazardous waste as fuel
in cement kilns to the tune of 600,000 tons per annum in 2013-14, a 35-times increase with respect
to 2009-10 figures (Karthikeyan et al. 2018).
In addition, most of the hazardous wastes are rich in chemicals, which can be re-used after isolation
or recovered from the waste through processing. Such resource recovery boosts the cradle-to-cradle
approach towards sustainable manufacturing. For instance, spent solvents and metals can be
recovered and reused.
Figure 3.11: Fate of Hazardous Waste (Above % is an estimate presented by Devi et al. (2018))
Suggested To-do Activity: Visit to a hazardous waste management facility in Gujarat
Thus, to conclude, landfill management is a critical area of applied research today, and not without
opportunities. Ensuring maximal resource recovery from a landfill, using the most suitable landfill
closure technologies and ensuring the best possible alternate usage of reclaimed landfills are the
critical requirements for almost every municipality in India today.
Summary
Recyclable38%
Incinerable4%
Disposable in Sanitary Landfills
58%
Recyclable Incinerable Disposable in Sanitary Landfills

464 MGNCRE | E-Waste Management
464 MGNCRE | Reclamation and Remediation
To summarize, landfill management is a critical part of waste management, given how it is
connected with the valuable resource of land. Ensuring maximal resource recovery from a landfill,
using the most suitable landfill closure technologies and ensuring the best possible alternate usage
of reclaimed landfills are the critical requirements for almost every municipality in India today.
Landfill reclamation and landfill mining open up immense business opportunities, both from
resource recovery from waste as well as from the different alternate uses that reclaimed landfill
sites can be put to - ranging from real estate to eco-parks and solar energy parks.
Efficient landfill management through innovative technologies such as Phyto-capping offer the
advantage of novelty and larger environmental benefits.
Hazardous waste management, being in its early stages in India, need to be explored for business
opportunities, given that the current volume of available treatment and disposal facilities are much
less than required.
Model questions
Q1 A small town in the heart of an agricultural district has a thirty-year old landfill site which it now
plans to close. What action plan would you suggest to this municipality?
Q2 An old dumpsite had been receiving mixed waste from households as well as a nearby chemical
industry for several years. It was observed over the years that the hand pumps and wells in the area
near the dumpsite began to yield dark-coloured water. What do you think must have happened, and
what managerial suggestions would you give to the a) chemical industry b) local municipality c) local
residents?
Q3 How would your closed landfill after-use management decision differ for a) a city like Mumbai
(climatologically wet, real estate hub, surrounded by industries) and b) a city like Aurangabad
(climatologically dry, surrounded by agricultural fields)?
Q4 Which types of business activities are likely to gain from a municipal solid waste (non-hazardous)
landfill reclamation project if an ecologically beneficial after-use has been planned?
Q5 What business model can you envisage with reference to phyto-capping of landfills?
Q6 What business model can you envisage for hazardous waste management by a group of MSME
(medium, small and micro enterprises)?
Reading material
1. Anna University Chennai, Asian Institute of Technology, University of Kalmar https://www.elaw.org/system/files/Dumpsite%20Rehabilitation%20Manual.pdf)
2. Conner, J. R. (1990). Chemical Fixation and Solidification of Hazardous Wastes. Van Nostrand
Reinhold, New York, 692(1990), 335.
465 MGNCRE | E-Waste Management
465 MGNCRE | Reclamation and Remediation
3. Golush, T. V. (2008). Waste management research trends. Nova Publishers.
4. Guidelines and Check-list for evaluation of MSW Landfills proposals with Information on
existing landfills 5. Central Pollution control Board (2008),
http://cpcb.nic.in/openpdffile.php?id=UmVwb3J0RmlsZXMvTmV3SXRlbV8xMzNfTVNXLVJFUE9SVC5wZGY=, August 2008
6. Landva, A., & Knowles, G. D. (1990). Geotechnics of waste fills: theory and practice (No.
1070). ASTM International.
7. https://www.acee.gc.ca/050/documents_staticpost/cearref_8989/stp-0203.pdf
References 1. Albright, W., Benson, C., Gee, G., Roesler, A., Abichou, T., Apiwantragoon, P., et al. (2004).
Field water balance of landfill final covers. Journal of Environmental Quality, 33 2. (6), 2317–2332.
3. Bhatnagar, A., Kaczala, F., Burlakovs, J., Kriipsalu, M., Hogland, M., &Hogland, W. (2017).
Hunting for valuables from landfills and assessing their market opportunities A case study with Kudjape landfill in Estonia. Waste Management & Research, 35(6), 627-635.
4. Bogner, J. and Matthews, E. (1999) Temporal variations in landfills methane emissions: A
global perspective. In: Proceedings Sardinia 9, Seventh International Waste Management and Landfill Symposium, Environmental Sanitary Engineering Centre, Cagliari, Italy.
5. Department for Environment, Food and Rural
Affairs(2004)https://webarchive.nationalarchives.gov.uk/20090318074725/http://www.defr
a.gov.uk/farm/environment/land-use/reclamation/guidance-full.pdf, August 2004
6. Ding, W., Cai, Z. and Tsuruta, H. (2005) Plant species effects on methane emissions
from freshwater marshes, Atmospheric Environment, 39: 3199-3207.
7. Guerriero, J. R. (1996). Status of landfill reclamation and its applicability to solid waste management (No. CONF-960345-). American Society of Mechanical Engineers, New York, NY (United States).
8. Hogland, M., Hogland, W., Jani, Y., Kaczala, F., de Sá Salomão, A. L., Kriipsalu, M., ...
&Burlakovs, J. (2014). Experiences of three landfill mining projects in the baltic sea area: with focus on machinery for material recovery. Linnaeus Eco-Tech.
9. Jain, P., Townsend, T. G., & Johnson, P. (2013). Case study of landfill reclamation at a Florida
landfill site. Waste Management, 33(1), 109-116.
10. Karthikeyan, L., Suresh, V., Krishnan, V., Tudor, T., &Varshini, V. (2018). The management of hazardous solid waste in India: An overview. Environments, 5(9), 103.
466 MGNCRE | E-Waste Management
466 MGNCRE | Reclamation and Remediation
11. Lamb, D. T., Venkatraman, K., Bolan, N., Ashwath, N., Choppala, G., & Naidu, R. (2014). Phytocapping: an alternative technology for the sustainable management of landfill sites. Critical Reviews in Environmental Science and Technology, 44(6), 561-637.
12. Preston, G. M., & McBride, R. A. (2004). Assessing the use of poplar tree systems as a landfill
evapotranspiration barrier with the SHAW model. Waste Management & Research, 22(4), 291-305.
13. Rawlinson, H., Dickinson, N., Nolan, P., &Putwain, P. (2004). Woodland establishment on
closed old-style landfill sites in NW England. Forest Ecology and Management, 202(1-3), 265-280.
14. Stulgis, R. P., Soydemir, C., Telgener, R. J., & Hewitt, R. D. (1996). Use of geosynthetics in
‘piggyback landfills’: a case study. Geotextiles and Geomembranes, 14(7-8), 341-364.
15. Vacenovska, B., &Drochytka, R. (2012). Development of a new reclamation material by hazardous waste solidification/stabilization. In Advanced Materials Research (Vol. 446, pp. 2793-2799). Trans Tech Publications.
16. Vaverková, M. D., &Adamcová, D. (2018). CASE STUDY OF LANDFILL RECLAMATION AT
CZECH LANDFILL SITE. Environmental Engineering & Management Journal (EEMJ), 17(3).
17. Venkatraman, K., &Ashwath, N. (2008). Phytocapping of landfills: an Australian experience.
18. Venkatraman, K., &Ashwath, N. (2009). Phytocaps Reduce Methane Emission from Landfills.
19. Venkatraman, K., &Ashwath, N. (2010). Field performance of a phytocap at Lakes Creek landfill, Rockhampton, Australia. Management of Environmental Quality: An International Journal, 21(2), 237-252.
20. Wiley, J. B., &Assadi, B. (2002). Redevelopment potential of landfills. A case study of six New
Jersey projects. WIT Transactions on Ecology and the Environment, 55.
21. Yuen, S. T. S., Michael, R. N., Salt, M., Jaksa, M. B., & Sun, J. (2013). Phytocapping as a cost-effective and sustainable cover option for waste disposal sites in developing countries.
22. United States Environmental Protection Agency (1997),
https://www.epa.gov/sites/production/files/2016-03/documents/land-rcl.pdf, July 1997
23. Ryan Carpus and Phil Koerschner(2017) https://www.geoengineer.org/education/web-based-class-projects/geoenvironmental-engineering-fall-2017/end-uses-of-landfills?showall=1&limitstart=, December 2017
24. United States Environmental Protection Agency (2013),
https://www.nrel.gov/docs/fy13osti/52615.pdf , February 2013
25. United States Environmental Protection Agency,https://www.epa.gov/lmop/about-landfill-methane-outreach-program

467 MGNCRE | E-Waste Management
467 MGNCRE | Reclamation and Remediation
Chapter 4 Bioremediation Introduction Pollution amelioration using living organisms (bacteria, fungi and plants) has immense scope in
waste management. Each living cell is a tiny factory, with its own unique naturally-formed machinery
with a variety of biochemicals to help tackle pollution.
Living cells require a source of energy and a source of carbon – there is immense diversity among
different taxonomic groups with respect to the different sources of these two critical factors. In
addition to this, different species are exposed to adverse environmental conditions (less or no
oxygen, carbon sources other than glucose, acidic or alkaline pH, high pressure, high radioactivity or
very high or very low temperatures). These organisms have successfully adapted to extreme
environmental conditions – by successful adaptation it is implied that they have in place a specific
machinery of biochemicals that helps them combat the adversities and continue with their basic life
processes of respiration, ingestion, excretion and reproduction.
To link diverse physiologies of different types of living cells with waste management, it may be
understood that what appears as waste for us may actually be the natural living condition for a
bacteria or a fungal cell!
In fact, if it is attempted to synthetically design a chemical reaction for pollution remediation it is
possible that the attempt fails, or becomes too complex or too costly for practical purposes – in
contrast, it can be a one-step reaction for a bacterial or fungal cell. In other cases, even if a pollution
remediation is chemically feasible, using living cells can reduce operation or maintenance costs.
Objectives The objectives of this Chapter can be summarized as:
• To understand the underlying physiological mechanisms that make it possible for living
organisms to take up seemingly harmful pollutants.
• To understand how natural processes occurring in the living cells be designed to fit into
various pollution amelioration technologies
• To understand the basics of ex-situ and in-situ approaches to pollution amelioration
• To understand how technologies need to be designed differently for treating polluted soil or
polluted water
4.1 Overview of Processes Involved in Bioremediation and Phytoremediation
History
The concept of using batch-reactor type jars to bio-remediate wastewater was practically tried out in
the early 1960s, and the technology of bioremediation was born (Agnihotri 2017). However, it took

468 MGNCRE | E-Waste Management
468 MGNCRE | Reclamation and Remediation
nearly a decade for the technology to come out of the laboratory and be applied on-field. Also,
Chapelle (1999) in his studies mentioned that in the early 1970s, bioremediation efforts were
extended toward hydrocarbon-contaminated groundwater (Chapelle 1999). From then onwards,
there has been no looking back, with more and more natural as well as genetically modified
microbes being discovered or designed to make bioremediation the sophisticated technology it is
today.
Bioremediation
The process of pollution remediation involving microorganisms or their purified enzymes is called
bioremediation. Microorganisms or microbes are extremely tiny organisms, not visible to the naked
eye. While in classic microbiology (the branch of life science that studies microorganisms) virus,
bacteria, algae, fungi and Protista are included, from bioremediation perspective, research is largely
focused on bacteria and fungi (myco-remediation), which have acquired much significance.
The beauty of microorganisms lies in the fact that their natural metabolism processes are unique
and they can grow and reproduce using inputs far different from those required by plants, animals
or human beings. For instance, glucose is the most significant source of energy for all – plants make
it by themselves while animals get it from plants (herbivores), other animals (carnivores) or both
(omnivores). However, microbes are not limited to accepting glucose. For them, the source of
energy can be several, some of them extremely complex compounds.
In addition to this, in some cases, several microorganism species called extremophiles can exist in
environments where other organisms can never survive – for example, under extreme heat
(thermophiles), extreme cold (psychrophiles), pH extremes (acidophiles and alkaliphiles), extremely
high pressure (barophiles), high radioactivity (radiation-resistant) and even the absence of oxygen
(anaerobic).
Thus, given their extreme sturdiness and flexibility with using different sources of energy and
tolerating extreme conditions, microorganisms become ideal candidates for pollution remediation.
Not only can they tolerate the adverse environment created by the pollutant, they can use the
pollutant as a source of energy! In fact, the conditions deemed adverse for us are actually ideal and
optimum for a microorganism.
To better understand the diversity of metabolic processes microorganisms can display, a few details
must necessarily be comprehended:
All life on earth can largely be categorized into Autotrophic and Heterotrophic. While autotrophs
prepare their own food and are not dependent on other organisms, heterotrophs are dependent on
other organisms.

469 MGNCRE | E-Waste Management
469 MGNCRE | Reclamation and Remediation
Among autotrophs, there is a sub-division, depending on the source of energy – Photoautotrophs
(algae, photosynthetic bacteria) use light as the source of energy, while Chemoautotrophs (like
chemoautotrophic bacteria) harness the energy from inorganic chemical reactions. Both use carbon
dioxide as a carbon source.
The same sub-division heterotrophs – while Photoheterotrophs use light as the source of energy,
they are dependent on carbon compounds other than carbon dioxide. Similarly, chemoheterotrophs
can obtain energy from inorganic chemical reactions but cannot fix carbon dioxide and will require
other sources of carbon.
Figure 4.1: Basics of Microbial Metabolism
Thus, based on the wealth of microbial research, if such information emerges that bacteria X can
metabolize organic compound C (which happens to have contaminated a given site), a
bioremediation procedure can be designed and executed.
Interestingly, use as a source of energy or carbon is not the only mechanism by which a
microorganism may help remediate a contaminated site. There are a host of other processes by
which microorganisms take up pollutants. Some such processes are:
• Biosorption: a property of certain types of inactive, dead, microbial biomass to bind and
concentrate heavy metals from even very dilute aqueous solutions. Biomass exhibits this
property, acting just as a chemical substance, as an ion exchanger of biological origin.
• Bioaccumulation: a property by which certain elements are accumulated within the
microbial cell – not getting excreted or catabolized at the rate at which it is getting ingested.
• Bioleaching: extraction of metal from its compounds with the help of enzymatic processes
within a living cell
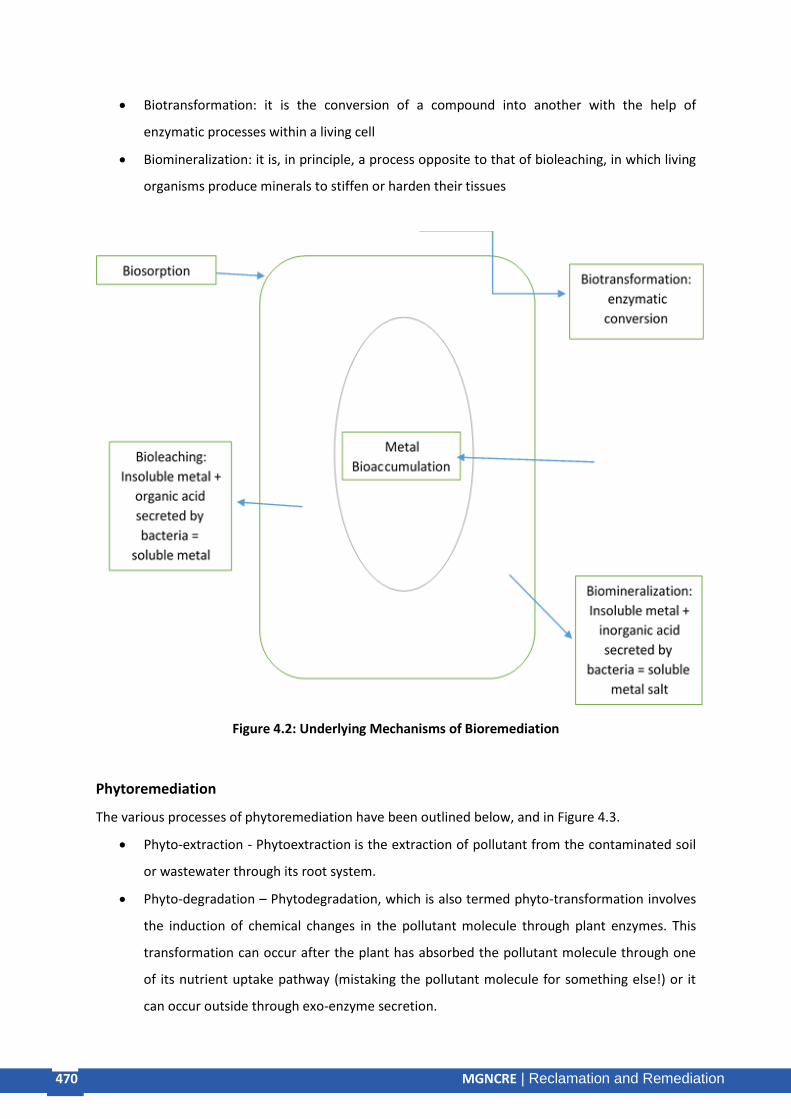
470 MGNCRE | E-Waste Management
470 MGNCRE | Reclamation and Remediation
• Biotransformation: it is the conversion of a compound into another with the help of
enzymatic processes within a living cell
• Biomineralization: it is, in principle, a process opposite to that of bioleaching, in which living
organisms produce minerals to stiffen or harden their tissues
Figure 4.2: Underlying Mechanisms of Bioremediation
Phytoremediation
The various processes of phytoremediation have been outlined below, and in Figure 4.3.
• Phyto-extraction - Phytoextraction is the extraction of pollutant from the contaminated soil
or wastewater through its root system.
• Phyto-degradation – Phytodegradation, which is also termed phyto-transformation involves
the induction of chemical changes in the pollutant molecule through plant enzymes. This
transformation can occur after the plant has absorbed the pollutant molecule through one
of its nutrient uptake pathway (mistaking the pollutant molecule for something else!) or it
can occur outside through exo-enzyme secretion.

471 MGNCRE | E-Waste Management
471 MGNCRE | Reclamation and Remediation
• Phyto-stimulation – Bacteria inhabiting the root zone of plants are stimulated by the plant
atmosphere such that they together assist in contamination removal. It may also be referred
to as plant-assisted bioremediation.
• Phyto-volatilization – Conversion of contaminants to the gaseous form after undergoing
phyto-transformation. Volatile organic compounds may be volatilized from stems or leaves
(direct) or from soil due to plant root activities (indirect).
• Rhizo-filtration – suitable plant species with stabilized root systems can absorb, concentrate,
and precipitate toxic metals when irrigated with contaminated water, or if growing in soil
with contaminated groundwater.
• Hyperaccumulation - Hyperaccumulator plants have the capacity to accumulate a substantial
amount of pollutant, usually heavy metals or metalloids, in their plant body. Sites of
accumulation are cell vacuoles, cell walls of roots, and bundle sheath of leaves.
• Hydraulic containment – Pollutant dissolved in groundwater can spread to an
unprecedented degree if left unchecked. Hydraulic containment is the activity of preventing
contaminated groundwater from spreading. This may be achieved with the help of deep-
rooted trees such as poplar.
• Phyto-capping - Phyto-capping may be defined as the dumpsite capping technology that
uses plants and unconsolidated soil to control and limit entry of water into waste (Lamb et
al. 2014).
• Phyto-desalination – Phytodesalination is the process of using halophytes (i.e., plants that
flourish on saline soil) to remove salt from the soil and make it more amenable for
cultivation.

472 MGNCRE | E-Waste Management
472 MGNCRE | Reclamation and Remediation
Figure: 4.3: Underlying Mechanisms of Phytoremediation
4.2 Bioremediation
Bioremediation technologies shall differ with:
• Type of waste – heavy metals, hydrocarbons, are the types of pollutants that can be
efficiently tackled with the help of bioremediation.
• Site where remediation is required
In general, in-situ (i.e., at the site itself) technologies are preferred over ex-situ ones wherein it is
necessary to physically remove the polluted component and transport it to site where remediation
efforts will be initiated. Usually, the ex-situ approach can be justified only if the site in question is
under threat, or the remediation process entails heavy machinery that cannot translocate onsite.
In-situ bioremediation technologies
In-situ soil bioremediation technologies have been described later in this unit (section 4.5). To
summarize here, a suitable microbial consortium or culture is sparged into the contaminated soil
layers and given additional dosages of required nutrients to help it grow. Additionally, oxygen or
ozone is also sparged into the contaminated soil layers if the microbial flora of interest is aerobic in
nature.
In-situ water bioremediation technologies have been established by various studies. One such
technology is that of Microbial Dosing, wherein a suitable microbial consortium or culture is added
to the water body in question. The natural microbial flora of the water body is augmented and
pollution is gradually remediated.
Rhizofiltration Phyto-stabilization
Phyto-volatilization
Phyto-stimulation
n
Phyto-degradation
Phyto-extraction
n
Phyto-volatilization
Phyto-volatilization

473 MGNCRE | E-Waste Management
473 MGNCRE | Reclamation and Remediation
Figure 4.4: In situ microbial dosing system
Bio-film formation is another in-situ water bioremediation. The bio-film technology mimics the
natural bio-film forming property of various microorganisms with the help of processes such as
adsorption, degradation and filtration. The nutrients required to assist microbial growth are
externally provided.
Figure 4.5 Biofilm formation
Polluted water body
Dosing tank
Delivery system
474 MGNCRE | E-Waste Management
474 MGNCRE | Reclamation and Remediation
Ex-situ bioremediation technologies
Invariably, ex-situ or offsite bioremediation technologies will be conducted in the liquid or slurry
phase within a bioreactor, or, if the physical state of the waste permits, then in the solid phase.
Ex-situ liquid or slurry-phase bioremediation is typically carried out in a bioreactor. A bioreactor is an
apparatus wherein a biological reaction or process is encouraged to take place, maintaining
optimum conditions for the growth of the microorganism within. A bioreactor typically operates at
the industrial scale and for profitable operations, though it can be scaled down to the pilot or
laboratory levels for research and development activities. A bioreactor may also be referred to as a
fermenter. Bacterial and fungal cultures as well as plant and animal cells can be cultivated in
bioreactors. In the context of bioremediation, though, we are restricting ourselves to bacterial and
fungal cultures. A typical bioreactor has been described below:
• Material used to make a bioreactor –
o It is most commonly fashioned out of stainless steel (for industrial and pilot scales),
though at the laboratory scale, glass may be preferred
o While the bioreactor vessel can take any shape and size depending on project-
specific requirements, it is essential that the vessel withstand sterilization - given
that it is a microbial process where contamination can reduce process efficiency, the
bioreactor vessel needs to be sterilized before the cocktail of growth media +
microbial culture + pollutant to be remediated is introduced into it
o In addition, it is significant that the bioreactor vessel is so constructed that there is
no scope of entry of non-sterile air /media/ water or any other substance during the
period (of a few hours to a few days) in which the microbial process is going on.
• A growth medium feeding pump – through this, a pre-determined optimal growth medium
rich in sufficient nutrients, is pumped into the bioreactor.
• Autoclave – to steam-sterilize the growth medium (steam sterilization is the most preferred
method for microbial growth media sterilization)
• An air feeding pump – for aerobic microbial systems, sterilized/filtered air that is free of
cross-contaminating microbes is introduced into the bioreactor.
• An air sparging system/ aerator – for efficient bubbling of air through the growth medium
• A stirrer/agitation system – a stirrer ensures that the air and nutrients are evenly distributed
within the bioreactor vessel, and none of the microbial cell is deprived of these growth
essentials. This enhances speed and efficiency of the bioremediation process
• Sensor probes – sensors of pH, temperature, pressure etc. yield real-time outputs of these
microbial growth-affecting parameters; they are indicators of whether the microbial growth

475 MGNCRE | E-Waste Management
475 MGNCRE | Reclamation and Remediation
is following its usual trajectory, and whether the bioremediation process is proceeding with
its predicted efficiency
Contrastingly, in an anaerobic bioreactor, the stress is on
• Stress on maintaining oxygen-free conditions within the bioreactor, as anaerobic microbes
perish upon exposure to air
• Absence of air pumping and sparging system
• Release mechanism for the gases that will be inevitably generated
In Figures 4.5 and 4.6 below, a typical aerobic and anaerobic reactor system has been depicted,
respectively.
Figure 4.6: A Typical Aerobic Bioreactor

476 MGNCRE | E-Waste Management
476 MGNCRE | Reclamation and Remediation
Figure 4.7: A typical anaerobic reactor system
Sterilization protocol
Steam Sterilization – an autoclave is an apparatus used commonly for steam sterilization. As per
microbiology standards, an autoclave regime of 15 minutes sterilization at 15 pounds per square
inch (psi) pressure at a temperature of 120°C is considered sufficient to destroy even thermophilic
microbes and their spores.
Filtration – media components that are heat-labile (i.e. will degrade under high temperature) can be
filter-sterilized, using a filter of 0.2 micron or smaller pore size.
Radiation – ultraviolet rays in the laminar air flow units are commonly used for surface sterilization
of the working surface
Chemical disinfection for glassware is also a part of the standard procedures.
Disadvantages of bioremediation
• Requirement of acclimatization
• Risk of contamination
• If optimum growth conditions are not met, process becomes inefficient
• Inability to perform in wastewater streams with widely fluctuating chemical constitution
• Not an instantaneous solution
Case studies
Mandal et al. (2012) prepared a consortium of four bacterial species, selecting their isolates from
crude oil-contaminated soil samples from various oil refineries and oil exploration sites of India. As
per their report, the consortium could efficiently remediate crude oil-contaminated soil.
Gas vent
Inlet of material to
be remediated
Outlet
Access cover
Slurry
Expression chamber
Digestate

477 MGNCRE | E-Waste Management
477 MGNCRE | Reclamation and Remediation
Istok et al. (2004) reported the in situ bioreduction of technetium and uranium in a nitrate-
contaminated aquifer; they concluded that the natural bio-reduction of Uranium (VI) and
Technetium (VII) mixtures at high-nitrate concentrations could be stimulated by the addition of
organic compounds such as ethanol or acetate, which served as electron donors.
Algae can be also used for the removal of nonconventional pollutants such as uranium from
wastewater (Kalin et al. 2004).
Mingjun et al. (2009) described the in-situ bioremediation of a eutrophic lake, namely Yingze Lake in
Anshan, China for four months. Microbial consortium was prepared from the bacterial species
screened from the lake waters and sediment.
To-do activity: Visit to a biomethanation or biogas plant near you; both are examples of anaerobic
reactions. Prepare a plan for establishing a biomethanation plan for your city/ bulk generators.
4.3 Phytoremediation
Phytoremediation can be defined as “the efficient use of plants to remove, detoxify or immobilize
environmental contaminants in a growth matrix (soil, water or sediments) through the natural
biological, chemical or physical activities and processes of the plants”.
In situ technologies
Floating treatment wetlands (FTWs) are currently gaining popularity as an in-situ phytoremediation
technology for water-based ecosystems. Despite the inherent difficulties in providing the necessary
hydraulic retention time (HRT), variants of this technology continue to be used. FTWs mimic nature’s
floating wetlands, and employ emergent aquatic plants such as Canna, Typha sp., Scripus, etc. Not
only do the FTWs serve as a contaminant removal system but serve the ecological role of bird
perches and fish egg-laying sites.

478 MGNCRE | E-Waste Management
478 MGNCRE | Reclamation and Remediation
Figure 4.8: Initial Prototype of CSIR-NEERI’s Floraft Technology
In situ soil phytoremediation is a popular approach for pollution amelioration. The use of
plants to ‘cap’ landfills (Phyto-capping), as described in Unit 3, may be observed as an in-situ
phytoremediation approach for landfill sites.
Depending on how deep the contaminant has penetrated the soil layers, the decision to use
deep-rooted trees or shoots with shorter root depths can be selected.
Ex-situ technologies
Constructed Wetland technology has been a popular ex-situ phytoremediation technology of choice.
Constructed wetland technology
The constructed wetland is an artificial wetland, constructed of suitable locally available
construction material, which is used to mimic natural ecosystems using soil and local vegetation, and
aimed at the remediation of polluted water, sewage, or industrial effluent. Constructed wetlands are
engineered to suit local conditions and are designed for treating specific types of pollutants.
Constructed wetland has been discussed here as an off-site or ex-situ remediation technology.
However, constructed wetlands are simple enough to be constructed on-site; the wastewater
stream to be treated can be pumped into it, given the adequate hydraulic retention time, and then
pumped back.
Typha and Phragmites are two emergent macrophytes that are used most frequently in constructed
wetland systems.

479 MGNCRE | E-Waste Management
479 MGNCRE | Reclamation and Remediation
Constructed wetland technology is often used after primary and secondary treatments, as a
polishing tertiary treatment.
Depending on the direction of flow of the effluent through the constructed wetland, the CW design
can be segregated into horizontal and vertical flow systems. While in the horizontal flow system the
inlet and outlet are at the two ends, in the vertical flow vertical flow constructed wetland system,
the effluent is drained from the bottom of the bed and loaded on the top with pipes.
Figure 4.9: Representation of Horizontal Flow Constructed Wetland (Source: Tilley et al. 2014)
Figure 4.10: Representation of Vertical Flow Constructed Wetland (Source: Tilley et al. 2014)

480 MGNCRE | E-Waste Management
480 MGNCRE | Reclamation and Remediation
The scientific community stands divided as to whether the vertical flow CW is more efficient than
the horizontal one. Few authors report nearly equal performance (Luederitz et al. 2001), whereas
other studies indicate that while the vertical system is more efficient at removing some pollutants,
the horizontal system displays its higher efficiency with other pollutants (Yalcuk and Urgulu 2009).
Hence, hybrid systems, as in, a combination of horizontal and vertical constructed wetlands have
also been engineered and reported to show good efficiency.
Case studies
• Selvaraj et al. (2013) in his recent studies reported that Brassica junceato be an efficient species
for arsenic phytoremediation
• Banach et al. (2012) concluded that Azolla sp. was capable of accumulating significant quantities
of mercury, cadmium, lead, chromium, arsenic, silver, platinum and gold.
• In a study by Arora et al (2009) a pot trial was set up in order to evaluate bioremediation
efficiency of Panicum virgatum (switchgrass) in association with PAMs (Plant Associated
Microbes). Growth parameters and bioremediation potential of endomycorrhizal fungi (AMF)
and Azospirillum against different concentrations of lead and cadmium were compared.
• Barac et al. (2009) in his studies reported that the hydraulic containment of a BTEX plume in
groundwater was reported by poplar tree plantations near a car factory. 275 poplar trees took
about 5 years to grow down to the groundwater level and then significantly reduced the spread
of the BTEX plume.
• Hadad et al. (2006) demonstrated the phytoremediation of industrial wastewater using
macrophytes such as Typha domingensis in a pilot-scale constructed wetland. The highly alkaline
wastewater was also rich in nickel, zinc and chromium; T. dominngensis was found to effectively
phyto-remediate the wastewater.
• Zimmels et al. (2008) reported the use of floating aquatic plants water hyacinth and water
cabbage (also known as water lettuce) for sewage treatment.
• Francis et al. (2017) in his recent study reported that in-situ soil phytoremediation for an arsenic-
contaminated site was carried out in a location in China. The arsenic hyperaccumulating plant
Pteris vittata was grown in the contaminated soils amended with citric acid and EDTA. The
results showed a positive impact on the contaminated soil.
• Pongwichian et al. (2014) describe the phytoremediation of salinity-infused soils in the coastal
areas of Petchabauri in Thailand. The species used were Sporobolusvirginicus, Distichlis spicata,
and Spartina patens.

481 MGNCRE | E-Waste Management
481 MGNCRE | Reclamation and Remediation
4.4 Bio-mining of Waste
Popular connotation
Bio-mining of waste should not be confused with the more popular connotation of the term Bio-
mining. Bio-mining popularly refers to the extraction of metals of economic interest from rock ores
or mine and industrial wastes using microorganisms. Understandably, bio-mining has been
considered a greener technology than conventional mining that relies heavily on environmentally-
harmful chemicals.
Industrial and mine waste management through bio-mining
Various anthropogenic activities such as mining, metallurgy, leather tanning, electroplating and
industries manufacturing paints, dyes, batteries, photovoltaic cells etc. can generate wastewater
streams rich in metals. Bio-mining can be offered as a green solution herein, aiding recovery of
metals that are scarce and valuable; in addition, this reduces pressure on natural mine resources if
taken up on full scale.
As outlined above, microbes are capable of multiple metabolic pathways that are far removed from
modern life forms. The extremophiles and metal-metabolizing microbes can carry out bio-leaching
and remove metals from their ores. Unlike chemical processes, even low-yielding ores can be
utilized. This bio-leaching can be carried out under controlled environments in bioreactors, and the
metal of interest can then be extracted from the microbial biomass in a two-step reaction.
Case studies
In a novel attempt, Hong and Valix (2014) reported the use of acidophilus sulfur-oxidizing bacteria
for bio-leaching of electronic waste. They used Acidithiobacillusthiooxidans on Cu-rich electronic
waste and found that e-waste toxicity did not deter bacterial growth.
Stirrer
pH electrode
Thermostat
Air sparger
Figure 4.11: Bio-mining of mine tailings for metal concentration; Bioreactor 1 (step 1): Bio-leaching of tailings; Bioreactor 2 (step 2): Selective precipitation of metal

482 MGNCRE | E-Waste Management
482 MGNCRE | Reclamation and Remediation
Hoque and Philip (2011) enlist several case studies wherein bio-hydrometallurgical processes were
employed to recover heavy metals from a variety of secondary sources including low grade ores,
wastewater streams, river sediments and electronic waste ashes.
Mishra and Rhee (2014) described the bio-leaching of metals from industrial solid waste. They
emphasized the conversion of insoluble sulfide ores to their corresponding soluble sulfate forms
under acidic conditions, with the help of acidophilus bacteria such as Acidithiobacillusferrooxidans,
Acidithiobacillusthiooxidans, Leptospirillumferrooxidans and Sulfolobus spp.
In Table 4.1 below, bio-leaching efficiency of different metals from different waste streams has been
outlined:
Table 4.1: Bio-leaching efficiency of different metals from different waste streams
Type of waste
Bioleaching
efficiency
Microorganism Reference
Fly ash Al:97%; Zn:98%; Fe:56%
Aspergillus niger Xu and Ting
(2009)
Sewage sludge
Cu:64%; Zn:76%; Ni:58%; Cr:52%
Acidithiobacillusthiooxidans Pathak et al.
(2009)
Zn:89%; Cu:80%; Pb:50%; Cr:32%
Iron-oxidizing bacteria Wen et al. (2013)
Electronic scrap
Cu:90%; Al:80%; Ni:82%; Zn:80%
Thermoplasmaacidophilum&Sulfobacillusthermosulfidooxidans
Ilyas et al. (2013)
Cu & Sn:65%; Al, Ni, Pb&
Zn:>95%
Aspergillus niger& Penicillium simplicissimum Brandl et al. (2001)
Cu:71% Acidithiobacillusferrooxidans Yang et al. (2009)
Au:68.5% Chromobacteriumviolaceum Brandl et al. (2008)
Spent battery
Co:99.9% Acidithiobacillusferrooxidans Zeng et al. (2012)
Co:100% Acidithiobacillusferrooxidans Velgosova et al. (2013)
Co:>90; Acidithiobacillus spp. Xin et al.

483 MGNCRE | E-Waste Management
483 MGNCRE | Reclamation and Remediation
Ni:>80% (2009)
Co:65% Acidithiobacillusferrooxidans Mishra et al.
(2008)
Spent petroleu
m catalyst
Fe, Ni & Mo:100%;
Al:67%
Acidianusbrierleyi Bharadwaj and Ting
(2013)
Al:35%; Mo:83%; Ni:69%
Acidianusbrierleyi Gerayeli et al.
(2013)
Al:63%; Co:96%; Mo:84%; Ni:99%
Acidihtiobacillus spp. Gholami et al.
(2011)
Ni:88%; Mo:46%;
V:95%
Acidithiobacillusthiooxidans Mishra et al.
(2008)
Spent fluid
cracking catalyst
Al:54.5%; Ni:58.2%;
Aspergillus niger Saanthiya and Ting
(2005)
Mo:82.3% Mo:99.5%
; Ni:45.8%; Al:13.9%
Aspergillus niger Amiri et al. (2012)
W:100%; Mo:92.7%
; Ni:66.4%;
Al:25%
Penicillium simplicissimum Amiri et al. (2011)
Waste electronic
device
Au:11.3% Chromobacteriumviolaceum Chi et al. (2011)
Jewelry waste
Ag:5% Pseudomonas plecoglossicida Brandl et al. (2008)
Spent automobi
le catalytic
converter
Pt:0.2% Pseudomonas plecoglossicida Brandl et al. (2008)
Reproduced from Mishra and Rhee (2014)
Bio-mining of waste: the context in India
Now, in the Indian context, Bio-mining of waste refers to the reduction in volume of garbage in
landfill sites through –

484 MGNCRE | E-Waste Management
484 MGNCRE | Reclamation and Remediation
• Physically mining for recoverable waste portions using appropriate machinery (detailed in
Unit 3)
• Use of bio-culture to reduce garbage volume
• Transfer of the non-biodegradable portion of the waste for energy recovery
The terminology became popular since its mention in the Solid Waste Management Rules, 2016,
post which, several municipal tenders were published. Currently, few such projects are underway
while some are slated to be started in the near-future.
In the Mulund dumping ground in Mumbai, a bio-mining project has been proposed. While that is a
large dumpsite with associated complexities, South Kannanaur town panchayat in Tamil Nadu
reported a successful case study of the same. With about 3400 households, the waste generated is.
With the help of a microbial culture, nearly 70 tons organic manure was formed over a period of 45
days, which was later distributed to local farmers. Thus, to summarize the process in Figure 4.11
below:
Figure 4.12: Overview of the Dumpsite Bio-mining Process in the context of India
4.5 Soil-related aspects
Importance of soil resources
Blanco and Lal (2010) describe soil as the “most fundamental and basic resource”. Human survival
owes aplenty to soil, given that all terrestrial vegetation (our source of oxygen, food, medicines,
fiber etc.) grows in soil. Without a doubt, human food security is dependent on soil.
However, soil is much at risk today, depleting under the twin stressors of erosion and pollution.
Juxtaposed with the fact that soil is a non-renewable source (over the human timeline), it becomes
crucial to conserve and remediate soil.
Soil monitoring parameters
Physical and chemical parameters of soil need to be monitored to –

485 MGNCRE | E-Waste Management
485 MGNCRE | Reclamation and Remediation
• Understand the baseline environmental status
• For agricultural purposes
• For risk assessment in contaminated areas or in areas at risk of contamination (i.e., areas
near a nuclear power facility, or hazardous waste treatment facility etc.)
The physical parameters of soil that must be monitored include –
Soil color – soil color indicates the mineral content of soil.
Soil texture – i.e., whether soil is clayey, sandy or silty or a combination. Soil texture may be
determined as per the Soil Texture Triangle given in Figure--- below.
Figure 4.13: Soil Texture Triangle
Other important physical parameters are – bulk density, particle density, pore space, moisture
holding capacity and Attenberg limits. Phogat et al. (2015) in his studies mentioned that physical
characteristics of soil are important as they help decide how much water the soil can hold, the
movement and retention of nutrients in its pores, its microbial life supporting ability, air and heat
flow, or how easy or difficult it will be for plant roots to penetrate the soil.
Important chemical properties of soil include its pH (which helps decide whether soil is acidic/
alkaline/ neutral), conductivity (which indicates how), and its nutrient (nitrogen- N, phosphorus- P
and potassium- K content) content (which helps decide the fertilization regimen).
Sensor-based soil monitoring
Badhe et al (2018) worked on sensors that could estimate atmospheric temperature & humidity, soil
pH, soil moisture, and NPK (nitrogen, phosphorus, potassium) sensors.

486 MGNCRE | E-Waste Management
486 MGNCRE | Reclamation and Remediation
Dhivya et al (2015) reported a smart sensor-based soil monitoring system wherein moisture, light
and temperature were measured using sensors and could give output in an Android smart phone.
Soil contamination
Soil remediation technologies- in-situ versus ex-situ approaches
In-situ remediation approaches may come across as –
• More efficient, as it negates the possibility of residual contamination
• Negates the risk of cross-contamination during transport
• Less disruptive
Soil remediation technologies – Bio-remediation vs. physico-chemical approaches
While bioremediation processes involve living organisms (largely microbes) to metabolize the
pollutants and ameliorate contamination, in physico-chemical processes, it is done so through
engineering and the use of chemicals. However, in several technologies, these boundaries are
difficult to demarcate and a combination of approaches is required to ensure efficiency.
Advantages of bio-remediation
• Bio-remediation, when compared with the corresponding physic-chemical process may
come across as economical
• As an in-situ approach, it creates relatively less environmental disruption in contaminated
sites
• In some cases, it may be the only feasible solution, as the microbial systems may possess an
entire metabolic process to digest some pollutant naturally
Soil bio-remediation
Bio-venting – Bioventing is an in-situ remediation technology wherein injection wells are used to
force air or oxygen or ozone, along with other nutrients, into the layers of contaminated soil with
the aim of encouraging the local soil micro-flora to flourish and bio-remediate the soil.

487 MGNCRE | E-Waste Management
487 MGNCRE | Reclamation and Remediation
Figure 4.14: Illustration of Bioventing
In contrast, on several occasions, anaerobic microorganisms fare better than their aerobic
counterparts, in which case, no oxygen /air /ozone is sent into the contaminated soil pile; instead,
the anaerobic microbial culture /consortium and the substrates likely to serve as electron acceptors
to them to aid their respiration and metabolism are injected.
It must be understood that in the immediate wake of soil contamination, urgent and active efforts
to ameliorate the situation must be taken. However, more often than not, complete remediation will
take a long period of time. During this period, it is the native soil micro-flora that gradually ensures
that the soil environment returns to normalcy. During this period, minimal human intervention is
required – to the extent of periodically monitoring the necessary parameters to ascertain that
natural bioremediation is in progress. This process has been termed as Monitored Natural
Attenuation.
Ex-situ bioremediation of soil
Bio-remediation processes that are conducted off-site (that is, contaminated soil is removed and
carried over to the site where remediation facilities have been housed) are called ex-situ processes.
The bioremediation process may be conducted in a slurry phase (after mixing soil with water) or
solid phase.
In the slurry phase, the soil-water suspension is infused with the relevant microbial culture or
consortium and other necessary nutrients in a bio-reactor or fermenter. To maintain ideal growth
conditions, temperature, pressure and other environmental parameters are maintained in the
Soil gas monitoring wells
Air flow
Surface
Vacuum pump Air-water
separator
Discharge to air
Vapor treatment
Air treatmen
t

488 MGNCRE | E-Waste Management
488 MGNCRE | Reclamation and Remediation
optimum ranged. Also, the slurry is stirred continuously to ensure that oxygen and nutrients are
available to the microbes. During the bio-remediation process, samples are regularly withdrawn
from the bio-reactor and tested to ascertain the rate at which the contaminant is getting
metabolized. Once the remediation process is deemed complete, the soil is dewatered and returned
to the site. Robles-González et al. (2008) give a detailed description of slurry bioreactors for soil/
sediment treatment.
In Solid-phase soil bioremediation, the process is above-ground, and as indicated, occurs in the solid
phase with water inputs reduced to a minimum. Just as in a bio-reactor, for solid-phase bio-
remediation as well growth conditions for the microbe need to be maintained at the optimum level.
Though requiring lower maintenance than slurry-phase bioremediation, solid-phase bioremediation
requires ample land space and is a relatively slower process. Processes involved are: land-farming,
soil bio-piles, and composting.
Figure 4.15: Illustration of Slurry-phase Soil Bioremediation
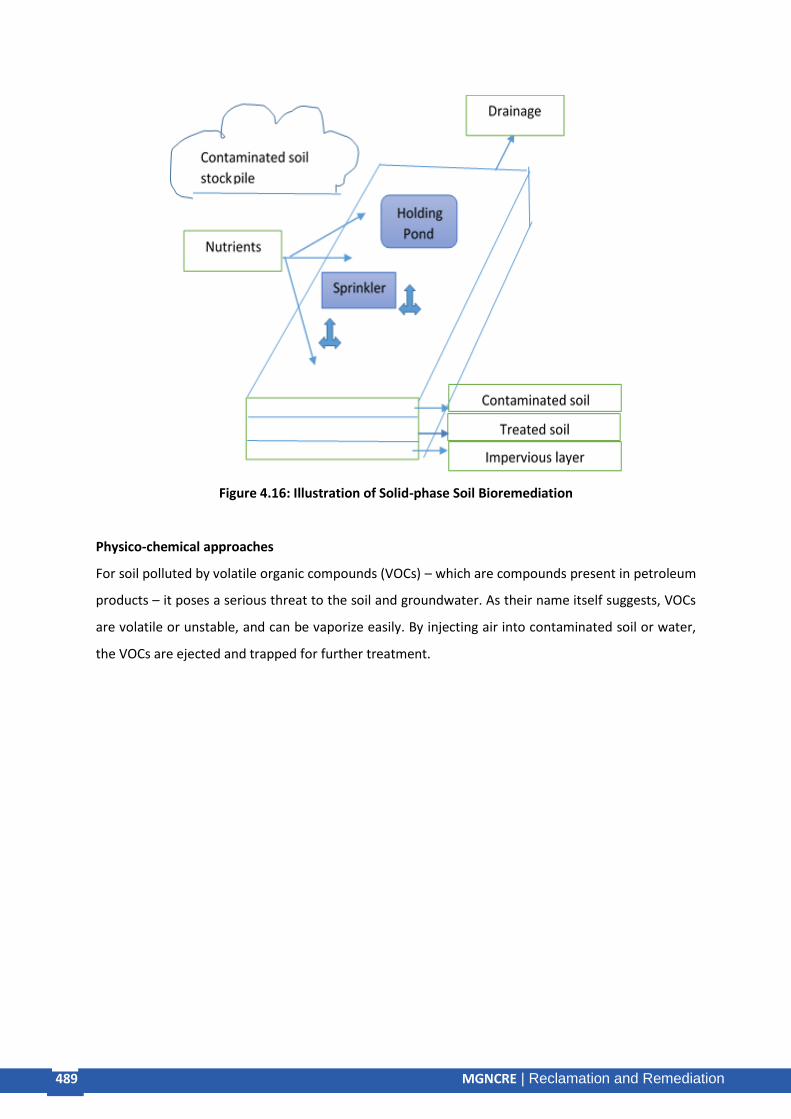
489 MGNCRE | E-Waste Management
489 MGNCRE | Reclamation and Remediation
Figure 4.16: Illustration of Solid-phase Soil Bioremediation
Physico-chemical approaches
For soil polluted by volatile organic compounds (VOCs) – which are compounds present in petroleum
products – it poses a serious threat to the soil and groundwater. As their name itself suggests, VOCs
are volatile or unstable, and can be vaporize easily. By injecting air into contaminated soil or water,
the VOCs are ejected and trapped for further treatment.

490 MGNCRE | E-Waste Management
490 MGNCRE | Reclamation and Remediation
Figure 4.17: Illustration of Air-sparging for in-situ soil remediation
Night-soil management
Night soil refers to human excreta obtained from cesspools, pit latrines, and septic tanks, etc. It is an
obsolete term, now largely replaced by the term ‘fecal sludge’. The approach to fecal sludge
management varies with the nature of human habitation, being more technology-driven in urban
areas and relying on manual and non-technical approaches in rural regions.
Challenges of night soil management are:
• While now the age-old practice of manual scavenging has been illegalized and is largely
forgone, it still persists in remote rural pockets
• Also, a pervasive human reluctance to think of fecal sludge as useful often leads to this
valuable resource getting wasted
• Worse still, due to irresponsible, non-technical disposal in many areas, it can actually harm
human health and the environment
In urban areas, most of the households are a part of the sewerage grid, where sewage is collected in
sumps, pumped out into pipelines and from there, disposed of into the nearest water body (sea or
river) with or without treatment.
However, in urban areas the challenge persists in urban slums that are off the sewerage network.
The septic tanks of many densely-populated slums are inaccessible. Hence, here too, the approach
to fecal sludge management is manual, with some technical assistance.
Blower
Groundwater level
Pollutant VOCs
Hydrocarbon vapors in soil pores
Air-sparging
well
Extraction well
Treatment Unit

491 MGNCRE | E-Waste Management
491 MGNCRE | Reclamation and Remediation
In rural areas, where it is difficult for technologies to be set up and maintained – given the high costs
associated with skilled manpower, energy and chemical inputs – it makes more sense to employ
green technologies.
Outline of a typical sludge management plan has been provided in Figure 4.17 below:
Fig.4.18: Flow Diagram of steps in sludge management
However, the most significant aspect of night soil management is to change the average individual’s
perception about it, recognizing it as the resource that it is:
• Night soil /fecal sludge makes excellent manure
• It can also be used as a soil-conditioner
• Alternately, it can be used for landfilling
Thickening
Stabilization
Conditioning
Dewatering
Heat drying
Disposal
• Pathogen Destruction
• Volume and Weight reduction
• Odor control
• Putrescibility Control
• Gas Production
• Improve dewatering or thickening rate
• Improve solids capture
• Improve compatibility
• Stabilization
• Water removal
• Sterilization
• Utilization
• Water removal
• Volume and weight reduction
• Change to Damp cake
• Utilization (cropland)
• Utilization (Land reclamation)
• Disposal (Landfill)
• Water removal
• Volume reduction
• Post process efficiencies
• Blending

492 MGNCRE | E-Waste Management
492 MGNCRE | Reclamation and Remediation
In Table 4.2 below, the equipment utilized in different stages of sludge management have been
enlisted:
Table 4.2: Equipment used in different stages of sludge management
Process Equipment/Procedure
Sludge Thickening Gravity Thickener
Centrifuge
Sludge Stabilization Lime addition
Sludge Conditioning
Charge neutralization
Polymer bridge formation
Sludge Dewatering Belt Filter Press
Heat Drying Direct/indirect dryers
Summary
Thus, to summarize, by a number of natural processes, bacteria, fungi, algae and plants can either
passively trap pollutants onto their surfaces, or take them inside their cells, where they either
accumulate them within or metabolize them into less harmful or harmless end-products.
Several technologies have been envisaged to ensure that these natural processes become
quantifiable, replicable and scalable - and hence, practically usable for actual pollution remediation.
In-situ technologies are applied on the site, while ex-situ technologies require off-site transport of
the polluted material. The selection of the most suitable technology depends on actual site
conditions, available skill-set and available technologies.
Bioremediation and phytoremediation technologies are central to the vision of sustainability, given
their low dependence on energy, chemical and manpower with comparable efficiency to
conventional technologies in several cases. These green technologies need to be explored further
with respect to their applicability in different scenarios, and present ample business opportunity
given their attractive features.
Model questions
Q. Explain clearly how in some cases microbial treatment of waste is the only feasible solution.
Q. In what cases it would not be possible to employ a Bioremediation approach to waste treatment?
Q. Outline an innovative business plan with the following inputs – Gram Panchayat, Swachh Bharat
Abhiyan, a green category manufacturing industrial plant in the vicinity, Phytoremediation approach.

493 MGNCRE | E-Waste Management
493 MGNCRE | Reclamation and Remediation
Q. What is bio-mining of industrial waste? How can you prepare a business case around it, with the
understanding that it is a new field with few set protocols?
Q. Despite the associated social challenges, can you envisage night soil as a resource and prepare a
business case for its multifarious uses?
Reading material
Willey, N. (Ed.). (2006). Phytoremediation: methods and reviews (Vol. 23). Springer Science &
Business Media.
Singh, S. N., & Tripathi, R. D. (Eds.). (2007). Environmental bioremediation technologies. Springer
Science & Business Media.
Soil Science: An Introduction, Edition: First, Publisher: Indian Society of Soil Science, Editors: Rattan
R.K., Katyal J.C., Dwivedi B.S., Sarkar A.K., BhattachatyyaTapan, Tarafdar J.C., Kukal S.S., pp.135-171
Reference:
1. Agnihotri, V. (2017). Advancement in Bioremediation of Pharmaceutical and Personal Care Products. In Handbook of Research on Inventive Bioremediation Techniques (pp. 451-469). IGI Global.
2. Arora, K., Sharma, S., & Monti, A. (2016). Bio-remediation of Pb and Cd polluted soils by
switchgrass: a case study in India. International journal of phytoremediation, 18(7), 704-709.
3. Badhe, A., Kharadkar, S., Ware, R., Kamble, P., & Chavan, S. (2018) IOT Based Smart
Agriculture And Soil Nutrient Detection System.
4. Barac, T., Weyens, N., Oeyen, L., Taghavi, S., van der Lelie, D., Dubin, D., ... &Vangronsveld, J.
(2009). Field note: hydraulic containment of a BTEX plume using poplar trees. International
journal of phytoremediation, 11(5), 416-424.
5. Blanco, H., & Lal, R. (2010). Soil and water conservation. Principles of Soil Conservation and
Management. Springer, 2.
6. Chapelle, F. H. (1999). Bioremediation of petroleum hydrocarbon‐contaminated ground
water: The perspectives of history and hydrology. Groundwater, 37(1), 122-132.
7. Dhivya, J., SivaSundari. R, Sudha S., Thenmozhi R. (2016), Smart Sensor Based Soil
Monitoring System, International Journal of Advanced Research in Electrical, Electronics and
Instrumentation Engineering (An ISO 3297: 2007 Certified Organization)Vol. 5, Issue 4
8. Hadad HR, Maine MA, Bonetto CA (2006) Macrophyte growth in a pilot-scale constructed
wetland for industrial wastewater treatment. Chemosphere 63: 1744-1753.
9. Hong, Y., &Valix, M. (2014). Bioleaching of electronic waste using acidophilic sulfur oxidising

494 MGNCRE | E-Waste Management
494 MGNCRE | Reclamation and Remediation
bacteria. Journal of cleaner production, 65, 465-472.
10. Hoque, M. E., & Philip, O. J. (2011). Biotechnological recovery of heavy metals from
secondary sources—An overview. Materials Science and Engineering: C, 31(2), 57-66.
11. Istok J, Senko J, Krumholz L, Watson D, Bogle M, Peacock A, Chang Y, White D: In situ
bioreduction of technetium and uranium in a nitrate-contaminated aquifer. Environ Sci
Technol 2004, 38:468-475.
12. Kalin M, Wheeler W,Meinrath G (2004) The removal of uranium from mining waste
water using algal/microbial biomass. Journal of environmental radioactivity 78: 151-177.
13. Luederitz, V., Eckert, E., Lange-Weber, M., Lange, A., &Gersberg, R. M. (2001). Nutrient
removal efficiency and resource economics of vertical flow and horizontal flow constructed
wetlands. Ecological Engineering, 18(2), 157-171.
14. Mandal, A. K., Sarma, P. M., Jeyaseelan, C. P., Channashettar, V. A., Singh, B., Lal, B., & Datta,
J. (2012). Large scale bioremediation of petroleum hydrocarbon contaminated waste at
indian oil refineries: case studies. Int. J. Life Sci. Pharm. Res, 2(4), L114-L128.
15. Mingjun S, YanqiuW,Xue S (2009) Study on bioremediation of eutrophic lake. Journal of
Environmental Sciences 21: S8-S16.
16. Mishra, D., & Rhee, Y. H. (2014). Microbial leaching of metals from solid industrial
wastes. Journal of Microbiology, 52(1), 1-7.
17. Pongwichian, P., Yuwaniyama, A., Dissataporn, C., Im-Erb, R., Kohno, E., Roy, K., &Sasada, K.
(2014). Utilization of Salt Tolerant Species for Rehabilitation of Coastal Saline Soil in
Petchaburi Province Thailand. Indian J. Ecol, 41(1), 53-56.
18. Robles-González, I. V., Fava, F., & Poggi-Varaldo, H. M. (2008). A review on slurry bioreactors
for bioremediation of soils and sediments. Microbial Cell Factories, 7(1), 5.
19. Tilley, E. (2014). Compendium of sanitation systems and technologies. Eawag.
20. Yalcuk, Arda&Ugurlu, Aysenur. (2009). Comparison of Horizontal and Vertical Constructed Wetland Systems for Landfill Leachate Treatment. Bioresource technology. 100. 2521-6. 10.1016/j.biortech.2008.11.029.
21. Zimmels Y, KirzhnerF,Malkovskaja A (2008) Application and features of cascade aquatic
plants system for sewage treatment. Ecological engineering 34: 147-161.

495 MGNCRE | E-Waste Management
495 MGNCRE | Reclamation and Remediation
Chapter 5 Multi-Criteria Decision Analysis (MCDA)
Introduction Public decision-making is a challenging task given that any social subject has multiple facets, multiple
criteria and sub-criteria with varying weights and multiple viewpoints and preferences. In this light,
making the correct or most suitable decision is a tough responsibility. Be it philosophy or the more
prosaic concerns of welfare economics or utility theory, decision-making is a central concern.
A decision-maker often questions –
• What alternative or choices are available?
• What are the criteria to be considered for making the right selection?
• Which criteria directly impact the decision-making and which do so indirectly?
• Does each criterion have equal importance?
• If not, which is the most important criterion?
Such questions cannot be answered randomly, or on the basis of subjective, individual viewpoints.
Mathematical data analysis comes to the aid in such circumstances.
Objectives
The objective of this unit is to:
o Understand the fundamentals of the MCDA approach
o Elucidate the working principle of popular MCDA tools such as AHP, TOPSIS and ELECTRE
o Enlist the software packages that can be used to process raw data using one or more of the
MCDA tools
o Comprehend how MCDA tools can be applied to decision-making challenges in waste
management by understanding the drivers and challenges, and studying relevant case
studies

496 MGNCRE | E-Waste Management
496 MGNCRE | Reclamation and Remediation
5.1 MCDA – Overview, History and Current Trends
Even the simplest of decisions in one’s day-to-day life depends on multiple criteria. For instance, the
purchase of a car is a serious decision for a middle-class family who would base its final judgment on
criteria such as –
• Size and style of the vehicle
• Cost
• Fuel economy
• Safety features
• Comfort
Now under each criterion, it is possible to have a set of sub-criteria. For instance, a few sub-criteria
for the simplified example of car purchase have been provided:
• Size and style of the vehicle
o Sedan / Multi-utility vehicle/ Minimum-budget car
o Over-all look
• Cost
o Minimum down payment
o Easy EMI options
• Fuel economy
o Type of fuel used (CNG/ petrol/ diesel)
o Mileage
• Safety features
o Power brakes
o Seat belts
o Air bags
o Reverse sensing system
o Head injury protection
• Comfort features
o Leg-space
o Seat breadth
o Seat cushion covers
Now, it is necessary to understand if the decision-makers given equal importance to each criterion.
For instance, the cost becomes a critical criterion for a middle-class family. Similarly, comfort-related
aspects would score lower than safety features. Next, the decision-maker would draw up a list of
options – what the market has to offer in terms of four-wheelers. Following this, a score from 0-1
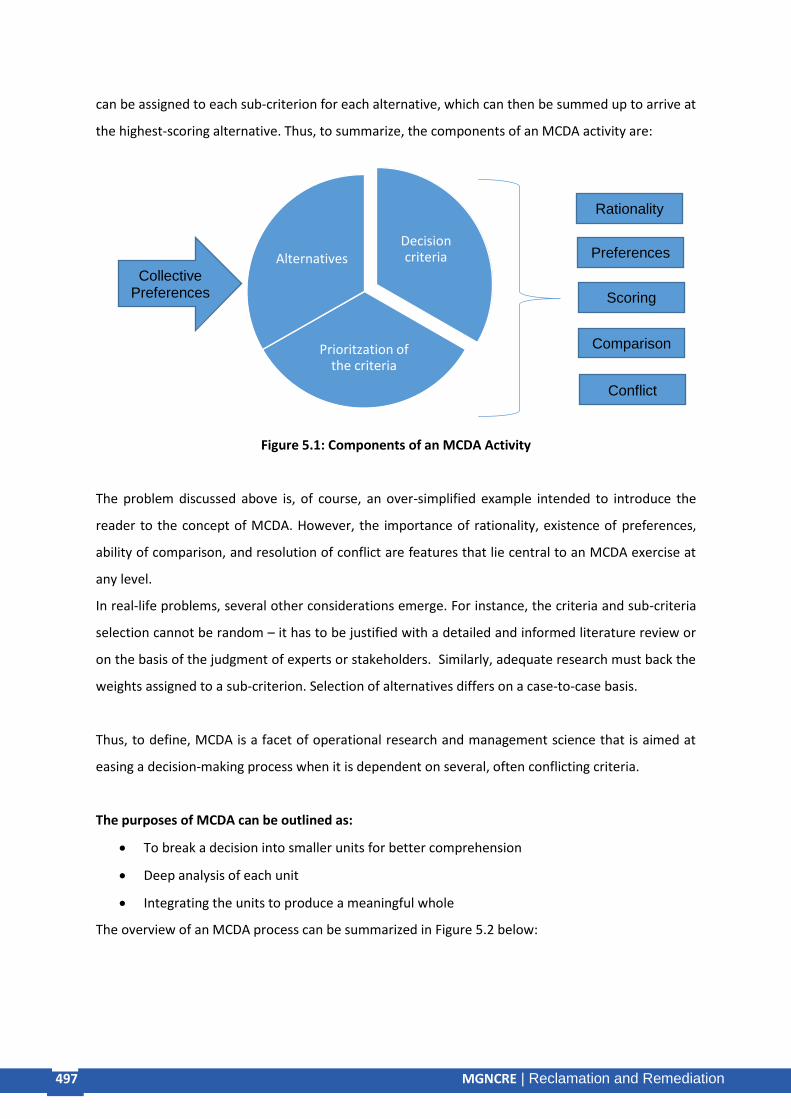
497 MGNCRE | E-Waste Management
497 MGNCRE | Reclamation and Remediation
can be assigned to each sub-criterion for each alternative, which can then be summed up to arrive at
the highest-scoring alternative. Thus, to summarize, the components of an MCDA activity are:
Figure 5.1: Components of an MCDA Activity
The problem discussed above is, of course, an over-simplified example intended to introduce the
reader to the concept of MCDA. However, the importance of rationality, existence of preferences,
ability of comparison, and resolution of conflict are features that lie central to an MCDA exercise at
any level.
In real-life problems, several other considerations emerge. For instance, the criteria and sub-criteria
selection cannot be random – it has to be justified with a detailed and informed literature review or
on the basis of the judgment of experts or stakeholders. Similarly, adequate research must back the
weights assigned to a sub-criterion. Selection of alternatives differs on a case-to-case basis.
Thus, to define, MCDA is a facet of operational research and management science that is aimed at
easing a decision-making process when it is dependent on several, often conflicting criteria.
The purposes of MCDA can be outlined as:
• To break a decision into smaller units for better comprehension
• Deep analysis of each unit
• Integrating the units to produce a meaningful whole
The overview of an MCDA process can be summarized in Figure 5.2 below:
Decision criteria
Prioritzation of the criteria
Alternatives
Rationality
Preferences
Comparison
Conflict
Scoring
Collective Preferences
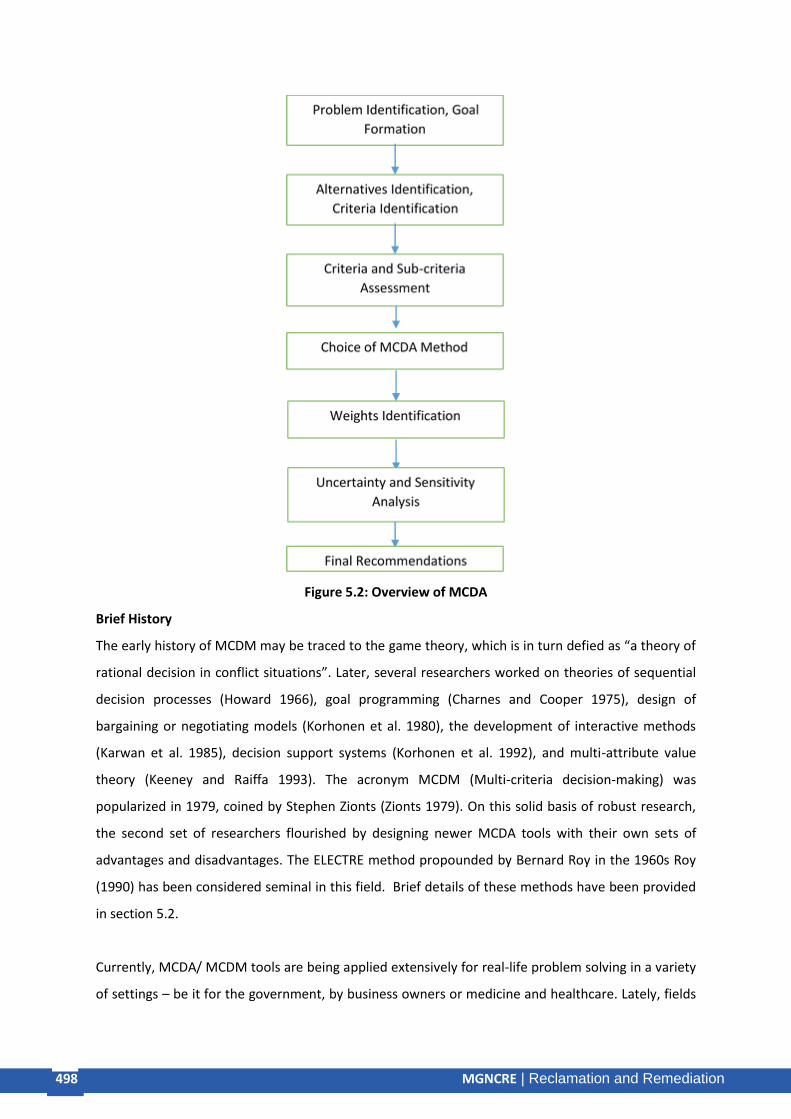
498 MGNCRE | E-Waste Management
498 MGNCRE | Reclamation and Remediation
Figure 5.2: Overview of MCDA
Brief History
The early history of MCDM may be traced to the game theory, which is in turn defied as “a theory of
rational decision in conflict situations”. Later, several researchers worked on theories of sequential
decision processes (Howard 1966), goal programming (Charnes and Cooper 1975), design of
bargaining or negotiating models (Korhonen et al. 1980), the development of interactive methods
(Karwan et al. 1985), decision support systems (Korhonen et al. 1992), and multi-attribute value
theory (Keeney and Raiffa 1993). The acronym MCDM (Multi-criteria decision-making) was
popularized in 1979, coined by Stephen Zionts (Zionts 1979). On this solid basis of robust research,
the second set of researchers flourished by designing newer MCDA tools with their own sets of
advantages and disadvantages. The ELECTRE method propounded by Bernard Roy in the 1960s Roy
(1990) has been considered seminal in this field. Brief details of these methods have been provided
in section 5.2.
Currently, MCDA/ MCDM tools are being applied extensively for real-life problem solving in a variety
of settings – be it for the government, by business owners or medicine and healthcare. Lately, fields
499 MGNCRE | E-Waste Management
499 MGNCRE | Reclamation and Remediation
such as land and real estate, environmental management, and public utility have also begun utilizing
multi-criteria decision-making tools.
Managerial advantages of MCDA
• Legitimizing previous decisions, which may have been a source of contention
• Enhancing transparency
• Integrating multiple viewpoints (individual versus collective approach)
• Justifying decisions taken even on the basis of incomplete information by accepting
qualitative as well as quantitative inputs and by quantifying the uncertainty
• Enhancing ease of decision-making – situations that may appear to be insurmountable and
have remained undecided for long may be tackled afresh using MCDA tools
Disadvantages of MCDA
However, challenges to MCDA do exist. For instance as per Kujaowski (2003),
• Conflicting results may be obtained using different MCDA methods, as one method may end
up assigning a different score to a sub-criteria than the other, even if same problem and
criteria are fed as inputs. In fact, this has been described as the Decision-making paradox by
Triantaphyllou (2000)
• Improper selection of the MCDA software can yield confusing results
• Final interpretation of results may suffer from the inexperience of the analyst
• The conclusion at which an MCDA exercise arrives at need not be the ‘best’ solution – it is
merely the most suitable solution depending on the alternatives and criteria selected. In
other words, the output is dependent on the inputs, and if the inputs are incomplete or
inaccurate, the output is bound to suffer
Hence, a detailed ex-post analysis of MCDA applications is necessary to ensure that the challenges
outlined above are addressed.
5.2 MCDA Tools
The field of MCDA is a highly dynamic one, with several researchers involved in designing newer
methods and software tools to improve accuracy of decision-making. However, this sub-section is
restricted to the conventional MCDA methods, their overview and fundamentals included. Once the
basic concepts are in place, the newer tools may be explored.
Criteria selection
Selection of the relevant criteria must be on the basis of the following considerations:

500 MGNCRE | E-Waste Management
500 MGNCRE | Reclamation and Remediation
• The criteria selected must possess the following characteristics:
• The criteria should be independent of each other
• They should be quantifiable
• They should be related with the alternatives and with the final outcome
• Criteria should fit in the same scale
Alternative selection
Similarly, selection of alternatives should also follow certain basic considerations:
• The alternatives should be real, not ideal
• They should be comparable
• They should be available
Compensatory and Outranking Methods of MCDA
As per the Compensatory Method, the various alternatives are evaluated on the basis of various
criteria; it is quite possible that each alternative will have some attractive criteria and some
unattractive ones (a car may give good mileage but may not have adequate safety features). Hence,
a positive score on one criteria compensates for the negative score on the other. In short, there is a
trade-off between the positive and negative attributes. Analytical Hierarchy Process and Fuzzy
MCDA are examples of Compensatory methods of MCDA.
In the Outranking approach, pair-wise comparisons are made among alternatives under each
criterion separately. Post this, the alternatives are placed in an order (ranked) according to criteria
and decision-maker preference (strict preference, weak preference, indifference). Hence, there is no
elimination.
Few selected MCDA methods, which have been used most popularly across literature, have been
described briefly below. These include the WSM, WPM, AHP, TOPSIS, ELECTRE and PROMETHEE
methods.
• Analytical Hierarchy Process (AHP) was propounded by Thomas L. Saaty in the 1970s. The
first step of AHP is the building of the hierarchy, as illustrated in Figure 5.3 below:
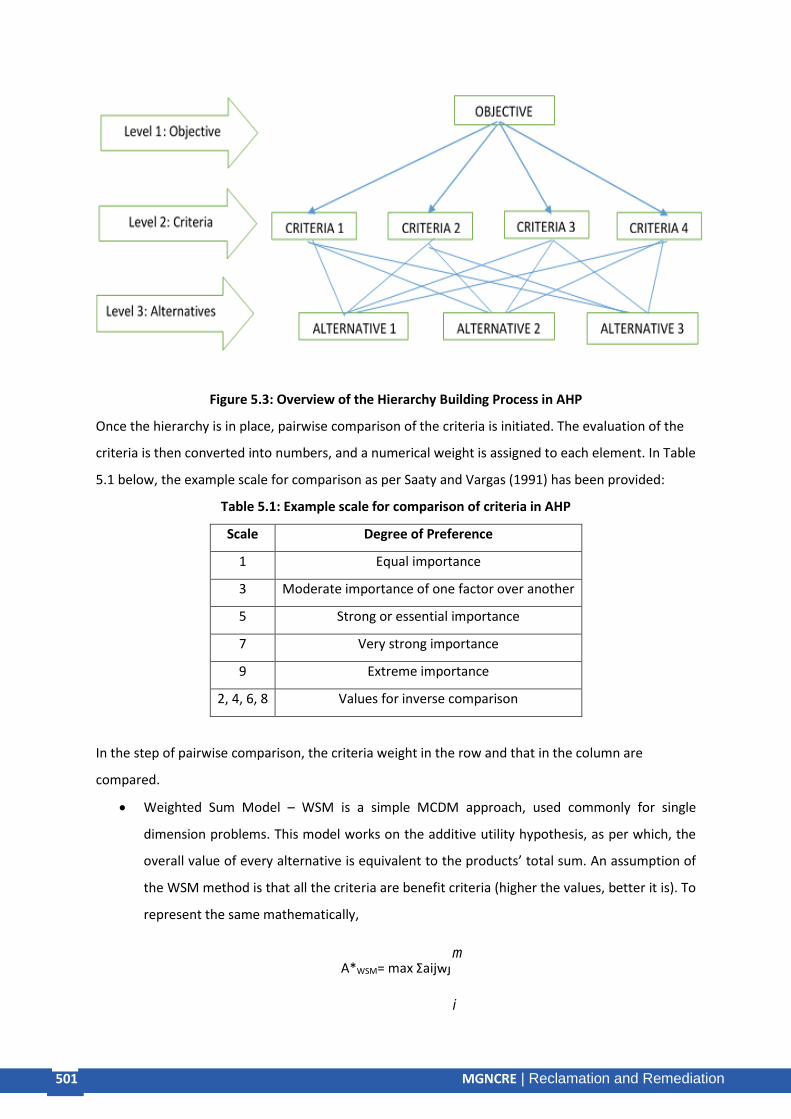
501 MGNCRE | E-Waste Management
501 MGNCRE | Reclamation and Remediation
Figure 5.3: Overview of the Hierarchy Building Process in AHP
Once the hierarchy is in place, pairwise comparison of the criteria is initiated. The evaluation of the
criteria is then converted into numbers, and a numerical weight is assigned to each element. In Table
5.1 below, the example scale for comparison as per Saaty and Vargas (1991) has been provided:
Table 5.1: Example scale for comparison of criteria in AHP
Scale Degree of Preference
1 Equal importance
3 Moderate importance of one factor over another
5 Strong or essential importance
7 Very strong importance
9 Extreme importance
2, 4, 6, 8 Values for inverse comparison
In the step of pairwise comparison, the criteria weight in the row and that in the column are
compared.
• Weighted Sum Model – WSM is a simple MCDM approach, used commonly for single
dimension problems. This model works on the additive utility hypothesis, as per which, the
overall value of every alternative is equivalent to the products’ total sum. An assumption of
the WSM method is that all the criteria are benefit criteria (higher the values, better it is). To
represent the same mathematically,
A*WSM= max Σaijwj
m
i

502 MGNCRE | E-Waste Management
502 MGNCRE | Reclamation and Remediation
For a decision problem with
o ‘m’ alternatives
o ‘n’ criteria
o i can take values of 1, 2, 3…..m
o j can take values of 1, 2, 3…..n
o aij is the score of the ith alternative with respect to the jth criterion
o wj is the weight of the jth criterion
• Weighted Product Model – WPM is a modified version of the WSM, designed to overcome
disadvantages of WSM. It is suitable for multi-dimensional as well as single-dimensional
problems. Each alternative is compared to the rest through a multiplication of ratios that are
related to every criterion. Mathematically,
R (Ak
Al) = ᴨ (
akj
a ij)w
While comparing the solutions Ak and Al, the best solution is Ak when R (Ak
Al) is > 1.
Here, too,
o m’ alternatives
o ‘n’ criteria
o i can take values of 1, 2, 3…..m
o j can take values of 1, 2, 3…..n
o aij is the score of the ith alternative with respect to the jth criterion
o wj is the weight of the jth criterion
Both for WSM and WPM it is necessary that the criteria are in the same range.
• TOPSIS stands for the Technique for Order Preference by Similarly to Ideal Solution, which
was developed by Hwang and Yoon in 1980. In the TOPSIS method, an ideal and a negative
ideal solution are determined, and at the conclusion of the TOPSIS process, that alternative
is selected which is closes to the ideal solution and farthest from the negative ideal solution.
Overview of the TOPSIS methodology has been provided below:
n
j=1

503 MGNCRE | E-Waste Management
503 MGNCRE | Reclamation and Remediation
Figure 5.4: Overview of the TOPSIS Methodology
• ELECTRE (Elimination Et Choix Traduisant la Realité, translated as ELimination and Choice
Expressing REality), as discussed above, was a radically different MCDA approach
propounded by Roy (1990). Currently, several versions of ELECTRE are available (ELECTRE I,
II, III, IV, IS and TRI) that together form the ELECTRE family of outranking MCDA tools.
ELECTRE is better suited for problem cases involving at least three criteria (Figueira et al.
2005). ELECTRE offers the opportunity to model preferences using the binary outranking
approach using S that stands for ‘at least as good as.’ Hence, if there are two actions ‘a’ and
’b’, four situations can emerge:
o aSb and not bSa
o bSa and not aSb
o aSb and bSa
o Not aSb and not bSa
Thus, in these four cases, the four different outputs obtained are –
o a is strictly preferred to b (aPb)
o b is strictly preferred to a (bPa)

504 MGNCRE | E-Waste Management
504 MGNCRE | Reclamation and Remediation
o a is indifferent to b (aIb)
o a is incomparable to b (aRb)
The uniqueness of ELECTRE lies in the fourth output, wherein the decision-maker is granted the
opportunity to not compare when situations do not permit a rational comparison.
Concordance and Non-discordance are the two conceptual pillars on which outranking relations are
poised:
o Concordance – for the validation of aSb, a sufficient majority of criteria must be in
support
o Non-discordance – once concordance has been established, a strong opposition
should not be observed from any of the criteria in minority
Interestingly, a second MCDA tool can be applied to the data that has been processed using
ELECTRE, which has helped discard the unacceptable alternatives in step 1.
• PROMETHEE (Preference ranking organization method for enrichment evaluation) - The
process initiates with a set of n actions and q criteria. Using these, an n × q table is
generated with each row corresponding to an action and each column corresponding to a
criterion. Following this, a pair-wise comparison is conducted and a preference degree is
assigned. While PROMETHEE I uses partial ranking, complete ranking is used in PROMETHEE
II. In PROMETHEE III, the ranks are based on intervals. In contrast, PROMETHEE IV is
continuous. PROMETHEE V includes integer linear programming and net flows while the
human brain is epitomized by PRMOETHEE VI.

505 MGNCRE | E-Waste Management
505 MGNCRE | Reclamation and Remediation
Figure 5.5: Overview of the PROMETHEE MCDA Method
• GAIA (Geometric analysis for interactive aid) is the descriptive complement of the
PROMETHEE method.
Figure 5.6: Representation of the GAIA Method
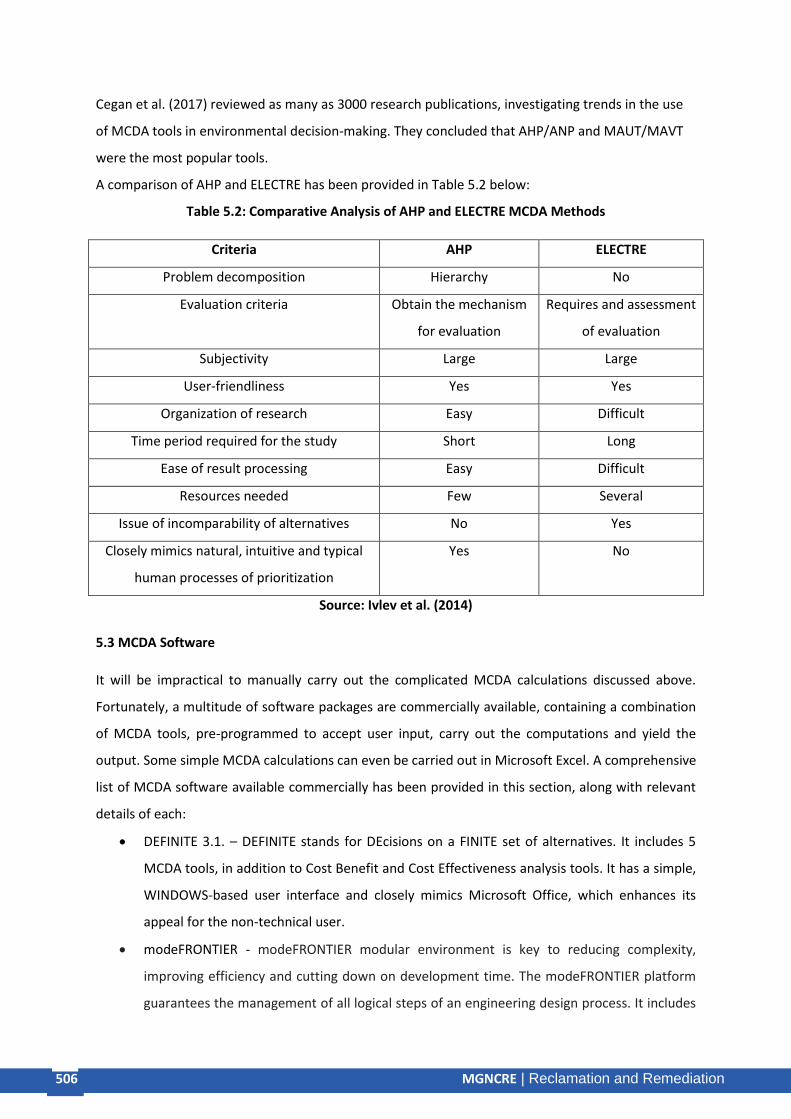
506 MGNCRE | E-Waste Management
506 MGNCRE | Reclamation and Remediation
Cegan et al. (2017) reviewed as many as 3000 research publications, investigating trends in the use
of MCDA tools in environmental decision-making. They concluded that AHP/ANP and MAUT/MAVT
were the most popular tools.
A comparison of AHP and ELECTRE has been provided in Table 5.2 below:
Table 5.2: Comparative Analysis of AHP and ELECTRE MCDA Methods
Criteria AHP ELECTRE
Problem decomposition Hierarchy No
Evaluation criteria Obtain the mechanism
for evaluation
Requires and assessment
of evaluation
Subjectivity Large Large
User-friendliness Yes Yes
Organization of research Easy Difficult
Time period required for the study Short Long
Ease of result processing Easy Difficult
Resources needed Few Several
Issue of incomparability of alternatives No Yes
Closely mimics natural, intuitive and typical
human processes of prioritization
Yes No
Source: Ivlev et al. (2014)
5.3 MCDA Software
It will be impractical to manually carry out the complicated MCDA calculations discussed above.
Fortunately, a multitude of software packages are commercially available, containing a combination
of MCDA tools, pre-programmed to accept user input, carry out the computations and yield the
output. Some simple MCDA calculations can even be carried out in Microsoft Excel. A comprehensive
list of MCDA software available commercially has been provided in this section, along with relevant
details of each:
• DEFINITE 3.1. – DEFINITE stands for DEcisions on a FINITE set of alternatives. It includes 5
MCDA tools, in addition to Cost Benefit and Cost Effectiveness analysis tools. It has a simple,
WINDOWS-based user interface and closely mimics Microsoft Office, which enhances its
appeal for the non-technical user.
• modeFRONTIER - modeFRONTIER modular environment is key to reducing complexity,
improving efficiency and cutting down on development time. The modeFRONTIER platform
guarantees the management of all logical steps of an engineering design process. It includes

507 MGNCRE | E-Waste Management
507 MGNCRE | Reclamation and Remediation
multi-strategy algorithms (Hybrid, FAST, pilOPT, SANGEA) that can combine different
optimization methods.
• Super Decisions – Based on Analytical Hierarchy Process (AHP) and Analytical Network
Process (ANP), Super Decisions employ pairwise comparison and sensitivity analysis to help
decision-makers reach consensus.
• Decision Lens – Similar to Super Decisions, Decision Lens is also AHP and ANP based.
Pairwise comparison, group evaluation and sensitivity analysis are employed herein.
• IDS – IDS stands for Intelligent Decision System. It is used for Multiple Criteria Decision
Analysis under Uncertainty (using the Evidential Reasoning Approach). The advantage of IDS
is its ability to handle accuracy-afflicting conditions such as missing data, uncertainty, and
subjectivity or a combination of the above. It is based on the MCDA approach of Evidential
Reasoning Approach.
• D-Sight - It is a visual and interactive tool that is used for multi-criteria decision aid problems
based on the PROMETHEE methods and Multi-Attribute Utility Theory.
• DecideIT – The DecideIT software is based on the Delta MCDA method and MAUT (Multi-
attribute utility theory), employing pairwise comparison, sensitivity analysis as well as group
evaluation.
• Expert Choice – this is another AHP-based software available in the market, involving the use
of pairwise comparison, group evaluation and sensitivity analysis
• MEM – Multiplex ElectionisMethodus (Multiple Election Method) is based on the AHP.
• IDSS Software - IDSS stands for Intelligent Decision Support Systems. This system makes
maximum use of artificial intelligence. It allows one or more people to take decisions in a
concrete domain. Formal quantitative models such as logic, logic, simulation and
optimization models are used to represent the decision model. Fuzzy logic and case-based
reasoning are used.
• DiViz - It helps researchers to construct algorithmic MCDA workflows. It functions by
allowing the user to compare, add and calculate. It relies on ACUTA and linear additive value
functions.
• MCDA Package for R – this package uses a wide variety of MCDA algorithms along with the R
statistical environment.
• MACBETH for MCDA/ M-MACBETH – MACBETH for MCDA stands for Measuring
Attractiveness by a Categorical Based Evaluation Technique in Multi-criteria Decision Aid.
Interestingly, this method relies only on qualitative judgments regarding the value difference
between alternatives.
508 MGNCRE | E-Waste Management
508 MGNCRE | Reclamation and Remediation
• Ahoona – This free-of-charge web-based network uses the MCDA tools of Weighted Sum
Model (WSM) and Utility theory and relies on Group evaluation. The Ahoona project traces
its roots to the I-Corps initiative of the National Science Foundation.
• AltovaMetaTeam – It is also WSM and Group Evaluation based.
• PriEsT – PriEst stands for Priority Estimation Tool. It is a tool used for analysis of the decision.
It can be used for ranking available options or in budgeting problems. It is based on the
popular MCDA tool Analytical Hierarchy Process (AHP).
• IND-NIMBUS – It is used for solving non-linear multi-objective optimization problems. It
contains the implementation of different interactive multi-objective optimization
methods. It is available for different operating systems.
• Criterium DecisionPlus – Based on AHP and Simple Multi-Attribute Rating Technique
(SMART), Criterium DecisionPlus employs sensitivity analysis and pairwise comparison.
• 1000Minds – It is a web application used for decision making and conjoint analysis. It helps
governments, NGOs and business corporates to make decisions that are based on
considering multiple objectives/ criteria. The method used in this software is one of their
own design, patented in three countries, and named as PAPRIKA (Potentially All Pairwise
Rankings of all Possible Alternatives).
• IRIS and VIP - IRIS stands for Interactive Robustness analysis and parameters' Inference
software for multi-criteria Sorting problems and VIP - Variable Interdependent Parameters
Analysis software. This software has been built to support the assignment of actions
(alternatives, projects, candidates) described by their evaluation (performance) at multiple
dimensions (criteria)
• Interalg - InterAlg stands for Interval Logarithm. It is a free solver for multi-objective
optimization by providing specifically accuracy, possibly with categorical variables and
general logical constraints. It can handle problems with hundreds of variables.
• MakeItRational - One can use it to make complex decisions when one knows how to
measure strength, weaknesses and overall utility of each option. One can evaluate projects,
technologies, candidates, products, employees, Suppliers, software packages, buildings,
processes, investments, locations, subcontractors, cars, outsourcing companies, players,
strategies, markets, customers, requirements, and ERP systems. It is based on the AHP
MCDA tool.
• Hiview3 – This software employs direct rating and swing weighting methods and employs
group evaluation and sensitivity analysis.

509 MGNCRE | E-Waste Management
509 MGNCRE | Reclamation and Remediation
• BENSOLVE - This tool is based on Benson's algorithm and its extensions. It is used as a solver
for vector linear programs (VLP), in particular, for the subclass of multiple objective linear
programs (MOLP).
• Bubble Chart Pro Optimal - It is a desktop software application that integrates a variety of
bubble chart types with a SMART (Simple Multi-Attribute Ranking Technique) prioritizer and
an easy-to-use LP optimizer.
• ChemDecide – this software package includes 3 MCDA tools – Analytical Hierarchy Process
(AHP), MARE and ELECTRE III.
• Comprehensive Package for Multi-objective Integer Programming
• Decisionarium – this is a site that houses several web-based and Windows-based software to
be used for decision-making.
• DEXi – DEXi is the upgraded version of DEX. While DEX is still superior in its ability to deal
with incomplete option descriptions, DEXi scores with a better user interface and improved
graphical outputs. The DEXi MCDA software employs the Delphi process, and is available
free-of-cost in a Microsoft Windows-compatible version.
• Logical Decisions – Logical Decisions is yet another AHP-based MCDA software also utilizing
the benefits of MAUT, involving pairwise comparison, group evaluation and sensitivity
analysis.
As is apparent from the above list, several MCDA software tools are available in the market. Most of
these software rely on the Analytical Hierarchy Process (AHP).
However, selection of the most suitable MCDA software is critical, as it will have an impact on the
final output. The selection of a given software will largely depend on its:
• Purpose for which the software will be utilized (Environment impact assessment? Landfill
site selection? Healthcare product selection? Vendor finalization?)
• Cost
• Ease of operation
• Simplicity of user interface
• Visual representation of the output
• Most critically, the types and numbers of MCDA tools included in the package, as this would
directly affect the accuracy of the final result; hence, selection of the most suitable MCDA
software pre-supposes a deep understanding of the fundamentals of MCDA methods on the
part of the user.

510 MGNCRE | E-Waste Management
510 MGNCRE | Reclamation and Remediation
Figure 5.7: Screenshot of a typical MCDA Software Visual Display
To-Do activity: Follow the tutorial of any one MCDA software (freely available on their website)
and ascertain which among the above software are most suitable for environmental studies
5.4 MCDA in Waste Management
Waste management is one sector providing ample scope for the application of MCDA statistical tools
– given the conflicting aspects of environment and socio-economics that help shape decision-
making. Indeed, waste management today may be one of the most complex subjects challenging
local administrative bodies, given the enhanced stringency of government legislation and rising
public awareness.
The different viewpoints
• Environmental viewpoint – from the environmental viewpoint, the significant criteria
affecting the decision-making process are –
o Choice of technology – how green the technology is or how small its environmental
footprint is; in other words, the technology’s requirement of energy, chemicals and
other resources is computed.
o Location of technology set-up – whether it is clashing with an existing ecological
feature. For example, the Kanjur Marg dumping ground of Mumbai is in close vicinity

511 MGNCRE | E-Waste Management
511 MGNCRE | Reclamation and Remediation
of mangroves; the Guwahati dumping ground is on the banks of an internationally
acclaimed water body – the DeeporBeel.
• Technological viewpoint – from the technical perspective, the essential criteria that emerge
are –
o Efficiency of the technology and its applicability to the type of waste being treated -
for instance, incineration of MSW in India, where most of the MSW is largely wet
waste, may not be a suitable option.
o Ease of operation – easier the operation, better the chances of acceptance of a given
technology.
o Energy, chemical and manpower input required – for instance, Phytorid and Soil
Biotechnology are low on such input requirements
o AMC requirements – the lower the better
• Administrative viewpoint
o Cost – the lower the better. However, this comes with a rider – several times, in
technology-neutral tenders, cost becomes the deciding criterion, overriding the
importance of selecting the correct technology.
o Policies – for instance, in a few local municipalities, application of patented
technologies becomes difficult with enhanced requirement of documentation and
paperwork
• Topographical viewpoint
o Land availability
o Site topography
• Social viewpoint
o Consent to operate yielded by the local population – it is critical if the technology in
question is likely to generate noise, malodor, heat or harmful chemicals
o Safety of the equipment on site - threat of theft and vandalism is very real,
especially if there is general disapproval from the locals regarding the upcoming
project.
o Social benefits, if any,which emerge from the decision – for instance, more
employment opportunities, infrastructural growth etc. can be a boost to the
proposal.

512 MGNCRE | E-Waste Management
512 MGNCRE | Reclamation and Remediation
Figure 5.8: Multiple Aspects of Waste Management MCDA
While this provides an overview, MCDA exercise may be required even at lower and finer levels of
decision-making. For instance, at the finer level, it may be required to employ MCDA to select the
most optimum route to be followed by the solid waste collection vehicle, while at the higher levels,
MCDA may help decide the most cost-efficient way of waste management at the municipality level.
Although gradually gaining importance in the Indian scenario in the last few years, waste
management in Europe and USA has often relied on MCDA tools where it is a part of the protocol in
several administrative units. Importantly, even third-world countries are investing in cutting-edge
research in waste management-related MCDA.
5.5 Drivers for and Challenges against Enhancing the Use of MCDA by Decision-makers in India, Case
Studies & Recommendations
Drivers
• Plenty of opportunity for application – in a culturally, ecologically and economically diverse
and populated country like India where resources are limited and their usage almost always
conflicted, there are humungous opportunities for the application of MCDA tools. Waste
management is merely one among several other fields where MCDA tools can aid decision-
makers in India.

513 MGNCRE | E-Waste Management
513 MGNCRE | Reclamation and Remediation
• Requirement of transparency – one managerial advantage of MCDA pointed out in section
5.1 is the degree of transparency that the tools bring about. This can be a significant driver
for public-spirited and aware citizens.
• Possibility of cost-reduction – quicker decision-making, and selection of most suitable
options can improve the economic aspects of an issue.
Challenges
• Cost – MCDA software tools and the skilled manpower required to operate them have a cost
that many municipalities may find beyond their budget. This is especially true for small
municipalities and town and village panchayats.
• Social acceptability – on several occasions, it is possible that MCDA statistical tools help
arrive at a decision that had already been propounded and accepted by the local
administrative decision-makers as it happened to be a common sense decision. In other
words, on occasions, the MCDA predictions can only end up providing a buttress to the
committee decision. Under such circumstances, the outcry may be that public money was
spent in purchasing a tool that could add but little to the manual decision-making process.
This may be especially true for small municipalities and town and village panchayats.
• Lack of awareness among decision-makers – as described above, decision-making at the
level of local government in small Indian towns and villages is often a contentious topic,
involving several local nagarsevaks who have the political will and wherewithal to influence
decision-making but who may not be technically aware of the credibility of statistical tools or
the wholesomeness of statistically-aided decisions.
• Vested interests and corruption – this may further impact the application of MCDA statistical
tools
• Manpower shortage – in many small local municipalities, manpower shortage is a challenge.
There often exist occasions where there is a struggle even to provide the basic amenities to
the local public. Under such circumstances, it may be difficult to divert manpower to form an
MCDA team.
Recommendations
• Using MCDA statistical tools is a technical process that requires statistical software, skilled
manpower, and a certain minimum time-frame for basic data collection and analysis. It is,
therefore, strongly recommended that each local administrative body responsible for
centralized solid and liquid waste management ties up with a local academic institute
wherefrom the technical knowhow can be sourced.

514 MGNCRE | E-Waste Management
514 MGNCRE | Reclamation and Remediation
• Among academic institutions as well, adequate attention must be directed towards MCDA-
related research. Such research in India is not being addressed with the requisite vigor.
While larger municipalities can turn to local academic experts, such may not be true for
smaller municipalities and town and village panchayats.
• Regular training sessions must be organized with the help of the academic institutes so that
the resident staff of the local administrative body gets familiar with the statistical
procedures.
• One-time investment can be planned to purchase the necessary software. Else, options of
software rental can be explored and budgeted.
• In small municipalities or village and town panchayats, company CSR funds may be
requested to facilitate the usage of MCDA tools.
• It must be understood that MCDA statistical tools need not be limited to solid and liquid
waste management related decisions – these tools have applicability in almost every field.
• It may be appreciated that MCDA tools do involve complicated mathematical calculations
and technical jargons; for a managerial and administrative team to grasp the nuances of a
lengthy statistical procedure may be difficult. Hence, it is important that academicians
attempt to ease the user interface for the managerial and administrative team likely to be
the long-term end-user.

515 MGNCRE | E-Waste Management
515 MGNCRE | Reclamation and Remediation
Figure 5.9: Integrating MCDA into Government Decision-making
Case studies
Landfill/Waste management site selection
• Cheng et al. (2002) employed a set of MCDA tools (Simple Weighted Addition method,
Weighted Product method, TOPSIS, cooperative game theory, and ELECTRE) to help select
the most suitable landfill site inRegina of Saskatchewan Canada.
• Vego et al. (2008) employed the MCDA tools PROMETHEE and GAIA to finalize the number
and location of waste management centers at the country-level.
• Onut and Soner (2008) used TOPSIS and AHP (under fuzzy environment) for solid waste
trans-shipment site selection
Technology or process selection
• Qazi et al. (2018) used AHP MCDA tool for the most suitable Waste to energy technology
selection in the Sultanate of Oman

516 MGNCRE | E-Waste Management
516 MGNCRE | Reclamation and Remediation
• Gomez-Lopez et al. (2009) showed that chlorination and UV disinfection were two
wastewater disinfection options that emerged as most suitable under different scenarios,
using TOPSIS.
• DEMATEL and fuzzy MULTIMOORA MCDA techniques were used to select the most suitable
healthcare waste management technology by Liu et al. (2015) in the context of the Chinese
city of Shanghai.
• Ilangkumaran et al. (2013) made use of Fuzzy AHP, PROMETHEE and GRA MCDA tools to
select the most suitable wastewater treatment technology
• Based on TOPSIS, Kalbar et al. (2012) evaluated 7 criteria with 12 indicators to select the
most suitable wastewater treatment technology in the Indian context. The technologies
compared were Constructed Wetland, Sequencing Batch Reactors, Activated Sludge Process
and Upflow Anaerobic Sludge Blanket. All the technologies were selected under different
scenarios. The CW technology ranked 1 under four of the six technologies.
• Centralized incineration emerged as the most suitable waste management technology in the
Uusimaa region of Finland, using ELECTRE II as the MCDA tool (Hokkanen et al. 1995).
• Karagiannidis and Moussiopoulos (1997) employed ELECTRE III to accentuate the importance
of at-source separate waste collection to be critical to MSWM in the context of Greece.
• Garfi et al (2009) employed the Analytical hierarchy Process (AHP) MCDA tool for selecting
the most feasible waste management solution in the Saharawi refugee camps (Algeria). They
compared the following four scenarios:
Figure 5.10: Description of waste management scenarios adapted from Garfi et al. (2009)

517 MGNCRE | E-Waste Management
517 MGNCRE | Reclamation and Remediation
As per the authors, options two and three were found to be the most suitable based on
environmental, social and technological concerns. The scenarios described by Garfi et al. (2009) are
similar to those experienced in Indian rural and small town settings and the approach taken is
relatively simple and can be adopted.
Vendor Selection
• Gumus (2009) made use of fuzzy AHP and TOPSIS methodologies to select the most suitable
firm for hazardous waste transport.
• Hsu et al. (2012) employed two MCDA tools (VIKOR and DANP) to select the most suitable
vendor for resource recovery from waste.
• Büyüközkan and Çifçi (2012) selected most suitable green suppliers using three MCDA tools
– fuzzy TOPSIS, fuzzy ANP and fuzzy DEMATEL.
• On the basis of AHP and TOPSIS, Yazdani (2014) selected the most suitable green suppliers.
• Integrating grey based method with ELECTRE and VIKOR approaches, Chithambaranathan et
al. (2015) aimed at a green supply chain.
Waste Transport Route Selection
• Chen et al. (2008) employed a multi-objective Geographic Information System (GIS) for
selecting the most optimum transport route for nuclear waste.
Hence, to conclude, MCDA tools have the potential to make waste management decision-making
more precise, quicker, and more clear-cut. MCDA tools are ideally equipped to address a situation
where uncertainty, data deficiency, qualitative attributes and subjective judgments impact decision-
making. It may seem a far cry today, for large to small municipalities and villages in India still
struggling with basic municipal solid waste segregation and decentralized liquid waste management;
however, instead of making this a hen-and-egg problem, it is necessary to employ well-proven
techniques even at the grass-root levels and even at the first step of waste management.
Model Questions
Q. How would you select the most suitable MCDA tool for the multi-criteria decision-making
problem of landfill site selection for a small town municipality?
Q. Try out the demo/trial version of any one MCDA software with a dummy problem, and analyze
your experience.

518 MGNCRE | E-Waste Management
518 MGNCRE | Reclamation and Remediation
Q. Can you sense a business opportunity in providing technical support to municipalities in
conducting statistical analyses? Give an overview of your sales pitch.
Suggested Reading
Greco, S., Figueira, J., &Ehrgott, M. (2016). Multiple criteria decision analysis. New York: Springer.
References
1. Büyüközkan, G., &Çifçi, G. (2012). A novel hybrid MCDM approach based on fuzzy DEMATEL,
fuzzy ANP and fuzzy TOPSIS to evaluate green suppliers. Expert Systems with
Applications, 39(3), 3000-3011.
2. Cegan, J. C., Filion, A. M., Keisler, J. M., &Linkov, I. (2017). Trends and applications of multi-
criteria decision analysis in environmental sciences: literature review. Environment Systems
and Decisions, 37(2), 123-133.
3. Charnes, A., & Cooper, W. W. (1975). Goal programming and constrained regression—A
comment. Omega, 3(4), 403-409.
4. Chen, Y. W., Wang, C. H., & Lin, S. J. (2008). A multi-objective geographic information system
for route selection of nuclear waste transport. Omega, 36(3), 363-372.
5. Cheng, S., Chan, C. W., & Huang, G. H. (2002). Using multiple criteria decision analysis for
supporting decisions of solid waste management. Journal of Environmental Science and
Health, Part A, 37(6), 975-990.
6. Chithambaranathan, P., Subramanian, N., Gunasekaran, A., &Palaniappan, P. K. (2015).
Service supply chain environmental performance evaluation using grey based hybrid MCDM
approach. International Journal of Production Economics, 166, 163-176.
7. Figueira, J., Mousseau, V., & Roy, B. (2005). ELECTRE methods. In Multiple criteria decision
analysis: State of the art surveys (pp. 133-153). Springer, New York, NY.
8. Garfi, M., Tondelli, S., &Bonoli, A. (2009). Multi-criteria decision analysis for waste
management in Saharawi refugee camps. Waste management, 29(10), 2729-2739.
9. Gbanie, S. P., Tengbe, P. B., Momoh, J. S., Medo, J., &Kabba, V. T. S. (2013). Modelling landfill
location using geographic information systems (GIS) and multi-criteria decision analysis
(MCDA): case study Bo, Southern Sierra Leone. Applied Geography, 36, 3-12.
10. Gómez-López, M. D., Bayo, J., García-Cascales, M. S., &Angosto, J. M. (2009). Decision
support in disinfection technologies for treated wastewater reuse. Journal of Cleaner
Production, 17(16), 1504-1511.

519 MGNCRE | E-Waste Management
519 MGNCRE | Reclamation and Remediation
11. Gumus, A. T. (2009). Evaluation of hazardous waste transportation firms by using a two
step fuzzy-AHP and TOPSIS methodology. Expert systems with applications, 36(2), 4067-
4074.
12. Hokkanen, J., Salminen, P., Rossi, E., &Ettala, M. (1995). The choice of a solid waste
management system using the ELECTRE II decision-aid method. Waste Management &
Research, 13(2), 175-193.
13. Howard, R. A. (1966). Dynamic programming. Management Science, 12(5), 317-348.
14. Hsu, C. H., Wang, F. K., & Tzeng, G. H. (2012). The best vendor selection for conducting the
recycled material based on a hybrid MCDM model combining DANP with VIKOR. Resources,
Conservation and Recycling, 66, 95-111.
15. Hwang, C.-L.; Yoon, K.P. Multiple Attribute Decision Making, 1981; Lecture Notes in
Economics and Mathematical Systems; SAGE Publications: Thousand Oaks, CA, USA, 1981.
16. Ilangkumaran, M., Sasirekha, V., Anojkumar, L., Sakthivel, G., Boopathi Raja, M.,
RubanSundara Raj, T., ... & Praveen Kumar, S. (2013). Optimization of wastewater treatment
technology selection using hybrid MCDM. Management of Environmental Quality: An
International Journal, 24(5), 619-641.
17. Ivlev, Ilya &Kneppo, Peter &Barták, Miroslav. (2014). Multicriteria Decision Analysis: a
Multifaceted Approach to Medical Equipment Management. Technological and Economic
Development. 20. 576-589. 10.3846/20294913.2014.943333.
18. Kalbar, P. P., Karmakar, S., &Asolekar, S. R. (2012). Selection of an appropriate wastewater
treatment technology: A scenario-based multiple-attribute decision-making
approach. Journal of environmental management, 113, 158-169.
19. Karagiannidis, A., &Moussiopoulos, N. (1997). Application of ELECTRE III for the integrated
management of municipal solid wastes in the Greater Athens Area. European Journal of
Operational Research, 97(3), 439-449.
20. Karwan, M. H., Zionts, S., Villarreal, B., & Ramesh, R. (1985). An improved interactive
multicriteria integer programming algorithm. In Decision making with multiple
objectives (pp. 261-271). Springer, Berlin, Heidelberg.
21. Keeney, R. L., &Raiffa, H. (1993). Decisions with multiple objectives: preferences and value
trade-offs. Cambridge university press.
22. Korhonen, P., Moskowitz, H., &Wallenius, J. (1992). Multiple criteria decision support-A
review. European Journal of Operational Research, 63(3), 361-375.

520 MGNCRE | E-Waste Management
520 MGNCRE | Reclamation and Remediation
23. Korhonen, P., Wallenius, J., &Zionts, S. (1980). A bargaining model for solving the multiple
criteria problem. In Multiple Criteria Decision Making Theory and Application (pp. 178-188).
Springer, Berlin, Heidelberg.
24. Kujawski, E. (2003). Multi-Criteria Decision Analysis: Limitations. Pitfalls, and Practical
Difficulties.
25. Liu, H. C., You, J. X., Lu, C., & Chen, Y. Z. (2015). Evaluating health-care waste treatment
technologies using a hybrid multi-criteria decision making model. Renewable and
Sustainable Energy Reviews, 41, 932-942.
26. Önüt, S., &Soner, S. (2008). Transshipment site selection using the AHP and TOPSIS
approaches under fuzzy environment. Waste Management, 28(9), 1552-1559.
27. Qazi, Wajeeha&Abushammala, Mohammed & Azam, Mohammed-Hasham. (2018). Multi-
criteria decision analysis of waste-to-energy technologies for municipal solid waste
management in Sultanate of Oman. Waste Management & Research. 36. 0734242X1877780.
10.1177/0734242X18777800.
28. Roy, B. (1990). The outranking approach and the foundations of ELECTRE methods.
In Readings in multiple criteria decision aid (pp. 155-183). Springer, Berlin, Heidelberg.
29. Triantaphyllou, E. (2000). Multi-Criteria Decision Making: A Comparative Study. Dordrecht,
The Netherlands: Kluwer Academic Publishers (now Springer). p. 320. ISBN 0-7923-6607-7.
30. Vego, G., Kučar-Dragičević, S., &Koprivanac, N. (2008). Application of multi-criteria decision-
making on strategic municipal solid waste management in Dalmatia, Croatia. Waste
management, 28(11), 2192-2201.
31. Yazdani, M. (2014). An integrated MCDM approach to green supplier selection. International
Journal of Industrial Engineering Computations, 5(3), 443-458.
32. Zionts, S. (1979). MCDM—if not a roman numeral, then what?. Interfaces, 9(4), 94-101.

521 MGNCRE | E-Waste Management
521 MGNCRE | Reclamation and Remediation
Editors’ Profile
Dr W G Prasanna Kumar
Dr. W. G. Prasanna Kumar, PhD in Education with basic degree in Social Work and Master’s Degrees in Sociology, Public Administration and Political Science has professional education in Environmental Economics, Public Relations, Communication and Training and Development. Presently Chairman, Mahatma Gandhi National Council of Rural Education (MGNCRE) under the Ministry of Human Resource Development, in Government of India strives to promote resilient rural India through Higher Education interventions. The national initiative of reviving Mahatma Gandhi’s ideas of Nai Talim, spearheaded by Dr. W G Prasanna Kumar, has met unprecedented success at both national and state levels. The primary objective of this initiative is to promote Gandhiji’s ideas on Experiential Learning, NaiTalim, Work Education and Community Engagement, and mainstreaming them in School Education and Teacher Education Curriculum & Pedagogy. As Professor and Head Centre for Climate Education and Disaster Management in Dr MCR HRD Institute, conducted several capacity building and action research programmes in climate education, disaster management and crowd management. He has handled many regional, national and international environmental education programmes and events including UN CoP11 to Convention on Biological Diversity and Media Information Management on Environmental Issues.
He was Director in National Green Corps in the State Government for over 11 years and Senior Social Scientist in State Pollution Control Board for 6 years. Conducted various curriculum and non- curriculum related training programmes in environmental education. He was a Resource Person for AP Judicial Academy, AP Police Academy, AP Forest Academy, EPTRI, Commissonerate of Higher Education and Intermediate Education, State Council for Educational Research and Training and National Council for Educational Research and Training New Delhi, CCRT, Bharathiya Vidyapeet University Pune, CPR Environmental Education Centre Chennai and Centre for Environment Education Ahmedabad. Dr W G Prasanna Kumar was trained in Community Consultation for Developmental Projects in EPA Victoria Australia in 1997 trained as State Chief Information Officer by IIM Ahmedabad and MCRHRDI Government of Andhra Pradesh in 2004 and trained in Environmental Education and Waste Management Technique by JICA, Japan in 2011.
He was awarded Best State Nodal Officer of National Green Corps Award from Centre for Science and Environment, New Delhi, 2008, Jal Mithra Award from Earthwatch Institute of India and Water Aid New Delhi, 2014 and Certificate of Commendation for the services in UN Conference of Parties to Convention for Biodiversity conducted at Hyderabad from 1-20 October 2012 by the Government of Andhra Pradesh 2012.
Dr K N Rekha
Dr K N Rekha, is a PhD Graduate from IIT Madras. She has 13 years of experience in training and education Industry. She works at Mahatma Gandhi National Council of Rural Education (MGNCRE), Hdyerabad as Academic Consutlant. She is involved in curriculum development on Rural Management and Waste Management. Prior to this, she worked as a Researcher at Indian School of Business, Hyderaba, and has a short stint at Centre for Organization Development (COD), Hyderabad. She has Co-authored a book on “Introduction to Mentoring”, book chapters, Peer reviewed research papers, book reviews, casestudy, and caselets in the area of HR/OB. She also presented papers in various national and international conferences. Her research areas include Mentoring, Leadership, Change Management, Coaching, 360 Degree Feedback appraisal, etc. She was also invited as a guest speaker at proiminent institutions like IIT Hyderabad.

Authors’ Profile Dr Vandana Mathur
Dr. Vandana Mathur is Ph.D in Entrepreneurship. She has rich experience in teaching(MBA students),
training, research and mentoring. She has developed more than 40 case studies of successful
entrepreneurs & won 2nd prize in Annual case study competition organized by IIPA, New Delhi. She
has published more than 20 research papers in reputed journals & presented papers in many
conferences. She is accredited Entrepreneurial Motivational Trainer from NIESBUD. She has written
many books. She has organized many Business Plan competitions at national and International level.
Mr. R M Bharadwaj
Mr. R M Bharadwaj has over 35 years experience in various aspects of environmental management.
Spearheaded activities of Pollution Assessment and preparation of mitigation plan in Central
Pollution Control Board, Ministry of Environment Forests & Climate Change,Government of
India and designated National Focal Point of United Nations Environment Programme-Global
Environmental Monitoring System, India.
Dr Leon Raj
Dr. Leon Raj is a Scientist at CSIR-North East Institute of Science and Technology, Jorhat, Assam. He
has completed his Ph.D. and Post-Doctoral Fellowship at Indian Institute of Technology Madras
(IITM), Chennai. He obtained UG and PG from St. Xavier's Catholic College of Engineering (SXCCE)
and A.C Government College of Engineering and Technology (ACGCET), Karaikudi, respectively. He
secured first class with distinction in both UG and PG degrees. He obtained merit Prime Minister
Fellowship for 4 years in UG program at SXCCE. He has visited countries, namely, Jordan, Singapore
and Malaysia for attending conferences which were funded by IITM. He has received Post-Doctoral
Fellowship from IITM since he finished his Ph.D. thesis within a period of 4 years and 4 months.
Dr Deepti Sharma
Dr. Deepti Sharma is the Founder-Director of TerraNero Environmental Solutions Pvt. Ltd., a niche
environmental research consultancy. Also, she is the Founder and Chief Editor of Poison Pen
Enterprises, in which capacity she has edited and proofread PhD theses, dissertations and research
publications from
several elite research and academic institutes of India such as IIT-Bombay, NITIE, JNU, BHU, CSIR-
NIO,CSIR-NEERI, JNCASR and NMIMS. She herself has several research publications in peer-reviewed
journals. With a doctorate in the field of Biodiversity (Botany), Dr. Sharma has been recognized as a
Category ‘A’ Functional Area Expert in the field of Ecology and Biodiversity by the Quality Council of
India (QCI)- NABET. She was formerly associated with CSIR-NEERI, Mumbai Zonal Lab in the capacity
of a Project Scientist. As a part of TerraNero and CSIR-NEERI, she has worked with several eminent
organizations like IIT-Bombay, TCE Pvt. Ltd., ACC Ltd., AECOM Pvt. Ltd., MMR-EIS, various municipal
bodies of Maharashtra and Karnataka, the Goa State Biodiversity Board, and the Maharashtra State
Forest Dept among others. Dr. Sharma’s tryst with solid and liquid waste management began when
she was working with CSIR- NEERI, where she worked on preparing a microbial consortium for
liquefying fecal sludge and designing floating treatment wetlands for impounded wastewater
treatment. Her organization TerraNero has conducted various waste management-related projects
in Maharashtra and Karnataka.

#5-10-174, Shakkar Bhavan, Fateh Maidan Lane, Band Colony, Basheer Bagh, Hyderabad-500004
[email protected] - 2321 2120
Department of Higher EducationMinistry of Human Resource Development, Government of India
Mahatma Gandhi National Council of Rural Education(MGNCRE)
ISBN 978-81-940618-5-4
₹ 750