Washington Metropolitan Area Transit Authority (WMATA ...
95
Description of document: Washington Metropolitan Area Transit Authority (WMATA) memoranda from the Deputy General Manager of Administration and Chief Financial Officer (DGMA/CFO) to the General Manager and Chief Executive Officer (GM/CEO), January 1, 2012 - March 31, 2012 Released date: 23-May-2014 Posted date: 23-June-2014 Source of document: Office of General Counsel PARP Administrator Washington Metropolitan Area Transit Authority 600 Fifth Street, NW Washington, D.C. 20001 The governmentattic.org web site (“the site”) is noncommercial and free to the public. The site and materials made available on the site, such as this file, are for reference only. The governmentattic.org web site and its principals have made every effort to make this information as complete and as accurate as possible, however, there may be mistakes and omissions, both typographical and in content. The governmentattic.org web site and its principals shall have neither liability nor responsibility to any person or entity with respect to any loss or damage caused, or alleged to have been caused, directly or indirectly, by the information provided on the governmentattic.org web site or in this file. The public records published on the site were obtained from government agencies using proper legal channels. Each document is identified as to the source. Any concerns about the contents of the site should be directed to the agency originating the document in question. GovernmentAttic.org is not responsible for the contents of documents published on the website.
-
Upload
khangminh22 -
Category
Documents
-
view
0 -
download
0
Transcript of Washington Metropolitan Area Transit Authority (WMATA ...
Description of document: Washington Metropolitan Area Transit Authority (WMATA) memoranda from the Deputy General Manager of Administration and Chief Financial Officer (DGMA/CFO) to the General Manager and Chief Executive Officer (GM/CEO), January 1, 2012 - March 31, 2012
Released date: 23-May-2014 Posted date: 23-June-2014 Source of document: Office of General Counsel
PARP Administrator Washington Metropolitan Area Transit Authority 600 Fifth Street, NW Washington, D.C. 20001
The governmentattic.org web site (“the site”) is noncommercial and free to the public. The site and materials made available on the site, such as this file, are for reference only. The governmentattic.org web site and its principals have made every effort to make this information as complete and as accurate as possible, however, there may be mistakes and omissions, both typographical and in content. The governmentattic.org web site and its principals shall have neither liability nor responsibility to any person or entity with respect to any loss or damage caused, or alleged to have been caused, directly or indirectly, by the information provided on the governmentattic.org web site or in this file. The public records published on the site were obtained from government agencies using proper legal channels. Each document is identified as to the source. Any concerns about the contents of the site should be directed to the agency originating the document in question. GovernmentAttic.org is not responsible for the contents of documents published on the website.

Washington Me1ro11oinan Area Trlasn l urfloritJ
600 Fifth Street, NW
Washington, DC 20001
202/962-1234
By Metrorail: Judiciary Square--Red Line Gallery Place-Chinatown-
Red, Green and Yellow Lines
By Metrobus: Routes 01, 03, 06, P6,
70, 71,BO,X2
A District of Columbia, Maryland and Virginia
Transit Partnership
May 23, 2014
Re: PARP Request No. 12-0163
This is in response to your request for a copy of each Memorandum from the Deputy General Manager of Administration and Chief Financial Officer (DGMA/CFO) to the General Manager and Chief Executive Officer (GM/CEO) during January 1, 2012 - March 31, 2012. On June 27, 2012, you revised Y.OUr request to only those records that can be provided within two hours of search time. Your request was processed pursuant to the Public Access to Records Policy (PARP), which can be viewed on our website at http://www.wmata.com/about_metro/public_rr.cfm.
We apologize for the delay in responding to your request. Enclosed is a CD that contains Memoranda from the DGMA/CFO to the GM/CEO for the requested time-frame (1. Declaration of Emergency, dated March 15, 2012; 2. Declaration of Emergency, dated January 6, 2012; 3. RCF Changes and Enhancements, dated March 5, 2012; 4. Financial Data Conversion, dated March 21, 2012; 5. December Monthly and 2nd Quarter Financial Reports, dated February 3, 2012; 6. Capital Reprogramming, dated March 22, 2012; 7. Capital Reprogramming, dated January 11 , 2012, 8. Fare Policy Issues, dated January 24, 2012; and 8. February Monthly Financial Reports, dated March 16, 2012). Pursuant to PARP Exemptions 6.1.6 (personal privacy), we have redacted names below the Executive Leadership Team, all employee signatures, and job titles that reveal the identity of employees. Pursuant to PARP Exemptions 6.1.1 (safety and security) and 6.1 .2 (internal personnel rules and procedures), we have redacted information from the RCF Changes Memorandum that could be used to circumvent procedures and harm the security of the Metrorail and Metrobus systems.
If you wish to appeal WMATA's decision, in accordance with WMATA's PARP § 9.1 , you may file a written appeal of the action with the Chief of Staff within 30 business days of the date of this denial letter. Further details about our appeals process can be found on our website.
Future correspondence regarding your request should be directed to my attention and should reference the PARP request number above. If you have any legal questions please contact Mark Pohl, Chief Counsel, Finance and Administration at 202-962-2541 or [email protected]. You

May 23, 2014 Page 2
may also contact me at 202-962-2058 or [email protected], if you require clarification on any administrative matters.
Sincerely,
.~.J,,...~ _ ~ ~e;r;r.Thom PARP/Privacy Policy Administrator
Enclosure

Washington Metropolitan Area
Transit AuUtorttv
M E M 0 R
SUBJECT: Capital Reprogramming
FROM: DGMA/CFO - Carol Dillon Kiss
TO: GMGR/CEO- Richard Sarles
A N D u M
This past June, the Board of Directors granted the General Manager and Chief Executive Officer (GM/CEO) the authority to reprogram up to five percent of the Capital Improvement Program (CIP) budget in any given year. The approved FY2012 CIP budget is $888.9 million, which results in GM/CEO reprogramming authority of $44.445 million. To date, $34.792 million of that authority has been reprogrammed leaving a balance of $9.653 million of available reprogramming authority.
The reprogramming request, summarized below, will use the entirety of the remaining $9.653 million of available authority. This request is to accommodate an opportunity to accelerate project work and does not represent an increase in the scope or budget of the project. All of these funds will be expended during the current fiscal year.
Funds Being Reprogrammed From:
CIP011 O Rail Rehabilitation Tier I: National Airport to Stadium Armory Change in FY12 Budget-$9 .653 million Initial negotiations with the Contractor delayed start of the project. The negotiations dealt with applying "lessons learned" from the Red Line contract such as phasing of work, track allocation, and construction practices. As a result CIP0110 will not expend its FY12 budget. The funds being made available for this reprogramming action do not represent a reduction to the overall project budget and will be required in future years to complete the scope of work associated with this project. The revisions to this projects spending plan will be incorporated in the updated Annual Work Plan.
Funds Being Reprogrammed To:
CIP0107 Rail Rehabilitation Tier l: DuPont to Silver Spdrlg__ Change in FY12 Budget: $8.903 million The increased use of track-outages, rather than single-track·ing, along the Red Line has created an opportunity for the project team to accelerate work originally scheduled to be done during FY13. The work that is being accelerated includes platform rehabilitation, ETS installation and cut-overs. This request represents an

acceleration of work and will not increase the overall project budget. All of the funds being requested will be expended during this fiscal year. The accelerated spending plan for this project will be incorporated into the updated Annual Work Plan.
CIP0106 Special Operations Division Facility Change in FY12 Budget: $0.75 million Renovation to the first of the four buildings included in this project was completed ahead of schedule. Additional funds are being requested to advance design work on the remaining three buildings that was originally planned to be done in FY13. The reprogramming of these funds will allow the project manager to issue a fullNTP for design to the contractor. All of the requested funds will be expended in
this fiscal year. -sl z, r/ tpl '-
- 2 -
~ I
Washington Metronotitan llrea
Transit Authoritv
E M 0 A N M
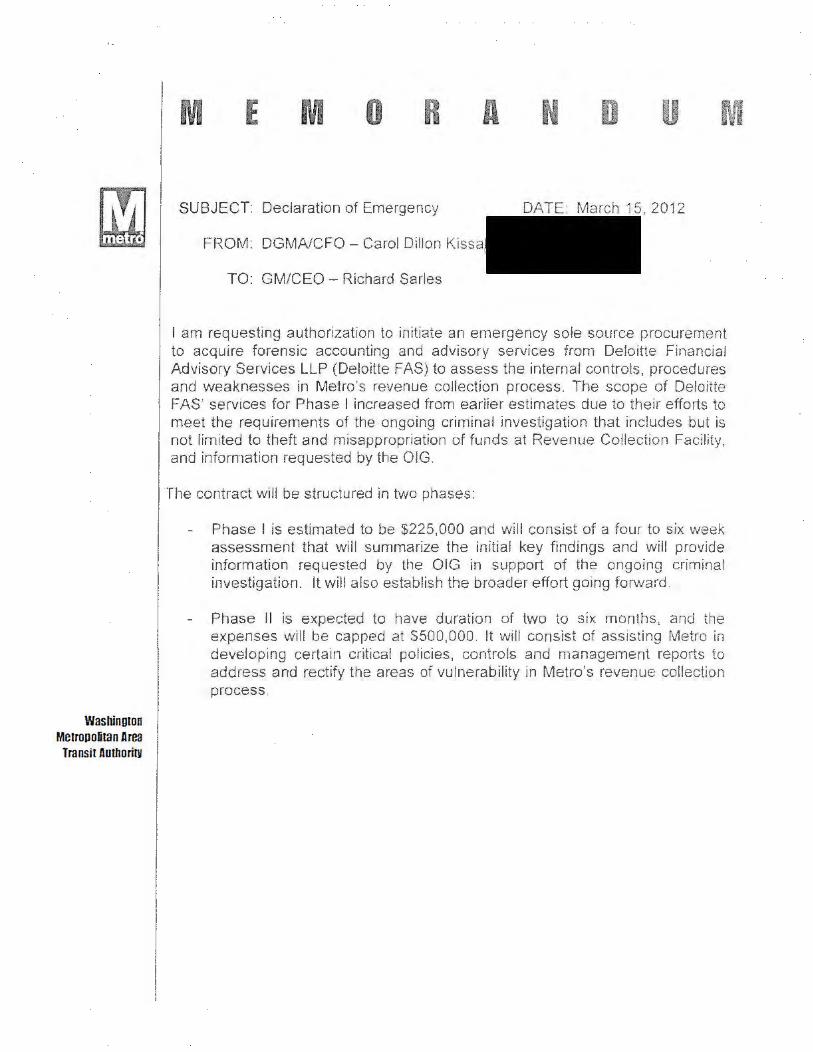
SUBJECT: Declaration of Emergency DATE: March 15, 2012
FROM: DGMA/CFO - Carol Dillon Kissa
TO: GM/CEO - Richard Sarles
I am requesting authorization to initiate an emergency sole source procurement to acquire forensic accounting and advisory services from Deloitte Financial Advisory Services LLP (Deloitte FAS) to assess the internal controls, procedures and weaknesses in Metro's revenue collection process. The scope of Deloitte FAS' services for Phase I increased from earHer estimates due to their efforts to meet the requ irements of the ongoing criminal investigation that includes but is not limited to theft and misappropriation of funds at Revenue Collection Facility, and information requested by the OIG.
The contract will be structured in two phases:
Phase I is estimated to be $225,000 and will consist of a four to six week assessment that wil l summarize the initial key findings and will provide information requested by the OIG in support of the ongoing criminal investigation. It will also establish the broader effort going for\vard .
Phase II is expected to have duration of two to six months, and the expenses will be capped at $500,000. It will consist of assisting Metro in developing certain critical policies, controls and management reports to address and rectify the areas of vulnerability in Metro's revenue collection process.

WasJlillOlOll Merroooman Ares
Tr.msit Aulhorib
M E M 0 R A N D u M
SUBJECT: RCF Changes and Enhancements
DATE: March 5, 2012
FROM: DGMA/CFO-Carol Dillon Kissal
TO: GMGR/CEO - Richard Sarles
Revenue Collection and Processing
In response to the recent fraudulent and criminal activities in its revenue collection and processing operations, the Authority retained the services of Oeloitte Financial Advisory Services LLP (Deloitte) to perform an assessment of the existing internal controls, policies and procedures of WMATA's revenue collection and processing operations. While Deloitte's initial assessment will not be complete until March 9, 2012. the following actions have already been implemented or are in the process of being implemented to enhance internal controls and improve the processes to prevent the risk associated with fraud and reduce potential areas of vulnerability.
I Personnel Changes
• and subsequently Processing is serving as
was relieved of his responsibilities , 2012. The Manager, Revenue
• The Manager, Revenue Collection position, which was vacant since January 2. 2012 due to retirement, has been filled by a candidate with 20+ years of operations and cash control experience working with FedEx and Loomis Armored. The new Manager will be starting on March 5, 2012.
• ill be retiring effective n e pos1t1on 1s eing upgra e to a Manager, Treasury
Reconciliation and Reporting reflecting responsibilities that have been expanded to cover a wider range of audit responsibilities and will report to Treasury management at the Jackson Graham Building to enhance accountability.
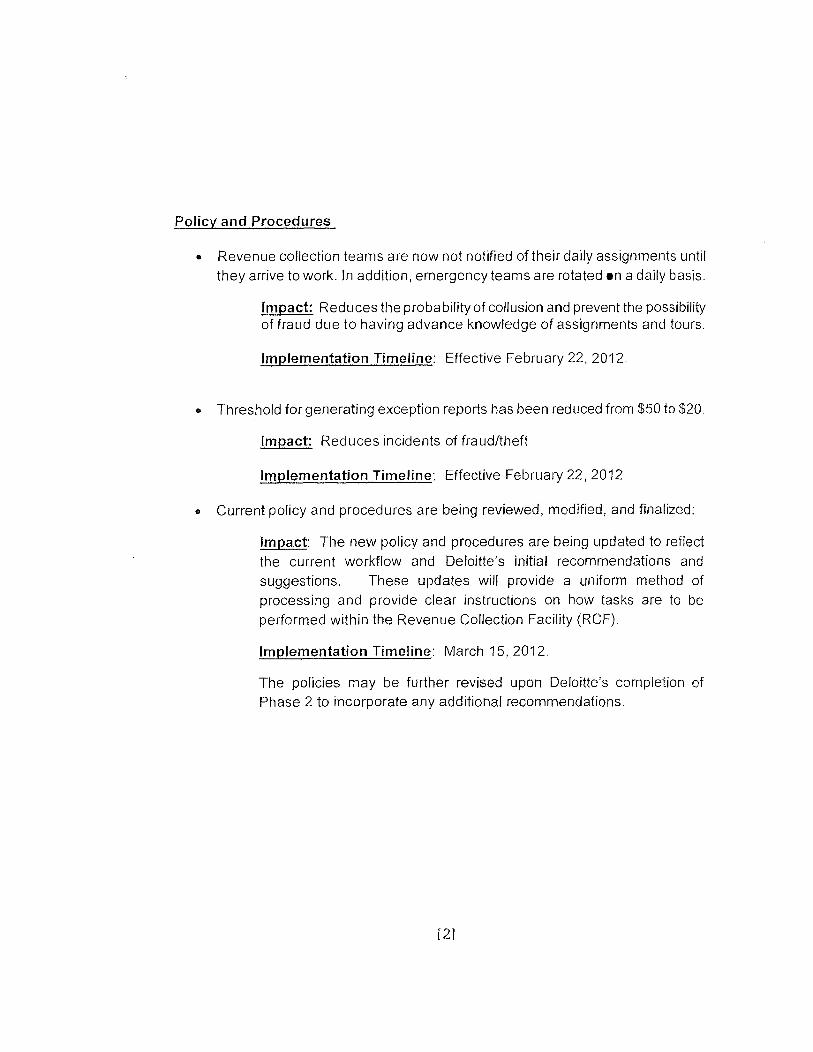
Policy and Procedures
• Revenue collection teams are now not notified of their daily assignments until they arrive to work. In addition, emergency teams are rotated en a daily basis.
Impact: Reduces the probability of collusion and prevent the possibility of fraud due to having advance knowledge of assignments and tours.
Implementation Timeline: Effective February 22, 2012.
• Threshold for generating exception reports has been reduced from $50 to $20.
Impact: Reduces incidents of fraud/theft
Implementation Timeline: Effective February 22, 2012
• Current policy and procedures are being reviewed, modified, and finalized:
Impact: The new policy and procedures are being updated to reflect the current workflow and Deloitte's initial recommendations and suggestions. These updates will provide a uniform method of processing and provide clear instructions on how tasks are to be performed within the Revenue Collection Facility (RCF).
Implementation Timeline: March 15, 2012.
The policies may be further revised upon Deloitte's completion of Phase 2 to incorporate any additional recommendations.
[2]

• With assistance and input from Deloitte, the current daily reconciliation and exception reports are being reviewed and validated against the raw tlata to ensure the exception reports reflect accurate information that may be used ity Treasury management. The daily exceptions will be logged and tracked to ensure appropriate handling and closure.
Impact: This will support the process of reviewing the exception reports and developing an action plan for submitting reports to Metro Transit Police Department {MTPD) for investigation, which will include MTPD providing a report of actions taken to address the exceptions.
Implementation Timeline : Effective April 30, 2012.
• The policies will be presented and communicated to all RCF personnel
Impact: The RCF staff has operated based on "word of mouth". Written policies which are communicated will provide personnel with a clear understanding of workflow processes and established controls.
Implementation Timeline: March 15, 2012
• Comprehensive review of the current IT structure and a feasibility study of needed upgrades will be conducted. Identify and document necessary AS400 reprogramming needs in an effort to convert manual processes to automation .
Impact: To streamline and reduce manual processes and errors. In addition, we expect to replace antiquated processors with more advanced technology which will enhance productivity.
Implementation Timeline: June 30, 2012
[3]

·----··~~
• Automation of coin count data processing for rail and bus (converted from a manual process)
Impact: This process is currently manual and as a result it is time consuming and error prone. Networking the rail and bus processes will allow coin revenue data to be 'transferred into the database in an automated manner.
Implementation Timeline: April 30, 2012
• RCF will pilot test a new analysis to monitor and audit coins dispensed in the coin hoppers.
Impact: This process will allow the newly created auditing group to analyze coin hopper activity in the system to prevent potential revenue loss due.
Implementation Timeline: June 30, 2012.
• All vehicles are tracked and monitored by GPS when in usage. Tracking includes travel routes, location stops, and speed.
Impact: The benefit of this enhancement will provide real time data to the supervisors in an effort to know the locality and travel haltits of technicians in the field.
Implementation Timeline: Effective date February 27, 2012.
f 4]

Key Management and Control
• The RCF staff is in the process
Impact: Due to the lack of.ontrol, ~II minimize loss in the event there was an a~reach~ventory and .. are unaccounted for. The ~ontrols the entrance into the stacker where currency is housed.
lementation Timeline: About 30% of the stackers have been all the slackers will be- by March 15, 2012
• Partner with MTPO to establish master key control ownership and procedures
Implementation Timeline: March 30, 2012 .
cc: lv1TPD - Chief Michael Taborn TRES- -
[5]

ir.ras11i1111ton 111c1ro11olit:m .nrea
Transll llullml'illl
SUBJECT: Declaration of Emergency
FROM: DGMA/CFO - Carol Dillon Kissa
TO: GM/CEO - Richard Sarles
Due to the sensitive, ongoing nature of the criminal investigation regarding Metro revenue collections, I am requesting authorization to initiate an emergency sole source procurement to acquire forensic accounting and advisory services from Deloftte Financial Advisory Services LLP (Deloitte FAS), in order to conduct an assessment of internal controls, procedures and weaknesses in Metro's revenue collection process.
The contract will be structured in two phases:
Phase r is estimated to be $25,000 - $50,000, and will consist of a two to three week assessment that will summarize tl1e initial key findings and establish the broader effort going fo1ward
Phase II is estimated to cap at $500,000 with a duration of two to six

washinoton Me1ro11olitan Area
TranSil Aulhori!Y
'.
M E M 0 R A N D u M
SUBJECT: Financial Data Conversion 1, 2012
FROM: DGMA/CFO - Carol Kissa
As Metro approaches the start of preparations for its FY2012 audited financial statements, I wanted to provide you with assurance as to the reliability of data in our financial system of record, in light of the most recent upgrade of our enterprise financial system , PeopleSoft. I also wanted to bring to your attention one controlrelated issue that has surfaced and been resolved.
Metro upgraded its PeopleSoft Financial system in FY2011 , a process that provided updated and enhanced capability, while establishing better integration with other mission critical systems. The upgrade was completed and launched at the start of FY2012. Throughout the conversion process. the fundamental priority was that financial data stayed intact, which was ensured by multiple checkpoints and verifications along the way. The following describes the methodology, as well as the actual work that was done to ensure correctness and completeness of the accounting data used to state Metro's financial position . A description of how various data elements were handled and confirmed for this migration is attached.
Data conversion was merely one aspect of the rigorous methodology used for the re architecture of Metro's enterprise financial system. The project governance framework included direct leadership from the DGMA/CFO, DGMO. AGM Bus, and CIO through an Executive Steering Committee (ESC) , which ensured communication, as well as timely escalation and resolution of issues. The Board directed the OIG to monitor the project. Consequently, the OIG or her designee was invited to attend all ESC meetings, from August 2010 until the week prior to go live in June 2011. The OIG or her designee attended most of these meetings, so all major decisions and discussions on project status had the benefit of her counsel. As work progressed and milestones were reached, the ESC provided approval to go live on July 10, 2011 , after staff representing Operations, Procurement, Accounting , and Budget confirmed that the data in the system was correct and that the system was ready for use.
Since the go live in July 2011 , one control-related issue has surfaced related to inventory usage, with an impact of $4.5 million in inventory balances and material costs. Part of this upgrade was the implementation of a new PeopleSoft Inventory module at Metro's main warehouse and storeroom. Satellite storerooms continued to use Maximo -- a different but integrated inventory system -- for transactions . Although these transactions continued to be captured in Maximo,
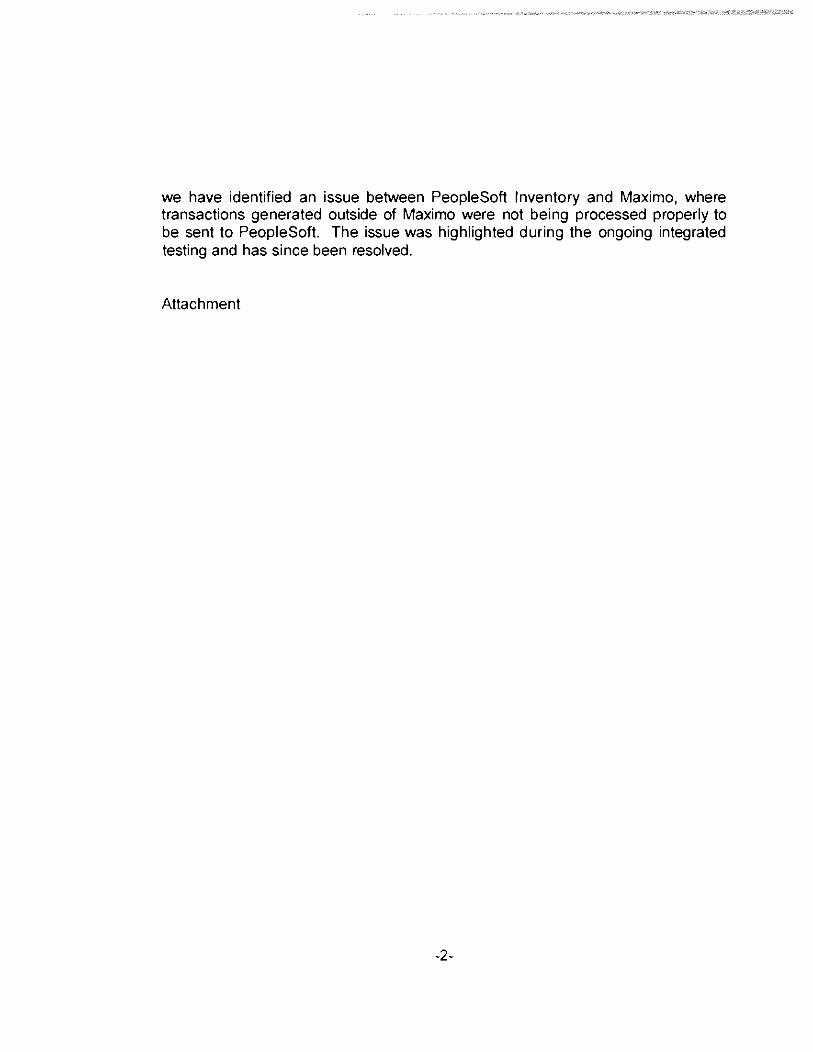
we have identified an issue between PeopleSoft Inventory and Maximo, where transactions generated outside of Maximo were not being processed properly to be sent to PeopleSoft. The issue was highlighted during the ongoing integrated testing and has since been resolved.
Attachment
-2-

General Ledger (GU
PeopleSoft Financial Upgrade Control Procedures
Balances were carried forward and mapped to the new chart of accounts design and then verified. The GL manager reviewed the ending balances for 2011 and verified the beginning balances for 2012 during the cutover period.
Commitment Control The budget ledgers were redesigned and the beginning balances were established through a combination of previous balance and business logic, using standard methods provided by the software. The step-by-step crosswalk from the previous balance to the new balance was verified by the appropriate Budget department manager.
Billing All open Billing documents were closed or converted to Accounts Receivable (AR) Items prior to fiscal year-end. Installment bills were manually reconfigured or reestablished with the new chart of accounts design. This was verified by the GL manager.
Accounts Receivable AH open AR Items were converted to the new chart of accounts design and Commitment Control structure. The AR conversion took in to account revenue from project revenue budgets and was coordinated with GL and Projects conversion activities. These activities were tested prior to the actual conversion in June and verified by the GL manager.
Accounts Payable (AP} All payable activity was closed or completed by the end of FY2011, so no conversion was needed. This was confirmed by the AP manager.
Cash Balances No conversion was necessary; balances were brought forward and verified by the GL manager.
Projects All open projects, including those that have both (1) a start date in fiscal year 2011 or prior and (2) an end date in fiscal year 2012 or beyond, were renumbered to support a clean conversion as well as maintenance of historical project data. The renumbering was communicated to the affected parties prior to the cutover.
Grants There was no conversion necessary, as the Grants module is brand new and had no prior data in the system. Grants are created by the Grants team in OMBS through manual entry or through an automated upload to the system and verified by the Grants team.
1

Contracts All open grants, including those that have both (1) a start date in fiscal year 2011 or prior and (2) an end date in fiscal year 2012 or beyond were entered in the system. Conversion included mapping Fund and Funding Line Item and their historical balances from the GL used for FTA reporting to Customer Contract and Contract Lines. Contract Limits were gained from Commitment Control and established for each Contract Line. Contract Limits were validated by the Grants manager.
Purchasing Conversion was required to support use of Purchasing Contracts, new chart of accounts design, and new Commitment Control design. All un-sourced requisitions were cancelled and any remaining requisitions at FY2011 year-end were either closed or cancelled. These were executed at the direction of the Chief Procurement Officer and communicated broadly between March and June of 2011.
Purchase Orders Over 40,000 Purchase Orders were closed prior to year-end FY2011 to enhance the quality of data. For conversion purposes, all open Purchase Orders that did not have obvious data corruption issues were converted with the new chart of accounts design and Commitment Control structure, along with associated open receipts. All Purchase Orders that had obvious data corruption issues were replaced with newly created Purchase Orders that had the new chart of accounts design and new Commitment Control structure. Where data corruption issues were identified, the new Purchase Orders were established using their FY2011 ending balance. Where new Purchase Orders were created, the Purchasing managers reviewed and approved the crosswalk, and communicated any Purchase Order number changes to the vendors.
Assets There was limited conversion for Assets; balances were brought forward and verified by the Asset management manager.
2

M E M 0 R A
SUBJECT: December Monthly and 2nd Quarter Financial Reports
FROM: DGMNCFO-Carol Dillon
TO: GM/CEO- Richard Sarle
N D u M
DATE: 02/03/2012
I am enclosing for your review the monthly financial report and the quarterly financial report for the period ending December 31 , 2011 .
Per the Capital Funding Agreement (CFA), I will be transmitting to the Jurisdictions the Quarterly Capital Program report by February 15, 2012. A summary of this report on the Capital Program will be presented as part of the March Finance and Administration Committee materials (FA Committee).
Through the end of the second fiscal quarter Metro has a positive net position of $16.6 million; a positive expenditure variance of $20.1 million was partially offset by a $3.5 million negative revenue variance.
Year-to-date ridership of 108 million was lower than forecast on Metrorail by one percent, or 1.4 million trips but ridership was virtually identical to the same period last year. Metrobus ridership continues to exceed budget for the eleventh consecutive month. Metrobus ridership year-to-date of 66 million trips was seven percent higher than the same period last year and eight percent higher than forecast (4.3 million and 5.0 million riders, respectively) through the second quarter of FY2012. MetroAccess passenger trips are 15% lower than experienced during the same period last year with one million total passenger trips. This decrease can be attributed to the implementation of demand management initiatives.
Year-to-date operating revenues of $397 million were one percent or $3.5 million below budget due to lower than forecasted Metrorai l ridership. Year to-date Metrorail passenger fare revenue was $6.5 million lower than forecast, parking revenue was $0.8 million lower than forecast, Metrobus passenger fares
' exceeded forecast by $4.5 million and MetroAccess revenue exceeded forecast by $0.7 million .
Operating expenditures through the end of December were $20.1 million dollars or 2. 7 percent under budget on a tota! operating budget of $730.8 mil lion. The overruns associated with personnel costs were offset by favorable variances in services, propulsion/diesel , and utilities.
Year-to-date expenditures for the capital program, including the ARRA, Safety & Security, and Reimbursable capital programs, are $383 million with $848 million in obligations. The Capital Improvement Program (ClP) has expended $307 million with $699 million in obligations through the end of December. The CIP has expended $51 million, or 20 percent, more than during the same period last year and has obligated $124 million, or 22 percent more.
Activity on major projects include: • 94 of the 100 scheduled FY2012 replacement buses have been received.
48 of those buses are in service. Full delivery of these replacement buses will be completed in January of 2012.
• Major escalator repairs were completed at six rail stations, and additional projects are underway at six stations. Rehabilitation/modernization projects are underway at several stations throughout the system. Seven rehabilitation/modernization projects were completed in the second quarter
• Significant track and structure work is either underway or planned on all lines reflecting the prioritization of state of good repair projects.
• Station enhancements are ongoing at five Metrorail stations. Station rehabilitations were completed at two stations.
The attached capital financial reports and quarterly capital program progress report include project level detail, project summaries, and performance data related to project and program delivery. Operating budget details in the financial reports include ridership, revenue, expenditure, vacancy rates, and other operaUng information.
Attachments
2
Finance & Administration Committee
Fiscal Year 2012
Financial Summary and
Quarterly Financial Report
2nd Quarter FY2012 December 2011
1of59
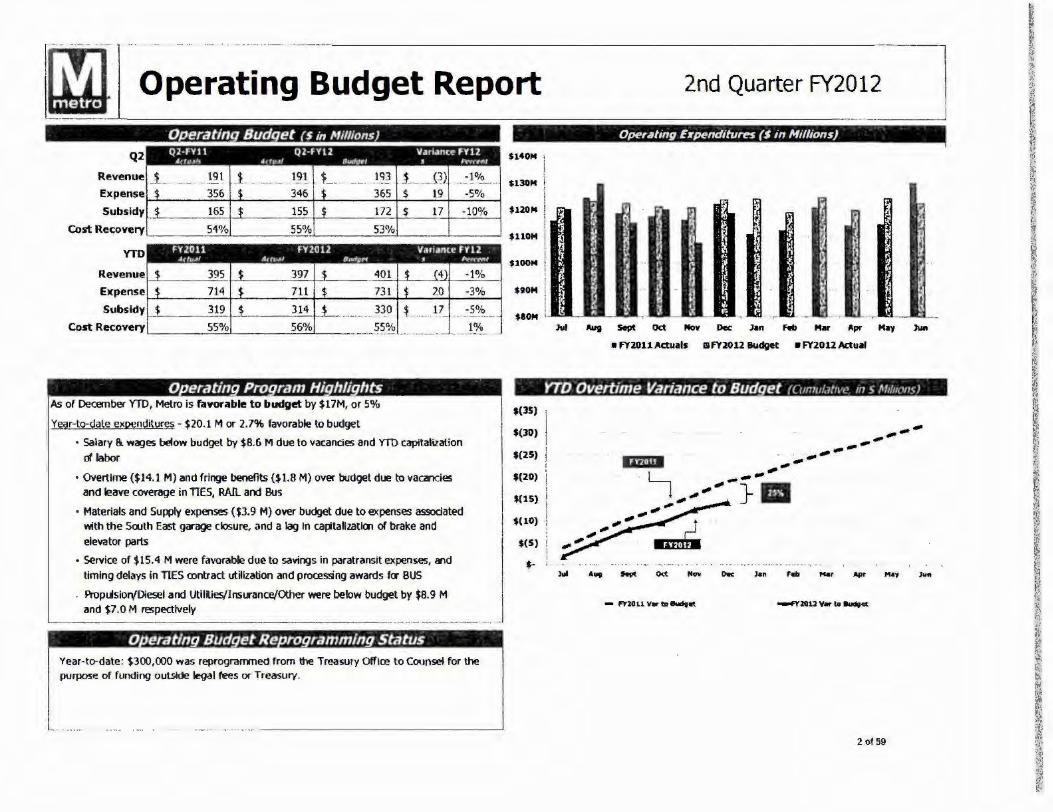
1.~J~] _o_~-·~_;a_· ~-·· ~-~9_ .. __ ~_u_d_g_e_t_R_e_p_o_rt _____ 2n_d_Q_ua_rt_er_FY_2012-I
Operatin Budqet (Sin Mil/Ions
Q2
Expense..._._~~~-+ ......... ~~---+-.._~---+-'----+-~~ Subsldy,_L-~~~-+-'---~-'-'-+-.._~---'"_;,.-1-L~......;;.-+-~""'--I
Cost Recovery.__ _ _ _ ~-·--~~~--'----~--"'-~--'-~~--'
YTD
$140M l S130M I $120M l $110M 1
UOOM II Revenue
1-J..----=-~·__._-----'"-'-'--+--'--~--'-"~~--"~'+----'-'-'---I ! EKpense -3% UOM !
i
Oper.atrng EJTpenditu~ (S in Hi/lions}
. t
Subsidy 17 -5% •eou ,' , ..,.. ... _--..--... Cost Recovery..._ ___ -'"5..;;..5°_V"o"-----S'"-'6'-0/c"'"'o~--.- ---~~-'Y2 -·· ·-···-· . . ·~i~··- 1 "' ... - M Aug Sept O<.t Nov Dec .Jan hi> M• Apr May l\lft
O eratin Pro ram Hi hi/ hts As of December YTD, Metro is favorable to budget by $17M, or 5%
Year-to-Qatui:<i>enditures - $20.1 Mor 2.7% favorable to budget
I • Salary &. wages below budget by $8.6 M due to vacancies and YTO capital ization
d labor
• Overtime ($14.1 M) and fringe benefits ($1.8 M) over budget due to vacancies and leave coverage in TIES, RAIL and Bus
• Materials and Supply expenses ($3.9 M) over budget due to expenses associated with the Sooth East garage closure, and a lag In capltallzatlOn or brake and
elevator parts
• Service of $15.4 M were favorable due to savings in paratransit expenses, and
timing delays in TIES contract uUilation and processing awards fa- BUS
. Prop~sior\fOiesel and Uttllies/Insurance/Other were below budget by $8.9 M and $7.0 M respectively
L-- - ---------------------··--·---···---O eratlng Bud et Re rogrammlng Status
Year-to-date: $300,000 was reprogrammed from the Treasury Office to Counsel for the purpose of runding outside legal fees or Treasury.
• FY2011 Actu;ils llFY2012 lludget • FY2012 Actulll
YTD Overtime Variance to Bud et f( 11m111.1t1L ,. /11 s "''''"'"<;' $(35) '
::: I ' $(20) j
$(15) ! $( 10} 'j
$(5)
$-
!
Jul
2 of 59

1~I Revenue and Ridershi~~e~~-rt --;nd Quarter FY2012 __ ]
Q2
Metrorall
Metrobus
MetroAcces.s
System Total
YTO
Metrorail
Metrobus
Metro Access
System Total
Ridershi tri s In thousands Q2·FY20l l Q2 FY2012
Actt1.tl AchMI 8"'1;Jrt
~Ji!82 _ . --~JJfill 52 136
'}9J.778 _ ___ 32,252 _ _ 29.152 .
598 514 613
81 558 84.554 81,901
FYlOll fY20l2 Athl~f A<t11.M ,,~,,.,,.,
107709 107689 109 099
--- --~-1 ... 14Q. . - . ..•. .§?,7?9 60/73
1 21 1 1030 1.247
170.360 1~11z .. ____ rr!,119
Va111ncc """" 'rt".tl ifulfVrf
1% -1%
8% 11% ... . ·-·--·-14% -16%
4% ____ .]% ___
Vat lance ,.,,., .,,.,,, a,,_,,, 0% -1%
7% 6% -15% -17%
2% 2%
Revenue and Ridership Highlights Year-to-date Revenue
• Year to date, Metro Is 1$3.S M) unfavorable to budget in revenue
• RaU passenger fares are ($6.S M) below budget. Revenue in December was favorable to
budget due to high ri dership, resulting in an average fare of$2.6S for the month, $2.61 year to date.
• Bus passenger revenue is $4.S M favorable, December was highly favorable due to
strong ridership. Average fare year-to-date Is $1.00
• Total other revenue is ($1.S M} below b udget
Year· t o-da.1e Ridership
• Rail ridership in December continued to show signs of Improvement, exceeding
projection by 500,000. Similar to November, passenger trips were up during all periods
over the prior year; the largest increase occurring during the evening period. YTD
ridership is l . 3% below projection.
• Bus ridership YTDis SM or 8.2% above bu dget, and 4 .3 Mor 7% above prior year.
Average weekday ridership has been strong at 441,000 trips per day.
• Both Rail and Bus ridership were strong in December due to favorable wea ther.
Compared to the prior two years, the warm temperatures and no snow encouraged
people to utilize public transit.
• In addit ion, the holidays fell on the weekends, resulting in only one federal holiday In
December. As a result, there was an increase In commuter trips over thP. prior year.
'---- -------- ·- .. - ·-·- . -···-- ---·- - --------'
$80M r ·
$75M
$70 H
USM
$60M
! I
$SSH ·
$SOM l
Revenue
Jul Feb Mar Apr ~ Jun
• FY1011 Actual lllFY1012 Budget • FY2012 Act\lill
Month/ Ridershi for Rail and Bus m Millions
20
18
16
14
, I
I , ..,4 __ ..,, ..
,,_ - ........... _,.~ , .... ...-
-.-Rail Budget -Rail Acblals -e llus Budget -sus Actuals
3 of 59

l~ l ~-------~----------- · -· ·- ~·-·---------------------
·---------·---1 2nd Quarter FY2012 Capital Program Report
Sources of Funds rs in HillionsJ ' Uses of Funds (S in Hillions)
FY2011CIP ,._~---+--~~
290 FY201LC1P f---'-"..;..;.---1--'-'-"--+---'~5~75"---t--'=..;'--+--'-';..;...:..--1-..:'-'-'-=--t FY2012CIP,_~'-----''---'--'-----'-~- FY2012 CIP.__,_._ _ _, _ _,__ _ _ _ _ $699 _ _
Safety • Seait lty
ARRA Reimbursable
Total
p • .,,.f"f
is7 56
100
$213
Obhoatlon·l5.1s.ed to Doll• SourrM ofrunrl• .a.,,_.,tfNI lltH(V"""1
_$~--- ·· - lQ 56 34
100 26
$213 $60
Capital Program Highlights
'•"" """' .ts7 ___
22_ __ ·--75
$153
I As of December 31•t
• The Capital Improvement Program {CIP) has e)(pended $307 million in FY2012. This is $51 million. or 20 percent. more than the same period in FY201 1.
• 94 of the 100 FY2012 replacement buses have been received of which 48 have
Safety • Security
ARRA Relmbursable
Total
•tlOM
$ 140M
$UOM • The current forecast ls projecting expenditures of $917 million for the fiscal year. ,
1
.
been placed into service. ! $100"1 • Major repairs were completed on escalators at the largo Town Center and t
Minnesota Ave Metrorail stations. • Rehabilitation/modernizations were completed on escalators at the Arlington
Cemetery and Metro Center Metrorail stations. • Station rehabilitations were completed at the Greenbelt Metrorail station. • Track rehabilitation work completed YTD include the following: welded 523 open
joints; retrofitted 1.3 75 In ft of float ing slabs: replaced 542 "High Voltage" roadway safety signs; rehabilitated 6,698 In ft of grout pads; tamped 26 miles of track; repaired 597 leaks: and replaced 11.307 cross ties. 1, 1680 fasteners, 4.729 insulators. 6.5 miles ft of running rall. 6.455 direct fil(ation fasteners, 16 tum outs
"----------··-· - ---
f I
--$60 M
$40M
$20M
$OM J..i -""
Obl19,,tton-B.uf'd t o D.1tr U•rs of Funds . .,,-"' .. ' ('t('Jl .. .tf*1(f "''~"~d n.t ""''" c.,, ,, .. ,,.
_ _ $57 --.- $9 -.. ·--·- !1_ 16% 1% - - -··- - ··-·- ·--------56 55 35 98% f>~.!2_ 100 85 41 84% 41%
$213 $149 $76 70% 36%
CIP Ex nditures ($in Million5) $700H
$600M
·- I r: &
:~: $400M .:! I: ~ 0
UOOM J:
. ~ i " U OOM E a
~ $100M
$OM
:'. ,,
s.,.t Oct - Dec Jon Fa Mu .. , ...., ,.., -n20110a....- e.,. -4'\'JOl20.mulotlvt Exp.
Ca ital Budget Re rogramming Status Through the end of the second quarter, $30.S mUlloo , or 3.4%, or an approved budget of $888.9 miUion has been authorized for reprogramming by the General Manager. This leaves $13.9 n'fUion available for reprogramming before the 5% cap set l7f the Board is reached.
4 of 59

---~-~ - -- ··- · .. - ··-·· ·-·-- ··-··-··--·-·· -- .. --·- ·--------~~
HR Vacancy Report 2nd Quarter FY2012 ---·· ·---·-·· --·-- - - ·-· ······- --··----·------------------
Operating Vacancies Budget Approved .
P -t· Total Number Vacant Vacancy Rate Discussion os1 ions
~t~Ope~ti~Po~tion~L---·-· ·_~10~·=ll.::.;6~---_--_~]_-___ ~5~5~8----~----5~%~---~v~a~~~n~ci~e~s~w~~~"~~~~~~~~u~~~~~~~ ~s~~ --~] Departments with a large number of vacancies:
Transit Infra. & Engineering ServicesL~~: ···-;,~ ~5-_ _ ·_ _.).5~---. -
1 _ TlJ:i~eauitment Specialist recently hired ... --l
&.is ServiCes 3 796 122 3 o/o ~----'"-'--'"'-----+-----==-----+-------"--"-'------·· · ··---- .. -·· ··-·- -··-- -·-···-· -- -- ··----------~
Rall Trar6portation~----1~4_99-"-----+------1H ____ . ···-· _ !~.l!.hi_~!1Jl.P.!'..~.S.S i§__9~p~der].L~ progress in Bus nlling positions __
Information Ted1oology,__ ____ 25~1 _ _ _ 49 . __ .. _. - ··-· __ io0~0 ___ · ·-- · _ fIT-RE!9.:Yl~~r .?~alist ret:entlr hired
Metro Police Oepartmeot . -~s. ... ..?:~-- -·· ·-·----··-·· 4% ____ ~! ---------- - - - - -Rail Transportation
Capital Vacancies Budget Approved
P .t . Total Number Vacant Vacancy Rate Discussion
os1 tons
Total Capital Positions[ _1~,0_19'-----··~i-_-_-_· ____ )~ 18%
Departments with a large number of va~c~es_;__
Transit Infra.&. Engineering Servicesf---·-'-76"'7'-----~1~---""ll°"'I _ __ -_--_-~-·-_-_·- -~~~681s~o0__ ~1)-E~-R~~it~~nt ~pe.fl~list_recently hir~ -H-- - ··- - - . _-..• ~-- . -· ···
725
675
625
515
525
475
415
....
, ..
Jn formation I echnotogy _ .. } _I __ ~ :..!'-'0-' ----+IT~R..:.:ec=-=ru:::.:itm'-=e'-'nt"-'S=e:.:::ci:.::al"'ist~re"'c~en-"tJ'-'-'-h""ir-=ed=-- _ -·- - ···
Procurement (apltal Support.__ ___ --'2'"''1 ___ _ _,_ _ _ _ _ 24 · : ·-=-~. · 1= ~ ~ ~-:;~% Recrui~men!_Qr~ess .~\!S bee~n_in __ iu~·a-'-ted~--------- . _
..... ..... ...... .... ,.,.
Operating Vacancy Trend Capital Vacancy Trend
.... .,.... __ .... ___ . ,.,,,
"'' "'' , ...
:MS 2l5
225 215 205
195 185
115 1 I.
.....
)ul
... ....... ' ' ' ' ' ' ·---·---........ ....... - Hit ,.,,, ... , Jm
5 of59

~ Washington Metropolitan Area Transit Authority
Fiscal Year 2012 Financials
Quarterly Financial Report
2°d Quarter
October - December 2011
6 or 59
WASHINGTON .METRO POLIT A.1\f AREA TRANSIT AUTHORITY QUARTERLY FINANCL.\L REPORT
Q2 - FY2012 October - December 2011
REPORT SECTIONS
Operating Budget • Revenue • Ridership e Expense
Capital Finances • Revenues e Costs • Projects
Outstanding Debt
Appendix
Operating Financials
Ridership and utilization analysis
Capital expenditures and Reimbursable projects
American Recovery & Reinvestment Act (ARRA)
Safety and Security expenditures
Passenger Rail Investment and Improvement Act (PRIIA)
Jurisdictional balances on account
Grant activity
Sole source awards
of59
Washington Metropolitan Area Transit Authority Quarterly Financial Report -- Q 2 - FY2012
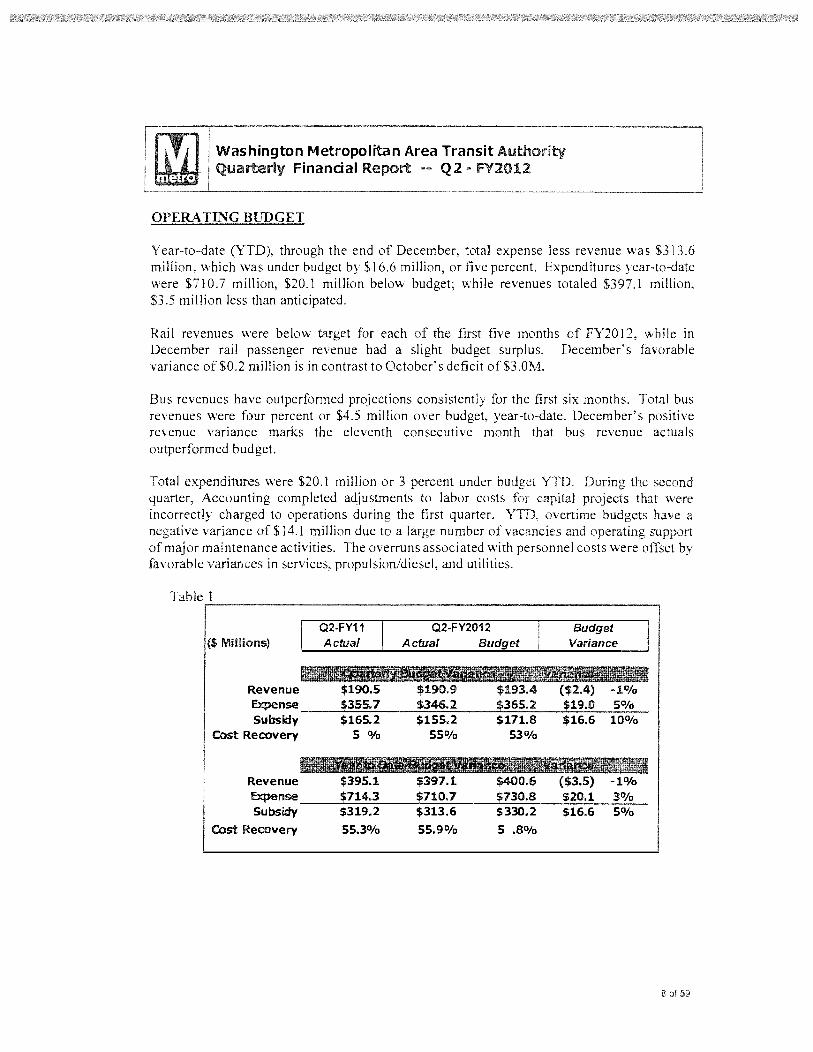
OPERA TING BUDGET
Year-to-date (YTD), through the end of December, total expense less revenue was $313.6 million, which was under budget by $16.6 million, or five percent. Expenditures year-to-date were $710.7 million, $20.1 million below budget; while revenues totaled $397.1 million, $3.5 million less than anticipated.
Rai 1 revenues were below target for each of the first five months of FY2012, while in December rail passenger revenue had a slight budget surplus. December's favorable variance of $0.2 million is in contrast to October's deficit of $3.0M.
Bus revenues have outperformed projections consistently for the first six months. Total bus revenues were four percent or $4.5 million over budget, year-to-date. December's positive revenue variance marks the eleventh consecutive month that bus revenue actuals outperformed budget.
Total expenditures were $20.1 million or 3 percent under budget YTD. the second quarter, Accounting completed adjustments to labor costs for capital projects that were incorrectly charged to operations during the first quarter. YTD, overtime budgets have a negative variance of $14. l million due to a large number of vacancies and operating support of major maintenance activities. The overruns associated with personnel costs were offset by favorable variances in services, propulsion/diesel, and utilities.
{$Millions) Q2-FY11 Q2-FY2012 Budget _J Actual Actual Budget Variance
Revenue -1°/o 5°/o Expense~~-'-~~~~-'-~~~~-'-~~~-'-~~~~~
Subsidy 10°/o COst Recovery 5 O/o 55°/o 53010
• Revenue $395.1 $397.1 $400.6 ($3.5) -1% Expense~~_._$7_1_4_.3~~_...$_71_0_._7~~-$~7_3_0_.8~~$~2_0_.1~_3_0_~~ Subsidy $319.2 $313.6 $330.2 $16.6 5%
Cost Recovery 55.30/o 55.90/o 5 .80/o
8 of 59
I ~·· J Washington Metropolitan Area Transit Authority I . I Quarterly Financial Report -- Q2 - FY2012 f . "' • !
I I
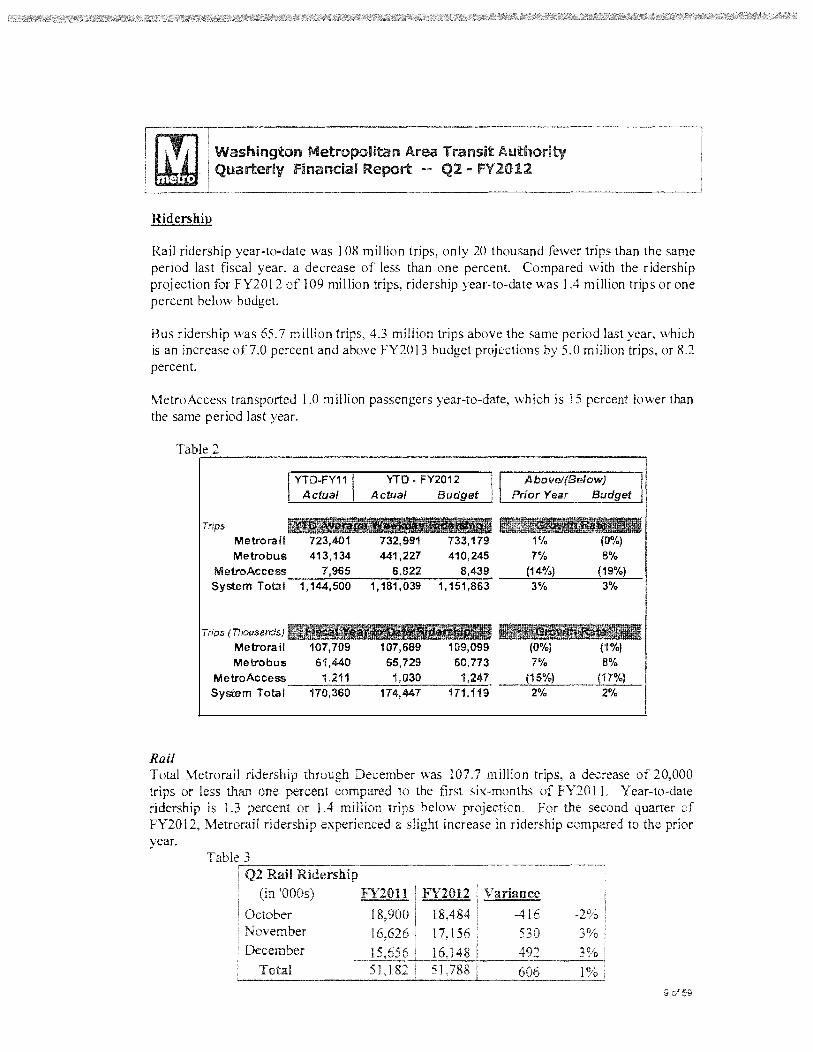
Ridership
Rail ridership year-to-date was 108 million trips, only 20 thousand fewer trips than the same period last fiscal year, a decrease of less than one percent. Compared with the ridership projection for FY2012of109 million trips, ridership year-to-date was 1.4 million trips or one percent below budget.
Bus ridership was 65. 7 million trips, 4.3 million trips above the same period last year, which is an increase of7.0 percent and above FY2013 budget projections by 5.0 million trips, or 8.2 percent.
MetroAccess transported 1.0 million passengers year-to-date, which is 15 percent lower than the same period last year.
Rail
Trips
[ YTD-FY11 I
Actual YTD - FY2012 1
A ctua/ Budget ....J
Metrorail 723,401 732,991 733,179 Metrobus 413,134 441,227 410,245
MetroAccess 7,965 6,822 8,439 System Total 1,144,500 1,181,039 1,151,863
Trips (Thousands)
Metrorail Metrobus
MetroAccess System Total
~~--'--~~~~'--~~~-=--~
174,447
A bovel(Below) Prior Year Budget
1% 7%
(14%) 3%
7% (15%)
2%
(0%)
B% (19%) 3%
8% (17%} 2%
Total Metrorail ridership through December was 107.7 million trips, a decrease of 20,000 trips or less than one percent compared to the first six-months of FY201 l. Year-to-date ridership is 1.3 percent or 1.4 million trips below projection. For the second quarter of FY2012, Metrorail ridership experienced a slight increase in ridership compared to the prior year.
(in 'OOOs)
October November December
FY2011 FY2012 Variance
18,900 -416
9 of 59

Washington Metropolitan Area Transit Authority Quarterly Financial Report - - Q2 ~ FY2012
The weather for the Washington DC metropolitan area was unusually warm during the second quarter. There were twenty days in November and eight days in December were the daily high was above sixty degrees Fahrenheit. In comparison, temperatures for the prior two years were seasonal and both received snow in December. The warm temperatures had a favorable impact on passengers, encouraging people to utilize public transit.
In November, Metrorail Jost an estimated 11,000 trips due to the cancellation of the two NBA games resulting from the lockout dispute. "fois loss was countered by other large events held in the District of Columbia during the month.
This year Christmas Eve, Christmas Day, New Year's Eve and New Year's Day fell on the weekend. The federal holidays for Christmas and New Year's Day both fell on Monday after the holiday. This had two effects on ridership. First, there was an overall increase in commuters compared to prior year because there was less incentive to take the eve of the holiday off of work. Second, there was one less federal holiday in the month of December. An additional 500,000 trips were taken during the last week in December FY2012 compared to FY2011 .
For second quarter, average weekday ridership was 717,400 trips, a three percent increase over the same period last fiscal year. The average weekday ridership for the quarter was up during all time periods of the day. Year-to-date average weekday ridership of 733,000 is above prior year by 1.3 percent and only slightly less than projections with a variance of less than one percent.
Total weekend ridership was in November, but below prior year in October and December due to low Saturday ridership . For the quarter, average Saturday ridership was 329, 700 trips, a decline in average Saturday ridership of 10.0 percent from the previous year. Saturday ridership during the prior October FY2011 was uncommonly high due to the Rally to Restore Sanity held on October 3 J si, resulting in the year over year decline to be greater than it would have been. Average Sunday ridership for the second quarter was 203,000 trips, one percent above the average for the previous year.
Bus Total Metrobus ridership for the second quarter of the fiscal year increased from 30 million trips in FY2011 to 32.3 million trips in FY20 12, an increase of 2.5 million trips or 8.3 percent. When compared to budget, ridership was 3 .1 mi !lion trips above projection. Yearto-date bus ridership is 65.7 million, an increase of seven percent over prior year and 8.2 percent over projection.
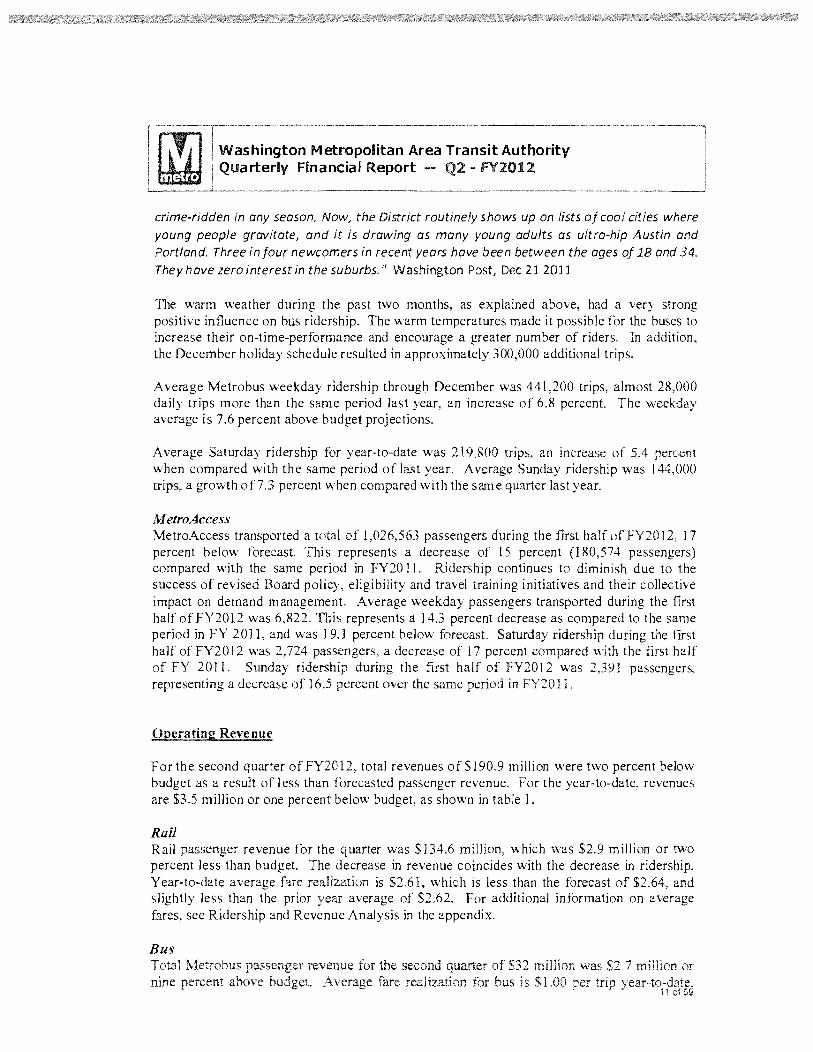
Metrobus monthly ridership continues to be higher than the same period from the prior year. One of the variables correlated to Metrobus ridership is Washington DC population growth and demographics. Wbile population growth is starting to slow, there has been a very slight demographic shift in residents who are inclined to utilize the bus for commuting purposes.
"The District's population figures cop a decode of success in maneuvering a turnaround in the city's fortunes, and its image. Barely 15 years ago, the District hod a widespread reputation for having streets that wouldn't get plowed after a winter storm and that were
10 of 59
Washington Metropolitan Area Transit Authority Quarterly Financial Report -- Q2 - FY2012
crime-ridden in any season. Now, the District routinely shows up on lists of cool cities where young people gravitate, and it is drawing as many young adults as ultra-hip Austin and Portland. Three in four newcomers in recent years have been between the ages of 18 and 34. They have zero interest in the suburbs." Washington Post, Dec 21 2011
The warm weather during the past two months, as explained above, had a very strong positive influence on bus ridership. The warm temperatures made it possible for the buses to increase their on-time-performance and encourage a greater number of riders. In addition, the December holiday schedule resulted in approximately 300,000 additional trips.
Average Metro bus weekday ridership through December was 441,200 trips, almost 28,000 daily trips more than the same period last year, an increase of 6.8 percent The weekday average is 7.6 percent above budget projections.
Average Saturday ridership for year-to-date was 219,800 trips, an of 5.4 percent when compared with the same period of last year. Average Sunday ridership was J 44,000 trips, a groVvth of7.3 percent when compared with the same quarter last year.
]';f etroAccess MetroAccess transported a total of 1,026,563 passengers during the first half FY20 I 2, 17 percent below forecast This represents a decrease of I 5 percent (180,574 passengers) compared with the same period in FY2011. Ridership continues to diminish due to the success of revised Board policy, eligibility and travel training initiatives and their collective impact on demand management. Average weekday passengers transported during the first half of FY2012 was 6,822. This represents a 14.3 percent decrease as compared to the same period in FY 2011, and was 19. I percent below forecast. Saturday ridership during the first half of FY2012 was 2, 724 passengers, a decrease of 17 percent compared the first half of FY 201 l. Sunday ridership during the first half of FY2012 was 2,391 passengers, representing a decrease of 16.5 percent over the same period in FY2011
Operating Revenue
For the second quarter ofFY2012, total revenues of$190.9 million were two percent below budget as a result of 1 ess than forecasted passenger revenue. For the year-to-date, revenues are $3.5 million or one percent below budget, as shown in table 1.
Rail Rail passenger revenue for the quarter was $134.6 million, which was $2.9 million or two percent less than budget The decrease in revenue coincides with the decrease in ridership. Year-to-date average fare realization is $2.61, which is less than the forecast of $2.64, and slightly less than the prior year average of $2.62. For additional information on average fares, see Ridership and Revenue Analysis in the appendix.
Bus Metrobus passenger revenue for the second quarter of $32 million was $2.7 million or
nine percent above budget Average fare realization for bus is $1.00 per trip
Washington Metropolitan Area Transit Authority Quarterly Financial Report -- Q2 - FY2012
which is Jess than the forecast of $1.0 l and the prior year average of $1.07. The reimbursement to the Regional bus partners for bus passes averages $160,000 per month. This amount is reduced from Metrobus revenue, decreasing the average fare.
MetroAccess MetroAccess passenger revenue for the second quarter of FY2012 is $1.6 million. Year-todate MetroAccess passenger revenue forFY2012 is $3.9 million which is significantly higher than revenue for the same reporting period in FY201 l. The FY2012 monthly passenger revenue reflects the implementation of the fare increase on February 2011. Additionally, in FY2011, although revenue collected through the EZ-Pay system was appropriately recorded in a deferred revenue account, it was not recorded as earned revenue upon usage. In FY2012, the process has been revised to record revenue monthly based on usage.
Parking Parking revenue year-to-date of $22.6 million was Jess than budget by $0.8 million or three percent. System-wide parking uti Jization of 83 percent was up by three percentage points as compared to the first six-months of the prior year. December parking revenue includes an annual payment of$300,000 from Prince George's County for garage spaces.
Other Revenue Sources Total non-passenger revenue was below budget by $1.4 mil lion the first half the fiscal year. See Operating Financials in appendix. Of non-passenger revenue, advertising revenue was $2.2 million below budget. Because of the way in which the CBS Broadcasting Inc. contract is structured, advertising revenue will appear below budget each quarter until the year-end reconciliation of total advertising sales, which we expect to be on budget or slightly ahead of the annual $15 million budget. The category of Other Revenue includes used equipment sales, subrogation (receipt of insurance funds) and purchase card rebates.
Expenses
Metro was $20 million, or 2. 7 percent, below budget in expenditure through the end of the second quarter, as shovvn in table I.
Labor Total personnel expenses were over budget by $7.3 million for the first six months. Overtime was over budget by $ 14.1 million mainly in the departments of Transit Infrastructure and Engineering Services (TIES), Rail Transportation (Rail) and Bus Services (Bus). The primary contributor to overtime has been the large number of vacancies which has resulted in the need for bus and rail operator overtime, as well as overtime to complete necessary maintenance and repairs. Salary and wage expenses were under budget by $8.6 million primarily due to vacancies in Bus, Rail and Fringe benefits were 1.7 million over budget year-to-date. The variance in fringe benefits is partially due to the overrun in overtime.
Non-Labor Year-to-date non-personnel expenses were under budget by million. Services were under budget $15 .4 million mainly due to lower than projected utilization paratransit
12 of 59

~-----------------~'''''''''~~' ----~---------~
I j Washington Metropolitan Area Transit Authority
• I Quarterly Financial Report -- Q2 - FY2012
and delays in initiating service contracts. The MetroAccess service contract was $6.4 million favorable to budget through the second quarter. Fuel & Propulsion and Utilities were under budget by $15.9 million mainly due to lower than budgeted propulsion and utility rates. Both of these situations will continue through the rest of the fiscal year. Part of this favorable performance was offset by Materials and Supplies, which was over budget by $3.9 million due to a lag in capitalization car maintenance parts.
CAPITAL FINANCES
Sources of Funds
The total available budget authority for FY2012 is $1.15 billion. In October, per the Capital Funding Agreement (CFA), Metro provided the Contributing Jurisdictions (Jurisdictions) with a reconciliation of actual FY2011 expenditures and a revised forecast of expenditures for FY2012 (FY2012 Forecast). The FY2012 Forecast formed the basis for the revised scheduled Allocation Contribution each of the Jurisdictions and the Annual Work Plan (A WP) delivered to the Jurisdictions on December 22, 2011 . The FY20l 2 Forecast projects expenditures of$ l.03 billion.
Year-to-date sources of funds per the FY 2012 Forecast total $1.03 billion. As of December 31, 2011 the amount awarded to Metro, including federal grants, totals $475 million. Revenue received year-to-date is $392 million, and represents available cash on hand. Total miscellaneous revenue consists of $69 million from Metro Matters rollover, land sales, West Falls Church insurance settlement and other Jurisdictional proceeds.
Capital Revenues (dollars in millions) Received To be
CIP Budget* Forecast to Date Received Federal Grants $ 530 $ 494 $ 123 $ 371
State & Local Contributions 422 354 165 189 Miscellaneous 91 69 69
Subtotal 1,042 9'~ ~I 357 560
Semrity - Federal Grants $ 57 $ 57 $ $ 57 ARRA - Federal Grants 56 56 34 22
Subtotal 113 113 34 78
Total $ 1fl55 $ 1,030 $ 392 $ 638
•CiP Budget includes unexpended FY2G1 I Rollover of$l53 rni!Hon plus Board Approved FY20l 2 Budget of$8~9 million
13 cl 59

I~ I
Washington Metropolitan Area Transit Authority Quarterly Financial Report - - Q2 - FY2012
Capital Revenue Forecast
• l'eder alGrant>
• Stote & local Contributions
• M"iscellineous
• safety & Secvrity
• Amer·Kan Recovery & Rtin-wutrnent Act
As of December 31 , 201 I, $357 million of the Capital Improvement Program revenue in FY2012 has been received as compared to $290 million received at this time in FY201 I .
Capital Revenues (dollars in millions)
Budget• December FY2011 $ 84<1 December FY2012 $ 1,042
Forecast: $ 754 $ 917
Received to Date $ 290 $ 357
Tobe Received $ 464
$ 560
•CIP Budget mcludes unexpended FY20J I RoDover of SI 53 million plus Board Approved FY20l 2 Budget of 889 m11lion
Uses of Funds
The FY2012 Forecast is $1.03 billion. As of December 31, 2011 , capital spending was as follows: $763 million, or 74 percent, had been obligated and $342 million, or 33 percent, had been expended. The appendix includes budget and spending data for each capital project.
14 of 59

I
Washington Metropolitan Area Transit Authority Quarterly Financial Report •u Q2 - FY2012
I Capital Spending I (dollars in millions)
I Coplt.i Imprn~me"1 Prng""' Budget* Forecast Obligated Expended Unexpended Obi. Rate Exp. Rate I Vehides/Vehicles Parts $ 278 $ 269 $ 225 $ 118 $ 160 84% 44%
Rail System Infrastrudl.Jre Rehab 102 100 102 48 54 102% 49% I Maintenance Failil:Jes 163 126 61 19 144 49% 15% I Systems and Tedmo!ogy 108 91 72 32 75 79% 36% I I Track and Structure 83 81 72 34 48 89% 42% I
Passenger Facilities 121 116 82 27 93 71% ~:~: I Maintenance Equipment 156 105 65 16 140 62% Other Facilities 26 25 20 11 15 77% 42%
Project Management and Support 5 5 s 14% 14% Subtotal $ 1,042 $ 917 $ 699 $ 307 $ 736 76% 33%
Serurity Program $ 57 $ 57 $ 9 $ $ 56 16% 1 O/o
ARRA Program Vehides and Vehide Parts $ 0 $ 0 $ 0 $ 0 $ 0 97% 8%
Maintenance Facilities 19 19 18 17 1 99% 94% Passenger Facilities 6 6 6 0 6 92% 5% Safety and Security 1 1 0 98% 82%
Maintenance and Repair Equipment 12 12 12 9 100% 74% Operations System 16 16 16 6 10 100% 40%
Information Technology 1 0 100% 59%
Total $ 1,155 $ 1,030 $ 763 $ 342 $ 813 74% 33% *C!P Budget includes unexpended FY201 l Rollover of $153 million plus Board Approved FY20l2 Budget of$889 million.
The FY2012 Capital Improvement Program had relatively flat changes in both obligation and expenditure rates when compared to December FY2011. However, the Program actually expended $51 million or 20 percent more and obligated $124 million or 22 percent more than during the same period last year
Capital Spending (dollars in millions)
Budget* Forecast Obligated Expended Unexpended Obi. Rate Exp. Rate Capital Improvement Program FY2011 $ 844 $ 754 $ 575 $ 256 $ 588 76% 34% J
Capital Improvement Program FY2012 $ 1,042 $ 917 $ 699 $ 307 $ 736 76% 33% I'
MM!llHil!lliiililb_il'M_ I Budget Forecast Obligated E.xpended Unexpended Obi. Rate Exp. Rate I
American Rerovery & Reinvestment Act $ 202 $ 56 $ 20 l $ 181 $ 21 100% 90% Reimbursable Projects 1,851 100 1,561 1,337 514 84% 72% ,
Safety & Security Projects 51 57 13 5 56 22% 8% I Total $ 2,114 $ 213 $ 1,775 $ 1,522 $ 592 84% 72%
1
,
Obllgaffor,-Based projects do not have annual bu::igets _
•C!P Budget mcludes unexpended FY20l l Rollover of$!53 million plus Board Approved FY20\2 Budget of$889 mi!iion.
CAPITAL PROJECT HIGHLIGHTS
VehkleNehicle Parts
Metro currently has a of ,500 buses, each with a useful life. In order to insure a modem operating fleet that operates Mhtw

i
I Washington Metropolitan Area Transit Authority . I Quarterly Financial Report -- Q2 - FY2012
combines an aggressive and effective maintenance program and a bus replacement program that sets a target of I 00 buses for replacement each year. As of December 31 si, 94 of the 100 FY2012 replacement buses have been received with 48 of those buses in service. Full delivery of the remaining replacement buses will be completed in January 2012. The delivery of the 51 thirty (30) foot BRT buses (26 clean diesel and 25 hybrid/electric) is scheduled to commence in March and be completed by May 2012.
MetroAccess currently has a fleet of approximately 600 paratransit vehicles. Metro strives to maintain an average MetroAccess fleet age of four years which requires the replacement of approximately 200 vehicles per year. The procurement of 221 vehicles is scheduled for this fiscal year. As of December 31 5
\ thirty four (34) vans had entered the production line with approximately twenty nearing completion. Production of the 16 MV-1 Accessible Sedans will commence January 23 with deliveries scheduled for mid February. The project continues to be on schedule with no issues.
Passenger Facilities
Major repairs were completed on elevators at the Congress Heights Metrorail station.
Rehabilitation/modernizations were started on elevators at the Metro Center and Congress Heights Metrorail stations.
Major repairs were started on escalators at the Huntington, College Park-U of !\ID, Potomac Ave, Largo Town Center, Minnesota Ave, Addison Road-Seat Pleasant, Columbia Heights, Eastern Market, Federal Triangle, Grosvenor-Strathmore, Metro Center and Stadium-Armory Metrorail stations. Major repairs were completed on escalators at the Huntington, Minnesota Ave, Potomac Ave, College Park-U of !\ID, Largo Tov.11 Center and Minnesota Ave Metrorail stations.
Rehabilitation/modernizations were started on escalators at the Dupont Circle, Judiciary Square, Metro Center, Federal Center SW, Gallery Pl-Chinatown, Huntington and Arlington Cemetery Metrorail stations. Rehabilitation/modernizations were completed on escalators at the Judiciary Square, Farragut North, Foggy Bottorn-GWU, Union Station , Federal Center SW, Arlington Cemetery and Metro Center Metrorail stations.
Escalator Rehabilitations 42 17
Escalator Replacements 3 3
Station Rehabilitation Revort
16 of 59

Quarterly Financial Report -- Q2 - FY2012
Station enhancements were started at the Federal Center SW, Capitol South, Crystal City, Pentagon City and Clarendon (mini) Metrorail stations. Station rehabilitations were completed at the New York Ave-Florida Ave-Gallaudet U and Greenbelt Metrorail stations.
Track and Structures Maintenance
Red Line " Cable installations, station and signal upgrades, optic cable installation and
platform rehabilitation bet\veen Takoma and Forest G Jen • Rail and infrastructure renewal between Shady Grove and Twinbrook .. Rail renewal and tunnel leak repairs between Friendship Heights and Grosvenor
Strathmore • Rail and ties renewal work between New York Ave-Florida Ave-Gallaudet U and
Fort Totten • Platform repairs bet\veen Shady Grove and Grosvenor-Strathmore • Municipal water main and sewer line stabilization within Farragut North Station • Track rebuilds, tie and insulator installations, communication cable replacements and
station platfonn renovations bet,veen Glenmont and Fort Totten "' Municipal water main and sewer line stabilization as well as new emergency
phone installations at Farragut North • Track circuit replacements between Dupont Circle and Medical Center • Signal system repairs between Shady Grove and Rockville • Rail renewal work between Farragut North and Judiciary Square • New rai 1, fastener, and communication cable installations for improved cell service
between Brookland-CU A and Glenmont • Automatic train control upgrades at the Silver Spring • Rail and fastener renewal between Van Ness-UDC and Friendship Heights • Rail and tie renewal work between Rhode Island Ave-Brentwood and Fort Totten • Rail upgrades between Dupont Circle and Van Ness-UDC • Rail fastener renewal between Friendship Heights and Medical Center • Track circuit replacement between Van Ness-UDC and Medical Center
Blue and Orange Lines • Rail fastener replacements and tunnel repairs between Eastern Market and Stadium-
Armory • Rail renewal work between Foggy Bottom-GWU and McPherson Square • Track maintenance between Foggy Bottom-G\VlJ and Arlington Cemetery/Clarendon • Switch replacement preparation between Smithsonian and Eastern Market
Green and Yellow Lines • New track switch installations at U Street/African-Amer Civil War Memorial/
Cardozo • Rail maintenance and renewal work between U Street/African-Amer Civil War
Memorial/Cardozo and Georgia Ave-Petworth
17 C>! 59
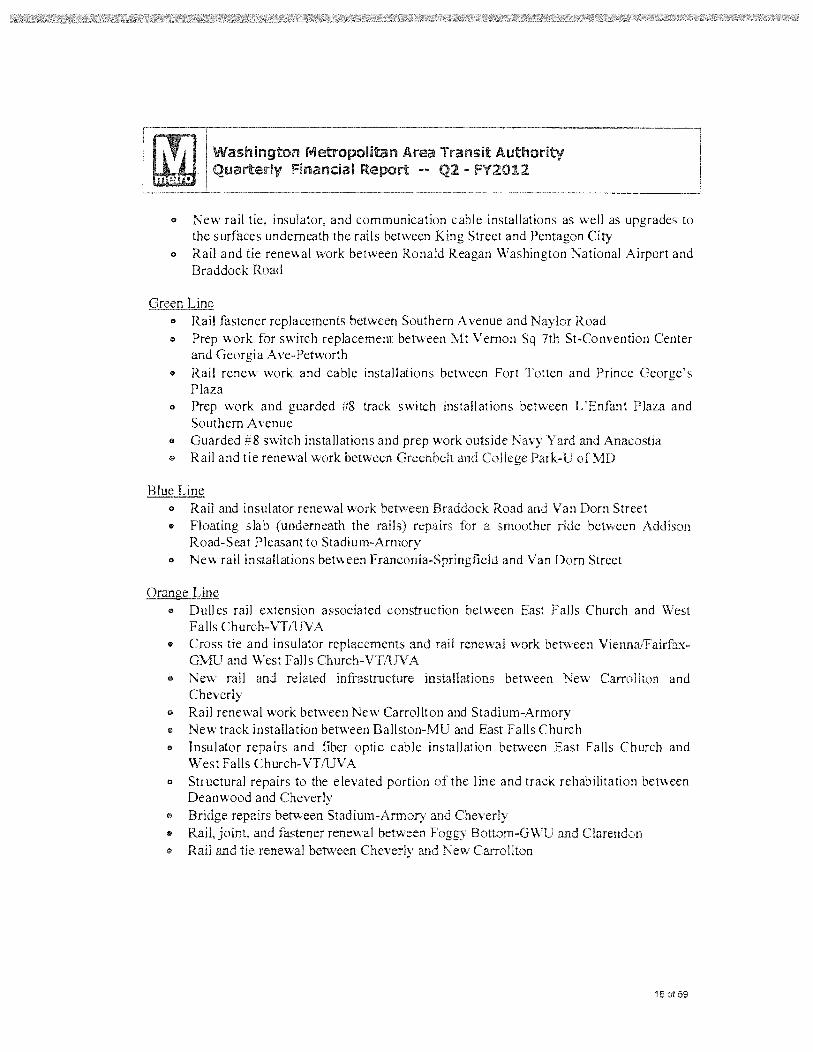
• New rail tie, insulator, and communication cable installations as well as upgrades to the surfaces underneath the rails between King Street and Pentagon City
• Rail and tie renewal work between Ronald Reagan Washington National Airport and Braddock Road
• Rail fastener replacements between Southern A venue and Naylor Road • Prep work for switch replacement between Mt Vernon Sq 7th St-Convention Center
and Georgia Ave-Penvorth • Rail renew work and cable installations between Fort Totten and Prince George's
Plaza • Prep work and guarded #8 track switch installations between L'Enfant Plaza and
Southern A venue • Guarded # 8 switch installations and prep work outside Navy Yard and Anacostia • Rail and tie renewal work between Greenbelt and College Park-0 of MD
Blue Line • Raii and insulator renewal work between Braddock Road and Van Dorn Street • Floating slab (underneath the a smoother ride between Addison
Road-Seat Pleasant to Stadium-Armory • New rail installations between Franconia-Springfield and Yan Dom Street
Orange Line • Dull es rail extension associated construction between East Falls Church and West
Falls Church-VT1UVA • Cross tie and insulator replacements and rail renewal work between Vienna/Fairfa.x
GivfU and West Falls Church-VT/UVA • New rail and related infrastructure installations between New Carrollton and
Cheverly • Rail renewal work between New Carrollton and Stadium-Armory • New track installation between Ballston-MU and East Falls Church • Insulator repairs and fiber optic cable installation between East Falls Church and
West Falls Church-VT /UVA • Structural repairs to the elevated portion of the line and track rehabilitation between
Deanwood and Cheverly s Bridge repairs between Stadium-Armory and Cheverly • Rail, joint, and fastener renewal between Foggy Bottom-GWlJ and Clarendon • Rail and tie renewal benvcen Cheverly and New Carrollton
18 ol 59
Washington Metropolitan Area Transit Authority Quarterly Financial Report -- Q2 - FY2012
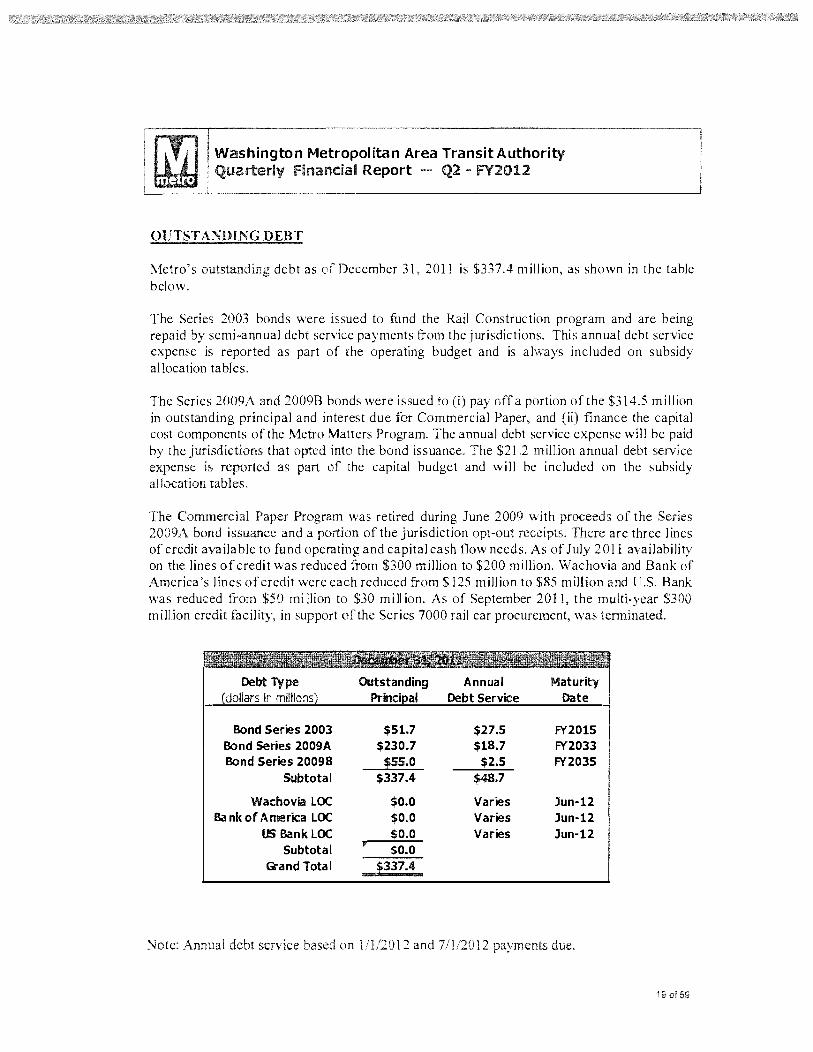
OUTST A1,'DING DEBT
Metro's outstanding debt as December 31, 2011 is $337.4 million, as shown in the table below.
The 2003 bonds were issued to fund the Rail Construction program and are being repaid by semi-annual debt service payments from the jurisdictions. This annual debt service expense is reported as part of the operating budget and is always included on subsidy allocation tables.
The Series 2009A and 2009B bonds were issued to (i) pay off a portion of the $314.5 million in outstanding principal and interest due for Commercial Paper, and (ii) finance the capital cost components of the Metro Matters Program. The annual debt service expense will be paid by the jurisdictions that opted into the bond issuance. The $21.2 million annual debt service expense is reported as part of the capital budget and will be included on the subsidy allocation tables .
The Commercial Paper Program was retired during June 2009 with proceeds of the Series 2009A bond issuance and a portion of the jurisdiction opt-out receipts. There are three I ines of credit available to fund operating and capital cash flow needs. As of July 2011 availability on the lines of credit was reduced from $300 million to $200 million. Wachovia and Bank of America's lines of credit were each reduced from$ l 25 million to $85 million and U.S. Bank was reduced from $50 mi Ilion to $30 mill ion. As of September 2011, the multi-year $300 million credit facility, in support of the Series 7000 rail car procurement, was terminated.
Debt Type Outstanding Annual Maturity (dollars in miltlons) Principal Debt Service Date
Bond Series 2003 $51.7 $27.S FY2015 Bond Series 2009A $230.7 $18.7 FY2033 Bond Series 20098 ~55.0 $2.S FY2035
subtotal $337.4 $48.7
Wachovia LOC $0.0 Varies Jun-12 Bank of America LOC $0.0 Varies Jun-12
US Bank LOC so.a Varies Jun-12 Subtotal $0.0
G-and Total !J37.4
Note: Annual debt service based on 12 and 2 payments due.
19 of 59

Quarterly Financial Report -- Q2 - FY2012
APPENDIX
• Operating Financials (budget variance report, by mode)
• Ridership and utilization analysis
• MetroAccess ridership by jurisdiction and Parking facility usage
• Capital expenditures and Reimbursable Projects
• American Recovery & Reinvestment Act (ARRA)
• Safety and Security Expenditures
,. Passenger Rai I Investment and Improvement Act (PRIIA)
• Jurisdictional Balances on Account
• Grant Activity
• Sole Source Awards
20 of 59

Prior Year Actual
$134.7 31.7
0.8 10.2
$177.4
$2.2 3.8 1.2 3.6 2.1 0.1 0.0 0.2
$13.1
$155.9 $20.7 76.4 45.4 17.5 20.7
8.3 10.8
54°/o
1/20/2012
Budget
$134.6 $137.4 32.0 29.4
1.6 1.6 11.3 11.4
$179.5 $179.8
$2.0 $2.1 3.2 4.2 1.7 1.6 3.3 3.7 1.2 1.8 0.0 0.1 0.0 0.0 0.0 0.0
$11.4 $13.6
$157.5 $163.4 $20.5 $14.4
73.5 77.8 45.l 50.3 11.5 13.0 21.5 26.2
7.8 11.3 8.8 8.6
55°/o 53%
Operating Financials
~
Variance
($2.9) -2% 2.7 9%
(0.0) 0% {0.1} 1%
($0.3) 0%
($0.1} -5% (1.0} -24%
0.1 6% (0.4) 10% (0.6) -35% (O.l) -98%
0.0 0.0
($2.2) -16%
December-11 FISCAL YEAR 2012
Dollars in Millions
REVENUES: Passenger Revenue Metrorail Metrobus MetroAccess Parking
subtotal
Non-Passenger Revenue D.C. Schools Advertisilg Jont Dev/Property Rent Fber Optic Other Interest SE Oosure SCR Funding
subtotal
EXPENSES: $5.9 4% Salary/Wages
($6.1) -42% Overtime 4.3 6% Fringe Benefits 5.2 10% Services 1.5 11% Supplies 4.7 18% Power/Diesel/CNG 3. 5 31 % Utilities
(O.l) -2% Insurance/Other
Favorable/(Unfavorable)
COST RECOVERY RATIO
Prior Year Actual
$282.6 66.0
2.1 20.8
$371.4
$3.1 5.9 2.8 7.0 4.3 0.1 0.0 0.4
$23.7
$313.2 $43.4 150.1 89.3 37.2 43.5 16.5 21.1
550/o
$281.0 $287.5 ( $6.5) -2% 65.7 61.2 4.5 7%
3.9 3.2 0.7 22% 22.6 23.4 ~0.8i -3%
$373.1 $375.3 ($2.1) 1%
$3.3 $3.0 $0.3 11% 5.6 7.8 (2.2) -28% 3.2 3.2 (0.0) 0% 7.2 7.4 (0.3) -4% 4.6 3.7 1.0 26% 0.0 0.3 (0.2) -94% 0.0 0.0 0.0 0.0 0.0 0.0
$24.0 $25.4 ($1.4) -5%
$318.8 $327.3 $8.6 3% $43.0 $28.9 ($14.1) -49% 154.7 152.9 (1.8) 1% 66.2 101.6 15.4 15% 29.7 25.8 (3.9) -15% 45.2 54.l 8.9 16% 15.8 22.8 7.0 31% 17.3 17.3 0.0 0%
Favorable/(Unfavorable)
560/o 550/o 21of59

RAIL Operating Financials
December-11 FISCAL YEAR 2011
Dollars in Millions ?>";)< ... , • • ,,.,..,~ . l lff 'l;:-, ,·.-... ,·1 1. ,_:j l ~~ l i l\1 :~11·;~f6 ... :".:.~.: • ' ' - - _J • t • •' ,.~ t., I • • O , , JI! ~~ • '-' , ...... ft
Prior Year Actual
$134.7 0.7
10.2 2.5 1.2 3.6 1.7 0.0 0.2
$93.8 $13.1
45.S 13.3 11.8 13.7 6.4 6.7
76°/o
$134.6 (0.1) 11.3
1.1 1.7 3.3 0.6 0.0 0.0
$94.1 $12.6 43.9 14.1 5.1
13.0 6.3 5.2
$137.4 0.6
11.4 1.4 1.6 3.7 1.4 0.1 0.0
$97.7 $6.9 45.8 15.1 8.3
15.3 9.1 4.3
MYM#M
780/o
($2.9) (0.7) (0.1) (0.3)
0.1 (0.4) (0.7) (0.1)
0.0
-2% -115%
-1% -24%
6% ·10% -53% -97%
REVENUES: Passenger Fares D.C. Schools Parking AdvertiSing Joint Dev /Property Rent Fiber Optic Other Interest SCR Ft.11ding
EXPENSES: 4% Salary/Wages
-83% Overtime 4% Fringe Benefits 6% Services
39% Supplies 15% Power/Diesel/CNG
Utiities Insurance/Other 1011••-.·
Favora~e/(Unfavorable)
COST RECOVERY RA no
Prior Year Actual
$282.6 $281 .0 $287.S ($6.5) 2% 1.2 0.8 0.9 (0.1) -13%
20.8 22.6 23.4 (0.8) -3% 4.0 1.9 2.6 (0.7) -28% 2.8 3.2 3.2 (0.0) 0% 7.0 7.2 7.4 (0.3) -4% 3.0 3.6 2.7 0.8 29% 0.0 0.0 0.2 (0.2) -99% 0.4 0.0 0.0 0.0
$186.1 $189.8 $195.7 $5.9 3% $27.5 $26.8 $13.8 ($12.9) -94% 88.9 92.2 89.8 (2.4) -3% 24.9 25.4 30.6 5.2 17% 23.8 17.8 16.4 (1.3) -8% 27.7 26.3 32.3 6.0 18% 13.1 13.1 18.6 5.5 30% 13.0 10.2 8.7
dffi (1.5) -18%
Favorable./(Unfavorable)
790/o 800/o
22 ol 59

Prior Year Actual Actual
$31.7 $32.0 1.5 2.1 1.3 2.1 0.3 0.4 0.1 (0.0} 0.0 0.0 0.0 0.0
$61.3 $62.5 $7.5 $7.9 30.5 29.1
7.3 7.0 5.6 6.3 7.0 8.4 1.8 1.5 3.8 3.4
29o/o
$29.4 1.5 2.8 0.5 0.0 0.0 0.0
$64.5 $7.5 31.5
8.3 4.6
10.9 2.2 4.0
$2.7 0.6
(0.7) (0.1) (0.0)
0.0 0.0
$2.0 ($0.4)
2.4 1.2
( 1.8) 2.4 0.8 0.6
METRO BUS Operating Financials
December·11 FISCAL YEAR 2011
Dolars in M~~oos
REVENUES: 9% Passenger Fares
42% D.C. Schods -24% Advertising -13% Other
-101 % Interest
3% -5% 8%
15% -39% 22% 35% 16%
SE Oosure SCR Funding
EXPENSES: SalCIY/Wages Overtime Frnge Benefits Services Supplies Power/Oiesel/CNG Utilities Insur a-ice/Other
Favorable/(Unfavorable)
260/o COST RECOVERY RATIO
Prior Year Ac ual
$66.0 $65.7 $61.2 $4.5 7% 1.9 2.5 2.1 0.5 22% 1.9 3.8 5.2 (1.5) -28% 0.8 0.9 0.9 (0.1) -7% 0.1 0.0 0.1 (0.1) 86% 0.0 0.0 0.0 0.0 0.0 0.0 0.0 0.0
$125.4 $127.l $129.3 $2.2 2% $15.8 $16.2 $15.0 ($1.2) -8% 60.5 61.5 62.1 0.5 1% 13.1 12.4 16.5 4.1 25% 13.3 11.8 9.1 (2.7) 30% 15.7 18.9 21.8 2.9 13% 3.4 2.7 4.2 1.5 35% 7.7 6.7 8.1 1.4 17%
Favorable/(Unfavora~e)
280/o 28% 260/o
23 or 59
Prior Year A ual
$26.6 $26.7 $24.4 1.5 2.1 1.5 1.3 2.1 2.8 0.3 0.4 0.5 0.1 (0.0) 0.0 o.o o.o 0.0 0.0 0.0 0.0
$50 .8 $51.6 $53.2 $6.2 $6.5 $6.2 25.3 24.0 26.0 6.1 5.8 6.8 4.7 5.2 3.8 5.8 7.0 9.0 1.5 1.2 1.9 3.2 2.8 3.3
29o/o 30o/o
$2.2 0.6
(0.7) (0.1) (0.0)
0.0 0.0
$1.7 ($0.3)
2.0 1.0
(1.5) 2.0 0.7 0.5
9% 42%
-24% -13% 101%
3% 5% 8%
15% ·39% 22% 35% 16%
Favorable/(Unfavorable)
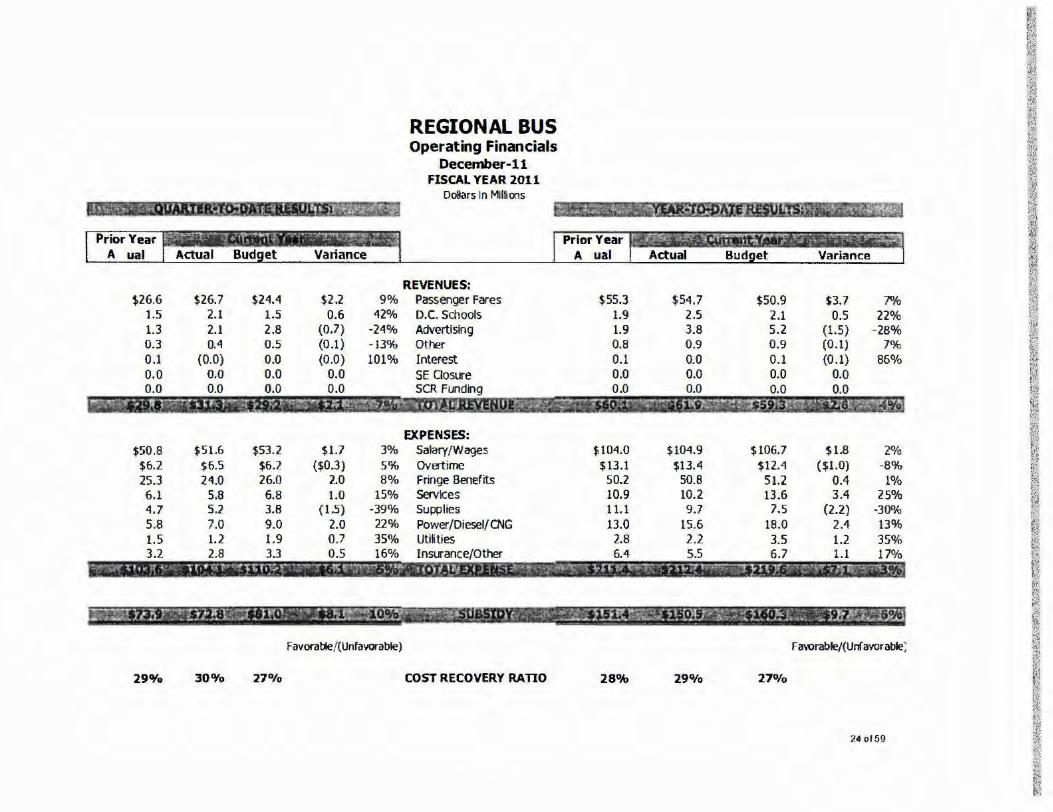
REGIONAL BUS Operating Financials
December-11 FISCAL YEAR 2011
Dollars In Mll&ons
REVENUES: Passenger Fares D.C. Schools Advertising Other Interest SE Closure SCR Fooding
EXPENSES: Salary/Wages Overtime Fringe Benefits Services Supplies Power/Diesel/CNG UtiHies Insurance/Other
COST RECOVERY RATIO
Prior Year A ual
$55.3 $54.7 $50.9 $3.7 7% 1.9 2.5 2.1 0.5 22% 1.9 3.8 5.2 (1.5) -28% 0.8 0.9 0.9 (0.1) 7% 0.1 0.0 0.1 (0.1) 86% 0.0 0.0 0.0 o.o 0.0 0.0 o.o 0.0
$104.0 $104.9 $106.7 $1.8 2% $13.1 $13.4 $12.4 ( $1.0) -8%
50.2 50.8 51.2 0.4 1% 10.9 10.2 13.6 3.4 25% 11.1 9.7 7.5 (2.2) -30% 13.0 15.6 18.0 2.4 13%
2.8 2.2 3.5 1.2 35% 6.4 5.5 6.7 1.1 17%
F avorable/(Unf avor able;
28% 290/o 27°/o
24 of 59
Prior Year Actual
$5.1 .0
$10.4 $1.3 5.2 1.3 1.0 1.2 0.3
.6
24%
$5.4 .0
$10.9 $1.4
5.1 1.2 l.l 1.5 0.3
.6
24%
$4.9 .0
$11.3 $1.3 5.5 1.4 0.8 1.9 0.4
.7
21%
Variance
$0.5 .o
$0.3 ($0.1)
0.4 0.2
(0.3) 0.4 O.l
.1
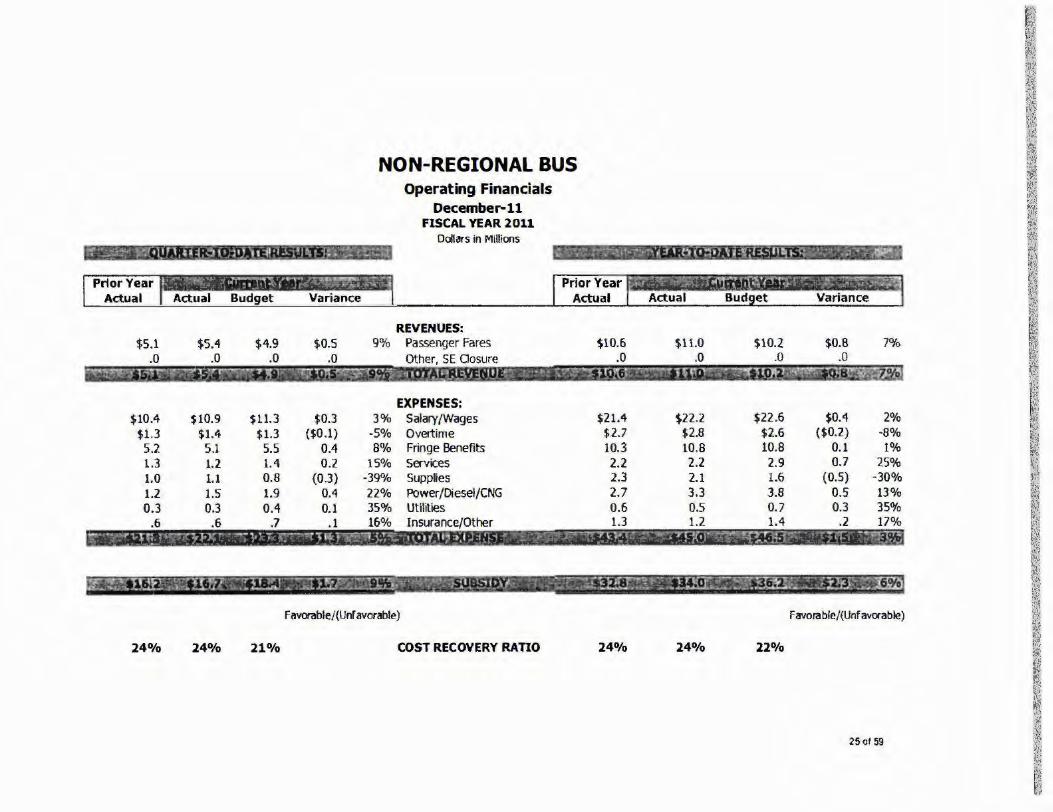
NON-REGIONAL BUS Operating Financials
December-11 FISCAL YEAR 2011
Dollars in Millions
Prior Year Actual
REVENUES: 9% Passenger Fares
Other, SE Oosure
3% -5% 8%
15% -39% 22% 35% 16%
EXPENSES: Salary/Wages Overtime Fringe Benefits Services Supp~es
Power/Diesel/CNG Utilities Insurance/Other
$10.6 .0
$21.4 $2.7 10.3
2.2 2.3 2.7 0.6 1.3
Favorable/(Unf avorable)
COST RECOVERY RATIO 24%
$11.0 .0
$22.2 $2.8 10.8 2.2 2.1 3.3 0.5 1.2
24%
$10.2 .0
$22.6 $2.6 10.8
2.9 1.6 3.8 0.7 1.4
22%
$0.8 7°/o .0
$0.4 2% ($0.2) -8%
0.1 1% 0.7 25%
(0.5) -30% 0.5 13% 0.3 35%
.2 17%
Favorable/{Unf avorable)
25or 59

METROACCESS Operating Financials
December·11 FISCAL YEAR 2011
Dollars in Millions
Prior Year jtr!±iOMf~i§f;ftitiij~ Actual Actual eUdeE Varianc~
$0.8 .1
$0.9 $0.0 0.4
24.7 0.0 0.0
.3
] O/o
$1.6 .l
$0.9 $0.0
0.5 23 .9 0 .1 0.0
.2
7%
$1.6 .0
$1.2 $0.0
0.5 26.9 0.2 0.0
.3
5%
($0.0) .1
$0.2 $0.0
0.1 3.0 0.1 o.o
.1
REVENUES: 0% Passenger FCW"es
Other
EXPENSES; 21% Salary/WCJl:jeS 30% Overtime 12% Fringe Benefits 11% Services 39% Supplies 46% Utilities 34% Insur3nce/Other
Favorable/(Unfavorable)
COST RECOVERY RATIO
$2.l .5
$1.8 $0.0
0.8 51.3 0.0 0.0
.4
50/o
$3.9 .2
$1.8 $0.0
0.9 48.4
0.2 0.0
.3
8%
$3.2 .0
$2.4 $0.0
1.0 54.5 0.3 0.1
.5
$0.7 .2
$0.5 $0.0
0.1 6.l 0.1 0.0
.2
22%
21% 38% 11% 11 % 37% 22% 35%
Favorable/(Unfavora~e~
26 of 59

RIDERSHIP and AVERAGE FARE ANALYSIS
Rail Ridership Rail Average Fare ,.. ·"
_,.._Actual -•·FY2011 22
21
~ 20
~ $2.65
!. 19
& (?: 18 $2.fiO
17
16 $2..SS I $2.57
15
14 $2.50 Jul Aug Oct Nov Dec: Jan Mar Apr May Jun
-·----- ------ --------------------·--------, --------------------------------------., Bus Ridership Bus Average Fare
-.-: sudg~t --~---· · :..:.:O.:.Act:llil1 14 $1.30
13
-.;- $1.20 c: 12 ~ !, 8. 11
·c .... $1.10
10
!I
8 $1.00 $1.00 $0.98 $0.98
""•--"- I $1.02 , I
tr- ........ ~~---······ $1.00 \ I
i 7 $0.90
Jul Aug Sep Oct Nov Oec Jan Feb Mar Apr May Jun
'-------------------------------------~ '------------------------------------·----
27 of 59
22.11,000
200,000
1!10,001!
160,000
14-0,000
120,000
100,000
1,300,000
1,100,000
900,000
700,000
!!i00,000
RIDERSHIP and AVERAGE FARE ANALYSIS
MetroAccess Ridership
Jul Aug Sep Oct l'lov Dec Jan FdJ Mar Apr
Parking Transactions
$7.00
$6.00
$5.00
$4.00
$3.00
$2.00
$1.00
$0.00
$4.20
$4.10
$4.01)
$3.90
$3.80
$3.70
$3.60
$3.50
$3.40
$3.30
$3.20
$3.10
$3.00
MetroAccess Average Fare
Parking Average fee
26 of 59

Last Year Actual
a. Passenger Revenue Metrorail $134,7 14 Metrobus $31,723 Metro Access $798 Monthly Total $167,235
b. Ridership Metrorail 51.182 Metro bus 29.778 MetroAooess 598 Monthly Total 81,558
c. Average Fare Melrorail $2.63 Metrobus $1.07 MetroAccess $1.33
Monthly Total $2.05
Ridership and Revenue Analysis: Quarter-to-Date Q2 FY2012 - December 2011
This Year This Year Actual Actual Budget Bud2et Variance Actual vs Budget vs. Last Year Actual
d. Metrorail $134,565 $137,428 ($2,863) (2%) Ridership ($918) (1%) $1,594 1.2% $32,045 S29,355 $2,689 9% Average Fare ~ (1 %) ill...llil {1%1
$1,553 $ 1.557 {$4) (0%) Budget Variance ($2,863) (2%) ($149) (0%) $168.163 $168,341 ($178) (0%)
e. Metrobus 51,788 52,136 (348) (1%) Ridership $3, 121 11% $2,635 8% 32,252 29,152 3.099 11% Average Fare ~ ill'tl ~ (7%)
514 613 (99) (16%) Budget Variance $2.689 9% $321 1% 84,553 81.902 2,651 3%
f . MetroAccess $2.60 $2.64 ($0.04) (1%) Ridership {$253) (16%) (St 13) (14%) $0.99 $1.01 (S0.01) (1%) Average Fare $248 19% $866 127% $3.02 $2.54 $0.46 19% Budget Variance ($4) (O"/o) $755 95% $1 .99 $2.06 ($0.07) (3%)
• Modal Analysis defines what portion of the budget variance is due to ridership being below plan and the portion due to revenue actuals being below forecast
29 of 59
Last Year Actual
a. Passenger Revenue Metrora~ $282,580 Metro bus $65,951 MetroAcoes!'i $2,068
Monthly Total $350,599
b . Ridership M etrorail 107,709 Met rob us 61,440 MetroAccess 1,211
Monthly Total 170.360
c. A verage Fare Melrora~ $'162 Metrobus $1.07 MetroAccess $1 . 71
Monthly Total $2.06
Ridership and Revenue Analysis: Year-to-Date FY2012 - December 2011
This Year This Year Actual Actual Budizet Bu~et Variance Actual vs Budget vs. Last Year Actual
d. Metrorail $280,950 $287,484 ($6,534) (2%) Ridership ($3,716) (1%) ($53) (0.0%)
$65,680 $61 ,195 $4,485 7% Average Fare ru..filfil @l (lllli} fil2) $3,876 $3,167 $709 22% Budget Variance ($6,534) (2%) ($1,630) (1%)
$350,506 $351,847 ($1 ,341) (0%)
e. Metrobus t07,689 109,099 (1,4 10) (1%) Ridership $4,991 8% $4,604 7% 65,729 60,773 4 ,956 8% Average Fare ($506) m'~ ~ {7%)
1,030 1,247 \2 1 ?2 (17%) Budget Variance $4,485 7% ($271) (0%) 174,447 171,119 3,329 2%
f . MetroAccess
$2 61 $264 ($0.03) (1%) Ridership ($552) (17%) ($309) (15%) $1.00 $1.01 ($0.01) (1%) Average Fare $1.261 ~ $2 118 .ll.Q.'Y2 $3.76 $2.54 $1.22 48% Budget Variance $709 22% $ 1,808 87% $2.01 $206 ($005) (2%)
• Modal Analysis defines ~t portion of 1he budget variance is due to ridership being below plan and the portion due to revenue actuals being below forecast
30 ol 59

. _ MetroAccess Ridership b~ Home Jurisdiction, ~- ---------
Passengers. FY 2010 Q1 Q2 Q3 Q4 Total FY 2010
Alexandria 5,509 6.065 6.245 7,269 25,088
Ariington 7,637 7,324 6.592 7 ,711 29,26•
District of Coiumbia 156,090 154,292 150 .052 173,352 633,786
Fairfax County 61,598 61,371 59,621 68,084 250,674
Fairfax Ctty 1,409 ,449, 1,381 1,68E 5,925
Falls Church 522 749 772 983 3,126
Montgomery County 124,702 124,050 116,927 132 ,380 498,055 I Prince George's County 234.586 225, i58 216, 792 252,895 929,429
Sub Total: 592,153 580,456 5 58,382 644,360 2,375,351
Visitor: 482 420 573 597 2,072
Total Reported Ridership: 592,635 580,876 558,955 644,957 2,377,423
I Passengers· FY 2011 01 Q2 Q3 Q4 Total FY 20
IAlexandna 6,589 6,441 6,052 5,293 24,37
!Arlington 8,228 7,157 6 .996 6,337 28,71S
I District of Co u · ~ I I mb,., 158,476 155,324 146,5881 136 980 597 368
IF airfax County r 64,51 r 261,5071
!Fairfax City r 5,9591
!Falls Churcn r I Montgomery County r 125.488r 118 7851 486,9711
IP rince George's County 243,609 235,969 231.552r 215.460 926,590
I Sub Total: 611.738 597,907 576.4521 548,104 2,334,201
other Big1b1e-r I
j Temporary Visitor: 363 422 311 379 1,475
!Total Reported Ridership: 612,217 598,437 576,917 548,648 2,336,219
I Passengers· FY2012 Q1 Q2 Q3 Q4 Total FY 2012
' 5,3941 -I -I 10,3571 iAlexandria
-I -I 11,4371
[District of Columbia 129.2231 -I 260,4091 i I Fa1lfax County 63,1321 62,3251
I -I -I 125,4571 I i Failfax City
' 1,369] -I -I !Falls Church 4671 -I -I I Montgomery County 110,5291 106,880f -I -I 217,4091
I Prince George's County 199.640 200, 1381 -I . 399,778
I 515.455 513.0551 I 1,028,510 I Sub Total: ., -Other Sigible:I 1421
I -I -I Temporary Visitor:! 403j -I -I
I
Total Reported Ridership: 1 515,9001 513,663 i,029,553
1/ 6/2012, Ridership/Revenue Report-Oct - Dec 2011 of 59
MetroAccess Ridership by Home Jurisdiction: FY10 to
300
250 ~
"' "'C c;
"' zoo "' :s 0
J:. .::. 150 ,,, ... QI bO t: 100 QI
"' VI
"' Q. so
Quarter
County -t-Montgomery County -@-Prince
MetroAccess Ridership by Home Jurisdiction: FY10 to FY12
9,000
8,000
7,000
6,000
"' ~ 5,000 "'° c: "' "' 4,000 "' <11 Q.
3,000
2,000
1,000
Quarter
-e-Alexandria ........ Arlington ....,... Fairfax City -Falls Church ~Temporary Visitor
1/6/2012, Ridership/Revenue - Dec 2011 32 of 59

WMATA PARKING FACILITY USAGE
Paid Utilization (% of Capacity) STATION/LOT LOT ELU EY.ll REGION CAP OUARTER2 Y::.I::Jl OUARTERZ I Y:.I:.Q
MQ~IGQMEBY~QUNTY j Grosvenor l,B94 99%
I 96% 94%
l 96%
White Flint 1,270 52% 49% 52% 4B% Twin brook 1,097 66% 62% 70% l 70% Rockville 524 95% 98% 99% I 89% Shady Grove 5,745 91% B3% 86% l B6% Glenmont 1,781 9B% 98tfo 87% 8B% Wheaton 977 49% 49% 50% 4B% Forest Glen 596 97% 96% 97% 9B%
Mon!gome~ Coun!}: Total 13,BB4 85% B3% Bl% Bl%
~Bl~CE ClllQRGE'S CQU!ffY l New Carrollton 3,519 89% B8% 86% 87% Landover 1,866 51% 50% 39% 32% Cheverly 500 90% B8% 91% 94% Addison Road 1,26B 61% 64% 62% 61% Capitol Heights 372 80% B2% 78% 80% Greenbelt 3,399 74% 77% 82% 82% College Park 1,820 62% I 62% 63% 66% P.G. Plaza 1,068 49%
I 49% 47% 43%
West Hyattsville 453 93% 94% 95% 96% Southern Avenue 1.9BO 73% l 71% 73% I 76% Naylor Road 368 99% 99% 81% 76% Suitland Garage 1,890 78% B1% 76% l 75% Branch Avenue 3,072 96% 95% 91% l 90% Morgan Blvd. 60B 92% B5% 63% 1 51% Largo 2,200 75% 75% B8% !
Bl%
1 Prince Georee's County Total 24,383 76% 77% 76% 74%
I l
I Marvland Total 3B,267 80% 79% 78% I 77%
QISTRICI QE CQl,1.IMBlA Deanwood 194 58% 60% 44% 28% Minnesota Ave. 333 67% 6B% 43% 43% Rhode Island Ave. 2~· L.; 39% 1B% Fort Totten 40B 83% 82% 81% 84% Anacostia Garage BOB 67% 64% 56% 60%
District of Columbia Total 1,964 68% 67% 56% 570/o
l'!Qrthern Virainla I Huntington 3,617 83% B3% 80% B1% West Falls Church 2,009 96% 96% 94% 94% Dunn Loring 1,326 99% 99% 99% 102% Vienna 5,169 98% 9B% 96% 95% Franconia 5,069 85% B5% 88% 88%1 Van Dorn 361 108% 101% 109% 106% East Falls Church 422 117% llBo/o 98% 108%
Northern Vinrinia Total 17,973 92% 92% 91% 91%
I l l
I S~st:em Total SB,204 83% 83% B1% I 80%
33 of 59
d· '(ebi<les/ Veh/c/e Parts Replaument of Rall C~
<.lP0057 1000 Se<oes Rai Car Replileeme1l\ SWtotill
ReplacementofBuses 0!'0006 Bus Replacement
Subtotal
R~hat>ilitatfon or Ralf C;rs r.tPOOSR 2000/3000 Series lei Car Mid-life RehabilitatiOn OP0063 Rilil Rehabilitation Progr.Yll Qf'006<1 1000 SerlesRailCarHVAC Rehabl~n CIP0061 Rai Olr Sarety & Reliability fMil\cernents CIP0125 Rail Prcv~ilive Mailtenance ClP0142 Ra~ Lfecyde Overl1alA !:;IPOMB Re[!air otDamasred RMce..s
Subtotal
Rehabllltatton of 811s~s OPOOOS &.Is Retebfitation Pta<yam CIPOOOB Bus Repal'ab~ C IPOl37 llus PrevenUve Milint<!fla1lfP. CIPOt43 Bus Ufe<:yde Overhaul
S\btotal
Replacement of MetroN:cess Vehlctes Of'OOlS Metrol\ccess l'1ed Replacement
St.t>tot<ll
Replacement of Service Ve/lie/es CIP0009 Scmce vehide Reetacef11€nt
&ibtotal
Rall Car Fleel EJtpanston CIP0062 6000 Series Ra~ Cw Prowrement
SW total
Bus Enhance-nts CJl'0002 Aitom..OC VEhicle loc.atton F.q1J4lment Rqilaccmcnl CIP0007 8vs <:amera lnsta!latlOf 1
Subtotal
Total: Vd>ides[ Vehide Parts
Washington Metropolitan Area Transit Authority Capital Project Financials
Fiscal Year 2012 - December 2011 Oolars In Thousands
is,635.7 i s,s?a.2 $8,635.7 $5,578.2
~114,495.7 $114,495.7
p 1.4,500.2 $114,500.2
$3.362.S $94a6 22,915.8 22,917.5 2,152.0 3,183.6
10,li'S.9 11,792.4 SS.I 0.0
20,800.0 20.810.I 7,908.7 2,t93.8
$67,373.2 $61,8'16.S
$31 ,518.6 $31,528.3 11,84 l.7 11,731.6
47.J 0.0 l0,7!S.O i0,720.5
$~4,132.6 $53,980.4
$11,558.6 111,391.9 $11,558.6 $11,391.9
$7,5§9.9 ··- .$7 .606.6 $7,569.9 $7,606.6
$5,490.l $4,634.7 $5.'190.7 $4,634.7
$8,174.} $8,3285 489.4 1,287.J
$8,6!3.6 $9,615.8
12771870.0 i269,,1~J
18,635.7 10.3 ~S,57'1.9 154.8% 0.0% $8,635.7 $0.3 $5,577.9 IS<l.8% 0.0%
1103,836.6 __ i 62,s2a.9 ~511671.3 90.7% 54.9'!>. 10),83&.6 $&2.828.9 $51,611.3 90.7% 54. 9o/o
$2,553.1 $174.5 474.1 269.1% 50.!1% 22,915.8 11,585.1 11,332.4 100.0% 50.6%
1,832.9 407.3 $2,776.3 57.6% 12.8% 10,178.9 2,932.3 8.860.l 86.3% 21.9%
0.9 0.0 0.0 0.0% 0.0% 7.0,800.0 10,491.9 10,318.R 99.9% 50.4%
667.7 !9.:»} 2,203.3 30.4% -0.4% $58,949.4 $25,881.5 $35,965.0 95.3% 41.8%
$25,135.6 $17,262.1 $14,266.2 'NJo/o 54.8% S,395.0 2,173.4 9,558.3 46.0% 18.S%
0.0 0.0 0.0 0.0% 0.0% 10,715,() S,101.8 S,315.7 99.9% 50.1%
$41,245.7 $24,840.3 $29,140. 1 76.4% 46.0%
$2,45lL2 $1 ,303.3 $10,098.6 21.5% 11.4% $2,452.2 $1,303.3 $1 0,088.6 11.5% 11.4%
$1,317._3 $721.5 .\ !j,8!l'i.) 17.3% 9.5% $1,317.3 $721.S $6,885.1 11.)% 9.5%
$3,679.4 $349.3 $4,..f!!S.5 79.4% 7.5% $3,679.4 $349.3 $4,:185.~ 79.4% 7.5%
$'1,879.4 $1 ,3&2.3 $6,966.1 58.6% 16.4% '189.4 337.2 950.1 38.0o/o 26 .2%
$5,J(i8.8 $1,699.5 P,916.2 5S.6o/o 17.lo/o
i~B;4as.o 11171624.6 its1,su.1 SJ.rt. 43.7'1'•
34 of 59

Washington Metropolitan Area Transit Authority Capital Project Financials
Flsc:al Year 2012 - December 2011 Dolars In Thousands
B. Bail System fnb:AslDlaJIL~ 8dJ1bl!}fattoo Rdl/ Line Segment Rt!hdbilltatlon
OPOI07 Rai ReM>iitationller I: OuponttoSUver Sllf1no $48,720.5 $59,613.6 O POJ 10 Ra• REhablitation Tier I: Natiooal Ai~rt to Stadium At~ SJ.718.7 4(},000.0
&btota! $10i,439.2 $~9,61l6
Total: Rail S'lsb:ln lnfrastru<:ture Rehabllitatlon 110~4l9.2 !99,dl.6
C Halatcnaace Fac/[ltles 811h11blfitllll on and 8t!plaa1-nt of Bus Garages
OP0084 Soull"!m Avenue 8us Garage Re~cement $30,640.2 $26,612.8 C!P0085 Roy4 Street Ut.6 Garage R'Placement (Older Bed Road) 30,311.8 19,338.2 CJ1'()()86 Sl1e~hertJ Parl\W!!Y 6ll5 f<JCili\y 22,719.2 6,913.4
SIA>lOlal $83,671.2 $52,864.4
Halnt1Jn11nce of Sus G1rages Ol'Ol 19 Bus Gar~~ facUI~ Rcl'!'!l<S l ler I: Western, NOrttiem and Landover pi,,~o.3 po,<183.9
SIA>tolal $32.,250.3 S30,483.9
flfalnt11nanc11 of Rall Yards OPO! 16 Rai Yard Fi!Ci~!}'. Re~air:o; Tier I : Nexandrta, Brentwood aod New Carrollton t1S,499.4 il5,4SS.3
SW total u~.499.4 $1~.485.3
Rall Malrtenanc11 Facllltles CIP0071 Test Tiack &. Commissioning ractlity $3,(i22.7 $5.172,6
SOOtolal $3,671./ $5,l'n.6
En.-lronmental Compliance Pro }IJCts OPOOlO EmAronmental C0IT4llianee Projecis $823.0 $593.4 OPOO 11 Underyround Storage Tank ~epl<!ce,ment 4,658.3 4,989.3
SVbtolal SS,481.4 $5,582.7
Halntt!nanu Bus ind Rall Flldllties OPOI 26 nnandal PlaMlng, Project Admnstratloo, !I'd SY5l!m Wide Jnrrastructure Upgrades $2,079.4 Sl,577.S OPOI n Support fQtjpment - MTl'O 1.029.8 1,238.4 OP0145 Rall Yar1l Hartlenl'lg and Bus Seo.dy 13,378.7 9,238.7 OP0117 Electronic Coo.•1t~mr.asoire~ 351.0 3502
Sib total $16,838.8 $12,404.9
Expansion of Bus Gara~~ O P0038 Bus Garage Capacity frflilncements $705.S $61.S OP0078 Ol<lde11sbu'g SI~ Recool''!JIOOOn 5,133.1 3,539.1
Subtotal $5,838.6 $},600.6
Total: Malntet1111_ce..fa.dlltlt9 _,,g,,,IJt' 11~,~ftA
s1a.nos $35,370.6 $'-4,243.0 81.7% 59.3% 53
1180.5 13,052.9 26,947.1 133.0% 32.6%
h<lt,901.t $4li,4iH s5f.i9ij.2 1(12.3"'1; ~
!iol,901,1 ~8,423.5 ,!S l ,190 .2 102.JO/o 4U•7.
$4,4]3.7 $1,4310 25,179.7 16.6% 5.4% 6,642.4 1,830.0 S V,508.2 34 .3% 9 .5%
630.2 34.S 6,878.9 9 .1 o/o 0.5% $11,696.2 $3,297.S $49,566.9 72J% ().2%
$25,051.6 $10,113.5 $20,310.3 82.2% 33.2% $25,054.6 $10,1135 $20,J'I0.3 82.2% 33.2%
F,833.4 il,201./ 114.783.6 50.6% 7.8% $7,633.4 $1,201.7 $14,283.6 So.6% /.8%
.. 1l,Q74.4 $1, UJ.t $4,039.S Sl.7% 21.9% $2,674.4 $1,133.1 $1,039.S 51.7% 21.9%
$~.7 S17l.l $422.3 75.3% ]8.8% 2,Q?2.9 5~9.9 ·- 'l,399.4 11.9% U .8% $],539.~ $761.0 $4,82\. 7 45.5% 13.6%
$964.6 $6!¥.>.7 8Rl.8 61.1% 44.1% 751.1 286.6 $951.8 60.6% 23.1 'lb
5,6685 2S~.6 8,983.1 61.q% 2.8% 120.0 20.2 330.0 34.3% 5.8%
$7,504.1 $1.258.1 $1l,M6.8 60.5% 10.1%
S 70S.~ $148.3 (86.8) 11'16.5% 211.1% 3,145.9 997.0 12,542.1 8am 28.2%
$3,8.Sl.4 $1,145.3 $2 ,4 55.3 107.0% 31.8%
'l~I!~., ill,§ID.~ 1 1ngtg~.1 4l.71i. 15.l "lo
35 of 59

O....S.rsmns llQd TcclmofRor Porru Systun Upgrades - Rall
OP0077 8~a< .Train rpwer U~rades Sobtotal
OpKatlons Support S()(twal? OP0042 Bus a Rail Asset Maoi19ement Softwore CIP0013 Bus Operations Support Sol\ware CIPOO•M Cu!;tomer a Rcgiooal lotegatiOn Cll'OCM5 Data Centers aid lnfr.Nn.ch.1'eS Cl POO<l7 F.nterpnse Geographic lttamation System OPOOS I P<ice Dispatch a"d Re<ords Management CIPOOS2 Netwo<it and Olmmunic:atklns QPOOS3 Networ1c Operations Center (NOC) CIP0056 Rail OperatlatlS s~ Soltwa-e OP0128 Data Gove<nance and SllSWlesS lnteligence CIPQl 40 Rail Micage B~ Asset Mamgement CIPQ149 Transit /\sset Ma~f11(!nt
SWtotal
8ustness Support Soflw11rr II Equipment OP0030 Currency Proc5Sing Machnes f. J'0046 Docunent Mana9cment System Clf'0048 Seosltive Dal<> Protection Tecllnology Cll'0019 Manil<)Emert SWl!o•t Soltware Cll'OOSO Metro IT OneStop and OITi<:e Automatbn CIPOOS1 Cost001C1' Electt'onic Cormunc.ations & <Mreach Cll'O!,O J PoliCe Rlt1abte Radio Reelacement
Stbtotal
Rall Far~ Equipment CIP0031 l>P.blt/CrP.dit Processing Requirements OPOO 37 Far~ Media Encoders C:IP0091 Automalle f a-e CollectiOn Machnes CIP0092 f.lhemet Wiring lo r Rat Fare Machines C1P0093 Integrating regloM! NOOFAAE 5ys1em CIP0094 lmptovemerts lo Coin Codectton Machines
Washington Metropolitan Area Transit Authority Capital Project Anandals
fiscal Year 2012 - December 2011 Dolars in Thousands
1107.7 $107.7
p1.o $71.0
$4,358.9 $4,556.7 2,04-0.9 4,365.1 8,1159. J 7,471.0 6.614.9 5,290.7 3,625.6 3,029.0 1.559.3 l,480.5 S,515.6 S,659.1
896.0 2,070.6 2,824.2 2,366.4 1.559.3 3,630.8 4,516.2 J,395.8 J,000.0 1,375.0
$4~.370.1 $1'1,694.0
$1.978.J $2,303.0 2.050./ 2,052.0 7,728.8 '1,135.G
25,780.7 1a,n1A 3,115.l 4,051.0 3, 1q1.1 3.133.7
667.0 693.& $41,571.7 $35,096.2
$1,Dl.9 $886.6 913.3 516.2
l,07U 919.0 1,756.0 1,362.1 7,709.9 2.068.0 2.166.9 2,167.0
CIP0097 Open Bani<eaod and Aott>mauc Fare Cokc:tiOn Systems 2,793.7 2,858.0 Subtotal $17.536.5 $10,776.8
Total< Sy5te1111 and Technol~ ! 107,586.0 i90,641.l
i 107.7 1107.7 (p 3.!J 145.6% 145.6% $101./ $107.7 ($~3 7\ 145.6% MS.6%
$4,358.9 $2,519.7 $2,037.0 95.7% 55.3% 2.01-0.9 1,185.S 2,879.9 46.8% 34.0o/o 8,3995 2,857.9 4,616.0 112-4% 38.2% 4,07M 2,676.2 2,614.S 71.1% SU.6% ] ,()()! . ! 687.7 2,346.4 66.1% 22.5%
o.o o.o 1,480.~ 0.0% 0.0% 1.568.7 2,226.2 J,432.9 80.7% 39.3%
572.S 3&7.5 1,703.l 27.7% 17.7% 1,204.3 387.7 1,978.7 50.9% 16.4%
847.5 200.4 3,430.5 23.3% 5.5% 3,611.9 208.8 3,187.0 1065% 6.1%
245.6 o.o 1,375.0 17.9% 0 .0% $31.931.8 $13,612.7 $31.081.3 7t4% J0.5%
$1 ,918.3 $J,48S.O $818.0 85.9% 64.5% l,682.3 657.9 l,394.l 82.0% 32.1% S,097.3 l ,783.4 1,852.1 1113% 5~2%
13,518.4 7,063.7 11,663.7 72.7% 31.7% 2,683.0 1,867.9 2,183.1 66.2% '16.1% 3,191.l 1,J31.3 1,8'2.3 101.8% 42.5%
267.5 182.3 SI l.J 38.6% 26.3% $28,417.9 $14,871.7 s20,n1.s 81.0% 1•.4%
869.3 416.5 470.1 98.1% 17.0o/o 913.J 0.0 516.2 176.9% 0.0% 320. l 4.7 $914.3 34.8% 0.5%
1.756.0 146.6 1,215.S 128.9% 10.11% J.562.4 2,093.l (l5.6) 172.3% 101.2% 1,866.7 86.6 2,080.4 8(,,1% 4.0% J,~7 !. I 913.8 1,9¥..) 69.0% 32.()%
$11,258.9 $3,661.9 $7,11.S.0 101.5% 34.0%
i7l1716A p;254..0 f58,J87,l 79.10/o 35.60/o
36 of 59

E. rr,za anrt srrucrures Trad: Rehllbflftllllfon
aro0ta lmk welding Prog11m Ul'OOl 9 Trad\ FloatJng Slab Rellabf~atlon OP0021 T1adt Pad/910Ck Absotbet Rellablitalicl<> Cll'OOU Tradt Stiuch.ral Rehlbiitatioo OP0023 Thir!l Ra~ Reh~iitaticn OP0024 Track Rel'labilltation OP0089 T racH asteners 0!'0141 O>evetly llhctmeot CIP0146 M.Jmlioe 18 Switch Replacemef1t Pro~am
Subtotal
Stalfon/Tvnnel Rt1h11bllftat/on CIP0026 s1.1tinrfl unnel l eak Mitigalit>n
SU:ltotal
Tot.I: Tntek and StNctUl'9
f.. eassenaer fad/It/cs Elt!Yator/Esclllator FaclfftlH
QP0071 Mevator Rt'h~firatloo OP0073 Escalator Rehabnation OP0132 Elevator/Escalator Repairables
HalntttnMce of Riii/ Station f11dlltles CIP0087 Station Reh<t>ilitat\On Progam OP0138 5y!tem-wide lnfrastruct\l'e Rehabiitat!On OPOl50 Fire Systems CIPOl 51 Station Cooling Progarn OPOISl Parklog Garage RetiabM1'.iOn
8/cycle .t Pt!destrlilfl FacllfUl!:S OP003S Blcyele & Pedestrian fadlilie~: C;,pacity lmp<OVemef1ls OP0036 Replacement Of Bicycle Rad<s fc I ocker;
Subtotal
Rafi Station: Cap11clty/Enhancements CIP0039 Core &. System C;ipacity fl'oject De•eloimen! CIP0074 lnst!llallonor Pa<king lot Credit Card Readen;
Sdltotal
Washington Metropolitan Area Transit Authority capital Project Financials
Fiscal Year 2012 - December 2011 OoR.n in Thousands
$2,756.5 $7.,887.1 1,503.2 1,511 .1 4,097.0 2, 569.2 4, 036.9 4,101.9 5,517.4 5,017..0
S0.413.7 51,161.0 3, 553.2 3, 614.1 1.54(;.9 254.3 5,900.4 6,495. l
$19.331. l Pl,605.7
p,m.3 11Jl~.4 $3,298.3 $3.33!.4
$82,6l9A $80,937.1
$5,475.4 $'\714.9 17, 501.6 15,816.7 4,825.3 1,622.l
$27)52.3 $25,173.6
$7,831.4 $12,M2.0 SS,205.9 57,459.!
2,160.0 2,166.0 8 ,725.0 J,2~~.o
l ,000.0 t,000.0 $7·1,923.3 S76,n2.1
$1,690.6 $1,556.2 623.8 402.9
$2,314.4 s1,95q_o
$3,283.3 Sl,547.1 2,750.1 5,476.7
$6.033.3 $7,023.B
·:1~·~~~ .... ·tc.:t1 ~~iJ'! ·· ~ ' .• ' . ,. :t
$?,095.0 $M4.8 2,042.3 72.6% 29.3% 992.9 691.7 816.1 65-7% 4<i.0%
2.)14.9 1,198.7 1,370.S 92.4% 46.7% 3,804.9 l,323 .7 2,178.2 92.8% 323%
476.9 328.t $<1,683.9 9.5% 6.So/o 47.710.1 24, 818.'I 26.)U6 93.3% 48.5% 3553.2 l ,41R.2 2,l95.8 98.3% 39.2% 1,546.9 283.7 (29.1) 608.3% 111.6% 5,906.4 l ,642.1 1,853.0 90.9% 25.3%
$68,491.1 $32,552.4 $45,053.4 88.3% 41.9%
13,:>98.3 f l,637.1 $1,494.3 99.0o/o SS.1% $3,298.3 $1,837 .1 SI ,491.3 99.0% S'.>. lo/o
p t ,789A $34,389.4 }46,547.7 88.7"f. 42.50/a
$4,909.8 $944.9 $3,no.o 104.1'!1> 20.0o/o 11,137.1 5,380.9 10, 455.8 IJ.')% 34.0%
975.4 782.4 3.839.7 21.1% 16.9% $17,32M $7, 108.2 $18,065.4 68.8% 28.2%
F .832.4 $4,204.6 8,6J7.4 61.0 o/o 32.7% 37,340.6 12,168.2 $45,290.9 65.0% 21.2%
1,646.9 87.6 2,078.4 76.0% 4.0% 8)25.0 1,714.8 1, 540.2 268.0% 52.7%
382.3 31.) 968.7 38.2% 3.1% sSS,927.l Sl8,206.S $58,51~.6 72. 9% 23.7%
$1,350.9 $505.9 $1 ,050.J 86.8% 32.5% 162.0 37.6 365.2 40.2% 9.Jo/o
$1.513.0 $5<135 $1 ,415.5 77.7% n.1%
$1,214 .2 $4ll. 8 $1,125.3 78.So/o 27.3% 2,sos.o 0.0 S,176.7 45.8% 0.0%
$3,722.2 $421.8 $6'602.0 53.0% 6.0o/o
37 of 59

Bus Prlor#y Corridor l mprow!ments OPOOJl Bus Prior~ Corridor Netv>Orl\ Errancem~rb
5'botal
Rall Station Equipment Cl'0099 POiice Emer~n~ Man.'lgement l:gul~ment
Subtotal
Total: Pass~r Faci11Uf:s
.!iJlil.iat~~Eau/pmeat Rall Maintenance Equipment
CIP0020 RejllacemEJ'lt of Rail Trad Signagc 01'00~5 Trild< Mili 1l<!nancc E~ CIP0027 Swldl Mochine Rehabiltation Project 01'0065 ('..eornefry V~l'Odc CIP0066 Rail Shop Repai- Fquipment OP0133 w~e wort< EQU!lmcr11 CIP0135 Train Control Signal CIPOl36 fCC Rado fleQUency Comnvnication Olilnyes CIPO IJ9 NTSB RecommendallOClS
Subtotal Bus Rt!palr Equ/pmt!nl
Clf'OOO'I Bus f\epair Eqi.Ji~nt Su«otal
Busl llt!SS Flldlltles Equipment C!P()()7.8 Materials Hanclllng E~ent Cll'0029 WaithooSe Vertical stora!IE! Units/Shelving
Subtotal
Total: ....,lntO!nanceEgulemerrt
If, Other &.ciDJi.~ 8us11~ss Support f i1Cilitles
OrOQ33 Replacement d Revt<lue facioty EQUll>ment C IP0031 Rcvcruc Collecbon f aclty ( R Cl') Building bi>ansion CIP0080 Jocks-On Graham 6uildi:lg RenovalJoo Ol'OWI Bus 0 11eratlons Coolrd Center
Subtotal
MTPD Support Fad/ltlt!J CJPOI OI Police SubstatiOn New Oisl!icl 2/Trainlog ~<>dirty Cl'O 106 Special O~ratl0<1S OMsiOn facllity
Suhlotill
Washington Metropolitan Area Transit Authority Capital Project Financials
fiscal Year lOU · December 2011 Dolla~ in Thousands
f81S46.9 $8,546.9
14,<143.9 $4,443.9
1981.Ci $981.6
1565.G $585.6
p20,551.8 ~115,908.1
$1,060.6 $1,053 2 34,663.2 4,317.8
1.535.0 l.5'18.0 8.928.3 l,599.1 6,571.3 5,338.3 5,232.l 3,687.~
5,317.1 2, 514.6 8.691.2 1,336.0
75,089.3 74,41.5 .4 $1 47 ,138.J $9S,809.8
$7,790.7 $7,769.S $7,J90J $7,789.5
$194.9 $/.11. I 1,181.8 1,242.9
$1,376.7 $1,"60.0
1 is~:!o~.6 11os,os9.l
$9921 $605.2 0.0 250.0
11,896.9 11,919.3 269.3 )./
$1 3,058.) $12,778.3
$),501.8 $1, 743.8 9,530 .2 10,823.2
S l3,037.0 Sl7,~67.0
i 1,m.3 i s2s.s P,918.1 61.2'1\i 11.8% $2.721.3 $525.8 $3, 918.l 61.2% 11.8%
~54/.8 1573.9 i61.1 93.5'1\i 89.S'lb S~47. 8 $m.9 $61 7 93.S% 89.5%
,81,753.8 i211329.7 isa1578.J 70.S"la 23.'1'/e
$1,060.6 Sl 19.6 733.6 100.7% J 0.3% 2,03'1.9 952.7 3,365.l 17.1% 22.1% 1.522.1 515.6 1,032.4 98.3% 33.3% 8,177.9 614.l 985.0 511 .1% 38.4% 1,583.3 367J 4,9/0.6 29./% 6.9% 2,021.4 700.S Z,986.9 54.9% 19.0% 2,759.8 267.9 2,246.7 109.8% 10.~ 1,803.1 239.3 $1,096.7 JJS .0% 17.9%
38,303.7 11,876.4 6?,588.9 S l .S~ 15.9% S!>9,Z69.8 $1 5,8:>3.8 SS0,005.9 61.9% 16.5%
$1,578.0 $ 18 .7 $1,710.I 58.8% 0.}o/o $4,578.0 $18 .7 $7,770.7 58.8% 0.7%
~S.I $SS.I $137.1 39.2% 39.2% __ e_9_3.8 ___ ~l.6 811. 3 71.9% 32.3%
s91as $486J $913.~ 61 .0% 3U%
$64,826.7 116,309.2 1s11,150,o 61.7'11> 15.5.,,,,
$710.6 $2.1 603.1 117.4% Q.4% 0.0 0.0 250.0 0 .0% 0.0%
7 ,777.7 1,380.6 I0,538.7 65.3% l !.6% 269.3 3,7 ~0.0 7199.6% 100.0%
$8,757.7 $1,386.S $11,3 1.8 &ii:5% 10.9%
$1,691.0 $372.3 $1,371.S 108.4% 2l.3% 8,966.2 s,an.a I 9$0.1 82.6% 8.1.0%
$!0,857.2 $9,215.1 $1Ji!.9 86.~% 73.6%
38 Of 59

Total< O!Mr Fectlttles
~Ul.RiliWlfllm!iln<f SllfJPOft Credit Facility
CIP0131 ~_facili!t_ Subtotal
Total: Project Management and Support
Griind Total: Capital Improvement Program
Washington Metropolitan Area Transit Authority Capital Project Rnanclals
Fiscal Year 2012 · December 2011 Dolia-s in ThouSCYlds
$26,090.3 $25,345.3
~ 5,4'11.1 ~1,78l.S $5,4"l.4 $4,783.5
$~,Z4tA p,,I~.!
$1,042,115 .9 $917,036.6
$19,614.9 $10,631.6 514,71J.7 77.40/o 41.90/o
l 686.0 ~666.5 ~1, ll7.0 14.3~ 139% $686.0 $666.5 $4, 117.0 11.3% 13.9%
ig8u 5ggg:! $4,1i,.o 14.,,,,; n.1 .....
$698,927.0 $306,538.9 $610,497.8 76.2"9 3140/o
•f101El_ln _ _,__.,.,_11Nt w-onvN11¥--tot1«11<l111'YJOJ11Jutw.,.ftOf-.:ufWdlirt11•-oftfl•llxlll,_., ~rorill-,,,rwlflorffytt>rl'YlOJl, Hfl-.,tHl#ll.lmllltm
--·,,,,_~-tfl•ltSl.J--Hdlll'tlttl-oll'Y101116II.~IJlll-
~ Budvet 11,. curent fiscal re•'• 10181 plaon..i cash payou! Obl911ed ~ poftion of Ile current t'i9cai yea( s budget for pa;ymett aoainst aW8t"ded coN!.cts, p11.11 1he r •sp.ectlvetebor cost b p.ndW l l' e actual cesh peyout that has OQ:::l..fft'd to date in the CUfTtrtt fiscal year Uno-ndo<I: The dlflettnoo bel'Mlen "'9 pllnned ai1h peyout ond llMt octual cu h poyout that hu occure<S to dllo In tti. OJrrent fi>ul i-r
39 of 59

Washington Metropolitan Area Transit Authority Reimbursable Projeds
Fiscal Year 2012 - December 2011 Dollars in Thousands
Prior Year FY12 Total Un- Obligation Reimbursable Projects Budget Obligated Expended Expended Expended Expended Rate Expend Rate
Q/strict oft;olumbta CRBOOOl Anacostia Light Rail Demon::.iration $16,973.8 $16,636.0 $15,826.0 $7.3 $15,833.4 $1,140.4 98.0% 93.3% CRB0002 DC Downtown Circulator Buses 18,850.0 17,734.9 17,643.7 17,643.7 1,206.3 94.1% 93.6% CRB0003 New York Ave. Metrorall Station 109,950.0 109,673.2 109,622.9 109,622.9 327.1 99.7% 99.7% CRB000'1 Southeast Bus Garage Replacement 67,534.8 47,860.9 15,669.2 9,632.0 25,301.2 42,233.6 70.9% 37.5% CRB0005 Project Development 10,784.8 10,784.8 7 ,045.4 488.0 7,533.4 3,2514 100.0% 69.9% CRB0027 Brentwood Rail Yard Expansion 2,390.3 2,390.3 2,339.0 2,339.0 51.3 100.0% 97.9% CRB0031 DC Convention Center 29,938.9 29,938.9 29,822.1 29,822.1 116,9 100.0% 99.6% CRB0036 Navy Yard Station Modification 19,585.4 19,543.5 19,499.1 19,499.1 86.3 99.8% 99.6% CRB0045 DC Real Time Sign Bus Shelters 190.0 51.3 51.3 51.3 138.7 27.0% 27.0% CRB0047 DC Student Smar Trip Pass 390.0 390.0 13.4 13.4 376.6 100.0% 3.4% CRB0049 Union Row: U Str /Cardozo Station 1,500.0 1,008.7 1,008.7 1,008.7 491.3 67.2'%1 67.2% CRBOOS2 u St Stat 14 St Bus Access Imp 500.0 500.0 480.7 19.3 500.0 100.0l/o 100.0% CRB0056 Yellow Line Extension 1,500.0 914.1 609.1 609.1 890.9 60.9% 40.6°/i, CRB0073 Du1:xmt Circle Artwork 112.0 111.7 111.7 Hl.7 0.3 99.7% 99.7% CRB0078 Minnesota Avenue Public Hearing 50.0 50.0 20.4 20.4 29.6 100.0% 40.8% CR!30096 DC Station Name Changes 2.19.3 219.3 218.6 218.6 0.7 100.0% 99:7% CRBOlOO Georgetown Streelscape 1,455.0 1,454.9 1,411.9 l,411.9 43.1 100.0% 97.0% CRB0107 MO Arena 18,384.4 18,384.4 18,096.4 288.l 100.0% 98.4% CRB0119 DC Station Trailblazer Signs 130.8 123.8 93.9 0.0 94.0 36.8 94.7'Yo 71..8% CRB0121 Connec.ticut Avenue Streetscape 30.0 30.0 30.0 100.0% CRB0122 Union Station Metrorail Access and Capacity I 2,550.0 2,550.0
DC Uncommitted Funds 1,118.6 1,118.6
District of Columbia Total $304,138.2 $277,801.0 $239,583.4 $10,146.7 $249,730.2 $54,408.0 91.3% 82.1%
Mim'li.md. Montgomery County
CRB0006 Glenmont Parking Facility Design Work $26,610.0 $9,450.2 $12,241.6 $21,691.8 $8,429.2 88.3% 72.0% CRB0007 Takoma Langley Park Center 6,700.0 1,339.S 1,339.5 l,339.5 5,360.5 20.0% 2.0.0% CRB0043 Shady Grove Rail Yard Expansion 2,247.9 2,228.8 2,212.6 2,212.6 35.3 99.1% 98.4% CRB0046 Silver Spring South Entrance 400.0 272.1 261.3 261.3 138.l 68.0% 65.3% CRB0055 White Flint Pari<ing Structure 17,390.0 17,382.B 17,373,2 16.8 100.0% 99.9% CRB0062 Twinbrook Facility Relocation 1,000.0 525.6 525.6 525.6 474.4 52.6% 52.6% CRB0106 Rockville MARC ADA 50.0 50.0 21.0 21.0 29.0 100.0% 42.0% CRB011 6 Shady Grove Parking II
Subtotal
40 of 59

Washington Metropolitan Area Transit Authority Reimbursable Projects
Fiscal Year 2012- December 2011 Dollars in TI10usands
PriorYe;~r FY12 Total Un- Obligation
Reimbursable Projects Budget Obligated Expended Expended Expended Expended Rate Expend Rate
Prince Geor-ge's County CRB0008 New Carrollton Rail Yard Expansion $70,375.0 $69,884.4 $69,410.2 $3.2 $69,413.4 $961.6 99.3°1<1 98.6% CRB0034 Greenbelt Rall Yard Expansion 1,828.8 1,801.2 1, 765.4 1,765.4 63.3 98.5% 96.5% CRBOlH7 New Carrollton Parking Garage 23,115.0 22,417.4 22,417.1 22,417.1 697.9 97.0% 97.0%
Subtotal $95,318.8 $94,103.0 $93,592.8 $3.2 $93,596.0 $1,722.8 98.7% 98.2%
Maryland-wide CRB0009 Project Development $9,390.5 $6,576.8 $5,546.5 $303.3 $5,849.8 $31540.7 70.0% 62.3% CRBOOlO Largo Blue Line Extension 469,590.8 467,481.2 466,980.4 466,980.4 2,610.4 99.6% 99.4% CRB0092 Bike Lockers 399.5 379.6 379.6 379.6 19.9 95.0% 95.0% CRBOlOS Largo Blue Line Extension Prelim Engr 10,397.3 10,397.3 10,198.0 10,198.0 199.2 100.0% 98.1% CRB0108 Maryland Station Name Cl1;;mge
Subtotal
Maryland Total $643,580.1 $627,651.7 $608,185.7 $12,548.l $620,733.8 $221846.3 97.5% 96.5%
YiJ:g}jJjjl Alexandria
CRBOOH Eisenhower Station Entrance $1,800.0 $304.1 $125. 7 $102.9 $228.6 1,571. 4 16.9% 12.7% CRB0012 King Street Station Bus Loop Reconfiguration 4,189.4 727.2 25.0 401.2 426.2 3,763.2 17.4% 10.2%
CRBOOB Potomac Yard Alt:. Analysis 3,000.0 1,496.3 559.6 506.7 1,066.3 1,933.7 49.9% 35.5% CRB0023 Alexandria Rail Yard - EA 200.0 138.5 94 .l 94.1 $105.9 69.3% 4:7.0% CRB0032 Crystal City • Potomac (Alex) 300.0 70.0 49.4 49.4 250.6 23.3% 16.5% CRB0075 King Street Station Improvements 16,600.0 16,363.7 16,349.0 16,349.0 251.0 98.6% 98.5% CRB011] Potomac Yards
Subtotal
Arlington County CRB0015 Columbia Pike NEPA and PE $4,060.0 $3,392.S $2,027.2 $499.4 $2,526.6 1,533.4 83.6% 62.2% CRB0016 Columbia Pike Super Stops 2,000,0 1,060.0 298.7 374.2 672.9 1,327.1 53.0% 33.6% CRB0025 Ballston Station Improvements 14,763.4 14,674.7 14,640.9 1.0 14,641.8 121.6 99.4% 99.2% CRB0042 Rosslyn Station New Entrance 5,089.0 4,344.5 3,.973.2 86.3 4,059.5 1,029.5 85.4% 79.8% CRB0044 Shirlington Bus Station 5,096.2 5,096.2 5,074.3 5,074.3 21.9 100.0% 99.6% CRB0064 Arlington County Project Mgmt. 900.0 900.0 780.3 780.3 119.7 100.0% 86.7% CRBOll 1 National Airport 4,960.7 4,960.7 4,510.3 4,510.3 450.5 100.0%1 90.9% CRB0117 Shirlington Gara~Je Design Study 7.0 6.8 6.8 6.8 0.2 97.1% 97.1%
Subtotal $36,876.4 $34,435.5 $31,311.7 $960.8 $32,272.5 $4,603.9 93.4% 87.5%
City of Fairfax None
41 of

Washington Metropolitan Area Transit Authority Reimbursable Projects
Fiscal Year 2012 ·December 2011 Dollars In Thousands
Prior Year fY12 Total Un- Obligation Reimbursable Projects Budget Obligated Expended Expended Expended Expended Rate Expend Rate
Fairfax County CRB0017 Vienna Station Mezzanine Stair $2,000.0 $1 ,099.8 $415.8 $494.7 $910.5 $1,089.5 55.0% 45.5% CRB0026 Bus Stop Signs 600 in Fairfax 96.0 l0.0 96.0 10.4% CRB0035 Huntington Parking Structure 32,732.8 32,701.5 32,698.9 32,698.9 33.8 99.9% 99.9% CRB0050 Vienna/Fairfax·~MU Parking Structure 1,000.0 866.3 733.5 733.5 266.5 86.6% 73.3% CRB0051 Vienna Parking Structure 27,100.0 26,169.5 26,163.5 26,163.5 936.5 96.6% 96.5% CRB0053 Vienna Station Improve - Pulte Home 350.0 350.0 48.5 48.5 301.5 100.0% 13.9% CRB0054 West Falls Church Parking Structure 17,029.9 16,889.6 16,762.2 16,762.2 267.8 99.2% 98.4% CRB0084 West Fall Church Bus Bays 2,750.0 2,667.6 2,569.7 2,569.7 180.3 97.0% 93.4% ORB0006 Springfield Circulator l,814.4 1,814.4 1,790.5 1 790.5 23.9 100.0% 98.7%
Subtotal $84,873.0 $82,568.7 $81,182.5 $494.7 $81,677.2 $3,195.8 97.3% 96.2°i;
Falls Church None
Virginia-wide CRBOOlll Project Development $7,941.5 $7,941.5 $5,932.9 $315.8 $6,248.7 $1,692.8 100.0% 78.7% CRB0019 Dulles Extension Design/Build 478,718.2 246,323.4 52,320.l 14,881.2 67,201.8 411,516.4 51.5% 14.0% CRB0020 Dulles Phase 2 (PE) 3,500.0 2,609.0 617.5 207.0 824.4 2,675.6 74.5% 23.6% CRB0029 Crystal City/Potomac Yard l,505.8 l,443.2 1,267.9 7.2 1,275.0 230.7 95.8% 84.7% CRB0059 Dulles Preliminary Engineering/NEPA
Subtotal
Virginia Total $697,774.2 $452,684.5 $247,991.9 $17,877.4 $ 265,869.3 $431,904.9 64.9% 38.1%
Regional CRB0021 6000 Rail Car Purchase Base $120,000.0 $119,988.2 $118,961.0 $118,961.0 $1,039.0 !00.0% 99.1% CRB0022 Regional Travel Training ACCS 1,234.5 $1, 101.2 $603.2 $240.3 $843.5 $391.0 89.2% 68.3% CRB0038 Precision Stopping 992.1 $917.6 $867.0 $867.0 $125.1 92.5% 87.4% CRB0040 Bus Bike Racks 1,645.0 $1,429.8 $1,429.8 $1,429.8 $215.2 86.9% 86.9% CRB0041 Il Communication Enhancement l,562.5 $1,425.3 $1,425.3 $137.2 91.2% 91.2% CRB0060 Regional Fare Int. (MT A) 7,607.6 $6,521.9 $6,139.0 $6,139.0 $1,468.6 85.7% 80.7% CRB0065 Precision Stopping Pilot Prog. $3,000.0 $2,610.4 $2,605.0 $2,605.0 $395.0 87.0% 86.8% CHB0097 Dynamic Display System 10,261.4 $10 ,226.7 $10,226.7 $Hl,22G.7 $34.7 99.7% 99.7% MSC0005 Tax Advantage Lease Program 8,419.9 $7,360.6 $7,111.6 $28.1 $7,139.7 $1,280.2 87.4% 84.8%
Regional Total $154,722.9 $151,581.7 $149,368.6 $268.3 $149,636.9 $5,086.0 98.0% 96.7%
www!~tal:_~ Reimbursable Projects ---· -·-~-l!tf!C>l'.>,}15. 4 $1,509,718.8 $1,245,129.7 --~·~---~-~---
$40,840.6 $1,285,970.2 $514,245.2 83.9°/o 71.4%
42 ol 59
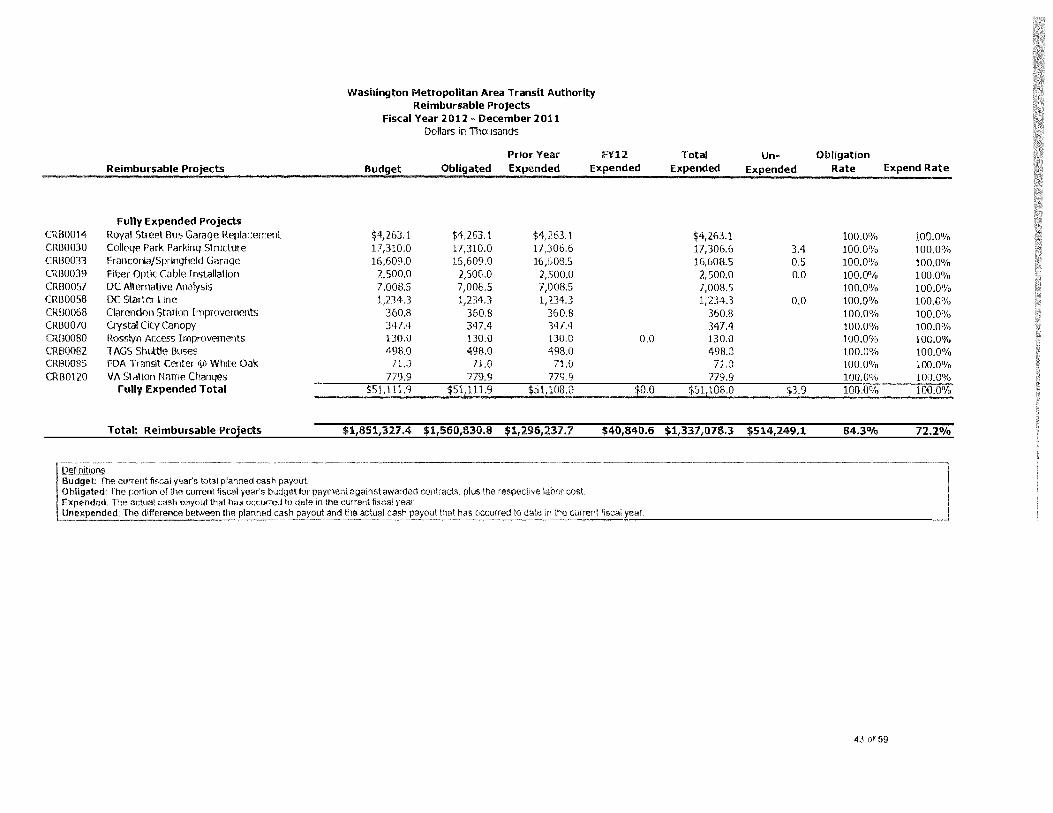
CREl0014 CRBOOJO CRB0033 CRB0039 CRB0057 CRB0058 CRB0068 CRB0070 CRB0080 CRB0082 CR BOOBS CRB0120
Washington Metropolitan Area Transit Authority Reimbursable Projects
Fiscal Year 2012 - December 201.1 Dollars in Thousands
Prior Year Reimbursable Projects Budget Obligated Ex~nded
Fully Expended Projects Royal Street Bus Garage Replacement $4,263.1 College Park Parking Structure 17,310.0 17,310.0 17,306.6 Franconia/Springfield Garage 16,609.0 16,609.0 16,608.5 Fiber Optic Cable Installation 2,500.0 2,500.0 2,SOO.O DC Alternative Analysis 7,008.5 7,008.5 7,008.5 DC Starter Line l ,234.3 1,234.3 1,234.3 Clarendon :;talion Improvements 360.8 360.8 360.8 Crystal City f.;mopy 347.4 347.4 347.4 Rosslyn Access Improvements 130.0 130.0 130.0 TAGS Shuttle Buses 498.0 498.0 498.0 FDA Transit Center @ White Oak 71.0 71.0 71.0 VA Station Name Changes 779.9 779.9 779.9
Fully Expended Total $51,111.9 $51,111.9 $51,108.0
Total: Reimbursable Projects $1,851,327.4 $1,560,830.8 $1,296,237.7
cash payout year's budget for payment against awarded contracts, plus the respective labor cost
occurred to date in the current fiscal year cash and t11e actual cash
FY12 Expended
0.0
$0.0
$40,840.6
Total Expended
$4,263.1 17,306.6 16,608.5
2,500.0 7,008.5 l,234.3
360.8 347.4 130.0 498.0
71.0 779.9
$51,108.0
$1,337,078.J
Un- Obligation Expended Rate Expend Rate
100.0% 100.0% 3.4 100.0% 100.0% 0.5 100.0% 100.0% 0.0 100.0% 100.0%
100.0% 100.0% 0.0 100.0% 100.()%
100.0% 100.0% 100.0% 100.0% 100.0% 100.0% 100.0% 100.0% 100.0% 100.0% 100.0% 100.0%
$3.9 100.0% 100.0%
$514,249.1 84.3% 72.2%
43 of 59

American Recovery & Reinvestment Act (ARRA}
Vehicles & Vehicle Parts ARA0021 Bus Replacement f,0mponents (ST26) ARA0022 Preventative Maintenance ARA0027 Replacement of Oldest Buses ( ST02) ARA0028 Service Vehicle Replacement
/lfalntemmce Facilities ARAOOOl New Bus Body and Paint Shop (ST04) ARA0002 Replacement of Southeastern Bus
Passenger Facilities ARA0004 Replacement of Crumbling Platforms {ST08) ARA0005 Update Platform Real-Time Signs (5128)
.?afety & Security ARA0008 Addihonal Station Alarm/ Chemical Sensors (ST48) ARA0007 Bus Garage Security Update {ST23)
Washington Metropolitan Area Transit Authority Capital Project Financials
Fiscal Year 2012 - December 2011 l1ollars in Thousands
Prior Year f'f12 Budget
$21,400.0 30,000.0
$16,000.0 2,500.0
$3,991.2 3,000.0
Obli2ated Expended Expended
$21,286.0 29,985 .5
$15,886.0 2,133.5
$3,991.2 2,971.5
$17,861.4 15,606.0
$13,250.5 126.8
$3,684.0 2.,134.0
$2,538.6 14,360.0
274.5
$307.1 690.5
ARAOOll Communic<itions Equipment for Operations Control Center· (ST24) 3,000.0 3,000.0 2,953.3 0.0 ARA0025 Emergency Tunnel Evacuallon carts {ST30)
Maintenance & Repair Equipment ARA0009 Heavy Duty Locomotives for Maintenance (ST12) ARA0010 60-Ton Crane for Track Work (ST17)
Heavy Duty Trnck Equipment {ST07) Track Welding Program to Repair Defects Power Tool Equipment Replacement
836.3 836.3 836.3
$4,998.9 1,151.7 2,084.8
737.8
Total Un- Obligation Expend Expended Expended Rate Rate
$2,490.0 11,087.1 27,025.2
$20,400.0 29,966.1
$13,250.5 401.3
$3,991.l 2,824.5 2,953.3
836.3
$4,998.9 1,535.6 9,-r37.5 3,844.2
5.0
$1 ,000.0 33.9
$2,749.5 2,098.7
$0.l 175.5 46.7
0.0
2,303.3 770.7
100.0% 100.0%
99.5% 100.0%
99.3% 85.3%
100.0% 99.1%
100.0% 100.0%
lG0.0% !00.0% 100.0%
44 ol 59
100.0% 100,0% 100.0%
95.3% 99.9%
82.8% lli.1%
100.0% 94.2% 98.4%
100.0%
100.0% 40.0% 92.7%
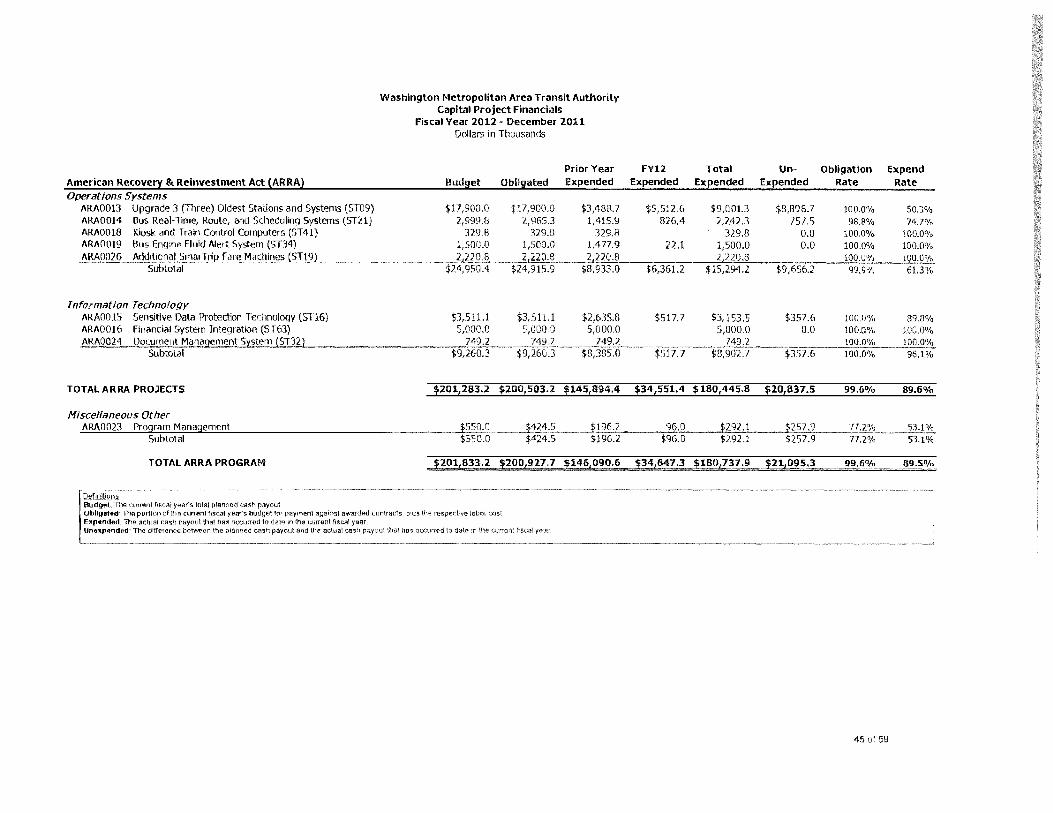
American Recovery & Reinvestment Act (AR.RA) Operations Systems
/\R/\0013 Upgrade 3 (ll1ree) Oldest Stations and Systems (ST09) /\RA0014 Bus Real· Time, Route, and Scheduling Systems (ST21) Jl1R/\0018 Kiosk and Train Control Computers (ST41) /\R/\0019 Bus Engine Fluid /\lert System (ST34)
Information Technology /\RA0015 Sensitive Data Protection Technology (ST16) /\R/\0016 Financial System Integration (ST63)
TOTAL ARRA PROJECTS
Miscellaneous Other /\R/\0023 Program Management
Subtotal
TOTAL ARRA PROGRAM
tola! r1lanne<l cash paym;t
Washington Metropolitan Area Transit Authority Capital Project Financials
Fiscal Year 2012 - December 2011 Dollars in Thousands
Budget
$17,900.0 2,999.8
329.8 1,500.0
$3,511.1 5,000.0
Obligated
$17,900.0 2,965.3
329.8 1,500.0
$3,511.1 5,000.0
Prior Year Expended
$3,488.7 1,415.9
329.8 1,477.9
$2,635.8 5,()00.0
F'll12 Expended
$5,512.6 826.4
22.1
$517.7
Total Expended
$9,001.3 2,242.3
329.8 1,500.0
$3, 153.5 5,000.0
Un-Expended
$8,898.7 757.S
0.0 0.0
$357.6 0.0
$201,283.2 $200,503.2 $145,894.4 $34,551.4 $180,445.8 $20,837.5
·~---J.E.Cl,.Q______lli,1,s __ ~$~19_6_.2 _____ 9_6_.o __ ~i2~9~2-.1 $550.0 $424.5 $196.2 $96.0 $292.1
po1,833.2 $200,927L.l146,o9o.6 $34,647.3 $180,737.9 p11095.3
Thn por1lon of ctJrrent fiscal year's budget for payrnenl against awarded contracts, plus the respective labor cost The actual casti payout 1hat has occurred to date in the current fiscal
lln••P•,M••U The difference bet~en Um planned cash payout and the actual
Obligation Rate
100.0% 98.8%
100.0% 100.0%
100.0% 100.0%
99.6"/o
99.6%
Expend Rate
50.3% 74.l%
100.0% 100.0%
89.8% 100.0%
89.6%
89.5%
45 of 59

SECOOOl SEC0002 SEC0003 SEC0004 SECOOOS_Ol SEC0006 SEC0007 SEC0008 SEC0009 SECOOlO SECOOll SEC0012 SEC0030
Secvrltv f'rcqWJJ. Bus Gcrage Security Cameras on Buses C¥neras oo Rail C<rS CCV and Access Control Chemic~ Detection Metrorail Station Camera Montgomery Garage PG Radio Upgrade Platform Seaxity PROltCT Systems Rildio Rerundancy AOCC V eot Intrusion Detection
Washington Metropolitan Area Transit Authority Approved Capital Safety & Security Program Financials
Fiscal Year 2012 - December 2011 OoB.vs in Thousands
$5,836.5 $2,834.0 $2,626.8 $99.3 6,410.0 5,912.3 7,139.7 221.6 6.5 3.5
11,675.8 385.7 40.3 44.7 1,906.0 39.1 2,n4.o 553.6 35.4 82.4
23.1 500.0 '105.4 405.4
6,517.8 1,282.4 38.4 88.3 606.0 606.0 606.0
5,900.0 543.0 218.7 236.3 11 ,500.0 443.0
Mobile Erner9~ Resf!:211se Vehicle Cabinets 175.0 175.0 141.4 1.0
Total: SecUrity Program $60,964.0 $13,401.1 $4,119.0 $555.S
$2,726.l $3,110.4 48.6% 46.7% 6,410.0 92.2% 0.0%
10.1 7,129.6 3.1% 0.1% 85.0 11,590.8 3.3% 0.7%
1,906.0 2.0% 0.()% 117.B 2,656.2 20.0% 4.2%
23.l 0.0% 0.0% 405.4 94.6 81.1% 81.1% 126.7 6,391.l 19.7% 1.9% 606.0 100.0% 100.0% 455.0 5,445.0 9.2% 7.7%
11,500.0 3.9% 0.0% 142.4 32.6 100.0% 81.4%
$4,674.S $56,289.S 22.00/o 7.7°/o
46 of 59

&.'ie!ztdes/ Vehtcfe Parts. Replacement of Rall Cars
CJP0067 Rail Car Safety &. Reliability Enhancements CIP0063 Rail Rehabilitation
Rehabilitation of Buse.~
Bus Enhancements
Washington Metropolitan Area Transit Authority Capital Project Financials
Fiscal Year 2012 - December 2011 Dollars in Thousands
$14,546.5 28,893.2
$14,546.5 28,893.2
$9,827.1 9,607.B
$2,464.1 11,602.6
$12,291.2 21,210.4
$2,255.3 7,682."l
10(!.0% 100.0%
84.5°/v 73.4%
_}otal: Vehicles/ Veh~c:!.e Parts __ ·~- . -~ -~--·----·--~-----·-_1181.L1!l3.f!j_178104~()-1!.~.58,~ __ $24,76'!_,~1±!6._2_!""'3;;..;5.;.<,.c..03'-7'-._.6_-"9-"8'-'. l'-'¥1_n_..;.8..;;0.:...7_0..._Vo
ll.Jla.lL~tw_JnfJ:astructure RehaA Rall line Segment Rehabllltatfon
CIP01{)7 Rail Rehabilitation Tier 1: Dupont to Silver Spring $4,871.3 $4,871.3 $4,871.3 $0.0 $4,871.3 $0.0 100.0% 100.0%
110.5% 85.6%
Maintenance of Ralf Yards
Rafi Maintenance Facllltles
Total: Maintenance facilities $39,532.l $28,539.4 $20,591.8 $1,201.7 121,793.5 $17,7311.6 72.2% 55.1%
47 of 59

E,..Iad ilnd Structures Trilck Rehabflltatlon
CIP0023 Ttird Rai Rehabiitatlon C1P0069 Trac:.k Fi!Steners OP0019 Trad< Floating Slab Rdlabilitatioo CIP0021 Trad< Pad/Shock Al>sOfber Rchablltation CIP0024 Track Rehabilitation CIP0022 Trad< StlUctural Rchablfft:ation CIPOJ46 Mainline #8 Switc:.h Replacement Program CIP0018 Traek Welding Program
SUblotal
St lit ion/ Tunnel Rehabilitation CIP0026 Station/Tumel Leak Mitigation
Subtotal
Tobit: Track and Structures
E..Passeag.er..F.MilJtl.es. Elevator/Escala tor F4cllltles
0'0072 Elevator RehabilitatiOf\ OP0132 Elevator(Esc.alator Rcpalrables CJP0073 Escalator Reflabilita~on
Subtotal
Maint enance of Rall Stilt/on Facllltles CIP0087 Station REhabiCita!io> Pr9gram
Subtotal
Rall Stat/Ofl Equipment OP0099 Police Emergen~ Management Egui2meot
Subtotal
Tobi: Passenger fadlities
Wa.shington Metropolitan Area Transit Authority Capital Project Financi.als
Fiscal Year 2012 - December 2011 Dollars In Thousands
$5,517.4 $476. 9 $0.0 4,1 14.9 4,114.9 2,061.7 J , 137.3 2,682.4 1,486.3 6, 194.6 4,290.6 2,268.6
79,573.9 79,573.9 37,219.S 4,017.4 4,017.'\ 2,242.9 6,331.0 6,331.0 424.6 ~125.7 2, 125.7 466.9
$111,012.1 .$103,612.8 $46,170.6
$6,198.6 $6,198.6 $3,057.4 $6,198.6 $6,198.6 $3,057.4
$328.l 1, 402.7
687.4 1,176.1
21,397.3 1,302.7 1,642.1
725.I $211,662.1
$L, 76Q,L $1,760.1
!117,2~Q.6 H0.9,1!11.3 . $49,228.0 $30,4 22.2
$6,292.7 $5,811.7 $1,182.8 $684.9 3,772.'I 917.6 0.0 763.6
17,413.0 13,450.S 4,099.9 J,294.3 $27,478.1 $19,262.1 SS,282.7 $4,742.8
P.095.4 P,095.4 ~o.o p,095.4 $3,095.4 $3,095.4 so.o $3,095.4
$1,084. l !650.6 1626.7 ($0.3) $1,084 .1 S650.6 $62{,.7 (S0.3)
in,6 57.6 i 23,o oe .2 i s,909,5 p ,8 3 8.0
$328.1 $5,189.3 8.6% 5.9% 3,464.4 650.S 100.0% 84.2% 2, 173.7 963.5 85.5% 69.3% 3,444.7 2,749.8 69.3% SS.6%
58,616.8 20,957.1 100.0% 73.7% 3,54 5.6 471.8 100.0% 88.3% 2,066.7 4,264.3 100.0% 32.6% 1,192.6 933.J 100.0% 56.1%
$74,832.7 $36,179.4 93.3% 67.4%
$4,817.5 $1,381.1 100.0% 77.7% $4,817.5 $1 ,38\.1 100.0% 77. 7%
$79,650.2 $'.37,56 0.4 93.7 % 68.0 %
$1,867.7 $<1,42S.O 92.4% 29.7% 763.6 3,008.8 24.3% 20.2%
7,394.2 10,018.8 n .2% 42.So/e $10,025.S $17,452.S 70.1% 36.5%
P,095.4 $0.0 100.0% I00.0% $3,095.4 $0.0 100.0o/o 100.0%
~626.S 1457.7 60.0'Yo 57.8% $626.5 $457.7 60.0'Yo 57.8%
1 13,747.4 f17,910.2 7 2 .7•/o 43,4810
48 Of 59
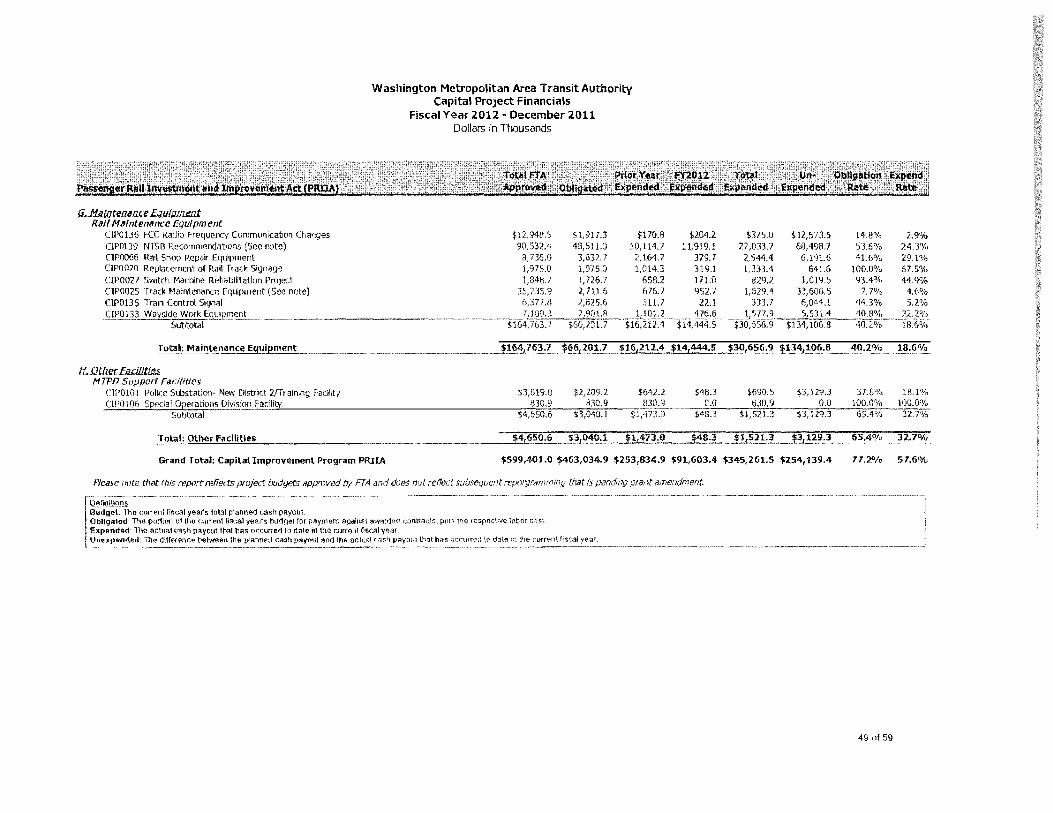
fiJ1Alalenaw:e .. Ea11./Jmlml Ri111 Malnt·eni1nce Equipment
ClPO 136 FCC Radio Frequency Communication Changes CIP0139 NTSB Recommendations (See note) CIP0066 Rail Shop Repair Equipment CTP0-020 Replacement of Rail Track Signage CIP0027 Switch Machine Rel1abilitation Project CIP0025 Track Maintenance Equipment (See note) CTP0135 Train Control Signal
Illl:aJ: .. ~ilil_lt!.Oance Equipment
!LOtill:ct.~ MTPD Support. Fi1Ci/ities
ClPOlOl Police Substation- New District 2JTraining Facility
Washington Metropolitan Area Transit Authority Capital Project Financials
Fiscal Year 2012 - December 2011 Dollars in Thousands
$170.8 10,114.7
2,164.7 1,014.3
658.2 676.7 311.7
$3,819.8 $2,209.2 $642.2
$20'1.2 $375.0 $12,573.5 11,919.1 22,033.7 68,498.7
379.7 2,544.4 6, 191.6 319.1 1,333.4 641.6 171.0 829.2 1,019.5 952.l 33,606.5
22.l
$690.5 $3,129.3
Grand Total: Capital Improvement Program PRIIA $599,401.0 $463,034.9 $253,834.9 $91,603.4 $345,261.5 $254,139.4
Please rmte that tlii.s mport ref1ect!i project budgets approved by FTA and does not reflect subsequent reporgramming that is pending grant amendment
current fiscal yea~s tolal planned casll payout nhHno••A•• The por\ion Qf lhe current nsr;al yea1~s budget for payment against awarded contracts, p\us the respective cost Expended The actual cash payout that ~as occurred 10 date in lhe current fiscal year. Umu:pendnd:: The difference bet\tl'Oen the planned cash and the actval cash that has occurrorj \o date in !he current
14.8°1<, 2.9% 53.6% 24.3% 41.6% 29.1%
100.0% 67.5% 93.4% 44.9%
7.7% 4.6%
57.8% l8.1%
77.'J!'lo 57.6%
49 of 59

Washington Metropolitan Area Transit Authority Transit Infrastructure Investment Fund (TIIF)
Fiscal Year 2012 ~December 2011 Dollars in Thousands
...--~-----~~~~~·~~~~~~~~--~~~=--:---:---:------:-~--,--~~---:-~~~~~~--------
Funds Jurisdictional Approved Unexpended Received Allocation Uses Expenses Ap(?roved Uses
Total Received for THF Resti:Jct£;d F1,1J1J)s:
Huntington Parking White Flint Parking FY05/06/07 /08/09 /10 Operating FYll Operating (continues thru FY12) FY07 /08/09/10 Safe, Clean Reliable SmarTrip Program CNG Buses Procurement Precision Stopping TSSM from Twinbrook to Shady Grove Gallery Place Remediation
Unrestricted Funds Available for Use: Total allocated to the Jurisdictions
District of Columbia 36% U_~J Fu11d~
Tivoli
$143,175.5
Anacostia Light Rail Program/Demonstration U Street/ Adams Morgan Link Navy Yard Design Union Row /U Street Yellow Line Extension Navy Yard Improvements View 14 /U Street & 14 Th
($2,414.5) $60,000.0
$21,600.0
$12,900.0 4,421.7
12,000.0 4,000.0
26,850.0 9,600.0
11,800.0 3,000.0 1,000.0
18.4 $85,590.l
$12,808.8 4,404.9
12,000.0 2,000.0
26,850.0 0.0 0.0 0.0
525.6 18.4
$58,607.7
$91.2 16.8
0.0 2,000.0
0.0 9,600.0
11,800.0 3,000.0
474.4 0.0
$26,982.4
$2,500.0 $2,500.0 $0.0 10,000.0 9,009.3 990.7
150.0 150.0 0.0 500.0 497.4 2.6
1,500.0 1,008.7 491.3 1,500.0 609. 1 890.9 4,452 .0 4,412.2 39.8
500.0 480.7 19.3
~--------~~-----------~4_ •• '_s~o---$-2-1,_10_2_.o_. __ $_18_,6_6_7~.2---_:12,434.s Balance of DC Funds Available for Use: '• DC Portion includes $447,-589 in uncommitted funds
50 of !i9

Washington Metropolitan Area Transit Authority Transit Infrastructure Investment Fund (TIIF)
Fiscal Year 2012 - December 2011 Dollars in Thousands
Ms0tland 37% Use of FUIJOJ>,~
New Carrollton Parking College Park Parking Largo Parking Largo Day Care Center Takoma-Langley
---~funds
Received
Balance of ~aryhmd Funds Available for Use:
Virginia 27% .U~_of FtLnds~
Huntington West Falls Church Royal Street Bus Garage Ballston (Multi-modal improvements) Rosslyn Station Access Improve Shirlington Crystal City Potomac Yard Bus Way Potomac Yard Station
Balance of Virginia Funds Available for Use:
~--·
Grand Total : i143(175.S
luriSdictional Approved AHocation Uses
$22,200.0
$497.6 9,514.7 2,432.7 3,000.0 6/44.3
$22,189.3 _!!.0.7
--··-
$16,200.0
$8,082.8 2,000.0
100.0 1,032.2
798.1 1,978.0
522.0 1 500.0
$16,013.0 ~187.0
~143i:17'5.5 $144.894.4
Expenses
$496.0 9,512.2 2,432.7 3,000.0 11339.5 ..
$16,780.4
$8,082.8 2,000.0
100.0 909.6 691.2
1,978.0 284.2 558.5
$14,604.2
$108,659.5
Unexpended-, Approved Uses
$1.6 2.5 0.0 0.0
5,404.8 $5,408.91
$0.0 0.0 0.0
122.6 106.9
0.0 237.8 941.5
$1,408.8
$36,234-:9
51 of

JURISDICTIONAL BAlANCES ON ACCOUNT AS OF SECOND QUARTER FISCAL YEAR 2012 - DECEMBER 31, 2011
($ Refund to Jurisdictions) / $ Due from Jurisdictions
JU~[)ICTION
DC Dept of Transportation DC Dept of Transportation DC DC Dept of Transportation DC Dept of Plbllc Works DC Dept of Public Works Credits to be Applied to 3rd Quarter FY2012 Billing:
Interest Earnings on OP &. PRIIA Contributions OCTO'fN...
Montgomery County Prince George's County credits to be Applied to 3rd Quarter FY2012 Billing:
Interest Earnings on PRllA Contributions MD TOTAL
Alex<Wldria Arington City cl Fakfax Fairfax County Fairfax County Dept. cl Family Semce FalsCtuch Northern VA Transportation Comm. Virginia Department of Rail and Public Transportation Credits to be Applied to 3rd Quarter FY2012 Billing:
Interest Earnings on CIP and PRIIA Contributions VA TOTAL
GRAND TOT AL ... ............ .......... . .............. ..... ........... .
$ In millions
OPERATING
(0.003) 0.169 0.000 0.000 0 .162 0. 150
0.001) $0.498
0.085 (0.155)
0.000 ($0.070)
(0.101) (0.660) (0.Q31) (0.'147)
0.093 (0.000) (0,285)
0.000
0.000 ($1.430)
NOTES
Station enhancements & Navy Yart! improvement. excludes TIFF 7th Street Bridge Joint and Adjacent Escort Services Joint and Adjacent ESJCOrt SefVices
Pending receipt of qierating & capital/CMAQ Perong receipt of operating & capital/CMAQ
Access to Jobs

Washington MetropolitJm Area Transit Authority (lletro) GraJ'lt Activity for the Quarter ending December, 2011
S201 .8 m"ion a waded, ...tiich includes$ 11. 1 mi1i0n f0< Prevenfive Maintenance (PM) Due to cost savio;is on o!tler ARRA projects, Mero wi ll purchase additional Metro Access vans to replace vans that have exceeoed the recormiended IWe span. Sixteen projects have been c:omPeted wl:h a total value cl $69.7 milion
FTA Formula Grants for I Capital Transit Assistance
and Fl•.cl Guldeway f------------------------------~
lnfrattruel\lre Improvement
Oepart.ment of Homeland Serunty Transit Security
GTant
Annual Formula Grants tor Sectlons 5309 and 5307
Passef19er Ral lnve5tment and Improvement Act
(PRllA)
Con~stlon Mitigation & Air Quality (CMAQ)
Federal Earmart(s
Comp•tltlve Programs
Transit Secunty Grant Program (TSGPI
Urban Areas Security Initiative eJ ASI)
To meet heig.hleneO reporting e .p«tatt0ns ·Submitted re"*ed 151 2 reporting of jobs and project progress that is viewable by the public: at www.reoovery.gov.
Anti· Terrorism Teams conducted Targeted Train and Bus ~spections. critical onfra,tructure inspections .. area saturation patrocs. anti SeCLlity lnspectiOtl Points.
Metro FY20t I • FF Y2010 Sedioo 5307 !1'anl for $139 .4 milliOn was awarded. • FFY2010 Sectoon 5309gantforS101 3 milion was awarded
Metro FY2012 • FFY201 t Sectbn 5307 grant for S 128 6 rmlion was SlJbmitted and awarded
• FFY20tt Section 5309 grantappijcatioo for $101.2 milion wassuetnitted and~ certification has bttn recei-ed from the Oepaitment of labor
·From the FFY2010 $150.0 mlJOn PRllA grant FTA has disbursed$125.0 million to remburse Metro for payment$ fO< the rat car proc~ement milestone and ottler projects in Metro's FY2011 CIP • Metro submittec a draft appfication for $149. 7 milion of FFY201t PRllA funds to supl>Ol'I the Metro FY2012 CIP
• FFY2009. FFY2010, FFY2011 CMAO Fund$ for Sus Replacement. Metro continues to use CMAO funds to ctoseoul New flyer oootrac1$ for the purchase of replacement buses. spare parts. trai'>ing aid miscellaneous cost a.5$0CJ3!ed With the contracts • 54 .9 miion in CMAQ Funding was anocaled by the Virginia Department of Rall and Public Transporation for the purchase of replacement buses.
• FFY2010 Largo Ex1ension Approprialion The grant 1s e><PeCted to dose in 2013 wtlen right of way claims have been resotved. 96 percent of the projects have been C:Ol'fllleled.
• FFY2010 Section 5309 State of Good Repair - $2.4 ml!ion grant applieatlon forMetro to develop an A.sset Management Plan was awarded in July 2011. • FFY2011 - Meb'o won 5317 New Fr eedom award in the amoontof S1 O mili oo for Bus Stop Improvements. The grant application is unoer review w lh FTA • FfY2011 Section 5309 State of Good Repair. St .5 milionwas...on tor Metro to conliriu its Asset Management Plan l)(Oject
• FFY2007 - lntelliljl!nce Analyst t.as begun work. Front line ~oyee training contmued. • FFY2008 - Continued site lli$lts for assessrneftt Propo&als fa-CCTV on rai1Cars uncser review. NTP on bus cameras issued.
• FFY2009 - Kll teams in se-vice Solicitations is sued for various securl1y technologies, tlids received. and reviews begun. • FFY2010 - Physical sec1Sity 30% design re-.iewconc!ucted • FFY20i1 - Won $12.7 rril\ion in TSGP fl.OOing and was awarded in September Processes withr. MlPO fa- rte'N positions begyn to permit revise<: detaile<I budget subrTission to OHS for release or funding.
• FFY2008 - l\Aetro Emergerq Respc1'~ Vehicle grant dosed. • FFY2009 - Completed Radio Upgrade pro1eet for Prince George's County Fi nal reirrbursemen!s sit>mitled • FFV2Q10 - Requested additional funding due to c:hanges 11 equipment requrements by
FB 1. Began PIOCllfement of speciafized equipment
53 of59

Kelsa11 YRl2020 - --· -·~
2 Merak NA Co YR12057
3 Me<ak NA Corp. GR12065
4 NFF CQ10015TOG9-RFQ6
5 Cll2Mliil C012075
6 tuminalor C012073
er---·-·-··
Office of Procurement and Materials Sol• Source Awards= I > $100,000
October - Decembw 2011
Vatioua KelsanOEM hems 509.228 32 1111•111
Merak OEM $ 1.237 408.00 10/25/11
Merak OEM s ~88,337.38 11115111
Senior Into Sec ConttAting En mcer $ 312,000.00 10/24/11
Strategic Plan s 450,000.00 1u29n1
Oestino.ltlon Sign Maintenance $ 750 ,000.00 12/0111,
. [
Operating RAIL Mort!• Moses Ol iVI& Reynolds
er!ltin RAIL MotrisMosu Olivia Reynolds
Feder•! RAIL Morri• Mose. OIMa Reynolds
era~n IT MITS Victor lwvgo Celena Cochrane
0 f}et3ling DCPQ Rick Harcum Celena Cocllrane
Operating SUS Rvth Jeffecson Jeanann VVlll$0\'I - - · -·- --··--
54 or 59 ll20120IZ

Finance & Administration Committee
Fiscal Year 2012
Financial Summary and
Monthly Financial Report
December 2011
55 of 59

l~~.11.·_ O_p_erating Budget Repo~·-· · Operatinq Budqet rs in Mil/Ions
MTD
2%
Expense 5 -4%
6 -10%
Cost Recovery
-3%
Subsidy L . 319 . . L ______ _ :u~- _L _ _l.10 J_ 17 ___:TI'o
Cost Recovery 55% 56% 55%
Operatln Pro ram Hfqhllqhts As of December YTD, Metro is favorable lo budget by $17M, or 5%
Year-to-date exoenditures - $20.1 M or 2.7% favoral:Ae to budget
• Salary & wages below budget by $8.6 M due to vacancies and YTt> capitalization
«labor
• Overtime ($14 .1 M) and frllge benefits ($1.8 M) over budget due to vacancies and leave coverage in TIES, RAIL and Bus
• Materials and ~ply expenses ($3.9 M) over budget due to expenses associated with the South East garage dosure, and a lag in capitalization of brake ~d elevator parts
• Service of $15.4 M were favorable due to savings In paratransit expenses, and liming delays in TIES contract utilization and processing awards for BUS
Prq>ulsion/Diesel and Utilities/Insurance/Other were below budget by $8.9 M
and $7.0 M respectively
a eratin Budi et Re ro rammin Status December. No reprogrammfng of operating funds
1%
Year-to-<late: $300,000 was reprogrammed from the Treasury Offlce to Counsel for the purpose of funding outside legal fees f CK Treasay.
Open1ti ng Expenditures{$ In /ff/I/ions) -
$140M .,
! !
r .i < "
UOOM .> ~i
HOM
I' ~
"
HOM Jul
• FY2011 Actuo1I• lllFY2012 Budget • FY2012 Actual
YTD Overtime Variance tii Bud et cumulaf!'v,•. ·in ~ i-11111a11s) •
$(3S)
$(30)
$(25)
$(20)
$(15)
$(10)
$(5)
$-
- fY1011-to MQ.t
56 a 59

[~ I Revenue and Ridership Report December FY2012 ~ _ _J ' · Ridershl tr/, -~ in thousd1uls :
D~t·FY2011 D•t• FYZOU V.1r1ancc I MTD
Metroral Met robus
MetroAccess System Total
Ac tu.1/ A.ctu.tl •utl•rl ,,..,,, ""'" tl.d~d
__ JS,~S§ 16148 16 133 3% ___ q'~o. -
9012 10 367 a 9'19 15% 16% ··--·- ....... ----·· 195 169 195 -13% -13%
L. 24 863 26 684 25.277 ~?~·- · 6%
FY20l1 fY20lZ V1rlanrn YTD
Metrorail
Metro bus
MetroAccess
Syst em Total
Atlu~I Artu» llldqrt "'""Yo.ii Bl!d9f/l
107,709 107,689 1Q2,099 0% -1% ·- ··
---~1.~o ._§.~9 60 773 7% 8%
l,211 1,030 1,247 -15°(0 -17% ---170 360 174,tJ.? . . 171 119 2% 2% ....
• Year to date, Metro is ($35 M) unfavorable to budget in revenue
• Rall passcngN r~res arc (.$6.5 M) below budget. Revenue in December was favaable to
budget due to h igh rid.,,ohip, resulting in an average fare of $2.65 lor the month, $2.61
year-to date.
• Bus passenger revenue Is $4.S M favorable, Oecerrbcr was highly favorable due to
s trong ridershfp. Average fare year t o date is $1.00
• Total other revenue is ( $1 .S M) below budget
'.(~ate Ridersh iD • Raol ridersh ip n Oecember continued to show signs or improvement, exceeding
projection sligh tly by 15,000. Similar to November, passenger trips w ere up durong a ll
weekday travel penods over the prior year; the largest increase cxcurring during the
evening period. Y"fO ridership Is 1.3% below projection.
• Busridership YTO is 5 Mor 8 .2% above budgP.t, and 4.3 Mor 7% above prior year.
Aver age weekday ridership has been stror-c at 441,000 trips per day.
• Both Rall and Sus ridership were strong in December due to favorable weather.
Compared to the prior two years, t he warm temperatu res and no snow encouraged
people to utilize public transit.
• ln addilin n, tht> holidays fe H on the weekends , resulting In only one f cderal holid~y in
December. As a result, there was an increase In commuter trips over t he prior year . ---------·--· -- ... .. ··- -- _ .. , '"' . ~ .,_ -----------
$80M
$7SM
$70M
$65M
t•OM
$55"M ·-$SllM
20
18
16
14
12 I
10
8
· Revenue · . · ~ *-.._ ·-~ • · · ... ~
;; ;
~. l ;.•
: ·~~ ' ~ ~
_ltn.J Jul Aug Sept Oct "°" Dec Jan Feb Mir Ape' May l<ln
• FY2011 Actual llFY2012 Budget • FY2012 Actual
Month/ Rldershl for Rail and Bus in Millions ·
__ ,. .-' I ,,,
.. -----... _,,, , ....... I
I I
·- ----- ·-··-- ··· ·-·- - ·r· .. · -··. - · ..... ~--·- ..,
--Rail Budget -Rall Actuals - Bus Budget -Sus Actuals
57 of 59

l....._1.~_- ,_J___.\_c_a_p_it_a_l _P_r_o_g_ra_m_ R_e_po_rt _ __ o_e_ce_m_be_r _FY_20_1_2 ___ J Sources of Funds ($ In NI/lions) . · . ~ ---<' . .,.. 1
FY2011 CIP >--'-~~-+-~~~-+-....... ~~-+-~~~~+--'-~~-<
FY2012CIP
. , · Obhgalion-lfo~l!d to O~te Sc>utm ol Fund\ •; ' .. · I lftJd~f ,jf/f.Jlfk:J f;"'*1'1vffld ;. ~ /f# "/' •
Safety & Security -· ... _$5.7_ -~ ·-·· -····-· t_5_7 ___ ·- - _ .... l~·-·- .. ~5_7 __ --ARRA · ----~'? ...... ·· -- ·-·--· ... ?i_ ___ 34 22 --·-- .. ··- ·· - ·-·-............ ----
Reimbursable 100 100 26 75
Total $213 $213 $60 $153
Capita/ Program Highlights · As of December 31 .
• The Capital Improvement Pr ogram (CIP) has expended $307 million l n FY2012. This is $5 1 million, or 20 peicent, more than the same period in FY201 1.
• The current f orecast is projecting expenditures of $917 million for the fiscal year . • 94 of the 100 FY2012 replacement buses have been received of which 46 have
been placed into service. •Major repairs were completed on escalators at the Largo Town Center and
Minnesota A ve Metrorail stations. 1
• Rehab!Ntation/modernizalions were completed on escalators at the .Arlington 1
1
·
Cemetery and Metro Center Metrorail stations. • Station rehabilitations were completed al the Greenbelt Metrorail stat ion. • Track rehabilitation work completed YlD indude the toNowing: welde<l 523 open
joints; retrofitted 1,375 In ft of floating slabs; replaced 542 "High Voltage· roadw ay safety signs: rehabiUated 6,696 In ft of grout pads; tamped 26 miles of track: repaired 597 leaks; and replaced 11,307 cross lies. 1.1660 fasteners. 4,729 insulators. 6.5 miles It of running rail, 6,455 direct fixation fasteners. 16 tum outs
.. · · - r .. • ·:Uses of Funds , (S In Ml/lion!;) · · '•.; ~-.· ...... ..,... ·
FY2011 CIP 1--~~~-+--'-~~-+-~~~-+~~--+~~~__,__
FY2012 CIP'--'-'-''--'---'-'---'--'-'-'-"--.,_
Safety & Security
ARRA 98% 62%
Reimbursable 100 BS 41 84% 41%
Total 213 149 76 70% 36%
· . · ·. CJP'Ex. enditures'·'S.lnMlllions · :;.~-·-:..;\. •":~
0601( • $700M
$140 .. S600M
fllO .. ' ! ··- t 1
~ $1- l '400H
.. OM I ::· .!l
! ( ! ~
t f i uoo .. :c
l 6DH I ~
l~ i ~ I t200M s -
~J '
J20H ! $100M
. !· ' . $OM ... . Hi SOM , .. AVV ~ Ott - o.c Jan -- ""' ""' Jun
O FY20Ubp. ""IFYlOll l!l<p. -n2011 c ..... i.ti.,. Exp. -nl012 Clomulotlft EXP.
· -. . Capital Budget Reprogramming Status · · .. -. . _ · , .... · There was no repr!J'am"*1g actioo raken in the Capit!I Ptogram during the month or December
58 of 59
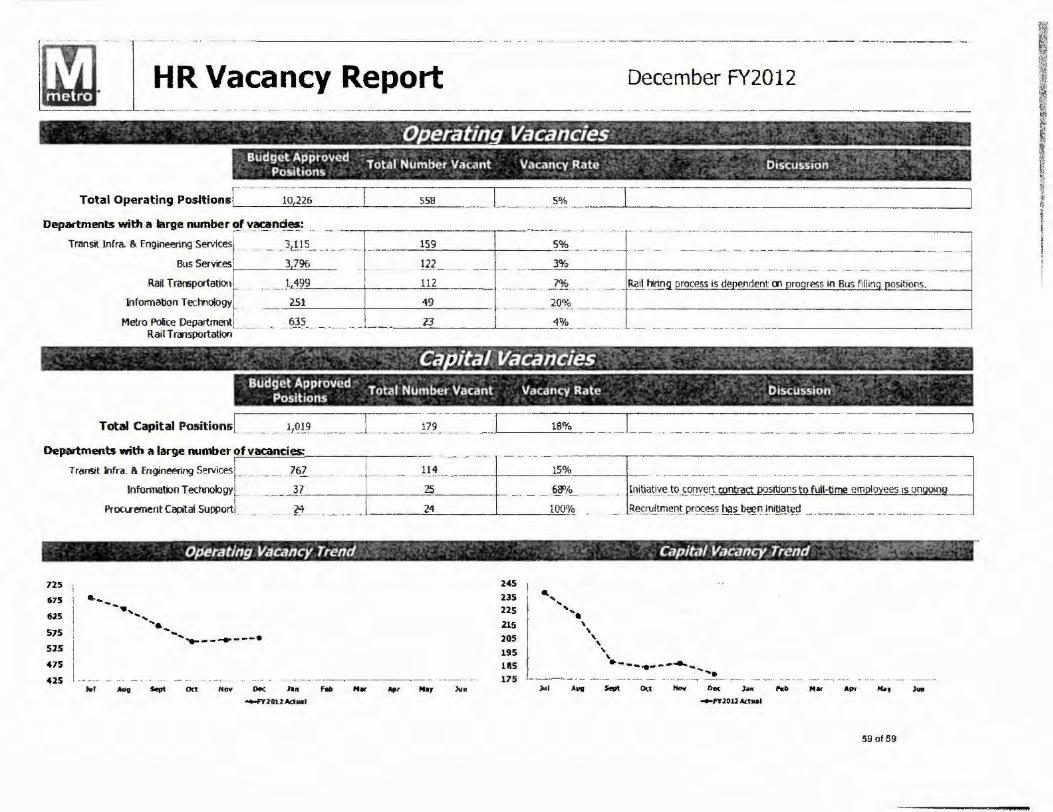
\1.~.J · . ]__~~ ~~c_a_n __ -~-~-----~e-_._P-_o-_rt~-----·- ·-_· ··· _···--_· _ December FY2012 ------------- -···· ·-·-
· , ·operating Vacancies· - " · .... · ·. -' .- .. - ·, :.· .' · · · Budget Approved · ' · · • · .. , -.- J •
P .t . Total Number Vacant Vacancy Rate . Discussion • : • · · · · · ' os1 i ons .. . . . ·
To~IOpe~tingPoslt~ns[~_· _·_·_-_-_-_;~,2_2_6 ___ ~ ____ s_s_a ___ ~_ [ __ =~-~-~=-------~---------------------------~ Departments with a large number '!J v~n~~: .. __ ---.----------..------- _ -· •
Transit Inrra. & fngineering Set'Vicesj __ 3._!) S _ -· __ ---1-··----- 1_5_9 ________ ~~ ·-- ·--- ··- ···'"·-----------------.
- ·-···- - -· -·· -- --·------------ ·-- - -
Bus Services' 3796 .!7-L _ --· -·· --~------1-------·--·· ..... . __ . Rail Trart>portation ... __ )._1.9,.=9----+-----=-l=-=12.__ ____ 1 ... _ ·- .J."A. . . _ _ ~ail ~~9. rJ!:Qfess is dep!'ndent en progress 1n Bus filhn ositions.
lnfomation Tecmology 251 I 49 20%
Metro Polee Department . . . _-__ -=-~)"".?'--__ -_ --.-_-__ -_+l_----~~~~~2-"-3'-----_-_~_-_-_-_.__ _ _ ----'~r;~ =--~:.~.~ : __ ... _ ·- ·- ··- - - ~·- -·--Rail Transportation -----------
: · · ... · · .· ca -itarvacancies ··· · · · :- ...... ·· -·.-::~-." · · --: .. ~ · · Budget Approved .. . ,
P 't ' Total Number Vacant Vacancy Rate D1scuss1on 0 51 100 5
Total Capital PositionsL-.:" _ 11~.~9. __ j . . _ :--·E,?~ ------~~,_[_-_--_· __ 1_so_v._ J __ __I Departments with a large numbeto """-fv""'aca=·=-=nc=- =i~=·----.----
Transit Infra. & fn""neemVl Servicest ·· __ ..... ·-·· _7 __ 6_7 I 114 - - -• +~ ---·-1~0~
725
575
&25
575
525
475
42$
~,,:=.~:,::,::r ----~ I -:m ----±----,:; !ni_ti_~~ye_~O.fO[l.Y~l1 contract positions to full-time employees 1s on oi
[le£Mlm.~n~ pr~~-~ ~~J>~n lni!J.~t~~ _ -···--- ·-· _ •. _ ... __ _ ·- __ -··
Opt!rating Vacancy Trend · · . Capital Vacancy Tre11d . "t-·_.~:·r· r-- · ·
Jun
245
235
225
215 205
195 185 175
-.... .. ..... _
' ' ' ' ' \ ·---.. ---....... L.·-·-·- ·- ··-· --···- - ··---- - -··· · -· ··~'::! __ ··-
,.,, All!I $CWI( 0<t """ Dec J oo
-1'1'201l""""'
l•
59 of 59

WashJn9ton Meb'OPoltan Area
Transit Authority
M E M 0 R
SUBJECT: January Monthly Financial Repo
FROM: DGMNCFO - Carol Dillon . al
TO: GM/CEO~ Richard Sarle
A N
D TE _ •I I • 14, 201 2
I am enclosing for your review the Ja ry 2012 financial report, wh ich is being published 11 working days from the prior month close. The improved timeliness is a direct result of the Financial Peoplesoft upgrade and system integration project (IFO). Our ultimate goal is to prepare the analysis and publish a report eight working days after the close, which we anticipate achieving by June. As a comparison, prior monthly reports had a cycle time of 21 days after the month close. Other financial work underway includes development of a new forecast for the end of the year. It will be provided in the March report.
Through the end of January. Metro's operating budget had a positive net position of $18 million as a result of a $3.0 million negative variance on revenues offs.et by a $21 million positive expenditure variance. Totaf ridership through the end of January was 5.3 million higher than budget, or three percent, and 6 million higher than the same period last year.
Year-to-date, ridership was lower than budget on Metrorail by less than one percent or one million riders. January rail ridership showed improvement exceeding budget by three percent or 323 ,000 riders. Metrobus ridership continues to exceed budget for the twelfth consecutive month. Metrobus ridership year to date of 76.4 million was eight percent higher than the same period last year and nine percent higher than budget for the first five months of FY2012. Metro continues to monitor the impact of the Smartbenefits reduction frcm $2 30 to $125 a month and will report its effect on ridership and/or revenue. if any.
MetroAccess transported fewer passengers than during the same period last year and fewer than forecast for this year, 14 and 17 percent respectively with total passengers of 1.2 million. The dedine is attributed to the successful implementat ion of demand management initiatives. Operating expense savings are occurring in conjunction with the lower passenger ridership.
Year-to-date operating reven ues of $458 million were one percent or $3.1 million below forecast due to lower than forecasted Metr orail passenger revenues. For the year. Metrorail revenues were $6.5 million lower lhan forecast however, in January Metrorail revenue came in modestly ($31 thousand) above forecast. Metrobus continues to exceed forecast by $5.9 million and MetroAccess generated $872,000 more in revenues than forecasted. Non-passenger revenue
M
was off by $2 million year~to~date mostly due to advertising revenue. This is attributable to the structure of the CBS advertising contract, which calls for a portion of the revenue to be reconciled end of the fiscal year. Accordingly, we anticipate that advertising revenue to budget
Operating expenditures through the end of January were $21 million or two-anda-half percent under budget Overruns in overtime and fringe benefit costs, were offset by under runs in non-personnel expenses, particularly services (including paratransit and other contracted services) propulsion power, and electricity.
The capital program year-to-date expenditures are $327 million with $764 million in obligations. This represents a $38 million increase in expenditures as compared to the same period last year and an obligation rate of 83% of available budget
Project Milestones include:
~ Major bus purchases have been completed in FY 2012 with acceptance of 95 of the 115 replacement buses planned delivery FY 2012. Of those buses, 75 have been placed into service. Major repairs were completed on escalators at Addison RoadSeat Pleasant, Columbia Heights, Eastern Market, GrosvenorStrathmore, Federal Triangle, Metro Center, and Stadium-Armory Metrorail stations.
• Rehabilitation/modernizations were completed on escalators at the Dupont Circle (2), Judiciary Square, and Metro Center Metrorail stations.
Attachment
2
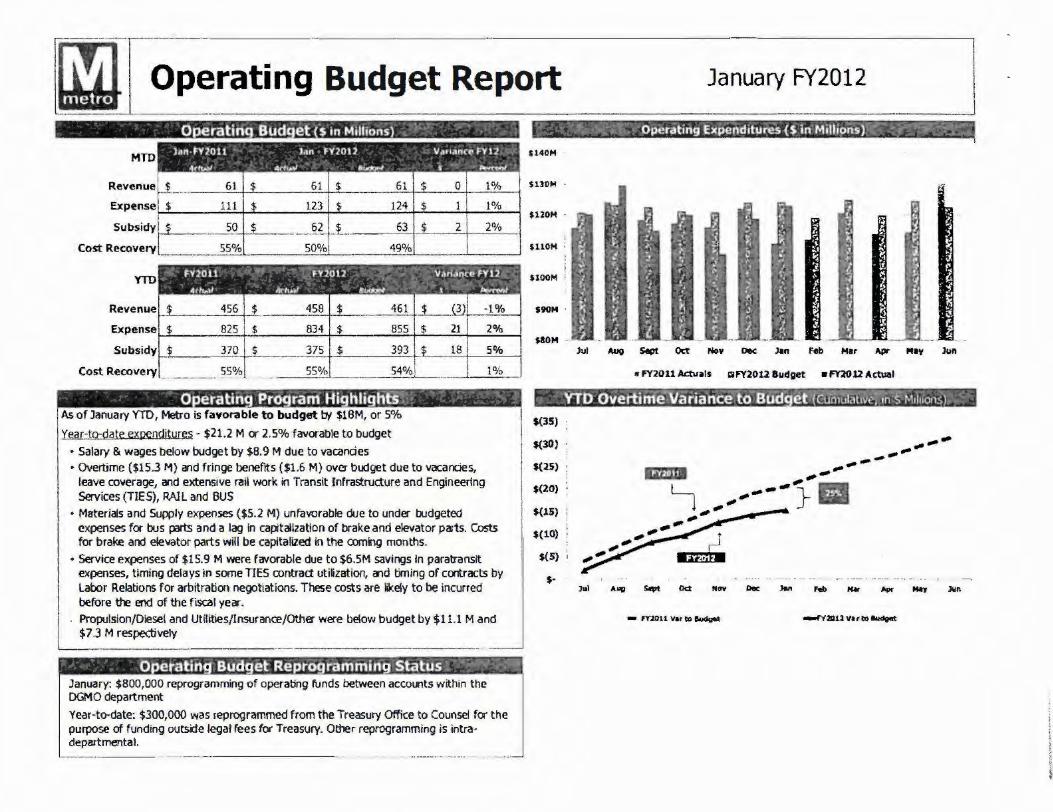
~] r~;~rating Budget Report Operating Bud et 's In Millions) . ' .: ·
MTD
Revenue
YTD
· 1%
Expensei-i~~~..=c=-+..;i;._--_,;;8~3~4+"$:....__~-=-"-+-_,_-~~;:;..+-~2°~~;...._,;
Subsidyf--T·---=..c..:-+-,__ __ ...c:3:..;.7~5+-'$'----...;;.;,..'-+-"--·--'l""8-+---=-5-'-'%=-------t
-·--~% - ·--- s4%L . ____ _, __ 1_'¥._o_ ,
0 eratin Pro ram Hi hlights! · · 1
A.s of January YTD, Metro is favorable to budget l:1f $18M, or 5%
Yfill!.:.t;Q:@le expenditures - $21.2 M or 2.5% favorable to budget
• Salary & wages below budget by $8. 9 M due to vacancies • Overtime ($15.3 M) and fringe benefits ($1.6 M) over budget due to vacancies,
leave coverage, and extensive rail work in Transit Infrastructure and Engineering Services (TIES), RAIL and BUS
• Materials and Supply expenses ($5.2 M) unfavorable due to under budgeted expenses for bus parts and a lag in capitalization of brake and elevator paits. Costs for brake and elevator parts will be capitaliZed in the coming months.
• Service expenses of $15.9 M were favorable due to $6.SM savings In paratransit expenses, timing delays in some TIES contract utilization, and timing of contracts by Labor Relations for arbitration negotiations. These costs are ikely to be incurred before the end of the fiscal ye;r. Propulsion/Diesel and Utilities/Insurance/Other were below budget by $11.1 M and $7.3 M respectively
. 0 etating Bud et Repr·o ramming Status : '~r.-.· .. :-.~ January: $800,000 reprogramming of operating funds between accounts within the DGMO department
Year-to-date: $300,000 was reprogrammed from the Treasury Office to Counsel for the purpose of funding outside legal fees for Treasury. Other reprogramming is intradepartmental.
..... - ---· ----------
$1.40M
$130M
$110M ·
UlOM ·
$100M
$90M ·
$&OM · ·
${35)
$(30) ..
$(25)
$(20}
${15)
$(10)
$(5} '
$·
January FY2012
"FY2011 Actuals lllfY20U Budget •FY2012 Actual
Jul Jun
_..,21111 VI t to 1ktd9«t

\l.~.I jR.e~~nue -~nd Ridership Rep_o_rt ___ Ja_n~_arv_:V __ 2.~_1_2 _ H _ _ _ _ J MTD ' ..
Metrorail ·--J2i~_§7 16187 3% ~1 --~512t 10,603 9,018 14% 18% l Metrobus ~~9~,3~0~2-+-~~-'--~+--~~'----+~~~~+--~~------;
169 191 -7% -11%
27 284 25 395 7% 7% Metr0Access1--~~--'1~a~2~~~~~~-+-~~~~-1-~-'-'----~~...;;..;.-'-'----<
System To alL...-_---"25'-'---4 5-"2'--'----"---L""-"--'---"'-="-'-'-'------'---'----''----l FY2011 FY2012 . .... -: - •;·' Vorl.lnce ...... ' ·
llriOt ""' '~ ' ~ " YTO
Metrorail Metro bus
MetroAccess System Total
... ~wl .
- 123,676
,___?Q/42 1 393
. . 195,811
,.clwl
124 200
, ___ 76,416
1198
·--~J,~14
~
125 286 0% -1% ·------~f790 8% 9%
11138 ·14% -17%
- --· 196,514 ! 3% 3%
- · ' .. -, Revenue ·and RidersHi ·Hr htr tits~;'f.;,~~·· :'"..?:: ..... ·'
I Ye 1~:~~eB=~~~ule Ml b~=-~::et, an i:provement of $0.4 M due to favorable
revenue in bus passenger fares
• While Rail passenger fares are ($6.5 M) below budget YlD, January was above budget tJ, $31,000, which is the second month in a row of favorable performance.
•Bus passengerrevemie YTO is S5.9M favorable as reflected in the strong ridership
numbers • MetroAccess is SSn.OOO above budget, while parking revenue is $1.3 M below budget
• Other revenue is ($2 M) below to budget, mostly due to advertising revenue that wiR be
received at the end of the fiscal year .
Year-to.date R!dushin
• Rail ridership in January showed a third month of continued improvement, exceeding
projection by 323,000 trips. The largest increases passenger trips were during the AM
peak and evening periods compared to the prior year. The midday period had a slight
decrease. YTO'• ri dership L~ 0.9% below projettioo.
• 8us ridership YID is 6.6 M °' 9.S% above budget, and 5. 7 M or 8% above prior year. Average wP.ekday ridership has been strong at 437 ,000 trips per day.
• Both Rail and Bus ridership were strong in January due to continued favorable weather.
Janua"' this year had only 7 days of temper atures below 40'1', compared to January 2011 that had 20 days below40'F, and 14 days of temperatures above SO'f. The warm
temperatures encouraged people to utilize public transit. .__ _______ ,,_, __ -·- ... - - --·
$IOM
$7SM
$10M
$6SM
$60M
$SSM
20
18
16
14
12
10
8
ill ~
Jul Aug Sept Oct ,..,-, Dec Jan filb Mar A.Pl' May Jun
" Jul
...
• FY2011 Actual L1 FY2012 Budget • FY2012 Actual
------.. ..,. ....
,,.. - ... - ... ... ... .... ,. ,_ -Aug ~ Oct Nov Dec Jan
I , ..~
,. ff'
,,.
... ,11----..--.,' , I
,,~ ... ..... ... ... ....
Mar At" ~y Jun
-·Rail Budget -Rail Actual - &us Budget -aus Actual

r-- - ---,---· .. -··- -------·---· .. -------------------
l~ I Capital Program Report January FY2012
_. · Sources of Funds ($In Millions) .. · ,
~: ~ ~~.O'?'icJ;it)ori:ll:-!":d 1.0· Ollt~ u""'~ of. F'unds ~ :-~;.,~ ~ '• a"°9<'f · ··''-· "otJJ-.;;~ - ,. ' ' 1..,,,,.,.,., °"' _.,, · · h~ ""'~11:
· Capital Program Highlights.-.; :<~.-•• -. - "·- -;
As of January 31 •,
• The Captal Improvement Program (ClP) has expended $327 minion in FY2012. Ttls is $38 million, or 13 percent, more than the same period in FY2011.
• 95of the 115 FY2012 replacement ruses have been rec.eivedof which 75 have been placed Into seNiCe. Delivery of an additional 51 30-foot BRT Buses WIB commenre in Marctl. ln addition, all 52 of the FY2011 replacements buses have been recetved as well.
• MajOr repairs W8'e completed on escalators at the Addson Road-Seat Pleasant, Cofurntla Helgits, Eastern Market, Grosvenor-Strathmore, Federal Triangle, Metro Center, and Stadium-Armory Metrorail stations.
• Rehablltation/modemizations were completed on escalators at the Dupont Cirde (2), Judiciary Square, ard Metro Center Metrorall stations.
• Station rehabllitallons were completed at the Grosvenor-Strathrrore MetrCX'ail station.
Safety & Security
ARRA Reimbursable
Total
$'60M
$140H
$UOM
·~ :
'°" .
~ $57 l $10 $2 17%
56 I 55 36 98%
100 I 85 45 84%
l~EQ __ _J __ _j149 !t82 IO%
• Track rehabilitation work completed YTD include the folowiog: welded 626 open joints; retrofitted 1,375 In ft of floating slabs; replaced 1,020 "High Vdtage" roadway safety Signs; r&labilitated 6,904 n ft of grout pads; tamped 26 miles of track; repaired t,028 leaks; and replaced 12,061 cross ties, 5,903 fasteners, S,422 insulators, 7.6 miles rt of runnng rail, 13,162 drrect fixatbn fasteners, 20 >iii O<t - Dec .JM f<lb Hw ~ l<•Y t un
_ .... tun~ts -- ·-· .. - ·---... -...... ·- ·-- _ --.. ·--... -.... ,, .. -.-· .... _ __]
~Oll f.i>. ~2011 CUlnulotM h p. -r20J2 Cwlllu!MMI Exp.
Approved In January: EE.QM.: CIPO 13 l : Credit Facility CIP0086: Shephefd Par1'.way 81.6 Fadity
($1.907)
__(f:~..91 ($4.747)
IQ.: CIP0097: Open Bankcard &. Automatic Fare Collections Systems CIP0132: Elevator/Escalator Repakables GP0074: Installation of Parking Lot Credit Card Readers
$0.490 1.917 23 40 S<l.747
3%
64%
45%
39%
I $SOOM
I $100H
j tSOOH
: $300M
: $100M
' U OOH I
.. I $OM

----·-- ···-------·T-----·--------· -- · ·--.. - ···--·
~ . HR Vacancy Report ·· ··-··--·-----
January FY2012 - ··-·---··· ·····-·----- - ----··--··-··--·--···-- - - ----
Budgpet IAt~proved Total .Number Vacant Vacanq Rate' · . ~-· -. ·. . · Oi~us's10~ :: ' .. os ions · . · · .
Total Operating Positionsl ___ ~o,2.~so~ __ :[:~=.-..:·~---~~----L ___ . __ s_01_0 ____ [_~--.. =~------------- - ·------Departments with a large number lo_f.~~_C?ncie~:_ _____ [ .... . _ ... _ .__ -,--
1._ .. _____ .. _
Transit Infra. & Engineering Services ---··· _ }1..HQ ____ _____ 143 . =±····-.. ·-----· .?.0:..:Yn___ - - - --·· ···-- ······-·---
Bus Services . · - ·----~1_1l_QL ..• -~ ____ ....ll.L. __________ l'Y.L~~~_,l,__ ------~--~- -- ·····--·---·- ·--··- ·----Rail Transportationt-__ _b1.\1~-- __ .!J] ____ ..... 1= 8% !Rail hirif!9J:irocess is dependent on progr~_ss in Bus ft.ll!D_g_positions.
lnforrnat1on Ted1no!ogyl ____ _1?.L_ . . __ L_____ so__ . .JQ.% -·- -·-L-------·--·.. . ··----···-- -- -- ---·-···-·----·-Metro Police Departrnentl ---· ---~-----J- 27 . ______ 4% _L ··- -- ··----- ·---------'
Total Capital Positions[:.~~--- . __ !,.?:QL----L=~=---~-2~; --- - -·,
---·- - _______ _[ Departments with a large number ot v~~~Je~ _____ _ _ _____ _
Transit Infra. & Engineering Services~---··-94~------~1_77 .±. -l~~o
725
675
625
575
525
475
42S
.. _
Jul
lnfo1mation Ts:hn009Y1----. __ ;J]._____ __ 23 _ __ 62%
Procurement Cap'1ta SupportL_ _ _ _ .1.1_._________ --··· )~- ··-- _ 100%
...... .... ..... ..... , ....
' ............. ---·----.
255 l45 235 225 215 205 195 185 175
•... ! .. .. , ,' ' I
' ' \ I
', I
·---.... --...... - 1' --. 1•1 - ....
•GM authoriZed 86 additional TlES headcount associated with ramp up of capita! program Recruting wll begin immediately with goal or nmng positions by July l, 2012.

January-12 FISCAL YEAR 2012
Dollars in M!llic•ns MONTHLY RESULTS: YEAR·TO..DAT£ RESULTS~
Prior Year I Current Year Prior Year I CurrentYur Actual Actual Budget Variance Actual Actual Budget Variance
REVENUES: Passenger Revenue
$42.0 $42.7 $0.0 QO/o Metrora!I $330.2 -2% 105 10.5 9.1 1.4 15% Metro bus 76.4 76.1 70.3 5.9 8% 0.3 0.6 0.5 0.2 34% Metro Access 2.4 4.5 3.7 0.9 24% 3.3 3.6 4.1 (0.5) -11%
$56.0 $57.5 $56.3 $1.1 2% subtotal
Non-Passenger Revenue $0.7 $0.6 $0.7 ($0.1) ·11% D.C. Schools $3.6 7°/o
LS l.1 1.2 (0.1) -11% 7.5 6.7 9.0 -26°/o 0.7 0.4 0.5 (0.1) -28% 3.5 3.6 3.8 (0.2) ·4% 1.3 Ll 1.2 (0.1) -9% 8.3 8.3 8.7 ·4% 0.4 0 i: .::> 0.6 (0.2) ·25% 4.7 5.1 4.3 0.8 19% 0.0 0.0 0.0 (0.0) ·861Vo Interest 0.2 0.0 0.3 ·930/t.i
0.0 0.0 0.0 SE Closure 0.0 0.0 0.0 0.0 0.0 SCR
subtotal
TOTAL REVENUE
EXPENSES: $49.0 $54.2 $0.4 1%) Salary/Wages $373.0 21Yo
$6.0 $4.9 ($1.1) ·24°/o Overtime ($15.3) ·45% 26 .0 27.2 2'7.4 0.2 1% Bene fl ts 176.2 181.9 180.3 ·1% 15.4 15.8 16.3 0.5 3% Services 104.7 102.0 117.9 15.9 14%
4.3 5.8 4.4 ·30% 4L5 35.5 30.3 -17% 4.4 7.0 9.2 2.2 24% 47.8 52.2 63.3 11.1 18% 3.2 3.9 4.3 0.4 9% Utilities 19.7 19.7 27.1 7.4 27% 3.1 3.0 2.9 (0.1) -5% Insurance/Other 24.2 20.3 20.2 (O.l) -1%
$111.0 $122.8 $123.9 $1.1 1% TOT AL EXPENSE $825.3 $833.6 $854.7 $21.2 2%
fS0.3 ffi1.8 f63.3 f1.5 2% SUBSIDY Favorable./( Unfavorable)
550/o 500/o 490/o COST RECOVERY RA TIO 55% 55% 540/o
WashilDtOO Metropotian Area
Transil AuthorilV
M E M 0 R A N D u M
SUBJECT: Fare Policy Issues
FROM: DGMA/CFO-Carol Dillon
TO: GM/CEO - Richard Sarle
As a follow up to the Finance and Admin istration Committee's discussions on fare concepts, I am providing further information for the Board's consideration to provide greater context on the capabilities and limitations of the existing fare collection system, as well as to identify additions to the docket that were not specifically addressed but have a dependency on other fare constructs.
Metro's fare system is based on a proprietary operating system (Nextfare), which is used to manage fare products, calculate fares and provide data on revenue and ridership. This system has the capacity to process fare products as designed to reflect Metro's current fare structure:
o Time and distance fare calculation using tap in and tap out, pay at exit • Daily, Weekly and Monthly pass products; including DC Student,
employee, regional bus pass • Transfers between bus and rail, and regional operators bus systems • Specialty products including the virtual tunnel, or rail to rail t ransfers; and • Autoload functions
All of the above are developed and designed for a card-based system, meaning that all of the information is stored on a SmarTrip® card.
Under the current contract with Cubic, WMA TA pays for the license of the base software system, in addition to any customized functionality to the system; e.g., SmartBenefits to manage Federal transit benefits.
To the extent that fare products and pricing can be developed with in the parameters of the existing system, the proposed fare products can be implemented through a fare configuration process that WMATA controls. The fare changes outlined in the General Manager's proposed docket can be achieved by
·wMATA through the fare configu ration approach.
Introducing fare concepts that are outside the capabilities of Nextfare necessitates software changes to the system, driving implementation costs and increasing time to market. Further, significant regression testing is required on WMATA's system, as well as systems of regional operators, to ensure reliability and performance. Therefore, introducing a new fare concept at this time would not be achievable by the start of the new fiscal year.
As the Board considers the concept of introducing customized monthly passes that reflect a regular commuter path and are designed and priced to promote trips within that route, this functionality is not within the construct of our current system. It would have to be developed and analyzed from a market perspective, quantified with respect to customer demand and priced effectively. In addition, a software change would have to reflect that design and capability. To some extent this would create many combinations that may complicate the system, but it could create simplification, if the goal was to move most of our riders to this construct. In summary, there are many things to think about before we move in that direction.
In the future with the introduction of the New Electronic Payment Program (NEPP), the monthly pass would become a workable option. Instead of today's card-based system using fare product applications on the card to drive transactions as the card is tapped to the reader, the new system will rely on a centralized fare engine -- a single cash register, if you will -- to calculate fare products and pricing.
The NEPP's fare payment architecture mimics the transactions processing of bigbox retailers where the readers at the check-out lanes get their product pricing from a central pricing engine. This architecture will greatly simplify our fare payments system and provide far greater flexibility in designing fare products in the future. Based on our current schedule to award this summer, we plan to conduct proofs of concept in early 2013 and pilot programs in mid-2013. We expect to provide a procurement update to the Board in March 2012.
And finally, I wanted to bring your attention to a change that will be added to the docket that was not specifically discussed, but has an impact to our 7-day rail pass.
We recommend that the 7-day pass be placed on the docket at a price of $57.50. This equates to 10 trips at maximum fare and would properly reflect potential increase for maximum fare at $5. 75.
-2-

~
Washington MelroPOlltan Area
Transit Aulhorllr
I
M E M 0 R
SUBJECT: Capital Reprogramming
FROM: DGMA/CFO- Carol Dillon Kissal
TO: GMGR/CEO - Richard Sarles
A N D u M
This past June, the Board of Directors granted the General Manager and Chief Executive Officer (GM/CEO) the authority to reprogram up to five percent of the Cap~al Improvement Program (CIP) budget in any given year. The approved FY2012 CIP budget is $888.9 million, which results in GM/CEO reprogramming authority of $44.445 million. To date, $30.045 million of that authority has been reprogrammed leaving a balance of $14.4 million of available reprogramming authority.
Keeping with Metro's expenditure-based capital budgeting philosophy, this reprogramming request is a result of actively managing project budgets to ensure Metro maximizes the use of available resources. All of the funds being reprogrammed will be spent in FY12. This reprogramming request, summarized below, would use $4. 747 million of the available authority leaving a balance of $9.653 million.
Funds Being Reprogrammed From: Two projects have identified $4.747 million in FY12 funds that are available for reprogramming. Both of these projects are reducing their overall project budgets and will not require these funds in future years.
CIP0131 Credit Facility Change in FY12 Budget: -$1.907 million The credit facility is setup to fund available lines of credit to finance capital cash flow needs. The credit lines have been reduced which has resulted in lower fees for the year. These funds are available to be reprogrammed and will not be required in future years.
CIP086 Shepherd Parkway Bus Facility Change in FY12 Budget: - $2.84 million Due to economic conditions WMATA was able to enter into a contract for the construction of the Shepherd Parkway Bus Facility that was substantially below the project estimate and approved budget. As~esult , the FY 12 and overall project budget is being reduced. The funds being reprogrammed will not be needed in future years.

Funds Being Reprogrammed To: Three projects have requested to have the $4.747 million of available funds reprogrammed to thei r FY12 budgets. All three of these reprogramming requests represent projects that will be increasing their overall project budgets.
CIP0074 Installation of Parking !,.ot Credit Card Readers/Parking Automation Change in FY12 Budget: $2.34 million Due to higher material costs and a series of requirements that were not anticipated in the project budget, additional funds are being requested for this project. The revised ROI for this project is 42 months, a little over one year longer than the original ROI of 28 months. The full implementation of this project will benefit WMATA by reducing operating costs by $3.1 million annually. Without the reprogramming of additional funds, WMATA will only recognize $1 .5 million of these savings. The budget savings are anticipated to begin being recognized in the 2013 budget. It should be noted, beyond the $2.34 million of FY12 funds being requested, an additio(1al $1 .16 million is required in FY13. Those funds will be included in the FY13 Annual Work Plan if this requestjf approved.
is
CIP0097 New Electronic Payments Program Change in FY12 Budget $0.49 million The additional funds being requested are to cover costs forfinancial advisors and outside legal counsel to negotiate the financial terms of the contract, finalize transactional documents. These funds will also allow WMATA to hire two additional project employees who will coordinate design deliverables, manage deployment of a pilot program, and reduce our reliance on consultant staff.
Cl PO 132 Elevator/Escalator Repairables Change in FY12 Budget: $1.917 Escalator steps are deteriorating at a quicker rate than anticipated and the existing inventory cannot be rehabilitated indefinitely. Thus, the inventory of replacement steps has been substantially depleted. Additional resources are being requested to fund the purchase of escalator steps to replenish the inventory that was not identified in the approved FY12 budget. This request represents an i ncrease in scope for FY2012. It should be noted, this program will also require additional funds in subsequent years, approximately $2 million annually. The increase in the out years is related to an improved preventive maintenance program for escalators that focuses on reliability and reoogn izes that additional rehab ilitation activities will need to be performed. These improvements will move WMATA toward a targeted component replacement schedule and away from the run-until-fail approach.
Wasllil9IOll Mdl'ODOlbll Ara
TraASll AulllOri1J
M E M 0 ft A
SUBJECT: February Monthly Financia l Repor
FROM: DGMA/CFO - C
TO: GM/CEO - Richar
I am enclosing for your review published 10 business days fro
N D u M
10 days is our most timely pe nee to date. We continue to improve our internal processes and are making progress toward our working goal of eight business days.
Through the end of February, Metro's operating budget had a positive net position of $20. 7 million as a result of a $3. 7 million negative variance on revenues offset by a $24.4 million positive expenditure variance. Total ridership through the end of February was 5.6 million higher than budget, or three percent, and 7.6 million higher (three percent) than the same period last year.
February rail ridership was two percent below budget or 316,000 trips. Rail trips in February surpassed last year's total due to the leap-year. When removing this factor, ridership was actually .6% lower than the prior year. It is worth noting that February was the first month passengers would have seen the impacts of the reduction in their SmartBenefits. We are not prepared at this time to attribute the decline in ridership to this policy change. However. we will continue to monitor this issue in the coming months and will report back to you if this trend continues.
Metrobus ridership continues to exceed budget for the 13th consecutive month. Metrobus ridership year-to-date of 87.2 million was eight percent higher (6. 7 million riders) than the same period last year and nine percent (7.3 million riders) higher than budget for the first eight months of FY2012. Year-to-date. ridersh ip was lower than budget on Metrorail by one percent or 1.4 million riders.
MetroAccess transported 1.37 million passengers this year as compared to 1. 58 million passengers in the same period last year. That represents a 13 percent reduction from last year and is 16 percent lower than forecasted. The decline is attributed to the successful implementation of demand management initiatives. Operating expense savings are occurring in conjunction with the lower passenger ridership.
Year-to-date operating revenues of $521 million were less than one percent or $3.7 million below forecast due primarily to lower than forecasted Metrorai l passenger revenues. For the year. Metrorail revenues were $7 million lower than forecast. However, most of that shortfall has been offset by Metrobus revenue

that continued to exceed forecast and is now $6.3 million (eight percent) favorable to budget for the year. Non-passenger revenue was $2.4 million (seven percent) less than forecasted year-to-date mostly due to advertising revenue. This is attributable to the structure of the CBS advertising contract. which calls for a portion of the revenue to be reconciled at the end of the fiscal year. Accordingly, we anticipate that advertising revenue will be favorable to the budget by year end.
Operating expenditures through the end of February were $24.4 million or twoand-a-half percent under budget. Overruns in overtime and fringe benefit costs, were offset by under-runs in non-personnel expenses, particularly services (including paratransit and other contracted services) propulsion power. and electricity/utilities.
The capital program year-to-date expenditures are $381 million or 47 percent of the most recent $805 million forecast. $781 million or 97% of the most recent forecast has been obligated. When compared to the same period last year, expenditures are $61 million above where they were a year ago. Due to accelerated performance on phase rehabilitation of the Red Line, I anticipate advancing funds this quarter to support that investment. A reprogramming authorization may be requested from the board in April.
Capital Project Milestones include:
• Continued Red Line rehabilitation between Dupont Circle and Silver Spring stations. Started work to replace escalator at south entrance of Dupont Station and rehabilitate escalators at Metro Center;
• Major repairs were completed on escalators at Capitol South, Medical Center, Van Ness-UDC. and Mt. Vernon Square/7th Street-Convention Center Stations;
• Rehabilitation/modernizations were completed on escalators at Federal Center SW and Wheaton Stations;
• Station rehabilitation completed at Eastern Market, Navy Yard, ShawHoward Univ., and Waterfront-SEU Stations; and
• 136 of the 221 planned paratransit vans have entered production and 37 have been delivered.
I am also pleased to inform you that the Federal fiscal year FTA 5309 grant has been awarded. However. it is worth noting that despite Metro submitting the grant application in July, after a four month preliminary review by the FTA. the grant was not awarded until early March, eight months later. In recent weeks, my office initiated the process to audit our financial systems. the first step of the
-2
financial statements audit. To that end, we will be providing the board a detailed memo on the status of the process with regard to our converted financial systems.
In the coming months we will be expanding the report to include information on the status of contracts in procurement. grants. draw downs and the agency's cash position.
Attachment
-3-

l~ I Operating Budget Report OperatinQ Budget cs in Millions)
MTD
YTD
Revenue
Operating Program Highli hts As of February YTD, Metro is favorable to budget by $20. 7M, Of 5%
Year-to-date expenditures $24.4 Mor 2.5% favorable to budget
• Salary & wages below budget by $9.2 M due to vacancies
3%
.. ~2.1_ _5%_
•Overtime ($17.3 M) and frnge benefts ($1.5 M) over budget due to vacancies, leave coverage, and extensive r aij work ifl Transit Infrastructure and Engineering Services (TIES), RAIL and BUS
• Materials and Supply expenses ($5.1 M) unfavorable due to under budgeted expenses for bus parts and a lag in capitatization of brake and elevatOf parts. Costs for brake and elevator parts win be capita~zed in the colllng months.
• Service expenses of $17.8 M were favorable due to $7.2M savings in paratransit expenses, timing delays in some TIES contract utilization, and timing of contracts by Labor Relations for ar bitration negotiations. These costs are likely to be incurred before the end of the fiscal year.
• Propulsion/Diesel and Utilities/Insurance/Other were below budget by $12.0 M and $9.6 M respectively
0 eratin Budget Re rogramming Status Year-to-date: $300,000 was reprogrammed from the TreaSllry Office to Counsel for the purpose of funding outside legal fees for Treasury. Other reprogramming is intradepartmental.
$l40H
$l30 M
$120M
$110M
$100M
$90M
$10M
$(35)
$(30)
$(25)
$ (20)
$(15)
$ (10)
$(5 )
$·
February FY2012
Ope~ting Expenditures($ in Millions)
' ,.
FY20l1 Ac:tualS CFY2012 Budget •FY2012 Actual
YTD Overtime Variance to Bud et (Cumulative, ins M1111ons)
- FY2011 V ot IV lludOet ~2012 v,.. to a..cleot
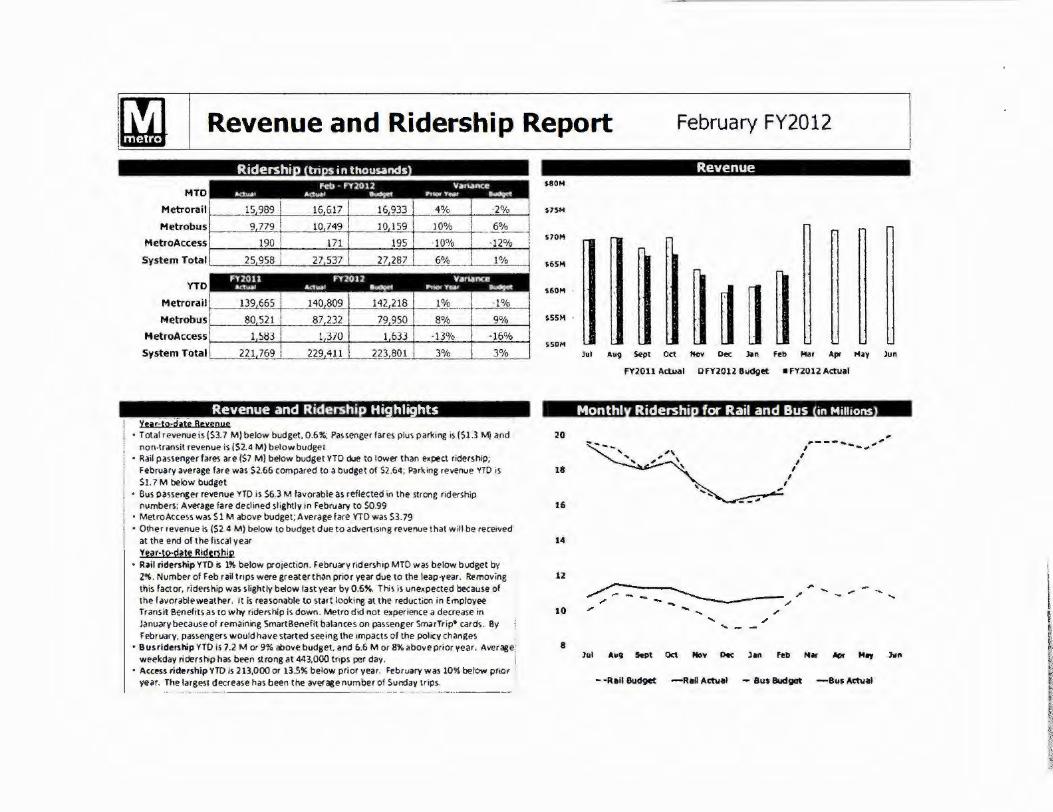
I~ Revenue and Ridership Report February FY2012
MTO
Metrorail
Metrobus
MetroAccess
System Total
YTO
Metrora il
Metrobus
H etroAccess
System Total
Ridershi tn in thousands
kt> . n2012 "" ... ' ........ -t5 989 I 16 617 16 933
9 ;79 I 10 749 10 159
190 ! 171 195
25 958 I 27 537 27 287
FY 20 ll FYlO U ..,...., ..,.,., ......... 139 665 1'10 809 142 218
80 521 87 232 79 950
1 S83 1 370 1 633
221 769 229 411 223 801
V•~ncc Pt\Of ,.., ._
4% ·2%
10% _..§.°!L_ · 10% ·12%
6% 1%
v. r .. nce Pnor Y'Nr
1.'.'!L .. _ · 1% ---~
8% 9%
· 13% -16%
3% 3%
Revenue and Ridership Hi hr hts Ycar~f0=(fil!tt Bcyenye
• Total revenue is ($3.7 M) below budget. 0.6%; PaHenger fares plus parking is ($1J M) and non-transit revenue is ($2.4 M) below budget
• Rail passenger fares are ($7 Ml below budget YTO due to lower than expect ridership; February average fare was $2.66 compared to a budget of $2.64; Pa<Xing revenue YTO is Sl. 7 M below budget
• Bus Passenger revenue YTO is S6.3 M favorable as reflected in the strong ride<Ship numbers: Average fare declined slightly in February to $0.99
• MetroAccess was SIM above budget;Averagefare YTO was S3.79 • Other revenue~ ($2.4 M) below 10 budget due to advertising revenue t hat w ill be received
at the end of the fiscal year Ytar·tO=d!le RldtQhip
• Rail ridership YTO is 1% below projection. February ridersh ip MTC was below budget by 2%. Number of Feb ra~ trips were greater than prior year due 10 the leap-year. Removing this factor, ridership was slightly below last year by 0.6%. Ttus is unexpected because of the f,worableweather. It is reasonable to start loo~ing at the reduction in Employee Trans it Senefits as to why ridership is down. Metro did not e•perience a decrease in January because of remaining SmartBenefit balances on passenger SmarTrip• cards. By February , passengers would have started seeing the impacts o f the POiicy changes
• 8usrldership YTO is 7.2 M or 9% above budget. and 6.6 Mor 8% above prior vear. Average~ weekday riderst'ip has been strong at 443,000 trips per day. i
• AccPSs ri~rship YTD is 213,000 or 13-~% below prior year. February was 10% below prior : year. The largest decrease has been the average number of Sunday trips.
... ·- ···- - ·----------·-···· ·· ··- - .... ··- ···--- - -
$SOM
S7SH
570M
S65M
SSSM
SSOM
20
18
16
14
12
10
8
Revenue
Jul Aug Sept Oct Nov Dec Jan f eb Mar AfJf M•Y Jun
FY2011 Actual OFY2012 Budget • FY2012 Actual
Month! Ridershi for Rail and Bus in Millions
/ - -,..
J ul
- -Reil Budget
,
, ,~--- .... -- .,"' '
I I
I I
I
----~----~~/ / ....
' -Oct llov Dec l •n feb Har /lor M., Ju"
- Bus Budget -eus ActuCll

Capital Program Report February FY2012
Source of Funds $ in Millions
FY2011 CIPi i--~------t-_;..----+---''-'-'---+---"-'-'-'----l~-"-~---1
FY2012 CIP I $1,0'!2
Safety & Security
ARRA
RelmbUl"Sable
Total
I I
....... $57
56
100
_ _ p q
Obllg;itJon-11.u.ed to O.te Sources of Funds . .... ,,,,ed .......... lli_ ---+- _jg_-56 37
100 I 42
$213 I $79
Ca ital Pro ram HI hli hts
To boRK.
$57
19 59
$D 4
I As rJ February 29th,
I •The Capital I mprovement Program (CIP) has expended $381 mttlion in FY2012. , This is $61 mHlion, or 19 percent, more than the same period in FY2011.
I. . The current forecast is projecting expenditures of $805 million for the fiscal year.
1 • Contilued red line rehabilitation between Dupont Circle and Silver Spring stations. Started work to replace escalator at South Entrance of Dupont Statlon, rehabifitate escalator at Metro Center
• 136 or the 221 planned paratransit vans have entered production and 37 have been delivered.
• Station rehabilitation completed at Eastern Market, Navy Yard, Shaw-Howard Univ., and Waterfront-SEU (Mini) Stations
• Major repairs were completed on escalators at Capitol South, Medical Center, Van Ness-UOC, and Mt. Vernon Sq;are/7'1' Street-Convention Center Stations
• Rehabilitation/modernizations were co111>leted on escalators at Federal Center SW and Wheaton Stations
•Track rehabilitation work completed YTO Include the following; welded l,046 open joints; retrofitted 1, 375 In ft of floating slabs; replaced 1,382 "High Voltage" roadway safety signs; rehabilitated 6,992 In ft or grout pads; tamped
I I I
Use of Funds $in Millions)
FY2011 CIP r---------=---......__--+--''-'-'-"---t-~~'--+---..._._--t-=-'--l FY 2012 CIP '--=--~'--'---~-=---'--=-=--..____· = -"-----=--'-' ·---'----"-;.._;_:--'
Safety & Security
ARRA
Reimbursable
Total
L ~
157 56
100
$21)
Obl19..Uon-~ t.o D.l~ U~ of Funds
OC>1o0•"' c.._,.,.., ... °"' 512 53 21%
SS 38 98%
85 53 84%
$151~- $9'1 71%
CIP Ex enditures in Millio ns
$ l60M
$140H
SUOM
I) t SIOOM
_: SIOM
; i :i:
S:ZOM
SOM Jul
: ; I ' . I I -i ~ I ' I ' ~ !
""' s.sit <=NJOU&p.
Ott Ho• Oec >an FY2011 CUmulotlwe ( qi.
n 11
I
Feb M• ~, M•y >un
- nou C.......ittiwe Elli>-
... hp
5%
68%
53%
'1'1% '
S"OOM
$600M
SSOOM
S200M
$100f4
Ca ital Bud et Re ro rammin Status in millions
There were no reoroqamminqs in Februacv.

~· I
HR Vacancy Report February FY2012
Operating Vacancies Budgpet IAti~proved Total Number Vacant Vacancy Rate Discussion
os ons
Total Operating Positions ~I ___ .... 10...,, .. 2_s._o'------'-- ---'"'53""2 _____ _,___ ____ --'s~0"'!-li- ___ _..
Departments with a large number of vacanc·es I :
Transit Infra. & Engineering Services
Bus Services
Rail Transportatioo
Information T echnolo9f
Metro Poice Department
I
--·
3 120
3 807
I 499 + 251
635
Budget Approved Positions
140 4%
105 3%
113 8% - A tra1lll'!!j Class fOt 29tra111opera:ors oS Ll~tW<t~. Next Class t>en•nS Marcil 25
SI 20%
29 5%
Capital Vacancies
J
l
TotalCapitalPosttions ~I ----'-'''~20~1'------'-----2~2~s ____ _.,_ ___ ~1~9o/c--'o _____ ~IR~~~~GM~avt~nor._12ec1~~·ncr~e<lsed~._1>e~aoc~oun~t~·----------------;' ~ Departments with a large number of vacancies·
---~·
Transit Infra. & Engineering Services
Clief Financial Office
Information Technology
949
382
37
---++
--+--168 18%
27 7% -24 65% Jn;batr,t to convert c(ll'(ract 00<100os to full timt emolo-.-teS is CllQOU'IC
Operating Vacancy Trend I Capital Vacancy Trend
n5
675
625
575
525
475
425 Jul .... M•r
255 245 235 225 215 205 195 185 1?5
• . ' ,, ' ,, I ',
'• I • ' I
' I ' I
' I ' I
~---·--- ... -....... ,' .. Jul - - , .. ••b "~' .... '""
"GM authori zed 86 additional TIES headcount associated with ramp up of capital program. Recruting W1H begin immedately with goal of filing positions by July 1, 2012.
'---------·--·-----·--------·· - ---.·- - - ---