
Waiting for supershrink: an empirical analysis of therapist effects
15
Clinical Psychology and Psychotherapy Clin. Psychol. Psychother. 10, 361–373 (2003) Copyright © 2003 John Wiley & Sons, Ltd. Published online in Wiley InterScience (www.interscience.wiley.com). DOI: 10.1002/cpp.383 INTRODUCTION In 1974 D.F. Ricks described an exceptional thera- pist whom the author called ‘supershrink’. This therapist, who worked with highly disturbed ado- lescents, demonstrated exceptional outcomes when the boys were later examined as adults. In contrast to ‘supershrink’ another therapist, later labelled ‘pseudoshrink’ by Bergin and Suinn (1975), was the antithesis of supershrink. The boys treated by this therapist had adult adjustment that was alarmingly poor. In the decades since this report there has been little research carried out on the effects of the indi- vidual therapist (Lambert & Okiishi, 1997). Instead, researchers turned their attention to the search for effective psychotherapies rather than effective therapy providers (Task Force, 1995). A focus on therapies makes good theoretical sense and typifies the approach of academics who are interested in identifying effective treatments and developing theories of change. In the long run such studies can be highly useful by helping to identify uniquely effective treatments. In the applied world, however, such studies make less sense and are inadequate for improving the quality of patient care as the treatment is being offered. Research about effective treatments generally Waiting for Supershrink: An Empirical Analysis of Therapist Effects John Okiishi, 1 Michael J. Lambert, 1 * Stevan L. Nielsen 1 and Benjamin M. Ogles 2 1 Brigham Young University, UT, USA 2 Ohio University, OH, USA Improving the effects of psychotherapy has been accomplished through a variety of methods. One infrequently used method involves profiling patient outcomes within therapist in order to find the empirically supported psychotherapist. This study examined data collected on 1841 clients seen by 91 therapists over a 2.5-year period in a University Counseling Center. Clients were given the Outcome Questionnaire-45 (OQ-45) on a weekly basis. After analysing data to see if general therapist traits (i.e. theoretical orientation, type of train- ing) accounted for differences in clients’ rate of improvement, data were then analysed again using Hierarchical Linear Modeling (HLM), to compare individual therapists to see if there were significant dif- ferences in the overall outcome and speed of client improvement. There was a significant amount of variation among therapists’ clients’ rates of improvement. The therapists whose clients showed the fastest rate of improvement had an average rate of change 10 times greater than the mean for the sample. The therapists whose clients showed the slowest rate of improvement actually showed an average increase in symptoms among their clients. Use of this information for improv- ing quality of patient outcomes is discussed. Copyright © 2003 John Wiley & Sons, Ltd. * Correspondence to: Professor Michael J. Lambert, Depart- ment of Psychology, Brigham Young University, Provo UT 84602, USA. E-mail: [email protected]
Transcript of Waiting for supershrink: an empirical analysis of therapist effects

Clinical Psychology and PsychotherapyClin. Psychol. Psychother. 10, 361–373 (2003)
Copyright © 2003 John Wiley & Sons, Ltd.Published online in Wiley InterScience (www.interscience.wiley.com). DOI: 10.1002/cpp.383
INTRODUCTIONIn 1974 D.F. Ricks described an exceptional thera-pist whom the author called ‘supershrink’. Thistherapist, who worked with highly disturbed ado-lescents, demonstrated exceptional outcomes whenthe boys were later examined as adults. In contrastto ‘supershrink’ another therapist, later labelled‘pseudoshrink’ by Bergin and Suinn (1975), was theantithesis of supershrink. The boys treated by thistherapist had adult adjustment that was alarmingly
poor. In the decades since this report there has beenlittle research carried out on the effects of the indi-vidual therapist (Lambert & Okiishi, 1997). Instead,researchers turned their attention to the search for effective psychotherapies rather than effectivetherapy providers (Task Force, 1995).
A focus on therapies makes good theoreticalsense and typifies the approach of academics whoare interested in identifying effective treatmentsand developing theories of change. In the long runsuch studies can be highly useful by helping toidentify uniquely effective treatments. In theapplied world, however, such studies make lesssense and are inadequate for improving the qualityof patient care as the treatment is being offered.Research about effective treatments generally
Waiting for Supershrink: An Empirical Analysis of Therapist Effects
John Okiishi,1 Michael J. Lambert,1* Stevan L. Nielsen1
and Benjamin M. Ogles2
1 Brigham Young University, UT, USA2 Ohio University, OH, USA
Improving the effects of psychotherapy has been accomplishedthrough a variety of methods. One infrequently used methodinvolves profiling patient outcomes within therapist in order to findthe empirically supported psychotherapist. This study examined datacollected on 1841 clients seen by 91 therapists over a 2.5-year periodin a University Counseling Center. Clients were given the OutcomeQuestionnaire-45 (OQ-45) on a weekly basis. After analysing data tosee if general therapist traits (i.e. theoretical orientation, type of train-ing) accounted for differences in clients’ rate of improvement, datawere then analysed again using Hierarchical Linear Modeling (HLM),to compare individual therapists to see if there were significant dif-ferences in the overall outcome and speed of client improvement.There was a significant amount of variation among therapists’ clients’rates of improvement. The therapists whose clients showed the fastestrate of improvement had an average rate of change 10 times greaterthan the mean for the sample. The therapists whose clients showedthe slowest rate of improvement actually showed an average increasein symptoms among their clients. Use of this information for improv-ing quality of patient outcomes is discussed. Copyright © 2003 JohnWiley & Sons, Ltd.
* Correspondence to: Professor Michael J. Lambert, Depart-ment of Psychology, Brigham Young University, Provo UT84602, USA.E-mail: [email protected]

362 J. Okiishi et al.
Copyright © 2003 John Wiley & Sons, Ltd. Clin. Psychol. Psychother. 10, 361–373 (2003)
assumes that the individual therapist is a relativelyunimportant part of the outcome equation, ratherthan the central figure that facilitates patientimprovement. Clinical trials research attempts tominimize the contribution of individual therapists(through standardizing treatment with treatmentmanuals, adherence assessments, and supervision)in order to discover the impact of specific tech-niques on outcome. Interpretation of such researchthus overemphasizes the importance of theory-based techniques in the clinical setting, and essen-tially ignores the contribution of the individualtherapists.
Unfortunately, the central place of theory-basedinterventions in clinical training and in clinicalpractice overshadows possibly more importanttherapist-based contributions often subsumedunder the general rubric of common factors (Steering Committee, 2002). Within the generaldomain of quality management in routine practiceit may make more sense to study the effects of par-ticular therapists and then develop interventions toenhance patient outcomes. Referring patients tothe most effective therapists and offering feedbackand training to therapists with less than adequatepatient outcome could further enhance positiveclient change.
Although it is clinically assumed that some ther-apists are better than others at facilitating change(Albert, 1997; Jennings & Skovholt, 1999), verylittle is known about the actual outcomes of indi-vidual therapists. Orlinsky and Howard (1980), ina retrospective study, examined the outcome of 143female clients seen by 23 therapists. Six of the 23had clients whose outcome was outstanding, withnone deteriorating. On the other hand, five of the23 therapists were labelled ‘X-rated’, that is, theirclients showed low improvement rates and morethan 10% were worse at termination. Additionalattempts to measure the outcome of individualtherapists have been reported in the literature (e.g. Luborsky, McClellan, Woody, O’Brien, &Auerbach, 1985). In a summary of this literatureCrits-Christoph and Mintz (1991) conducted ameta-analysis of 15 studies on the contribution ofthe individual therapist and concluded that theeffect of individual therapists was negligible insome studies and so large in others that itaccounted for a significant amount of the variance.Such findings argue for the importance of examin-ing individual therapist outcome, but the use ofresearch to enhance the outcome of clients whilebeing seen by a therapist has rarely been reported(Lutz, 2002).
The following study was conducted in order toclarify the extent of variability in outcome as afunction of individual therapists and to explore thefeasibility of improving patient outcome within aclinic through quality management efforts. It tookplace within a clinic that eventually developed anexperimental outcome management system. Theresults of experimental investigations into theeffects of this feedback system have been reportedon elsewhere (Lambert et al., 2001, 2002; Whippleet al., 2003). The studies involved collecting weeklyratings of client treatment response and providingtherapists with progress graphs and messagesabout the extent to which clients were recoveringas expected. Results indicated that feedback totherapists about likely treatment failure reducedpremature termination and enhanced outcomes forpatients who were predicted to be treatment fail-ures. The studies showed that deterioration ratescould be reduced and that success rates could beincreased if feedback on progress was provided totherapists. Although this quality managementpractice proved to be consistently effective, it wasapparent that the kind of data generated from suchstudies could also be used to assess the effects ofindividual providers and then be used to maketreatment assignment decisions and programmaticinterventions for therapist training. Data for thecurrent study was collected prior to implementa-tion of the feedback studies but examined similarweekly outcome ratings (that were not shared with the therapists).
The purpose of this study was to use this archivaldata to examine client outcome within therapists ina treatment as usual circumstance. The studyaddressed two questions: Do clients show similaroutcomes across therapists? And, are therapistsequally efficient? Obviously the outcome for clientsattending a treatment clinic can be enhanced if themost effective therapists see the majority of clients.In addition, the sooner a client’s symptoms abatethe better for the client; and within contexts wheretreatment costs are considered, faster improvementhas economic implications for those who arepaying for the treatment.
METHODParticipants
ClientsThe client sample for this study consisted of
college students seen for individual psychotherapyat a large university counselling centre. Treatment

Waiting for Supershrink: Therapist Effects 363
Copyright © 2003 John Wiley & Sons, Ltd. Clin. Psychol. Psychother. 10, 361–373 (2003)
was available to full-time students of the Univer-sity. Clients at the centre presented with a widerange of problems from simple homesickness topersonality disorders. The most common diag-noses in the final dataset were mood disorders (n = 614, 34.5%), anxiety disorders (n = 372, 20.89%)and adjustment disorders (n = 305, 17.17%).
Students were initially seen in a 30-min intakeinterview and then assigned to a particular thera-pist based on the client’s needs and therapist avail-ability. No experimental control was exercised overthis routine assignment procedure. Although therewas a 14-session ‘limit’ at the centre, clients wereallowed to be seen for more sessions if their thera-pist felt that it was necessary. The range of sessionsin this sample was 1 to 69, with a mean of 5.16 (SD= 7.2).
Although 3266 students were seen at the centreover the 2-year period of data collection, the analy-sis being used for this study included only clientswith at least two data points This selection crite-rion yielded a data set of 1841 clients. Demo-graphic information was collected on clients and is shown in Table 1.
TherapistsNinety-one therapists contributed data to the
entire data pool of 3266 clients. Therapists who haddata for fewer than 15 clients were excluded fromthe study. Using this selection criterion as well as
the three data-point minimum described above,the final sample consisted of 56 therapists who hadseen a total of 1779 clients. Data were also collectedon a variety of therapist variables: level of training(pre-internship, internship and post-internship),type of training (clinical psychology, counsellingpsychology and social work), sex and primary theoretical orientation (cognitive-behavioural,humanistic, and psychodynamic). A summary ofthese therapist variables is shown in Table 2. Themodal therapist was a male, licensed, counsellingpsychology PhD, who identified their primary theoretical orientation as cognitive-behavioural/behavioural.
Measure
Client progress in this study was tracked using theOutcome Questionnaire (OQ), a 45-item self-reportmeasure developed specifically for the purpose oftracking and assessing client outcomes in a thera-peutic setting (Lambert et al., 1996). The OQ is awell-established instrument that has been vali-dated across the USA and in Germany and acrossa broad range of normal and client populations.Lambert et al. (1996) reported an internal consis-tency for the OQ of 0.93 and a 3-week test–retestvalue of 0.84, both of which are considered adequate. Concurrent validity figures were calcu-lated by comparing the OQ total score with totalscores from other measures including the SCL-90(Derogatis, 1983), BDI (Beck, Steer, & Garbin, 1988),Zung Depression Scale (Zung, 1965) and the STAI(Spielberger, 1983). All of the concurrent validity
Table 1. Client demographics
N Percentage
SexMale 614 34.49Female 1165 65.51
RaceCaucasian 1548 87.01Hispanic 77 4.31Asian-American 58 3.24Native American 16 0.88Other ethnicity 80 4.56
DiagnosisMood Disorder 614 34.50Anxiety 372 20.89Adjustment 305 17.17Psychotic 27 1.54Eating Disorder 109 6.12Axis II 31 1.76Sexual 56 3.13Other 113 6.33Deferred 152 8.56
Mean SD RangeInitial OQ Score 73.00 18.57 0–176
Table 2. Therapist characteristics
N Percentage
Experience levelPre-Internship 20 35.72Intern 10 17.85Post-Internship 26 46.43
Type of trainingClinical Psychology 16 28.57Counselling Psychology 38 67.86MSW 2 3.57
Primary theoretical orientationCognitive Behavioural/Behavioural 23 41.07Humanistic/Existential 19 33.93Psychodynamic/Interpersonal 14 25.00
SexMale 34 60.71Female 22 39.29
364 J. Okiishi et al.
Copyright © 2003 John Wiley & Sons, Ltd. Clin. Psychol. Psychother. 10, 361–373 (2003)
figures with the OQ and these instruments weresignificant at the 0.01 level with a range of rs from0.50 to 0.85. The OQ has been shown to be sensi-tive to change over treatment and relatively stableover time when symptomatic individuals are nottreated (Vermeersch, Lambert, & Burlingame,2000).
The OQ is scored using a 5-point scale (0 = never,1 = rarely, 2 = sometimes, 3 = frequently, 4 = almostalways), which yields a possible range of scoresform 0 to 180. High scores on the OQ indicate moredistress and as clients improve scores decrease.Although not used in this study, the OQ has threesubscales that measure quality of interpersonalrelations, social role functioning and symptom dis-tress. The total score, which provides a globalassessment of functioning, was used in this study.As often as possible, the OQ was administered toclients before each session. However, the statisticalmethods being used in this study do allow formissing values and collection of data at variabletimes. These methods will be discussed in moredetail in the following section.
Procedures
In addition to providing information about theprogress of the clients, each OQ contained infor-mation making it possible to identify the client, thetherapist and the date of the session. The OQ,administered before each psychotherapy session, isused as a routine part of accountability and qualityimprovement procedures at the counselling centre.After these data were collected, they were enteredinto a data base that also contained informationgathered at intake including the clients’ ages,gender, and ethnicity. Therapist identities wereprotected by randomly assigning each therapist anumber so that identifying individual therapistswould be impossible by viewing the data set.Client identities were similarly protected.
Data Analysis
Hierarchical Linear Modelling (HLM)Data were analysed using a statistical technique
called multi-level modelling or hierarchical linearmodelling (HLM). The computer program used for this analysis was HLM for Windows (Bryk,Raudenbush, & Congdon, 1996). HLM has beendemonstrated to have a number of advantagesover other multivariate repeated measuresmethods (Bryk & Raudenbush, 1992). HLM
actually represents individuals’ growth rather thanbeing based on the interaction of repeated obser-vations for a group of subjects. It is more flexiblein its data requirements and the data are nested,which allows for the study of organizational effectson growth. Multivariate repeated measures tech-niques do not offer these advantages. HLM is idealfor a naturalistic study, such as this, in that itaccounts for missing and erratic data.
Before the main analyses were performed, aninitial HLM was carried out taking into accounttherapist variables (i.e. level of training, primarytheoretical orientation). This was done in order todetermine if some therapist variable other than theindividual therapists themselves might be respon-sible for differences in clients’ outcome. It was notanticipated that any of these variables would contribute significantly to the outcome of a client,however in the case that they did, this possibilityneeded to be considered before drawing conclu-sions about variance between therapist outcomes.
Following this initial check of therapist variables,HLM information was used in two ways. First, OQscores for clients were used to generate improve-ment curves for each client and then for all clientswithin each therapist. Once these combined recov-ery curves were computed it was possible to see ifthere was significant variation among therapists ontheir clients’ initial OQ scores to answer the ques-tion ‘do some therapists see patients whoseaverage initial disturbance is greater than othertherapists?’ Using these same curves, it was alsopossible to examine the rate at which clients’ OQscores decrease in order to answer the question ‘arethere some therapists whose clients improve sig-nificantly more or less rapidly than others?’
The second way HLM information was used wasto examine how much change clients experiencedon average when seeing a particular therapist. Thiswas accomplished by taking the average rate ofchange for a therapist’s clients and multiplying itby the average number of sessions for that therapist. Although HLM information aboutclients’ rate of change is important, this methodprovided an analysis to answer the question:‘when average treatment duration is considered,do some therapists’ clients improve more thanothers?’
RESULTSAs seen in Table 3, clients’ initial OQ scores had an intercept of 73.79 (p < 0.0001). Similarly, the

Waiting for Supershrink: Therapist Effects 365
Copyright © 2003 John Wiley & Sons, Ltd. Clin. Psychol. Psychother. 10, 361–373 (2003)
slopes, or rates of improvement for clients showedsignificant variation (p < 0.001), with a mean slopeof -0.79. The negative slope indicates a decrease inOQ points (i.e. a lessening of endorsed client sym-ptomatology). These findings suggest that both the slope and intercept are necessary to describethe growth trajectory for this sample (Bryk & Raudenbush, 1992). Figure 1 represents thisgrowth curve graphically.
As can be seen in the Table 3, the HLM analysisof this sample indicated that clients within therapists differed significantly on both their initial
OQ scores (HLM intercept; p < 0.001) and in theirrates of improvement (HLM slope; p < 0.001). Thissuggests that clients showed a broad range ofinitial endorsed symptomatology and varyingrates of improvement.
Therapist Variables
The initial analysis of therapist data were aimed atseeing if therapists differed from one another onoutcomes based on four therapist variables: type oftraining, amount of training, theoretical orientationand gender. An HLM was performed using thesefour variables as predictors. This analysis indicatedthat none of these therapist variables differentiallycontributed to the outcomes of patients. Results ofthis analysis are shown in Table 4. These resultsindicate that the type of training (counselling psychology, clinical psychology, social work), theyears of training (pre-internship, internship, post-internship), theoretical orientation (cognitivebehavioural, humanistic, psychodynamic) andgender did not change the slope of improvementacross therapists. This suggests that any differ-ences found between individual therapists are theresult of other therapist variables.
50
55
60
65
70
75
80
1 2 3 4 5 6 7 8 9 10 11 12 13 14 15
Session #
OQ
To
tal S
core
Figure 1. HLM growth curve for the entire clientsample
Table 3. HLM modelling of change in OQ scores for the entire sample
Coefficient SE T-ratio SD VAR df Chi-square p-value
Fixed Effect: Client Recovery LineIntercept 73.787 0.295 249.94 0.001Slope -0.79 0.060 -13.10 0.001
Random Effect: Variation of clients within therapistsIntercept 14.389 207.04 1778 9629.09 0.001Slope 1.156 1.338 1778 3504.65 0.001
Random Effect: Variation among therapistsIntercept 0.481 0.231 55 48.095 >0.50Slope 0.240 0.057 55 80.567 0.014
Table 4. HLM with experience level, sex, level of training and theoretical orientation as predictors
Fixed effect Coefficient Standard Error T-ratio p-value
Experience 0.108273 0.061340 1.765 0.083Sex -0.038107 0.118145 -0.323 0.748Training 0.012136 0.110959 0.109 0.914Orientation 0.052142 0.070472 0.740 0.463
366 J. Okiishi et al.
Copyright © 2003 John Wiley & Sons, Ltd. Clin. Psychol. Psychother. 10, 361–373 (2003)
Differences Between Therapists
After the general HLM growth curve was gener-ated for all the participants in the study and it hadbeen determined that the therapist characteristicsexamined did not account for variation in out-comes, growth curves were generated based on allof the clients in each therapist’s caseload. Usingthis client growth curve data, curves were gener-ated for each of the therapists in the study in orderto compare therapists’ outcomes to the generalgrowth curve and to each other.
In the HLM analysis for the entire centre, clientsshowed significant variation in initial intercept. Asseen in the ‘variation among therapists’ portion ofTable 3, when clients were grouped by therapist,there was no significant variation among thera-pists’ clients on their average initial OQ score (p > 0.50). This indicates that although clients dif-fered significantly from one another initially andrepresented a wide range of initial symptomatol-ogy when looked at as a whole, therapists couldnot be shown to have unequivalent caseloads atintake.
Again referencing the ‘variation among thera-pists’ section of Table 3, the HLM analysis indi-cated that therapists’ clients differed significantlyon their rate of change. The therapists’ growthcurve slopes (i.e. rate at which their clients’ growthcurves moved in a negative direction, indicatingless endorsed symptomatology), showed a widerange of variability (p < 0.001). This finding sug-gests differential recovery rates among clientsdepending on which therapist they were assignedto see. Slopes, intercepts and average number ofsessions for all the therapists in the sample areshown in Table 5. (It should be noted that in thistable ‘0’ session refers to the intake session. This is why each therapist has a minimum number ofsessions at zero.) This is also why it is possible for a therapist to have an average session length ofless than one.
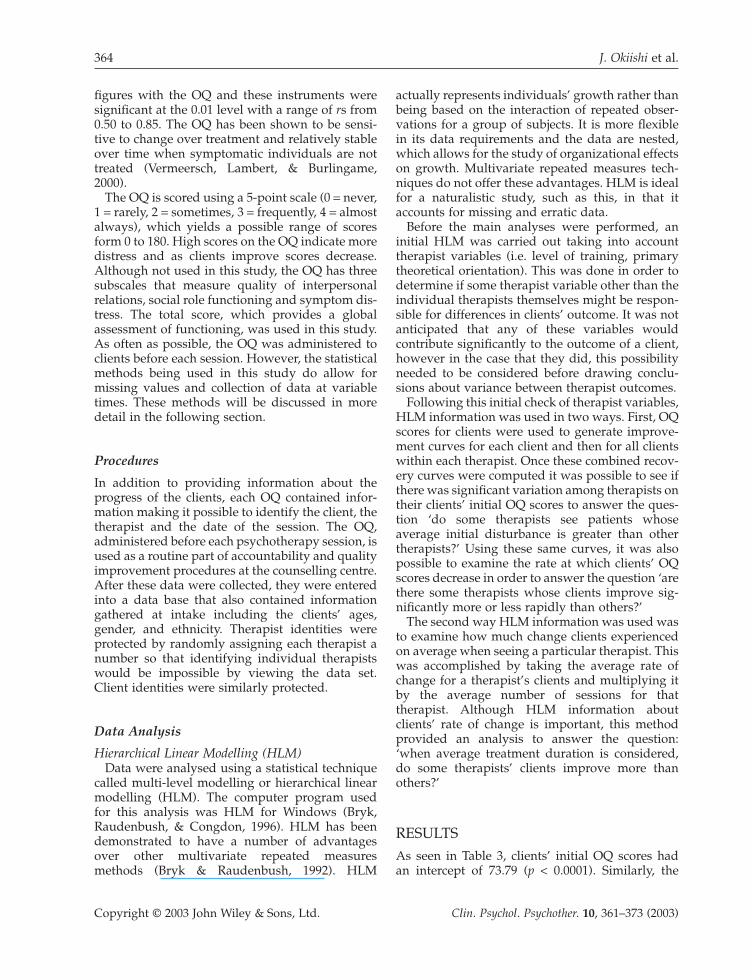
For example, the therapist (no. 1) whose clientsdemonstrated the steepest HLM improvementslopes had an average drop of 7.97 OQ points persession. This is 10 times the average rate of changefor the entire centre. The therapist whose clientsshowed the least improvement (no. 56) actuallyhad a positive slope, indicating that on averageclients were endorsing more pathology at the endof treatment than when they entered treatment.This therapist’s clients endorsed a higher degree ofpathology at a rate of 0.68 points per session. Agraph of these two therapists’ growth curves and
the growth curve for the entire centre is shown inFigure 2. As can been seen by examining thisgraph, the difference in rate of change betweenthese two therapists is dramatic.
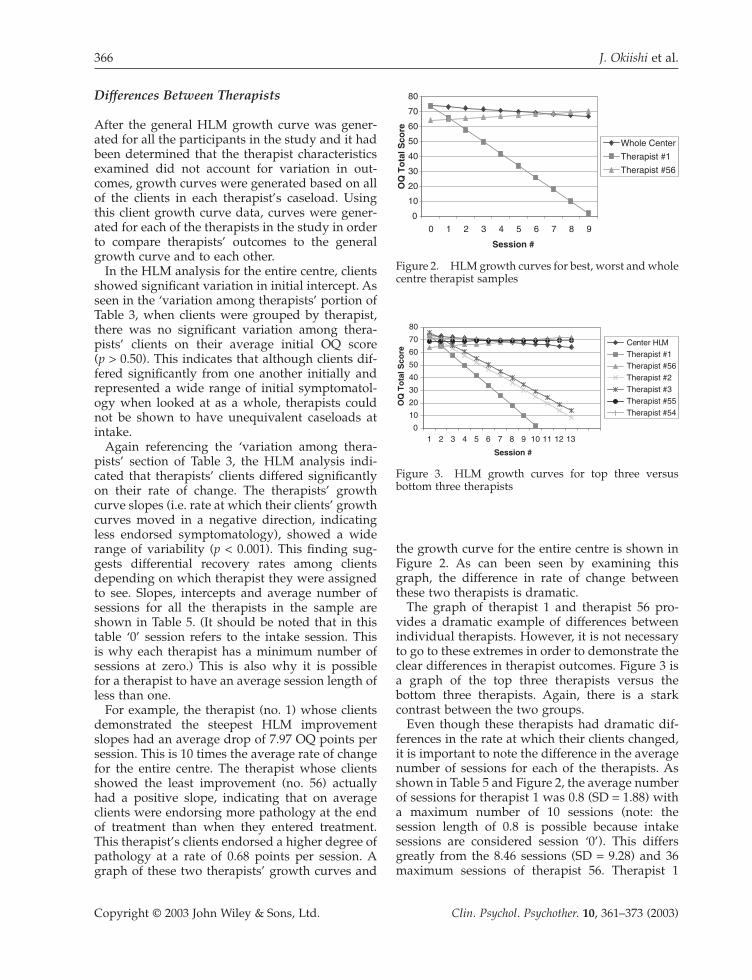
The graph of therapist 1 and therapist 56 pro-vides a dramatic example of differences betweenindividual therapists. However, it is not necessaryto go to these extremes in order to demonstrate theclear differences in therapist outcomes. Figure 3 isa graph of the top three therapists versus thebottom three therapists. Again, there is a stark contrast between the two groups.
Even though these therapists had dramatic dif-ferences in the rate at which their clients changed,it is important to note the difference in the averagenumber of sessions for each of the therapists. Asshown in Table 5 and Figure 2, the average numberof sessions for therapist 1 was 0.8 (SD = 1.88) witha maximum number of 10 sessions (note: thesession length of 0.8 is possible because intake sessions are considered session ‘0’). This differsgreatly from the 8.46 sessions (SD = 9.28) and 36maximum sessions of therapist 56. Therapist 1
0
10
20
30
40
50
60
70
80
0 1 2 3 4 5 6 7 8 9
Session #
OQ
To
tal S
core
Whole Center
Therapist #1
Therapist #56
Figure 2. HLM growth curves for best, worst and wholecentre therapist samples
0
10
20
30
40
50
60
70
80
1 2 3 4 5 6 7 8 9 10 11 12 13
Session #
OQ
To
tal S
core
Center HLMTherapist #1Therapist #56Therapist #2Therapist #3Therapist #55Therapist #54
Figure 3. HLM growth curves for top three versusbottom three therapists

Waiting for Supershrink: Therapist Effects 367
Copyright © 2003 John Wiley & Sons, Ltd. Clin. Psychol. Psychother. 10, 361–373 (2003)
Table 5. Therapist mean sessions, HLM slopes and HLM intercepts for whole sample
Therapist Mean no. of Session SD Minimum Maximum HLM HLMSessions sessions sessions slope intercept
Whole Center 4.47 6.89 0 69 -0.79 73.791 0.80 1.88 0 10 -7.97 73.672 3.77 3.72 0 16 -5.51 74.463 2.85 2.72 0 13 -5.19 76.124 3.44 2.58 0 10 -5.07 74.935 2.78 2.63 0 12 -4.85 76.686 2.50 3.34 0 17 -4.21 73.487 2.88 4.42 0 22 -4.06 77.098 4.55 6.28 0 28 -3.96 70.889 3.64 4.49 0 17 -3.57 74.71
10 2.60 2.85 0 14 -3.43 74.5911 3.15 3.84 0 12 -3.18 77.2812 4.59 3.12 0 12 -3.14 67.6513 2.67 3.22 0 15 -3.10 72.3014 4.03 5.28 0 32 -3.08 77.5215 4.43 3.79 0 18 -2.98 75.7416 2.34 2.07 0 9 -2.93 74.0917 3.87 3.15 0 13 -2.90 78.0918 4.87 5.21 0 26 -2.87 71.3519 7.31 11.95 0 49 -2.65 75.6720 3.85 5.26 0 27 -2.56 70.8721 3.01 4.92 0 23 -2.53 73.7922 3.36 3.04 0 14 -2.52 74.6623 3.25 2.39 0 11 -2.49 72.6124 3.14 2.47 0 9 -2.45 70.3225 4.76 5.53 0 26 -2.40 72.2226 4.49 4.73 0 22 -2.36 69.8627 4.31 5.69 0 34 -2.02 73.4128 4.31 4.15 0 24 -1.74 69.4029 6.81 12.38 0 58 -1.51 68.2530 4.04 4.24 0 20 -1.49 70.2131 4.11 6.01 0 43 -1.48 75.0432 5.38 6.69 0 30 -1.44 72.5433 9.09 11.80 0 57 -1.43 76.9134 3.46 5.33 0 31 -1.33 74.0935 5.09 4.65 0 19 -1.33 71.5036 9.15 7.97 0 35 -1.31 71.4137 6.46 6.27 0 34 -1.18 69.6938 5.81 7.00 0 49 -1.13 73.9039 6.01 7.48 0 35 -1.11 70.8140 4.03 4.72 0 33 -1.07 74.6741 3.03 3.25 0 15 -1.01 70.5042 6.81 5.92 0 25 -0.99 73.3543 6.68 5.41 0 21 -0.99 71.5844 4.30 3.52 0 14 -0.92 68.1245 5.57 4.70 0 19 -0.92 68.7746 4.83 6.04 0 28 -0.86 70.3247 7.05 8.91 0 37 -0.83 73.5548 6.95 8.52 0 50 -0.83 68.1649 3.82 4.94 0 23 -0.75 74.3150 6.51 11.04 0 69 -0.68 70.6251 3.83 6.46 0 40 -0.67 73.9452 5.03 8.04 0 57 -0.45 70.5453 5.10 5.75 0 24 -0.32 67.0754 6.17 7.76 0 44 -0.13 71.2155 9.06 11.08 0 54 0.05 68.9056 8.46 9.28 0 36 0.68 64.01

368 J. Okiishi et al.
Copyright © 2003 John Wiley & Sons, Ltd. Clin. Psychol. Psychother. 10, 361–373 (2003)
clearly saw clients for a much shorter time than didtherapist 56.
Examining average session length helps furtherclarify the picture of how these therapists prac-ticed. The average number of sessions for the top three therapists was 2.4 (SD = 3.05) with amaximum of 16 sessions. The bottom three therapists had a mean session length of 7.05 (SD =8.75) with a maximum of 54 sessions. As with the top and bottom individual therapists, the topthree and bottom three therapists showed sig-nificantly different lengths of treatment (t = 9.42, p < 0.01).
Due to the large difference in session lengthbetween the two groups the sample was split intothree groups based on the ranking of therapists byHLM slope. A one-way ANOVA was calculated inorder to determine the relationship between theranking of the therapists and their average sessionlength based on these three groups. Results are presented in Table 6.
As can be seen in this table, there were signifi-cant differences in length of session between thetop one-third and the bottom two-thirds of thera-pists. This finding suggests that the clients with thegreatest rate of change were seen by therapists whosaw them for shorter periods of time on average.Figure 4 presents therapist rankings and averagesession length graphically to better illustrate thisfinding.
‘Exceptional’ Therapists: An Alternate View
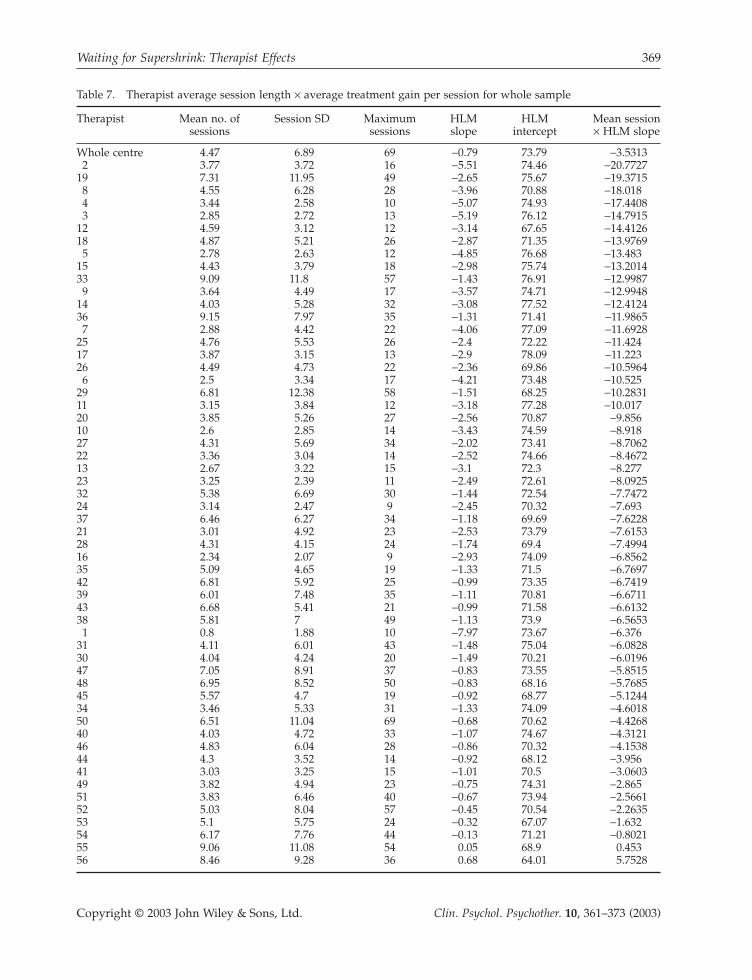
In order to synthesize our findings and to clarifywhich therapists might be considered ‘super-shrinks’ and which might be ‘pseudoshrinks’ theaverage session length of individual therapists wasmultiplied by the slope of their HLM line. This pro-vided an index of therapist ‘exceptionality’ thattakes into account both the rate of change and theaverage amount of time spent in therapy. Resultsof this procedure are shown in Table 7.
Comparing Table 7 to Table 5 provides insightinto who might actually be considered the ‘super-shrinks’ and ‘pseudoshrinks’ of the sample using
Table 6. One-way ANOVA examining rank ordered therapists and number of sessions for the entire sample
Sum of squares df Mean square F p-value
Between groups 1162.011 2 581.006 11.148 0.001Within groups 574045.877 11014 52.120Total 575207.888 11016
Post-hoc comparison: Tukey HSD
Ranking group Comparison Mean SE p-value 95% Uppergroup difference confidence bound
intervalLowerbound
Top one-third Middle -0.82* 0.179 0.001 -1.24 -0.40Bottom -0.56* 0.166 0.002 -0.95 -0.17
Middle one-third Top 0.82* 0.179 0.001 0.40 1.24Bottom 0.27 0.167 0.249 -0.13 0.66
Bottom one-third Top 0.56* 0.166 0.002 0.17 0.95
* The mean difference is significant at the 0.05 level.
Average Session Length
0
2
4
6
8
10
0 5 10 15 20 25 30 35 40 45 50 55 60
Therapist Ranking
Figure 4. Scatterplot of therapist rankings and averagesession length
Waiting for Supershrink: Therapist Effects 369
Copyright © 2003 John Wiley & Sons, Ltd. Clin. Psychol. Psychother. 10, 361–373 (2003)
Table 7. Therapist average session length ¥ average treatment gain per session for whole sample
Therapist Mean no. of Session SD Maximum HLM HLM Mean sessionsessions sessions slope intercept ¥ HLM slope
Whole centre 4.47 6.89 69 -0.79 73.79 -3.53132 3.77 3.72 16 -5.51 74.46 -20.7727
19 7.31 11.95 49 -2.65 75.67 -19.37158 4.55 6.28 28 -3.96 70.88 -18.0184 3.44 2.58 10 -5.07 74.93 -17.44083 2.85 2.72 13 -5.19 76.12 -14.7915
12 4.59 3.12 12 -3.14 67.65 -14.412618 4.87 5.21 26 -2.87 71.35 -13.9769
5 2.78 2.63 12 -4.85 76.68 -13.48315 4.43 3.79 18 -2.98 75.74 -13.201433 9.09 11.8 57 -1.43 76.91 -12.9987
9 3.64 4.49 17 -3.57 74.71 -12.994814 4.03 5.28 32 -3.08 77.52 -12.412436 9.15 7.97 35 -1.31 71.41 -11.98657 2.88 4.42 22 -4.06 77.09 -11.6928
25 4.76 5.53 26 -2.4 72.22 -11.42417 3.87 3.15 13 -2.9 78.09 -11.22326 4.49 4.73 22 -2.36 69.86 -10.5964
6 2.5 3.34 17 -4.21 73.48 -10.52529 6.81 12.38 58 -1.51 68.25 -10.283111 3.15 3.84 12 -3.18 77.28 -10.01720 3.85 5.26 27 -2.56 70.87 -9.85610 2.6 2.85 14 -3.43 74.59 -8.91827 4.31 5.69 34 -2.02 73.41 -8.706222 3.36 3.04 14 -2.52 74.66 -8.467213 2.67 3.22 15 -3.1 72.3 -8.27723 3.25 2.39 11 -2.49 72.61 -8.092532 5.38 6.69 30 -1.44 72.54 -7.747224 3.14 2.47 9 -2.45 70.32 -7.69337 6.46 6.27 34 -1.18 69.69 -7.622821 3.01 4.92 23 -2.53 73.79 -7.615328 4.31 4.15 24 -1.74 69.4 -7.499416 2.34 2.07 9 -2.93 74.09 -6.856235 5.09 4.65 19 -1.33 71.5 -6.769742 6.81 5.92 25 -0.99 73.35 -6.741939 6.01 7.48 35 -1.11 70.81 -6.671143 6.68 5.41 21 -0.99 71.58 -6.613238 5.81 7 49 -1.13 73.9 -6.5653
1 0.8 1.88 10 -7.97 73.67 -6.37631 4.11 6.01 43 -1.48 75.04 -6.082830 4.04 4.24 20 -1.49 70.21 -6.019647 7.05 8.91 37 -0.83 73.55 -5.851548 6.95 8.52 50 -0.83 68.16 -5.768545 5.57 4.7 19 -0.92 68.77 -5.124434 3.46 5.33 31 -1.33 74.09 -4.601850 6.51 11.04 69 -0.68 70.62 -4.426840 4.03 4.72 33 -1.07 74.67 -4.312146 4.83 6.04 28 -0.86 70.32 -4.153844 4.3 3.52 14 -0.92 68.12 -3.95641 3.03 3.25 15 -1.01 70.5 -3.060349 3.82 4.94 23 -0.75 74.31 -2.86551 3.83 6.46 40 -0.67 73.94 -2.566152 5.03 8.04 57 -0.45 70.54 -2.263553 5.1 5.75 24 -0.32 67.07 -1.63254 6.17 7.76 44 -0.13 71.21 -0.802155 9.06 11.08 54 0.05 68.9 0.45356 8.46 9.28 36 0.68 64.01 5.7528

370 J. Okiishi et al.
Copyright © 2003 John Wiley & Sons, Ltd. Clin. Psychol. Psychother. 10, 361–373 (2003)
the criteria of total OQ-45 point change. Forexample, therapist 2 saw clients an average of 3.77times and the average gain for these clients was -20.77 points. Therapist 19 was a close second(although remarkably less efficient), seeingpatients for 7.31 sessions while they improved anaverage of -19.37 points. Clients of therapists 8 and4 also had remarkably good outcomes withaverage treatment gains of -18.02 and -17.44points. Interestingly, therapist 1, who was consid-ered to be the supershrink therapist in terms ofHLM slope, fell to 38 in the rankings when the datawere examined in this way (due to this therapist’slow average session rate).
At the bottom end of the spectrum, therapist 56is a clear standout as a ‘pseudoshrink’. Therapist56 saw patients for an average of 8.46 sessions (thefourth highest average) while they worsened by anaverage of +5.75 points. This is more than 5 pointson average worse than the penultimate lowest-ranked therapist.
DISCUSSIONThe purpose of this study was to systematicallyexamine a large sample of therapists who had seena large number of clients in order to answer thequestion: ‘are there some therapists whose clientshave better or worse outcomes than others?’ Thisis a question that has rarely been investigated in asample the size of this study (Lambert & Okiishi,1997). The HLM analysis of the entire sample pro-vided the clearest evidence that there are indeedsignificant differences among therapists in the out-comes of their psychotherapy clients. The HLManalysis indicated that overall, clients seen at thecentre showed a broad range of initial symptoma-tology and varying rates of improvement. Clientshad a similar level of symptomatology at intakeacross therapists. In fact, the similarity in degree ofdisturbance across therapist caseloads called intoquestion the necessity of case-mix adjustments forthe purpose of fairly contrasting therapists in thissample.
As expected based on prior research (e.g. Beutler,Machado, & Neufeldt, 1994), there were no signif-icant differences in client outcome between thera-pists’ based on the four therapist demographicvariables of sex, level of training, type of trainingor theoretical orientation. This supports the ideathat even though graduate school training andmanaged health care tend to focus on training inspecific techniques, something else, perhaps the
individual therapists themselves are responsiblefor variation in client outcomes (Lambert &Okiishi, 1997).
Although therapists appeared to have roughlyequivalent caseloads at intake, there was a significant, sometimes dramatic difference whenimprovement curves of clients (using session-by-session outcome ratings) within therapist caseloads were examined and compared to each other. There were also large differencesbetween therapists when outcome was assessedbased on pre–post differences. Both of thesemethods of defining outcomes, provided verypowerful evidence that in fact some therapists’clients do have much better and worse outcomesthan others.
A client seeing one of the top three therapists fortheir average session length of 2.47 sessions can expect to improve by about 15 points on the OQ-45. This is a reliable change according toJacobson and Truax’s (1991) criteria and amountsto a client loosing about four full symptoms. Aclient seeing one of the bottom three therapists fortheir average session length of 7.89 sessions couldexpect to get worse by about five OQ-45 points.The difference between these best and worst out-comes is 20 OQ-45 points, which is well over astandard deviation in difference. Additionally, aperson being seen by one of the best three couldexpect to be done with therapy at a much morerapid rate. A client seen by one of the ‘best’ thera-pists can expect to be feeling significantly betterafter a few weeks of treatment. A client seen by oneof the ‘worst’ therapists can expect to feel about thesame, if not worse, than when they started treat-ment, and this after almost three times as muchtreatment as those clients seeing the more efficienttherapists.
The significant correlation between therapistranking and session length provided interestinginsight into the best and worst therapists. The ther-apists who saw clients that had the most rapidrates of improvement had significantly shortertreatment times. This makes logical sense. Ifsomeone seeking treatment improves at a morerapid rate, then they will stay in treatment for ashorter period of time. Conversely and in relationto the worst therapists, clients who experience nochange or an increase in symptomatology willlikely stay in treatment longer because they are notfeeling better. These findings are consistent withanother large data set where more symptomaticclients were shown to stay in therapy for signifi-cantly longer periods of time (Lueger et al., 2001).

Waiting for Supershrink: Therapist Effects 371
Copyright © 2003 John Wiley & Sons, Ltd. Clin. Psychol. Psychother. 10, 361–373 (2003)
So does this mean that shorter treatment is better?We would argue ‘no’. These data demonstrate thattherapists whose clients show superior rates ofchange see clients on average for a shorter periodof time, but short treatment time is not the deter-minate so much as rapid improvement of theclients. It appears likely that something about thesetherapists and the way the work, independent ofthe amount of time spent with clients, has a significant impact.
When average session length and HLM slopewere looked at together a different picture of thesuper- and pseudoshrinks emerged. With totalaverage change for a course of therapy as the deter-minate of the effectiveness of a therapist, some ofthe more efficient therapists (those with the steepest HLM slopes) go down in the rankings and therapists who showed slower rates ofimprovement but kept clients in therapy longer arehigher in the rankings.
Findings on the worst therapists when examinedthis way are more consistent with the findingsusing HLM slope only. The worst therapists seemto spend a lot of time with clients even though nomeasurable gains can be found. It could be inferredfrom this data that these therapists are encourag-ing dependency from their clients. Their clientsstick around for much longer despite no changesin symptomatology.
These data could be used in several ways toenhance outcome for clients in this clinic. First,results of the study could be provided to each ther-apist and the implications for practice and trainingdiscussed. Some analysis of the causes for differ-ences could be explored and lead to qualitative andprocess research. Intervention strategies, such assupervision by the supershrinks could be encour-aged. Continued monitoring of client progress andthen updating of the database are essential andcould be used to test the effects of interventionswith the therapists and revise judgments aboutwho are most effective.
Second, clients who come to the centre could bereferred to the most effective therapists from a rankordered listing of therapists (based on past out-comes). Clients would be referred to the most effec-tive therapists if available. This would mean thatthe least effective therapists would be given moresupport tasks rather than treatment tasks, therebyfreeing up the most effective therapists for clinicalwork. Less effective therapists could spend moretime in training activities, administration, orcentre-related tasks for which they may be bettersuited.
Limitations
There are a number of limitations of this studyincluding: (1) lack of random assignment of clientsto therapists, (2) not being able to identify thera-pists and their traits specifically, and (3) the OQ-45being the only measure used in the study. In thissection we will discuss these limitations in detailand describe how they may have impacted theresults of this study.
As stated previously, the clients in this studywere not randomly assigned. At the centre wheredata were collected, case assignments were madeby individuals (full-time staff and interns) doingintakes and were routinely assigned presumablybased on the clients perceived level of pathology,difficulty, gender and goodness of personality fitwith the therapist. Most importantly, therapists’availability of times to meet with new clients deter-mined assignment. These assignments were madeentirely on the basis of clinical judgment andwithout regard to OQ-45 scores at intake. Thismethod of deliberate case assignment could pose athreat to the validity of the findings. Withoutrandom assignment, it was possible for a particu-lar therapist to be given a disproportionate numberof ‘easy’ or ‘difficult’ cases, thus inflating their levelof effectiveness. Case-mixing was originally pro-posed to counter-balance this problem, but it wasfound that in the analysis of the sample, there wereno significant differences overall in the averagescore among therapists and the possible benefits ofcase-mixing were nullified. Nevertheless, sometherapists may have seen clients because of a spe-cific specialty interest (e.g. eating disorders) whichwould presumably influence the outcome rates.Further examination of other client variables maybe needed in order to rule out case-mix factors thatare not captured by the OQ scores. At the sametime the present analysis was based on archivaldata that were not collected with the intent ofexamining outcomes by therapist, a factor whichwould limit any tendency for experimental bias to determine assignment of cases.
Outcome was measured with the use of a singleself-report measure. This does have its method-ological limitations. A self-report measure onlytaps into what the client is willing to show to theclinician and researchers. If a client wanted to mis-represent what they were experiencing it would be as easy as filling out a few bubbles differently.It would be naïve to assume that this measure fully captured the ‘reality’ about a person’s psy-chological functioning and their pattern of change.

372 J. Okiishi et al.
Copyright © 2003 John Wiley & Sons, Ltd. Clin. Psychol. Psychother. 10, 361–373 (2003)
OQ scores are the product, as are all self-reportmeasures, of the trade-off between depth andbreadth. It was possible to collect a large amountof repeated measures data across a wide range ofclients, but at the cost of a fuller picture of eachclient’s mental state. This is a trade-off that iscommon in quality assurance research undertakenin routine practice.
Possibly the biggest limitation of this study wasour inability to examine identifying informationabout therapists more closely. This specific infor-mation was masked in order to protect the confi-dentiality of therapists and ensure that a largenumber of therapists were included in the study.We were able to identify that there were excep-tional therapists on both ends of the spectrum, aswell as how exceptional they were, but wereunable to dig deeper into who they actually wereor use the data for quality assurance purposes. Ifpossible it would have been valuable to knowmore about what therapists actually did and howthey thought and felt about their work. Knowinghow these individuals were perceived by them-selves, their colleagues and their clients would alsoprovide valuable information. Client satisfaction aswell as interviews with co-workers and the thera-pists themselves could easily yield this data if confidentiality of therapists was not an issue.
Investigation of therapist development couldalso be important to examine. How did these ther-apists become significantly better or worse thantheir peers? The possibilities for exploration intothis topic are limitless. Although the questions wedid answer were important, a closer look at theexceptional therapists we were able to identify willbe important to examine in the future. Unfortu-nately, what these therapists did to be ‘super-shrinks’ and ‘pseudoshrinks’ remains a mystery.
Finally, examining follow-up data on the clientsin this study could also be very useful. Although it is clear that clients benefited from therapy andbenefited more so from receiving treatment fromparticular therapists, it is important to determine ifthese gains are maintained after therapy. In light ofthe finding that the most effective therapists sawclients for a shorter period of time, this is a partic-ularly important question to explore. It could beargued that since clients were seen for a relativelyshort amount of time by the most effective thera-pists that they had a ‘flight into health’ rather thanhaving true therapeutic gains. Although there has been some research that indicates that rapidtreatment gains are stable at follow-up, this hasnever been examined while taking into account
individual therapists (Haas, Hill, Lambert, &Morrell, 2002). Follow-up on these clients post-treatment, particularly the clients of the ‘super’and ‘pseudo’ shrinks could help us ascertainwhether these gains (and losses) were stable aftertermination of treatment.
In the spirit of patient-focused research weencourage researchers and clinicians to enhancepatient outcomes through studies that examine the treatment response of clients as a function ofthe individual provider. Bohart (2000) suggestedthat the quality of clinical services would benefitmore from a research paradigm that emphasizes‘empirically supported psychotherapy practice’than one focused on ‘empirically supported treat-ments’. We take an even stronger stance andbelieve that emphasizing ‘empirically supportedtherapists’ may prove even more beneficial toclient outcomes. There is an urgent need to takeaccount of the effectiveness of the individual therapist and it is time for clinicians to welcomesuch research.
REFERENCESAlbert, G. (1997). What are the characteristics of effective
psychotherapists? The experts speak. Journal of Practi-cal Psychology and Behavioral Health, 3, 36–44.
Beck, A.T., Steer, R.A., & Garbin, M.G. (1988). Psycho-metric properties of the Beck Depression Inventory:twenty-five years later. Clinical Psychology Review, 8,77–100.
Bergin, A.E., & Suinn, R.M. (1975). Individual psy-chotherapy and behavior therapy. Annual Review ofPsychology, 26, 509–556.
Beutler, L.E., Machado, P.P.P., & Neufeldt, S.A. (1994).Therapist variables. In A.E. Bergin, & S.L. Garfield(Eds), Handbook of psychotherapy and behavior change (4thed.). New York: Wiley.
Bohart, A.C. (2000). Paradigm clash: Empirically supported treatments versus empirically supportedpsychotherapy practice. Psychotherapy Research, 10,488–493.
Bryk, A.S., & Raudenbush, S.W. (1992). Hierarchical linearmodels: Applications and data analysis methods. NewburyPark, CA: Sage Publications.
Bryk, A.S., Raudenbush, S.W., & Congdon, R.T. (1996).HLM for Windows (version 4.01.01) (ComputerProgram) SSI, Inc.
Crits-Christoph, P., & Mintz, J. (1991). Implications of therapist effects for the design and analysis of comparative studies of psychotherapies. Journal of Consulting and Clinical Psychology, 59, 20–26.
Derogatis, L.R. (1977). The SCL-90 manual: Scoring, admin-istration and procedures for the SCL-90. Baltimore: Johns-Hopkins University School of Medicine, ClinicalPsychometrics Unit.
Waiting for Supershrink: Therapist Effects 373
Copyright © 2003 John Wiley & Sons, Ltd. Clin. Psychol. Psychother. 10, 361–373 (2003)
Haas, E., Hill R., Lambert, M.J., & Morrell, B. (2002). Doearly responders to psychotherapy maintain treatmentgains? Journal of Clinical Psychology, 58, 1157–1172.
Jacobson, N.S., & Truax, P. (1991). Clinical significance: a statistical approach to defining meaningful change inpsychotherapy research. Journal of Consulting and Clin-ical Psychology, 59, 12–19.
Jennings, L., & Skovholt, T.M. (1999). The cognitive, emo-tional and relational characteristics of master thera-pists. Journal of Counseling Psychology, 46, 3–11.
Lambert, M.J., & Okiishi, J.C. (1997). The effects of theindividual psychotherapist and implications for futureresearch. Clinical Psychology: Research and Practice, 4,66–75.
Lambert, M.J., Hansen, N.B., Umphress, V., Lunnen, K.,Okiishi, J., Burlingame, G.M., Heufner, J.C., &Riesinger, C.R. (1996). Administration and scoringmanual for the Outcome Questionnaire. Wilmington,Delaware: APCS-LLC.
Lambert, M.J., Whipple, J.L., Smart, D.W., Vermeersch,D.A., Nielsen, S.L., & Hawkins, E.J. (2001). The effectsof providing therapists with feedback on patientprogress during psychotherapy: are outcomesenhanced? Psychotherapy Research, 11, 49–68.
Lambert, M.J., Whipple, J.L., Vermeersch, D.A., Smart,D.W., Hawkins, E.J., Nielsen, S.L., & Goates, M. (2002).Enhancing psychotherapy outcomes via providingfeedback on client progress: a replication. Clinical Psy-chology and Psychotherapy, 9, 91–103.
Luborsky, L., McClellan, A.T., Woody, G.E., O’Brien, C.P.,& Auerbach, A. (1985). Therapist success and its deter-minants. Archives of General Psychiatry, 42, 602–611.
Lueger, R.J., Howard, K.I., Martinovitch, Z., Lutz, W.,Andersen, E.E., & Grissom, G. (2001). Assessing treat-ment progress with individualized models of expectedresponse. Journal of Consulting and Clinical Psychology,69, 150–158.
Lutz, W. (2002). Patient-focused psychotherapy researchand individual treatment progress as scientificgroundwork for an empirically based clinical practice.Psychotherapy Research, 12, 251–272.
Orlinsky, D.E., & Howard, K.I. (1980). Gender and psy-chotherapeutic outcome. In A.M. Brodsky, & R.T. Hare-Mustin (Eds), Women and psychotherapy (pp. 3–34).New York: Guilford Press.
Ricks, D.F. (1974). Supershrink: methods of a therapistjudged successful on the basis of adult outcomes ofadolescent patients. In D.F. Ricks, M. Roff, & A.Thomas (Eds), Life history research in psychopathology.Minneapolis: University of Minnesota Press.
Spielberger, C.D. (1983). Manual for the State-Trait AnxietyInventory: STAI (Form Y). Palo Alto, CA: ConsultingPsychologists Press.
Steering Committee. (2002). Empirically supportedtherapy relationships: Conclusions and recommenda-tions of the Division 29 Task Force. Psychotherapy:Theory, Research, Practice, & Training, 38, 495–497.
Task Force. (1995). Training in and dissemination ofempirically-validated psychological treatments. TheClinical Psychologist, 48, 3–23.
Vermeersch, D.A., Lambert, M.J., & Burlingame, G.M.(2000). Outcome Questionnaire: item sensitivity tochange. Journal of Personality Assessment, 742, 242–261.
Whipple, J.L., Lambert, M.J., Vermeersch, D.A., Smart,D.W., Nielsen, S.L., & Hawkins, E.J. (2003). Improvingthe effects of psychotherapy: the use of early iden-tification of treatment failure and problem solvingstrategies in routine practice. Journal of Counseling Psychology, 50, 59–68.
Zung, W.W. (1965). A self-rating depression scale.Archives of General Psychiatry, 12, 63–70.


Copyright of Clinical Psychology & Psychotherapy is the property of John Wiley & Sons, Inc. and its content
may not be copied or emailed to multiple sites or posted to a listserv without the copyright holder's express
written permission. However, users may print, download, or email articles for individual use.